pco2 variability in the surface waters of the eastern gulf of
TRANSCRIPT

Ocean Sci., 15, 1225–1245, 2019https://doi.org/10.5194/os-15-1225-2019© Author(s) 2019. This work is distributed underthe Creative Commons Attribution 4.0 License.
pCO2 variability in the surface waters of the eastern Gulf of Cádiz(SW Iberian Peninsula)Dolores Jiménez-López1, Ana Sierra1, Teodora Ortega1, Soledad Garrido2, Nerea Hernández-Puyuelo1,Ricardo Sánchez-Leal3, and Jesús Forja1
1Departamento de Química-Física, INMAR, Facultad de Ciencias del Mar y Ambientales, Universidad de Cádiz, CampusUniversitario Río San Pedro, 11510 – Puerto Real, Cádiz, Andalucía, Spain2Instituto Español de Oceanografía, Centro Oceanográfico de Murcia, Varadero 1, 30740, San Pedro del Pinatar,Murcia, Spain3Instituto Español de Oceanografía, Centro Oceanográfico de Cádiz, Puerto Pesquero, Muelle de Levante s/n, Apdo. 2609,11006, Cádiz, Spain
Correspondence: Dolores Jiménez-López ([email protected])
Received: 6 February 2019 – Discussion started: 15 February 2019Revised: 8 August 2019 – Accepted: 10 August 2019 – Published: 12 September 2019
Abstract. Spatio-temporal variations in the partial pressureof CO2 (pCO2) were studied during eight oceanographiccruises conducted between March 2014 and February 2016in surface waters of the eastern shelf of the Gulf of Cádiz(SW Iberian Peninsula) between the Guadalquivir river andCape Trafalgar. pCO2 presents a range of variation between320.6 and 513.6 µatm with highest values during summer andautumn and lowest during spring and winter. For the wholestudy, pCO2 shows a linear dependence with temperature,and spatially there is a general decrease from coastal to off-shore stations associated with continental inputs and an in-crease in the zones deeper than 400 m related to the influenceof the eastward branch of the Azores Current. The study areaacts as a source of CO2 to the atmosphere during summerand autumn and as a sink in spring and winter with a meanvalue for the study period of−0.18±1.32 mmol m−2 d−1. Inthe Guadalquivir and Sancti Petri transects, the CO2 fluxesdecrease towards offshore, whereas in the Trafalgar tran-sect fluxes increase due to the presence of an upwelling.The annual uptake capacity of CO2 in the Gulf of Cádiz is4.1 Gg C yr−1.
1 Introduction
Continental shelves play a key role in the global carbon cycleas this is where the interactions between terrestrial, marineand atmospheric systems take place (Mackenzie et al., 1991;Walsh, 1991; Smith and Hollibaugh, 1993). These zones areconsidered to be among the most dynamic in biogeochem-ical terms (Wollast, 1991; Bauer et al., 2013) as they areaffected by several factors, particularly high rates of pri-mary production, remineralization and organic carbon burial(Walsh, 1988; Wollast, 1993; de Haas et al., 2002). Conti-nental shelves account for about 10 %–15 % of the ocean pri-mary production, and they contribute approximately 40 % ofthe total carbon sequestration through the mechanism of thebiological pump (Muller-Karger et al., 2005).
Generally, waters over the continental shelf account for ∼15 % of the global ocean CO2 uptake (−2.6± 0.5 Pg C yr−1;Le Quéré et al., 2018). Using direct surface ocean CO2 mea-surements from the global Surface Ocean CO2 Atlas (SO-CAT) database, Laruelle et al. (2014) estimated a sea–airexchange of CO2 in these zones of −0.19± 0.05 Pg C yr−1,lower than that estimated in other studies published in the lastdecade (e.g. Borges et al., 2005; Cai et al., 2006; Chen andBorges, 2009; Laruelle et al., 2010; Chen et al., 2013). Thediscrepancies with respect to this estimation derive from thedifferent definitions of the continental shelf domain and theskewed distribution of local studies (Laruelle et al., 2010).
Published by Copernicus Publications on behalf of the European Geosciences Union.

1226 D. Jiménez-López et al.: pCO2 variability in the surface waters of the eastern Gulf of Cádiz
In several works, it has been observed that the continentalshelves present different behaviour according to their lati-tude: they tend to act as a sink of carbon (−0.33 Pg C yr−1)at high and middle latitudes (30–90◦) and as a weak source(0.11 Pg C yr−1) at low latitudes (0–30◦) (Cai et al., 2006;Hofmann et al., 2011; Bauer et al., 2013; Chen et al., 2013;Laruelle et al., 2014, 2017). Laruelle et al. (2010) found dif-ferences between the two hemispheres: the continental shelfseas of the Northern Hemisphere are a net sink of CO2(−0.24 Pg C yr−1) and those of the Southern Hemisphere area weak source of CO2 (0.03 Pg C yr−1).
At the continental shelf, a high spatio-temporal variabil-ity in the air–sea CO2 fluxes occurs due to various effects,such as the thermodynamic effects, the biological processes,the gas exchange, the upwelling zones and the continentalinputs (e.g. Chen and Borges, 2009; Ito et al., 2016). Ther-modynamic effects are controlled by the inverse relationshipbetween temperature and solubility (0.0423 ◦C−1; Takahashiet al., 1993). Biological processes can induce CO2 uptakeor release, deriving respectively from phytoplankton photo-synthesis that decreases the concentration of inorganic car-bon and respiration by plankton and all other organisms thatincreases the concentration of inorganic carbon (Fennel andWilkin, 2009). Both factors (thermodynamic effects and bi-ological processes) are associated with the sea–air CO2 ex-change by physical and biological pumps (Volk and Hoffert,1985). The effects of upwelling systems are not clearly de-fined (Michaels et al., 2001). Although this process producesa vertical transport that brings up CO2 and remineralized in-organic nutrients from deep seawater (Liu et al., 2010), up-wellings are also responsible for high rates of primary pro-duction and a reduction of pCO2 under equilibrium with theatmosphere (e.g. van Geen et al., 2000; Borges and Frankig-noulle, 2002; Friederich et al., 2002). Several studies indicatethat these systems act as either a source or sink of CO2 de-pending on their location (Cai et al., 2006; Chen et al., 2013).Upwelling systems at low latitudes act mainly as a source ofCO2 but as a sink of CO2 at mid-latitudes (Frankignoulle andBorges, 2001; Feely et al., 2002; Astor et al., 2005; Borgeset al., 2005; Friederich et al., 2008; González-Dávila et al.,2009; Santana-Casiano et al., 2009). Upwelling systems inthe Pacific Ocean and Indian Ocean act as sources of CO2to the atmosphere, whereas in the Atlantic Ocean they aresinks of atmospheric CO2 (Borges et al., 2006; Laruelle et al.,2010). Additionally, the inner shelf is more affected by river-ine inputs of nutrients and terrestrial carbon (e.g. Gypens etal., 2011; Vandemark et al., 2011) and by human impact (Co-hen et al., 1997) than the outer shelf. The influence of bothfactors (riverine inputs and human impact) decreases towardsoffshore (Walsh, 1991). Several studies have determined thatthe inner shelf tends to act as a source of CO2 and the outershelf as a sink (e.g. Rabouille et al., 2001; Cai, 2003; Jianget al., 2008, 2013; Arruda et al., 2015). The inner platform(depth of less than 40 m) also shows greater seasonal vari-ability in temperature than the outer platform, and conse-
quently the effect of temperature on pCO2 will be greaterin the inner zone (Chen et al., 2013).
The Gulf of Cádiz is strategically located, connecting theAtlantic Ocean with the Mediterranean Sea through the Straitof Gibraltar, and in addition it receives continental inputsfrom several major rivers, i.e. the Guadalquivir, Rio Tinto,Odiel and Guadiana. Various studies have been conductedin this area to evaluate the variability in the sea surface par-tial pressure of CO2 (pCO2), although they cover smaller ar-eas and a shorter duration of time than this work (González-Dávila et al., 2003; Aït-Ameur and Goyet, 2006; Huertas etal., 2006; Ribas-Ribas et al., 2011) or only a specific area likethe Strait of Gibraltar (Dafner et al., 2001; Santana-Casianoet al., 2002; de la Paz et al., 2009). All of these studies, how-ever, have determined that this zone behaves as a sink of CO2with seasonal variations induced mainly by the combinationof the fluctuations of biomass concentration and temperature.
In this paper we evaluate the spatial and seasonal variationin the sea-surface pCO2 on the eastern shelf of the Gulf ofCádiz. In addition, we aim to assess the relative contributionof the thermal and non-thermal effects to pCO2 distributionand to determine if the area as a whole acts as a sink or asource of CO2 to the atmosphere over time. It has also beenpossible to estimate the influence that various sea surfacecurrents have on pCO2 variability since this study considersdeeper areas than previous works. Therefore, we can analysethe change that has occurred in relation to the CO2 uptake ca-pacity in the Gulf of Cádiz in the last 10 years in comparisonwith other studies that analyse the seasonal variation under-way by pCO2 in this area (Ribas-Ribas et al., 2011). In thiswork we have analysed a surface measurement database of> 26 000 values of pCO2 obtained during cruises made be-tween 2014 and 2016 and covering an area of 0.8◦× 1.3◦ ofthe Gulf of Cádiz.
2 Material and methods
2.1 Study area
This study was carried out over the eastern shelf of theGulf of Cádiz (Fig. 1), which forms a large basin betweenthe southwest of the Iberian Peninsula and the northwest ofAfrica, where the Atlantic Ocean connects with the Mediter-ranean Sea through the Strait of Gibraltar. In the Strait ofGibraltar a bilayer flow takes place with an upper Atlanticlayer flowing towards the Mediterranean basin and a deeperoutflow of higher-density Mediterranean waters flowing tothe Atlantic Ocean (e.g. Armi and Farmer, 1988; Baringerand Price, 1999; Sánchez-Leal et al., 2017). A similar cir-culation pattern of opposing flows is found in the Gulf ofCádiz where three main water masses are distributed at well-defined depth intervals and areas: the Surface Atlantic Wa-ter (SAW) with coastal and atmospheric influence, inflowingat the shallowest depths; the Eastern North Atlantic Central
Ocean Sci., 15, 1225–1245, 2019 www.ocean-sci.net/15/1225/2019/
D. Jiménez-López et al.: pCO2 variability in the surface waters of the eastern Gulf of Cádiz 1227
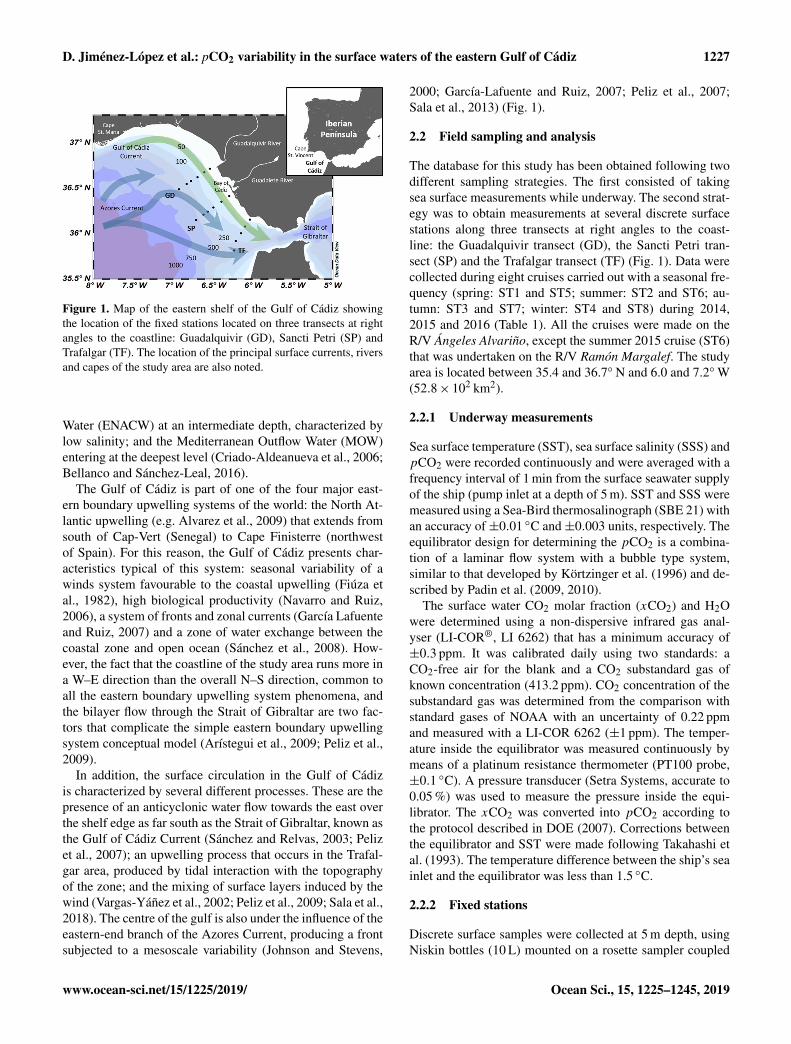
Figure 1. Map of the eastern shelf of the Gulf of Cádiz showingthe location of the fixed stations located on three transects at rightangles to the coastline: Guadalquivir (GD), Sancti Petri (SP) andTrafalgar (TF). The location of the principal surface currents, riversand capes of the study area are also noted.
Water (ENACW) at an intermediate depth, characterized bylow salinity; and the Mediterranean Outflow Water (MOW)entering at the deepest level (Criado-Aldeanueva et al., 2006;Bellanco and Sánchez-Leal, 2016).
The Gulf of Cádiz is part of one of the four major east-ern boundary upwelling systems of the world: the North At-lantic upwelling (e.g. Alvarez et al., 2009) that extends fromsouth of Cap-Vert (Senegal) to Cape Finisterre (northwestof Spain). For this reason, the Gulf of Cádiz presents char-acteristics typical of this system: seasonal variability of awinds system favourable to the coastal upwelling (Fiúza etal., 1982), high biological productivity (Navarro and Ruiz,2006), a system of fronts and zonal currents (García Lafuenteand Ruiz, 2007) and a zone of water exchange between thecoastal zone and open ocean (Sánchez et al., 2008). How-ever, the fact that the coastline of the study area runs more ina W–E direction than the overall N–S direction, common toall the eastern boundary upwelling system phenomena, andthe bilayer flow through the Strait of Gibraltar are two fac-tors that complicate the simple eastern boundary upwellingsystem conceptual model (Arístegui et al., 2009; Peliz et al.,2009).
In addition, the surface circulation in the Gulf of Cádizis characterized by several different processes. These are thepresence of an anticyclonic water flow towards the east overthe shelf edge as far south as the Strait of Gibraltar, known asthe Gulf of Cádiz Current (Sánchez and Relvas, 2003; Pelizet al., 2007); an upwelling process that occurs in the Trafal-gar area, produced by tidal interaction with the topographyof the zone; and the mixing of surface layers induced by thewind (Vargas-Yáñez et al., 2002; Peliz et al., 2009; Sala et al.,2018). The centre of the gulf is also under the influence of theeastern-end branch of the Azores Current, producing a frontsubjected to a mesoscale variability (Johnson and Stevens,
2000; García-Lafuente and Ruiz, 2007; Peliz et al., 2007;Sala et al., 2013) (Fig. 1).
2.2 Field sampling and analysis
The database for this study has been obtained following twodifferent sampling strategies. The first consisted of takingsea surface measurements while underway. The second strat-egy was to obtain measurements at several discrete surfacestations along three transects at right angles to the coast-line: the Guadalquivir transect (GD), the Sancti Petri tran-sect (SP) and the Trafalgar transect (TF) (Fig. 1). Data werecollected during eight cruises carried out with a seasonal fre-quency (spring: ST1 and ST5; summer: ST2 and ST6; au-tumn: ST3 and ST7; winter: ST4 and ST8) during 2014,2015 and 2016 (Table 1). All the cruises were made on theR/V Ángeles Alvariño, except the summer 2015 cruise (ST6)that was undertaken on the R/V Ramón Margalef. The studyarea is located between 35.4 and 36.7◦ N and 6.0 and 7.2◦W(52.8× 10² km2).
2.2.1 Underway measurements
Sea surface temperature (SST), sea surface salinity (SSS) andpCO2 were recorded continuously and were averaged with afrequency interval of 1 min from the surface seawater supplyof the ship (pump inlet at a depth of 5 m). SST and SSS weremeasured using a Sea-Bird thermosalinograph (SBE 21) withan accuracy of±0.01 ◦C and±0.003 units, respectively. Theequilibrator design for determining the pCO2 is a combina-tion of a laminar flow system with a bubble type system,similar to that developed by Körtzinger et al. (1996) and de-scribed by Padin et al. (2009, 2010).
The surface water CO2 molar fraction (xCO2) and H2Owere determined using a non-dispersive infrared gas anal-yser (LI-COR®, LI 6262) that has a minimum accuracy of±0.3 ppm. It was calibrated daily using two standards: aCO2-free air for the blank and a CO2 substandard gas ofknown concentration (413.2 ppm). CO2 concentration of thesubstandard gas was determined from the comparison withstandard gases of NOAA with an uncertainty of 0.22 ppmand measured with a LI-COR 6262 (±1 ppm). The temper-ature inside the equilibrator was measured continuously bymeans of a platinum resistance thermometer (PT100 probe,±0.1 ◦C). A pressure transducer (Setra Systems, accurate to0.05 %) was used to measure the pressure inside the equi-librator. The xCO2 was converted into pCO2 according tothe protocol described in DOE (2007). Corrections betweenthe equilibrator and SST were made following Takahashi etal. (1993). The temperature difference between the ship’s seainlet and the equilibrator was less than 1.5 ◦C.
2.2.2 Fixed stations
Discrete surface samples were collected at 5 m depth, usingNiskin bottles (10 L) mounted on a rosette sampler coupled
www.ocean-sci.net/15/1225/2019/ Ocean Sci., 15, 1225–1245, 2019

1228 D. Jiménez-López et al.: pCO2 variability in the surface waters of the eastern Gulf of Cádiz
Table 1. Date, number of measurements (n), range, average values, and standard deviation of underway sea surface temperature (SST),sea surface salinity (SSS), and pCO2 during the eight cruises undertaken: March 2014 (ST1), June 2014 (ST2), October 2014 (ST3),December 2014 (ST4), March 2015 (ST5), June 2015 (ST6), September 2015 (ST7) and February 2016 (ST8).
Cruise Date n SST (◦C) SSS pCO2 (µatm)
Range Mean±SD Range Mean±SD Range Mean±SD
ST1 28/03–01/04, 2014 3874 14.3–16.4 15.4± 0.6 35.57–37.06 36.11± 0.18 365.4–513.6 396.5± 19.0ST2 25/06–01/07, 2014 4118 17.0–22.9 21.1± 0.9 35.90–36.45 36.21± 0.15 368.7–459.5 412.9± 12.6ST3 01/10–07/10, 2014 4233 16.1–23.4 21.5± 1.3 35.80–36.79 36.26± 0.22 391.6–444.5 413.5± 9.8ST4 10/12–16/12, 2014 2938 15.6–19.1 18.1± 0.7 34.68–36.72 36.36± 0.21 369.6–444.5 388.7± 12.9ST5 28/03–01/04, 2015 3180 14.6–16.9 15.6± 0.4 35.54–36.52 36.12± 0.14 320.6–416.5 368.6± 14.9ST6 19/06–25/06, 2015 3677 17.4–22.1 20.9± 0.8 35.63–36.92 36.40± 0.08 372.1–464.1 410.3± 13.8ST7 15/09–18/09, 2015 2575 17.0–21.9 20.6± 1.1 35.03–36.79 35.64± 0.08 387.6–457.1 407.6± 11.2ST8 02/02–03/02, 2016 1812 15.1–17.5 16.8± 0.4 35.83–36.55 36.44± 0.09 346.2–442.6 392.9± 17.9
to a Sea-Bird CTD 911+ (conductivity–temperature–depthsystem), to measure pH, dissolved oxygen, chlorophyll a andnutrient concentrations.
The pH was measured by potentiometer in duplicate us-ing 100 mL of seawater with a glass-combined electrode(Metrohm, 905) calibrated on the total pH scale using a TRISbuffer solution (tris(hydroxymethyl) aminomethane; Zeebeand Wolf-Gladrow, 2001). Dissolved oxygen values were ob-tained with the sensor of the rosette (SBE 63) pre-calibratedusing Winkler titration (±0.1 µmol L−1) of samples collectedfrom several water depths at selected stations (Parsons et al.,1984). Apparent oxygen utilization (AOU) was determinedas the difference between the solubility calculated applyingthe expression proposed by Weiss (1974) and the experi-mental values of dissolved oxygen. For chlorophyll a de-termination, 1 L of seawater was filtered (Whatman, GF/F0.7 µm) and frozen (−20 ◦C) until analysis in the labora-tory. Total chlorophyll a was extracted with 90 % pure ace-tone and quantified after 24 h by fluorometry analysis (Hi-tachi F-2500) (Yentsch and Menzel, 1963). Nutrient samplesfor analysis of nitrate and phosphate contents were filteredthrough pre-combusted glass-fibre filters (Whatman, GF/F0.7 µm) and frozen at −20 ◦C. Analyses were performed ina segmented flow auto-analyser (Skalar, San Plus) based onclassic spectrophotometric methods (Grasshoff et al., 1983).The accuracies of the determinations obtained are the follow-ing: ±0.003 for pH, ±0.1µmol L−1 for dissolved oxygen,±0.1 µg L−1 for chlorophyll a, ±0.10 µmol L−1 for nitrate,and ±0.02 µmol L−1 for phosphate.
The corresponding data of SST, SSS and pCO2 forthe fixed stations were obtained by the underway mea-surements, averaging data corresponding to approximately0.9 km around the location of the fixed stations. SST and SSSdata were compared with the values collected with the CTDcoupled to the rosette sampler, and they do not show differ-ences greater than 0.04 ◦C and 0.01 units, respectively.
2.3 Thermal and non-thermal effects on pCO2calculations
To determine the relative importance of the thermal and non-thermal effects on the changes in pCO2 in seawater (e.g.Landschützer et al., 2015; Reimer et al., 2017), we followthe method described by Takahashi et al. (2002). To removethe thermal effect from the observed pCO2, the data werenormalized to a constant temperature (the mean in situ SSTdepending on the focus considered) according to Eq. (1).
pCO2 at SSTmean = (pCO2)obs
· exp[0.0423 · (SSTmean−SSTobs)] , (1)
where the subscripts “mean” and “obs” indicate the averageand observed SST values, respectively.
To analyse the effect of the thermal changes in pCO2 atthe given observed temperatures (SSTobs) the following ex-pression has been used:
pCO2 at SSTobs = (pCO2)mean
· exp[0.0423 · (SSTobs−SSTmean)] . (2)
When the thermal effect is removed, the remaining variationsin pCO2 are due to the non-thermal influences, such as thebiological utilization of CO2, the vertical and lateral trans-port, the sea–air exchange of CO2, and terrestrial inputs (e.g.Qu et al., 2014; Arruda et al., 2015; Ito et al., 2016; Xueet al., 2016). The non-thermal effects on the surface waterpCO2, (1pCO2)n-T, can be calculated from the seasonal am-plitude of pCO2 values normalized to the mean SST, (pCO2at SSTmean), using Eq. (1):
(1pCO2)n-T = (pCO2 at SSTmean)max
− (pCO2 at SSTmean)min. (3)
The seasonal amplitude of pCO2 values normalized to theobserved SST (pCO2 at SSTobs) represents the thermal effectof changes in the mean annual pCO2 value, (1pCO2)T, and
Ocean Sci., 15, 1225–1245, 2019 www.ocean-sci.net/15/1225/2019/
D. Jiménez-López et al.: pCO2 variability in the surface waters of the eastern Gulf of Cádiz 1229
it is calculated with the following expression:
(1pCO2)T = (pCO2 at SSTobs)max
− (pCO2 at SSTobs)min. (4)
The ratio between the thermal effects (T ) and non-thermaleffects (B) quantifies the relative importance of each effect(Takahashi et al., 2002):
T/B = (1pCO2)T/(1pCO2)n-T. (5)
A T/B ratio greater than 1 implies the dominance of ther-mal effects over non-thermal effects on the pCO2 dynamics.However, a T/B lower than 1 reveals a greater influence ofnon-thermal processes. This method was originally designedfor open ocean systems, but it has been widely used by otherauthors in coastal areas (e.g. Schiettecatte et al., 2007; Ribas-Ribas et al., 2011; Qu et al., 2014; Burgos et al., 2018).
In addition, Olsen et al. (2008) propose a method in whichthe seasonal signal of pCO2 data is decomposed into indi-vidual components due to variations in SST, in air–sea CO2exchange, in SSS, and in combined mixing and biologicalprocesses, according to Eq. (6).
dpCO2sw,i= dSSTpCO2
sw,i+ dASpCO2
sw,i
+ dSSSpCO2sw,i+ dMBpCO2
sw,i, (6)
where the superscript “sw” makes reference to the surfacepCO2 in the seawater and “i” to the mean value betweenconsecutive cruises for all variables; dpCO2
sw,i is the ob-served change in pCO2; dSSTpCO2
sw,i is the change dueto SST changes; dASpCO2
sw,i is the change due to air–seaexchange; dSSSpCO2
sw,i is the change due to salinity vari-ations; and dMBpCO2
sw,i is the change due to mixing plusbiology. At the same time, each process is calculated withthe following equations (Olsen et al., 2008):
dSSTpCO2sw,i= pCO2
sw,i· e0.0423(1SST)
−pCO2sw,i, (7)
where 1SST is the SST difference between two cruises.
dASpCO2sw,i=−
(d ·F i
)/MLDi, (8)
where d is the number of days passed between two cruises(90 d approximately); F i is the mean flux of CO2; and MLDi
is the mean mixed layer depth.
dSSSpCO2sw,i= pCO2
sw,n+1(
DICn+1,TAn+1,SSSn+1,SSTi)
−pCO2sw,n
(DICn,TAn,SSSn,SSTi
), (9)
where the superscript “n” refers to the mean value of eachcruise and the variables DIC (dissolved inorganic carbon)and TA (total alkalinity) have been estimated from pH andpCO2 using the K1 and K2 acidity constants proposed byLueker et al. (2000) in the total pH scale through the pro-gram CO2SYS (Lewis et al., 1998). dMBpCO2
sw,i is calcu-lated as a residual, i.e. as the change in pCO2 that is not ex-plained by other processes. Additionally, this study includes
both coastal areas and deeper areas (the analysis is dividedinto a function of the system depth) between coastal (wa-ter depth < 50 m) and distal (water depth > 50 m) areas. Thus,MLDi in distal areas (Table 3) was calculated and derivedfrom the thermocline position that separates the SAW and theENACW (71.3–96.8 m), while the coastal areas correspondto the depth of these areas (15–50 m).
2.4 Estimation of CO2 fluxes
Fluxes of CO2 across the sea–air interface were estimatedusing the following relationship:
FCO2 = α · k · (1pCO2)sea−air, (10)
where k (cm h−1) is the gas transfer velocity; α is the sol-ubility coefficient of CO2 (Weiss, 1974) and 1pCO2 is thedifference between the sea and air values of pCO2. The at-mospheric pCO2 (pCO2
atm) values were obtained from themonthly atmospheric data of xCO2 (xCO2
atm) at the IzañaAtmospheric Research Center in Spain (Earth System Re-search Laboratory; https://www.esrl.noaa.gov/gmd/dv/data/index.php, last access: 9 January 2019). The xCO2
atm wasconverted to pCO2
atm as described in DOE (2007).The gas transfer velocity, k, was calculated using the pa-
rameterization formulated by Wanninkhof (2014):
k = 0.251 · u2(Sc/660)−0.5, (11)
where u (m s−1) is the mean wind speed at 10 m height oneach cruise, obtained from the shipboard weather station; Scis the Schmidt number of CO2 in seawater and 660 is the Scin seawater at 20 ◦C.
2.5 Statistical analysis
Statistical analyses were performed with IBM SPSS Statis-tics software (version 20.0; Armonk, New York, USA). Thedataset was analysed using a one-way analysis of variancetest (ANOVA) for analysing significant differences betweencruises for discrete and continuous surface data on hydrolog-ical and biogeochemical characteristics. The threshold valuefor statistical significance was taken as p < 0.05. Moreover,all reported linear correlations are type I and they are statisti-cally significant with p values smaller than 0.05 in the entirearticle unless indicated otherwise.
3 Results
3.1 Underway variables
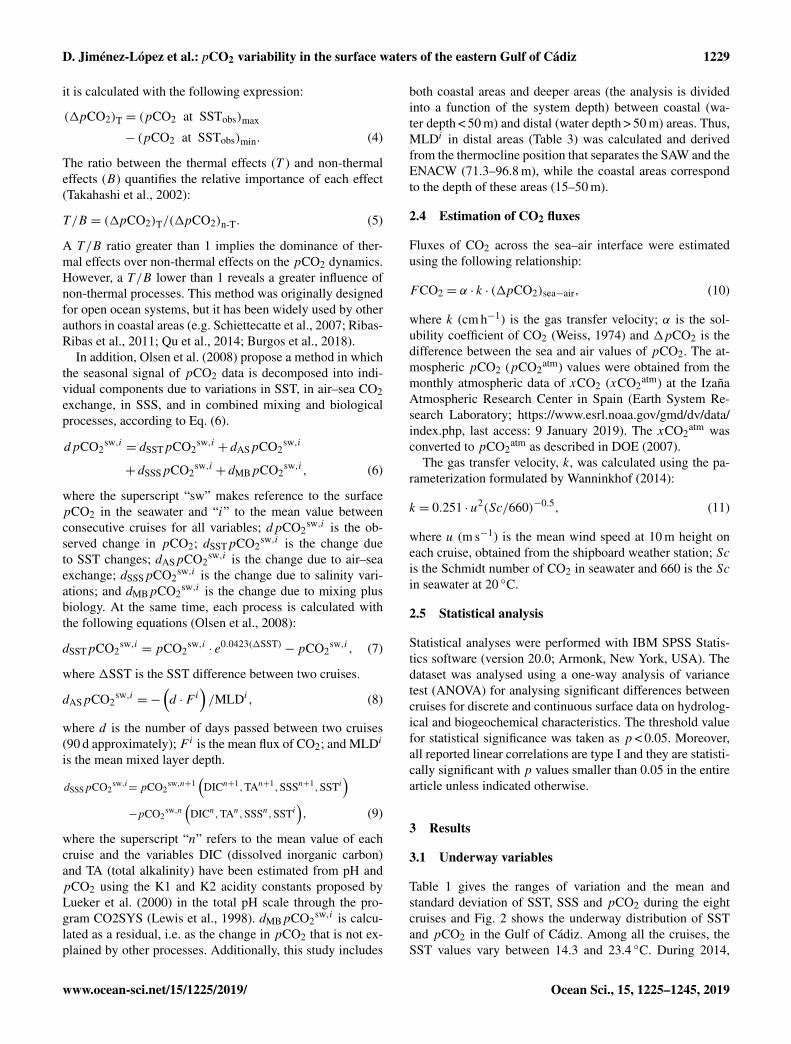
Table 1 gives the ranges of variation and the mean andstandard deviation of SST, SSS and pCO2 during the eightcruises and Fig. 2 shows the underway distribution of SSTand pCO2 in the Gulf of Cádiz. Among all the cruises, theSST values vary between 14.3 and 23.4 ◦C. During 2014,
www.ocean-sci.net/15/1225/2019/ Ocean Sci., 15, 1225–1245, 2019
1230 D. Jiménez-López et al.: pCO2 variability in the surface waters of the eastern Gulf of Cádiz
SST values were found to be higher than those in 2015and 2016 (Table 1). For the whole period, the averaged val-ues were highest during summer (21.0± 0.8 ◦C) and au-tumn (21.1± 1.2 ◦C), lowest during spring (15.5± 0.5 ◦C),and intermediate during winter (17.5± 0.6 ◦C). In general,SST tended to increase from coastal to offshore areas duringspring and winter, while in summer and autumn this SST gra-dient was inverse (Fig. 2a). No substantial differences werefound between the three transects studied (GD, SP and TF),although near the Guadalquivir river mouth and Cape Trafal-gar (36.19◦ N, 6.03◦W) the lowest values of SST due tofreshwater inputs and the frequent upwelled waters, respec-tively, were detected.
Since the cruises were carried out at the beginning ofeach meteorological season, it is appropriate to analyse howrepresentative is the range of temperatures that has beenobtained. Figure 3 shows the mean value over the last10 years of the maximum and minimum temperatures in theGulf of Cádiz acquired by an oceanographic buoy (bottom-mounted at 36.48◦ N, 6.96◦W; Puertos del Estado; http://www.puertos.es/es-es/oceanografia/Paginas/portus.aspx, lastaccess: 12 July 2018); the mean values and standard devi-ations of the eight cruises are superimposed. It can be ob-served that the mean values for each cruise are within therange of variation of the typical temperature in the Gulf ofCádiz, and the mean temperature found (18.8 ◦C) is veryclose to the mean value obtained at the oceanographic buoy(19.2 ◦C, Fig. 3). Sampling during our cruises did not detectthe highest temperatures occurring in the Gulf of Cádiz dur-ing August, which may indicate that the real range of pCO2variation is greater than that determined in this study.
Average values of SSS varied significantly among thecruises, ranging between 35.03 and 37.06. The highest meanvalues were recorded during February 2016 (36.44± 0.09)and lowest during September 2015 (35.64± 0.08) (Table 1).The lowest salinity value (35.03) and the most notable spa-tial variation (35.03–36.36) was observed during Decem-ber 2014 in the area of the Guadalquivir river, associatedwith a period of storms with consequent major freshwaterdischarges. The area that presented the highest mean salinityvalue for the whole study was TF (36.19± 0.25).
During our study period, pCO2 values ranged from 320.6to 513.6 µatm. The highest values were recorded during sum-mer and autumn of 2014 and 2015 (Table 1) with similarmean values, 411.6± 13.2 µatm and 410.6± 10.5 µatm, re-spectively, found for both seasons; the lowest mean valuewas logged during spring (382.5± 16.9 µatm), while winterpresented an intermediate value (390.8± 15.4 µatm). Thesemean values are not significantly different and the standarddeviations are high, indicating high spatial and inter-annualvariability. In general, the pCO2 tended to decrease with thedistance to the coast (Fig. 2b). When comparing these val-ues with pCO2 values in the atmosphere, an undersaturationof CO2 was observed during spring and winter (15.3± 15.7and 18.0± 11.4 µatm, respectively) and an oversaturation in
summer and autumn (−20.4± 24.6 and −8.0± 15.3 µatm,respectively). In Fig. 2 a sharp variation of SST and pCO2can be observed in some zones that coincides with the sta-tions where discrete water samples were taken. This may bedue to the different sampling times at these stations, whichvaried between 2 and 8 h as a function of the depth of thesystem.
The database of this study includes the transition fromcoastal zones with depths of the order of 20 m to distalshelf waters with depths greater than 800 m. Figure 4 showsthe general trend of the mean values of pCO2 and SSTfor different intervals of depth of the water column basedon the information obtained in the eight cruises. Althoughthere is no statistical difference in pCO2 or SST with bot-tom depth, it can be observed that the highest values ofpCO2 (408.3± 26.7 µatm) correspond to the coastal zone(< 50 m) and that values decrease down to a depth of 100–200 m (396.1± 23 µatm). In addition, towards open waters(> 600 m) there is a progressive increase in pCO2 and SST(404.3± 16.5 µatm and 20.1± 2.4 ◦C, respectively).
3.2 Discrete surface variables
Table 2 shows the average values and standard deviationfor the underway averaged measurements of SST and SSSand for the discrete samples of pH, AOU, chlorophyll a, ni-trate and phosphate at fixed stations along the three transectsduring the eight cruises. The pH presented significant dif-ferences among the cruises with a range of variation from7.84 to 8.34. Lowest mean values were found during sum-mer (8.00± 0.04) and autumn (7.96± 0.05) of 2014 and2015, respectively (Table 2), coinciding with the highest av-erage values of pCO2 recorded (Table 1). The pH values forspring and winter were practically equal for 2014 and 2015(8.08±0.08 and 8.07±0.05, respectively). AOU was signif-icantly different between all the cruises but a clear seasonalvariability was not observed. Values measured ranged from−31.9 to 12.3 µmol L−1 with the highest values in Decem-ber 2014 (7.7±2.1 µmol L−1) and the lowest in March 2015(−19.1±9.4 µmol L−1) (Table 2). For both years, the lowestmean value was recorded in spring (−11.3± 8.9 µmol L−1)and the highest in winter (1.3±2.6 µmol L−1). All mean val-ues were negative except for those of December 2014; thatexception may have been due to the exceptional mixing ofthe water column caused by the storms. No general trend inthe spatial variations in pH and AOU was found.
Chlorophyll a values presented significant differencesamong the cruises and between the same seasons of eachyear. This variable varied from 0.02 to 2.37 µg L−1 withthe highest mean value measured in March 2015 (0.76±0.55 µg L−1), which coincides with the lowest (negative)mean value of AOU (Table 2). The lowest mean value wasin June 2014 (0.18±0.14 µg L−1). With reference to the sea-sons of both years, the highest value was in spring (0.71±0.46 µg L−1), followed by winter (0.58± 0.33 µg L−1) and
Ocean Sci., 15, 1225–1245, 2019 www.ocean-sci.net/15/1225/2019/
D. Jiménez-López et al.: pCO2 variability in the surface waters of the eastern Gulf of Cádiz 1231
Figure 2. Underway distribution of sea surface temperature (SST (◦C), a) and pCO2 (µ atm, b) during the eight cruises in the Gulf of Cádiz:March 2014 (ST1), June 2014 (ST2), October 2014 (ST3), December 2014 (ST4), March 2015 (ST5), June 2015 (ST6), September 2015(ST7) and February 2016 (ST8).
Table 2. Number of samples (n), mean values, and standard deviation for the averaged underway measurements of sea surface temperature(SST), sea surface salinity (SSS), pH, apparent oxygen utilization (AOU), chlorophyll a (data from González-García et al., 2018), and nitrateand phosphate in surface water samples (at depth of 5 m) at fixed stations during the eight cruises: March 2014 (ST1), June 2014 (ST2),October 2014 (ST3), December 2014 (ST4), March 2015 (ST5), June 2015 (ST6), September 2015 (ST7) and February 2016 (ST8).
Cruise n SST SSS pH AOU Chlorophyll a Nitrate Phosphate(◦C) (µmol L−1) (µg L−1)∗ (µmol L−1) (µmol L−1)
ST1 18 15.2± 0.5 36.05± 0.13 8.06± 0.03 −3.6± 8.4 0.65± 0.37 0.96± 1.01 0.14± 0.06ST2 16 21.0± 1.3 36.11± 0.11 7.97± 0.03 −10.3± 5.7 0.18± 0.14 0.42± 0.60 0.12± 0.04ST3 17 21.6± 0.7 36.09± 0.28 7.97± 0.06 −4.6± 3.2 0.24± 0.29 0.34± 0.27 0.09± 0.03ST4 17 17.7± 0.7 36.03± 0.13 8.05± 0.05 7.7± 2.1 0.46± 0.33 1.05± 1.96 0.23± 0.09ST5 16 15.4± 0.3 36.03± 0.13 8.09± 0.12 −19.1± 9.4 0.76± 0.55 0.68± 1.17 0.17± 0.09ST6 16 21.1± 1.0 36.37± 0.05 8.01± 0.03 −2.4± 3.2 0.26± 0.34 0.12± 0.14 0.10± 0.05ST7 17 20.6± 1.2 35.63± 0.03 7.94± 0.03 −2.6± 5.0 0.29± 0.31 0.37± 0.50 0.50± 0.55ST8 6 16.8± 0.3 36.44± 0.04 8.09± 0.05 −5.1± 3.1 0.69± 0.32 0.41± 0.31 0.14± 0.11
∗ González-García et al. (2018).
autumn (0.26± 0.30 µg L−1), and the lowest value in sum-mer (0.23±0.25 µg L−1). The SP transect presented the low-est mean value of the whole study (0.33± 0.31 µg L−1) andthe TF zone the highest (0.49± 0.37 µg L−1).
Nitrate concentration did not show significant differ-ences among the cruises, ranging between 0.00 and1.93 µmol L−1. The highest mean value was recorded inspring (0.82± 1.09 µmol L−1) and the lowest in summer
(0.25± 0.35 µmol L−1) of both years. The TF transect pre-sented the highest mean concentration for the whole study(0.77±0.76 µmol L−1). Phosphate concentration showed sig-nificant differences among all the cruises. By season, thehighest mean value was obtained during autumn (0.31±0.30 µmol L−1), although the average data in October 2014(0.09±0.03 µmol L−1) were lower than that of 2015 (0.50±0.55 µmol L−1) (Table 2). The lowest mean value was ob-
www.ocean-sci.net/15/1225/2019/ Ocean Sci., 15, 1225–1245, 2019

1232 D. Jiménez-López et al.: pCO2 variability in the surface waters of the eastern Gulf of Cádiz
Figure 3. Maximum and minimum sea surface temperature (SST)variation during a 10-year period recorded by an oceanographicbuoy located in the Gulf of Cádiz (36.48◦ N, 6.96◦W). The red lineshows maximum SST variation. The green line shows minimumSST variation. The grey line shows the average temperature for the10-year period. Blue circles show mean values and standard devi-ations of underway SST measured during the eight cruises carriedout during this study.
Figure 4. Underway variation in pCO2 and sea surface temperature(SST) at different bottom-depth ranges of the water column (metres)during the eight cruises. The mean values and standard deviations ofpCO2 (blue) and SST (red) for each range of depth are represented.High standard deviations are associated with the seasonal and inter-annual variability for the whole sampling period.
served during summer (0.10±0.05 µmol L−1). The GD tran-sect presented the highest mean value of the whole study(0.28± 0.39 µmol L−1), and the lowest values were found inthe TF and SP transects with similar values in each, 0.15±0.07 µmol L−1 and 0.14± 0.09 µmol L−1, respectively. Themean N/P ratio in surface waters for the whole study was3.5± 2.0, similar to that estimated by Anfuso et al. (2010)in the northeast continental shelf of the Gulf of Cádiz, which
indicates a relative phosphate deficit with respect to the Red-field ratio (Redfield et al., 1963).
3.3 Air–sea CO2 exchange
Table 3 summarizes the mean values and standard devia-tions for atmospheric pCO2, wind speed, gas transfer ve-locity and the air–sea CO2 fluxes measured in this study.The mean wind speeds were relatively similar for the wholestudy period, ranging between 5.5±2.8 m s−1 (March 2015)and 7.7± 4.2 m s−1 (December 2014). The gas transfer ve-locity varied between 6.9± 0.1 cm h−1 in March 2015 and14.4± 0.3 cm h−1 in June 2015 since it is very sensitive tochanges in wind speed. There was a slight seasonal variationin the CO2 fluxes similar to pCO2, because they are associ-ated to the spatio-temporal variability and they present highstandard deviations. The study area acted as a source of CO2to the atmosphere during summer and autumn (0.7±1.5 and1.2±0.9 mmol m−2 d−1, respectively) and as a sink in springand winter (−1.3± 1.6 and −1.3± 1.6 mmol m−2 d−1, re-spectively).
4 Discussion
4.1 Thermal influence in pCO2
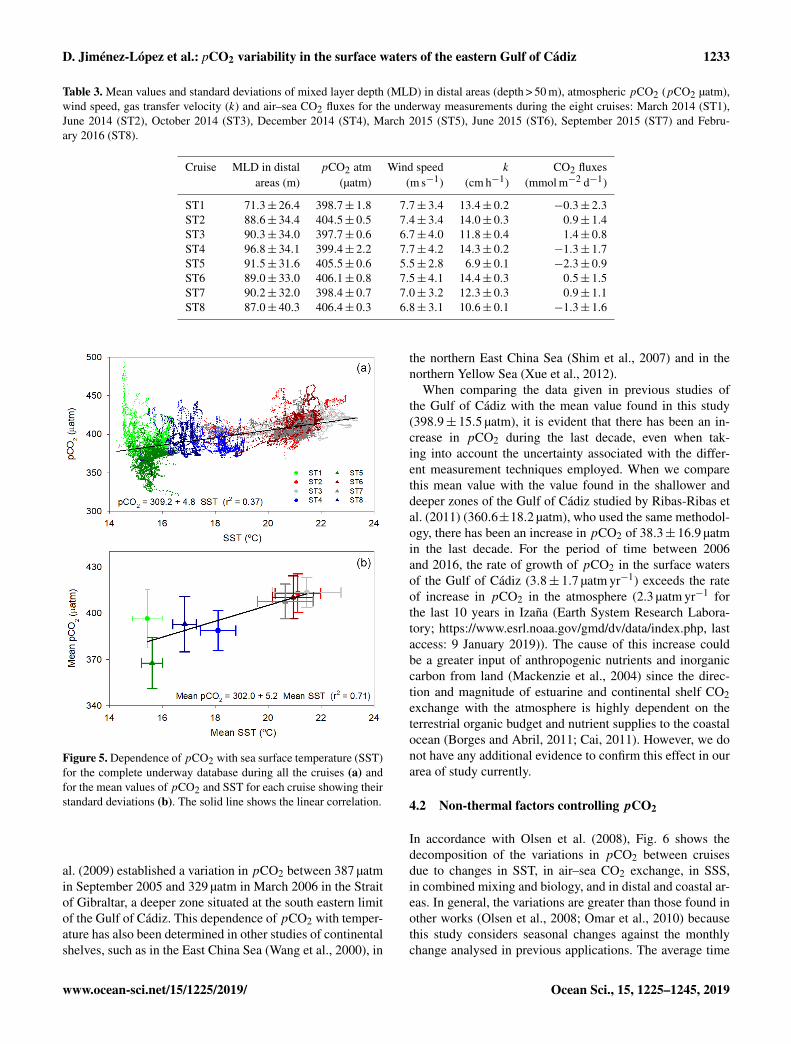
Numerous research studies have determined that tempera-ture is one of the most important factors that controls thevariability in pCO2 in the ocean (e.g. Millero, 1995; Bateset al., 2000; Takahashi et al., 2002; Carvalho et al., 2017)as a consequence of the dependence of the solubility ofCO2 with the temperature (Weiss, 1974; Woolf et al., 2016).When pCO2 is affected only by the temperature, Takahashiet al. (1993) determined a relative variation in pCO2 of0.0423 ◦C−1, equivalent to 16.9 µatm◦C−1 for experimentalpCO2 of 400 µatm. In our study, all data from all seasonstogether exhibited a linear relationship between pCO2 andSST (r2
= 0.37, Fig. 5a). This relationship becomes evenmore significant when it is obtained from the mean values ofpCO2 and SST of each cruise (r2
= 0.71, Fig. 5b). The slope,4.80 µatm ◦C−1, is lower than the thermal effect on pCO2 de-scribed by Takahashi et al. (1993) and indicates the influenceof other non-thermal processes on the distribution of pCO2in this zone of the Gulf of Cádiz.
There are previous studies in which the seasonal vari-ations in pCO2 in more coastal zones of the Gulf ofCádiz (depth < 100 m) are described (Table 4). Ribas-Ribaset al. (2011) found in the north eastern shelf during June 2006and May 2007 a dependence of pCO2 with temperaturesimilar to that found in this study (5.03 µatm ◦C−1, r2
=
0.42) and a pCO2 that ranged between 338 and 397 µatm.In 2003, Huertas et al. (2006) found variations in pCO2ranging between 196 µatm in March and 400–650 µatm inAugust in a zone situated more to the west, between therivers Guadalquivir and Guadiana. In addition, de la Paz et
Ocean Sci., 15, 1225–1245, 2019 www.ocean-sci.net/15/1225/2019/
D. Jiménez-López et al.: pCO2 variability in the surface waters of the eastern Gulf of Cádiz 1233
Table 3. Mean values and standard deviations of mixed layer depth (MLD) in distal areas (depth > 50 m), atmospheric pCO2 (pCO2 µatm),wind speed, gas transfer velocity (k) and air–sea CO2 fluxes for the underway measurements during the eight cruises: March 2014 (ST1),June 2014 (ST2), October 2014 (ST3), December 2014 (ST4), March 2015 (ST5), June 2015 (ST6), September 2015 (ST7) and Febru-ary 2016 (ST8).
Cruise MLD in distal pCO2 atm Wind speed k CO2 fluxesareas (m) (µatm) (m s−1) (cm h−1) (mmol m−2 d−1)
ST1 71.3± 26.4 398.7± 1.8 7.7± 3.4 13.4± 0.2 −0.3± 2.3ST2 88.6± 34.4 404.5± 0.5 7.4± 3.4 14.0± 0.3 0.9± 1.4ST3 90.3± 34.0 397.7± 0.6 6.7± 4.0 11.8± 0.4 1.4± 0.8ST4 96.8± 34.1 399.4± 2.2 7.7± 4.2 14.3± 0.2 −1.3± 1.7ST5 91.5± 31.6 405.5± 0.6 5.5± 2.8 6.9± 0.1 −2.3± 0.9ST6 89.0± 33.0 406.1± 0.8 7.5± 4.1 14.4± 0.3 0.5± 1.5ST7 90.2± 32.0 398.4± 0.7 7.0± 3.2 12.3± 0.3 0.9± 1.1ST8 87.0± 40.3 406.4± 0.3 6.8± 3.1 10.6± 0.1 −1.3± 1.6
Figure 5. Dependence of pCO2 with sea surface temperature (SST)for the complete underway database during all the cruises (a) andfor the mean values of pCO2 and SST for each cruise showing theirstandard deviations (b). The solid line shows the linear correlation.
al. (2009) established a variation in pCO2 between 387 µatmin September 2005 and 329 µatm in March 2006 in the Straitof Gibraltar, a deeper zone situated at the south eastern limitof the Gulf of Cádiz. This dependence of pCO2 with temper-ature has also been determined in other studies of continentalshelves, such as in the East China Sea (Wang et al., 2000), in
the northern East China Sea (Shim et al., 2007) and in thenorthern Yellow Sea (Xue et al., 2012).
When comparing the data given in previous studies ofthe Gulf of Cádiz with the mean value found in this study(398.9± 15.5 µatm), it is evident that there has been an in-crease in pCO2 during the last decade, even when tak-ing into account the uncertainty associated with the differ-ent measurement techniques employed. When we comparethis mean value with the value found in the shallower anddeeper zones of the Gulf of Cádiz studied by Ribas-Ribas etal. (2011) (360.6±18.2 µatm), who used the same methodol-ogy, there has been an increase in pCO2 of 38.3±16.9 µatmin the last decade. For the period of time between 2006and 2016, the rate of growth of pCO2 in the surface watersof the Gulf of Cádiz (3.8± 1.7 µatm yr−1) exceeds the rateof increase in pCO2 in the atmosphere (2.3 µatm yr−1 forthe last 10 years in Izaña (Earth System Research Labora-tory; https://www.esrl.noaa.gov/gmd/dv/data/index.php, lastaccess: 9 January 2019)). The cause of this increase couldbe a greater input of anthropogenic nutrients and inorganiccarbon from land (Mackenzie et al., 2004) since the direc-tion and magnitude of estuarine and continental shelf CO2exchange with the atmosphere is highly dependent on theterrestrial organic budget and nutrient supplies to the coastalocean (Borges and Abril, 2011; Cai, 2011). However, we donot have any additional evidence to confirm this effect in ourarea of study currently.
4.2 Non-thermal factors controlling pCO2
In accordance with Olsen et al. (2008), Fig. 6 shows thedecomposition of the variations in pCO2 between cruisesdue to changes in SST, in air–sea CO2 exchange, in SSS,in combined mixing and biology, and in distal and coastal ar-eas. In general, the variations are greater than those found inother works (Olsen et al., 2008; Omar et al., 2010) becausethis study considers seasonal changes against the monthlychange analysed in previous applications. The average time
www.ocean-sci.net/15/1225/2019/ Ocean Sci., 15, 1225–1245, 2019

1234 D. Jiménez-López et al.: pCO2 variability in the surface waters of the eastern Gulf of Cádiz
Table 4. Range, mean and standard deviation of pCO2, air–sea CO2 fluxes (FCO2) and T/B ratio found in different areas of the Gulf ofCádiz.
Site ◦ E ◦ N Date pCO2 FCO2 T/B Reference(µatm) (mmol m−2 d−1)a
Strait of Gibraltar −5.5 to −5.2 35.6 to 36.0 September 1997 352.8± 2.0 3± 8b – Santana-Casiano et al. (2002)339–381
Gulf of Cádiz −7.0 to −6.5 36.3 to 36.7 February 1998 360.2± 27.9 −19.5± 3.5b – González-Dávila et al. (2003)334–416
Gulf of Cádiz −8.3 to −6.0 33.5 to 37.0 July 2002 – 18.6± 4b – Aït-Ameur and Goyet (2006)300–450
Northeastern shelf of −7.5 to −6.3 36.6 to 37.3 March 2003 to March 2004 – −2.5–1.0b – Huertas et al. (2006)the Gulf of Cádiz 130–650
Strait of Gibraltar −6.0 to −5.2 35.8 to 36.1 September, December 2005; – −1.9–1.9b 2.4 de la Paz et al. (2009)March, May 2006 320–387
Northeastern shelf of −6.8 to −6.3 36.4 to 36.9 June, November 2006; 360.6± 18.2 −2.2–3.6b 1.3 Ribas-Ribas et al. (2011)the Gulf of Cádiz February, May 2007 338–397
Gulf of Cádiz −6.0 to −7.2 35.4 to 36.7 March, June, October, December 2014; 398.9± 15.5 −2.3–1.5c 1.15 This workMarch, June, September 2015; 321–514March 2016
a Gas transfer coefficient (k): b Wanninkhof (1992). c Wanninkhof et al. (2014).
between cruises is 86±8 d, with the exception of the last pe-riod (between September 2015 and February 2016) that was140 d. dpCO2
sw presents a similar variation between deepand coastal areas but with small differences in the mean val-ues between the distal zones (dpCO2
sw=−3.4±28.9 µatm)
and the shallower areas (dpCO2sw= 0.2± 22.7 µatm). The
high standard deviations associated with this variable aredue to the spatio-temporal variability in the database. In dis-tal areas (Fig. 6), pCO2 changes are mainly brought aboutby SST (−58.4–106.2 µatm) together with mixing and bio-logical processes (−90.8–36.2 µatm). An inverse coupling isobserved between dSSTpCO2
sw and dMBpCO2sw since with
the increase in the system SST (increase dSSTpCO2sw) there
is greater biological uptake of CO2 (decrease dMBpCO2sw).
As reported in the studies of Olsen et al. (2008) and Omaret al. (2010), the changes produced by the air–sea CO2 ex-change are relatively small. Instead, in coastal areas (Fig. 6),the dominant effects on pCO2 changes are produced by air–sea CO2 exchange (−196.2 to 103.4 µatm) and mixing plusbiology (−101.1 to 198.5 µatm). In regions with shallowermixed layers, the effect of air–sea exchange on the pCO2variation is larger (Olsen et al., 2008). A relative inversecoupling between the two factors was also observed; out-gassing is produced (decrease dASpCO2
sw,i) when the sys-tem receives greater inputs or production of CO2 (increasedMBpCO2
sw). There is a different behaviour between thetransition from spring to summer of 2014 (ST1 and ST2)and 2015 (ST5 and ST6) for dMBpCO2
sw, which may bedue to a greater quantity of continental inputs, as reflected inthe Guadalquivir river flow rate in these periods (85.1±75.4and 25.3±10.2 m3 s−1, respectively). Changes in SSS do nothave a substantial effect on pCO2 during the whole period inboth areas with a range of variation in dSSSpCO2
sw,i between
−11.3 and 11.0 µatm. This behaviour was also described byOlsen et al. (2008) in the subpolar North Atlantic, exceptfor an area influenced by continental runoff where pCO2 de-creases.
In relation to the factors that affect the pCO2 changesbrought about by mixing and biological processes, a de-pendence between the mean values of pCO2 and pH, AOUand the concentration of chlorophyll a has been observedat the fixed stations (n= 126, Fig. 7). AOU and pCO2show a positive relationship (pCO2 (µatm)= 410+ 1.1 AOU(µmol L−1), r2
= 0.21) with a slope close to what would beobtained taking into account the processes of formation oroxidation of the organic matter phytoplankton consideringa Redfield-type relationship. Inverse relationships betweenpCO2 and dissolved oxygen were also found in other stud-ies of a continental shelf (Zhai et al., 2009; de la Paz etal., 2010; Xue et al., 2012, 2016). The pCO2 and pH de-pendence presents an inverse relationship (pCO2 (µatm)=1710− 162.8 pH, r2
= 0.34) due to the effect of the uptakeor production of CO2 on the pH (Tsunogai et al., 1997;Shaw et al., 2014). The variation in pCO2 with chloro-phyll a (pCO2 (µatm)= 413−20.8 [chlorophyll a] (µg L−1),r2= 0.14) also shows the influence of the processes of pho-
tosynthesis and respiration (e.g. Cai et al., 2011; Clargo etal., 2015) with a slope value similar to that obtained in thestudy of Huertas et al. (2005) (pCO2 (µatm)= 274− 19.6[chlorophyll a] (µg L−1), r2
= 0.32; n= 28). Other authorshave also described the interrelationships existing betweenpCO2 and chlorophyll a in other coastal areas (Borges andFrankignoulle, 1999; Tseng et al., 2011; Zhang et al., 2012;Qin et al., 2014; Litt et al., 2018).
Something that could affect the distribution of pCO2 in theGulf of Cádiz (and could be considered to be part of mixing
Ocean Sci., 15, 1225–1245, 2019 www.ocean-sci.net/15/1225/2019/

D. Jiménez-López et al.: pCO2 variability in the surface waters of the eastern Gulf of Cádiz 1235
Figure 6. Observed changes in pCO2 (first row) and pCO2 changesbroken down due to SST changes (second row), air–sea CO2 ex-change (third row), SSS changes (fourth row), and biology plusmixing (last row) in the distal (left column) and coastal areas (rightcolumn) between the periods of each cruise: ST1 (March 2014),ST2 (June 2014), ST3 (October 2014), ST4 (December 2014), ST5(March 2015), ST6 (June 2015), ST7 (September 2015) and ST8(February 2016).
and biology; sensu Olsen et al., 2008) is the vertical and lat-eral transport. For example, there are two upwelling systemsin our study zone: one more permanent situated in the coastalzone (depth between 50 and 100 m) of the Trafalgar section(Prieto et al., 1999; Vargas-Yáñez et al., 2002) and the otherlocated between the Cape Santa María and the Guadalquivirriver and more sensitive to meteorological forcing (Criado-Aldeanueva et al., 2006). In our database, experimental evi-dence of the upwelling was found only in the TF transect. Alocal decrease in the mean values of SST (17.4 ◦C) and pCO2(399.1 µatm) was observed in this coastal area of TF withrespect to the deeper areas (18.8 ◦C and 405.1 µatm, respec-tively) for the whole period. This input of colder waters couldcause higher or lower concentrations of CO2 (e.g. Liu et al.,
Figure 7. Relationships between the surface values of pCO2 andapparent oxygen utilization (AOU), pH and chlorophyll a (Chl a) atthe 16 discrete stations during the eight cruises. pCO2 presents thestandard deviation associated with the mean value obtained fromthe underway measurements.
2010; Xue et al., 2015; González-Dávila et al., 2017). Thereis a progressive increase in SST and pCO2 with increasingdepth of the system measured below 100–200 m (Fig. 4); thisis associated with the presence of a branch of the Azores Cur-rent that introduces warmer waters in the central part of theGulf of Cádiz (Gould, 1985; Käse et al., 1985; Johnson andStevens, 2000). The influence of warmer surface currents onthe variability in pCO2 has been observed in other studies,such as the Gulf Stream in the southeastern continental shelfof the United States (Wang et al., 2005; Jiang et al., 2008) andthe Kuroshio Current in the northern East China Sea (Shimet al., 2007).
Additionally, related to the lateral transport on the distri-bution of pCO2 in surface waters, several authors have de-
www.ocean-sci.net/15/1225/2019/ Ocean Sci., 15, 1225–1245, 2019

1236 D. Jiménez-López et al.: pCO2 variability in the surface waters of the eastern Gulf of Cádiz
scribed the influence of the continental inputs. In general,the continental shelf as a whole acts as a sink of atmosphericCO2 (e.g. Rabouille et al., 2001; Chen and Borges, 2009),whereas the coastal zone is usually oversaturated with CO2(Fig. 4). This behaviour has been described in other sys-tems, including the southern part of the Yellow Sea (Qu etal., 2014), the southwestern part of the Atlantic Ocean (Ar-ruda et al., 2015), the North Sea (Clargo et al., 2015) and onthe continental shelf of Maranhense (Lefèvre et al., 2017).
The principal continental inputs in the northeast zone ofthe Gulf of Cádiz derive from the estuary of the Guadalquivirand from the systems associated with the Bay of Cádiz.De la Paz et al. (2007) found values of pCO2 higherthan 3000 µatm in the internal part of the estuary of theGuadalquivir, and Ribas-Ribas et al. (2013) established thatthis estuary acts as an exporter system of inorganic carbon,nutrients and water oversaturated with CO2 to the adjoin-ing coastal zone. The importance of the contributions fromthe Guadalquivir on the distribution of pCO2 depends onthe river’s flow rate, as can be appreciated in Fig. 2b. Thehighest values of pCO2 (up to 500 µatm) were observedduring March 2014 in the zone close to the Guadalquivirriver mouth, a consequence of the river’s high flow rate(between 192.7 and 299.2 m3 s−1; Confederación Hidro-gráfica del Guadalquivir; http://www.chguadalquivir.es/saih/DatosHistoricos.aspx, last access: 19 July 2018). In contrast,the lowest values of pCO2 were recorded in spring of 2015in this zone (as low as 320 µatm) in a period of drought (flowrate 20 m3 s−1) and subject to intense biological activity as-sociated with the highest value found for the concentrationof chlorophyll a (2.4 µg L−1). The Bay of Cádiz occupies anarea of 38 km2 and receives urban effluents from a popula-tion of 640 000 inhabitants. This shallow zone is oversatu-rated with CO2 (Ribas-Ribas et al., 2011) due largely to theinputs of inorganic carbon, organic matter and nutrients thatare received from the Guadalete River, Sancti Petri Channeland the Río San Pedro tidal creeks (de la Paz et al., 2008a, b;Burgos et al., 2018).
Moreover, in the coastal zone another source of CO2 re-sults from the net production of inorganic carbon derivedfrom the processes of remineralization of the organic mat-ter in the surface sediments originating from the continu-ous deposition of organic matter through the water column(de Haas et al., 2002; Jahnke et al., 2005). The intensityof this effect decreases towards offshore areas since the in-fluence of primary production and the continental supplieson the deposition of the particulate organic matter are less(Friedl et al., 1998; Burdige, 2007; Al Azhar et al., 2017),which could be related to the greater effect determined bythe mixing and biology processes in the coastal areas usingthe Olsen et al. (2008) method. Ferrón et al. (2009) quantifiedthe release from the sediment of DIC related to the processesof oxidation of organic matter in the coastal zone (depth<50 m) of the Gulf of Cádiz, between the Guadalquivir andthe Bay of Cádiz. These authors found a mean benthic flux
of 27± 8 mmol C m−2 d−1 for stations with a mean depthof 23 m. This flux of DIC is equivalent to a CO2 flux of198± 80 µmol C m−2 d−1 through the sediment–water inter-face when considering a well-mixed water column, a pH of8, the conditions of mean temperature and salinity in the Gulfof Cádiz (18.8 ◦C and 36.19, respectively), and using the K1and K2 acidity constants proposed by Lueker et al. (2000) inthe total pH scale through the program CO2SYS (Lewis etal., 1998). Moreover, this estimated CO2 benthic flux wouldproduce an increase in pCO2 of 0.25± 0.10 µatm d−1 in thewater column.
4.3 T/B ratio
In this study, the total T/B ratio is 1.15, which indicates thatthe thermal effect is an important factor controlling intra-annual variation in pCO2. This value is similar to that de-termined by Ribas-Ribas et al. (2011) (see date and studyzone in Table 4) in the northeast zone of the shelf of the Gulfof Cádiz with a ratio of 1.3. De la Paz et al. (2009) (see dateand study zone in Table 4) propose a T/B ratio of 2.4 in theStrait of Gibraltar, indicating very significant thermal controlin this relatively deep zone situated to the east of the Gulf ofCádiz.
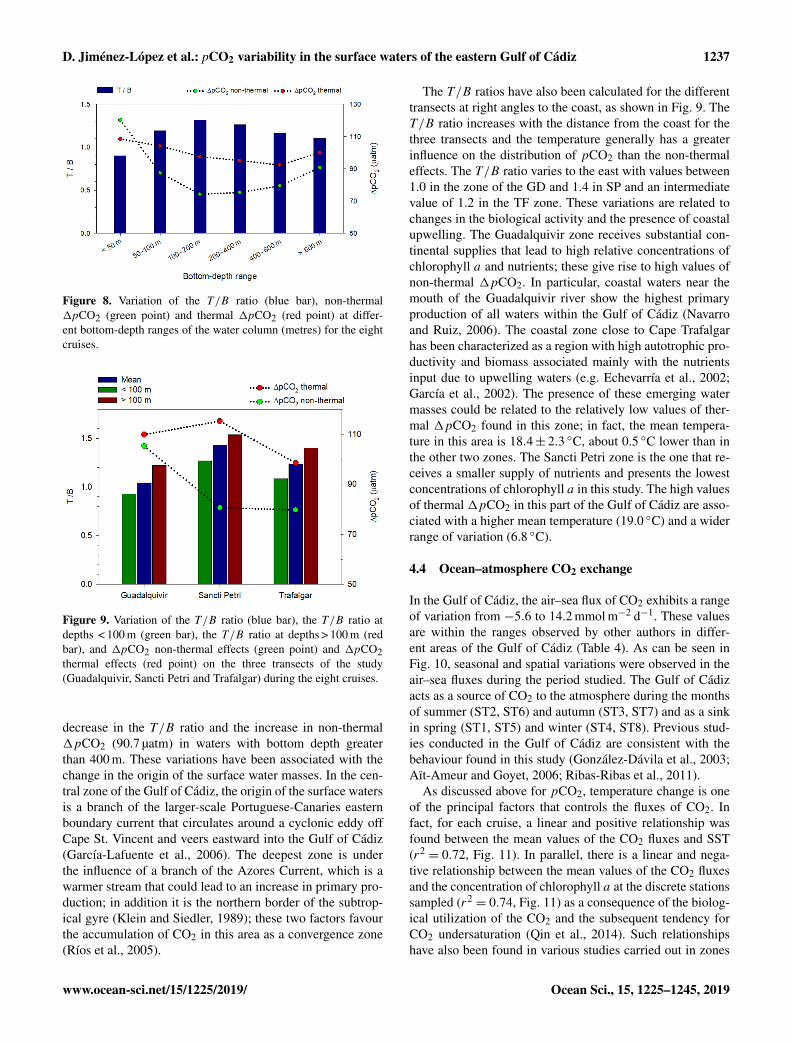
Figure 8 presents the values of the T/B ratio grouped indifferent bottom-depth intervals of the water column in thesystem. The variations found in non-thermal 1pCO2 andthermal1pCO2 have been superimposed. In the coastal zone(depth < 50 m), the T/B ratio is below 1 (0.9) and increasesto values of 1.3 in the central zone of the Gulf of Cádiz atdepths ranging from 100 to 400 m. However, in the deep-est zone (depth > 600 m), a progressive decrease to a value of1.1 is found. Qu et al. (2014) also reported the variation in thevalues of the T/B ratio with the distance from the coast in thesouthern Yellow Sea: between 0.4 and 0.6 in the nearshorearea (depth < 50 m) to more than 1 (up to 2.4) in the offshorearea (depth > 50 m).
This variation in the T/B ratio is largely caused by thevariations in 1pCO2 non-thermal effects, which are ob-served to decrease from the coast to the deeper zone regard-less of which method is used (Takahashi et al., 2002; Olsenet al., 2008). High values of non-thermal 1pCO2 close tothe coast were observed (120.2 µatm), affected by continen-tal inputs, processes of remineralization in the sediment andbiological utilization of CO2. The increase in the T/B ratioand the decrease in non-thermal 1pCO2 (75 µatm) from thecoastal zone to the central part of the Gulf of Cádiz are as-sociated with the variations in the chlorophyll a and nutrientconcentrations that diminish exponentially with the depth ofthe system. Thus, the mean concentrations of chlorophyll a,nitrate and phosphate in the distal zone are 66.3 %, 81.9 %and 44.8 % less, respectively, than the concentrations foundclose to the coast. However, the concentrations of chloro-phyll a and nutrients are relatively constant in waters withbottom depth greater than 200 m and do not explain the
Ocean Sci., 15, 1225–1245, 2019 www.ocean-sci.net/15/1225/2019/
D. Jiménez-López et al.: pCO2 variability in the surface waters of the eastern Gulf of Cádiz 1237
Figure 8. Variation of the T/B ratio (blue bar), non-thermal1pCO2 (green point) and thermal 1pCO2 (red point) at differ-ent bottom-depth ranges of the water column (metres) for the eightcruises.
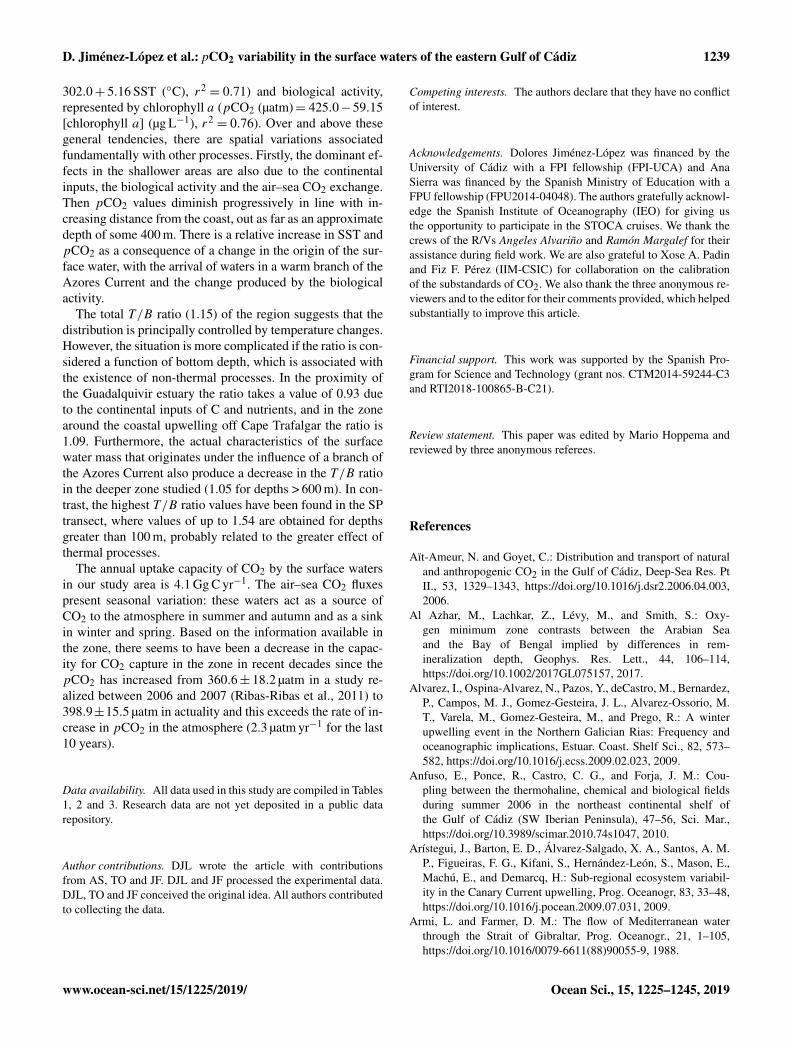
Figure 9. Variation of the T/B ratio (blue bar), the T/B ratio atdepths < 100 m (green bar), the T/B ratio at depths > 100 m (redbar), and 1pCO2 non-thermal effects (green point) and 1pCO2thermal effects (red point) on the three transects of the study(Guadalquivir, Sancti Petri and Trafalgar) during the eight cruises.
decrease in the T/B ratio and the increase in non-thermal1pCO2 (90.7 µatm) in waters with bottom depth greaterthan 400 m. These variations have been associated with thechange in the origin of the surface water masses. In the cen-tral zone of the Gulf of Cádiz, the origin of the surface watersis a branch of the larger-scale Portuguese-Canaries easternboundary current that circulates around a cyclonic eddy offCape St. Vincent and veers eastward into the Gulf of Cádiz(García-Lafuente et al., 2006). The deepest zone is underthe influence of a branch of the Azores Current, which is awarmer stream that could lead to an increase in primary pro-duction; in addition it is the northern border of the subtrop-ical gyre (Klein and Siedler, 1989); these two factors favourthe accumulation of CO2 in this area as a convergence zone(Ríos et al., 2005).
The T/B ratios have also been calculated for the differenttransects at right angles to the coast, as shown in Fig. 9. TheT/B ratio increases with the distance from the coast for thethree transects and the temperature generally has a greaterinfluence on the distribution of pCO2 than the non-thermaleffects. The T/B ratio varies to the east with values between1.0 in the zone of the GD and 1.4 in SP and an intermediatevalue of 1.2 in the TF zone. These variations are related tochanges in the biological activity and the presence of coastalupwelling. The Guadalquivir zone receives substantial con-tinental supplies that lead to high relative concentrations ofchlorophyll a and nutrients; these give rise to high values ofnon-thermal 1pCO2. In particular, coastal waters near themouth of the Guadalquivir river show the highest primaryproduction of all waters within the Gulf of Cádiz (Navarroand Ruiz, 2006). The coastal zone close to Cape Trafalgarhas been characterized as a region with high autotrophic pro-ductivity and biomass associated mainly with the nutrientsinput due to upwelling waters (e.g. Echevarría et al., 2002;García et al., 2002). The presence of these emerging watermasses could be related to the relatively low values of ther-mal 1pCO2 found in this zone; in fact, the mean tempera-ture in this area is 18.4± 2.3 ◦C, about 0.5 ◦C lower than inthe other two zones. The Sancti Petri zone is the one that re-ceives a smaller supply of nutrients and presents the lowestconcentrations of chlorophyll a in this study. The high valuesof thermal 1pCO2 in this part of the Gulf of Cádiz are asso-ciated with a higher mean temperature (19.0 ◦C) and a widerrange of variation (6.8 ◦C).
4.4 Ocean–atmosphere CO2 exchange
In the Gulf of Cádiz, the air–sea flux of CO2 exhibits a rangeof variation from −5.6 to 14.2 mmol m−2 d−1. These valuesare within the ranges observed by other authors in differ-ent areas of the Gulf of Cádiz (Table 4). As can be seen inFig. 10, seasonal and spatial variations were observed in theair–sea fluxes during the period studied. The Gulf of Cádizacts as a source of CO2 to the atmosphere during the monthsof summer (ST2, ST6) and autumn (ST3, ST7) and as a sinkin spring (ST1, ST5) and winter (ST4, ST8). Previous stud-ies conducted in the Gulf of Cádiz are consistent with thebehaviour found in this study (González-Dávila et al., 2003;Aït-Ameur and Goyet, 2006; Ribas-Ribas et al., 2011).
As discussed above for pCO2, temperature change is oneof the principal factors that controls the fluxes of CO2. Infact, for each cruise, a linear and positive relationship wasfound between the mean values of the CO2 fluxes and SST(r2= 0.72, Fig. 11). In parallel, there is a linear and nega-
tive relationship between the mean values of the CO2 fluxesand the concentration of chlorophyll a at the discrete stationssampled (r2
= 0.74, Fig. 11) as a consequence of the biolog-ical utilization of the CO2 and the subsequent tendency forCO2 undersaturation (Qin et al., 2014). Such relationshipshave also been found in various studies carried out in zones
www.ocean-sci.net/15/1225/2019/ Ocean Sci., 15, 1225–1245, 2019

1238 D. Jiménez-López et al.: pCO2 variability in the surface waters of the eastern Gulf of Cádiz
Figure 10. Spatial distribution of mean values of air–sea CO2 fluxesin the eastern shelf of the Gulf of Cádiz at the 16 discrete stationsduring spring (ST1, ST5), summer (ST2, ST6), autumn (ST3, ST7)and winter (ST4, ST8).
Figure 11. Correlations between the mean values of air–seaCO2 fluxes and sea surface temperature (SST) for the underwaydatabase (a) and the CO2 fluxes and chlorophyll a (Chl-a) at the 16discrete surface stations (b) for each cruise and showing the stan-dard deviations.
similar to the area studied (Zhang et al., 2010; Arnone et al.,2017; Carvalho et al., 2017).
The air–sea fluxes of CO2 in the Gulf of Cádiz tend todecrease with the distance from the coast (Fig. 10). Thecoastal zone (< 50 m) presents a mean air–sea CO2 flux of0.8± 1.8 mmol m−2 d−1 that reduces progressively to reacha value of−0.3±1.6 mmol m−2 d−1 in open waters with bot-tom depth greater than 600 m. However, these differences arenot statistically significant because of the high standard de-viations associated with the seasonal variations. This depen-dence of the air–sea CO2 fluxes with distance from the coasthas also been reported in other systems, such as in the SouthAtlantic Bight of the United States (Jiang et al., 2008), inthe southwestern part of the Atlantic Ocean (Arruda et al.,2015), in the Patagonian Sea (Kahl et al., 2017) and on thecontinental shelf of Maranhense (Lefèvre et al., 2017). Thisdependence is the consequence of the decrease in influenceof the continental supplies on the CO2 fluxes as one moves
towards the open sea. Ribas-Ribas et al. (2011) also foundthat in the Gulf of Cádiz the air–sea CO2 fluxes vary withthe distance from the coast; the zone close to the estuaryof the Guadalquivir and the Bay of Cádiz acts as a source(1.39 mmol m−2 d−1) and the zone comprising the rest of theshelf acts as a sink (−0.44 mmol m−2 d−1).
In addition, on both the GD and SP transects a decreasein the air–sea CO2 flux is found towards the open ocean dueto the continental inputs associated with the estuary of theGuadalquivir and with the Bay of Cádiz, respectively. On theTF transect, in contrast, it was observed that the zone close tothe coast acts as a sink of CO2 (−0.4± 1.2 mmol m−2 d−1)and the deeper zone is a weak source of CO2 to the atmo-sphere (0.3± 1.3 mmol m−2 d−1), although these variationsare not statistically significant due to the seasonal variabilityassociated with the values. This finding can be explained bythe presence of an upwelling close to the coast that is likelyto be causing an increase in the production (e.g. Hales et al.,2005; Borges et al., 2005). With reference to this, on the TFtransect there are significant differences between the meansurface concentrations of chlorophyll a and nitrate in thecoastal zone (0.63± 0.43 µg L−1 and 1.09± 0.77 µmol L−1,respectively) and in deeper zones (0.17± 0.12 µg L−1 and0.32± 0.33 µmol L−1, respectively).
The Gulf of Cádiz carbon flux, during the sampling pe-riod, shows a mean rate of−0.18±1.32 mmol m−2 d−1 eventhough it is necessary to consider the intrinsic variability inthe database that generates a high standard deviation. Withthe total surface of the study area (52.8× 10² km2) and themean annual flux during the eight cruises, the uptake capac-ity estimated for the Gulf of Cádiz will be 4.1 Gg C yr−1.The findings of previous studies carried out in the Gulf ofCádiz coincide with the behaviour observed in this study(Santana-Casiano et al., 2002; González-Dávila et al., 2003;Huertas et al., 2006; de la Paz et al., 2009; Ribas-Ribas etal., 2011), with the exception of the study by Aït-Ameurand Goyet (2006) in which it was estimated that the Gulfof Cádiz acts as a source of CO2 to the atmosphere, althoughthat study only corresponds to the summer season.
5 Conclusions
A high variability in pCO2 in the Gulf of Cádiz was observedwhich is associated with its location as a transition zone be-tween coastal and shelf areas, superimposed on the usualseasonal variation due to thermal and biological effects. Themean value of pCO2 found in this study (398.9±15.5 µatm)indicates that the Gulf of Cádiz could be slightly under-saturated in CO2 with respect to the atmosphere (402.1±3.9 µatm). The spatio-temporal variation in pCO2 found re-sponds to the influence of different factors that usually affectits distribution in the littoral oceans. The temporal variabilityin pCO2 is principally explained by two factors, consideringthe mean values of the eight cruises: SST (pCO2 (µatm)=
Ocean Sci., 15, 1225–1245, 2019 www.ocean-sci.net/15/1225/2019/
D. Jiménez-López et al.: pCO2 variability in the surface waters of the eastern Gulf of Cádiz 1239
302.0+ 5.16 SST (◦C), r2= 0.71) and biological activity,
represented by chlorophyll a (pCO2 (µatm)= 425.0−59.15[chlorophyll a] (µg L−1), r2
= 0.76). Over and above thesegeneral tendencies, there are spatial variations associatedfundamentally with other processes. Firstly, the dominant ef-fects in the shallower areas are also due to the continentalinputs, the biological activity and the air–sea CO2 exchange.Then pCO2 values diminish progressively in line with in-creasing distance from the coast, out as far as an approximatedepth of some 400 m. There is a relative increase in SST andpCO2 as a consequence of a change in the origin of the sur-face water, with the arrival of waters in a warm branch of theAzores Current and the change produced by the biologicalactivity.
The total T/B ratio (1.15) of the region suggests that thedistribution is principally controlled by temperature changes.However, the situation is more complicated if the ratio is con-sidered a function of bottom depth, which is associated withthe existence of non-thermal processes. In the proximity ofthe Guadalquivir estuary the ratio takes a value of 0.93 dueto the continental inputs of C and nutrients, and in the zonearound the coastal upwelling off Cape Trafalgar the ratio is1.09. Furthermore, the actual characteristics of the surfacewater mass that originates under the influence of a branch ofthe Azores Current also produce a decrease in the T/B ratioin the deeper zone studied (1.05 for depths > 600 m). In con-trast, the highest T/B ratio values have been found in the SPtransect, where values of up to 1.54 are obtained for depthsgreater than 100 m, probably related to the greater effect ofthermal processes.
The annual uptake capacity of CO2 by the surface watersin our study area is 4.1 Gg C yr−1. The air–sea CO2 fluxespresent seasonal variation: these waters act as a source ofCO2 to the atmosphere in summer and autumn and as a sinkin winter and spring. Based on the information available inthe zone, there seems to have been a decrease in the capac-ity for CO2 capture in the zone in recent decades since thepCO2 has increased from 360.6± 18.2 µatm in a study re-alized between 2006 and 2007 (Ribas-Ribas et al., 2011) to398.9±15.5 µatm in actuality and this exceeds the rate of in-crease in pCO2 in the atmosphere (2.3 µatm yr−1 for the last10 years).
Data availability. All data used in this study are compiled in Tables1, 2 and 3. Research data are not yet deposited in a public datarepository.
Author contributions. DJL wrote the article with contributionsfrom AS, TO and JF. DJL and JF processed the experimental data.DJL, TO and JF conceived the original idea. All authors contributedto collecting the data.
Competing interests. The authors declare that they have no conflictof interest.
Acknowledgements. Dolores Jiménez-López was financed by theUniversity of Cádiz with a FPI fellowship (FPI-UCA) and AnaSierra was financed by the Spanish Ministry of Education with aFPU fellowship (FPU2014-04048). The authors gratefully acknowl-edge the Spanish Institute of Oceanography (IEO) for giving usthe opportunity to participate in the STOCA cruises. We thank thecrews of the R/Vs Angeles Alvariño and Ramón Margalef for theirassistance during field work. We are also grateful to Xose A. Padinand Fiz F. Pérez (IIM-CSIC) for collaboration on the calibrationof the substandards of CO2. We also thank the three anonymous re-viewers and to the editor for their comments provided, which helpedsubstantially to improve this article.
Financial support. This work was supported by the Spanish Pro-gram for Science and Technology (grant nos. CTM2014-59244-C3and RTI2018-100865-B-C21).
Review statement. This paper was edited by Mario Hoppema andreviewed by three anonymous referees.
References
Aït-Ameur, N. and Goyet, C.: Distribution and transport of naturaland anthropogenic CO2 in the Gulf of Cádiz, Deep-Sea Res. PtII., 53, 1329–1343, https://doi.org/10.1016/j.dsr2.2006.04.003,2006.
Al Azhar, M., Lachkar, Z., Lévy, M., and Smith, S.: Oxy-gen minimum zone contrasts between the Arabian Seaand the Bay of Bengal implied by differences in rem-ineralization depth, Geophys. Res. Lett., 44, 106–114,https://doi.org/10.1002/2017GL075157, 2017.
Alvarez, I., Ospina-Alvarez, N., Pazos, Y., deCastro, M., Bernardez,P., Campos, M. J., Gomez-Gesteira, J. L., Alvarez-Ossorio, M.T., Varela, M., Gomez-Gesteira, M., and Prego, R.: A winterupwelling event in the Northern Galician Rias: Frequency andoceanographic implications, Estuar. Coast. Shelf Sci., 82, 573–582, https://doi.org/10.1016/j.ecss.2009.02.023, 2009.
Anfuso, E., Ponce, R., Castro, C. G., and Forja, J. M.: Cou-pling between the thermohaline, chemical and biological fieldsduring summer 2006 in the northeast continental shelf ofthe Gulf of Cádiz (SW Iberian Peninsula), 47–56, Sci. Mar.,https://doi.org/10.3989/scimar.2010.74s1047, 2010.
Arístegui, J., Barton, E. D., Álvarez-Salgado, X. A., Santos, A. M.P., Figueiras, F. G., Kifani, S., Hernández-León, S., Mason, E.,Machú, E., and Demarcq, H.: Sub-regional ecosystem variabil-ity in the Canary Current upwelling, Prog. Oceanogr, 83, 33–48,https://doi.org/10.1016/j.pocean.2009.07.031, 2009.
Armi, L. and Farmer, D. M.: The flow of Mediterranean waterthrough the Strait of Gibraltar, Prog. Oceanogr., 21, 1–105,https://doi.org/10.1016/0079-6611(88)90055-9, 1988.
www.ocean-sci.net/15/1225/2019/ Ocean Sci., 15, 1225–1245, 2019
1240 D. Jiménez-López et al.: pCO2 variability in the surface waters of the eastern Gulf of Cádiz
Arnone, V., González-Dávila, M., and Santana-Casiano, J. M.: CO2fluxes in the South African coastal region, Mar. Chem., 195, 41–49, https://doi.org/10.1016/j.marchem.2017.07.008, 2017.
Arruda, R., Calil, P. H. R., Bianchi, A. A., Doney, S. C., Gru-ber, N., Lima, I., and Turi, G.: Air-sea CO2 fluxes and the con-trols on ocean surface pCO2 seasonal variability in the coastaland open-ocean southwestern Atlantic Ocean: a modeling study,Biogeosciences, 12, 5793–5809, https://doi.org/10.5194/bg-12-5793-2015, 2015.
Astor, Y. M., Scranton, M. I., Muller-Karger, F., Bohrer, R.,and Garcia, J.: CO2 variability at the CARIACO tropicalcoastal upwelling time series station, Mar. Chem., 97, 245–261,https://doi.org/10.1016/j.marchem.2005.04.001, 2005.
Baringer, M. O. N. and Price, J. F.: A review of the physicaloceanography of the Mediterranean outflow, Mar. Geol., 155,63–82, https://doi.org/10.1016/S0025-3227(98)00141-8, 1999.
Bates, N. R., Merlivat, L., Beaumont, L., and Pequignet, A. C.: In-tercomparison of shipboard and moored CARIOCA buoy sea-water fCO2 measurements in the Sargasso Sea, Mar. Chem.,72, 239–255, https://doi.org/10.1016/S0304-4203(00)00084-0,2000.
Bauer, J. E., Cai, W. J., Raymond, P. A., Bianchi, T.S., Hopkinson, C. S., and Regnier, P. A.: The changingcarbon cycle of the coastal ocean, Nature, 504, 61–70,https://doi.org/10.1038/nature12857, 2013.
Bellanco, M. J. and Sánchez-Leal, R. F.: Spatial distributionand intra-annual variability of water masses on the East-ern Gulf of Cádiz seabed, Cont. Shelf Res., 128, 26–35,https://doi.org/10.1016/j.csr.2016.09.001, 2016.
Borges, A. V. and Frankignoulle, M.: Daily and seasonal variationsof the partial pressure of CO2 in surface seawater along Belgianand southern Dutch coastal areas, J. Mar. Syst., 19, 251–266,https://doi.org/10.1016/S0924-7963(98)00093-1, 1999.
Borges, A. V. and Frankignoulle, M.: Distribution of surface car-bon dioxide and air-sea exchange in the upwelling systemoff the Galician coast, Global Biogeochem. Cy., 16, 1020,https://doi.org/10.1029/2000GB001385, 2002.
Borges, A. V. and Abril., G.: Treatise on Estuarine and Coastal Sci-ence, Elsevier, Waltham, 328 pp., 2011.
Borges, A. V., Delille, B., and Frankignoulle, M.: Budget-ing sinks and sources of CO2 in the coastal ocean: Diver-sity of ecosystems counts, Geophys. Res. Lett., 32, L14601,https://doi.org/10.1029/2005GL023053, 2005.
Borges, A. V., Schiettecatte, L. S., Abril, G., Delille,B., and Gazeau, F.: Carbon dioxide in Europeancoastal waters, Estuar. Coast. Shelf Sci., 70, 375–387,https://doi.org/10.1016/j.ecss.2006.05.046, 2006.
Burdige, D. J.: Preservation of Organic Matter in Marine Sed-iments?: Controls, Mechanisms, and an Imbalance in Sedi-ment Organic Carbon Budgets?, Chem. Rev., 107, 467–485,https://doi.org/10.1021/cr050347q, 2007.
Burgos, M., Ortega, T., and Forja, J.: Carbon Dioxide and MethaneDynamics in Three Coastal Systems of Cádiz Bay (SW Spain),Estuar. Coast., 41, 1069–1088, https://doi.org/10.1007/s12237-017-0330-2, 2018.
Cai, W. J.: Estuarine and coastal ocean carbon paradox: CO2sinks or sites of terrestrial carbon incineration?, Ann. Rev.Mar. Sci., 3, 123–145, https://doi.org/10.1146/annurev-marine-120709-142723, 2011.
Cai, W. J., Wang, Z. A., and Wang, Y.: The role of marsh-dominatedheterotrophic continental margins in transport of CO2 betweenthe atmosphere, the land-sea interface and the ocean, Geophys.Res. Lett., 30, 1–4, https://doi.org/10.1029/2003GL017633,2003.
Cai, W. J., Dai, M., and Wang, Y.: Air-sea exchange of carbon diox-ide in ocean margins: A province-based synthesis, Geophys. Res.Lett., 33, 2–5, https://doi.org/10.1029/2006GL026219, 2006.
Cai, W. J., Hu, X., Huang, W. J., Murrell, M. C., Lehrter, J.C., Lohrenz, S. E., Chou, W. C., Zhai, W., Hollibaugh, J.T., Wang, Y., Zhao, P., Guo, X., Gunderser, K., Dai, M.,and Gong, G. C.: Acidification of subsurface coastal wa-ters enhanced by eutrophication, Nat. Geosci., 4, 766–770,https://doi.org/10.1038/ngeo1297, 2011.
Carvalho, A. C. O., Marins, R. V., Dias, F. J. S., Rezende, C.E., Lefèvre, N., Cavalcante, M. S., and Eschrique, S. A.: Air-sea CO2 fluxes for the Brazilian northeast continental shelfin a climatic transition region, J. Mar. Syst., 173, 70–80,https://doi.org/10.1016/j.jmarsys.2017.04.009, 2017.
Chen, C. T. A. and Borges, A. V.: Reconciling opposing viewson carbon cycling in the coastal ocean: Continental shelvesas sinks and near-shore ecosystems as sources of atmosphericCO2, Deep. Res. Part II Top. Stud. Oceanogr., 56, 578–590,https://doi.org/10.1016/j.dsr2.2009.01.001, 2009.
Chen, C.-T. A., Huang, T.-H., Chen, Y.-C., Bai, Y., He, X., andKang, Y.: Air–sea exchanges of CO2 in the world’s coastal seas,Biogeosciences, 10, 6509–6544, https://doi.org/10.5194/bg-10-6509-2013, 2013.
Clargo, N. M., Salt, L. A., Thomas, H., and de Baar, H. J. W.: Rapidincrease of observed DIC and pCO2 in the surface waters of theNorth Sea in the 2001–2011 decade ascribed to climate changesuperimposed by biological processes, Mar. Chem., 177, 566–581, https://doi.org/10.1016/j.marchem.2015.08.010, 2015.
Cohen, J. E., Small, C., Mellinger, A., Gallup, J., and Sachs,J.: Estimates of coastal populations, Science, 278, 1209–1213,https://doi.org/10.1126/science.278.5341.1209c, 1997.
Criado-Aldeanueva, F., García-Lafuente, J., Vargas, J. M., DelRío, J., Vázquez, A., Reul, A., and Sánchez, A.: Distribu-tion and circulation of water masses in the Gulf of Cádizfrom in situ observations, Deep-Sea Res. Pt II, 53, 1144–1160,https://doi.org/10.1016/j.dsr2.2006.04.012, 2006.
Dafner, E. V., González-Dávila, M., Santana-Casiano, J. M., andSempere, R.: Total organic and inorganic carbon exchangethrough the Strait of Gibraltar in September 1997, Deep-Sea Res. Pt I, 48, 1217–1235, https://doi.org/10.1016/S0967-0637(00)00064-9, 2001.
de Haas, H., van Weering, T. C. E., and de Stieger, H.: Organiccarbon in shelf seas: sinks or sources, processes and products,Cont. Shelf Res., 22, 691–717, https://doi.org/10.1016/S0278-4343(01)00093-0, 2002.
de la Paz, M., Gómez-Parra, A., and Forja, J.: Inorganic car-bon dynamic and air-water CO2 exchange in the GuadalquivirEstuary (SW Iberian Península), J. Mar. Syst., 68, 265–277,https://doi.org/10.1016/j.jmarsys.2006.11.011, 2007.
de la Paz, M., Debelius, B., Macías, D., Vázquez, A., Gómez-Parra,A., and Forja, J. M.: Tidal-induced inorganic carbon dynam-ics in the Strait of Gibraltar, Cont. Shelf Res., 28, 1827–1837,https://doi.org/10.1016/j.csr.2008.04.012, 2008a.
Ocean Sci., 15, 1225–1245, 2019 www.ocean-sci.net/15/1225/2019/

D. Jiménez-López et al.: pCO2 variability in the surface waters of the eastern Gulf of Cádiz 1241
de la Paz, M., Gómez-Parra, A., and Forja, J.: Tidal-to-seasonalvariability in the parameters of the carbonate system in a shal-low tidal creek influenced by anthropogenic inputs, Rio San Pe-dro (SW Iberian Península), Cont. Shelf Res., 28, 1394–1404,https://doi.org/10.1016/j.csr.2008.04.002, 2008b.
de la Paz, M., Gómez-Parra, A., and Forja, J. M.: Seasonal vari-ability of surface fCO2 in the Strait of Gibraltar, Aquat. Sci., 71,55–64, https://doi.org/10.1007/s00027-008-8060-y, 2009.
de la Paz, M., Padín, X. A., Ríos, A.F., and Pérez, F.F.: Surface fCO2 variability in the Loire plume and ad-jacent shelf waters: High spatio-temporal resolution studyusing ships of opportunity, Mar. Chem., 118, 108–118,https://doi.org/10.1016/j.marchem.2009.11.004, 2010.
DOE: in: Guide to best practices for ocean CO2 measurement,edited by: Dickson, A. G., Sabine, C. L. and Christian, J.R., North Pacific Marine Science Organization Sidney, BritishColumbia, 191 pp., 2007.
Echevarría, F., García-Lafuente, J., Bruno, M., Gorsky, G., Goutx,M., González, N., García, C. M., Gómez, F., Vargas, J. M.,Picheral, M., Striby, L., Varela, M., Alonso, J. J., Reul, A., Cózar,A., Prieto, L., Sarhan, T., Plaza, F., and Jiménez-González, F.:Physical-biological coupling in the Strait of Gibraltar, Deep-Sea Res. Pt. II, 49, 4115–4130, https://doi.org/10.1016/S0967-0645(02)00145-5, 2002.
Feely, R. A., Boutin, J., Cosca, C. E., Dandonneau, Y., Etcheto, J.,Inoue, H. Y., Ishii, M., Quéré, C. L., Mackey, D. J., McPhaden,M., Metzl, N., Poisson, A., and Wanninkhof, R.: Seasonal andinterannual variability of CO2 in the equatorial Pacific, Deep-Sea Res. Pt. II, 49, 2443–2469, https://doi.org/10.1016/S0967-0645(02)00044-9, 2002.
Fennel, K. and Wilkin, J.: Quantifying biological carbon export forthe northwest North Atlantic continental shelves, Geophys. Res.Lett., 36, 2–5, https://doi.org/10.1029/2009GL039818, 2009.
Ferrón, S., Alonso-Pérez, F., Anfuso, E., Murillo, F. J., Or-tega, T., Castro, C. G., and Forja, J. M.: Benthic nutri-ent recycling on the northeastern shelf of the Gulf of Cádiz(SW Iberian Península), Mar. Ecol. Prog. Ser., 390, 79–95,https://doi.org/10.3354/meps08199, 2009.
Fiúza, A. F., de Macedo, M., and Guerreiro, M.: Climatologicalspace and time variation of the Portuguese coastal upwelling,Oceanol. Acta, 5, 31–40, 1982.
Frankignoulle, M. and Borges, A. V.: European conti-nental shelf as a significant sink for atmospheric car-bon dioxide, Global Biogeochem. Cy., 15, 569–576,https://doi.org/10.1029/2000GB001307, 2001.
Friederich, G. E., Walz, P. M., Burczynski, M. G., and Chavez, F.P.: Inorganic carbon in the central California upwelling systemduring the 1997–1999 El Niño-La Niña event, Prog. Oceanogr.,54, 185–203, https://doi.org/10.1016/S0079-6611(02)00049-6,2002.
Friederich, G. E., Ledesma, J., Ulloa, O., and Chavez, F.P.: Air-sea carbon dioxide fluxes in the coastal south-eastern tropical Pacific, Prog. Oceanogr., 79, 156–166,https://doi.org/10.1016/j.pocean.2008.10.001, 2008.
Friedl, G., Dinkel, C., and Wehrli, B.: Benthic fluxes of nutri-ents in the northwestern Black Sea, Mar. Chem., 62, 77–88,https://doi.org/10.1016/S0304-4203(98)00029-2, 1998.
García Lafuente, J. and Ruiz, J.: The Gulf of Cádiz pelagicecosystem: A review, Prog. Oceanogr., 74, 228–251,https://doi.org/10.1016/j.pocean.2007.04.001, 2007.
García, C. M., Prieto, L., Vargas, M., Echevarría, F., García-Lafuente, J., Ruiz, J., and Rubín, J. P.: Hydrodynamics andthe spatial distribution of plankton and TEP in the Gulf ofCádiz (SW Iberian Península), J. Plankton Res., 24, 817–833,https://doi.org/10.1093/plankt/24.8.817, 2002.
Garcia-Lafuente, J., Delgado, J., Criado-Aldeanueva, F., Bruno, M.,del Rio, J., and Vargas, J. M.: Water mass circulation on the conti-nental shelf of the Gulf of Cádiz, Deep-Sea Res. Pt. II, 53, 1182–1197, https://doi.org/10.1016/j.dsr2.2006.04.011, 2006.
González-Dávila, M., Santana-Casiano, J. M., and Dafner, E. V.:Winter mesoscale variations of carbonate system parameters andestimates of CO2 fluxes in the Gulf of Cádiz, northeast At-lantic Ocean (February 1998), J. Geophys. Res., 108, 1–11,https://doi.org/10.1029/2001JC001243, 2003.
González-Dávila, M., Santana-Casiano, J. M., and Ucha,I. R.: Seasonal variability of fCO2 in the Angola-Benguela region, Prog. Oceanogr., 83, 124–133,https://doi.org/10.1016/j.pocean.2009.07.033, 2009.
González-Dávila, M., Santana Casiano, J. M., and Machín, F.:Changes in the partial pressure of carbon dioxide in theMauritanian–Cap Vert upwelling region between 2005 and 2012,Biogeosciences, 14, 3859–3871, https://doi.org/10.5194/bg-14-3859-2017, 2017.
González-García, C., Forja, J., González-Cabrera, M. C., Jiménez,M. P., and Lubián, L. M.: Annual variations of totaland fractionated chlorophyll and phytoplankton groups inthe Gulf of Cádiz, Sci. Total Environ., 613, 1551–1565,https://doi.org/10.1016/j.scitotenv.2017.08.292, 2018.
Gould, W. J.: Physical oceanography of the Azores Front,Prog. Oceanogr., 14, 167–190, https://doi.org/10.1016/0079-6611(85)90010-2, 1985.
Grasshoff, K., Erhardt, M., and Kremiling, K.: Methods of SeawaterAnalysis, Verlag Chemie, New York, 419 pp., 1983.
Gypens, N., Lacroix, G., Lancelot, C., and Borges, A. V.: Seasonaland inter-annual variability of air–sea CO2 fluxes and seawatercarbonate chemistry in the Southern North Sea, Prog. Oceanogr.,88, 59–77, https://doi.org/10.1016/j.pocean.2010.11.004, 2011.
Hales, B., Takahashi, T., and Bandstra, L.: Atmospheric CO2 uptakeby a coastal upwelling system, Global Biogeochem. Cy., 19, 1–11, https://doi.org/10.1029/2004GB002295, 2005.
Hofmann, E. E., Cahill, B., Fennel, K., Friedrichs, M. A. M.,Hyde, K., Lee, C., Mannino, A., Najjar, R. G., O’Reilly,J. E., Wilkin, J., and Xue, J.: Modeling the Dynamics ofContinental Shelf Carbon, Annu. Rev. Mar. Sci., 3, 93–122,https://doi.org/10.1146/annurev-marine-120709-142740, 2011.
Huertas, E., Navarro, G., Rodríguez-Gálvez, S., and Prieto, L.: Theinfluence of phytoplankton biomass on the spatial distributionof carbon dioxide in surface sea water of a coastal area of theGulf of Cádiz (southwestern Spain), Can. J. Bot., 83, 929–940,https://doi.org/10.1139/b05-082, 2005.
Huertas, I. E., Navarro, G., Rodríguez-Gálvez, S., and Lubián, L.M.: Temporal patterns of carbon dioxide in relation to hydrolog-ical conditions and primary production in the northeastern shelfof the Gulf of Cádiz (SW Spain), Deep-Sea Res. Pt II., 53, 1344–1362, https://doi.org/10.1016/j.dsr2.2006.03.010, 2006.
www.ocean-sci.net/15/1225/2019/ Ocean Sci., 15, 1225–1245, 2019

1242 D. Jiménez-López et al.: pCO2 variability in the surface waters of the eastern Gulf of Cádiz
Ito, R. G., Garcia, C. A. E., and Tavano, V. M.: Netsea-air CO2 fluxes and modelled pCO2 in the south-western subtropical Atlantic continental shelf during spring2010 and summer 2011, Cont. Shelf Res., 119, 68–84,https://doi.org/10.1016/j.csr.2016.03.013, 2016.
Jahnke, R., Richards, M., Nelson, J., Robertson, C., Rao, A.,and Jahnke, D.: Organic matter remineralization and porewa-ter exchange rates in permeable South Atlantic Bight con-tinental shelf sediments, Cont. Shelf Res., 25, 1433–1452,https://doi.org/10.1016/j.csr.2005.04.002, 2005.
Jiang, L. Q., Cai, W. J., Wanninkhof, R., Wang, Y., and Lüger,H.: Air-sea CO2 fluxes on the U.S. South Atlantic Bight: Spa-tial and seasonal variability, J. Geophys. Res., 113, C07019,https://doi.org/10.1029/2007JC004366, 2008.
Jiang, L.-Q., Cai, W.-J., Wang, Y., and Bauer, J. E.: Influence ofterrestrial inputs on continental shelf carbon dioxide, Biogeo-sciences, 10, 839–849, https://doi.org/10.5194/bg-10-839-2013,2013.
Johnson, J. and Stevens, I.: A fine resolution model of the east-ern North Atlantic between the Azores, the Canary Islandsand the Gibraltar Strait, Deep-Sea Res. Pt. I, 47, 875–899,https://doi.org/10.1016/S0967-0637(99)00073-4, 2000.
Kahl, L. C., Bianchi, A. A., Osiroff, A. P., Pino, D. R., and Piola,A. R.: Distribution of sea-air CO2 fluxes in the Patagonian Sea:seasonal, biological and thermal effects, Cont. Shelf Res., 143,18–28, https://doi.org/10.1016/j.csr.2017.05.011, 2017.
Käse, R. H., Zenk, W., Sanford, T. B., and Hiller, W.:Currents, Fronts and Eddy Fluxes in the Canary Basin,Progr. Oceanogr., 14, 231–257, https://doi.org/10.1016/0079-6611(85)90013-8, 1985.
Klein, B. and Siedler, G.: On the origin of theAzores Current, J. Geophys. Res., 94, 6159–6168,https://doi.org/10.1029/JC094iC05p06159, 1989.
Körtzinger, A., Thomas, H., Schneider, B., Gronau, N., Mintrop,L., and Duinker, J. C.: At-sea intercomparison of twonewly designed underway pCO2 systems encouraging re-sults, Mar. Chem., 52, 133–145, https://doi.org/10.1016/0304-4203(95)00083-6, 1996.
Landschützer, P., Gruber, N., Haumann, F. A., Rödenbeck, C.,Bakker, D. c. E., van Heuven, S., Hoppema, M., Metzl, N.,Sweeney, C., Tkahashi, T., Tilbrook, B., and Wanninkhof, R.:The reinvigration of the Southern Ocean carbon sink, Science,349, 1221–1224, https://doi.org/10.1126/science.aab2620, 2015.
Laruelle, G. G., Dürr, H. H., Slomp, C. P., and Borges, A.V.: Evaluation of sinks and sources of CO2 in the globalcoastal ocean using a spatially-explicit typology of estuar-ies and continental shelves, Geophys. Res. Lett., 37, L15607,https://doi.org/10.1029/2010GL043691, 2010.
Laruelle, G. G., Lauerwald, R., Pfeil, B., and Regnier, P.: Region-alized global budget of the CO2 exchange at the air-water in-terface in continental shelf seas, Global Biogeochem. Cy., 28,1199–1214, https://doi.org/10.1002/2014GB004832, 2014.
Laruelle, G. G., Landschützer, P., Gruber, N., Tison, J.-L.,Delille, B., and Regnier, P.: Global high-resolution monthlypCO2 climatology for the coastal ocean derived from neu-ral network interpolation, Biogeosciences, 14, 4545–4561,https://doi.org/10.5194/bg-14-4545-2017, 2017.
Le Quéré, C., Andrew, R. M., Friedlingstein, P., Sitch, S., Pongratz,J., Manning, A. C., Korsbakken, J. I., Peters, G. P., Canadell,
J. G., Jackson, R. B., Boden, T. A., Tans, P. P., Andrews, O.D., Arora, V. K., Bakker, D. C. E., Barbero, L., Becker, M.,Betts, R. A., Bopp, L., Chevallier, F., Chini, L. P., Ciais, P.,Cosca, C. E., Cross, J., Currie, K., Gasser, T., Harris, I., Hauck,J., Haverd, V., Houghton, R. A., Hunt, C. W., Hurtt, G., Ily-ina, T., Jain, A. K., Kato, E., Kautz, M., Keeling, R. F., KleinGoldewijk, K., Körtzinger, A., Landschützer, P., Lefèvre, N.,Lenton, A., Lienert, S., Lima, I., Lombardozzi, D., Metzl, N.,Millero, F., Monteiro, P. M. S., Munro, D. R., Nabel, J. E. M.S., Nakaoka, S., Nojiri, Y., Padin, X. A., Peregon, A., Pfeil, B.,Pierrot, D., Poulter, B., Rehder, G., Reimer, J., Rödenbeck, C.,Schwinger, J., Séférian, R., Skjelvan, I., Stocker, B. D., Tian, H.,Tilbrook, B., Tubiello, F. N., van der Laan-Luijkx, I. T., van derWerf, G. R., van Heuven, S., Viovy, N., Vuichard, N., Walker,A. P., Watson, A. J., Wiltshire, A. J., Zaehle, S., and Zhu, D.:Global Carbon Budget 2017, Earth Syst. Sci. Data, 10, 405–448,https://doi.org/10.5194/essd-10-405-2018, 2018.
Lefèvre, N., da Silva Dias, F. J., de Torres, A. R., Noriega,C., Araujo, M., de Castro, A. C. L., Rocha, C., Jiang,S., and Ibánhez, J. S. P.: A source of CO2 to the at-mosphere throughout the year in the Maranhense continen-tal shelf (2◦30′ S, Brazil), Cont. Shelf Res., 141, 38–50,https://doi.org/10.1016/j.csr.2017.05.004, 2017.
Lewis, E., Wallace, D., and Allison, L. J.: Program developed forCO2 system calculations. Carbon Dioxide Information AnalysisCenter, managed by Lockheed Martin Energy Research Corpo-ration for the US Department of Energy Tennessee, 1998.
Litt, E. J., Hardman-Mountford, N. J., Blackford, J. C., andMitchelson-Jacob, G. A. Y.: Biological control of pCO2 at sta-tion L4 in the Western English Channel over 3 years, J. Plank.Res, 32, 621–629, https://doi.org/10.1093/plankt/fbp133, 2018.
Liu, S. M., Zhu, B. D., Zhang, J., Wu, Y., Liu, G. S., Deng, B.,Zhao, M. X., Liu, G. Q., Du, J. Z., Ren, J. L., and Zhang, G.L.: Environmental change in Jiaozhou Bay recorded by nutri-ent components in sediments, Mar. Pollut. Bull., 60, 1591–1599,https://doi.org/10.1016/j.marpolbul.2010.04.003, 2010.
Lueker, T. J., Dickson, A. G., and Keeling, C. D.: Ocean pCO2 cal-culated from dissolved inorganic carbon alkalinity, and equationsfor K1 and K2: validation based on laboratory measurements ofCO2 in gas and seawater at equilibrium, Mar. Chem., 70, 105–119, https://doi.org/10.1016/S0304-4203(00)00022-0, 2000.
Mackenzie, F. T., Bewers, J. M., Charlson, R. J., Hofmann, E. E.,Knauer, G. A., Kraft, J. C., Nöthig, E. M., Quack, B., Walsh, J. J.,Whitfield, M., and Wollast, R.: What is the importance of oceanmargin processes in global change?, in: Ocean Margin Processesin Global Change, edited by: Mantoura, R. F. C., Martin, J. M.,Wollast, R., Dahlem workshop reports, J. Wiley & Sons, Chich-ester, 433–454, 1991.
Mackenzie, F. T., Lerman, A., and Andersson, A. J.: Past andpresent of sediment and carbon biogeochemical cycling models,Biogeosciences, 1, 11–32, https://doi.org/10.5194/bg-1-11-2004,2004.
Michaels, A. F., Karl, D. M., and Capone, D. G.: Element stoi-chiometry, new production and nitrogen fixation, Oceanography,14, 68–77, https://doi.org/10.5670/oceanog.2001.08, 2001.
Millero, F. J.: Thermodynamics of the carbon dioxide sys-tem in the oceans, Geochi. Cosmo. Acta, 59, 661–677,https://doi.org/10.1016/0016-7037(94)00354-O, 1995.
Ocean Sci., 15, 1225–1245, 2019 www.ocean-sci.net/15/1225/2019/
D. Jiménez-López et al.: pCO2 variability in the surface waters of the eastern Gulf of Cádiz 1243
Muller-Karger, F. E., Varela, R., Thunell, R., Luerssen, R., Hu,C., and Walsh, J. J.: The importance of continental mar-gins in the global carbon cycle, Geophys. Res. Lett, 32, 1–4,https://doi.org/10.1029/2004GL021346, 2005.
Navarro, G. and Ruiz, J.: Spatial and temporal variabil-ity of phytoplankton in the Gulf of Cádiz through re-mote sensing images, Deep-Sea Res. Pt II., 53, 11–13,https://doi.org/10.1016/j.dsr2.2006.04.014, 2006.
Olsen, A., Brown, K. R., Chierici, M., Johannessen, T., and Neill,C.: Sea-surface CO2 fugacity in the subpolar North Atlantic,Biogeosciences, 5, 535–547, https://doi.org/10.5194/bg-5-535-2008, 2008.
Omar, A. M., Olsen, A., Johannessen, T., Hoppema, M., Thomas,H., and Borges, A. V.: Spatiotemporal variations of fCO2 inthe North Sea, Ocean Sci., 6, 77–89, https://doi.org/10.5194/os-6-77-2010, 2010.
Padin, X. A., Navarro, G., Gilcoto, M., Rios, A. F., andPérez, F. F.: Estimation of air-sea CO2 fluxes in theBay of Biscay based on empirical relationships and re-motely sensed observations, J. Mar. Syst., 75, 280–289,https://doi.org/10.1016/j.jmarsys.2008.10.008, 2009.
Padin, X. A., Vázquez-Rodríguez, M., Castaño, M., Velo, A.,Alonso-Pérez, F., Gago, J., Gilcoto, M., Álvarez, M., Pardo, P. C.,de la Paz, M., Ríos, A. F., and Pérez, F. F.: Air-Sea CO2 fluxes inthe Atlantic as measured during boreal spring and autumn, Bio-geosciences, 7, 1587–1606, https://doi.org/10.5194/bg-7-1587-2010, 2010.
Parsons, T. R., Maita, Y., and Lalli, C. M.: A Manual Of Chemi-cal And Biological Methods For Seawater Analysis, PergamonPress, Oxford, 172 pp., 1984.
Peliz, A., Dubert, J., Marchesiello, P., and Teles-Machado,A.: Surface circulation in the Gulf of Cádiz: Model andmean flow structure, J. Geophys. Res.-Oceans, 112, 1–20,https://doi.org/10.1029/2007JC004159, 2007.
Peliz, A., Marchesiello, P., Santos, A. M. P., Dubert, J., Teles-Machado, A., Marta-Almeida, M., and Le Cann, B.: Surface cir-culation in the Gulf of Cádiz: 2. Inflow-outflow coupling and theGulf of Cádiz slope current, J. Geophys. Res.-Oceans, 114, 1–16,https://doi.org/10.1029/2008JC004771, 2009.
Prieto, L., Garcia, C. M., Corzo, A., Ruiz Segura, J., and Echevarria,F.: Phytoplankton, bacterioplankton and nitrate reductase activitydistribution in relation to physical structure in the northern Albo-ran Sea and Gulf of Cádiz (southern Iberian Península), Bol. Inst.Esp. Oceanogr., 15, 401–411, 1999.
Qin, B. Y., Tao, Z., Li, Z. W., and Yang, X. F.: Seasonal changesand controlling factors of sea surface pCO2 in the YellowSea, in: IOP Conf. Ser.: Earth Environ. Sci., 17, 012025,https://doi.org/10.1088/1755-1315/17/1/012025, 2014.
Qu, B., Song, J., Yuan, H., Li, X., and Li, N.: Air-sea CO2 ex-change process in the southern Yellow Sea in April of 2011,and June, July, October of 2012, Cont. Shelf Res., 80, 8–19,https://doi.org/10.1016/j.csr.2014.02.001, 2014.
Rabouille, C., Mackenzie, F. T., and Ver, L. M.: Influence of the hu-man perturbation on carbon, nitrogen, and oxygen biogeochemi-cal cycles in the global coastal ocean, Geochim. Cosmo. Acta,65, 3615–3641, https://doi.org/10.1016/S0016-7037(01)00760-8, 2001.
Redfield, A. C., Ketchum, B. H., and Richards, F. A.: The influ-ence of organisms on the composition of sea-water, in: , The sea,edited by: Hill, M. N., 2, Interscience, New York, 26–77, 1963.
Reimer, J. J., Cai, W.-J., Xue, L., Vargas, R., Noakes, S., Hu, X.,Signorini, S. R., Mathis, J. T., Feely, R. A., Sutton, A. J., Sabine,C., Musielewicz, S., Chen, B., and Wanninkhof, R.: Time seriesof pCO2 at a coastal mooring: Internat consistency, seasonal cy-cles, and interannual variaiblity, Cont. Shelf Res., 145, 95–108,https://doi.org/10.1016/j.csr.2017.06.022, 2017.
Ribas-Ribas, M., Gómez-Parra, A., and Forja, J. M.: Air-sea CO2 fluxes in the north-eastern shelf of the Gulf ofCádiz (southwest Iberian Península), Mar. Chem., 123, 56–66,https://doi.org/10.1016/j.marchem.2010.09.005, 2011.
Ribas-Ribas, M., Sobrino, C., Debelius, B., Lubián, L.M.,Ponce, R., Gómez-Parra, A., and Forja, J. M.: Picophyto-plankton and carbon cycle on the northeastern shelf of theGulf of Cádiz (SW Iberian Península), Sci. Mar., 77, 49–62,https://doi.org/10.3989/scimar.03732.27D, 2013.
Ríos, A. F., Pérez, F. F., Álvarez, M. A., Mintrop, L.,González-Dávila, M., Santana-Casiano, J. M., Lefèvre,N., and Watson, A. J.: Seasonal sea-surface carbondioxide in the Azores area, Mar. Chem., 96, 35–51,https://doi.org/10.1016/j.marchem.2004.11.001, 2005.
Sala, I., Caldeira, R. M. A., Estrada-Allis, S. N., Froufe, E., andCouvelard, X.: Lagrangian transport pathways in the north-east Atlantic and their environmental impact, Limnol. Oceanogr.Fluids Environ., 3, 40–60, https://doi.org/10.1215/21573689-2152611, 2013.
Sala, I., Navarro, G., Bolado-Penagos, M., Echevarría, F., and Gar-cía, C. M.: High-Chlorophyll-Area Assessment Based on Re-mote Sensing Observations: The Case Study of Cape Trafalgar,Remote Sensing, 10, 165, https://doi.org/10.3390/rs10020165,2018.
Sánchez, R. F. and Relvas, P.: Spring-summer climatological cir-culation in the upper layer in the region of Cape St. Vin-cent, Southwest Portugal, ICES J. Mar. Sci., 60, 1232–1250,https://doi.org/10.1016/S1054-3139(03)00137-1, 2003.
Sánchez, R. F., Relvas, P., Martinho, A., and Miller, P.: Physicaldescription of an upwelling filament west of Cape St. Vincentin late October 2004, J. Geophys. Res.-Oceans, 113, C07044,https://doi.org/10.1029/2007JC004430, 2008.
Sánchez-Leal, R. F., Bellanco, M. J., Fernández-Salas, L. M.,García-Lafuente, J., Gasser-Rubinat, M., González-Pola, C.,Hernández-Molina, F. J., Pelegrí, J. L., Peliz, A., Rel-vas, P., Roque, D., Ruiz-Villarreal, M., Sammartino, S., andSánchez-Garrido, J. C.: The Mediterranean Overflow in theGulf of Cádiz: A rugged journey, Sci. Adv., 3, eaao0609,https://doi.org/10.1126/sciadv.aao0609, 2017.
Santana-Casiano, J. M., Gonzalez-Davila, M., and Laglera, L. M.:The carbon dioxide system in the Strait of Gibraltar, Deep-Sea Res. Pt II., 49, 4145–4161, https://doi.org/10.1016/S0967-0645(02)00147-9, 2002.
Santana-Casiano, J., González-Dávila, M., and Ucha, I.:Carbon dioxide fluxes in the Benguela upwelling sys-tem during winter and spring: A comparison between2005 and 2006, Deep-Sea Res. Pt. II, 56, 533–541,https://doi.org/10.1016/j.dsr2.2008.12.010, 2009.
Schiettecatte, L. S., Thomas, H., Bozec, Y., and Borges, A. V.:High temporal coverage of carbon dioxide measurements in the
www.ocean-sci.net/15/1225/2019/ Ocean Sci., 15, 1225–1245, 2019
1244 D. Jiménez-López et al.: pCO2 variability in the surface waters of the eastern Gulf of Cádiz
Southern Bight of the North Sea, Mar. Chem., 106, 161–173,https://doi.org/10.1016/j.marchem.2007.01.001, 2007.
Shaw, E. C. and McNeil, B. I.: Seasonal variability incarbonate chemistry and air-sea CO2 fluxes in thesouthern Great Barrier Reef, Mar. Chem., 158, 49–58,https://doi.org/10.1016/j.marchem.2013.11.007, 2014.
Shim, J. H., Kim, D., Kang, Y. C., Lee, J. H., Jang, S. T., and Kim,C. H.: Seasonal variations in pCO2 and its controlling factorsin surface seawater of the northern East China Sea, Cont. ShelfRes., 27, 2623–2636, https://doi.org/10.1016/j.csr.2007.07.005,2007.
Smith, S. V. and Hollibaugh, J. T.: Coastal metabolism and theoceanic organic carbon balance, Rev. Geophys, 31, 75–89,https://doi.org/10.1029/92RG02584, 1993.
Takahashi, T., Olafsson, J., Goddard, J. G., Chipman, D. W., andSutherland, S. C.: Seasonal variations of CO2 and nutrients in thehigh-latitude surface oceans: A comparative study, Global Bio-geochem. Cy., 7, 843–878, https://doi.org/10.1029/93GB02263,1993.
Takahashi, T., Sutherland, S. C., Sweeney, C., Poisson, A., Metzl,N., Tilbrook, B., Bates, N., Wanninkhof, R., Feely, R. A., Sabine,C., Olafsson, J., and Nojiri, Y.: Global sea-air CO2 flux basedon climatological surface ocean pCO2, and seasonal biologicaland temperature effects, Deep-Sea Res. Pt. II, 49, 1601–1622,https://doi.org/10.1016/S0967-0645(02)00003-6, 2002.
Tseng, C. M., Liu, K. K., Gong, G. C., Shen, P. Y., and Cai, W.J.: CO2 uptake in the East China Sea relying on Changjiangrunoff is prone to change, Geophys. Res. Lett., 38, 1–6,https://doi.org/10.1029/2011GL049774, 2011.
Tsunogai, S., Watanabe, S., Nakamura, J., Ono, T., and Sato, T.:A preliminary study of carbon system in the East China Sea, J.Oceanogr., 53, 9–17, https://doi.org/10.1007/BF02700744, 1997.
Vandemark, D., Salisbury, J. E., Hunt, C. W., Shellito, S. M.,Irish, J. D., McGillis, W. R., Sabine, C. L., and Maenner, S.M.: Temporal and spatial dynamics of CO2 air–sea flux inthe Gulf of Maine, J. Geophys. Res.-Oceans, 116, C01012,https://doi.org/10.1029/2010JC006408, 2011.
van Geen, A., Takesue, R. K., Goddard, J., Takahashi, T., Barth,J. A., and Smith, R. L.: Carbon and nutrient dynamics duringcoastal upwelling off Cape Blanco, Oregon, Deep-Sea Res. Pt. II,47, 975–1002, https://doi.org/10.1016/S0967-0645(99)00133-2,2000.
Vargas-Yáñez, M., Viola, T. S., Jorge, F. P., Rubín, J. P.,and García, M. C.: The influence of tide-topography in-teraction on low-frequency heat and nutrient fluxes, Appli-cation to Cape Trafalgar, Cont. Shelf Res., 22, 115–139,https://doi.org/10.1016/S0278-4343(01)00063-2, 2002.
Volk, T. and Hoffert, M. I.: Ocean carbon pumps: Analysis of rela-tive strengths and efficiencies in ocean-driven atmospheric CO2changes in The Carbon Cycle and Atmospheric CO2: NaturalVariations Archean to Present, Geophys. Monogr. Ser., 32, 99–110, https://doi.org/10.1029/GM032p0099, 1985.
Walsh, J. J.: On the Nature of Continental Shelves, Academic Press,New York, 510 pp., 1988
Walsh, J. J.: Importance of continental margins in the marine bio-geochemical cycling of carbon and nitrogen, Nature, 350, 53–55,https://doi.org/10.1038/350053a0, 1991.
Wang, S. L., Arthur Chen, C. T., Hong, G. H., and Chung, C. S.:Carbon dioxide and related parameters in the East China Sea,
Cont. Shelf Res., 20, 525–544, https://doi.org/10.1016/S0278-4343(99)00084-9, 2000.
Wang, Z. A., Cai, W. J., Wang, Y., and Ji, H.: The southeastern con-tinental shelf of the United States as an atmospheric CO2 sourceand an exporter of inorganic carbon to the ocean, Cont. ShelfRes., 25, 1917–1941, https://doi.org/10.1016/j.csr.2005.04.004,2005.
Wanninkhof, R.: Relationship between wind speed andgas exchange, J. Geophys. Res., 97, 7373–7382,https://doi.org/10.1029/92JC00188, 1992.
Wanninkhof, R.: Relationship between wind speed and gas ex-change over the ocean revisited. Limnol. Oceanogr. Methods, 12,351–362, https://doi.org/10.4319/lom.2014.12.351, 2014.
Weiss, R.: Carbon dioxide in water and seawater: the sol-ubility of a non-ideal gas, Mar. Chem., 2, 203–215,https://doi.org/10.1016/0304-4203(74)90015-2, 1974.
Wollast, R.: The Coastal Carbon Cycle: Fluxes, Sources and Sinks,in: Ocean Margin Processes in Global Change, edited by: Man-toura, R. F. C., Martin, J. M., and Wollast, R., J.Wiley & SonsChichester, 365–382, 1991.
Wollast, R.: Interactions of Carbon and Nitrogen cycles in theCoastal Zone, in: Interactions of C, N, P, and S biogeochemi-cal cycles and global change, edited by: Wollast, R., Mackenzie,F. T., and Chou, L., Springer, Berlin, NATOASI Series, 14, 195–210, https://doi.org/10.1007/978-3-642-76064-8_7, 1993.
Woolf, D. K., Land, P. E., Shutler, J. D., Goddijn-Murphy,L. M., and Donlon, C. J.: On the calculation of air-seafluxes of CO2 in the presence of temperature and salin-ity gradients, J. Geophys. Res.-Oceans, 121, 1229–1248,https://doi.org/10.1002/2015JC011427, 2016.
Xue, L., Xue, M., Zhang, L., Sun, T., Guo, Z., and Wang,J.: Surface partial pressure of CO2 and air-sea exchange inthe northern Yellow Sea, J. Mar. Syst., 105–108, 194–206,https://doi.org/10.1016/j.jmarsys.2012.08.006, 2012.
Xue, L., Gao, L., Cai, W. J., Yu, W., and Wei, M.: Response ofsea surface fugacity of CO2 to the SAM shift south of Tasma-nia: Regional differences, Geophys. Res. Lett., 42, 3973–3979,https://doi.org/10.1002/2015GL063926, 2015.
Xue, L., Cai, W. J., Hu, X., Sabine, C., Jones, S., Sutton,A. J., Jiang, L. Q., and Reimer, J. J.: Sea surface carbondioxide at the Georgia time series site (2006–2007): Air-seaflux and controlling processes, Prog. Oceanogr., 140, 14–26,https://doi.org/10.1016/j.pocean.2015.09.008, 2016.
Yentsch, C. S. and Menzel, D. W.: A method for the determi-nation of phytoplankton chlorophyll and pheophytin by flu-orescence, Deep-Sea Res. Oceanogr. Abstracts, 10, 221–231,https://doi.org/10.1016/0011-7471(63)90358-9, 1963.
Zeebe, R. E. and Wolf-Gladrow, D. A.: CO2 in seawater: equilib-rium, kinetics, isotopes, Elsevier Oceanography Series, Amster-dam, 347 pp., 2001.
Zhai, W. D., Dai, M., and Cai, W.-J.: Coupling of surface pCO2and dissolved oxygen in the northern South China Sea: impactsof contrasting coastal processes, Biogeosciences, 6, 2589–2598,https://doi.org/10.5194/bg-6-2589-2009, 2009.
Zhang, L., Xue, L., Song, M., and Jiang, C.: Distribution ofthe surface partial pressure of CO2 in the southern Yel-low Sea and its controls, Cont. Shelf Res., 30, 293–304,https://doi.org/10.1016/j.csr.2009.11.009, 2010.
Ocean Sci., 15, 1225–1245, 2019 www.ocean-sci.net/15/1225/2019/
D. Jiménez-López et al.: pCO2 variability in the surface waters of the eastern Gulf of Cádiz 1245
Zhang, L., Xue, M., and Liu, Q.: Distribution and seasonal varia-tion in the partial pressure of CO2 during autumn and winter inJiaozhou Bay, a region of high urbanization, Mar. Pollut. Bull.,64, 56–65, https://doi.org/10.1016/j.marpolbul.2011.10.023,2012.
www.ocean-sci.net/15/1225/2019/ Ocean Sci., 15, 1225–1245, 2019