pccp 2014 rh
TRANSCRIPT
13136 | Phys. Chem. Chem. Phys., 2014, 16, 13136--13144 This journal is© the Owner Societies 2014
Cite this:Phys.Chem.Chem.Phys.,
2014, 16, 13136
Spectral evidence for hydrogen-induced reversiblesegregation of CO adsorbed on titania-supportedrhodium†
D. Panayotov,*a M. Mihaylov,a D. Nihtianova,ab T. Spassovc and K. Hadjiivanov*a
The reduction of a 1.3% Rh/TiO2 sample with carbon monoxide leads to the formation of uniform Rh
nanoparticles with a mean diameter of dp E 2.2 nm. Adsorption of CO on the reduced Rh/TiO2 produces
linear and bridged carbonyls bound to metallic Rh0 sites and only a few geminal dicarbonyls of RhI. The
n(CO) of linear Rh0–CO complexes is strongly coverage dependent: it is observed at 2078 cm�1 at full
coverage and at ca. 2025 cm�1 at approximated zero coverage. At low coverage, this shift is mainly caused
by a dipole–dipole interaction between the adsorbed CO molecules while at high coverage, the chemical
shift also becomes important. Hydrogen hardly affects the CO adlayer at high CO coverages. However, on
a partially CO-covered surface (yCO E 0.5), the adsorption of H2 at increasing pressure leads to a gradual
shift in the band of linear Rh0–CO from 2041 to 2062 cm�1. Subsequent evacuation almost restores the
original spectrum, demonstrating the reversibility of the hydrogen effect. Through the use of 12CO + 13CO
isotopic mixtures, it is established that the addition of hydrogen to the CO–Rh/TiO2 system leads to an
increase in the dynamic interaction between the adsorbed CO molecules. This evidences an increase in the
density of the adsorbed CO molecules and indicates segregation of the CO and hydrogen adlayers. When
CO is adsorbed on a hydrogen-precovered surface, the carbonyl band maximum is practically coverage
independent and is observed at 2175–2173 cm�1. These results are explained by a model according to
which CO successively occupies different rhodium nanoparticles.
1. Introduction
The vibrational spectroscopy of adsorbed CO is among themost used and powerful methods for identification of activesites and elementary mechanistic steps in heterogeneous cata-lytic reactions proceeding on the surfaces of both single crystalsand supported metals.1 The spectral performance of adsorbedCO is determined by different factors: geometry of the bonding,nature of the bond and the coverage.1–3 For linearly bonded CO,the position of the carbonyl band depends mainly on thebalance between the s- and p-bonds.3–6 The s-bonding leadsto an increase in n(CO), while the p-bonding causes theopposite effect.3 With metal surfaces, the p-bonding usuallypredominates and, as a result, n(CO) is detected below the COgas-phase stretching frequency (2143 cm�1). When CO bridgestwo metal atoms, rehybridization to sp2 hybrid orbitals occurs,
which leads to a lower C–O bond order and n(CO) is shifted to2000–1880 cm�1. Multi-centered carbonyls formed on three-fold and four-fold hollow sites are observed at even lowerwavenumbers (below B1880 cm�1).7
The position of n(CO) for linear carbonyls is primarily affectedby the coordination state of the adsorption site. The lower itscoordination number, the greater the adsorption strength andthus, the frequency of the n(CO) mode normally appears at lowerwavenumbers. Note that low coordinate atoms on edges, cornersand defects are likely to represent a large proportion of all theavailable adsorption sites on small particles.5,6,8
Usually, the position of the carbonyl bands is coveragedependent. For most metal surfaces, n(CO) for linearly adsorbedCO is blue shifted with the increase of coverage. This shiftis mainly caused by the cooperative effect of two phenomena:(i) dipole–dipole coupling between the adsorbed molecules(dynamic shift) and (ii) competition between adsorbate mole-cules for electrons back donated from the metal to form p-bonds(chemical shift).3
Rhodium is an important component in many catalysts forCO conversion, e.g. selective CO hydrogenation,9,10 reduction ofNO by CO in automotive exhaust gas,11,12 hydroformylationreactions (aldehyde production from olefins, carbon monoxide,
a Institute of General and Inorganic Chemistry, Bulgarian Academy of Sciences,
Sofia 1113, Bulgaria. E-mail: [email protected], [email protected] Institute of Mineralogy and Crystallography, Bulgarian Academy of Sciences,
Sofia 1113, Bulgariac University of Sofia, Department of Chemistry and Pharmacy, Sofia 1126, Bulgaria
† Electronic supplementary information (ESI) available: Fig. S1–S7 and details onthe CO interaction with single rhodium surfaces. See DOI: 10.1039/c4cp01136h
Received 17th March 2014,Accepted 14th April 2014
DOI: 10.1039/c4cp01136h
www.rsc.org/pccp
PCCP
PAPER
This journal is© the Owner Societies 2014 Phys. Chem. Chem. Phys., 2014, 16, 13136--13144 | 13137
and hydrogen),13,14 etc. The Rh–TiO2 system is well known as aFischer–Tropsch catalyst,15 where the details on the CO and H2
adsorption and coadsorption have fundamental importance.There are many studies of CO and H2 adsorption and
coadsorption on rhodium single crystals. On both Rh(111)and Rh(100) planes, CO forms coverage dependent orderedstructures consisting of linear (on top) and bridge-boundspecies.16–21 Two-fold bridge-bound CO has been observed ona Rh(100) surface22 while CO bound at three-fold bridge (hollowsites) sites is characteristic for a Rh(111) surface.17 Hydrogenadsorbs dissociatively on both Rh(111)23 and Rh(100)24 surfaces(at B100 K), and forms no ordered structures observable byLEED. Co-adsorbed CO and hydrogen are found to segregate onthe close packed Rh(111) surface.25 On the more open Rh(100)surface, CO and hydrogen adsorbates segregate when CO ispreadsorbed, whereas a mixed adlayer is formed when H2 isadsorbed first.18,24
The chemistry of CO adsorbed on supported rhodiumcatalysts is different. Numerous studies have shown that COprovokes oxidative disruption of supported metal rhodiumparticles, forming isolated rhodium(I) geminal dicarbonyls.26,27
The disruption of Rh crystallites is assisted by surface hydroxylgroups28–30 or surface defects31,32 of the oxide support. Theeffect of hydrogen on CO preadsorbed on oxide-supportedrhodium has also been studied.9,29,33–35 However, most of thesestudies were focused on the interaction of H2 with isolatedgeminal dicarbonyl species of RhI and the reverse aggregationof isolated RhI ions to metallic Rh crystallites.28,29,36 Theproduction of water during the interaction of hydrogen withrhodium on reducible supports is an additional factor thatcomplicates the spectra compared to the single crystal systems.Generally, a detailed spectroscopic investigation of supportedrhodium systems towards the effect of hydrogen on theadsorbed CO layer has not attracted the attention that hasbeen paid when the effect was studied with single crystals. It isof definite interest to establish the phenomena occurring withsupported metal nanoparticles because they are characteristicof the real Rh-metal oxide catalyst systems.
The aim of this work is to study the effect of hydrogen on theCO adsorbate layer formed on titania-supported rhodiumnanoparticles. To clarify the nature of this effect, we used IRspectroscopy of adsorbed CO and a 13CO-enriched 12CO + 13COisotopic mixture.
2. Experimental2.1. Sample preparation
The support used for the deposition of Rh nanoparticles was acommercially available Degussa P25 titanium dioxide material con-taining 80% anatase and 20% rutile.37 The Rh/TiO2 sample wasprepared by incipient wetness impregnation of 1.0 g of TiO2 with2.5 mL of a 1.4 wt% aqueous solution of RhCl3�xH2O (38.7% Rh,VEB Bergbau und Huttenkombinat ‘‘Albert Funk’’) and dried at373 K. The Rh/TiO2 sample thus obtained contained, nominally,1.3 wt% of rhodium. Before the IR experiments, the sample was
reduced in situ in the IR cell by CO, as described below. For the TEManalysis, the reduced Rh/TiO2 sample was passivated by successiveadditions of small doses of oxygen in situ in the IR cell beforeexposing to air and transferring into the TEM equipment.
2.2. Techniques
FTIR spectra were recorded at ambient temperature with a NicoletAvatar 360 FTIR spectrometer accumulating 64 scans at a spectralresolution of 2 cm�1. Self-supporting pellets (ca. 10 mg cm�2) wereprepared from the sample powder and treated directly in a purpose-made IR cell. The cell was connected to a vacuum-adsorptionapparatus with a residual pressure below 10�3 Pa. Prior to theadsorption experiments, the sample was first oxidized (15.0 kPa O2,673 K, 30 min), evacuated at 523 K for 2 min and then cooled to298 K under a dynamic vacuum. After that, the sample was reducedby exposure to 4.0 kPa CO at 523 K for 1 min and then evacuated at298 K. The CO coverage measured by the integrated IR absorbanceof rhodium carbonyls under these conditions was adopted as thesaturation CO coverage of exposed Rh sites. Partial CO coverageswere obtained by the evacuation of CO-saturated Rh/TiO2 at chosenelevated temperatures. A liquid nitrogen trap served to removetraces of water vapour from the cell during the experiments.
Carbon monoxide (>99.5% purity) was supplied by Merck andlabelled carbon monoxide 13CO (99 atom% 13C, o5 atom% 18O),by ISOTEC. Oxygen (>99.999%) and hydrogen (>99.999%) wereboth purchased from Messer. All the gases (CO, CO isotopicmixture, O2 and H2) were additionally purified by passingthrough a liquid nitrogen trap.
The histogram of the metal particle size has been obtainedby counting about 300 particles.
3. Results3.1. Sample characterization by TEM
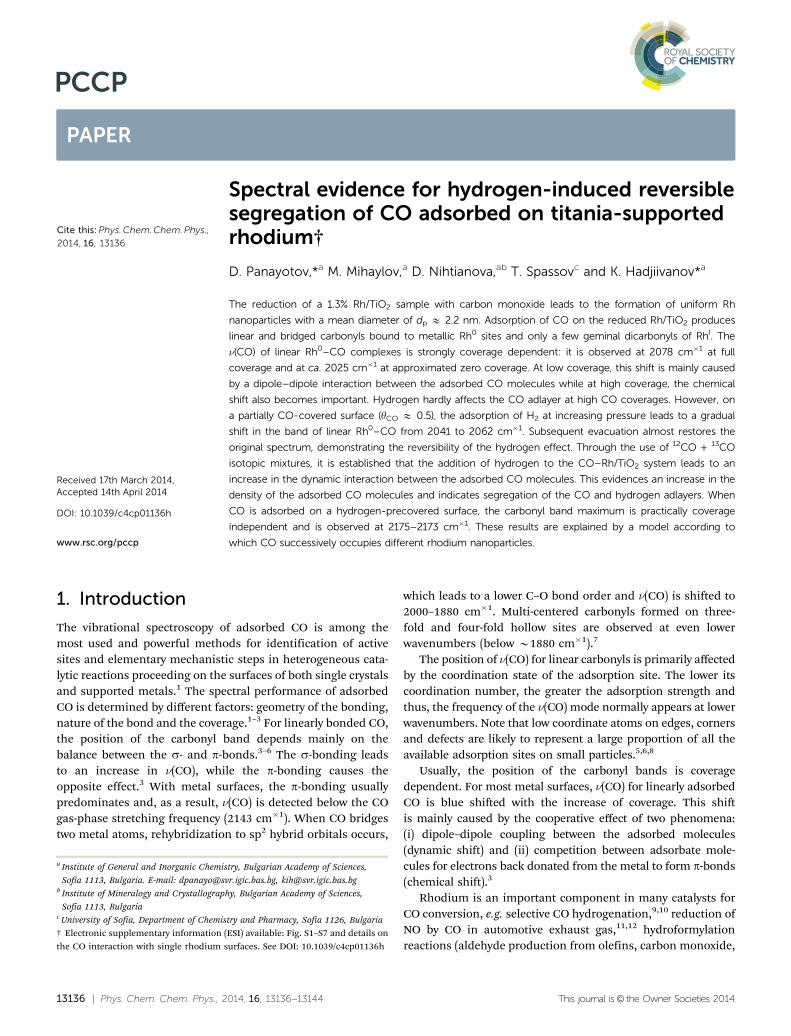
The TEM study was performed with an ex situ CO-reducedRh/TiO2 sample. The low-magnification TEM images (Fig. 1Aand B) revealed that the TiO2 particles (average size 25 nm) aredecorated by Rh nanoparticles. The recorded one- and two-dimensional HRTEM images confirmed the phase compositionof the TiO2 support.
The histogram in Fig. 1C shows a rather narrow size dis-tribution of Rh particles with a mean diameter of dp E 2.2 nm.An estimate showed that the Rh nanoparticles are pseudo-hemispherical and possess an aspect ratio (height/diameter)of B0.3–0.4. The (100) and (111) lattice fringes of the rhodiumparticles are also registered. Moreover, the (100) lattice fringesof anatase coexist with the (100) lattice fringes of rhodium(Fig. 1D) while the (101) lattice fringes of anatase TiO2 coexistwith the (111) lattice fringes of rhodium (Fig. 1E). These datasuggest that Rh nanoparticles with different exposed facespreferentially grow on different TiO2 crystal planes.
3.2. Adsorption of CO
The IR spectrum of CO (4 kPa equilibrium pressure) adsorbedat 298 K on the CO-reduced Rh/TiO2 sample exhibits two sharp
Paper PCCP
13138 | Phys. Chem. Chem. Phys., 2014, 16, 13136--13144 This journal is© the Owner Societies 2014
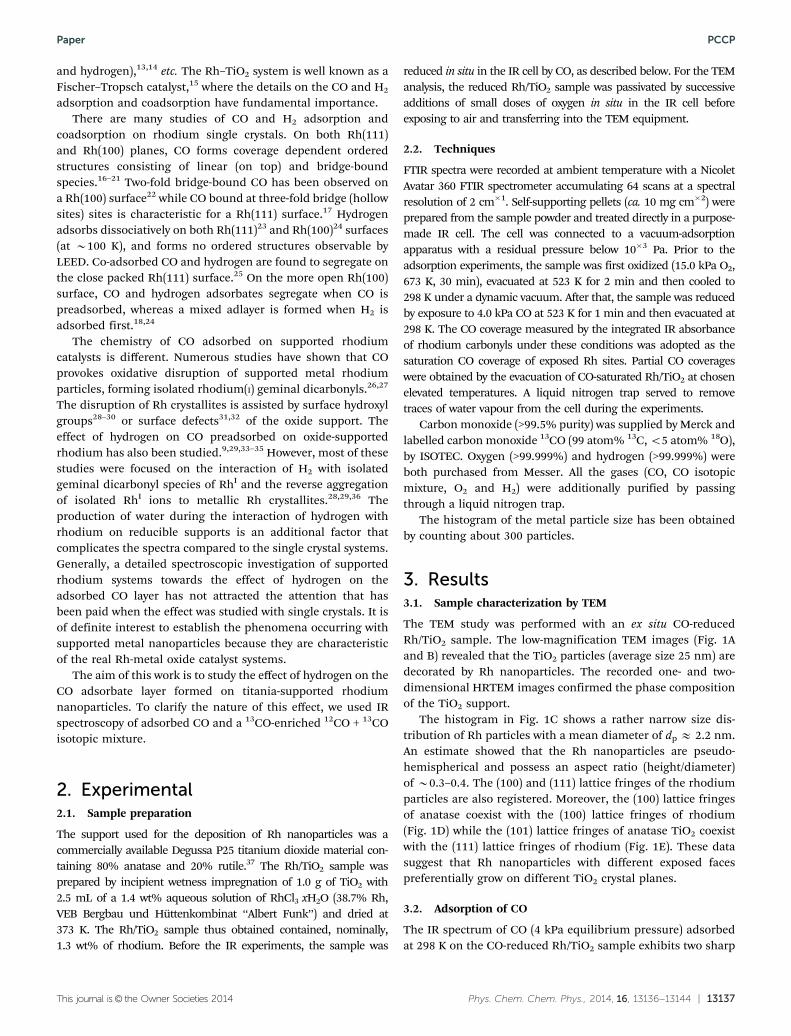
bands at 2187 and 2078 cm�1 and a broad feature centered at1870 cm�1 (Fig. 2A, spectrum a). The band at 2187 cm�1 isobserved only in the presence of gas-phase CO and arises fromCO bound to low-coordinated Ti4+ sites on the TiO2 support.38 Theintense band at 2078 cm�1 is unambiguously assigned to linearRh0–CO species while the broad band at B1870 cm�1 is attri-buted to bridged carbonyls formed on the Rh nanoparticles.8,36,38
The sample was evacuated at ambient and elevated tempera-tures (Fig. 2A spectra b–j). This resulted in the fast disappearanceof the Ti4+–CO band at 2187 cm�1. The principal Rh0–COcarbonyl band decreased in intensity and was gradually shiftedfrom 2078 cm�1 to 2026 cm�1. The dependence of the bandposition on the coverage is shown in Fig. 2B. The measured shiftin n(CO) was Dn(CO) = 52 cm�1 for a CO coverage (yCO) changefrom B1 to B0.04.8
Computer treatment indicates a good approximation of thespectrum when the band of Rh0–CO carbonyls was deconvo-luted into three components (see Fig. S1 of the ESI†). Thesecomponents could be attributed to CO bound to Rh sites withdifferent coordinations.5,8,39 For small Rh particles with meansizes of 2–3 nm, the fraction of low-coordinated Rh sites atedge, step and corner positions may account for B50% of thetotal number of exposed rhodium.8 Unfortunately, it is difficultto estimate the fraction of various Rh sites from the IR spectrabecause of intensity transfer phenomena usually observed withCO adsorbed on metal surfaces.5,40,41
The changes in the region of the bridging carbonyls aremore complex: the broad band consists of at least two maincomponents. These features show different stabilities and thehigh-frequency component tends to red shift with decreasingcoverage. Based on previous assignments,8 the bands in the1910–1890 cm�1 region can be attributed to two-fold bridge-bound CO while the bands in the 1870–1820 cm�1 region to CObound to three-fold hollow sites.
After evacuation at 298 K (Fig. 2A, spectrum b), a weak bandat 2098 cm�1 becomes observable and is more discernible aftera short evacuation at 448 K (Fig. 2A, spectrum c). This band isattributed to the symmetric modes of isolated RhI(CO)2
Fig. 1 (A) Bright field TEM image of the 1.3 wt% Rh/TiO2 sample; (B) anenlarged view of the small Rh particles at the surface of TiO2; (C) ahistogram of the apparent diameter of the Rh particles; (D) and (E) HRTEMimages of B25 nm anatase particles bearing B2–3 nm Rh particles.
Fig. 2 Panel (A): FTIR spectra of CO adsorbed at 298 K on CO-reducedRh/TiO2. Equilibrium CO pressure of 4 kPa, spectrum a; evacuation at298 K, b; and, sequential 10 min evacuations at 448 K (c–h) and at 523 K (i–j).The spectra are background corrected. Panel (B): dependence of n(CO) ofthe Rh0–CO species on the relative CO coverage. The dashed line is a guidefor the eye.
PCCP Paper
This journal is© the Owner Societies 2014 Phys. Chem. Chem. Phys., 2014, 16, 13136--13144 | 13139
geminal species,28,29,36,38 the respective antisymmetric modesbeing masked by the intense carbonyl band of the Rh0–COspecies.29,36,38 The 2098 cm�1 band declined under a dynamicvacuum at elevated temperatures and vanished at 523 K. Theposition of the band was not affected by the coverage. Suchbehavior is consistent with the proposed assignment as longas the two CO ligands in the geminal species do not participatein dipole–dipole interactions.29,36 Separate experiments haverevealed that the fraction of the geminal dicarbonyls is muchmore important with the hydrogen-reduced sample (Fig. S2,ESI,† spectrum b), in line with literature reports.36,38 RhI(CO)2
species were the principal carbonyls produced after CO adsorp-tion on oxidized Rh particles after exposure to O2. In the lattercase, however, some carbonates were produced after COadsorption. The results evidence that the reduction with COensures that rhodium remains mainly in a metallic state in thepresence CO at 298 K.
After evacuation at 523 K, re-adsorption of CO (4 kPa) at298 K practically reproduced the spectrum of the CO-saturatedsample (shown in Fig. 2A, spectrum a), evidencing that noirreversible changes occurred with the Rh particles during theexperiments.
3.3. Adsorption of H2
To obtain a clean surface, the reduced sample was evacuated at548 K for 20 min. This procedure ensured the disappearance ofall the carbonyl bands. Exposure of the sample to H2 gas at 298 Kled to an immediate rise in the IR background absorbance, asshown in Fig. S3 (ESI†). The observed IR absorbance is feature-less and increases exponentially from B4000 to 1000 cm�1. It isattributed to delocalized conduction band electrons that accu-mulate in TiO2 with the H2 exposure. Similar observations wererecently reported for H2 adsorption on Au/TiO2.42 The resultsevidence that H2 dissociates on the metallic Rh particles andproduces atomic hydrogen that spills over onto the TiO2 support.The H atoms protonate surface oxygen atoms to OH groupswhile injecting electrons into the conduction band of TiO2.15,42
These observations are consistent with the literature data on H2
adsorption on rhodium monocrystals where H2 was found todissociate. More details on the sample interaction with H2 arepresented in the ESI.†
3.4. Adsorption of CO on the hydrogen pre-covered sample
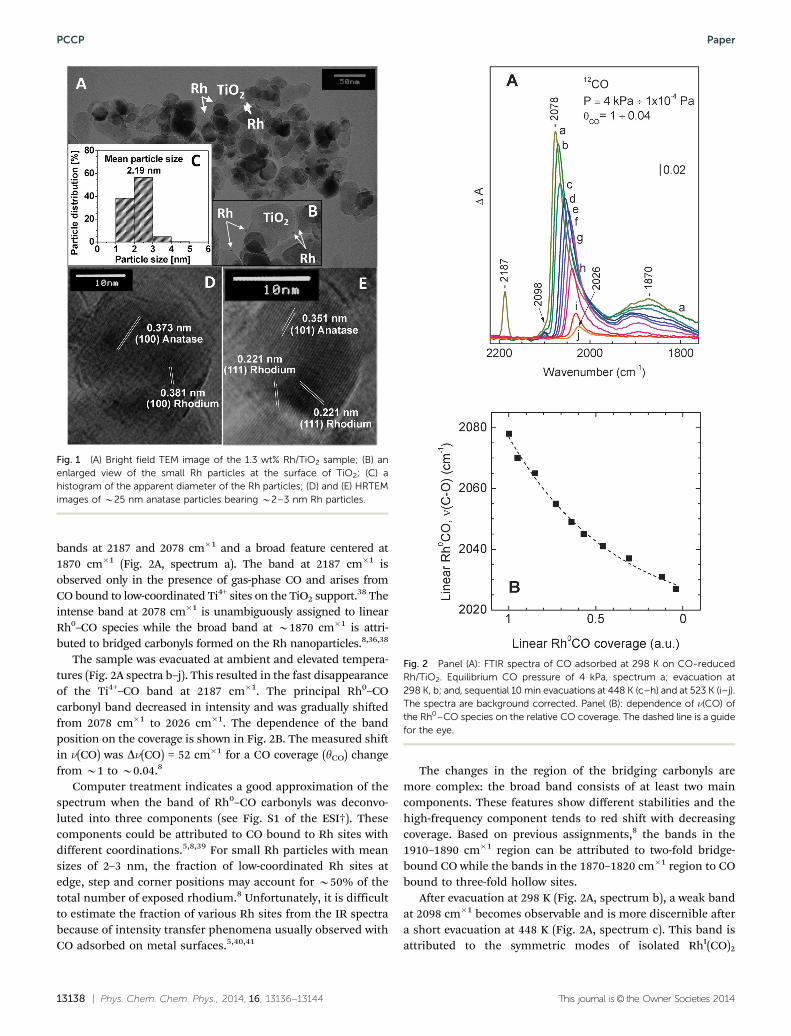
The next experiments were designed to check the effect ofpre-adsorbed hydrogen on the adsorption of CO. Before theH2 exposure, the CO-reduced Rh/TiO2 sample was first evacu-ated at 548 K for 20 min and then cooled down to 298 K under adynamic vacuum. Then, hydrogen (4 kPa equilibrium pressure)was introduced to the sample and small portions of CO weresuccessively added to the system to increase the CO coverage, asshown in Fig. 3. The Rh0–CO band appeared at 2073 cm�1 foryCO = 0.27 and its position changed only slightly with thecoverage, reaching a value of 2075 cm�1 for yCO = 0.67. Notethat this value is very close to the value observed for full COcoverage in the absence of hydrogen (Fig. 2A, spectrum a). Theband for bridging carbonyls which appeared at ca. 1900 cm�1
was expressed even at low coverages. As seen from the inset inFig. 3, where normalized spectra are presented, the relativeintensity of the bands due to linear and bridge species remainsthe same at different CO coverages. The observations thatunder H2 equilibrium pressure, the ratio of liner/bridgingcarbonyls as well as that the positions of the carbonyl bandsremain constant with CO coverage can be rationalized byassuming that, in the presence of pre-adsorbed hydrogen, evensmall amounts of adsorbed CO form an adlayer with a highdensity of CO molecules. In this CO adlayer, the interactionbetween CO oscillators is similar to that in the CO-saturatedlayer on the hydrogen-free surface.
This supposition is confirmed by the computer treatment ofthe spectra for linear Rh0–CO species, which revealed a goodapproximation when the bands were deconvoluted into threecomponents with positions similar to the positions observed withfull CO coverage in the absence of hydrogen (see Fig. S4, ESI†).
3.5. Effect of hydrogen on pre-adsorbed CO
The first series of experiments were performed with a Rh/TiO2
sample that was saturated with CO and then evacuated at 298 K.Just before the admission of H2, the spectrum of the sampleexhibited a band at 2066 cm�1 due to linearly bound Rh0–COspecies and the estimated yCO was 0.87 (Fig. S5, spectrum a). Atthis high CO coverage, the effect of H2 admission on thecarbonyl bands was practically negligible: after 60 min exposureto hydrogen, the band at 2066 cm�1 due to Rh0–CO species wasslightly blue shifted to 2069 cm�1 (Fig. S5, ESI,† spectrum b).
Fig. 3 FTIR spectra of CO adsorbed at 298 K on a H2-precovered Rh/TiO2
sample. The sample was then exposed to H2 (4 kPa equilibrium pressure)and small portions of CO were added at 298 K (a–d). The spectra arebackground corrected. The inset shows the same spectra normalizedaccording to the intensity of the band at 2075–2073 cm�1.
Paper PCCP
13140 | Phys. Chem. Chem. Phys., 2014, 16, 13136--13144 This journal is© the Owner Societies 2014
Upon evacuation, this band appeared at 2063 cm�1 (Fig. S5,ESI,† spectrum c), i.e. at a slightly lower frequency than thatregistered before H2 exposure. This small difference is attributedto the desorption of some CO during evacuation. Thus, theresults evidence that hydrogen hardly affects preadsorbed COwhen the CO coverage is relatively high.
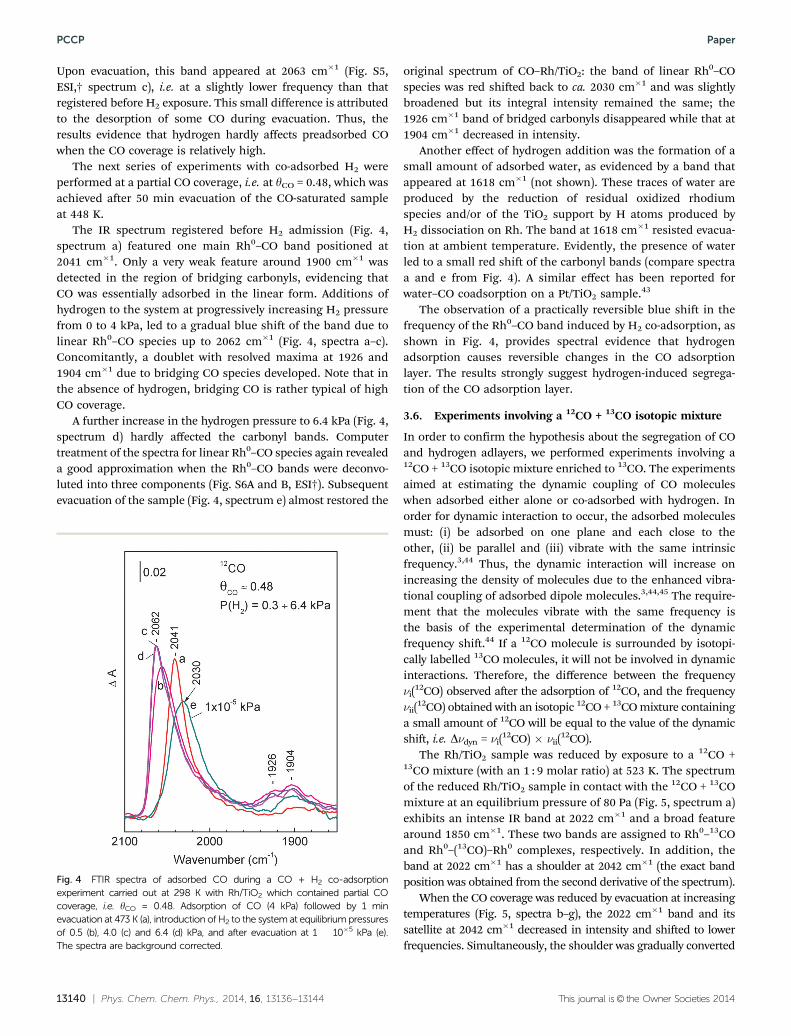
The next series of experiments with co-adsorbed H2 wereperformed at a partial CO coverage, i.e. at yCO = 0.48, which wasachieved after 50 min evacuation of the CO-saturated sampleat 448 K.
The IR spectrum registered before H2 admission (Fig. 4,spectrum a) featured one main Rh0–CO band positioned at2041 cm�1. Only a very weak feature around 1900 cm�1 wasdetected in the region of bridging carbonyls, evidencing thatCO was essentially adsorbed in the linear form. Additions ofhydrogen to the system at progressively increasing H2 pressurefrom 0 to 4 kPa, led to a gradual blue shift of the band due tolinear Rh0–CO species up to 2062 cm�1 (Fig. 4, spectra a–c).Concomitantly, a doublet with resolved maxima at 1926 and1904 cm�1 due to bridging CO species developed. Note that inthe absence of hydrogen, bridging CO is rather typical of highCO coverage.
A further increase in the hydrogen pressure to 6.4 kPa (Fig. 4,spectrum d) hardly affected the carbonyl bands. Computertreatment of the spectra for linear Rh0–CO species again revealeda good approximation when the Rh0–CO bands were deconvo-luted into three components (Fig. S6A and B, ESI†). Subsequentevacuation of the sample (Fig. 4, spectrum e) almost restored the
original spectrum of CO–Rh/TiO2: the band of linear Rh0–COspecies was red shifted back to ca. 2030 cm�1 and was slightlybroadened but its integral intensity remained the same; the1926 cm�1 band of bridged carbonyls disappeared while that at1904 cm�1 decreased in intensity.
Another effect of hydrogen addition was the formation of asmall amount of adsorbed water, as evidenced by a band thatappeared at 1618 cm�1 (not shown). These traces of water areproduced by the reduction of residual oxidized rhodiumspecies and/or of the TiO2 support by H atoms produced byH2 dissociation on Rh. The band at 1618 cm�1 resisted evacua-tion at ambient temperature. Evidently, the presence of waterled to a small red shift of the carbonyl bands (compare spectraa and e from Fig. 4). A similar effect has been reported forwater–CO coadsorption on a Pt/TiO2 sample.43
The observation of a practically reversible blue shift in thefrequency of the Rh0–CO band induced by H2 co-adsorption, asshown in Fig. 4, provides spectral evidence that hydrogenadsorption causes reversible changes in the CO adsorptionlayer. The results strongly suggest hydrogen-induced segrega-tion of the CO adsorption layer.
3.6. Experiments involving a 12CO + 13CO isotopic mixture
In order to confirm the hypothesis about the segregation of COand hydrogen adlayers, we performed experiments involving a12CO + 13CO isotopic mixture enriched to 13CO. The experimentsaimed at estimating the dynamic coupling of CO moleculeswhen adsorbed either alone or co-adsorbed with hydrogen. Inorder for dynamic interaction to occur, the adsorbed moleculesmust: (i) be adsorbed on one plane and each close to theother, (ii) be parallel and (iii) vibrate with the same intrinsicfrequency.3,44 Thus, the dynamic interaction will increase onincreasing the density of molecules due to the enhanced vibra-tional coupling of adsorbed dipole molecules.3,44,45 The require-ment that the molecules vibrate with the same frequency isthe basis of the experimental determination of the dynamicfrequency shift.44 If a 12CO molecule is surrounded by isotopi-cally labelled 13CO molecules, it will not be involved in dynamicinteractions. Therefore, the difference between the frequencyni(
12CO) observed after the adsorption of 12CO, and the frequencynii(
12CO) obtained with an isotopic 12CO + 13CO mixture containinga small amount of 12CO will be equal to the value of the dynamicshift, i.e. Dndyn = ni(
12CO) � nii(12CO).
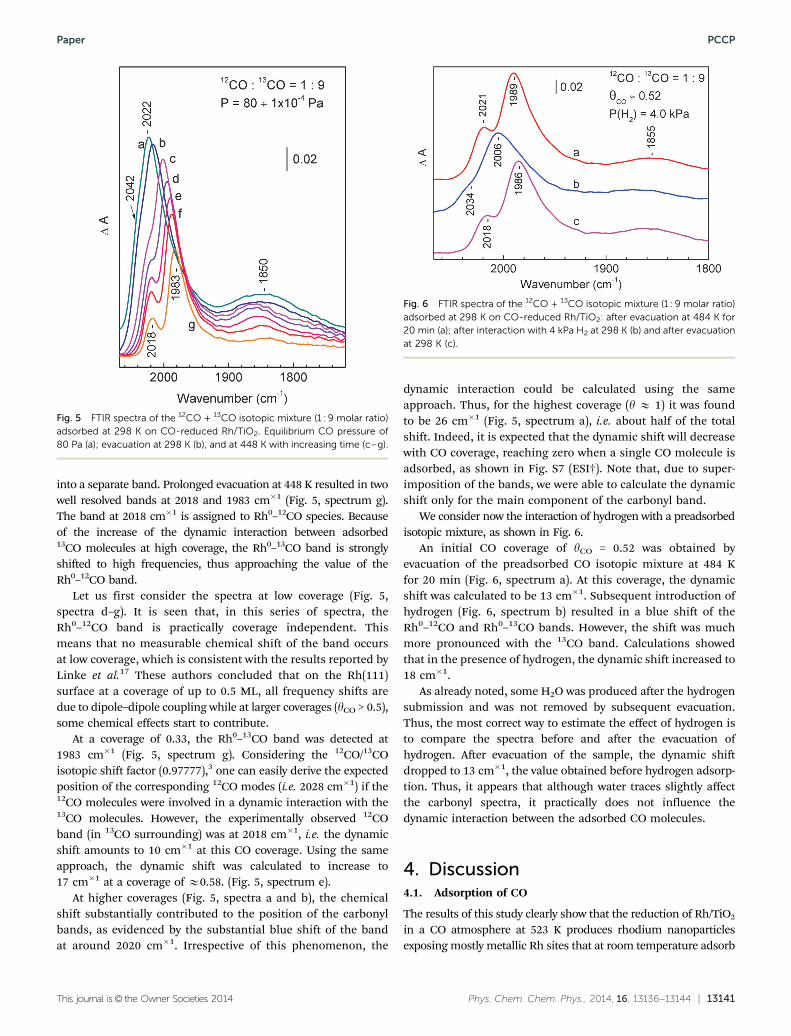
The Rh/TiO2 sample was reduced by exposure to a 12CO +13CO mixture (with an 1 : 9 molar ratio) at 523 K. The spectrumof the reduced Rh/TiO2 sample in contact with the 12CO + 13COmixture at an equilibrium pressure of 80 Pa (Fig. 5, spectrum a)exhibits an intense IR band at 2022 cm�1 and a broad featurearound 1850 cm�1. These two bands are assigned to Rh0–13COand Rh0–(13CO)–Rh0 complexes, respectively. In addition, theband at 2022 cm�1 has a shoulder at 2042 cm�1 (the exact bandposition was obtained from the second derivative of the spectrum).
When the CO coverage was reduced by evacuation at increasingtemperatures (Fig. 5, spectra b–g), the 2022 cm�1 band and itssatellite at 2042 cm�1 decreased in intensity and shifted to lowerfrequencies. Simultaneously, the shoulder was gradually converted
Fig. 4 FTIR spectra of adsorbed CO during a CO + H2 co-adsorptionexperiment carried out at 298 K with Rh/TiO2 which contained partial COcoverage, i.e. yCO = 0.48. Adsorption of CO (4 kPa) followed by 1 minevacuation at 473 K (a), introduction of H2 to the system at equilibrium pressuresof 0.5 (b), 4.0 (c) and 6.4 (d) kPa, and after evacuation at 1 � 10�5 kPa (e).The spectra are background corrected.
PCCP Paper
This journal is© the Owner Societies 2014 Phys. Chem. Chem. Phys., 2014, 16, 13136--13144 | 13141
into a separate band. Prolonged evacuation at 448 K resulted in twowell resolved bands at 2018 and 1983 cm�1 (Fig. 5, spectrum g).The band at 2018 cm�1 is assigned to Rh0–12CO species. Becauseof the increase of the dynamic interaction between adsorbed13CO molecules at high coverage, the Rh0–13CO band is stronglyshifted to high frequencies, thus approaching the value of theRh0–12CO band.
Let us first consider the spectra at low coverage (Fig. 5,spectra d–g). It is seen that, in this series of spectra, theRh0–12CO band is practically coverage independent. Thismeans that no measurable chemical shift of the band occursat low coverage, which is consistent with the results reported byLinke et al.17 These authors concluded that on the Rh(111)surface at a coverage of up to 0.5 ML, all frequency shifts aredue to dipole–dipole coupling while at larger coverages (yCO > 0.5),some chemical effects start to contribute.
At a coverage of 0.33, the Rh0–13CO band was detected at1983 cm�1 (Fig. 5, spectrum g). Considering the 12CO/13COisotopic shift factor (0.97777),3 one can easily derive the expectedposition of the corresponding 12CO modes (i.e. 2028 cm�1) if the12CO molecules were involved in a dynamic interaction with the13CO molecules. However, the experimentally observed 12COband (in 13CO surrounding) was at 2018 cm�1, i.e. the dynamicshift amounts to 10 cm�1 at this CO coverage. Using the sameapproach, the dynamic shift was calculated to increase to17 cm�1 at a coverage of E0.58. (Fig. 5, spectrum e).
At higher coverages (Fig. 5, spectra a and b), the chemicalshift substantially contributed to the position of the carbonylbands, as evidenced by the substantial blue shift of the bandat around 2020 cm�1. Irrespective of this phenomenon, the
dynamic interaction could be calculated using the sameapproach. Thus, for the highest coverage (y E 1) it was foundto be 26 cm�1 (Fig. 5, spectrum a), i.e. about half of the totalshift. Indeed, it is expected that the dynamic shift will decreasewith CO coverage, reaching zero when a single CO molecule isadsorbed, as shown in Fig. S7 (ESI†). Note that, due to super-imposition of the bands, we were able to calculate the dynamicshift only for the main component of the carbonyl band.
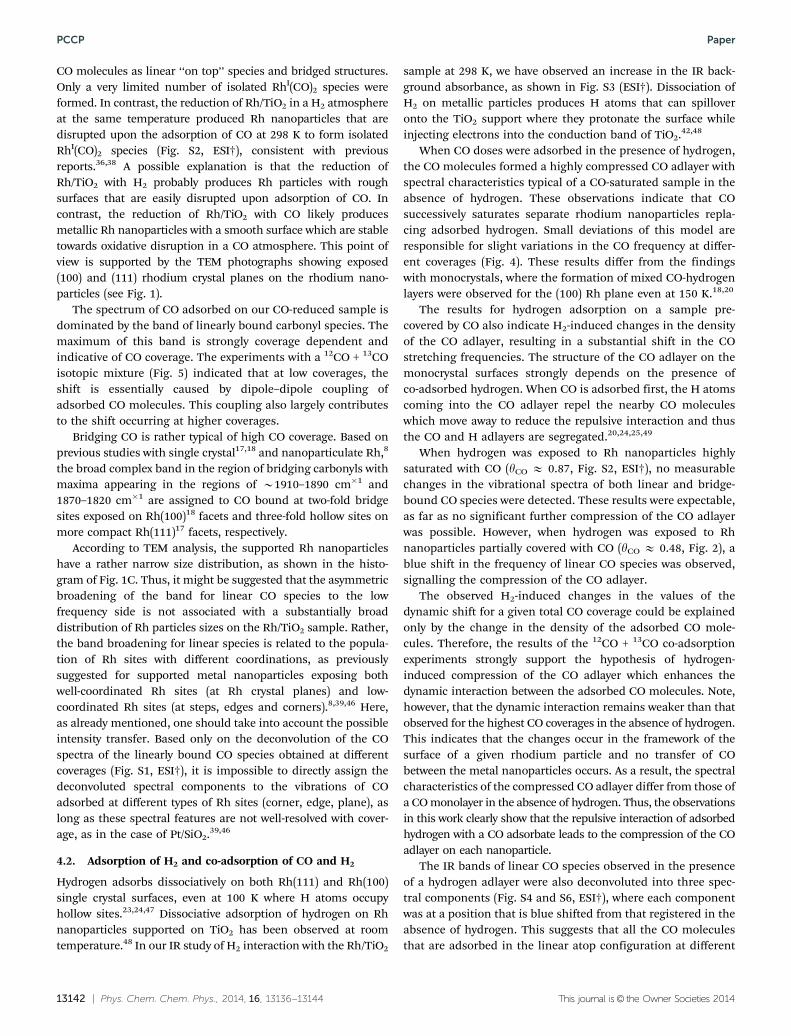
We consider now the interaction of hydrogen with a preadsorbedisotopic mixture, as shown in Fig. 6.
An initial CO coverage of yCO = 0.52 was obtained byevacuation of the preadsorbed CO isotopic mixture at 484 Kfor 20 min (Fig. 6, spectrum a). At this coverage, the dynamicshift was calculated to be 13 cm�1. Subsequent introduction ofhydrogen (Fig. 6, spectrum b) resulted in a blue shift of theRh0–12CO and Rh0–13CO bands. However, the shift was muchmore pronounced with the 13CO band. Calculations showedthat in the presence of hydrogen, the dynamic shift increased to18 cm�1.
As already noted, some H2O was produced after the hydrogensubmission and was not removed by subsequent evacuation.Thus, the most correct way to estimate the effect of hydrogen isto compare the spectra before and after the evacuation ofhydrogen. After evacuation of the sample, the dynamic shiftdropped to 13 cm�1, the value obtained before hydrogen adsorp-tion. Thus, it appears that although water traces slightly affectthe carbonyl spectra, it practically does not influence thedynamic interaction between the adsorbed CO molecules.
4. Discussion4.1. Adsorption of CO
The results of this study clearly show that the reduction of Rh/TiO2
in a CO atmosphere at 523 K produces rhodium nanoparticlesexposing mostly metallic Rh sites that at room temperature adsorb
Fig. 5 FTIR spectra of the 12CO + 13CO isotopic mixture (1 : 9 molar ratio)adsorbed at 298 K on CO-reduced Rh/TiO2. Equilibrium CO pressure of80 Pa (a); evacuation at 298 K (b), and at 448 K with increasing time (c–g).
Fig. 6 FTIR spectra of the 12CO + 13CO isotopic mixture (1 : 9 molar ratio)adsorbed at 298 K on CO-reduced Rh/TiO2: after evacuation at 484 K for20 min (a); after interaction with 4 kPa H2 at 298 K (b) and after evacuationat 298 K (c).
Paper PCCP
13142 | Phys. Chem. Chem. Phys., 2014, 16, 13136--13144 This journal is© the Owner Societies 2014
CO molecules as linear ‘‘on top’’ species and bridged structures.Only a very limited number of isolated RhI(CO)2 species wereformed. In contrast, the reduction of Rh/TiO2 in a H2 atmosphereat the same temperature produced Rh nanoparticles that aredisrupted upon the adsorption of CO at 298 K to form isolatedRhI(CO)2 species (Fig. S2, ESI†), consistent with previousreports.36,38 A possible explanation is that the reduction ofRh/TiO2 with H2 probably produces Rh particles with roughsurfaces that are easily disrupted upon adsorption of CO. Incontrast, the reduction of Rh/TiO2 with CO likely producesmetallic Rh nanoparticles with a smooth surface which are stabletowards oxidative disruption in a CO atmosphere. This point ofview is supported by the TEM photographs showing exposed(100) and (111) rhodium crystal planes on the rhodium nano-particles (see Fig. 1).
The spectrum of CO adsorbed on our CO-reduced sample isdominated by the band of linearly bound carbonyl species. Themaximum of this band is strongly coverage dependent andindicative of CO coverage. The experiments with a 12CO + 13COisotopic mixture (Fig. 5) indicated that at low coverages, theshift is essentially caused by dipole–dipole coupling ofadsorbed CO molecules. This coupling also largely contributesto the shift occurring at higher coverages.
Bridging CO is rather typical of high CO coverage. Based onprevious studies with single crystal17,18 and nanoparticulate Rh,8
the broad complex band in the region of bridging carbonyls withmaxima appearing in the regions of B1910–1890 cm�1 and1870–1820 cm�1 are assigned to CO bound at two-fold bridgesites exposed on Rh(100)18 facets and three-fold hollow sites onmore compact Rh(111)17 facets, respectively.
According to TEM analysis, the supported Rh nanoparticleshave a rather narrow size distribution, as shown in the histo-gram of Fig. 1C. Thus, it might be suggested that the asymmetricbroadening of the band for linear CO species to the lowfrequency side is not associated with a substantially broaddistribution of Rh particles sizes on the Rh/TiO2 sample. Rather,the band broadening for linear species is related to the popula-tion of Rh sites with different coordinations, as previouslysuggested for supported metal nanoparticles exposing bothwell-coordinated Rh sites (at Rh crystal planes) and low-coordinated Rh sites (at steps, edges and corners).8,39,46 Here,as already mentioned, one should take into account the possibleintensity transfer. Based only on the deconvolution of the COspectra of the linearly bound CO species obtained at differentcoverages (Fig. S1, ESI†), it is impossible to directly assign thedeconvoluted spectral components to the vibrations of COadsorbed at different types of Rh sites (corner, edge, plane), aslong as these spectral features are not well-resolved with cover-age, as in the case of Pt/SiO2.39,46
4.2. Adsorption of H2 and co-adsorption of CO and H2
Hydrogen adsorbs dissociatively on both Rh(111) and Rh(100)single crystal surfaces, even at 100 K where H atoms occupyhollow sites.23,24,47 Dissociative adsorption of hydrogen on Rhnanoparticles supported on TiO2 has been observed at roomtemperature.48 In our IR study of H2 interaction with the Rh/TiO2
sample at 298 K, we have observed an increase in the IR back-ground absorbance, as shown in Fig. S3 (ESI†). Dissociation ofH2 on metallic particles produces H atoms that can spilloveronto the TiO2 support where they protonate the surface whileinjecting electrons into the conduction band of TiO2.42,48
When CO doses were adsorbed in the presence of hydrogen,the CO molecules formed a highly compressed CO adlayer withspectral characteristics typical of a CO-saturated sample in theabsence of hydrogen. These observations indicate that COsuccessively saturates separate rhodium nanoparticles repla-cing adsorbed hydrogen. Small deviations of this model areresponsible for slight variations in the CO frequency at differ-ent coverages (Fig. 4). These results differ from the findingswith monocrystals, where the formation of mixed CO-hydrogenlayers were observed for the (100) Rh plane even at 150 K.18,20
The results for hydrogen adsorption on a sample pre-covered by CO also indicate H2-induced changes in the densityof the CO adlayer, resulting in a substantial shift in the COstretching frequencies. The structure of the CO adlayer on themonocrystal surfaces strongly depends on the presence ofco-adsorbed hydrogen. When CO is adsorbed first, the H atomscoming into the CO adlayer repel the nearby CO moleculeswhich move away to reduce the repulsive interaction and thusthe CO and H adlayers are segregated.20,24,25,49
When hydrogen was exposed to Rh nanoparticles highlysaturated with CO (yCO E 0.87, Fig. S2, ESI†), no measurablechanges in the vibrational spectra of both linear and bridge-bound CO species were detected. These results were expectable,as far as no significant further compression of the CO adlayerwas possible. However, when hydrogen was exposed to Rhnanoparticles partially covered with CO (yCO E 0.48, Fig. 2), ablue shift in the frequency of linear CO species was observed,signalling the compression of the CO adlayer.
The observed H2-induced changes in the values of thedynamic shift for a given total CO coverage could be explainedonly by the change in the density of the adsorbed CO mole-cules. Therefore, the results of the 12CO + 13CO co-adsorptionexperiments strongly support the hypothesis of hydrogen-induced compression of the CO adlayer which enhances thedynamic interaction between the adsorbed CO molecules. Note,however, that the dynamic interaction remains weaker than thatobserved for the highest CO coverages in the absence of hydrogen.This indicates that the changes occur in the framework of thesurface of a given rhodium particle and no transfer of CObetween the metal nanoparticles occurs. As a result, the spectralcharacteristics of the compressed CO adlayer differ from those ofa CO monolayer in the absence of hydrogen. Thus, the observationsin this work clearly show that the repulsive interaction of adsorbedhydrogen with a CO adsorbate leads to the compression of the COadlayer on each nanoparticle.
The IR bands of linear CO species observed in the presenceof a hydrogen adlayer were also deconvoluted into three spec-tral components (Fig. S4 and S6, ESI†), where each componentwas at a position that is blue shifted from that registered in theabsence of hydrogen. This suggests that all the CO moleculesthat are adsorbed in the linear atop configuration at different
PCCP Paper
This journal is© the Owner Societies 2014 Phys. Chem. Chem. Phys., 2014, 16, 13136--13144 | 13143
Rh sites (edges, corners, steps, and face sites) form denseislands separated from the islands formed by absorbed H,probably at (100), (110) and (111) facets.
Under evacuation, the hydrogen adlayer is destroyed ashydrogen desorbs and CO coverage expands back over all theexposed Rh sites on the metal particle. Thus, a less dense COadlayer is formed in which the dipole–dipole interactionbetween CO molecules is weaker and this reflects in a backred shift in n(CO).
5. Conclusions
Rhodium particles obtained by CO reduction of Rh/TiO2 arehighly resistant to CO-induced oxidative disruption: the adsorp-tion of CO on the sample at ambient temperature results mainlyin the formation of linear Rh0–CO and bridge-bound carbonylswhereas the amount of RhI(CO)2 geminal-dicarbonyls is negli-gible. The position of the carbonyl band due to linear CO speciesstrongly shifts to higher frequencies with coverage increases. Thisshift is due to two effects: a dipole–dipole interaction between theadsorbed CO molecules (prevailing at low coverages) and compe-tition of CO adsorbates for electrons donated from the solid (botheffects contribute almost equally at high coverages). The adsorp-tion of CO in the presence of hydrogen leads to successiveoccupation of rhodium nanoparticles. However, the adsorptionof hydrogen on the surface of Rh particles partially pre-coveredwith CO leads to reversible segregation and compression of theCO adlayer on each rhodium nanoparticle.
Acknowledgements
The authors are indebted to the Union Centre of Excellence(Contract No. DCVP 02-2/2009 with the National Science Fund).The support of the European FP7 project ‘‘Beyond Everest’’ isgratefully acknowledged.
Notes and references
1 G. Rupprechter, Annu. Rep. Prog. Chem., Sect. C, 2004, 100,237–311.
2 A. Fohlisch, M. Nyberg, P. Bennich, L. Triguero,J. Hasselstrom, O. Karis, L. G. M. Pettersson andA. Nilsson, J. Chem. Phys., 2000, 112, 1946–1958.
3 K. I. Hadjiivanov and G. N. Vayssilov, Adv. Catal., 2002, 47,307–511.
4 R. M. Hammaker, S. A. Francis and R. P. Eischens, Spectro-chim. Acta, 1965, 21, 1295–1309.
5 P. Hollins, Surf. Sci. Rep., 1992, 16, 51–94.6 C. Ruggiero and P. Hollins, J. Chem. Soc., Faraday Trans.,
1996, 92, 4829–4834.7 N. Sheppard and T. T. Ngyen, in Adv. Infrared and Raman
Spectros., ed. R. J. H. Clark and R. E. Hester, Heyden,London, 1978, vol. 5, pp. 67–148.
8 M. M. Sean, M. Lundwall, F. Yang, Z. Zhou andD. W. Goodman, J. Phys.: Condens. Matter, 2009, 21, 474223.
9 S. D. Worley and C. H. Dai, Catalytic Activation of CarbonDioxide, American Chemical Society, Washington, DC, 1988,vol. 363, pp. 133–146.
10 J. A. Anderson, M. W. McQuire, C. H. Rochester andT. Sweeney, Catal. Today, 1991, 9, 23–30.
11 B. E. Nieuwenhuys, Adv. Catal., 1999, 44, 259–328.12 C. Dujardin, A. S. Mamede, E. Payen, B. Sombret,
J. P. Huvenne and P. Granger, Top. Catal., 2004, 30–31,347–352.
13 C. C. Miyagawa, J. Kupka and A. Schumpe, J. Mol. Catal. A:Chem., 2005, 234, 9–17.
14 S. M. McClure, M. J. Lundwall and D. W. Goodman, Proc.Natl. Acad. Sci. U. S. A., 2011, 108, 931–936.
15 T. M. Apple and C. Dybowski, J. Catal., 1981, 71, 316–319.16 B. A. Gurney, L. J. Richter, J. S. Villarrubia and W. Ho,
J. Chem. Phys., 1987, 87, 6710–6721.17 R. Linke, D. Curulla, M. J. P. Hopstaken and
J. W. Niemantsverdriet, J. Chem. Phys., 2001, 115, 8209–8216.18 M. M. M. Jansen, J. Gracia, B. E. Nieuwenhuys and
J. W. Niemantsverdriet, Phys. Chem. Chem. Phys., 2009, 11,10009–10016.
19 I. Nakamura, Y. Kobayashi, H. Hamada and T. Fujitani,Surf. Sci., 2006, 600, 3235–3242.
20 L. J. Richter, B. A. Gurney and W. Ho, J. Chem. Phys., 1987,86, 477–490.
21 M. M. M. Jansen, C. G. M. Hermse and A. P. J. Jansen, Phys.Chem. Chem. Phys., 2010, 12, 8054–8062.
22 M. M. M. Jansen, O. Caniaz, B. E. Nieuwenhuys andJ. W. Niemantsverdriet, Langmuir, 2010, 26, 16239–16245.
23 J. T. Yates Jr, P. A. Thiel and W. H. Weinberg, Surf. Sci., 1979,84, 427–439.
24 Y. Kim, H. C. Peebles and J. M. White, Surf. Sci., 1982, 114,363–380.
25 E. D. Williams, P. A. Thiel, W. H. Weinberg and J. J. T. Yates,J. Chem. Phys., 1980, 72, 3496–3505.
26 S. Trautmann and M. Baerns, J. Catal., 1994, 150, 335–344.27 H. F. J. Van’t Blik, J. B. A. D. Van Zon, T. Huizinga, J. C. Vis,
D. C. Koningsberger and R. Prins, J. Am. Chem. Soc., 1985,107, 3139–3147.
28 F. Solymosi and M. Pasztor, J. Phys. Chem., 1986, 90,5312–5317.
29 P. Basu, D. Panayotov and J. T. Yates, J. Am. Chem. Soc.,1988, 110, 2074–2081.
30 M. I. Zaki, B. Tesche, L. Kraus and H. Knozinger, Surf.Interface Anal., 1988, 12, 239–246.
31 M. Frank, R. Kuhnemuth, M. Baumer and H. J. Freund, Surf.Sci., 1999, 427–428, 288–293.
32 J. Evans, B. Hayden, F. Mosselmans and A. Murray, Surf.Sci., 1992, 279, L159–L164.
33 F. Solymosi, A. Erdohelyi and M. Kocsis, J. Catal., 1980, 65,428–436.
34 F. Solymosi and M. Pasztor, J. Catal., 1987, 104, 312–322.35 S. D. Worley, G. A. Mattson and R. Caudill, J. Phys. Chem.,
1983, 87, 1671–1673.36 Z. L. Zhang, A. Kladi and X. E. Verykios, J. Mol. Catal., 1994,
89, 229–246.
Paper PCCP
13144 | Phys. Chem. Chem. Phys., 2014, 16, 13136--13144 This journal is© the Owner Societies 2014
37 M. Addamo, V. Augugliaro, A. Di Paola, E. Garcia-Lopez,V. Loddo, G. Marci, R. Molinari, L. Palmisano andM. Schiavello, J. Phys. Chem. B, 2004, 108, 3303–3310.
38 D. A. Buchanan, M. E. Hernandez, F. Solymosi andJ. M. White, J. Catal., 1990, 125, 456–466.
39 M. J. Lundwall, S. M. McClure and D. W. Goodman,J. Phys. Chem. C, 2010, 114, 7904–7912.
40 F. M. Hoffmann, Surf. Sci. Rep., 1983, 3, 107.41 F. Mauge, C. Binet and J. C. Lavalley, in Catalysis by Metals,
ed. A. Renouprez and H. Jobic, Springer, Berlin Heidelberg,1997, vol. 6, pp. 1–17.
42 D. A. Panayotov and J. T. Yates Jr, J. Phys. Chem. C, 2007,111, 2959–2964.
43 K. Hadjiivanov, J. Chem. Soc., Faraday Trans., 1998, 94, 1901–1904.44 K. Hadjiivanov, B. M. Reddy and H. Knozinger, Appl. Catal.,
A, 1999, 188, 355–360.45 R. M. Hammaker, S. A. Francis and R. P. Eischens, Spectro-
chim. Acta, 1965, 21, 1295.46 R. K. Brandt, M. R. Hughes, L. P. Bourget, K. Truszkowska
and R. G. Greenler, Surf. Sci., 1993, 286, 15–25.47 M. Fukuoka, M. Okada, M. Matsumoto, S. Ogura,
K. Fukutani and T. Kasai, Phys. Rev. B: Condens. MatterMater. Phys., 2007, 75, 235434.
48 J. C. Conesa and J. Soria, J. Phys. Chem., 1982, 86, 1392–1395.49 L. J. Richter, T. A. Germer and W. Ho, Surf. Sci., 1988, 195,
L182–L192.
PCCP Paper