paying for locally owned roads: a crisis in local government highway finance
TRANSCRIPT
http://pwm.sagepub.com/Policy
Public Works Management &
http://pwm.sagepub.com/content/16/3/250The online version of this article can be found at:
DOI: 10.1177/1087724X11402357
2011 16: 250 originally published online 20 May 2011Public Works Management PolicyJuita-Elena Yusuf, Lenahan O'Connell and Sawsan Abutabenjeh
FinancePaying for Locally Owned Roads: A Crisis in Local Government Highway
Published by:
http://www.sagepublications.com
can be found at:Public Works Management & PolicyAdditional services and information for
http://pwm.sagepub.com/cgi/alertsEmail Alerts:
http://pwm.sagepub.com/subscriptionsSubscriptions:
http://www.sagepub.com/journalsReprints.navReprints:
http://www.sagepub.com/journalsPermissions.navPermissions:
http://pwm.sagepub.com/content/16/3/250.refs.htmlCitations:
What is This?
- May 20, 2011Proof
- Jul 19, 2011Version of Record >>
at OLD DOMINION UNIV LIBRARY on October 5, 2011pwm.sagepub.comDownloaded from
Public Works Management & Policy16(3) 250 –269
© The Author(s) 2011Reprints and permission: http://www. sagepub.com/journalsPermissions.nav
DOI: 10.1177/1087724X11402357http://pwm.sagepub.com
Paying for Locally Owned Roads: A Crisis in Local Government Highway Finance
Juita-Elena (Wie) Yusuf1, Lenahan O’Connell2, and Sawsan Abutabenjeh1
Abstract
The past two decades have witnessed substantial changes in the dynamics of state–local relationships for highway funding. We argue that four factors have produced a funding crisis for local governments: an increase in developed land and locally owned roads; a rise in construction and maintenance costs; devolution of highway financing responsibility from the states to localities with a reduction in intergovernmental transfers; and more wear and tear on roads due to increased vehicle miles traveled. Local governments can delay maintenance and build fewer new facilities, but eventually many will seek new sources of revenues to fund their growing responsibilities. We identify several potential financing mechanisms: impact fees and smart growth policies; local option transportation taxes; nontraditional taxes and fees such as transportation utility fees and land taxes; and low-cost debt financing from state infrastructure banks. We discuss challenges faced by local governments in continuing to meet their responsibilities and financing needs.
Keywords
highway finance, intergovernmental relationships, local roads, urban sprawl, devolution of highway financing responsibility, local highway finance
Introduction
Transportation policy in the United States, and highway policy in particular, is inher-ently intergovernmental, with all levels of government having a vested interest in
1Old Dominion University, Norfolk, VA2University of Kentucky, Lexington, KY
Corresponding Author:Lenahan O’Connell, Kentucky Transportation Center, University of Kentucky, 176 Raymond Bldg, Lexington, KY 40506Email: [email protected]
at OLD DOMINION UNIV LIBRARY on October 5, 2011pwm.sagepub.comDownloaded from

Yusuf et al. 251
transportation policy and funding. The reason for this intergovernmental role is self-evident, as many roads are designed to connect cities in one jurisdiction with cities in another. Thus state highway systems link cities to each other within the state and the federal highway system links cities to each other across the country. Local roads and streets, in turn, are intended to link citizens and businesses within the local jurisdiction.
Following passage of the Federal Aid Road Act of 1916, highways and roads became an intergovernmental responsibility (Netherton, 1968). While the federal gov-ernment has played the dominant role in setting nationwide highway priorities, states and localities have been involved in implementing the policies, including financing and ownership of the roads and highways. Just as there is a hierarchy of jurisdictions, there is a hierarchy of roads: local roads, collectors, arterials, and interstates. The first two tend to be the responsibility (for construction and maintenance) of local govern-ments. Arterials are usually in the state highway system with the states having respon-sibility for their maintenance. The federal government provides most of the funding for the construction of interstates and often contributes to the building of arterials.
The funds for highway construction, operation, and maintenance come from all levels of government. The federal government and the states levy fuel taxes, which are often dedicated for highway purposes. Local governments, through various mecha-nisms, receive fund transfers from those fuel tax revenues, but they also pay for roads with other taxes and fees and with general revenues.
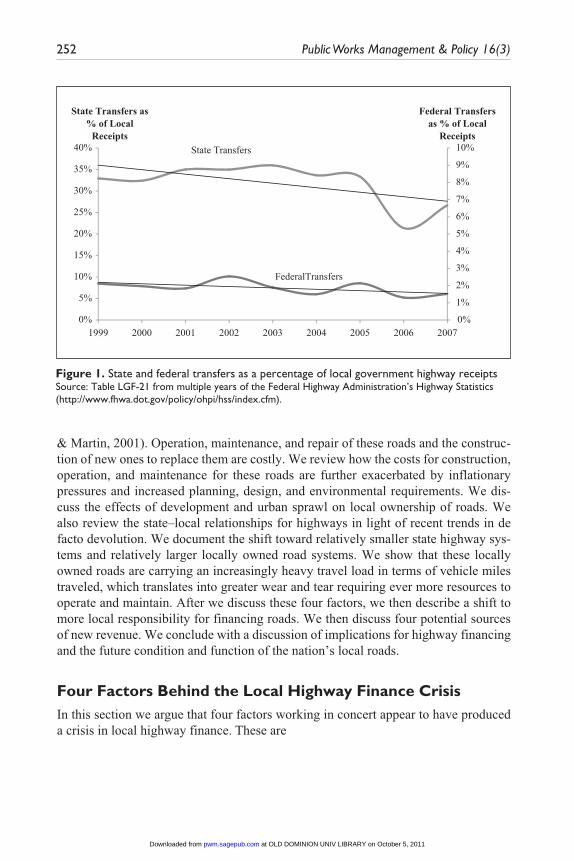
While the nature of the state–local relationship for highways has been an ever changing one, Dilger (2003) and others suggest that highway policy has been in a state of disequilibrium since the interstate highway system’s completion in the early 1990s. With the rise in automobile fuel efficiency, fuel tax receipts have dropped and local governments now receive a proportionately smaller share of their highways funds from federal and state sources. In fact, in the early 1980s, local governments received about 7% of their transportation-related revenues from the federal government. By 2006, transfers from the federal government to localities reached a record low of 1.3% of local government total receipts. In terms of state support for their localities, state transfers to local governments have typically exceeded 30% of local governments’ revenues for road projects. In recent years, however, such support has decreased (Fisher, 2003). In 2006, transfers from the state constituted only 21% of local govern-ment receipts for highways (see Figure 1). This suggests that there has also been second-order de facto devolution of responsibility from states to their localities.
In this article, we first argue that local governments are confronting a crisis in high-way finance. Beyond the revenue loss from the current recession, four additional fac-tors are forcing local governments to look for new sources of funds and new approaches to transportation planning. The national and state highway systems, and the local streets and roads that feed these systems, have reached maturity and a growing share of revenues are needed just for their basic maintenance and repair (Goldman, Corbett,
at OLD DOMINION UNIV LIBRARY on October 5, 2011pwm.sagepub.comDownloaded from
252 Public Works Management & Policy 16(3)
& Martin, 2001). Operation, maintenance, and repair of these roads and the construc-tion of new ones to replace them are costly. We review how the costs for construction, operation, and maintenance for these roads are further exacerbated by inflationary pressures and increased planning, design, and environmental requirements. We dis-cuss the effects of development and urban sprawl on local ownership of roads. We also review the state–local relationships for highways in light of recent trends in de facto devolution. We document the shift toward relatively smaller state highway sys-tems and relatively larger locally owned road systems. We show that these locally owned roads are carrying an increasingly heavy travel load in terms of vehicle miles traveled, which translates into greater wear and tear requiring ever more resources to operate and maintain. After we discuss these four factors, we then describe a shift to more local responsibility for financing roads. We then discuss four potential sources of new revenue. We conclude with a discussion of implications for highway financing and the future condition and function of the nation’s local roads.
Four Factors Behind the Local Highway Finance CrisisIn this section we argue that four factors working in concert appear to have produced a crisis in local highway finance. These are
0%
1%
2%
3%
4%
5%
6%
7%
8%
9%
10%
0%
5%
10%
15%
20%
25%
30%
35%
40%
Federal Transfersas % of Local
Receipts
State Transfers as% of Local
ReceiptsState Transfers
FederalTransfers
200720062005200420032002200120001999
Figure 1. State and federal transfers as a percentage of local government highway receiptsSource: Table LGF-21 from multiple years of the Federal Highway Administration’s Highway Statistics (http://www.fhwa.dot.gov/policy/ohpi/hss/index.cfm).
at OLD DOMINION UNIV LIBRARY on October 5, 2011pwm.sagepub.comDownloaded from
Yusuf et al. 253
1. An increase in developed land with an associated increase in locally owned roads.
2. The escalation of construction and maintenance costs due to higher material and labor prices, right-of-way costs, and more extensive planning, design, and environmental work.
3. De facto devolution with a reduction in intergovernmental transfers from the states to their localities.
4. Wear and tear on the road system, especially arterials, as a result of increased automobile and truck traffic.
An Increase in Developed Land With an Associated Increase in Locally Owned Roads.The urban growth patterns of the last 30 years have continued the kind of low-density development referred to as urban sprawl. While there are many definitions of sprawl (Gillham, 2002), Bruegmann (2005) captures the features common to most definitions, namely, that sprawl is “low density, scattered urban development without systematic large-scale or regional planning” (p. 18). This growth pattern of low-density develop-ment is marked by development spread out over greater land area. Therefore, these growth patterns require additional highway and other infrastructure investment to ensure access and mobility for those living and working in the newly developed areas. Thus the burdens on local governments have expanded beyond simply operating and maintaining existing roads to also constructing, operating, and maintaining new roads.
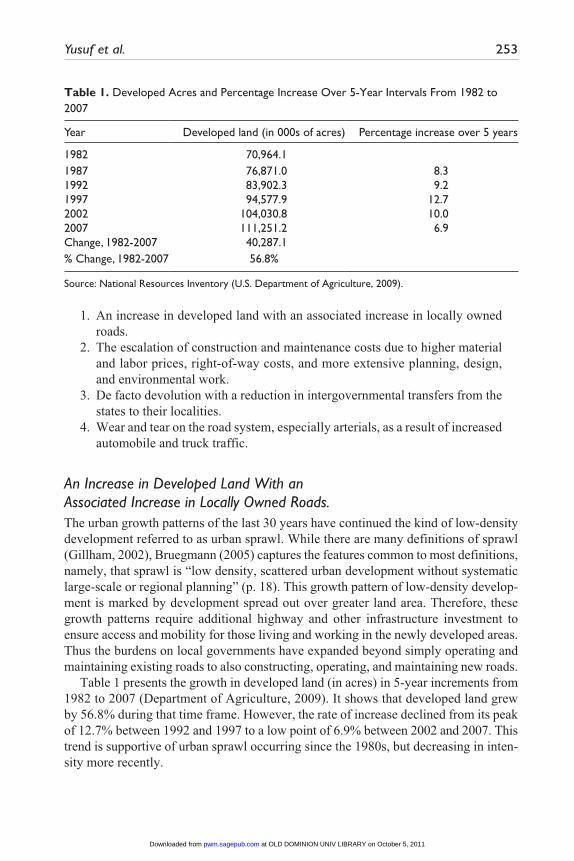
Table 1 presents the growth in developed land (in acres) in 5-year increments from 1982 to 2007 (Department of Agriculture, 2009). It shows that developed land grew by 56.8% during that time frame. However, the rate of increase declined from its peak of 12.7% between 1992 and 1997 to a low point of 6.9% between 2002 and 2007. This trend is supportive of urban sprawl occurring since the 1980s, but decreasing in inten-sity more recently.
Table 1. Developed Acres and Percentage Increase Over 5-Year Intervals From 1982 to 2007
Year Developed land (in 000s of acres) Percentage increase over 5 years
1982 70,964.11987 76,871.0 8.31992 83,902.3 9.21997 94,577.9 12.72002 104,030.8 10.02007 111,251.2 6.9Change, 1982-2007 40,287.1% Change, 1982-2007 56.8%
Source: National Resources Inventory (U.S. Department of Agriculture, 2009).
at OLD DOMINION UNIV LIBRARY on October 5, 2011pwm.sagepub.comDownloaded from
254 Public Works Management & Policy 16(3)
As development increased and acreage of developed land grew, cities expanded outwards along rural arterials. Many rural arterials became urban arterials and expanded from two to four lanes to accommodate the additional traffic (Gillham, 2002). To some extent state policies through their highway spending formulas favored new construc-tion in rural areas, contributing to the spread of low-density development and growth patterns that “undermine urban and inner-suburban jurisdictions by enabling people and businesses to locate miles from urban centers and still benefit from metropolitan life” (Hill et al., 2003).
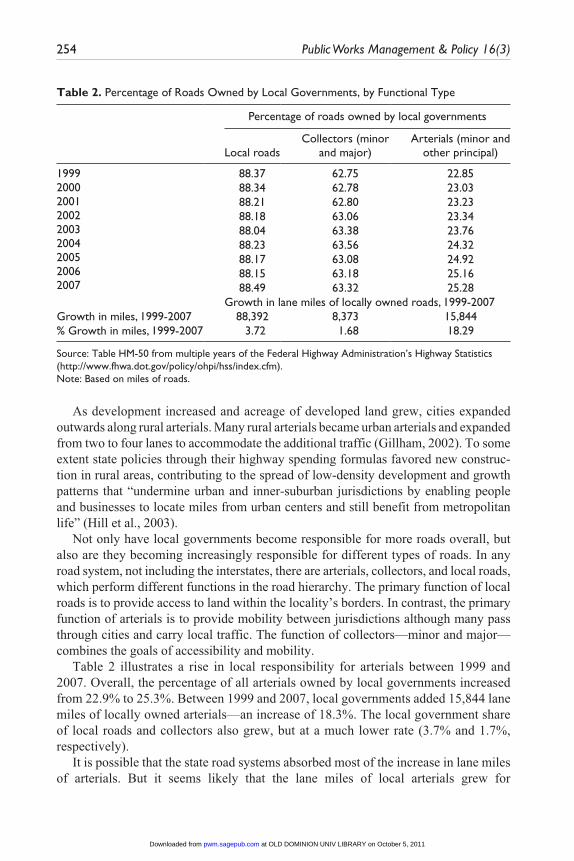
Not only have local governments become responsible for more roads overall, but also are they becoming increasingly responsible for different types of roads. In any road system, not including the interstates, there are arterials, collectors, and local roads, which perform different functions in the road hierarchy. The primary function of local roads is to provide access to land within the locality’s borders. In contrast, the primary function of arterials is to provide mobility between jurisdictions although many pass through cities and carry local traffic. The function of collectors—minor and major—combines the goals of accessibility and mobility.
Table 2 illustrates a rise in local responsibility for arterials between 1999 and 2007. Overall, the percentage of all arterials owned by local governments increased from 22.9% to 25.3%. Between 1999 and 2007, local governments added 15,844 lane miles of locally owned arterials—an increase of 18.3%. The local government share of local roads and collectors also grew, but at a much lower rate (3.7% and 1.7%, respectively).
It is possible that the state road systems absorbed most of the increase in lane miles of arterials. But it seems likely that the lane miles of local arterials grew for
Table 2. Percentage of Roads Owned by Local Governments, by Functional Type
Percentage of roads owned by local governments
Local roadsCollectors (minor
and major)Arterials (minor and
other principal)
199920002001200220032004200520062007
88.37 62.75 22.8588.34 62.78 23.0388.21 62.80 23.2388.18 63.06 23.3488.04 63.38 23.7688.23 63.56 24.3288.17 63.08 24.9288.15 63.18 25.1688.49 63.32 25.28
Growth in lane miles of locally owned roads, 1999-2007Growth in miles, 1999-2007 88,392 8,373 15,844% Growth in miles, 1999-2007 3.72 1.68 18.29
Source: Table HM-50 from multiple years of the Federal Highway Administration’s Highway Statistics (http://www.fhwa.dot.gov/policy/ohpi/hss/index.cfm).Note: Based on miles of roads.
at OLD DOMINION UNIV LIBRARY on October 5, 2011pwm.sagepub.comDownloaded from
Yusuf et al. 255
two reasons. First, the percentage of all miles of minor and principal arterials in local compared to other systems increased. Second, local governments added far more miles of roadway compared to states. The upsurge in vehicle miles traveled on local roads in urban areas also implies that drivers are using local arterials.
The Escalation of Construction and Maintenance Costs due to Higher Material and Labor Prices, Right-of-Way Costs, and More Extensive Planning, Design and Environmental Work
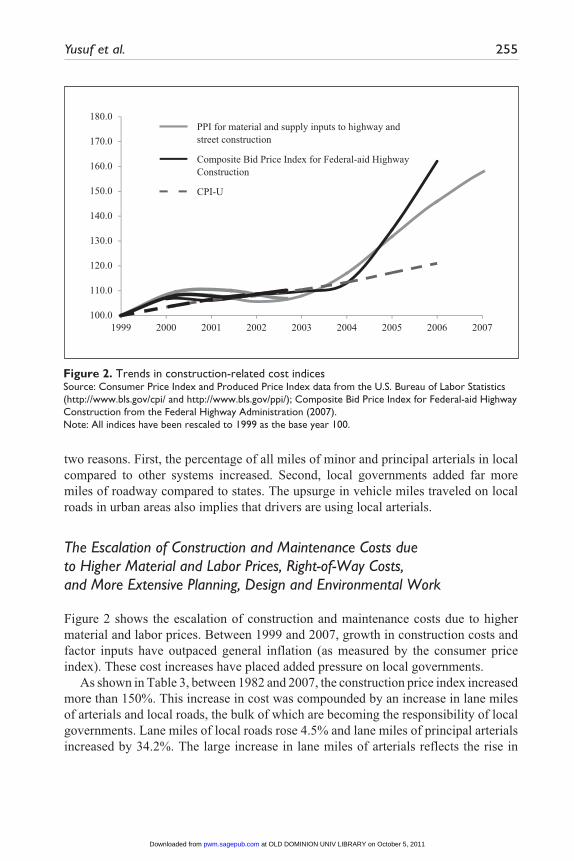
Figure 2 shows the escalation of construction and maintenance costs due to higher material and labor prices. Between 1999 and 2007, growth in construction costs and factor inputs have outpaced general inflation (as measured by the consumer price index). These cost increases have placed added pressure on local governments.
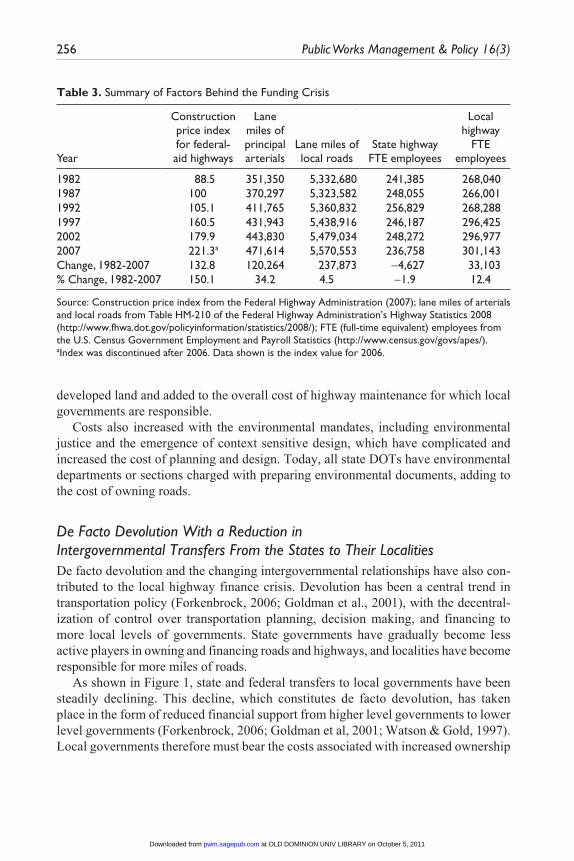
As shown in Table 3, between 1982 and 2007, the construction price index increased more than 150%. This increase in cost was compounded by an increase in lane miles of arterials and local roads, the bulk of which are becoming the responsibility of local governments. Lane miles of local roads rose 4.5% and lane miles of principal arterials increased by 34.2%. The large increase in lane miles of arterials reflects the rise in
100.0
110.0
120.0
130.0
140.0
150.0
160.0
170.0
180.0PPI for material and supply inputs to highway andstreet construction
Composite Bid Price Index for Federal-aid HighwayConstruction
CPI-U
200720062005200420032002200120001999
Figure 2. Trends in construction-related cost indicesSource: Consumer Price Index and Produced Price Index data from the U.S. Bureau of Labor Statistics (http://www.bls.gov/cpi/ and http://www.bls.gov/ppi/); Composite Bid Price Index for Federal-aid Highway Construction from the Federal Highway Administration (2007).Note: All indices have been rescaled to 1999 as the base year 100.
at OLD DOMINION UNIV LIBRARY on October 5, 2011pwm.sagepub.comDownloaded from
256 Public Works Management & Policy 16(3)
developed land and added to the overall cost of highway maintenance for which local governments are responsible.
Costs also increased with the environmental mandates, including environmental justice and the emergence of context sensitive design, which have complicated and increased the cost of planning and design. Today, all state DOTs have environmental departments or sections charged with preparing environmental documents, adding to the cost of owning roads.
De Facto Devolution With a Reduction in Intergovernmental Transfers From the States to Their LocalitiesDe facto devolution and the changing intergovernmental relationships have also con-tributed to the local highway finance crisis. Devolution has been a central trend in transportation policy (Forkenbrock, 2006; Goldman et al., 2001), with the decentral-ization of control over transportation planning, decision making, and financing to more local levels of governments. State governments have gradually become less active players in owning and financing roads and highways, and localities have become responsible for more miles of roads.
As shown in Figure 1, state and federal transfers to local governments have been steadily declining. This decline, which constitutes de facto devolution, has taken place in the form of reduced financial support from higher level governments to lower level governments (Forkenbrock, 2006; Goldman et al, 2001; Watson & Gold, 1997). Local governments therefore must bear the costs associated with increased ownership
Table 3. Summary of Factors Behind the Funding Crisis
Year
Construction price index for federal-aid highways
Lane miles of principal arterials
Lane miles of local roads
State highway FTE employees
Local highway
FTE employees
1982 88.5 351,350 5,332,680 241,385 268,0401987 100 370,297 5,323,582 248,055 266,0011992 105.1 411,765 5,360,832 256,829 268,2881997 160.5 431,943 5,438,916 246,187 296,4252002 179.9 443,830 5,479,034 248,272 296,9772007 221.3a 471,614 5,570,553 236,758 301,143Change, 1982-2007 132.8 120,264 237,873 -4,627 33,103% Change, 1982-2007 150.1 34.2 4.5 -1.9 12.4
Source: Construction price index from the Federal Highway Administration (2007); lane miles of arterials and local roads from Table HM-210 of the Federal Highway Administration’s Highway Statistics 2008 (http://www.fhwa.dot.gov/policyinformation/statistics/2008/); FTE (full-time equivalent) employees from the U.S. Census Government Employment and Payroll Statistics (http://www.census.gov/govs/apes/).aIndex was discontinued after 2006. Data shown is the index value for 2006.
at OLD DOMINION UNIV LIBRARY on October 5, 2011pwm.sagepub.comDownloaded from
Yusuf et al. 257
of roads and streets, but without additional resources from higher level governments and with limited authority to generate needed revenue. Table 3 also shows another indicator of the devolution of responsibility from states to localities—as state high-way agencies shrank in size, local highway agencies grew by more than 12% between 1982 and 2007.1
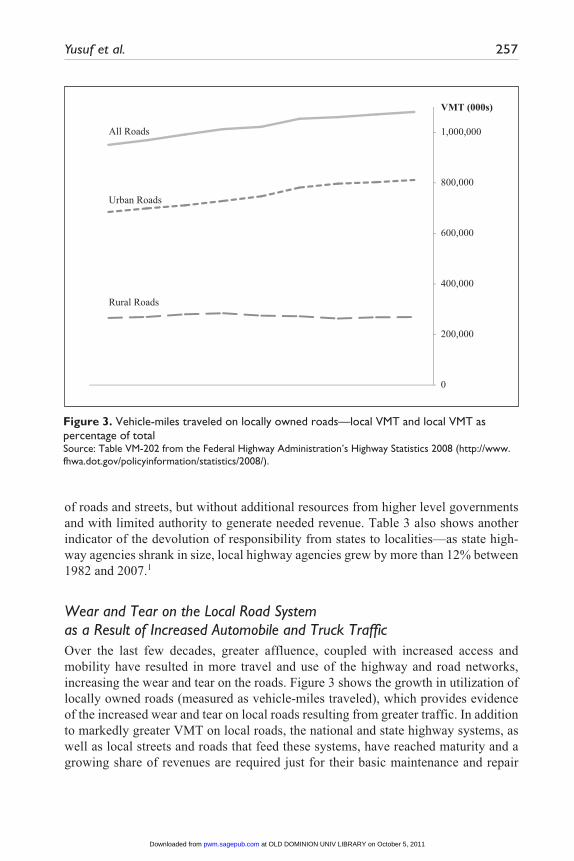
Wear and Tear on the Local Road System as a Result of Increased Automobile and Truck TrafficOver the last few decades, greater affluence, coupled with increased access and mobility have resulted in more travel and use of the highway and road networks, increasing the wear and tear on the roads. Figure 3 shows the growth in utilization of locally owned roads (measured as vehicle-miles traveled), which provides evidence of the increased wear and tear on local roads resulting from greater traffic. In addition to markedly greater VMT on local roads, the national and state highway systems, as well as local streets and roads that feed these systems, have reached maturity and a growing share of revenues are required just for their basic maintenance and repair
0
200,000
400,000
600,000
800,000
1,000,000
VMT (000s)
Rural Roads
Urban Roads
All Roads
Figure 3. Vehicle-miles traveled on locally owned roads—local VMT and local VMT as percentage of totalSource: Table VM-202 from the Federal Highway Administration’s Highway Statistics 2008 (http://www.fhwa.dot.gov/policyinformation/statistics/2008/).
at OLD DOMINION UNIV LIBRARY on October 5, 2011pwm.sagepub.comDownloaded from
258 Public Works Management & Policy 16(3)
(Goldman et al., 2001). These all point to greater need for maintenance-related expenditures.
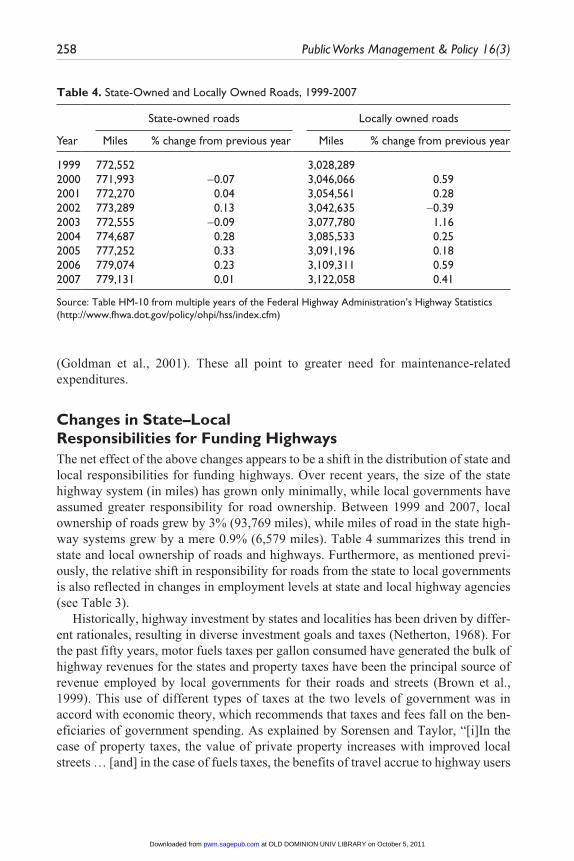
Changes in State–Local Responsibilities for Funding HighwaysThe net effect of the above changes appears to be a shift in the distribution of state and local responsibilities for funding highways. Over recent years, the size of the state highway system (in miles) has grown only minimally, while local governments have assumed greater responsibility for road ownership. Between 1999 and 2007, local ownership of roads grew by 3% (93,769 miles), while miles of road in the state high-way systems grew by a mere 0.9% (6,579 miles). Table 4 summarizes this trend in state and local ownership of roads and highways. Furthermore, as mentioned previ-ously, the relative shift in responsibility for roads from the state to local governments is also reflected in changes in employment levels at state and local highway agencies (see Table 3).
Historically, highway investment by states and localities has been driven by differ-ent rationales, resulting in diverse investment goals and taxes (Netherton, 1968). For the past fifty years, motor fuels taxes per gallon consumed have generated the bulk of highway revenues for the states and property taxes have been the principal source of revenue employed by local governments for their roads and streets (Brown et al., 1999). This use of different types of taxes at the two levels of government was in accord with economic theory, which recommends that taxes and fees fall on the ben-eficiaries of government spending. As explained by Sorensen and Taylor, “[i]In the case of property taxes, the value of private property increases with improved local streets … [and] in the case of fuels taxes, the benefits of travel accrue to highway users
Table 4. State-Owned and Locally Owned Roads, 1999-2007
State-owned roads Locally owned roads
Year Miles % change from previous year Miles % change from previous year
1999 772,552 3,028,2892000 771,993 -0.07 3,046,066 0.592001 772,270 0.04 3,054,561 0.282002 773,289 0.13 3,042,635 -0.392003 772,555 -0.09 3,077,780 1.162004 774,687 0.28 3,085,533 0.252005 777,252 0.33 3,091,196 0.182006 779,074 0.23 3,109,311 0.592007 779,131 0.01 3,122,058 0.41
Source: Table HM-10 from multiple years of the Federal Highway Administration’s Highway Statistics (http://www.fhwa.dot.gov/policy/ohpi/hss/index.cfm)
at OLD DOMINION UNIV LIBRARY on October 5, 2011pwm.sagepub.comDownloaded from
Yusuf et al. 259
in rough proportion to fuel consumed” (2006, pp. 111-112). It is no surprise, then, that local governments have primarily relied on general revenues and property taxes to pay for transportation improvements.
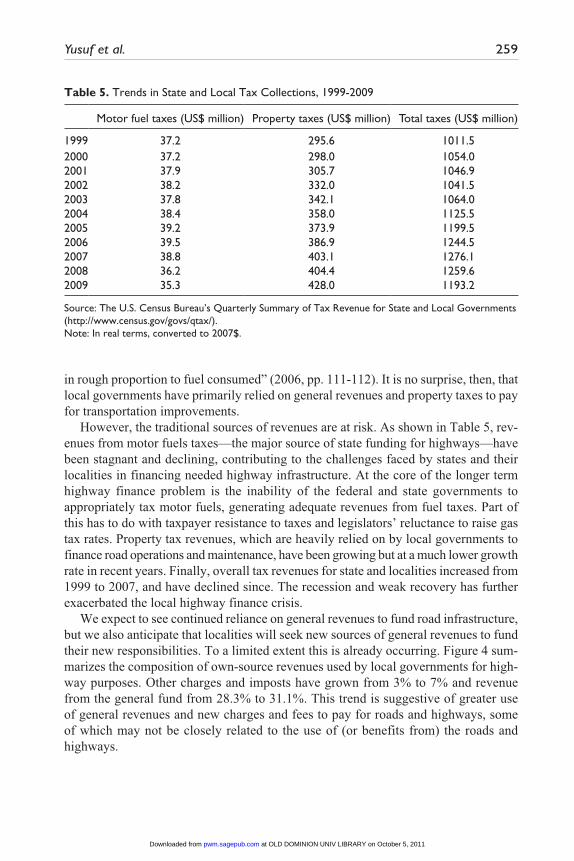
However, the traditional sources of revenues are at risk. As shown in Table 5, rev-enues from motor fuels taxes—the major source of state funding for highways—have been stagnant and declining, contributing to the challenges faced by states and their localities in financing needed highway infrastructure. At the core of the longer term highway finance problem is the inability of the federal and state governments to appropriately tax motor fuels, generating adequate revenues from fuel taxes. Part of this has to do with taxpayer resistance to taxes and legislators’ reluctance to raise gas tax rates. Property tax revenues, which are heavily relied on by local governments to finance road operations and maintenance, have been growing but at a much lower growth rate in recent years. Finally, overall tax revenues for state and localities increased from 1999 to 2007, and have declined since. The recession and weak recovery has further exacerbated the local highway finance crisis.
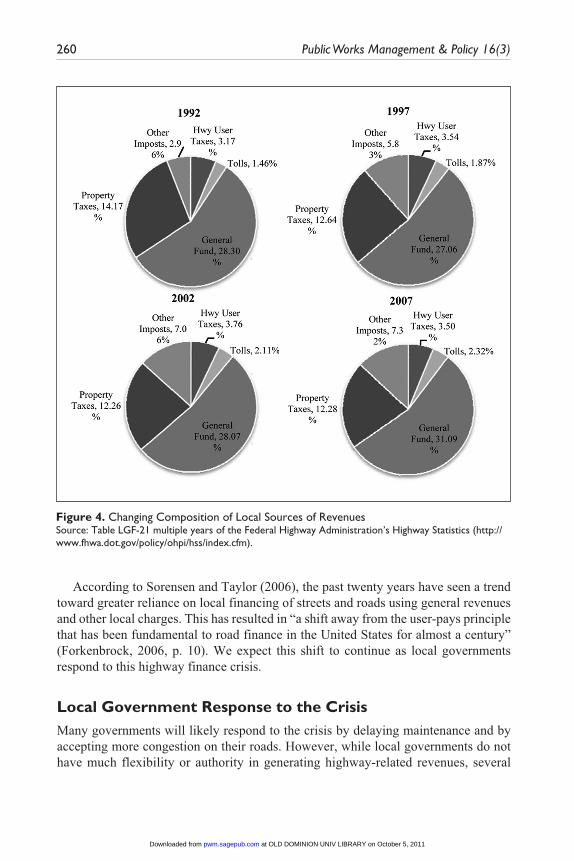
We expect to see continued reliance on general revenues to fund road infrastructure, but we also anticipate that localities will seek new sources of general revenues to fund their new responsibilities. To a limited extent this is already occurring. Figure 4 sum-marizes the composition of own-source revenues used by local governments for high-way purposes. Other charges and imposts have grown from 3% to 7% and revenue from the general fund from 28.3% to 31.1%. This trend is suggestive of greater use of general revenues and new charges and fees to pay for roads and highways, some of which may not be closely related to the use of (or benefits from) the roads and highways.
Table 5. Trends in State and Local Tax Collections, 1999-2009
Motor fuel taxes (US$ million) Property taxes (US$ million) Total taxes (US$ million)
1999 37.2 295.6 1011.52000 37.2 298.0 1054.02001 37.9 305.7 1046.92002 38.2 332.0 1041.52003 37.8 342.1 1064.02004 38.4 358.0 1125.52005 39.2 373.9 1199.52006 39.5 386.9 1244.52007 38.8 403.1 1276.12008 36.2 404.4 1259.62009 35.3 428.0 1193.2
Source: The U.S. Census Bureau’s Quarterly Summary of Tax Revenue for State and Local Governments (http://www.census.gov/govs/qtax/).Note: In real terms, converted to 2007$.
at OLD DOMINION UNIV LIBRARY on October 5, 2011pwm.sagepub.comDownloaded from
260 Public Works Management & Policy 16(3)
According to Sorensen and Taylor (2006), the past twenty years have seen a trend toward greater reliance on local financing of streets and roads using general revenues and other local charges. This has resulted in “a shift away from the user-pays principle that has been fundamental to road finance in the United States for almost a century” (Forkenbrock, 2006, p. 10). We expect this shift to continue as local governments respond to this highway finance crisis.
Local Government Response to the CrisisMany governments will likely respond to the crisis by delaying maintenance and by accepting more congestion on their roads. However, while local governments do not have much flexibility or authority in generating highway-related revenues, several
Figure 4. Changing Composition of Local Sources of RevenuesSource: Table LGF-21 multiple years of the Federal Highway Administration’s Highway Statistics (http://www.fhwa.dot.gov/policy/ohpi/hss/index.cfm).
at OLD DOMINION UNIV LIBRARY on October 5, 2011pwm.sagepub.comDownloaded from
Yusuf et al. 261
financing options offer limited relief for local governments in need of greater revenue to support their roads and highways. These are (a) adoption of smart growth policies and new types of impact fees to increase density and improve the revenue base; (b) implementation of local option transportation taxes; (c) greater use of nontraditional revenue sources such as transportation utility fees (TUFs) and land taxes; and (d) reli-ance on debt financing support from state and federal sources through State Infrastructure Banks (SIBs).2
Smart Growth Policies and New Types of Impact FeesMany cities have responded and are continuing to respond to their financial problems by adopting policies advocated by the smart growth movement—a set of policies designed to improve the revenue base by redeveloping inner cities and suburbs to increase residential and commercial density. These presumably will decrease reliance on the automobile and foster greater use of transit. In the words of the American Plan-ning Association (2002), smart growth
refocuses a larger share of regional growth within central cities, urbanized areas, inner suburbs and areas already served by infrastructure. Smart growth reduces the share of growth that occurs on newly urbanized land, on existing farmlands, and in environmentally sensitive areas. (p. 1)
The goal of more compact development can be reached with a number of policy choices. Among those commonly advocated are urban growth boundaries, transfer of development rights, transit-oriented development, smaller lots, mixed use develop-ment, and infill development. More compact development can also be advanced with impact fees, which raise the cost of developing new land (Brueckner, 1997). Develop-ment impact fees are also a popular financing mechanism for addressing the addi-tional costs associated with new development (Brueckner, 1997). Developers or new property owners pay the fees or provide the road infrastructure in question—which reduces the burden for the residents of the overall locality. For some time, develop-ment impact fees for roads, sewer, and water have been popular (Altshuler & Gomez-Ibanez, 1993; Nelson & Moody, 2003). Recently cities have been imposing impact fees for schools, parks, and other expenses associated with growth.3
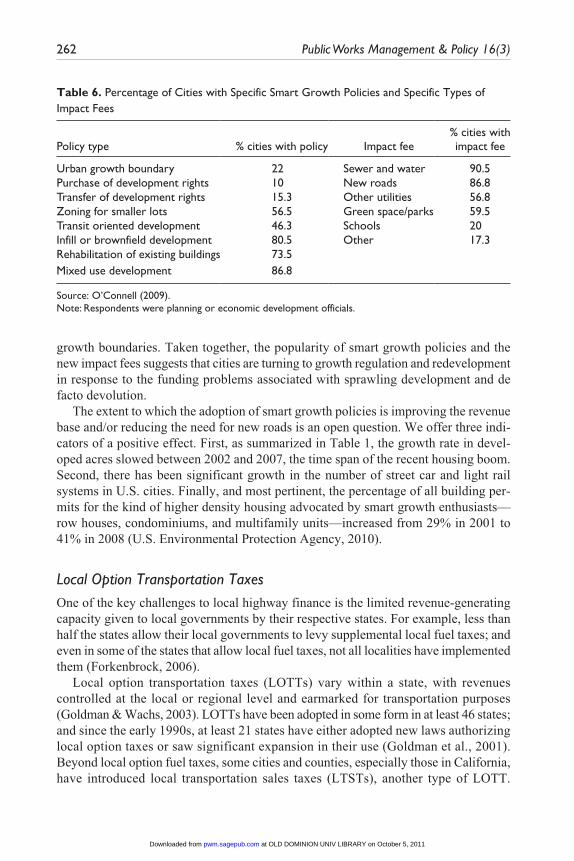
Table 6 reports the results of a 2003 survey by O’Connell (2009) that sampled American cities of 50,000 or more residents. The survey found that a majority of cities are adopting smart growth policies and many are adopting the new types of impact fees and doing so in a way that suggests economic as well as environmental motiva-tions. For example, only 10% of cities have a program for the purchase of development rights—an expensive policy. But the policies that can increase the revenue base and/or reduce sprawl and the need for new roads are quite popular. Thus more than 80% of cities have policies for infill development and mixed use. More than 70% have poli-cies to encourage the rehabbing of existing buildings. And approximately 50% have policies for smaller lots and transit-oriented development. More than 20% have urban
at OLD DOMINION UNIV LIBRARY on October 5, 2011pwm.sagepub.comDownloaded from
262 Public Works Management & Policy 16(3)
growth boundaries. Taken together, the popularity of smart growth policies and the new impact fees suggests that cities are turning to growth regulation and redevelopment in response to the funding problems associated with sprawling development and de facto devolution.
The extent to which the adoption of smart growth policies is improving the revenue base and/or reducing the need for new roads is an open question. We offer three indi-cators of a positive effect. First, as summarized in Table 1, the growth rate in devel-oped acres slowed between 2002 and 2007, the time span of the recent housing boom. Second, there has been significant growth in the number of street car and light rail systems in U.S. cities. Finally, and most pertinent, the percentage of all building per-mits for the kind of higher density housing advocated by smart growth enthusiasts—row houses, condominiums, and multifamily units—increased from 29% in 2001 to 41% in 2008 (U.S. Environmental Protection Agency, 2010).
Local Option Transportation TaxesOne of the key challenges to local highway finance is the limited revenue-generating capacity given to local governments by their respective states. For example, less than half the states allow their local governments to levy supplemental local fuel taxes; and even in some of the states that allow local fuel taxes, not all localities have implemented them (Forkenbrock, 2006).
Local option transportation taxes (LOTTs) vary within a state, with revenues controlled at the local or regional level and earmarked for transportation purposes (Goldman & Wachs, 2003). LOTTs have been adopted in some form in at least 46 states; and since the early 1990s, at least 21 states have either adopted new laws authorizing local option taxes or saw significant expansion in their use (Goldman et al., 2001). Beyond local option fuel taxes, some cities and counties, especially those in California, have introduced local transportation sales taxes (LTSTs), another type of LOTT.
Table 6. Percentage of Cities with Specific Smart Growth Policies and Specific Types of Impact Fees
Policy type % cities with policy Impact fee% cities with impact fee
Urban growth boundary 22 Sewer and water 90.5Purchase of development rights 10 New roads 86.8Transfer of development rights 15.3 Other utilities 56.8Zoning for smaller lots 56.5 Green space/parks 59.5Transit oriented development 46.3 Schools 20Infill or brownfield development 80.5 Other 17.3Rehabilitation of existing buildings 73.5Mixed use development 86.8
Source: O’Connell (2009).Note: Respondents were planning or economic development officials.
at OLD DOMINION UNIV LIBRARY on October 5, 2011pwm.sagepub.comDownloaded from
Yusuf et al. 263
Other types of LOTTs include property, income, and payroll taxes. However, the sales tax approach to LOTTs has been the most popular, and LTSTs have been the fastest growing source of revenue for transportation in California (Crabbe, Hiatt, Poliwka, & Wachs, 2005). While the use of LTSTs in California was pioneered by public transit districts, revenues from LTSTs have been used for a wide variety of transportation purposes and are almost evenly distributed across state highways, local roads, and transit (Crabbe et al., 2005). Interestingly, “LTSTs did not simply substitute a new source of financial support for projects that would have been built anyway. Many of the capital projects [were] too costly to have been built without the sales-tax revenue” (Crabbe et al., 2005, p. 119). In the absence of the LTST revenues, local governments may have had to forgo much needed transportation infrastructure and services.
Transportation Utility Fees and Land TaxationLocal governments may also consider several nontraditional solutions. One financing alternative for local governments is the use of transportation utility fees (TUFs), also known as road user fees, street maintenance charges, street utility fees, and street lighting fees (Carlson, Duckwitz, Kurowski, & Smith, 2007). With TUFs, roads and streets are treated as a public utility, and properties are charged a fee-for-service similar to those charged for trash collection, sewer and wastewater, and other utility services. In most localities, TUFs are structured as a monthly user fee collected on residences and businesses and based on the use or “consumption” of the transportation system. Fees are assessed to properties based on the amount of trips these properties generate, and therefore offer a more direct connection between demand for and costs of trans-portation infrastructure (Junge & Levinson, 2010).
TUFs have three significant advantages: (a) they provide a new source of revenue for local governments; (b) they are an equitable approach for financing roads and streets (Forkenbrock, 2006); and (c) they contribute to economic efficiency (Ewing, 1993). Furthermore, because it is a fee and not a tax, any TUF can be established by most local governments without a public referendum or without authorizing legisla-tion from the state.
TUFs are gaining in acceptance. A survey of localities, conducted in 1991, deter-mined that only 9 localities had adopted TUFs (Ewing, 1993, 1994); but a recent study (Junge & Levinson, 2010) listed 26 examples of TUFs used by local governments. While TUFs have been in existence for at least two decades, the 1990s were marked by widespread national interest in TUFs and, recently, they have again become the focus of policy debate (see, for example, Carlson et al., 2007; Junge & Levinson, 2010).
Another local financing option is land taxation, a property tax imposed either exclusively or primarily on land (Chapman, Cornia, Facer, & Walters, 2009). One of the most important advantages of a land tax (or land value tax) is that it encourages more efficient (i.e., higher density) land use (see, for example, Brueckner, 2001; Gihring, 1999), and thus can help curb urban sprawl. Also, the link between transpor-tation infrastructure and land values makes the land tax more like a quasiuser charge.
at OLD DOMINION UNIV LIBRARY on October 5, 2011pwm.sagepub.comDownloaded from
264 Public Works Management & Policy 16(3)
But, there are challenges to adoption of a land tax, most notably its lack of political popularity (given its similarity to the highly unpopular property tax) and various administrative concerns. However, in their simulative application of the land tax to Utah counties, Chapman and his colleagues (2009) determined that the administrative concerns may not be as strenuous as was previously thought.
In the United States, the land tax has been implemented as a single land tax or as a quasiland tax in the form of a two-rate or split-rate property tax. The two-rate tax is the most widely adopted. Local governments in Pennsylvania, including Pittsburgh,4 have used a two-rate property tax system in which the tax on land value is higher and the tax on improvement value is lower (Hughes, 2006). In addition, the state of Connecti-cut passed legislation enabling two-rate taxes in 2009.
Debt Financing and State Infrastructure BanksBeyond these partial solutions for easing the highway finance burden of local govern-ments, several other issues and challenges remain. For example, local governments have become increasingly reliant on debt to finance needed highway investment. According to statistics from the Federal Highway Administration’s Highway Statis-tics Series (Table LGF-1), local government debt outstanding for highway purposes grew by more than 50% between 1999 and 2007. This increased borrowing is doubly troubling. First, the greater the debt level, the higher the debt service requirements faced by local governments. Second, the financing ability of most local governments is hampered by state-imposed debt limits. The higher the level of debt, the closer these local governments would be to their debt limit and the lower their ability to borrow more. Currently, all but two states limit the amount of debt issued by their city and county governments (Advisory Commission on Intergovernmental Relations, 1993). These state-imposed limitations inhibit localities’ ability to issue debt to finance their highway needs. Moreover, only 13 states support their local governments by issuing state debt for local highways.
One way that states (and the federal government) have helped local governments in regard to capital financing has been through the creation of State Infrastructure Banks (SIBs). SIBs are federally authorized, state-run revolving loan funds that offer finan-cial assistance for mostly local transportation projects mainly through low interest loans (Yusuf, O’Connell, Hackbart, & Liu, 2010). Thirty-two states have established SIBs, many of which are designed to support local transportation investment through below-market loans. SIBs, therefore, provide a debt financing alternative for local governments that need to borrow to pay for needed highway infrastructure but are constrained by state-imposed debt limits.
SIBs offer two sources of borrowing cost savings to local governments: (a) avoid-ance of transaction costs associated with issuing municipal bonds and (b) lower interest rates. For example, one study found that localities in Ohio receiving SIB loans real-ized borrowing cost savings between 34 and 184 basis points (Yusuf & Liu, 2008).
at OLD DOMINION UNIV LIBRARY on October 5, 2011pwm.sagepub.comDownloaded from
Yusuf et al. 265
These cost savings represent subsidies from states to localities as states work to help their localities address highway infrastructure challenges. SIBs also offer a possible solution to the current crisis, in that they provide a mechanism through which the federal government may support local governments. Ryu (2006, 2007) examined the lever-aging effect of federal resources used to capitalize SIBs and fund SIB loans. He found that one dollar of federal funds deposited into the SIBs had a leveraging effect on state highway funds of as much as US$7.55. Therefore, every federal dollar committed to the SIB program could potentially generate more than US$8 of loan resources to be made available for local highway projects.
SIBs can also reduce financing disparities between urban and rural areas. In most states, localities in rural areas benefit disproportionately from state aid. State highway funds are usually spent on interstate highways, and state roads and highways, which typically run through unincorporated areas, townships, and rural counties. While states also pay for state system arterials in and around urban areas, the states do not generally provide support for locally owned roads in urban areas. This generally leaves local governments in urban areas responsible for maintaining their own roads while those in rural areas benefit from greater state attention and state investment (Hill et al., 2003).
Summary and ConclusionsHighway finance in the United States is at a crossroads (Sorensen & Taylor, 2006), and local governments appear to be facing a crisis related to financing construction, operation, and maintenance of their roads and highways. At the same time that urban sprawl was increasing the total lane mileage of local roads, de facto devolution changed the state–local financing relationships, further exacerbating the local high-way finance crisis. Thus localities have become responsible for more miles of arterials, collectors, and local roads, and must bear the costs associated with this increased ownership. Furthermore, improved access and mobility have resulted in increased travel and subsequently greater wear and tear on the highway and road networks. Economic growth, coupled with greater ownership of personal vehicles, has also contributed to the upsurge in traffic. The result has been greater need for maintenance-related expenditures and greater need for expansion of existing roads or construction of new ones.
It is now incumbent on local governments to spend less on roads per lane mile or obtain resources to meet their greater road- and highway-related responsibilities. We do not foresee an ability to greatly reduce spending over the long term; thus additional revenue must be found, although the apparent turn to more compact development can reduce the amount needed. Given the challenges faced by the federal and state govern-ments in raising their motor fuel tax rates, it might be unrealistic for cities and counties to impose local fuel taxes. Rather, we expect local governments to raise the needed revenues, in part at least, from the general fund by creating a variety of nontraditional taxes and fees such as TUFs and by more low-cost borrowing from SIBs. We also expect increases in their traditional taxes, perhaps with dedicated sales and property
at OLD DOMINION UNIV LIBRARY on October 5, 2011pwm.sagepub.comDownloaded from
266 Public Works Management & Policy 16(3)
tax increases. Thus we expect a continuation of the trend away from the user pay prin-ciple (Forkenbrook, 2006; Sorensen & Taylor, 2006). And last, we expect to see more willingness to tolerate congestion and less than perfect roads.
But, the potential sources of revenues previously discussed have their drawbacks and the securing of adequate funding will likely remain a perennial problem. The lin-gering recession along with the vast number of foreclosed homes has reduced con-struction and therefore revenue from the new types of impact fees. Local option taxes, while popular in the early 2000s, are now much harder to get passed by voters and legislators in the current political environment. TUFs can be effectively employed in new development but are hard to retrofit on existing jurisdictions. The savings made possible with SIB loans will help. But, even with lower interest rates, cities and coun-ties will have limited funds available to repay the loans. Unless there is growth in revenues, debt finance simply represents a forward shift of construction spending.
Clearly, finding revenue to invest in transportation facilities will be difficult in the current fiscal, economic, and political environments. The federal government is strug-gling to address its deficit. Most state governments, in turn, are dealing with severe declines in all revenues, which may reduce further the amount of aid they can provide to localities. Stimulus funds from the federal government have helped states and localities deal with their revenue shortfalls, but these funds will soon run out. Many communi-ties will confront an additional impediment—the popular sentiment against tax increases spearheaded by the Tea Party movement. This political context too is particularly chal-lenging, as many legislators and local politicians took a pledge of no new taxes.
The challenges notwithstanding, legislators will have to respond, as a sustained underinvestment in infrastructure can negatively impact highway safety as well as quality and performance. Statistics from the Federal Highway Administration’s High-way Statistics 2008 (Table FI-220) show that an increasing percentage of fatalities are occurring on local roads. In addition, previous studies have linked larger amounts of financing and investment with the quality of road pavement and surface (see, for exam-ple, Oh & Sinha, 2009).
Unless local governments find some way to properly charge for transportation, tak-ing into consideration changing technology (e.g., much higher gas taxes, carbon tax, parking charges, etc.), there really is no simple cure for the current crisis. Cities and counties will probably continue to patch together a number of policies to bring growth, redevelopment, taxes, and transportation needs into some semblance of balance. In all likelihood, however, most cities will seek more tax revenue to meet their greater needs. We expect them to raise it because, as Dilger (2003) observes, “[m]ost stake-holders agree that government should spend more than it does on transportation infra-structure” (p. 149).
Declaration of Conflicting Interests
The author(s) declared no potential conflicts of interests with respect to the authorship and/or publication of this article.
at OLD DOMINION UNIV LIBRARY on October 5, 2011pwm.sagepub.comDownloaded from
Yusuf et al. 267
Funding
The author(s) received no financial support for the research and/or authorship of this article.
Notes
1. Note that these employment numbers only account for state employees performing highway-related functions. They do not consider growth in private contractors or private sector employees contracted by the state to perform highway functions.
2. Privatization and tolling are possible solutions for alleviating public sector financial chal-lenges. However, we doubt the applicability of privatization and tolling to local government transportation projects. Furthermore, the current economy has affected public and private organizations alike and has diminished the amount of private capital that may be available to be invested in transportation. This further limits the applicability of privatization.
3. With the new types of impact fees, as with the old, the facilities become the responsibility of the local government to operate and maintain.
4. Pittsburgh had a two-rate property tax system from 1913 to 2001. Prior to 1979, the ratio of the tax rate for land to that for improvements was 2:1. The tax system was re-structured in 1979 and under the new system the tax on land was more than five times the tax on improve-ments made to the land (Oates &Schwab, 1997).
References
Advisory Commission on Intergovernmental Relations. (1993). State laws governing local gov-ernment structure and administration. Washington, DC: Advisory Commission on Intergov-ernmental Relations.
Altshuler, A. A., & Gomez-Ibanez, J. A. (1993). Regulation for revenue: The political economy of land-use exactions. Washington, DC: Brookings Institution.
American Planning Association. (2002). A policy guide on smart growth. Retrieved from http://www.planning.org/policy/guides/pdf/smartgrowth.pdf
Brown, J., DiFrancia, M., Hill, M. C., Philip, L., Olson, J., Taylor, B. D., . . . Weinstein, A. (1999). The future of California highway finance: Detailed research findings. UCB-ITS-RR-99-3. Berkeley: University of California Institute of Transportation Studies.
Brueckner, J. (1997). Infrastructure financing and urban development: The economics of impact fees. Journal of Public Economics, 66, 383-407.
Brueckner, J. K. (2001). Property taxation and urban sprawl. In W. E. Oates (Ed.), Property taxation and local government finance (pp. 153-172). Cambridge, MA: Lincoln Institute of Land Policy.
Bruegmann, R. (2005). Sprawl: A compact history. Chicago, IL: University of Chicago Press.Carlson, D., Duckwitz, B., Kurowski, K., & Smith, L. (2007). Transportation utility fees: Pos-
sibilities for the City of Milwaukee. Report prepared for the City of Milwaukee Department of Administration Division of Budget and Management by the University of Wisconsin-Madison Robert M. La Follette School of Public Affairs.
Chapman, J. I., Cornia, G. C., Facer, R. L., & Walters, L. C. (2009). Alternative financing models for transportation: A case study of land taxation in Utah. Public Works Management and Policy, 13, 202-214.
at OLD DOMINION UNIV LIBRARY on October 5, 2011pwm.sagepub.comDownloaded from
268 Public Works Management & Policy 16(3)
Crabbe, A., Hiatt, R., Poliwka, S. D., & Wachs, M. (2005). Local transportation sales taxes: California’s experiment in transportation finance. Public Budgeting and Finance, 25(3), 91-121.
Department of Agriculture. (2009). Summary report: 2007 National Resources Inventory. Washington, DC: Natural Resources Conservation Service and Iowa State University Center for Survey Statistics and Methodology. Retrieved from http://www.nrcs.usda.gov/technical/NRI/2007/2007_NRI_Summary.pdf
Dilger, R. J. (2003). American transportation policy. Westport, CT: Praeger.Ewing, R. (1993). Transportation utility fees. ITE Journal, 63, 34-38.Ewing, R. (1994). Transportation utility fees. Government Finance Review, 10, 13-17.Federal Highway Administration. (2007). Price trends for federal-aid highway construction
(Publication no. FHA-HIF-07-018). Washington, DC: U.S. Department of Transportation. Retrieved from http://www.fhwa.dot.gov/programadmin/pt2006q4.pdf
Fisher, R. C. (2003). The changing state-local fiscal environment: A 25-year retrospective. In D. L. Sjoquist (Ed.), State and local finances under pressure (pp. 9-29). Northampton, MA: Edward Elgar.
Forkenbrock, D. J. (2006). Financing local roads: Current problems and new paradigms. Trans-portation Research Record: Journal of the Transportation Research Board, 1960, 8-14.
Gihring, T. A. (1999). Incentive property tax: A potential tool for urban growth management. Journal of the American Planning Association, 65, 62-79.
Gillham, O. (2002). The limitless city: A primer on the urban sprawl debate. Washington, DC: Island Press.
Goldman, T., Corbett, S., & Martin, W. (2001). Local option transportation taxes in the United States (Part One: “Issues and Trends”; Research Report UCB-ITS-RR-2001-3). Berkeley: University of California Institute of Transportation Studies.
Goldman, T., & Wachs, M. (2003). A quiet revolution in transportation finance: The rise of local option transportation taxes. Transportation Quarterly, 57, 19-32.
Hill, E., Geyer, B., O’Brien, K., Robey, C., Brennan, J., & Puentes, R. (2003). Slanted pavement: How Ohio’s highway spending shortchanges cities and suburbs (A discussion paper prepared for the Brookings Institution Center on urban and metropolitan policy). Washington, DC: The Brookings Institution.
Hughes, M. A. (2006). Why so little Georgism in America: Using the Pennsylvania case files to understand the slow, uneven progress of land value taxation (Lincoln Institute of Land Policy Working Paper). Cambridge, MA: Lincoln Institute of Land Policy. Retrieved from https://www.lincolninst.edu/pubs/dl/1275_Hughes%20Final.pdf
Junge, J., & Levinson, D. (2010). Economic and equity effects of transportation utility fees (Transportation Research Board Annual Meeting 2010 Paper No. 10-0572). Washington, DC: Transportation Research Board.
Nelson, A. C., & Moody, M. (2003). Paying for prosperity: Impact fees and job growth (A discussion paper prepared for the Brookings Institution Center on urban and metropolitan policy). Washington, DC: The Brookings Institution.
Netherton, R. D. (1968). Intergovernmental relations under the Federal-Aid Highway Program. Urban Law Annals, 1, 15-32.
Oates, W. E., & Schwab, R. M. (1997). The impact of urban land taxation: The Pittsburgh expe-rience. National Tax Journal, 50(1), 1-21.
at OLD DOMINION UNIV LIBRARY on October 5, 2011pwm.sagepub.comDownloaded from
Yusuf et al. 269
O’Connell, L. (2009). The impact of local supporters on smart growth policy adoption. Journal of the American Planning Association, 75, 281-291.
Oh, J. E., & Sinha, K. C. (2009). The effectiveness of highway expenditure and highway needs: Some new evidence (Transportation Research Board Annual Meeting Paper No. 09-3445). Washington, DC: Transportation Research Board.
Ryu, J. E. (2006). Fiscal impacts of an innovative highway financing alternative on state high-way expenditures: The case of federal assistance funds in the state infrastructure bank (SIB) programs. Public Works Management and Policy, 11, 33-48.
Ryu, J. E. (2007). Federal highway assistance funds in the state infrastructure bank programs: Mechanisms, merits, and modifications. Public Budgeting and Finance, 27, 43-65.
Sorensen, P. A., & Taylor, B. D. (2006). Innovations in road finance: Examining the growth in electronic tolling. Public Works Management and Policy, 11, 110-125.
U.S. Environmental Protection Agency. (2010). Residential construction trends in America’s metropolitan regions. Retrieved from http://www.epa.gov/smartgrowth
Watson, K., & Gold, S. D. (1997). The other side of devolution: Shifting relationships between state and local governments: Evidence from social services, public assistance, and work-force development programs (Assessing the New Federalism Project Occasional Paper No. 2). Washington, DC: The Urban Institute.
Yusuf, J., & Liu, G. (2008). State Infrastructure Banks and intergovernmental subsidies for local transportation investment. Public Budgeting and Finance, 28, 71-89.
Yusuf, J., O’Connell, L., Hackbart, M., & Liu, G. (2010). State infrastructure banks and borrow-ing costs for transportation projects. Public Finance Review, 38, 682-709.
Bios
Juita-Elena (Wie) Yusuf is an assistant professor at Old Dominion University. Her areas of research include transportation policy, entrepreneurship and economic development, and public budgeting and finance. Her work has been published in Public Works Management and Policy, Public Budgeting and Finance, American Review of Public Administration, Public Finance Review, and other journals.
Lenahan O’Connell is a research associate at the Kentucky Transportation Center, where he conducts research on transportation and environmental policy He holds a Ph.D. in public admin-istration from the University of Kentucky and a M.A. degree in sociology from Columbia University. His articles have appeared in Transportation and Statistics, The Transportation Research Record, Administration and Society, Public Administration Review, Urban Studies, Public Works Management and Policy, Journal of the American Planning Association, Social Science Quarterly and other journals.
Sawsan Abutabenjeh is a PhD candidate in the Urban Studies and Public Administration Department at Old Dominion University. She graduated with MBA degree in 2006 from the Hashemite University, Jordan. Currently, she is graduate research assistant at the Urban Studies and Public Administration Department at Old Dominion University. Her current research inter-ests include public finance, financial management, transportation policy, and econometrics.
at OLD DOMINION UNIV LIBRARY on October 5, 2011pwm.sagepub.comDownloaded from