patterns of innovation organisation in service firms: postal survey results and theoretical models
TRANSCRIPT
Patterns of innovation organisation in service firms:
postal survey results and theoretical models
Faridah Djellal, FaIz Gallouj
To cite this version:
Faridah Djellal, FaIz Gallouj. Patterns of innovation organisation in service firms: postal surveyresults and theoretical models. Science and public policy, 2001, 28 (1), pp.57-67. <halshs-01133139>
HAL Id: halshs-01133139
https://halshs.archives-ouvertes.fr/halshs-01133139
Submitted on 18 Mar 2015
HAL is a multi-disciplinary open accessarchive for the deposit and dissemination of sci-entific research documents, whether they are pub-lished or not. The documents may come fromteaching and research institutions in France orabroad, or from public or private research centers.
L’archive ouverte pluridisciplinaire HAL, estdestinee au depot et a la diffusion de documentsscientifiques de niveau recherche, publies ou non,emanant des etablissements d’enseignement et derecherche francais ou etrangers, des laboratoirespublics ou prives.
1
Patterns of innovation organisation in service firms: postal survey results and
theoretical models1
Faridah Djellal and Faïz Gallouj
Clersé (Ifrési and University of Lille I)
(Published in Science and Public Policy: DJELLAL F., GALLOUJ F. (2001), Patterns of
innovation organisation in service firms: postal survey results and theoretical models,
Science and Public Policy, Vol. 28, n°1, p. 57-67.)
Abstract:
This paper is based on a postal survey of innovation in services carried out in France. It
seeks to account for the modes of organisation of innovation processes. It addresses the
following themes: the sources of information, the internal and external actors involved in
innovation, the costs and duration of projects, the realisation of R&D activity,
experimentation and innovation protection systems. Statistical data are used to test the
validity of a certain number of theoretical models of the organisation of innovation, in
particular the professionals in partnership model, the managerial model, the traditional
industrial model, the neo-industrial model, the entrepreneurial model and the artisanal or
craft model.
Introduction
If what is now called "the new economy" is an economy based on innovation and services,
there is still considerable unwillingness to accept the idea that it may be an economy based on
innovation in services. Nevertheless, some theoretical and methodological attempts have been
made over the past few years to reconcile these two fundamental facets of contemporary
economies2.
Three words can be used to sum up the (historical) evolution of the theoretical perception of
innovation in services: non-existence, subordination and autonomisation. The notion that
services are resistant to innovation is part of a negative assessment of services as peripheral,
unproductive and non-capital-intensive. The subordination manifests itself in an approach to
innovation in services that focuses on the adoption of technologies developed by specialist
departments of manufacturing firms. Autonomisation is a process, currently ongoing, that
1 The authors gratefully acknowledge the comments made by the anonymous referees, and the funding of
the TSER programme. 2 For a survey of these studies, cf. C. and F. Gallouj (1996), Sundbo (1998), Miles et al (1995), the EC
SI4S project (cf. SI4S web site http://www.step.no/Projectarea/si4s/)
involves examination of the multiplicity of relationships between technology and innovation
in services, an emphasis on the non-technological forms of innovation in services and a re-
examination of the models of the organisation of innovation.
The evolution of theoretical perceptions has brought with it changes in the methodological
tools deployed (Djellal and Gallouj, 1999; Sirilli and Evangelista, 1998). Thus surveys on
innovation long excluded services. They then began to be concerned solely with
technological innovation in services. Attempts are now being made (and this study is one of
them) to give an account of non-technological innovation as well.
The above findings also hold true for research and development, which is also considered to
have a weak position in services. This assessment, however, could be modified or
reconsidered if R and D were to be redefined, taking conception and development (C and D)
and research in social sciences more into account (cf. Gadrey et al, 1993; Gault, 19983).
It is important to note that these theoretical and methodological developments, which reflect
the evolution of the definition or conception of the nature of innovation, also reflect changes
in the conception of models of the organisation of innovation.
The completion by the OECD of a collection of indicators of innovation (Oslo Manual, 1992,
1997) intended to supplement the old collection of R&D indicators (Frascati Manual, 1973,
1993) illustrates the transition towards a more comprehensive approach to innovation. In the
new concept, which is based on the model developed by Kline and Rosenberg (1986),
innovation is perceived as a collective process in which, at various points in time and by
means of links of variable length and frequency, various chains (research, accumulated
knowledge and innovation chains) are articulated.
This article seeks to contribute to an autonomised concept of innovation in services. It is
based on a postal survey carried out in France as part of a European research programme4.
The definition of innovation adopted goes beyond technical systems to encompass:
3 Gault considers that in Canada, 60 % of the measured R-D is performed within the service sector.
4 SI4S project (Innovation in services and services in innovation). The questionnaire was jointly
designed by four European teams (French, Norwegian, Danish and Swedish). It contains 26 open or closed
questions, some of which are quantitative, some qualitative. The 26 questions cover the following themes: the
3
- product/service innovation, defined sufficiently broadly to include both tangible and
"intangible" products (for example, a new training method, a new area of consultancy, etc);
- process innovation, whether involving technical systems or more intangible processes (such
as consultants' methods, for example);
- (internal) organisational innovation, which differs from process innovation in that it
constitutes the structure within which activities and processes take place. The introduction of
a matrix structure, for example, belongs in this category;
- external relational innovation, defined as the establishment of particular relationships with a
firm’s partners, whether they be customers, suppliers, public authorities or competitors.
Examples might include strategic alliances, new types of interface, appointment of a
mediator, etc.
This paper doesn’t account for the issue of the nature of innovation in services (Djellal and
Gallouj, 2000). It is given over to the different facets of the organisation of innovation within
the service firms in our sample. It follows the innovation processes, proceeding from
upstream components (i.e. sources of innovation information and ideas) to those downstream
of the innovation (means of protecting the innovation).
Firstly, the main points will be examined through an overall presentation of the statistics,
then, bringing in a number of variables. The principal points are: 1) sources of information,
2) (internal) actors in innovation, 3) collaboration in innovation, 4) innovation costs and
existence of R and D activity, 5) duration of innovation processes, 6) carrying out tests, 7)
means of protecting the innovation.
1. Sources of information
nature of innovation, its modes of organisation, its objectives and its impediments. In line with the other three
European teams involved in the research, we studied the following service industries: consultancy (in its
different forms), financial and insurance services, operational services (contract cleaning, road haulage,…)
hotels, catering, retailing. A postal questionnaire was sent to 3500 service firms between June 1997 and October
1997. Several follow-ups were made by post and telephone. In total, after incomplete questionnaires and
duplications were eliminated, 324 usable questionnaires remained. The response rate of some 10% may appear
low given the importance of the question being dealt with and statistical norms. However, it seems quite
satisfactory when compared to the usual response rate to this type of survey in France. Given its size, our sample
cannot, therefore, claim to be representative. However, the fact that this type of study, as we highlighted above,
is the first of its kind in France, means that statistical rules may be bent a little. The statistical materials
collected, although they cannot claim to be generalised, and although they must be analysed with caution, do
serve to do the groundwork in this field where little research has been done.
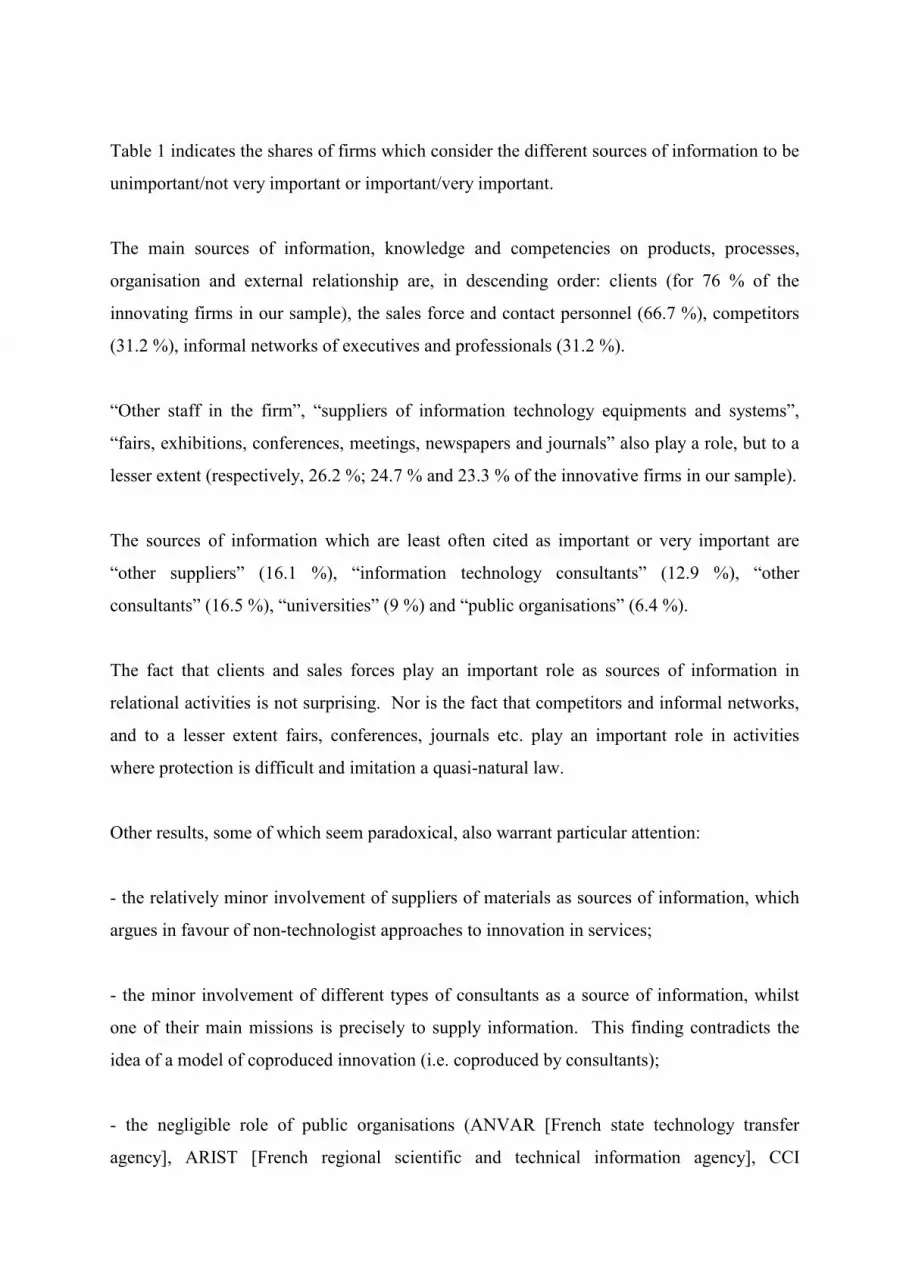
Table 1 indicates the shares of firms which consider the different sources of information to be
unimportant/not very important or important/very important.
The main sources of information, knowledge and competencies on products, processes,
organisation and external relationship are, in descending order: clients (for 76 % of the
innovating firms in our sample), the sales force and contact personnel (66.7 %), competitors
(31.2 %), informal networks of executives and professionals (31.2 %).
“Other staff in the firm”, “suppliers of information technology equipments and systems”,
“fairs, exhibitions, conferences, meetings, newspapers and journals” also play a role, but to a
lesser extent (respectively, 26.2 %; 24.7 % and 23.3 % of the innovative firms in our sample).
The sources of information which are least often cited as important or very important are
“other suppliers” (16.1 %), “information technology consultants” (12.9 %), “other
consultants” (16.5 %), “universities” (9 %) and “public organisations” (6.4 %).
The fact that clients and sales forces play an important role as sources of information in
relational activities is not surprising. Nor is the fact that competitors and informal networks,
and to a lesser extent fairs, conferences, journals etc. play an important role in activities
where protection is difficult and imitation a quasi-natural law.
Other results, some of which seem paradoxical, also warrant particular attention:
- the relatively minor involvement of suppliers of materials as sources of information, which
argues in favour of non-technologist approaches to innovation in services;
- the minor involvement of different types of consultants as a source of information, whilst
one of their main missions is precisely to supply information. This finding contradicts the
idea of a model of coproduced innovation (i.e. coproduced by consultants);
- the negligible role of public organisations (ANVAR [French state technology transfer
agency], ARIST [French regional scientific and technical information agency], CCI
5
[Chambers of Commerce], etc.) and universities as sources of information; result, which has
been confirmed several times by surveys in manufacturing.
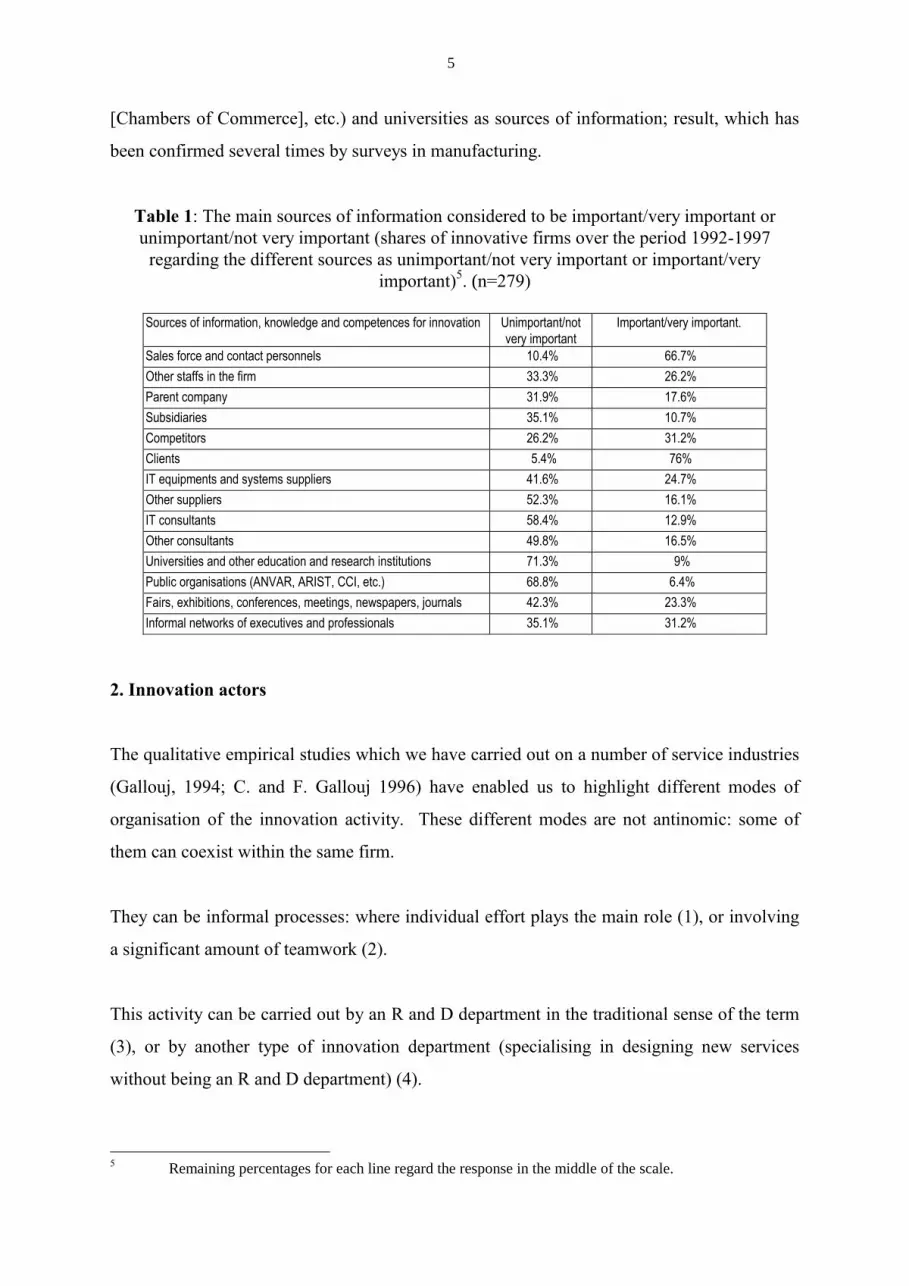
Table 1: The main sources of information considered to be important/very important or
unimportant/not very important (shares of innovative firms over the period 1992-1997
regarding the different sources as unimportant/not very important or important/very
important)5. (n=279)
Sources of information, knowledge and competences for innovation Unimportant/not
very important
Important/very important.
Sales force and contact personnels 10.4% 66.7%
Other staffs in the firm 33.3% 26.2%
Parent company 31.9% 17.6%
Subsidiaries 35.1% 10.7%
Competitors 26.2% 31.2%
Clients 5.4% 76%
IT equipments and systems suppliers 41.6% 24.7%
Other suppliers 52.3% 16.1%
IT consultants 58.4% 12.9%
Other consultants 49.8% 16.5%
Universities and other education and research institutions 71.3% 9%
Public organisations (ANVAR, ARIST, CCI, etc.) 68.8% 6.4%
Fairs, exhibitions, conferences, meetings, newspapers, journals 42.3% 23.3%
Informal networks of executives and professionals 35.1% 31.2%
2. Innovation actors
The qualitative empirical studies which we have carried out on a number of service industries
(Gallouj, 1994; C. and F. Gallouj 1996) have enabled us to highlight different modes of
organisation of the innovation activity. These different modes are not antinomic: some of
them can coexist within the same firm.
They can be informal processes: where individual effort plays the main role (1), or involving
a significant amount of teamwork (2).
This activity can be carried out by an R and D department in the traditional sense of the term
(3), or by another type of innovation department (specialising in designing new services
without being an R and D department) (4).
5 Remaining percentages for each line regard the response in the middle of the scale.
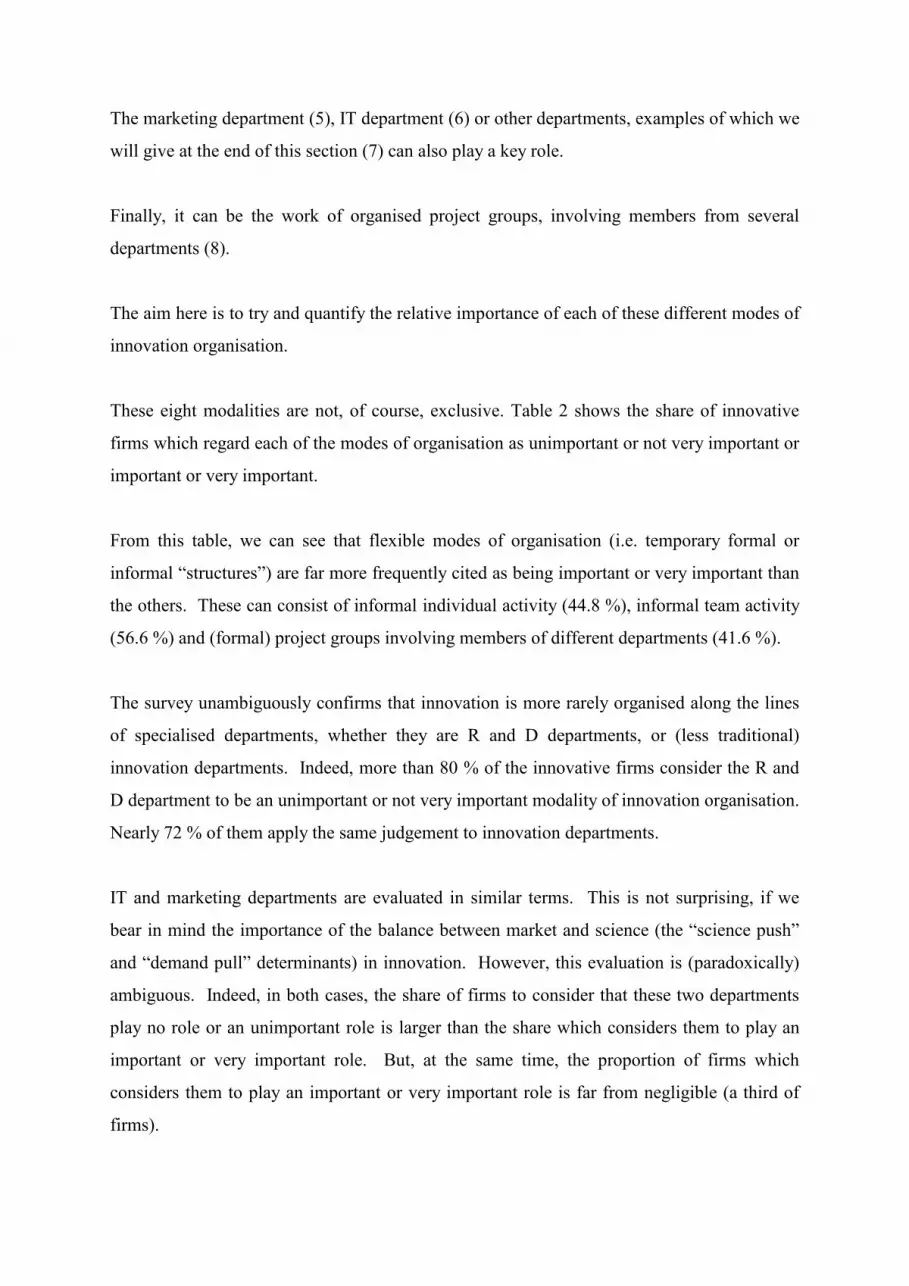
The marketing department (5), IT department (6) or other departments, examples of which we
will give at the end of this section (7) can also play a key role.
Finally, it can be the work of organised project groups, involving members from several
departments (8).
The aim here is to try and quantify the relative importance of each of these different modes of
innovation organisation.
These eight modalities are not, of course, exclusive. Table 2 shows the share of innovative
firms which regard each of the modes of organisation as unimportant or not very important or
important or very important.
From this table, we can see that flexible modes of organisation (i.e. temporary formal or
informal “structures”) are far more frequently cited as being important or very important than
the others. These can consist of informal individual activity (44.8 %), informal team activity
(56.6 %) and (formal) project groups involving members of different departments (41.6 %).
The survey unambiguously confirms that innovation is more rarely organised along the lines
of specialised departments, whether they are R and D departments, or (less traditional)
innovation departments. Indeed, more than 80 % of the innovative firms consider the R and
D department to be an unimportant or not very important modality of innovation organisation.
Nearly 72 % of them apply the same judgement to innovation departments.
IT and marketing departments are evaluated in similar terms. This is not surprising, if we
bear in mind the importance of the balance between market and science (the “science push”
and “demand pull” determinants) in innovation. However, this evaluation is (paradoxically)
ambiguous. Indeed, in both cases, the share of firms to consider that these two departments
play no role or an unimportant role is larger than the share which considers them to play an
important or very important role. But, at the same time, the proportion of firms which
considers them to play an important or very important role is far from negligible (a third of
firms).
7
In the case of the IT department, this result should go some way towards reconsidering the
place of IT in innovation in service.
Nevertheless, in both cases, this ambiguity could stem from the over-representation of small
firms in our sample (which do not have an IT department or a marketing department).
Other departments can intervene in innovation, particularly the following departments and
instances (the first two being the most frequently cited): sales department, top management,
“ telecommunication ”, “technical”, “operational”, “administrative”, “creativity”, “human
resources”, “design”, “scanning”, “logistics”, “development”, “quality”, “research” and
“products and advice” departments (the latter cited by a hotel firm). But the share of firms
which accord them importance is relatively small (17.2 %).
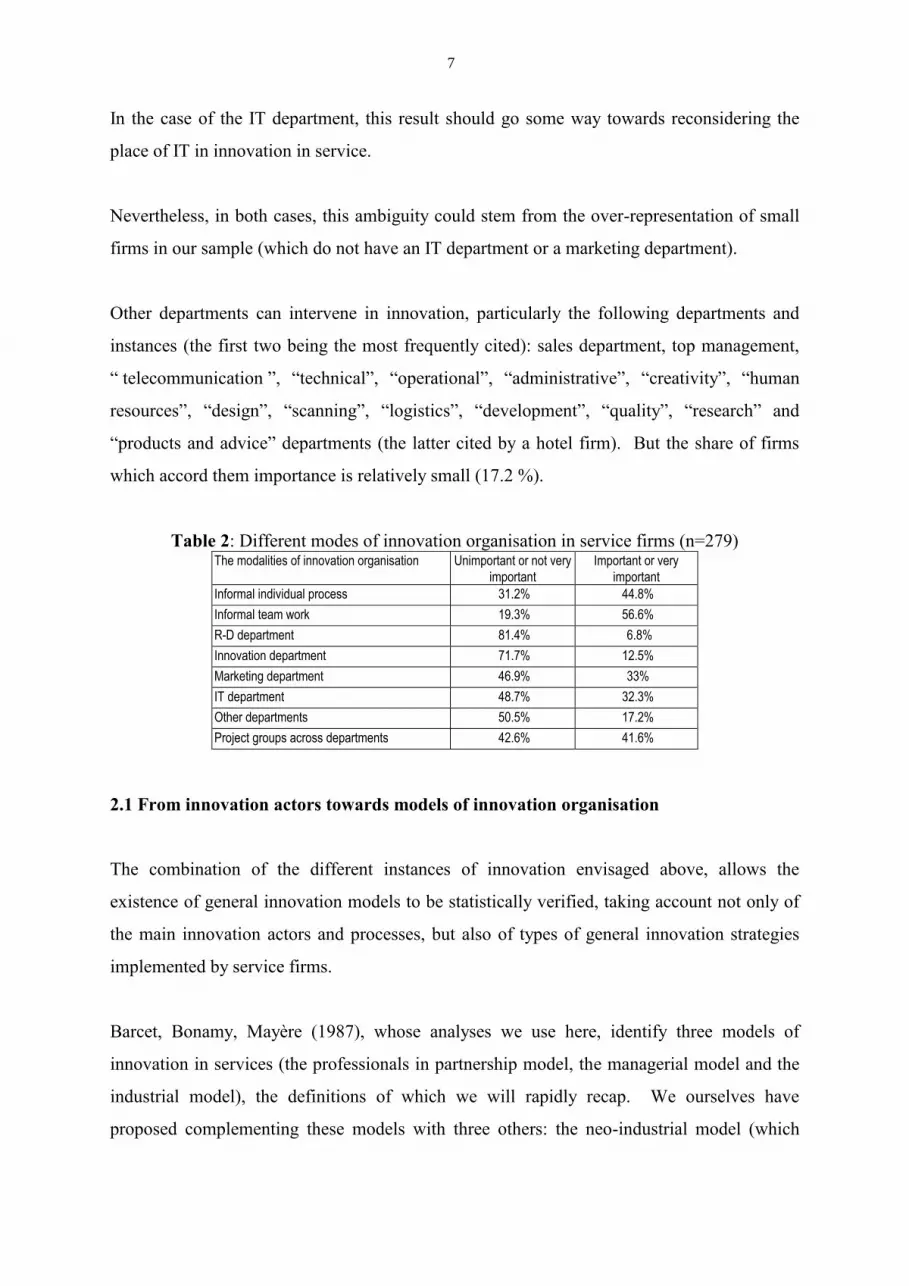
Table 2: Different modes of innovation organisation in service firms (n=279) The modalities of innovation organisation Unimportant or not very
important
Important or very
important
Informal individual process 31.2% 44.8%
Informal team work 19.3% 56.6%
R-D department 81.4% 6.8%
Innovation department 71.7% 12.5%
Marketing department 46.9% 33%
IT department 48.7% 32.3%
Other departments 50.5% 17.2%
Project groups across departments 42.6% 41.6%
2.1 From innovation actors towards models of innovation organisation
The combination of the different instances of innovation envisaged above, allows the
existence of general innovation models to be statistically verified, taking account not only of
the main innovation actors and processes, but also of types of general innovation strategies
implemented by service firms.
Barcet, Bonamy, Mayère (1987), whose analyses we use here, identify three models of
innovation in services (the professionals in partnership model, the managerial model and the
industrial model), the definitions of which we will rapidly recap. We ourselves have
proposed complementing these models with three others: the neo-industrial model (which
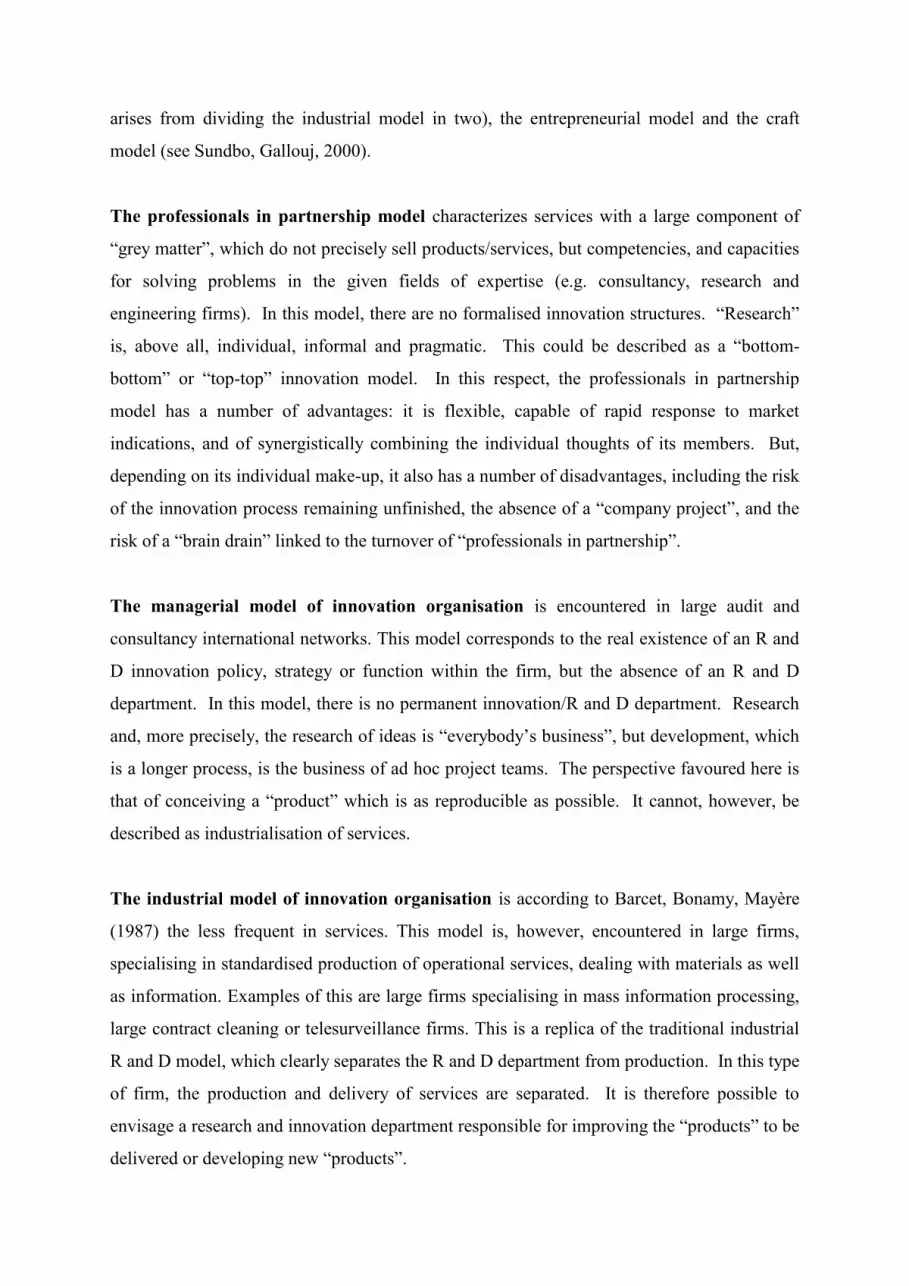
arises from dividing the industrial model in two), the entrepreneurial model and the craft
model (see Sundbo, Gallouj, 2000).
The professionals in partnership model characterizes services with a large component of
“grey matter”, which do not precisely sell products/services, but competencies, and capacities
for solving problems in the given fields of expertise (e.g. consultancy, research and
engineering firms). In this model, there are no formalised innovation structures. “Research”
is, above all, individual, informal and pragmatic. This could be described as a “bottom-
bottom” or “top-top” innovation model. In this respect, the professionals in partnership
model has a number of advantages: it is flexible, capable of rapid response to market
indications, and of synergistically combining the individual thoughts of its members. But,
depending on its individual make-up, it also has a number of disadvantages, including the risk
of the innovation process remaining unfinished, the absence of a “company project”, and the
risk of a “brain drain” linked to the turnover of “professionals in partnership”.
The managerial model of innovation organisation is encountered in large audit and
consultancy international networks. This model corresponds to the real existence of an R and
D innovation policy, strategy or function within the firm, but the absence of an R and D
department. In this model, there is no permanent innovation/R and D department. Research
and, more precisely, the research of ideas is “everybody’s business”, but development, which
is a longer process, is the business of ad hoc project teams. The perspective favoured here is
that of conceiving a “product” which is as reproducible as possible. It cannot, however, be
described as industrialisation of services.
The industrial model of innovation organisation is according to Barcet, Bonamy, Mayère
(1987) the less frequent in services. This model is, however, encountered in large firms,
specialising in standardised production of operational services, dealing with materials as well
as information. Examples of this are large firms specialising in mass information processing,
large contract cleaning or telesurveillance firms. This is a replica of the traditional industrial
R and D model, which clearly separates the R and D department from production. In this type
of firm, the production and delivery of services are separated. It is therefore possible to
envisage a research and innovation department responsible for improving the “products” to be
delivered or developing new “products”.
9
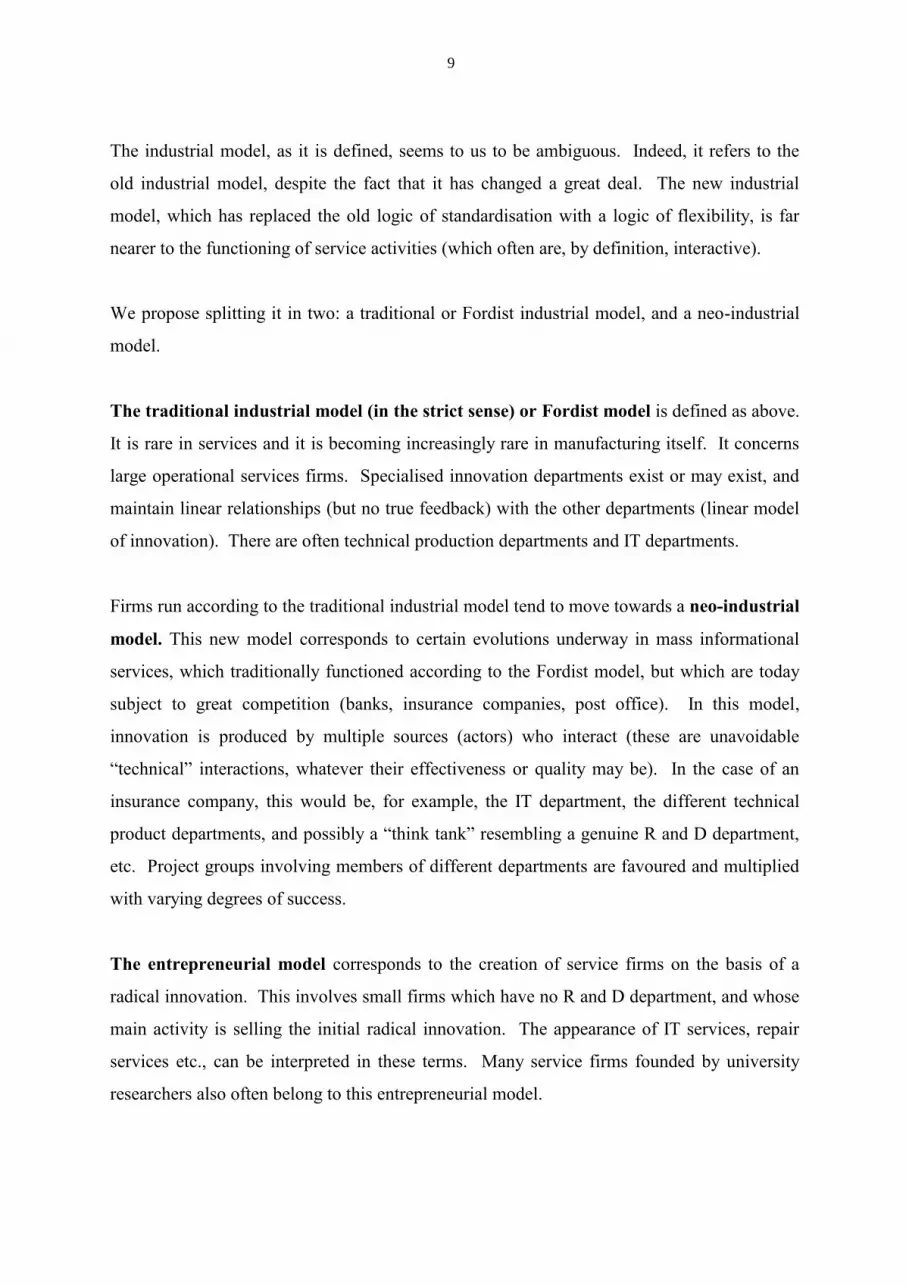
The industrial model, as it is defined, seems to us to be ambiguous. Indeed, it refers to the
old industrial model, despite the fact that it has changed a great deal. The new industrial
model, which has replaced the old logic of standardisation with a logic of flexibility, is far
nearer to the functioning of service activities (which often are, by definition, interactive).
We propose splitting it in two: a traditional or Fordist industrial model, and a neo-industrial
model.
The traditional industrial model (in the strict sense) or Fordist model is defined as above.
It is rare in services and it is becoming increasingly rare in manufacturing itself. It concerns
large operational services firms. Specialised innovation departments exist or may exist, and
maintain linear relationships (but no true feedback) with the other departments (linear model
of innovation). There are often technical production departments and IT departments.
Firms run according to the traditional industrial model tend to move towards a neo-industrial
model. This new model corresponds to certain evolutions underway in mass informational
services, which traditionally functioned according to the Fordist model, but which are today
subject to great competition (banks, insurance companies, post office). In this model,
innovation is produced by multiple sources (actors) who interact (these are unavoidable
“technical” interactions, whatever their effectiveness or quality may be). In the case of an
insurance company, this would be, for example, the IT department, the different technical
product departments, and possibly a “think tank” resembling a genuine R and D department,
etc. Project groups involving members of different departments are favoured and multiplied
with varying degrees of success.
The entrepreneurial model corresponds to the creation of service firms on the basis of a
radical innovation. This involves small firms which have no R and D department, and whose
main activity is selling the initial radical innovation. The appearance of IT services, repair
services etc., can be interpreted in these terms. Many service firms founded by university
researchers also often belong to this entrepreneurial model.
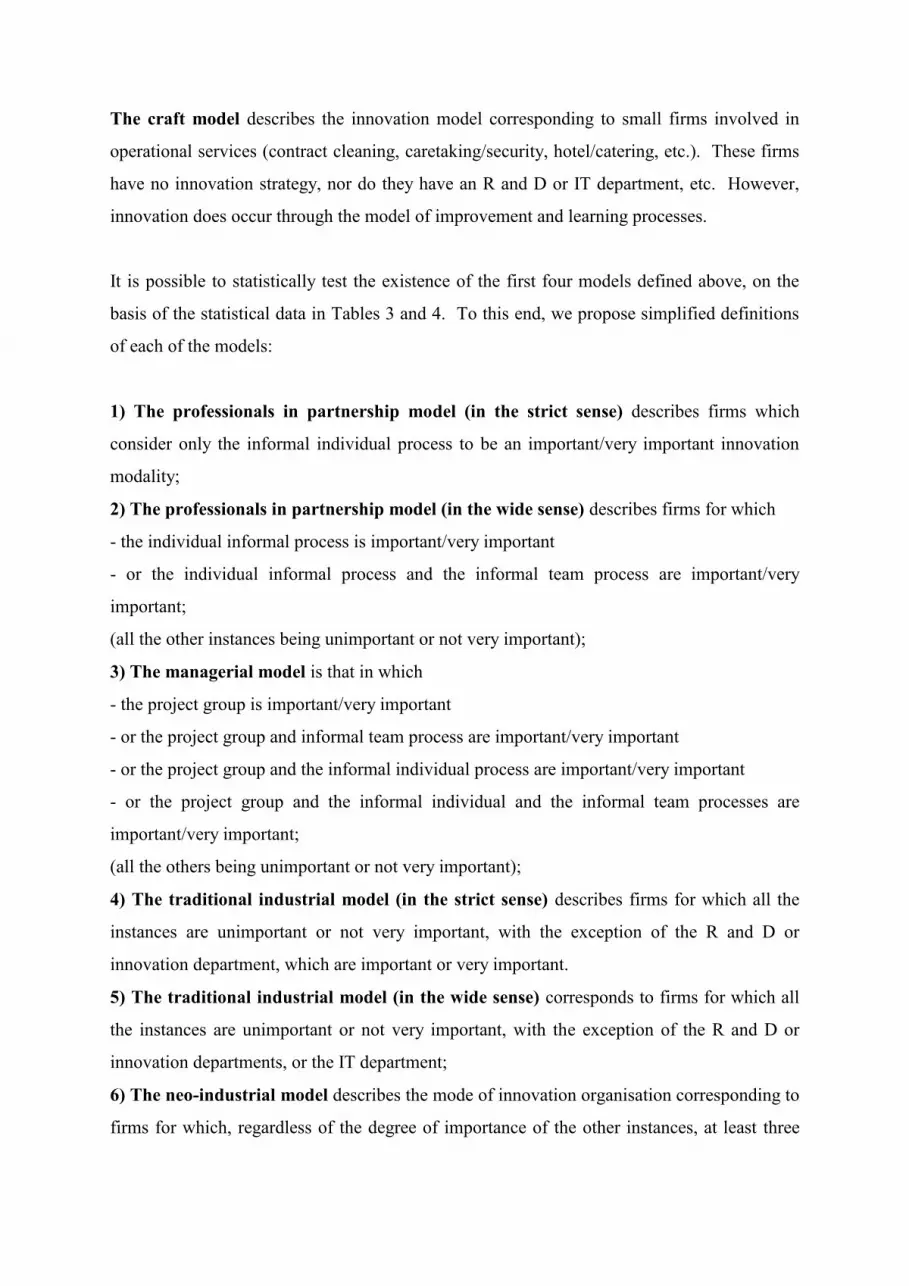
The craft model describes the innovation model corresponding to small firms involved in
operational services (contract cleaning, caretaking/security, hotel/catering, etc.). These firms
have no innovation strategy, nor do they have an R and D or IT department, etc. However,
innovation does occur through the model of improvement and learning processes.
It is possible to statistically test the existence of the first four models defined above, on the
basis of the statistical data in Tables 3 and 4. To this end, we propose simplified definitions
of each of the models:
1) The professionals in partnership model (in the strict sense) describes firms which
consider only the informal individual process to be an important/very important innovation
modality;
2) The professionals in partnership model (in the wide sense) describes firms for which
- the individual informal process is important/very important
- or the individual informal process and the informal team process are important/very
important;
(all the other instances being unimportant or not very important);
3) The managerial model is that in which
- the project group is important/very important
- or the project group and informal team process are important/very important
- or the project group and the informal individual process are important/very important
- or the project group and the informal individual and the informal team processes are
important/very important;
(all the others being unimportant or not very important);
4) The traditional industrial model (in the strict sense) describes firms for which all the
instances are unimportant or not very important, with the exception of the R and D or
innovation department, which are important or very important.
5) The traditional industrial model (in the wide sense) corresponds to firms for which all
the instances are unimportant or not very important, with the exception of the R and D or
innovation departments, or the IT department;
6) The neo-industrial model describes the mode of innovation organisation corresponding to
firms for which, regardless of the degree of importance of the other instances, at least three
1
1
formal structures (one of which being a “project group involving members of several
departments”) are important or very important.
To summarise the definitions we have just proposed, the central elements for establishing a
quantified evaluation of the innovation models are the following:
- the “individual” element for the professional partnership model;
- the existence of formal project groups for the managerial model;
- the existence of specialised innovation departments for the industrial model;
- the existence of organised interaction for the neo-industrial model. Project groups involving
members of several departments can be regarded, in this case, as indicators of this interaction,
provided that importance is accorded to other formal structures.
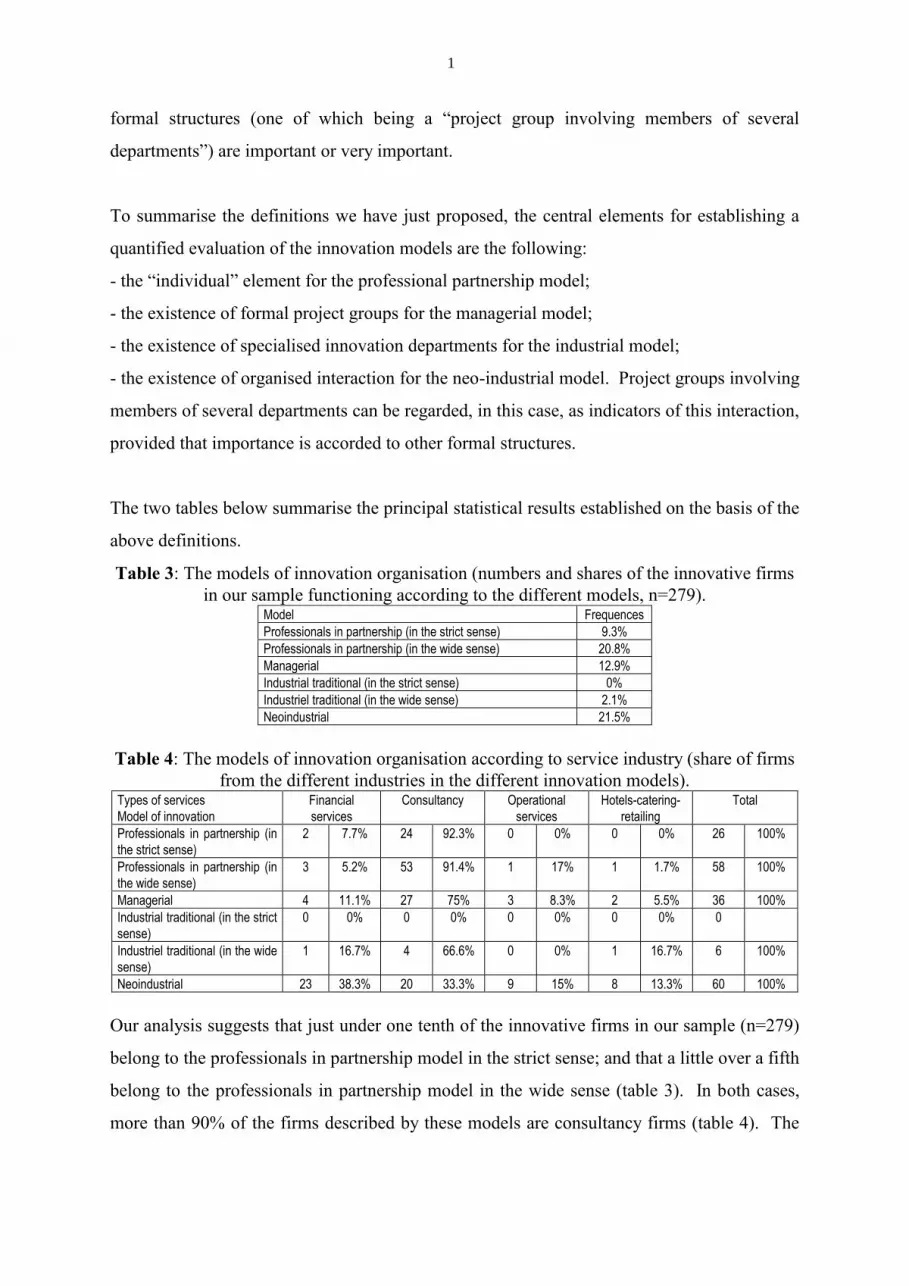
The two tables below summarise the principal statistical results established on the basis of the
above definitions.
Table 3: The models of innovation organisation (numbers and shares of the innovative firms
in our sample functioning according to the different models, n=279). Model Frequences
Professionals in partnership (in the strict sense) 9.3%
Professionals in partnership (in the wide sense) 20.8%
Managerial 12.9%
Industrial traditional (in the strict sense) 0%
Industriel traditional (in the wide sense) 2.1%
Neoindustrial 21.5%
Table 4: The models of innovation organisation according to service industry (share of firms
from the different industries in the different innovation models). Types of services
Model of innovation
Financial
services
Consultancy Operational
services
Hotels-catering-
retailing
Total
Professionals in partnership (in
the strict sense)
2 7.7% 24 92.3% 0 0% 0 0% 26 100%
Professionals in partnership (in
the wide sense)
3 5.2% 53 91.4% 1 17% 1 1.7% 58 100%
Managerial 4 11.1% 27 75% 3 8.3% 2 5.5% 36 100%
Industrial traditional (in the strict
sense)
0 0% 0 0% 0 0% 0 0% 0
Industriel traditional (in the wide
sense)
1 16.7% 4 66.6% 0 0% 1 16.7% 6 100%
Neoindustrial 23 38.3% 20 33.3% 9 15% 8 13.3% 60 100%
Our analysis suggests that just under one tenth of the innovative firms in our sample (n=279)
belong to the professionals in partnership model in the strict sense; and that a little over a fifth
belong to the professionals in partnership model in the wide sense (table 3). In both cases,
more than 90% of the firms described by these models are consultancy firms (table 4). The
few financial services belonging to this model are brokers who, as an intermediary service,
can be regarded as a particular category of consultancy.
The managerial model also mainly describes consultancy firms. 13 % of the innovative firms
in our sample conform to this model’s definition, and 75 % of them are consultancy firms.
No firms in our sample seem to conform to the traditional industrial model. If the definition
is relaxed by introducing IT departments, 2.1 % of the firms in our sample (one bank, two
information technology service firms, one recruitment consultant, a market research office,
and one firm from the retailing field) seem to conform to a traditional industrial model in the
wide sense.
Finally, a little over a fifth of the firms in our sample conform to our definition of the neo-
industrial model. The largest share of firms belonging to this model were financial services
firms. But significant shares of the other industries also conformed to this model, including
consultancy firms, particularly in the following fields: information technology consultancy,
market research (10 firms and 6 firms, respectively) which, together, represented 27 % of the
firms functioning according to the neo-industrial model.
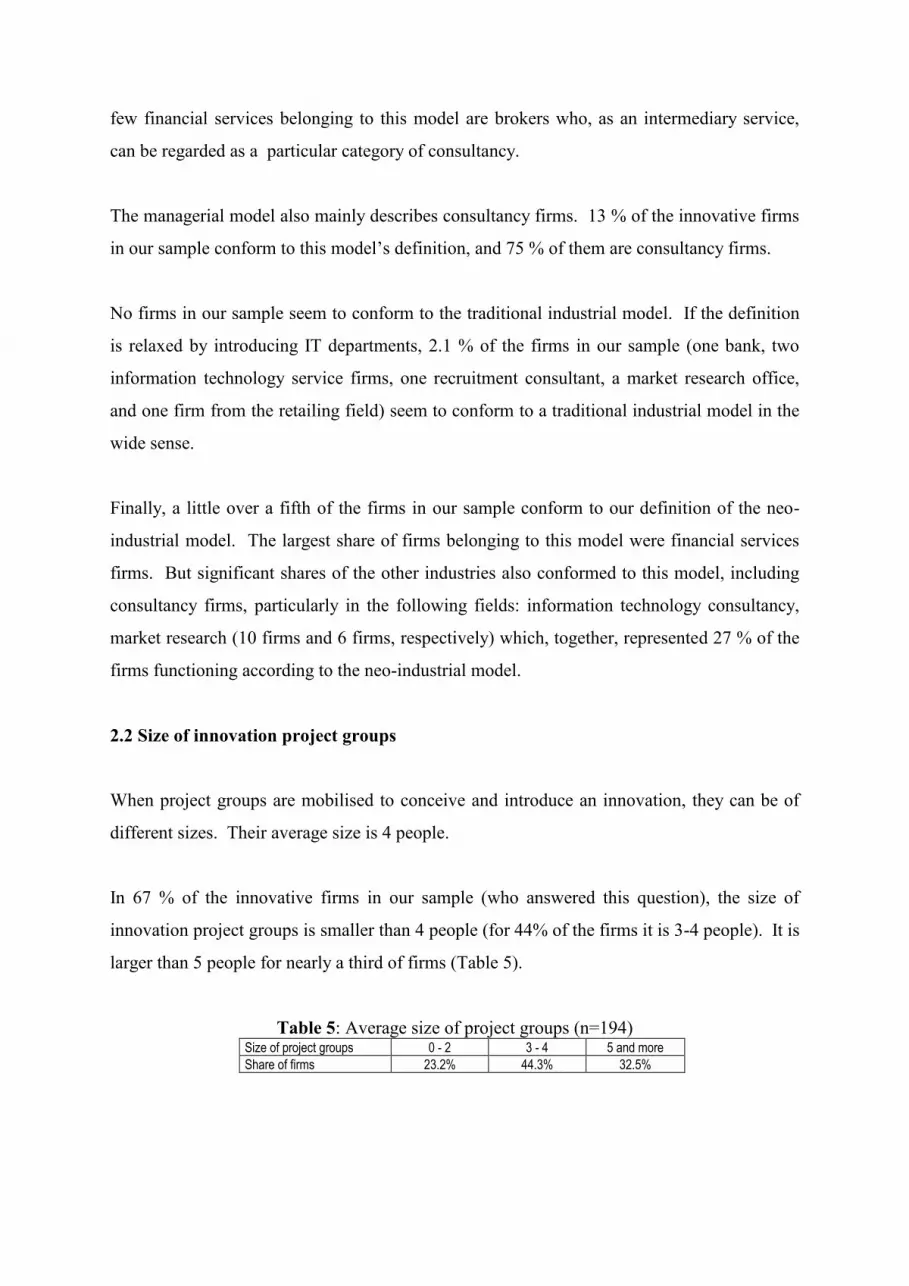
2.2 Size of innovation project groups
When project groups are mobilised to conceive and introduce an innovation, they can be of
different sizes. Their average size is 4 people.
In 67 % of the innovative firms in our sample (who answered this question), the size of
innovation project groups is smaller than 4 people (for 44% of the firms it is 3-4 people). It is
larger than 5 people for nearly a third of firms (Table 5).
Table 5: Average size of project groups (n=194) Size of project groups 0 - 2 3 - 4 5 and more
Share of firms 23.2% 44.3% 32.5%
1
3
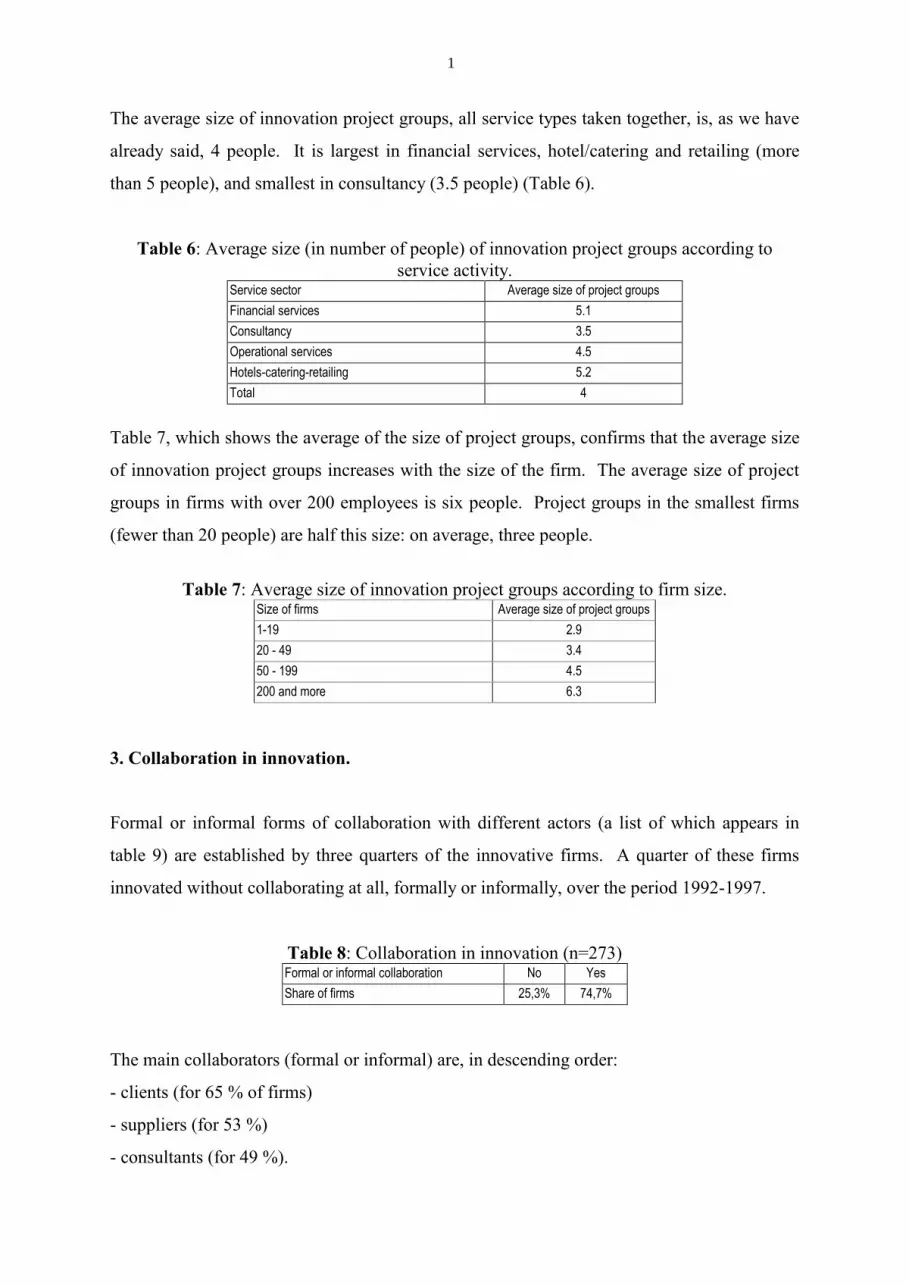
The average size of innovation project groups, all service types taken together, is, as we have
already said, 4 people. It is largest in financial services, hotel/catering and retailing (more
than 5 people), and smallest in consultancy (3.5 people) (Table 6).
Table 6: Average size (in number of people) of innovation project groups according to
service activity. Service sector Average size of project groups
Financial services 5.1
Consultancy 3.5
Operational services 4.5
Hotels-catering-retailing 5.2
Total 4
Table 7, which shows the average of the size of project groups, confirms that the average size
of innovation project groups increases with the size of the firm. The average size of project
groups in firms with over 200 employees is six people. Project groups in the smallest firms
(fewer than 20 people) are half this size: on average, three people.
Table 7: Average size of innovation project groups according to firm size. Size of firms Average size of project groups
1-19 2.9
20 - 49 3.4
50 - 199 4.5
200 and more 6.3
3. Collaboration in innovation.
Formal or informal forms of collaboration with different actors (a list of which appears in
table 9) are established by three quarters of the innovative firms. A quarter of these firms
innovated without collaborating at all, formally or informally, over the period 1992-1997.
Table 8: Collaboration in innovation (n=273) Formal or informal collaboration No Yes
Share of firms 25,3% 74,7%
The main collaborators (formal or informal) are, in descending order:
- clients (for 65 % of firms)
- suppliers (for 53 %)
- consultants (for 49 %).
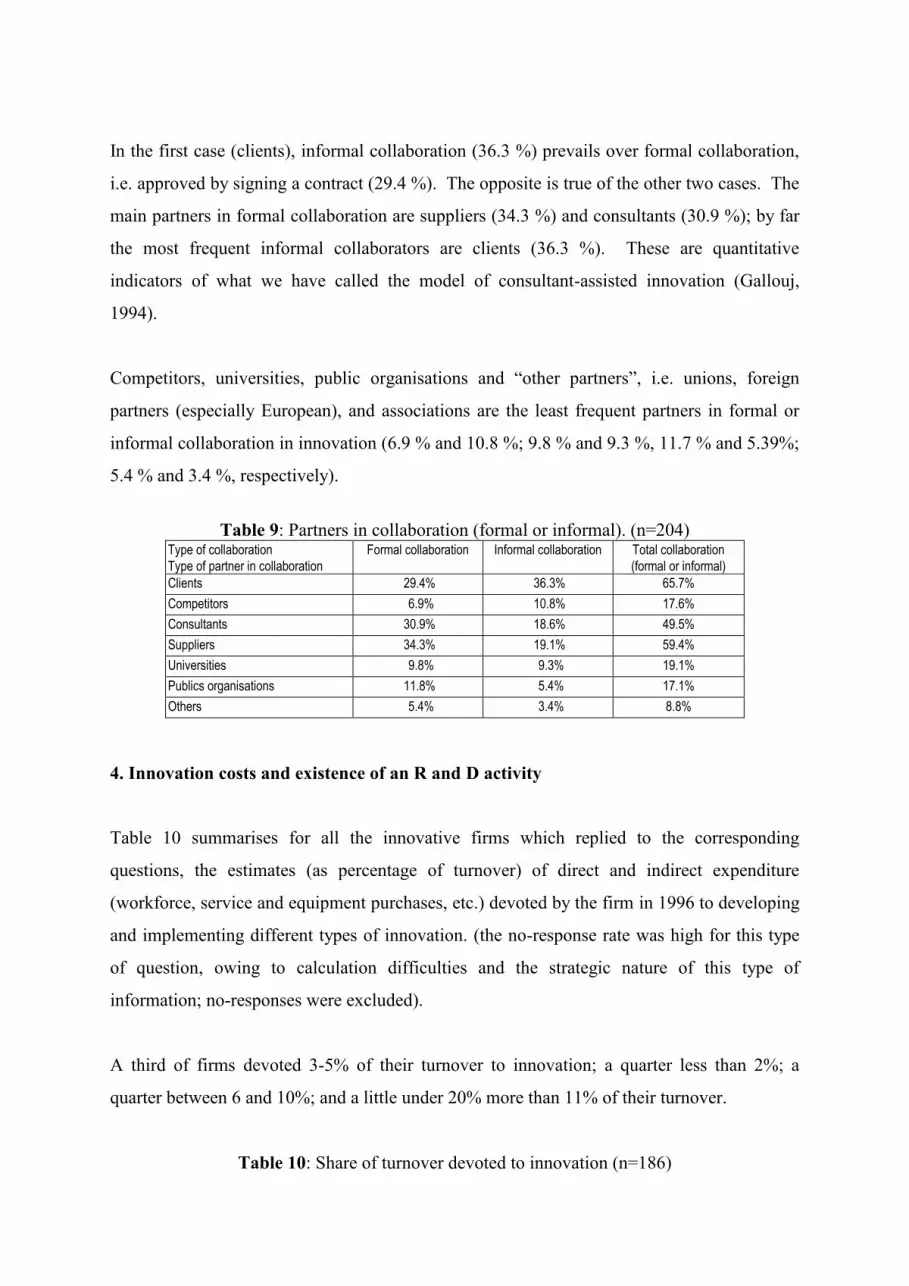
In the first case (clients), informal collaboration (36.3 %) prevails over formal collaboration,
i.e. approved by signing a contract (29.4 %). The opposite is true of the other two cases. The
main partners in formal collaboration are suppliers (34.3 %) and consultants (30.9 %); by far
the most frequent informal collaborators are clients (36.3 %). These are quantitative
indicators of what we have called the model of consultant-assisted innovation (Gallouj,
1994).
Competitors, universities, public organisations and “other partners”, i.e. unions, foreign
partners (especially European), and associations are the least frequent partners in formal or
informal collaboration in innovation (6.9 % and 10.8 %; 9.8 % and 9.3 %, 11.7 % and 5.39%;
5.4 % and 3.4 %, respectively).
Table 9: Partners in collaboration (formal or informal). (n=204) Type of collaboration
Type of partner in collaboration
Formal collaboration Informal collaboration Total collaboration
(formal or informal)
Clients 29.4% 36.3% 65.7%
Competitors 6.9% 10.8% 17.6%
Consultants 30.9% 18.6% 49.5%
Suppliers 34.3% 19.1% 59.4%
Universities 9.8% 9.3% 19.1%
Publics organisations 11.8% 5.4% 17.1%
Others 5.4% 3.4% 8.8%
4. Innovation costs and existence of an R and D activity
Table 10 summarises for all the innovative firms which replied to the corresponding
questions, the estimates (as percentage of turnover) of direct and indirect expenditure
(workforce, service and equipment purchases, etc.) devoted by the firm in 1996 to developing
and implementing different types of innovation. (the no-response rate was high for this type
of question, owing to calculation difficulties and the strategic nature of this type of
information; no-responses were excluded).
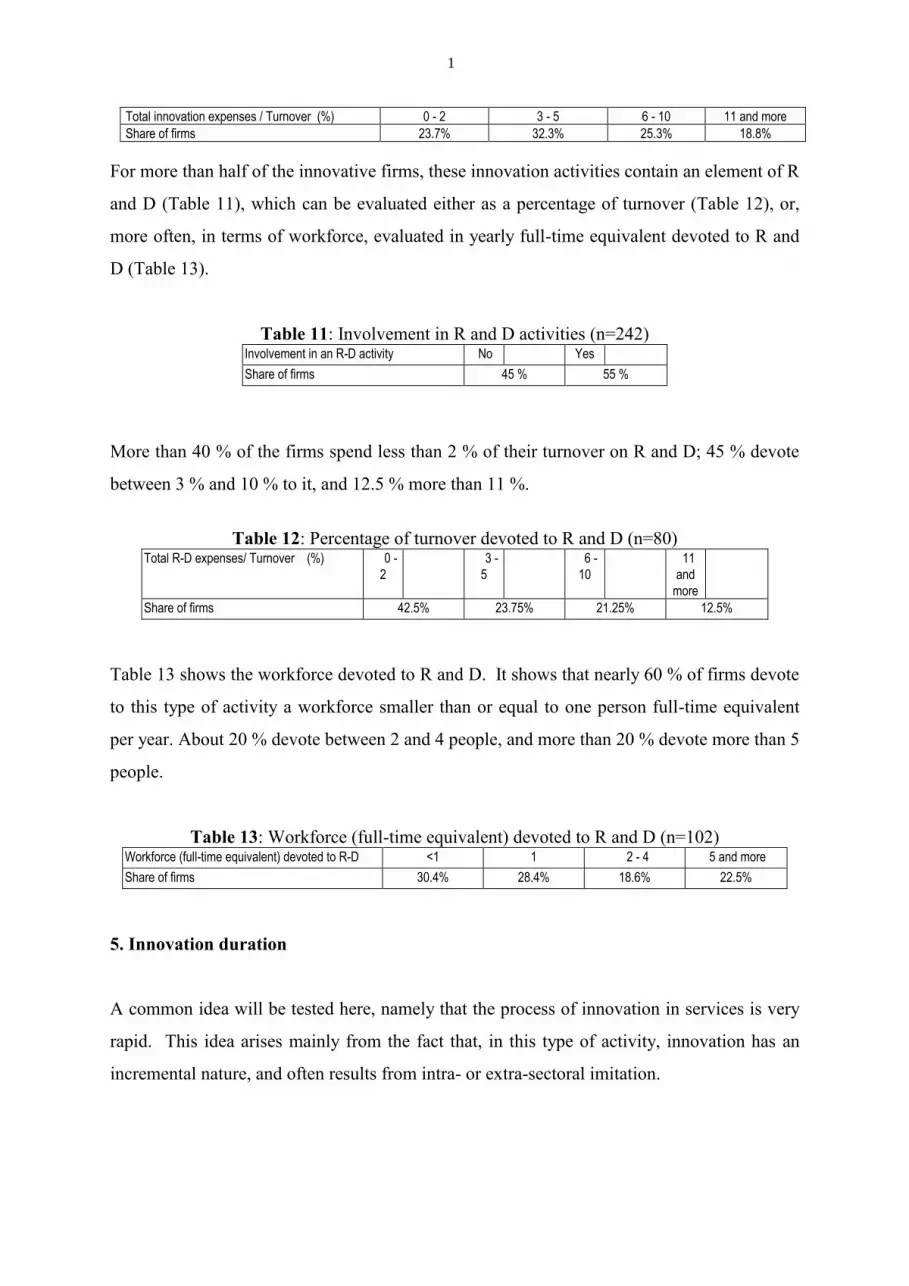
A third of firms devoted 3-5% of their turnover to innovation; a quarter less than 2%; a
quarter between 6 and 10%; and a little under 20% more than 11% of their turnover.
Table 10: Share of turnover devoted to innovation (n=186)
1
5
Total innovation expenses / Turnover (%) 0 - 2 3 - 5 6 - 10 11 and more
Share of firms 23.7% 32.3% 25.3% 18.8%
For more than half of the innovative firms, these innovation activities contain an element of R
and D (Table 11), which can be evaluated either as a percentage of turnover (Table 12), or,
more often, in terms of workforce, evaluated in yearly full-time equivalent devoted to R and
D (Table 13).
Table 11: Involvement in R and D activities (n=242) Involvement in an R-D activity No Yes
Share of firms 45 % 55 %
More than 40 % of the firms spend less than 2 % of their turnover on R and D; 45 % devote
between 3 % and 10 % to it, and 12.5 % more than 11 %.
Table 12: Percentage of turnover devoted to R and D (n=80) Total R-D expenses/ Turnover (%) 0 -
2
3 -
5
6 -
10
11
and
more
Share of firms 42.5% 23.75% 21.25% 12.5%
Table 13 shows the workforce devoted to R and D. It shows that nearly 60 % of firms devote
to this type of activity a workforce smaller than or equal to one person full-time equivalent
per year. About 20 % devote between 2 and 4 people, and more than 20 % devote more than 5
people.
Table 13: Workforce (full-time equivalent) devoted to R and D (n=102) Workforce (full-time equivalent) devoted to R-D <1 1 2 - 4 5 and more
Share of firms 30.4% 28.4% 18.6% 22.5%
5. Innovation duration
A common idea will be tested here, namely that the process of innovation in services is very
rapid. This idea arises mainly from the fact that, in this type of activity, innovation has an
incremental nature, and often results from intra- or extra-sectoral imitation.
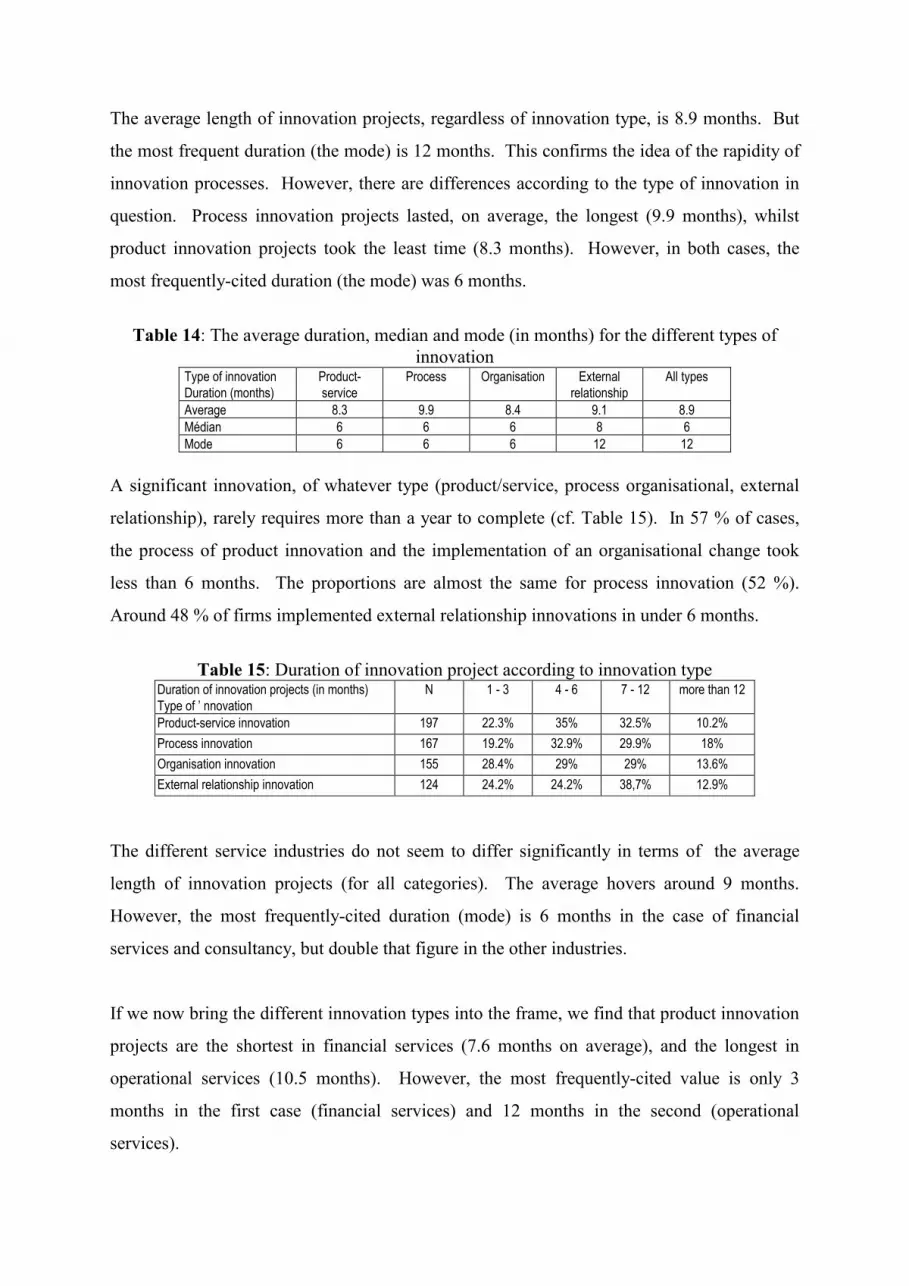
The average length of innovation projects, regardless of innovation type, is 8.9 months. But
the most frequent duration (the mode) is 12 months. This confirms the idea of the rapidity of
innovation processes. However, there are differences according to the type of innovation in
question. Process innovation projects lasted, on average, the longest (9.9 months), whilst
product innovation projects took the least time (8.3 months). However, in both cases, the
most frequently-cited duration (the mode) was 6 months.
Table 14: The average duration, median and mode (in months) for the different types of
innovation Type of innovation
Duration (months)
Product-
service
Process Organisation External
relationship
All types
Average 8.3 9.9 8.4 9.1 8.9
Médian 6 6 6 8 6
Mode 6 6 6 12 12
A significant innovation, of whatever type (product/service, process organisational, external
relationship), rarely requires more than a year to complete (cf. Table 15). In 57 % of cases,
the process of product innovation and the implementation of an organisational change took
less than 6 months. The proportions are almost the same for process innovation (52 %).
Around 48 % of firms implemented external relationship innovations in under 6 months.
Table 15: Duration of innovation project according to innovation type Duration of innovation projects (in months)
Type of ’ nnovation
N 1 - 3 4 - 6 7 - 12 more than 12
Product-service innovation 197 22.3% 35% 32.5% 10.2%
Process innovation 167 19.2% 32.9% 29.9% 18%
Organisation innovation 155 28.4% 29% 29% 13.6%
External relationship innovation 124 24.2% 24.2% 38,7% 12.9%
The different service industries do not seem to differ significantly in terms of the average
length of innovation projects (for all categories). The average hovers around 9 months.
However, the most frequently-cited duration (mode) is 6 months in the case of financial
services and consultancy, but double that figure in the other industries.
If we now bring the different innovation types into the frame, we find that product innovation
projects are the shortest in financial services (7.6 months on average), and the longest in
operational services (10.5 months). However, the most frequently-cited value is only 3
months in the first case (financial services) and 12 months in the second (operational
services).
1
7
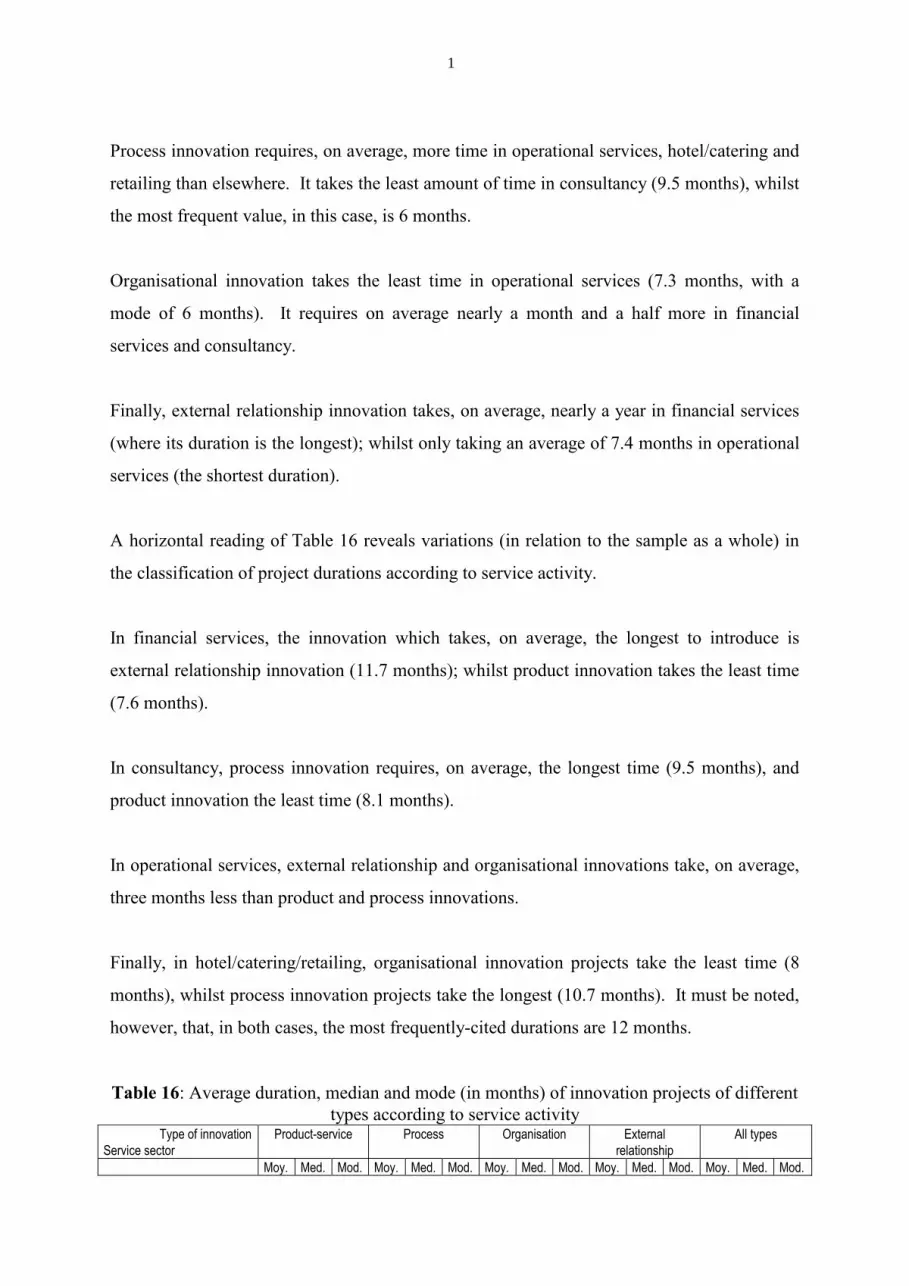
Process innovation requires, on average, more time in operational services, hotel/catering and
retailing than elsewhere. It takes the least amount of time in consultancy (9.5 months), whilst
the most frequent value, in this case, is 6 months.
Organisational innovation takes the least time in operational services (7.3 months, with a
mode of 6 months). It requires on average nearly a month and a half more in financial
services and consultancy.
Finally, external relationship innovation takes, on average, nearly a year in financial services
(where its duration is the longest); whilst only taking an average of 7.4 months in operational
services (the shortest duration).
A horizontal reading of Table 16 reveals variations (in relation to the sample as a whole) in
the classification of project durations according to service activity.
In financial services, the innovation which takes, on average, the longest to introduce is
external relationship innovation (11.7 months); whilst product innovation takes the least time
(7.6 months).
In consultancy, process innovation requires, on average, the longest time (9.5 months), and
product innovation the least time (8.1 months).
In operational services, external relationship and organisational innovations take, on average,
three months less than product and process innovations.
Finally, in hotel/catering/retailing, organisational innovation projects take the least time (8
months), whilst process innovation projects take the longest (10.7 months). It must be noted,
however, that, in both cases, the most frequently-cited durations are 12 months.
Table 16: Average duration, median and mode (in months) of innovation projects of different
types according to service activity Type of innovation
Service sector
Product-service Process Organisation External
relationship
All types
Moy. Med. Mod. Moy. Med. Mod. Moy. Med. Mod. Moy. Med. Mod. Moy. Med. Mod.

Financial services 7,6 6 3 10 9 6 8,6 6 6 11,7 12 12 9,3 6 6
Consultancy 8,1 6 6 9,5 6 6 8,7 6 12 8,9 6 12 8,8 6 6
Operational services 10,5 6 12 10,8 9,5 12 7,3 6 6 7,4 6 12 8,9 6 12
Hotels-catering-retailing 8,9 6 6 10,7 10 12 8 7 12 8,9 12 12 9,2 8 12
Total 8,3 6 6 9,9 6 6 8,4 6 6 9,1 8 12 8,9 6 12
The average length of innovation projects (all types taken together) increases with the size of
the firm. Thus, while the average duration for the smallest firms is 7.8 months, it is 10.3
months for the largest firms.
This relationship is confirmed globally by an examination of each of the innovation types
(product, process, organisational, external relationship).
Reading the table 17 horizontally indicates that to the small firms tend to devote more time to
external relationship innovation projects than the other types, and large firms tend to devote
more time to process innovation projects (12.2 months) than to the other types.
Table 17: Average duration, median and mode (in months) of innovation projects according
to firm size Type of innovation
Size of firms
Product-service Process Organisation External
relationship
All types
Moy. Med. Mod. Moy. Med. Mod. Moy. Med. Mod. Moy. Med. Mod. Moy. Med. Mod.
1-19 7,9 6 6 7,4 6 6 7,5 6 12 8,7 7 12 7,8 6 6
20-49 7,2 6 3 10,8 6 6 8,6 6 6 9,1 6 6 8,8 6 6
50-199 8,7 6 6 11,1 12 12 9,3 6 12 9,1 7 12 9,6 6 6
200 and more 9,9 12 12 12,2 12 12 8,8 6 6 10 12 12 10,3 12 12
6. Testing
The question about carrying out tests only concerned “product/service” innovations. We did
not provide an exact definition of the term, which means it could have been interpreted in
different ways: “technical” test (test of functioning), marketing test (on potential markets),
economic test on forecast income, etc. In services, it is difficult, in many cases, to make a
distinction between these different meanings of the notion of “test”.
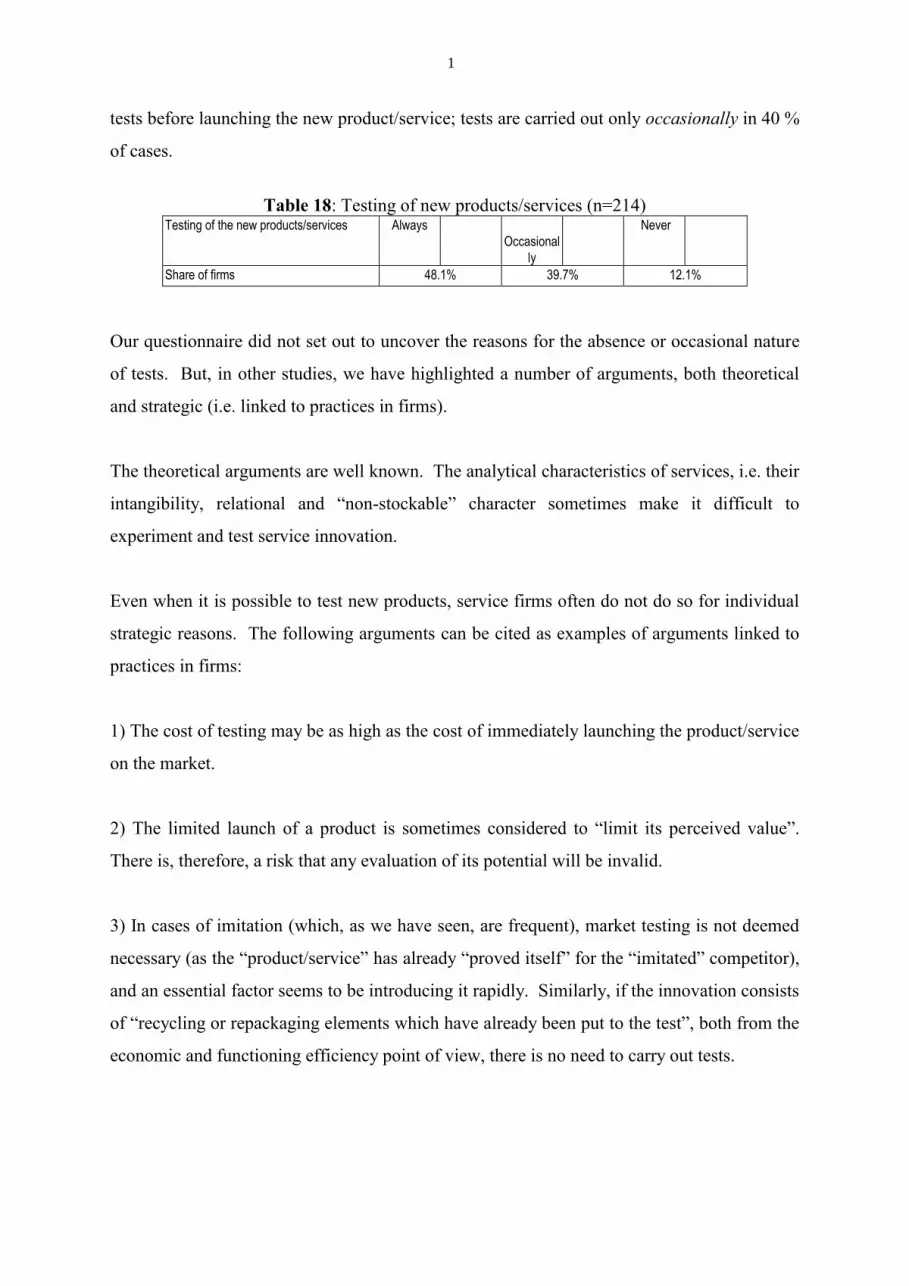
However the meaning of test was taken, it would seem that the systematic absence of any
testing of new products/services is relatively rare (12.1 % of cases). Nearly half the firms
which introduced “product/service” innovations over the period 1992-1997 always carry out
1
9
tests before launching the new product/service; tests are carried out only occasionally in 40 %
of cases.
Table 18: Testing of new products/services (n=214) Testing of the new products/services Always
Occasional
ly
Never
Share of firms 48.1% 39.7% 12.1%
Our questionnaire did not set out to uncover the reasons for the absence or occasional nature
of tests. But, in other studies, we have highlighted a number of arguments, both theoretical
and strategic (i.e. linked to practices in firms).
The theoretical arguments are well known. The analytical characteristics of services, i.e. their
intangibility, relational and “non-stockable” character sometimes make it difficult to
experiment and test service innovation.
Even when it is possible to test new products, service firms often do not do so for individual
strategic reasons. The following arguments can be cited as examples of arguments linked to
practices in firms:
1) The cost of testing may be as high as the cost of immediately launching the product/service
on the market.
2) The limited launch of a product is sometimes considered to “limit its perceived value”.
There is, therefore, a risk that any evaluation of its potential will be invalid.
3) In cases of imitation (which, as we have seen, are frequent), market testing is not deemed
necessary (as the “product/service” has already “proved itself” for the “imitated” competitor),
and an essential factor seems to be introducing it rapidly. Similarly, if the innovation consists
of “recycling or repackaging elements which have already been put to the test”, both from the
economic and functioning efficiency point of view, there is no need to carry out tests.
4) If the innovation is aimed at complementing a product line, so that a complete range can be
offered, market testing may seem superfluous, as “the new product will be introduced even if
sales forecasts are limited”.
5) Some firms, particularly large financial firms, may not want to run the risk of testing their
product on a limited population, as problems arising from this, far from leading to
improvements (as it should be the case), could damage the product’s image with the sales
network who would sell it.
6) Some innovations, particularly in financial services and legal consultancy, are brought
about by government decisions which have fixed deadlines and therefore do not leave enough
time to carry out tests.
7. Protecting innovation
It is extremely difficult to protect innovation in services. Different possible means of
protection are shown in Table 19, i.e.:
• brand image,
• dominant market position,
• patents, registered trademarks, etc.,
• marketing, advertising,
• process secrecy and know-how,
• integration with main suppliers of technology,
• integration with main clients,
• “restriction of competition” clauses with key personnel.
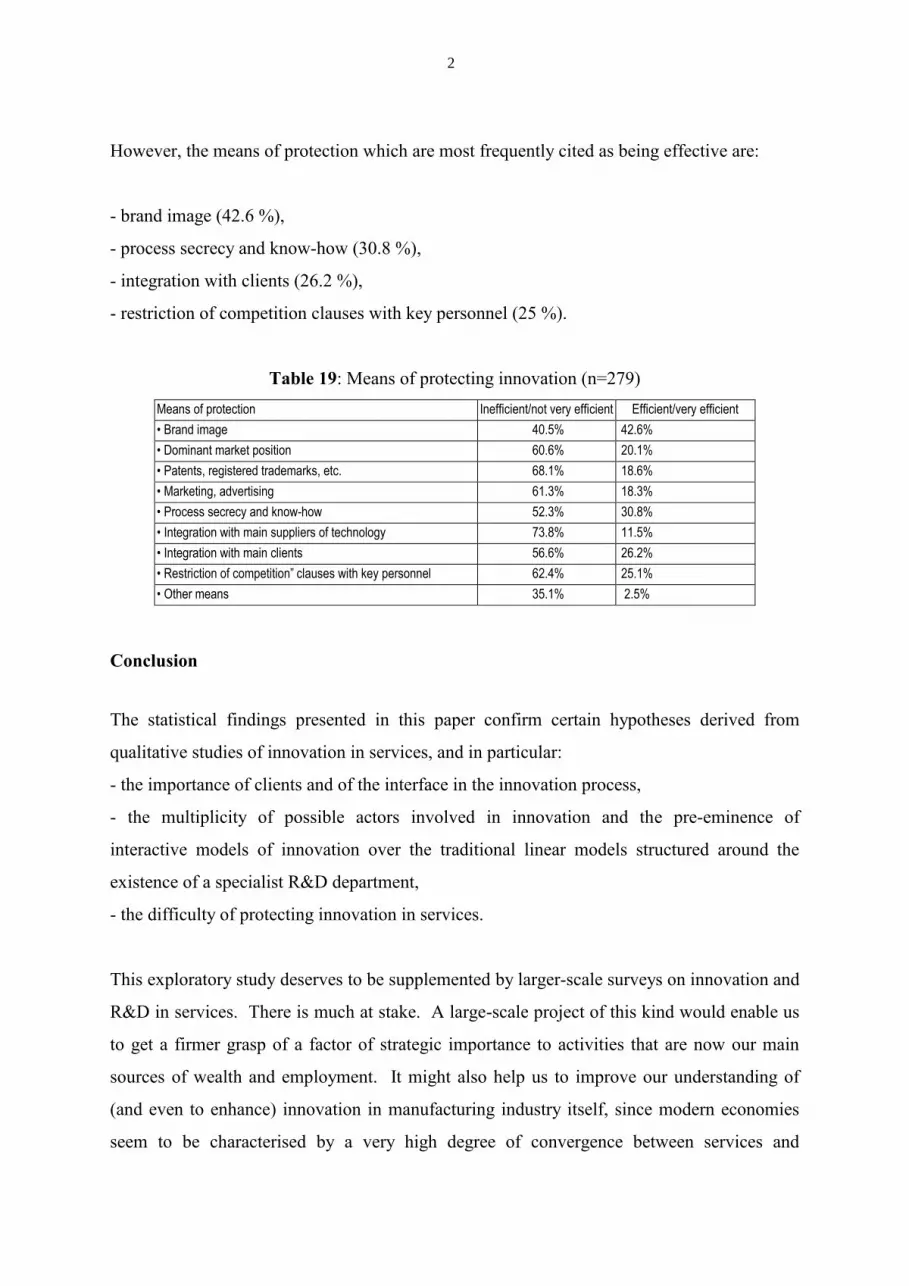
All these means of protection are considered to be ineffective or not very effective by a
considerable proportion of firms. With one exception (brand image), this share is always far
larger than the share of firms which consider these means of protection to be at least partly
effective. With the same exception, the percentage of firms which consider the methods to be
ineffective/not very effective is always higher than 50 %, and in most cases, higher than 60
%.
2
1
However, the means of protection which are most frequently cited as being effective are:
- brand image (42.6 %),
- process secrecy and know-how (30.8 %),
- integration with clients (26.2 %),
- restriction of competition clauses with key personnel (25 %).
Table 19: Means of protecting innovation (n=279)
Means of protection Inefficient/not very efficient Efficient/very efficient
• Brand image 40.5% 42.6%
• Dominant market position 60.6% 20.1%
• Patents, registered trademarks, etc. 68.1% 18.6%
• Marketing, advertising 61.3% 18.3%
• Process secrecy and know-how 52.3% 30.8%
• Integration with main suppliers of technology 73.8% 11.5%
• Integration with main clients 56.6% 26.2%
• Restriction of competition” clauses with key personnel 62.4% 25.1%
• Other means 35.1% 2.5%
Conclusion
The statistical findings presented in this paper confirm certain hypotheses derived from
qualitative studies of innovation in services, and in particular:
- the importance of clients and of the interface in the innovation process,
- the multiplicity of possible actors involved in innovation and the pre-eminence of
interactive models of innovation over the traditional linear models structured around the
existence of a specialist R&D department,
- the difficulty of protecting innovation in services.
This exploratory study deserves to be supplemented by larger-scale surveys on innovation and
R&D in services. There is much at stake. A large-scale project of this kind would enable us
to get a firmer grasp of a factor of strategic importance to activities that are now our main
sources of wealth and employment. It might also help us to improve our understanding of
(and even to enhance) innovation in manufacturing industry itself, since modern economies
seem to be characterised by a very high degree of convergence between services and
manufacturing, which is reflected in the "industrialisation" of certain services and the
increasing importance of the service dimension and, more generally, of intangible factors in
the production of manufactured goods.
References
A Barcet, J Bonamy, A Mayère (1987), Modernisation et innovation dans les services aux
entreprises (Modernisation and innovation in business services), Commissariat Général du
Plan, Paris.
F Djellal and F Gallouj (1999) Services and the search for relevant innovation indicators : a
review of national and international surveys, Science and Public Policy, Vol 26, August,
pages 218-232.
F Djellal and F Gallouj, (2000), What is innovation in services ? the results of a postal survey,
European Journal of Innovation management (forthcoming).
J Gadrey, F Gallouj F., S Lhuillery, O Weinstein (1993), La R-D et l'innovation dans les
services (R-D and innovation in services), Report for the French Ministry of higher
education and research, october.
F Gallouj, (1994), Economie de l’innovation dans les services (Economics of innovation in
services), (Editions L’Harmattan, Logiques économiques, Paris).
C Gallouj and F Gallouj, (1996), L’innovation dans les services (Innovation in services),
(Editions Economica, Paris).
F Gallouj and O Weinstein, (1997), Innovation in Services, Research Policy, 26, pages 537-
556.
F D Gault (1998), Research and Development in a service economy, Research Evaluation,
Vol. 7, n°2, pages 79-91.
S Kline, N Rosenberg (1986), An overview of innovation in Landau R., Rosenberg N. (eds),
The positive sum strategy : harnessing technology for economic growth, (National
Academy Press, Washington DC).
I Miles, N Kastrinos, K Flanagan, R Bilderbeek, P Den Hertog, W Huntik, M Bouman, (1995)
Knowledge-Intensive Business Services : Users, Carriers and Sources of Innovation,
Rapport pour DG13 SPRINT-EIMS, March.
G Sirilli and R Evangelista (1998), Technological innovation in services and manufacturing :
results from Italian surveys, Research Policy, 27, p. 881-899.
2
3
J Sundbo (1998), The organisation of innovation in services, Roskilde University Press.
J Sundbo and F Gallouj, (2000) Innovation as a loosely coupled system in services,
International Journal of Service Technology and Management, Vol. 1, n°1, p. 15-36.
OECD (1973), Proposed standard practice for surveys of research and experimental
development Frascati manual (OECD, Paris).
OECD (1992), Proposed guidelines for collecting and interpreting technological innovation
data, Oslo manual (OECD, Paris)
OECD (1993), Proposed standard practice for surveys of research and experimental
development Frascati manual (OECD, Paris).
OECD (1997), Proposed guidelines for collecting and interpreting technological innovation
data, Oslo manual (OECD, Paris).