passport proposal category level detail (updated 17 ... - chest
TRANSCRIPT
CATEGORY LEVEL: ALCOHOLIC DRINKS GEOGRAPHIC COVERAGE Western Europe: Austria; Belgium; Denmark; Finland; France; Germany; Greece; Ireland; Italy; Netherlands; Norway; Portugal; Spain; Sweden; Switzerland; Turkey; United Kingdom Eastern Europe: Belarus; Bosnia-Herzegovina; Bulgaria; Croatia; Czech Republic; Estonia; Georgia; Hungary; Latvia; Lithuania; Macedonia; Poland; Romania; Russia; Serbia; Slovakia; Slovenia; Ukraine North America: Canada; USA Latin America: Argentina; Bolivia; Brazil; Chile; Colombia; Costa Rica; Dominican Republic; Ecuador; El Salvador*, Guatemala; Honduras*; Mexico; Panama*; Paraguay*; Peru; Uruguay; Venezuela Asia Pacific: Azerbaijan; Bangladesh*; Cambodia*; China; Hong Kong, China; India; Indonesia; Japan; Kazakhstan; Laos*; Malaysia; Myanmar*; Pakistan; Philippines; Singapore; South Korea; Sri Lanka*; Taiwan; Thailand; Uzbekistan; Vietnam Australasia: Australia; New Zealand Africa and Middle East: Algeria; Angola*; Cameroon; Côte d'Ivoire*; Egypt; Ethiopia*; Ghana*; Iraq*; Israel; Jordan*; Kenya; Kuwait*; Lebanon*; Morocco; Nigeria; Oman*; Qatar*, Saudi Arabia; South Africa; Tanzania*; Tunisia; Uganda*, United Arab Emirates *research data available only at top line category level CATEGORIES Beer Cider / Perry RTDs / High-strength Premixes
Spirits Wine
STATISTICS Off-trade, on-trade and total value sales trends ▪ 2003-2022 ▪ Off-trade, on-trade and total manufacturer selling prices
(msp) ▪ Off-, on-trade and total volume sales trends ▪ 2003-2022 ▪ litres, hectolitres, cases, UK and US barrels Company shares ▪ 2008-2017 for beer, RTDs / high-strength premixes, spirits
and cider / perry markets ▪ 2008-2017 wine*** ▪ % and actual ▪ Total volume terms ▪ Total value terms (modelled) **** ▪ by global brand owner and local brand owner Brand shares ▪ 2008-2017 beer, RTDs / high-strength premixes, spirits
and cider / perry
▪ 2008-2017 for wine*** ▪ % and actual ▪ Total volume terms ▪ Total value terms (modelled) **** ▪ by global brand name and local brand name Retail distribution patterns ▪ 2003-2017 ▪ on-trade vs. off-trade ▪ off-trade broken out by distribution channel ▪ % and actual Pricing ▪ 2017 ▪ retail price per brand ▪ price ranges of premium, standard and economy beer *** Data available for 55 markets only **** Data available for 78 markets and will appear shortly after the main project’s publication
CATEGORY LEVEL: APPAREL AND FOOTWEAR GEOGRAPHIC COVERAGE Western Europe: Austria; Denmark; France; Germany; Greece; Italy; Netherlands; Norway; Portugal; Spain; Sweden; Turkey; United Kingdom Eastern Europe: Czech Republic; Hungary; Poland; Romania; Russia; Ukraine North America: Canada; USA Latin America: Argentina; Brazil; Chile; Colombia; Mexico; Venezuela Asia Pacific: China; Hong Kong, China; India; Indonesia; Japan; Malaysia; Philippines; Singapore; South Korea; Taiwan; Thailand; Vietnam Australasia: Australia Africa and Middle East: Egypt; Israel; Morocco; Nigeria, Saudi Arabia; South Africa; United Arab Emirates CATEGORIES Apparel Childrenswear Apparel Accessories Apparel by Men’s vs. Women’s Menswear Womenswear Apparel by Category Nightwear Outerwear
Jeans Swimwear Underwear Hosiery Footwear Children’s Footwear Men’s Footwear Women’s Footwear Sportswear
STATISTICS Retail value sales trends ▪ 2003-2022 ▪ Retail selling price (rsp) Retail volume sales trends ▪ 2003-2022 Company shares ▪ 2008-2017 ▪ % share, actuals and rankings ▪ by global brand owner and local brand owner
Brand shares ▪ 2008-2017 ▪ % share, actuals and rankings ▪ by umbrella, global and local brand name Retail distribution patterns ▪ 2003-2017 ▪ % share and actual
CATEGORY LEVEL: AUTOMOTIVE [THIS PREMIUM INDUSTRY CAN BE ADDED TO CATEGORY LEVEL] GEOGRAPHIC COVERAGE Western Europe: Austria; Belgium; France; Germany; Italy; Netherlands; Portugal; Spain; Sweden; Switzerland; Turkey; United Kingdom Eastern Europe: Czech Republic; Poland; Romania; Russia North America: Canada; USA Latin America: Argentina; Brazil; Chile; Mexico Asia Pacific: China; India; Indonesia; Japan; Malaysia; Singapore; South Korea; Taiwan; Thailand; Vietnam Australasia: Australia Africa and Middle East: Israel; South Africa Modelled Regional and World Totals *We research Automotive in 197 markets and offer detailed segment- and GBO-level analysis for the above 35 countries. CATEGORIES Vehicles in Use Commercial Vehicles in Use Passenger Cars in Use Motorcycles and Mopeds in Use Vehicle Production Commercial Vehicle Production Passenger Car Production Motorcycles and Mopeds Production Vehicle Registrations Commercial Vehicle Registrations Diesel Car Registrations Passenger Car Registrations Motorcycles and Mopeds Registrations Car Traffic Volume Distances Travelled by Mode of Transport Kilometres Travelled by Air Kilometres Travelled by Rail Kilometres Travelled by Road Distances Flown on Scheduled Flights Average Annual Distance Travelled by Car Fuel Prices Price per 10 Litres of Automotive Diesel
Price per 10 Litres of Premium Unleaded Petrol Light Vehicles Passenger Cars Light Commercial Vehicles Light Vehicles by Segment, GBO and Brand Mini Cars Small Cars Lower Medium Cars Upper Medium Cars Executive Cars Luxury Cars Sports Cars Mini MPVs Compact MPVs Full Size MPVs SUVs Pick-Ups Car-Derived Vans Small Vans Medium Vans Measures Brand Origin Premium vs. Mainstream
STATISTICS Per capita and per household sales trends ▪ by total population and number of households Retail volume sales trends ▪ 2003-2033
▪ Unit volumes Company shares ▪ 2008-2017 ▪ % share and actual volume
▪ by global brand owner Brand shares ▪ 2007-2017 ▪ % share and actual volume ▪ by brand Vehicles in use, vehicle production, vehicle registrations ▪ 1977-2017 ▪ Unit volumes split between passenger cars and
commercial vehicles ▪ All geographies, not just the 35 countries covered in detail Car traffic volume
▪ 1977-2017 ▪ Distance travelled in car-kilometres ▪ All geographies, not just the 35 countries covered in detail Distances travelled by mode of transport ▪ 1977-2017 ▪ Kms travelled by air, rail and road ▪ Distance flown on scheduled flights ▪ Average annual distance travelled by car ▪ All geographies, not just the 35 countries covered in detail Fuel prices ▪ 1977-2017 ▪ Price for 10 litres; diesel and premium unleaded petrol ▪ All geographies, not just the 35 countries covered in detail
ANALYSIS Strategy Briefings World Market Overview by Segment (SUVs, Luxury Cars, etc.) Select Country Profiles ARTICLES Expert analysis of immediate and potential consequences of key industry events ▪ Economic situation ▪ Legislation and regulatory issues ▪ Technology developments ▪ Changing country environment ▪ Demographic shifts
▪ Income distribution ▪ Emerging consumer trends and attitudes ▪ Segmentation trends ▪ New product launches and marketing strategies ▪ Acquisitions, disposals and strategic partnerships
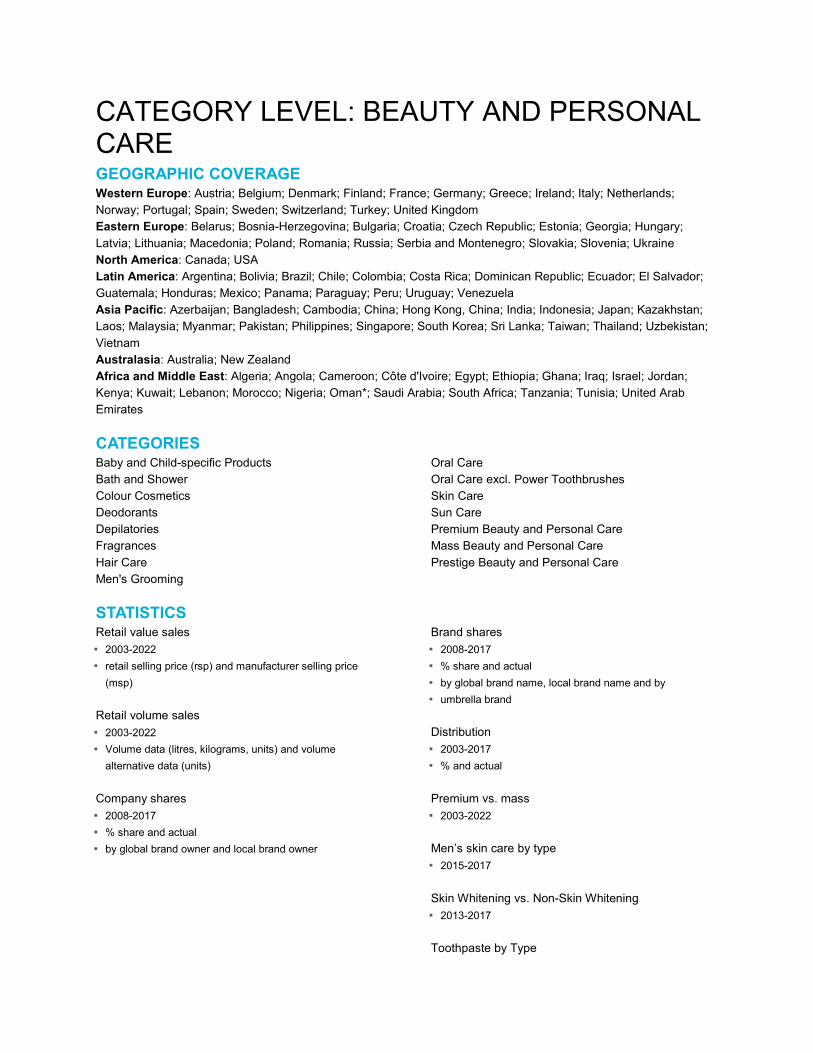
CATEGORY LEVEL: BEAUTY AND PERSONAL CARE GEOGRAPHIC COVERAGE Western Europe: Austria; Belgium; Denmark; Finland; France; Germany; Greece; Ireland; Italy; Netherlands; Norway; Portugal; Spain; Sweden; Switzerland; Turkey; United Kingdom Eastern Europe: Belarus; Bosnia-Herzegovina; Bulgaria; Croatia; Czech Republic; Estonia; Georgia; Hungary; Latvia; Lithuania; Macedonia; Poland; Romania; Russia; Serbia and Montenegro; Slovakia; Slovenia; Ukraine North America: Canada; USA Latin America: Argentina; Bolivia; Brazil; Chile; Colombia; Costa Rica; Dominican Republic; Ecuador; El Salvador; Guatemala; Honduras; Mexico; Panama; Paraguay; Peru; Uruguay; Venezuela Asia Pacific: Azerbaijan; Bangladesh; Cambodia; China; Hong Kong, China; India; Indonesia; Japan; Kazakhstan; Laos; Malaysia; Myanmar; Pakistan; Philippines; Singapore; South Korea; Sri Lanka; Taiwan; Thailand; Uzbekistan; Vietnam Australasia: Australia; New Zealand Africa and Middle East: Algeria; Angola; Cameroon; Côte d'Ivoire; Egypt; Ethiopia; Ghana; Iraq; Israel; Jordan; Kenya; Kuwait; Lebanon; Morocco; Nigeria; Oman*; Saudi Arabia; South Africa; Tanzania; Tunisia; United Arab Emirates CATEGORIES Baby and Child-specific Products Bath and Shower Colour Cosmetics Deodorants Depilatories Fragrances Hair Care Men's Grooming
Oral Care Oral Care excl. Power Toothbrushes Skin Care Sun Care Premium Beauty and Personal Care Mass Beauty and Personal Care Prestige Beauty and Personal Care
STATISTICS Retail value sales ▪ 2003-2022 ▪ retail selling price (rsp) and manufacturer selling price
(msp) Retail volume sales ▪ 2003-2022 ▪ Volume data (litres, kilograms, units) and volume
alternative data (units) Company shares ▪ 2008-2017 ▪ % share and actual ▪ by global brand owner and local brand owner
Brand shares ▪ 2008-2017 ▪ % share and actual ▪ by global brand name, local brand name and by ▪ umbrella brand Distribution ▪ 2003-2017 ▪ % and actual Premium vs. mass ▪ 2003-2022 Men’s skin care by type ▪ 2015-2017 Skin Whitening vs. Non-Skin Whitening ▪ 2013-2017 Toothpaste by Type

▪ 2013-2017
Razors and Blades by Type ▪ 2013-2017
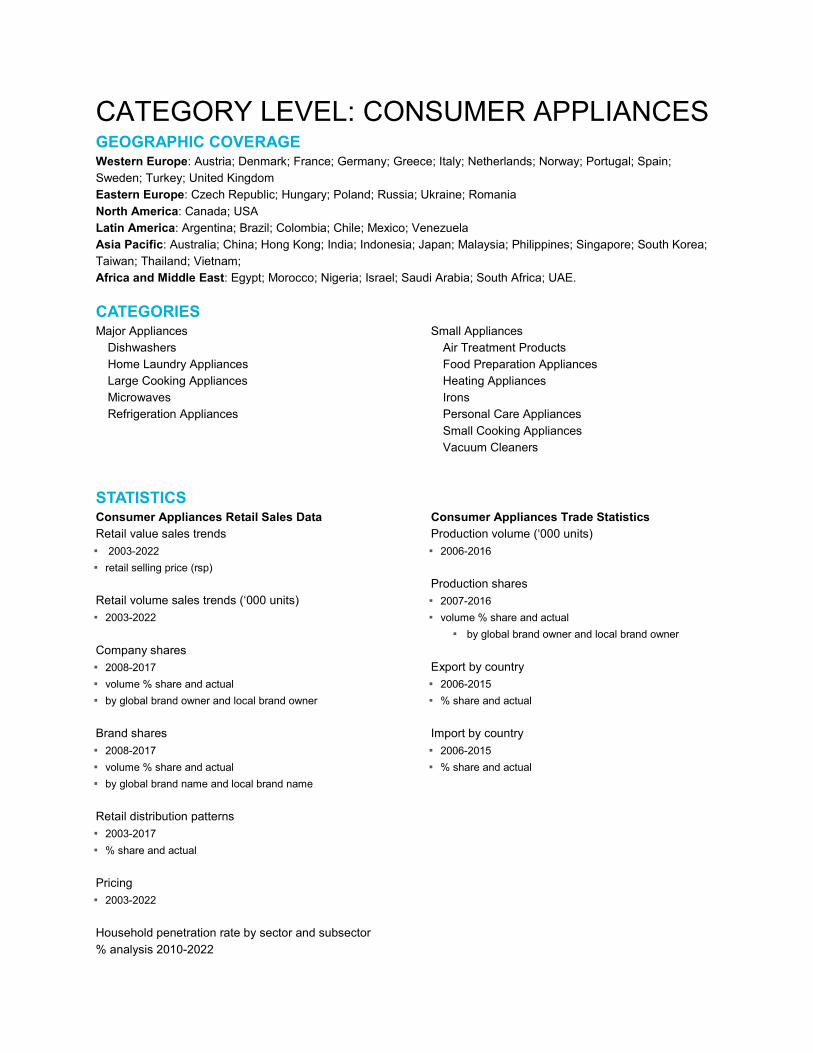
CATEGORY LEVEL: CONSUMER APPLIANCES GEOGRAPHIC COVERAGE Western Europe: Austria; Denmark; France; Germany; Greece; Italy; Netherlands; Norway; Portugal; Spain; Sweden; Turkey; United Kingdom Eastern Europe: Czech Republic; Hungary; Poland; Russia; Ukraine; Romania North America: Canada; USA Latin America: Argentina; Brazil; Colombia; Chile; Mexico; Venezuela Asia Pacific: Australia; China; Hong Kong; India; Indonesia; Japan; Malaysia; Philippines; Singapore; South Korea; Taiwan; Thailand; Vietnam; Africa and Middle East: Egypt; Morocco; Nigeria; Israel; Saudi Arabia; South Africa; UAE. CATEGORIES Major Appliances Dishwashers Home Laundry Appliances Large Cooking Appliances Microwaves Refrigeration Appliances
Small Appliances Air Treatment Products Food Preparation Appliances Heating Appliances Irons Personal Care Appliances Small Cooking Appliances Vacuum Cleaners
STATISTICS Consumer Appliances Retail Sales Data Retail value sales trends ▪ 2003-2022 ▪ retail selling price (rsp) Retail volume sales trends (‘000 units) ▪ 2003-2022 Company shares ▪ 2008-2017 ▪ volume % share and actual ▪ by global brand owner and local brand owner Brand shares ▪ 2008-2017 ▪ volume % share and actual ▪ by global brand name and local brand name Retail distribution patterns ▪ 2003-2017 ▪ % share and actual Pricing ▪ 2003-2022 Household penetration rate by sector and subsector % analysis 2010-2022
Consumer Appliances Trade Statistics Production volume (‘000 units) ▪ 2006-2016 Production shares ▪ 2007-2016 ▪ volume % share and actual
▪ by global brand owner and local brand owner Export by country ▪ 2006-2015 ▪ % share and actual Import by country ▪ 2006-2015 ▪ % share and actual
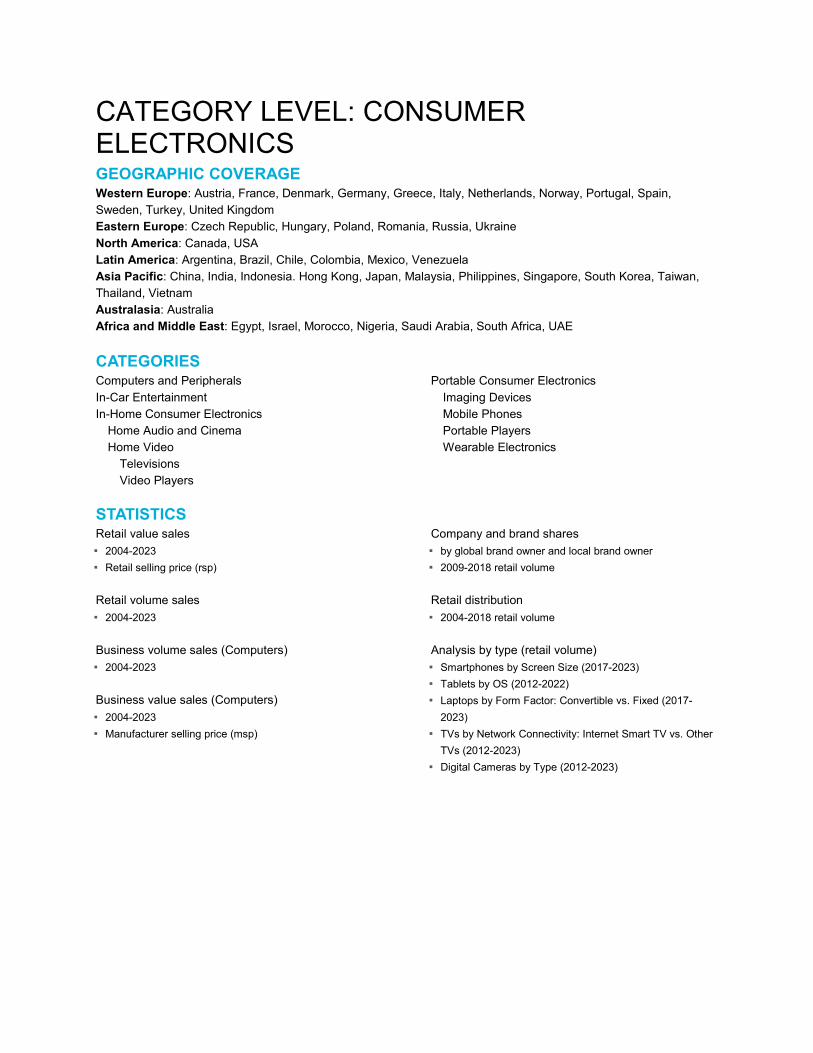
CATEGORY LEVEL: CONSUMER ELECTRONICS GEOGRAPHIC COVERAGE Western Europe: Austria, France, Denmark, Germany, Greece, Italy, Netherlands, Norway, Portugal, Spain, Sweden, Turkey, United Kingdom Eastern Europe: Czech Republic, Hungary, Poland, Romania, Russia, Ukraine North America: Canada, USA Latin America: Argentina, Brazil, Chile, Colombia, Mexico, Venezuela Asia Pacific: China, India, Indonesia. Hong Kong, Japan, Malaysia, Philippines, Singapore, South Korea, Taiwan, Thailand, Vietnam Australasia: Australia Africa and Middle East: Egypt, Israel, Morocco, Nigeria, Saudi Arabia, South Africa, UAE CATEGORIES Computers and Peripherals In-Car Entertainment In-Home Consumer Electronics Home Audio and Cinema Home Video Televisions Video Players
Portable Consumer Electronics Imaging Devices Mobile Phones Portable Players Wearable Electronics
STATISTICS Retail value sales ▪ 2004-2023 ▪ Retail selling price (rsp) Retail volume sales ▪ 2004-2023 Business volume sales (Computers) ▪ 2004-2023 Business value sales (Computers) ▪ 2004-2023 ▪ Manufacturer selling price (msp)
Company and brand shares ▪ by global brand owner and local brand owner ▪ 2009-2018 retail volume Retail distribution ▪ 2004-2018 retail volume Analysis by type (retail volume) ▪ Smartphones by Screen Size (2017-2023) ▪ Tablets by OS (2012-2022) ▪ Laptops by Form Factor: Convertible vs. Fixed (2017-
2023) ▪ TVs by Network Connectivity: Internet Smart TV vs. Other
TVs (2012-2023) ▪ Digital Cameras by Type (2012-2023)
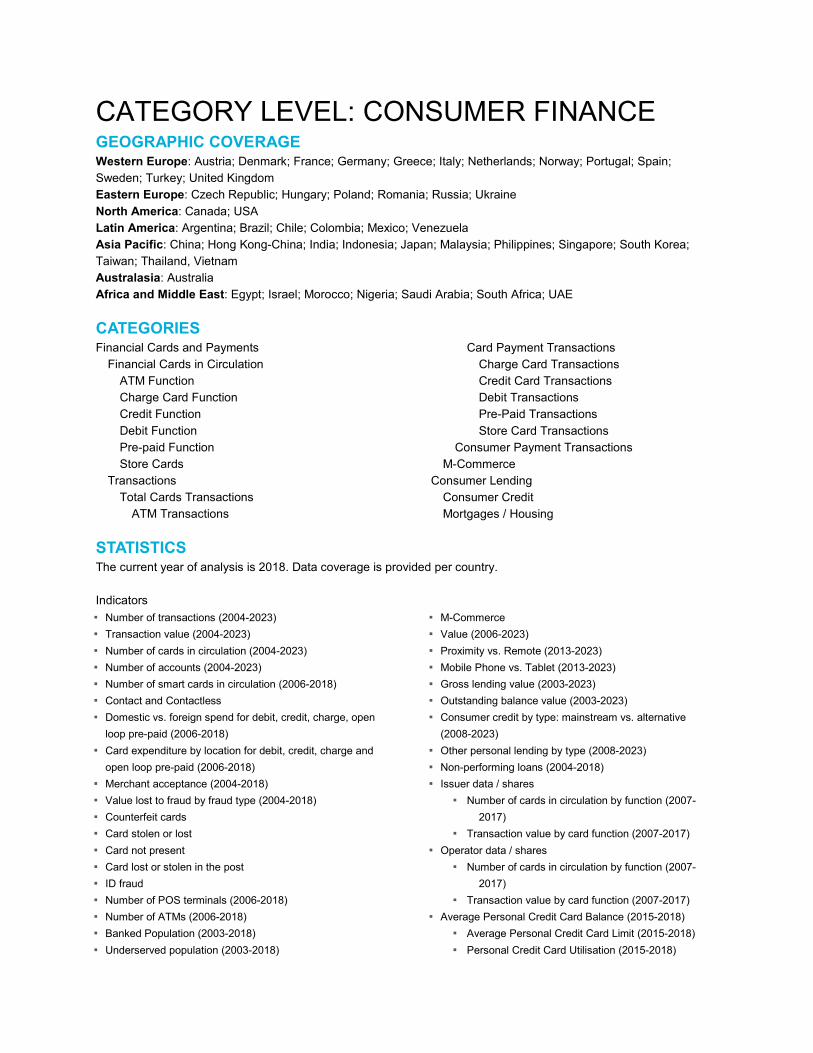
CATEGORY LEVEL: CONSUMER FINANCE GEOGRAPHIC COVERAGE Western Europe: Austria; Denmark; France; Germany; Greece; Italy; Netherlands; Norway; Portugal; Spain; Sweden; Turkey; United Kingdom Eastern Europe: Czech Republic; Hungary; Poland; Romania; Russia; Ukraine North America: Canada; USA Latin America: Argentina; Brazil; Chile; Colombia; Mexico; Venezuela Asia Pacific: China; Hong Kong-China; India; Indonesia; Japan; Malaysia; Philippines; Singapore; South Korea; Taiwan; Thailand, Vietnam Australasia: Australia Africa and Middle East: Egypt; Israel; Morocco; Nigeria; Saudi Arabia; South Africa; UAE CATEGORIES Financial Cards and Payments Financial Cards in Circulation ATM Function Charge Card Function Credit Function Debit Function Pre-paid Function Store Cards Transactions Total Cards Transactions ATM Transactions
Card Payment Transactions Charge Card Transactions Credit Card Transactions Debit Transactions Pre-Paid Transactions Store Card Transactions Consumer Payment Transactions M-Commerce Consumer Lending Consumer Credit Mortgages / Housing
STATISTICS The current year of analysis is 2018. Data coverage is provided per country. Indicators ▪ Number of transactions (2004-2023) ▪ Transaction value (2004-2023) ▪ Number of cards in circulation (2004-2023) ▪ Number of accounts (2004-2023) ▪ Number of smart cards in circulation (2006-2018) ▪ Contact and Contactless ▪ Domestic vs. foreign spend for debit, credit, charge, open
loop pre-paid (2006-2018) ▪ Card expenditure by location for debit, credit, charge and
open loop pre-paid (2006-2018) ▪ Merchant acceptance (2004-2018) ▪ Value lost to fraud by fraud type (2004-2018) ▪ Counterfeit cards ▪ Card stolen or lost ▪ Card not present ▪ Card lost or stolen in the post ▪ ID fraud ▪ Number of POS terminals (2006-2018) ▪ Number of ATMs (2006-2018) ▪ Banked Population (2003-2018) ▪ Underserved population (2003-2018)
▪ M-Commerce ▪ Value (2006-2023) ▪ Proximity vs. Remote (2013-2023) ▪ Mobile Phone vs. Tablet (2013-2023) ▪ Gross lending value (2003-2023) ▪ Outstanding balance value (2003-2023) ▪ Consumer credit by type: mainstream vs. alternative
(2008-2023) ▪ Other personal lending by type (2008-2023) ▪ Non-performing loans (2004-2018) ▪ Issuer data / shares
▪ Number of cards in circulation by function (2007-2017)
▪ Transaction value by card function (2007-2017) ▪ Operator data / shares
▪ Number of cards in circulation by function (2007-2017)
▪ Transaction value by card function (2007-2017) ▪ Average Personal Credit Card Balance (2015-2018)
▪ Average Personal Credit Card Limit (2015-2018) ▪ Personal Credit Card Utilisation (2015-2018)
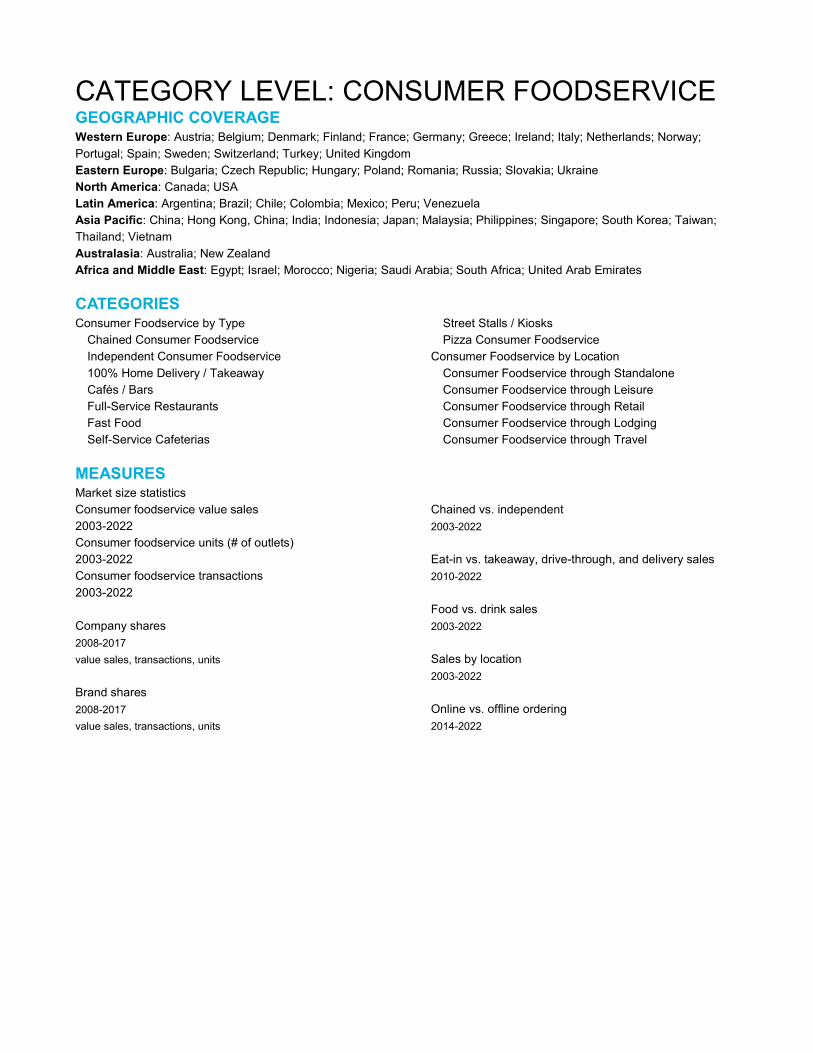
CATEGORY LEVEL: CONSUMER FOODSERVICE GEOGRAPHIC COVERAGE Western Europe: Austria; Belgium; Denmark; Finland; France; Germany; Greece; Ireland; Italy; Netherlands; Norway; Portugal; Spain; Sweden; Switzerland; Turkey; United Kingdom Eastern Europe: Bulgaria; Czech Republic; Hungary; Poland; Romania; Russia; Slovakia; Ukraine North America: Canada; USA Latin America: Argentina; Brazil; Chile; Colombia; Mexico; Peru; Venezuela Asia Pacific: China; Hong Kong, China; India; Indonesia; Japan; Malaysia; Philippines; Singapore; South Korea; Taiwan; Thailand; Vietnam Australasia: Australia; New Zealand Africa and Middle East: Egypt; Israel; Morocco; Nigeria; Saudi Arabia; South Africa; United Arab Emirates CATEGORIES Consumer Foodservice by Type Chained Consumer Foodservice Independent Consumer Foodservice 100% Home Delivery / Takeaway Cafés / Bars Full-Service Restaurants Fast Food Self-Service Cafeterias
Street Stalls / Kiosks Pizza Consumer Foodservice Consumer Foodservice by Location Consumer Foodservice through Standalone Consumer Foodservice through Leisure Consumer Foodservice through Retail Consumer Foodservice through Lodging Consumer Foodservice through Travel
MEASURES Market size statistics Consumer foodservice value sales 2003-2022 Consumer foodservice units (# of outlets) 2003-2022 Consumer foodservice transactions 2003-2022 Company shares 2008-2017 value sales, transactions, units Brand shares 2008-2017 value sales, transactions, units
Chained vs. independent 2003-2022 Eat-in vs. takeaway, drive-through, and delivery sales 2010-2022 Food vs. drink sales 2003-2022 Sales by location 2003-2022 Online vs. offline ordering 2014-2022
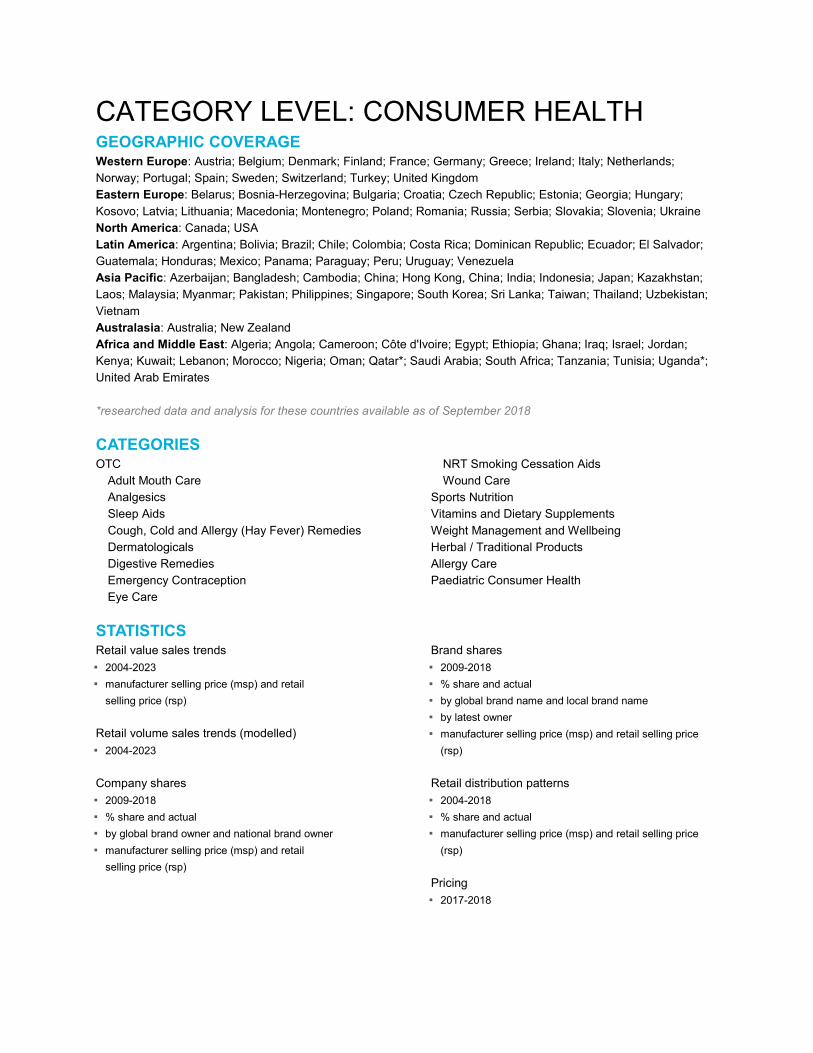
CATEGORY LEVEL: CONSUMER HEALTH GEOGRAPHIC COVERAGE Western Europe: Austria; Belgium; Denmark; Finland; France; Germany; Greece; Ireland; Italy; Netherlands; Norway; Portugal; Spain; Sweden; Switzerland; Turkey; United Kingdom Eastern Europe: Belarus; Bosnia-Herzegovina; Bulgaria; Croatia; Czech Republic; Estonia; Georgia; Hungary; Kosovo; Latvia; Lithuania; Macedonia; Montenegro; Poland; Romania; Russia; Serbia; Slovakia; Slovenia; Ukraine North America: Canada; USA Latin America: Argentina; Bolivia; Brazil; Chile; Colombia; Costa Rica; Dominican Republic; Ecuador; El Salvador; Guatemala; Honduras; Mexico; Panama; Paraguay; Peru; Uruguay; Venezuela Asia Pacific: Azerbaijan; Bangladesh; Cambodia; China; Hong Kong, China; India; Indonesia; Japan; Kazakhstan; Laos; Malaysia; Myanmar; Pakistan; Philippines; Singapore; South Korea; Sri Lanka; Taiwan; Thailand; Uzbekistan; Vietnam Australasia: Australia; New Zealand Africa and Middle East: Algeria; Angola; Cameroon; Côte d'Ivoire; Egypt; Ethiopia; Ghana; Iraq; Israel; Jordan; Kenya; Kuwait; Lebanon; Morocco; Nigeria; Oman; Qatar*; Saudi Arabia; South Africa; Tanzania; Tunisia; Uganda*; United Arab Emirates *researched data and analysis for these countries available as of September 2018 CATEGORIES OTC Adult Mouth Care Analgesics Sleep Aids Cough, Cold and Allergy (Hay Fever) Remedies Dermatologicals Digestive Remedies Emergency Contraception Eye Care
NRT Smoking Cessation Aids Wound Care Sports Nutrition Vitamins and Dietary Supplements Weight Management and Wellbeing Herbal / Traditional Products Allergy Care Paediatric Consumer Health
STATISTICS Retail value sales trends ▪ 2004-2023 ▪ manufacturer selling price (msp) and retail
selling price (rsp) Retail volume sales trends (modelled) ▪ 2004-2023 Company shares ▪ 2009-2018 ▪ % share and actual ▪ by global brand owner and national brand owner ▪ manufacturer selling price (msp) and retail
selling price (rsp)
Brand shares ▪ 2009-2018 ▪ % share and actual ▪ by global brand name and local brand name ▪ by latest owner ▪ manufacturer selling price (msp) and retail selling price
(rsp) Retail distribution patterns ▪ 2004-2018 ▪ % share and actual ▪ manufacturer selling price (msp) and retail selling price
(rsp) Pricing ▪ 2017-2018
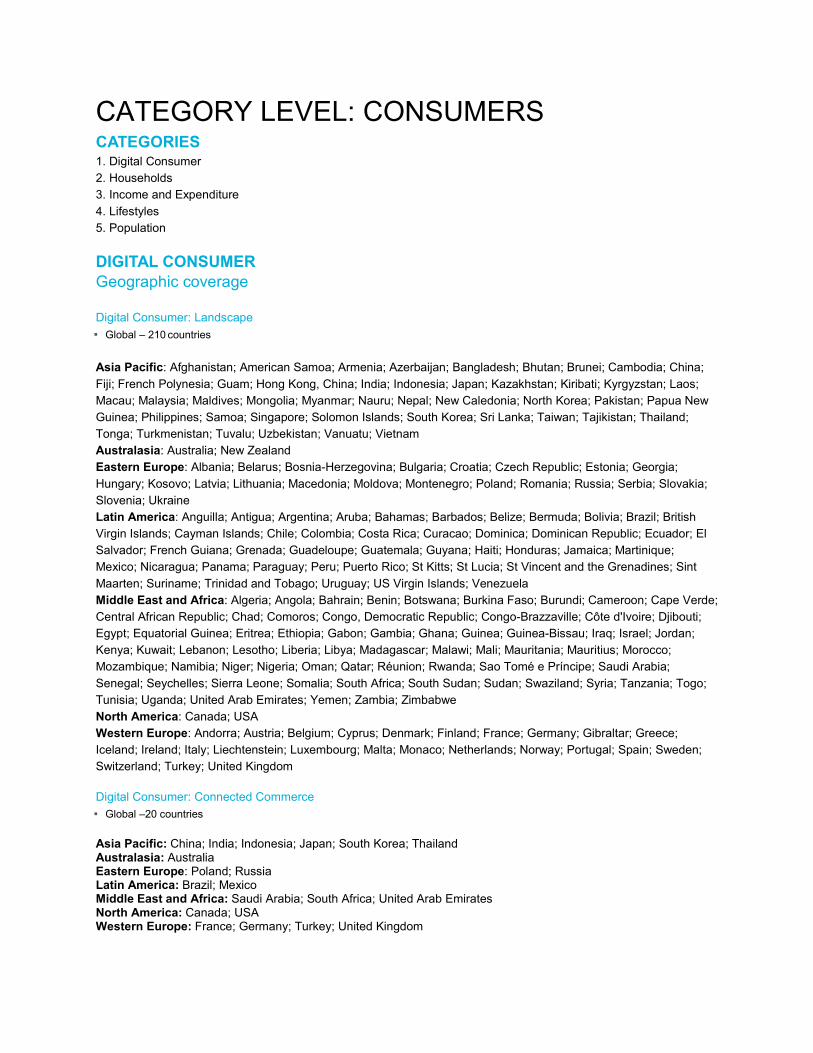
CATEGORY LEVEL: CONSUMERS CATEGORIES 1. Digital Consumer 2. Households 3. Income and Expenditure 4. Lifestyles 5. Population DIGITAL CONSUMER Geographic coverage Digital Consumer: Landscape ▪ Global – 210 countries Asia Pacific: Afghanistan; American Samoa; Armenia; Azerbaijan; Bangladesh; Bhutan; Brunei; Cambodia; China; Fiji; French Polynesia; Guam; Hong Kong, China; India; Indonesia; Japan; Kazakhstan; Kiribati; Kyrgyzstan; Laos; Macau; Malaysia; Maldives; Mongolia; Myanmar; Nauru; Nepal; New Caledonia; North Korea; Pakistan; Papua New Guinea; Philippines; Samoa; Singapore; Solomon Islands; South Korea; Sri Lanka; Taiwan; Tajikistan; Thailand; Tonga; Turkmenistan; Tuvalu; Uzbekistan; Vanuatu; Vietnam Australasia: Australia; New Zealand Eastern Europe: Albania; Belarus; Bosnia-Herzegovina; Bulgaria; Croatia; Czech Republic; Estonia; Georgia; Hungary; Kosovo; Latvia; Lithuania; Macedonia; Moldova; Montenegro; Poland; Romania; Russia; Serbia; Slovakia; Slovenia; Ukraine Latin America: Anguilla; Antigua; Argentina; Aruba; Bahamas; Barbados; Belize; Bermuda; Bolivia; Brazil; British Virgin Islands; Cayman Islands; Chile; Colombia; Costa Rica; Curacao; Dominica; Dominican Republic; Ecuador; El Salvador; French Guiana; Grenada; Guadeloupe; Guatemala; Guyana; Haiti; Honduras; Jamaica; Martinique; Mexico; Nicaragua; Panama; Paraguay; Peru; Puerto Rico; St Kitts; St Lucia; St Vincent and the Grenadines; Sint Maarten; Suriname; Trinidad and Tobago; Uruguay; US Virgin Islands; Venezuela Middle East and Africa: Algeria; Angola; Bahrain; Benin; Botswana; Burkina Faso; Burundi; Cameroon; Cape Verde; Central African Republic; Chad; Comoros; Congo, Democratic Republic; Congo-Brazzaville; Côte d'Ivoire; Djibouti; Egypt; Equatorial Guinea; Eritrea; Ethiopia; Gabon; Gambia; Ghana; Guinea; Guinea-Bissau; Iraq; Israel; Jordan; Kenya; Kuwait; Lebanon; Lesotho; Liberia; Libya; Madagascar; Malawi; Mali; Mauritania; Mauritius; Morocco; Mozambique; Namibia; Niger; Nigeria; Oman; Qatar; Réunion; Rwanda; Sao Tomé e Príncipe; Saudi Arabia; Senegal; Seychelles; Sierra Leone; Somalia; South Africa; South Sudan; Sudan; Swaziland; Syria; Tanzania; Togo; Tunisia; Uganda; United Arab Emirates; Yemen; Zambia; Zimbabwe North America: Canada; USA Western Europe: Andorra; Austria; Belgium; Cyprus; Denmark; Finland; France; Germany; Gibraltar; Greece; Iceland; Ireland; Italy; Liechtenstein; Luxembourg; Malta; Monaco; Netherlands; Norway; Portugal; Spain; Sweden; Switzerland; Turkey; United Kingdom Digital Consumer: Connected Commerce ▪ Global –20 countries Asia Pacific: China; India; Indonesia; Japan; South Korea; Thailand Australasia: Australia Eastern Europe: Poland; Russia Latin America: Brazil; Mexico Middle East and Africa: Saudi Arabia; South Africa; United Arab Emirates North America: Canada; USA Western Europe: France; Germany; Turkey; United Kingdom
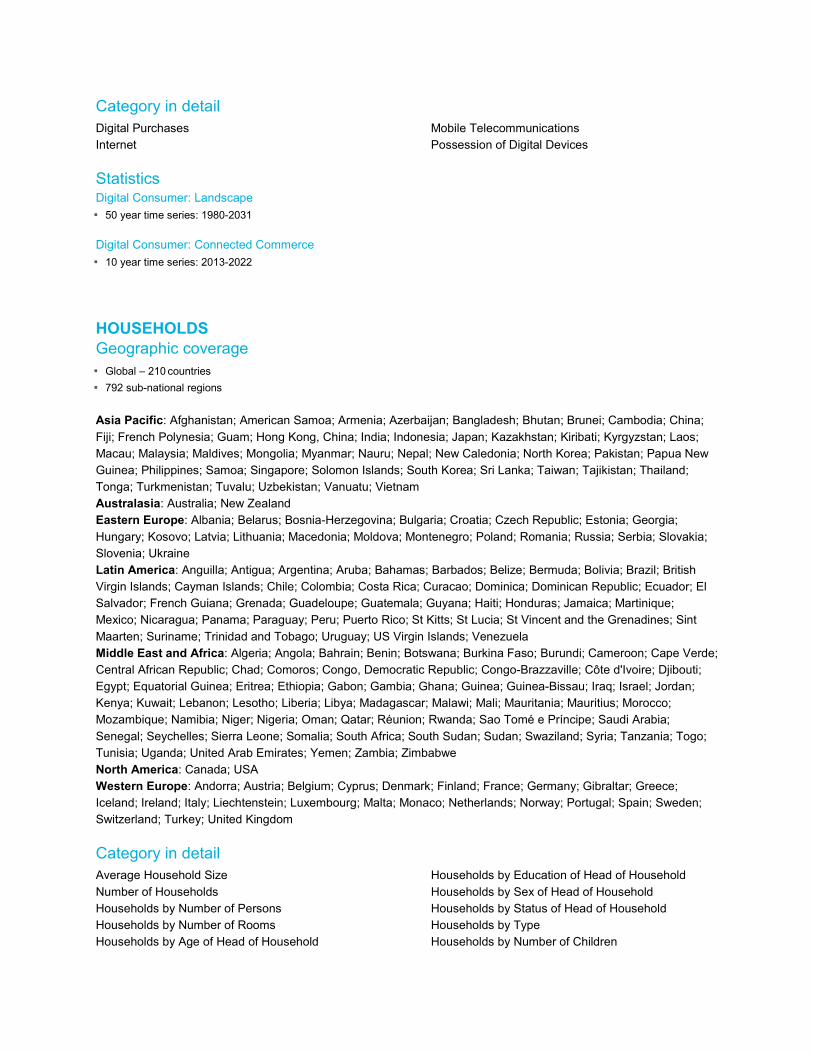
Category in detail Digital Purchases Internet
Mobile Telecommunications Possession of Digital Devices
Statistics Digital Consumer: Landscape ▪ 50 year time series: 1980-2031 Digital Consumer: Connected Commerce ▪ 10 year time series: 2013-2022 HOUSEHOLDS Geographic coverage ▪ Global – 210 countries ▪ 792 sub-national regions Asia Pacific: Afghanistan; American Samoa; Armenia; Azerbaijan; Bangladesh; Bhutan; Brunei; Cambodia; China; Fiji; French Polynesia; Guam; Hong Kong, China; India; Indonesia; Japan; Kazakhstan; Kiribati; Kyrgyzstan; Laos; Macau; Malaysia; Maldives; Mongolia; Myanmar; Nauru; Nepal; New Caledonia; North Korea; Pakistan; Papua New Guinea; Philippines; Samoa; Singapore; Solomon Islands; South Korea; Sri Lanka; Taiwan; Tajikistan; Thailand; Tonga; Turkmenistan; Tuvalu; Uzbekistan; Vanuatu; Vietnam Australasia: Australia; New Zealand Eastern Europe: Albania; Belarus; Bosnia-Herzegovina; Bulgaria; Croatia; Czech Republic; Estonia; Georgia; Hungary; Kosovo; Latvia; Lithuania; Macedonia; Moldova; Montenegro; Poland; Romania; Russia; Serbia; Slovakia; Slovenia; Ukraine Latin America: Anguilla; Antigua; Argentina; Aruba; Bahamas; Barbados; Belize; Bermuda; Bolivia; Brazil; British Virgin Islands; Cayman Islands; Chile; Colombia; Costa Rica; Curacao; Dominica; Dominican Republic; Ecuador; El Salvador; French Guiana; Grenada; Guadeloupe; Guatemala; Guyana; Haiti; Honduras; Jamaica; Martinique; Mexico; Nicaragua; Panama; Paraguay; Peru; Puerto Rico; St Kitts; St Lucia; St Vincent and the Grenadines; Sint Maarten; Suriname; Trinidad and Tobago; Uruguay; US Virgin Islands; Venezuela Middle East and Africa: Algeria; Angola; Bahrain; Benin; Botswana; Burkina Faso; Burundi; Cameroon; Cape Verde; Central African Republic; Chad; Comoros; Congo, Democratic Republic; Congo-Brazzaville; Côte d'Ivoire; Djibouti; Egypt; Equatorial Guinea; Eritrea; Ethiopia; Gabon; Gambia; Ghana; Guinea; Guinea-Bissau; Iraq; Israel; Jordan; Kenya; Kuwait; Lebanon; Lesotho; Liberia; Libya; Madagascar; Malawi; Mali; Mauritania; Mauritius; Morocco; Mozambique; Namibia; Niger; Nigeria; Oman; Qatar; Réunion; Rwanda; Sao Tomé e Príncipe; Saudi Arabia; Senegal; Seychelles; Sierra Leone; Somalia; South Africa; South Sudan; Sudan; Swaziland; Syria; Tanzania; Togo; Tunisia; Uganda; United Arab Emirates; Yemen; Zambia; Zimbabwe North America: Canada; USA Western Europe: Andorra; Austria; Belgium; Cyprus; Denmark; Finland; France; Germany; Gibraltar; Greece; Iceland; Ireland; Italy; Liechtenstein; Luxembourg; Malta; Monaco; Netherlands; Norway; Portugal; Spain; Sweden; Switzerland; Turkey; United Kingdom Category in detail Average Household Size Number of Households Households by Number of Persons Households by Number of Rooms Households by Age of Head of Household
Households by Education of Head of Household Households by Sex of Head of Household Households by Status of Head of Household Households by Type Households by Number of Children
Households by Urban/Rural Location Households by Tenure Households by Type of Dwelling Households by Size of Dwelling
Households by Construction Material of Outer Walls Housing Stock Household Facilities Possession of Household Durables
Statistics ▪ 54 year time series: 1977-2030 INCOME AND EXPENDITURE Geographic coverage ▪ Global – 210 countries ▪ 792 sub-national regions Asia Pacific: Afghanistan; American Samoa; Armenia; Azerbaijan; Bangladesh; Bhutan; Brunei; Cambodia; China; Fiji; French Polynesia; Guam; Hong Kong, China; India; Indonesia; Japan; Kazakhstan; Kiribati; Kyrgyzstan; Laos; Macau; Malaysia; Maldives; Mongolia; Myanmar; Nauru; Nepal; New Caledonia; North Korea; Pakistan; Papua New Guinea; Philippines; Samoa; Singapore; Solomon Islands; South Korea; Sri Lanka; Taiwan; Tajikistan; Thailand; Tonga; Turkmenistan; Tuvalu; Uzbekistan; Vanuatu; Vietnam Australasia: Australia; New Zealand Eastern Europe: Albania; Belarus; Bosnia-Herzegovina; Bulgaria; Croatia; Czech Republic; Estonia; Georgia; Hungary; Kosovo; Latvia; Lithuania; Macedonia; Moldova; Montenegro; Poland; Romania; Russia; Serbia; Slovakia; Slovenia; Ukraine Latin America: Anguilla; Antigua; Argentina; Aruba; Bahamas; Barbados; Belize; Bermuda; Bolivia; Brazil; British Virgin Islands; Cayman Islands; Chile; Colombia; Costa Rica; Curacao; Dominica; Dominican Republic; Ecuador; El Salvador; French Guiana; Grenada; Guadeloupe; Guatemala; Guyana; Haiti; Honduras; Jamaica; Martinique; Mexico; Nicaragua; Panama; Paraguay; Peru; Puerto Rico; St Kitts; St Lucia; St Vincent and the Grenadines; Sint Maarten; Suriname; Trinidad and Tobago; Uruguay; US Virgin Islands; Venezuela Middle East and Africa: Algeria; Angola; Bahrain; Benin; Botswana; Burkina Faso; Burundi; Cameroon; Cape Verde; Central African Republic; Chad; Comoros; Congo, Democratic Republic; Congo-Brazzaville; Côte d'Ivoire; Djibouti; Egypt; Equatorial Guinea; Eritrea; Ethiopia; Gabon; Gambia; Ghana; Guinea; Guinea-Bissau; Iraq; Israel; Jordan; Kenya; Kuwait; Lebanon; Lesotho; Liberia; Libya; Madagascar; Malawi; Mali; Mauritania; Mauritius; Morocco; Mozambique; Namibia; Niger; Nigeria; Oman; Qatar; Réunion; Rwanda; Sao Tomé e Príncipe; Saudi Arabia; Senegal; Seychelles; Sierra Leone; Somalia; South Africa; South Sudan; Sudan; Swaziland; Syria; Tanzania; Togo; Tunisia; Uganda; United Arab Emirates; Yemen; Zambia; Zimbabwe North America: Canada; USA Western Europe: Andorra; Austria; Belgium; Cyprus; Denmark; Finland; France; Germany; Gibraltar; Greece; Iceland; Ireland; Italy; Liechtenstein; Luxembourg; Malta; Monaco; Netherlands; Norway; Portugal; Spain; Sweden; Switzerland; Turkey; United Kingdom Category in detail Consumer Expenditure Consumer Expenditure by Category Consumer Expenditure as a % of GDP Consumer Expenditure by Urban / rural Split Index of Consumer Prices Gini Index Gross Income Average Gross Income by Age Population by Income Band and Age Social Class (ABCDE) by Age
Gross Income by Source Tax and Social Security Contributions Tax and Social Security Contributions as a % of Gross Income Disposable Income Average Disposable Income by Sex Disposable Income by Urban / rural Split Households by Disposable Income Band Household Disposable Income Deciles Median Disposable Income per Household
Middle Class Households (% of Total) Middle Class Households Poverty
Savings Savings Ratio
Statistics ▪ 54 year time series: 1977-2030 Extra detail Income and Expenditure Dashboard ▪ This dashboard is an interactive tool which enables clients to create instant maps, bar charts and scatter plots in order to visualise
data with ease and make cross-country and regional comparisons. The dashboard tool covers every income and consumer expenditure indicator and includes download and export functionality.
Income and Wealth Distribution Model ▪ The Income and Wealth Distribution Model is an interactive visual tool showcasing disposable income, net wealth and joint
income-wealth across 50 countries. This innovative dashboard provides a complete view of the personal economic resources to finance consumption, giving insight on consumer behaviour and purchasing decisions.
Consumer Spending by Income Band Analysis Tool ▪ The Consumer Spending by Income Band Analysis Tool allows you to explore how spending on consumer goods and services
varies across households’ income levels, countries and time. The tool captures consumer expenditure data on 12 key categories including food, clothing and housing in 85 countries through to 2030. Use the tool to identify product potential and target consumer groups by sizing the populatio nfor different income bands. See what families are spending their income on and how discretionary versus non-discretionary spending varies by Top, Middle and Bottom socioeconomic classes.
LIFESTYLES Geographic coverage ▪ Consumer survey data: 21 key countries (indicated by * in list below) in 2017 and future years ▪ Consumer Lifestyles reports: 85 countries Africa and the Middle East: Algeria; Bahrain; Cameroon; Egypt*; Israel; Jordan; Kenya; Kuwait; Morocco; Nigeria; Qatar*; Saudi Arabia*; South Africa*; Tunisia; United Arab Emirates* Asia Pacific: China*; Hong Kong, China; India*; Indonesia*; Japan*; Kazakhstan; Malaysia; Pakistan; Philippines; Singapore; South Korea*; Taiwan; Thailand*; Turkmenistan; Uzbekistan; Vietnam Australasia: Australia*; New Zealand Eastern Europe: Azerbaijan; Belarus; Bosnia and Herzegovina; Bulgaria; Croatia; Czech Republic; Estonia; Georgia; Hungary; Latvia; Lithuania; Macedonia; Poland*; Romania; Russia*; Serbia; Slovakia; Slovenia; Ukraine Latin America: Argentina; Bolivia; Brazil*; Chile; Colombia*; Costa Rica; Dominican Republic; Ecuador; Guatemala; Mexico*; Peru; Uruguay; Venezuela North America: Canada†; USA* Western Europe: Austria; Belgium; Denmark; Finland; France*; Germany*; Greece; Ireland; Italy*; Netherlands; Norway; Portugal; Spain; Sweden; Switzerland; Turkey*; United Kingdom* Category in detail The system contains online consumer survey data from the following surveys: The Global Consumer Trends Survey In September 2011, Euromonitor began conducting an online tracking survey of consumer attitudes and behaviours to explore key consumer lifestyle areas and influencers: healthy living, food and drink, technology, shopping, leisure activities, and personal traits and values. Data and analysis from the first five waves of the Global Consumer Trends
Survey (2011, 2013, 2015, 2017) are available in the Lifestyles system. In 2016, the Global Consumer Trends Survey expanded from 9 to 20 countries and will continue to be updated annually. In 2017, Canada was added, bringing coverage up to 21 countries. Question topics The Global Consumer Trends Survey contains 130+ topics and 1250+ unique sub-questions, relating to the following themes: ▪ Eating and Drinking ▪ Green Influences ▪ Healthy Living ▪ Personal Traits and Values
▪ Shopping ▪ Spending ▪ Technology
Geographic coverage 2011-2015 (9) ▪ Asia Pacific: China; India; Japan ▪ Eastern Europe: Russia (2013 and 2015 only) ▪ Latin America: Brazil ▪ North America: Canada, USA ▪ Western Europe: France; Germany; United Kingdom Geographic coverage 2016-onward (21) ▪ Africa and the Middle East: “Middle East” (pooled responses from Egypt; Qatar; Saudi Arabia; United Arab Emirates); South Africa ▪ Asia Pacific: China˟; India˟; Japan˟; Indonesia; South Korea; Thailand ▪ Australasia: Australia ▪ Eastern Europe: Poland; Russia* ▪ Latin America: Brazil˟; Colombia; Mexico˟ ▪ North America: USA˟ ▪ Europe: France˟; Germany˟; Italy; Turkey; United Kingdom˟ Sample and statistical data detail ▪ 2015 and previous: 1,800+ responses in each of 9 countries (2013, 2015); 2,000 responses in each of 8 countries (2011) ▪ 2016-onward: 1,800+ responses in each of 9 core countries (indicated by ˟ in “Geographic Coverage
2016-onward” above), and 1000+ responses in each of the remaining 12 countries ▪ Online panelists participating in the Global Consumer Trends Survey were pre-screened to ensure the sample was representative
of each country under review for a) age and b) gender. ▪ Data was reviewed to ensure that only unique, complete responses to the questionnaires were used in analysis, that response
times were appropriate for the number of questions provided and that repeat or illegible open responses were removed. Demographic detail All 130+ topics in the Global Consumer Trends Survey can be segmented by the following demographic indicators: ▪ Age ▪ Euromonitor Consumer Type (eg, Undaunted Striver) ▪ Education Level ▪ Employment Status ▪ Gender ▪ Home Ownership ▪ Household Members
▪ Income ▪ Race / ethnicity (starting in 2015) ▪ Size of City
▪ Starting in 2015: Including name of city for those City Dwellers in larger urban areas and name of Region for those in smaller urban or more rural areas
Statistics ▪ There are over 109,000 consumer survey responses in the system, providing information about 300+ topics and 1,400+ sub-
questions.
▪ Data from the consumer surveys described above is accessible via state-of-the-art visualisations as well as Excel exports in the Lifestyles online dashboard. ▪ Survey responses are displayed in a variety of ways, from overall to country comparisons to demographic and other
consumer type segmentations. Users may customise the dashboard view to showcase the segments of their choice. ▪ Respondent counts as well as percent responding to each answer option are shown for each sub-question. ▪ Please see individual surveys (in “Categories in Detail” above) for more information about the themes covered and potential
demographic segmentation options for each survey. ▪ On request, subscribers are also entitled to copies of the survey data in its original form: untabulated datasets in csv or
SPSS format, with accompanying codebook. ▪ The Global Consumer Trends survey has time series data from 2011, 2013, 2015, 2016 and 2017 with annual updates going
forward. ▪ Survey data in the dashboard is organized according to the following themes:
▪ Eating and Drinking ▪ Healthy and Ethical Living ▪ House and Home ▪ Leisure and Recreation ▪ Path to Purchase
▪ Personal Traits and Values ▪ Respondent Demographics ▪ Shopping ▪ Spending and Saving ▪ Technology
Reports ▪ 85 Consumer Lifestyles reports, with updates every 1-2 years ▪ 70 Strategy Briefings, with new topics coming in the future ▪ 50 Global Survey Reports ▪ New releases every month The system contains analysis pertaining to social and lifestyle changes, trends and developments in consumer behaviour, attitudes and habits. This analysis is published in the form of reports, articles, opinion pieces, datagraphics, multimedia (podcasts, videocasts), and visual applications. It is organized around the following themes: ▪ Eating and Drinking ▪ Grooming and Appearances ▪ Healthy and Ethical Living ▪ House and Home ▪ Leisure and Recreation ▪ Shopping ▪ Spending and Saving ▪ Technology Consumer Lifestyle reports Each report focuses on a particular country and examines how people live their lives and the factors influencing lifestyle choices in that geographic market: eating and drinking, grooming and appearances, healthy and ethical living, house and home, leisure and recreation, shopping and spending and saving. Strategy Briefings Written from global and regional perspectives, these reports reveal major and emerging trends in consumer behaviour, which will have an impact on sales and marketing of all consumer products. They also present detail on Euromonitor International’s proprietary Consumer Types at the global and country level. Articles ▪ Annual profiling of the year’s predicted Top 10 Global Consumer Trends, with monthly follow-ups detailing recent updates ▪ Future Watch articles documenting up-and-coming consumer trends at the local, regional, and global levels ▪ Regular articles on topical issues relevant to lifestyles and major consumer trends ▪ Visuals and multimedia content bring the data and themes alive
▪ New releases every month Extra detail Visual applications featuring survey data: ▪ Survey: Online Activities ▪ Survey: Parents ▪ Survey: Buying Green? ▪ Survey: Youthful Diets Consumers in 2030 Vis App ▪ Explore trends across households, population, income and expenditure among 85 of the world’s largest economies. POPULATION Geographic coverage Global – 210 countries Asia Pacific: Afghanistan; American Samoa; Armenia; Azerbaijan; Bangladesh; Bhutan; Brunei; Cambodia; China; Fiji; French Polynesia; Guam; Hong Kong, China; India; Indonesia; Japan; Kazakhstan; Kiribati; Kyrgyzstan; Laos; Macau; Malaysia; Maldives; Mongolia; Myanmar; Nauru; Nepal; New Caledonia; North Korea; Pakistan; Papua New Guinea; Philippines; Samoa; Singapore; Solomon Islands; South Korea; Sri Lanka; Taiwan; Tajikistan; Thailand; Tonga; Turkmenistan; Tuvalu; Uzbekistan; Vanuatu; Vietnam Australasia: Australia; New Zealand Eastern Europe: Albania; Belarus; Bosnia-Herzegovina; Bulgaria; Croatia; Czech Republic; Estonia; Georgia; Hungary; Kosovo; Latvia; Lithuania; Macedonia; Moldova; Montenegro; Poland; Romania; Russia; Serbia; Slovakia; Slovenia; Ukraine Latin America: Anguilla; Antigua; Argentina; Aruba; Bahamas; Barbados; Belize; Bermuda; Bolivia; Brazil; British Virgin Islands; Cayman Islands; Chile; Colombia; Costa Rica; Curacao; Dominica; Dominican Republic; Ecuador; El Salvador; French Guiana; Grenada; Guadeloupe; Guatemala; Guyana; Haiti; Honduras; Jamaica; Martinique; Mexico; Nicaragua; Panama; Paraguay; Peru; Puerto Rico; St Kitts; St Lucia; St Vincent and the Grenadines; Sint Maarten; Suriname; Trinidad and Tobago; Uruguay; US Virgin Islands; Venezuela Middle East and Africa: Algeria; Angola; Bahrain; Benin; Botswana; Burkina Faso; Burundi; Cameroon; Cape Verde; Central African Republic; Chad; Comoros; Congo, Democratic Republic; Congo-Brazzaville; Côte d'Ivoire; Djibouti; Egypt; Equatorial Guinea; Eritrea; Ethiopia; Gabon; Gambia; Ghana; Guinea; Guinea-Bissau; Iraq; Israel; Jordan; Kenya; Kuwait; Lebanon; Lesotho; Liberia; Libya; Madagascar; Malawi; Mali; Mauritania; Mauritius; Morocco; Mozambique; Namibia; Niger; Nigeria; Oman; Qatar; Réunion; Rwanda; Sao Tomé e Príncipe; Saudi Arabia; Senegal; Seychelles; Sierra Leone; Somalia; South Africa; South Sudan; Sudan; Swaziland; Syria; Tanzania; Togo; Tunisia; Uganda; United Arab Emirates; Yemen; Zambia; Zimbabwe North America: Canada; USA Western Europe: Andorra; Austria; Belgium; Cyprus; Denmark; Finland; France; Germany; Gibraltar; Greece; Iceland; Ireland; Italy; Liechtenstein; Luxembourg; Malta; Monaco; Netherlands; Norway; Portugal; Spain; Sweden; Switzerland; Turkey; United Kingdom Category in detail Total Population Male Population Female Population Population by Urban / rural Location Population Density Median Age of Population Dependency Ratio
Fertility Mortality Migration and Natural Population Change Marital Status Population Segmentation Health
Statistics 54 year time series: 1977-2030 Population by Diversity ▪ Population by Citizenship ▪ Population by Country of Birth ▪ Population by Ethnicity and Race ▪ Population by Religion ▪ Population by Language

Extra detail Population Dashboard ▪ This dashboard is a visual, interactive tool which maps out every indicator of the page providing at-a-glance analysis. It
enables country and regional comparisons and includes download and export functionality. Future Demographics Model ▪ An interactive visual app which brings unique functionality showcasing our cross-country comparable demographic data
together with innovative data-dense visuals. Examine the demographic structure of countries around the world and search for similarities.
Consumers Overview Vis App ▪ Explore the consumer profile of a particular economy and compare it against 85 of the world's largest economies
benchmarking it against regional peers.
CATEGORY LEVEL: ECONOMIES CATEGORIES 1. Business Dynamics 2. Cities 3. Economy, Finance and Trade 4. Industrial 5. Natural Resources BUSINESS DYNAMICS Geographic coverage ▪ Global – 210 countries ▪ 792 sub-national regions Asia Pacific: Afghanistan; American Samoa; Armenia; Azerbaijan; Bangladesh; Bhutan; Brunei; Cambodia; China; Fiji; French Polynesia; Guam; Hong Kong, China; India; Indonesia; Japan; Kazakhstan; Kiribati; Kyrgyzstan; Laos; Macau; Malaysia; Maldives; Mongolia; Myanmar; Nauru; Nepal; New Caledonia; North Korea; Pakistan; Papua New Guinea; Philippines; Samoa; Singapore; Solomon Islands; South Korea; Sri Lanka; Taiwan; Tajikistan; Thailand; Tonga; Turkmenistan; Tuvalu; Uzbekistan; Vanuatu; Vietnam Australasia: Australia; New Zealand Eastern Europe: Albania; Belarus; Bosnia-Herzegovina; Bulgaria; Croatia; Czech Republic; Estonia; Georgia; Hungary; Kosovo; Latvia; Lithuania; Macedonia; Moldova; Montenegro; Poland; Romania; Russia; Serbia; Slovakia; Slovenia; Ukraine Latin America: Anguilla; Antigua; Argentina; Aruba; Bahamas; Barbados; Belize; Bermuda; Bolivia; Brazil; British Virgin Islands; Cayman Islands; Chile; Colombia; Costa Rica; Curacao; Dominica; Dominican Republic; Ecuador; El Salvador; French Guiana; Grenada; Guadeloupe; Guatemala; Guyana; Haiti; Honduras; Jamaica; Martinique; Mexico; Nicaragua; Panama; Paraguay; Peru; Puerto Rico; St Kitts; St Lucia; St Vincent and the Grenadines; Sint Maarten; Suriname; Trinidad and Tobago; Uruguay; US Virgin Islands; Venezuela Middle East and Africa: Algeria; Angola; Bahrain; Benin; Botswana; Burkina Faso; Burundi; Cameroon; Cape Verde; Central African Republic; Chad; Comoros; Congo, Democratic Republic; Congo-Brazzaville; Côte d'Ivoire; Djibouti; Egypt; Equatorial Guinea; Eritrea; Ethiopia; Gabon; Gambia; Ghana; Guinea; Guinea-Bissau; Iraq; Israel; Jordan; Kenya; Kuwait; Lebanon; Lesotho; Liberia; Libya; Madagascar; Malawi; Mali; Mauritania; Mauritius; Morocco; Mozambique; Namibia; Niger; Nigeria; Oman; Qatar; Réunion; Rwanda; Sao Tomé e Príncipe; Saudi Arabia; Senegal; Seychelles; Sierra Leone; Somalia; South Africa; South Sudan; Sudan; Swaziland; Syria; Tanzania; Togo; Tunisia; Uganda; United Arab Emirates; Yemen; Zambia; Zimbabwe North America: Canada; USA Western Europe: Andorra; Austria; Belgium; Cyprus; Denmark; Finland; France; Germany; Gibraltar; Greece; Iceland; Ireland; Italy; Liechtenstein; Luxembourg; Malta; Monaco; Netherlands; Norway; Portugal; Spain; Sweden; Switzerland; Turkey; United Kingdom Category in detail Access to Finance Advertising and Media Access Communications Corruption Crime Ease of Doing Business Ranking Economic Freedom Education and Skills Freedom in the World Index Global Competitiveness Global Peace Index Global Peace Ranking Global Terrorism Index
Global Terrorism Ranking Government Stability Human Development Index Labour New Businesses Registered R&D and Patents Transport
Statistics ▪ 54 year time series: 1977-2030 ▪ Monthly and quarterly key economic data CITIES Geographic coverage ▪ Global – 1220 cities in 101 countries AFRICA (100 cities): Algeria (9 cities), Angola (4 cities), Cameroon (7 cities), Cote d’Ivoire (6 cities), Egypt (8 cities), Ethiopia (7 cities), Ghana (4 cities), Kenya (5 cities), Morocco (10 cities), Nigeria (10 cities), South Africa (12 cities), Tanzania (5 cities), Tunisia (7 cities), Uganda (6 cities). ASIA PACIFIC (240 cities): Azerbaijan (2 cities), Bangladesh (4 cities), Cambodia (3 cities), China (61 cities), India (41 cities), Indonesia (16 cities), Japan (14 cities), Kazakhstan (10 cities), Laos (3 cities), Malaysia (10 cities), Myanmar (7 cities), Pakistan (9 cities), Philippines (7 cities), South Korea (11 cities), Sri Lanka (1 city), Taiwan (7 cities), Thailand (13 cities), Turkmenistan (2 cities), Uzbekistan (8 cities), Vietnam (11 cities). AUSTRALASIA (17 cities): Australia (10 cities), New Zealand (7 cities). CENTRAL AND EASTERN EUROPE (124 cities): Belarus (8 cities), Bosnia-Herzegovina (2 cities), Bulgaria (7 cities), Croatia (3 cities), Czech Republic (5 cities), Egypt (7 cities), Estonia (2 cities), Georgia (4 cities), Hungary (9 cities), Latvia (3 cities), Lithuania (5 cities), Macedonia (2 cities), Romania (10 cities), Russia (26 cities), Serbia (5 cities), Slovakia (6 cities), Slovenia (2 cities), Ukraine (10 cities). LATIN AMERICA (134 cities): Argentina (14 cities), Bolivia (7 cities), Brazil (26 cities), Chile (8 cities), Colombia (10 cities), Costa Rica (1 cities), Dominican Republic (7 cities), Ecuador (9 cities), El Salvador (1 city), Guatemala (4 cities), Honduras (4 cities), Mexico (12 cities), Panama (2 cities), Paraguay (3 cities), Peru (12 cities), Uruguay (3 cities), Venezuela (11 cities). MIDDLE EAST (46 cities): Bahrain (1 cities), Iran (8 cities), Iraq (7 cities), Israel (4 cities), Jordan (3 cities), Kuwait (1 city), Lebanon (2 cities), Oman (1 city), Qatar (1 city), Saudi Arabia (13 cities), United Arab Emirates (5 cities). NORTH AMERICA (370 cities): Canada (20 cities), USA (350 cities). WESTERN EUROPE (189 cities): Austria (6 cities), Belgium (8 cities), Denmark (5 cities), Finland (8 cities), France (25 cities), Germany (25 cities), Greece (4 cities), Ireland (4 cities), Italy (17 cities), Netherlands (10 cities), Norway (6 cities), Portugal (5 cities), Spain (15 cities), Sweden (10 cities), Switzerland (7 cities), Turkey (16 cities), United Kingdom (18 cities). Category in detail Total Population Male Population Female Population Population Density Migration and Natural Population Change Average Household Size Number of Households Possession of Digital Devices Disposable Income Households by Disposable Income Band Household Disposable Income Deciles
Consumer Expenditure Consumer Expenditure by Category Consumer Expenditure as a % of GDP Index of Consumer Prices Gini Index GDP Labour Transport Air Pollution of Cities Air Temperature
Statistics ▪ 26 year time series: 2005-2030
Extra detail Cities Income Distribution Model: ▪ Ascertain disposable income distribution of households ▪ Flexibly analyse the income resources of households ▪ Assess the impact of hypothetic macroeconomic scenarios on cities’ income distribution ECONOMY, FINANCE AND TRADE Geographic coverage ▪ Global – 210 countries ▪ 792 sub-national regions Asia Pacific: Afghanistan; American Samoa; Armenia; Azerbaijan; Bangladesh; Bhutan; Brunei; Cambodia; China; Fiji; French Polynesia; Guam; Hong Kong, China; India; Indonesia; Japan; Kazakhstan; Kiribati; Kyrgyzstan; Laos; Macau; Malaysia; Maldives; Mongolia; Myanmar; Nauru; Nepal; New Caledonia; North Korea; Pakistan; Papua New Guinea; Philippines; Samoa; Singapore; Solomon Islands; South Korea; Sri Lanka; Taiwan; Tajikistan; Thailand; Tonga; Turkmenistan; Tuvalu; Uzbekistan; Vanuatu; Vietnam Australasia: Australia; New Zealand Eastern Europe: Albania; Belarus; Bosnia-Herzegovina; Bulgaria; Croatia; Czech Republic; Estonia; Georgia; Hungary; Kosovo; Latvia; Lithuania; Macedonia; Moldova; Montenegro; Poland; Romania; Russia; Serbia; Slovakia; Slovenia; Ukraine Latin America: Anguilla; Antigua; Argentina; Aruba; Bahamas; Barbados; Belize; Bermuda; Bolivia; Brazil; British Virgin Islands; Cayman Islands; Chile; Colombia; Costa Rica; Curacao; Dominica; Dominican Republic; Ecuador; El Salvador; French Guiana; Grenada; Guadeloupe; Guatemala; Guyana; Haiti; Honduras; Jamaica; Martinique; Mexico; Nicaragua; Panama; Paraguay; Peru; Puerto Rico; St Kitts; St Lucia; St Vincent and the Grenadines; Sint Maarten; Suriname; Trinidad and Tobago; Uruguay; US Virgin Islands; Venezuela Middle East and Africa: Algeria; Angola; Bahrain; Benin; Botswana; Burkina Faso; Burundi; Cameroon; Cape Verde; Central African Republic; Chad; Comoros; Congo, Democratic Republic; Congo-Brazzaville; Côte d'Ivoire; Djibouti; Egypt; Equatorial Guinea; Eritrea; Ethiopia; Gabon; Gambia; Ghana; Guinea; Guinea-Bissau; Iraq; Israel; Jordan; Kenya; Kuwait; Lebanon; Lesotho; Liberia; Libya; Madagascar; Malawi; Mali; Mauritania; Mauritius; Morocco; Mozambique; Namibia; Niger; Nigeria; Oman; Qatar; Réunion; Rwanda; Sao Tomé e Príncipe; Saudi Arabia; Senegal; Seychelles; Sierra Leone; Somalia; South Africa; South Sudan; Sudan; Swaziland; Syria; Tanzania; Togo; Tunisia; Uganda; United Arab Emirates; Yemen; Zambia; Zimbabwe North America: Canada; USA Western Europe: Andorra; Austria; Belgium; Cyprus; Denmark; Finland; France; Germany; Gibraltar; Greece; Iceland; Ireland; Italy; Liechtenstein; Luxembourg; Malta; Monaco; Netherlands; Norway; Portugal; Spain; Sweden; Switzerland; Turkey; United Kingdom Category in detail Balance of Payments Confidence Indicators Exchange and Interest Rates External Debt External Debt as a % of GDP Foreign Direct Investment (FDI) Foreign Trade GDP Government Finance
Gross National Income (GNI) Industrial Production Index Inflation Money Supply Net Capital Stock Non-residential Construction Producer Price Index, Manufacturing Productivity Retail Sales
Statistics ▪ 54 year time series: 1977-2030
▪ Annual, quarterly and monthly data Extra detail Macro Model ▪ Our Macro Model provides forecasts of GDP, inflation, interest rates and unemployment for the world’s major economies. The
model measures spillover effects and provides alternative “what-if” scenarios.
Economic Barometer ▪ The Economic Barometer is an interactive dashboard that provides an overview of the latest monthly and quarterly macro-
economic data in a single, easy-to-use location. It enables quick identification of the strongest and weakest economies and the latest positive and negative changes.
INDUSTRIAL (ENTIRE ECONOMY) [THIS PREMIUM INDUSTRY CAN BE ADDED TO CATEGORY LEVEL] Geographic coverage ▪ Global, regional, 90 countries World and Regions: World, Asia Pacific, Australasia, Eastern Europe, Latin America, Middle East and Africa, North America, Western Europe Core countries: Australia, Brazil, Canada, China, France, Germany, India, Indonesia, Italy, Japan, Mexico, Russia, Saudi Arabia, South Korea, Spain, Turkey, UK, USA. None-core countries: Algeria, Angola, Argentina, Austria, Azerbaijan, Bangladesh, Belarus, Belgium, Bulgaria, Cambodia, Cameroon, Chile, Columbia, Costa Rica, Croatia, Cuba, Cyprus, Czech Republic, Denmark, Dominican Republic, Ecuador, Egypt, Estonia, Ethiopia, Finland, Georgia, Ghana, Greece, Hong Kong, Hungary, Iceland, Iran, Iraq, Ireland, Israel, Kazakhstan, Kenya, Kuwait, Latvia, Lithuania, Luxembourg, Malaysia, Morocco, Netherlands, New Zealand, Nigeria, Norway, Pakistan, Panama, Peru, Philippines, Poland, Portugal, Puerto Rico, Qatar, Romania, Singapore, Slovakia, Slovenia, South Africa, Sri Lanka, Sweden, Switzerland, Taiwan, Thailand, Tunisia, Ukraine, United Arab Emirates, Uruguay, Uzbekistan, Venezuela, Vietnam Category in detaiAgriculture Energy Utilities and Recycling Construction and Real Estate Food, Beverages and Tobacco Chemical Products Rubber and Plastic Metal Products Non-metallic Mineral Products Textile and Leather Products Forestry, Wood and Paper Pharmaceuticals and Medical Equipment Household Goods Machinery
Hi-tech Goods Transport Equipment Hotels and Restaurants Retail and Wholesale Transport and Storage Information and Communication Finance and insurance Business Services Education Healthcare and Social Services Government and Memebership Organizations Personal Services Recreation, Entertainment and Arts
Statistics Core 18 countries, industry level Core countries data is built off an input / output structure to allow for maximum flexibility when it comes to deconstructing and analysing supply chains. Each industry contains the following breakdown of buyer and supplier relationships and comparable figures such as Total market Size, Imports and Exports. ▪ 34 year time series: 1997-2030 Buyers and Suppliers Through an exhaustive sourcing process and sophisticated modelling techniques, each industry is matched with 177 buying and supplying industries and details regarding the size of the relationship (value) and respective bargaining power. Detailed Buyers and Suppliers data is available for nine countries: Brazil, China, France, Germany, India, Japan, Russia, UK and USA. Statistics core countries at industry level Industry Growth / Performance ▪ Market size ▪ Production value
▪ Production volume index 2015 = 100 ▪ Value added ▪ Profit
▪ Profit margin (%) ▪ Number of employees ▪ Average wages Role of Imports and Exports ▪ Imports CIF ▪ Top 10 Importing Countries ▪ Imported products in total market (%) ▪ Exports FOB ▪ Top 10 Exporting Countries ▪ Exported products in total product output (%) Competitive Environment ▪ Number of enterprises ▪ Number of companies by employment size ▪ Production by employment size ▪ Top 5 Producing companies
Buyers ▪ Market Size segmented by Buyers ▪ Household Expenditure ▪ Government Expenditure ▪ Investments ▪ B2B expenditures Suppliers ▪ Cost structure segmented by Suppliers ▪ Labour costs ▪ Taxes ▪ B2B costs Future Outlook ▪ Turnover by industry forecast
Category coverage core countries Industrial covers over 500 non-overlapping categories for each economy that sum to 100% GDP. Category divisions: ▪ Agriculture (1 industry, 8 categories) ▪ Energy (6 industries, 5 categories) ▪ Utilities and Recycling (6 industries, 9 categories) ▪ Construction and Real Estate (2 industries, 5 categories) ▪ Food, Beverages and Tobacco (19 industries, 50
categories) ▪ Chemical Products (8 industries, 26 categories) ▪ Rubber and Plastic (2 industries, 7 categories) ▪ Metal Products (9 industries, 30 categories) ▪ ]Non-metallic Mineral Products (3 industries, 15
categories) ▪ Textile and Leather Products (12 industries, 29 categories) ▪ Forestry, Wood and Paper (5 industries, 15 categories) ▪ Pharmaceuticals and Medical Equipment (2 industries, 12
categories) ▪ Household Goods (7 industries, 27 categories) ▪ Machinery (16 industries, 51 categories)
▪ Hi-tech Goods (14 industries, 48 categories) ▪ Transport Equipment (5 industries, 16 categories) ▪ Hotels and Restaurants (2 industries, 7 categories) ▪ Retail and Wholesale (3 industries, 16 categories) ▪ Transport and Storage (7 industries, 18 categories) ▪ Information and Communication ( 11industries, 23
categories) ▪ Finance and insurance (2 industries, 6 categories) ▪ Business Services (19 industries, 54 categories) ▪ Education (1 industry, 4 categories) ▪ Healthcare and Social Services (3 industries, 7 categories) ▪ Government and Memebership Organizations (2
industries, 6 categories) ▪ Personal Services (4 industries, 10 categories) ▪ Recreation, Entertainment and Arts (5 industries, 13
categories)
Statistics core countries at category level ▪ Market size ▪ Production value ▪ Imports CIF ▪ Exports FOB ▪ Turnover by category forecast Non-core countries, global and regional, industry level Industrial covers over 177 non-overlapping industries for each economy that sum to 100% GDP. Industry divisions: ▪ Agriculture (1 industry) ▪ Energy (6 industries)
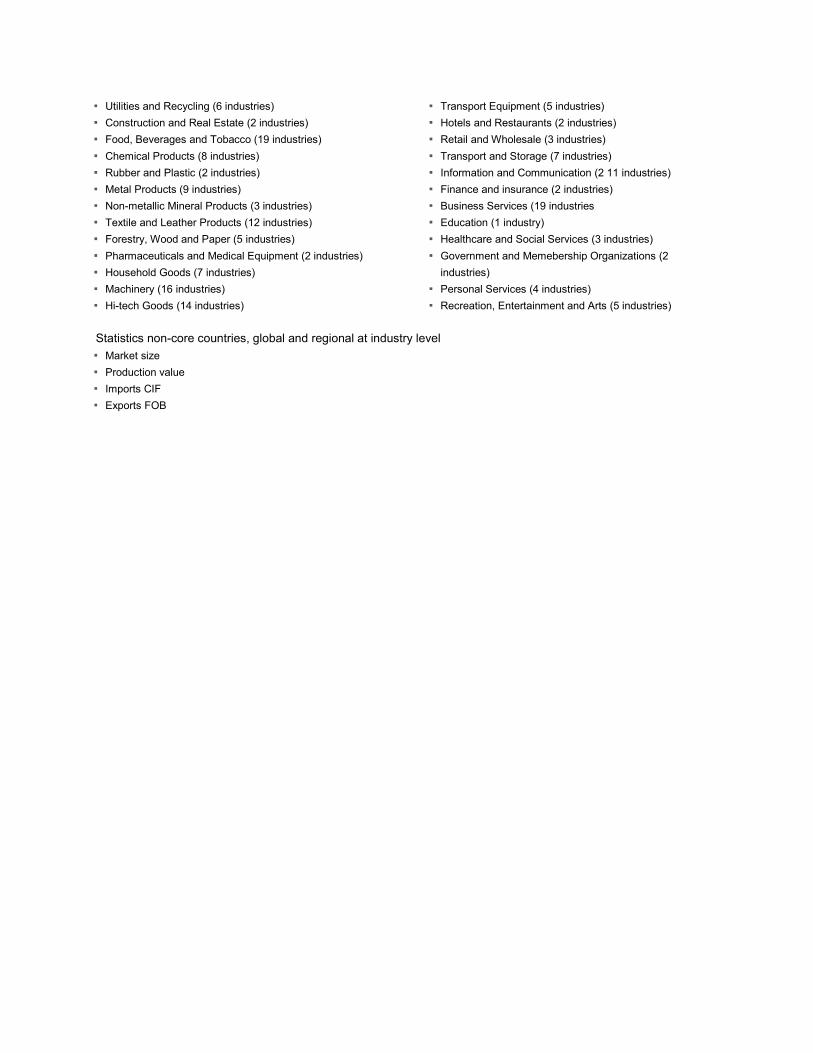
▪ Utilities and Recycling (6 industries) ▪ Construction and Real Estate (2 industries) ▪ Food, Beverages and Tobacco (19 industries) ▪ Chemical Products (8 industries) ▪ Rubber and Plastic (2 industries) ▪ Metal Products (9 industries) ▪ Non-metallic Mineral Products (3 industries) ▪ Textile and Leather Products (12 industries) ▪ Forestry, Wood and Paper (5 industries) ▪ Pharmaceuticals and Medical Equipment (2 industries) ▪ Household Goods (7 industries) ▪ Machinery (16 industries) ▪ Hi-tech Goods (14 industries)
▪ Transport Equipment (5 industries) ▪ Hotels and Restaurants (2 industries) ▪ Retail and Wholesale (3 industries) ▪ Transport and Storage (7 industries) ▪ Information and Communication (2 11 industries) ▪ Finance and insurance (2 industries) ▪ Business Services (19 industries ▪ Education (1 industry) ▪ Healthcare and Social Services (3 industries) ▪ Government and Memebership Organizations (2
industries) ▪ Personal Services (4 industries) ▪ Recreation, Entertainment and Arts (5 industries)
Statistics non-core countries, global and regional at industry level ▪ Market size ▪ Production value ▪ Imports CIF ▪ Exports FOB
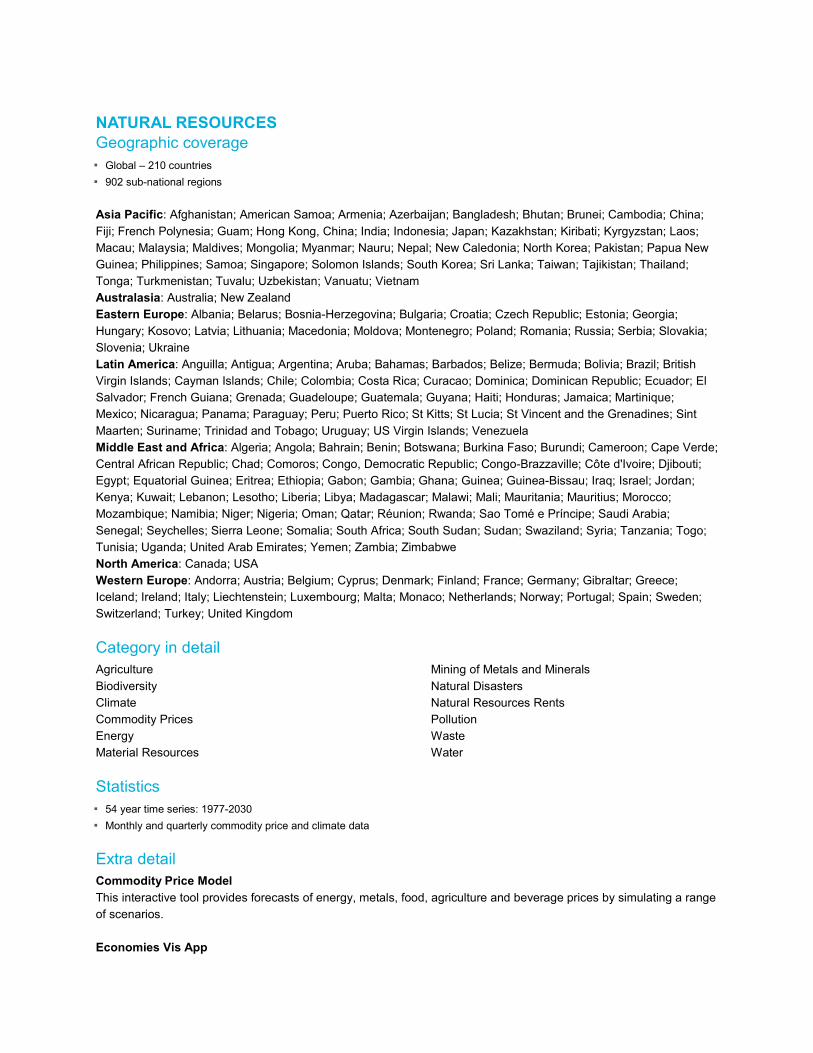
NATURAL RESOURCES Geographic coverage ▪ Global – 210 countries ▪ 902 sub-national regions Asia Pacific: Afghanistan; American Samoa; Armenia; Azerbaijan; Bangladesh; Bhutan; Brunei; Cambodia; China; Fiji; French Polynesia; Guam; Hong Kong, China; India; Indonesia; Japan; Kazakhstan; Kiribati; Kyrgyzstan; Laos; Macau; Malaysia; Maldives; Mongolia; Myanmar; Nauru; Nepal; New Caledonia; North Korea; Pakistan; Papua New Guinea; Philippines; Samoa; Singapore; Solomon Islands; South Korea; Sri Lanka; Taiwan; Tajikistan; Thailand; Tonga; Turkmenistan; Tuvalu; Uzbekistan; Vanuatu; Vietnam Australasia: Australia; New Zealand Eastern Europe: Albania; Belarus; Bosnia-Herzegovina; Bulgaria; Croatia; Czech Republic; Estonia; Georgia; Hungary; Kosovo; Latvia; Lithuania; Macedonia; Moldova; Montenegro; Poland; Romania; Russia; Serbia; Slovakia; Slovenia; Ukraine Latin America: Anguilla; Antigua; Argentina; Aruba; Bahamas; Barbados; Belize; Bermuda; Bolivia; Brazil; British Virgin Islands; Cayman Islands; Chile; Colombia; Costa Rica; Curacao; Dominica; Dominican Republic; Ecuador; El Salvador; French Guiana; Grenada; Guadeloupe; Guatemala; Guyana; Haiti; Honduras; Jamaica; Martinique; Mexico; Nicaragua; Panama; Paraguay; Peru; Puerto Rico; St Kitts; St Lucia; St Vincent and the Grenadines; Sint Maarten; Suriname; Trinidad and Tobago; Uruguay; US Virgin Islands; Venezuela Middle East and Africa: Algeria; Angola; Bahrain; Benin; Botswana; Burkina Faso; Burundi; Cameroon; Cape Verde; Central African Republic; Chad; Comoros; Congo, Democratic Republic; Congo-Brazzaville; Côte d'Ivoire; Djibouti; Egypt; Equatorial Guinea; Eritrea; Ethiopia; Gabon; Gambia; Ghana; Guinea; Guinea-Bissau; Iraq; Israel; Jordan; Kenya; Kuwait; Lebanon; Lesotho; Liberia; Libya; Madagascar; Malawi; Mali; Mauritania; Mauritius; Morocco; Mozambique; Namibia; Niger; Nigeria; Oman; Qatar; Réunion; Rwanda; Sao Tomé e Príncipe; Saudi Arabia; Senegal; Seychelles; Sierra Leone; Somalia; South Africa; South Sudan; Sudan; Swaziland; Syria; Tanzania; Togo; Tunisia; Uganda; United Arab Emirates; Yemen; Zambia; Zimbabwe North America: Canada; USA Western Europe: Andorra; Austria; Belgium; Cyprus; Denmark; Finland; France; Germany; Gibraltar; Greece; Iceland; Ireland; Italy; Liechtenstein; Luxembourg; Malta; Monaco; Netherlands; Norway; Portugal; Spain; Sweden; Switzerland; Turkey; United Kingdom Category in detail Agriculture Biodiversity Climate Commodity Prices Energy Material Resources
Mining of Metals and Minerals Natural Disasters Natural Resources Rents Pollution Waste Water
Statistics ▪ 54 year time series: 1977-2030 ▪ Monthly and quarterly commodity price and climate data Extra detail Commodity Price Model This interactive tool provides forecasts of energy, metals, food, agriculture and beverage prices by simulating a range of scenarios. Economies Vis App

This app contains a snapshot of our short-term economic data to provide an at-a-glance overview of 85 of the world’s largest economies. Commodity Price Vis App This app shows the percentage change in price over previous month and year across more than 50 countries. Natural Resources Vis App This app shows global rankings across five resource types: land, food, energy, metals and minerals, and water resources.
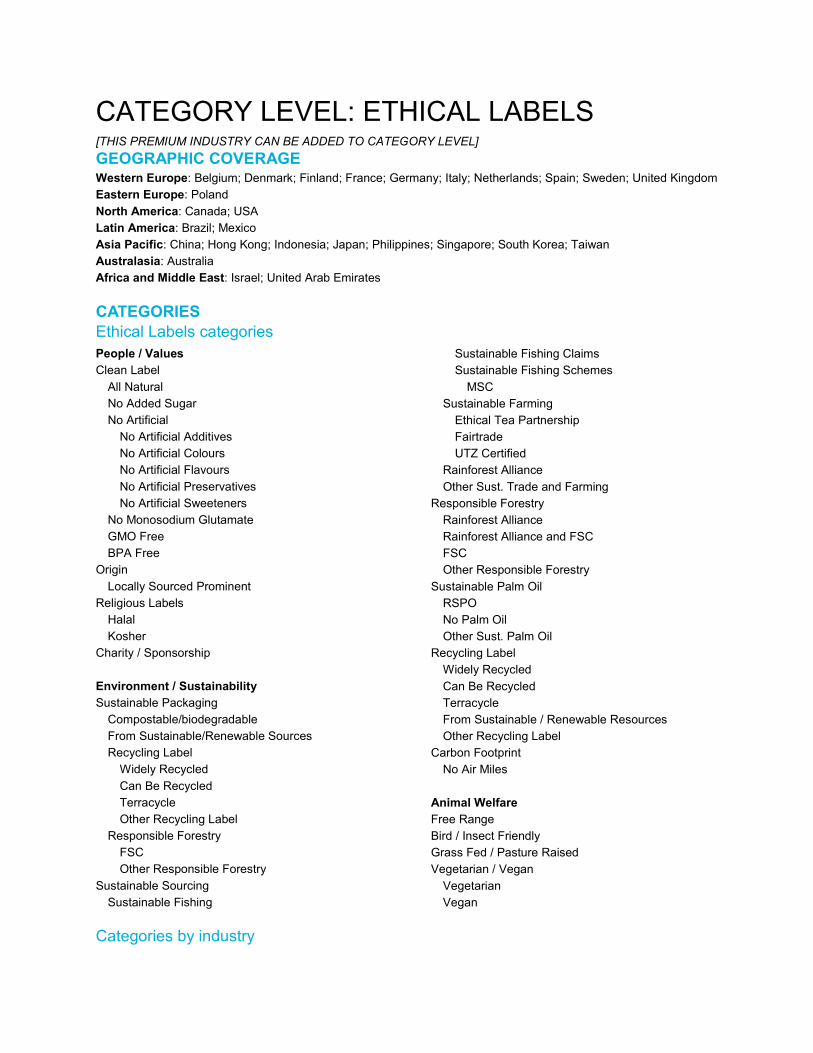
CATEGORY LEVEL: ETHICAL LABELS [THIS PREMIUM INDUSTRY CAN BE ADDED TO CATEGORY LEVEL] GEOGRAPHIC COVERAGE Western Europe: Belgium; Denmark; Finland; France; Germany; Italy; Netherlands; Spain; Sweden; United Kingdom Eastern Europe: Poland North America: Canada; USA Latin America: Brazil; Mexico Asia Pacific: China; Hong Kong; Indonesia; Japan; Philippines; Singapore; South Korea; Taiwan Australasia: Australia Africa and Middle East: Israel; United Arab Emirates CATEGORIES Ethical Labels categories People / Values Clean Label All Natural No Added Sugar No Artificial No Artificial Additives No Artificial Colours No Artificial Flavours No Artificial Preservatives No Artificial Sweeteners No Monosodium Glutamate GMO Free BPA Free Origin Locally Sourced Prominent Religious Labels Halal Kosher Charity / Sponsorship Environment / Sustainability Sustainable Packaging Compostable/biodegradable From Sustainable/Renewable Sources Recycling Label Widely Recycled Can Be Recycled Terracycle Other Recycling Label Responsible Forestry FSC Other Responsible Forestry Sustainable Sourcing Sustainable Fishing
Sustainable Fishing Claims Sustainable Fishing Schemes MSC Sustainable Farming Ethical Tea Partnership Fairtrade UTZ Certified Rainforest Alliance Other Sust. Trade and Farming Responsible Forestry Rainforest Alliance Rainforest Alliance and FSC FSC Other Responsible Forestry Sustainable Palm Oil RSPO No Palm Oil Other Sust. Palm Oil Recycling Label Widely Recycled Can Be Recycled Terracycle From Sustainable / Renewable Resources Other Recycling Label Carbon Footprint No Air Miles Animal Welfare Free Range Bird / Insect Friendly Grass Fed / Pasture Raised Vegetarian / Vegan Vegetarian Vegan
Categories by industry
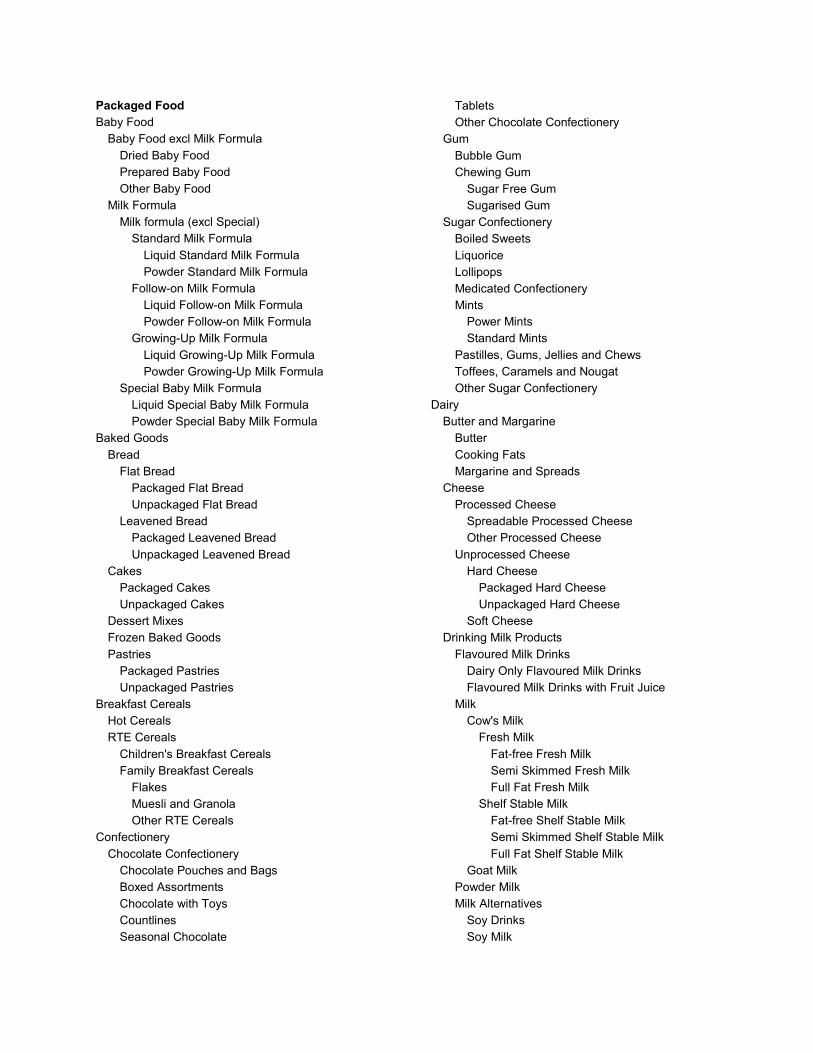
Packaged Food Baby Food Baby Food excl Milk Formula Dried Baby Food Prepared Baby Food Other Baby Food Milk Formula Milk formula (excl Special) Standard Milk Formula Liquid Standard Milk Formula Powder Standard Milk Formula Follow-on Milk Formula Liquid Follow-on Milk Formula Powder Follow-on Milk Formula Growing-Up Milk Formula Liquid Growing-Up Milk Formula Powder Growing-Up Milk Formula Special Baby Milk Formula Liquid Special Baby Milk Formula Powder Special Baby Milk Formula Baked Goods Bread Flat Bread Packaged Flat Bread Unpackaged Flat Bread Leavened Bread Packaged Leavened Bread Unpackaged Leavened Bread Cakes Packaged Cakes Unpackaged Cakes Dessert Mixes Frozen Baked Goods Pastries Packaged Pastries Unpackaged Pastries Breakfast Cereals Hot Cereals RTE Cereals Children's Breakfast Cereals Family Breakfast Cereals Flakes Muesli and Granola Other RTE Cereals Confectionery Chocolate Confectionery Chocolate Pouches and Bags Boxed Assortments Chocolate with Toys Countlines Seasonal Chocolate
Tablets Other Chocolate Confectionery Gum Bubble Gum Chewing Gum Sugar Free Gum Sugarised Gum Sugar Confectionery Boiled Sweets Liquorice Lollipops Medicated Confectionery Mints Power Mints Standard Mints Pastilles, Gums, Jellies and Chews Toffees, Caramels and Nougat Other Sugar Confectionery Dairy Butter and Margarine Butter Cooking Fats Margarine and Spreads Cheese Processed Cheese Spreadable Processed Cheese Other Processed Cheese Unprocessed Cheese Hard Cheese Packaged Hard Cheese Unpackaged Hard Cheese Soft Cheese Drinking Milk Products Flavoured Milk Drinks Dairy Only Flavoured Milk Drinks Flavoured Milk Drinks with Fruit Juice Milk Cow's Milk Fresh Milk Fat-free Fresh Milk Semi Skimmed Fresh Milk Full Fat Fresh Milk Shelf Stable Milk Fat-free Shelf Stable Milk Semi Skimmed Shelf Stable Milk Full Fat Shelf Stable Milk Goat Milk Powder Milk Milk Alternatives Soy Drinks Soy Milk
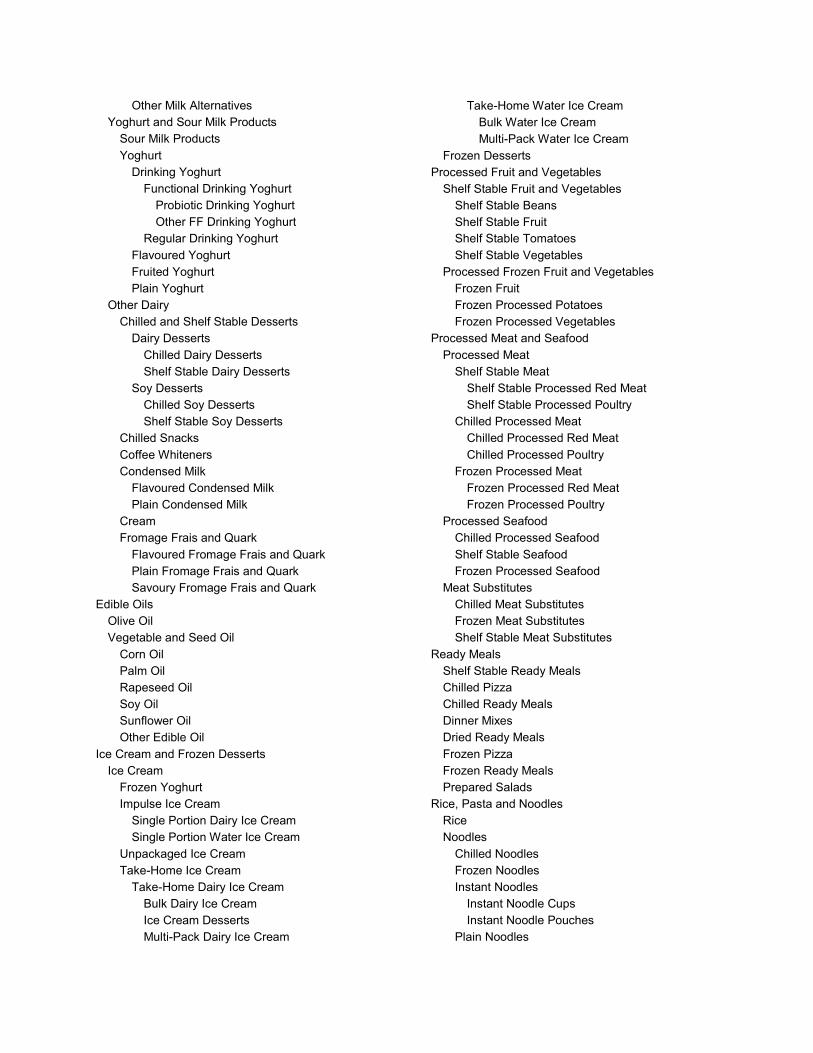
Other Milk Alternatives Yoghurt and Sour Milk Products Sour Milk Products Yoghurt Drinking Yoghurt Functional Drinking Yoghurt Probiotic Drinking Yoghurt Other FF Drinking Yoghurt Regular Drinking Yoghurt Flavoured Yoghurt Fruited Yoghurt Plain Yoghurt Other Dairy Chilled and Shelf Stable Desserts Dairy Desserts Chilled Dairy Desserts Shelf Stable Dairy Desserts Soy Desserts Chilled Soy Desserts Shelf Stable Soy Desserts Chilled Snacks Coffee Whiteners Condensed Milk Flavoured Condensed Milk Plain Condensed Milk Cream Fromage Frais and Quark Flavoured Fromage Frais and Quark Plain Fromage Frais and Quark Savoury Fromage Frais and Quark Edible Oils Olive Oil Vegetable and Seed Oil Corn Oil Palm Oil Rapeseed Oil Soy Oil Sunflower Oil Other Edible Oil Ice Cream and Frozen Desserts Ice Cream Frozen Yoghurt Impulse Ice Cream Single Portion Dairy Ice Cream Single Portion Water Ice Cream Unpackaged Ice Cream Take-Home Ice Cream Take-Home Dairy Ice Cream Bulk Dairy Ice Cream Ice Cream Desserts Multi-Pack Dairy Ice Cream
Take-Home Water Ice Cream Bulk Water Ice Cream Multi-Pack Water Ice Cream Frozen Desserts Processed Fruit and Vegetables Shelf Stable Fruit and Vegetables Shelf Stable Beans Shelf Stable Fruit Shelf Stable Tomatoes Shelf Stable Vegetables Processed Frozen Fruit and Vegetables Frozen Fruit Frozen Processed Potatoes Frozen Processed Vegetables Processed Meat and Seafood Processed Meat Shelf Stable Meat Shelf Stable Processed Red Meat Shelf Stable Processed Poultry Chilled Processed Meat Chilled Processed Red Meat Chilled Processed Poultry Frozen Processed Meat Frozen Processed Red Meat Frozen Processed Poultry Processed Seafood Chilled Processed Seafood Shelf Stable Seafood Frozen Processed Seafood Meat Substitutes Chilled Meat Substitutes Frozen Meat Substitutes Shelf Stable Meat Substitutes Ready Meals Shelf Stable Ready Meals Chilled Pizza Chilled Ready Meals Dinner Mixes Dried Ready Meals Frozen Pizza Frozen Ready Meals Prepared Salads Rice, Pasta and Noodles Rice Noodles Chilled Noodles Frozen Noodles Instant Noodles Instant Noodle Cups Instant Noodle Pouches Plain Noodles
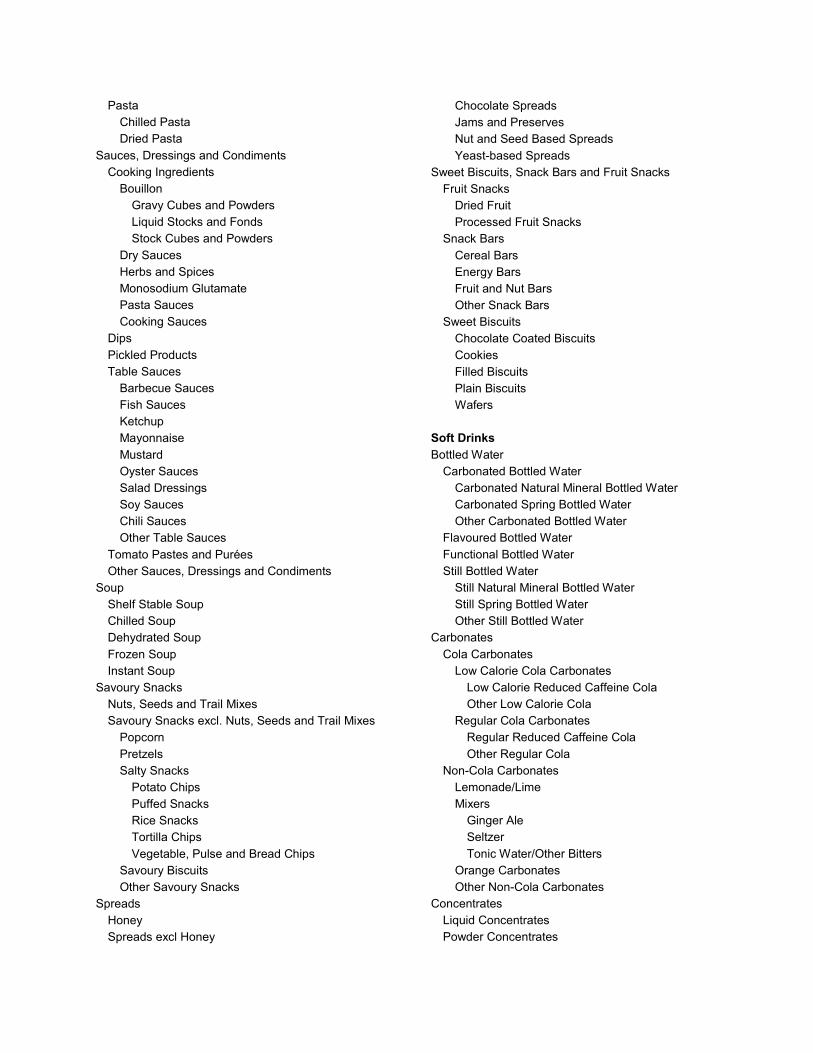
Pasta Chilled Pasta Dried Pasta Sauces, Dressings and Condiments Cooking Ingredients Bouillon Gravy Cubes and Powders Liquid Stocks and Fonds Stock Cubes and Powders Dry Sauces Herbs and Spices Monosodium Glutamate Pasta Sauces Cooking Sauces Dips Pickled Products Table Sauces Barbecue Sauces Fish Sauces Ketchup Mayonnaise Mustard Oyster Sauces Salad Dressings Soy Sauces Chili Sauces Other Table Sauces Tomato Pastes and Purées Other Sauces, Dressings and Condiments Soup Shelf Stable Soup Chilled Soup Dehydrated Soup Frozen Soup Instant Soup Savoury Snacks Nuts, Seeds and Trail Mixes Savoury Snacks excl. Nuts, Seeds and Trail Mixes Popcorn Pretzels Salty Snacks Potato Chips Puffed Snacks Rice Snacks Tortilla Chips Vegetable, Pulse and Bread Chips Savoury Biscuits Other Savoury Snacks Spreads Honey Spreads excl Honey
Chocolate Spreads Jams and Preserves Nut and Seed Based Spreads Yeast-based Spreads Sweet Biscuits, Snack Bars and Fruit Snacks Fruit Snacks Dried Fruit Processed Fruit Snacks Snack Bars Cereal Bars Energy Bars Fruit and Nut Bars Other Snack Bars Sweet Biscuits Chocolate Coated Biscuits Cookies Filled Biscuits Plain Biscuits Wafers Soft Drinks Bottled Water Carbonated Bottled Water Carbonated Natural Mineral Bottled Water Carbonated Spring Bottled Water Other Carbonated Bottled Water Flavoured Bottled Water Functional Bottled Water Still Bottled Water Still Natural Mineral Bottled Water Still Spring Bottled Water Other Still Bottled Water Carbonates Cola Carbonates Low Calorie Cola Carbonates Low Calorie Reduced Caffeine Cola Other Low Calorie Cola Regular Cola Carbonates Regular Reduced Caffeine Cola Other Regular Cola Non-Cola Carbonates Lemonade/Lime Mixers Ginger Ale Seltzer Tonic Water/Other Bitters Orange Carbonates Other Non-Cola Carbonates Concentrates Liquid Concentrates Powder Concentrates
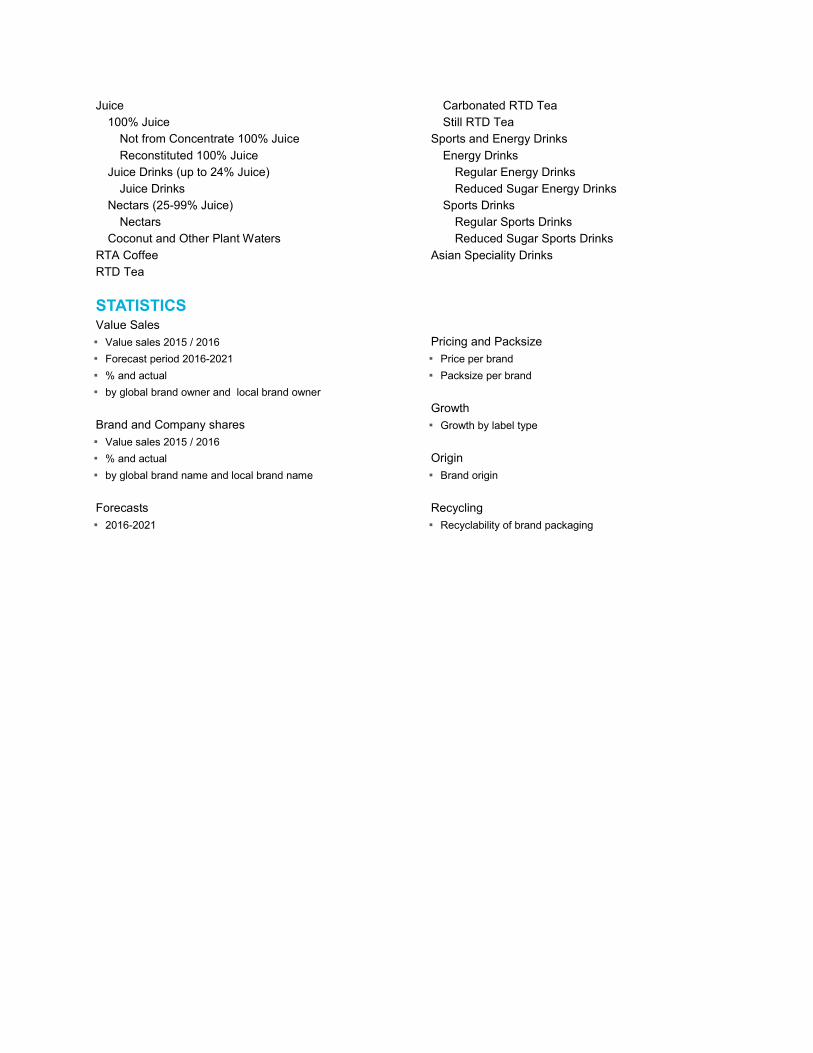
Juice 100% Juice Not from Concentrate 100% Juice Reconstituted 100% Juice Juice Drinks (up to 24% Juice) Juice Drinks Nectars (25-99% Juice) Nectars Coconut and Other Plant Waters RTA Coffee RTD Tea
Carbonated RTD Tea Still RTD Tea Sports and Energy Drinks Energy Drinks Regular Energy Drinks Reduced Sugar Energy Drinks Sports Drinks Regular Sports Drinks Reduced Sugar Sports Drinks Asian Speciality Drinks
STATISTICS Value Sales ▪ Value sales 2015 / 2016 ▪ Forecast period 2016-2021 ▪ % and actual ▪ by global brand owner and local brand owner Brand and Company shares ▪ Value sales 2015 / 2016 ▪ % and actual ▪ by global brand name and local brand name Forecasts ▪ 2016-2021
Pricing and Packsize ▪ Price per brand ▪ Packsize per brand Growth ▪ Growth by label type Origin ▪ Brand origin Recycling ▪ Recyclability of brand packaging
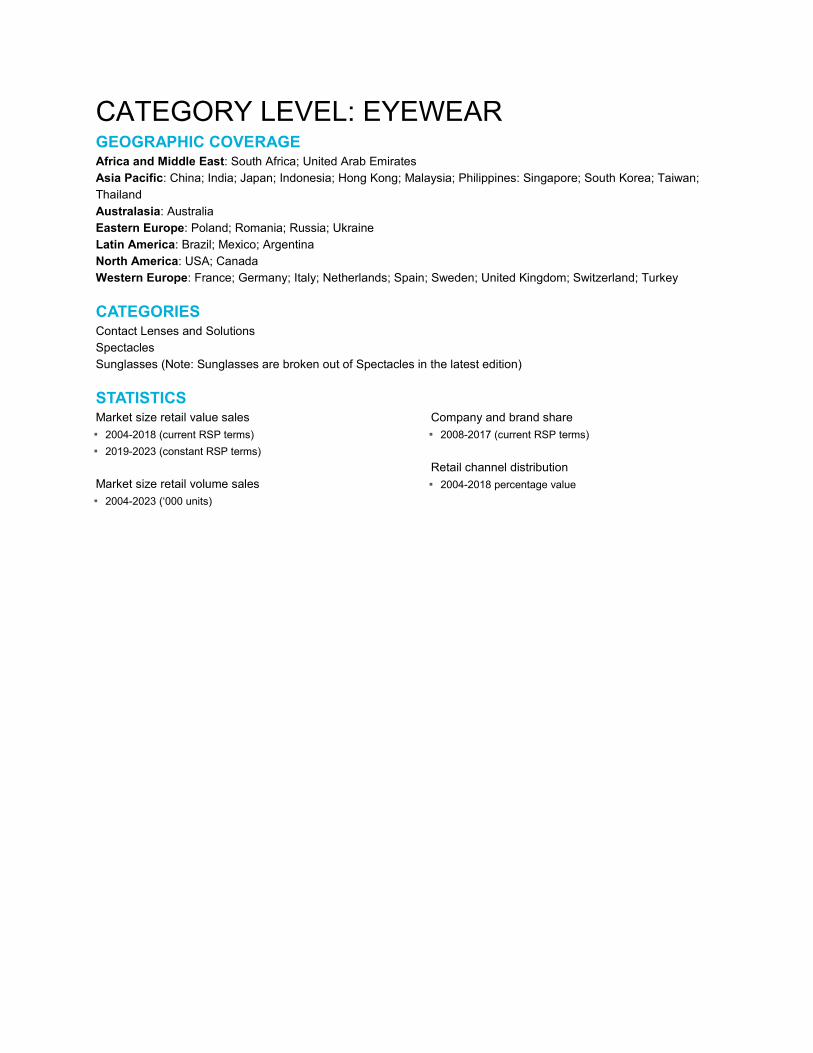
CATEGORY LEVEL: EYEWEAR GEOGRAPHIC COVERAGE Africa and Middle East: South Africa; United Arab Emirates Asia Pacific: China; India; Japan; Indonesia; Hong Kong; Malaysia; Philippines: Singapore; South Korea; Taiwan; Thailand Australasia: Australia Eastern Europe: Poland; Romania; Russia; Ukraine Latin America: Brazil; Mexico; Argentina North America: USA; Canada Western Europe: France; Germany; Italy; Netherlands; Spain; Sweden; United Kingdom; Switzerland; Turkey CATEGORIES Contact Lenses and Solutions Spectacles Sunglasses (Note: Sunglasses are broken out of Spectacles in the latest edition) STATISTICS Market size retail value sales ▪ 2004-2018 (current RSP terms) ▪ 2019-2023 (constant RSP terms) Market size retail volume sales ▪ 2004-2023 (‘000 units)
Company and brand share ▪ 2008-2017 (current RSP terms) Retail channel distribution ▪ 2004-2018 percentage value
CATEGORY LEVEL: FRESH FOOD GEOGRAPHIC COVERAGE* Western Europe: Austria; Belgium; Denmark; Finland; France; Germany; Greece; Ireland; Italy; Netherlands; Norway; Portugal; Spain; Sweden; Switzerland; Turkey; United Kingdom Eastern Europe: Bulgaria; Czech Republic; Hungary; Poland; Romania; Russia; Slovakia; Ukraine North America: Canada; USA Latin America: Argentina; Brazil; Chile; Colombia; Mexico; Peru; Venezuela Asia Pacific: China; Hong Kong, China; India; Indonesia; Japan; Malaysia; Philippines; Singapore; South Korea; Taiwan; Thailand; Vietnam Australasia: Australia; New Zealand Africa and Middle East: Egypt; Israel; Morocco; Saudi Arabia; South Africa; United Arab Emirates *Note: Only 18 key markets are researched with a full individual country research programme, with national-level desk research, trade interviews with statistical sources, associations and national players, and market analysis. These 18 are: Australia, Brazil, China, France, Germany, India, Italy, Japan, Mexico, Morocco, Russia, South Africa, Spain, Thailand, UK, UAE, US and Vietnam. For the additional 36 countries, market sizes are built centrally using secondary source information: estimates are calculated from apparent consumption and derived from production and trade statistics published by the UN Food and Agriculture Organisation (FAO) and local statistical and trade sources. These 38 countries are: Argentina; Austria; Belgium; Bulgaria; Canada; Chile; Colombia; Czech Republic; Denmark; Egypt; Finland; Greece; Hong Kong, China; Hungary; Indonesia; Ireland; Israel; Malaysia; Netherlands; New Zealand; Norway; Peru; Philippines; Poland; Portugal; Romania; Saudi Arabia; Singapore; Slovakia; South Korea; Sweden; Switzerland; Taiwan; Turkey; Ukraine; Venezuela. In addition, we model market data for 156 countries. These are marked on Passport as “modelled”. CATEGORIES Eggs Fish and Seafood Fruits Meat Nuts Pulses Starchy Roots Sugar and Sweeteners Vegetables
STATISTICS Total volume sales 2003-2022 Total volume sales through retail, foodservice and institutional channels** 2008-2017 Retail value sales** 2006-2022
Retail distribution patterns (retail volume, Fresh Food level)** 2008-2017 Analysis by type (standard vs. organic / Fairtrade) for Eggs, Fish and seafood, Fruits, Meat, Nuts, Pulses, Starchy roots and Vegetables (total volume level)** 2012-2017

Retail volume sales breakdown: packaged vs. unpackaged fresh food 2013-2017 Retail value and volume sales of organic products for Eggs, Fish and Seafood, Fruits, Meat, Nuts, Pulses, Starchy Roots and Vegetables**2012-2017
**Note: Data provided for 18 key markets only: Australia, Brazil, China, France, Germany, India, Italy, Japan, Mexico, Morocco, Russia, South Africa, Spain, Thailand, UK, UAE, US and Vietnam
CATEGORY LEVEL: HEALTH AND WELLNESS GEOGRAPHIC COVERAGE Western Europe: Austria, Belgium, Denmark, Finland, France, Germany, Greece, Ireland, Italy, Netherlands, Norway, Spain, Sweden, Switzerland, United Kingdom, Turkey, Portugal Eastern Europe: Bulgaria, Czech Republic, Hungary, Poland, Romania, Russia, Slovakia, Ukraine North America: Canada, USA Latin America: Argentina, Brazil, Chile, Colombia, Mexico, Venezuela, Peru Asia Pacific: China, Hong Kong (China), India, Indonesia, Japan, Malaysia, Philippines, Singapore, South Korea, Taiwan, Thailand, Vietnam Australasia: Australia, New Zealand Middle East and Africa: Egypt, Israel, Morocco, Saudi Arabia, South Africa, UAE Health and Wellness draws on in-depth packaged food and beverages industry research and analysis in 54 national markets. CATEGORIES Health and Wellness by Type Better For You (BFY) Free From Fortified / Functional (FF) Naturally Healthy (NH) Organic Health and Wellness by Category HW Beverages HW Packaged Food Health and Wellness by Prime Positioning and Focus Categories by Key Functional Ingredients Health and Wellness by Prime Positioning Beauty From Within Bone and Joint Health Brain Health and Memory Cardiovascular Health Digestive Health Endurance Energy Boosting Free From
General Wellbeing Immune Support Oral and Respiratory Health Urinary Tract Health Vision Health Weight Management Focus Categories by Key Functional Ingredients FF Dairy-Based Yoghurt FF Milk Formula FF Powder Milk FF Gum FF Margarine and Spreads FF Energy Bars FF Cereal Bars NH Cereal Bars Organic Cereal Bars FF Flavoured Milk Drinks
STATISTICS ▪ Retail value sales (rsp) 2003-2022 ▪ Retail volume sales 2003-2022 ▪ Brand and company shares on all levels 2008-2017
▪ Retail distribution patterns 2003-2017* ▪ Pricing 2015
*Health and wellness distribution patterns include packaged food and beverages organic, fortified / functional, better for you, naturally healthy and free from products.
CATEGORY LEVEL: HOME AND GARDEN GEOGRAPHIC COVERAGE Western Europe: France; Germany; Italy; Netherlands; Spain; Sweden; Switzerland; Turkey; United Kingdom Eastern Europe: Poland; Romania; Russia; Ukraine North America: Canada; USA Latin America: Argentina; Brazil; Mexico Asia Pacific: China; India; Indonesia; Hong Kong; Japan; Malaysia; Philippines; Singapore; South Korea; Taiwan; Thailand Australasia: Australia Africa and Middle East: South Africa; UAE CATEGORIES Gardening Home Furnishings Home Improvement Homewares STATISTICS Retail value sales trends ▪ 2003-2022 ▪ Retail selling price (rsp) Retail volume sales ▪ 2003-2022 ▪ Retail volume (litres) for Decorative Paint ▪ Retail volume (units) for Mattresses Company shares ▪ 2009-2017 ▪ % share, actuals and rankings ▪ by global brand owner and local brand owner
Brand shares ▪ 2009-2017 ▪ % share, actuals and rankings ▪ by global brand name and local brand name Retail distribution patterns ▪ 2003-2017 ▪ % share and actual
CATEGORY LEVEL: HOME CARE GEOGRAPHIC COVERAGE Western Europe: Austria; Belgium; Denmark; Finland; France; Germany; Greece; Ireland; Italy; Netherlands; Norway; Portugal; Spain; Sweden; Switzerland; Turkey; United Kingdom Eastern Europe: Belarus; Bosnia-Herzegovina; Bulgaria; Croatia; Czech Republic; Estonia; Georgia; Hungary; Latvia; Lithuania; Macedonia; Poland; Romania; Russia; Serbia and Montenegro; Slovakia; Slovenia; Ukraine North America: Canada; USA Latin America: Argentina; Bolivia; Brazil; Chile; Colombia; Costa Rica; Dominican Republic; Ecuador; El Salvador*; Guatemala; Honduras*; Mexico; Panama*; Paraguay*; Peru; Uruguay; Venezuela Asia Pacific: Azerbaijan; Bangladesh*; Cambodia*; China; Hong Kong, China; India; Indonesia; Japan; Kazakhstan; Laos*; Malaysia; Myanmar*; Pakistan; Philippines; Singapore; South Korea; Sri Lanka*; Taiwan; Thailand; Uzbekistan; Vietnam Australasia: Australia; New Zealand Africa and Middle East: Algeria; Angola*; Cameroon; Côte d'Ivoire*; Egypt; Ethiopia*; Ghana*; Iraq*; Israel; Jordan*; Kenya; Kuwait*; Lebanon*; Morocco; Nigeria; Oman*; Saudi Arabia; South Africa; Tanzania*; Tunisia; United Arab Emirates *researched data and analysis for these countries will be available as of December 2017 CATEGORIES Air care Bleach Dishwashing Home Insecticides
Laundry Care Polishes Surface Care Toilet Care
STATISTICS Retail value sales trends ▪ 2002-2021 ▪ Manufacturer selling price (msp) and retail selling price
(rsp) Retail volume sales trends ▪ 2002-2021 Company shares ▪ 2007-2016 ▪ % share, actuals and rankings ▪ volume shares for 10 key laundry care categories,
including: powder detergents (concentrated / standard format), liquid detergents(concentrated / standard format), compact powder tablet detergents, liquid tablet detergents, hand wash detergents, bar detergents and fabric softeners
▪ by global brand owner and local brand owner ▪ Private label share split by retailer
Brand shares ▪ 2007-2016 ▪ % share, actuals and rankings ▪ volume shares for 10 key laundry care categories,
including: powder detergents (concentrated / standard format), liquid detergents (concentrated / standard format), compact powder tablet detergents, liquid tablet detergents, hand wash detergents, bar detergents and fabric softeners by global brand name and local brand name
▪ Private label share split by retailer brand ▪ Average recommended dosage by brand across 10 key
laundry care categories over 55 markets (2014-2016) Retail distribution patterns ▪ 2002-2016 Pricing ▪ 2015-2016
CATEGORY LEVEL: HOT DRINKS GEOGRAPHIC COVERAGE Western Europe: Austria; Belgium; Denmark; Finland; France; Germany; Greece; Ireland; Italy; Netherlands; Norway; Portugal; Spain; Sweden; Switzerland; Turkey; United Kingdom Eastern Europe: Belarus; Bosnia-Herzegovina; Bulgaria; Croatia; Czech Republic; Estonia; Georgia; Hungary; Latvia; Lithuania; Macedonia; Poland; Romania; Russia; Serbia; Slovakia; Slovenia; Ukraine North America: Canada; USA Latin America: Argentina; Bolivia; Brazil; Chile; Colombia; Costa Rica; Dominican Republic; Ecuador; El Salvador; Guatemala; Honduras; Mexico; Panama; Paraguay; Peru; Uruguay; Venezuela Asia Pacific: Azerbaijan; Bangladesh; Cambodia; China; Hong Kong, China; India; Indonesia; Japan; Kazakhstan; Laos; Malaysia; Myanmar; Pakistan; Philippines; Singapore; South Korea; Sri Lanka; Taiwan; Thailand; Uzbekistan; Vietnam Australasia: Australia; New Zealand Africa and Middle East: Algeria; Angola; Cameroon; Côte d'Ivoire; Egypt; Ethiopia; Ghana; Iraq; Israel; Jordan; Kenya; Kuwait; Lebanon; Morocco; Nigeria; Oman; Saudi Arabia; South Africa; Tanzania; Tunisia; United Arab Emirates CATEGORIES Coffee TeaOther Hot Drinks STATISTICS Off-trade value historic sales trends ▪ 2003-2022 ▪ Manufacturer selling price (msp) and retail selling price
(rsp) Off-trade value forecast sales trends ▪ 2017-2022 ▪ Manufacturer selling price (msp) and retail selling price
(rsp) Volume historic sales trends ▪ 2003-2017 ▪ Off-trade, on-trade and total volume Volume forecast sales trends ▪ 2017-2022 ▪ Off-trade, on-trade and total volume Company shares ▪ 2008-2017 ▪ % and actual
▪ value terms share analysis for all sectors ▪ additional volume terms share analysis for coffee ▪ global brand owner and local brand owner Brand shares ▪ 2008-2017 ▪ % and actual ▪ value terms share analysis for all sectors ▪ additional volume terms share analysis for coffee ▪ by global brand name and local brand name Off-trade distribution patterns ▪ 2004-2017 ▪ off-trade volume % breakdown and actual ▪ Measures ▪ 2008-2017 ▪ Hard vs. soft coffee pods Pricing ▪ 2016, 2017
CATEGORY LEVEL: INGREDIENTS [THIS PREMIUM INDUSTRY CAN BE ADDED TO CATEGORY LEVEL] GEOGRAPHIC COVERAGE Western Europe: Austria; Belgium; Denmark; Finland; France; Germany; Greece; Ireland; Italy; Netherlands; Norway; Portugal; Spain; Sweden; Switzerland; Turkey; United Kingdom Eastern Europe: Belarus; Bosnia-Herzegovina; Bulgaria; Croatia; Czech Republic; Estonia; Georgia; Hungary; Latvia; Lithuania; Macedonia; Poland; Romania; Russia; Serbia and Montenegro; Slovakia; Slovenia; Ukraine North America: Canada; USA Latin America: Argentina; Bolivia; Brazil; Chile; Colombia; Costa Rica; Dominican Republic; Ecuador; Guatemala; Mexico; Peru; Uruguay; Venezuela Asia Pacific: Azerbaijan; China; Hong Kong, China; India; Indonesia; Japan; Kazakhstan; Malaysia; Pakistan; Philippines; Singapore; South Korea; Taiwan; Thailand; Uzbekistan; Vietnam Australasia: Australia; New Zealand Africa and Middle East: Algeria; Cameroon; Egypt; Israel; Kenya; Morocco; Nigeria; Saudi Arabia; South Africa; Tunisia; United Arab Emirates CATEGORIES Abrasives / inorganics Acidulants Antifoams Antifungals Antimicrobials Antiperspirants Bleach Precursors Bleaching Agents Botanicals Carotenoids Cocoa Liquor Cocoa Powder Colours Conditioning Agents (Skin, Hair, Fabric) Cultures Emollients Emulsifiers and Co-Emulsifiers Enzyme Stabilisers Enzymes Fats and Oils Flavours Flavour Enhancers Flours Fluorescers Fragrances Humectants Insect Repellents
Insecticides Lacquers Milk Minerals Modified Flour pH Control / Salts Polysaccharides and Oligosaccharides Phytoestrogens Preservatives / Antioxidants Propellants Proteins Raising Agents Reducing Agents Skin Benefit Agents Skin Lighteners Skin Tanning Agents Solvents Sunscreens Surfactant Cleansers and Adjuvants Sweeteners Synthetic Polymers, Homopolymers and Copolymers Thickeners / Structurants Tooth Care Vitamins and Derivatives Water Softeners / Chelators Miscellaneous Ingredients Commodities
STATISTICS Volume sales trends ▪ 2004-2022 ▪ Retail and foodservice / on-trade data for all food and beverages categories

CATEGORY LEVEL: INSTITUTIONAL CHANNELS [THIS PREMIUM INDUSTRY CAN BE ADDED TO CATEGORY LEVEL] GEOGRAPHIC COVERAGE Western Europe: Denmark; France; Germany; Italy; Netherlands; Norway; Spain; Sweden; Turkey; United Kingdom Eastern Europe: Poland; Russia North America: Canada; USA Latin America: Argentina; Brazil; Mexico Asia Pacific: China; India; Indonesia; Japan; Malaysia; Philippines; South Korea; Taiwan; Thailand; Vietnam Australasia: Australia Africa and Middle East: South Africa; United Arab Emirates CATEGORIES Agriculture, Hunting, Forestry and Fishing Energy, Mining and Utilities Manufacturing Construction Retail and Wholesale Retail Wholesale Official Accommodation Food and Beverage Services Restaurants and Bars Event Catering and Contract Foodservice Transport and Communications Airports Other Transport Finance, Insurance and Business Services Financial Intermediation Insurance Business Services Government Government Administration Foreign Affairs Defence Military Public Order and Safety Police Stations Fire Stations Prisons and Detention Centres Other Public Order and Safety Education Primary Education Secondary Education Higher Education Adult and Other Education Health and Social Care
Hospitals, Medical and Dental Services Hospitals Medical Practice Dental Practice Other Health Services Residential Care Residential Care Facilities for the Elderly Other Residential Care Veterinary Services Social Work Services Child Day Care Other Social Work Services Arts, Entertainment and Recreation Motion Picture, Radio, Television, News Agency Activities and Other Entertainment Activities Cinemas Theatre and Music Production Theme Parks Other Entertainment Activities Libraries, Museums and Cultural Services Libraries Museums Zoos and Botanical Gardens Sporting and Recreational Services Sports Arenas and Stadiums Sport Clubs and Gyms Other Sports Facilities Lotteries and Gambling Membership Organisations Religious Organisations Other Non-Religious Membership Organisations Personal Services Washing and Cleaning Hairdressing and Beauty Treatment Funeral and Related Services
Other Personal Services STATISTICS Establishments ▪ 2002-2021 ▪ Outlets ▪ Establishment breakdowns, public sector vs. private sector ▪ Establishment breakdowns by size Populations ▪ 2002-2021 ▪ Employees ▪ Prisoners (prisons and detention centres) ▪ Enrolment (primary schools, secondary schools, higher
education)
▪ Capacity (sports arenas and stadiums) ▪ Visitors (cinemas, theatre and music production, theme
parks, museums, zoos and botanical gardens) ▪ In-Patient admissions (hospitals) ▪ In-patient beds (hospitals)Occupancy (hospitals, prisons
and detention centres) ▪ Out-patient contacts (hospitals) ▪ Average length of stay (hospitals) ▪ Residents (residential care facilities for the elderly, other
residential care)
CATEGORY LEVEL: LUXURY GOODS [THIS PREMIUM INDUSTRY CAN BE ADDED TO CATEGORY LEVEL] GEOGRAPHIC COVERAGE Western Europe: France; Germany; Italy; Netherlands; Spain; Sweden; Turkey; United Kingdom; Switzerland Eastern Europe: Poland; Russia, Romania, Ukraine North America: Canada; USA Latin America: Brazil; Mexico, Argentina Asia Pacific: China; Hong Kong; India; Indonesia; Japan; Malaysia; Philippines, Singapore; South Korea; Taiwan, Thailand Australasia: Australia Africa and Middle East: South Africa; UAE CATEGORIES Designer Apparel and Footwear (Ready-to-Wear) Fine Wines / Champagne and Spirits Luxury Cars Luxury Eyewear Luxury Foodservice Luxury Hotel
Luxury Jewellery Luxury Leather Goods Luxury Portable Consumer Electronics Luxury Timepieces Luxury Writing Instruments and Stationery Super Premium Beauty and Personal Care
STATISTICS Retail value sales trends ▪ 2005-2023 ▪ Retail selling price (rsp) Retail volume sales trends ▪ 2005-2023 Company shares ▪ 2008-2017 ▪ % share, actuals and rankings by global brand owner and
local brand owner
Brand shares ▪ 2008-2017 ▪ % share, actuals and rankings by global brand name and
local brand name Retail distribution patterns ▪ 2005-2018 ▪ % share and actual
CATEGORY LEVEL: NUTRITION [THIS PREMIUM INDUSTRY CAN BE ADDED TO CATEGORY LEVEL] GEOGRAPHIC COVERAGE Western Europe: Austria, Belgium; Denmark, Finland; France; Germany; Greece; Ireland; Italy; Netherlands; Norway; Portugal; Spain; Sweden; Switzerland; Turkey; United Kingdom Eastern Europe: Bulgaria; Czech Republic, Hungary; Poland; Romania, Russia, Slovakia; Ukraine North America: Canada; USA Latin America: Argentina; Brazil; Chile; Colombia, Mexico, Peru; Venezuela Asia Pacific: China; Hong Kong, India; Indonesia, Japan; Malaysia; Philippines, Singapore; South Korea; Taiwan, Thailand, Vietnam Australasia: Australia; New Zealand Africa and Middle East: Egypt, Israel, Morocco, Saudi Arabia, South Africa, United Arab Emirates CATEGORY COVERAGE Nutrient types Energy (calories) Protein Carbohydrate Sugar Fat Saturated Fat Fibre Salt All eight of these nutrients have been researched for the packaged food, soft drink, drink categories listed below in each of the 54 countries that Passport Nutrition covers. Alcoholic Drinks Beer Cider / Perry RTDs / High-Strength Premixes Spirits Wine Fresh Food Eggs Fish and Seafood Fruits Meat Nuts Pulses Starchy Roots Sugar and Sweeteners Vegetables Soft Drinks Bottled Water Carbonates Concentrates Juice
RTD Coffee RTD Tea Sports and Energy Drinks Asian Speciality Drinks Packaged Food Baby Food Baked Goods Breakfast Cereals Confectionery Dairy Edible Oils Ice Cream and Frozen Desserts Processed Fruit and Vegetables Processed Meat and Seafood Ready Meals Rice, Pasta and Noodles Sauces, Dressings and Condiments Soup Savoury Snacks Spreads Sweet Biscuits, Snack Bars and Fruit Snacks
STATISTICS Nutrient consumption trends ▪ 2009-2021 ▪ Grams or calories per capita per day ▪ Annual total Company shares ▪ 2014-2016 ▪ % share, actuals and rankings ▪ by global brand owner and local brand owner
Brand shares ▪ 2014-2016 ▪ % share, actuals and rankings ▪ by global brand name and local brand name Nutrient Content per 100g ▪ 2014-2016 ▪ Nutrient content per 100g of each brand researched ▪ Available at the lowest category and country level only
CATEGORY LEVEL: PACKAGED FOOD GEOGRAPHIC COVERAGE Western Europe: Austria; Belgium; Denmark; Finland; France; Germany; Greece; Ireland; Italy; Netherlands; Norway; Portugal; Spain; Sweden; Switzerland; Turkey; United Kingdom Eastern Europe: Belarus; Bosnia-Herzegovina; Bulgaria; Croatia; Czech Republic; Estonia; Georgia; Hungary; Latvia; Lithuania; Macedonia; Poland; Romania; Russia; Serbia; Slovakia; Slovenia; Ukraine North America: Canada; USA Latin America: Argentina; Bolivia; Brazil; Chile; Colombia; Costa Rica; Dominican Republic; Ecuador; El Salvador*; Guatemala; Honduras*; Mexico; Panama*; Paraguay*; Peru; Uruguay; Venezuela Asia Pacific: Azerbaijan; Bangladesh*; Cambodia*; China; Hong Kong, China; India; Indonesia; Japan; Kazakhstan; Laos*; Malaysia; Myanmar*; Pakistan; Philippines; Singapore; South Korea; Sri Lanka*; Taiwan; Thailand; Uzbekistan; Vietnam Australasia: Australia; New Zealand Africa and Middle East: Algeria; Angola*; Cameroon; Côte d'Ivoire*; Egypt; Ethiopia*; Ghana*; Iraq*; Israel; Jordan*; Kenya; Kuwait*; Lebanon*; Morocco; Nigeria; Oman*; Qatar*; Saudi Arabia; South Africa; Tanzania*; Tunisia; Uganda; United Arab Emirates *researched data for these countries will be available as of October 2018, and analysis will follow. CATEGORIES Baby Food Baked Goods Breakfast Cereals Confectionery Chocolate Confectionery Gum Sugar Confectionery Dairy Butter and Spreads Cheese Drinking Milk Products Yoghurt and Sour Milk Products Other Dairy
Edible Oils Ice Cream and Frozen Desserts Processed Fruit and Vegetables Processed Meat and Seafood Ready Meals Rice, Pasta and Noodles Sauces, Dressings and Condiments Savoury Snacks Soup Sweet Spreads Sweet Biscuits, Snack Bars and Fruit Snacks
STATISTICS Retail value sales trends ▪ 2004-2023 ▪ manufacturer selling price (msp) and retail selling price
(rsp) Retail and foodservice volume sales trends ▪ 2004-2023 Company shares ▪ 2009-2018 ▪ % share and actual ▪ by global brand owner and local brand owner Brand shares* ▪ 2009-2018
▪ % share and actual ▪ by global brand name and local brand name Retail distribution patterns ▪ 2004-2018 ▪ % share and actual Pricing ▪ 2018 Market sizes ▪ Market sizes from 2004 to 2018, with forecast data through
2023 City Reports for Bangalore, Beijing, Calcutta, Delhi, Kunming, Shanghai

Market size data covering all packaged food categories, including baby food, baked goods, sweet biscuits, snack bars and fruit snacks, breakfast cereals, chocolate confectionery, sugar confectionery, gum, cheese, drinking milk products, yoghurt and sour milk products, other dairy, ice cream and frozen desserts, processed fruit and vegetables, processed meat and seafood, ready meals, rice, pasta and noodles, sauces, dressings and condiments, soup, spreads, savoury snacks. * Retail share and actual only for 80 markets on higher hierarchy level.
CATEGORY LEVEL: PACKAGING GEOGRAPHIC COVERAGE Africa and Middle East: Egypt; Israel; Morocco; Saudi Arabia*; South Africa*; United Arab Emirates* Asia Pacific: China*; Hong Kong, China*; India*; Indonesia*; Japan*; Malaysia*; Philippines*; Singapore*; South Korea*; Taiwan; Thailand*; Vietnam* Australasia: Australia*; New Zealand Eastern Europe: Bulgaria; Czech Republic; Hungary; Poland*; Romania*; Russia*; Slovakia; Ukraine* North and Latin America: Argentina*; Brazil*; Canada*; Chile; Colombia*; Mexico*; Peru; US*; Venezuela Western Europe: Austria; Belgium; Denmark; Finland; France*; Germany*; Greece; Ireland; Italy*; Netherlands*; Norway; Portugal; Spain*; Sweden*; Switzerland*; Turkey*; UK* *Individually researched packaging markets Packaging draws on in-depth packaging industry research and analysis in 34 national markets (all those marked with an asterisk above), along with centralised research and analysis for 20 additional countries. The end product markets in all 54 of these countries are individually researched, providing the highly detailed product sales data on which packaging mix trends are based. All pack types and sizes of end products in each of the 34 countries are researched. CATEGORY TREE Beauty and Personal Care Packaging Baby and Child-Specific Products Packaging Bath and Shower Packaging Colour Cosmetics Packaging Deodorants Packaging Depilatories Packaging Fragrances Packaging Hair Care Packaging Men’s Grooming Packaging Oral Care Packaging Skin Care Packaging Adult Sun Care Packaging Beverages Packaging Alcoholic Drinks Packaging Hot Drinks Packaging Soft Drinks Packaging Dog and Cat Food Packaging Cat Food Dog Food Food Packaging Baby Food Packaging Baked Goods Packaging Breakfast Cereals Packaging
Confectionery Packaging Dairy Packaging Edible Oils Packaging Ice Cream and Frozen Desserts Packaging Processed Fruit and Vegetables Packaging Processed Meat and Seafood Packaging Ready Meals Packaging Rice, Pasta and Noodles Packaging Sauces, Dressings and Condiments Packaging Savoury Snacks Packaging Soup Packaging Spreads Packaging Sweet Biscuits, Snack Bars and Fruit Snacks Packaging Home Care Packaging Air Care Bleach Dishwashing Home Insecticides Laundry Care Polishes Surface Care Toilet Care
STATISTICS Retail packaging volume sales trends ▪ 2003-2022 ▪ alcoholic drinks packaging; beauty and personal care packaging; dog and cat food packaging*; food packaging;
home care packaging; hot drinks packaging; soft drinks packaging; ▪ packaging unit volumes and product filled volumes by pack type
▪ by packaging class (ie primary, secondary) ▪ by pack size, and by pack size band ▪ metric measures and imperial as relevant Foodservice packaging volume sales trends ▪ 2003-2022 ▪ alcoholic drinks packaging; beauty and personal care packaging; dog and cat food packaging*; food packaging; home care packaging; hot drinks packaging; soft drinks packaging; ▪ packaging unit volumes and product filled volumes by pack type ▪ by packaging class (ie primary, secondary) ▪ by pack size, and by pack size band ▪ metric measures and imperial as relevant Closure volume sales trends ▪ 2006-2022 ▪ alcoholic drinks packaging; beauty and personal care packaging; dog and cat food packaging*; food packaging; home care packaging; hot drinks packaging; soft drinks packaging;
▪ packaging unit volumes and product filled volumes by pack type ▪ by packaging class (ie primary, secondary) ▪ by pack size, and by pack size band ▪ metric measures and imperial as relevant Retail multipack volume sales trends ▪ 2006-2022 ▪ alcoholic drinks packaging; dairy packaging; soft drinks packaging ▪ multipack unit and case volumes by multipack type and multipack size, by pack type Returnables volumes ▪ Retail / off-trade and foodservice / on-trade data for returnable glass bottles and PET bottles ▪ 2006-2022 ▪ alcoholic drinks packaging; soft drinks packaging ▪ share of returnable versus non-returnable packaging, unit volumes
* For dog and cat food packaging, retail packaging volumes are available from 2003-2022 and closure volumes from 2006-2022
CATEGORY LEVEL: PERSONAL ACCESSORIES GEOGRAPHIC COVERAGE Africa and Middle East: South Africa; United Arab Emirates Asia Pacific: China; India; Japan; Indonesia; Hong Kong; Malaysia; Philippines: Singapore; South Korea; Taiwan; Thailand Australasia: Australia Eastern Europe: Poland; Romania; Russia; Ukraine Latin America: Brazil; Mexico; Argentina North America: USA; Canada Western Europe: France; Germany; Italy; Netherlands; Spain; Sweden; United Kingdom; Switzerland; Turkey CATEGORIES Bags and Luggage Jewellery
Watches Writing Instruments
STATISTICS Market size retail value sales ▪ 2004-2018 (current RSP terms) ▪ 2019-2023(constant RSP terms) Market size retail volume sales ▪ 2004-2023 (‘000 units)
Company and brand share ▪ 2008-2017 (current RSP terms) Retail channel distribution ▪ 2004-2018 percentage value
CATEGORY LEVEL: PET CARE GEOGRAPHIC COVERAGE Western Europe: Austria; Belgium; Denmark; Finland; France; Germany; Greece; Ireland; Italy; Netherlands; Norway; Portugal; Spain; Sweden; Switzerland; Turkey; United Kingdom Eastern Europe: Bulgaria; Czech Republic; Hungary; Poland; Romania; Russia; Slovakia; Ukraine North America: Canada; USA Latin America: Argentina; Brazil; Chile; Colombia; Mexico; Peru; Venezuela Asia Pacific: China; Hong Kong, China; India; Indonesia; Japan; Malaysia; Philippines; Singapore; South Korea; Taiwan; Thailand; Vietnam Australasia: Australia; New Zealand Africa and Middle East: Egypt; Israel; Morocco; Saudi Arabia; South Africa; UAE CATEGORIES Pet Food Dog and Cat Food Cat Food
Dog Food Other Pet Food Pet Products
STATISTICS Pet population ▪ 2004-2023 ▪ broken down by dogs, cats, birds, fish, small mammals
and reptiles ▪ dog population broken down by size (large, medium and
small) Prepared food as % of total consumption for dogs and cats ▪ 2004-2018 Retail value sales trends ▪ 2004-2023 ▪ manufacturer selling price (msp) and retail selling price
(rsp) Retail volume sales trends (excluding pet products) ▪ 2004-2023 Per pet expenditure and consumption trends ▪ 2004-2018 Number of vets ▪ 2004-2018 Number of vet clinics for pets ▪ 2004-2018 Proportion of households owning a dog / cat ▪ 2004-2018
Pricing ▪ 2017; 2018 Company shares for dog food, cat food, cat litter ▪ 2008-2017 ▪ % value share and actual ▪ by global brand owner and local brand owner ▪ shares for other pet food and pet products provided on an
as available basis Brand shares for dog food, cat food, cat litter ▪ 2008-2017 ▪ % value share and actual ▪ by global brand name and local brand name ▪ shares for other pet food and pet products provided on an
as available basis Retail distribution patterns ▪ 2004-2018 ▪ % value share and actual ▪ includes breakdown for dog / cat food by type (eg. wet /
dry / treats / mixers) Healthcare products by type ▪ 2008-2018 ▪ % value share and actual ▪ includes breakdown for flea / tick treatments, worming
treatments, and other products

Dog and cat food by life-cycle ▪ 2012-2018 ▪ % value share and actual ▪ Broken down by wet versus dry food
Other pet products by type ▪ 2014-2018 ▪ % value share and actual ▪ Broken down by beauty products, accessories and other
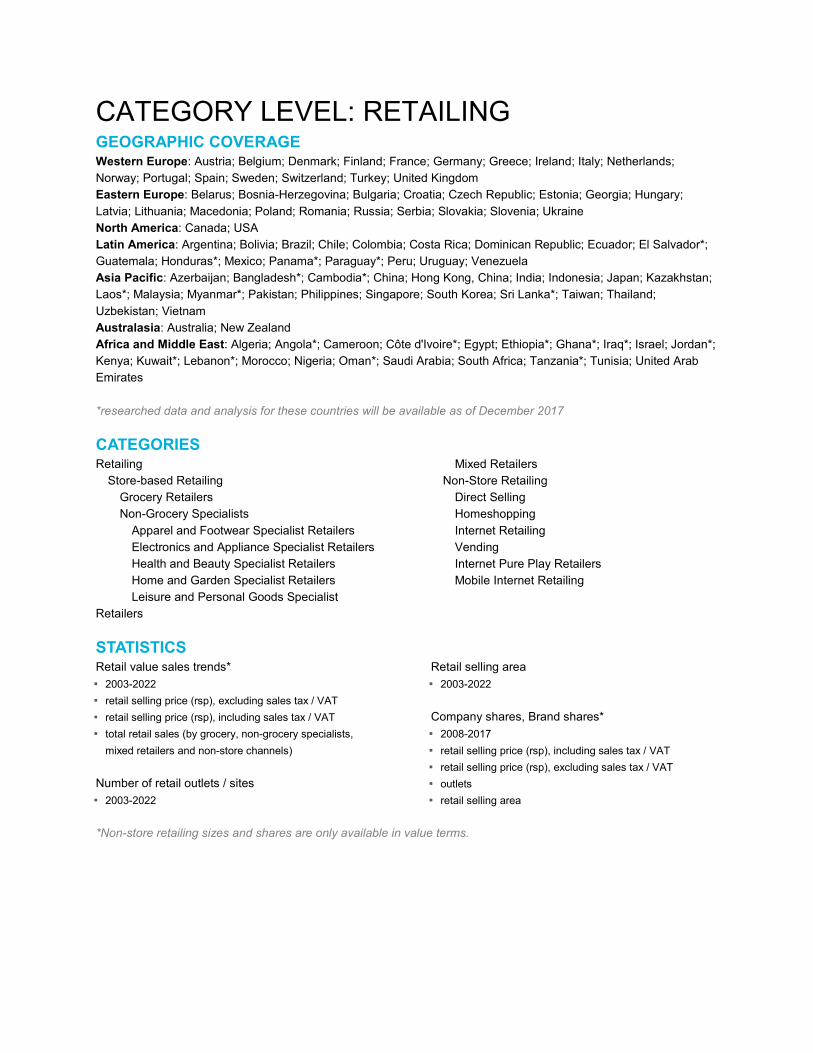
CATEGORY LEVEL: RETAILING GEOGRAPHIC COVERAGE Western Europe: Austria; Belgium; Denmark; Finland; France; Germany; Greece; Ireland; Italy; Netherlands; Norway; Portugal; Spain; Sweden; Switzerland; Turkey; United Kingdom Eastern Europe: Belarus; Bosnia-Herzegovina; Bulgaria; Croatia; Czech Republic; Estonia; Georgia; Hungary; Latvia; Lithuania; Macedonia; Poland; Romania; Russia; Serbia; Slovakia; Slovenia; Ukraine North America: Canada; USA Latin America: Argentina; Bolivia; Brazil; Chile; Colombia; Costa Rica; Dominican Republic; Ecuador; El Salvador*; Guatemala; Honduras*; Mexico; Panama*; Paraguay*; Peru; Uruguay; Venezuela Asia Pacific: Azerbaijan; Bangladesh*; Cambodia*; China; Hong Kong, China; India; Indonesia; Japan; Kazakhstan; Laos*; Malaysia; Myanmar*; Pakistan; Philippines; Singapore; South Korea; Sri Lanka*; Taiwan; Thailand; Uzbekistan; Vietnam Australasia: Australia; New Zealand Africa and Middle East: Algeria; Angola*; Cameroon; Côte d'Ivoire*; Egypt; Ethiopia*; Ghana*; Iraq*; Israel; Jordan*; Kenya; Kuwait*; Lebanon*; Morocco; Nigeria; Oman*; Saudi Arabia; South Africa; Tanzania*; Tunisia; United Arab Emirates *researched data and analysis for these countries will be available as of December 2017 CATEGORIES Retailing Store-based Retailing Grocery Retailers Non-Grocery Specialists Apparel and Footwear Specialist Retailers Electronics and Appliance Specialist Retailers Health and Beauty Specialist Retailers Home and Garden Specialist Retailers Leisure and Personal Goods Specialist Retailers
Mixed Retailers Non-Store Retailing Direct Selling Homeshopping Internet Retailing Vending Internet Pure Play Retailers Mobile Internet Retailing
STATISTICS Retail value sales trends* ▪ 2003-2022 ▪ retail selling price (rsp), excluding sales tax / VAT ▪ retail selling price (rsp), including sales tax / VAT ▪ total retail sales (by grocery, non-grocery specialists,
mixed retailers and non-store channels) Number of retail outlets / sites ▪ 2003-2022
Retail selling area ▪ 2003-2022 Company shares, Brand shares* ▪ 2008-2017 ▪ retail selling price (rsp), including sales tax / VAT ▪ retail selling price (rsp), excluding sales tax / VAT ▪ outlets ▪ retail selling area
*Non-store retailing sizes and shares are only available in value terms.
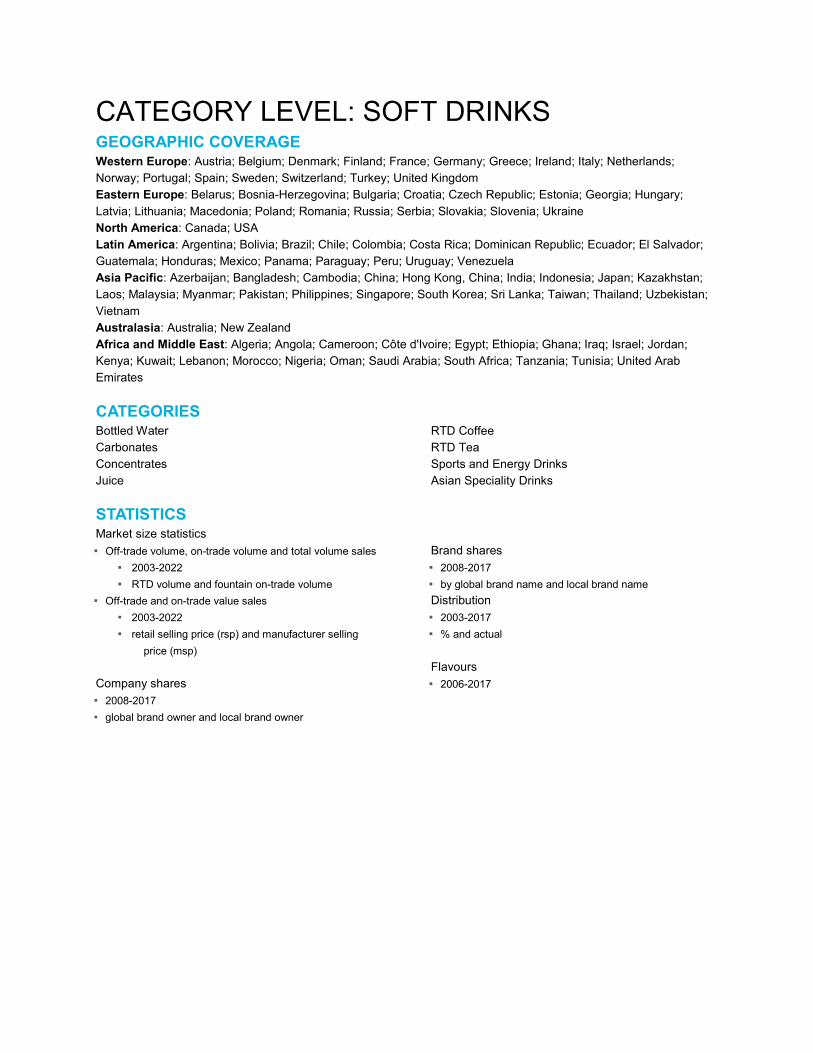
CATEGORY LEVEL: SOFT DRINKS GEOGRAPHIC COVERAGE Western Europe: Austria; Belgium; Denmark; Finland; France; Germany; Greece; Ireland; Italy; Netherlands; Norway; Portugal; Spain; Sweden; Switzerland; Turkey; United Kingdom Eastern Europe: Belarus; Bosnia-Herzegovina; Bulgaria; Croatia; Czech Republic; Estonia; Georgia; Hungary; Latvia; Lithuania; Macedonia; Poland; Romania; Russia; Serbia; Slovakia; Slovenia; Ukraine North America: Canada; USA Latin America: Argentina; Bolivia; Brazil; Chile; Colombia; Costa Rica; Dominican Republic; Ecuador; El Salvador; Guatemala; Honduras; Mexico; Panama; Paraguay; Peru; Uruguay; Venezuela Asia Pacific: Azerbaijan; Bangladesh; Cambodia; China; Hong Kong, China; India; Indonesia; Japan; Kazakhstan; Laos; Malaysia; Myanmar; Pakistan; Philippines; Singapore; South Korea; Sri Lanka; Taiwan; Thailand; Uzbekistan; Vietnam Australasia: Australia; New Zealand Africa and Middle East: Algeria; Angola; Cameroon; Côte d'Ivoire; Egypt; Ethiopia; Ghana; Iraq; Israel; Jordan; Kenya; Kuwait; Lebanon; Morocco; Nigeria; Oman; Saudi Arabia; South Africa; Tanzania; Tunisia; United Arab Emirates CATEGORIES Bottled Water Carbonates Concentrates Juice
RTD Coffee RTD Tea Sports and Energy Drinks Asian Speciality Drinks
STATISTICS Market size statistics ▪ Off-trade volume, on-trade volume and total volume sales
▪ 2003-2022 ▪ RTD volume and fountain on-trade volume
▪ Off-trade and on-trade value sales ▪ 2003-2022 ▪ retail selling price (rsp) and manufacturer selling
price (msp) Company shares ▪ 2008-2017 ▪ global brand owner and local brand owner
Brand shares ▪ 2008-2017 ▪ by global brand name and local brand name Distribution ▪ 2003-2017 ▪ % and actual Flavours ▪ 2006-2017
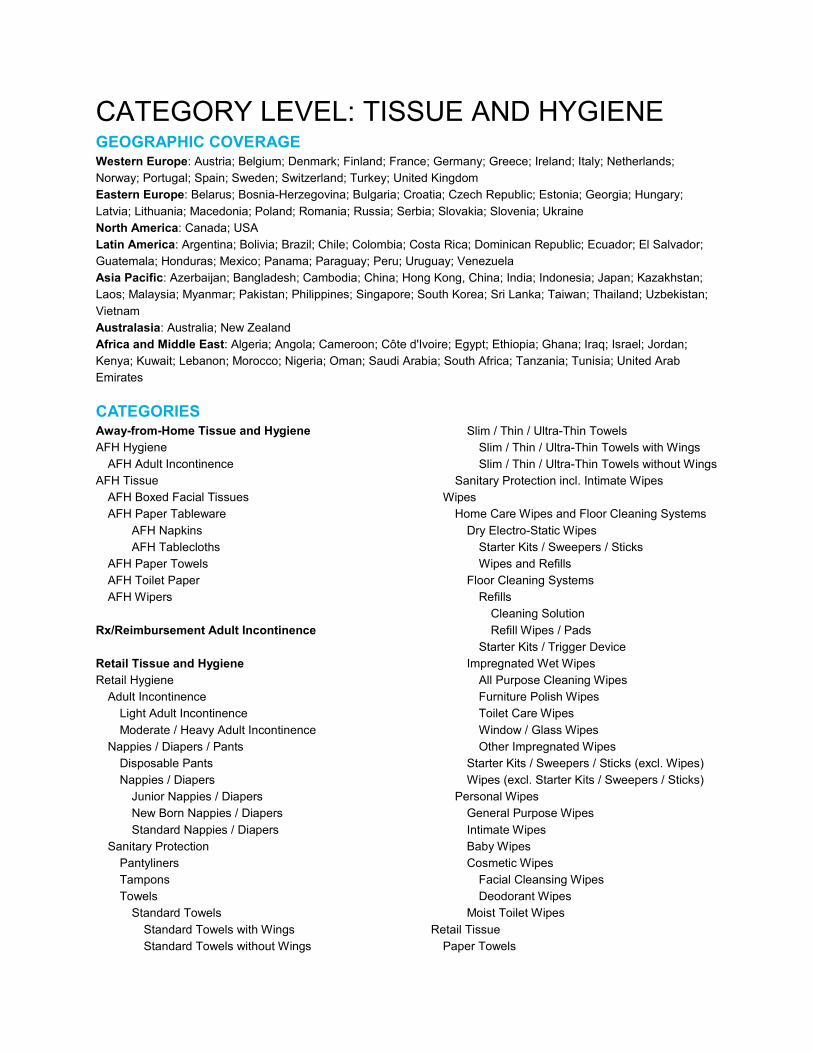
CATEGORY LEVEL: TISSUE AND HYGIENE GEOGRAPHIC COVERAGE Western Europe: Austria; Belgium; Denmark; Finland; France; Germany; Greece; Ireland; Italy; Netherlands; Norway; Portugal; Spain; Sweden; Switzerland; Turkey; United Kingdom Eastern Europe: Belarus; Bosnia-Herzegovina; Bulgaria; Croatia; Czech Republic; Estonia; Georgia; Hungary; Latvia; Lithuania; Macedonia; Poland; Romania; Russia; Serbia; Slovakia; Slovenia; Ukraine North America: Canada; USA Latin America: Argentina; Bolivia; Brazil; Chile; Colombia; Costa Rica; Dominican Republic; Ecuador; El Salvador; Guatemala; Honduras; Mexico; Panama; Paraguay; Peru; Uruguay; Venezuela Asia Pacific: Azerbaijan; Bangladesh; Cambodia; China; Hong Kong, China; India; Indonesia; Japan; Kazakhstan; Laos; Malaysia; Myanmar; Pakistan; Philippines; Singapore; South Korea; Sri Lanka; Taiwan; Thailand; Uzbekistan; Vietnam Australasia: Australia; New Zealand Africa and Middle East: Algeria; Angola; Cameroon; Côte d'Ivoire; Egypt; Ethiopia; Ghana; Iraq; Israel; Jordan; Kenya; Kuwait; Lebanon; Morocco; Nigeria; Oman; Saudi Arabia; South Africa; Tanzania; Tunisia; United Arab Emirates CATEGORIES Away-from-Home Tissue and Hygiene AFH Hygiene AFH Adult Incontinence AFH Tissue AFH Boxed Facial Tissues AFH Paper Tableware AFH Napkins AFH Tablecloths AFH Paper Towels AFH Toilet Paper AFH Wipers Rx/Reimbursement Adult Incontinence Retail Tissue and Hygiene Retail Hygiene Adult Incontinence Light Adult Incontinence Moderate / Heavy Adult Incontinence Nappies / Diapers / Pants Disposable Pants Nappies / Diapers Junior Nappies / Diapers New Born Nappies / Diapers Standard Nappies / Diapers Sanitary Protection Pantyliners Tampons Towels Standard Towels Standard Towels with Wings Standard Towels without Wings
Slim / Thin / Ultra-Thin Towels Slim / Thin / Ultra-Thin Towels with Wings Slim / Thin / Ultra-Thin Towels without Wings Sanitary Protection incl. Intimate Wipes Wipes Home Care Wipes and Floor Cleaning Systems Dry Electro-Static Wipes Starter Kits / Sweepers / Sticks Wipes and Refills Floor Cleaning Systems Refills Cleaning Solution Refill Wipes / Pads Starter Kits / Trigger Device Impregnated Wet Wipes All Purpose Cleaning Wipes Furniture Polish Wipes Toilet Care Wipes Window / Glass Wipes Other Impregnated Wipes Starter Kits / Sweepers / Sticks (excl. Wipes) Wipes (excl. Starter Kits / Sweepers / Sticks) Personal Wipes General Purpose Wipes Intimate Wipes Baby Wipes Cosmetic Wipes Facial Cleansing Wipes Deodorant Wipes Moist Toilet Wipes Retail Tissue Paper Towels
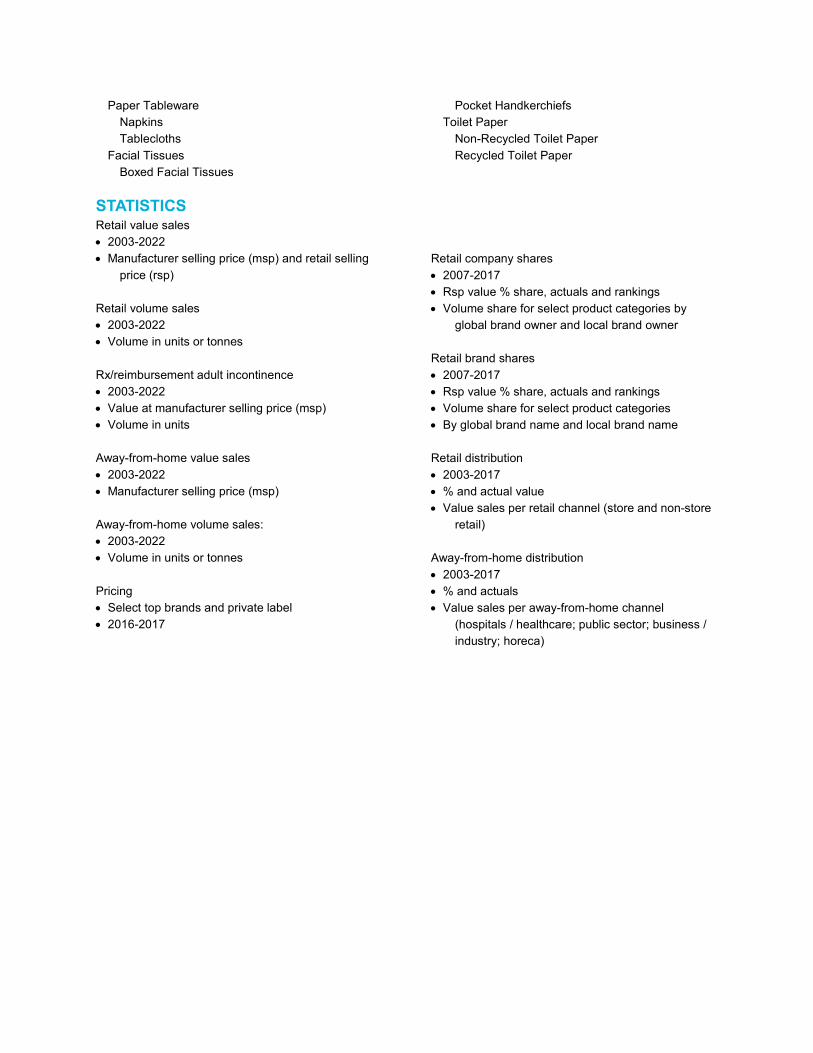
Paper Tableware Napkins Tablecloths Facial Tissues Boxed Facial Tissues
Pocket Handkerchiefs Toilet Paper Non-Recycled Toilet Paper Recycled Toilet Paper
STATISTICS Retail value sales • 2003-2022 • Manufacturer selling price (msp) and retail selling
price (rsp) Retail volume sales • 2003-2022 • Volume in units or tonnes Rx/reimbursement adult incontinence • 2003-2022 • Value at manufacturer selling price (msp) • Volume in units Away-from-home value sales • 2003-2022 • Manufacturer selling price (msp) Away-from-home volume sales: • 2003-2022 • Volume in units or tonnes Pricing • Select top brands and private label • 2016-2017
Retail company shares • 2007-2017 • Rsp value % share, actuals and rankings • Volume share for select product categories by
global brand owner and local brand owner Retail brand shares • 2007-2017 • Rsp value % share, actuals and rankings • Volume share for select product categories • By global brand name and local brand name Retail distribution • 2003-2017 • % and actual value • Value sales per retail channel (store and non-store
retail) Away-from-home distribution • 2003-2017 • % and actuals • Value sales per away-from-home channel
(hospitals / healthcare; public sector; business / industry; horeca)
CATEGORY LEVEL: TOBACCO GEOGRAPHIC COVERAGE Western Europe: Austria; Belgium; Denmark; Finland; France; Germany; Greece; Ireland; Italy; Netherlands; Norway; Portugal; Spain; Sweden; Switzerland; Turkey; United Kingdom Eastern Europe: Belarus; Bosnia-Herzegovina; Bulgaria; Croatia; Czech Republic; Estonia; Georgia; Hungary; Latvia; Lithuania; Macedonia; Poland; Romania; Russia; Serbia; Slovakia; Slovenia; Ukraine North America: Canada; USA Latin America: Argentina; Bolivia; Brazil; Chile; Colombia; Costa Rica; Dominican Republic; Ecuador; El Salvador; Guatemala; Honduras; Mexico; Panama; Paraguay; Peru; Uruguay; Venezuela Asia Pacific: Azerbaijan; Bangladesh; Cambodia; China; Hong Kong, China; India; Indonesia; Japan; Kazakhstan; Laos; Malaysia; Myanmar; Pakistan; Philippines; Singapore; South Korea; Sri Lanka; Taiwan; Thailand; Uzbekistan; Vietnam Australasia: Australia; New Zealand Africa and Middle East: Algeria; Angola; Cameroon; Côte d'Ivoire; Egypt; Ethiopia; Ghana; Iraq; Israel; Jordan; Kenya; Kuwait; Lebanon; Morocco; Nigeria; Oman; Saudi Arabia; South Africa; Tanzania; Tunisia; United Arab Emirates CATEGORIES Cigarettes Cigars and Cigarillos Smoking Tobacco
Smokeless Tobacco Vapour Products
STATISTICS Per capita expenditure and consumption trends ▪ by total population and number of smokers Retail volume sales trends ▪ 2003-2022 ▪ billions of sticks / tonnes as appropriate Retail value sales trends ▪ 2003-2022 ▪ retail selling price (rsp) Illicit trade volume sales trends (cigarettes only) ▪ 2003-2022 Company shares ▪ 2008-2017 ▪ % share and actual (Vapour Products ranking only)
▪ by global brand owner and local brand owner Brand shares ▪ 2008-2017 ▪ % share and actual ▪ by global brand name and local brand name Retail distribution patterns ▪ 2003-2017 ▪ % share and actual Smoking prevalence ▪ 2003-2022 ▪ % share and actual Taxation ▪ 2005-2017
CATEGORY LEVEL: TOYS AND GAMES GEOGRAPHIC COVERAGE Western Europe: France; Germany; Italy; Netherlands; Spain; Switzerland; Sweden; Turkey; United Kingdom Eastern Europe: Poland; Russia; Romania; Ukraine North America: Canada; USA Latin America: Argentina; Brazil; Mexico Asia Pacific: China; Hong Kong; India; Indonesia; Japan; Malaysia; Philippines; Singapore; South Korea; Taiwan; Thailand Australasia: Australia Africa and Middle East: South Africa; UAE CATEGORIES Traditional Toys and Games Video Games Video Games Hardware Video Games Software STATISTICS Retail value sales trends ▪ 2003-2022 ▪ Retail selling price (rsp) ▪ Retail volume (for static Consoles, hand-held consoles, AR
/ VR headsets) Company and brand shares ▪ 2009-2017 ▪ % retail value share, actuals and rankings ▪ % retail volume share, actuals and rankings (for static
Consoles, hand-held consoles, AR/VR headsets) ▪ by global brand owner and local brand owner Retail distribution patterns ▪ 2003-2017 ▪ % retail value share and actuals Pricing ▪ 2017 for static consoles, hand-held consoles, AR / VR
headsets Analysis by Demographic ▪ 2005-2022 ▪ Traditional toys and games by target target
▪ % retail value share and actuals Analysis by Licensing ▪ 2008-2022 ▪ Traditional toys and games categories by licencing ▪ % retail value share and actuals Analysis by Type ▪ 2005-2017 ▪ Traditional toys and games by type: electronic vs. non-
electronic ▪ % retail value share and actuals Video Games Software by Format ▪ 2011-2022 ▪ Game sales vs. in-game purchases for video games
software ▪ % retail value share and actuals ▪ Install base and replacement cycle ▪ 2015-2022 ▪ Install base (’000 units), penetration rates (percentage),
and replacement cycle (months) for static consoles and AR / VR headsets
CATEGORY LEVEL: TRAVEL GEOGRAPHIC COVERAGE Major markets Africa and Middle East: Egypt; Israel; Kenya; Morocco; Saudi Arabia; South Africa; UAE Asia Pacific: China; Hong Kong, China; India; Indonesia; Japan; Malaysia; Philippines; Singapore; South Korea; Taiwan; Thailand; Vietnam Australasia: Australia; New Zealand Eastern Europe: Bulgaria; Croatia; Czech Republic; Hungary; Poland; Romania; Russia; Slovakia; Slovenia, Ukraine Latin America: Argentina; Brazil; Chile; Colombia; Ecuador; Mexico; Peru; Venezuela North America: Canada; USA Western Europe: Austria; Belgium; Denmark; Finland; France; Germany; Greece; Ireland; Italy; Netherlands; Norway; Portugal; Spain; Sweden; Switzerland; Turkey; United Kingdom Market Insights Africa and Middle East: Algeria; Bahrain, Cameroon; Jordan; Kuwait; Lebanon; Mauritius; Mozambique; Nigeria; Oman; Qatar; Tanzania; Tunisia Asia Pacific: Azerbaijan; Cambodia; Fiji; Kazakhstan; Laos; Macau; Maldives; Myanmar; Pakistan; Sri Lanka; Uzbekistan Eastern Europe: Belarus; Bosnia-Herzegovina; Estonia; Georgia; Latvia; Lithuania; Macedonia; Serbia Latin America: Bolivia; Costa Rica; Dominican Republic; Guatemala; Jamaica; Panama, Uruguay Western Europe: Cyprus; Iceland; Malta 100 countries are available for category research including 58 Major Markets and 42 Insight countries as listed above. 210 countries are available for inbound and outbound tourism flows data, including: Afghanistan; Albania; American Samoa; Andorra, Angola; Anguilla; Antigua; Armenia; Aruba; Bahamas; Bangladesh; Barbados; Belize; Benin; Bermuda; Bhutan; British Virgin Islands; Brunei; Botswana; Burkina Faso; Burundi; Cape Verde; Cayman Islands; Chad; Central African Republic; Comoros; Côte d'Ivoire; Curaçao; Democratic Republic Congo; Djibouti; Dominica; Equatorial Guinea; El Salvador; Eritrea; Ethiopia; French Guiana; French Polynesia; Gabon; Gambia; Ghana; Gibraltar; Grenada; Guadeloupe; Guam; Guinea; Guinea-Bissau; Guyana; Haiti; Honduras; Iraq; Kiribati; Kosovo; Lesotho; Liberia; Liechtenstein; Libya; Luxembourg; Madagascar; Malawi; Mali; Martinique; Mauritania; Moldova; Monaco; Mongolia; Montenegro; Namibia; Nauru; New Caledonia; Nepal; Nicaragua; Niger; North Korea; Papua New Guinea; Paraguay; Puerto Rico; Réunion; Rwanda Samoa; Sao Tomé e Príncipe; Senegal; Seychelles; Sint Maarten; Sierra Leone; St Kitts; St Lucia; St Vincent and the Grenadines; Solomon Islands; Somalia; South Sudan; Sudan; Suriname; Swaziland; Syria; Tajikistan; Togo; Tonga; Trinidad and Tobago; Turkmenistan; Tuvalu; Uganda; US Virgin Islands; Vanuatu; Yemen; Zambia; Zimbabwe. CATEGORIES Tourism Flows Domestic Trips Domestic Expenditure Inbound Arrivals Inbound Receipts Outbound Departures Outbound Expenditure Traveller Profiles Annual Leave
Leisure Outbound Demographics Seasonality Travellers by Age Travel Modes Airlines Other Transport Bus
Cruise Ferry Rail Lodging Hotels Short-term rentals Other Lodging Activities Attractions Medical Tourism Shopping by International Tourists Spas
Online Travel Sales and Intermediaries Intermediaries Lodging (Source of Demand) Car Rental (Source of Demand) Cruise (Source of Demand) Air (Source of Demand) Other Transport (Source of Demand) Package Holiday (Source of Demand) Other Sales (Source of Demand) Online Travel Sales to Residents Mobile Travel Sales to Residents Online sales channels Direct suppliers Intermediaries
STATISTICS Major markets Travel Traveller Profiles ▪ annual leave ▪ leisure outbound demographics ▪ seasonality ▪ travellers by age Tourism Flows ▪ 2004-2023 ▪ inbound arrivals ▪ business arrivals ▪ leisure arrivals ▪ arrivals by travel mode ▪ inbound length of stay ▪ inbound receipts ▪ inbound business receipts ▪ inbound leisure receipts ▪ inbound receipts by category ▪ leisure inbound demographics (2008-2018) ▪ city arrivals (2008-2018) ▪ outbound source markets ▪ business outbound departures ▪ leisure outbound departures ▪ outbound departures by travel mode ▪ outbound length of stay ▪ outbound expenditure ▪ outbound business expenditure ▪ outbound leisure expenditure ▪ outbound expenditure by category ▪ domestic trips ▪ domestic trips by travel mode ▪ domestic trips by destination
▪ domestic business expenditure ▪ domestic leisure expenditure ▪ leisure domestic trips by travel mode ▪ business domestic trips by travel mode ▪ domestic expenditure ▪ domestic expenditure by category Travel Modes ▪ 2004-2023 ▪ average annual distance travelled by car ▪ airlines sales ▪ airlines sales by charter, low cost carrier, schedule ▪ schedule airlines: aircraft departures ▪ airlines km travelled ▪ distance flown on scheduled flights ▪ airlines passengers traffic ▪ online and offline sales ▪ online sales by direct vs intermediaries ▪ leading airports (2012-2018) ▪ airlines company and brand shares (2009-2018) ▪ airlines passengers carried, average % load factor, sales
per passenger (2009-2017) ▪ other transport sales ▪ other transport km travelled ▪ other transport average annual distance travelled by car ▪ other transport ▪ bus ▪ cruise ▪ ferry ▪ rail km travelled ▪ rail sales ▪ other transport online and offline sales ▪ other transport by direct vs intermediaries
▪ car rental sales ▪ car rental sales by business/leisure/insurance replacement
car rental ▪ car rental transactions ▪ fleet size ▪ number of operators ▪ number of rental days ▪ online and offline sales ▪ online sales by direct vs intermediaries ▪ car rental company and brand shares (2008-2018) ▪ car rental brand transactions, average rental duration, fleet
size (2008-2018) Lodging ▪ 2004-2023 ▪ sales by category ▪ outlets by category ▪ hotels by price platform (luxury and upscale hotels, mid-
priced hotels, budget hotels, unrated hotels) ▪ short -term rentals sales and outlets ▪ lodging and hotels rooms ▪ lodging and hotels room nights** ▪ lodging and hotels % occupancy ▪ lodging and hotels online and offline sales
▪ online sales by direct vs intermediaries for lodging, hotels, short-term rentals and other lodging
▪ hotel company and brand shares (2009-2018) ▪ hotel brand outlets and rooms (2009-2018) ▪ short-term rentals brand shares (2009-2018) Activities (Destination) ▪ 2004-2023 ▪ sales by category ▪ attractions visitors by category ▪ attractions online and offline sales ▪ attractions online sales by direct vs intermediaries ▪ leading attractions 2006-2018 Online Travel Sales and Intermediaries 2004-2023 Intermediaries ▪ 2004-2023 ▪ sales by category ▪ online and offline sales ▪ sales by corporate business vs leisure ▪ intermediaries outlets ▪ intermediaries company and brand shares 2009-2018 ▪ intermediaries % online sales and shares 2009-2018
Insights Flows ▪ 2004-2023 ▪ inbound arrivals ▪ arrivals by country of origin ▪ arrivals by travel mode ▪ arrivals by purpose of visit ▪ city arrivals (2010-2018) ▪ inbound receipts ▪ outbound source markets ▪ outbound departures by destination ▪ outbound departures by travel mode ▪ outbound departures by purpose of visit ▪ outbound expenditure ▪ domestic trips ▪ leisure domestic trips by travel mode ▪ business domestic trips by travel mode ▪ domestic expenditure Travel Modes ▪ 2004-2023 ▪ value ▪ online sales ▪ offline sales
▪ Airlines ▪ 2004-2023 ▪ value ▪ online sales ▪ offline sales
▪ Other Transport ▪ Online Value Sales ▪ Offline Value Sales ▪ Other Transport by Category ▪ Bus ▪ Cruise ▪ Ferry ▪ Rail ▪ Other Transport Types ▪ Other Transport Direct ▪ Other Transport Intermediaries Car rental ▪ 2004-2023 ▪ value ▪ online sales ▪ offline sales
Lodging ▪ 2004-2023 ▪ value ▪ outlets ▪ rooms and room nights** ▪ online sales ▪ offline sales ▪ Hotels
▪ 2004-2023 ▪ value, outlets and rooms ▪ online sales ▪ offline sales
▪ Short-term rentals ▪ Other Lodging ▪ Online Value Sales ▪ Offline Value Sales ▪ Other Lodging by Category
▪ Campsites ▪ Hostels ▪ Other Lodging Types ▪ Other Lodging Direct ▪ Other Lodging Intermediaries Attractions ▪ 2004-2023 ▪ value ▪ online sales ▪ offline sales Intermediaries ▪ 2004-2023 ▪ value ▪ online sales ▪ offline sales
**Room nights for campsites and other lodging are no longer researched datasets