pass on - new world development
TRANSCRIPT
New
Wo
rld D
evelop
men
t Co
mp
any Limited
An
nu
al Rep
ort 2009
Cert no. SGS-COC-003677
New World Development Company Limited takes every practicable measure to conserve resources and minimize waste.
This annual report is printed on FSC certifi ed paper using vegetable oil-based inks. Pulps used are elemental chlorine-free. The FSC logo identifi es product group from well-managed forests and other controlled sources in accordance with the rules of the Forest Stewardship Council.
Innovationand initiative
Integrity and trust
Stakeholders’ interest
Pursuit of excellence
Social responsibility
People growthand development
OUR VALUESAnnual Report 2009
Pass On

Corporate Philosophy
CHINESE VERSION
The Chinese version of this Annual Report is availableon request from New World Development Company Limited.Where the English and the Chinese texts conflict,the English text prevails.
© New World Development Company Limited 2009
VisionTo build a better society through innovation and sustainable growth
Mission• PIONEER URBAN LIVING STANDARD
THROUGH THE DELIVERY OF SUPERB QUALITY PRODUCTS
• DELIVER SUPERIOR CUSTOMER SERVICES THAT WIN CUSTOMERS’ TRUST
• COMMIT TO LONGTERM VALUE CREATION FOR SHAREHOLDERS VIA DISTINGUISHED LEADERSHIP
• NURTURE A PROFESSIONAL AND ENERGETIC STAFF FORCE WITH COMMITMENT AND PRIDE
• CARE FOR THE COMMUNITIES WE SERVE AND RESPECT THE ENVIRONMENT WE LIVE IN
Core Values• INNOVATION AND INITIATIVE
• PURSUIT OF EXCELLENCE
• INTEGRITY AND TRUST
• PEOPLE GROWTH AND DEVELOPMENT
• SOCIAL RESPONSIBILITY
• STAKEHOLDERS’ INTEREST
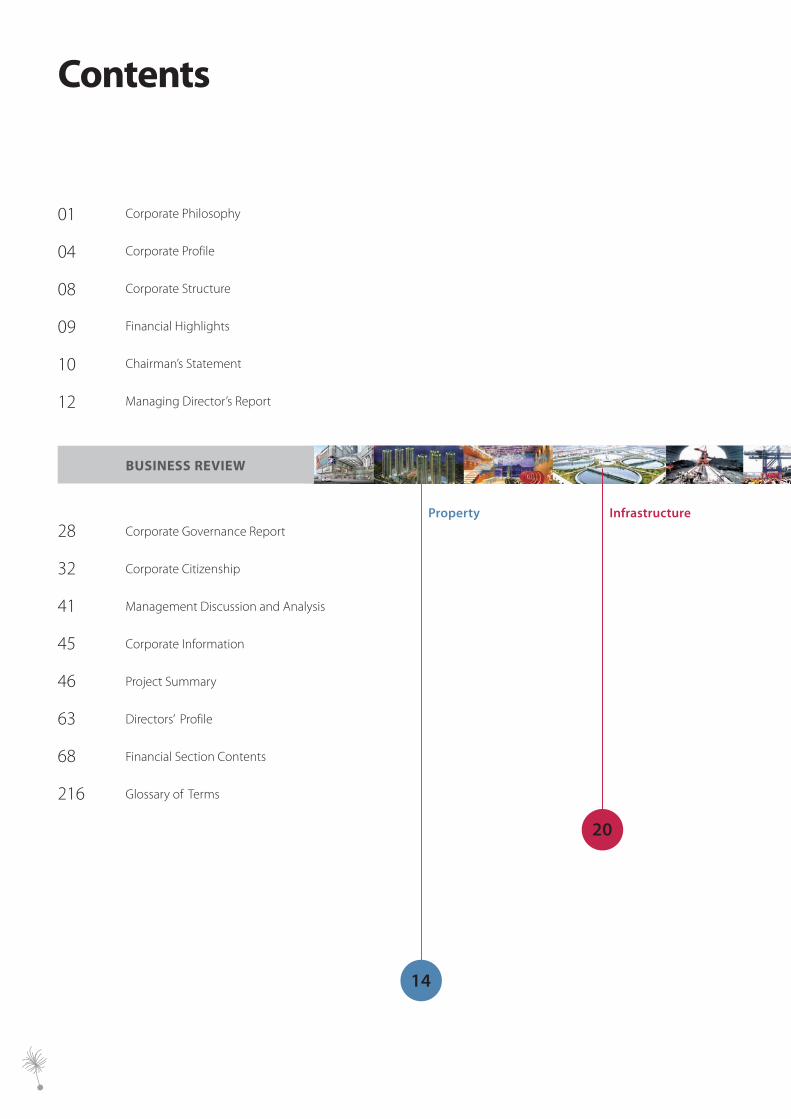
Contents
01
04
08
09
10
12
Corporate Philosophy
Corporate Profile
Corporate Structure
Financial Highlights
Chairman’s Statement
Managing Director’s Report
28
32
41
45
46
63
68
216
Corporate Governance Report
Corporate Citizenship
Management Discussion and Analysis
Corporate Information
Project Summary
Directors’ Profile
Financial Section Contents
Glossary of Terms
BUSINESS REVIEW
20
Property Infrastructure
14
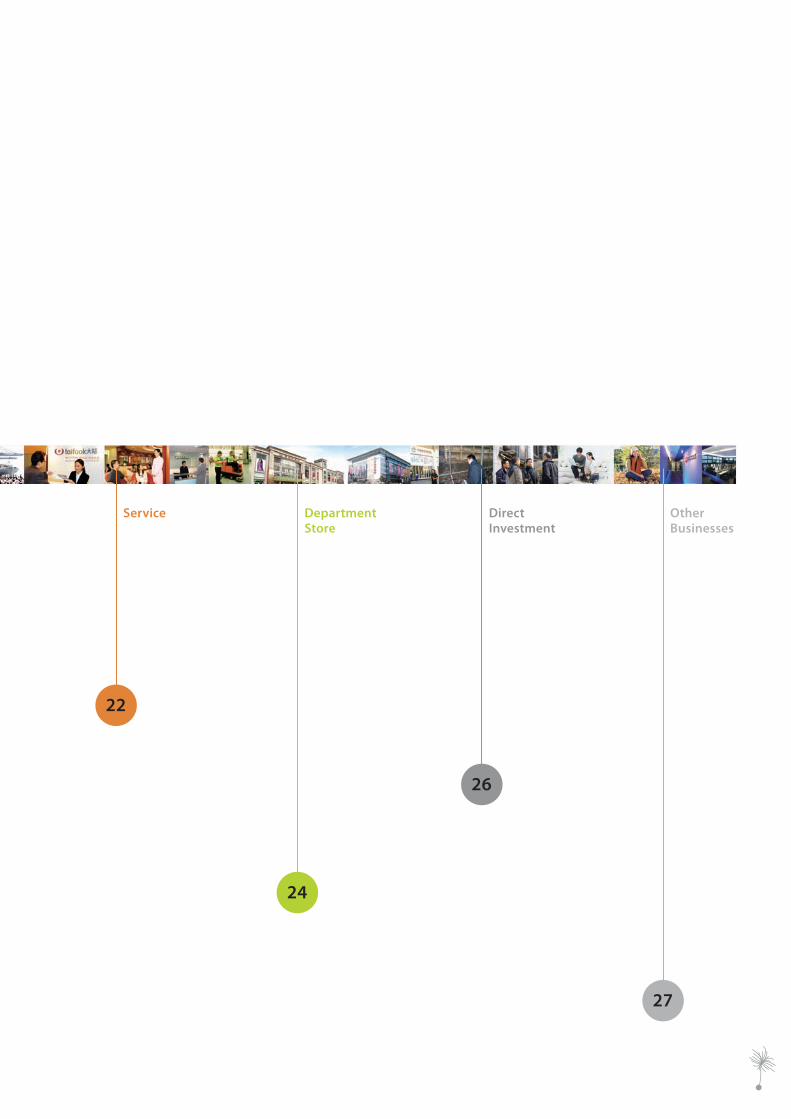
22
24
26
27
Service Department Store
Direct Investment
Other Businesses
4
Corporate Profi le
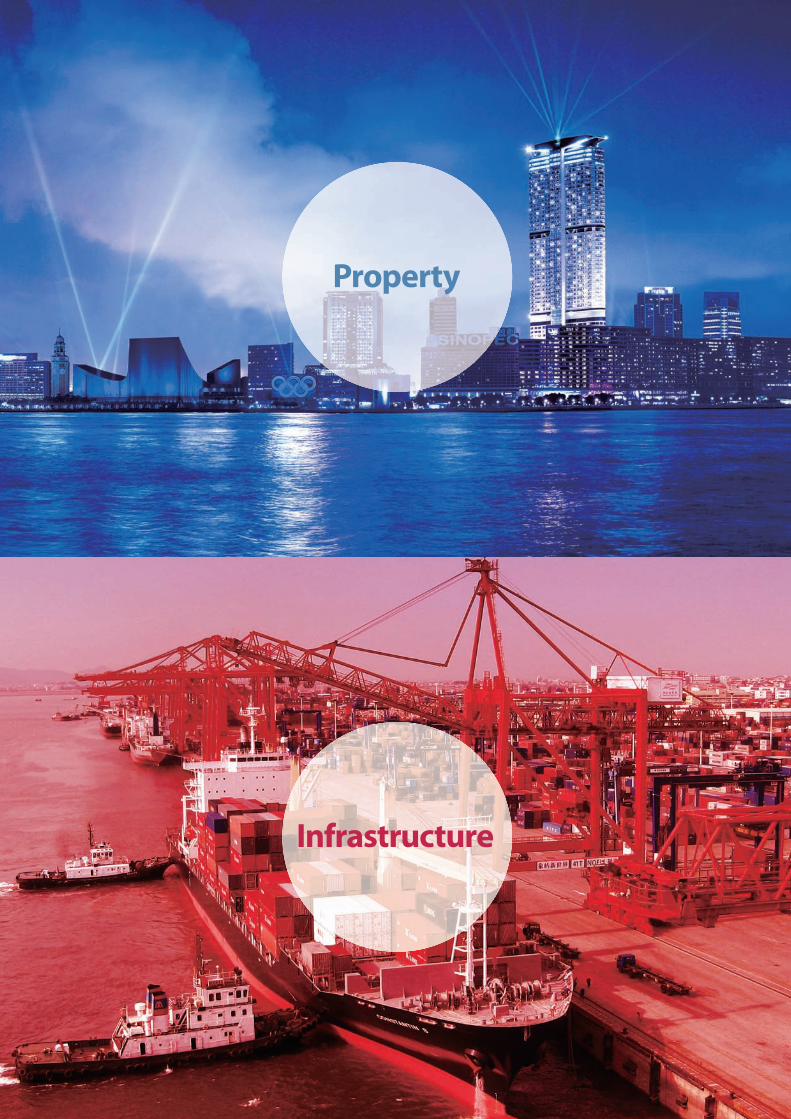
Our infrastructure portfolio includes roads,
energy, water and ports & logistics projects
in Hong Kong, Mainland China and Macau.
Our property development portfolio is focused
on residential usage in Hong Kong and Mainland
China. This is complemented by a sizable
investment property portfolio comprising
shopping malls, offices, hotels and service
apartments. Our property arm in Mainland China,
New World China Land, is one of the leading
national property developers in Mainland China.
Property Infrastructure
5New World Development Company Limited - Annual Report 2009
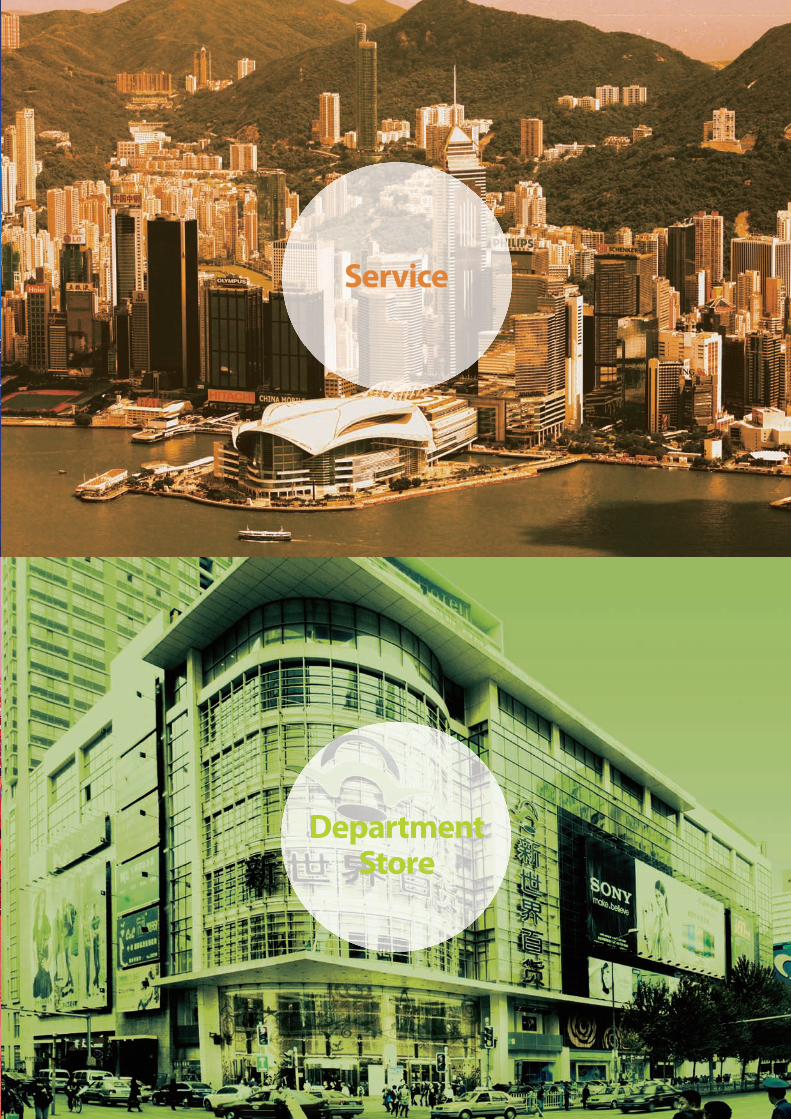
New World Department Store
operates and manages renowned department
store chain in 17 major cities in China.
Our service businesses comprise
facilities management, contracting & transport
and financial services.
Service Department Store
Infrastructure
Property
Department Store
Service
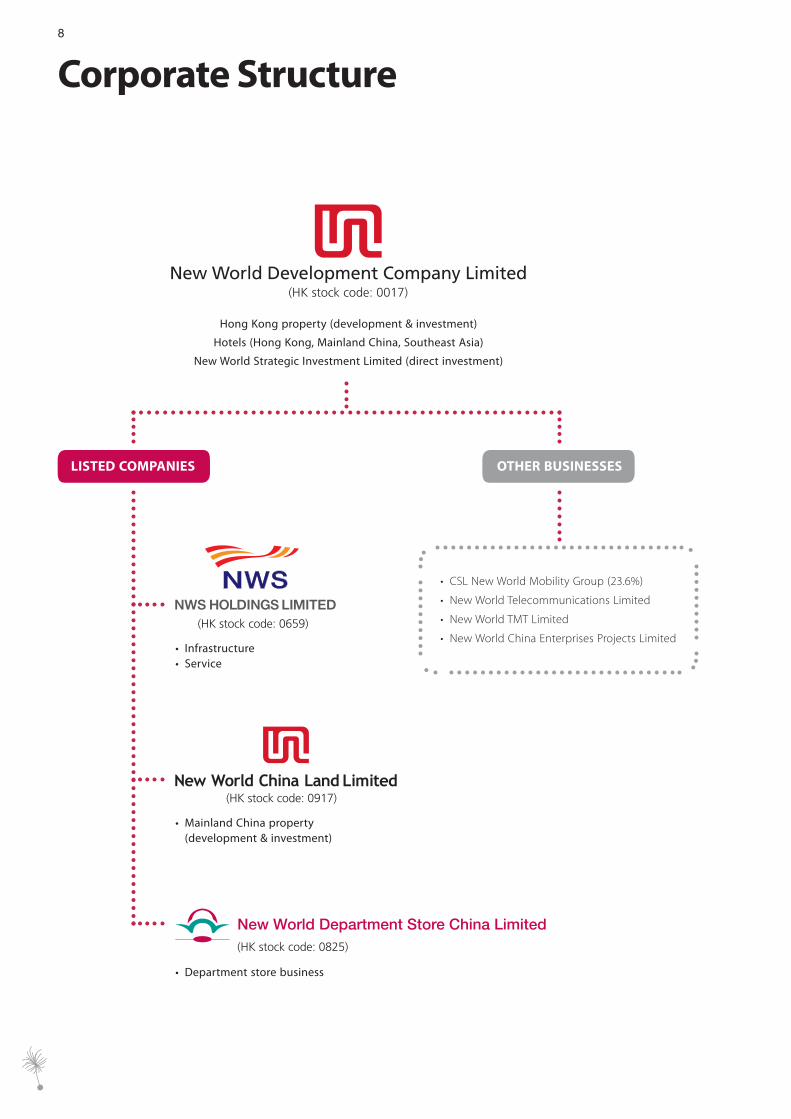
8
Corporate Structure
Hong Kong property (development & investment)
Hotels (Hong Kong, Mainland China, Southeast Asia)
New World Strategic Investment Limited (direct investment)
OTHER BUSINESSES
• Infrastructure• Service
• Mainland China property (development & investment)
• Department store business
LISTED COMPANIES
• CSL New World Mobility Group (23.6%)
• New World Telecommunications Limited
• New World TMT Limited
• New World China Enterprises Projects Limited
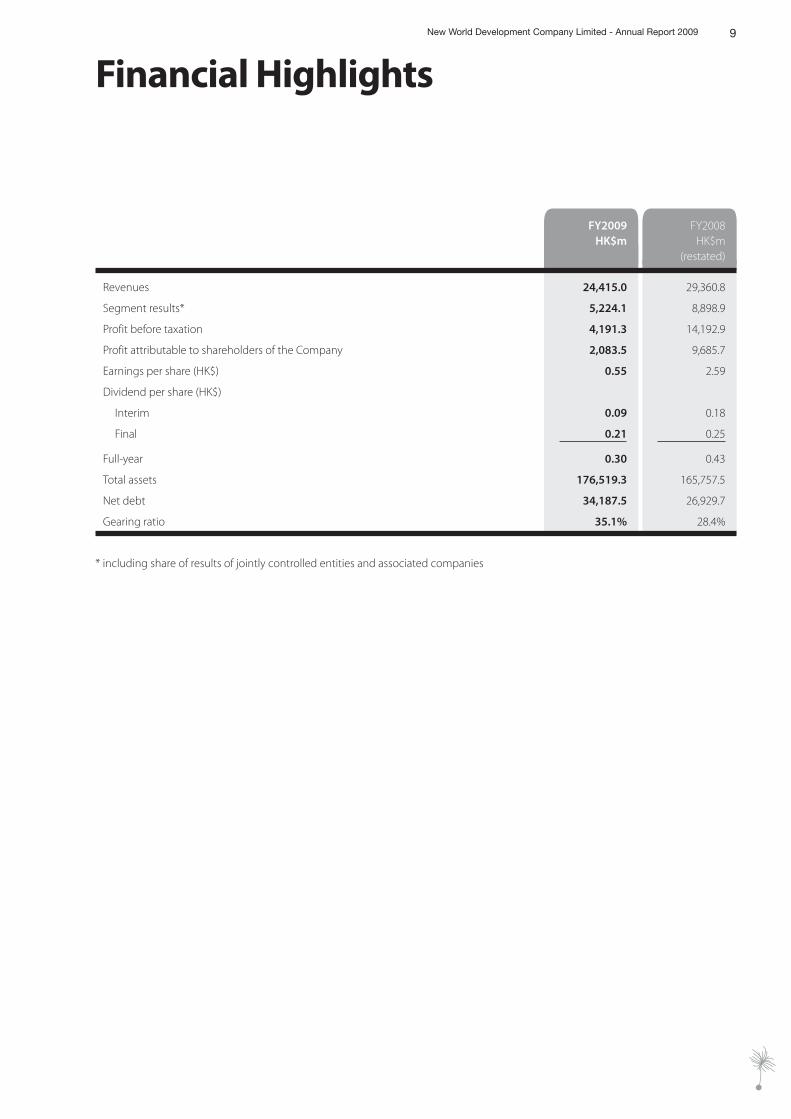
9
Financial HighlightsNew World Development Company Limited - Annual Report 2009
FY2009 FY2008HK$m HK$m
(restated)
Revenues 24,415.0 29,360.8
Segment results* 5,224.1 8,898.9
Profit before taxation 4,191.3 14,192.9
Profit attributable to shareholders of the Company 2,083.5 9,685.7
Earnings per share (HK$) 0.55 2.59
Dividend per share (HK$)
Interim 0.09 0.18
Final 0.21 0.25
Full-year 0.30 0.43
Total assets 176,519.3 165,757.5
Net debt 34,187.5 26,929.7
Gearing ratio 35.1% 28.4%
* including share of results of jointly controlled entities and associated companies
10
Chairman’s Statement
TO OUR SHAREHOLDERS,
As the Chinese generally believe, “no man can place himself in society without integrity; no family will be blessed with harmony without mutual trust among its members; no trade can flourish without credit; and no nation can enjoy peace without public confidence”. To lead a meaningful life, one must build trust with others. To enjoy peace, a nation must win the confidence and support of its people. To achieve stable growth, an enterprise must live up to its conviction. Since its founding, New World Group has gone through adversities and changes and fully understands that only with unwavering conviction can an enterprise stand out from the crowd.
The Group’s chronicle of development spanning 40 years is characterized by the New World Centre in the 70s, the Hong Kong Convention and Exhibition Centre in the 80s, Old Cities Rehabilitation Projects in the 90s and numerous infrastructure construction projects ,including roads, bridges as well as water and power supplies, undertaken in the PRC in recent years. The success we are now taking pride in is the natural outcome of our adhesion to our principles to start with: an enterprise shall take care of the people’s livelihood, through thick and thin; an enterprise shall help
the people overcome all difficulties to savor the fruit to be borne on the motherland, come rain or shine.
In 1973 when Hong Kong stock market witnessed an unprecedented slump with Hang Seng Index plunging by over 90% in a year, the Group built the New World Centre in Tsim Sha Tsui, Hong Kong through the acquisition of Holt’s Wharf. In doing so we broke the dominance of the UK-based conglomerates and, as if a shot in the arm, initiated the course of weaving the companies with Chinese capital into the economic fabric of Hong Kong.
In 1984, the Sino-British talks on the future of Hong Kong triggered a confidence crisis. Daunted by the uncertainties over the colony’s future, most developers shied away from construction projects that took considerable time to complete. In that year the Group recognized what the community needed and actively responded to the government’s call for a landmark convention and exhibition venue of international standard to be built in Hong Kong. The Group turned out to be the only developer willing to take financial and operating risks on a long-term basis, thereby laying a solid foundation for Hong Kong to host international conventions and
11New World Development Company Limited - Annual Report 2009
exhibitions. Coupled with its excellent services, Hong Kong soon secured world-wide recognition as an ideal spot for conferences and exhibitions.
In 1992, the implementation of the reform and opening up policy in the PRC was on the right track. Improvement to living environment was in need. The Group took the initiative to lobby the local government of Chongwen district in Beijing for the Old City Rehabilitation Project and was committed to bearing all the costs and expenses required. We then proceeded to revamp other old cities like Wuhan, Shenyang, Tianjin and Jinan, merely hoping to contribute to a better living environment for the country and, in turn, the well-being of my fellow countrymen.
In recent years the PRC has been keen on promoting the transportation and infrastructure development across the nation and procuring the progress of its people. In contrast with others who craved for instant benefits, the Group, eyeing the long-term development of the national transportation system, succeeded in securing cooperation with the Ministry of Railways to construct in stages 18 rail container terminals in 18 major cities.
With our compatriots in mind and backed by our conviction, we remain committed to investing wholeheartedly to improve the people’s living conditions, regardless of all uncertainties. With the motherland in mind and based on our confidence, we remain committed to investing to put her on track to greater success, against all odds.
The arrival of the 21st century precedes the onslaught of turmoil and tsunami. Business environment has become unpredictable and the global economy even harsher. Notwithstanding the ups and downs of the economic cycles, New World Group remains adamant as always. Underpinned by its faith in the motherland and judging the situation at commanding heights, we survive the market volatility and political changes. We cater for the actual need of the people and keep pace with the country. These explain for New World Group’s steady growth amid adversities over the past decades.
Dr Cheng Yu-TungChairman
Hong Kong, 8 October 2009
To achievestable growth,
an enterprise mustlive up to
its conviction.
12
Managing Director’s Report
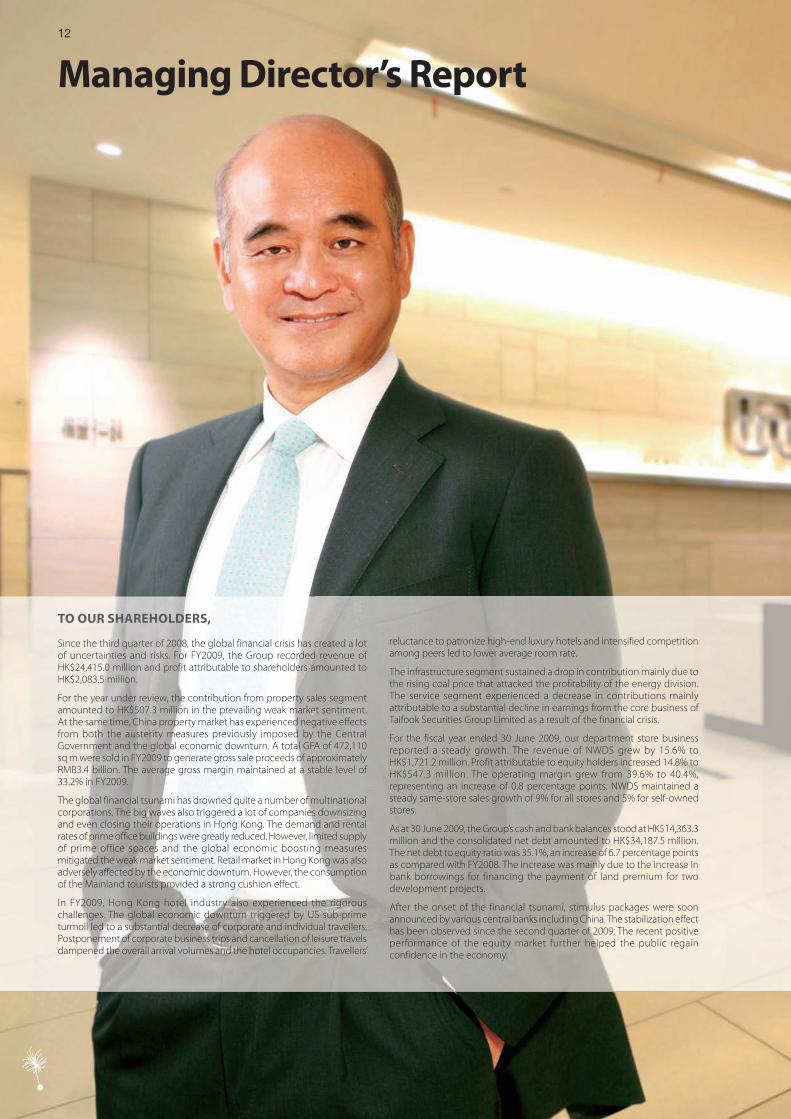
TO OUR SHAREHOLDERS,
Since the third quarter of 2008, the global financial crisis has created a lot of uncertainties and risks. For FY2009, the Group recorded revenue of HK$24,415.0 million and profit attributable to shareholders amounted to HK$2,083.5 million.
For the year under review, the contribution from property sales segment amounted to HK$507.3 million in the prevailing weak market sentiment. At the same time, China property market has experienced negative effects from both the austerity measures previously imposed by the Central Government and the global economic downturn. A total GFA of 472,110 sq m were sold in FY2009 to generate gross sale proceeds of approximately RMB3.4 billion. The average gross margin maintained at a stable level of 33.2% in FY2009.
The global financial tsunami has drowned quite a number of multinational corporations. The big waves also triggered a lot of companies downsizing and even closing their operations in Hong Kong. The demand and rental rates of prime office buildings were greatly reduced. However, limited supply of prime office spaces and the global economic boosting measures mitigated the weak market sentiment. Retail market in Hong Kong was also adversely affected by the economic downturn. However, the consumption of the Mainland tourists provided a strong cushion effect.
In FY2009, Hong Kong hotel industry also experienced the rigorous challenges. The global economic downturn triggered by US sub-prime turmoil led to a substantial decrease of corporate and individual travellers. Postponement of corporate business trips and cancellation of leisure travels dampened the overall arrival volumes and the hotel occupancies. Travellers’
reluctance to patronize high-end luxury hotels and intensified competition among peers led to lower average room rate.
The infrastructure segment sustained a drop in contribution mainly due to the rising coal price that attacked the profitability of the energy division. The service segment experienced a decrease in contributions mainly attributable to a substantial decline in earnings from the core business of Taifook Securities Group Limited as a result of the financial crisis.
For the fiscal year ended 30 June 2009, our department store business reported a steady growth. The revenue of NWDS grew by 15.6% to HK$1,721.2 million. Profit attributable to equity holders increased 14.8% to HK$547.3 million. The operating margin grew from 39.6% to 40.4%, representing an increase of 0.8 percentage points. NWDS maintained a steady same-store sales growth of 9% for all stores and 5% for self-owned stores.
As at 30 June 2009, the Group’s cash and bank balances stood at HK$14,363.3 million and the consolidated net debt amounted to HK$34,187.5 million. The net debt to equity ratio was 35.1%, an increase of 6.7 percentage points as compared with FY2008. The increase was mainly due to the increase in bank borrowings for financing the payment of land premium for two development projects.
After the onset of the financial tsunami, stimulus packages were soon announced by various central banks including China. The stabilization effect has been observed since the second quarter of 2009. The recent positive performance of the equity market further helped the public regain confidence in the economy.
13New World Development Company Limited - Annual Report 2009
The Group’s recurrent operations will generate stable cashflow. Low interest environment and the tight supply pipeline will continue to favour the Hong Kong property market. Local homebuyers are regaining confidence with improved affordability. Transaction volume and property prices are both growing healthily. Our luxury trophy project, The Masterpiece (名鑄 ), has received overwhelming market responses when launched in August 2009. Signs of stabilization have recently been observed in the office market.
K11, the first Art Mall in the world, is scheduled to be opened in the fourth quarter of 2009. The renowned shopping mall is of 340,000 sq ft, six-storey high. K11, together with the deluxe hotel, Hyatt Regency Hong Kong, Tsim Sha Tsui and luxury residences, The Masterpiece, is situated at the Group’s trophy downtown development project overlooking the Victoria Harbour.
Currently, the Group has a landbank of 4.6 million sq ft total GFA for immediate development. The Group also has a total of over 21.5 million sq ft of agricultural land reserve pending conversion. The Group is now negotiating with the government on the land premium for conversion of 6.6 million sq ft agricultural land, most of them designated for residential usage.
We believe the Central Government will continue its stance in the economic boosting measures. Mainland property market should be on track along its broad base rebound since late March 2009 with significant increase in prices and sales volume.
China United International Rail Containers Co., Ltd. (“CUIRC”), the joint venture company that develops 18 rail container terminals in Mainland China, was established in March 2007. The current standalone facility in Kunming is operated smoothly in FY2009. The construction of the terminals in Zhengzhou, Chongqing and Dalian is expected to be completed in late
2009. The construction works of the next batch of terminals in Qingdao, Chengdu, Xian and Wuhan are also underway and expected to be completed in 2010. Upon the completion of these new terminals, an initial railway terminal network for CUIRC will be established, serving strategic locations at major seaports and inland cities in Mainland China.
Construction works for the extension of Hong Kong Convention and Exhibition Centre (“HKCEC”) were completed in April 2009. The total rental space has been increased to 91,500 sq m, enabling HKCEC to host bigger and better mega-sized exhibitions and maintain its leading position in the market.
The overall impact of the global financial tsunami on the water market to date has been relatively small although demand growth may slow down. Environmental issue remains a top priority on the government’s agenda. The Central Government has increased spending on various environmental initiatives, covering waste water treatment in particular.
In June 2009, NWDS announced its rebranding project of adopting the new operational concept of “Fashion Style” and “Living Style”, offering customers an entirely new shopping experience. The whole project is expected to be completed in two years.
On the whole, the Group will keep monitoring the risks affecting our operations and adjust our plans and executions for the best interests of the Group’s stakeholders.
Dr Cheng Kar-Shun, HenryManaging Director
Hong Kong, 8 October 2009
The stabilization effectof the stimulus packages has been observed since
2Q of 2009. The recent positive performance of
the equity market further helped the public regain
confidencein the economy.
14
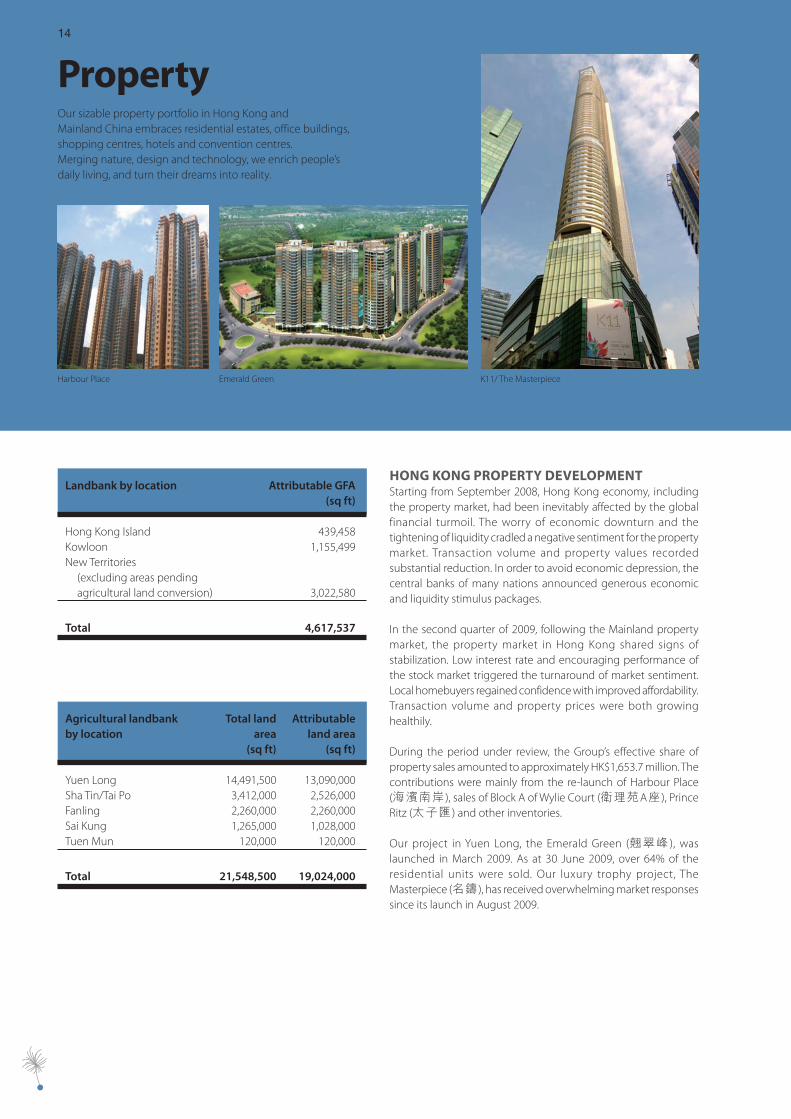
PropertyOur sizable property portfolio in Hong Kong andMainland China embraces residential estates, office buildings,shopping centres, hotels and convention centres.Merging nature, design and technology, we enrich people’sdaily living, and turn their dreams into reality.
Harbour Place Emerald Green K11/ The Masterpiece
HONG KONG PROPERTY DEVELOPMENTStarting from September 2008, Hong Kong economy, including the property market, had been inevitably affected by the global financial turmoil. The worry of economic downturn and the tightening of liquidity cradled a negative sentiment for the property market. Transaction volume and property values recorded substantial reduction. In order to avoid economic depression, the central banks of many nations announced generous economic and liquidity stimulus packages.
In the second quarter of 2009, following the Mainland property market, the property market in Hong Kong shared signs of stabilization. Low interest rate and encouraging performance of the stock market triggered the turnaround of market sentiment. Local homebuyers regained confidence with improved affordability. Transaction volume and property prices were both growing healthily.
During the period under review, the Group’s effective share of property sales amounted to approximately HK$1,653.7 million. The contributions were mainly from the re-launch of Harbour Place(海濱南岸 ), sales of Block A of Wylie Court (衛理苑A座 ), Prince Ritz (太子匯 ) and other inventories.
Our project in Yuen Long, the Emerald Green (翹翠峰 ), was launched in March 2009. As at 30 June 2009, over 64% of the residential units were sold. Our luxury trophy project, The Masterpiece (名鑄 ), has received overwhelming market responses since its launch in August 2009.
Landbank by location Attributable GFA(sq ft)
Hong Kong Island 439,458Kowloon 1,155,499New Territories (excluding areas pending agricultural land conversion) 3,022,580
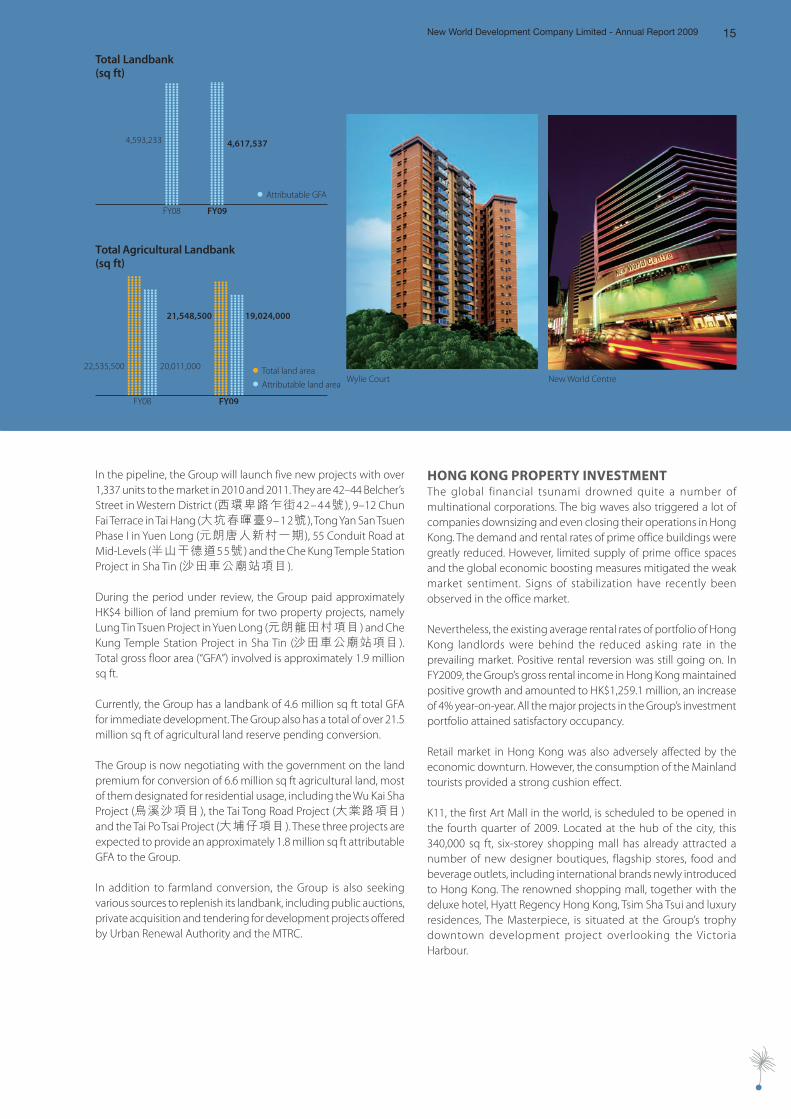
Total 4,617,537
Agricultural landbankby location
Total land area
Attributable land area
(sq ft) (sq ft)
Yuen Long 14,491,500 13,090,000Sha Tin/Tai Po 3,412,000 2,526,000Fanling 2,260,000 2,260,000Sai Kung 1,265,000 1,028,000Tuen Mun 120,000 120,000
Total 21,548,500 19,024,000
15New World Development Company Limited - Annual Report 2009
Wylie Court New World Centre
In the pipeline, the Group will launch five new projects with over 1,337 units to the market in 2010 and 2011. They are 42–44 Belcher’s Street in Western District (西環卑路乍街42–44號 ), 9–12 Chun Fai Terrace in Tai Hang (大坑春暉臺9–12號 ), Tong Yan San Tsuen Phase I in Yuen Long (元朗唐人新村一期 ), 55 Conduit Road at Mid-Levels (半山干德道55號 ) and the Che Kung Temple Station Project in Sha Tin (沙田車公廟站項目 ).
During the period under review, the Group paid approximately HK$4 billion of land premium for two property projects, namely Lung Tin Tsuen Project in Yuen Long (元朗龍田村項目 ) and Che Kung Temple Station Project in Sha Tin (沙田車公廟站項目 ). Total gross floor area (“GFA”) involved is approximately 1.9 million sq ft.
Currently, the Group has a landbank of 4.6 million sq ft total GFA for immediate development. The Group also has a total of over 21.5 million sq ft of agricultural land reserve pending conversion.
The Group is now negotiating with the government on the land premium for conversion of 6.6 million sq ft agricultural land, most of them designated for residential usage, including the Wu Kai Sha Project (烏溪沙項目 ), the Tai Tong Road Project (大棠路項目 ) and the Tai Po Tsai Project (大埔仔項目 ). These three projects are expected to provide an approximately 1.8 million sq ft attributable GFA to the Group.
In addition to farmland conversion, the Group is also seeking various sources to replenish its landbank, including public auctions, private acquisition and tendering for development projects offered by Urban Renewal Authority and the MTRC.
HONG KONG PROPERTY INVESTMENTThe global financial tsunami drowned quite a number of multinational corporations. The big waves also triggered a lot of companies downsizing and even closing their operations in Hong Kong. The demand and rental rates of prime office buildings were greatly reduced. However, limited supply of prime office spaces and the global economic boosting measures mitigated the weak market sentiment. Signs of stabilization have recently been observed in the office market.
Nevertheless, the existing average rental rates of portfolio of Hong Kong landlords were behind the reduced asking rate in the prevailing market. Positive rental reversion was still going on. In FY2009, the Group’s gross rental income in Hong Kong maintained positive growth and amounted to HK$1,259.1 million, an increase of 4% year-on-year. All the major projects in the Group’s investment portfolio attained satisfactory occupancy.
Retail market in Hong Kong was also adversely affected by the economic downturn. However, the consumption of the Mainland tourists provided a strong cushion effect.
K11, the first Art Mall in the world, is scheduled to be opened in the fourth quarter of 2009. Located at the hub of the city, this 340,000 sq ft, six-storey shopping mall has already attracted a number of new designer boutiques, flagship stores, food and beverage outlets, including international brands newly introduced to Hong Kong. The renowned shopping mall, together with the deluxe hotel, Hyatt Regency Hong Kong, Tsim Sha Tsui and luxury residences, The Masterpiece, is situated at the Group’s trophy downtown development project overlooking the Victoria Harbour.
4,617,5374,593,233
Total Landbank(sq ft)
Attributable GFA
FY08 FY09
16
Property
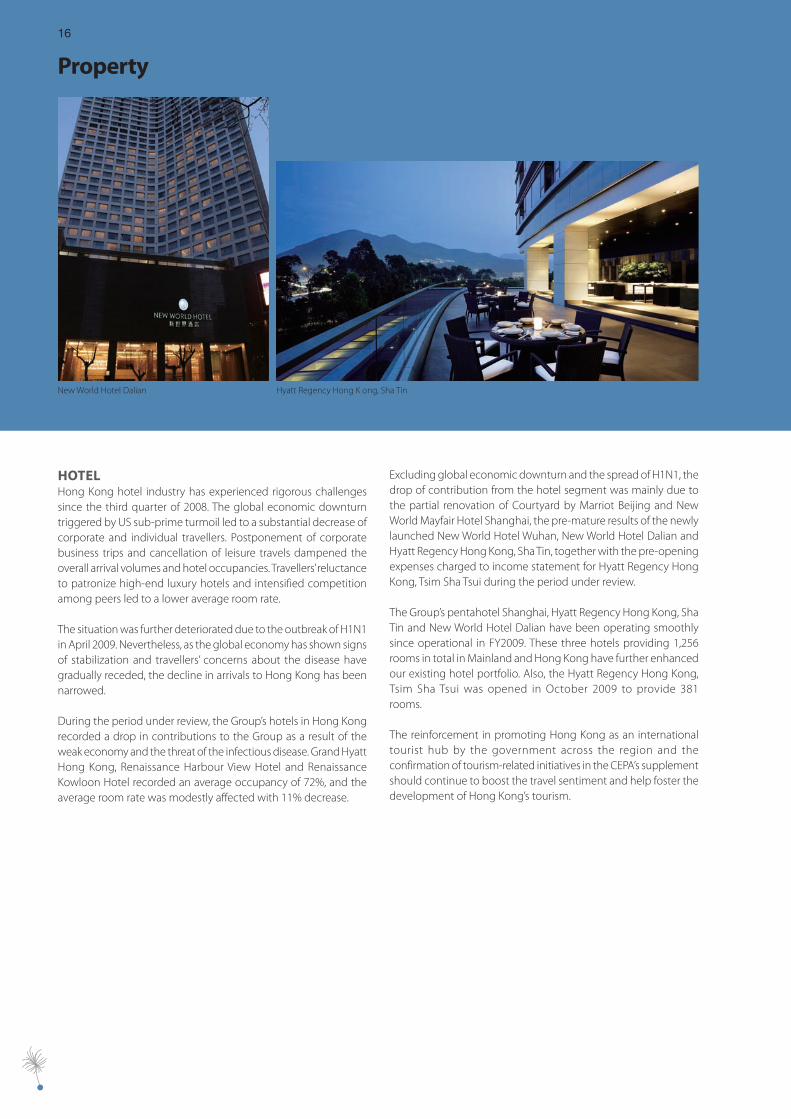
New World Hotel Dalian Hyatt Regency Hong K ong, Sha Tin
HOTELHong Kong hotel industry has experienced rigorous challenges since the third quarter of 2008. The global economic downturn triggered by US sub-prime turmoil led to a substantial decrease of corporate and individual travellers. Postponement of corporate business trips and cancellation of leisure travels dampened the overall arrival volumes and hotel occupancies. Travellers’ reluctance to patronize high-end luxury hotels and intensified competition among peers led to a lower average room rate.
The situation was further deteriorated due to the outbreak of H1N1 in April 2009. Nevertheless, as the global economy has shown signs of stabilization and travellers’ concerns about the disease have gradually receded, the decline in arrivals to Hong Kong has been narrowed.
During the period under review, the Group’s hotels in Hong Kong recorded a drop in contributions to the Group as a result of the weak economy and the threat of the infectious disease. Grand Hyatt Hong Kong, Renaissance Harbour View Hotel and Renaissance Kowloon Hotel recorded an average occupancy of 72%, and the average room rate was modestly affected with 11% decrease.
Excluding global economic downturn and the spread of H1N1, the drop of contribution from the hotel segment was mainly due to the partial renovation of Courtyard by Marriot Beijing and New World Mayfair Hotel Shanghai, the pre-mature results of the newly launched New World Hotel Wuhan, New World Hotel Dalian and Hyatt Regency Hong Kong, Sha Tin, together with the pre-opening expenses charged to income statement for Hyatt Regency Hong Kong, Tsim Sha Tsui during the period under review.
The Group’s pentahotel Shanghai, Hyatt Regency Hong Kong, Sha Tin and New World Hotel Dalian have been operating smoothly since operational in FY2009. These three hotels providing 1,256 rooms in total in Mainland and Hong Kong have further enhanced our existing hotel portfolio. Also, the Hyatt Regency Hong Kong, Tsim Sha Tsui was opened in October 2009 to provide 381 rooms.
The reinforcement in promoting Hong Kong as an international tourist hub by the government across the region and the confirmation of tourism-related initiatives in the CEPA’s supplement should continue to boost the travel sentiment and help foster the development of Hong Kong’s tourism.
17New World Development Company Limited - Annual Report 2009
During the period under review, China property market has experienced negative effects from both the austerity measures previously imposed by the Central Government and the global economic downturn triggered by the US sub-prime turmoil. In order to stimulate the economy by achieving a year-on-year 8% growth in GDP, Central Government has ambitiously adopted a series of stimulus policies, including monetary easing and support measures for various sectors, to promote stable and fairly fast economic growth since early 2009. The record lending spree recorded in the first half of 2009 not only boosted the economic growth, but also improved the sentiment of property market. The China property market has shown signs of recovery since the end of the first quarter of 2009 with a significant increase in prices and sales volume.
In FY2009, New World China Land Limited (“NWCL”) recorded a profit of HK$1,359.4 million, a decrease of 33% from FY2008. The decrease in profit for the year was mainly attributable to the effect from changes in fair value of investment properties which recorded
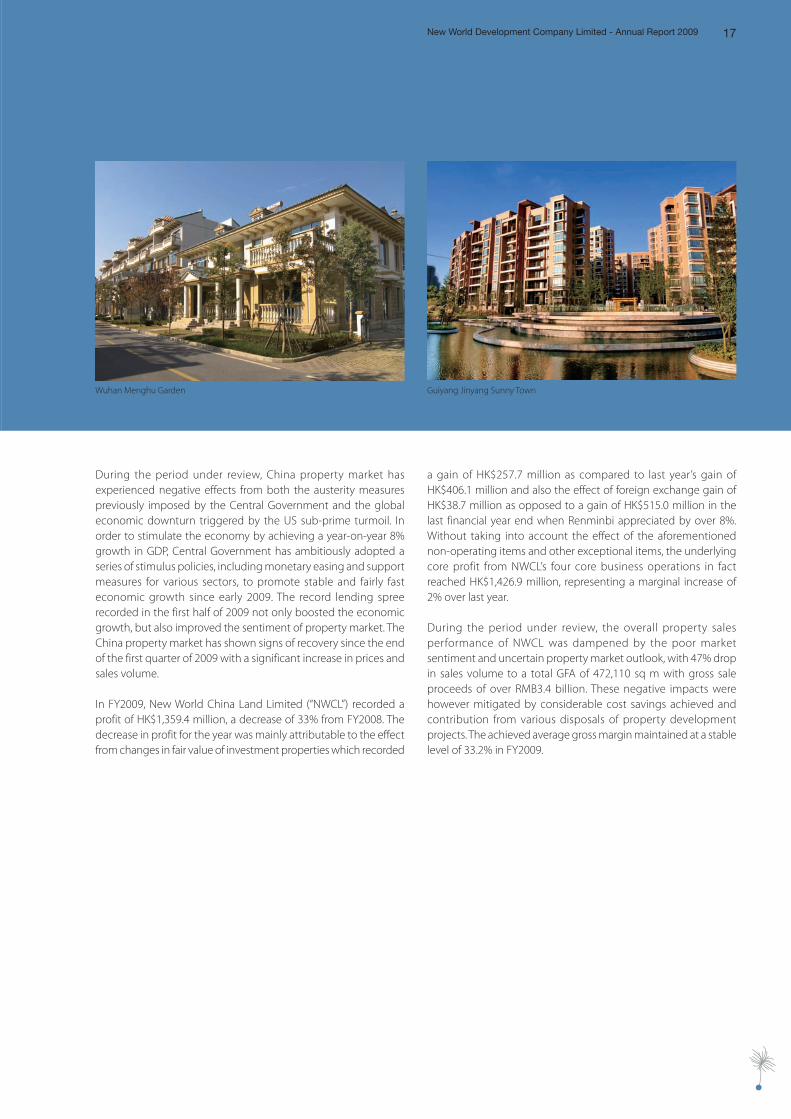
Wuhan Menghu Garden Guiyang Jinyang Sunny Town
a gain of HK$257.7 million as compared to last year’s gain of HK$406.1 million and also the effect of foreign exchange gain of HK$38.7 million as opposed to a gain of HK$515.0 million in the last financial year end when Renminbi appreciated by over 8%. Without taking into account the effect of the aforementioned non-operating items and other exceptional items, the underlying core profit from NWCL’s four core business operations in fact reached HK$1,426.9 million, representing a marginal increase of 2% over last year.
During the period under review, the overall property sales performance of NWCL was dampened by the poor market sentiment and uncertain property market outlook, with 47% drop in sales volume to a total GFA of 472,110 sq m with gross sale proceeds of over RMB3.4 billion. These negative impacts were however mitigated by considerable cost savings achieved and contribution from various disposals of property development projects. The achieved average gross margin maintained at a stable level of 33.2% in FY2009.
18
Property
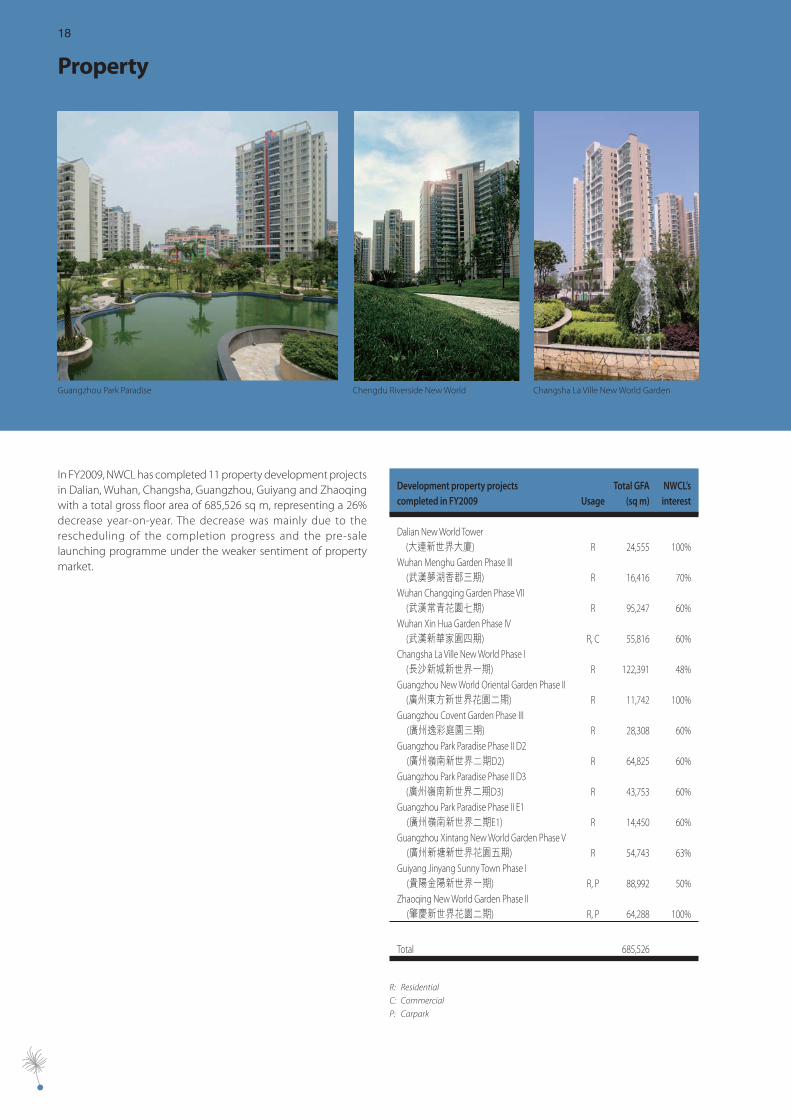
In FY2009, NWCL has completed 11 property development projects in Dalian, Wuhan, Changsha, Guangzhou, Guiyang and Zhaoqing with a total gross floor area of 685,526 sq m, representing a 26% decrease year-on-year. The decrease was mainly due to the rescheduling of the completion progress and the pre-sale launching programme under the weaker sentiment of property market.
Development property projects Total GFA NWCL’scompleted in FY2009 Usage (sq m) interest
Dalian New World Tower (大連新世界大廈) R 24,555 100%Wuhan Menghu Garden Phase III (武漢夢湖香郡三期) R 16,416 70%Wuhan Changqing Garden Phase VII (武漢常青花園七期) R 95,247 60%Wuhan Xin Hua Garden Phase IV (武漢新華家園四期) R, C 55,816 60%Changsha La Ville New World Phase I (長沙新城新世界一期) R 122,391 48%Guangzhou New World Oriental Garden Phase II (廣州東方新世界花園二期) R 11,742 100%Guangzhou Covent Garden Phase III (廣州逸彩庭園三期) R 28,308 60%Guangzhou Park Paradise Phase II D2 (廣州嶺南新世界二期D2) R 64,825 60%Guangzhou Park Paradise Phase II D3 (廣州嶺南新世界二期D3) R 43,753 60%Guangzhou Park Paradise Phase II E1 (廣州嶺南新世界二期E1) R 14,450 60%Guangzhou Xintang New World Garden Phase V (廣州新塘新世界花園五期) R 54,743 63%Guiyang Jinyang Sunny Town Phase I (貴陽金陽新世界一期) R, P 88,992 50%Zhaoqing New World Garden Phase II (肇慶新世界花園二期) R, P 64,288 100%
Total 685,526
R: Residential
C: Commercial
P: Carpark
Changsha La Ville New World GardenChengdu Riverside New WorldGuangzhou Park Paradise
19New World Development Company Limited - Annual Report 2009
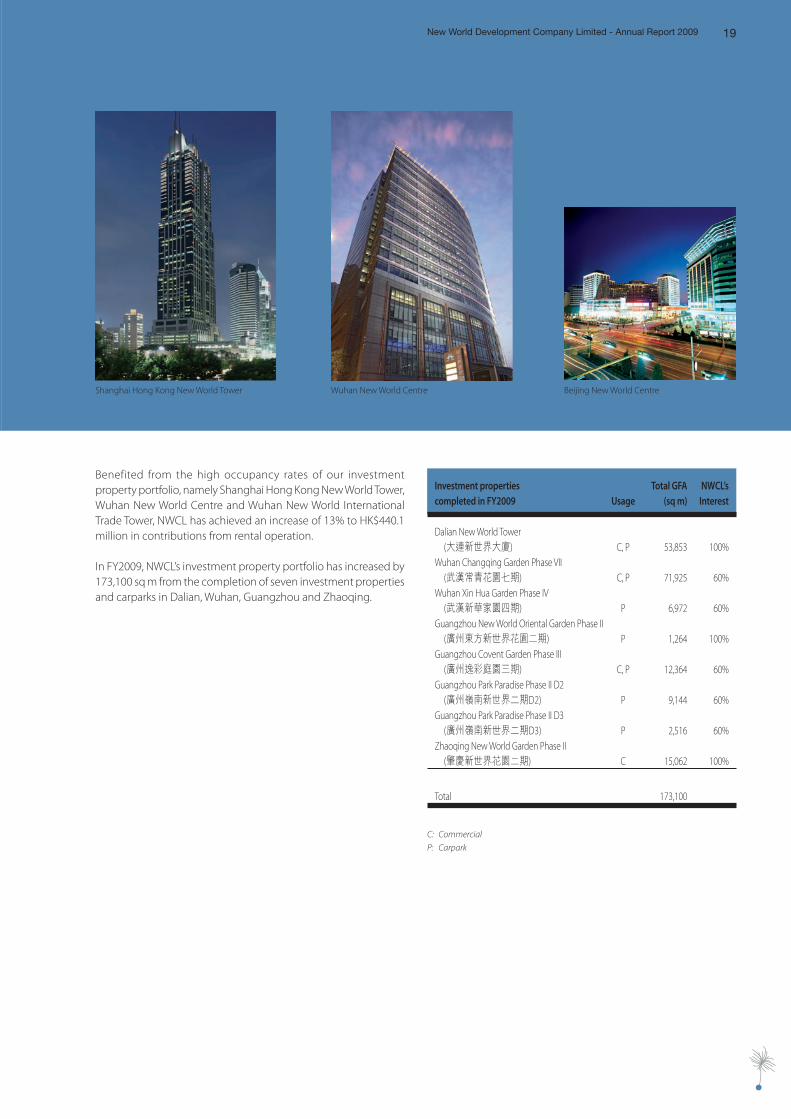
Benefited from the high occupancy rates of our investment property portfolio, namely Shanghai Hong Kong New World Tower, Wuhan New World Centre and Wuhan New World International Trade Tower, NWCL has achieved an increase of 13% to HK$440.1 million in contributions from rental operation.
In FY2009, NWCL’s investment property portfolio has increased by 173,100 sq m from the completion of seven investment properties and carparks in Dalian, Wuhan, Guangzhou and Zhaoqing.
Investment properties Total GFA NWCL’scompleted in FY2009 Usage (sq m) Interest
Dalian New World Tower (大連新世界大廈) C, P 53,853 100%Wuhan Changqing Garden Phase VII (武漢常青花園七期) C, P 71,925 60%Wuhan Xin Hua Garden Phase IV (武漢新華家園四期) P 6,972 60%Guangzhou New World Oriental Garden Phase II (廣州東方新世界花園二期) P 1,264 100%Guangzhou Covent Garden Phase III (廣州逸彩庭園三期) C, P 12,364 60%Guangzhou Park Paradise Phase II D2 (廣州嶺南新世界二期D2) P 9,144 60%Guangzhou Park Paradise Phase II D3 (廣州嶺南新世界二期D3) P 2,516 60%Zhaoqing New World Garden Phase II (肇慶新世界花園二期) C 15,062 100%
Total 173,100
C: Commercial
P: Carpark
Shanghai Hong Kong New World Tower Wuhan New World Centre Beijing New World Centre
20
Infrastructure
The recent period of economic uncertainty has posed a limited negative effect on the NWS Holdings Limited (“NWSH”) well-managed portfolio which has been proved to be highly sustainable. Despite the worldwide economic downturn, and excluding the standalone effect of the sale of the Harbour Place residential flats, NWSH’s profits for FY2009 stood at a healthy HK$2,191 million, representing a mild decrease of less than 1% as compared to HK$2,204 million for FY2008.
The Infrastructure operation sustained a drop in contribution mainly due to the high coal price that attacked the profitability of the energy division. Nevertheless, a series of restructuring initiatives were accomplished in several roadways in Guangxi Province, Wuhan Airport Expressway and Wenzhou Zhuangyuan Ao New World International Terminals Company Limited during the year, resulting in a net gain of HK$215.7 million.
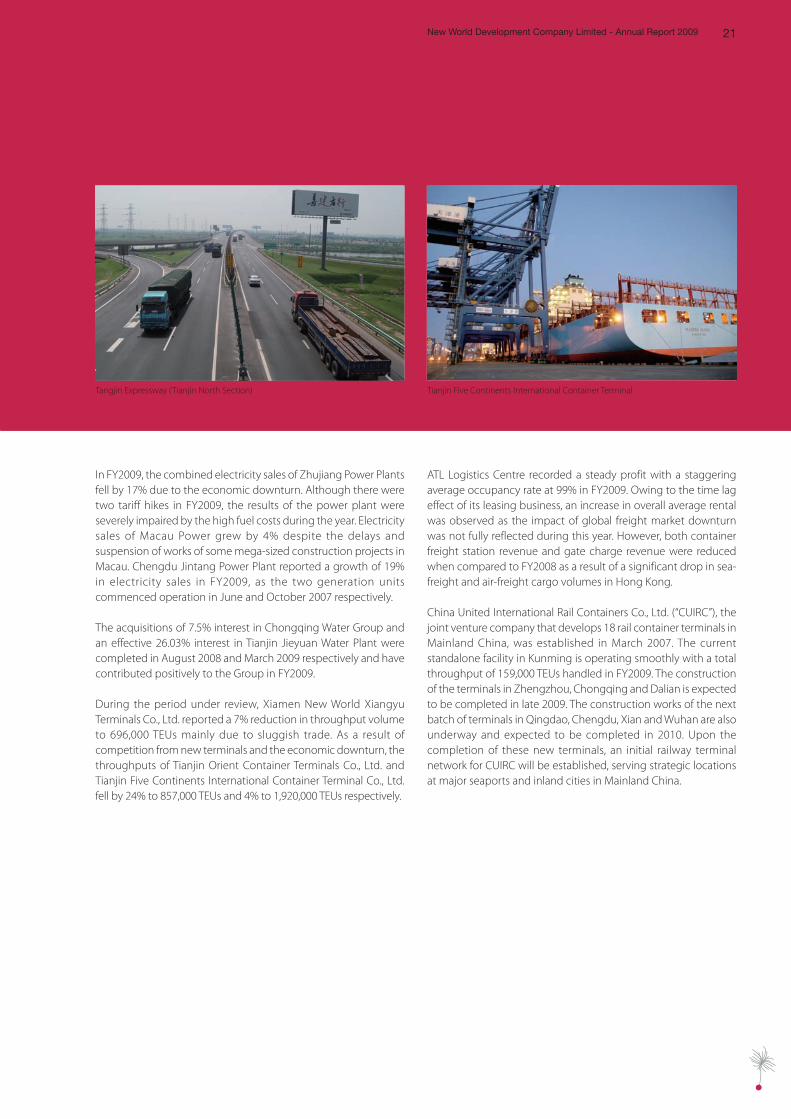
The global financial tsunami has adversely impacted the economic activities of Mainland China, especially within the Pearl River Delta Region. Average daily traffic flow of Guangzhou City Northern Ring Road and Beijing-Zhuhai Expressway — Guangzhou-Zhuhai Section decreased by 2% and 11% respectively. Toll income of Tangjin Expressway — Tianjin North Section grew by 25% with an increase of 28% in average daily traffic flow, which was partly due to the diversion of traffic to the expressway during the Olympic period and partly due to the economic development of the Bohai Rim region.
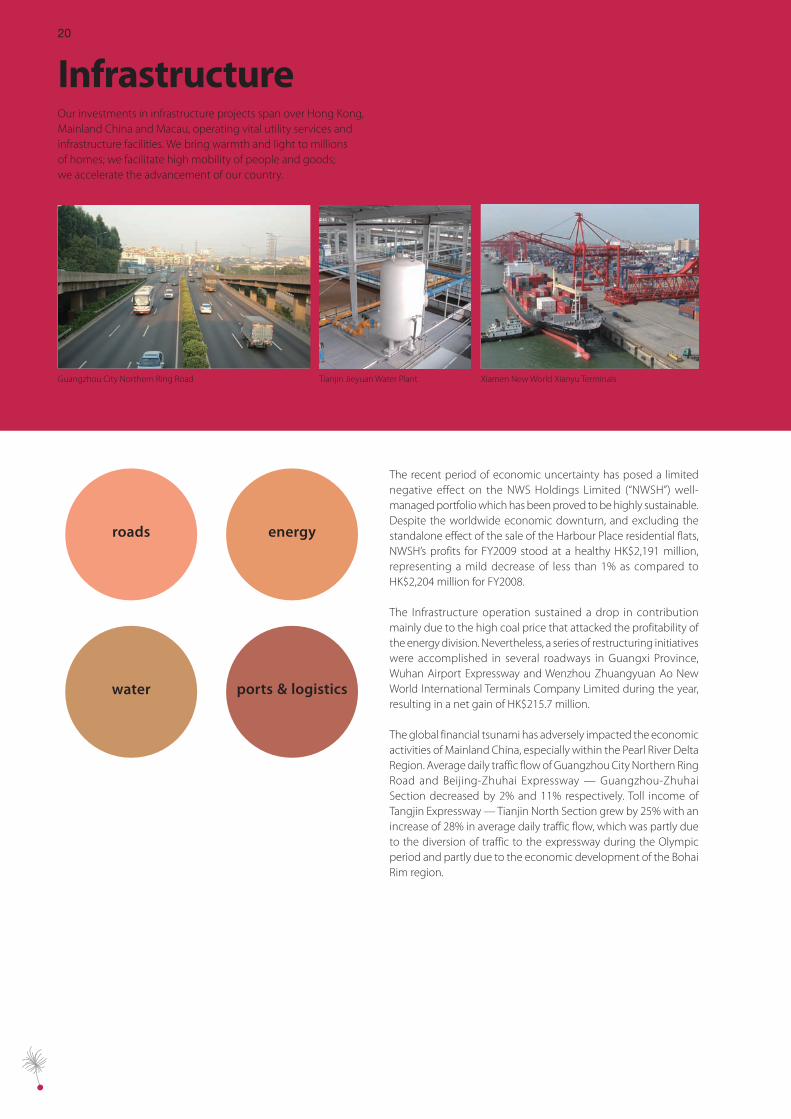
Our investments in infrastructure projects span over Hong Kong,Mainland China and Macau, operating vital utility services andinfrastructure facilities. We bring warmth and light to millionsof homes; we facilitate high mobility of people and goods;we accelerate the advancement of our country.
Tianjin Jieyuan Water PlantGuangzhou City Northern Ring Road Xiamen New World Xianyu Terminals
roads energy
water ports & logistics
21New World Development Company Limited - Annual Report 2009
In FY2009, the combined electricity sales of Zhujiang Power Plants fell by 17% due to the economic downturn. Although there were two tariff hikes in FY2009, the results of the power plant were severely impaired by the high fuel costs during the year. Electricity sales of Macau Power grew by 4% despite the delays and suspension of works of some mega-sized construction projects in Macau. Chengdu Jintang Power Plant reported a growth of 19% in electricity sales in FY2009, as the two generation units commenced operation in June and October 2007 respectively.
The acquisitions of 7.5% interest in Chongqing Water Group and an effective 26.03% interest in Tianjin Jieyuan Water Plant were completed in August 2008 and March 2009 respectively and have contributed positively to the Group in FY2009.
During the period under review, Xiamen New World Xiangyu Terminals Co., Ltd. reported a 7% reduction in throughput volume to 696,000 TEUs mainly due to sluggish trade. As a result of competition from new terminals and the economic downturn, the throughputs of Tianjin Orient Container Terminals Co., Ltd. and Tianjin Five Continents International Container Terminal Co., Ltd. fell by 24% to 857,000 TEUs and 4% to 1,920,000 TEUs respectively.
ATL Logistics Centre recorded a steady profit with a staggering average occupancy rate at 99% in FY2009. Owing to the time lag effect of its leasing business, an increase in overall average rental was observed as the impact of global freight market downturn was not fully reflected during this year. However, both container freight station revenue and gate charge revenue were reduced when compared to FY2008 as a result of a significant drop in sea-freight and air-freight cargo volumes in Hong Kong.
China United International Rail Containers Co., Ltd. (“CUIRC”), the joint venture company that develops 18 rail container terminals in Mainland China, was established in March 2007. The current standalone facility in Kunming is operating smoothly with a total throughput of 159,000 TEUs handled in FY2009. The construction of the terminals in Zhengzhou, Chongqing and Dalian is expected to be completed in late 2009. The construction works of the next batch of terminals in Qingdao, Chengdu, Xian and Wuhan are also underway and expected to be completed in 2010. Upon the completion of these new terminals, an initial railway terminal network for CUIRC will be established, serving strategic locations at major seaports and inland cities in Mainland China.
Tangjin Expressway (Tianjin North Section) Tianjin Five Continents International Container Terminal
22
Service
Hong Kong Convention and Exhibition Centre (“HKCEC”) continued to provide a steady source of income and cash inflow to the Group. A total of 1,076 events were held during the year and patronage exceeded 4.2 million. Construction works for the Atrium Link extension were substantially completed in April 2009 and its total rental space has been increased to 91,500 sq m. The purpose-built exhibition hall space of 66,000 sq m enables HKCEC to host bigger and better mega-sized exhibitions and maintain its leading position in the market.
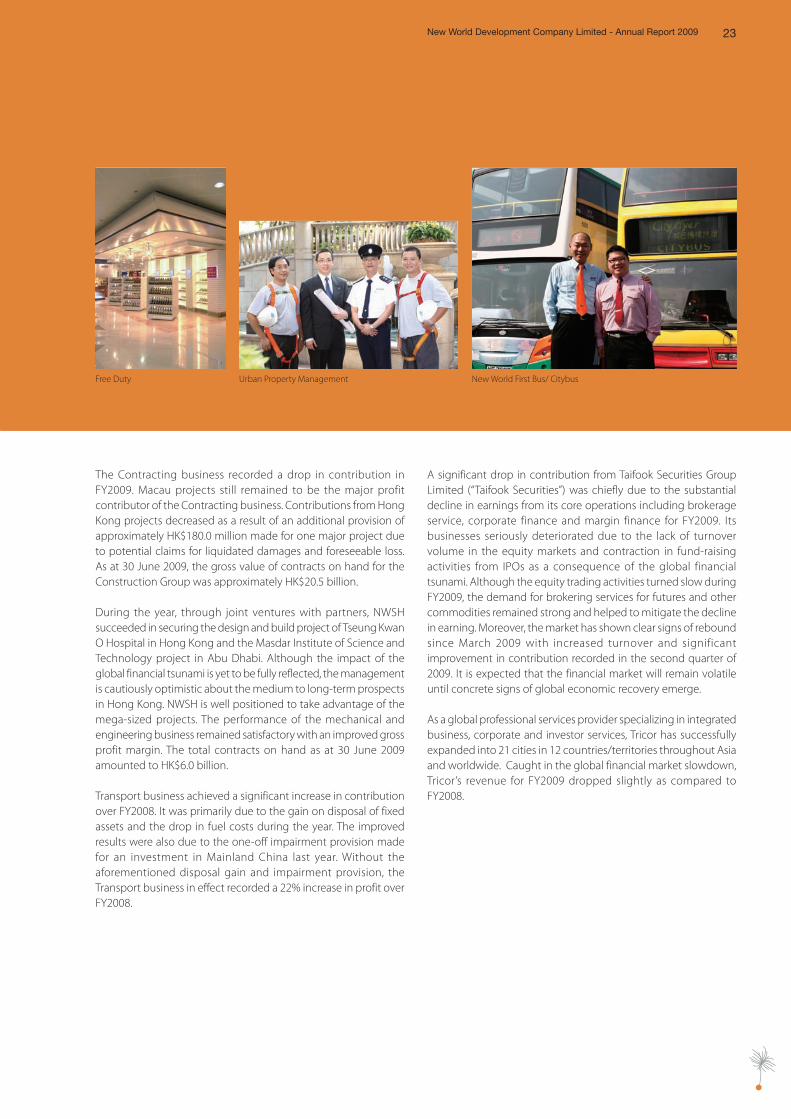
Free Duty, the duty free tobacco and liquor retail business at various cross-boundary transportation terminals in Hong Kong, achieved very satisfactory results in FY2009. Benefiting from the steady traffic growth via railway between Hong Kong and Mainland China, Free Duty in Lo Wu and Hunghom MTR Stations, which commenced in January 2008, produced outstanding results in FY2009. However, the ongoing global economic recession together with the human swine influenza outbreak have caused a decline in patronage at the Hong Kong International Airport.
The Facility Services business, including property management, security guarding, professional cleaning services and laundry, continued to contribute a stable profit and cashflow to the Group in FY2009. Our property management portfolio covers over 16.5 million sq m of commercial, industrial and residential areas in Hong Kong and Mainland China.
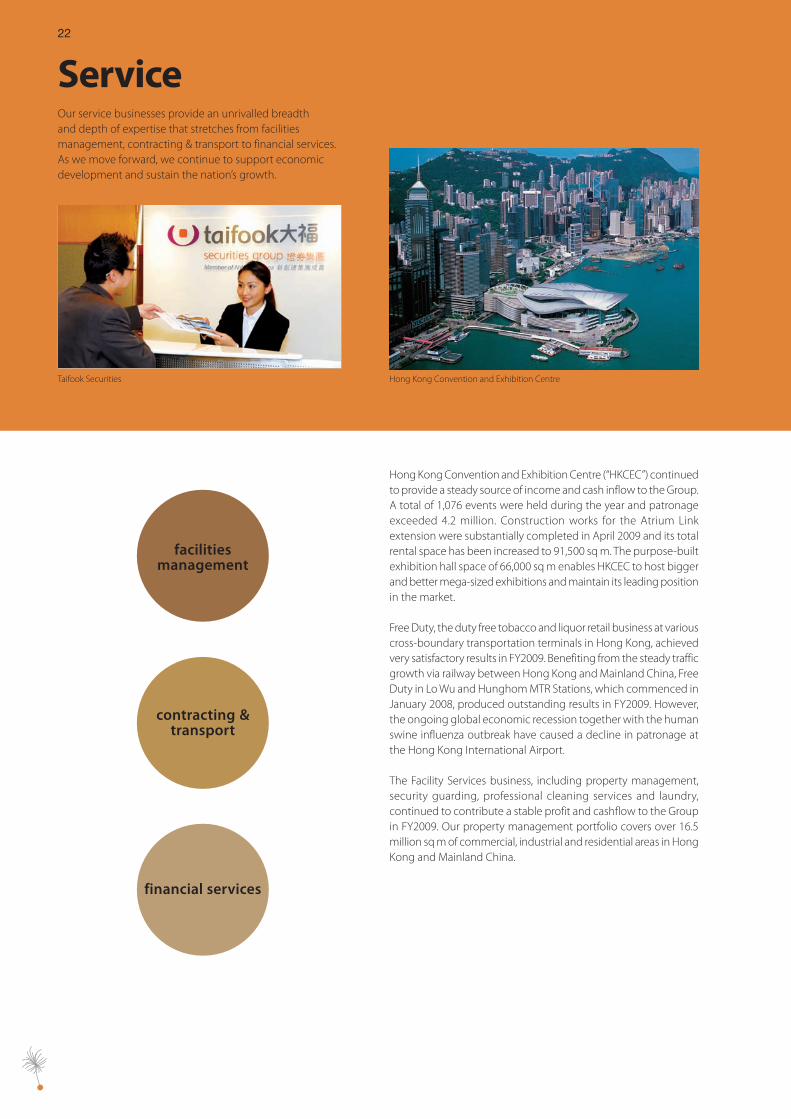
Our service businesses provide an unrivalled breadthand depth of expertise that stretches from facilitiesmanagement, contracting & transport to financial services.As we move forward, we continue to support economicdevelopment and sustain the nation’s growth.
Hong Kong Convention and Exhibition CentreTaifook Securities
facilities management
contracting & transport
financial services
23New World Development Company Limited - Annual Report 2009
The Contracting business recorded a drop in contribution in FY2009. Macau projects still remained to be the major profit contributor of the Contracting business. Contributions from Hong Kong projects decreased as a result of an additional provision of approximately HK$180.0 million made for one major project due to potential claims for liquidated damages and foreseeable loss. As at 30 June 2009, the gross value of contracts on hand for the Construction Group was approximately HK$20.5 billion.
During the year, through joint ventures with partners, NWSH succeeded in securing the design and build project of Tseung Kwan O Hospital in Hong Kong and the Masdar Institute of Science and Technology project in Abu Dhabi. Although the impact of the global financial tsunami is yet to be fully reflected, the management is cautiously optimistic about the medium to long-term prospects in Hong Kong. NWSH is well positioned to take advantage of the mega-sized projects. The performance of the mechanical and engineering business remained satisfactory with an improved gross profit margin. The total contracts on hand as at 30 June 2009 amounted to HK$6.0 billion.
Transport business achieved a significant increase in contribution over FY2008. It was primarily due to the gain on disposal of fixed assets and the drop in fuel costs during the year. The improved results were also due to the one-off impairment provision made for an investment in Mainland China last year. Without the aforementioned disposal gain and impairment provision, the Transport business in effect recorded a 22% increase in profit over FY2008.
A significant drop in contribution from Taifook Securities Group Limited (“Taifook Securities”) was chiefly due to the substantial decline in earnings from its core operations including brokerage service, corporate finance and margin finance for FY2009. Its businesses seriously deteriorated due to the lack of turnover volume in the equity markets and contraction in fund-raising activities from IPOs as a consequence of the global financial tsunami. Although the equity trading activities turned slow during FY2009, the demand for brokering services for futures and other commodities remained strong and helped to mitigate the decline in earning. Moreover, the market has shown clear signs of rebound since March 2009 with increased turnover and significant improvement in contribution recorded in the second quarter of 2009. It is expected that the financial market will remain volatile until concrete signs of global economic recovery emerge.
As a global professional services provider specializing in integrated business, corporate and investor services, Tricor has successfully expanded into 21 cities in 12 countries/territories throughout Asia and worldwide. Caught in the global financial market slowdown, Tricor’s revenue for FY2009 dropped slightly as compared to FY2008.
Urban Property ManagementFree Duty New World First Bus/ Citybus
24
Department Store
In FY2009, the total revenue of New World Department Store China Limited (“NWDS”) amounted to HK$1,721.2 million, a growth of 15.6% year-on-year. Net profit stood at HK$547.3 million, an increase of 14.8% compared to the previous year.
In the year under review, NWDS opened three new stores in Beijing, Wuhan and Taizhou. They included two self-owned stores of Wuhan Hanyang Branch Store (武漢漢陽店 ) and Taizhou Store (台州店 ), as well as one managed store of Beijing Liying Store (北京利瑩店 ). The expansion of Harbin Store (哈爾濱店 ) has been in phased operation starting from May 2009.
NWDS made two acquisitions during the period under review. Two managed stores, namely Kunming Store (昆明店 ) and Ningbo Trendy Store (寧波匯美店 ), were acquired and converted to self-owned stores in March and April 2009 respectively. After the acquisition, NWDS owns its first self-owned store in Southwestern China, which helps consolidate its market position in the region.
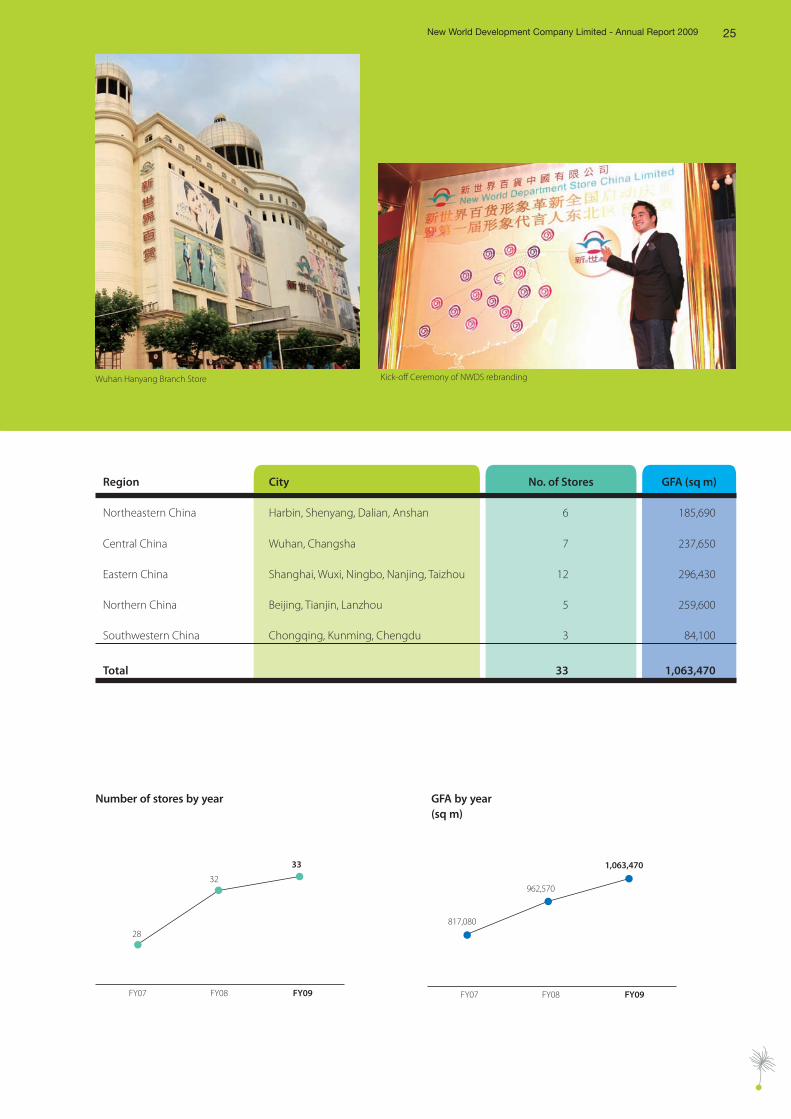
At the end of June 2009, NWDS business network comprised 22 self-owned stores and 11 managed stores, with a total GFA of about 1,063,470 sq m. Located in five operational regions, namely Northeastern China, Northern China, Eastern China, Central China and Southwestern China, the stores covered 17 major cities in the PRC. These included Wuhan, Shenyang, Wuxi, Harbin, Tianjin, Ningbo, Beijing, Shanghai, Dalian, Kunming, Lanzhou, Taizhou, Changsha, Chongqing, Chengdu, Anshan and Nanjing.
In the period under review, the Central China Region contributed the most to NWDS’s revenue, accounting for 31.8% of total revenue, followed by the Eastern China Region and the Northeastern China Region, accounting for 28.6% and 25.1% respectively.
In June 2009, NWDS announced to rebrand its image with new operation concept of “Fashion Style” and “Living Style”, offering customers an entirely new shopping experience. The new NWDS concept abandons the conventional class-basis positioning and initiates “Fashion Style” and “Living Style” concept in the retail industry by categorizing the stores into two types: “Fashion Gallery” and “Living Gallery”. Stores with a smaller GFA will be converted to “Fashion Gallery” while selected stores with a larger GFA will be transformed into “Living Gallery”.
Rebranding of NWDS will be implemented by phases in different regions. Northeastern region will be the first region to be inaugurated with Shenyang as the pilot city. Northern region and Eastern region will commence the rebranding project in 2010 with Beijing and Shanghai as the pilot cities respectively. Central region and Southwestern region will start the revamp in 2011 whereas Wuhan and Chengdu as the respective cities to embark on. The whole project is expected to be completed in two years.
The rebranding project will be implemented by three stages in order to offer a refreshing outlook to consumers. Revamping the merchandize mix will be the first phase; refining the graphic design and decoration of the stores will be the second phase; upgrading the exterior and interior design as well as the shopping atmosphere of the stores will be the third phase.
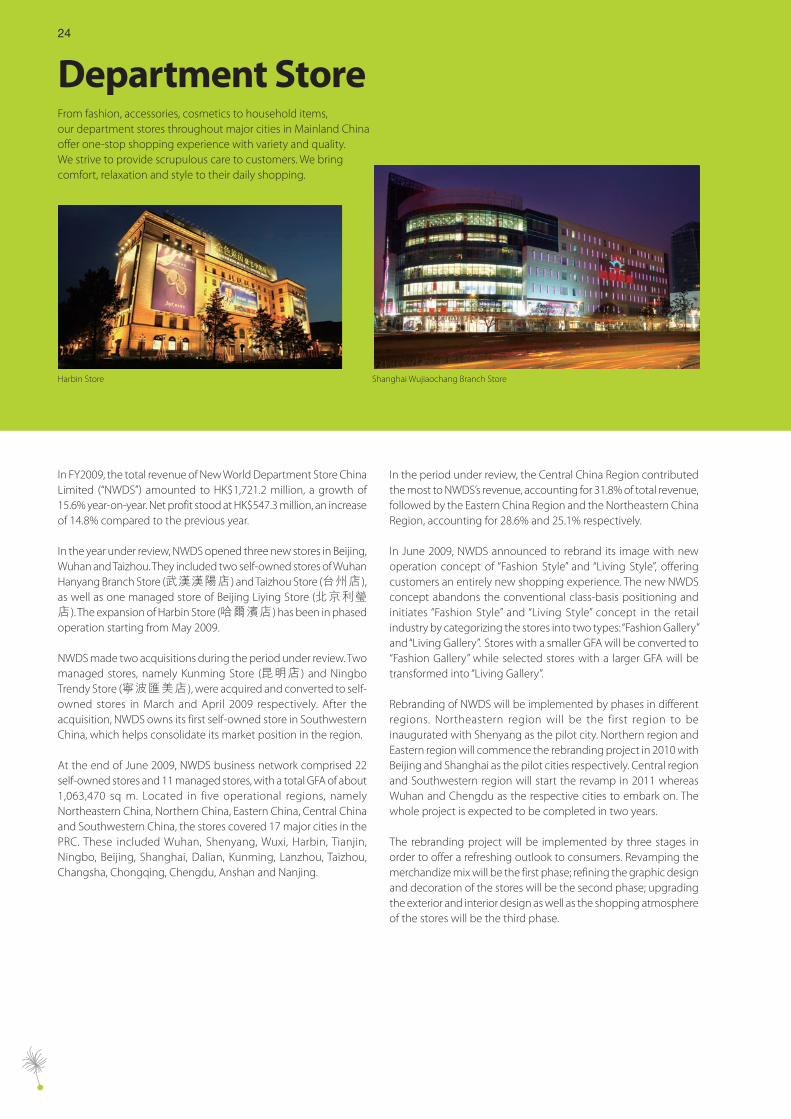
From fashion, accessories, cosmetics to household items,our department stores throughout major cities in Mainland Chinaoffer one-stop shopping experience with variety and quality. We strive to provide scrupulous care to customers. We bringcomfort, relaxation and style to their daily shopping.
Shanghai Wujiaochang Branch StoreHarbin Store
25New World Development Company Limited - Annual Report 2009
Region City No. of Stores GFA (sq m)
Northeastern China Harbin, Shenyang, Dalian, Anshan 6 185,690
Central China Wuhan, Changsha 7 237,650
Eastern China Shanghai, Wuxi, Ningbo, Nanjing, Taizhou 12 296,430
Northern China Beijing, Tianjin, Lanzhou 5 259,600
Southwestern China Chongqing, Kunming, Chengdu 3 84,100
Total 33 1,063,470
Wuhan Hanyang Branch Store Kick-off Ceremony of NWDS rebranding
26
Direct Investment
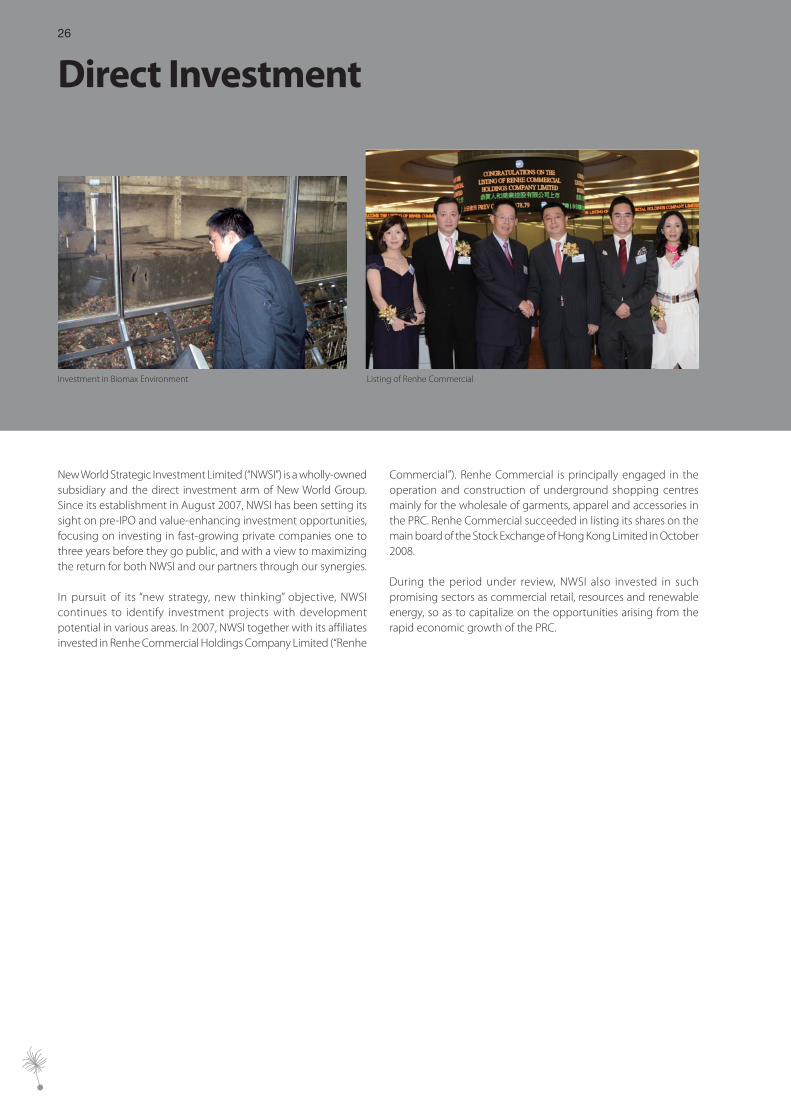
Investment in Biomax Environment Listing of Renhe Commercial
New World Strategic Investment Limited (“NWSI”) is a wholly-owned subsidiary and the direct investment arm of New World Group. Since its establishment in August 2007, NWSI has been setting its sight on pre-IPO and value-enhancing investment opportunities, focusing on investing in fast-growing private companies one to three years before they go public, and with a view to maximizing the return for both NWSI and our partners through our synergies.
In pursuit of its “new strategy, new thinking” objective, NWSI continues to identify investment projects with development potential in various areas. In 2007, NWSI together with its affiliates invested in Renhe Commercial Holdings Company Limited (“Renhe
Commercial”). Renhe Commercial is principally engaged in the operation and construction of underground shopping centres mainly for the wholesale of garments, apparel and accessories in the PRC. Renhe Commercial succeeded in listing its shares on the main board of the Stock Exchange of Hong Kong Limited in October 2008.
During the period under review, NWSI also invested in such promising sectors as commercial retail, resources and renewable energy, so as to capitalize on the opportunities arising from the rapid economic growth of the PRC.
27
Other BusinessesNew World Development Company Limited - Annual Report 2009
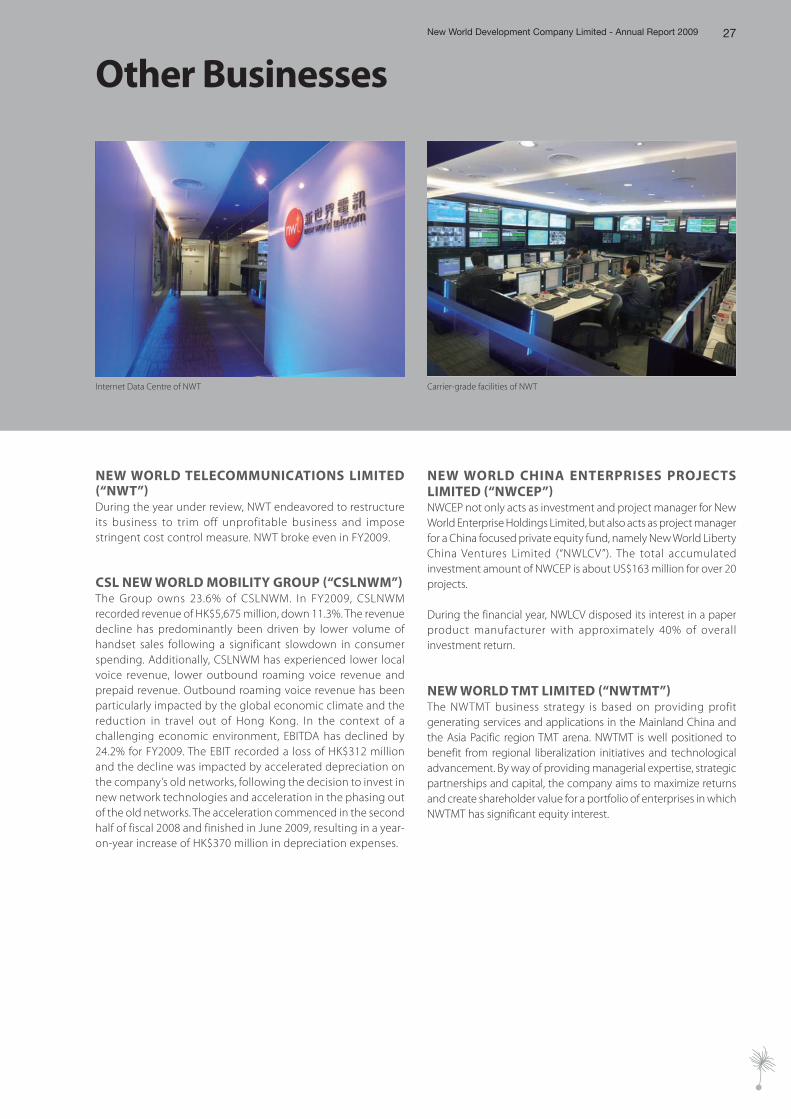
NEW WORLD TELECOMMUNICATIONS LIMITED “NWT”During the year under review, NWT endeavored to restructure its business to trim off unprofitable business and impose stringent cost control measure. NWT broke even in FY2009.
CSL NEW WORLD MOBILITY GROUP “CSLNWM”The Group owns 23.6% of CSLNWM. In FY2009, CSLNWM recorded revenue of HK$5,675 million, down 11.3%. The revenue decline has predominantly been driven by lower volume of handset sales following a significant slowdown in consumer spending. Additionally, CSLNWM has experienced lower local voice revenue, lower outbound roaming voice revenue and prepaid revenue. Outbound roaming voice revenue has been particularly impacted by the global economic climate and the reduction in travel out of Hong Kong. In the context of a challenging economic environment, EBITDA has declined by 24.2% for FY2009. The EBIT recorded a loss of HK$312 million and the decline was impacted by accelerated depreciation on the company’s old networks, following the decision to invest in new network technologies and acceleration in the phasing out of the old networks. The acceleration commenced in the second half of fiscal 2008 and finished in June 2009, resulting in a year-on-year increase of HK$370 million in depreciation expenses.
NEW WORLD CHINA ENTERPRISES PROJECTS LIMITED “NWCEP”NWCEP not only acts as investment and project manager for New World Enterprise Holdings Limited, but also acts as project manager for a China focused private equity fund, namely New World Liberty China Ventures Limited (“NWLCV”). The total accumulated investment amount of NWCEP is about US$163 million for over 20 projects.
During the financial year, NWLCV disposed its interest in a paper product manufacturer with approximately 40% of overall investment return.
NEW WORLD TMT LIMITED “NWTMT”The NWTMT business strategy is based on providing profit generating services and applications in the Mainland China and the Asia Pacific region TMT arena. NWTMT is well positioned to benefit from regional liberalization initiatives and technological advancement. By way of providing managerial expertise, strategic partnerships and capital, the company aims to maximize returns and create shareholder value for a portfolio of enterprises in which NWTMT has significant equity interest.
Internet Data Centre of NWT Carrier-grade facilities of NWT
28
Corporate Governance Report
CORPORATE GOVERNANCE PRACTICESThe Company is committed to maintain a high standard of corporate governance practices and procedures. For the year under review, the Company has complied with all the applicable code provisions of the Code on Corporate Governance Practices (the “CG Code”) contained in Appendix 14 of the Listing Rules, except for the deviations as disclosed in this report.
The board of Directors (the “Board”) will review and improve the corporate governance practices from time to time to ensure that the Group is under the leadership of an effective board to optimise return for shareholders.
DIRECTORS’ SECURITIES TRANSACTIONSThe Company has adopted the Model Code for Securities Transactions by Directors of Listed Issuers as set out in Appendix 10 to the Listing Rules (the “Model Code”) as its own code of conduct regarding securities transactions. Having made specific enquiry of all Directors, the Directors of the Company confirmed that they had complied with the required standard set out in the Model Code during the year ended 30 June 2009.
As required under code provision A.5.4 of the CG Code, the Board should establish written guidelines on no less exacting terms than the Model Code for relevant employees in respect of their dealings in the securities of the Company. The Board has established guidelines for employees in respect of their dealings in the securities of the Company but they are not on no less exacting terms than the Model Code. The deviation is mainly due to the fact that the Company currently has over 55,000 employees and operates diversified businesses, it will cause immense administrative burden for processing written notifications from the relevant employees by the Company.
BOARD OF DIRECTORSThe Board oversees the management, businesses, strategic directions and financial performance of the Group. The Board currently comprises a total of 14 Directors, with six Executive Directors, four Non-executive Directors and four Independent Non-executive Directors. The biographies of the Directors are set out on pages 63 to 67 of this annual report.
The Company has received annual confirmation of independence from all the Independent Non-executive Directors in accordance with Rule 3.13 of the Listing Rules. The Board is of the view that all the Independent Non-executive Directors are independent in accordance with the Listing Rules.
The Board has delegated an Executive Committee comprising all Executive Directors of the Board, with authority and responsibility for handling the management functions and day-to-day operations of the Group, while reserving certain key matters such as the declaration of interim dividend, making recommendation of final dividend or other distributions for the approval by the Board. The Executive Committee meets regularly as when necessary.
CHAIRMAN AND MANAGING DIRECTORThe Board has appointed a Chairman who provides leadership for the Board and ensures that the Board works effectively and that all important issues are discussed in a timely manner. The Managing Director takes the lead in the Group’s operations and business development. The positions of the Chairman and the Managing Director are held by separate individuals so as to maintain an effective segregation of duties.
29New World Development Company Limited - Annual Report 2009
NONEXECUTIVE DIRECTORSNon-executive Directors (including the Independent Non-executive Directors) serve the relevant function of bringing independent judgement on the development, performance and risk management of the Group. The Non-executive Directors are not appointed for a specific term as is stipulated in Code provision A.4.1, but are subject to retirement by rotation in accordance with the articles of association of the Company. Article 103(A) of the articles of association of the Company provides that at each annual general meeting, one-third of the Directors for the time being (or if their number is not a multiple of three, the number nearest to but not less than one-third) shall retire from office by rotation, provided that every Director (including those appointed for a specific term) shall be subject to retirement by rotation at least once every three years.
REMUNERATION OF DIRECTORSThe Company established the Remuneration Committee on 22 September 2005 with specific written terms of reference. The Remunerat ion Committee is responsible for mak ing recommendations on the Company’s policy and structure for the remuneration of all the Directors and senior management of the Company and on the establishment of a formal and transparent procedure for developing remuneration policy for approval by the Board. The Remuneration Committee met once during the year to review the remuneration policy for Directors and senior management of the Company. Current Members of the Remuneration Committee are Mr. Leung Chi-Kin, Stewart (Chairman), Mr. Yeung Ping-Leung, Howard, Dr. Cha Mou-Sing, Payson, Mr. Ho Hau-Hay, Hamilton and Mr. Lee Luen-Wai, John.
The remuneration for the Executive Directors comprises basic salary, pensions and discretionary bonus. Share options were granted to all Directors to subscribe for shares in the Company under the Company’s share options scheme. In addition to the above, certain Directors had been granted options under share option schemes of various listed subsidiaries to enable the Directors to subscribe for shares in those subsidiaries. Details of the amount of emoluments of Directors paid for the financial year ended 30 June 2009 are set out in Note 16 to the financial statements.
NOMINATION OF DIRECTORSThe Board is responsible for considering the suitability of a candidate to act as a Director on the basis of the candidate’s qualification, experience, integrity and potential contribution to the Company, and approving and terminating the appointment of a Director. A candidate to be appointed as Independent Non-executive Director must also meet the independence requirement set out in Rule 3.13 of the Listing Rules. During the year under review, the Company had not established a nomination committee.
AUDIT COMMITTEEThe Audit Committee, established in fiscal year 1999 with specific written terms of reference, currently consists of four Independent Non-executive Directors of the Board. Due to the amendments to the CG Code effective from 1 January 2009, the terms of reference of the Audit Committee were updated during the year. The Audit Committee is responsible for the review and supervision of the Group’s financial reporting process and internal controls. To assist the Audit Committee to carry out its duties, briefing sessions conducted by heads of the Group’s key business segments were organised for the Audit Committee during the year to provide its Members a better understanding of the Group.
During the year, the Audit Committee reviewed with the auditors the audited financial statements for the year ended 30 June 2008 and the unaudited interim financial statements for the six months ended 31 December 2008 with recommendations to the Board for approval, reviewed reports on internal control system of the Group, and discussed with the management and the external auditors the accounting policies and practices which may affect the Group and financial reporting matters. The Audit Committee reviewed the system of internal control and the financial statements for the year ended 30 June 2009 with recommendation to the Board for approval. Current Members of the Audit Committee are Dr. Cha Mou-Sing, Payson (Chairman), Mr. Yeung Ping-Leung, Howard, Mr. Ho Hau-Hay, Hamilton and Mr. Lee Luen-Wai, John.
30
Corporate Governance Report
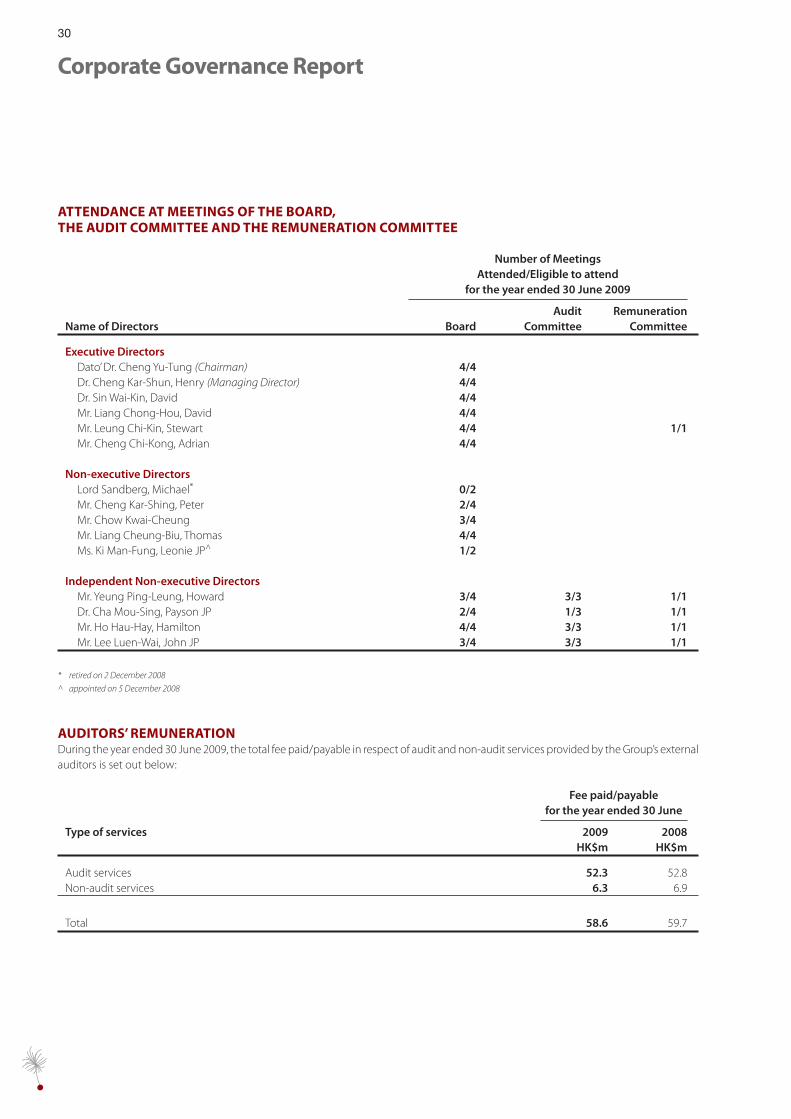
ATTENDANCE AT MEETINGS OF THE BOARD,THE AUDIT COMMITTEE AND THE REMUNERATION COMMITTEE
Number of MeetingsAttended/Eligible to attend
for the year ended 30 June 2009
Name of Directors BoardAudit
CommitteeRemuneration
Committee
Executive Directors Dato’ Dr. Cheng Yu-Tung (Chairman) 4/4 Dr. Cheng Kar-Shun, Henry (Managing Director) 4/4 Dr. Sin Wai-Kin, David 4/4 Mr. Liang Chong-Hou, David 4/4 Mr. Leung Chi-Kin, Stewart 4/4 1/1 Mr. Cheng Chi-Kong, Adrian 4/4
Non-executive Directors Lord Sandberg, Michael* 0/2 Mr. Cheng Kar-Shing, Peter 2/4 Mr. Chow Kwai-Cheung 3/4 Mr. Liang Cheung-Biu, Thomas 4/4 Ms. Ki Man-Fung, Leonie JP^ 1/2
Independent Non-executive Directors Mr. Yeung Ping-Leung, Howard 3/4 3/3 1/1 Dr. Cha Mou-Sing, Payson JP 2/4 1/3 1/1 Mr. Ho Hau-Hay, Hamilton 4/4 3/3 1/1 Mr. Lee Luen-Wai, John JP 3/4 3/3 1/1
* retired on 2 December 2008
^ appointed on 5 December 2008
AUDITORS’ REMUNERATIONDuring the year ended 30 June 2009, the total fee paid/payable in respect of audit and non-audit services provided by the Group’s external auditors is set out below:
Fee paid/payablefor the year ended 30 June
Type of services 2009 2008HK$m HK$m
Audit services 52.3 52.8Non-audit services 6.3 6.9
Total 58.6 59.7
31New World Development Company Limited - Annual Report 2009
DIRECTORS’ RESPONSIBILITY FOR THE FINANCIAL STATEMENTSThe Board, supported by the accounts department, is responsible for the preparation of the financial statements of the Company and the Group. The Board has prepared the financial statements in accordance with the Hong Kong Financial Reporting Standards issued by the Hong Kong Institute of Certified Public Accountants. Appropriate accounting policies have also been used and applied consistently. The Directors were not aware of any material uncertainties relating to events or conditions which may cast significant doubt upon the Group’s ability to continue as a going concern.
The statement by the auditors of the Company and the Group regarding their reporting responsibilities on the financial statements of the Company and the Group is set out in the Independent Auditors’ Report on page 103 of this annual report.
INTERNAL CONTROLThe Board is responsible for the internal control of the Group and for reviewing its effectiveness. Procedures have been designed for safeguarding assets against unauthorised use or disposition, ensure the maintenance of proper accounting records for the provision of reliable financial information for internal use or for publication, and ensure compliance of applicable laws, rules and regulations. The procedures provide reasonable but not absolute assurance against material errors, losses or fraud.
An internal audit department has been established to conduct audits of the Company and its subsidiaries, jointly controlled entities and associated companies. The internal audit department performs
risk-based audits to review the effectiveness of the Group’s material internal controls so as to provide assurance that key businesses and operational risks are identified and managed. The work carried out by the internal audit department will ensure the internal controls are carried out appropriately and functioning as intended. The internal audit department reports to the Board with its findings and makes recommendations to improve the internal control of the Group.
The Audit Committee also receives the report from the internal audit department and takes such report into consideration when it makes its recommendation to the Board for approval of the half-yearly or annual results of the Group.
COMMUNICATION WITH SHAREHOLDERSThe Board and senior management maintain a continuing dialogue with the Company’s shareholders and investors through various channels including the Company’s annual general meeting. The Chairman, Managing Director, other members of the Board and external auditors attend the annual general meeting. The Directors will answer questions raised by the shareholders on the performance of the Group. The Company holds press and analysts conferences at least twice a year following the release of interim and full year results announcements at which the Executive Directors and senior management of the Group are available to answer questions regarding the performance of the Group. Our corporate website which contains corporate information, interim and annual reports, announcements and circulars issued by the Group as well as the recent developments of the Group enables the Company’s shareholders to have a timely and updated information of the Group.
32
Corporate Citizenship
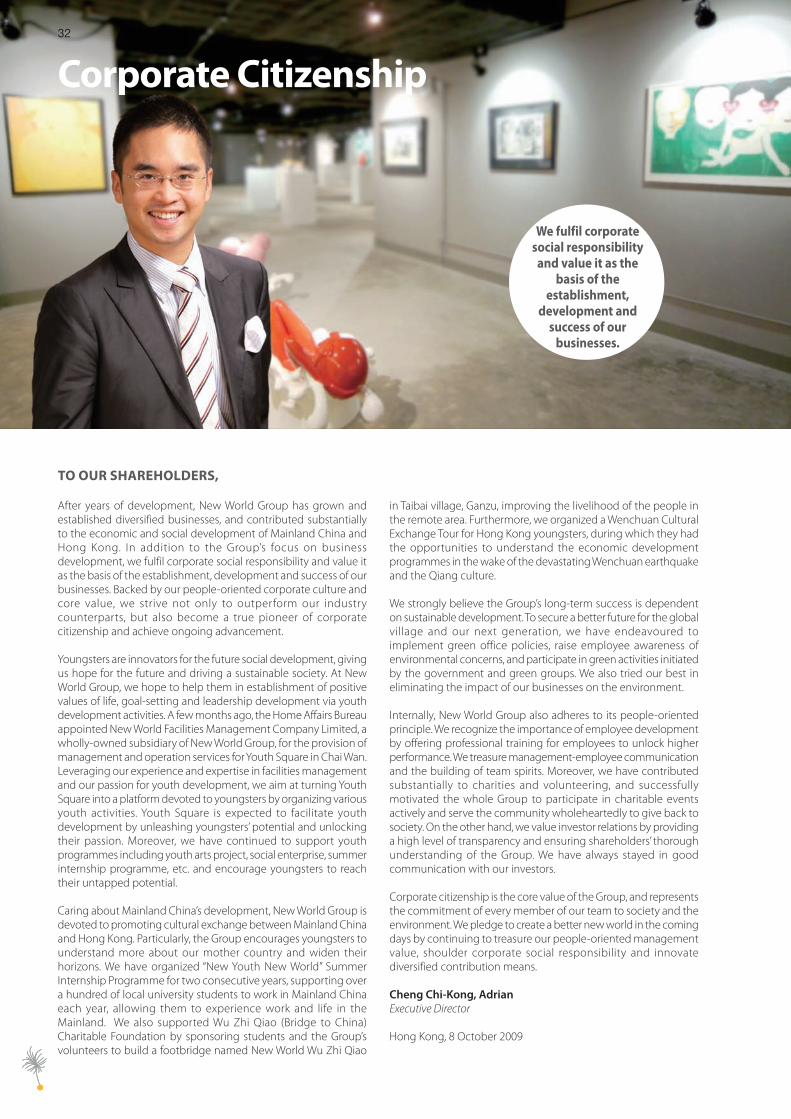
TO OUR SHAREHOLDERS,
After years of development, New World Group has grown and established diversified businesses, and contributed substantially to the economic and social development of Mainland China and Hong Kong. In addition to the Group’s focus on business development, we fulfil corporate social responsibility and value it as the basis of the establishment, development and success of our businesses. Backed by our people-oriented corporate culture and core value, we strive not only to outperform our industry counterparts, but also become a true pioneer of corporate citizenship and achieve ongoing advancement.
Youngsters are innovators for the future social development, giving us hope for the future and driving a sustainable society. At New World Group, we hope to help them in establishment of positive values of life, goal-setting and leadership development via youth development activities. A few months ago, the Home Affairs Bureau appointed New World Facilities Management Company Limited, a wholly-owned subsidiary of New World Group, for the provision of management and operation services for Youth Square in Chai Wan. Leveraging our experience and expertise in facilities management and our passion for youth development, we aim at turning Youth Square into a platform devoted to youngsters by organizing various youth activities. Youth Square is expected to facilitate youth development by unleashing youngsters’ potential and unlocking their passion. Moreover, we have continued to support youth programmes including youth arts project, social enterprise, summer internship programme, etc. and encourage youngsters to reach their untapped potential.
Caring about Mainland China’s development, New World Group is devoted to promoting cultural exchange between Mainland China and Hong Kong. Particularly, the Group encourages youngsters to understand more about our mother country and widen their horizons. We have organized “New Youth New World” Summer Internship Programme for two consecutive years, supporting over a hundred of local university students to work in Mainland China each year, allowing them to experience work and life in the Mainland. We also supported Wu Zhi Qiao (Bridge to China) Charitable Foundation by sponsoring students and the Group’s volunteers to build a footbridge named New World Wu Zhi Qiao
in Taibai village, Ganzu, improving the livelihood of the people in the remote area. Furthermore, we organized a Wenchuan Cultural Exchange Tour for Hong Kong youngsters, during which they had the opportunities to understand the economic development programmes in the wake of the devastating Wenchuan earthquake and the Qiang culture.
We strongly believe the Group’s long-term success is dependent on sustainable development. To secure a better future for the global village and our next generation, we have endeavoured to implement green office policies, raise employee awareness of environmental concerns, and participate in green activities initiated by the government and green groups. We also tried our best in eliminating the impact of our businesses on the environment.
Internally, New World Group also adheres to its people-oriented principle. We recognize the importance of employee development by offering professional training for employees to unlock higher performance. We treasure management-employee communication and the building of team spirits. Moreover, we have contributed substantially to charities and volunteering, and successfully motivated the whole Group to participate in charitable events actively and serve the community wholeheartedly to give back to society. On the other hand, we value investor relations by providing a high level of transparency and ensuring shareholders’ thorough understanding of the Group. We have always stayed in good communication with our investors.
Corporate citizenship is the core value of the Group, and represents the commitment of every member of our team to society and the environment. We pledge to create a better new world in the coming days by continuing to treasure our people-oriented management value, shoulder corporate social responsibility and innovate diversified contribution means.
Cheng Chi-Kong, AdrianExecutive Director
Hong Kong, 8 October 2009
We fulfil corporate social responsibility
and value it as the basis of the
establishment, development and
success of our businesses.

33New World Development Company Limited - Annual Report 2009
Sharing Love and CareBuilding a Harmonious New WorldNEW WORLD GROUP HAS ALWAYS BEEN COMMITTED TO PARTICIPATING IN COMMUNITY AFFAIRS AND CARING FOR THE PEOPLE IN NEED. AS A RESPONSIBLE CORPORATE CITIZEN, THE GROUP ALWAYS CARES FOR THE COMMUNITY WE SERVE AND RESPECTS THE ENVIRONMENT WE LIVE IN. THEREFORE, THE GROUP HAS ACTIVELY SUPPORTED VARIOUS COMMUNITY EVENTS, PROMOTED EXCHANGE BETWEEN HONG KONG AND MAINLAND CHINA, AND FORMED CORPORATE VOLUNTEER TEAMS TO PROVIDE SERVICES FOR THE NEEDY. THE GROUP HAS ALSO BEEN DEVOTED TO NURTURING PROFESSIONAL AND ENERGETIC STAFF WITH COMMITMENT AND PRIDE, AND TARGETED TO BUILD A BETTER SOCIETY THROUGH INNOVATION AND SUSTAINABLE GROWTH.
NWD AND MORE THAN 20 OF ITS GROUP COMPANIES HAVE BEEN DEVOTED TO CORPORATE SOCIAL RESPONSIBILITY AND AWARDED THE CARING COMPANY LOGO BY THE HONG KONG COUNCIL OF SOCIAL SERVICE, RECOGNIZING THEIR OUTSTANDING PERFORMANCE IN IMPLEMENTING CORPORATE SOCIAL SERVICES.
33New World Development Company Limited - Annual Report 2009
PROVIDING MANAGEMENT AND OPERATION SERVICES FOR YOUTH SQUARENew World Group understands the importance of providing a diverse development platform for youngsters and has been committed to promoting all-round youth development. New World Facilities Management Company Limited, a wholly-owned subsidiary of the Group, has been appointed by the Home Affairs Bureau to provide management and operation services for Youth Square in Chai Wan, on a non-profit making basis, starting from 23 April 2009. Youth Square, being the first of its kind, serves as the base of the youth development activities. It comprises an auditorium, multi-purpose halls, offices as well as retail shops, providing space and facilities for a variety of youth activities.
Moreover, Youth Square is equipped with a youth hostel, providing 150 rooms for accommodation of Hong Kong-Mainland and international exchange activities.
Since its commencement of services, Youth Square has offered a platform for diversified youth activities by organizing various activities, including “Organic Life Fair”, “Youth Square Career Seminar”, Anti-drug Concert and more.
NURTURING ALLROUND DEVELOPMENT OF YOUNGSTERSNew World Group values local young people as an important asset and future leaders of our society. The Group has put great emphasis on nurturing young people and providing training and artistic creation opportunities for all-round youth development. We hope that the young people can unleash their full potential and develop professionalism for contribution to the society in the future.
34
Corporate Citizenship
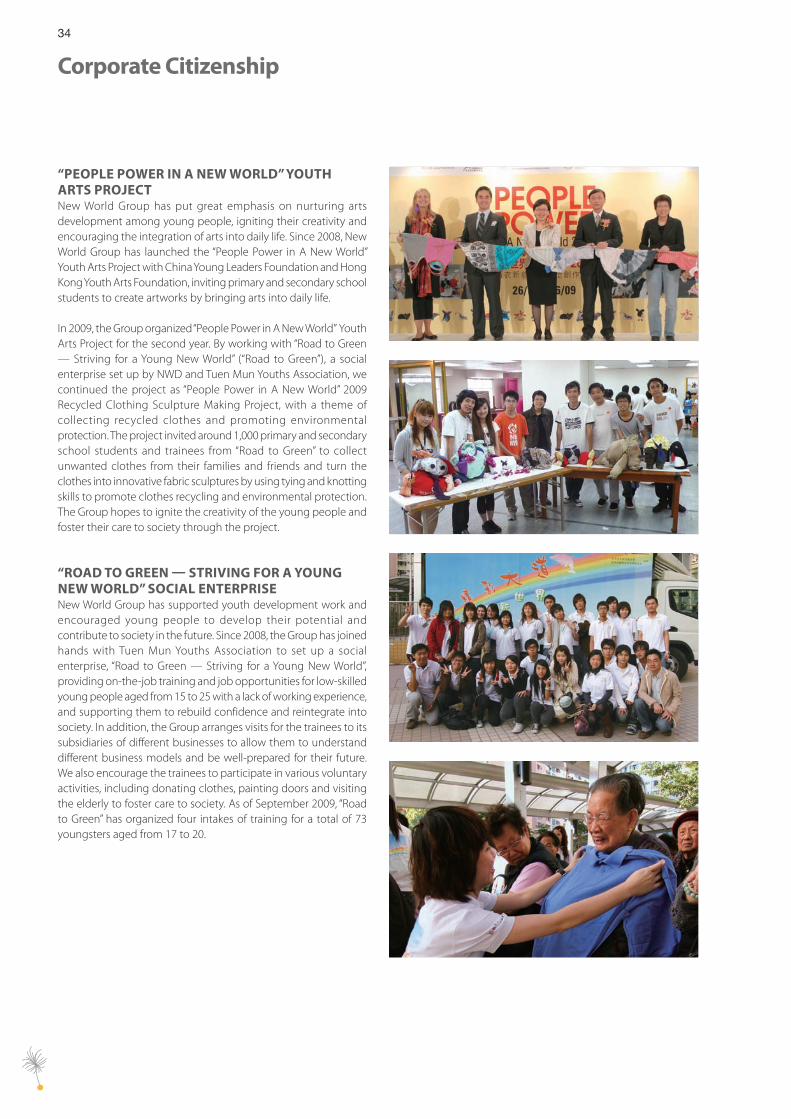
“PEOPLE POWER IN A NEW WORLD” YOUTH ARTS PROJECTNew World Group has put great emphasis on nurturing arts development among young people, igniting their creativity and encouraging the integration of arts into daily life. Since 2008, New World Group has launched the “People Power in A New World” Youth Arts Project with China Young Leaders Foundation and Hong Kong Youth Arts Foundation, inviting primary and secondary school students to create artworks by bringing arts into daily life.
In 2009, the Group organized “People Power in A New World” Youth Arts Project for the second year. By working with “Road to Green — Striving for a Young New World” (“Road to Green”), a social enterprise set up by NWD and Tuen Mun Youths Association, we continued the project as “People Power in A New World” 2009 Recycled Clothing Sculpture Making Project, with a theme of collecting recycled clothes and promoting environmental protection. The project invited around 1,000 primary and secondary school students and trainees from “Road to Green” to collect unwanted clothes from their families and friends and turn the clothes into innovative fabric sculptures by using tying and knotting skills to promote clothes recycling and environmental protection. The Group hopes to ignite the creativity of the young people and foster their care to society through the project.
“ROAD TO GREEN STRIVING FOR A YOUNG NEW WORLD” SOCIAL ENTERPRISENew World Group has supported youth development work and encouraged young people to develop their potential and contribute to society in the future. Since 2008, the Group has joined hands with Tuen Mun Youths Association to set up a social enterprise, “Road to Green — Striving for a Young New World”, providing on-the-job training and job opportunities for low-skilled young people aged from 15 to 25 with a lack of working experience, and supporting them to rebuild confidence and reintegrate into society. In addition, the Group arranges visits for the trainees to its subsidiaries of different businesses to allow them to understand different business models and be well-prepared for their future. We also encourage the trainees to participate in various voluntary activities, including donating clothes, painting doors and visiting the elderly to foster care to society. As of September 2009, “Road to Green” has organized four intakes of training for a total of 73 youngsters aged from 17 to 20.
35New World Development Company Limited - Annual Report 2009
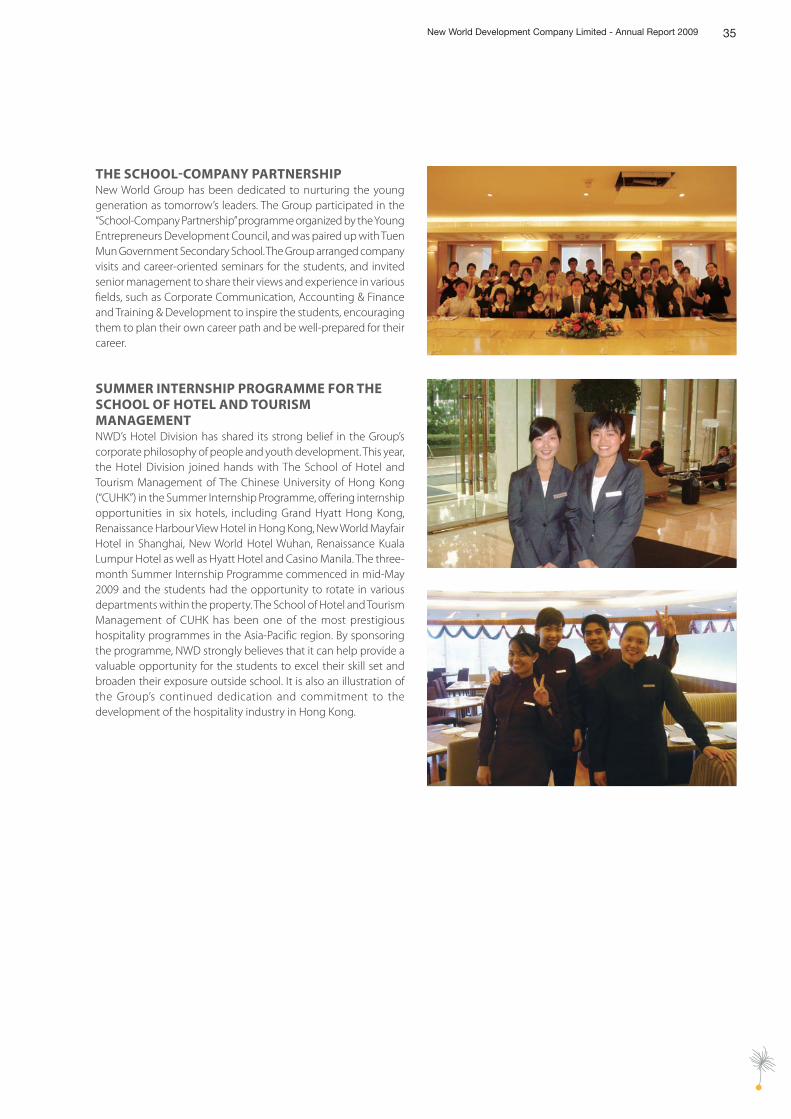
THE SCHOOLCOMPANY PARTNERSHIPNew World Group has been dedicated to nurturing the young generation as tomorrow’s leaders. The Group participated in the “School-Company Partnership” programme organized by the Young Entrepreneurs Development Council, and was paired up with Tuen Mun Government Secondary School. The Group arranged company visits and career-oriented seminars for the students, and invited senior management to share their views and experience in various fields, such as Corporate Communication, Accounting & Finance and Training & Development to inspire the students, encouraging them to plan their own career path and be well-prepared for their career.
SUMMER INTERNSHIP PROGRAMME FOR THE SCHOOL OF HOTEL AND TOURISM MANAGEMENTNWD’s Hotel Division has shared its strong belief in the Group’s corporate philosophy of people and youth development. This year, the Hotel Division joined hands with The School of Hotel and Tourism Management of The Chinese University of Hong Kong (“CUHK”) in the Summer Internship Programme, offering internship opportunities in six hotels, including Grand Hyatt Hong Kong, Renaissance Harbour View Hotel in Hong Kong, New World Mayfair Hotel in Shanghai, New World Hotel Wuhan, Renaissance Kuala Lumpur Hotel as well as Hyatt Hotel and Casino Manila. The three-month Summer Internship Programme commenced in mid-May 2009 and the students had the opportunity to rotate in various departments within the property. The School of Hotel and Tourism Management of CUHK has been one of the most prestigious hospitality programmes in the Asia-Pacific region. By sponsoring the programme, NWD strongly believes that it can help provide a valuable opportunity for the students to excel their skill set and broaden their exposure outside school. It is also an illustration of the Group’s continued dedication and commitment to the development of the hospitality industry in Hong Kong.
36
Corporate Citizenship
BRIDGING THE RELATIONS BETWEEN MAINLAND CHINA AND HONG KONGFounded in Hong Kong, New World Group always concerns the development of Mainland China and actively promotes cultural exchange between the Mainland and Hong Kong. In addition to organizing disaster relief activities, the Group has encouraged local young people to learn about their home country and care about their motherland by arranging students to join internships and cultural exchange programmes in the Mainland.
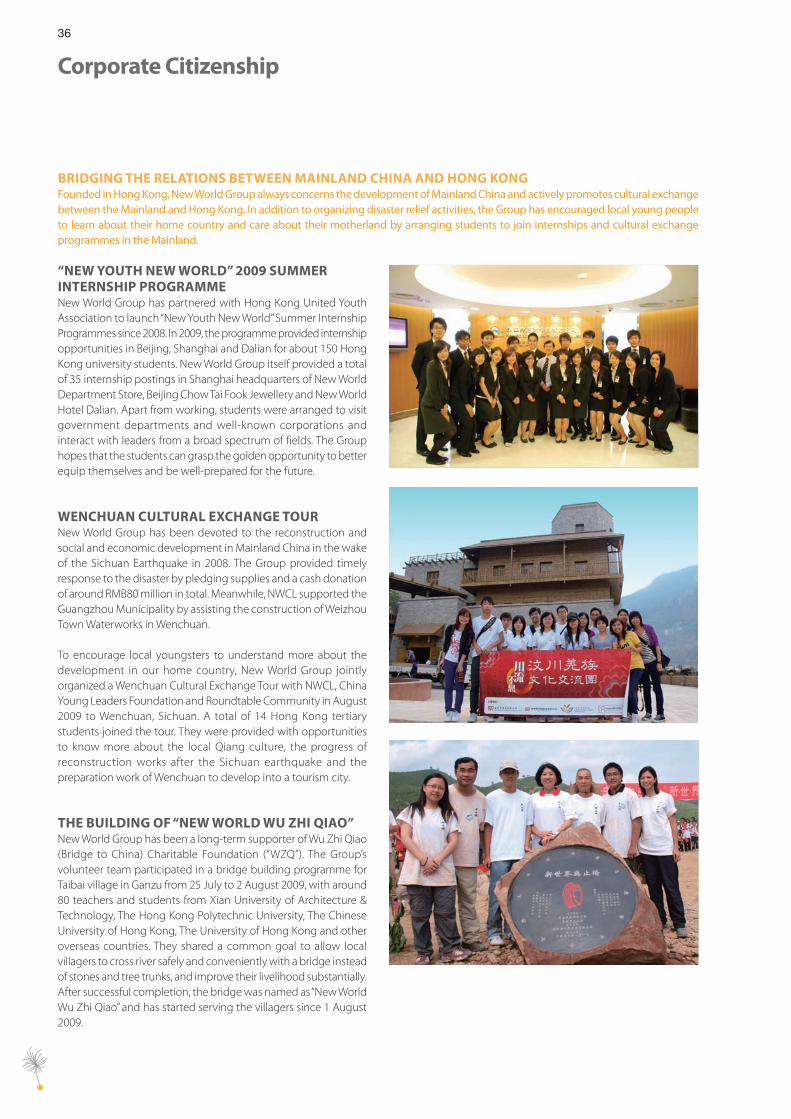
“NEW YOUTH NEW WORLD” 2009 SUMMER INTERNSHIP PROGRAMMENew World Group has partnered with Hong Kong United Youth Association to launch “New Youth New World” Summer Internship Programmes since 2008. In 2009, the programme provided internship opportunities in Beijing, Shanghai and Dalian for about 150 Hong Kong university students. New World Group itself provided a total of 35 internship postings in Shanghai headquarters of New World Department Store, Beijing Chow Tai Fook Jewellery and New World Hotel Dalian. Apart from working, students were arranged to visit government departments and well-known corporations and interact with leaders from a broad spectrum of fields. The Group hopes that the students can grasp the golden opportunity to better equip themselves and be well-prepared for the future.
WENCHUAN CULTURAL EXCHANGE TOURNew World Group has been devoted to the reconstruction and social and economic development in Mainland China in the wake of the Sichuan Earthquake in 2008. The Group provided timely response to the disaster by pledging supplies and a cash donation of around RMB80 million in total. Meanwhile, NWCL supported the Guangzhou Municipality by assisting the construction of Weizhou Town Waterworks in Wenchuan.
To encourage local youngsters to understand more about the development in our home country, New World Group jointly organized a Wenchuan Cultural Exchange Tour with NWCL, China Young Leaders Foundation and Roundtable Community in August 2009 to Wenchuan, Sichuan. A total of 14 Hong Kong tertiary students joined the tour. They were provided with opportunities to know more about the local Qiang culture, the progress of reconstruction works after the Sichuan earthquake and the preparation work of Wenchuan to develop into a tourism city.
THE BUILDING OF “NEW WORLD WU ZHI QIAO”New World Group has been a long-term supporter of Wu Zhi Qiao (Bridge to China) Charitable Foundation (“WZQ”). The Group’s volunteer team participated in a bridge building programme for Taibai village in Ganzu from 25 July to 2 August 2009, with around 80 teachers and students from Xian University of Architecture & Technology, The Hong Kong Polytechnic University, The Chinese University of Hong Kong, The University of Hong Kong and other overseas countries. They shared a common goal to allow local villagers to cross river safely and conveniently with a bridge instead of stones and tree trunks, and improve their livelihood substantially. After successful completion, the bridge was named as “New World Wu Zhi Qiao” and has started serving the villagers since 1 August 2009.
37New World Development Company Limited - Annual Report 2009
PROTECTING THE ENVIRONMENT FOR A GREENER SOCIETYEnvironment protection is a most-concerned global issue today, and New World Group deeply understands the importance of protecting the environment. As a responsible corporate citizen, the Group has carried out internal green policies and actively supported and participated in various environmental protection activities organized by the government and the community, hoping to contribute more to environmental protection.
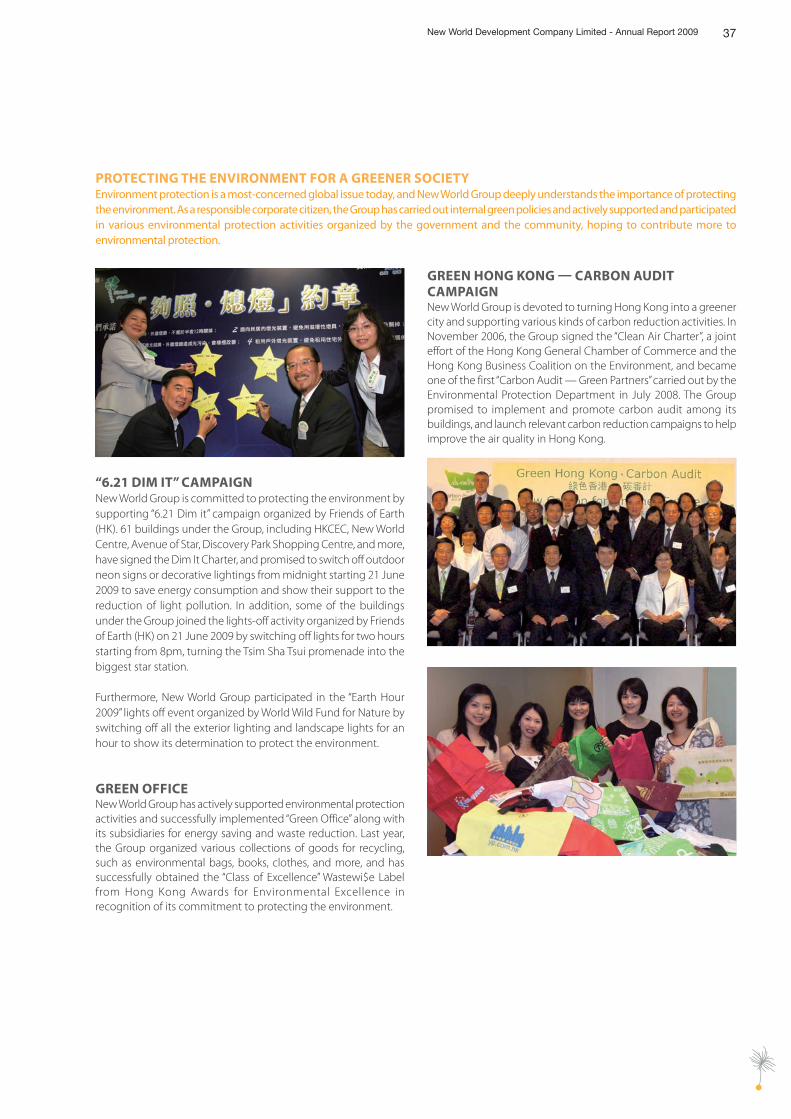
“6.21 DIM IT” CAMPAIGNNew World Group is committed to protecting the environment by supporting “6.21 Dim it” campaign organized by Friends of Earth (HK). 61 buildings under the Group, including HKCEC, New World Centre, Avenue of Star, Discovery Park Shopping Centre, and more, have signed the Dim It Charter, and promised to switch off outdoor neon signs or decorative lightings from midnight starting 21 June 2009 to save energy consumption and show their support to the reduction of light pollution. In addition, some of the buildings under the Group joined the lights-off activity organized by Friends of Earth (HK) on 21 June 2009 by switching off lights for two hours starting from 8pm, turning the Tsim Sha Tsui promenade into the biggest star station.
Furthermore, New World Group participated in the “Earth Hour 2009” lights off event organized by World Wild Fund for Nature by switching off all the exterior lighting and landscape lights for an hour to show its determination to protect the environment.
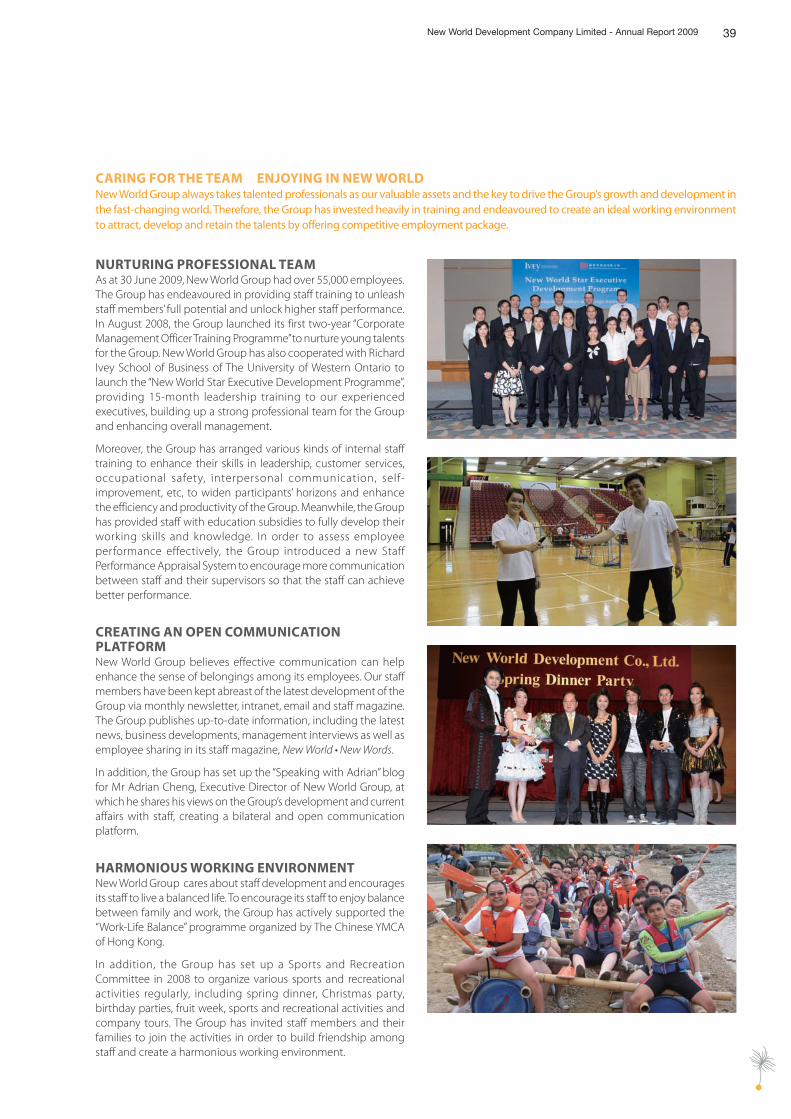
GREEN OFFICENew World Group has actively supported environmental protection activities and successfully implemented “Green Office” along with its subsidiaries for energy saving and waste reduction. Last year, the Group organized various collections of goods for recycling, such as environmental bags, books, clothes, and more, and has successfully obtained the “Class of Excellence” Wastewi$e Label from Hong Kong Awards for Environmental Excellence in recognition of its commitment to protecting the environment.
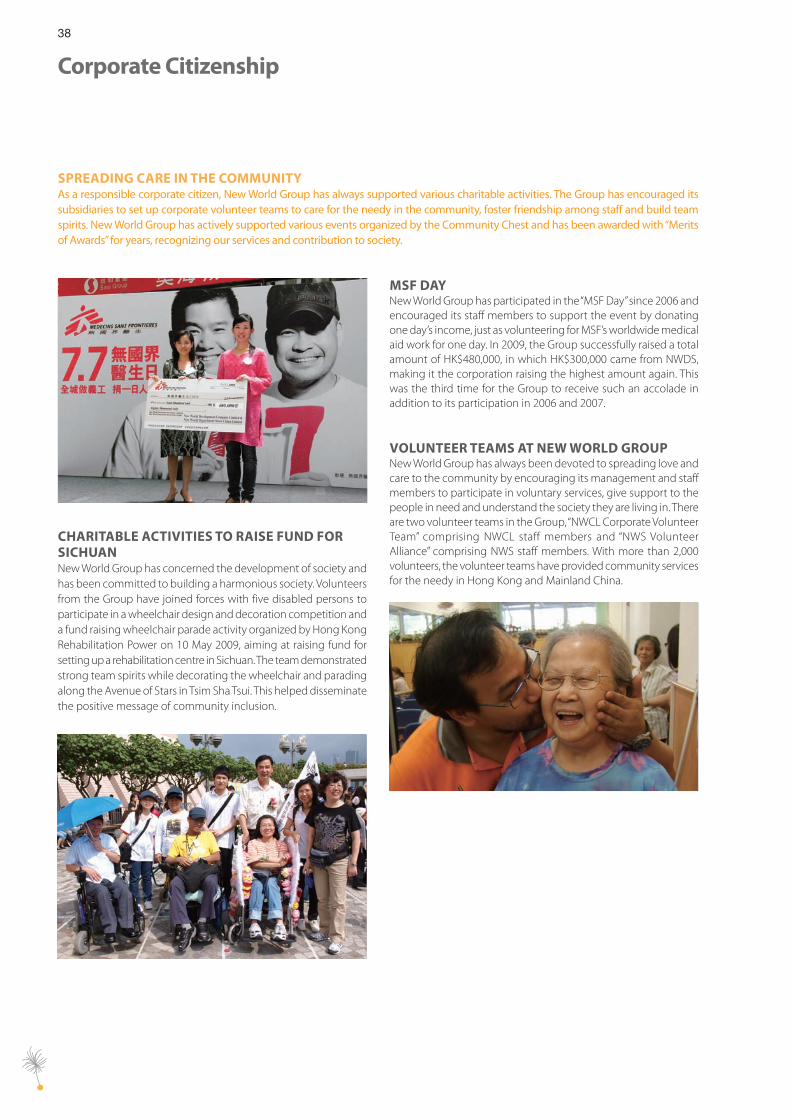
GREEN HONG KONG CARBON AUDIT CAMPAIGNNew World Group is devoted to turning Hong Kong into a greener city and supporting various kinds of carbon reduction activities. In November 2006, the Group signed the “Clean Air Charter”, a joint effort of the Hong Kong General Chamber of Commerce and the Hong Kong Business Coalition on the Environment, and became one of the first “Carbon Audit — Green Partners” carried out by the Environmental Protection Department in July 2008. The Group promised to implement and promote carbon audit among its buildings, and launch relevant carbon reduction campaigns to help improve the air quality in Hong Kong.
38
Corporate Citizenship
MSF DAYNew World Group has participated in the “MSF Day” since 2006 and encouraged its staff members to support the event by donating one day’s income, just as volunteering for MSF’s worldwide medical aid work for one day. In 2009, the Group successfully raised a total amount of HK$480,000, in which HK$300,000 came from NWDS, making it the corporation raising the highest amount again. This was the third time for the Group to receive such an accolade in addition to its participation in 2006 and 2007.
VOLUNTEER TEAMS AT NEW WORLD GROUPNew World Group has always been devoted to spreading love and care to the community by encouraging its management and staff members to participate in voluntary services, give support to the people in need and understand the society they are living in. There are two volunteer teams in the Group, “NWCL Corporate Volunteer Team” comprising NWCL staff members and “NWS Volunteer Alliance” comprising NWS staff members. With more than 2,000 volunteers, the volunteer teams have provided community services for the needy in Hong Kong and Mainland China.
CHARITABLE ACTIVITIES TO RAISE FUND FOR SICHUANNew World Group has concerned the development of society and has been committed to building a harmonious society. Volunteers from the Group have joined forces with five disabled persons to participate in a wheelchair design and decoration competition and a fund raising wheelchair parade activity organized by Hong Kong Rehabilitation Power on 10 May 2009, aiming at raising fund for setting up a rehabilitation centre in Sichuan. The team demonstrated strong team spirits while decorating the wheelchair and parading along the Avenue of Stars in Tsim Sha Tsui. This helped disseminate the positive message of community inclusion.
SPREADING CARE IN THE COMMUNITYAs a responsible corporate citizen, New World Group has always supported various charitable activities. The Group has encouraged its subsidiaries to set up corporate volunteer teams to care for the needy in the community, foster friendship among staff and build team spirits. New World Group has actively supported various events organized by the Community Chest and has been awarded with “Merits of Awards” for years, recognizing our services and contribution to society.
39New World Development Company Limited - Annual Report 2009
CARING FOR THE TEAM ENJOYING IN NEW WORLDNew World Group always takes talented professionals as our valuable assets and the key to drive the Group’s growth and development in the fast-changing world. Therefore, the Group has invested heavily in training and endeavoured to create an ideal working environment to attract, develop and retain the talents by offering competitive employment package.
NURTURING PROFESSIONAL TEAMAs at 30 June 2009, New World Group had over 55,000 employees. The Group has endeavoured in providing staff training to unleash staff members’ full potential and unlock higher staff performance. In August 2008, the Group launched its first two-year “Corporate Management Officer Training Programme” to nurture young talents for the Group. New World Group has also cooperated with Richard Ivey School of Business of The University of Western Ontario to launch the “New World Star Executive Development Programme”, providing 15-month leadership training to our experienced executives, building up a strong professional team for the Group and enhancing overall management.
Moreover, the Group has arranged various kinds of internal staff training to enhance their skills in leadership, customer services, occupational safety, interpersonal communication, self-improvement, etc, to widen participants’ horizons and enhance the efficiency and productivity of the Group. Meanwhile, the Group has provided staff with education subsidies to fully develop their working skills and knowledge. In order to assess employee performance effectively, the Group introduced a new Staff Performance Appraisal System to encourage more communication between staff and their supervisors so that the staff can achieve better performance.
CREATING AN OPEN COMMUNICATION PLATFORMNew World Group believes effective communication can help enhance the sense of belongings among its employees. Our staff members have been kept abreast of the latest development of the Group via monthly newsletter, intranet, email and staff magazine. The Group publishes up-to-date information, including the latest news, business developments, management interviews as well as employee sharing in its staff magazine, New World • New Words.
In addition, the Group has set up the “Speaking with Adrian” blog for Mr Adrian Cheng, Executive Director of New World Group, at which he shares his views on the Group’s development and current affairs with staff, creating a bilateral and open communication platform.
HARMONIOUS WORKING ENVIRONMENTNew World Group cares about staff development and encourages its staff to live a balanced life. To encourage its staff to enjoy balance between family and work, the Group has actively supported the “Work-Life Balance” programme organized by The Chinese YMCA of Hong Kong.
In addition, the Group has set up a Sports and Recreation Committee in 2008 to organize various sports and recreational activities regularly, including spring dinner, Christmas party, birthday parties, fruit week, sports and recreational activities and company tours. The Group has invited staff members and their families to join the activities in order to build friendship among staff and create a harmonious working environment.
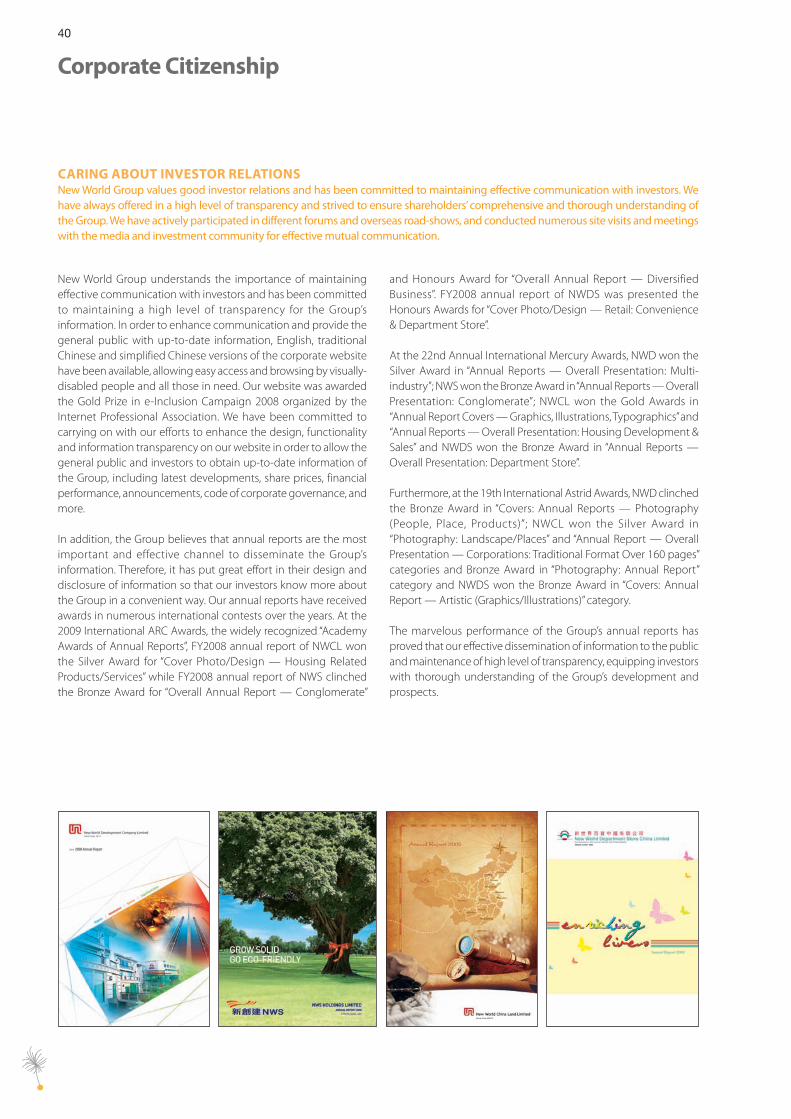
40
Corporate Citizenship
CARING ABOUT INVESTOR RELATIONSNew World Group values good investor relations and has been committed to maintaining effective communication with investors. We have always offered in a high level of transparency and strived to ensure shareholders’ comprehensive and thorough understanding of the Group. We have actively participated in different forums and overseas road-shows, and conducted numerous site visits and meetings with the media and investment community for effective mutual communication.
and Honours Award for “Overall Annual Report — Diversified Business”. FY2008 annual report of NWDS was presented the Honours Awards for “Cover Photo/Design — Retail: Convenience & Department Store”.
At the 22nd Annual International Mercury Awards, NWD won the Silver Award in “Annual Reports — Overall Presentation: Multi-industry”; NWS won the Bronze Award in “Annual Reports — Overall Presentation: Conglomerate”; NWCL won the Gold Awards in “Annual Report Covers — Graphics, Illustrations, Typographics” and “Annual Reports — Overall Presentation: Housing Development & Sales” and NWDS won the Bronze Award in “Annual Reports — Overall Presentation: Department Store”.
Furthermore, at the 19th International Astrid Awards, NWD clinched the Bronze Award in “Covers: Annual Reports — Photography (People, Place, Products)”; NWCL won the Silver Award in “Photography: Landscape/Places” and “Annual Report — Overall Presentation — Corporations: Traditional Format Over 160 pages” categories and Bronze Award in “Photography: Annual Report” category and NWDS won the Bronze Award in “Covers: Annual Report — Artistic (Graphics/Illustrations)” category.
The marvelous performance of the Group’s annual reports has proved that our effective dissemination of information to the public and maintenance of high level of transparency, equipping investors with thorough understanding of the Group’s development and prospects.
New World Group understands the importance of maintaining effective communication with investors and has been committed to maintaining a high level of transparency for the Group’s information. In order to enhance communication and provide the general public with up-to-date information, English, traditional Chinese and simplified Chinese versions of the corporate website have been available, allowing easy access and browsing by visually-disabled people and all those in need. Our website was awarded the Gold Prize in e-Inclusion Campaign 2008 organized by the Internet Professional Association. We have been committed to carrying on with our efforts to enhance the design, functionality and information transparency on our website in order to allow the general public and investors to obtain up-to-date information of the Group, including latest developments, share prices, financial performance, announcements, code of corporate governance, and more.
In addition, the Group believes that annual reports are the most important and effective channel to disseminate the Group’s information. Therefore, it has put great effort in their design and disclosure of information so that our investors know more about the Group in a convenient way. Our annual reports have received awards in numerous international contests over the years. At the 2009 International ARC Awards, the widely recognized “Academy Awards of Annual Reports”, FY2008 annual report of NWCL won the Silver Award for “Cover Photo/Design — Housing Related Products/Services” while FY2008 annual report of NWS clinched the Bronze Award for “Overall Annual Report — Conglomerate”
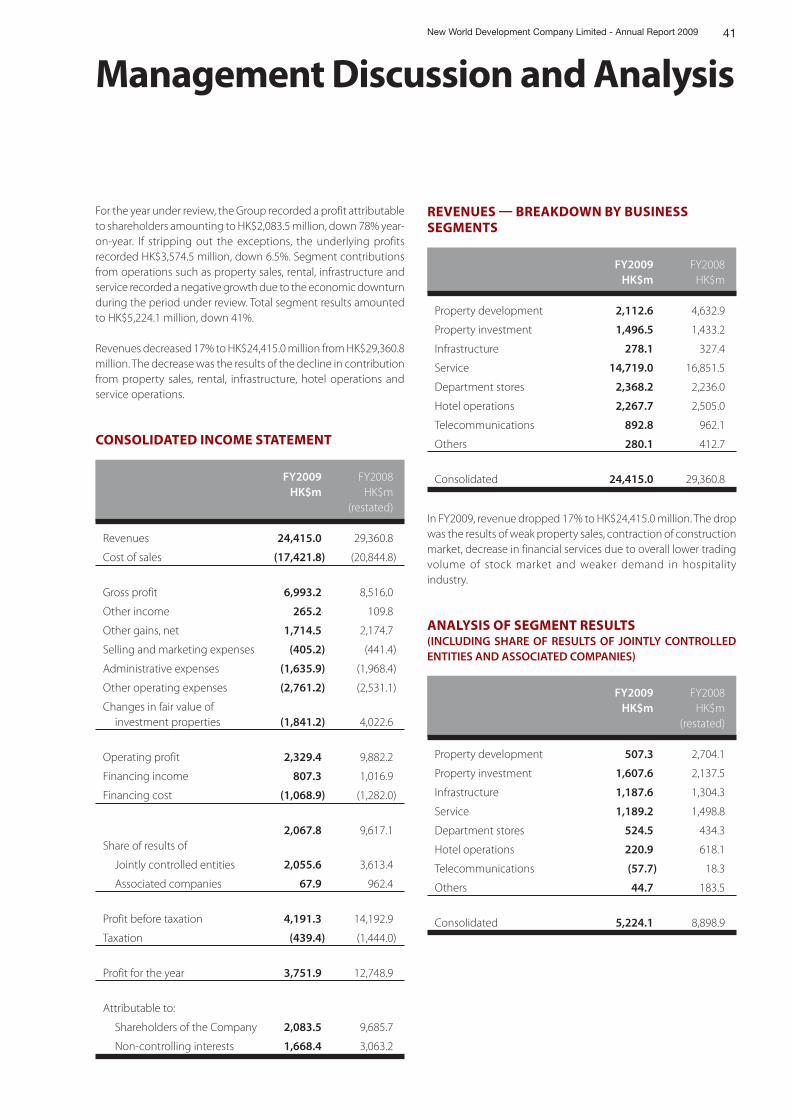
41
Management Discussion and AnalysisNew World Development Company Limited - Annual Report 2009
For the year under review, the Group recorded a profit attributable to shareholders amounting to HK$2,083.5 million, down 78% year-on-year. If stripping out the exceptions, the underlying profits recorded HK$3,574.5 million, down 6.5%. Segment contributions from operations such as property sales, rental, infrastructure and service recorded a negative growth due to the economic downturn during the period under review. Total segment results amounted to HK$5,224.1 million, down 41%.
Revenues decreased 17% to HK$24,415.0 million from HK$29,360.8 million. The decrease was the results of the decline in contribution from property sales, rental, infrastructure, hotel operations and service operations.
CONSOLIDATED INCOME STATEMENT
FY2009 FY2008HK$m HK$m
(restated)
Revenues 24,415.0 29,360.8
Cost of sales (17,421.8) (20,844.8)
Gross profit 6,993.2 8,516.0
Other income 265.2 109.8
Other gains, net 1,714.5 2,174.7
Selling and marketing expenses (405.2) (441.4)
Administrative expenses (1,635.9) (1,968.4)
Other operating expenses (2,761.2) (2,531.1)
Changes in fair value of investment properties (1,841.2) 4,022.6
Operating profit 2,329.4 9,882.2
Financing income 807.3 1,016.9
Financing cost (1,068.9) (1,282.0)
2,067.8 9,617.1Share of results of
Jointly controlled entities 2,055.6 3,613.4
Associated companies 67.9 962.4
Profit before taxation 4,191.3 14,192.9
Taxation (439.4) (1,444.0)
Profit for the year 3,751.9 12,748.9
Attributable to:
Shareholders of the Company 2,083.5 9,685.7
Non-controlling interests 1,668.4 3,063.2
REVENUES BREAKDOWN BY BUSINESS SEGMENTS
FY2009 FY2008HK$m HK$m
Property development 2,112.6 4,632.9
Property investment 1,496.5 1,433.2
Infrastructure 278.1 327.4
Service 14,719.0 16,851.5
Department stores 2,368.2 2,236.0
Hotel operations 2,267.7 2,505.0
Telecommunications 892.8 962.1
Others 280.1 412.7
Consolidated 24,415.0 29,360.8
In FY2009, revenue dropped 17% to HK$24,415.0 million. The drop was the results of weak property sales, contraction of construction market, decrease in financial services due to overall lower trading volume of stock market and weaker demand in hospitality industry.
ANALYSIS OF SEGMENT RESULTS(INCLUDING SHARE OF RESULTS OF JOINTLY CONTROLLED ENTITIES AND ASSOCIATED COMPANIES)
FY2009 FY2008HK$m HK$m
(restated)
Property development 507.3 2,704.1
Property investment 1,607.6 2,137.5
Infrastructure 1,187.6 1,304.3
Service 1,189.2 1,498.8
Department stores 524.5 434.3
Hotel operations 220.9 618.1
Telecommunications (57.7) 18.3
Others 44.7 183.5
Consolidated 5,224.1 8,898.9
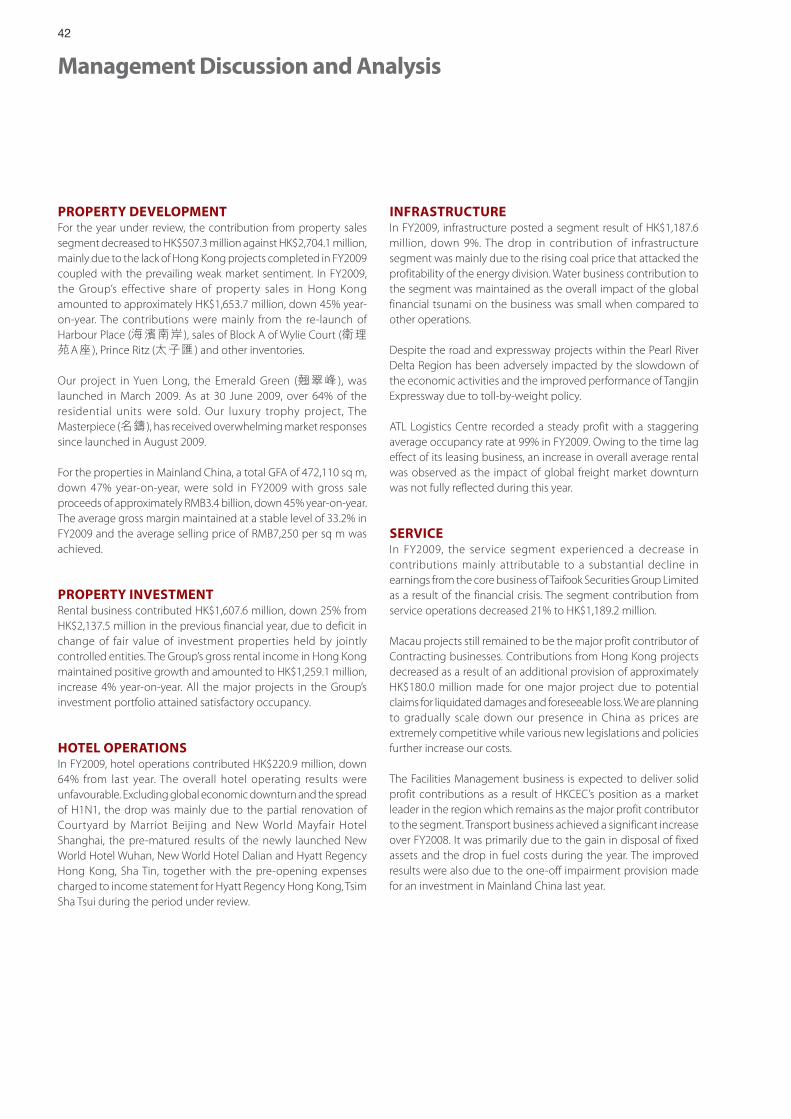
42
Management Discussion and Analysis
PROPERTY DEVELOPMENTFor the year under review, the contribution from property sales segment decreased to HK$507.3 million against HK$2,704.1 million, mainly due to the lack of Hong Kong projects completed in FY2009 coupled with the prevailing weak market sentiment. In FY2009, the Group’s effective share of property sales in Hong Kong amounted to approximately HK$1,653.7 million, down 45% year-on-year. The contributions were mainly from the re-launch of Harbour Place (海濱南岸 ), sales of Block A of Wylie Court (衛理苑A座 ), Prince Ritz (太子匯 ) and other inventories.
Our project in Yuen Long, the Emerald Green (翹翠峰 ), was launched in March 2009. As at 30 June 2009, over 64% of the residential units were sold. Our luxury trophy project, The Masterpiece (名鑄 ), has received overwhelming market responses since launched in August 2009.
For the properties in Mainland China, a total GFA of 472,110 sq m, down 47% year-on-year, were sold in FY2009 with gross sale proceeds of approximately RMB3.4 billion, down 45% year-on-year. The average gross margin maintained at a stable level of 33.2% in FY2009 and the average selling price of RMB7,250 per sq m was achieved.
PROPERTY INVESTMENTRental business contributed HK$1,607.6 million, down 25% from HK$2,137.5 million in the previous financial year, due to deficit in change of fair value of investment properties held by jointly controlled entities. The Group’s gross rental income in Hong Kong maintained positive growth and amounted to HK$1,259.1 million, increase 4% year-on-year. All the major projects in the Group’s investment portfolio attained satisfactory occupancy.
HOTEL OPERATIONSIn FY2009, hotel operations contributed HK$220.9 million, down 64% from last year. The overall hotel operating results were unfavourable. Excluding global economic downturn and the spread of H1N1, the drop was mainly due to the partial renovation of Courtyard by Marriot Beijing and New World Mayfair Hotel Shanghai, the pre-matured results of the newly launched New World Hotel Wuhan, New World Hotel Dalian and Hyatt Regency Hong Kong, Sha Tin, together with the pre-opening expenses charged to income statement for Hyatt Regency Hong Kong, Tsim Sha Tsui during the period under review.
INFRASTRUCTUREIn FY2009, infrastructure posted a segment result of HK$1,187.6 million, down 9%. The drop in contribution of infrastructure segment was mainly due to the rising coal price that attacked the profitability of the energy division. Water business contribution to the segment was maintained as the overall impact of the global financial tsunami on the business was small when compared to other operations.
Despite the road and expressway projects within the Pearl River Delta Region has been adversely impacted by the slowdown of the economic activities and the improved performance of Tangjin Expressway due to toll-by-weight policy.
ATL Logistics Centre recorded a steady profit with a staggering average occupancy rate at 99% in FY2009. Owing to the time lag effect of its leasing business, an increase in overall average rental was observed as the impact of global freight market downturn was not fully reflected during this year.
SERVICEIn FY2009, the service segment experienced a decrease in contributions mainly attributable to a substantial decline in earnings from the core business of Taifook Securities Group Limited as a result of the financial crisis. The segment contribution from service operations decreased 21% to HK$1,189.2 million.
Macau projects still remained to be the major profit contributor of Contracting businesses. Contributions from Hong Kong projects decreased as a result of an additional provision of approximately HK$180.0 million made for one major project due to potential claims for liquidated damages and foreseeable loss. We are planning to gradually scale down our presence in China as prices are extremely competitive while various new legislations and policies further increase our costs.
The Facilities Management business is expected to deliver solid profit contributions as a result of HKCEC’s position as a market leader in the region which remains as the major profit contributor to the segment. Transport business achieved a significant increase over FY2008. It was primarily due to the gain in disposal of fixed assets and the drop in fuel costs during the year. The improved results were also due to the one-off impairment provision made for an investment in Mainland China last year.
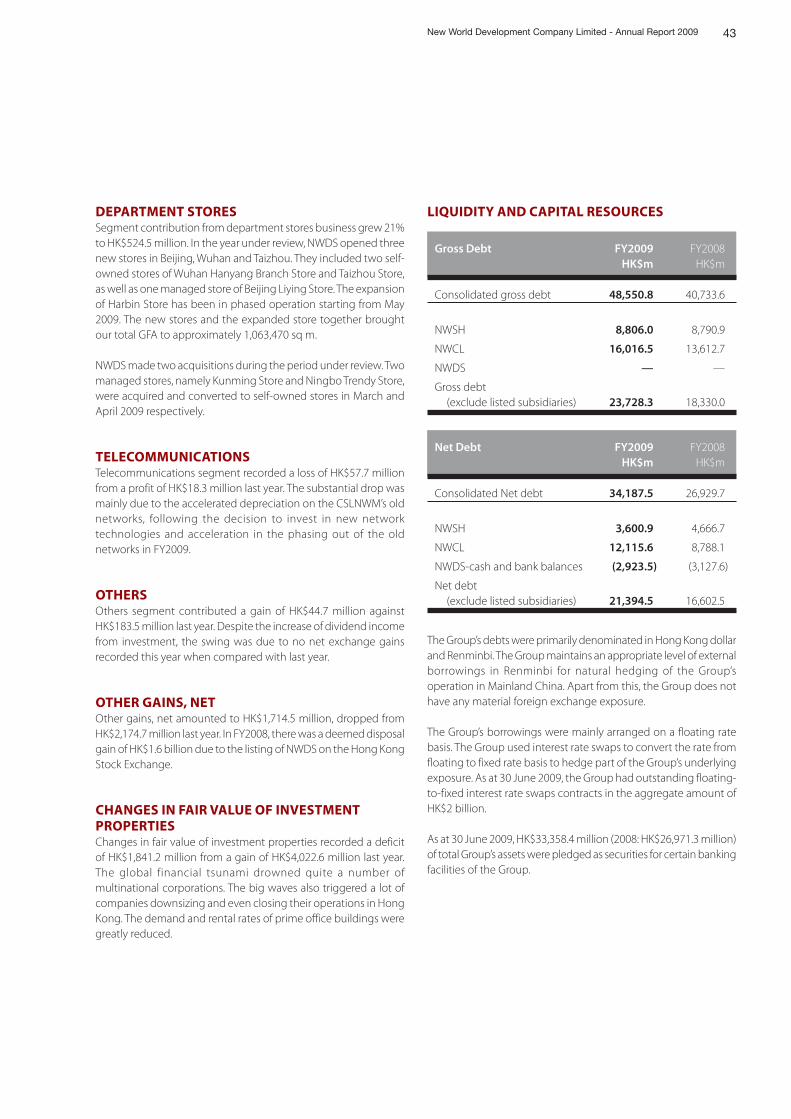
43New World Development Company Limited - Annual Report 2009
DEPARTMENT STORESSegment contribution from department stores business grew 21% to HK$524.5 million. In the year under review, NWDS opened three new stores in Beijing, Wuhan and Taizhou. They included two self-owned stores of Wuhan Hanyang Branch Store and Taizhou Store, as well as one managed store of Beijing Liying Store. The expansion of Harbin Store has been in phased operation starting from May 2009. The new stores and the expanded store together brought our total GFA to approximately 1,063,470 sq m.
NWDS made two acquisitions during the period under review. Two managed stores, namely Kunming Store and Ningbo Trendy Store, were acquired and converted to self-owned stores in March and April 2009 respectively.
TELECOMMUNICATIONSTelecommunications segment recorded a loss of HK$57.7 million from a profit of HK$18.3 million last year. The substantial drop was mainly due to the accelerated depreciation on the CSLNWM’s old networks, following the decision to invest in new network technologies and acceleration in the phasing out of the old networks in FY2009.
OTHERSOthers segment contributed a gain of HK$44.7 million against HK$183.5 million last year. Despite the increase of dividend income from investment, the swing was due to no net exchange gains recorded this year when compared with last year.
OTHER GAINS, NETOther gains, net amounted to HK$1,714.5 million, dropped from HK$2,174.7 million last year. In FY2008, there was a deemed disposal gain of HK$1.6 billion due to the listing of NWDS on the Hong Kong Stock Exchange.
CHANGES IN FAIR VALUE OF INVESTMENT PROPERTIESChanges in fair value of investment properties recorded a deficit of HK$1,841.2 million from a gain of HK$4,022.6 million last year. The global financial tsunami drowned quite a number of multinational corporations. The big waves also triggered a lot of companies downsizing and even closing their operations in Hong Kong. The demand and rental rates of prime office buildings were greatly reduced.
LIQUIDITY AND CAPITAL RESOURCES
Gross Debt FY2009 FY2008HK$m HK$m
Consolidated gross debt 48,550.8 40,733.6
NWSH 8,806.0 8,790.9
NWCL 16,016.5 13,612.7
NWDS — —
Gross debt (exclude listed subsidiaries) 23,728.3 18,330.0
Net Debt FY2009 FY2008HK$m HK$m
Consolidated Net debt 34,187.5 26,929.7
NWSH 3,600.9 4,666.7
NWCL 12,115.6 8,788.1
NWDS-cash and bank balances (2,923.5) (3,127.6)
Net debt (exclude listed subsidiaries) 21,394.5 16,602.5
The Group’s debts were primarily denominated in Hong Kong dollar and Renminbi. The Group maintains an appropriate level of external borrowings in Renminbi for natural hedging of the Group’s operation in Mainland China. Apart from this, the Group does not have any material foreign exchange exposure.
The Group’s borrowings were mainly arranged on a floating rate basis. The Group used interest rate swaps to convert the rate from floating to fixed rate basis to hedge part of the Group’s underlying exposure. As at 30 June 2009, the Group had outstanding floating-to-fixed interest rate swaps contracts in the aggregate amount of HK$2 billion.
As at 30 June 2009, HK$33,358.4 million (2008: HK$26,971.3 million) of total Group’s assets were pledged as securities for certain banking facilities of the Group.
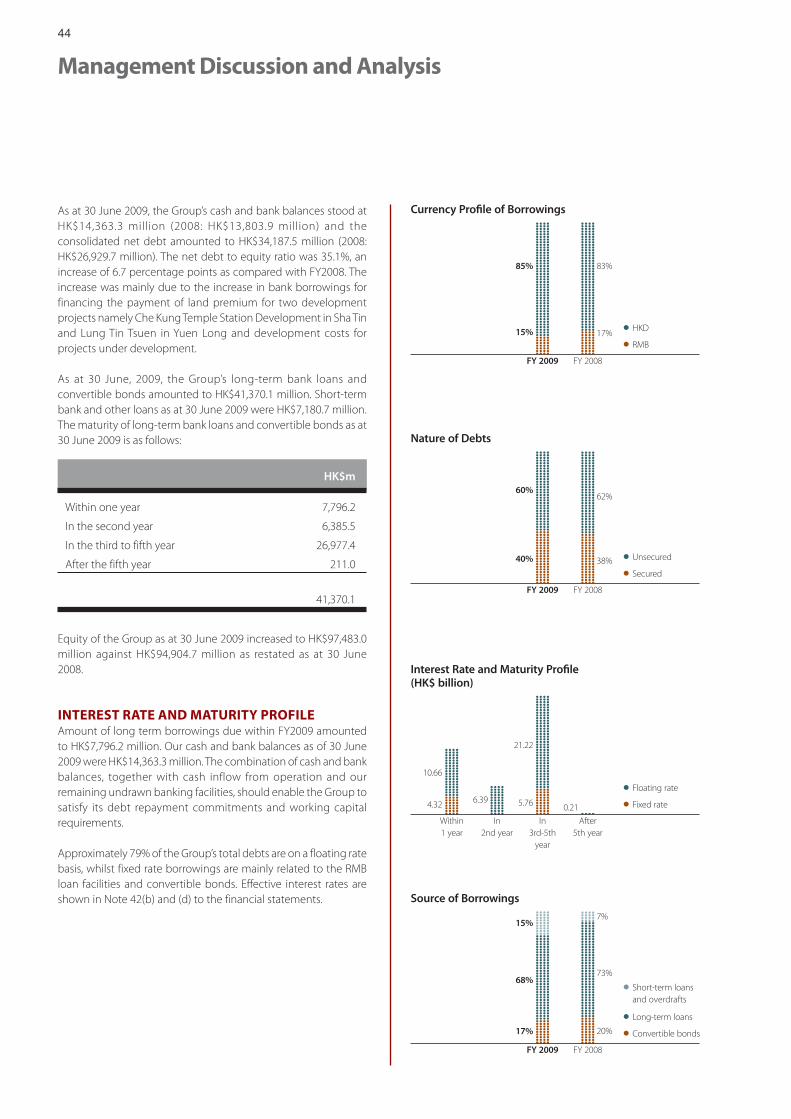
44
Management Discussion and Analysis
As at 30 June 2009, the Group’s cash and bank balances stood at HK$14,363.3 million (2008: HK$13,803.9 million) and the consolidated net debt amounted to HK$34,187.5 million (2008: HK$26,929.7 million). The net debt to equity ratio was 35.1%, an increase of 6.7 percentage points as compared with FY2008. The increase was mainly due to the increase in bank borrowings for financing the payment of land premium for two development projects namely Che Kung Temple Station Development in Sha Tin and Lung Tin Tsuen in Yuen Long and development costs for projects under development.
As at 30 June, 2009, the Group’s long-term bank loans and convertible bonds amounted to HK$41,370.1 million. Short-term bank and other loans as at 30 June 2009 were HK$7,180.7 million. The maturity of long-term bank loans and convertible bonds as at 30 June 2009 is as follows:
HK$m
Within one year 7,796.2
In the second year 6,385.5
In the third to fifth year 26,977.4
After the fifth year 211.0
41,370.1
Equity of the Group as at 30 June 2009 increased to HK$97,483.0 million against HK$94,904.7 million as restated as at 30 June 2008.
INTEREST RATE AND MATURITY PROFILEAmount of long term borrowings due within FY2009 amounted to HK$7,796.2 million. Our cash and bank balances as of 30 June 2009 were HK$14,363.3 million. The combination of cash and bank balances, together with cash inflow from operation and our remaining undrawn banking facilities, should enable the Group to satisfy its debt repayment commitments and working capital requirements.
Approximately 79% of the Group’s total debts are on a floating rate basis, whilst fixed rate borrowings are mainly related to the RMB loan facilities and convertible bonds. Effective interest rates are shown in Note 42(b) and (d) to the financial statements.
45
Corporate InformationNew World Development Company Limited - Annual Report 2009
BOARD OF DIRECTORS
EXECUTIVE DIRECTORS
Dato’ Dr. Cheng Yu-Tung (Chairman)Dr. Cheng Kar-Shun, Henry (Managing Director)Dr. Sin Wai-Kin, DavidMr. Liang Chong-Hou, DavidMr. Leung Chi-Kin, StewartMr. Cheng Chi-Kong, Adrian
NONEXECUTIVE DIRECTORS
Mr. Cheng Kar-Shing, PeterMr. Chow Kwai-CheungMr. Liang Cheung-Biu, ThomasMs. Ki Man-Fung, Leonie JP
INDEPENDENT NONEXECUTIVE DIRECTORS
Mr. Yeung Ping-Leung, HowardDr. Cha Mou-Sing, Payson JPMr. Cha Mou-Zing, Victor (alternate director to Dr. Cha Mou-Sing, Payson)Mr. Ho Hau-Hay, HamiltonMr. Lee Luen-Wai, John JP
COMPANY SECRETARY
Mr. Leung Chi-Kin, Stewart
JOINT AUDITORS
PricewaterhouseCoopersH.C. Watt & Company Limited
SOLICITORS
Woo, Kwan, Lee & LoKao, Lee & YipVincent T.K. Cheung, Yap & CoK.C. Yung & CoYung, Yu, Yuen & Company
SHARE REGISTRARS AND TRANSFER OFFICE
Tricor Tengis Limited26/F., Tesbury Centre,28 Queen’s Road East,Hong Kong
REGISTERED OFFICE
30/F., New World Tower,18 Queen’s Road Central, Hong KongTel: (852) 2523 1056Fax: (852) 2810 4673
PRINCIPAL BANKERS
Bank of ChinaBank of CommunicationsBank of East AsiaChina Merchants BankCitibank N.A.DBS BankHang Seng BankIndustrial and Commercial Bank of China (Asia) Ltd.Nanyang Commercial BankSumitomo Mitsui Banking CorporationStandard Chartered BankThe Hongkong and Shanghai Banking CorporationThe Bank of Tokyo-Mitsubishi UFJ
STOCK CODE
Hong Kong Stock Exchange 0017Reuters 0017HKBloomberg 17HK
INFORMATION FOR INVESTORS
For more information about the Group,please contact the Corporate Affairs Department at:New World Development Company Limited30/F., New World Tower,18 Queen’s Road Central,Hong KongTel: (852) 2131 6790Fax: (852) 2810 4673e-mail: [email protected]
WEBSITE
www.nwd.com.hk
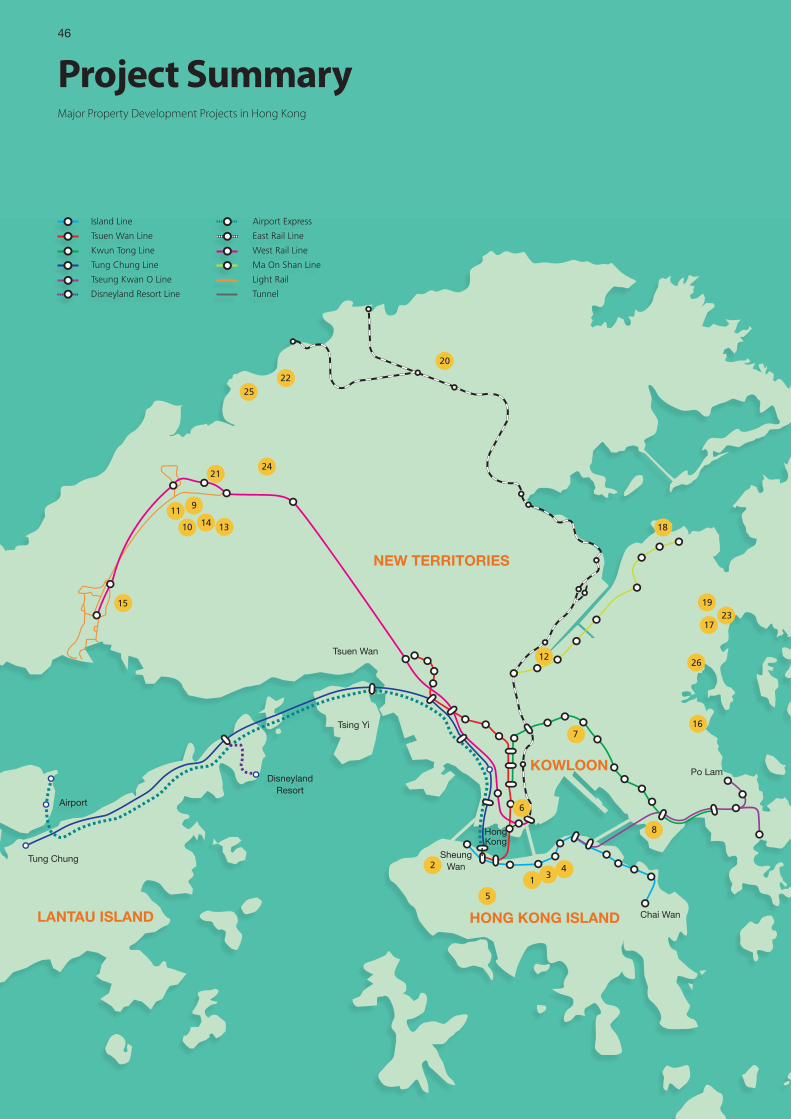
4646
Project SummaryMajor Property Development Projects in Hong Kong
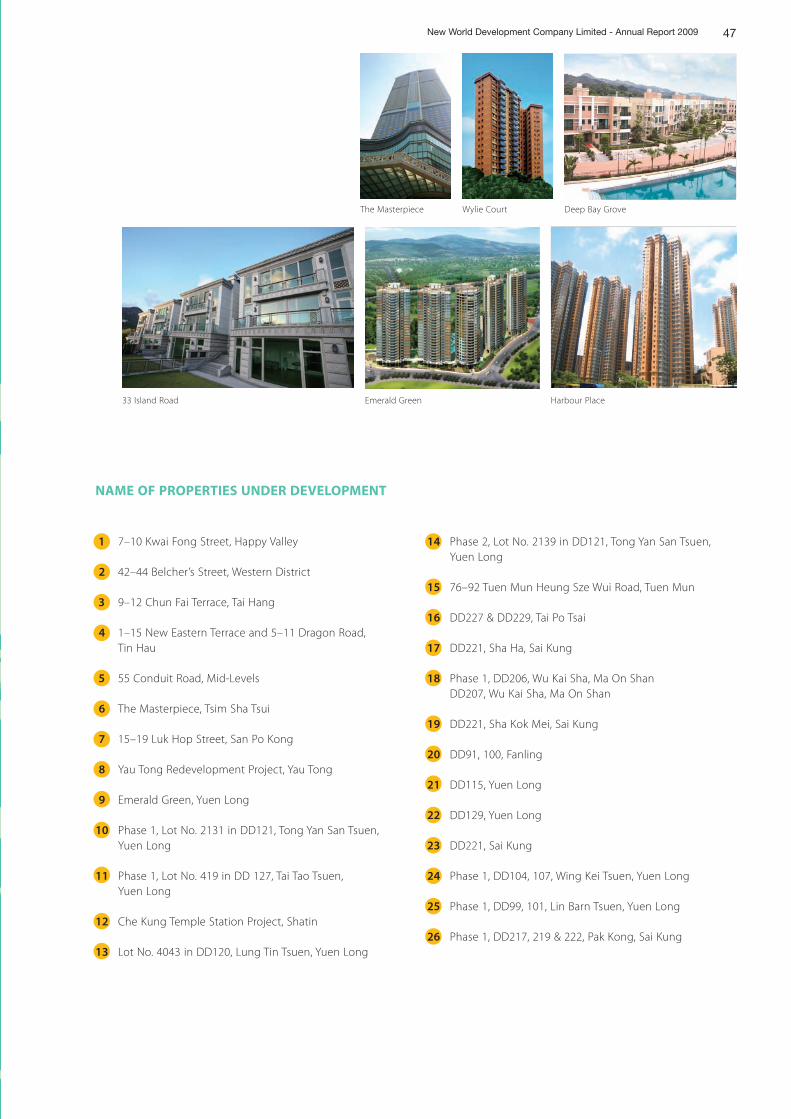
47New World Development Company Limited - Annual Report 2009
NAME OF PROPERTIES UNDER DEVELOPMENT
1 7–10 Kwai Fong Street, Happy Valley
2 42–44 Belcher’s Street, Western District
3 9–12 Chun Fai Terrace, Tai Hang
4 1–15 New Eastern Terrace and 5–11 Dragon Road, Tin Hau
5 55 Conduit Road, Mid-Levels
6 The Masterpiece, Tsim Sha Tsui
7 15–19 Luk Hop Street, San Po Kong
8 Yau Tong Redevelopment Project, Yau Tong
9 Emerald Green, Yuen Long
10 Phase 1, Lot No. 2131 in DD121, Tong Yan San Tsuen, Yuen Long
11 Phase 1, Lot No. 419 in DD 127, Tai Tao Tsuen, Yuen Long
12 Che Kung Temple Station Project, Shatin
13 Lot No. 4043 in DD120, Lung Tin Tsuen, Yuen Long
14 Phase 2, Lot No. 2139 in DD121, Tong Yan San Tsuen, Yuen Long
15 76–92 Tuen Mun Heung Sze Wui Road, Tuen Mun
16 DD227 & DD229, Tai Po Tsai
17 DD221, Sha Ha, Sai Kung
18 Phase 1, DD206, Wu Kai Sha, Ma On Shan DD207, Wu Kai Sha, Ma On Shan
19 DD221, Sha Kok Mei, Sai Kung
20 DD91, 100, Fanling
21 DD115, Yuen Long
22 DD129, Yuen Long
23 DD221, Sai Kung
24 Phase 1, DD104, 107, Wing Kei Tsuen, Yuen Long
25 Phase 1, DD99, 101, Lin Barn Tsuen, Yuen Long
26 Phase 1, DD217, 219 & 222, Pak Kong, Sai Kung
Harbour PlaceEmerald Green33 Island Road
Deep Bay GroveWylie CourtThe Masterpiece
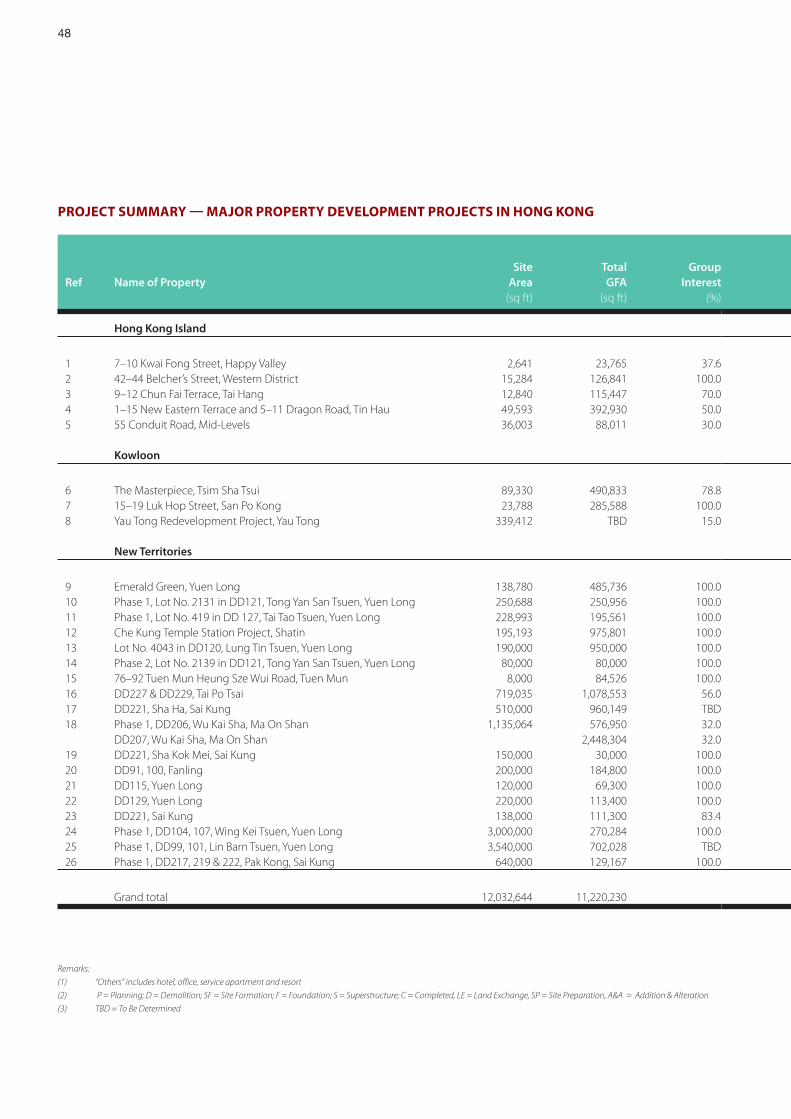
48
PROJECT SUMMARY MAJOR PROPERTY DEVELOPMENT PROJECTS IN HONG KONG
Site Total GroupRef Name of Property Area GFA Interest
(sq ft) (sq ft) (%)
Hong Kong Island
1 7–10 Kwai Fong Street, Happy Valley 2,641 23,765 37.62 42–44 Belcher’s Street, Western District 15,284 126,841 100.03 9–12 Chun Fai Terrace, Tai Hang 12,840 115,447 70.04 1–15 New Eastern Terrace and 5–11 Dragon Road, Tin Hau 49,593 392,930 50.05 55 Conduit Road, Mid-Levels 36,003 88,011 30.0
Kowloon
6 The Masterpiece, Tsim Sha Tsui 89,330 490,833 78.87 15–19 Luk Hop Street, San Po Kong 23,788 285,588 100.08 Yau Tong Redevelopment Project, Yau Tong 339,412 TBD 15.0
New Territories
9 Emerald Green, Yuen Long 138,780 485,736 100.010 Phase 1, Lot No. 2131 in DD121, Tong Yan San Tsuen, Yuen Long 250,688 250,956 100.011 Phase 1, Lot No. 419 in DD 127, Tai Tao Tsuen, Yuen Long 228,993 195,561 100.012 Che Kung Temple Station Project, Shatin 195,193 975,801 100.013 Lot No. 4043 in DD120, Lung Tin Tsuen, Yuen Long 190,000 950,000 100.014 Phase 2, Lot No. 2139 in DD121, Tong Yan San Tsuen, Yuen Long 80,000 80,000 100.015 76–92 Tuen Mun Heung Sze Wui Road, Tuen Mun 8,000 84,526 100.016 DD227 & DD229, Tai Po Tsai 719,035 1,078,553 56.017 DD221, Sha Ha, Sai Kung 510,000 960,149 TBD18 Phase 1, DD206, Wu Kai Sha, Ma On Shan 1,135,064 576,950 32.0
DD207, Wu Kai Sha, Ma On Shan 2,448,304 32.019 DD221, Sha Kok Mei, Sai Kung 150,000 30,000 100.020 DD91, 100, Fanling 200,000 184,800 100.021 DD115, Yuen Long 120,000 69,300 100.022 DD129, Yuen Long 220,000 113,400 100.023 DD221, Sai Kung 138,000 111,300 83.424 Phase 1, DD104, 107, Wing Kei Tsuen, Yuen Long 3,000,000 270,284 100.025 Phase 1, DD99, 101, Lin Barn Tsuen, Yuen Long 3,540,000 702,028 TBD26 Phase 1, DD217, 219 & 222, Pak Kong, Sai Kung 640,000 129,167 100.0
Grand total 12,032,644 11,220,230
Remarks:
(1) “Others” includes hotel, office, service apartment and resort
(2) P = Planning; D = Demolition; SF = Site Formation; F = Foundation; S = Superstructure; C = Completed, LE = Land Exchange, SP = Site Preparation, A&A = Addition & Alteration
(3) TBD = To Be Determined
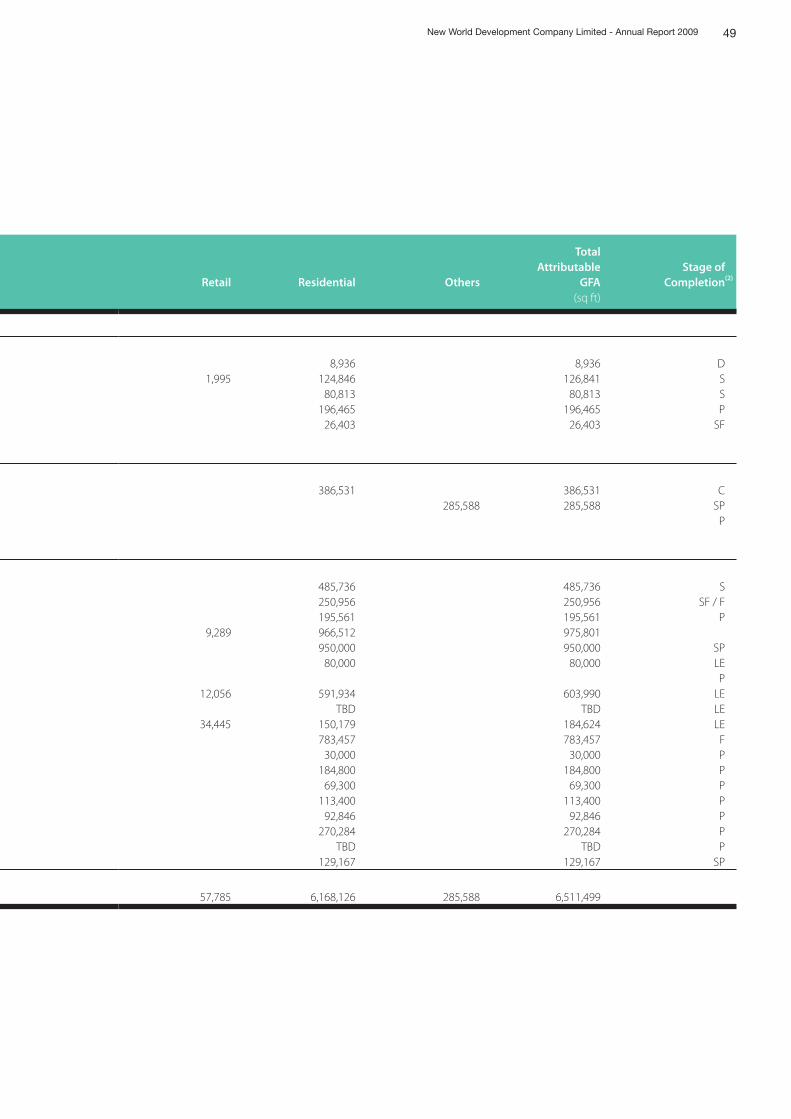
49New World Development Company Limited - Annual Report 2009
TotalAttributable Stage of
Retail Residential Others GFA Completion(2)
(sq ft)
8,936 8,936 D 1,995 124,846 126,841 S
80,813 80,813 S 196,465 196,465 P
26,403 26,403 SF
386,531 386,531 C 285,588 285,588 SP
P
485,736 485,736 S 250,956 250,956 SF / F 195,561 195,561 P
9,289 966,512 975,801 950,000 950,000 SP
80,000 80,000 LEP
12,056 591,934 603,990 LE TBD TBD LE
34,445 150,179 184,624 LE 783,457 783,457 F
30,000 30,000 P 184,800 184,800 P
69,300 69,300 P 113,400 113,400 P
92,846 92,846 P 270,284 270,284 P
TBD TBD P 129,167 129,167 SP
57,785 6,168,126 285,588 6,511,499
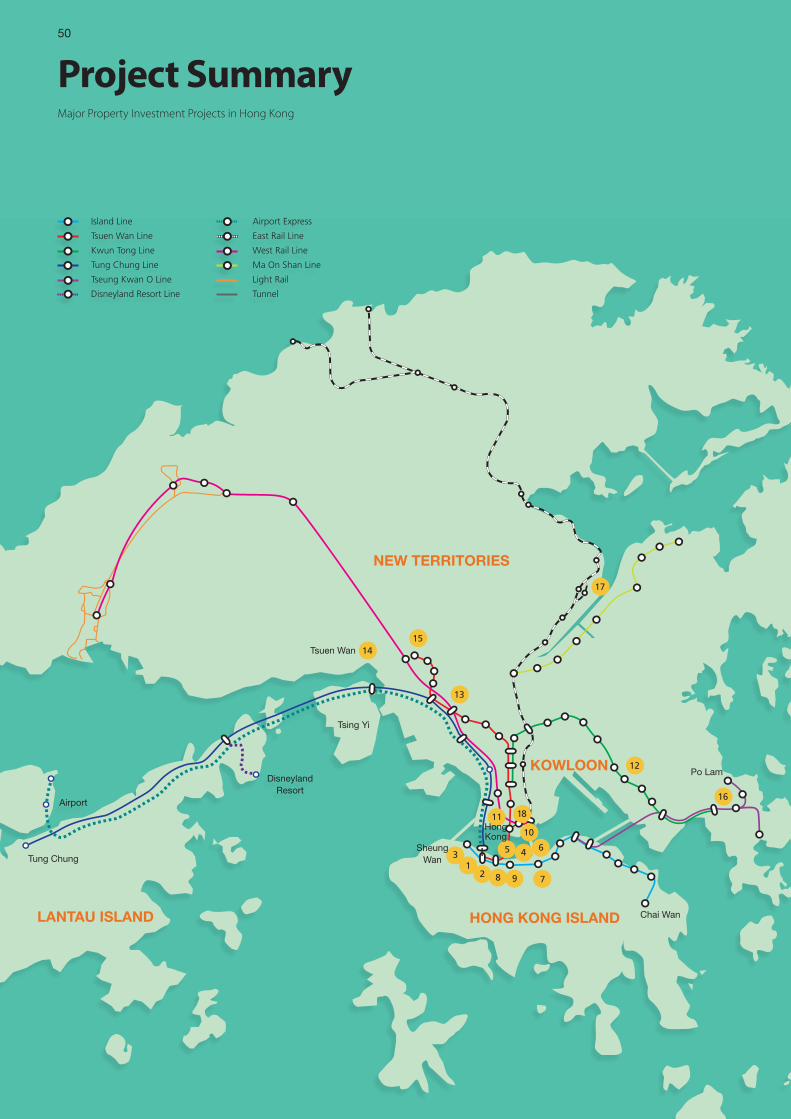
5050
Project SummaryMajor Property Investment Projects in Hong Kong
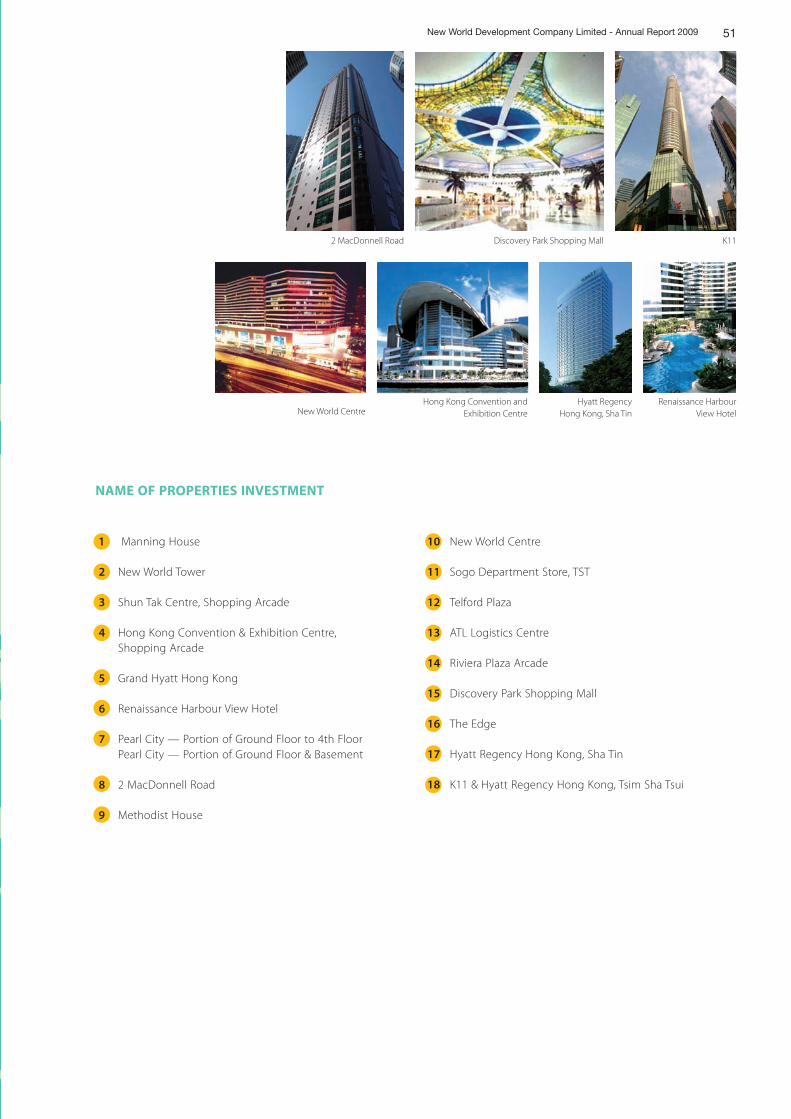
51New World Development Company Limited - Annual Report 2009
NAME OF PROPERTIES INVESTMENT
1 Manning House
2 New World Tower
3 Shun Tak Centre, Shopping Arcade
4 Hong Kong Convention & Exhibition Centre, Shopping Arcade
5 Grand Hyatt Hong Kong
6 Renaissance Harbour View Hotel
7 Pearl City — Portion of Ground Floor to 4th Floor Pearl City — Portion of Ground Floor & Basement
8 2 MacDonnell Road
9 Methodist House
10 New World Centre
11 Sogo Department Store, TST
12 Telford Plaza
13 ATL Logistics Centre
14 Riviera Plaza Arcade
15 Discovery Park Shopping Mall
16 The Edge
17 Hyatt Regency Hong Kong, Sha Tin
18 K11 & Hyatt Regency Hong Kong, Tsim Sha Tsui
2 MacDonnell Road
New World Centre
Discovery Park Shopping Mall
Hong Kong Convention andExhibition Centre
Hyatt RegencyHong Kong, Sha Tin
Renaissance HarbourView Hotel
K11
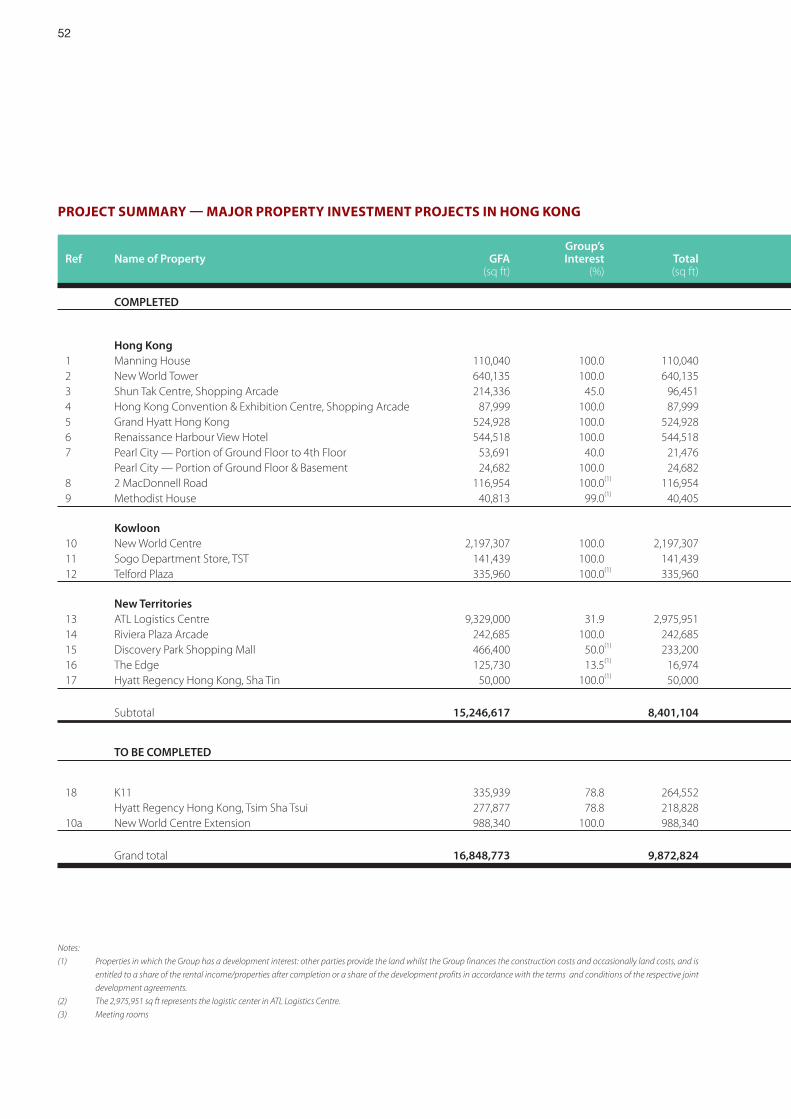
52
Group’s Ref Name of Property GFA Interest Total
(sq ft) (%) (sq ft)
COMPLETED
Hong Kong1 Manning House 110,040 100.0 110,040 2 New World Tower 640,135 100.0 640,135 3 Shun Tak Centre, Shopping Arcade 214,336 45.0 96,451 4 Hong Kong Convention & Exhibition Centre, Shopping Arcade 87,999 100.0 87,999 5 Grand Hyatt Hong Kong 524,928 100.0 524,928 6 Renaissance Harbour View Hotel 544,518 100.0 544,518 7 Pearl City — Portion of Ground Floor to 4th Floor 53,691 40.0 21,476
Pearl City — Portion of Ground Floor & Basement 24,682 100.0 24,682 8 2 MacDonnell Road 116,954 100.0 (1) 116,954 9 Methodist House 40,813 99.0 (1) 40,405
Kowloon10 New World Centre 2,197,307 100.0 2,197,307 11 Sogo Department Store, TST 141,439 100.0 141,439 12 Telford Plaza 335,960 100.0(1) 335,960
New Territories13 ATL Logistics Centre 9,329,000 31.9 2,975,95114 Riviera Plaza Arcade 242,685 100.0 242,685 15 Discovery Park Shopping Mall 466,400 50.0 (1) 233,200 16 The Edge 125,730 13.5 (1) 16,974 17 Hyatt Regency Hong Kong, Sha Tin 50,000 100.0 (1) 50,000
Subtotal 15,246,617 8,401,104
TO BE COMPLETED
18 K11 335,939 78.8 264,552Hyatt Regency Hong Kong, Tsim Sha Tsui 277,877 78.8 218,828
10a New World Centre Extension 988,340 100.0 988,340
Grand total 16,848,773 9,872,824
PROJECT SUMMARY MAJOR PROPERTY INVESTMENT PROJECTS IN HONG KONG
Notes:
(1) Properties in which the Group has a development interest: other parties provide the land whilst the Group finances the construction costs and occasionally land costs, and is
entitled to a share of the rental income/properties after completion or a share of the development profits in accordance with the terms and conditions of the respective joint
development agreements.
(2) The 2,975,951 sq ft represents the logistic center in ATL Logistics Centre.
(3) Meeting rooms
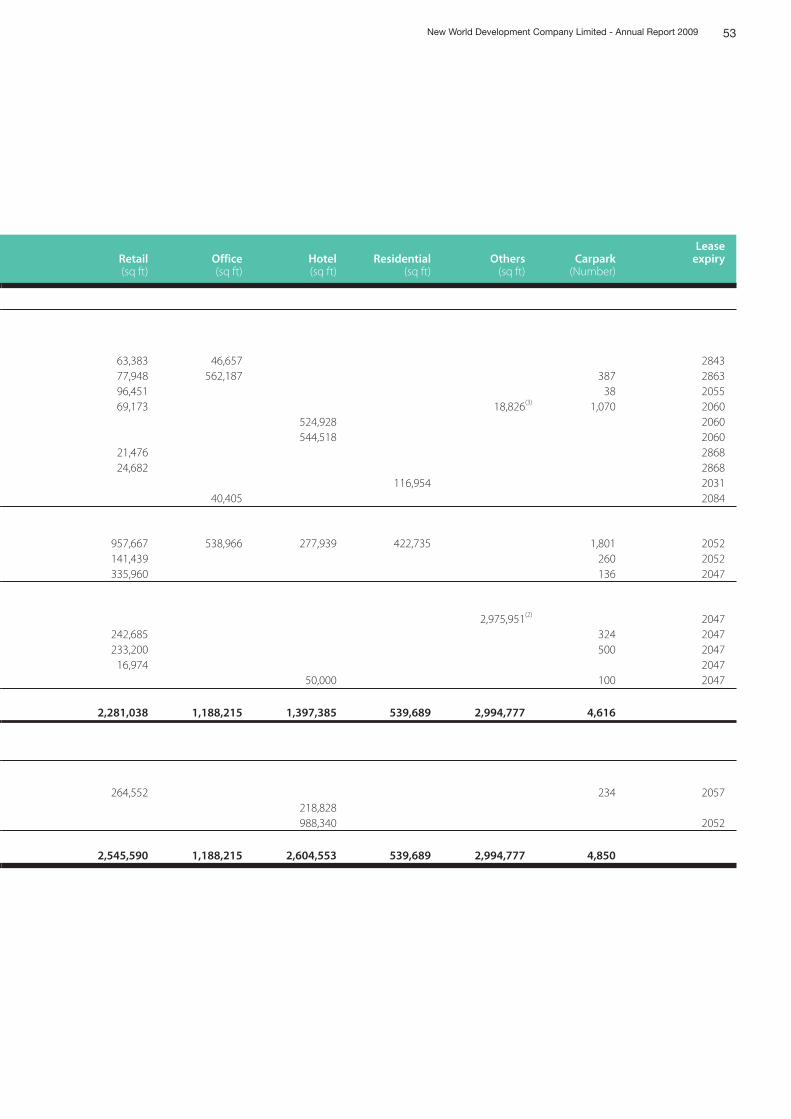
53New World Development Company Limited - Annual Report 2009
LeaseRetail Office Hotel Residential Others Carpark expiry(sq ft) (sq ft) (sq ft) (sq ft) (sq ft) (Number)
63,383 46,657 2843 77,948 562,187 387 2863 96,451 38 2055 69,173 18,826 (3) 1,070 2060
524,928 2060 544,518 2060
21,476 2868 24,682 2868
116,954 2031 40,405 2084
957,667 538,966 277,939 422,735 1,801 2052 141,439 260 2052 335,960 136 2047
2,975,951(2) 2047 242,685 324 2047 233,200 500 2047
16,974 2047 50,000 100 2047
2,281,038 1,188,215 1,397,385 539,689 2,994,777 4,616
264,552 234 2057218,828988,340 2052
2,545,590 1,188,215 2,604,553 539,689 2,994,777 4,850
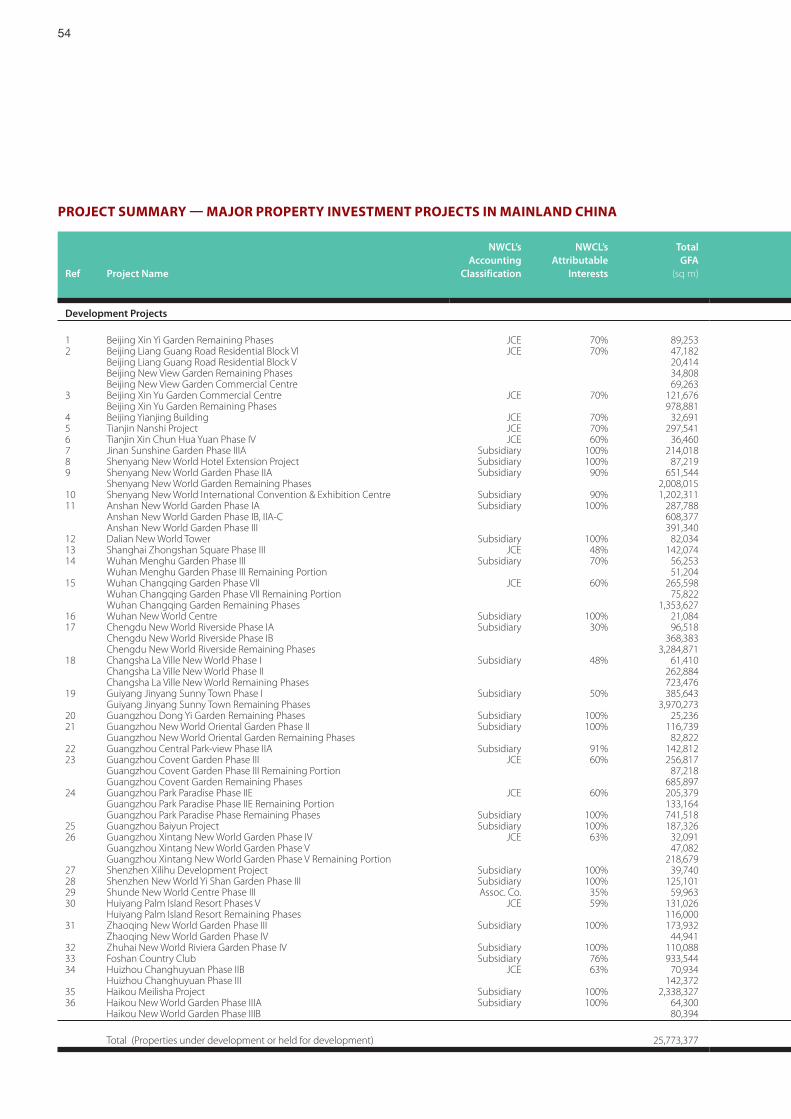
54
PROJECT SUMMARY MAJOR PROPERTY INVESTMENT PROJECTS IN MAINLAND CHINA
NWCL’s NWCL’s TotalAccounting Attributable GFA
Ref Project Name Classification Interests (sq m)
Development Projects
1 Beijing Xin Yi Garden Remaining Phases JCE 70% 89,253 2 Beijing Liang Guang Road Residential Block VI JCE 70% 47,182
Beijing Liang Guang Road Residential Block V 20,414 Beijing New View Garden Remaining Phases 34,808 Beijing New View Garden Commercial Centre 69,263
3 Beijing Xin Yu Garden Commercial Centre JCE 70% 121,676 Beijing Xin Yu Garden Remaining Phases 978,881
4 Beijing Yianjing Building JCE 70% 32,691 5 Tianjin Nanshi Project JCE 70% 297,541 6 Tianjin Xin Chun Hua Yuan Phase IV JCE 60% 36,460 7 Jinan Sunshine Garden Phase IIIA Subsidiary 100% 214,018 8 Shenyang New World Hotel Extension Project Subsidiary 100% 87,219 9 Shenyang New World Garden Phase IIA Subsidiary 90% 651,544
Shenyang New World Garden Remaining Phases 2,008,015 10 Shenyang New World International Convention & Exhibition Centre Subsidiary 90% 1,202,311 11 Anshan New World Garden Phase IA Subsidiary 100% 287,788
Anshan New World Garden Phase IB, IIA-C 608,377 Anshan New World Garden Phase III 391,340
12 Dalian New World Tower Subsidiary 100% 82,034 13 Shanghai Zhongshan Square Phase III JCE 48% 142,074 14 Wuhan Menghu Garden Phase III Subsidiary 70% 56,253
Wuhan Menghu Garden Phase III Remaining Portion 51,204 15 Wuhan Changqing Garden Phase VII JCE 60% 265,598
Wuhan Changqing Garden Phase VII Remaining Portion 75,822 Wuhan Changqing Garden Remaining Phases 1,353,627
16 Wuhan New World Centre Subsidiary 100% 21,084 17 Chengdu New World Riverside Phase IA Subsidiary 30% 96,518
Chengdu New World Riverside Phase IB 368,383 Chengdu New World Riverside Remaining Phases 3,284,871
18 Changsha La Ville New World Phase I Subsidiary 48% 61,410 Changsha La Ville New World Phase II 262,884 Changsha La Ville New World Remaining Phases 723,476
19 Guiyang Jinyang Sunny Town Phase I Subsidiary 50% 385,643 Guiyang Jinyang Sunny Town Remaining Phases 3,970,273
20 Guangzhou Dong Yi Garden Remaining Phases Subsidiary 100% 25,236 21 Guangzhou New World Oriental Garden Phase II Subsidiary 100% 116,739
Guangzhou New World Oriental Garden Remaining Phases 82,822 22 Guangzhou Central Park-view Phase IIA Subsidiary 91% 142,812 23 Guangzhou Covent Garden Phase III JCE 60% 256,817
Guangzhou Covent Garden Phase III Remaining Portion 87,218 Guangzhou Covent Garden Remaining Phases 685,897
24 Guangzhou Park Paradise Phase IIE JCE 60% 205,379 Guangzhou Park Paradise Phase IIE Remaining Portion 133,164 Guangzhou Park Paradise Phase Remaining Phases Subsidiary 100% 741,518
25 Guangzhou Baiyun Project Subsidiary 100% 187,326 26 Guangzhou Xintang New World Garden Phase IV JCE 63% 32,091
Guangzhou Xintang New World Garden Phase V 47,082 Guangzhou Xintang New World Garden Phase V Remaining Portion 218,679
27 Shenzhen Xilihu Development Project Subsidiary 100% 39,740 28 Shenzhen New World Yi Shan Garden Phase III Subsidiary 100% 125,101 29 Shunde New World Centre Phase III Assoc. Co. 35% 59,963 30 Huiyang Palm Island Resort Phases V JCE 59% 131,026
Huiyang Palm Island Resort Remaining Phases 116,000 31 Zhaoqing New World Garden Phase III Subsidiary 100% 173,932
Zhaoqing New World Garden Phase IV 44,941 32 Zhuhai New World Riviera Garden Phase IV Subsidiary 100% 110,088 33 Foshan Country Club Subsidiary 76% 933,544 34 Huizhou Changhuyuan Phase IIB JCE 63% 70,934
Huizhou Changhuyuan Phase III 142,372 35 Haikou Meilisha Project Subsidiary 100% 2,338,327 36 Haikou New World Garden Phase IIIA Subsidiary 100% 64,300
Haikou New World Garden Phase IIIB 80,394
Total (Properties under development or held for development) 25,773,377
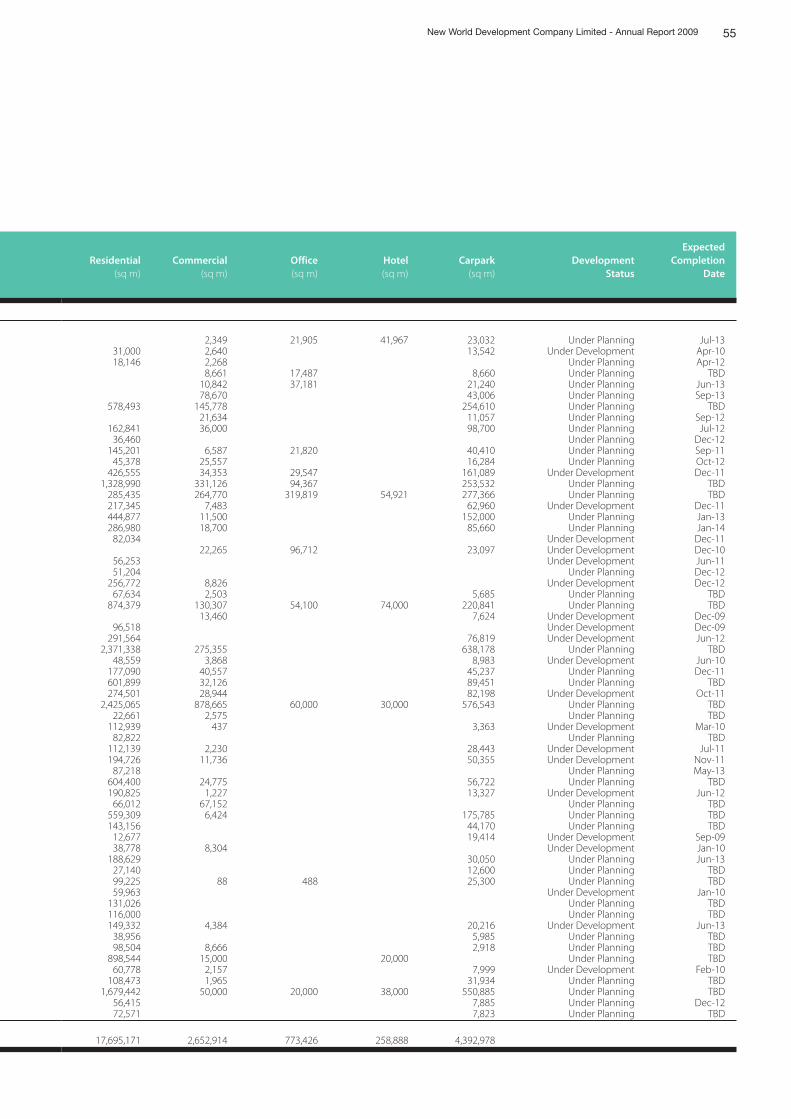
55New World Development Company Limited - Annual Report 2009
ExpectedResidential Commercial Office Hotel Carpark Development Completion
(sq m) (sq m) (sq m) (sq m) (sq m) Status Date
2,349 21,905 41,967 23,032 Under Planning Jul-1331,000 2,640 13,542 Under Development Apr-1018,146 2,268 Under Planning Apr-12
8,661 17,487 8,660 Under Planning TBD10,842 37,181 21,240 Under Planning Jun-1378,670 43,006 Under Planning Sep-13
578,493 145,778 254,610 Under Planning TBD21,634 11,057 Under Planning Sep-12
162,841 36,000 98,700 Under Planning Jul-1236,460 Under Planning Dec-12
145,201 6,587 21,820 40,410 Under Planning Sep-1145,378 25,557 16,284 Under Planning Oct-12
426,555 34,353 29,547 161,089 Under Development Dec-111,328,990 331,126 94,367 253,532 Under Planning TBD
285,435 264,770 319,819 54,921 277,366 Under Planning TBD217,345 7,483 62,960 Under Development Dec-11444,877 11,500 152,000 Under Planning Jan-13286,980 18,700 85,660 Under Planning Jan-14
82,034 Under Development Dec-1122,265 96,712 23,097 Under Development Dec-10
56,253 Under Development Jun-1151,204 Under Planning Dec-12
256,772 8,826 Under Development Dec-1267,634 2,503 5,685 Under Planning TBD
874,379 130,307 54,100 74,000 220,841 Under Planning TBD13,460 7,624 Under Development Dec-09
96,518 Under Development Dec-09291,564 76,819 Under Development Jun-12
2,371,338 275,355 638,178 Under Planning TBD48,559 3,868 8,983 Under Development Jun-10
177,090 40,557 45,237 Under Planning Dec-11601,899 32,126 89,451 Under Planning TBD274,501 28,944 82,198 Under Development Oct-11
2,425,065 878,665 60,000 30,000 576,543 Under Planning TBD22,661 2,575 Under Planning TBD
112,939 437 3,363 Under Development Mar-1082,822 Under Planning TBD
112,139 2,230 28,443 Under Development Jul-11194,726 11,736 50,355 Under Development Nov-11
87,218 Under Planning May-13604,400 24,775 56,722 Under Planning TBD190,825 1,227 13,327 Under Development Jun-12
66,012 67,152 Under Planning TBD559,309 6,424 175,785 Under Planning TBD143,156 44,170 Under Planning TBD
12,677 19,414 Under Development Sep-0938,778 8,304 Under Development Jan-10
188,629 30,050 Under Planning Jun-1327,140 12,600 Under Planning TBD99,225 88 488 25,300 Under Planning TBD59,963 Under Development Jan-10
131,026 Under Planning TBD116,000 Under Planning TBD149,332 4,384 20,216 Under Development Jun-13
38,956 5,985 Under Planning TBD98,504 8,666 2,918 Under Planning TBD
898,544 15,000 20,000 Under Planning TBD60,778 2,157 7,999 Under Development Feb-10
108,473 1,965 31,934 Under Planning TBD1,679,442 50,000 20,000 38,000 550,885 Under Planning TBD
56,415 7,885 Under Planning Dec-1272,571 7,823 Under Planning TBD
17,695,171 2,652,914 773,426 258,888 4,392,978
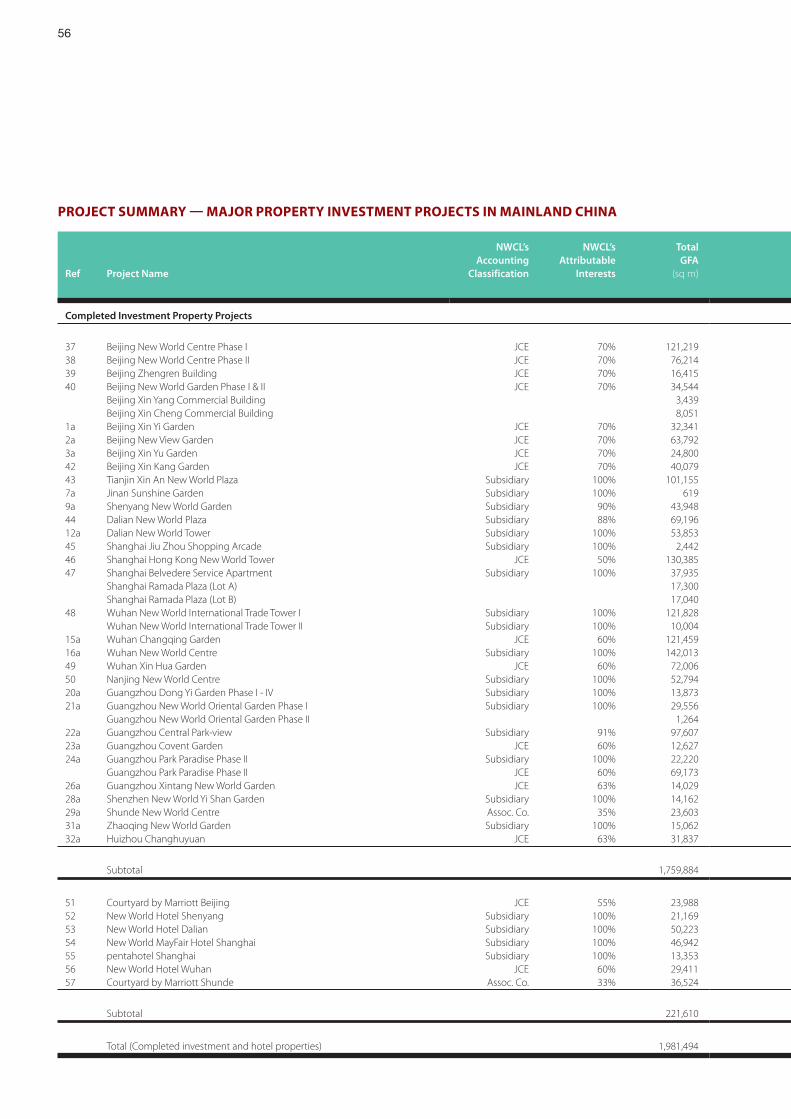
56
PROJECT SUMMARY MAJOR PROPERTY INVESTMENT PROJECTS IN MAINLAND CHINA
NWCL’s NWCL’s TotalAccounting Attributable GFA
Ref Project Name Classification Interests (sq m)
Completed Investment Property Projects
37 Beijing New World Centre Phase I JCE 70% 121,219 38 Beijing New World Centre Phase II JCE 70% 76,214 39 Beijing Zhengren Building JCE 70% 16,415 40 Beijing New World Garden Phase I & II JCE 70% 34,544
Beijing Xin Yang Commercial Building 3,439 Beijing Xin Cheng Commercial Building 8,051
1a Beijing Xin Yi Garden JCE 70% 32,341 2a Beijing New View Garden JCE 70% 63,792 3a Beijing Xin Yu Garden JCE 70% 24,800 42 Beijing Xin Kang Garden JCE 70% 40,079 43 Tianjin Xin An New World Plaza Subsidiary 100% 101,155 7a Jinan Sunshine Garden Subsidiary 100% 619 9a Shenyang New World Garden Subsidiary 90% 43,948 44 Dalian New World Plaza Subsidiary 88% 69,196 12a Dalian New World Tower Subsidiary 100% 53,853 45 Shanghai Jiu Zhou Shopping Arcade Subsidiary 100% 2,442 46 Shanghai Hong Kong New World Tower JCE 50% 130,385 47 Shanghai Belvedere Service Apartment Subsidiary 100% 37,935
Shanghai Ramada Plaza (Lot A) 17,300 Shanghai Ramada Plaza (Lot B) 17,040
48 Wuhan New World International Trade Tower I Subsidiary 100% 121,828 Wuhan New World International Trade Tower II Subsidiary 100% 10,004
15a Wuhan Changqing Garden JCE 60% 121,459 16a Wuhan New World Centre Subsidiary 100% 142,013 49 Wuhan Xin Hua Garden JCE 60% 72,006 50 Nanjing New World Centre Subsidiary 100% 52,794 20a Guangzhou Dong Yi Garden Phase I - IV Subsidiary 100% 13,873 21a Guangzhou New World Oriental Garden Phase I Subsidiary 100% 29,556
Guangzhou New World Oriental Garden Phase II 1,264 22a Guangzhou Central Park-view Subsidiary 91% 97,607 23a Guangzhou Covent Garden JCE 60% 12,627 24a Guangzhou Park Paradise Phase II Subsidiary 100% 22,220
Guangzhou Park Paradise Phase II JCE 60% 69,173 26a Guangzhou Xintang New World Garden JCE 63% 14,029 28a Shenzhen New World Yi Shan Garden Subsidiary 100% 14,162 29a Shunde New World Centre Assoc. Co. 35% 23,603 31a Zhaoqing New World Garden Subsidiary 100% 15,062 32a Huizhou Changhuyuan JCE 63% 31,837
Subtotal 1,759,884
51 Courtyard by Marriott Beijing JCE 55% 23,988 52 New World Hotel Shenyang Subsidiary 100% 21,169 53 New World Hotel Dalian Subsidiary 100% 50,223 54 New World MayFair Hotel Shanghai Subsidiary 100% 46,942 55 pentahotel Shanghai Subsidiary 100% 13,353 56 New World Hotel Wuhan JCE 60% 29,411 57 Courtyard by Marriott Shunde Assoc. Co. 33% 36,524
Subtotal 221,610
Total (Completed investment and hotel properties) 1,981,494
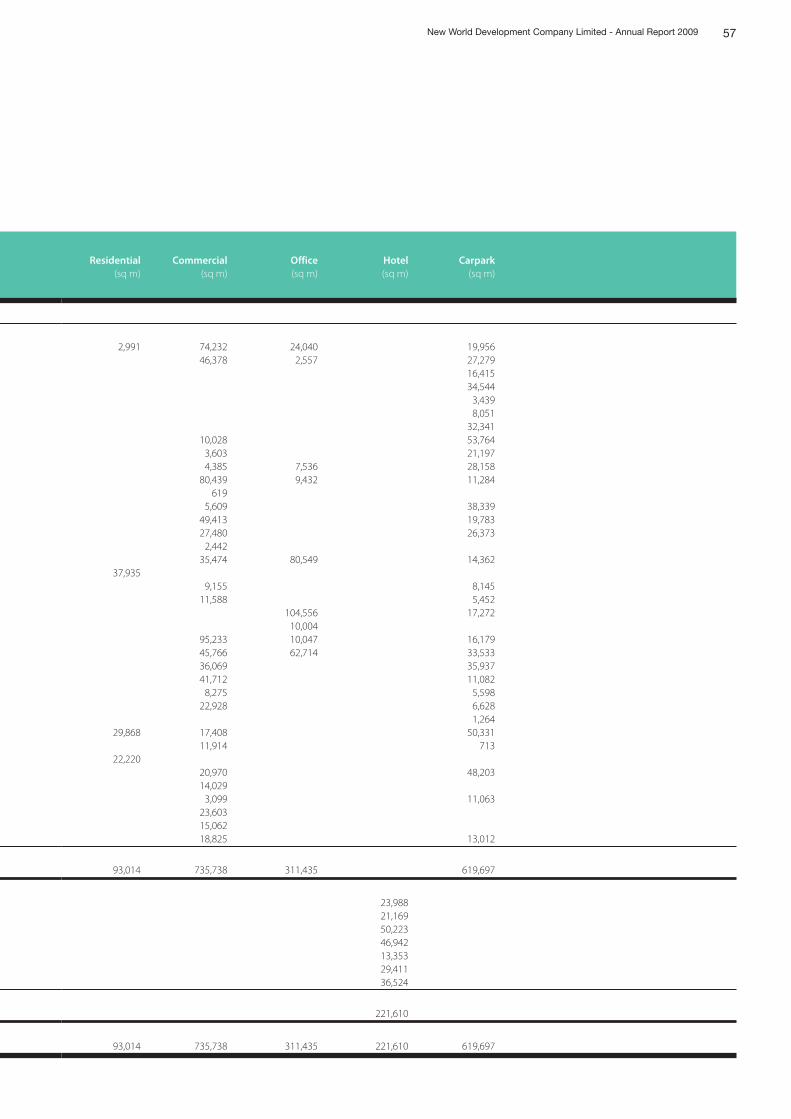
57New World Development Company Limited - Annual Report 2009
Residential Commercial Office Hotel Carpark(sq m) (sq m) (sq m) (sq m) (sq m)
2,991 74,232 24,040 19,956 46,378 2,557 27,279
16,415 34,544
3,4398,051
32,341 10,028 53,764
3,603 21,197 4,385 7,536 28,158
80,439 9,432 11,284619
5,609 38,339 49,413 19,783 27,480 26,373
2,442 35,474 80,549 14,362
37,935 9,155 8,145
11,588 5,452 104,556 17,272
10,00495,233 10,047 16,17945,766 62,714 33,533 36,069 35,937 41,712 11,082 8,275 5,598
22,928 6,628 1,264
29,868 17,408 50,331 11,914 713
22,220 20,970 48,203 14,029
3,099 11,06323,603 15,062 18,825 13,012
93,014 735,738 311,435 619,697
23,98821,16950,22346,94213,35329,41136,524
221,610
93,014 735,738 311,435 221,610 619,697
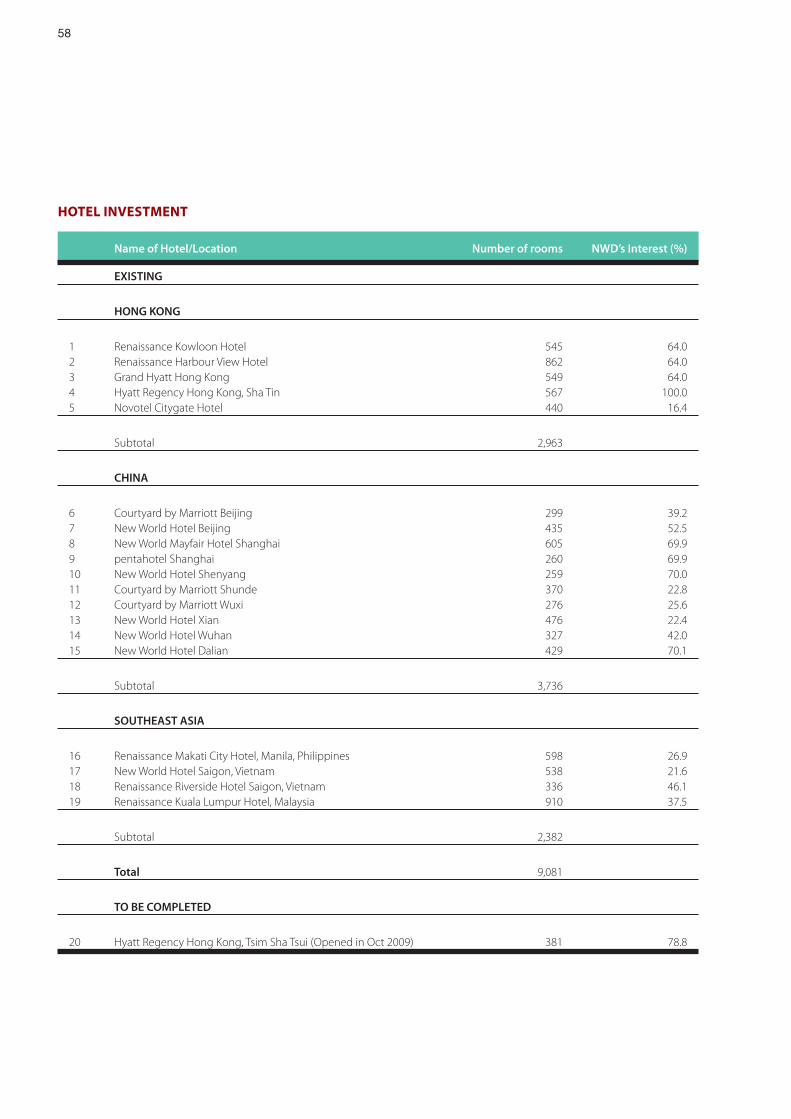
58
HOTEL INVESTMENT
Name of Hotel/Location Number of rooms NWD’s Interest (%)
EXISTING
HONG KONG
1 Renaissance Kowloon Hotel 545 64.02 Renaissance Harbour View Hotel 862 64.03 Grand Hyatt Hong Kong 549 64.04 Hyatt Regency Hong Kong, Sha Tin 567 100.05 Novotel Citygate Hotel 440 16.4
Subtotal 2,963
CHINA
6 Courtyard by Marriott Beijing 299 39.27 New World Hotel Beijing 435 52.58 New World Mayfair Hotel Shanghai 605 69.99 pentahotel Shanghai 260 69.910 New World Hotel Shenyang 259 70.011 Courtyard by Marriott Shunde 370 22.812 Courtyard by Marriott Wuxi 276 25.613 New World Hotel Xian 476 22.414 New World Hotel Wuhan 327 42.015 New World Hotel Dalian 429 70.1
Subtotal 3,736
SOUTHEAST ASIA
16 Renaissance Makati City Hotel, Manila, Philippines 598 26.917 New World Hotel Saigon, Vietnam 538 21.618 Renaissance Riverside Hotel Saigon, Vietnam 336 46.119 Renaissance Kuala Lumpur Hotel, Malaysia 910 37.5
Subtotal 2,382
Total 9,081
TO BE COMPLETED
20 Hyatt Regency Hong Kong, Tsim Sha Tsui (Opened in Oct 2009) 381 78.8
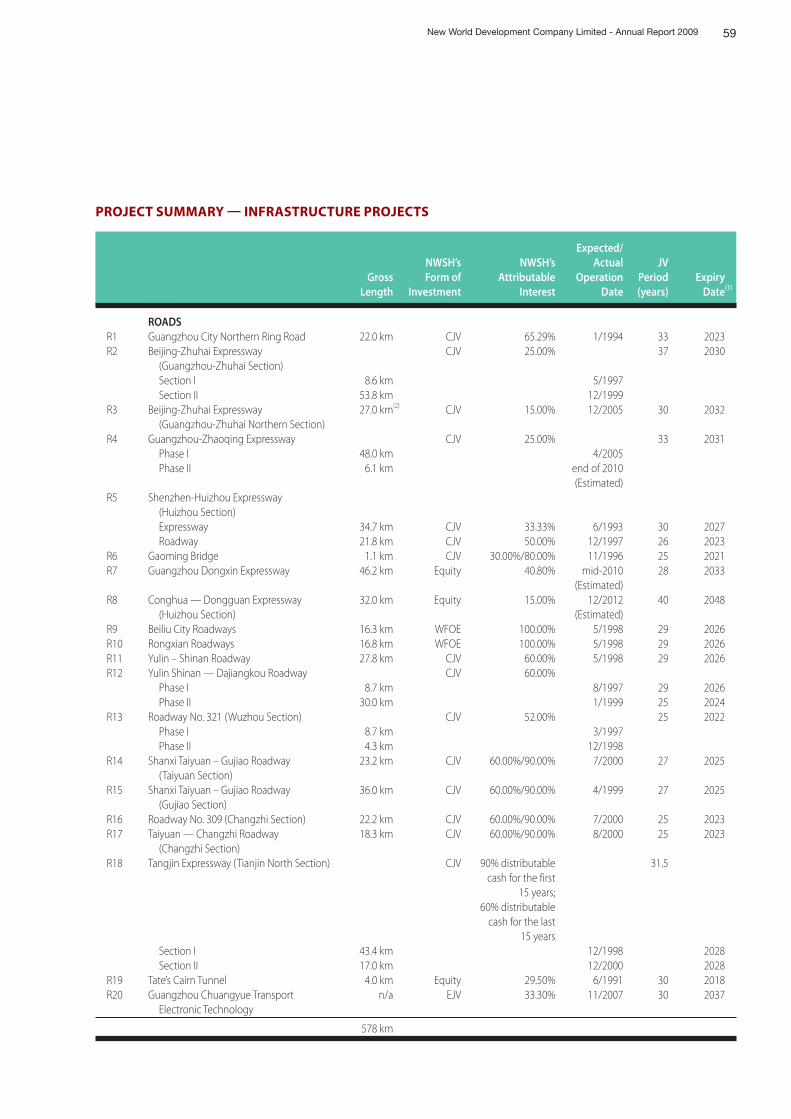
59New World Development Company Limited - Annual Report 2009
PROJECT SUMMARY INFRASTRUCTURE PROJECTS
GrossLength
NWSH’sForm of
Investment
NWSH’sAttributable
Interest
Expected/Actual
OperationDate
JVPeriod(years)
ExpiryDate(1)
ROADSR1 Guangzhou City Northern Ring Road 22.0 km CJV 65.29% 1/1994 33 2023R2 Beijing-Zhuhai Expressway CJV 25.00% 37 2030
(Guangzhou-Zhuhai Section) Section I 8.6 km 5/1997 Section II 53.8 km 12/1999
R3 Beijing-Zhuhai Expressway 27.0 km(2) CJV 15.00% 12/2005 30 2032 (Guangzhou-Zhuhai Northern Section)
R4 Guangzhou-Zhaoqing Expressway CJV 25.00% 33 2031 Phase I 48.0 km 4/2005 Phase II 6.1 km end of 2010
(Estimated)R5 Shenzhen-Huizhou Expressway
(Huizhou Section) Expressway 34.7 km CJV 33.33% 6/1993 30 2027 Roadway 21.8 km CJV 50.00% 12/1997 26 2023
R6 Gaoming Bridge 1.1 km CJV 30.00%/80.00% 11/1996 25 2021R7 Guangzhou Dongxin Expressway 46.2 km Equity 40.80% mid-2010
(Estimated)28 2033
R8 Conghua — Dongguan Expressway (Huizhou Section)
32.0 km Equity 15.00% 12/2012(Estimated)
40 2048
R9 Beiliu City Roadways 16.3 km WFOE 100.00% 5/1998 29 2026R10 Rongxian Roadways 16.8 km WFOE 100.00% 5/1998 29 2026R11 Yulin – Shinan Roadway 27.8 km CJV 60.00% 5/1998 29 2026R12 Yulin Shinan — Dajiangkou Roadway CJV 60.00%
Phase I 8.7 km 8/1997 29 2026 Phase II 30.0 km 1/1999 25 2024
R13 Roadway No. 321 (Wuzhou Section) CJV 52.00% 25 2022 Phase I 8.7 km 3/1997 Phase II 4.3 km 12/1998
R14 Shanxi Taiyuan – Gujiao Roadway (Taiyuan Section)
23.2 km CJV 60.00%/90.00% 7/2000 27 2025
R15 Shanxi Taiyuan – Gujiao Roadway (Gujiao Section)
36.0 km CJV 60.00%/90.00% 4/1999 27 2025
R16 Roadway No. 309 (Changzhi Section) 22.2 km CJV 60.00%/90.00% 7/2000 25 2023R17 Taiyuan — Changzhi Roadway
(Changzhi Section)18.3 km CJV 60.00%/90.00% 8/2000 25 2023
R18 Tangjin Expressway (Tianjin North Section) CJV 90% distributable 31.5cash for the first
15 years;60% distributable
cash for the last15 years
Section I 43.4 km 12/1998 2028 Section II 17.0 km 12/2000 2028
R19 Tate’s Cairn Tunnel 4.0 km Equity 29.50% 6/1991 30 2018R20 Guangzhou Chuangyue Transport
Electronic Technologyn/a EJV 33.30% 11/2007 30 2037
578 km
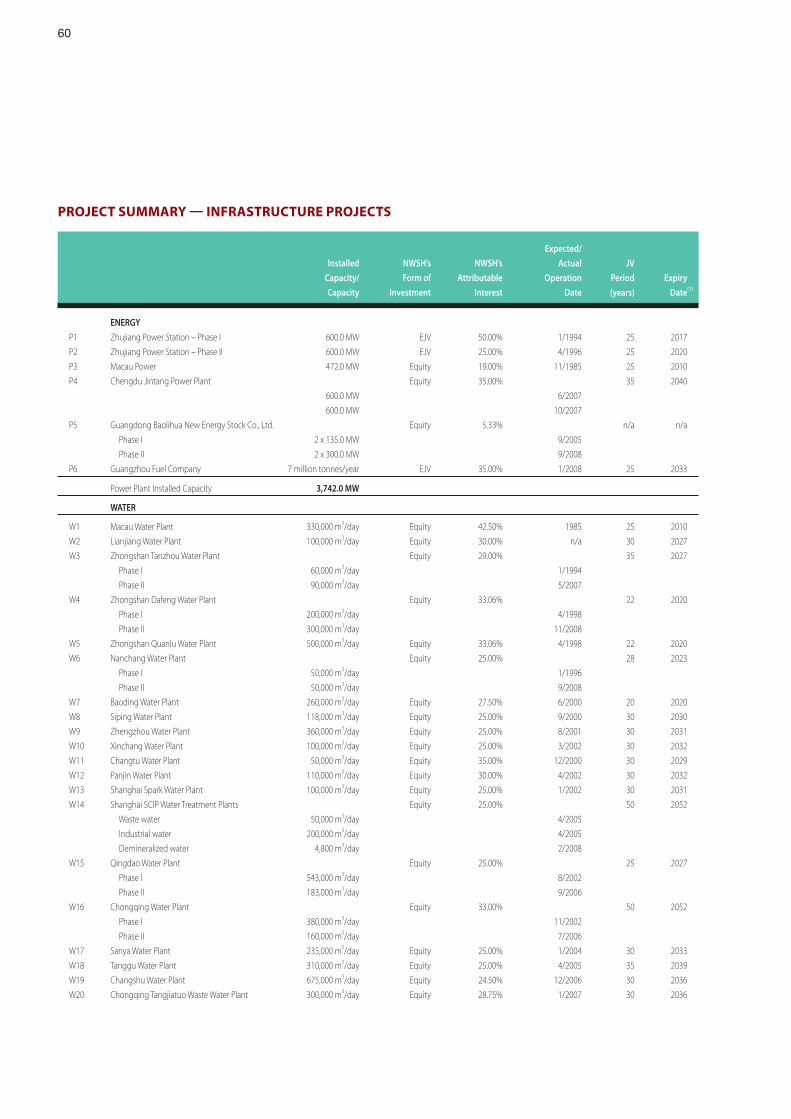
60
PROJECT SUMMARY INFRASTRUCTURE PROJECTS
Installed
Capacity/
Capacity
NWSH’s
Form of
Investment
NWSH’s
Attributable
Interest
Expected/
Actual
Operation
Date
JV
Period
(years)
Expiry
Date(1)
ENERGY
P1 Zhujiang Power Station – Phase I 600.0 MW EJV 50.00% 1/1994 25 2017
P2 Zhujiang Power Station – Phase II 600.0 MW EJV 25.00% 4/1996 25 2020
P3 Macau Power 472.0 MW Equity 19.00% 11/1985 25 2010
P4 Chengdu Jintang Power Plant Equity 35.00% 35 2040
600.0 MW 6/2007
600.0 MW 10/2007
P5 Guangdong Baolihua New Energy Stock Co., Ltd. Equity 5.33% n/a n/a
Phase I 2 x 135.0 MW 9/2005
Phase II 2 x 300.0 MW 9/2008
P6 Guangzhou Fuel Company 7 million tonnes/year EJV 35.00% 1/2008 25 2033
Power Plant Installed Capacity 3,742.0 MW
WATER
W1 Macau Water Plant 330,000 m3/day Equity 42.50% 1985 25 2010
W2 Lianjiang Water Plant 100,000 m3/day Equity 30.00% n/a 30 2027
W3 Zhongshan Tanzhou Water Plant Equity 29.00% 35 2027
Phase I 60,000 m3/day 1/1994
Phase II 90,000 m3/day 5/2007
W4 Zhongshan Dafeng Water Plant Equity 33.06% 22 2020
Phase I 200,000 m3/day 4/1998
Phase II 300,000 m3/day 11/2008
W5 Zhongshan Quanlu Water Plant 500,000 m3/day Equity 33.06% 4/1998 22 2020
W6 Nanchang Water Plant Equity 25.00% 28 2023
Phase I 50,000 m3/day 1/1996
Phase II 50,000 m3/day 9/2008
W7 Baoding Water Plant 260,000 m3/day Equity 27.50% 6/2000 20 2020
W8 Siping Water Plant 118,000 m3/day Equity 25.00% 9/2000 30 2030
W9 Zhengzhou Water Plant 360,000 m3/day Equity 25.00% 8/2001 30 2031
W10 Xinchang Water Plant 100,000 m3/day Equity 25.00% 3/2002 30 2032
W11 Changtu Water Plant 50,000 m3/day Equity 35.00% 12/2000 30 2029
W12 Panjin Water Plant 110,000 m3/day Equity 30.00% 4/2002 30 2032
W13 Shanghai Spark Water Plant 100,000 m3/day Equity 25.00% 1/2002 30 2031
W14 Shanghai SCIP Water Treatment Plants Equity 25.00% 50 2052
Waste water 50,000 m3/day 4/2005
Industrial water 200,000 m3/day 4/2005
Demineralized water 4,800 m3/day 2/2008
W15 Qingdao Water Plant Equity 25.00% 25 2027
Phase I 543,000 m3/day 8/2002
Phase II 183,000 m3/day 9/2006
W16 Chongqing Water Plant Equity 33.00% 50 2052
Phase I 380,000 m3/day 11/2002
Phase II 160,000 m3/day 7/2006
W17 Sanya Water Plant 235,000 m3/day Equity 25.00% 1/2004 30 2033
W18 Tanggu Water Plant 310,000 m3/day Equity 25.00% 4/2005 35 2039
W19 Changshu Water Plant 675,000 m3/day Equity 24.50% 12/2006 30 2036
W20 Chongqing Tangjiatuo Waste Water Plant 300,000 m3/day Equity 28.75% 1/2007 30 2036
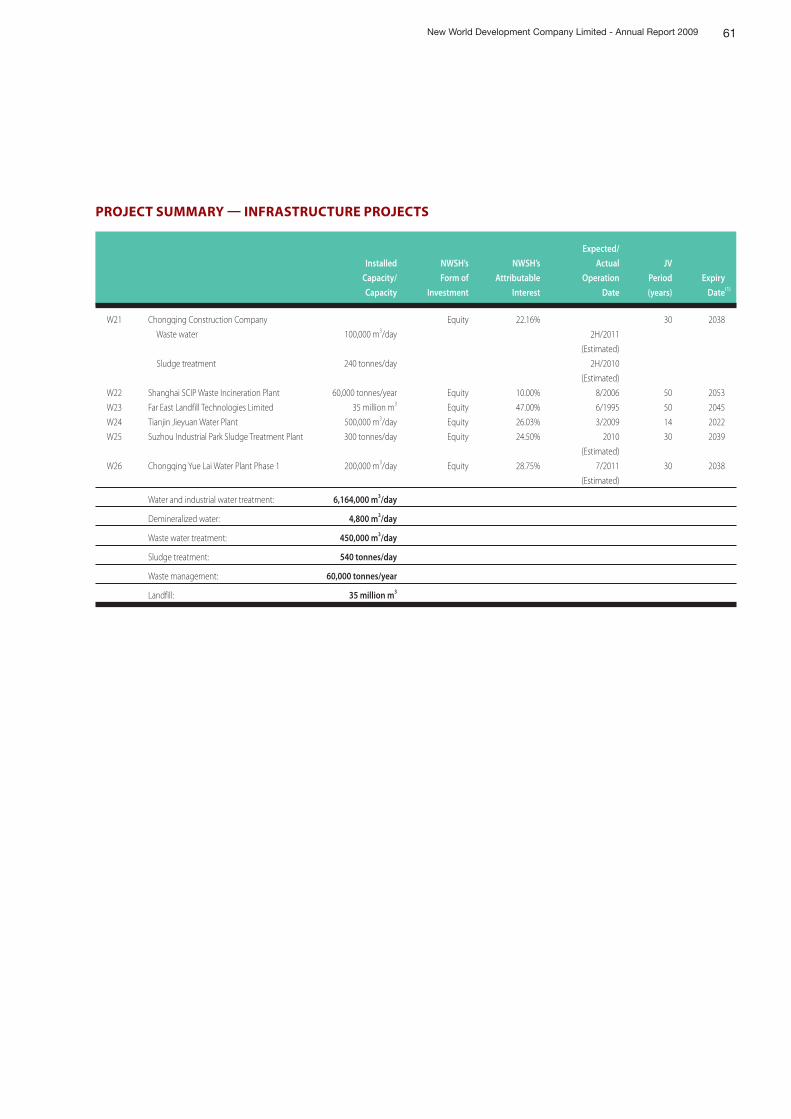
61New World Development Company Limited - Annual Report 2009
Installed
Capacity/
Capacity
NWSH’s
Form of
Investment
NWSH’s
Attributable
Interest
Expected/
Actual
Operation
Date
JV
Period
(years)
Expiry
Date(1)
W21 Chongqing Construction Company Equity 22.16% 30 2038
Waste water 100,000 m3/day 2H/2011
(Estimated)
Sludge treatment 240 tonnes/day 2H/2010
(Estimated)
W22 Shanghai SCIP Waste Incineration Plant 60,000 tonnes/year Equity 10.00% 8/2006 50 2053
W23 Far East Landfill Technologies Limited 35 million m3 Equity 47.00% 6/1995 50 2045
W24 Tianjin Jieyuan Water Plant 500,000 m3/day Equity 26.03% 3/2009 14 2022
W25 Suzhou Industrial Park Sludge Treatment Plant 300 tonnes/day Equity 24.50% 2010
(Estimated)
30 2039
W26 Chongqing Yue Lai Water Plant Phase 1 200,000 m3/day Equity 28.75% 7/2011
(Estimated)
30 2038
Water and industrial water treatment: 6,164,000 m3/day
Demineralized water: 4,800 m3/day
Waste water treatment: 450,000 m3/day
Sludge treatment: 540 tonnes/day
Waste management: 60,000 tonnes/year
Landfill: 35 million m3
PROJECT SUMMARY INFRASTRUCTURE PROJECTS
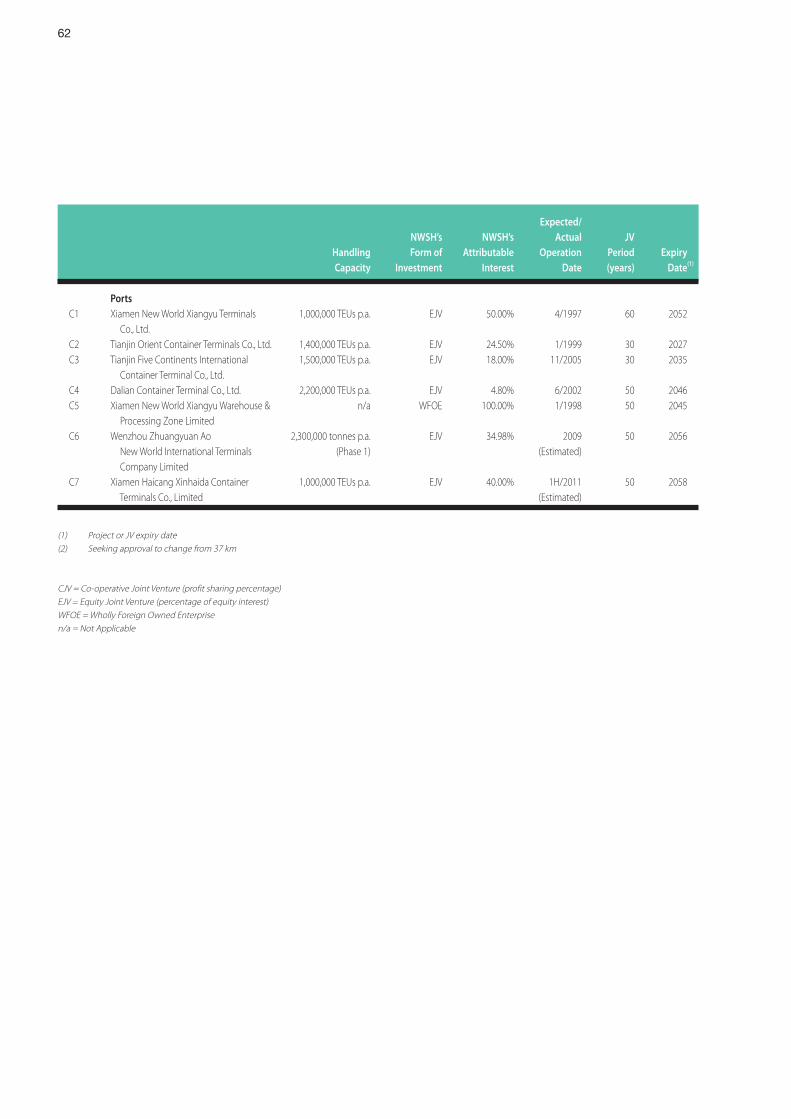
62
HandlingCapacity
NWSH’sForm of
Investment
NWSH’sAttributable
Interest
Expected/Actual
OperationDate
JVPeriod(years)
ExpiryDate(1)
PortsC1 Xiamen New World Xiangyu Terminals
Co., Ltd.1,000,000 TEUs p.a. EJV 50.00% 4/1997 60 2052
C2 Tianjin Orient Container Terminals Co., Ltd. 1,400,000 TEUs p.a. EJV 24.50% 1/1999 30 2027C3 Tianjin Five Continents International
Container Terminal Co., Ltd.1,500,000 TEUs p.a. EJV 18.00% 11/2005 30 2035
C4 Dalian Container Terminal Co., Ltd. 2,200,000 TEUs p.a. EJV 4.80% 6/2002 50 2046C5 Xiamen New World Xiangyu Warehouse &
Processing Zone Limitedn/a WFOE 100.00% 1/1998 50 2045
C6 Wenzhou Zhuangyuan Ao 2,300,000 tonnes p.a. EJV 34.98% 2009 50 2056 New World International Terminals (Phase 1) (Estimated) Company Limited
C7 Xiamen Haicang Xinhaida Container Terminals Co., Limited
1,000,000 TEUs p.a. EJV 40.00% 1H/2011(Estimated)
50 2058
(1) Project or JV expiry date(2) Seeking approval to change from 37 km
CJV = Co-operative Joint Venture (profit sharing percentage)EJV = Equity Joint Venture (percentage of equity interest)WFOE = Wholly Foreign Owned Enterprisen/a = Not Applicable
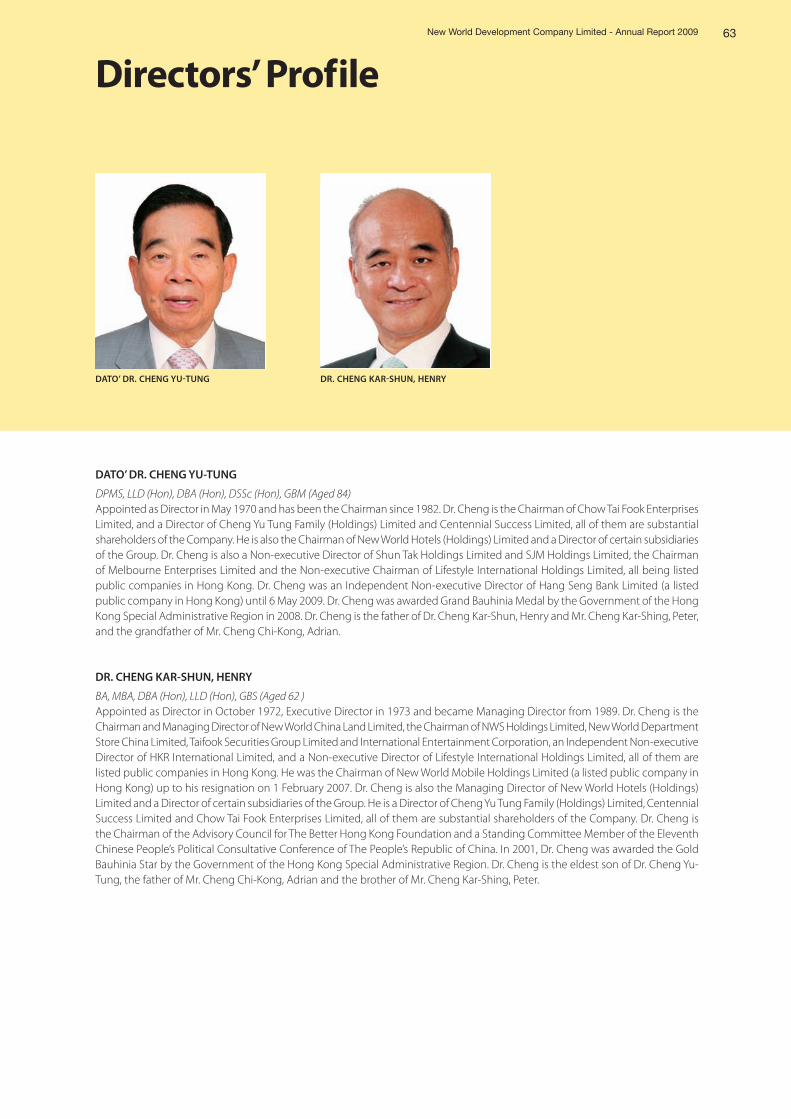
63
Directors’ ProfileNew World Development Company Limited - Annual Report 2009
DATO’ DR. CHENG YUTUNG DR. CHENG KARSHUN, HENRY
DATO’ DR. CHENG YU-TUNG
DPMS, LLD (Hon), DBA (Hon), DSSc (Hon), GBM (Aged 84)Appointed as Director in May 1970 and has been the Chairman since 1982. Dr. Cheng is the Chairman of Chow Tai Fook Enterprises Limited, and a Director of Cheng Yu Tung Family (Holdings) Limited and Centennial Success Limited, all of them are substantial shareholders of the Company. He is also the Chairman of New World Hotels (Holdings) Limited and a Director of certain subsidiaries of the Group. Dr. Cheng is also a Non-executive Director of Shun Tak Holdings Limited and SJM Holdings Limited, the Chairman of Melbourne Enterprises Limited and the Non-executive Chairman of Lifestyle International Holdings Limited, all being listed public companies in Hong Kong. Dr. Cheng was an Independent Non-executive Director of Hang Seng Bank Limited (a listed public company in Hong Kong) until 6 May 2009. Dr. Cheng was awarded Grand Bauhinia Medal by the Government of the Hong Kong Special Administrative Region in 2008. Dr. Cheng is the father of Dr. Cheng Kar-Shun, Henry and Mr. Cheng Kar-Shing, Peter, and the grandfather of Mr. Cheng Chi-Kong, Adrian.
DR. CHENG KAR-SHUN, HENRY
BA, MBA, DBA (Hon), LLD (Hon), GBS (Aged 62 )Appointed as Director in October 1972, Executive Director in 1973 and became Managing Director from 1989. Dr. Cheng is the Chairman and Managing Director of New World China Land Limited, the Chairman of NWS Holdings Limited, New World Department Store China Limited, Taifook Securities Group Limited and International Entertainment Corporation, an Independent Non-executive Director of HKR International Limited, and a Non-executive Director of Lifestyle International Holdings Limited, all of them are listed public companies in Hong Kong. He was the Chairman of New World Mobile Holdings Limited (a listed public company in Hong Kong) up to his resignation on 1 February 2007. Dr. Cheng is also the Managing Director of New World Hotels (Holdings) Limited and a Director of certain subsidiaries of the Group. He is a Director of Cheng Yu Tung Family (Holdings) Limited, Centennial Success Limited and Chow Tai Fook Enterprises Limited, all of them are substantial shareholders of the Company. Dr. Cheng is the Chairman of the Advisory Council for The Better Hong Kong Foundation and a Standing Committee Member of the Eleventh Chinese People’s Political Consultative Conference of The People’s Republic of China. In 2001, Dr. Cheng was awarded the Gold Bauhinia Star by the Government of the Hong Kong Special Administrative Region. Dr. Cheng is the eldest son of Dr. Cheng Yu-Tung, the father of Mr. Cheng Chi-Kong, Adrian and the brother of Mr. Cheng Kar-Shing, Peter.
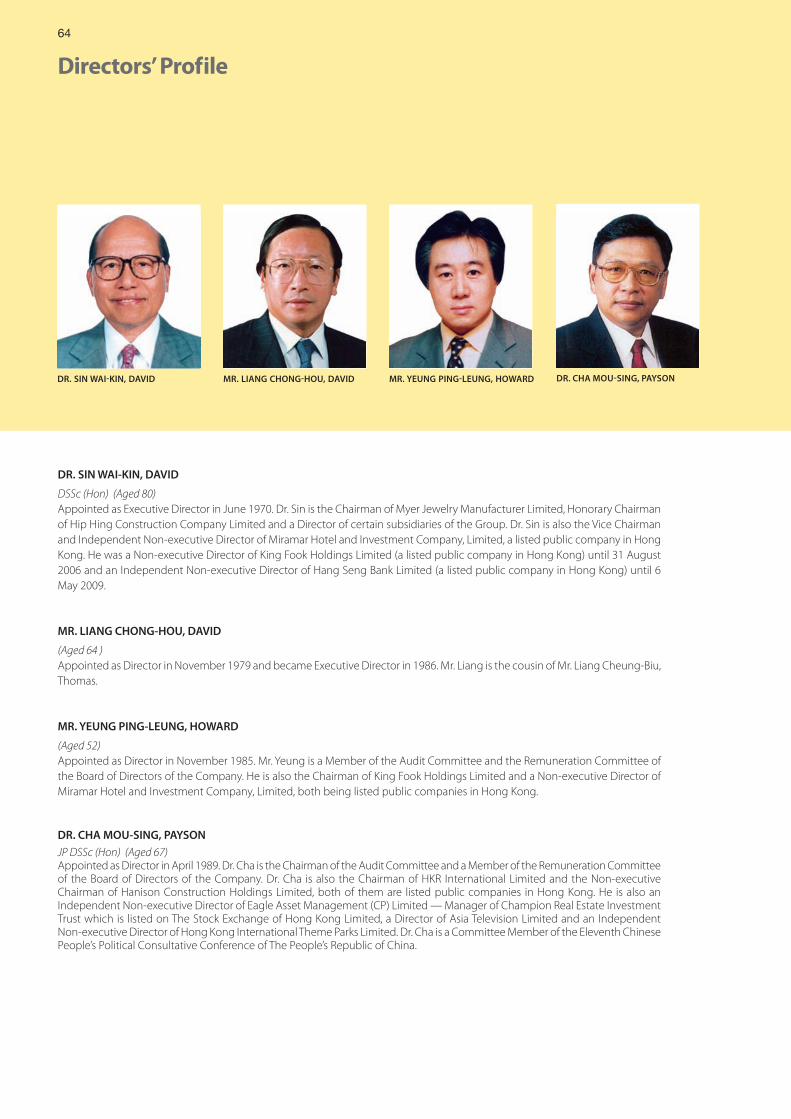
64
Directors’ Profile
DR. SIN WAIKIN, DAVID MR. LIANG CHONGHOU, DAVID MR. YEUNG PINGLEUNG, HOWARD
DR. SIN WAI-KIN, DAVID
DSSc (Hon) (Aged 80)Appointed as Executive Director in June 1970. Dr. Sin is the Chairman of Myer Jewelry Manufacturer Limited, Honorary Chairman of Hip Hing Construction Company Limited and a Director of certain subsidiaries of the Group. Dr. Sin is also the Vice Chairman and Independent Non-executive Director of Miramar Hotel and Investment Company, Limited, a listed public company in Hong Kong. He was a Non-executive Director of King Fook Holdings Limited (a listed public company in Hong Kong) until 31 August 2006 and an Independent Non-executive Director of Hang Seng Bank Limited (a listed public company in Hong Kong) until 6 May 2009.
MR. LIANG CHONG-HOU, DAVID
(Aged 64 )Appointed as Director in November 1979 and became Executive Director in 1986. Mr. Liang is the cousin of Mr. Liang Cheung-Biu, Thomas.
MR. YEUNG PING-LEUNG, HOWARD
(Aged 52)Appointed as Director in November 1985. Mr. Yeung is a Member of the Audit Committee and the Remuneration Committee of the Board of Directors of the Company. He is also the Chairman of King Fook Holdings Limited and a Non-executive Director of Miramar Hotel and Investment Company, Limited, both being listed public companies in Hong Kong.
DR. CHA MOU-SING, PAYSON
JP DSSc (Hon) (Aged 67)Appointed as Director in April 1989. Dr. Cha is the Chairman of the Audit Committee and a Member of the Remuneration Committee of the Board of Directors of the Company. Dr. Cha is also the Chairman of HKR International Limited and the Non-executive Chairman of Hanison Construction Holdings Limited, both of them are listed public companies in Hong Kong. He is also an Independent Non-executive Director of Eagle Asset Management (CP) Limited — Manager of Champion Real Estate Investment Trust which is listed on The Stock Exchange of Hong Kong Limited, a Director of Asia Television Limited and an Independent Non-executive Director of Hong Kong International Theme Parks Limited. Dr. Cha is a Committee Member of the Eleventh Chinese People’s Political Consultative Conference of The People’s Republic of China.
DR. CHA MOUSING, PAYSON
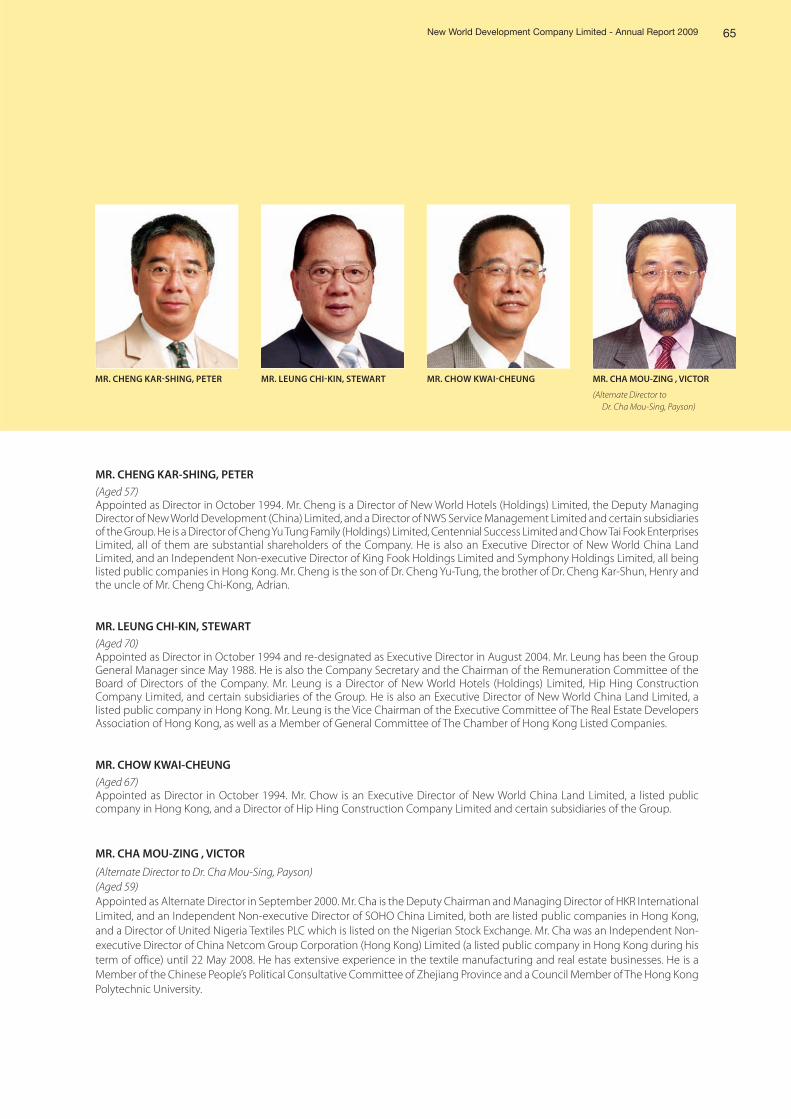
65New World Development Company Limited - Annual Report 2009
MR. CHENG KARSHING, PETER MR. LEUNG CHIKIN, STEWART MR. CHOW KWAICHEUNG
MR. CHENG KAR-SHING, PETER
(Aged 57)Appointed as Director in October 1994. Mr. Cheng is a Director of New World Hotels (Holdings) Limited, the Deputy Managing Director of New World Development (China) Limited, and a Director of NWS Service Management Limited and certain subsidiaries of the Group. He is a Director of Cheng Yu Tung Family (Holdings) Limited, Centennial Success Limited and Chow Tai Fook Enterprises Limited, all of them are substantial shareholders of the Company. He is also an Executive Director of New World China Land Limited, and an Independent Non-executive Director of King Fook Holdings Limited and Symphony Holdings Limited, all being listed public companies in Hong Kong. Mr. Cheng is the son of Dr. Cheng Yu-Tung, the brother of Dr. Cheng Kar-Shun, Henry and the uncle of Mr. Cheng Chi-Kong, Adrian.
MR. LEUNG CHI-KIN, STEWART
(Aged 70)Appointed as Director in October 1994 and re-designated as Executive Director in August 2004. Mr. Leung has been the Group General Manager since May 1988. He is also the Company Secretary and the Chairman of the Remuneration Committee of the Board of Directors of the Company. Mr. Leung is a Director of New World Hotels (Holdings) Limited, Hip Hing Construction Company Limited, and certain subsidiaries of the Group. He is also an Executive Director of New World China Land Limited, a listed public company in Hong Kong. Mr. Leung is the Vice Chairman of the Executive Committee of The Real Estate Developers Association of Hong Kong, as well as a Member of General Committee of The Chamber of Hong Kong Listed Companies.
MR. CHOW KWAI-CHEUNG
(Aged 67)Appointed as Director in October 1994. Mr. Chow is an Executive Director of New World China Land Limited, a listed public company in Hong Kong, and a Director of Hip Hing Construction Company Limited and certain subsidiaries of the Group.
MR. CHA MOU-ZING , VICTOR
(Alternate Director to Dr. Cha Mou-Sing, Payson)(Aged 59)Appointed as Alternate Director in September 2000. Mr. Cha is the Deputy Chairman and Managing Director of HKR International Limited, and an Independent Non-executive Director of SOHO China Limited, both are listed public companies in Hong Kong, and a Director of United Nigeria Textiles PLC which is listed on the Nigerian Stock Exchange. Mr. Cha was an Independent Non-executive Director of China Netcom Group Corporation (Hong Kong) Limited (a listed public company in Hong Kong during his term of office) until 22 May 2008. He has extensive experience in the textile manufacturing and real estate businesses. He is a Member of the Chinese People’s Political Consultative Committee of Zhejiang Province and a Council Member of The Hong Kong Polytechnic University.
MR. CHA MOU-ZING , VICTOR
(Alternate Director to Dr. Cha Mou-Sing, Payson)
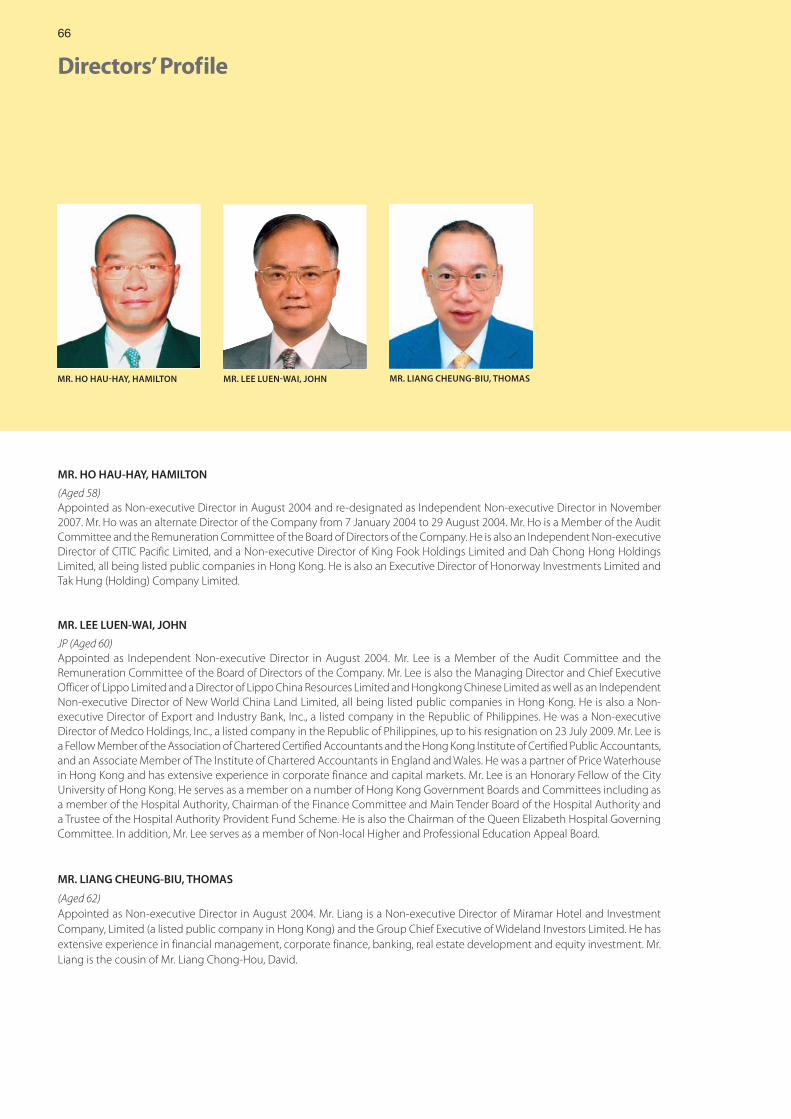
66
Directors’ Profile
MR. HO HAU-HAY, HAMILTON
(Aged 58)Appointed as Non-executive Director in August 2004 and re-designated as Independent Non-executive Director in November 2007. Mr. Ho was an alternate Director of the Company from 7 January 2004 to 29 August 2004. Mr. Ho is a Member of the Audit Committee and the Remuneration Committee of the Board of Directors of the Company. He is also an Independent Non-executive Director of CITIC Pacific Limited, and a Non-executive Director of King Fook Holdings Limited and Dah Chong Hong Holdings Limited, all being listed public companies in Hong Kong. He is also an Executive Director of Honorway Investments Limited and Tak Hung (Holding) Company Limited.
MR. LEE LUEN-WAI, JOHN
JP (Aged 60)Appointed as Independent Non-executive Director in August 2004. Mr. Lee is a Member of the Audit Committee and the Remuneration Committee of the Board of Directors of the Company. Mr. Lee is also the Managing Director and Chief Executive Officer of Lippo Limited and a Director of Lippo China Resources Limited and Hongkong Chinese Limited as well as an Independent Non-executive Director of New World China Land Limited, all being listed public companies in Hong Kong. He is also a Non-executive Director of Export and Industry Bank, Inc., a listed company in the Republic of Philippines. He was a Non-executive Director of Medco Holdings, Inc., a listed company in the Republic of Philippines, up to his resignation on 23 July 2009. Mr. Lee is a Fellow Member of the Association of Chartered Certified Accountants and the Hong Kong Institute of Certified Public Accountants, and an Associate Member of The Institute of Chartered Accountants in England and Wales. He was a partner of Price Waterhouse in Hong Kong and has extensive experience in corporate finance and capital markets. Mr. Lee is an Honorary Fellow of the City University of Hong Kong. He serves as a member on a number of Hong Kong Government Boards and Committees including as a member of the Hospital Authority, Chairman of the Finance Committee and Main Tender Board of the Hospital Authority and a Trustee of the Hospital Authority Provident Fund Scheme. He is also the Chairman of the Queen Elizabeth Hospital Governing Committee. In addition, Mr. Lee serves as a member of Non-local Higher and Professional Education Appeal Board.
MR. LIANG CHEUNG-BIU, THOMAS
(Aged 62)Appointed as Non-executive Director in August 2004. Mr. Liang is a Non-executive Director of Miramar Hotel and Investment Company, Limited (a listed public company in Hong Kong) and the Group Chief Executive of Wideland Investors Limited. He has extensive experience in financial management, corporate finance, banking, real estate development and equity investment. Mr. Liang is the cousin of Mr. Liang Chong-Hou, David.
MR. HO HAUHAY, HAMILTON MR. LEE LUENWAI, JOHN MR. LIANG CHEUNGBIU, THOMAS
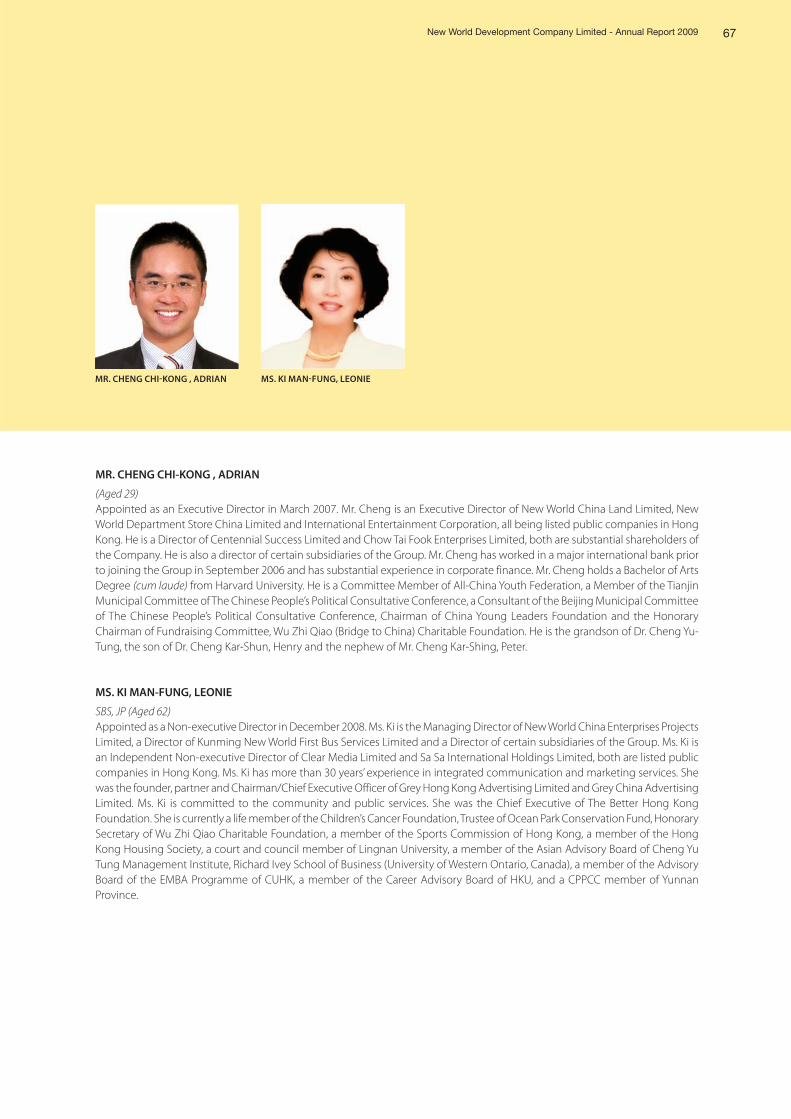
67New World Development Company Limited - Annual Report 2009
MR. CHENG CHI-KONG , ADRIAN
(Aged 29)Appointed as an Executive Director in March 2007. Mr. Cheng is an Executive Director of New World China Land Limited, New World Department Store China Limited and International Entertainment Corporation, all being listed public companies in Hong Kong. He is a Director of Centennial Success Limited and Chow Tai Fook Enterprises Limited, both are substantial shareholders of the Company. He is also a director of certain subsidiaries of the Group. Mr. Cheng has worked in a major international bank prior to joining the Group in September 2006 and has substantial experience in corporate finance. Mr. Cheng holds a Bachelor of Arts Degree (cum laude) from Harvard University. He is a Committee Member of All-China Youth Federation, a Member of the Tianjin Municipal Committee of The Chinese People’s Political Consultative Conference, a Consultant of the Beijing Municipal Committee of The Chinese People’s Political Consultative Conference, Chairman of China Young Leaders Foundation and the Honorary Chairman of Fundraising Committee, Wu Zhi Qiao (Bridge to China) Charitable Foundation. He is the grandson of Dr. Cheng Yu-Tung, the son of Dr. Cheng Kar-Shun, Henry and the nephew of Mr. Cheng Kar-Shing, Peter.
MS. KI MAN-FUNG, LEONIE
SBS, JP (Aged 62)Appointed as a Non-executive Director in December 2008. Ms. Ki is the Managing Director of New World China Enterprises Projects Limited, a Director of Kunming New World First Bus Services Limited and a Director of certain subsidiaries of the Group. Ms. Ki is an Independent Non-executive Director of Clear Media Limited and Sa Sa International Holdings Limited, both are listed public companies in Hong Kong. Ms. Ki has more than 30 years’ experience in integrated communication and marketing services. She was the founder, partner and Chairman/Chief Executive Officer of Grey Hong Kong Advertising Limited and Grey China Advertising Limited. Ms. Ki is committed to the community and public services. She was the Chief Executive of The Better Hong Kong Foundation. She is currently a life member of the Children’s Cancer Foundation, Trustee of Ocean Park Conservation Fund, Honorary Secretary of Wu Zhi Qiao Charitable Foundation, a member of the Sports Commission of Hong Kong, a member of the Hong Kong Housing Society, a court and council member of Lingnan University, a member of the Asian Advisory Board of Cheng Yu Tung Management Institute, Richard Ivey School of Business (University of Western Ontario, Canada), a member of the Advisory Board of the EMBA Programme of CUHK, a member of the Career Advisory Board of HKU, and a CPPCC member of Yunnan Province.
MR. CHENG CHIKONG , ADRIAN MS. KI MANFUNG, LEONIE
Financial Section Contents
69 Report of the Directors
103 Independent Auditors ‘ Report
104 Consolidated Income Statement
105 Consolidated Balance Sheet
107 Company Balance Sheet
108 Consolidated Statement of Changes in Equity
110 Consolidated Cash Flow Statement
112 Notes to the Financial Statements
214 Five-year Financial Summary
69
Report of the DirectorsNew World Development Company Limited - Annual Report 2009
The Directors present their annual report and financial statements for the year ended 30 June 2009.
GROUP ACTIVITIESThe principal activities of the Company remain investment holding and property investment. The principal activities of the principal subsidiaries, jointly controlled entities and associated companies are shown in Notes 51, 52 and 53 to the financial statements on pages 200 to 213.
RESULTS AND APPROPRIATIONThe result of the Group for the year ended 30 June 2009 are set out in the consolidated income statement on page 104 of this annual report.
The Directors have resolved to recommend a final dividend for the year ended 30 June 2009 of HK$0.21 per share (2008: HK$0.25 per share) comprising a cash dividend of HK$0.01 per share (which is being paid in order to ensure that the shares of the Company continue to qualify as Authorised Investments for the purpose of the Trustee Ordinance of Hong Kong) and a scrip dividend by way of an issue of new shares equivalent to HK$0.20 per share with a cash option to shareholders registered on 9 December 2009. Together with the interim dividend of HK$0.09 per share paid in June 2009, total distribution for the year ended 30 June 2009 would thus be HK$0.30 per share (2008: HK$0.43 per share).
SHARE CAPITALDetails of movements in share capital during the year are set out in Note 40 to the financial statements.
RESERVESDetails of movements in reserves are set out in Note 41 to the financial statements. Distributable reserves of the Company at 30 June 2009 amounted to HK$11,453.5 million (2008: HK$11,258.3 million).
FIVEYEAR FINANCIAL SUMMARYA summary of the results and the assets and liabilities of the Group for the last five financial years is set out on pages 214 and 215.
PURCHASE, SALE OR REDEMPTION OF LISTED SECURITIESThe Company has not redeemed any of its listed securities during the year. Neither the Company nor any of its subsidiaries has purchased or sold any of the Company’s listed securities during the year.
DONATIONSThe Group made charitable and other donations during the year amounting to HK$29.8 million (2008: HK$45.5 million).
PROPERTY, PLANT AND EQUIPMENTDetails of movements in property, plant and equipment during the year are set out in Note 18 to the financial statements.
MAJOR ACQUISITION AND DISPOSALIn March 2009, New World China Land Limited, a 70.0% owned subsidiary of the Group, and its subsidiaries ( the “NWCL Group”) acquired additional 25.0%, 50.0%, 60.0% and 5.9% equity interest in Ramada Property Ltd. (“Ramada”), Faith Yard Property Limited (“Faith Yard”), Fortune Star Worldwide Limited (“Fortune Star”) and Shanghai New World Huai Hai Property Development Co., Ltd. (“Huai Hai”) respectively from the respective former shareholders for an aggregate total consideration of approximately HK$1,039.5 million. Ramada is the holding company of Shanghai Ramada Plaza Ltd. which holds a portion of Shanghai Ramada Plaza (comprising two hotels) located at 1525 Dingxi Road, Changning District, Shanghai, the PRC. The principal activity of Faith Yard is the holding of a portion of Shanghai Ramada Plaza and Shanghai Belvedere Service Apartments located at 1555 Dingxi Road, Changning District, Shanghai, the PRC. Fortune Star is an investment holding company whose major assets are holding of interest in Zhaoqing New World Property Development Limited (“Zhaoqing Property”) and Zhaoqing Fubang Property Management Limited. Zhaoqing Property is principally engaged in the development of Zhaoqing New World Garden, a residential development located besides the Banyue Lake, Zhaoqing, Guangdong Province, the PRC. The principal asset of Huai Hai is its holding of Shanghai Hong Kong New World Tower located at Huaihaizhong Road, Luwan District, Shanghai, the PRC.
70
Report of the Directors (Continued)
MAJOR ACQUISITION AND DISPOSAL (Continued)In March 2009, the NWCL Group disposed of its entire interest in Shanghai New World Shangxian Lane Development Ltd. (“Shangxian Lane”) and 20.0% interest in Shanghai Juyi Real Estate Development Co., Ltd. (“Juyi”) to Golden Wealth Investment Limited for an aggregate total consideration of approximately HK$620.4 million. Shangxian Lane has obtained a development right in respect of a property project in Luwan District, Shanghai, the PRC. The principal activity of Juyi is the development of Shanghai Hong Kong New World Garden located in Luwan District, Shanghai, the PRC. The above transactions gave rise to a net disposal gain of approximately HK$370.1 million to the NWCL Group.
CONNECTED TRANSACTIONSConnected transactions of the Company during the year and up to the date of this report are set out on pages 75 to 82.
RULE 13.20 AND 13.22 OF THE LISTING RULESThe disclosure pursuant to Rule 13.20 and 13.22 of the Listing Rules is set out on page 102.
DIRECTORSThe Directors of the Company during the year and up to the date of this report are:
EXECUTIVE DIRECTORS
Dato’ Dr. Cheng Yu-Tung (Chairman)Dr. Cheng Kar-Shun, Henry (Managing Director)Dr. Sin Wai-Kin, DavidMr. Liang Chong-Hou, DavidMr. Leung Chi-Kin, StewartMr. Cheng Chi-Kong, Adrian
NONEXECUTIVE DIRECTORS
Lord Sandberg, Michael (retired on 2 December 2008)Mr. Cheng Kar-Shing, PeterMr. Chow Kwai-CheungMr. Liang Cheung-Biu, ThomasMs. Ki Man-Fung, Leonie JP (appointed on 5 December 2008)
INDEPENDENT NONEXECUTIVE DIRECTORS
Mr. Yeung Ping-Leung, HowardDr. Cha Mou-Sing, Payson JPMr. Cha Mou-Zing, Victor (alternate director to Dr. Cha Mou-Sing, Payson)Mr. Ho Hau-Hay, HamiltonMr. Lee Luen-Wai, John JP
In accordance with Article 94 of the Company’s Articles of Association, Ms. Ki Man-Fung, Leonie shall retire and, being eligible, offer herself for re-election.
In accordance with Article 103(A) of the Company’s Articles of Association, Dr. Cheng Kar-Shun, Henry, Dr. Cha Mou-Sing, Payson, Mr. Cheng Kar-Shing, Peter, Mr. Leung Chi-Kin, Stewart and Mr. Chow Kwai-Cheung shall retire by rotation and, being eligible, offer themselves for re-election.
None of the Directors had a service contract with the Company or any of its subsidiaries which cannot be terminated within one year without any compensation.
AUDIT COMMITTEEAn Audit Committee has been established and the members of the Committee are Dr. Cha Mou-Sing, Payson, Mr. Yeung Ping-Leung, Howard, Mr. Ho Hau-Hay, Hamilton and Mr. Lee Luen-Wai, John. The principal responsibilities of the Audit Committee include the review and supervision of the Group’s financial reporting process and internal controls.
71New World Development Company Limited - Annual Report 2009
Report of the Directors (Continued)
DIRECTORS’ INTERESTS IN CONTRACTSPursuant to an agreement dated 5 August 1993 (the “Agreement”) made between Hotel Property Investments (B.V.I.) Limited (“HPI”) and Renaissance Hotel Holdings (B.V.I.) Limited (“Renaissance”), both being former subsidiaries of the Group, and CTF Holdings Limited (“CTFHL”), HPI agreed to pay CTFHL an annual fee in accordance with the terms of the Agreement. This Agreement was assigned to New World Hotels (Holdings) Limited (“NWHH”), a subsidiary of the Group, on 25 July 1997. CTFHL was paid a fee of US$9.7 million (approximately HK$75.5 million) for the year ended 30 June 2009 (2008: US$12.7 million (approximately HK$99.0 million)). Dr. Cheng Kar-Shun, Henry, Director of the Company and Mr. Doo Wai-Hoi, William (“Mr. Doo”), director of certain subsidiaries of the Group, are interested in this transaction to the extent that they have beneficial interests in CTFHL.
Save for contracts amongst group companies and the aforementioned transaction, no other contracts of significance to which the Company or any of its subsidiaries was a party and in which a Director of the Company had a material interest, whether directly or indirectly, subsisted at the end of the year or at any time during the year.
DIRECTORS’ INTERESTS IN SHARES, UNDERLYING SHARES AND DEBENTURESAs at 30 June 2009, interests of the Directors and their associates in shares, underlying shares and debentures of the Company and its associated corporations which were recorded in the register to be kept by the Company under Section 352 of the Securities and Futures Ordinance (“SFO”) are set out on pages 83 to 101.
DIRECTORS’ INTERESTS IN COMPETING BUSINESSESDuring the year, according to the Listing Rules, the following Directors have interests in the following businesses which are considered to compete or are likely to compete, either directly or indirectly, with the businesses of the Group other than those businesses where the Directors of the Company were appointed as Directors to represent the interests of the Company and/or the Group:
Businesses which are considered to compete or likely tocompete with the businesses of the Group
Nature ofinterest ofthe Director
Name of Director Name of entity Description of businesses in the entity
Dr. Cheng Yu-Tung Shun Tak Holdings Limited (“Shun Tak”)group of companies
Property investment and development,ferry services and hotel related services
Director
Chow Tai Fook Enterprises Limited (“CTF”)group of companies
Property investment and development,hotel operations and transport
Director
Melbourne Enterprises Limited(“Melbourne”) group of companies
Property investment Director
Lifestyle International Holdings Limited(“Lifestyle”) group of companies
Department stores operations andproperty investment
Director
Dr. Cheng Kar-Shun, Henry
CTF group of companies Property investment and development,hotel operations and transport
Director
HKR International Limited groupof companies
Property investment and development,and property management
Director
Lifestyle group of companies Department stores operations andproperty investment
Director
International Entertainment Corporationgroup of companies
Hotel operations Director
72
Report of the Directors (Continued)
DIRECTORS’ INTERESTS IN COMPETING BUSINESSES (Continued)
Businesses which are considered to compete or likely tocompete with the businesses of the Group
Nature ofinterest ofthe Director
Name of Director Name of entity Description of businesses in the entity
Dr. Sin Wai-Kin, David Miramar Hotel and Investment Company,Limited (“Miramar”) group of companies
Property investment and development and hotel operations
Director
Mr. Cheng Kar-Shing, Peter
CTF group of companies Property investment and development,hotel operations and transport
Director
Long Vocation Investments Limited groupof companies
Property investment Director andshareholder
Mr. Chow Kwai-Cheung Flying Dragon Properties Limited Property investment Director andshareholder
Asia Leisure Development Co. Ltd. Property development Director
Mr. Liang Cheung-Biu, Thomas
Bermuda Investments Limited Property investment Director
Greenwich Investors Limited Property investment Director
Lambda Enterprises Limited Property management Director
Miramar group of companies Property investment and development and hotel operations
Director
Mr. Cheng Chi-Kong, Adrian
CTF group of companies Property investment and development,hotel operations and transport
Director
Grandhope Properties Limited Property investment Director andshareholder
Cheung Hung Development (Holdings)Limited
Property investment and development Director
International Entertainment Corporationgroup of companies
Hotel operations Director
As the Board of Directors of the Company is independent of the boards of the above-mentioned entities and none of the above Directors can control the Board of the Company, the Group is therefore capable of carrying on its businesses independently of, and at arm’s length from the businesses of these entities.
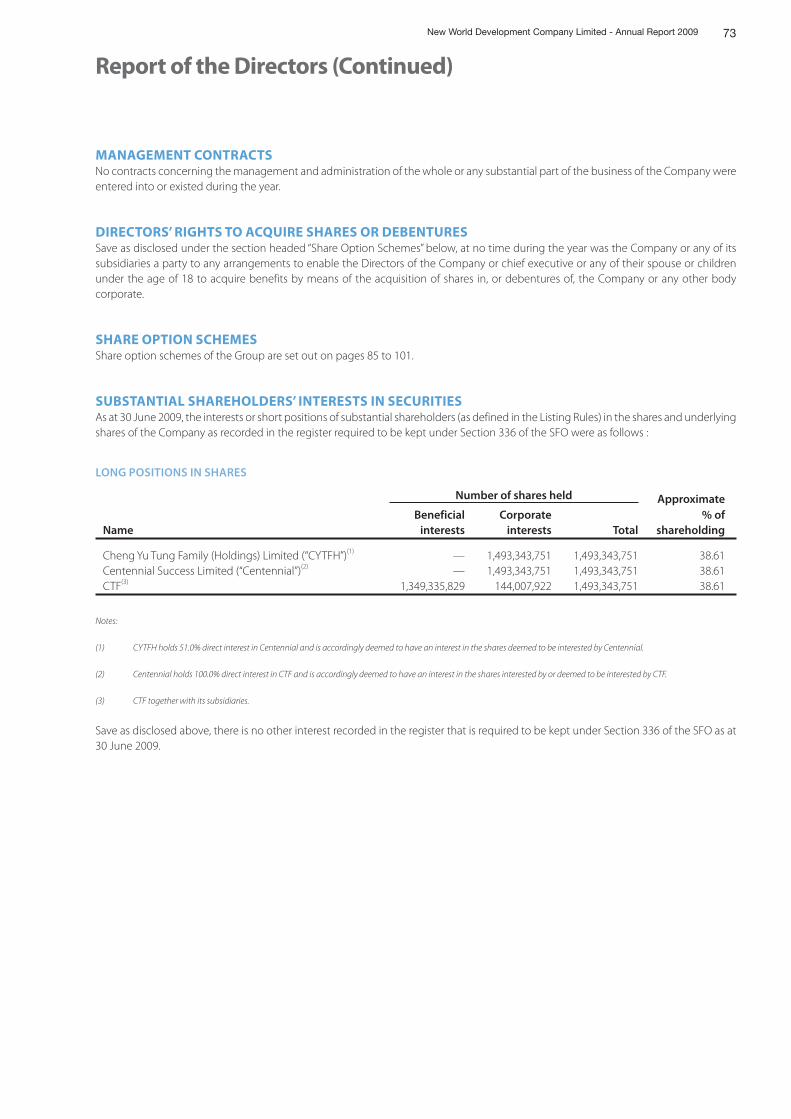
73New World Development Company Limited - Annual Report 2009
Report of the Directors (Continued)
MANAGEMENT CONTRACTSNo contracts concerning the management and administration of the whole or any substantial part of the business of the Company were entered into or existed during the year.
DIRECTORS’ RIGHTS TO ACQUIRE SHARES OR DEBENTURESSave as disclosed under the section headed “Share Option Schemes” below, at no time during the year was the Company or any of its subsidiaries a party to any arrangements to enable the Directors of the Company or chief executive or any of their spouse or children under the age of 18 to acquire benefits by means of the acquisition of shares in, or debentures of, the Company or any other body corporate.
SHARE OPTION SCHEMESShare option schemes of the Group are set out on pages 85 to 101.
SUBSTANTIAL SHAREHOLDERS’ INTERESTS IN SECURITIESAs at 30 June 2009, the interests or short positions of substantial shareholders (as defined in the Listing Rules) in the shares and underlying shares of the Company as recorded in the register required to be kept under Section 336 of the SFO were as follows :
LONG POSITIONS IN SHARES
Number of shares held Approximate
NameBeneficial
interestsCorporate
interests Total% of
shareholding
Cheng Yu Tung Family (Holdings) Limited (“CYTFH”)(1) — 1,493,343,751 1,493,343,751 38.61Centennial Success Limited (“Centennial”)(2) — 1,493,343,751 1,493,343,751 38.61CTF(3) 1,349,335,829 144,007,922 1,493,343,751 38.61
Notes:
(1) CYTFH holds 51.0% direct interest in Centennial and is accordingly deemed to have an interest in the shares deemed to be interested by Centennial.
(2) Centennial holds 100.0% direct interest in CTF and is accordingly deemed to have an interest in the shares interested by or deemed to be interested by CTF.
(3) CTF together with its subsidiaries.
Save as disclosed above, there is no other interest recorded in the register that is required to be kept under Section 336 of the SFO as at 30 June 2009.
74
Report of the Directors (Continued)
SUFFICIENCY OF PUBLIC FLOATAccording to information that is available to the Company, the percentage of the Company’s shares which are in the hands of the public exceeds 25.0% of the Company’s total number of issued shares.
MAJOR CUSTOMERS AND SUPPLIERSDuring the year, less than 30.0% of the Group’s turnover and less than 30.0% of the Group’s purchases were attributable to the Group’s five largest customers and five largest suppliers respectively.
AUDITORSThe financial statements have been audited by Messrs PricewaterhouseCoopers and H.C. Watt & Company Limited, who retire and, being eligible, offer themselves for re-appointment as joint auditors of the Company.
On Behalf of the Board
Dr. Cheng Yu-TungChairman
Hong Kong, 8 October 2009
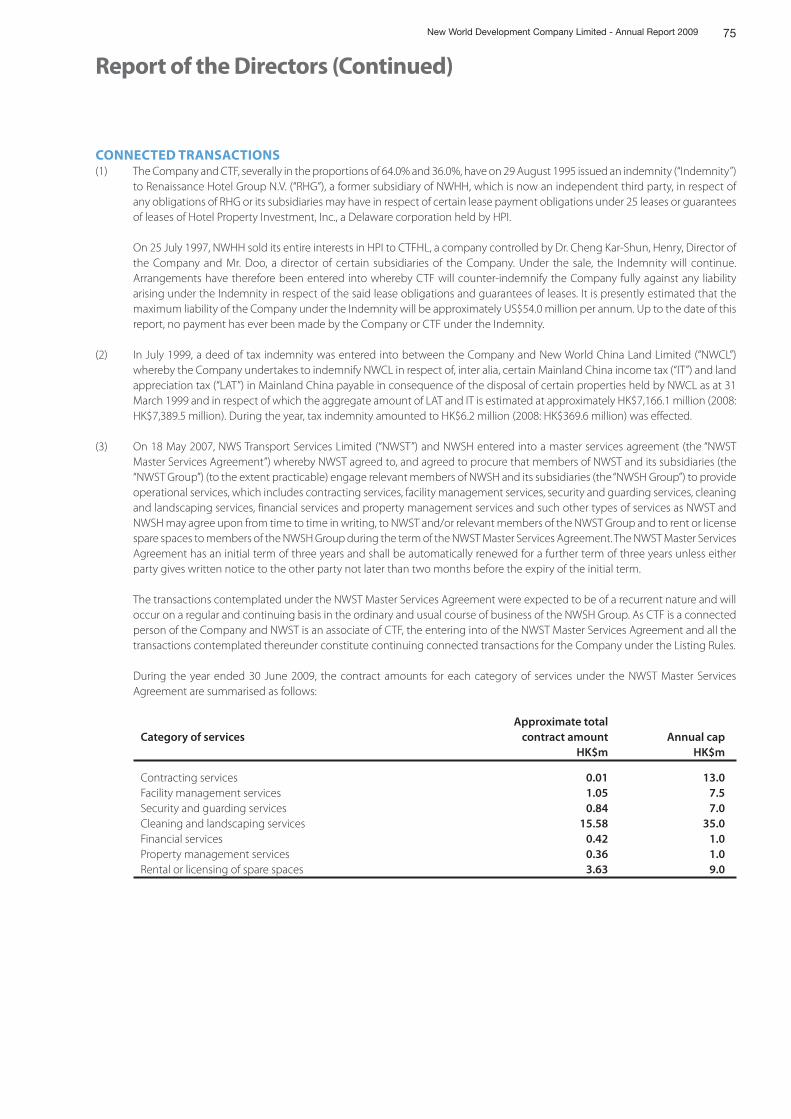
75New World Development Company Limited - Annual Report 2009
Report of the Directors (Continued)
CONNECTED TRANSACTIONS(1) The Company and CTF, severally in the proportions of 64.0% and 36.0%, have on 29 August 1995 issued an indemnity (“Indemnity”)
to Renaissance Hotel Group N.V. (“RHG”), a former subsidiary of NWHH, which is now an independent third party, in respect of any obligations of RHG or its subsidiaries may have in respect of certain lease payment obligations under 25 leases or guarantees of leases of Hotel Property Investment, Inc., a Delaware corporation held by HPI.
On 25 July 1997, NWHH sold its entire interests in HPI to CTFHL, a company controlled by Dr. Cheng Kar-Shun, Henry, Director of the Company and Mr. Doo, a director of certain subsidiaries of the Company. Under the sale, the Indemnity will continue. Arrangements have therefore been entered into whereby CTF will counter-indemnify the Company fully against any liability arising under the Indemnity in respect of the said lease obligations and guarantees of leases. It is presently estimated that the maximum liability of the Company under the Indemnity will be approximately US$54.0 million per annum. Up to the date of this report, no payment has ever been made by the Company or CTF under the Indemnity.
(2) In July 1999, a deed of tax indemnity was entered into between the Company and New World China Land Limited (“NWCL”) whereby the Company undertakes to indemnify NWCL in respect of, inter alia, certain Mainland China income tax (“IT”) and land appreciation tax (“LAT”) in Mainland China payable in consequence of the disposal of certain properties held by NWCL as at 31 March 1999 and in respect of which the aggregate amount of LAT and IT is estimated at approximately HK$7,166.1 million (2008: HK$7,389.5 million). During the year, tax indemnity amounted to HK$6.2 million (2008: HK$369.6 million) was effected.
(3) On 18 May 2007, NWS Transport Services Limited (“NWST”) and NWSH entered into a master services agreement (the “NWST Master Services Agreement”) whereby NWST agreed to, and agreed to procure that members of NWST and its subsidiaries (the “NWST Group”) (to the extent practicable) engage relevant members of NWSH and its subsidiaries (the “NWSH Group”) to provide operational services, which includes contracting services, facility management services, security and guarding services, cleaning and landscaping services, financial services and property management services and such other types of services as NWST and NWSH may agree upon from time to time in writing, to NWST and/or relevant members of the NWST Group and to rent or license spare spaces to members of the NWSH Group during the term of the NWST Master Services Agreement. The NWST Master Services Agreement has an initial term of three years and shall be automatically renewed for a further term of three years unless either party gives written notice to the other party not later than two months before the expiry of the initial term.
The transactions contemplated under the NWST Master Services Agreement were expected to be of a recurrent nature and will occur on a regular and continuing basis in the ordinary and usual course of business of the NWSH Group. As CTF is a connected person of the Company and NWST is an associate of CTF, the entering into of the NWST Master Services Agreement and all the transactions contemplated thereunder constitute continuing connected transactions for the Company under the Listing Rules.
During the year ended 30 June 2009, the contract amounts for each category of services under the NWST Master Services Agreement are summarised as follows:
Category of servicesApproximate total
contract amount Annual capHK$m HK$m
Contracting services 0.01 13.0Facility management services 1.05 7.5Security and guarding services 0.84 7.0Cleaning and landscaping services 15.58 35.0Financial services 0.42 1.0Property management services 0.36 1.0Rental or licensing of spare spaces 3.63 9.0
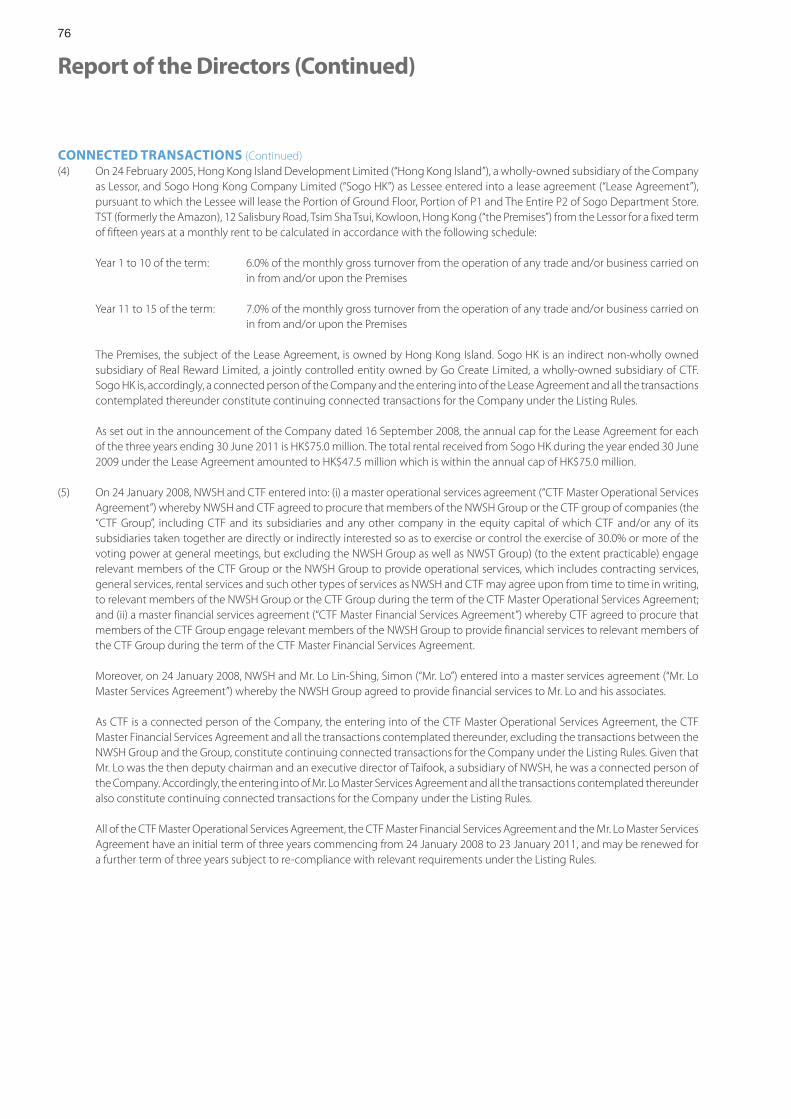
76
Report of the Directors (Continued)
CONNECTED TRANSACTIONS (Continued)(4) On 24 February 2005, Hong Kong Island Development Limited (“Hong Kong Island”), a wholly-owned subsidiary of the Company
as Lessor, and Sogo Hong Kong Company Limited (“Sogo HK”) as Lessee entered into a lease agreement (“Lease Agreement”), pursuant to which the Lessee will lease the Portion of Ground Floor, Portion of P1 and The Entire P2 of Sogo Department Store. TST (formerly the Amazon), 12 Salisbury Road, Tsim Sha Tsui, Kowloon, Hong Kong (“the Premises”) from the Lessor for a fixed term of fifteen years at a monthly rent to be calculated in accordance with the following schedule:
Year 1 to 10 of the term: 6.0% of the monthly gross turnover from the operation of any trade and/or business carried on in from and/or upon the Premises
Year 11 to 15 of the term: 7.0% of the monthly gross turnover from the operation of any trade and/or business carried on in from and/or upon the Premises
The Premises, the subject of the Lease Agreement, is owned by Hong Kong Island. Sogo HK is an indirect non-wholly owned subsidiary of Real Reward Limited, a jointly controlled entity owned by Go Create Limited, a wholly-owned subsidiary of CTF. Sogo HK is, accordingly, a connected person of the Company and the entering into of the Lease Agreement and all the transactions contemplated thereunder constitute continuing connected transactions for the Company under the Listing Rules.
As set out in the announcement of the Company dated 16 September 2008, the annual cap for the Lease Agreement for each of the three years ending 30 June 2011 is HK$75.0 million. The total rental received from Sogo HK during the year ended 30 June 2009 under the Lease Agreement amounted to HK$47.5 million which is within the annual cap of HK$75.0 million.
(5) On 24 January 2008, NWSH and CTF entered into: (i) a master operational services agreement (“CTF Master Operational Services Agreement”) whereby NWSH and CTF agreed to procure that members of the NWSH Group or the CTF group of companies (the “CTF Group”, including CTF and its subsidiaries and any other company in the equity capital of which CTF and/or any of its subsidiaries taken together are directly or indirectly interested so as to exercise or control the exercise of 30.0% or more of the voting power at general meetings, but excluding the NWSH Group as well as NWST Group) (to the extent practicable) engage relevant members of the CTF Group or the NWSH Group to provide operational services, which includes contracting services, general services, rental services and such other types of services as NWSH and CTF may agree upon from time to time in writing, to relevant members of the NWSH Group or the CTF Group during the term of the CTF Master Operational Services Agreement; and (ii) a master financial services agreement (“CTF Master Financial Services Agreement”) whereby CTF agreed to procure that members of the CTF Group engage relevant members of the NWSH Group to provide financial services to relevant members of the CTF Group during the term of the CTF Master Financial Services Agreement.
Moreover, on 24 January 2008, NWSH and Mr. Lo Lin-Shing, Simon (“Mr. Lo”) entered into a master services agreement (“Mr. Lo Master Services Agreement”) whereby the NWSH Group agreed to provide financial services to Mr. Lo and his associates.
As CTF is a connected person of the Company, the entering into of the CTF Master Operational Services Agreement, the CTF Master Financial Services Agreement and all the transactions contemplated thereunder, excluding the transactions between the NWSH Group and the Group, constitute continuing connected transactions for the Company under the Listing Rules. Given that Mr. Lo was the then deputy chairman and an executive director of Taifook, a subsidiary of NWSH, he was a connected person of the Company. Accordingly, the entering into of Mr. Lo Master Services Agreement and all the transactions contemplated thereunder also constitute continuing connected transactions for the Company under the Listing Rules.
All of the CTF Master Operational Services Agreement, the CTF Master Financial Services Agreement and the Mr. Lo Master Services Agreement have an initial term of three years commencing from 24 January 2008 to 23 January 2011, and may be renewed for a further term of three years subject to re-compliance with relevant requirements under the Listing Rules.
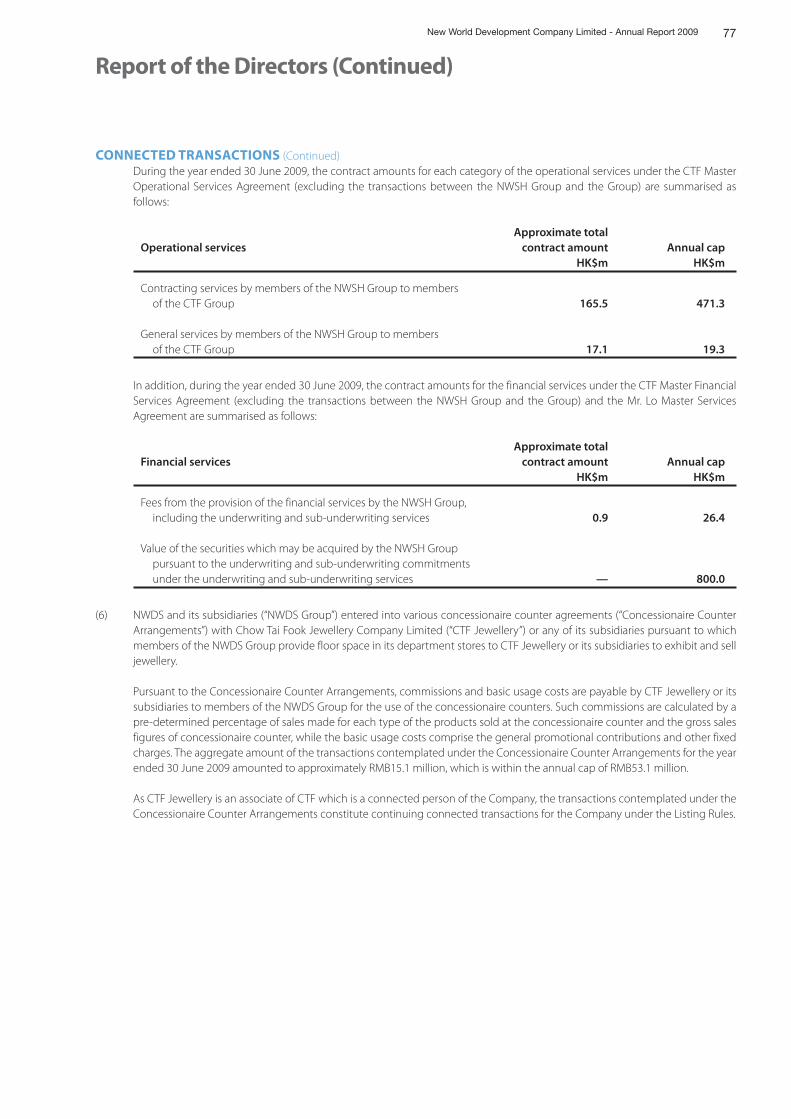
77New World Development Company Limited - Annual Report 2009
Report of the Directors (Continued)
CONNECTED TRANSACTIONS (Continued) During the year ended 30 June 2009, the contract amounts for each category of the operational services under the CTF Master
Operational Services Agreement (excluding the transactions between the NWSH Group and the Group) are summarised as follows:
Operational servicesApproximate total
contract amount Annual capHK$m HK$m
Contracting services by members of the NWSH Group to members of the CTF Group 165.5 471.3
General services by members of the NWSH Group to members of the CTF Group 17.1 19.3
In addition, during the year ended 30 June 2009, the contract amounts for the financial services under the CTF Master Financial Services Agreement (excluding the transactions between the NWSH Group and the Group) and the Mr. Lo Master Services Agreement are summarised as follows:
Financial servicesApproximate total
contract amount Annual capHK$m HK$m
Fees from the provision of the financial services by the NWSH Group, including the underwriting and sub-underwriting services 0.9 26.4
Value of the securities which may be acquired by the NWSH Group pursuant to the underwriting and sub-underwriting commitments under the underwriting and sub-underwriting services — 800.0
(6) NWDS and its subsidiaries (“NWDS Group”) entered into various concessionaire counter agreements (“Concessionaire Counter Arrangements”) with Chow Tai Fook Jewellery Company Limited (“CTF Jewellery”) or any of its subsidiaries pursuant to which members of the NWDS Group provide floor space in its department stores to CTF Jewellery or its subsidiaries to exhibit and sell jewellery.
Pursuant to the Concessionaire Counter Arrangements, commissions and basic usage costs are payable by CTF Jewellery or its subsidiaries to members of the NWDS Group for the use of the concessionaire counters. Such commissions are calculated by a pre-determined percentage of sales made for each type of the products sold at the concessionaire counter and the gross sales figures of concessionaire counter, while the basic usage costs comprise the general promotional contributions and other fixed charges. The aggregate amount of the transactions contemplated under the Concessionaire Counter Arrangements for the year ended 30 June 2009 amounted to approximately RMB15.1 million, which is within the annual cap of RMB53.1 million.
As CTF Jewellery is an associate of CTF which is a connected person of the Company, the transactions contemplated under the Concessionaire Counter Arrangements constitute continuing connected transactions for the Company under the Listing Rules.
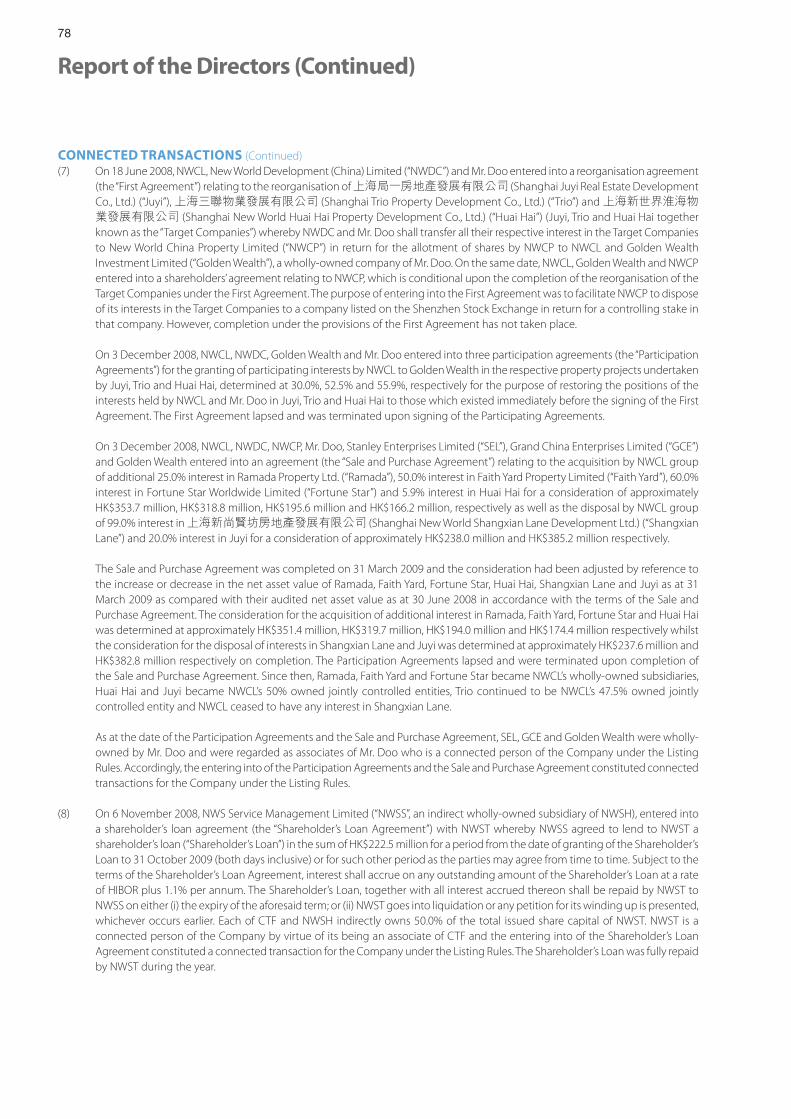
78
Report of the Directors (Continued)
CONNECTED TRANSACTIONS (Continued)(7) On 18 June 2008, NWCL, New World Development (China) Limited (“NWDC”) and Mr. Doo entered into a reorganisation agreement
(the “First Agreement”) relating to the reorganisation of 上海局一房地產發展有限公司 (Shanghai Juyi Real Estate Development Co., Ltd.) (“Juyi”), 上海三聯物業發展有限公司 (Shanghai Trio Property Development Co., Ltd.) (“Trio”) and 上海新世界淮海物業發展有限公司 (Shanghai New World Huai Hai Property Development Co., Ltd.) (“Huai Hai”) (Juyi, Trio and Huai Hai together known as the “Target Companies”) whereby NWDC and Mr. Doo shall transfer all their respective interest in the Target Companies to New World China Property Limited (“NWCP”) in return for the allotment of shares by NWCP to NWCL and Golden Wealth Investment Limited (“Golden Wealth”), a wholly-owned company of Mr. Doo. On the same date, NWCL, Golden Wealth and NWCP entered into a shareholders’ agreement relating to NWCP, which is conditional upon the completion of the reorganisation of the Target Companies under the First Agreement. The purpose of entering into the First Agreement was to facilitate NWCP to dispose of its interests in the Target Companies to a company listed on the Shenzhen Stock Exchange in return for a controlling stake in that company. However, completion under the provisions of the First Agreement has not taken place.
On 3 December 2008, NWCL, NWDC, Golden Wealth and Mr. Doo entered into three participation agreements (the “Participation Agreements”) for the granting of participating interests by NWCL to Golden Wealth in the respective property projects undertaken by Juyi, Trio and Huai Hai, determined at 30.0%, 52.5% and 55.9%, respectively for the purpose of restoring the positions of the interests held by NWCL and Mr. Doo in Juyi, Trio and Huai Hai to those which existed immediately before the signing of the First Agreement. The First Agreement lapsed and was terminated upon signing of the Participating Agreements.
On 3 December 2008, NWCL, NWDC, NWCP, Mr. Doo, Stanley Enterprises Limited (“SEL”), Grand China Enterprises Limited (“GCE”) and Golden Wealth entered into an agreement (the “Sale and Purchase Agreement”) relating to the acquisition by NWCL group of additional 25.0% interest in Ramada Property Ltd. (“Ramada”), 50.0% interest in Faith Yard Property Limited (“Faith Yard”), 60.0% interest in Fortune Star Worldwide Limited (“Fortune Star”) and 5.9% interest in Huai Hai for a consideration of approximately HK$353.7 million, HK$318.8 million, HK$195.6 million and HK$166.2 million, respectively as well as the disposal by NWCL group of 99.0% interest in 上海新尚賢坊房地產發展有限公司 (Shanghai New World Shangxian Lane Development Ltd.) (“Shangxian Lane”) and 20.0% interest in Juyi for a consideration of approximately HK$238.0 million and HK$385.2 million respectively.
The Sale and Purchase Agreement was completed on 31 March 2009 and the consideration had been adjusted by reference to the increase or decrease in the net asset value of Ramada, Faith Yard, Fortune Star, Huai Hai, Shangxian Lane and Juyi as at 31 March 2009 as compared with their audited net asset value as at 30 June 2008 in accordance with the terms of the Sale and Purchase Agreement. The consideration for the acquisition of additional interest in Ramada, Faith Yard, Fortune Star and Huai Hai was determined at approximately HK$351.4 million, HK$319.7 million, HK$194.0 million and HK$174.4 million respectively whilst the consideration for the disposal of interests in Shangxian Lane and Juyi was determined at approximately HK$237.6 million and HK$382.8 million respectively on completion. The Participation Agreements lapsed and were terminated upon completion of the Sale and Purchase Agreement. Since then, Ramada, Faith Yard and Fortune Star became NWCL’s wholly-owned subsidiaries, Huai Hai and Juyi became NWCL’s 50% owned jointly controlled entities, Trio continued to be NWCL’s 47.5% owned jointly controlled entity and NWCL ceased to have any interest in Shangxian Lane.
As at the date of the Participation Agreements and the Sale and Purchase Agreement, SEL, GCE and Golden Wealth were wholly-owned by Mr. Doo and were regarded as associates of Mr. Doo who is a connected person of the Company under the Listing Rules. Accordingly, the entering into of the Participation Agreements and the Sale and Purchase Agreement constituted connected transactions for the Company under the Listing Rules.
(8) On 6 November 2008, NWS Service Management Limited (“NWSS”, an indirect wholly-owned subsidiary of NWSH), entered into a shareholder’s loan agreement (the “Shareholder’s Loan Agreement”) with NWST whereby NWSS agreed to lend to NWST a shareholder’s loan (“Shareholder’s Loan”) in the sum of HK$222.5 million for a period from the date of granting of the Shareholder’s Loan to 31 October 2009 (both days inclusive) or for such other period as the parties may agree from time to time. Subject to the terms of the Shareholder’s Loan Agreement, interest shall accrue on any outstanding amount of the Shareholder’s Loan at a rate of HIBOR plus 1.1% per annum. The Shareholder’s Loan, together with all interest accrued thereon shall be repaid by NWST to NWSS on either (i) the expiry of the aforesaid term; or (ii) NWST goes into liquidation or any petition for its winding up is presented, whichever occurs earlier. Each of CTF and NWSH indirectly owns 50.0% of the total issued share capital of NWST. NWST is a connected person of the Company by virtue of its being an associate of CTF and the entering into of the Shareholder’s Loan Agreement constituted a connected transaction for the Company under the Listing Rules. The Shareholder’s Loan was fully repaid by NWST during the year.
79New World Development Company Limited - Annual Report 2009
Report of the Directors (Continued)
CONNECTED TRANSACTIONS (Continued)(9) On 4 February 2009, Silver World H.K. Development Limited (“Silver World”, an indirect wholly-owned subsidiary of NWCL), entered
into an agreement (the “Acquisition Agreement”) with 海南中泓投資有限公司 (Hainan Zhonghong investments Company Limited) (“Hainan Zhonghong”) whereby Silver World agreed to acquire an additional 5.0% equity interest in 湖南成功新世紀投資有限公司 (Hunan Success New Century Investment Company Limited) (“Hunan Success”), the then 90.0%-owned subsidiary of Silver World, from Hainan Zhonghong for a consideration of RMB94.0 million. Upon completion of the Acquisition Agreement on 30 June 2009, Hunan Success was owned by Silver World and Hainan Zhonghong as to 95.0% and 5.0%, respectively. Hunan Success is principally engaged in the development of a residential property project known as Changsha La Ville New World located in Yuhua District, Changsha City, Hunan Province, the PRC with a total gross floor area of approximately 1,111,600 sq m and car parking spaces of approximately 168,500 sq m as well as a land improvement project in Changsha City, Hunan Provinces, the PRC with a net site area of approximately 666,670 sq m. As Hainan Zhonghong was a connected person of the Company by virtue of its being a substantial shareholder of certain subsidiaries of NWCL, the entering into of the Acquisition Agreement constituted a connected transaction for the Company under the Listing Rules.
(10) On 10 March 2009, ProPlus Limited (“ProPlus”, an indirect wholly-owned subsidiary of NWSH) entered into an agreement (the “Agreement”) with Bransfield Assets Limited (“Bransfield”) pursuant to which ProPlus agreed to sell, and Bransfield agreed to purchase (i) 18,057,780 ordinary shares of HK$1.0 each and 425,017 non-voting deferred shares of HK$1.0 each of Pollution & Protection Services Limited (“PPS”); and (ii) two ordinary shares of of HK$100.0 each and 12,257 non-voting deferred shares of HK$100.0 each of Pollution & Protection Consultant Limited (“PPC”), which represented the shares beneficially held by ProPlus in each of PPS and PPC (both were the then subsidiaries of NWSH and engaged in the provision of cleaning services) at a consideration of HK$34.5 million.
Bransfield was jointly owned by Mr. Fan Shek-Cheong, Allan (“Mr. Fan”) and his daughter. As at the date of the Agreement, Mr. Fan was a director of each of PPS and PPC, and as both PPS and PPC were the then subsidiaries of NWSH, Mr. Fan and Bransfield were connected persons of the Company under the Listing Rules. As such, the entering into of the Agreement constituted a connected transaction for the Company under the Listing Rules. Upon completion of the Agreement on 9 April 2009, each of PPS and PPC ceased to be a subsidiary of the Group.
(11) On 10 March 2009, Prosperity Developments Limited (“Prosperity Developments”, a wholly-owned subsidiary of the Company), entered into (a) an agreement (the “Pearls Acquisition Agreement”) with Kawick Enterprises Limited (“Kawick Enterprises”) to acquire 40 shares of HK$1.0 each in Pearls Limited, representing 40.0% of the issued share capital of Pearls Limited, and to take an assignment of the interest free, repayable on demand loan due from Pearls Limited to Kawick Enterprises as at the date of completion of the Pearls Acquisition Agreement from Kawick Enterprises at a total consideration of approximately HK$10.6 million and (b) an agreement (the “Polyworth Acquisition Agreement”) with Kawick Enterprises to acquire four shares of HK$1.0 each in Polyworth Limited, representing 40.0% of the issued share capital of Polyworth Limited, and to take an assignment of the interest free, repayable on demand loan due and owing from Polyworth Limited to Kawick Enterprises as at the date of completion of the Polyworth Acquisition Agreement from Kawick Enterprises at a total consideration of approximately HK$19.4 million.
On the same date, Ease Kind Development Limited, a non-wholly-owned subsidiary of the Company, entered into agreements (the “Property Acquisition Agreements”) with Lucky World Investment Limited (“Lucky World”) to acquire the properties situate at G/F, 5/F and the Roof of No. 4 Kwai Fong Street, Happy Valley, Hong Kong at an aggregate consideration of HK$15.0 million.
Kawick Enterprises and Lucky World were owned not less than 30.0% by Dr. Larry Chong, a substantial shareholder of certain subsidiaries of the Group and also a cousin of a then director of NWSH. As such, Kawick Enterprises and Lucky World were connected persons of the Company under the Listing Rules and the acquisitions contemplated under the Pearls Acquisition Agreement, the Polyworth Acquisition Agreement and the Property Acquisition Agreements (collectively, the “Acquisition Agreements”) constituted connected transactions for the Company under the Listing Rules. As at the date of the Acquisition Agreements, each of Pearls Limited and Polyworth Limited was a 51.8% owned subsidiary of the Company. Upon completion of the Acquisition Agreements on 10 July 2009, each of Pearls Limited and Polyworth Limited became a 91.8% owned subsidiary of the Company.
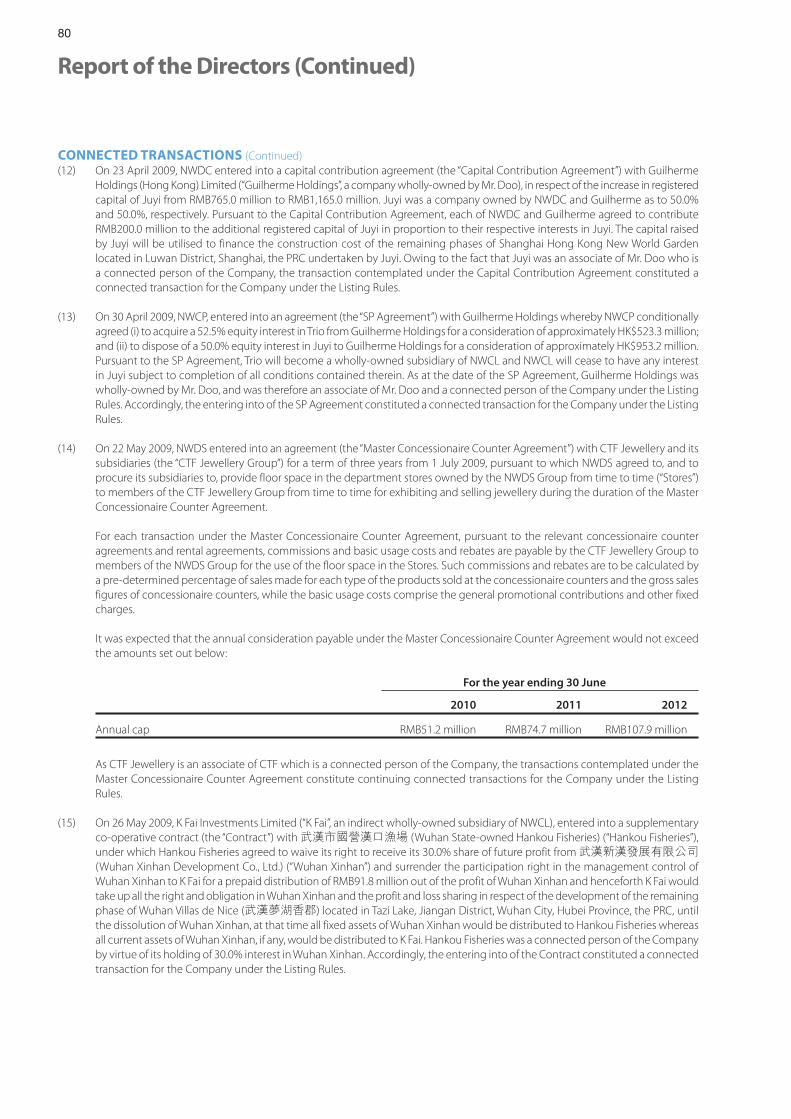
80
Report of the Directors (Continued)
CONNECTED TRANSACTIONS (Continued)(12) On 23 April 2009, NWDC entered into a capital contribution agreement (the “Capital Contribution Agreement”) with Guilherme
Holdings (Hong Kong) Limited (“Guilherme Holdings”, a company wholly-owned by Mr. Doo), in respect of the increase in registered capital of Juyi from RMB765.0 million to RMB1,165.0 million. Juyi was a company owned by NWDC and Guilherme as to 50.0% and 50.0%, respectively. Pursuant to the Capital Contribution Agreement, each of NWDC and Guilherme agreed to contribute RMB200.0 million to the additional registered capital of Juyi in proportion to their respective interests in Juyi. The capital raised by Juyi will be utilised to finance the construction cost of the remaining phases of Shanghai Hong Kong New World Garden located in Luwan District, Shanghai, the PRC undertaken by Juyi. Owing to the fact that Juyi was an associate of Mr. Doo who is a connected person of the Company, the transaction contemplated under the Capital Contribution Agreement constituted a connected transaction for the Company under the Listing Rules.
(13) On 30 April 2009, NWCP, entered into an agreement (the “SP Agreement”) with Guilherme Holdings whereby NWCP conditionally agreed (i) to acquire a 52.5% equity interest in Trio from Guilherme Holdings for a consideration of approximately HK$523.3 million; and (ii) to dispose of a 50.0% equity interest in Juyi to Guilherme Holdings for a consideration of approximately HK$953.2 million. Pursuant to the SP Agreement, Trio will become a wholly-owned subsidiary of NWCL and NWCL will cease to have any interest in Juyi subject to completion of all conditions contained therein. As at the date of the SP Agreement, Guilherme Holdings was wholly-owned by Mr. Doo, and was therefore an associate of Mr. Doo and a connected person of the Company under the Listing Rules. Accordingly, the entering into of the SP Agreement constituted a connected transaction for the Company under the Listing Rules.
(14) On 22 May 2009, NWDS entered into an agreement (the “Master Concessionaire Counter Agreement”) with CTF Jewellery and its subsidiaries (the “CTF Jewellery Group”) for a term of three years from 1 July 2009, pursuant to which NWDS agreed to, and to procure its subsidiaries to, provide floor space in the department stores owned by the NWDS Group from time to time (“Stores”) to members of the CTF Jewellery Group from time to time for exhibiting and selling jewellery during the duration of the Master Concessionaire Counter Agreement.
For each transaction under the Master Concessionaire Counter Agreement, pursuant to the relevant concessionaire counter agreements and rental agreements, commissions and basic usage costs and rebates are payable by the CTF Jewellery Group to members of the NWDS Group for the use of the floor space in the Stores. Such commissions and rebates are to be calculated by a pre-determined percentage of sales made for each type of the products sold at the concessionaire counters and the gross sales figures of concessionaire counters, while the basic usage costs comprise the general promotional contributions and other fixed charges.
It was expected that the annual consideration payable under the Master Concessionaire Counter Agreement would not exceed the amounts set out below:
For the year ending 30 June
2010 2011 2012
Annual cap RMB51.2 million RMB74.7 million RMB107.9 million
As CTF Jewellery is an associate of CTF which is a connected person of the Company, the transactions contemplated under the Master Concessionaire Counter Agreement constitute continuing connected transactions for the Company under the Listing Rules.
(15) On 26 May 2009, K Fai Investments Limited (“K Fai”, an indirect wholly-owned subsidiary of NWCL), entered into a supplementary co-operative contract (the “Contract”) with 武漢市國營漢口漁場 (Wuhan State-owned Hankou Fisheries) (“Hankou Fisheries”), under which Hankou Fisheries agreed to waive its right to receive its 30.0% share of future profit from 武漢新漢發展有限公司 (Wuhan Xinhan Development Co., Ltd.) (“Wuhan Xinhan”) and surrender the participation right in the management control of Wuhan Xinhan to K Fai for a prepaid distribution of RMB91.8 million out of the profit of Wuhan Xinhan and henceforth K Fai would take up all the right and obligation in Wuhan Xinhan and the profit and loss sharing in respect of the development of the remaining phase of Wuhan Villas de Nice (武漢夢湖香郡) located in Tazi Lake, Jiangan District, Wuhan City, Hubei Province, the PRC, until the dissolution of Wuhan Xinhan, at that time all fixed assets of Wuhan Xinhan would be distributed to Hankou Fisheries whereas all current assets of Wuhan Xinhan, if any, would be distributed to K Fai. Hankou Fisheries was a connected person of the Company by virtue of its holding of 30.0% interest in Wuhan Xinhan. Accordingly, the entering into of the Contract constituted a connected transaction for the Company under the Listing Rules.
81New World Development Company Limited - Annual Report 2009
Report of the Directors (Continued)
CONNECTED TRANSACTIONS (Continued)(16) On 16 July 2009, Trio, 新創機電工程有限公司 (NWS Engineering Ltd.) (“NWS Engineering”, an indirect wholly-owned subsidiary
of NWSH) and NWS Engineering (Shanghai branch office) entered into an agreement (the “Shanghai Agreement”) whereby NWS Engineering agreed to provide to Trio project management services in respect of the electrical and mechanical engineering works of the property development project (the “Shanghai Zhongshan Square (Phase III) Project”) situated at Hongqiao Development Zone, Shanghai, the PRC, for a service fee of RMB19.0 million. If the aggregate of the final total construction costs incurred in respect of the electrical and mechanical engineering works of the Shanghai Zhongshan Square (Phase III) Project is less than RMB197.0 million (which is subject to final determination), NWS Engineering shall be entitled to a bonus in the amount to be agreed between the contracting parties.
On the same date, Dragon Plaza (H.K.) Limited (“DPHKL”), Great City Developments Limited (“GCDL”) and Hip Hing Builders Company Limited (“Hip Hing Builders”, an indirect wholly-owned subsidiary of NWSH) entered into an agreement (the “Li Yuen Street East Agreement”) whereby Hip Hing Builders agreed to provide to DPHKL and GCDL project management services for the development of the property development project (“Li Yuen Street East Project”) situated at No. 39 Queen’s Road Central and Nos. 19-28 Li Yuen Street East, Hong Kong. Hip Hing Builders shall be entitled to a management fee which shall be calculated as follows:
(a) 2.0% of the part of the cost in relation to the execution and completion of mechanical and electrical installations of the Li Yuen Street East Project; and
(b) 6.0% of the cost of the Li Yuen Street East Project other than that in paragraph (a) above.
Under the estimation based on the budget of the project, the maximum management fee in respect of the Li Yuen Street East Project was expected to be approximately HK$18.7 million.
As at the date of the Shanghai Agreement and the Li Yuen Street East Agreement, Mr. Doo beneficially owned 52.5% interest in Trio and 50.0% interest in each of DPHKL and GCDL and thus, Trio, DPHKL and GCDL were associates of Mr. Doo and in turn connected persons of the Company. The transactions contemplated under the Shanghai Agreement and the Li Yuen Street East Agreement constituted connected transactions for the Company under the Listing Rules.
Furthermore, certain members of the Group had entered into the following transactions (the “Previous Transactions”) with Juyi prior to the execution of the Shanghai Agreement and the Li Yuen Street East Agreement:
(a) the provision of project management services by 協興建築(中國)有限公司 (Hip Hing Construction (China) Company Limited) (an indirect wholly-owned subsidiary of NWSH) to Juyi pursuant to the relevant project management agreement dated 16 January 2009 in relation to the construction works of a property development project situated at Shanghai, the PRC at a service fee of 2.7% of the total estimated construction costs which amounted to approximately RMB81.0 million; and
(b) the provision of project management services by NWS Engineering to Juyi pursuant to the relevant project management agreement dated 28 February 2009 in relation to the electrical and mechanical engineering works of a property development project situated at Shanghai, the PRC at a service fee of approximately RMB40.4 million.
At the time when the relevant agreements for the Previous Transactions were entered into, apart from the participating interest held by Mr. Doo (in which he was entitled to 30.0% of the returns received by NWCL in respect of Juyi), he did not have any equity interest or voting right in Juyi. He also did not have any power to control the composition of a majority of the board of directors of Juyi. Juyi was therefore not a connected person of the Company and the Previous Transactions did not constitute connected transactions for the Company on the date of execution of the relevant agreements. However, at the date of execution of the Shanghai Agreement and the Li Yuen Street East Agreement, Juyi was owned as to 50.0% by Mr. Doo and being an associate of Mr. Doo and therefore a connected person of the Company. Thus, the Previous Transactions then also constituted connected transactions for the Company and were further aggregated together with the transactions contemplated under the Shanghai Agreement and the Li Yuen Street East Agreement upon the disclosure made by the Company pursuant to the Listing Rules.
82
Report of the Directors (Continued)
CONNECTED TRANSACTIONS (Continued)(17) On 30 September 2009, an agreement (the “WZNWT Agreement”) was entered into between 溫州港集團有限公司 Wenzhou
Port Group Co., Ltd. (the “PRC Party”) and NWS Ports Management (Wenzhou) Limited (“NWSPMWZ”, an indirect 63.6% subsidiary of NWSH), pursuant to which NWSPMWZ agreed to sell, and the PRC Party agreed to purchase and procure its nominee(s) to purchase, 55.0% equity interest in 溫州狀元嶴新創建國際碼頭有限公司 Wenzhou Zhuangyuan Ao New World International Terminals Company Limited (“WZNWT”) for the consideration of RMB282.0 million (equivalent to approximately HK$320.5 million). Upon completion of the WZNWT Agreement, which shall take place within 6 months upon signing of the WZNWT Agreement, the said 55.0% equity interest in WZNWT will be transferred by NWSPMWZ to the PRC Party and its nominee(s). The identity of the nominee(s) will be determined by the PRC Party later.
As at the date of signing of the WZNWT Agreement, WZNWT was 55.0% owned by NWSPMWZ which was a non-wholly owned subsidiary of NWSH. The PRC Party owned 45.0% equity interest in WZNWT and thus, the PRC Party was a connected person of the Company under the Listing Rules. The disposal contemplated under the WZNWT Agreement constituted a connected transaction for the Company under the Listing Rules.
The continuing connected transactions mentioned in paragraphs (3) to (6) above have been reviewed by the Independent Non-executive Directors of the Company who have confirmed that the transactions have been entered into:
(a) in the ordinary and usual course of business of the Company;
(b) on normal commercial terms; and
(c) in accordance with the relevant agreements governing them on terms that are fair and reasonable and in the interests of the shareholders of the Company as a whole.
In accordance with Rule 14A.38 of the Listing Rules, the Board of Directors engaged the auditors of the Company to perform certain agreed-upon procedures on the continuing connected transactions stated in paragraphs (3) to (6) above in accordance with Hong Kong Standard on Related Services 4400 “Engagements to Perform Agreed-Upon Procedures Regarding Financial Information” issued by the Hong Kong Institute of Certified Public Accountants. The auditors have reported to the Board of Directors of the Company that:
(a) the transactions have been approved by the Executive Committee of the Company;
(b) the transactions selected have been entered into in accordance with the relevant agreements governing such transactions; and
(c) the transactions have not exceeded the caps disclosed in the relevant announcements.
Save as disclosed above, a summary of significant related party transactions that did not constitute connected transactions made during the year was disclosed in Note 50 to the financial statements.
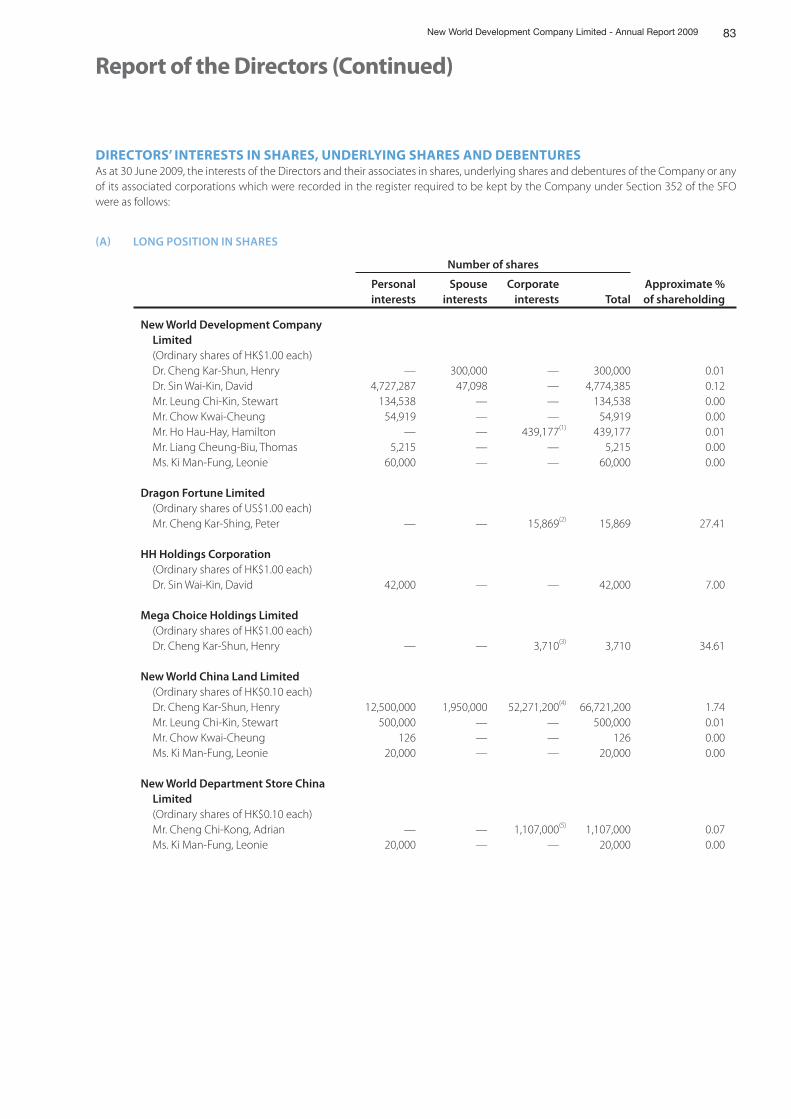
83New World Development Company Limited - Annual Report 2009
Report of the Directors (Continued)
DIRECTORS’ INTERESTS IN SHARES, UNDERLYING SHARES AND DEBENTURESAs at 30 June 2009, the interests of the Directors and their associates in shares, underlying shares and debentures of the Company or any of its associated corporations which were recorded in the register required to be kept by the Company under Section 352 of the SFO were as follows:
A LONG POSITION IN SHARES
Number of shares
Personal interests
Spouse interests
Corporate interests Total
Approximate %of shareholding
New World Development Company Limited (Ordinary shares of HK$1.00 each) Dr. Cheng Kar-Shun, Henry — 300,000 — 300,000 0.01 Dr. Sin Wai-Kin, David 4,727,287 47,098 — 4,774,385 0.12 Mr. Leung Chi-Kin, Stewart 134,538 — — 134,538 0.00 Mr. Chow Kwai-Cheung 54,919 — — 54,919 0.00 Mr. Ho Hau-Hay, Hamilton — — 439,177(1) 439,177 0.01 Mr. Liang Cheung-Biu, Thomas 5,215 — — 5,215 0.00 Ms. Ki Man-Fung, Leonie 60,000 — — 60,000 0.00
Dragon Fortune Limited (Ordinary shares of US$1.00 each) Mr. Cheng Kar-Shing, Peter — — 15,869(2) 15,869 27.41
HH Holdings Corporation (Ordinary shares of HK$1.00 each) Dr. Sin Wai-Kin, David 42,000 — — 42,000 7.00
Mega Choice Holdings Limited (Ordinary shares of HK$1.00 each) Dr. Cheng Kar-Shun, Henry — — 3,710(3) 3,710 34.61
New World China Land Limited (Ordinary shares of HK$0.10 each) Dr. Cheng Kar-Shun, Henry 12,500,000 1,950,000 52,271,200(4) 66,721,200 1.74 Mr. Leung Chi-Kin, Stewart 500,000 — — 500,000 0.01 Mr. Chow Kwai-Cheung 126 — — 126 0.00 Ms. Ki Man-Fung, Leonie 20,000 — — 20,000 0.00
New World Department Store China Limited (Ordinary shares of HK$0.10 each) Mr. Cheng Chi-Kong, Adrian — — 1,107,000(5) 1,107,000 0.07 Ms. Ki Man-Fung, Leonie 20,000 — — 20,000 0.00
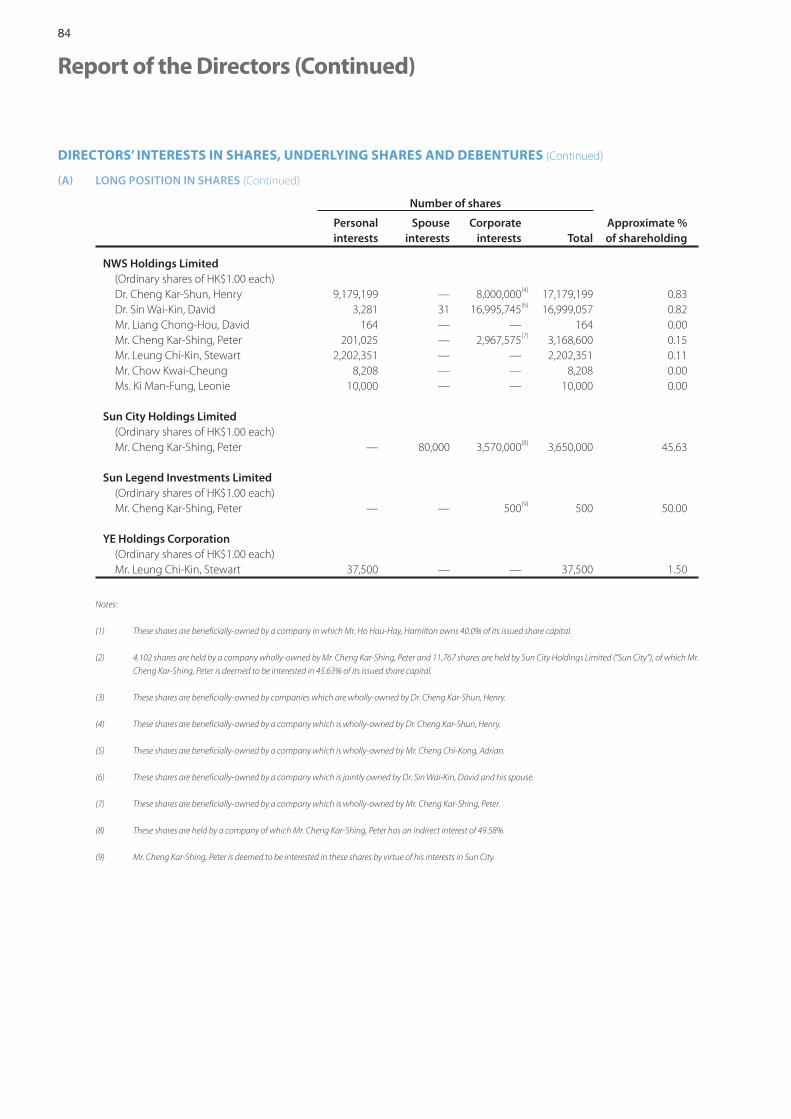
84
Report of the Directors (Continued)
DIRECTORS’ INTERESTS IN SHARES, UNDERLYING SHARES AND DEBENTURES (Continued)
A LONG POSITION IN SHARES (Continued)
Number of shares
Personal interests
Spouse interests
Corporate interests Total
Approximate %of shareholding
NWS Holdings Limited (Ordinary shares of HK$1.00 each) Dr. Cheng Kar-Shun, Henry 9,179,199 — 8,000,000(4) 17,179,199 0.83 Dr. Sin Wai-Kin, David 3,281 31 16,995,745(6) 16,999,057 0.82 Mr. Liang Chong-Hou, David 164 — — 164 0.00 Mr. Cheng Kar-Shing, Peter 201,025 — 2,967,575(7) 3,168,600 0.15 Mr. Leung Chi-Kin, Stewart 2,202,351 — — 2,202,351 0.11 Mr. Chow Kwai-Cheung 8,208 — — 8,208 0.00 Ms. Ki Man-Fung, Leonie 10,000 — — 10,000 0.00
Sun City Holdings Limited (Ordinary shares of HK$1.00 each) Mr. Cheng Kar-Shing, Peter — 80,000 3,570,000(8) 3,650,000 45.63
Sun Legend Investments Limited (Ordinary shares of HK$1.00 each) Mr. Cheng Kar-Shing, Peter — — 500(9) 500 50.00
YE Holdings Corporation (Ordinary shares of HK$1.00 each) Mr. Leung Chi-Kin, Stewart 37,500 — — 37,500 1.50
Notes:
(1) These shares are beneficially-owned by a company in which Mr. Ho Hau-Hay, Hamilton owns 40.0% of its issued share capital.
(2) 4,102 shares are held by a company wholly-owned by Mr. Cheng Kar-Shing, Peter and 11,767 shares are held by Sun City Holdings Limited (“Sun City”), of which Mr.
Cheng Kar-Shing, Peter is deemed to be interested in 45.63% of its issued share capital.
(3) These shares are beneficially-owned by companies which are wholly-owned by Dr. Cheng Kar-Shun, Henry.
(4) These shares are beneficially-owned by a company which is wholly-owned by Dr. Cheng Kar-Shun, Henry.
(5) These shares are beneficially-owned by a company which is wholly-owned by Mr. Cheng Chi-Kong, Adrian.
(6) These shares are beneficially-owned by a company which is jointly owned by Dr. Sin Wai-Kin, David and his spouse.
(7) These shares are beneficially-owned by a company which is wholly-owned by Mr. Cheng Kar-Shing, Peter.
(8) These shares are held by a company of which Mr. Cheng Kar-Shing, Peter has an indirect interest of 49.58%.
(9) Mr. Cheng Kar-Shing, Peter is deemed to be interested in these shares by virtue of his interests in Sun City.
85New World Development Company Limited - Annual Report 2009
Report of the Directors (Continued)
DIRECTORS’ INTERESTS IN SHARES, UNDERLYING SHARES AND DEBENTURES (Continued)
B LONG POSITION IN UNDERLYING SHARES SHARE OPTIONS
During the year ended 30 June 2009, certain Directors of the Company have interest in share options to subscribe for shares in the Company and certain of its subsidiaries. Details of such interests and summaries of share option schemes of the Company and its subsidiaries are shown below.
SHARE OPTION SCHEME OF THE COMPANYOn 24 November 2006, the Company adopted a share option scheme (the “Scheme”). Under the Scheme, the Directors of the Company may at their discretion grant options to any eligible participant (as explained hereinafter) to subscribe for shares in the Company.
Summary of the Scheme disclosed in accordance with the Listing Rules is as follows:
The Scheme
Purpose of the scheme To reward directors and employees of the Group for past service or performance, to provide incentive, motivation or reward to eligible participants for increasing performance or making contribution to the Group, to attract and retain persons of right caliber with the necessary experience to work for or make contribution to the Group, to foster a sense of corporate identity and to allow the eligible participants to enjoy the results of the Company attained through their relationship, efforts and/or contribution.
Participants of the scheme Eligible participant may be a person or an entity belonging to any of the following classes:
(i) any eligible employee;
(ii) any non-executive director (including independent non-executive director) of the Company or any invested entity of the Group (the “Invested Entity”);
(iii) any person seconded or nominated by the Group to represent the Group’s interest in any of the Invested Entity or any other company or organisation;
(iv) any supplier of goods or services to any member of the Group or any Invested Entity;
(v) any customer of any member of the Group or any Invested Entity;
(vi) any person or entity that provides research, development or other technological support to the Group or any Invested Entity;
(vii) any adviser (professional or otherwise) or consultant to any area of business or business development of any member of the Group or any Invested Entity; and
(viii) any joint venture partner or business alliance that co-operates with any member of the Group or any Invested Entity in any area of business operation or development.
Total number of shares available forissue under the scheme andpercentage of issued share capitalas at the date of this annual report
The Company had granted 136,450,000 shares of the Company under the Scheme up to the date of this report.
The total number of shares available for issue under the Scheme is 230,908,518 representing approximately 6.0% of the Company’s issued share capital as at the date of this report.
86
Report of the Directors (Continued)
SHARE OPTION SCHEME OF THE COMPANY (Continued)
The Scheme
Maximum entitlement of eachparticipant under the scheme
Unless approved by shareholders of the Company, the total number of shares issued and to be issued upon exercise of the share options granted to each eligible participant (including both exercised and outstanding options) in any 12-month period must not exceed 1.0% of the share capital of the Company in issue.
The period within which the sharesmust be taken up under an option
A period to be specified by the Directors and not to exceed 10 years from the date of grant of options.
The minimum period for which anoption must be held before it can beexercised
Any period as determined by the Directors.
The amount payable on applicationor acceptance of the option andthe period within which paymentsor calls must or may be made or loansfor such purposes must be paid
HK$10.0 is to be paid as consideration for the grant of option within 14 days from the date of offer.
The basis of determining theexercise price
The exercise price is determined by the Directors which must be at least the higher of (i) the closing price of the shares on the HKEx as stated in the HKEx’s daily quotations sheets on the date of grant, which must be a business day; and (ii) the average closing price of the shares as stated in the HKEx’s daily quotation sheets for the five business days immediately preceding the date of grant.
The remaining life of the scheme The Scheme shall be valid and effective for a period of 10 years from the date of adoption, i.e. 24 November 2006.
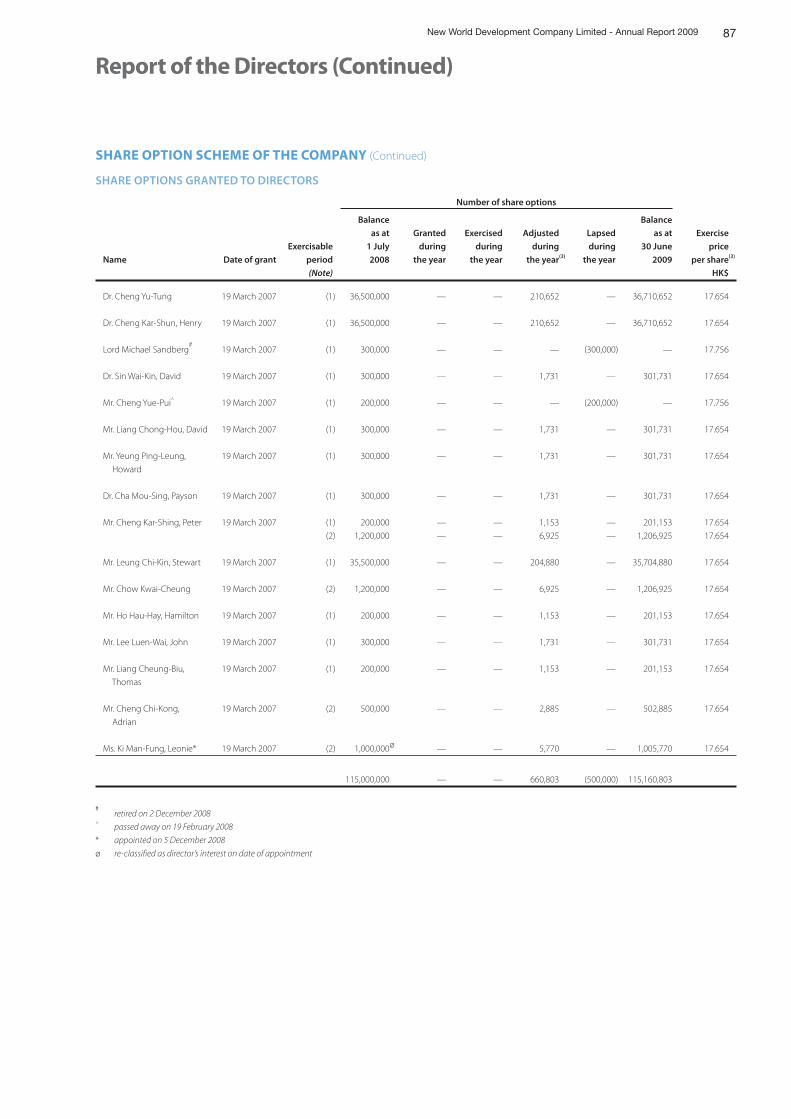
87New World Development Company Limited - Annual Report 2009
Report of the Directors (Continued)
SHARE OPTION SCHEME OF THE COMPANY (Continued)
SHARE OPTIONS GRANTED TO DIRECTORS
Number of share options
Name Date of grant
Exercisable
period
Balance
as at
1 July
2008
Granted
during
the year
Exercised
during
the year
Adjusted
during
the year(3)
Lapsed
during
the year
Balance
as at
30 June
2009
Exercise
price
per share(3)
(Note) HK$
Dr. Cheng Yu-Tung 19 March 2007 (1) 36,500,000 — — 210,652 — 36,710,652 17.654
Dr. Cheng Kar-Shun, Henry 19 March 2007 (1) 36,500,000 — — 210,652 — 36,710,652 17.654
Lord Michael Sandberg#
19 March 2007 (1) 300,000 — — — (300,000) — 17.756
Dr. Sin Wai-Kin, David 19 March 2007 (1) 300,000 — — 1,731 — 301,731 17.654
Mr. Cheng Yue-Pui^ 19 March 2007 (1) 200,000 — — — (200,000) — 17.756
Mr. Liang Chong-Hou, David 19 March 2007 (1) 300,000 — — 1,731 — 301,731 17.654
Mr. Yeung Ping-Leung,
Howard
19 March 2007 (1) 300,000 — — 1,731 — 301,731 17.654
Dr. Cha Mou-Sing, Payson 19 March 2007 (1) 300,000 — — 1,731 — 301,731 17.654
Mr. Cheng Kar-Shing, Peter 19 March 2007 (1) 200,000 — — 1,153 — 201,153 17.654
(2) 1,200,000 — — 6,925 — 1,206,925 17.654
Mr. Leung Chi-Kin, Stewart 19 March 2007 (1) 35,500,000 — — 204,880 — 35,704,880 17.654
Mr. Chow Kwai-Cheung 19 March 2007 (2) 1,200,000 — — 6,925 — 1,206,925 17.654
Mr. Ho Hau-Hay, Hamilton 19 March 2007 (1) 200,000 — — 1,153 — 201,153 17.654
Mr. Lee Luen-Wai, John 19 March 2007 (1) 300,000 — — 1,731 — 301,731 17.654
Mr. Liang Cheung-Biu,
Thomas
19 March 2007 (1) 200,000 — — 1,153 — 201,153 17.654
Mr. Cheng Chi-Kong,
Adrian
19 March 2007 (2) 500,000 — — 2,885 — 502,885 17.654
Ms. Ki Man-Fung, Leonie* 19 March 2007 (2) 1,000,000ø — — 5,770 — 1,005,770 17.654
115,000,000 — — 660,803 (500,000) 115,160,803
# retired on 2 December 2008
^ passed away on 19 February 2008
* appointed on 5 December 2008
ø re-classified as director’s interest on date of appointment
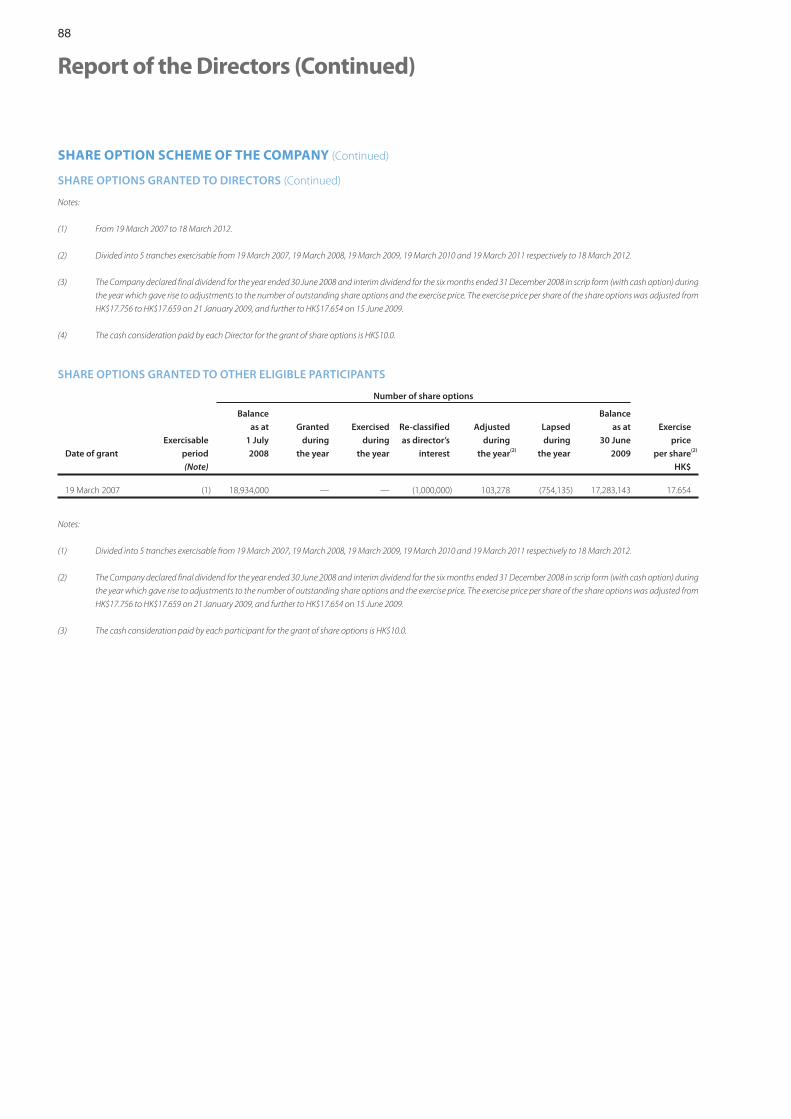
88
Report of the Directors (Continued)
SHARE OPTION SCHEME OF THE COMPANY (Continued)
SHARE OPTIONS GRANTED TO DIRECTORS (Continued)
Notes:
(1) From 19 March 2007 to 18 March 2012.
(2) Divided into 5 tranches exercisable from 19 March 2007, 19 March 2008, 19 March 2009, 19 March 2010 and 19 March 2011 respectively to 18 March 2012.
(3) The Company declared final dividend for the year ended 30 June 2008 and interim dividend for the six months ended 31 December 2008 in scrip form (with cash option) during
the year which gave rise to adjustments to the number of outstanding share options and the exercise price. The exercise price per share of the share options was adjusted from
HK$17.756 to HK$17.659 on 21 January 2009, and further to HK$17.654 on 15 June 2009.
(4) The cash consideration paid by each Director for the grant of share options is HK$10.0.
SHARE OPTIONS GRANTED TO OTHER ELIGIBLE PARTICIPANTS
Number of share options
Date of grant
Exercisable
period
Balance
as at
1 July
2008
Granted
during
the year
Exercised
during
the year
Re-classified
as director’s
interest
Adjusted
during
the year(2)
Lapsed
during
the year
Balance
as at
30 June
2009
Exercise
price
per share(2)
(Note) HK$
19 March 2007 (1) 18,934,000 — — (1,000,000) 103,278 (754,135) 17,283,143 17.654
Notes:
(1) Divided into 5 tranches exercisable from 19 March 2007, 19 March 2008, 19 March 2009, 19 March 2010 and 19 March 2011 respectively to 18 March 2012.
(2) The Company declared final dividend for the year ended 30 June 2008 and interim dividend for the six months ended 31 December 2008 in scrip form (with cash option) during
the year which gave rise to adjustments to the number of outstanding share options and the exercise price. The exercise price per share of the share options was adjusted from
HK$17.756 to HK$17.659 on 21 January 2009, and further to HK$17.654 on 15 June 2009.
(3) The cash consideration paid by each participant for the grant of share options is HK$10.0.
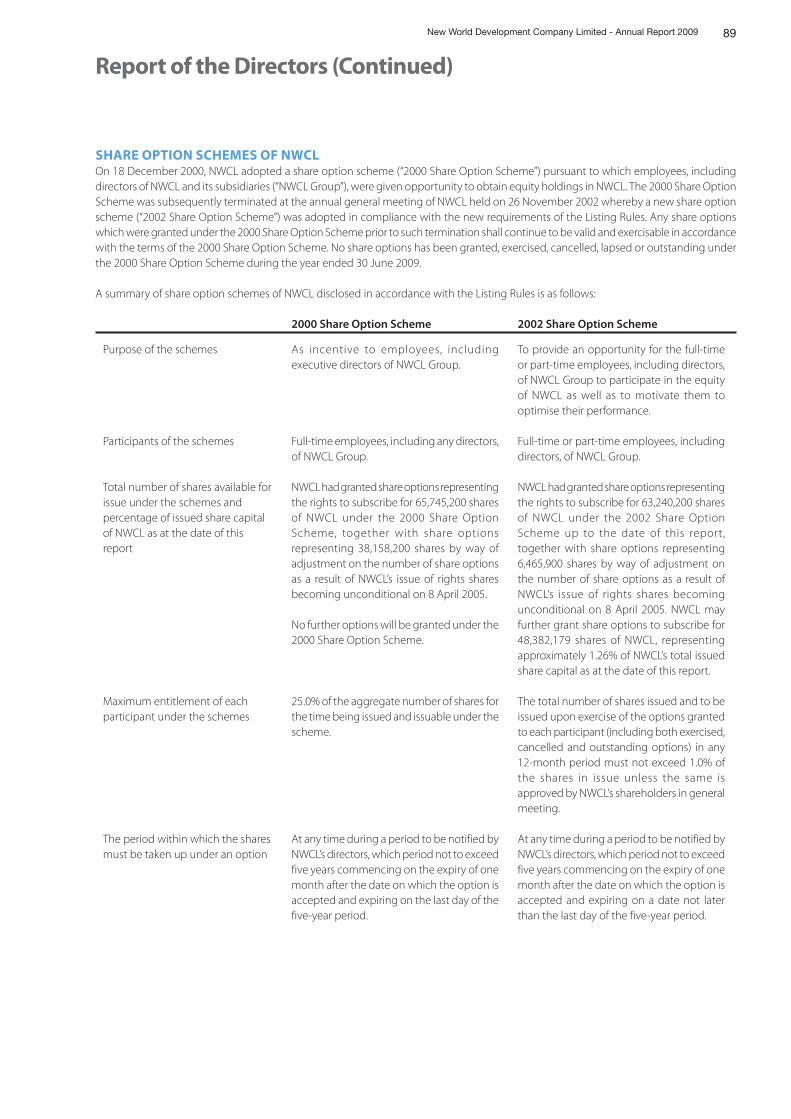
89New World Development Company Limited - Annual Report 2009
Report of the Directors (Continued)
SHARE OPTION SCHEMES OF NWCLOn 18 December 2000, NWCL adopted a share option scheme (“2000 Share Option Scheme”) pursuant to which employees, including directors of NWCL and its subsidiaries (“NWCL Group”), were given opportunity to obtain equity holdings in NWCL. The 2000 Share Option Scheme was subsequently terminated at the annual general meeting of NWCL held on 26 November 2002 whereby a new share option scheme (“2002 Share Option Scheme”) was adopted in compliance with the new requirements of the Listing Rules. Any share options which were granted under the 2000 Share Option Scheme prior to such termination shall continue to be valid and exercisable in accordance with the terms of the 2000 Share Option Scheme. No share options has been granted, exercised, cancelled, lapsed or outstanding under the 2000 Share Option Scheme during the year ended 30 June 2009.
A summary of share option schemes of NWCL disclosed in accordance with the Listing Rules is as follows:
2000 Share Option Scheme 2002 Share Option Scheme
Purpose of the schemes As incentive to employees, including executive directors of NWCL Group.
To provide an opportunity for the full-time or part-time employees, including directors, of NWCL Group to participate in the equity of NWCL as well as to motivate them to optimise their performance.
Participants of the schemes Full-time employees, including any directors, of NWCL Group.
Full-time or part-time employees, including directors, of NWCL Group.
Total number of shares available for issue under the schemes and percentage of issued share capital of NWCL as at the date of this report
NWCL had granted share options representing the rights to subscribe for 65,745,200 shares of NWCL under the 2000 Share Option Scheme, together with share options representing 38,158,200 shares by way of adjustment on the number of share options as a result of NWCL’s issue of rights shares becoming unconditional on 8 April 2005.
No further options will be granted under the 2000 Share Option Scheme.
NWCL had granted share options representing the rights to subscribe for 63,240,200 shares of NWCL under the 2002 Share Option Scheme up to the date of this report, together with share options representing 6,465,900 shares by way of adjustment on the number of share options as a result of NWCL’s issue of rights shares becoming unconditional on 8 April 2005. NWCL may further grant share options to subscribe for 48,382,179 shares of NWCL, representing approximately 1.26% of NWCL’s total issued share capital as at the date of this report.
Maximum entitlement of each participant under the schemes
25.0% of the aggregate number of shares for the time being issued and issuable under the scheme.
The total number of shares issued and to be issued upon exercise of the options granted to each participant (including both exercised, cancelled and outstanding options) in any 12-month period must not exceed 1.0% of the shares in issue unless the same is approved by NWCL’s shareholders in general meeting.
The period within which the shares must be taken up under an option
At any time during a period to be notified by NWCL’s directors, which period not to exceed five years commencing on the expiry of one month after the date on which the option is accepted and expiring on the last day of the five-year period.
At any time during a period to be notified by NWCL’s directors, which period not to exceed five years commencing on the expiry of one month after the date on which the option is accepted and expiring on a date not later than the last day of the five-year period.
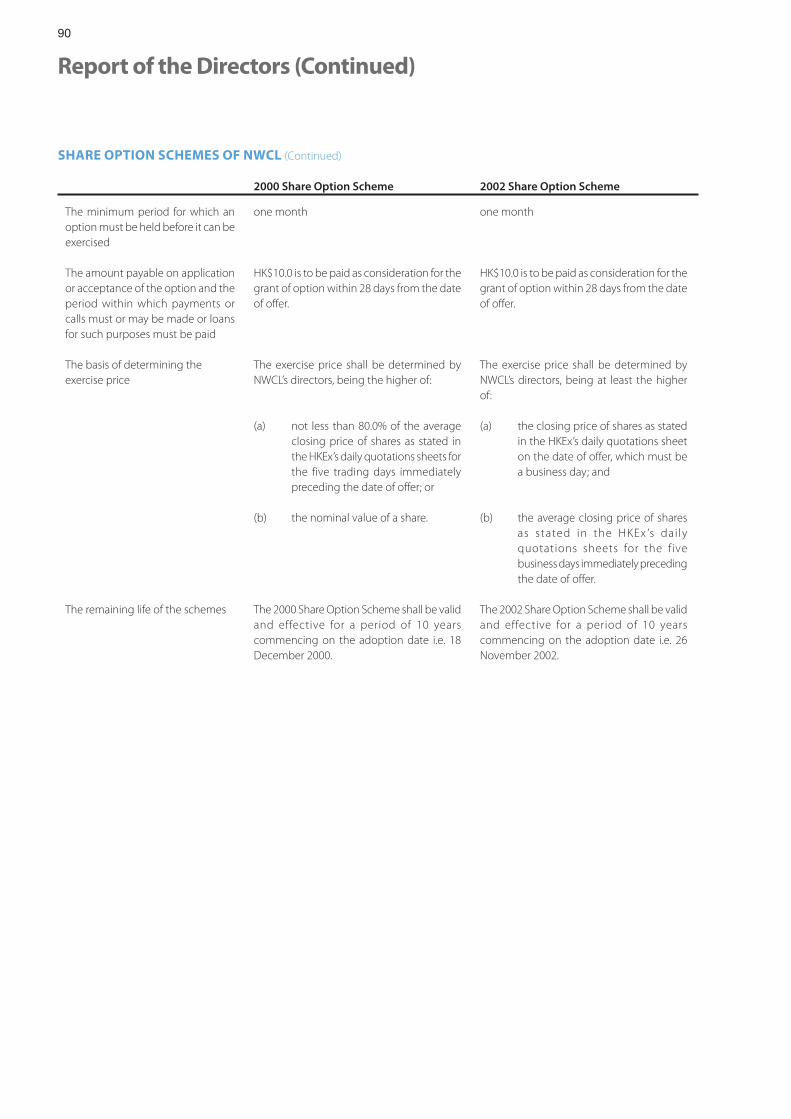
90
Report of the Directors (Continued)
SHARE OPTION SCHEMES OF NWCL (Continued)
2000 Share Option Scheme 2002 Share Option Scheme
The minimum period for which an option must be held before it can be exercised
one month one month
The amount payable on application or acceptance of the option and the period within which payments or calls must or may be made or loans for such purposes must be paid
HK$10.0 is to be paid as consideration for the grant of option within 28 days from the date of offer.
HK$10.0 is to be paid as consideration for the grant of option within 28 days from the date of offer.
The basis of determining the exercise price
The exercise price shall be determined by NWCL’s directors, being the higher of:
The exercise price shall be determined by NWCL’s directors, being at least the higher of:
(a) not less than 80.0% of the average closing price of shares as stated in the HKEx’s daily quotations sheets for the five trading days immediately preceding the date of offer; or
(a) the closing price of shares as stated in the HKEx’s daily quotations sheet on the date of offer, which must be a business day; and
(b) the nominal value of a share. (b) the average closing price of shares as stated in the HKEx ’s dai ly quotations sheets for the five business days immediately preceding the date of offer.
The remaining life of the schemes The 2000 Share Option Scheme shall be valid and effective for a period of 10 years commencing on the adoption date i.e. 18 December 2000.
The 2002 Share Option Scheme shall be valid and effective for a period of 10 years commencing on the adoption date i.e. 26 November 2002.
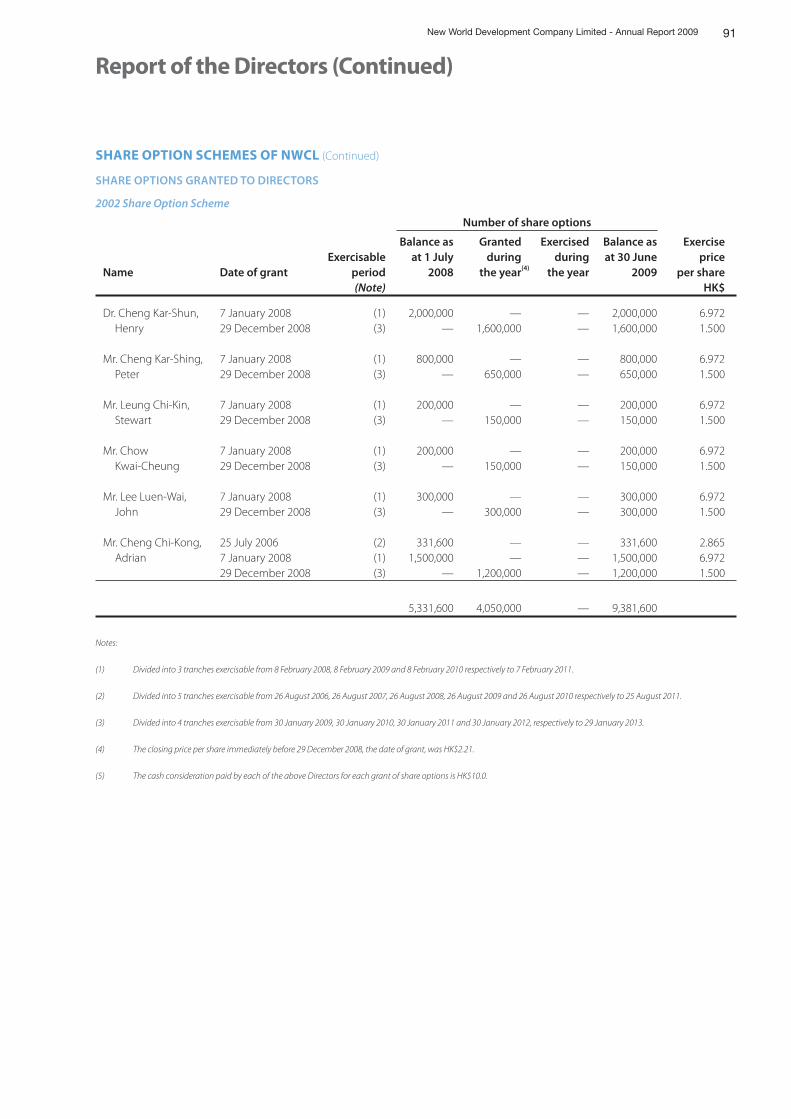
91New World Development Company Limited - Annual Report 2009
Report of the Directors (Continued)
SHARE OPTION SCHEMES OF NWCL (Continued)
SHARE OPTIONS GRANTED TO DIRECTORS
2002 Share Option Scheme
Number of share options
Name Date of grantExercisable
period
Balance as at 1 July
2008
Granted during
the year(4)
Exercised during
the year
Balance as at 30 June
2009
Exercise price
per share(Note) HK$
Dr. Cheng Kar-Shun, Henry
7 January 2008 (1) 2,000,000 — — 2,000,000 6.97229 December 2008 (3) — 1,600,000 — 1,600,000 1.500
Mr. Cheng Kar-Shing, Peter
7 January 2008 (1) 800,000 — — 800,000 6.97229 December 2008 (3) — 650,000 — 650,000 1.500
Mr. Leung Chi-Kin, Stewart
7 January 2008 (1) 200,000 — — 200,000 6.97229 December 2008 (3) — 150,000 — 150,000 1.500
Mr. Chow Kwai-Cheung
7 January 2008 (1) 200,000 — — 200,000 6.97229 December 2008 (3) — 150,000 — 150,000 1.500
Mr. Lee Luen-Wai, John
7 January 2008 (1) 300,000 — — 300,000 6.97229 December 2008 (3) — 300,000 — 300,000 1.500
Mr. Cheng Chi-Kong, Adrian
25 July 2006 (2) 331,600 — — 331,600 2.8657 January 2008 (1) 1,500,000 — — 1,500,000 6.97229 December 2008 (3) — 1,200,000 — 1,200,000 1.500
5,331,600 4,050,000 — 9,381,600
Notes:
(1) Divided into 3 tranches exercisable from 8 February 2008, 8 February 2009 and 8 February 2010 respectively to 7 February 2011.
(2) Divided into 5 tranches exercisable from 26 August 2006, 26 August 2007, 26 August 2008, 26 August 2009 and 26 August 2010 respectively to 25 August 2011.
(3) Divided into 4 tranches exercisable from 30 January 2009, 30 January 2010, 30 January 2011 and 30 January 2012, respectively to 29 January 2013.
(4) The closing price per share immediately before 29 December 2008, the date of grant, was HK$2.21.
(5) The cash consideration paid by each of the above Directors for each grant of share options is HK$10.0.
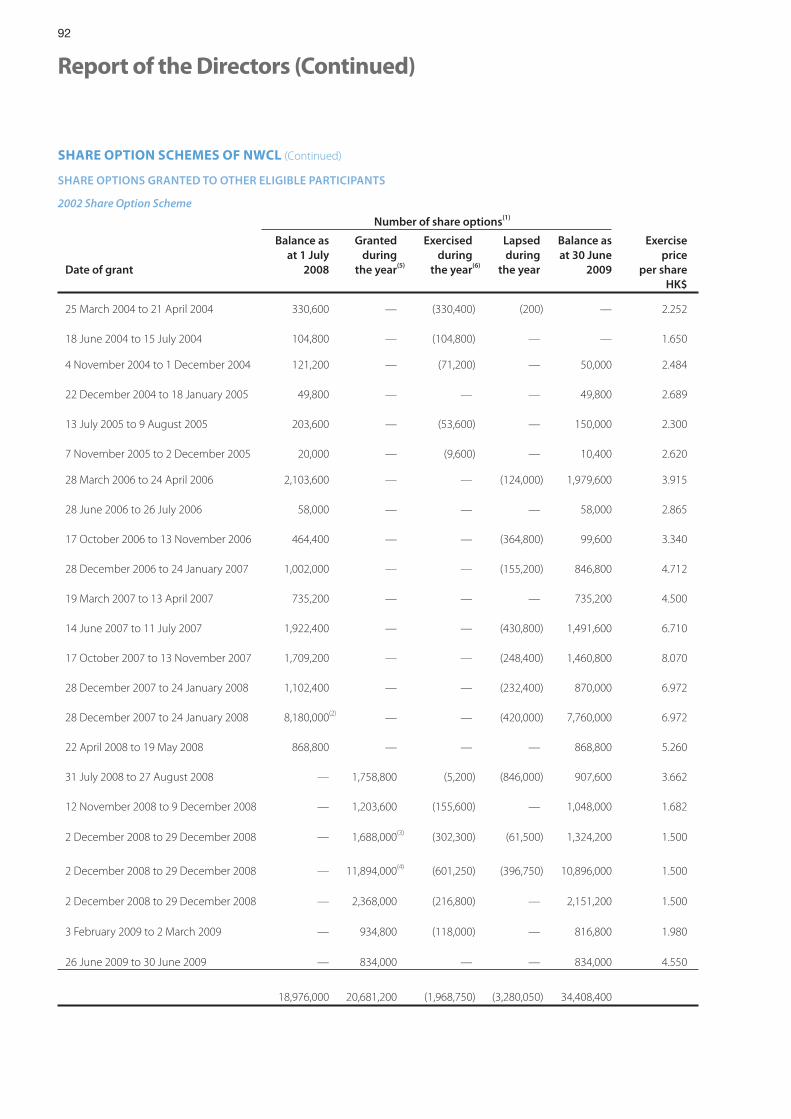
92
Report of the Directors (Continued)
SHARE OPTION SCHEMES OF NWCL (Continued)
SHARE OPTIONS GRANTED TO OTHER ELIGIBLE PARTICIPANTS
2002 Share Option Scheme
Number of share options(1)
Date of grant
Balance as at 1 July
2008
Granted during
the year(5)
Exercised during
the year(6)
Lapsed during
the year
Balance as at 30 June
2009
Exercise price
per shareHK$
25 March 2004 to 21 April 2004 330,600 — (330,400) (200) — 2.252
18 June 2004 to 15 July 2004 104,800 — (104,800) — — 1.650
4 November 2004 to 1 December 2004 121,200 — (71,200) — 50,000 2.484
22 December 2004 to 18 January 2005 49,800 — — — 49,800 2.689
13 July 2005 to 9 August 2005 203,600 — (53,600) — 150,000 2.300
7 November 2005 to 2 December 2005 20,000 — (9,600) — 10,400 2.620
28 March 2006 to 24 April 2006 2,103,600 — — (124,000) 1,979,600 3.915
28 June 2006 to 26 July 2006 58,000 — — — 58,000 2.865
17 October 2006 to 13 November 2006 464,400 — — (364,800) 99,600 3.340
28 December 2006 to 24 January 2007 1,002,000 — — (155,200) 846,800 4.712
19 March 2007 to 13 April 2007 735,200 — — — 735,200 4.500
14 June 2007 to 11 July 2007 1,922,400 — — (430,800) 1,491,600 6.710
17 October 2007 to 13 November 2007 1,709,200 — — (248,400) 1,460,800 8.070
28 December 2007 to 24 January 2008 1,102,400 — — (232,400) 870,000 6.972
28 December 2007 to 24 January 2008 8,180,000(2) — — (420,000) 7,760,000 6.972
22 April 2008 to 19 May 2008 868,800 — — — 868,800 5.260
31 July 2008 to 27 August 2008 — 1,758,800 (5,200) (846,000) 907,600 3.662
12 November 2008 to 9 December 2008 — 1,203,600 (155,600) — 1,048,000 1.682
2 December 2008 to 29 December 2008 — 1,688,000(3) (302,300) (61,500) 1,324,200 1.500
2 December 2008 to 29 December 2008 — 11,894,000(4) (601,250) (396,750) 10,896,000 1.500
2 December 2008 to 29 December 2008 — 2,368,000 (216,800) — 2,151,200 1.500
3 February 2009 to 2 March 2009 — 934,800 (118,000) — 816,800 1.980
26 June 2009 to 30 June 2009 — 834,000 — — 834,000 4.550
18,976,000 20,681,200 (1,968,750) (3,280,050) 34,408,400
93New World Development Company Limited - Annual Report 2009
Report of the Directors (Continued)
SHARE OPTION SCHEMES OF NWCL (Continued)
SHARE OPTIONS GRANTED TO OTHER ELIGIBLE PARTICIPANTS (Continued)
2002 Share Option Scheme (Continued)Notes:
(1) The share options are exercisable within five years commencing from one month after the dates of grant, provided that the maximum number of share options that can be exercised during each anniversary year is 20.0% of the total number of the share options granted together with any unexercised share options carried forward from the previous anniversary years, except otherwise specified in notes 2, 3 and 4.
(2) The share options are exercisable within three years commencing from one month after the dates of grant, provided that the maximum number of share options that can be exercised during each anniversary year is about 33.0% of the total number of the share options granted together with any unexercised share options carried forward from the previous anniversary year.
(3) The share options are exercisable within two years commencing from one month after the dates of grant, provided that the maximum number of share options that can be exercised during each anniversary year is 50.0% of the total number of the share options granted together with any unexercised share options carried forward from the previous anniversary year.
(4) The share options are exercisable within four years commencing from one month after the dates of grant, provided that the maximum number of share options that can be exercised during each anniversary year is 25.0% of the total number of the share options granted together with any unexercised share options carried forward from the previous anniversary year.
(5) The closing price per share immediately before 31 July 2008, 12 November 2008, 2 December 2008, 3 February 2009 and 26 June 2009, the dates of offer to grant, was HK$3.60, HK$1.65, HK$1.64, HK$2.02 and HK$4.39 respectively.
(6) The weighted average closing price of the shares immediately before the dates on which share options were exercised was HK$3.64.
(7) The cash consideration paid by each eligible participant for each grant of share option is HK$10.0.
The fair values of the share options granted during the year with exercise prices per share of HK$3.662, HK$1.682, HK$1.500, HK$1.980 and HK$4.550 are estimated at HK$1.37, HK$0.65, HK$0.46 to HK$0.58, HK$0.78 and HK$1.85 respectively using the binomial pricing model. Values are estimated based on the risk-free rate ranging from 0.96% to 3.32% per annum with reference to the rate prevailing on the Exchange Fund Notes, a five-year period historical volatility of ranging from 46.0% to 61.0%, assuming dividend yield ranging from 0.85% to 1.45% and an expected option life of two to five years.
The binomial pricing model requires input of subjective assumptions such as the expected stock price volatility. Change in the subjective input may materially affect the fair value estimates.
94
Report of the Directors (Continued)
SHARE OPTION SCHEME OF NWSHOn 6 December 2001, NWSH adopted a share option scheme (the “2001 Share Option Scheme”) and certain rules of such scheme were amended on 12 March 2003 and 24 November 2006. Under the 2001 Share Option Scheme, the directors of NWSH may at their discretion grant options to any eligible participant as defined in the scheme to subscribe for shares in NWSH.
Summary of the share option scheme of NWSH disclosed in accordance with the Listing Rules is as follows:
2001 Share Option Scheme
Purpose of the scheme To reward directors and employees of NWSH and its subsidiaries (“NWSH Group”) for past service or performance, to provide incentive and motivation or reward to eligible participants for increasing performance or making contribution to NWSH Group, to attract and retain persons of right caliber with the necessary experience to work for NWSH Group and to foster a sense of corporate identity.
Participants of the scheme Eligible participant may be a person or an entity belonging to any of the following classes:
(i) any eligible employee;
(ii) any non-executive director (including independent non-executive director) of NWSH Group or any invested entity of NWSH Group (the “Invested Entity”);
(iii) any supplier of goods or services to any member of NWSH Group or any Invested Entity;
(iv) any customer of any member of NWSH Group or any Invested Entity;
(v) any person or entity that provides research, development or other technological support to NWSH Group or any Invested Entity;
(vi) any shareholder of any member of NWSH Group or any Invested Entity or any holder of any securities issued by any member of NWSH Group or any Invested Entity;
(vii) any adviser (professional or otherwise) or consultant to any area of business or business development of any member of NWSH Group or any Invested Entity; and
(viii) any joint venture partner or business alliance that co-operates with any member of NWSH Group or any Invested Entity in any area of business operation or development.
Total number of shares available for issue under the scheme and percentage of issued share capital of NWSH as at the date of this annual report
NWSH had granted options to certain eligible participants to subscribe for a total of 72,518,283 shares of NWSH, which included certain adjustments made pursuant to the scheme, up to the date of this report.
The total number of shares available for issue under the scheme is 108,390,774 representing approximately 5.23% of NWSH’s issued share capital as at the date of this report.
Maximum entitlement of each participant under the scheme
Unless approved by shareholders of NWSH, the total number of shares issued and to be issued upon exercise of the share options granted to each eligible participant (including both exercised and outstanding options) in any 12-month period must not exceed 1.0% of the share capital of NWSH in issue.
The period within which the shares must be taken up under an option
At any time during a period as specified by NWSH’s directors, however in any event the share options must be exercised within 10 years from the date of grant of the share options.
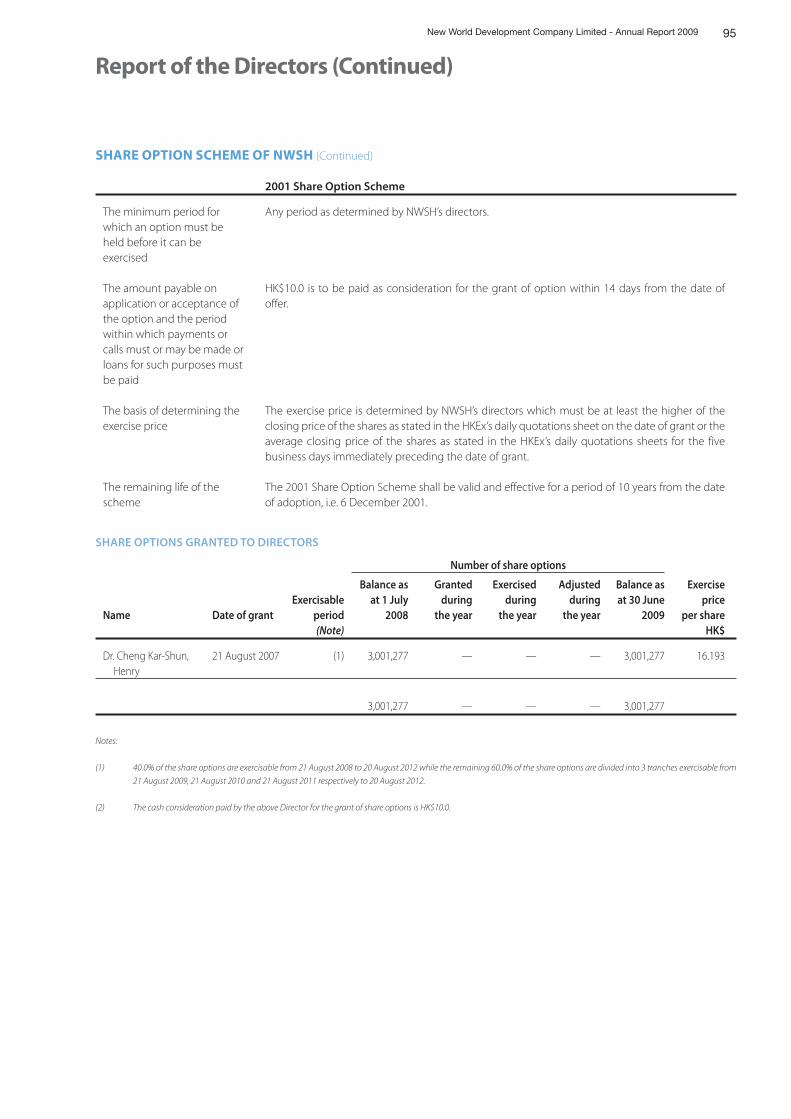
95New World Development Company Limited - Annual Report 2009
Report of the Directors (Continued)
SHARE OPTION SCHEME OF NWSH (Continued)
2001 Share Option Scheme
The minimum period for which an option must be held before it can be exercised
Any period as determined by NWSH’s directors.
The amount payable on application or acceptance of the option and the period within which payments or calls must or may be made or loans for such purposes must be paid
HK$10.0 is to be paid as consideration for the grant of option within 14 days from the date of offer.
The basis of determining the exercise price
The exercise price is determined by NWSH’s directors which must be at least the higher of the closing price of the shares as stated in the HKEx’s daily quotations sheet on the date of grant or the average closing price of the shares as stated in the HKEx’s daily quotations sheets for the five business days immediately preceding the date of grant.
The remaining life of the scheme
The 2001 Share Option Scheme shall be valid and effective for a period of 10 years from the date of adoption, i.e. 6 December 2001.
SHARE OPTIONS GRANTED TO DIRECTORS
Number of share options
Name Date of grantExercisable
period
Balance as at 1 July
2008
Granted during
the year
Exercised during
the year
Adjusted during
the year
Balance as at 30 June
2009
Exercise price
per share(Note) HK$
Dr. Cheng Kar-Shun, Henry
21 August 2007 (1) 3,001,277 — — — 3,001,277 16.193
3,001,277 — — — 3,001,277
Notes:
(1) 40.0% of the share options are exercisable from 21 August 2008 to 20 August 2012 while the remaining 60.0% of the share options are divided into 3 tranches exercisable from
21 August 2009, 21 August 2010 and 21 August 2011 respectively to 20 August 2012.
(2) The cash consideration paid by the above Director for the grant of share options is HK$10.0.
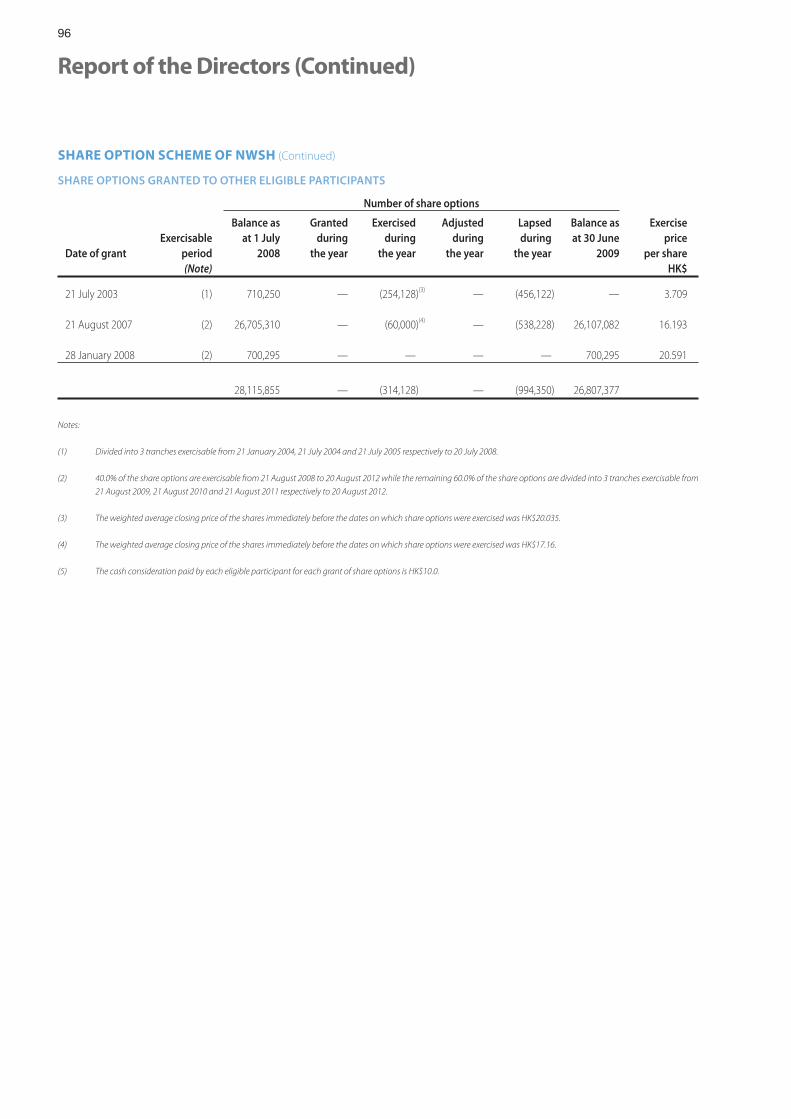
96
Report of the Directors (Continued)
SHARE OPTION SCHEME OF NWSH (Continued)
SHARE OPTIONS GRANTED TO OTHER ELIGIBLE PARTICIPANTS
Number of share options
Date of grantExercisable
period
Balance as at 1 July
2008
Granted during
the year
Exercised during
the year
Adjusted during
the year
Lapsed during
the year
Balance as at 30 June
2009
Exercise price
per share(Note) HK$
21 July 2003 (1) 710,250 — (254,128)(3) — (456,122) — 3.709
21 August 2007 (2) 26,705,310 — (60,000)(4) — (538,228) 26,107,082 16.193
28 January 2008 (2) 700,295 — — — — 700,295 20.591
28,115,855 — (314,128) — (994,350) 26,807,377
Notes:
(1) Divided into 3 tranches exercisable from 21 January 2004, 21 July 2004 and 21 July 2005 respectively to 20 July 2008.
(2) 40.0% of the share options are exercisable from 21 August 2008 to 20 August 2012 while the remaining 60.0% of the share options are divided into 3 tranches exercisable from
21 August 2009, 21 August 2010 and 21 August 2011 respectively to 20 August 2012.
(3) The weighted average closing price of the shares immediately before the dates on which share options were exercised was HK$20.035.
(4) The weighted average closing price of the shares immediately before the dates on which share options were exercised was HK$17.16.
(5) The cash consideration paid by each eligible participant for each grant of share options is HK$10.0.
97New World Development Company Limited - Annual Report 2009
Report of the Directors (Continued)
SHARE OPTION SCHEME OF NWDSOn 12 June 2007, NWDS adopted a share option scheme (the “NWDS Scheme”). Under the NWDS Scheme, the directors of NWDS may at their discretion grant options to any eligible participant (as explained hereinafter) to subscribe for shares in NWDS.
Summary of the NWDS Scheme disclosed in accordance with the Listing Rules is as follows:
NWDS Scheme
Purpose of the scheme The purpose of the NWDS Scheme is to attract and retain the best available personnel and to provide additional incentives to employees, directors, consultants, business associates and advisers of NWDS to promote the success of NWDS and its subsidiaries (“NWDS Group”).
Participants of the scheme The directors of NWDS may offer any employee (whether full-time or part-time), director, consultant, business associate or adviser of NWDS Group options to subscribe for shares of NWDS at a price calculated in accordance with the terms of the NWDS Scheme.
Total number of shares available for issue under the scheme and percentage of issued share capital of NWDS as at the date of this annual report
NWDS had granted share options representing the rights to subscribe for 24,128,000 shares of NWDS under the NWDS Scheme up to the date of this report.
NWDS may further grant share options to subscribe for 138,392,500 shares of NWDS, representing approximately 8.21% of the issued share capital of NWDS as at the date of this report.
Maximum entitlement of each participant under the scheme
Unless approved by shareholders of NWDS in the manner as set out in the NWDS Scheme, the total number of shares of NWDS issued and to be issued upon exercise of the options granted to each eligible person (including both exercised, cancelled and outstanding options) in any 12-month period must not exceed 1.0% of the relevant class of securities of NWDS in issue.
The period within which the shares must be taken up under an option
A period to commence not less than one year and not to exceed 10 years from the date of grant of options.
The minimum period for which an option must be held before it can be exercised
Not less than one year upon the grant of options by the directors of NWDS.
The amount payable on application or acceptance of the option and the period within which payments or calls must or may be made or loans for such purposes must be paid
The amount payable for the acceptance of an option shall be the sum of HK$1.0 which shall be paid upon acceptance of the offer of such option. An offer of an option must be made by NWDS in writing on a business day and accepted in writing by the participant in such manner as the board of directors of NWDS may prescribe within 21 calendar days (from and including the date of the offer by NWDS) of the same being made and if not so accepted such offer shall lapse.
The basis of determining the exercise price
The exercise price is determined by the directors of NWDS and shall be not less than the greater of (i) the closing price of the shares as stated in the HKEx’s daily quotations sheet on the date of grant of option; (ii) the average closing price of the shares as stated in the HKEx’s daily quotations sheets for the five business days immediately preceding the date of grant of option; and (iii) the nominal value of a share.
The remaining life of the scheme
The NWDS Scheme shall be valid and effective for a period not to exceed 10 years from the date of adoption, i.e. 12 June 2007.
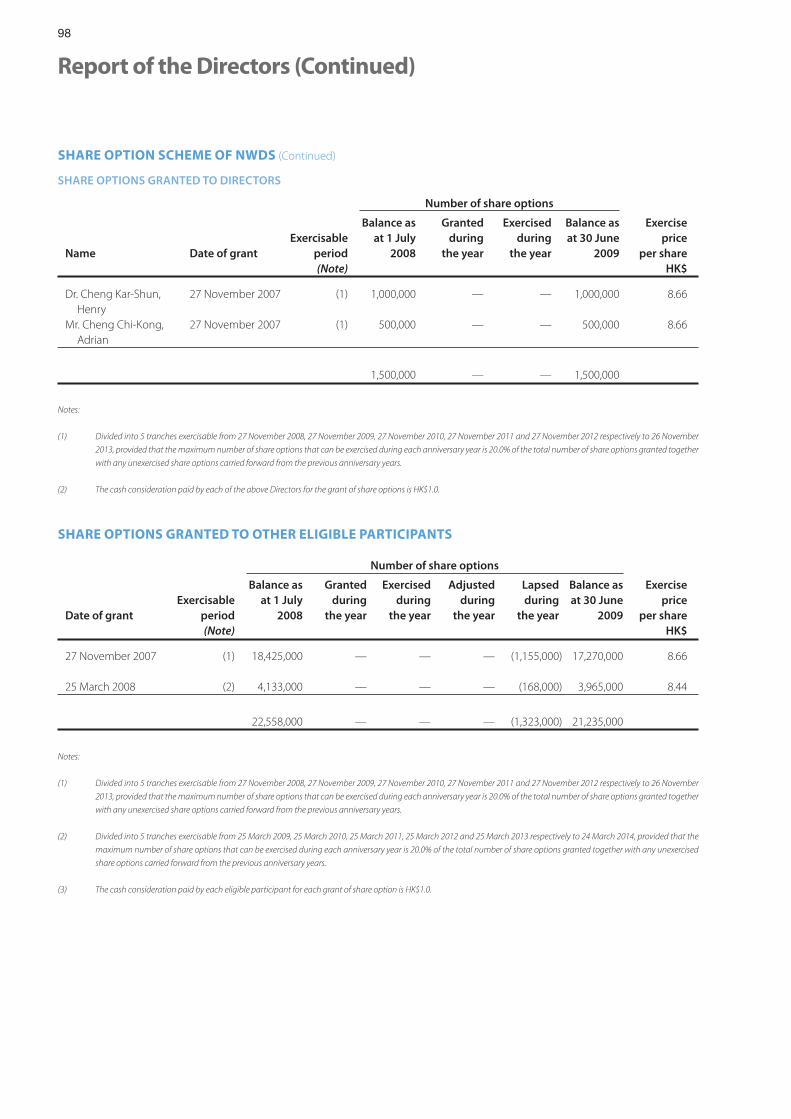
98
Report of the Directors (Continued)
SHARE OPTION SCHEME OF NWDS (Continued)
SHARE OPTIONS GRANTED TO DIRECTORS
Number of share options
Name Date of grantExercisable
period
Balance as at 1 July
2008
Granted during
the year
Exercised during
the year
Balance as at 30 June
2009
Exercise price
per share(Note) HK$
Dr. Cheng Kar-Shun, Henry
27 November 2007 (1) 1,000,000 — — 1,000,000 8.66
Mr. Cheng Chi-Kong, Adrian
27 November 2007 (1) 500,000 — — 500,000 8.66
1,500,000 — — 1,500,000
Notes:
(1) Divided into 5 tranches exercisable from 27 November 2008, 27 November 2009, 27 November 2010, 27 November 2011 and 27 November 2012 respectively to 26 November
2013, provided that the maximum number of share options that can be exercised during each anniversary year is 20.0% of the total number of share options granted together
with any unexercised share options carried forward from the previous anniversary years.
(2) The cash consideration paid by each of the above Directors for the grant of share options is HK$1.0.
SHARE OPTIONS GRANTED TO OTHER ELIGIBLE PARTICIPANTS
Number of share options
Date of grantExercisable
period
Balance as at 1 July
2008
Granted during
the year
Exercised during
the year
Adjusted during
the year
Lapsed during
the year
Balance as at 30 June
2009
Exercise price
per share(Note) HK$
27 November 2007 (1) 18,425,000 — — — (1,155,000) 17,270,000 8.66
25 March 2008 (2) 4,133,000 — — — (168,000) 3,965,000 8.44
22,558,000 — — — (1,323,000) 21,235,000
Notes:
(1) Divided into 5 tranches exercisable from 27 November 2008, 27 November 2009, 27 November 2010, 27 November 2011 and 27 November 2012 respectively to 26 November
2013, provided that the maximum number of share options that can be exercised during each anniversary year is 20.0% of the total number of share options granted together
with any unexercised share options carried forward from the previous anniversary years.
(2) Divided into 5 tranches exercisable from 25 March 2009, 25 March 2010, 25 March 2011, 25 March 2012 and 25 March 2013 respectively to 24 March 2014, provided that the
maximum number of share options that can be exercised during each anniversary year is 20.0% of the total number of share options granted together with any unexercised
share options carried forward from the previous anniversary years.
(3) The cash consideration paid by each eligible participant for each grant of share option is HK$1.0.
99New World Development Company Limited - Annual Report 2009
Report of the Directors (Continued)
SHARE OPTION SCHEME OF TAIFOOKOn 23 August 2002, the shareholders of Taifook approved the adoption of a share option scheme (the “Taifook Scheme”). Summary of the Taifook Scheme disclosed in accordance with the Listing Rules is as follows:
Taifook Scheme
Purpose of the scheme To attract, retain and motivate talented employees to strive towards long term performance targets set by Taifook and its subsidiaries and at the same time to allow the participants to enjoy the results of Taifook attained through their effort and contribution.
Participants of the scheme Any full time employees, executive and non-executive directors of Taifook or any of its subsidiaries or associates.
Total number of shares available for issue under the scheme and percentage of issued share capital of Taifook as at the date of this annual report
The maximum number of shares which may be issued upon exercise of all options to be granted under the Taifook Scheme and any other share option schemes of Taifook shall not in aggregate exceed 10.0% of the total number of shares in issue as at the date of adoption of the Taifook Scheme (the “Scheme Mandate Limit”) but Taifook may seek approval of its shareholders at general meetings to refresh the Scheme Mandate Limit, save that the maximum number of shares in respect of which options may be granted by directors of Taifook under the Taifook Scheme and any other share option schemes of Taifook shall not exceed 10.0% of the issued share capital of Taifook as at the date of approval by the shareholders of Taifook at general meetings where such limit is refreshed. Options previously granted under the Taifook Scheme and any other share option schemes of Taifook (including those outstanding, cancelled, lapsed or exercised options) will not be counted for the purpose of calculating such 10.0% limit as refreshed. Notwithstanding the aforesaid in this paragraph, the maximum number of shares which may be issued upon exercise of all outstanding options granted and yet to be exercised under the Taifook Scheme and any other share option schemes of Taifook shall not exceed 30.0% (or such higher percentage as may be allowed under the Listing Rules) of the total number of shares of Taifook in issue from time to time.
The total number of shares available for issue under the Taifook Scheme is 33,523,747 shares representing approximately 4.75% of the issued share capital of Taifook as at the date of this report.
Maximum entitlement of each participant under the scheme
The maximum number of shares issued and to be issued upon exercise of the options granted to each participant under the Taifook Scheme and any other share option schemes of Taifook (including both exercised and outstanding options) in any 12-month period shall not exceed 1.0% of the total number of shares of Taifook in issue. Any further grant of share options in excess of this limit is subject to approval by the shareholders of Taifook at a general meeting.
Share options granted to a director, chief executive or substantial shareholders of Taifook, or to any of their associates, are subject to approval in advance by the independent non-executive directors of Taifook. In addition, any share options granted to a substantial shareholder or an independent non-executive director of Taifook, or to any of their associates, in excess of 0.1% of the total number of shares in issue of Taifook at the date on which such grant is proposed by the directors of Taifook or with an aggregate value (based on the closing price of shares at the date on which such grant is proposed by the directors of Taifook) in excess of HK$5.0 million, within any 12-month period, are subject to shareholders’ approval in advance at a general meeting of Taifook.
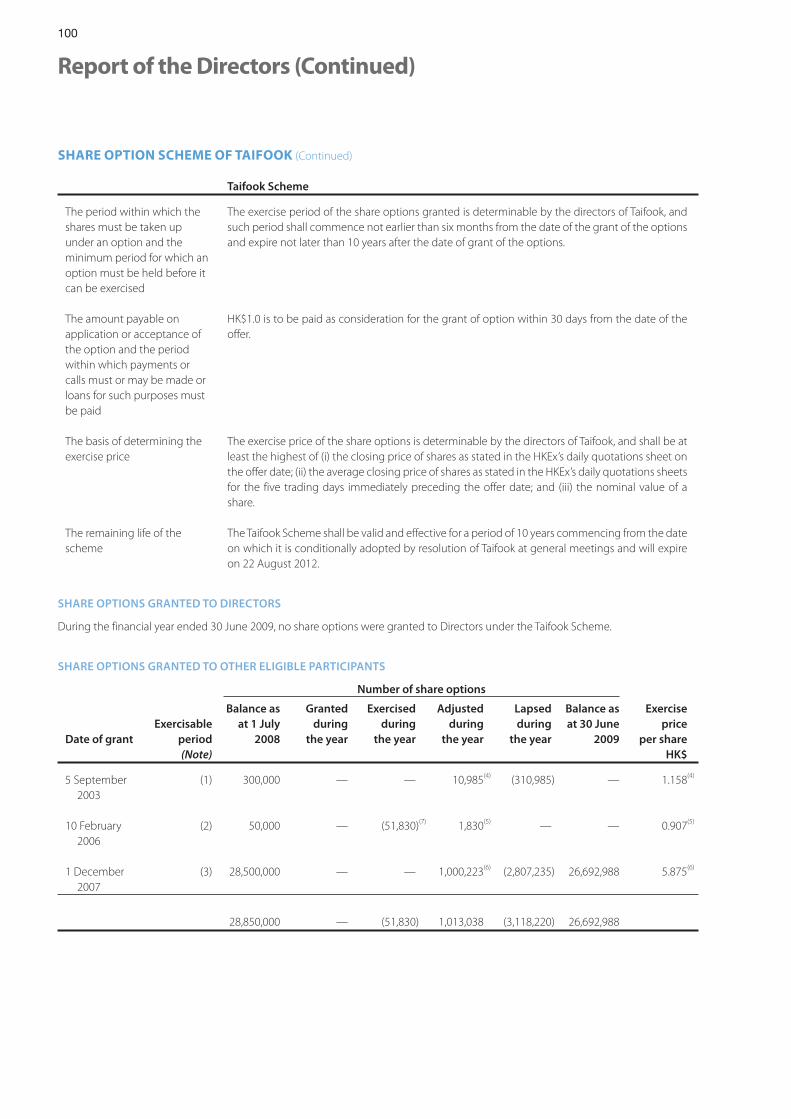
100
Report of the Directors (Continued)
SHARE OPTION SCHEME OF TAIFOOK (Continued)
Taifook Scheme
The period within which the shares must be taken up under an option and the minimum period for which an option must be held before it can be exercised
The exercise period of the share options granted is determinable by the directors of Taifook, and such period shall commence not earlier than six months from the date of the grant of the options and expire not later than 10 years after the date of grant of the options.
The amount payable on application or acceptance of the option and the period within which payments or calls must or may be made or loans for such purposes must be paid
HK$1.0 is to be paid as consideration for the grant of option within 30 days from the date of the offer.
The basis of determining the exercise price
The exercise price of the share options is determinable by the directors of Taifook, and shall be at least the highest of (i) the closing price of shares as stated in the HKEx’s daily quotations sheet on the offer date; (ii) the average closing price of shares as stated in the HKEx’s daily quotations sheets for the five trading days immediately preceding the offer date; and (iii) the nominal value of a share.
The remaining life of the scheme
The Taifook Scheme shall be valid and effective for a period of 10 years commencing from the date on which it is conditionally adopted by resolution of Taifook at general meetings and will expire on 22 August 2012.
SHARE OPTIONS GRANTED TO DIRECTORS
During the financial year ended 30 June 2009, no share options were granted to Directors under the Taifook Scheme.
SHARE OPTIONS GRANTED TO OTHER ELIGIBLE PARTICIPANTS
Number of share options
Date of grantExercisable
period
Balance as at 1 July
2008
Granted during
the year
Exercised during
the year
Adjusted during
the year
Lapsed during
the year
Balance as at 30 June
2009
Exercise price
per share(Note) HK$
5 September 2003
(1) 300,000 — — 10,985(4) (310,985) — 1.158(4)
10 February 2006
(2) 50,000 — (51,830)(7) 1,830(5) — — 0.907(5)
1 December 2007
(3) 28,500,000 — — 1,000,223(6) (2,807,235) 26,692,988 5.875(6)
28,850,000 — (51,830) 1,013,038 (3,118,220) 26,692,988
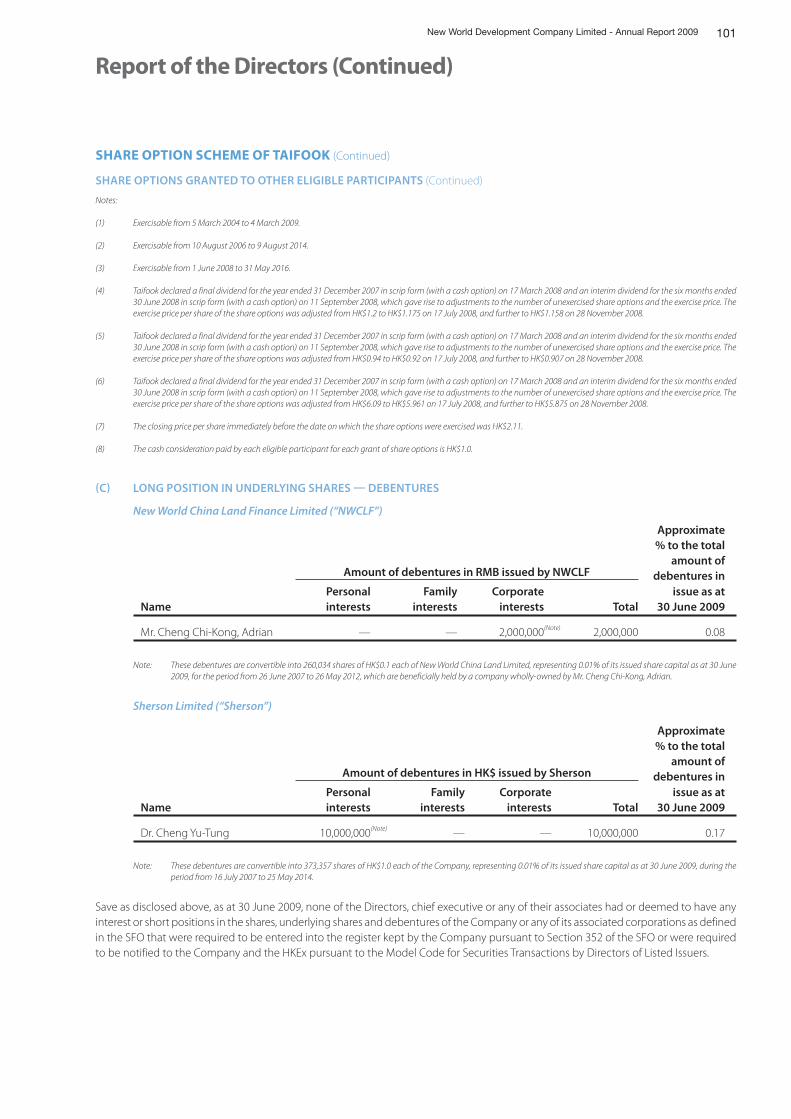
101New World Development Company Limited - Annual Report 2009
Report of the Directors (Continued)
SHARE OPTION SCHEME OF TAIFOOK (Continued)
SHARE OPTIONS GRANTED TO OTHER ELIGIBLE PARTICIPANTS (Continued)
Notes:
(1) Exercisable from 5 March 2004 to 4 March 2009.
(2) Exercisable from 10 August 2006 to 9 August 2014.
(3) Exercisable from 1 June 2008 to 31 May 2016.
(4) Taifook declared a final dividend for the year ended 31 December 2007 in scrip form (with a cash option) on 17 March 2008 and an interim dividend for the six months ended 30 June 2008 in scrip form (with a cash option) on 11 September 2008, which gave rise to adjustments to the number of unexercised share options and the exercise price. The exercise price per share of the share options was adjusted from HK$1.2 to HK$1.175 on 17 July 2008, and further to HK$1.158 on 28 November 2008.
(5) Taifook declared a final dividend for the year ended 31 December 2007 in scrip form (with a cash option) on 17 March 2008 and an interim dividend for the six months ended 30 June 2008 in scrip form (with a cash option) on 11 September 2008, which gave rise to adjustments to the number of unexercised share options and the exercise price. The exercise price per share of the share options was adjusted from HK$0.94 to HK$0.92 on 17 July 2008, and further to HK$0.907 on 28 November 2008.
(6) Taifook declared a final dividend for the year ended 31 December 2007 in scrip form (with a cash option) on 17 March 2008 and an interim dividend for the six months ended 30 June 2008 in scrip form (with a cash option) on 11 September 2008, which gave rise to adjustments to the number of unexercised share options and the exercise price. The exercise price per share of the share options was adjusted from HK$6.09 to HK$5.961 on 17 July 2008, and further to HK$5.875 on 28 November 2008.
(7) The closing price per share immediately before the date on which the share options were exercised was HK$2.11.
(8) The cash consideration paid by each eligible participant for each grant of share options is HK$1.0.
C LONG POSITION IN UNDERLYING SHARES DEBENTURES
New World China Land Finance Limited (“NWCLF”)
Amount of debentures in RMB issued by NWCLF
Approximate % to the total
amount of debentures in
NamePersonal interests
Family interests
Corporate interests Total
issue as at 30 June 2009
Mr. Cheng Chi-Kong, Adrian — — 2,000,000(Note) 2,000,000 0.08
Note: These debentures are convertible into 260,034 shares of HK$0.1 each of New World China Land Limited, representing 0.01% of its issued share capital as at 30 June 2009, for the period from 26 June 2007 to 26 May 2012, which are beneficially held by a company wholly-owned by Mr. Cheng Chi-Kong, Adrian.
Sherson Limited (“Sherson”)
Amount of debentures in HK$ issued by Sherson
Approximate % to the total
amount of debentures in
NamePersonal interests
Family interests
Corporate interests Total
issue as at 30 June 2009
Dr. Cheng Yu-Tung 10,000,000(Note) — — 10,000,000 0.17
Note: These debentures are convertible into 373,357 shares of HK$1.0 each of the Company, representing 0.01% of its issued share capital as at 30 June 2009, during the period from 16 July 2007 to 25 May 2014.
Save as disclosed above, as at 30 June 2009, none of the Directors, chief executive or any of their associates had or deemed to have any interest or short positions in the shares, underlying shares and debentures of the Company or any of its associated corporations as defined in the SFO that were required to be entered into the register kept by the Company pursuant to Section 352 of the SFO or were required to be notified to the Company and the HKEx pursuant to the Model Code for Securities Transactions by Directors of Listed Issuers.
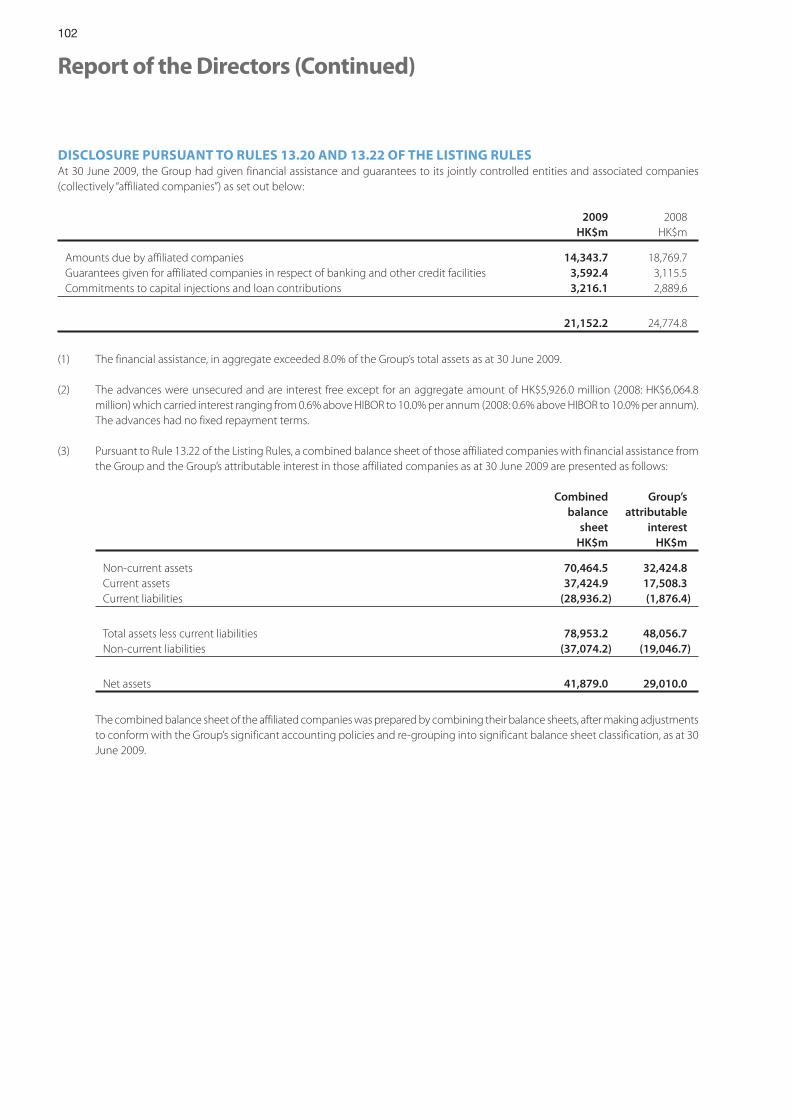
102
Report of the Directors (Continued)
DISCLOSURE PURSUANT TO RULES 13.20 AND 13.22 OF THE LISTING RULESAt 30 June 2009, the Group had given financial assistance and guarantees to its jointly controlled entities and associated companies (collectively ‘‘affiliated companies’’) as set out below:
2009 2008HK$m HK$m
Amounts due by affiliated companies 14,343.7 18,769.7Guarantees given for affiliated companies in respect of banking and other credit facilities 3,592.4 3,115.5Commitments to capital injections and loan contributions 3,216.1 2,889.6
21,152.2 24,774.8
(1) The financial assistance, in aggregate exceeded 8.0% of the Group’s total assets as at 30 June 2009.
(2) The advances were unsecured and are interest free except for an aggregate amount of HK$5,926.0 million (2008: HK$6,064.8 million) which carried interest ranging from 0.6% above HIBOR to 10.0% per annum (2008: 0.6% above HIBOR to 10.0% per annum). The advances had no fixed repayment terms.
(3) Pursuant to Rule 13.22 of the Listing Rules, a combined balance sheet of those affiliated companies with financial assistance from the Group and the Group’s attributable interest in those affiliated companies as at 30 June 2009 are presented as follows:
Combined balance
sheet
Group’s attributable
interestHK$m HK$m
Non-current assets 70,464.5 32,424.8Current assets 37,424.9 17,508.3Current liabilities (28,936.2) (1,876.4)
Total assets less current liabilities 78,953.2 48,056.7Non-current liabilities (37,074.2) (19,046.7)
Net assets 41,879.0 29,010.0
The combined balance sheet of the affiliated companies was prepared by combining their balance sheets, after making adjustments to conform with the Group’s significant accounting policies and re-grouping into significant balance sheet classification, as at 30 June 2009.
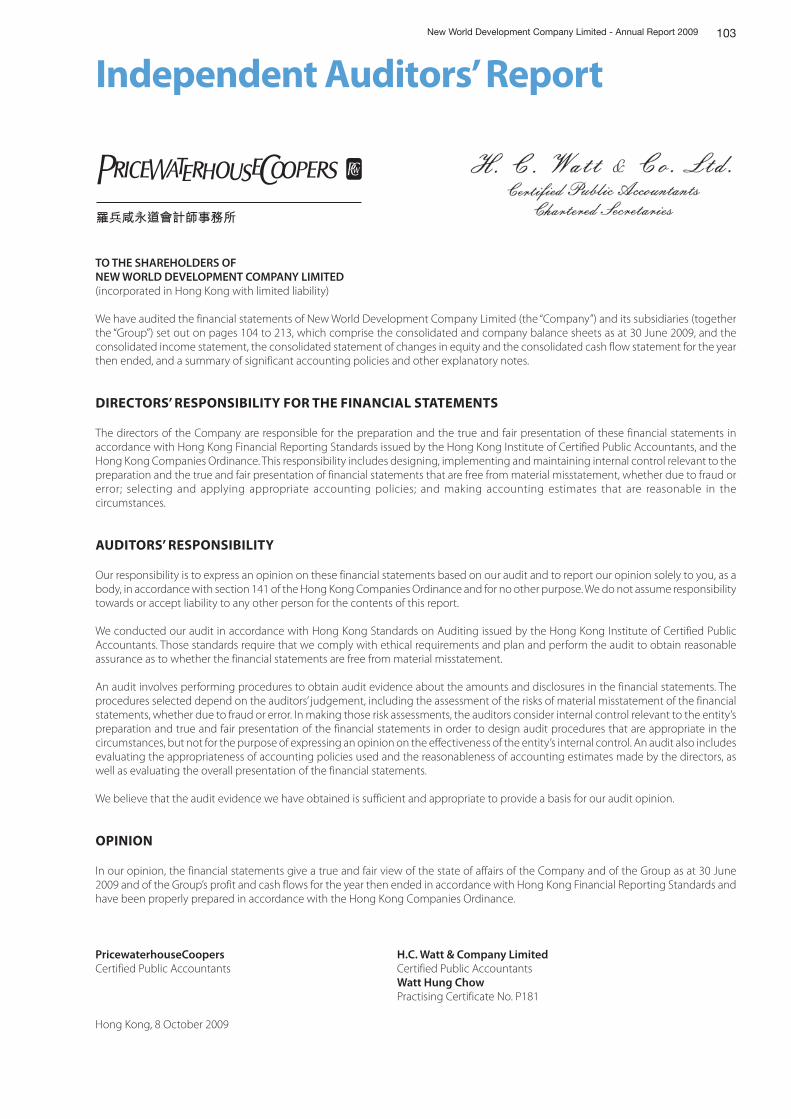
103
Independent Auditors’ ReportNew World Development Company Limited - Annual Report 2009
TO THE SHAREHOLDERS OF NEW WORLD DEVELOPMENT COMPANY LIMITED(incorporated in Hong Kong with limited liability)
We have audited the financial statements of New World Development Company Limited (the “Company”) and its subsidiaries (together the “Group”) set out on pages 104 to 213, which comprise the consolidated and company balance sheets as at 30 June 2009, and the consolidated income statement, the consolidated statement of changes in equity and the consolidated cash flow statement for the year then ended, and a summary of significant accounting policies and other explanatory notes.
DIRECTORS’ RESPONSIBILITY FOR THE FINANCIAL STATEMENTS
The directors of the Company are responsible for the preparation and the true and fair presentation of these financial statements in accordance with Hong Kong Financial Reporting Standards issued by the Hong Kong Institute of Certified Public Accountants, and the Hong Kong Companies Ordinance. This responsibility includes designing, implementing and maintaining internal control relevant to the preparation and the true and fair presentation of financial statements that are free from material misstatement, whether due to fraud or error; selecting and applying appropriate accounting policies; and making accounting estimates that are reasonable in the circumstances.
AUDITORS’ RESPONSIBILITY
Our responsibility is to express an opinion on these financial statements based on our audit and to report our opinion solely to you, as a body, in accordance with section 141 of the Hong Kong Companies Ordinance and for no other purpose. We do not assume responsibility towards or accept liability to any other person for the contents of this report.
We conducted our audit in accordance with Hong Kong Standards on Auditing issued by the Hong Kong Institute of Certified Public Accountants. Those standards require that we comply with ethical requirements and plan and perform the audit to obtain reasonable assurance as to whether the financial statements are free from material misstatement.
An audit involves performing procedures to obtain audit evidence about the amounts and disclosures in the financial statements. The procedures selected depend on the auditors’ judgement, including the assessment of the risks of material misstatement of the financial statements, whether due to fraud or error. In making those risk assessments, the auditors consider internal control relevant to the entity’s preparation and true and fair presentation of the financial statements in order to design audit procedures that are appropriate in the circumstances, but not for the purpose of expressing an opinion on the effectiveness of the entity’s internal control. An audit also includes evaluating the appropriateness of accounting policies used and the reasonableness of accounting estimates made by the directors, as well as evaluating the overall presentation of the financial statements.
We believe that the audit evidence we have obtained is sufficient and appropriate to provide a basis for our audit opinion.
OPINION
In our opinion, the financial statements give a true and fair view of the state of affairs of the Company and of the Group as at 30 June 2009 and of the Group’s profit and cash flows for the year then ended in accordance with Hong Kong Financial Reporting Standards and have been properly prepared in accordance with the Hong Kong Companies Ordinance.
PricewaterhouseCoopers H.C. Watt & Company LimitedCertified Public Accountants Certified Public Accountants Watt Hung Chow Practising Certificate No. P181
Hong Kong, 8 October 2009
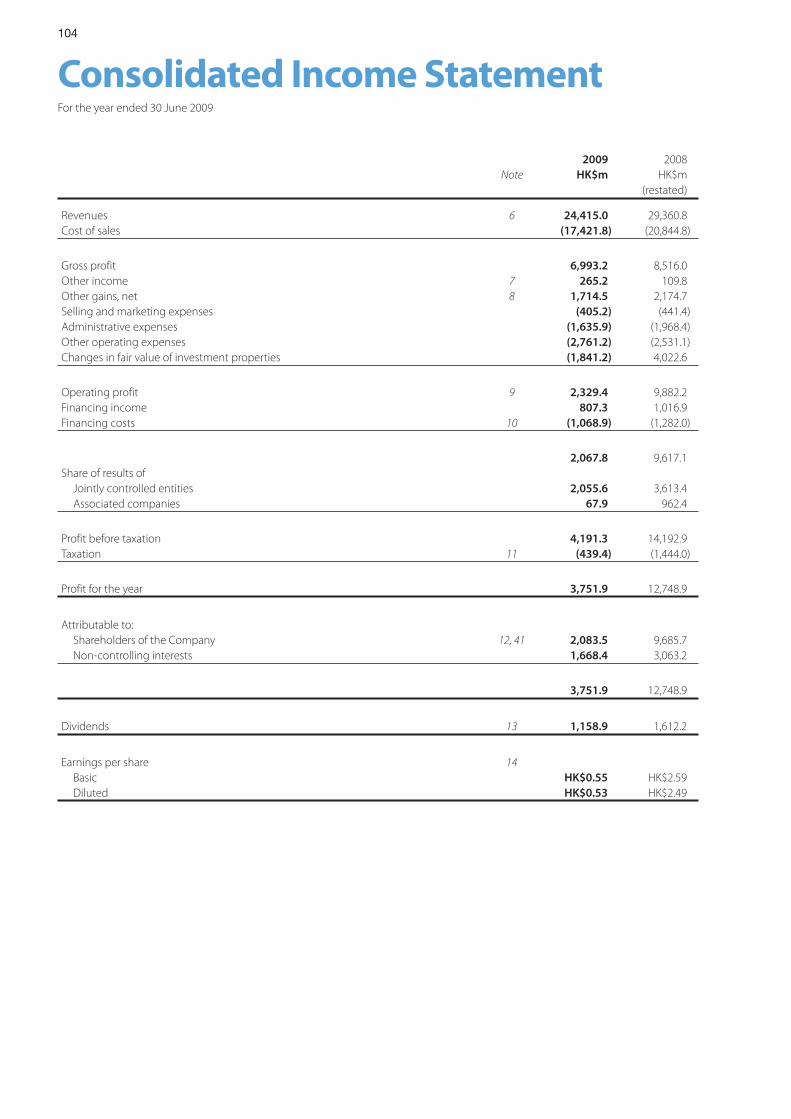
104
Consolidated Income StatementFor the year ended 30 June 2009
2009 2008Note HK$m HK$m
(restated)
Revenues 6 24,415.0 29,360.8Cost of sales (17,421.8) (20,844.8)
Gross profit 6,993.2 8,516.0Other income 7 265.2 109.8Other gains, net 8 1,714.5 2,174.7Selling and marketing expenses (405.2) (441.4)Administrative expenses (1,635.9) (1,968.4)Other operating expenses (2,761.2) (2,531.1)Changes in fair value of investment properties (1,841.2) 4,022.6
Operating profit 9 2,329.4 9,882.2Financing income 807.3 1,016.9Financing costs 10 (1,068.9) (1,282.0)
2,067.8 9,617.1Share of results of Jointly controlled entities 2,055.6 3,613.4 Associated companies 67.9 962.4
Profit before taxation 4,191.3 14,192.9Taxation 11 (439.4) (1,444.0)
Profit for the year 3,751.9 12,748.9
Attributable to: Shareholders of the Company 12, 41 2,083.5 9,685.7 Non-controlling interests 1,668.4 3,063.2
3,751.9 12,748.9
Dividends 13 1,158.9 1,612.2
Earnings per share 14 Basic HK$0.55 HK$2.59 Diluted HK$0.53 HK$2.49
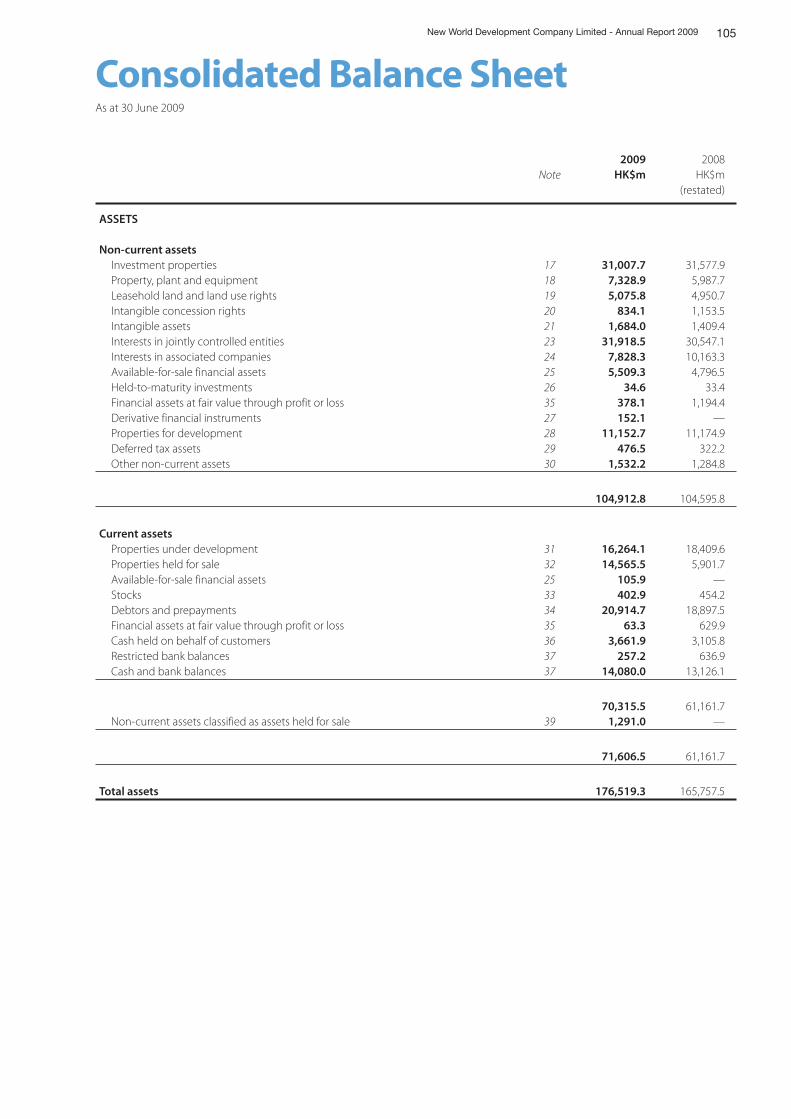
105
Consolidated Balance SheetNew World Development Company Limited - Annual Report 2009
As at 30 June 2009
2009 2008Note HK$m HK$m
(restated)
ASSETS
Non-current assets Investment properties 17 31,007.7 31,577.9 Property, plant and equipment 18 7,328.9 5,987.7 Leasehold land and land use rights 19 5,075.8 4,950.7 Intangible concession rights 20 834.1 1,153.5 Intangible assets 21 1,684.0 1,409.4 Interests in jointly controlled entities 23 31,918.5 30,547.1 Interests in associated companies 24 7,828.3 10,163.3 Available-for-sale financial assets 25 5,509.3 4,796.5 Held-to-maturity investments 26 34.6 33.4 Financial assets at fair value through profit or loss 35 378.1 1,194.4 Derivative financial instruments 27 152.1 — Properties for development 28 11,152.7 11,174.9 Deferred tax assets 29 476.5 322.2 Other non-current assets 30 1,532.2 1,284.8
104,912.8 104,595.8
Current assets Properties under development 31 16,264.1 18,409.6 Properties held for sale 32 14,565.5 5,901.7 Available-for-sale financial assets 25 105.9 — Stocks 33 402.9 454.2 Debtors and prepayments 34 20,914.7 18,897.5 Financial assets at fair value through profit or loss 35 63.3 629.9 Cash held on behalf of customers 36 3,661.9 3,105.8 Restricted bank balances 37 257.2 636.9 Cash and bank balances 37 14,080.0 13,126.1
70,315.5 61,161.7 Non-current assets classified as assets held for sale 39 1,291.0 —
71,606.5 61,161.7
Total assets 176,519.3 165,757.5
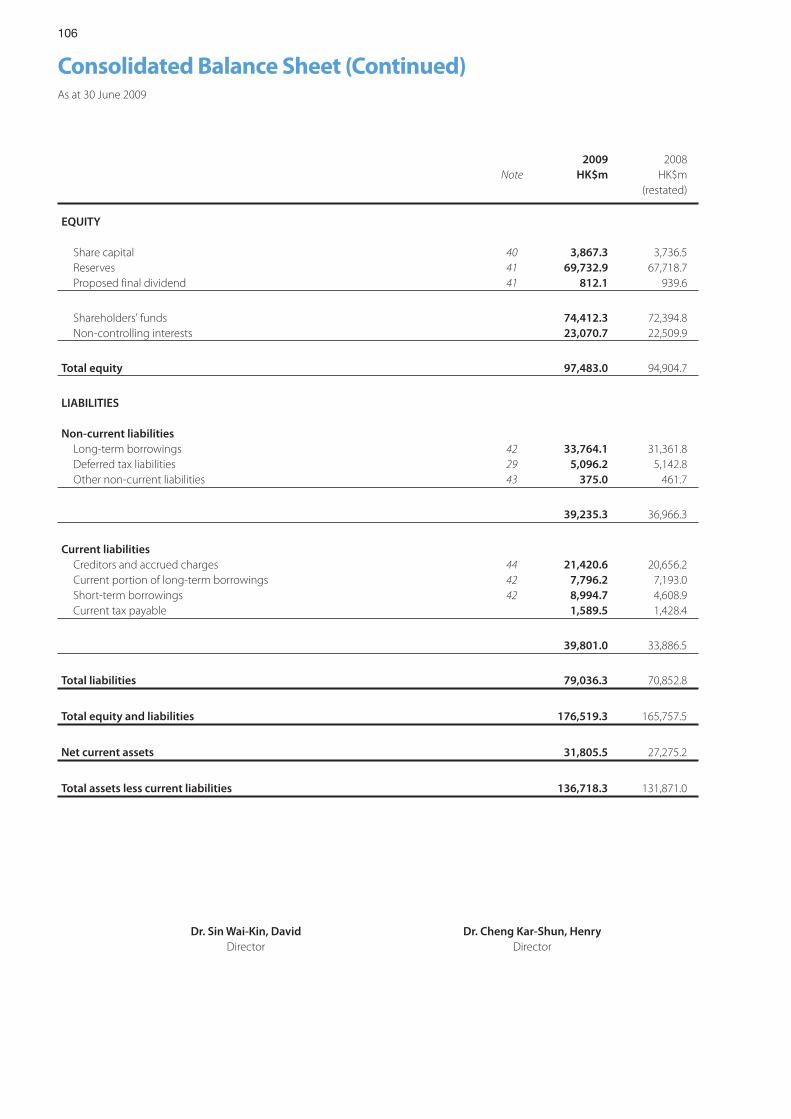
106
As at 30 June 2009
Consolidated Balance Sheet (Continued)
2009 2008Note HK$m HK$m
(restated)
EQUITY
Share capital 40 3,867.3 3,736.5 Reserves 41 69,732.9 67,718.7 Proposed final dividend 41 812.1 939.6
Shareholders’ funds 74,412.3 72,394.8 Non-controlling interests 23,070.7 22,509.9
Total equity 97,483.0 94,904.7
LIABILITIES
Non-current liabilities Long-term borrowings 42 33,764.1 31,361.8 Deferred tax liabilities 29 5,096.2 5,142.8 Other non-current liabilities 43 375.0 461.7
39,235.3 36,966.3
Current liabilities Creditors and accrued charges 44 21,420.6 20,656.2 Current portion of long-term borrowings 42 7,796.2 7,193.0 Short-term borrowings 42 8,994.7 4,608.9 Current tax payable 1,589.5 1,428.4
39,801.0 33,886.5
Total liabilities 79,036.3 70,852.8
Total equity and liabilities 176,519.3 165,757.5
Net current assets 31,805.5 27,275.2
Total assets less current liabilities 136,718.3 131,871.0
Dr. Sin Wai-Kin, David Dr. Cheng Kar-Shun, Henry Director Director
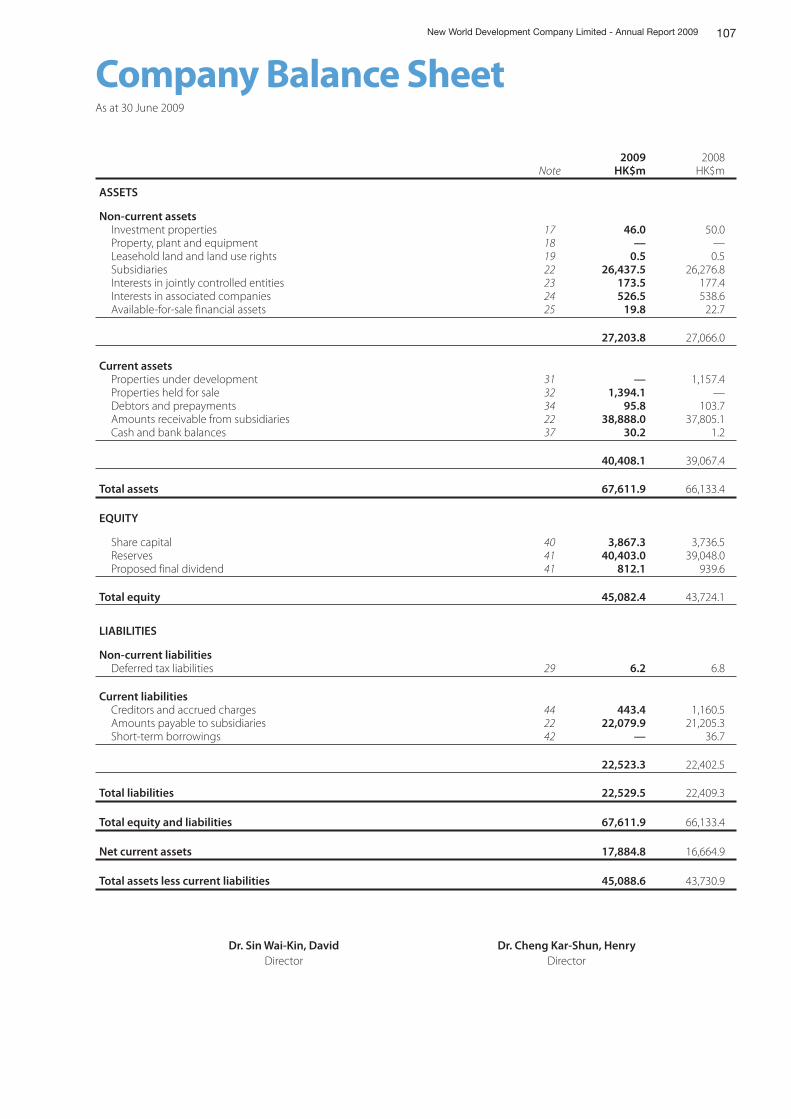
107
Company Balance SheetNew World Development Company Limited - Annual Report 2009
As at 30 June 2009
2009 2008Note HK$m HK$m
ASSETS
Non-current assets Investment properties 17 46.0 50.0 Property, plant and equipment 18 — — Leasehold land and land use rights 19 0.5 0.5 Subsidiaries 22 26,437.5 26,276.8 Interests in jointly controlled entities 23 173.5 177.4 Interests in associated companies 24 526.5 538.6 Available-for-sale financial assets 25 19.8 22.7
27,203.8 27,066.0
Current assets Properties under development 31 — 1,157.4 Properties held for sale 32 1,394.1 — Debtors and prepayments 34 95.8 103.7 Amounts receivable from subsidiaries 22 38,888.0 37,805.1 Cash and bank balances 37 30.2 1.2
40,408.1 39,067.4
Total assets 67,611.9 66,133.4
EQUITY
Share capital 40 3,867.3 3,736.5 Reserves 41 40,403.0 39,048.0 Proposed final dividend 41 812.1 939.6
Total equity 45,082.4 43,724.1
LIABILITIES
Non-current liabilities Deferred tax liabilities 29 6.2 6.8
Current liabilities Creditors and accrued charges 44 443.4 1,160.5 Amounts payable to subsidiaries 22 22,079.9 21,205.3 Short-term borrowings 42 — 36.7
22,523.3 22,402.5
Total liabilities 22,529.5 22,409.3
Total equity and liabilities 67,611.9 66,133.4
Net current assets 17,884.8 16,664.9
Total assets less current liabilities 45,088.6 43,730.9
Dr. Sin Wai-Kin, David Dr. Cheng Kar-Shun, Henry Director Director
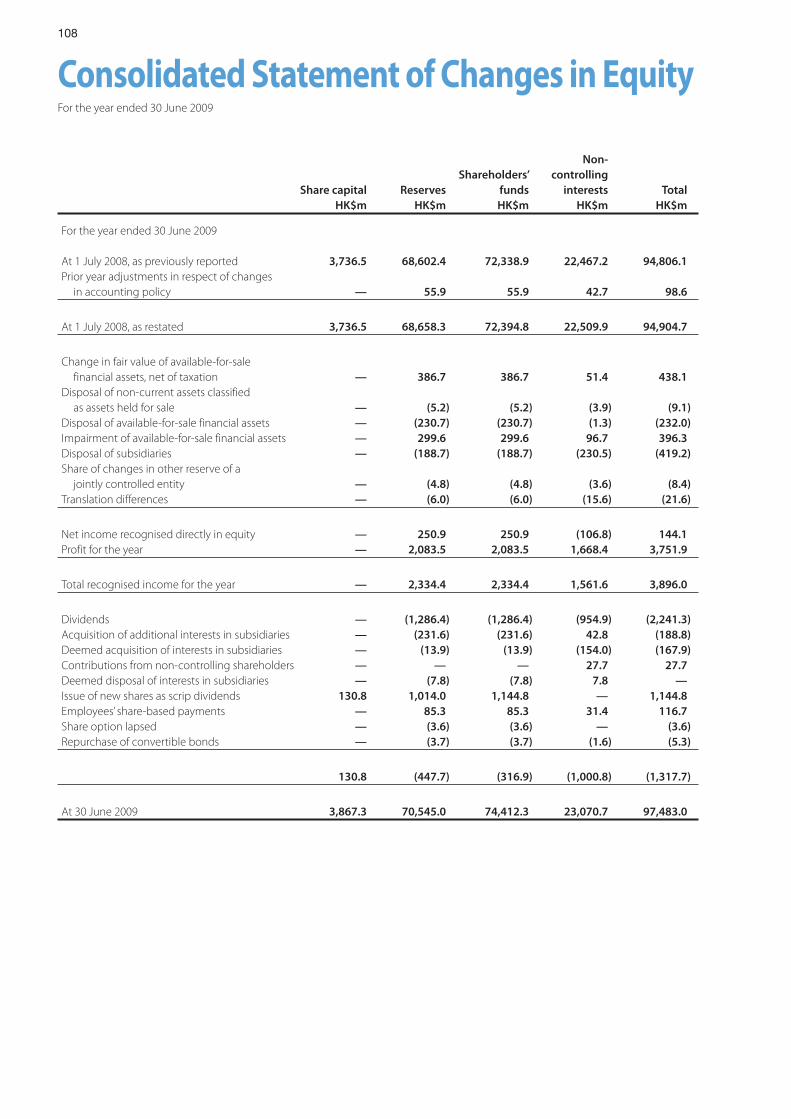
108
Consolidated Statement of Changes in EquityFor the year ended 30 June 2009
Share capital ReservesShareholders’
funds
Non-controlling
interests TotalHK$m HK$m HK$m HK$m HK$m
For the year ended 30 June 2009
At 1 July 2008, as previously reported 3,736.5 68,602.4 72,338.9 22,467.2 94,806.1Prior year adjustments in respect of changes in accounting policy — 55.9 55.9 42.7 98.6
At 1 July 2008, as restated 3,736.5 68,658.3 72,394.8 22,509.9 94,904.7
Change in fair value of available-for-sale financial assets, net of taxation — 386.7 386.7 51.4 438.1Disposal of non-current assets classified as assets held for sale — (5.2) (5.2) (3.9) (9.1)Disposal of available-for-sale financial assets — (230.7) (230.7) (1.3) (232.0)Impairment of available-for-sale financial assets — 299.6 299.6 96.7 396.3Disposal of subsidiaries — (188.7) (188.7) (230.5) (419.2)Share of changes in other reserve of a jointly controlled entity — (4.8) (4.8) (3.6) (8.4)Translation differences — (6.0) (6.0) (15.6) (21.6)
Net income recognised directly in equity — 250.9 250.9 (106.8) 144.1Profit for the year — 2,083.5 2,083.5 1,668.4 3,751.9
Total recognised income for the year — 2,334.4 2,334.4 1,561.6 3,896.0
Dividends — (1,286.4) (1,286.4) (954.9) (2,241.3)Acquisition of additional interests in subsidiaries — (231.6) (231.6) 42.8 (188.8)Deemed acquisition of interests in subsidiaries — (13.9) (13.9) (154.0) (167.9)Contributions from non-controlling shareholders — — — 27.7 27.7Deemed disposal of interests in subsidiaries — (7.8) (7.8) 7.8 —Issue of new shares as scrip dividends 130.8 1,014.0 1,144.8 — 1,144.8Employees’ share-based payments — 85.3 85.3 31.4 116.7Share option lapsed — (3.6) (3.6) — (3.6)Repurchase of convertible bonds — (3.7) (3.7) (1.6) (5.3)
130.8 (447.7) (316.9) (1,000.8) (1,317.7)
At 30 June 2009 3,867.3 70,545.0 74,412.3 23,070.7 97,483.0
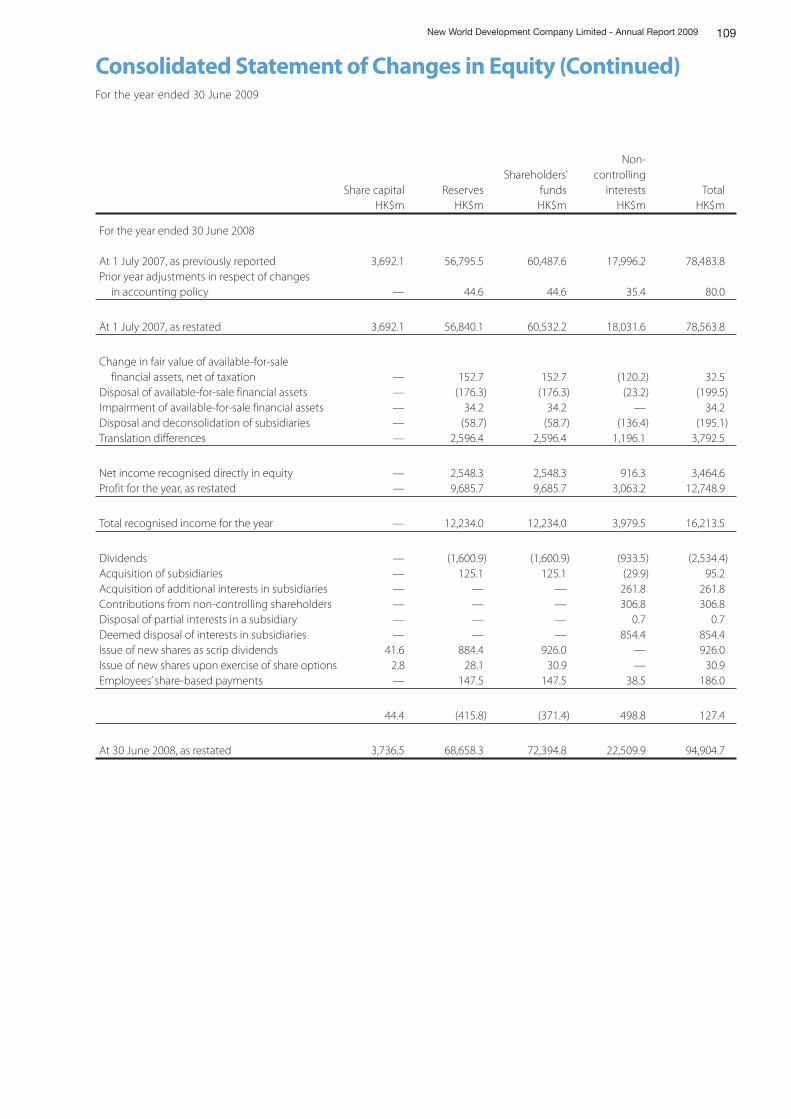
109New World Development Company Limited - Annual Report 2009
For the year ended 30 June 2009
Consolidated Statement of Changes in Equity (Continued)
Share capital ReservesShareholders’
funds
Non-controlling
interests TotalHK$m HK$m HK$m HK$m HK$m
For the year ended 30 June 2008
At 1 July 2007, as previously reported 3,692.1 56,795.5 60,487.6 17,996.2 78,483.8Prior year adjustments in respect of changes in accounting policy — 44.6 44.6 35.4 80.0
At 1 July 2007, as restated 3,692.1 56,840.1 60,532.2 18,031.6 78,563.8
Change in fair value of available-for-sale financial assets, net of taxation — 152.7 152.7 (120.2) 32.5Disposal of available-for-sale financial assets — (176.3) (176.3) (23.2) (199.5)Impairment of available-for-sale financial assets — 34.2 34.2 — 34.2Disposal and deconsolidation of subsidiaries — (58.7) (58.7) (136.4) (195.1)Translation differences — 2,596.4 2,596.4 1,196.1 3,792.5
Net income recognised directly in equity — 2,548.3 2,548.3 916.3 3,464.6Profit for the year, as restated — 9,685.7 9,685.7 3,063.2 12,748.9
Total recognised income for the year — 12,234.0 12,234.0 3,979.5 16,213.5
Dividends — (1,600.9) (1,600.9) (933.5) (2,534.4)Acquisition of subsidiaries — 125.1 125.1 (29.9) 95.2Acquisition of additional interests in subsidiaries — — — 261.8 261.8Contributions from non-controlling shareholders — — — 306.8 306.8Disposal of partial interests in a subsidiary — — — 0.7 0.7Deemed disposal of interests in subsidiaries — — — 854.4 854.4Issue of new shares as scrip dividends 41.6 884.4 926.0 — 926.0Issue of new shares upon exercise of share options 2.8 28.1 30.9 — 30.9Employees’ share-based payments — 147.5 147.5 38.5 186.0
44.4 (415.8) (371.4) 498.8 127.4
At 30 June 2008, as restated 3,736.5 68,658.3 72,394.8 22,509.9 94,904.7
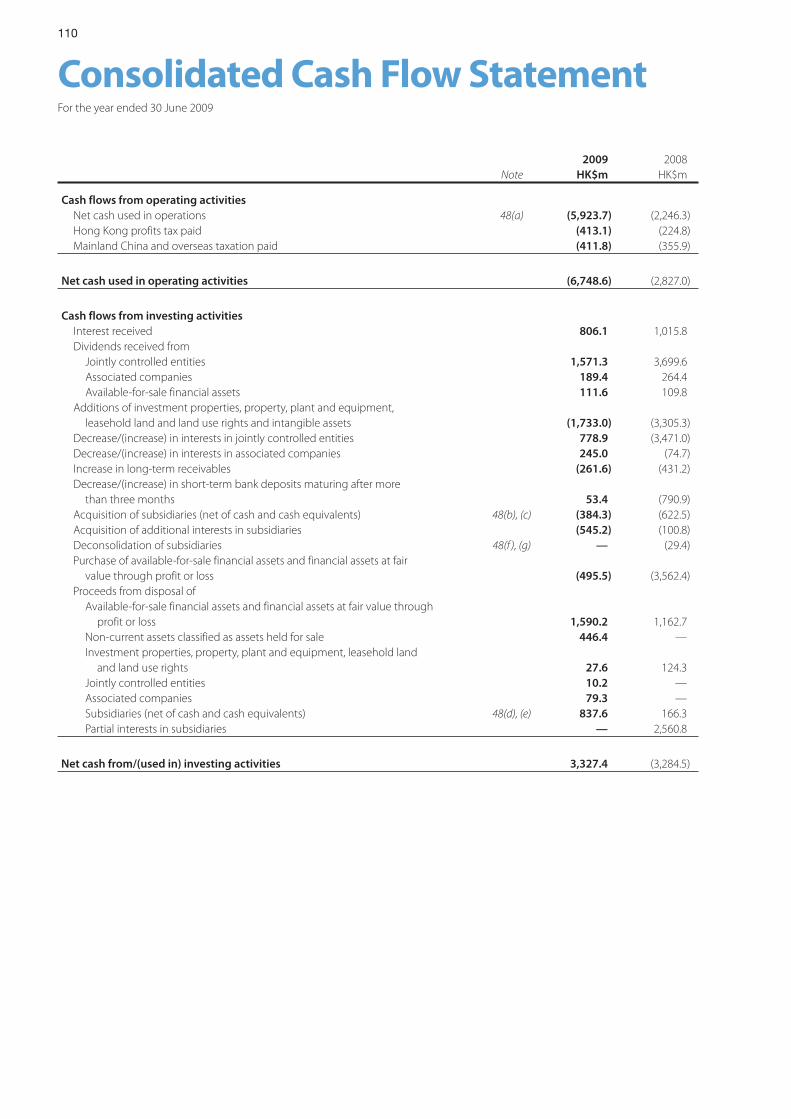
110
Consolidated Cash Flow StatementFor the year ended 30 June 2009
2009 2008Note HK$m HK$m
Cash flows from operating activities Net cash used in operations 48(a) (5,923.7) (2,246.3) Hong Kong profits tax paid (413.1) (224.8) Mainland China and overseas taxation paid (411.8) (355.9)
Net cash used in operating activities (6,748.6) (2,827.0)
Cash flows from investing activities Interest received 806.1 1,015.8 Dividends received from Jointly controlled entities 1,571.3 3,699.6 Associated companies 189.4 264.4 Available-for-sale financial assets 111.6 109.8 Additions of investment properties, property, plant and equipment, leasehold land and land use rights and intangible assets (1,733.0) (3,305.3) Decrease/(increase) in interests in jointly controlled entities 778.9 (3,471.0) Decrease/(increase) in interests in associated companies 245.0 (74.7) Increase in long-term receivables (261.6) (431.2) Decrease/(increase) in short-term bank deposits maturing after more than three months 53.4 (790.9) Acquisition of subsidiaries (net of cash and cash equivalents) 48(b), (c) (384.3) (622.5) Acquisition of additional interests in subsidiaries (545.2) (100.8) Deconsolidation of subsidiaries 48(f ), (g) — (29.4) Purchase of available-for-sale financial assets and financial assets at fair value through profit or loss (495.5) (3,562.4) Proceeds from disposal of Available-for-sale financial assets and financial assets at fair value through profit or loss 1,590.2 1,162.7 Non-current assets classified as assets held for sale 446.4 — Investment properties, property, plant and equipment, leasehold land and land use rights 27.6 124.3 Jointly controlled entities 10.2 — Associated companies 79.3 — Subsidiaries (net of cash and cash equivalents) 48(d), (e) 837.6 166.3 Partial interests in subsidiaries — 2,560.8
Net cash from/(used in) investing activities 3,327.4 (3,284.5)
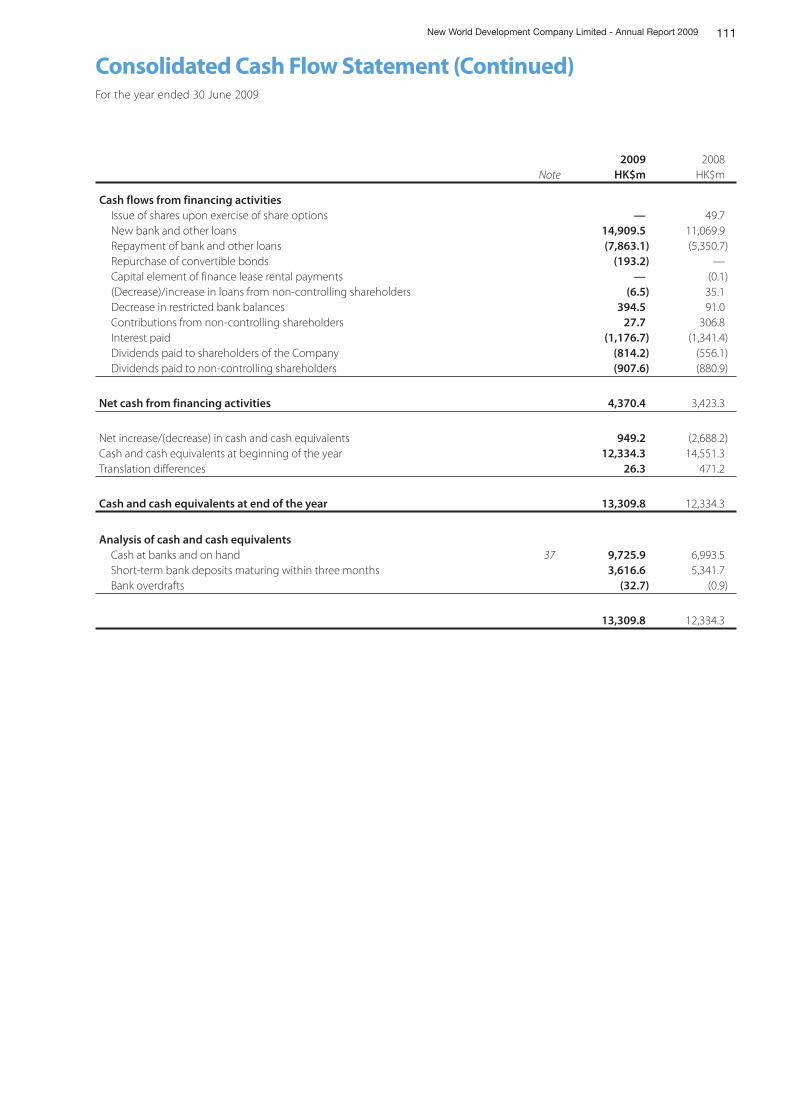
111New World Development Company Limited - Annual Report 2009
For the year ended 30 June 2009
Consolidated Cash Flow Statement (Continued)
2009 2008Note HK$m HK$m
Cash flows from financing activities Issue of shares upon exercise of share options — 49.7 New bank and other loans 14,909.5 11,069.9 Repayment of bank and other loans (7,863.1) (5,350.7) Repurchase of convertible bonds (193.2) — Capital element of finance lease rental payments — (0.1) (Decrease)/increase in loans from non-controlling shareholders (6.5) 35.1 Decrease in restricted bank balances 394.5 91.0 Contributions from non-controlling shareholders 27.7 306.8 Interest paid (1,176.7) (1,341.4) Dividends paid to shareholders of the Company (814.2) (556.1) Dividends paid to non-controlling shareholders (907.6) (880.9)
Net cash from financing activities 4,370.4 3,423.3
Net increase/(decrease) in cash and cash equivalents 949.2 (2,688.2)Cash and cash equivalents at beginning of the year 12,334.3 14,551.3Translation differences 26.3 471.2
Cash and cash equivalents at end of the year 13,309.8 12,334.3
Analysis of cash and cash equivalents Cash at banks and on hand 37 9,725.9 6,993.5 Short-term bank deposits maturing within three months 3,616.6 5,341.7 Bank overdrafts (32.7) (0.9)
13,309.8 12,334.3
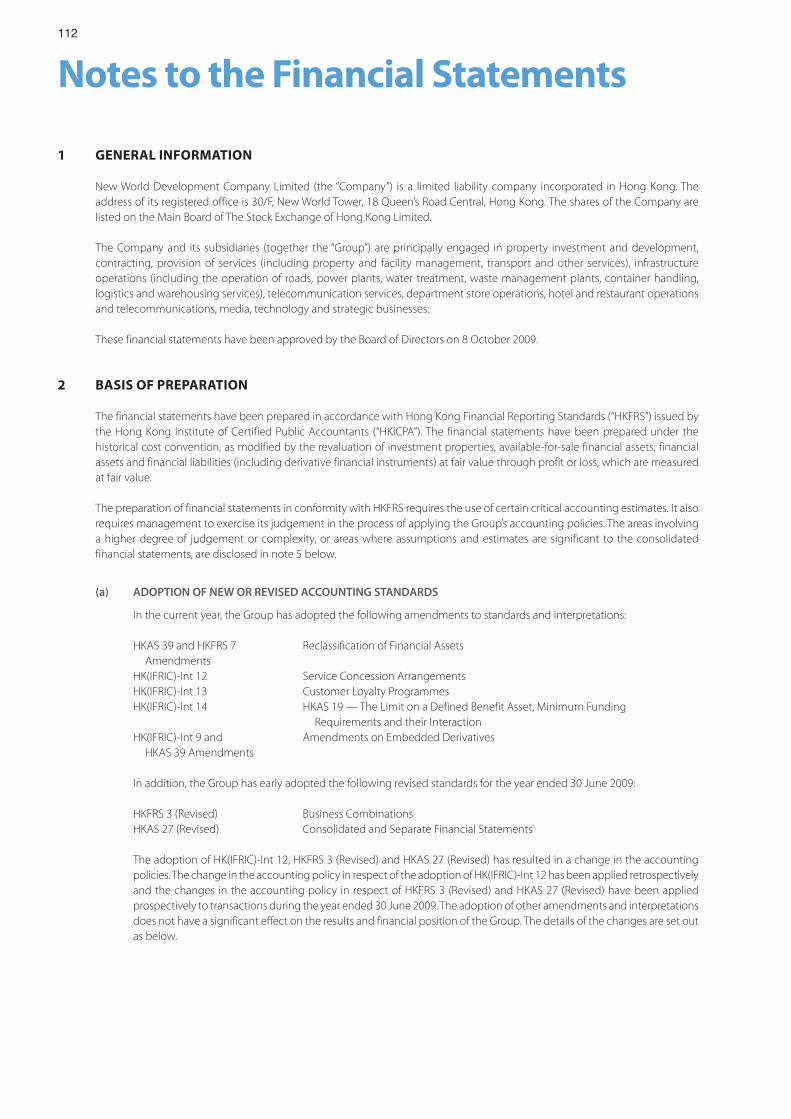
112
Notes to the Financial Statements
1 GENERAL INFORMATION
New World Development Company Limited (the “Company”) is a limited liability company incorporated in Hong Kong. The address of its registered office is 30/F, New World Tower, 18 Queen’s Road Central, Hong Kong. The shares of the Company are listed on the Main Board of The Stock Exchange of Hong Kong Limited.
The Company and its subsidiaries (together the “Group”) are principally engaged in property investment and development, contracting, provision of services (including property and facility management, transport and other services), infrastructure operations (including the operation of roads, power plants, water treatment, waste management plants, container handling, logistics and warehousing services), telecommunication services, department store operations, hotel and restaurant operations and telecommunications, media, technology and strategic businesses.
These financial statements have been approved by the Board of Directors on 8 October 2009.
2 BASIS OF PREPARATION
The financial statements have been prepared in accordance with Hong Kong Financial Reporting Standards (“HKFRS”) issued by the Hong Kong Institute of Certified Public Accountants (“HKICPA”). The financial statements have been prepared under the historical cost convention, as modified by the revaluation of investment properties, available-for-sale financial assets, financial assets and financial liabilities (including derivative financial instruments) at fair value through profit or loss, which are measured at fair value.
The preparation of financial statements in conformity with HKFRS requires the use of certain critical accounting estimates. It also requires management to exercise its judgement in the process of applying the Group’s accounting policies. The areas involving a higher degree of judgement or complexity, or areas where assumptions and estimates are significant to the consolidated financial statements, are disclosed in note 5 below.
(a) ADOPTION OF NEW OR REVISED ACCOUNTING STANDARDS
In the current year, the Group has adopted the following amendments to standards and interpretations:
HKAS 39 and HKFRS 7 Reclassification of Financial Assets AmendmentsHK(IFRIC)-Int 12 Service Concession ArrangementsHK(IFRIC)-Int 13 Customer Loyalty ProgrammesHK(IFRIC)-Int 14 HKAS 19 — The Limit on a Defined Benefit Asset, Minimum Funding
Requirements and their InteractionHK(IFRIC)-Int 9 and Amendments on Embedded Derivatives HKAS 39 Amendments
In addition, the Group has early adopted the following revised standards for the year ended 30 June 2009:
HKFRS 3 (Revised) Business CombinationsHKAS 27 (Revised) Consolidated and Separate Financial Statements
The adoption of HK(IFRIC)-Int 12, HKFRS 3 (Revised) and HKAS 27 (Revised) has resulted in a change in the accounting policies. The change in the accounting policy in respect of the adoption of HK(IFRIC)-Int 12 has been applied retrospectively and the changes in the accounting policy in respect of HKFRS 3 (Revised) and HKAS 27 (Revised) have been applied prospectively to transactions during the year ended 30 June 2009. The adoption of other amendments and interpretations does not have a significant effect on the results and financial position of the Group. The details of the changes are set out as below.
113New World Development Company Limited - Annual Report 2009
Notes to the Financial Statements (Continued)
2 BASIS OF PREPARATION (Continued)
(a) ADOPTION OF NEW OR REVISED ACCOUNTING STANDARDS (Continued)
HK(IFRIC)-Int 12:
HK(IFRIC)-Int 12 applies to contractual service concession arrangements (“Service Concessions”) whereby the Group participates in the development, financing, operation and maintenance of infrastructures for public services, such as toll roads and bridges, power plants and water treatment plants (the “Infrastructures”). Prior to the adoption of HK(IFRIC)-Int 12, the costs incurred for the construction or upgrade work or the acquisition of the Infrastructures under the Service Concessions were accounted for as property, plant and equipment. On the adoption of HK(IFRIC)-Int 12, these Service Concessions are accounted for as intangible assets to the extent that the Group receives a right to charge users of the respective Infrastructures, or as financial assets to the extent that the Group has an unconditional contractual right to receive cash or another financial asset from or at the direction of the granting authorities under the service concession arrangement.
Intangible assets resulting from the application of HK(IFRIC)-Int 12 are recorded in the balance sheet as “Intangible concession rights”. The intangible concession rights are amortised, where applicable, on an economic usage basis for roads and bridges or on a straight-line basis for water treatment plants over the periods to which the Group is granted the rights to operate these Infrastructures.
Financial assets held by jointly controlled entities resulting from the application of HK(IFRIC)-Int 12 are recognised initially at fair value and subsequently measured at amortised cost using the effective interest method.
Furthermore, the Group recognises income and expenses associated with construction services and upgrade services provided under the Service Concessions in accordance with the Group’s accounting policy on construction revenue.
HKFRS 3 (Revised) and HKAS 27 (Revised):
HKFRS 3 (Revised) continued to apply the acquisition method to business combinations, with some significant changes. For example, all acquisition-related costs should be expensed. The cost of acquisition includes the fair value at the acquisition date of any contingent purchase consideration. In a business combination undertaken in phases/stages, the previously held equity interest in the acquiree is remeasured at fair value and the difference between its fair value and carrying amount is recognised in the income statement. There is a choice, on the basis of each acquisition, to measure the non-controlling interest in the acquiree either at fair value or at the non-controlling interest’s proportionate share of the acquiree’s net assets.
As the Group has early adopted HKFRS 3 (Revised), it is required to early adopt HKAS 27 (Revised) at the same time. HKAS 27 (Revised) provides that the transactions undertaken with non-controlling interests that do not result in the loss of control are accounted for as equity transactions and these transactions will no longer result in goodwill or gains and losses. When control is lost, any remaining interest in the entity is remeasured to fair value and the difference between the fair value and the carrying amount is recognised in the income statement.
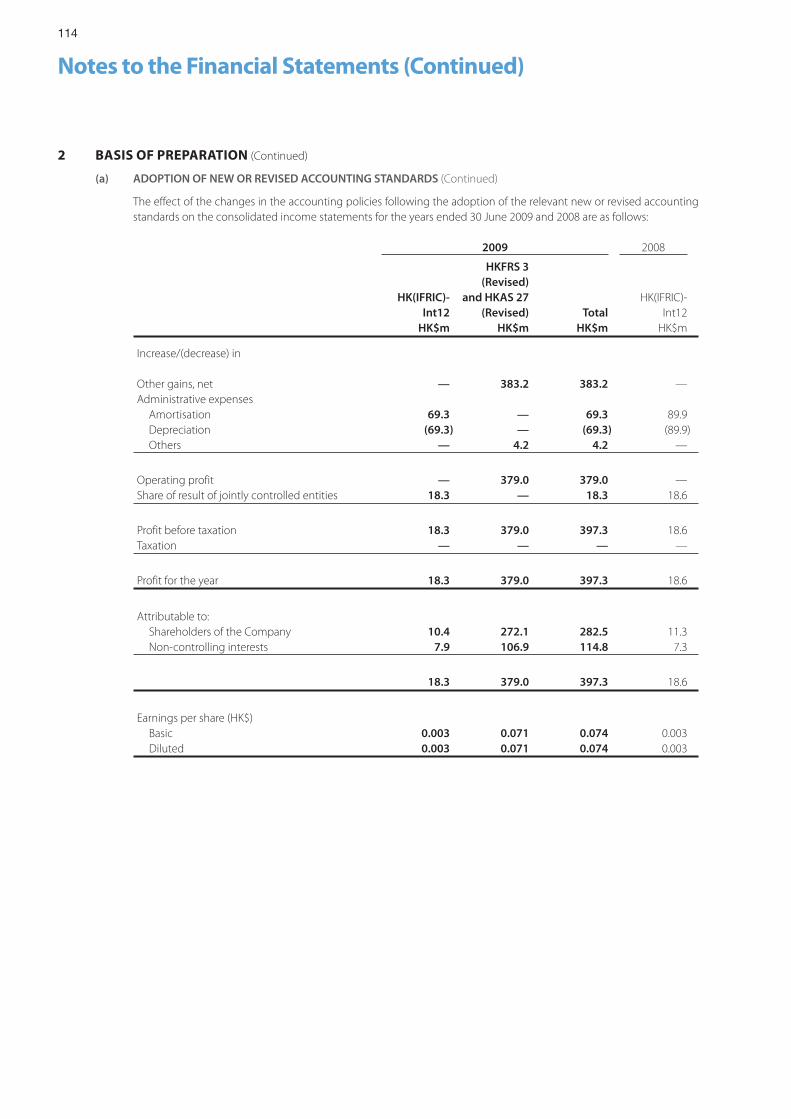
114
Notes to the Financial Statements (Continued)
2 BASIS OF PREPARATION (Continued)
(a) ADOPTION OF NEW OR REVISED ACCOUNTING STANDARDS (Continued)
The effect of the changes in the accounting policies following the adoption of the relevant new or revised accounting standards on the consolidated income statements for the years ended 30 June 2009 and 2008 are as follows:
2009 2008
HK(IFRIC)-Int12
HKFRS 3 (Revised)
and HKAS 27 (Revised) Total
HK(IFRIC)-Int12
HK$m HK$m HK$m HK$m
Increase/(decrease) in
Other gains, net — 383.2 383.2 —Administrative expenses Amortisation 69.3 — 69.3 89.9 Depreciation (69.3) — (69.3) (89.9) Others — 4.2 4.2 —
Operating profit — 379.0 379.0 —Share of result of jointly controlled entities 18.3 — 18.3 18.6
Profit before taxation 18.3 379.0 397.3 18.6Taxation — — — —
Profit for the year 18.3 379.0 397.3 18.6
Attributable to: Shareholders of the Company 10.4 272.1 282.5 11.3 Non-controlling interests 7.9 106.9 114.8 7.3
18.3 379.0 397.3 18.6
Earnings per share (HK$) Basic 0.003 0.071 0.074 0.003 Diluted 0.003 0.071 0.074 0.003
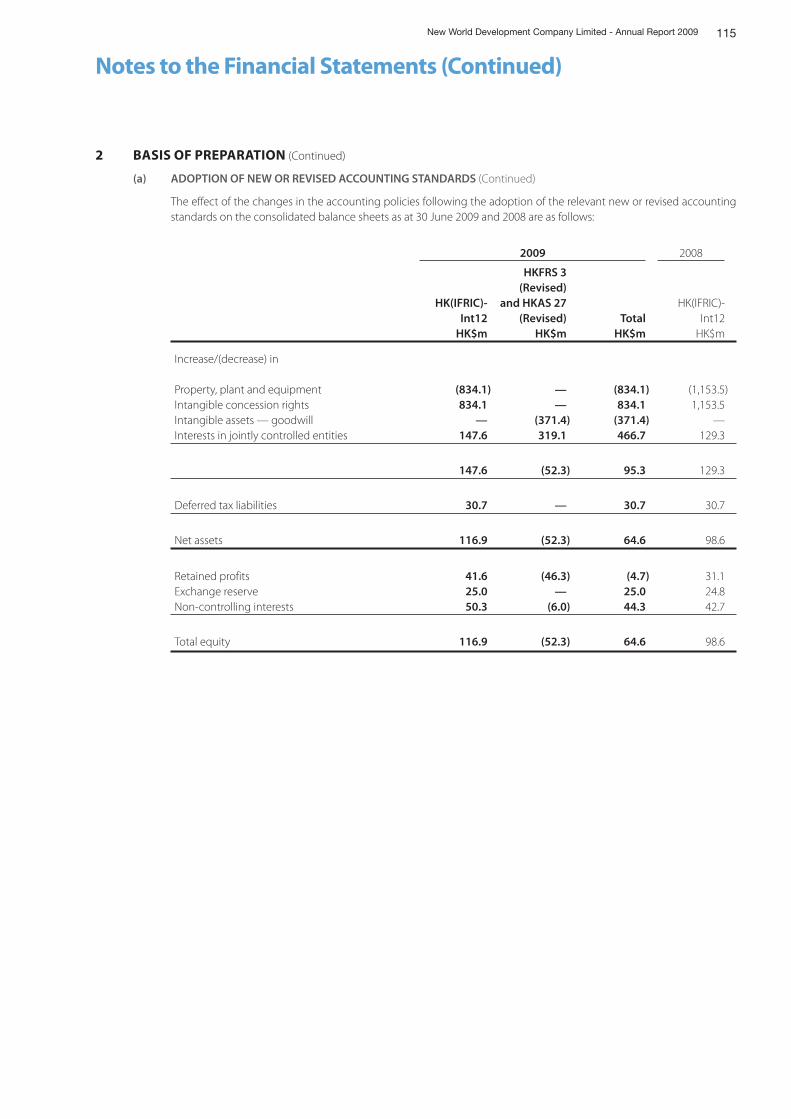
115New World Development Company Limited - Annual Report 2009
Notes to the Financial Statements (Continued)
2 BASIS OF PREPARATION (Continued)
(a) ADOPTION OF NEW OR REVISED ACCOUNTING STANDARDS (Continued)
The effect of the changes in the accounting policies following the adoption of the relevant new or revised accounting standards on the consolidated balance sheets as at 30 June 2009 and 2008 are as follows:
2009 2008
HK(IFRIC)-Int12
HKFRS 3 (Revised)
and HKAS 27 (Revised) Total
HK(IFRIC)-Int12
HK$m HK$m HK$m HK$m
Increase/(decrease) in
Property, plant and equipment (834.1) — (834.1) (1,153.5)Intangible concession rights 834.1 — 834.1 1,153.5Intangible assets — goodwill — (371.4) (371.4) —Interests in jointly controlled entities 147.6 319.1 466.7 129.3
147.6 (52.3) 95.3 129.3
Deferred tax liabilities 30.7 — 30.7 30.7
Net assets 116.9 (52.3) 64.6 98.6
Retained profits 41.6 (46.3) (4.7) 31.1Exchange reserve 25.0 — 25.0 24.8Non-controlling interests 50.3 (6.0) 44.3 42.7
Total equity 116.9 (52.3) 64.6 98.6
116
Notes to the Financial Statements (Continued)
2 BASIS OF PREPARATION (Continued)
(b) STANDARDS, AMENDMENTS AND INTERPRETATIONS WHICH ARE NOT YET EFFECTIVE
The following new/revised standards, amendments and interpretations are mandatory for the Group’s accounting periods beginning on or after 1 July 2009 but which the Group has not early adopted, are as follows:
Effective for the year ending 30 June 2010
HKFRS 1 (Revised) First-time Adoption of HKFRSHKFRS 1 and Cost of an Investment in a Subsidiary, Jointly Controlled Entity or Associate HKAS 27 AmendmentsHKFRS 2 Amendments Vesting Conditions and CancellationsHKFRS 7 Amendments Financial Instruments: Disclosures — Improving Disclosures about Financial
InstrumentsHKFRS 8 Operating SegmentsHKAS 1 (Revised) Presentation of Financial StatementsHKAS 23 (Revised) Borrowing CostsHKAS 32 and HKAS 1 Puttable Financial Instruments and Obligations Arising on Liquidation AmendmentsHKAS 39 Amendments Eligible Hedged ItemsHK(IFRIC)-Int 15 Agreements for the Construction of Real EstateHK(IFRIC)-Int 16 Hedges of a Net Investment in a Foreign OperationHK(IFRIC)-Int 17 Distributions of Non-cash Assets to OwnersHK(IFRIC)-Int 18 Transfers of Assets from CustomersHKFRSs Amendments Improvement to HKFRSs 2008
Effective for the year ending 30 June 2011
HKFRS 1 Amendments Additional Exemptions for First-time AdoptersHKFRS 2 Amendments Group Cash-settled Share-based Payment TransactionsHKFRSs Amendments Improvement to HKFRSs 2009
The Group has already commenced an assessment of the impact of these new or revised standards, amendments and interpretations, certain of which are relevant to the Group’s operation and will give rise to changes in presentation, disclosures and measurements of certain items in the financial statements.
117New World Development Company Limited - Annual Report 2009
Notes to the Financial Statements (Continued)
3 PRINCIPAL ACCOUNTING POLICIES
The principal accounting policies adopted for the preparation of these financial statements, which have been consistently applied to all the years presented, unless otherwise stated, are set out as below:
(a) CONSOLIDATION
The consolidated financial statements incorporate the financial statements of the Company and all its subsidiaries made up to 30 June.
(i) Subsidiaries
Subsidiaries are all entities (including special purpose entities) over which the Group has the power to govern the financial and operating policies generally accompanying a shareholding of more than one half of the voting rights. The existence and effect of potential voting rights that are currently exercisable or convertible are considered when assessing whether the Group controls another entity. Subsidiaries are fully consolidated from the date on which control is transferred to the Group. They are deconsolidated from the date that control ceases. Any investment retained in the former subsidiary is recognised at its fair value at the date when control is lost.
The acquisition method of accounting is used to account for business combinations by the Group. The consideration transferred for the acquisition of a subsidiary is the fair values of the assets transferred, the liabilities incurred and the equity interests issued by the Group. The consideration transferred includes the fair value of any asset or liability resulting from a contingent consideration arrangement. Acquisition-related costs are expensed as incurred. Identifiable assets acquired and liabilities and contingent liabilities assumed in a business combination are measured initially at their fair values at the acquisition date. There is a choice, on the basis of each acquisition to measure the non-controlling interest in the acquiree either at fair value or at the non-controlling interest’s proportionate share of the acquiree’s net assets.
The excess of the consideration transferred, the amount of any non-controlling interest in the acquiree and the fair value of any previous equity interest in the acquiree at the date of acquisition over the fair value of the Group’s share of the identifiable net assets acquired is recorded as goodwill. If this is less than the fair value of the net assets of the subsidiary acquired in the case of a bargain purchase, the difference is recognised directly in the income statement.
Inter-company transactions, balances and unrealised gains on transactions between Group companies are eliminated. Unrealised losses are also eliminated. Accounting policies of subsidiaries have been changed where necessary to ensure consistency with the policies adopted by the Group.
The Company’s investments in subsidiaries are stated at cost less provision for impairment losses. The results of subsidiaries are accounted for by the Company on the basis of dividend received and receivable.
118
Notes to the Financial Statements (Continued)
3 PRINCIPAL ACCOUNTING POLICIES (Continued)
(a) CONSOLIDATION (Continued)
(ii) Joint ventures
(1) Jointly controlled entitiesA jointly controlled entity is a joint venture established as a corporation, partnership or other entity in which the venturers have their respective interests and establish a contractual arrangement among them to define their joint control over the economic activity of the entity.
The Group recognises its interest in jointly controlled entities using equity method of accounting. Interests in jointly controlled entities are stated in the consolidated financial statements at cost plus the share of post-acquisition results and reserves and goodwill on acquisition less provision for impairment losses. Goodwill represents the excess of the cost of an acquisition over the fair value of the Group’s share of the net identifiable assets of the acquired jointly controlled entities at the date of acquisition. The interests in jointly controlled entities also include long-term interest that, in substance, form part of the Group’s net investment in the jointly controlled entities. The share of post-acquisition results and reserves is based on the relevant profit sharing ratios which vary according to the nature of the jointly controlled entities set out as follows:
Equity joint ventures/wholly foreign owned enterprises
Equity joint ventures/wholly foreign owned enterprises are joint ventures in respect of which the capital contribution ratios of the venturers are defined in the joint venture contracts and the profit sharing ratios of the venturers are in proportion to the capital contribution ratios.
Co-operative joint ventures
Co-operative joint ventures are joint ventures in respect of which the profit sharing ratios of the venturers and share of net assets upon the expiration of the joint venture periods are not in proportion to their capital contribution ratios but are as defined in the joint venture contracts.
Companies limited by shares
Companies limited by shares are limited liability companies in respect of which each shareholder’s beneficial interests therein is in accordance with the amount of the voting share capital held thereby.
The Group recognises the portion of gains or losses on the sale of assets by the Group to the jointly controlled entity that it is attributable to the other venturers. The Group does not recognise its share of profits or losses from the jointly controlled entity that result from the purchase of assets from the jointly controlled entity until it resells the assets to an independent party. However, a loss on the transaction is recognised immediately if the loss provides evidence of a reduction in the net realisable value of current assets, or an impairment loss.
For equity accounting purpose, accounting policies of jointly controlled entities have been changed where necessary to ensure consistency with the policies adopted by the Group.
The Company’s interests in jointly controlled entities are stated at cost less provision for impairment losses. The results of jointly controlled entities are accounted for by the Company on the basis of dividend received and receivable.
(2) Jointly controlled operationsThe assets that the Group controls and liabilities that the Group incurs in relation to the jointly controlled operation are recognised in the balance sheet on an accrual basis and classified according to the nature of the item. The expenses that the Group incurs and its share of income that it earns from the jointly controlled operations are included in the income statement.
119New World Development Company Limited - Annual Report 2009
Notes to the Financial Statements (Continued)
3 PRINCIPAL ACCOUNTING POLICIES (Continued)
(a) CONSOLIDATION (Continued)
(iii) Associated companies
An associated company is a company other than a subsidiary and a jointly controlled entity, in which the Group has significant influence exercised through representatives on the board of directors.
Investments in associated companies are accounted for by the equity method of accounting and are initially recognised at cost. The Group’s investments in associated companies include goodwill (net of any accumulated impairment loss) identified on acquisition. Goodwill represents the excess of the cost of an acquisition over the fair value of the Group’s share of the net identifiable assets of the acquired associated companies at the date of acquisition. The interests in associated companies also include long-term interest that, in substance, form part of the Group’s net investment in the associated companies.
The Group’s share of its associated companies’ post acquisition profits or losses is recognised in the consolidated income statement, and the share of post-acquisition movements in reserves is recognised in equity. The cumulative post-acquisition movements are adjusted against the carrying amount of the investment. When the share of losses in an associated company equals or exceeds its interest in the associated company, including any other unsecured receivable, the Group does not recognise further losses, unless it has incurred obligations or made payments on behalf of the associated company.
Unrealised gains on transactions between the Group and its associated companies are eliminated to the extent of the Group’s interest in the associated companies. Unrealised losses are also eliminated unless the transaction provides evidence of an impairment of the asset transferred. For equity accounting purpose, accounting policies of associated companies have been changed where necessary to ensure consistency with the policies adopted by the Group.
The Company’s investments in associated companies are stated at cost less provision for impairment losses. The results of associated companies are accounted for by the Company on the basis of dividend income received and receivable.
(iv) Transactions with non-controlling interests
Non-controlling interests (previously known as minority interests) is the equity in a subsidiary which is not attributable, directly or indirectly, to a parent. The Group treats transactions with non-controlling interests (namely, acquisitions of additional interests and disposals of partial interests in subsidiaries that do not result in a loss of control) as transactions with equity owners of the Group, instead of transactions with parties not within the Group. For purchases of additional interests in subsidiaries from non-controlling shareholders, the difference between any consideration paid and the relevant share acquired of the carrying value of net assets of the subsidiary is recorded in equity. Gains or losses on disposals of partial interests to non-controlling shareholders are also recorded in equity.
(b) INTANGIBLE ASSETS
(i) Goodwill
Goodwill on acquisitions of subsidiaries is included in intangible assets. Goodwill on acquisitions of jointly controlled entities and associated companies is included in interests in jointly controlled entities and associated companies respectively and is tested for impairment as part of overall balance. Separately recognised goodwill is tested annually for impairment and carried at cost less accumulated impairment losses. Impairment losses on goodwill are not reversed. Gains and losses on the disposal of all or part of an entity include the carrying amount of goodwill relating to the entity sold.
Goodwill is allocated to cash-generating units for the purpose of testing for impairment. The allocation is made to those cash-generating units or groups of cash-generating units that are expected to benefit from the business combination in which the goodwill arose.
120
Notes to the Financial Statements (Continued)
3 PRINCIPAL ACCOUNTING POLICIES (Continued)
(b) INTANGIBLE ASSETS (Continued)
(ii) Trademark and licences
Acquired trademark and licenses are recognised initially at cost. Acquired trademark has a finite useful life and is carried at cost less accumulated amortisation and impairment. Amortisation is calculated using the straight-line method to allocate the cost of trademark over their estimated useful lives of 20 years.
Licences with indefinite lives are carried at cost less impairment. Such licences are not amortised. The useful lives of licences are reviewed annually to determine whether indefinite life assessment continues to be supportable. If not, the change in the useful life assessment from indefinite to finite is accounted for on a prospective basis.
(iii) Operating right
Operating right primarily resulted from the acquisition of right to operate facilities rental business. Operating right is carried at cost less accumulated amortisation and impairment. Amortisation is calculated using the straight-line method to allocate the cost over the period of the operating right.
(iv) Intangible concession rights
Where the Group has entered into contractual service arrangements (“Service Concessions”) with local government authorities for its participation in the development, financing, operation and maintenance of various infrastructures for public services, such as toll roads and bridges, power plants and water treatment plants (the “Infrastructures”). The Group carries out the construction or upgrade work of Infrastructures for the granting authorities in exchange for the right to operate the Infrastructures concerned and the right to collect the fees for a specified period of time. The fees collected during the operating periods are attributable to the Group. The relevant Infrastructures are required to be returned to the local government authorities upon the expiry of the operating rights without significant compensation to the Group.
The Group applies the intangible asset model to account for the Infrastructures where they are paid by the users of the Infrastructures and the concession grantors (the respective local governments) have not provided any contractual guarantees in respect of the amounts of construction costs incurred to be recoverable.
Land use rights acquired in conjunction with the Service Concessions which the Group has no discretion or latitude to deploy for other services other than the use in the Service Concessions are treated as intangible assets acquired under the Service Concessions.
Amortisation of intangible concession rights is calculated to write off their costs, where applicable, on an economic usage basis for roads and bridges whereby the amount of amortisation is provided based on the ratio of actual volume compared to the total projected volume or on a straight-line basis for water treatment plants over the periods which the Group is granted the rights to operate these Infrastructures. The total projected volume of the respective Infrastructures is reviewed regularly with reference to both internal and external sources of information and appropriate adjustments will be made should there be a material change.
121New World Development Company Limited - Annual Report 2009
Notes to the Financial Statements (Continued)
3 PRINCIPAL ACCOUNTING POLICIES (Continued)
(c) NON-CURRENT ASSETS CLASSIFIED AS ASSETS HELD FOR SALE
Non-current assets are classified as assets held for sale when their carrying amount is to be recovered principally through a sale transaction and a sale is considered highly probable. They are stated at the lower of carrying amount and fair value less costs to sell if their carrying amount is to be recovered principally through a sale transaction rather than through continuing use.
(d) LEASEHOLD LAND AND LAND USE RIGHTS
The upfront prepayments made for the leasehold land and land use rights are expensed in the income statement on a straight-line basis over the period of the lease or when there is impairment, the impairment is expensed in the income statement. In the course of property development, the amortisation is included as part of the costs of the property under development.
(e) INVESTMENT PROPERTIES
Property that is held for long-term rental yields or for capital appreciation or both, and that is not occupied by the Group, is classified as investment property.
Investment property comprises land held under operating leases and buildings held under finance leases. Land held under operating leases are classified and accounted for as investment property when the rest of the definition of investment property is met. The operating lease is accounted for as if it were a finance lease.
Investment property is measured initially at its cost, including related transaction costs. After initial recognition, investment property is carried at fair value. Fair value is determined by professional valuation conducted at each balance sheet date. Changes in fair value are recognised in the income statement.
Subsequent expenditure is included in the carrying amount of the asset only when it is probable that future economic benefits associated with the asset will flow to the Group and the cost of the asset can be measured reliably. All other repairs and maintenance costs are expensed in the income statement during the financial period in which they are incurred.
If an investment property becomes owner-occupied, it is reclassified as property, plant and equipment, and its fair value at the date of reclassification becomes its cost for accounting purposes. Property that is being constructed or developed for future use as investment property is classified as property, plant and equipment and stated at cost until construction or development is complete, at which time it is reclassified to investment property and stated at fair value.
If a property becomes an investment property because its use has changed, any difference resulting between the carrying amount and the fair value of this property at the date of transfer is recognised in equity as a revaluation of property, plant and equipment. However, if a fair value gives rise to a reversal of the previous impairment loss, the write-back is recognised in the income statement.
122
Notes to the Financial Statements (Continued)
3 PRINCIPAL ACCOUNTING POLICIES (Continued)
(f) PROPERTY, PLANT AND EQUIPMENT
Property, plant and equipment are stated at historical cost less accumulated depreciation and impairment losses. Historical cost includes expenditure that is directly attributable to the acquisition of assets. Subsequent costs are included in the carrying amount of the assets or recognised as a separate asset, as appropriate, only when it is probable that future economic benefits associated with the asset will flow to the Group and the cost of the asset can be measured reliably. The carrying amount of the replaced part is derecognised. All other repair and maintenance costs are charged in the income statement during the financial period in which they are incurred. The carrying amount of an asset is written down immediately to its recoverable amount if the carrying value of an asset is greater than its estimated recoverable amount.
(i) Assets under construction
All direct and indirect costs relating to the construction of property, plant and equipment, including borrowing costs during the construction period are capitalised as the costs of the assets.
(ii) Depreciation
No depreciation is provided on assets under construction.
Depreciation of other property, plant and equipment is calculated to allocate their costs to their estimated residual values over their estimated useful lives or, if shorter, the relevant finance lease periods, using the straight-line method. Estimated useful lives are summarised as follows:
Buildings 20 to 40 yearsPorts facilities and terminal equipment 7 to 44 yearsTelecommunication equipment and systems 3 to 15 yearsOther assets 2 to 25 years
The residual values and useful lives of the assets are reviewed, and adjusted if appropriate, at each balance sheet date.
(iii) Gain or loss on disposal
The gain or loss on disposal of property, plant and equipment is determined by comparing the difference between the net sales proceeds and the carrying amount of the relevant asset, and is recognised in the income statement.
(g) IMPAIRMENT OF INVESTMENTS IN SUBSIDIARIES, JOINTLY CONTROLLED ENTITIES, ASSOCIATED COMPANIES AND NON-FINANCIAL ASSETS
Non-financial assets that have an indefinite useful life, for example goodwill, or have not yet been available for use are not subject to amortisation and are tested annually for impairment. Assets are reviewed for impairment whenever events or changes in circumstances indicate that the carrying amount may not be recoverable. The carrying amount of an asset is written down immediately to its recoverable amount if the carrying amount of the asset is greater than its estimated recoverable amount. An impairment loss is recognised in the income statement for the amount by which the carrying amount of an asset exceeds its recoverable amount. The recoverable amount is the higher of its fair value less costs to sell and value in use. For the purpose of assessing impairment, assets are grouped as cash-generating units for which there are separately identifiable cash flows. Non-financial assets other than goodwill that suffered an impairment are reviewed for possible reversal of the impairment at each balance sheet date.
123New World Development Company Limited - Annual Report 2009
Notes to the Financial Statements (Continued)
3 PRINCIPAL ACCOUNTING POLICIES (Continued)
(h) INVESTMENTS
The Group classifies its investments in the categories of financial assets at fair value through profit or loss, loans and receivables, held-to-maturity investments, and available-for-sale financial assets. Management determines the classification of its investments at initial recognition depending on the purpose for which the investments are acquired.
(i) Financial assets at fair value through profit or loss
Financial assets at fair value through profit or loss are financial assets held for trading and those designated as at fair value through profit or loss at inception under certain circumstances. A financial asset is classified in this category if acquired principally for the purpose of selling in the short-term or if so designated by management.
(ii) Loans and receivables
Loans and receivables are non-derivative financial assets with fixed or determinable payments that are not quoted in an active market. They arise when the Group provides money, goods or services directly to a debtor with no intention of trading the receivable and are included in current assets, except for those with maturities more than twelve months after the balance sheet date, which are classified as non-current assets.
(iii) Held-to-maturity investments
Held-to-maturity investments are non-derivative financial assets with fixed or determinable payments and fixed maturities that management has the positive intention and ability to hold to maturity. Held-to-maturity financial assets are included in non-current assets, except for those with maturities less than twelve months from the balance sheet date, which are classified as current assets.
(iv) Available-for-sale financial assets
Available-for-sale financial assets are non-derivatives that are either designated in this category or not classified in any of the other categories. They are included in non-current assets unless management intends to dispose of the investment within twelve months of the balance sheet date.
Regular purchases and sales of financial assets are recognised on trade-date, which is the date on which the Group commits to purchase or sell the asset. Investments are initially recognised at fair value plus transaction costs for all financial assets not carried at fair value through profit or loss. Financial assets carried at fair value through profit or loss are initially recognised at fair value and transaction cost are expensed in the income statement. Financial assets are derecognised when the rights to receive cash flows from the investments have expired or have been transferred and the Group has transferred substantially all risks and rewards of ownership.
Available-for-sale financial assets and financial assets at fair value through profit or loss are subsequently carried at fair value. Loans and receivables and held-to-maturity investments are carried at amortised cost using the effective interest method.
Gains and losses arising from changes in the fair value of the financial assets at fair value through profit or loss are included in the income statement in the financial period in which they arise. Changes in the fair value of available-for-sale financial assets are recognised in equity. When available-for-sale financial assets are sold, the accumulated fair value adjustments are included in the income statement as gains or losses from financial assets. Changes in the fair value of monetary financial assets denominated in a foreign currency and classified as available-for-sale are analysed between translation differences resulting from changes in amortised cost of the financial asset and other changes in the carrying amount of the financial asset. The translation differences on monetary financial assets are recognised in the income statement; translation differences on non-monetary financial assets are recognised in equity.
124
Notes to the Financial Statements (Continued)
3 PRINCIPAL ACCOUNTING POLICIES (Continued)
(h) INVESTMENTS (Continued)
The fair values of listed investments are based on quoted bid prices at the balance sheet date. If the market for a financial asset is not active and for unlisted financial assets, the Group establishes fair value by using valuation techniques. These include the use of recent arm’s length transactions, reference to other instruments that are substantially the same, discounted cash flow analysis and option pricing models, making maximum use of market inputs and relying as little as possible on entity-specific inputs.
The Group assesses at each balance sheet date whether there is objective evidence that a financial asset or a group of financial assets is impaired. In the case of equity instruments classified as available-for-sale financial assets, a significant or prolonged decline in the fair value of the asset below its cost is considered in determining whether the assets are impaired. In case of debt instruments, objective evidence of impairment includes significant financial difficulty of the issuer or counterparty; default or delinquency in interest or principal payments; or it becoming probable that the borrower will enter bankruptcy or financial re-organisation.
If any such evidence exists for available-for-sale financial assets, the cumulative loss, measured as the difference between the acquisition cost and the current fair value, less any impairment loss on that financial asset previously recognised in the income statement, is removed from equity and recognised in the income statement. Impairment losses recognised in the income statement on equity instruments classified as available-for-sale are not reversed through the income statement.
(i) DERIVATIVE FINANCIAL INSTRUMENTS
A derivative is initially recognised at fair value on the date a derivative contract is entered into and is subsequently re-measured at its fair value at each balance sheet date. The change in the fair value is recognised in the income statement.
(j) PROPERTIES FOR/UNDER DEVELOPMENT
Properties for/under development comprise prepayments for leasehold land and land use rights, development expenditure and borrowing costs capitalised. In the course of property development, the amortisation charge of leasehold land and land use rights is included as part of the costs of the property under development. Properties under development included in the current assets are expected to be realised in, or is intended for sale in the Group’s normal operating cycle.
(k) PROPERTIES HELD FOR SALE
Properties held for sale are initially measured at the carrying amount of the property at the date of reclassification from properties under development. Subsequently, the prepaid leasehold land component is stated at cost less accumulated amortisation and impairment losses; the building component is carried at the lower of cost and net realisable value. The amortisation of leasehold land is recognised in the income statement. Net realisable value is determined by reference to management estimates based on prevailing market conditions.
(l) STOCKS
Stocks are stated at the lower of cost and net realisable value. Cost is calculated on the weighted average basis. Net realisable value is determined on the basis of anticipated sales proceeds less estimated selling expenses.
125New World Development Company Limited - Annual Report 2009
Notes to the Financial Statements (Continued)
3 PRINCIPAL ACCOUNTING POLICIES (Continued)
(m) CONTRACTS IN PROGRESS
Cost comprises materials, direct labour and overheads attributable to bringing the inventories and work in progress to its present condition.
The Group presents as an asset the gross amount due from customers for contract work for all contracts in progress for which costs incurred plus recognised profits (less recognised losses) exceed progress billings. Progress billings not yet paid by customers and retention are included under current assets.
The Group presents as a liability the gross amount due to customers for contract work for all contracts in progress for which progress billings exceed costs incurred plus recognised profits (less recognised losses).
(n) TRADE AND OTHER DEBTORS
Trade and other debtors are recognised initially at fair value and subsequently measured at amortised cost using the effective interest method, less provision for impairment, which is established when there is objective evidence that the Group will not be able to collect all amounts due according to the original terms of receivable. Significant financial difficulties of the debtor, probability that the debtor will enter bankruptcy and default or delinquency in payments are considered indicators that the receivable is impaired. The amount of the provision is the difference between the carrying amount of the assets and the present value of estimated future cash flows, discounted at the original effective interest rate. The carrying amount of the assets is reduced through the use of an allowance account, and the amount of the provision is recognised in the income statement. When a receivable is uncollectible, it is written off against the allowance account for receivable. Subsequent recoveries of amounts previously written off are credited in the income statement.
(o) CASH AND CASH EQUIVALENTS
Cash and cash equivalents include cash in hand, deposits held at call with banks, other short-term highly liquid investments with original maturities of three months or less and bank overdrafts. Bank overdrafts are shown within borrowings under current liabilities in the balance sheet.
(p) SHARE CAPITAL
Ordinary shares are classified as equity.
Incremental costs directly attributable to the issue of new shares or options are shown in equity as a deduction, net of tax, from the proceeds.
(q) TRADE PAYABLES
Trade payables are recognised initially at fair value and subsequently measured at amortised cost using the effective interest method.
(r) PROVISIONS
Provisions are recognised when the Group has a present legal or constructive obligation as a result of past events; it is probable that an outflow of resources will be required to settle the obligation; and the amount has been reliably estimated.
Where there are a number of similar obligations, the likelihood that an outflow will be required in settlement is determined by considering the class of obligations as a whole. A provision is recognised even if the likelihood of an outflow with respect to any one item included in the same class of obligations may be small.
126
Notes to the Financial Statements (Continued)
3 PRINCIPAL ACCOUNTING POLICIES (Continued)
(s) CONTINGENT LIABILITIES AND CONTINGENT ASSETS
A contingent liability is a possible obligation that arises from past events and whose existence will only be confirmed by the occurrence or non-occurrence of one or more uncertain future events not wholly within the control of the Group. It can also be a present obligation arising from past events that is not recognised because it is not probable that outflow of economic resources will be required or the amount of obligation cannot be measured reliably.
A contingent liability, other than that assumed in a business combination, is not recognised but is disclosed in the notes to the financial statements. When a change in the probability of an outflow occurs so that outflow is probable, it will then be recognised as a provision.
A contingent asset is a possible asset that arises from past events and whose existence will be confirmed only by the occurrence or non-occurrence of one or more uncertain events not wholly within the control of the Group.
A contingent asset is not recognised but is disclosed in the notes to the financial statements when an inflow of economic benefits is probable. When inflow is virtually certain, an asset is recognised.
(t) CURRENT AND DEFERRED INCOME TAX
The current income tax charge is calculated on the basis of the tax laws enacted or substantively enacted at the balance sheet date in the countries where the Group, jointly controlled entities and associated companies operate and generate taxable income. Management periodically evaluates positions taken in tax returns with respect to situations in which applicable tax regulation is subject to interpretation and establishes provisions where appropriate on the basis of amounts expected to be paid to the tax authorities.
Deferred income tax is provided in full, using the liability method, on temporary differences arising between the tax bases of assets and liabilities and their carrying amounts in the financial statements. However, the deferred income tax is not accounted for if it arises from initial recognition of an asset or liability in a transaction other than a business combination that at the time of transaction affects neither accounting nor taxable profit or loss. Deferred income tax is determined using tax rates and laws that have been enacted or substantively enacted by the balance sheet date and are expected to apply when the related deferred income tax asset is realised or the deferred income tax liability is settled.
Deferred income tax assets are recognised to the extent that it is probable that future taxable profit will be available against which the temporary differences can be utilised.
Deferred income tax is provided on temporary differences arising on investments in subsidiaries, jointly controlled entities and associated companies, except where the timing of the reversal of the temporary difference can be controlled and it is probable that the temporary difference will not reverse in the foreseeable future.
(u) BORROWINGS
Borrowings are recognised initially at fair value, net of transaction costs incurred. Borrowings are subsequently stated at amortised cost; any difference between the proceeds (net of transaction costs) and the redemption value is recognised in the income statement or capitalised on the basis set out in note 3(y) over the period of the borrowings using the effective interest method where appropriate.
Borrowings are classified as current liabilities unless the Group has an unconditional right to defer settlement of the liability for at least twelve months after the balance sheet date.
127New World Development Company Limited - Annual Report 2009
Notes to the Financial Statements (Continued)
3 PRINCIPAL ACCOUNTING POLICIES (Continued)
(v) CONVERTIBLE BONDS
(i) Convertible bonds with equity component
Convertible bonds that can be converted to equity share capital at the option of the holders, where the number of shares that would be issued on conversion and the value of the consideration that would be received do not vary, are accounted for as compound financial instruments which contain both a liability component and an equity component.
At initial recognition, the liability component of the convertible bonds is determined using a market interest rate for an equivalent non-convertible bond. The remainder of the proceeds is allocated to the conversion option as equity component. Transaction costs that relate to the issue of a compound financial instrument are allocated to the liability and equity components in proportion to the allocation of proceeds.
The liability component is subsequently carried at amortised cost, calculated using the effective interest method, until extinguished on conversion, redemption or maturity. The equity component is recognised in equity, net of any tax effects.
When the bond is converted, the relevant equity component and the carrying amount of the liability component at the time of conversion are transferred to share capital and share premium for the shares issued. When the bond is redeemed, the relevant equity component is transferred to retained profits.
(ii) Convertible bonds without equity component
All other convertible bonds which do not exhibit the characteristics mentioned in (i) above are accounted for as hybrid instruments consisting of an embedded derivative and a host debt contract.
At initial recognition, the embedded derivative of the convertible bonds is accounted for as derivative financial instruments and is measured at fair value. Any excess of proceeds over the amount initially recognised as the derivative component is recognised as a liability under the contract. Transaction costs that relate to the issue of the convertible bonds are allocated to the liability under the contract.
The derivative component is subsequently carried at fair value and changes in fair value are recognised in the income statement. The liability under the contract is subsequently carried at amortised cost, calculated using the effective interest method, until extinguished on conversion, redemption or maturity.
When the bond is converted, the carrying amount of the liability under the contract together with the fair value of the relevant derivative component at the time of conversion are transferred to share capital and share premium as consideration for the shares issued. When the bond is redeemed, any difference between the redemption amount and the carrying amounts of both components is recognised in the income statement.
(w) REVENUE RECOGNITION
Revenue comprises the fair value of the consideration received or receivable for the sale of goods and services rendered in the ordinary course of the Group’s activities. Revenue is shown net of value-added tax, returns, rebates and discounts, allowances for credit and other revenue reducing factors after eliminating sales within the Group.
Revenue is recognised when the amount can be reliably measured, it is probable that future economic benefits will flow to the Group and specific criteria for each of the activities have been met. Estimates are based on historical results, taking into consideration the type of customers, the type of transactions and the specifics of each arrangement.
(i) Rental
Rental is recognised on a straight-line basis over the terms of lease agreements.
128
Notes to the Financial Statements (Continued)
3 PRINCIPAL ACCOUNTING POLICIES (Continued)
(w) REVENUE RECOGNITION (Continued)
(ii) Property sales
Sale of properties is recognised when the risks and rewards of the properties are passed to the purchasers. Deposits and instalments received on properties sold prior to their completion are included under current liabilities.
(iii) Construction and engineering
Revenue from construction and engineering service contracts is recognised using the percentage of completion method when the contracts have progressed to a stage where an outcome can be estimated reliably. Revenue from construction and engineering service contracts is measured by reference to the proportion of costs incurred for work performed to the balance sheet date as compared to the estimated total costs to completion. Anticipated losses on contracts are fully provided when it is probable that total contract costs will exceed total contract revenue.
When the outcome of construction and engineering service contract cannot be estimated reliably, contract revenue is recognised only to the extent of contract costs incurred that are likely to be recoverable.
(iv) Service fees
Property management service fee, property letting agency fee, transportation service fee, security service fee and financial service fee are recognised when services are rendered.
(v) Infrastructure operations
Toll revenue from road and bridge operations, income from port operation, cargo, container handling and storage are recognised when services are rendered.
(vi) Telecommunication services
Telecommunication service revenue is recognised when service is rendered and is based on the usage of telecommunication network and facilities. Telecommunication revenue in respect of standard service plans billed in advance at year end is deferred and recognised when service is rendered. Revenue received in advance for the provision of telecommunication services using prepaid cards is deferred and amortised based on the actual usage by customers.
(vii) Department store operation
Sale of goods and merchandise is recognised upon delivery of goods.
Income from concessionaire sale is recognised upon the sale of goods and merchandise by the relevant stores.
(viii) Hotel operations
Revenue from hotel and restaurant operations is recognised upon provision of the services.
(ix) Interest
Interest is recognised on a time proportion basis using the effective interest method. When a receivable is impaired, the Group reduces the carrying amount to its recoverable amount, being the estimated future cash flow discounted at the original effective interest rate of the instrument, and continues unwinding the discount as interest income. Interest income on impaired receivables is recognised using the original effective interest rate.
(x) Dividend
Dividend is recognised when the right to receive payment is established.
129New World Development Company Limited - Annual Report 2009
Notes to the Financial Statements (Continued)
3 PRINCIPAL ACCOUNTING POLICIES (Continued)
(x) LEASES
(i) Finance leases
Leases that transfer to the Group substantially all the risks and rewards of ownership of assets are accounted for as finance leases. Finance leases are capitalised at the lease’s commencement date at the lower of the fair value of the leased assets and the present value of the minimum lease payments. Each lease payment is allocated between the liability and finance charges so as to achieve a constant rate on the finance balance outstanding. The corresponding rental obligations, net of finance charges, are included in liabilities, as trade and other payables. The finance charges are charged to the income statement over the lease periods so as to produce a constant periodic rate of interest on the remaining balance of the liability for each period.
Assets held under finance leases are depreciated on the basis described in note 3(f )(ii) above.
(ii) Operating leases
Leases in which a significant portion of the risks and rewards of ownership are retained by the lessor are classified as operating leases. Payments made under operating leases (net of any incentives received from the lessor), are charged to the income statement on a straight-line basis over the period of the lease.
(y) BORROWING COSTS
Borrowing costs incurred for the construction of any qualifying assets are capitalised during the period of time that is required to complete and prepare the asset for its intended use. Other borrowing costs are expensed as incurred.
(z) EMPLOYEE BENEFITS
(i) Employee leave entitlements
Employee entitlements to annual leave are recognised when they accrue to employees. A provision is made for the estimated liability for annual leave as a result of services rendered by employees up to the balance sheet date. Employee entitlements to sick leave and maternity leave are not recognised until the time of leave.
(ii) Bonus plans
Provision for bonus plans are recognised when the Group has a present legal or constructive obligation as a result of services rendered by employees and a reliable estimate of the obligation can be made.
(iii) Defined contribution plans
A defined contribution plan is a pension plan under which the Group pays contributions into a separate entity. The Group has no legal or constructive obligations to pay further contributions if the fund does not hold sufficient assets to pay all employees the benefits relating to employee service in the current and prior periods. Contributions to defined contribution plans, including the Mandatory Provident Fund Scheme and employee pension schemes established by municipal government in the People’s Republic of China (“PRC”) are expensed as incurred. Contributions are reduced by contributions forfeited by those employees who leave the schemes prior to vesting fully in the contributions, where applicable.
(iv) Defined benefit plans
Defined benefit plans define an amount of pension benefit that an employee will receive on retirement, usually dependent on one or more factors such as age, years of services and compensation. Defined benefit costs under defined benefit plans, which are assessed using the projected unit credit method, are charged to the income statement. Under this method, plan assets are measured at fair value and defined benefit obligations are measured as the present value of the estimated future cash outflows using interest rates determined by reference to market yields at the balance sheet date based on Exchange Fund Notes, which have terms to maturity approximating the terms of the related liability. The actuarial gains and losses to the extent of the amount in excess of 10.0% of the greater of the present value of the plan obligations and the fair value of plan assets are recognised in the income statement over the expected average remaining service lives of the participating employees.
130
Notes to the Financial Statements (Continued)
3 PRINCIPAL ACCOUNTING POLICIES (Continued)
(z) EMPLOYEE BENEFITS (Continued)
(v) Share-based compensation
The Group operates a number of equity-settled, share-based compensation plans. The fair value of the employee services received in exchange for the grant of share options is recognised as an expense. The total amount to be expensed over the vesting period is determined by reference to the fair value of the options granted at the date of grant, excluding the impact of any non-market vesting conditions. At each balance sheet date, the Group revises its estimates of the number of options that are expected to vest. It recognises the impact of the revision of original estimates, if any, in the income statement, with a corresponding adjustment to equity.
The proceeds received net of any directly attributable transaction costs are credited to share capital (nominal value) and share premium when the options are exercised.
On lapse of share option according to the plan, corresponding amount recognised in employee’ share based compensation reserve is transferred to retained profits.
(aa) FOREIGN CURRENCIES
(i) Functional and presentation currency
Items included in the financial statements of each of the Group’s entities are measured using the currency of the primary economic environment in which the entity operates (the “functional currency”). The financial statements are presented in Hong Kong dollar, which is the Company’s functional and presentation currency.
(ii) Transactions and balances
Foreign currency transactions are translated into the functional currency using the exchange rates prevailing at the dates of the transactions. Foreign exchange gains and losses resulting from the settlement of such transactions and from the translation of monetary assets and liabilities denominated in foreign currencies at the exchange rates ruling at the balance sheet date are recognised in the income statement.
Changes in the fair value of monetary securities denominated in foreign currency classified as available-for-sale are analysed between translation differences resulting from changes in the amortised cost of the security and other changes in the carrying amount of the security. Translation differences related to changes in the amortised cost are recognised in profit or loss, and other changes in the carrying amount are recognised in equity.
Translation differences on financial assets and liabilities held at fair value through profit or loss is reported as part of the fair value gain or loss. Translation differences on non-monetary available-for-sale financial assets are included in equity.
(iii) Group companies
The results and financial position of all the Group entities that have a functional currency different from the presentation currency are translated into the presentation currency as follows:
(1) assets and liabilities for each balance sheet presented are translated at the exchange rate ruling at the date of that balance sheet;
(2) income and expenses for each income statement are translated at the average exchange rate during the period covered by the income statement; and
(3) all resulting exchange differences are recognised as a separate component of equity.
131New World Development Company Limited - Annual Report 2009
Notes to the Financial Statements (Continued)
3 PRINCIPAL ACCOUNTING POLICIES (Continued)
(aa) FOREIGN CURRENCIES (Continued)
(iii) Group companies (Continued)
On consolidation, exchange differences arising from the translation of the net investment in foreign operations, and of borrowings, are taken to shareholders’ equity. When a foreign operation is partially disposed of or sold, exchange differences that were recorded in equity are recognised in the consolidated income statement as part of the gain or loss on sale.
Goodwill and fair value adjustments arising on the acquisition of a foreign entity are treated as assets and liabilities of the foreign entity and translated at the exchange rate ruling at the balance sheet date.
(bb) INSURANCE CONTRACTS
The Group assesses at each balance sheet date the liabilities under its insurance contracts using current estimates of future cash flows. Changes in carrying amount of these insurance liabilities are recognised in the income statement.
The Group regards its financial guarantee contracts in respect of mortgage facilities provided to certain property purchasers, guarantees provided to its related parties and tax indemnity provided to its non-wholly owned subsidiary as insurance contracts.
(cc) SEGMENT REPORTING
A business segment is a group of assets and operations engaged in providing products or services that are subject to risks and returns that are different from those of other business segments. A geographical segment is engaged in providing products or services within a particular economic environment that is subject to risks and returns that are different from those of segments operating in other economic environments.
In accordance with the internal financial reporting of the Group, the Group has determined that business segments be presented as the primary reporting format and geographical segments as the secondary reporting format.
Segment assets consist primarily of property, plant and equipment, leasehold land and land use rights, investment properties, intangible concession rights, intangible assets, available-for-sale financial assets, held-to-maturity investments, financial assets at fair value through profit or loss, properties for development, other non-current assets, properties under development, properties held for sale, stocks and receivables and exclude derivative financial instruments, deferred tax assets, restricted bank balances and cash and bank balances. Segment liabilities comprise operating liabilities and exclude items such as taxation and borrowings. Capital expenditure comprises additions to investment properties, property, plant and equipment, intangible concession rights and intangible assets.
(dd) DIVIDEND DISTRIBUTION
Dividend distribution to the Company’s shareholders is recognised as a liability in the financial statements in the financial period when the dividends are approved by the Company’s shareholders/directors.
132
Notes to the Financial Statements (Continued)
4 FINANCIAL RISK MANAGEMENT AND FAIR VALUE ESTIMATION
The Group’s activities expose it to a variety of financial risks: market risk (including foreign exchange risk, interest rate risk and price risk), credit risk and liquidity risk.
The Group has centralised treasury function for all of its subsidiaries except for listed subsidiaries which arrange their financial and treasury affairs on a stand-alone basis and in a manner consistent with the overall policies of the Group.
a MARKET RISK
(i) Foreign exchange risk
The Group’s operations is mainly in Hong Kong and Mainland China. Entities within the Group are exposed to foreign exchange risk from future commercial transactions and monetary assets and liabilities that are denominated in a currency that is not the entity’s functional currency.
The Group currently does not have a foreign currency hedging policy. It manages its foreign currency risk by closely monitoring the movement of the foreign currency rates and will consider entering into forward foreign exchange contracts to reduce the exposure should the need arises.
At 30 June 2009, the Group’s entities with functional currency of Hong Kong dollar had United States dollar net monetary assets of HK$684.5 million (2008: HK$815.3 million). Under the Linked Exchange Rate System in Hong Kong, Hong Kong dollar is pegged to the United States dollar, management therefore considers that there are no significant foreign exchange risk with respect to the United States dollar.
At 30 June 2009, the Group’s entities with functional currency of Hong Kong dollar had Renminbi net monetary assets of HK$364.1 million (2008: HK$420.1 million). If Hong Kong dollar had strengthened/weakened by 5% against Renminbi with all other variables unchanged, the Group’s profit before taxation would have been HK$18.2 million (2008: HK$21.0 million) lower/higher.
At 30 June 2009, the Group’s entities with functional currency of Renminbi had net monetary assets denominated in United States dollar of HK$881.2 million (2008: HK$871.2 million). If Renminbi had strengthened/weakened by 5% against United States dollar with all other variables unchanged, the Group’s profit before taxation would have been HK$44.1 million (2008: HK$43.6 million) lower/higher.
At 30 June 2009, the Group’s entities with functional currency of Renminbi had net monetary liabilities denominated in Hong Kong dollar of HK$5,768.0 million (2008: HK$3,295.3 million). If Renminbi had strengthened/weakened by 5% against Hong Kong dollar with all other variables unchanged, the Group’s profit before taxation would have been HK$288.4 million (2008: HK$164.8 million) higher/lower.
This sensitivity analysis ignores any offsetting foreign exchange factors and has been determined assuming that the change in foreign exchange rates had occurred at the balance sheet date. The stated change represents management’s assessment of reasonably possible changes in foreign exchange rates over the period until the next annual balance sheet date. There are no other significant monetary balances held by Group companies at 30 June 2009 that are denominated in a non-functional currency. Currency risks as defined by HKFRS 7 arise on account of monetary assets and liabilities being denominated in a currency that is not the functional currency; differences resulting from the translation of financial statements into the Group’s presentation currency are not taken into consideration.
(ii) Interest rate risk
The Group is exposed to interest rate risk through the impact of rate changes on interest bearing liabilities and assets. Cash flow interest rate risk is the risk that changes in market interest rates will impact cash flows arising from variable rate financial instruments. The Group’s interest bearing assets mainly include cash deposits, advances to customers and amounts due from jointly controlled entities and associated companies. The Group’s floating rate borrowings will be affected by fluctuation of prevailing market interest rates and will expose the Group to cash flow interest rate risk. The Group’s borrowings issued at fixed rates expose the Group to fair value interest rate risk.
133New World Development Company Limited - Annual Report 2009
Notes to the Financial Statements (Continued)
4 FINANCIAL RISK MANAGEMENT AND FAIR VALUE ESTIMATION (Continued)
a MARKET RISK (Continued)
(ii) Interest rate risk Continued
To mitigate the risk, the Group has maintained fixed and floating rate debts. To match with underlying risk faced by the Group, the level of fixed rate debt for the Group is decided after taking into consideration the potential impact of higher interest rates on profit or loss, interest cover and the cash flow cycles of the Group’s businesses and investments.
If interest rates had been 100 basis points higher/lower with all other variables held constant, the Group’s profit before taxation would have been HK$36.0 million higher/lower (2008: HK$153.8 million lower/higher). The sensitivity analysis has been determined assuming that the change in interest rates had occurred throughout the year and had been applied to the exposure to interest rate risk for financial instruments in existence at the balance sheet date. The 100 basis point increase or decrease represents management’s assessment of a reasonably possible change in those interest rates which have the most impact on the Group over the period until the next annual balance sheet date. Changes in market interest rates affect the interest income or expense of non-derivative variable-interest financial instruments. As a consequence, they are included in the calculation of profit before taxation sensitivities.
(iii) Price risk
The Group is exposed to equity securities price risk arising from the listed and unlisted equity investments held by the Group. Gains and losses arising from changes in the fair value of available-for-sale financial assets and financial assets at fair value through profit or loss are dealt with in equity and income statement respectively. The performance of the Group’s listed and unlisted equity investments are monitored regularly, together with an assessment of their relevance to the Group’s strategic plans. The Group is not exposed to commodity price risk.
At 30 June 2009, if the price of listed and unlisted equity investments in available-for-sale financial assets had been 25% higher with all other variables held constant, the Group’s investment revaluation reserve would have been HK$1,401.3 million (2008: HK$1,189.4 million) higher. If the price of listed and unlisted equity investments in available-for-sale financial assets had been 25% lower with all other variables held constant, the Group’s profit before taxation and investment revaluation reserve would have been HK$96.5 million and HK$1,304.8 million (2008: Nil and HK$1,189.4 million) lower respectively. The sensitivity analysis has been determined based on a reasonable expectation of possible valuation volatility over the next 12 months.
At 30 June 2009, if the price of listed and unlisted equity investments in financial assets at fair value through profit and loss had been 25% higher/lower with all other variables held constant, the Group’s profit before taxation would have been HK$109.2 million (2008: HK$144.2 million) higher/lower. The sensitivity analysis has been determined based on a reasonable expectation of possible valuation volatility over the next 12 months.
b CREDIT RISK
The credit risk of the Group and the Company mainly arises from deposits with banks, trade and other debtors and balances receivable from investee companies, jointly controlled entities and associated companies. The exposures to these credit risks are closely monitored on an ongoing basis by established credit policies in each of its core businesses.
Deposits are mainly placed with high-credit-quality financial institutions. Trade debtors mainly include receivables from sale and lease of properties and other services. Loan receivables included in other non-current assets are normally carry interest at rates with reference to prevailing market interest rate and are secured by collaterals. The Group and the Company carry out regular review and follow-up action on any overdue amounts to minimise exposures to credit risk. There is no concentration of credit risk with respect to trade debtors from third party customers as the customer bases are widely dispersed in different sectors and industries. Under the current circumstances of the global financial turmoil, the Group monitors its credit control procedures and policies so as to minimise the impact to the Group.
In addition, the Group and the Company monitor the exposure to credit risk in respect of the financial assistance provided to subsidiaries, jointly controlled entities and associated companies through exercising control or significant influence over their financial and operating policy decisions and reviewing their financial positions on a regular basis.
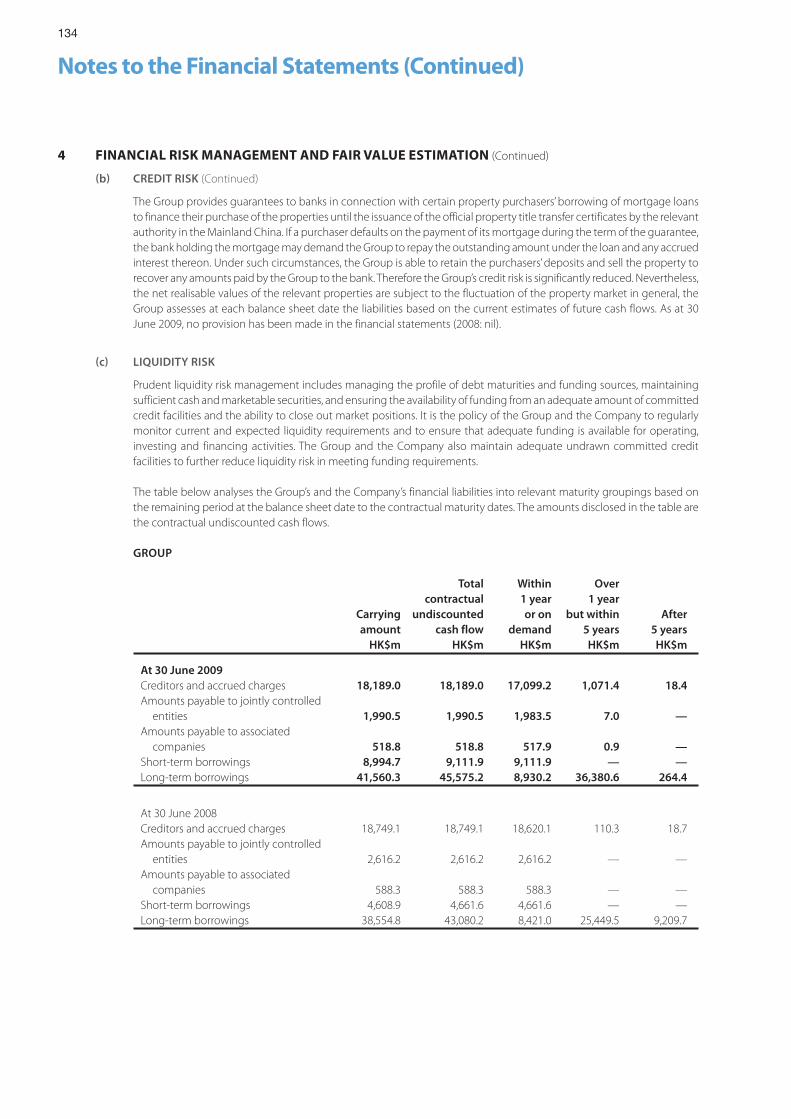
134
Notes to the Financial Statements (Continued)
4 FINANCIAL RISK MANAGEMENT AND FAIR VALUE ESTIMATION (Continued)
b CREDIT RISK (Continued)
The Group provides guarantees to banks in connection with certain property purchasers’ borrowing of mortgage loans to finance their purchase of the properties until the issuance of the official property title transfer certificates by the relevant authority in the Mainland China. If a purchaser defaults on the payment of its mortgage during the term of the guarantee, the bank holding the mortgage may demand the Group to repay the outstanding amount under the loan and any accrued interest thereon. Under such circumstances, the Group is able to retain the purchasers’ deposits and sell the property to recover any amounts paid by the Group to the bank. Therefore the Group’s credit risk is significantly reduced. Nevertheless, the net realisable values of the relevant properties are subject to the fluctuation of the property market in general, the Group assesses at each balance sheet date the liabilities based on the current estimates of future cash flows. As at 30 June 2009, no provision has been made in the financial statements (2008: nil).
c LIQUIDITY RISK
Prudent liquidity risk management includes managing the profile of debt maturities and funding sources, maintaining sufficient cash and marketable securities, and ensuring the availability of funding from an adequate amount of committed credit facilities and the ability to close out market positions. It is the policy of the Group and the Company to regularly monitor current and expected liquidity requirements and to ensure that adequate funding is available for operating, investing and financing activities. The Group and the Company also maintain adequate undrawn committed credit facilities to further reduce liquidity risk in meeting funding requirements.
The table below analyses the Group’s and the Company’s financial liabilities into relevant maturity groupings based on the remaining period at the balance sheet date to the contractual maturity dates. The amounts disclosed in the table are the contractual undiscounted cash flows.
GROUP
Carryingamount
Totalcontractual
undiscountedcash flow
Within1 yearor on
demand
Over1 year
but within5 years
After5 years
HK$m HK$m HK$m HK$m HK$m
At 30 June 2009Creditors and accrued charges 18,189.0 18,189.0 17,099.2 1,071.4 18.4Amounts payable to jointly controlled entities 1,990.5 1,990.5 1,983.5 7.0 —Amounts payable to associated companies 518.8 518.8 517.9 0.9 —Short-term borrowings 8,994.7 9,111.9 9,111.9 — —Long-term borrowings 41,560.3 45,575.2 8,930.2 36,380.6 264.4
At 30 June 2008Creditors and accrued charges 18,749.1 18,749.1 18,620.1 110.3 18.7Amounts payable to jointly controlled entities 2,616.2 2,616.2 2,616.2 — —Amounts payable to associated companies 588.3 588.3 588.3 — —Short-term borrowings 4,608.9 4,661.6 4,661.6 — —Long-term borrowings 38,554.8 43,080.2 8,421.0 25,449.5 9,209.7
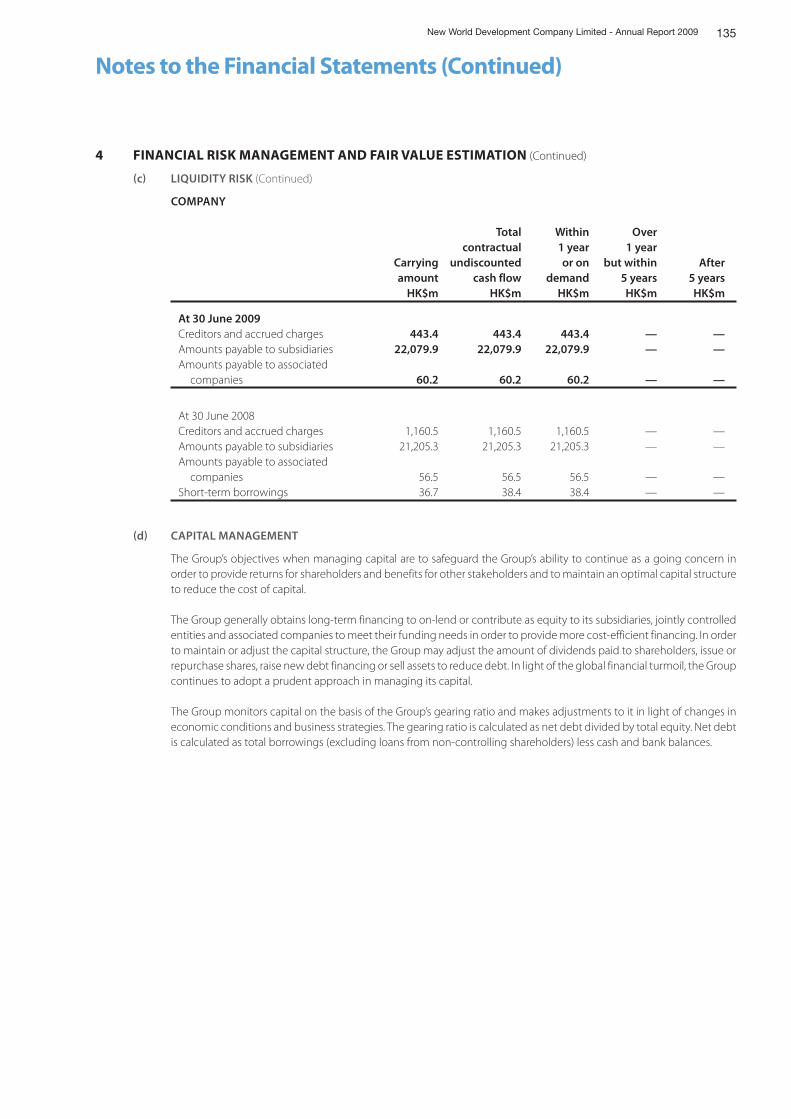
135New World Development Company Limited - Annual Report 2009
Notes to the Financial Statements (Continued)
4 FINANCIAL RISK MANAGEMENT AND FAIR VALUE ESTIMATION (Continued)
c LIQUIDITY RISK (Continued)
COMPANY
Carryingamount
Totalcontractual
undiscountedcash flow
Within1 yearor on
demand
Over1 year
but within5 years
After5 years
HK$m HK$m HK$m HK$m HK$m
At 30 June 2009Creditors and accrued charges 443.4 443.4 443.4 — —Amounts payable to subsidiaries 22,079.9 22,079.9 22,079.9 — —Amounts payable to associated companies 60.2 60.2 60.2 — —
At 30 June 2008Creditors and accrued charges 1,160.5 1,160.5 1,160.5 — —Amounts payable to subsidiaries 21,205.3 21,205.3 21,205.3 — —Amounts payable to associated companies 56.5 56.5 56.5 — —Short-term borrowings 36.7 38.4 38.4 — —
d CAPITAL MANAGEMENT
The Group’s objectives when managing capital are to safeguard the Group’s ability to continue as a going concern in order to provide returns for shareholders and benefits for other stakeholders and to maintain an optimal capital structure to reduce the cost of capital.
The Group generally obtains long-term financing to on-lend or contribute as equity to its subsidiaries, jointly controlled entities and associated companies to meet their funding needs in order to provide more cost-efficient financing. In order to maintain or adjust the capital structure, the Group may adjust the amount of dividends paid to shareholders, issue or repurchase shares, raise new debt financing or sell assets to reduce debt. In light of the global financial turmoil, the Group continues to adopt a prudent approach in managing its capital.
The Group monitors capital on the basis of the Group’s gearing ratio and makes adjustments to it in light of changes in economic conditions and business strategies. The gearing ratio is calculated as net debt divided by total equity. Net debt is calculated as total borrowings (excluding loans from non-controlling shareholders) less cash and bank balances.
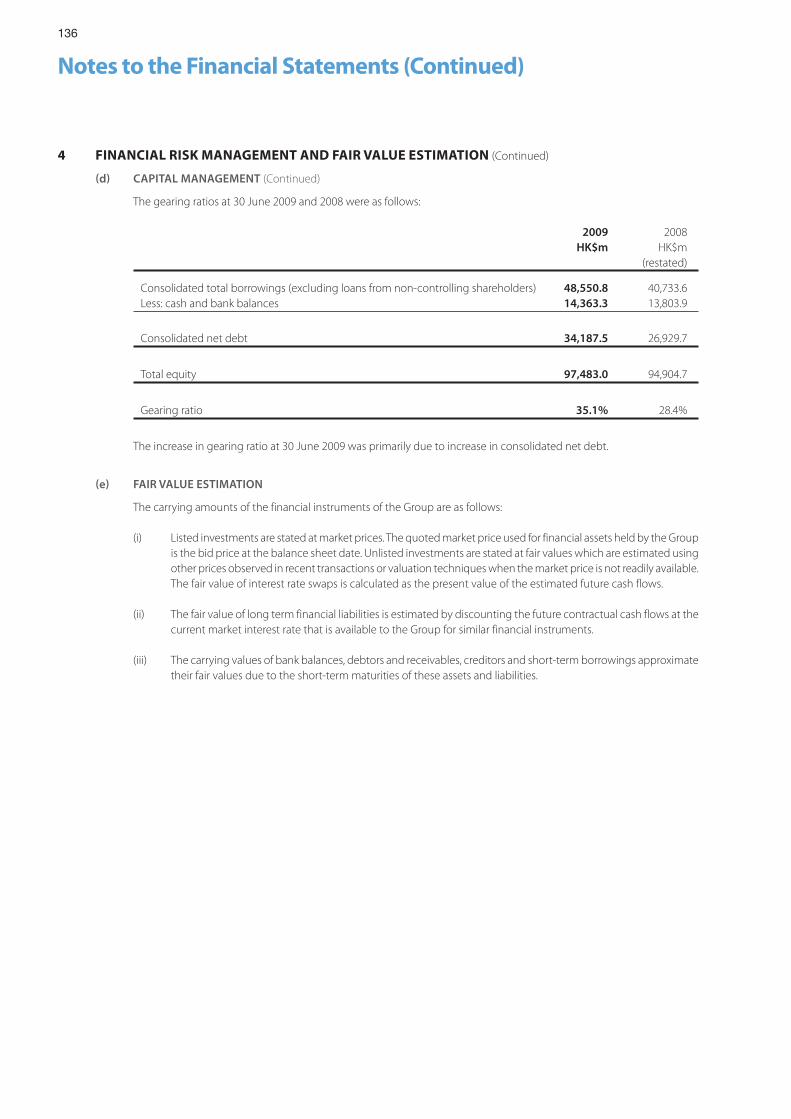
136
Notes to the Financial Statements (Continued)
4 FINANCIAL RISK MANAGEMENT AND FAIR VALUE ESTIMATION (Continued)
d CAPITAL MANAGEMENT (Continued)
The gearing ratios at 30 June 2009 and 2008 were as follows:
2009 2008HK$m HK$m
(restated)
Consolidated total borrowings (excluding loans from non-controlling shareholders) 48,550.8 40,733.6Less: cash and bank balances 14,363.3 13,803.9
Consolidated net debt 34,187.5 26,929.7
Total equity 97,483.0 94,904.7
Gearing ratio 35.1% 28.4%
The increase in gearing ratio at 30 June 2009 was primarily due to increase in consolidated net debt.
e FAIR VALUE ESTIMATION
The carrying amounts of the financial instruments of the Group are as follows:
(i) Listed investments are stated at market prices. The quoted market price used for financial assets held by the Group is the bid price at the balance sheet date. Unlisted investments are stated at fair values which are estimated using other prices observed in recent transactions or valuation techniques when the market price is not readily available. The fair value of interest rate swaps is calculated as the present value of the estimated future cash flows.
(ii) The fair value of long term financial liabilities is estimated by discounting the future contractual cash flows at the current market interest rate that is available to the Group for similar financial instruments.
(iii) The carrying values of bank balances, debtors and receivables, creditors and short-term borrowings approximate their fair values due to the short-term maturities of these assets and liabilities.
137New World Development Company Limited - Annual Report 2009
Notes to the Financial Statements (Continued)
5 CRITICAL ACCOUNTING ESTIMATES AND JUDGEMENTS
Estimates and judgements are continually evaluated by the Group and are based on historical experience and other factors, including expectations of future events that are believed to be reasonable under the circumstance.
The Group makes estimates and assumptions concerning the future. The resulting accounting estimates will, by definition, seldom equal the related actual results. The estimates and assumptions that have a significant effect on carrying amounts of assets and liabilities are as follows:
a FAIR VALUE OF AVAILABLEFORSALE FINANCIAL ASSETS AND FINANCIAL ASSETS AT FAIR VALUE THROUGH PROFIT OR LOSS
The fair value of available-for-sale financial assets and financial assets at fair value through profit or loss that are not traded in an active market is determined by using valuation techniques. The Group uses its judgement to select a variety of methods (such as discounted cash flow model and option pricing models) and evaluates, among other factors, the duration and extent to which the fair value of an investment is less than its cost; and the financial health and short-term business outlook for the investee and historical price volatility of these investments. The key assumptions adopted on projected cashflow are based on management’s best estimates. Sensitivity analysis of changes in fair value of available-for-sale financial assets and financial assets at fair value through profit or loss as detailed in note 4(a)(iii).
b VALUATION OF INVESTMENT PROPERTIES
The fair value of each investment property is individually determined at each balance sheet date by independent valuers based on a market value assessment. The valuers have relied on the discounted cash flow analysis and the capitalisation of income approach as their primary methods, supported by the direct comparison method. These methodologies are based upon estimates of future results and a set of assumptions specific to each property to reflect its tenancy and cashflow profile. The fair value of each investment property reflects, among other things, rental income from current leases and assumptions about rental income from future leases in light of current market conditions. The fair value also reflects, on a similar basis, any cash outflows that could be expected in respect of the property.
At 30 June 2009, if the market value of investment properties had been 8% higher/lower with all other variables held constant, the carrying value of the Group’s investment properties would have been HK$2,480.6 million (2008: HK$2,526.2 million) higher/lower.
c ESTIMATED USEFUL LIVES AND IMPAIRMENT OF PROPERTY, PLANT AND EQUIPMENT
Property, plant and equipment are long-lived but may be subject to technical obsolescence. The annual depreciation charges are affected by the estimated useful lives that the Group allocates to each type of property, plant and equipment. Management performs annual reviews to assess the appropriateness of the estimated useful lives. Such reviews take into account the technological changes, prospective economic utilisation and physical condition of the assets concerned.
Management also regularly reviews whether there are any indications of impairment and will recognise an impairment loss if the carrying amount of an asset is lower than its recoverable amount which is the greater of its net selling price or its value in use. In determining the value in use, management assesses the present value of the estimated future cash flows expected to arise from the continuing use of the asset and from its disposal at the end of its useful life. Estimates and judgements are applied in determining these future cash flows and the discount rate. Management estimates the future cash flows based on certain assumptions, such as market competition and development and the expected growth in business.
138
Notes to the Financial Statements (Continued)
5 CRITICAL ACCOUNTING ESTIMATES AND JUDGEMENTS (Continued)
d IMPAIRMENT OF ASSETS
The Group tests annually whether goodwill has suffered any impairment according to their recoverable amounts determined by the cash-generating units based on value-in-use calculations. These calculations require the use of estimates which are subject to change of economic environment in future. Details are set out in note 21.
The Group determines whether an investment in jointly controlled entities, associated companies or available-for-sale financial assets is impaired by evaluating the duration or extent to which the fair value of an investment is less than its cost. This evaluation is subject to changes in factors such as industry and sector performance, changes in technology and operational and financing cash flow.
The Group assesses whether there is objective evidence as stated in note 3(n) that deposits, loans and receivables are impaired. It recognises impairment based on estimates of the extent and timing of future cash flows using applicable discount rates. The final outcome of the recoverability and cash flows of these receivables will impact the amount of impairment required.
e IMPAIRMENT OF PROPERTIES FOR/UNDER DEVELOPMENT AND PROPERTIES HELD FOR SALE
The Group assesses the carrying amounts of properties for/under development and properties held for sale according to their estimated net realisable value based on assessment of the realisability of these properties, taking into account costs to completion based on past experience and net sales value based on prevailing market conditions. Provision is made when events or changes in circumstances indicate that the carrying amounts may not be realised. The assessment requires the use of judgement and estimates.
f FINANCIAL GUARANTEES AND TAX INDEMNITY
The Group assesses at each balance sheet date the liabilities under insurance contracts, using current estimates of future cash flows.
In respect of the financial guarantee contracts provided to property purchasers, the Group considers the net realisable value of the relevant properties against their outstanding mortgage principal and interest.
In respect of the tax indemnity provided to its non-wholly owned subsidiary, the Group makes estimates on the project costs for the development of the relevant properties and the potential exposure to the relevant Mainland China tax liabilities based on an estimation of the future market condition and economic environment. The future cash flows cannot be reliably estimated and therefore will impact the amount of provision that may be required and the future determination of the ultimate amount of taxation payable. Provision will only be made in the financial period when the outcome of the potential liabilities can be reliably determined, or otherwise, the potential exposure attributable to the Group and the Company is disclosed as contingent liabilities set out in note 47.
g INCOME TAXES
The Group is subject to income taxes in numerous jurisdictions. Significant judgement is required in determining the provision for income taxes. There are many transactions and calculations for which the ultimate tax determination is uncertain during the ordinary course of business. Where the final tax outcome of these matters is different from the amounts that were initially recorded, such differences will impact the current tax and deferred tax provisions in the financial period in which such determination is made.
Recognition of deferred tax assets, which principally relate to tax losses, depends on the expectation of future taxable profit that will be available against which tax losses can be utilised. The outcome of their actual utilisation may be different.
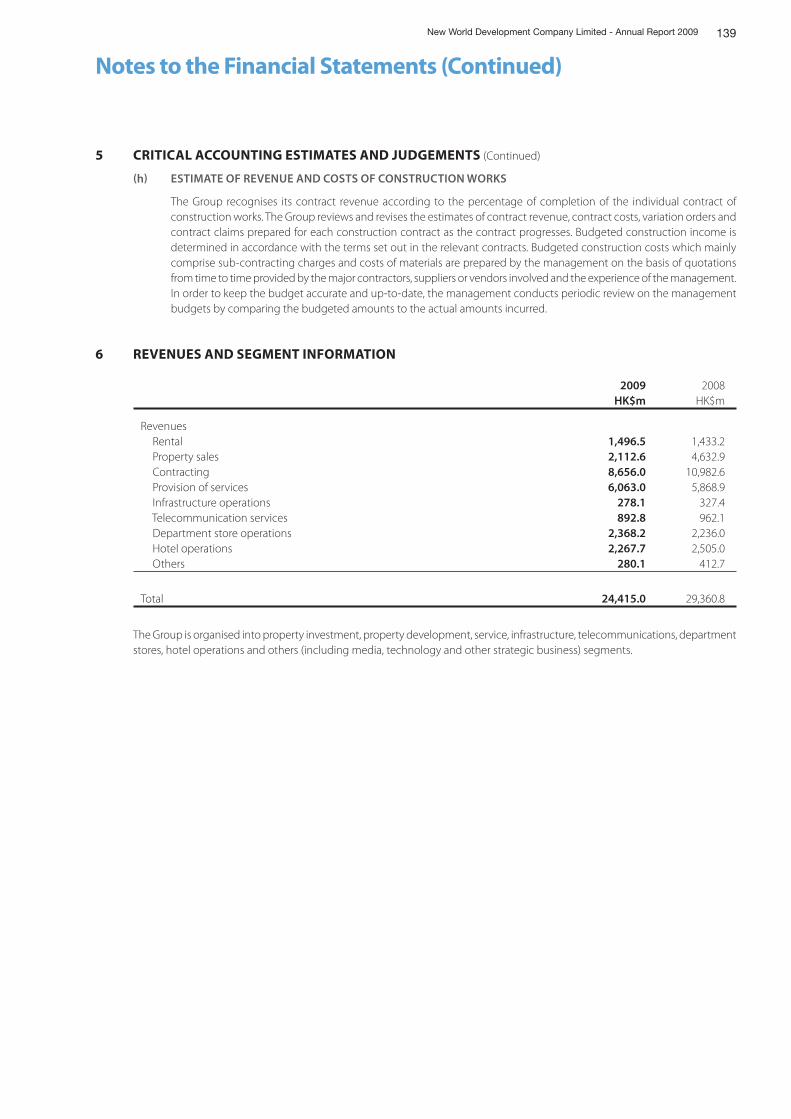
139New World Development Company Limited - Annual Report 2009
Notes to the Financial Statements (Continued)
5 CRITICAL ACCOUNTING ESTIMATES AND JUDGEMENTS (Continued)
h ESTIMATE OF REVENUE AND COSTS OF CONSTRUCTION WORKS
The Group recognises its contract revenue according to the percentage of completion of the individual contract of construction works. The Group reviews and revises the estimates of contract revenue, contract costs, variation orders and contract claims prepared for each construction contract as the contract progresses. Budgeted construction income is determined in accordance with the terms set out in the relevant contracts. Budgeted construction costs which mainly comprise sub-contracting charges and costs of materials are prepared by the management on the basis of quotations from time to time provided by the major contractors, suppliers or vendors involved and the experience of the management. In order to keep the budget accurate and up-to-date, the management conducts periodic review on the management budgets by comparing the budgeted amounts to the actual amounts incurred.
6 REVENUES AND SEGMENT INFORMATION
2009 2008HK$m HK$m
Revenues Rental 1,496.5 1,433.2 Property sales 2,112.6 4,632.9 Contracting 8,656.0 10,982.6 Provision of services 6,063.0 5,868.9 Infrastructure operations 278.1 327.4 Telecommunication services 892.8 962.1 Department store operations 2,368.2 2,236.0 Hotel operations 2,267.7 2,505.0 Others 280.1 412.7
Total 24,415.0 29,360.8
The Group is organised into property investment, property development, service, infrastructure, telecommunications, department stores, hotel operations and others (including media, technology and other strategic business) segments.
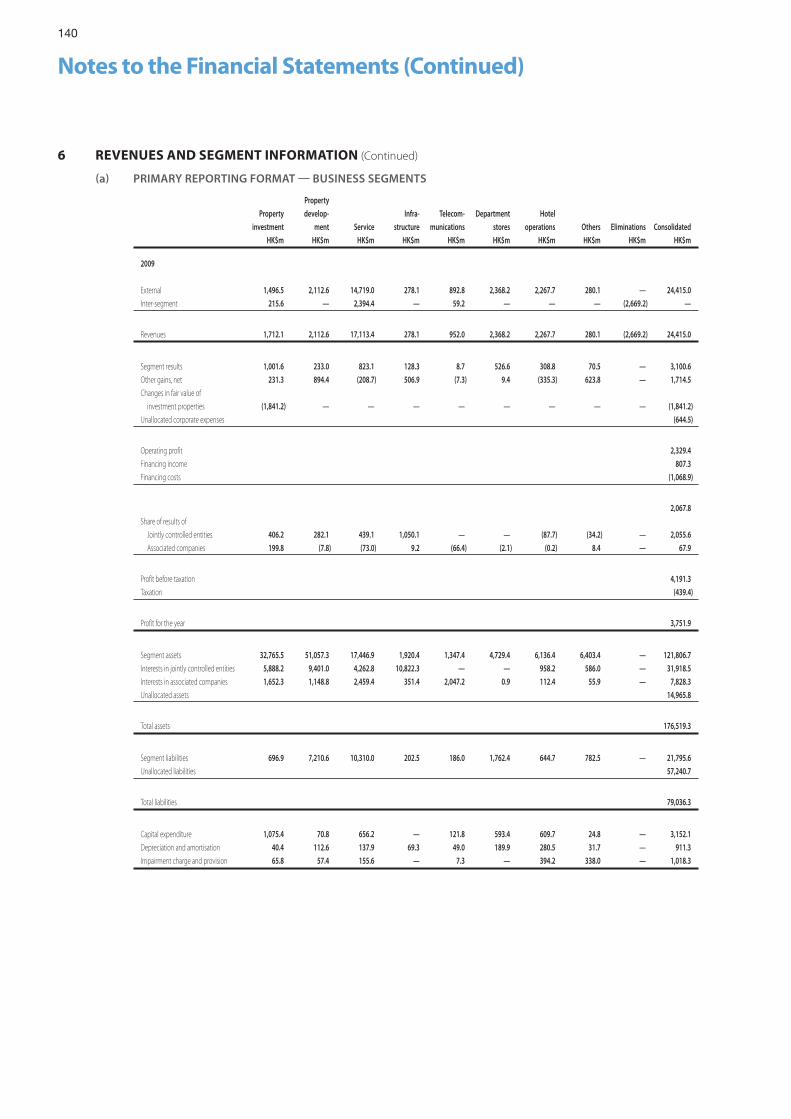
140
Notes to the Financial Statements (Continued)
6 REVENUES AND SEGMENT INFORMATION (Continued)
a PRIMARY REPORTING FORMAT BUSINESS SEGMENTS
Property
investment
Property
develop-
ment Service
Infra-
structure
Telecom-
munications
Department
stores
Hotel
operations Others Eliminations Consolidated
HK$m HK$m HK$m HK$m HK$m HK$m HK$m HK$m HK$m HK$m
2009
External 1,496.5 2,112.6 14,719.0 278.1 892.8 2,368.2 2,267.7 280.1 — 24,415.0
Inter-segment 215.6 — 2,394.4 — 59.2 — — — (2,669.2) —
Revenues 1,712.1 2,112.6 17,113.4 278.1 952.0 2,368.2 2,267.7 280.1 (2,669.2) 24,415.0
Segment results 1,001.6 233.0 823.1 128.3 8.7 526.6 308.8 70.5 — 3,100.6
Other gains, net 231.3 894.4 (208.7) 506.9 (7.3) 9.4 (335.3) 623.8 — 1,714.5
Changes in fair value of
investment properties (1,841.2) — — — — — — — — (1,841.2)
Unallocated corporate expenses (644.5)
Operating profit 2,329.4
Financing income 807.3
Financing costs (1,068.9)
2,067.8
Share of results of
Jointly controlled entities 406.2 282.1 439.1 1,050.1 — — (87.7) (34.2) — 2,055.6
Associated companies 199.8 (7.8) (73.0) 9.2 (66.4) (2.1) (0.2) 8.4 — 67.9
Profit before taxation 4,191.3
Taxation (439.4)
Profit for the year 3,751.9
Segment assets 32,765.5 51,057.3 17,446.9 1,920.4 1,347.4 4,729.4 6,136.4 6,403.4 — 121,806.7
Interests in jointly controlled entities 5,888.2 9,401.0 4,262.8 10,822.3 — — 958.2 586.0 — 31,918.5
Interests in associated companies 1,652.3 1,148.8 2,459.4 351.4 2,047.2 0.9 112.4 55.9 — 7,828.3
Unallocated assets 14,965.8
Total assets 176,519.3
Segment liabilities 696.9 7,210.6 10,310.0 202.5 186.0 1,762.4 644.7 782.5 — 21,795.6
Unallocated liabilities 57,240.7
Total liabilities 79,036.3
Capital expenditure 1,075.4 70.8 656.2 — 121.8 593.4 609.7 24.8 — 3,152.1
Depreciation and amortisation 40.4 112.6 137.9 69.3 49.0 189.9 280.5 31.7 — 911.3
Impairment charge and provision 65.8 57.4 155.6 — 7.3 — 394.2 338.0 — 1,018.3
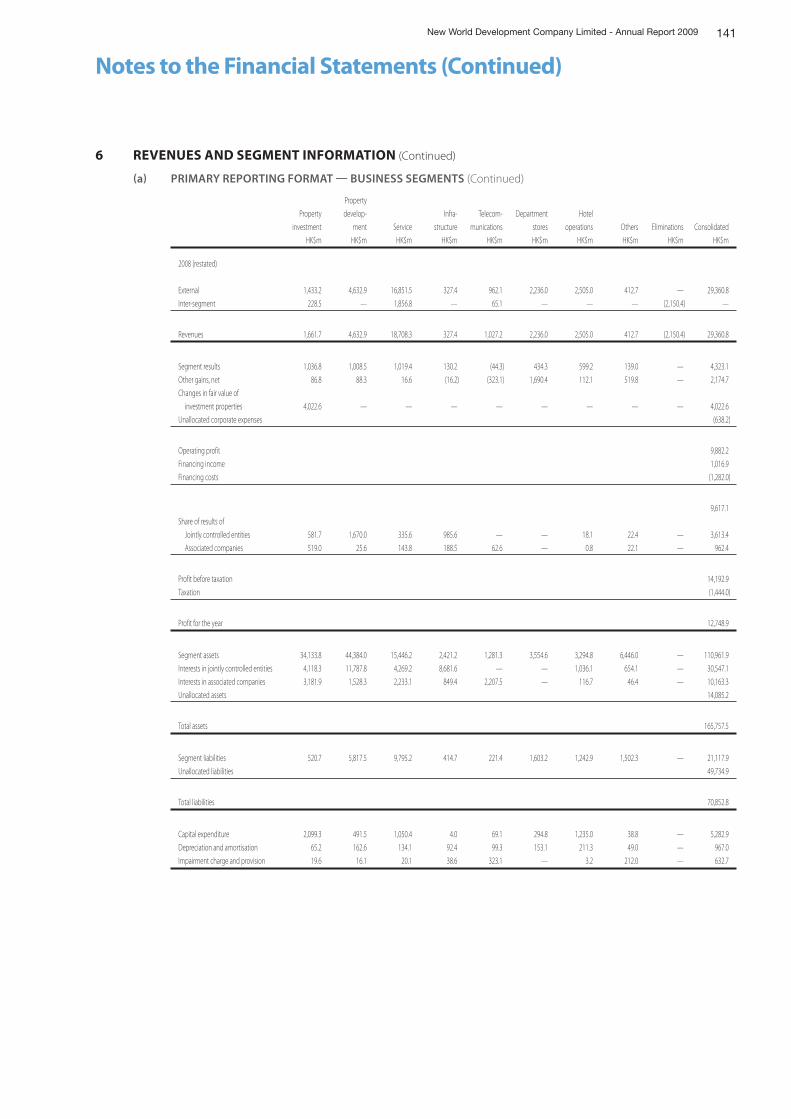
141New World Development Company Limited - Annual Report 2009
Notes to the Financial Statements (Continued)
6 REVENUES AND SEGMENT INFORMATION (Continued)
a PRIMARY REPORTING FORMAT BUSINESS SEGMENTS (Continued)
Property
investment
Property
develop-
ment Service
Infra-
structure
Telecom-
munications
Department
stores
Hotel
operations Others Eliminations Consolidated
HK$m HK$m HK$m HK$m HK$m HK$m HK$m HK$m HK$m HK$m
2008 (restated)
External 1,433.2 4,632.9 16,851.5 327.4 962.1 2,236.0 2,505.0 412.7 — 29,360.8
Inter-segment 228.5 — 1,856.8 — 65.1 — — — (2,150.4) —
Revenues 1,661.7 4,632.9 18,708.3 327.4 1,027.2 2,236.0 2,505.0 412.7 (2,150.4) 29,360.8
Segment results 1,036.8 1,008.5 1,019.4 130.2 (44.3) 434.3 599.2 139.0 — 4,323.1
Other gains, net 86.8 88.3 16.6 (16.2) (323.1) 1,690.4 112.1 519.8 — 2,174.7
Changes in fair value of
investment properties 4,022.6 — — — — — — — — 4,022.6
Unallocated corporate expenses (638.2)
Operating profit 9,882.2
Financing income 1,016.9
Financing costs (1,282.0)
9,617.1
Share of results of
Jointly controlled entities 581.7 1,670.0 335.6 985.6 — — 18.1 22.4 — 3,613.4
Associated companies 519.0 25.6 143.8 188.5 62.6 — 0.8 22.1 — 962.4
Profit before taxation 14,192.9
Taxation (1,444.0)
Profit for the year 12,748.9
Segment assets 34,133.8 44,384.0 15,446.2 2,421.2 1,281.3 3,554.6 3,294.8 6,446.0 — 110,961.9
Interests in jointly controlled entities 4,118.3 11,787.8 4,269.2 8,681.6 — — 1,036.1 654.1 — 30,547.1
Interests in associated companies 3,181.9 1,528.3 2,233.1 849.4 2,207.5 — 116.7 46.4 — 10,163.3
Unallocated assets 14,085.2
Total assets 165,757.5
Segment liabilities 520.7 5,817.5 9,795.2 414.7 221.4 1,603.2 1,242.9 1,502.3 — 21,117.9
Unallocated liabilities 49,734.9
Total liabilities 70,852.8
Capital expenditure 2,099.3 491.5 1,050.4 4.0 69.1 294.8 1,235.0 38.8 — 5,282.9
Depreciation and amortisation 65.2 162.6 134.1 92.4 99.3 153.1 211.3 49.0 — 967.0
Impairment charge and provision 19.6 16.1 20.1 38.6 323.1 — 3.2 212.0 — 632.7
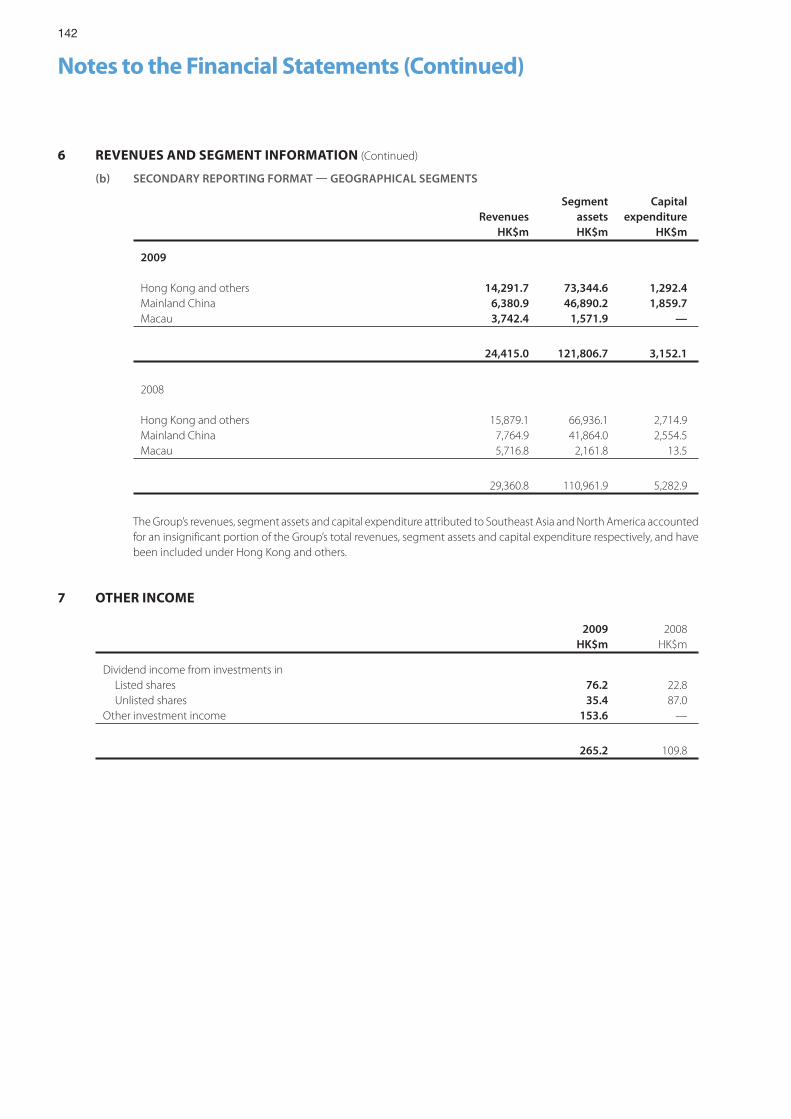
142
Notes to the Financial Statements (Continued)
6 REVENUES AND SEGMENT INFORMATION (Continued)
b SECONDARY REPORTING FORMAT GEOGRAPHICAL SEGMENTS
RevenuesSegment
assetsCapital
expenditureHK$m HK$m HK$m
2009
Hong Kong and others 14,291.7 73,344.6 1,292.4Mainland China 6,380.9 46,890.2 1,859.7Macau 3,742.4 1,571.9 —
24,415.0 121,806.7 3,152.1
2008
Hong Kong and others 15,879.1 66,936.1 2,714.9Mainland China 7,764.9 41,864.0 2,554.5Macau 5,716.8 2,161.8 13.5
29,360.8 110,961.9 5,282.9
The Group’s revenues, segment assets and capital expenditure attributed to Southeast Asia and North America accounted for an insignificant portion of the Group’s total revenues, segment assets and capital expenditure respectively, and have been included under Hong Kong and others.
7 OTHER INCOME
2009 2008HK$m HK$m
Dividend income from investments in Listed shares 76.2 22.8 Unlisted shares 35.4 87.0Other investment income 153.6 —
265.2 109.8
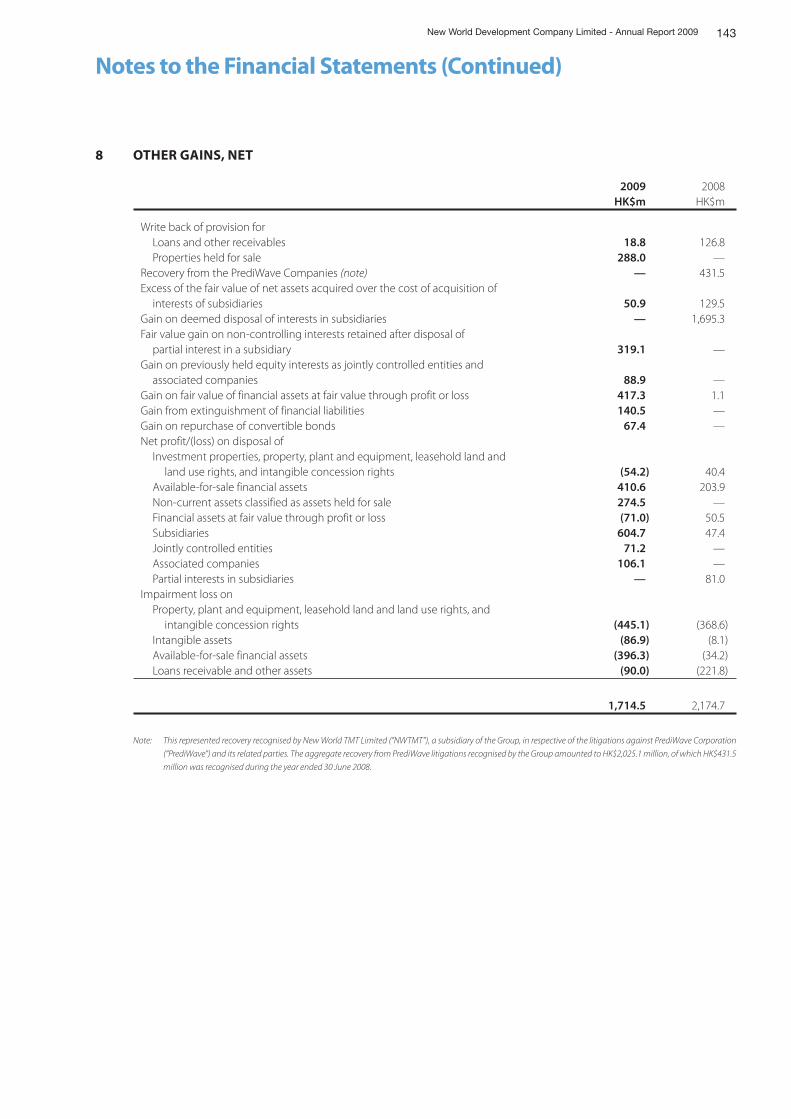
143New World Development Company Limited - Annual Report 2009
Notes to the Financial Statements (Continued)
8 OTHER GAINS, NET
2009 2008HK$m HK$m
Write back of provision for Loans and other receivables 18.8 126.8 Properties held for sale 288.0 —Recovery from the PrediWave Companies (note) — 431.5Excess of the fair value of net assets acquired over the cost of acquisition of interests of subsidiaries 50.9 129.5Gain on deemed disposal of interests in subsidiaries — 1,695.3Fair value gain on non-controlling interests retained after disposal of partial interest in a subsidiary 319.1 —Gain on previously held equity interests as jointly controlled entities and associated companies 88.9 —Gain on fair value of financial assets at fair value through profit or loss 417.3 1.1Gain from extinguishment of financial liabilities 140.5 —Gain on repurchase of convertible bonds 67.4 —Net profit/(loss) on disposal of Investment properties, property, plant and equipment, leasehold land and land use rights, and intangible concession rights (54.2) 40.4 Available-for-sale financial assets 410.6 203.9 Non-current assets classified as assets held for sale 274.5 — Financial assets at fair value through profit or loss (71.0) 50.5 Subsidiaries 604.7 47.4 Jointly controlled entities 71.2 — Associated companies 106.1 — Partial interests in subsidiaries — 81.0Impairment loss on Property, plant and equipment, leasehold land and land use rights, and intangible concession rights (445.1) (368.6) Intangible assets (86.9) (8.1) Available-for-sale financial assets (396.3) (34.2) Loans receivable and other assets (90.0) (221.8)
1,714.5 2,174.7
Note: This represented recovery recognised by New World TMT Limited (“NWTMT”), a subsidiary of the Group, in respective of the litigations against PrediWave Corporation
(“PrediWave”) and its related parties. The aggregate recovery from PrediWave litigations recognised by the Group amounted to HK$2,025.1 million, of which HK$431.5
million was recognised during the year ended 30 June 2008.
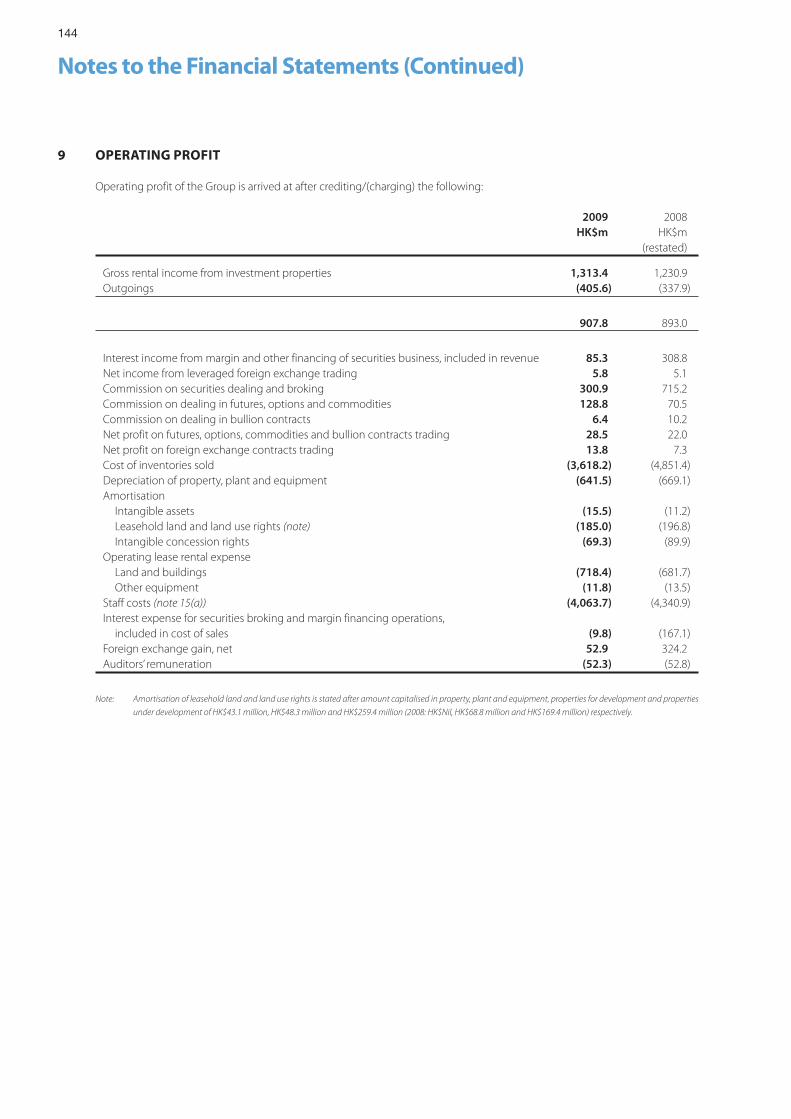
144
Notes to the Financial Statements (Continued)
9 OPERATING PROFIT
Operating profit of the Group is arrived at after crediting/(charging) the following:
2009 2008HK$m HK$m
(restated)
Gross rental income from investment properties 1,313.4 1,230.9Outgoings (405.6) (337.9)
907.8 893.0
Interest income from margin and other financing of securities business, included in revenue 85.3 308.8Net income from leveraged foreign exchange trading 5.8 5.1Commission on securities dealing and broking 300.9 715.2Commission on dealing in futures, options and commodities 128.8 70.5Commission on dealing in bullion contracts 6.4 10.2Net profit on futures, options, commodities and bullion contracts trading 28.5 22.0Net profit on foreign exchange contracts trading 13.8 7.3Cost of inventories sold (3,618.2) (4,851.4)Depreciation of property, plant and equipment (641.5) (669.1)Amortisation Intangible assets (15.5) (11.2) Leasehold land and land use rights (note) (185.0) (196.8) Intangible concession rights (69.3) (89.9)Operating lease rental expense Land and buildings (718.4) (681.7) Other equipment (11.8) (13.5)Staff costs (note 15(a)) (4,063.7) (4,340.9)Interest expense for securities broking and margin financing operations, included in cost of sales (9.8) (167.1)Foreign exchange gain, net 52.9 324.2Auditors’ remuneration (52.3) (52.8)
Note: Amortisation of leasehold land and land use rights is stated after amount capitalised in property, plant and equipment, properties for development and properties
under development of HK$43.1 million, HK$48.3 million and HK$259.4 million (2008: HK$Nil, HK$68.8 million and HK$169.4 million) respectively.
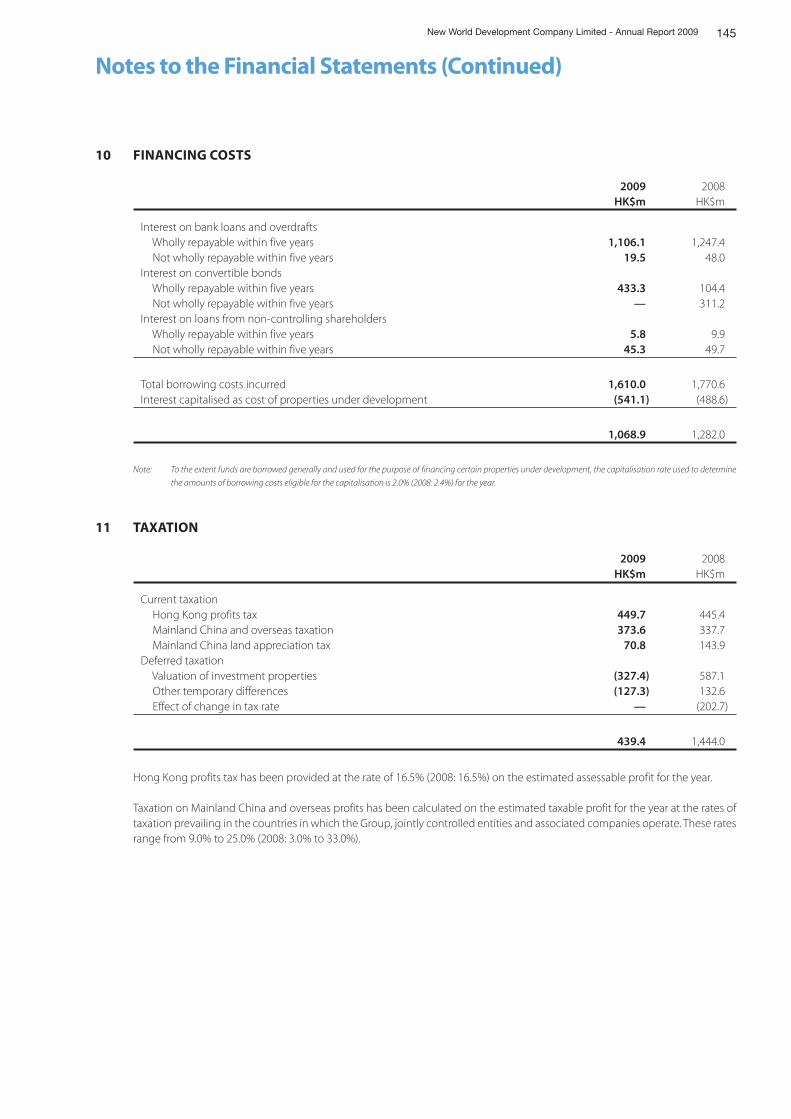
145New World Development Company Limited - Annual Report 2009
Notes to the Financial Statements (Continued)
10 FINANCING COSTS
2009 2008HK$m HK$m
Interest on bank loans and overdrafts Wholly repayable within five years 1,106.1 1,247.4 Not wholly repayable within five years 19.5 48.0Interest on convertible bonds Wholly repayable within five years 433.3 104.4 Not wholly repayable within five years — 311.2Interest on loans from non-controlling shareholders Wholly repayable within five years 5.8 9.9 Not wholly repayable within five years 45.3 49.7
Total borrowing costs incurred 1,610.0 1,770.6Interest capitalised as cost of properties under development (541.1) (488.6)
1,068.9 1,282.0
Note: To the extent funds are borrowed generally and used for the purpose of financing certain properties under development, the capitalisation rate used to determine
the amounts of borrowing costs eligible for the capitalisation is 2.0% (2008: 2.4%) for the year.
11 TAXATION
2009 2008HK$m HK$m
Current taxation Hong Kong profits tax 449.7 445.4 Mainland China and overseas taxation 373.6 337.7 Mainland China land appreciation tax 70.8 143.9Deferred taxation Valuation of investment properties (327.4) 587.1 Other temporary differences (127.3) 132.6 Effect of change in tax rate — (202.7)
439.4 1,444.0
Hong Kong profits tax has been provided at the rate of 16.5% (2008: 16.5%) on the estimated assessable profit for the year.
Taxation on Mainland China and overseas profits has been calculated on the estimated taxable profit for the year at the rates of taxation prevailing in the countries in which the Group, jointly controlled entities and associated companies operate. These rates range from 9.0% to 25.0% (2008: 3.0% to 33.0%).
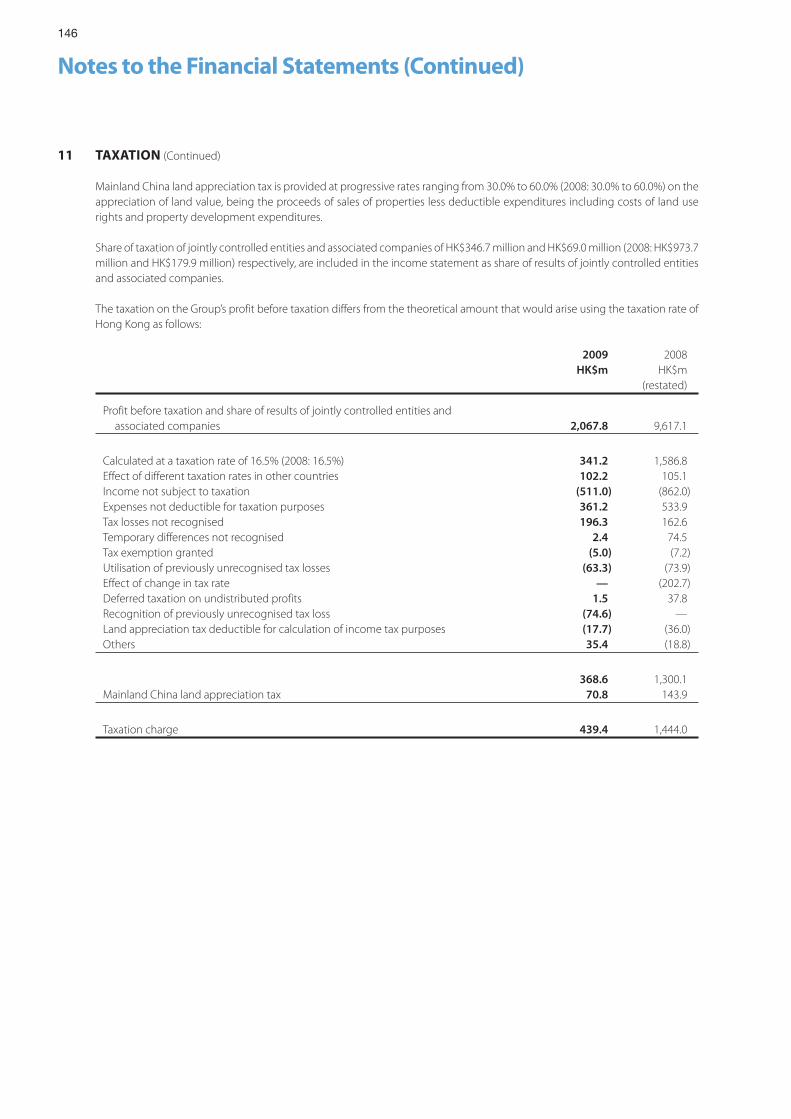
146
Notes to the Financial Statements (Continued)
11 TAXATION (Continued)
Mainland China land appreciation tax is provided at progressive rates ranging from 30.0% to 60.0% (2008: 30.0% to 60.0%) on the appreciation of land value, being the proceeds of sales of properties less deductible expenditures including costs of land use rights and property development expenditures.
Share of taxation of jointly controlled entities and associated companies of HK$346.7 million and HK$69.0 million (2008: HK$973.7 million and HK$179.9 million) respectively, are included in the income statement as share of results of jointly controlled entities and associated companies.
The taxation on the Group’s profit before taxation differs from the theoretical amount that would arise using the taxation rate of Hong Kong as follows:
2009 2008HK$m HK$m
(restated)
Profit before taxation and share of results of jointly controlled entities and associated companies 2,067.8 9,617.1
Calculated at a taxation rate of 16.5% (2008: 16.5%) 341.2 1,586.8Effect of different taxation rates in other countries 102.2 105.1Income not subject to taxation (511.0) (862.0)Expenses not deductible for taxation purposes 361.2 533.9Tax losses not recognised 196.3 162.6Temporary differences not recognised 2.4 74.5Tax exemption granted (5.0) (7.2)Utilisation of previously unrecognised tax losses (63.3) (73.9)Effect of change in tax rate — (202.7)Deferred taxation on undistributed profits 1.5 37.8Recognition of previously unrecognised tax loss (74.6) —Land appreciation tax deductible for calculation of income tax purposes (17.7) (36.0)Others 35.4 (18.8)
368.6 1,300.1Mainland China land appreciation tax 70.8 143.9
Taxation charge 439.4 1,444.0
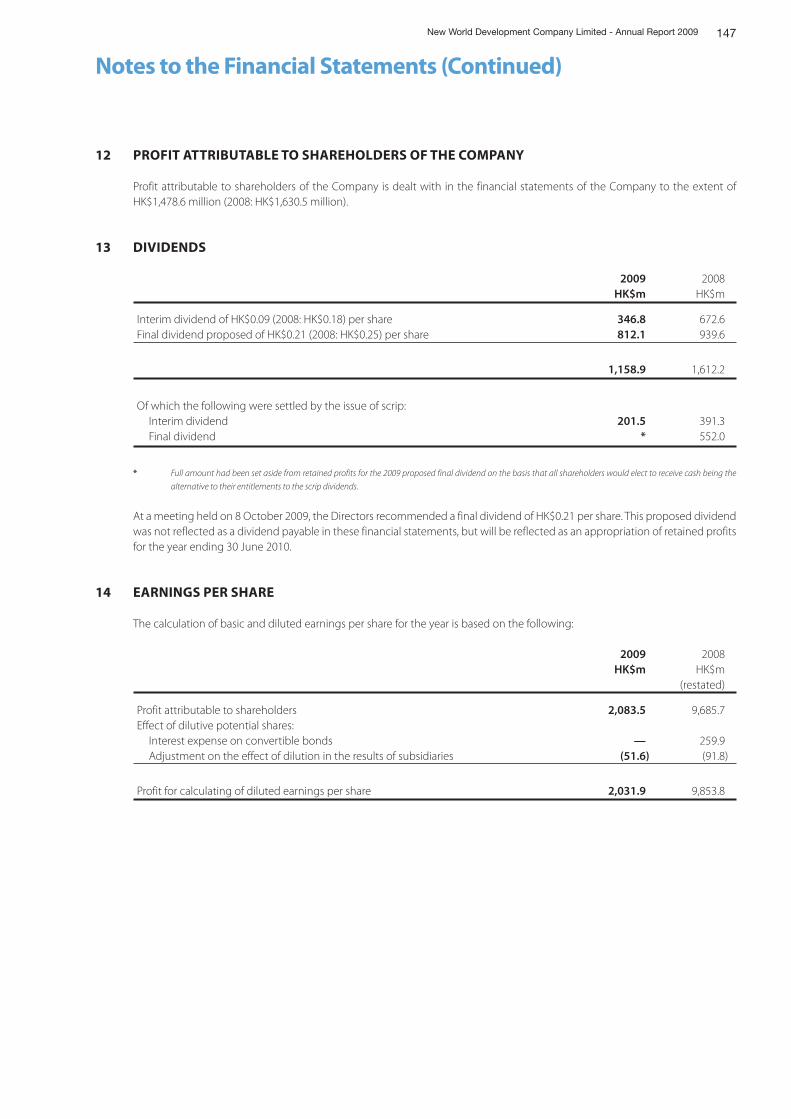
147New World Development Company Limited - Annual Report 2009
Notes to the Financial Statements (Continued)
12 PROFIT ATTRIBUTABLE TO SHAREHOLDERS OF THE COMPANY
Profit attributable to shareholders of the Company is dealt with in the financial statements of the Company to the extent of HK$1,478.6 million (2008: HK$1,630.5 million).
13 DIVIDENDS
2009 2008HK$m HK$m
Interim dividend of HK$0.09 (2008: HK$0.18) per share 346.8 672.6Final dividend proposed of HK$0.21 (2008: HK$0.25) per share 812.1 939.6
1,158.9 1,612.2
Of which the following were settled by the issue of scrip: Interim dividend 201.5 391.3 Final dividend * 552.0
* Full amount had been set aside from retained profits for the 2009 proposed final dividend on the basis that all shareholders would elect to receive cash being the
alternative to their entitlements to the scrip dividends.
At a meeting held on 8 October 2009, the Directors recommended a final dividend of HK$0.21 per share. This proposed dividend was not reflected as a dividend payable in these financial statements, but will be reflected as an appropriation of retained profits for the year ending 30 June 2010.
14 EARNINGS PER SHARE
The calculation of basic and diluted earnings per share for the year is based on the following:
2009 2008HK$m HK$m
(restated)
Profit attributable to shareholders 2,083.5 9,685.7Effect of dilutive potential shares: Interest expense on convertible bonds — 259.9 Adjustment on the effect of dilution in the results of subsidiaries (51.6) (91.8)
Profit for calculating of diluted earnings per share 2,031.9 9,853.8
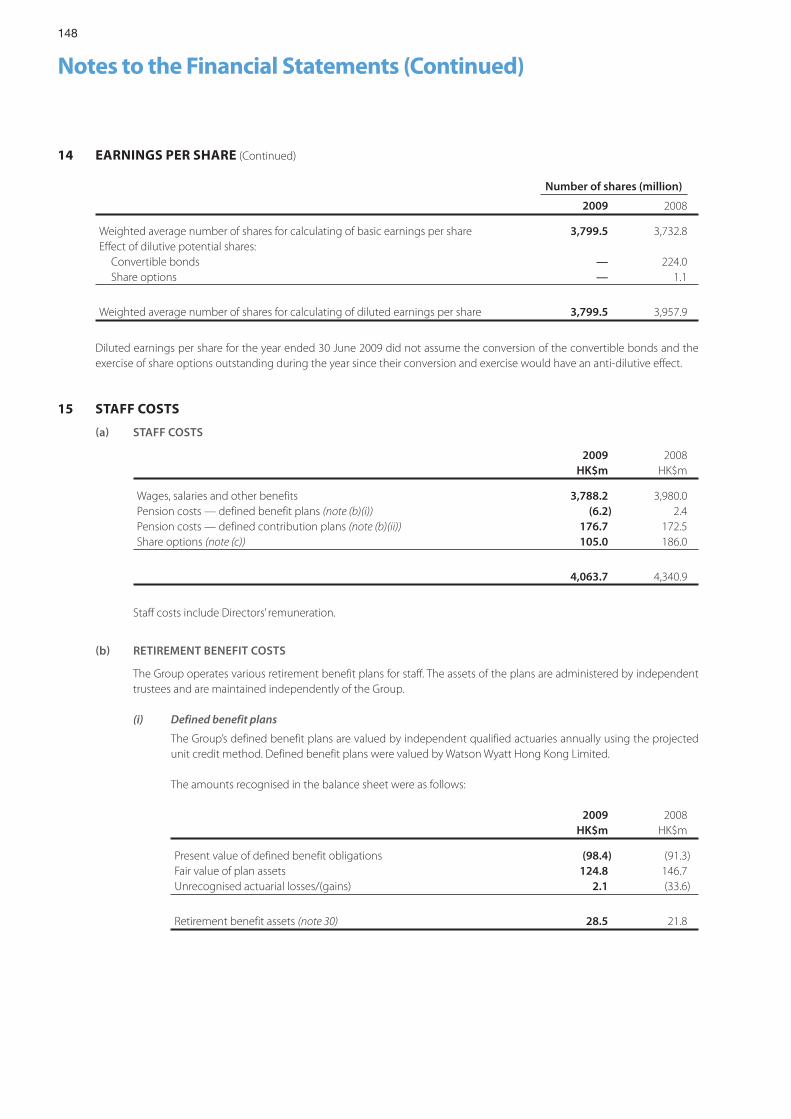
148
Notes to the Financial Statements (Continued)
14 EARNINGS PER SHARE (Continued)
Number of shares (million)
2009 2008
Weighted average number of shares for calculating of basic earnings per share 3,799.5 3,732.8Effect of dilutive potential shares: Convertible bonds — 224.0 Share options — 1.1
Weighted average number of shares for calculating of diluted earnings per share 3,799.5 3,957.9
Diluted earnings per share for the year ended 30 June 2009 did not assume the conversion of the convertible bonds and the exercise of share options outstanding during the year since their conversion and exercise would have an anti-dilutive effect.
15 STAFF COSTS
a STAFF COSTS
2009 2008HK$m HK$m
Wages, salaries and other benefits 3,788.2 3,980.0Pension costs — defined benefit plans (note (b)(i)) (6.2) 2.4Pension costs — defined contribution plans (note (b)(ii)) 176.7 172.5Share options (note (c)) 105.0 186.0
4,063.7 4,340.9
Staff costs include Directors’ remuneration.
b RETIREMENT BENEFIT COSTS
The Group operates various retirement benefit plans for staff. The assets of the plans are administered by independent trustees and are maintained independently of the Group.
(i) Defined benefit plans
The Group’s defined benefit plans are valued by independent qualified actuaries annually using the projected unit credit method. Defined benefit plans were valued by Watson Wyatt Hong Kong Limited.
The amounts recognised in the balance sheet were as follows:
2009 2008HK$m HK$m
Present value of defined benefit obligations (98.4) (91.3)Fair value of plan assets 124.8 146.7Unrecognised actuarial losses/(gains) 2.1 (33.6)
Retirement benefit assets (note 30) 28.5 21.8
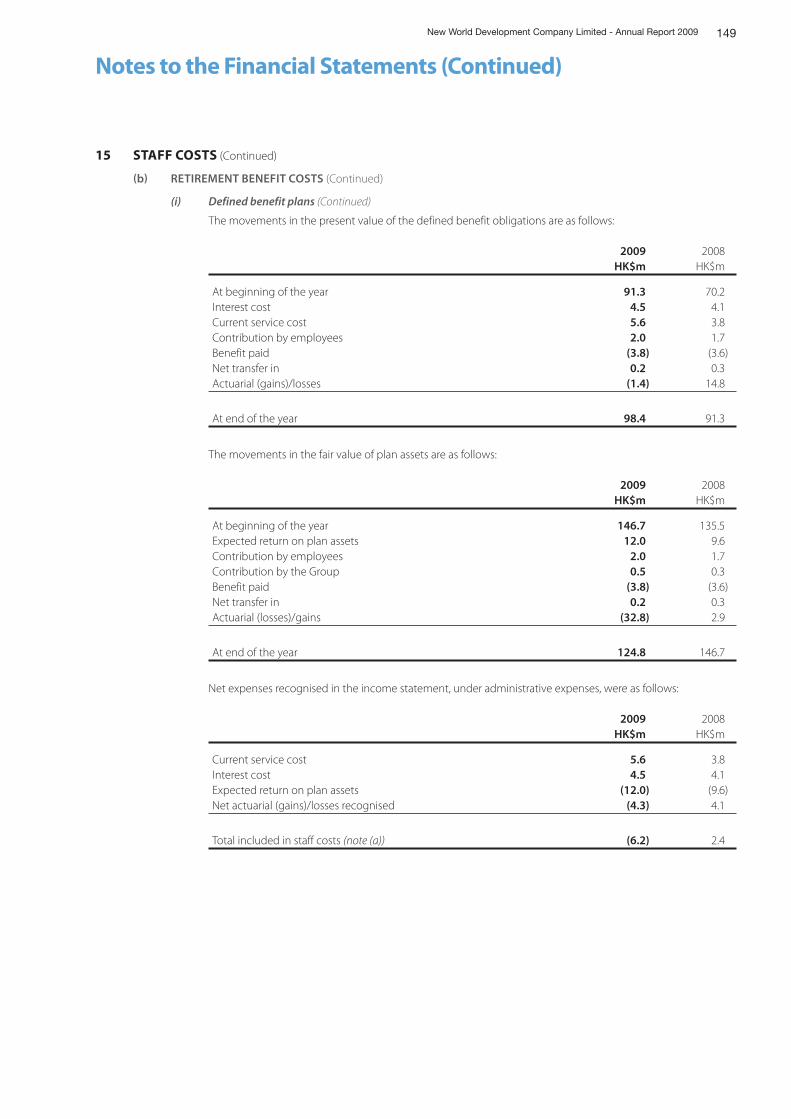
149New World Development Company Limited - Annual Report 2009
Notes to the Financial Statements (Continued)
15 STAFF COSTS (Continued)
b RETIREMENT BENEFIT COSTS (Continued)
(i) Defined benefit plans (Continued)
The movements in the present value of the defined benefit obligations are as follows:
2009 2008HK$m HK$m
At beginning of the year 91.3 70.2Interest cost 4.5 4.1Current service cost 5.6 3.8Contribution by employees 2.0 1.7Benefit paid (3.8) (3.6)Net transfer in 0.2 0.3Actuarial (gains)/losses (1.4) 14.8
At end of the year 98.4 91.3
The movements in the fair value of plan assets are as follows:
2009 2008HK$m HK$m
At beginning of the year 146.7 135.5Expected return on plan assets 12.0 9.6Contribution by employees 2.0 1.7Contribution by the Group 0.5 0.3Benefit paid (3.8) (3.6)Net transfer in 0.2 0.3Actuarial (losses)/gains (32.8) 2.9
At end of the year 124.8 146.7
Net expenses recognised in the income statement, under administrative expenses, were as follows:
2009 2008HK$m HK$m
Current service cost 5.6 3.8Interest cost 4.5 4.1Expected return on plan assets (12.0) (9.6)Net actuarial (gains)/losses recognised (4.3) 4.1
Total included in staff costs (note (a)) (6.2) 2.4
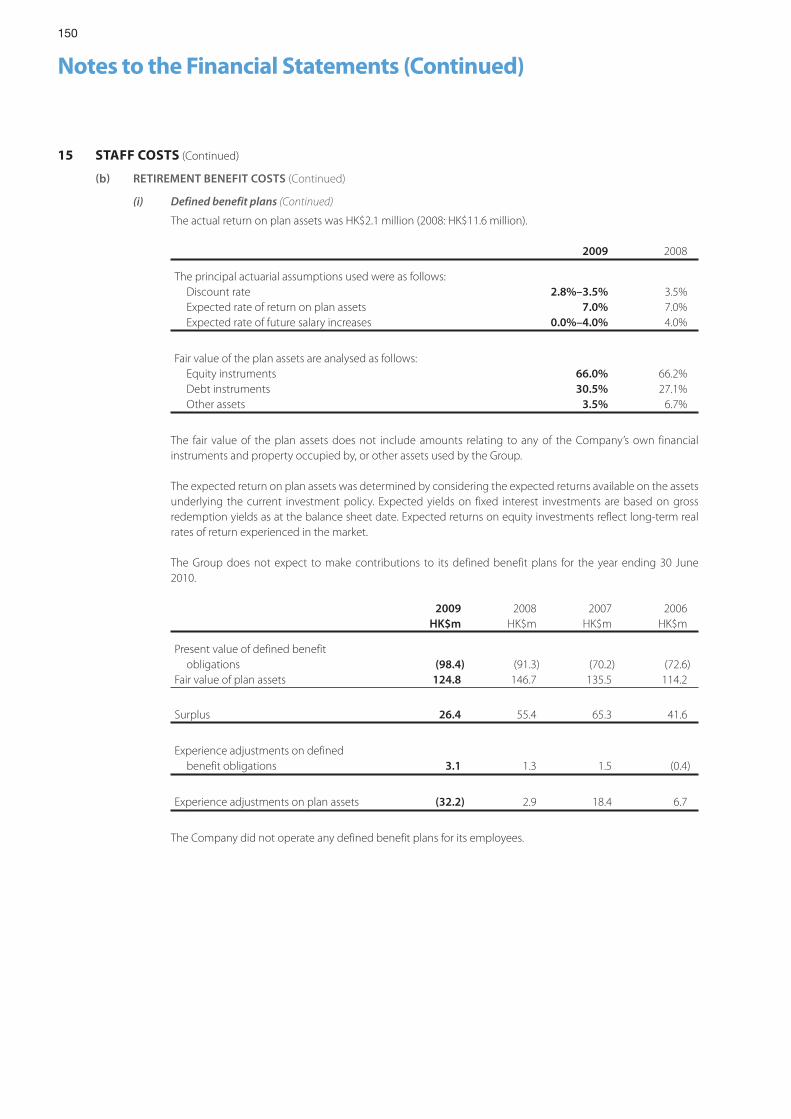
150
Notes to the Financial Statements (Continued)
15 STAFF COSTS (Continued)
b RETIREMENT BENEFIT COSTS (Continued)
(i) Defined benefit plans (Continued)
The actual return on plan assets was HK$2.1 million (2008: HK$11.6 million).
2009 2008
The principal actuarial assumptions used were as follows: Discount rate 2.8%–3.5% 3.5% Expected rate of return on plan assets 7.0% 7.0% Expected rate of future salary increases 0.0%–4.0% 4.0%
Fair value of the plan assets are analysed as follows: Equity instruments 66.0% 66.2% Debt instruments 30.5% 27.1% Other assets 3.5% 6.7%
The fair value of the plan assets does not include amounts relating to any of the Company’s own financial instruments and property occupied by, or other assets used by the Group.
The expected return on plan assets was determined by considering the expected returns available on the assets underlying the current investment policy. Expected yields on fixed interest investments are based on gross redemption yields as at the balance sheet date. Expected returns on equity investments reflect long-term real rates of return experienced in the market.
The Group does not expect to make contributions to its defined benefit plans for the year ending 30 June 2010.
2009 2008 2007 2006HK$m HK$m HK$m HK$m
Present value of defined benefit obligations (98.4) (91.3) (70.2) (72.6)Fair value of plan assets 124.8 146.7 135.5 114.2
Surplus 26.4 55.4 65.3 41.6
Experience adjustments on defined benefit obligations 3.1 1.3 1.5 (0.4)
Experience adjustments on plan assets (32.2) 2.9 18.4 6.7
The Company did not operate any defined benefit plans for its employees.
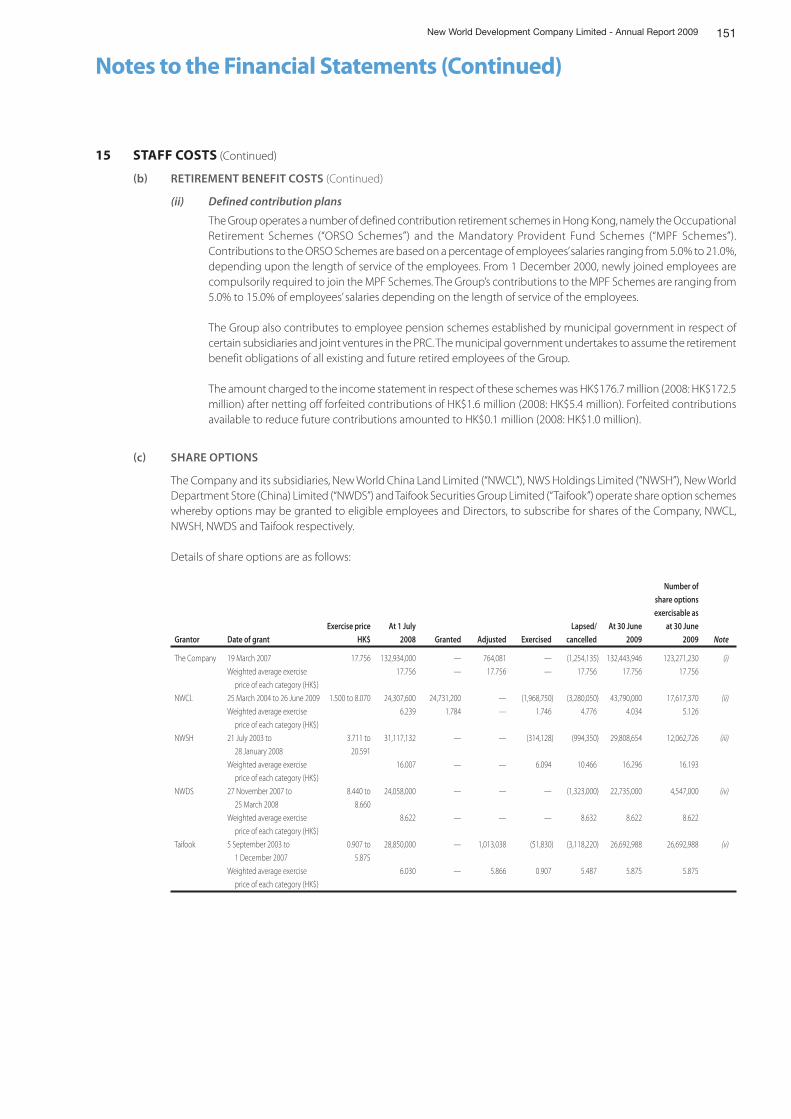
151New World Development Company Limited - Annual Report 2009
Notes to the Financial Statements (Continued)
15 STAFF COSTS (Continued)
b RETIREMENT BENEFIT COSTS (Continued)
(ii) Defined contribution plans
The Group operates a number of defined contribution retirement schemes in Hong Kong, namely the Occupational Retirement Schemes (“ORSO Schemes”) and the Mandatory Provident Fund Schemes (“MPF Schemes”). Contributions to the ORSO Schemes are based on a percentage of employees’ salaries ranging from 5.0% to 21.0%, depending upon the length of service of the employees. From 1 December 2000, newly joined employees are compulsorily required to join the MPF Schemes. The Group’s contributions to the MPF Schemes are ranging from 5.0% to 15.0% of employees’ salaries depending on the length of service of the employees.
The Group also contributes to employee pension schemes established by municipal government in respect of certain subsidiaries and joint ventures in the PRC. The municipal government undertakes to assume the retirement benefit obligations of all existing and future retired employees of the Group.
The amount charged to the income statement in respect of these schemes was HK$176.7 million (2008: HK$172.5 million) after netting off forfeited contributions of HK$1.6 million (2008: HK$5.4 million). Forfeited contributions available to reduce future contributions amounted to HK$0.1 million (2008: HK$1.0 million).
c SHARE OPTIONS
The Company and its subsidiaries, New World China Land Limited (“NWCL”), NWS Holdings Limited (“NWSH”), New World Department Store (China) Limited (“NWDS”) and Taifook Securities Group Limited (“Taifook”) operate share option schemes whereby options may be granted to eligible employees and Directors, to subscribe for shares of the Company, NWCL, NWSH, NWDS and Taifook respectively.
Details of share options are as follows:
Grantor Date of grant
Exercise price
HK$
At 1 July
2008 Granted Adjusted Exercised
Lapsed/
cancelled
At 30 June
2009
Number of
share options
exercisable as
at 30 June
2009 Note
The Company 19 March 2007 17.756 132,934,000 — 764,081 — (1,254,135) 132,443,946 123,271,230 (i)
Weighted average exercise
price of each category (HK$)
17.756 — 17.756 — 17.756 17.756 17.756
NWCL 25 March 2004 to 26 June 2009 1.500 to 8.070 24,307,600 24,731,200 — (1,968,750) (3,280,050) 43,790,000 17,617,370 (ii)
Weighted average exercise
price of each category (HK$)
6.239 1.784 — 1.746 4.776 4.034 5.126
NWSH 21 July 2003 to
28 January 2008
3.711 to
20.591
31,117,132 — — (314,128) (994,350) 29,808,654 12,062,726 (iii)
Weighted average exercise
price of each category (HK$)
16.007 — — 6.094 10.466 16.296 16.193
NWDS 27 November 2007 to
25 March 2008
8.440 to
8.660
24,058,000 — — — (1,323,000) 22,735,000 4,547,000 (iv)
Weighted average exercise
price of each category (HK$)
8.622 — — — 8.632 8.622 8.622
Taifook 5 September 2003 to
1 December 2007
0.907 to
5.875
28,850,000 — 1,013,038 (51,830) (3,118,220) 26,692,988 26,692,988 (v)
Weighted average exercise
price of each category (HK$)
6.030 — 5.866 0.907 5.487 5.875 5.875
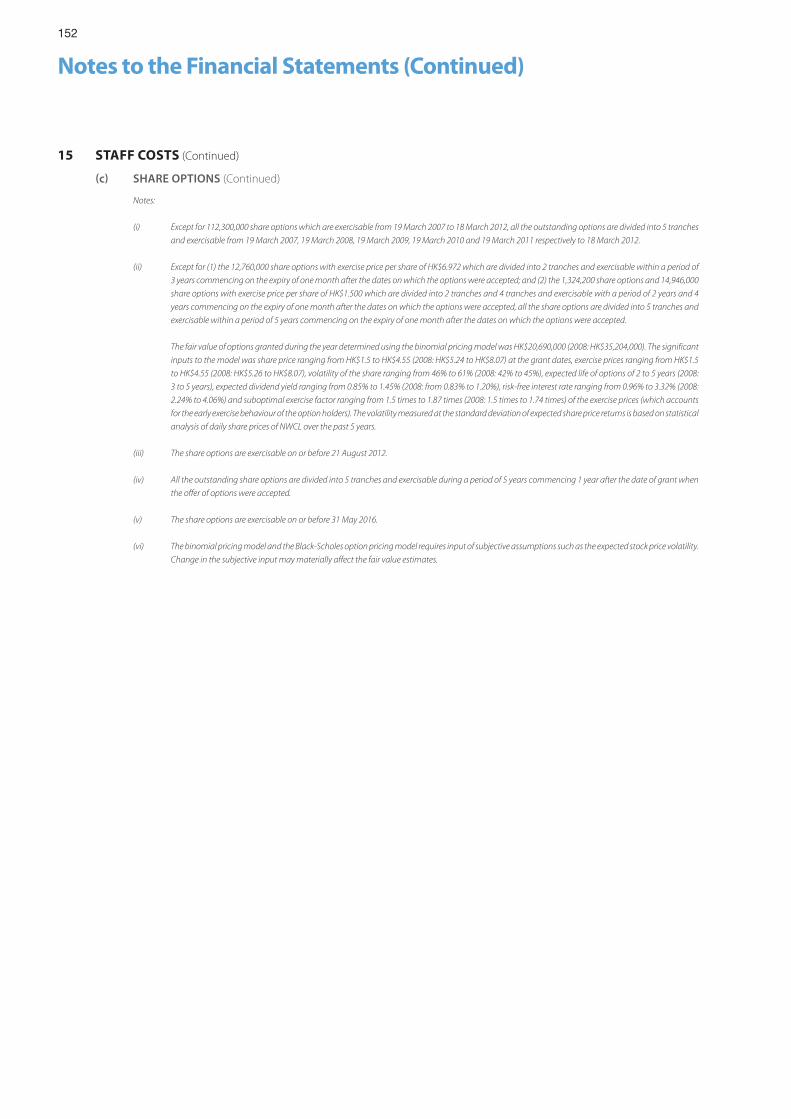
152
Notes to the Financial Statements (Continued)
15 STAFF COSTS (Continued)
c SHARE OPTIONS (Continued)
Notes:
(i) Except for 112,300,000 share options which are exercisable from 19 March 2007 to 18 March 2012, all the outstanding options are divided into 5 tranches
and exercisable from 19 March 2007, 19 March 2008, 19 March 2009, 19 March 2010 and 19 March 2011 respectively to 18 March 2012.
(ii) Except for (1) the 12,760,000 share options with exercise price per share of HK$6.972 which are divided into 2 tranches and exercisable within a period of
3 years commencing on the expiry of one month after the dates on which the options were accepted; and (2) the 1,324,200 share options and 14,946,000
share options with exercise price per share of HK$1.500 which are divided into 2 tranches and 4 tranches and exercisable with a period of 2 years and 4
years commencing on the expiry of one month after the dates on which the options were accepted, all the share options are divided into 5 tranches and
exercisable within a period of 5 years commencing on the expiry of one month after the dates on which the options were accepted.
The fair value of options granted during the year determined using the binomial pricing model was HK$20,690,000 (2008: HK$35,204,000). The significant
inputs to the model was share price ranging from HK$1.5 to HK$4.55 (2008: HK$5.24 to HK$8.07) at the grant dates, exercise prices ranging from HK$1.5
to HK$4.55 (2008: HK$5.26 to HK$8.07), volatility of the share ranging from 46% to 61% (2008: 42% to 45%), expected life of options of 2 to 5 years (2008:
3 to 5 years), expected dividend yield ranging from 0.85% to 1.45% (2008: from 0.83% to 1.20%), risk-free interest rate ranging from 0.96% to 3.32% (2008:
2.24% to 4.06%) and suboptimal exercise factor ranging from 1.5 times to 1.87 times (2008: 1.5 times to 1.74 times) of the exercise prices (which accounts
for the early exercise behaviour of the option holders). The volatility measured at the standard deviation of expected share price returns is based on statistical
analysis of daily share prices of NWCL over the past 5 years.
(iii) The share options are exercisable on or before 21 August 2012.
(iv) All the outstanding share options are divided into 5 tranches and exercisable during a period of 5 years commencing 1 year after the date of grant when
the offer of options were accepted.
(v) The share options are exercisable on or before 31 May 2016.
(vi) The binomial pricing model and the Black-Scholes option pricing model requires input of subjective assumptions such as the expected stock price volatility.
Change in the subjective input may materially affect the fair value estimates.
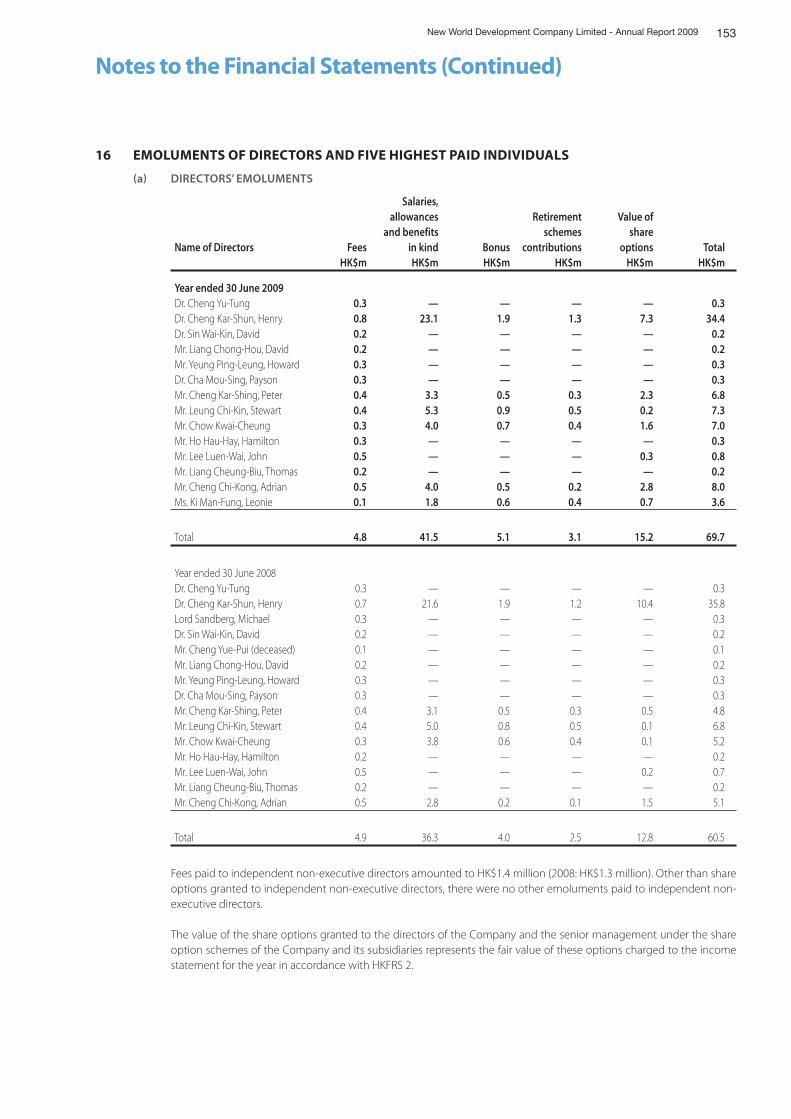
153New World Development Company Limited - Annual Report 2009
Notes to the Financial Statements (Continued)
16 EMOLUMENTS OF DIRECTORS AND FIVE HIGHEST PAID INDIVIDUALS
a DIRECTORS’ EMOLUMENTS
Name of Directors Fees
Salaries, allowances
and benefits in kind Bonus
Retirement schemes
contributions
Value of share
options TotalHK$m HK$m HK$m HK$m HK$m HK$m
Year ended 30 June 2009Dr. Cheng Yu-Tung 0.3 — — — — 0.3Dr. Cheng Kar-Shun, Henry 0.8 23.1 1.9 1.3 7.3 34.4Dr. Sin Wai-Kin, David 0.2 — — — — 0.2Mr. Liang Chong-Hou, David 0.2 — — — — 0.2Mr. Yeung Ping-Leung, Howard 0.3 — — — — 0.3Dr. Cha Mou-Sing, Payson 0.3 — — — — 0.3Mr. Cheng Kar-Shing, Peter 0.4 3.3 0.5 0.3 2.3 6.8Mr. Leung Chi-Kin, Stewart 0.4 5.3 0.9 0.5 0.2 7.3Mr. Chow Kwai-Cheung 0.3 4.0 0.7 0.4 1.6 7.0Mr. Ho Hau-Hay, Hamilton 0.3 — — — — 0.3Mr. Lee Luen-Wai, John 0.5 — — — 0.3 0.8Mr. Liang Cheung-Biu, Thomas 0.2 — — — — 0.2Mr. Cheng Chi-Kong, Adrian 0.5 4.0 0.5 0.2 2.8 8.0Ms. Ki Man-Fung, Leonie 0.1 1.8 0.6 0.4 0.7 3.6
Total 4.8 41.5 5.1 3.1 15.2 69.7
Year ended 30 June 2008Dr. Cheng Yu-Tung 0.3 — — — — 0.3Dr. Cheng Kar-Shun, Henry 0.7 21.6 1.9 1.2 10.4 35.8Lord Sandberg, Michael 0.3 — — — — 0.3Dr. Sin Wai-Kin, David 0.2 — — — — 0.2Mr. Cheng Yue-Pui (deceased) 0.1 — — — — 0.1Mr. Liang Chong-Hou, David 0.2 — — — — 0.2Mr. Yeung Ping-Leung, Howard 0.3 — — — — 0.3Dr. Cha Mou-Sing, Payson 0.3 — — — — 0.3Mr. Cheng Kar-Shing, Peter 0.4 3.1 0.5 0.3 0.5 4.8Mr. Leung Chi-Kin, Stewart 0.4 5.0 0.8 0.5 0.1 6.8Mr. Chow Kwai-Cheung 0.3 3.8 0.6 0.4 0.1 5.2Mr. Ho Hau-Hay, Hamilton 0.2 — — — — 0.2Mr. Lee Luen-Wai, John 0.5 — — — 0.2 0.7Mr. Liang Cheung-Biu, Thomas 0.2 — — — — 0.2Mr. Cheng Chi-Kong, Adrian 0.5 2.8 0.2 0.1 1.5 5.1
Total 4.9 36.3 4.0 2.5 12.8 60.5
Fees paid to independent non-executive directors amounted to HK$1.4 million (2008: HK$1.3 million). Other than share options granted to independent non-executive directors, there were no other emoluments paid to independent non-executive directors.
The value of the share options granted to the directors of the Company and the senior management under the share option schemes of the Company and its subsidiaries represents the fair value of these options charged to the income statement for the year in accordance with HKFRS 2.
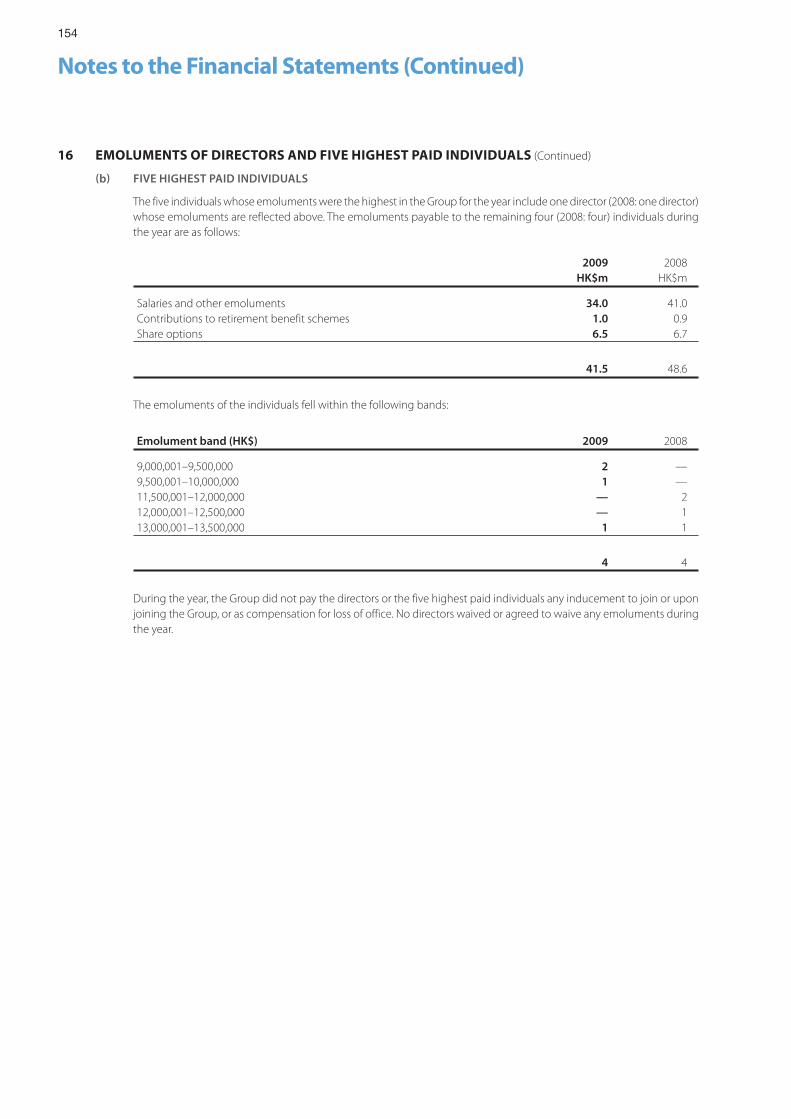
154
Notes to the Financial Statements (Continued)
16 EMOLUMENTS OF DIRECTORS AND FIVE HIGHEST PAID INDIVIDUALS (Continued)
b FIVE HIGHEST PAID INDIVIDUALS
The five individuals whose emoluments were the highest in the Group for the year include one director (2008: one director) whose emoluments are reflected above. The emoluments payable to the remaining four (2008: four) individuals during the year are as follows:
2009 2008HK$m HK$m
Salaries and other emoluments 34.0 41.0Contributions to retirement benefit schemes 1.0 0.9Share options 6.5 6.7
41.5 48.6
The emoluments of the individuals fell within the following bands:
Emolument band (HK$) 2009 2008
9,000,001–9,500,000 2 —9,500,001–10,000,000 1 —11,500,001–12,000,000 — 212,000,001–12,500,000 — 113,000,001–13,500,000 1 1
4 4
During the year, the Group did not pay the directors or the five highest paid individuals any inducement to join or upon joining the Group, or as compensation for loss of office. No directors waived or agreed to waive any emoluments during the year.
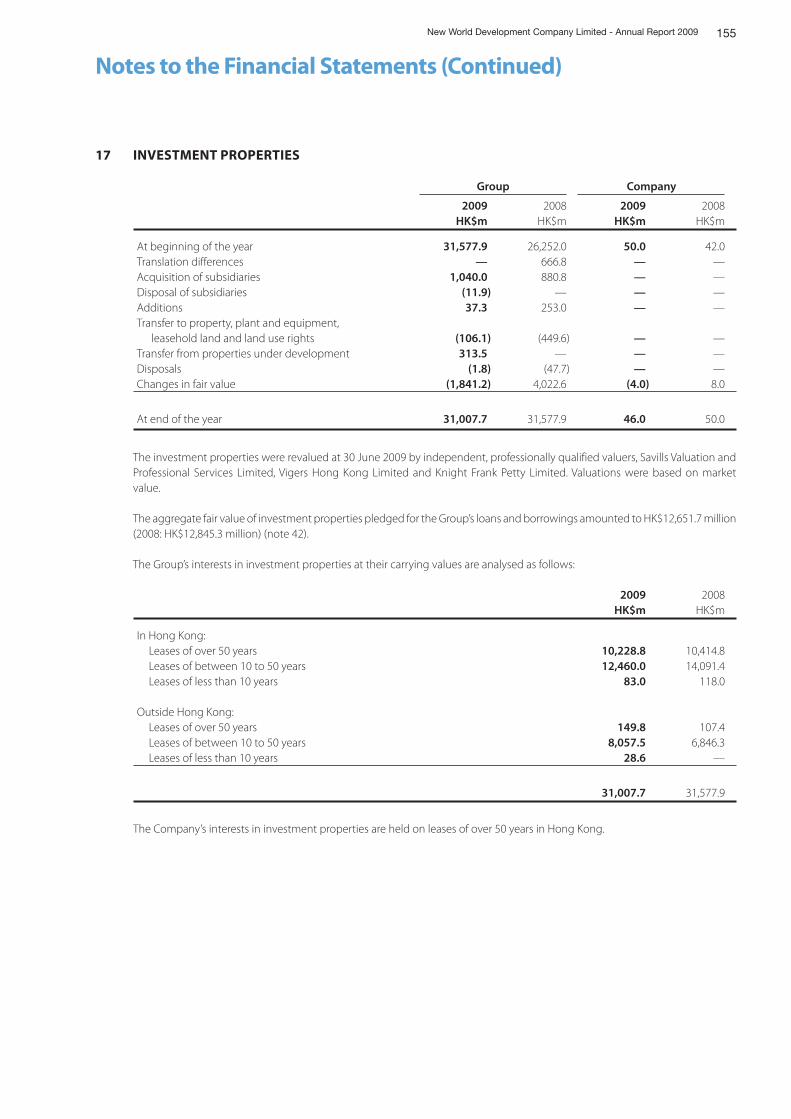
155New World Development Company Limited - Annual Report 2009
Notes to the Financial Statements (Continued)
17 INVESTMENT PROPERTIES
Group Company
2009 2008 2009 2008HK$m HK$m HK$m HK$m
At beginning of the year 31,577.9 26,252.0 50.0 42.0Translation differences — 666.8 — —Acquisition of subsidiaries 1,040.0 880.8 — —Disposal of subsidiaries (11.9) — — —Additions 37.3 253.0 — —Transfer to property, plant and equipment, leasehold land and land use rights (106.1) (449.6) — —Transfer from properties under development 313.5 — — —Disposals (1.8) (47.7) — —Changes in fair value (1,841.2) 4,022.6 (4.0) 8.0
At end of the year 31,007.7 31,577.9 46.0 50.0
The investment properties were revalued at 30 June 2009 by independent, professionally qualified valuers, Savills Valuation and Professional Services Limited, Vigers Hong Kong Limited and Knight Frank Petty Limited. Valuations were based on market value.
The aggregate fair value of investment properties pledged for the Group’s loans and borrowings amounted to HK$12,651.7 million (2008: HK$12,845.3 million) (note 42).
The Group’s interests in investment properties at their carrying values are analysed as follows:
2009 2008HK$m HK$m
In Hong Kong: Leases of over 50 years 10,228.8 10,414.8 Leases of between 10 to 50 years 12,460.0 14,091.4 Leases of less than 10 years 83.0 118.0
Outside Hong Kong: Leases of over 50 years 149.8 107.4 Leases of between 10 to 50 years 8,057.5 6,846.3 Leases of less than 10 years 28.6 —
31,007.7 31,577.9
The Company’s interests in investment properties are held on leases of over 50 years in Hong Kong.
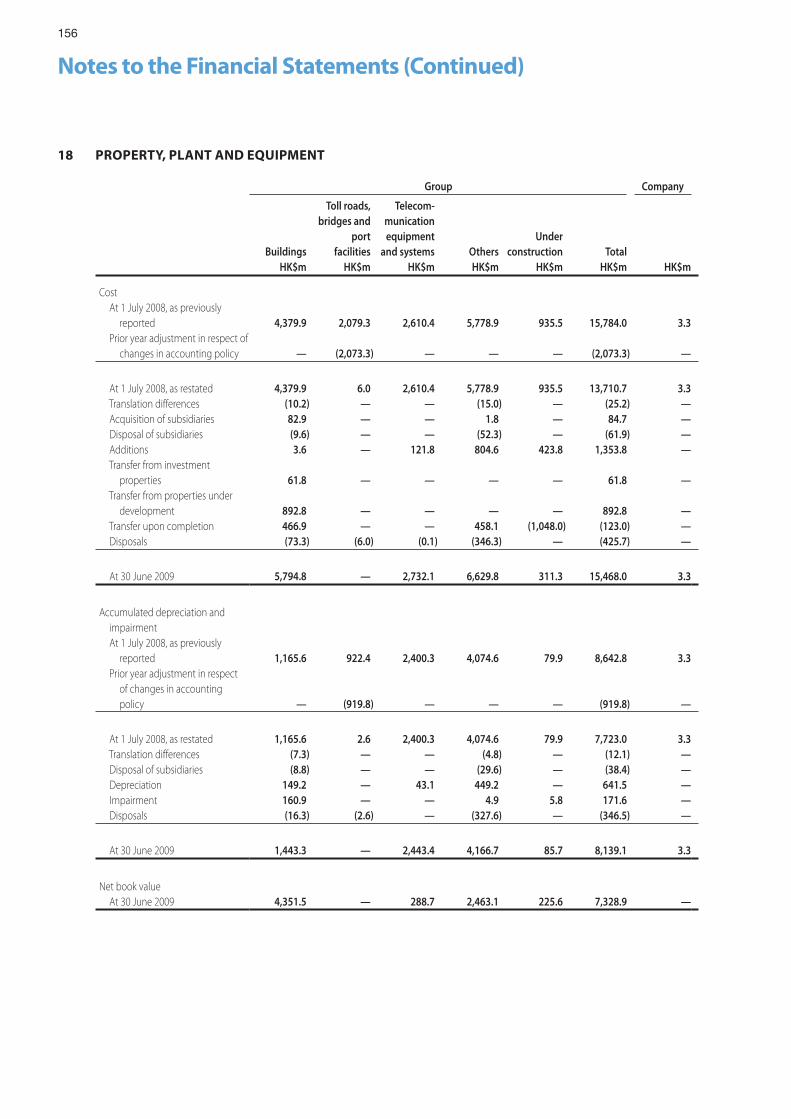
156
Notes to the Financial Statements (Continued)
18 PROPERTY, PLANT AND EQUIPMENT
Group Company
Buildings
Toll roads, bridges and
port facilities
Telecom-munication equipment
and systems OthersUnder
construction TotalHK$m HK$m HK$m HK$m HK$m HK$m HK$m
Cost At 1 July 2008, as previously reported 4,379.9 2,079.3 2,610.4 5,778.9 935.5 15,784.0 3.3 Prior year adjustment in respect of changes in accounting policy — (2,073.3) — — — (2,073.3) —
At 1 July 2008, as restated 4,379.9 6.0 2,610.4 5,778.9 935.5 13,710.7 3.3 Translation differences (10.2) — — (15.0) — (25.2) — Acquisition of subsidiaries 82.9 — — 1.8 — 84.7 — Disposal of subsidiaries (9.6) — — (52.3) — (61.9) — Additions 3.6 — 121.8 804.6 423.8 1,353.8 — Transfer from investment properties 61.8 — — — — 61.8 — Transfer from properties under development 892.8 — — — — 892.8 — Transfer upon completion 466.9 — — 458.1 (1,048.0) (123.0) — Disposals (73.3) (6.0) (0.1) (346.3) — (425.7) —
At 30 June 2009 5,794.8 — 2,732.1 6,629.8 311.3 15,468.0 3.3
Accumulated depreciation and impairment At 1 July 2008, as previously reported 1,165.6 922.4 2,400.3 4,074.6 79.9 8,642.8 3.3 Prior year adjustment in respect of changes in accounting policy — (919.8) — — — (919.8) —
At 1 July 2008, as restated 1,165.6 2.6 2,400.3 4,074.6 79.9 7,723.0 3.3 Translation differences (7.3) — — (4.8) — (12.1) — Disposal of subsidiaries (8.8) — — (29.6) — (38.4) — Depreciation 149.2 — 43.1 449.2 — 641.5 — Impairment 160.9 — — 4.9 5.8 171.6 — Disposals (16.3) (2.6) — (327.6) — (346.5) —
At 30 June 2009 1,443.3 — 2,443.4 4,166.7 85.7 8,139.1 3.3
Net book value At 30 June 2009 4,351.5 — 288.7 2,463.1 225.6 7,328.9 —
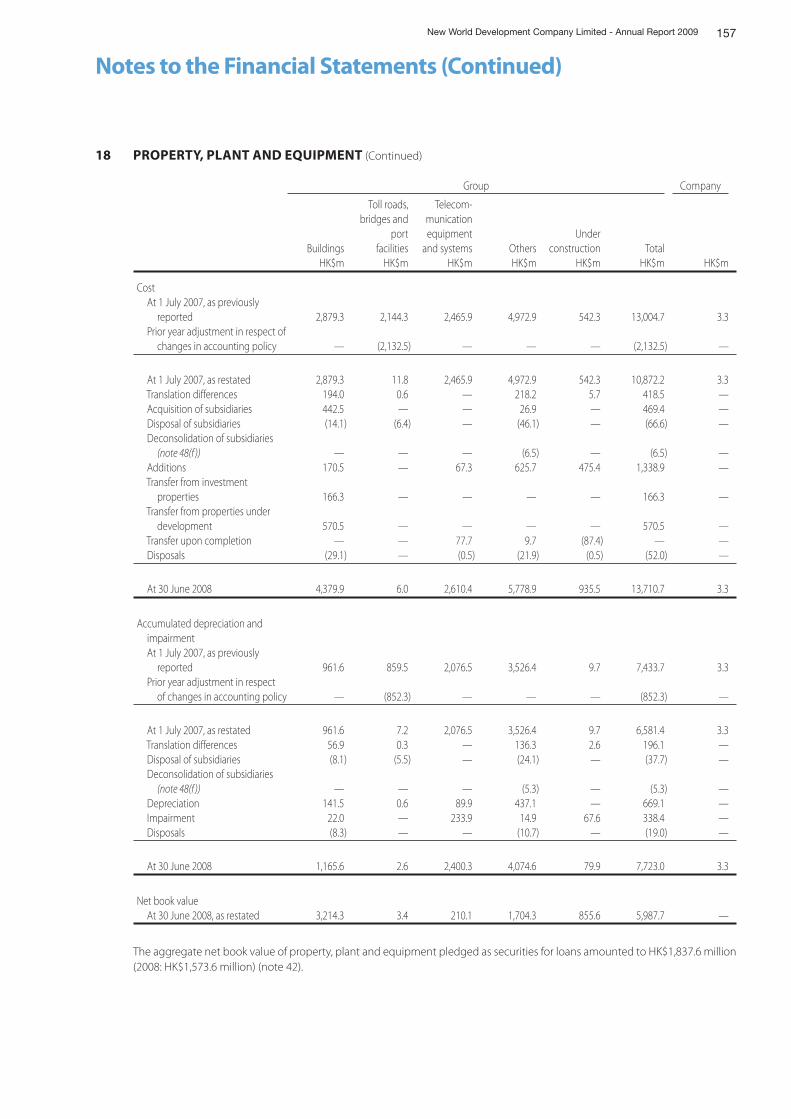
157New World Development Company Limited - Annual Report 2009
Notes to the Financial Statements (Continued)
18 PROPERTY, PLANT AND EQUIPMENT (Continued)
Group Company
Buildings
Toll roads, bridges and
portfacilities
Telecom- munication equipment
and systems OthersUnder
construction TotalHK$m HK$m HK$m HK$m HK$m HK$m HK$m
Cost At 1 July 2007, as previously reported 2,879.3 2,144.3 2,465.9 4,972.9 542.3 13,004.7 3.3 Prior year adjustment in respect of changes in accounting policy — (2,132.5) — — — (2,132.5) —
At 1 July 2007, as restated 2,879.3 11.8 2,465.9 4,972.9 542.3 10,872.2 3.3 Translation differences 194.0 0.6 — 218.2 5.7 418.5 — Acquisition of subsidiaries 442.5 — — 26.9 — 469.4 — Disposal of subsidiaries (14.1) (6.4) — (46.1) — (66.6) — Deconsolidation of subsidiaries (note 48(f )) — — — (6.5) — (6.5) — Additions 170.5 — 67.3 625.7 475.4 1,338.9 — Transfer from investment properties 166.3 — — — — 166.3 — Transfer from properties under development 570.5 — — — — 570.5 — Transfer upon completion — — 77.7 9.7 (87.4) — — Disposals (29.1) — (0.5) (21.9) (0.5) (52.0) —
At 30 June 2008 4,379.9 6.0 2,610.4 5,778.9 935.5 13,710.7 3.3
Accumulated depreciation and impairment At 1 July 2007, as previously reported 961.6 859.5 2,076.5 3,526.4 9.7 7,433.7 3.3 Prior year adjustment in respect of changes in accounting policy — (852.3) — — — (852.3) —
At 1 July 2007, as restated 961.6 7.2 2,076.5 3,526.4 9.7 6,581.4 3.3 Translation differences 56.9 0.3 — 136.3 2.6 196.1 — Disposal of subsidiaries (8.1) (5.5) — (24.1) — (37.7) — Deconsolidation of subsidiaries (note 48(f )) — — — (5.3) — (5.3) — Depreciation 141.5 0.6 89.9 437.1 — 669.1 — Impairment 22.0 — 233.9 14.9 67.6 338.4 — Disposals (8.3) — — (10.7) — (19.0) —
At 30 June 2008 1,165.6 2.6 2,400.3 4,074.6 79.9 7,723.0 3.3
Net book value At 30 June 2008, as restated 3,214.3 3.4 210.1 1,704.3 855.6 5,987.7 —
The aggregate net book value of property, plant and equipment pledged as securities for loans amounted to HK$1,837.6 million (2008: HK$1,573.6 million) (note 42).
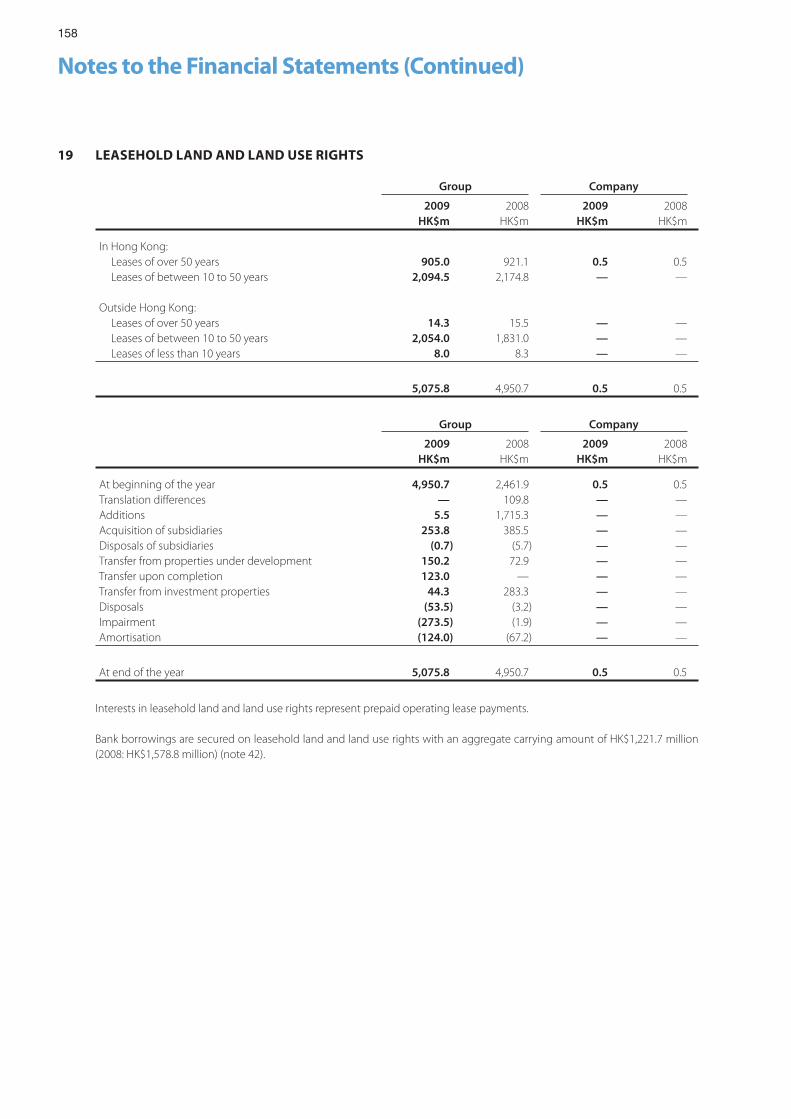
158
Notes to the Financial Statements (Continued)
19 LEASEHOLD LAND AND LAND USE RIGHTS
Group Company
2009 2008 2009 2008HK$m HK$m HK$m HK$m
In Hong Kong: Leases of over 50 years 905.0 921.1 0.5 0.5 Leases of between 10 to 50 years 2,094.5 2,174.8 — —
Outside Hong Kong: Leases of over 50 years 14.3 15.5 — — Leases of between 10 to 50 years 2,054.0 1,831.0 — — Leases of less than 10 years 8.0 8.3 — —
5,075.8 4,950.7 0.5 0.5
Group Company
2009 2008 2009 2008HK$m HK$m HK$m HK$m
At beginning of the year 4,950.7 2,461.9 0.5 0.5Translation differences — 109.8 — —Additions 5.5 1,715.3 — —Acquisition of subsidiaries 253.8 385.5 — —Disposals of subsidiaries (0.7) (5.7) — —Transfer from properties under development 150.2 72.9 — —Transfer upon completion 123.0 — — —Transfer from investment properties 44.3 283.3 — —Disposals (53.5) (3.2) — —Impairment (273.5) (1.9) — —Amortisation (124.0) (67.2) — —
At end of the year 5,075.8 4,950.7 0.5 0.5
Interests in leasehold land and land use rights represent prepaid operating lease payments.
Bank borrowings are secured on leasehold land and land use rights with an aggregate carrying amount of HK$1,221.7 million (2008: HK$1,578.8 million) (note 42).
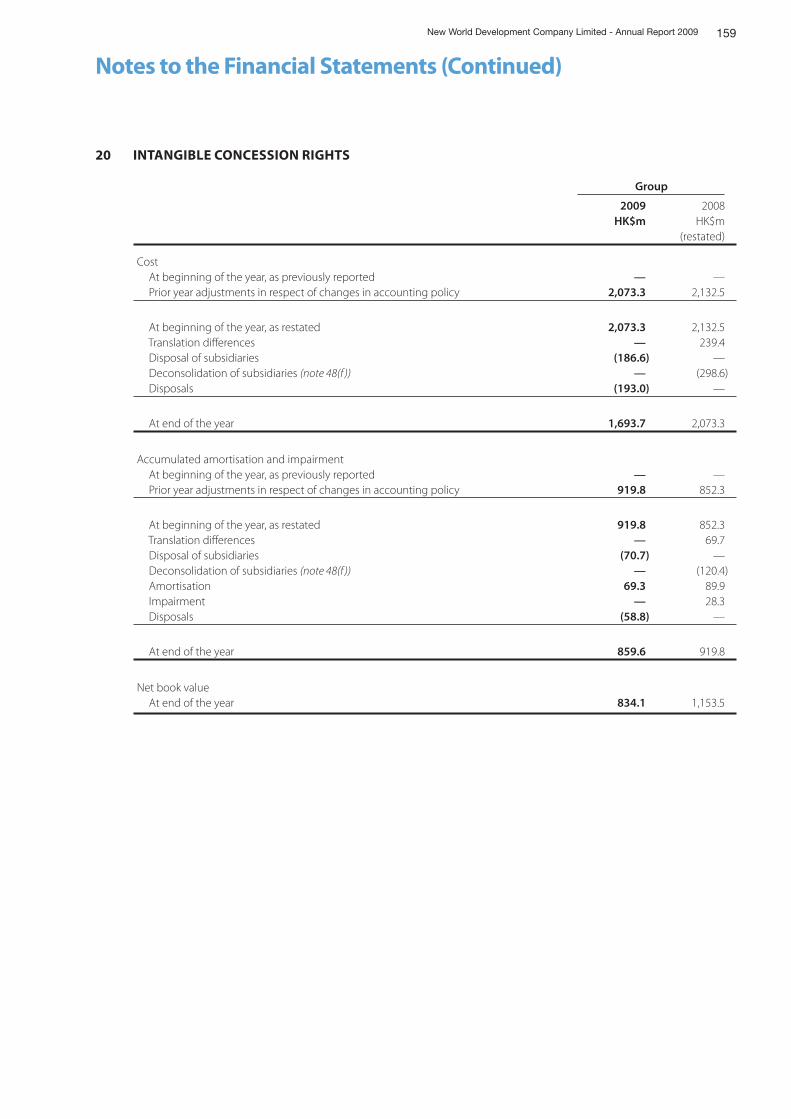
159New World Development Company Limited - Annual Report 2009
Notes to the Financial Statements (Continued)
20 INTANGIBLE CONCESSION RIGHTS
Group
2009 2008HK$m HK$m
(restated)
Cost At beginning of the year, as previously reported — — Prior year adjustments in respect of changes in accounting policy 2,073.3 2,132.5
At beginning of the year, as restated 2,073.3 2,132.5 Translation differences — 239.4 Disposal of subsidiaries (186.6) — Deconsolidation of subsidiaries (note 48(f )) — (298.6) Disposals (193.0) —
At end of the year 1,693.7 2,073.3
Accumulated amortisation and impairment At beginning of the year, as previously reported — — Prior year adjustments in respect of changes in accounting policy 919.8 852.3
At beginning of the year, as restated 919.8 852.3 Translation differences — 69.7 Disposal of subsidiaries (70.7) — Deconsolidation of subsidiaries (note 48(f )) — (120.4) Amortisation 69.3 89.9 Impairment — 28.3 Disposals (58.8) —
At end of the year 859.6 919.8
Net book value At end of the year 834.1 1,153.5
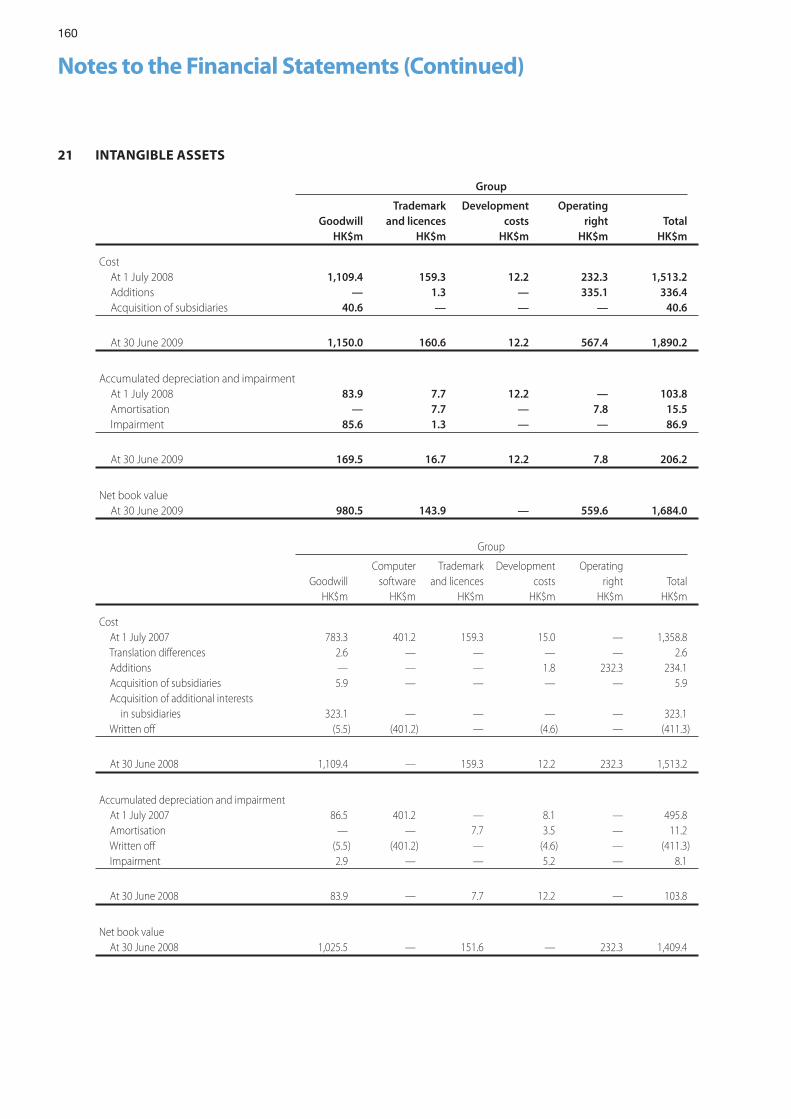
160
Notes to the Financial Statements (Continued)
21 INTANGIBLE ASSETS
Group
GoodwillTrademark
and licencesDevelopment
costsOperating
right TotalHK$m HK$m HK$m HK$m HK$m
Cost At 1 July 2008 1,109.4 159.3 12.2 232.3 1,513.2 Additions — 1.3 — 335.1 336.4 Acquisition of subsidiaries 40.6 — — — 40.6
At 30 June 2009 1,150.0 160.6 12.2 567.4 1,890.2
Accumulated depreciation and impairment At 1 July 2008 83.9 7.7 12.2 — 103.8 Amortisation — 7.7 — 7.8 15.5 Impairment 85.6 1.3 — — 86.9
At 30 June 2009 169.5 16.7 12.2 7.8 206.2
Net book value At 30 June 2009 980.5 143.9 — 559.6 1,684.0
Group
GoodwillComputer
softwareTrademark
and licencesDevelopment
costsOperating
right TotalHK$m HK$m HK$m HK$m HK$m HK$m
Cost At 1 July 2007 783.3 401.2 159.3 15.0 — 1,358.8 Translation differences 2.6 — — — — 2.6 Additions — — — 1.8 232.3 234.1 Acquisition of subsidiaries 5.9 — — — — 5.9 Acquisition of additional interests in subsidiaries 323.1 — — — — 323.1 Written off (5.5) (401.2) — (4.6) — (411.3)
At 30 June 2008 1,109.4 — 159.3 12.2 232.3 1,513.2
Accumulated depreciation and impairment At 1 July 2007 86.5 401.2 — 8.1 — 495.8 Amortisation — — 7.7 3.5 — 11.2 Written off (5.5) (401.2) — (4.6) — (411.3) Impairment 2.9 — — 5.2 — 8.1
At 30 June 2008 83.9 — 7.7 12.2 — 103.8
Net book value At 30 June 2008 1,025.5 — 151.6 — 232.3 1,409.4
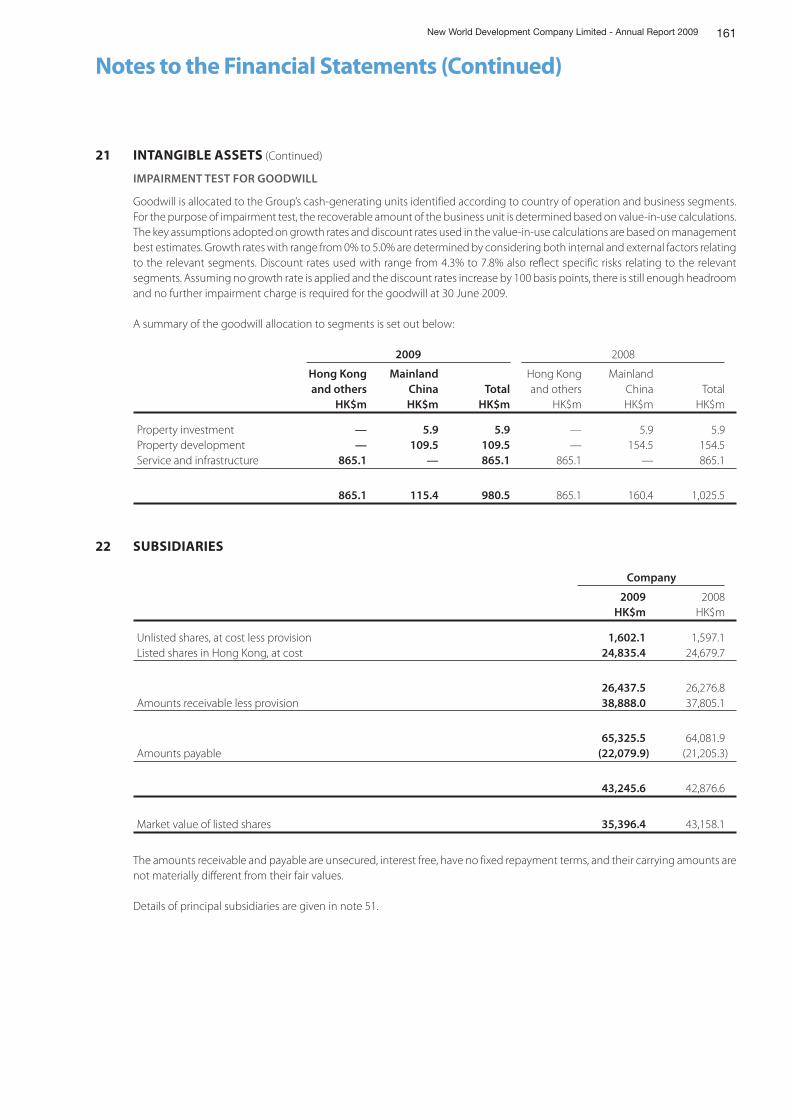
161New World Development Company Limited - Annual Report 2009
Notes to the Financial Statements (Continued)
21 INTANGIBLE ASSETS (Continued)
IMPAIRMENT TEST FOR GOODWILL
Goodwill is allocated to the Group’s cash-generating units identified according to country of operation and business segments. For the purpose of impairment test, the recoverable amount of the business unit is determined based on value-in-use calculations. The key assumptions adopted on growth rates and discount rates used in the value-in-use calculations are based on management best estimates. Growth rates with range from 0% to 5.0% are determined by considering both internal and external factors relating to the relevant segments. Discount rates used with range from 4.3% to 7.8% also reflect specific risks relating to the relevant segments. Assuming no growth rate is applied and the discount rates increase by 100 basis points, there is still enough headroom and no further impairment charge is required for the goodwill at 30 June 2009.
A summary of the goodwill allocation to segments is set out below:
2009 2008
Hong Kong and others
Mainland China Total
Hong Kong and others
Mainland China Total
HK$m HK$m HK$m HK$m HK$m HK$m
Property investment — 5.9 5.9 — 5.9 5.9Property development — 109.5 109.5 — 154.5 154.5Service and infrastructure 865.1 — 865.1 865.1 — 865.1
865.1 115.4 980.5 865.1 160.4 1,025.5
22 SUBSIDIARIES
Company
2009 2008HK$m HK$m
Unlisted shares, at cost less provision 1,602.1 1,597.1Listed shares in Hong Kong, at cost 24,835.4 24,679.7
26,437.5 26,276.8Amounts receivable less provision 38,888.0 37,805.1
65,325.5 64,081.9Amounts payable (22,079.9) (21,205.3)
43,245.6 42,876.6
Market value of listed shares 35,396.4 43,158.1
The amounts receivable and payable are unsecured, interest free, have no fixed repayment terms, and their carrying amounts are not materially different from their fair values.
Details of principal subsidiaries are given in note 51.
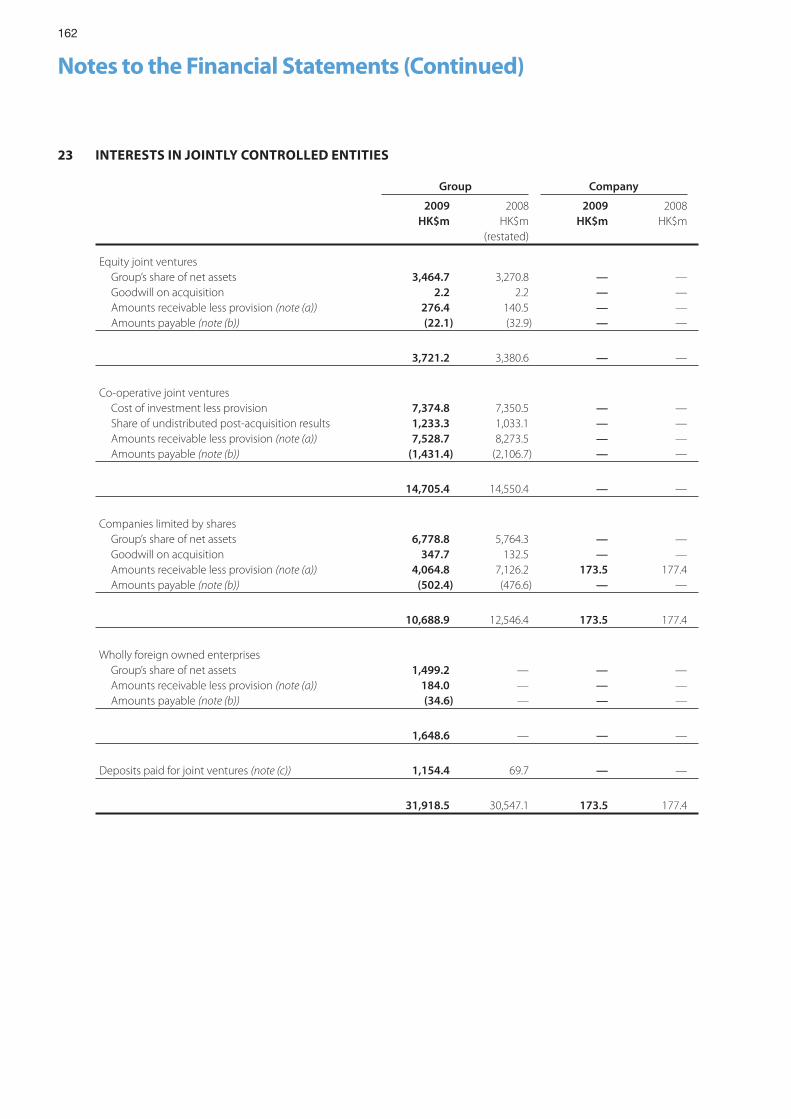
162
Notes to the Financial Statements (Continued)
23 INTERESTS IN JOINTLY CONTROLLED ENTITIES
Group Company
2009 2008 2009 2008HK$m HK$m HK$m HK$m
(restated)
Equity joint ventures Group’s share of net assets 3,464.7 3,270.8 — — Goodwill on acquisition 2.2 2.2 — — Amounts receivable less provision (note (a)) 276.4 140.5 — — Amounts payable (note (b)) (22.1) (32.9) — —
3,721.2 3,380.6 — —
Co-operative joint ventures Cost of investment less provision 7,374.8 7,350.5 — — Share of undistributed post-acquisition results 1,233.3 1,033.1 — — Amounts receivable less provision (note (a)) 7,528.7 8,273.5 — — Amounts payable (note (b)) (1,431.4) (2,106.7) — —
14,705.4 14,550.4 — —
Companies limited by shares Group’s share of net assets 6,778.8 5,764.3 — — Goodwill on acquisition 347.7 132.5 — — Amounts receivable less provision (note (a)) 4,064.8 7,126.2 173.5 177.4 Amounts payable (note (b)) (502.4) (476.6) — —
10,688.9 12,546.4 173.5 177.4
Wholly foreign owned enterprises Group’s share of net assets 1,499.2 — — — Amounts receivable less provision (note (a)) 184.0 — — — Amounts payable (note (b)) (34.6) — — —
1,648.6 — — —
Deposits paid for joint ventures (note (c)) 1,154.4 69.7 — —
31,918.5 30,547.1 173.5 177.4
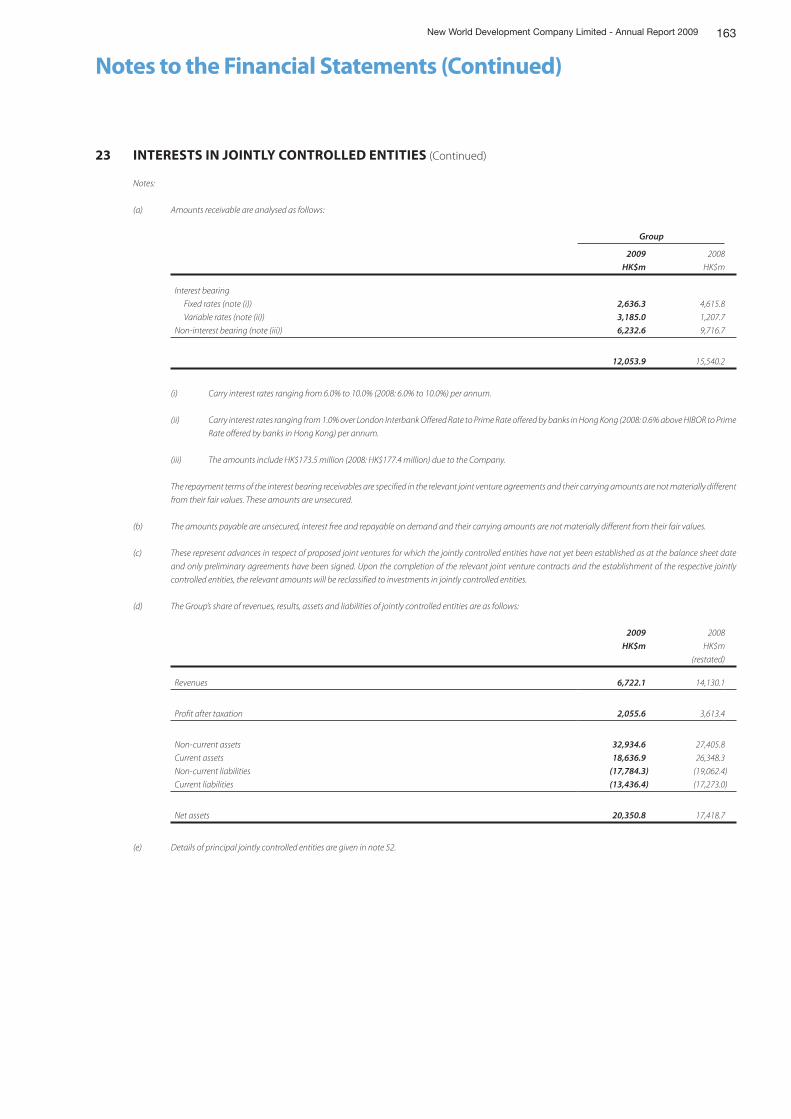
163New World Development Company Limited - Annual Report 2009
Notes to the Financial Statements (Continued)
23 INTERESTS IN JOINTLY CONTROLLED ENTITIES (Continued)
Notes:
(a) Amounts receivable are analysed as follows:
Group
2009 2008
HK$m HK$m
Interest bearing
Fixed rates (note (i)) 2,636.3 4,615.8
Variable rates (note (ii)) 3,185.0 1,207.7
Non-interest bearing (note (iii)) 6,232.6 9,716.7
12,053.9 15,540.2
(i) Carry interest rates ranging from 6.0% to 10.0% (2008: 6.0% to 10.0%) per annum.
(ii) Carry interest rates ranging from 1.0% over London Interbank Offered Rate to Prime Rate offered by banks in Hong Kong (2008: 0.6% above HIBOR to Prime
Rate offered by banks in Hong Kong) per annum.
(iii) The amounts include HK$173.5 million (2008: HK$177.4 million) due to the Company.
The repayment terms of the interest bearing receivables are specified in the relevant joint venture agreements and their carrying amounts are not materially different
from their fair values. These amounts are unsecured.
(b) The amounts payable are unsecured, interest free and repayable on demand and their carrying amounts are not materially different from their fair values.
(c) These represent advances in respect of proposed joint ventures for which the jointly controlled entities have not yet been established as at the balance sheet date
and only preliminary agreements have been signed. Upon the completion of the relevant joint venture contracts and the establishment of the respective jointly
controlled entities, the relevant amounts will be reclassified to investments in jointly controlled entities.
(d) The Group’s share of revenues, results, assets and liabilities of jointly controlled entities are as follows:
2009 2008
HK$m HK$m
(restated)
Revenues 6,722.1 14,130.1
Profit after taxation 2,055.6 3,613.4
Non-current assets 32,934.6 27,405.8
Current assets 18,636.9 26,348.3
Non-current liabilities (17,784.3) (19,062.4)
Current liabilities (13,436.4) (17,273.0)
Net assets 20,350.8 17,418.7
(e) Details of principal jointly controlled entities are given in note 52.
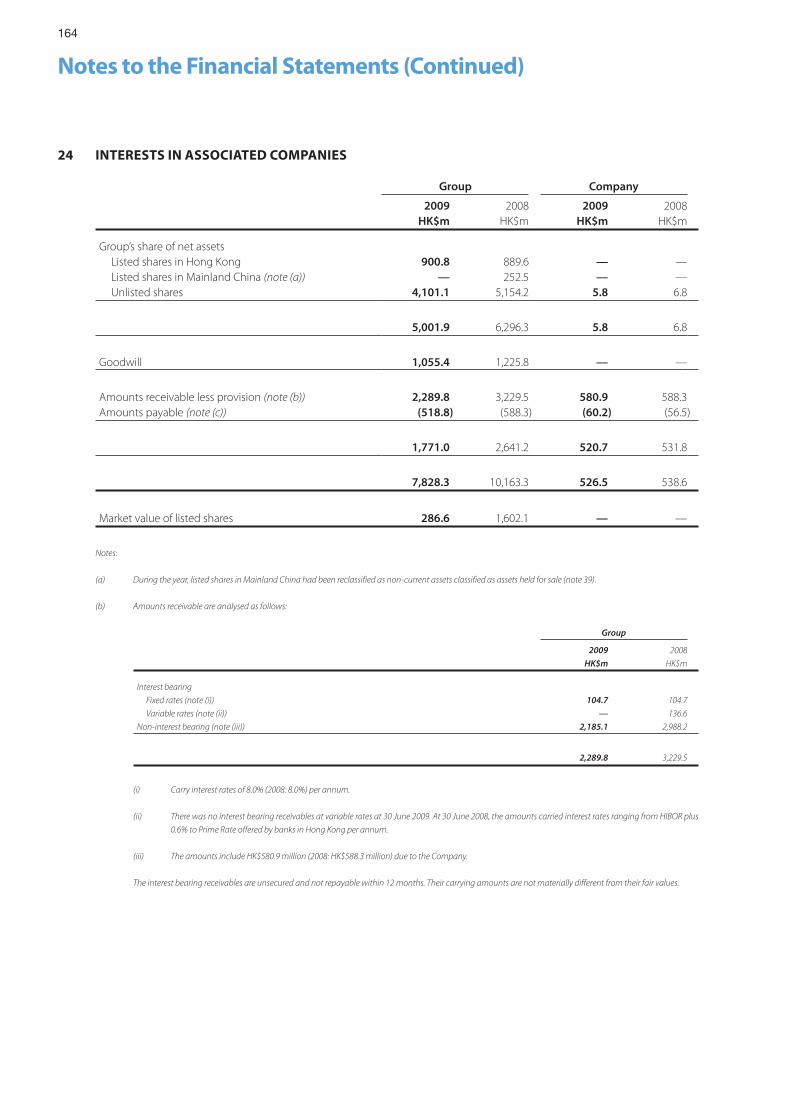
164
Notes to the Financial Statements (Continued)
24 INTERESTS IN ASSOCIATED COMPANIES
Group Company
2009 2008 2009 2008HK$m HK$m HK$m HK$m
Group’s share of net assets Listed shares in Hong Kong 900.8 889.6 — — Listed shares in Mainland China (note (a)) — 252.5 — — Unlisted shares 4,101.1 5,154.2 5.8 6.8
5,001.9 6,296.3 5.8 6.8
Goodwill 1,055.4 1,225.8 — —
Amounts receivable less provision (note (b)) 2,289.8 3,229.5 580.9 588.3Amounts payable (note (c)) (518.8) (588.3) (60.2) (56.5)
1,771.0 2,641.2 520.7 531.8
7,828.3 10,163.3 526.5 538.6
Market value of listed shares 286.6 1,602.1 — —
Notes:
(a) During the year, listed shares in Mainland China had been reclassified as non-current assets classified as assets held for sale (note 39).
(b) Amounts receivable are analysed as follows:
Group
2009 2008
HK$m HK$m
Interest bearing
Fixed rates (note (i)) 104.7 104.7
Variable rates (note (ii)) — 136.6
Non-interest bearing (note (iii)) 2,185.1 2,988.2
2,289.8 3,229.5
(i) Carry interest rates of 8.0% (2008: 8.0%) per annum.
(ii) There was no interest bearing receivables at variable rates at 30 June 2009. At 30 June 2008, the amounts carried interest rates ranging from HIBOR plus
0.6% to Prime Rate offered by banks in Hong Kong per annum.
(iii) The amounts include HK$580.9 million (2008: HK$588.3 million) due to the Company.
The interest bearing receivables are unsecured and not repayable within 12 months. Their carrying amounts are not materially different from their fair values.
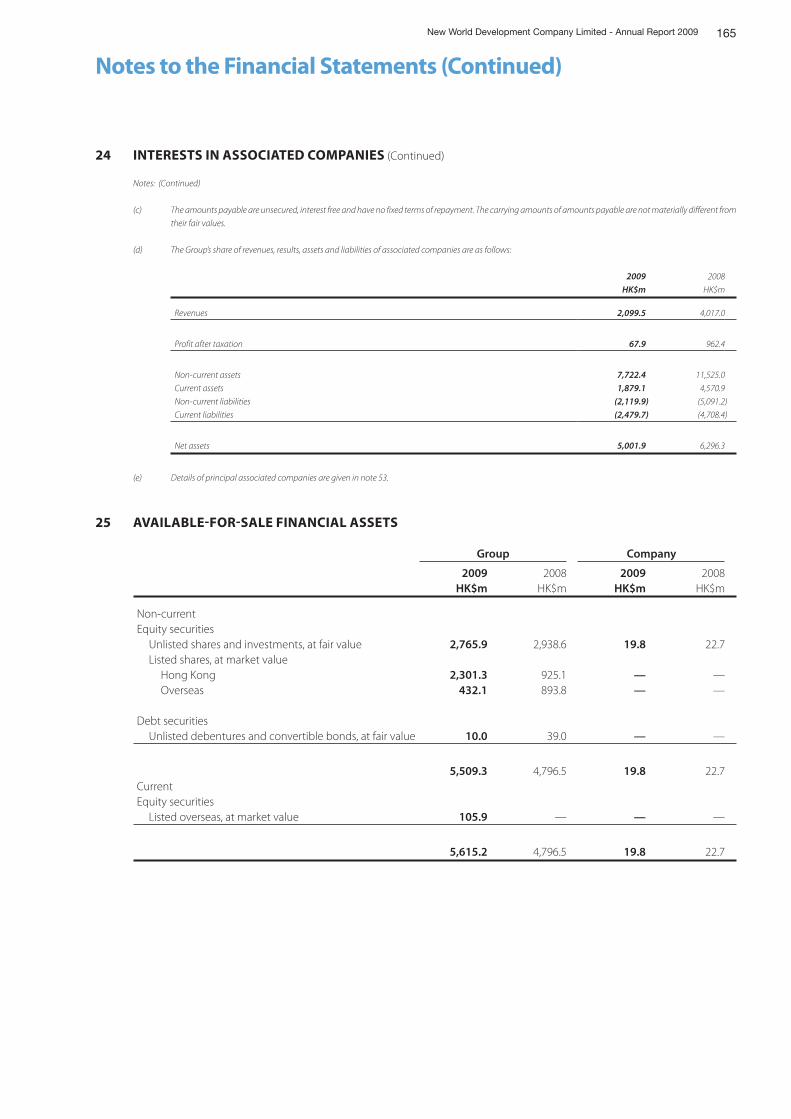
165New World Development Company Limited - Annual Report 2009
Notes to the Financial Statements (Continued)
24 INTERESTS IN ASSOCIATED COMPANIES (Continued)
Notes: (Continued)
(c) The amounts payable are unsecured, interest free and have no fixed terms of repayment. The carrying amounts of amounts payable are not materially different from
their fair values.
(d) The Group’s share of revenues, results, assets and liabilities of associated companies are as follows:
2009 2008
HK$m HK$m
Revenues 2,099.5 4,017.0
Profit after taxation 67.9 962.4
Non-current assets 7,722.4 11,525.0
Current assets 1,879.1 4,570.9
Non-current liabilities (2,119.9) (5,091.2)
Current liabilities (2,479.7) (4,708.4)
Net assets 5,001.9 6,296.3
(e) Details of principal associated companies are given in note 53.
25 AVAILABLEFORSALE FINANCIAL ASSETS
Group Company
2009 2008 2009 2008HK$m HK$m HK$m HK$m
Non-currentEquity securities Unlisted shares and investments, at fair value 2,765.9 2,938.6 19.8 22.7 Listed shares, at market value Hong Kong 2,301.3 925.1 — — Overseas 432.1 893.8 — —
Debt securities Unlisted debentures and convertible bonds, at fair value 10.0 39.0 — —
5,509.3 4,796.5 19.8 22.7CurrentEquity securities Listed overseas, at market value 105.9 — — —
5,615.2 4,796.5 19.8 22.7
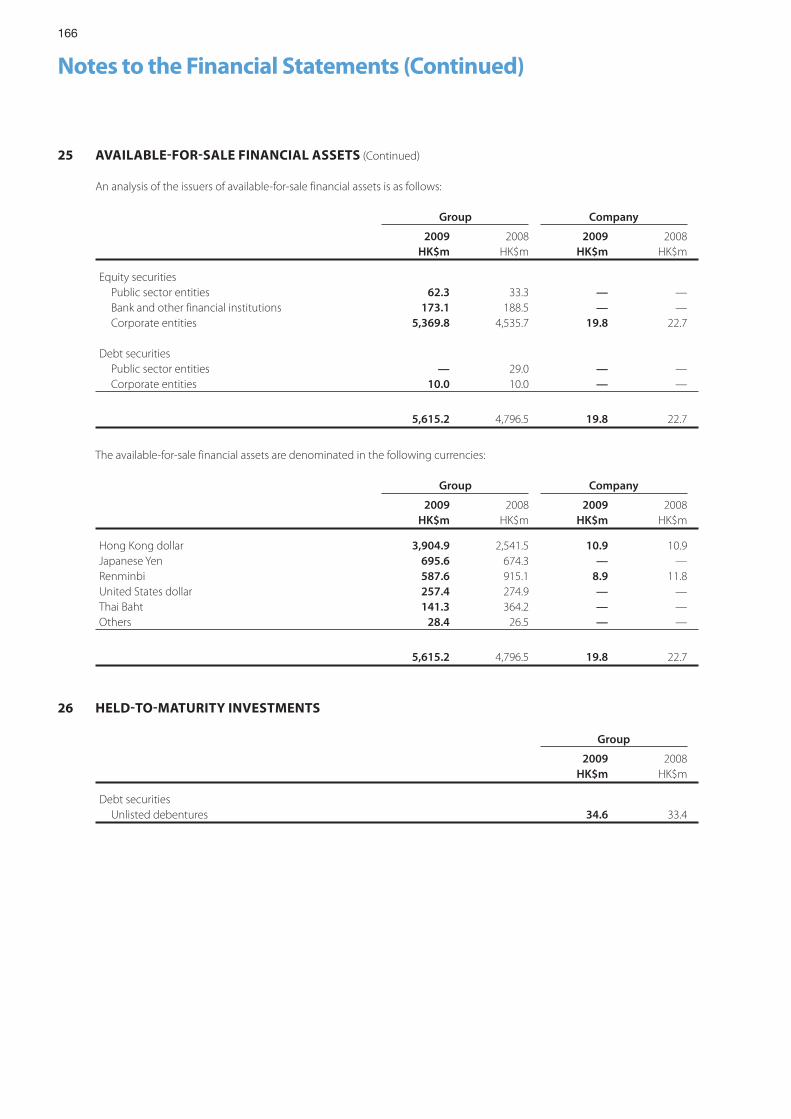
166
Notes to the Financial Statements (Continued)
25 AVAILABLEFORSALE FINANCIAL ASSETS (Continued)
An analysis of the issuers of available-for-sale financial assets is as follows:
Group Company
2009 2008 2009 2008HK$m HK$m HK$m HK$m
Equity securities Public sector entities 62.3 33.3 — — Bank and other financial institutions 173.1 188.5 — — Corporate entities 5,369.8 4,535.7 19.8 22.7
Debt securities Public sector entities — 29.0 — — Corporate entities 10.0 10.0 — —
5,615.2 4,796.5 19.8 22.7
The available-for-sale financial assets are denominated in the following currencies:
Group Company
2009 2008 2009 2008HK$m HK$m HK$m HK$m
Hong Kong dollar 3,904.9 2,541.5 10.9 10.9Japanese Yen 695.6 674.3 — —Renminbi 587.6 915.1 8.9 11.8United States dollar 257.4 274.9 — —Thai Baht 141.3 364.2 — —Others 28.4 26.5 — —
5,615.2 4,796.5 19.8 22.7
26 HELDTOMATURITY INVESTMENTS
Group
2009 2008HK$m HK$m
Debt securities Unlisted debentures 34.6 33.4
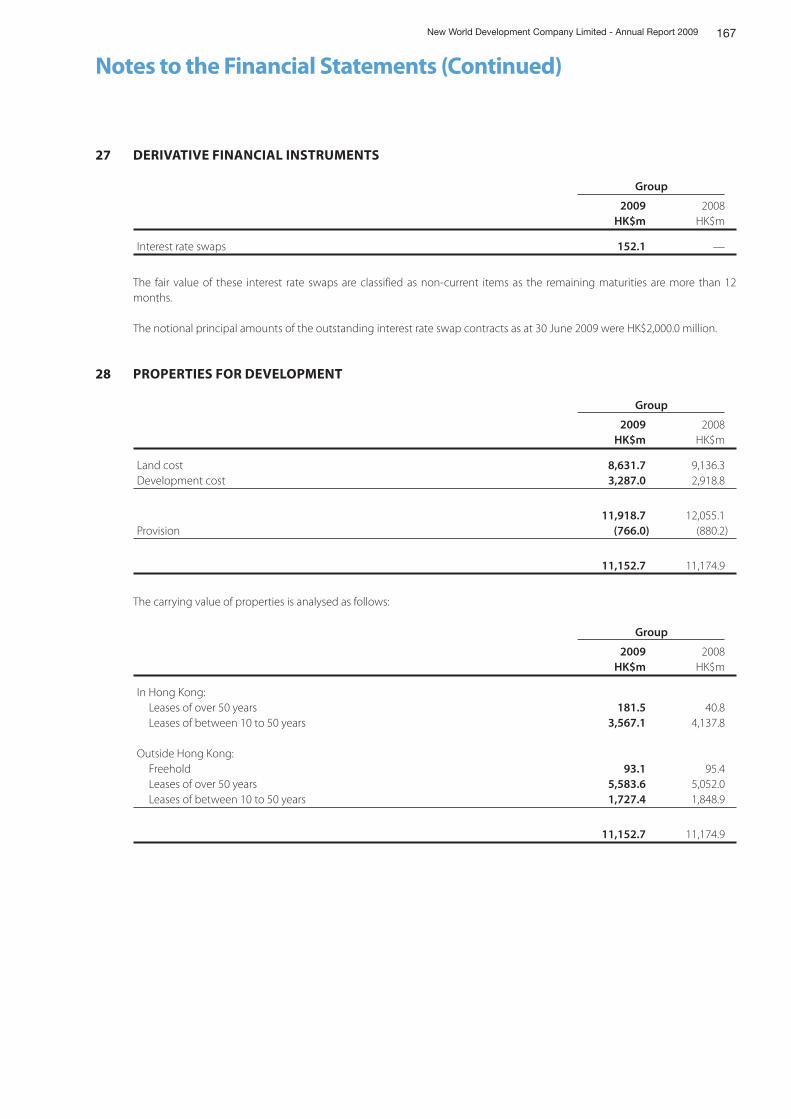
167New World Development Company Limited - Annual Report 2009
Notes to the Financial Statements (Continued)
27 DERIVATIVE FINANCIAL INSTRUMENTS
Group
2009 2008HK$m HK$m
Interest rate swaps 152.1 —
The fair value of these interest rate swaps are classified as non-current items as the remaining maturities are more than 12 months.
The notional principal amounts of the outstanding interest rate swap contracts as at 30 June 2009 were HK$2,000.0 million.
28 PROPERTIES FOR DEVELOPMENT
Group
2009 2008HK$m HK$m
Land cost 8,631.7 9,136.3Development cost 3,287.0 2,918.8
11,918.7 12,055.1Provision (766.0) (880.2)
11,152.7 11,174.9
The carrying value of properties is analysed as follows:
Group
2009 2008HK$m HK$m
In Hong Kong: Leases of over 50 years 181.5 40.8 Leases of between 10 to 50 years 3,567.1 4,137.8
Outside Hong Kong: Freehold 93.1 95.4 Leases of over 50 years 5,583.6 5,052.0 Leases of between 10 to 50 years 1,727.4 1,848.9
11,152.7 11,174.9
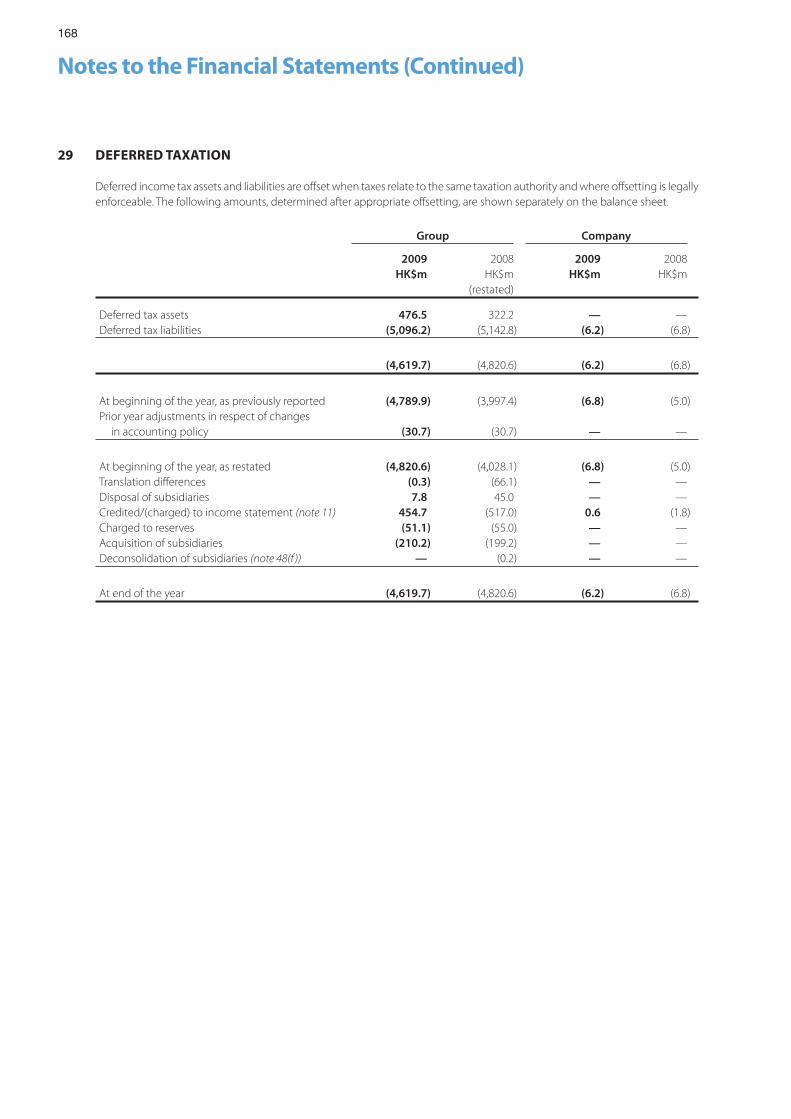
168
Notes to the Financial Statements (Continued)
29 DEFERRED TAXATION
Deferred income tax assets and liabilities are offset when taxes relate to the same taxation authority and where offsetting is legally enforceable. The following amounts, determined after appropriate offsetting, are shown separately on the balance sheet.
Group Company
2009 2008 2009 2008HK$m HK$m HK$m HK$m
(restated)
Deferred tax assets 476.5 322.2 — —Deferred tax liabilities (5,096.2) (5,142.8) (6.2) (6.8)
(4,619.7) (4,820.6) (6.2) (6.8)
At beginning of the year, as previously reported (4,789.9) (3,997.4) (6.8) (5.0)Prior year adjustments in respect of changes in accounting policy (30.7) (30.7) — —
At beginning of the year, as restated (4,820.6) (4,028.1) (6.8) (5.0)Translation differences (0.3) (66.1) — —Disposal of subsidiaries 7.8 45.0 — —Credited/(charged) to income statement (note 11) 454.7 (517.0) 0.6 (1.8)Charged to reserves (51.1) (55.0) — —Acquisition of subsidiaries (210.2) (199.2) — —Deconsolidation of subsidiaries (note 48(f )) — (0.2) — —
At end of the year (4,619.7) (4,820.6) (6.2) (6.8)
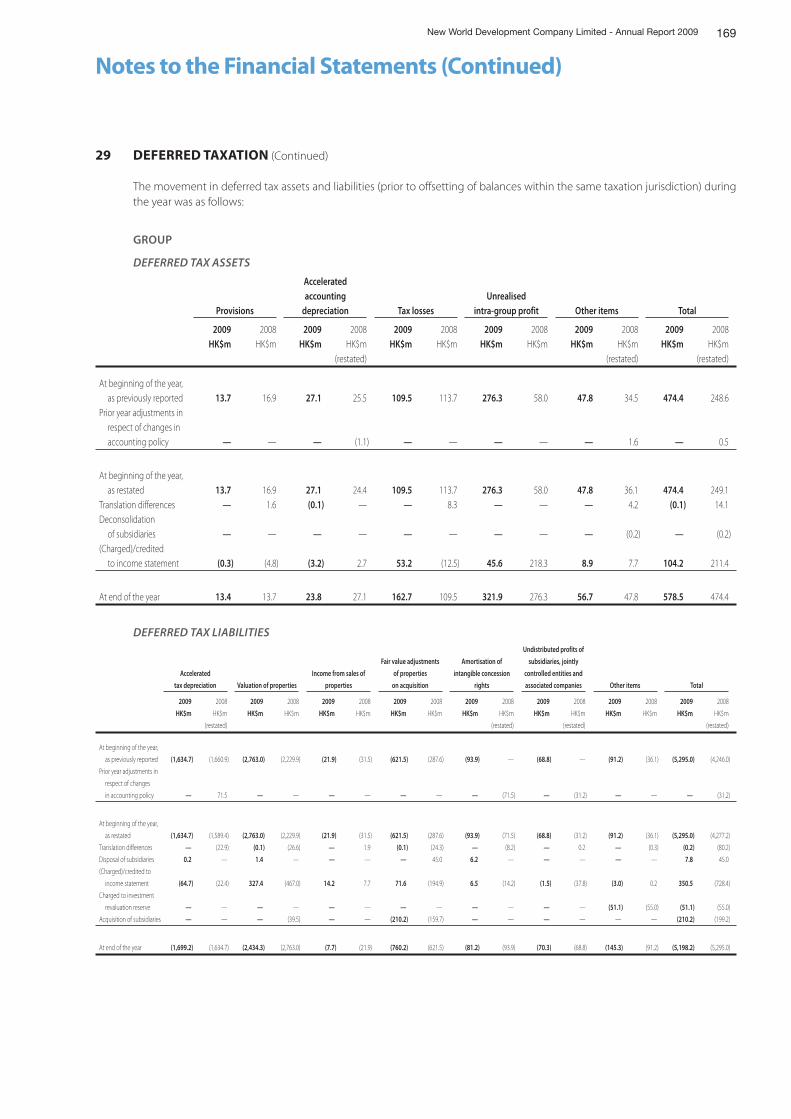
169New World Development Company Limited - Annual Report 2009
Notes to the Financial Statements (Continued)
29 DEFERRED TAXATION (Continued)
The movement in deferred tax assets and liabilities (prior to offsetting of balances within the same taxation jurisdiction) during the year was as follows:
GROUP
DEFERRED TAX ASSETS
Provisions
Acceleratedaccounting
depreciation Tax lossesUnrealised
intra-group profit Other items Total
2009 2008 2009 2008 2009 2008 2009 2008 2009 2008 2009 2008HK$m HK$m HK$m HK$m HK$m HK$m HK$m HK$m HK$m HK$m HK$m HK$m
(restated) (restated) (restated)
At beginning of the year, as previously reported 13.7 16.9 27.1 25.5 109.5 113.7 276.3 58.0 47.8 34.5 474.4 248.6Prior year adjustments in respect of changes in accounting policy — — — (1.1) — — — — — 1.6 — 0.5
At beginning of the year, as restated 13.7 16.9 27.1 24.4 109.5 113.7 276.3 58.0 47.8 36.1 474.4 249.1Translation differences — 1.6 (0.1) — — 8.3 — — — 4.2 (0.1) 14.1Deconsolidation of subsidiaries — — — — — — — — — (0.2) — (0.2)(Charged)/credited to income statement (0.3) (4.8) (3.2) 2.7 53.2 (12.5) 45.6 218.3 8.9 7.7 104.2 211.4
At end of the year 13.4 13.7 23.8 27.1 162.7 109.5 321.9 276.3 56.7 47.8 578.5 474.4
DEFERRED TAX LIABILITIES
Accelerated
tax depreciation Valuation of properties
Income from sales of
properties
Fair value adjustments
of properties
on acquisition
Amortisation of
intangible concession
rights
Undistributed profits of
subsidiaries, jointly
controlled entities and
associated companies Other items Total
2009 2008 2009 2008 2009 2008 2009 2008 2009 2008 2009 2008 2009 2008 2009 2008
HK$m HK$m HK$m HK$m HK$m HK$m HK$m HK$m HK$m HK$m HK$m HK$m HK$m HK$m HK$m HK$m
(restated) (restated) (restated) (restated)
At beginning of the year,
as previously reported (1,634.7) (1,660.9) (2,763.0) (2,229.9) (21.9) (31.5) (621.5) (287.6) (93.9) — (68.8) — (91.2) (36.1) (5,295.0) (4,246.0)
Prior year adjustments in
respect of changes
in accounting policy — 71.5 — — — — — — — (71.5) — (31.2) — — — (31.2)
At beginning of the year,
as restated (1,634.7) (1,589.4) (2,763.0) (2,229.9) (21.9) (31.5) (621.5) (287.6) (93.9) (71.5) (68.8) (31.2) (91.2) (36.1) (5,295.0) (4,277.2)
Translation differences — (22.9) (0.1) (26.6) — 1.9 (0.1) (24.3) — (8.2) — 0.2 — (0.3) (0.2) (80.2)
Disposal of subsidiaries 0.2 — 1.4 — — — — 45.0 6.2 — — — — — 7.8 45.0
(Charged)/credited to
income statement (64.7) (22.4) 327.4 (467.0) 14.2 7.7 71.6 (194.9) 6.5 (14.2) (1.5) (37.8) (3.0) 0.2 350.5 (728.4)
Charged to investment
revaluation reserve — — — — — — — — — — — — (51.1) (55.0) (51.1) (55.0)
Acquisition of subsidiaries — — — (39.5) — — (210.2) (159.7) — — — — — — (210.2) (199.2)
At end of the year (1,699.2) (1,634.7) (2,434.3) (2,763.0) (7.7) (21.9) (760.2) (621.5) (81.2) (93.9) (70.3) (68.8) (145.3) (91.2) (5,198.2) (5,295.0)
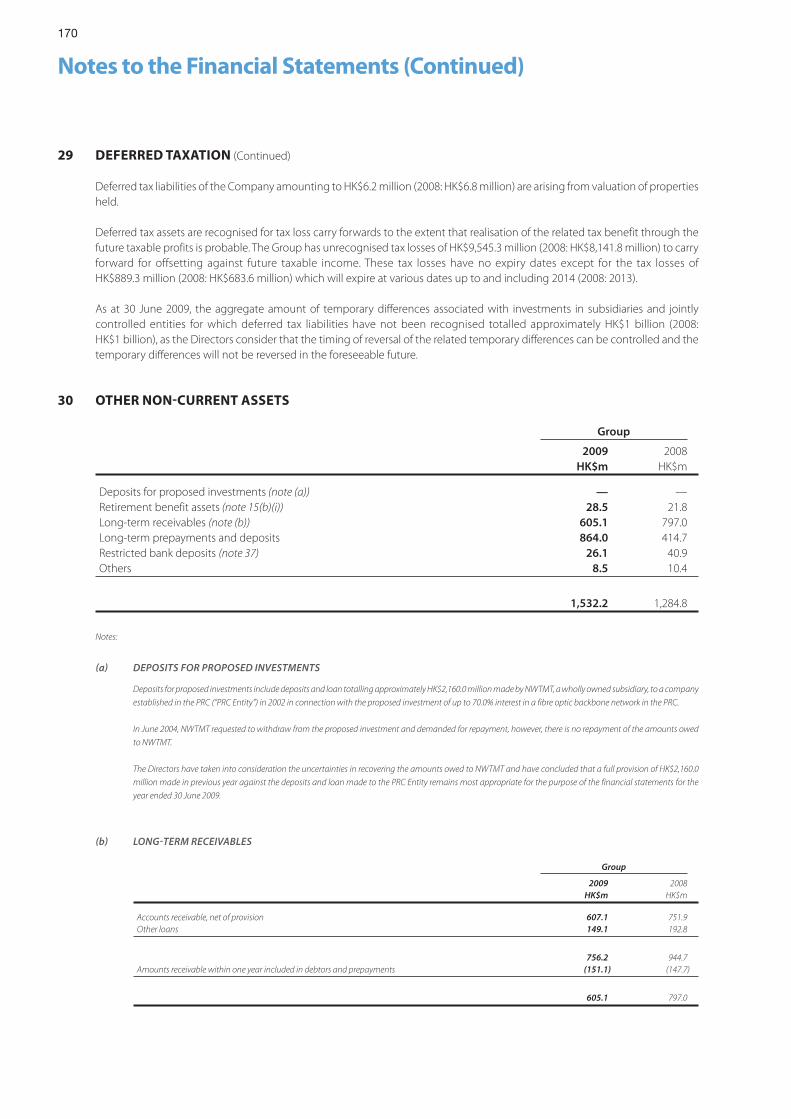
170
Notes to the Financial Statements (Continued)
29 DEFERRED TAXATION (Continued)
Deferred tax liabilities of the Company amounting to HK$6.2 million (2008: HK$6.8 million) are arising from valuation of properties held.
Deferred tax assets are recognised for tax loss carry forwards to the extent that realisation of the related tax benefit through the future taxable profits is probable. The Group has unrecognised tax losses of HK$9,545.3 million (2008: HK$8,141.8 million) to carry forward for offsetting against future taxable income. These tax losses have no expiry dates except for the tax losses of HK$889.3 million (2008: HK$683.6 million) which will expire at various dates up to and including 2014 (2008: 2013).
As at 30 June 2009, the aggregate amount of temporary differences associated with investments in subsidiaries and jointly controlled entities for which deferred tax liabilities have not been recognised totalled approximately HK$1 billion (2008: HK$1 billion), as the Directors consider that the timing of reversal of the related temporary differences can be controlled and the temporary differences will not be reversed in the foreseeable future.
30 OTHER NONCURRENT ASSETS
Group
2009 2008HK$m HK$m
Deposits for proposed investments (note (a)) — —Retirement benefit assets (note 15(b)(i)) 28.5 21.8Long-term receivables (note (b)) 605.1 797.0Long-term prepayments and deposits 864.0 414.7Restricted bank deposits (note 37) 26.1 40.9Others 8.5 10.4
1,532.2 1,284.8
Notes:
a DEPOSITS FOR PROPOSED INVESTMENTS
Deposits for proposed investments include deposits and loan totalling approximately HK$2,160.0 million made by NWTMT, a wholly owned subsidiary, to a company
established in the PRC (‘‘PRC Entity’’) in 2002 in connection with the proposed investment of up to 70.0% interest in a fibre optic backbone network in the PRC.
In June 2004, NWTMT requested to withdraw from the proposed investment and demanded for repayment, however, there is no repayment of the amounts owed
to NWTMT.
The Directors have taken into consideration the uncertainties in recovering the amounts owed to NWTMT and have concluded that a full provision of HK$2,160.0
million made in previous year against the deposits and loan made to the PRC Entity remains most appropriate for the purpose of the financial statements for the
year ended 30 June 2009.
b LONGTERM RECEIVABLES
Group
2009 2008HK$m HK$m
Accounts receivable, net of provision 607.1 751.9Other loans 149.1 192.8
756.2 944.7Amounts receivable within one year included in debtors and prepayments (151.1) (147.7)
605.1 797.0
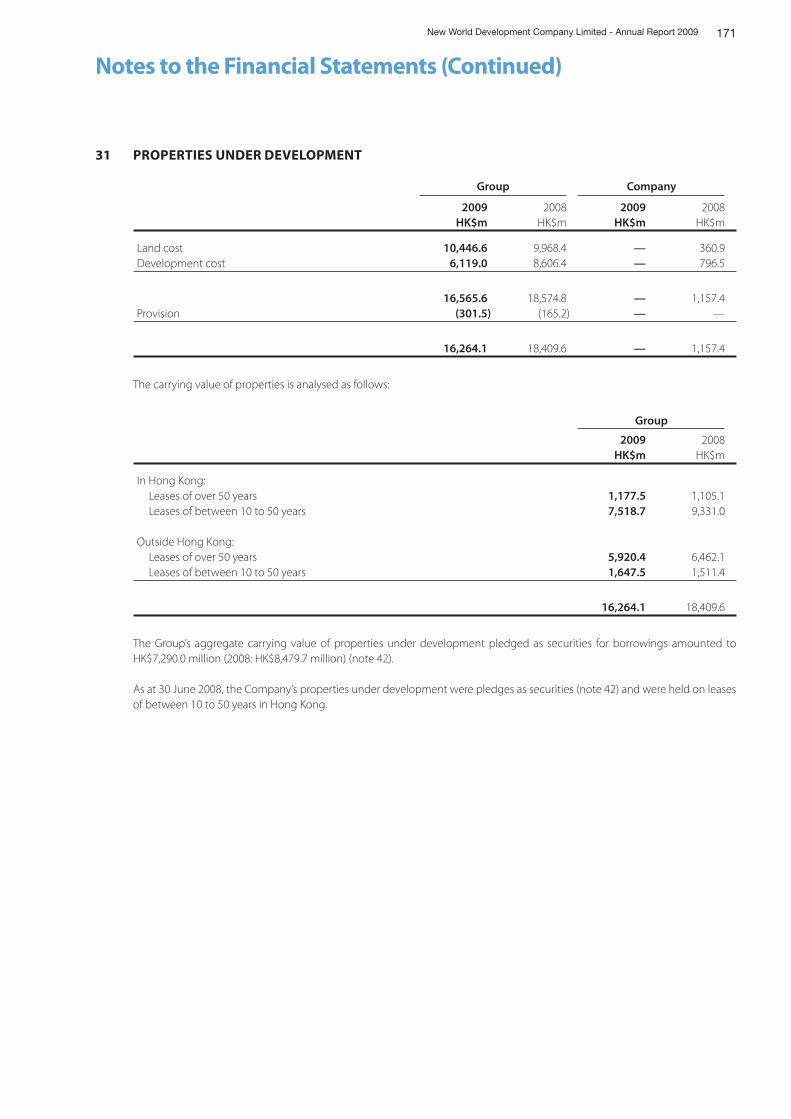
171New World Development Company Limited - Annual Report 2009
Notes to the Financial Statements (Continued)
31 PROPERTIES UNDER DEVELOPMENT
Group Company
2009 2008 2009 2008HK$m HK$m HK$m HK$m
Land cost 10,446.6 9,968.4 — 360.9Development cost 6,119.0 8,606.4 — 796.5
16,565.6 18,574.8 — 1,157.4Provision (301.5) (165.2) — —
16,264.1 18,409.6 — 1,157.4
The carrying value of properties is analysed as follows:
Group
2009 2008HK$m HK$m
In Hong Kong: Leases of over 50 years 1,177.5 1,105.1 Leases of between 10 to 50 years 7,518.7 9,331.0
Outside Hong Kong: Leases of over 50 years 5,920.4 6,462.1 Leases of between 10 to 50 years 1,647.5 1,511.4
16,264.1 18,409.6
The Group’s aggregate carrying value of properties under development pledged as securities for borrowings amounted to HK$7,290.0 million (2008: HK$8,479.7 million) (note 42).
As at 30 June 2008, the Company’s properties under development were pledges as securities (note 42) and were held on leases of between 10 to 50 years in Hong Kong.
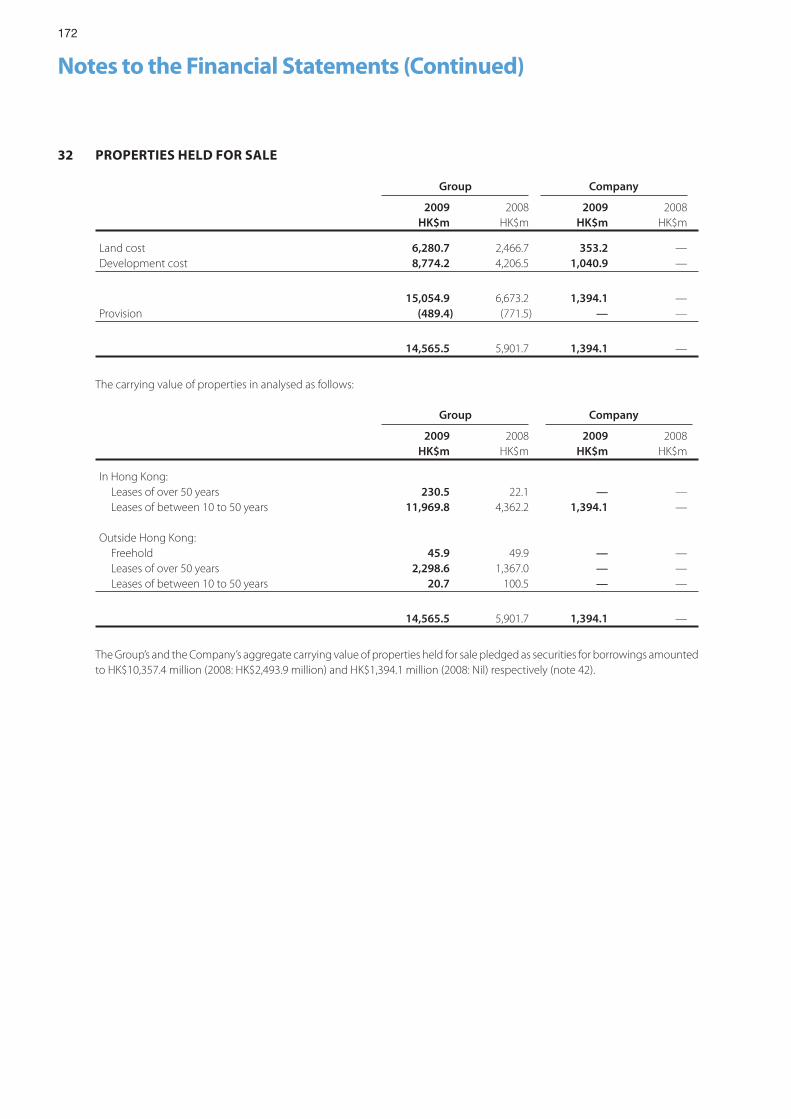
172
Notes to the Financial Statements (Continued)
32 PROPERTIES HELD FOR SALE
Group Company
2009 2008 2009 2008HK$m HK$m HK$m HK$m
Land cost 6,280.7 2,466.7 353.2 —Development cost 8,774.2 4,206.5 1,040.9 —
15,054.9 6,673.2 1,394.1 —Provision (489.4) (771.5) — —
14,565.5 5,901.7 1,394.1 —
The carrying value of properties in analysed as follows:
Group Company
2009 2008 2009 2008HK$m HK$m HK$m HK$m
In Hong Kong: Leases of over 50 years 230.5 22.1 — — Leases of between 10 to 50 years 11,969.8 4,362.2 1,394.1 —
Outside Hong Kong: Freehold 45.9 49.9 — — Leases of over 50 years 2,298.6 1,367.0 — — Leases of between 10 to 50 years 20.7 100.5 — —
14,565.5 5,901.7 1,394.1 —
The Group’s and the Company’s aggregate carrying value of properties held for sale pledged as securities for borrowings amounted to HK$10,357.4 million (2008: HK$2,493.9 million) and HK$1,394.1 million (2008: Nil) respectively (note 42).
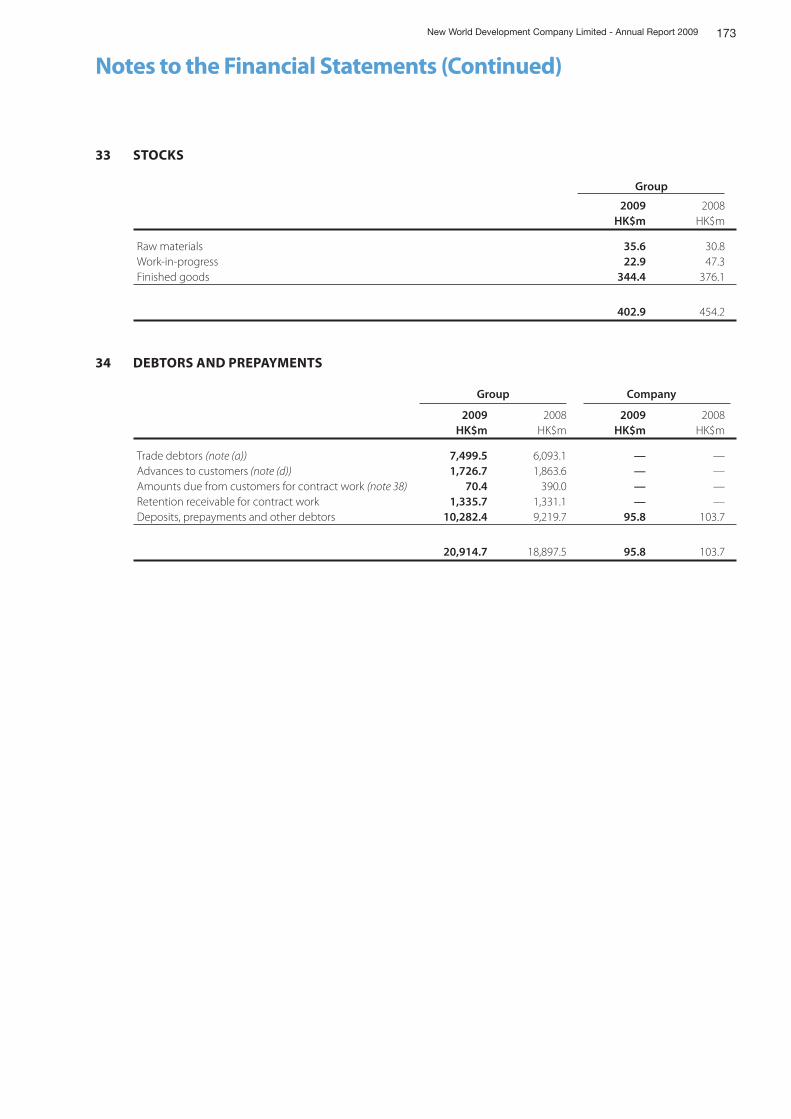
173New World Development Company Limited - Annual Report 2009
Notes to the Financial Statements (Continued)
33 STOCKS
Group
2009 2008HK$m HK$m
Raw materials 35.6 30.8Work-in-progress 22.9 47.3Finished goods 344.4 376.1
402.9 454.2
34 DEBTORS AND PREPAYMENTS
Group Company
2009 2008 2009 2008HK$m HK$m HK$m HK$m
Trade debtors (note (a)) 7,499.5 6,093.1 — —Advances to customers (note (d)) 1,726.7 1,863.6 — —Amounts due from customers for contract work (note 38) 70.4 390.0 — —Retention receivable for contract work 1,335.7 1,331.1 — —Deposits, prepayments and other debtors 10,282.4 9,219.7 95.8 103.7
20,914.7 18,897.5 95.8 103.7
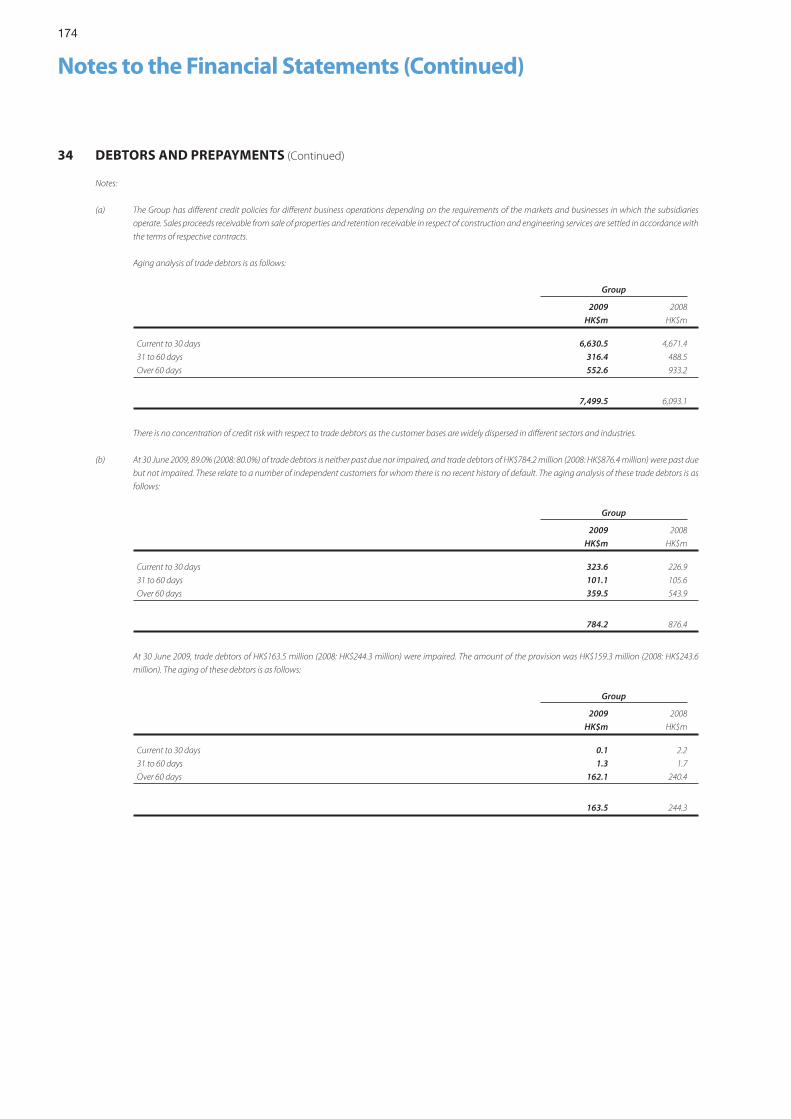
174
Notes to the Financial Statements (Continued)
34 DEBTORS AND PREPAYMENTS (Continued)
Notes:
(a) The Group has different credit policies for different business operations depending on the requirements of the markets and businesses in which the subsidiaries
operate. Sales proceeds receivable from sale of properties and retention receivable in respect of construction and engineering services are settled in accordance with
the terms of respective contracts.
Aging analysis of trade debtors is as follows:
Group
2009 2008
HK$m HK$m
Current to 30 days 6,630.5 4,671.4
31 to 60 days 316.4 488.5
Over 60 days 552.6 933.2
7,499.5 6,093.1
There is no concentration of credit risk with respect to trade debtors as the customer bases are widely dispersed in different sectors and industries.
(b) At 30 June 2009, 89.0% (2008: 80.0%) of trade debtors is neither past due nor impaired, and trade debtors of HK$784.2 million (2008: HK$876.4 million) were past due
but not impaired. These relate to a number of independent customers for whom there is no recent history of default. The aging analysis of these trade debtors is as
follows:
Group
2009 2008
HK$m HK$m
Current to 30 days 323.6 226.9
31 to 60 days 101.1 105.6
Over 60 days 359.5 543.9
784.2 876.4
At 30 June 2009, trade debtors of HK$163.5 million (2008: HK$244.3 million) were impaired. The amount of the provision was HK$159.3 million (2008: HK$243.6
million). The aging of these debtors is as follows:
Group
2009 2008
HK$m HK$m
Current to 30 days 0.1 2.2
31 to 60 days 1.3 1.7
Over 60 days 162.1 240.4
163.5 244.3
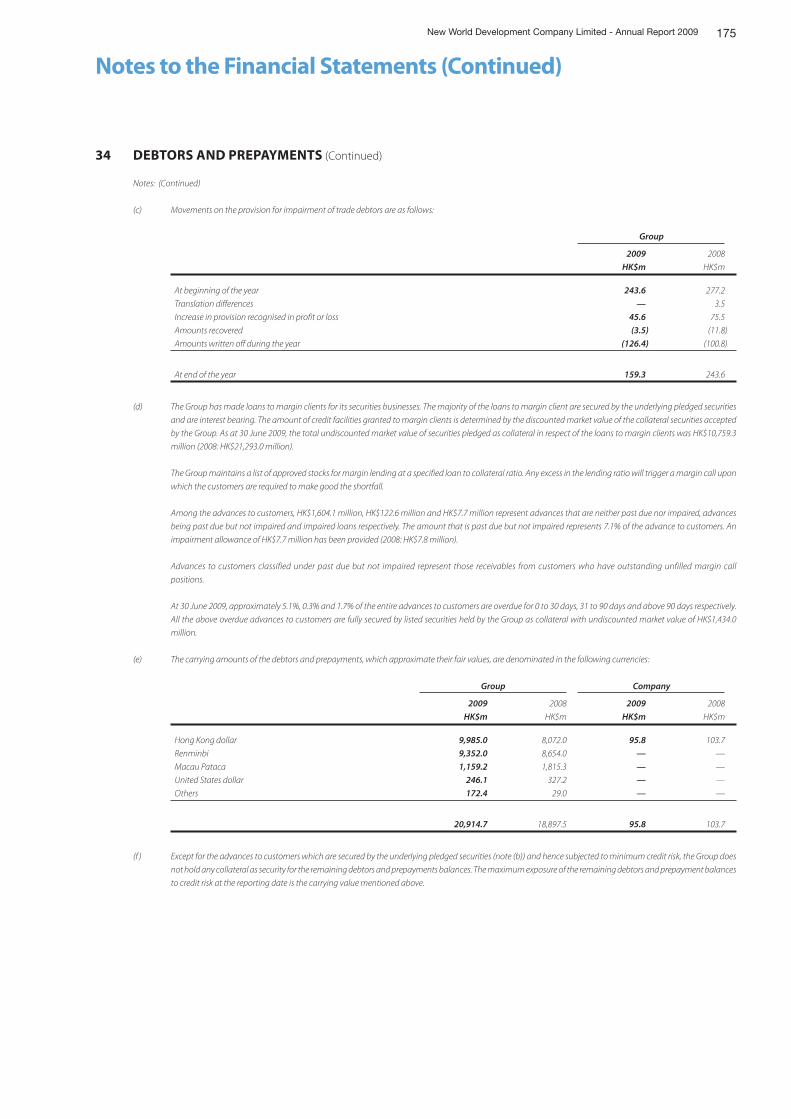
175New World Development Company Limited - Annual Report 2009
Notes to the Financial Statements (Continued)
34 DEBTORS AND PREPAYMENTS (Continued)
Notes: (Continued)
(c) Movements on the provision for impairment of trade debtors are as follows:
Group
2009 2008
HK$m HK$m
At beginning of the year 243.6 277.2
Translation differences — 3.5
Increase in provision recognised in profit or loss 45.6 75.5
Amounts recovered (3.5) (11.8)
Amounts written off during the year (126.4) (100.8)
At end of the year 159.3 243.6
(d) The Group has made loans to margin clients for its securities businesses. The majority of the loans to margin client are secured by the underlying pledged securities
and are interest bearing. The amount of credit facilities granted to margin clients is determined by the discounted market value of the collateral securities accepted
by the Group. As at 30 June 2009, the total undiscounted market value of securities pledged as collateral in respect of the loans to margin clients was HK$10,759.3
million (2008: HK$21,293.0 million).
The Group maintains a list of approved stocks for margin lending at a specified loan to collateral ratio. Any excess in the lending ratio will trigger a margin call upon
which the customers are required to make good the shortfall.
Among the advances to customers, HK$1,604.1 million, HK$122.6 million and HK$7.7 million represent advances that are neither past due nor impaired, advances
being past due but not impaired and impaired loans respectively. The amount that is past due but not impaired represents 7.1% of the advance to customers. An
impairment allowance of HK$7.7 million has been provided (2008: HK$7.8 million).
Advances to customers classified under past due but not impaired represent those receivables from customers who have outstanding unfilled margin call
positions.
At 30 June 2009, approximately 5.1%, 0.3% and 1.7% of the entire advances to customers are overdue for 0 to 30 days, 31 to 90 days and above 90 days respectively.
All the above overdue advances to customers are fully secured by listed securities held by the Group as collateral with undiscounted market value of HK$1,434.0
million.
(e) The carrying amounts of the debtors and prepayments, which approximate their fair values, are denominated in the following currencies:
Group Company
2009 2008 2009 2008
HK$m HK$m HK$m HK$m
Hong Kong dollar 9,985.0 8,072.0 95.8 103.7
Renminbi 9,352.0 8,654.0 — —
Macau Pataca 1,159.2 1,815.3 — —
United States dollar 246.1 327.2 — —
Others 172.4 29.0 — —
20,914.7 18,897.5 95.8 103.7
(f ) Except for the advances to customers which are secured by the underlying pledged securities (note (b)) and hence subjected to minimum credit risk, the Group does
not hold any collateral as security for the remaining debtors and prepayments balances. The maximum exposure of the remaining debtors and prepayment balances
to credit risk at the reporting date is the carrying value mentioned above.
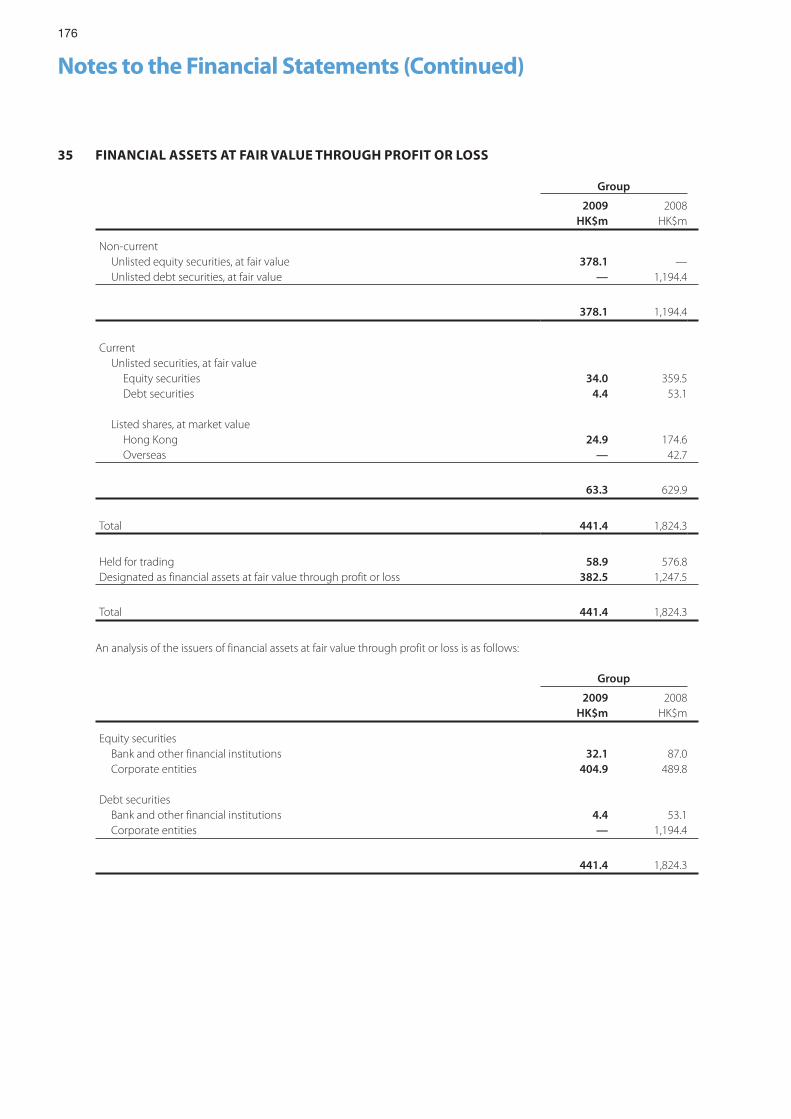
176
Notes to the Financial Statements (Continued)
35 FINANCIAL ASSETS AT FAIR VALUE THROUGH PROFIT OR LOSS
Group
2009 2008HK$m HK$m
Non-current Unlisted equity securities, at fair value 378.1 — Unlisted debt securities, at fair value — 1,194.4
378.1 1,194.4
Current Unlisted securities, at fair value Equity securities 34.0 359.5 Debt securities 4.4 53.1
Listed shares, at market value Hong Kong 24.9 174.6 Overseas — 42.7
63.3 629.9
Total 441.4 1,824.3
Held for trading 58.9 576.8Designated as financial assets at fair value through profit or loss 382.5 1,247.5
Total 441.4 1,824.3
An analysis of the issuers of financial assets at fair value through profit or loss is as follows:
Group
2009 2008HK$m HK$m
Equity securities Bank and other financial institutions 32.1 87.0 Corporate entities 404.9 489.8
Debt securities Bank and other financial institutions 4.4 53.1 Corporate entities — 1,194.4
441.4 1,824.3
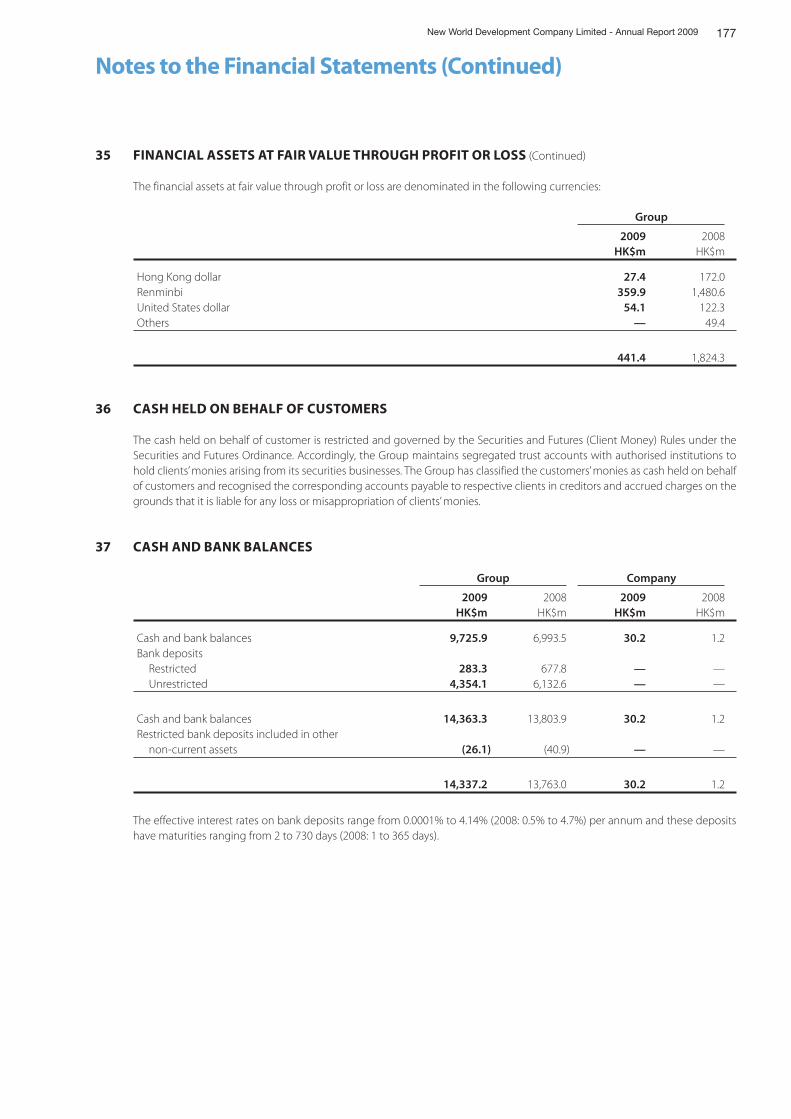
177New World Development Company Limited - Annual Report 2009
Notes to the Financial Statements (Continued)
35 FINANCIAL ASSETS AT FAIR VALUE THROUGH PROFIT OR LOSS (Continued)
The financial assets at fair value through profit or loss are denominated in the following currencies:
Group
2009 2008HK$m HK$m
Hong Kong dollar 27.4 172.0Renminbi 359.9 1,480.6United States dollar 54.1 122.3Others — 49.4
441.4 1,824.3
36 CASH HELD ON BEHALF OF CUSTOMERS
The cash held on behalf of customer is restricted and governed by the Securities and Futures (Client Money) Rules under the Securities and Futures Ordinance. Accordingly, the Group maintains segregated trust accounts with authorised institutions to hold clients’ monies arising from its securities businesses. The Group has classified the customers’ monies as cash held on behalf of customers and recognised the corresponding accounts payable to respective clients in creditors and accrued charges on the grounds that it is liable for any loss or misappropriation of clients’ monies.
37 CASH AND BANK BALANCES
Group Company
2009 2008 2009 2008HK$m HK$m HK$m HK$m
Cash and bank balances 9,725.9 6,993.5 30.2 1.2Bank deposits Restricted 283.3 677.8 — — Unrestricted 4,354.1 6,132.6 — —
Cash and bank balances 14,363.3 13,803.9 30.2 1.2Restricted bank deposits included in other non-current assets (26.1) (40.9) — —
14,337.2 13,763.0 30.2 1.2
The effective interest rates on bank deposits range from 0.0001% to 4.14% (2008: 0.5% to 4.7%) per annum and these deposits have maturities ranging from 2 to 730 days (2008: 1 to 365 days).
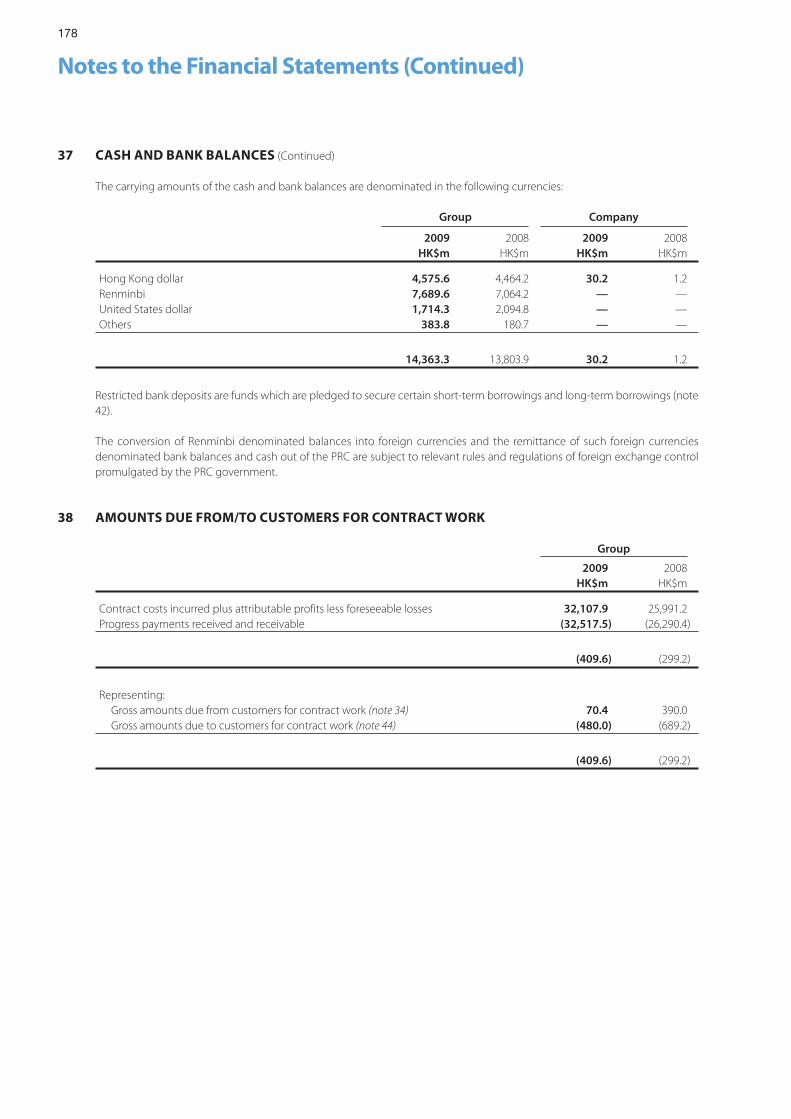
178
Notes to the Financial Statements (Continued)
37 CASH AND BANK BALANCES (Continued)
The carrying amounts of the cash and bank balances are denominated in the following currencies:
Group Company
2009 2008 2009 2008HK$m HK$m HK$m HK$m
Hong Kong dollar 4,575.6 4,464.2 30.2 1.2Renminbi 7,689.6 7,064.2 — —United States dollar 1,714.3 2,094.8 — —Others 383.8 180.7 — —
14,363.3 13,803.9 30.2 1.2
Restricted bank deposits are funds which are pledged to secure certain short-term borrowings and long-term borrowings (note 42).
The conversion of Renminbi denominated balances into foreign currencies and the remittance of such foreign currencies denominated bank balances and cash out of the PRC are subject to relevant rules and regulations of foreign exchange control promulgated by the PRC government.
38 AMOUNTS DUE FROM/TO CUSTOMERS FOR CONTRACT WORK
Group
2009 2008HK$m HK$m
Contract costs incurred plus attributable profits less foreseeable losses 32,107.9 25,991.2Progress payments received and receivable (32,517.5) (26,290.4)
(409.6) (299.2)
Representing: Gross amounts due from customers for contract work (note 34) 70.4 390.0 Gross amounts due to customers for contract work (note 44) (480.0) (689.2)
(409.6) (299.2)

179New World Development Company Limited - Annual Report 2009
Notes to the Financial Statements (Continued)
39 NONCURRENT ASSETS CLASSIFIED AS ASSETS HELD FOR SALE
Group
2009 2008HK$m HK$m
Listed securities at market value (note (i)) Equity securities listed in Hong Kong 10.8 — Equity securities listed in Mainland China 255.0 —Interest in a jointly controlled entity (note (ii)) 1,025.2 —
Total 1,291.0 —
Notes:
(i) As at 30 June 2009, balance represents the carrying amount of assets previously classified as associated companies.
(ii) In April 2009, the Group entered into an agreement to dispose of 50.0% equity interest in Shanghai Juyi Real Estate Development Co., Ltd. (“Juyi”) which is engaged
in property development in PRC, at a consideration of not less than HK$953.2 million, subject to adjustment for any changes in the attributable net asset value of
Juyi as at the date of completion which in any event not exceeding HK$1,174.5 million. The completion is expected to be on or before 30 November 2009. After the
completion, the Group will cease to have any interest in Juyi.
Include in the balance is an amount due from Juyi of HK$170.4 million which is unsecured, interest free and repayable on demand.
40 SHARE CAPITAL
2009 2008
Number ofshares
Number of shares
(million) HK$m (million) HK$m
Authorised: Shares of HK$1.00 each 10,000.0 10,000.0 10,000.0 10,000.0
Issued and fully paid: Shares of HK$1.00 each At beginning of the year 3,736.5 3,736.5 3,692.1 3,692.1 Issue of new shares as scrip dividends 130.8 130.8 41.6 41.6 Exercise of share options — — 2.8 2.8
At end of the year 3,867.3 3,867.3 3,736.5 3,736.5
During the year, 21,888,184, 94,439,797 and 14,459,582 new shares were issued by the Company at HK$17.87516, HK$5.84522 and HK$13.93840 per share respectively for the settlement of 2008 interim and final scrip dividends and 2009 interim scrip dividends.
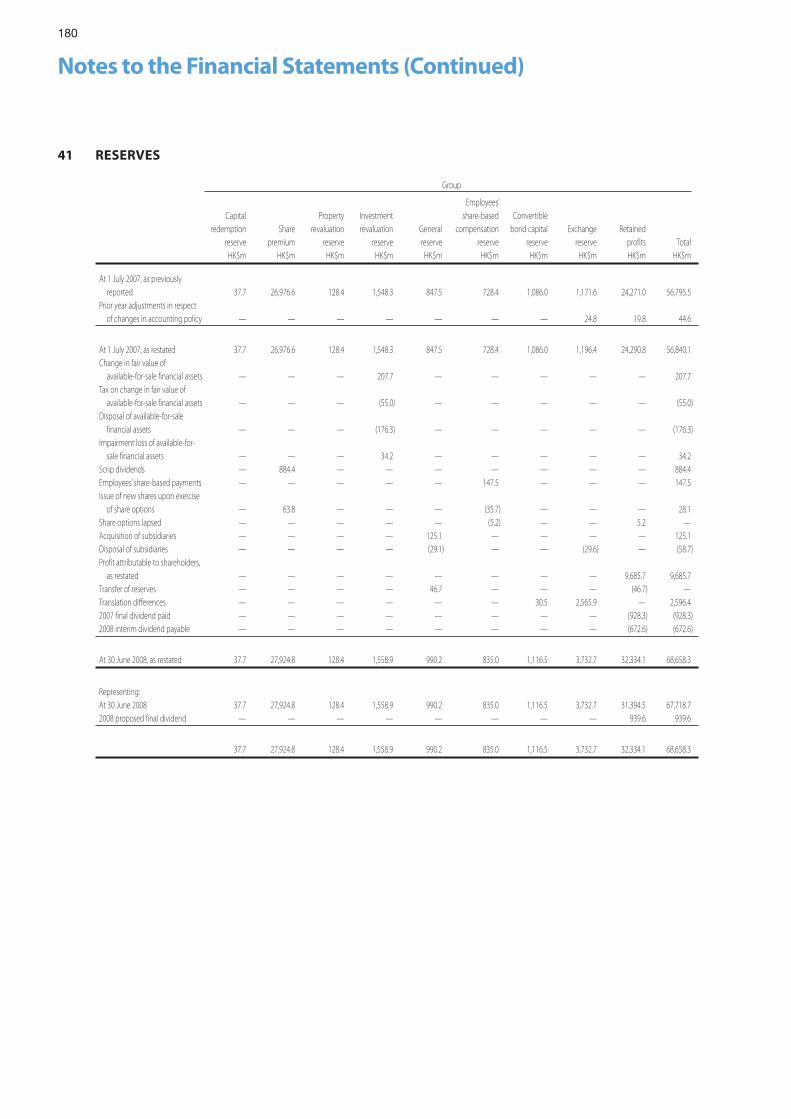
180
Notes to the Financial Statements (Continued)
41 RESERVES
Group
Capitalredemption
reserveShare
premium
Propertyrevaluation
reserve
Investmentrevaluation
reserveGeneralreserve
Employees’share-based
compensationreserve
Convertiblebond capital
reserveExchange
reserveRetained
profits TotalHK$m HK$m HK$m HK$m HK$m HK$m HK$m HK$m HK$m HK$m
At 1 July 2007, as previously reported 37.7 26,976.6 128.4 1,548.3 847.5 728.4 1,086.0 1,171.6 24,271.0 56,795.5Prior year adjustments in respect of changes in accounting policy — — — — — — — 24.8 19.8 44.6
At 1 July 2007, as restated 37.7 26,976.6 128.4 1,548.3 847.5 728.4 1,086.0 1,196.4 24,290.8 56,840.1Change in fair value of available-for-sale financial assets — — — 207.7 — — — — — 207.7Tax on change in fair value of available-for-sale financial assets — — — (55.0) — — — — — (55.0)Disposal of available-for-sale financial assets — — — (176.3) — — — — — (176.3)Impairment loss of available-for- sale financial assets — — — 34.2 — — — — — 34.2Scrip dividends — 884.4 — — — — — — — 884.4Employees’ share-based payments — — — — — 147.5 — — — 147.5Issue of new shares upon exercise of share options — 63.8 — — — (35.7) — — — 28.1Share options lapsed — — — — — (5.2) — — 5.2 —Acquisition of subsidiaries — — — — 125.1 — — — — 125.1Disposal of subsidiaries — — — — (29.1) — — (29.6) — (58.7)Profit attributable to shareholders, as restated — — — — — — — — 9,685.7 9,685.7Transfer of reserves — — — — 46.7 — — — (46.7) —Translation differences — — — — — — 30.5 2,565.9 — 2,596.42007 final dividend paid — — — — — — — — (928.3) (928.3)2008 interim dividend payable — — — — — — — — (672.6) (672.6)
At 30 June 2008, as restated 37.7 27,924.8 128.4 1,558.9 990.2 835.0 1,116.5 3,732.7 32,334.1 68,658.3
Representing:At 30 June 2008 37.7 27,924.8 128.4 1,558.9 990.2 835.0 1,116.5 3,732.7 31,394.5 67,718.72008 proposed final dividend — — — — — — — — 939.6 939.6
37.7 27,924.8 128.4 1,558.9 990.2 835.0 1,116.5 3,732.7 32,334.1 68,658.3
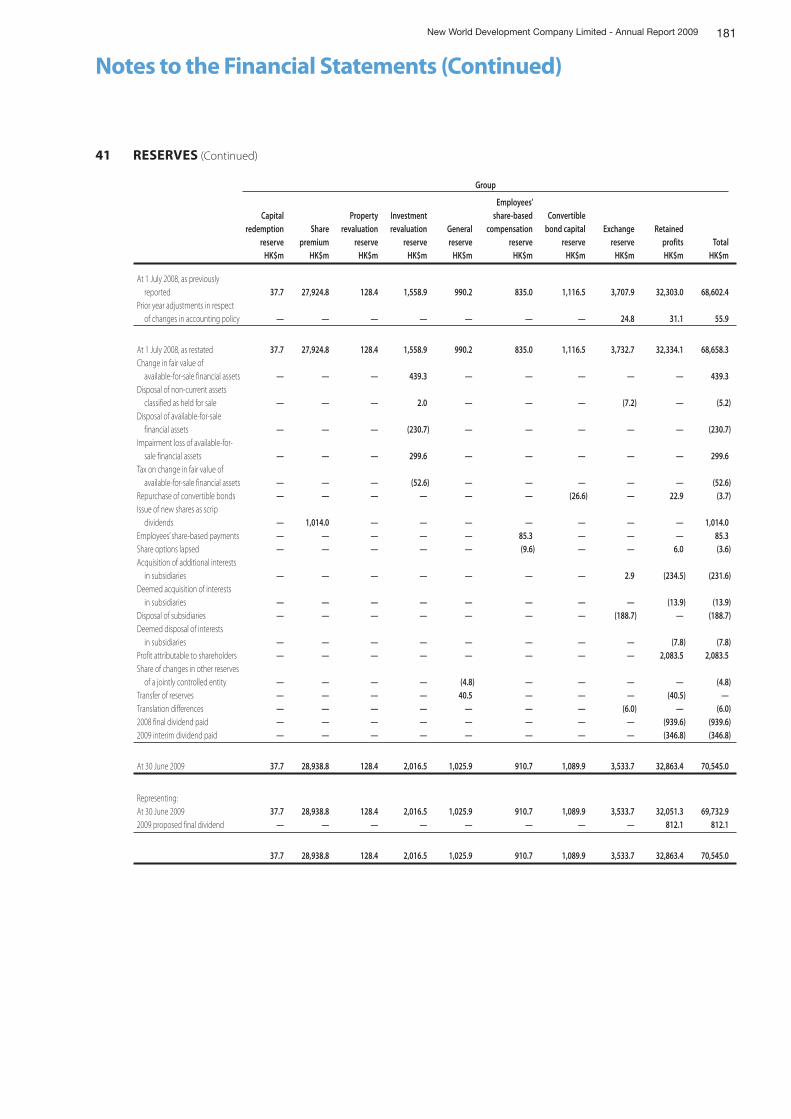
181New World Development Company Limited - Annual Report 2009
Notes to the Financial Statements (Continued)
41 RESERVES (Continued)
Group
Capitalredemption
reserveShare
premium
Propertyrevaluation
reserve
Investmentrevaluation
reserveGeneralreserve
Employees’share-based
compensationreserve
Convertiblebond capital
reserveExchange
reserveRetained
profits TotalHK$m HK$m HK$m HK$m HK$m HK$m HK$m HK$m HK$m HK$m
At 1 July 2008, as previously reported 37.7 27,924.8 128.4 1,558.9 990.2 835.0 1,116.5 3,707.9 32,303.0 68,602.4Prior year adjustments in respect of changes in accounting policy — — — — — — — 24.8 31.1 55.9
At 1 July 2008, as restated 37.7 27,924.8 128.4 1,558.9 990.2 835.0 1,116.5 3,732.7 32,334.1 68,658.3Change in fair value of available-for-sale financial assets — — — 439.3 — — — — — 439.3Disposal of non-current assets classified as held for sale — — — 2.0 — — — (7.2) — (5.2)Disposal of available-for-sale financial assets — — — (230.7) — — — — — (230.7)Impairment loss of available-for- sale financial assets — — — 299.6 — — — — — 299.6Tax on change in fair value of available-for-sale financial assets — — — (52.6) — — — — — (52.6)Repurchase of convertible bonds — — — — — — (26.6) — 22.9 (3.7)Issue of new shares as scrip dividends — 1,014.0 — — — — — — — 1,014.0Employees’ share-based payments — — — — — 85.3 — — — 85.3Share options lapsed — — — — — (9.6) — — 6.0 (3.6)Acquisition of additional interests in subsidiaries — — — — — — — 2.9 (234.5) (231.6)Deemed acquisition of interests in subsidiaries — — — — — — — — (13.9) (13.9)Disposal of subsidiaries — — — — — — — (188.7) — (188.7)Deemed disposal of interests in subsidiaries — — — — — — — — (7.8) (7.8)Profit attributable to shareholders — — — — — — — — 2,083.5 2,083.5Share of changes in other reserves of a jointly controlled entity — — — — (4.8) — — — — (4.8)Transfer of reserves — — — — 40.5 — — — (40.5) —Translation differences — — — — — — — (6.0) — (6.0)2008 final dividend paid — — — — — — — — (939.6) (939.6)2009 interim dividend paid — — — — — — — — (346.8) (346.8)
At 30 June 2009 37.7 28,938.8 128.4 2,016.5 1,025.9 910.7 1,089.9 3,533.7 32,863.4 70,545.0
Representing:At 30 June 2009 37.7 28,938.8 128.4 2,016.5 1,025.9 910.7 1,089.9 3,533.7 32,051.3 69,732.92009 proposed final dividend — — — — — — — — 812.1 812.1
37.7 28,938.8 128.4 2,016.5 1,025.9 910.7 1,089.9 3,533.7 32,863.4 70,545.0
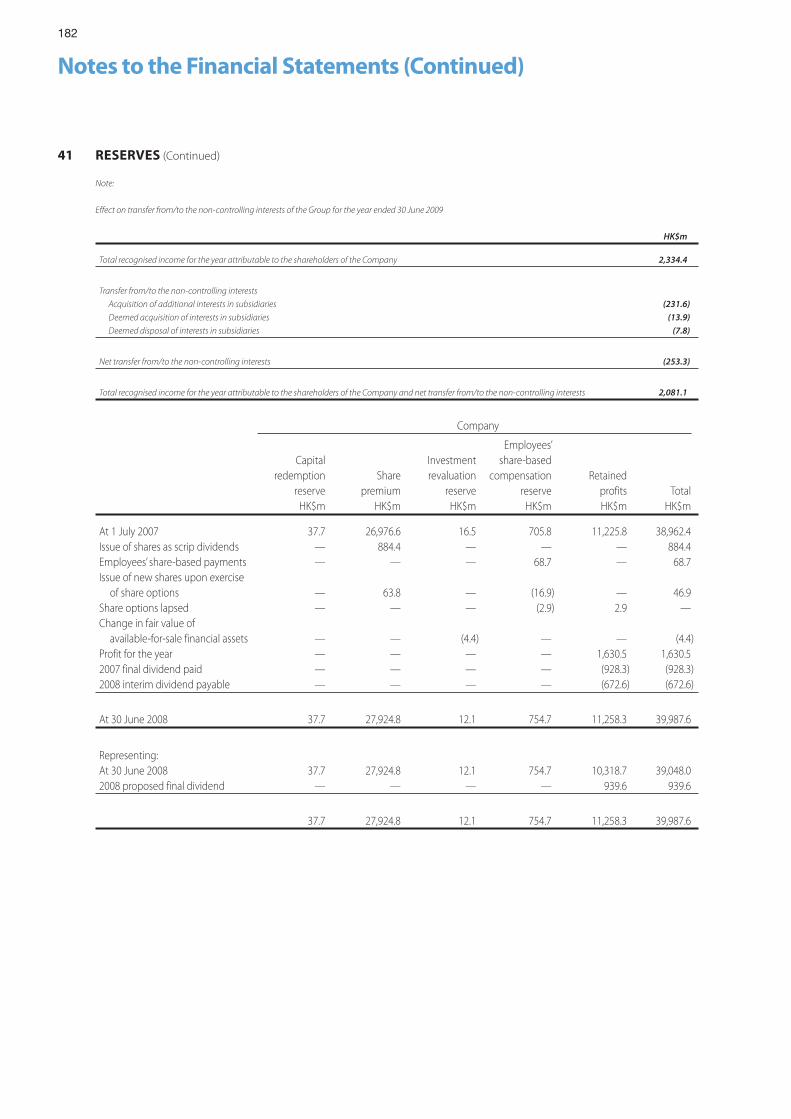
182
Notes to the Financial Statements (Continued)
41 RESERVES (Continued)
Note:
Effect on transfer from/to the non-controlling interests of the Group for the year ended 30 June 2009
HK$m
Total recognised income for the year attributable to the shareholders of the Company 2,334.4
Transfer from/to the non-controlling interests
Acquisition of additional interests in subsidiaries (231.6)
Deemed acquisition of interests in subsidiaries (13.9)
Deemed disposal of interests in subsidiaries (7.8)
Net transfer from/to the non-controlling interests (253.3)
Total recognised income for the year attributable to the shareholders of the Company and net transfer from/to the non-controlling interests 2,081.1
Company
Capitalredemption
reserveShare
premium
Investmentrevaluation
reserve
Employees’share-based
compensationreserve
Retainedprofits Total
HK$m HK$m HK$m HK$m HK$m HK$m
At 1 July 2007 37.7 26,976.6 16.5 705.8 11,225.8 38,962.4Issue of shares as scrip dividends — 884.4 — — — 884.4Employees’ share-based payments — — — 68.7 — 68.7Issue of new shares upon exercise of share options — 63.8 — (16.9) — 46.9Share options lapsed — — — (2.9) 2.9 —Change in fair value of available-for-sale financial assets — — (4.4) — — (4.4)Profit for the year — — — — 1,630.5 1,630.52007 final dividend paid — — — — (928.3) (928.3)2008 interim dividend payable — — — — (672.6) (672.6)
At 30 June 2008 37.7 27,924.8 12.1 754.7 11,258.3 39,987.6
Representing:At 30 June 2008 37.7 27,924.8 12.1 754.7 10,318.7 39,048.02008 proposed final dividend — — — — 939.6 939.6
37.7 27,924.8 12.1 754.7 11,258.3 39,987.6
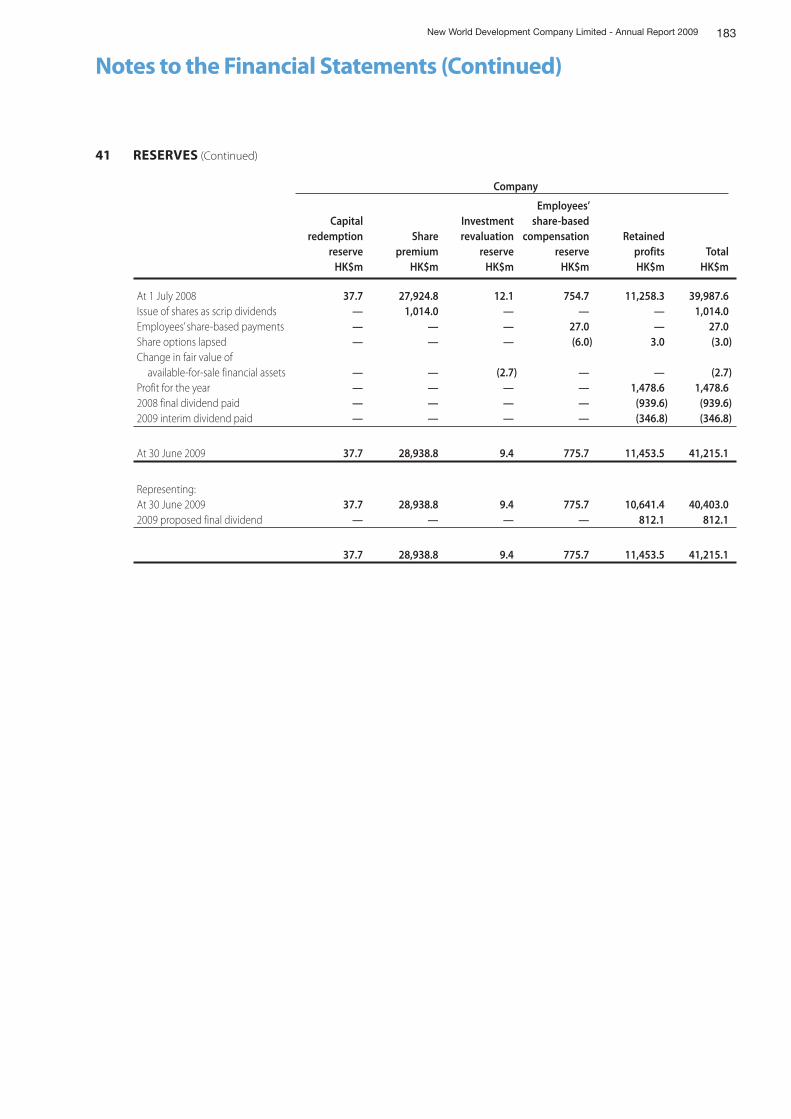
183New World Development Company Limited - Annual Report 2009
Notes to the Financial Statements (Continued)
41 RESERVES (Continued)
Company
Capitalredemption
reserveShare
premium
Investmentrevaluation
reserve
Employees’share-based
compensationreserve
Retainedprofits Total
HK$m HK$m HK$m HK$m HK$m HK$m
At 1 July 2008 37.7 27,924.8 12.1 754.7 11,258.3 39,987.6Issue of shares as scrip dividends — 1,014.0 — — — 1,014.0Employees’ share-based payments — — — 27.0 — 27.0Share options lapsed — — — (6.0) 3.0 (3.0)Change in fair value of available-for-sale financial assets — — (2.7) — — (2.7)Profit for the year — — — — 1,478.6 1,478.62008 final dividend paid — — — — (939.6) (939.6)2009 interim dividend paid — — — — (346.8) (346.8)
At 30 June 2009 37.7 28,938.8 9.4 775.7 11,453.5 41,215.1
Representing:At 30 June 2009 37.7 28,938.8 9.4 775.7 10,641.4 40,403.02009 proposed final dividend — — — — 812.1 812.1
37.7 28,938.8 9.4 775.7 11,453.5 41,215.1
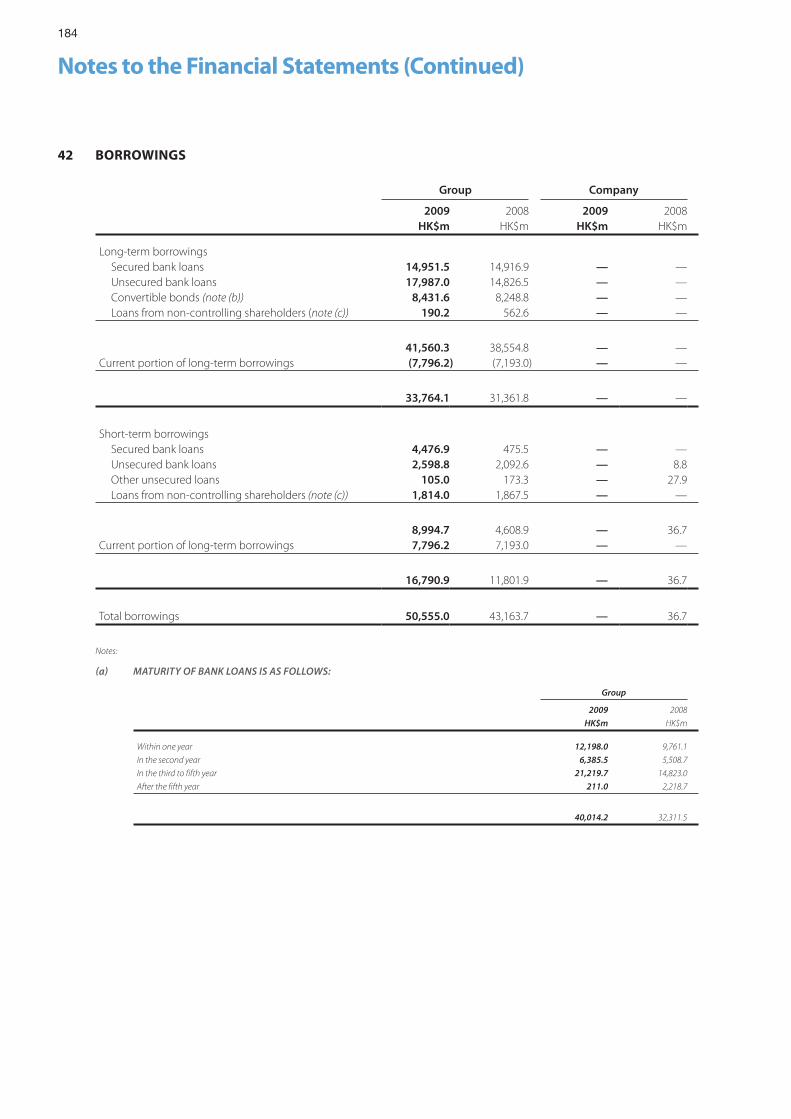
184
Notes to the Financial Statements (Continued)
42 BORROWINGS
Group Company
2009 2008 2009 2008HK$m HK$m HK$m HK$m
Long-term borrowings Secured bank loans 14,951.5 14,916.9 — — Unsecured bank loans 17,987.0 14,826.5 — — Convertible bonds (note (b)) 8,431.6 8,248.8 — — Loans from non-controlling shareholders (note (c)) 190.2 562.6 — —
41,560.3 38,554.8 — —Current portion of long-term borrowings (7,796.2) (7,193.0) — —
33,764.1 31,361.8 — —
Short-term borrowings Secured bank loans 4,476.9 475.5 — — Unsecured bank loans 2,598.8 2,092.6 — 8.8 Other unsecured loans 105.0 173.3 — 27.9 Loans from non-controlling shareholders (note (c)) 1,814.0 1,867.5 — —
8,994.7 4,608.9 — 36.7Current portion of long-term borrowings 7,796.2 7,193.0 — —
16,790.9 11,801.9 — 36.7
Total borrowings 50,555.0 43,163.7 — 36.7
Notes:
a MATURITY OF BANK LOANS IS AS FOLLOWS:
Group
2009 2008
HK$m HK$m
Within one year 12,198.0 9,761.1
In the second year 6,385.5 5,508.7
In the third to fifth year 21,219.7 14,823.0
After the fifth year 211.0 2,218.7
40,014.2 32,311.5
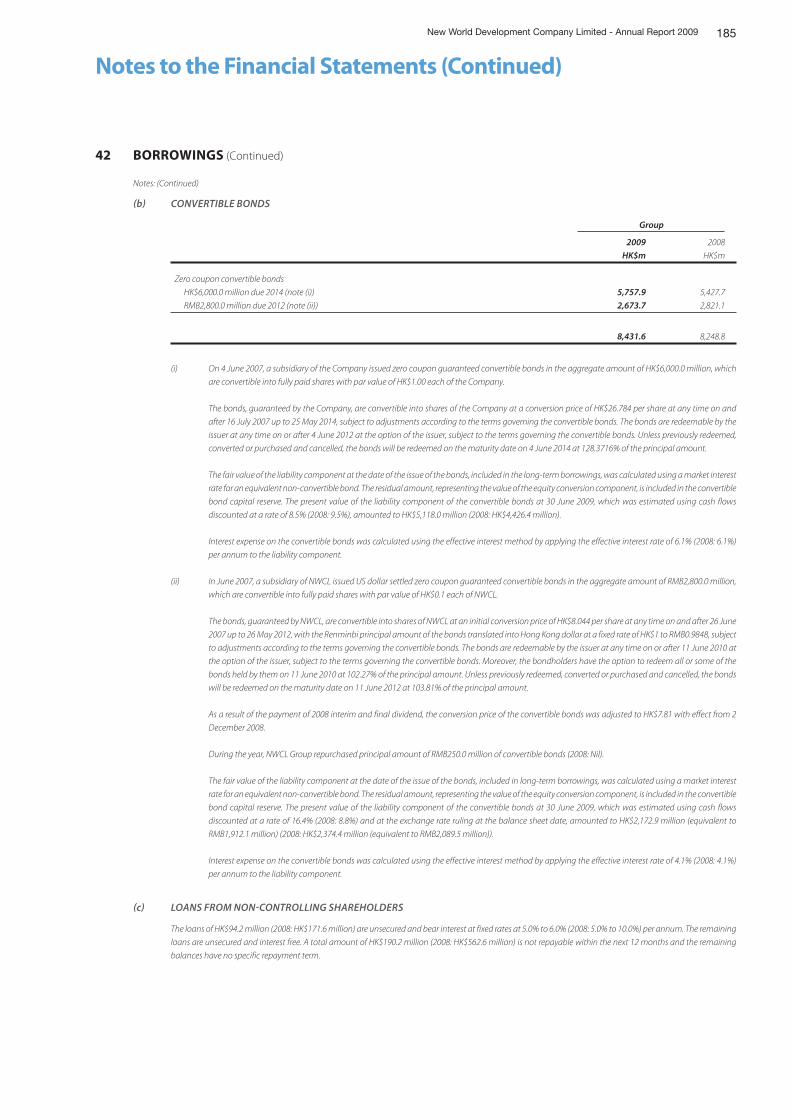
185New World Development Company Limited - Annual Report 2009
Notes to the Financial Statements (Continued)
42 BORROWINGS (Continued)
Notes: (Continued)
b CONVERTIBLE BONDS
Group
2009 2008
HK$m HK$m
Zero coupon convertible bonds
HK$6,000.0 million due 2014 (note (i)) 5,757.9 5,427.7
RMB2,800.0 million due 2012 (note (ii)) 2,673.7 2,821.1
8,431.6 8,248.8
(i) On 4 June 2007, a subsidiary of the Company issued zero coupon guaranteed convertible bonds in the aggregate amount of HK$6,000.0 million, which
are convertible into fully paid shares with par value of HK$1.00 each of the Company.
The bonds, guaranteed by the Company, are convertible into shares of the Company at a conversion price of HK$26.784 per share at any time on and
after 16 July 2007 up to 25 May 2014, subject to adjustments according to the terms governing the convertible bonds. The bonds are redeemable by the
issuer at any time on or after 4 June 2012 at the option of the issuer, subject to the terms governing the convertible bonds. Unless previously redeemed,
converted or purchased and cancelled, the bonds will be redeemed on the maturity date on 4 June 2014 at 128.3716% of the principal amount.
The fair value of the liability component at the date of the issue of the bonds, included in the long-term borrowings, was calculated using a market interest
rate for an equivalent non-convertible bond. The residual amount, representing the value of the equity conversion component, is included in the convertible
bond capital reserve. The present value of the liability component of the convertible bonds at 30 June 2009, which was estimated using cash flows
discounted at a rate of 8.5% (2008: 9.5%), amounted to HK$5,118.0 million (2008: HK$4,426.4 million).
Interest expense on the convertible bonds was calculated using the effective interest method by applying the effective interest rate of 6.1% (2008: 6.1%)
per annum to the liability component.
(ii) In June 2007, a subsidiary of NWCL issued US dollar settled zero coupon guaranteed convertible bonds in the aggregate amount of RMB2,800.0 million,
which are convertible into fully paid shares with par value of HK$0.1 each of NWCL.
The bonds, guaranteed by NWCL, are convertible into shares of NWCL at an initial conversion price of HK$8.044 per share at any time on and after 26 June
2007 up to 26 May 2012, with the Renminbi principal amount of the bonds translated into Hong Kong dollar at a fixed rate of HK$1 to RMB0.9848, subject
to adjustments according to the terms governing the convertible bonds. The bonds are redeemable by the issuer at any time on or after 11 June 2010 at
the option of the issuer, subject to the terms governing the convertible bonds. Moreover, the bondholders have the option to redeem all or some of the
bonds held by them on 11 June 2010 at 102.27% of the principal amount. Unless previously redeemed, converted or purchased and cancelled, the bonds
will be redeemed on the maturity date on 11 June 2012 at 103.81% of the principal amount.
As a result of the payment of 2008 interim and final dividend, the conversion price of the convertible bonds was adjusted to HK$7.81 with effect from 2
December 2008.
During the year, NWCL Group repurchased principal amount of RMB250.0 million of convertible bonds (2008: Nil).
The fair value of the liability component at the date of the issue of the bonds, included in long-term borrowings, was calculated using a market interest
rate for an equivalent non-convertible bond. The residual amount, representing the value of the equity conversion component, is included in the convertible
bond capital reserve. The present value of the liability component of the convertible bonds at 30 June 2009, which was estimated using cash flows
discounted at a rate of 16.4% (2008: 8.8%) and at the exchange rate ruling at the balance sheet date, amounted to HK$2,172.9 million (equivalent to
RMB1,912.1 million) (2008: HK$2,374.4 million (equivalent to RMB2,089.5 million)).
Interest expense on the convertible bonds was calculated using the effective interest method by applying the effective interest rate of 4.1% (2008: 4.1%)
per annum to the liability component.
c LOANS FROM NONCONTROLLING SHAREHOLDERS
The loans of HK$94.2 million (2008: HK$171.6 million) are unsecured and bear interest at fixed rates at 5.0% to 6.0% (2008: 5.0% to 10.0%) per annum. The remaining
loans are unsecured and interest free. A total amount of HK$190.2 million (2008: HK$562.6 million) is not repayable within the next 12 months and the remaining
balances have no specific repayment term.
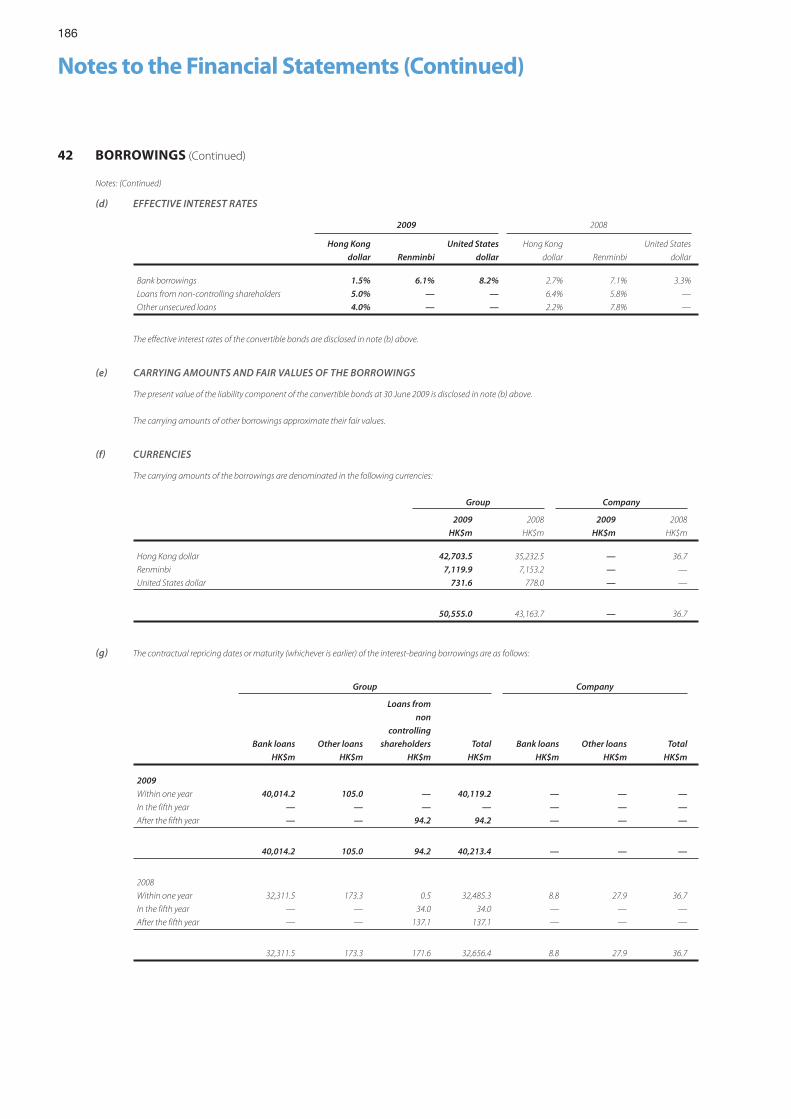
186
Notes to the Financial Statements (Continued)
42 BORROWINGS (Continued)
Notes: (Continued)
d EFFECTIVE INTEREST RATES
2009 2008
Hong Kong
dollar Renminbi
United States
dollar
Hong Kong
dollar Renminbi
United States
dollar
Bank borrowings 1.5% 6.1% 8.2% 2.7% 7.1% 3.3%
Loans from non-controlling shareholders 5.0% — — 6.4% 5.8% —
Other unsecured loans 4.0% — — 2.2% 7.8% —
The effective interest rates of the convertible bonds are disclosed in note (b) above.
e CARRYING AMOUNTS AND FAIR VALUES OF THE BORROWINGS
The present value of the liability component of the convertible bonds at 30 June 2009 is disclosed in note (b) above.
The carrying amounts of other borrowings approximate their fair values.
f CURRENCIES
The carrying amounts of the borrowings are denominated in the following currencies:
Group Company
2009 2008 2009 2008
HK$m HK$m HK$m HK$m
Hong Kong dollar 42,703.5 35,232.5 — 36.7
Renminbi 7,119.9 7,153.2 — —
United States dollar 731.6 778.0 — —
50,555.0 43,163.7 — 36.7
g The contractual repricing dates or maturity (whichever is earlier) of the interest-bearing borrowings are as follows:
Group Company
Bank loans Other loans
Loans from
non
controlling
shareholders Total Bank loans Other loans Total
HK$m HK$m HK$m HK$m HK$m HK$m HK$m
2009
Within one year 40,014.2 105.0 — 40,119.2 — — —
In the fifth year — — — — — — —
After the fifth year — — 94.2 94.2 — — —
40,014.2 105.0 94.2 40,213.4 — — —
2008
Within one year 32,311.5 173.3 0.5 32,485.3 8.8 27.9 36.7
In the fifth year — — 34.0 34.0 — — —
After the fifth year — — 137.1 137.1 — — —
32,311.5 173.3 171.6 32,656.4 8.8 27.9 36.7
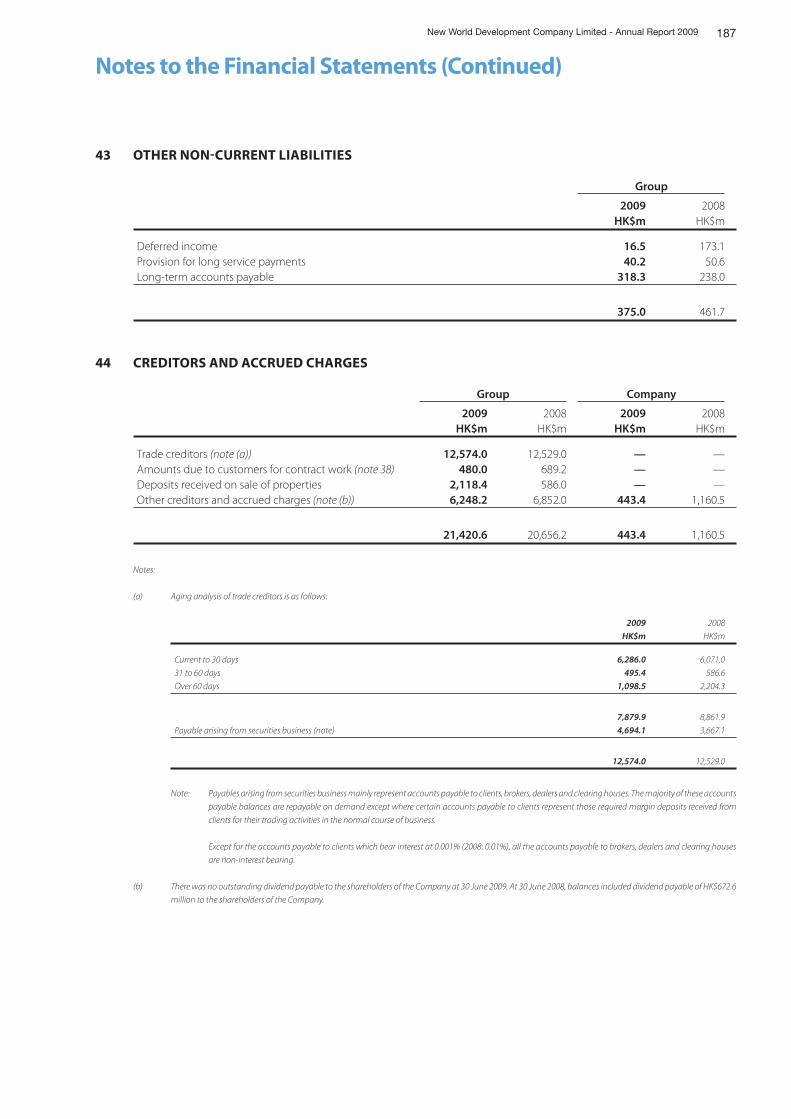
187New World Development Company Limited - Annual Report 2009
Notes to the Financial Statements (Continued)
43 OTHER NONCURRENT LIABILITIES
Group
2009 2008HK$m HK$m
Deferred income 16.5 173.1Provision for long service payments 40.2 50.6Long-term accounts payable 318.3 238.0
375.0 461.7
44 CREDITORS AND ACCRUED CHARGES
Group Company
2009 2008 2009 2008HK$m HK$m HK$m HK$m
Trade creditors (note (a)) 12,574.0 12,529.0 — —Amounts due to customers for contract work (note 38) 480.0 689.2 — —Deposits received on sale of properties 2,118.4 586.0 — —Other creditors and accrued charges (note (b)) 6,248.2 6,852.0 443.4 1,160.5
21,420.6 20,656.2 443.4 1,160.5
Notes:
(a) Aging analysis of trade creditors is as follows:
2009 2008
HK$m HK$m
Current to 30 days 6,286.0 6,071.0
31 to 60 days 495.4 586.6
Over 60 days 1,098.5 2,204.3
7,879.9 8,861.9
Payable arising from securities business (note) 4,694.1 3,667.1
12,574.0 12,529.0
Note: Payables arising from securities business mainly represent accounts payable to clients, brokers, dealers and clearing houses. The majority of these accounts
payable balances are repayable on demand except where certain accounts payable to clients represent those required margin deposits received from
clients for their trading activities in the normal course of business.
Except for the accounts payable to clients which bear interest at 0.001% (2008: 0.01%), all the accounts payable to brokers, dealers and clearing houses
are non-interest bearing.
(b) There was no outstanding dividend payable to the shareholders of the Company at 30 June 2009. At 30 June 2008, balances included dividend payable of HK$672.6
million to the shareholders of the Company.
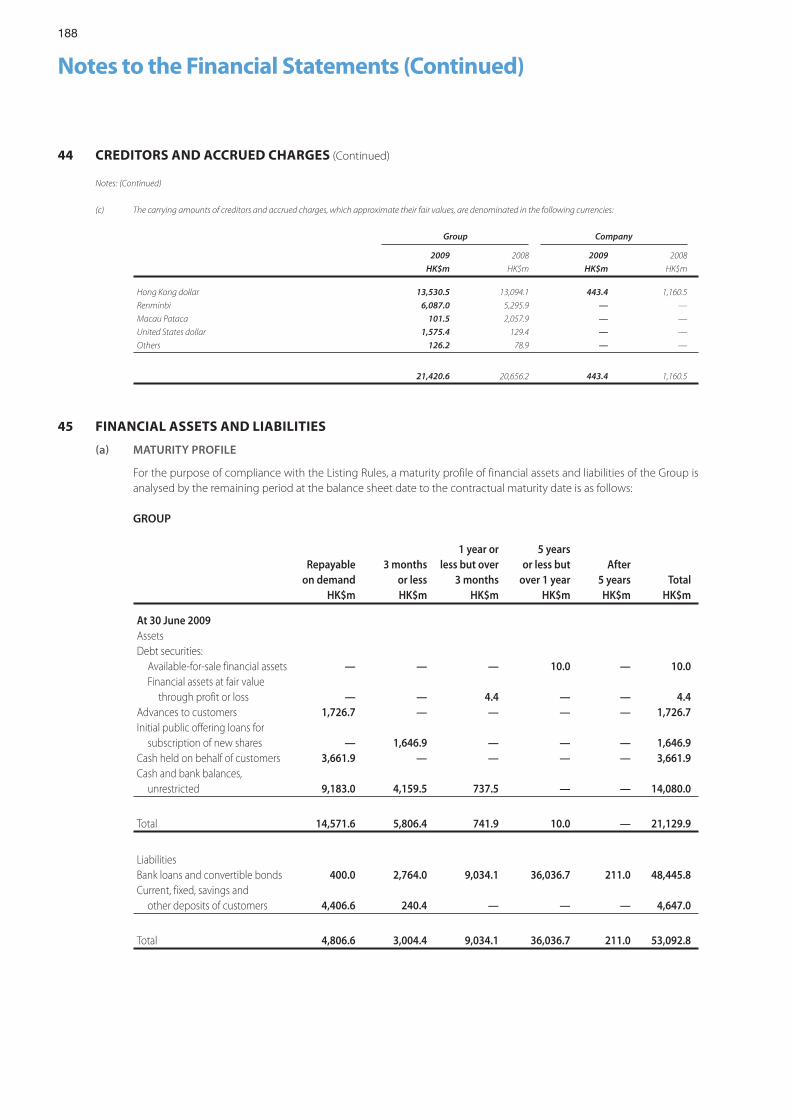
188
Notes to the Financial Statements (Continued)
44 CREDITORS AND ACCRUED CHARGES (Continued)
Notes: (Continued)
(c) The carrying amounts of creditors and accrued charges, which approximate their fair values, are denominated in the following currencies:
Group Company
2009 2008 2009 2008
HK$m HK$m HK$m HK$m
Hong Kong dollar 13,530.5 13,094.1 443.4 1,160.5
Renminbi 6,087.0 5,295.9 — —
Macau Pataca 101.5 2,057.9 — —
United States dollar 1,575.4 129.4 — —
Others 126.2 78.9 — —
21,420.6 20,656.2 443.4 1,160.5
45 FINANCIAL ASSETS AND LIABILITIES
a MATURITY PROFILE
For the purpose of compliance with the Listing Rules, a maturity profile of financial assets and liabilities of the Group is analysed by the remaining period at the balance sheet date to the contractual maturity date is as follows:
GROUP
Repayableon demand
3 monthsor less
1 year orless but over
3 months
5 yearsor less but
over 1 yearAfter
5 years TotalHK$m HK$m HK$m HK$m HK$m HK$m
At 30 June 2009AssetsDebt securities: Available-for-sale financial assets — — — 10.0 — 10.0 Financial assets at fair value through profit or loss — — 4.4 — — 4.4Advances to customers 1,726.7 — — — — 1,726.7Initial public offering loans for subscription of new shares — 1,646.9 — — — 1,646.9Cash held on behalf of customers 3,661.9 — — — — 3,661.9Cash and bank balances, unrestricted 9,183.0 4,159.5 737.5 — — 14,080.0
Total 14,571.6 5,806.4 741.9 10.0 — 21,129.9
LiabilitiesBank loans and convertible bonds 400.0 2,764.0 9,034.1 36,036.7 211.0 48,445.8Current, fixed, savings and other deposits of customers 4,406.6 240.4 — — — 4,647.0
Total 4,806.6 3,004.4 9,034.1 36,036.7 211.0 53,092.8
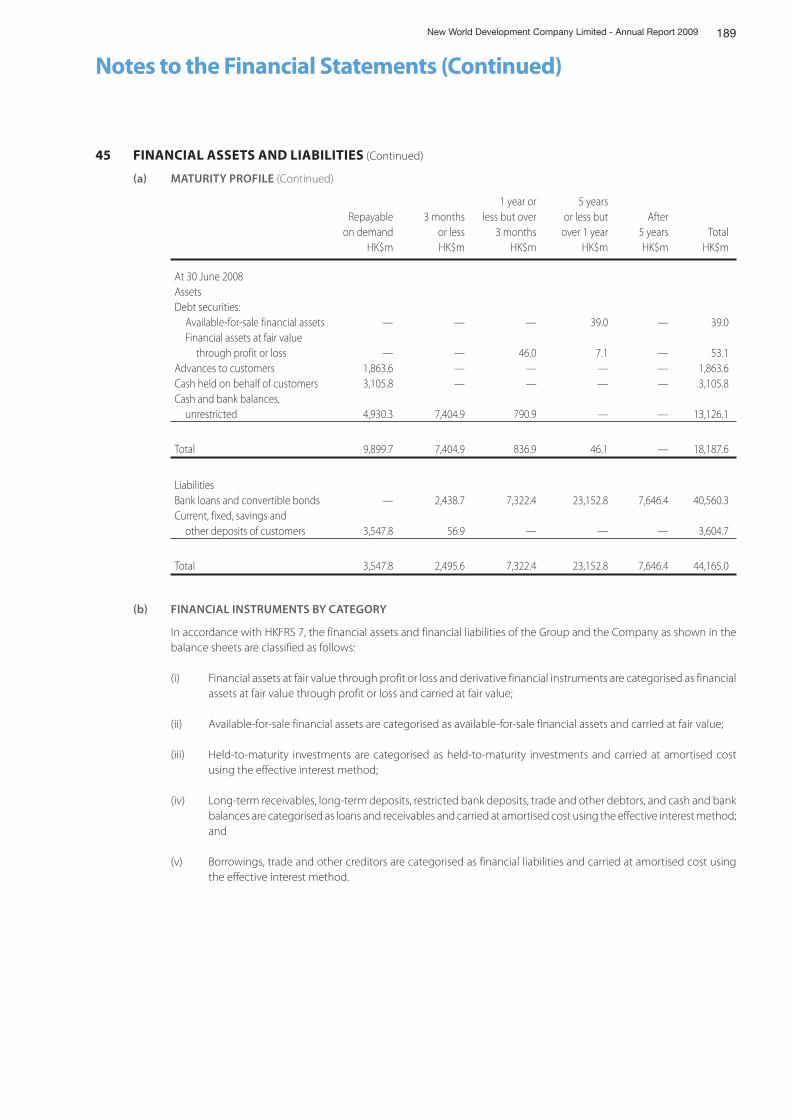
189New World Development Company Limited - Annual Report 2009
Notes to the Financial Statements (Continued)
45 FINANCIAL ASSETS AND LIABILITIES (Continued)
a MATURITY PROFILE (Continued)
Repayableon demand
3 monthsor less
1 year orless but over
3 months
5 yearsor less but
over 1 yearAfter
5 years TotalHK$m HK$m HK$m HK$m HK$m HK$m
At 30 June 2008AssetsDebt securities: Available-for-sale financial assets — — — 39.0 — 39.0 Financial assets at fair value through profit or loss — — 46.0 7.1 — 53.1Advances to customers 1,863.6 — — — — 1,863.6Cash held on behalf of customers 3,105.8 — — — — 3,105.8Cash and bank balances, unrestricted 4,930.3 7,404.9 790.9 — — 13,126.1
Total 9,899.7 7,404.9 836.9 46.1 — 18,187.6
LiabilitiesBank loans and convertible bonds — 2,438.7 7,322.4 23,152.8 7,646.4 40,560.3Current, fixed, savings and other deposits of customers 3,547.8 56.9 — — — 3,604.7
Total 3,547.8 2,495.6 7,322.4 23,152.8 7,646.4 44,165.0
b FINANCIAL INSTRUMENTS BY CATEGORY
In accordance with HKFRS 7, the financial assets and financial liabilities of the Group and the Company as shown in the balance sheets are classified as follows:
(i) Financial assets at fair value through profit or loss and derivative financial instruments are categorised as financial assets at fair value through profit or loss and carried at fair value;
(ii) Available-for-sale financial assets are categorised as available-for-sale financial assets and carried at fair value;
(iii) Held-to-maturity investments are categorised as held-to-maturity investments and carried at amortised cost using the effective interest method;
(iv) Long-term receivables, long-term deposits, restricted bank deposits, trade and other debtors, and cash and bank balances are categorised as loans and receivables and carried at amortised cost using the effective interest method; and
(v) Borrowings, trade and other creditors are categorised as financial liabilities and carried at amortised cost using the effective interest method.
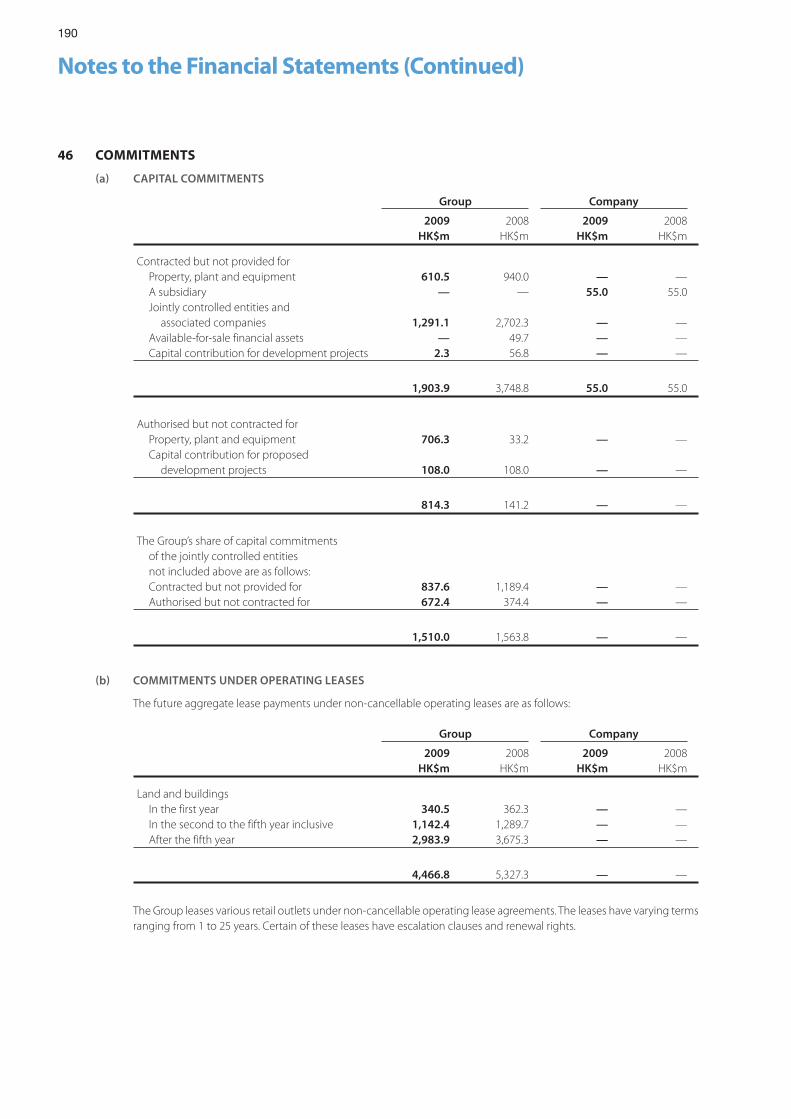
190
Notes to the Financial Statements (Continued)
46 COMMITMENTS
a CAPITAL COMMITMENTS
Group Company
2009 2008 2009 2008HK$m HK$m HK$m HK$m
Contracted but not provided for Property, plant and equipment 610.5 940.0 — — A subsidiary — — 55.0 55.0 Jointly controlled entities and associated companies 1,291.1 2,702.3 — — Available-for-sale financial assets — 49.7 — — Capital contribution for development projects 2.3 56.8 — —
1,903.9 3,748.8 55.0 55.0
Authorised but not contracted for Property, plant and equipment 706.3 33.2 — — Capital contribution for proposed development projects 108.0 108.0 — —
814.3 141.2 — —
The Group’s share of capital commitments of the jointly controlled entities not included above are as follows: Contracted but not provided for 837.6 1,189.4 — — Authorised but not contracted for 672.4 374.4 — —
1,510.0 1,563.8 — —
b COMMITMENTS UNDER OPERATING LEASES
The future aggregate lease payments under non-cancellable operating leases are as follows:
Group Company
2009 2008 2009 2008HK$m HK$m HK$m HK$m
Land and buildings In the first year 340.5 362.3 — — In the second to the fifth year inclusive 1,142.4 1,289.7 — — After the fifth year 2,983.9 3,675.3 — —
4,466.8 5,327.3 — —
The Group leases various retail outlets under non-cancellable operating lease agreements. The leases have varying terms ranging from 1 to 25 years. Certain of these leases have escalation clauses and renewal rights.
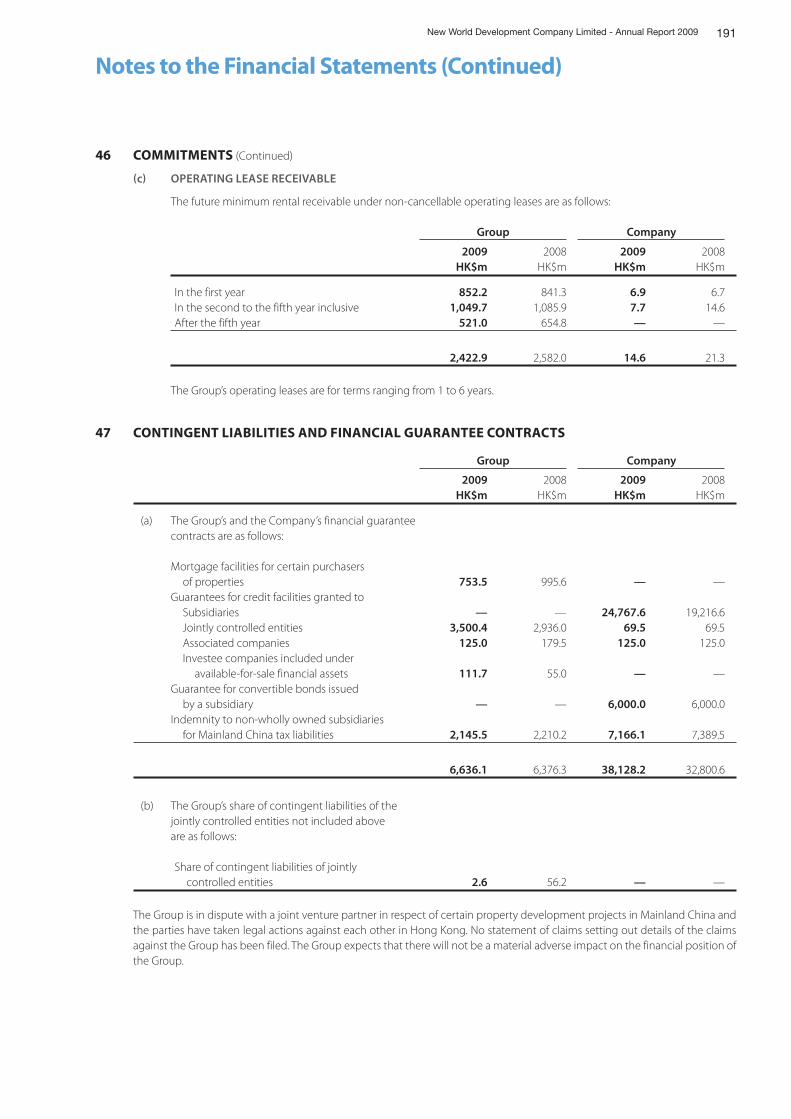
191New World Development Company Limited - Annual Report 2009
Notes to the Financial Statements (Continued)
46 COMMITMENTS (Continued)
c OPERATING LEASE RECEIVABLE
The future minimum rental receivable under non-cancellable operating leases are as follows:
Group Company
2009 2008 2009 2008HK$m HK$m HK$m HK$m
In the first year 852.2 841.3 6.9 6.7In the second to the fifth year inclusive 1,049.7 1,085.9 7.7 14.6After the fifth year 521.0 654.8 — —
2,422.9 2,582.0 14.6 21.3
The Group’s operating leases are for terms ranging from 1 to 6 years.
47 CONTINGENT LIABILITIES AND FINANCIAL GUARANTEE CONTRACTS
Group Company
2009 2008 2009 2008HK$m HK$m HK$m HK$m
(a) The Group’s and the Company’s financial guaranteecontracts are as follows:
Mortgage facilities for certain purchasers of properties 753.5 995.6 — —Guarantees for credit facilities granted to Subsidiaries — — 24,767.6 19,216.6 Jointly controlled entities 3,500.4 2,936.0 69.5 69.5 Associated companies 125.0 179.5 125.0 125.0 Investee companies included under available-for-sale financial assets 111.7 55.0 — —Guarantee for convertible bonds issued by a subsidiary — — 6,000.0 6,000.0Indemnity to non-wholly owned subsidiaries for Mainland China tax liabilities 2,145.5 2,210.2 7,166.1 7,389.5
6,636.1 6,376.3 38,128.2 32,800.6
(b) The Group’s share of contingent liabilities of thejointly controlled entities not included aboveare as follows:
Share of contingent liabilities of jointly controlled entities 2.6 56.2 — —
The Group is in dispute with a joint venture partner in respect of certain property development projects in Mainland China and the parties have taken legal actions against each other in Hong Kong. No statement of claims setting out details of the claims against the Group has been filed. The Group expects that there will not be a material adverse impact on the financial position of the Group.
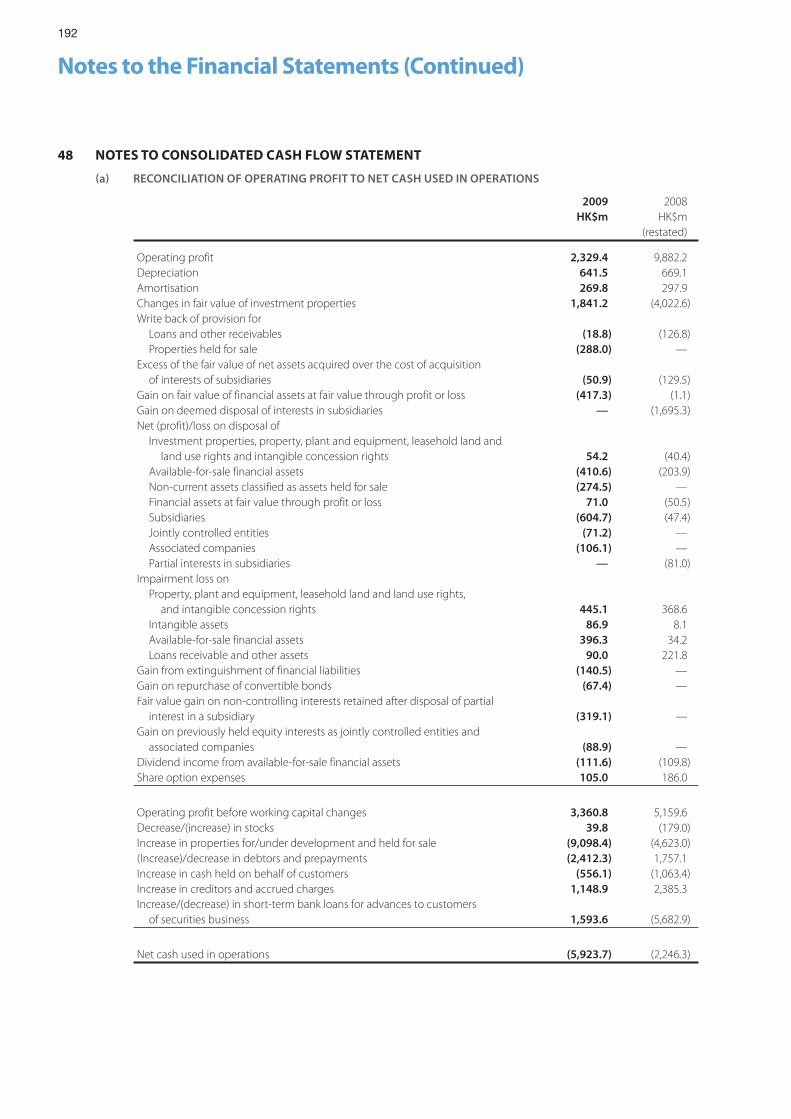
192
Notes to the Financial Statements (Continued)
48 NOTES TO CONSOLIDATED CASH FLOW STATEMENT
a RECONCILIATION OF OPERATING PROFIT TO NET CASH USED IN OPERATIONS
2009 2008HK$m HK$m
(restated)
Operating profit 2,329.4 9,882.2Depreciation 641.5 669.1Amortisation 269.8 297.9Changes in fair value of investment properties 1,841.2 (4,022.6)Write back of provision for Loans and other receivables (18.8) (126.8) Properties held for sale (288.0) —Excess of the fair value of net assets acquired over the cost of acquisition of interests of subsidiaries (50.9) (129.5)Gain on fair value of financial assets at fair value through profit or loss (417.3) (1.1)Gain on deemed disposal of interests in subsidiaries — (1,695.3)Net (profit)/loss on disposal of Investment properties, property, plant and equipment, leasehold land and land use rights and intangible concession rights 54.2 (40.4) Available-for-sale financial assets (410.6) (203.9) Non-current assets classified as assets held for sale (274.5) — Financial assets at fair value through profit or loss 71.0 (50.5) Subsidiaries (604.7) (47.4) Jointly controlled entities (71.2) — Associated companies (106.1) — Partial interests in subsidiaries — (81.0)Impairment loss on Property, plant and equipment, leasehold land and land use rights, and intangible concession rights 445.1 368.6 Intangible assets 86.9 8.1 Available-for-sale financial assets 396.3 34.2 Loans receivable and other assets 90.0 221.8Gain from extinguishment of financial liabilities (140.5) —Gain on repurchase of convertible bonds (67.4) —Fair value gain on non-controlling interests retained after disposal of partial interest in a subsidiary (319.1) —Gain on previously held equity interests as jointly controlled entities and associated companies (88.9) —Dividend income from available-for-sale financial assets (111.6) (109.8)Share option expenses 105.0 186.0
Operating profit before working capital changes 3,360.8 5,159.6Decrease/(increase) in stocks 39.8 (179.0)Increase in properties for/under development and held for sale (9,098.4) (4,623.0)(Increase)/decrease in debtors and prepayments (2,412.3) 1,757.1Increase in cash held on behalf of customers (556.1) (1,063.4)Increase in creditors and accrued charges 1,148.9 2,385.3Increase/(decrease) in short-term bank loans for advances to customers of securities business 1,593.6 (5,682.9)
Net cash used in operations (5,923.7) (2,246.3)
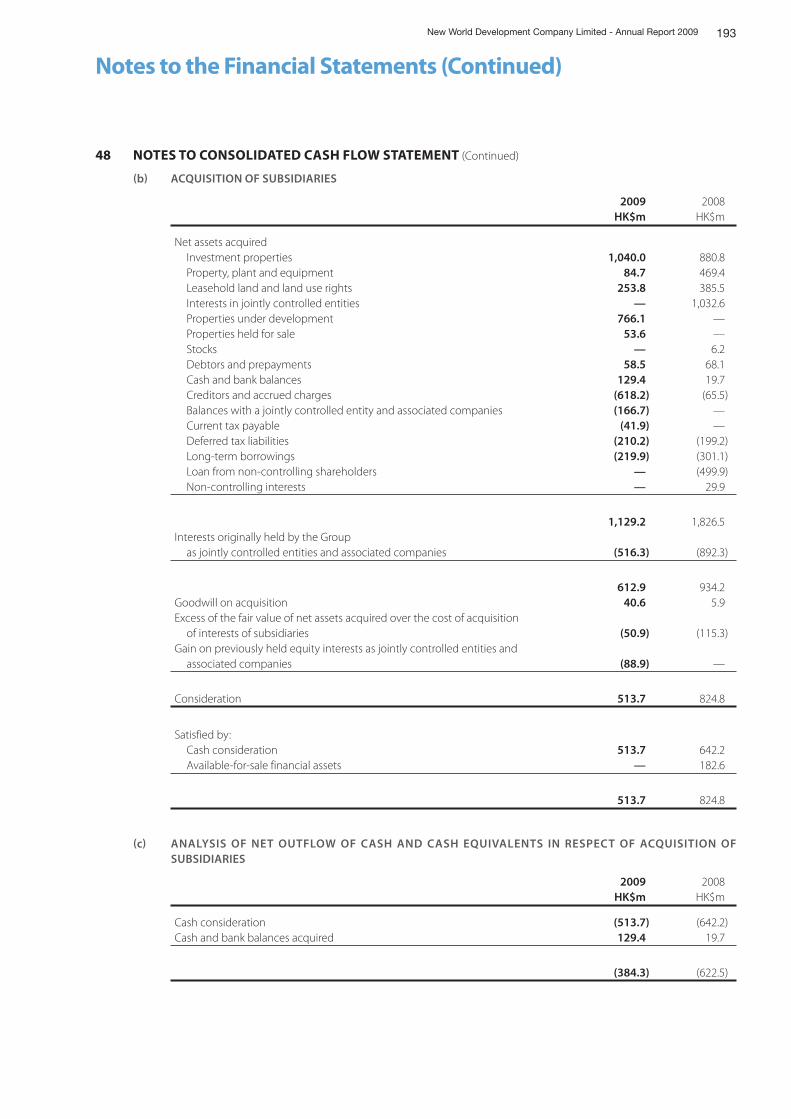
193New World Development Company Limited - Annual Report 2009
Notes to the Financial Statements (Continued)
48 NOTES TO CONSOLIDATED CASH FLOW STATEMENT (Continued)
b ACQUISITION OF SUBSIDIARIES
2009 2008HK$m HK$m
Net assets acquired Investment properties 1,040.0 880.8 Property, plant and equipment 84.7 469.4 Leasehold land and land use rights 253.8 385.5 Interests in jointly controlled entities — 1,032.6 Properties under development 766.1 — Properties held for sale 53.6 — Stocks — 6.2 Debtors and prepayments 58.5 68.1 Cash and bank balances 129.4 19.7 Creditors and accrued charges (618.2) (65.5) Balances with a jointly controlled entity and associated companies (166.7) — Current tax payable (41.9) — Deferred tax liabilities (210.2) (199.2) Long-term borrowings (219.9) (301.1) Loan from non-controlling shareholders — (499.9) Non-controlling interests — 29.9
1,129.2 1,826.5Interests originally held by the Group as jointly controlled entities and associated companies (516.3) (892.3)
612.9 934.2Goodwill on acquisition 40.6 5.9Excess of the fair value of net assets acquired over the cost of acquisition of interests of subsidiaries (50.9) (115.3)Gain on previously held equity interests as jointly controlled entities and associated companies (88.9) —
Consideration 513.7 824.8
Satisfied by: Cash consideration 513.7 642.2 Available-for-sale financial assets — 182.6
513.7 824.8
c ANALYSIS OF NET OUTFLOW OF CASH AND CASH EQUIVALENTS IN RESPECT OF ACQUISITION OF SUBSIDIARIES
2009 2008HK$m HK$m
Cash consideration (513.7) (642.2)Cash and bank balances acquired 129.4 19.7
(384.3) (622.5)
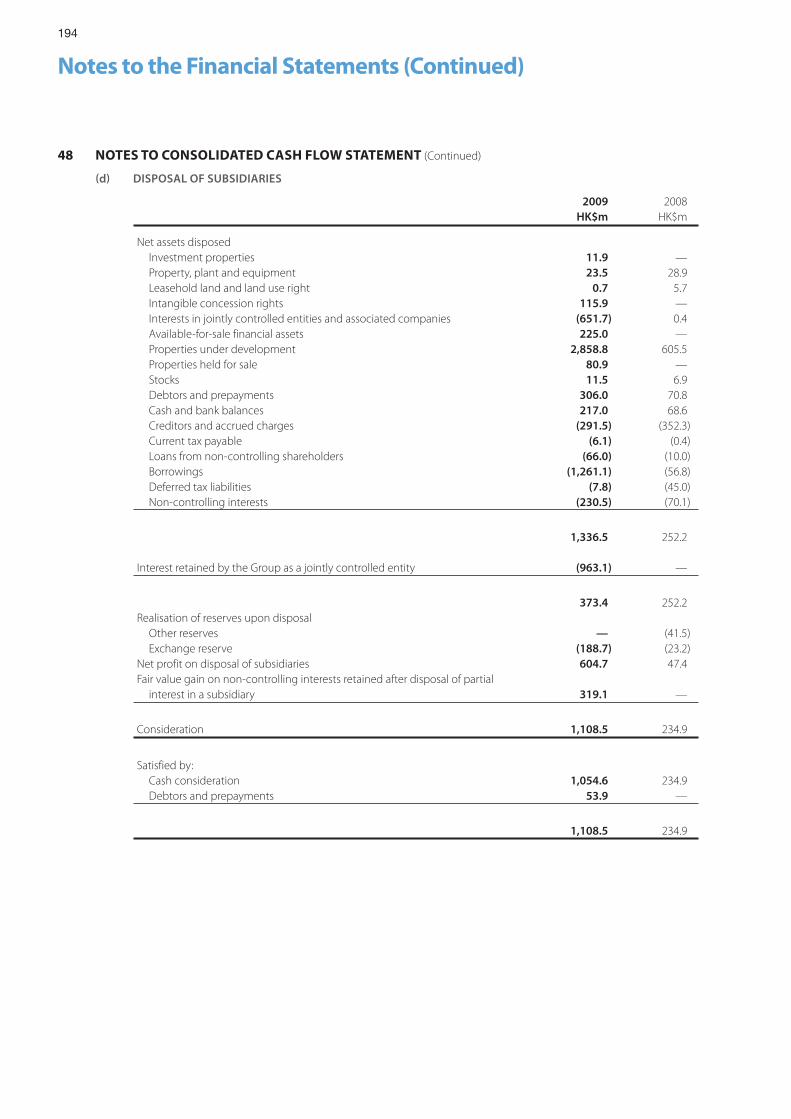
194
Notes to the Financial Statements (Continued)
48 NOTES TO CONSOLIDATED CASH FLOW STATEMENT (Continued)
d DISPOSAL OF SUBSIDIARIES
2009 2008HK$m HK$m
Net assets disposed Investment properties 11.9 — Property, plant and equipment 23.5 28.9 Leasehold land and land use right 0.7 5.7 Intangible concession rights 115.9 — Interests in jointly controlled entities and associated companies (651.7) 0.4 Available-for-sale financial assets 225.0 — Properties under development 2,858.8 605.5 Properties held for sale 80.9 — Stocks 11.5 6.9 Debtors and prepayments 306.0 70.8 Cash and bank balances 217.0 68.6 Creditors and accrued charges (291.5) (352.3) Current tax payable (6.1) (0.4) Loans from non-controlling shareholders (66.0) (10.0) Borrowings (1,261.1) (56.8) Deferred tax liabilities (7.8) (45.0) Non-controlling interests (230.5) (70.1)
1,336.5 252.2
Interest retained by the Group as a jointly controlled entity (963.1) —
373.4 252.2Realisation of reserves upon disposal Other reserves — (41.5) Exchange reserve (188.7) (23.2)Net profit on disposal of subsidiaries 604.7 47.4Fair value gain on non-controlling interests retained after disposal of partial interest in a subsidiary 319.1 —
Consideration 1,108.5 234.9
Satisfied by: Cash consideration 1,054.6 234.9 Debtors and prepayments 53.9 —
1,108.5 234.9
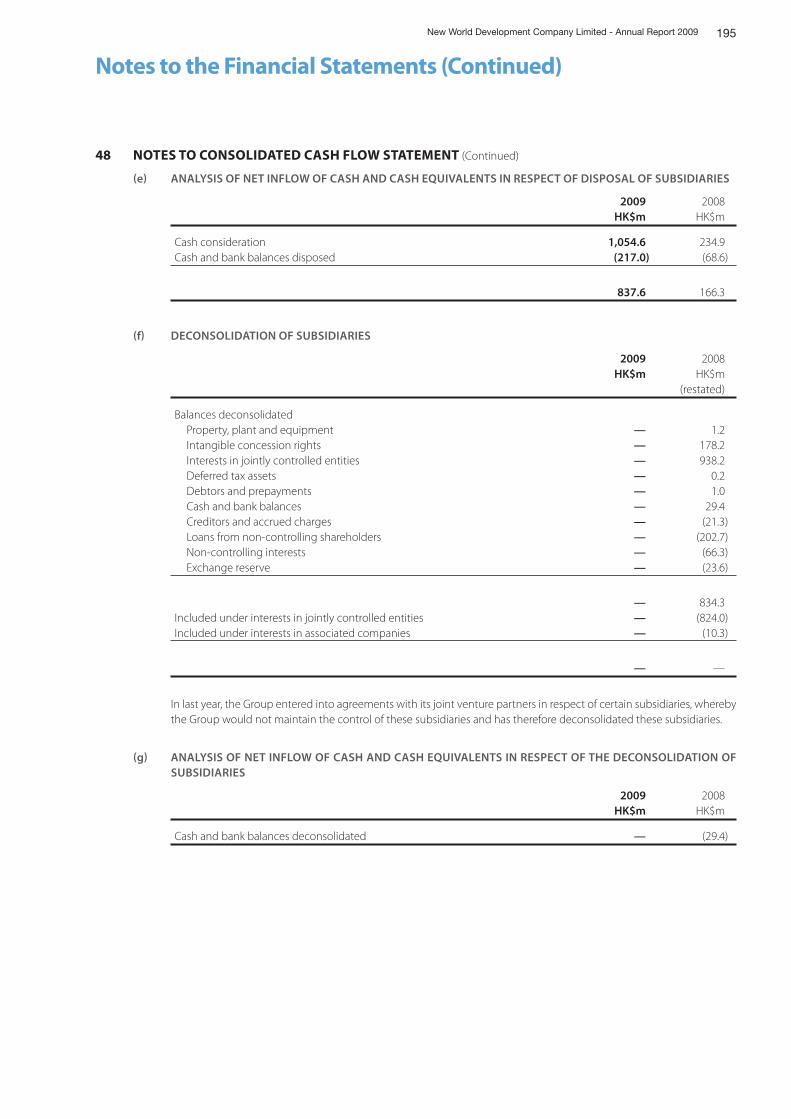
195New World Development Company Limited - Annual Report 2009
Notes to the Financial Statements (Continued)
48 NOTES TO CONSOLIDATED CASH FLOW STATEMENT (Continued)
e ANALYSIS OF NET INFLOW OF CASH AND CASH EQUIVALENTS IN RESPECT OF DISPOSAL OF SUBSIDIARIES
2009 2008HK$m HK$m
Cash consideration 1,054.6 234.9Cash and bank balances disposed (217.0) (68.6)
837.6 166.3
f DECONSOLIDATION OF SUBSIDIARIES
2009 2008HK$m HK$m
(restated)
Balances deconsolidated Property, plant and equipment — 1.2 Intangible concession rights — 178.2 Interests in jointly controlled entities — 938.2 Deferred tax assets — 0.2 Debtors and prepayments — 1.0 Cash and bank balances — 29.4 Creditors and accrued charges — (21.3) Loans from non-controlling shareholders — (202.7) Non-controlling interests — (66.3) Exchange reserve — (23.6)
— 834.3Included under interests in jointly controlled entities — (824.0)Included under interests in associated companies — (10.3)
— —
In last year, the Group entered into agreements with its joint venture partners in respect of certain subsidiaries, whereby the Group would not maintain the control of these subsidiaries and has therefore deconsolidated these subsidiaries.
g ANALYSIS OF NET INFLOW OF CASH AND CASH EQUIVALENTS IN RESPECT OF THE DECONSOLIDATION OF SUBSIDIARIES
2009 2008HK$m HK$m
Cash and bank balances deconsolidated — (29.4)
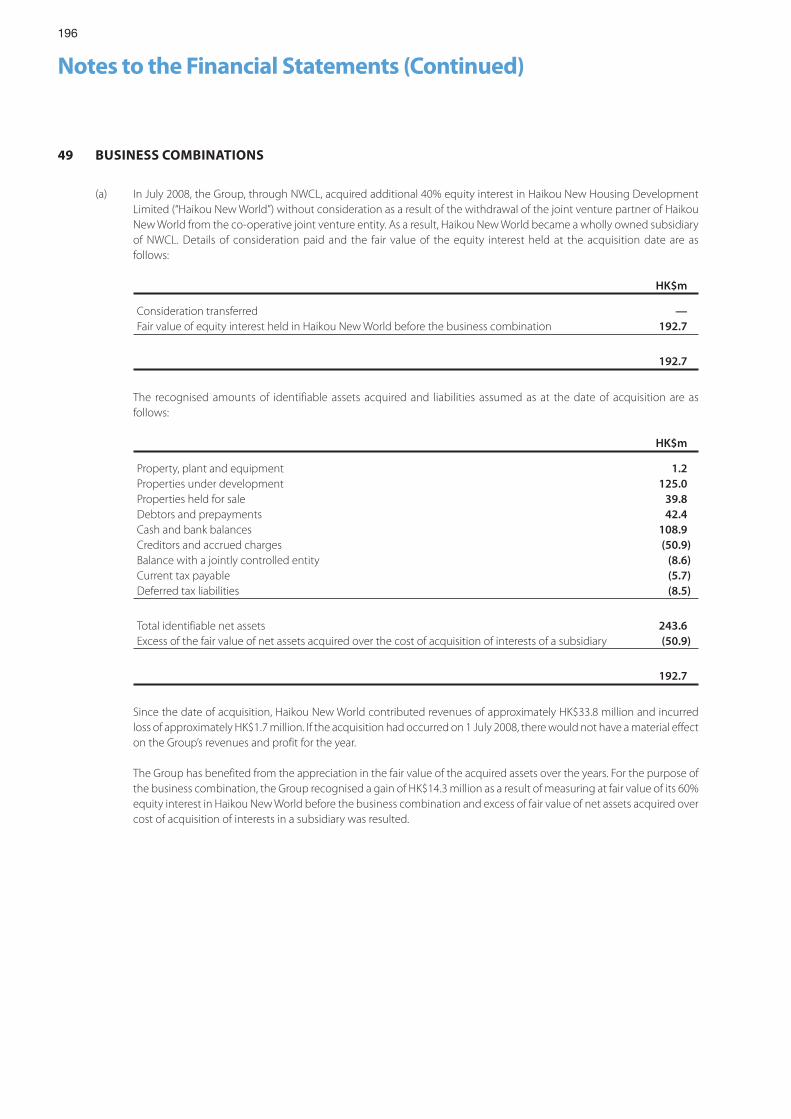
196
Notes to the Financial Statements (Continued)
49 BUSINESS COMBINATIONS
(a) In July 2008, the Group, through NWCL, acquired additional 40% equity interest in Haikou New Housing Development Limited (“Haikou New World”) without consideration as a result of the withdrawal of the joint venture partner of Haikou New World from the co-operative joint venture entity. As a result, Haikou New World became a wholly owned subsidiary of NWCL. Details of consideration paid and the fair value of the equity interest held at the acquisition date are as follows:
HK$m
Consideration transferred —Fair value of equity interest held in Haikou New World before the business combination 192.7
192.7
The recognised amounts of identifiable assets acquired and liabilities assumed as at the date of acquisition are as follows:
HK$m
Property, plant and equipment 1.2Properties under development 125.0Properties held for sale 39.8Debtors and prepayments 42.4Cash and bank balances 108.9Creditors and accrued charges (50.9)Balance with a jointly controlled entity (8.6)Current tax payable (5.7)Deferred tax liabilities (8.5)
Total identifiable net assets 243.6Excess of the fair value of net assets acquired over the cost of acquisition of interests of a subsidiary (50.9)
192.7
Since the date of acquisition, Haikou New World contributed revenues of approximately HK$33.8 million and incurred loss of approximately HK$1.7 million. If the acquisition had occurred on 1 July 2008, there would not have a material effect on the Group’s revenues and profit for the year.
The Group has benefited from the appreciation in the fair value of the acquired assets over the years. For the purpose of the business combination, the Group recognised a gain of HK$14.3 million as a result of measuring at fair value of its 60% equity interest in Haikou New World before the business combination and excess of fair value of net assets acquired over cost of acquisition of interests in a subsidiary was resulted.
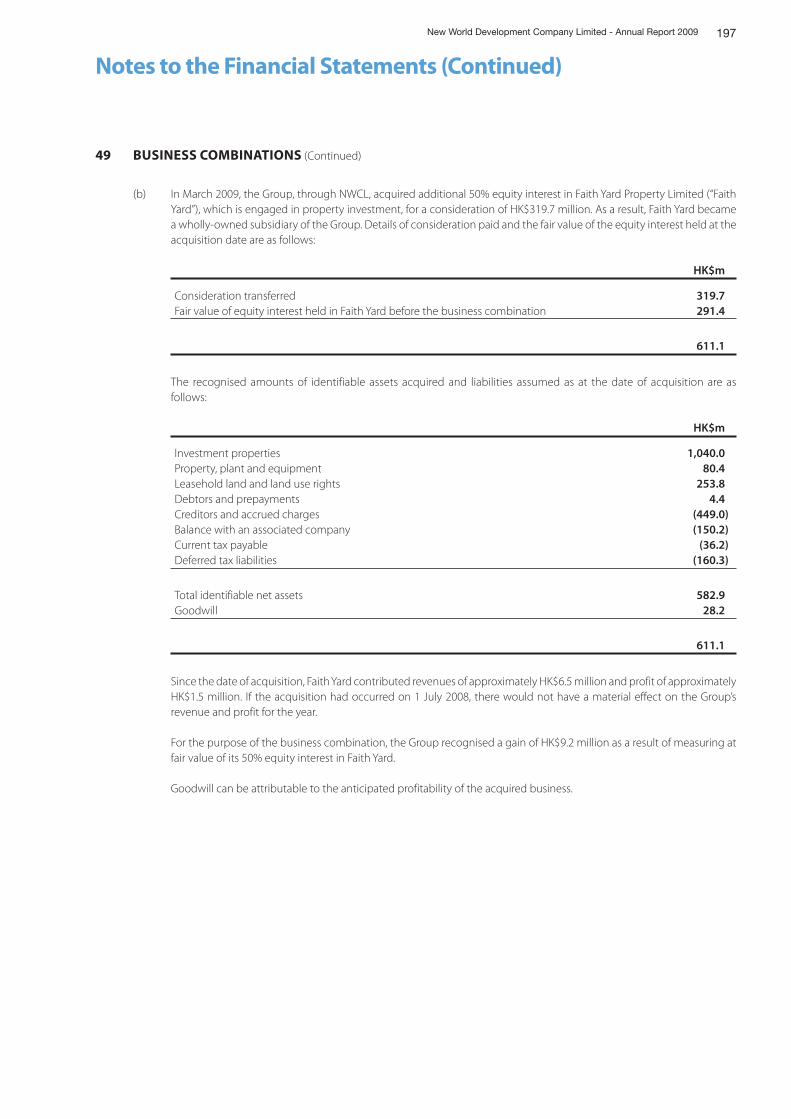
197New World Development Company Limited - Annual Report 2009
Notes to the Financial Statements (Continued)
49 BUSINESS COMBINATIONS (Continued)
(b) In March 2009, the Group, through NWCL, acquired additional 50% equity interest in Faith Yard Property Limited (“Faith Yard”), which is engaged in property investment, for a consideration of HK$319.7 million. As a result, Faith Yard became a wholly-owned subsidiary of the Group. Details of consideration paid and the fair value of the equity interest held at the acquisition date are as follows:
HK$m
Consideration transferred 319.7Fair value of equity interest held in Faith Yard before the business combination 291.4
611.1
The recognised amounts of identifiable assets acquired and liabilities assumed as at the date of acquisition are as follows:
HK$m
Investment properties 1,040.0Property, plant and equipment 80.4Leasehold land and land use rights 253.8Debtors and prepayments 4.4Creditors and accrued charges (449.0)Balance with an associated company (150.2)Current tax payable (36.2)Deferred tax liabilities (160.3)
Total identifiable net assets 582.9Goodwill 28.2
611.1
Since the date of acquisition, Faith Yard contributed revenues of approximately HK$6.5 million and profit of approximately HK$1.5 million. If the acquisition had occurred on 1 July 2008, there would not have a material effect on the Group’s revenue and profit for the year.
For the purpose of the business combination, the Group recognised a gain of HK$9.2 million as a result of measuring at fair value of its 50% equity interest in Faith Yard.
Goodwill can be attributable to the anticipated profitability of the acquired business.
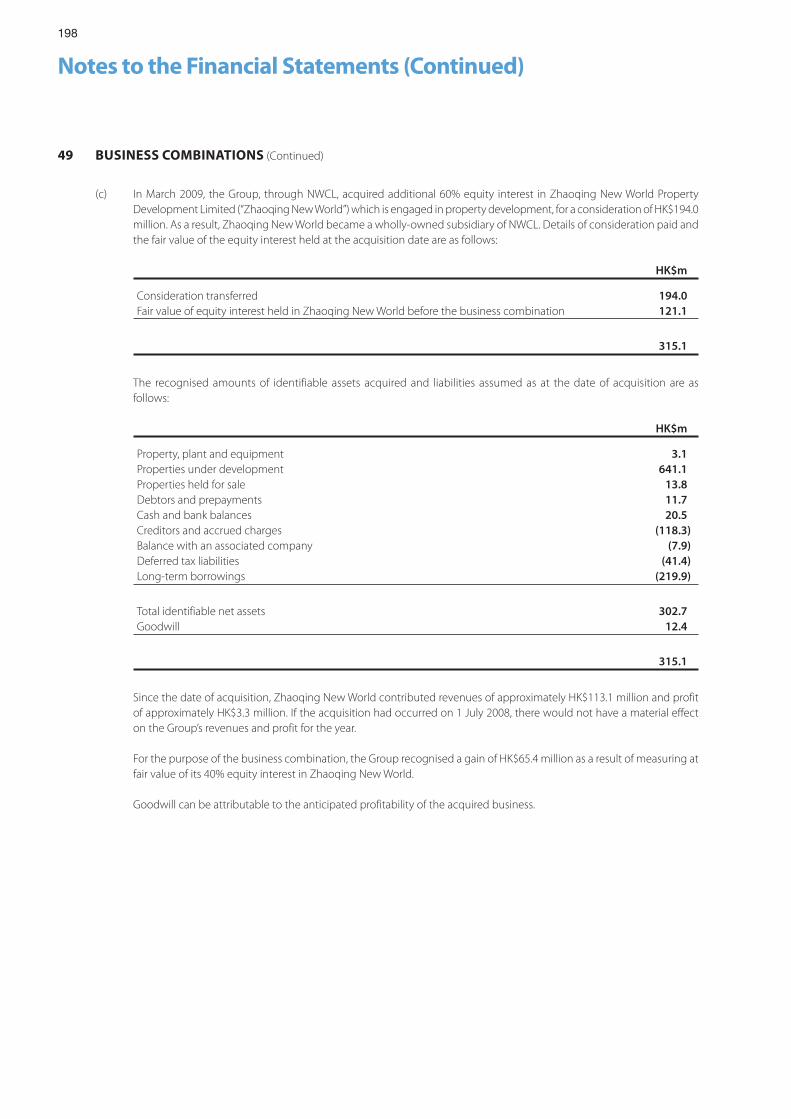
198
Notes to the Financial Statements (Continued)
49 BUSINESS COMBINATIONS (Continued)
(c) In March 2009, the Group, through NWCL, acquired additional 60% equity interest in Zhaoqing New World Property Development Limited (“Zhaoqing New World”) which is engaged in property development, for a consideration of HK$194.0 million. As a result, Zhaoqing New World became a wholly-owned subsidiary of NWCL. Details of consideration paid and the fair value of the equity interest held at the acquisition date are as follows:
HK$m
Consideration transferred 194.0Fair value of equity interest held in Zhaoqing New World before the business combination 121.1
315.1
The recognised amounts of identifiable assets acquired and liabilities assumed as at the date of acquisition are as follows:
HK$m
Property, plant and equipment 3.1Properties under development 641.1Properties held for sale 13.8Debtors and prepayments 11.7Cash and bank balances 20.5Creditors and accrued charges (118.3)Balance with an associated company (7.9)Deferred tax liabilities (41.4)Long-term borrowings (219.9)
Total identifiable net assets 302.7Goodwill 12.4
315.1
Since the date of acquisition, Zhaoqing New World contributed revenues of approximately HK$113.1 million and profit of approximately HK$3.3 million. If the acquisition had occurred on 1 July 2008, there would not have a material effect on the Group’s revenues and profit for the year.
For the purpose of the business combination, the Group recognised a gain of HK$65.4 million as a result of measuring at fair value of its 40% equity interest in Zhaoqing New World.
Goodwill can be attributable to the anticipated profitability of the acquired business.
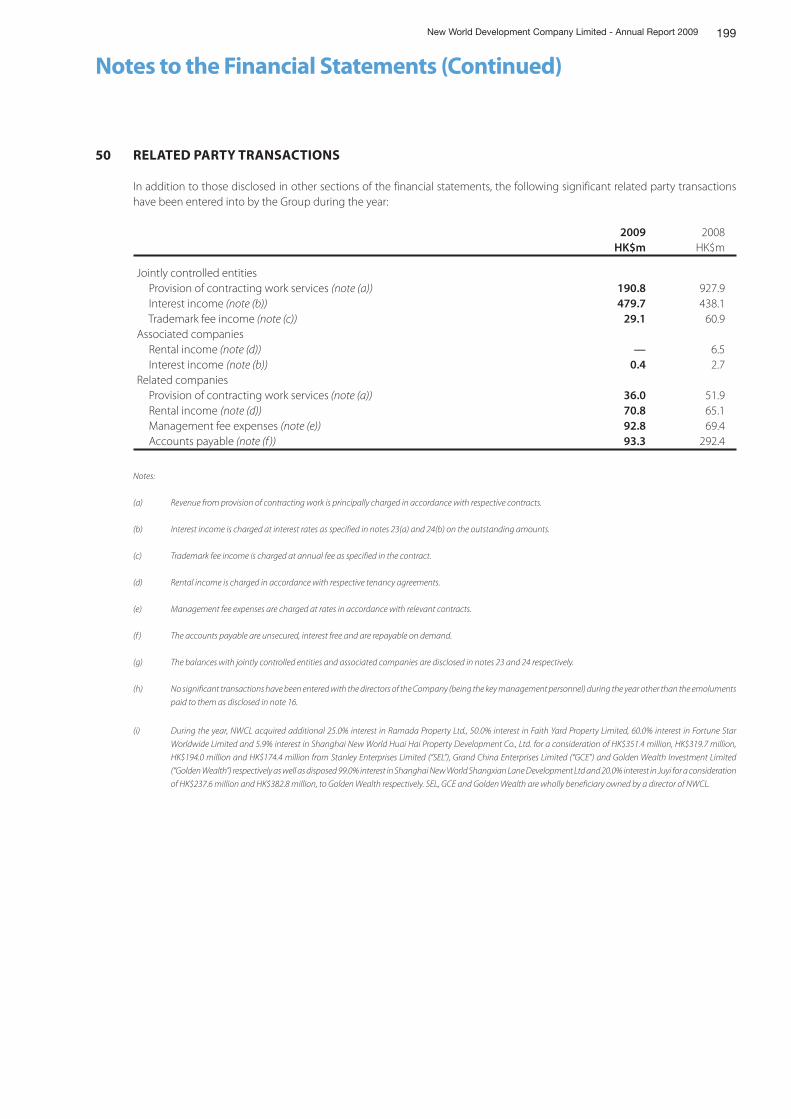
199New World Development Company Limited - Annual Report 2009
Notes to the Financial Statements (Continued)
50 RELATED PARTY TRANSACTIONS
In addition to those disclosed in other sections of the financial statements, the following significant related party transactions have been entered into by the Group during the year:
2009 2008HK$m HK$m
Jointly controlled entities Provision of contracting work services (note (a)) 190.8 927.9 Interest income (note (b)) 479.7 438.1 Trademark fee income (note (c)) 29.1 60.9Associated companies Rental income (note (d)) — 6.5 Interest income (note (b)) 0.4 2.7Related companies Provision of contracting work services (note (a)) 36.0 51.9 Rental income (note (d)) 70.8 65.1 Management fee expenses (note (e)) 92.8 69.4 Accounts payable (note (f )) 93.3 292.4
Notes:
(a) Revenue from provision of contracting work is principally charged in accordance with respective contracts.
(b) Interest income is charged at interest rates as specified in notes 23(a) and 24(b) on the outstanding amounts.
(c) Trademark fee income is charged at annual fee as specified in the contract.
(d) Rental income is charged in accordance with respective tenancy agreements.
(e) Management fee expenses are charged at rates in accordance with relevant contracts.
(f ) The accounts payable are unsecured, interest free and are repayable on demand.
(g) The balances with jointly controlled entities and associated companies are disclosed in notes 23 and 24 respectively.
(h) No significant transactions have been entered with the directors of the Company (being the key management personnel) during the year other than the emoluments
paid to them as disclosed in note 16.
(i) During the year, NWCL acquired additional 25.0% interest in Ramada Property Ltd., 50.0% interest in Faith Yard Property Limited, 60.0% interest in Fortune Star
Worldwide Limited and 5.9% interest in Shanghai New World Huai Hai Property Development Co., Ltd. for a consideration of HK$351.4 million, HK$319.7 million,
HK$194.0 million and HK$174.4 million from Stanley Enterprises Limited (“SEL”), Grand China Enterprises Limited (“GCE”) and Golden Wealth Investment Limited
(“Golden Wealth”) respectively as well as disposed 99.0% interest in Shanghai New World Shangxian Lane Development Ltd and 20.0% interest in Juyi for a consideration
of HK$237.6 million and HK$382.8 million, to Golden Wealth respectively. SEL, GCE and Golden Wealth are wholly beneficiary owned by a director of NWCL.
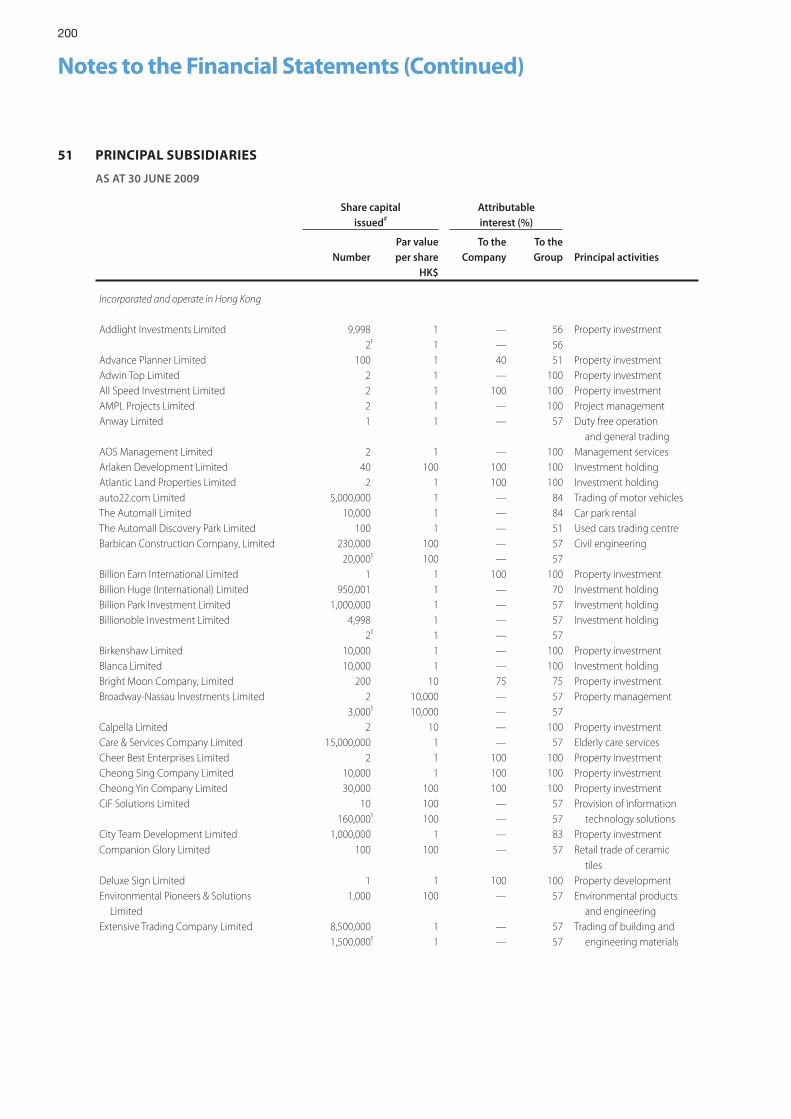
200
Notes to the Financial Statements (Continued)
51 PRINCIPAL SUBSIDIARIES
AS AT 30 JUNE 2009
Share capitalissued#
Attributableinterest (%)
NumberPar valueper share
To theCompany
To theGroup Principal activities
HK$
Incorporated and operate in Hong Kong
Addlight Investments Limited 9,998 1 — 56 Property investment2¹ 1 — 56
Advance Planner Limited 100 1 40 51 Property investmentAdwin Top Limited 2 1 — 100 Property investmentAll Speed Investment Limited 2 1 100 100 Property investmentAMPL Projects Limited 2 1 — 100 Project managementAnway Limited 1 1 — 57 Duty free operation
and general tradingAOS Management Limited 2 1 — 100 Management servicesArlaken Development Limited 40 100 100 100 Investment holdingAtlantic Land Properties Limited 2 1 100 100 Investment holdingauto22.com Limited 5,000,000 1 — 84 Trading of motor vehiclesThe Automall Limited 10,000 1 — 84 Car park rentalThe Automall Discovery Park Limited 100 1 — 51 Used cars trading centreBarbican Construction Company, Limited 230,000 100 — 57 Civil engineering
20,000¹ 100 — 57Billion Earn International Limited 1 1 100 100 Property investmentBillion Huge (International) Limited 950,001 1 — 70 Investment holdingBillion Park Investment Limited 1,000,000 1 — 57 Investment holdingBillionoble Investment Limited 4,998 1 — 57 Investment holding
2¹ 1 — 57Birkenshaw Limited 10,000 1 — 100 Property investmentBlanca Limited 10,000 1 — 100 Investment holdingBright Moon Company, Limited 200 10 75 75 Property investmentBroadway-Nassau Investments Limited 2 10,000 — 57 Property management
3,000¹ 10,000 — 57Calpella Limited 2 10 — 100 Property investmentCare & Services Company Limited 15,000,000 1 — 57 Elderly care servicesCheer Best Enterprises Limited 2 1 100 100 Property investmentCheong Sing Company Limited 10,000 1 100 100 Property investmentCheong Yin Company Limited 30,000 100 100 100 Property investmentCiF Solutions Limited 10 100 — 57 Provision of information
160,000¹ 100 — 57 technology solutionsCity Team Development Limited 1,000,000 1 — 83 Property investmentCompanion Glory Limited 100 100 — 57 Retail trade of ceramic
tilesDeluxe Sign Limited 1 1 100 100 Property developmentEnvironmental Pioneers & Solutions Limited
1,000 100 — 57 Environmental products and engineering
Extensive Trading Company Limited 8,500,000 1 — 57 Trading of building and1,500,000¹ 1 — 57 engineering materials
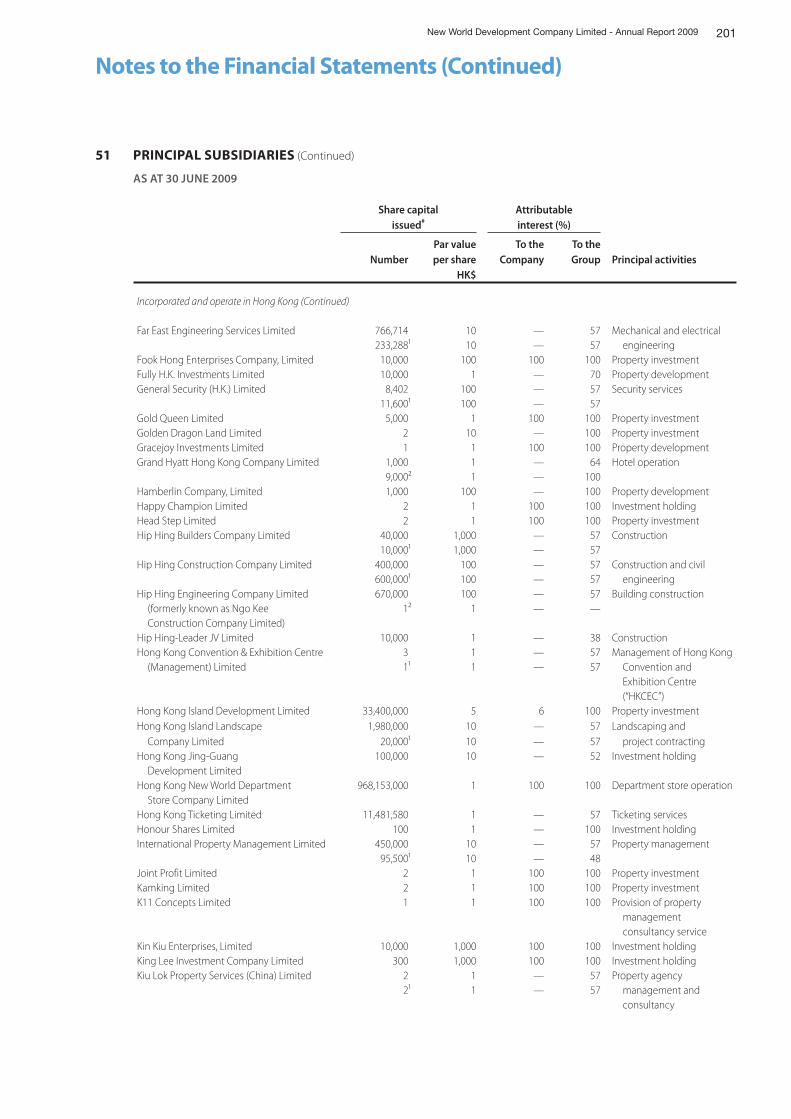
201New World Development Company Limited - Annual Report 2009
Notes to the Financial Statements (Continued)
Share capitalissued#
Attributableinterest (%)
NumberPar valueper share
To theCompany
To theGroup Principal activities
HK$
Incorporated and operate in Hong Kong (Continued)
Far East Engineering Services Limited 766,714 10 — 57 Mechanical and electrical engineering233,288¹ 10 — 57
Fook Hong Enterprises Company, Limited 10,000 100 100 100 Property investmentFully H.K. Investments Limited 10,000 1 — 70 Property developmentGeneral Security (H.K.) Limited 8,402 100 — 57 Security services
11,600¹ 100 — 57Gold Queen Limited 5,000 1 100 100 Property investmentGolden Dragon Land Limited 2 10 — 100 Property investmentGracejoy Investments Limited 1 1 100 100 Property developmentGrand Hyatt Hong Kong Company Limited 1,000 1 — 64 Hotel operation
9,000² 1 — 100Hamberlin Company, Limited 1,000 100 — 100 Property developmentHappy Champion Limited 2 1 100 100 Investment holdingHead Step Limited 2 1 100 100 Property investmentHip Hing Builders Company Limited 40,000 1,000 — 57 Construction
10,000¹ 1,000 — 57Hip Hing Construction Company Limited 400,000 100 — 57 Construction and civil
600,000¹ 100 — 57 engineeringHip Hing Engineering Company Limited 670,000 100 — 57 Building construction (formerly known as Ngo Kee Construction Company Limited)
1² 1 — —
Hip Hing-Leader JV Limited 10,000 1 — 38 ConstructionHong Kong Convention & Exhibition Centre 3 1 — 57 Management of Hong Kong (Management) Limited 1¹ 1 — 57 Convention and
Exhibition Centre (“HKCEC”)
Hong Kong Island Development Limited 33,400,000 5 6 100 Property investmentHong Kong Island Landscape 1,980,000 10 — 57 Landscaping and Company Limited 20,000¹ 10 — 57 project contractingHong Kong Jing-Guang Development Limited
100,000 10 — 52 Investment holding
Hong Kong New World Department Store Company Limited
968,153,000 1 100 100 Department store operation
Hong Kong Ticketing Limited 11,481,580 1 — 57 Ticketing servicesHonour Shares Limited 100 1 — 100 Investment holdingInternational Property Management Limited 450,000 10 — 57 Property management
95,500¹ 10 — 48Joint Profit Limited 2 1 100 100 Property investmentKamking Limited 2 1 100 100 Property investmentK11 Concepts Limited 1 1 100 100 Provision of property
management consultancy service
Kin Kiu Enterprises, Limited 10,000 1,000 100 100 Investment holdingKing Lee Investment Company Limited 300 1,000 100 100 Investment holdingKiu Lok Property Services (China) Limited 2 1 — 57 Property agency
2¹ 1 — 57 management and consultancy
51 PRINCIPAL SUBSIDIARIES (Continued)
AS AT 30 JUNE 2009
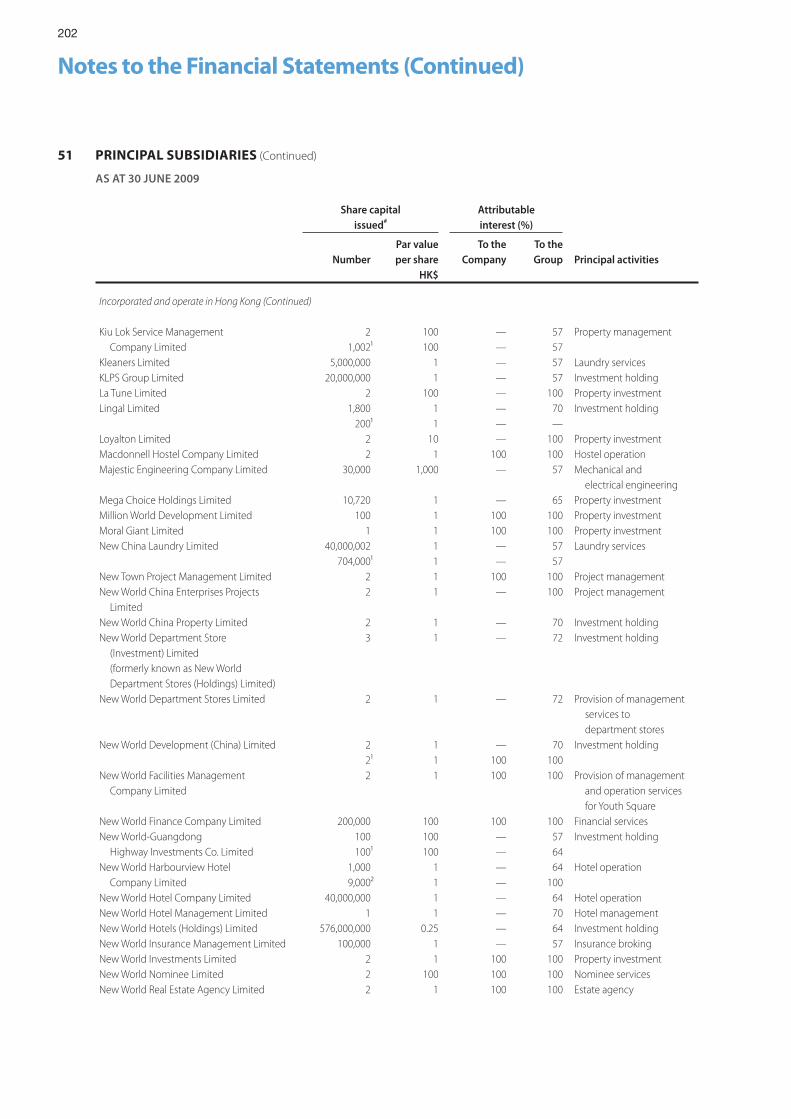
202
Notes to the Financial Statements (Continued)
Share capitalissued#
Attributableinterest (%)
NumberPar valueper share
To theCompany
To theGroup Principal activities
HK$
Incorporated and operate in Hong Kong (Continued)
Kiu Lok Service Management 2 100 — 57 Property management Company Limited 1,002¹ 100 — 57Kleaners Limited 5,000,000 1 — 57 Laundry servicesKLPS Group Limited 20,000,000 1 — 57 Investment holdingLa Tune Limited 2 100 — 100 Property investmentLingal Limited 1,800 1 — 70 Investment holding
200¹ 1 — —Loyalton Limited 2 10 — 100 Property investmentMacdonnell Hostel Company Limited 2 1 100 100 Hostel operationMajestic Engineering Company Limited 30,000 1,000 — 57 Mechanical and
electrical engineeringMega Choice Holdings Limited 10,720 1 — 65 Property investmentMillion World Development Limited 100 1 100 100 Property investmentMoral Giant Limited 1 1 100 100 Property investmentNew China Laundry Limited 40,000,002 1 — 57 Laundry services
704,000¹ 1 — 57New Town Project Management Limited 2 1 100 100 Project managementNew World China Enterprises Projects Limited
2 1 — 100 Project management
New World China Property Limited 2 1 — 70 Investment holdingNew World Department Store (Investment) Limited (formerly known as New World Department Stores (Holdings) Limited)
3 1 — 72 Investment holding
New World Department Stores Limited 2 1 — 72 Provision of management services to department stores
New World Development (China) Limited 2 1 — 70 Investment holding2¹ 1 100 100
New World Facilities Management Company Limited
2 1 100 100 Provision of management and operation services for Youth Square
New World Finance Company Limited 200,000 100 100 100 Financial servicesNew World-Guangdong 100 100 — 57 Investment holding Highway Investments Co. Limited 100¹ 100 — 64New World Harbourview Hotel 1,000 1 — 64 Hotel operation Company Limited 9,000² 1 — 100New World Hotel Company Limited 40,000,000 1 — 64 Hotel operationNew World Hotel Management Limited 1 1 — 70 Hotel managementNew World Hotels (Holdings) Limited 576,000,000 0.25 — 64 Investment holdingNew World Insurance Management Limited 100,000 1 — 57 Insurance brokingNew World Investments Limited 2 1 100 100 Property investmentNew World Nominee Limited 2 100 100 100 Nominee servicesNew World Real Estate Agency Limited 2 1 100 100 Estate agency
51 PRINCIPAL SUBSIDIARIES (Continued)
AS AT 30 JUNE 2009
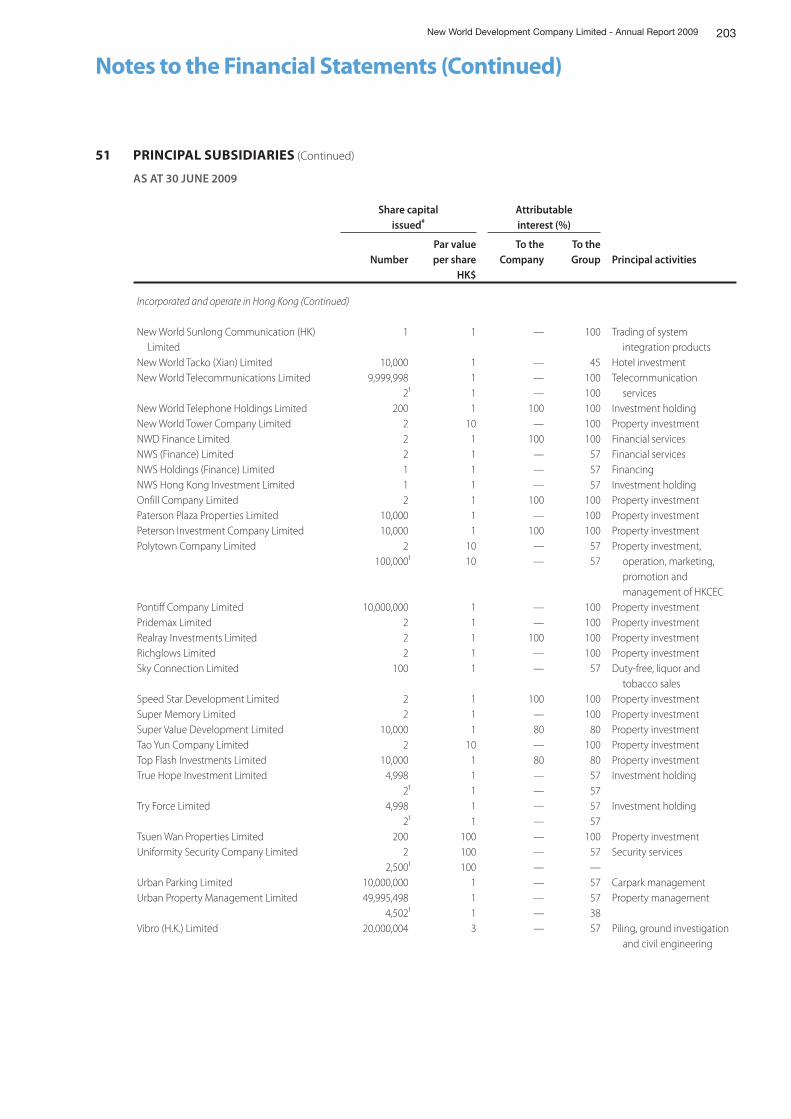
203New World Development Company Limited - Annual Report 2009
Notes to the Financial Statements (Continued)
Share capitalissued#
Attributableinterest (%)
NumberPar valueper share
To theCompany
To theGroup Principal activities
HK$
Incorporated and operate in Hong Kong (Continued)
New World Sunlong Communication (HK) Limited
1 1 — 100 Trading of system integration products
New World Tacko (Xian) Limited 10,000 1 — 45 Hotel investmentNew World Telecommunications Limited 9,999,998 1 — 100 Telecommunication
2¹ 1 — 100 servicesNew World Telephone Holdings Limited 200 1 100 100 Investment holdingNew World Tower Company Limited 2 10 — 100 Property investmentNWD Finance Limited 2 1 100 100 Financial servicesNWS (Finance) Limited 2 1 — 57 Financial servicesNWS Holdings (Finance) Limited 1 1 — 57 FinancingNWS Hong Kong Investment Limited 1 1 — 57 Investment holdingOnfill Company Limited 2 1 100 100 Property investmentPaterson Plaza Properties Limited 10,000 1 — 100 Property investmentPeterson Investment Company Limited 10,000 1 100 100 Property investmentPolytown Company Limited 2 10 — 57 Property investment,
100,000¹ 10 — 57 operation, marketing, promotion and management of HKCEC
Pontiff Company Limited 10,000,000 1 — 100 Property investmentPridemax Limited 2 1 — 100 Property investmentRealray Investments Limited 2 1 100 100 Property investmentRichglows Limited 2 1 — 100 Property investmentSky Connection Limited 100 1 — 57 Duty-free, liquor and
tobacco salesSpeed Star Development Limited 2 1 100 100 Property investmentSuper Memory Limited 2 1 — 100 Property investmentSuper Value Development Limited 10,000 1 80 80 Property investmentTao Yun Company Limited 2 10 — 100 Property investmentTop Flash Investments Limited 10,000 1 80 80 Property investmentTrue Hope Investment Limited 4,998 1 — 57 Investment holding
2¹ 1 — 57Try Force Limited 4,998 1 — 57 Investment holding
2¹ 1 — 57Tsuen Wan Properties Limited 200 100 — 100 Property investmentUniformity Security Company Limited 2 100 — 57 Security services
2,500¹ 100 — —Urban Parking Limited 10,000,000 1 — 57 Carpark managementUrban Property Management Limited 49,995,498 1 — 57 Property management
4,502¹ 1 — 38Vibro (H.K.) Limited 20,000,004 3 — 57 Piling, ground investigation
and civil engineering
51 PRINCIPAL SUBSIDIARIES (Continued)
AS AT 30 JUNE 2009
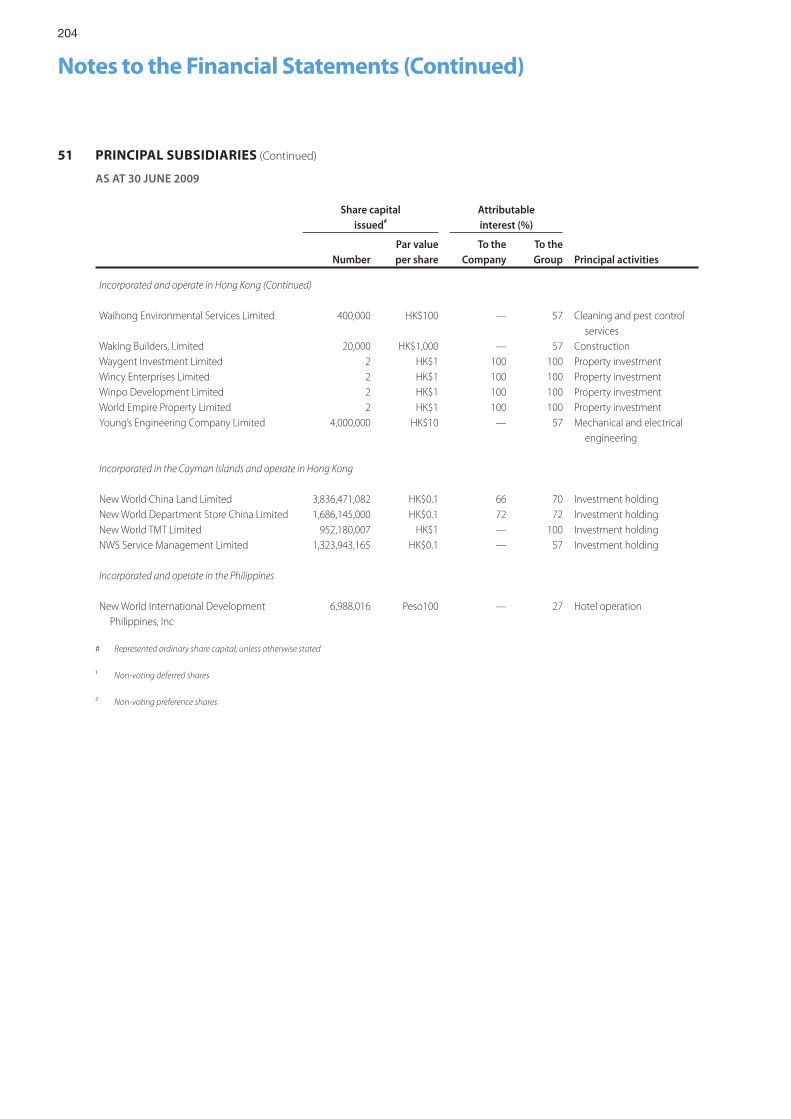
204
Notes to the Financial Statements (Continued)
Share capitalissued#
Attributableinterest (%)
NumberPar valueper share
To theCompany
To theGroup Principal activities
Incorporated and operate in Hong Kong (Continued)
Waihong Environmental Services Limited 400,000 HK$100 — 57 Cleaning and pest control services
Waking Builders, Limited 20,000 HK$1,000 — 57 ConstructionWaygent Investment Limited 2 HK$1 100 100 Property investmentWincy Enterprises Limited 2 HK$1 100 100 Property investmentWinpo Development Limited 2 HK$1 100 100 Property investmentWorld Empire Property Limited 2 HK$1 100 100 Property investmentYoung’s Engineering Company Limited 4,000,000 HK$10 — 57 Mechanical and electrical
engineering
Incorporated in the Cayman Islands and operate in Hong Kong
New World China Land Limited 3,836,471,082 HK$0.1 66 70 Investment holdingNew World Department Store China Limited 1,686,145,000 HK$0.1 72 72 Investment holdingNew World TMT Limited 952,180,007 HK$1 — 100 Investment holdingNWS Service Management Limited 1,323,943,165 HK$0.1 — 57 Investment holding
Incorporated and operate in the Philippines
New World International Development Philippines, Inc
6,988,016 Peso100 — 27 Hotel operation
# Represented ordinary share capital, unless otherwise stated
¹ Non-voting deferred shares
² Non-voting preference shares
51 PRINCIPAL SUBSIDIARIES (Continued)
AS AT 30 JUNE 2009
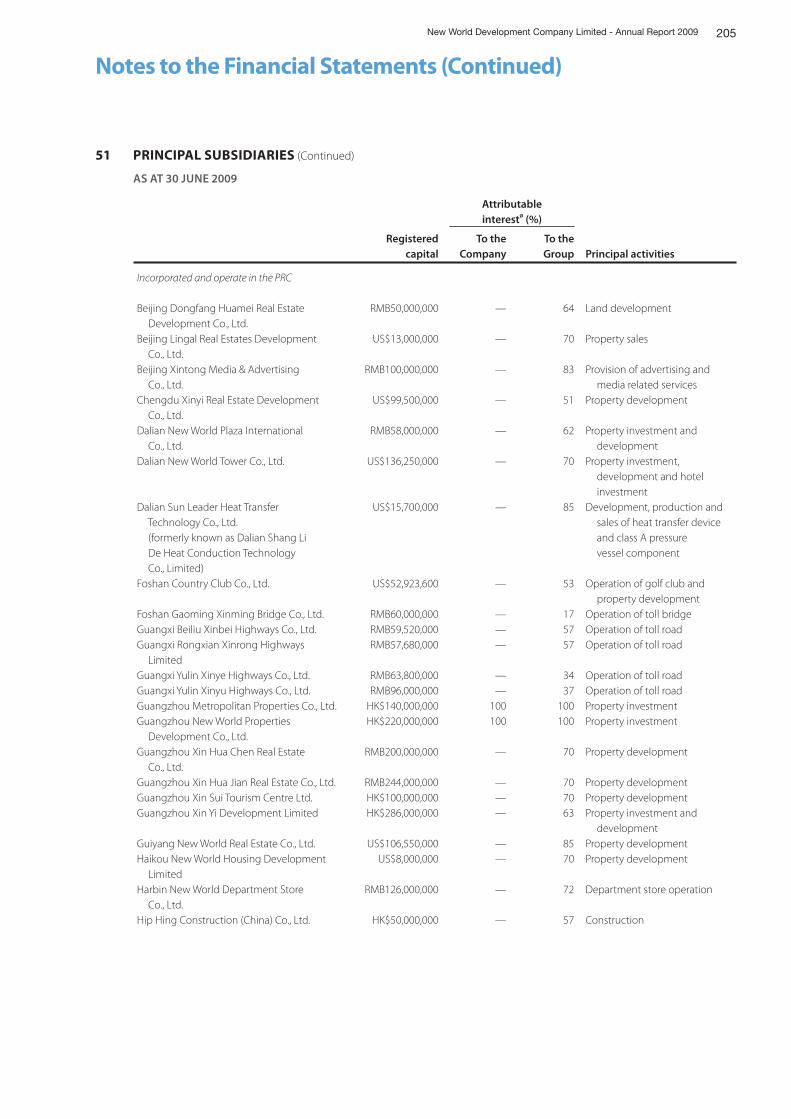
205New World Development Company Limited - Annual Report 2009
Notes to the Financial Statements (Continued)
Attributableinterestø (%)
Registered capital
To theCompany
To theGroup Principal activities
Incorporated and operate in the PRC
Beijing Dongfang Huamei Real Estate Development Co., Ltd.
RMB50,000,000 — 64 Land development
Beijing Lingal Real Estates Development Co., Ltd.
US$13,000,000 — 70 Property sales
Beijing Xintong Media & Advertising Co., Ltd.
RMB100,000,000 — 83 Provision of advertising and media related services
Chengdu Xinyi Real Estate Development Co., Ltd.
US$99,500,000 — 51 Property development
Dalian New World Plaza International Co., Ltd.
RMB58,000,000 — 62 Property investment and development
Dalian New World Tower Co., Ltd. US$136,250,000 — 70 Property investment, development and hotel investment
Dalian Sun Leader Heat Transfer Technology Co., Ltd. (formerly known as Dalian Shang Li De Heat Conduction Technology Co., Limited)
US$15,700,000 — 85 Development, production and sales of heat transfer device and class A pressure vessel component
Foshan Country Club Co., Ltd. US$52,923,600 — 53 Operation of golf club and property development
Foshan Gaoming Xinming Bridge Co., Ltd. RMB60,000,000 — 17 Operation of toll bridgeGuangxi Beiliu Xinbei Highways Co., Ltd. RMB59,520,000 — 57 Operation of toll roadGuangxi Rongxian Xinrong Highways Limited
RMB57,680,000 — 57 Operation of toll road
Guangxi Yulin Xinye Highways Co., Ltd. RMB63,800,000 — 34 Operation of toll roadGuangxi Yulin Xinyu Highways Co., Ltd. RMB96,000,000 — 37 Operation of toll roadGuangzhou Metropolitan Properties Co., Ltd. HK$140,000,000 100 100 Property investmentGuangzhou New World Properties Development Co., Ltd.
HK$220,000,000 100 100 Property investment
Guangzhou Xin Hua Chen Real Estate Co., Ltd.
RMB200,000,000 — 70 Property development
Guangzhou Xin Hua Jian Real Estate Co., Ltd. RMB244,000,000 — 70 Property developmentGuangzhou Xin Sui Tourism Centre Ltd. HK$100,000,000 — 70 Property developmentGuangzhou Xin Yi Development Limited HK$286,000,000 — 63 Property investment and
developmentGuiyang New World Real Estate Co., Ltd. US$106,550,000 — 85 Property developmentHaikou New World Housing Development Limited
US$8,000,000 — 70 Property development
Harbin New World Department Store Co., Ltd.
RMB126,000,000 — 72 Department store operation
Hip Hing Construction (China) Co., Ltd. HK$50,000,000 — 57 Construction
51 PRINCIPAL SUBSIDIARIES (Continued)
AS AT 30 JUNE 2009
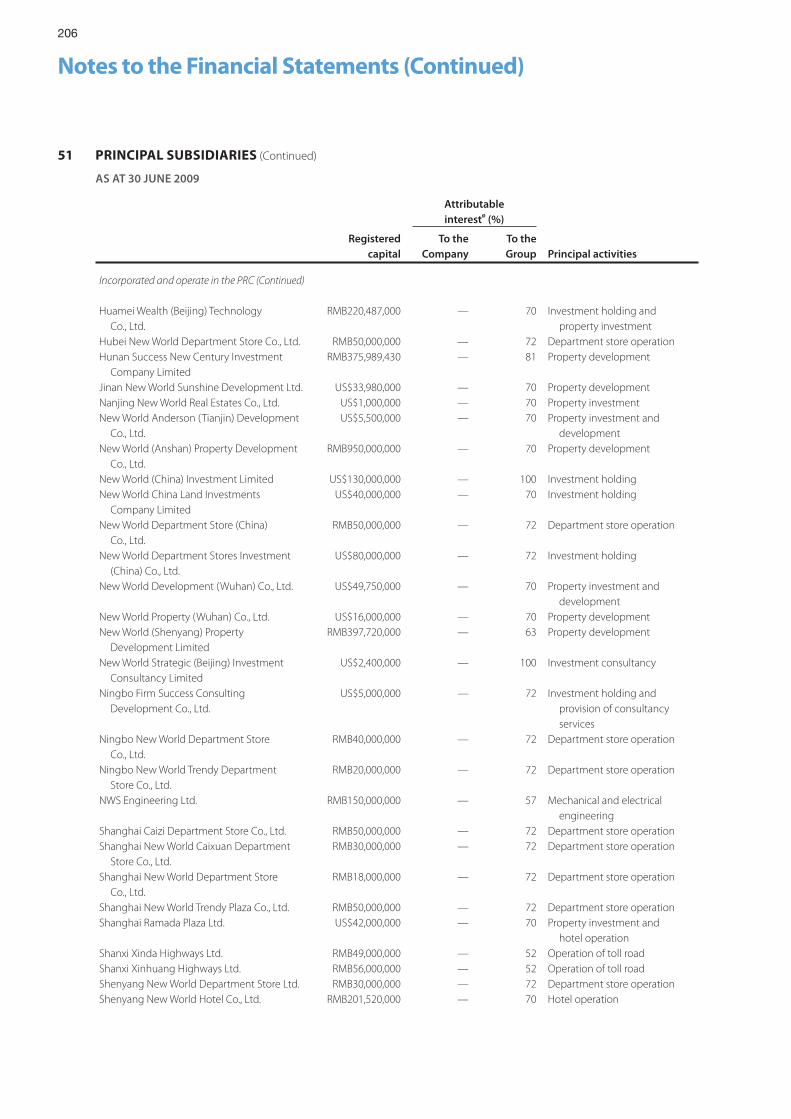
206
Notes to the Financial Statements (Continued)
Attributableinterestø (%)
Registered capital
To theCompany
To theGroup Principal activities
Incorporated and operate in the PRC (Continued)
Huamei Wealth (Beijing) Technology Co., Ltd.
RMB220,487,000 — 70 Investment holding and property investment
Hubei New World Department Store Co., Ltd. RMB50,000,000 — 72 Department store operationHunan Success New Century Investment Company Limited
RMB375,989,430 — 81 Property development
Jinan New World Sunshine Development Ltd. US$33,980,000 — 70 Property developmentNanjing New World Real Estates Co., Ltd. US$1,000,000 — 70 Property investmentNew World Anderson (Tianjin) Development Co., Ltd.
US$5,500,000 — 70 Property investment and development
New World (Anshan) Property Development Co., Ltd.
RMB950,000,000 — 70 Property development
New World (China) Investment Limited US$130,000,000 — 100 Investment holdingNew World China Land Investments Company Limited
US$40,000,000 — 70 Investment holding
New World Department Store (China) Co., Ltd.
RMB50,000,000 — 72 Department store operation
New World Department Stores Investment (China) Co., Ltd.
US$80,000,000 — 72 Investment holding
New World Development (Wuhan) Co., Ltd. US$49,750,000 — 70 Property investment and development
New World Property (Wuhan) Co., Ltd. US$16,000,000 — 70 Property developmentNew World (Shenyang) Property Development Limited
RMB397,720,000 — 63 Property development
New World Strategic (Beijing) Investment Consultancy Limited
US$2,400,000 — 100 Investment consultancy
Ningbo Firm Success Consulting Development Co., Ltd.
US$5,000,000 — 72 Investment holding and provision of consultancy services
Ningbo New World Department Store Co., Ltd.
RMB40,000,000 — 72 Department store operation
Ningbo New World Trendy Department Store Co., Ltd.
RMB20,000,000 — 72 Department store operation
NWS Engineering Ltd. RMB150,000,000 — 57 Mechanical and electrical engineering
Shanghai Caizi Department Store Co., Ltd. RMB50,000,000 — 72 Department store operationShanghai New World Caixuan Department Store Co., Ltd.
RMB30,000,000 — 72 Department store operation
Shanghai New World Department Store Co., Ltd.
RMB18,000,000 — 72 Department store operation
Shanghai New World Trendy Plaza Co., Ltd. RMB50,000,000 — 72 Department store operationShanghai Ramada Plaza Ltd. US$42,000,000 — 70 Property investment and
hotel operationShanxi Xinda Highways Ltd. RMB49,000,000 — 52 Operation of toll roadShanxi Xinhuang Highways Ltd. RMB56,000,000 — 52 Operation of toll roadShenyang New World Department Store Ltd. RMB30,000,000 — 72 Department store operationShenyang New World Hotel Co., Ltd. RMB201,520,000 — 70 Hotel operation
51 PRINCIPAL SUBSIDIARIES (Continued)
AS AT 30 JUNE 2009
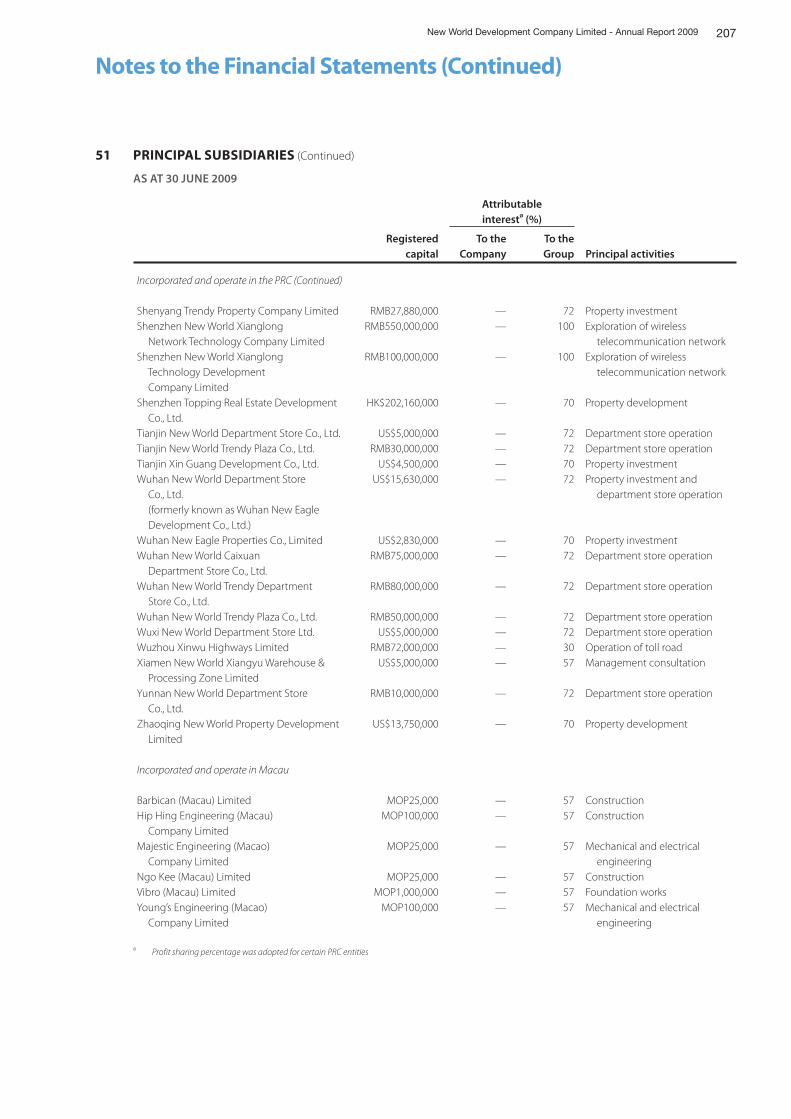
207New World Development Company Limited - Annual Report 2009
Notes to the Financial Statements (Continued)
Attributableinterestø (%)
Registered capital
To theCompany
To theGroup Principal activities
Incorporated and operate in the PRC (Continued)
Shenyang Trendy Property Company Limited RMB27,880,000 — 72 Property investmentShenzhen New World Xianglong Network Technology Company Limited
RMB550,000,000 — 100 Exploration of wireless telecommunication network
Shenzhen New World Xianglong Technology Development Company Limited
RMB100,000,000 — 100 Exploration of wireless telecommunication network
Shenzhen Topping Real Estate Development Co., Ltd.
HK$202,160,000 — 70 Property development
Tianjin New World Department Store Co., Ltd. US$5,000,000 — 72 Department store operationTianjin New World Trendy Plaza Co., Ltd. RMB30,000,000 — 72 Department store operationTianjin Xin Guang Development Co., Ltd. US$4,500,000 — 70 Property investmentWuhan New World Department Store Co., Ltd. (formerly known as Wuhan New Eagle Development Co., Ltd.)
US$15,630,000 — 72 Property investment and department store operation
Wuhan New Eagle Properties Co., Limited US$2,830,000 — 70 Property investmentWuhan New World Caixuan Department Store Co., Ltd.
RMB75,000,000 — 72 Department store operation
Wuhan New World Trendy Department Store Co., Ltd.
RMB80,000,000 — 72 Department store operation
Wuhan New World Trendy Plaza Co., Ltd. RMB50,000,000 — 72 Department store operationWuxi New World Department Store Ltd. US$5,000,000 — 72 Department store operationWuzhou Xinwu Highways Limited RMB72,000,000 — 30 Operation of toll roadXiamen New World Xiangyu Warehouse & Processing Zone Limited
US$5,000,000 — 57 Management consultation
Yunnan New World Department Store Co., Ltd.
RMB10,000,000 — 72 Department store operation
Zhaoqing New World Property Development Limited
US$13,750,000 — 70 Property development
Incorporated and operate in Macau
Barbican (Macau) Limited MOP25,000 — 57 ConstructionHip Hing Engineering (Macau) Company Limited
MOP100,000 — 57 Construction
Majestic Engineering (Macao) Company Limited
MOP25,000 — 57 Mechanical and electrical engineering
Ngo Kee (Macau) Limited MOP25,000 — 57 ConstructionVibro (Macau) Limited MOP1,000,000 — 57 Foundation worksYoung’s Engineering (Macao) Company Limited
MOP100,000 — 57 Mechanical and electrical engineering
ø Profit sharing percentage was adopted for certain PRC entities
51 PRINCIPAL SUBSIDIARIES (Continued)
AS AT 30 JUNE 2009
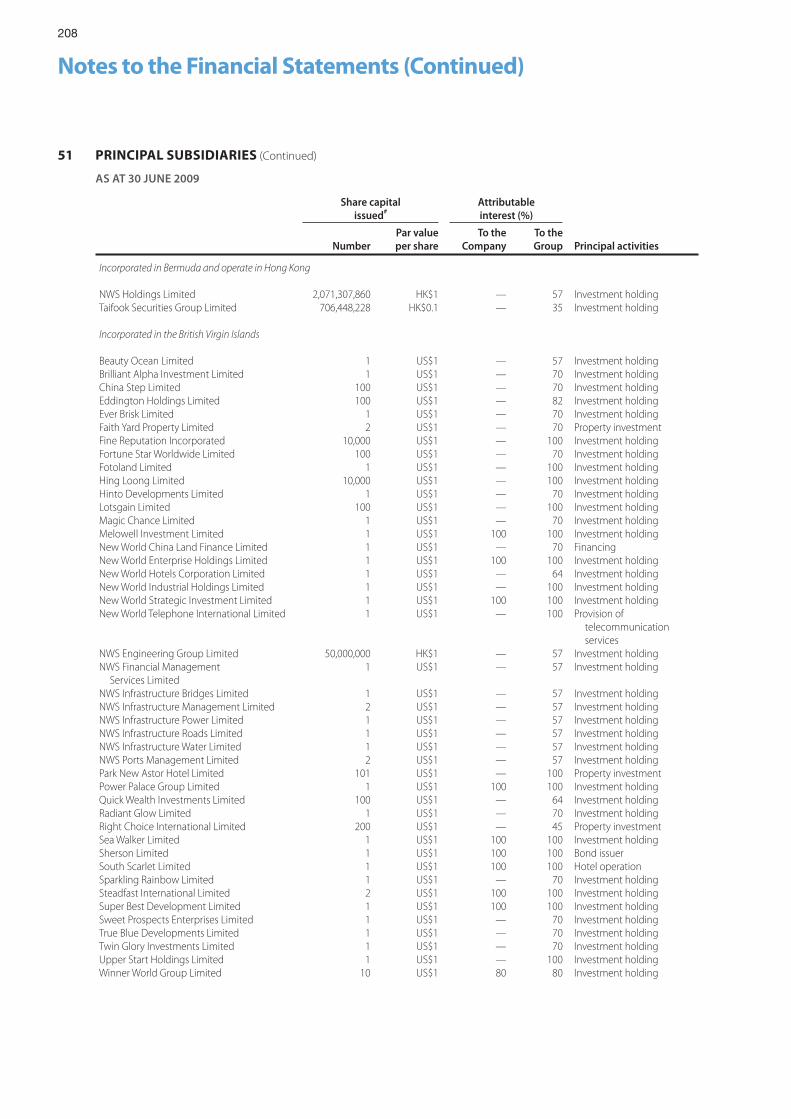
208
Notes to the Financial Statements (Continued)
Share capitalissued#
Attributableinterest (%)
NumberPar value per share
To the Company
To the Group Principal activities
Incorporated in Bermuda and operate in Hong Kong
NWS Holdings Limited 2,071,307,860 HK$1 — 57 Investment holdingTaifook Securities Group Limited 706,448,228 HK$0.1 — 35 Investment holding
Incorporated in the British Virgin Islands
Beauty Ocean Limited 1 US$1 — 57 Investment holdingBrilliant Alpha Investment Limited 1 US$1 — 70 Investment holdingChina Step Limited 100 US$1 — 70 Investment holdingEddington Holdings Limited 100 US$1 — 82 Investment holdingEver Brisk Limited 1 US$1 — 70 Investment holdingFaith Yard Property Limited 2 US$1 — 70 Property investmentFine Reputation Incorporated 10,000 US$1 — 100 Investment holdingFortune Star Worldwide Limited 100 US$1 — 70 Investment holdingFotoland Limited 1 US$1 — 100 Investment holdingHing Loong Limited 10,000 US$1 — 100 Investment holdingHinto Developments Limited 1 US$1 — 70 Investment holdingLotsgain Limited 100 US$1 — 100 Investment holdingMagic Chance Limited 1 US$1 — 70 Investment holdingMelowell Investment Limited 1 US$1 100 100 Investment holdingNew World China Land Finance Limited 1 US$1 — 70 FinancingNew World Enterprise Holdings Limited 1 US$1 100 100 Investment holdingNew World Hotels Corporation Limited 1 US$1 — 64 Investment holdingNew World Industrial Holdings Limited 1 US$1 — 100 Investment holdingNew World Strategic Investment Limited 1 US$1 100 100 Investment holdingNew World Telephone International Limited 1 US$1 — 100 Provision of
telecommunication services
NWS Engineering Group Limited 50,000,000 HK$1 — 57 Investment holdingNWS Financial Management Services Limited
1 US$1 — 57 Investment holding
NWS Infrastructure Bridges Limited 1 US$1 — 57 Investment holdingNWS Infrastructure Management Limited 2 US$1 — 57 Investment holdingNWS Infrastructure Power Limited 1 US$1 — 57 Investment holdingNWS Infrastructure Roads Limited 1 US$1 — 57 Investment holdingNWS Infrastructure Water Limited 1 US$1 — 57 Investment holdingNWS Ports Management Limited 2 US$1 — 57 Investment holdingPark New Astor Hotel Limited 101 US$1 — 100 Property investmentPower Palace Group Limited 1 US$1 100 100 Investment holdingQuick Wealth Investments Limited 100 US$1 — 64 Investment holdingRadiant Glow Limited 1 US$1 — 70 Investment holdingRight Choice International Limited 200 US$1 — 45 Property investmentSea Walker Limited 1 US$1 100 100 Investment holdingSherson Limited 1 US$1 100 100 Bond issuerSouth Scarlet Limited 1 US$1 100 100 Hotel operationSparkling Rainbow Limited 1 US$1 — 70 Investment holdingSteadfast International Limited 2 US$1 100 100 Investment holdingSuper Best Development Limited 1 US$1 100 100 Investment holdingSweet Prospects Enterprises Limited 1 US$1 — 70 Investment holdingTrue Blue Developments Limited 1 US$1 — 70 Investment holdingTwin Glory Investments Limited 1 US$1 — 70 Investment holdingUpper Start Holdings Limited 1 US$1 — 100 Investment holdingWinner World Group Limited 10 US$1 80 80 Investment holding
51 PRINCIPAL SUBSIDIARIES (Continued)
AS AT 30 JUNE 2009
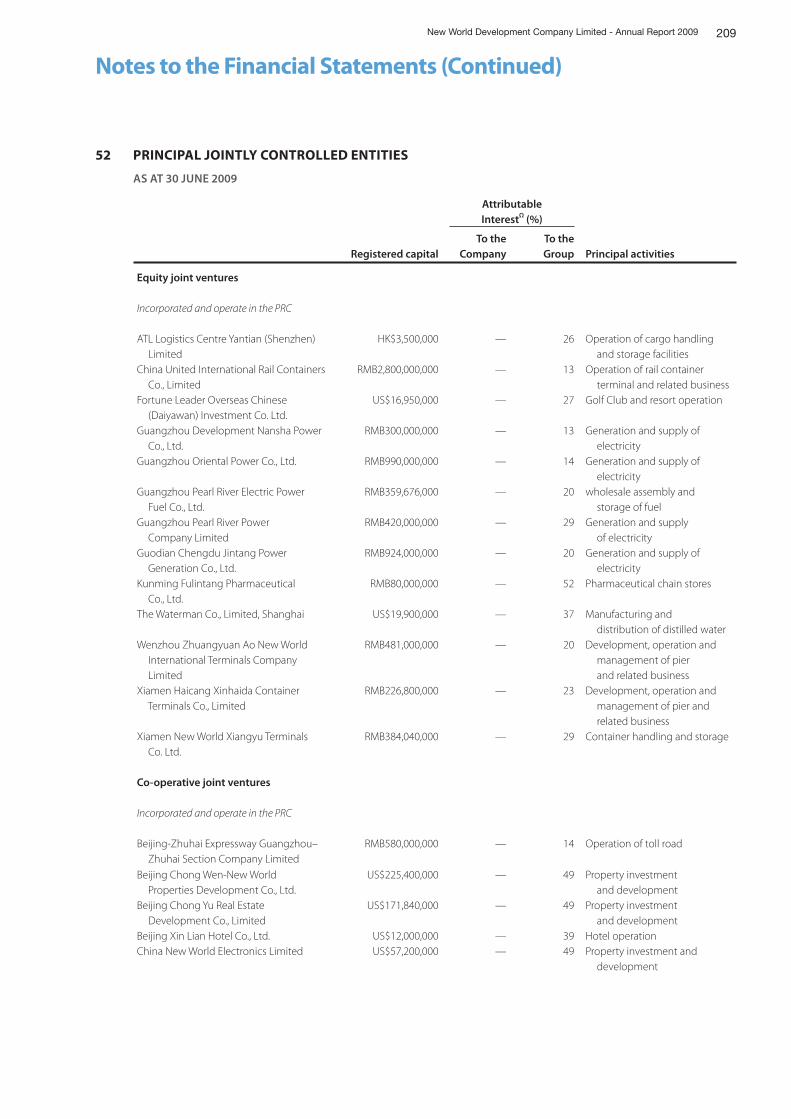
209New World Development Company Limited - Annual Report 2009
Notes to the Financial Statements (Continued)
AttributableInterestΩ (%)
Registered capitalTo the
CompanyTo theGroup Principal activities
Equity joint ventures
Incorporated and operate in the PRC
ATL Logistics Centre Yantian (Shenzhen) Limited
HK$3,500,000 — 26 Operation of cargo handling and storage facilities
China United International Rail Containers Co., Limited
RMB2,800,000,000 — 13 Operation of rail container terminal and related business
Fortune Leader Overseas Chinese (Daiyawan) Investment Co. Ltd.
US$16,950,000 — 27 Golf Club and resort operation
Guangzhou Development Nansha Power Co., Ltd.
RMB300,000,000 — 13 Generation and supply of electricity
Guangzhou Oriental Power Co., Ltd. RMB990,000,000 — 14 Generation and supply of electricity
Guangzhou Pearl River Electric Power Fuel Co., Ltd.
RMB359,676,000 — 20 wholesale assembly and storage of fuel
Guangzhou Pearl River Power Company Limited
RMB420,000,000 — 29 Generation and supply of electricity
Guodian Chengdu Jintang Power Generation Co., Ltd.
RMB924,000,000 — 20 Generation and supply of electricity
Kunming Fulintang Pharmaceutical Co., Ltd.
RMB80,000,000 — 52 Pharmaceutical chain stores
The Waterman Co., Limited, Shanghai US$19,900,000 — 37 Manufacturing and distribution of distilled water
Wenzhou Zhuangyuan Ao New World International Terminals Company Limited
RMB481,000,000 — 20 Development, operation and management of pier and related business
Xiamen Haicang Xinhaida Container Terminals Co., Limited
RMB226,800,000 — 23 Development, operation and management of pier and related business
Xiamen New World Xiangyu Terminals Co. Ltd.
RMB384,040,000 — 29 Container handling and storage
Co-operative joint ventures
Incorporated and operate in the PRC
Beijing-Zhuhai Expressway Guangzhou– Zhuhai Section Company Limited
RMB580,000,000 — 14 Operation of toll road
Beijing Chong Wen-New World Properties Development Co., Ltd.
US$225,400,000 — 49 Property investment and development
Beijing Chong Yu Real Estate Development Co., Limited
US$171,840,000 — 49 Property investment and development
Beijing Xin Lian Hotel Co., Ltd. US$12,000,000 — 39 Hotel operationChina New World Electronics Limited US$57,200,000 — 49 Property investment and
development
52 PRINCIPAL JOINTLY CONTROLLED ENTITIES
AS AT 30 JUNE 2009
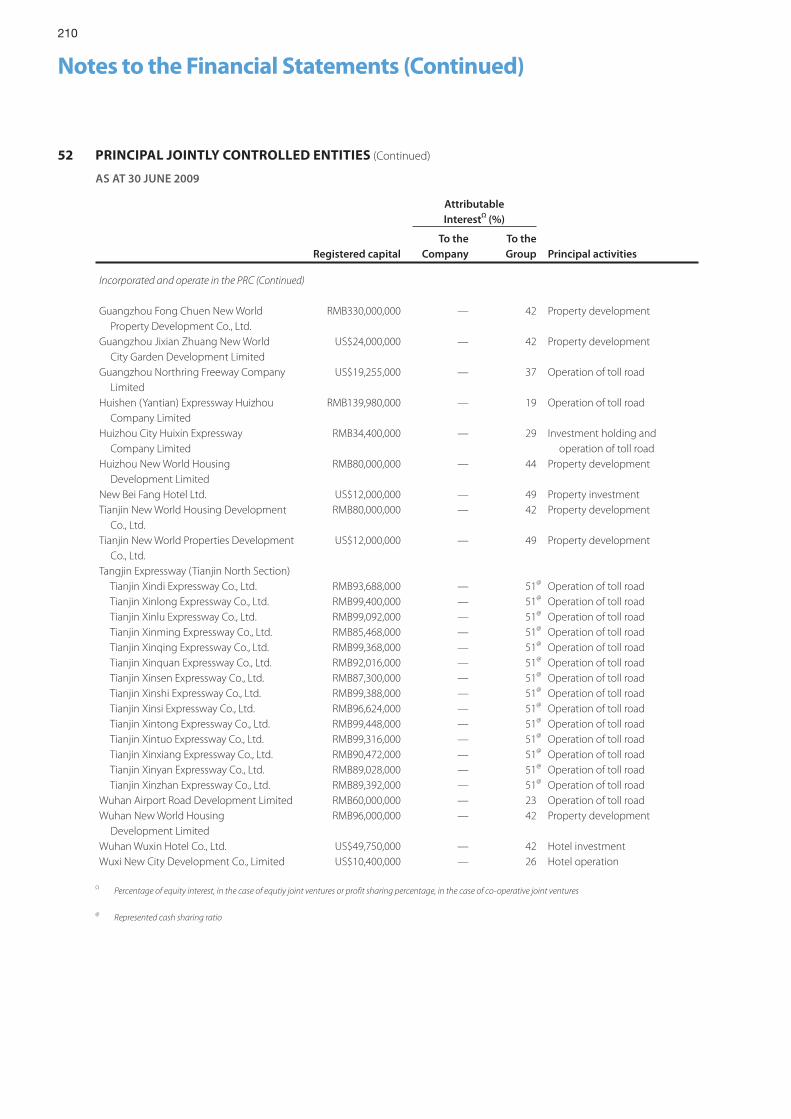
210
Notes to the Financial Statements (Continued)
AttributableInterestΩ (%)
Registered capitalTo the
CompanyTo theGroup Principal activities
Incorporated and operate in the PRC (Continued)
Guangzhou Fong Chuen New World Property Development Co., Ltd.
RMB330,000,000 — 42 Property development
Guangzhou Jixian Zhuang New World City Garden Development Limited
US$24,000,000 — 42 Property development
Guangzhou Northring Freeway Company Limited
US$19,255,000 — 37 Operation of toll road
Huishen (Yantian) Expressway Huizhou Company Limited
RMB139,980,000 — 19 Operation of toll road
Huizhou City Huixin Expressway Company Limited
RMB34,400,000 — 29 Investment holding and operation of toll road
Huizhou New World Housing Development Limited
RMB80,000,000 — 44 Property development
New Bei Fang Hotel Ltd. US$12,000,000 — 49 Property investmentTianjin New World Housing Development Co., Ltd.
RMB80,000,000 — 42 Property development
Tianjin New World Properties Development Co., Ltd.
US$12,000,000 — 49 Property development
Tangjin Expressway (Tianjin North Section) Tianjin Xindi Expressway Co., Ltd. RMB93,688,000 — 51@ Operation of toll road Tianjin Xinlong Expressway Co., Ltd. RMB99,400,000 — 51@ Operation of toll road Tianjin Xinlu Expressway Co., Ltd. RMB99,092,000 — 51@ Operation of toll road Tianjin Xinming Expressway Co., Ltd. RMB85,468,000 — 51@ Operation of toll road Tianjin Xinqing Expressway Co., Ltd. RMB99,368,000 — 51@ Operation of toll road Tianjin Xinquan Expressway Co., Ltd. RMB92,016,000 — 51@ Operation of toll road Tianjin Xinsen Expressway Co., Ltd. RMB87,300,000 — 51@ Operation of toll road Tianjin Xinshi Expressway Co., Ltd. RMB99,388,000 — 51@ Operation of toll road Tianjin Xinsi Expressway Co., Ltd. RMB96,624,000 — 51@ Operation of toll road Tianjin Xintong Expressway Co., Ltd. RMB99,448,000 — 51@ Operation of toll road Tianjin Xintuo Expressway Co., Ltd. RMB99,316,000 — 51@ Operation of toll road Tianjin Xinxiang Expressway Co., Ltd. RMB90,472,000 — 51@ Operation of toll road Tianjin Xinyan Expressway Co., Ltd. RMB89,028,000 — 51@ Operation of toll road Tianjin Xinzhan Expressway Co., Ltd. RMB89,392,000 — 51@ Operation of toll roadWuhan Airport Road Development Limited RMB60,000,000 — 23 Operation of toll roadWuhan New World Housing Development Limited
RMB96,000,000 — 42 Property development
Wuhan Wuxin Hotel Co., Ltd. US$49,750,000 — 42 Hotel investmentWuxi New City Development Co., Limited US$10,400,000 — 26 Hotel operation
Ω Percentage of equity interest, in the case of equtiy joint ventures or profit sharing percentage, in the case of co-operative joint ventures
@ Represented cash sharing ratio
52 PRINCIPAL JOINTLY CONTROLLED ENTITIES (Continued)
AS AT 30 JUNE 2009
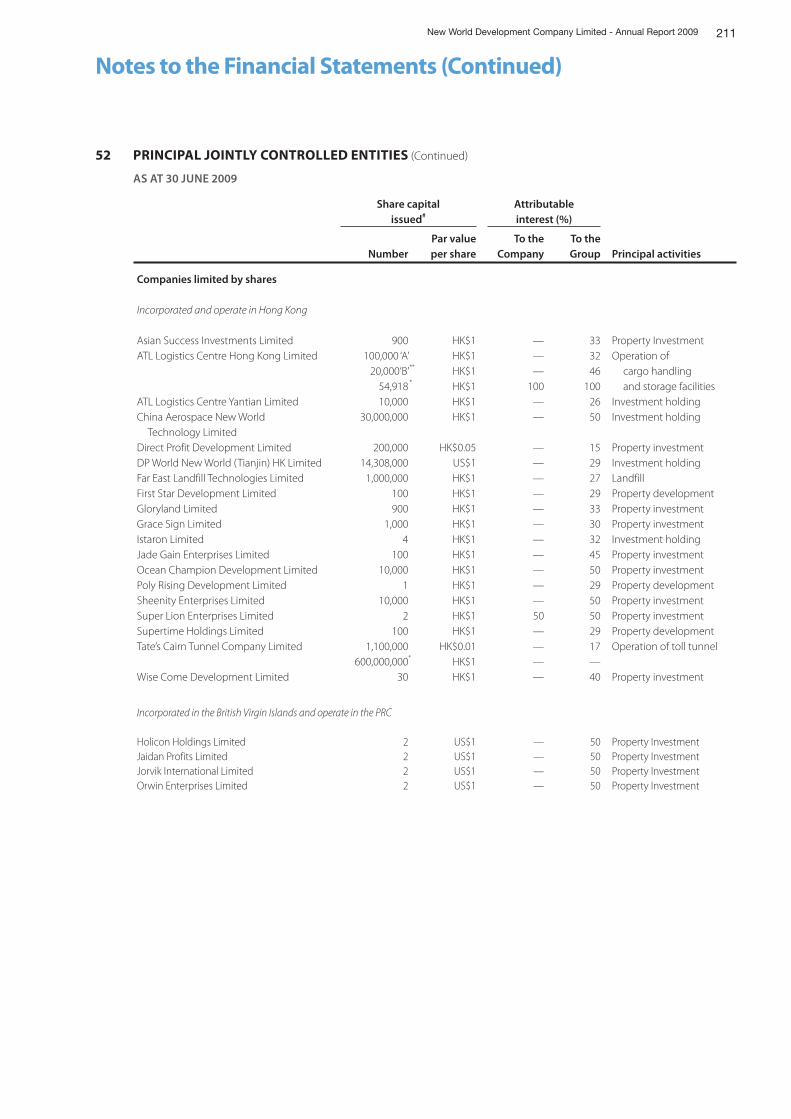
211New World Development Company Limited - Annual Report 2009
Notes to the Financial Statements (Continued)
Share capitalissued#
Attributableinterest (%)
NumberPar value per share
To theCompany
To theGroup Principal activities
Companies limited by shares
Incorporated and operate in Hong Kong
Asian Success Investments Limited 900 HK$1 — 33 Property InvestmentATL Logistics Centre Hong Kong Limited 100,000 ‘A’ HK$1 — 32 Operation of
20,000‘B’** HK$1 — 46 cargo handling54,918 * HK$1 100 100 and storage facilities
ATL Logistics Centre Yantian Limited 10,000 HK$1 — 26 Investment holdingChina Aerospace New World Technology Limited
30,000,000 HK$1 — 50 Investment holding
Direct Profit Development Limited 200,000 HK$0.05 — 15 Property investmentDP World New World (Tianjin) HK Limited 14,308,000 US$1 — 29 Investment holdingFar East Landfill Technologies Limited 1,000,000 HK$1 — 27 LandfillFirst Star Development Limited 100 HK$1 — 29 Property developmentGloryland Limited 900 HK$1 — 33 Property investmentGrace Sign Limited 1,000 HK$1 — 30 Property investmentIstaron Limited 4 HK$1 — 32 Investment holdingJade Gain Enterprises Limited 100 HK$1 — 45 Property investmentOcean Champion Development Limited 10,000 HK$1 — 50 Property investmentPoly Rising Development Limited 1 HK$1 — 29 Property developmentSheenity Enterprises Limited 10,000 HK$1 — 50 Property investmentSuper Lion Enterprises Limited 2 HK$1 50 50 Property investmentSupertime Holdings Limited 100 HK$1 — 29 Property developmentTate’s Cairn Tunnel Company Limited 1,100,000 HK$0.01 — 17 Operation of toll tunnel
600,000,000* HK$1 — —Wise Come Development Limited 30 HK$1 — 40 Property investment
Incorporated in the British Virgin Islands and operate in the PRC
Holicon Holdings Limited 2 US$1 — 50 Property InvestmentJaidan Profits Limited 2 US$1 — 50 Property InvestmentJorvik International Limited 2 US$1 — 50 Property InvestmentOrwin Enterprises Limited 2 US$1 — 50 Property Investment
52 PRINCIPAL JOINTLY CONTROLLED ENTITIES (Continued)
AS AT 30 JUNE 2009
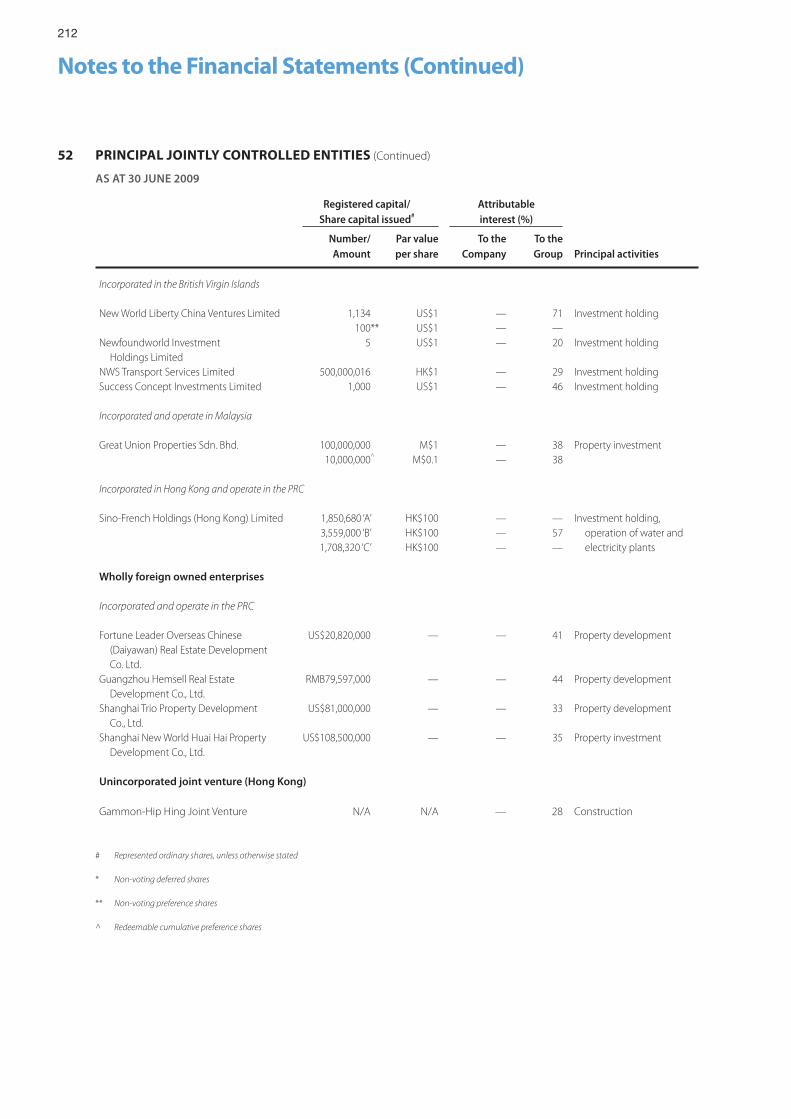
212
Notes to the Financial Statements (Continued)
Registered capital/Share capital issued#
Attributableinterest (%)
Number/Amount
Par value per share
To theCompany
To theGroup Principal activities
Incorporated in the British Virgin Islands
New World Liberty China Ventures Limited 1,134 US$1 — 71 Investment holding100** US$1 — —
Newfoundworld Investment Holdings Limited
5 US$1 — 20 Investment holding
NWS Transport Services Limited 500,000,016 HK$1 — 29 Investment holdingSuccess Concept Investments Limited 1,000 US$1 — 46 Investment holding
Incorporated and operate in Malaysia
Great Union Properties Sdn. Bhd. 100,000,000 M$1 — 38 Property investment10,000,000^ M$0.1 — 38
Incorporated in Hong Kong and operate in the PRC
Sino-French Holdings (Hong Kong) Limited 1,850,680 ‘A’ HK$100 — — Investment holding,3,559,000 ‘B’ HK$100 — 57 operation of water and1,708,320 ‘C’ HK$100 — — electricity plants
Wholly foreign owned enterprises
Incorporated and operate in the PRC
Fortune Leader Overseas Chinese (Daiyawan) Real Estate Development Co. Ltd.
US$20,820,000 — — 41 Property development
Guangzhou Hemsell Real Estate Development Co., Ltd.
RMB79,597,000 — — 44 Property development
Shanghai Trio Property Development Co., Ltd.
US$81,000,000 — — 33 Property development
Shanghai New World Huai Hai Property Development Co., Ltd.
US$108,500,000 — — 35 Property investment
Unincorporated joint venture (Hong Kong)
Gammon-Hip Hing Joint Venture N/A N/A — 28 Construction
# Represented ordinary shares, unless otherwise stated
* Non-voting deferred shares
** Non-voting preference shares
^ Redeemable cumulative preference shares
52 PRINCIPAL JOINTLY CONTROLLED ENTITIES (Continued)
AS AT 30 JUNE 2009
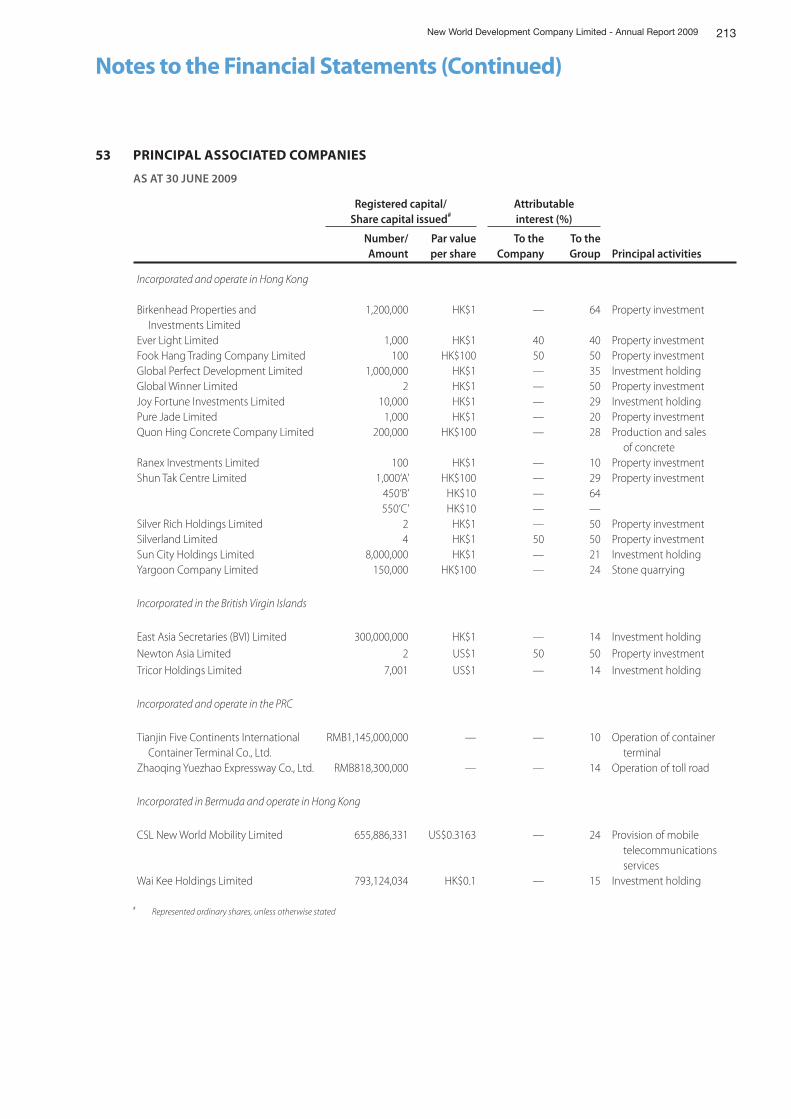
213New World Development Company Limited - Annual Report 2009
Notes to the Financial Statements (Continued)
Registered capital/Share capital issued#
Attributableinterest (%)
Number/Amount
Par value per share
To the Company
To the Group Principal activities
Incorporated and operate in Hong Kong
Birkenhead Properties and Investments Limited
1,200,000 HK$1 — 64 Property investment
Ever Light Limited 1,000 HK$1 40 40 Property investmentFook Hang Trading Company Limited 100 HK$100 50 50 Property investmentGlobal Perfect Development Limited 1,000,000 HK$1 — 35 Investment holdingGlobal Winner Limited 2 HK$1 — 50 Property investmentJoy Fortune Investments Limited 10,000 HK$1 — 29 Investment holdingPure Jade Limited 1,000 HK$1 — 20 Property investmentQuon Hing Concrete Company Limited 200,000 HK$100 — 28 Production and sales
of concreteRanex Investments Limited 100 HK$1 — 10 Property investmentShun Tak Centre Limited 1,000‘A’ HK$100 — 29 Property investment
450‘B’ HK$10 — 64550‘C’ HK$10 — —
Silver Rich Holdings Limited 2 HK$1 — 50 Property investmentSilverland Limited 4 HK$1 50 50 Property investmentSun City Holdings Limited 8,000,000 HK$1 — 21 Investment holdingYargoon Company Limited 150,000 HK$100 — 24 Stone quarrying
Incorporated in the British Virgin Islands
East Asia Secretaries (BVI) Limited 300,000,000 HK$1 — 14 Investment holdingNewton Asia Limited 2 US$1 50 50 Property investmentTricor Holdings Limited 7,001 US$1 — 14 Investment holding
Incorporated and operate in the PRC
Tianjin Five Continents International Container Terminal Co., Ltd.
RMB1,145,000,000 — — 10 Operation of container terminal
Zhaoqing Yuezhao Expressway Co., Ltd. RMB818,300,000 — — 14 Operation of toll road
Incorporated in Bermuda and operate in Hong Kong
CSL New World Mobility Limited 655,886,331 US$0.3163 — 24 Provision of mobile telecommunications services
Wai Kee Holdings Limited 793,124,034 HK$0.1 — 15 Investment holding
# Represented ordinary shares, unless otherwise stated
53 PRINCIPAL ASSOCIATED COMPANIES
AS AT 30 JUNE 2009
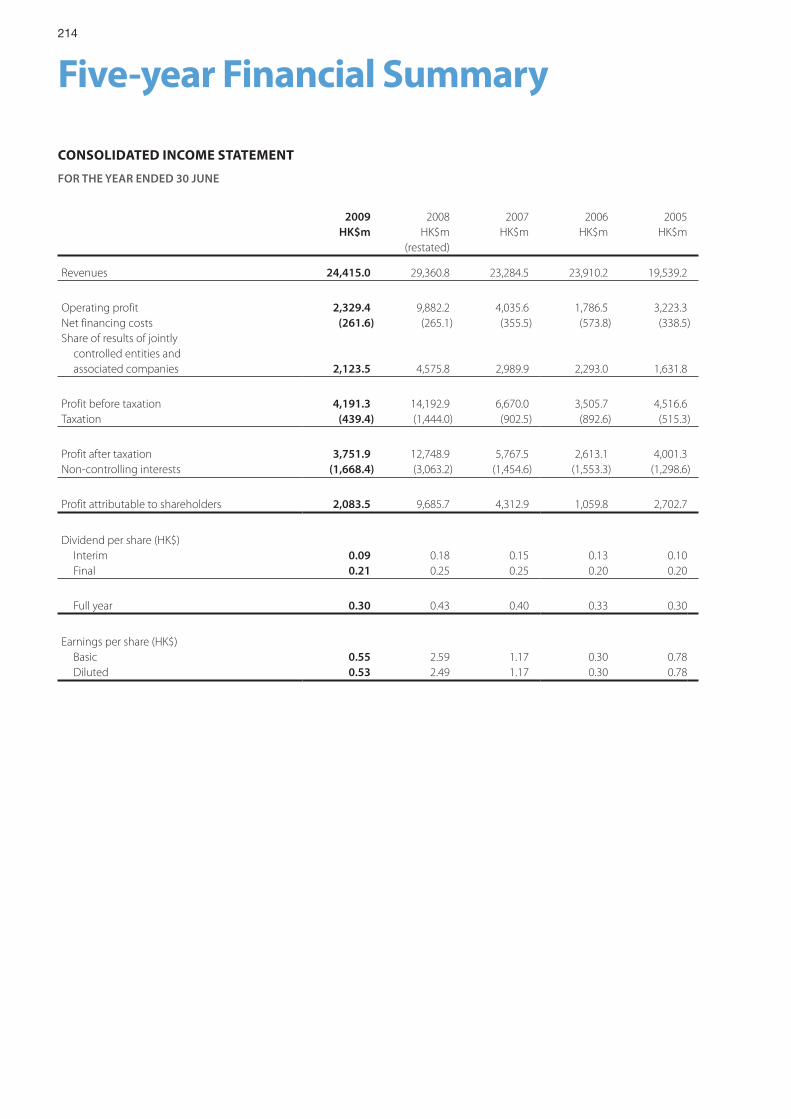
214
Five-year Financial Summary
CONSOLIDATED INCOME STATEMENT
FOR THE YEAR ENDED 30 JUNE
2009 2008 2007 2006 2005HK$m HK$m HK$m HK$m HK$m
(restated)
Revenues 24,415.0 29,360.8 23,284.5 23,910.2 19,539.2
Operating profit 2,329.4 9,882.2 4,035.6 1,786.5 3,223.3Net financing costs (261.6) (265.1) (355.5) (573.8) (338.5)Share of results of jointly controlled entities and associated companies 2,123.5 4,575.8 2,989.9 2,293.0 1,631.8
Profit before taxation 4,191.3 14,192.9 6,670.0 3,505.7 4,516.6Taxation (439.4) (1,444.0) (902.5) (892.6) (515.3)
Profit after taxation 3,751.9 12,748.9 5,767.5 2,613.1 4,001.3Non-controlling interests (1,668.4) (3,063.2) (1,454.6) (1,553.3) (1,298.6)
Profit attributable to shareholders 2,083.5 9,685.7 4,312.9 1,059.8 2,702.7
Dividend per share (HK$) Interim 0.09 0.18 0.15 0.13 0.10 Final 0.21 0.25 0.25 0.20 0.20
Full year 0.30 0.43 0.40 0.33 0.30
Earnings per share (HK$) Basic 0.55 2.59 1.17 0.30 0.78 Diluted 0.53 2.49 1.17 0.30 0.78
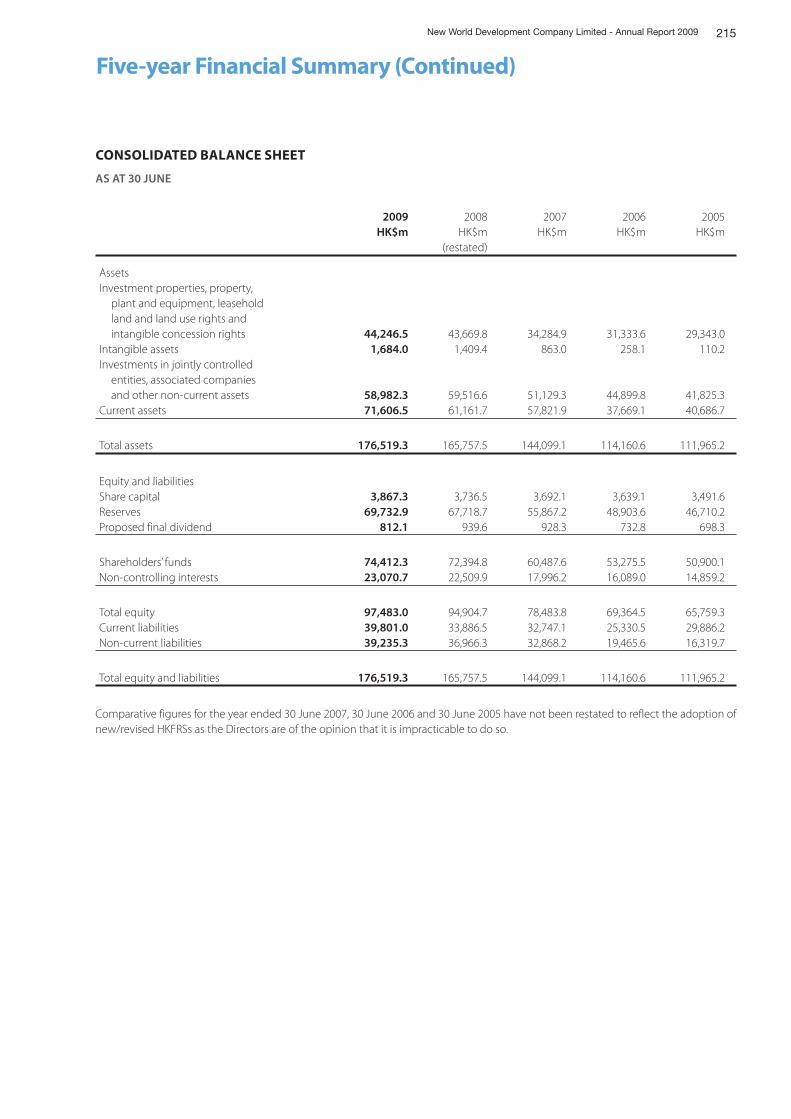
215New World Development Company Limited - Annual Report 2009
Five-year Financial Summary (Continued)
CONSOLIDATED BALANCE SHEET
AS AT 30 JUNE
2009 2008 2007 2006 2005HK$m HK$m HK$m HK$m HK$m
(restated)
AssetsInvestment properties, property, plant and equipment, leasehold land and land use rights and intangible concession rights 44,246.5 43,669.8 34,284.9 31,333.6 29,343.0Intangible assets 1,684.0 1,409.4 863.0 258.1 110.2Investments in jointly controlled entities, associated companies and other non-current assets 58,982.3 59,516.6 51,129.3 44,899.8 41,825.3Current assets 71,606.5 61,161.7 57,821.9 37,669.1 40,686.7
Total assets 176,519.3 165,757.5 144,099.1 114,160.6 111,965.2
Equity and liabilitiesShare capital 3,867.3 3,736.5 3,692.1 3,639.1 3,491.6Reserves 69,732.9 67,718.7 55,867.2 48,903.6 46,710.2Proposed final dividend 812.1 939.6 928.3 732.8 698.3
Shareholders’ funds 74,412.3 72,394.8 60,487.6 53,275.5 50,900.1Non-controlling interests 23,070.7 22,509.9 17,996.2 16,089.0 14,859.2
Total equity 97,483.0 94,904.7 78,483.8 69,364.5 65,759.3Current liabilities 39,801.0 33,886.5 32,747.1 25,330.5 29,886.2Non-current liabilities 39,235.3 36,966.3 32,868.2 19,465.6 16,319.7
Total equity and liabilities 176,519.3 165,757.5 144,099.1 114,160.6 111,965.2
Comparative figures for the year ended 30 June 2007, 30 June 2006 and 30 June 2005 have not been restated to reflect the adoption of new/revised HKFRSs as the Directors are of the opinion that it is impracticable to do so.
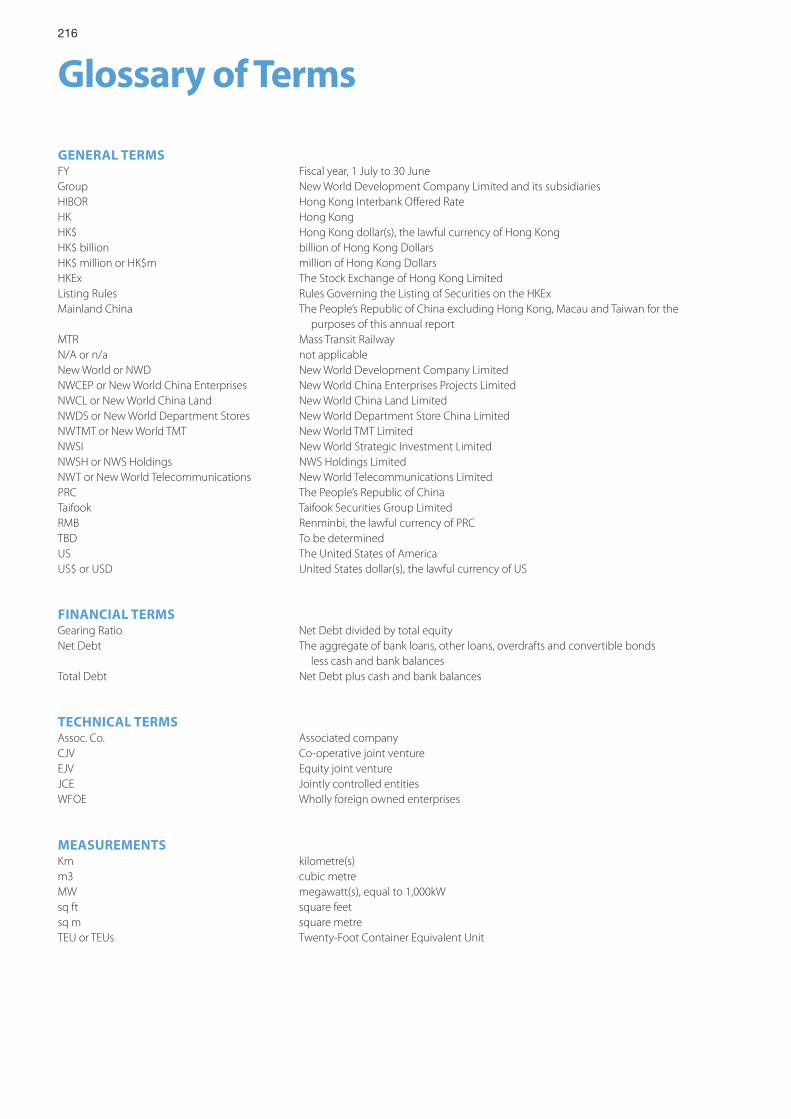
216
Glossary of Terms
GENERAL TERMSFY Fiscal year, 1 July to 30 JuneGroup New World Development Company Limited and its subsidiariesHIBOR Hong Kong Interbank Offered RateHK Hong KongHK$ Hong Kong dollar(s), the lawful currency of Hong KongHK$ billion billion of Hong Kong DollarsHK$ million or HK$m million of Hong Kong DollarsHKEx The Stock Exchange of Hong Kong LimitedListing Rules Rules Governing the Listing of Securities on the HKExMainland China The People’s Republic of China excluding Hong Kong, Macau and Taiwan for the
purposes of this annual reportMTR Mass Transit RailwayN/A or n/a not applicableNew World or NWD New World Development Company LimitedNWCEP or New World China Enterprises New World China Enterprises Projects LimitedNWCL or New World China Land New World China Land LimitedNWDS or New World Department Stores New World Department Store China LimitedNWTMT or New World TMT New World TMT LimitedNWSI New World Strategic Investment LimitedNWSH or NWS Holdings NWS Holdings LimitedNWT or New World Telecommunications New World Telecommunications LimitedPRC The People’s Republic of ChinaTaifook Taifook Securities Group LimitedRMB Renminbi, the lawful currency of PRCTBD To be determinedUS The United States of AmericaUS$ or USD United States dollar(s), the lawful currency of US
FINANCIAL TERMSGearing Ratio Net Debt divided by total equityNet Debt The aggregate of bank loans, other loans, overdrafts and convertible bonds
less cash and bank balancesTotal Debt Net Debt plus cash and bank balances
TECHNICAL TERMSAssoc. Co. Associated companyCJV Co-operative joint ventureEJV Equity joint ventureJCE Jointly controlled entitiesWFOE Wholly foreign owned enterprises
MEASUREMENTSKm kilometre(s)m3 cubic metreMW megawatt(s), equal to 1,000kWsq ft square feetsq m square metreTEU or TEUs Twenty-Foot Container Equivalent Unit

Corporate Philosophy
CHINESE VERSION
The Chinese version of this Annual Report is availableon request from New World Development Company Limited.Where the English and the Chinese texts conflict,the English text prevails.
© New World Development Company Limited 2009
New
Wo
rld D
evelop
men
t Co
mp
any Limited
An
nu
al Rep
ort 2009
Cert no. SGS-COC-003677
New World Development Company Limited takes every practicable measure to conserve resources and minimize waste.
This annual report is printed on FSC certifi ed paper using vegetable oil-based inks. Pulps used are elemental chlorine-free. The FSC logo identifi es product group from well-managed forests and other controlled sources in accordance with the rules of the Forest Stewardship Council.
Innovationand initiative
Integrity and trust
Stakeholders’ interest
Pursuit of excellence
Social responsibility
People growthand development
OUR VALUESAnnual Report 2009
Pass On