part i - sage publications
TRANSCRIPT
137
PART I
Strategy, Evaluation, and Learning
Each of the following seven profiles is an exciting example of how people in diverse roles used models to support the design, development, and communication of important work. As often as models assist with evaluation, they help significantly with strategy and tactics. They can be used to improve and prove services and to provide a vision of intentional, hopeful change. While never perfect or comprehen-sive, models offer an alternative to long narrative and are easily revised to suit a change in context as well as adaptive management. Models can be vital tools in learning—for individuals, teams, and organizations.
8
137
Action Profiles
T his chapter demonstrates the amazing utility and vast application of logic models. It includes model examples with tremendous variation in subject content and display. Generally, these models have enough detail to sup-
port design, planning, and management as well as evaluation. In several instances, they supported multiple functions. These “practice profiles” include models about civic engagement, corporate giving, international development, public health, sus-tainability, human services, and environmental leadership. This chapter displays the versatile functionality of logic models.
LEARNER OBJECTIVES
•• Describe•the•benefits•and•limitations•of•logic•models•in•practice
•• Identify•the•rationale•for•model•use•in•multiple•contexts
•• Recognize•and•use•concepts•introduced•in•Chapters•1–7
•• Show•how•models•display•problems•and•support•strategy,•evaluation,•and•learning
138 PART II APPLICATIONS
We hope these examples inspire and encourage your work across a range of issues. The profiles include: civic engagement, corporate giving, labor practices in Eastern Europe, asthma management, sustainability, homelessness, and an effort to minimize the destructive influence of paint disposal.
Profile 1: Building Civic Engagement
What exciting invitation for a “civic life” could entice a hip population in a progres-sive West Coast city?
More than 20 years ago, Seattle Works began as The Benefit Gang, a motivated group of twenty-somethings who formed an organization dedicated to involving their generation in the Seattle community. The citizen-led group believed that people in their twenties desired community engagement but needed alternatives to the service clubs and expensive charity balls attended by their parents. Their leaders understood the importance of giving back and sought means of community par-ticipation that matched their lifestyle.
Now broadly known as an influential resource, Seattle Works supports energetic volunteer teams that have generated inventive programs recognized for their impact on the community.Through volunteer and leadership development opportunities, Seattle Works con-nects young adults with a range of service options. In turn, these volunteers become more civically engaged and take action in their communities.
Volunteerism and civic engagement research points to participant-driven deci-sion making, relationship building, and a variety of opportunities for participation as viable means to increase participation in community service, philanthropic giv-ing, and community action. Seattle Works’s targeted population reflects a socio-demographic profile that seeks technology-enhanced support and social networking. Seattle Works increases access to information and opportunities, both of which are important factors in developing engagement.
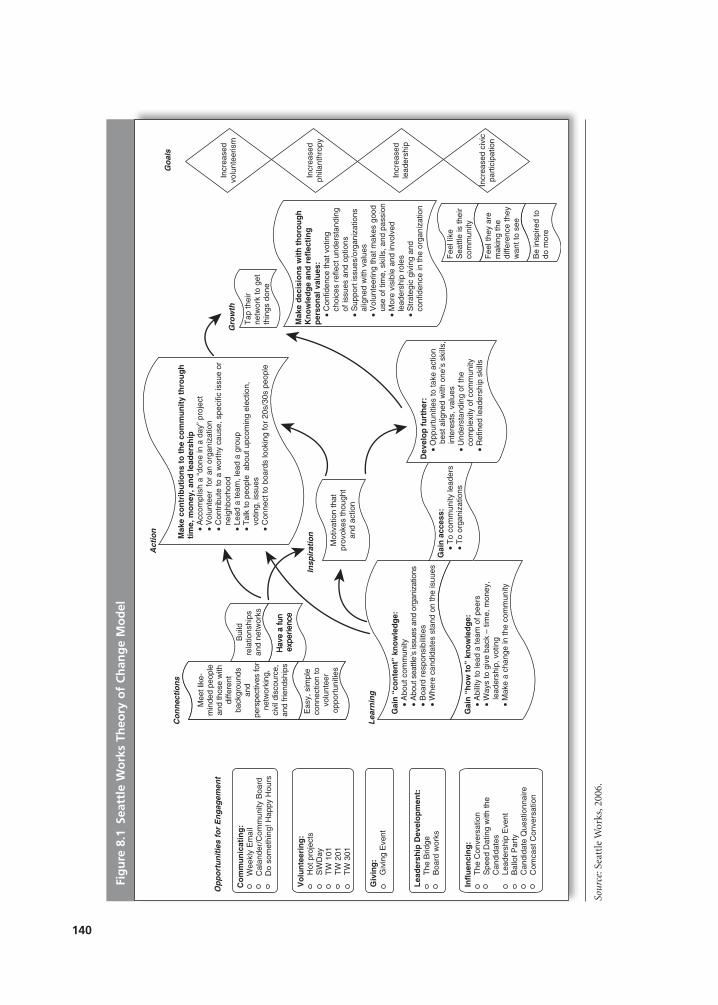
The model reads from left to right and uses bright green labels to cite primary elements. These include: Opportunities for Engagement, Connections, Learning, Inspiration, Action, Growth, and Goals. The model suggests if opportunities are identified, then connections, learning, inspiration, action, and growth will occur that lead to vital community goals. On the far right, Seattle Works goals are positive changes in volunteerism, philanthropy, leadership, and civic participation. Under the Opportunities for Engagement column, there are five primary sections that could be synonymous with strategies.
Those five include communicating, volunteering, giving, developing leadership, and influencing. Each of these includes specific events, products, or activities. The steps toward the ultimate goals are not linear but do build from the initial connections and learning, and the frequent and recurring involvement is what leads to growth and devel-opment. The graphic choice of a “waving flag” (instead of a f lat rectangle) was meant to symbolize the fluid nature of people’s involvement and the motion of forward prog-ress (see Figure 8.1). The “messiness” in the middle of the model is denoted by white
Chapter 8 Action Profiles 139
space and curving arrows. This is intentional and is meant to communicate a relative and intimate interpretation of an individual’s change process.
This evidence-based theory of change model was developed in a small group that included Seattle Works staff. Through expert facilitation, a draft model was created. Participants indicate the modeling process clarified the unique work and mission of the organization. Subsequently, it was shared with the Seattle Works board for discussion and development. It is used primarily for communications with board members and other stakeholders.
In 2007, Seattle Works members were surveyed to determine the influence of this organization. Findings from that data collection indicate since becoming affili-ated with Seattle Works, respondents volunteer with greater frequency than the national average for comparable age groups; demonstrate more civic engagement in political activities, particularly voting rates; and the majority made a financial contribution to a charitable organization at rates considerably higher than the norm for a comparable population. In addition, respondents are more aware of service opportunities, feel they contribute and are connected to their community, and indicate a good fit for their time, skills, and passion.
Seattle Works was honored with a community service award from the Municipal League of King County in 1996, the History Makers in Community Service Award from the Museum of History and Industry in 1997, the YMCA of Greater Seattle’s AK Guy Award in 2002, and Seattle Parks & Recreation’s Denny Award for Outstanding Volunteer Service in 2005 and was named an Innovation Hub by the HandsOn Network in 2011.
Will is a key assumption for Seattle Works programs. Their efforts rely on an expectation that people are eager to step up as active community participants early in their careers and adult lives. They believe a vibrant Seattle depends on the civic engagement of young adults who, over time, will continue to demonstrate their mettle as volunteers, voters, leaders, and philanthropic investors bringing positive impact to their communities. After more than two decades of operation, Seattle Works remains a highly regarded organization that launches and supports vital civic capital in the Puget Sound.
References
See the Seattle Works website at www.seattleworks.org.
Creation of this model was led by Dawn Smart at Clegg & Associates. Contact her via e-mail
Profile 2: Better Corporate Giving
Childhood hunger in America is a significant challenge. It is likely to increase as our population grows, climates change, and food prices rise.
In households across every state in our nation, every day, children face inconsis-tent access to nutritious and adequate food. They don’t know if or from where they
140
Sour
ce: S
eatt
le W
orks
, 200
6.
Fig
ure
8.1
Sea
ttle
Wo
rks
Theo
ry o
f C
han
ge
Mo
del
Op
po
rtu
nit
ies
for
En
gag
emen
t
Co
nn
ecti
on
s
Act
ion
Gro
wth
Go
als
Insp
irat
ion
Lea
rnin
g
Mee
t lik
e-m
inde
d pe
ople
and
thos
e w
ithdi
ffere
ntba
ckgr
ound
san
dpe
rspe
ctiv
es fo
rne
twor
king
,ci
vil d
isco
urce
,an
d fr
iend
ship
s
Eas
y, s
impl
e co
nnec
tion
to
volu
ntee
rop
port
uniti
es
Hav
e a
fun
expe
rienc
e
Bui
ldre
latio
nshi
ps
and
netw
orks
Gai
n “
con
ten
t” k
no
wle
dg
e:
• A
bout
com
mun
ity
• A
bout
sea
ttle’
s is
sues
and
org
aniz
atio
ns
• B
oard
res
pons
ibili
ties
•
Whe
re c
andi
date
s st
and
on th
e is
uues
Gai
n “
ho
w t
o”
kno
wle
dg
e:
• A
bilit
y to
lead
a te
am o
f pee
rs
• W
ays
to g
ive
back
– ti
me,
mon
ey,
lead
ersh
ip, v
otin
g
• M
ake
a ch
ange
in th
e co
mm
unity
Mak
e co
ntr
ibu
tio
ns
to t
he
com
mu
nit
y th
rou
gh
tim
e, m
on
ey, a
nd
lead
ersh
ip
• A
ccom
plis
h a
“don
e in
a d
ay”
proj
ect
•
Vol
unte
er f
or a
n or
gani
zatio
n
• C
ontr
ibut
e to
a w
orth
y ca
use,
spe
cific
issu
e or
neig
hbor
hood
•
Lead
a te
am, l
ead
a gr
oup
•
Tal
k to
peo
ple
abo
ut u
pcom
ing
elec
tion,
votin
g, is
sues
•
Con
nect
to b
oard
s lo
okin
g fo
r 20
s/30
s pe
ople
Mot
ivat
ion
that
prov
okes
thou
ght
and
actio
n
Gai
n a
cces
s:
• T
o co
mm
unity
lead
ers
•
To
orga
niza
tions
Dev
elo
p f
urt
her
:
• O
ppur
tuni
ties
to ta
ke a
ctio
n
b
est a
ligne
d w
ith o
ne’s
ski
lls,
inte
rest
s, v
alue
s
• U
nder
stan
ding
of t
he
co
mpl
exity
of c
omm
unity
•
Ref
ined
lead
ersh
ip s
kills
Tap
thei
rne
twor
k to
get
th
ings
don
e
Mak
e d
ecis
ion
s w
ith
th
oro
ug
hK
no
wle
dg
e an
d r
efle
ctin
gp
erso
nal
val
ues
:
• C
onfid
ence
that
vot
ing
choi
ces
refle
ct u
nder
stan
ding
of is
sues
and
opt
ions
•
Sup
port
issu
es/o
rgan
izat
ions
alig
ned
with
val
ues
•
Vol
unte
erin
g th
at m
akes
goo
d
us
e of
tim
e, s
kills
, and
pas
sion
•
Mor
e vi
sibl
e an
d in
volv
ed
le
ader
ship
rol
es
• S
trat
egic
giv
ing
and
conf
iden
ce in
the
orga
niza
tion
Fee
l lik
eS
eattl
e is
thei
rco
mm
unity
Fee
l the
y ar
e m
akin
g th
edi
ffere
nce
they
w
ant t
o se
e
Be
insp
ired
todo
mor
e
Incr
ease
dvo
lunt
eeris
m
Incr
ease
dph
ilant
hrop
y
Incr
ease
dle
ader
ship
Incr
ease
d ci
vic
part
icip
atio
n
Hav
e a
fun
expe
rienc
e
Co
mm
un
icat
ing
:
Wee
kly
Em
ail
C
alan
der/
Com
mun
ity B
oard
D
o so
met
hing
! Hap
py H
ours
Vo
lun
teer
ing
:
Hot
pro
ject
s
SW
Day
T
W 1
01
TW
201
T
W 3
01
Giv
ing
:
Giv
ing
Eve
nt
Infl
uen
cin
g:
T
he C
onve
rsat
ion
S
peed
Dat
ing
with
the
C
andi
date
s
Lead
ersh
ip E
vent
B
allo
t Par
ty
C
andi
date
Que
stio
nnai
re
Com
cast
Con
vers
atio
n
Lea
der
ship
Dev
elo
pm
ent:
T
he B
ridge
B
oard
wor
ks
Chapter 8 Action Profiles 141
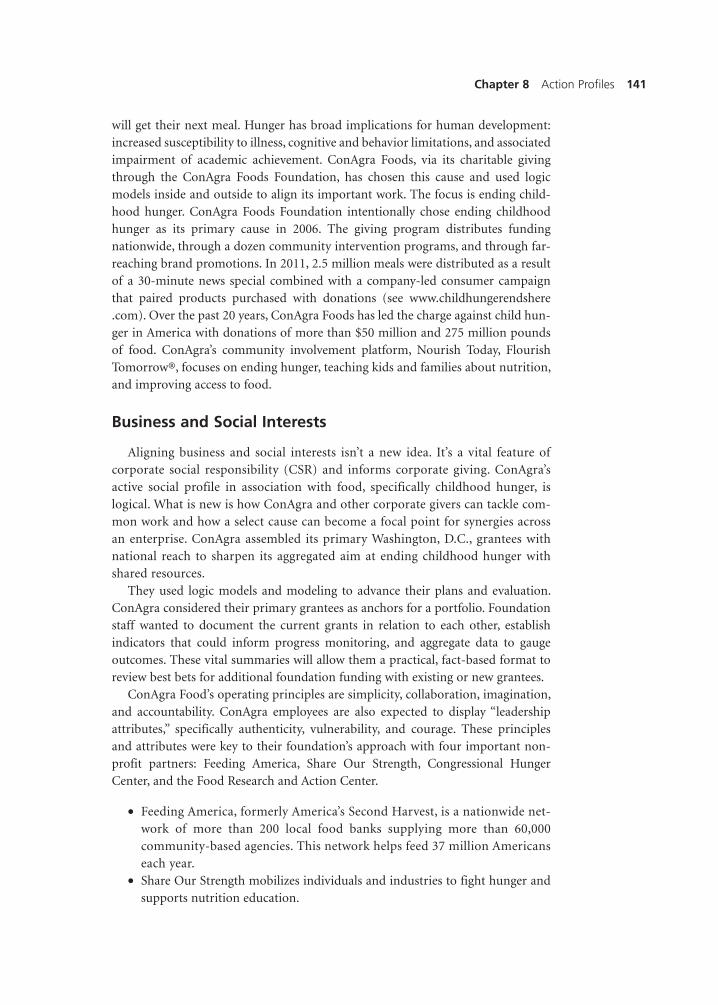
will get their next meal. Hunger has broad implications for human development: increased susceptibility to illness, cognitive and behavior limitations, and associated impairment of academic achievement. ConAgra Foods, via its charitable giving through the ConAgra Foods Foundation, has chosen this cause and used logic models inside and outside to align its important work. The focus is ending child-hood hunger. ConAgra Foods Foundation intentionally chose ending childhood hunger as its primary cause in 2006. The giving program distributes funding nationwide, through a dozen community intervention programs, and through far-reaching brand promotions. In 2011, 2.5 million meals were distributed as a result of a 30-minute news special combined with a company-led consumer campaign that paired products purchased with donations (see www.childhungerendshere .com). Over the past 20 years, ConAgra Foods has led the charge against child hun-ger in America with donations of more than $50 million and 275 million pounds of food. ConAgra’s community involvement platform, Nourish Today, Flourish Tomorrow®, focuses on ending hunger, teaching kids and families about nutrition, and improving access to food.
Business and Social Interests
Aligning business and social interests isn’t a new idea. It’s a vital feature of corporate social responsibility (CSR) and informs corporate giving. ConAgra’s active social profile in association with food, specifically childhood hunger, is logical. What is new is how ConAgra and other corporate givers can tackle com-mon work and how a select cause can become a focal point for synergies across an enterprise. ConAgra assembled its primary Washington, D.C., grantees with national reach to sharpen its aggregated aim at ending childhood hunger with shared resources.
They used logic models and modeling to advance their plans and evaluation. ConAgra considered their primary grantees as anchors for a portfolio. Foundation staff wanted to document the current grants in relation to each other, establish indicators that could inform progress monitoring, and aggregate data to gauge outcomes. These vital summaries will allow them a practical, fact-based format to review best bets for additional foundation funding with existing or new grantees.
ConAgra Food’s operating principles are simplicity, collaboration, imagination, and accountability. ConAgra employees are also expected to display “leadership attributes,” specifically authenticity, vulnerability, and courage. These principles and attributes were key to their foundation’s approach with four important non-profit partners: Feeding America, Share Our Strength, Congressional Hunger Center, and the Food Research and Action Center.
• Feeding America, formerly America’s Second Harvest, is a nationwide net-work of more than 200 local food banks supplying more than 60,000 community-based agencies. This network helps feed 37 million Americans each year.
• Share Our Strength mobilizes individuals and industries to fight hunger and supports nutrition education.
142 PART II APPLICATIONS
• Congressional Hunger Center focuses on domestic and international anti-hunger leadership development.
• Food Research Action Center influences public policy and coordinates public–private partnerships to eradicate hunger and under-nutrition.
While all these organizations have active and long roles in antihunger work, their staff had never convened to see or understand the roles each played among key strategies supported through ConAgra funding.
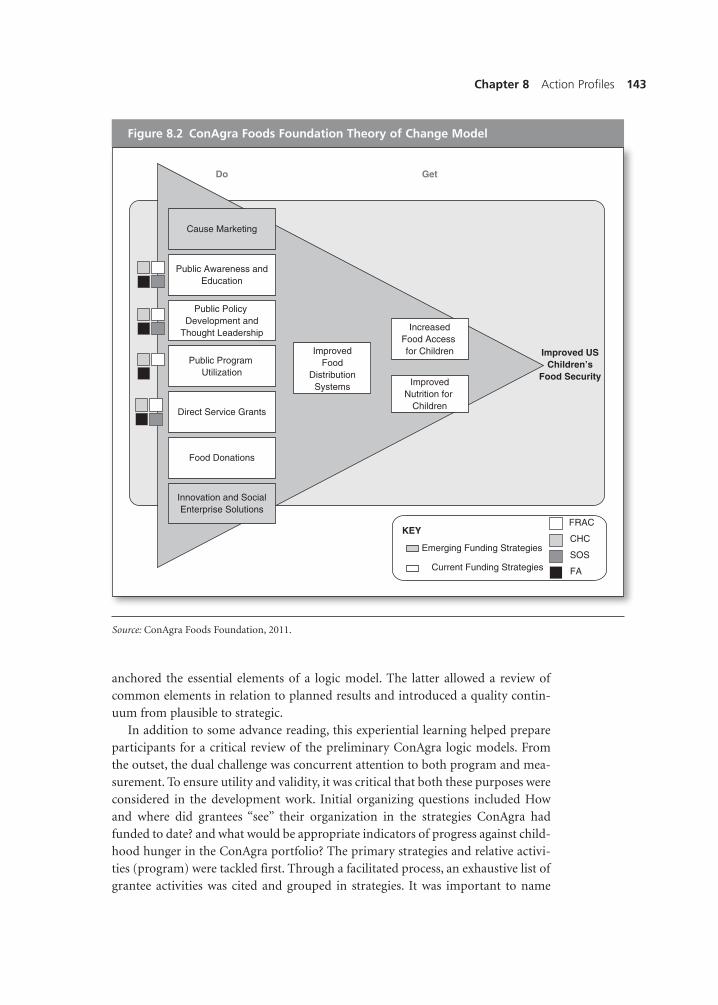
Our firm used highly participatory processes to ensure that multiple perspec-tives were expressed and reflected in any products. A thorough review of internal and external ConAgra documents along with several phone conferences were essen-tial to inform a preliminary draft of both a theory of change (TOC) and a program logic model. The TOC, shown in Figure 8.2, remained largely unchanged over the project. It simply documented the knowledge-based strategies that would most likely influence childhood hunger.
Reducing Childhood Hunger
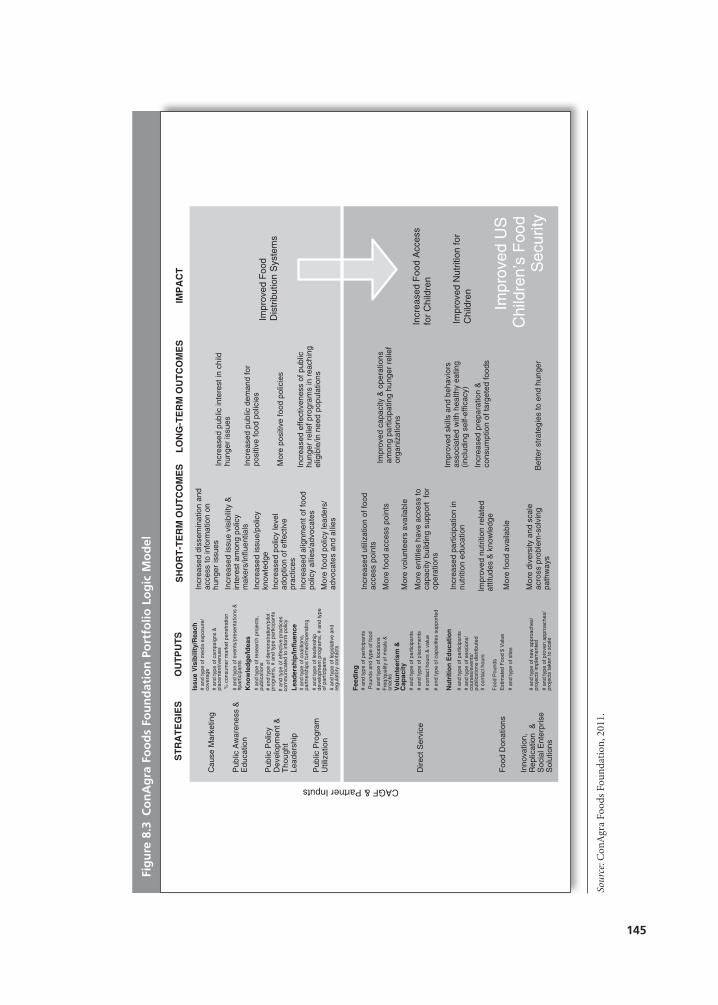
The ConAgra Foods Foundation theory of change, read from left to right, iden-tifies five strategies for current funding: public awareness and education, public policy and thought leadership, public program utilization, direct service (feeding efforts), and food donations. Emerging funding strategies include cause market-ing as well as innovation, replication, and social enterprise solutions. By integrating these strategies where appropriate, the expectations are that the U.S. food distribu-tion systems will both improve nutrition for children and increase food access. These outcomes will ultimately contribute to the planned result of ending child-hood hunger. This logic model represents a framework for how planned work can be organized by and with ConAgra Foods Foundation staff, corporate functions, grantees, and other stakeholders. The key code identifies grantees by their contribu-tion to relevant strategy.
Next, grantees were approached about a meeting to articulate their organiza-tions’ work and contribute to a collective view that would inform the ConAgra theory of change and program logic models. Prior to this meeting, grantee repre-sentatives were asked to consider only their work (relative to ConAgra strategies) with internal colleagues. This was designed to ensure that inside discussions defined a shared understanding of responsibilities associated with ConAgra sup-port. Armed with this information, they could then confidently articulate their representative portion vis-á-vis peers from other grantee organizations.
Setting the stage for better understanding about models and vibrant participa-tion, we provided stakeholders with a brief and practical introduction to logic models. Using adult learning techniques, we asked organization representatives working in small groups to plan an ideal event by specifying what they’d do and get. Then we deconstructed the activities and primary strategies relative to intended outcome. This easy, kinesthetic activity offered a simple way to practice transferring what they’d learned in the orientation to action steps in co-creating a model. It
Chapter 8 Action Profiles 143
anchored the essential elements of a logic model. The latter allowed a review of common elements in relation to planned results and introduced a quality contin-uum from plausible to strategic.
In addition to some advance reading, this experiential learning helped prepare participants for a critical review of the preliminary ConAgra logic models. From the outset, the dual challenge was concurrent attention to both program and mea-surement. To ensure utility and validity, it was critical that both these purposes were considered in the development work. Initial organizing questions included How and where did grantees “see” their organization in the strategies ConAgra had funded to date? and what would be appropriate indicators of progress against child-hood hunger in the ConAgra portfolio? The primary strategies and relative activi-ties (program) were tackled first. Through a facilitated process, an exhaustive list of grantee activities was cited and grouped in strategies. It was important to name
Source: ConAgra Foods Foundation, 2011.
Figure 8.2 ConAgra Foods Foundation Theory of Change Model
Cause Marketing
Public Awareness andEducation
Innovation and SocialEnterprise Solutions
Direct Service Grants
Food Donations
IncreasedFood Access for Children
ImprovedNutrition for
Children
Improved USChildren’s
Food Security
Do Get
Public Policy Development and
Thought Leadership
Public Program Utilization
ImprovedFood
DistributionSystems
Emerging Funding Strategies
Current Funding Strategies
KEYFRAC
CHC
SOS
FA
144 PART II APPLICATIONS
strategies that held shared meaning. Then, relative to the activities and strategies, their associated outputs and outcomes were identified.
Measuring and Managing
A version of the socially constructed model generated by the DC antihunger grantees and their funder is shown in Figure 8.3. Note, again, the intended result on the far right of this graphic is “improved children’s food security.” While the version displayed here does not explicate the assumptions for resources/inputs (far left), they can be generally identified as well-managed grantee partners and financial capital, as well as supporting functions like public relations, communications, mar-keting, product promotions, and others. Because the model needed to support the creation of a monitoring and measurement system, it was practical to identify rea-sonable outputs and related short-term outcomes.
In this model (see Figure 8.3), the impacts (far right) are likely to occur if the long-term outcomes do. In this way, a dependent chain of “if–then” steps is pro-jected from the cited strategies (at the far left). The model is not a substitute for action planning that would detail by which grantee, when, with whom, and how (tactically) each strategy plays out over time. But it does provide a high-level road map to specify what information will be gathered and what indicators will suggest progress. At a point in time, this anti-hunger portfolio-level model reflects the aggregate investment and associated metrics for selected ConAgra grantees.
Modeling, the process of creating multiple versions of a display, is generative. Additions and changes to models are crucial as they adapt to capture knowledge. While this case “backed into” a model as documentation from existing plans and work, more often, modeling happens at the design phase. Modeling adds tremen-dous value in an initial (and ongoing) convening of multiple stakeholders to launch, manage, and evaluate projects, programs, or change work.
The ConAgra models are dynamic and will change. Any model, like a photo-graph, is simply a snapshot in time. To remain relevant, it must be revised. As evaluation provides feedback about what’s working, what’s not, and rate of return on investment, changes in the grantee portfolio can occur. This “steers the ship” based on performance data and changing contextual factors.
Alignment, Accountability, Action
These models and associated modeling supported plans and communication with external partners. It was critical to citing grantee accountabilities. It offered an important way to specify relative and shared outputs from activities that would influence outcomes. This evaluation capability is a challenge—often considered a “resource drain and distraction for nonprofit organizations.”
Ultimately, the indicators from the four grantees were used to inform an elec-tronic reporting template. For ConAgra, it allows annual aggregation and can be used to describe value for its corporate giving. Like other corporate funders, ConAgra uses this information in internal communications and planning as well as
145
Fig
ure
8.3
Co
nA
gra
Fo
od
s Fo
un
dat
ion
Po
rtfo
lio L
og
ic M
od
el
Pub
lic A
war
enes
s &
E
duca
tion
Pub
lic P
olic
y D
evel
opm
ent &
T
houg
htLe
ader
ship
Inno
vatio
n,R
eplic
atio
n &
S
ocia
l Ent
erpr
ise
Sol
utio
ns
Foo
d D
onat
ions
Incr
ease
d F
ood
Acc
ess
for
Chi
ldre
n
Impr
oved
Nut
ritio
n fo
r C
hild
ren
Impr
oved
US
C
hild
ren’
s F
ood
Sec
urity
Foo
d P
ound
s
# an
d ty
pe o
f site
s
Est
imat
ed F
ood
$ V
alue
# an
d ty
pe o
f new
app
roac
hes/
proj
ects
impl
emen
ted
# an
d ty
pe o
f coa
litio
ns,
part
ners
hips
form
ed/o
pera
ting
# an
d ty
pe o
f leg
isla
tive
and
regu
lato
ry c
onta
cts
# an
d ty
pe o
f eve
nts/
pres
enta
tions
&
#par
ticip
ants
# an
d ty
pe o
f med
ia e
xpos
ure/
cove
rage
# an
d ty
pe o
f cam
paig
ns &
pl
acem
ent/v
enue
s
Mor
e fo
od a
cces
s po
ints
% c
onsu
mer
mar
ket p
enet
ratio
n
IMP
AC
TL
ON
G-T
ER
M O
UT
CO
ME
SS
HO
RT
-TE
RM
OU
TC
OM
ES
OU
TP
UT
SS
TR
AT
EG
IES
Impr
oved
cap
acity
& o
pera
tions
am
ong
part
icip
atin
g hu
nger
rel
ief
orga
niza
tions
Mor
e fo
od a
vaila
ble
Incr
ease
d al
ignm
ent o
f foo
d po
licy
allie
s/ad
voca
tes
Incr
ease
d is
sue
visi
bilit
y &
in
tere
st a
mon
g po
licy
mak
ers/
influ
entia
ls
Incr
ease
d pa
rtic
ipat
ion
in
nutr
ition
edu
catio
n
CAGF & Partner Inputs
Dire
ct S
ervi
ce
Incr
ease
d pu
blic
inte
rest
in c
hild
hu
nger
issu
es
Incr
ease
d is
sue/
polic
y kn
owle
dge
# an
d ty
pe o
f res
earc
h pr
ojec
ts,
publ
icat
ions
Incr
ease
d di
ssem
inat
ion
and
acce
ss to
info
rmat
ion
on
hung
er is
sues
Incr
ease
d pu
blic
dem
and
for
posi
tive
food
pol
icie
s
Mor
e po
sitiv
e fo
od p
olic
ies
Incr
ease
d ut
iliza
tion
of fo
od
acce
ss p
oint
s
Mor
e vo
lunt
eers
ava
ilabl
e
Mor
e en
titie
s ha
ve a
cces
s to
capa
city
bui
ldin
g su
ppor
t fo
r op
erat
ions
Impr
oved
Foo
d D
istr
ibut
ion
Sys
tem
s
Pub
lic P
rogr
am
Util
izat
ion
# an
d ty
pe o
f lea
ders
hip
deve
lopm
ent p
rogr
ams,
# a
nd ty
pe
of p
artic
ipan
ts
# an
d ty
pe o
f dem
onst
ratio
n/pi
lot
prog
ram
s, #
and
type
par
ticip
ants
Issu
e V
isib
ility
/Rea
ch
Kn
ow
led
ge/
Idea
s
Lea
der
ship
/Infl
uen
ce
Mor
e fo
od p
olic
y le
ader
s/ad
voca
tes
and
allie
s
# an
d ty
pe o
f par
ticip
ants
#
and
type
of s
essi
ons/
cour
ses/
even
ts/
publ
icat
ions
dis
trib
uted
# co
ntac
t hou
rs
Nu
trit
ion
Ed
uca
tio
n
Impr
oved
nut
ritio
n re
late
d at
titud
es &
kno
wle
dge
Incr
ease
d pr
epar
atio
n &
co
nsum
ptio
n of
targ
eted
food
s
# an
d ty
pe o
f par
ticip
ants
P
ound
s an
d ty
pe o
f foo
d
# an
d ty
pe o
f loc
atio
ns
Fee
din
g
# an
d ty
pe o
f par
ticip
ants
# an
d ty
pe o
f pla
cem
ents
# co
ntac
t hou
rs &
val
ue
# an
d ty
pe o
f cap
aciti
es s
uppo
rted
Vo
lun
teer
ism
&
Cap
acit
y
Mor
e di
vers
ity a
nd s
cale
ac
ross
pro
blem
-sol
ving
pa
thw
ays
Incr
ease
d ef
fect
iven
ess
of p
ublic
hu
nger
rel
ief p
rogr
ams
in r
each
ing
elig
ible
/in n
eed
popu
latio
ns
Bet
ter
stra
tegi
es to
end
hun
ger
Cau
se M
arke
ting
# an
d ty
pe o
f effe
ctiv
e pr
actic
es
com
mun
icat
ed to
info
rm p
olic
y
Incr
ease
d po
licy
leve
l ad
optio
n of
effe
ctiv
e pr
actic
es
# an
d ty
pe o
f pro
ven
appr
oach
es/
proj
ects
take
n to
sca
le
Fre
q/qu
ality
of m
eals
&
snac
ks
Impr
oved
ski
lls a
nd b
ehav
iors
as
soci
ated
with
hea
lthy
eatin
g (in
clud
ing
self-
effic
acy)
Sour
ce: C
onA
gra
Food
s Fo
un
dati
on, 2
011.
146 PART II APPLICATIONS
with external stakeholders. With a clear picture, foundation staff can better manage emphasis within strategies that could have yields as the context for antihunger efforts changes.
Some of the important exploration, documentation, and accountability in this corporate giving example provides vital context for related internal CSR efforts. At ConAgra, CSR translates to “Good for You, Good For Community, Good for the Planet.” These planks address an enormous range of issues, including food safety and quality, health and nutrition, biotechnology, animal welfare, workplace, suppli-ers, community investment, water stewardship, sustainable packaging, and climate change. Corporate philanthropy is included in the community plank.
We created proprietary models of ConAgra’s cause and corporate giving in rela-tion to other corporate functions. Those models are early inputs for strategic and structural decisions that will drive the childhood hunger cause across the enter-prise. Importantly, they provide an initial view of how functional areas can coop-eratively contribute to ConAgra’s CSR profile. Explicating the potential synergies for functions like government relations, sales, and supply chain relative to a specific CSR cause supports “shared value” for multiple stakeholders.
As sectors converge, organizations of many types partner, and new alliances form, talented professionals need tools and processes that improve chances of suc-cess. Logic models and modeling offer great value to design, strategic planning, monitoring, and evaluation. They can contribute enormously to alignment and integration because they offer a picture that displays these powerful principles. When people and organizations can clearly see their role, it is more likely they can fully contribute. This case also offers a gentle reminder that accountability is central to social change. It cites not only the intentions of a large corporation but also its grantee partners, who publicly called out their own work.
Ultimately, consumer awareness and action in communities all across the coun-try are necessary to progress against this devastating problem. Along the way, savvy corporate funders and their colleagues will get further faster on complex social issues with potent tools and processes.
References
This content is adapted from a feature article, “Corporate Giving Gets Smarter,” in The
Foundation Review, Spring 2012.
Kotler, P., Hessekiel, D., & Lee, N. (2012). Good works: Marketing and corporate initiatives that
build a better world . . . and the bottom line. New York: Wiley.
Creation of this model was led by Phillips Wyatt Knowlton, Inc.
Profile 3: Kyrgyzstan Decent Work Country Programme
From 2006 through 2009, the International Labour Organization (ILO) sup-ported a Decent Work Country Programme (DWCP) in the Kyrgyz Republic with 40 community-based projects. In 2010, the ILO hired a team of consultants to conduct an independent evaluation of its support to the program.
Chapter 8 Action Profiles 147
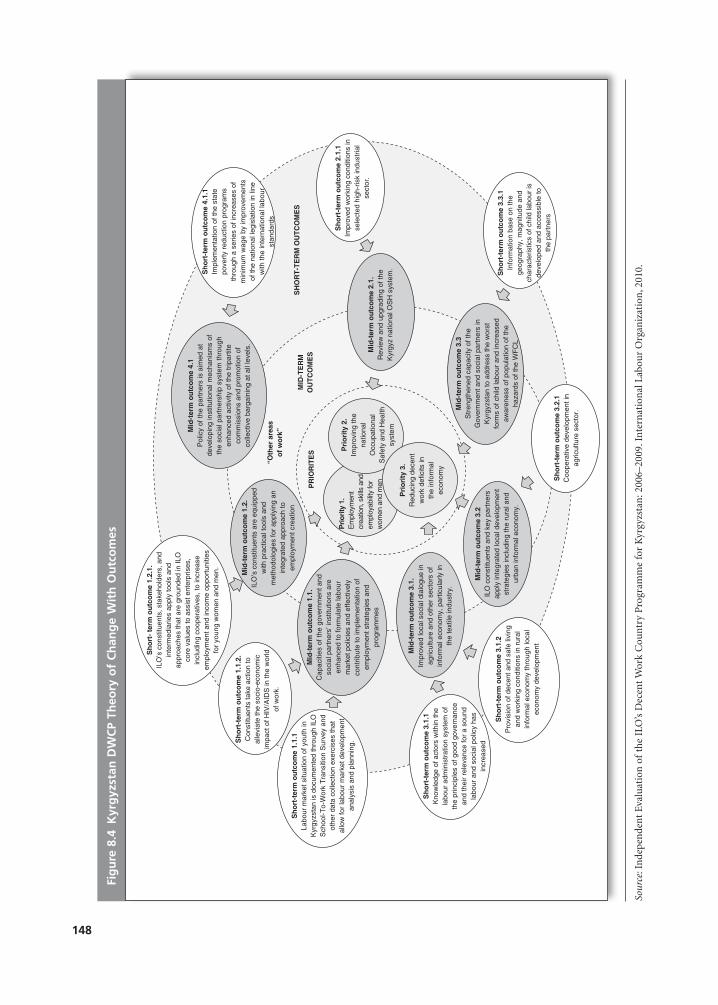
Based on an extensive review of documents, evaluators drafted a logic model (Figure 8.4) to conduct program design analysis. This model helped to show the entire program concept, or theory, at a glance and to visualize some gaps in the program logic. For example, the model showed a midterm outcome that was not related to a program priority (see “other areas of work” at roughly one o’clock on the orbital model).
Kyrgyzstan’s DWCP had three main priorities:
• Priority A: Employment creation, skills, and employability for women and men covers issues such as creating more job opportunities for both young women and men, including improving their work abilities, in order to increase their employability.
• Priority B: Improving the national Occupational Safety and Health (OSH) system focuses on upgrading policies, programs, and practices pertaining to the Kyrgyz national Occupational Safety and Health system.
• Priority C: Reducing the decent work deficit in the informal economy focuses on extending decent work reality and standards to other sectors of work, in particular the informal economy.
Because the program theory included several chains of intended outcomes con-tributing to three overlapping priority areas, a graphical representation was used given that a narrative description may have been inadequate or easily misinterpreted. The authors used a priority-centered “orbital” model with mid-term outcomes on the low orbit and the short-term outcomes on the high orbit. On this first, more complex model, the evaluators purposefully used shades of gray and made the center (priorities) dark, mid-term outcomes lighter, and short-term outcomes lightest. The importance of the three priorities suggested they would be best in dark and placed at the center to immediately attract the reader’s attention. The arrows show the theory behind the DWCP as illustrated by outcome chains leading to each priority. To read the model, begin from the outside and move toward the center.
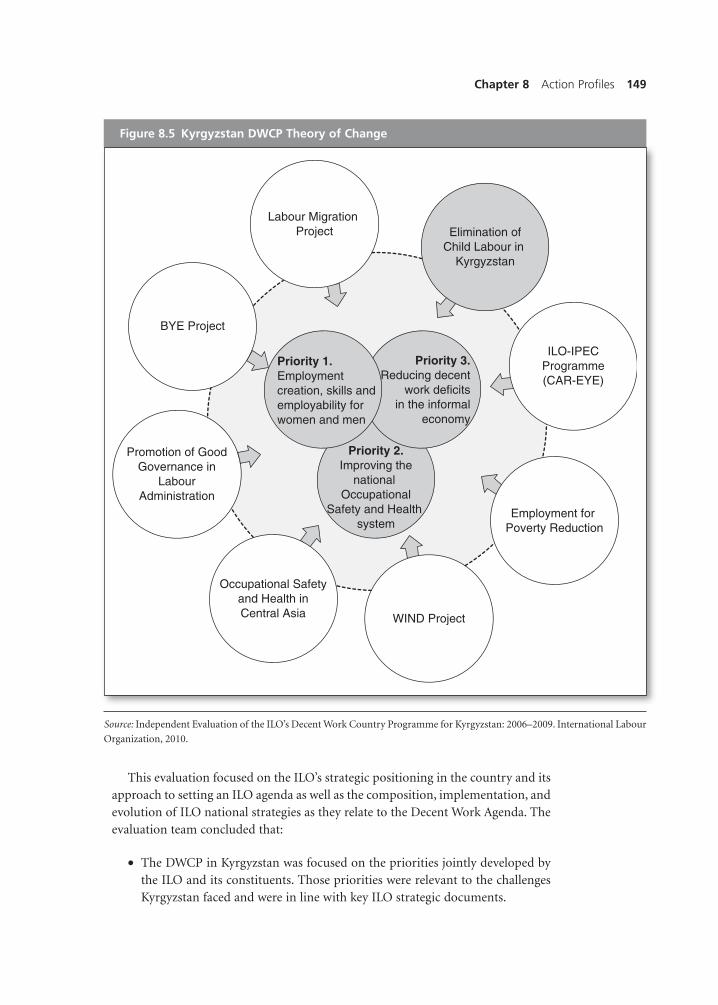
As the evaluation process unfolded, it became clear to the evaluators that the core of the DWCP could be presented as a combination of subregional project activities implemented in Kyrgyzstan that contributed to DWCP outcomes. To visualize this finding, evaluators developed a simpler orbital model that showed several projects that made major contributions to the implementation of the DWCP (Figure 8.5). The project shaded gray in this second model was the only “national” project (i.e., a project implemented exclusively in Kyrgyzstan).
This model helped demonstrate the actual nature of the DWCP (combination of activities implemented under independent subregional projects) as opposed to the theory described in program documents and illustrated in Figure 8.4. The two models were presented in the same way and could be easily compared. The evalua-tors indicate this simpler version “represented evidence in a way that helped the evaluation team to introduce some findings in a clear and convincing manner.” This profile demonstrates that models can be used to illustrate both theory and the actual program as implemented. The relative contrast can be informative for operations staff.
148
Sour
ce: I
nde
pen
den
t Ev
alu
atio
n o
f th
e IL
O’s
Dec
ent
Wor
k C
oun
try
Pro
gram
me
for
Kyr
gyzs
tan
: 200
6–20
09. I
nte
rnat
ion
al L
abou
r O
rgan
izat
ion
, 201
0.
Fig
ure
8.4
Kyr
gyz
stan
DW
CP
Theo
ry o
f C
han
ge
Wit
h O
utc
om
es
Mid
-ter
m o
utc
om
e 1.
2.IL
O’s
con
stitu
ents
are
equ
ippe
dw
ith p
ract
ical
tool
s an
dm
etho
dolo
gies
for
appl
ying
an
inte
grat
ed a
ppro
ach
toem
ploy
men
t cre
atio
n
Mid
-ter
m o
utc
om
e 4.
1P
olic
y of
the
part
ners
is a
imed
at
deve
lopi
ng in
stitu
tiona
l mec
hani
sms
ofth
e so
cial
par
tner
ship
sys
tem
thro
ugh
enha
nced
act
ivity
of t
he tr
ipar
tite
com
mis
sion
s an
d pr
omot
ion
ofco
llect
ive
barg
aini
ng a
t all
leve
ls.
Mid
-ter
m o
utc
om
e 1.
1.C
apac
ities
of t
he g
over
nmen
t and
soci
al p
artn
ers’
inst
itutio
ns a
reen
hanc
ed to
form
ulat
e la
bour
mar
ket p
olic
ies
and
effe
ctiv
ely
cont
ribut
e to
impl
emen
tatio
n of
empl
oym
ent s
trat
egie
s an
dpr
ogra
mm
esM
id-t
erm
ou
tco
me
2.1.
Rev
iew
and
upg
radi
ng o
f the
Kyr
gyz
natio
nal O
SH
sys
tem
.
Mid
-ter
m o
utc
om
e 3.
1.Im
prov
ed lo
cal s
ocia
l dia
logu
e in
agric
ultu
re a
nd o
ther
sec
tors
of
info
rmal
eco
nom
y, p
artic
ular
ly in
the
text
ile in
dust
ry.
Mid
-ter
m o
utc
om
e 3.
3S
tren
gthe
ned
capa
city
of t
heG
over
nmen
t and
soc
ial p
artn
ers
inK
yrgy
zsta
n to
add
ress
the
wor
stfo
rms
of c
hild
labo
ur a
nd in
crea
sed
awar
enes
s of
pop
ulat
ion
of th
eha
zard
s of
the
WF
CL
Mid
-ter
m o
utc
om
e 3.
2IL
O c
onst
ituen
ts a
nd k
ey p
artn
ers
appl
y in
tegr
ated
loca
l dev
elop
men
tst
rate
gies
incl
udin
g th
e ru
ral a
ndur
ban
info
rmal
eco
nom
y.
Pri
ority
1.
Em
ploy
men
tcr
eatio
n, s
kills
and
empl
oyab
ility
for
wom
en a
nd m
enPR
IOR
ITE
S
“Oth
er a
reas
of
wo
rk”
SH
OR
T-T
ER
M O
UT
CO
ME
SM
ID-T
ER
MO
UT
CO
ME
S
Pri
ori
ty 2
.Im
prov
ing
the
natio
nal
Occ
upat
iona
lS
afet
y an
d H
ealth
syst
em
Pri
ori
ty 3
.R
educ
ing
dece
ntw
ork
defic
its in
the
info
rmal
econ
omy
Sh
ort
-ter
m o
utc
om
e 3.
1.2
Pro
visi
on o
f dec
ent a
nd s
afe
livin
gan
d w
orki
ng c
ondi
tions
in r
ural
info
rmal
eco
nom
y th
roug
h lo
cal
econ
omy
deve
lopm
ent
Sh
ort
-ter
m o
utc
om
e 3.
1.1
Kno
wle
dge
of a
ctor
s w
ithin
the
labo
ur a
dmin
istr
atio
n sy
stem
of
the
prin
cipl
es o
f goo
d go
vern
ance
and
thei
r re
leva
nce
for
a so
und
labo
ur a
nd s
ocia
l pol
icy
has
incr
ease
d
Sh
ort
-ter
m o
utc
om
e 1.
1.1
Labo
ur m
arke
t situ
atio
n of
you
th in
Kyr
gyzs
tan
is d
ocum
ente
d th
roug
h IL
OS
choo
l-To-
Wor
k T
rans
ition
Sur
vey
and
othe
r da
ta c
olle
ctio
n ex
erci
ses
that
allo
w fo
r la
bour
mar
ket d
evel
opm
ent
anal
ysis
and
pla
nnin
g.Sh
ort
-ter
m o
utc
om
e 1.
1.2.
Con
stitu
ents
take
act
ion
toal
levi
ate
the
soci
o-ec
onom
icim
pact
of H
IV/A
IDS
in th
e w
orld
of w
ork.
Sh
ort
- te
rm o
utc
om
e 1.
2.1.
ILO
’s c
onst
ituen
ts, s
take
hold
ers,
and
inte
rmed
iarie
s ap
ply
tool
s an
dap
proa
ches
that
are
gro
unde
d in
ILO
core
val
ues
to a
ssis
t ent
erpr
ises
,in
clud
ing
coop
erat
ives
, to
incr
ease
empl
oym
ent a
nd in
com
e op
port
uniti
esfo
r yo
ung
wom
en a
nd m
en.
Sh
ort
-ter
m o
utc
om
e 2.
1.1
Impr
oved
wor
king
con
ditio
ns in
sele
cted
hig
h-ris
k in
dust
rial
sect
or.
Sh
ort
-ter
m o
utc
om
e 4.
1.1
Impl
emen
tatio
n of
the
stat
epo
vert
y re
duct
ion
prog
ram
sth
roug
h a
serie
s of
incr
ease
s of
min
imum
wag
e by
impr
ovem
ents
of th
e na
tiona
l leg
isla
tion
in li
new
ith th
e in
tern
atio
nal l
abou
rst
anda
rds
Sh
ort
-ter
m o
utc
om
e 3.
3.1
Info
rmat
ion
base
on
the
geog
raph
y, m
agni
tude
and
char
acte
ristic
s of
chi
ld la
bour
isde
velo
ped
and
acce
ssib
le to
the
part
ners
Sh
ort
-ter
m o
utc
om
e 3.
2.1
Coo
pera
tive
deve
lopm
ent i
nag
ricul
ture
sec
tor.
Chapter 8 Action Profiles 149
This evaluation focused on the ILO’s strategic positioning in the country and its approach to setting an ILO agenda as well as the composition, implementation, and evolution of ILO national strategies as they relate to the Decent Work Agenda. The evaluation team concluded that:
• The DWCP in Kyrgyzstan was focused on the priorities jointly developed by the ILO and its constituents. Those priorities were relevant to the challenges Kyrgyzstan faced and were in line with key ILO strategic documents.
Source: Independent Evaluation of the ILO’s Decent Work Country Programme for Kyrgyzstan: 2006–2009. International Labour
Organization, 2010.
Figure 8.5 Kyrgyzstan DWCP Theory of Change
BYE Project
Promotion of GoodGovernance in
LabourAdministration
Occupational Safetyand Health inCentral Asia WIND Project
Employment for Poverty Reduction
ILO-IPECProgramme(CAR-EYE)
Elimination ofChild Labour in
Kyrgyzstan
Labour Migration Project
Priority 1.Employmentcreation, skills andemployability for women and men
Priority 2.Improving the
national Occupational
Safety and Health system
Priority 3.Reducing decent
work deficitsin the informal
economy
150 PART II APPLICATIONS
• Although it focused on the three clearly defined priorities relevant to the country context, the program was not based on a clearly defined logic model and was not logically coherent.
The evaluation team used primarily qualitative methods to collect data on the DWCP results. During data collection, the evaluation team reviewed 33 documents, interviewed 56 stakeholders, and conducted direct observation of several ILO proj-ects. Evaluators recommended that the DWCP develop a coherent program logic based on priorities. The new DWCP program logics should be coherent and focused on the priorities identified by the tripartite constituents rather than on the existing regional projects with secure funding.
References
For additional information, contact Alexey Kuzmin at [email protected] and
Craig Russon at [email protected].
The evaluation report for this work is found at Independent Evaluation of the ILO’s Decent Work
Country Program: Kyrgyzstan: 2006–2009. Retrieved December 22, 2011, from http://
www.ilo.org/public/english/bureau/program/dwcp/download/eval-kyrgyzstan.pdf
Profile 4: Alabama Tackles Asthma
Twenty-three million adults and children suffer from asthma in the United States, incurring an estimated $13 to $20 billion in direct medical costs and indirect costs due to lost productivity annually. In Alabama, 1 in 10 residents is diagnosed with asthma. It is a substantial chronic health issue with significantly different prevalence for gender and race. Women experience asthma at a rate twice that for men and have a nearly double rate of death. African Americans have an incidence rate of 3 percentage points more but double the rate of death for the Caucasian or white population.
Led by the Alabama Department of Public Health and co-created with the Alabama Asthma Coalition, public health officials and a broad assembly of stake-holders built a 5-year strategic plan to affect asthma. This plan was the basis for an overarching and generic model that guided multiple committees to author com-mittee models with specific activities and outcomes.
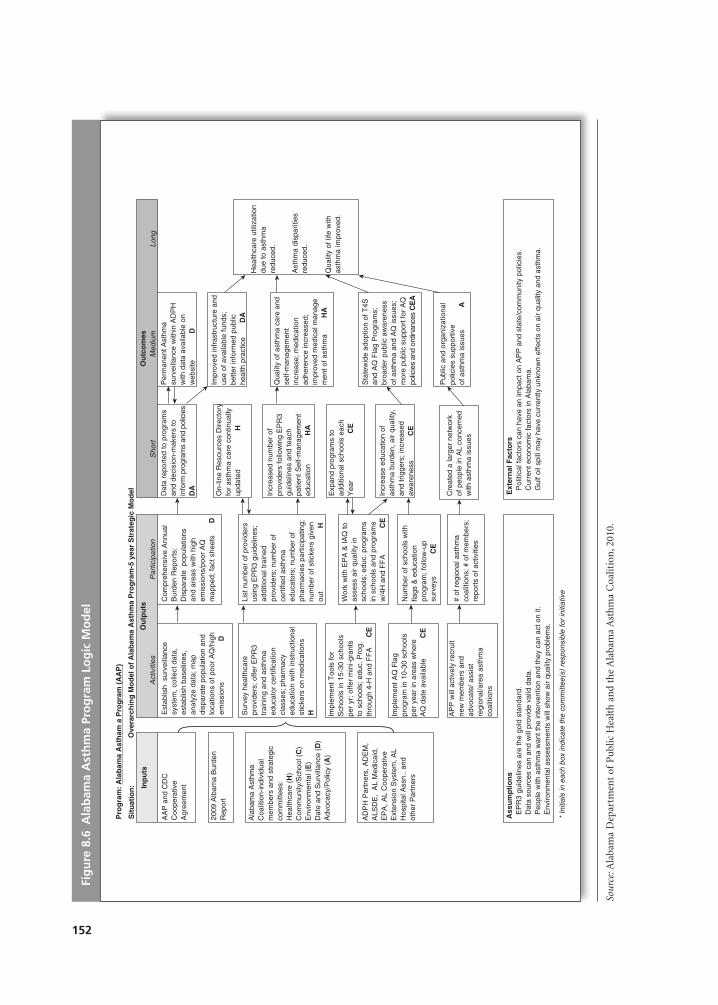
The model generates its own evidence base for community- and statewide pro-grams (see Figure 8.6). A primary activity of the model is to act as a surveillance system. It will collect data, establish baselines in areas where no data exist, and map disparate populations and areas of poor air quality or high emissions. This initially informs comprehensive annual burden reports. In this way, the surveillance system enables other aspects of the program to rely on data. Short-term outcomes include acquisition of baseline data as well as a continuing stream of information that will be used to inform activities, programs, and policymaking efforts.
Three gross areas are identified in the model, reading left to right: inputs, out-puts, and outcomes. The meta-model is intended to be generic; the color-keyed
Chapter 8 Action Profiles 151
letters refer the reader to specific committee pages for more detailed descriptions of the activities and outcomes. The activities listed on this page are intended to be implemented in the coming years, with selected activities to continue throughout the cooperative agreement. These activities are jointly performed by separate com-mittees, from different viewpoints. For instance, both the Community/School (C) Committee and the Environmental (E) Committee will be working on implement-ing Tools for Schools in schools. However, the C Committee will be working on the educational programs and public awareness, while the E Committee will work from the indoor and outdoor air quality aspect. Once the program has been imple-mented by those committees, the project will be picked up by the Advocacy and Policy (A) Committee to bolster statewide adoption and public support for asthma-friendly policies and ordinances. The model also includes a specific list of both assumptions and external factors.
Each committee has its own “nested” logic model that coordinates with the meta-model but gives more details regarding each planned activity and its intended outcomes, as well as tailored inputs, assumptions, and external factors. Future logic models will include separate models for each intervention planned during a par-ticular time frame and thus allowing for ease in adapting activities as needs change or evaluation shows the efficacy of the planned interventions.
After providing an initial overview of logic models, Public Health staff sent each committee labeled sheets (a template) for them to prepare relevant and focused content for their committee models. In a social process, the facilitator provided a chance for review of each model and its fit with a larger view. This provided an important opportunity for engagement.
The logic model shown here has been used as a guide to where interventions and activities are leading—the ultimate outcome—as well as showing which commit-tees have parts to play during the process. It has been adapted and changed as there is discovery about what works and what doesn’t. For example, funding has been limited in some of the work associated with schools, but the “No Idling Campaign” exceeded expectations. School bus drivers attended an in-service and signed a pledge not to idle buses more than 5 minutes, resulting in gas cost savings and less emissions in the environment.
In this case, modeling was an asset for several reasons: It helped connect stake-holders, engaged vital expert contributions, provided a common communication platform, and managed expectations for more realistic timelines, resources, and program design. The nested models contributing to a whole also ensured impor-tant alignment among work teams.
Note that the model includes short-, medium-, and long-term outcomes, which are planned to reduce healthcare utilization due to asthma, reduce disparities among those who suffer asthma, and improve quality of life for patients and their families.
This exciting public health work to reduce asthma in Alabama was part of the CDC National Asthma Control Program. Staff expect models will be revised to serve future planning, monitoring, and evaluation needs as their work continues through 2014.
152
Sour
ce: A
laba
ma
Dep
artm
ent
of P
ubl
ic H
ealt
h a
nd
the
Ala
bam
a A
sth
ma
Coa
litio
n, 2
010.
Fig
ure
8.6
Ala
bam
a A
sth
ma
Pro
gra
m L
og
ic M
od
el
Pro
gra
m:
Ala
bam
a A
sth
am a
Pro
gra
m (
AA
P)
Sit
uat
ion
: Inp
uts
AA
P a
nd C
DC
Coo
pera
tive
Agr
eem
ent
2009
Alb
ama
Bur
den
Rep
ort
Ala
bam
a A
sthm
aC
oalit
ion-
indi
vidu
alm
embe
rs a
nd s
trat
egic
com
mitt
ees:
Hea
lthca
re (
H)
Com
mun
ity/S
choo
l (C
)E
nviro
nmen
tal (
E)
Dat
e an
d S
urvi
llanc
e (D
)A
dvoc
acy/
Pol
icy
(A)
AD
PH
Par
tner
s, A
DE
M,
ALS
DE
, A
L M
edic
aid,
EP
A, A
L C
oope
rativ
eE
xten
sion
Sys
tem
, AL
Hos
pita
l Ass
n.. a
ndot
her
Par
tner
s
Ove
rarc
hin
g M
od
el o
f A
lab
ama
Ast
hm
a P
rog
ram
-5 y
ear
Str
ateg
ic M
od
el
Ou
tpu
tsO
utc
om
esS
hort
Med
ium
Long
Act
iviti
esP
artic
ipat
ion
Est
ablis
h s
urve
illan
cesy
stem
, col
lect
dat
a,es
tabl
ish
base
lines
,an
alyz
e da
ta; m
apdi
spar
ate
popu
latio
n an
dlo
catio
ns o
f poo
r A
Q/h
igh
emis
sion
s
D
Com
preh
ensi
ve A
nnua
lB
urde
n R
epor
ts;
Dis
para
te p
opul
atio
nsan
d ar
eas
with
hig
h em
issi
ons/
poor
AQ
map
ped;
fact
she
ets
D
Dat
a re
port
ed to
pro
gram
s an
d de
cisi
on-m
aker
s to
in
form
pro
gram
s an
d po
licie
s D
A
Per
man
ent A
sthm
asu
rvei
llanc
e w
ithin
AD
PH
with
dat
a av
aila
ble
onw
ebsi
te
D
Impr
oved
infr
astr
uctu
re a
ndus
e of
ava
ilabl
e fu
nds;
bette
r in
form
ed p
ublic
heal
th p
ract
ice
DA
Qua
lity
of a
sthm
a ca
re a
ndse
lf-m
anag
emen
tin
crea
se; m
edic
atio
nad
here
nce
incr
ease
d;im
prov
ed m
edic
al m
anag
em
ent o
f ast
hma
HA
Hea
lthca
re u
tiliz
atio
ndu
e to
ast
hma
redu
ced.
Ast
hma
disp
ariti
esre
duce
d.
Qua
lity
of li
fe w
ithas
thm
a im
prov
ed.
Sta
tew
ide
adop
tion
of T
4San
d A
Q F
lag
Pro
gram
s;br
oade
r pu
blic
aw
aren
ess
of a
sthm
a an
d A
Q is
sues
; m
ore
publ
ic s
uppo
rt fo
r A
Qpo
licie
s an
d or
dina
nces
CE
A
Pub
lic a
nd o
rgan
izat
iona
lpo
licie
s su
ppor
tive
of a
sthm
a is
sues
A
On-
line
Res
ourc
es D
irect
ory
for
asth
ma
care
con
tinua
llyup
date
d
H
Incr
ease
d nu
mbe
r of
prov
ider
s fo
llow
ing
EP
R3
guid
elin
es a
nd te
ach
patie
nt S
elf-
man
agem
ent
educ
atio
n
H
A
Exp
and
prog
ram
s to
ad
ditio
nal s
choo
ls e
ach
Yea
r
CE
Incr
ease
edu
catio
n of
asth
ma
burd
en, a
ir qu
ality
,an
d tr
igge
rs; i
ncre
ased
awar
enes
s
CE
Cre
ated
a la
rger
net
wor
kof
peo
ple
in A
L co
ncem
edw
ith a
sthm
a is
sues
List
num
ber
of p
rovi
ders
us
ing
EP
R3
guid
elin
es;
addi
tiona
l tra
ined
prov
ider
s; n
umbe
r of
cert
ified
ast
hma
educ
ator
s; n
umbe
r of
phar
mac
ies
part
icip
atin
g;nu
mbe
r of
stic
kers
giv
en
out
H
Wor
k w
ith E
PA
& IA
Q to
asse
ss a
ir qu
ality
in
scho
ols;
edu
c. p
rogr
ams
in s
choo
ls a
nd p
rogr
ams
w/4
H a
nd F
FA
CE
Num
ber
of s
choo
ls w
ithfla
gs &
edu
catio
npr
ogra
m; f
ollo
w-u
psu
rvey
s
CE
# of
reg
iona
l ast
hma
coal
ition
s; #
of m
embe
rs;
repo
rts
of a
ctiv
ities
Sur
vey
heal
thca
repr
ovid
ers;
offe
r E
PR
3tr
aini
ng a
nd a
sthm
aed
ucat
or c
ertif
icat
ion
clas
ses;
pha
rmac
yed
ucat
ion
with
inst
ruct
iona
lst
icke
rs o
n m
edic
atio
nsH Im
plem
ent T
ools
for
Sch
ools
in 1
5-30
sch
ools
per
yr; o
ffer
min
i-gra
nts
to s
choo
ls; e
duc.
Pro
g.th
roug
h 4-
H a
nd F
FA
C
E
Impl
emen
t AQ
Fla
gpr
ogra
m in
10-
30 s
choo
lspe
r ye
ar in
are
as w
here
AQ
dat
e av
aila
ble
C
E
AP
P w
ill a
ctiv
ely
recr
uit
new
mem
bers
and
advo
cate
/ ass
ist
regi
onal
/are
a as
thm
aco
aliti
ons
Ass
um
pti
on
s E
PR
3 gu
idel
ines
are
the
gold
sta
ndar
d. D
ata
sour
ces
can
and
will
pro
vide
val
id d
ata.
Peo
ple
with
ast
hma
wan
t the
inte
rven
tion
and
they
can
act
on
it. E
nviro
nmen
tal a
sses
smen
ts w
ill s
how
air
qual
ity p
robl
ems.
* In
itial
s in
eac
h bo
x in
dica
te th
e co
mm
ittee
(s)
resp
onsi
ble
for
initi
ativ
e
Ext
ern
al F
acto
rs P
oliti
cal f
acto
rs c
an h
ave
an im
pact
on
AP
P a
nd s
tate
/com
mun
ity p
olic
ies.
Cur
rent
eco
nom
ic fa
ctor
s in
Ala
bam
a. G
ulf o
il sp
ill m
ay h
ave
curr
ently
unk
now
n ef
fect
s on
air
qual
ity a
nd a
sthm
a.
Chapter 8 Action Profiles 153
References
Contact Debra Hodges (at [email protected]), Alabama Department of Public
Health. See also:
Williamson, D. E., Miller, T. M., & McVay, J. (2009). Alabama asthma burden report.
Montgomery, AL: Alabama Department of Public Health. Retrieved December 22,
2011, from http://adph.org/steps/assets/ALAsthmaBurden.pdf
Profile 5: Resilient Communities
A “world of resilient communities and re-localized economies that thrive within ecological bounds” is an exciting vision. This is the work of the Post Carbon Institute (PCI). Created in 2003, PCI is leading the transition to a more resilient, equitable, and sustainable world.
Alarming changes reflecting fundamental crises face our planet. Experts in eco-nomics, ecology, political systems, social justice, public health, and the environment can each cite complex challenges in their respective content areas. As these challenges converge and interact, they affect every living thing. Identifying those intersections for both vulnerabilities and opportunities is vital to building a more resilient society. The PCI suggests the following assumptions are essential in future planning:
• None of our global problems can be tackled in isolation.• We must focus on responses not just solutions.• We must prepare for business unusual.
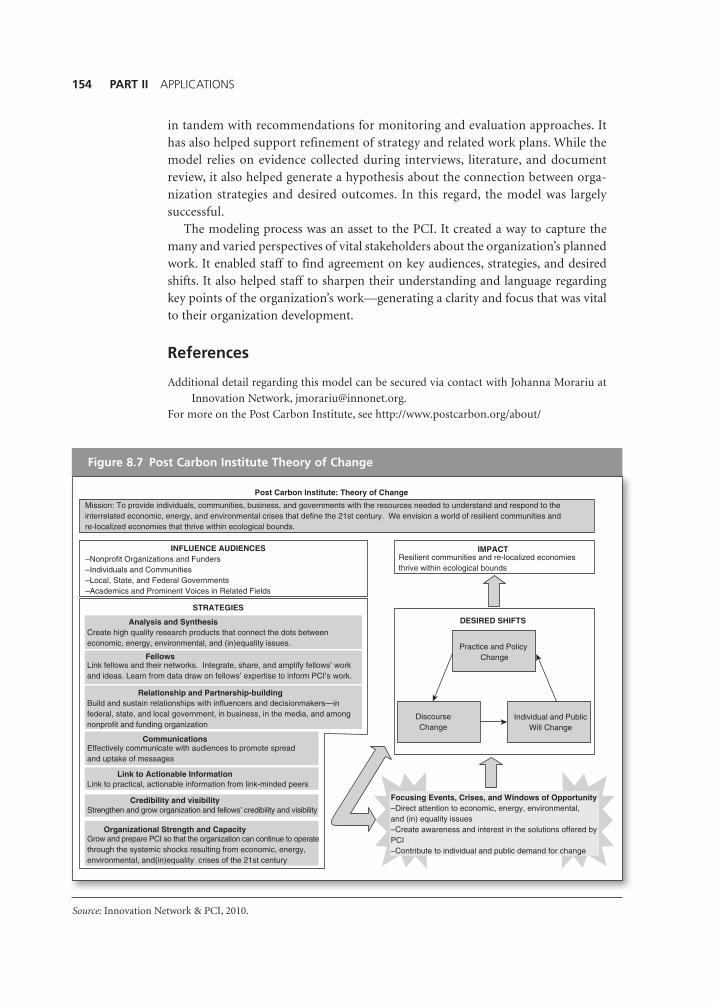
The PCI theory of change model (see Figure 8.7) is read counterclockwise, beginning with mission and continuing through audiences, strategies, focusing events, desired shifts, and impact.
The model uses variations in contrast to sequentially lead the reader through the information. The stylized area around focusing events, crises, and windows of opportunity was included to emphasize this area: an integral part of strategy formulation/implementation that can be easily overlooked in logic models/theories of change. The increased contrast around the area of impact was chosen to add emphasis, implying the role the rest of the model serves in contributing to impact. Authors elected to design the model in grayscale, since it is so common to see beau-tifully color-rendered models lose significance when they are printed—which is often in black and white.
Innovation Network staff created the model based on content gathered from inter-views with PCI staff, fellows, board members, volunteers, funders, and peers. A litera-ture review of assessment areas for similar thought leadership organizations was conducted and also informed the work. The model is based on interview theme analy-sis, field approaches to evaluation of like entities, and a thorough review of PCI docu-ments. Iterative feedback on versions of the model contributed to its development.
Models provided an interactive and important approach to discovering a rep-resentative consensus by stakeholders. The theory of change model was presented
154 PART II APPLICATIONS
in tandem with recommendations for monitoring and evaluation approaches. It has also helped support refinement of strategy and related work plans. While the model relies on evidence collected during interviews, literature, and document review, it also helped generate a hypothesis about the connection between orga-nization strategies and desired outcomes. In this regard, the model was largely successful.
The modeling process was an asset to the PCI. It created a way to capture the many and varied perspectives of vital stakeholders about the organization’s planned work. It enabled staff to find agreement on key audiences, strategies, and desired shifts. It also helped staff to sharpen their understanding and language regarding key points of the organization’s work—generating a clarity and focus that was vital to their organization development.
References
Additional detail regarding this model can be secured via contact with Johanna Morariu at
Innovation Network, [email protected].
For more on the Post Carbon Institute, see http://www.postcarbon.org/about/
Source: Innovation Network & PCI, 2010.
Figure 8.7 Post Carbon Institute Theory of Change
Post Carbon Institute: Theory of Change
–Nonprofit Organizations and Funders–Individuals and Communities–Local, State, and Federal Governments–Academics and Prominent Voices in Related Fields
Create high quality research products that connect the dots betweeneconomic, energy, environmental, and (in)equality issues.
Resilient communities and re-localized economiesthrive within ecological bounds
Practice and Policy Change
DiscourseChange
Individual and PublicWill Change
Mission: To provide individuals, communities, business, and governments with the resources needed to understand and respond to theinterrelated economic, energy, and environmental crises that define the 21st century. We envision a world of resilient communities andre-localized economies that thrive within ecological bounds.
INFLUENCE AUDIENCES IMPACT
DESIRED SHIFTS
STRATEGIES
Analysis and Synthesis
Link fellows and their networks. Integrate, share, and amplify fellows’ workand ideas. Learn from data draw on fellows’ expertise to inform PCI’s work.
Fellows
Build and sustain relationships with influencers and decisionmakers—infederal, state, and local government, in business, in the media, and amongnonprofit and funding organization
Relationship and Partnership-building
Effectively communicate with audiences to promote spreadand uptake of messages
Communications
Strengthen and grow organization and fellows’ credibility and visibility
Grow and prepare PCI so that the organization can continue to operate through the systemic shocks resulting from economic, energy,environmental, and(in)equality crises of the 21st century
Link to practical, actionable information from link-minded peersLink to Actionable Information
Credibility and visibility
Organizational Strength and Capacity
Focusing Events, Crises, and Windows of Opportunity–Direct attention to economic, energy, environmental,and (in) equality issues–Create awareness and interest in the solutions offered by PCI–Contribute to individual and public demand for change
Chapter 8 Action Profiles 155
Profile 6: Sheltering Families
Michigan’s challenging economy has created structural unemployment and increases in poverty. These conditions affect people in serious, life-altering ways. Fortunately, there’s an important resource for homeless families in East Lansing called Haven House. It provides emergency housing and support services for one- and two-parent families with children. The shelter helps families who are homeless prepare for permanent hous-ing by developing and promoting self-sufficiency, stability, and financial responsibility.
Through an applied experience, students in a Michigan State University (MSU) evaluation course became acquainted with the services of Haven House. The first model draft was created by working with the MSU professor and describing what happens to clients when they come into shelter. This initial work was given to the students, who then met with staff to ask clarification questions and direct program questions. Several meetings and associated modeling were required to edit and revise the display to accurately represent the Haven House program.
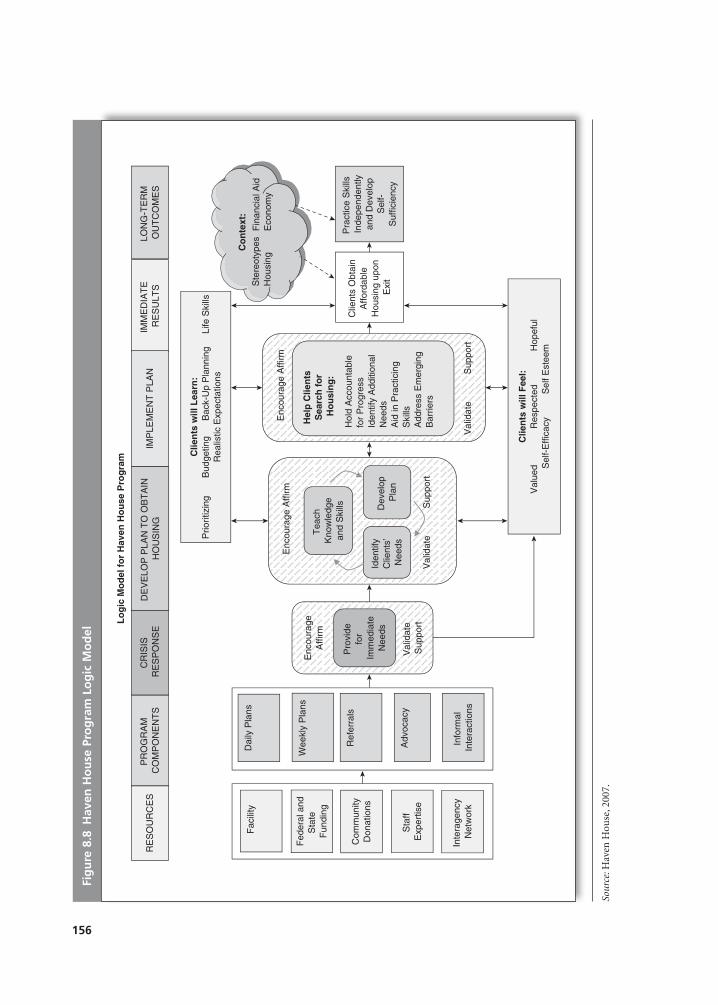
The model (see Figure 8.8) describes Haven House programs, including case management. It portrays the evolution of a client in the shelter, barriers, and pos-sible outcomes and includes external and internal forces that affect outcomes. Read from left to right, the Haven House model is based on the typical elements of a program logic model with some important adaptations. The program components appear in a single column, but this version of the model explicates both the crisis response and the intervention to obtain housing and its implementation. The orga-nization’s response and specificity in the service delivery raises important feedback issues about a key constituency: Haven House clients. The original model uses color to code elements of the plan to column headers. Note that in this display, immedi-ate and long-term outcomes are cited. Important context is also articulated.
As part of a broader evaluation plan, students focused on assessment of client satisfaction as well as changes in knowledge and skill. For this reason, they posted, on the model, constructs about client feeling and learning. These constructs guided the creation of features that indicate intended feelings (e.g., hopeful, valued) and new skills like budgeting. To determine the influence of Haven House, one aspect of the evaluation included a client survey. These data were collected and analyzed for shar-ing with staff. They provided important feedback and insight from the client’s per-spective. One resident shared, “I loved the experience. It was something I needed at 18 so that I can grow, meet different people, and learn new ways to do different things.” Another said, “Overall it’s a good program and if the rules are followed then success will come.” The model is a valued communication tool in external relations. It also helps staff to visualize their role and the barriers residents face. Participants indicate the modeling process and associated evaluation work were clarifying. Angie Mayeaux, Haven House director, says, “Much of the services we provide are difficult to articulate. The modeling pushed staff to really look at what they do and how they do it. Our staff also took some pride in seeing their work captured in the logic model.”
References
For more information, see www.havenhouseel.org.
156
Sour
ce: H
aven
Hou
se, 2
007.
Fig
ure
8.8
Hav
en H
ou
se P
rog
ram
Lo
gic
Mo
del
RE
SO
UR
CE
SP
RO
GR
AM
C
OM
PO
NE
NT
SC
RIS
IS
RE
SP
ON
SE
DE
VE
LOP
PLA
N T
O O
BT
AIN
H
OU
SIN
GIM
ME
DIA
TE
R
ES
ULT
SIM
PLE
ME
NT
PLA
NLO
NG
-TE
RM
O
UT
CO
ME
S
Clie
nts
will
Lea
rn:
Prio
ritiz
ing
Bud
getin
g
Bac
k-U
p P
lann
ing
L
ife S
kills
Rea
listic
Exp
ecta
tions
Clie
nts
will
Fee
l:V
alue
d
R
espe
cted
Hop
eful
Sel
f-E
ffica
cy
Sel
f Est
eem
Clie
nts
Obt
ain
Affo
rdab
le
Hou
sing
upo
n E
xit
Pra
ctic
e S
kills
In
depe
nden
tlyan
d D
evel
opS
elf-
Suf
ficie
ncy
Enc
oura
geA
ffirm
Val
idat
e S
uppo
rt
Pro
vide
fo
r Im
med
iate
Nee
dsD
evel
op
Pla
n
Iden
tify
Clie
nts’
N
eeds
Tea
ch
Kno
wle
dge
and
Ski
lls
Enc
oura
ge A
ffirm
Enc
oura
ge A
ffirm
Hel
p C
lien
ts
Sea
rch
fo
r H
ou
sin
g:
Hol
d A
ccou
ntab
le
for
Pro
gres
sId
entif
y A
dditi
onal
N
eeds
Aid
in P
ract
icin
g S
kills
Add
ress
Em
ergi
ng
Bar
riers
Co
nte
xt:
Lo
gic
Mo
del
fo
r H
aven
Ho
use
Pro
gra
m
Sup
port
Val
idat
e
Sup
port
Val
idat
e
Fac
ility
Fed
eral
and
Sta
te
Fun
ding
Com
mun
ityD
onat
ions
Sta
ff E
xper
tise
Inte
rage
ncy
Net
wor
k
Dai
ly P
lans
Wee
kly
Pla
ns
Ref
erra
ls
Adv
ocac
y
Info
rmal
In
tera
ctio
ns
Ste
reot
ypes
Hou
sing
F
inan
cial
Aid
Eco
nom
y
Chapter 8 Action Profiles 157
Profile 7: Environmental Leadership
Paint can have significant unintended environmental impacts—contaminating groundwater, harming fish and other aquatic life. Because it is combustible and contains solvents, it is also considered a hazardous waste. While most paint sold is now latex instead of oil based, managing leftover paint is a big and costly challenge for Americans. Nationwide, households generate some 75 million gal-lons of leftover paint. This is about 10% of the amount of paint purchased annually. At more than $8 per gallon, the estimated cost to manage it is substan-tial. In Oregon, paint is the single largest contributor to household hazardous waste programs.
In 2002, product stewardship for postconsumer paint began when paint manufacturers, local state and federal agencies, and retailers, along with con-sumer and environmental agencies, formed the Paint Product Stewardship Initiative (PPSI). Facilitated negotiations by the Product Stewardship Institute (PSI) helped to create an industry-managed postconsumer paint management system. After many years, in 2009, Oregon became the first state in the United States to enact a law that identifies product stewardship as the preferred method to reduce environmental impacts and costs associated with leftover paint.
Oregon’s statewide system for the collection of postconsumer latex- and oil-based paint is based on six goals originally created by the PPSI:
• Goal 1: The pilot project is a collaborative and cooperative process.• Goal 2: Establish a paint stewardship organization (PSO), which operates
under the direction of the paint industry.• Goal 3: Consumers (including painting contractors) generate no or less waste
paint and containers.• Goal 4: The statewide postconsumer paint management system should be
designed to ensure that it is environmentally beneficial, economical, and con-venient. With these considerations, the system should strive to use methods highest on the following waste management hierarchy: reuse, recycling (into paint or other products), energy recovery (generally applicable to oil-based paint), and proper disposal.
• Goal 5: Identify cost-effective alternatives for using postconsumer paint prod-ucts and explore means to expand the market for products containing post-consumer paint.
• Goal 6: Measure and evaluate the performance of the pilot project, and ensure the results and learning that the evaluation generates are transfer-able and relevant to the rollout of a national postconsumer paint manage-ment system.
The PPSI formed an evaluation committee to ensure overall accountability and implementation of the last goal.
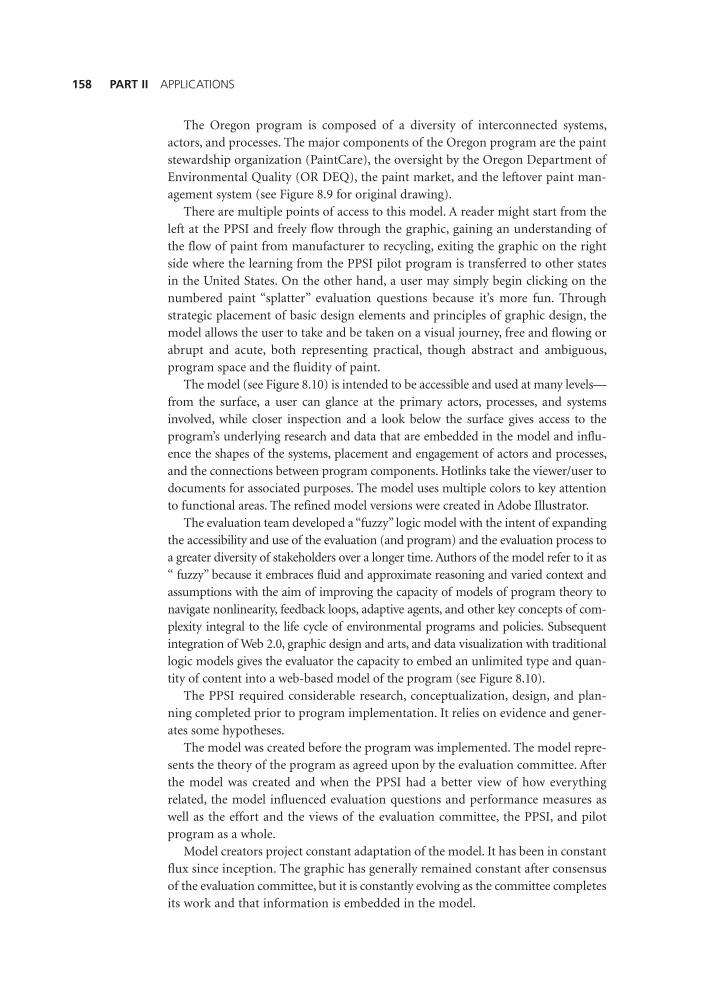
158 PART II APPLICATIONS
The Oregon program is composed of a diversity of interconnected systems, actors, and processes. The major components of the Oregon program are the paint stewardship organization (PaintCare), the oversight by the Oregon Department of Environmental Quality (OR DEQ), the paint market, and the leftover paint man-agement system (see Figure 8.9 for original drawing).
There are multiple points of access to this model. A reader might start from the left at the PPSI and freely flow through the graphic, gaining an understanding of the flow of paint from manufacturer to recycling, exiting the graphic on the right side where the learning from the PPSI pilot program is transferred to other states in the United States. On the other hand, a user may simply begin clicking on the numbered paint “splatter” evaluation questions because it’s more fun. Through strategic placement of basic design elements and principles of graphic design, the model allows the user to take and be taken on a visual journey, free and flowing or abrupt and acute, both representing practical, though abstract and ambiguous, program space and the fluidity of paint.
The model (see Figure 8.10) is intended to be accessible and used at many levels—from the surface, a user can glance at the primary actors, processes, and systems involved, while closer inspection and a look below the surface gives access to the program’s underlying research and data that are embedded in the model and influ-ence the shapes of the systems, placement and engagement of actors and processes, and the connections between program components. Hotlinks take the viewer/user to documents for associated purposes. The model uses multiple colors to key attention to functional areas. The refined model versions were created in Adobe Illustrator.
The evaluation team developed a “fuzzy” logic model with the intent of expanding the accessibility and use of the evaluation (and program) and the evaluation process to a greater diversity of stakeholders over a longer time. Authors of the model refer to it as “ fuzzy” because it embraces fluid and approximate reasoning and varied context and assumptions with the aim of improving the capacity of models of program theory to navigate nonlinearity, feedback loops, adaptive agents, and other key concepts of com-plexity integral to the life cycle of environmental programs and policies. Subsequent integration of Web 2.0, graphic design and arts, and data visualization with traditional logic models gives the evaluator the capacity to embed an unlimited type and quan-tity of content into a web-based model of the program (see Figure 8.10).
The PPSI required considerable research, conceptualization, design, and plan-ning completed prior to program implementation. It relies on evidence and gener-ates some hypotheses.
The model was created before the program was implemented. The model repre-sents the theory of the program as agreed upon by the evaluation committee. After the model was created and when the PPSI had a better view of how everything related, the model influenced evaluation questions and performance measures as well as the effort and the views of the evaluation committee, the PPSI, and pilot program as a whole.
Model creators project constant adaptation of the model. It has been in constant flux since inception. The graphic has generally remained constant after consensus of the evaluation committee, but it is constantly evolving as the committee completes its work and that information is embedded in the model.
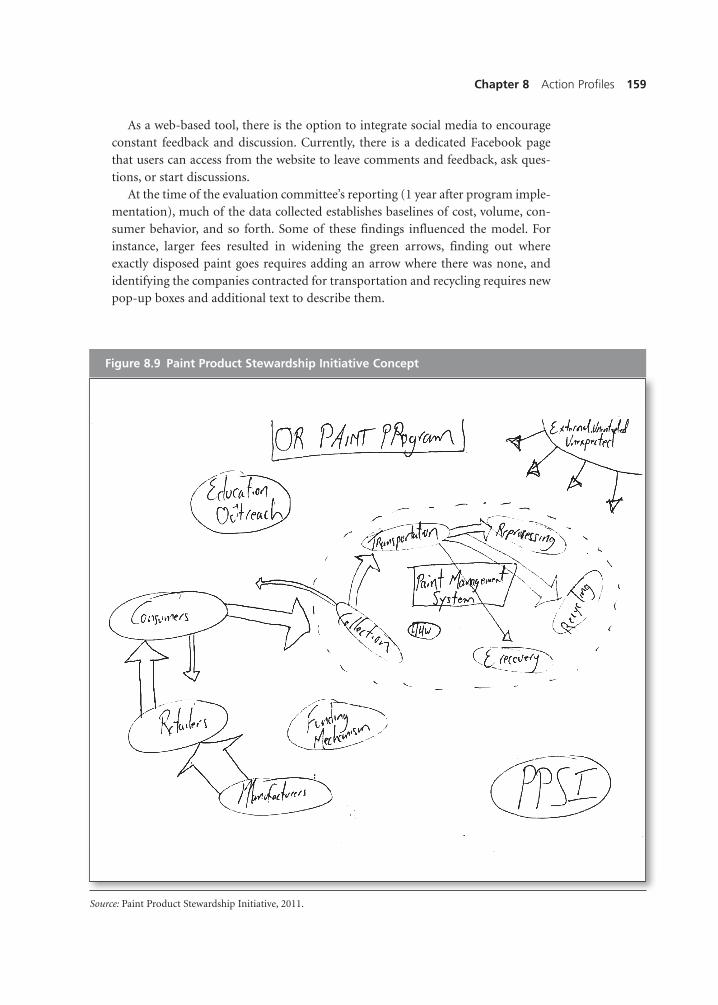
Chapter 8 Action Profiles 159
As a web-based tool, there is the option to integrate social media to encourage constant feedback and discussion. Currently, there is a dedicated Facebook page that users can access from the website to leave comments and feedback, ask ques-tions, or start discussions.
At the time of the evaluation committee’s reporting (1 year after program imple-mentation), much of the data collected establishes baselines of cost, volume, con-sumer behavior, and so forth. Some of these findings influenced the model. For instance, larger fees resulted in widening the green arrows, finding out where exactly disposed paint goes requires adding an arrow where there was none, and identifying the companies contracted for transportation and recycling requires new pop-up boxes and additional text to describe them.
Figure 8.9 Paint Product Stewardship Initiative Concept
Source: Paint Product Stewardship Initiative, 2011.
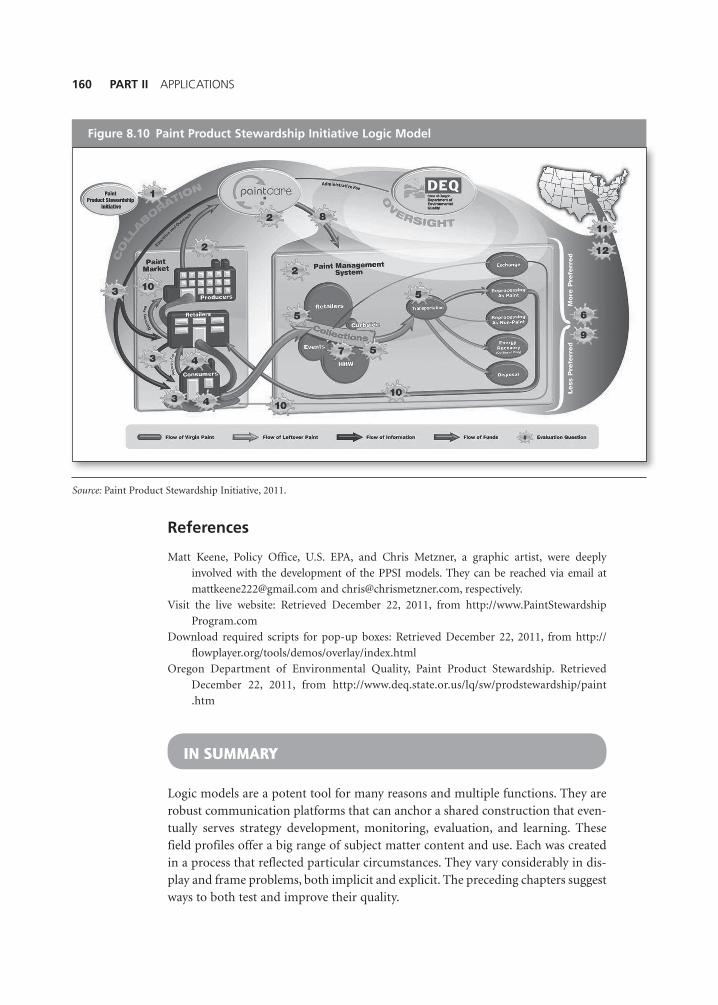
160 PART II APPLICATIONS
References
Matt Keene, Policy Office, U.S. EPA, and Chris Metzner, a graphic artist, were deeply
involved with the development of the PPSI models. They can be reached via email at
[email protected] and [email protected], respectively.
Visit the live website: Retrieved December 22, 2011, from http://www.PaintStewardship
Program.com
Download required scripts for pop-up boxes: Retrieved December 22, 2011, from http://
flowplayer.org/tools/demos/overlay/index.html
Oregon Department of Environmental Quality, Paint Product Stewardship. Retrieved
December 22, 2011, from http://www.deq.state.or.us/lq/sw/prodstewardship/paint
.htm
IN SUMMARY
Logic models are a potent tool for many reasons and multiple functions. They are robust communication platforms that can anchor a shared construction that even-tually serves strategy development, monitoring, evaluation, and learning. These field profiles offer a big range of subject matter content and use. Each was created in a process that reflected particular circumstances. They vary considerably in dis-play and frame problems, both implicit and explicit. The preceding chapters suggest ways to both test and improve their quality.
Figure 8.10 Paint Product Stewardship Initiative Logic Model
Source: Paint Product Stewardship Initiative, 2011.
Chapter 8 Action Profiles 161
LEARNING RESOURCES
Reflection
1. What features of logic models are most common in the field profiles shown in this chapter? Why?
2. Which model is most like the one you might create? Why does it resonate with your communication style or purpose?
3. Which model is most difficult to interpret? Can you name the reasons? Are there changes you would make to simplify or clarify it?
4. Which model represents work that’s most likely to garner the intended results?
5. Can you articulate assumptions for each model? How would you cite the problem(s) each solves?
6. Consider contextual barriers and facilitators for each model. Try to name some for each.
Exercises
1. Revisit Chapter 4 and consider quality principles for each model. How does this influence your perception of the model’s potential to describe work and associ-ated results? Are there changes you would make?
2. Explain the purpose of a given model and its content. Then ask two small groups to draw a model. Compare it to the figure shown. What differences are there? Why? Any improvements?
3. Prepare an evaluation design for the ConAgra Foods Foundation (Profile 2). How do the models help or hinder? What questions does the process raise?
4. Try to locate an evidence base for each of the models. How does your discovery inform corrections or edits to the models?
References and Supplemental Readings
Texts
Krogerus, M., Tschappler, R., & Piening, J. (2008). The decision book: Fifty models for strategic
thinking. London: Kein & Aber.
Nissen, M. E. (2006). Harnessing knowledge dynamics: Principled organizational knowing and
learning. Hershey, PA: IRM Press.
Osterwalder, A. (2010). Business model generation: A handbook for visionaries, game changers
and challengers. Hoboken, NJ: Wiley.
Pugh, K. (2011). Sharing hidden know-how: How managers solve thorny problems with the
knowledge jam. San Francisco: Jossey-Bass.
162 PART II APPLICATIONS
Rumelt, R. (2011). Good strategy bad strategy: The difference and why it matters. New York:
Random House.
Sibbett, D. (2010). Visual meetings: How graphics, sticky notes and idea mapping can transform
group productivity. Hoboken, NJ: Wiley.
Journal Articles
Astbury, B., & Leeuw, F. L. (2010). Unpacking black boxes: Mechanisms and theory building
in evaluation. American Journal of Evaluation, 31(3), 363–381.
Brandon, P. R., Smith, N. L., & Hwalek, M. (2011). Aspects of successful evaluation practice at
an established private evaluation firm. American Journal of Evaluation, 32(2), 295–307.
Garcia-Iriarte, E., Suarez-Balcazar, Y., Taylor-Ritzler, T., & Luna, M. (2011). A catalyst-for-change
approach to evaluation capacity building. American Journal of Evaluation, 32(1), 168–182.
Kundin, D. M. (2010). A conceptual framework for how evaluators make everyday practice
decisions. American Journal of Evaluation, 31(3), 347–362.
Piggott-Irvine, E. (2010). Confronting evaluation blindness: Evidence of impact of action
science-based feedback. American Journal of Evaluation, 31(3), 314–35.
Saari, E., & Kallio, K. (2011). Developmental impact evaluation for facilitating learning in
innovation networks. American Journal of Evaluation, 32(2), 227–245.
Skolits, G. J., Morrow, J. A., & Burr, E. M. (2009). Reconceptualizing evaluator roles. American
Journal of Evaluation, 30(3), 275–295.
Internet and Other Resources
Center for Civic Partnerships. (2007). Organizational learning: Tips, tools and resources.
Retrieved December 21, 2011, from http://www.civicpartnerships.org/toolsRes.htm
Foundation Center. (2011). Tools and resources for assessing social impact. Retrieved
December 21, 2011, from http://trasi.foundationcenter.org/about.php
Human Resource Development Council. (n.d.). Organizational learning strategies. Retrieved
December 22, 2011, from http://www.humtech.com/opm/grtl/ols/ols2.cfm
Problem-solving Techniques. (2011). Problem-solving techniques portal. Retrieved December 22,
2011, from http://www.problem-solving-techniques.com/Problem-Solving-Tools.html