parental involvement and the intergenerational ... - econtribute
TRANSCRIPT
Funding by the Deutsche Forschungsgemeinschaft (DFG, German Research Foundation) underGermany´s Excellence Strategy – EXC 2126/1– 390838866 is gratefully acknowledged.
www.econtribute.de
ECONtributeDiscussion Paper No. 027
September 2020
Maria Zumbuehl Thomas Dohmen Gerard Pfann
Parental Involvement and theIntergenerational Transmission of EconomicPreferences, Attitude and Personality Traits
Parental Involvement and the Intergenerational
Transmission of Economic Preferences, Attitudes
and Personality Traits
Maria Zumbuehl ∗ Thomas Dohmen † Gerard Pfann ‡
September 20, 2020
Abstract
We empirically investigate the link between parental involvement
and shaping of the economic preferences, attitudes and personality
traits of their children. We exploit information on the risk and trust
attitudes, the Big Five personality traits and locus of control of parents
and their children, as well as rich information about parental e↵orts
in the upbringing of their children from the German Socio-Economic
Panel Study. Our results show that parents who are more involved
in the upbringing of their children have children with more favourable
attitudes and traits. These children rank higher in traits that further
their success in life, and they are more similar to their parents in those
attitudes, where the optimum level is more ambiguous.
We thank Fabrizio Zilibotti, Arjan Non, Lex Borghans, Nicolas Salamanca, as well as
the members of the IAME retreat at the University of Bonn for their helpful comments
and suggestions. Thomas Dohmen gratefully acknowledges funding from the Deutsche
Forschungsgemeinschaft (DFG, German Research Foundation) through CRC TR 224
(Project A01) and Germany’s Excellence Strategy - EXC 2126/1- 390838866. Maria
Zumbuehl gratefully acknowledges funding by the Swiss State Secretariat for Education,
Research and Innovation SERI through the Leading House grant 1315000881. Gerard
Pfann gratefully acknowledges the hospitality of SOFI at Stockholm University.
∗CPB Netherlands Bureau for Economic Policy Analysis (corresponding author:
[email protected])†University of Bonn, Maastricht University, IZA, DIW and CESifo‡Maastricht University, CEPR, CESifo, IZA, DIA and SOFI
1
1 Introduction
Mounting evidence in the economics, psychology and sociology literature
indicates that preferences, attitudes and personality traits are transmitted
from parents to children.1 Dohmen et al. (2012) document an intergener-
ational correlation in risk and trust attitudes, while Duncan et al. (2005)
show that personality traits are transmitted from parents to their children.
This intergenerational transmission arguably contributes to the intergen-
erational correlation in economic outcomes such as income, education, or
health that has been well documented in the literature (for reviews see, e.g.,
Bjorklund and Salvanes, 2011; Black and Devereux, 2011; Holmlund et al.,
2011; Lindahl et al., 2016).2 As social mobility is of prime interest for soci-
ety, social scientists need to better understand the channels through which
these facets of human personality are transmitted from parents to children.
How preferences are formed and whether they can be moulded by nurture is
of particular concern for policy makers.3 Despite some recent evidence (see
Kosse et al., 2019, Falk et al., 2019 or Heckman et al., 2017 for socialisation
in general and Alan et al., 2017 and Brenøe and Epper, 2019 for socialisation
by parents), little is known about the channels through which socialisation
a↵ects preference formation.
A common central assumption in theories of cultural transmission (e.g.,
Bisin and Verdier, 2001; Doepke and Zilibotti, 2008), is that parents and the
social environment a↵ect the transmission of culture, values, attitudes and
preferences. These models di↵er in their assumptions about parental motives
that shape the transmission process. Bisin and Verdier (2001), for example,
assume that imperfect empathy prevails among parents, i.e. that parents
are altruistic towards their children but postulate that children’s evaluation
of choices resembles their own subjective evaluation, which is determined
by their own utility function. Hence, parents cannot “perfectly empathize”
with their children and evaluate their children’s choices only through the
1Psychologists and sociologist have been studying the transmission of personality traitsfrom parents to children since the 1930s (Loehlin, 2008), in economics the interest in thetopic is more recent (e.g. Anger, 2012 and Gronqvist et al., 2017).
2Bowles and Gintis (2002), for example, investigate how the transmission of personalitytraits, as well as IQ and race, influences intergenerational mobility in socioeconomic status.
3There is evidence that both nature and nurture play a role in preference transmission.Cesarini et al. (2009) show that there is a genetic e↵ect on preferences, while Dohmen et al.(2012) point out the importance of socialisation in the intergenerational transmission ofpreferences.
2
lens of their own utility function. As a result, they are inclined to incul-
cate their own values, attitudes and preferences in children, which leads to
similarity in these facets of personality between parents and their children.
Di↵erent from assuming imperfect empathy, Doepke and Zilibotti (2017) as-
sume that parents are driven by a combination of concern for the well-being
of the child (i.e. altruism) and a paternalistic motive. These parents try to
mould their children’s preferences to increase the children’s life-time welfare.
They are prepared to incur costs and trade-o↵ their children’s felicity during
childhood for higher utility as adults. Instilling preferences and traits that
foster success, e.g. that are conducive to human capital accumulation, does
not necessarily imply that parents want their children to have preferences
and traits that are similar to their own, especially if their own preferences do
not foster success in life. Such traits include, for example, conscientiousness
and an internal locus of control.
We assess empirically the role of parents in the transmission of pref-
erences and traits, by studying whether and how children’s attitudes and
personality traits are shaped by parental involvement. We thereby make
two contributions to the literature. First, since our results indicate that
increased parental involvement strengthens the preference transmission, we
document empirically that there is a mechanism through which children’s
preferences can be moulded by parents. We thereby also provide evidence
that supports a key assumption of Doepke and Zilibotti (2017), namely that
parents can mould their children’s preferences.4 Second, we document that
parental involvement increases similarity between parents and children for
preferences and traits for which a stronger preference or a higher level of a
trait is not unambiguously favorable. This is, for example, the case for risk
and trust attitudes, as circumstances, economic conditions and the social
environment determine how these attitudes a↵ect life success.
We measure parental involvement by combining proxies about the fre-
quency and intensity of parental engagement in their o↵spring’s life during
childhood and adolescence. These proxies capture aspects such as talking
about the child’s life and worries, but also the degree of parental involvement
in their children’s educational development.
4However, our data do not allow us to test whether parents follow an optimal parentingstrategy, because, firstly, we lack data on parental intentions and their utility functions,and secondly, we do not observe the costs and returns of moulding preferences.
3
In our empirical analysis, we focus on risk and trust attitudes, as well as
on the Big Five personality traits and locus of control, all of which have been
shown to play an important role in decision making. Risk attitudes have
an impact not only on financial decision making but also on other realms
of a person’s life, such as choice of education, occupation as well as health
outcomes (Dohmen et al., 2011). Trust has been shown to be conducive to
the development of impersonal markets and the well-functioning of political
systems (see e.g., Guiso et al., 2008). Personality traits, in particular consci-
entiousness, openness to experience, and internal locus of control, are linked
positively to life outcomes, such as educational attainment and economic
success (see e.g. Bowles et al., 2001, Almlund et al., 2011, or Becker et al.,
2012).
Using data from the German Socio-Economic Panel Study (SOEP) we
find that parents who are more involved in the upbringing of their children
are more similar to their adult children in willingness to take risk and in
trust towards strangers. We also find that parents who are more involved in
the upbringing of their kids have children who are more conscientious and
have a stronger internal locus of control. This is in line with the assumption
in Doepke and Zilibotti (2017) that parents maximize an objective function
that combines altruism and paternalism towards children.
We start by investigating the transmission of the parents’ own pref-
erences on the basis of risk and trust attitudes, and extend the array of
preferences and traits to personality traits, in order to further investigate
the option of targeted moulding of traits. This also allows to test for inter-
action e↵ects between parents’ traits and their e↵orts. Having established
the existence of a significant correlation between parental involvement and
the formation of preferences and personality, we exploit the panel structure
of our data set and provide additional evidence from the TwinLife data set,
a SOEP related study, in order to shed light on the causal nature of this
relationship.
The remainder of this paper is structured as follows. Section 2 intro-
duces our data and explains the choice of the main variables. Section 3
introduces the model, discusses the main results, measurement error and
causality issues. Section 4 concludes the paper.
4
2 Data
Our analysis uses data from the German Socio-Economic Panel Study (SOEP),5
which not only provides information about economic attitudes and parental
involvement, but also allows us to link grown up children to their parents.
(We hereafter refer to these young adults who are our main observations as
children, according to their position in the family.) The SOEP is a large rep-
resentative household survey that has been conducted annually since 1984.6
Once sampled in the SOEP, each individual is followed, even after leaving
the initially sampled household. This feature is especially important for our
study since it allows us to observe also young adults and their parents who
no longer live in the same household.
An important source of information for our paper is the youth biogra-
phy questionnaire that is requested of every newly entering young individual
since 2000. This questionnaire is administered to young people who live in a
SOEP household and have just become old enough (turning 18 in the follow-
ing year) to enter the regular personal survey in the next year. Aside from
background questions, such as personal education history, the respondents
to the youth survey are asked detailed questions about their upbringing and
their interaction and relationship with their parents. In addition, a set of
economic attitudes and personality traits are elicited subsequently in the
regular SOEP questionnaires that are administered after age 17. If the in-
dividual answered the question to a certain attitude in several subsequent
waves, we consider the first of those waves. The information on the attitudes
of the parents is taken from the same wave as that of the child’s attitudes.
Every observation thus consists of a child–mother–father triplet. For risk
attitudes we have a sample of 3,393 observations. Since the trust questions
were asked only three times (compared to nine waves containing the risk
questions), the trust sample has 2,119 observed parent–child triplets.The
sample sizes for personality traits range from 1,915 to 2,274.7 The person-
ality traits have been elicited at the same time, but they sample di↵er per
5Socio-Economic Panel (SOEP), data for years 1984-2015, version 32, SOEP, 2015,doi:10.5684/soep.v32.
6Schupp andWagner (2002), Wagner et al. (2007) andWagner et al. (2008) give detailedinformation on the construction and maintenance of the SOEP.
7The sample sizes are: Big Five openness (1,919), Big Five conscientiousness (1,915),Big Five extraversion (1,918), Big Five agreeableness (1,926), Big Five neuroticism (1,924)and locus of control (2,274).
5
trait due to item non-response.
2.1 Preference and personality measures
This section describes how we construct our dependent variable and measure
the underlying attitudes.
2.1.1 Risk
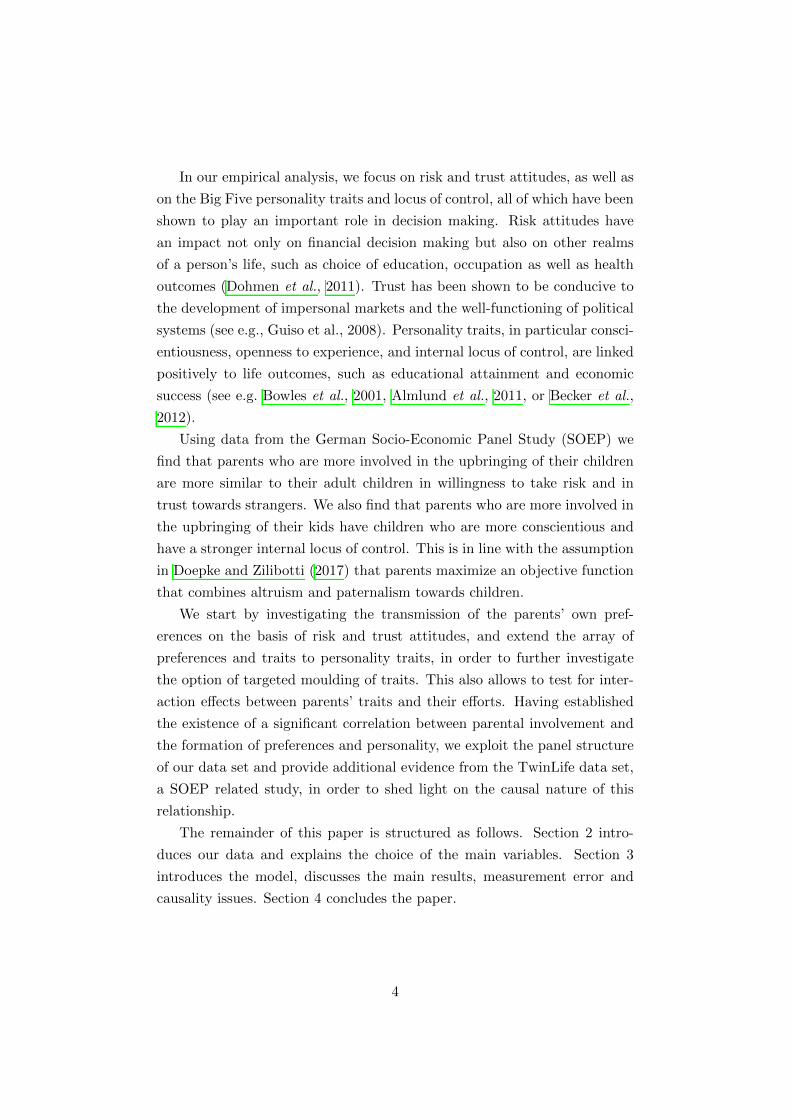
Individuals’ risk attitudes are assessed based on a survey question asking
the parents and children in our sample how willing they are to take risks in
general. The answer categories range from zero, which denotes not willing to
take risks at all, to ten, which stands for very willing to take risks. The left
panel of Figure 1 shows the distribution of answers in our sample of young
adults. The survey question is experimentally validated in the study by
Dohmen et al. (2011), which also documents that the answer to the general
risk question is a good predictor for a number of risky decisions. The general
risk question was asked in 10 waves: in 2004, 2006, and yearly since 2008.
2.1.2 Trust
The measure of trust attitudes is slightly more complex as it combines three
survey questions into an aggregated trust index. In 2003, 2008 and 2014 the
respondents of the main SOEP survey were asked how strongly they agreed
with the following three statements on a scale from one to four, where one
means “Agree completely” and four means “Disagree completely”: “On the
whole one can trust people,” “Nowadays one can’t rely on anyone,” and “If
one is dealing with strangers, it is better to be careful before one can trust
them.” We use a simple average over the three trust measures as our trust
index.8 The right panel of Figure 1 shows the distribution of the trust index
for our sample of young adults. Fehr et al. (2003) validate this trust measure
by showing that trust in strangers, measured by the three above-mentioned
questions, indeed predicts first mover behaviour in a trust game.
8We reversed the answers of the first question so that a higher number on the trustindex indicates a higher level of trust.
6
2.1.3 Similarity in preferences
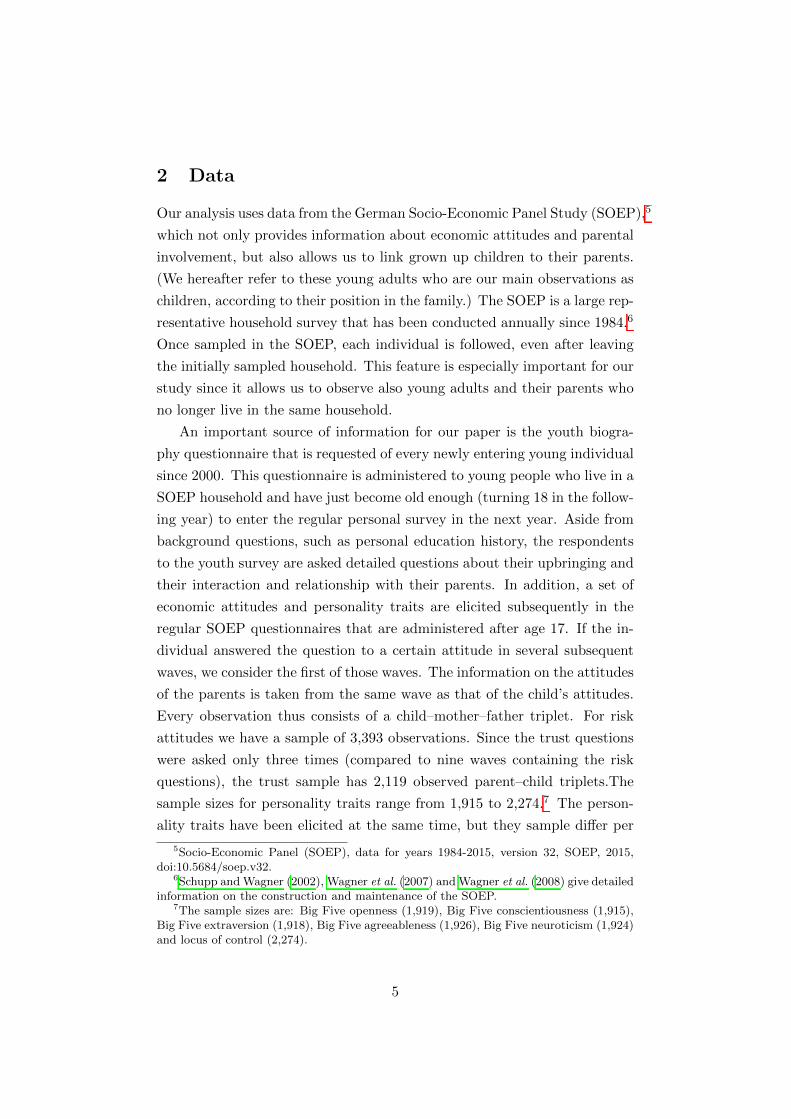
Figure 2 displays the di↵erences between parents’ and children’s risk and
trust attitudes. Since we conjecture that parents want to transmit their
own attitudes in the domains of risk taking and trust to their children, we
posit that a higher degree of similarity of parents’ and their child’s attitude
indicates stronger transmission.
We construct four di↵erent similarity measures that serve as dependent
variables in the first part of our analysis that investigates similarity: the
di↵erence in risk attitudes between mother and child (�MCR ) and between
father and child (�FCR ) and the di↵erence in trust attitudes between mother
and child (�MCT ) and between father and child (�FC
T ). We calculate each
di↵erence measure as the absolute di↵erence between the child’s and par-
ent’s attitude. The average di↵erence in risk attitudes between mothers and
their children is 2.46 with a standard deviation of 1.95, while that between
fathers and their children is 2.24, with a standard deviation of 1.84. In trust
attitudes, mothers and their children di↵er, on average, by 0.46 points on
the trust index, with a standard deviation of 0.40, while fathers di↵er by
0.49 points from their children, with a standard deviation of 0.42. In our
analysis, we standardise each di↵erence measure.
In our main model, we use current measures of attitude, without con-
trolling for the e↵ect of age on attitudes. We do this for two reasons. First,
we assume that the parents want to transmit their current attitudes, rather
than the attitudes they had when they were of the same age as their children
are now. Second, if children use their parents as role models, they can only
observe the parents’ current attitudes. However, later we demonstrate as a
robustness check that this age-induced di↵erence in attitudes is not driving
our results.
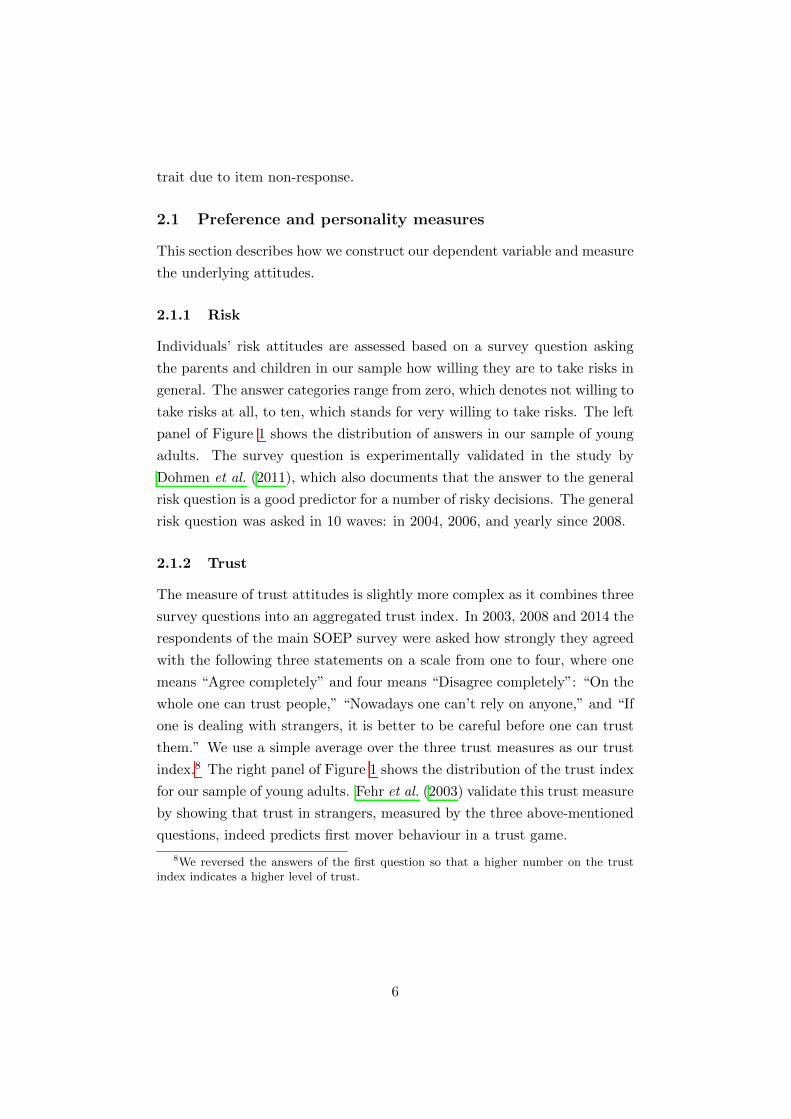
2.1.4 Personality traits and locus of control
The SOEP contains various measures that pertain to personality, most im-
portantly measures of locus of control and the Big Five personality traits.
We focus on these measures, as evidence shows that the underlying con-
structs relate to economic outcomes (Bowles et al., 2001, Almlund et al.,
2011, and Becker et al., 2012). SOEP respondents answered questions de-
signed to measure locus of control in the 2005, the 2010 and the 2015 wave
7
of the survey. We construct a measure of internal locus of control as the
first principal component of answers to 7 questions (following Specht et al.
(2013)). Individuals with a higher score have a stronger sense of being able
to shape their own environment.
The Big Five consist of the personality traits openness, conscientious-
ness, extraversion, agreeableness, and neuroticism. The Big Five in the
SOEP survey are assessed using the BFI-S psychology questionnaire, a 15-
item subset of the NEO-FFI version (see Gerlitz and Schupp, 2005). For
each trait there are three items in the survey, for which individuals indi-
cate on a seven-point scale to what extent they agree with the statement.
Averaging over the three responses yields the score for the particular trait.
The Big Five personality traits questions were asked in 2005, 2009 and 2013.
Figure 3 shows the distribution of the personality traits among our sample
of children.
2.2 Parental involvement
We are interested in whether parental involvement, broadly defined, relate
to the transmission of economic preferences, attitudes and traits. We focus
on measures of parental e↵ort in the upbringing of children.9 This includes,
on the one hand, how much parents are involved in their children’s school
situation, which is an important part of a child’s daily life, and, on the other
hand, how much the parent participates in the child’s life, and how much
the parent involves the child in family matters.10
We consider general parental involvement for two reasons. First, parental
involvement can be seen as a type of general investment, that parents could
choose to engage in if they wanted.11 Second, the growing literature on
9The importance of parental e↵ort or involvement in intergenerational transmission hasbeen demonstrated in the transmission of economic outcomes. In an investigation of thedriving forces of sibling correlations in long-run income, Bjorklund et al. (2010) find thatparental investments and parenting practices have strong predictive power in explainingsibling correlations.
10The measures for parental participation in a child’s life and how much the parentinvolves the child in decision making are taken from a 9 item scale for supportive parenting(see Weinhardt and Schupp (2011) for more information on the supportive parenting scaleand it’s application in the SOEP). We use 7 out of the 9 items, excluding two itemswhich might be reversely related with our dependent variable. The two omitted items are:”The parent shows that she/he loves you”, and ”The parent gives you the impression thatshe/he really trusts you”.
11Such investments would not be directed but rather general investments. There is novery specific and easily observable parental investment we can link directly to the transmis-
8
parenting style points out the importance and potential scope of parental
behaviour on the formation of children’s non-cognitive skills.12 A comple-
mentary approach would be to focus on time investments of parents. How-
ever, this approach has its own shortcomings. Firstly, a pure quantitative
measure neglects the quality of the time spent.13 Secondly, this approach
requires to aggregate the time spent throughout the childhood into a mean-
ingful measure. The aggregation would ideally weigh investments in sensitive
periods of the child’s life more and adjust for the timing and sequence of
investments Cunha and Heckman (2007).
2.2.1 Involvement proxies
The youth questionnaire of the SOEP provides proxies for the type of
parental involvement that we are investigating. We can measure how in-
volved parents are in their children’s school situation, how much parents
participate in the life of their children, and how strongly they integrate
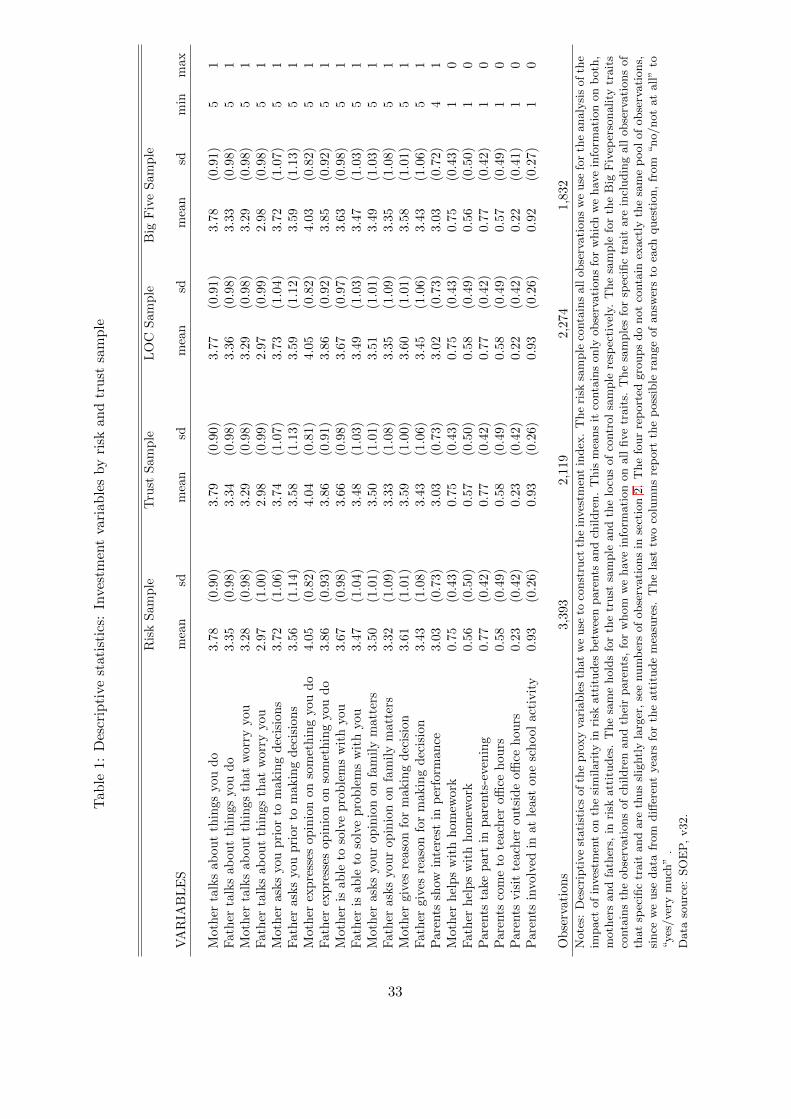
their children in decision processes. Table 1 lists the proxies we use in our
study, with means and standard deviations for both (risk and trust) sam-
ples. All the proxies are measured either as binary variables or on a four-
or five-point scale, as described in the last two columns of Table 1. Most
of the school-related proxies are measured on an aggregate level for both
parents together, while for the other proxies we can distinguish between the
e↵orts of mothers and fathers. Together, these 13 proxies provide insight
into the general involvement of parents in their children’s upbringing. How-
ever, there are many more possible ways of parental involvement that we
cannot address in this study, such as e.g. joint leisure activities. We assume
that all the proxy variables measure parental involvement, but none of them
measure it perfectly. We combine the proxies in an index to measure the
underlying true parental involvement. Using principal component analysis
sion of both risk and trust attitudes, like it is possible for the research on the transmissionof particular cultural traits or religion (for example Patacchini and Zenou (2016) investi-gate the transmission of religiousness by using the frequency of taking children to religiousservices as a measure of involvement).
12See (Heckman et al., 2013) for the importance of early childhood environment moregenerally.
13Since the range of possible interaction opportunities, as well as the level of (mental)engagement in them is wide, a simple quantitative time measure would not capture theintensity of involvement. Further, if a family has more than one child, it is hard to captureexactly how much the time is spent with one specific child.
9
on the respective 13 proxies allows us to construct such an involvement in-
dex for mothers and fathers (we take the first factor to be the involvement
index, Table A1 in the appendix displays the factor loadings).
Parents who invest much in their children, as measured by our involve-
ment proxy, di↵er from parents who invest little in the upbringing of their
children. Table 2 displays the means and standard deviations of background
characteristics for the groups of high and low investing mothers and fathers.
We find that parents who invest more in the upbringing of their children are
on average more educated, earn more and are older than parents who invest
less.
3 Results
Next, we analyse the relationship between the e↵ort parents put into the
upbringing of their children and their influence on the formation of the
children’s preferences. We begin by establishing the link between parental
involvement and the formation of the children’s attitudes. We start with
risk and trust attitudes and then extend the analysis to personality traits.
This first part of the results section documents the correlation, without any
claim to causality. In the second part of the section we then address the
question of causality.
3.1 Parental involvement and the transmission of risk and
trust attitudes
3.1.1 Main results
Findings by Dohmen et al. (2012) and recent evidence by Kosse et al. (2019)
highlight the role of the social environment for the development of economic
preferences and prosociality. As parental behaviour is a key facet of the
social environment during childhood and adolescence, it is natural to inves-
tigate the role of parents for preference formation. We show that parental
involvement is related to the transmission of own risk and trust attitudes to
children. In particular, we investigate the similarity of children to their par-
ents. In a next step we will, however, also consider the option that parental
involvement can have a direct impact on the level of the child’s attitude,
independent of the parents’ attitudes.
10
Table 3 reports the results of regressing the similarity in risk and trust at-
titudes on parental involvement and background characteristics, for mother
and child or father and child respectively. We find a negative relation be-
tween the involvement and the di↵erence in attitude between parents and
their children in all 4 cases; however, in the second case (risk attitudes
father–child) the relation is not statistically significant.14 In other words, we
find that parents who are more involved in the upbringing of their children
have children who are more similar to them with respect to their willingness
to take risks and with respect to trust in strangers. One standard devia-
tion increase in the involvement by the mother, for example, is related to
a decrease in the absolute di↵erence in risk attitudes between mother and
child of 0.061 standard deviations. These findings support the theoretical
models on the transmission of attitudes (Bisin and Verdier, 2001; Doepke
and Zilibotti, 2017) that assume that parents can influence the preferences
and attitudes of their children.
Table 2 shows that parents who are highly involved in the upbringing
of their children di↵er from less involved parents in many aspects. For our
main analysis we thus control for an array of potentially important back-
ground variables.15 We control for the socio-economic background of the
family by including the level of education of both parents as well as the
level of household income per capita in the year when the child filled out the
youth questionnaire (to make the income measure comparable across years
we compute households’ placement in the income distribution of the actual
SOEP wave, in 20-quantiles). Family size is another important variable in
our analysis, since it can influence the formation of preferences and attitudes
not only through available financial resources per child and potential envi-
ronment e↵ects of siblings, but also through the amount of time available
to the parents for every single child in the family (Table 2 provides some
evidence that parents with more children do on average invest less in every
14If we only take involvement that pertains to parenting style into account, we find verysimilar results. The involvement in schooling is largely insignificant on the transmission ofattitudes. This is not unexpected, however, since involvement in schooling is in part alsodriven by the child’s needs. The results with di↵erent involvement measures (only par-enting, only school, or only a single item of parenting) can be found in the supplementarymaterial
15Table A2 in the appendix provides the results of the main regressions without controlvariables. The coe�cient estimates for parental involvement remain quantitatively verysimilar.
11
single child). We control for age di↵erences between the child and both
parents.16
The literature on the intergenerational transmission of culture (e.g. Bisin
and Verdier, 2001) shows that under certain assumptions minorities have
bigger incentives to invest in their children. We thus include a variable
that captures whether the child has a migration background (both direct
migration and migration of parents) to control for possible e↵ects of being a
member of an ethnic minority. We also include a measure of how heteroge-
neous the parents are with respect to the attitude in question. Finally, we
also control for the age of the child at the time of the attitude elicitation,
the gender of the child, and the year in which the attitude was elicited.
Conditional on parents’ involvement, we find little e↵ects of family back-
ground on the transmission of attitudes, and also personal characteristics of
the child are mostly insignificant. Having a migration background is re-
lated to weaker transmission of risk attitudes. Finally, the coe�cient for
the binary variable that indicates heterogeneous parents is both large and
statistically significant. This is not surprising: If the parents’ attitudes are
far apart from each other, the child’s attitude mechanically has to be far
apart from at least one parent, or equally far away from both if the child is
in the middle. In the risk sample, parents are classified as heterogeneous if
they are separated by 3 or more points on the 11 point Likert scale for the
general risk question. The average distance among heterogeneous parents is
4.2 points.
One could conjecture that the relation between parental involvement and
the transmission is not linear and homogeneous across di↵erent demographic
groups. For example, the transmission might be stronger for same-sex parent
child couples (mother–daughter or father–son). Likewise, the same level of
parental involvement might have a stronger e↵ect on transmission for more
educated parents. Further, the e↵ect of involvement might be weaker the
more dissimilar the preferences of the parents are, because each parent might
want to influence the child in a di↵erent direction. Finally, the returns to
involvement might depend on the level of involvement, or on the direction of
the intended change of preference (e.g. it might be easier to reduce risk aver-
16Table A3 in the Appendix shows the coe�cients for parental involvement when theattitude variables are adjusted for the age of the respondent. The results stay qualitativelythe same.
12

sion than to increase it). We therefore assess whether transmission depends
on gender of parents and children, parental education, degree of diversity of
parents’ preferences and nonlinearities in returns to involvements.
In Table 4 we show that parental and child characteristics as well as non-
linearities and asymmetries of the e↵ect of parental involvement do not play
a major role. While we find similar coe�cients on the relationship between
parental involvement and similarity in attitudes and preferences to those
reported in Table 3, this relationship does not depend on the gender-match
of parents and children. This is evident from the insignificant coe�cient on
the interaction term between the gender of the child and parental involve-
ment in each column of Panel 1, which are based on the same regression
as reported in the respective column of Table 3, augmented with the inter-
action term. Likewise, each of the following panels is based on the main
regressions, reported in Table 3, augmented by di↵erent interaction terms.
The second panel indicates that the relationship between involvement
and the transmission of attitudes does not depend on parental education.
In 3 out of 4 cases, there is no significant interaction e↵ect between involve-
ment and parental education, and for the last case, the transmission of risk
attitudes by mothers, we even find that the interaction term is positive. This
means that the relation between involvement and similarity in risk attitudes
is stronger for lower educated mothers.
While having heterogeneous parents relates to a greater average distance
from both parents generally, we do not find a significant interaction e↵ect
between the parents’ heterogeneity in attitudes and parental involvement on
the transmission of the attitudes, as can be seen in the third panel.
In Panel 4 we find weak support for decreasing marginal returns to
parental involvement. Concerning the transmission of trust by fathers, we
find a significant and positive coe�cient for a quadratic term in involvement.
However, for the transmission of risk, and for the transmission of trust by
mothers, we do not find non-linear e↵ects of involvement.
Panel 5 shows some asymmetric e↵ects with respect to the direction of
the di↵erence in attitudes. We add an interaction term with an indica-
tor for the direction of the di↵erence in attitudes and find that for fathers
the transmission of attitudes is asymmetric and dependent on the direction
of the change in attitudes. For the relation between involvement and the
transmission of mothers’ attitudes, however, we find no such asymmetries.
13
3.1.2 Measurement error
So far, we have shown that there is a relationship between parental involve-
ment and similarity in attitudes. However, due to measurement error in
the proxies, our point estimates might underestimate the true e↵ect. Aside
from being rather noisy measures themselves, the proxy variables are all
taken from the youth questionnaire, which means that they are measured
at one point in time. The measurement error is thus very likely to be corre-
lated across the proxy variables. In this case, the first principal component
includes also part of the measurement error, which leads to an attenuation
bias in our analysis. We address this problem by constructing an alternative
index of parental involvement, which combines the available proxy variables
in an e�cient way, so that the measurement error captured in the resulting
index is minimised. The procedure we use has been introduced by Lubotsky
and Wittenberg (2006).
To construct this new involvement index, we first regress the di↵erence
in attitudes between parents and children on all 13 proxy variables xj and
all K control variables zk. In particular, for parent–child pair i,
�PCPref i
=13X
j=1
xjibj +KX
k
zki�k + "i.
We then use the estimates to construct the involvement index
Ii = �13X
j=1
xjibj .
Finally, we standardise I and obtain our LW parental involvement index.
The assumptions made to generate the index are that the proxies and their
measurement errors are not correlated with the error term and that all the
proxies share an underlying trait. The weights that minimise the attenuation
bias are endogenous to the system. The absolute size of the involvement
index is therefore not comparable across di↵erent samples or estimations
with di↵erent dependent variables.
Table 5 reports the results of the regressions of the di↵erence between
a parent’s and a child’s attitude (risk and trust) on the level of parental
involvement in the upbringing of the child. All the involvement indices
used in the four displayed regressions are constructed using the Lubotsky–
14
Wittenberg method. Since the weights that are used to construct the indices
are endogenous, the indices are not directly comparable across the specifica-
tions. We find point estimates for parental involvement that are larger than
the estimates for the PCA involvement index and statistically highly signifi-
cant in all four scenarios (risk/trust, mother/father). Apart from the change
in the point estimates for the involvement index the regression output stays
largely similar to the output of our earlier analysis, the correlation coef-
ficients of the control variables stay unchanged, while the total explained
variance increases slightly. Given the noisy nature of the proxy variables
and the fact that this is only a small selection of possible means of parental
involvement the results of this analysis are likely to still underestimate the
true e↵ect.
Since all the dependent variables as well as the involvement variables
are standardised, the economic significance of our findings is not straight-
forward. In Table 6 we present our main results in terms of absolute points
on the risk and trust scale. For example, a change from the 5th to the 95th
percentile in maternal involvement relates to a decrease in di↵erence in will-
ingness to take risks of 0.620 points on the risk scale that ranges from 0 to
10. Comparing the size of the e↵ect to the gender di↵erence in willingness
to take risks, we see that the e↵ect of a change from the 5th to the 95th
percentile in maternal involvement exceeds the di↵erence in willingness to
take risks between men and women in our sample, which amounts to 0.531.
3.2 Parental involvement and the formation of personality
traits
While it is not always obvious whether a higher degree of risk and trust at-
titudes is conducive to success, the literature (see e.g. Almlund et al. (2011),
for an overview) indicates that higher levels of certain personality traits, like
conscientiousness, internal locus of control and openness, are clearly linked
to favourable outcomes. If parents want to mould their children’s person-
ality, it is plausible to assume that they would like to equip their children
with a personality that contributes to life success. As a result, they will
instill higher levels of favourable traits in their children rather than simply
transmitting their own traits.
We therefore extend our analysis, investigating whether parental involve-
ment is associated with higher levels of internal locus of control and advan-
15
tageous Big Five personality traits. In particular, we regress the level of
a child’s personality trait on parental involvement and control variables.
Alongside these results we provide estimates for the relationship between
involvement and similarity in parents’ and their child’s personality.17
Table 8 provides the results of both types of regressions. Each row
presents the coe�cients of the respective parent’s involvement variable from
regressions of a particular personality trait or attitude of the child, both
in levels in terms of the distance to the respective trait or attitude of the
parent.18 Since the attitudes and personality traits are gathered from dif-
ferent waves of the SOEP, the samples do not coincide between the di↵erent
attitudes and traits. The sample size is, however, the same for both parents
and across the specification in levels and in di↵erences for a given trait.
The same control variables as in our main analysis are included in every
regression. For each attitude and parent we highlight the coe�cients (on
similarity or level of attitude) that are statistically significant at the 5% level.
As can be inferred from Table 8, parent’s involvement has a positive impact
on the level of locus of control, which means that children of more involved
parents feel that they have more control over their own lives. Likewise,
for most personality traits involvement is related more strongly to the level
than to the distance to a parent. In fact, higher parental involvement is
associated with higher levels of openness to experience, conscientiousness,
extraversion and agreeableness. Involvement in the upbringing of children is
related to a more favourable personality of children. Note that we also find
that more involved mothers (fathers) have children that are more similar to
them in terms of openness to experience (conscientiousness), but the e↵ects
are weaker than the estimated e↵ects on levels. For neuroticism we find a
significant correlation between mother’s involvement and similarity, but do
not observe this for fathers.
Importantly, we find for risk and trust attitudes that the level e↵ects are
indeed insignificant.19 In sum, these results strongly support the hypoth-
17While the transmission of own preferences and traits is aligned with models of culturaltransmission, e.g. in Bisin and Verdier, 2001, investment in a↵ecting the absolute level ofthe child’s preference or personality is more in accordance with the model of Doepke andZilibotti, 2017.
18We provide the complete regression output for all specifications, and the results of thesame regressions without control variables in the supplementary material.
19In the appendix we also provide the results of the two types of regressions for thedomain specific risks (Table A5). In case of the domain specific risk attitudes it is more
16
esis that parental involvement is related to the formation of the children’s
preferences. It is unlikely that the correlation between parental involvement
and similarity in preferences of parents and their children comes about be-
cause parents want to be more involved with children who are similar to
them in the first place. If it is similarity that causes involvement, it is hard
to explain the result, that involvement is associated with higher levels of
favourable traits in children. Yet, a causal e↵ect of parental involvement
on the formation of preferences and personality is consistent with the whole
set of findings. To gain a better understanding of these two dimensions
of the outcome variable, we investigate in the next section how parental
involvement and parental traits interact in the formation of personality.
Concluding this section, if we apply the Lubotsky–Wittenberg method,
reducing measurement error, we find stronger e↵ects for both levels and dis-
tance, and the coe�cients on the similarity become statistically significant.
3.3 Heterogeneous treatment e↵ects
We conjecture that benevolent parents, in the best interest of their children,
try to mould their children’s characters in order to increase their chances
for success in life. Although we expect that all parents want to inculcate
higher levels of favourable traits in their children, parents who have high
levels of these traits themselves might be more e�cient in instilling them in
their children. Being a role model, for example, could intensify the e↵ect of
involvement.
We therefore study the heterogeneous e↵ects of involvement at di↵erent
levels of parent’s own trait. To do so, we estimate a similar model to the
one on levels, but now also include the parent’s own trait and an interaction
term between the parent’s trait and involvement.20
di�cult to predict whether the level or the transmission e↵ect should be stronger. Inthe domains health and driving a level e↵ect seems more likely, which coincides with ourresults.
20We now estimate for each attitude or trait (AT )
ATC = ↵+ �1InvP + �2ATP + �3(Inv
P ⇤ATP ) + �Z+ "i
and report the marginal e↵ect of the parent’s involvement (InvP )
d(ATC)d(InvP )
= �1 + �3ATP
.
17
Figures 4 and 5 show the conditional marginal e↵ects of parental in-
volvement on children’s attitudes and traits. Specifically, in Figure 4 each
graph plots the marginal e↵ects of involvement on a particular attitude or
personality trait of a child for given level of the same maternal attitude or
trait. A positive slope indicates that the marginal e↵ect of involvement in-
creases in the level of the mother’s attitude or trait. The vertical location of
the line indicates whether the marginal e↵ect is positive or negative, i.e. if
the line crosses the x-axis, the marginal e↵ect changes sign. As a result, the
slope and location of the conditional marginal e↵ect function reveals whether
parental involvement interacts with parental attitudes/traits to boost simi-
larity of parents’ and children’s traits and attitudes or to exacerbate or mute
the impact on the level of children’s attitudes/traits.
The first panel of Figure 4 on risk attitudes shows that the slope of the
conditional marginal e↵ect function is increasing and crosses the x-axis at
the midpoint of the scale. The fact that the conditional marginal e↵ect of the
interaction between involvement and mother’s attitudes crosses the x-axis
at the midpoint of the scale indicates that risk attitudes and involvement in-
teract to boost similarity. Involvement reduces children’s willingness to take
risks for mothers with a willingness to take risks smaller than a value of 5 on
the risk scale and increases it for mothers with a value that exceeds 5. Im-
portantly, these marginal e↵ects become stronger (reflected by the positive
slope of the conditional marginal e↵ect function) if we move towards the tails
of the distribution of mother’s risk attitudes. This means that additional
involvement of mothers with high willingness to take risks is associated with
an even stronger increase of their children’s willingness than the same incre-
mental increase of involvement of mothers with (slightly) lower willingness
to take risks. For mothers with low willingness to take risks, involvement
reduces their children’s willingness to take risk. This e↵ect is stronger the
less willing mothers are to take risks.
A di↵erent pattern is observed for locus of control. Although the size of
the marginal e↵ect of involvement increases with mothers’ internal locus, in-
volvement is never associated with decrease in children’s locus of control. In
other words, involvement always tends to increase children’s locus of control,
but the e↵ect of involvement is stronger the higher the internal locus of con-
trol of the mother is. We find a similar pattern for conscientiousness. For
extraversion and agreeableness, involvement always has a positive impact
18
on the level, but this e↵ect is dampened for higher maternal levels of the
respective trait. Figure 5 shows similar patterns for father’s involvement.
3.4 Causal nature of the relationship between parental in-
volvement and the transmission of personality and pref-
erences
In this subsection we address the causal nature of the relationship between
parental involvement and the transmission of personality and preferences.
The identification of a causal e↵ect of parental involvement on this transmis-
sion is challenging as two requirements have to be met. First, we would need
to be able to exogenously alter parental involvement (i.e., ideally randomly
assign the intensity of parental involvement to children), and at the same
time we would need to be ascertained that the intervention that changes
parental involvement does not directly a↵ect children’s preferences (Heck-
man, 2005).21 A second challenge, which applies particularly when the e↵ect
of the treatment is heterogeneous, is that the counterfactual is not readily
observed (i.e., we cannot observe the same child growing up with di↵erent
levels of parental involvement at the same time). Therefore, we would have
to find a suitable comparison group. An additional complication for the
measurement of e↵ect sizes arises when the impact of parental involvement
evolves over time.
Despite these challenges, there are some avenues that we can pursue
to at least address some of the most pressing concerns that could refute a
causal e↵ect of parental involvement on the transmission of preferences and
personality, namely the concern of a spurious correlation and the concern of
reverse causality.22
3.4.1 Is the relationship driven by omitted variables?
To avoid that our results arise from a spurious correlation, i.e. that omitted
variables drive our results, we already control for factors that, according to
the literature, are related to children’s preferences and likely correlate with
21Random assignments of parental involvement is not feasible due to legal and ethicalconstraints.
22Note that simultaneity, i.e., a two-way causal relationship, which would arise, for ex-ample if parental involvement a↵ects children’s preferences and children’s preferences thentrigger parental involvement, does not rule out a causal impact of parental involvementon the transmission of personality and preferences.
19
the parents’ involvement, such as the parents’ education, income or migra-
tion status, as well as the child’s gender (Alesina and La Ferrara, 2002;
Dohmen et al., 2011). However, there could be other unobservable factors
that a↵ect both children’s personality and preferences and parents’ involve-
ment. In order to gauge the impact of such unobserved, and hence omitted,
variables on the estimated relationship between parental involvement and
similarity in risk and trust attitudes of parents and their children, we fol-
low the method suggested by Oster (2019). To this end, we estimate the
share of unobserved confounders in R-squared relative to that of observable
variables, that would be necessary to overturn our results on parental in-
volvement. For the similarity in trust between mother and child we find
that “adding unobservables” similar to the observable confounders would
strengthen the coe�cient on mothers involvement, while for fathers the co-
e�cient would cross zero if we would add factors that explain a fraction of
at least 0.48 of that explained by the regressors that are already included in
our main model. Since we already control for factors in our main analysis
that have been argued to be key determinants of transmission of trust in
the literature, it is unlikely that there is a set of unobservable factors that
are su�ciently important to overturn our results. For risk attitudes, the
critical fractions of explanatory power of unobservable factors relative to
that of included regressors are, however, smaller. They amount to 0.15 and
0.06 for mothers and fathers, respectively. While these results suggests that,
in our sample, it is harder to reject the possibility that unobserved factors
drive the observed relationship between parental involvement and similarity
on risk attitudes of parents and their children, it should be noted that the
relationship between fathers’ involvement and similarity in risk attitudes is
also weakest in our main specification in Table 3.
3.4.2 Can reverse causality drive our findings?
Reverse causality can arise for three reasons: 1) It could be conjectured that
parents’ attitudes are changed by children and that the child’s influence is
stronger the more the parent is involved. 2) The observed correlation might
be caused by biased responses. In particular, it might be conjectured that
children who are more similar to their parents systematically state retrospec-
tively that their parents were more involved. 3) It might be the case that
parents are more involved with children who are more similar to them, for
20
example because they enjoy interaction with more similar kids. In order to
address these three issues, we conduct additional analyses, using additional
data. We focus on the transmission of risk attitudes since the information
on the willingness to take risks satisfies the requirements needed for these
additional analyses. Firstly, risk attitudes are measured frequently enough
to allow longitudinal analyses. Secondly, an additional data set on younger
children, the pupils survey, also contains the risk question.
Is there an impact of children’s attitudes on parents’ attitudes?
A causal interpretation of our results relies on the assumption, that par-
ents’ attitudes are well established and not dependent on their children’s
attitudes. While there is a growing body of evidence that suggests that
risk attitudes are fairly stable in adults, there might still be the possibility
that children can shape parents’ preferences.23 Even though the literature
suggests that preferences and personality traits become much less malleable
after adolescence, it cannot be fully excluded a priori that parents’ pref-
erences become more similar to those of their children if they are more
involved with the children. To test this hypothesis, we investigate the im-
pact of changes in parents’ stated risk attitudes on changes their children’s
stated risk attitudes and vice versa. For this additional test we construct a
panel of young adults (19-32) and their parents with repeated risk attitude
measures. The results in Table 7 show a significant e↵ect of lagged changes
in attitudes of parents on the children’s attitudes, but little to no e↵ects in
the opposite direction. Parents’ attitudes appear to be independent of their
children’s past developments in attitudes and changes in their partners’ at-
titudes. The risk attitudes of young adults, however, still partially depend
on their parents’ risk attitudes.
Are retrospective parental involvement measures endogenous?
The optimal timing and way to elicit parental involvement is not straightfor-
ward. It might be beneficial to measure the timing and intensity of parental
involvement, particularly if the e↵ect of parental involvement on the for-
mation of preferences and attitudes varies over time. However, if parental
involvement is stable over time — or at least rank-order stable — measuring
parental involvement only once is less of a concern. The second issue is how
23See Josef et al. (2016) for a discussion of the stability of risk preferences.
21
the information on parenting is gathered. Since quality and quantity of
parenting e↵orts are not directly observable, we mostly have to rely on self-
reports from either the parents or the children. There is some evidence
that the reports by young adults about their own upbringing are a better
measure to predict achievement than reports about parenting by their par-
ents (Aunola et al., 2000). This evidence supports our use of retrospective
questions to the children to elicit parental involvement.
However, using children’s self-reports to investigate the transmission of
attitudes could potentially invite reversed causality issues. A suggested
path is that children who are more similar to their parents remember the
interaction with their parents more positively and answer the questions on
parental involvement more favourably.
We address this problem by making use of a small sub sample of the
SOEP that provides parenting measures that are based on parents’ answers.
Starting with the cohort of children born to SOEP households in 2002 and
2003 the SOEP survey asks parents a battery of questions about their young
children. Parents answer questions regarding the behaviour of their child
and about their own role and expectations in the upbringing of the child
at di↵erent stages of the childhood. The survey is administered to both
parents when their child is seven or eight years old and it includes several
measures of parenting style (see Richter et al., 2013, for information on the
parenting style indices). These children were then interviewed personally
for the first time in the pupil survey at the age of eleven or twelve. The first
cohort of children completed this survey in 2014. The interviewed children
are 11 to 12 years old. In this survey the children answer the general risk
question.24 We use this information of children’s self-reported risk attitudes
of all children for whom we know the parenting style their parents reported
four years earlier, i.e. when the children were aged 7 or 8, in order to assess
the relation of parental e↵orts on the transmission of attitudes. We focus
on the parenting style scale for emotional warmth, since the items to this
scale are closest to our parental involvement measure.25 We find a nega-
tive relation between the mother’s reported emotional warmth and distance
between mother and child in risk attitudes. However, due to a small sam-
24The question is asked in exactly the same way as in the adult questionnaire.25The emotional warmth index is based on the following 3 questions: 1) I show my child
with words and gestures that I care about him/her. 2) I console child up when he/she issad. 3) I praise my child.
22
ple size and large standard errors the results are not statistically significant.
Controlling for the child’s gender and the parents’ years of education we find
that an increase of one point on the emotional warmth scale (1-5) relates
to -.25 standard deviations in distance in risk attitudes between mothers
and child.26 The relation between fathers emotional warmth and distance
in risk attitudes is also negative, but closer to zero in this sample. These
results indicate that more parental involvement is associated with a higher
degree of similarity between parents’ and children’s preferences later in their
children’s life, casting doubt on the explanation that the observed correla-
tion between parental involvement and similarity in preference is driven by
biased retrospective reporting of parental involvement.
Ideally, we would like to present additional direct evidence that shows
that our retrospective measure of parental involvement is not biased. This
is, however, not possible as we do not have an objective benchmark. Hence,
we provide more indirect evidence on quality of the retrospective measure.
For this, we focus on the correlation of answers of siblings about their par-
ents’ involvement. Of course, this could di↵er by sibling and circumstances,
although this is not clear a priori. In order to limit this possibility we focus
on twins, who arguably are a↵ected by the same parental behaviour at the
same time during their life. We use the correlation of answers of the two
twins in order to gauge the degree of measurement error. We then compare
the extent of potential measurement error in children’s answers to the test-
retest correlation of parent’s answers to the parenting style questions that
were collected when the children were eight and ten years of age.
Since the children cohort is still too young to have been part of the youth
survey, we can not directly compare the parents’ answers to the children’s
answers. We can however compare the quality of answers by parents to
the quality of answers of siblings. The parents of the children cohort have
answered the same parenting style questions twice, at age 8 and 10 of the
child. In Figure 6 we compare the correlations between two answering waves
of parents’ answers to the correlation in answers to parenting style questions
by twins. We use the TwinLife study for that purpose to get a su�ciently
large amount of data points. The test-retest correlations of the parents’ an-
swers are between 0.4 and 0.6 for all items, as the graph on the right hand
26The full regression outputs for the analysis with parents contemporary and averagerisk preferences are reported in the supplementary material.
23
side illustrates. The correlation of answers by twins are primarily between
0.2 and 0.7, with stronger correlations between monozygotic twins than be-
tween dizygotic twins. The similar range of correlations between siblings
and between answers of a parent at di↵erent points in time suggests that
our retrospective measure of parental involvement is not biased.
Does similarity lead to more involvement?
We have suggested that higher parental involvement leads to stronger sim-
ilarity in risk and trust attitudes of parents and their children. One could,
however, challenge such an interpretation of the observed correlation based
on the argument that similarity between parents and children leads to higher
involvement. Such an alternative explanation would entail, however, that
similarity among other dimensions of personality, as measured for example
by the Big Five personality traits, would also be associated with higher
levels of parental involvement. As we show in section 3.2, this is not the
case. Finding that for personality traits the levels matter more mitigates the
concern of endogenous parental involvement, since the benefits of increased
interaction with a more similar child are no longer an issue.
We provide additional evidence that questions the conjecture that sim-
ilarity drives parental involvement by investigating birth-order e↵ects and
di↵erences between siblings.
Firstly, we observe that the first child is on average more similar to the
parent in risk attitudes (the di↵erence in similarity to the mother is 0.23,
and 0.15 to the father, though only the di↵erence for mothers is significant
at the 5% level). If we assume that the attitudes dispositions are randomly
distributed among children with the same parents, parents should be most
involved with the most similar child. Thus there should be no birth order
e↵ect in the similarity to the parents. Instead we observe that the parents
who have more than one child are on average more involved in the first child’s
upbringing (0.1 standard deviations di↵erence between the first and the later
child in parental involvement from mothers and fathers, both di↵erences are
statistically significant at the 5% level).
A di↵erent approach would be to investigate occurrences where the first
child happens to be very similar in attitudes and traits to the parent. If
parents are more involved with children that are similar to them, and if
there are no birth-order e↵ects in the occurrence of attitudes, we should
24
expect parents with a very similar first child to be less involved with the
upbringing of the second child. Using the cases of siblings in our sample,
we estimate the probability that the parents are more involved with the
first child, based on the distance in risk attitudes between the parent and
the child. We do not find support for any relation between the match in
attitudes of the first child and the parent and the distribution of parental
e↵orts between the children. The marginal e↵ects of the similarity in risk
attitudes between the mother and the first child on the probability that
the mother is more involved with the first child than with the later child
is small and statistically not di↵erent from zero, independent on whether
we consider only same-sex siblings27, or any constellation of siblings. For
fathers the marginal e↵ects are also statistically insignificant, while the sign
is even inverted for same sex siblings.
4 Conclusion
Our analysis reveals that parents can a↵ect their children’s preferences, at-
titudes and personality. Parents who are more involved in the lives of their
children have children who are more similar to them in dimensions of person-
ality for which the optimal level depends on conditions of the environment,
as is the case for risk and trust attitudes. At the same time, parental in-
volvement is associated with higher levels of traits in dimensions in which
a higher level is conducive to success in life, e.g. conscientiousness. The ef-
fects of involvement are similar for mothers and fathers. Our results indicate
that parents are equipped with a technology that enables them to shape the
preferences of their children.
While our data do not allow us to directly ascertain that parental involve-
ment causally a↵ects preferences, we provide ample evidence that preempt
the most obvious reservations against a causal interpretation. First, there
is no evidence of reversed causality. Statistical tests indicate that parental
preferences and attitudes do not respond to children’s attitudes over time.
Second, we show that the involvement decision is not determined by sim-
ilarities of parents and children. When it comes to personality traits, for
example, parental involvement is not associated with similarity in person-
27We exclude mixed sibling couples because there could be di↵erences in levels of in-volvement by gender of the child, see e.g. (Baker and Milligan, 2016)
25
ality of parents and their children, but is rather related to the level of the
child’s traits. Moreover, we do not find evidence that parental involve-
ment di↵ers across same-sex siblings, even though parent–child similarity
might di↵er between siblings. Third, the relationship between parental in-
volvement and similarity in preferences is not a consequence of a specific
answering behaviour, where children who are more similar to their parents
answer the questions on parental involvement more favourably.
Our results have important implications. Evidence that a mechanism
exists that enables parents to a↵ect the transmission of preferences by in-
vestments, such as parental involvement, not only supports the view that
preferences are malleable during childhood, but also that preferences can
purposefully be shaped by parenting (Doepke and Zilibotti, 2017). Our find-
ings thereby lend additional support to a central assumption of prominent
theoretical models of cultural transmission, namely that parents can a↵ect
the intergenerational transmission of preferences and attitudes through nur-
ture (Bisin and Verdier, 2001). As it is very likely that other investment
opportunities, beyond the ones documented in this paper (e.g. the choice of
neighbourhood in which the child grows up), exist that allow parents to di-
rectly or indirectly mould their children’s attitudes, beliefs, and preferences,
we interpret our findings as a lower bound for the e↵ect of parental invest-
ments on the intergenerational transmission of preferences and attitudes.
This result is of great consequence for our understanding of intergenera-
tional mobility and for the design and appraisal of policies that a↵ect social
mobility. While the malleability of preferences suggests scope for policy in-
tervention during childhood, we deliberately have not indicated that policy
makers should aim at influencing the formation of preferences. Too little
is known about whether such changes are desirable. For example, it is not
obvious what bundles of preferences are superior in di↵erent conditions, and
we want to caution policy makers to jump to conclusions too quickly.
26
References
Alan, S., Baydar, N., Boneva, T., Crossley, T.F. and Ertac, S. (2017). ‘Trans-
mission of risk preferences from mothers to daughters’, Journal of Eco-
nomic Behavior & Organization, vol. 134, pp. 60 – 77, ISSN 0167-2681,
doi:https://doi.org/10.1016/j.jebo.2016.12.014.
Alesina, A. and La Ferrara, E. (2002). ‘Who trusts others?’, Journal of
Public Economics, vol. 85(2), pp. 207–234.
Almlund, M., Duckworth, A.L., Heckman, J. and Kautz, T. (2011). ‘Person-
ality psychology and economics’, Handbook of the Economics of Education,
vol. 4(1), pp. 1–181.
Anger, S. (2012). ‘The intergenerational transmission of cognitive and non-
cognitive skills during adolescence and young adulthood’, .
Aunola, K., Stattin, H. and Nurmi, J.E. (2000). ‘Parenting styles and adoles-
cents’ achievement strategies’, Journal of Adolescence, vol. 23(2), pp. 205
– 222, ISSN 0140-1971, doi:http://dx.doi.org/10.1006/jado.2000.0308.
Baker, M. and Milligan, K. (2016). ‘Boy-girl di↵erences in parental time
investments: Evidence from three countries’, Journal of Human Capital,
vol. 10(4), pp. 399–441.
Becker, A., Deckers, T., Dohmen, T., Falk, A. and Kosse, F. (2012). ‘The
relationship between economic preferences and psychological personality
measures’, Annual Review of Economics, vol. 4(1), pp. 453–478, doi:10.
1146/annurev-economics-080511-110922.
Bisin, A. and Verdier, T. (2001). ‘The economics of cultural transmission
and the dynamics of preferences.’, Journal of Economic Theory, vol. 97(2),
pp. 298 – 319, ISSN 00220531.
Bjorklund, A., Lindahl, L. and Lindquist, M. (2010). ‘What more than
parental income, education and occupation? An exploration of what
Swedish siblings get from their parents’, BE Journal of Economic Analysis
& Policy, vol. 10(1), p. 102.
27
Bjorklund, A. and Salvanes, K.G. (2011). ‘Education and family back-
ground: Mechanisms and policies’, Handbook of the Economics of Ed-
ucation, vol. 3, pp. 201–247.
Black, S.E. and Devereux, P.J. (2011). ‘Recent developments in intergenera-
tional mobility’, in (Handbook of Labor Economicspp. 1487–1541, Elsevier.
Bowles, S. and Gintis, H. (2002). ‘The inheritance of inequality’, Journal of
Economic Perspectives, vol. 16(3), pp. pp. 3–30, ISSN 08953309.
Bowles, S., Gintis, H. and Osborne, M. (2001). ‘The determinants of earn-
ings: A behavioral approach’, Journal of Economic Literature, vol. 39(4),
pp. 1137–1176.
Brenøe, A.A. and Epper, T. (2019). ‘Parenting values moderate the inter-
generational transmission of time preferences’, .
Cesarini, D., Dawes, C., Johannesson, M., Lichtenstein, P. and Wallace,
B. (2009). ‘Genetic variation in preferences for giving and risk taking’,
Quarterly Journal of Economics, vol. 124(2), pp. 809–842.
Cunha, F. and Heckman, J. (2007). ‘The technology of skill formation’,
American Economic Review, vol. 97(2), pp. 31–47.
Doepke, M. and Zilibotti, F. (2008). ‘Occupational choice and the spirit of
capitalism’, Quarterly Journal of Economics, vol. 123(2), pp. 747–793.
Doepke, M. and Zilibotti, F. (2017). ‘Parenting with style: Altruism and
paternalism in intergenerational preference transmission’, Econometrica,
vol. 85(5), pp. 1331–1371.
Dohmen, T., Falk, A., Hu↵man, D. and Sunde, U. (2012). ‘The intergen-
erational transmission of risk and trust attitudes’, Review of Economic
Studies, vol. 79(2), pp. 645–677.
Dohmen, T., Falk, A., Hu↵man, D., Sunde, U., Schupp, J. and Wagner,
G.G. (2011). ‘Individual risk attitudes: Measurement, determinants, and
behavioral consequences’, Journal of the European Economic Associa-
tion, vol. 9(3), pp. 522–550, ISSN 1542-4774, doi:10.1111/j.1542-4774.
2011.01015.x.
28
Duncan, G., Kalil, A., Mayer, S., Tepper, R. and Payne, M. (2005). ‘The
apple does not fall far from the tree’, in (Unequal chances: Family back-
ground and economic successpp. 23–79, Russell Sage Foundation.
Falk, A., Kosse, F., Pinger, P., Deckers, T. and Schildberg-Horisch, H.
(2019). ‘Socio-economic status and inequalities in children’s IQ and eco-
nomic preferences’, Journal of Political Economy, vol. forthcoming.
Fehr, E., Fischbacher, U., Von Rosenbladt, B., Schupp, J. and Wagner, G.G.
(2003). ‘A nation-wide laboratory: examining trust and trustworthiness
by integrating behavioral experiments into representative survey’, .
Gerlitz, J.Y. and Schupp, J. (2005). ‘Zur Erhebung der Big-Five-basierten
persoenlichkeitsmerkmale im SOEP’, DIW Berlin.
Gronqvist, E., Ockert, B. and Vlachos, J. (2017). ‘The intergenerational
transmission of cognitive and noncognitive abilities’, Journal of Human
Resources, vol. 52(4), pp. 887–918.
Guiso, L., Sapienza, P. and Zingales, L. (2008). ‘Social capital as good cul-
ture’, Journal of the European Economic Association, vol. 6(2-3), pp.
295–320.
Heckman, J., Pinto, R. and Savelyev, P. (2013). ‘Understanding the mecha-
nisms through which an influential early childhood program boosted adult
outcomes’, American Economic Review, vol. 103(6), doi:doi:10.1257/aer.
103.6.2052.
Heckman, J.J. (2005). ‘1. The scientific model of causality’, Sociological
Methodology, vol. 35(1), pp. 1–97.
Heckman, J.J., Holland, M.L., Makino, K.K., Pinto, R. and Rosales-Rueda,
M. (2017). ‘An analysis of the memphis nurse-family partnership pro-
gram’, National Bureau of Economic Research, doi:10.3386/w23610.
Holmlund, H., Lindahl, M. and Plug, E. (2011). ‘The causal e↵ect of parents’
schooling on children’s schooling: A comparison of estimation methods’,
Journal of Economic Literature, vol. 49(3), pp. 615–651.
Josef, A.K., Richter, D., Samanez-Larkin, G.R., Wagner, G.G., Hertwig,
R. and Mata, R. (2016). ‘Stability and change in risk-taking propensity
29
across the adult life span.’, Journal of Personality and Social Psychology,
vol. 111(3), p. 430.
Kosse, F., Deckers, T., Pinger, P., Schildberg-Horisch, H. and Falk, A.
(2019). ‘The Formation of Prosociality: Causal Evidence on the Role of
Social Environment’, Journal of Political Economy, vol. forthcoming.
Lindahl, M., Lundberg, E., Palme, M. and Simeonova, E. (2016). ‘Parental
influences on health and longevity: Lessons from a large sample of
adoptees’, National Bureau of Economic Research.
Loehlin, J.C. (2008). ‘Resemblance in personality and attitudes between
parents and their children’, in (S. Bowles, H. Gintis and M. Groves, eds.),
Unequal Chances: Family Background and Economic Success, Princeton
University Press.
Lubotsky, D. and Wittenberg, M. (2006). ‘Interpretation of regressions with
multiple proxies.’, Review of Economics and Statistics, vol. 88(3), pp. 549
– 562, ISSN 00346535.
Oster, E. (2019). ‘Unobservable selection and coe�cient stability: Theory
and evidence’, Journal of Business & Economic Statistics, vol. 37(2), pp.
187–204, doi:10.1080/07350015.2016.1227711.
Patacchini, E. and Zenou, Y. (2016). ‘Social networks and parental behavior
in the intergenerational transmission of religion’, Quantitative Economics,
vol. 7(3), pp. 969–995.
Richter, D., Metzing, M., Weinhardt, M. and Schupp, J. (2013). ‘SOEP
scales manual’, DIW/SOEP.
Schupp, J. and Wagner, G.G. (2002). ‘Maintenance of and innovation in
long-term panel studies: The case of the German Socio-Economic Panel
(GSOEP).’, Allgemeines Statistisches Archiv/Journal of the German Sta-
tistical Society, vol. 86(2), pp. 163 – 175, ISSN 00026018.
Specht, J., Eglo↵, B. and Schmukle, S.C. (2013). ‘Everything under control?
the e↵ects of age, gender, and education on trajectories of perceived con-
trol in a nationally representative german sample.’, Developmental Psy-
chology, vol. 49(2), p. 353.
30
Wagner, G.G., Frick, J.R. and Schupp, J. (2007). ‘The German Socio-
Economic Panel study (SOEP) – scope, evolution and enhancements’,
Schmollers Jahrbuch, vol. 127(1), pp. 139–169.
Wagner, G.G., Gobel, J., Krause, P., Pischner, R. and Sieber, I. (2008). ‘Das
Sozio-oekonomische Panel (SOEP): Multidisziplinares Haushaltspanel
und Kohortenstudie fur Deutschland–Eine Einfuhrung (fur neue Daten-
nutzer) mit einem Ausblick (fur erfahrene Anwender)’, AStA Wirtschafts-
und Sozialstatistisches Archiv, vol. 2(4), pp. 301–328.
Weinhardt, M. and Schupp, J. (2011). ‘Multi-Itemskalen im SOEP Jugend-
fragebogen’, DIW Berlin, German Institute for Economic Research.
31

5 Tables
32
Tab
le1:
Descriptive
statistics:Investmentvariab
lesby
risk
andtrust
sample
RiskSam
ple
Trust
Sam
ple
LOC
Sam
ple
Big
FiveSam
ple
VARIA
BLES
mean
sdmean
sdmean
sdmean
sdmin
max
Mother
talksab
outthings
youdo
3.78
(0.90)
3.79
(0.90)
3.77
(0.91)
3.78
(0.91)
51
Father
talksab
outthings
youdo
3.35
(0.98)
3.34
(0.98)
3.36
(0.98)
3.33
(0.98)
51
Mother
talksab
outthings
that
worry
you
3.28
(0.98)
3.29
(0.98)
3.29
(0.98)
3.29
(0.98)
51
Father
talksab
outthings
that
worry
you
2.97
(1.00)
2.98
(0.99)
2.97
(0.99)
2.98
(0.98)
51
Mother
asks
youprior
tomak
ingdecisions
3.72
(1.06)
3.74
(1.07)
3.73
(1.04)
3.72
(1.07)
51
Father
asks
youprior
tomak
ingdecisions
3.56
(1.14)
3.58
(1.13)
3.59
(1.12)
3.59
(1.13)
51
Mother
expresses
opinionon
somethingyoudo
4.05
(0.82)
4.04
(0.81)
4.05
(0.82)
4.03
(0.82)
51
Father
expresses
opinionon
somethingyo
udo
3.86
(0.93)
3.86
(0.91)
3.86
(0.92)
3.85
(0.92)
51
Mother
isab
leto
solveproblemswithyou
3.67
(0.98)
3.66
(0.98)
3.67
(0.97)
3.63
(0.98)
51
Father
isab
leto
solveproblemswithyou
3.47
(1.04)
3.48
(1.03)
3.49
(1.03)
3.47
(1.03)
51
Mother
asks
yourop
inionon
familymatters
3.50
(1.01)
3.50
(1.01)
3.51
(1.01)
3.49
(1.03)
51
Father
asks
yourop
inionon
familymatters
3.32
(1.09)
3.33
(1.08)
3.35
(1.09)
3.35
(1.08)
51
Mother
givesreason
formak
ingdecision
3.61
(1.01)
3.59
(1.00)
3.60
(1.01)
3.58
(1.01)
51
Father
givesreason
formak
ingdecision
3.43
(1.08)
3.43
(1.06)
3.45
(1.06)
3.43
(1.06)
51
Parents
show
interest
inperform
ance
3.03
(0.73)
3.03
(0.73)
3.02
(0.73)
3.03
(0.72)
41
Mother
helpswithhom
ework
0.75
(0.43)
0.75
(0.43)
0.75
(0.43)
0.75
(0.43)
10
Father
helpswithhom
ework
0.56
(0.50)
0.57
(0.50)
0.58
(0.49)
0.56
(0.50)
10
Parents
take
partin
parents-evening
0.77
(0.42)
0.77
(0.42)
0.77
(0.42)
0.77
(0.42)
10
Parents
cometo
teacher
o�ce
hou
rs0.58
(0.49)
0.58
(0.49)
0.58
(0.49)
0.57
(0.49)
10
Parents
visitteacher
outsideo�
cehou
rs0.23
(0.42)
0.23
(0.42)
0.22
(0.42)
0.22
(0.41)
10
Parents
involved
inat
leaston
eschoo
lactivity
0.93
(0.26)
0.93
(0.26)
0.93
(0.26)
0.92
(0.27)
10
Observations
3,393
2,119
2,274
1,832
Notes:Descriptive
statistics
oftheproxyvariab
lesthat
weuse
toconstruct
theinvestmen
tindex.Therisk
sample
containsallob
servationsweuse
forthean
alysisof
the
impactof
investmenton
thesimilarityin
risk
attitudes
betweenparen
tsan
dchildren.This
meansit
containson
lyob
servationsforwhichwehaveinform
ationon
both,
mothersan
dfathers,
inrisk
attitudes.Thesameholdsforthetrust
sample
andthelocu
sof
control
sample
resp
ectively.Thesample
fortheBig
Fivep
ersonalitytraits
containstheob
servationsof
childrenan
dtheirparents,forwhom
wehaveinform
ationon
allfive
traits.Thesamplesforsp
ecifictraitareincludingallob
servationsof
that
specifictraitan
darethusslightlylarger,seenumbersof
observationsin
section2.
Thefourreportedgrou
psdonot
contain
exactlythesamepool
ofob
servations,
since
weuse
datafrom
di↵erentyearsfortheattitudemeasures.
Thelast
twocolumnsreportthepossible
range
ofan
swersto
each
question
,from
“no/
not
atall”
to“y
es/v
erymuch”.
Datasource:
SOEP,v32
.
33
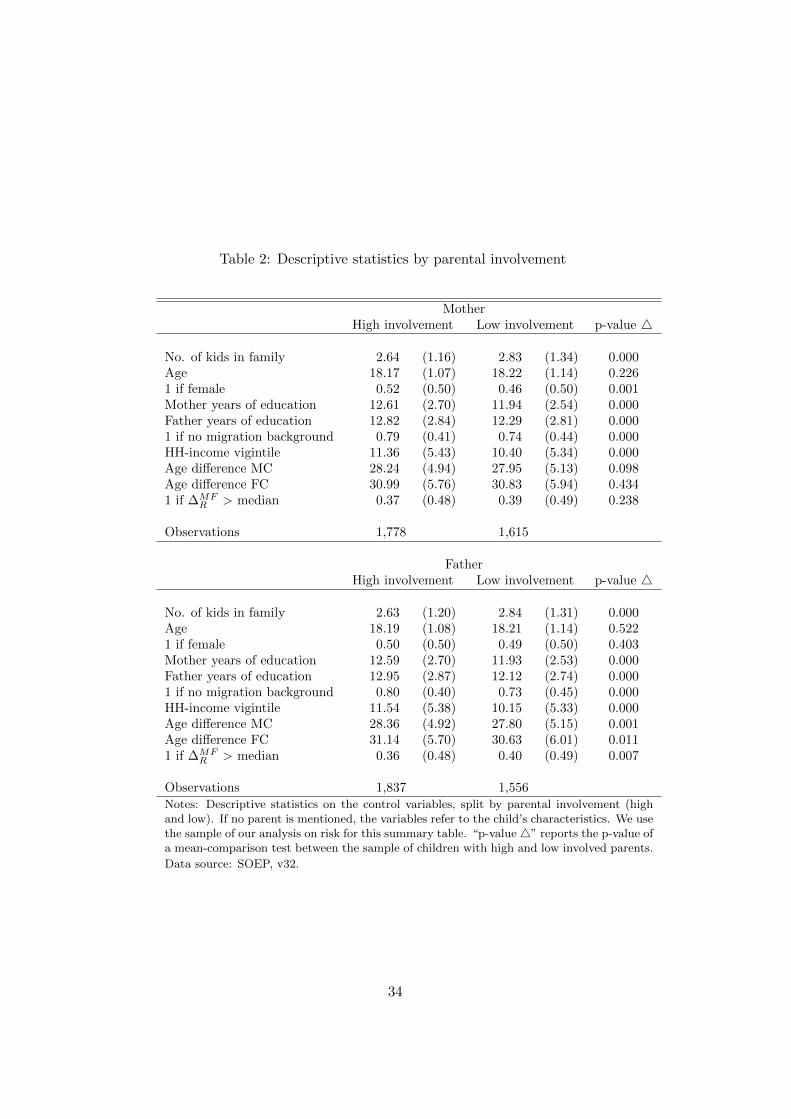
Table 2: Descriptive statistics by parental involvement
MotherHigh involvement Low involvement p-value 4
No. of kids in family 2.64 (1.16) 2.83 (1.34) 0.000Age 18.17 (1.07) 18.22 (1.14) 0.2261 if female 0.52 (0.50) 0.46 (0.50) 0.001Mother years of education 12.61 (2.70) 11.94 (2.54) 0.000Father years of education 12.82 (2.84) 12.29 (2.81) 0.0001 if no migration background 0.79 (0.41) 0.74 (0.44) 0.000HH-income vigintile 11.36 (5.43) 10.40 (5.34) 0.000Age di↵erence MC 28.24 (4.94) 27.95 (5.13) 0.098Age di↵erence FC 30.99 (5.76) 30.83 (5.94) 0.4341 if �MF
R > median 0.37 (0.48) 0.39 (0.49) 0.238
Observations 1,778 1,615
FatherHigh involvement Low involvement p-value 4
No. of kids in family 2.63 (1.20) 2.84 (1.31) 0.000Age 18.19 (1.08) 18.21 (1.14) 0.5221 if female 0.50 (0.50) 0.49 (0.50) 0.403Mother years of education 12.59 (2.70) 11.93 (2.53) 0.000Father years of education 12.95 (2.87) 12.12 (2.74) 0.0001 if no migration background 0.80 (0.40) 0.73 (0.45) 0.000HH-income vigintile 11.54 (5.38) 10.15 (5.33) 0.000Age di↵erence MC 28.36 (4.92) 27.80 (5.15) 0.001Age di↵erence FC 31.14 (5.70) 30.63 (6.01) 0.0111 if �MF
R > median 0.36 (0.48) 0.40 (0.49) 0.007
Observations 1,837 1,556Notes: Descriptive statistics on the control variables, split by parental involvement (highand low). If no parent is mentioned, the variables refer to the child’s characteristics. We usethe sample of our analysis on risk for this summary table. “p-value 4” reports the p-value ofa mean-comparison test between the sample of children with high and low involved parents.
Data source: SOEP, v32.
34
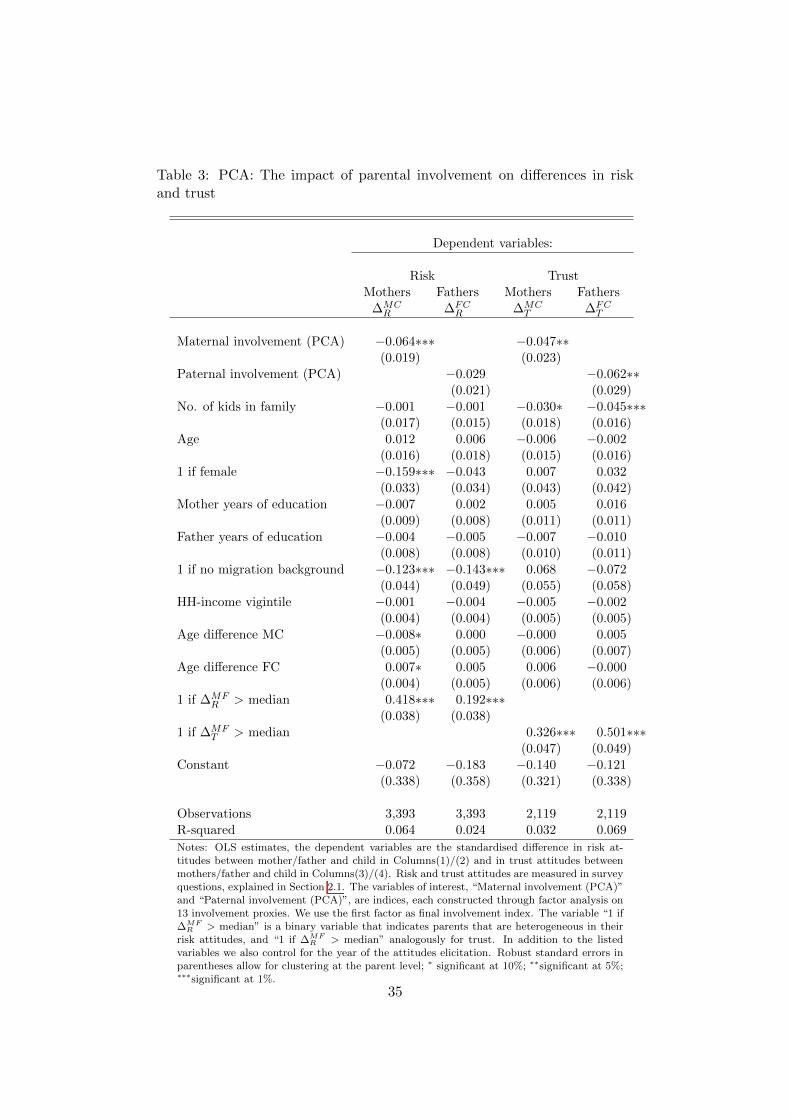
Table 3: PCA: The impact of parental involvement on di↵erences in riskand trust
Dependent variables:
Risk TrustMothers Fathers Mothers Fathers�MC
R �FCR �MC
T �FCT
Maternal involvement (PCA) �0.064⇤⇤⇤ �0.047⇤⇤(0.019) (0.023)
Paternal involvement (PCA) �0.029 �0.062⇤⇤(0.021) (0.029)
No. of kids in family �0.001 �0.001 �0.030⇤ �0.045⇤⇤⇤(0.017) (0.015) (0.018) (0.016)
Age 0.012 0.006 �0.006 �0.002(0.016) (0.018) (0.015) (0.016)
1 if female �0.159⇤⇤⇤ �0.043 0.007 0.032(0.033) (0.034) (0.043) (0.042)
Mother years of education �0.007 0.002 0.005 0.016(0.009) (0.008) (0.011) (0.011)
Father years of education �0.004 �0.005 �0.007 �0.010(0.008) (0.008) (0.010) (0.011)
1 if no migration background �0.123⇤⇤⇤ �0.143⇤⇤⇤ 0.068 �0.072(0.044) (0.049) (0.055) (0.058)
HH-income vigintile �0.001 �0.004 �0.005 �0.002(0.004) (0.004) (0.005) (0.005)
Age di↵erence MC �0.008⇤ 0.000 �0.000 0.005(0.005) (0.005) (0.006) (0.007)
Age di↵erence FC 0.007⇤ 0.005 0.006 �0.000(0.004) (0.005) (0.006) (0.006)
1 if �MFR > median 0.418⇤⇤⇤ 0.192⇤⇤⇤
(0.038) (0.038)1 if �MF
T > median 0.326⇤⇤⇤ 0.501⇤⇤⇤(0.047) (0.049)
Constant �0.072 �0.183 �0.140 �0.121(0.338) (0.358) (0.321) (0.338)
Observations 3,393 3,393 2,119 2,119R-squared 0.064 0.024 0.032 0.069Notes: OLS estimates, the dependent variables are the standardised di↵erence in risk at-titudes between mother/father and child in Columns(1)/(2) and in trust attitudes betweenmothers/father and child in Columns(3)/(4). Risk and trust attitudes are measured in surveyquestions, explained in Section 2.1. The variables of interest, “Maternal involvement (PCA)”and “Paternal involvement (PCA)”, are indices, each constructed through factor analysis on13 involvement proxies. We use the first factor as final involvement index. The variable “1 if�MF
R > median” is a binary variable that indicates parents that are heterogeneous in theirrisk attitudes, and “1 if �MF
R > median” analogously for trust. In addition to the listedvariables we also control for the year of the attitudes elicitation. Robust standard errors inparentheses allow for clustering at the parent level; ⇤ significant at 10%; ⇤⇤significant at 5%;⇤⇤⇤significant at 1%.
35
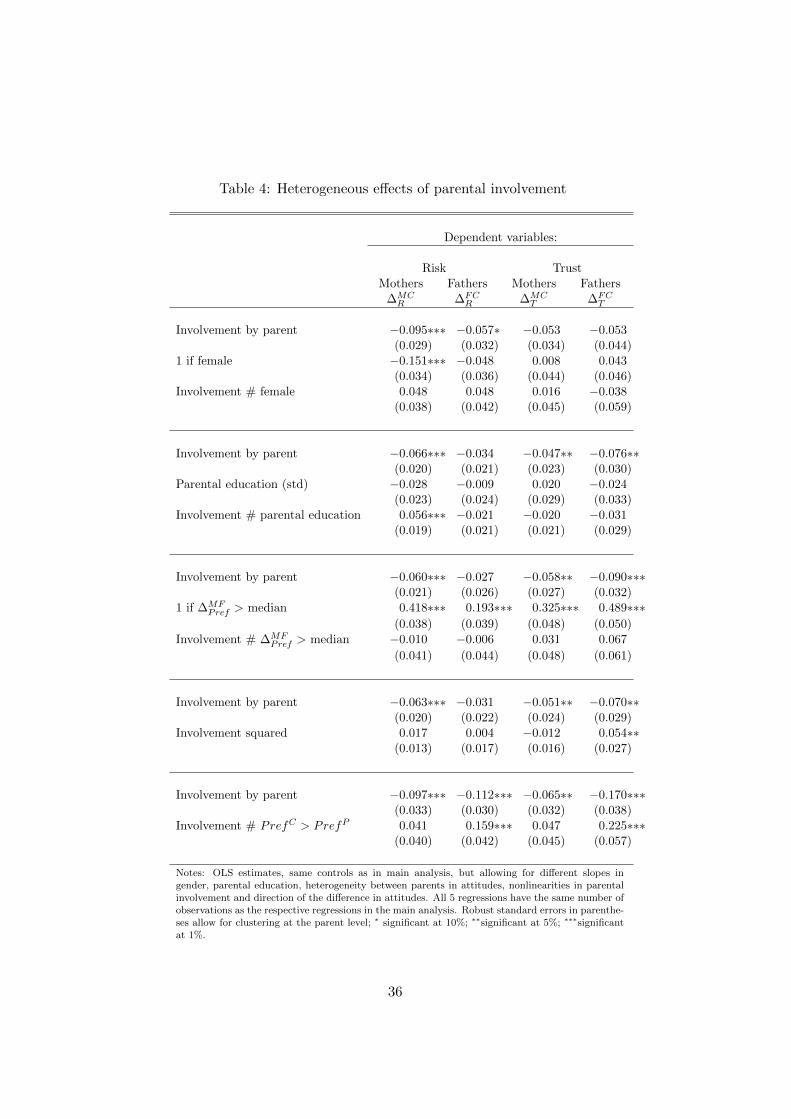
Table 4: Heterogeneous e↵ects of parental involvement
Dependent variables:
Risk TrustMothers Fathers Mothers Fathers�MC
R �FCR �MC
T �FCT
Involvement by parent �0.095⇤⇤⇤ �0.057⇤ �0.053 �0.053(0.029) (0.032) (0.034) (0.044)
1 if female �0.151⇤⇤⇤ �0.048 0.008 0.043(0.034) (0.036) (0.044) (0.046)
Involvement # female 0.048 0.048 0.016 �0.038(0.038) (0.042) (0.045) (0.059)
Involvement by parent �0.066⇤⇤⇤ �0.034 �0.047⇤⇤ �0.076⇤⇤(0.020) (0.021) (0.023) (0.030)
Parental education (std) �0.028 �0.009 0.020 �0.024(0.023) (0.024) (0.029) (0.033)
Involvement # parental education 0.056⇤⇤⇤ �0.021 �0.020 �0.031(0.019) (0.021) (0.021) (0.029)
Involvement by parent �0.060⇤⇤⇤ �0.027 �0.058⇤⇤ �0.090⇤⇤⇤(0.021) (0.026) (0.027) (0.032)
1 if �MFPref > median 0.418⇤⇤⇤ 0.193⇤⇤⇤ 0.325⇤⇤⇤ 0.489⇤⇤⇤
(0.038) (0.039) (0.048) (0.050)Involvement # �MF
Pref > median �0.010 �0.006 0.031 0.067(0.041) (0.044) (0.048) (0.061)
Involvement by parent �0.063⇤⇤⇤ �0.031 �0.051⇤⇤ �0.070⇤⇤(0.020) (0.022) (0.024) (0.029)
Involvement squared 0.017 0.004 �0.012 0.054⇤⇤(0.013) (0.017) (0.016) (0.027)
Involvement by parent �0.097⇤⇤⇤ �0.112⇤⇤⇤ �0.065⇤⇤ �0.170⇤⇤⇤(0.033) (0.030) (0.032) (0.038)
Involvement # PrefC > PrefP 0.041 0.159⇤⇤⇤ 0.047 0.225⇤⇤⇤(0.040) (0.042) (0.045) (0.057)
Notes: OLS estimates, same controls as in main analysis, but allowing for di↵erent slopes ingender, parental education, heterogeneity between parents in attitudes, nonlinearities in parentalinvolvement and direction of the di↵erence in attitudes. All 5 regressions have the same number ofobservations as the respective regressions in the main analysis. Robust standard errors in parenthe-ses allow for clustering at the parent level; ⇤ significant at 10%; ⇤⇤significant at 5%; ⇤⇤⇤significantat 1%.
36
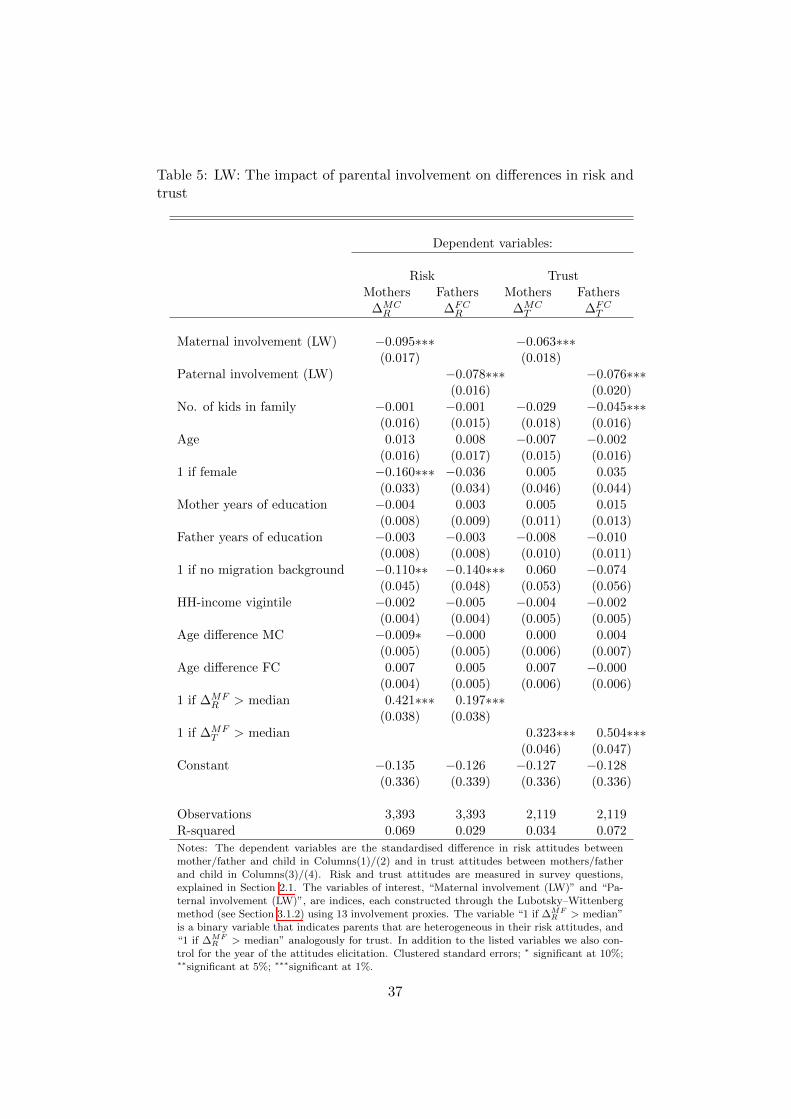
Table 5: LW: The impact of parental involvement on di↵erences in risk andtrust
Dependent variables:
Risk TrustMothers Fathers Mothers Fathers�MC
R �FCR �MC
T �FCT
Maternal involvement (LW) �0.095⇤⇤⇤ �0.063⇤⇤⇤(0.017) (0.018)
Paternal involvement (LW) �0.078⇤⇤⇤ �0.076⇤⇤⇤(0.016) (0.020)
No. of kids in family �0.001 �0.001 �0.029 �0.045⇤⇤⇤(0.016) (0.015) (0.018) (0.016)
Age 0.013 0.008 �0.007 �0.002(0.016) (0.017) (0.015) (0.016)
1 if female �0.160⇤⇤⇤ �0.036 0.005 0.035(0.033) (0.034) (0.046) (0.044)
Mother years of education �0.004 0.003 0.005 0.015(0.008) (0.009) (0.011) (0.013)
Father years of education �0.003 �0.003 �0.008 �0.010(0.008) (0.008) (0.010) (0.011)
1 if no migration background �0.110⇤⇤ �0.140⇤⇤⇤ 0.060 �0.074(0.045) (0.048) (0.053) (0.056)
HH-income vigintile �0.002 �0.005 �0.004 �0.002(0.004) (0.004) (0.005) (0.005)
Age di↵erence MC �0.009⇤ �0.000 0.000 0.004(0.005) (0.005) (0.006) (0.007)
Age di↵erence FC 0.007 0.005 0.007 �0.000(0.004) (0.005) (0.006) (0.006)
1 if �MFR > median 0.421⇤⇤⇤ 0.197⇤⇤⇤
(0.038) (0.038)1 if �MF
T > median 0.323⇤⇤⇤ 0.504⇤⇤⇤(0.046) (0.047)
Constant �0.135 �0.126 �0.127 �0.128(0.336) (0.339) (0.336) (0.336)
Observations 3,393 3,393 2,119 2,119R-squared 0.069 0.029 0.034 0.072Notes: The dependent variables are the standardised di↵erence in risk attitudes betweenmother/father and child in Columns(1)/(2) and in trust attitudes between mothers/fatherand child in Columns(3)/(4). Risk and trust attitudes are measured in survey questions,explained in Section 2.1. The variables of interest, “Maternal involvement (LW)” and “Pa-ternal involvement (LW)”, are indices, each constructed through the Lubotsky–Wittenbergmethod (see Section 3.1.2) using 13 involvement proxies. The variable “1 if �MF
R > median”is a binary variable that indicates parents that are heterogeneous in their risk attitudes, and“1 if �MF
R > median” analogously for trust. In addition to the listed variables we also con-trol for the year of the attitudes elicitation. Clustered standard errors; ⇤ significant at 10%;⇤⇤significant at 5%; ⇤⇤⇤significant at 1%.
37
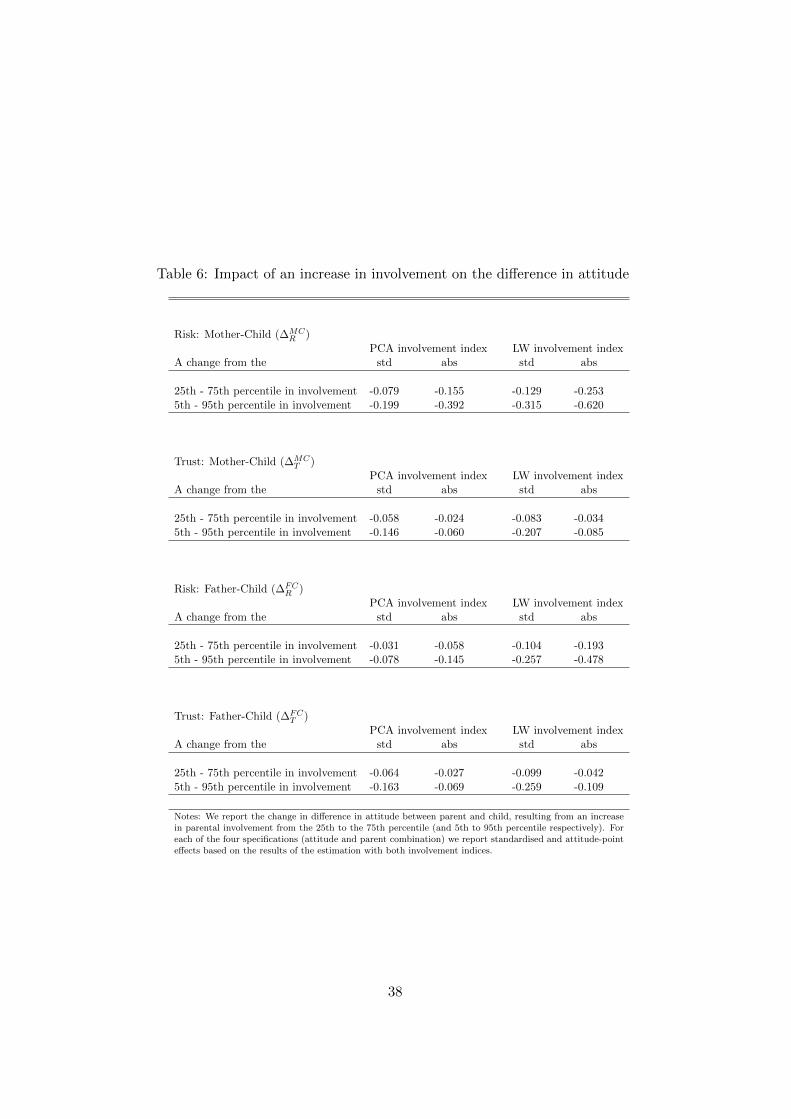
Table 6: Impact of an increase in involvement on the di↵erence in attitude
Risk: Mother-Child (�MCR )
PCA involvement index LW involvement indexA change from the std abs std abs
25th - 75th percentile in involvement -0.079 -0.155 -0.129 -0.2535th - 95th percentile in involvement -0.199 -0.392 -0.315 -0.620
Trust: Mother-Child (�MCT )
PCA involvement index LW involvement indexA change from the std abs std abs
25th - 75th percentile in involvement -0.058 -0.024 -0.083 -0.0345th - 95th percentile in involvement -0.146 -0.060 -0.207 -0.085
Risk: Father-Child (�FCR )
PCA involvement index LW involvement indexA change from the std abs std abs
25th - 75th percentile in involvement -0.031 -0.058 -0.104 -0.1935th - 95th percentile in involvement -0.078 -0.145 -0.257 -0.478
Trust: Father-Child (�FCT )
PCA involvement index LW involvement indexA change from the std abs std abs
25th - 75th percentile in involvement -0.064 -0.027 -0.099 -0.0425th - 95th percentile in involvement -0.163 -0.069 -0.259 -0.109
Notes: We report the change in di↵erence in attitude between parent and child, resulting from an increasein parental involvement from the 25th to the 75th percentile (and 5th to 95th percentile respectively). Foreach of the four specifications (attitude and parent combination) we report standardised and attitude-pointe↵ects based on the results of the estimation with both involvement indices.
38
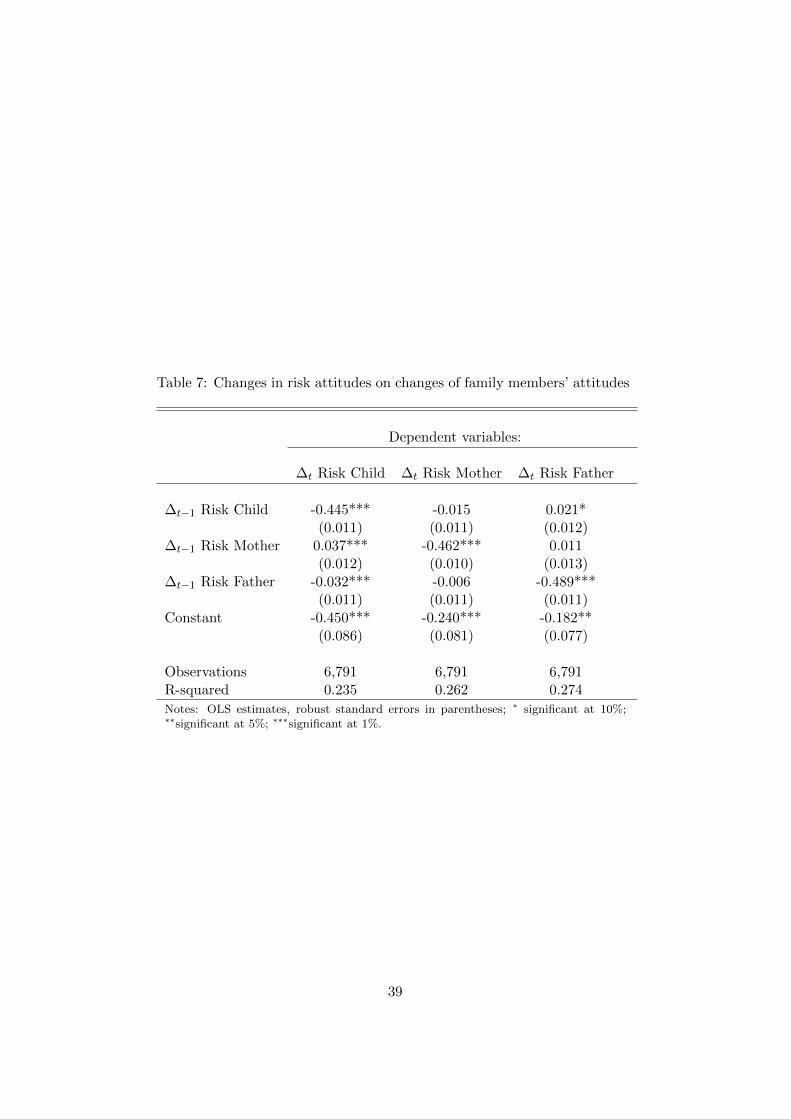
Table 7: Changes in risk attitudes on changes of family members’ attitudes
Dependent variables:
�t Risk Child �t Risk Mother �t Risk Father
�t�1 Risk Child -0.445*** -0.015 0.021*(0.011) (0.011) (0.012)
�t�1 Risk Mother 0.037*** -0.462*** 0.011(0.012) (0.010) (0.013)
�t�1 Risk Father -0.032*** -0.006 -0.489***(0.011) (0.011) (0.011)
Constant -0.450*** -0.240*** -0.182**(0.086) (0.081) (0.077)
Observations 6,791 6,791 6,791R-squared 0.235 0.262 0.274Notes: OLS estimates, robust standard errors in parentheses; ⇤ significant at 10%;⇤⇤significant at 5%; ⇤⇤⇤significant at 1%.
39
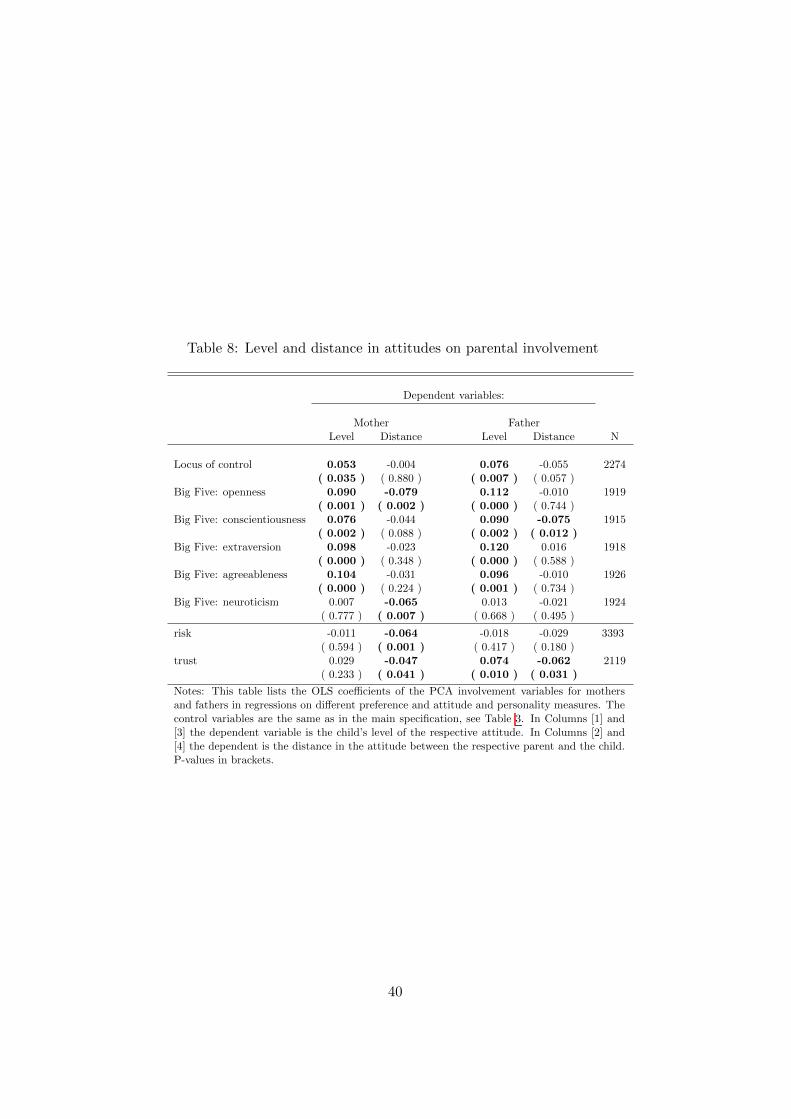
Table 8: Level and distance in attitudes on parental involvement
Dependent variables:
Mother FatherLevel Distance Level Distance N
Locus of control 0.053 -0.004 0.076 -0.055 2274( 0.035 ) ( 0.880 ) ( 0.007 ) ( 0.057 )
Big Five: openness 0.090 -0.079 0.112 -0.010 1919( 0.001 ) ( 0.002 ) ( 0.000 ) ( 0.744 )
Big Five: conscientiousness 0.076 -0.044 0.090 -0.075 1915( 0.002 ) ( 0.088 ) ( 0.002 ) ( 0.012 )
Big Five: extraversion 0.098 -0.023 0.120 0.016 1918( 0.000 ) ( 0.348 ) ( 0.000 ) ( 0.588 )
Big Five: agreeableness 0.104 -0.031 0.096 -0.010 1926( 0.000 ) ( 0.224 ) ( 0.001 ) ( 0.734 )
Big Five: neuroticism 0.007 -0.065 0.013 -0.021 1924( 0.777 ) ( 0.007 ) ( 0.668 ) ( 0.495 )
risk -0.011 -0.064 -0.018 -0.029 3393( 0.594 ) ( 0.001 ) ( 0.417 ) ( 0.180 )
trust 0.029 -0.047 0.074 -0.062 2119( 0.233 ) ( 0.041 ) ( 0.010 ) ( 0.031 )
Notes: This table lists the OLS coe�cients of the PCA involvement variables for mothersand fathers in regressions on di↵erent preference and attitude and personality measures. Thecontrol variables are the same as in the main specification, see Table 3. In Columns [1] and[3] the dependent variable is the child’s level of the respective attitude. In Columns [2] and[4] the dependent is the distance in the attitude between the respective parent and the child.P-values in brackets.
40
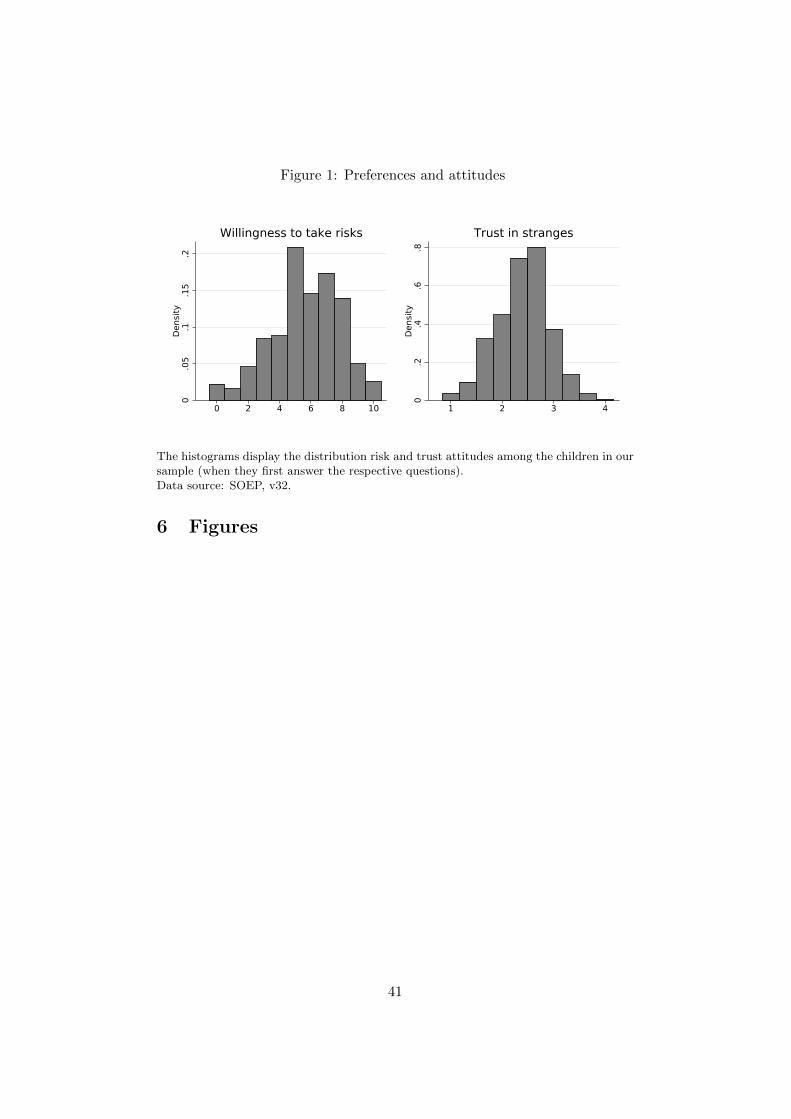
Figure 1: Preferences and attitudes0
.05
.1.1
5.2
Dens
ity
0 2 4 6 8 10
Willingness to take risks
0.2
.4.6
.8De
nsity
1 2 3 4
Trust in stranges
The histograms display the distribution risk and trust attitudes among the children in oursample (when they first answer the respective questions).Data source: SOEP, v32.
6 Figures
41
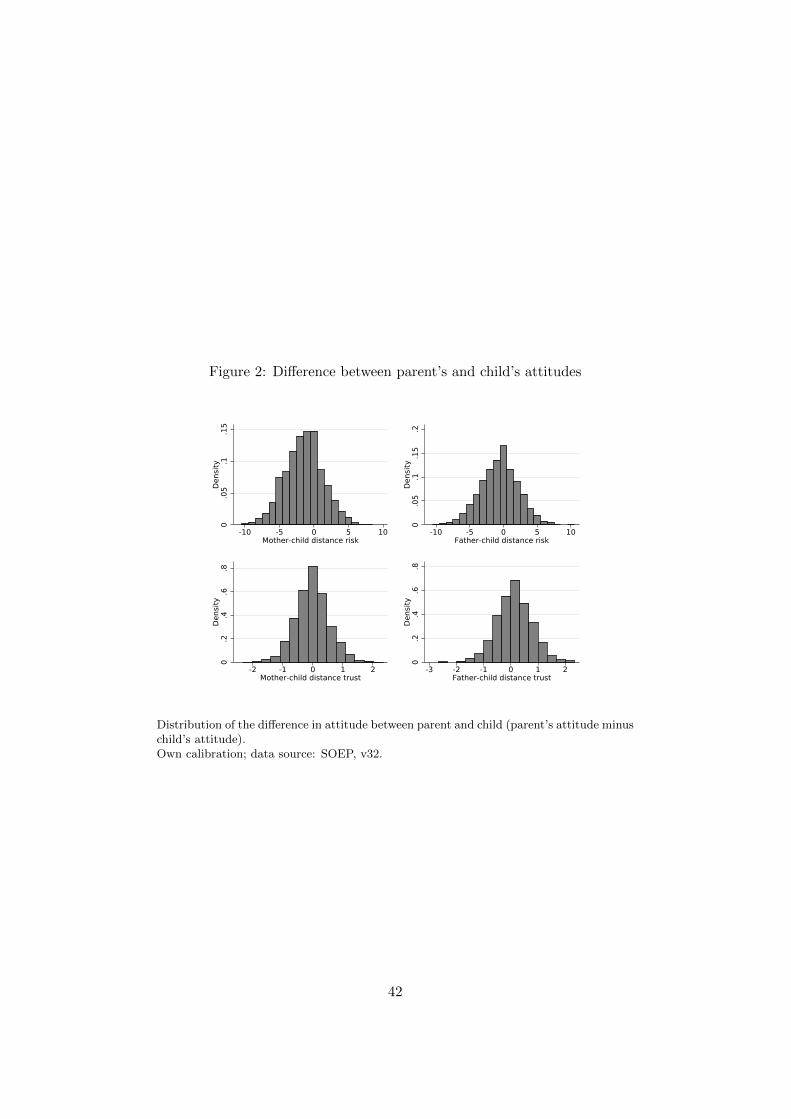
Figure 2: Di↵erence between parent’s and child’s attitudes
0.0
5.1
.15
Dens
ity
-10 -5 0 5 10Mother-child distance risk
0.0
5.1
.15
.2De
nsity
-10 -5 0 5 10Father-child distance risk
0.2
.4.6
.8De
nsity
-2 -1 0 1 2Mother-child distance trust
0.2
.4.6
.8De
nsity
-3 -2 -1 0 1 2Father-child distance trust
Distribution of the di↵erence in attitude between parent and child (parent’s attitude minuschild’s attitude).Own calibration; data source: SOEP, v32.
42
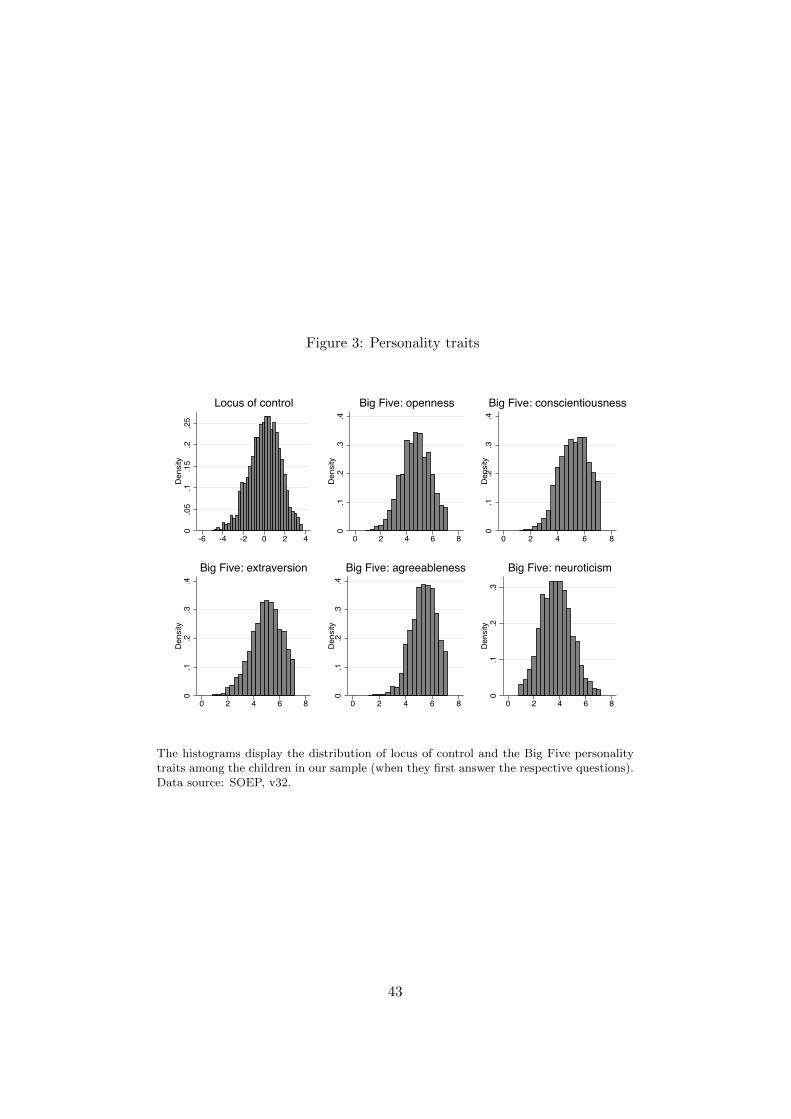
Figure 3: Personality traits
0.0
5.1
.15
.2.2
5D
ensi
ty
-6 -4 -2 0 2 4
Locus of control
0.1
.2.3
.4D
ensi
ty
0 2 4 6 8
Big Five: openness
0.1
.2.3
.4D
ensi
ty
0 2 4 6 8
Big Five: conscientiousness
0.1
.2.3
.4D
ensi
ty
0 2 4 6 8
Big Five: extraversion
0.1
.2.3
.4D
ensi
ty
0 2 4 6 8
Big Five: agreeableness
0.1
.2.3
Den
sity
0 2 4 6 8
Big Five: neuroticism
The histograms display the distribution of locus of control and the Big Five personalitytraits among the children in our sample (when they first answer the respective questions).Data source: SOEP, v32.
43
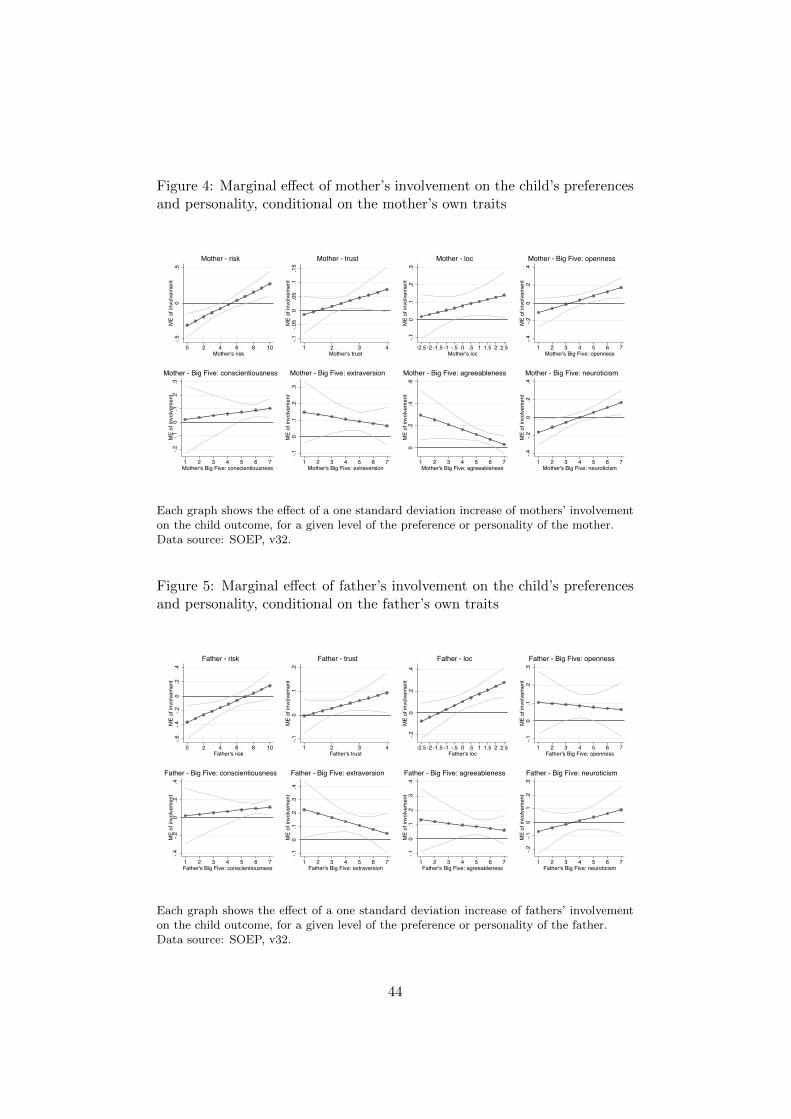
Figure 4: Marginal e↵ect of mother’s involvement on the child’s preferencesand personality, conditional on the mother’s own traits
-.50
.5M
E of
invo
lvem
ent
0 2 4 6 8 10Mother's risk
Mother - risk
-.1-.0
50
.05
.1.1
5M
E of
invo
lvem
ent
1 2 3 4Mother's trust
Mother - trust
-.10
.1.2
.3M
E of
invo
lvem
ent
-2.5 -2 -1.5 -1 -.5 0 .5 1 1.5 2 2.5Mother's loc
Mother - loc
-.4-.2
0.2
.4M
E of
invo
lvem
ent
1 2 3 4 5 6 7Mother's Big Five: openness
Mother - Big Five: openness
-.2-.1
0.1
.2.3
ME
of in
volv
emen
t
1 2 3 4 5 6 7Mother's Big Five: conscientiousness
Mother - Big Five: conscientiousness
-.10
.1.2
.3M
E of
invo
lvem
ent
1 2 3 4 5 6 7Mother's Big Five: extraversion
Mother - Big Five: extraversion
0.2
.4.6
ME
of in
volv
emen
t
1 2 3 4 5 6 7Mother's Big Five: agreeableness
Mother - Big Five: agreeableness
-.4-.2
0.2
.4M
E of
invo
lvem
ent
1 2 3 4 5 6 7Mother's Big Five: neuroticism
Mother - Big Five: neuroticism
Each graph shows the e↵ect of a one standard deviation increase of mothers’ involvementon the child outcome, for a given level of the preference or personality of the mother.Data source: SOEP, v32.
Figure 5: Marginal e↵ect of father’s involvement on the child’s preferencesand personality, conditional on the father’s own traits
-.6-.4
-.20
.2.4
ME
of in
volv
emen
t
0 2 4 6 8 10Father's risk
Father - risk
-.10
.1.2
ME
of in
volv
emen
t
1 2 3 4Father's trust
Father - trust
-.20
.2.4
ME
of in
volv
emen
t
-2.5 -2 -1.5 -1 -.5 0 .5 1 1.5 2 2.5Father's loc
Father - loc
-.10
.1.2
.3M
E of
invo
lvem
ent
1 2 3 4 5 6 7Father's Big Five: openness
Father - Big Five: openness
-.4-.2
0.2
.4M
E of
invo
lvem
ent
1 2 3 4 5 6 7Father's Big Five: conscientiousness
Father - Big Five: conscientiousness
-.10
.1.2
.3.4
ME
of in
volv
emen
t
1 2 3 4 5 6 7Father's Big Five: extraversion
Father - Big Five: extraversion
-.10
.1.2
.3.4
ME
of in
volv
emen
t
1 2 3 4 5 6 7Father's Big Five: agreeableness
Father - Big Five: agreeableness
-.2-.1
0.1
.2.3
ME
of in
volv
emen
t
1 2 3 4 5 6 7Father's Big Five: neuroticism
Father - Big Five: neuroticism
Each graph shows the e↵ect of a one standard deviation increase of fathers’ involvementon the child outcome, for a given level of the preference or personality of the father.Data source: SOEP, v32.
44
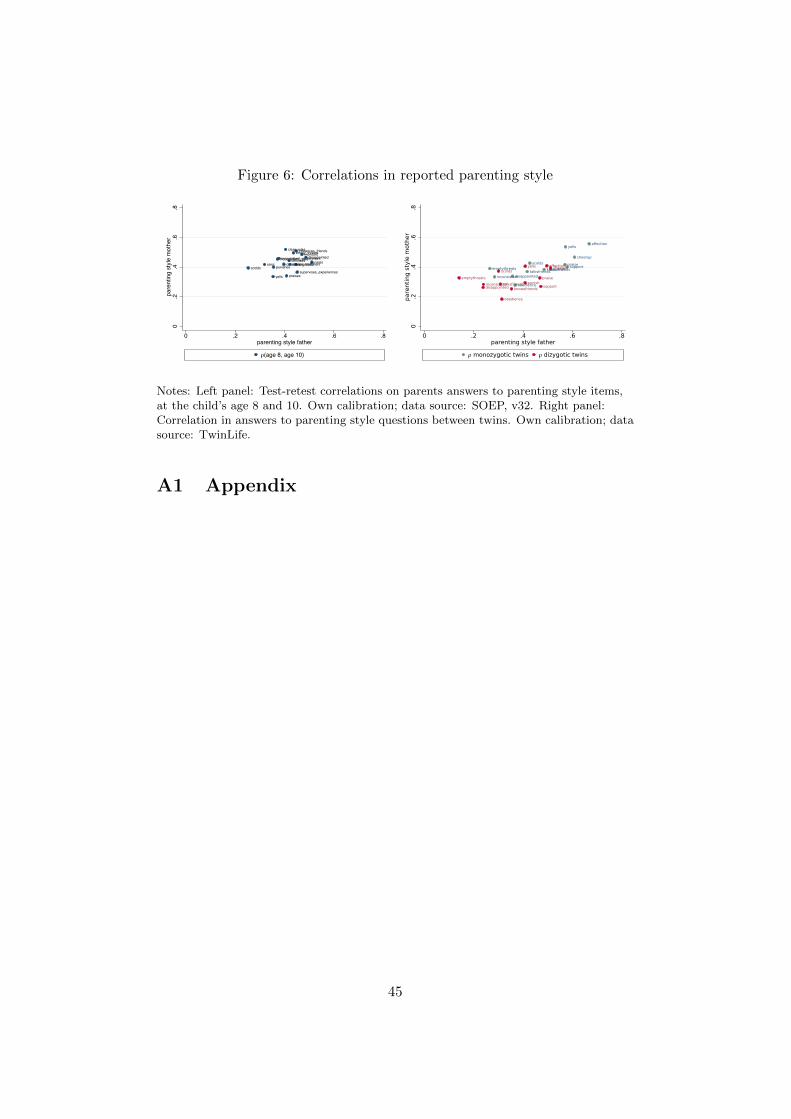
Figure 6: Correlations in reported parenting style
caresconsoles
praises
inconsistent_punishmentempty_threats
inconsistent_rules
influences_friends
supervises_experiences
monitorscriticizes
yells
scolds
disappointed
ungratefulsilence_treatmentstrictpunishes
clear_rules
0.2
.4.6
.8pa
rent
ing
styl
e m
othe
r
0 .2 .4 .6 .8parenting style father
ρ(age 8, age 10)
affection
praisecheerup
supportpunishdisappointed
obedience
yells
scolds
talksfriendsknowsfriendsemptythreats
inconsistent
affection
praise
cheerup
supportpunish
disappointed
obedience
yellsscolds
talksfriendsknowsfriends
emptythreatsinconsistent
0.2
.4.6
.8pa
rent
ing
styl
e m
othe
r
0 .2 .4 .6 .8parenting style father
ρ monozygotic twins ρ dizygotic twins
Notes: Left panel: Test-retest correlations on parents answers to parenting style items,at the child’s age 8 and 10. Own calibration; data source: SOEP, v32. Right panel:Correlation in answers to parenting style questions between twins. Own calibration; datasource: TwinLife.
A1 Appendix
45
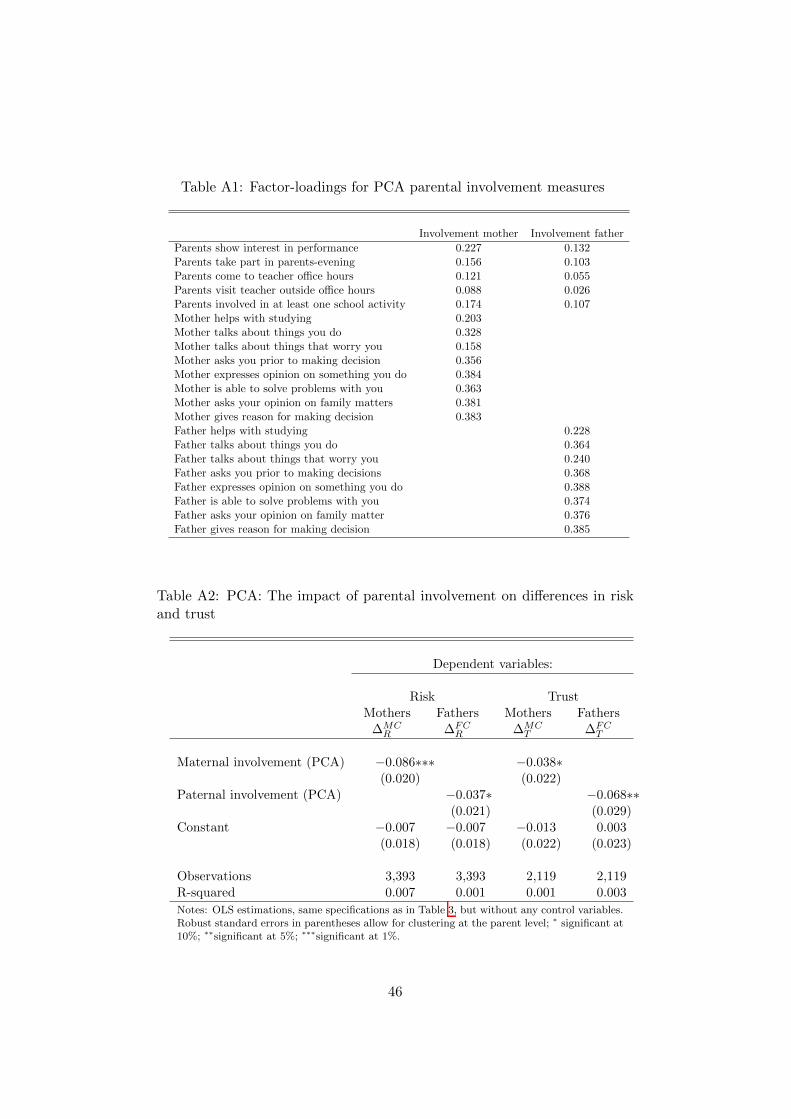
Table A1: Factor-loadings for PCA parental involvement measures
Involvement mother Involvement fatherParents show interest in performance 0.227 0.132Parents take part in parents-evening 0.156 0.103Parents come to teacher o�ce hours 0.121 0.055Parents visit teacher outside o�ce hours 0.088 0.026Parents involved in at least one school activity 0.174 0.107Mother helps with studying 0.203Mother talks about things you do 0.328Mother talks about things that worry you 0.158Mother asks you prior to making decision 0.356Mother expresses opinion on something you do 0.384Mother is able to solve problems with you 0.363Mother asks your opinion on family matters 0.381Mother gives reason for making decision 0.383Father helps with studying 0.228Father talks about things you do 0.364Father talks about things that worry you 0.240Father asks you prior to making decisions 0.368Father expresses opinion on something you do 0.388Father is able to solve problems with you 0.374Father asks your opinion on family matter 0.376Father gives reason for making decision 0.385
Table A2: PCA: The impact of parental involvement on di↵erences in riskand trust
Dependent variables:
Risk TrustMothers Fathers Mothers Fathers�MC
R �FCR �MC
T �FCT
Maternal involvement (PCA) �0.086⇤⇤⇤ �0.038⇤(0.020) (0.022)
Paternal involvement (PCA) �0.037⇤ �0.068⇤⇤(0.021) (0.029)
Constant �0.007 �0.007 �0.013 0.003(0.018) (0.018) (0.022) (0.023)
Observations 3,393 3,393 2,119 2,119R-squared 0.007 0.001 0.001 0.003Notes: OLS estimations, same specifications as in Table 3, but without any control variables.Robust standard errors in parentheses allow for clustering at the parent level; ⇤ significant at10%; ⇤⇤significant at 5%; ⇤⇤⇤significant at 1%.
46
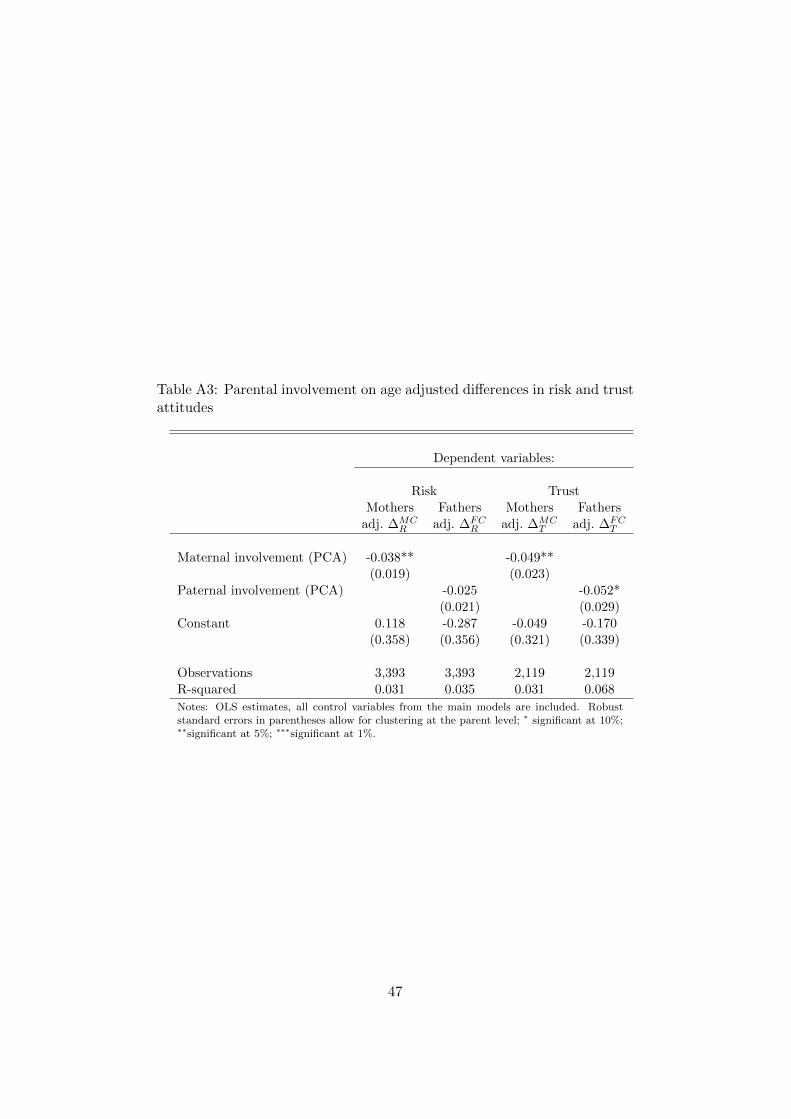
Table A3: Parental involvement on age adjusted di↵erences in risk and trustattitudes
Dependent variables:
Risk TrustMothers Fathers Mothers Fathersadj. �MC
R adj. �FCR adj. �MC
T adj. �FCT
Maternal involvement (PCA) -0.038** -0.049**(0.019) (0.023)
Paternal involvement (PCA) -0.025 -0.052*(0.021) (0.029)
Constant 0.118 -0.287 -0.049 -0.170(0.358) (0.356) (0.321) (0.339)
Observations 3,393 3,393 2,119 2,119R-squared 0.031 0.035 0.031 0.068Notes: OLS estimates, all control variables from the main models are included. Robuststandard errors in parentheses allow for clustering at the parent level; ⇤ significant at 10%;⇤⇤significant at 5%; ⇤⇤⇤significant at 1%.
47
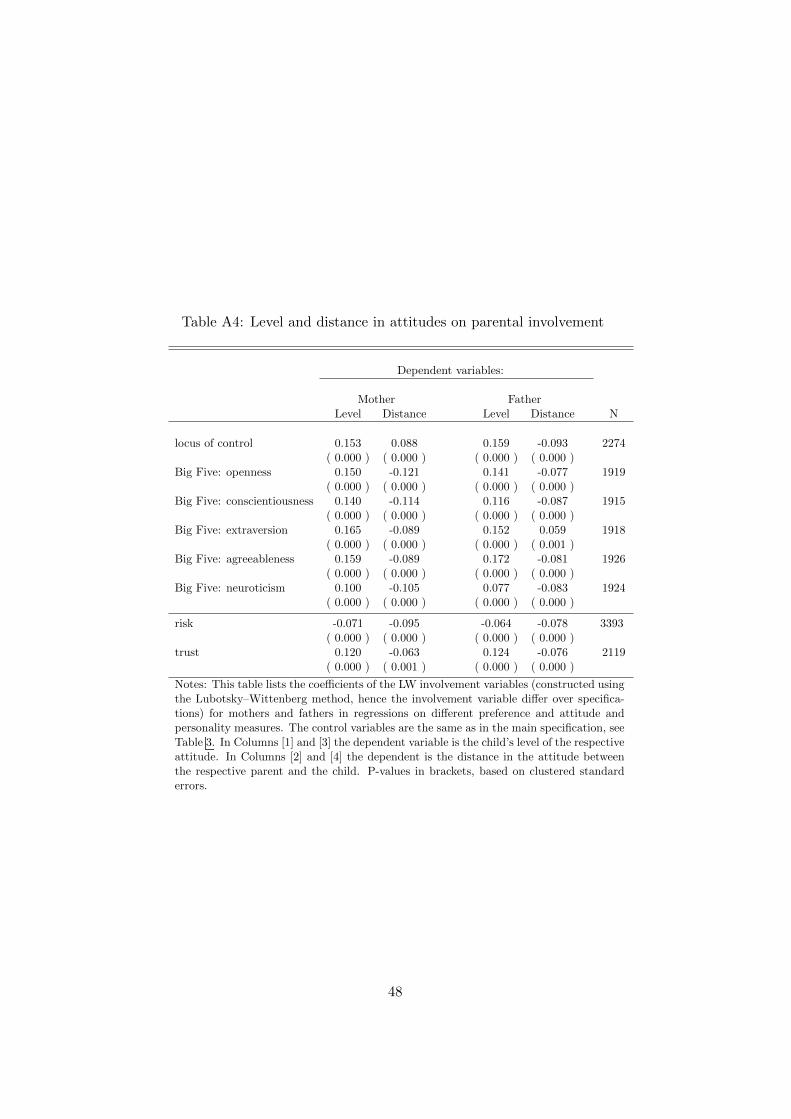
Table A4: Level and distance in attitudes on parental involvement
Dependent variables:
Mother FatherLevel Distance Level Distance N
locus of control 0.153 0.088 0.159 -0.093 2274( 0.000 ) ( 0.000 ) ( 0.000 ) ( 0.000 )
Big Five: openness 0.150 -0.121 0.141 -0.077 1919( 0.000 ) ( 0.000 ) ( 0.000 ) ( 0.000 )
Big Five: conscientiousness 0.140 -0.114 0.116 -0.087 1915( 0.000 ) ( 0.000 ) ( 0.000 ) ( 0.000 )
Big Five: extraversion 0.165 -0.089 0.152 0.059 1918( 0.000 ) ( 0.000 ) ( 0.000 ) ( 0.001 )
Big Five: agreeableness 0.159 -0.089 0.172 -0.081 1926( 0.000 ) ( 0.000 ) ( 0.000 ) ( 0.000 )
Big Five: neuroticism 0.100 -0.105 0.077 -0.083 1924( 0.000 ) ( 0.000 ) ( 0.000 ) ( 0.000 )
risk -0.071 -0.095 -0.064 -0.078 3393( 0.000 ) ( 0.000 ) ( 0.000 ) ( 0.000 )
trust 0.120 -0.063 0.124 -0.076 2119( 0.000 ) ( 0.001 ) ( 0.000 ) ( 0.000 )
Notes: This table lists the coe�cients of the LW involvement variables (constructed usingthe Lubotsky–Wittenberg method, hence the involvement variable di↵er over specifica-tions) for mothers and fathers in regressions on di↵erent preference and attitude andpersonality measures. The control variables are the same as in the main specification, seeTable 3. In Columns [1] and [3] the dependent variable is the child’s level of the respectiveattitude. In Columns [2] and [4] the dependent is the distance in the attitude betweenthe respective parent and the child. P-values in brackets, based on clustered standarderrors.
48
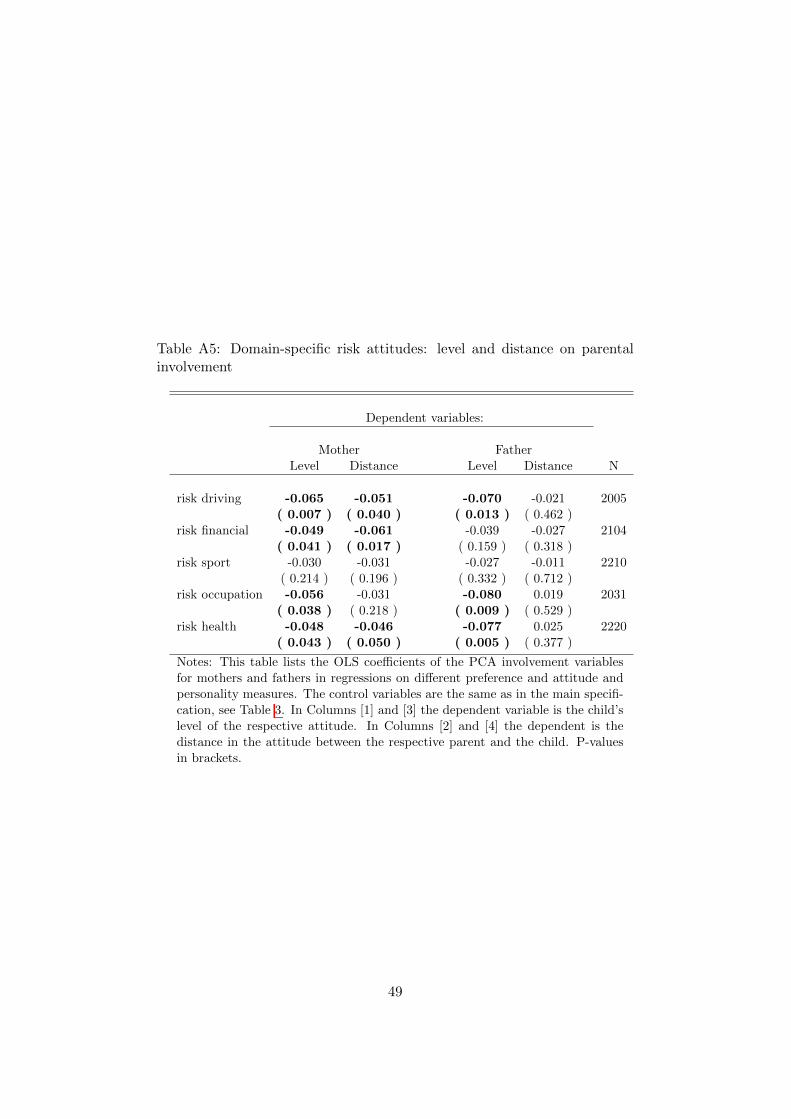
Table A5: Domain-specific risk attitudes: level and distance on parentalinvolvement
Dependent variables:
Mother FatherLevel Distance Level Distance N
risk driving -0.065 -0.051 -0.070 -0.021 2005( 0.007 ) ( 0.040 ) ( 0.013 ) ( 0.462 )
risk financial -0.049 -0.061 -0.039 -0.027 2104( 0.041 ) ( 0.017 ) ( 0.159 ) ( 0.318 )
risk sport -0.030 -0.031 -0.027 -0.011 2210( 0.214 ) ( 0.196 ) ( 0.332 ) ( 0.712 )
risk occupation -0.056 -0.031 -0.080 0.019 2031( 0.038 ) ( 0.218 ) ( 0.009 ) ( 0.529 )
risk health -0.048 -0.046 -0.077 0.025 2220( 0.043 ) ( 0.050 ) ( 0.005 ) ( 0.377 )
Notes: This table lists the OLS coe�cients of the PCA involvement variablesfor mothers and fathers in regressions on di↵erent preference and attitude andpersonality measures. The control variables are the same as in the main specifi-cation, see Table 3. In Columns [1] and [3] the dependent variable is the child’slevel of the respective attitude. In Columns [2] and [4] the dependent is thedistance in the attitude between the respective parent and the child. P-valuesin brackets.
49