optimizing protections against cascades in network systems: a modified binary differential evolution...
TRANSCRIPT

Optimizing protections against cascades in network
systems: A modified binary differential evolution
algorithm
Enrico Zio, L. R. Golea, Giovanni Sansavini
To cite this version:
Enrico Zio, L. R. Golea, Giovanni Sansavini. Optimizing protections against cascades in net-work systems: A modified binary differential evolution algorithm. Reliability Engineering andSystem Safety, Elsevier, 2012, 103, pp.72-83. <10.1016/j.ress.2012.03.007>. <hal-00777140>
HAL Id: hal-00777140
https://hal-supelec.archives-ouvertes.fr/hal-00777140
Submitted on 16 Jan 2013
HAL is a multi-disciplinary open accessarchive for the deposit and dissemination of sci-entific research documents, whether they are pub-lished or not. The documents may come fromteaching and research institutions in France orabroad, or from public or private research centers.
L’archive ouverte pluridisciplinaire HAL, estdestinee au depot et a la diffusion de documentsscientifiques de niveau recherche, publies ou non,emanant des etablissements d’enseignement et derecherche francais ou etrangers, des laboratoirespublics ou prives.

1
Optimizing protections against cascades in
network systems: a modified binary
differential evolution algorithm
E. Zio1,2
, L.R. Golea2, G. Sansavini
2
1Chair on Systems Science and the Energetic challenge, European Foundation for New Energy-
Electricite’ de France, Ecole Centrale Paris and Supelec, Paris, France
2Politecnico di Milano, Milano, Italy
*corresponding author: [email protected], [email protected], [email protected]
Abstract – This paper addresses the optimization of protection strategies in critical infrastructures
within a complex network systems perspective. The focus is on cascading failures triggered by the
intentional removal of a single network component. Three different protection strategies are
proposed that minimize the consequences of cascading failures on the entire system, on
predetermined areas or on both scales of protective intervention in a multi-objective optimization
framework. We optimize the three protection strategies by devising a modified binary differential
evolution scheme that overcomes the combinatorial complexity of this optimization problem. We
exemplify our methodology with reference to the topology of an electricity infrastructure, i.e. the
380 kV Italian power transmission network. We only focus on the structure of this network as a test
case for the suggested protection strategies, with no further reference on its physical and electrical
properties.
Keywords: critical infrastructure; network protection; line switching; cascading failure; differential
evolution algorithm; multi-objective optimization.
1 Introduction
Engineered critical infrastructures (CIs) are the systems of interest in this work as of fundamental
importance for the sustainment of modern Societies. The motivation is that they provide the
continuous flow of essential goods (e.g. energy, water, data) and services (e.g. banking, health care,
transportation) which the welfare and security of our nations rely on. Their security against
cascading failures, triggered by random failures or malevolent acts, is a priority for all developed
Countries.
Network interdiction (NI) is a common approach for the identification of opportunities for choosing
components, allocating redundancies or modifying the system with the aim of strengthening
(‘hardening’) a CI. The approach consists in finding a set of network elements, usually links, to be
interdicted in order to minimize the maximum flow that can be transmitted between any two (or
among any) specific nodes. The underlying idea is that the identification of those components or
groups of components whose damage yields the largest disruption to the network, provides
indications on how to protect for improving its safety and security. Several models have been
developed for identifying optimal NI strategies, i.e. sets of attacks/failures that cause the largest
possible disruption given minimum or limited offensive resources [Dai and Poh, 2002; Arroyo and
Fernandez, 2009; Rocco and Ramirez, 2009].
2
For large networks, the combinatorial problems which arise from the search among the multiple
interdiction scenarios, have been tackled by heuristic algorithms like Genetic Algorithms (GAs)
[Arroyo and Fernandez, 2009], metaheuristic algorithms like greedy algorithms [Bier et al., 2007]
or non-linear programming [Salmeron et al., 2004]. However, these methods fail to represent the
aftermath of an attack or failure, i.e. to account for the propagation of the initial disturbance in the
network by cascading failures. Furthermore, hardening the network by modifications, i.e. via
replacement of components or addition of redundancies, can be difficult, slow and expensive.
A more feasible alternative is network protection (NP) by line switching, done automatically or by a
system operator, following an attack or a failure. In the energy field, this is common practice in
problems like line overloads [Granelli et al., 2006], loss and/or cost reductions [Schnyder and
Glavitsch, 1990], system security improvements [Schnyder and Glavitsch, 1988], or a combination
of them [Shao and Vittal, 2005]. Other examples of line switching are the traffic closure due to road
work, accidents or natural disasters, interruption of internet or telecommunication lines. Unlike NI,
that aims at hindering failure propagation in a passive way, i.e. by designing components and
allocating redundancies to avoid failures, NP aims at hindering failure propagation by cutting off
the possible “directions” along which failures can spread within the network. The strategy for such
protection stands on the possibility of finding the optimal set of lines to be cut-off in order to limit
the consequences of cascade failures; in large networks, this poses a combinatorial optimization
problem.
In this paper, we offer a complex network perspective on the NP problem. This approach aims at
characterizing the topology of network systems and identifying critical parts by an analysis that is
preliminary and complementary to more detailed and realistic approaches [Bier et al., 2007; Dobson
et al., 2007; Hines et al., 2010; Salmeron et al., 2004]. The feasibility of line switching is evaluated
by a model of cascading failure process which relies on a topological representation of the network
connection pattern [Zio and Sansavini, 2009]. The abstract model of flow and cascades is not based
on the physics of the actual power flow but rather mimics the flow in the network based on the
shortest paths that connect generation and load nodes. The topological, abstract representation is
useful for preliminary vulnerability analysis of CIs; it requires minimum information on the
network but is capable of identifying critical elements with respect to the structure, i.e. edges and
nodes whose failure can induce a severe structural damage to the network and split it into isolated
clusters [Eusgeld et al., 2009]. This modeling entails considering the interplay between structural
characteristics and dynamical aspects and provides indications on the elements critical for the
failure propagation process [Zio and Sansavini, 2010], and on the actions that prevent or mitigate
undesired effects [Motter, 2004]. Moreover, these models shed light on the way complex networks
react to faults and attacks, evaluating their consequences when propagation dynamics are taken into
account. The system response often results in a dramatic cascade phenomenon due to avalanches of
node outages.
Abstract modeling paradigms [Dobson et al., 2005; Hines and Blumsack, 2008; Holme, 2002;
Kinney et al., 2005; Motter and Lai, 2002] are introduced in the analysis of CIs to fulfill two main
objectives: (I) helping to identify preliminary vulnerabilities of critical infrastructures by topology-
driven and dynamical analysis, (II) to guide and focus further detailed analyses of critical areas of
the CIs. However, given the somewhat abstract level of the modeling supporting topological
analysis, the results gained with respect to the vulnerable points (or lines) in the system (first
findings) may not be clear-cut, and major hidden vulnerabilities may still be expected. Then, to
achieve a higher degree of accuracy, system understanding has to be further developed and more
detailed information about the system and its operating environment may be needed. The re-
assessment of simplifications made earlier may call for more sophisticated methods of their
successive in-depth analysis [Kroger and Zio, 2011]. In order to draw firm conclusions about the
significance of topological methods, e.g. in electricity infrastructure vulnerability, current research

3
focuses on systematically comparing the results from power-flow based vulnerability models with
those from graph theoretic models of vulnerability [Hines et al., 2010; Rosato et al., 2009; Zio et al.,
2011]. The general impression is that there is only a partial superposition of functional and
structural criticalities. In this respect, the abstract model of flow and cascading that is used in this
study, is not validated as an approximation to real or simulated data.
The combinatorial optimization problem of identifying the optimal set of lines to be cut-off in order
to limit the consequences of cascade failures is addressed by a modified version of the binary
differential evolution (MBDE) algorithm [Wang et al., 2010]. Differential Evolution (DE) is an
emerging population-based stochastic optimization technique [Storn and Price, 1995]. The standard
DE algorithm is simple and efficient and has been successfully applied in various scientific and
engineering fields [Greem and Kim, 2001; Mahdavi et al., 2007; Coelho and Bernert, 2008; Saka,
2009], often with superior performance than alternative optimization algorithms, e.g. particle swarm
optimization and GAs [Ponsich and Coello, 2009]. MBDE is a novel binary version of DE
developed to tackle binary-coded optimization problems [Wang et al., 2010]: thus, it is suitable to
solve our discrete combinational NP optimization problem.
The rest of the paper is organized as follows: Section 2 describes the basis of the adopted model of
cascading failures. Section 3 presents the suggested NP strategies. The description of the MBDE
algorithm is provided in Section 4 and its application to NP optimization in a case study, i.e. the
topological structure of the Italian 380kV power transmission grid, is conducted in Section 5.
Section 6 provides conclusions and points out directions for future work.
2. The model of cascading failures in network systems
We adopt an abstract modeling framework, which allows analyzing in an effective way the extent to
which the failure propagation process affects the network system and to devise prevention or
mitigation of the undesired effects [Motter and Lai, 2002, Dobson et al., 2005]. The abstraction is
founded on a topological representation of a network of N nodes (these would be the buses in an
electric power grid) and K edges (these would be the electrical lines). The topological
representation abstracts the physical properties of the elements of the network to highlight its
structural properties. Two types of nodes are distinguished here: NG source nodes and ND sink
nodes. In order to abstractly account for the flow of the physical quantities in the network, we
assume that it is transmitted along the source-sink shortest paths [Batagelj, 1994; Motter and Lai,
2002; Albert et al., 2004; Newman and Girvan, 2004; Latora and Marchiori, 2005; Duenas-Osorio
and Vemuru, 2009; Zio and Sansavini, 2010].
We model the load on a component, e.g. a node or line, as dependent on the number of shortest
paths transiting through it, when flow is sent from each available source node to each sink node. In
this view, the load, jL , or amount of flow passing through a node, is measured by the node
betweenness [Sabidussi, 1966; Nieminen, 1974; Freeman, 1978; Freeman, et al. 1991; Little, 2002]:
, ,
( )1
( 1)( 2)
G D
ikj
i N j N i j k ik
n jL
N N n (1)
where ikn is the number of topological shortest paths between the source-sink nodes and ( )ikn j is
the number of source-sink shortest paths that pass through node j. The computation can be
accomplished using Floyd’s shortest paths algorithm for source-sink pair of nodes [Floyd, 1962].
Assuming that the flow is routed through the most direct path, the betweenness of a node gives an
approximation of the amount of information flowing through it [Albert et al. 2004], and for this

4
reason the alternative term load is used to denote it. Likewise, the load, ijL , or amount of flow
passing through an edge, is measured by the edge betweenness [Girvan and Newman, 2002].
Node/edge betweenness measures the influence of a node/edge with respect to the flow of
information in the network, especially in cases where the flow of information follows the available
source-sink shortest path [Albert et al., 2004].
In order to assess the status of a component, its load is compared with the component capacity, i.e.
the maximum load that it can process. The capacity is limited by technological constraints and
economic factors. The capacity of node j is dimensioned proportionally to its nominal load jL at
which it is designed to operate, (1 )j jC L . Likewise, the capacity of link ij is dimensioned
proportionally to its nominal load ijL at which it is designed to operate, (1 )ij ijC L , where
0 is the tolerance parameter of the network system. This parameter can be regarded as an
operating margin allowing safe operations of the component under possible load increments. When
α = 0, the system is working at its limit capacity, its operating margin being null: any further load
added to a component would result in its failure and, possibly, in the propagation of a cascading
failure involving a large part of the system.
When a component fails, it ceases to provide its service; thus, it is considered inactive, i.e., as
removed from the system. This leads to a redistribution of the shortest paths in the network and,
consequently, to a change in the loads of the active components. If the load on a component
increases beyond its capacity upon redistribution of the shortest paths, the component fails and a
new redistribution follows. This iterative process results in a cascade of successive failures.
Therefore, the cascading failure dynamics is function of both edges and nodes states. This adds to
the reference abstract model [Batagelj, 1994; Motter and Lai, 2002; Albert et al., 2004; Newman
and Girvan, 2004; Latora and Marchiori, 2005; Duenas-Osorio and Vemuru, 2009; Zio and
Sansavini, 2010], that does not account for the loads on the edges.
In this work, the effects of cascading failures is summarized by two indicators, the connectivity
loss, CL, and the cascade size, S. The former quantifies the decrease of the ability of sink nodes to
receive flow from source nodes; its calculation relies on the topological structure of the network and
the available “least-resistance” pathways:
1
11
D iN
GL
iD G
NC
N N
(1)
where NG and DN represent the numbers of source and sink nodes in the unperturbed state of the
network system, and i
GN represents the number of source nodes able to supply flow to sink node i
after failures take place [Albert et al. 2004; Duenas-Osorio and Vemuru, 2009].
While the failure of lines only contributes to the further propagation of the cascade through load
redirection, the failure of nodes implies also the inability to provide flow to certain areas of the
network. Therefore, the disruption caused by the cascade of failures is quantified by the number of
inactive nodes, through S, and by the inability of source nodes to provide flow to sink nodes,
through LC .

5
3. Network protection strategies
Prior to the development of the NP strategies, we introduce the attack/failure scenario whose
consequences have to be minimized.
Similar to the network worst-case interdiction contingency [Salmeron et al., 2009], we consider the
attack/failure that maximizes the damage from a cascading process triggered by the removal of a
single component. This is consistent both with an optimal attack strategy that minimizes the
damaging resources and with the worst-case random failure of a single component. Intuitively, two
situations are expected. If prior to its removal the component is operating at a relatively small load,
its removal will not cause major changes in the balance of loads, and subsequent over load failures
are unlikely. However, if the load of the component is relatively large, its removal is likely to affect
significantly the loads of other neighboring components, and possibly to start a sequence of
overloads impacting on the whole system. Furthermore, the following behavior is expected [Motter
and Lai, 2002]: global cascades occur if the network exhibits a highly heterogeneous distribution of
loads, and the removed component is among those with highest loads; otherwise, cascades are not
expected. Therefore, to define the scenario that triggers the cascade of failures, we identify the
component whose removal yields the largest disruption in the network. This is equivalent to
identifying the worst NI scenario that is produced by damaging one single component.
Unlike the common NI practice [Salmeron et al., 2004, Bier et al., 2007, Salmeron et al., 2009],
here the results of NI are not subsequently employed to harden the identified critical components;
rather, NP by line switching is performed.
Specifically, NP is modeled as an operator intervention aiming at minimizing the effects of the
cascade failure propagation by disconnecting lines immediately after a cascade is triggered. In other
words, line switching is used as corrective measure, to prevent the propagation of the cascade of
overloads. This control technique has here been deployed within the devised modeling framework
which abstracts the physical properties of the network system, and assumes that flow is routed
through the source-sink shortest paths in the network. Due to the rapid unfolding of a cascade, we
assume that the protection intervention takes place only once after the cascade is triggered: no
further actions to correct the effects of this only protective action are taken.
In order to highlight the benefits of the optimized NP, we present and investigate several protection
strategies:
- Single-line switching
First, we consider a “blind” protection strategy consisting in opening one single line to prevent
failure propagation. This scenario implies that the operator is endowed by enough time and/or
resources to perform the switch off of a single line. We aim at identifying the line whose
disconnection hinders the most the cascade propagation, yielding the best improvement in
terms of LC and S.
- Multiple-line switching
A more realistic protection intervention assumes that the operator is given time, resources and
knowledge enough to be able to switch off more than just one line. Then, the problem arises of
what is the best set of lines whose disconnection hinders the most the cascade propagation. This
issue is not trivial in that the intentional disconnection of lines can worsen the effects of the
cascade in the same way as propagation of failures does. As in the single-line protection
strategy of Section 3.1, the operator intervention occurs immediately after the cascading failure
is triggered.

6
Two complementary approaches to NP are suggested in the literature [Talukdar et al., 2003].
The first aims at minimizing the effects of cascading failures at the global system level. A
measure of network disruption is identified and the operator acts on the network by switching
off lines in order to minimize it. This global protection strategy points to the development of an
invulnerable network. On the other hand, it fails identifying those critical locations or essential
services to which flow of information has to be guaranteed under any contingency. Therefore, a
second, local perspective on NP is directed towards assuring the continuation of identified
essential locations, services and missions even after the network has failed. In light of these
dual perspectives on NP, we devise three strategies that differ in the objectives of the
optimization.
As previously explained, the two indicators, LC and S can be used to quantify the effects of
cascading failures. Nevertheless, there is a strong correlation between them in the sense that the
failure of nodes, which is equivalent to an increase of S, produces also an increase of LC .
Similarly, we expect that an improvement in LC by NP will produce an improvement of S. Due
to the fact that it is intrinsically easier to reduce S than LC , we set the minimization of LC as
the sole objective of NP optimization.
The global protection optimization seeks interventions that minimize the objective function
f( ) min ( )LCx
x x , i.e. the connectivity loss of the network configuration
0,1 , 1,...,j jx x j K x , where 1jx if line j is operating, or 0 otherwise.
On the other hand, the local optimization searches for the optimal intervention in terms of the
line switching set x that minimizes the connectivity loss ALC of a specific area A identified as
of particular importance, f( ) min ( )ALC
xx x . In this framework of the problem,
ALC measures
the ability of the sink nodes j within the area A to receive flow from any source in the whole
network:
1
11 ,
DA
A
A
N i
GL
iD G
NC
N N
(2)
where NG represents the number of the source nodes at the unperturbed state of the network,
ADN represents the number of sink nodes within the area A at the unperturbed state of the
network, and i
GN represents the number of source nodes able to supply flow to sink node i in
area A, after failures take place.
In order to fully take advantage of both perspectives on NP, we look into a third “hybrid”
protection strategy that finds the set of lines to be switched-off, x , that minimize both the
connectivity loss of a pre-identified area A, ( )ALC x , and the connectivity loss of the whole
network, ( )LC x . This originates a multi-objective (MO) optimization problem.
The optimizations are carried out by a MBDE algorithm, that uses binary variables to
characterize the line switching decisions. The developed optimization algorithm is detailed in
Section 4.
The algorithm for simulating the combined effects of cascading failures and protection
strategies (hereafter optimally implemented) proceeds in successive stages as follows.

7
Initially, all components, N nodes and K lines, are characterized by initial loads Li and Lij,
respectively, and maximum capacities, Ci and Cij, respectively.
0. The initiating event occurs, i.e. the failure of the most critical component, which is removed
from the network. This triggers the cascading failure. Each component that is operating is
tested for failure: for 1, ...,i N , if node i is working and i iL C then node i fails; if link ij is
working and ij ijL C then link ij fails.
1. The operator intervenes by disconnecting a set of lines, in order to limit the cascade failure
effects, expressed by the objective functions relative to the selected optimization strategy
(global, local or hybrid). The MBDE optimization algorithm returns the most appropriate
network configuration that minimizes the objective functions at the end of the current step 1t .
2. The components loads are re-distributed taking into account the new, protected network
topology. Each component that is operating is tested for failure: for i =1,..., N, if node i is
working and i iL C then node i fails; if link ij is working and ij ijL C then link ij fails.
3. The stage counter t is incremented by 1 and the algorithm is returned to step 2.
The algorithm stops when no more working nodes fail.
4. Modified binary differential evolution algorithm
A binary DE [Wang et al., 2010] is used for optimizing a multiple-line switching strategy.
DE has been originally developed as a population-based global optimization algorithm for real-
valued optimization problems [Storn and Price, 1995]. The revolutionary idea of DE lies in the
perturbation of the current population: this is obtained by adding to a chromosome the weighted
difference between two others randomly selected from the population. The initial population is
randomly generated by sampling values uniformly distributed between the lower and upper bounds
of each of the decision variables. Three evolutionary operations, i.e., mutation, crossover and
selection are used to update the population.
During the first operation, the mutated individual iv , called noisy vector, is generated according to
the following equation
1 2 3
1 ( )t t t t
i r r rF v x x x (3)
where F , a positive real constant, is the scaling factor, t is the index of generation and
1 2 3, and t t t
r r rx x x are three randomly chosen individuals, i.e., target vectors, with indexes
1 2 3r r r i .
After mutation, the noisy vector is further modified by the crossover process, in which the noisy and
target vectors are mixed according to some rule to create the trial vector iu . The trial vector inherits
from the noisy and the target vectors different pieces of chromosome, as regulated by the crossover
rate CR. The commonly used binomial crossover is defined as:

8
1
1, if (0,1] or irand( )
, if (0,1] and irand( )
1,2,...,
t
jit
ji t
ji
U CR j NP
U CR j NP
j K
vu
x (4)
where (0,1]U is a uniform continuous random value [0,1] , ( )irand NP is a uniform discrete
random number in the set 1,2,..., NP , NP is the population size, j is the index of the
dimensionality and K is the length of the chromosome.
The selection operator is defined as:
1 1
1, if f( ) f( )
, otherwise
1,2,...,
t t t
i i it
i t
i
i NP
u u xx
x (5)
Referring to a single objective (SO) minimization, if the fitness value of the trial individual is better
than the target one, it replaces the target individual; otherwise, the target individual is preserved in
the next generation. This criterion ensures that the next generation is better or at least equal to the
previous one.
DE can tackle MO optimization problems in different ways [Babu et al., 2007]. In this work, we
adopted an efficient MO differential evolution (MODE) version [Babu et al., 2007] that inherits the
strength of the selection process thought for SO optimization: each trial vector is compared only
with its target from which it inherits some variables, and, if the trial dominates the target vector, it
takes its place in the population for the next generation; otherwise the target vector survives. The
selection procedure, applied with its original purpose but under a MO frame of dominance [Babu et
al., 2007], allows saving considerable time because no ranking of the population is adopted and a
dominated comparison is made only NP times each generation [Zio and Viadana, 2011].
Of course, without any ranking, the selection of the chromosomes for reproduction can only be
random. The stopping criteria usually adopted in MO optimization is the reaching of a defined
number of maximum generations. Thanks to the goodness of the reproduction ability and
exploration of DE, the Pareto frontier of optimality [Babu et al., 2007] is achieved by a large
fraction of the population.
Two indicators of the performances of MO optimization schemes are the computation time and the
fraction of non-dominated solutions found in the last population: the larger the fraction is, the
higher is the ability to get to the Pareto frontier.
In order to solve discrete optimization problems, MBDE uses a bit-string framework: each
individual is represented as a vector and denoted as 0,1 ; 1, 2,..., ,i ij ij i NP px px px
1,...,j K where NP is the population size and K is the dimensionality of the solutions. MBDE
preserves the updating strategy of the standard DE, including the mutation, crossover and selection
operators. Since the standard mutant operator generates real-coded vectors and not binary-coded
strings, an effective probability estimator operator is integrated into the mutant operator [Wang et
al., 2010]:

9
1, 2, 3,2 [ ( ) 0.5]
1 2
1( )
1
t t tr j r j r j
t
ij b F
F
P
e
px px pxpx (6)
where b is a positive real constant, often set to values around 6, F is the scaling factor just the same
as that of the standard DE, 1, 2, 3,, and t t t
r j r j r jpx px px are the j-th bits of the three randomly chosen
individuals at generation t.
The decision variable vector is composed of K elements corresponding to the network lines; each
element contains 1 if the corresponding line is to be switched-off, 0 otherwise. The optimization is
SO for the global and local protection strategies, and MO for the “hybrid” protection strategy.
5. Results and discussion
We illustrate the dynamics of the network model and its optimal NP protection by the framework of
Sections 3 and 4, taking for reference the topology of a realistic network system, i.e. the 380 kV
Italian power transmission network (Figure 1).
It is understood that the outcome of the vulnerability analysis of an infrastructure such as the
electricity network here considered significantly depends on the modeling paradigm and on the
metrics that are used to quantify the response of the network to attacks and failures. In this respect,
[Hineset al., 2010] have compared three vulnerability measures, respectively, two topological
measures, i.e. path length and LC , and one functional measure, i.e. blackout size for the analysis of
an electric power grid. The topological measures quantify the effects of the disconnection of groups
of components on the network structure irrespective of flow rerouting. On the contrary, the blackout
size is the amount of load curtailed in a DC power-flow simulation that incorporates line tripping
due to flow limits, generator set-point adjustments and load shedding. Within the embraced frame
of work, they found that LC predicts only the minimum size of the blackout because it does not
directly account for cascading failures. Furthermore, the three vulnerability measures provide
different rankings for the identified risks. From the path length metric, the removal of components
with large betweenness appears to have the greatest impact, while LC ranks as more dangerous the
removal of the most connected nodes. Eventually, from the blackout model, the removal of nodes
that transport the largest amount of power appears to contribute most to vulnerability.
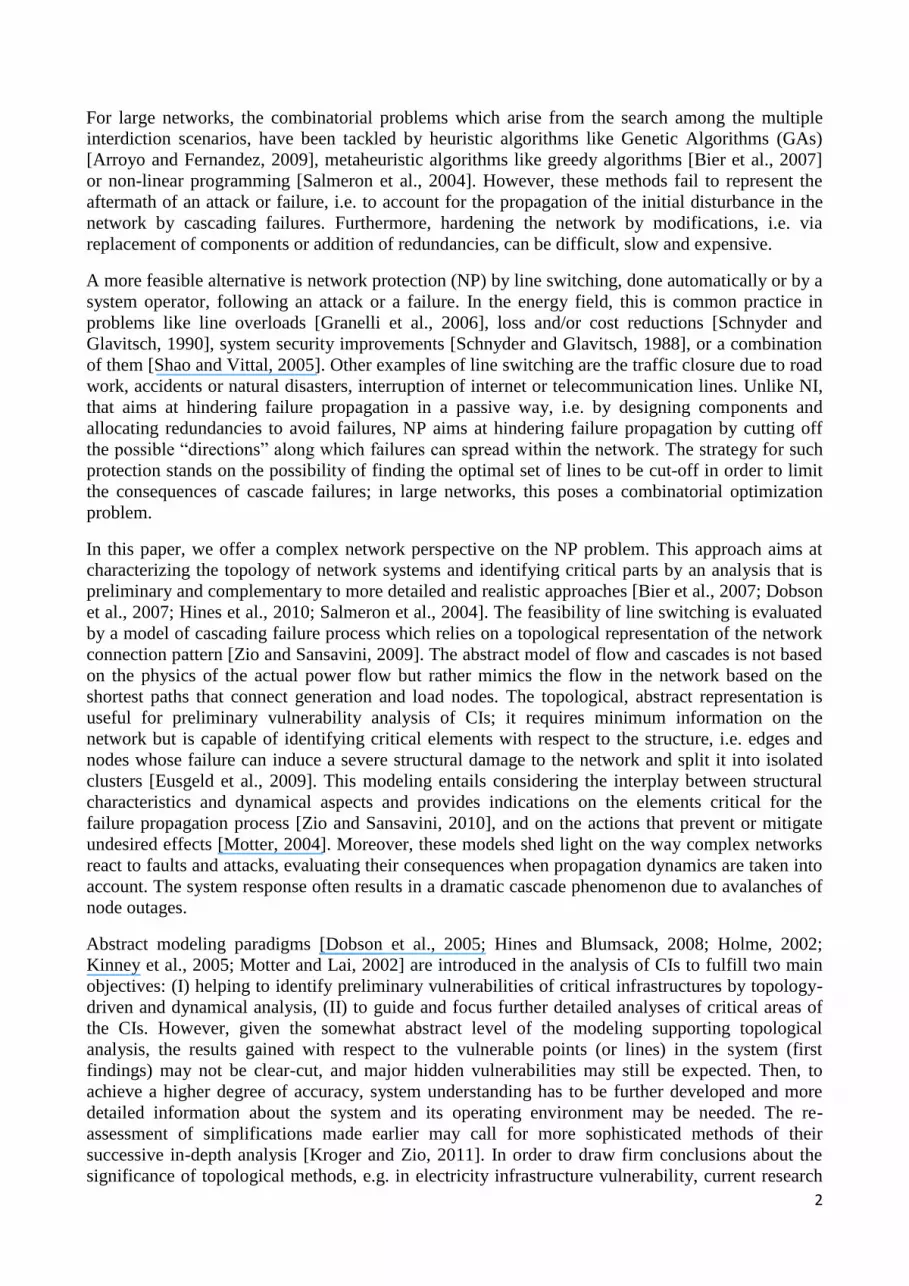
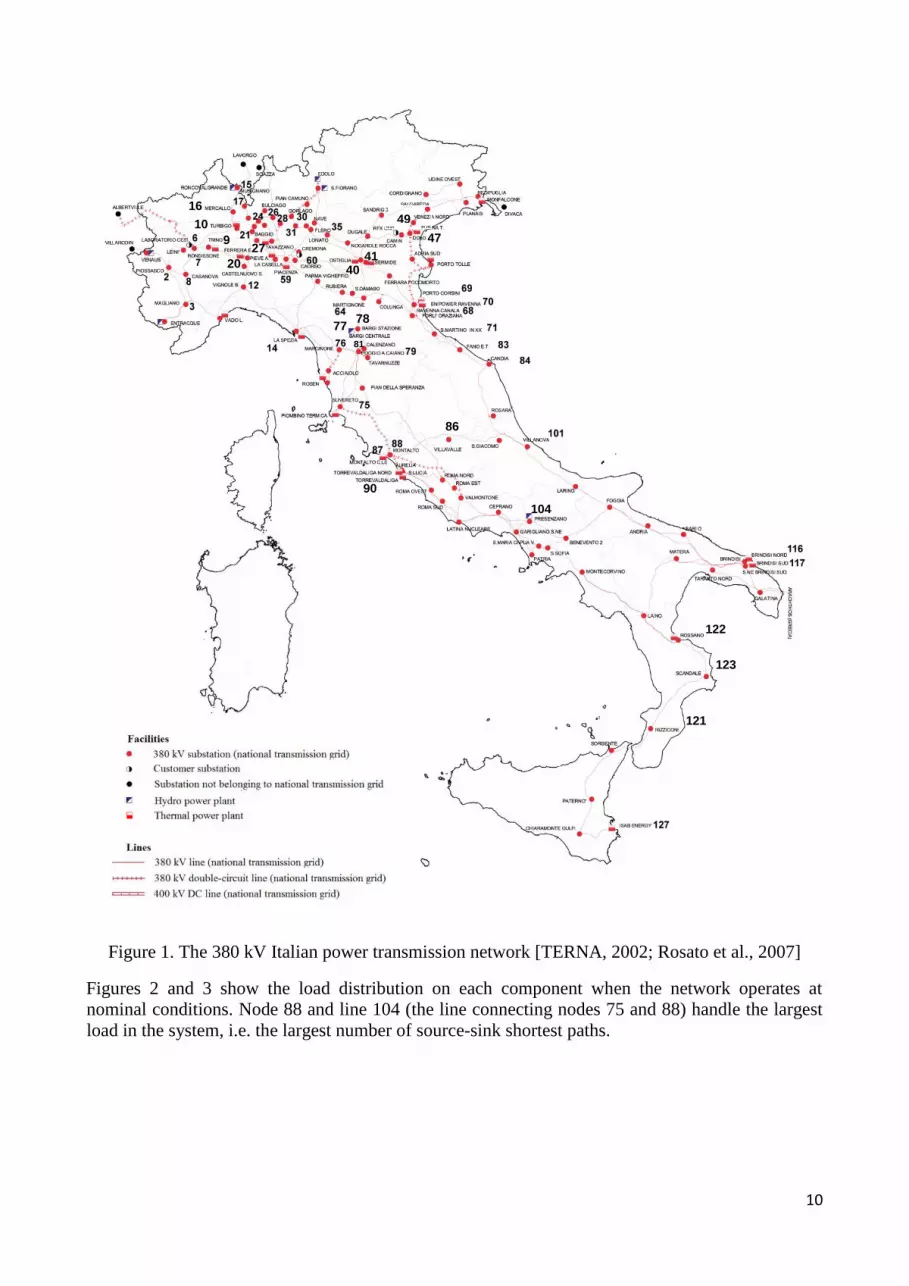
Here, we exemplify the proposed methodology with reference to the power transmission network
mentioned above, focusing only on its the structure with no further reference on the physical and
electrical properties. The 380 kV Italian power transmission network is a branch of a high voltage
level transmission, which can be modeled as a network of 127N nodes, i.e. buses ( 30GN
source nodes, i.e. generators and 97DN sink nodes, i.e. distribution substations) and 171K
edges, i.e. electrical connections. The generator substations, i.e. hydro and thermal power plants are
represented in Figure 1 by squares whereas the distribution substations are represented by circles.
As described in Section 2, the load of a component, i.e. nodes and lines, is assumed equal to the
total number of shortest paths connecting every source node to every sink node passing through that
component. This assumption may not be valid for electrical power grids, where power flows
according to physical rules such as Kirchhoff’s laws, and load requests. Nevertheless, it serves the
purpose of the paper which is to look into the structural properties and apply the NP optimization
framework to a complex network of realistic size.
10
Figure 1. The 380 kV Italian power transmission network [TERNA, 2002; Rosato et al., 2007]
Figures 2 and 3 show the load distribution on each component when the network operates at
nominal conditions. Node 88 and line 104 (the line connecting nodes 75 and 88) handle the largest
load in the system, i.e. the largest number of source-sink shortest paths.
122
123
121
47
49 10
16
41 40
90
104
77
27
78
86
86
86
81
86
20
86
9
86

11
Figure 2. Loads on each node in the unperturbed configuration
Figure 3. Loads on each line in the unperturbed configuration
The initiating event is identified as described in Section 3. Contrary to what can be supposed, it is
found that the largest damages to the network are due to removals of components that are not
among the most loaded (Figures 4-7). The removals of nodes 86 and 78 have the largest impacts on
the network with respect to both LC and S . The failure of the most loaded node, i.e. node 88, leads
to cascades involving 28 components, compared to 48 components that failed when node 86
triggers the cascade. Also, 0.77LC when the system stabilizes if node 88 is removed, but
0.94LC when node 78 fails. The criticality of nodes 86 and 78 with respect to cascading failures
is due to their position in the network, in proximity of highly loaded nodes.
0 10 20 30 40 50 60 70 80 90 100 110 120 1270
100
200
300
400
500
600
700
800
900
Node
Node load L
i
0 10 20 30 40 50 60 70 80 90 100 110 120 130 140 150 160 1710
100
200
300
400
500
600
700
800
Link
Lin
k load L
ij

12
Figure 4. The cascade size, S , caused by the removal of each node (abscissa) in the power
transmission system of Figure 1
Figure 5. The connectivity loss, LC , caused by the removal of each node (abscissa) in the power
transmission system of Figure 1
In order to identify the worst NI scenario that triggers the cascading failure, the effects of cascading
failures are further investigated also with respect to the loss of lines. The removal of link 107
connecting nodes 78 and 81, results in the largest damage in terms of S (57 nodes fail at the end of
the cascade failure propagation) and 0.96LC , while the failure of the most loaded link, i.e. 104,
leads to 27S components and 0.71LC . Also in this case, the average initial load has little
influence on the criticality, whereas the neighbors load and the failure of the connection between
node 78 and 81, have a large impact (node 78 was found to be one of the most critical nodes in
triggering the cascading failure propagation).
0 10 20 30 40 50 60 70 80 90 100 110 120 1270
10
20
30
40
50
60
Removed node
Cascade s
ize, S
0 10 20 30 40 50 60 70 80 90 100 110 120 1270
0.1
0.2
0.3
0.4
0.5
0.6
0.7
0.8
0.9
1
Removed node
Connectivity loss,
CL

13
Figure 6. The cascade size, S , caused by the removal of each link (abscissa) in the power
transmission system of Figure 1
Figure 7. The connectivity loss, LC , caused by the removal of each link (abscissa) in the power
transmission system of Figure 1
The difference between the failure of a node and that of a link lies in the redistribution of the
components loads. A major initial damage is obtained after the failure of a node, since this implies
also the disconnection of its direct connections. Nevertheless, the redistribution of the shortest paths
leads to a small increase of load of a larger number of components. On the other side, the failure of
a line produces a larger increase of load of the first order neighbors that further affects the cascade
propagation. We observe that, on average, the loss of links results in a more severe damage than
that caused by the loss of nodes, at the end of the cascade propagation, both in terms of LC and S .
We therefore identify the disconnection of the transmission line (edge) 107 as the worst-case NI
scenario.
0 10 20 30 40 50 60 70 80 90 100 110 120 130 140 150 160 1710
10
20
30
40
50
60
Removed link
Cascade s
ize, S
0 10 20 30 40 50 60 70 80 90 100 110 120 130 140 150 160 1710
0.2
0.4
0.6
0.8
1
Removed link
Connectivity loss,
CL

14
5.1 Single-line switching
As we have explained, the cascade propagation is triggered at 0t by an attack/failure consisting
in the disruption of link 107, which produces the loss of six nodes by the end of the computational
step. We aim at reducing the effects of the cascade of failures in the network through the application
at 1t of the single-line switching strategy described in Section 3.
Figures 8 and 9 show the effect of single-line switching as compared to not protecting the network,
in terms of both LC and S .
Figure 8. The cascade size, S , resulting from the initial attack on the line 107 followed by the
operator intervention of opening a line (abscissa). Horizontal line 57S represents the reference
cascade size, i.e. obtained without any further intervention after the attack
Figure 9. The connectivity loss, LC , resulting from the initial attack on line 107 followed by the
operator intervention of opening a line (abscissa). Horizontal line 0.96LC represents the
reference connectivity loss, i.e. obtained without any further intervention after the attack
0 10 20 30 40 50 60 70 80 90 100 110 120 130 140 150 160 1710
10
20
30
40
50
60
Removed link
Cascade s
ize, S
0 10 20 30 40 50 60 70 80 90 100 110 120 130 140 150 160 1710
0.1
0.2
0.3
0.4
0.5
0.6
0.7
0.8
0.9
1
Removed link
Connectivity loss,
CL

15
The following observations can be drawn from Figures 8 and 9: i) the disconnection of a line as a
corrective measure mostly reduces S but in some cases it enhances it, as for the disconnection of
lines 28, 30, 35; this is due to the increase of node loads after the redistribution of shortest paths,
following the removal of a link; ii) with few exceptions (lines 19, 41, 89), LC remains mostly
unchanged upon intervention that disconnects a single line; this indicates that the identified best
interdiction scenario causes severe network disruptions before any intervention is made; iii) while
S can be reduced to a maximum of 60%, LC can be barely reduced by 15% of its value when no
intervention occurs: this is due to the irreversible partition of the network into two islands (the north
and the south halves) with the associated irreversible loss of north-south source-sink connections.
Then, this protection strategy fails to maintain a satisfactory level of connectivity between source
and sink nodes, although it improves the survivability of the network components. These
observations suggest the need of a more effective protection strategy, capable of decreasing the
effects of connectivity disruption of cascading failures. Since LC and S are directly related, we
expect that an improvement in the loss of connectivity will lead to a decrease of S . We therefore
propose an optimization scheme for protecting the network that aims at minimizing LC .
5.2. Multiple-line switching
We assume that the protection intervention takes place only once at 1t after the cascade is
triggered at 0t . The attack/failure of the transmission line 107, i.e. the worst-case NI scenario,
produces the loss of six nodes before any operator intervention can occur. This Section presents the
results obtained by combining the protection strategies of Section 3 and the MBDE of Section 4.
The simulation parameters used in the optimization schemes are summarized in Table 1.
Table 1. The parameters of the MBDE algorithm
MBDE parameters
Population size NP 40
Dimensionality of solutions K 171
Crossover rate CR 0.8
Scaling factor F 0.2
Minimum fitness error 10-4
Maximum number of generation 1500
5.2.1 Global protection
Figure 10 presents the evolution of the cascade after the initial failure, without any intervention
(dotted line) and with the intervention of switching off the optimal set of lines, both in terms of S
(left graph) and LC (right graph). The results obtained at the end of the optimization algorithm are
summarized in Table 2.
The effects of the optimal intervention in terms of line switching can be evinced by comparing the
evolutions in Figure 10. The optimal line switching intervention at 1t reduces S and LC by
87.7% and by 34.6%, respectively. The failures keep propagating in the network and the cascade

16
ends at 3t . The results obtained when the system is stabilized are satisfactory: S is reduced from
57 nodes to 10 nodes, while LC is improved by approximately 21%. There are four nodes that fail
after the operator intervenes according to the protection strategy, i.e. nodes 7, 9, 10 and 20, located
in two different geographical regions of northern Italy (Figure 1).
Figure 10. The cascade evolution in terms of cascade size, S , and connectivity loss, LC , after the
failure of line 107 and with no intervention at 1t (solid lines) or optimal operator intervention at
1t (dotted lines)
Table 2. Best optimal global switching scheme
Number
of lines
Optimal line switching scheme Connectivity loss, LC
computational
time 1t
end of cascade
27
2-8, 5-6, 14-73, 15-17, 17-18, 24-28, 25-27, 28-30,
32-35, 34-38, 41-64, 41-66, 43-46, 48-53, 51-54,
55-56, 79-81, 89-91, 91-92, 92-93, 96-98, 97-103,
103-104, 110-111, 113-120, 115-118, 121-123
0.608
0.758
These improvements have been achieved by disabling 27 lines, i.e. 21% of the network connections
(Table 2, column 2). For most of the network systems [Arroyo and Ferdandez, 2009], this
represents a feasible number of lines to be switched-off and it is consistent with the size of other
protection strategies reported in the literature. As an example, in [Arroyo and Fernandez, 2009] a
strategy is suggested that involves the switching-off of 24% of the network lines. For particular
complex network systems such as electrical networks, for which the proposed protection scheme is
nearly equivalent to a black-out, a multiobjective optimization aimed also at reducing the number of
lines to be switched-off could be addressed. The optimal set of lines identified in the protection
strategy is represented in Figure 11. The lines are spread over the entire network with a major
concentration in the northern part. By adopting this protection strategy, the operator intervention
maintains a good level of working components with acceptable LC .
0 1 2 3 4 5 60
10
20
30
40
50
60
Step, ti
Cascade s
ize, S
0 1 2 3 4 5 60
0.1
0.2
0.3
0.4
0.5
0.6
0.7
0.8
0.9
1
Step, ti
Connectivity loss,
CL

17
Figure 11. The dashdotted lines in this graphic representation of the network are the optimal set of
27 edges to be switched-off to optimally contain the failure cascade, in the global optimization
approach to protection
5.2.2 Local protection
Since the region of Lombardy, situated in the central part of the northern Italy, includes the largest
number of distribution substations, i.e. sink nodes in the network of Figure 1, i.e. 21 sink nodes, our
local protection strategy will focus on the minimization of the loss of connectivity of this specific
area, ALC .
The results obtained by the MBDE optimization are summarized in Table 3. The operator
intervention entails the disconnection of 41 lines. The effects of the operator optimal intervention in
terms of line switching can be evinced by comparing the evolutions in Figure 12. The immediate
aftermath of the protection strategy is the reduction of the local-area average ALC from 0.979 to
0.551 at 2t . The modest decrease of 0.823ALC (by 16% of the value obtained with no
intervention 0.979ALC ) at the end of the cascade, is conditioned by the loss of a large number of
paths connecting long-distant source nodes, while the nearby ones keep supplying the sink nodes
within the region of interest. Indeed, the protection strategy entails a small number of lines to be
switched-off in the northern regions, while the majority of lines belonging to the identified optimal

18
set are located in the other areas of the network. It is worth noticing that even if the total number of
failures at the end of the propagation is the same as in the global strategy, i.e. 10S , in this case
the sink node 20 located in the northern side of Figure 1 is protected through line switching; this
validates the efficiency of the local protection strategy.
Figure 12. The cascade evolution in terms of cascade size, S, and local-area connectivity loss, ALC ,
after the failure of line 107 and with no intervention at 1t (solid lines) or optimal operator
intervention at 1t (dotted lines)
5.2.3 “Hybrid” protection
As explained in Section 3, the “hybrid” multiple-line switching protection strategy aims at
minimizing both the overall network connectivity loss, LC and the connectivity loss of the region of
Lombardy, ALC , within a multi-objective optimization framework.
The results obtained are summarized in the last 3 rows of Table 3. Five MBDE optimization runs
were performed, starting from different initial random populations. The Pareto frontier, obtained by
selecting the non-dominated solutions among those reached in the different runs is represented in
Figure 13. The fraction of dominant solutions is 0.8; of these, 32 are present in the last population.
The CPU time was 4300 s on a Pentium(R) Dual-Core 2.7 GHz PC with 3 GB RAM.
This protection strategy yields the best results. We are able to reduce both values of connectivity
loss, LC and ALC , near their minimum values obtained in the global and local protection strategies.
A small variation can be observed regarding the total number of lines to be switched-off, which
remains always lower than in the local strategy, and the final size of the cascade failure propagation.
0 1 2 3 4 5 60
10
20
30
40
50
60
Step, ti
Cascade s
ize
S
0 1 2 3 4 5 60
0.2
0.4
0.6
0.8
1
Step, ti
Connectivity loss,
CL
A

19
Figure 13. The Pareto frontier identified at 1t after the multiple-line switching optimal operator
intervention
The effects of the operator optimal intervention in terms of line switching can be evinced by
comparing the evolutions in Figure 14. The first NP strategy identified within the “hybrid”
protection strategy presents the best performances with respect to the local parameters, i.e. ALC
after the protection strategy, at 2t , and at the end of the cascade failure, i.e. at the end of the
cascade, maintaining S at the same level of the global and local strategies. The results obtained by
the second “hybrid” strategies are satisfactory with respect to the number of lines to be switched-off
and also with respect to LC and ALC , but entail an increase of S . The best strategy is the third one,
that even if it fails to minimize the immediate aftermath of the protection strategy, it achieves an
improvement of all indicators at the end of the cascade propagation.
0.6 0.62 0.64 0.66 0.68 0.7 0.72 0.74 0.760,54
0,545
0,55
0,555
0,56
0,565
0,57
0,575
0,58
0,585
0,59
0,595
0,6
Global connectivity loss, CL
Local connectivity loss C
LA
Hybrid protection strategy
Global protection strategy
Local protection strategy
0 1 2 3 4 5 60
10
20
30
40
50
60
Step, ti
Cascade s
ize S
No operator intervention
Hybrid protection strategy 1
Hybrid protection strategy 2
Hybrid protection strategy 3
0 1 2 3 4 5 60
0.1
0.2
0.3
0.4
0.5
0.6
0.7
0.8
0.9
1
Step, ti
Connectivity loss, C
LA
No operator intervention
Hybrid protection strategy 1
Hybrid protection strategy 2
Hybrid protection strategy 3

20
Figure 14. The cascade evolution in terms of cascade size, S, and connectivity loss, LC and ALC ,
after the failure of line 107 and with no intervention at 1t (solid lines) or with optimal operator
intervention at 1t (dashed and dotted lines for the three hybrid strategies resulting from the MO
optimization)
It is interesting to note that in all optimal strategies there are three common nodes that always fail
after the protection intervention, i.e. nodes 7, 9 and 10, all situated in the northwestern region
(Figure 1). Following this observation, a more accurate vulnerability analysis involving these nodes
could be performed and a decision regarding the protection and the strengthening of them could be
taken. This would lead to a further reduction of the number of nodes failed and the cascade failure
propagation could be avoided.
Table 3. Comparison of different protection strategies (dark-shaded areas denote the results
obtained at 2t , light-shaded areas denote the results obtained at the end of the cascade after the
operator intervention)
Protection strategy LC
ALC Number of
switched-off
lines
Cascade
size, S computational
time 2t
end of
cascade
computational
time 2t
end of
cascade
No operator intervention 0.959 0.959 0.979 0.979 - 57
Single-line switching 0.810 0.818 0.914 0.932 1 27
Mult
iple
-lin
e
swit
chin
g
Global protection 0.608 0.758 0.581 0.832 27 10
Local protection 0.743 0.844 0.551 0.823 41 10
Hybrid
protection
1 0.652 0.762 0.555 0.811 31 10
2 0.614 0.765 0.575 0.894 26 13
3 0.643 0.753 0.557 0.797 30 9
6. Conclusions
In this paper, we embraced a complex network perspective on the problem of optimal protection of
network systems. We extended a previously developed model for cascading failures propagation
0 1 2 3 4 5 60
0.1
0.2
0.3
0.4
0.5
0.6
0.7
0.8
0.9
1
Step, ti
Connectivity loss,
CL
No operator intervention
Hybrid protection strategy 1
Hybrid protection strategy 2
Hybrid protection strategy 3

21
based on complex network theory, and embedded it in an original MBDE scheme of optimization
which considers both global and local effects on the network.
Optimal protection strategies involving line switching have been identified such as to limit the
cascade failure consequences. Numerical results obtained by application of the MBDE optimization
methodology on a mid-size network have proved both feasible and satisfactory. The suggested
protection strategy, i.e. the optimal set of lines to be switched-off, proved efficient in limiting the
cascading failure consequences of the worst-case interdiction scenario. Nonetheless, we observed
that the disconnection of a single line as a corrective measure may increase the extent of a cascade
in some cases. We conclude that a hybrid protection strategy would combine the benefits of the
global network protection and of the predefined local area protection. Therefore, the results of this
work foster the use of a hybrid approach to obtain the optimal network protection.
The abstract modeling approach undertaken for analyzing the system aims at characterizing the
topology of network systems for identifying critical parts and selecting optimal protection
strategies. However, given the somewhat abstract level of the modeling supporting complex
network analysis, the insights gained with respect to the vulnerable areas in the system (first
findings) may not be clear-cut, and additional vulnerabilities may still be expected, and more
detailed information about the system and its operating environment needed. Then, for practical
uses the analysis can serve for guiding more detailed approaches that include operational aspects
related to the specific system. For example, for a power system it would be necessary to account
for: the line impedances and Kirchhoff's laws in assessing the power flows from the generators to
the loads, the fact that the line capacities are engineered to accommodate the usual patterns of line
flows, the effects of automatic protection, power flow redistribution after transients and after re-
dispatch of generation and shedding of load. Further, the use of line switching, here taken only as an
example of protection measure, must be carefully considered in practice: as observed in our results,
the action of switching off transmission lines during a failure could itself worsen the behavior of the
system.
In this direction, introduction of physical characteristics into abstract modeling approaches is
envisaged. The introduction must be suitable to bridge the modeling to reality, without over-
complicating the model that remains appealing if it requires minimum information and provides
prompt results about network vulnerability.
In this respect, this work just takes the preliminary step of framing the complex network perspective
on the problem of optimal protection of network systems. Future research steps will consider the
extension of the abstract model of cascading failures “beyond network abstraction” to incorporate
physical properties of the specific systems.
Acknowledgements
This work was funded by the Foundation pour une Culture de Securite Industrielle of Toulouse,
France, under the research contract AO2006–01.
References [Albert et al. 2004] Albert, R., Albert, I., and Nakarado, G.L., Structural vulnerability of the North American
power grid, Physical Review E 69, 025103(R).
[Arroyo and Fernandez, 2009] Arroyo, J.M., Fernández, F.J., A Genetic Algorithm Approach for the
Analysis of Electric Grid Interdiction with Line Switching, Intelligent System Applications to Power
Systems, ISAP '09, 15th International Conference on, pp. 1-6, Curitiba, 8-12 Nov. 2009.

22
[Batagelj, 1994] Batagelj, V., Semirings for social networks analysis. Journal of Mathematical Sociology
19(1): 53-68, 1994.
[Babu et al., 2007] Babu, B.V., Gujarathi, A.M., Katla, P., Laxmi, V.B., Strategies of Multi-Objective
Differential Evolution (MODE) for Optimization of Adiabatic Styrene Reactor. In Proceedings of the
International Conference on Emerging Mechanical Technology: Macro to Nano (EMTMN-2007); p 243.
[Bier et al., 2007] Bier, V.M., Gratz, E.R:, Haphuriwat, N.J., Magua, W., and Wierzbicki, K.R.,
Methodology for identifying near-optimal interdiction strategies for a power transmission system, Reliab.
Eng. Syst. Saf., vol. 92, no. 9 , pp. 1155–1161, Sep. 2007.
[Coelho and Bernert, 2008] Coelho, L.S., Bernert, D.L.A., An improved harmony search algorithm for
synchronization of discrete-time chaotic systems, Chaos Solitons Fract 2008.
doi:10.1016/j.chaos.2008.09.02.
[Dai and Poh, 2002] Dai Y, Poh K. Solving the network interdiction problem with genetic algorithms. In:
Proceedings of the fourth Asia-Pacific conference on industrial engineering and management system, Taipei;
2002. p. 18–20.
[Dobson et al., 2005] Dobson, I., Carreras, B.A., Newman, D.E., A loading-dependent model of probabilistic
cascading failure. Probability in the Engineering and Informational Sciences 19(1): 15-32, Cambridge
University Press, 2005.
[Dobson et al., 2007] Dobson, I., B. A. Carreras, V.E. Lynch and D.E. Newman, Complex systems analysis
of series of blackouts: Cascading failure, critical points, and self-organization. Chaos: An Interdisciplinary
Journal of Nonlinear Science 17(2), 2007.
[Duenas-Osorio and Vemuru, 2009] Dueñas-Osorio, L., and Vemuru, S.M., Cascading failures in complex
infrastructures systems. Structural safety 31: 157-167.
[Eusgeld et al., 2009] Eusgeld, I., Kröger, W., Sansavini, G., Schläpfer, M., Zio, E., The role of network
theory and object-oriented modeling within a framework for the vulnerability analysis of critical
infrastructures, Reliability Engineering & System Safety, Volume 94, Issue 5, May 2009, Pages 954-963.
[Floyd, 1962] Floyd, R.W. Algorithm 97: Shortest path, Communications of the ACM, 5(6):345, 1962.
[Freeman, 1978] Freeman, L.C., Centrality in social networks conceptual clarification. Social Networks 1(3):
215-239.
[Freeman et al. 1991] Freeman, L.C., Borgatti, S.P., and White, D.R., Centrality in valued graphs: A measure
of betweenness based on network flow, Social Networks 13(2): 141-154,1991.
[Girvan and Newman, 2002] Girvan, M., Newman, M.E.J., Community structure in social and biological
networks, Proc. Natl. Acad. Sci., USA 99, 5890, 2002.
[Granelli et al., 2006] Granelli, G., Montagna, M., Zanellini, F., Bresesti, P., Vailati, R., and Innorta, M.,
Optimal network reconfiguration for congestion management by deterministic and genetic algorithms, Elect.
Power Syst. Res., vol. 76, pp. 549–556, Apr. 2006.
[Greem and Kim, 2001] Geem, Z.W., Kim, J.H., Loganathan, G.V., A new heuristic optimization algorithm:
harmony search, Simulation 2001; 76(2):60–8.
[Hines and Blumsack, 2008] Hines, H. and Blumsack, S. (2008). A Centrality Measure for Electrical
Networks, Proceedings of the 41st Hawaii International Conference on System Science.
[Hines et al., 2010] Hines P., Cotilla-Sanchez E., Blumsack S. Do topological models provide good
information about electricity infrastructure vulnerability? Chaos 20 (3), 033122 (2010).
[Holme, 2002] Holme P. Edge overload breakdown in evolving networks. Phys.Rev.E, 66, 036119, 2002.
[Kinney et al., 2005] Kinney P., Crucitti P., Albert R., Latora V. Modeling cascading failures in the North
American power grid, The European Physical Journal B- Condensed matter and complex systems, 46 (1):
101-107, 2005.
[Kroger and Zio, 2011] Kroger W., Zio E., Vulnerable Systems, Springer-Verlag London, 1st Edition, 2011.
[Latora and Marchiori, 2005] Latora, V., and Marchoiri, M., Vulnerability and protection of infrastructure
networks. Physical Review E 71, 015103.
[Little 2002] Little, R.G., Controlling Cascading Failure: Understanding the Vulnerabilities of
Interconnected Infrastructures. Journal of Urban Technology 9(1): 109 – 123, 2002.

23
[Mahdavi et al., 2007] Mahdavi, M., Fesanghary, M., Damangir, E., An improved harmony search algorithm
for solving optimization problems, Appl Math Comput 2007; 188(2):1567–79.
[Motter and Lai, 2002] Motter, A.E., and Lai, Y.-C., Cascade-based attacks on complex networks. Physical
Review E 66(6): 065102, 2002..
[Motter, 2004] Motter, A.E., Cascade control and defense in complex Networks, Physical Review Letters,
vol. 93, nr 9, pp. 098701(1-4), 2004.
[Newman and Girvan, 2004] Newman, M.E.J., and Girvan, M., Finding and evaluating community structure
in networks. Physical Review E 69(2): 026113, 2004.
[Nieminen, 1974] Nieminen, J., On the centrality in a graph. Scandinavian Journal of Psychology 15(1): 332-
336, 1974.
[Ponsich and Coello, 2009] Ponsich, A., Coello, C.A., Differential Evolution performances for the solution
of mixed integer constrained Process Engineering problems, Applied Soft Computing (2009),
doi:10.1016/j.asoc.2009.11.030.
[Rocco and Ramirez, 2009] C.M. Rocco, S., Ramirez-Marquez, J.E., Deterministic network interdiction
optimization via an evolutionary approach, Reliability Engineering and System Safety 94 (2009) 568–576.
[Rosato et al., 2007] Rosato V., Bologna A., Tiriticco F., Topological properties of high-voltage electrical
transmission networks, Electric Power Systems Research, 77 (2): 99-105, 2007.
[Rosato et al., 2009] Rosato V., Issacharoff L., Gianese G., Bologna S., Influence of the topology on the
power flux of the Italian high-voltage electrical network, arXiv.org, physics, arXiv:0909.1664 2009.
[Sabidussi, 1966] Sabidussi, G., The centrality index of graphs, Psychometrika, 31(4), pp. 581-603, 1966.
[Saka, 2009] Saka, M.P., Optimum design of steel sway frames to BS5950 using harmony search algorithm,
J Constr Steel Res 2009; 65(1):36–43.
[Salmeron et al., 2004] Salmeron, J., Wood, K., and Baldick, R., Analysis of Electric Grid Security Under
Terrorist Threat, IEEE Transactions on power systems, Vol. 19, no. 2, May 2004.
[Salmeron et al., 2009] Salmeron, J., Wood, K., and Baldick, R., Worst-Case Interdiction Analysis of Large-
Scale Electric Power Grids, IEEE Transactions on power systems, Vol. 24, no. 1, February 2009.
[Schnyder and Glavitsch, 1988] Schnyder, G., and Glavitsch, H., Integrated security control using an optimal
power flow and switching concepts, IEEE Trans. Power Syst., vol. 3, no. 2, pp. 782–790, May 1988.
[Schnyder and Glavitsch, 1990] Schnyder, G., and Glavitsch, H., Security enhancement using an optimal
switching power flow, IEEE Trans. Power Syst., vol. 5, no. 2, pp. 674–681, May 1990.
[Shao and Vittal, 2005] Shao, W., and Vittal, V., Corrective switching algorithm for relieving overloads and
voltage violations, IEEE Trans. Power Syst., vol. 20, no. 4, pp. 1877–1885, Nov. 2005.
[Storn and Price, 1995] Storn, R., Price, K., Differential evolution – A simple and efficient adaptive scheme
for global optimization over continuous spaces, Technical Report TR-95-012, International Computer
Science Institute, Berkeley, CA. 1995.
[Talukdar et al., 2003] Talukdar, S.N., Apt, J., Ilic, M., Lave, L.B., and Morgan, M.G:, Cascading Failures:
Survival versus Prevention, The Electricity Journal, Vol. 16, Issue 9, November 2003, pp. 25-31.
[Wang et al., 2010] Wang, L., Fu, X., Menhas, M.I., and Fei, M., A Modified Binary Differential Evolution
Algorithm, Life System Modeling and Intelligent Computing, Lecture Notes in Computer Science, 2010,
Volume 6329/2010, 49-57, DOI: 10.1007/978-3-642-15597-0_6.
[Zio and Sansavini, 2009] Zio, E., and Sansavini, G., Modeling failure cascade in network systems due to
distributed random disturbances. Proceedings ESREL 2008. Martorell et al. (eds): Safety, Reliability and
Risk Analysis: Theory, Methods and Applications. CRC Press, Taylor & Francis Group, London, 2009.
[Zio and Sansavini, 2010] Zio, E., and Sansavini, G., Modeling failure cascades in critical infrastructures
with physically-characterized components and interdependencies, in Reliability, Risk and Safety: Back to the
Future – Ale, Papazoglou & Zio (eds), pp. 652 - 661, Proceedings of ESREL 2010 Europe Annual
Conference, 5-9 September 2010, Rhodes, Greece, Taylor & Francis Group, London, 2010.
[Zio and Viadana, 2011] Zio, E., and Viadana, G., A thorough analysis of Differential Evolution in single-
objective and multi-objective optimization, submitted to The Seventh International Conference on“
Mathematical Methods in Reliability”- Theory. Methods. Applications, June 20-24, 2011.

24
[Zio et al., 2011] Zio E., Golea L.R., Rocco C.M.S., Identifying groups of critical edges in a realistic
electrical network by multi-objective genetic algorithms, Reliability Engineering and System Safety (2011),
doi:10.1016/j.ress.2011.11.008.