optimal allocation of captive-reared puerto rican parrots: decisions when divergent dynamics...
TRANSCRIPT
Seediscussions,stats,andauthorprofilesforthispublicationat:https://www.researchgate.net/publication/260162273
OptimalAllocationofCaptive-RearedPuertoRicanParrots:DecisionsWhenDivergentDynamicsCharacterizeManagedPopulations
ARTICLEinJOURNALOFWILDLIFEMANAGEMENT·AUGUST2013
ImpactFactor:1.73·DOI:10.2307/23470650
CITATIONS
4
READS
34
6AUTHORS,INCLUDING:
PaulFackler
NorthCarolinaStateUniversity
53PUBLICATIONS1,668CITATIONS
SEEPROFILE
KrishnaPacifici
NorthCarolinaStateUniversity
16PUBLICATIONS161CITATIONS
SEEPROFILE
ThomasHWhite,Jr.
U.S.FishandWildlifeService
33PUBLICATIONS265CITATIONS
SEEPROFILE
Allin-textreferencesunderlinedinbluearelinkedtopublicationsonResearchGate,
lettingyouaccessandreadthemimmediately.
Availablefrom:ThomasHWhite,Jr.
Retrievedon:05February2016
Demographics of Reintroduction Special Section
Optimal Allocation of Captive-Reared PuertoRican Parrots: Decisions When DivergentDynamics Characterize Managed Populations
JAIME A. COLLAZO,1 U.S. Geological Survey, North Carolina Cooperative Fish and Wildlife Unit, North Carolina State University,225 David Clark Labs, Campus Box 7617, Raleigh, NC 27695, USA
PAUL L. FACKLER, Agricultural and Resource Economics, North Carolina State University, Raleigh, NC 27695, USA
KRISHNA PACIFICI, North Carolina Cooperative Fish and Wildlife Unit, North Carolina State University, Raleigh, NC 27695, USA
THOMAS H. WHITE JR., Puerto Rican Parrot Field Office, US Fish and Wildlife Service, Rio Grande, PR 00745, USA
IVAN LLERANDI-ROMAN, Puerto Rican Parrot Recovery Program, Department of Natural and Environmental Resources, Wildlife Division,San Juan, PR 00936, USA
STEPHEN J. DINSMORE, Department of Natural Resource Ecology & Management, Iowa State University, Ames, IA 50011, USA
ABSTRACT Reintroduction programs often face the challenge of sustaining multiple populations, each withunique demographic rates. Decision makers must determine how to allocate a finite number of captive-rearedanimals among these populations to achieve the fundamental objective of the program. We explored theoptimal allocation of captive-reared Puerto Rican parrots (Amazona vittata) to 3 distinct populations: astruggling relict (population 1), a successfully reintroduced population (population 2), and a potential (new)population (population 3). We illustrate decision tradeoffs using 4 hypothetical scenarios of demographicperformance created using the parrot literature and expert opinion and find the optimal decision byformulating the problem as a Markov decision process. Across all scenarios, our analysis favored releasingparrots into population 2 first when population sizes were small, followed by releases into population 3, andsubsequently to population 1. The point in the decision space at which these transitions occurred was afunction of location demographic rates. Releasing parrots in a location harboring an extant population versusa location that does not is advisable if differences in environmental conditions that promote populationgrowth between locations are small. If management actions cannot ameliorate limiting factors in a location,decisions will favor translocations from such locations and allocations to locations where growth is morelikely.When the cost of conducting a release is considered, managers should occasionally postpone releases toavoid these costs. This is optimal whenever the weighted contribution of the additional parrots to the sum ofthe discounted additional expected future population levels is less than the size of the fixed costs. This wasmost often the case for population 1 as costs increased. � 2013 The Wildlife Society.
KEY WORDS allocation, captive-reared birds, conservation, costs, optimization, population growth, Puerto RicanParrot, recurrent decisions, reintroduction.
Once widespread throughout the island, the Puerto Ricanparrot (Amazona vittata) was reduced to a relict population atEl Yunque National Forest (EY), one of few forested areasleft on the island by the late 1930s (Brash 1987, Snyderet al. 1987). The range contraction was followed by a markeddecrease in population size. Estimated at 2,000 individualsin the 1940s, the parrot numbered under 20 individuals by thelate 1960s when recovery efforts started in earnest (Rodrı-guez-Vidal 1959, Snyder et al. 1987, United States Fish andWildlife Service [USFWS] 2009). Nearly every aspect of thespecies’ life cycle, including most biotic interactions (e.g.,predators, ectoparasites), have been managed to promote its
persistence (USFWS 2009). Moreover, 55 captive-rearedparrots were released at EY between 2000 and 2010 to fosterpopulation growth. Yet, after more than 40 years, thepopulation size at EY remains at 15–20 individuals. Of thefactors restricting population growth, rainfall and raptors areconsidered the most influential (White et al. 2005, Beissingeret al. 2008, USFWS 2009, Collazo et al. 2010). The formeraffects post-fledging survival and breeding productivity (e.g.,respiratory diseases); the latter impinges upon juvenile andadult survival.The reintroduction of the Puerto Rican parrot into
historical habitat is central to the recovery and persistenceof the species (Lacy et al. 1989, USFWS 2009) by providing ameans to reduce the risk of extinction due to environmentaland demographic stochasticity. This recovery strategy wasimplemented in 2006 when captive-reared parrots werereleased in the Rio Abajo Forest, a state reserve imbedded inthe northern karst region of the island (USFWS 2009). The
Received: 30 March 2012; Accepted: 12 March 2013Published: 14 June 2013
1E-mail: [email protected]
The Journal of Wildlife Management 77(6):1124–1134; 2013; DOI: 10.1002/jwmg.569
1124 The Journal of Wildlife Management � 77(6)

incipient population exhibits demographic attributes associ-ated with successful reintroductions (White et al. 2012).These include a greater number of breeding pairs (10) thanthe maximum (6) recorded in El Yunque since 1973, similarbreeding productivity (1.6 chicks/nesting attempt), a corepopulation size (around the release area) of 40–50individuals, and a floating population of >20 individualswith the potential of pioneering a separate location. Effortsto start a third population are in motion (White et al. 2010),triggered by the successful trajectory of the Rio Abajo Forestpopulation but also by the negative trajectory of thepopulation at El Yunque. The observed finite rate ofincrease ðlÞ at El Yunque has averaged 0.94 since 1998despite intensive management aimed at increasing breedingproductivity and supplementing the population since 2000(Collazo et al. 2010). Parrots released at a third site,scheduled to start in 2015, are expected to perform as well asthose released at the Rio Abajo Forest based on similarities inhabitat quality parameters (White et al. 2010).The confluence of the aforementioned circumstances has
ushered the recovery program into a phase of expanded andcompeting needs to sustain 2 extant populations and createa third one. The constraint is largely imposed by theproduction capacity of 2 captive breeding facilities(USFWS 2009), 1 located at El Yunque and the other atthe Rio Abajo Forest. Together these facilities are projectedto produce, on average, 8 birds for release annually.Managersmust decide how to allocate captive-reared parrots within anemerging metapopulation (Armstrong and Seddon 2008).For example, should parrots be used to build up a single largepopulation or to supplement multiple smaller ones? Thischallenge is underscored by mounting evidence indicatingthat El Yunque is a sink habitat for parrots (Muiznieks 2003,Beissinger et al. 2008). In this context, decisions toperpetuate this relict population could undermine effortsto foster growth of reintroduced populations, and thus, anassessment of tradeoffs among alternative release options isimportant.We assessed a population on a downward trajectory
(henceforth population 1), a successfully reintroducedpopulation (henceforth population 2), and a third, potentialpopulation expected to perform much like population 2(henceforth population 3). In this context, we explored howto allocate a finite number of captive-reared parrots among 3populations with distinct vital rates. We also explored howthese decisions would be affected if a cost was assessed onreleases. This is a hypothetical scenario aimed at assessingtradeoffs, given the costs of releasing 8 parrots or none in agiven year.We present a recurrent decision framework aimed at
assessing different allocation options to maximize populationnumbers of parrots. We consider 4 population scenarios,where scenarios depict distinct demographic rates for eachpopulation, and are based on expert opinion and availabledata. The scenarios represent different possible models ofdemographic performance for the 3 populations, and socapture uncertainty (Regan et al. 2002). Decisions are guidedby the fundamental objective of the recovery program, that is,
attain self-sustaining, viable populations (USFWS 2009).We focused on population numbers because endangeredspecies face the possibility of extinction due to bothdemographic and environmental stochasticity. Risk of lossdue to demographic stochasticity decreases as the populationsize increases, whereas risk of loss due to environmentalstochasticity decreases as the geographic extent or thenumber of populations increases. Risks were minimized byestablishing a second population at a location (Rio Abajo)with more favorable environmental conditions (e.g., lessprecipitation) and reduce risk of a direct hit by a hurricanecompared to the El Yunque parrot population (Lacyet al. 1989, USFWS 2009). These 2 populations (El Yunqueand Rio Abajo) are considered independent, allowing for anexploration of different allocation options to meet ourfundamental objective. We used a population growth modelthat incorporated Allee effects (Wang et al. 1999, Armstrongand Wittmer 2011) because the individual populationnumbers at El Yunque can be very small thus raising theprobability that these effects might undermine populationgrowth (e.g., predator avoidance, inbreeding; Beissinger et al.2008). Finally, we articulate ways in which the decisionframework presented here could incorporate uncertainty andlearning, and opportunities to adopt similar approaches toaddress other challenges in recovery programs. The decisioncontext discussed here is not unique to the Puerto Ricanparrot, and thus, we hope that insights derived from thisassessment will be useful to other programs facing similarchallenges.
METHODS
We formulated the problem as a Markov decision process(MDP; Puterman 2005). We assumed stationarity in thetransitions and rewards and solved for an infinite horizonstationary solution with stochastic dynamic programmingusing the MATLAB toolbox MDPSolve (Fackler 2011) todetermine the optimal allocation of parrots. FollowingPuterman (2005), MDPs are models for sequential decisionmaking when outcomes are uncertain. The MDPs consist of4 essential elements: states, actions, transition probabilities todetermine how each state evolves given the different actions(i.e., model of the system), and rewards (i.e., utility orobjective function). Two additional pieces are necessary tosolve MDPs as well, a time horizon and discount factor,which are necessary to ensure convergence of the algorithms.We were interested in exploring the consequences ofchoosing different actions in a state, which generates areward (through our objective function), and determines thefuture state at the next period through our model. The goalof solving an MDP is to obtain an optimal policy or strategy(optimal in the sense it maximizes our utility) that provides aprescription of which action to choose given any possiblestate at a future time. It allows one to explore and understandthe implications of choosing specific actions when one isuncertain about how the actions may influence the system.Therefore, MDPs provide a logical and transparent approachto making optimal decisions in the face of uncertainty.
Collazo et al. � Supplementing Multiple Populations 1125
We considered a setting in which 3 independentpopulations exist with the current size of population i givenby Ni where the Ni define a discrete set of states. Supposefurther that X animals are available for release and that Ri arereleased into population i. Therefore, our set of availableactions consist of the number of parrots to be released intopopulation i (here capped at 8). The managers have thefurther option to refrain from releasing any animals in a givenyear, so the total number released is either X or 0.Each subpopulation is governed by the same population
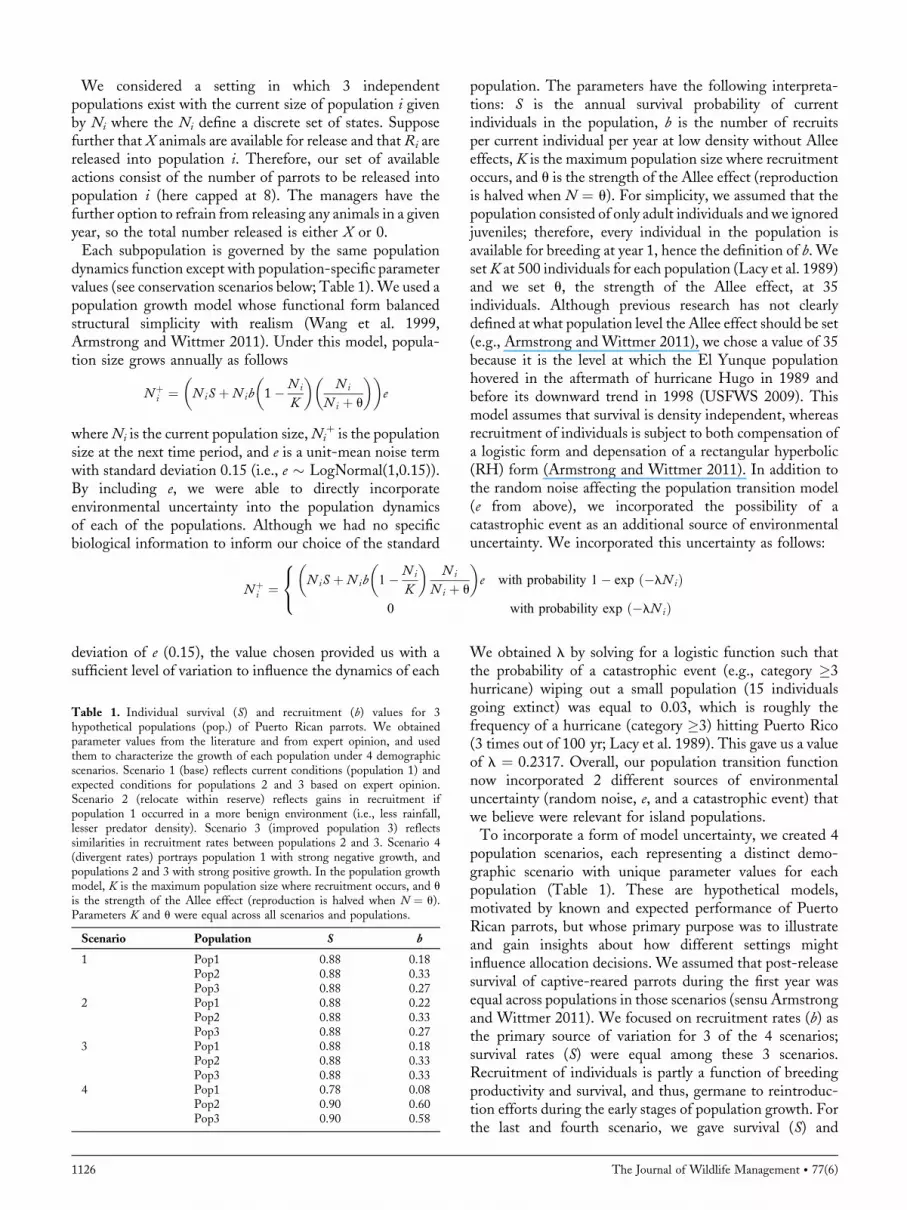
dynamics function except with population-specific parametervalues (see conservation scenarios below; Table 1).We used apopulation growth model whose functional form balancedstructural simplicity with realism (Wang et al. 1999,Armstrong and Wittmer 2011). Under this model, popula-tion size grows annually as follows
Nþi ¼ NiS þNib 1�Ni
K
� �Ni
N i þ u
� �� �e
whereNi is the current population size,Niþ is the population
size at the next time period, and e is a unit-mean noise termwith standard deviation 0.15 (i.e., e � LogNormal(1,0.15)).By including e, we were able to directly incorporateenvironmental uncertainty into the population dynamicsof each of the populations. Although we had no specificbiological information to inform our choice of the standard
deviation of e (0.15), the value chosen provided us with asufficient level of variation to influence the dynamics of each
population. The parameters have the following interpreta-tions: S is the annual survival probability of currentindividuals in the population, b is the number of recruitsper current individual per year at low density without Alleeeffects, K is the maximum population size where recruitmentoccurs, and u is the strength of the Allee effect (reproductionis halved when N ¼ u). For simplicity, we assumed that thepopulation consisted of only adult individuals and we ignoredjuveniles; therefore, every individual in the population isavailable for breeding at year 1, hence the definition of b. WesetK at 500 individuals for each population (Lacy et al. 1989)and we set u, the strength of the Allee effect, at 35individuals. Although previous research has not clearlydefined at what population level the Allee effect should be set(e.g., Armstrong and Wittmer 2011), we chose a value of 35because it is the level at which the El Yunque populationhovered in the aftermath of hurricane Hugo in 1989 andbefore its downward trend in 1998 (USFWS 2009). Thismodel assumes that survival is density independent, whereasrecruitment of individuals is subject to both compensation ofa logistic form and depensation of a rectangular hyperbolic(RH) form (Armstrong and Wittmer 2011). In addition tothe random noise affecting the population transition model(e from above), we incorporated the possibility of acatastrophic event as an additional source of environmentaluncertainty. We incorporated this uncertainty as follows:
We obtained l by solving for a logistic function such thatthe probability of a catastrophic event (e.g., category �3hurricane) wiping out a small population (15 individualsgoing extinct) was equal to 0.03, which is roughly thefrequency of a hurricane (category �3) hitting Puerto Rico(3 times out of 100 yr; Lacy et al. 1989). This gave us a valueof l ¼ 0.2317. Overall, our population transition functionnow incorporated 2 different sources of environmentaluncertainty (random noise, e, and a catastrophic event) thatwe believe were relevant for island populations.To incorporate a form of model uncertainty, we created 4
population scenarios, each representing a distinct demo-graphic scenario with unique parameter values for eachpopulation (Table 1). These are hypothetical models,motivated by known and expected performance of PuertoRican parrots, but whose primary purpose was to illustrateand gain insights about how different settings mightinfluence allocation decisions. We assumed that post-releasesurvival of captive-reared parrots during the first year wasequal across populations in those scenarios (sensu Armstrongand Wittmer 2011). We focused on recruitment rates (b) asthe primary source of variation for 3 of the 4 scenarios;survival rates (S) were equal among these 3 scenarios.Recruitment of individuals is partly a function of breedingproductivity and survival, and thus, germane to reintroduc-tion efforts during the early stages of population growth. Forthe last and fourth scenario, we gave survival (S) and
Table 1. Individual survival (S) and recruitment (b) values for 3hypothetical populations (pop.) of Puerto Rican parrots. We obtainedparameter values from the literature and from expert opinion, and usedthem to characterize the growth of each population under 4 demographicscenarios. Scenario 1 (base) reflects current conditions (population 1) andexpected conditions for populations 2 and 3 based on expert opinion.Scenario 2 (relocate within reserve) reflects gains in recruitment ifpopulation 1 occurred in a more benign environment (i.e., less rainfall,lesser predator density). Scenario 3 (improved population 3) reflectssimilarities in recruitment rates between populations 2 and 3. Scenario 4(divergent rates) portrays population 1 with strong negative growth, andpopulations 2 and 3 with strong positive growth. In the population growthmodel, K is the maximum population size where recruitment occurs, and uis the strength of the Allee effect (reproduction is halved when N ¼ u).Parameters K and u were equal across all scenarios and populations.
Scenario Population S b
1 Pop1 0.88 0.18Pop2 0.88 0.33Pop3 0.88 0.27
2 Pop1 0.88 0.22Pop2 0.88 0.33Pop3 0.88 0.27
3 Pop1 0.88 0.18Pop2 0.88 0.33Pop3 0.88 0.33
4 Pop1 0.78 0.08Pop2 0.90 0.60Pop3 0.90 0.58
Nþi ¼ NiS þNib 1�Ni
K
� �Ni
N i þ u
� �e with probability 1� exp ð�lNiÞ
0 with probability exp ð�lNiÞ
8<:
1126 The Journal of Wildlife Management � 77(6)
recruitment of individuals (b) different values as describedbelow.We obtained parameter values for each scenario from
published literature and expert opinion.We acknowledge theuncertainty associated with all parameters, including post-release survival, but we did not explore this form ofparametric uncertainty in this manuscript. However, we dodiscuss its implications later in the context of decisionmaking. We parameterized the first (base) scenario using themost recent estimates of vital rates for parrots reported in theliterature and used in population viability analyses forpopulation 1 (Beissinger et al. 2008, Collazo et al. 2010), andexpert opinion for populations 2 and 3. The second scenario(improved habitat at EY) reflected hypothesized gains inrecruitment if population 1 occurred in slightly more suitablehabitat, simulating a supplementation within El YunqueNational Forest in an area where rainfall and avian predationpressure would be lesser (USFWS 2009). The third scenario(improved population 3) reflected similar recruitment ratesbetween population 3 (potential population) and population2, also reintroduced and deemed successful. The last scenario(divergent rates) portrayed a setting where populations 2 and3 exhibit high but plausible survival and recruitment rates(sensu Snyder et al. 1987, Lacy et al. 1989), whereas rates forpopulation 1 represent a set of plausible values of a severelystruggling and down-spiraling population. We obtainedparameter values from simulations aimed at tracking the ElYunque population trajectory since 1998 using programVortex (Lacy et al. 2009) and insights from recent analyses ofpost-fledging survival (Collazo et al. 2010).In addition to the available actions and the transition
functions described above, we also defined a reward function(objective function), time horizon, and discount rate tocomplete a full specification of an MDP. The rewardfunction used to determine an optimal strategy for the 4scenarios is to maximize the total population size summedover all 3 populations with the constraint that all 3populations have to exist (i.e., if 1 of the populations goesextinct, the reward is 0), which is a stated requirementof the recovery program. We used an infinite time horizon(i.e., we plan to make decisions indefinitely vs. a finite timeframe wherein a terminal decision period would exist) and,therefore, needed a discount rate to ensure convergence of anoptimal action. To reflect the sense that success in the nearterm is more valuable than success in the distant future, weused a discount rate of 2%, which means that future rewards(sum of population sizes for all 3 populations) are discountedrelative to current rewards. This discount rate followsthe current Office of Management and Budget (OMB)recommendations on evaluating the cost effectiveness offederal programs (OMB 1993, 2011).We also examined how consideration of program costs
would affect the optimal strategies. In other words, managersmay want to have the ability to forgo releases in a given yearto avoid costs. The optimal strategy depends strongly on theassessment of the monetary value of an additional bird in thepopulation. Multi-criteria objective functions are difficult tospecify, but a common way to do this simply places weights
on metrics for different objectives (alternative performanceindicators) such that a linear tradeoff exists amongcompeting objectives. In our study, the performanceindicators were the number of animals and the dollar costs.To illustrate the effect of the weighting factor, we depictedthe effect of alternative weighting factors on the 100-yearexpected population sizes, based on scenario 1. We startedpopulations at the estimated current population sizes in thewild for Puerto Rican parrots. These were 25 (population 1,El Yunque), 45 (population 2, Rio Abajo), and 0 individualsin population 3 (new reintroduction). The utility function toillustrate this effect was wN-C, where N is the total numberof birds in the 3 subpopulations,C is the release cost, andw isa weight measuring the monetary value of an additional bird.We expressed weight as units of $1,000 (i.e., a weight of 0.4results in a value of $400 put on each additional bird in N).We explored the sensitivity of the optimal strategy to thisweighting factor. We considered the alternative actions ofplacing 8 parrots in the wild or placing none. Therefore, therelevant cost in this example is the money saved in a givenyear from forgoing the release of 8 birds in a given year,which was estimated to be C ¼ $88,000. This cost is basedon the average cost of producing a parrot per year (approx.$11,000) by the aviaries supporting the release program(Engeman et al. 2003).
RESULTS
In all scenarios, without incorporating environmentalstochasticity, populations 2 and 3 always exhibited growthover a range of population sizes (Fig. 1, above horizontaldotted line), whereas population 1 always followed a negativegrowth trajectory (below horizontal dotted line). Populations2 and 3 exhibited positive growth up to about 250–300individuals.Allocation decisions for scenario 1 suggested that popula-
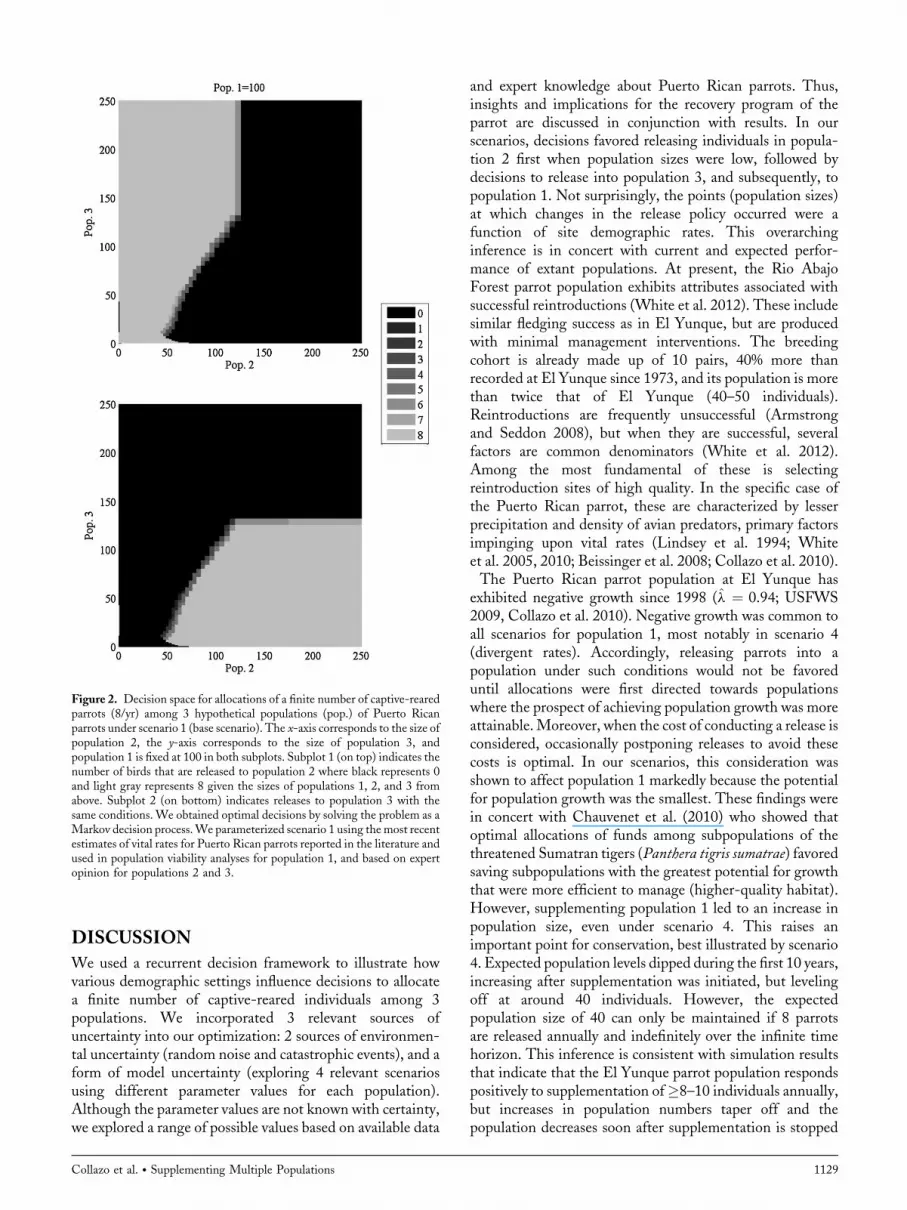
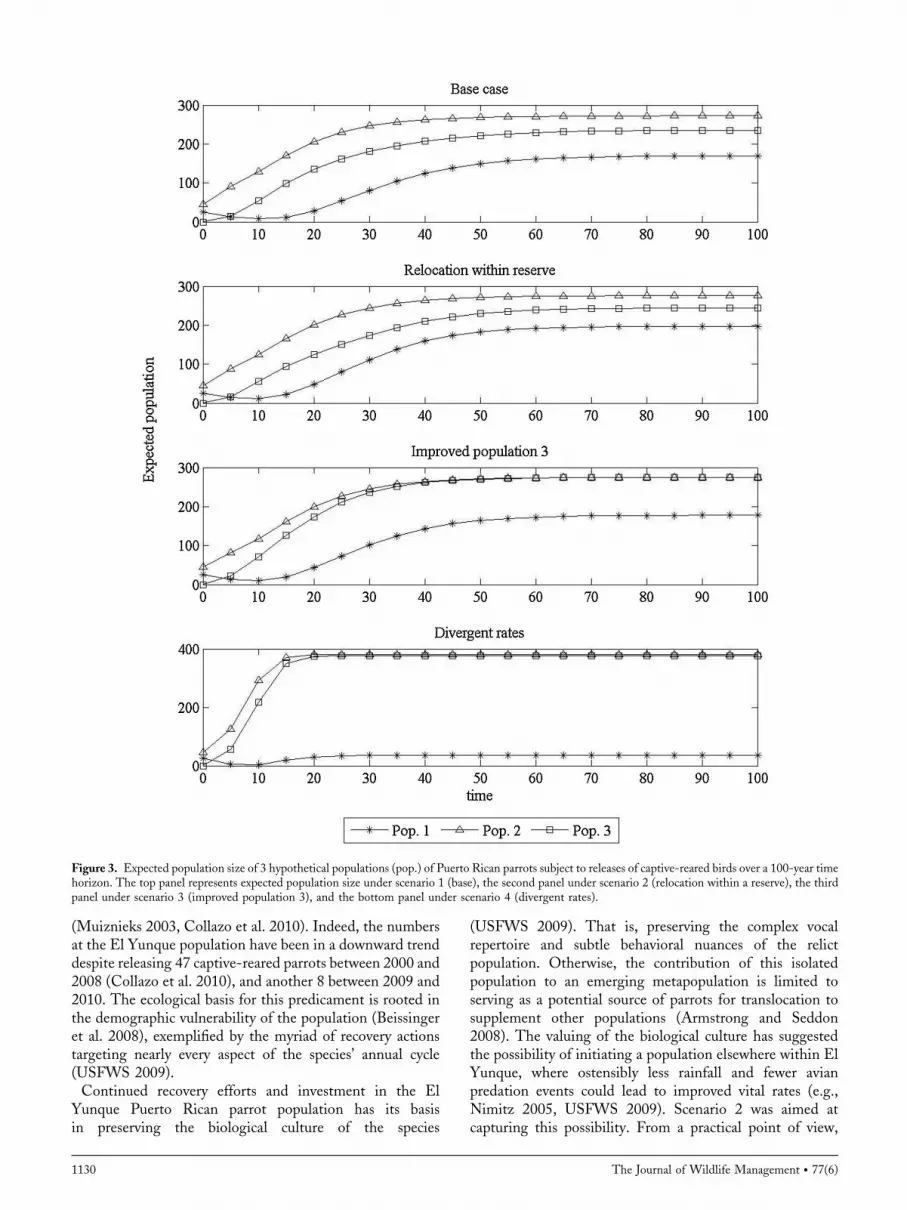
tion 2 should be supplemented and grown up to 70individuals (Fig. 2, top panel).When population 2 is between70 and 100, but population 3 is less than 70, parrots should bereleased into population 3 (Fig. 2, bottom panel). Whenpopulations 2 and 3 exceed 100 parrots, no more birds shouldbe released to either population, but should be released intopopulation 1 (i.e., shared black decision space for population2 and 3; Supplemental 1.1, available online at www.onlinelibrary.wiley.com). Under optimal management, theexpected population sizes for all 3 populations suggest thatpopulations 2 and 3 grow, but at slightly different rates,leveling off around 40–50 years from the initiation of thesupplementation effort at 280 and 230 individuals, respec-tively (Fig. 3, top panel). Population 1 starts growing aroundyear 20, leveling off around year 60 at about 150 individualsin scenario 1.Hypothetical gains in recruitment rates by reintroducing
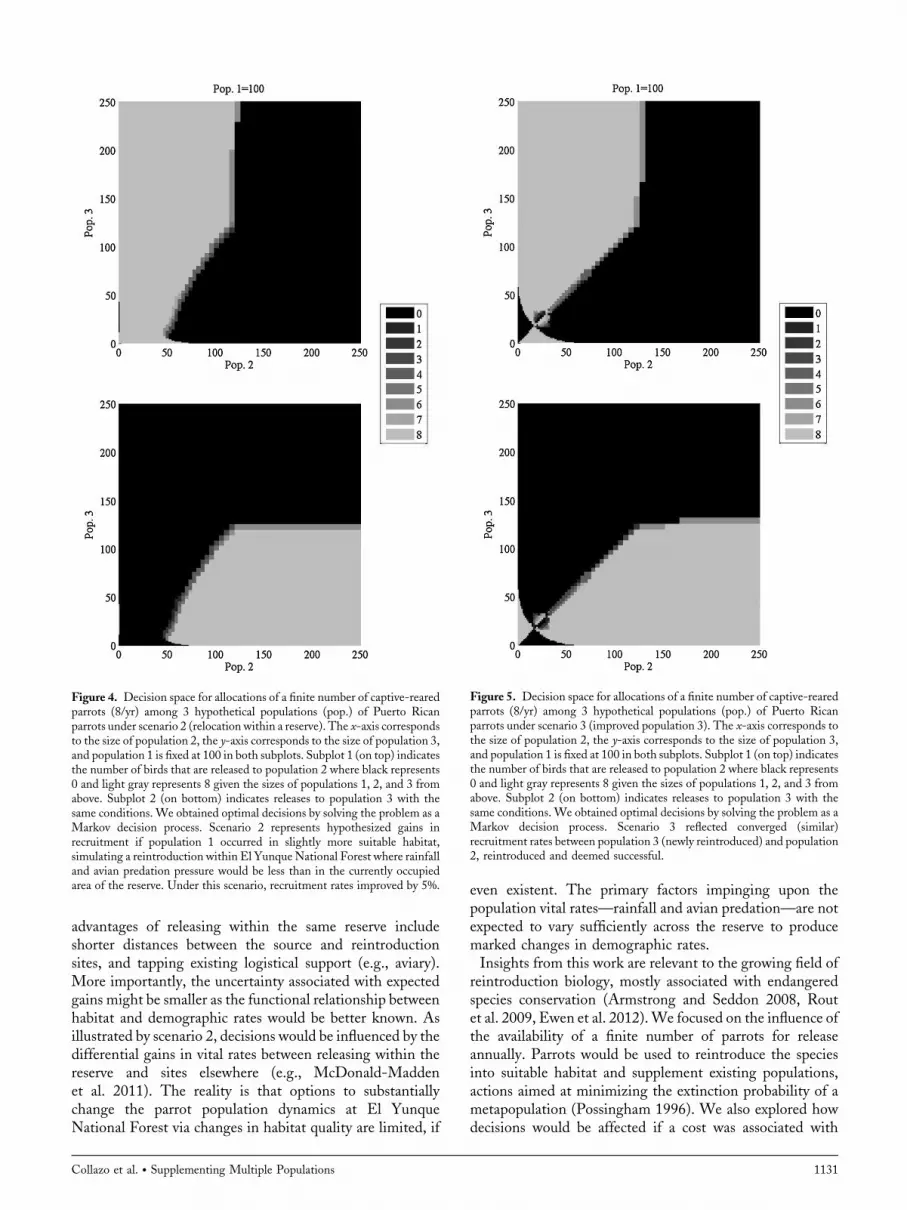
population 1 into more suitable habitat within the samereserve (scenario 2) did not change allocation decisionsappreciably as compared to the base scenario (Fig. 4, toppanel; Supplemental 1.2, available online at www.onlineli-brary.wiley.com). The benefit of this recovery action for
Collazo et al. � Supplementing Multiple Populations 1127

population 1 is captured by more rapid growth betweenyears 10 and 20, leveling off at 200 individuals (Fig. 3, secondpanel).In a setting where population 3 was expected to perform
like population 2 (scenario 3), birds should be released intopopulation 2 first and releases should continue until thepopulation reaches about 55 individuals (Fig. 5, top panel)to reduce the risk associated with the Allee effect. Parrotsshould be released into population 3 afterwards, and noparrots should be released to either population if theyexceed 90 individuals. At those levels, parrots should bereleased into population 1 (i.e., shared black decisionspace for population 2 and 3, Supplemental 1.3, availableonline at www.onlinelibrary.wiley.com). Populations 2and 3 leveled off at around 280 individuals (Fig. 3, thirdpanel).Situations where population 1 exhibits strong negative
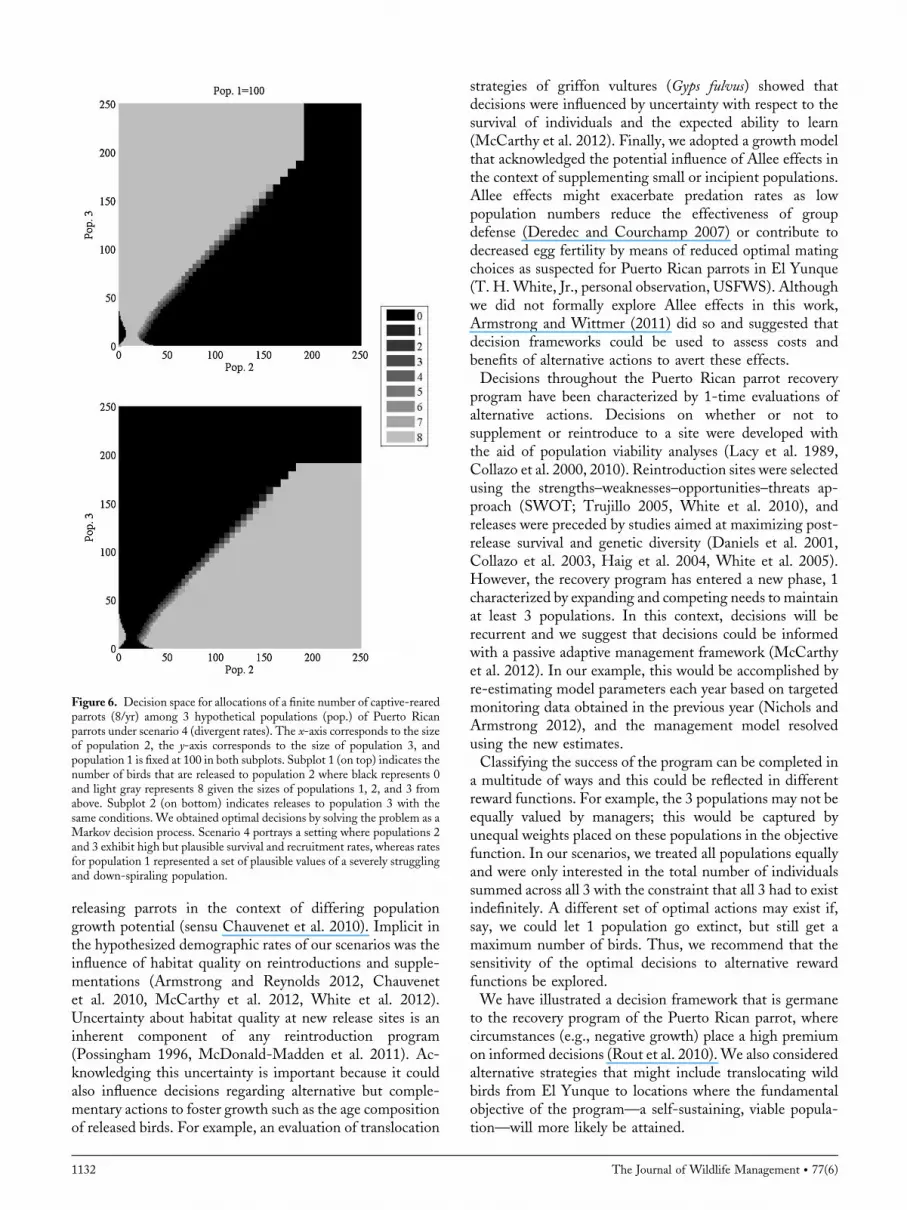
growth (scenario 4) and the others strong positive growthindicated that population 2 should be supplemented first, upto about 35 individuals, followed by releases into population3 (Fig. 6, top panel). Subsequent decisions depend on thetrajectory of each population up to about 175 individuals atwhich level birds should be released into population 1 (i.e.,shared black decision space for population 2 and 3,Supplemental 1.4, available online at www.onlinelibrary.wiley.com). The response by populations 2 and 3 tosupplementation is strong, leveling off at around 390 parrotsby year 20–25 (Fig. 3, bottom panel). Although populations2 and 3 are supplemented, population 1 exhibits a reduction
in the expected number of parrots. Growth in population 1 isapparent between years 10 and 20, leveling off at about 40individuals (Fig. 3, bottom panel).We explored the effect of alternative weights for the value
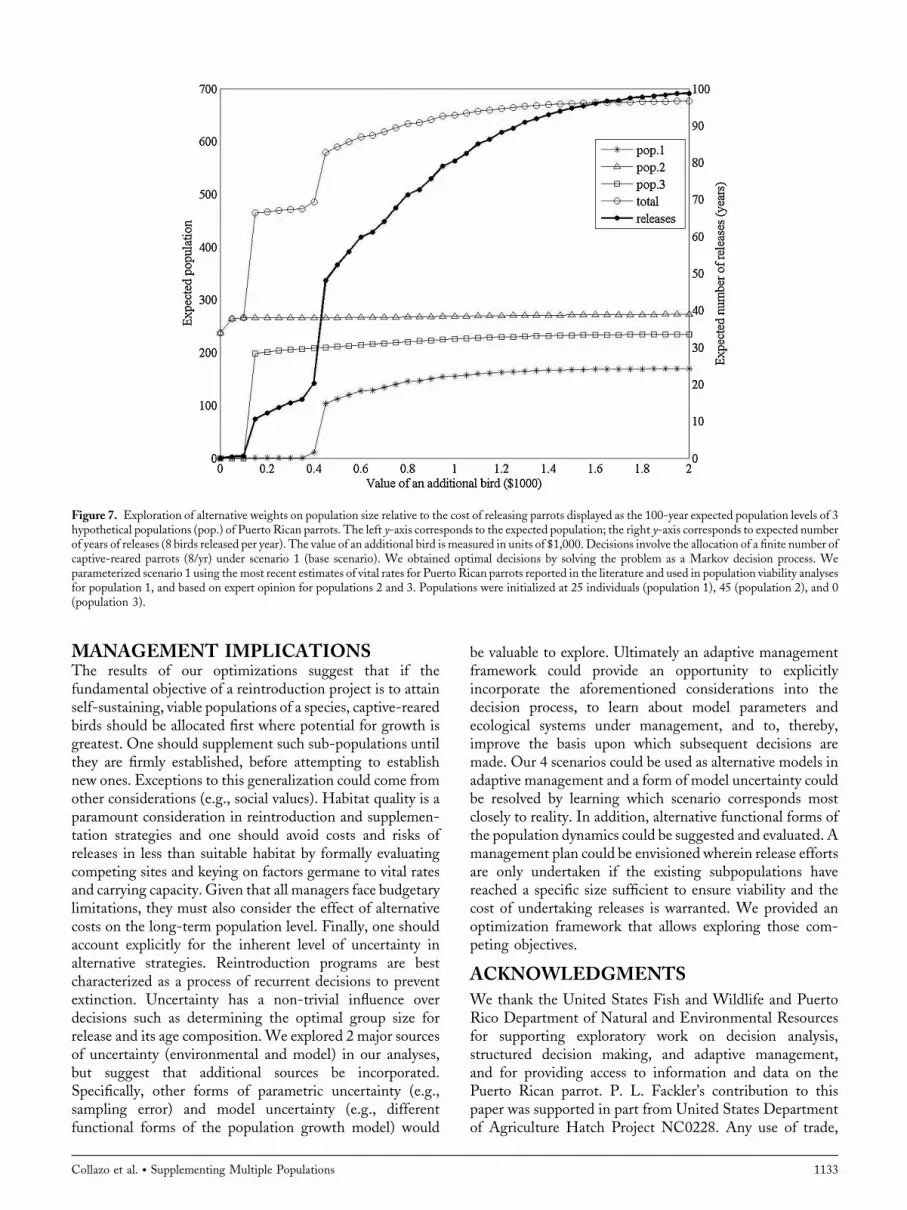
of an additional bird in the population (measured in units of$1,000) on the 100-year expected population sizes andexpected number of years of releases (Fig. 7). When no valueis put on the population size (w ¼ 0), releasing birds is notoptimal. In this case population 3 is never established,population 2 is expected to grow to about 231 birds in100 years, and population 1 is expected to go extinct. At lowvalues of w (between 0.2 and 0.4, corresponding to values of$200 and $400 for each additional bird), releasing some birdsinto populations 2 and 3 is optimal, resulting in expectedpopulation sizes of 264 and 206 for populations 2 and 3,respectively, or a total population of 470 animals. This can bedone with relatively few releases (about 18 in 100 years).When even greater value is placed on population size,releasing some birds into population 1 becomes optimal.With w ¼ 0.6 (i.e., value of additional bird ¼ $600), apopulation of 594 animals is possible, but the expectednumber of releases in 100 years needed to accomplish thisrises to 55. Further gains in population numbers are possibleif a greater number of releases are undertaken. Using aweighting factor ofw ¼ 2, achieving an expected populationsize of 672 is possible, but it requires about 98 releases in100 years. However, we found little gain in expectedpopulation sizes at 100 years with weights greater thanapproximately 1.3.
Figure 1. Growth curves for 3 hypothetical Puerto Rican parrot populations using a deterministic logistic growth model that incorporates Allee effects. Weestimated growth under our base scenario (scenario 1). The x-axis corresponds to the population size (N); the y-axis corresponds to population growth(Nþ � N). One population (pop.) is on a downward trajectory (population 1), whereas a successfully reintroduced population (population 2), and a third,potential population (population 3) are expected to perform similarly. The black horizontal (dotted) line indicates population stability, the space above this lineindicates population growth, and the space below this line indicates population decline.
1128 The Journal of Wildlife Management � 77(6)
DISCUSSION
We used a recurrent decision framework to illustrate howvarious demographic settings influence decisions to allocatea finite number of captive-reared individuals among 3populations. We incorporated 3 relevant sources ofuncertainty into our optimization: 2 sources of environmen-tal uncertainty (random noise and catastrophic events), and aform of model uncertainty (exploring 4 relevant scenariosusing different parameter values for each population).Although the parameter values are not known with certainty,we explored a range of possible values based on available data
and expert knowledge about Puerto Rican parrots. Thus,insights and implications for the recovery program of theparrot are discussed in conjunction with results. In ourscenarios, decisions favored releasing individuals in popula-tion 2 first when population sizes were low, followed bydecisions to release into population 3, and subsequently, topopulation 1. Not surprisingly, the points (population sizes)at which changes in the release policy occurred were afunction of site demographic rates. This overarchinginference is in concert with current and expected perfor-mance of extant populations. At present, the Rio AbajoForest parrot population exhibits attributes associated withsuccessful reintroductions (White et al. 2012). These includesimilar fledging success as in El Yunque, but are producedwith minimal management interventions. The breedingcohort is already made up of 10 pairs, 40% more thanrecorded at El Yunque since 1973, and its population is morethan twice that of El Yunque (40–50 individuals).Reintroductions are frequently unsuccessful (Armstrongand Seddon 2008), but when they are successful, severalfactors are common denominators (White et al. 2012).Among the most fundamental of these is selectingreintroduction sites of high quality. In the specific case ofthe Puerto Rican parrot, these are characterized by lesserprecipitation and density of avian predators, primary factorsimpinging upon vital rates (Lindsey et al. 1994; Whiteet al. 2005, 2010; Beissinger et al. 2008; Collazo et al. 2010).The Puerto Rican parrot population at El Yunque has
exhibited negative growth since 1998 (l ¼ 0.94; USFWS2009, Collazo et al. 2010). Negative growth was common toall scenarios for population 1, most notably in scenario 4(divergent rates). Accordingly, releasing parrots into apopulation under such conditions would not be favoreduntil allocations were first directed towards populationswhere the prospect of achieving population growth was moreattainable.Moreover, when the cost of conducting a release isconsidered, occasionally postponing releases to avoid thesecosts is optimal. In our scenarios, this consideration wasshown to affect population 1 markedly because the potentialfor population growth was the smallest. These findings werein concert with Chauvenet et al. (2010) who showed thatoptimal allocations of funds among subpopulations of thethreatened Sumatran tigers (Panthera tigris sumatrae) favoredsaving subpopulations with the greatest potential for growththat were more efficient to manage (higher-quality habitat).However, supplementing population 1 led to an increase inpopulation size, even under scenario 4. This raises animportant point for conservation, best illustrated by scenario4. Expected population levels dipped during the first 10 years,increasing after supplementation was initiated, but levelingoff at around 40 individuals. However, the expectedpopulation size of 40 can only be maintained if 8 parrotsare released annually and indefinitely over the infinite timehorizon. This inference is consistent with simulation resultsthat indicate that the El Yunque parrot population respondspositively to supplementation of�8–10 individuals annually,but increases in population numbers taper off and thepopulation decreases soon after supplementation is stopped
Figure 2. Decision space for allocations of a finite number of captive-rearedparrots (8/yr) among 3 hypothetical populations (pop.) of Puerto Ricanparrots under scenario 1 (base scenario). The x-axis corresponds to the size ofpopulation 2, the y-axis corresponds to the size of population 3, andpopulation 1 is fixed at 100 in both subplots. Subplot 1 (on top) indicates thenumber of birds that are released to population 2 where black represents 0and light gray represents 8 given the sizes of populations 1, 2, and 3 fromabove. Subplot 2 (on bottom) indicates releases to population 3 with thesame conditions. We obtained optimal decisions by solving the problem as aMarkov decision process.We parameterized scenario 1 using themost recentestimates of vital rates for Puerto Rican parrots reported in the literature andused in population viability analyses for population 1, and based on expertopinion for populations 2 and 3.
Collazo et al. � Supplementing Multiple Populations 1129
(Muiznieks 2003, Collazo et al. 2010). Indeed, the numbersat the El Yunque population have been in a downward trenddespite releasing 47 captive-reared parrots between 2000 and2008 (Collazo et al. 2010), and another 8 between 2009 and2010. The ecological basis for this predicament is rooted inthe demographic vulnerability of the population (Beissingeret al. 2008), exemplified by the myriad of recovery actionstargeting nearly every aspect of the species’ annual cycle(USFWS 2009).Continued recovery efforts and investment in the El
Yunque Puerto Rican parrot population has its basisin preserving the biological culture of the species
(USFWS 2009). That is, preserving the complex vocalrepertoire and subtle behavioral nuances of the relictpopulation. Otherwise, the contribution of this isolatedpopulation to an emerging metapopulation is limited toserving as a potential source of parrots for translocation tosupplement other populations (Armstrong and Seddon2008). The valuing of the biological culture has suggestedthe possibility of initiating a population elsewhere within ElYunque, where ostensibly less rainfall and fewer avianpredation events could lead to improved vital rates (e.g.,Nimitz 2005, USFWS 2009). Scenario 2 was aimed atcapturing this possibility. From a practical point of view,
Figure 3. Expected population size of 3 hypothetical populations (pop.) of Puerto Rican parrots subject to releases of captive-reared birds over a 100-year timehorizon. The top panel represents expected population size under scenario 1 (base), the second panel under scenario 2 (relocation within a reserve), the thirdpanel under scenario 3 (improved population 3), and the bottom panel under scenario 4 (divergent rates).
1130 The Journal of Wildlife Management � 77(6)
advantages of releasing within the same reserve includeshorter distances between the source and reintroductionsites, and tapping existing logistical support (e.g., aviary).More importantly, the uncertainty associated with expectedgains might be smaller as the functional relationship betweenhabitat and demographic rates would be better known. Asillustrated by scenario 2, decisions would be influenced by thedifferential gains in vital rates between releasing within thereserve and sites elsewhere (e.g., McDonald-Maddenet al. 2011). The reality is that options to substantiallychange the parrot population dynamics at El YunqueNational Forest via changes in habitat quality are limited, if
even existent. The primary factors impinging upon thepopulation vital rates—rainfall and avian predation—are notexpected to vary sufficiently across the reserve to producemarked changes in demographic rates.Insights from this work are relevant to the growing field of
reintroduction biology, mostly associated with endangeredspecies conservation (Armstrong and Seddon 2008, Routet al. 2009, Ewen et al. 2012).We focused on the influence ofthe availability of a finite number of parrots for releaseannually. Parrots would be used to reintroduce the speciesinto suitable habitat and supplement existing populations,actions aimed at minimizing the extinction probability of ametapopulation (Possingham 1996). We also explored howdecisions would be affected if a cost was associated with
Figure 4. Decision space for allocations of a finite number of captive-rearedparrots (8/yr) among 3 hypothetical populations (pop.) of Puerto Ricanparrots under scenario 2 (relocation within a reserve). The x-axis correspondsto the size of population 2, the y-axis corresponds to the size of population 3,and population 1 is fixed at 100 in both subplots. Subplot 1 (on top) indicatesthe number of birds that are released to population 2 where black represents0 and light gray represents 8 given the sizes of populations 1, 2, and 3 fromabove. Subplot 2 (on bottom) indicates releases to population 3 with thesame conditions. We obtained optimal decisions by solving the problem as aMarkov decision process. Scenario 2 represents hypothesized gains inrecruitment if population 1 occurred in slightly more suitable habitat,simulating a reintroduction within El YunqueNational Forest where rainfalland avian predation pressure would be less than in the currently occupiedarea of the reserve. Under this scenario, recruitment rates improved by 5%.
Figure 5. Decision space for allocations of a finite number of captive-rearedparrots (8/yr) among 3 hypothetical populations (pop.) of Puerto Ricanparrots under scenario 3 (improved population 3). The x-axis corresponds tothe size of population 2, the y-axis corresponds to the size of population 3,and population 1 is fixed at 100 in both subplots. Subplot 1 (on top) indicatesthe number of birds that are released to population 2 where black represents0 and light gray represents 8 given the sizes of populations 1, 2, and 3 fromabove. Subplot 2 (on bottom) indicates releases to population 3 with thesame conditions. We obtained optimal decisions by solving the problem as aMarkov decision process. Scenario 3 reflected converged (similar)recruitment rates between population 3 (newly reintroduced) and population2, reintroduced and deemed successful.
Collazo et al. � Supplementing Multiple Populations 1131
releasing parrots in the context of differing populationgrowth potential (sensu Chauvenet et al. 2010). Implicit inthe hypothesized demographic rates of our scenarios was theinfluence of habitat quality on reintroductions and supple-mentations (Armstrong and Reynolds 2012, Chauvenetet al. 2010, McCarthy et al. 2012, White et al. 2012).Uncertainty about habitat quality at new release sites is aninherent component of any reintroduction program(Possingham 1996, McDonald-Madden et al. 2011). Ac-knowledging this uncertainty is important because it couldalso influence decisions regarding alternative but comple-mentary actions to foster growth such as the age compositionof released birds. For example, an evaluation of translocation
strategies of griffon vultures (Gyps fulvus) showed thatdecisions were influenced by uncertainty with respect to thesurvival of individuals and the expected ability to learn(McCarthy et al. 2012). Finally, we adopted a growth modelthat acknowledged the potential influence of Allee effects inthe context of supplementing small or incipient populations.Allee effects might exacerbate predation rates as lowpopulation numbers reduce the effectiveness of groupdefense (Deredec and Courchamp 2007) or contribute todecreased egg fertility by means of reduced optimal matingchoices as suspected for Puerto Rican parrots in El Yunque(T. H.White, Jr., personal observation, USFWS). Althoughwe did not formally explore Allee effects in this work,Armstrong and Wittmer (2011) did so and suggested thatdecision frameworks could be used to assess costs andbenefits of alternative actions to avert these effects.Decisions throughout the Puerto Rican parrot recovery
program have been characterized by 1-time evaluations ofalternative actions. Decisions on whether or not tosupplement or reintroduce to a site were developed withthe aid of population viability analyses (Lacy et al. 1989,Collazo et al. 2000, 2010). Reintroduction sites were selectedusing the strengths–weaknesses–opportunities–threats ap-proach (SWOT; Trujillo 2005, White et al. 2010), andreleases were preceded by studies aimed at maximizing post-release survival and genetic diversity (Daniels et al. 2001,Collazo et al. 2003, Haig et al. 2004, White et al. 2005).However, the recovery program has entered a new phase, 1characterized by expanding and competing needs to maintainat least 3 populations. In this context, decisions will berecurrent and we suggest that decisions could be informedwith a passive adaptive management framework (McCarthyet al. 2012). In our example, this would be accomplished byre-estimating model parameters each year based on targetedmonitoring data obtained in the previous year (Nichols andArmstrong 2012), and the management model resolvedusing the new estimates.Classifying the success of the program can be completed in
a multitude of ways and this could be reflected in differentreward functions. For example, the 3 populations may not beequally valued by managers; this would be captured byunequal weights placed on these populations in the objectivefunction. In our scenarios, we treated all populations equallyand were only interested in the total number of individualssummed across all 3 with the constraint that all 3 had to existindefinitely. A different set of optimal actions may exist if,say, we could let 1 population go extinct, but still get amaximum number of birds. Thus, we recommend that thesensitivity of the optimal decisions to alternative rewardfunctions be explored.We have illustrated a decision framework that is germane
to the recovery program of the Puerto Rican parrot, wherecircumstances (e.g., negative growth) place a high premiumon informed decisions (Rout et al. 2010).We also consideredalternative strategies that might include translocating wildbirds from El Yunque to locations where the fundamentalobjective of the program—a self-sustaining, viable popula-tion—will more likely be attained.
Figure 6. Decision space for allocations of a finite number of captive-rearedparrots (8/yr) among 3 hypothetical populations (pop.) of Puerto Ricanparrots under scenario 4 (divergent rates). The x-axis corresponds to the sizeof population 2, the y-axis corresponds to the size of population 3, andpopulation 1 is fixed at 100 in both subplots. Subplot 1 (on top) indicates thenumber of birds that are released to population 2 where black represents 0and light gray represents 8 given the sizes of populations 1, 2, and 3 fromabove. Subplot 2 (on bottom) indicates releases to population 3 with thesame conditions. We obtained optimal decisions by solving the problem as aMarkov decision process. Scenario 4 portrays a setting where populations 2and 3 exhibit high but plausible survival and recruitment rates, whereas ratesfor population 1 represented a set of plausible values of a severely strugglingand down-spiraling population.
1132 The Journal of Wildlife Management � 77(6)
MANAGEMENT IMPLICATIONSThe results of our optimizations suggest that if thefundamental objective of a reintroduction project is to attainself-sustaining, viable populations of a species, captive-rearedbirds should be allocated first where potential for growth isgreatest. One should supplement such sub-populations untilthey are firmly established, before attempting to establishnew ones. Exceptions to this generalization could come fromother considerations (e.g., social values). Habitat quality is aparamount consideration in reintroduction and supplemen-tation strategies and one should avoid costs and risks ofreleases in less than suitable habitat by formally evaluatingcompeting sites and keying on factors germane to vital ratesand carrying capacity. Given that all managers face budgetarylimitations, they must also consider the effect of alternativecosts on the long-term population level. Finally, one shouldaccount explicitly for the inherent level of uncertainty inalternative strategies. Reintroduction programs are bestcharacterized as a process of recurrent decisions to preventextinction. Uncertainty has a non-trivial influence overdecisions such as determining the optimal group size forrelease and its age composition.We explored 2 major sourcesof uncertainty (environmental and model) in our analyses,but suggest that additional sources be incorporated.Specifically, other forms of parametric uncertainty (e.g.,sampling error) and model uncertainty (e.g., differentfunctional forms of the population growth model) would
be valuable to explore. Ultimately an adaptive managementframework could provide an opportunity to explicitlyincorporate the aforementioned considerations into thedecision process, to learn about model parameters andecological systems under management, and to, thereby,improve the basis upon which subsequent decisions aremade. Our 4 scenarios could be used as alternative models inadaptive management and a form of model uncertainty couldbe resolved by learning which scenario corresponds mostclosely to reality. In addition, alternative functional forms ofthe population dynamics could be suggested and evaluated. Amanagement plan could be envisioned wherein release effortsare only undertaken if the existing subpopulations havereached a specific size sufficient to ensure viability and thecost of undertaking releases is warranted. We provided anoptimization framework that allows exploring those com-peting objectives.
ACKNOWLEDGMENTS
We thank the United States Fish and Wildlife and PuertoRico Department of Natural and Environmental Resourcesfor supporting exploratory work on decision analysis,structured decision making, and adaptive management,and for providing access to information and data on thePuerto Rican parrot. P. L. Fackler’s contribution to thispaper was supported in part from United States Departmentof Agriculture Hatch Project NC0228. Any use of trade,
Figure 7. Exploration of alternative weights on population size relative to the cost of releasing parrots displayed as the 100-year expected population levels of 3hypothetical populations (pop.) of Puerto Rican parrots. The left y-axis corresponds to the expected population; the right y-axis corresponds to expected numberof years of releases (8 birds released per year). The value of an additional bird is measured in units of $1,000. Decisions involve the allocation of a finite number ofcaptive-reared parrots (8/yr) under scenario 1 (base scenario). We obtained optimal decisions by solving the problem as a Markov decision process. Weparameterized scenario 1 using the most recent estimates of vital rates for Puerto Rican parrots reported in the literature and used in population viability analysesfor population 1, and based on expert opinion for populations 2 and 3. Populations were initialized at 25 individuals (population 1), 45 (population 2), and 0(population 3).
Collazo et al. � Supplementing Multiple Populations 1133

product, or firms names is for descriptive purposes only anddoes not imply endorsement by the U.S. government.
LITERATURE CITEDArmstrong, D. P., and M. H. Reynolds. 2012. Modelling reintroducedpopulations: the state of the art and future directions. Pages. 165–222 in J.G. Ewen, D. P. Armstrong, K. A. Parker, and P. J. Seddon, editors.Reintroduction biology: integrating science and management. Conserva-tion Science and Practice, No. 9. Wiley-Blackwell, Oxford, UnitedKingdom.
Armstrong, D. P., and P. J. Seddon. 2008. Directions in reintroductionbiology. Trends in Ecology and Evolution 23:20–25.
Armstrong, D. P., and H. U. Wittmer. 2011. Incorporating Allee effectsinto reintroduction strategies. Ecological Research 26:687–695.
Beissinger, S. R., J. M. Wunderle, Jr., J. M. Meyers, B.-E. Sæther, and S.Engen. 2008. Anatomy of a bottleneck: diagnosing factors limitingpopulation growth in the Puerto Rican parrot. Ecological Monographs78:185–203.
Brash, A. R. 1987. The history of avian extinction and forest conservation onPuerto Rico. Biological Conservation 39:97–111.
Chauvenet, A. L. M., P. W. J. Baxter, E. McDonald-Madden, and H. P.Possingham. 2010. Optimal allocation of conservation effort amongsubpopulations of a threatened species: how important is patch quality?Ecological Applications 20:789–797.
Collazo, J. A., M. Krachey, S. J. Dinsmore, T. H. White, Jr., and I.Llerandi-Roman. 2010. Assessment of Puerto Rican parrot demography:implications for its recovery program. Final Report to the U.S. Fish andWildlife Service, Puerto Rican Parrot Field Office, Rio Grande, PuertoRico, USA.
Collazo, J. A., F. J. Vilella, T.H.White, and S. Guerrero. 2000. Survival, useof habitat, andmovement of captive-rearedHispaniolan parrots released inhistorical, occupied habitat: implications for the recovery of the PuertoRican parrot. Final Report to the U.S. Fish and Wildlife Service, RioGrande, Puerto Rico. North Carolina Cooperative Fish and WildlifeResearch Unit, Raleigh, North Carolina, USA.
Collazo, J. A., T. H. White, F. J. Vilella, and S. Guerrero. 2003. Survival ofcaptive-reared Hispaniolan parrots released in Parque Nacional del Este,Dominican Republic. Condor 105:198–207.
Daniels, S., S. M. Haig, and J. A. Collazo. 2001. Preliminary pedigreeanalyses for the Puerto Rican parrot. Report to the U.S. Fish andWildlifeService, Atlanta, Georgia, USA.
Deredec, A., and F. Courchamp. 2007. Importance of the Allee effect forreintroductions. Ecoscience 4:440–451.
Engeman, R. M., S. A. Shwiff, F. Cano, and B. Constantin. 2003. Aneconomic assessment of the potential for predator management to benefitPuerto Rican parrots. Ecological Economics 46:283–292.
Ewen, J. G., D. P. Armstrong, K. A. Parker, and P. J. Seddon. 2012.Reintroduction biology: integrating science and management. Conserva-tion Science and Practice, No. 9. Wiley-Blackwell, Oxford, UnitedKingdom.
Fackler, P. L. 2011. MDPSolve User’s Guide. <https://sites.google.com/site/mdpsolve/>. Accessed 18 Feb 2013.
Haig, S. M., J. Collazo, H. Draheim, and S. Daniels. 2004. Populationstructure and pedigree definition in captive and wild Puerto Rican parrots(Amazona vittata). Conservation genetics. Report to USFWS-RioGrandeField, Office and the Puerto Rico Department of Natural andEnvironmental Resources, San Juan, Puerto Rico, USA.
Lacy, R. C., M. Borbat, and J. P. Pollack. 2009. Vortex: a stochasticsimulation of the extinction process. Version 9.95. Chicago ZoologicalSociety, Brookfield, Illinois, USA.
Lacy, R. C., N. R. Flesness, and U. S. Seal. 1989. Puerto Rican parrotpopulation viability analysis. U.S. Fish and Wildlife Service CooperativeAgreement 14-16-0004-89-927. Captive Breeding Specialist Group,Apple Valley, Minnesota, USA.
Lindsey, G. D., W. J. Arendt, and J. Kalina. 1994. Survival and causes ofmortality in juvenile Puerto Rican parrots. Journal Field Ornithology65:76–82.
McCarthy, M. A., D. P. Armstrong, and M. C. Runge. 2012. Adaptivemanagement of reintroduction. Pages 256–289 in J. G. Ewen, D. P.Armstrong, K. A. Parker, and P. J. Seddon, editors. Reintroduction
biology: integrating science and management. Conservation Science andPractice, No. 9. Wiley-Blackwell, Oxford, United Kingdom.
McDonald-Madden, E., M. C. Runge, H. P. Possingham, and T. G.Martin. 2011. Optimal timing for managed relocation of species facedwith climate change. Nature Climate Change (Letters) 1:261–265.
Muiznieks, B. D. 2003. Population viability analysis of the Puerto Ricanparrot: an evaluation of its current status and prognosis for recovery.Thesis, North Carolina State University, Raleigh, USA.
Nichols, J. D., and D. P. Armstrong. 2012. Monitoring for reintroductions.Pages 223–255 in J. G. Ewen, D. P. Armstrong, K. A. Parker, and P. J.Seddon, editors. Reintroduction biology: integrating science andmanagement. Conservation Science and Practice, No. 9.Wiley-Blackwell,Oxford, United Kingdom.
Nimitz, W. F. 2005. Habitat use and activity patterns of red-tailed hawks inoccupied and historic Puerto Rican parrot habitat. Thesis, MississippiState University, Starkville, USA.
Office of Management and Budget [OMB]. 1993. Guidelines and discountrates for benefit-cost analysis of federal programs, circular A-4. Office ofManagement and Budget, Washington, D.C., USA.
Office of Management and Budget [OMB]. 2011. Circular A-94 AppendixC. Office of Management and Budget, Washington, D.C., USA.
Possingham, H. P. 1996. Decision theory and biodiversity management:how to manage a metapopulation. Pages 391–398 in R. B. Floyd, A. W.Sheppard, and P. J. De Barro, editors. Frontiers in population ecology.CSIRO Publishing, Melbourne, Australia.
Puterman, M. L. 2005. Markov decision processes: discrete dynamicstochastic programming. John Wiley and Sons, Hoboken, New Jersey,USA.
Regan, H. M., M. Colyvan, and M. A. Burgman. 2002. A taxonomy andtreatment of uncertainty for ecology and conservation biology. EcologicalApplications 12:618–628.
Rodrıguez-Vidal, J. A. 1959. Puerto Rican parrot study. Puerto RicanAgricultural Commission, Monograph Number, 1, Rio Piedras, PuertoRico.
Rout, T. M., C. E. Hauser, and H. P. Possingham. 2009. Optimal adaptivemanagement for the translocation of the threatened species. EcologicalApplications 19:515–526.
Rout, T. M., D. Heinze, and M. A. McCarthy. 2010. Optimal allocation ofconservation resources to species that may be extinct. ConservationBiology 24:1111–1118.
Snyder, N. F. R., J. W. Wiley, and C. B. Kepler. 1987. The parrots ofLuquillo. Western Foundation of Vertebrate Zoology, Los Angeles,California, USA.
Trujillo, A. M. 2005. Evaluation of the suitability of the karst region ofnorth-central Puerto Rico for the reintroduction of Puerto Rican parrot(Amazona vittata). Thesis, University of Puerto Rico, Mayaguez Campus,Puerto Rico, USA.
U.S. Fish and Wildlife Service. 2009. Recovery plan for the Puerto Ricanparrot (Amazona vittata). U.S. Fish and Wildlife Service, Atlanta,Georgia, USA.
Wang, G., X.-G. Liang, and F.-Z. Wang. 1999. The competitive dynamicsof populations subject to an Allee effect. Ecological Modelling 124:183–192.
White, T. H. Jr., N. J. Collar, R. J. Moorhouse, V. Sanz, E. D. Stolen, andD. J. Brightsmith. 2012. Psittacine reintroductions: common denomi-nators of success. Biological Conservation 148:106–115.
White, T. H. Jr., J. A. Collazo, and F. J. Vilella. 2005. Survival of captive-reared Puerto Rican parrots released in the Caribbean National Forest.Condor 107:426–434.
White, T. H. Jr., I. C. Llerandi-Roman, and O. Monsegur. 2010. PuertoRican Parrot Recovery Program: third population reintroduction siteevaluation. Final report. U.S. Fish and Wildlife Service, Rio Grande,Puerto Rico, USA.
Associate Editor: Sarah Converse.
SUPPORTING INFORMATION
Additional supporting information may be found in theonline version of this article of the publisher’s web-site.
1134 The Journal of Wildlife Management � 77(6)