optical characterization of component ... - core
TRANSCRIPT
OPTICAL CHARACTERIZATION OF COMPONENT WEAR AND NEAR-FIELD PLASMA OF THE HERMES THRUSTER
George J. Williams, Jr.
Ohio Aerospace Institute, NASA GRC, Cleveland, OH 44135
Hani Kamhawi
NASA Glenn Research Center, Cleveland, OH 44135
ABSTRACT
Optical emission spectral (OES) data are presented which correlate trends in sputtered species and the near-field plasma with the Hall-Effect Rocket with Magnetic Shielding (HERMeS) thruster operating condition. The relative density of singly-ionized xenon (Xe II) is estimated using a collisional-radiative model. OES data were collected at three radial and several axial locations downstream of the thruster’s exit plane. These data were deconvolved to show the sturcture fo the near–field plasma as a function of thruster operating condition. The magnetic field is shown to have a much greater affect on plasma structure than the discharge voltage with the primary ionization/acceleration zone boundary being similar for all nominal operating voltages at constant power. OES measurement of sputtered boron shows that the HERMeS thruster is magnetically shielded across its operating envelope. Preliminary assessment of carbon sputtered from the keeper face suggest it increases significantly with operating voltage, but the uncertainty associated with these measurements is very high.
NOMENCLATURE
c = speed of light, 2.998108 m/s d = distance between lenses, m E = energy, eV e- = an electron F = Thrust, N f = focal length, m
h = Planck’s constant, 6.62610-34 Js
I() = Intensity of a transition with
wavelength, JD = Discharge, current, A
ke = Boltzmann’s constant, 1.3811023 J/K
𝑘𝑖𝑜𝑛𝑞 = excitation rate due to collisions with
ions of charge q, m3 s-1
M = ion mass, kg m = mass flow rate, kg/s
me = electron mass, 9.10910-31 kg
N0 = sputtered particle number density, m-3
NB = normalized signal strength for the boron transition
Ne = electron number density, m-3
q = ion charge S = amplification factor
T()= optical transmission function Te = electron temperature, eV VD = discharge voltage, V Xei = xenon ion of charge i
= ratio of first ion number density to electron number density
= wavelength, m
= frequency, s-1
INTRODUCTION
NASA’s Space Technology Mission Directorate (STMD) is sponsoring the development, maturation, and evaluation of the key technologies needed to reduce the cost and expand the capability of future space exploration activities. One of the projects under STMD is the Solar Electric Propulsion (SEP) project. The SEP project’s major development activities are the
https://ntrs.nasa.gov/search.jsp?R=20150023086 2019-08-31T05:00:03+00:00ZCORE Metadata, citation and similar papers at core.ac.uk
Provided by NASA Technical Reports Server
development of large deployable solar array structures and the high-power EP system (Hall thruster and power processing unit technologies) that can meet NASA’s near term science and exploration needs but are also extensible to NASA’s future Human exploration needs. The NASA Glenn Research Center (GRC) is partnering with the Jet Propulsion Laboratory (JPL) to carry out the Hall thruster development work. The SEP TDM, initially announced in 2011, is aimed at demonstrating new cutting edge technology in flexible solar arrays and electric propulsion that will increase the maturity of these key SEP technologies for future commercial and government uses. Once these technologies have been demonstrated, they are expected to enable higher performance Low Earth Orbit (LEO) to Geosynchronous Earth Orbit (GEO) transfers as well as a number of other near-Earth orbit transfers and station-keeping maneuvers. These technologies may also benefit a potential robotic mission to redirect an asteroid into cis-lunar orbit for crew exploration. In longer terms, these technologies will reduce mission costs for NASA interplanetary robotic missions in general, and will serve as a precursor to higher power systems for human interplanetary exploration.
Erosion of the boron-nitride (BN) insulators in the discharge channel has been the
primary service life limiter of Hall-effect thrusters (HETs) and, in addition to limits on the available in-space power, has precluded its use as primary propulsino on most NASA missions. Magnetic shielding has been explored in recent years as a breakthrough approach to mitigate this erosion,1 resulting in laboratory demonstration of the expected reduction of the erosion rates in 6-kW and 20-kW Hall thrusters.2,3 Knowledge gained from applying magnetic shielding circuit design approach in these two Hall thrusters is leveraged in the design and construction of the 12.5-kW Hall thruster.4 The effort has generated the Hall-Effect Rocket with Magnetic Shielding (HERMeS) thruster which is intended to provide the primary propulsion for NASA’s Asteroid Redirect Mission (ARM).5,6
Optical emission spectroscopy (OES) has been used successfully to correlate the erosion
of HET boron nitride with thruster operating csteondition.7,8 However, recent advances in thruster design have significantly mitigated this erosion requiring the OES techniques to become significantly more sensitive and adaptable to be of value. Now, in addition to the BN surfaces, other components including the (carbon) cathode keeper are of interest in assessing service life. Better optics and more sensitive detectors have been incorporated to provide a real-time capability to assess HET wear as a function of operating condition and time of operation. OES data are presented which correlate trends in sputtered species with thruster operating condition. Near-field plume OES data are used to localize the regions of primary ionization. This region is identified by changes in electron temperature as well as significant changes is ion density.
THEORETICAL BACKGROUND
In order to correlate the observed spectra to physical characteristics of the plasma or the generation of high-energy ions, it is necessary to relate the changes in the strengths of particular transitions to changes in the species or in plasma as a whole. A simple collisional-radiative model allows correlation of the xenon spectra to plasma parameters.
XENON MODEL
A simple collisional radiative model has been exercised to correlate the xenon spectra to plasma properties. It assumes all excitation occurs through collisions and all emission is governed by natural relaxation. Because there are several metastable states within the xenon spectra, a corona model cannot be applied reasonably without very high electron temperatures (Te > 40).9
A model which includes all of these relations is considered to be a partial collisional-radiative model (CRM) since it includes both modes of population and depopulation of excited states. Unfortunately, CRMs require knowledge of the rate coefficients associated with these transitions over a large number of possible transitions. In general for xenon these are not known.
Recent studies have experimentally determined the rate coefficients associated with Xe I and Xe II for a few transitions in the near infrared and in the visible spectrum. In particular, Chiu9 has
developed effective excitation cross-sections (e and ion) which experimentally convolve the possible transitions enabling a much simpler set of equations:
ke = ∫ 2E√2
π(kTe)3me
∞
0exp (
E
kTe) σe(E)dE (1)
and
kionq
≈ σe(eV)√2qE
M (2)
where E in Eqn 1 is the energy of the electron undergoing collision and V in Eqn 2 is the discharge voltage and M is the mass of a xenon atom. Equation 1 is numerically integrated given
a table of or function for e(E).10 Assuming quasineutrality, the intensity of a particular transition is
then
I() =hc
4πN0Ne (∑
𝑁𝑝
𝑁0𝑝 ke,p + αkion
1 +1−α
2kion2 ) (3)
For Xe I, which can be used for calculation of Te, Eqn. 3 can be simplified to10
I𝑋𝑒 𝐼() =hc
4πN0Ne (ke + αkion
1 +1−α
2kion2 ) (4)
where is the ratio of single ion density to electron number density. While it is imperative to include the heavy particle collision excitation terms in the high-density, low-Te region of interest, there is negligible sensitivity to α since the excitation of the Xe I levels is similar regardless of the heavy particle collision. In some respects this is unfortunate since it precludes estimating α via Te parameterization. The ratio of two lines is
I1
I2=
(ke+αkion1 +
1−α
2kion2 )
1
(ke+αkion1 +
1−α
√2kion2 )
2
(5)
Equation 5 can be used to either calculate Te or to estimate I1 given I2. The latter is of value if the rate coefficients are of different species in that, in principle, it could predict relative populations of the different states.
OES yields path-integrated measurements through the plume. Several OES measurements taken together can, however, be deconvolved to yield spatially resolved measurements. One common technique which has been applied to the deconvolution of optical measurements in HETs is called “onion peeling”, a very discreet form of Abel inversion.11 Assuming azimuthal symmetry, the thruster plume can be divided into concentric annuli. This is illustrated schematically in Fig. 1. The path-integrated number densities associated with the emission spectra are then related to the densities in each annulus by
𝐾𝑖𝑗𝑁𝑗(𝑟) = (∫𝑁(𝑟)𝑑𝑥)𝑖 (6)
Where the elements of the matrix K are the path lengths of the beam at position pj within each ring at radius ri and are given by
𝐾𝑖𝑗 =
{
0, 𝑖 < 𝑗
2√𝑟𝑖2 − 𝑝𝑗
2, 𝑖 = 𝑗
2√𝑟𝑖2 − 𝑝𝑗
2 − 2√𝑟𝑖−12 − 𝑝𝑗
2, 𝑖 > 𝑗
(7)
BORON NITRIDE SPUTTERING
Since the B ground state transition at 250 nm is populated almost exclusively by electron impact and depopulated by spontaneous emission, a corona model is justified. However, the excitation cross-section is unknown. Pagnon demonstrated that one can approximate the cross-section using actinometry to normalize the B OES signals.12 Actinometry uses the emission of one species (which is well-characterized) to correct the emission of another and is limited to applications with corona equilibrium and where the species have similar cross-sections, thresholds, and shapes as a function of electron energy.13
Following Pagnon,12 the upper state 5p1D0 (7/2) of the Xe II (484 nm) is populated principally by radiative decay from two ionic metastable states 5d1D (7/2) and 5d1F (7/2). Therefore, the electrons that excite the 484 nm line (via the metastable states) have similar energy to those that excite the 250 nm boron line. The excitation of the two states should vary similarly with changes in the discharge. However, being an ion transition, the degree of ionization must also be accounted for. Pagnon does this by including the strength of the Xe I (828 nm) transition. In this investigation, the Xe I (407 nm) transition is used instead as its upper state is closer to ionization potential. All means of excitation including ion-atom collisions are included in this way—there is no need to separate them into specific rate coefficients.
The resulting expression for the amount of sputtered material, NB, is
NB ∝IB,250 nm∙IXe I,407 nm
IXe II 484 nm (8)
If NB at a particular operating condition can be tied to an insulator erosion rate, then Eqn 5 can be used to predict the erosion at other operating conditions.
Before the intensities of the lines were included in Eqn 8 or any other comparative analysis, the raw signals were corrected for systematic perturbations or errors. These include offsets in the spectrometer baseline, transmission losses, and amplification through spectrometer sensitivity settings or data logging software. Equation 6 summarizes the correction of each raw signal:
Icor = (
Iraw−Ioffset
S)T() , (9)
where T() is a self-normalized transmission function unique to each probe and S is an amplification correction factor unique to each wavelength. As no “raw” data are presented, the superscript “raw” is dropped throughout this paper. “Uncorrected” data are those which have not undergone the normalization of Eqn 9.
EXPERIMENTAL CONFIGURATION
The HERMeS thruster was operated in Vacuum Facility 5 (VF5) at NASA GRC. VF 5
utilized cryogenic surfaces to maintain a pressure near the thruster less than 310-5 Torr (corrected for Xe) during full power operation of the thruster. The operation leveraged a laboratory propellant feed system and power console, an inverted pendulum thruster stand, a data acquisition system, and several physical probes for plume interrogation. Detailed discussion of the testing of the thruster is available in a companion paper by Kamhawi.14
Optical probes were constructed using 1.25 cm diameter UV-silica lenses and flat windows, optical tubes, and SMA fiber optic connections. Lenses which matched the acceptance
angle of the 400 m diameter UV-VIS fiber optic cables and protective windows were incorporated in all of the probes. For those probes focused on the BN surface, a second lens with a 30 cm or 50 cm focal length was incorporated in a threaded section which allowed adjustment of the focal point. Single-fiber, metal jacketed fiber optic cables coupled the probes to vacuum feed thrus and the feed thrus to a fiber optic multiplexer located external to the vacuum chamber. The probes were mounted near the thruster outside of a 45-degree exclusion zone.
Five probes were used to interrogate the thruster and the near-field plume. All of the probes were mounted on a 50-mm travel linear translation stage. Four probes were used to interrogate the plume of the thruster. These were collimated to cylindrical volumes 2 mm in diameter. As the stage translated downstream of the exit plane, the point of interrogation of this fifth probe moved across the face of the thruster. However, its primary region of interrogation was the chamfered lip of the inner boron-nitride insulator. Figure 2 shows a photograph of the probes to the lower left of the HERMeS thruster in VF-5.
The probes were calibrated before, during, and after each test. Standard Xe and W lamps were placed at the same distance as the location of measurement in the thruster for each probe and spectral data were recorded using the entirety of the probe-fiber-feed thru system before and after each series of testing. This measured the transmission function of the different probe assemblies which was used in the reduction of the data. Minor variations were noted which were likely the result of sputter deposition on the protective windows. The deposition tended to preferentially reduce the signal strength below a wavelength of 350 nm. However, the degradation was negligible. Calibrations were performed during a test sequence by recording spectra at repeated thruster operating conditions. No significant changes in line intensities were noted, and the slight degradation of the UV signal was recorded and used in the normalization of the data.
RESULTS AND DISCUSSION
TRENDS IN PLASMA DENSITY
Plasma density was estimated using the method outlined in Karabadzhak (via Eqn 3) associated with the 541 nm Xe II transition.10 This technique only yields relative measurements; therefore, the values are normalized. To facilitate comparison of the trends in the plume, the relative densities are normalized by the maximum value observed which was at the center of the channel, at the exit plane, during 300 V, 9.4 kW operation. Correction (adjustment) due to the presence of electrons from multiply charged ions was incorporated assuming a doubles to singles density ratio of 0.25. This value is consistent with previous measurements.15
Overall uncertainty in the Xe II density values are on the order of 50%, with larger uncertainties in the inner zone values given their dependence on the removal of the other zones. The uncertainties result from variations in OES line intensities, estimation of α, divergence of the collection volumes, and approximations made in implementing Eqn. 3. No error bars are given in the figures because of the normalization. The systematic errors should be reduced in the normalize comparison, though small differences between values in a trend or between trends should be considered to lie within the uncertainty.
Figure 3 shows the variation in Xe II density as a function of position downstream of the HERMeS exit plane for 300 V, 9.4 W thruster operation. Note that the outer and middle zones have nearly identical trends and that the inner zone is weaker, but otherwise similar. All show a significant decrease between 10 and 20 mm downstream suggesting that the acceleration region lay between these values. This is about 30% more downstream than the estimate based on previously-measured electron temperature distributions for the NASA-300M (unshielded) operating at 300 V, 10 kW.16 Qualitative assessment following probe measurements of the NASA-300MS (magnetically shielded) indicated that the acceleration zone had moved downstream at similar operating conditions.17 The OES data support this conclusion.
Figure 4 shows the same trends for operation at 400 V, 12.5 kW. Note that the peak Xe II density is not the same as that in Fig. 3 even though the current densities are. The lower OES-based densities may result from the assumption of constant α for these two conditions. The overall structure of the plume appears to be very similar with the acceleration zone lying in nearly the same location. The OES technique cannot distinguish between primary and charge-exchange (CEX) ions. The lower-density tails in all of these plots may be dominated by CEX ions
which would explain their similar densities despite the primary ions having very different velocities.
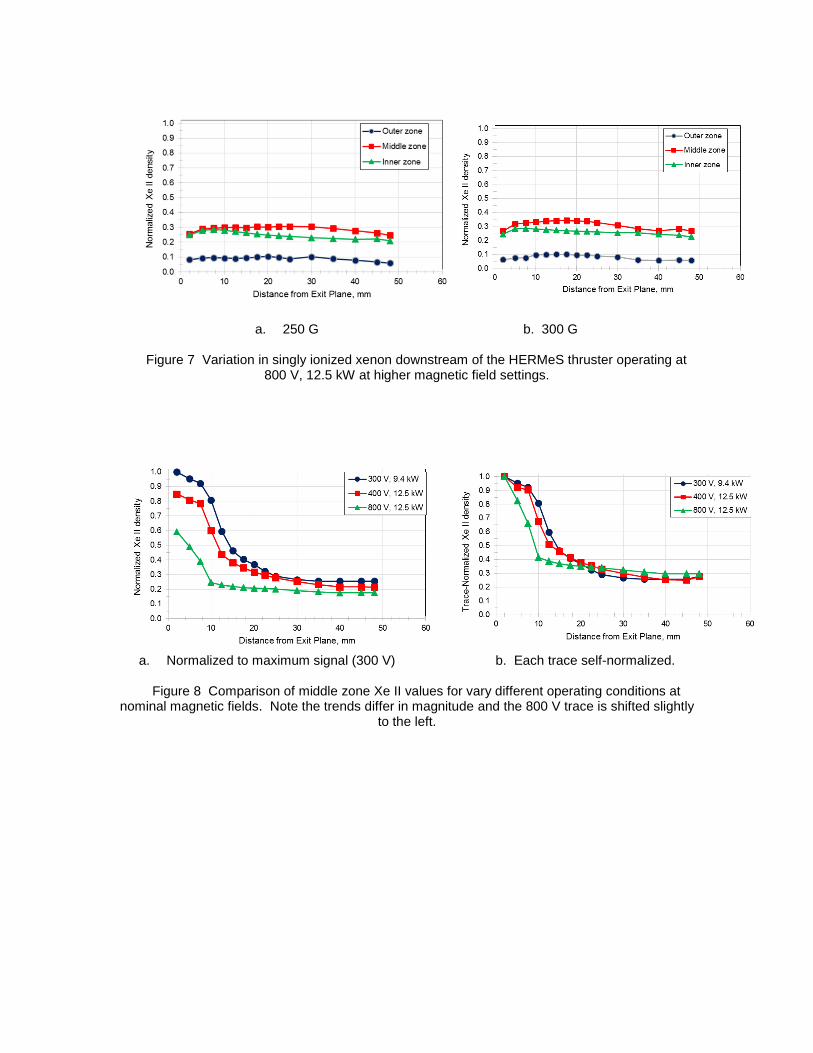
Figure 5 illustrates the effect of operating at a higher magnetic field setting and discharge voltage. The lower signal corresponds to the lower current associated with 600 V, 12.5 kW operation. Note that only the middle zone has a different trend; extending to roughly 15 mm before decreasing rapidly. This trend was not seen when the magnetic field was adjusted (optimized) for the operating condition. In that case, all three zones trended like those in Fig. 4 (and Fig. 6), though at the lower magnitudes consistent with Fig. 5.
Trends for operation at 800 V, 12.5 kW are shown in Fig. 6 for a peak magnetic field of 150 G. The trends in the inner and outer Xe-II density curves now lay on top of each other suggesting that the plasma is denser in the center of the channel, unlike that for 300 and 400 V operation which show higher densities along the outer wall than along the inner. This is consistent with slightly higher outer wall temperatures observed in these operating conditions. Figures 5 and 6 suggest that as the discharge voltage is increased, the beam is more confined to the center of the channel. Qualitatively, there is an observable change in plasma structure at the higher voltages.
Figures 7a and 7b show the trends associated with operation at much higher magnetic field settings, 250 and 300 G, respectively. These trends are significantly different than those observed at the lower magnetic fields and suggest that either both the ionization and acceleration zones have receded into the thruster channel or the ionization region has broadened significantly, i.e. beyond the region of interrogation. Slight variations in the magnitudes fall within the uncertainty of the measurements, though both trends in the middle zone are higher than the downstream values seen in Fig. 6. Trends in the inner and outer zones are similar to the downstream values and this supports the hypothesis that the ionization and acceleration zones have moved upstream.
Electron temperatures on the order of 70 eV (at least above the viable range of Eqn 3) are expected in the ionization range for an 800 V discharge. Te estimated in the plumes of the 150 G 800 V case (shown in Fig. 6) are over 40 eV (beyond estimation threshold) at 2 and 5 mm downstream and then transition to 4±2 eV at 45 mm. For the higher B-field operating conditions shown in Fig. 7, Te is near the threshold of estimation where there is at least a factor of two uncertainty in value. This suggests that the extended, low-density region shown in Fig. 7 is a region of ionization which has been greatly extended. The extension of the ionization region is more consistent with expectations.
The middle-annulus zone values for nominal operation at 300 V, 9.4 kW, 400 V, 12.5 kW, and 800 V, 12.5 kW are shown in Fig. 8a. Note that the trends are similar except for magnitudes. Figure 8b shows the same trends with each trace normalized to itself. Note there is a slight shift upstream for the 800 V case. This suggests that the ionization/acceleration zone is shifting upstream or contracting. This is somewhat unexpected as previous investigations have shown that it extends downstream (and upstream) with voltage.15 It’s possible that the physical probes used in previous measurements “extended” the plasma through intrusion into it, but it is also possible that better resolution is needed in the OES technique. In particular, more than three annular zones would yield much better deconvolution and therefore much better resolution of the plasma structure. As it is, weaker plasma structures will be removed through averaging. Figure 8b also shows very similar Xe II densities downstream despite the lower current and higher velocities of the 800 V case.
THRUSTER EROSION
Figure 9 shows the normalized boron signal, NB, measured at the downstream edge of the inner chamfer for various thruster operating conditions. Uncertainty in the absolute values associated with NB are large, perhaps a factor of 2 or more because the OES signal strengths lay close to the signal to noise limit. For comparison, two NB values obtained at similar operating conditions with the unshielded NASA 300M HET and at a similar location are also shown.
Uncertainty in the relative, normalized values are small, perhaps only 20% of the normalized value. Note that the latter are nearly two orders of magnitude higher than those observed in this investigation. This suggests that at this location, the boron erosion is negligible. Also shown in Fig. 9 are NB data obtained during testing of the magnetically shielded NASA 300MS HET. These data are similar in magnitude to those of the HERMeS data and suggest similar shielding. Note that the 300 G operating point at 800 V, 12.5 kW is the lowest of all of the values. This is consistent with either option regarding the ionization and acceleration zone if the thruster remains shielded (which, given the low BN signal it does).
Similar negligible NB signals were observed across the inner BN insulator for all nominal operating conditions. Table 1 shows values obtained at three locations on the inner insulator for four nominal thruster operating conditions. Since previous data have indicated that the inner channel has higher sputtering than the outer for similar powers,8 it is very likely that the sputtering of the outer BN insulator was also negligible. Preliminary post-test inspections have confirmed this. Spurious signals were detected during significant deviations from nominal conditions such as operation at very low magnetic field strengths. These data suggest that the HERMeS thruster is very well shielded.
Figure 10 shows the variation in OES signal strengths associated with neutral and singly ionized carbon atoms averaged across the radius of the keeper. There is no established correction for these transitions similar to that of Eqn 6. Instead, the data represent peak heights at these locations corrected for background and normalized to their peak values. This forces coincidence at the 800 V, 300 G point, but the coincidence at the 300 V, 9.4 kW point is not an artifact of the data reduction. There is a significant increase in both carbon signals at the higher voltages. If Te near the cathode is trending with Te in the plume, then the data are very misleading and the trends are dominated by the excitation rates and not the local densities. However, if as expected, the Te are only slightly higher near the cathode, then the data suggest that most of the keeper erosion occurs at higher discharge voltage.
SUMMARY AND CONCLUSION
The use of fiber optic probes to characterize the wear and operation of HERMeS thrusters has been demonstrated. Trends in the singly-ionized xenon spectra were converted to a basic approximation of Xe II number density. Use of an onion-peeling technique yielded rough spatial resolution of the near-field plume. In particular, the technique captured changes in the plasma structure associated with changes in the peak magnetic field strength and with discharge voltage.
Correlation of the Xe II OES data with far field plume measurements remains to be completed. Preliminary calculations of electron temperature yielded values that are consistent with expectations for ionization and near-field plume regions. Complete correlation should yield a very comprehensive characterization of the near-field plasma without intrusion of physical probes.
Insulator erosion trends characterized by the normalized boron neutral atom spectral emission at 250 nm were obtained. The NB values were negligible across the inner channel for all nominal operating conditions. They were observed to slightly decrease at higher than nominal magnetic field settings. This suggests that the thruster is magnetically shielded for all operating conditions across its throttling range.
Carbon OES near the cathode keeper show the erosion of the keeper is likely more of a concern at high discharge voltages. However, more data and a correction methodology for these OES transitions are required in order to truly correlate the OES signals to amount of sputtered material.
REFERENCES
1 I. G. Mikellides, I. Katz, R. R. Hofer et al., “Magnetic shielding of a laboratory Hall thruster. I. Theory and validation,” Journal of Applied Physics, vol. 115, no. 4, Jan 28, 2014. 2 Kamhawi, H., et al., “Performance and Thermal Characterization of the NASA-300MS 20 kW Hall Effect Thruster,” Proceedings of the 33rd International Electric Propulsion Conference, IEPC-2013-444, Washington, D.C., October 6-10, 2013. 3 R. R. Hofer, D. M. Goebel, I. G. Mikellides et al., “Magnetic shielding of a laboratory Hall thruster. II. Experiments,” Journal of Applied Physics, vol. 115, no. 4, Jan 28, 2014. 4 Kamhawi, H., et al., “Overview of the Development of the Solar Electric Propulsion Technology Demonstration Mission 12.5-kW Hall Thruster,” 50th AIAA Joint Propulsion Conference, AIAA Paper 2014-3898, July, 2014. 5 Hofer, R. R., et al., “Development Risks and Design of the 12.5 kW HERMeS Hall Thruster for the Solar Electric Propulsion Technology Demonstration Mission,” 62nd JANNAF Propulsion Meeting, June, 2015. 6 Brophy, J., “Near-Earth Asteroid Retrieval Mission (ARM) Study,” 33rd International Electric Propulsion Conference, IEPC Paper 2013-082, October, 2013. 7 Williams, G. J., Soulas, G. C., and Kamhawi, H., “Optical Diagnostic Characterization of High-Power Hall Thruster Wear and Operation, 37th AIAA Joint Propulsion Conference, AIAA Paper 2012-4036, July, 2012. 8 Williams, G. J., and Kamhawi, H., “Optical Emission Characterization of High-Power Hall Thruster Wear,” 60th JANNAF Propulsion Joint Subcommittee Meeting, May, 2013. 9 Chiu, Y. H., et al., “Passive Optical Diagnostic of Xe Propelled Hall Thrusters, Part 1: Emission Cross Sections, Journal of Applied Physics 99 113304 (2006). 10 Karabadzhak, G. F., Chiu, Y., and Dressler, R. A., “Passive Optical Diagnostic of Xe Propelled Hall Thrusters, Part 2: Collisional-radiative model,” Journal of Applied Physics 99 113305 (2006). 11 Lee, B. C., et al., “Real-Time Boron Nitride Erosion Measurements of the HiVHAc Thruster via Cavity Rign-Down Spectroscopy,” ,” 33rd International Electric Propulsion Conference, IEPC Paper 2013-119, October, 2013. 12 Pagnon, D., Touzeau, M., and Lasgorceix, P., “Control of the Ceramic Erosion by Optical Emission Spectroscopy: Parametric Studies of SPT 100-ML,” AIAA Paper 2004-3773, July 2004. 13 Selwyn, G. S., Optical Diagnostic Techniques for Plasma Processing, American Vacuum Society, New York, 1993, pp47-50. 14 Kamhawi, H., et al., “The Voltage-Current Characteristics of the 12.5 kW Hall Effect Rocket with Magnetic Shielding at Different Background Pressure Conditions,” 62nd JANNAF Propulsion Meeting, June, 2015. 15 Huang, W., et al., “Ion Current Density Study of the NASA-300M and NASA-457M v2 Hall Thrusters," 48th AIAA/ASME/SAE/ASEE Joint Propulsion Conference, AIAA Paper 2012-1111, July, 2012.

16 Herman, D., A., et al., “Plasma Potential and Langmuir Probe Measurements in the Near-field Plume of the NASA 300M Hall Thruster,” 48th Joint Propulsion Conference, AIAA Paper 2012-4115, July, 2012. 17 Shastry, R., et al. “Langmuir Probe Measurements Within the Discharge Channel of the 20-kW NASA-300M and NASA-300MS Hall Thrusters,” NASA/TM-2013-216611, 33rd International Electric Propulsion Conference, IEPC Paper 2013-122, October, 2013.
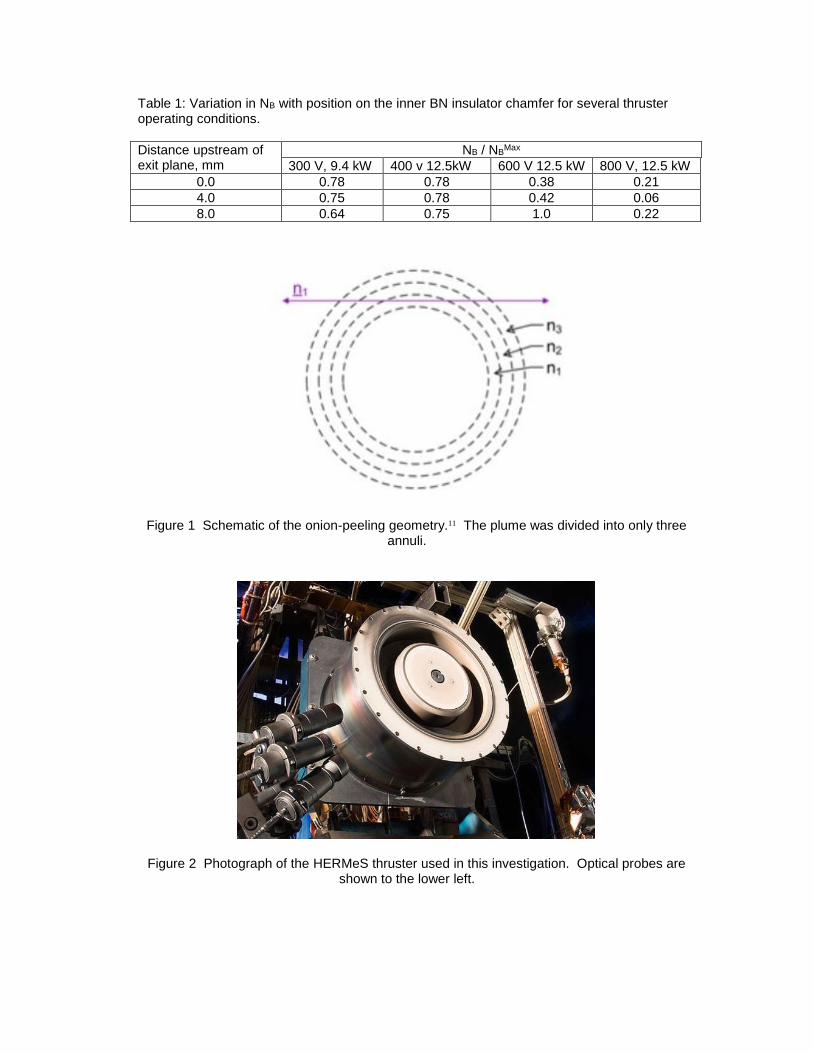
Table 1: Variation in NB with position on the inner BN insulator chamfer for several thruster operating conditions.
Distance upstream of exit plane, mm
NB / NBMax
300 V, 9.4 kW 400 v 12.5kW 600 V 12.5 kW 800 V, 12.5 kW
0.0 0.78 0.78 0.38 0.21
4.0 0.75 0.78 0.42 0.06
8.0 0.64 0.75 1.0 0.22
Figure 1 Schematic of the onion-peeling geometry.11 The plume was divided into only three annuli.
Figure 2 Photograph of the HERMeS thruster used in this investigation. Optical probes are shown to the lower left.
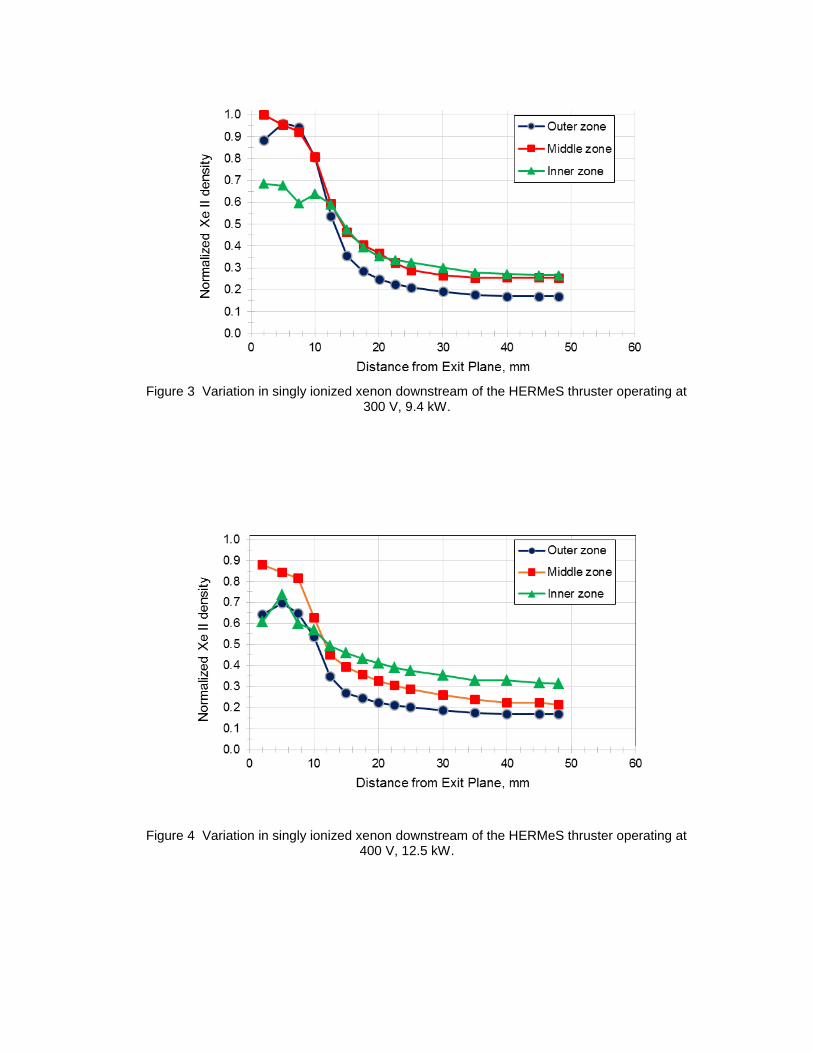
Figure 3 Variation in singly ionized xenon downstream of the HERMeS thruster operating at
300 V, 9.4 kW.
Figure 4 Variation in singly ionized xenon downstream of the HERMeS thruster operating at 400 V, 12.5 kW.
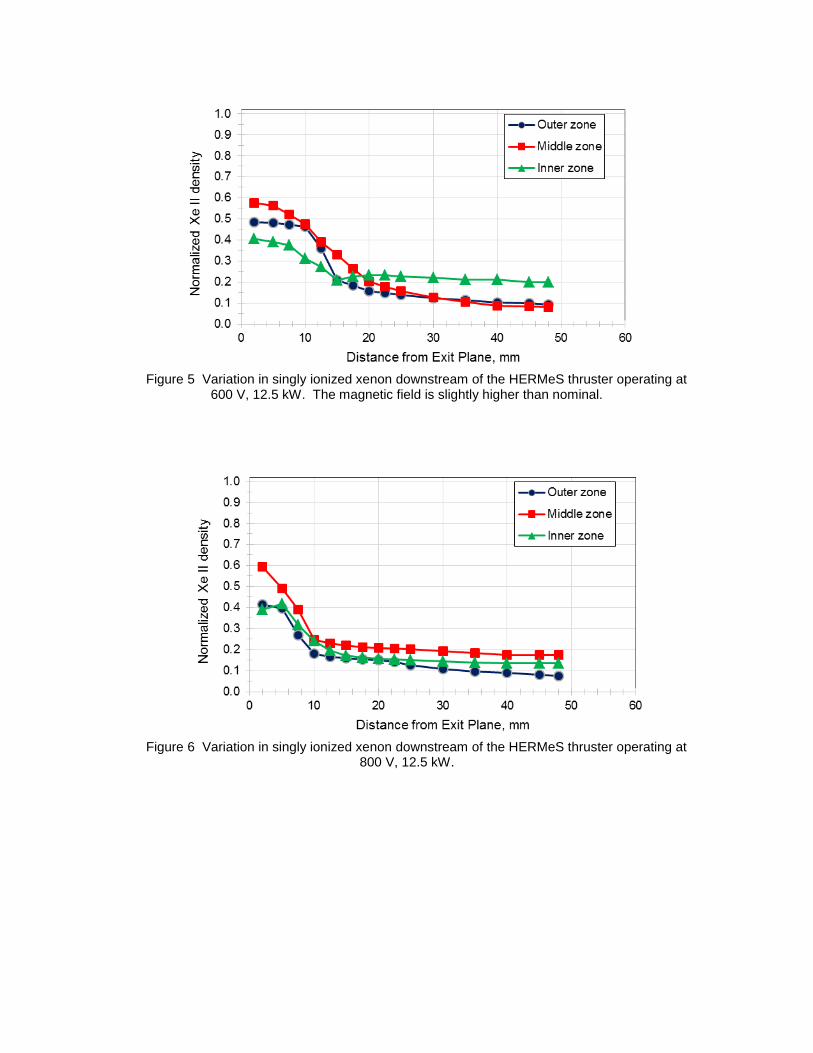
Figure 5 Variation in singly ionized xenon downstream of the HERMeS thruster operating at
600 V, 12.5 kW. The magnetic field is slightly higher than nominal.
Figure 6 Variation in singly ionized xenon downstream of the HERMeS thruster operating at
800 V, 12.5 kW.
a. 250 G b. 300 G
Figure 7 Variation in singly ionized xenon downstream of the HERMeS thruster operating at
800 V, 12.5 kW at higher magnetic field settings.
a. Normalized to maximum signal (300 V) b. Each trace self-normalized.
Figure 8 Comparison of middle zone Xe II values for vary different operating conditions at nominal magnetic fields. Note the trends differ in magnitude and the 800 V trace is shifted slightly
to the left.
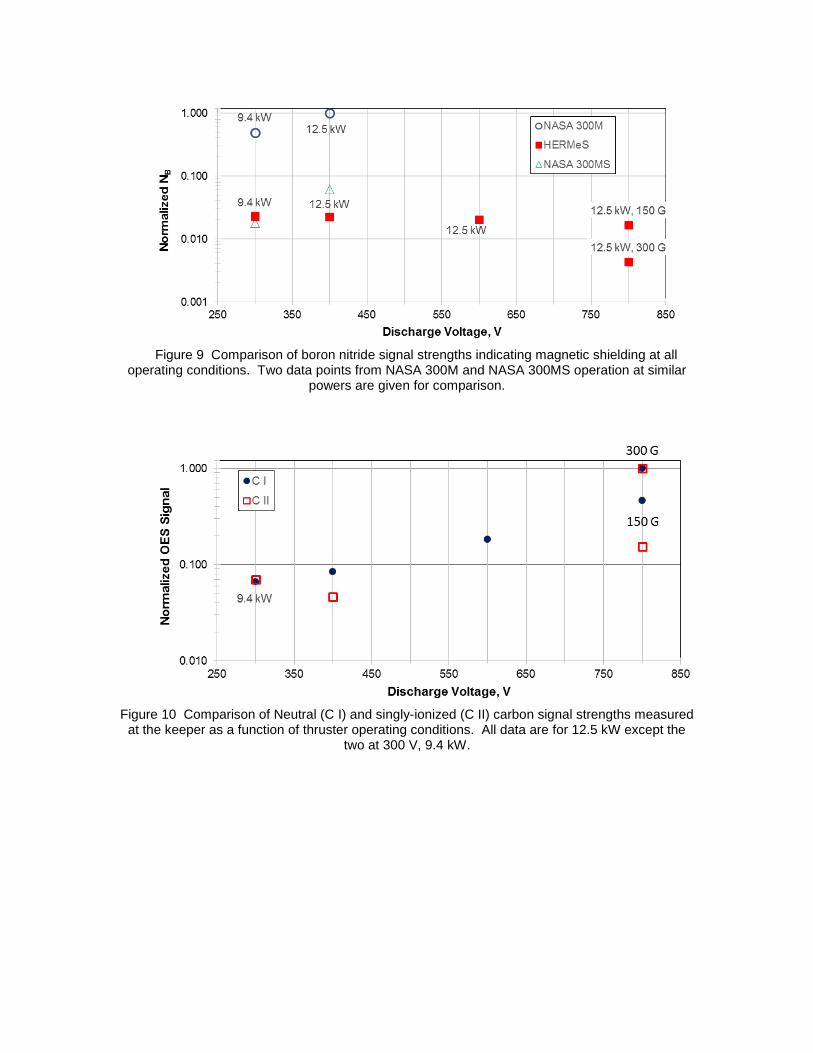
Figure 9 Comparison of boron nitride signal strengths indicating magnetic shielding at all
operating conditions. Two data points from NASA 300M and NASA 300MS operation at similar powers are given for comparison.
Figure 10 Comparison of Neutral (C I) and singly-ionized (C II) carbon signal strengths measured
at the keeper as a function of thruster operating conditions. All data are for 12.5 kW except the two at 300 V, 9.4 kW.