opportunities and barriers for fintech in saarc and asean
TRANSCRIPT
�����������������
Citation: Imam, Tasadduq,
Angelique McInnes, Sisira
Colombage, and Robert Grose. 2022.
Opportunities and Barriers for
FinTech in SAARC and ASEAN
Countries. Journal of Risk and
Financial Management 15: 77.
https://doi.org/10.3390/
jrfm15020077
Academic Editor: Thanasis Stengos
Received: 25 October 2021
Accepted: 20 January 2022
Published: 13 February 2022
Publisher’s Note: MDPI stays neutral
with regard to jurisdictional claims in
published maps and institutional affil-
iations.
Copyright: © 2022 by the authors.
Licensee MDPI, Basel, Switzerland.
This article is an open access article
distributed under the terms and
conditions of the Creative Commons
Attribution (CC BY) license (https://
creativecommons.org/licenses/by/
4.0/).
Journal of
Risk and FinancialManagement
Article
Opportunities and Barriers for FinTech in SAARC andASEAN CountriesTasadduq Imam 1 , Angelique McInnes 2 , Sisira Colombage 3,* and Robert Grose 1
1 School of Business & Law, CQUniversity (Melbourne Campus), Melbourne, VIC 3000, Australia;[email protected] (T.I.); [email protected] (R.G.)
2 School of Business & Law, CQUniversity (Brisbane Campus), Brisbane, QLD 4000, Australia;[email protected]
3 Federation Business School, Federation University, Berwick, VIC 3806, Australia* Correspondence: [email protected]
Abstract: This article assesses the opportunities and challenges for different categories of FinTechsin the SAARC and ASEAN regions. We consider the global financial inclusion data released by theWorld Bank and map the responses to gain insights into the opportunities and challenges for FinTechsin the respective regions. We develop a new index, termed the FinTech Opportunity Index (FOI), toconceptualise the opportunities and barriers based on individual savings, borrowings, purchasingbehaviour, and payment preferences. We note that FinTech services have potential opportunities forexpansion in the ASEAN regions but less so in the SAARC regions. The need for different types ofFinTech services varies between regions. Services such as crowdfunding, neobanks, and InsurTechhave potential in the ASEAN regions, especially with the positive attitude towards entrepreneurshipand asset investments. In the SAARC regions, InsurTechs linked to health care has potential alongwith LendTechs and neobanks. We further note that males, and the young are more likely adopters ofFinTechs in both regions. The analysis suggests the need for innovative promotions and education tomotivate the more sceptical, especially women and the elderly population, to adopt FinTech services.
Keywords: FinTech; SAARC; ASEAN; technology adoption
1. Introduction
FinTechs (financial technologies) have expanded the financial services digital ecosys-tem across countries, particularly during the COVID-19 crisis (Abdillah 2020; Rahman et al.2018). However, FinTech adoption in different developing countries has been slow, despitethem having different opportunities for growth and expansion of the digital economy, as isvital for future economic sustainable growth (Iman 2018; Zhang et al. 2020).
In this research, we consider two regions with similar economic, political, and socialstructures—the SAARC (South Asian Association for Regional Cooperation) region andthe ASEAN (Association of South East Asian Nations) region (Rahman et al. 2018). TheSouth Asian Association of Regional Cooperation (SAARC) region, currently compriseseight countries (India, Pakistan, Bangladesh, Sri Lanka, Nepal, Bhutan and the Maldives,and Afghanistan) and came into effect in 1985 with a view to encourage socio-culturaldevelopment and interregional cooperation and collaborations (South Asian Associationfor Regional Cooperation 2020). The total population of SAARC countries approximatesthe total population of China, South Korea, and Japan (Dey et al. 2019). Although mostSAARC countries have a strong historical connection with the late British/Indian Empire,South East Asian countries have a high diversity in ethnicity, religion, and language(Dey et al. 2019) and have a median age of 27 (Prasad and Aravindakshan 2021). Thepolitical and social systems of these countries have incorporated “the English language,standard English spelling, Westminster-style Parliamentary democracy, the common lawlegal system, driving on the left, etc.” (Dey et al. 2019, p. 1020). The region hosts a culture
J. Risk Financial Manag. 2022, 15, 77. https://doi.org/10.3390/jrfm15020077 https://www.mdpi.com/journal/jrfm
J. Risk Financial Manag. 2022, 15, 77 2 of 37
that is strongly familial and collectivist in ethos and practices, and exists under an economiccontext that is highly reliant on banking systems, and where digital services are evolving(Dey et al. 2019; Pandey et al. 2019; Prasad and Aravindakshan 2021). The Association ofSouth East Asian Nations (ASEAN), represents 10 countries (Brunei, Cambodia, Indonesia,Lao PDR (or Laos), Malaysia, Myanmar, Philippines, Singapore, Thailand, and Vietnam),and was established in 1967 (Association of South East Asian Nations 2020). The region isthe seventh largest economy in the world with a combined GDP of $US2.5 trillion, and isexpected to be the fourth largest economy by 2030 (Aujirapongpan et al. 2020). The regionhosts an economic context that encourages digitisation (Avirutha 2021) and has a focuson developing communities respecting equity, freedom, and a collective spirit (Ullah andMing Yit Ho 2021).
In 2016 ASEAN and SAARC countries comprised 8.8% and 23.75% respectively ofthe world’s population and contributed a combined 5.81% to the world’s GDP (Rahmanet al. 2018). Economic conditions in ASEAN and SAARC countries are quite distinct,with GDP per capita in ASEAN countries considerably higher than SAARC countries(Akhter 2019), and income convergence among member countries being more evident inthe ASEAN regions than in the SAARC regions (Zia and Mahmood 2019). Comparedto OECD (Organization for Economic Cooperation and Development) countries, whichgenerally have a larger aging population, the SAARC and ASEAN regions have a largeryounger population (Rahman et al. 2018). Their contributions to the world economy cannotbe ignored.
Thus, it is interesting to explore the extent that FinTech services, including those offeredby traditional banks, can develop in these regions, and potentially contribute towardsreducing the financial inclusion gap. Today, smartphone devices and their applicationshave become an integral part of people’s daily lives, particularly in the SAARC and ASEANregions, where the underlying context and social media have led to the high growthof smartphone adoptions (Babu 2016; Dey et al. 2019; Prasad and Aravindakshan 2021;Widyastuti 2017). Different categories of FinTechs have the opportunity to benefit theseregions, especially by making financial services accessible to rural and remote populationswhere banking services are not available (GSMA 2019; Gupta and Xia 2018; Jain and Gabor2020; Mohammad 2020; Patil et al. 2018; Schatt 2014). Indeed, in SAARC countries, giventhe deficiencies in financial infrastructure, the opportunities of expanding mobile bankingservices has expanded to those who cannot access traditional banking facilities (Lenka andBarik 2018). In the ASEAN regions, digital financial services also hold potential to stimulateeconomic growth, banking and financial stability (Banna and Alam 2021). Furthermore,FinTech services are not all the same. Different FinTech services bring different benefits toa user, and the available services will not necessarily appeal to everyone in each of theseregions. Thus, an insight into the potential of different FinTech services in the area could beof interest to FinTech providers, especially from a business development and expansionperspective. To the best of our knowledge, such an exploration that comprehensively coversthe SAARC and ASEAN regions is missing. There is, furthermore, a lack of literature thatcompares FinTech opportunities and barriers in the SAARC and ASEAN regions. Thisresearch article fills these gaps.
In this respect, it is worth referring to the Global Findex Database (GFD), whichperiodically stores different financial inclusion information, such as mobile phone andinternet usage for financial transactions. While there are academic articles (Demirguc-Kuntet al. 2018; GSMA 2019; OECD 2020) that incorporate the GFD to help explore the financialinclusion gaps and determinants across regions, there is a deficiency in the literatureexploring the dataset from the perspective of FinTech opportunities and barriers, especiallywith regards to the potential use of mobile financial services and the financial inclusionbarriers in the surveyed countries. There are articles that have reviewed the mobile paymentliterature (Dahlberg et al. 2008, 2015) and the factors that influence their acceptance (Schierzet al. 2010) and assumed risks (Yang et al. 2015). Other articles have examined the wayFinTech adoption can influence consumers’ use of credits (Carlin et al. 2017), examine
J. Risk Financial Manag. 2022, 15, 77 3 of 37
the perceived risks and benefits that influence FinTech adoptions at different stages (Ryu2018), and examine the determinants influencing FinTech usage (Singh et al. 2020). Manyexisting articles have principally focused on specific regions with small-sized samples, anddrawn conclusions on Fintech adoption based on theoretical models such as the technologyacceptance model (TAM) (Davis 1993; Davis et al. 1989). To the best of our knowledge,however, there is no research that focuses on individuals’ buying, savings, and borrowingbehaviour, and use of financial services as captured by the GFD. Nor does any researchmaps this behaviour and usage to conceptualise the opportunities and barriers for FinTechservices. This article bridges this gap.
The following research questions (RQs) are addressed:
• What are the opportunities and barriers for different FinTech services in the SAARCand ASEAN regions?
• Is there any notable difference between the SAARC and ASEAN regions concerningdigital financial services adoption and potential developments?
In addressing these RQs, we make the following contributions:
• The GFD has typically been assessed to conceptualise banking and financial inclusiongaps, and opportunities for digital payment services (Demirguc-Kunt et al. 2018). Wego beyond this practice and conceptualise the GFD information to assess opportunitiesand barriers to FinTech developments across countries for payment services and otherdifferent categories of FinTech services.
• We compare the relative opportunities and barriers of FinTechs across the SAARC andASEAN regions. To the best of our knowledge, this is pioneering work.
• We propose a new index, named the FinTech Opportunity Index (FOI), to conceptualisethe opportunities and barriers across the SAARC and ASEAN regions, based onindividuals’ savings, borrowing, purchasing behaviour, and payment preferences. Itis anticipated that this new index will guide further research in this space.
• We explore the association between the demographic attributes of the two regionsand opportunities for FinTech development—another area where the literature hasremained largely silent.
Overall, we make an academic contribution that can guide further similar researchacross locations. Simultaneously, we make a practical contribution. The outcomes of thisresearch will be particularly useful to FinTech providers and economic policy makers,especially in the current context, where social distancing and public health protection havebecome the new norm, leading to an increasing acceptance of digital systems for shopping,payments, and financial services.
2. Literature Review
Although providing financial services via technology is not a new concept, attentiontowards FinTechs from a broad group of stakeholders has been quite recent (Arner et al.2016), Thus, research in this space is still at a very early stage and is gradually evolving.So, too, is the development and expansion of FinTechs in both developed and developingcountries (Arner et al. 2016; Patil et al. 2018). To clarify the position of the article, thisliterature review will focus on the evolution and characteristics of different digital financialservices, FinTech adoptions, barriers, and opportunities for adoption in the context of theASEAN and SAARC regions.
2.1. Different Types of FinTech
FinTech is an umbrella term that covers different financial services offered as techno-logical solutions via the internet and/or via mobile apps, and its historical evolution can betraced to the early 1990s (Arner et al. 2016). There are several categories of Fintech servicesthat can enhance the financial service experience of consumers by digitising financing,investment, money, insurances, and financial advice (Chinnasamy et al. 2021; Gomber et al.2017; Pollari and Teper 2021). Some of the common FinTech services include:
J. Risk Financial Manag. 2022, 15, 77 4 of 37
• PayTech—(payment technologies) offering digital payment services;• LendTech—(lending technologies) offering streamlined accurate digital lending solutions;• Crowdfunding/equity financing—offering opportunities to raise funds through the
sale of securities online or via some incentive promises to the funders;• Neobanks—offering digital financial and banking services;• RegTech (regulatory technologies)—offering the delivery of regulatory compliance
securely and cost-effectively within a standardised, integrated, transparent ecosystem;• InsurTech (insurance technologies)—offering insurance solutions within a digital
financial ecosystem; and• Personal finance/robo-advisers/WealthTech—offering personal digital financial plan-
ning or management services using robotic technology involved in portfolio construc-tion and stock trading.
Mobile payment services (a form of PayTech) facilitate payments for purchases orbills using mobile devices such as smartphones, tablets, or other computing and mobiletechnologies (Dahlberg et al. 2008; de Luna et al. 2019). The services have expanded acrossregions, including developing countries with an increased usage of mobile devices andsupportive socioeconomic conditions and other determinants facilitating such growth (Iman2018; Kang 2018). Peer-to-peer payments, and mobile payment services have expanded tocover government payments to individuals (Iman 2018).
LendTech and crowdfunding have evolved, especially as alternatives to traditionalfinancing sources such as banks, venture capitalists, angel investors, and governmentfundings (Gomber et al. 2017). LendTech can provide borrowing solutions to consumerswith weak credit ratings or consumers who may be refused mortgage loans by traditionalcredit entities (Jagtiani et al. 2021). The use of technology has benefited credit entities byallowing assessments of extended information and prediction of default risks (Jagtiani andLemieux 2019).
Crowdfunding platforms facilitate entrepreneurial financing and business ventures,and, contrary to traditional sources, connect entrepreneurs and investors from diversegeographical locations (Agrawal et al. 2011; Mollick 2014). There are many differentcrowdfunding models (Meyskens and Bird 2015). Of these the most common is the equitycrowdfunding model, which can make entrepreneurial investment opportunities availableto inexperienced investors and where investors expect compensation from the ventures’cash inflows (Hornuf and Schwienbacher 2018; Ralcheva and Roosenboom 2016).
Neobanks provide banking functions fully online, and are gaining popularity amongmillennials and consumers expecting enhanced banking experiences (El-Gohary et al. 2021;Temelkov 2020). They often operate at a low cost, offering consumers banking services at alow fee and investors a higher return (Maiti et al. 2021).
In a context of high-volume information, changing regulations, and the need forprotection of consumers’ rights, RegTechs assist businesses with regulatory compliance,controlling risks, and reporting (Butler and O’Brien 2019). With the development ofdifferent FinTech services, RegTechs are expected to play a significant role in monitoringinformation and the prevention of financial crimes (Dubey et al. 2020).
InsurTech is another recent FinTech development, that automates data collection, helpsmanage risks, and offers digital and integrated insurance solutions (Stoeckli et al. 2018).With significant investments in the InsurTech industry, it is expected that InsurTechs willincreasingly disrupt traditional insurance providers in the aftermath of COVID-19 (Nealeet al. 2020).
Personal financial management services and WealthTech have seen a spike in growthrecently, especially with the increased digitisation of financial markets and technologicaladvancements facilitating functions such as automated trading, micro-investments at alow commission, automated asset management, and retail investments (Dziawgo 2021).WealthTechs can make available wealth management opportunities which were tradition-ally accessible only to high-worth individuals and middle-class cohorts (Arslanian 2018; Liet al. 2020).
J. Risk Financial Manag. 2022, 15, 77 5 of 37
Thus, recent developments in the information technologies space, including machinelearning, big data analytics, cloud computing, blockchain, distributed database systems,and virtualisations have paved the way to a variety of FinTechs that target financial services.
2.2. FinTechs in SAARC and ASEAN Country Context
It is informative to note the differences in the adoption and development of FinTechsin SAARC and ASEAN regions.
2.2.1. SAARC Countries
India is the leading country among the SAARC nations in adopting digital technolo-gies. The Indian government is digitising services and educating citizens under the “DigitalIndia” outreach programme. India has also introduced polices that demonetise currencynotes (Government of India, Ministry of Electronics & Information Technology n.d.; Kumarand Puttanna 2018). Currently, India is facing a difficult regulatory and operating environ-ment and a slowing of growth in the adoption of mobile money, compared to the ASEANregion (GSMA 2019). Additional challenges for FinTech development in India include thepreference towards cash transactions, fraudulent online activities, and the lack of sufficientsupport and incentives (Priya and Kanagala 2019).
Pakistan is another SAARC country where FinTech services are growing, even thoughvery few FinTech firms operate outside the major cities (Ali et al. 2021; Saleem 2021). Witha young, technology-savvy population and high smartphone usage, Pakistan has all theattributes that are conducive to FinTech adoption (Saleem 2021). However, perceptionsassociated with risk and the lack of partnerships between local firms and FinTech companiesare seen as barriers for the rapid development of FinTech services in Pakistan (Ali et al.2021; Saleem 2021).
In Bangladesh, the government has an explicit focus on digitalisation, includingsupporting FinTech initiatives (Ayoungman et al. 2021). While different FinTech services,especially mobile banking, have expanded in Bangladesh, there are FinTech categories suchas crowdfunding, cryptocurrency, and InsurTech that have a limited penetration or arenot allowed by law (Ayoungman et al. 2021). Users’ perceived risks and trust are notedas critical determinants of FinTech adoption (Hasan 2021). Issues associated with datastorage, and insufficient development of human resources remain as barriers in FinTechdevelopment (Rahman et al. 2021).
In Nepal, the growth in mobile banking is strong, especially among the young who areaware of technological developments and are willing to accept mobile banking services andthe benefits they bring (Kunwar and Thakur 2019). Indeed, several payment companieshave received approval to operate in Nepal and have been adopted by the Nepalesepopulation for bill and invoice payments (Bazarbash 2020).
FinTechs, especially peer-to-peer lending and cryptocurrency, have achieved con-siderable success in Sri Lanka, but uncertainties and risks associated with this form ofinnovation remain (Dharmadasa 2021). Additionally, regulatory barriers and the lack of acentral structure for identity verification have hindered FinTechs’ progression in Sri Lanka(Samarasinghe 2021).
Research on the prospects of mobile money in Afghanistan have noted mixed viewsconcerning acceptance (Blumenstock et al. 2015). There are further concerns about internetcosts and available infrastructure, which have the potential to hinder the adoption ofsophisticated technologies (Lukonga 2021).
Bhutan has strategies encouraging FinTech developments (FIS of Royal MonetaryAuthority of Bhutan 2020), and has recently adopted an innovative Indian FinTech paymentservice that is expected to benefit both its citizens and tourists (Vidyashree 2021).
Research on internet banking in the Maldives reflects the influence that trust, socialcontext, and performance expectations can have on its adoption (Zahir and Gharleghi 2014),and there is a view that offering Islamic FinTech services holds promise in the country(Alam and Zameni 2021).
J. Risk Financial Manag. 2022, 15, 77 6 of 37
Overall, FinTech initiatives involving SAARC countries have generally focused on mobilemoney and payment services, but there also remain opportunities for other services such ascrowdfunding, which have made limited penetration in the SAARC region (Nepali 2021).
2.2.2. ASEAN Countries
In the ASEAN region, there are concerns about low financial and digital literacy ratesin the Philippines, Indonesia, and Thailand (Banna and Alam 2021). Even so, FinTechservices have emerged in each of the countries across the ASEAN region.
Mobile phones have led to mobile payment apps in Indonesia, such as TCASH (Iman2018) and “Go-Pay” via the Gojek start-up application (Abdillah 2020, p. 265). Focusing onthe user experience of Indonesian computer science students belonging to the Millennialand Z generations, Abdillah (2020) claims that despite its efficiency and clarity, the Go-Payservice needs to develop a unique footprint. Research also points to user trust, rather thanperceived risks, as a key factor influencing FinTech adoption in Indonesia (Meyliana et al.2019). There are calls for establishing laws regulating the fast-growing FinTech servicesin Indonesia (Kharisma 2020). Research additionally points to the potential for FinTechservices to assist micro, small, and medium-sized businesses to expand and develop (Darmaet al. 2020).
Malaysia has seen the growth of Islamic FinTech organisations, including those pro-viding crowdfunding and data analytics services (Hasan et al. 2020). Research suggests thatIslamic FinTech services have the potential for further development in Malaysia, and thereare calls to establish regulations to govern the services on offer (Ab et al. 2020; Miskam et al.2019). Research also notes that Malaysian males have a greater intention to adopt FinTechservices than females (Tun-Pin et al. 2019).
Singapore is a leader in the ASEAN region with respect to hosting FinTech services,and attracting funding for relevant initiatives (Lin 2019). Singapore is regarded as “aregional financial capital” (Lin 2019) with a financial ecosystem and policies conducive toFinTech services (Tao and Azhgaliyeva 2018). A particularly unique initiative in Singaporeis a well-established regulatory sandbox that facilitates experimentation in Fintech products,while also considering public perceptions, stereotypes and protection of consumer rights(Fan 2018; Lin 2019; Ng 2018). Indeed, the impact of such a regulatory sandbox is evidentin research. A study comparing peer-to-peer lending services in Singapore and Indonesianotes that while FinTech start-ups enjoy a very supportive context in Singapore from abroad range of consumers, the development of such services in Indonesia is affected byconflicting regulations, and the user base is made up of Millennials (Yunus 2019).
FinTech is gradually developing in the Philippines, although relatively low financialliteracy and difficulties in accessing funds and expertise have acted as barriers to suchdevelopment (Schellhase and Garcia 2019). Research, however, suggests that FinTechs canact as complementary service and be beneficial to incumbent formal financial institutions(Low and Wong 2021).
FinTech payment services are expanding rapidly in Thailand and the expansion hasbeen energised by public–private entity partnerships (Moenjak et al. 2020). The countryhosts a central platform for the verification of individual identity, and this platform islikely to facilitate the further expansion of different FinTech services (Moenjak et al. 2020).Research has also explored the acceptability of artificial intelligence (AI)-based financialservices in Thailand (Noonpakdee 2020).
In Myanmar, users’ perception of credibility and compatibility appear to drive theadoption of FinTech lending services, while perceptions about costs have a negative influ-ence (Aye 2021). Myanmar has recently introduced several reforms in the financial servicessector, including those giving permission to foreign banks to operate FinTech services. Itis worth noting that a number of microfinance and nonbank financial institutions haveemerged in Myanmar in recent times (Aye 2021). An interesting aspect in Myanmar iswhat Laik and Wei (2019) refer to as the “leapfrog nature” of its society. While mobilephone penetration in the country was low just a few years ago, the penetration of mobile
J. Risk Financial Manag. 2022, 15, 77 7 of 37
and smartphones in recent years has been very significant—an indication of the growthpotential for mobile banking services in the country (Laik and Wei 2019).
There has been sound growth of FinTech organisations in Vietnam as well; however, theservices covered are limited mainly to payments and associated services, with a few firmsfacilitating robo-advice (Morgan and Trinh 2020). There are also a number of foreign ownedFinTech services in the country (Tapanainen 2020). Research suggests that there is potentialfor the development of microfinancing via FinTechs in Vietnam (Dang and Vu 2020).
FinTech services are in the very early stages of development in Lao PDR, with depositservices dominating and a few mobile add-on services facilitating card payments. (Morganand Long 2019). Inadequate access to the internet and low financial literacy are noted asthe main barriers to FinTech adoption (Morgan and Long 2019).
FinTechs, particularly payment services, are growing in Cambodia due to high smart-phone usage, especially among the Millennial generation, which seeks efficient and conve-nient financial transactions (Cheng et al. 2018). Interestingly, social influence may not beeffective in convincing the Cambodian Millennials to adopt FinTechs (Cheng et al. 2018).
Research suggests that Islamic financial institutions can assist the unbanked or under-banked people of Brunei Darussalam to adopt FinTech services (Ali et al. 2019). It is claimedthat FinTechs can assist Brunei to fulfil its development pursuits (Haqqi 2020). However,the lack of proper regulation governing FinTech services pose risks to its expansion andthere is a call for innovation in the authentication space (Haqqi 2020). Another studyexplored the potential of biometric authentication in Brunei and suggests that ease of useand trust are two notable factors that can impact innovation acceptance (Sulaiman andAlmunawar 2021).
Overall, ASEAN countries and their road to FinTech adoption have featured in theliterature at various levels. It appears that payment services have received acceptance inmost ASEAN countries. The regulatory context however differs, with some countries yetto establish any meaningful regulation while other countries already have a supportiveregulatory and policy regime in place.
2.3. Drivers and Barriers for FinTechs
The literature notes different drivers and barriers for FinTechs across countries. Aparticular driver in SAARC and ASEAN regions is the encouragement from national gov-ernments, who are attempting to foster an ecosystem of cyberspace, mobile phones andblockchain to empower individuals to gain access to technologies that enable them totransact from anywhere. For example, in Indonesia, the adoption of FinTech has beenhigh among women, the Y generation, and high-school equivalents. In India, demon-etisation policies have encouraged the acceptance of digital platforms (Abdillah 2020;Banna and Alam 2021; Demirguc-Kunt et al. 2018; Huwaydi and Persada 2018; Prasad andAravindakshan 2021).
Drivers for FinTech services can also include the perceived benefits of these services bytheir users or the potential positive implications of their use. The literature, in this regard,points to consumer benefits associated with the use of FinTech, including making financialtransactions affordable, transparent, accessible, inclusive, convenient and secure (Abdillah2020; Patil et al. 2018; Puschmann 2017; Zhang et al. 2020). There are also explorationsrelated to the benefits of FinTech for small and medium-sized enterprises (SMEs). Research,for instance, notes that FinTechs can play a positive role in enhancing exports (Ragimun andYosepha 2018). It is also argued that the low costs associated with FinTech payment servicesto consumers can boost their spending, which in turn can enhance the growth of businesses(Agarwal et al. 2020). Fintech platforms can help reduce the cost of borrowing by assistingfinancial institution to be more efficient (Mardiana and Kembauw 2021). The broaderimplications of FinTechs are also noted and can act as drivers of these services at a nationallevel. FinTech development can enhance job creation, entrepreneurship opportunities, andreduce the digital divide (Zhang et al. 2020). Under COVID-19-like situations, there is also
J. Risk Financial Manag. 2022, 15, 77 8 of 37
the added advantage of avoiding the threat to health and life, because contactless paymentsfacilitate transactions without physical contact (Srivastava et al. 2021).
Conversely, the literature also identifies various barriers to FinTech developments.The access to financial services remains a challenge in the developing economies of theworld (Demirguc-Kunt et al. 2018; Mohammad 2020). Growth in FinTech in the Asia Pacificregion is made all the more difficult (Aujirapongpan et al. 2020; Patil et al. 2018) because of:
• slower IT spending by the traditional banks; and• concerns about security, privacy, and risks.
Other FinTech adoption challenges include regulatory barriers, a less-sophisticatedpopulation, information asymmetries, and constraints placed on FinTech companies (Arneret al. 2016; Dhar and Stein 2017; Moradi et al. 2020; OECD 2020). Consumer expectationsconcerning performance, perceived benefits, usefulness, usability, and associated risks caninfluence a person’s intention to adopt FinTech services (Patil et al. 2017). Mohammad(2020) reported that social norms can have a more significant influence on the adoptionof FinTech applications than perceived technology risks. However, trust mediates therelationship between perceived risks and FinTech application adoption (Mohammad 2020).Security breaches can lead to mistrust about mobile apps and detrimentally affect theintention to use FinTech services (Kang 2018). Developing confidence in new FinTechservices takes time. The respective regulatory environment, such as government-initiatedmeasures concerning cryptocurrencies in some countries, can potentially impact the cost ofadoption and early adoptions (Luther 2016).
Overall, there are adoption opportunities and barriers for FinTechs across differentregions. Thus, it is interesting to note the extent various contextual circumstances affect thepotential of FinTech developments in the different SAARC and ASEAN countries and howthe regions compare in this regard.
2.4. Research Gaps and the Position of This Article
Despite a rich level of literature covering both SAARC and ASEAN countries, researchgaps exist. Most of the existing research has focused on a limited number of participants todraw conclusions. The GFD information (Demirguc-Kunt et al. 2018) we use in this researchuses a large number of participants across the two regions. The GFD includes multiplequestions covering various aspects of borrowing, savings behaviour, digital paymentusage, and financial inclusion. Such information can, in turn, point to opportunities todevelop FinTechs services in these two regions. To the best of the authors’ knowledge, theliterature is yet to explore the GFD from this angle and therefore this article has a verydifferent perspective to the existing literature concerning FinTech adoption in SAARC andASEAN countries.
Also, there is a limited focus on quantifying the opportunities (and barriers) faced byFinTech organisations in SAARC and ASEAN countries. Interestingly, Huong et al. (Huonget al. 2021) recently developed an index, named the “FinTech adoption index for ASEANcountries (AFAI)”, which considered various indicators such as the transaction valuesof mobile payments, crowdfunding, crowdlending, e-commerce, marketplace lending,electronic remittance, and other macrolevel information in the ASEAN region. It is note-worthy that the AFAI (Huong et al. 2021) looked only at ASEAN countries and consideredconsumers’ adoption of FinTech services at a macro-level, though did not explicitly scoreopportunities for FinTech expansion. The current article fills the above-mentioned gapby developing a new index, termed the “FinTech Opportunity Index” (FOI), to conceptu-alise the opportunities and barriers based on individual savings, borrowings, purchasingbehaviour, and payment preferences. It is a unique index that scores potential barriersto FinTech expansion opportunities in both the ASEAN and SAARC regions. In effect, itis an index that focuses on micro-level information, such as individualistic savings andborrowing behaviour, and quantifies opportunities for the expansion of FinTechs in boththe SAARC and ASEAN regions. To the best of the authors’ knowledge, an index at thislevel of sophistication has not been developed. Also, while macro-level information, as
J. Risk Financial Manag. 2022, 15, 77 9 of 37
considered in the AFAI, can provide useful information, micro-level information arguablyprovides additional insights. The current article bridges this research gap vacuum.
3. Methodology
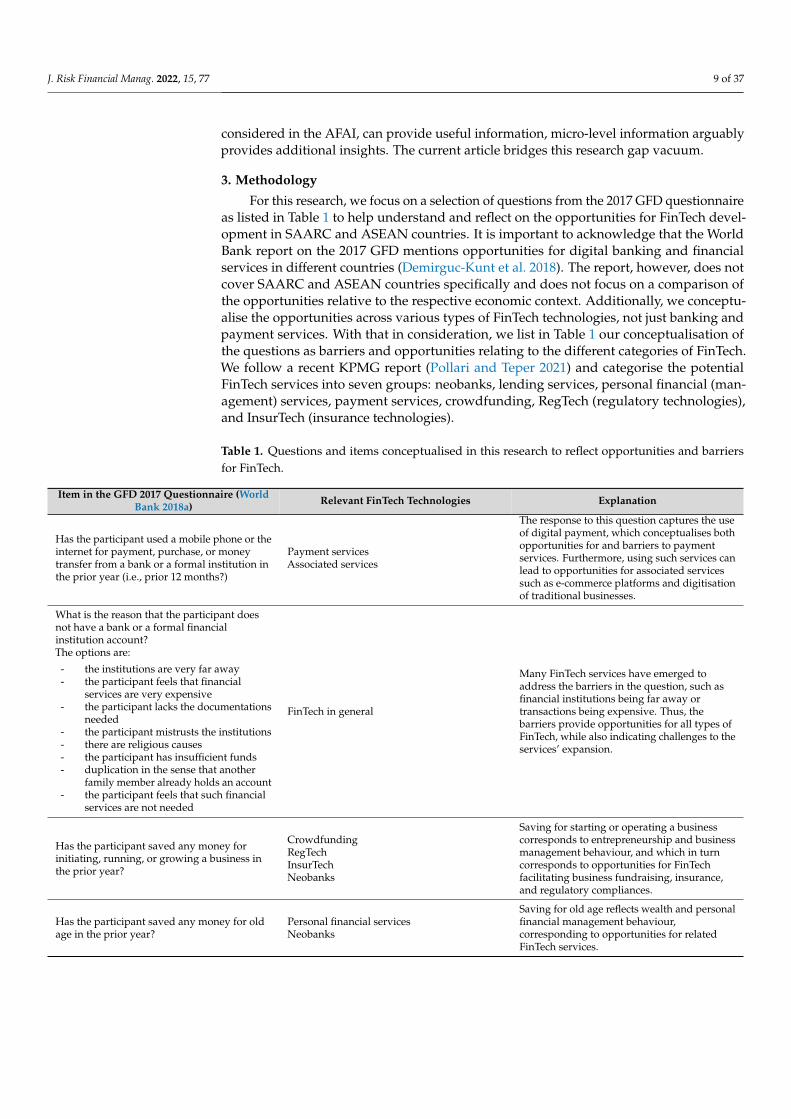
For this research, we focus on a selection of questions from the 2017 GFD questionnaireas listed in Table 1 to help understand and reflect on the opportunities for FinTech devel-opment in SAARC and ASEAN countries. It is important to acknowledge that the WorldBank report on the 2017 GFD mentions opportunities for digital banking and financialservices in different countries (Demirguc-Kunt et al. 2018). The report, however, does notcover SAARC and ASEAN countries specifically and does not focus on a comparison ofthe opportunities relative to the respective economic context. Additionally, we conceptu-alise the opportunities across various types of FinTech technologies, not just banking andpayment services. With that in consideration, we list in Table 1 our conceptualisation ofthe questions as barriers and opportunities relating to the different categories of FinTech.We follow a recent KPMG report (Pollari and Teper 2021) and categorise the potentialFinTech services into seven groups: neobanks, lending services, personal financial (man-agement) services, payment services, crowdfunding, RegTech (regulatory technologies),and InsurTech (insurance technologies).
Table 1. Questions and items conceptualised in this research to reflect opportunities and barriersfor FinTech.
Item in the GFD 2017 Questionnaire (WorldBank 2018a) Relevant FinTech Technologies Explanation
Has the participant used a mobile phone or theinternet for payment, purchase, or moneytransfer from a bank or a formal institution inthe prior year (i.e., prior 12 months?)
Payment servicesAssociated services
The response to this question captures the useof digital payment, which conceptualises bothopportunities for and barriers to paymentservices. Furthermore, using such services canlead to opportunities for associated servicessuch as e-commerce platforms and digitisationof traditional businesses.
What is the reason that the participant doesnot have a bank or a formal financialinstitution account?The options are:
- the institutions are very far away- the participant feels that financial
services are very expensive- the participant lacks the documentations
needed- the participant mistrusts the institutions- there are religious causes- the participant has insufficient funds- duplication in the sense that another
family member already holds an account- the participant feels that such financial
services are not needed
FinTech in general
Many FinTech services have emerged toaddress the barriers in the question, such asfinancial institutions being far away ortransactions being expensive. Thus, thebarriers provide opportunities for all types ofFinTech, while also indicating challenges to theservices’ expansion.
Has the participant saved any money forinitiating, running, or growing a business inthe prior year?
CrowdfundingRegTechInsurTechNeobanks
Saving for starting or operating a businesscorresponds to entrepreneurship and businessmanagement behaviour, and which in turncorresponds to opportunities for FinTechfacilitating business fundraising, insurance,and regulatory compliances.
Has the participant saved any money for oldage in the prior year?
Personal financial servicesNeobanks
Saving for old age reflects wealth and personalfinancial management behaviour,corresponding to opportunities for relatedFinTech services.
J. Risk Financial Manag. 2022, 15, 77 10 of 37
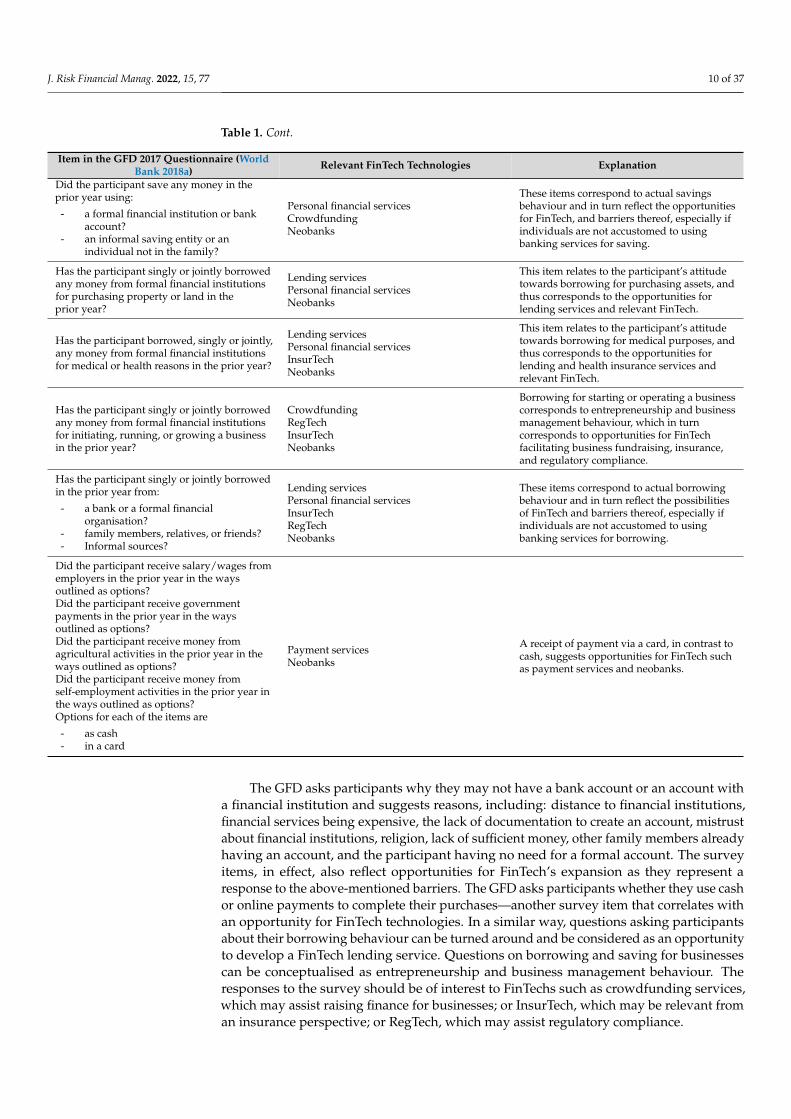
Table 1. Cont.
Item in the GFD 2017 Questionnaire (WorldBank 2018a) Relevant FinTech Technologies Explanation
Did the participant save any money in theprior year using:
- a formal financial institution or bankaccount?
- an informal saving entity or anindividual not in the family?
Personal financial servicesCrowdfundingNeobanks
These items correspond to actual savingsbehaviour and in turn reflect the opportunitiesfor FinTech, and barriers thereof, especially ifindividuals are not accustomed to usingbanking services for saving.
Has the participant singly or jointly borrowedany money from formal financial institutionsfor purchasing property or land in theprior year?
Lending servicesPersonal financial servicesNeobanks
This item relates to the participant’s attitudetowards borrowing for purchasing assets, andthus corresponds to the opportunities forlending services and relevant FinTech.
Has the participant borrowed, singly or jointly,any money from formal financial institutionsfor medical or health reasons in the prior year?
Lending servicesPersonal financial servicesInsurTechNeobanks
This item relates to the participant’s attitudetowards borrowing for medical purposes, andthus corresponds to the opportunities forlending and health insurance services andrelevant FinTech.
Has the participant singly or jointly borrowedany money from formal financial institutionsfor initiating, running, or growing a businessin the prior year?
CrowdfundingRegTechInsurTechNeobanks
Borrowing for starting or operating a businesscorresponds to entrepreneurship and businessmanagement behaviour, which in turncorresponds to opportunities for FinTechfacilitating business fundraising, insurance,and regulatory compliance.
Has the participant singly or jointly borrowedin the prior year from:
- a bank or a formal financialorganisation?
- family members, relatives, or friends?- Informal sources?
Lending servicesPersonal financial servicesInsurTechRegTechNeobanks
These items correspond to actual borrowingbehaviour and in turn reflect the possibilitiesof FinTech and barriers thereof, especially ifindividuals are not accustomed to usingbanking services for borrowing.
Did the participant receive salary/wages fromemployers in the prior year in the waysoutlined as options?Did the participant receive governmentpayments in the prior year in the waysoutlined as options?Did the participant receive money fromagricultural activities in the prior year in theways outlined as options?Did the participant receive money fromself-employment activities in the prior year inthe ways outlined as options?Options for each of the items are
- as cash- in a card
Payment servicesNeobanks
A receipt of payment via a card, in contrast tocash, suggests opportunities for FinTech suchas payment services and neobanks.
The GFD asks participants why they may not have a bank account or an account witha financial institution and suggests reasons, including: distance to financial institutions,financial services being expensive, the lack of documentation to create an account, mistrustabout financial institutions, religion, lack of sufficient money, other family members alreadyhaving an account, and the participant having no need for a formal account. The surveyitems, in effect, also reflect opportunities for FinTech’s expansion as they represent aresponse to the above-mentioned barriers. The GFD asks participants whether they use cashor online payments to complete their purchases—another survey item that correlates withan opportunity for FinTech technologies. In a similar way, questions asking participantsabout their borrowing behaviour can be turned around and be considered as an opportunityto develop a FinTech lending service. Questions on borrowing and saving for businessescan be conceptualised as entrepreneurship and business management behaviour. Theresponses to the survey should be of interest to FinTechs such as crowdfunding services,which may assist raising finance for businesses; or InsurTech, which may be relevant froman insurance perspective; or RegTech, which may assist regulatory compliance.
J. Risk Financial Manag. 2022, 15, 77 11 of 37
In a subsequent step, we analyse and compare SAARC and ASEAN countries withrespect to each of the considered questions, that in turn lead to our findings and discussionssections of the article. We use the R statistical software and relevant packages to conductall analyses.
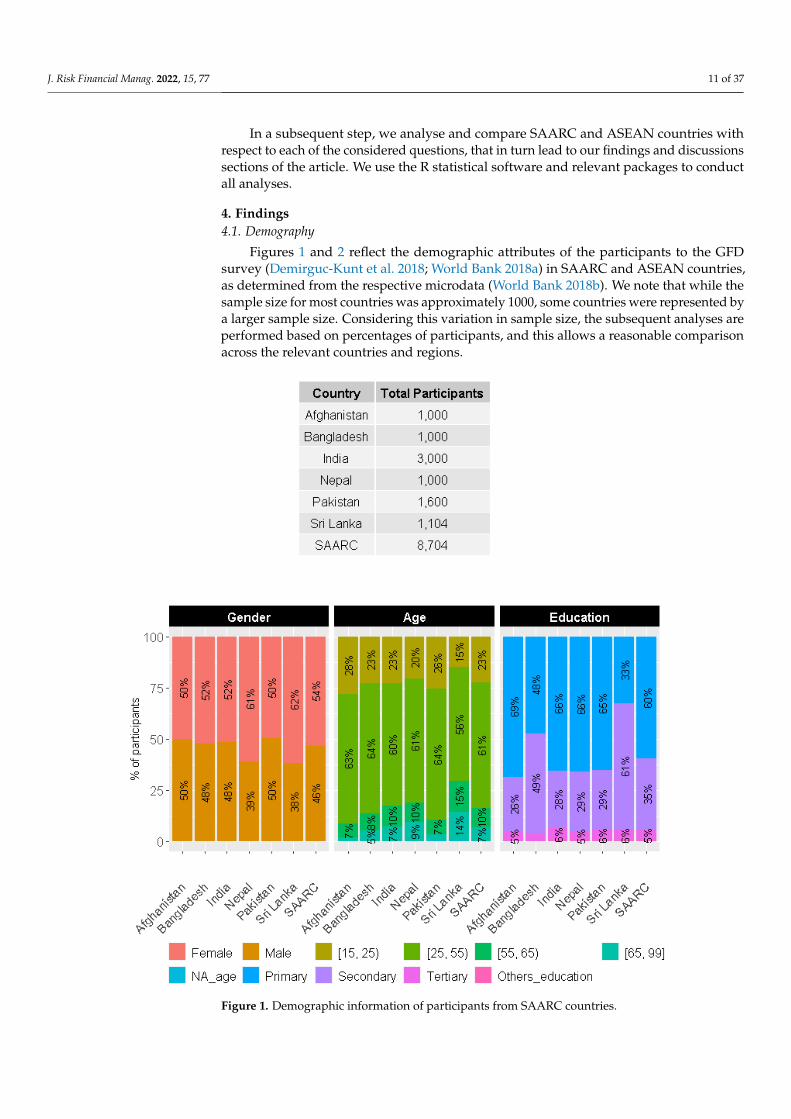
4. Findings4.1. Demography
Figures 1 and 2 reflect the demographic attributes of the participants to the GFDsurvey (Demirguc-Kunt et al. 2018; World Bank 2018a) in SAARC and ASEAN countries,as determined from the respective microdata (World Bank 2018b). We note that while thesample size for most countries was approximately 1000, some countries were represented bya larger sample size. Considering this variation in sample size, the subsequent analyses areperformed based on percentages of participants, and this allows a reasonable comparisonacross the relevant countries and regions.
J. Risk Financial Manag. 2022, 15, x FOR PEER REVIEW 12 of 40
subsequent analyses are performed based on percentages of participants, and this allows
a reasonable comparison across the relevant countries and regions.
Figure 1. Demographic information of participants from SAARC countries. Figure 1. Demographic information of participants from SAARC countries.
J. Risk Financial Manag. 2022, 15, 77 12 of 37J. Risk Financial Manag. 2022, 15, x FOR PEER REVIEW 13 of 40
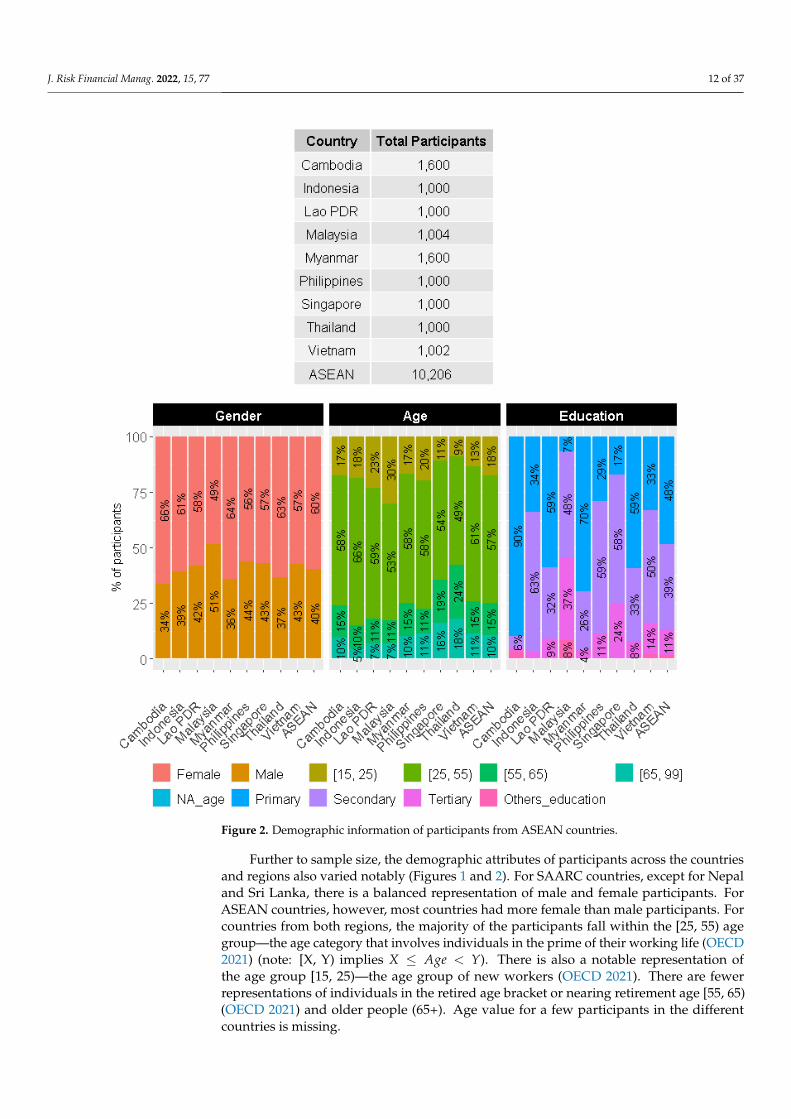
Figure 2. Demographic information of participants from ASEAN countries.
Further to sample size, the demographic attributes of participants across the
countries and regions also varied notably (Figures 1 and 2). For SAARC countries, except
for Nepal and Sri Lanka, there is a balanced representation of male and female
participants. For ASEAN countries, however, most countries had more female than male
participants. For countries from both regions, the majority of the participants fall within
the [25, 55) age group—the age category that involves individuals in the prime of their
working life (OECD 2021) (note: [X, Y) implies 𝑋 𝐴𝑔𝑒 𝑌 . There is also a notable
representation of the age group [15, 25)—the age group of new workers (OECD 2021).
There are fewer representations of individuals in the retired age bracket or nearing
retirement age [55, 65) (OECD 2021) and older people (65+). Age value for a few
participants in the different countries is missing.
Figure 2. Demographic information of participants from ASEAN countries.
Further to sample size, the demographic attributes of participants across the countriesand regions also varied notably (Figures 1 and 2). For SAARC countries, except for Nepaland Sri Lanka, there is a balanced representation of male and female participants. ForASEAN countries, however, most countries had more female than male participants. Forcountries from both regions, the majority of the participants fall within the [25, 55) agegroup—the age category that involves individuals in the prime of their working life (OECD2021) (note: [X, Y) implies X ≤ Age < Y). There is also a notable representation ofthe age group [15, 25)—the age group of new workers (OECD 2021). There are fewerrepresentations of individuals in the retired age bracket or nearing retirement age [55, 65)(OECD 2021) and older people (65+). Age value for a few participants in the differentcountries is missing.
J. Risk Financial Manag. 2022, 15, 77 13 of 37
Of particular interest is the demographic distribution with respect to education level.The survey recorded participants’ education levels across the categories of completingprimary education or less, secondary education, and tertiary education or more. A fewparticipants across countries refused to answer the education question or responded as“don’t know” or the respective information is missing—these have been grouped in thisarticle as the category “other education”. Participants with, at most a primary educationlevel, and those with a secondary education level, constitute the majority across countries.However, multiple ASEAN countries have a higher percentage of participants with asecondary education level than those with an at-most primary education level, except forBangladesh and Sri Lanka participants where an at-most primary education level exceedsthose with secondary levels in SAARC countries. Among ASEAN countries, Malaysia andSingapore have a sizeable percentage of participants with at-least tertiary education levels.
When assessed overall, the demographic patterns for the two country groups (i.e.,regions) are comparable with similar percentage representations in terms of gender, age,and education levels.
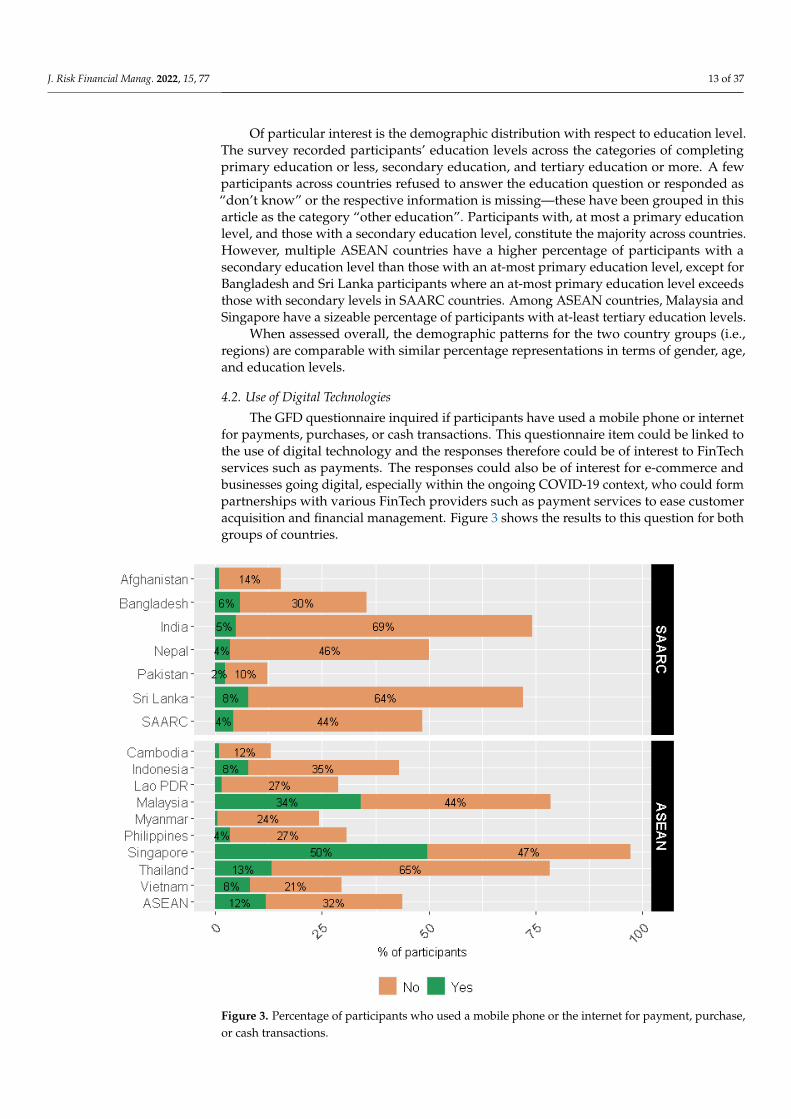
4.2. Use of Digital Technologies
The GFD questionnaire inquired if participants have used a mobile phone or internetfor payments, purchases, or cash transactions. This questionnaire item could be linked tothe use of digital technology and the responses therefore could be of interest to FinTechservices such as payments. The responses could also be of interest for e-commerce andbusinesses going digital, especially within the ongoing COVID-19 context, who could formpartnerships with various FinTech providers such as payment services to ease customeracquisition and financial management. Figure 3 shows the results to this question for bothgroups of countries.
J. Risk Financial Manag. 2022, 15, x FOR PEER REVIEW 14 of 40
Of particular interest is the demographic distribution with respect to education level.
The survey recorded participants’ education levels across the categories of completing
primary education or less, secondary education, and tertiary education or more. A few
participants across countries refused to answer the education question or responded as
“don’t know” or the respective information is missing—these have been grouped in this
article as the category “other education”. Participants with, at most a primary education
level, and those with a secondary education level, constitute the majority across countries.
However, multiple ASEAN countries have a higher percentage of participants with a
secondary education level than those with an at‐most primary education level, except for
Bangladesh and Sri Lanka participants where an at‐most primary education level exceeds
those with secondary levels in SAARC countries. Among ASEAN countries, Malaysia and
Singapore have a sizeable percentage of participants with at‐least tertiary education levels.
When assessed overall, the demographic patterns for the two country groups (i.e.,
regions) are comparable with similar percentage representations in terms of gender, age,
and education levels.
4.2. Use of Digital Technologies
The GFD questionnaire inquired if participants have used a mobile phone or internet
for payments, purchases, or cash transactions. This questionnaire item could be linked to
the use of digital technology and the responses therefore could be of interest to FinTech
services such as payments. The responses could also be of interest for e‐commerce and
businesses going digital, especially within the ongoing COVID‐19 context, who could
form partnerships with various FinTech providers such as payment services to ease
customer acquisition and financial management. Figure 3 shows the results to this
question for both groups of countries.
Figure 3. Percentage of participants who used a mobile phone or the internet for payment, purchase,
or cash transactions. Figure 3. Percentage of participants who used a mobile phone or the internet for payment, purchase,or cash transactions.
J. Risk Financial Manag. 2022, 15, 77 14 of 37
Overall, in 2017, when the GFD survey was published, participants from ASEAN coun-tries appeared to be higher users of digital technologies than those from SAARC countries.Arguably, this difference originates from the socio-economic difference and the educa-tion levels reflected by the differences in demographic patterns shown in Figures 1 and 2.Among the ASEAN countries, the main users of digital technologies were from Singaporeand Malaysia. There were also notable digital technology users from Thailand, Vietnam,Indonesia, and Bangladesh, with over 5% of participants using mobile phones, internetpayments, purchases, or cash transactions. Thus, for FinTech companies, as of 2017, thesecountries represent potential markets, especially ASEAN countries.
4.3. Barriers to Having a Bank Account
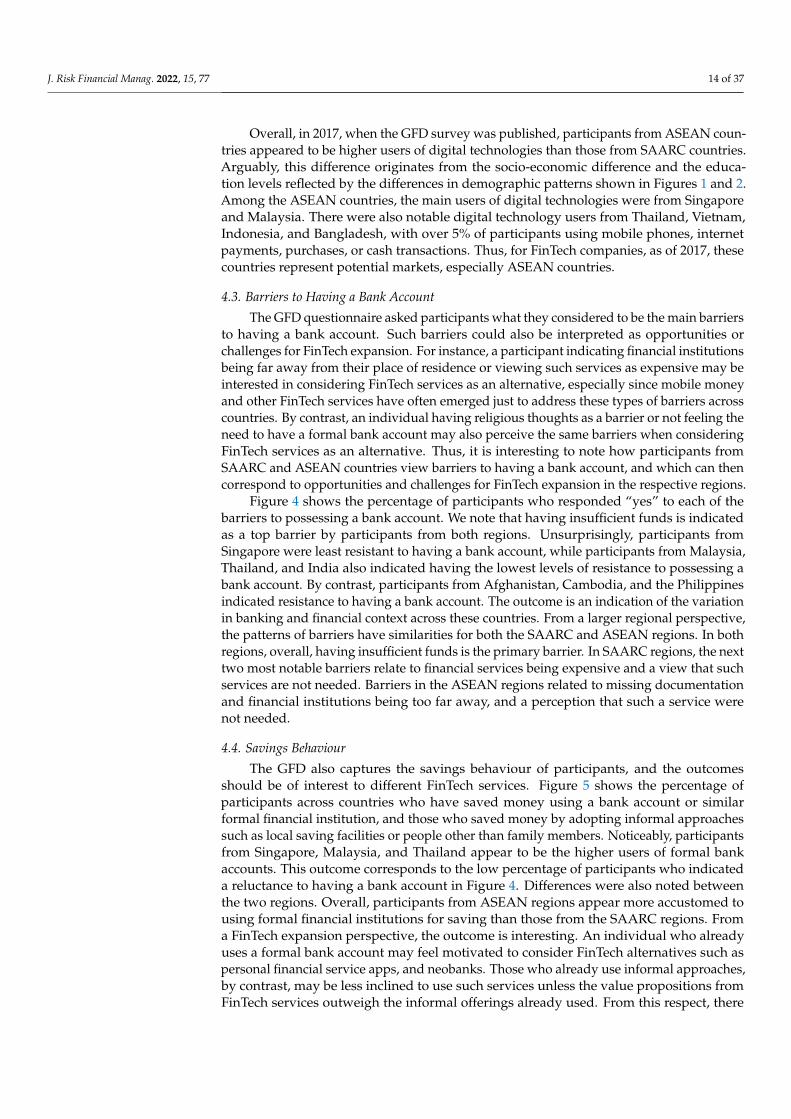
The GFD questionnaire asked participants what they considered to be the main barriersto having a bank account. Such barriers could also be interpreted as opportunities orchallenges for FinTech expansion. For instance, a participant indicating financial institutionsbeing far away from their place of residence or viewing such services as expensive may beinterested in considering FinTech services as an alternative, especially since mobile moneyand other FinTech services have often emerged just to address these types of barriers acrosscountries. By contrast, an individual having religious thoughts as a barrier or not feeling theneed to have a formal bank account may also perceive the same barriers when consideringFinTech services as an alternative. Thus, it is interesting to note how participants fromSAARC and ASEAN countries view barriers to having a bank account, and which can thencorrespond to opportunities and challenges for FinTech expansion in the respective regions.
Figure 4 shows the percentage of participants who responded “yes” to each of thebarriers to possessing a bank account. We note that having insufficient funds is indicatedas a top barrier by participants from both regions. Unsurprisingly, participants fromSingapore were least resistant to having a bank account, while participants from Malaysia,Thailand, and India also indicated having the lowest levels of resistance to possessing abank account. By contrast, participants from Afghanistan, Cambodia, and the Philippinesindicated resistance to having a bank account. The outcome is an indication of the variationin banking and financial context across these countries. From a larger regional perspective,the patterns of barriers have similarities for both the SAARC and ASEAN regions. In bothregions, overall, having insufficient funds is the primary barrier. In SAARC regions, the nexttwo most notable barriers relate to financial services being expensive and a view that suchservices are not needed. Barriers in the ASEAN regions related to missing documentationand financial institutions being too far away, and a perception that such a service werenot needed.
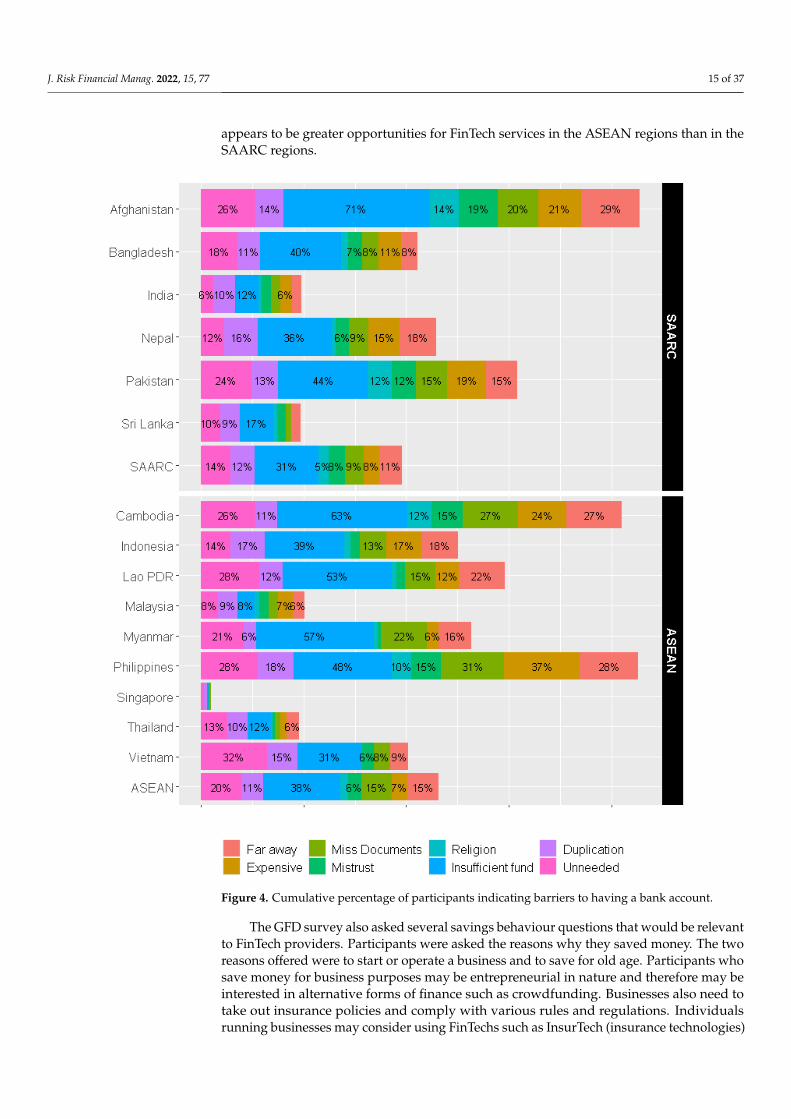
4.4. Savings Behaviour
The GFD also captures the savings behaviour of participants, and the outcomesshould be of interest to different FinTech services. Figure 5 shows the percentage ofparticipants across countries who have saved money using a bank account or similarformal financial institution, and those who saved money by adopting informal approachessuch as local saving facilities or people other than family members. Noticeably, participantsfrom Singapore, Malaysia, and Thailand appear to be the higher users of formal bankaccounts. This outcome corresponds to the low percentage of participants who indicateda reluctance to having a bank account in Figure 4. Differences were also noted betweenthe two regions. Overall, participants from ASEAN regions appear more accustomed tousing formal financial institutions for saving than those from the SAARC regions. Froma FinTech expansion perspective, the outcome is interesting. An individual who alreadyuses a formal bank account may feel motivated to consider FinTech alternatives such aspersonal financial service apps, and neobanks. Those who already use informal approaches,by contrast, may be less inclined to use such services unless the value propositions fromFinTech services outweigh the informal offerings already used. From this respect, there
J. Risk Financial Manag. 2022, 15, 77 15 of 37
appears to be greater opportunities for FinTech services in the ASEAN regions than in theSAARC regions.
J. Risk Financial Manag. 2022, 15, x FOR PEER REVIEW 16 of 40
Figure 4. Cumulative percentage of participants indicating barriers to having a bank account.
4.4. Savings Behaviour
The GFD also captures the savings behaviour of participants, and the outcomes
should be of interest to different FinTech services. Figure 5 shows the percentage of
participants across countries who have saved money using a bank account or similar
formal financial institution, and those who saved money by adopting informal
approaches such as local saving facilities or people other than family members.
Noticeably, participants from Singapore, Malaysia, and Thailand appear to be the higher
users of formal bank accounts. This outcome corresponds to the low percentage of
participants who indicated a reluctance to having a bank account in Figure 4. Differences
were also noted between the two regions. Overall, participants from ASEAN regions
Figure 4. Cumulative percentage of participants indicating barriers to having a bank account.
The GFD survey also asked several savings behaviour questions that would be relevantto FinTech providers. Participants were asked the reasons why they saved money. The tworeasons offered were to start or operate a business and to save for old age. Participants whosave money for business purposes may be entrepreneurial in nature and therefore may beinterested in alternative forms of finance such as crowdfunding. Businesses also need totake out insurance policies and comply with various rules and regulations. Individualsrunning businesses may consider using FinTechs such as InsurTech (insurance technologies)
J. Risk Financial Manag. 2022, 15, 77 16 of 37
and RegTech (regulatory technologies). Neobanks may also appear as viable alternatives forthese individuals, as well as for those who save money for old age. Saving money for oldage may open the possibility of providing personal financial services in the FinTech space.
J. Risk Financial Manag. 2022, 15, x FOR PEER REVIEW 17 of 40
appear more accustomed to using formal financial institutions for saving than those from
the SAARC regions. From a FinTech expansion perspective, the outcome is interesting.
An individual who already uses a formal bank account may feel motivated to consider
FinTech alternatives such as personal financial service apps, and neobanks. Those who
already use informal approaches, by contrast, may be less inclined to use such services
unless the value propositions from FinTech services outweigh the informal offerings
already used. From this respect, there appears to be greater opportunities for FinTech
services in the ASEAN regions than in the SAARC regions.
Figure 5. Cumulative percentage of participants who saved money in a bank or a financial
institution, and who used informal approaches, such as a group, or a club, or a person beyond the
family.
The GFD survey also asked several savings behaviour questions that would be
relevant to FinTech providers. Participants were asked the reasons why they saved
money. The two reasons offered were to start or operate a business and to save for old
age. Participants who save money for business purposes may be entrepreneurial in nature
and therefore may be interested in alternative forms of finance such as crowdfunding.
Businesses also need to take out insurance policies and comply with various rules and
regulations. Individuals running businesses may consider using FinTechs such as
InsurTech (insurance technologies) and RegTech (regulatory technologies). Neobanks
may also appear as viable alternatives for these individuals, as well as for those who save
money for old age. Saving money for old age may open the possibility of providing
personal financial services in the FinTech space.
Figures 6 and 7 show the percentage of participants from ASEAN and SAARC
regions who saved money to help start a business or for old age. Again, differences in the
two regions’ socioeconomic contexts influence opportunities and challenges for FinTech
Figure 5. Cumulative percentage of participants who saved money in a bank or a financial institution,and who used informal approaches, such as a group, or a club, or a person beyond the family.
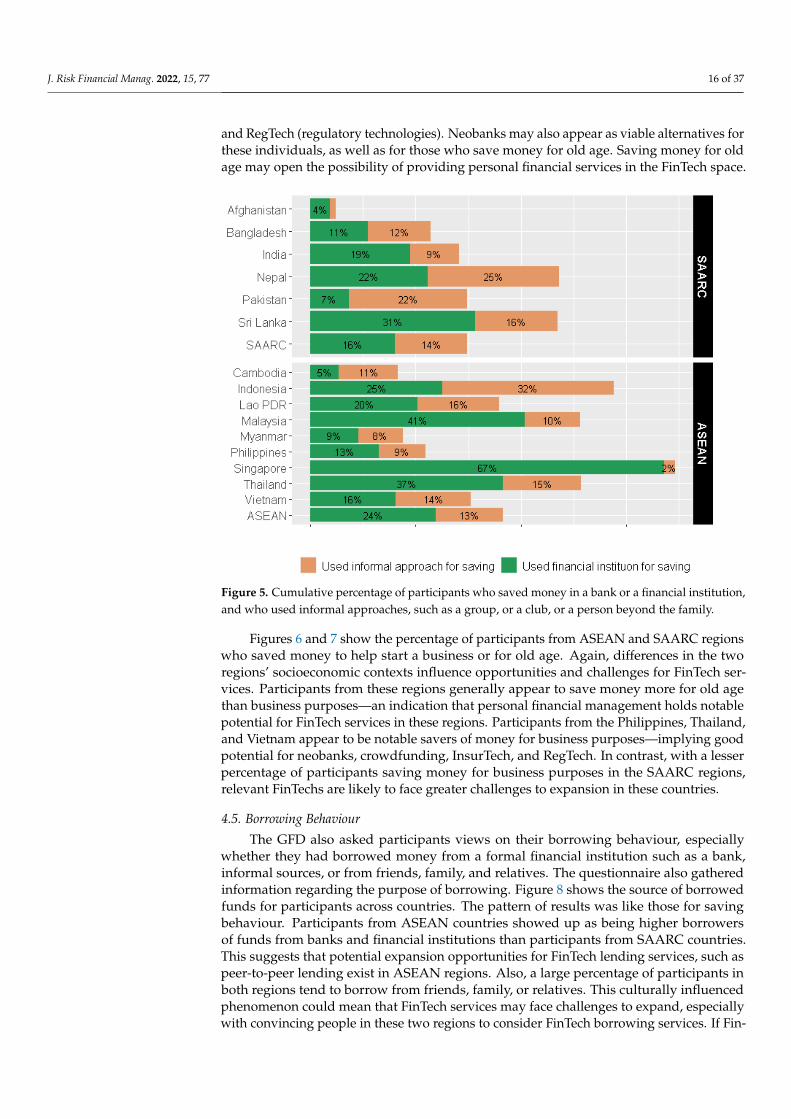
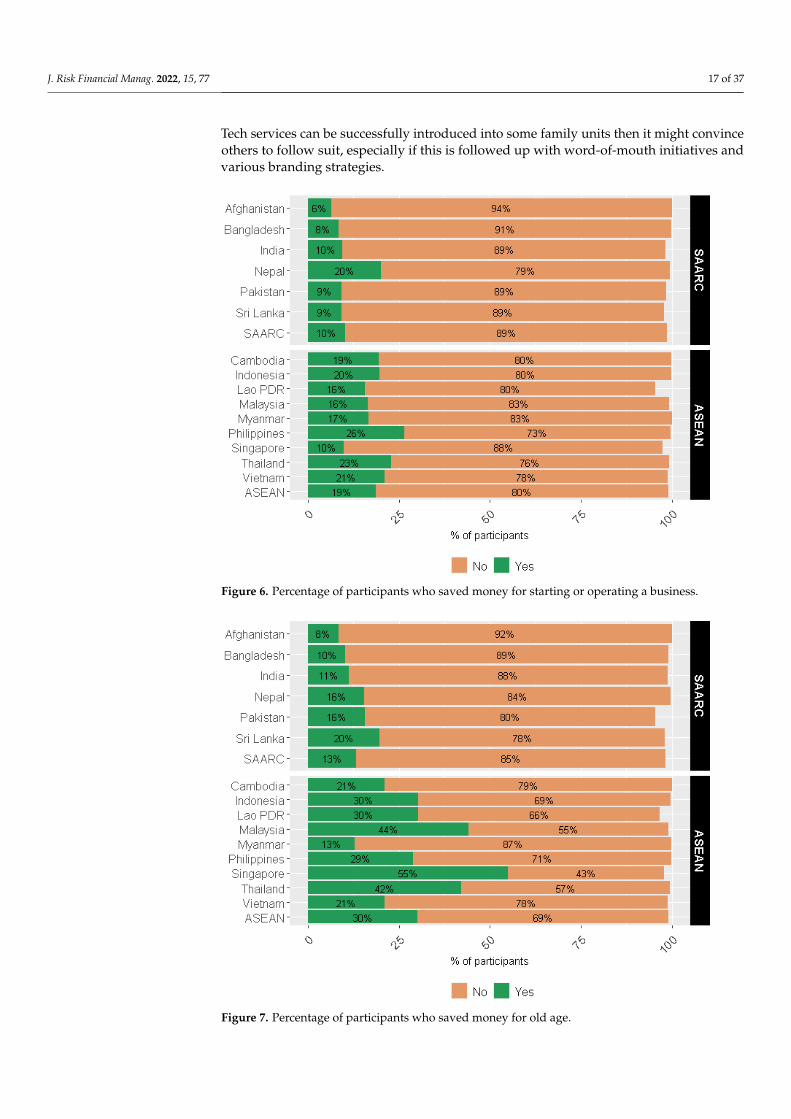
Figures 6 and 7 show the percentage of participants from ASEAN and SAARC regionswho saved money to help start a business or for old age. Again, differences in the tworegions’ socioeconomic contexts influence opportunities and challenges for FinTech ser-vices. Participants from these regions generally appear to save money more for old agethan business purposes—an indication that personal financial management holds notablepotential for FinTech services in these regions. Participants from the Philippines, Thailand,and Vietnam appear to be notable savers of money for business purposes—implying goodpotential for neobanks, crowdfunding, InsurTech, and RegTech. In contrast, with a lesserpercentage of participants saving money for business purposes in the SAARC regions,relevant FinTechs are likely to face greater challenges to expansion in these countries.
4.5. Borrowing Behaviour
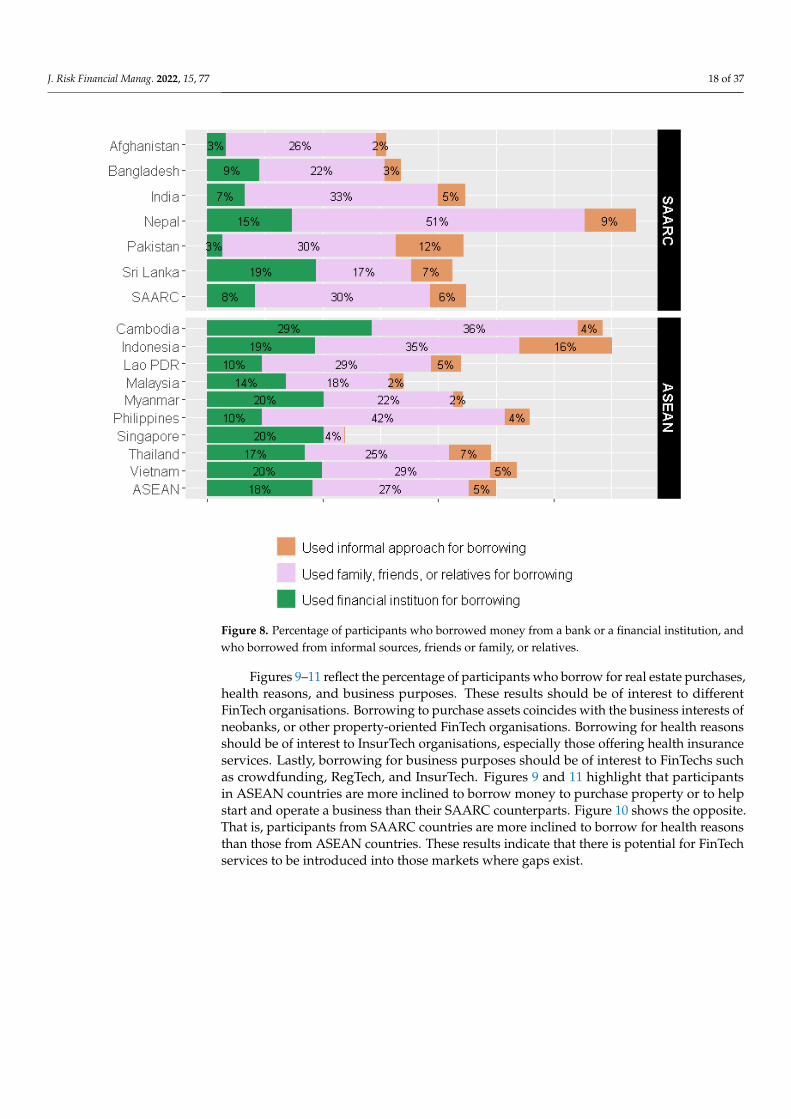
The GFD also asked participants views on their borrowing behaviour, especiallywhether they had borrowed money from a formal financial institution such as a bank,informal sources, or from friends, family, and relatives. The questionnaire also gatheredinformation regarding the purpose of borrowing. Figure 8 shows the source of borrowedfunds for participants across countries. The pattern of results was like those for savingbehaviour. Participants from ASEAN countries showed up as being higher borrowersof funds from banks and financial institutions than participants from SAARC countries.This suggests that potential expansion opportunities for FinTech lending services, such aspeer-to-peer lending exist in ASEAN regions. Also, a large percentage of participants inboth regions tend to borrow from friends, family, or relatives. This culturally influencedphenomenon could mean that FinTech services may face challenges to expand, especiallywith convincing people in these two regions to consider FinTech borrowing services. If Fin-
J. Risk Financial Manag. 2022, 15, 77 17 of 37
Tech services can be successfully introduced into some family units then it might convinceothers to follow suit, especially if this is followed up with word-of-mouth initiatives andvarious branding strategies.
J. Risk Financial Manag. 2022, 15, x FOR PEER REVIEW 18 of 40
services. Participants from these regions generally appear to save money more for old age
than business purposes—an indication that personal financial management holds notable
potential for FinTech services in these regions. Participants from the Philippines,
Thailand, and Vietnam appear to be notable savers of money for business purposes—
implying good potential for neobanks, crowdfunding, InsurTech, and RegTech. In
contrast, with a lesser percentage of participants saving money for business purposes in
the SAARC regions, relevant FinTechs are likely to face greater challenges to expansion
in these countries.
Figure 6. Percentage of participants who saved money for starting or operating a business. Figure 6. Percentage of participants who saved money for starting or operating a business.
J. Risk Financial Manag. 2022, 15, x FOR PEER REVIEW 19 of 40
Figure 7. Percentage of participants who saved money for old age.
4.5. Borrowing Behaviour
The GFD also asked participants views on their borrowing behaviour, especially
whether they had borrowed money from a formal financial institution such as a bank,
informal sources, or from friends, family, and relatives. The questionnaire also gathered
information regarding the purpose of borrowing. Figure 8 shows the source of borrowed
funds for participants across countries. The pattern of results was like those for saving
behaviour. Participants from ASEAN countries showed up as being higher borrowers of
funds from banks and financial institutions than participants from SAARC countries. This
suggests that potential expansion opportunities for FinTech lending services, such as
peer‐to‐peer lending exist in ASEAN regions. Also, a large percentage of participants in
both regions tend to borrow from friends, family, or relatives. This culturally influenced
phenomenon could mean that FinTech services may face challenges to expand, especially
with convincing people in these two regions to consider FinTech borrowing services. If
FinTech services can be successfully introduced into some family units then it might
convince others to follow suit, especially if this is followed up with word‐of‐mouth
initiatives and various branding strategies.
Figure 7. Percentage of participants who saved money for old age.
J. Risk Financial Manag. 2022, 15, 77 18 of 37J. Risk Financial Manag. 2022, 15, x FOR PEER REVIEW 20 of 40
Figure 8. Percentage of participants who borrowed money from a bank or a financial institution,
and who borrowed from informal sources, friends or family, or relatives.
Figures 9–11 reflect the percentage of participants who borrow for real estate
purchases, health reasons, and business purposes. These results should be of interest to
different FinTech organisations. Borrowing to purchase assets coincides with the business
interests of neobanks, or other property‐oriented FinTech organisations. Borrowing for
health reasons should be of interest to InsurTech organisations, especially those offering
health insurance services. Lastly, borrowing for business purposes should be of interest
to FinTechs such as crowdfunding, RegTech, and InsurTech. Figures 9 and 11 highlight
that participants in ASEAN countries are more inclined to borrow money to purchase
property or to help start and operate a business than their SAARC counterparts. Figure 10
shows the opposite. That is, participants from SAARC countries are more inclined to
borrow for health reasons than those from ASEAN countries. These results indicate that
there is potential for FinTech services to be introduced into those markets where gaps
exist.
Figure 8. Percentage of participants who borrowed money from a bank or a financial institution, andwho borrowed from informal sources, friends or family, or relatives.
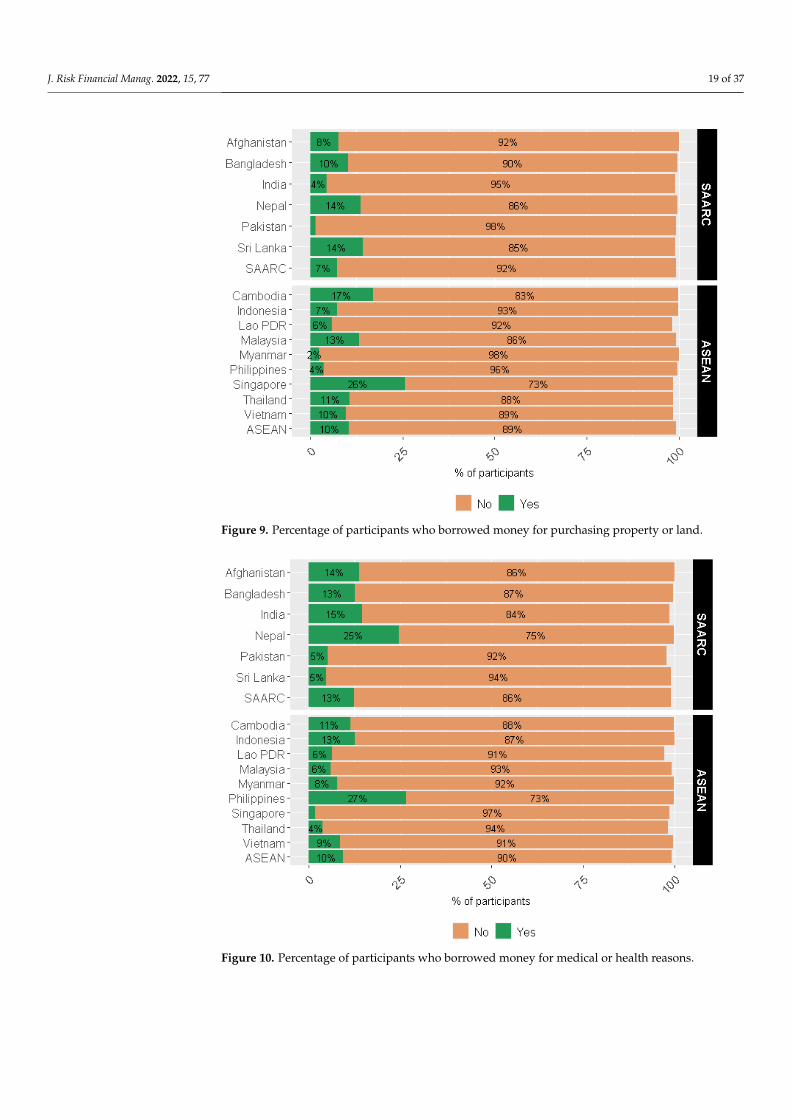
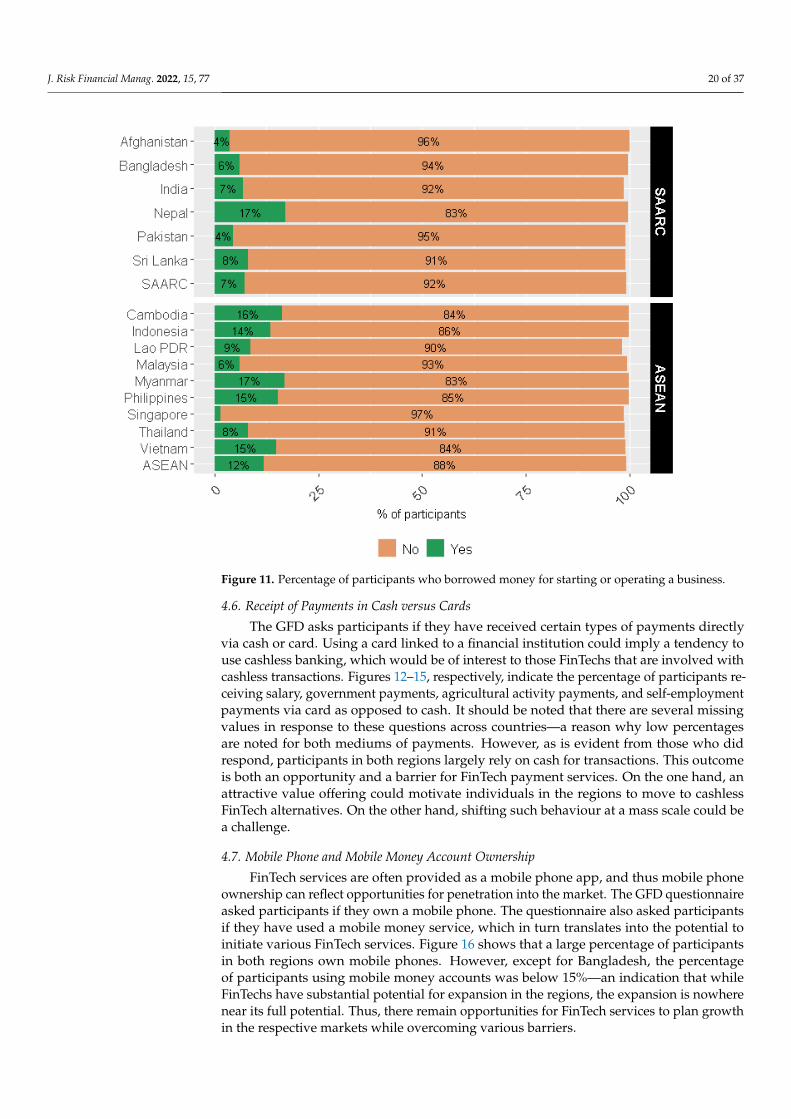
Figures 9–11 reflect the percentage of participants who borrow for real estate purchases,health reasons, and business purposes. These results should be of interest to differentFinTech organisations. Borrowing to purchase assets coincides with the business interests ofneobanks, or other property-oriented FinTech organisations. Borrowing for health reasonsshould be of interest to InsurTech organisations, especially those offering health insuranceservices. Lastly, borrowing for business purposes should be of interest to FinTechs suchas crowdfunding, RegTech, and InsurTech. Figures 9 and 11 highlight that participantsin ASEAN countries are more inclined to borrow money to purchase property or to helpstart and operate a business than their SAARC counterparts. Figure 10 shows the opposite.That is, participants from SAARC countries are more inclined to borrow for health reasonsthan those from ASEAN countries. These results indicate that there is potential for FinTechservices to be introduced into those markets where gaps exist.
J. Risk Financial Manag. 2022, 15, 77 19 of 37J. Risk Financial Manag. 2022, 15, x FOR PEER REVIEW 21 of 40
Figure 9. Percentage of participants who borrowed money for purchasing property or land.
Figure 10. Percentage of participants who borrowed money for medical or health reasons.
Figure 9. Percentage of participants who borrowed money for purchasing property or land.
J. Risk Financial Manag. 2022, 15, x FOR PEER REVIEW 21 of 40
Figure 9. Percentage of participants who borrowed money for purchasing property or land.
Figure 10. Percentage of participants who borrowed money for medical or health reasons. Figure 10. Percentage of participants who borrowed money for medical or health reasons.
J. Risk Financial Manag. 2022, 15, 77 20 of 37J. Risk Financial Manag. 2022, 15, x FOR PEER REVIEW 22 of 40
Figure 11. Percentage of participants who borrowed money for starting or operating a business.
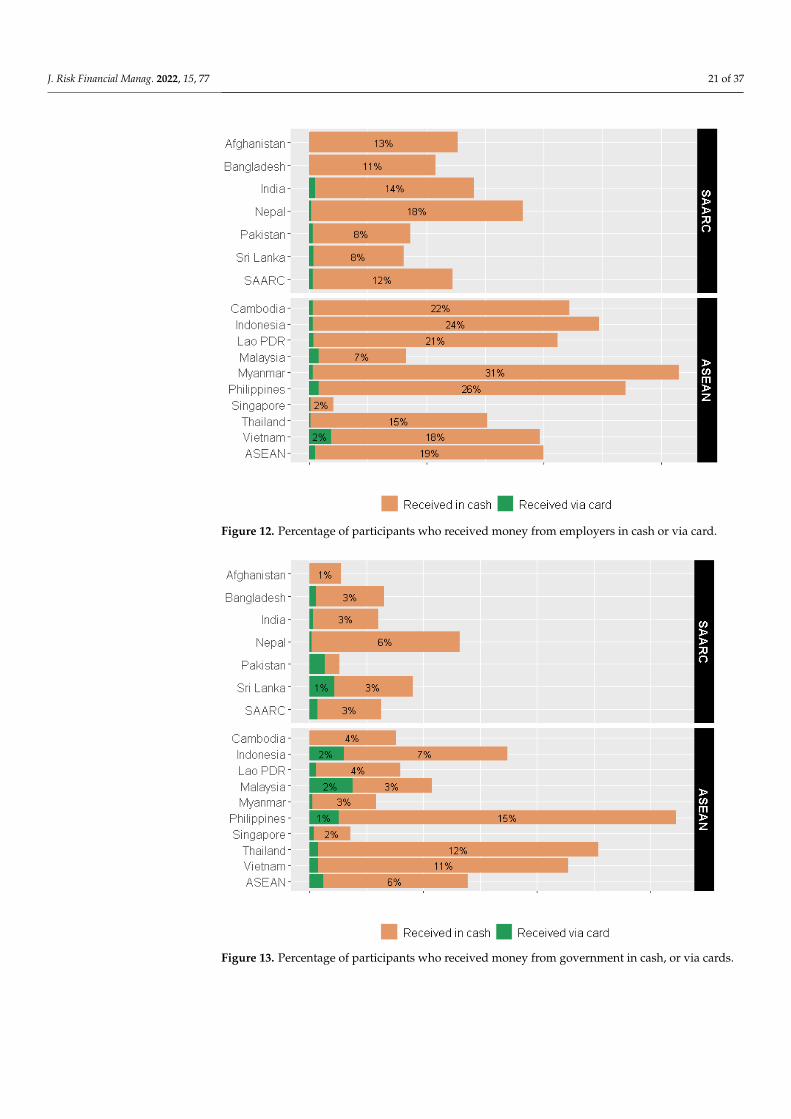
4.6. Receipt of Payments in Cash versus Cards
The GFD asks participants if they have received certain types of payments directly
via cash or card. Using a card linked to a financial institution could imply a tendency to
use cashless banking, which would be of interest to those FinTechs that are involved with
cashless transactions. Figures 12–15, respectively, indicate the percentage of participants
receiving salary, government payments, agricultural activity payments, and self‐
employment payments via card as opposed to cash. It should be noted that there are
several missing values in response to these questions across countries—a reason why low
percentages are noted for both mediums of payments. However, as is evident from those
who did respond, participants in both regions largely rely on cash for transactions. This
outcome is both an opportunity and a barrier for FinTech payment services. On the one
hand, an attractive value offering could motivate individuals in the regions to move to
cashless FinTech alternatives. On the other hand, shifting such behaviour at a mass scale
could be a challenge.
Figure 11. Percentage of participants who borrowed money for starting or operating a business.
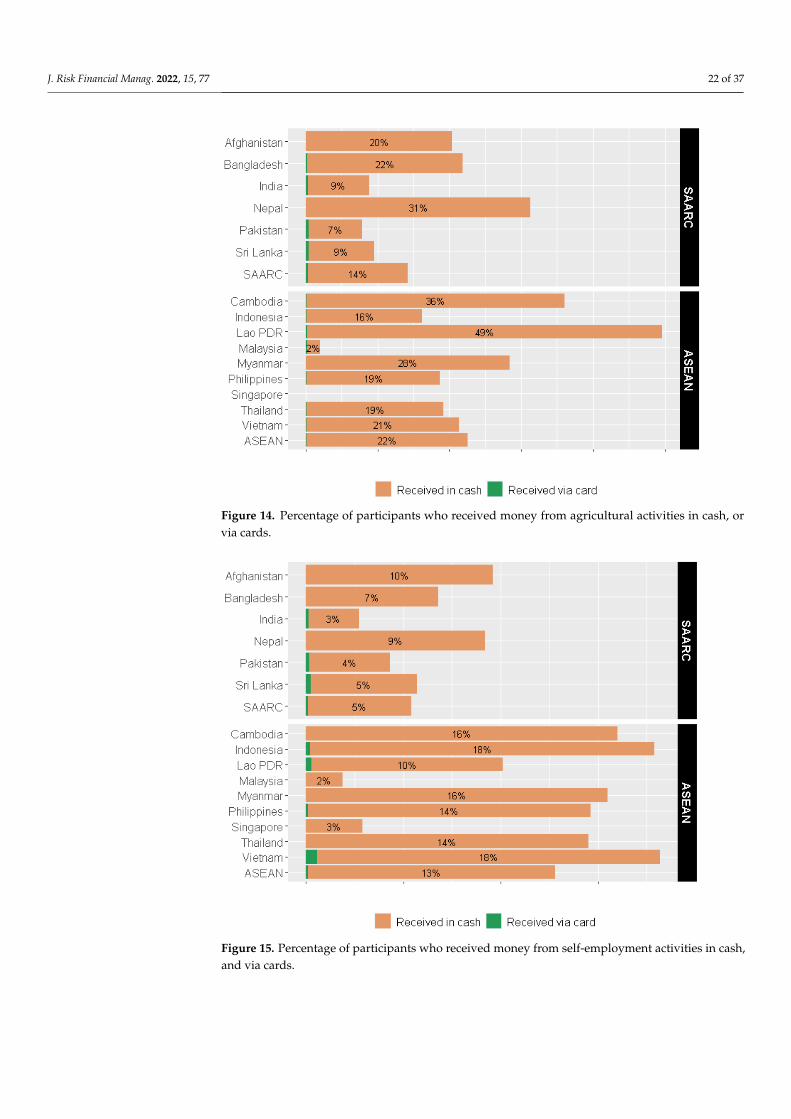
4.6. Receipt of Payments in Cash versus Cards
The GFD asks participants if they have received certain types of payments directlyvia cash or card. Using a card linked to a financial institution could imply a tendency touse cashless banking, which would be of interest to those FinTechs that are involved withcashless transactions. Figures 12–15, respectively, indicate the percentage of participants re-ceiving salary, government payments, agricultural activity payments, and self-employmentpayments via card as opposed to cash. It should be noted that there are several missingvalues in response to these questions across countries—a reason why low percentagesare noted for both mediums of payments. However, as is evident from those who didrespond, participants in both regions largely rely on cash for transactions. This outcomeis both an opportunity and a barrier for FinTech payment services. On the one hand, anattractive value offering could motivate individuals in the regions to move to cashlessFinTech alternatives. On the other hand, shifting such behaviour at a mass scale could bea challenge.
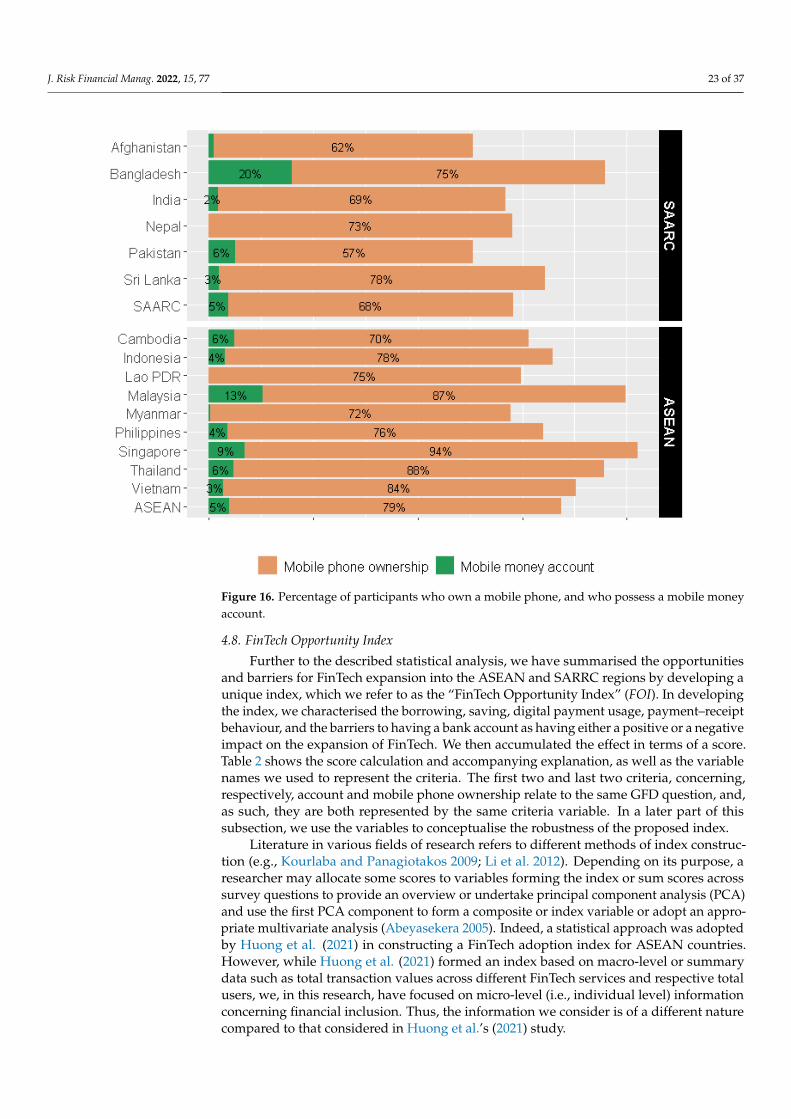
4.7. Mobile Phone and Mobile Money Account Ownership
FinTech services are often provided as a mobile phone app, and thus mobile phoneownership can reflect opportunities for penetration into the market. The GFD questionnaireasked participants if they own a mobile phone. The questionnaire also asked participantsif they have used a mobile money service, which in turn translates into the potential toinitiate various FinTech services. Figure 16 shows that a large percentage of participantsin both regions own mobile phones. However, except for Bangladesh, the percentageof participants using mobile money accounts was below 15%—an indication that whileFinTechs have substantial potential for expansion in the regions, the expansion is nowherenear its full potential. Thus, there remain opportunities for FinTech services to plan growthin the respective markets while overcoming various barriers.
J. Risk Financial Manag. 2022, 15, 77 21 of 37J. Risk Financial Manag. 2022, 15, x FOR PEER REVIEW 23 of 40
Figure 12. Percentage of participants who received money from employers in cash or via card.
Figure 13. Percentage of participants who received money from government in cash, or via cards.
Figure 12. Percentage of participants who received money from employers in cash or via card.
J. Risk Financial Manag. 2022, 15, x FOR PEER REVIEW 23 of 40
Figure 12. Percentage of participants who received money from employers in cash or via card.
Figure 13. Percentage of participants who received money from government in cash, or via cards. Figure 13. Percentage of participants who received money from government in cash, or via cards.
J. Risk Financial Manag. 2022, 15, 77 22 of 37J. Risk Financial Manag. 2022, 15, x FOR PEER REVIEW 24 of 40
Figure 14. Percentage of participants who received money from agricultural activities in cash, or via
cards.
Figure 15. Percentage of participants who received money from self‐employment activities in cash,
and via cards.
Figure 14. Percentage of participants who received money from agricultural activities in cash, orvia cards.
J. Risk Financial Manag. 2022, 15, x FOR PEER REVIEW 24 of 40
Figure 14. Percentage of participants who received money from agricultural activities in cash, or via
cards.
Figure 15. Percentage of participants who received money from self‐employment activities in cash,
and via cards. Figure 15. Percentage of participants who received money from self-employment activities in cash,and via cards.
J. Risk Financial Manag. 2022, 15, 77 23 of 37
J. Risk Financial Manag. 2022, 15, x FOR PEER REVIEW 25 of 40
4.7. Mobile Phone and Mobile Money Account Ownership
FinTech services are often provided as a mobile phone app, and thus mobile phone
ownership can reflect opportunities for penetration into the market. The GFD
questionnaire asked participants if they own a mobile phone. The questionnaire also
asked participants if they have used a mobile money service, which in turn translates into
the potential to initiate various FinTech services. Figure 16 shows that a large percentage
of participants in both regions own mobile phones. However, except for Bangladesh, the
percentage of participants using mobile money accounts was below 15%—an indication
that while FinTechs have substantial potential for expansion in the regions, the expansion
is nowhere near its full potential. Thus, there remain opportunities for FinTech services to
plan growth in the respective markets while overcoming various barriers.
Figure 16. Percentage of participants who own a mobile phone, and who possess a mobile money
account.
4.8. FinTech Opportunity Index
Further to the described statistical analysis, we have summarised the opportunities
and barriers for FinTech expansion into the ASEAN and SARRC regions by developing a
unique index, which we refer to as the “FinTech Opportunity Index” (FOI). In developing
the index, we characterised the borrowing, saving, digital payment usage, payment–
receipt behaviour, and the barriers to having a bank account as having either a positive or
a negative impact on the expansion of FinTech. We then accumulated the effect in terms
of a score. Table 2 shows the score calculation and accompanying explanation, as well as
the variable names we used to represent the criteria. The first two and last two criteria,
concerning, respectively, account and mobile phone ownership relate to the same GFD
question, and, as such, they are both represented by the same criteria variable. In a later
Figure 16. Percentage of participants who own a mobile phone, and who possess a mobile moneyaccount.
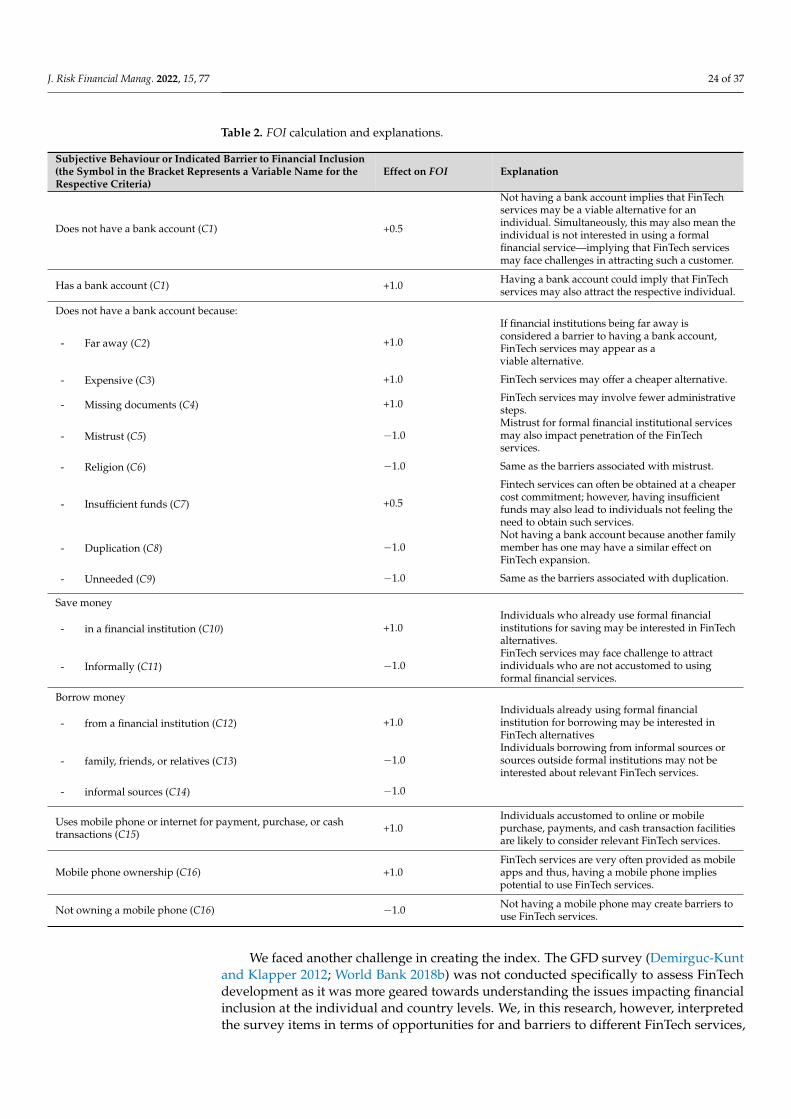
4.8. FinTech Opportunity Index
Further to the described statistical analysis, we have summarised the opportunitiesand barriers for FinTech expansion into the ASEAN and SARRC regions by developing aunique index, which we refer to as the “FinTech Opportunity Index” (FOI). In developingthe index, we characterised the borrowing, saving, digital payment usage, payment–receiptbehaviour, and the barriers to having a bank account as having either a positive or a negativeimpact on the expansion of FinTech. We then accumulated the effect in terms of a score.Table 2 shows the score calculation and accompanying explanation, as well as the variablenames we used to represent the criteria. The first two and last two criteria, concerning,respectively, account and mobile phone ownership relate to the same GFD question, and,as such, they are both represented by the same criteria variable. In a later part of thissubsection, we use the variables to conceptualise the robustness of the proposed index.
Literature in various fields of research refers to different methods of index construc-tion (e.g., Kourlaba and Panagiotakos 2009; Li et al. 2012). Depending on its purpose, aresearcher may allocate some scores to variables forming the index or sum scores acrosssurvey questions to provide an overview or undertake principal component analysis (PCA)and use the first PCA component to form a composite or index variable or adopt an appro-priate multivariate analysis (Abeyasekera 2005). Indeed, a statistical approach was adoptedby Huong et al. (2021) in constructing a FinTech adoption index for ASEAN countries.However, while Huong et al. (2021) formed an index based on macro-level or summarydata such as total transaction values across different FinTech services and respective totalusers, we, in this research, have focused on micro-level (i.e., individual level) informationconcerning financial inclusion. Thus, the information we consider is of a different naturecompared to that considered in Huong et al.’s (2021) study.
J. Risk Financial Manag. 2022, 15, 77 24 of 37
Table 2. FOI calculation and explanations.
Subjective Behaviour or Indicated Barrier to Financial Inclusion(the Symbol in the Bracket Represents a Variable Name for theRespective Criteria)
Effect on FOI Explanation
Does not have a bank account (C1) +0.5
Not having a bank account implies that FinTechservices may be a viable alternative for anindividual. Simultaneously, this may also mean theindividual is not interested in using a formalfinancial service—implying that FinTech servicesmay face challenges in attracting such a customer.
Has a bank account (C1) +1.0 Having a bank account could imply that FinTechservices may also attract the respective individual.
Does not have a bank account because:
- Far away (C2) +1.0
If financial institutions being far away isconsidered a barrier to having a bank account,FinTech services may appear as aviable alternative.
- Expensive (C3) +1.0 FinTech services may offer a cheaper alternative.
- Missing documents (C4) +1.0 FinTech services may involve fewer administrativesteps.
- Mistrust (C5) −1.0Mistrust for formal financial institutional servicesmay also impact penetration of the FinTechservices.
- Religion (C6) −1.0 Same as the barriers associated with mistrust.
- Insufficient funds (C7) +0.5
Fintech services can often be obtained at a cheapercost commitment; however, having insufficientfunds may also lead to individuals not feeling theneed to obtain such services.
- Duplication (C8) −1.0Not having a bank account because another familymember has one may have a similar effect onFinTech expansion.
- Unneeded (C9) −1.0 Same as the barriers associated with duplication.
Save money
- in a financial institution (C10) +1.0Individuals who already use formal financialinstitutions for saving may be interested in FinTechalternatives.
- Informally (C11) −1.0FinTech services may face challenge to attractindividuals who are not accustomed to usingformal financial services.
Borrow money
- from a financial institution (C12) +1.0Individuals already using formal financialinstitution for borrowing may be interested inFinTech alternatives
- family, friends, or relatives (C13) −1.0Individuals borrowing from informal sources orsources outside formal institutions may not beinterested about relevant FinTech services.
- informal sources (C14) −1.0
Uses mobile phone or internet for payment, purchase, or cashtransactions (C15) +1.0
Individuals accustomed to online or mobilepurchase, payments, and cash transaction facilitiesare likely to consider relevant FinTech services.
Mobile phone ownership (C16) +1.0FinTech services are very often provided as mobileapps and thus, having a mobile phone impliespotential to use FinTech services.
Not owning a mobile phone (C16) −1.0 Not having a mobile phone may create barriers touse FinTech services.
We faced another challenge in creating the index. The GFD survey (Demirguc-Kuntand Klapper 2012; World Bank 2018b) was not conducted specifically to assess FinTechdevelopment as it was more geared towards understanding the issues impacting financialinclusion at the individual and country levels. We, in this research, however, interpretedthe survey items in terms of opportunities for and barriers to different FinTech services,
J. Risk Financial Manag. 2022, 15, 77 25 of 37
as was explained in the results presented in the prior subsections. In other words, wehold an epistemological orientation similar to interpretivism (Hiller 2016), which is oftenapplied in a qualitative undertaking. Such an interpretivist epistemology expects theo-ries to emerge from data and accommodates knowledge creation in terms of “contextualmeanings” (Hiller 2016). Similarly, by working with the quantitative GFD data, we, in thisresearch, interpret the GFD questionnaire in terms of how different FinTech services mayappeal to an individual depending on his/her various financial inclusion status and thecontextual implications thereof. We then assign the scores indicated in Table 2 based on thisinterpretation. Overall, our approach corresponds to the approach of assigning scores by aresearcher when constructing an index (Abeyasekera 2005). Indeed, such arbitrary scoringbased on some judgement for index construction is not uncommon, such as in the healthfield (Kourlaba and Panagiotakos 2009), and in this research we follow a similar approach.
As noted in Table 2, for each of the financial inclusion criterion, we consider threedifferent scores: −1.0, 0.5, 1.0. There is a rationale behind such choices. For example, anindividual may not have a traditional bank account because the financial institution is faraway, or he/she feels maintaining a bank account is expensive, or the individual may lackdocuments to open a bank account. We assume that these individual circumstances mayimpose a positive impact on our proposed index, since FinTech services have historicallyoften evolved across countries to address these difficulties. Often FinTechs can bringfinancial services to consumers at a low cost and well within the reach of mobile phones. Bycontrast, if an individual does not have a bank account because of some subjective mistrustor religious reason(s), the individual may hold a similar belief about FinTech services. Thus,we assume that these financial inclusion criterion may have a negative impact on the index.There are some criteria which could be interpreted as having a neutral effect on FinTechadoption by an individual. For example, if an individual does not have a bank account atall, the individual may adopt FinTechs as an alternative to traditional banking services,provided that the value propositions of FinTech services appeal to him/her. Simultaneously,the lack of bank account may also mean that the individual is not interested in using aformal financial service. This, in turn, implies that FinTech services may face challengesin acquiring the respective individual as a customer. For these grey-area situations, wehave assigned a score of 0.5. With our focus on identifying opportunities for FinTechdevelopment in SAARC and ASEAN regions, and this positive score implies a bias towardsthe possibility of FinTech adoption, while also accommodating the potential barriers forsuch adoption.
Overall, while the scores assigned are arbitrary, they were chosen upon certain ratio-nales. Our use of subjective interpretation and scores was motivated by the need to gaininsights into the opportunities for FinTech services emerging from the GFD informationfor respective countries and economies. Thus, our epistemological stance is contrary to apositivist epistemological orientation, which is focused on proving a theory. We considerthe outcomes of the FOI analysis as supplementary to the descriptive statistical analysis con-ducted in prior subsections, while also acknowledging the subjectivity in conceptualisation.
We also explore the statistical aspects of the proposed index to conceptualise itsrobustness. First, we recode the GFD information corresponding to the criteria indicatedin Table 2 into binary variables where a value of 1 indicates that the respective criterionhas been satisfied. We then determine the Cronbach’s alpha (Taber 2018) for the binaryvariables representing the criteria indicated in Table 2.
Table 3 shows the outcome of assessing Cronbach’s alpha. The criterion C15 is excludeddue to many missing values not allowing its inclusion in the statistical process. Cronbach’salpha is a reflection of whether a set of variables measure a similar thing, which thenjustifies their inclusion in designing a composite variable (i.e., an index) (Taber 2018). Whilethere is a traditional view that the Cronbach’s alpha for a set of measurement variablesshould be high and a threshold of at least 0.7 is often recommended, an alternate viewargues that a low alpha value does not discount the usefulness of the respective measuresand there needs to be a focus on an interpretation of the measures (Taber 2018). We note
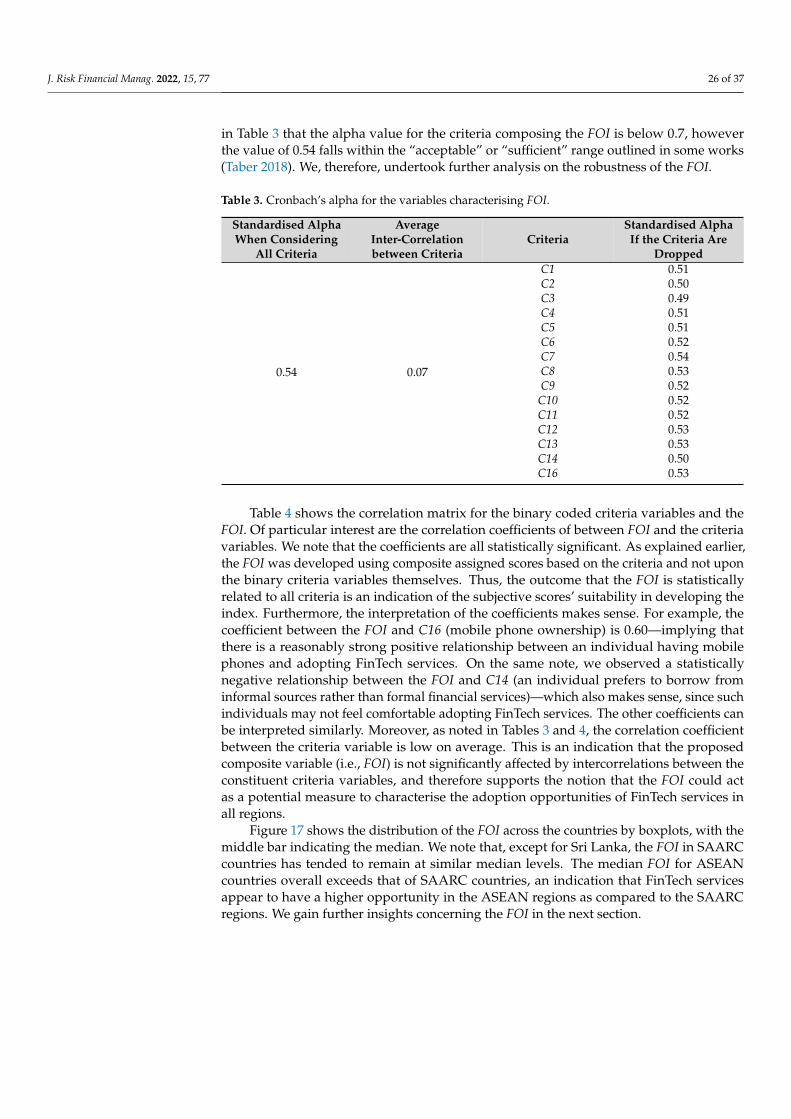
J. Risk Financial Manag. 2022, 15, 77 26 of 37
in Table 3 that the alpha value for the criteria composing the FOI is below 0.7, howeverthe value of 0.54 falls within the “acceptable” or “sufficient” range outlined in some works(Taber 2018). We, therefore, undertook further analysis on the robustness of the FOI.
Table 3. Cronbach’s alpha for the variables characterising FOI.
Standardised AlphaWhen Considering
All Criteria
AverageInter-Correlationbetween Criteria
CriteriaStandardised AlphaIf the Criteria Are
Dropped
0.54 0.07
C1 0.51C2 0.50C3 0.49C4 0.51C5 0.51C6 0.52C7 0.54C8 0.53C9 0.52
C10 0.52C11 0.52C12 0.53C13 0.53C14 0.50C16 0.53
Table 4 shows the correlation matrix for the binary coded criteria variables and theFOI. Of particular interest are the correlation coefficients of between FOI and the criteriavariables. We note that the coefficients are all statistically significant. As explained earlier,the FOI was developed using composite assigned scores based on the criteria and not uponthe binary criteria variables themselves. Thus, the outcome that the FOI is statisticallyrelated to all criteria is an indication of the subjective scores’ suitability in developing theindex. Furthermore, the interpretation of the coefficients makes sense. For example, thecoefficient between the FOI and C16 (mobile phone ownership) is 0.60—implying thatthere is a reasonably strong positive relationship between an individual having mobilephones and adopting FinTech services. On the same note, we observed a statisticallynegative relationship between the FOI and C14 (an individual prefers to borrow frominformal sources rather than formal financial services)—which also makes sense, since suchindividuals may not feel comfortable adopting FinTech services. The other coefficients canbe interpreted similarly. Moreover, as noted in Tables 3 and 4, the correlation coefficientbetween the criteria variable is low on average. This is an indication that the proposedcomposite variable (i.e., FOI) is not significantly affected by intercorrelations between theconstituent criteria variables, and therefore supports the notion that the FOI could actas a potential measure to characterise the adoption opportunities of FinTech services inall regions.
Figure 17 shows the distribution of the FOI across the countries by boxplots, with themiddle bar indicating the median. We note that, except for Sri Lanka, the FOI in SAARCcountries has tended to remain at similar median levels. The median FOI for ASEANcountries overall exceeds that of SAARC countries, an indication that FinTech servicesappear to have a higher opportunity in the ASEAN regions as compared to the SAARCregions. We gain further insights concerning the FOI in the next section.
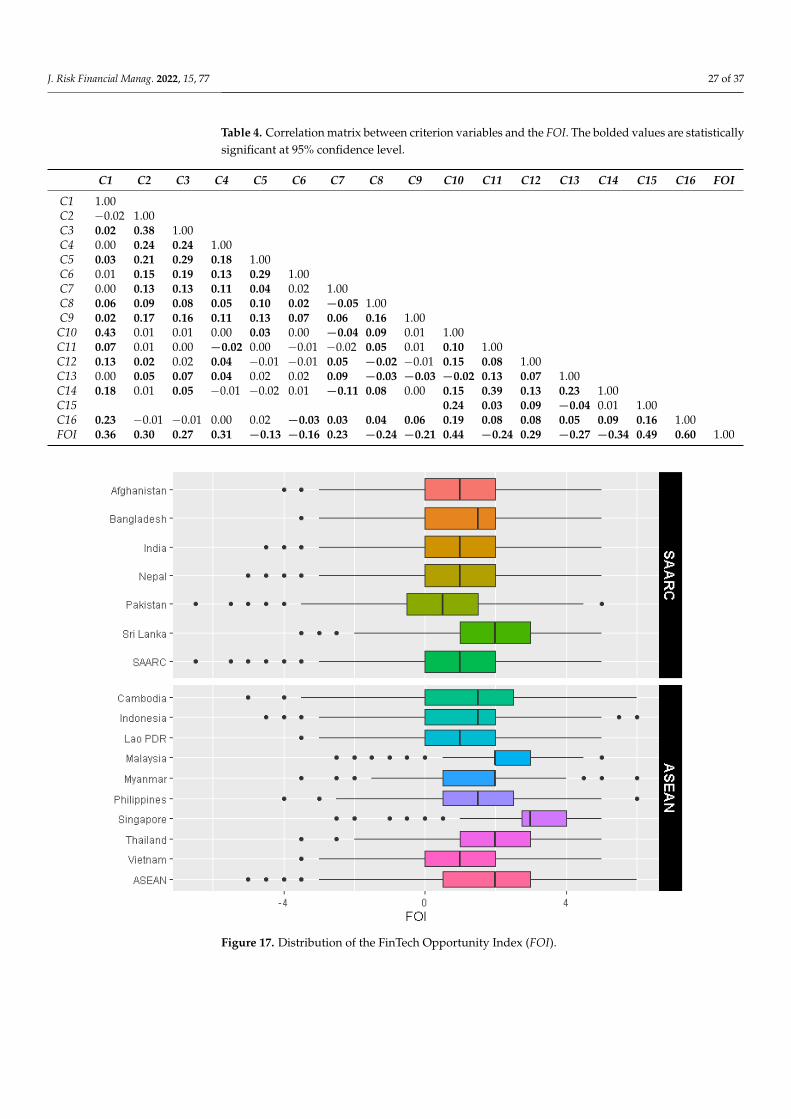
J. Risk Financial Manag. 2022, 15, 77 27 of 37
Table 4. Correlation matrix between criterion variables and the FOI. The bolded values are statisticallysignificant at 95% confidence level.
C1 C2 C3 C4 C5 C6 C7 C8 C9 C10 C11 C12 C13 C14 C15 C16 FOI
C1 1.00C2 −0.02 1.00C3 0.02 0.38 1.00C4 0.00 0.24 0.24 1.00C5 0.03 0.21 0.29 0.18 1.00C6 0.01 0.15 0.19 0.13 0.29 1.00C7 0.00 0.13 0.13 0.11 0.04 0.02 1.00C8 0.06 0.09 0.08 0.05 0.10 0.02 −0.05 1.00C9 0.02 0.17 0.16 0.11 0.13 0.07 0.06 0.16 1.00
C10 0.43 0.01 0.01 0.00 0.03 0.00 −0.04 0.09 0.01 1.00C11 0.07 0.01 0.00 −0.02 0.00 −0.01 −0.02 0.05 0.01 0.10 1.00C12 0.13 0.02 0.02 0.04 −0.01 −0.01 0.05 −0.02 −0.01 0.15 0.08 1.00C13 0.00 0.05 0.07 0.04 0.02 0.02 0.09 −0.03 −0.03 −0.02 0.13 0.07 1.00C14 0.18 0.01 0.05 −0.01 −0.02 0.01 −0.11 0.08 0.00 0.15 0.39 0.13 0.23 1.00C15 0.24 0.03 0.09 −0.04 0.01 1.00C16 0.23 −0.01 −0.01 0.00 0.02 −0.03 0.03 0.04 0.06 0.19 0.08 0.08 0.05 0.09 0.16 1.00FOI 0.36 0.30 0.27 0.31 −0.13 −0.16 0.23 −0.24 −0.21 0.44 −0.24 0.29 −0.27 −0.34 0.49 0.60 1.00J. Risk Financial Manag. 2022, 15, x FOR PEER REVIEW 30 of 40
Figure 17. Distribution of the FinTech Opportunity Index (FOI).
4.9. Regression Analysis
We conducted a regression analysis to understand the impact of demographic factors
on opportunities for FinTech services, conceptualised by the FOI, in SAARC and ASEAN
countries. We considered the following model:
𝐹𝑂𝐼 𝐺𝑒𝑛𝑑𝑒𝑟 𝐴𝑔𝑒 𝐸𝑑𝑢𝑐𝑎𝑡𝑖𝑜𝑛 𝜀 (1)
Thus, for an individual 𝑖 from country 𝑗, we assume that the individual’s gender,
age group, and education level have an impact on the FOI for that individual. As
discussed in the previous section, the FOI inherently considers individualistic saving and
borrowing behaviour, perceptions about barriers to financial inclusion, and ownership of
mobile phone and bank accounts to capture the opportunities for FinTech services. Thus,
Equation (1) extends the previous analysis by also capturing the demographic impact on
FinTech opportunities. We conducted a regression analysis based on Equation (1) for both
SAARC and ASEAN countries separately, as well as a pooled regression combining
information from both groups of countries.
Additionally, we consider that the country an individual is from will also have an
impact on the business context of FinTech services. Consequently, further to Equation (1),
we consider a fixed‐effect panel data model as shown in Equation (2) which inherently
captures the effects of country level variables such as GDP, innovation, labour market
status, inflation, interest rate, and other macro and micro‐economic variables.
𝐹𝑂𝐼 𝐺𝑒𝑛𝑑𝑒𝑟 𝐴𝑔𝑒 𝐸𝑑𝑢𝑐𝑎𝑡𝑖𝑜𝑛 𝐶𝑜𝑢𝑛𝑡𝑟𝑦 𝜀 (2)
Table 5 shows the regression outcome. We note that the models are statistically
significant, as evident from the F‐scores. Also, while the R2 values are low, the residual
Figure 17. Distribution of the FinTech Opportunity Index (FOI).
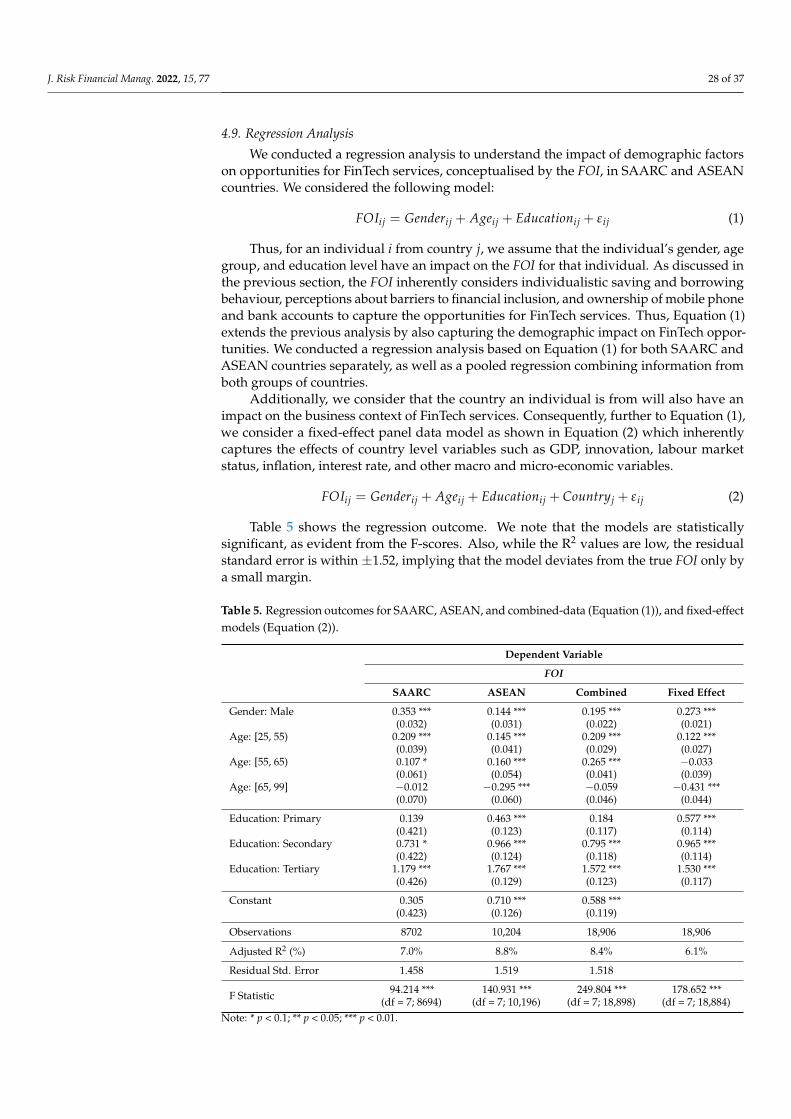
J. Risk Financial Manag. 2022, 15, 77 28 of 37
4.9. Regression Analysis
We conducted a regression analysis to understand the impact of demographic factorson opportunities for FinTech services, conceptualised by the FOI, in SAARC and ASEANcountries. We considered the following model:
FOIij = Genderij + Ageij + Educationij + εij (1)
Thus, for an individual i from country j, we assume that the individual’s gender, agegroup, and education level have an impact on the FOI for that individual. As discussed inthe previous section, the FOI inherently considers individualistic saving and borrowingbehaviour, perceptions about barriers to financial inclusion, and ownership of mobile phoneand bank accounts to capture the opportunities for FinTech services. Thus, Equation (1)extends the previous analysis by also capturing the demographic impact on FinTech oppor-tunities. We conducted a regression analysis based on Equation (1) for both SAARC andASEAN countries separately, as well as a pooled regression combining information fromboth groups of countries.
Additionally, we consider that the country an individual is from will also have animpact on the business context of FinTech services. Consequently, further to Equation (1),we consider a fixed-effect panel data model as shown in Equation (2) which inherentlycaptures the effects of country level variables such as GDP, innovation, labour marketstatus, inflation, interest rate, and other macro and micro-economic variables.
FOIij = Genderij + Ageij + Educationij + Countryj + εij (2)
Table 5 shows the regression outcome. We note that the models are statisticallysignificant, as evident from the F-scores. Also, while the R2 values are low, the residualstandard error is within ±1.52, implying that the model deviates from the true FOI only bya small margin.
Table 5. Regression outcomes for SAARC, ASEAN, and combined-data (Equation (1)), and fixed-effectmodels (Equation (2)).
Dependent Variable
FOI
SAARC ASEAN Combined Fixed Effect
Gender: Male 0.353 *** 0.144 *** 0.195 *** 0.273 ***(0.032) (0.031) (0.022) (0.021)
Age: [25, 55) 0.209 *** 0.145 *** 0.209 *** 0.122 ***(0.039) (0.041) (0.029) (0.027)
Age: [55, 65) 0.107 * 0.160 *** 0.265 *** −0.033(0.061) (0.054) (0.041) (0.039)
Age: [65, 99] −0.012 −0.295 *** −0.059 −0.431 ***(0.070) (0.060) (0.046) (0.044)
Education: Primary 0.139 0.463 *** 0.184 0.577 ***(0.421) (0.123) (0.117) (0.114)
Education: Secondary 0.731 * 0.966 *** 0.795 *** 0.965 ***(0.422) (0.124) (0.118) (0.114)
Education: Tertiary 1.179 *** 1.767 *** 1.572 *** 1.530 ***(0.426) (0.129) (0.123) (0.117)
Constant 0.305 0.710 *** 0.588 ***(0.423) (0.126) (0.119)
Observations 8702 10,204 18,906 18,906
Adjusted R2 (%) 7.0% 8.8% 8.4% 6.1%
Residual Std. Error 1.458 1.519 1.518
F Statistic 94.214 ***(df = 7; 8694)
140.931 ***(df = 7; 10,196)
249.804 ***(df = 7; 18,898)
178.652 ***(df = 7; 18,884)
Note: * p < 0.1; ** p < 0.05; *** p < 0.01.
J. Risk Financial Manag. 2022, 15, 77 29 of 37
We also consider the influence that demographic attributes have on the FOI. We notethat gender has a statistically significant positive impact on the FOI, irrespective of thecountry group and regression and fixed-effect analysis (Table 3). This is an indicationthat, in the regions considered in this research, males are more likely to adopt FinTechservices than females. Furthermore, the analysis notes that the age group between 25 and55 has a statistically significant positive impact on the FOI—an indication that individualsaged within the established working career age group are more likely to adopt FinTechservices. Of particular interest is the statistically significant negative impact on the FOIfor the age group between 65 and 99—an indication that elderly individuals in the regionsmay not be as open to FinTech expansion when compared with the younger age groups.Also, there is a statistically significant positive impact of the age group [55, 65) on theFOI in both country groups, even though a statistically significant effect is not notedfor fixed-effect analysis. We further find that having tertiary education or above has astatistically significant positive impact on the FOI for both SAARC and ASEAN countries.Additionally, having secondary education has a statistically significant positive impact forASEAN countries. This is an indication that more highly educated individuals are morereceptive to FinTech expansion in the regions. Also, individuals from ASEAN countriesappear more likely to be FinTech adopters.
5. Discussion
Assessment of the GFD reveals some interesting insights that are particularly relevantto the expansion of FinTech services across markets, including those from the SAARCand ASEAN regions. First, it is notable that the opportunities for FinTech services in thetwo regions vary. With a higher percentage of participants already using a mobile phoneor internet for payment, purchase, or cash transactions in countries such as Singapore,Malaysia, Thailand, Vietnam, Indonesia, and Bangladesh, it could be argued that FinTechs,and associated services hold potential opportunities in these countries, while the opportu-nity for development in other countries is less evident. Indeed, research suggests that users’trust that smartphones meet usage expectations, and their familiarity with smartphones,will positively influence the continued use of technology (Idemudia and Raisinghani 2014).A recent study noted that users’ experience with mobile payments and transfers were sig-nificant factors that influenced their adoption of mobile investment technologies (Fan 2021).Thus, individuals not accustomed to digital technologies such as the internet or mobilephones for payment, purchase, or cash transactions may not be interested in adoptinginnovative services such as FinTechs. For these reasons, irrespective of the service provided,FinTechs companies may face obstacles in some ASEAN and especially SAARC countries.The FinTech services that are in use in SAARC countries mainly relate to mobile moneyand payment services. By contrast, in ASEAN countries such as Singapore, Malaysia, andThailand, where there are supportive regulatory sandboxes and policies (Laik and Wei2019), and where the GFD shows a notable interest in technology usage, a variety of FinTechservices have grown and prospered in recent years.
The diversity of barriers faced in the different SAARC and ASEAN countries, par-ticularly those related to having a bank account, is informative and provides the basisfor further insights. In particular, having insufficient funds is a principal barrier acrossmost regions, but especially in SAARC countries. This finding corroborates with the wayFinTech expansion has occurred in the regions. As indicated earlier, in countries such asAfghanistan and Myanmar, costs associated with infrastructure and services have hinderedFinTech adoptions (Aye 2021; Lukonga 2021). FinTechs can reduce operational, transaction,and intermediation costs (Miskam et al. 2019). Therefore, for FinTech services to develop inthese regions, it is imperative that FinTechs consider and promote the cost benefits theirservices bring to consumers (Tapanainen 2020). As research points out, FinTech companiesoften collect customer data but it is unclear to what extent the data is used to achieveefficiencies and reduce costs as opposed to achieving profit (Tapanainen 2020). Arguably,opportunities for FinTech expansion in SAARC and ASEAN regions (where insufficient
J. Risk Financial Manag. 2022, 15, 77 30 of 37
funds can be a principal barrier to having a bank account) will largely depend on marketresearch and highlighting the cost advantages to end users.
Also, while some studies have emphasised the availability of special services suchas Islamic FinTechs (e.g., Ahmad and Mamun 2020; Haqqi 2020; Miskam et al. 2019),religion of itself does not appear to be a notable barrier to having bank accounts in eitherregion. Rather, analysis reveals there are more significant barriers to financial inclusionthat FinTech services will need to address if they are hopeful of gaining further inroadsinto these two regions. In the ASEAN region, for example, missing documentation isseen as a significant barrier in enabling potential customers to open a bank account. Toachieve feasible growth in the ASEAN region it is important for FinTech services such asRegTechs to develop more accessible and user-friendly authentication procedures, whichwould enable the less technology-savvy consumers to access FinTech services. Researchalready points to the need for innovative authentication processes in Brunei (Haqqi 2020).Thailand’s central platform for verification of individual identity is viewed as supportiveto the development of different FinTech services (Moenjak et al. 2020). It should also benoted that insufficient funds and user mistrust is noted as a considerable barrier to having abank account in both the SAARC and ASEAN regions, and such mistrust is likely to hinderFinTech developments in the absence of a robust regulatory framework. Arguably, theexpansion of FinTechs in both regions will depend on the extent of RegTech developmentswithin the respective framework environment of each country.
One aspect this article focuses on, and which stands out compared to the focus in theextant literature, is the saving, borrowing, and payment–receipt behaviours of individualsin the regions. Overall, participants from the ASEAN regions appear to be higher saversand borrowers of money for business activities than those from SAARC regions. Businessentrepreneurship and growth require funds. Crowdfunding and peer-to-peer lending canbe viable sources for raising such funds (Nepali 2021; Yunus 2019). There is high growthpotential for business-associated FinTechs such as crowdfunding, peer-to-peer lending,InsurTech, and RegTech in ASEAN regions. Conversely, each of these FinTech services facedifficulties when expanding, especially in SAARC countries. We argue that supportivepolicies and regulation that encourage entrepreneurship and business financing wouldconsiderably improve the likelihood of FinTech development in these two regions.
Participants from ASEAN regions, on average, are higher savers of money for old-age security and are higher borrowers of money for purchasing assets than those fromSAARC countries. This implies a positive attitude towards investments in the ASEANregion, which in turn corresponds to opportunities for FinTech development in the form ofpersonal financial management, and WealthTechs.
Participants from SAARC regions, on average, however, appear to be higher borrowersof money for health purposes than those from ASEAN regions. Arguably, this reflectsthe diversity of health care systems in these regions. There is a push for a universalhealth care system in many ASEAN countries (Van Minh et al. 2015), and despite someinequalities, health care services cover much of the ASEAN population (Van Minh et al.2015). Although there are some publically-funded health services, health care costs in manyof the SAARC regions can be very high (Hassan et al. 2014). Thus, there lies opportunitiesfor the development for FinTechs such as InsurTechs covering health insurance, as well aslow-cost borrowing services such as LendTechs and neobanks in SAARC countries.
Research notes that mobile payments can be viewed by users as providing additionalconvenience compared to bank card payments (Dorotic and Pauwels 2020). Arguably, thisimplies that people are used to using bank cards, which can pave the way for advancedFinTechs linked to payment services. However, since most of the population in both theASEAN and SAARC regions still prefer cash over bank cards when receiving differenttypes of money, FinTech expansions in these regions face the challenge of attracting newconsumers, especially within the population who remain outside the formal banking sectorand who are not accustomed to using bank cards. Indeed, this challenge becomes evidentfrom the noticeable gap in both regions between the percentage of participants using mobile
J. Risk Financial Manag. 2022, 15, 77 31 of 37
phones and those having mobile money accounts. Marketing literature suggests that, inthe modern era, educating customers about the process and benefits of using technologicalproducts will influence their usage decisions (Lewnes and Keller 2019). There is also a viewthat market penetration by a single technology product can be difficult in the modern era,and there is a need for collaboration and partnership (Lewnes and Keller 2019). Consideringthis, the expansion of FinTechs in the SAARC and ASEAN regions depends not only onproviding cheaper services and bringing convenience or efficiency to the end users, butalso on how providers collaboratively promote their service and educate end users to makebest use of the technologies.
The regression analysis, along with the newly developed index revealed some inter-esting insights. A study involving Malaysian participants (Tun-Pin et al. 2019), concludedthat males were the more likely adopters of FinTech services than were females. Ouranalysis of both the SAARC and ASEAN regions is consistent with the findings of Tun-Pin(Tun-Pin et al. 2019). Additionally, the elderly population beyond retirement age (i.e.,those aged 65 and over) appear less likely to adopt or use FinTech services as comparedto the younger-aged population. Thus, it seems that the elderly and women representuntapped markets. Research suggests that women in SAARC countries have low awarenessof mobile money awareness (GSMA 2019). Another study, also involving the same data asthis article (World Bank 2018a), points to the gender divide in financial inclusion in ASEANcountries, especially with women more likely than men to use cash for payments (Cheahet al. 2021). Research among elderly people suggests that they are less likely to adopttechnologies if they feel stressed by such use and if their expectations are not met (Golant2017). According to modern marketing literature, there is an argument to promote FinTechservices to the least receptive cohorts in SAARC and ASEAN regions (Lewnes and Keller2019), by highlighting their potential benefits. Indeed, the positive impact of secondary andtertiary education levels on FinTech opportunities corroborate the importance of educationin promoting FinTech adoptions in the regions.
Overall, in SAARC and ASEAN regions, just promoting and branding FinTech servicesas alternatives to formal services may not achieve sufficient traction. There is a needto plan value propositions according to the savings, borrowing, and payment practicesin the respective markets. An obstacle for SAARC initiatives in achieving the desiredoutcomes of integration of technology into financial services offerings, and hence economicdevelopment, has been the lack of an essential agreement between SAARC nations (Pandeyet al. 2019). ASEAN countries, in contrast, demonstrate a moderate level of financial andbanking integration (Fry-McKibbin et al. 2018; Zhang and Matthews 2019). This divergencemight help explain regional variations between SAARC and ASEAN countries in terms ofthe opportunities and challenges of FinTech expansion, with ASEAN countries appearingmore conducive in this respect.
6. Conclusions
This article explores the opportunities and barriers of FinTech developments in theSAARC and ASEAN regions. We use the GFD data collected in 2017 to conduct a compre-hensive analysis of responses to the GFD questionnaire from various angles. Overall, itis noted that FinTech services hold potential opportunities for expansions in the ASEANregion, while expansion in the SAARC region is more problematic. There also lies differentlevels of opportunities for different categories of FinTechs in the regions. Services suchas crowdfunding, neobanks, and InsurTech have sound growth potential in the ASEANregion, especially with the positive attitude towards entrepreneurship and asset invest-ments. In the SAARC regions, InsurTechs linked to health care, LendTechs, and neobankshave growth potential. Additionally, we note the need for innovative promotions and theeducation of users about the benefits of technologies in both regions to motivate cohortsthat are less likely to adopt FinTech services. We also develop an opportunity index thathelps facilitate further insights into the opportunities and barriers to FinTech expansion.
J. Risk Financial Manag. 2022, 15, 77 32 of 37
As with most studies, this research also has certain limitations. A limitation of thisresearch relates to the fact that the GFD data was collected in 2017, and the results aredependent on participants that featured in the GFD. Although we assume that the context,despite some changes in recent years, has not shifted significantly, future research couldexplore FinTech in the regions further with recent information and potentially a largerparticipant base. Another limitation of the research is that we have assumed that the oppor-tunities for FinTech may also translate into profitable developments in the region. Such mayor may not be the case, depending on context. However, with a notable interest concerningFinTech in each region and a lack of research that explores this issue, the outcomes derivedcan still be of interest to relevant business leaders and policy makers and guide furtherresearch in the field. Lastly, as explained earlier in this article, the scores assigned in indexdevelopment are subjective and the outcomes are to be considered with such subjectivity.Even so, as also reflected in the article, the index has both a rationale and statistical basisconcerning its suitability. Future research will explore the index development further byincluding other data and considering other scoring approaches. Any future undertakingcould also address another relevant issue, which could not be covered in this research dueto lack of relevant data—how the index adapts when considering any change over time.Overall, despite some limitations, we are confident that we have contributed to the bodyof literature in this research domain with a unique analysis of FinTech opportunities andchallenges in SAARC and ASEAN countries. The index and research findings should proveuseful to different stakeholders and pioneer further relevant studies.
Author Contributions: Conceptualization, all authors; methodology, T.I.; software, T.I.; validation,all authors; formal analysis, T.I.; investigation, T.I. and A.M.; resources, T.I. and A.M.; data curation,T.I.; writing—original draft preparation, T.I. and A.M.; writing—review and editing, S.C. and R.G.;visualization, T.I.; supervision, T.I. and S.C.; project administration, T.I.; funding acquisition, allauthors. All authors have read and agreed to the published version of the manuscript.
Funding: This research received no external funding.
Institutional Review Board Statement: Not applicable.
Informed Consent Statement: Not applicable.
Data Availability Statement: Data used in this research is available from the World Bank (WorldBank 2018b).
Acknowledgments: The authors would like to acknowledge the support from the Accounting andFinance Association of Australia and New Zealand (AFAANZ).
Conflicts of Interest: The authors declare no conflict of interest.
ReferencesAb, Razak, Muhammad Ilyas Bin, Nur Akma Mohd Dali, Guru Dhillon, and Azwina Wati Manaf. 2020. Fintech in Malaysia: An
Appraisal to the Need of Shariah-Compliant Regulation. Pertanika Journal of Social Science and Humanities 28: 3223–33. [CrossRef]Abdillah, Leon A. 2020. FinTech E-Commerce Payment Application User Experience Analysis during COVID-19 Pandemic. Scientific
Journal of Informatics 7: 265–78.Abeyasekera, Savitri. 2005. Chapter XVIII Multivariate Methods for Index Construction. In Household Sample Surveys in Developing and
Transition Countries. New York: United Nations, pp. 367–87.Agarwal, Sumit, Wenlan Qian, Yuan Ren, Hsin-Tien Tsai, and Bernard Yin Yeung. 2020. The Real Impact of FinTech: Evidence from Mobile
Payment Technology. SSRN Scholarly Paper ID 3556340. Rochester: Social Science Research Network. [CrossRef]Agrawal, Ajay K., Christian Catalini, and Avi Goldfarb. 2011. The Geography of Crowdfunding. Working Paper 16820. Working Paper
Series. Cambridge: National Bureau of Economic Research. [CrossRef]Ahmad, Syed Magfur, and Abdullah Al Mamun. 2020. Opportunities of Islamic FinTech: The Case of Bangladesh and Turkey. CenRaPS
Journal of Social Sciences 2: 412–26. [CrossRef]Akhter, Sharmin. 2019. Comparative Analysis of FDI in SAARC and ASEAN Countries. IOSR Journal of Economics and Finance 10: 1–5.Alam, Nafis, and Abdolhossein (Pejman) Zameni. 2021. Central Banks and Financial Authorities: Towards the Advancement of
I-Fintech. In Islamic FinTech: Insights and Solutions. Edited by Mohd Ma’Sum Billah. Cham: Springer International Publishing,pp. 59–72. [CrossRef]
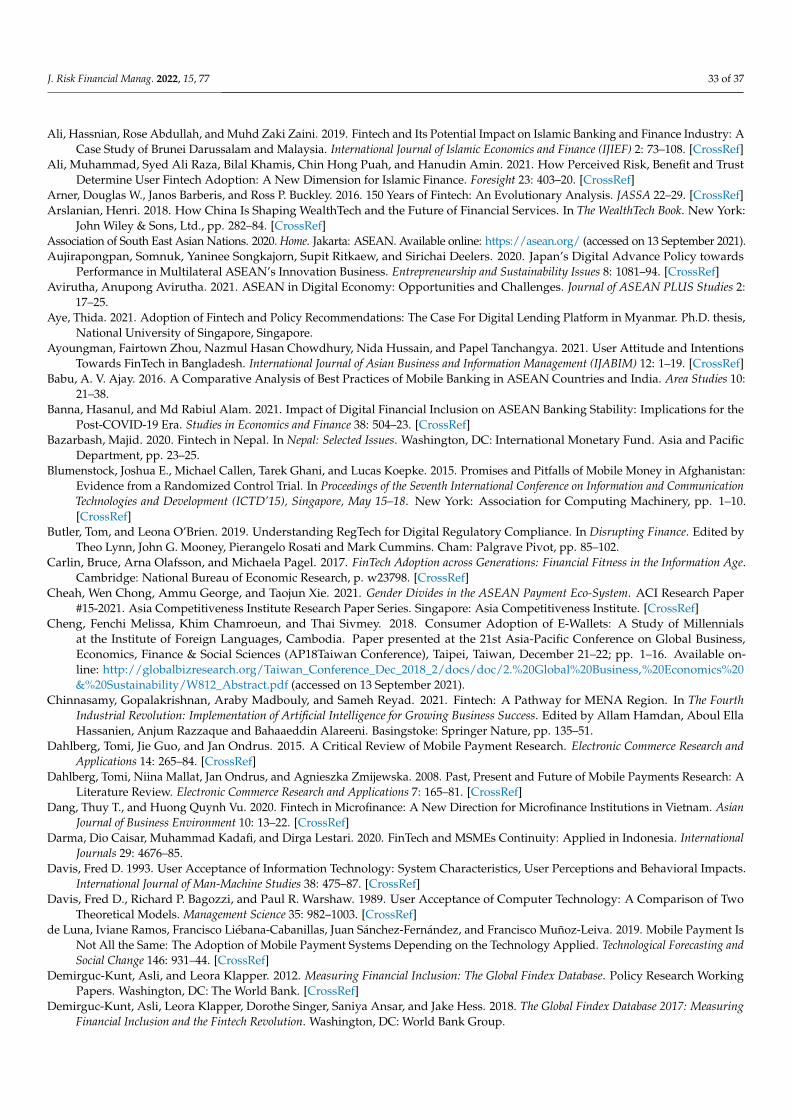
J. Risk Financial Manag. 2022, 15, 77 33 of 37
Ali, Hassnian, Rose Abdullah, and Muhd Zaki Zaini. 2019. Fintech and Its Potential Impact on Islamic Banking and Finance Industry: ACase Study of Brunei Darussalam and Malaysia. International Journal of Islamic Economics and Finance (IJIEF) 2: 73–108. [CrossRef]
Ali, Muhammad, Syed Ali Raza, Bilal Khamis, Chin Hong Puah, and Hanudin Amin. 2021. How Perceived Risk, Benefit and TrustDetermine User Fintech Adoption: A New Dimension for Islamic Finance. Foresight 23: 403–20. [CrossRef]
Arner, Douglas W., Janos Barberis, and Ross P. Buckley. 2016. 150 Years of Fintech: An Evolutionary Analysis. JASSA 22–29. [CrossRef]Arslanian, Henri. 2018. How China Is Shaping WealthTech and the Future of Financial Services. In The WealthTech Book. New York:
John Wiley & Sons, Ltd., pp. 282–84. [CrossRef]Association of South East Asian Nations. 2020. Home. Jakarta: ASEAN. Available online: https://asean.org/ (accessed on 13 September 2021).Aujirapongpan, Somnuk, Yaninee Songkajorn, Supit Ritkaew, and Sirichai Deelers. 2020. Japan’s Digital Advance Policy towards
Performance in Multilateral ASEAN’s Innovation Business. Entrepreneurship and Sustainability Issues 8: 1081–94. [CrossRef]Avirutha, Anupong Avirutha. 2021. ASEAN in Digital Economy: Opportunities and Challenges. Journal of ASEAN PLUS Studies 2:
17–25.Aye, Thida. 2021. Adoption of Fintech and Policy Recommendations: The Case For Digital Lending Platform in Myanmar. Ph.D. thesis,
National University of Singapore, Singapore.Ayoungman, Fairtown Zhou, Nazmul Hasan Chowdhury, Nida Hussain, and Papel Tanchangya. 2021. User Attitude and Intentions
Towards FinTech in Bangladesh. International Journal of Asian Business and Information Management (IJABIM) 12: 1–19. [CrossRef]Babu, A. V. Ajay. 2016. A Comparative Analysis of Best Practices of Mobile Banking in ASEAN Countries and India. Area Studies 10:
21–38.Banna, Hasanul, and Md Rabiul Alam. 2021. Impact of Digital Financial Inclusion on ASEAN Banking Stability: Implications for the
Post-COVID-19 Era. Studies in Economics and Finance 38: 504–23. [CrossRef]Bazarbash, Majid. 2020. Fintech in Nepal. In Nepal: Selected Issues. Washington, DC: International Monetary Fund. Asia and Pacific
Department, pp. 23–25.Blumenstock, Joshua E., Michael Callen, Tarek Ghani, and Lucas Koepke. 2015. Promises and Pitfalls of Mobile Money in Afghanistan:
Evidence from a Randomized Control Trial. In Proceedings of the Seventh International Conference on Information and CommunicationTechnologies and Development (ICTD’15), Singapore, May 15–18. New York: Association for Computing Machinery, pp. 1–10.[CrossRef]
Butler, Tom, and Leona O’Brien. 2019. Understanding RegTech for Digital Regulatory Compliance. In Disrupting Finance. Edited byTheo Lynn, John G. Mooney, Pierangelo Rosati and Mark Cummins. Cham: Palgrave Pivot, pp. 85–102.
Carlin, Bruce, Arna Olafsson, and Michaela Pagel. 2017. FinTech Adoption across Generations: Financial Fitness in the Information Age.Cambridge: National Bureau of Economic Research, p. w23798. [CrossRef]
Cheah, Wen Chong, Ammu George, and Taojun Xie. 2021. Gender Divides in the ASEAN Payment Eco-System. ACI Research Paper#15-2021. Asia Competitiveness Institute Research Paper Series. Singapore: Asia Competitiveness Institute. [CrossRef]
Cheng, Fenchi Melissa, Khim Chamroeun, and Thai Sivmey. 2018. Consumer Adoption of E-Wallets: A Study of Millennialsat the Institute of Foreign Languages, Cambodia. Paper presented at the 21st Asia-Pacific Conference on Global Business,Economics, Finance & Social Sciences (AP18Taiwan Conference), Taipei, Taiwan, December 21–22; pp. 1–16. Available on-line: http://globalbizresearch.org/Taiwan_Conference_Dec_2018_2/docs/doc/2.%20Global%20Business,%20Economics%20&%20Sustainability/W812_Abstract.pdf (accessed on 13 September 2021).
Chinnasamy, Gopalakrishnan, Araby Madbouly, and Sameh Reyad. 2021. Fintech: A Pathway for MENA Region. In The FourthIndustrial Revolution: Implementation of Artificial Intelligence for Growing Business Success. Edited by Allam Hamdan, Aboul EllaHassanien, Anjum Razzaque and Bahaaeddin Alareeni. Basingstoke: Springer Nature, pp. 135–51.
Dahlberg, Tomi, Jie Guo, and Jan Ondrus. 2015. A Critical Review of Mobile Payment Research. Electronic Commerce Research andApplications 14: 265–84. [CrossRef]
Dahlberg, Tomi, Niina Mallat, Jan Ondrus, and Agnieszka Zmijewska. 2008. Past, Present and Future of Mobile Payments Research: ALiterature Review. Electronic Commerce Research and Applications 7: 165–81. [CrossRef]
Dang, Thuy T., and Huong Quynh Vu. 2020. Fintech in Microfinance: A New Direction for Microfinance Institutions in Vietnam. AsianJournal of Business Environment 10: 13–22. [CrossRef]
Darma, Dio Caisar, Muhammad Kadafi, and Dirga Lestari. 2020. FinTech and MSMEs Continuity: Applied in Indonesia. InternationalJournals 29: 4676–85.
Davis, Fred D. 1993. User Acceptance of Information Technology: System Characteristics, User Perceptions and Behavioral Impacts.International Journal of Man-Machine Studies 38: 475–87. [CrossRef]
Davis, Fred D., Richard P. Bagozzi, and Paul R. Warshaw. 1989. User Acceptance of Computer Technology: A Comparison of TwoTheoretical Models. Management Science 35: 982–1003. [CrossRef]
de Luna, Iviane Ramos, Francisco Liébana-Cabanillas, Juan Sánchez-Fernández, and Francisco Muñoz-Leiva. 2019. Mobile Payment IsNot All the Same: The Adoption of Mobile Payment Systems Depending on the Technology Applied. Technological Forecasting andSocial Change 146: 931–44. [CrossRef]
Demirguc-Kunt, Asli, and Leora Klapper. 2012. Measuring Financial Inclusion: The Global Findex Database. Policy Research WorkingPapers. Washington, DC: The World Bank. [CrossRef]
Demirguc-Kunt, Asli, Leora Klapper, Dorothe Singer, Saniya Ansar, and Jake Hess. 2018. The Global Findex Database 2017: MeasuringFinancial Inclusion and the Fintech Revolution. Washington, DC: World Bank Group.
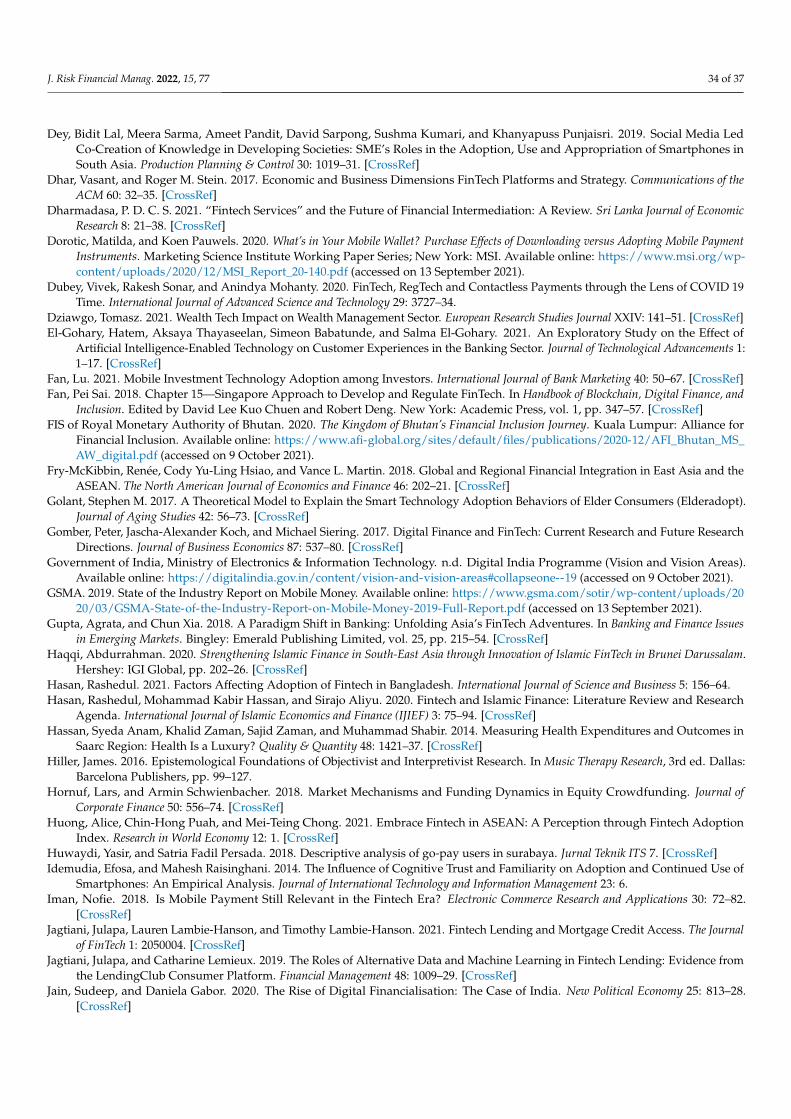
J. Risk Financial Manag. 2022, 15, 77 34 of 37
Dey, Bidit Lal, Meera Sarma, Ameet Pandit, David Sarpong, Sushma Kumari, and Khanyapuss Punjaisri. 2019. Social Media LedCo-Creation of Knowledge in Developing Societies: SME’s Roles in the Adoption, Use and Appropriation of Smartphones inSouth Asia. Production Planning & Control 30: 1019–31. [CrossRef]
Dhar, Vasant, and Roger M. Stein. 2017. Economic and Business Dimensions FinTech Platforms and Strategy. Communications of theACM 60: 32–35. [CrossRef]
Dharmadasa, P. D. C. S. 2021. “Fintech Services” and the Future of Financial Intermediation: A Review. Sri Lanka Journal of EconomicResearch 8: 21–38. [CrossRef]
Dorotic, Matilda, and Koen Pauwels. 2020. What’s in Your Mobile Wallet? Purchase Effects of Downloading versus Adopting Mobile PaymentInstruments. Marketing Science Institute Working Paper Series; New York: MSI. Available online: https://www.msi.org/wp-content/uploads/2020/12/MSI_Report_20-140.pdf (accessed on 13 September 2021).
Dubey, Vivek, Rakesh Sonar, and Anindya Mohanty. 2020. FinTech, RegTech and Contactless Payments through the Lens of COVID 19Time. International Journal of Advanced Science and Technology 29: 3727–34.
Dziawgo, Tomasz. 2021. Wealth Tech Impact on Wealth Management Sector. European Research Studies Journal XXIV: 141–51. [CrossRef]El-Gohary, Hatem, Aksaya Thayaseelan, Simeon Babatunde, and Salma El-Gohary. 2021. An Exploratory Study on the Effect of
Artificial Intelligence-Enabled Technology on Customer Experiences in the Banking Sector. Journal of Technological Advancements 1:1–17. [CrossRef]
Fan, Lu. 2021. Mobile Investment Technology Adoption among Investors. International Journal of Bank Marketing 40: 50–67. [CrossRef]Fan, Pei Sai. 2018. Chapter 15—Singapore Approach to Develop and Regulate FinTech. In Handbook of Blockchain, Digital Finance, and
Inclusion. Edited by David Lee Kuo Chuen and Robert Deng. New York: Academic Press, vol. 1, pp. 347–57. [CrossRef]FIS of Royal Monetary Authority of Bhutan. 2020. The Kingdom of Bhutan’s Financial Inclusion Journey. Kuala Lumpur: Alliance for
Financial Inclusion. Available online: https://www.afi-global.org/sites/default/files/publications/2020-12/AFI_Bhutan_MS_AW_digital.pdf (accessed on 9 October 2021).
Fry-McKibbin, Renée, Cody Yu-Ling Hsiao, and Vance L. Martin. 2018. Global and Regional Financial Integration in East Asia and theASEAN. The North American Journal of Economics and Finance 46: 202–21. [CrossRef]
Golant, Stephen M. 2017. A Theoretical Model to Explain the Smart Technology Adoption Behaviors of Elder Consumers (Elderadopt).Journal of Aging Studies 42: 56–73. [CrossRef]
Gomber, Peter, Jascha-Alexander Koch, and Michael Siering. 2017. Digital Finance and FinTech: Current Research and Future ResearchDirections. Journal of Business Economics 87: 537–80. [CrossRef]
Government of India, Ministry of Electronics & Information Technology. n.d. Digital India Programme (Vision and Vision Areas).Available online: https://digitalindia.gov.in/content/vision-and-vision-areas#collapseone--19 (accessed on 9 October 2021).
GSMA. 2019. State of the Industry Report on Mobile Money. Available online: https://www.gsma.com/sotir/wp-content/uploads/2020/03/GSMA-State-of-the-Industry-Report-on-Mobile-Money-2019-Full-Report.pdf (accessed on 13 September 2021).
Gupta, Agrata, and Chun Xia. 2018. A Paradigm Shift in Banking: Unfolding Asia’s FinTech Adventures. In Banking and Finance Issuesin Emerging Markets. Bingley: Emerald Publishing Limited, vol. 25, pp. 215–54. [CrossRef]
Haqqi, Abdurrahman. 2020. Strengthening Islamic Finance in South-East Asia through Innovation of Islamic FinTech in Brunei Darussalam.Hershey: IGI Global, pp. 202–26. [CrossRef]
Hasan, Rashedul. 2021. Factors Affecting Adoption of Fintech in Bangladesh. International Journal of Science and Business 5: 156–64.Hasan, Rashedul, Mohammad Kabir Hassan, and Sirajo Aliyu. 2020. Fintech and Islamic Finance: Literature Review and Research
Agenda. International Journal of Islamic Economics and Finance (IJIEF) 3: 75–94. [CrossRef]Hassan, Syeda Anam, Khalid Zaman, Sajid Zaman, and Muhammad Shabir. 2014. Measuring Health Expenditures and Outcomes in
Saarc Region: Health Is a Luxury? Quality & Quantity 48: 1421–37. [CrossRef]Hiller, James. 2016. Epistemological Foundations of Objectivist and Interpretivist Research. In Music Therapy Research, 3rd ed. Dallas:
Barcelona Publishers, pp. 99–127.Hornuf, Lars, and Armin Schwienbacher. 2018. Market Mechanisms and Funding Dynamics in Equity Crowdfunding. Journal of
Corporate Finance 50: 556–74. [CrossRef]Huong, Alice, Chin-Hong Puah, and Mei-Teing Chong. 2021. Embrace Fintech in ASEAN: A Perception through Fintech Adoption
Index. Research in World Economy 12: 1. [CrossRef]Huwaydi, Yasir, and Satria Fadil Persada. 2018. Descriptive analysis of go-pay users in surabaya. Jurnal Teknik ITS 7. [CrossRef]Idemudia, Efosa, and Mahesh Raisinghani. 2014. The Influence of Cognitive Trust and Familiarity on Adoption and Continued Use of
Smartphones: An Empirical Analysis. Journal of International Technology and Information Management 23: 6.Iman, Nofie. 2018. Is Mobile Payment Still Relevant in the Fintech Era? Electronic Commerce Research and Applications 30: 72–82.
[CrossRef]Jagtiani, Julapa, Lauren Lambie-Hanson, and Timothy Lambie-Hanson. 2021. Fintech Lending and Mortgage Credit Access. The Journal
of FinTech 1: 2050004. [CrossRef]Jagtiani, Julapa, and Catharine Lemieux. 2019. The Roles of Alternative Data and Machine Learning in Fintech Lending: Evidence from
the LendingClub Consumer Platform. Financial Management 48: 1009–29. [CrossRef]Jain, Sudeep, and Daniela Gabor. 2020. The Rise of Digital Financialisation: The Case of India. New Political Economy 25: 813–28.
[CrossRef]
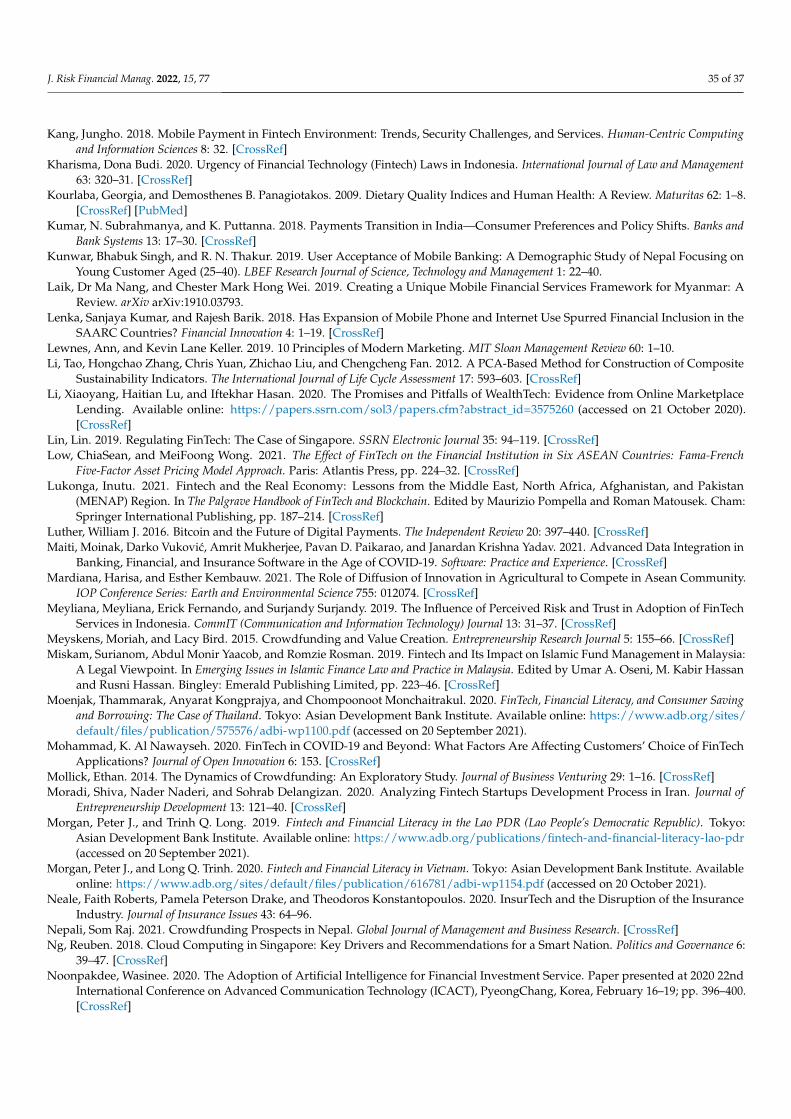
J. Risk Financial Manag. 2022, 15, 77 35 of 37
Kang, Jungho. 2018. Mobile Payment in Fintech Environment: Trends, Security Challenges, and Services. Human-Centric Computingand Information Sciences 8: 32. [CrossRef]
Kharisma, Dona Budi. 2020. Urgency of Financial Technology (Fintech) Laws in Indonesia. International Journal of Law and Management63: 320–31. [CrossRef]
Kourlaba, Georgia, and Demosthenes B. Panagiotakos. 2009. Dietary Quality Indices and Human Health: A Review. Maturitas 62: 1–8.[CrossRef] [PubMed]
Kumar, N. Subrahmanya, and K. Puttanna. 2018. Payments Transition in India—Consumer Preferences and Policy Shifts. Banks andBank Systems 13: 17–30. [CrossRef]
Kunwar, Bhabuk Singh, and R. N. Thakur. 2019. User Acceptance of Mobile Banking: A Demographic Study of Nepal Focusing onYoung Customer Aged (25–40). LBEF Research Journal of Science, Technology and Management 1: 22–40.
Laik, Dr Ma Nang, and Chester Mark Hong Wei. 2019. Creating a Unique Mobile Financial Services Framework for Myanmar: AReview. arXiv arXiv:1910.03793.
Lenka, Sanjaya Kumar, and Rajesh Barik. 2018. Has Expansion of Mobile Phone and Internet Use Spurred Financial Inclusion in theSAARC Countries? Financial Innovation 4: 1–19. [CrossRef]
Lewnes, Ann, and Kevin Lane Keller. 2019. 10 Principles of Modern Marketing. MIT Sloan Management Review 60: 1–10.Li, Tao, Hongchao Zhang, Chris Yuan, Zhichao Liu, and Chengcheng Fan. 2012. A PCA-Based Method for Construction of Composite
Sustainability Indicators. The International Journal of Life Cycle Assessment 17: 593–603. [CrossRef]Li, Xiaoyang, Haitian Lu, and Iftekhar Hasan. 2020. The Promises and Pitfalls of WealthTech: Evidence from Online Marketplace
Lending. Available online: https://papers.ssrn.com/sol3/papers.cfm?abstract_id=3575260 (accessed on 21 October 2020).[CrossRef]
Lin, Lin. 2019. Regulating FinTech: The Case of Singapore. SSRN Electronic Journal 35: 94–119. [CrossRef]Low, ChiaSean, and MeiFoong Wong. 2021. The Effect of FinTech on the Financial Institution in Six ASEAN Countries: Fama-French
Five-Factor Asset Pricing Model Approach. Paris: Atlantis Press, pp. 224–32. [CrossRef]Lukonga, Inutu. 2021. Fintech and the Real Economy: Lessons from the Middle East, North Africa, Afghanistan, and Pakistan
(MENAP) Region. In The Palgrave Handbook of FinTech and Blockchain. Edited by Maurizio Pompella and Roman Matousek. Cham:Springer International Publishing, pp. 187–214. [CrossRef]
Luther, William J. 2016. Bitcoin and the Future of Digital Payments. The Independent Review 20: 397–440. [CrossRef]Maiti, Moinak, Darko Vukovic, Amrit Mukherjee, Pavan D. Paikarao, and Janardan Krishna Yadav. 2021. Advanced Data Integration in
Banking, Financial, and Insurance Software in the Age of COVID-19. Software: Practice and Experience. [CrossRef]Mardiana, Harisa, and Esther Kembauw. 2021. The Role of Diffusion of Innovation in Agricultural to Compete in Asean Community.
IOP Conference Series: Earth and Environmental Science 755: 012074. [CrossRef]Meyliana, Meyliana, Erick Fernando, and Surjandy Surjandy. 2019. The Influence of Perceived Risk and Trust in Adoption of FinTech
Services in Indonesia. CommIT (Communication and Information Technology) Journal 13: 31–37. [CrossRef]Meyskens, Moriah, and Lacy Bird. 2015. Crowdfunding and Value Creation. Entrepreneurship Research Journal 5: 155–66. [CrossRef]Miskam, Surianom, Abdul Monir Yaacob, and Romzie Rosman. 2019. Fintech and Its Impact on Islamic Fund Management in Malaysia:
A Legal Viewpoint. In Emerging Issues in Islamic Finance Law and Practice in Malaysia. Edited by Umar A. Oseni, M. Kabir Hassanand Rusni Hassan. Bingley: Emerald Publishing Limited, pp. 223–46. [CrossRef]
Moenjak, Thammarak, Anyarat Kongprajya, and Chompoonoot Monchaitrakul. 2020. FinTech, Financial Literacy, and Consumer Savingand Borrowing: The Case of Thailand. Tokyo: Asian Development Bank Institute. Available online: https://www.adb.org/sites/default/files/publication/575576/adbi-wp1100.pdf (accessed on 20 September 2021).
Mohammad, K. Al Nawayseh. 2020. FinTech in COVID-19 and Beyond: What Factors Are Affecting Customers’ Choice of FinTechApplications? Journal of Open Innovation 6: 153. [CrossRef]
Mollick, Ethan. 2014. The Dynamics of Crowdfunding: An Exploratory Study. Journal of Business Venturing 29: 1–16. [CrossRef]Moradi, Shiva, Nader Naderi, and Sohrab Delangizan. 2020. Analyzing Fintech Startups Development Process in Iran. Journal of
Entrepreneurship Development 13: 121–40. [CrossRef]Morgan, Peter J., and Trinh Q. Long. 2019. Fintech and Financial Literacy in the Lao PDR (Lao People’s Democratic Republic). Tokyo:
Asian Development Bank Institute. Available online: https://www.adb.org/publications/fintech-and-financial-literacy-lao-pdr(accessed on 20 September 2021).
Morgan, Peter J., and Long Q. Trinh. 2020. Fintech and Financial Literacy in Vietnam. Tokyo: Asian Development Bank Institute. Availableonline: https://www.adb.org/sites/default/files/publication/616781/adbi-wp1154.pdf (accessed on 20 October 2021).
Neale, Faith Roberts, Pamela Peterson Drake, and Theodoros Konstantopoulos. 2020. InsurTech and the Disruption of the InsuranceIndustry. Journal of Insurance Issues 43: 64–96.
Nepali, Som Raj. 2021. Crowdfunding Prospects in Nepal. Global Journal of Management and Business Research. [CrossRef]Ng, Reuben. 2018. Cloud Computing in Singapore: Key Drivers and Recommendations for a Smart Nation. Politics and Governance 6:
39–47. [CrossRef]Noonpakdee, Wasinee. 2020. The Adoption of Artificial Intelligence for Financial Investment Service. Paper presented at 2020 22nd
International Conference on Advanced Communication Technology (ICACT), PyeongChang, Korea, February 16–19; pp. 396–400.[CrossRef]
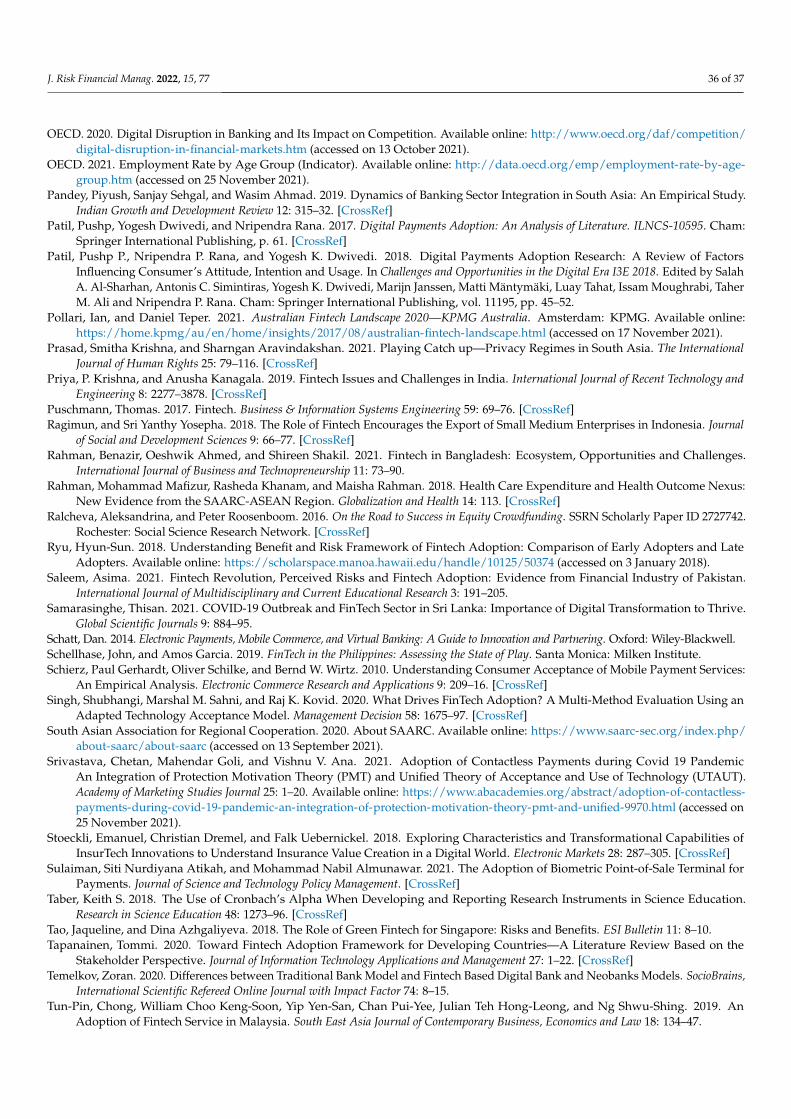
J. Risk Financial Manag. 2022, 15, 77 36 of 37
OECD. 2020. Digital Disruption in Banking and Its Impact on Competition. Available online: http://www.oecd.org/daf/competition/digital-disruption-in-financial-markets.htm (accessed on 13 October 2021).
OECD. 2021. Employment Rate by Age Group (Indicator). Available online: http://data.oecd.org/emp/employment-rate-by-age-group.htm (accessed on 25 November 2021).
Pandey, Piyush, Sanjay Sehgal, and Wasim Ahmad. 2019. Dynamics of Banking Sector Integration in South Asia: An Empirical Study.Indian Growth and Development Review 12: 315–32. [CrossRef]
Patil, Pushp, Yogesh Dwivedi, and Nripendra Rana. 2017. Digital Payments Adoption: An Analysis of Literature. ILNCS-10595. Cham:Springer International Publishing, p. 61. [CrossRef]
Patil, Pushp P., Nripendra P. Rana, and Yogesh K. Dwivedi. 2018. Digital Payments Adoption Research: A Review of FactorsInfluencing Consumer’s Attitude, Intention and Usage. In Challenges and Opportunities in the Digital Era I3E 2018. Edited by SalahA. Al-Sharhan, Antonis C. Simintiras, Yogesh K. Dwivedi, Marijn Janssen, Matti Mäntymäki, Luay Tahat, Issam Moughrabi, TaherM. Ali and Nripendra P. Rana. Cham: Springer International Publishing, vol. 11195, pp. 45–52.
Pollari, Ian, and Daniel Teper. 2021. Australian Fintech Landscape 2020—KPMG Australia. Amsterdam: KPMG. Available online:https://home.kpmg/au/en/home/insights/2017/08/australian-fintech-landscape.html (accessed on 17 November 2021).
Prasad, Smitha Krishna, and Sharngan Aravindakshan. 2021. Playing Catch up—Privacy Regimes in South Asia. The InternationalJournal of Human Rights 25: 79–116. [CrossRef]
Priya, P. Krishna, and Anusha Kanagala. 2019. Fintech Issues and Challenges in India. International Journal of Recent Technology andEngineering 8: 2277–3878. [CrossRef]
Puschmann, Thomas. 2017. Fintech. Business & Information Systems Engineering 59: 69–76. [CrossRef]Ragimun, and Sri Yanthy Yosepha. 2018. The Role of Fintech Encourages the Export of Small Medium Enterprises in Indonesia. Journal
of Social and Development Sciences 9: 66–77. [CrossRef]Rahman, Benazir, Oeshwik Ahmed, and Shireen Shakil. 2021. Fintech in Bangladesh: Ecosystem, Opportunities and Challenges.
International Journal of Business and Technopreneurship 11: 73–90.Rahman, Mohammad Mafizur, Rasheda Khanam, and Maisha Rahman. 2018. Health Care Expenditure and Health Outcome Nexus:
New Evidence from the SAARC-ASEAN Region. Globalization and Health 14: 113. [CrossRef]Ralcheva, Aleksandrina, and Peter Roosenboom. 2016. On the Road to Success in Equity Crowdfunding. SSRN Scholarly Paper ID 2727742.
Rochester: Social Science Research Network. [CrossRef]Ryu, Hyun-Sun. 2018. Understanding Benefit and Risk Framework of Fintech Adoption: Comparison of Early Adopters and Late
Adopters. Available online: https://scholarspace.manoa.hawaii.edu/handle/10125/50374 (accessed on 3 January 2018).Saleem, Asima. 2021. Fintech Revolution, Perceived Risks and Fintech Adoption: Evidence from Financial Industry of Pakistan.
International Journal of Multidisciplinary and Current Educational Research 3: 191–205.Samarasinghe, Thisan. 2021. COVID-19 Outbreak and FinTech Sector in Sri Lanka: Importance of Digital Transformation to Thrive.
Global Scientific Journals 9: 884–95.Schatt, Dan. 2014. Electronic Payments, Mobile Commerce, and Virtual Banking: A Guide to Innovation and Partnering. Oxford: Wiley-Blackwell.Schellhase, John, and Amos Garcia. 2019. FinTech in the Philippines: Assessing the State of Play. Santa Monica: Milken Institute.Schierz, Paul Gerhardt, Oliver Schilke, and Bernd W. Wirtz. 2010. Understanding Consumer Acceptance of Mobile Payment Services:
An Empirical Analysis. Electronic Commerce Research and Applications 9: 209–16. [CrossRef]Singh, Shubhangi, Marshal M. Sahni, and Raj K. Kovid. 2020. What Drives FinTech Adoption? A Multi-Method Evaluation Using an
Adapted Technology Acceptance Model. Management Decision 58: 1675–97. [CrossRef]South Asian Association for Regional Cooperation. 2020. About SAARC. Available online: https://www.saarc-sec.org/index.php/
about-saarc/about-saarc (accessed on 13 September 2021).Srivastava, Chetan, Mahendar Goli, and Vishnu V. Ana. 2021. Adoption of Contactless Payments during Covid 19 Pandemic
An Integration of Protection Motivation Theory (PMT) and Unified Theory of Acceptance and Use of Technology (UTAUT).Academy of Marketing Studies Journal 25: 1–20. Available online: https://www.abacademies.org/abstract/adoption-of-contactless-payments-during-covid-19-pandemic-an-integration-of-protection-motivation-theory-pmt-and-unified-9970.html (accessed on25 November 2021).
Stoeckli, Emanuel, Christian Dremel, and Falk Uebernickel. 2018. Exploring Characteristics and Transformational Capabilities ofInsurTech Innovations to Understand Insurance Value Creation in a Digital World. Electronic Markets 28: 287–305. [CrossRef]
Sulaiman, Siti Nurdiyana Atikah, and Mohammad Nabil Almunawar. 2021. The Adoption of Biometric Point-of-Sale Terminal forPayments. Journal of Science and Technology Policy Management. [CrossRef]
Taber, Keith S. 2018. The Use of Cronbach’s Alpha When Developing and Reporting Research Instruments in Science Education.Research in Science Education 48: 1273–96. [CrossRef]
Tao, Jaqueline, and Dina Azhgaliyeva. 2018. The Role of Green Fintech for Singapore: Risks and Benefits. ESI Bulletin 11: 8–10.Tapanainen, Tommi. 2020. Toward Fintech Adoption Framework for Developing Countries—A Literature Review Based on the
Stakeholder Perspective. Journal of Information Technology Applications and Management 27: 1–22. [CrossRef]Temelkov, Zoran. 2020. Differences between Traditional Bank Model and Fintech Based Digital Bank and Neobanks Models. SocioBrains,
International Scientific Refereed Online Journal with Impact Factor 74: 8–15.Tun-Pin, Chong, William Choo Keng-Soon, Yip Yen-San, Chan Pui-Yee, Julian Teh Hong-Leong, and Ng Shwu-Shing. 2019. An
Adoption of Fintech Service in Malaysia. South East Asia Journal of Contemporary Business, Economics and Law 18: 134–47.
J. Risk Financial Manag. 2022, 15, 77 37 of 37
Ullah, A. K. M. Ahsan, and Hannah Ming Yit Ho. 2021. Globalisation and Cultures in Southeast Asia: Demise, Fragmentation,Transformation. Global Society 35: 191–206. [CrossRef]
Van Minh, Hoang, Nicola Suyin Pocock, Nathorn Chaiyakunapruk, Chhea Chhorvann, Ha Anh Duc, Piya Hanvoravongchai, JeremyLim, Don Eliseo Lucero-Prisno III, Nawi Ng, Natalie Phaholyothin, and et al. 2015. Progress toward Universal Health Coveragein ASEAN. Global Health Action 8: 25856. [CrossRef] [PubMed]
Vidyashree, S. 2021. Bhutan Becomes First Country to Adopt India’s Unified Payment Interface (UPI). RepublicWorld. July 14.Available online: https://www.republicworld.com/world-news/rest-of-the-world-news/bhutan-becomes-first-country-to-adopt-indias-unified-payment-interface-upi-fin-min.html (accessed on 17 November 2021).
Widyastuti, Nurprapti Wahyu. 2017. Embedded Social Media and Its Implications for the Readiness of Sme’s in Asean EconomicCommunity Free Trade. Paper presented at the 1st International Conference on Social Sciences (ICSS), Jakarta, Indonesia,November 1–2.
World Bank. 2018a. The Global Findex Database 2017. Washington, DC: World Bank. Available online: https://globalfindex.worldbank.org/ (accessed on 13 September 2021).
World Bank. 2018b. World—Global Financial Inclusion (Global Findex) Database 2017. Washington, DC: Development Research Group,Finance and Private Sector Development Unit—World Bank. Available online: https://microdata.worldbank.org/index.php/catalog/3324/data-dictionary (accessed on 13 September 2021).
Yang, Yongqing, Yong Liu, Hongxiu Li, and Benhai Yu. 2015. Understanding Perceived Risks in Mobile Payment Acceptance. IndustrialManagement & Data Systems 115: 253–69. [CrossRef]
Yunus, Ulani. 2019. A Comparison Peer to Peer Lending Platforms in Singapore and Indonesia. Journal of Physics: Conference Series 1235:012008. [CrossRef]
Zahir, Mihna, and Behrooz Gharleghi. 2014. Adoption of Internet Banking in Maldives, the Most Important Determinants. Asian SocialScience 11: 181. [CrossRef]
Zhang, Tiantian, and Kent Matthews. 2019. Assessing the Degree of Financial Integration in ASEAN—A Perspective of BankingCompetitiveness. Research in International Business and Finance 47: 487–500. [CrossRef]
Zhang, Xun, Ying Tan, Zonghui Hu, Chen Wang, and Guanghua Wan. 2020. The Trickle-down Effect of Fintech Development: Fromthe Perspective of Urbanization. China & World Economy 28: 23–40. [CrossRef]
Zia, Uzma, and Zafar Mahmood. 2019. Tests of Income Convergence in ASEAN and SAARC Trading Blocs. South Asia Economic Journal20: 167–83. [CrossRef]