operations at risk: 2006 : findings from a survey of enterprise risk in australia and new zealand
TRANSCRIPT
�������������� ����
���������������
����Operations at Risk: 2006Findings from a Survey ofEnterprise Risk in Australiaand New Zealand Clive SmallmanSukihbir Sandhu
Research Report No. 292February 2007

Research to improve decisions and outcomes in agribusiness, resource, environmental, and social issues.
The Agribusiness and Economics Research Unit (AERU) operates from Lincoln University providing research expertise for a wide range of organisations. AERU research focuses on agribusiness, resource, environment, and social issues. Founded as the Agricultural Economics Research Unit in 1962 the AERU has evolved to become an independent, major source of business and economic research expertise. The Agribusiness and Economics Research Unit (AERU) has four main areas of focus. These areas are trade and environment; economic development; non-market valuation, and social research. Research clients include Government Departments, both within New Zealand and from other countries, international agencies, New Zealand companies and organisations, individuals and farmers. Two publication series are supported from the AERU Research Reports and Discussion Papers.
DISCLAIMER While every effort has been made to ensure that the information herein is accurate, the AERU does not accept any liability for error of fact or opinion which may be present, nor for the consequences of any decision based on this information. A summary of AERU Research Reports, beginning with #235, are available at the AERU website www.lincoln.ac.nz/aeru Printed copies of AERU Research Reports are available from the Secretary. Information contained in AERU Research Reports may be reproduced, providing credit is given and a copy of the reproduced text is sent to the AERU.

Operations at Risk: 2006
Findings from a Survey of Enterprise Risk in Australia and New Zealand
Clive Smallman Sukhbir Sandhu
February 2007
Research Report No. 292
Agribusiness and Economics Research Unit PO Box 84
Lincoln University Lincoln 7647 New Zealand
Ph: (64)(3) 325-3604 Fax: (64)(3) 325-3679 www.lincoln.ac.nz/aeru
ISSN 1170-7682
ISBN 0-909042-78-0


Contents
LIST OF TABLES ....................................................................................................................I
LIST OF FIGURES ..................................................................................................................I
ACKNOWLEDGEMENTS.................................................................................................. III
EXECUTIVE SUMMARY..................................................................................................... V
CHAPTER 1 INTRODUCTION .......................................................................................... 1 1.1 Background ............................................................................................................. 1 1.2 Research objectives ................................................................................................. 2
CHAPTER 2 SURVEY METHOD....................................................................................... 3 2.1 Research framework................................................................................................ 3
CHAPTER 3 FINDINGS: BUSINESS RISK IN AUSTRALIA ........................................ 5 3.1 Demographics.......................................................................................................... 5 3.2 Perceived enterprise risk ......................................................................................... 7 3.3 Risk policy............................................................................................................... 8 3.4 Risk management practice....................................................................................... 8
3.4.1 Risk monitoring.......................................................................................... 8 3.4.2 Responsibility for monitoring risk ........................................................... 11
3.5 Risk control ........................................................................................................... 12 3.5.1 Control systems’ ability ........................................................................... 12 3.5.2 Factors driving change in control systems ............................................... 13 3.5.3 Performance related practices .................................................................. 15
CHAPTER 4 FINDINGS: BUSINESS RISK IN NEW ZEALAND................................ 19 4.1 Demographics........................................................................................................ 19 4.2 Perceived enterprise risk ....................................................................................... 21 4.3 Risk policy............................................................................................................. 22 4.4 Risk management practice..................................................................................... 23
4.4.1 Risk monitoring........................................................................................ 23 4.5 Responsibility for monitoring risk ........................................................................ 25 4.6 Risk control ........................................................................................................... 26
4.6.1 Control systems’ ability ........................................................................... 26 4.6.2 Factors driving change in control systems ............................................... 28 4.6.3 Performance related practices .................................................................. 29
CHAPTER 5 BUSINESS RISKS IN AUSTRALIA AND NEW ZEALAND: A COMPARATIVE ANALYSIS .............................................................................................. 33
5.1 Australia and New Zealand: Comparable in Risk? ............................................... 33 5.2 Implications for the Practice of Risk Management ............................................... 33

REFERENCES....................................................................................................................... 35
APPENDIX A QUESTONNAIRE ITEMS AND SCALES.............................................. 37
APPENDIX B RESPONSE RATE CALCULATIONS .................................................... 38
i
List of Tables Table 1: Risk ranking by Australian respondents ...................................................................... 7 Table 2: Mean level of risk monitoring by Australian respondents ........................................... 9 Table 3: Risk ranking by New Zealand respondents................................................................ 21 Table 4: Mean level of risk monitoring by New Zealand respondents .................................... 24
List of Figures Figure 1: Enterprise risk survey framework............................................................................... 3 Figure 2: Industry groups of Australian respondents (percentage of total response)................. 5 Figure 3: Size distribution by number of employees of Australian respondents (percentage of total response) ............................................................................................................................ 6 Figure 4: Annual revenue (AU$m) distribution of Australian respondents (percentage of total response)..................................................................................................................................... 6 Figure 5: Occurrence of written risk management policies (Australian respondents) ............... 8 Figure 6: Rigour of risk monitoring by Australian respondents ................................................ 9 Figure 7: Responsibility for monitoring risk from Australian respondents ............................. 11 Figure 8: Confidence of Australian respondents in ability of control systems to manage risk 12 Figure 9: Satisfaction with performance of control system by Australian respondents........... 14 Figure 10: Factors driving changes in control systems - Australian respondents.................... 14 Figure 11: Vital practices and organizational performance (Australian respondents)............. 16 Figure 12: Goal satisfaction by control system (Australian respondents) ............................... 16 Figure 13: Industry groups of New Zealand respondents (percentage of total response)........ 19 Figure 14: Size distribution by number of employees of New Zealand respondents (percentage of total response) ...................................................................................................................... 20 Figure 15: Annual revenue (NZ$) distribution of New Zealand respondents (percentage of total response) .......................................................................................................................... 21 Figure 16: Occurrence of written risk management policies (New Zealand respondents) ...... 22 Figure 17: Rigour of risk monitoring by New Zealand respondents........................................ 23 Figure 18: Responsibility for monitoring risk from New Zealand respondents ...................... 25 Figure 19: Confidence of New Zealand respondents in ability of control systems to manage risk............................................................................................................................................ 27 Figure 20: Satisfaction with performance of control systems by New Zealand respondents .. 27 Figure 21: Factors driving changes in control systems (New Zealand respondents)............... 28 Figure 22: Vital practices and organizational performance (New Zealand respondents) ........ 29 Figure 23: Goal satisfaction by control system (New Zealand respondents)........................... 30

ii

iii
Acknowledgements The authors are grateful to Dr Mark Dibben for his initial contribution to this work, and to Lincoln University’s Commerce Division for funding Sukhbir’s contribution to this work, through a Summer Scholarship. We are also grateful to Professors Ross Cullen and Caroline Saunders for guidance on format and for reading earlier drafts.

iv

v
Executive Summary For more than a decade there has been a steady stream of events to support the thesis that we are now living in what has been termed the Risk Society. Outside of political instability and acts of terrorism and subsequent wars, we have seen a series of depressingly familiar high and low profile corporate failures. That these have all occurred is perhaps no surprise to those of us experienced in business or in the study of organizations. However, given the widespread interest in and upsurge in the use of risk management in organizations, it is distressing that events such as those surrounding Enron, the Australian Wheat Board, and Provincial Financial (NZ) still occur. What was not clear to the authors was exactly where Australia and New Zealand stood in terms of corporate confidence in enterprise risk management systems, and this report marks an attempt to offer an independent bench mark of risk management in the region. This survey of enterprise risk in Australia and New Zealand was undertaken in December 2005 and January 2006. It is based on a questionnaire developed out one of the authors’ earlier work in managerial perceptions of risk in Britain. 500 firms each in Australia and in New Zealand were surveyed. In Australia there was an effective response rate of 18 per cent, whilst in New Zealand the response rate was 22 per cent. Data have been analysed descriptively. Further analysis was used to identify underlying factors in the data sets. In Australia, 50 per cent of responding organisations were confident of being able to manage all potentially significant risks with their current management control systems. Credit risk was the most significant identified business hazard, followed by operational risks and exchange rate risks. Business risk, credit risk and exchange rate risk were the three most rigorously monitored risks. In a majority of the organisations, the responsibility for monitoring the risks lay at an organisational level, irrespective of the risk type. Credit risk and operational risk were the risks that a majority (56 per cent) of the respondents had a written and a communicated management policy on. 35 per cent of the respondents expressed great satisfaction with the routine provision of required tactical information for decision making at the customer service or production level. A further 38 per cent of the respondents were satisfied with this provision. 53 per cent of respondents had recently made substantial revisions to their organization’s performance control or evaluation systems. 68 per cent of the respondents planned to make revisions or further revision in the next 12 months. “Changes in customer needs” was regarded by 54 per cent of respondents as being very critical to the decision to revise the organisation’s performance control or evaluation systems. For Australian respondents, clear responsibility and authority was very vital to performance in the organisation and was therefore a very carefully managed practice. 45 per cent of respondents were satisfied that their current control environment’s was able to provide relevant internal financial information systems in a timely and accurate manner. In New Zealand 52 per cent of responding organisations were confident of being able to manage all potentially significant risks with their current management control systems. Operational risk was the most rigorously monitored and significant risk. Credit risk and exchange rate risk were the next most rigorously monitored risks respectively. In a majority of the organisations, the responsibility for monitoring the risks lay at an organisational level, irrespective of the risk type. Operational risk was the risk that the majority of the organisations (71 per cent) had a written and a communicated management policy on. This was followed by credit risk (57 per cent) and exchange rate risk (50 per cent). 77 per cent of respondents were satisfied that their control systems “routinely provide all required strategic information for decision making at the senior management or board level”. 58 per cent of the

vi
respondents had made substantial revisions to their organization’s performance control or evaluation systems, whilst 79 per cent planned to make revisions or further revision in the next 12 months. “Changes in customer needs” was regarded by 47 per cent of the respondents as being very critical to the decision of revision to the organisation’s performance control or evaluation systems. For New Zealand respondents, clear responsibility and authority was very vital to performance in the organisation and was therefore a carefully managed practice. 46 per cent of the respondents were satisfied with their current control environment’s ability to provide relevant internal financial information systems in a timely and accurate manner. The key message from the findings is that responsibility for risk management is too easily attributed to senior management, and that the corresponding tenet of good risk management – that risk is everybody’s concern – is not currently being followed.

1
Chapter 1 Introduction
1.1 Background Risk is amongst the oldest of all business issues, but nevertheless it is arguable that it remains perhaps the most enduring of all factors that managers must deal with on a daily or indeed more frequent basis. For more than a decade now there has been a steady stream of events to support the thesis that we are now living in what has been termed the Risk Society (Beck, 1992, 1999). Outside of political instability and acts of terrorism and subsequent wars, we have seen a series of depressingly familiar high and low profile corporate failures. That these have all occurred is perhaps no surprise to those of us experienced in business or in the study of organizations. However, given the widespread interest in and upsurge in the use of risk management in organizations (classically embodied in the development of the Australian and New Zealand Standard for Risk Management 9AS/NZS 4360: 2004), especially in the context of new corporate governance regulations, it is distressing that events such as those surrounding Enron, the Australian Wheat Board, and Provident Financial (NZ) still occur. Risk management lies at the centre of modern corporate governance practice and its management is practised daily by operational and financial managers alike. So too must front-line supervisors deal with health and safety risks on the production line, as must office managers. In other words risk is as endemic across business life, as it is in all human endeavours (Bernstein, 1996); yet what is it we are dealing with? “Enterprise risk” as such comprises any number of risks to enterprise, but these are generally allocated to one of six categories (Dowd, 1998, pp. 3-4):
• Business risks are risks that are specific to an industry or market in which an enterprise operates.
• Market risks are the risks of losses (or gains) arising from movements in market prices (e.g. equity prices) or rates (e.g. interest or exchange rates)
• Credit risks are the risks of loss arising from the failure of a counterparty to make a promised payment.
• Liquidity risks arising from the cost or inconvenience of ‘cashing-in’ a position or from inconsistent revenue flows.
• Operational risks arise from the failure of internal systems (systemic operational risk) or the people who operate them (behavioural operational risk).
• Legal risks arise from the prospects that contract may not be enforced. To these it is common to add (Economist Intelligence Unit and Arthur Andersen, 1995): regulatory risk, which is the risk arising from the enforcement of extant law or standards or the introduction new law or standard (related to the business and legal category); and country risk, which is the risk arising from operating in particular countries (a specific business risk). Of these categories, it is arguable that the best managed and most researched are market, credit, liquidity, and systemic operational risks. This is because the hazards with which most of these risks are associated readily lend themselves to quantitative analysis. Business, behavioural operational (Elliott, Letza, McGuinness, & Smallman, 2000; Smallman, 1999, 2000b, c) and legal risks are largely concerned with human behaviour (although this clearly plays a role in the

2
‘quantifiable’ categories). Risk and human behaviour, particularly in respect of decision making has the subject of considerable research effort, notably in psychology and in economics (Kahneman & Tversky, 1979), yet still poor or irrational decisions are made in business, operational or legal elements of enterprise. There are signs that we are beginning to better understand how professionals make decisions in natural situations (Klein, 1998), but these studies are at the moment largely restricted to emergency or military applications. The consequence of continuing examples of human error in managing business or operational risk, with concomitant legal consequences is that governments worldwide have turned to a mixture of regulation and the establishment of standards for risk management. The heightened regulation of corporate governance and the control of operational risk, particularly in the banking sector (Basel Committee on Banking Supervision, 2004), are inevitable consequences of corporate scandals and failure worldwide. Why is it that we have such an apparently dismal record in managing business and behavioural operational risk, especially when the patterns and symptoms of failure are well known (Stead & Smallman, 1999)? One of the great difficulties in managing enterprise risk is that in risk we are dealing largely with phenomena that are varying perceptions of individuals of the likelihood that a particular hazard will eventuate, and the impact of that event. In “managing risk” what we are actually doing is trying to mitigate (avoid, reduce, transfer or retain) the likelihood of occurrence or the impact of a hazardous event. Perhaps the most difficult aspect of this mitigation is that everybody’s reading of likelihood and impact of given hazard eventuating is different. Previous research has demonstrated that
“managers tend to focus upon a narrow band of [enterprise] risks, with a particular emphasis on a range of [business] risks and on those risks that arise from the processes of management. Managers display a reluctance to consider and act upon externally generated risks, and this …[has]…an impact upon their ability to generate comprehensive contingency plans. The picture of risk that emerges suggests that manager have a low opinion of their ability to intervene in decision-making with regard to risk, although there is a sense of reassurance that they have done all that they can. As a result, there is a sense in which responsibility for risk is attributed upward through level of the organization.”
(Smallman & Smith, 2003)
1.2 Research objectives The authors have yet to find any substantive independent and rigorous research of the nature of business risk in either Australia or New Zealand. Indeed, much of the research on business and operational risk mitigation in both countries focuses almost exclusively upon responding to the high profile natural hazards that are such a prominent feature of life in the Antipodes (e.g. bush fires in Australia; tsunami, flooding, earthquakes and volcanic eruptions in New Zealand). Other aspects of enterprise risk management are well-served in the economic and financial literatures worldwide. As is the case with the rest of the world, the risks posed by business and behavioural aspects of operations, seem to be poorly served by the research community and those tasked with allocating research funds. Consequently, in this research we focus in on key aspects of business and operational risk management (information and control), but in the context of wider enterprise risk issues. Hence, the objective of this research was to develop an independent view of the nature of enterprise risk and enterprise risk management in Australia and New Zealand through the eyes of practitioners.
3
Chapter 2 Survey Method
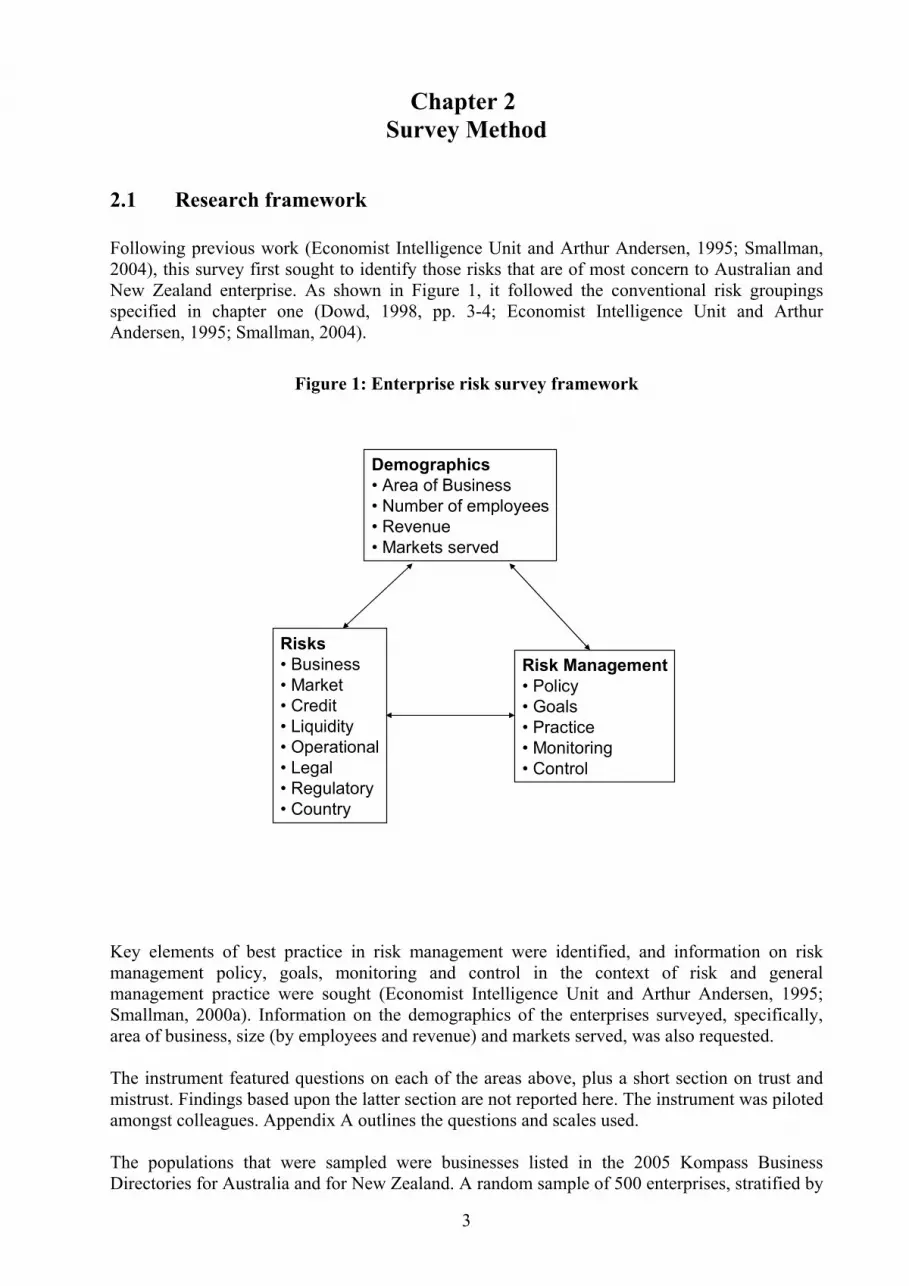
2.1 Research framework Following previous work (Economist Intelligence Unit and Arthur Andersen, 1995; Smallman, 2004), this survey first sought to identify those risks that are of most concern to Australian and New Zealand enterprise. As shown in Figure 1, it followed the conventional risk groupings specified in chapter one (Dowd, 1998, pp. 3-4; Economist Intelligence Unit and Arthur Andersen, 1995; Smallman, 2004).
Figure 1: Enterprise risk survey framework
Demographics• Area of Business• Number of employees• Revenue• Markets served
Risks• Business• Market• Credit• Liquidity• Operational• Legal• Regulatory• Country
Risk Management• Policy• Goals• Practice• Monitoring• Control
Key elements of best practice in risk management were identified, and information on risk management policy, goals, monitoring and control in the context of risk and general management practice were sought (Economist Intelligence Unit and Arthur Andersen, 1995; Smallman, 2000a). Information on the demographics of the enterprises surveyed, specifically, area of business, size (by employees and revenue) and markets served, was also requested. The instrument featured questions on each of the areas above, plus a short section on trust and mistrust. Findings based upon the latter section are not reported here. The instrument was piloted amongst colleagues. Appendix A outlines the questions and scales used. The populations that were sampled were businesses listed in the 2005 Kompass Business Directories for Australia and for New Zealand. A random sample of 500 enterprises, stratified by

4
enterprise size (number of employees), was drawn for each country. Key contacts in each enterprise (Chief Executive or equivalent) were identified and mailed a postcard advising them that the survey questionnaire would be following within the week. The questionnaire then followed with a response paid envelope. There were no further follow-ups. The New Zealand mailing took place in early December 2005 and the Australian mailing took place in late January 2006. Replies to both were received throughout January and February 2006. The response rate for Australia was 17.8 per cent. For New Zealand it was 21.8 per cent (see Appendix B for response rate calculations). The survey is representative in terms of enterprise distribution by size. This was exploratory research, and the responses were analysed using descriptive statistical techniques. Factor analysis was employed in selected areas in order to uncover latent factors in the responses.

5
Chapter 3 Findings: Business Risk in Australia
3.1 Demographics In the Australian sample, the largest proportion of respondents (see Figure 2) were from the manufacturing sector (41 per cent), followed by distribution and retail (12 per cent). Organisations whose main areas of business were agriculture, medical supplies, publishing and importing came next (six per cent each). Mining, finance and software were equally represented (three per cent each.). 15 per cent of the respondents did not specify their area of business.
Figure 2: Industry groups of Australian respondents (percentage of total response)
5.9
41.2
0
2.9
5.9
2.9
11.8
5.9
2.9
5.9
14.7
Agriculture
Manufacturing
Service
Mining
Medical
Finance
Distribution
Publishing
Software
Importers
Missing
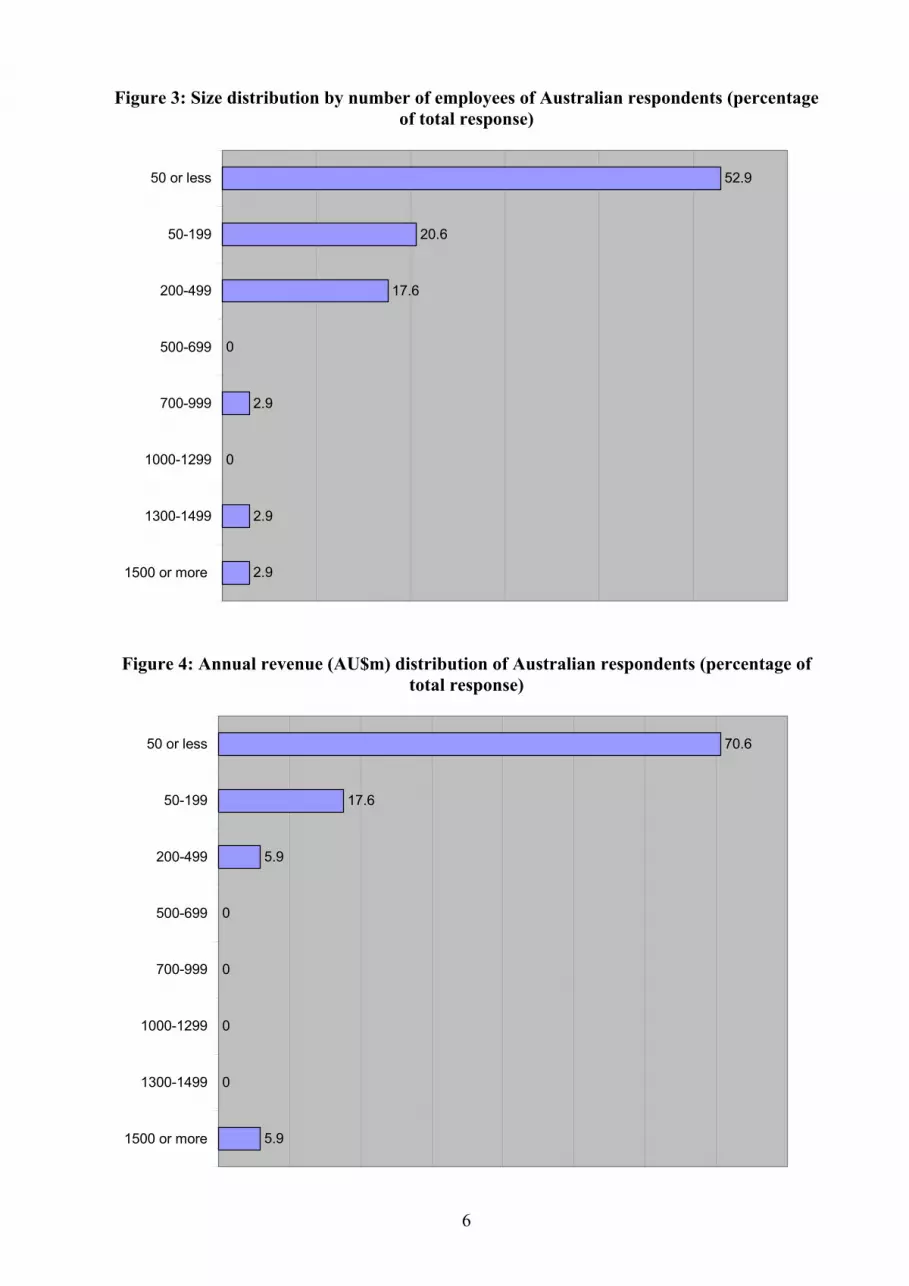
The majority (52.9 per cent) of the respondents were from organisations employing less than 50 employees (see Figure 3). The next major category was of organisations employing 50 - 199 people (20.6 per cent). Organisations with employees in the range of 200 – 499 were the third most represented category (17.6 per cent). Organisations with larger number of employees (1500 or more, 1300-1499 and 1000-1299) accounted for 2.9 per cent each. The majority (70.6 per cent) of the organisations who responded to the survey thus belonged to organisations that had less than AU$ 50 million annual revenue (see Figure 4). The next major category was of organisations that had annual revenue of AU$ 50-199. These organisations accounted for 17.6 per cent of the respondents. A total of 5.9 per cent of organisations had annual revenues of AU$ 200-499. The organisations with revenues more than AU$1500 also accounted for 5.9 per cent of the respondents.
6
Figure 3: Size distribution by number of employees of Australian respondents (percentage of total response)
52.9
20.6
17.6
0
2.9
0
2.9
2.9
50 or less
50-199
200-499
500-699
700-999
1000-1299
1300-1499
1500 or more
Figure 4: Annual revenue (AU$m) distribution of Australian respondents (percentage of total response)
70.6
17.6
5.9
0
0
0
0
5.9
50 or less
50-199
200-499
500-699
700-999
1000-1299
1300-1499
1500 or more

7
Cross tabulation of enterprise size against revenue reveals that the majority (53 per cent) of the respondents were organisations that had less than 50 employees and had annual revenues less than $50 million. There was just one organisation (three per cent) that had revenues more than $1500 million and employed 1500 or more people. Hence, the majority of the organisations tended to be small and medium sized firms. The market sector of the respondents ranged from 10 to hundred per cent in two of the three sectors (consumer and industrial). There were 10 organisations (43 per cent of total organisations in the industrial sector) that were 100 per cent industrial. Amongst the organisations that described themselves as being a part consumer goods sector there were 10 organisations (50 per cent that were 100 per cent consumer goods sector. The government sector was rather under represented with no organisation being 100 per cent industrial organisation (there were two organisations; (22 per cent) that were 80 per cent government sector).
3.2 Perceived enterprise risk Respondents were asked to rank the 11 common risk categories in order of significance to their organization1. In this raw ranking (see Table 1), credit risk, with a mean rank of 3.94, was the most significant factor, followed by operational risks and exchange rate risks. Legal risks (mean rank = 5.68) and commodity price risks (mean rank =5.76) were in the medium range of significance. Interest rate risk, liquidity risk and regulatory risk formed a common block with mean rankings averaging six. Equity price risk with a mean rank of 7.50 was relatively less important. Country risks were the least significant risks for this sample.
Table 1: Risk ranking by Australian respondents
Rank Minimum Maximum MeanCredit Risk 1 11 3.94Operational Risk 1 9 4.24Exchange Rate Risk 1 11 4.29Legal risk 1 11 5.68Commodity Price Risk 1 11 5.76Interest Rate Risk 1 11 6.12Liquidity Risk 2 11 6.18Regulatory Risk 1 11 6.38Equity Price Risk 0 11 7.50Country Risk 3 12 9.26
Factor analysis2 was used to further identify risks that were considered as the most important by the respondents in this sample. Legislative risks, associated with safety, raising capital, legalities, are a significant issue for the respondents. Two related significant factors are financial market based risk and the risk associated with international markets. Respondents also identified the risks associated with getting commodities or raw materials from overseas as significant.
1 An undetected printing error in the Australian questionnaire meant that respondents did not rank business risk in
this exercise. 2 Extraction Method: Principal Component Analysis. Rotation Method: Varimax with Kaiser Normalization.
Rotation converged in 4 iterations. The four factors that were extracted explained 70 per cent of the variance.

8
3.3 Risk policy Respondents were asked for which risks does their organisation have a written and a communicated management policy (see Figure 5). Credit risk and operational risk were the risks that a majority (56 per cent) of the respondents had a written and a communicated management policy on. This was followed by exchange rate risk (47 per cent) and legal risk (41 per cent). Equity price risk had the least number of respondents (six per cent) reporting a written and a communicated management policy.
Figure 5: Occurrence of written risk management policies (Australian respondents)
29.4
29.4
5.9
47.1
23.5
55.9
17.6
55.9
41.2
23.5
8.8
Business Risks
Interest Rate Risk
Equity Price Risk
Exchange Rate Risk
Commodity Price Risk
Credit Risk
Liquidity Risk
Operational Risk
Legal risk
Regulatory Risk
Country Risk
3.4 Risk management practice
3.4.1 Risk monitoring Respondents were asked how rigorously their organisations monitored the various risks (see Figure 6). The degree of rigour in risk monitoring varies considerably across the different categories.

9
Figure 6: Rigour of risk monitoring by Australian respondents
28.6
8.8
5.9
35.3
26.5
35.3
11.8
26.5
5.9
17.6
5.9
35.7
17.6
2.9
29.4
5.9
23.5
11.8
20.6
20.6
14.7
11.8
21.4
20.6
11.8
11.8
8.8
29.4
23.5
29.4
35.3
11.8
17.6
7.1
11.8
20.6
11.8
29.4
5.9
20.6
14.7
26.5
23.5
29.4
7.1
23.5
17.6
11.8
11.8
8.8
17.6
5.9
8.8
20.6
35.3
0
17.6
41.2
0
17.6
0
14.7
2.9
2.9
11.8
0
Business Risks
Interest Rate Risk
Equity Price Risk
Exchange Rate Risk
Commodity Price Risk
Credit Risk
Liquidity Risk
Operational Risk
Legal risk
Regulatory Risk
Country Risk
Rigorous Somewhat Rigorous Neither Rigorous nor Ad HocSomewhat Ad Hoc Ad Hoc Not Significant Risk
This picture becomes clearer when the mean value of risk monitoring is considered (see Table 2). This reveals that business risk, credit risk and exchange rate risk were the three most rigorously monitored risks. Operational risk was also monitored rigorously. Country risk and equity price risk were the two least rigorously monitored risks. Regulatory, legal, liquidity, commodity price risk and interest rate risk were in the middle range.
Table 2: Mean level of risk monitoring by Australian respondents Minimum Maximum Mean
Business Risks 1 5 2.29
Interest Rate Risk 1 6 3.76
Equity Price Risk 1 6 4.65
Exchange Rate Risk 1 5 2.35
Commodity Price Risk 1 6 3.47
Credit Risk 1 5 2.32
Liquidity Risk 1 6 3.65
Operational Risk 1 6 2.62
Legal risk 1 6 3.21
Regulatory Risk 1 6 3.50
Country Risk 2 6 4.76
Note: 1 = Rigorous; 2 = Somewhat Rigorous; 3 = Neither Rigorous nor Ad Hoc; 4 = Somewhat Ad Hoc; 5 = Ad Hoc; 6 = Not Significant Risk

10
Looking at the individual categories only 41 per cent of respondents responded to business risk. Of these 36 per cent considered their monitoring of business risks was somewhat rigorous, whilst 29 per cent considered their monitoring to be rigorous. 21 per cent of the respondents considered their business risk monitoring to be neither rigorous nor ad hoc. Seven per cent of respondents considered their monitoring to be somewhat ad hoc and the same proportion considered their monitoring of business risk to be ad hoc. The mean for this sample is 2.29. Thus a majority of the respondents assessed their monitoring of business risks to be somewhat rigorous. Looking at the family of market risks, 24 per cent of all respondents considered interest rate risk as a somewhat ad hoc monitored risk. The next major category (21 per cent) considered monitoring to be neither rigorous nor ad hoc. 18 per cent of respondents considered their monitoring to be somewhat ad hoc. Similarly, 18 per cent did not consider it a significant risk. The mean for the sample was 3.76. Thus this risk is relatively less rigorously monitored. Equity risk is not monitored significantly by 41 per cent of the respondents. Of the remainder, the majority (21 per cent) rated their monitoring as somewhat ad hoc and the rest (18 per cent) as ad hoc. The mean value is 4.65. Thus for most of the respondents equity price risk monitoring was somewhat laissez-faire. Exchange rate risk is monitored rigorously 35 per cent of the respondents and somewhat rigorously by 29.4 per cent of the respondents. No respondent considered it insignificant. The mean value for the monitoring of exchange rate risk was 2.35, meaning it is watched assiduously by a majority of respondents. For commodity price risk monitoring 29 per cent of the respondents monitoring was somewhat ad hoc and 27 per cent monitored was rigorous. The mean was 3.47. These conflicting results could perhaps be attributed to nature of industries responding to survey. For some commodity prices might be very significant and not quite so for others. 35 per cent of the respondents monitored credit risk rigorously, 29 per cent monitored it neither rigorously nor on an ad hoc basis, and 21 per cent who were somewhat rigorous in their approach. The mean value is 2.32. Thus a majority of the respondents considered credit risk requires monitoring somewhat rigorously.
Liquidity risk is monitored neither rigorously nor on an ad hoc basis by 23.5 per cent of respondents and on a somewhat ad hoc basis by 20.6 per cent of respondents. A further 17.6 per cent consider it’s monitoring to be ad hoc and 14.7 per cent consider it not significant for their company. The mean value is 3.65. This suggests a somewhat laissez-faire attitude to liquidity risk. Operational risk is monitored rigorously by 27 per cent of respondents, somewhat rigorously by 21 per cent of respondents and neither rigorously nor on an ad hoc basis by 29 per cent of respondents. Only three per cent of respondents judged this risk as not significant, with the remainder monitoring it on some degree of ad hoc basis. The mean value of operational risk monitoring was 2.62. This matter is taken seriously in this sample of respondents. Where legal risk is concerned, 35 per cent of respondents rated their monitoring as neither rigorous nor ad hoc. 27 per cent of respondents reported somewhat ad hoc monitoring, and 21 per cent of respondents at cited somewhat rigorous monitoring. Legal risk monitoring had a mean of 3.21 - neither rigorous nor ad hoc tending to somewhat ad hoc. Regulatory risk is monitored on either an ad hoc or somewhat ad hoc basis by 43 per cent of respondents, with a further 12 per cent reporting this risk as not significant. This laissez-faire position is confirmed by a mean score for the rigour of monitoring of 3.50.

11
A majority of the respondents considered country risk to be either not significant (35 per cent) or that they had an ad hoc approach to monitoring country risk (29.4 per cent). The mean for reported country risk monitoring is 4.76.
3.4.2 Responsibility for monitoring risk Respondents were asked at what level in their company does primary responsibility for the monitoring of risks sit (see Figure 7). We asked them to distinguish between organizational responsibility (at senior management or board level), at the process level (those who are responsible for the overall effectiveness of a business task) or the task level (responsibility is attributed to an individual or team with a business function). In all risk categories responsibility for risk monitoring is attributed predominantly to senior management.
Figure 7: Responsibility for monitoring risk from Australian respondents
81.85
70.6
51.5
58.8
42.4
44.1
48.5
47.1
57.6
56.3
55.2
18.18
17.6
15.2
26.5
24.2
38.2
27.3
44.1
30.3
28.1
13.8
0
8.8
12.1
14.7
21.2
14.7
15.2
8.8
9.1
9.4
6.9
0
2.9
21.2
0
12.1
2.9
9.1
0
3
6.3
24.1
Business Risks
Interest Rate Risk
Equity Price Risk
Exchange Rate Risk
Commodity Price Risk
Credit Risk
Liquidity Risk
Operational Risk
Legal risk
Regulatory Risk
Country Risk
Organisation Process Task Not Certain
Looking more detail at individual risk categories, 82 per cent of the respondents who responded to this issue said that the monitoring of business risks was done at organizational level. In terms of market risk, for 71 per cent of all respondents, interest rate risk monitoring was done at an organisational level. For equity price risk again for majority of the respondents the monitoring responsibility level lay primarily at an organisational level. For most of the organisations responsibility for monitoring exchange rate risk lay at the organizational level for 59 per cent of the respondents. 42 per cent of the respondents cited that commodity risk monitoring was done at the organisational level. For 44 per cent of respondents, credit risk monitoring was done at the organisational level.

12
49 per cent of respondents allocated responsibility for liquidity risk monitoring to the organisational level. 47 per cent of respondents identified responsibility for operational risk monitoring with the organisational level. However in a departure from other risk monitoring practices, a further 44 per cent of respondents attributed responsibility for operational risk management to the process level. For 58 per cent of respondents, legal risk monitoring was done at the organisational level. Also important is that for 30 per cent of such monitoring was done at the process level. 56 per cent of respondents associated regulatory risk with the organisational level. For 28 per cent this was done at the process level. For 55 per cent of respondents, country risk monitoring was done at the organisational level.
3.5 Risk control
3.5.1 Control systems’ ability Respondents were asked how confident they were in the ability of their organisation’s current management control systems to manage all potentially significant risks (see Figure 8).
Figure 8: Confidence of Australian respondents in ability of control systems to manage risk
5.88
50
32.35
11.76
0
Absolute confidence
Confident
Some confidence
Little confidence
No confidence

13
Only around six per cent of the organisations had absolute confidence in being able to manage all potentially significant risks with their current management control systems. Fifty per cent of the organisations expressed confidence and 32 per cent of the organisations expressed some confidence. Thus a majority of the organisations rated themselves in the median levels. The mean value for the sample lies between ‘confident’ and ‘some confidence’. There thus seems to be potential for helping organisations to be more confident about their risk management practices. Twelve per cent of the organisations were not very confident about their current management control systems being able to manage all potentially significant risks, but there was no organisation which assessed itself as having no confidence in its risk management systems. To place the former responses in a wider context, respondents were asked to rate their satisfaction with the abilities of their organisation’s current management and control systems. We identified six key issues in management control:
• the provision of strategic information for senior management or board decision making;
• the provision of tactical information for decision making at the customer service or production level;
• the provision of timely information; • the ability to alert senior management to potential risks or performance gaps in
critical areas; • the provision of relevant and timely information to business process owners; and • the ability to stimulate continuous improvement.
In terms of the provision of strategic information 38 per cent of the respondents were satisfied (see Figure 9) and a further 29 per cent were very satisfied. A total of 74 per cent of the respondents were either satisfied or very satisfied. with the provision of tactical information. 38 per cent of the respondents were very satisfied with the timeliness of information provision, with 24 per cent satisfied. 32 per cent of respondents were very satisfied, and 38 per cent were satisfied that the control systems they have alert senior management to potential business risks or performance gaps in critical areas. 38 per cent of respondents were satisfied with the relevance of information provided to them, and 53 per cent were satisfied or very satisfied that their control systems stimulate continuous improvement.
3.5.2 Factors driving change in control systems Approximately 53 per cent of the respondents had made substantial revisions to their organization’s performance control or evaluation systems and 47 per cent had not. 68 per cent of the respondents planned to make revisions or further revision in the next 12 months. 32 per cent did not plan to make revisions or further revision in the next 12 months. Respondents were asked to identify factors driving changes in control systems (see Figure 10).

14
Figure 9: Satisfaction with performance of control system by Australian respondents
29.4
35.3
38.2
32.4
20.6
26.5
38.2
38.2
23.5
38.2
38.2
20.6
14.7
17.6
29.4
17.6
29.4
26.5
11.8
8.8
8.8
8.8
11.8
23.5
5.9
0
0
2.9
0
2.9
Routine StrategicInformation
Routine TacticalInformation
Timely Basis
Alerts Senior Mgt
Timely Information toBusiness Process
Owners
Continuous Improvement
Very satisfied Satisfied Neither satisfied nor dissatisfied Dissatisfied Very Dissatisifed
Figure 10: Factors driving changes in control systems - Australian respondents
53.8
38.5
15.4
36
4
19.2
8
24
0
34.6
42.3
50
24
20
11.5
16
16
0
3.8
15.4
19.2
16
56
15.4
20
20
0
7.7
3.8
15.4
4
4
11.5
24
16
0
0
0
0
20
16
42.3
32
24
5.9
Changes in CustomerNeeds
Changes in BusinessStrategy
Business Process ReEng
TQM
Benchmarking
Merger Acquisition
Financial Distress
Regulatory Requirements
Others
Critical Near Critical Neither Critical nor Not Critical Near Not Critical Not Critical
15
“Changes in customer needs” was regarded by 54 per cent of the respondents as being critical to the decision of revision to their organisation’s performance control or evaluation systems. With a mean of 1.65 it is also a very important factor influencing the decisions about revisions to the organisations’ performance control and evaluation systems. “Changes in business strategy” was rated near critical rating by 42 per cent of the respondents and was the next most important factor influencing the decisions about revisions to the organisations’ performance control and evaluation systems. “Business process reengineering” was rated near critical by 50 per cent of the respondents, and was the third most important factor influencing the decisions about revisions to the organisations’ performance control and evaluation systems. “TQM” had 36 per cent of the respondents regarding it as a critical criterion in initiating revisions to the organisation’s performance control or evaluation systems; it is the fourth most important factor influencing the decisions about revisions to the organisations’ performance control and evaluation systems. The importance of “regulatory requirements” was not clear in this sample. Benchmarking was a relatively less important criterion. Merger and acquisition was regarded by 42.3 per cent of the respondents as being not critical. It ranked seventh on the most important factor influencing the decisions about revisions to the organisations’ performance control and evaluation systems. Financial Distress was also not a very important criterion. 32 per cent of the respondents regarded it as not critical.
3.5.3 Performance related practices Respondents were asked to indicate how vital (carefully managed) key practices are to performance in their organization (see Figure 11). For organisations responding, clear responsibility and authority was vital to performance in the organisation and was therefore a carefully managed practice. Clear and company wide dissemination of control standards, codes of conduct, policies and ethics was also an important factor. Clear establishment and careful maintenance of four-way communication processes – top-down, bottom-up and horizontal or cross-functional – was less vital. Employee evaluation by subordinates, peers or “process team” members, as well as by their managers was relatively the least vital of the four factors. Finally we asked how well respondents felt that their current control environment was routinely satisfying a series of goals:
• the provision of internal financial information; • the provision of internal operating information • guiding management action • tracking efficiency and effectiveness • the provision of early warnings relating to catastrophic business risk; • tracking responsiveness; • the stimulation of continuous improvement; • measures of individual as well as process performance; and • fault identification and analysis.

16
Figure 11: Vital practices and organizational performance (Australian respondents)
50
52.9
8.8
8.8
38.2
23.5
35.3
35.3
11.8
17.6
29.4
35.3
0
5.9
11.8
14.7
0
0
14.7
5.9
Clear Responsibility andAuthority
Controls ClearlyDisseminated
Subordinate Peer andManagerial Evaluation
Four WayCommunication Process
Vital Near Vital Neither Vital Nor Not Vital Near Not Vital Not Vital
Figure 12: Goal satisfaction by control system (Australian respondents)
29.4
17.6
9.1
2.9
5.9
3
26.5
2.9
36.4
44.1
47.1
45.5
23.5
32.4
21.2
41.2
29.4
39.4
23.5
29.4
39.4
44.1
29.4
45.5
20.6
50
18.2
2.9
5.9
6.1
23.5
23.5
21.2
11.8
8.8
5.9
0
0
0
5.9
8.8
9.1
0
8.8
0
Relevant FinancialInformation
Relevant OperatingInformation
Appropriate LevelManagement
Track Efficiency
Early Warnings
Track Responsiveness
Highly Visible
Overall Business Process& Individual Task
Effective in AnsweringWhat's Wrong
Excellent Near Excellent Good Near Poor Poor
44.8 per cent of the respondents reported near excellence their current control environment’s ability to provide relevant internal financial information systems in a timely and accurate manner (see Figure 12). The mean value was 2. As regards the goal of providing relevant internal

17
operating information in timely and accurate manner, the respondents assessed their current controls systems ability to meet this goal with a score at a mean value of 2.24. Appropriate level management being alerted as to where action is needed had a mean value of 2.42. Ability to track the effectiveness and efficiency of the process and not just of component function had a mean of 3.06. The ability of systems effectiveness in providing appropriately early warnings with regard to potentially catastrophic business risks had a mean of 2.97. The goal of systems tracking responsiveness, being met by current control systems scored a mean of 3.12. Visibility of systems and their ability to stimulate activities to continuously improve performance in critical areas had a mean of 3.18. As regards the goal of current control systems being able to provide measures at both the “overall business process” and the “individual task levels”, the mean score was 2.91. And on the last measure of assessing current systems on their effectiveness in answering “what is going wrong and why?” respondents had a mean score of 2.94.

18

19
Chapter 4 Findings: Business Risk in New Zealand
4.1 Demographics Fifty four organisations (59 per cent) specified their main area of business (see Figure 13). Amongst these, the largest percentage of organisations that chose to respond to this question, listed their main area of business as the manufacturing sector (48 per cent), followed by service sector (26 per cent). Organisations whose main areas of business were software and information technology, construction and energy companies came next came next (six per cent each). Importers represented four per cent of respondents to this question. Distribution companies, publishing and government organisations were equally represented (two per cent each.). A total of 41 per cent of the respondents did not specify their area of business.
Figure 13: Industry groups of New Zealand respondents (percentage of total response)
0
48.1
25.9
0
0
0
1.9
1.9
5.6
3.7
5.6
5.6
40.6
Agriculture
Manufacturing
Service
Mining
Medical
Finance
Distribution
Publishing
Software and IT
Importers
Construction
Energy
Missing
The majority (33 per cent) of the respondents were from organisations which employ less than 50 employees (see Figure 14). The next major category was organisations employing 50 - 199 people (32 per cent). Organisations with employees in the range of 200 – 499 were the third most represented category (17 per cent). Organisations with employee numbers of 500-699 and 700 -999 were equally represented (5 per cent each). Organizations employing between 100-1299 and 1300-1499 had 1.1 per cent in each category. Large organisations employing more than 1500 people constituted seven per cent of respondents. Thus 65 per cent of the total responses were from organizations employing less than 200 employees.

20
Figure 14: Size distribution by number of employees of New Zealand respondents (percentage of total response)
31.9
30.8
16.5
4.4
4.4
1.1
1.1
6.6
3.3
50 or less
50-199
200-499
500-699
700-999
1000-1299
1300-1499
1500 or more
Missing
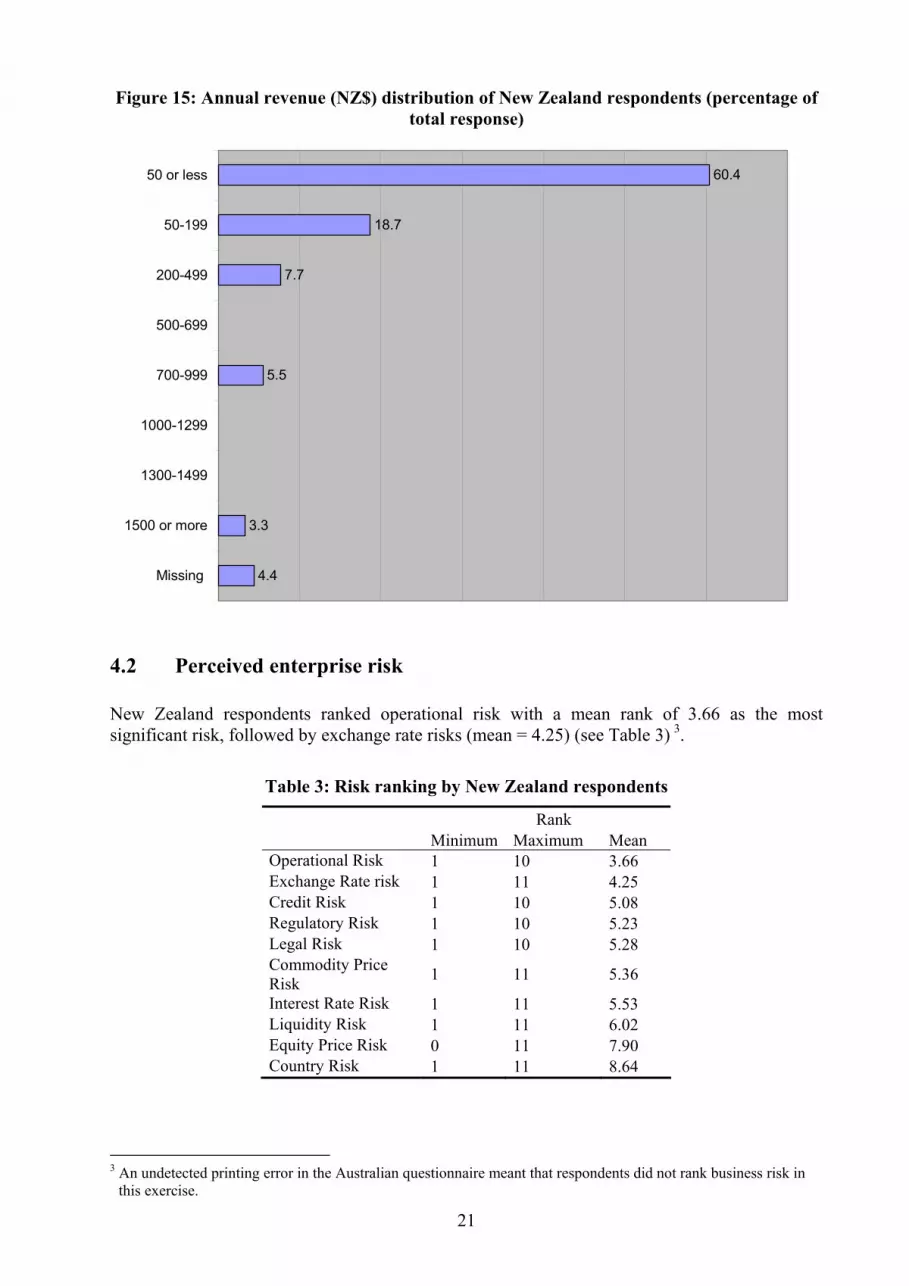
The majority (63 per cent) of respondents had less than NZ$ 50 million annual revenue (see Figure 15). The next major category was of organisations that had annual revenue of NZ$ 50-199. These organisations accounted for 20 per cent of the respondents. A total of eight per cent of organisations had annual revenues of NZ$ 200-499. The organisations with revenues of NZ$ 700-999 also accounted for six per cent of the respondents. Organisations with annual revenues exceeding NZ $1500 Million accounted for three per cent of organisations who responded to this question.
Cross tabulation of employee numbers and revenue shows that the majority of the organisations (29 per cent) had less than 50 employees and had annual revenues less than NZ 50 million. The next major category (25 per cent) was of organisations that had employees ranging from 50-199 and had annual revenues in the range of NZ$ 50-199 million. There were just two organisations (two per cent) that had revenues more than $1500 million and employed 1500 or more people. The majority of the organisations (56 per cent) thus tended to be small and medium sized firms employing less than 200 employees and with revenues ranging from less than NZ$50 million to NZ $ 50-199 million. The market sector of the respondents ranged from 10 to one hundred per cent in two of the three sectors (consumer and industrial). There were 26 organisations (42 per cent of total organisations in the consumer sector) that were 100 per cent consumer goods or services. Amongst the organisations that described themselves as being a part industrial sector there were 17 organisations (27 per cent) that were 100 per cent industrial sector. The government sector was rather under represented with no organisation being 100 per cent government organisation. The market share in the government sector ranged from 10 - 80 per cent (there were three organisations; (11 per cent) that were 80 per cent government sector).
21
Figure 15: Annual revenue (NZ$) distribution of New Zealand respondents (percentage of total response)
60.4
18.7
7.7
5.5
3.3
4.4
50 or less
50-199
200-499
500-699
700-999
1000-1299
1300-1499
1500 or more
Missing
4.2 Perceived enterprise risk New Zealand respondents ranked operational risk with a mean rank of 3.66 as the most significant risk, followed by exchange rate risks (mean = 4.25) (see Table 3) 3.
Table 3: Risk ranking by New Zealand respondents
Rank Minimum Maximum Mean Operational Risk 1 10 3.66 Exchange Rate risk 1 11 4.25 Credit Risk 1 10 5.08 Regulatory Risk 1 10 5.23 Legal Risk 1 10 5.28 Commodity Price Risk 1 11 5.36
Interest Rate Risk 1 11 5.53 Liquidity Risk 1 11 6.02 Equity Price Risk 0 11 7.90 Country Risk 1 11 8.64
3 An undetected printing error in the Australian questionnaire meant that respondents did not rank business risk in
this exercise.

22
Credit risks (mean = 5.08), regulatory risk (mean =5.23), legal risk (mean = 5.28), commodity price risks (mean =5.36) and interest rate risk (mean =5.53) were in the medium range of risks that were considered significant. Liquidity risk (mean =6.02) and equity price risk (mean =7.90) risk were relatively less important. Country risk (mean = 8.64) was the least significant risks for this sample. Factor analysis4 revealed a latent grouping of risks relating to markets that comprised interest rate, equity price, exchange rate and commodity price risks. Another factor identifies legal, regulatory and country risks together. A third latent factor combines credit, liquidity and operational risks – perhaps a reflection of the risks of running a business?
4.3 Risk policy Operational risk was the risk that the majority of New Zealand respondents (71 per cent) had a written and a communicated management policy on (see Figure 16). This was followed by credit risk (57 per cent) and exchange rate risk (50 per cent).
Figure 16: Occurrence of written risk management policies (New Zealand respondents)
25.3
37.4
12
49.5
24.2
57.1
21
71.4
35.2
29.5
4.4
Business Risk
Interest Rate Risk
Equity Price Risk
Exchange Rate risk
Commodity Price Risk
Credit Risk
Liquidity Risk
Operational Risk
Legal Risk
Regulatory Risk
Country Risk
Interest rate risk had 37 per cent of the respondents reporting a written and a communicated management policy. This was followed by legal risks (35 per cent). Regulatory risk had 30 per cent of the respondents saying they had a written and a communicated management policy. Country risk had the lowest percentage of respondents (four per cent) having a written and a communicated management policy. 4 Extraction Method: Principal Component Analysis. Rotation Method: Varimax with Kaiser Normalization. A
Rotation converged in 5 iterations.
23
4.4 Risk management practice
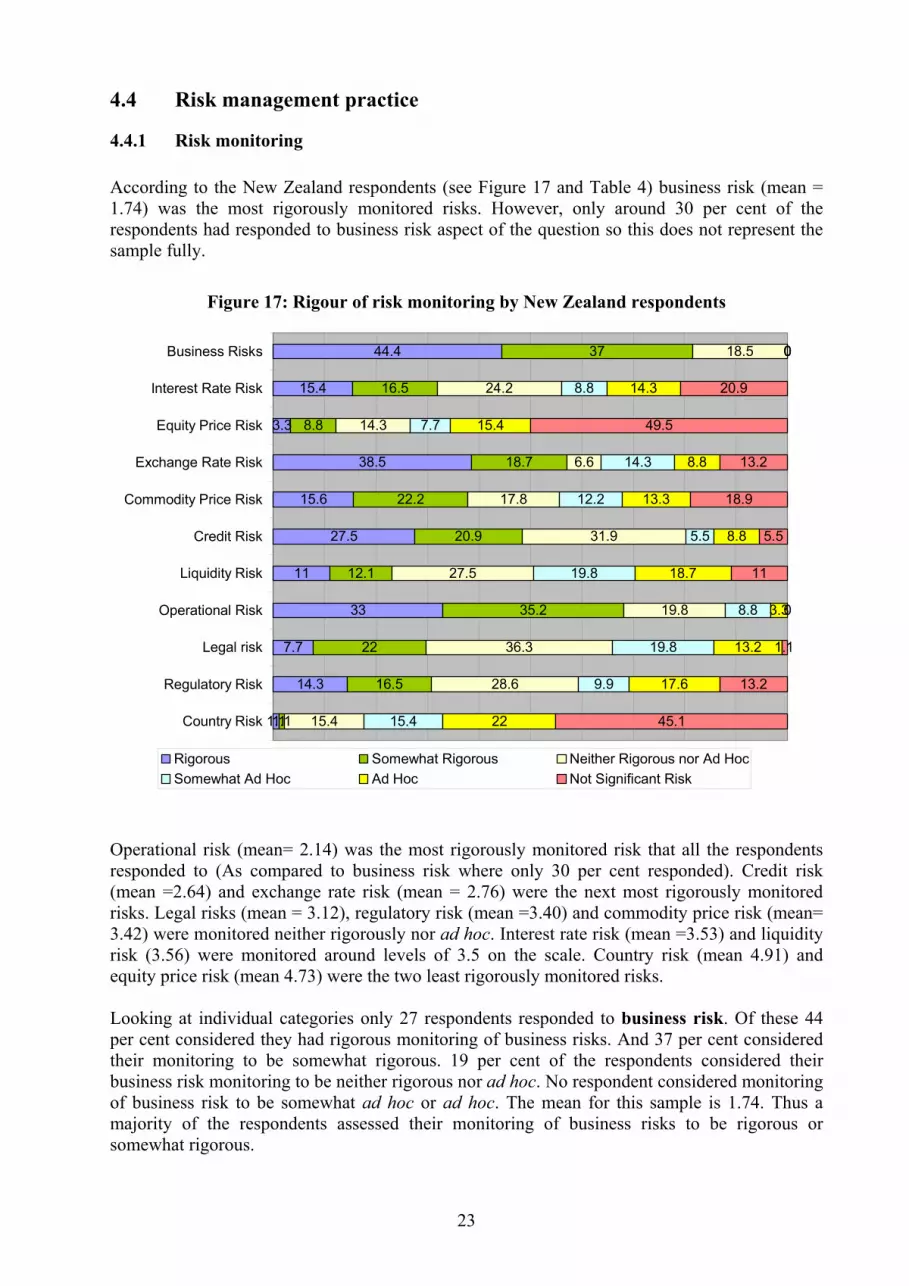
4.4.1 Risk monitoring According to the New Zealand respondents (see Figure 17 and Table 4) business risk (mean = 1.74) was the most rigorously monitored risks. However, only around 30 per cent of the respondents had responded to business risk aspect of the question so this does not represent the sample fully.
Figure 17: Rigour of risk monitoring by New Zealand respondents
44.4
15.4
3.3
38.5
15.6
27.5
11
33
7.7
14.3
1.1
37
16.5
8.8
18.7
22.2
20.9
12.1
35.2
22
16.5
1.1
18.5
24.2
14.3
6.6
17.8
31.9
27.5
19.8
36.3
28.6
15.4
0
8.8
7.7
14.3
12.2
5.5
19.8
8.8
19.8
9.9
15.4
0
14.3
15.4
8.8
13.3
8.8
18.7
3.3
13.2
17.6
22
0
20.9
49.5
13.2
18.9
5.5
11
0
1.1
13.2
45.1
Business Risks
Interest Rate Risk
Equity Price Risk
Exchange Rate Risk
Commodity Price Risk
Credit Risk
Liquidity Risk
Operational Risk
Legal risk
Regulatory Risk
Country Risk
Rigorous Somewhat Rigorous Neither Rigorous nor Ad HocSomewhat Ad Hoc Ad Hoc Not Significant Risk
Operational risk (mean= 2.14) was the most rigorously monitored risk that all the respondents responded to (As compared to business risk where only 30 per cent responded). Credit risk (mean =2.64) and exchange rate risk (mean = 2.76) were the next most rigorously monitored risks. Legal risks (mean = 3.12), regulatory risk (mean =3.40) and commodity price risk (mean= 3.42) were monitored neither rigorously nor ad hoc. Interest rate risk (mean =3.53) and liquidity risk (3.56) were monitored around levels of 3.5 on the scale. Country risk (mean 4.91) and equity price risk (mean 4.73) were the two least rigorously monitored risks. Looking at individual categories only 27 respondents responded to business risk. Of these 44 per cent considered they had rigorous monitoring of business risks. And 37 per cent considered their monitoring to be somewhat rigorous. 19 per cent of the respondents considered their business risk monitoring to be neither rigorous nor ad hoc. No respondent considered monitoring of business risk to be somewhat ad hoc or ad hoc. The mean for this sample is 1.74. Thus a majority of the respondents assessed their monitoring of business risks to be rigorous or somewhat rigorous.

24
Table 4: Mean level of risk monitoring by New Zealand respondents
Minimum Maximum Mean Business Risk 1 3 1.74 Operational Risk 1 5 2.14 Credit Risk 1 6 2.64 Exchange Rate risk 1 6 2.76 Legal Risk 1 6 3.12 Regulatory Risk 1 6 3.40 Commodity Price Risk 1 6 3.42
Interest Rate Risk 1 6 3.53 Liquidity Risk 1 6 3.56 Equity Price Risk 1 6 4.73 Country Risk 1 6 4.91
Note: 1 = Rigorous; 2 = Somewhat Rigorous; 3 = Neither Rigorous nor Ad Hoc; 4 = Somewhat Ad Hoc; 5 = Ad Hoc; 6 = Not Significant Risk
In terms of market risks, 24 per cent of the respondents considered interest rate risk as moderately monitored risk at neither rigorous nor ad hoc. The next major category (21 per cent) rated it not a significant risk. 17 per cent of respondents considered their monitoring to be somewhat rigorous. 15 per cent considered it’s monitoring to be rigorous and 14 per cent of the respondents monitored it on an ad hoc basis. The mean for the sample was 3.53. Thus this risk is relatively less rigorously monitored. Equity price risk is not considered a significant risk by 50 per cent of the respondents. This risk is monitored on an ad hoc approach by 16 per cent of the respondents, and for 14 per cent rate the monitoring is neither rigorous nor ad hoc. The mean value is 4.73. Thus for most of the respondents equity price risk monitoring is at a lower level on the scale. Exchange rate risk is monitored rigorously by 39 per cent of the respondents and at somewhat rigorously by 19 per cent of the respondents. Nine per cent of the respondent considered it not significant for their organisation. The mean value for the monitoring of exchange rate risk is 2.76. For commodity price risk monitoring 22 per cent of the respondents monitored it somewhat rigorously and16 per cent monitored rigorously. 18 per cent of the respondents monitored commodity price risk at neither rigorously nor in an ad hoc manner. The mean was 3.42. 19 per cent considered it as not a significant risk in their companies. 13 used an ad hoc approach to monitor commodity price risk. 32 per cent of the respondents considered credit risk was monitored in neither a rigorous nor ad hoc manner. This was followed by 28 per cent who monitored it rigorously and 21 per cent who monitored it somewhat rigorously. The mean value is 2.64. Liquidity risk is subject to neither rigorous nor ad hoc monitoring by 28 per cent of respondents and in a somewhat ad hoc manner by 20 per cent of respondents. A further 19 per cent consider it’s monitoring to be ad hoc and 11 per cent consider it as not significant for their company. The mean value is 3.56. The mean value of operational risk monitoring is 2.14. 35 per cent of the respondents rate the monitoring of operational risk as somewhat rigorous and 33 per cent as rigorous. 20 per cent considered their monitoring to be neither rigorous nor ad hoc. This accounts for nearly 88 per cent of responses. Operational risk is thus monitored rigorously.
25
Legal risk monitoring had a mean of 3.12. 36 per cent of the respondents rated their monitoring as neither rigorous nor ad hoc, 22 per cent as somewhat rigorous, and 19.8 per cent of the respondents as somewhat ad hoc. Regulatory risk had a mean of 3.40. 29 per cent of respondents rated regulatory risk monitoring as neither rigorous nor ad hoc and 18 per cent followed an ad hoc approach to monitor regulatory risk. 13 per cent of the respondents did not consider it a significant risk for their business. A majority of the respondents considered country risk to be either, not significant (45 per cent) or they had an ad hoc approach to monitoring it (22 per cent). The mean for country risk monitoring is 4.76.
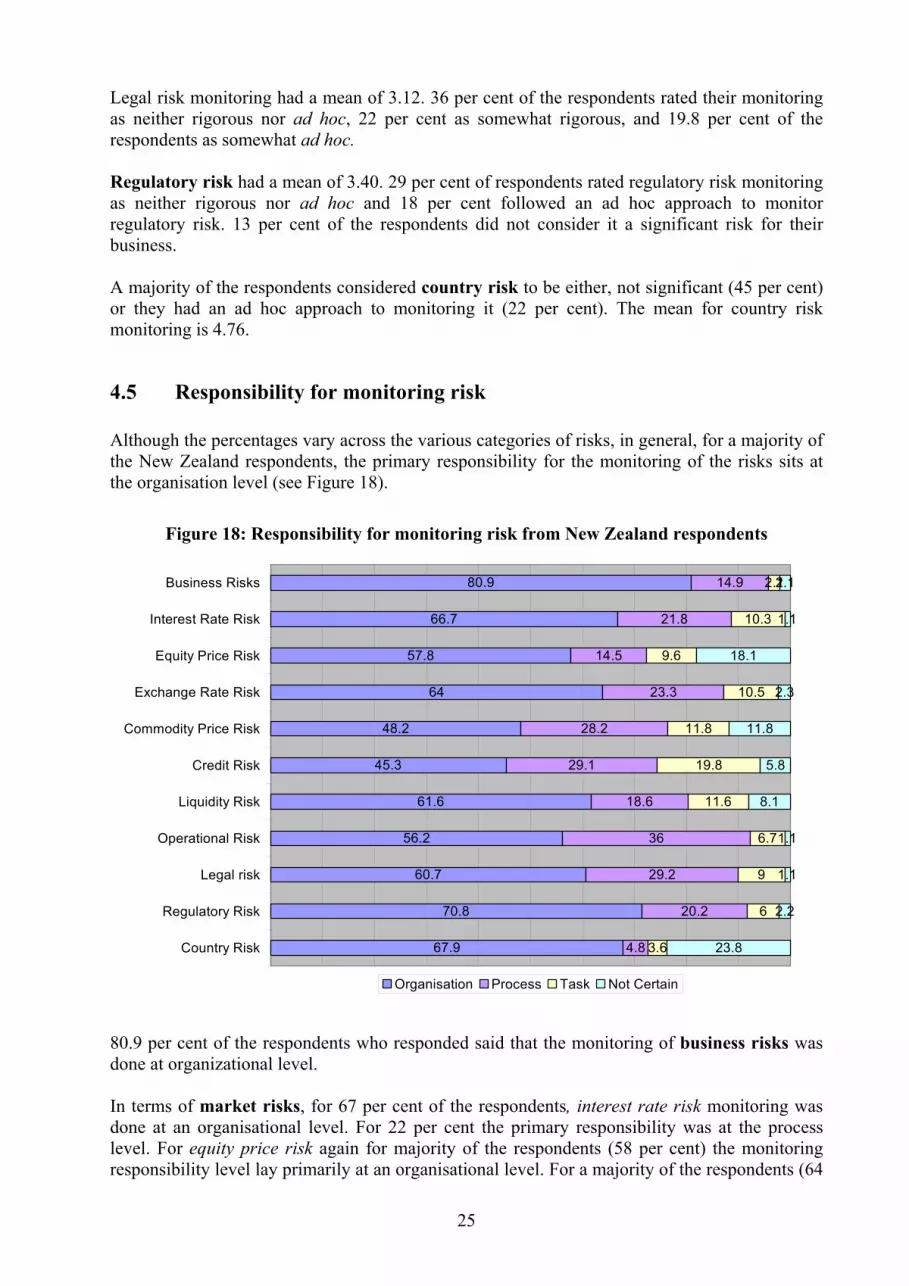
4.5 Responsibility for monitoring risk Although the percentages vary across the various categories of risks, in general, for a majority of the New Zealand respondents, the primary responsibility for the monitoring of the risks sits at the organisation level (see Figure 18).
Figure 18: Responsibility for monitoring risk from New Zealand respondents
80.9
66.7
57.8
64
48.2
45.3
61.6
56.2
60.7
70.8
67.9
14.9
21.8
14.5
23.3
28.2
29.1
18.6
36
29.2
20.2
4.8
2.1
10.3
9.6
10.5
11.8
19.8
11.6
6.7
9
6
3.6
2.1
1.1
18.1
2.3
11.8
5.8
8.1
1.1
1.1
2.2
23.8
Business Risks
Interest Rate Risk
Equity Price Risk
Exchange Rate Risk
Commodity Price Risk
Credit Risk
Liquidity Risk
Operational Risk
Legal risk
Regulatory Risk
Country Risk
Organisation Process Task Not Certain
80.9 per cent of the respondents who responded said that the monitoring of business risks was done at organizational level. In terms of market risks, for 67 per cent of the respondents, interest rate risk monitoring was done at an organisational level. For 22 per cent the primary responsibility was at the process level. For equity price risk again for majority of the respondents (58 per cent) the monitoring responsibility level lay primarily at an organisational level. For a majority of the respondents (64

26
per cent) monitoring exchange rate risk. For 48 per cent of the respondents commodity risk monitoring was done at the organisational level and for 28 per cent of the respondent at process level. For 45 per cent of the respondents, credit risk monitoring was done at the organisational level. The process level monitoring accounted for 29 per cent of the respondents. 62 per cent of the respondents identified liquidity risk monitoring at the organisational level. For 56 per cent of the respondents operational risk monitoring was done at the organisational level. However in a departure from other risk monitoring practices 36 per cent of operational risk management also lay at process level. 60.7 per cent of the respondents cited legal risk monitoring with the organisational level. Also important is that for 29 per cent of the organisations, legal risk management was done at process level. For 71 per cent of the respondents regulatory risk monitoring was done at the organisational level. For 20 per cent the regulatory risk monitoring was done at the process level. For 68 per cent of the respondents the country risk monitoring was done at the organisational level. 24 per cent of the respondents were not certain about who was responsible for monitoring these activities.
4.6 Risk control
4.6.1 Control systems’ ability Only 17 per cent of the organisations had absolute confidence in being able to manage all potentially significant risks with their current management control systems (see Figure 19). 52 per cent of the organisations were confident and 25 per cent of the organisations rated themselves with some confidence. The mean value for the sample was 2.20 (between confident and some confidence). Six per cent of the organisations had little confidence in their current management control systems being able to manage all potentially significant risks. There was no organisation which assessed itself as having no confidence in its risk management system In the context of wider management issues (see Figure 20), 40 per cent of the respondents were satisfied with the provision of strategic information and 37 per cent were very satisfied.

27
Figure 19: Confidence of New Zealand respondents in ability of control systems to manage risk
16.5
49.5
24.2
5.5
0
4.4
Absolute confidence
Confident
Some confidence
Little confidence
No confidence
Missing
Figure 20: Satisfaction with performance of control systems by New Zealand respondents
37.4
29.7
33
30.8
24.2
23.1
39.6
39.6
34.1
35.2
47.3
37.4
19.8
28.6
27.5
29.7
22
24.2
2.2
2.2
5.5
4.4
6.6
13.2
1.1
0
0
0
0
2.2
Routine StrategicInformation
Routine TacticalInformation
Timely Basis
Alerts Senior Mgt
Timely Information toBusiness Process
Owners
Continuous Improvement
Very satisfied Satisfied Neither satisfied nor dissatisfied Dissatisfied Very Dissatisifed

28
In terms of the routine provision of tactical information 40 per cent of respondents were satisfied and a further 30 per cent were very satisfied. The timely provision information was satisfactory for 34 per cent of the respondents, very satisfactory for 33 per cent and moderately satisfactory for a further 25 per cent. 35 per cent of the respondents were satisfied that the systems provided sufficient early warning for management, and a further 31 per cent were very satisfied. In terms of relevant and timely provision of information to process owners” 47 per cent of respondents reported satisfaction and 24 per cent were very satisfied. “Stimulates continuous improvement” saw 37 per cent of respondents satisfied and 23 per cent very satisfied. “Changes in customer needs” was regarded by 46.6 per cent of the respondents as being very critical to the decision of revision to the organisation’s performance control or evaluation systems. With a mean of 1.095 it is the most important factor influencing the decisions about revisions to the organisations’ performance control and evaluation systems.
4.6.2 Factors driving change in control systems 58.2 per cent of respondents had made substantial revisions to their organization’s performance control or evaluation systems and approximately 42 per cent had not. 79 per cent of respondents planned to make revisions or further revision in the next 12 months. 21 per cent did not plan to make revisions or further revision in the next 12 months.
Figure 21: Factors driving changes in control systems (New Zealand respondents)
46.6
34.2
17.6
28
11
11.3
18.3
13.7
33.3
40
31.5
41.1
50
36
31.5
14.1
26.8
27.4
11.1
20
9.6
16.4
23
26.7
28.8
16.9
18.3
23.3
0
0
9.6
8.2
5.4
5.3
15.1
16.9
9.9
16.4
0
0
2.7
0
4.1
4
13.7
40.8
26.8
19.2
55.6
40
Changes in CustomerNeeds
Changes in BusinessStrategy
Business Process ReEng
TQM
Benchmarking
Merger Acquisition
Financial Distress
Regulatory Requirements
Other 1
Other 2
Critical Near Critical Neither Critical nor Not Critical Near Not Critical Not Critical
Of factors driving changes in control systems, “changes in business strategy” were judged near critical 41 per cent of respondents. “TQM” had 36 per cent of the respondents regarding it as near critical and 28 per cent as critical. “Business process reengineering” was judged near critical by 50 per cent of the respondents. “Benchmarking” was regarded to near critical by 32 per cent of the respondents. Opinion was divided about “financial distress” with 27 per cent of

29
respondents considering it as near critical, but a similar percentage considering it not critical. 18.3 per cent regarded it as critical. 27 per cent of respondents ranked “regulatory requirements” as near critical and 23 per cent as neither critical nor not critical. “Merger and acquisition” was regarded by 41 per cent of the respondents as being not critical. There was an open ended question about other factors influencing change and the responses to this were:
• Sarbanes Oxley5 (two respondents) • Labour market and availability of personnel (one respondent) • Business planning and management (two respondents) • Management information systems (two respondents) • Growing the business (one respondent) • Health, safety, the natural environment and quality (one respondent)
4.6.3 Performance related practices For New Zealand respondents, clear responsibility and authority was very vital to performance in the organisation and was therefore a carefully managed practice. 60 per cent of the respondents rated it vital.
Figure 22: Vital practices and organizational performance (New Zealand respondents)
60.4
50
22
19.8
30.8
35.6
18.7
28.6
5.5
12.2
33
30.8
2.2
2.2
25.3
15.4
1.1
0
1.1
5.5
Clear Responsibility andAuth
Controls ClearlyDisseminated
Subordinate Peer andManagerial Evaluation
Four Way CommunicationProcess
Vital Near Vital Neither Vital Nor Not Vital Near Not Vital Not Vital
Clear and company wide dissemination of control standards, codes of conduct, policies and ethics was also an important factor. 50 per cent of the respondents rated it as vital and 36 per cent as near vital. Clear establishment and careful maintenance of four-way communication processes was the third most important out of the four factors.
5 Requiring mandatory reporting around corporate governance issues in U.S. listed companies.

30
46.2 per cent of the respondents reported near excellence in their current control environment’s ability to provide relevant internal financial information systems in a timely and accurate manner. The mean value was 1.86. This goal rated the highest satisfaction in terms of the current control systems being able to meet it. As regards the goal of providing relevant internal operating information in timely and accurate manner, the respondents assessed their current controls systems ability to meet this goal with a score at a mean value of 2.11. Nearly 38 per cent rated it at near excellent. This factor rated the second highest satisfaction. Appropriate level management being alerted as to where action is needed had a mean value of 2.23.
Figure 23: Goal satisfaction by control system (New Zealand respondents)
35.2
27.8
25.3
17
19.8
15.6
16.5
11
12.1
46.2
37.8
33
23.9
30.8
22.2
29.7
35.2
25.3
17.6
30
35.2
36.4
33
31.1
26.4
38.5
45.1
0
4.4
6.6
21.6
14.3
23.3
24.2
12.1
14.3
1.1
0
0
1.1
2.2
7.8
3.3
3.3
3.3
Relevant Financial Inf
Relevant OperatingInformation
Appropriate Level Mgt
Track Efficiency
Early Warnings
Track Responsiveness
Highly Visible
Overall B Process &Individual Task
Effective in AnsweringWhat's Wrong
Excellent Near Excellent Good Near Poor Poor
35.2 per cent of the respondents rated it as good and 33 per cent at near excellent. This factor rated the third highest satisfaction. The ability of systems being effective in providing appropriately early warnings with regard to potentially catastrophic business risks had a mean of 2.48. The majority (33 per cent) rated it as good. This factor rated the fourth highest satisfaction in terms of the current control systems being able to meet this criterion. As regards the goal of current control systems being able to provide measures at both the “overall business process” and the “individual task levels”, the mean score was 2.62. This factor was rated fifth in terms of satisfaction with the current control systems being able to meet it. Ability to track the effectiveness and efficiency of the process and not just of component function had a mean of 2.66. The majority (36.4 per cent) of the respondents rated it as good. Overall this factor rated sixth. Visibility of systems and their ability to stimulate activities to continuously improve performance in critical areas had a mean of 2.68 and was rated seventh in terms of the current control systems being able to meet this criterion.

31
As regards assessing current systems on their effectiveness in answering “what is going wrong and why?” respondents had a mean score of 2.71. This factor was ranked eighth. The goal of systems tracking responsiveness, being met by current control systems scored a mean of 2.86 and had the lowest satisfaction as regards current control systems being able to meet it.

32
33
Chapter 5 Business Risks in Australia and New Zealand: A Comparative
Analysis
5.1 Australia and New Zealand: Comparable in risk? Both samples are dominated by manufacturers, although the NZ sample demographic is partially compromised because of non-response to this item. Both samples are overwhelmingly dominated by small and medium sized enterprises (by both number of employees and by earnings). Consequently, the results of the two samples are comparable in principle. Whilst their ranking is different, the three same enterprise risks are ranked at the ‘top’ in both samples: credit, operational and exchange rate. Not surprisingly these risks are also the ones in both countries for which written risk policies are most common. Business risks are the most rigorously monitored in both samples. Exchange rate risk is also commonly monitored quite rigorously. There are considerable differences between the two samples thereafter, with the exception of country risk (not surprising given we are dealing with small and medium-sized enterprises here). Overwhelmingly the responsibility for monitoring all categories of risks in both samples sits with senior management or the board. Both samples express similar levels of confidence in their control systems ability to manage enterprise risk, and are similarly satisfied with the performance of those control systems. The factors driving changes in control systems are broadly similar in both samples. Opinions on performance related practices are broadly similar as is goal satisfaction by control system. Overall, perhaps not surprisingly, attitudes to risk in the two samples seem to be largely similar, except where the monitoring of risks other than business, exchange rate or country risk is concerned.
5.2 Implications for the Practice of Risk Management On the basis of this survey, whilst risk management in Australia and New Zealand seems to be taken seriously, there is one cautionary note:
Responsibility for risk management is consistently allocated to senior management or the board. This is not ideal, especially where operational risks are concerned, since neither the board nor senior management are generally well positioned to spot the warning signals. Here then is our initial message for risk professionals: responsibility for monitoring risk needs to be picked up across the organisation. Rather like quality, risk, particularly operational risk, should be everybody’s concern, and that message it seems at the moment is perhaps not getting through as well as it might. This is a matter of some concern given that this is central tenet of best practice in risk management (Smallman, 2000a; Standards New Zealand & Standards Australia, 2004a, b).

34
We aim to undertake further analysis of the data, taking us beyond descriptive statistics, and a follow up report will be issued in due course.

35
References Basel Committee on Banking Supervision. 2004. International Convergence of Capital
Measurement and Capital Standards. Basel: Bank for International Settlements. Beck, U. 1992. Risk Society. Towards a New Modernity (M. Ritter, Trans.). London: Sage. Beck, U. 1999. World Risk Society. Cambridge: Polity Press. Bernstein, P. L. 1996. Against the Gods. The Remarkable Story of Risk. Chichester: John Wiley
and Sons Inc. Dowd, K. 1998. Beyond Value at Risk. The New Science of Risk Management. Chichester: John
Wiley & Sons. Economist Intelligence Unit and Arthur Andersen. 1995. Managing Business Risks: an
Integrated Approach. London: The Economist Intelligence Unit. Elliott, D., Letza, S., McGuinness, M., & Smallman, C. 2000. Governance, control and
operational risk: the Turnbull effect. Risk Management: An International Journal, 2(3): 47-59.
Kahneman, D., & Tversky, A. 1979. Prospect theory: An analysis of decisions under risk. Econometrica, 47: 262-291.
Klein, G. 1998. Sources of Power: How People Make Decisions. Cambridge, MA: The MIT Press.
Smallman, C. 1999. The risk factor. Financial Times Mastering Management Review, 30 December: 42-45.
Smallman, C. 2000a. Challenging the orthodoxy in risk management. In E. Coles, D. Smith, & S. Tombs (Eds.), Risk Management and Society: 53-79. London: Kluwer Academic Publishers.
Smallman, C. 2000b. Epilogue: Some closing thoughts on operational risk. Risk Management: An International Journal, 2(3): 79-80.
Smallman, C. 2000c. What is operational risk and why is it important? Risk Management: An International Journal, 2(3): 7-14.
Smallman, C. 2004. A grounded theory of hazard priorities in British organizations. Risk Decision and Policy, 9(1): 55-74.
Smallman, C., & Smith, D. 2003. Patterns of managerial risk perceptions: exploring the dimensions of managers' accepted risks. Risk Management: an International Journal, 5(1): 7-32.
Standards New Zealand, & Standards Australia. 2004a. Risk Management, Australian/New Zealand Standard (AS/NZS 4360:2004). Wellington: Standards New Zealand.
Standards New Zealand, & Standards Australia. 2004b. Risk Management Guidelines, Australian/New Zealand Handbook (AS/NZS HB 4360:2004). Wellington: Standards New Zealand.
Stead, E., & Smallman, C. 1999. Understanding financial fraud: learning and unlearning lessons from industrial crises. Journal of Contingencies and Crisis Management, 7(1): 1-18.

36

37
Appendix A Questionnaire Items and Scales
Item Scale Area of business Open question Number of employees Choice of eight categories Annual revenue Choice of eight categories Market sectors Percentage in each of four categories Risk ranking Rank order of 11 risks Presence of written and communicated risk policy
Binary choice for 11 risks
Confidence in control systems ability of manage significant risks
Likert scale. Anchors: 1 = absolute confidence; 5 = no confidence
Rigour of risk monitoring Likert scale for each of 11 risks. Anchors: 1 = rigorous
monitoring; 5 = ad hoc monitoring; not significant also allowed
Level at which primary responsibility for risk sits
Selection from four categories (organization, process, task, not certain) for 11 risks
Satisfaction with general control system
Likert scale. Anchors: 1 = very satisfied; 5 = not satisfied
Revisions made to control system in last 12 months
Binary
Revisions planned for control system in last 12 months
Binary
Factors in decisions to change Likert scale for each of nine factors. Anchors: 1 = critical to
the decision; 5 = not critical Vital practices Likert scale for each of four factors. Anchors: 1 = vital; 5 =
not vital Goal satisfaction Likert scale for each of nine goals. Anchors: 1 = excellent;
5 = poor

38
Appendix B Response Rate Calculations
Table A.1: Australian enterprise risk survey response rate statistics Response rate statistics Numbers
a Total number of sample members 500
b Total number of respondents 89
c Total number of eligible respondents (complete and usable questionnaire) 34
d Total number of ineligible respondents 55
Blank returns 30
Returns with explanation 2
Person left address /moved to other company 23
e Proportion of eligible respondents =c/b*100 38.2 per cent
f Total number of non respondents = a - b 411
g Expected number of eligible sample members in non respondents = f * (c / b) 157
h Response rate = (c * 100) / (c + g) 17.8 per cent
Table A.2: New Zealand enterprise risk survey response rate statistics Response rate statistics Numbers a Total number of sample members 500 b Total number of respondents 109 c Total number of eligible respondents (complete and usable questionnaire) 91 d Total number of ineligible respondents 19 Blank returns (15) Returns with explanation (4) e Proportion of eligible respondents =c/b*100 83.5 per cent f Total number of non respondents = a - b 391 g Expected number of eligible sample members in non respondents = f * (c / b) 326 h Response rate = (c * 100) / (c + g) 21.8 per cent

39
RESEARCH REPORTS 271 Selwyn District Council. Cross, Tracey-Anne, Dalziel, Paul and Saunders, Caroline 2004 272 Instream Water Values: Canterbury’s Rakaia and Waimakariri Rivers. Kerr, Geoffrey N., Sharp, Basil M.H., and Leathers, Kenneth L. 2004 273 Public Perceptions of Outstanding Natural
Landscapes in the Auckland Region. Fairweather, John R. and Swaffield, Simon R. 2004 274 The Costs of Footrot and the Impact of the Footrot
Gene-Market Test in New Zealand. Greer, Glen 2005 275 Forecast of Skills Demand in the High Tech Sector
in Canterbury. Dalziel, Paul, Saunders, Caroline and Taylor, Greg 2005 276 Management of Himalayan Tahr in New Zealand. High Country Farmer Perspectives and
Implications. Hughey, Kenneth F.D. and Wason, Karen M. 2005 277 New Zealanders and Biotechnology: Attitudes,
Perceptions and Affective Reactions Cook, Andrew and Fairweather, J.R. 2005 278 Characteristics of Smallholdings in New Zealand: Results from a Nationwide Survey Cook, Andrew and Fairweather, J.R. 2005 279 The Economic contribution of Four Biotechnologies
to New Zealand’s Primary Sector Kaye-Blake, William, Saunders, Caroline,
Emanuelsson, Martin, Dalziel, Paul, and Wreford, Anita 2005
280 Smallholding in the Selwyn District Cook, Andrew J. and Fairweather, J.R. 2005
281 Nanotechnology – ethical and social issues: Results from New Zealand Focus Groups Cook, Andrew and Fairweather, John R. 2006 282 The Economic Benefits of the Possum Control Area Programme Greer, Glen 2006 283 Maramataka: the Maori Moon Calendar Roberts, Mere, Frank, Wero, and Clarke, Liliana 2006 284 Agricultural Sector Adjustment Following Removal of Government Subsidies in New Zealand Gouin, Daniel-M 2006 285 Food Miles – Comparative Energy/Emissions Performance of New Zealand’s Agriculture Industry Saunders, Caroline, Barber, Andrew, and Taylor, Greg 2006 286 The Influence of Perceptions of New Zealand Identity on Attitudes to Biotechnology Hunt, Lesley and Fairweather, John 2006 287 New Zealander Reactions to the use of Biotechnology and Nanotechnology in Medicine, Farming and Food Cook, Andrew and Fairweather, John 2006 288 Forecast of Skills Demand in the High Tech Sector in Canterbury: Phase Two Dalziel, Paul, Saunders, Caroline and Zellman, Eva 2006 289 Nanotechnology – Ethical and Social Issues: Results from a New Zealand Survey Cook, Andrew and Fairweather, John 2006 290 Single Farm Payment in the European Union and its Implications on New Zealand Dairy and Beef Trade Kogler, Klaus 2006 291 Organic Certification Systems and Farmers’ Livelihoods in New Zealand Herberg, L.A. 2007
DISCUSSION PAPERS
145 Papers Presented at the 4th Annual Conference of
the NZ Agricultural Economics Society. Blenheim 1997
146 Papers Presented at the 5th Annual Conference of
the NZ Agricultural Economics Society. Blenheim 1998
147 Papers Presented at the 6th Annual Conference of
the NZ Agricultural Economics Society. Blenheim 2000
148 Papers Presented at the 7th Annual Conference of the NZ Agricultural Economics Society. Blenheim 2001
149 Papers Presented at the 8th Annual Conference of the NZ Agricultural Economics Society. Blenheim 2002 150 Papers Presented at the 9th Annual Conference of the NZ Agricultural Economics Society. Blenheim 2003 151 Papers Presented at the 10th Annual Conference of the NZ Agricultural Economics Society. Blenheim 2004 152 Papers Presented at the 11th Annual Conference of
the NZ Agricultural Economics Society. Blenheim 2005