on variation of diversity of soil oribatids (acari, oribatida) in three differently used soil...
TRANSCRIPT
International Journal of Scientific and Research Publications, Volume 3, Issue 11, November 2013 1 ISSN 2250-3153
www.ijsrp.org
On variation of diversity of soil oribatids (Acari,
Oribatida) in three differently used soil habitats- a waste
disposal site, a natural forest and a tea garden in the
northern plains of Bengal, India.
M. N. Moitra
Department of Zoology, P. D. Women’s College, Jalpaiguri-735101, West Bengal, India
Abstract- Soil samples were collected from three different
habitats at monthly intervals. Order Oribatida was the highest
numerically abundant group of acrarines followed by order
Mesostigmata. ANOVA indicated significant difference (p<0.05)
in population density of oribatid mites among the sites. Five,
eight and ten species of oribatid mites were recorded from the
waste disposal site at Panga, Denguajhar tea estate and Bodaganj
forest respectively. Tectocepheus velatus, Lamellobates palustris
and the species of genus Scheloribates were dominant in all the
sites. Species abundance distribution at waste disposal site fitted
well to geometric series while log normal model appeared
applicable at tea estate and forest site. Population density as well
as Shannon’s index of diversity (H’) was highest at forest site.
Right tailed sum diversity ordering showed following order-
forest floor > tea estate > waste disposal site. Richness and
evenness indices were also highest at Bodaganj forest for the
higher number of species and population density. Dominance
index was highest at the waste disposal site. Greater similarity
was recorded between tea estate and waste disposal site. Beta
diversity was a moderately high in the sampling region.
Index Terms- Diversity, Oribatid mite, Soil habitats.
I. INTRODUCTION
rder Oribatida is often found to be the single largest group
in abundance among soil microarthropods in various types
of ecosystems (Wallwork, 1983; Lamoncha and Crossley, 1998).
Their role in maintaining physicochemical dynamics of soil is
well illustrated which particularly involves their active
participation in the decomposition process of organic debris in
soil (Sanyal and Bhaduri, 1998; Renker et al., 2005). They are
found to occur in a wide range of area from tropics to Antarctic
regions and from desert to high mountains (Wallwork, 1967b;
Buryn and Usher, 1986; Sanyal et al., 2002; Sanyal, 2004;
Moitra et al., 2006, 2007). Their uses as effective bio-indicator
have also been addressed (Franchini and Rockett, 1996; Van
Straalen and Herman, 1997). Haq (2007) highlighted their use in
increasing fertility of soil. Abundance and diversity of oribatid
mites are found to vary depending upon the nature of soil and
environment and conspicuous change is observed even in local
level. It is therefore necessary to record basic information on
them that may be employed in further studies or applications and
future assessment of soil condition and the present study was
attempted keeping this aspect as major consideration.
II. MATERIALS AND METHODS
Three different sites were selected at Jalpaiguri district
(26o16''N to 27
o N and 88
o 4' E to 89
o 53'' E) in the state of West
Bengal - a waste disposal site at Panga (Site-I) run under
Jalpaiguri Municipal corporation, a tea garden at Denguajhar
(Site-II) and a natural forest at Bodaganj (Site-III). Average
maximum and minimum temperatures in the region are 30.9oC in
summer and 10.8oC in winter and average annual rainfall is 3160
mm.
Five samples were collected from each site at 30 days
interval from March, 2008 to February, 2009. A total of 180
samples were collected by stainless steel core (Dhillon and
Gibson, 1962) and soil fauna was extracted using modified
Tullgren funnel apparatus (Macfadyen, 1953). Soil fauna was
collected in 90% alcohol and oribatid mites were separated using
a fine brush. Prior to identification, oribatids were placed in 1:1
Lactic acid and alcohol and left for an hour to a few days
depending upon their pigmentation.
Diversity indices - Shannon’s diversity index (Shannon and
Weaver, 1963), Richness (Menhinick, 1964), Dominance
(Simpson, 1949), Evenness (Pielou, 1966), Simiarity (Sorenson,
1948) and Whittaker’s βw (Whittaker, 1960) were worked out.
Right-tailed sum method was applied for the diversity ordering.
This method may be considered preferable for practical purposes
(Liu et al., 2007).
Logarithmic transformations of data were made to meet the
requirement of parametric statistical analyses (ANOVA and
Tukey test).
III. RESULTS AND DISCUSSION
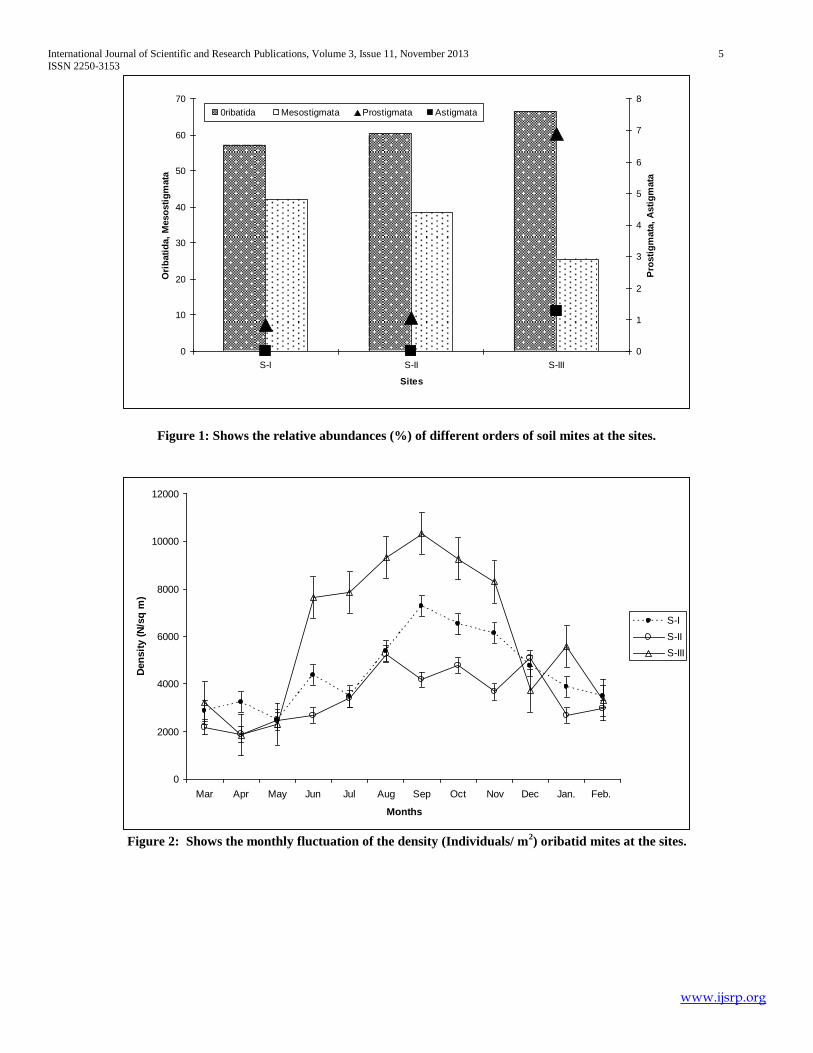
Relative abundance of oribatid mites (Order Oribatida) was
highest among the soil acarines, followed by order
Mesostigmata. Other two groups of mites (Prostigmata,
Astigmata) were fewer in abundance and of them astigmatid
mites were recorded only from Site-III (Fig. 1). Higher
abundance of oribatids in soil earlier have been reported by many
workers (Bhattacharya and Chakraborti, 1994; Moitra et. al.,
2007).
O
International Journal of Scientific and Research Publications, Volume 3, Issue 11, November 2013 2
ISSN 2250-3153
www.ijsrp.org
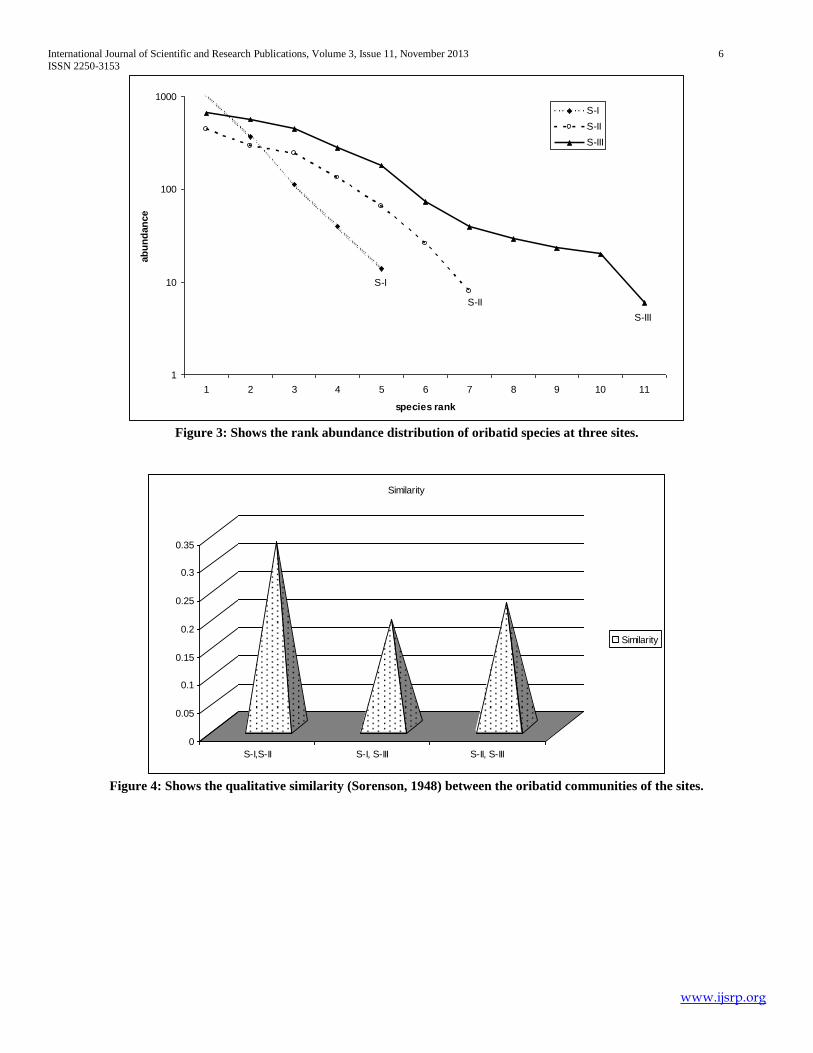
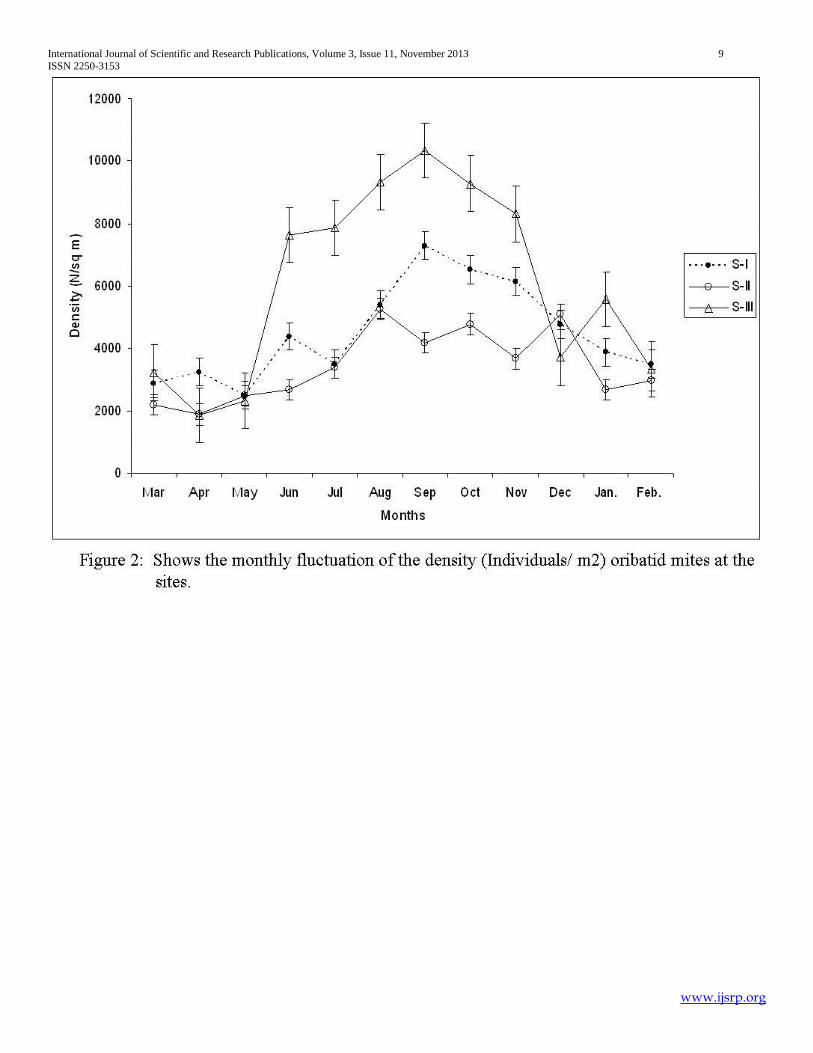
Mean density and fluctuation (coefficient of variation) of
oribatid mites were highest at Site-III probably because of the
presence of natural forest (Table 1, Fig. 2). It is generally found
that the oribatids are more numerous in forest floor (Colman et
al., 1999; Crossley and Coleman, 1999). Population maxima of
oribatids were recorded during the post monsoons and the
minima was observed during the summer in all the three sites
(Fig. 2). Similar observations earlier were made by a few
workers (Choudhuri and Banerjee, 1977; Bhattacharya and
Raychaudhuri, 1979). One way ANOVA revealed statistically
significant difference between the oribatid populations of the
sites (p< 0.05) and further, Tukey test indicated significant
difference between the mean populations of Sites-II and III
(Table 2).
A total of fifteen species of oribatid mites were recorded
from three sites. Highest number of species (10 species) was
collected from Site-III, Site-II was the next (8 species) while the
waste disposal site (Site-I) had the least (5 species).
Tectocepheus velatus was the most abundant species in the sites,
having highest abundance at Site-I and also comprised a
considerable part of oribatid fauna at other two sites. Other major
components included Scheloribates albialatus, Lamellobates
palustris, Galumna sp., Rostrozetes foveolatus etc (Table 3).
Tectocepheus velatus have a wide range of tolerance to various
environmental factors like humus content, pH, mechanical
disturbance etc that enable them to dwell at various types of
environments (Block, 1966; Hagvar and Amundsen, 1981;
Maraun et al., 1999). Most of the other species recorded from the
sites were also more or less common in the soil of West Bengal
(Sanyal and Bhaduri, 1998).
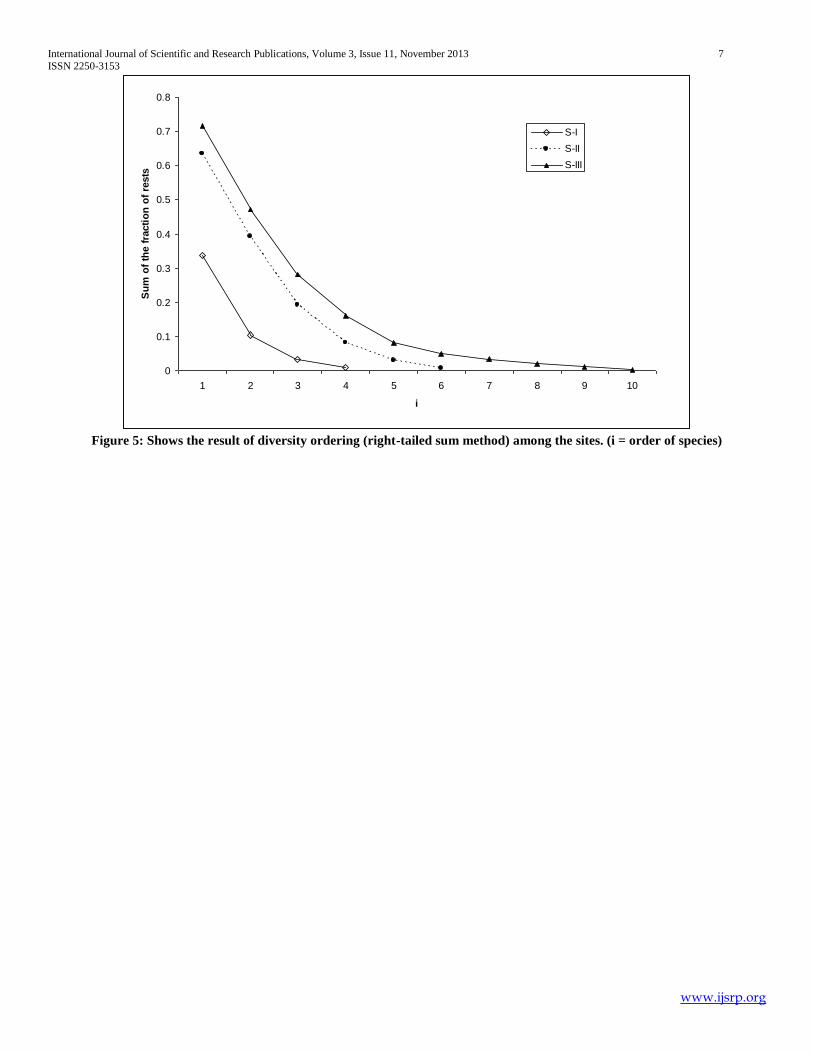
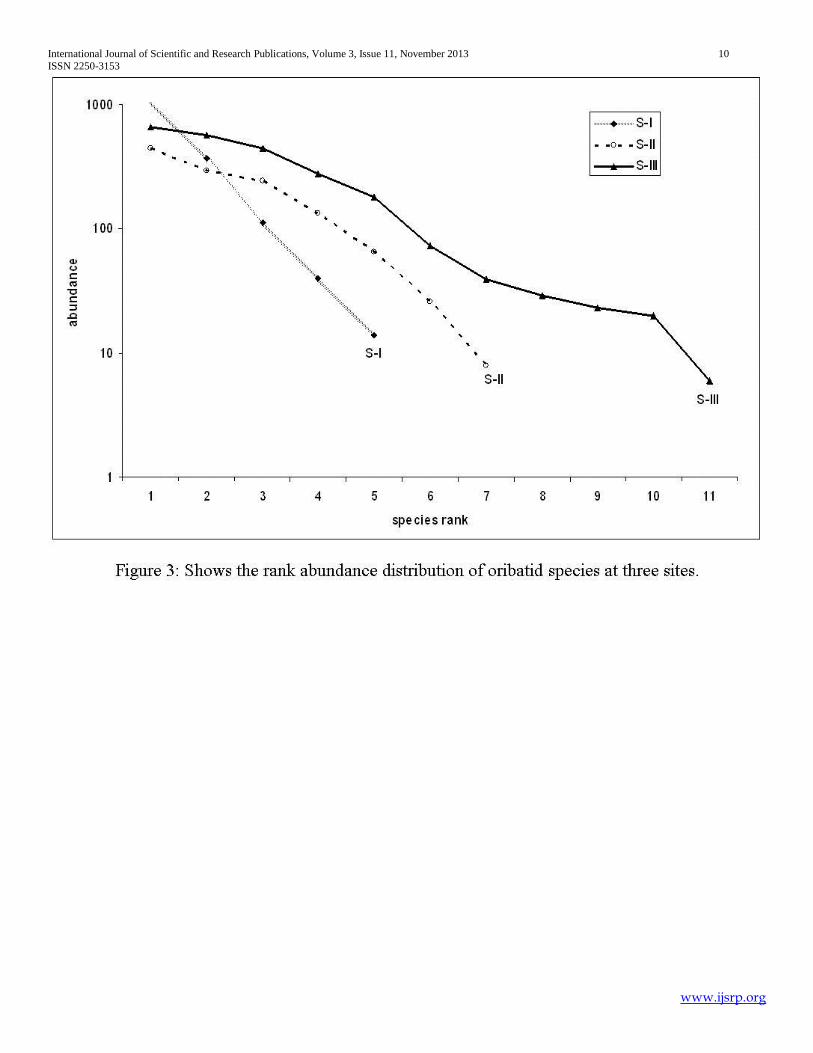
Geometric model fitted well to the species abundance
distribution at Site-I and at two other sites, log normal
distribution was applicable (Fig. 3). Log normal distribution is
relatively common in nature whereas geometric model is
generally encountered in the communities under comparatively
adverse or stressed environment. Only few species become
highly dominant in such condition (Southwood, 1978; Sugihara,
1980; Magurran, 1988). Diversity indices estimated at the sites
also substantiate this observation. Dominance index (Simpson,
1949) was highest at Site-I. This index becomes higher as the
adversity of the environment rise (Bhattacharya and Chakraborti,
1994). Shannon’s diversity index (Shannon and Weaver, 1963)
was highest at Site-III, Site-II and Site-I exhibited the least value.
Highest richness (Menhenick, 1964) and evenness (Pielou, 1966)
were also recorded at Site-III. Beta diversity was moderately
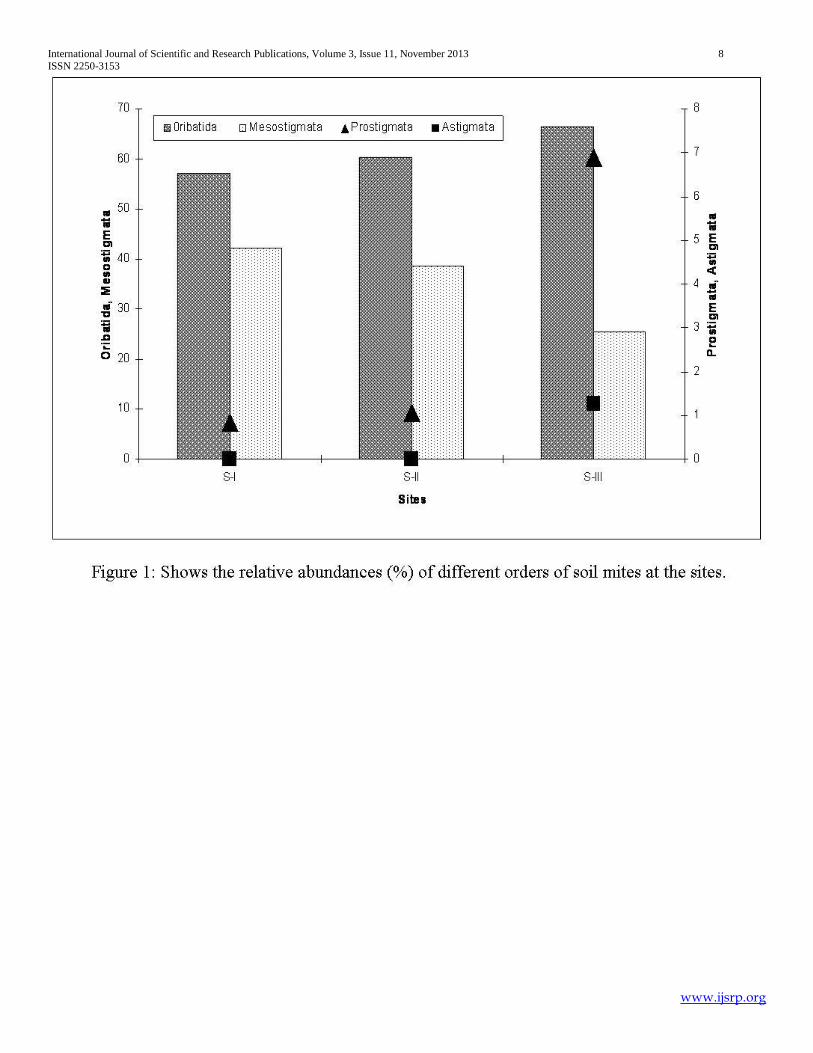
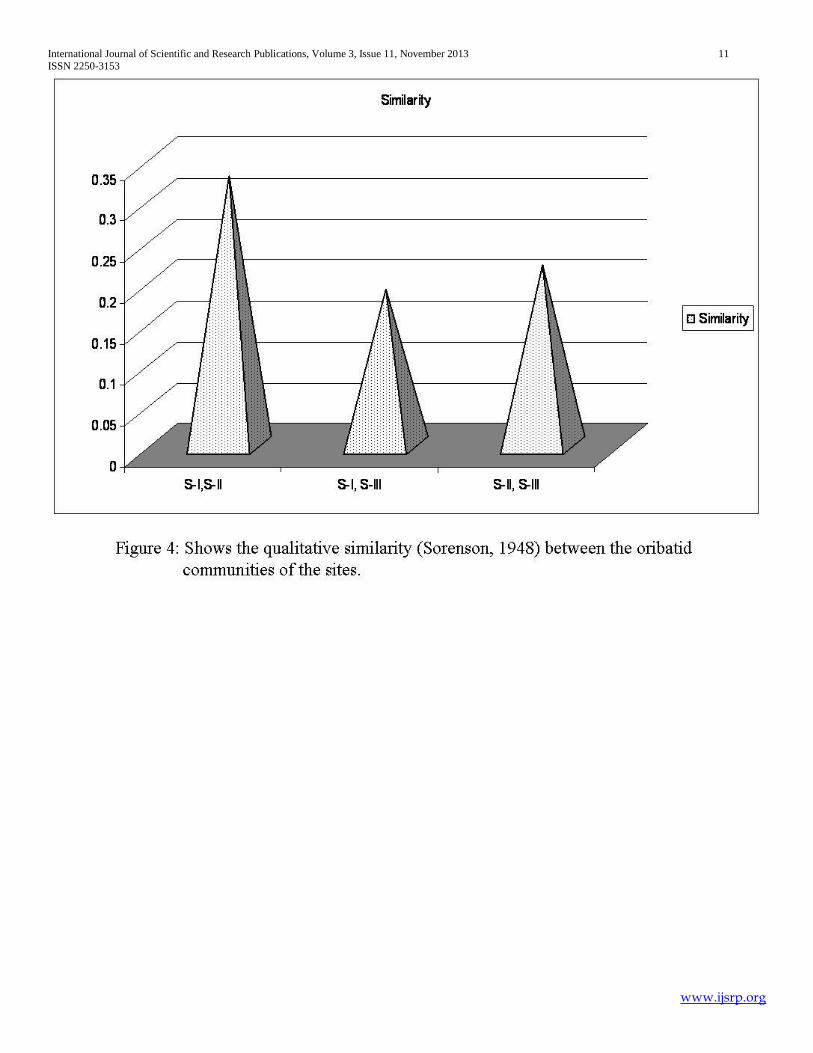
high in the region (Table 4) (Table 3). Sites-I and II exhibited
highest value of similarity (Sorenson, 1948) and Sites-I and III
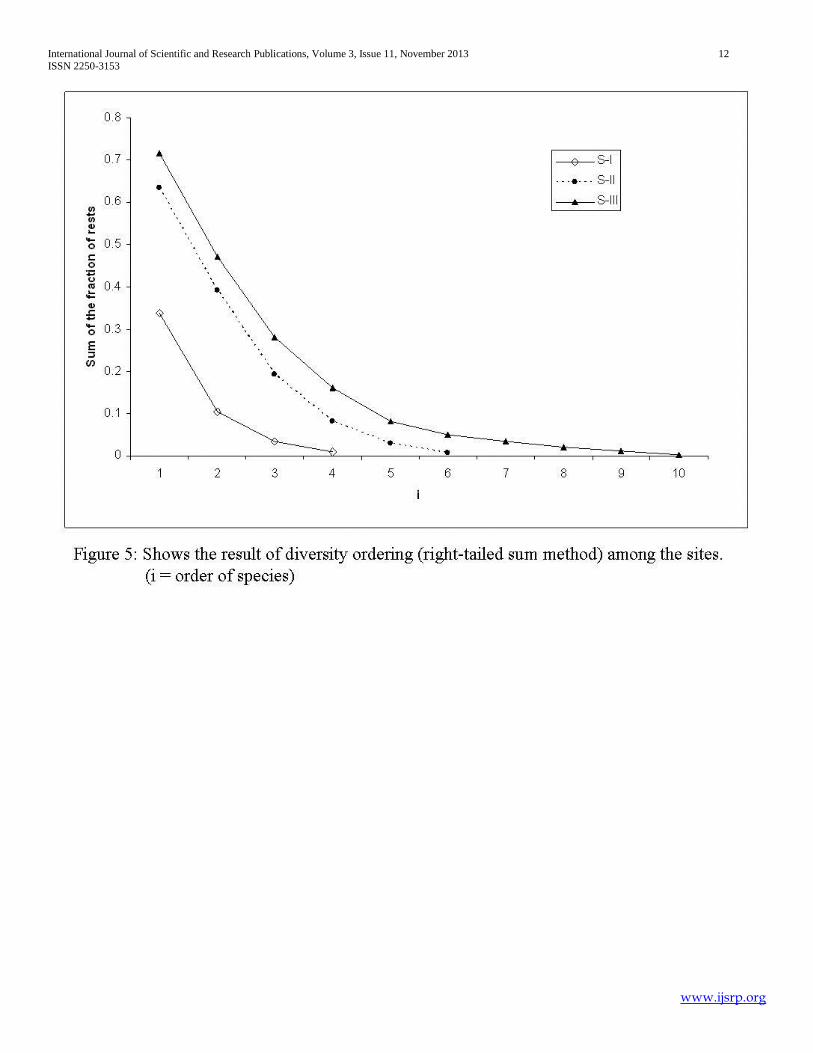
had the least (Fig. 4). Diversity ordering by right-tailed sum
method showed all the sites were comparable to one another and
clearly could be ordered as Site-III> Site-II> Site-I in terms of
diversity in oribatid communities (Fig. 5). The reasons for the
low diversity at Sites-I and II could be attributed to the less
complexity in vegetations and polluted condition (Hazra and
Choudhuri, 1990; Hansen and Coleman, 1998; Hooper et. al.,
2000).
Oribatid community in the natural forest floor was more
diverse and had higher density in comparison to other two sites
probably for higher diversity in vegetation and relatively
undisturbed environment. The selected waste disposal site was a
dumping ground for both organic and inorganic garbage of a
township. Though the lowest diversity and fitting to geometric
distribution indicated a stressed condition here, the density of
oribatids however was higher than that of tea garden. It may be
inferred that the dumping of garbage lowered diversity in
oribatid community but did not affect too much the density as did
the periodical chemical treatment in the well maintained tea
garden.
REFERENCES
[1] Bhattacharya, T. 1979. Climate, soil and soil inhabiting arthropods of Shantiniketan and adjoining areas. Journal of Research, Visva-Bharati, 3(2): 12-23.
[2] Bhattacharya, T. and Chakraborti, P. 1994. Community structure of soil Oribatida of a young Rubber plantation and an adjacent waste land in Tripura (India). In : Advances in Ecology and Environmental Science (P. C. Mishra, N. Behera, B. K. Senapati, B. C. Guru eds)., pp. 65-77.
[3] Bhattacharya, T. and Raychaudhuri, D.N. 1979. Monthly variation in the density of soil microarthropods in relation to some climatic and edaphic factors. Entomon 4(4): 313-318.
[4] Buryn, R and Usher, M. B. 1986. A morphometric study of the mite, Oppia loxolineata, in the maritime Antarctica. Bull. Br. Antarc. Surv. No. 73: 47-50.
[5] Block, W. C., 1966. Seasonal fluctuation and distribution of mite population in moorland soils, with a note on biomass. J. Anim. Ecol., 35(3): 487 – 503.
[6] Choudhuri, D.K. and Banerjee, S. 1977. Soil factors and oribatid mites under conditions of West Bengal. The University of Burdwan Publication. 88 pp.
[7] Coleman, David C., Blair, J. M., Elliott, E. T., and Wall, D. H. 1999. Soil Invertebrates. In: Standard Soil Methods for Long-Term Ecological Research. Oxford University Press, Oxford, New York. pp. 349-377 (Eds. G. Philip Robertson, David C. Coleman, Caroline S. Bledsoe, and Phillip Sollins).
[8] Crossley, D.A. (Jr.) and Coleman, D. C. 1999. Microarthropods. In: Handbook of Soil Science CRC Press, Boca Raton. ( Malcom E. Sumner ed.). pp. C-59 - C-65.
[9] Dhillon, B. S. and Gibson, N. R. E. 1962. A study of the Acarian and Collembolo of Agriculture soils. I. Numbers and distributions in undisturbed grassland. Pedobiologia, 1: 189-209.
[10] Franchini, P. and Rockett, C. L. 1996. Oribatid mites as “indicator” species for estimating environmental impact of conventional and conservation tillage practices. Pedobiologia. 40: 217-225.
[11] Hagvar, S. and Amundsen, T. 1981. Effects of liming and artificial acid rain on the mite (Acari) fauna in coniferous forest. Oikos, 37: 7-20.
[12] Hansen, R. A., and Coleman, D. C. 1998. Litter complexity and composition are determinants of the diversity and species composition of oribatid mites (Acari: Oribatida) in litterbags. Applied Soil Ecology, 9: 17-23.
[13] Haq, M. A. 2007. Oriculture technology- a better tribute to crop production. J. Acarol. 16 (1&2): 100-103.
[14] Hazra, A.K. and Choudhuri D.K. 1990. Ecology of subterranean macro and microarthropod fauna in different degraded and polluted soil environment of West Bengal, India. Rec. zool. Surv. India. Occ. Paper No. 120: 1-295.
[15] Hooper, D.U., Bignell, D.E., Brown, V.K., Brussaard, L., Dangerfield, J.M., Wall, D.H., Wardle, D.A., Coleman, D.C., Giller, K.E., Lavelle, P., van der Putten, W.H., de Ruiter, P.C., Rusek, J., Silver, W.L., Tiedje, J.M., Wolters, W., 2000. Interactions between aboveground and belowground biodiversity in terrestrial ecosystems: Patterns, Mechanisms, and Feedbacks. BioScience, 50: 1049–1061.
[16] Lamoncha, K. L. and Crossley, D. A. (Jr.). 1998. Oribatid mite diversity along an elevation gradient in a southeastern appalachian forest. Pedobiologia, 42: 43-55.
[17] Liu, C., Whittaker, R. J., Ma, K. and. Malcolm, J. R. 2007. Unifying and distinguishing diversity ordering methods for comparing communities. Popul. Ecol., 49: 89–100.
International Journal of Scientific and Research Publications, Volume 3, Issue 11, November 2013 3
ISSN 2250-3153
www.ijsrp.org
[18] MacFadyen, A. 1953. Notes on methods for the extraction of small soil arthropods. J. Animal Ecol., 22: 65- 77
[19] Magurran. A. E., 1988. In: Ecological Diversity and Its Measurement. Princeton University Press, Princeton, NJ. pp.1-179.
[20] Maraun M, Alphei J, Bonkowski M, Buryn R, Migge S, Peter M, Schaefer M, and Scheu S. 1999. Middens of the earthworm Lumbricus terrestris (Lumbricidae): microhabitats for micro- and mesofauna in forest soil. Pedobiologia, 43: 276-287.
[21] Menhinick E, F. 1964. A comparison of some species diversity indices applied to samples of field insects. Ecology, 45: 859-861.
[22] Moitra, M. N., Sanyal, A. K. and Chakrabarti, S. 2006. On a collection of soil oribatid mites from Sandakphu, Darjeeling, West Bengal, India. Rec. zool. Surv. India., 106(4): 55-60.
[23] Moitra, M. N., A. K. Sanyal, and Chakrabarti, S. 2007. Population of soil acari at two altitudes in Darjeeling Himalaya. J. Acarol. 16(1&2): 86-87.
[24] Pielou, E. C. 1966. The measurement of diversity in different types of biological collection. J. Theoret. Biol., 30: 131-144.
[25] Renker, C., Otto, P., Schneider, K., Zimdars, B., Maraun M. and Buscot, F. 2005. Oribatid Mites as Potential Vectors for Soil Microfungi: Study of Mite-Associated Fungal Species. Microbial Ecology, 50: 518–528.
[26] Sanyal, A. K. and Bhaduri, A. K. 1998. Diversity in Soil Mites (Acari ) of West Bengal. In: Proceedings of National Seminar on Environmental Biology. (A. K. Aditya and P. Haldar eds) Delhi. pp. 173-179.
[27] Sanyal, A. K., Basak, S. and Burman, R. P. 2002. Three new species of oribatid mites (Acarina, Oribatida, Haplochthoniidae) from the Antarctica continent. Acarina 10(1): 57-63.
[28] Sanyal, A. K. 2004. Notes on the ecology of soil mites (Acari) in two contrasting sites of Schirmachar Oasis, East Antarctica. Acarina. 12(2): 151-157.
[29] Shannon, C. E. and Weaver, W. 1963. In: The mathematical theory for communication. University of Illinois Press, Urbana. pp. 1-117.
[30] Simpson, E. H. 1949. Measurement of diversity. Nature, 163: 688.
[31] Sorenson, T. 1948. A method of establishing groups of equal amplitude in plant society based similarity of species content. K. Danske Vidensk. Selsk., 5: 1-34.
[32] Southwood, T. R. E. 1978. In: Ecological methods. Chapman and Hall. London. pp. 1-524.
[33] Sugihara, G. 1980. Minimal community structure: an explanation of species abundance pattern. Amer. Nat., 116: 770-787.
[34] Van Straalen, N. M. and Herman, A. V. 1997. The development of a bioindicator system of soil acidity based on arthropod pH preferences. Journal of Applied Ecology, 34(1): 217-232.
[35] Wallwork, J. A. I967. Cryptostigmata (Oribatid mites) Entomology of Antarctica. Antarctic Rec., 10: 105-122.
[36] Wallwork, J. A. 1983. Oribatids in forest ecosystems. Ann. Rev. Entomol. 28: 109-130.
[37] Whittaker, R. H. 1960. Vegetation of the Siskiyou Mountains, Oregaon and California. Ecol. Monogr., 30: 279-338.
AUTHORS
First Author – Manabendra Nath Moitra, Ph. D. Assistant
Professor, Dept. of Zoology, P. D. Women’s College, Jalpaiguri,
West Bengal, India, ([email protected]), (+91)
9831592641
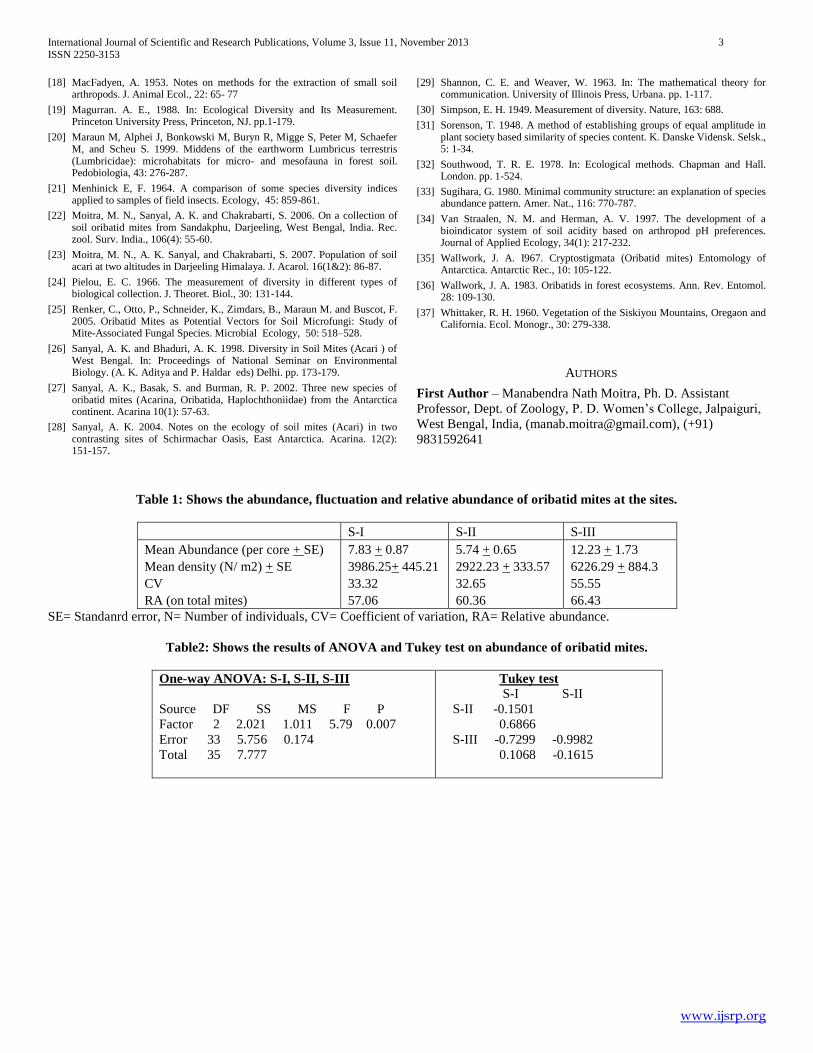
Table 1: Shows the abundance, fluctuation and relative abundance of oribatid mites at the sites.
S-I S-II S-III
Mean Abundance (per core + SE) 7.83 + 0.87 5.74 + 0.65 12.23 + 1.73
Mean density (N/ m2) + SE 3986.25+ 445.21 2922.23 + 333.57 6226.29 + 884.3
CV 33.32 32.65 55.55
RA (on total mites) 57.06 60.36 66.43
SE= Standanrd error, N= Number of individuals, CV= Coefficient of variation, RA= Relative abundance.
Table2: Shows the results of ANOVA and Tukey test on abundance of oribatid mites.
One-way ANOVA: S-I, S-II, S-III
Source DF SS MS F P
Factor 2 2.021 1.011 5.79 0.007
Error 33 5.756 0.174
Total 35 7.777
Tukey test
S-I S-II
S-II -0.1501
0.6866
S-III -0.7299 -0.9982
0.1068 -0.1615
International Journal of Scientific and Research Publications, Volume 3, Issue 11, November 2013 4
ISSN 2250-3153
www.ijsrp.org
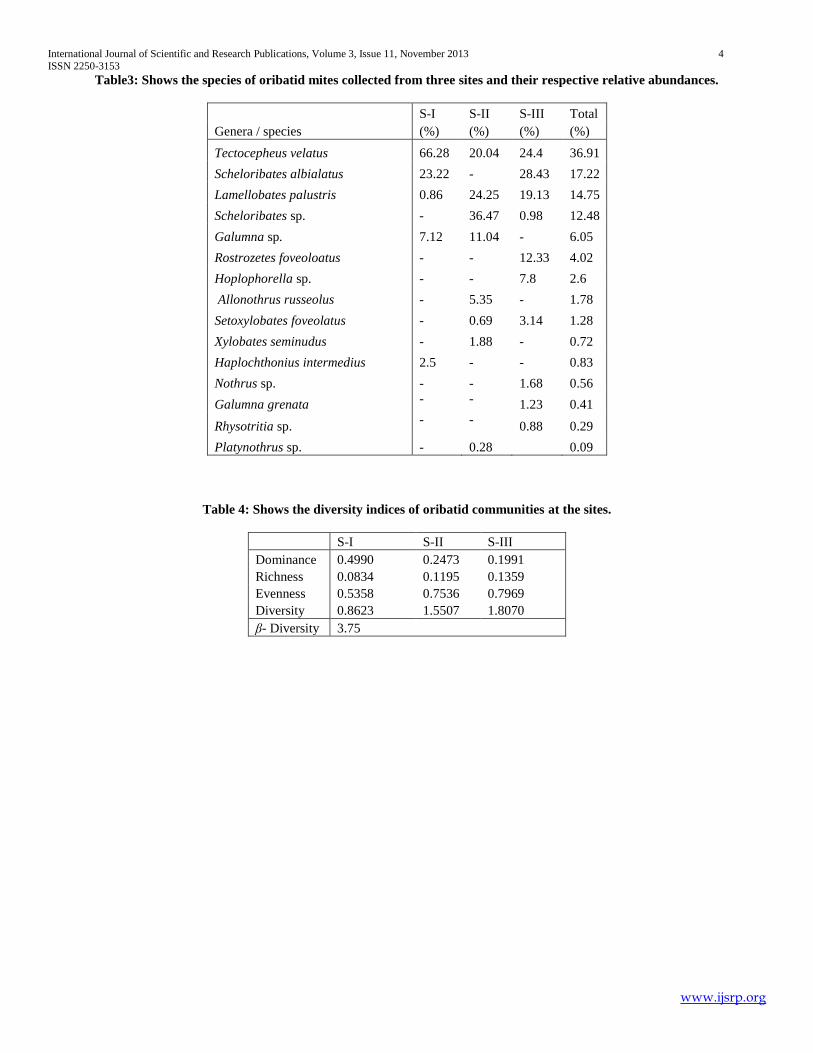
Table3: Shows the species of oribatid mites collected from three sites and their respective relative abundances.
Genera / species
S-I S-II S-III Total
(%) (%) (%) (%)
Tectocepheus velatus 66.28 20.04 24.4 36.91
Scheloribates albialatus 23.22 - 28.43 17.22
Lamellobates palustris 0.86 24.25 19.13 14.75
Scheloribates sp. - 36.47 0.98 12.48
Galumna sp. 7.12 11.04 - 6.05
Rostrozetes foveoloatus - - 12.33 4.02
Hoplophorella sp. - - 7.8 2.6
Allonothrus russeolus - 5.35 - 1.78
Setoxylobates foveolatus - 0.69 3.14 1.28
Xylobates seminudus - 1.88 - 0.72
Haplochthonius intermedius 2.5 - - 0.83
Nothrus sp. - - 1.68 0.56
Galumna grenata - - 1.23 0.41
Rhysotritia sp. - -
0.88 0.29
Platynothrus sp. - 0.28 0.09
Table 4: Shows the diversity indices of oribatid communities at the sites.
S-I S-II S-III
Dominance 0.4990 0.2473 0.1991
Richness 0.0834 0.1195 0.1359
Evenness 0.5358 0.7536 0.7969
Diversity 0.8623 1.5507 1.8070
β- Diversity 3.75
International Journal of Scientific and Research Publications, Volume 3, Issue 11, November 2013 5
ISSN 2250-3153
www.ijsrp.org
0
10
20
30
40
50
60
70
S-I S-II S-III
Sites
Ori
bati
da,
Meso
sti
gm
ata
0
1
2
3
4
5
6
7
8
Pro
sti
gm
ata
, A
sti
gm
ata
0ribatida Mesostigmata Prostigmata Astigmata
Figure 1: Shows the relative abundances (%) of different orders of soil mites at the sites.
0
2000
4000
6000
8000
10000
12000
Mar Apr May Jun Jul Aug Sep Oct Nov Dec Jan. Feb.
Months
Den
sit
y (
N/s
q m
)
S-I
S-II
S-III
Figure 2: Shows the monthly fluctuation of the density (Individuals/ m
2) oribatid mites at the sites.
International Journal of Scientific and Research Publications, Volume 3, Issue 11, November 2013 6
ISSN 2250-3153
www.ijsrp.org
S-I
S-II
S-III
1
10
100
1000
1 2 3 4 5 6 7 8 9 10 11
species rank
ab
un
dan
ce
S-I
S-II
S-III
Figure 3: Shows the rank abundance distribution of oribatid species at three sites.
0
0.05
0.1
0.15
0.2
0.25
0.3
0.35
S-I,S-II S-I, S-III S-II, S-III
Similarity
Similarity
Figure 4: Shows the qualitative similarity (Sorenson, 1948) between the oribatid communities of the sites.
International Journal of Scientific and Research Publications, Volume 3, Issue 11, November 2013 7
ISSN 2250-3153
www.ijsrp.org
0
0.1
0.2
0.3
0.4
0.5
0.6
0.7
0.8
1 2 3 4 5 6 7 8 9 10
i
Su
m o
f th
e f
racti
on
of
rests
S-I
S-II
S-III
Figure 5: Shows the result of diversity ordering (right-tailed sum method) among the sites. (i = order of species)
International Journal of Scientific and Research Publications, Volume 3, Issue 11, November 2013 8
ISSN 2250-3153
www.ijsrp.org
International Journal of Scientific and Research Publications, Volume 3, Issue 11, November 2013 9
ISSN 2250-3153
www.ijsrp.org
International Journal of Scientific and Research Publications, Volume 3, Issue 11, November 2013 10
ISSN 2250-3153
www.ijsrp.org
International Journal of Scientific and Research Publications, Volume 3, Issue 11, November 2013 11
ISSN 2250-3153
www.ijsrp.org
International Journal of Scientific and Research Publications, Volume 3, Issue 11, November 2013 12
ISSN 2250-3153
www.ijsrp.org