on the human sensorimotor-cortex beta rhythm: sources and
TRANSCRIPT
www.elsevier.com/locate/ynimg
NeuroImage 26 (2005) 347 – 355
On the human sensorimotor-cortex beta rhythm: Sources and
modeling
O. Jensen,a,b,* P. Goel,c N. Kopell,d M. Pohja,a R. Hari,a,e and B. Ermentroutf
aBrain Research Unit, Low Temperature Laboratory, Helsinki University of Technology, FinlandbF.C. Donders Centre for Cognitive Neuroimaging, Radboud University Nijmegen, NL-6500 HB Nijmegen, The NetherlandscMathematical Biosciences Institute, Ohio State University, OH 43210, USAdDepartment of Mathematics, Boston University, MA 02215, USAeDepartment of Clinical Neurophysiology, Helsinki University Central Hospital, 00270 Helsinki, FinlandfDepartment of Mathematics, University of Pittsburgh, PA 15260, USA
Received 24 March 2004; revised 24 January 2005; accepted 9 February 2005
Available online 7 April 2005
Cortical oscillations in the beta band (13–35 Hz) are known to be
modulated by the GABAergic agonist benzodiazepine. To investigate
the mechanisms generating the �20-Hz oscillations in the human
cortex, we administered benzodiazepines to healthy adults and
monitored cortical oscillatory activity by means of magnetoencepha-
lography. Benzodiazepine increased the power and decreased the
frequency of beta oscillations over rolandic areas. Minimum current
estimates indicated the effect to take place around the hand area of the
primary sensorimotor cortex. Given that previous research has
identified sources of the beta rhythm in the motor cortex, our results
suggest that these same motor-cortex beta sources are modulated by
benzodiazepine. To explore the mechanisms underlying the increase in
beta power with GABAergic inhibition, we simulated a conductance-
based neuronal network comprising excitatory and inhibitory neurons.
The model accounts for the increase in the beta power, the widening of
the spectral peak, and the slowing down of the rhythms with
benzodiazepines, implemented as an increase in GABAergic conduc-
tance. We found that an increase in IPSCs onto inhibitory neurons was
more important for generating neuronal synchronization in the beta
band than an increase in IPSCs onto excitatory pyramidal cells.
D 2005 Elsevier Inc. All rights reserved.
Keywords: Beta rhythm; Sensorimotor cortex; Electroencephalographic;
Magnetoencephalographic
Introduction
Oscillatory activity of the human cerebral cortex, readily
monitored by electroencephalographic (EEG) and magnetoence-
1053-8119/$ - see front matter D 2005 Elsevier Inc. All rights reserved.
doi:10.1016/j.neuroimage.2005.02.008
* Corresponding author. F.C. Donders Center for Cognitive Neuro-
imaging, P.O. Box 9101, NL-6500 HB Nijmegen, The Netherlands.
Fax: +31 24 36 10989.
E-mail address: [email protected] (O. Jensen).
Available online on ScienceDirect (www.sciencedirect.com).
phalographic (MEG) recordings, comprises several prominent
frequency bands. The best known is the �10 Hz parieto-occipital
‘‘alpha’’ rhythm that reacts strongly to opening/closing of the eyes.
The rolandic mu-rhythm is observed as spontaneous activity in
healthy subjects over sensorimotor areas and has a 10-Hz and
20-Hz components that have different sources in the primary
somatosensory and the motor cortex, respectively, (see Hari and
Salmelin, 1997 for a review). The 20-Hz rhythm is modulated
during various motor and cognitive tasks (Farmer, 1998; Hari and
Salmelin, 1997). Moreover, a part of the 20-Hz motor-cortex
oscillations are coherent with simultaneously recorded surface
electromyogram during isometric contraction (Conway et al.,
1995; Salenius et al., 1997) and have been suggested to be related
to re-calibration after movements (Kilner et al., 1999). Patients with
progressive myoclonus epilepsy and chronic pain display abnormal
reactivity of the motor-cortex beta-range activity (Juottonen et al.,
2002; Silen et al., 2000), suggesting reduced intracortical inhibition.
In clinical EEG records, rhythmic beta oscillations are observed
in frontal scalp electrodes in subjects who have taken benzodiaze-
pine-type drugs (Wanquier, 1998). Interestingly, Baker and Baker
(2003) reported that cortico-muscle coherence in the beta range
decreased after the application of benzodiazepines. Our exper-
imental aim was to investigate whether benzodiazepine would
modify the motor-cortex 20-Hz oscillations measured by MEG in
healthy subjects. Furthermore, we were interested in finding out
whether we could identify the generation site(s) of the beta-range
rhythms after benzodiazepine administration. Preliminary results on
this subject (Jensen et al., 2002) prompted the current study.
The primary effect of benzodiazepines is an increase in the
conductance of GABA-mediated currents. It is not intuitive how the
resulting increase in inhibition could increase the power of a
rhythm and why that increase would be in the beta band. We use
suggestions from in vitro research and computational modeling to
help to provide an answer. The human beta oscillations appear to
have many features in common with gamma band oscillations

O. Jensen et al. / NeuroImage 26 (2005) 347–355348
(30–80 Hz) observed in various animal preparations. Gamma
oscillations have been modeled in vitro in the hippocampus
(Towers et al., 2002; Traub et al., 1996; Whittington et al., 1995,
1997a). In those preparations, the fast-spiking interneurons are
important for the gamma frequency oscillations. Bacci et al. (2003)
and Faulkner et al. (1999) recently showed that these are the
interneurons affected by benzodiazepine-like agonists. Interest-
ingly, Shimono et al. (2000) showed that cholinergically induced
beta oscillations in hippocampal rat slice increased in power and
decreased in frequency by benzodiazepine.
The computational network model we offer hypothesizes that
the human beta oscillations in the sensorimotor cortex are an
analogue of the gamma oscillations studied in rats. Networks of
inhibitory interneurons have shown to be crucially involved in
generating the gamma rhythm (Towers et al., 2002; Traub et al.,
1996; Whittington et al., 1995, 1997a). The main motivation for
hypothesizing this analogy is the sensitivity in frequency and
power of these rhythms to GABAergic agonists, suggesting a
strong role to be played by the interneuronal network. The
frequencies of the rhythms are affected by the size and decay time
of the GABA conductance and the drive to both excitatory and
inhibitory neurons. We show a parameter range in which all the
behavior of the power spectrum described in the experimental
findings is replicated. Specifically, modeling the effects of
benzodiazepine as an increase in the strength of the GABA
conductance, we show that this can increase the power in the beta
frequency range, lower the frequency and broaden the range in
which there is large power. We show that the major effects come
about from an increase in inhibitory current to the inhibitory
interneurons; instead, increase in inhibitory currents to the
excitatory pyramidal cells does not increase the beta power.
Materials and methods
Subjects
Magnetoencephalographic (MEG) signals were recorded from
eight healthy subjects (ages 26–35 years; 3 males; 5 females) with
no history of neurological disorders. Informed consent was
obtained from each subject after full explanation of the study.
The work had a prior approval by the ethics committee of the
Helsinki Uusimaa Hospital District.
Procedure
The subjects were seated in a relaxed position under the MEG
helmet. They were instructed to keep their eyes closed and relax
without falling asleep while 3 min of ongoing MEG signals were
recorded. Following this control condition, about 80 Ag/kg, i.e.4–7.5 mg benzodiazepine (Diapam\) was administrated orally.
Following a 1-h break, the MEG measurement was repeated.
Data acquisition
MEG signals were recorded with a helmet-shaped 306-channel
detector array (Vectorviewi, Neuromag Ltd, Helsinki, Finland).
This system has 102 triple-sensor elements distributed over the
scalp, each element comprising two planar gradiometers and one
magnetometer. Typically, the local neuronal sources of the signals
are situated directly below those planar gradiometers that detect the
strongest signals. To measure the head position with respect to the
sensors, four coils were placed on the scalp, and their relative
positions with respect to anatomical landmarks on the head were
determined with a 3-D digitizer. After the subjects were seated
under the MEG helmet, the positions of the coils were determined
by measuring the magnetic signals produced by currents passed
through the coils. Magnetic resonance images (MRIs) were
obtained with a 1.5 T Siemens Magnetom scanner and were
aligned to the MEG coordinate system according to anatomical
landmarks. The ongoing MEG signals were bandpass filtered from
0.1 to 100 Hz, digitized at 300 Hz and stored for off-line analysis.
Data analysis
Power spectra of the neuromagnetic signals were calculated for
each sensor before and after benzodiazepine application according
to Welch’s method (Press et al., 1997) (Hanning window, 50%
overlapping 2048-points window). The dominant oscillatory
signals were identified and characterized from the spectra. For
source determination, the peak frequency in the beta band was first
identified for each subject and at these frequencies minimum
current estimates were calculated (Uutela et al., 1999). Applying a
sliding time window approach, this method allows us to calculate
the current distribution in the frequency domain. For each time
window, the minimum current estimate is calculated for the
frequency of interest. Subsequently, the absolute contributions of
the real and imaginary parts of the current estimates are averaged
(Jensen and Vanni, 2002). In several subjects, the sources of the
beta-range oscillations were then mapped onto the subject’s own
MRI (Uutela et al., 1999).
Modeling
The network consisted of 64 excitatory pyramidal neurons (e-
cells) and 16 inhibitory interneurons (i-cells) connected all-to-all
but with a weak e–e coupling. This type of network model allows
us explore the physiological mechanisms and dynamics producing
the beta oscillations. The model is constrained by the kinetics of
membrane and synaptic currents. The i-cells were modeled with
equations
CdVi
dt¼ � gL Vi � VLð Þ � gKn
4 Vi � VKð Þ � gNam3h Vi � VNað Þ
� Isyn;i þ I0
and the e-cells by equations of the form:
CdVe
dt¼ � gL Ve � VLð Þ � gKn
4 Ve � VKð Þ � gNam3h Ve � VNað Þ
� gAHPw Ve � VKð Þ � Isyn;e þ I0
Both types of cells have a leak (L), a transient sodium (Na) and
a delayed rectifier potassium (K) current. The e-cells have an
additional after-depolarizing potential (AHP) resulting in a slow
outward potassium current. Parameters and functional forms of the
equations are taken from Traub and Miles (1991).
The gating variables m, h, n satisfy equations of the form:
dx
dt¼ ax Vð Þ 1� xð Þ � bx Vð Þx
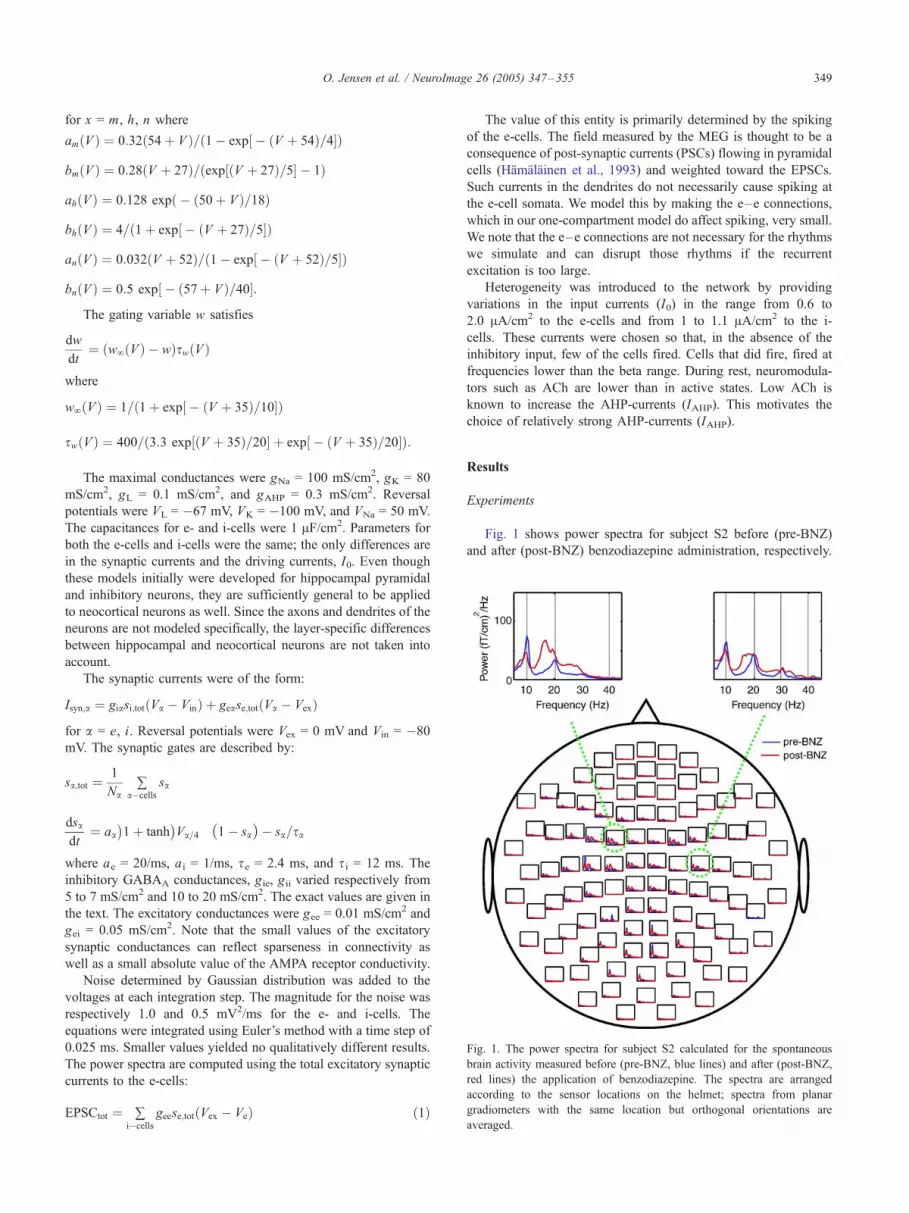
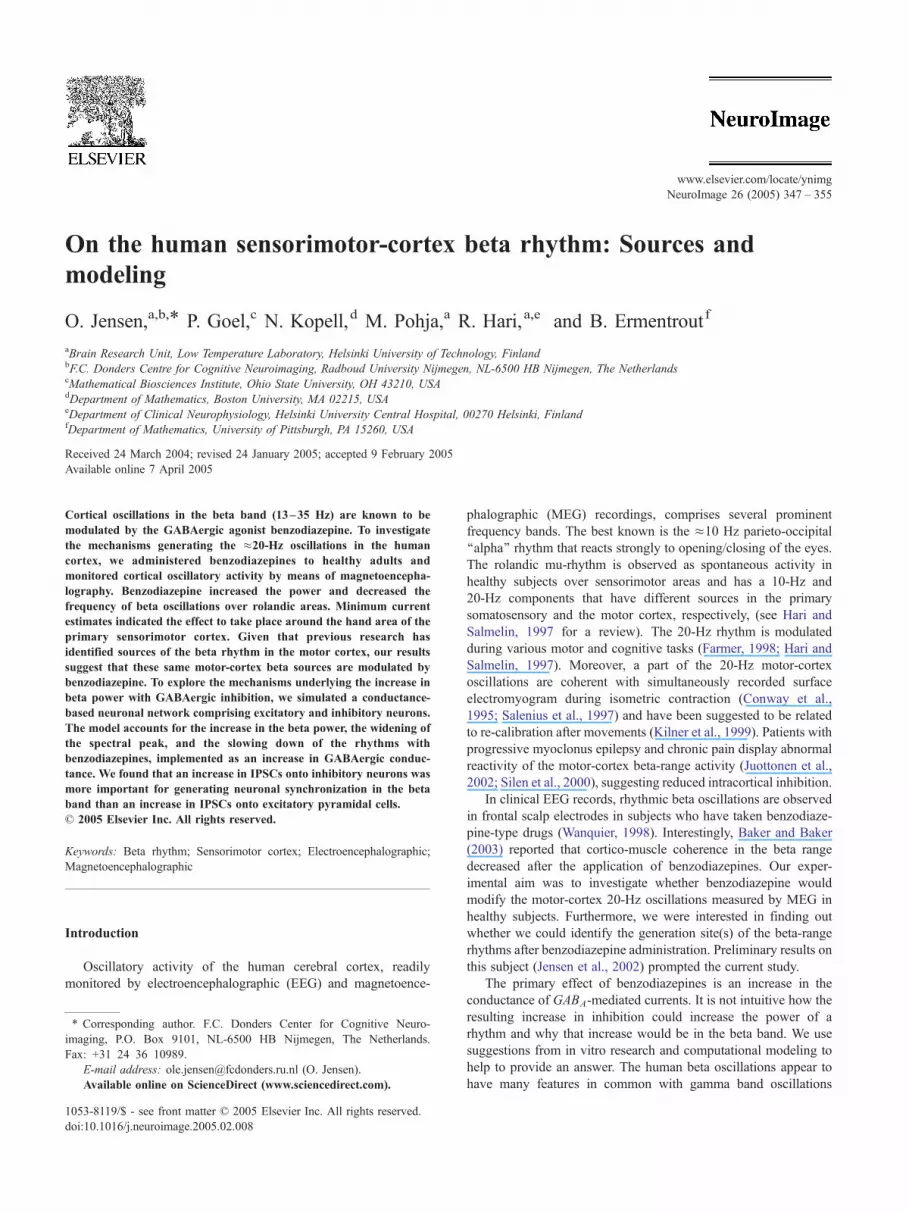
Fig. 1. The power spectra for subject S2 calculated for the spontaneous
brain activity measured before (pre-BNZ, blue lines) and after (post-BNZ,
red lines) the application of benzodiazepine. The spectra are arranged
according to the sensor locations on the helmet; spectra from planar
gradiometers with the same location but orthogonal orientations are
averaged.
O. Jensen et al. / NeuroImage 26 (2005) 347–355 349
for x = m, h, n where
am Vð Þ ¼ 0:32 54þ Vð Þ= 1� exp � V þ 54ð Þ=4½ �ð Þ
bm Vð Þ ¼ 0:28 V þ 27ð Þ= exp V þ 27ð Þ=5½ � � 1ð Þ
ah Vð Þ ¼ 0:128 exp � 50þ Vð Þ=18ð Þ
bh Vð Þ ¼ 4= 1þ exp � V þ 27ð Þ=5�Þ½ð
an Vð Þ ¼ 0:032 V þ 52ð Þ= 1� exp � V þ 52ð Þ=5½ �ð Þ
bn Vð Þ ¼ 0:5 exp � 57þ Vð Þ=40½ �:
The gating variable w satisfies
dw
dt¼ wV Vð Þ � wð Þsw Vð Þ
where
wV Vð Þ ¼ 1= 1þ exp � V þ 35ð Þ=10½ �ð Þ
sw Vð Þ ¼ 400= 3:3 exp V þ 35ð Þ=20½ � þ exp � V þ 35ð Þ=20½ �ð Þ:
The maximal conductances were gNa = 100 mS/cm2, gK = 80
mS/cm2, gL = 0.1 mS/cm2, and gAHP = 0.3 mS/cm2. Reversal
potentials were VL = �67 mV, VK = �100 mV, and VNa = 50 mV.
The capacitances for e- and i-cells were 1 AF/cm2. Parameters for
both the e-cells and i-cells were the same; the only differences are
in the synaptic currents and the driving currents, I0. Even though
these models initially were developed for hippocampal pyramidal
and inhibitory neurons, they are sufficiently general to be applied
to neocortical neurons as well. Since the axons and dendrites of the
neurons are not modeled specifically, the layer-specific differences
between hippocampal and neocortical neurons are not taken into
account.
The synaptic currents were of the form:
Isyn;a ¼ giasi;tot Va � Vinð Þ þ gease;tot Va � Vexð Þ
for a = e, i. Reversal potentials were Vex = 0 mV and Vin = �80
mV. The synaptic gates are described by:
sa;tot ¼1
Na~
a�cells
sa
dsa
dt¼ aa 1þ tanh Va=4
� �� �ð1� saÞ � sa=sa
where ae = 20/ms, ai = 1/ms, se = 2.4 ms, and si = 12 ms. The
inhibitory GABAA conductances, gie, gii varied respectively from
5 to 7 mS/cm2 and 10 to 20 mS/cm2. The exact values are given in
the text. The excitatory conductances were gee = 0.01 mS/cm2 and
gei = 0.05 mS/cm2. Note that the small values of the excitatory
synaptic conductances can reflect sparseness in connectivity as
well as a small absolute value of the AMPA receptor conductivity.
Noise determined by Gaussian distribution was added to the
voltages at each integration step. The magnitude for the noise was
respectively 1.0 and 0.5 mV2/ms for the e- and i-cells. The
equations were integrated using Euler’s method with a time step of
0.025 ms. Smaller values yielded no qualitatively different results.
The power spectra are computed using the total excitatory synaptic
currents to the e-cells:
EPSCtot ¼ ~i�cells
geese;tot Vex � Veð Þ ð1Þ
The value of this entity is primarily determined by the spiking
of the e-cells. The field measured by the MEG is thought to be a
consequence of post-synaptic currents (PSCs) flowing in pyramidal
cells (Hamalainen et al., 1993) and weighted toward the EPSCs.
Such currents in the dendrites do not necessarily cause spiking at
the e-cell somata. We model this by making the e–e connections,
which in our one-compartment model do affect spiking, very small.
We note that the e–e connections are not necessary for the rhythms
we simulate and can disrupt those rhythms if the recurrent
excitation is too large.
Heterogeneity was introduced to the network by providing
variations in the input currents (I0) in the range from 0.6 to
2.0 AA/cm2 to the e-cells and from 1 to 1.1 AA/cm2 to the i-
cells. These currents were chosen so that, in the absence of the
inhibitory input, few of the cells fired. Cells that did fire, fired at
frequencies lower than the beta range. During rest, neuromodula-
tors such as ACh are lower than in active states. Low ACh is
known to increase the AHP-currents (IAHP). This motivates the
choice of relatively strong AHP-currents (IAHP).
Results
Experiments
Fig. 1 shows power spectra for subject S2 before (pre-BNZ)
and after (post-BNZ) benzodiazepine administration, respectively.
O. Jensen et al. / NeuroImage 26 (2005) 347–355350
The spectra are arranged according to sensor locations on the
helmet. Each spectrum is the average calculated from two
orthogonal planar gradiometers at the same position. The enlarged
graphs show the spectra from a set of gradiometers over the
sensorimotor cortex. In the pre-BNZ condition, the rolandic mu
rhythm consists of �10 Hz and �20 Hz main frequencies. In the
post-BNZcondition, the�10Hzpeak isweaker,whereas the�20Hz
peak is now stronger and broader than during pre-BNZ, extending
towards lower frequencies.
To estimate the brain regions generating the changes in the 10
and 20 Hz bands sensitive to benzodiazepine, we first calculated
the increase in power for the planar gradiometers. Fig. 2 shows the
grand average of the Z-transformed power values for the pre-BNZ
subtracted from the post-BNZ on the geometry of the sensor
helmet. No significant changes were observed in the 9–13 Hz band
(Fig. 2a). A highly significant increase was observed in the 13–35
Hz band in sensors over the primary sensorimotor cortices of both
hemispheres (Fig. 2b).
To more accurately pinpoint the neuronal generators of alpha
and beta oscillations sensitive to benzodiazepine, we calculated the
minimum current estimates (MCEs) in the frequency domain for
individual subjects at the frequency of the strongest alpha and beta
peaks (Jensen and Vanni, 2002) (the beta frequency values
indicated in Fig. 4b). Fig. 3 shows the grand average MCEs for
the 8 subjects (in one subject, we did not have the MRI and applied
a standard brain model instead when determining the head model).
The strongest sources accounting for the activity in the 10 Hz band
Fig. 2. The difference in (a) alpha power and (b) beta power between the benzod
(shown from top-front and back). The color code represents the grand average of
where both of the two orthogonal planar gradiometers with the same position had a
gradiometers had a significant increase.
were identified in the left and right primary sensorimotor areas and
the parieto-occipital sulcus. The activity in the alpha band changed
little with the application of benzodiazepine. The sources of
activity in the beta band were in the sensorimotor cortex bilaterally,
and they became stronger after the application of benzodiazepine
(Fig. 3b). Note that the locations of the source are consistent with
increase in beta power observed at the sensors in Fig. 2. Fig. 3b
shows a representative example in which the centers of the sources
of the beta activity were coregistered with the subject’s MRI. The
source location agrees with hand sensorimotor cortex in the central
sulcus. The locations of the sources before (blue red lines) and
after (red lines) benzodiazepine administration are virtually
indistinguishable.
To quantify the effect of benzodiazepine, we selected 18
gradiometers over the left and 18 over the right sensorimotor
cortex, as indicated in Fig. 4a. The power spectra were then
averaged over both hemispheres for this set of gradiometers for
each subject. The individual frequencies in the 13–35 Hz band
were identified as the spectral peaks. The peaks and the
corresponding values are indicated in Fig. 4b. In two subjects
(S3 and S4), no clear frequency peaks were identified in the pre-
BNZ condition, however, there was an indication of the beta
rhythm observed as a ‘‘shoulder’’ in the power spectra. Interest-
ingly, in both subjects, a peak emerged in the post-BNZ
condition. In the remaining 6 subjects, beta frequencies were
decreased by an average value of 1.6 Hz (P < 0.033; paired t test,
2-tailed).
iazepine and control condition represented on the geometry of the helmet
the Z-transformed power for the 8 subjects. The *’s denote sensor locations
significant increase (P < 0.01) and o’s sensor locations where one of the two

Fig. 3. The grand average of the minimum currents estimates of
spontaneous oscillatory projected to the brain surface before and after the
application of benzodiazepines. (a) Sources accounting for activity in the
8–12 Hz band were strongest in primary sensorimotor areas (left and right)
and around to the parietal-occipital sulcus. (b) Sources in the 13–35 Hz
band were found in primary sensorimotor areas with an increase after
application of the benzodiazepine. (c) A representative example showing
that co-registration of the center of the beta band sources on S2’s MRI. The
centers before and after application of benzodiazepines are virtually
identical (pre-BNZ, green symbols; post-BNZ, red symbols).
Fig. 4. The black dots in panel (a) mark the planar gradiometers over
sensorimotor areas used to calculate the averaged spectra in panel (b). The
dotted and solid lines indicate the spectra for all 8 subjects calculated for the
condition respectively without and with benzodiazepines. The numerical
values refer to the identified peaks in the beta band.
O. Jensen et al. / NeuroImage 26 (2005) 347–355 351
Modeling
The aim of the modeling was to show that there is a
physiologically reasonable parameter range in which an increase
in GABA-mediated conductance can increase the power in the beta-
frequency band, broaden the spectrum and decrease the frequency,
as in the data presented above. Since the power in the alpha-
frequency band was relatively unaltered by benzodiazepine and
since it has been argued that alpha and beta oscillations have
different generators (Hari and Salmelin, 1997), the modeling did
not aim to account for oscillatory activity in the alpha band. The
network (Fig. 5a) contains excitatory (e) and inhibitory (i) cells,
each modeled by Hodgkin–Huxley dynamics (see Materials and
methods), with connections from i-cells to e-cells and to other
i-cells and connections from e-cells to i-cells. There are also
recurrent excitatory connections, but these are very small and do
not affect the dynamics of the network; however, they are the
source of the model MEG signal that we present. We cannot
exclude that thalamo-cortical connections are important for
modulating the beta rhythm as well; however, in this work, we
assume that a neocortical network alone is responsible for
producing the beta rhythm (see Materials and methods for details
and discussion on the modeling of the MEG signal).
The GABA decay time was chosen to be at H i 12 ms. The other
parameters of the baseline dynamics shown here were chosen so
that the frequency of the rhythm is in the beta-range and
dependent primarily on tonic AMPA-mediated input. Fig. 5b
shows an example from the simulations in which the voltage trace
of 5 of the 64 e-cells and three of the 16 i-cells are shown. The i-
cells fire spikes (action potentials) synchronously at �20 Hz. The
sparse firing of the e-cells is locked to the rhythm determined by
the i-cells.
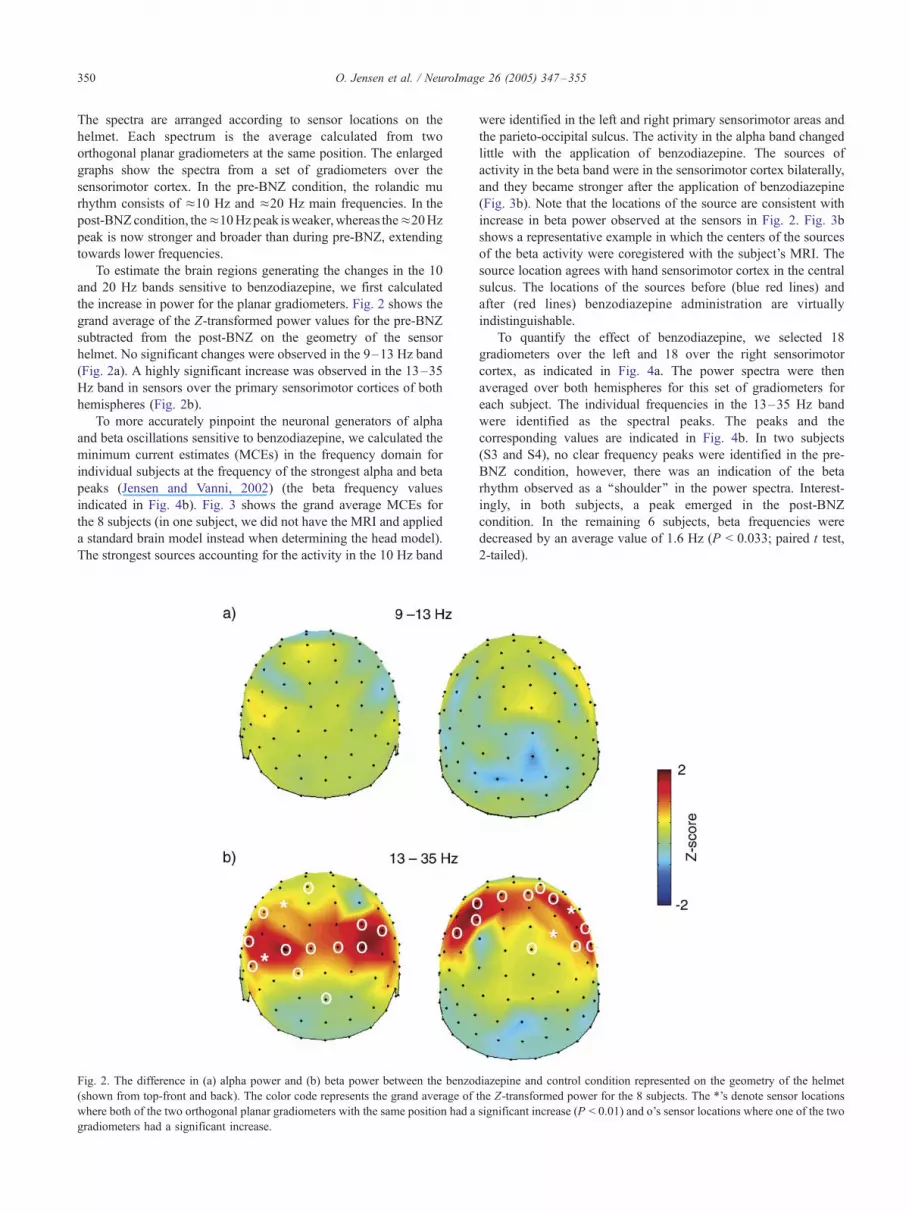
Fig. 6a shows the computed power spectra, mainly reflecting
the firing of the e-cells, for three values of the inhibitory
conductance between i-cells ( gii). As the conductance is increased,
the power in the beta frequency range increases, the maximal
power increases, and the spectral peak widens. Furthermore, the
frequency decreases.
Fig. 6b shows the power spectra for increasing values of gie, the
maximal inhibitory conductance for the e-cells. Note that, as gieincreases, the power decreases, the frequency remains constant,
and the spectral peak becomes thinner.
The mechanism behind the above results can be understood
from the raster plots in which the time of firing of each cell is
illustrated as dots as shown in Figs. 7 and 8. The firing times of the
i- and e-cells are plotted as respectively the lower and upper
Fig. 6. Power spectra of the quantity EPSCtot defined by Eq. (1) for
different values of the inhibitory conductance. (a) The power increases as
g ii is increased from 10 to 20 mS/cm2 and gie is constant at 5 mS/cm2. (b)
The power decreases as g ie is increased from 5 to 9 mS/cm2 and gii is
constant at 15 mS/cm2.
Fig. 7. Raster plots of the excitatory and inhibitory neurons in the network.
(a–c) The upper portion shows the firing times of the e-cells ordered by
the amount of drive applied to each of them with the cells in the highest
row receiving the largest drive. Lower portion shows the spike times of
the i-cells. In all plots, g ie = 5 mS/cm2; g ii takes on values of 10, 15 and
20 mS/cm2 in the successive plots. Panel (d) shows a histogram of the
phases of spike times over a run of 100 periods with respect to the firing
of the i-cells for the three rasters in panels (a–c).
Fig. 5. (a) A schematic diagram of the model constructed of 64 excitatory
(e-cells) and 16 inhibitory (i-cells) cells. In the simulations, we investigated
the consequences of changing the inhibitory conductances to respectively
inhibitory ( g ii) and excitatory ( g ie) cells. (b) A simulation example showing
the membrane potentials of a subset of e- and i-cells where GABAA
conductances were g ii = 7 mS/cm2 and g ie = 0.9 mS/cm2.
O. Jensen et al. / NeuroImage 26 (2005) 347–355352
portion and then ordered according to the amount of external drive.
The key point is that, since the e-cells have a range of external
drives, only cells that have enough drive will spike before the next
pulse of inhibition.
Fig. 6a shows that when gii is increased, the period of the
underlying rhythm increases. The raster plots of Figs. 7a–c show
that the increase of the period allows more e-cells to fire in a
given period. The firing of e-cells for larger values of gii is more
spread out within a given cycle. This is seen in Fig. 7d where the
histograms of the phase of firing of the e-cells are shown relative
to the firing of the i-cells. As the time window in which the e-
cells can fire is broadening with gii, more e-cells become
involved in the rhythm thereby resulting in increased power. This
is true because the e-cells fire when the inhibition has decayed
sufficiently, depending on the drive to those cells (Borgers and
Kopell, 2003; Ermentrout and Kopell, 1998). As the period
increases and the inhibition to the e-cells is not changing, there is
a longer interval for the e-cells to fire before the next bout of
inhibition. The set of e-cells that are allowed to fire in a given
cycle can be derived analytically (not shown).
Increasing gie has a different effect, as is shown in Fig. 8: the
e-cells receive more inhibition, and fewer cells fire. However, as

Fig. 8. Similar to Fig. 7, but here gii = 15 mS/cm2 is fixed and g ie takes on values 5, 7 and 9 mS/cm2.
O. Jensen et al. / NeuroImage 26 (2005) 347–355 353
shown both in the power spectra (Fig. 6b) and the histogram (Fig.
8d), the active e-cells fire more coherently. The reason is the
converse of the decrease in coherence for increasing gii: As gieincreases, the inhibition to the e-cells suppresses the firing of the
latter for a longer proportion of the period, and hence those that
fire must do so more coherently. In other words: the time window
in which the e-cells can fire becomes shorter as gie increases since
gie is preventing the firing. In these simulations, the coupling from
the e-cells to the i-cells, gei, was chosen to be small. A somewhat
larger value of gei did not appreciably change the results (data not
shown).
Discussion
Using magnetoencephalographic recordings in humans, we
observed a strong increase with benzodiazepines in the power of
beta oscillations in the primary sensorimotor regions of both
hemispheres. The increase in power was associated with a small
decrease in the beta frequency. The beta oscillations sensitive to
benzodiazepine originated from the primary sensorimotor cortex,
close to the hand area. Ours is the first study to demonstrate that
the 20-Hz oscillations emerging after benzodiazepine also
originate from the sensorimotor cortex and that the oscillations
decrease in frequency with benzodiazepine. Previous work has
identified sources of beta-range activity in the primary motor
cortex (reviewed in Hari and Salmelin, 1997). In these studies,
the beta activity was observed during rest or was induced 300–
1000 ms after somatosensory stimulation or movement. Using
intracranial recordings, beta oscillations have also been observed
in the motor cortex of monkeys (Baker et al., 1997; Jackson et
al., 2002; Murthy and Fetz, 1996; Sanes and Donoghue, 1993).
Our findings strongly suggest that it is these motor-cortex beta
sources which are modulated by benzodiazepine. We therefore
conclude that the motor cortex is a primary cortical effector site
of benzodiazepine. This is consistent with benzodiazepines acting
as muscle relaxants. Our results are at first sight at odds with
scalp EEG recordings which show that beta power primarily
increases over frontal regions after application of benzodiazepines
(Wanquier, 1998). However, tangential current dipoles in the wall
of the central sulcus can produce strong electrical potentials over
frontal areas. At the same time, the planar gradiometers used in
the present study measure the strongest magnetic signal over the
sensorimotor areas.
The primary effect of benzodiazepine is to increase the
conductance of GABA-mediated currents. Computer simulations
of a network of biophysically-based model neurons could
account for the increase in the power of the beta oscillations
by an increase in synaptic conductance of GABA-mediated
inhibition. As in the experiments, the increase in power was
associated with a decrease in frequency and a widening of the
spectral peak. An increase in the GABAergic inhibition among i-
cells was sufficient to produce these effects, while an increase in
inhibition to e-cells alone was not sufficient. Even though we
argue that the main effect of benzodiazepine is on the network
of i-cells, the i-cells strongly modulate the firing of pyramidal e-
cells. The resulting changes in excitatory post-synaptic currents
in the dendrites of the pyramidal e-cells likely result in the
signals detected by MEG.
The above results do not imply that the network produces beta-
band oscillations only through the interactions of i-cells. However,
based on extensive simulations (data not shown), we will argue that
an interneuron based beta (INB) mechanism reproduces the spectral
results much better than a rhythm based on the interaction between
pyramidal and inhibitory neurons (PINB). Suppose there is
significant excitatory phasic input to the i-cells from the e-cells
and significant phasic inhibition to the e-cells. The i-cells then fire
only during the peaks of the e-cell output. We aim to slow the
rhythm down by increasing the i– i conductance. With i-cells
spiking less frequently, the inhibition to the e-cells is decreased,
allowing more of the latter to fire; this, in turn speeds up the i-cells if
the eY i coupling is strong. Thus, in a PINB regime, in which the i-
cells are significantly affected by e-cell firing, frequency is not
responsive to changing the i– i conductance. As a consequence, the
change in power with a change in i– i conductance will also be
modest and cannot account for the experimental results. The
frequency is strongly affected by the strength of the i Y e
connections. However, increasing i Y e connections alone makes

O. Jensen et al. / NeuroImage 26 (2005) 347–355354
the power decrease, since fewer e-cells fire. Increase of inhibition to
e-cells also narrows the window within which e-cells can fire; this
makes the e-cells more synchronous and the spectral band narrower,
instead of the observed broadening.
In contrast, the INB mechanism (Figs. 7 and 8) is very sensitive
to the i– i conductance since the main driving force is tonic. Thus,
the period of the i-cells is determined not by when the e-cells fire,
but rather when the i– i inhibition wears away. The strong i Y e
connections then act as a gate allowing e-cells to fire only at certain
intervals. The main role of AMPA receptors on the i-cells in this
model is to create a tonic drive to the i-cells. The prediction that the
interneuronal network is responsible for producing the motor
cortical beta rhythm can be tested in in vitro slice preparations.
Specifically, we predict that beta oscillations can be produced in
motor cortical slice preparations following application of an AMPA
antagonist given that the interneurons are sufficiently depolarized
pharmacologically.
Hippocampal in vitro slices have been shown to produce
gamma and beta frequency rhythms with a spontaneous transition
between them (Whittington et al., 1997b). The spontaneous switch
was modeled in large networks by Traub et al. (1999) and
explained in a simpler model by Kopell et al. (2000). This model
was subjected to further analysis that investigated the transition
between the gamma and beta states (Sosnovtseva et al., 2002).
However, the mechanism in this model does not produce the beta
rhythm when the excitatory cells of the network fire sparsely, as is
the case in the sensory and motor cortices when no tasks are
performed (e.g. Mushiake et al., 1991). Another study on the
effects of benzodiazepines on rhythms (in vitro gamma and beta
rhythms) was done on hippocampal rat slices (Faulkner et al.,
1999) and did not show the same effects we are reporting here.
Another rat hippocampal slice study on cholinergically induced
beta oscillations demonstrated a clear increase in the power of beta
oscillations as well as a decrease in frequency with benzodiazepine
(Shimono et al., 2000).
Even though our study has concentrated on the beta rhythm,
other studies have identified changes with benzodiazepines in other
frequency bands as well. Fingelkurts et al. (2004) applied both
EEG and MEG to study the effect of the lorazepam. Classifying
short-term spectral changes, they showed that lorazepam changed
the temporal structures of oscillations in the delta, theta and alpha
band; however, the specificity of the effects to lorazepam remains
to be shown.
The functional role of the motor-cortex beta rhythm remains
unclear. The beta rhythm we investigated was observed during rest,
and it is not obvious how it is related to beta oscillations present
during motor tasks. For instance, the strong synchronization in the
beta band between motor cortex and the population firing of motor
units in isometrically contracted muscles suggests that the beta
rhythm is important for corticomuscle communication (Farmer,
1998; Hari and Salenius, 1999; Kilner et al., 2000; Mima and
Hallett, 1999; Salenius and Hari, 2003). Interestingly, Baker and
Baker (2003) reported a decrease in corticomusclar coherence in
the beta band with benzodiazepines, which might suggest that the
beta rhythm we observe during rest is different from the beta
rhythm involved in corticomusclar synchronization. However, it
should be noted that a change in coherence does not necessarily
imply a change in power of the sources involved. Furthermore,
Baker and Baker (2003) applied EEG which is more sensitive to
convexial cortex whereas MEG picks up signals mainly from the
fissural cortex.
Similar dissociation between beta-range rhythms is seen in
patients with progressive myoclonus epilepsy who may even have
2–4 times stronger corticomuscular coherence than healthy
control subjects although the reactivity of their motor-cortex
rhythms to external stimuli suggests reduced cortical inhibition
(Silen et al., 2000). Although the increased cortex-muscle
coherence could reflect enhanced recalibration of the inaccurate
muscle contractions, the question about several functionally
distinct beta-range motor-cortex rhythms seems difficult to be
resolved without further studies involving pharmacological
interventions.
Acknowledgments
The experimental part of the study has been financially
supported by the Academy of Finland, the NWO Innovative
Research Incentive Schemes with financial aid from the Nether-
lands Organization for Scientific Research (NWO) and by the EU’s
Large-Scale Facility Neuro-BIRCH III hosted at the Brain
Research Unit of the Low Temperature Laboratory, Helsinki
University of Technology. The theoretical parts of the study have
been supported by the National Institute of Heath, National Science
Foundation and the National Institute of Mental Health, USA. We
are grateful to Roger D. Traub for insightful comments and Kimmo
Uutela for help on the MCE software.
References
Bacci, A., Rudolph, U., Huguenard, J.R., Prince, D.A., 2003. Major
differences in inhibitory synaptic transmission onto two neocortical
interneuron subclasses. J. Neurosci. 23, 9664–9974.
Baker, M.R., Baker, S.N., 2003. The effect of diazepam on motor cortical
oscillations and corticomuscular coherence studied in man. J. Physiol.
546, 931–942.
Baker, S.N., Olivier, E., Lemon, R.N., 1997. Coherent oscillations in
monkey motor cortex and hand muscle EMG show task-dependent
modulation. J. Physiol. 501 (Pt. 1), 225–241.
Borgers, C., Kopell, N., 2003. Synchronization in networks of excitatory
and inhibitory neurons with sparse, random connectivity. Neural
Comput. 15, 509–538.
Conway, B.A., Halliday, D.M., Farmer, S.F., Shahani, U., Maas, P., Weir,
A.I., Rosenberg, J.R., 1995. Synchronization between motor cortex and
spinal motoneuronal pool during the performance of a maintained motor
task in man. J. Physiol. 489 (Pt. 3), 917–924.
Ermentrout, G.B., Kopell, N., 1998. Fine structure of neural spiking and
synchronization in the presence of conduction delays. Proc. Natl. Acad.
Sci. U. S. A. 95, 1259–1264.
Farmer, S.F., 1998. Rhythmicity, synchronization and binding in human and
primate motor systems. J. Physiol. 509 (Pt. 1), 3–14.
Faulkner, H.J., Traub, R.D., Whittington, M.A., 1999. Anaesthetic/amnesic
agents disrupt beta frequency oscillations associated with potentiation
of excitatory synaptic potentials in the rat hippocampal slice. Br. J.
Pharmacol. 128, 1813–1825.
Fingelkurts, A.A., Fingelkurts, A.A., Kivisaari, R., Pekkonen, E., Ilmo-
niemi, R., Kahkonen, S., 2004. The interplay of lorazepam-induced
brain oscillations: microstructural electromagnetic study. Clin. Neuro-
physiol. 115, 674–690.
Hamalainen, M., Hari, R., Ilmoniemi, R.J., Knuutila, J., Lounasmaa, O.V.,
1993. Magnetoencephalography—theory, instrumentation, and applica-
tions to noninvasive studies of the working human brain. Rev. Mod.
Phys. 65, 413–497.
Hari, R., Salenius, S., 1999. Rhythmical corticomotor communication.
NeuroReport 10, R1–R10.
O. Jensen et al. / NeuroImage 26 (2005) 347–355 355
Hari, R., Salmelin, R., 1997. Human cortical oscillations: a neuromagnetic
view through the skull. Trends Neurosci. 20, 44–49.
Jackson, A., Spinks, R.L., Freeman, T.C., Wolpert, D.M., Lemon, R.N.,
2002. Rhythm generation in monkey motor cortex explored using
pyramidal tract stimulation. J. Physiol. 541, 685–699.
Jensen, O., Pohja, M., Goel, P., Ermentrout, B., Kopell, N., Hari, R., 2002.
On the physiological basis of the 15–30 Hz motor-cortex rhythm. In:
Nowak, H., Haueisen, J., Giessler, F., Huonkler, R. (Eds.), Proceedings
of the 13th International Conference on Biomagnetism. VDE Verlag
GMBH, Berlin, pp. 313–315.
Jensen, O., Vanni, S., 2002. New method to identify multiple sources of
oscillatory activity from magnetoencephalographic data. NeuroImage
15, 568–574.
Juottonen, K., Gockel, M., Silen, T., Hurri, H., Hari, R., Forss, N., 2002.
Altered central sensorimotor processing in patients with complex
regional pain syndrome. Pain 98, 315–323.
Kilner, J.M., Baker, S.N., Salenius, S., Hari, R., Lemon, R.N., 2000.
Human cortical muscle coherence is directly related to specific motor
parameters. J. Neurosci. 20, 8838–8845.
Kilner, J.M., Baker, S.N., Salenius, S., Jousmaki, V., Hari, R., Lemon, R.N.,
1999. Task-dependent modulation of 15–30 Hz coherence between
rectified EMGs from human hand and forearm muscles. J. Physiol. 516
(Pt. 2), 559–570.
Kopell, N., Ermentrout, G.B., Whittington, M.A., Traub, R.D., 2000.
Gamma rhythms and beta rhythms have different synchronization
properties. Proc. Natl. Acad. Sci. U. S. A. 97, 1867–1872.
Mima, T., Hallett, M., 1999. Corticomuscular coherence: a review. J. Clin.
Neurophysiol. 16, 501–511.
Murthy, V.N., Fetz, E.E., 1996. Oscillatory activity in sensorimotor cortex
of awake monkeys: synchronization of local field potentials and relation
to behavior. J. Neurophysiol. 76, 3949–3967.
Mushiake, H., Inase, M., Tanji, J., 1991. Neuronal activity in the primate
premotor, supplementary, and precentral motor cortex during visually
guided and internally determined sequential movements. J. Neuro-
physiol. 66, 705–718.
Press, W.H., Teukolsky, S.A., Vetterling, W.T., Flannery, B.P., 1997.
Numerical Recipes in C. Cambridge Univ. Press, USA.
Salenius, S., Hari, R., 2003. Synchronous cortical oscillatory activity during
motor action. Curr. Opin. Neurobiol. 13, 678–684.
Salenius, S., Portin, K., Kajola, M., Salmelin, R., Hari, R., 1997.
Cortical control of human motoneuron firing during isometric
contraction. J. Neurophysiol. 77, 3401–3405.
Sanes, J.N., Donoghue, J.P., 1993. Oscillations in local field potentials of
the primate motor cortex during voluntary movement. Proc. Natl. Acad.
Sci. U. S. A. 90, 4470–4474.
Shimono, K., Brucher, F., Granger, R., Lynch, G., Taketani, M., 2000.
Origins and distribution of cholinergically induced beta rhythms in
hippocampal slices. J. Neurosci. 20, 8462–8473.
Silen, T., Forss, N., Jensen, O., Hari, R., 2000. Abnormal reactivity of the
approximately 20-Hz motor cortex rhythm in Unverricht Lundborg type
progressive myoclonus epilepsy. NeuroImage 12, 707–712.
Sosnovtseva, O.V., Setsinsky, D., Fausboll, A., Mosekilde, E., 2002.
Transitions between beta and gamma rhythms in neural systems. Phys.
Rev. E Stat. Nonlin. Soft Matter Phys. 66, 041901–1.
Towers, S.K., LeBeau, F.E., Gloveli, T., Traub, R.D., Whittington, M.A.,
Buhl, E.H., 2002. Fast network oscillations in the rat dentate gyrus in
vitro. J. Neurophysiol. 87, 1165–1168.
Traub, R.D., Miles, R., 1991. Neuronal Networks of the Hippocampus.
Cambridge Univ. Press.
Traub, R.D., Whittington, M.A., Buhl, E.H., Jefferys, J.G., Faulkner, H.J.,
1999. On the mechanism of the gamma –> beta frequency shift in
neuronal oscillations induced in rat hippocampal slices by tetanic
stimulation. J. Neurosci. 19, 1088–1105.
Traub, R.D., Whittington, M.A., Colling, S.B., Buzsaki, G., Jefferys, J.G.,
1996. Analysis of gamma rhythms in the rat hippocampus in vitro and
in vivo. J. Physiol. (Lond.) 493, 471–484.
Uutela, K., Hamalainen, M., Somersalo, E., 1999. Visualization of
magnetoencephalographic data using minimum current estimates.
NeuroImage 10, 173–180.
Wanquier, A., 1998. EEG and neuropharmachology, in electroencepha-
lography. In: Niedermeyer, E., Lopes da Silva, F. (Eds.), Basic
Principles, Clinical Applications, and Related FieldsWilliams and
Wilkins, pp. 660–670.
Whittington, M.A., Traub, R.D., Jefferys, J.G., 1995. Synchronized
oscillations in interneuron networks driven by metabotropic glutamate
receptor activation. Nature 373, 612–615.
Whittington, M.A., Stanford, I.M., Colling, S.B., Jefferys, J.G., Traub,
R.D., 1997a. Spatiotemporal patterns of gamma frequency oscillations
tetanically induced in the rat hippocampal slice. J. Physiol. 502 (Pt. 3),
591–607.
Whittington, M.A., Traub, R.D., Faulkner, H.J., Stanford, I.M., Jefferys,
J.G., 1997b. Recurrent excitatory postsynaptic potentials induced by
synchronized fast cortical oscillations. Proc. Natl. Acad. Sci. U. S. A.
94, 12198–12203.