observed climate trend analysis of nepal - department of
TRANSCRIPT
Government of Nepal
Ministry of Population and Environment
Department of Hydrology and Meteorology
Observed Climate Trend Analysis of Nepal
(1971-2014)
June 2017
ii | P a g e
Published by
Government of Nepal
Ministry of Population and Environment
Department of Hydrology and Meteorology
Naxal, Kathmandu
Nepal
Phone: (+977-1) 4436272, 4432409
Fax: (+977-1) 4429919, 4432136
Website: www.dhm.gov.np
E-mail: [email protected]
Copyright: ©Government of Nepal, Ministry of Population and Environment, Department of
Hydrology and Meteorology, 2017
This Publication may be used for educational and non-profit purposes, provided
acknowledgement of the source is accurately made. Use of any part of it for
commercial purpose is strictly prohibited.
Supported by:
Support to Rural Livelihoods and Climate Change Adaptation in the Himalayas
(Himalica), European Union, and International Centre for Integrated Mountain
and Development (ICIMOD);
UK-aid, Action on Climate Today, Oxford Policy Management Limited and Practical
Action
Citation: DHM, 2017. Observed Climate Trend Analysis in the Districts and Physiographic
Regions of Nepal (1971-2014). Department of Hydrology and Meteorology,
Kathmandu
Steering Committee
Dr. Rishi Ram Sharma, Director General Coordinator
Mr. Saraju Kumar Baidya, Deputy Director General Member
Mr. Durga Prakash Manandhar, Deputy Director General Member
Dr. Jagdishwor Karmacharya, Deputy Director General Member
Technical Committee Dr. Archana Shrestha, Senior Divisional Meteorologist Coordinator
Ms. Pratibha Manandhar, Senior Divisional Meteorologist Member
Mr. Bikash Nepal, Meteorologist Member
Mr. Lasakusa Samir Shrestha, Meteorologist Member

Office Address:
Singhdurbar
Kathmandu, Nepal
Government of Nepal
Ministry of Population and Environment
Tel. No.:
4211734, 4211641, 42111946, 4211996,
4211894, 4211737, 4211586, 4211698
Fax No.:
+977-1-4211954
Ref. No:
Website:
www.mope.gov.np
FOREWORD
Nepal has gradually developed institutional and technical capacity to adapt to climate
change. The country prepared National Adaptation Programme of Action (NAPA) in 2010 to
address the most urgent and immediate adaptation needs of the country. Nepal also
prepared National Framework on Local Adaptation Plans for Action (LAPA) in 2011 to
implement prioritised adaptation actions at the local level and ensure integration of climate
change adaptation into local and national planning processes. In 2011, Nepal formulated
Climate Change Policy to streamline climate change initiatives in the country.
Climate change impacts are increasing over time, particularly in the Least Developed Countries (LDCs) like Nepal.
Parties to the UN Framework Convention on Climate Change (UNFCCC) realised the urgency of expanding
adaptation actions in developing countries. The Conference of the Parties to the UNFCCC at its 16th session in
Cancun in 2010 established a process under the Cancun Adaptation Framework to enable LDC Parties to formulate
and implement National Adaptation Plans (NAPs) to prepare for the impacts of climate change through medium
and long-term adaptation measures. In Nepal, Ministry of Population and Environment (MoPE), the UNFCCC focal
point, launched the NAP process in September 2015.
The NAP process has commenced the analysis of climate change trends leading to the robust projections of climate
scenario in the medium- and long-run, based on which adaptation pathways could be developed. The Department
of Hydrology and Meteorology (DHM) has performed a meticulous task of analyzing available climate data and
produce a synthesized report containing results of climate change trend analysis. I would like to appreciate Dr. Rishi
Ram Sharma, Director General of the DHM and his team for producing such a wealth of knowledge which will
substantially inform the NAP process.
I would like to take this opportunity to appreciate the support provided by the Action on Climate Today (ACT), a UK-
Aid funded initiative managed by Oxford Policy Management Limited and Practical Action in initiating the NAP
process. I would also like to acknowledge the International Centre for Integrated Mountain Development (ICIMOD)
and the experts for their support in advancing the NAP process, including on technical and scientific studies.
I do appreciate the support and contribution of all coordinators, deputy-coordinators and members of the working
groups. The support from working groups in the NAP formulation process has truly helped realize the spirit of
"leaving no one behind" approach adopted in the NAP process.
I am also grateful toDr. Ram Prasad Lamsal, Joint-Secretary and Chief, Climate Change Management Division; Mr.
Naresh Sharma, NAP Coordinator; and NAP Team for their hard work, passion, and persistence to lay foundation for
the NAP process in Nepal.
Bishwa Nath Oli, PhD
Secretary
Government of Nepal
Nagpokhari, Naxal, P.O. Box: 406, Kathmandu, Nepal
Phone: 977 1 4436272, 4428532, 4441092, 4428229, 4433563
Fax: 977 1 4429919, 4426136
Government of Nepal
Ministry of Population and Environment
DEPARTMENT OF HYDROLOGY & METEOROLOGY
email: [email protected]
Website: www.dhm.gov.np, www.mfd.gov.np
www.hydrology.gov.np
Ref. No:
PREFACE
The global consensus on climate change as a serious threat to mankind is now stronger than
ever, thanks to the ever growing body of evidence based on historical trends of climate change.
Nepal is ranked as one of the most vulnerable countries in the world to climate change threats.
The Government of Nepal has been actively engaged in promoting climate change activities in
general, and adaptation measures in particular to help climate vulnerable communities to adapt
to climate change impacts. More recently, the Government of Nepal has initiated the National
Adaptation Plan (NAP) formulation process to develop medium and long-term adaptation
options for the country.
In order to be effective, a plan needs to be built on a strong scientific foundation and empirical evidences.
Designing adaptation plans at scale requires both the knowledge of historical climate data and the future climatic
scenarios. The Department of Hydrology and Meteorology (DHM) has been supporting the NAP process to prepare
the climatic trends in Nepal using the past historical data. I hope, this report will contribute to the NAP formulation
process and benefit all stakeholders engaged in climate-related planning activities.
Established in 1988, the DHM is responsible to monitor all the hydrological and meteorological events in the
country. The DHM regularly provides general and aviation weather forecasts, flood forecast, data dissemination
and special services. As Nepal's focal point for the World Meteorological Organization (WMO), the DHM also shares
the data to the global community on a regular basis. The DHM is now engaged in establishing real time
meteorological and hydrological stations to cover Nepal's varied topography and landscape. This initiative will
gradually help to improve climate data in developing science-based plans and programmes.
The DHM is pleased to publish this report on climate change trend analysis. I would like to thank my colleagues
directly involved in the study for their hard work and dedication. I appreciate technical guidance and supervision of
Mr. Saraju K. Baidya, Mr. Durga P. Manandhar and Dr. Jagdishwor Karmacharya, Deputy Director Generals at DHM.
I would also appreciate Dr. Archana Shrestha and Ms. Pratibha Manandhar, Senior Divisional Meteorologists, Mr.
Bikash Nepal and Mr. Lasakusa S. Shrestha, Meteorologists for their concerted effort in bringing this report in the
present form. Prof. Rupak Rajbhandari is greatly appreciated for his professional inputs in carrying out trend
analysis.
I would like to appreciate the support and contribution of the International Centre for Integrated Mountain
Development (ICIMOD) in preparation of this report.
During the course of preparing this report, the DHM received valuable suggestions from various organizations and
relevant experts in the field. I would like to take this opportunity to particularly thank Mr. Naresh Sharma, NAP
Coordinator, Practical Action, and the NAP Team.
I believe that this piece of work will enhance our understanding on climate variability and change. We also
reiterate our commitment to provide updated climate data for adaptation planning at different levels.
Rishi Ram Sharma, PhD
Director General, DHM
v | P a g e
APHRODITE Asian Precipitation Highly-Resolved Observational Data Integration Towards
Evaluation
CDR Central Development Region
CL Confidence Level
DJF December-January-February (Winter Season)
DHM Department of Hydrology and Meteorology
EDR Eastern Development Region
FMI Finnish Meteorological Institute
FWDR Far Western Development Region
GrADS Grid Analysis and Display System
ICIMOD International Centre for Integrated Mountain Development
JJAS June-July-August-September (Monsoon Season)
LDC Least Developed Country
LEG Least Developed Country Expert Group
MAM March-April-May (Pre-monsoon Season)
masl meters above sea level
MoPE Ministry of Population and Environment
MWDR Mid-Western Development Region
NAP National Adaptation Plan
NAPA National Adaptation Programme of Action
PAN Practical Action Nepal
QC Quality Control
WDR Western Development Region
ACRONYMS
vi | P a g e
Table of Contents
FOREWORD................................................................................................................................................................ iii
PREFACE ..................................................................................................................................................................... iv
ACRONYMS ................................................................................................................................................................. v
LIST OF FIGURES ........................................................................................................................................................ ix
EXECUTIVE SUMMARY .............................................................................................................................................. xi
Chapter I: Introduction.............................................................................................................................................. 1
1.1 Background .............................................................................................................................................. 1
1.2 Objectives ................................................................................................................................................ 2
1.3 Study Units ............................................................................................................................................... 2
1.4 The Report ............................................................................................................................................... 4
Chapter II: Data and Methodology ........................................................................................................................... 5
2.1 Data .......................................................................................................................................................... 5
2.2 Methodology............................................................................................................................................ 7
2.2.1 Temperature Data Quality Check........................................................................................................ 7
2.2.2 High Altitude Station Missing Data Filling .......................................................................................... 7
2.2.3 Gridding and Interpolation of Temperature Data .............................................................................. 8
2.2.4 District level and Physiographic Region Seasonal and Annual Time Series Calculation ................... 8
2.2.5 Trend Analysis ..................................................................................................................................... 9
2.2.6 Extreme Indices Analysis ..................................................................................................................... 9
2.6.7 Report preparation process .............................................................................................................. 10
Chapter III: Climatic Normal .................................................................................................................................... 11
3.1 Normal Precipitation for Districts and Physiographic Regions ............................................................ 11
3.1.1 Winter Precipitation .......................................................................................................................... 11
3.1.2 Pre–Monsoon Precipitation .............................................................................................................. 12
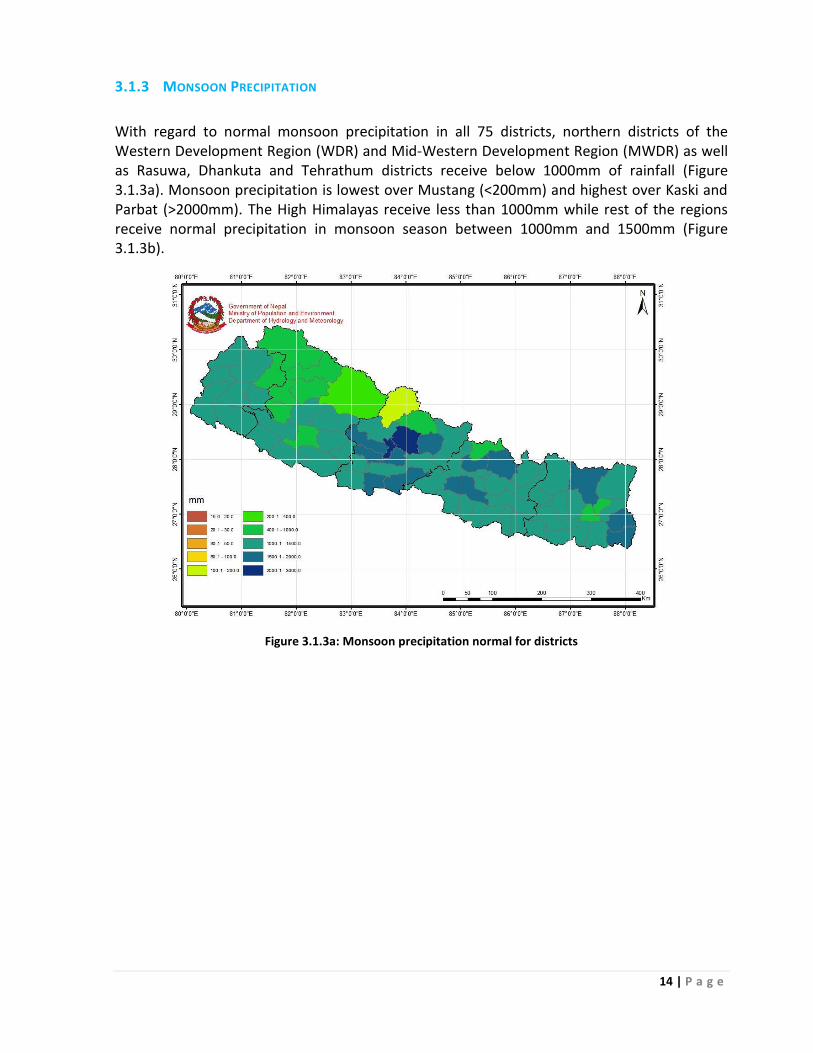
3.1.3 Monsoon Precipitation ...................................................................................................................... 14
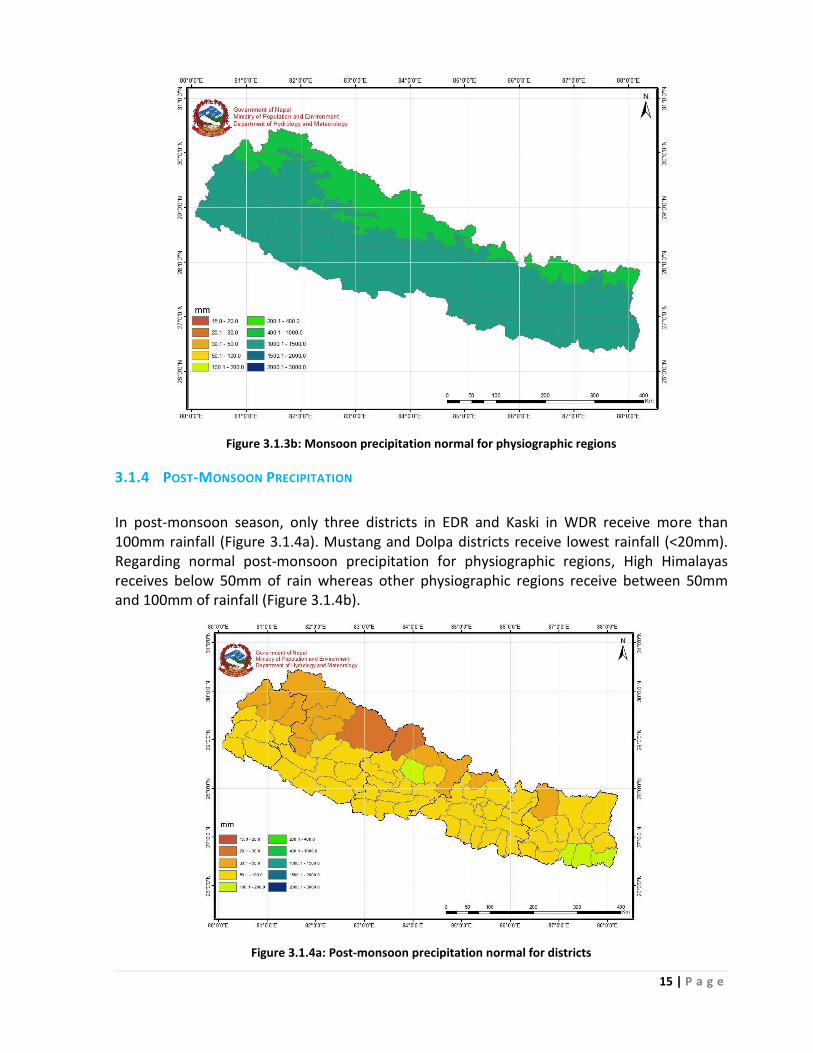
3.1.4 Post-Monsoon Precipitation ............................................................................................................. 15
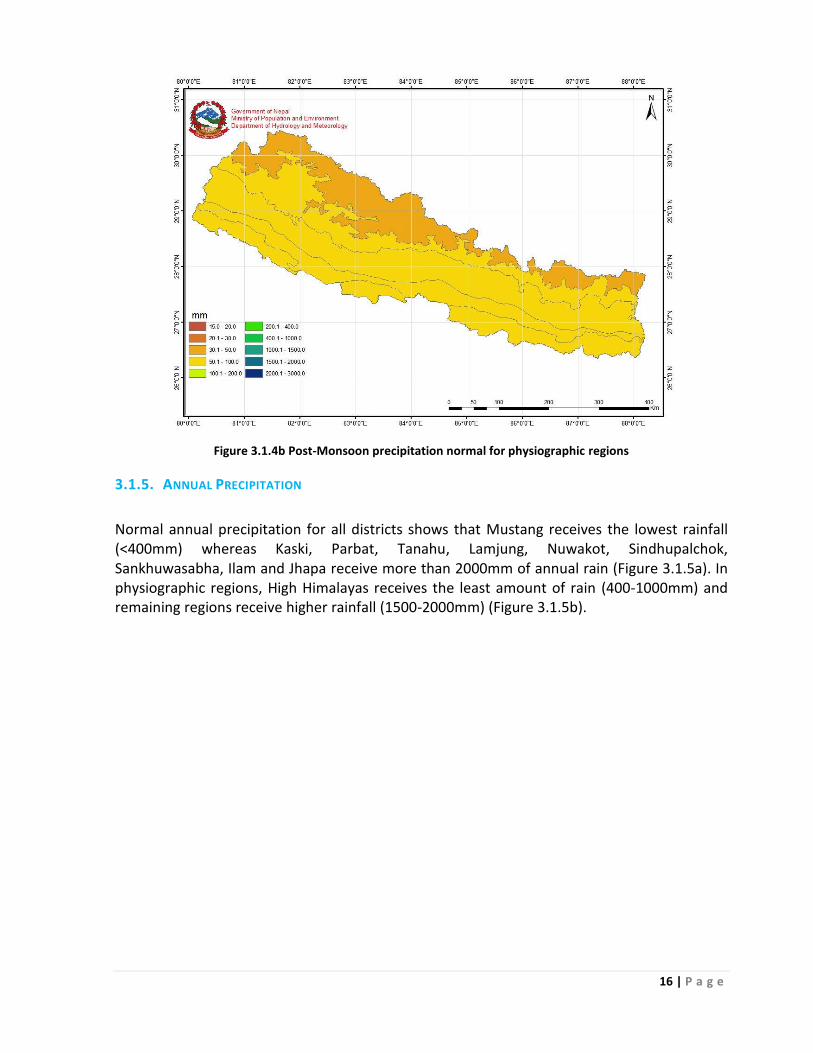
3.1.5. Annual Precipitation ..................................................................................................................... 16
3.2. Normal Maximum Temperature ........................................................................................................... 18
3.2.1 Winter Maximum Temperature ........................................................................................................ 18
3.2.2. Pre–Monsoon Maximum Temperature ........................................................................................ 19
3.2.3. Monsoon Maximum Temperature ............................................................................................... 21
3.2.4. Post-Monsoon Maximum Temperature ....................................................................................... 23
3.2.5. Annual Maximum Temperature ................................................................................................... 24
3.3. Normal Minimum Temperature ............................................................................................................ 26
vii | P a g e
3.3.1 Winter Minimum Temperature ........................................................................................................ 26
3.3.2 Pre–Monsoon Minimum Temperature ............................................................................................. 27
3.3.3 Monsoon Minimum Temperature .................................................................................................... 29
3.3.4 Post-Monsoon minimum temperature ............................................................................................. 31
3.3.5 Annual minimum temperature ......................................................................................................... 32
Chapter IV: ALL NEPAL CLIMATIC TRENDS .............................................................................................................. 34
4.1 All Nepal Maximum Temperature Trend .............................................................................................. 34
4.2 All Nepal Minimum Temperature Trend ............................................................................................... 35
4.3 All Nepal Precipitation Trend ................................................................................................................ 35
4.4 Summary of All Nepal Climate Trends .................................................................................................. 36
Chapter V: PRECIPITATION TRENDS FOR DISTRICTS AND PHYSIOGRAPHIC REGIONS .......................................... 37
5.1 Winter Precipitation Trend .................................................................................................................... 37
5.2 Pre-Monsoon Precipitation Trend ......................................................................................................... 38
5.3 Monsoon Precipitation Trend ............................................................................................................... 39
5.4 Post-Monsoon Precipitation Trend ....................................................................................................... 41
5.5 Annual Precipitation .............................................................................................................................. 42
5.6 Summary of Precipitation Trend ........................................................................................................... 43
Chapter VI: MAXIMUM TEMPERATURE TREND FOR DISTRICTS AND PHYSIOGRAPHIC REGIONS ........................ 44
6.1 Winter Maximum Temperature Trend.................................................................................................. 44
6.2 Pre-Monsoon Maximum Temperature Trend ....................................................................................... 46
6.3 Monsoon Maximum Temperature Trend ............................................................................................. 47
6.4 Post-Monsoon Maximum Temperature Trend ..................................................................................... 47
6.5 Annual Maximum Temperature Trend ................................................................................................. 49
6.6 Summary of Maximum Temperature Trend ......................................................................................... 50
Chapter VII: MINIMUM TEMPERATURE TREND FOR DISTRICTS AND PHYSIOGRAPHIC REGIONS ........................ 51
7.1 Winter Minimum Temperature Trend .................................................................................................. 51
7.2 Pre-monsoon Minimum Temperature Trend ....................................................................................... 53
7.3 Monsoon Minimum Temperature Trend .............................................................................................. 54
7.4 Post-monsoon Minimum Temperature Trend ...................................................................................... 54
7.5 Annual Minimum Temperature Trend .................................................................................................. 55
7.6 Summary of Minimum Temperature Trends ........................................................................................ 57
Chapter VIII: EXTREME EVENT TRENDS .................................................................................................................. 58
8.1 Number of Rainy Days ........................................................................................................................... 58
8.2 Very Wet Days ....................................................................................................................................... 58
8.3 Extremely Wet Days .............................................................................................................................. 59
viii | P a g e
8.4 Consecutive Dry Days ............................................................................................................................ 60
8.5 Consecutive Wet Days ........................................................................................................................... 61
8.6 Cool Days ................................................................................................................................................ 62
8.7 Cool Nights ............................................................................................................................................. 63
8.8 Warm Nights .......................................................................................................................................... 64
8.9 Warm Days ............................................................................................................................................. 65
8.10 Warm Spell Duration ............................................................................................................................. 66
8.11 Cold Spell Duration ................................................................................................................................ 67
8.12 Summary: Extreme Climate Trends ....................................................................................................... 68
Chapter IX: LINKING WITH PREVIOUS RESULTS ..................................................................................................... 70
Chapter X: CONCLUSION ......................................................................................................................................... 72
References ............................................................................................................................................................... 73
Appendix.................................................................................................................................................................. 74
ix | P a g e
LIST OF FIGURES
Figure 1. 1: Districts of nepal ............................................................................................................................... 3
Figure 1.2: physiographic regions of nepal .......................................................................................................... 3
Figure 2.1a: Distribution of 93 stations used for this study .................................................................................. 6
Figure 2.1b: Districtwise number of stations used in this study ........................................................................... 6
Figure 2.2: Schematic diagram of methodology .................................................................................................. 8
Figure 3.1.1a: Winter precipitation normal for districts ..................................................................................... 11
Figure 3.1.1b: Winter precipitation normal for physiographic regions ............................................................... 12
Figure 3.1.2a: Pre-monsoon precipitation normal for districts .......................................................................... 13
Figure 3.1.2b: Pre-monsoon precipitation normal for physiographic regions .................................................... 13
Figure 3.1.3a: Monsoon precipitation normal for districts ................................................................................. 14
Figure 3.1.3b: Monsoon precipitation normal for physiographic regions........................................................... 15
Figure 3.1.4a: Post-monsoon precipitation normal for districts ......................................................................... 15
Figure 3.1.4b Post-Monsoon precipitation normal for physiographic regions.................................................... 16
Figure 3.1.5a Annual precipitation normal for districts ..................................................................................... 17
Figure 3.1.5b Annual precipitation normal for physiographic regions ............................................................... 17
Figure 3.2.1a Winter maximum temperature normal for districts ..................................................................... 18
Figure 3.2.1b: Winter maximum temperature normal for physiographic regions .............................................. 19
Figure 3.2.2a: Pre-Monsoon maximum temperature normal for districts .......................................................... 20
Figure 3.2.2b Pre-Monsoon maximum temperature normal for physiographic regions ..................................... 21
Figure 3.2.3a Monsoon maximum temperature normal for districts ................................................................. 22
Figure 3.2.3b Monsoon maximum temperature normal for districts ................................................................. 22
Figure 3.2.4a Post-Monsoon maximum temperature normal for districts ......................................................... 23
Figure 3.2.4b: Post-Monsoon maximum temperature normal for districts ........................................................ 24
Figure 3.2.5a: Annual maximum temperature normal for districts .................................................................... 25
Figure 3.2.5b: Annual maximum temperature normal for physiographic regions .............................................. 25
Figure 3.3.1a: Winter minimum temperature normal for districts ..................................................................... 26
Figure 3.3.1b: Winter minimum temperature normal for physiographic regions ............................................... 27
Figure 3.3.2a: Pre-Monsoon minimum temperature normal for districts .......................................................... 28
Figure 3.3.2b: Pre-Monsoon minimum temperature normal for physiographic regions ................................... 29
Figure 3.3.3a Monsoon minimum temperature normal for districts .................................................................. 30
Figure 3.3.3b Monsoon minimum temperature normal for districts .................................................................. 30
Figure 3.3.4a Post Monsoon minimum temperature normal for districts .......................................................... 31
Figure 3.3.4b Post Monsoon minimum temperature normal for districts .......................................................... 32
Figure 3.3.5a Annual minimum temperature normal for districts ...................................................................... 33
Figure 3.3.5b Annual minimum temperature normal for districts ..................................................................... 33
Table 4: Climatic Trend of Nepal ........................................................................................................................ 34
Figure 4.1: Seasonal and annual maximum temperature time series of Nepal .................................................. 34
Figure 4.2: Seasonal and annual minimum temperature trend of Nepal ........................................................... 35
Figure 4.3 Precipitation time series of Nepal (a) Pre-Monsoon (b) Monsoon (c) Post-Monsoon (d) Winter (e)
Annual ....................................................................................................................................................... 36
Table 5.2: Seasonal and annual precipitation trends in physiographic regions of Nepal .................................... 37
Figure 5.1a: Winter precipitation trend for districts. ......................................................................................... 38
Figure 5.2a: Pre-Monsoon precipitation trend for districts. ............................................................................... 39
Figure 5.3a Monsoon Precipitation trend for districts. ...................................................................................... 40
Figure 5.4a Post-Monsoon Precipitation trend for districts. .............................................................................. 41
Figure 5.5a Annual Precipitation trend for districts. .......................................................................................... 42
x | P a g e
Table 6.1: Distribution of districts with positive and negative seasonal and annual maximum temperature
trends ........................................................................................................................................................ 44
Table 6.2: Seasonal and annual maximum temperature trends in the Physiographic Regions ........................... 44
Figure 6.1a Winter Maximum Temperature trend for districts .......................................................................... 45
Figure 6.2aPre-Monsoon Maximum Temperature trend for districts ................................................................ 46
Figure 6.3a Monsoon Maximum Temperature trend for districts ...................................................................... 47
Figure 6.4aPost-Monsoon Maximum Temperature trend for districts ............................................................... 48
Figure 6.5a Annual Maximum Temperature trend for districts. ......................................................................... 49
Figure 7.1a Winter Minimum Temperature trend for districts. .......................................................................... 52
Figure 7.2a Pre- Monsoon Minimum Temperature trend for districts. .............................................................. 53
Figure 7.3a Monsoon Minimum Temperature trend for districts. ...................................................................... 54
Figure 7.4a Post-Monsoon Minimum Temperature trend for districts ............................................................... 55
Figure 7.5a Annual Minimum Temperature trend for districts. ......................................................................... 56
Figure 8.1 District level number of rainy days trend. ......................................................................................... 58
Figure 8.2 District level Very Wet Days (R95P) trend. ........................................................................................ 59
Figure 8.3 District level Extremely Wet Days (R99P) trend. ............................................................................... 60
Figure 8.4 District level Consecutive Dry Days (CDD) trend. ............................................................................... 61
Figure 8.5 District Level Consecutive Wet Days (CWD) trend. ............................................................................ 62
Figure 8.6 District level Cool Days trend. ........................................................................................................... 63
Figure 8.7 District level Cool Nights trend.......................................................................................................... 64
Figure 8.8 District level Warm Nights trend. ...................................................................................................... 65
Figure 8.9 District level Warm Days trend. ........................................................................................................ 66
Figure 8.10 District level Warm Spell duration trend. ........................................................................................ 67
Figure 8.11 District level Cold Spell Duration Trend. .......................................................................................... 68
xi | P a g e
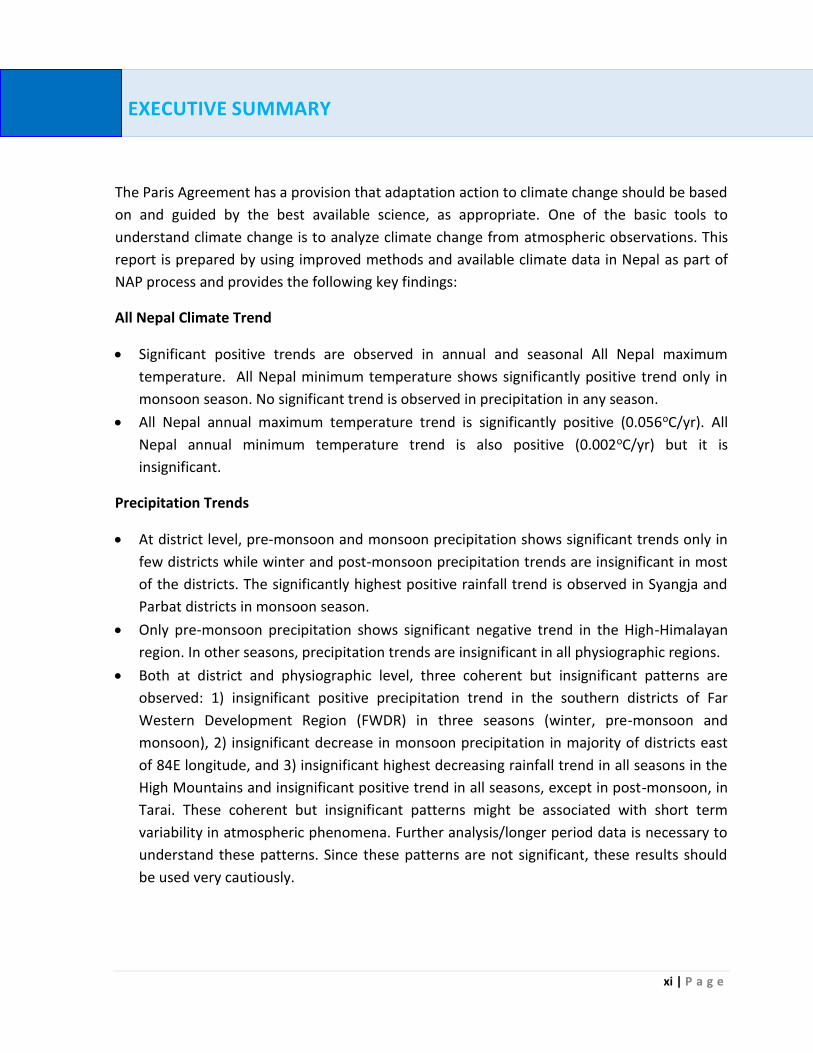
The Paris Agreement has a provision that adaptation action to climate change should be based
on and guided by the best available science, as appropriate. One of the basic tools to
understand climate change is to analyze climate change from atmospheric observations. This
report is prepared by using improved methods and available climate data in Nepal as part of
NAP process and provides the following key findings:
All Nepal Climate Trend
Significant positive trends are observed in annual and seasonal All Nepal maximum
temperature. All Nepal minimum temperature shows significantly positive trend only in
monsoon season. No significant trend is observed in precipitation in any season.
All Nepal annual maximum temperature trend is significantly positive (0.056oC/yr). All
Nepal annual minimum temperature trend is also positive (0.002oC/yr) but it is
insignificant.
Precipitation Trends
At district level, pre-monsoon and monsoon precipitation shows significant trends only in
few districts while winter and post-monsoon precipitation trends are insignificant in most
of the districts. The significantly highest positive rainfall trend is observed in Syangja and
Parbat districts in monsoon season.
Only pre-monsoon precipitation shows significant negative trend in the High-Himalayan
region. In other seasons, precipitation trends are insignificant in all physiographic regions.
Both at district and physiographic level, three coherent but insignificant patterns are
observed: 1) insignificant positive precipitation trend in the southern districts of Far
Western Development Region (FWDR) in three seasons (winter, pre-monsoon and
monsoon), 2) insignificant decrease in monsoon precipitation in majority of districts east
of 84E longitude, and 3) insignificant highest decreasing rainfall trend in all seasons in the
High Mountains and insignificant positive trend in all seasons, except in post-monsoon, in
Tarai. These coherent but insignificant patterns might be associated with short term
variability in atmospheric phenomena. Further analysis/longer period data is necessary to
understand these patterns. Since these patterns are not significant, these results should
be used very cautiously.
EXECUTIVE SUMMARY
xii | P a g e
Maximum Temperature Trend
The positive temperature trend is highly significant in majority of districts (more than 90%
of the districts) and in all physiographic regions in all the seasons, except in majority of the
Tarai districts in winter.
At the district level, the highest significant positive trend (0.12oC/yr) is observed in
Manang district in winter season.
All five physiographic regions show significant positive trend in all seasons, except in Tarai
in winter and pre-monsoon, and in Siwaliks in winter.
In High Mountains and High Himalayas, the highest positive trend is observed in winter
season and in Tarai, Siwaliks and Middle Mountains, the highest positive trend is observed
in monsoon season.
Both at district and physiographic levels, seasonal and annual maximum temperature
trends demonstrate a pattern in relation to altitude with negative trend or small positive
trend in lower altitude districts/regions and larger positive trend in higher altitude
districts/regions
Minimum Temperature Trend
The negative minimum temperature trend is significant in most of the northwestern
districts in winter and post-monsoon seasons while positive minimum temperature trend
is significant in majority of southern (Tarai to Middle Mountains) districts in Eastern
Development Region (EDR), Central Development Region (CDR) and WDR in all seasons.
Seasonal and annual minimum temperature trends, though majority are insignificant both
at district and physiographic levels, show positive trends in lower elevation and negative in
the higher elevation. Since these patterns are not significant, but might be associated with
short term variability in atmospheric phenomena, these results should be used very
cautiously.
At the district level, significantly highest positive trend (0.046oC/yr) is observed in Dolpa
district in monsoon and significantly highest negative trend (-0.076oC/yr) in Humla district
in winter.
At the physiographic level, Tarai and Siwaliks show significant increasing trend in most of
the seasons. The decreasing trend is significant only in winter season in the High
Himalayas.
Extreme Precipitation Trends
Number of rainy days is increasing significantly mainly in the northwestern districts.
Very wet days and extremely wet days are decreasing significantly, mainly in the northern
districts.
xiii | P a g e
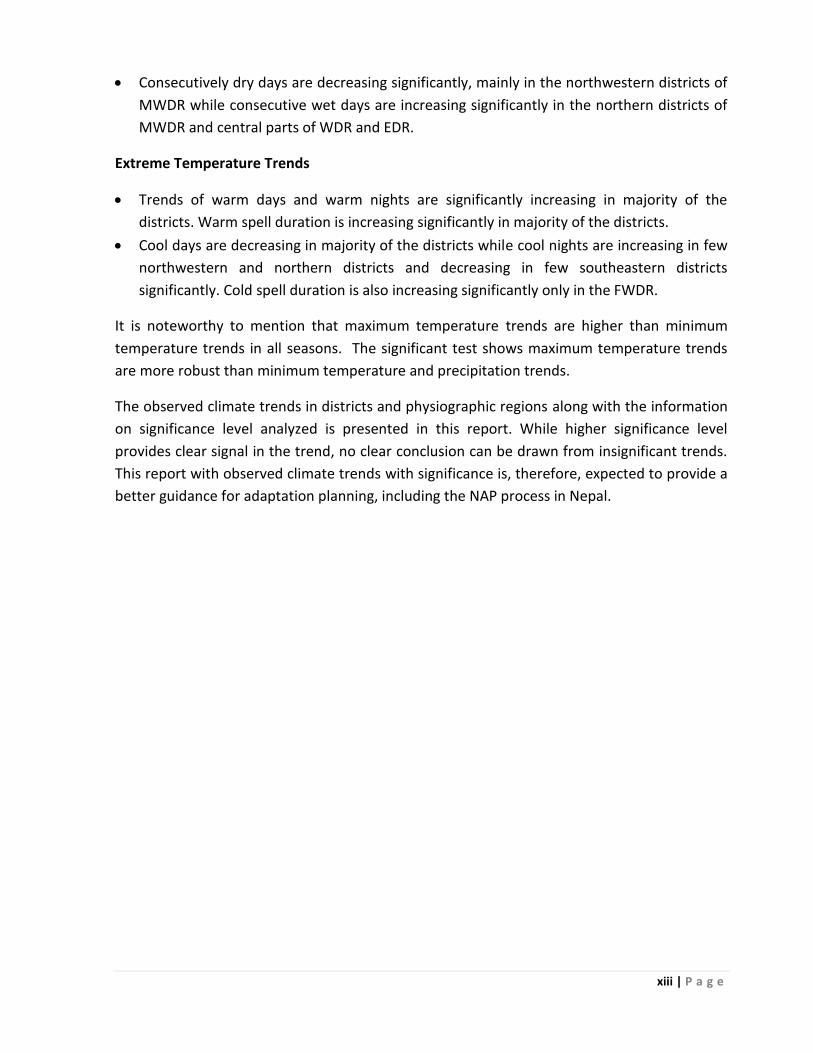
Consecutively dry days are decreasing significantly, mainly in the northwestern districts of
MWDR while consecutive wet days are increasing significantly in the northern districts of
MWDR and central parts of WDR and EDR.
Extreme Temperature Trends
Trends of warm days and warm nights are significantly increasing in majority of the
districts. Warm spell duration is increasing significantly in majority of the districts.
Cool days are decreasing in majority of the districts while cool nights are increasing in few
northwestern and northern districts and decreasing in few southeastern districts
significantly. Cold spell duration is also increasing significantly only in the FWDR.
It is noteworthy to mention that maximum temperature trends are higher than minimum
temperature trends in all seasons. The significant test shows maximum temperature trends
are more robust than minimum temperature and precipitation trends.
The observed climate trends in districts and physiographic regions along with the information
on significance level analyzed is presented in this report. While higher significance level
provides clear signal in the trend, no clear conclusion can be drawn from insignificant trends.
This report with observed climate trends with significance is, therefore, expected to provide a
better guidance for adaptation planning, including the NAP process in Nepal.
1 | P a g e
CHAPTER 1: INTRODUCTION
1.1 BACKGROUND
Parties to the United Nations Framework Convention on Climate Change (UNFCCC) at Cancun,
Mexico in 2010 realised the urgency of building adaptive capacity and resilience, and
established a process to enable Least Developed Country (LDC) Parties to formulate and
implement national adaptation plans (NAPs). The NAP builds on the experience in preparing
and implementing National Adaptation Programme of Action (NAPAs), as a means of
identifying medium- and long-term adaptation needs and developing and implementing
strategies and programmes to address those needs. The Conference of the Parties to the
UNFCCC at its 17th session (CoP 17) held in Durban, South Africa issued the initial guidelines
for NAP formulation. As per its mandate, the LDC Expert Group (LEG) prepared the NAP
Technical Guidelines to provide guidance to LDCs on the NAP formulation process. Each CoP
decision provides ample opportunities to formulate NAP. Article 7 of the Paris Agreement
(2015) urges each Party to, inter alia, engage in adaptation planning processes and
implementation of actions, including a process to formulate and implement the NAP.
The objective of NAP process is to reduce vulnerability to the impacts of climate change, by
building adaptive capacity and resilience; and facilitate the integration of climate change
adaptation, in a coherent manner, into relevant new and existing policies, programmes and
activities, in particular development planning processes and strategies, within all relevant
sectors and at different levels, as appropriate.
The Paris Agreement has a provision that adaptation action should be based on and guided by
the best available science, as appropriate. Each Party is obliged to submit and update
periodically an adaptation communication. In this pursuit, the Department of Hydrology and
Meteorology (DHM), a dedicated and responsible institution of the Ministry of Population and
Environment (MoPE) for climate data in Nepal, took a lead role and worked in collaboration
with International Centre for Integrated Mountain Development (ICIMOD) and Practical
Action to conduct a study on observed climatic trend of Nepal.
The purpose of this study is to analyse climate trend using most updated climatic data and
available improved methods. Previously detailed study on historical climate trend was
conducted by Practical Action Nepal (PAN) in 2009 using data from 1976 to 2005 and DHM
(2015) using data from 1971 to 2012. Prior to these two studies, most studies focused either
only on single climate variable (maximum temperature or precipitation or extremes only) or
on All Nepal average trend or only on station level trends (Shrestha et al., 1999 and Baidya et
al., 2008). Taking into consideration the results and limitations of previous studies conducted
by PAN (2009) and DHM (2015), in particular trend analysis using linear regression method
2 | P a g e
and with no significance tests of the trends and lack of trend analysis of extreme events, this
study has considered adequately non-normal (skewed) distribution and auto-correlation
present in climatic time series by using non-parametric tests for the analysis of magnitude and
significance test of the trends. This study also includes extreme event trend analysis at district
levels to facilitate the NAP process and adaptation planning.
This national document on climate trend analysis is a part of Nepal's NAP formulation process
and would contribute to adaptation communication. The MoPE launched the NAP process in
September 2015 and engaged the NAP team in May 2016. Nepal's NAP follows a process as
per Decision 5/CP.17 (initial guidelines for NAP formulation) and NAP Technical Guidelines and
focuses on analysing current and future climate scenarios. This technical report provides latest
updates on climate trend in Nepal.
1.2 OBJECTIVES
The main objective of this study is to analyse observed seasonal and annual climate change
trend in Nepal at district and physiographic regions for the NAP process.
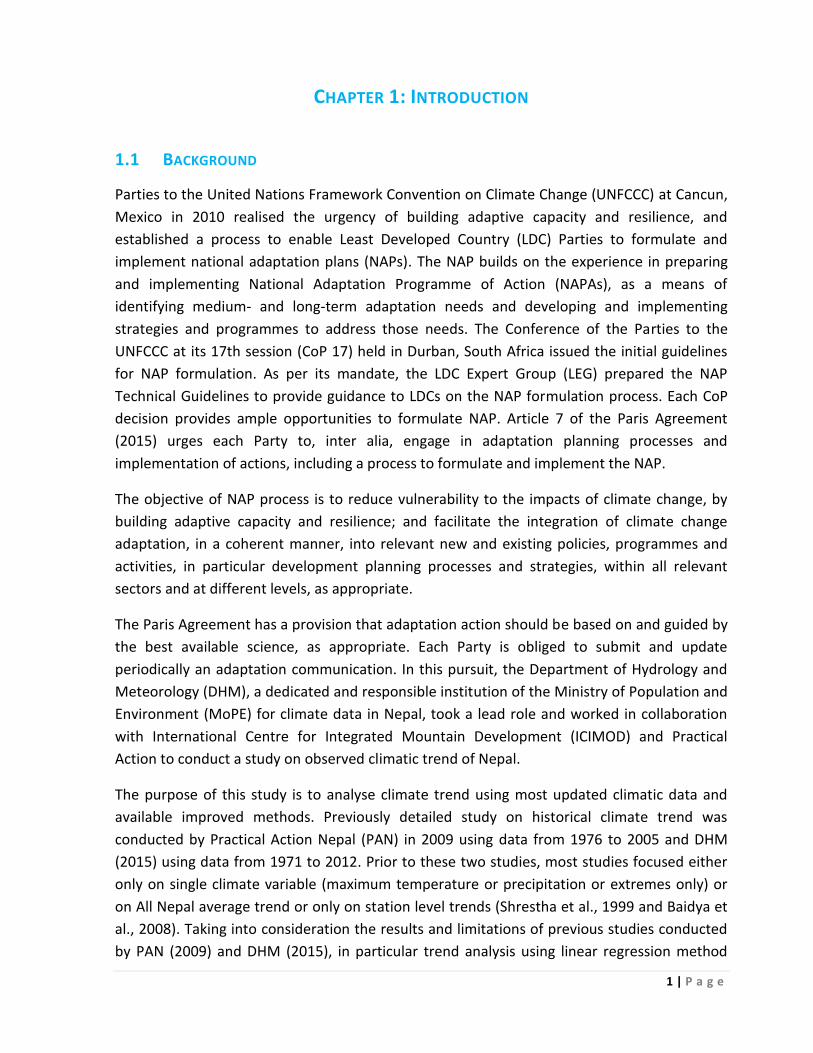
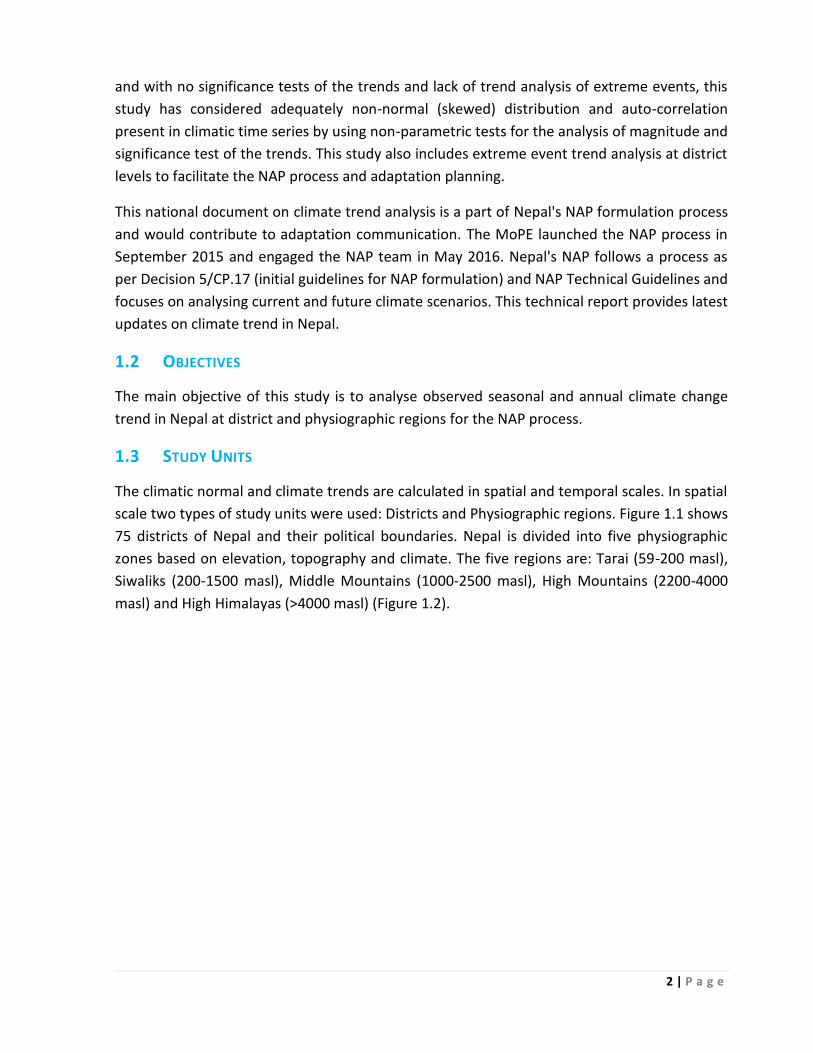
1.3 STUDY UNITS
The climatic normal and climate trends are calculated in spatial and temporal scales. In spatial
scale two types of study units were used: Districts and Physiographic regions. Figure 1.1 shows
75 districts of Nepal and their political boundaries. Nepal is divided into five physiographic
zones based on elevation, topography and climate. The five regions are: Tarai (59-200 masl),
Siwaliks (200-1500 masl), Middle Mountains (1000-2500 masl), High Mountains (2200-4000
masl) and High Himalayas (>4000 masl) (Figure 1.2).
3 | P a g e
FIGURE 1. 1: DISTRICTS OF NEPAL
FIGURE 1.2: PHYSIOGRAPHIC REGIONS OF NEPAL
4 | P a g e
In temporal scale, annual and seasonal time scales are used in this analysis. Based on rainfall
and temperature pattern, Nepal has four seasons. The climatic normal and trends are
calculated for these four seasons: (i) December, January and February is winter season that is
coldest and driest season; (ii) March to May is pre-monsoon season and experiences hot
weather and thunderstorms; (iii) June to September is monsoon season with rainy, hot and
humid weather; (iv) October and November is post-monsoon season, with pleasant weather.
1.4 THE REPORT
This report includes data and information on climate normal, All Nepal climate trends,
precipitation and temperature trends in seasons for districts and physiographic regions.
Following considerations are made during the preparation of this report:
This report is prepared on observed climate trend for Nepal using best available data
and tools.
This study is based on quality checked meteorological data in order to enhance the
quality of the report and assure the best output/outcome.
The study is based on 1km x 1km for temperature and 5km x 5km for precipitation daily
gridded data set.
This report presents All Nepal average, individual district average and individual
physiographic region average of normal annual and seasonal rainfall and maximum and
minimum temperatures using gridded data. This is the first study of its nature in Nepal
that uses gridded data to calculate district-wise normal rainfall and temperature.
This study calculates maximum and minimum temperature and precipitation trend for
annual and four seasons for each district with significance test at 95%, 99% and 99.9 %
confidence levels. Based on record, this is also the first study in Nepal that analyses
climate trend at district level over whole country.
Maps of eleven extreme climatic indices trend are prepared at district level.
The district normal climate and climate trends are presented in the maps for annual
and four seasons.
This report uses data of only two high altitude stations (> 2800 masl uptp 5000 masl).
District and physiographic trends were calculated using district average time series.
5 | P a g e
CHAPTER 2: DATA AND METHODOLOGY
2.1 DATA
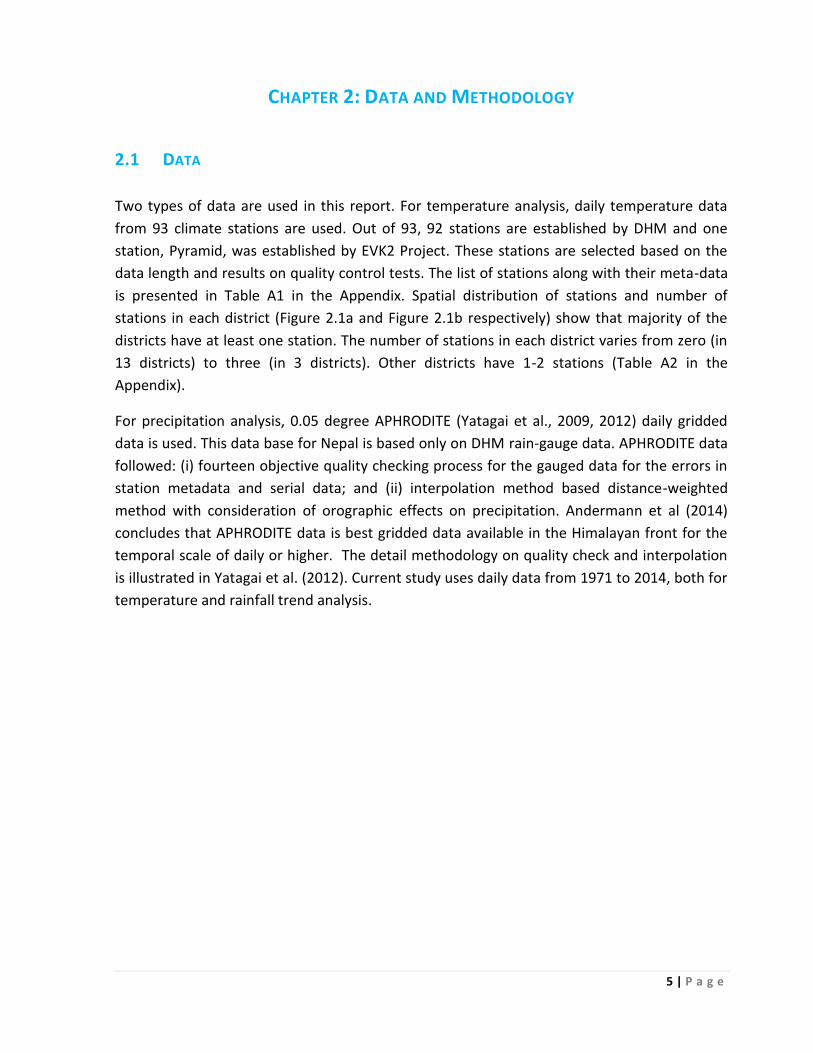
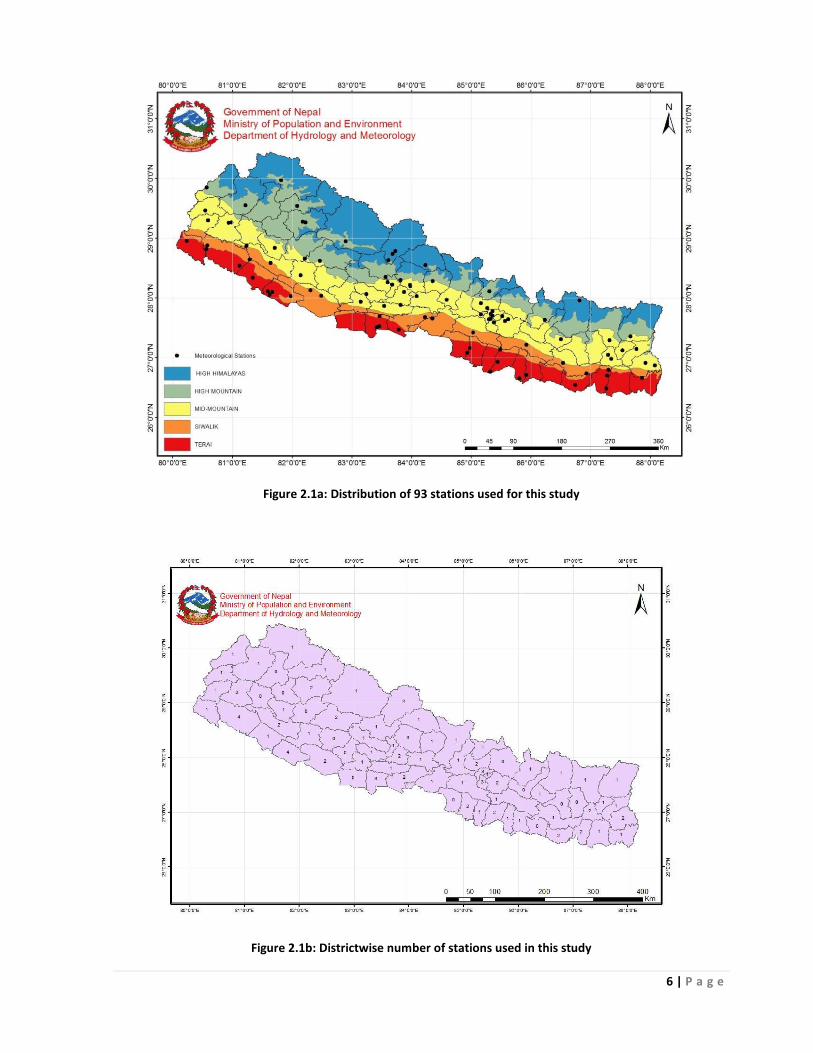
Two types of data are used in this report. For temperature analysis, daily temperature data
from 93 climate stations are used. Out of 93, 92 stations are established by DHM and one
station, Pyramid, was established by EVK2 Project. These stations are selected based on the
data length and results on quality control tests. The list of stations along with their meta-data
is presented in Table A1 in the Appendix. Spatial distribution of stations and number of
stations in each district (Figure 2.1a and Figure 2.1b respectively) show that majority of the
districts have at least one station. The number of stations in each district varies from zero (in
13 districts) to three (in 3 districts). Other districts have 1-2 stations (Table A2 in the
Appendix).
For precipitation analysis, 0.05 degree APHRODITE (Yatagai et al., 2009, 2012) daily gridded
data is used. This data base for Nepal is based only on DHM rain-gauge data. APHRODITE data
followed: (i) fourteen objective quality checking process for the gauged data for the errors in
station metadata and serial data; and (ii) interpolation method based distance-weighted
method with consideration of orographic effects on precipitation. Andermann et al (2014)
concludes that APHRODITE data is best gridded data available in the Himalayan front for the
temporal scale of daily or higher. The detail methodology on quality check and interpolation
is illustrated in Yatagai et al. (2012). Current study uses daily data from 1971 to 2014, both for
temperature and rainfall trend analysis.
6 | P a g e
Figure 2.1a: Distribution of 93 stations used for this study
Figure 2.1b: Districtwise number of stations used in this study
7 | P a g e
2.2 METHODOLOGY
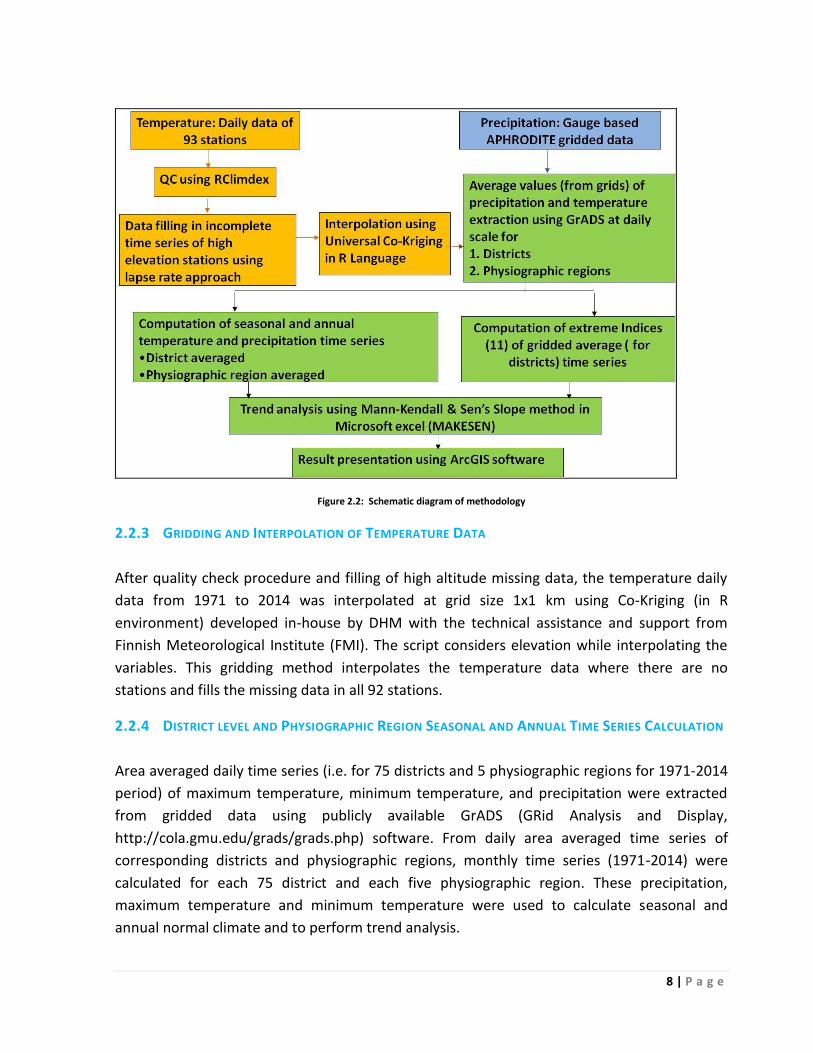
Schematic diagram of methodology used in this study is given in Figure 2.2. The detail
explanation of each step is as follows:
2.2.1 TEMPERATURE DATA QUALITY CHECK
The daily temperature data of 92 DHM stations were first quality checked using RClimdex
software. RClimdex is a free software which also tests quality of the meteorological data. The
methods used in RClimdex quality check are discussed in Alexander et al (2006). The station
data that showed outliers and unusual values were further processed. The outliers and
unusual values were corrected for individual stations by replacing them by average of the
value from previous day and the next day. Moreover, DHM regional offices were contacted to
confirm whether station location was changed and if there were issues with the performance
of instrument/observer in the stations that showed step changes in the record. No such issues
were reported for those stations and thus, the step changes in the records of those stations
were considered as natural and used in this analysis.
2.2.2 HIGH ALTITUDE STATION MISSING DATA FILLING
Out of 93 stations, only two stations used in this study are located in the altitude at about
3000m or above. These two stations are: Simikot (2993m) in the west in Humla District and
Pyramid (5035m) in the east in Solukhumbu district. Since Simikot station was established in
1989 and Pyramid in 1993, no data were available in these high Himalayan stations prior to
1989 and 1993 respectively. When the data was interpolated using RClimdex prior to 1989 for
Simikot and 1993 for Pyramid, the temperatures showed warm bias and this might lead to
either no trend or negative trend. Therefore, the missing data from 1971 was first filled in
both of these stations using the data from correlated neighbouring station (at lower altitude)
that has data for 1971 to 1993. For Simikot, Doti station in Doti district and for Pyramid, Jiri
station in Dolakha district showed best correlations. For each month, average rate of decrease
of temperature from Doti to Simikot and from Jiri to Pyramid due to elevation increase was
calculated. This is based on the assumption that surface air temperature decreases from low
elevation to high elevation. The monthly average rates were used as a coefficient to estimate
daily temperature from low elevation station to high elevation station for the missing data
period. The o thly a erage lapse rates for Jiri-Pyramid and Doti-Simikot were calculated
both for maximum and minimum temperature separately and are shown in Table A2 in the
Appendix.
8 | P a g e
Figure 2.2: Schematic diagram of methodology
2.2.3 GRIDDING AND INTERPOLATION OF TEMPERATURE DATA
After quality check procedure and filling of high altitude missing data, the temperature daily
data from 1971 to 2014 was interpolated at grid size 1x1 km using Co-Kriging (in R
environment) developed in-house by DHM with the technical assistance and support from
Finnish Meteorological Institute (FMI). The script considers elevation while interpolating the
variables. This gridding method interpolates the temperature data where there are no
stations and fills the missing data in all 92 stations.
2.2.4 DISTRICT LEVEL AND PHYSIOGRAPHIC REGION SEASONAL AND ANNUAL TIME SERIES CALCULATION
Area averaged daily time series (i.e. for 75 districts and 5 physiographic regions for 1971-2014
period) of maximum temperature, minimum temperature, and precipitation were extracted
from gridded data using publicly available GrADS (GRid Analysis and Display,
http://cola.gmu.edu/grads/grads.php) software. From daily area averaged time series of
corresponding districts and physiographic regions, monthly time series (1971-2014) were
calculated for each 75 district and each five physiographic region. These precipitation,
maximum temperature and minimum temperature were used to calculate seasonal and
annual normal climate and to perform trend analysis.
9 | P a g e
2.2.5 TREND ANALYSIS
Combined Mann-Ke dall test a d “e s “lope ethods ere used to a alyse type, ag itude and significance of trend in climate time series data. Mann-Kendall trend test is non-
parametric method that tests the presence and significance of monotonic positive or negative
tre d i a ti e series. It tests if the o oto ic tre d is sig ifica t or ot, hereas “e s “lope method estimates the magnitude of the linear trend (slope). In this study, MS-Excel program
called MAKESENS version 1.0 developed by FMI in 2002 (Salmi et al., 2002) was used to
calculate magnitude, and significance of the trend. This program incorporates both Mann-
Ke dall test a d “e s “lope ethod for tre d a alysis. The detail calculation method is
explained by Salmi et al. (2002).
A pri ary goal of sig ifica t test i tre d a alysis is to ide tify sig als i cha ge agai st the oise that occur i ter ally ge erated fluctuatio i cli ate syste . If the sig al is small
relative to the 'noise', trend may be observed in data by chance, purely due to random
fluctuations of the 'noise'. Therefore, significance test examines if the observed trend is a
'signal' of change or simply a random fluctuation (i.e., noise). The Mann-Kendall method of
significance test uses the hypothesis testing approach. It tests the null hypothesis that the
monotonic trend is by chance (due to noise) in the climate data against the alternative
hypothesis that there is a monotonic trend (signal) in the climate data at a certain significant
level. In this study, significant tests at the level of 0.001, 0.01 and 0.05 or at confidence levels
(CL) at 99.9%, 99% and 95% were used. Each significance level (0.001, 0.01, and 0.05) indicates
the probability ( 0.1%, 1%, and 5%) that the observed trend could have occurred by chance.
Significant test at 0.001 (at 99.9% CL) means that the probability that the null hypothesis (the
trend is by chance) might be true is less than 0.1%. With such low probability, the null
hypothesis is likely to be incorrect and therefore the alternative hypothesis can be accepted at
the confidence level of 99.9%. In other words, the trend in the data can be accepted as a real
signal at the confidence level of 99.9%.
Similarly, significant test at 0.01 (at 99% CL) means the trend in data can be accepted as a real
signal at the confidence level of 99%. Significant test at 0.05 (at 95% CL) means the trend in
data can be accepted as a real signal at the confidence level of 95%.
In this study, significant trend represents trends with 95% or higher CL and insignificant means
lower than 95% CL.
2.2.6 EXTREME INDICES ANALYSIS
These extreme indices were identified by NAP team, ICIMOD, DHM and PAN together after
mapping the sectoral requirement and need for NAP. Time series of extreme indices for each
district are calculated by using a programme in Fortran. Significance and slope of the trend of
10 | P a g e
output indices were estimated using Mann-Ke dall a d “e s slope ethod i M“-Excel. Time
series of extreme indices were obtained from GrADS extracted area averaged data.
Description of 11 extreme climate indices is shown in Table 2.
Table 2: Extreme indices and their description
Extreme Climate
Indices
Descriptions
a. Number of rainy
days
Annual count of days with daily precipitation > 1mm
b. Very wet days Annual total precipitation when daily rainfall >95th percentile
c. Extremely wet days Annual total precipitation when daily max rainfall >99th percentile
d. Consecutive wet
days
Maximum number of consecutive days with daily precipitation
>1mm
e. Consecutive dry
days
Maximum number of consecutive days with daily precipitation
<1mm
f. Warm days Percentage of days when maximum temperature >90th percentile
g. Warm nights Percentage of days when minimum temperature >90th percentile
h. Warm spell
duration
Annual count of days with at least 6 consecutive days when
maximum temperature > 90th percentile
i. Cool days Percentage of days when maximum temperature <10th
percentile
j. Cool nights Percentage of days when minimum temperature <10th percentile
k. Cold spell duration
Annual count of days with at least 6 consecutive days when
minimum temperature < 10th percentile
2.2.7 REPORT PREPARATION PROCESS
The Ministry of Population and Environment constituted a Steering Committee under the
coordination of the Director General of the DHM for necessary guidance, supervision and
coordination for the trend analysis and preparation of this report.
The DHM formed a Technical Committee under the coordination of Senior Divisional
Meteorologist for data checking, quality control, technical supervision of the work, and
finalisation of this report.
In order to best utilise the available climate data for Nepal's NAP formulation process, the
Technical Committee organised consultations at regular basis with NAP Team and those
engaged in supporting the NAP process, in particular ICIMOD and Practical Action for sharing
on approaches, data availability and results. This report accommodates concerns and inputs of
the reviewers, to the extent possible.
11 | P a g e
CHAPTER 3: CLIMATIC NORMAL
This chapter presents district and physiographic regions normals of precipitation, maximum
temperature and minimum temperature. Annual and seasonal normal are calculated by
averaging each time series data (for precipitation, maximum temperature and minimum
temperature) for the period from 1981 to 2010. The district and physiographic regions normal
climatic values are presented in the Table A3a and Table A3b in the Appendix respectively.
3.1 NORMAL PRECIPITATION FOR DISTRICTS AND PHYSIOGRAPHIC REGIONS
3.1.1 WINTER PRECIPITATION
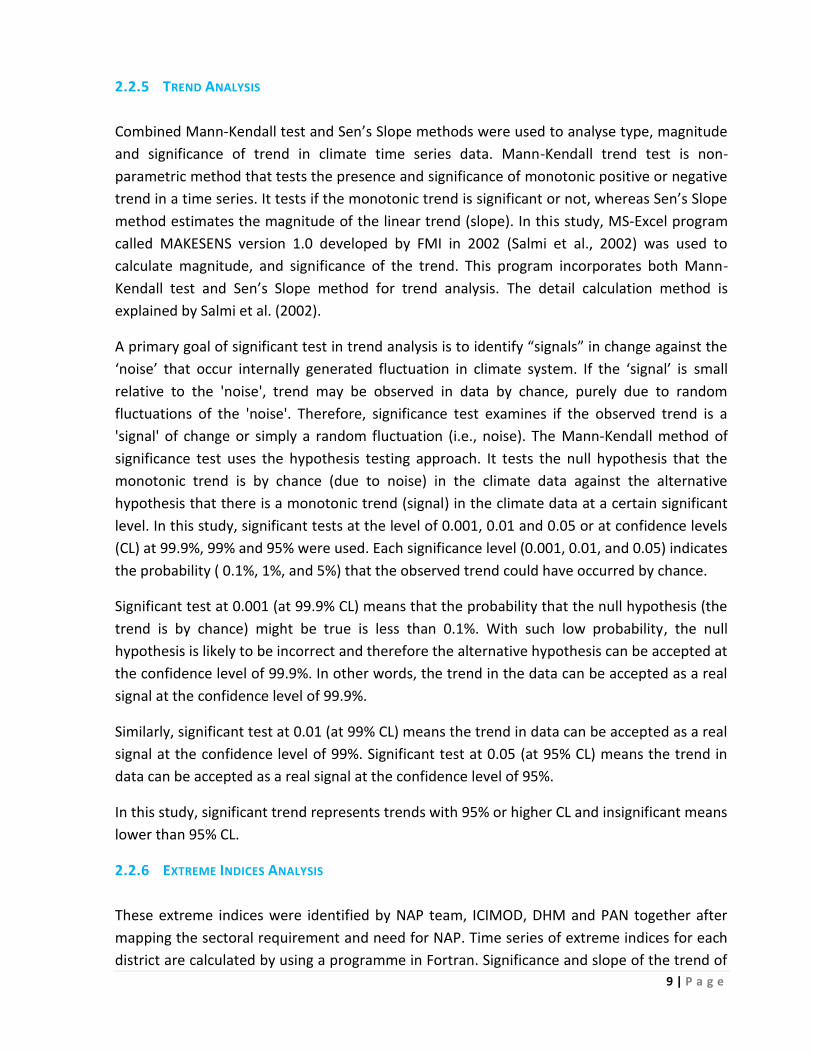
Districts in the Far Western Development Region (FWDR) have higher normal winter rainfall
than rest of the districts in the country (Figure 3.1.1a). The figure shows that the normal
winter precipitation decreases from west to east in the country, with lowest rainfall in the
districts of Central Development Region (CDR) and Eastern Development Region (EDR). Lowest
winter precipitation is observed in Mustang, Dhankuta and few Tarai districts in EDR and CDR.
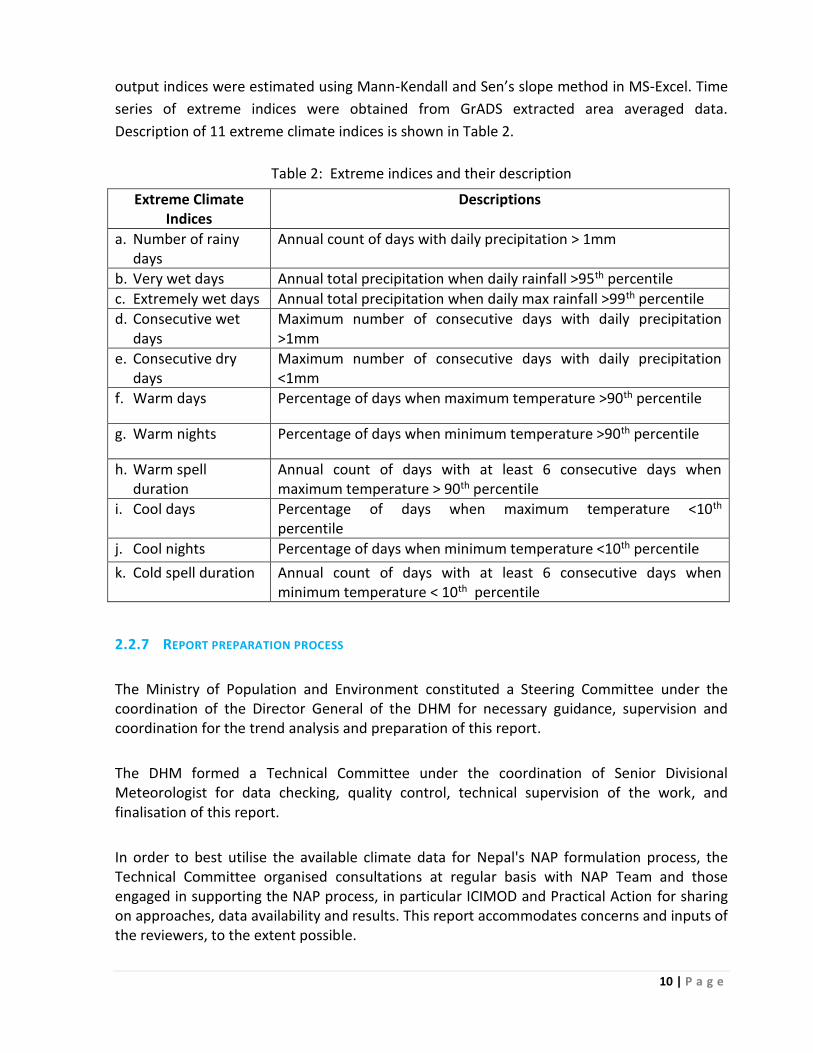
Normal winter precipitation for physiographic regions is lowest over the High Himalayas and
Tarai regions (Figure 3.1.1.b and Table A3b).
Figure 3.1.1a: Winter precipitation normal for districts
12 | P a g e
Figure 3.1.1b: Winter precipitation normal for physiographic regions
3.1.2 PRE–MONSOON PRECIPITATION
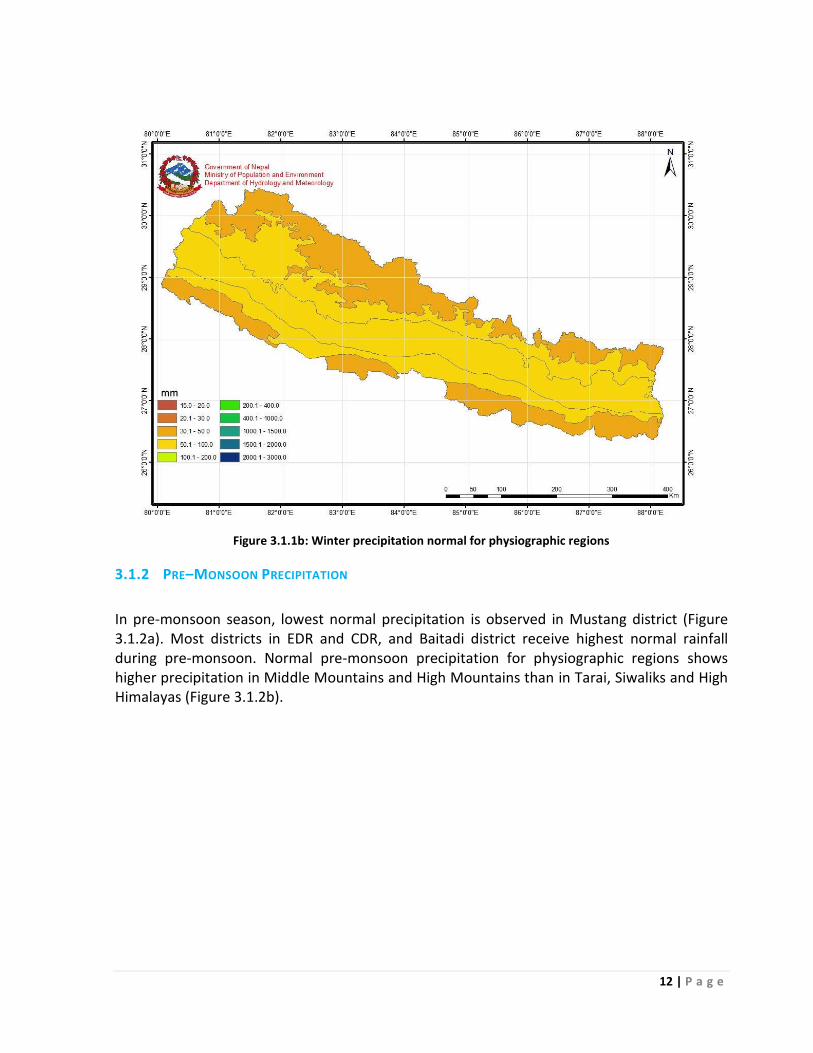
In pre-monsoon season, lowest normal precipitation is observed in Mustang district (Figure
3.1.2a). Most districts in EDR and CDR, and Baitadi district receive highest normal rainfall
during pre-monsoon. Normal pre-monsoon precipitation for physiographic regions shows
higher precipitation in Middle Mountains and High Mountains than in Tarai, Siwaliks and High
Himalayas (Figure 3.1.2b).
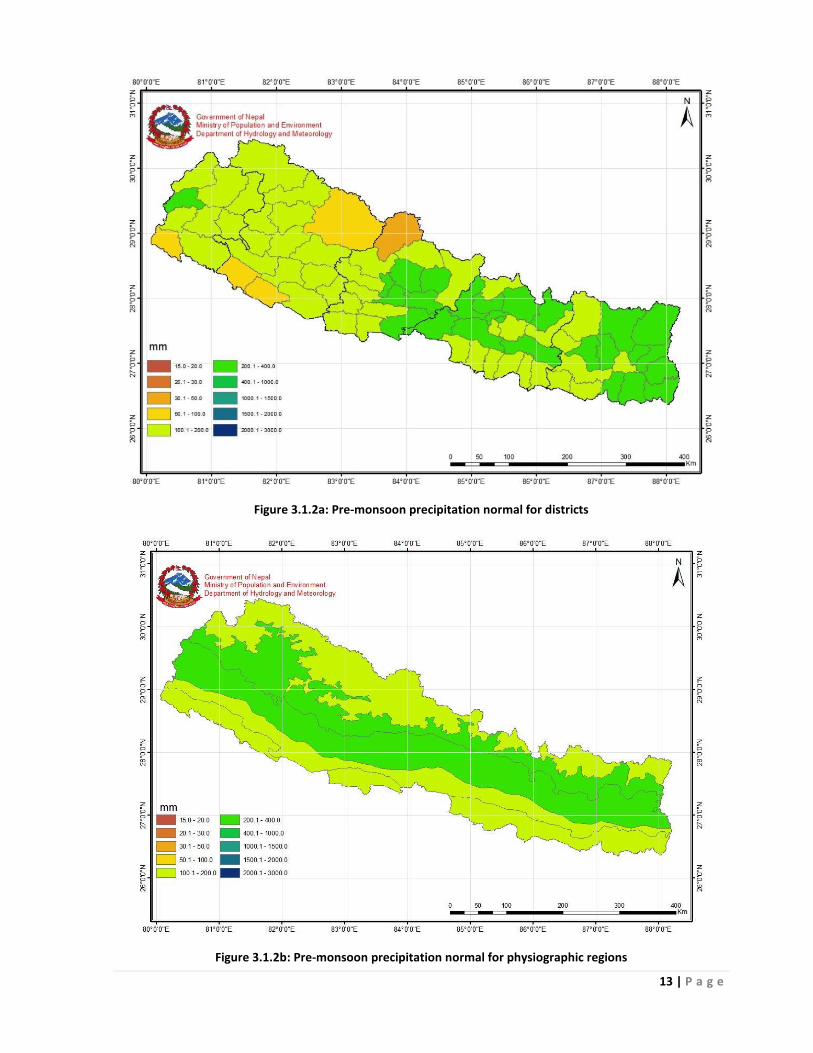
13 | P a g e
Figure 3.1.2a: Pre-monsoon precipitation normal for districts
Figure 3.1.2b: Pre-monsoon precipitation normal for physiographic regions
14 | P a g e
3.1.3 MONSOON PRECIPITATION
With regard to normal monsoon precipitation in all 75 districts, northern districts of the
Western Development Region (WDR) and Mid-Western Development Region (MWDR) as well
as Rasuwa, Dhankuta and Tehrathum districts receive below 1000mm of rainfall (Figure
3.1.3a). Monsoon precipitation is lowest over Mustang (<200mm) and highest over Kaski and
Parbat (>2000mm). The High Himalayas receive less than 1000mm while rest of the regions
receive normal precipitation in monsoon season between 1000mm and 1500mm (Figure
3.1.3b).
Figure 3.1.3a: Monsoon precipitation normal for districts
15 | P a g e
Figure 3.1.3b: Monsoon precipitation normal for physiographic regions
3.1.4 POST-MONSOON PRECIPITATION
In post-monsoon season, only three districts in EDR and Kaski in WDR receive more than
100mm rainfall (Figure 3.1.4a). Mustang and Dolpa districts receive lowest rainfall (<20mm).
Regarding normal post-monsoon precipitation for physiographic regions, High Himalayas
receives below 50mm of rain whereas other physiographic regions receive between 50mm
and 100mm of rainfall (Figure 3.1.4b).
Figure 3.1.4a: Post-monsoon precipitation normal for districts
16 | P a g e
Figure 3.1.4b Post-Monsoon precipitation normal for physiographic regions
3.1.5. ANNUAL PRECIPITATION
Normal annual precipitation for all districts shows that Mustang receives the lowest rainfall
(<400mm) whereas Kaski, Parbat, Tanahu, Lamjung, Nuwakot, Sindhupalchok,
Sankhuwasabha, Ilam and Jhapa receive more than 2000mm of annual rain (Figure 3.1.5a). In
physiographic regions, High Himalayas receives the least amount of rain (400-1000mm) and
remaining regions receive higher rainfall (1500-2000mm) (Figure 3.1.5b).
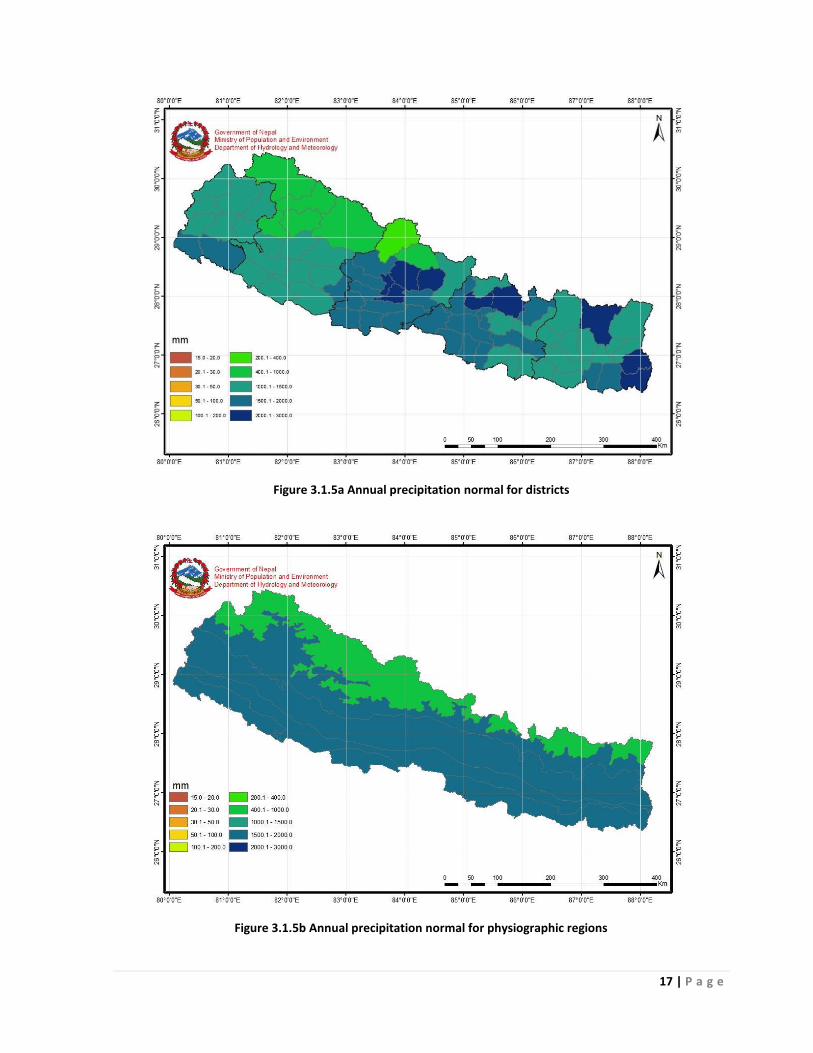
17 | P a g e
Figure 3.1.5a Annual precipitation normal for districts
Figure 3.1.5b Annual precipitation normal for physiographic regions
18 | P a g e
3.2. NORMAL MAXIMUM TEMPERATURE
3.2.1 WINTER MAXIMUM TEMPERATURE
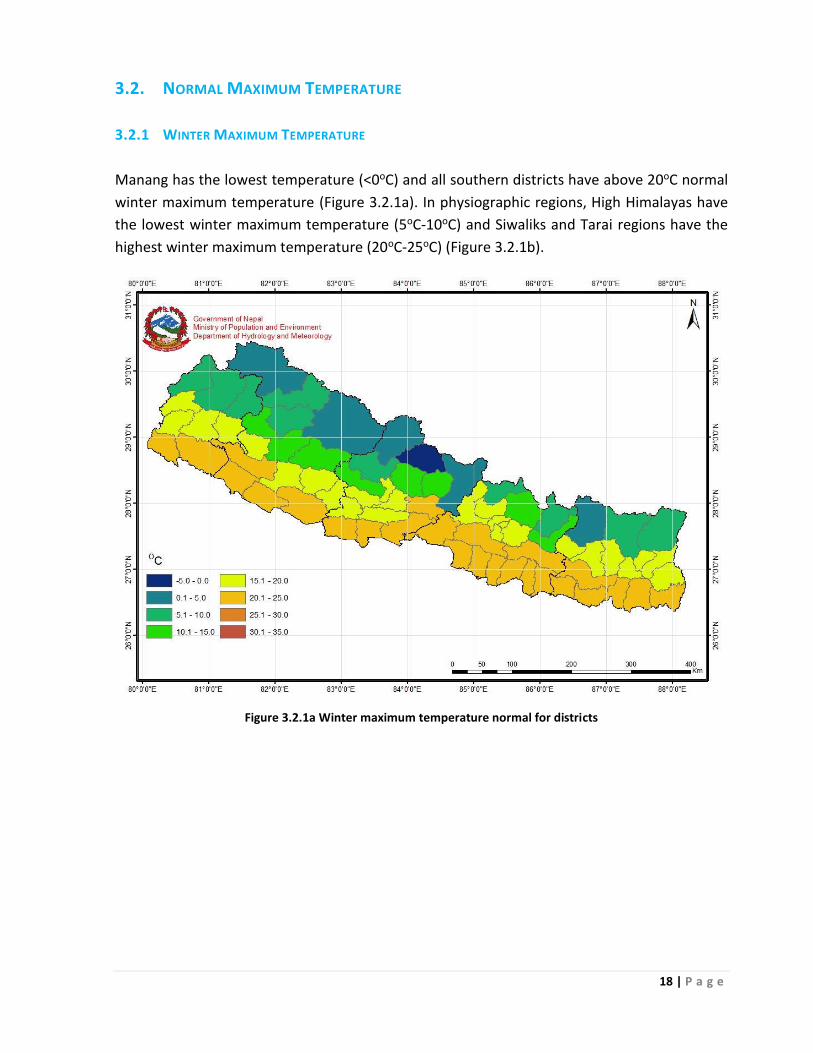
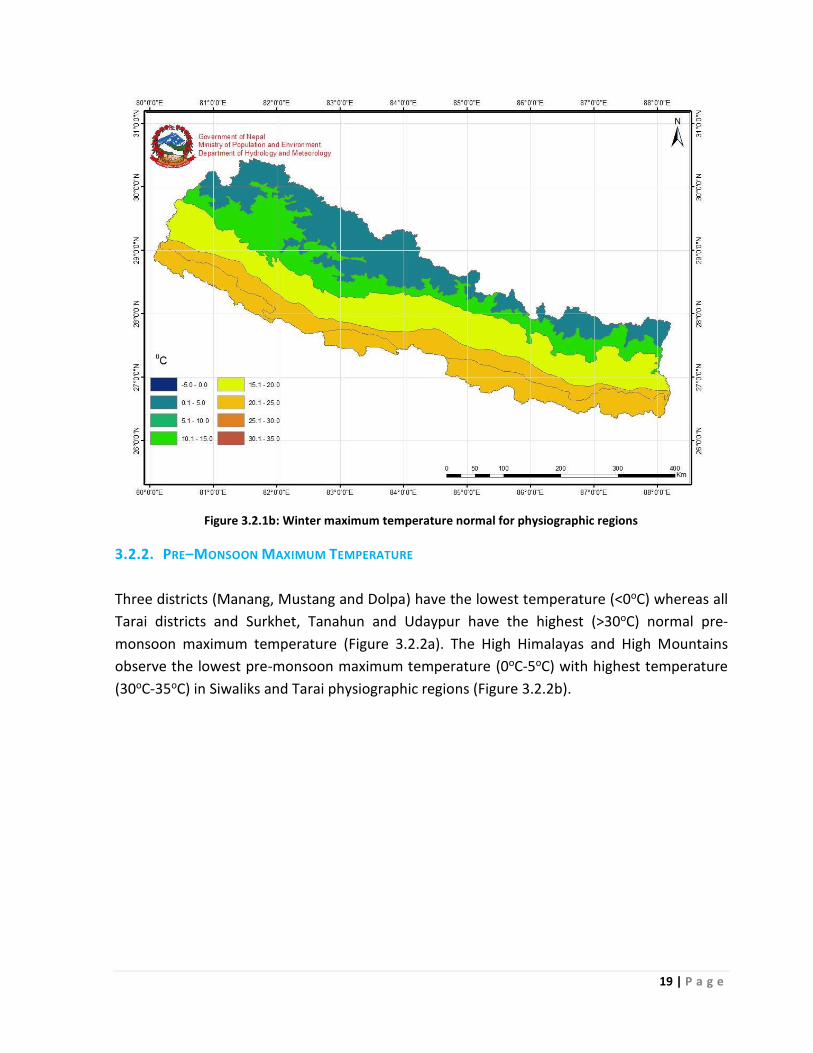
Manang has the lowest temperature (<0oC) and all southern districts have above 20oC normal
winter maximum temperature (Figure 3.2.1a). In physiographic regions, High Himalayas have
the lowest winter maximum temperature (5oC-10oC) and Siwaliks and Tarai regions have the
highest winter maximum temperature (20oC-25oC) (Figure 3.2.1b).
Figure 3.2.1a Winter maximum temperature normal for districts
19 | P a g e
Figure 3.2.1b: Winter maximum temperature normal for physiographic regions
3.2.2. PRE–MONSOON MAXIMUM TEMPERATURE
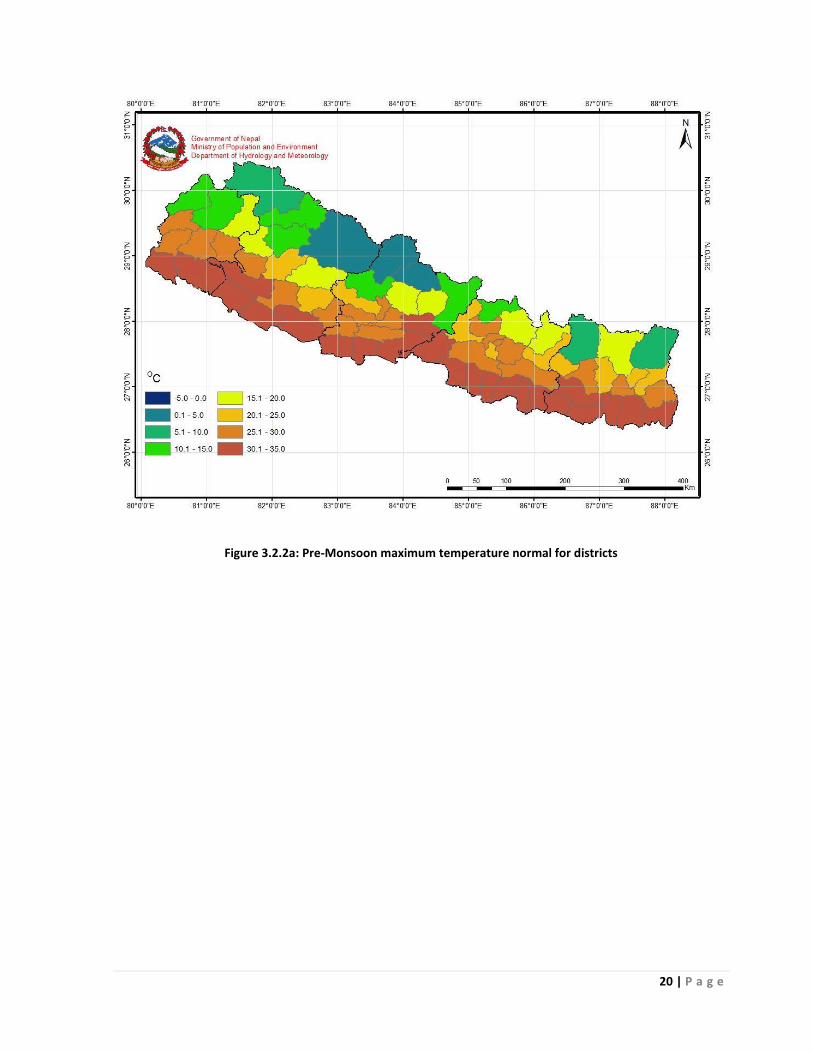
Three districts (Manang, Mustang and Dolpa) have the lowest temperature (<0oC) whereas all
Tarai districts and Surkhet, Tanahun and Udaypur have the highest (>30oC) normal pre-
monsoon maximum temperature (Figure 3.2.2a). The High Himalayas and High Mountains
observe the lowest pre-monsoon maximum temperature (0oC-5oC) with highest temperature
(30oC-35oC) in Siwaliks and Tarai physiographic regions (Figure 3.2.2b).
20 | P a g e
Figure 3.2.2a: Pre-Monsoon maximum temperature normal for districts
21 | P a g e
Figure 3.2.2b Pre-Monsoon maximum temperature normal for physiographic regions
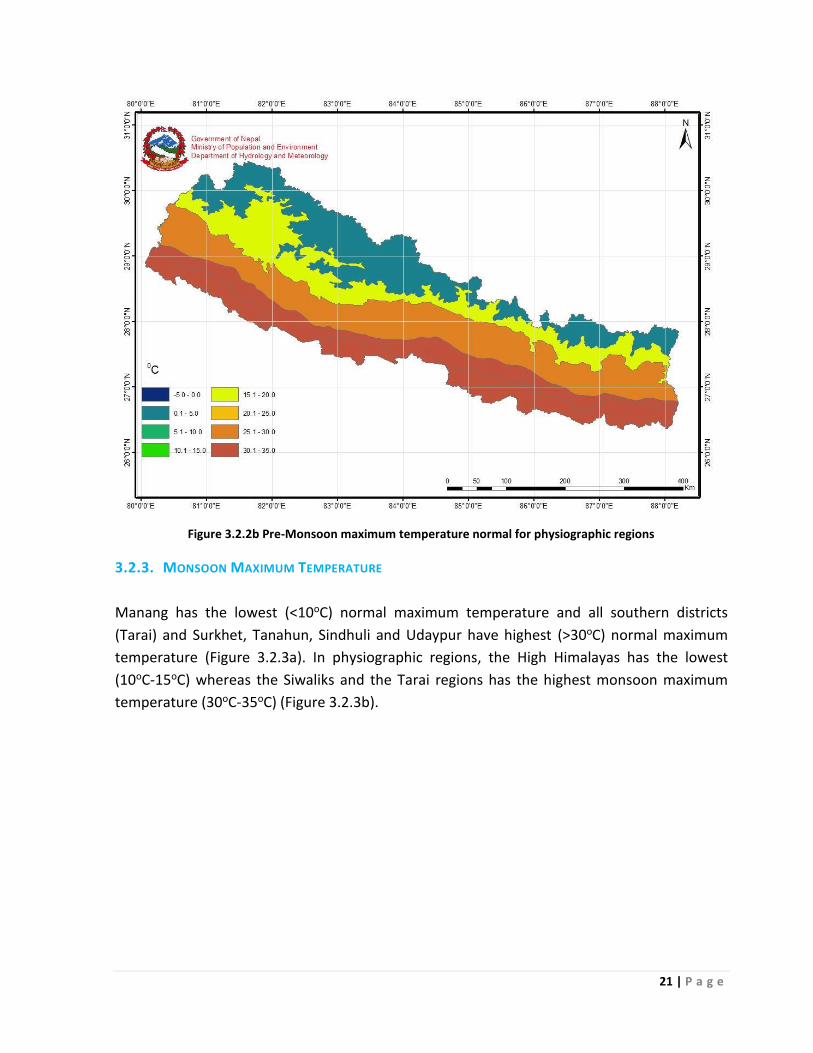
3.2.3. MONSOON MAXIMUM TEMPERATURE
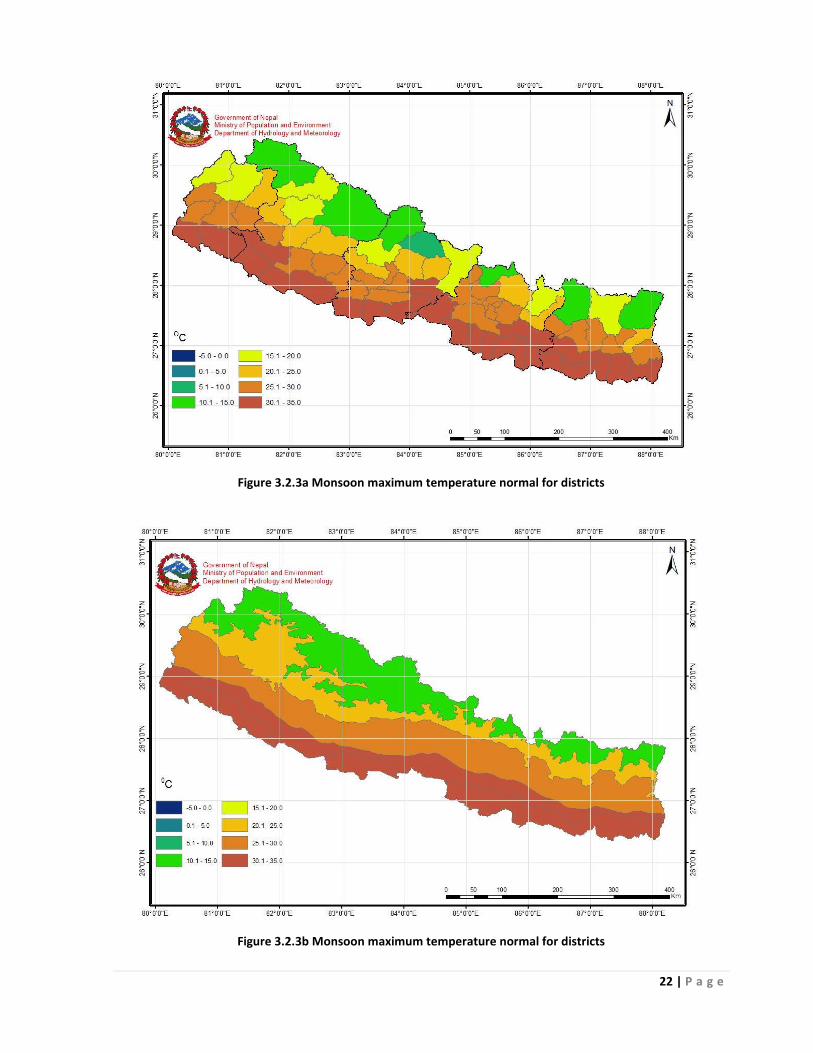
Manang has the lowest (<10oC) normal maximum temperature and all southern districts
(Tarai) and Surkhet, Tanahun, Sindhuli and Udaypur have highest (>30oC) normal maximum
temperature (Figure 3.2.3a). In physiographic regions, the High Himalayas has the lowest
(10oC-15oC) whereas the Siwaliks and the Tarai regions has the highest monsoon maximum
temperature (30oC-35oC) (Figure 3.2.3b).
22 | P a g e
Figure 3.2.3a Monsoon maximum temperature normal for districts
Figure 3.2.3b Monsoon maximum temperature normal for districts
23 | P a g e
3.2.4. POST-MONSOON MAXIMUM TEMPERATURE
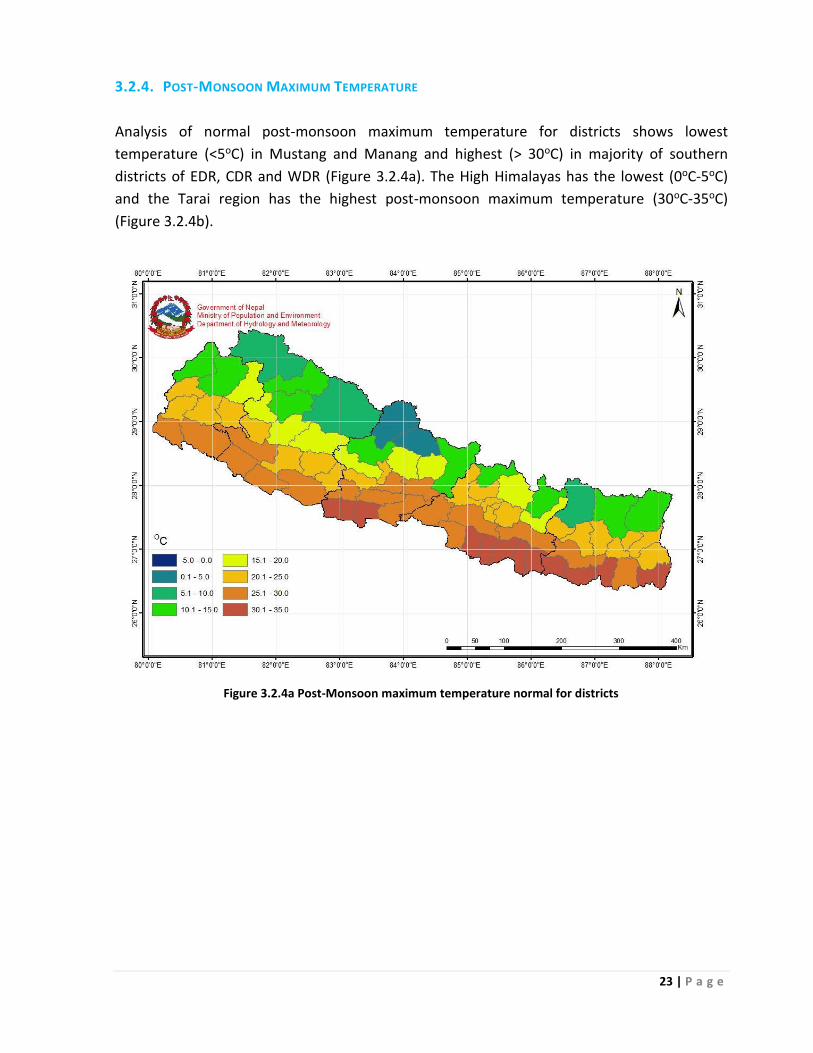
Analysis of normal post-monsoon maximum temperature for districts shows lowest
temperature (<5oC) in Mustang and Manang and highest (> 30oC) in majority of southern
districts of EDR, CDR and WDR (Figure 3.2.4a). The High Himalayas has the lowest (0oC-5oC)
and the Tarai region has the highest post-monsoon maximum temperature (30oC-35oC)
(Figure 3.2.4b).
Figure 3.2.4a Post-Monsoon maximum temperature normal for districts
24 | P a g e
Figure 3.2.4b: Post-Monsoon maximum temperature normal for districts
3.2.5. ANNUAL MAXIMUM TEMPERATURE
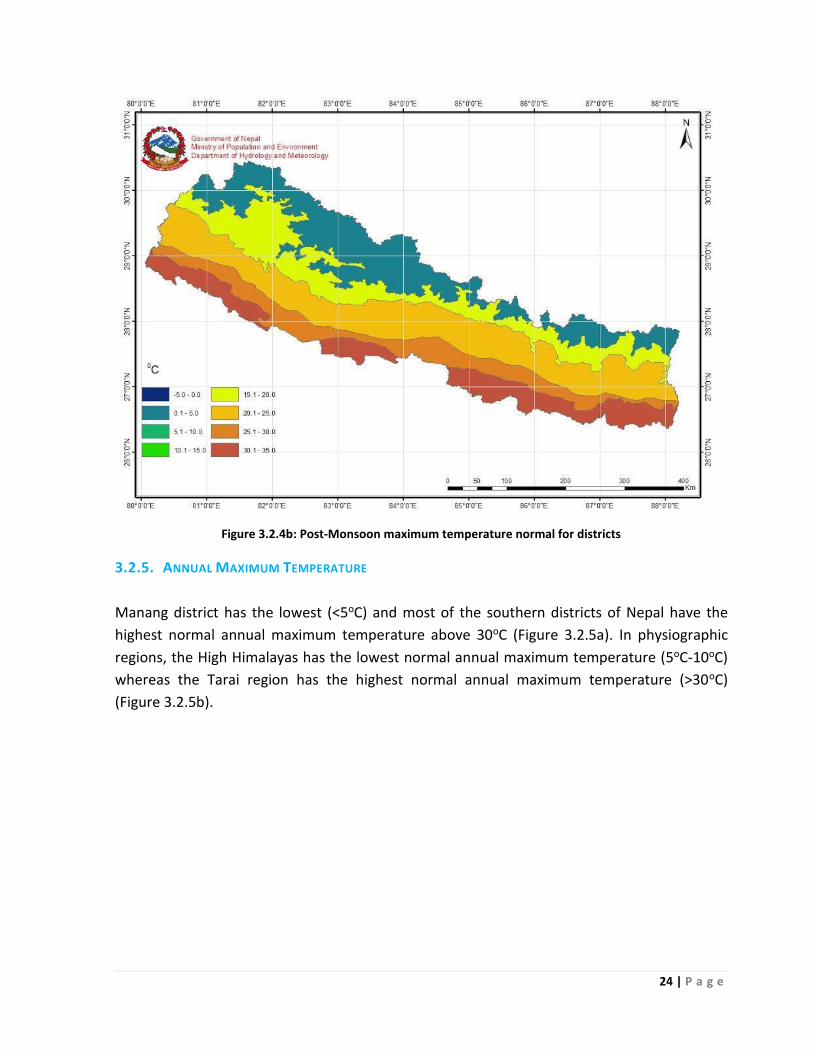
Manang district has the lowest (<5oC) and most of the southern districts of Nepal have the
highest normal annual maximum temperature above 30oC (Figure 3.2.5a). In physiographic
regions, the High Himalayas has the lowest normal annual maximum temperature (5oC-10oC)
whereas the Tarai region has the highest normal annual maximum temperature (>30oC)
(Figure 3.2.5b).
25 | P a g e
Figure 3.2.5a: Annual maximum temperature normal for districts
Figure 3.2.5b: Annual maximum temperature normal for physiographic regions
26 | P a g e
3.3. NORMAL MINIMUM TEMPERATURE
3.3.1 WINTER MINIMUM TEMPERATURE
With regard to normal winter minimum temperature for the districts, northern districts of
MWDR, WDR and Solukhumbu have the lowest (<-5oC) whereas all southern districts of EDR,
CDR and Kapilbastu and Rupandehi districts have the highest normal winter minimum
temperature (10oC-15oC) (Figure 3.3.1a). The High Himalayas has the lowest normal winter
minimum temperature (-10oC to -5oC) and highest normal winter minimum temperature in
the Tarai region ranges from 10oC to 15oC (Figure 3.3.1b).
Figure 3.3.1a: Winter minimum temperature normal for districts
27 | P a g e
Figure 3.3.1b: Winter minimum temperature normal for physiographic regions
3.3.2 PRE–MONSOON MINIMUM TEMPERATURE
Manang district has the lowest (<-5oC) and all southern districts have the highest normal
winter minimum temperature and it ranges between 15oC and 20oC (Figure 3.3.2a). In
physiographic regions, the High Himalayas has the lowest normal pre-monsoon minimum
temperature and it lies in between -5oC and 0oC. As compared to other regions, Siwaliks and
Tarai have the highest normal pre-monsoon minimum temperature (15oC-20oC) (Figure
3.3.2b).
28 | P a g e
Figure 3.3.2a: Pre-Monsoon minimum temperature normal for districts
29 | P a g e
Figure 3.3.2b: Pre-Monsoon minimum temperature normal for physiographic regions
3.3.3 MONSOON MINIMUM TEMPERATURE
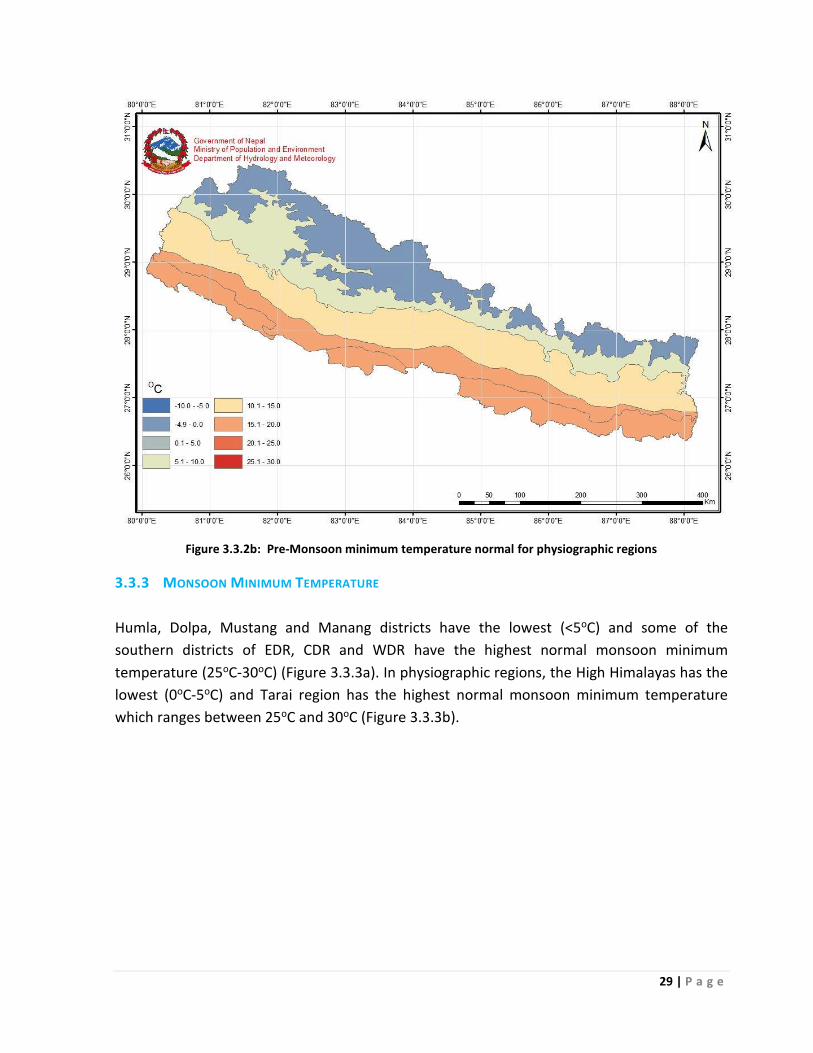
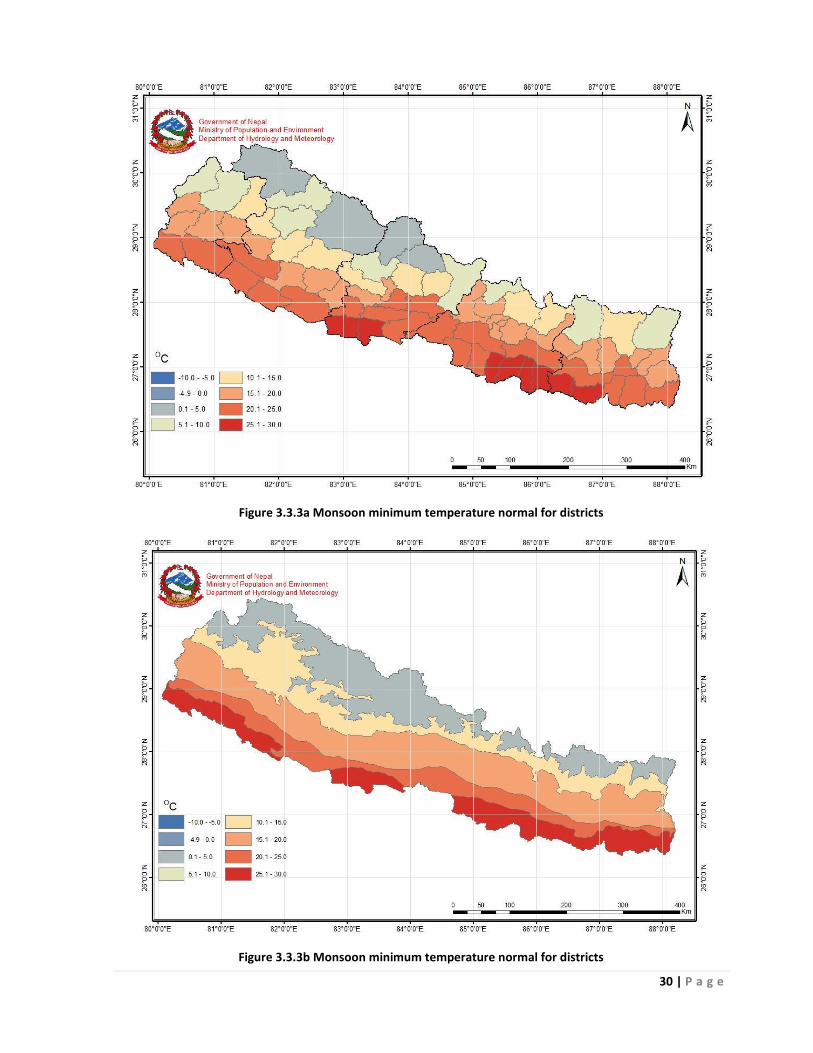
Humla, Dolpa, Mustang and Manang districts have the lowest (<5oC) and some of the
southern districts of EDR, CDR and WDR have the highest normal monsoon minimum
temperature (25oC-30oC) (Figure 3.3.3a). In physiographic regions, the High Himalayas has the
lowest (0oC-5oC) and Tarai region has the highest normal monsoon minimum temperature
which ranges between 25oC and 30oC (Figure 3.3.3b).
30 | P a g e
Figure 3.3.3a Monsoon minimum temperature normal for districts
Figure 3.3.3b Monsoon minimum temperature normal for districts
31 | P a g e
3.3.4 POST-MONSOON MINIMUM TEMPERATURE
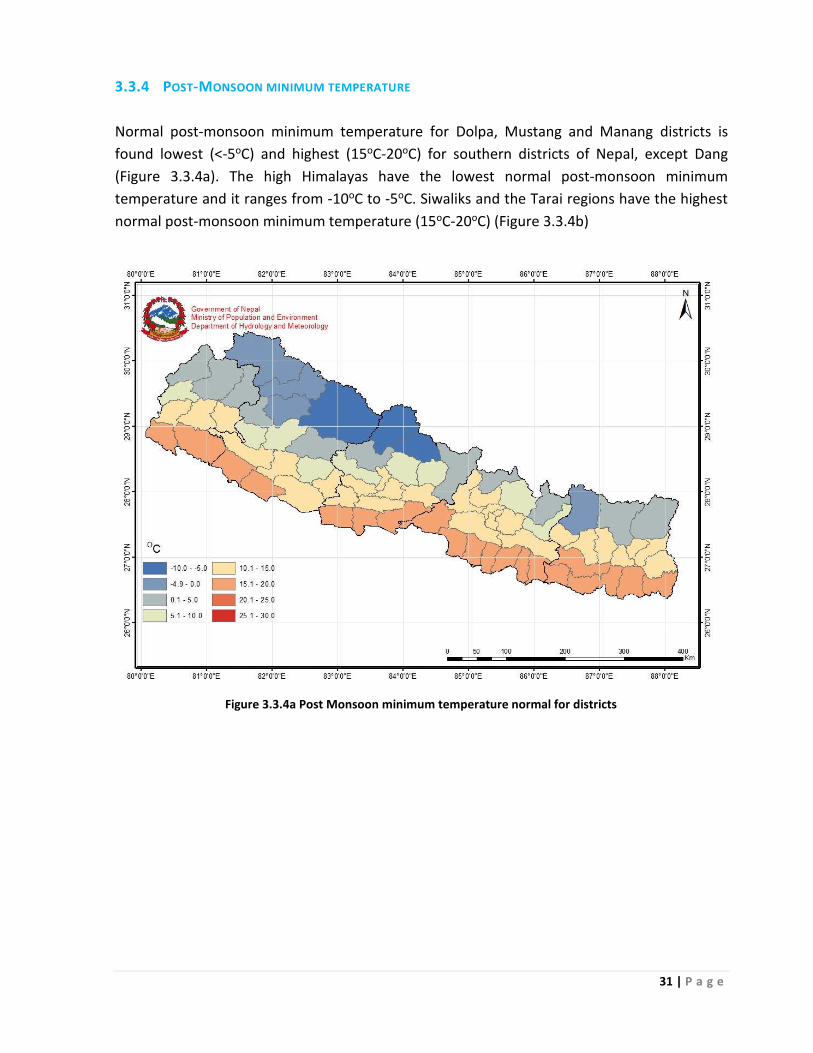
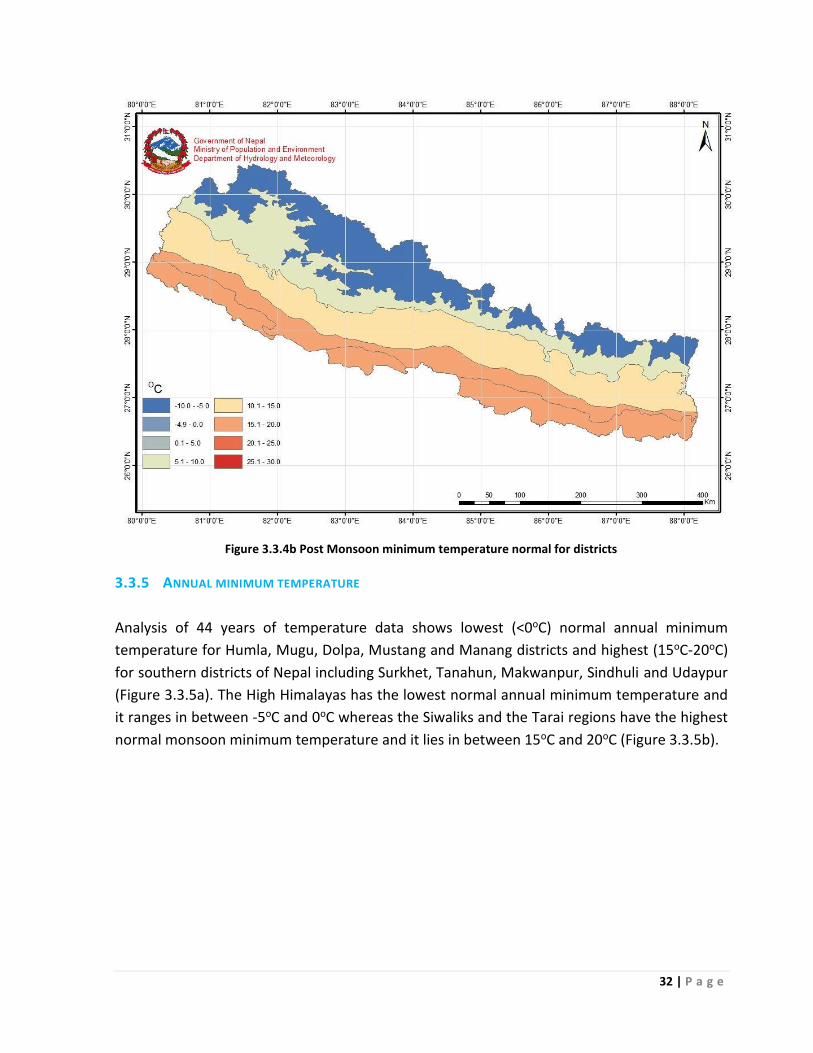
Normal post-monsoon minimum temperature for Dolpa, Mustang and Manang districts is
found lowest (<-5oC) and highest (15oC-20oC) for southern districts of Nepal, except Dang
(Figure 3.3.4a). The high Himalayas have the lowest normal post-monsoon minimum
temperature and it ranges from -10oC to -5oC. Siwaliks and the Tarai regions have the highest
normal post-monsoon minimum temperature (15oC-20oC) (Figure 3.3.4b)
Figure 3.3.4a Post Monsoon minimum temperature normal for districts
32 | P a g e
Figure 3.3.4b Post Monsoon minimum temperature normal for districts
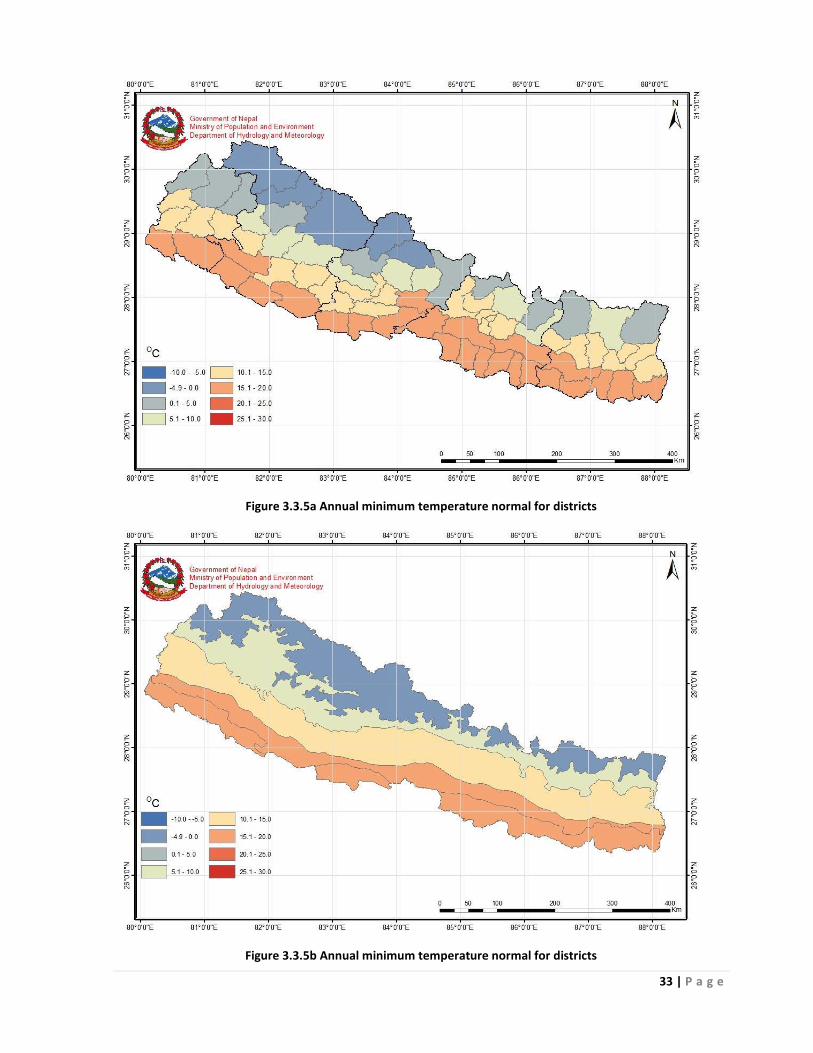
3.3.5 ANNUAL MINIMUM TEMPERATURE
Analysis of 44 years of temperature data shows lowest (<0oC) normal annual minimum
temperature for Humla, Mugu, Dolpa, Mustang and Manang districts and highest (15oC-20oC)
for southern districts of Nepal including Surkhet, Tanahun, Makwanpur, Sindhuli and Udaypur
(Figure 3.3.5a). The High Himalayas has the lowest normal annual minimum temperature and
it ranges in between -5oC and 0oC whereas the Siwaliks and the Tarai regions have the highest
normal monsoon minimum temperature and it lies in between 15oC and 20oC (Figure 3.3.5b).
33 | P a g e
Figure 3.3.5a Annual minimum temperature normal for districts
Figure 3.3.5b Annual minimum temperature normal for districts
34 | P a g e
CHAPTER 4: ALL NEPAL CLIMATIC TRENDS
Seasonal and annual climatic trends averaged for Nepal is discussed in this chapter. Nepal's
average precipitation, maximum temperature and minimum temperature trends for four
seasons and annually is given in Table 4.
Table 4: Climatic Trend of Nepal
Seasons
Precipitation
(mm/yr)
Maximum
Temperature
(oC/yr) Minimum Temperature (oC/yr)
α Q α Q α Q
Winter 0 -0.072 *** 0.054 0 -0.009
Pre-monsoon 0 -0.081 *** 0.051 0 -0.003
Monsoon 0 -0.085 *** 0.058 * 0.014
Post-monsoon 0 -0.324 *** 0.056 0 -0.005
Annual 0 -1.333 *** 0.056 0 0.002
Note: Significant: * 95% CL, ** 99% CL and *** 99.9% CL ; insignificant at 95% CL : + , 0
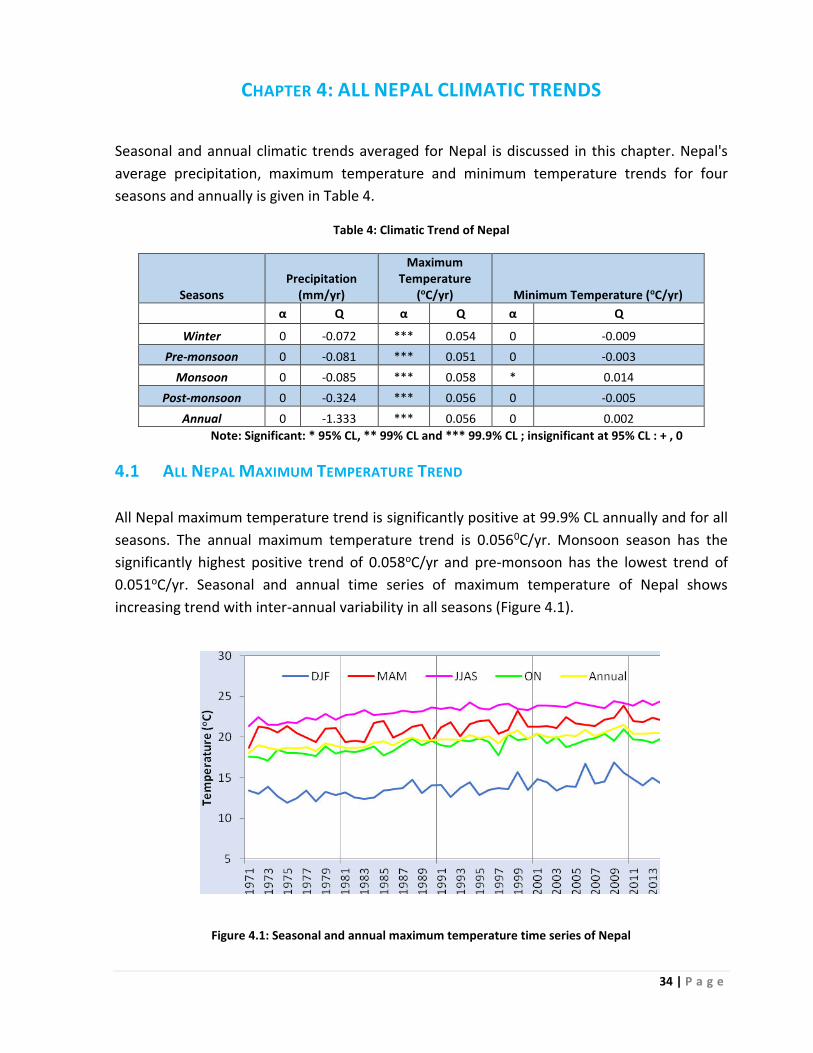
4.1 ALL NEPAL MAXIMUM TEMPERATURE TREND
All Nepal maximum temperature trend is significantly positive at 99.9% CL annually and for all
seasons. The annual maximum temperature trend is 0.0560C/yr. Monsoon season has the
significantly highest positive trend of 0.058oC/yr and pre-monsoon has the lowest trend of
0.051oC/yr. Seasonal and annual time series of maximum temperature of Nepal shows
increasing trend with inter-annual variability in all seasons (Figure 4.1).
Figure 4.1: Seasonal and annual maximum temperature time series of Nepal
35 | P a g e
Note: DJF means months of December, January and February; MAM is for March, April and
May; JJAS is for June, July, August and September; and ON denotes for October and November.
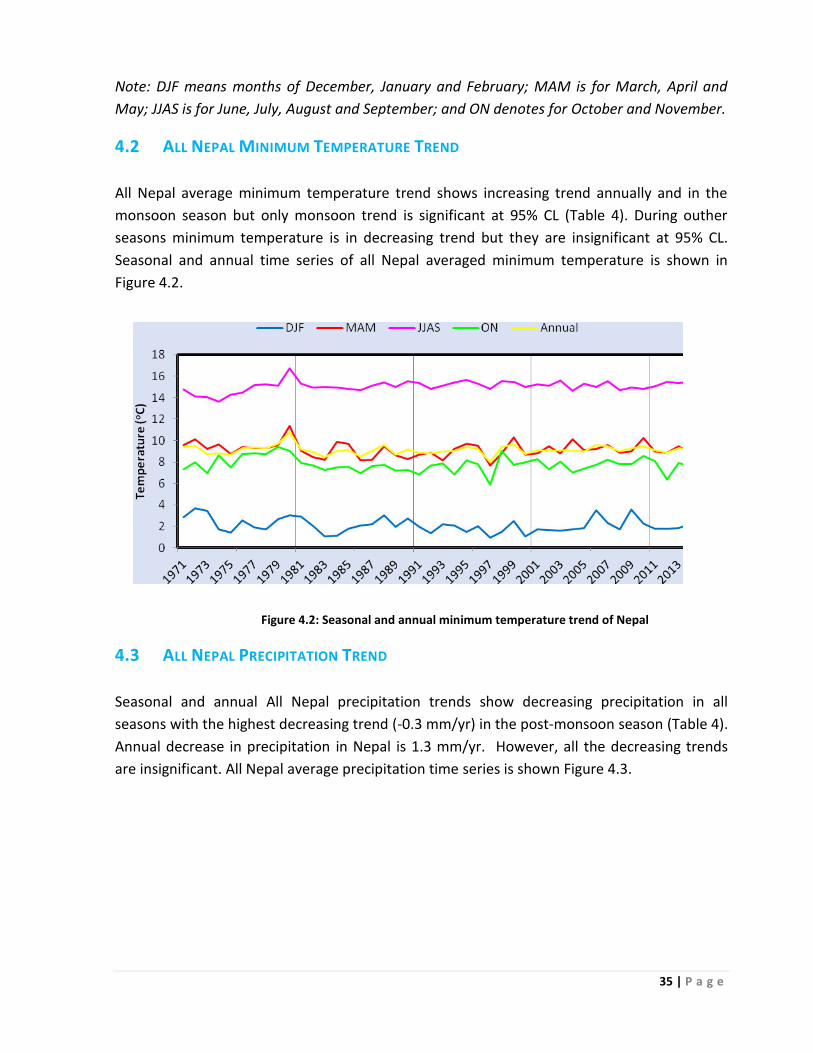
4.2 ALL NEPAL MINIMUM TEMPERATURE TREND
All Nepal average minimum temperature trend shows increasing trend annually and in the
monsoon season but only monsoon trend is significant at 95% CL (Table 4). During outher
seasons minimum temperature is in decreasing trend but they are insignificant at 95% CL.
Seasonal and annual time series of all Nepal averaged minimum temperature is shown in
Figure 4.2.
Figure 4.2: Seasonal and annual minimum temperature trend of Nepal
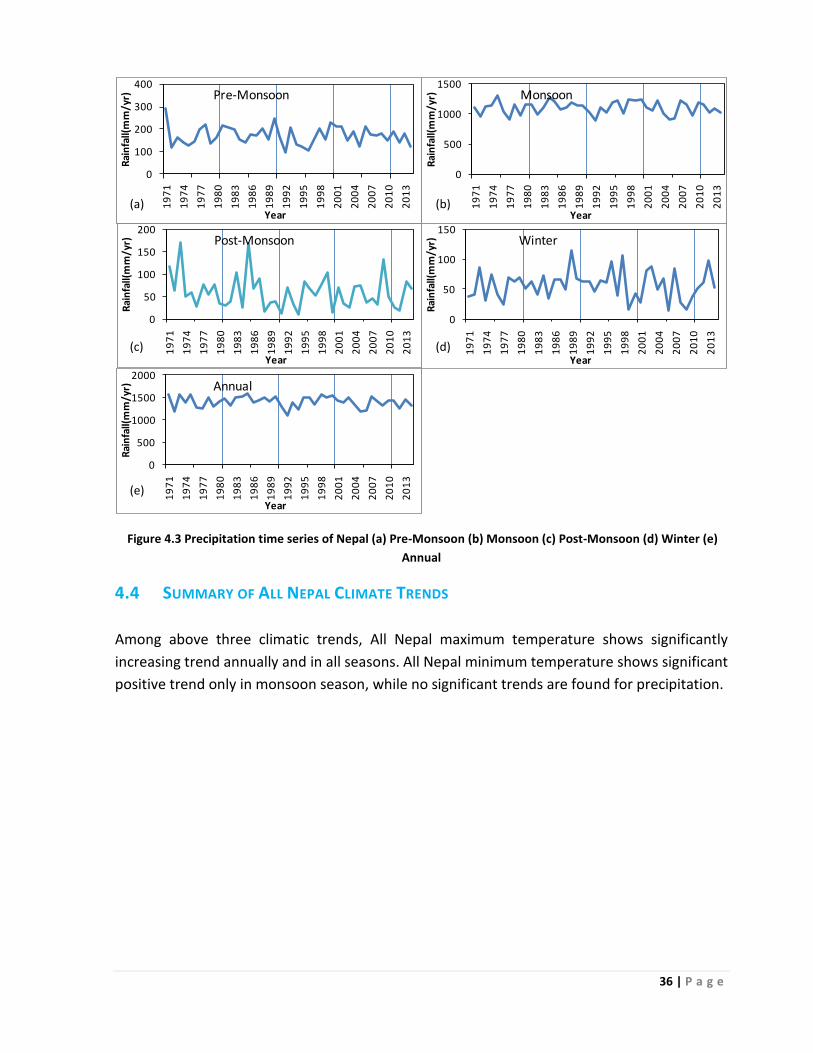
4.3 ALL NEPAL PRECIPITATION TREND
Seasonal and annual All Nepal precipitation trends show decreasing precipitation in all
seasons with the highest decreasing trend (-0.3 mm/yr) in the post-monsoon season (Table 4).
Annual decrease in precipitation in Nepal is 1.3 mm/yr. However, all the decreasing trends
are insignificant. All Nepal average precipitation time series is shown Figure 4.3.
36 | P a g e
0
50
100
150
200
19
71
19
74
19
77
19
80
19
83
19
86
19
89
19
92
19
95
19
98
20
01
20
04
20
07
20
10
20
13
Ra
infa
ll(m
m/
yr)
Year
Post-Monsoon
0
50
100
150
19
71
19
74
19
77
19
80
19
83
19
86
19
89
19
92
19
95
19
98
20
01
20
04
20
07
20
10
20
13
Ra
infa
ll(m
m/
yr)
Year
Winter
0
100
200
300
400
19
71
19
74
19
77
19
80
19
83
19
86
19
89
19
92
19
95
19
98
20
01
20
04
20
07
20
10
20
13
Ra
infa
ll(m
m/
yr)
Year
Pre-Monsoon
0
500
1000
1500
19
71
19
74
19
77
19
80
19
83
19
86
19
89
19
92
19
95
19
98
20
01
20
04
20
07
20
10
20
13
Ra
infa
ll(m
m/
yr)
Year
Monsoon
0
500
1000
1500
2000
19
71
19
74
19
77
19
80
19
83
19
86
19
89
19
92
19
95
19
98
20
01
20
04
20
07
20
10
20
13
Ra
infa
ll(m
m/
yr)
Year
Annual
Figure 4.3 Precipitation time series of Nepal (a) Pre-Monsoon (b) Monsoon (c) Post-Monsoon (d) Winter (e)
Annual
4.4 SUMMARY OF ALL NEPAL CLIMATE TRENDS
Among above three climatic trends, All Nepal maximum temperature shows significantly
increasing trend annually and in all seasons. All Nepal minimum temperature shows significant
positive trend only in monsoon season, while no significant trends are found for precipitation.
(a) (b)
(c) (d)
(e)
37 | P a g e
CHAPTER 5: PRECIPITATION TRENDS FOR DISTRICTS AND
PHYSIOGRAPHIC REGIONS
The distribution of districts with positive and negative seasonal and annual precipitation
trends is given in Table 5.1 and annual and seasonal precipitation trends for districts is given in
Table A5 in the Appendix. Seasonal and annual precipitation trends in 5 physiographic regions
are shown in Table 5.2.
Table 5.1: Distribution of districts with positive and negative seasonal and annual precipitation
trends
Winter Pre-
monsoon
Monsoon Post-
monsoon
Annual
Number of districts with
negative trend 42 (0) 35 (3) 47 (5) 73 (2) 47 (8)
Number of districts with
positive trend 33 (0) 40 (4) 28 (2) 2(0) 28(3)
Note: Number in parenthesis indicates number of districts with significant trend at 95%
or higher confidence level (Table A5 in Appendix)
Table 5.2: Seasonal and annual precipitation trends in physiographic regions of Nepal
Physiographic
Regions
Winter Pre-monsoon Monsoon Post-monsoon Annual
α
Trend
(mm/yr) α
Trend
(mm/yr) α
Trend
(mm/yr) α
Trend
(mm/yr) α
Trend
(mm/yr)
Tarai 0 0.09 + 1.24 0 0.51 0 -0.26 0 0.49
Siwaliks 0 0.08 0 0.75 0 -0.60 0 -0.38 0 -1.48
Mid Mountain 0 0.03 0 0.03 0 -0.45 0 -0.43 0 -1.58
High Mountains 0 -0.06 0 -0.82 0 -1.19 0 -0.50 + -3.17
High Himalayas 0 -0.03 * -0.74 0 -0.21 0 -0.32 + -1.46
Note: Significance (α): * 95% CL, ** 99% CL and *** 99.9% CL ; insignificant at 95% CL : + , 0
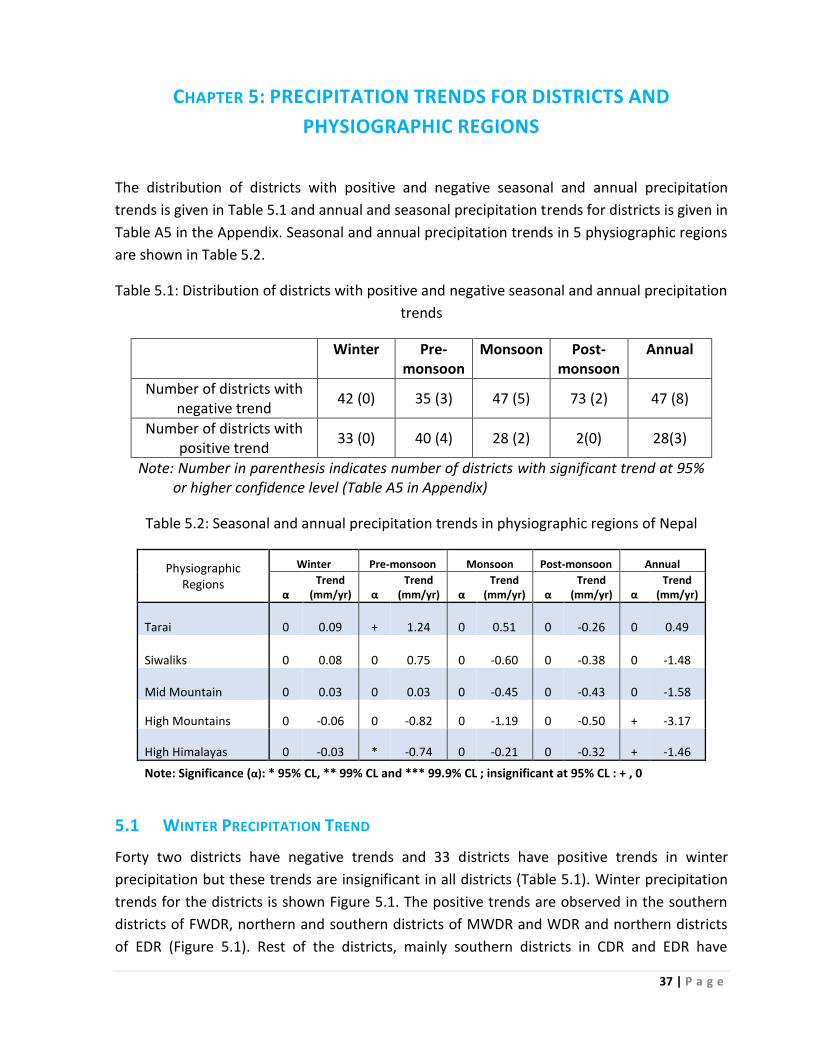
5.1 WINTER PRECIPITATION TREND
Forty two districts have negative trends and 33 districts have positive trends in winter
precipitation but these trends are insignificant in all districts (Table 5.1). Winter precipitation
trends for the districts is shown Figure 5.1. The positive trends are observed in the southern
districts of FWDR, northern and southern districts of MWDR and WDR and northern districts
of EDR (Figure 5.1). Rest of the districts, mainly southern districts in CDR and EDR have
38 | P a g e
negative trends in winter precipitation. The trend values of each district along with
significance level are given in Table A5 in the Appendix. Though insignificant, the highest
increasing trend (0.51mm/yr) is observed in Humla and highest decreasing trend (-0.60mm/yr)
is detected in Rasuwa (Table A5 in Appendix).
Winter precipitation trends in 5 physiographic regions (Table 5.2) show insignificant trends (at
95% CL). Tarai, Siwaliks and Middle Mountains show slightly increasing winter precipitation
trend. The High Mountains and High Himalayas show slightly decreasing winter precipitation.
It is noteworthy that both negative and positive trend values are less than 0.1mm/yr. Though
insignificant, the highest positive trend is observed in Tarai and the highest negative trend in
High Mountains (Table 5.2).
Figure 5.1a: Winter precipitation trend for districts.
(Significance: * 95% cl, ** 99% cl, *** is 99.9% cl; blank means insignificant at 95% cl)
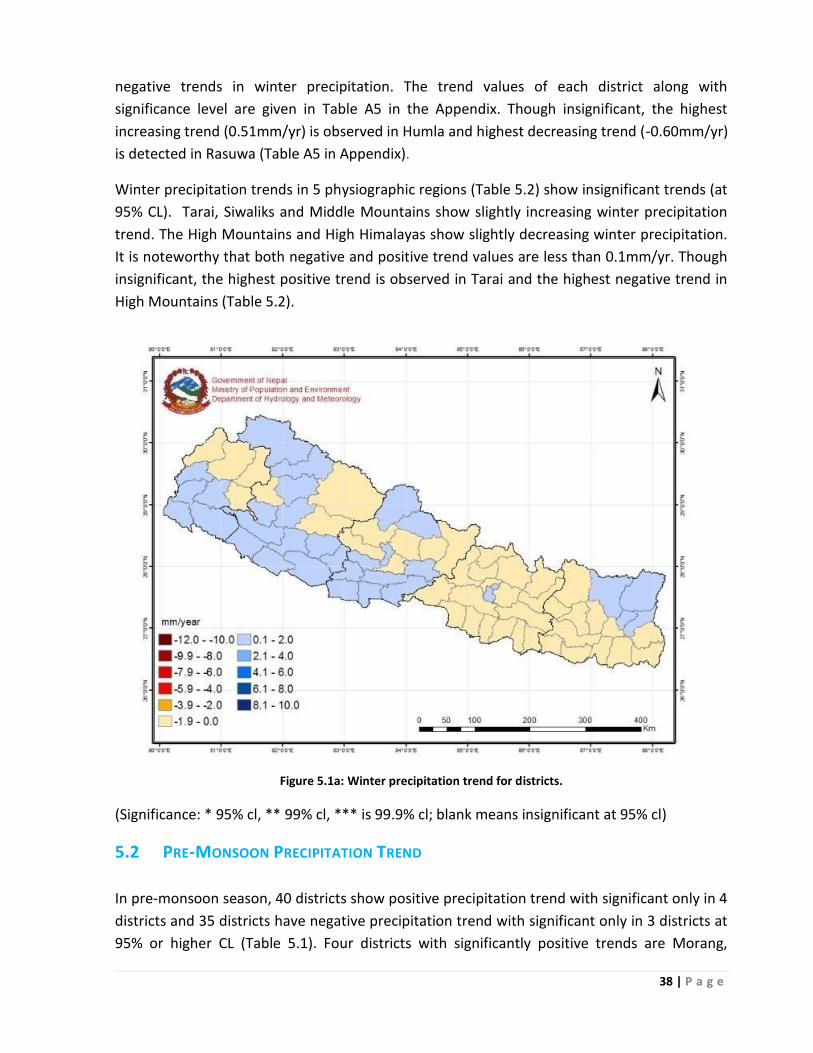
5.2 PRE-MONSOON PRECIPITATION TREND
In pre-monsoon season, 40 districts show positive precipitation trend with significant only in 4
districts and 35 districts have negative precipitation trend with significant only in 3 districts at
95% or higher CL (Table 5.1). Four districts with significantly positive trends are Morang,
39 | P a g e
Sunsari, Saptari and Mahottari in the Tarai region of EDR and CDR (Figure 5.2). The significant
negative districts are Humla, Rasuwa and Ramechhap (Figure 5.2). The significantly highest
increasing trend (2.2mm/yr) is observed in Sunsari and the significantly highest negative trend
(-1.3mm/yr) is observed in Rasuwa (Table A5 in Appendix)
Increasing trend of pre-monsoon precipitation is observed in Tarai, Siwaliks and Middle
Mountains, while decreasing trend is observed in High Mountains and High Himalayas
physiographic regions (Table 5.2). These trends are insignificant, except in the High Himalayan
region (significant negative trend at 95% CL). Though insignificant, the highest positive trend
value (1.24mm/yr) is found in Tarai and it is noteworthy to mention that pre-monsoon
precipitation is increasing in lower elevation and decreasing at higher elevation, with highest
decrease in High Mountains (Table 5.2).
Figure 5.2a: Pre-Monsoon precipitation trend for districts.
(Significance: * 95% CL, ** 99% CL, *** is 99.9% CL; blank means insignificant at 95% CL)
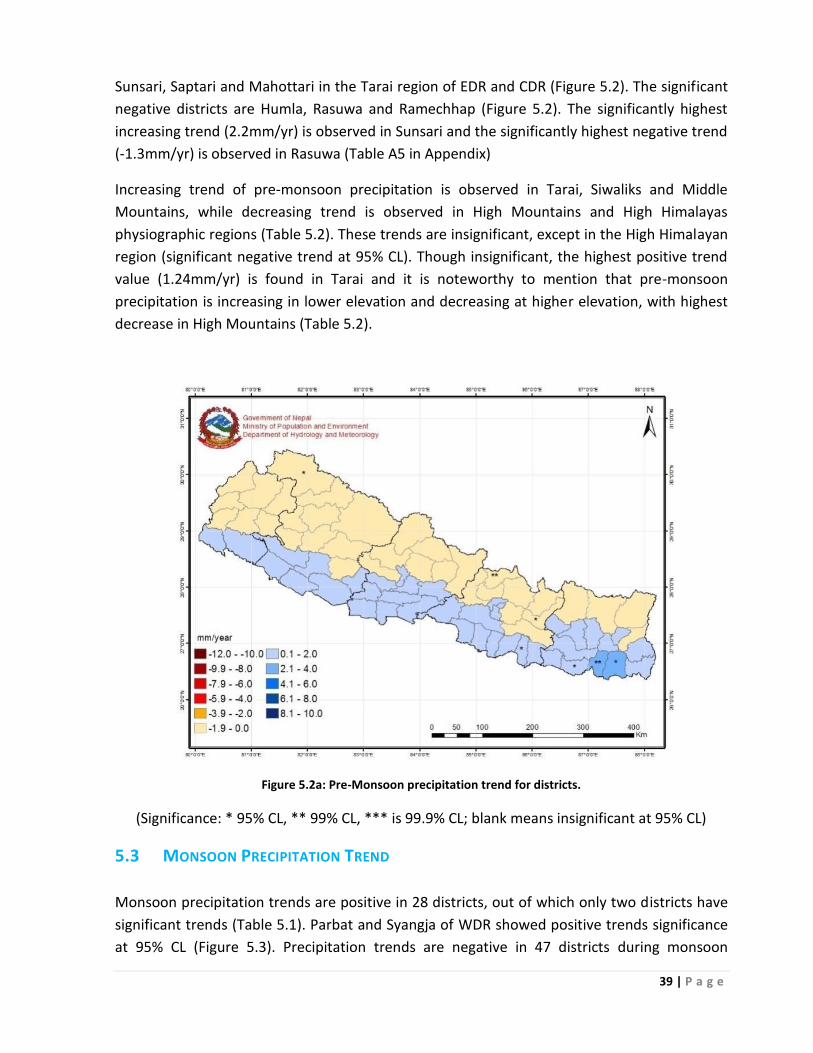
5.3 MONSOON PRECIPITATION TREND
Monsoon precipitation trends are positive in 28 districts, out of which only two districts have
significant trends (Table 5.1). Parbat and Syangja of WDR showed positive trends significance
at 95% CL (Figure 5.3). Precipitation trends are negative in 47 districts during monsoon
40 | P a g e
season, and of them, 5 districts have significant trend (Table 5.1). Manang, Dolakha,
Ramechhap, Sindhuli and Ilam are 5 districts that show significance at 95% or higher CL.
Monsoon precipitation trend is in increasing order in all districts of FWDR and southwestern
and northeastern districts in MWDR and central districts in WDR (Figure 5.3). Decreasing
monsoon precipitation is observed in large parts of EDR, CDR and northern part of WDR. The
southern districts of FWDR have insignificant positive precipitation trend, which is also
observed in winter (Figure 5.1) and pre-monsoon (Figure 5.2) seasons.
The highest significant increasing trend (9.04 mm/yr) and decreasing trend value (-7.5 mm/yr)
are observed in Syangja and Ilam districts respectively (Table A5 in the appendix).
Figure 5.3a Monsoon Precipitation trend for districts.
(Significance: * 95% CL, ** 99% CL, *** is 99.9% CL; blank means insignificant at 95% CL)
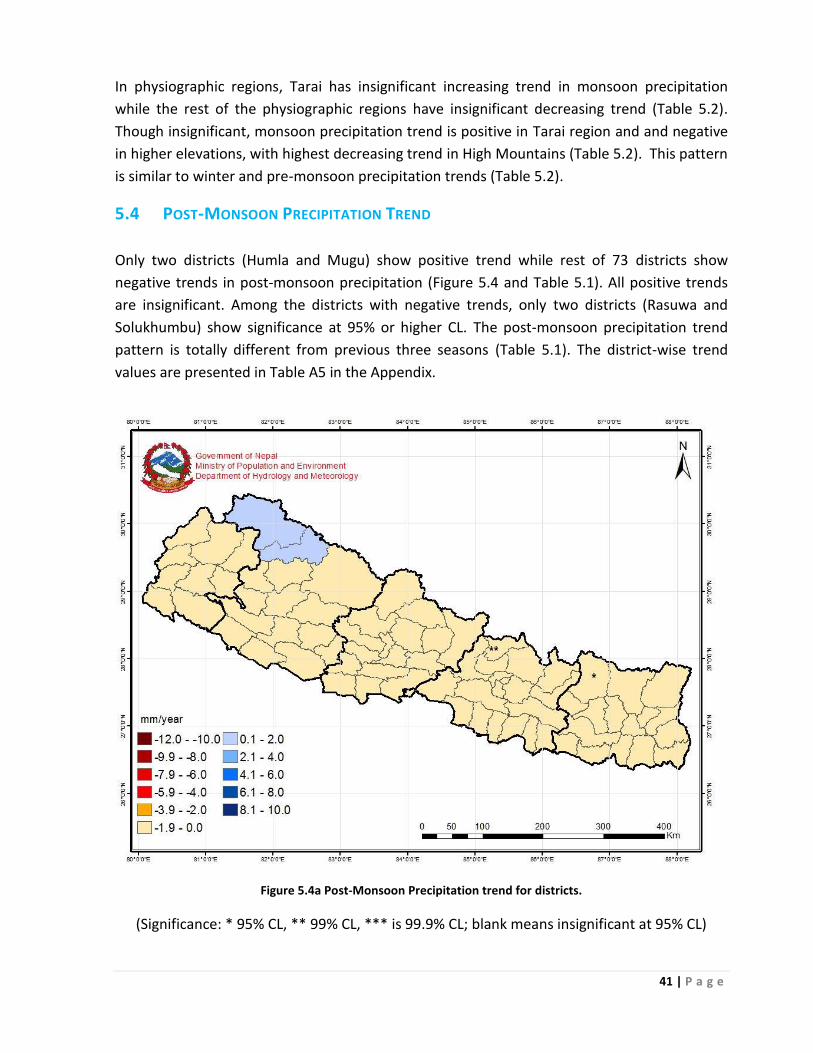
41 | P a g e
In physiographic regions, Tarai has insignificant increasing trend in monsoon precipitation
while the rest of the physiographic regions have insignificant decreasing trend (Table 5.2).
Though insignificant, monsoon precipitation trend is positive in Tarai region and and negative
in higher elevations, with highest decreasing trend in High Mountains (Table 5.2). This pattern
is similar to winter and pre-monsoon precipitation trends (Table 5.2).
5.4 POST-MONSOON PRECIPITATION TREND
Only two districts (Humla and Mugu) show positive trend while rest of 73 districts show
negative trends in post-monsoon precipitation (Figure 5.4 and Table 5.1). All positive trends
are insignificant. Among the districts with negative trends, only two districts (Rasuwa and
Solukhumbu) show significance at 95% or higher CL. The post-monsoon precipitation trend
pattern is totally different from previous three seasons (Table 5.1). The district-wise trend
values are presented in Table A5 in the Appendix.
Figure 5.4a Post-Monsoon Precipitation trend for districts.
(Significance: * 95% CL, ** 99% CL, *** is 99.9% CL; blank means insignificant at 95% CL)
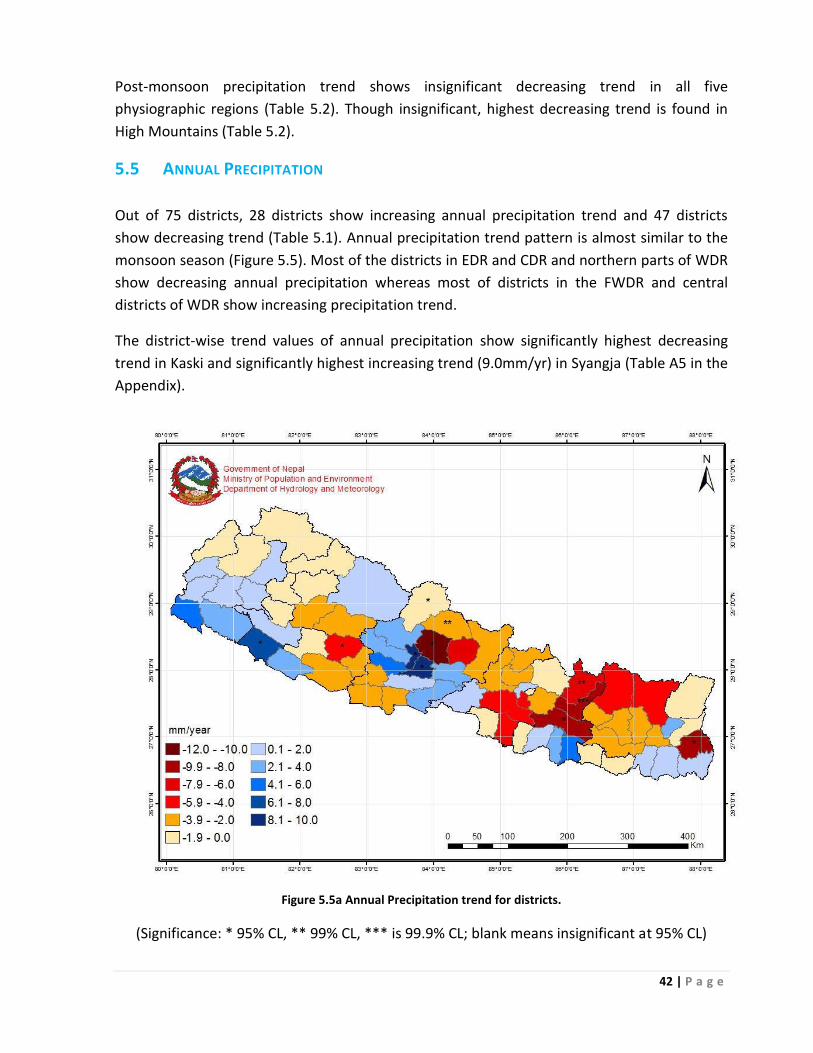
42 | P a g e
Post-monsoon precipitation trend shows insignificant decreasing trend in all five
physiographic regions (Table 5.2). Though insignificant, highest decreasing trend is found in
High Mountains (Table 5.2).
5.5 ANNUAL PRECIPITATION
Out of 75 districts, 28 districts show increasing annual precipitation trend and 47 districts
show decreasing trend (Table 5.1). Annual precipitation trend pattern is almost similar to the
monsoon season (Figure 5.5). Most of the districts in EDR and CDR and northern parts of WDR
show decreasing annual precipitation whereas most of districts in the FWDR and central
districts of WDR show increasing precipitation trend.
The district-wise trend values of annual precipitation show significantly highest decreasing
trend in Kaski and significantly highest increasing trend (9.0mm/yr) in Syangja (Table A5 in the
Appendix).
Figure 5.5a Annual Precipitation trend for districts.
(Significance: * 95% CL, ** 99% CL, *** is 99.9% CL; blank means insignificant at 95% CL)
43 | P a g e
In case of annual precipitation trend, all physiographic regions, except Tarai, show decreasing
trend (Figure 5.2). As in seasonal precipitation trends, highest negative trend (-3.17 mm/yr) is
observed in High Mountain region. The pattern of decreasing rainfall trend with elevation is
also found in annual precipitation.
5.6 SUMMARY OF PRECIPITATION TREND
Significant precipitation trends are observed only in few districts in pre-monsoon (Humla,
Rasuwa, Ramechhap, Mahottari, Saptari, Sunsari and Morang in Figure 5.2) and in monsoon
(Syangja, Parbat, Manang in Figure 5.3). Winter and post-monsoon precipitation trends are
insignificant in majority of the districts (Figure 5.1 and Figure 5.4). The highest significant
positive rainfall trend is observed in Syangja and Parbat districts in monsoon season.
In physiographic regions, only pre-monsoon precipitation shows significant positive trend in
the High-Himalayan region. In other seasons precipitation trends are insignificant in all
physiographic regions.
Both at district and physiographic level, three coherent but insignificant patterns are
noteworthy. For example, the southern districts of FWDR shows positive but insignificant
precipitation trend persistent in three seasons: winter, pre-monsoon and monsoon. Similarly,
it is noteworthy that monsoon precipitation is increasing in all districts in FWDR and central
part of WDR and is decreasing in majority of districts east of 84E longitude. The High
Mountain region shows insignificant highest decreasing rainfall trend among all seasons and
Tarai region shows insignificant positive trend in all seasons, except in post-monsoon.
These coherent but insignificant patterns might be associated with short term variability in
atmospheric phenomena. Further analysis is necessary to understand these patterns. Since
these patterns are not significant, these results should be used very cautiously.
44 | P a g e
CHAPTER 6: MAXIMUM TEMPERATURE TREND FOR DISTRICTS AND
PHYSIOGRAPHIC REGIONS
Summary of district distribution with positive and negative trends annually and seasonally is
given in Table 6.1. Annual and seasonal maximum temperature trends for districts along with
significance levels are annexed (Table A6 in the Appendix). Seasonal and annual maximum
temperature trends in physiographic regions are given Tables 6.2
Table 6.1: Distribution of districts with positive and negative seasonal and annual maximum
temperature trends
Winter Pre-
monsoon
Monsoon Post-
monsoon
Annual
Number of districts with
negative trend
11(0) (0) 0 (0) 0 (0) 0 (0)
Number of districts with
positive trend
64(59) 75(62) 75 (75) 75 (71) 75 (72)
Note: Number in parenthesis indicates number of districts with significant trend at
95% or higher confidence level (Table A6 in Appendix)
Table 6.2: Seasonal and annual maximum temperature trends in the Physiographic Regions
Physiographic
Regions
Winter Pre-
monsoon
Monsoon Post-
monsoon
Annual
α Trend
(oC/yr)
α Trend
(oC/yr)
α Trend
(oC/yr)
α Trend
(oC/yr)
α Trend
(oC/yr)
Tarai 0 -0.004 0 0.018 *** 0.036 ** 0.028 *** 0.021
Siwaliks 0 0.010 * 0.031 *** 0.040 *** 0.033 *** 0.030
Mid Mountain *** 0.046 *** 0.049 *** 0.055 *** 0.052 *** 0.052
High Mountains *** 0.070 *** 0.062 *** 0.064 *** 0.064 *** 0.068
High Himalayas *** 0.101 *** 0.076 *** 0.072 *** 0.085 *** 0.086
Note: Significant: * 95% CL, ** 99% CL and *** 99.9% CL ; insignificant at 95% CL : + , 0
6.1 WINTER MAXIMUM TEMPERATURE TREND
Winter maximum temperature is increasing significantly at 99% or higher CL in majority of the
districts, except in the Tarai districts (Figure 6.1). The Tarai districts, west of Mahottari show
slightly decreasing trend, but they are insignificant. Eastern districts including Mohottari show
increasing winter maximum temperature trend, among which only three districts (Jhapa,
Morang and Sunsari) have significant positive trend at 95% or higher CL. The negative trends
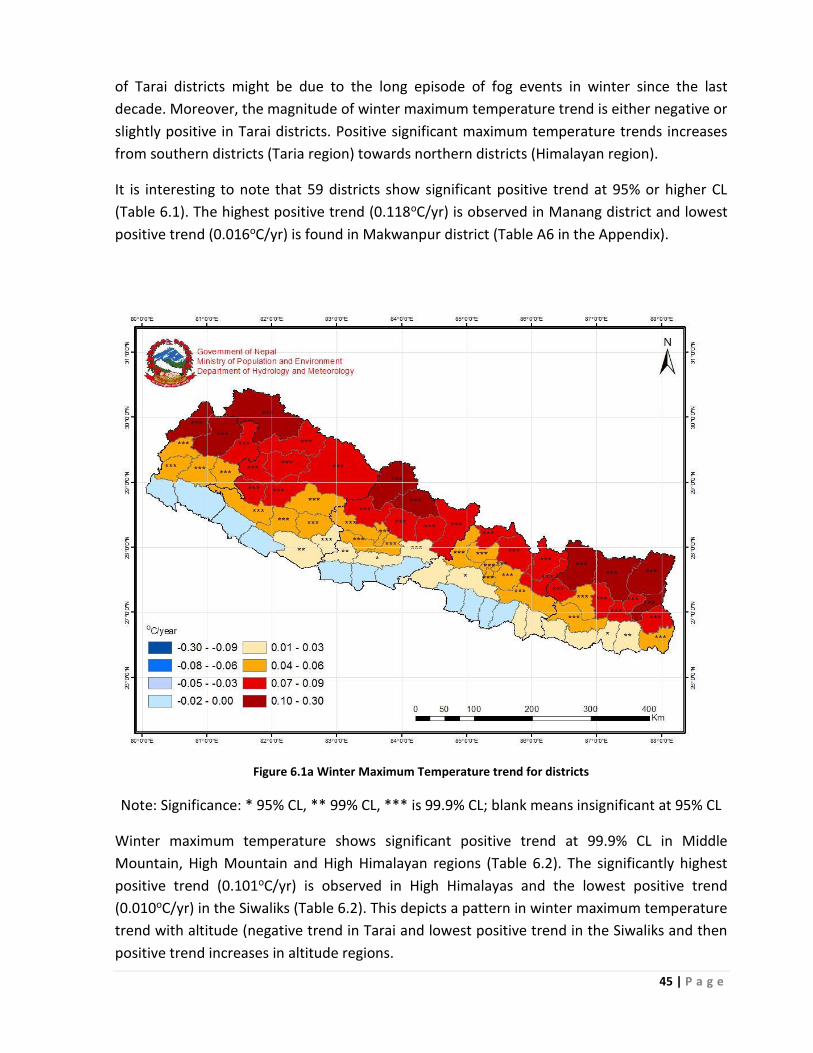
45 | P a g e
of Tarai districts might be due to the long episode of fog events in winter since the last
decade. Moreover, the magnitude of winter maximum temperature trend is either negative or
slightly positive in Tarai districts. Positive significant maximum temperature trends increases
from southern districts (Taria region) towards northern districts (Himalayan region).
It is interesting to note that 59 districts show significant positive trend at 95% or higher CL
(Table 6.1). The highest positive trend (0.118oC/yr) is observed in Manang district and lowest
positive trend (0.016oC/yr) is found in Makwanpur district (Table A6 in the Appendix).
Figure 6.1a Winter Maximum Temperature trend for districts
Note: Significance: * 95% CL, ** 99% CL, *** is 99.9% CL; blank means insignificant at 95% CL
Winter maximum temperature shows significant positive trend at 99.9% CL in Middle
Mountain, High Mountain and High Himalayan regions (Table 6.2). The significantly highest
positive trend (0.101oC/yr) is observed in High Himalayas and the lowest positive trend
(0.010oC/yr) in the Siwaliks (Table 6.2). This depicts a pattern in winter maximum temperature
trend with altitude (negative trend in Tarai and lowest positive trend in the Siwaliks and then
positive trend increases in altitude regions.
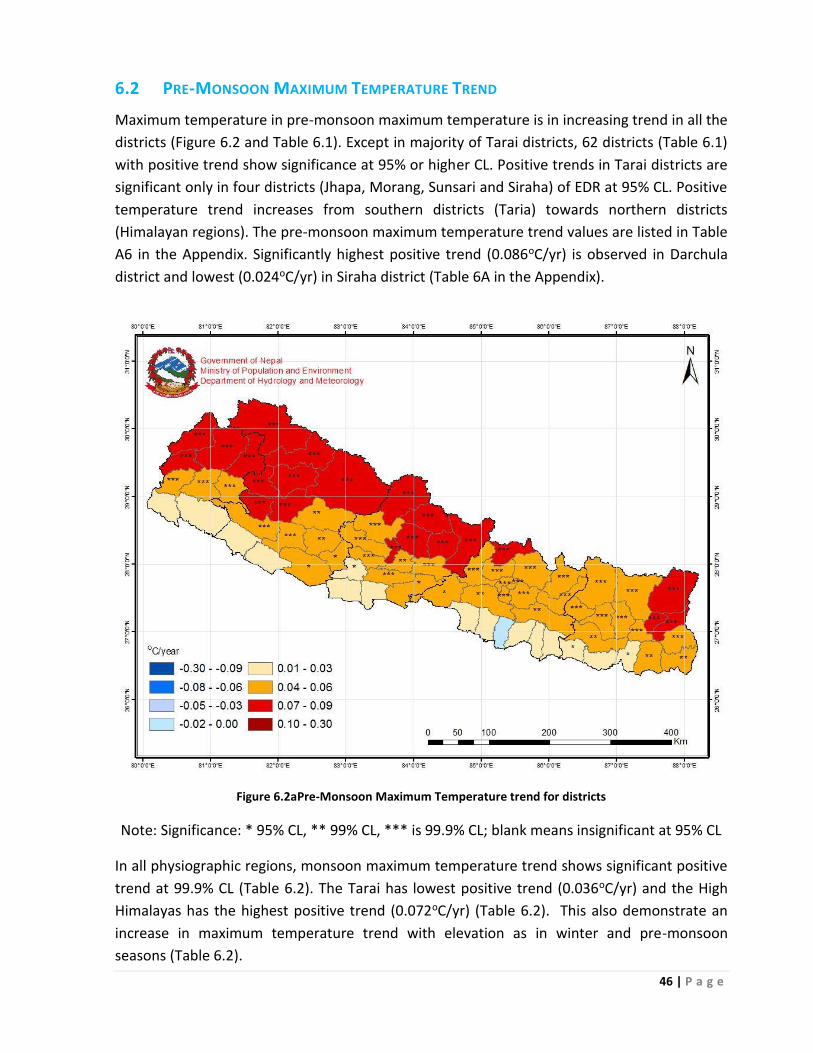
46 | P a g e
6.2 PRE-MONSOON MAXIMUM TEMPERATURE TREND
Maximum temperature in pre-monsoon maximum temperature is in increasing trend in all the
districts (Figure 6.2 and Table 6.1). Except in majority of Tarai districts, 62 districts (Table 6.1)
with positive trend show significance at 95% or higher CL. Positive trends in Tarai districts are
significant only in four districts (Jhapa, Morang, Sunsari and Siraha) of EDR at 95% CL. Positive
temperature trend increases from southern districts (Taria) towards northern districts
(Himalayan regions). The pre-monsoon maximum temperature trend values are listed in Table
A6 in the Appendix. Significantly highest positive trend (0.086oC/yr) is observed in Darchula
district and lowest (0.024oC/yr) in Siraha district (Table 6A in the Appendix).
Figure 6.2aPre-Monsoon Maximum Temperature trend for districts
Note: Significance: * 95% CL, ** 99% CL, *** is 99.9% CL; blank means insignificant at 95% CL
In all physiographic regions, monsoon maximum temperature trend shows significant positive
trend at 99.9% CL (Table 6.2). The Tarai has lowest positive trend (0.036oC/yr) and the High
Himalayas has the highest positive trend (0.072oC/yr) (Table 6.2). This also demonstrate an
increase in maximum temperature trend with elevation as in winter and pre-monsoon
seasons (Table 6.2).
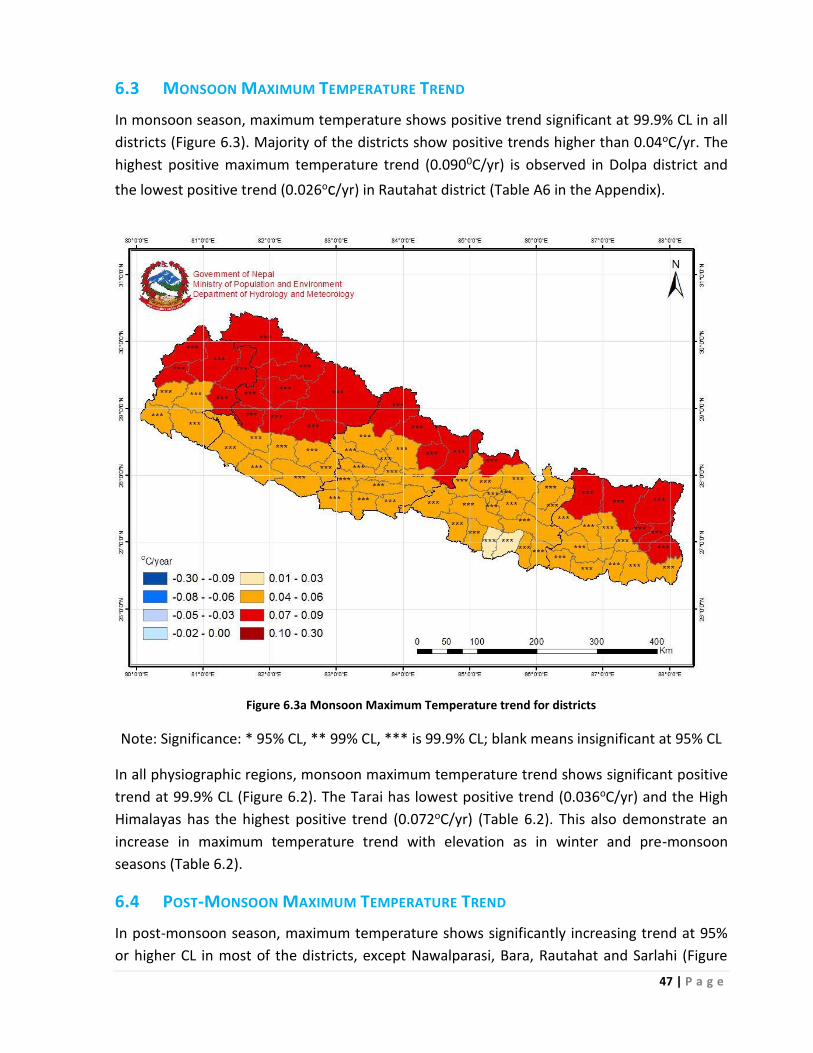
47 | P a g e
6.3 MONSOON MAXIMUM TEMPERATURE TREND
In monsoon season, maximum temperature shows positive trend significant at 99.9% CL in all
districts (Figure 6.3). Majority of the districts show positive trends higher than 0.04oC/yr. The
highest positive maximum temperature trend (0.0900C/yr) is observed in Dolpa district and
the lowest positive trend (0.026oc/yr) in Rautahat district (Table A6 in the Appendix).
Figure 6.3a Monsoon Maximum Temperature trend for districts
Note: Significance: * 95% CL, ** 99% CL, *** is 99.9% CL; blank means insignificant at 95% CL
In all physiographic regions, monsoon maximum temperature trend shows significant positive
trend at 99.9% CL (Figure 6.2). The Tarai has lowest positive trend (0.036oC/yr) and the High
Himalayas has the highest positive trend (0.072oC/yr) (Table 6.2). This also demonstrate an
increase in maximum temperature trend with elevation as in winter and pre-monsoon
seasons (Table 6.2).
6.4 POST-MONSOON MAXIMUM TEMPERATURE TREND
In post-monsoon season, maximum temperature shows significantly increasing trend at 95%
or higher CL in most of the districts, except Nawalparasi, Bara, Rautahat and Sarlahi (Figure
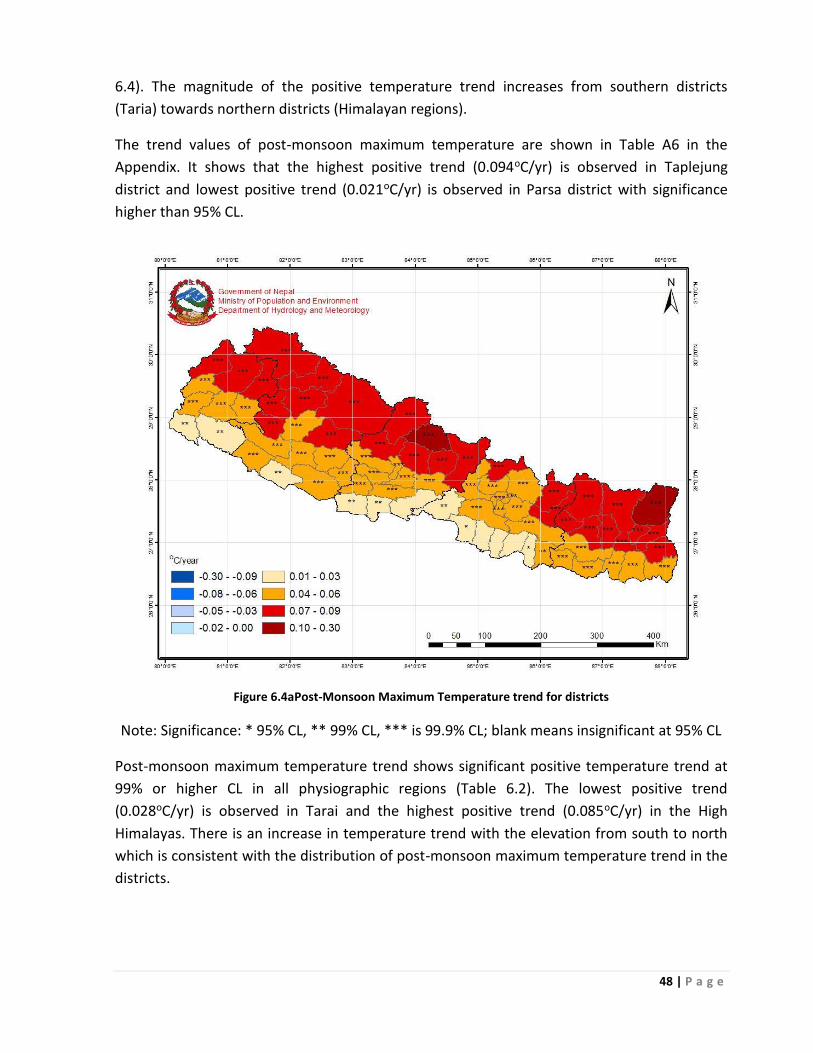
48 | P a g e
6.4). The magnitude of the positive temperature trend increases from southern districts
(Taria) towards northern districts (Himalayan regions).
The trend values of post-monsoon maximum temperature are shown in Table A6 in the
Appendix. It shows that the highest positive trend (0.094oC/yr) is observed in Taplejung
district and lowest positive trend (0.021oC/yr) is observed in Parsa district with significance
higher than 95% CL.
Figure 6.4aPost-Monsoon Maximum Temperature trend for districts
Note: Significance: * 95% CL, ** 99% CL, *** is 99.9% CL; blank means insignificant at 95% CL
Post-monsoon maximum temperature trend shows significant positive temperature trend at
99% or higher CL in all physiographic regions (Table 6.2). The lowest positive trend
(0.028oC/yr) is observed in Tarai and the highest positive trend (0.085oC/yr) in the High
Himalayas. There is an increase in temperature trend with the elevation from south to north
which is consistent with the distribution of post-monsoon maximum temperature trend in the
districts.
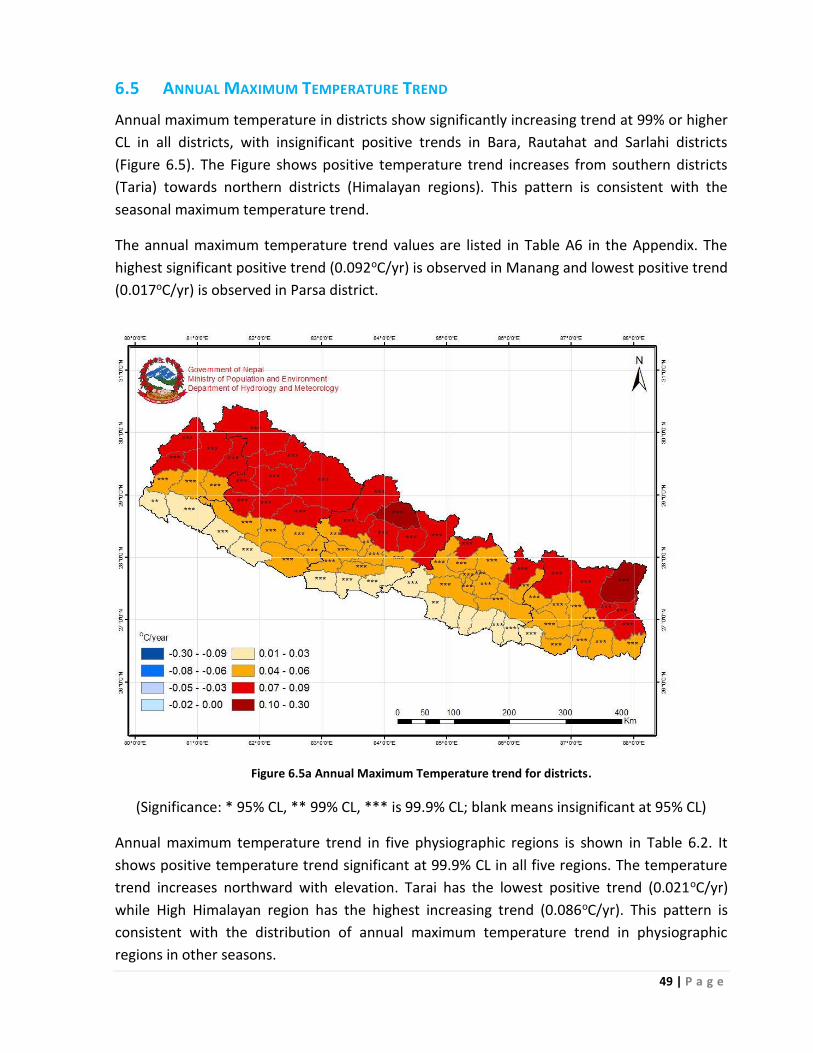
49 | P a g e
6.5 ANNUAL MAXIMUM TEMPERATURE TREND
Annual maximum temperature in districts show significantly increasing trend at 99% or higher
CL in all districts, with insignificant positive trends in Bara, Rautahat and Sarlahi districts
(Figure 6.5). The Figure shows positive temperature trend increases from southern districts
(Taria) towards northern districts (Himalayan regions). This pattern is consistent with the
seasonal maximum temperature trend.
The annual maximum temperature trend values are listed in Table A6 in the Appendix. The
highest significant positive trend (0.092oC/yr) is observed in Manang and lowest positive trend
(0.017oC/yr) is observed in Parsa district.
Figure 6.5a Annual Maximum Temperature trend for districts.
(Significance: * 95% CL, ** 99% CL, *** is 99.9% CL; blank means insignificant at 95% CL)
Annual maximum temperature trend in five physiographic regions is shown in Table 6.2. It
shows positive temperature trend significant at 99.9% CL in all five regions. The temperature
trend increases northward with elevation. Tarai has the lowest positive trend (0.021oC/yr)
while High Himalayan region has the highest increasing trend (0.086oC/yr). This pattern is
consistent with the distribution of annual maximum temperature trend in physiographic
regions in other seasons.
50 | P a g e
6.6 SUMMARY OF MAXIMUM TEMPERATURE TREND
At the District level, maximum temperature trend in most of the districts are significantly
positive for all seasons, except in Tarai districts in winter season. The highest significant
positive trend (0.12oC/yr) is found in winter season in Manang district.
At Physiographic level, all five regions show significant positive trend in all seasons, except in
Tarai in winter and pre-monsoon and in Siwaliks in winter. In High Mountains and High
Himalayas, the highest positive trend is observed in winter season and in Tarai, Siwaliks and
Mid Mountains, the highest positive trend is observed in monsoon season (Table 6.2).
Both at district and physiographic levels, seasonal and annual maximum temperature trends
show a pattern in relation to altitude (Negative trend or slightly positive trends in lower
altitude districts/regions and larger positive trends in higher altitude districts/regions).
51 | P a g e
CHAPTER 7: MINIMUM TEMPERATURE TREND FOR DISTRICTS AND
PHYSIOGRAPHIC REGIONS
The annual and seasonal minimum temperature trends for the districts are listed in Table A7
in the Appendix. Summary of districts with positive and negative trends for seasonal and
annual minimum temperature trends is given in Table 7.1. Seasonal and annual minimum
temperature trends in five physiographic regions are in Table 7.2.
Table 7.1 Distribution of districts with positive and negative seasonal and annual minimum
temperature trends
Trend types Winter Pre-
monsoon
Monsoon Post-
monsoon
Annual
Districts with negative
trend
33(14) 30(0) 8(0) 28 (7) 23 (3)
Districts with positive
trend
42(21) 45(19) 67(50) 47 (17) 52 (33)
Note: Number in parenthesis indicates number of districts with significant trend at 95% or
higher confidence level (Table A7 in Appendix)
Table 7.2 Seasonal and annual minimum temperature trends in the physiographic regions
Physiographic
Regions
Winter Pre-
monsoon
monsoon Post-
monsoon
Annual
α Trend
(oC/yr)
α Trend
(oC/yr)
α Trend
(oC/yr)
α Trend
(oC/yr)
α Trend
(oC/yr)
Tarai ** 0.025 * 0.015 *** 0.015 0 0.013 *** 0.018
Siwaliks * 0.016 * 0.013 *** 0.015 0 0.013 *** 0.016
Mid Mountain 0 0.004 0 0.004 ** 0.014 0 0.006 * 0.010
High
Mountains
+ -0.018 0 -0.011 * 0.013 0 -0.013 0 -0.005
High Himalayas ** -0.056 + -0.021 0 0.013 + -0.025 + -0.015
Note: Significant: * 95% CL, ** 99% CL and *** 99.9% CL; insignificant at 95% CL : + , 0
7.1 WINTER MINIMUM TEMPERATURE TREND
Winter minimum temperature shows positive trend in 42 districts (southern and southeastern
districts) and negative trend in 33 districts, in particular northern and northwestern districts
(Table 7.1 and Figure 7.1). Out of these 42 districts, 21 districts show significant positive trend
at 95% higher CL and these districts are located in the southern part of EDR, CDR and WDR.
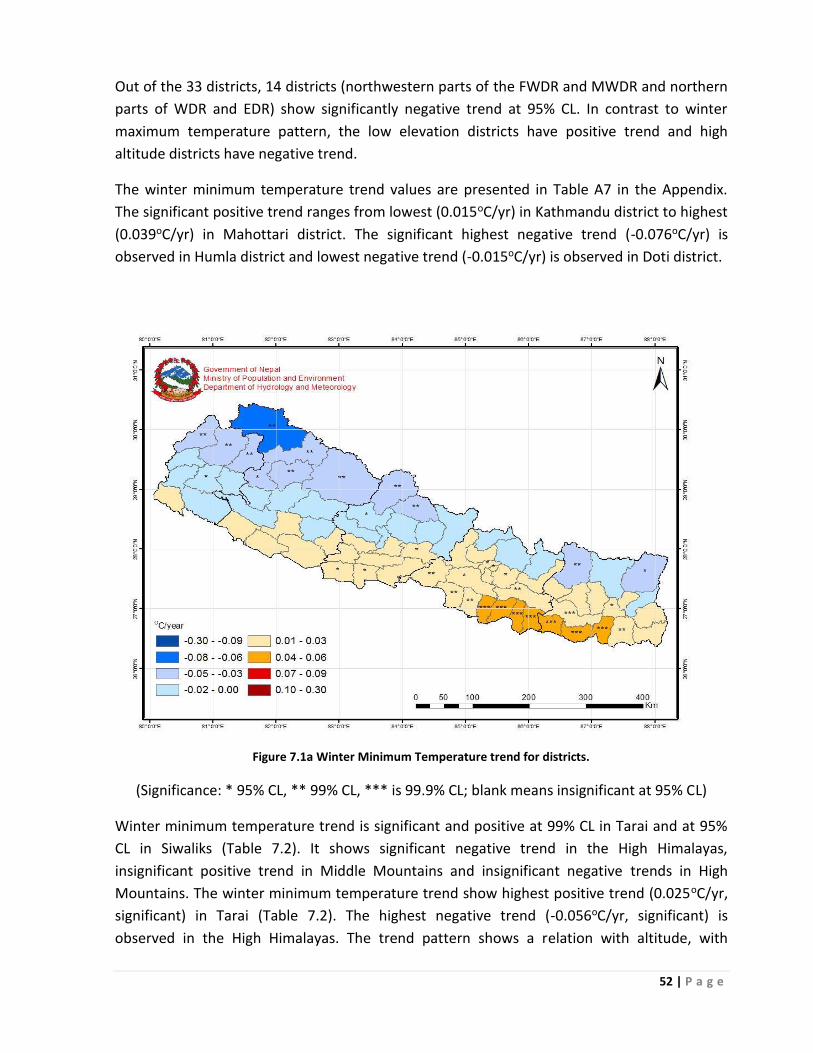
52 | P a g e
Out of the 33 districts, 14 districts (northwestern parts of the FWDR and MWDR and northern
parts of WDR and EDR) show significantly negative trend at 95% CL. In contrast to winter
maximum temperature pattern, the low elevation districts have positive trend and high
altitude districts have negative trend.
The winter minimum temperature trend values are presented in Table A7 in the Appendix.
The significant positive trend ranges from lowest (0.015oC/yr) in Kathmandu district to highest
(0.039oC/yr) in Mahottari district. The significant highest negative trend (-0.076oC/yr) is
observed in Humla district and lowest negative trend (-0.015oC/yr) is observed in Doti district.
Figure 7.1a Winter Minimum Temperature trend for districts.
(Significance: * 95% CL, ** 99% CL, *** is 99.9% CL; blank means insignificant at 95% CL)
Winter minimum temperature trend is significant and positive at 99% CL in Tarai and at 95%
CL in Siwaliks (Table 7.2). It shows significant negative trend in the High Himalayas,
insignificant positive trend in Middle Mountains and insignificant negative trends in High
Mountains. The winter minimum temperature trend show highest positive trend (0.025oC/yr,
significant) in Tarai (Table 7.2). The highest negative trend (-0.056oC/yr, significant) is
observed in the High Himalayas. The trend pattern shows a relation with altitude, with
53 | P a g e
positive minimum temperature trend in low altitude which decreases with altitude becoming
negative at High Mountains and Himalayas.
7.2 PRE-MONSOON MINIMUM TEMPERATURE TREND
Pre-monsoon minimum temperature show positive trend in 47 districts and negative trend in
30 districts (Table 7.1 and Figure 7.2). The increasing trends are significant at 95% or higher CL
in 19 districts (southern parts of EDR, CDR and WDR). Insignificant negative trends are found
in most of districts in FWDR and MWDR and northern districts of WDR and EDR. The pre-
monsoon minimum trends for districts are listed in Table A7 in the Appendix. The highest
significant positive trend (0.031oC/yr) is observed in Mahottari district.
In physiographic regions, pre-monsoon minimum temperature trend is significant and positive
at 95% CL in Tarai and Siwaliks and insignificant in Middle Mountains (Table 7.2). In High
Mountains and High Himalayas, the trend is negative but insignificant. The positive trend is
highest (0.015oC/yr) in Tarai while negative trend is highest (-0.021oC/yr) in High Himalayas
(Table 7.2).
Figure 7.2a Pre- Monsoon Minimum Temperature trend for districts.
(Significance: * 95% CL, ** 99% CL, *** is 99.9% CL; blank means insignificant at 95% CL)
54 | P a g e
7.3 MONSOON MINIMUM TEMPERATURE TREND
Monsoon minimum temperature is in positive trend in majority of districts (67 districts), and
negative trends in 8 districts (northwestern part of the country and Manang) (Table 7.1and
Figure 7.3). Positive trends are significant in 50 districts. All of the 8 districts with negative
trend show insignificant result. The monsoon minimum temperature trends are listed in Table
A7 in the Annex. It depicts significantly highest positive trend (0.046oC/yr) in Dolpa district and
lowest positive trend (0.010oC/yr) in Morang district.
Figure 7.3a Monsoon Minimum Temperature trend for districts.
(Significance: * 95% CL, ** 99% CL, *** is 99.9% CL; blank means insignificant at 95% CL)
Monsoon minimum temperature trend in the five physiographic regions is significant and
positive at 99.9% CL in Tarai and Siwaliks and at 99% CL in Middle Mountains and at 95% CL in
High Mountains, while insignificant positive trend is observed in High Himalayas (Table 7.2).
Tarai shows the highest positive trend (0.015oC/yr) while High Himalayan and High Mountain
regions show the lowest increasing trend (0.013oC/yr) in case of monsoon minimum
temperature (Table 7.2).
7.4 POST-MONSOON MINIMUM TEMPERATURE TREND
The pattern of minimum temperature trend in post-monsoon (Figure 7.4) has similarity with
that in pre-monsoon season (Figure 7.1). A total of 27 districts (the northwestern districts of
FDR, MWDR and WDR and northeastern districts of EDR) show negative trend (Table 7.1 and
55 | P a g e
Figure 7.4). Out of 27 districts only 7 districts show significant negative trend at 95% CL (Figure
7.4). Post-monsoon minimum temperature trend is positive in 47 districts, among which 17
districts (CDR and EDR) show significant positive trend at 95% or higher CL (Table 7.1 and
Figure 7.4).
Taking into the magnitudes of trend values (Table A7 in the Appendix), the significantly
highest positive trend (0.028oC/yr) is observed in Siraha districts. The significantly highest
negative trend (-0.037oC/yr) is found in Humla district.
Figure 7.4a Post-Monsoon Minimum Temperature trend for districts
(Significance: * 95% CL, ** 99% CL, *** is 99.9% CL; blank means insignificant at 95% CL)
Positive (but insignificant) temperature trend is observed in Tarai, Siwaliks and Middle
Mountains and negative trend (but insignificant) in the High Mountains and High Himalayas
(Table 7.2). This pattern of minimum temperature trend in relation to altitude is consistent
with the patterns in other 3 seasons.
7.5 ANNUAL MINIMUM TEMPERATURE TREND
Annual minimum temperature trend in 75 districts and number of districts with positive and
negative trends are given in Figure 7.5 and Table 7.1. Fifty two districts (southern parts of the
56 | P a g e
FWDR, MWDR, WDR, EDR and most of the districts of CDR) show positive annual minimum
trend while 23 districts (northwestern parts of FWDR, MWDR and WDR, northern part of CDR
and northeastern parts of EDR) show negative annual minimum temperature trend (Figure 7.5
and Table 7.1). Among the districts with positive trend, 33 districts show significant at 95% or
higher CL and only three districts (Manang, Humla and Kalikot) show significant negative trend
at 95% or higher CL. The pattern of annual minimum temperature trend also shows positive
trend in low elevation districts and negative trend in high elevation districts as in all the
seasons.
The trend values of annual minimum temperature are shown in Table A7 in the Appendix. The
significantly highest positive trend (0.029oC/yr) is found in Dhanusa district and significantly
highest negative trend (-0.030oC/yr) is observed in Manang district.
Figure 7.5a Annual Minimum Temperature trend for districts.
(Significance: * 95% CL, ** 99% CL, *** is 99.9% CL; blank means insignificant at 95% CL)
Annual minimum temperature trend of five physiographic regions show positive temperature
trend significant at 99.9% CL in Tarai and Siwaliks while at 95% CL in the Mid-mountains (Table
7.2). High mountains and High Himalayas did not show significant trend.
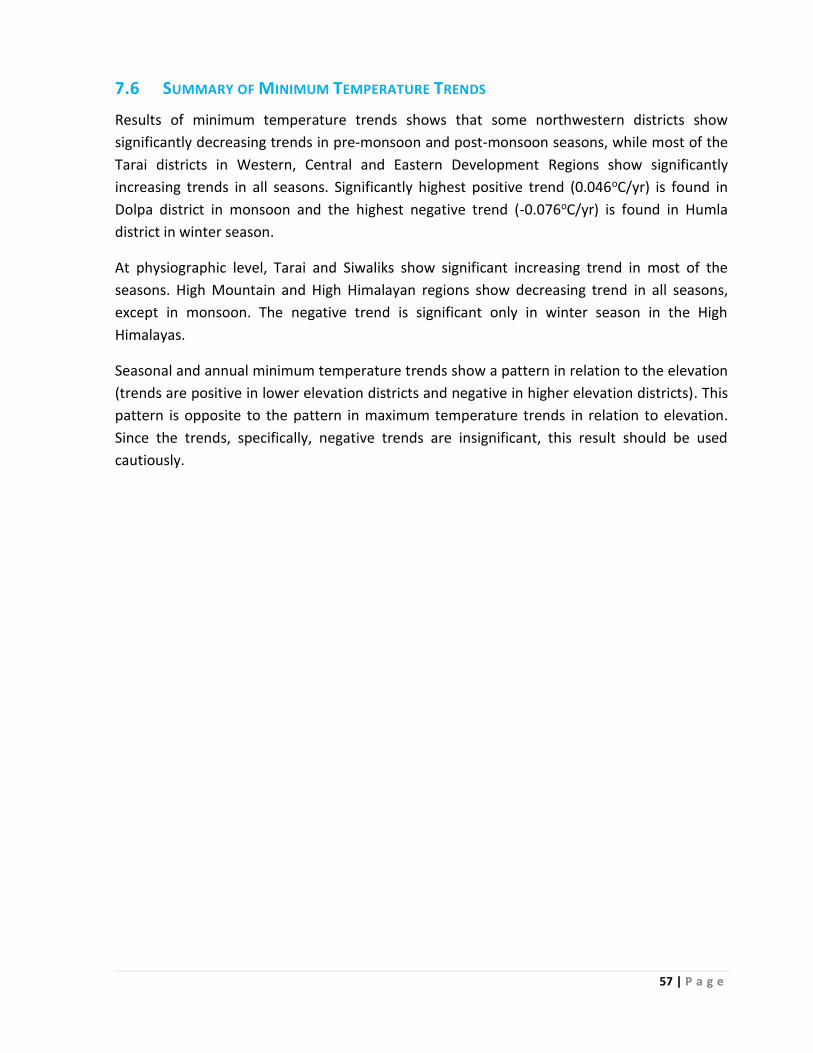
57 | P a g e
7.6 SUMMARY OF MINIMUM TEMPERATURE TRENDS
Results of minimum temperature trends shows that some northwestern districts show
significantly decreasing trends in pre-monsoon and post-monsoon seasons, while most of the
Tarai districts in Western, Central and Eastern Development Regions show significantly
increasing trends in all seasons. Significantly highest positive trend (0.046oC/yr) is found in
Dolpa district in monsoon and the highest negative trend (-0.076oC/yr) is found in Humla
district in winter season.
At physiographic level, Tarai and Siwaliks show significant increasing trend in most of the
seasons. High Mountain and High Himalayan regions show decreasing trend in all seasons,
except in monsoon. The negative trend is significant only in winter season in the High
Himalayas.
Seasonal and annual minimum temperature trends show a pattern in relation to the elevation
(trends are positive in lower elevation districts and negative in higher elevation districts). This
pattern is opposite to the pattern in maximum temperature trends in relation to elevation.
Since the trends, specifically, negative trends are insignificant, this result should be used
cautiously.
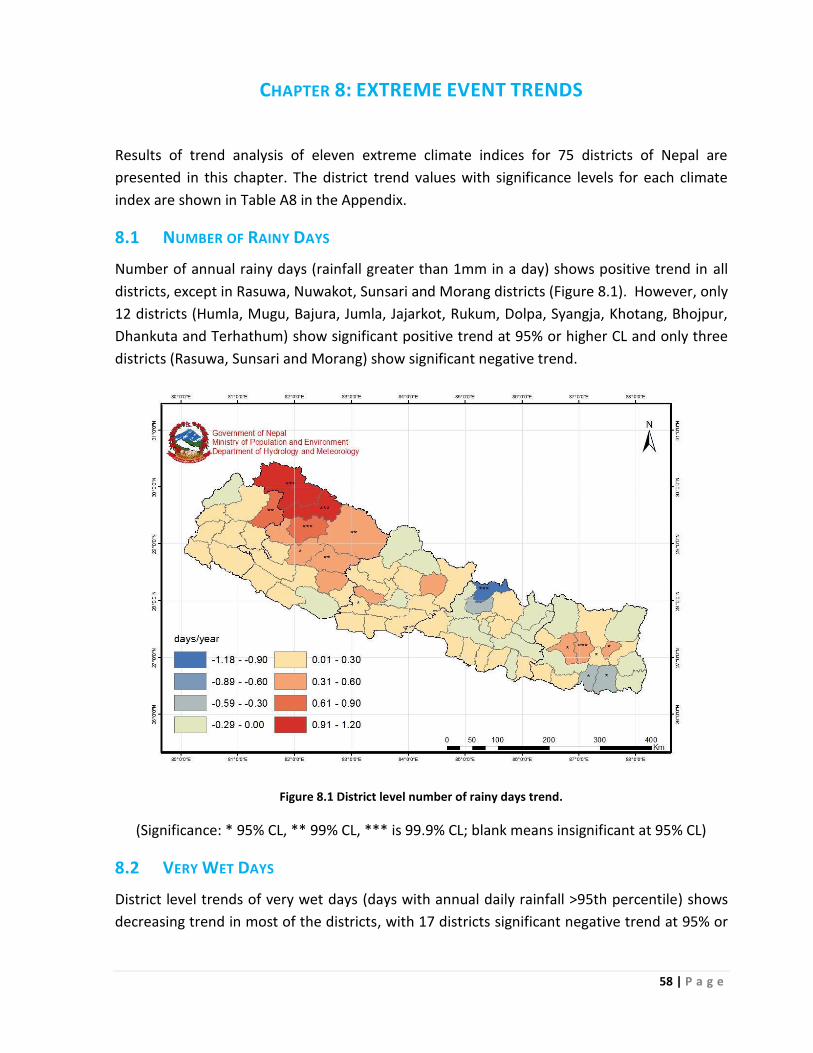
58 | P a g e
CHAPTER 8: EXTREME EVENT TRENDS
Results of trend analysis of eleven extreme climate indices for 75 districts of Nepal are
presented in this chapter. The district trend values with significance levels for each climate
index are shown in Table A8 in the Appendix.
8.1 NUMBER OF RAINY DAYS
Number of annual rainy days (rainfall greater than 1mm in a day) shows positive trend in all
districts, except in Rasuwa, Nuwakot, Sunsari and Morang districts (Figure 8.1). However, only
12 districts (Humla, Mugu, Bajura, Jumla, Jajarkot, Rukum, Dolpa, Syangja, Khotang, Bhojpur,
Dhankuta and Terhathum) show significant positive trend at 95% or higher CL and only three
districts (Rasuwa, Sunsari and Morang) show significant negative trend.
Figure 8.1 District level number of rainy days trend.
(Significance: * 95% CL, ** 99% CL, *** is 99.9% CL; blank means insignificant at 95% CL)
8.2 VERY WET DAYS
District level trends of very wet days (days with annual daily rainfall >95th percentile) shows
decreasing trend in most of the districts, with 17 districts significant negative trend at 95% or
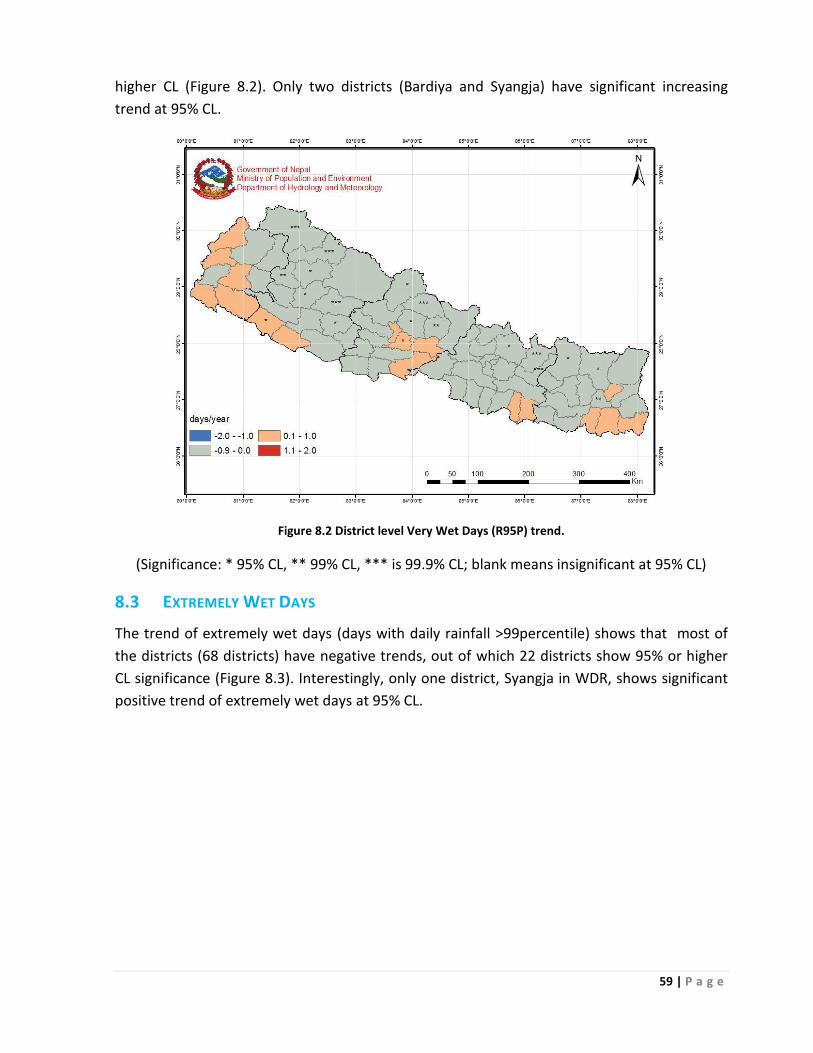
59 | P a g e
higher CL (Figure 8.2). Only two districts (Bardiya and Syangja) have significant increasing
trend at 95% CL.
Figure 8.2 District level Very Wet Days (R95P) trend.
(Significance: * 95% CL, ** 99% CL, *** is 99.9% CL; blank means insignificant at 95% CL)
8.3 EXTREMELY WET DAYS
The trend of extremely wet days (days with daily rainfall >99percentile) shows that most of
the districts (68 districts) have negative trends, out of which 22 districts show 95% or higher
CL significance (Figure 8.3). Interestingly, only one district, Syangja in WDR, shows significant
positive trend of extremely wet days at 95% CL.
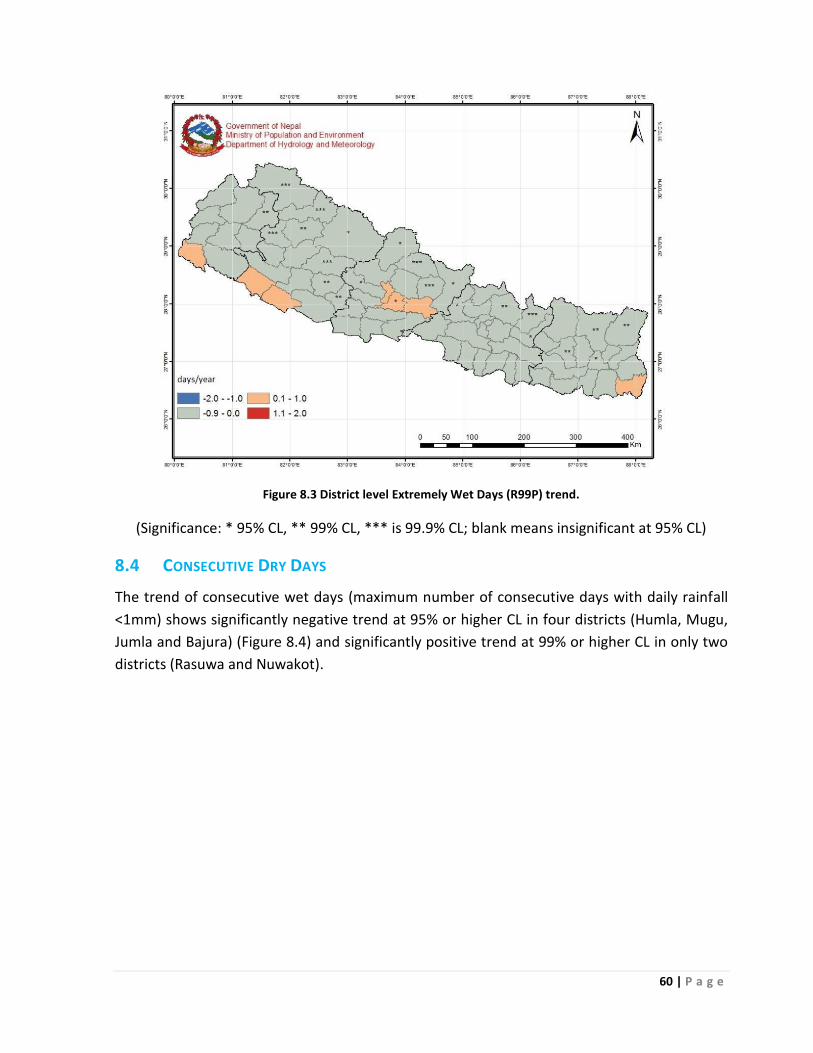
60 | P a g e
Figure 8.3 District level Extremely Wet Days (R99P) trend.
(Significance: * 95% CL, ** 99% CL, *** is 99.9% CL; blank means insignificant at 95% CL)
8.4 CONSECUTIVE DRY DAYS
The trend of consecutive wet days (maximum number of consecutive days with daily rainfall
<1mm) shows significantly negative trend at 95% or higher CL in four districts (Humla, Mugu,
Jumla and Bajura) (Figure 8.4) and significantly positive trend at 99% or higher CL in only two
districts (Rasuwa and Nuwakot).
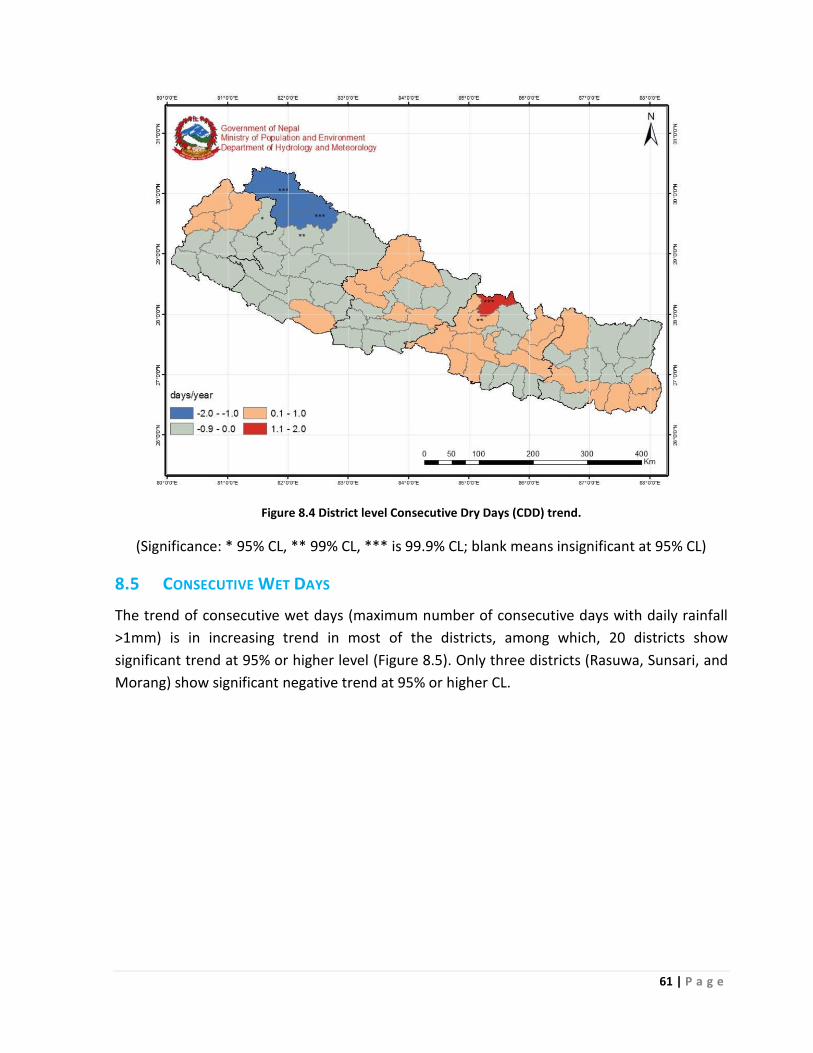
61 | P a g e
Figure 8.4 District level Consecutive Dry Days (CDD) trend.
(Significance: * 95% CL, ** 99% CL, *** is 99.9% CL; blank means insignificant at 95% CL)
8.5 CONSECUTIVE WET DAYS
The trend of consecutive wet days (maximum number of consecutive days with daily rainfall
>1mm) is in increasing trend in most of the districts, among which, 20 districts show
significant trend at 95% or higher level (Figure 8.5). Only three districts (Rasuwa, Sunsari, and
Morang) show significant negative trend at 95% or higher CL.
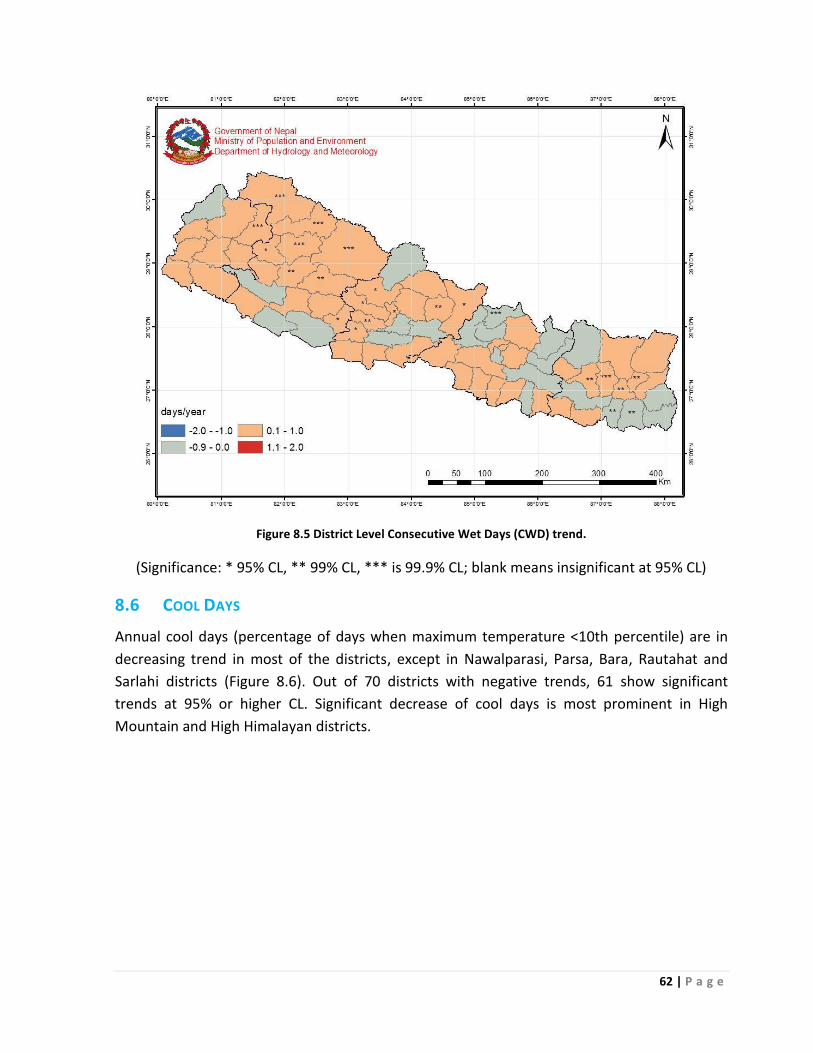
62 | P a g e
Figure 8.5 District Level Consecutive Wet Days (CWD) trend.
(Significance: * 95% CL, ** 99% CL, *** is 99.9% CL; blank means insignificant at 95% CL)
8.6 COOL DAYS
Annual cool days (percentage of days when maximum temperature <10th percentile) are in
decreasing trend in most of the districts, except in Nawalparasi, Parsa, Bara, Rautahat and
Sarlahi districts (Figure 8.6). Out of 70 districts with negative trends, 61 show significant
trends at 95% or higher CL. Significant decrease of cool days is most prominent in High
Mountain and High Himalayan districts.
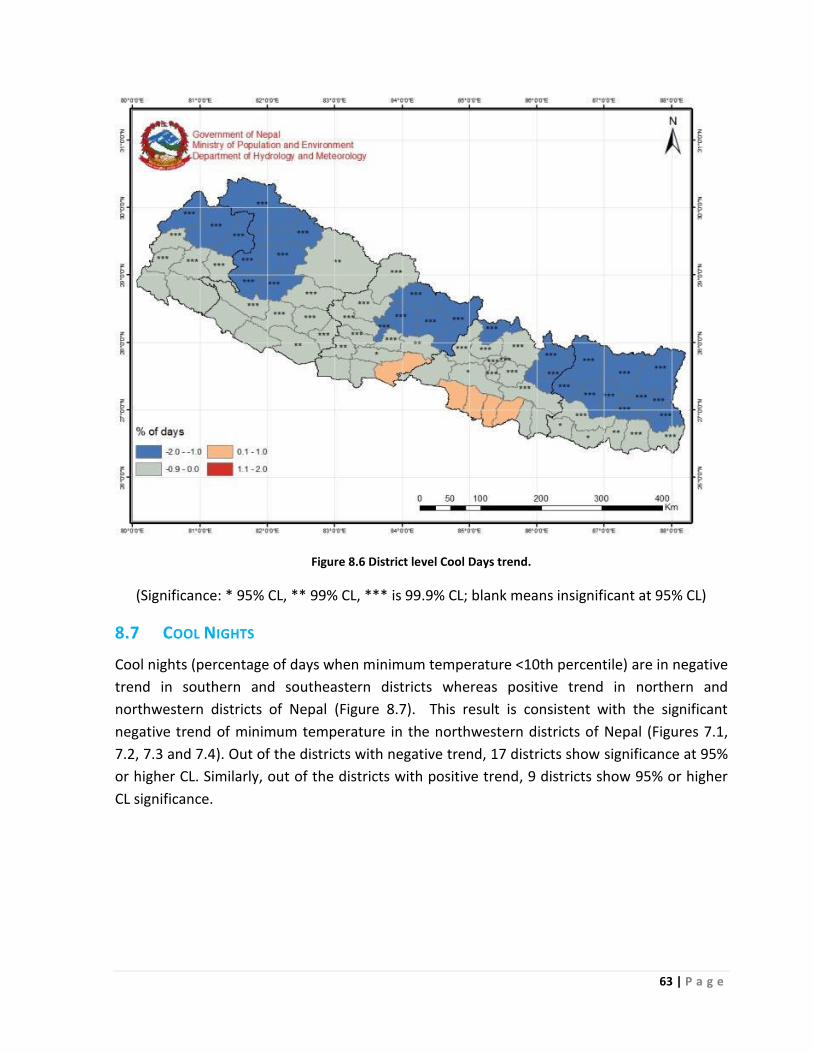
63 | P a g e
Figure 8.6 District level Cool Days trend.
(Significance: * 95% CL, ** 99% CL, *** is 99.9% CL; blank means insignificant at 95% CL)
8.7 COOL NIGHTS
Cool nights (percentage of days when minimum temperature <10th percentile) are in negative
trend in southern and southeastern districts whereas positive trend in northern and
northwestern districts of Nepal (Figure 8.7). This result is consistent with the significant
negative trend of minimum temperature in the northwestern districts of Nepal (Figures 7.1,
7.2, 7.3 and 7.4). Out of the districts with negative trend, 17 districts show significance at 95%
or higher CL. Similarly, out of the districts with positive trend, 9 districts show 95% or higher
CL significance.
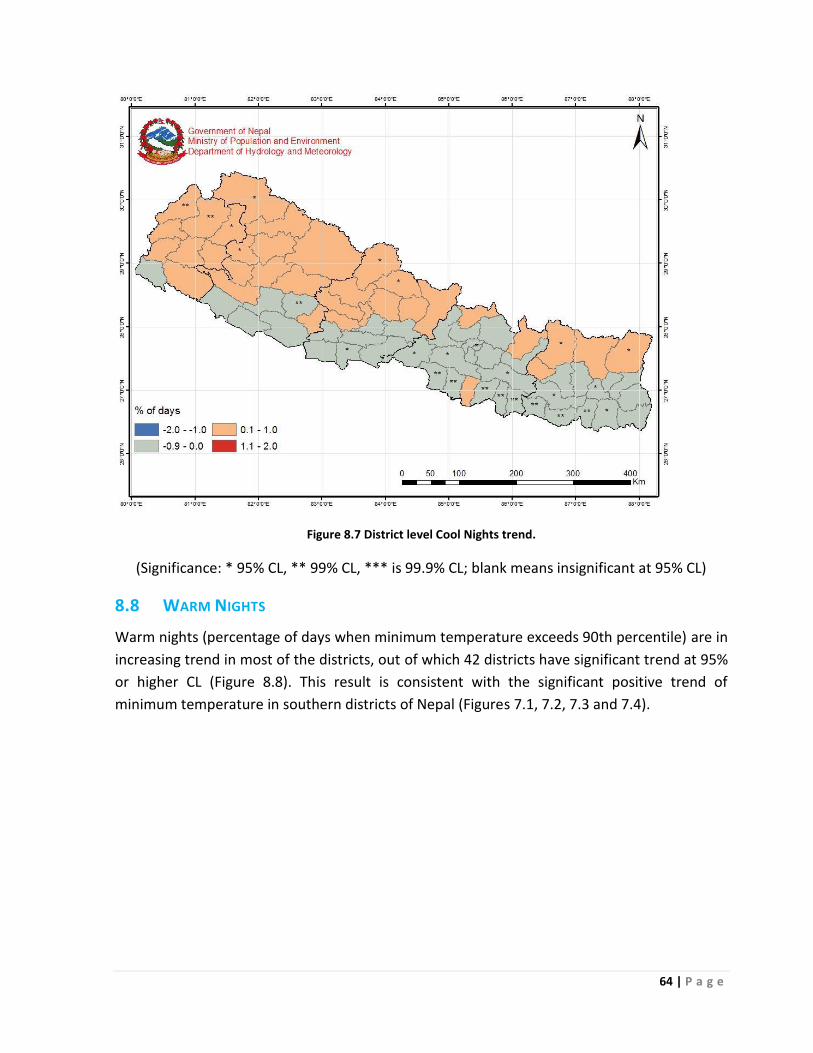
64 | P a g e
Figure 8.7 District level Cool Nights trend.
(Significance: * 95% CL, ** 99% CL, *** is 99.9% CL; blank means insignificant at 95% CL)
8.8 WARM NIGHTS
Warm nights (percentage of days when minimum temperature exceeds 90th percentile) are in
increasing trend in most of the districts, out of which 42 districts have significant trend at 95%
or higher CL (Figure 8.8). This result is consistent with the significant positive trend of
minimum temperature in southern districts of Nepal (Figures 7.1, 7.2, 7.3 and 7.4).
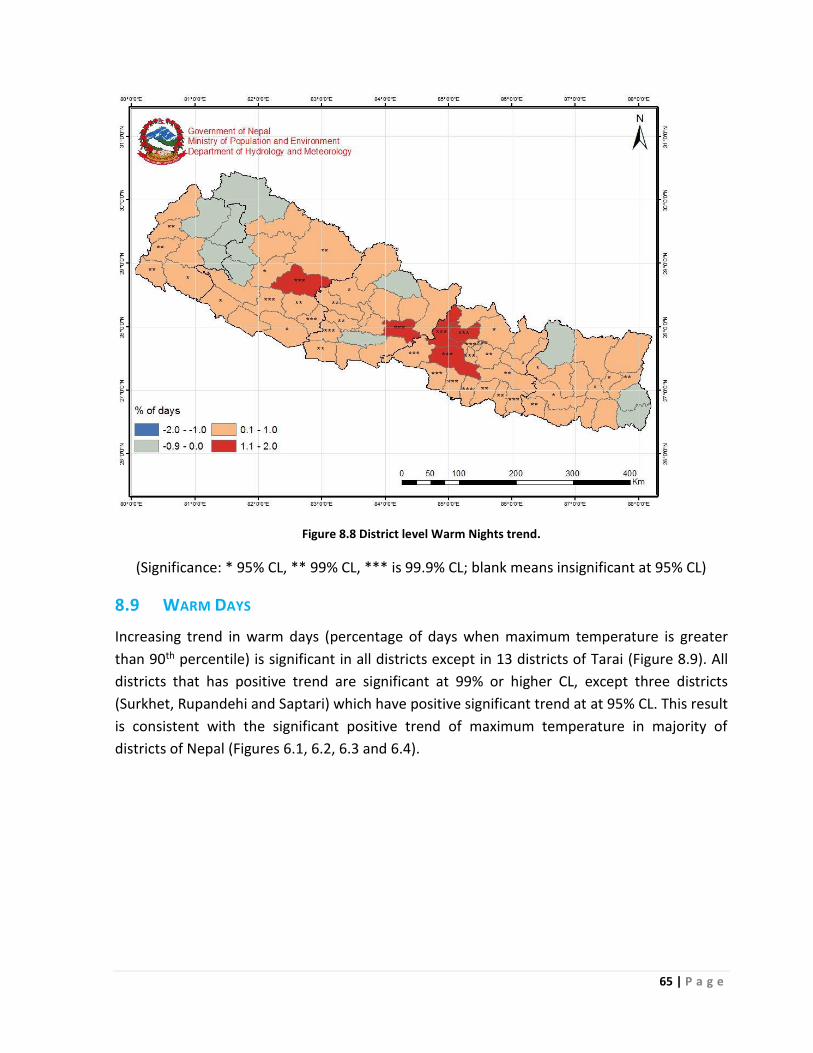
65 | P a g e
Figure 8.8 District level Warm Nights trend.
(Significance: * 95% CL, ** 99% CL, *** is 99.9% CL; blank means insignificant at 95% CL)
8.9 WARM DAYS
Increasing trend in warm days (percentage of days when maximum temperature is greater
than 90th percentile) is significant in all districts except in 13 districts of Tarai (Figure 8.9). All
districts that has positive trend are significant at 99% or higher CL, except three districts
(Surkhet, Rupandehi and Saptari) which have positive significant trend at at 95% CL. This result
is consistent with the significant positive trend of maximum temperature in majority of
districts of Nepal (Figures 6.1, 6.2, 6.3 and 6.4).
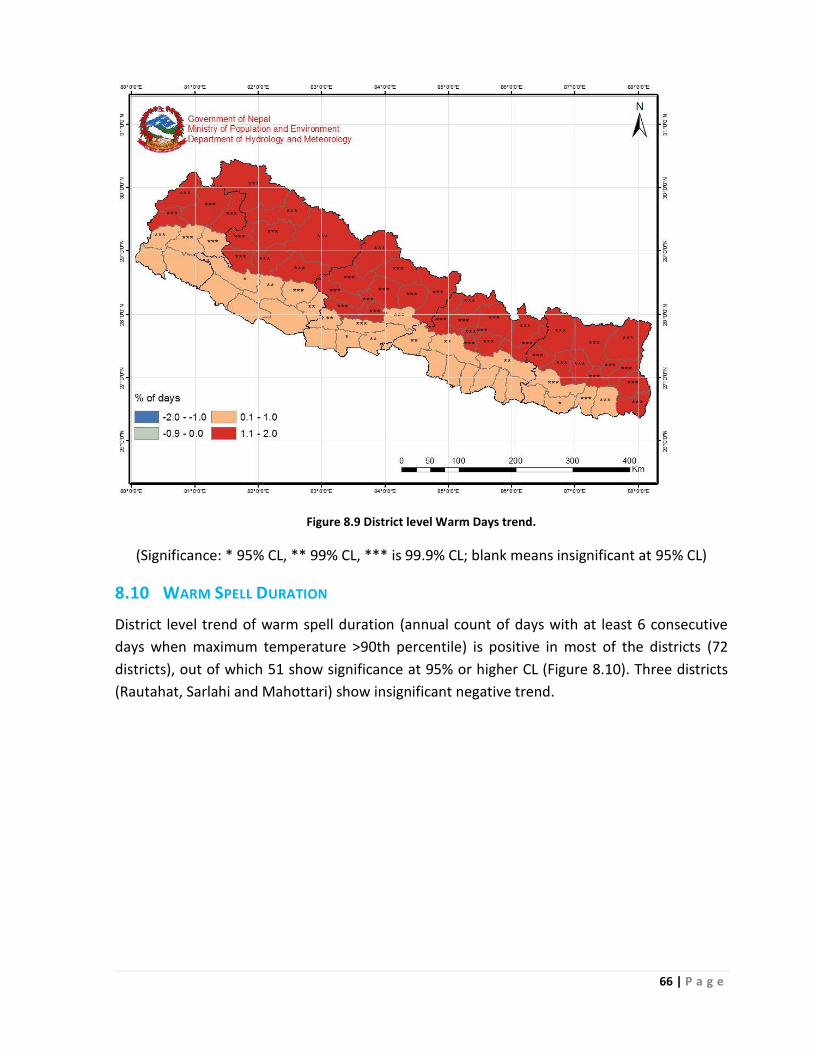
66 | P a g e
Figure 8.9 District level Warm Days trend.
(Significance: * 95% CL, ** 99% CL, *** is 99.9% CL; blank means insignificant at 95% CL)
8.10 WARM SPELL DURATION
District level trend of warm spell duration (annual count of days with at least 6 consecutive
days when maximum temperature >90th percentile) is positive in most of the districts (72
districts), out of which 51 show significance at 95% or higher CL (Figure 8.10). Three districts
(Rautahat, Sarlahi and Mahottari) show insignificant negative trend.
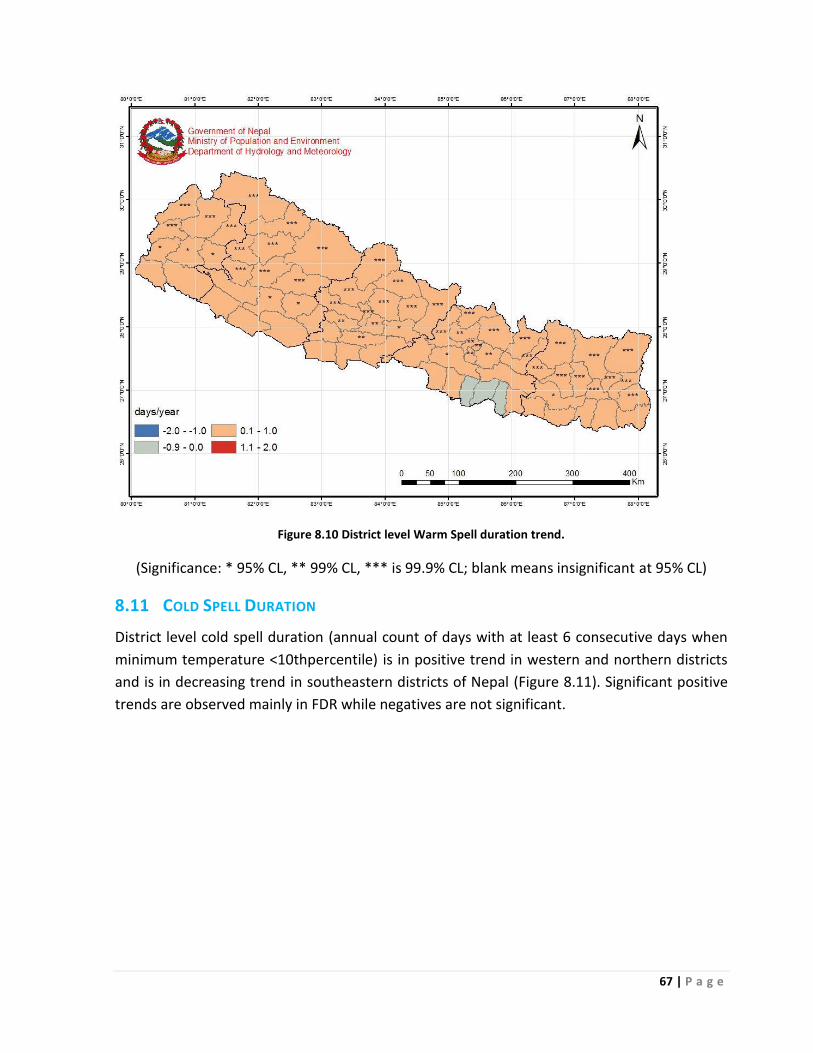
67 | P a g e
Figure 8.10 District level Warm Spell duration trend.
(Significance: * 95% CL, ** 99% CL, *** is 99.9% CL; blank means insignificant at 95% CL)
8.11 COLD SPELL DURATION
District level cold spell duration (annual count of days with at least 6 consecutive days when
minimum temperature <10thpercentile) is in positive trend in western and northern districts
and is in decreasing trend in southeastern districts of Nepal (Figure 8.11). Significant positive
trends are observed mainly in FDR while negatives are not significant.
68 | P a g e
Figure 8.11 District level Cold Spell Duration Trend.
(Significance: * 95% CL, ** 99% CL, *** is 99.9% CL; blank means insignificant at 95% CL)
8.12 SUMMARY: EXTREME CLIMATE TRENDS
Extreme precipitation trends show significant trends in northwestern and northern districts
Number of rainy days is increasing significantly mainly in northwestern districts. Very wet days
and extremely wet days are also decreasing significantly, mainly in the northern districts.
Consecutive wet days are increasing significantly in the northern districts of MWDR, and
central parts of WDR and EDR while consecutively dry days are decreasing significantly, mainly
in the northwestern districts.
Extreme temperature show significant trends in the majority of the districts. Warm days and
warm nights are in increasing trend significantly in majority of the districts. Warm spell
duration is increasing in majority of the districts and cold spell duration is increasing only in
the FWDR significantly. Cool days are decreasing in majority of the districts significantly while
cool nights are increasing significantly in few districts in the northern and northwestern parts
and decreasing significantly in the southeastern districts.

69 | P a g e
Table 8 Summary of extreme climate indices trend
Extreme Climate
Indices
Trend pattern/regions
a. Number of rainy
days
Increasing significantly, mainly in the northwestern
districts and trends are insignificant in other districts
b. Very wet days and Decreasing significantly, mainly in the northern districts
and trends are insignificant in other districts c. Extremely wet days
d. Consecutive wet
days
Increasing significantly in the northern districts of MWDR,
central part of WDR and EDR and trends are insignificant
in other districts
e. Consecutive dry
days
Decreasing significantly, mainly in the northwestern
districts and trends are insignificant in other districts
f. Warm days Increasing significantly in majority of the districts
g. Warm nights Increasing significantly in majority of the districts
h. Warm spell
duration
Increasing in majority of the districts
i. Cool days Decreasing in majority of the districts
j. Cool nights Increasing in the northwestern significantly & decreasing
in the southeast significantly
k. Cold spell duration Increasing significantly only in the FWDR districts and
trends are insignificant in other districts
70 | P a g e
CHAPTER 9: LINKING WITH PREVIOUS RESULTS
This chapter links the results of this study with previous studies in Nepal. This study is based
on gridded station data while almost all previous studies (e.g. Baidya et al., 2008; PAN, 2009;
DHM, 2015) on climate trend analysis in Nepal were based on the trend analysis of station
data. This study has longer data period than previous studies. This study has used largest
number of stations as compared to previous studies. This study went through extensive
quality control of temperature data, in which inconsistent records were corrected before
using them for analysis. In previous studies data/stations with inconsistent records were
excluded, which led to fewer stations for analysis (e.g. Baidya et al., 2008; DHM, 2015). This
study has applied non-parametric method, Mann-Kendal–“e “lope s Method for trend
analysis while previous studies have used linear regression method that is more suitable for
normally distributed and independent time series. Considering methodology and data period
in this study, different results are expected. However, it is important to point out the
differences and similarities in the results with previous results on trend analysis in Nepal.
This study shows higher annual positive trends in Nepal average maximum temperature than
in minimum temperature. This pattern is consistent with previous studies (e.g. Shrestha et al.,
1999; PAN, 2009; DHM, 2015). This study shows All Nepal average annual maximum
temperature trend is increasing at 0.056oC/yr, which is lower than result of Shrestha et al.
(1999) ( 0.059oC/yr) and higher than DHM (2015) study (0.04oC/yr). Similarly, in this report
minimum temperature trend is increasing at 0.002oC/yr while DHM (2015) and PAN (2009)
showed 0.01oC/yr and 0.03oC/yr increase in minimum temperature respectively. Minimum
temperature trend is lower in magnitude than those from the previous studies.
This study shows that significant warming trend (at greater than 95% CL) in maximum
temperature is greater in higher altitude districts and regions. This result confirms similar
findings of previous studies in Nepal (e.g. Shrestha et al., 1999; PAN, 2009; DHM 2015;
Shrestha and Devkota, 2010). This study finds negative minimum temperature trend annually
and seasonally (except in post-monsoon) in high altitude districts/regions and positive trend in
lower elevation districts/regions, which is opposite of the maximum temperature trend
variation with altitude. Similar results in minimum temperature trends were reported in PAN
(2009) and DHM (2015).
Seasonal and annual precipitation trends in this study show different pattern than the
previous studies in most parts of the country, mainly in winter and monsoon (PAN, 2009;
DHM, 2015). In pre-monsoon and post-monsoon seasons, the rainfall trend matches with
findings of DHM (2015) to some extent, while in winter and monsoon seasons, the rainfall
trend is different than PAN (2009) and DHM (2015). This might be due to two reasons: (i) this
study used gridded Aphrodite data (in which missing data were filled) whereas previous

71 | P a g e
studies conducted trend analysis only on available data; and (ii) this study used non-
parametric test while previous studies used linear regression method for trend analysis.
The findings that show decreasing trend in the cool days and cold nights and increasing trend
in warm days and warm nights in Nepal are also reported in Baidya et al (2007) and Shrestha
et al (2016). This study found significant trends in extreme precipitation indices in certain
districts, while previous studies reported no clear trend in most of precipitation extremes
(Baidya et al 2007; Shrestha et al, 2016). The different results in current study could be due to
the fact that it used APHRODITE data that provides long term time series data compare to
previous studies that used station data.
72 | P a g e
CHAPTER 10: CONCLUSION
This study was conducted to provide information on observed climate trends in Nepal for the
NAP process. The observed climate trend analysis was performed using gridded temperature
and precipitation data for the period from 1971 to 2014. The non-parametric Mann-Kendall
a d “e s “lope ethod as used to calculate the tre ds a d to test the sig ifica ce of tre ds for districts and physiographic regions for four seasons and annually.
All Nepal trend analysis shows a significant positive trend in annual and seasonal maximum
temperature. Significant positive trend in all Nepal minimum temperature is observed only in
monsoon. No significant trend is found annually or seasonally in All Nepal precipitation trend.
District level trend analysis shows a robust positive trend (significant at 99.9% confidence
level) in maximum temperature in all districts for all seasons, except in Tarai districts in winter
season. The significance of minimum temperature and in precipitation are only limited to few
districts and seasons.
Extreme events (indices) associated with precipitation show significant trends (positive and
negative) specifically in northwestern or northern districts. In contrary the extreme warm
temperature indices showed significantly increasing trends in majority of districts. The
extreme cool temperature indices are increasing significantly, mainly in the northwestern
parts of the country.
The results on significance test from this study allows identifying the real clear trend various
spatial and temporal scales. Nonetheless, a number of insignificant but coherent patterns are
noted in the precipitation and temperature trends. It is important to note such patterns, as it
could be related to the short term climate variability. Further study is necessary to understand
the underlying atmospheric phenomena associated with respective climatic trends and
patterns.
This study provides the district level climate trends and their level of significance. While using
these results for vulnerability and risk assessment and adaptation planning for NAP process,
level of significance of the climate trends should be considered. Therefore, further discussion
with each thematic group is necessary for better implication of the results in NAP process.
73 | P a g e
REFERENCES
Alexander, L.V., Zhang, X., Peterson, T.C., Caesar, J., Gleason, B., Klein Tank, A.M.G., Haylock,
M., Collins, D., Trewin, B., Rahimzadeh, F., Tagipour, A., Rupa Kumar, K., Revadekar, J.,
Griffiths, G., Vincent, L., Stephenson, D.B., Burn, J., Aguilar, E., Brunet, M., Taylor, M.,
New, M., Zhai, P., Rusticucci, M., Vazquez-Aguirre, J.L., (2006) Global observed changes
in daily climate extremes of temperature and precipitation. J. Geophys. Res. Atmos.
111, D05109. doi:10.1029/2005JD006290.
Andermann, C., Bonnet, S., and Gloaguen, R. (2014) Evaluation of precipitation data sets along
the Himalayan front. Geochemistry, Geophysics, Geosystems, AGU and the
Geochemical Society, 2011, 12 (7), pp. Q07023. .
Baidya S.K.; Shrestha M.L; Srikh M. M. (2008) Trends in daily climatic extremes of temperature
and precipitation in Nepal. Journal of Hydrology and Meteorology, 5(1)
DHM (2015) Study of Climate and climatic variation over Nepal. Department of Hydrology and
Meteorology, Ministry of Population and Environment, Nepal
PAN (2009) Temporal and Spatial Variability of Climate Change over Nepal (1976-2005).
Practical Action Nepal, Kathmandu.
Salmi, T., Määttä, A., Anttila, P., Ruoho-Airola, T., Amnell, T. (2002) Detecting trends of annual
values of atmospheric pollutants by the Mann-Kendall test a d “e s slope esti ates –
the Excel template application MAKESENS. Finnish Meteorological Institute, Helsinki.
Shrestha, A. B., C. P. Wake, P. A. Mayewski, and J. E. Dibb, (1999) Maximum temperature
trends in the Himalaya and its vicinity: An analysis based on temperature records from
Nepal for the period 1971-94. Journal of Climate, 12, 2775-2787.
Shrestha A. B. and Devekota L. P. (2010) Climate Change in the Eastern Himalayas: Observed
Trends and Model Projections. Climate Change Impact and Vulnerability in the Eastern
Himalayas - Technical Report 1. ICIMOD, Kathmandu
Shrestha A.B.; Bajracharya S.; Sharma A.R.; Duo C.; Kulkarni A (2016) Observed trends and
changes in daily temperature and precipitation extremes over the Koshi river basin
1975–2010. J. Climatology DOI: 10.1002/joc.4761
Yatagai, A., Arakawa, O., Kamiguchi, K., Kawamoto, H., Nodzu, M.I., Hamada, A., (2009). A 44-
year daily gridded precipitation dataset for Asia based on a dense network of rain
gauges. Sci. Online Lett. Atmos. 5, 137–140.
Yatagai A, Kamiguchi K, Arakawa O, Hamada A, Yasutomi N, Kitoh A (2012) APHRODITE:
Constructing a long-term daily gridded precipitation dataset for Asia based on a dense
network of rain gauges. Bulletin of the American Meteorological Society 93:1401–1
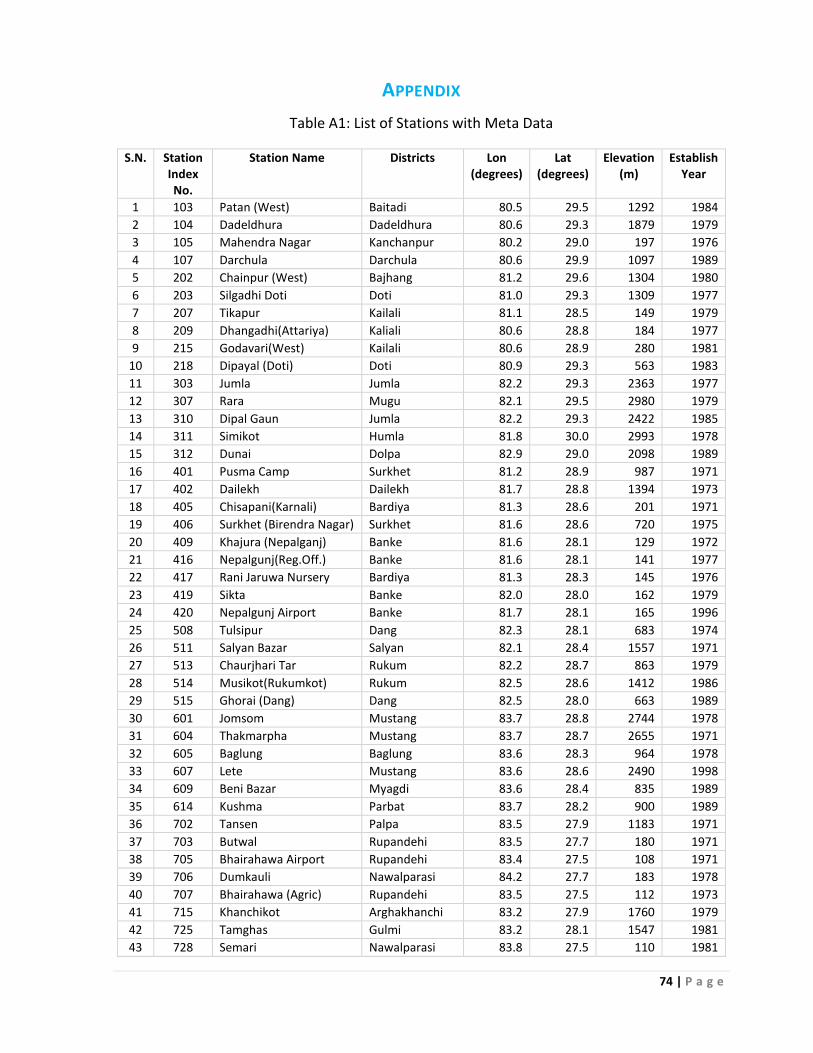
74 | P a g e
APPENDIX
Table A1: List of Stations with Meta Data
S.N. Station
Index
No.
Station Name Districts Lon
(degrees)
Lat
(degrees)
Elevation
(m)
Establish
Year
1 103 Patan (West) Baitadi 80.5 29.5 1292 1984
2 104 Dadeldhura Dadeldhura 80.6 29.3 1879 1979
3 105 Mahendra Nagar Kanchanpur 80.2 29.0 197 1976
4 107 Darchula Darchula 80.6 29.9 1097 1989
5 202 Chainpur (West) Bajhang 81.2 29.6 1304 1980
6 203 Silgadhi Doti Doti 81.0 29.3 1309 1977
7 207 Tikapur Kailali 81.1 28.5 149 1979
8 209 Dhangadhi(Attariya) Kaliali 80.6 28.8 184 1977
9 215 Godavari(West) Kailali 80.6 28.9 280 1981
10 218 Dipayal (Doti) Doti 80.9 29.3 563 1983
11 303 Jumla Jumla 82.2 29.3 2363 1977
12 307 Rara Mugu 82.1 29.5 2980 1979
13 310 Dipal Gaun Jumla 82.2 29.3 2422 1985
14 311 Simikot Humla 81.8 30.0 2993 1978
15 312 Dunai Dolpa 82.9 29.0 2098 1989
16 401 Pusma Camp Surkhet 81.2 28.9 987 1971
17 402 Dailekh Dailekh 81.7 28.8 1394 1973
18 405 Chisapani(Karnali) Bardiya 81.3 28.6 201 1971
19 406 Surkhet (Birendra Nagar) Surkhet 81.6 28.6 720 1975
20 409 Khajura (Nepalganj) Banke 81.6 28.1 129 1972
21 416 Nepalgunj(Reg.Off.) Banke 81.6 28.1 141 1977
22 417 Rani Jaruwa Nursery Bardiya 81.3 28.3 145 1976
23 419 Sikta Banke 82.0 28.0 162 1979
24 420 Nepalgunj Airport Banke 81.7 28.1 165 1996
25 508 Tulsipur Dang 82.3 28.1 683 1974
26 511 Salyan Bazar Salyan 82.1 28.4 1557 1971
27 513 Chaurjhari Tar Rukum 82.2 28.7 863 1979
28 514 Musikot(Rukumkot) Rukum 82.5 28.6 1412 1986
29 515 Ghorai (Dang) Dang 82.5 28.0 663 1989
30 601 Jomsom Mustang 83.7 28.8 2744 1978
31 604 Thakmarpha Mustang 83.7 28.7 2655 1971
32 605 Baglung Baglung 83.6 28.3 964 1978
33 607 Lete Mustang 83.6 28.6 2490 1998
34 609 Beni Bazar Myagdi 83.6 28.4 835 1989
35 614 Kushma Parbat 83.7 28.2 900 1989
36 702 Tansen Palpa 83.5 27.9 1183 1971
37 703 Butwal Rupandehi 83.5 27.7 180 1971
38 705 Bhairahawa Airport Rupandehi 83.4 27.5 108 1971
39 706 Dumkauli Nawalparasi 84.2 27.7 183 1978
40 707 Bhairahawa (Agric) Rupandehi 83.5 27.5 112 1973
41 715 Khanchikot Arghakhanchi 83.2 27.9 1760 1979
42 725 Tamghas Gulmi 83.2 28.1 1547 1981
43 728 Semari Nawalparasi 83.8 27.5 110 1981
75 | P a g e
44 802 Khudi Bazar Lamjung 84.4 28.3 838 1971
45 804 Pokhara Airport Kaski 84.0 28.2 827 1971
46 805 Syangja Syangia 83.9 28.1 871 1980
47 809 Gorkha Gorkha 84.6 28.0 724 1973
48 810 Chapkot Syangja 83.8 27.9 460 1981
49 811 Malepatan (Pokhara) Kaski 84.0 28.2 859 1971
50 814 Lumle Kaski 83.8 28.3 1738 1971
51 815 Khairini Tar Tanahun 84.1 28.0 515 1972
52 816 Chame Manang 84.2 28.6 2680 1978
53 902 Rampur Chitawan 84.4 27.7 189 1972
54 906 Hetaunda N.F.I. Makwanpur 85.0 27.4 452 1972
55 909 Simara Airport Bara 85.0 27.2 137 1972
56 911 Parwanipur Bara 84.9 27.1 87 1972
57 922 Gaur Routahat 85.3 26.8 77 1989
58 1004 Nuwakot Nuwakot 85.2 27.9 966 1983
59 1007 Kakani Nuwakot 85.3 27.8 2034 1972
60 1022 Godavari Lalitpur 85.4 27.6 1527 1972
61 1024 Dhulikhel Kabhre 85.6 27.6 1543 1986
62 1029 Khumaltar Lalitpur 85.3 27.7 1334 1971
63 1030 Kathmandu Airport Kathmandu 85.4 27.7 1337 1971
64 1036 Panchkhal Kabhre 85.6 27.6 857 1979
65 1038 Dhunibesi Dhading 85.2 27.7 991 1973
66 1039 Panipokhari(Kathmandu) Kathmandu 85.3 27.7 1329 1974
67 1043 Nagarkot Bhaktapur 85.5 27.7 2147 1977
68 1055 Dhunche Rasuwa 85.3 28.1 1993 1989
69 1071 Buddhanilakantha Kathmandu 85.4 27.8 1428 1987
70 1073 Khokana Lalitpur 85.3 27.6 1309 1998
71 1103 Jiri Dolkha 86.2 27.6 1877 1971
72 1107 Sindhuli Madhi Sindhuli 85.9 27.2 556 1989
73 1111 Janakpur Airport Dhanusa 85.9 26.7 76 1971
74 1118 Manusmara Sarlahi 85.4 26.9 90 1987
75 1121 Karmaiya Sarlahi 85.5 27.1 139 1985
76 1122 Jalesore Mahottari 85.8 26.7 68 1989
77 1206 Okhaldhunga Okhaldhunga 86.5 27.3 1731 1971
78 1212 Phatepur Saptari 86.9 26.7 83 1982
79 1213 Udayapur Gadhi Udayapur 86.5 26.9 469 1989
80 1223 Rajbiraj Saptari 86.7 26.5 68 1985
81 1303 Chainpur (East) Sankhuwasabha 87.3 27.3 1277 1987
82 1304 Pakhribas Dhankuta 87.3 27.0 1720 1987
83 1307 Dhankuta Dhankuta 87.3 27.0 1192 1976
84 1311 Dharan Bazar Sunsari 87.3 26.8 310 1998
85 1314 Terhathum Terhathum 87.5 27.1 1525 1989
86 1319 Biratnagar Airport Morang 87.3 26.5 72 1972
87 1320 Tarahara Sunsari 87.3 26.7 120 1987
88 1405 Taplejung Taplejung 87.7 27.4 1744 1971
89 1407 Ilam Tea Estate Ilam 87.9 26.9 1208 1972
90 1416 Kanyam Tea Estate Ilam 88.1 26.9 1570 1973
91 1419 Phidim (Panchther) Panchther 87.8 27.1 1157 1973
92 1421 Gaida (Kankai) Jhapa 87.9 26.7 107 1985
93 2000 Pyramid Solukhumbu 86.8 28.0 5035 1992
76 | P a g e
Table A2: Maximum temperature coefficient (lapse rate) (o C/km)
Months
Maximum temperature
coefficient "lapse rate"
Minimum temperature
coefficient "lapse rate"
Doti :
Simikot
Jiri:
Pyramid
Doti :
Simikot
Jiri:
Pyramid
Jan -5.45 -5.81 -7.57 -3.20
Feb -6.71 -6.41 -8.67 -3.99
Mar -7.47 -6.77 -8.07 -4.34
Apr -6.87 -6.87 -5.96 -4.58
May -6.74 -6.36 -5.80 -4.81
Jun -5.76 -5.73 -6.01 -4.97
Jul -4.65 -5.59 -5.10 -4.97
Aug -4.92 -5.71 -5.04 -5.00
Sep -4.93 -6.01 -5.46 -5.06
Oct -4.92 -6.26 -6.56 -4.74
Nov -4.83 -5.75 -6.47 -3.66
Dec -3.90 -5.36 -7.87 -2.90
77 | P a g e
Table A3a: Seasonal and Annual Climatic Normals for 75 Districts
Precipitaton (mm) Maximum Temperature (oC) Minimum Temperature (oC)
Winte
r
Pre-
mons
oon
Monso
on
Post-
mons
oon
Annual Winte
r
Pre-
mons
oon
mon
soon
Post-
mons
oon
Annu
al
Win
ter
Pre-
mon
soon
mon
soon
Post-
mons
oon
Annual
Achham 109.9 166.7 1051.4 51.4 1379.0 17.7 27.0 28.2 23.3 24.5 5.0 13.1 18.9 10.9 12.6
Arghakhanchi 57.5 141.7 1367.0 61.4 1627.7 19.6 28.4 28.9 25.3 25.8 7.2 15.5 20.9 13.6 14.9
Baglung 62.4 186.6 1610.4 59.0 1918.5 13.2 20.0 22.6 18.2 18.9 5.0 8.1 14.2 6.8 8.3
Baitadi 107.1 203.5 1110.1 51.9 1472.4 16.9 25.5 27.1 22.4 23.4 4.1 11.8 18.0 9.9 11.6
Bajhang 103.0 162.3 1012.5 46.6 1323.9 7.6 13.8 17.9 12.6 13.4 -3.8 2.3 8.8 0.7 2.6
Bajura 100.3 148.1 728.9 46.8 1023.8 9.9 16.6 20.3 15.2 15.9 -2.4 4.2 10.8 2.6 4.5
Banke 49.7 85.9 1024.7 50.6 1210.8 23.3 34.4 33.5 29.5 30.5 9.3 18.7 24.6 16.4 17.9
Bara 34.9 171.8 1419.2 66.4 1692.3 24.0 33.6 33.3 30.1 30.5 9.8 19.0 25.0 17.3 18.4
Bardiya 64.8 94.0 1252.8 54.7 1466.3 22.8 33.9 33.2 29.1 30.1 9.3 18.6 24.7 16.4 17.9
Bhaktapur 43.3 202.1 1173.8 54.2 1473.2 17.9 25.6 26.8 23.0 23.7 4.7 12.3 18.6 11.0 12.3
Bhojpur 33.8 241.2 1091.0 69.6 1435.5 17.9 25.0 26.3 23.1 23.3 5.8 13.2 18.6 12.0 12.9
Chitawan 44.5 211.1 1460.7 67.4 1783.7 23.0 32.6 32.5 28.8 29.5 9.2 18.0 23.8 16.3 17.4
Dadeldhura 108.5 164.9 1151.6 52.8 1477.5 17.1 26.4 27.5 22.6 23.8 4.3 12.3 17.8 10.0 11.7
Dailekh 82.1 141.2 952.8 43.2 1219.3 22.0 31.8 31.4 27.6 28.5 8.1 17.2 22.7 14.8 16.4
Dang 52.7 114.8 1230.9 59.6 1457.9 8.1 14.6 18.5 13.2 14.1 -3.1 3.1 9.5 1.5 3.4
Darchula 96.1 180.8 1079.9 46.9 1403.4 18.0 27.2 28.2 23.8 24.7 5.4 13.5 19.5 11.5 13.1
Dhading 48.3 217.8 1366.2 51.7 1683.9 17.0 24.7 26.2 22.1 22.8 4.7 12.0 17.7 10.7 11.8
Dhankuta 29.4 185.9 847.8 57.8 1120.8 19.5 26.7 27.7 24.8 24.9 7.3 15.0 20.2 13.6 14.6
Dhanusa 24.7 151.6 1075.8 59.7 1311.8 24.4 33.4 33.1 30.2 30.5 10.4 19.5 25.2 18.1 18.9
Dolakha 39.6 200.8 1253.0 60.0 1553.3 9.6 15.3 18.5 14.4 14.8 -1.5 4.4 11.0 3.5 5.0
Dolpa 37.8 68.3 352.8 28.1 487.0 0.7 4.9 11.2 5.4 6.1 -9.0 -4.5 3.0 -5.2 -3.3
Doti 107.9 161.5 1093.8 52.5 1415.4 17.1 26.1 27.4 22.7 23.7 4.5 12.4 18.5 10.4 12.1
Gorkha 52.0 196.9 1016.1 47.4 1312.3 0.1 14.8 18.3 13.8 12.1 -1.4 4.3 9.9 3.2 4.6
Gulmi 63.5 199.0 1512.9 52.0 1827.4 18.3 26.5 27.6 23.7 24.4 5.9 13.7 19.2 12.0 13.3
Humla 75.8 119.3 421.5 39.4 655.7 2.0 6.7 12.4 7.1 7.5 -8.8 -3.5 3.5 -4.5 -2.7
Ilam 36.1 259.9 1677.8 96.1 2069.9 19.0 26.0 27.4 24.6 24.5 7.1 14.8 19.9 13.5 14.4
Jajarkot 84.3 141.1 1088.3 58.2 1372.0 13.7 21.5 23.9 18.8 19.9 0.5 7.7 14.2 5.8 7.8
Jhapa 30.8 262.0 1936.3 117.5 2346.6 24.4 32.6 32.7 30.2 30.2 10.7 19.5 24.5 17.8 18.7
Jumla 80.6 138.8 598.2 43.6 861.4 7.4 13.1 17.6 12.3 13.0 -5.4 0.5 8.0 -1.0 1.3
Kailali 83.4 109.8 1472.3 53.8 1719.0 18.0 25.9 27.1 23.2 23.9 5.0 12.6 18.9 11.4 12.6
Kalikot 89.8 142.1 557.1 41.9 830.9 21.8 32.8 32.3 28.1 29.1 8.8 17.9 23.8 15.7 17.2
Kanchanpur 74.8 94.0 1430.9 55.3 1655.0 11.5 18.9 21.9 16.7 17.7 -1.0 5.8 12.1 3.9 5.9
Kapilbastu 43.8 100.2 1331.1 56.9 1532.0 23.0 33.9 33.5 29.5 30.3 9.4 18.7 24.7 16.5 18.0
Kaski 78.4 356.5 2173.2 102.5 2710.5 23.9 34.2 33.5 30.1 30.7 10.4 19.7 25.1 17.5 18.8
Kathmandu 46.9 217.2 1345.6 57.1 1666.6 11.4 17.6 20.8 16.3 16.9 0.3 6.3 12.2 5.3 6.6
Kavrepalanch
ok
39.2 171.0 1046.7 54.5 1311.3 17.4 25.0 26.3 22.4 23.1 4.4 11.8 18.1 10.6 11.9
Khotang 35.2 201.6 1104.5 60.9 1402.2 18.1 25.2 26.4 23.3 23.5 5.8 13.3 18.8 12.1 13.1
Lalitpur 50.7 195.2 1297.2 61.0 1603.9 17.3 24.9 26.3 22.4 23.0 4.3 11.9 18.2 10.6 11.9
Lamjung 69.6 311.0 1695.7 76.4 2152.6 13.2 19.9 22.5 18.1 18.8 1.7 8.1 13.6 6.9 8.2
Mahottari 27.1 150.7 1071.6 59.5 1308.9 24.2 33.4 33.1 30.1 30.4 10.2 19.4 25.1 17.9 18.7
Makwanpur 45.2 217.0 1622.7 76.6 1961.4 20.6 29.2 29.7 26.0 26.7 7.1 15.4 21.3 13.9 15.1
Manang 56.5 107.1 406.2 42.4 612.0 -0.7 3.1 8.9 3.8 4.2 -9.3 -5.4 0.3 -6.2 -4.6
Morang 33.4 237.5 1491.7 101.3 1863.9 23.8 31.7 31.9 29.4 29.4 10.1 18.8 24.1 17.3 18.1
Mugu 74.4 131.6 554.0 41.1 801.0 5.3 10.4 15.6 10.3 10.8 -6.6 -1.0 6.4 -2.2 -0.1
Mustang 25.6 44.7 166.6 21.0 257.8 0.2 4.3 10.2 4.7 5.3 -8.9 -4.8 1.9 -5.5 -3.7
Myagdi 59.8 176.7 1247.5 62.2 1546.2 7.0 12.4 16.7 11.8 12.4 -3.4 1.9 8.3 0.9 2.5
Nawalparasi 51.4 205.4 1622.8 73.2 1952.8 22.8 32.7 32.7 28.8 29.6 9.3 18.1 23.9 16.3 17.5
78 | P a g e
Nuwakot 54.4 243.7 1820.1 67.8 2185.9 17.8 25.5 26.8 22.8 23.6 5.1 12.5 18.4 11.3 12.4
Okhaldhunga 32.5 185.2 1107.0 60.1 1384.8 17.0 24.1 25.4 22.1 22.4 4.7 12.0 17.9 10.9 12.0
Palpa 51.4 169.7 1399.7 59.6 1680.5 19.7 28.6 29.2 25.4 26.1 7.2 15.2 20.7 13.6 14.8
Panchthar 41.1 271.4 1087.0 69.3 1468.8 16.3 22.8 24.7 21.6 21.6 5.0 12.0 17.4 10.8 11.8
Parbat 64.1 274.9 2169.5 80.2 2588.7 17.9 25.5 27.0 23.0 23.7 5.2 12.4 18.2 11.1 12.3
Parsa 34.8 159.4 1308.8 62.7 1565.6 23.7 33.4 33.1 29.7 30.3 9.6 18.7 24.6 17.0 18.1
Pyuthan 60.3 152.2 1264.5 54.4 1531.6 18.3 26.7 27.7 23.7 24.4 5.6 13.7 19.3 11.8 13.2
Ramechhap 33.4 175.2 1037.8 53.0 1299.4 14.2 20.9 23.0 19.3 19.7 2.2 9.0 15.3 8.0 9.2
Rasuwa 42.8 125.3 860.7 46.0 1074.7 5.5 10.5 14.6 10.1 10.6 -4.2 0.9 6.9 0.1 1.5
Rautahat 30.7 154.9 1285.5 66.8 1537.8 15.8 23.6 25.2 20.8 21.7 3.1 10.7 16.7 8.9 10.5
Rolpa 71.7 157.8 1171.5 57.2 1458.2 24.2 33.8 33.6 30.4 30.8 10.2 19.4 25.3 17.8 18.8
Rukum 65.6 139.7 1031.1 55.6 1292.1 11.2 17.9 21.2 16.1 17.1 -0.8 5.7 12.5 4.4 6.1
Rupandehi 47.0 121.5 1502.7 74.3 1745.4 23.8 34.3 33.6 30.2 30.7 10.4 19.7 25.2 17.7 18.9
Salyan 64.8 110.3 935.1 52.7 1162.9 19.2 28.4 28.7 24.4 25.5 5.6 13.9 19.8 11.8 13.4
Sankhuwasab
ha
50.9 385.4 1513.6 99.5 2049.4 25.0 33.4 33.1 30.7 30.7 10.6 19.7 25.0 18.2 18.9
Saptari 27.7 166.0 1140.2 68.2 1402.0 24.2 33.6 33.4 30.2 30.6 10.2 19.4 25.2 17.9 18.8
Sarlahi 29.2 152.7 1221.4 69.9 1473.2 10.0 15.7 18.8 14.9 15.2 -0.1 5.7 11.4 4.7 6.0
Sindhuli 36.2 205.4 1376.3 80.9 1698.8 21.3 29.6 30.0 26.8 27.2 7.8 16.1 22.0 14.8 15.8
Sindhupalcho
k
51.9 218.4 1687.8 77.0 2034.9 11.9 18.3 21.0 16.8 17.4 0.3 6.7 13.0 5.7 7.0
Siraha 26.3 151.0 1047.1 61.4 1285.7 24.6 33.4 33.1 30.4 30.6 10.5 19.6 25.1 18.2 19.0
Solukhumbu 30.5 138.1 1040.8 48.8 1257.9 3.6 8.1 12.5 8.3 8.5 -5.4 -0.7 5.6 -1.3 0.1
Sunsari 32.8 226.9 1433.6 101.1 1794.3 24.5 32.6 32.5 30.1 30.1 10.4 19.3 24.7 17.8 18.6
Surkhet 77.8 115.1 1148.1 51.1 1391.9 20.1 30.3 30.4 25.9 27.0 7.0 15.7 21.5 13.4 15.1
Syangja 54.5 268.5 1729.9 65.2 2118.4 20.0 28.3 29.3 25.3 26.0 7.1 14.7 20.5 13.4 14.5
Tanahu 56.4 330.7 1472.4 65.7 1925.2 21.5 30.3 30.9 27.0 27.8 8.2 16.3 22.1 14.9 16.0
Taplejung 40.6 271.4 1087.0 69.3 1468.4 5.2 9.8 14.3 10.1 10.2 -3.5 1.5 7.3 0.7 2.0
Terhathum 34.6 244.5 846.4 53.9 1179.4 17.4 24.1 25.8 22.7 22.8 5.8 13.0 18.2 11.7 12.7
Udayapur 30.7 177.0 1076.0 65.5 1349.3 22.5 30.4 30.6 27.9 28.1 8.9 17.3 22.8 16.1 16.8
79 | P a g e
Table A3b: Seasonal and Annual Climatic Normals for Physiographic Region
Precipitation (mm) Maximum Temperature (oC) Minimum Temperature (oC)
Win
ter
Pre-
mons
oon
monso
on
Post
-
mon
soon
Annual Win
ter
Pre-
mon
soon
mon
soon
Post
-
mon
soon
Ann
ual
Win
ter
Pre-
mons
oon
mon
soon
Post-
monso
on
Annua
l
High
Himalayas
49.6 105.4 502.9 36.5 694.2 11.8 18.5 21.5 16.9 17.6 -9.1 -4.8 2.0 -5.5 -3.8
High
Mountains
72.6 202.7 1189.8 62.9 1527.9 11.8 18.5 21.5 16.9 17.6 -0.2 6.4 12.8 5.0 6.6
Mid
Mountain
60.2 212.9 1292.7 61.7 1627.4 18.6 26.8 27.8 23.9 24.6 5.8 13.6 19.4 12.0 13.3
Siwaliks 52.0 160.9 1426.3 69.4 1708.5 22.6 32.5 32.4 28.5 29.3 8.9 17.7 23.5 15.9 17.1
Terai 41.7 149.5 1339.1 70.2 1600.4 23.9 34.1 33.9 30.3 30.8 10.3 19.5 25.2 17.7 18.8
80 | P a g e
Table A5a: District Precipitation Trends with Corresponding Significance Levels
S.N. Districts
Winter Pre-monsoon Monsoon Post-monsoon Annual
α Trend α Trend α Trend α Trend α Trend
1 Achham 0 -0.16 0 -0.61111 0 2.38 0 -0.45 0 1.628571
2 Arghakhanchi 0 0.14 0 1.073317 0 -1.53 0 -0.56 0 -3.0477
3 Baglung 0 -0.22 0 -0.19858 0 4.53 0 -0.62 0 2.38447
4 Baitadi 0 0.01 0 -0.68915 0 2.21 0 -0.23 0 1.302564
5 Bajhang 0 -0.20 0 -1.26754 0 2.67 0 -0.28 0 -0.49
6 Bajura 0 -0.18 0 -0.82333 0 1.91 0 -0.05 0 0.935453
7 Banke 0 0.23 + 0.812944 0 3.94 0 -0.11 0 3.752963
8 Bara 0 -0.15 0 0.052421 0 -2.72 0 -0.62 0 -4.64427
9 Bardiya 0 0.41 0 0.6734 + 6.56 0 -0.18 * 7.864615
10 Bhaktapur 0 0.02 0 0.56125 0 -0.20 0 -0.31 0 -0.09457
11 Bhojpur 0 -0.16 0 0.085484 0 -0.47 0 -0.79 0 -2.18021
12 Chitawan 0 -0.12 + 1.708489 0 0.17 0 -0.33 0 1.319968
13 Dadeldhura 0 0.08 0 -0.50238 0 0.44 0 -0.17 0 0.643
14 Dailekh 0 0.05 0 -0.41769 0 -0.12 0 -0.36 0 -1.18278
15 Dang 0 0.14 0 0.672059 0 -1.28 0 -0.62 0 -2.27303
16 Darchula 0 -0.28 0 -0.86389 0 1.13 0 -0.38 0 -1.03459
17 Dhading 0 -0.19 0 -0.144 0 -2.94 0 -0.77 + -3.86083
18 Dhankuta 0 -0.09 0 0.023846 0 -1.91 0 -0.53 0 -2.76092
19 Dhanusa 0 -0.20 + 1.467619 0 3.60 0 -0.40 0 4.135667
20 Dolakha 0 -0.26 + -1.52972 ** -5.63 0 -0.45 ** -7.72086
21 Dolpa 0 0.00 0 -0.45936 0 1.19 0 -0.13 0 0.210714
22 Doti 0 0.29 0 -0.44273 0 3.47 0 -0.33 0 1.948684
23 Gorkha 0 -0.19 0 -0.7214 0 -1.38 0 -0.45 0 -3.35296
24 Gulmi 0 0.15 0 0.917148 0 5.40 0 -0.73 0 5.11581
25 Humla 0 0.51 * -1.3 0 -0.19 0 0.03 0 -0.7395
26 Ilam 0 -0.20 0 0.450877 * -7.50 0 -0.60 * -9.56731
27 Jajarkot 0 0.10 0 -0.5075 0 -0.34 0 -0.65 0 -2.945
28 Jhapa 0 -0.04 + 1.606224 0 -0.21 0 -0.23 0 1.495135
29 Jumla 0 0.09 0 -0.64776 0 0.30 0 -0.08 0 -0.57946
30 Kailali 0 0.48 0 0.469982 0 3.04 0 -0.22 0 3.443212
31 Kalikot 0 -0.48 0 -0.76944 0 -0.06 0 -0.25 0 -1.82952
32 Kanchanpur 0 0.45 0 0.358333 0 3.96 0 -0.26 0 5.23
33 Kapilbastu 0 0.19 0 0.672222 0 -1.86 0 -0.59 0 -2.17636
34 Kaski 0 -0.10 0 -1.37321 + -7.59 0 -1.30 * -11.4408
35 Kathmandu 0 -0.02 0 0.437647 0 0.83 0 -0.38 0 1.000962
36 Kavrepalanchok 0 -0.09 0 -0.03929 0 -2.44 0 -0.18 0 -2.45481
37 Khotang 0 -0.15 0 0.736667 0 -1.94 0 -0.59 0 -3.04
38 Lalitpur 0 0.118333 0 0.21 0 -4.94 0 -0.24 + -4.95
39 Lamjung 0 -0.02926 0 -0.81 0 -3.99 0 -0.76 + -6.47
81 | P a g e
40 Mahottari 0 -0.07906 * 1.36 0 2.23 0 -0.50 0 2.79
41 Makwanpur 0 -0.13284 0 0.07 0 -3.96 0 -0.44 0 -5.13
42 Manang 0 0.240783 + -0.70 ** -2.76 + -0.52 ** -3.88
43 Morang 0 -0.0375 * 2.00 0 -0.67 0 -0.57 0 0.04
44 Mugu 0 0.238889 0 -0.62 0 -1.15 0 0.01 0 -1.84
45 Mustang 0 0.120606 0 -0.23 + -0.94 0 -0.20 * -1.16
46 Myagdi 0 -0.04308 0 -0.33 0 4.14 0 -0.60 0 2.18
47 Nawalparasi 0 0.088429 0 1.58 0 2.64 0 -0.30 0 3.72
48 Nuwakot 0 -0.13843 0 -0.09 0 -1.97 + -0.99 0 -2.74
49 Okhaldhunga 0 -0.12804 0 0.12 0 -2.24 0 -0.47 0 -2.69
50 Palpa 0 0.005124 0 1.04 0 0.77 0 -0.51 0 0.81
51 Panchthar 0 0.227083 0 -0.33 0 -0.43 0 -0.70 0 -1.39
52 Parbat 0 0.021637 0 0.98 * 8.65 0 -0.52 * 8.80
53 Parsa 0 -0.19125 0 0.50 0 -1.53 0 -0.43 0 -1.43
54 Pyuthan 0 0.087302 0 0.21 0 -1.88 0 -0.68 0 -3.69
55 Ramechhap 0 -0.21996 * -1.19 *** -6.67 + -0.73 *** -9.22
56 Rasuwa 0 -0.58578 ** -1.31 0 -0.07 ** -1.04 + -2.60
57 Rautahat 0 -0.1265 0 0.21 0 -2.16 0 -0.39 0 -1.79
58 Rolpa 0 0.031067 0 -0.48 0 -3.92 0 -0.40 * -5.19
59 Rukum 0 -0.12381 0 -0.70 0 -2.50 0 -0.37 0 -3.80
60 Rupandehi 0 0.176389 0 0.89 0 -2.70 0 -0.42 0 -3.28
61 Salyan 0 0.083283 0 0.00 0 -0.51 0 -0.22 0 -1.04
62 Sankhuwasabha 0 0.003472 0 -1.14 0 -3.22 0 -0.91 0 -4.68
63 Saptari 0 -0.196 * 1.44 0 -0.92 0 -0.26 0 -0.24
64 Sarlahi 0 -0.00757 0 1.04 0 1.13 0 -0.28 0 1.23
65 Sindhuli 0 -0.2151 0 -0.37 * -6.82 0 -0.98 * -8.14
66 Sindhupalchok 0 -0.05833 0 -0.10 0 -0.54 0 -0.06 0 -0.19
67 Siraha 0 -0.20185 0 0.71 0 -1.76 0 -0.44 0 -1.62
68 Solukhumbu 0 -0.35813 0 -0.15 0 -3.03 * -0.94 0 -4.36
69 Sunsari 0 -0.09722 ** 2.19 0 -0.79 0 -0.20 0 0.72
70 Surkhet 0 0.203613 0 0.04 0 0.72 0 -0.41 0 0.28
71 Syangja 0 -0.10683 0 0.69 * 9.04 0 -0.53 * 8.99
72 Tanahu 0 0.030075 0 0.10 0 4.77 0 -0.18 0 3.76
73 Taplejung 0 0.248437 0 -0.33 0 -0.43 0 -0.70 0 -1.36
74 Terhathum 0 0.213393 0 0.03 0 2.54 0 -0.40 0 2.99
75 Udayapur 0 -0.21514 0 0.80 0 -3.81 0 -0.68 0 -3.35
Note: * 95%, ** 99% and *** 99.9% Significant; '+' & '0': Insignificant
82 | P a g e
Table A6a: District maximum temperature trends with corresponding significance levels
S.N. Districts Winter Pre-monsoon Monsoon Post-monsoon Annual
α Trend α Trend α Trend α Trend α Trend
1 Achham *** 0.047 *** 0.057 *** 0.063 *** 0.047 *** 0.056052
2 Arghakhanchi ** 0.019 * 0.029 *** 0.043 *** 0.034 *** 0.034
3 Baglung *** 0.050 *** 0.047 *** 0.055 *** 0.057 *** 0.055
4 Baitadi *** 0.056 *** 0.061 *** 0.066 *** 0.053 *** 0.062
5 Bajhang *** 0.103 *** 0.077 *** 0.072 *** 0.072 *** 0.084
6 Bajura *** 0.086 *** 0.072 *** 0.065 *** 0.066 *** 0.077
7 Banke 0 -0.005 + 0.024 *** 0.034 ** 0.025 *** 0.020
8 Bara + -0.021 0 0.007 *** 0.030 0 0.016 0 0.010
9 Bardiya 0 -0.003 0 0.020 *** 0.036 *** 0.032 *** 0.024
10 Bhaktapur *** 0.043 *** 0.042 *** 0.043 *** 0.046 *** 0.044
11 Bhojpur *** 0.062 *** 0.057 *** 0.053 *** 0.064 *** 0.057
12 Chitawan 0 0.002 * 0.034 *** 0.048 ** 0.029 *** 0.027
13 Dadeldhura *** 0.036 *** 0.045 *** 0.053 *** 0.046 *** 0.047
14 Dailekh *** 0.064 *** 0.081 *** 0.078 *** 0.061 *** 0.072
15 Dang ** 0.017 * 0.032 *** 0.037 *** 0.032 *** 0.031
16 Darchula *** 0.096 *** 0.086 *** 0.081 *** 0.073 *** 0.087
17 Dhading *** 0.047 *** 0.055 *** 0.059 *** 0.050 *** 0.052
18 Dhankuta *** 0.063 *** 0.055 *** 0.056 *** 0.065 *** 0.059
19 Dhanusa 0 0.007 + 0.022 *** 0.032 ** 0.033 *** 0.024
20 Dolakha *** 0.078 *** 0.050 *** 0.059 *** 0.067 *** 0.063
21 Dolpa *** 0.078 *** 0.065 *** 0.090 *** 0.078 *** 0.078
22 Doti *** 0.048 *** 0.051 *** 0.058 *** 0.046 *** 0.052
23 Gorkha *** 0.083 *** 0.070 *** 0.072 *** 0.072 *** 0.076
24 Gulmi *** 0.034 *** 0.046 *** 0.051 *** 0.043 *** 0.045
25 Humla *** 0.104 *** 0.083 *** 0.068 *** 0.077 *** 0.085
26 Ilam *** 0.068 *** 0.058 *** 0.067 *** 0.070 *** 0.067
27 Jajarkot *** 0.066 *** 0.070 *** 0.071 *** 0.060 *** 0.072
28 Jhapa *** 0.035 ** 0.034 *** 0.053 *** 0.052 *** 0.044
29 Jumla *** 0.090 *** 0.078 *** 0.071 *** 0.080 *** 0.086
30 Kailali 0 -0.005 + 0.023 *** 0.038 ** 0.028 *** 0.023
31 Kalikot *** 0.089 *** 0.085 *** 0.075 *** 0.071 *** 0.082
32 Kanchanpur 0 -0.012 + 0.020 *** 0.033 ** 0.023 ** 0.018
33 Kapilbastu 0 -0.003 0 0.020 *** 0.035 ** 0.022 *** 0.021
34 Kaski *** 0.074 *** 0.060 *** 0.058 *** 0.069 *** 0.067
35 Kathmandu *** 0.044 *** 0.045 *** 0.045 *** 0.047 *** 0.044
36 Kavrepalanchok *** 0.037 *** 0.039 *** 0.043 *** 0.043 *** 0.042
37 Khotang *** 0.060 *** 0.052 *** 0.052 *** 0.066 *** 0.057
83 | P a g e
38 Lalitpur *** 0.043 *** 0.045 *** 0.046 *** 0.049 *** 0.045
39 Lamjung *** 0.078 *** 0.065 *** 0.065 *** 0.071 *** 0.070
40 Mahottari 0 0.001 0 0.013 *** 0.031 * 0.026 *** 0.019
41 Makwanpur * 0.016 ** 0.038 *** 0.045 *** 0.034 *** 0.034
42 Manang *** 0.118 *** 0.086 *** 0.071 *** 0.090 *** 0.092
43 Morang ** 0.028 ** 0.034 *** 0.046 *** 0.051 *** 0.040
44 Mugu *** 0.085 *** 0.070 *** 0.068 *** 0.075 *** 0.080
45 Mustang *** 0.092 *** 0.069 *** 0.065 *** 0.080 *** 0.080
46 Myagdi *** 0.068 *** 0.052 *** 0.059 *** 0.070 *** 0.065
47 Nawalparasi 0 -0.009 * 0.033 *** 0.049 + 0.018 *** 0.026
48 Nuwakot *** 0.038 *** 0.045 *** 0.050 *** 0.041 *** 0.045
49 Okhaldhunga *** 0.063 *** 0.052 *** 0.053 *** 0.067 *** 0.057
50 Palpa * 0.020 *** 0.045 *** 0.056 *** 0.039 *** 0.043
51 Panchthar *** 0.093 *** 0.073 *** 0.074 *** 0.085 *** 0.082
52 Parbat *** 0.059 *** 0.063 *** 0.057 *** 0.056 *** 0.059
53 Parsa 0 -0.014 + 0.023 *** 0.036 * 0.021 ** 0.017
54 Pyuthan *** 0.028 * 0.031 *** 0.045 *** 0.038 *** 0.040
55 Ramechhap *** 0.067 *** 0.047 *** 0.053 *** 0.065 *** 0.056
56 Rasuwa *** 0.077 *** 0.061 *** 0.063 *** 0.068 *** 0.069
57 Rautahat + -0.019 0 0.004 *** 0.026 0 0.018 0 0.009
58 Rolpa *** 0.047 ** 0.039 *** 0.051 *** 0.048 *** 0.048
59 Rukum *** 0.056 ** 0.042 *** 0.068 *** 0.060 *** 0.064
60 Rupandehi 0 -0.012 + 0.025 *** 0.043 ** 0.022 *** 0.021
61 Salyan *** 0.047 *** 0.052 *** 0.051 *** 0.044 *** 0.051
62 Sankhuwasabha *** 0.091 *** 0.056 *** 0.066 *** 0.078 *** 0.072
63 Saptari 0 0.017 + 0.025 *** 0.036 *** 0.044 *** 0.030
64 Sarlahi 0 -0.010 0 0.002 *** 0.029 + 0.019 + 0.013
65 Sindhuli *** 0.032 ** 0.035 *** 0.039 *** 0.043 *** 0.037
66 Sindhupalchok *** 0.063 *** 0.049 *** 0.053 *** 0.056 *** 0.055
67 Siraha 0 0.015 * 0.024 *** 0.034 *** 0.039 *** 0.029
68 Solukhumbu *** 0.100 *** 0.056 *** 0.068 *** 0.084 *** 0.076
69 Sunsari * 0.020 * 0.029 *** 0.040 *** 0.045 *** 0.033
70 Surkhet *** 0.032 *** 0.049 *** 0.052 *** 0.042 *** 0.044
71 Syangja *** 0.036 ** 0.046 *** 0.052 *** 0.043 *** 0.047
72 Tanahu *** 0.028 *** 0.044 *** 0.050 *** 0.038 *** 0.042
73 Taplejung *** 0.113 *** 0.072 *** 0.077 *** 0.094 *** 0.091
74 Terhathum *** 0.088 *** 0.068 *** 0.070 *** 0.082 *** 0.077
75 Udayapur *** 0.036 ** 0.038 *** 0.043 *** 0.056 *** 0.043
Note: Significance α : * 95% CL, ** 99% CL and *** 99.9% CL ; insignificant at 95% CL : + , 0
84 | P a g e
Table A7a: District minimum temperature trends with corresponding significance levels
S.N. Districts Winter Pre-monsoon Monsoon Post-monsoon Annual
α Trend α Trend α Trend α Trend α Trend
1 Achham + -0.018 0 -0.012 0 -0.001 + -0.016 0 -0.0043
2 Arghakhanchi 0 0.009 0 0.011 *** 0.018 0 0.004 ** 0.013
3 Baglung 0 -0.013 0 -0.006 ** 0.019 0 -0.005 0 0.003
4 Baitadi 0 -0.016 0 -0.007 * 0.015 + -0.018 0 0.000
5 Bajhang ** -0.048 + -0.028 0 -0.003 * -0.032 + -0.018
6 Bajura ** -0.044 + -0.025 0 -0.005 ** -0.034 + -0.019
7 Banke + 0.015 0 0.005 0 0.010 0 0.009 * 0.009
8 Bara ** 0.030 ** 0.023 *** 0.017 * 0.018 *** 0.023
9 Bardiya + 0.012 0 0.009 ** 0.017 0 0.013 *** 0.012
10 Bhaktapur * 0.018 * 0.016 *** 0.021 ** 0.016 *** 0.020
11 Bhojpur 0 0.009 0 0.004 0 0.008 0 0.002 0 0.007
12 Chitawan ** 0.022 ** 0.018 *** 0.022 * 0.028 *** 0.025
13 Dadeldhura 0 -0.012 0 -0.002 ** 0.016 0 -0.011 0 0.003
14 Dailekh 0 -0.012 0 -0.011 0 -0.009 * -0.021 + -0.010
15 Dang 0 0.005 0 0.006 ** 0.014 0 0.001 * 0.008
16 Darchula ** -0.045 + -0.024 0 -0.001 ** -0.035 + -0.016
17 Dhading 0 0.002 + 0.013 *** 0.027 * 0.019 *** 0.017
18 Dhankuta * 0.018 0 0.011 ** 0.014 0 0.006 * 0.014
19 Dhanusa *** 0.038 ** 0.029 *** 0.022 * 0.026 *** 0.029
20 Dolakha 0 -0.013 0 -0.006 ** 0.013 0 -0.007 0 -0.002
21 Dolpa ** -0.052 0 -0.016 ** 0.046 0 -0.017 0 0.000
22 Doti * -0.019 0 -0.013 0 0.007 0 -0.013 0 -0.003
23 Gorkha + -0.019 0 0.005 * 0.018 0 0.000 0 0.002
24 Gulmi 0 0.002 0 0.005 ** 0.013 0 0.003 0 0.007
25 Humla ** -0.076 + -0.032 0 -0.005 ** -0.037 * -0.028
26 Ilam 0 0.001 0 -0.004 0 0.004 0 -0.010 0 -0.001
27 Jajarkot 0 -0.014 0 -0.010 * 0.016 0 -0.011 0 0.000
28 Jhapa + 0.014 0 0.003 0 0.001 0 0.002 0 0.005
29 Jumla ** -0.051 0 -0.017 * 0.016 + -0.028 0 -0.012
30 Kailali * 0.017 + 0.012 ** 0.017 + 0.012 *** 0.016
31 Kalikot 0 0.000 0 0.005 * 0.015 0 0.004 + 0.011
32 Kanchanpur * -0.035 + -0.020 0 -0.008 * -0.033 * -0.018
33 Kapilbastu 0 0.009 0 0.014 ** 0.018 0 0.004 ** 0.016
34 Kaski * 0.022 ** 0.018 *** 0.018 0 0.006 *** 0.018
35 Kathmandu 0 -0.014 0 -0.004 0 0.005 0 -0.003 0 -0.002
36 Kavrepalanchok * 0.015 * 0.016 *** 0.023 ** 0.017 *** 0.020
37 Khotang 0 0.008 0 0.004 * 0.011 0 0.007 * 0.010
85 | P a g e
38 Lalitpur + 0.014 + 0.013 *** 0.019 * 0.013 *** 0.017
39 Lamjung 0 -0.009 0 0.007 + 0.015 0 0.009 0 0.008
40 Mahottari *** 0.039 ** 0.031 *** 0.019 * 0.023 *** 0.027
41 Makwanpur * 0.021 ** 0.018 *** 0.023 ** 0.024 *** 0.023
42 Manang ** -0.050 0 -0.019 0 -0.017 + -0.030 ** -0.030
43 Morang ** 0.024 + 0.013 * 0.010 0 0.007 ** 0.014
44 Mugu ** -0.055 0 -0.019 0 0.013 + -0.030 0 -0.011
45 Mustang ** -0.043 0 -0.016 0 0.013 * -0.027 + -0.014
46 Myagdi * -0.029 0 -0.015 * 0.016 0 -0.014 0 -0.004
47 Nawalparasi + 0.017 + 0.015 0 0.009 0 0.010 ** 0.015
48 Nuwakot 0 0.009 * 0.016 *** 0.024 ** 0.022 *** 0.021
49 Okhaldhunga 0 0.002 0 0.001 ** 0.014 0 0.002 + 0.008
50 Palpa 0 0.004 0 0.005 0 0.002 0 0.001 0 0.004
51 Panchthar 0 -0.001 0 0.001 *** 0.018 0 -0.006 0 0.007
52 Parbat 0 -0.002 0 -0.003 0 0.008 0 -0.001 0 0.003
53 Parsa ** 0.026 ** 0.018 *** 0.020 * 0.022 *** 0.023
54 Pyuthan 0 0.003 0 0.007 *** 0.019 0 0.003 * 0.009
55 Ramechhap 0 0.001 0 0.001 ** 0.014 0 0.001 0 0.005
56 Rasuwa + -0.020 0 -0.001 + 0.015 0 -0.005 0 -0.001
57 Rautahat 0 -0.004 0 -0.001 *** 0.021 0 0.001 + 0.008
58 Rolpa *** 0.033 *** 0.028 ** 0.026 * 0.019 0 0.025
59 Rukum + -0.019 0 -0.007 *** 0.038 0 0.002 0 0.008
60 Rupandehi * 0.021 * 0.014 ** 0.013 0 0.007 ** 0.017
61 Salyan 0 0.003 0 -0.001 *** 0.019 0 0.011 ** 0.012
62 Sankhuwasabha + -0.017 0 -0.010 0 0.005 0 -0.012 0 -0.007
63 Saptari *** 0.035 ** 0.022 * 0.011 * 0.020 *** 0.023
64 Sarlahi *** 0.037 *** 0.031 *** 0.019 * 0.021 *** 0.027
65 Sindhuli ** 0.027 ** 0.019 *** 0.017 + 0.018 *** 0.021
66 Sindhupalchok 0 -0.004 0 0.003 ** 0.014 0 0.004 0 0.006
67 Siraha *** 0.039 ** 0.026 *** 0.019 ** 0.028 *** 0.029
68 Solukhumbu ** -0.037 0 -0.016 0 0.007 0 -0.017 0 -0.010
69 Sunsari *** 0.032 * 0.019 ** 0.010 0 0.015 *** 0.019
70 Surkhet 0 -0.004 0 0.000 * 0.011 0 0.004 0 0.006
71 Syangja 0 0.006 0 0.005 + 0.008 0 0.007 * 0.009
72 Tanahu * 0.018 * 0.016 *** 0.026 * 0.025 *** 0.023
73 Taplejung * -0.034 0 -0.014 0 0.008 + -0.023 0 -0.010
74 Terhathum 0 0.007 0 0.007 ** 0.014 0 -0.003 + 0.009
75 Udayapur *** 0.028 * 0.019 ** 0.013 * 0.020 *** 0.020
Note: “ig ifica ce α : * 95% CL, ** 99% CL a d *** 99.9% CL; insignificant at 95% CL: +,
85 | P a g e
Table A8: District trends for extreme climate indices
Districts Rainy Days
Consecutive
dry days
Consecutive
wet days
Very wet
days
Extremely
wet days Warm days Cool days
Warm spell
duration Warm nights Cool nights
Cold spell
duration
α Trend α Trend α Trend α Trend α Trend α Trend α Trend α Trend α Trend α Trend α Trend
Achham 0 0.2 0 -0.2 0 0.2 0 0.0 0 0.0 *** 0.8 *** -0.8 * 0.3 0 -0.1 0 0.3 * 0.3
Arghakhanchi * 0.3 0 -0.2 * 0.3 0 -0.1 0 0.0 ** 0.7 ** -0.4 0 0.2 *** 0.8 0 0.0 0 0.2
Baglung 0 0.2 0 0.1 * 0.5 0 0.0 * -0.1 *** 1.4 *** -0.9 *** 0.4 ** 0.9 0 0.2 0 0.2
Baitadi 0 0.1 0 0.0 0 0.1 0 0.1 0 0.0 *** 1.2 *** -1.0 *** 0.4 ** 0.7 0 0.3 * 0.3
Bajhang 0 0.1 0 0.1 + 0.2 0 0.0 0 0.0 *** 1.6 *** -1.2 *** 0.3 0 0.0 ** 0.6 * 0.3
Bajura ** 0.7 * -0.6 *** 0.7 0 -0.1 ** -0.1 *** 1.4 *** -1.1 *** 0.4 0 -0.1 * 0.6 * 0.3
Banke 0 0.1 0 -0.1 0 -0.1 0 0.1 0 0.0 0 0.3 0 -0.1 0 0.2 0 0.2 0 -0.1 0 0.0
Bara 0 0.2 0 0.1 0 0.3 0 -0.1 0 0.0 0 0.2 0 0.2 0 0.0 *** 0.6 ** -0.5 + -0.2
Bardiya 0 0.1 0 -0.2 0 0.1 * 0.2 0 0.0 0 0.2 0 -0.1 0 0.2 * 0.5 0 -0.1 0 0.1
Bhaktapur 0 0.1 0 0.1 0 0.1 0 0.0 0 0.0 *** 1.0 *** -0.9 ** 0.3 *** 0.9 * -0.3 0 -0.1
Bhojpur *** 0.5 0 -0.2 *** 0.8 0 -0.1 0 0.0 *** 1.4 *** -1.1 *** 0.3 0 0.2 0 -0.1 0 0.0
Chitawan 0 0.0 0 0.1 0 0.1 0 0.0 0 0.0 ** 0.6 0 -0.2 0 0.2 *** 1.0 * -0.3 0 0.0
Dadeldhura 0 0.1 0 -0.1 0 0.0 0 0.0 0 0.0 *** 0.7 *** -0.6 * 0.3 ** 0.8 0 0.3 * 0.3
Dailekh 0 0.1 0 -0.1 0 0.2 0 -0.1 0 0.0 *** 1.0 *** -1.0 *** 0.4 0 -0.2 0 0.2 + 0.2
Dang 0 -0.1 0 0.1 0 -0.1 0 0.0 0 0.0 + 0.4 ** -0.4 0 0.2 * 0.5 0 0.0 + 0.2
Darchula 0 -0.1 + 0.3 0 0.0 0 0.0 0 0.0 *** 1.7 *** -1.1 *** 0.4 0 0.1 ** 0.6 * 0.2
Dhading 0 -0.3 + 0.4 0 -0.3 0 -0.1 * -0.1 *** 1.3 *** -0.8 *** 0.3 *** 1.2 0 -0.1 0 0.0
Dhankuta * 0.3 0 -0.2 ** 0.4 ** -0.1 * -0.1 *** 1.5 *** -1.1 *** 0.3 * 0.6 * -0.3 0 -0.1
Dhanusa + 0.3 0 -0.2 + 0.3 0 0.1 0 0.0 0 0.4 0 -0.2 0 0.1 *** 0.7 ** -0.5 0 -0.2
Dolakha 0 -0.2 0 0.2 0 -0.2 *** -0.3 *** -0.1 *** 1.5 *** -1.1 *** 0.3 + 0.5 0 0.1 0 0.2
Dolpa ** 0.5 0 -0.3 *** 0.7 + -0.2 * -0.1 *** 1.5 ** -0.7 *** 0.2 ** 1.0 + 0.4 + 0.2
Doti 0 0.1 0 -0.1 0 0.2 0 0.0 0 0.0 *** 0.8 *** -0.7 * 0.3 0 0.3 + 0.3 ** 0.3
Gorkha 0 0.2 0 -0.1 * 0.3 0 -0.1 * -0.1 *** 1.6 *** -1.1 *** 0.4 0 0.2 0 0.2 0 0.1
Gulmi + 0.3 0 -0.2 ** 0.5 0 0.0 0 0.0 *** 1.0 *** -0.7 ** 0.3 ** 0.6 0 0.1 + 0.2
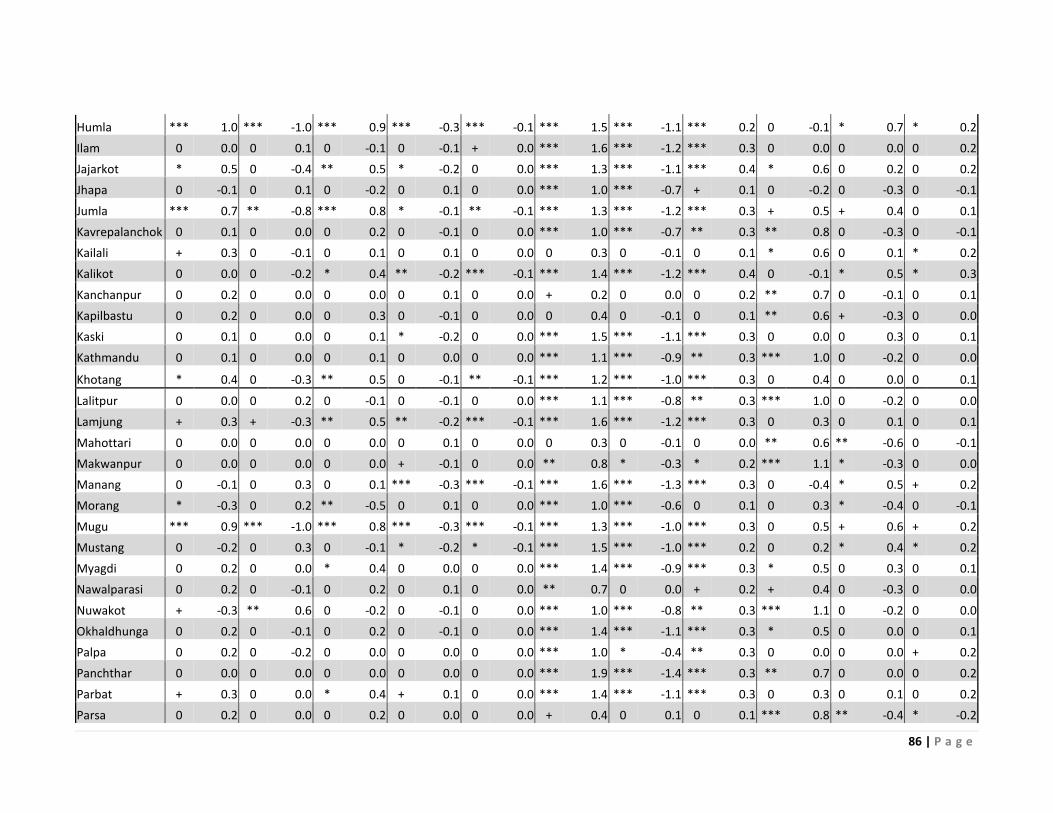
86 | P a g e
Humla *** 1.0 *** -1.0 *** 0.9 *** -0.3 *** -0.1 *** 1.5 *** -1.1 *** 0.2 0 -0.1 * 0.7 * 0.2
Ilam 0 0.0 0 0.1 0 -0.1 0 -0.1 + 0.0 *** 1.6 *** -1.2 *** 0.3 0 0.0 0 0.0 0 0.2
Jajarkot * 0.5 0 -0.4 ** 0.5 * -0.2 0 0.0 *** 1.3 *** -1.1 *** 0.4 * 0.6 0 0.2 0 0.2
Jhapa 0 -0.1 0 0.1 0 -0.2 0 0.1 0 0.0 *** 1.0 *** -0.7 + 0.1 0 -0.2 0 -0.3 0 -0.1
Jumla *** 0.7 ** -0.8 *** 0.8 * -0.1 ** -0.1 *** 1.3 *** -1.2 *** 0.3 + 0.5 + 0.4 0 0.1
Kavrepalanchok 0 0.1 0 0.0 0 0.2 0 -0.1 0 0.0 *** 1.0 *** -0.7 ** 0.3 ** 0.8 0 -0.3 0 -0.1
Kailali + 0.3 0 -0.1 0 0.1 0 0.1 0 0.0 0 0.3 0 -0.1 0 0.1 * 0.6 0 0.1 * 0.2
Kalikot 0 0.0 0 -0.2 * 0.4 ** -0.2 *** -0.1 *** 1.4 *** -1.2 *** 0.4 0 -0.1 * 0.5 * 0.3
Kanchanpur 0 0.2 0 0.0 0 0.0 0 0.1 0 0.0 + 0.2 0 0.0 0 0.2 ** 0.7 0 -0.1 0 0.1
Kapilbastu 0 0.2 0 0.0 0 0.3 0 -0.1 0 0.0 0 0.4 0 -0.1 0 0.1 ** 0.6 + -0.3 0 0.0
Kaski 0 0.1 0 0.0 0 0.1 * -0.2 0 0.0 *** 1.5 *** -1.1 *** 0.3 0 0.0 0 0.3 0 0.1
Kathmandu 0 0.1 0 0.0 0 0.1 0 0.0 0 0.0 *** 1.1 *** -0.9 ** 0.3 *** 1.0 0 -0.2 0 0.0
Khotang * 0.4 0 -0.3 ** 0.5 0 -0.1 ** -0.1 *** 1.2 *** -1.0 *** 0.3 0 0.4 0 0.0 0 0.1
Lalitpur 0 0.0 0 0.2 0 -0.1 0 -0.1 0 0.0 *** 1.1 *** -0.8 ** 0.3 *** 1.0 0 -0.2 0 0.0
Lamjung + 0.3 + -0.3 ** 0.5 ** -0.2 *** -0.1 *** 1.6 *** -1.2 *** 0.3 0 0.3 0 0.1 0 0.1
Mahottari 0 0.0 0 0.0 0 0.0 0 0.1 0 0.0 0 0.3 0 -0.1 0 0.0 ** 0.6 ** -0.6 0 -0.1
Makwanpur 0 0.0 0 0.0 0 0.0 + -0.1 0 0.0 ** 0.8 * -0.3 * 0.2 *** 1.1 * -0.3 0 0.0
Manang 0 -0.1 0 0.3 0 0.1 *** -0.3 *** -0.1 *** 1.6 *** -1.3 *** 0.3 0 -0.4 * 0.5 + 0.2
Morang * -0.3 0 0.2 ** -0.5 0 0.1 0 0.0 *** 1.0 *** -0.6 0 0.1 0 0.3 * -0.4 0 -0.1
Mugu *** 0.9 *** -1.0 *** 0.8 *** -0.3 *** -0.1 *** 1.3 *** -1.0 *** 0.3 0 0.5 + 0.6 + 0.2
Mustang 0 -0.2 0 0.3 0 -0.1 * -0.2 * -0.1 *** 1.5 *** -1.0 *** 0.2 0 0.2 * 0.4 * 0.2
Myagdi 0 0.2 0 0.0 * 0.4 0 0.0 0 0.0 *** 1.4 *** -0.9 *** 0.3 * 0.5 0 0.3 0 0.1
Nawalparasi 0 0.2 0 -0.1 0 0.2 0 0.1 0 0.0 ** 0.7 0 0.0 + 0.2 + 0.4 0 -0.3 0 0.0
Nuwakot + -0.3 ** 0.6 0 -0.2 0 -0.1 0 0.0 *** 1.0 *** -0.8 ** 0.3 *** 1.1 0 -0.2 0 0.0
Okhaldhunga 0 0.2 0 -0.1 0 0.2 0 -0.1 0 0.0 *** 1.4 *** -1.1 *** 0.3 * 0.5 0 0.0 0 0.1
Palpa 0 0.2 0 -0.2 0 0.0 0 0.0 0 0.0 *** 1.0 * -0.4 ** 0.3 0 0.0 0 0.0 + 0.2
Panchthar 0 0.0 0 0.0 0 0.0 0 0.0 0 0.0 *** 1.9 *** -1.4 *** 0.3 ** 0.7 0 0.0 0 0.2
Parbat + 0.3 0 0.0 * 0.4 + 0.1 0 0.0 *** 1.4 *** -1.1 *** 0.3 0 0.3 0 0.1 0 0.2
Parsa 0 0.2 0 0.0 0 0.2 0 0.0 0 0.0 + 0.4 0 0.1 0 0.1 *** 0.8 ** -0.4 * -0.2
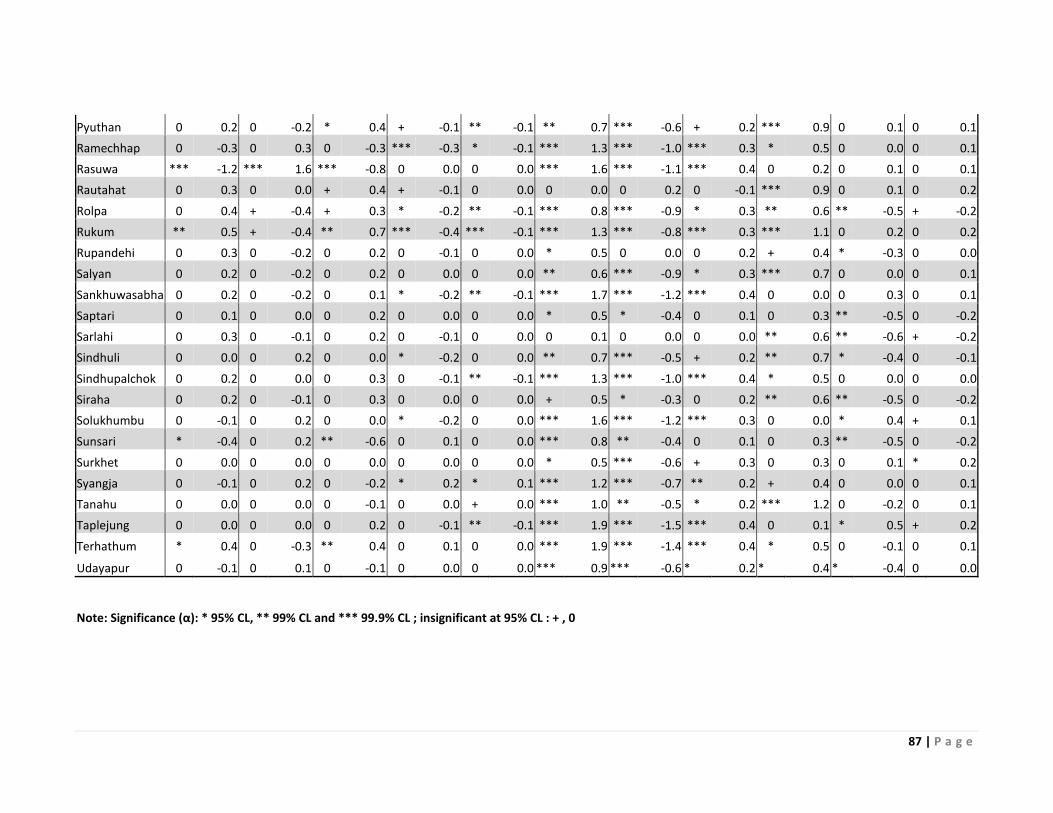
87 | P a g e
Pyuthan 0 0.2 0 -0.2 * 0.4 + -0.1 ** -0.1 ** 0.7 *** -0.6 + 0.2 *** 0.9 0 0.1 0 0.1
Ramechhap 0 -0.3 0 0.3 0 -0.3 *** -0.3 * -0.1 *** 1.3 *** -1.0 *** 0.3 * 0.5 0 0.0 0 0.1
Rasuwa *** -1.2 *** 1.6 *** -0.8 0 0.0 0 0.0 *** 1.6 *** -1.1 *** 0.4 0 0.2 0 0.1 0 0.1
Rautahat 0 0.3 0 0.0 + 0.4 + -0.1 0 0.0 0 0.0 0 0.2 0 -0.1 *** 0.9 0 0.1 0 0.2
Rolpa 0 0.4 + -0.4 + 0.3 * -0.2 ** -0.1 *** 0.8 *** -0.9 * 0.3 ** 0.6 ** -0.5 + -0.2
Rukum ** 0.5 + -0.4 ** 0.7 *** -0.4 *** -0.1 *** 1.3 *** -0.8 *** 0.3 *** 1.1 0 0.2 0 0.2
Rupandehi 0 0.3 0 -0.2 0 0.2 0 -0.1 0 0.0 * 0.5 0 0.0 0 0.2 + 0.4 * -0.3 0 0.0
Salyan 0 0.2 0 -0.2 0 0.2 0 0.0 0 0.0 ** 0.6 *** -0.9 * 0.3 *** 0.7 0 0.0 0 0.1
Sankhuwasabha 0 0.2 0 -0.2 0 0.1 * -0.2 ** -0.1 *** 1.7 *** -1.2 *** 0.4 0 0.0 0 0.3 0 0.1
Saptari 0 0.1 0 0.0 0 0.2 0 0.0 0 0.0 * 0.5 * -0.4 0 0.1 0 0.3 ** -0.5 0 -0.2
Sarlahi 0 0.3 0 -0.1 0 0.2 0 -0.1 0 0.0 0 0.1 0 0.0 0 0.0 ** 0.6 ** -0.6 + -0.2
Sindhuli 0 0.0 0 0.2 0 0.0 * -0.2 0 0.0 ** 0.7 *** -0.5 + 0.2 ** 0.7 * -0.4 0 -0.1
Sindhupalchok 0 0.2 0 0.0 0 0.3 0 -0.1 ** -0.1 *** 1.3 *** -1.0 *** 0.4 * 0.5 0 0.0 0 0.0
Siraha 0 0.2 0 -0.1 0 0.3 0 0.0 0 0.0 + 0.5 * -0.3 0 0.2 ** 0.6 ** -0.5 0 -0.2
Solukhumbu 0 -0.1 0 0.2 0 0.0 * -0.2 0 0.0 *** 1.6 *** -1.2 *** 0.3 0 0.0 * 0.4 + 0.1
Sunsari * -0.4 0 0.2 ** -0.6 0 0.1 0 0.0 *** 0.8 ** -0.4 0 0.1 0 0.3 ** -0.5 0 -0.2
Surkhet 0 0.0 0 0.0 0 0.0 0 0.0 0 0.0 * 0.5 *** -0.6 + 0.3 0 0.3 0 0.1 * 0.2
Syangja 0 -0.1 0 0.2 0 -0.2 * 0.2 * 0.1 *** 1.2 *** -0.7 ** 0.2 + 0.4 0 0.0 0 0.1
Tanahu 0 0.0 0 0.0 0 -0.1 0 0.0 + 0.0 *** 1.0 ** -0.5 * 0.2 *** 1.2 0 -0.2 0 0.1
Taplejung 0 0.0 0 0.0 0 0.2 0 -0.1 ** -0.1 *** 1.9 *** -1.5 *** 0.4 0 0.1 * 0.5 + 0.2
Terhathum * 0.4 0 -0.3 ** 0.4 0 0.1 0 0.0 *** 1.9 *** -1.4 *** 0.4 * 0.5 0 -0.1 0 0.1
Udayapur 0 -0.1 0 0.1 0 -0.1 0 0.0 0 0.0 *** 0.9 *** -0.6 * 0.2 * 0.4 * -0.4 0 0.0
Note: Significance α : * 95% CL, ** 99% CL and *** 99.9% CL ; insignificant at 95% CL : + , 0