nucleosome landscape and control of transcription in the human malaria parasite
TRANSCRIPT
10.1101/gr.101063.109Access the most recent version at doi: published online January 6, 2010Genome Res.
Nadia Ponts, Elena Y. Harris, Jacques Prudhomme, et al. malaria parasiteNucleosome landscape and control of transcription in the human
MaterialSupplemental http://genome.cshlp.org/content/suppl/2009/12/08/gr.101063.109.DC1.html
P<P Published online January 6, 2010 in advance of the print journal.
serviceEmail alerting
click heretop right corner of the article orReceive free email alerts when new articles cite this article - sign up in the box at the
object identifier (DOIs) and date of initial publication. by PubMed from initial publication. Citations to Advance online articles must include the digital publication). Advance online articles are citable and establish publication priority; they are indexedappeared in the paper journal (edited, typeset versions may be posted when available prior to final Advance online articles have been peer reviewed and accepted for publication but have not yet
http://genome.cshlp.org/subscriptions go to: Genome ResearchTo subscribe to
Copyright © 2010 by Cold Spring Harbor Laboratory Press
Cold Spring Harbor Laboratory Press on January 11, 2010 - Published by genome.cshlp.orgDownloaded from
Letter
Nucleosome landscape and control of transcriptionin the human malaria parasiteNadia Ponts,1,6 Elena Y. Harris,2,6 Jacques Prudhomme,1 Ivan Wick,3
Colleen Eckhardt-Ludka,3 Glenn R. Hicks,4 Gary Hardiman,3,5 Stefano Lonardi,2
and Karine G. Le Roch1,7
1Department of Cell Biology and Neuroscience, University of California, Riverside, California 92521, USA; 2Department of Computer
Science and Engineering, University of California, Riverside, California 92521, USA; 3BIOGEM, School of Medicine, University
of California, San Diego, La Jolla, California 92093, USA; 4Center for Plant Cell Biology and Dept of Botany & Plant Sciences,
University of California, Riverside, California 92521, USA; 5Department of Medicine, University of California, San Diego, La Jolla,
California 92093, USA
In eukaryotic cells, chromatin reorganizes within promoters of active genes to allow the transcription machinery andvarious transcription factors to access DNA. In this model, promoter-specific transcription factors bind DNA to initiate theproduction of mRNA in a tightly regulated manner. In the case of the human malaria parasite, Plasmodium falciparum, specifictranscription factors are apparently underrepresented with regards to the size of the genome, and mechanisms underlyingtranscriptional regulation are controversial. Here, we investigate the modulation of DNA accessibility by chromatinremodeling during the parasite infection cycle. We have generated genome-wide maps of nucleosome occupancy acrossthe parasite erythrocytic cycle using two complementary assays—the formaldehyde-assisted isolation of regulatory ele-ments to extract protein-free DNA (FAIRE) and the MNase-mediated purification of mononucleosomes to extract histone-bound DNA (MAINE), both techniques being coupled to high-throughput sequencing. We show that chromatin archi-tecture undergoes drastic upheavals throughout the parasite’s cycle, contrasting with targeted chromatin reorganizationusually observed in eukaryotes. Chromatin loosens after the invasion of the red blood cell and then repacks prior to thenext cycle. Changes in nucleosome occupancy within promoter regions follow this genome-wide pattern, with a few ex-ceptions such as the var genes involved in virulence and genes expressed at early stages of the cycle. We postulate thatchromatin structure and nucleosome turnover control massive transcription during the erythrocytic cycle. Our resultsdemonstrate that the processes driving gene expression in Plasmodium challenge the classical eukaryotic model of tran-scriptional regulation occurring mostly at the transcription initiation level.
[Supplemental material is available online at http://www.genome.org. The sequence data from this study have beensubmitted to the NCBI Short Read Archive (http://www.ncbi.nlm.nih.gov/Traces/sra/sra.cgi) under accession nos.SRA010122 and SRA010123.]
With up to 1 million deaths per year (Snow et al. 2005), malaria
remains one of the most deadly infectious diseases in the world.
The absence of a vaccine and the spread of parasite multiple drug
resistances hasten the need to better comprehend the parasite bi-
ology to identify new anti-malarial strategies. The human malaria
parasite, Plasmodium falciparum, is a unicellular eukaryote with
a complex life cycle, which includes an asexual erythrocytic stage
associated with morbidity and mortality of the human host. De-
spite nearly a decade of investigation into the 23-Mb Plasmodium
genome (Gardner et al. 2002), more than half of its approximately
5500 predicted genes are still annotated as ‘‘hypothetical,’’ and
most of the promoter structures and putative regulatory regions
remain indeterminate. In addition, the mechanisms driving gene
expression are poorly understood. Although genome-wide gene
expression analyses have shown remarkable variations of steady-
state mRNA levels with a tightly regulated cascade of transcripts
throughout the parasite life cycle (Bozdech et al. 2003; Le Roch
et al. 2003), only a handful of transcription factors have been
identified to date (Coulson et al. 2004; Balaji et al. 2005; Llinas
et al. 2006). Moreover, recent studies have demonstrated that the
parasite has a limited capacity to regulate the expression of its
genes in response to metabolic stresses (Ganesan et al. 2008; Le
Roch et al. 2008). Altogether, these findings present an enigma as
to how gene expression is regulated with regards to the paucity of
transcription factors and the apparent absence of gene feedback
circuits. A key to this riddle could come from alterations of chro-
matin structure that are known to modulate DNA accessibility to
DNA-binding proteins and thus regulate, to some extent, gene
expression in eukaryotic cells. The presence of histones, as well as
the nucleosome structure of chromatin in P. falciparum, were evi-
denced many years ago (Cary et al. 1994). Gene homologs coding
for the core histones are present in the genome, and their tran-
script and protein levels vary during the parasite life cycle (Le Roch
et al. 2004). A recognizable homolog of the linker histone H1,
however, is absent from the parasite’s genome with the expected
consequence that the intensely packed chromosome as it usually
appears in metaphase never occurs in Plasmodium. In Plasmodium,
chromatin remodeling is believed to play a role in the mutually
exclusive expression of genes responsible for antigenic variation,
the var genes family, at the surface of infected red blood cells
(Deitsch et al. 2001; Duraisingh et al. 2005; Chookajorn et al. 2007;
6These authors contributed equally to this work.7Corresponding author.E-mail [email protected]; fax (951) 827-3087.Article published online before print. Article and publication date are athttp://www.genome.org/cgi/doi/10.1101/gr.101063.109.
20:000–000 � 2010 by Cold Spring Harbor Laboratory Press; ISSN 1088-9051/10; www.genome.org Genome Research 1www.genome.org
Cold Spring Harbor Laboratory Press on January 11, 2010 - Published by genome.cshlp.orgDownloaded from
Lopez-Rubio et al. 2007; Epp et al. 2009). Nonetheless, the role of
chromatin structure alterations in regulating Plasmodium tran-
scripts in a genome-wide manner remains unknown.
To discover the role of chromatin remodeling in regulating
parasite transcription, we applied both formaldehyde-assisted
isolation of regulatory elements (FAIRE) (Nagy et al. 2003; Hogan
et al. 2006; Giresi et al. 2007), to isolate active transcriptional
regulatory elements, and micrococcal nuclease digestion of mono-
nucleosomes (here called MNase-assisted isolation of nucleo-
somes, or MAINE) (Bernstein et al. 2004; Gupta et al. 2008; Kaplan
et al. 2009) coupled to massively parallel sequencing to dynami-
cally and concomitantly map protein-free and nucleosome-rich
regions during P. falciparum’s erythrocytic cycle. Using these two
independent and complementary assays, we explored the kinetics
of changes in chromatin structure with regards to transcriptional
activity and progression through the malaria infection cycle. Al-
together, our results picture a system where global changes of
chromatin structure control the progression of the human malaria
parasite through its cell cycle.
Results
Using FAIRE-seq and MAINE-seq to study an AT-rich genome
To explore chromatin architecture changes during P. falciparum’s
erythrocytic cycle, we used high-throughput sequencing (Illumina
Genome Analyzer) to compare genomic regions enriched by FAIRE
(isolates protein-free DNA) and MAINE (isolates histone-associated
DNA) at seven different time points throughout the parasite
erythrocytic cycle (Supplemental Fig. S1). Genomic DNA samples,
prepared by FAIRE and MAINE, were collected immediately after
invasion and with a 6-h increment throughout the erythrocytic
cycle. During these experiments, more than 42 million of high-
quality reads were uniquely mapped, with up to two mismatches,
to P. falciparum genome (sequencing metrics and a chart describing
the mapping procedure are given in Supplemental Fig. S2). Depths
of base coverage in FAIRE-seq and MAINE-seq were expressed per
million mapped reads (pmmr) throughout the present study. Using
a reference composed of a mix of each FAIRE and MAINE sample
(see Methods), we found that the sequencing can retrieve more
than 90% of P. falciparum’s genome, with a nucleotide covered by
at least one base (Supplemental Fig. S3). These results are consis-
tent with the coverage obtained when in silico–generated 36-bp-
long reads are mapped (allowing up to two mismatches) to the
genome of P. falciparum (data not shown). Nonetheless, there is still
a proportion of the genome that is undetected by both FAIRE- and
MAINE-seq. A first explanation could be that nonhistone proteins
are bound to certain regions of the genome stably enough that
cross-linking occurs. A second explanation resides in the repetitive
nature of certain regions that would lead to nonunique short se-
quenced reads and therefore their exclusion from the data set.
To validate the complementarity of the two methods, we
compared the genome-wide distributions of mapped reads ob-
tained with FAIRE-seq to the ones measured with MAINE-seq (Fig.
1). A visual examination of mapped reads distributions reveals that
profiles of coverage for FAIRE-seq and MAINE-seq are inversely
correlated: FAIRE shows high coverage where MAINE has low
coverage and vice versa (Fig. 1A). To investigate objectively the
extent of this inverse correlation, we compared the trends of cov-
erage with FAIRE-seq (enrichment in protein-free DNA) to the
trends of coverage with MAINE-seq (enrichment in nucleosome-
bound DNA); Pearson’s product-moment coefficient was com-
puted between corresponding average base coverage pmmr across
the seven investigated time points (Fig. 1B). The average correla-
tion coefficient is strongly negative between 12 and 36 h post-
invasion (hpi), indicating excellent complementation between
FAIRE and MAINE (R2 = �0.75). To further investigate our data, we
monitored the number of nucleotides that are actually covered by
reads from FAIRE-seq, MAINE-seq, or both (hereafter ‘‘overlapping
coverage’’) (Fig. 2). The general genome coverage trends are con-
sistent with our measure of the average depth of base coverage
obtained previously (Fig. 1B); the least nucleotides are covered by
MAINE-seq reads (red) at 18 hpi, while high nucleotide coverage is
observed with FAIRE-seq (black). Overlapping coverage increases
over the course of the cycle to reach a maximum (below 10% of the
genome) at the latest time point. This observation is consistent
with the progressive degradation of the parasites’ synchrony across
time that is commonly observed in vitro. Finally, the genome is
consistently more covered with FAIRE-seq than with MAINE-seq,
which demonstrates a higher content in protein-free DNA. This
latest observation indicates that the parasite’s DNA contains more
Figure 1. FAIRE-seq and MAINE-seq are two complementary ap-proaches to study nucleosome occupancy in P. falciparum. (A) Example ofthe complementarity between FAIRE-seq and MAINE-seq. We overlaid thecoverages obtained for both FAIRE (black) and MAINE (red) at 18 hpi inchromosome 4. The chromosomal region [615,000; 635,000] is zoomedin. (B) Evaluation of the complementarity between FAIRE (black) andMAINE (red) at the genomic scale. For each time point, the average depthof base coverage pmmr in each chromosome was measured genome-wide for both FAIRE and MAINE (error bars, SD).
2 Genome Researchwww.genome.org
Ponts et al .
Cold Spring Harbor Laboratory Press on January 11, 2010 - Published by genome.cshlp.orgDownloaded from
protein-free DNA than histone-bound regions and can be accessed
by any type of DNA-binding proteins during most of the eryth-
rocytic cycle, especially at the trophozoite and early schizont
stages (18–30 hpi).
We verified that this abundance of protein-free regions was
not due to an artefact caused by the extreme AT-richness of the
parasite genome. First we verified the formaldehyde treatment ef-
ficiency by PCR amplification of potentially cross-linked regions
(see Supplemental Methods; Supplemental Fig. S4). Then, we ver-
ified that the low complexity of AT-rich sequence has no effect
on the base coverage; using a 1-kb-long non-overlapping sliding
window approach (see Supplemental Methods), we calculated the
AT-content in the P. falciparum genome and compared it to the AT-
content within FAIRE- and MAINE-enriched regions (all time
points averaged) (Fig. 3A). AT-content in FAIRE-covered regions is
identical to the genome-wide one. Thus, AT-rich regions can be
sequenced by the Illumina technology; the high AT-content of
sequences enriched by FAIRE reflects the parasite’s genome AT-
content itself. On the contrary, MAINE-enriched regions have
a lower AT-content, which is in agreement with lower nucleosome
affinity for AT-rich regions (Field et al. 2008; Kaplan et al. 2009;
Segal and Widom 2009a,b). This observation may suggest that AT-
rich regions limit nucleosome binding on P. falciparum’s genome.
To further explore this hypothesis, we examined the physical
properties of the parasite’s genomic DNA. We compared our ex-
perimental nucleosome landscape to in silico modeling of the
sequence-based DNA elastic properties that determine the bend-
ability of DNA around histones and is thought to drive nucleosome
positioning in eukaryotic model organisms (Miele et al. 2008;
Tolstorukov et al. 2008). An example of our results is given in
Figure 3B. We found that our experimental nucleosome position-
ing correlates with the in silico predictions and demonstrates that
the marked nucleosome preferences for regions with lower AT-
content are biologically relevant. Altogether, our results demon-
strate the suitability of both FAIRE-seq and MAINE-seq to study
chromatin organization of the P. falciparum AT-rich genome.
Chromatin remodeling occurs massively at the genomic scale
We observed that, in average, the parasite’s DNA contains more
protein-free DNA than histone-bound regions during most of the
erythrocytic cycle. A similar trend is observed when chromosomes
are considered individually (Supplemental Fig. S5). Several regions
with relatively high coverage are observed with FAIRE-seq at ring
stage, indicating insulated open chromatin. At trophozoite stage
(18 hpi), the coverage with FAIRE-seq is uniformly deeper, showing
completely loosened chromatin. Only a few regions, including
telomeric/subtelomeric regions, have lower coverage, which could
reflect the repetitive nature of these regions and therefore the
limited capacity of mapping short reads to a single location in the
genome. Finally, in all chromosomes, the intensity of coverage
drastically drops at late schizont (36 hpi). Conversely, in MAINE-
seq, the intensity of coverage reaches a minimum at trophozoite
stage and a maximum at late schizont (data not shown). Alto-
gether, these results demonstrate that the parasite’s chromatin
undergoes drastic changes at the early trophozoite and schizont
stages of the parasite infectious erythrocytic cycle. Our observa-
tions suggest a simple model in which the chromatin has a maxi-
mal ‘‘open’’ state at the early trophozoite stage, and packs into
a relatively ‘‘closed’’ state when parasites are ready for the next
invasion. Interestingly, this pattern is also observed in the apico-
plast genome. The apicoplast is a plastid-like organelle found in
Figure 2. Evolution of genome coverage across time. (Black) FAIRE;(red) MAINE. Overlapping coverage, i.e., the number of nucleotides thatare covered by five reads and more in both FAIRE- and MAINE-seq, isshown in green. The genome is consistently more covered with FAIRE-seq,which demonstrates a high content in protein-free DNA, especially at 18hpi. A t-test was performed and showed that the observed differences aresignificant, with P < 0.001 for all time points (**) except 6 hpi, where P <0.01 (*). Overlapping coverage increasing at the latest time point isconsistent with a progressive degradation of the parasites synchronyacross time.
Figure 3. P. falciparum genome and its effect on nucleosome posi-tioning. (A) AT-content distributions across the genome, FAIRE-enrichedand MAINE-enriched regions were compared. AT-content was calculatedin a 1000-bp-long sliding window for the P. falciparum genome (blue) andregions covered by FAIRE- and MAINE-seq (black and red, respectively).AT-content is similar genome-wide and in FAIRE-covered regions. On thecontrary, regions enriched by MAINE are influenced toward less AT-richregions, which is in agreement with the low affinity of nucleosomes for AT-rich sequences. Same distributions were obtained using sliding windowsof various sizes (10, 50, 100, 1000, and 20,000 bp) (data not shown) fur-ther validating the efficiency of Illumina technology for the P. falciparumAT-rich genome. (B) Correlation between experimental and in silico nu-cleosome positioning was explored. MAINE profile (red) and DNA bend-ing free energy profile (blue) were z-normalized and overlaid for theregion [90,000–125,000] of chromosome 1. Oriented boxes representgene models retrieved from http://www.plasmodb.org: (1) PFA0095c; (2)PFA0100c; (3) PFA0105w; (4) PFA0110w; (5) PFA0115w; (6) PFA0120c;(7) PFA0125c; (8) PFA0130c. Our results show that the energy profilecorrelates well with our experimental nucleosome landscape (averagecorrelation coefficient = 0.65, measured using a 10-kb-long nonover-lapping sliding window approach), indicating that DNA bending prop-erties dictates, at least partially, the parasite nucleosome positioning.
Nucleosome positioning in Plasmodium
Genome Research 3www.genome.org
Cold Spring Harbor Laboratory Press on January 11, 2010 - Published by genome.cshlp.orgDownloaded from
apicomplexan parasites that is homologous to the chloroplast in
plants and essential for the parasite’s life cycle (Goodman and
McFadden 2007). While the mitochondrial DNA is entirely cov-
ered with FAIRE-seq (consistent with the fact that mitochondria
lack histones) (Supplemental Fig. S6A), the apicoplast DNA show
reduced FAIRE-seq coverage in ring and late schizont stages (Sup-
plemental Fig. S6B), consistent with the presence of histone-like
proteins.
Dynamic nucleosome mapping
To explore nucleosome position changes over time, the center of
a nucleosome was positioned on every local maximum of MAINE-
seq coverage for each time point. Since MAINE-seq enrichment at
a particular locus correlates with the presence of a given nucleo-
some in a population of parasites, a well-positioned nucleosome
will lead to a MAINE-seq peak stronger than a floating nucleosome
would display. With regards to this statement, we scored the po-
sitioning of every nucleosome using the total number of reads per
base involved in the nucleosome (i.e., the sum of coverage on the
147 bp around the local maximum).
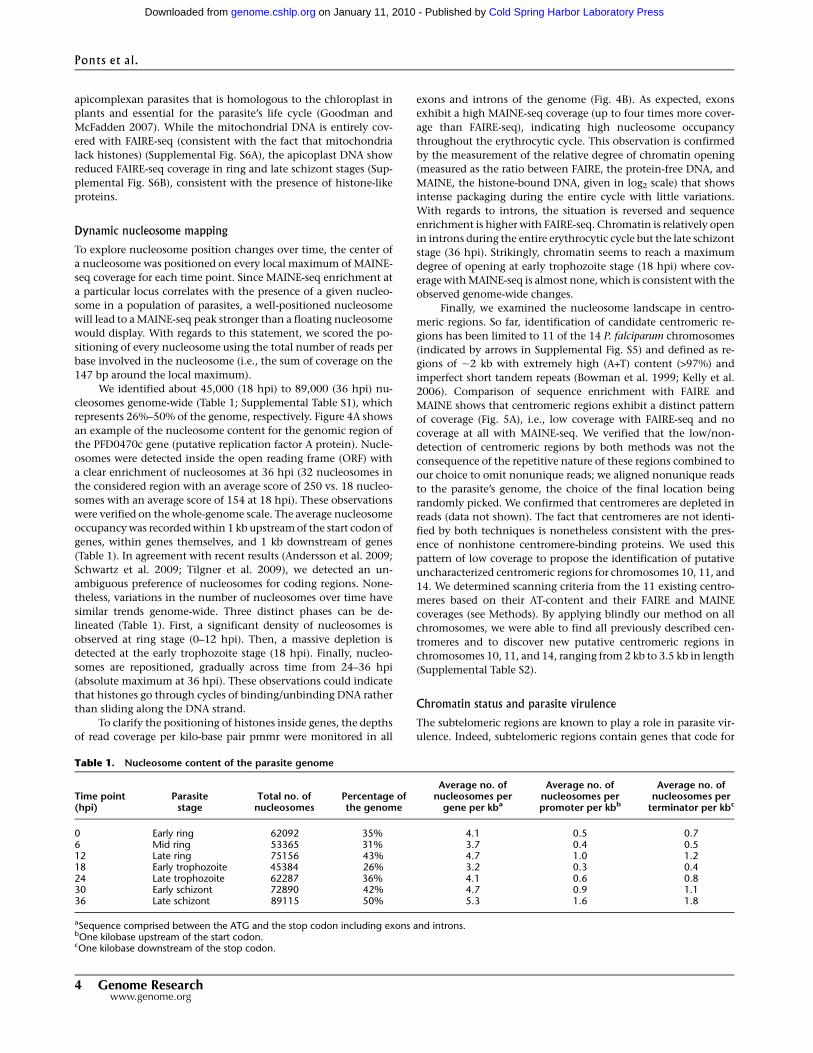
We identified about 45,000 (18 hpi) to 89,000 (36 hpi) nu-
cleosomes genome-wide (Table 1; Supplemental Table S1), which
represents 26%–50% of the genome, respectively. Figure 4A shows
an example of the nucleosome content for the genomic region of
the PFD0470c gene (putative replication factor A protein). Nucle-
osomes were detected inside the open reading frame (ORF) with
a clear enrichment of nucleosomes at 36 hpi (32 nucleosomes in
the considered region with an average score of 250 vs. 18 nucleo-
somes with an average score of 154 at 18 hpi). These observations
were verified on the whole-genome scale. The average nucleosome
occupancy was recorded within 1 kb upstream of the start codon of
genes, within genes themselves, and 1 kb downstream of genes
(Table 1). In agreement with recent results (Andersson et al. 2009;
Schwartz et al. 2009; Tilgner et al. 2009), we detected an un-
ambiguous preference of nucleosomes for coding regions. None-
theless, variations in the number of nucleosomes over time have
similar trends genome-wide. Three distinct phases can be de-
lineated (Table 1). First, a significant density of nucleosomes is
observed at ring stage (0–12 hpi). Then, a massive depletion is
detected at the early trophozoite stage (18 hpi). Finally, nucleo-
somes are repositioned, gradually across time from 24–36 hpi
(absolute maximum at 36 hpi). These observations could indicate
that histones go through cycles of binding/unbinding DNA rather
than sliding along the DNA strand.
To clarify the positioning of histones inside genes, the depths
of read coverage per kilo-base pair pmmr were monitored in all
exons and introns of the genome (Fig. 4B). As expected, exons
exhibit a high MAINE-seq coverage (up to four times more cover-
age than FAIRE-seq), indicating high nucleosome occupancy
throughout the erythrocytic cycle. This observation is confirmed
by the measurement of the relative degree of chromatin opening
(measured as the ratio between FAIRE, the protein-free DNA, and
MAINE, the histone-bound DNA, given in log2 scale) that shows
intense packaging during the entire cycle with little variations.
With regards to introns, the situation is reversed and sequence
enrichment is higher with FAIRE-seq. Chromatin is relatively open
in introns during the entire erythrocytic cycle but the late schizont
stage (36 hpi). Strikingly, chromatin seems to reach a maximum
degree of opening at early trophozoite stage (18 hpi) where cov-
erage with MAINE-seq is almost none, which is consistent with the
observed genome-wide changes.
Finally, we examined the nucleosome landscape in centro-
meric regions. So far, identification of candidate centromeric re-
gions has been limited to 11 of the 14 P. falciparum chromosomes
(indicated by arrows in Supplemental Fig. S5) and defined as re-
gions of ;2 kb with extremely high (A+T) content (>97%) and
imperfect short tandem repeats (Bowman et al. 1999; Kelly et al.
2006). Comparison of sequence enrichment with FAIRE and
MAINE shows that centromeric regions exhibit a distinct pattern
of coverage (Fig. 5A), i.e., low coverage with FAIRE-seq and no
coverage at all with MAINE-seq. We verified that the low/non-
detection of centromeric regions by both methods was not the
consequence of the repetitive nature of these regions combined to
our choice to omit nonunique reads; we aligned nonunique reads
to the parasite’s genome, the choice of the final location being
randomly picked. We confirmed that centromeres are depleted in
reads (data not shown). The fact that centromeres are not identi-
fied by both techniques is nonetheless consistent with the pres-
ence of nonhistone centromere-binding proteins. We used this
pattern of low coverage to propose the identification of putative
uncharacterized centromeric regions for chromosomes 10, 11, and
14. We determined scanning criteria from the 11 existing centro-
meres based on their AT-content and their FAIRE and MAINE
coverages (see Methods). By applying blindly our method on all
chromosomes, we were able to find all previously described cen-
tromeres and to discover new putative centromeric regions in
chromosomes 10, 11, and 14, ranging from 2 kb to 3.5 kb in length
(Supplemental Table S2).
Chromatin status and parasite virulence
The subtelomeric regions are known to play a role in parasite vir-
ulence. Indeed, subtelomeric regions contain genes that code for
Table 1. Nucleosome content of the parasite genome
Time point(hpi)
Parasitestage
Total no. ofnucleosomes
Percentage ofthe genome
Average no. ofnucleosomes per
gene per kba
Average no. ofnucleosomes perpromoter per kbb
Average no. ofnucleosomes per
terminator per kbc
0 Early ring 62092 35% 4.1 0.5 0.76 Mid ring 53365 31% 3.7 0.4 0.512 Late ring 75156 43% 4.7 1.0 1.218 Early trophozoite 45384 26% 3.2 0.3 0.424 Late trophozoite 62287 36% 4.1 0.6 0.830 Early schizont 72890 42% 4.7 0.9 1.136 Late schizont 89115 50% 5.3 1.6 1.8
aSequence comprised between the ATG and the stop codon including exons and introns.bOne kilobase upstream of the start codon.cOne kilobase downstream of the stop codon.
Ponts et al .
4 Genome Researchwww.genome.org
Cold Spring Harbor Laboratory Press on January 11, 2010 - Published by genome.cshlp.orgDownloaded from
adhesion molecules such as those of the var gene family that
consists of about 60 members. var genes code for P. falciparum
erythrocyte membrane protein 1 (PfEMP1) members that are
expressed one at a time at the surface of infected erythrocytes, the
other members being transcriptionally silent. PfEMP1 proteins are
responsible for antigenic variation, allowing the parasite to escape
from the host immune system and to adhere to the microvascu-
lature, resulting in severe disease outcome (Ralph and Scherf 2005;
Pasternak and Dzikowski 2009). In telomeric and subtelomeric
regions, our data show an overenrichment with MAINE-seq in
comparison with the rest of the genome, in particular at 18 hpi,
while nucleosome content is minimal in the rest of the genome
and with the exception of 36 hpi (Fig. 5B). In order to clarify the
distribution of this enrichment, coverage distributions in sub-
telomeric regions were dissected at the gene level (Supplemental
Fig. S7). For both FAIRE-seq and MAINE-seq, and consistently with
our genome-wide observations described in the previous section,
enrichment is linked to the presence of genes: The coverage with
MAINE-seq is denser inside the ORFs, whereas the coverage with
FAIRE-seq localizes within the surrounding noncoding regions.
We further explored the chromatin status within putative
promoter regions of var genes (up to 1.5 kb upstream of the ATG)
and their intron from which a role in allelic exclusion has been
proposed (Deitsch et al. 2001; Calderwood et al. 2003; Dzikowski
et al. 2007); var introns are believed to pair with the promoter to
promote gene silencing. We monitored the distributions of FAIRE
and MAINE reads within putative promoter regions from all var
genes and grouped these regions according to their profiles of
nucleosome-free regions occupancy obtained with FAIRE-seq
(FAIRE-seq is an indicator of the presence/absence of any tightly
DNA-bound histone and nonhistone protein, but the binding of
other proteins such as transcription factors is rather transient and
unlikely to be detected). We delineated three groups (Supple-
mental Fig. S8A). The first group contains 18 genes with high
density of protein-free DNA within 500 bp upstream of the ATG,
the second group (three genes) shows high coverage in the more
distal part of the promoter, and the third group has only low
coverage (low DNA availability, which is consistent with the gen-
erally silent state of var genes in vitro). These observations suggest
that regulatory sequences may be present within relatively close
proximity to the ATG. With regards to introns, they are covered by
FAIRE-seq on their whole length, i.e., 896 bp 6 175 bp in average,
indicating no distance preference (Supplemental Fig. S8B). Then
we measured the relative degree of chromatin loosening within
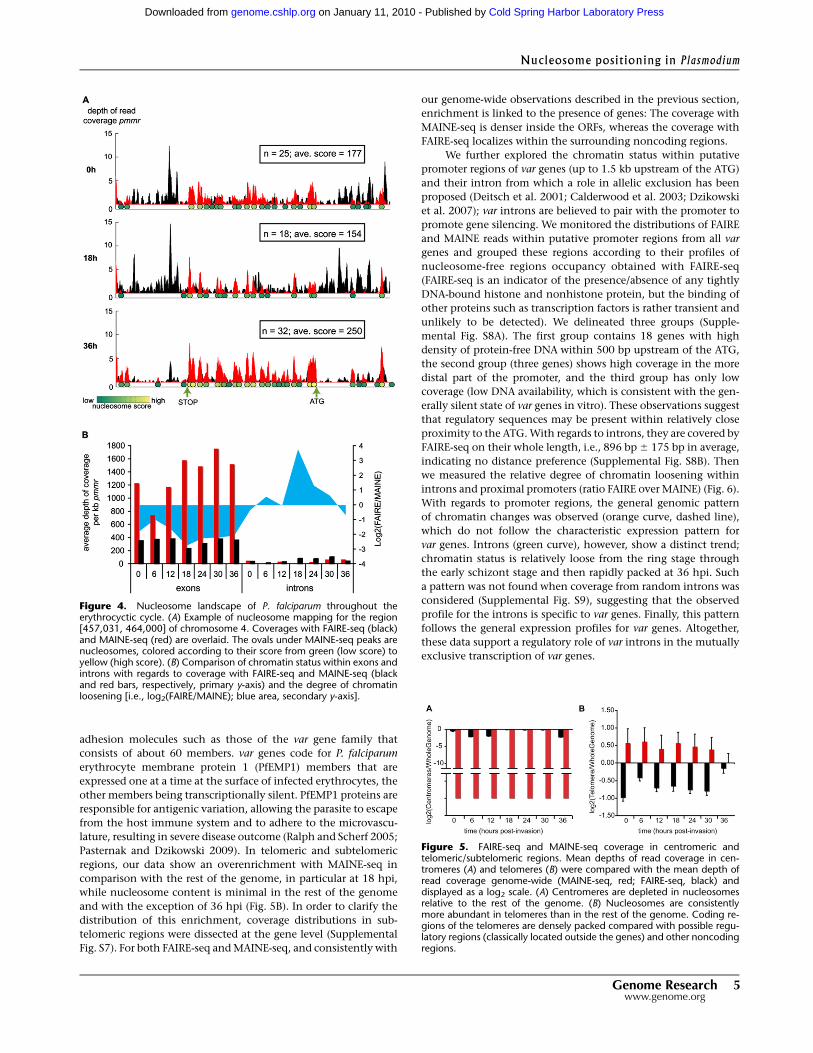
introns and proximal promoters (ratio FAIRE over MAINE) (Fig. 6).
With regards to promoter regions, the general genomic pattern
of chromatin changes was observed (orange curve, dashed line),
which do not follow the characteristic expression pattern for
var genes. Introns (green curve), however, show a distinct trend;
chromatin status is relatively loose from the ring stage through
the early schizont stage and then rapidly packed at 36 hpi. Such
a pattern was not found when coverage from random introns was
considered (Supplemental Fig. S9), suggesting that the observed
profile for the introns is specific to var genes. Finally, this pattern
follows the general expression profiles for var genes. Altogether,
these data support a regulatory role of var introns in the mutually
exclusive transcription of var genes.
Figure 4. Nucleosome landscape of P. falciparum throughout theerythrocyctic cycle. (A) Example of nucleosome mapping for the region[457,031, 464,000] of chromosome 4. Coverages with FAIRE-seq (black)and MAINE-seq (red) are overlaid. The ovals under MAINE-seq peaks arenucleosomes, colored according to their score from green (low score) toyellow (high score). (B) Comparison of chromatin status within exons andintrons with regards to coverage with FAIRE-seq and MAINE-seq (blackand red bars, respectively, primary y-axis) and the degree of chromatinloosening [i.e., log2(FAIRE/MAINE); blue area, secondary y-axis].
Figure 5. FAIRE-seq and MAINE-seq coverage in centromeric andtelomeric/subtelomeric regions. Mean depths of read coverage in cen-tromeres (A) and telomeres (B) were compared with the mean depth ofread coverage genome-wide (MAINE-seq, red; FAIRE-seq, black) anddisplayed as a log2 scale. (A) Centromeres are depleted in nucleosomesrelative to the rest of the genome. (B) Nucleosomes are consistentlymore abundant in telomeres than in the rest of the genome. Coding re-gions of the telomeres are densely packed compared with possible regu-latory regions (classically located outside the genes) and other noncodingregions.
Nucleosome positioning in Plasmodium
Genome Research 5www.genome.org
Cold Spring Harbor Laboratory Press on January 11, 2010 - Published by genome.cshlp.orgDownloaded from
We also investigated other gene families that are involved in
virulence and are located in subtelomeric regions; we explored the
chromatin status within putative promoter regions of rifin, stevor,
and Maurer’s cleft PfMC-2TM genes. Lit-
tle variations were observed throughout
the parasite erythrocytic stages with a
general low coverage in FAIRE-seq and
MAINE-seq (data not shown). These re-
sults are not surprising, considering that
most of these genes seem to be heavily
down regulated in vitro (Le Roch et al.
2003; Daily et al. 2005). Further inves-
tigation of the chromatin status in vivo
will be required to understand the tran-
scriptional regulation of these particular
gene families.
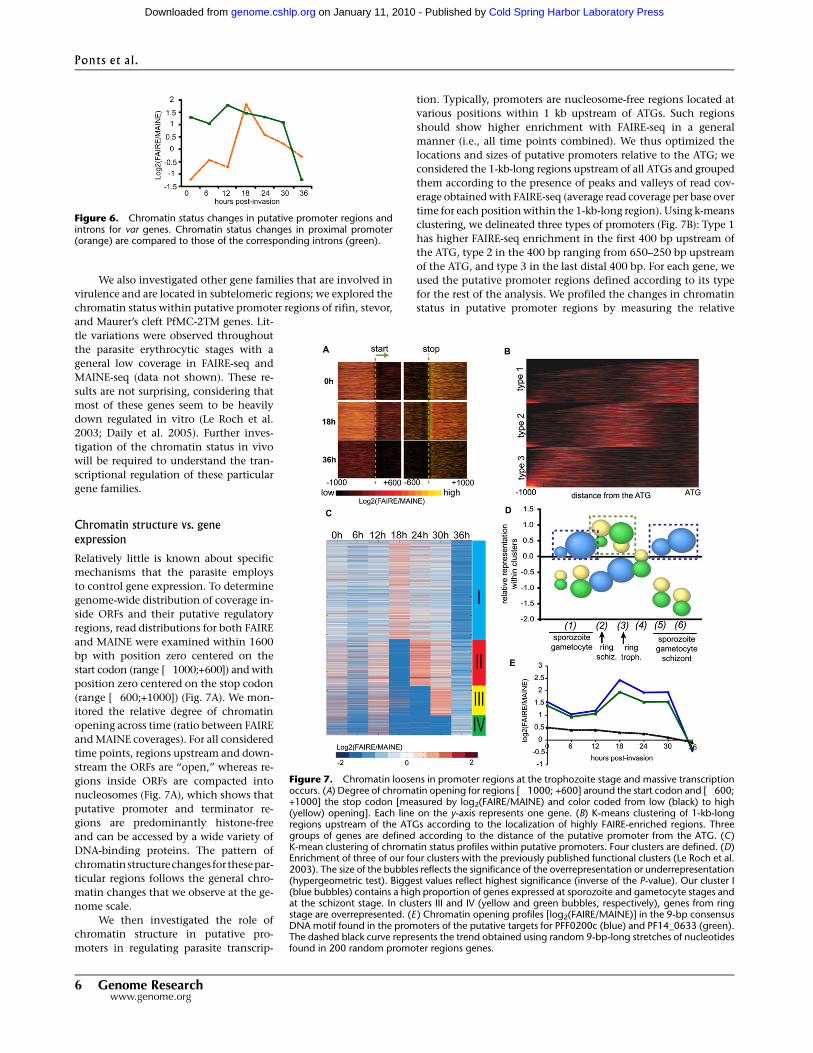
Chromatin structure vs. geneexpression
Relatively little is known about specific
mechanisms that the parasite employs
to control gene expression. To determine
genome-wide distribution of coverage in-
side ORFs and their putative regulatory
regions, read distributions for both FAIRE
and MAINE were examined within 1600
bp with position zero centered on the
start codon (range [�1000;+600]) and with
position zero centered on the stop codon
(range [�600;+1000]) (Fig. 7A). We mon-
itored the relative degree of chromatin
opening across time (ratio between FAIRE
and MAINE coverages). For all considered
time points, regions upstream and down-
stream the ORFs are ‘‘open,’’ whereas re-
gions inside ORFs are compacted into
nucleosomes (Fig. 7A), which shows that
putative promoter and terminator re-
gions are predominantly histone-free
and can be accessed by a wide variety of
DNA-binding proteins. The pattern of
chromatinstructurechanges for thesepar-
ticular regions follows the general chro-
matin changes that we observe at the ge-
nome scale.
We then investigated the role of
chromatin structure in putative pro-
moters in regulating parasite transcrip-
tion. Typically, promoters are nucleosome-free regions located at
various positions within 1 kb upstream of ATGs. Such regions
should show higher enrichment with FAIRE-seq in a general
manner (i.e., all time points combined). We thus optimized the
locations and sizes of putative promoters relative to the ATG; we
considered the 1-kb-long regions upstream of all ATGs and grouped
them according to the presence of peaks and valleys of read cov-
erage obtained with FAIRE-seq (average read coverage per base over
time for each position within the 1-kb-long region). Using k-means
clustering, we delineated three types of promoters (Fig. 7B): Type 1
has higher FAIRE-seq enrichment in the first 400 bp upstream of
the ATG, type 2 in the 400 bp ranging from 650–250 bp upstream
of the ATG, and type 3 in the last distal 400 bp. For each gene, we
used the putative promoter regions defined according to its type
for the rest of the analysis. We profiled the changes in chromatin
status in putative promoter regions by measuring the relative
Figure 6. Chromatin status changes in putative promoter regions andintrons for var genes. Chromatin status changes in proximal promoter(orange) are compared to those of the corresponding introns (green).
Figure 7. Chromatin loosens in promoter regions at the trophozoite stage and massive transcriptionoccurs. (A) Degree of chromatin opening for regions [�1000; +600] around the start codon and [�600;+1000] the stop codon [measured by log2(FAIRE/MAINE) and color coded from low (black) to high(yellow) opening]. Each line on the y-axis represents one gene. (B) K-means clustering of 1-kb-longregions upstream of the ATGs according to the localization of highly FAIRE-enriched regions. Threegroups of genes are defined according to the distance of the putative promoter from the ATG. (C)K-mean clustering of chromatin status profiles within putative promoters. Four clusters are defined. (D)Enrichment of three of our four clusters with the previously published functional clusters (Le Roch et al.2003). The size of the bubbles reflects the significance of the overrepresentation or underrepresentation(hypergeometric test). Biggest values reflect highest significance (inverse of the P-value). Our cluster I(blue bubbles) contains a high proportion of genes expressed at sporozoite and gametocyte stages andat the schizont stage. In clusters III and IV (yellow and green bubbles, respectively), genes from ringstage are overrepresented. (E ) Chromatin opening profiles [log2(FAIRE/MAINE)] in the 9-bp consensusDNA motif found in the promoters of the putative targets for PFF0200c (blue) and PF14_0633 (green).The dashed black curve represents the trend obtained using random 9-bp-long stretches of nucleotidesfound in 200 random promoter regions genes.
Ponts et al .
6 Genome Researchwww.genome.org
Cold Spring Harbor Laboratory Press on January 11, 2010 - Published by genome.cshlp.orgDownloaded from
degree of opening at each time point. K-means clustering was used
to group genes according to the variations in their chromatin
status across time. Four clusters were found, numbered I–IV (for the
list of clustered genes). Hierarchical ordering of these clusters (see
Supplemental Table S3; Fig. 7C) evoke the waves of expression
throughout the erythrocytic cycle that were observed in previous
microarray studies (Bozdech et al. 2003; Le Roch et al. 2003). The
majority of the genes behave similarly: Promoters are closed at ring
stage (0–12 hpi) and then open at the early trophozoite stage (18
hpi, cluster I). This enrichment in open chromatin fades with time
as the parasite progresses through its erythrocytic cycle. In clusters
II–IV, scattered groups of genes have promoters enriched in pro-
tein-free DNA at the ring stage. They are likely actively transcribed
during the ring stage (Fig. 7C). In addition, promoters from genes
in clusters II and III reopen at the late trophozoite (24 hpi) and
early schizont (30 hpi) stages, respectively. In clusters I–III, all of
the possible promoter regions are enriched in more compact
structure at the late schizont stage (36 hpi). Genes belonging to
cluster IV behave a little differently. Their promoters slightly open
at ring stage and then pack at trophozoite stage to slightly reopen
at 36 hpi. These observations may suggest that promoters that are
open at ring stage could be regulated in a time-dependent manner.
Then, the majority of the promoters could be activated at the
trophozoite stage and slowly inactivated through the late tro-
phozoite and schizont stages.
The composition of these four clusters was analyzed with
regards to the 15 functional clusters (here designed at FC1–FC15)
previously published based on mRNA level quantification (Le
Roch et al. 2003). Le Roch et al. (2003) established that: (1) genes
from FC1–FC3 are expressed in sporozoites and gametocytes; (2)
genes from FC4 are corresponding to ring and schizont stages; (3)
FC5–FC7 contain ring and trophozoite genes; (4) FC8–FC13 are
devoted to trophozoite genes; (5) FC14 contains a mix of sporo-
zoite, gametocyte, and schizont genes; and (6) FC15 contains
schizont stage genes, in particular genes involved in the invasion
of red blood cells. We performed our analysis considering these six
master groups. Each of the 15 functional clusters was represented
within our four groups. Nevertheless, certain functional clusters
seem to be differentially represented (Fig. 7D). FC2, FC3, FC14,
and FC15 are overrepresented in cluster I whereas members of
FC4 abound in cluster III and FC5/FC6 are significantly over-
represented in cluster IV. Cluster II did not show any significant
enrichment in any of the FCs. For clarity, the graphical display of
the results for this cluster is proposed separately in Supplemental
Figure S10. According to the annotation of the functional clusters
(Le Roch et al. 2003), cluster I is enriched in sporozoite and ga-
metocyte stage specific genes (respectively, the exoerythrocytic
mosquito stage and sexual form of P. falciparum), whereas cluster III
is enriched in genes expressed at the ring and late trophozoite/
early schizont stages, and cluster IV is enriched in ring and tro-
phozoite specific genes. In addition to the exoerythrocytic stages
previously mentioned, cluster I is enriched in housekeeping genes,
genes involved in DNA replication and cell cycle control, antigenic
variation (rifin and stevor genes), as well as in most genes pre-
viously found in FC15 that have high steady-state mRNA levels
during the schizont stage and mainly involved in invasion. This
latest observation is in apparent contradiction with the classical
model of chromatin remodeling upon transcriptional activation of
invasion genes occurring at the schizont stage. On the contrary, in
the case of ring-expressed genes, the dynamics of chromatin seems
to fit with gene expression kinetics. To further validate these re-
sults, we performed a gene ontology analysis for each of our four
clusters (the Gene Ontology [GO] term association was evaluated
with an hypergeometric test, the threshold for significance being
set to 0.0001). Cluster I is enriched with various DNA- and RNA-
related processes (e.g., DNA replication and chromosome cycle,
mitotic cell cycle, DNA metabolism, mRNA polyadenylation, tRNA
metabolism), with genes involved in sexual development, and
with sporozoite-specific genes. In addition to these classical GO
terms, cluster I is significantly enriched in parasite-customized
GO terms (see Zhou et al. 2008) such as ‘‘antigenic variation,’’
‘‘cytoadherence,’’ ‘‘merozoite development,’’ or ‘‘protease activity’’
commonly associated with invasion and virulence. These results
are in agreement with our previous observations.
To further investigate the possible regulatory events that oc-
cur at the late stages of the erythrocytic cycle, we analyzed the
consensus DNA binding motif (9-bp-long) coverage profile of
PF14_0633 and PFF0200c, two members of the Apicomplexan AP2
(ApiAP2) protein family (Balaji et al. 2005; De Silva et al. 2008).
Very recently, these proteins were identified as putative P. falciparum
transcription factors of late-stage genes (Balaji et al. 2005; De
Silva et al. 2008). We compared the profiles of coverage within the
9 bp of their proposed targets to the profiles of 9-bp-long stretches
of DNA randomly chosen within 200 random promoter regions.
Both PFF0200c and PF14_0633 targets have similar coverage pro-
files within their consensus sequence (Fig. 7E), i.e., a peak of
coverage occurs at the trophozoite stage (18–24 hpi), which are
different from the profile of random sequences (dashed line) but
follow the genome-wide pattern of chromatin remodeling. This
observation seems to support the hypothesis of a general regula-
tory function for these predicted consensus DNA motifs. As
a whole, these observations support a model where the vast ma-
jority of the promoters are activated at the trophozoite stage, cer-
tain sets of genes (i.e., ring or var genes) being subjected to finer
regulation.
DiscussionWe have analyzed the dynamic remodeling of nucleosome occu-
pancy in P. falciparum along the erythrocytic cycle using a combi-
nation of FAIRE and MAINE coupled with high-throughput se-
quencing. We showed that both techniques are complementary
and allow the quantification de novo of the relative enrichment in
open (FAIRE-seq) or closed (MAINE-seq) chromatin for different
regions of the genome. We demonstrated that the techniques are
efficient for the study of the AT-rich genome of P. falciparum. We
also verified that our experimental determination of nucleosome
positioning is in agreement with predictions made using the DNA
sequence as unique input. Given these observations, the particular
AT-richness of intergenic regions in the parasite genome could
serve as intrinsic signals for nucleosome positioning.
The application of these techniques on the P. falciparum ge-
nome clearly demonstrates that nucleosome distribution is re-
stricted to coding regions. This observation is consistent with three
recent analyses of nucleosome distribution in human, worms, and
flies demonstrating a marked preference of nucleosomes for exons
(Andersson et al. 2009; Schwartz et al. 2009; Tilgner et al. 2009).
These investigators link these observations to the suspected cou-
pling that occurs between transcription and splicing in eukary-
otes nucleosome positioning being determinant for exon selec-
tion. Our results show that P. falciparum has the same features as
those higher eukaryotes. However, due to the extreme AT-richness
of the parasite’s intergenic regions, histone depletion in non-
coding regions seems to be more pronounced; this may create an
Nucleosome positioning in Plasmodium
Genome Research 7www.genome.org
Cold Spring Harbor Laboratory Press on January 11, 2010 - Published by genome.cshlp.orgDownloaded from
extreme illustration of a eukaryotic nucleosome landscape. In ad-
dition, Plasmodium also differs from common eukaryotes in the
intensity of its DNA packing. Indeed, no recognizable homolog of
the linker histone H1 can be found in Plasmodium’s genome, and
the intensely packed metaphase chromosome is not expected
during the parasite’s infection cycle. Finally, our results revealed
that a maximum of 50% of the genome was found to be occupied
by nucleosomes (at the late schizont stage), a value much lower
than the 81% found in yeast (Lee et al. 2007). In their study, Lee
et al. (2007) identified more than 1 million well-positioned nu-
cleosomes (and as much floating nucleosomes) in the yeast ge-
nome, whereas less than 100,000 nucleosomes occupy Plasmo-
dium’s genome at the late schizont stage (Saccharomyces cerevisiae’s
and Plasmodium’s genomes are similar in size). As nucleosome
occupancy is thought to be dictated by DNA sequence itself
(Kaplan et al. 2009), we hypothesize that the very high (AT)-
content of Plasmodium’s noncoding regions confers rigidity to the
DNA and hinders the double helix from wrapping around his-
tones. This hypothesis is consistent with the in silico prediction of
P. falciparum nucleosome landscape and explains the differences
with the yeast nucleosome landscape.
A drastic genome-wide nucleosome loss is observed at 18 and
24 hpi, when DNA replication and active transcriptional activity
occur (Bozdech et al. 2003; Le Roch et al. 2003). This finding is
consistent with the dip in histone abundance that has been pre-
viously observed at the trophozoite stage (Le Roch et al. 2004).
The investigators described a loss of more than 85% of histones
levels between ring and trophozoite stages. This dip is consistent
with previous Plasmodium proteome analysis that demonstrated a
highly connected interaction network between proteins involved
in chromatin and ubiquitin metabolism (LaCount et al. 2005).
The pattern of chromatin remodeling was also observed for
the apicoplast DNA. To our knowledge, our results provide the first
indications of structural modifications of P. falciparum’s apicoplast
DNA throughout the erythrocytic cycle. The presence of a few
MAINE-enriched regions of apicoplast DNA is consistent with the
recent characterization of a nuclear encoded bacterial histone-like
protein PfHU, which plays a role in the compaction of the circular
apicoplast DNA (Ram et al. 2008). PfHU was shown to bind pref-
erably to supercoiled DNA in a nonsequence-specific manner. Such
binding is sometimes associated with reduction of supercoils,
known to affect DNA replication and transcription. In bacteria,
positive supercoils could be relaxed by wrapping the DNA around
histone-like octamers (Kar et al. 2006). These considerations sug-
gest that transcription and replication in the apicoplast may be
modulated by DNA architecture.
Altogether, our results are consistent with a model of global
and intense changes in chromatin structure throughout the
erythrocytic cycle. In this model, the chromatin opens at the early
erythrocytic stage, reaching a maximum at the trophozoite stage,
and an intense packaging at the late schizont stage. Such massive
structural changes at the genomic scale are not found in other
eukaryotes. Classically, chromatin remodeling is only observed in
transcribed regions and is associated with the displacement and
repositioning of one or two nucleosomes in the promoter rather
than broader, region-wide, changes (Hogan et al. 2006; Lee et al.
2007). On the whole, our observations suggest that the situation in
Plasmodium could represent an extremely reduced and simplified
version of the eukaryotic transcriptional device, where the AT-
content of the genome itself could be a major regulator. The rela-
tive degree of chromatin opening in putative promoter regions ge-
nome-wide was compared to previously published mRNA steady-
state level measurements (Bozdech et al. 2003; Le Roch et al. 2003).
Our results confirm that the cascade of mRNA steady-state levels
observed during the parasite’s erythrocytic cycle (Bozdech et al.
2003; Le Roch et al. 2003, 2004) cannot be explained by fine
chromatin structure remodeling (more than half of the genes are
in this situation, see cluster I), with the exceptions of ring stage-
specific genes (clusters III and IV). Our data demonstrate binary
changes of chromatin structure throughout the erythrocytic cycle
(open/closed) and further confront the classical eukaryotic model
of transcription initiation after precise removal of nucleosomes.
Genes in which mRNA products were detected at the schizont
stage (and involved in invasion) in previous microarray expression
analyses belong to this group (Le Roch et al. 2003). The apparent
paradox of a closed state of chromatin while corresponding
mRNAs can be detected could be explained by the regulation of
RNA stability. Indeed, previous experiments clearly demonstrate
that mRNA half-life is drastically extended during the asexual
erythrocytic cycle, especially at late schizont stage with a general
half-life of 65 min against 9.5 min for ring stage (Shock et al. 2007).
The fact that ring stage–specific genes of our data set seem to follow
a more classical pattern of chromatin loosening/tightening in
phase with gene expression is consistent with a shorter mRNA half-
life. To our knowledge, this decay pattern seems to be unique to
Plasmodium. All together these data indicate that post-transcriptional
mechanisms may be major mechanisms of gene regulation in the
asexual development of the parasite. The classical transcription-
driven eukaryotic model of gene regulation was already challenged
by the relative paucity of transcription factors (Coulson et al. 2004)
and cis-acting regulatory elements detected in the parasite genome
(Jason et al. 2005; De Silva et al. 2008). Moreover, even though our
chromatin dynamic analyses at the binding sites of the ApiAP2
transcription factors support a role for transcriptional regulation
(De Silva et al. 2008), our results indicate that these transcription
factors are following the general pattern found for most genes
(cluster I). In this scenario, the identified ApiAP2 could be master
regulators of transcription at the trophozoite stage rather than fine
regulators of targeted transcription initiation.
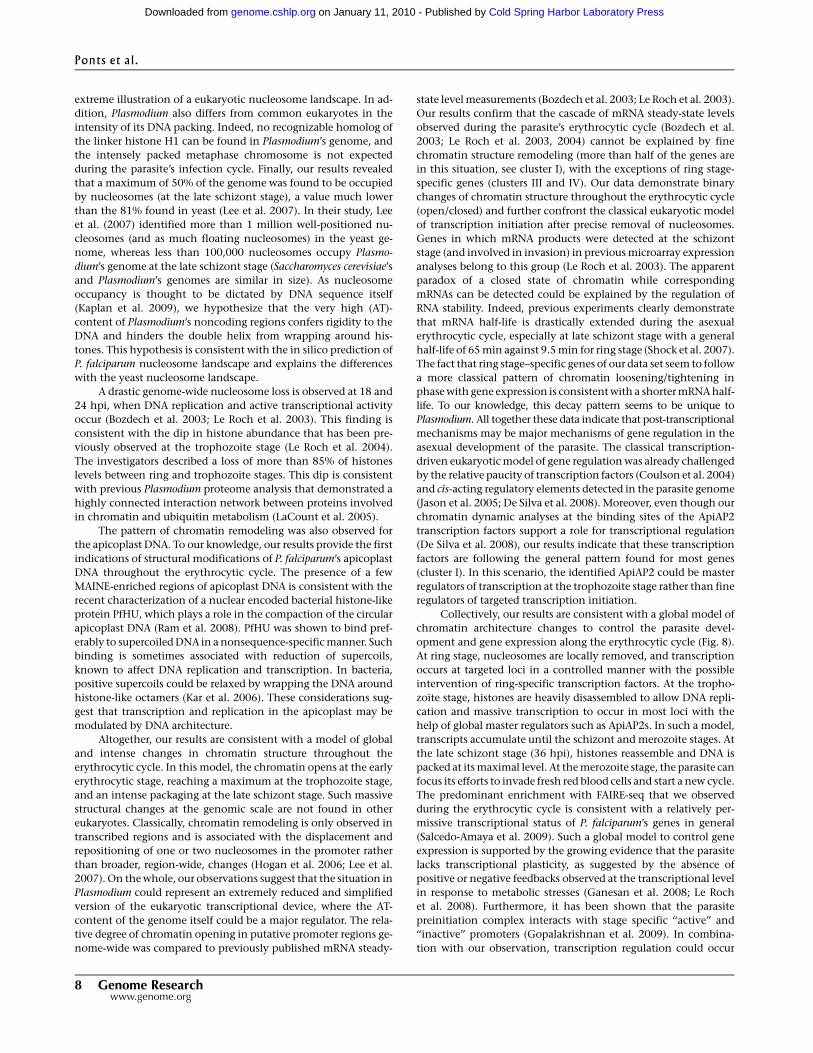
Collectively, our results are consistent with a global model of
chromatin architecture changes to control the parasite devel-
opment and gene expression along the erythrocytic cycle (Fig. 8).
At ring stage, nucleosomes are locally removed, and transcription
occurs at targeted loci in a controlled manner with the possible
intervention of ring-specific transcription factors. At the tropho-
zoite stage, histones are heavily disassembled to allow DNA repli-
cation and massive transcription to occur in most loci with the
help of global master regulators such as ApiAP2s. In such a model,
transcripts accumulate until the schizont and merozoite stages. At
the late schizont stage (36 hpi), histones reassemble and DNA is
packed at its maximal level. At the merozoite stage, the parasite can
focus its efforts to invade fresh red blood cells and start a new cycle.
The predominant enrichment with FAIRE-seq that we observed
during the erythrocytic cycle is consistent with a relatively per-
missive transcriptional status of P. falciparum’s genes in general
(Salcedo-Amaya et al. 2009). Such a global model to control gene
expression is supported by the growing evidence that the parasite
lacks transcriptional plasticity, as suggested by the absence of
positive or negative feedbacks observed at the transcriptional level
in response to metabolic stresses (Ganesan et al. 2008; Le Roch
et al. 2008). Furthermore, it has been shown that the parasite
preinitiation complex interacts with stage specific ‘‘active’’ and
‘‘inactive’’ promoters (Gopalakrishnan et al. 2009). In combina-
tion with our observation, transcription regulation could occur
Ponts et al .
8 Genome Researchwww.genome.org
Cold Spring Harbor Laboratory Press on January 11, 2010 - Published by genome.cshlp.orgDownloaded from
during the elongation level rather than the initiation one. In ad-
dition, our model is consistent with recent data demonstrating
that mRNA steady-state levels and transcription rate are not cor-
related for about half of the parasite’s genes (Sims et al. 2009). Fi-
nally, our results are consistent with the ring stage being crucial for
the parasite fate. It has been long known that any kind of stress
applied at the early ring stage can induce parasite sexual differen-
tiation and gametocytogenesis.
Since Plasmodia genomes present many points of similarity, it
is highly probable that the regulations that we describe here in the
case of P. falciparum are conserved among other species: All Plas-
modia genomes are uniform in size (23–27 Mb across 14 chromo-
somes) and gene number (;5500 genes), and they reveal marked
gene conservation (77% of the genes are orthologous) and gene
synteny within the body of each chromosome (Carlton et al.
2008b). Among other similarities, they all appear to lack homologs
for most of the specific elements of the eukaryotic transcriptional
machinery and promoters but encode a very high number of pro-
teins involved in RNA stability and chromatin structure mainte-
nance (Coulson et al. 2004; Carlton et al. 2008b). The accumula-
tion of such genomic specificities further indicates that gene
expression regulation in Plasmodium species appears unusual
compared with other eukaryotes; similar nucleosome positioning
studies should be applied to other Plasmodia genomes to confirm
this potentially conserved transcriptional control mechanism.
Nonetheless, while it has been shown that Plasmodia genomes are
well conserved, the differences in nucleotide bias can be extreme
(ranging from 42.3% G+C in Plasmodium vivax and 19.4% in
P. falciparum) (Carlton et al. 2008a), suggesting that the AT-richness
of the P. falciparum genome might not be the only regulator of
chromatin structure changes.
Taken together, our results revive the importance of post-
transcriptional mechanisms in the regulation of mRNA steady-
state level. The rigid and minimal transcriptional device identified
in P. falciparum challenges the classical idea of eukaryotic gene
regulation occurring mostly at the transcription initiation level.
Our data assign malaria parasite’s machinery components that
control wide chromatin remodeling as putative targets for new
therapeutic interventions.
MethodsFor detailed methods, see Supplemental material.
P. falciparum strain and culture conditions
Sorbitol synchronized P. falciparum parasite strain 3D7 was main-tained in human erythrocytes according to previously describedprotocols (Lambros and Vanderberg 1979; Le Roch et al. 2003). Foreach experiment, cultures were harvested 48 h after the first sor-bitol treatment (immediately after reinvasion, time point namedT0) and then every 6 h for 36 h (respectively, T6, T12, T18, T24,T30, and T36).
FAIRE procedure
The FAIRE procedure was performed as described previously (Giresiand Lieb 2009). P. falciparum cultures were harvested in phosphatebuffered saline and treated with formaldehyde 1% for 20 min atroom temperature. The cross-linking duration was set after opti-mization for the AT-rich genome of P. falciparum (SupplementalFig. S4). Formaldehyde was quenched with glycine 125 mM for10 min, and cultures were spun 5 min at 3600g. Pellets were washedthree times with phosphate buffered saline containing 2 mMphenylmethylsulfoxide and flash frozen in liquid nitrogen. Pelletswere resuspended in 1 mL of FAIRE lysis buffer (25 mM Tris-HCl atpH 7.8, 1 mM EDTA, 0.25% [v/v] Igepal CA-630, Roche Complete MiniEDTA-free protease inhibitor cocktail, 20 mM N-ethylmaleimide) per0.4 g of cells. Samples were then sonicated for 12 sessions of 12 secon a Sonic Dismembrator 100 (Fischer Scientific) at 20% amplitudeuntil DNA was sheared into fragments ranging from 50 to 800 bp.Lysates were cleared by centrifugation for 20 min at 4°C and16,000g. DNA was extracted with phenol-chloroform-isoamyl al-cohol 25:24:1 and precipitated with ethanol following a previouslydescribed protocol (Giresi et al. 2007). DNA samples were thentreated for 30 min at 37°C with RNase A 60 mg/mL (Promega), andfinally incubated 8 h at 65°C to remove any eventual DNA–DNAcross-link.
MAINE procedure
Parasite cultures were harvested at 50% hematocrit in phosphatebuffered saline containing 2 mM phenylmethylsulfoxide and threevolumes of cell lysis solution (Promega) were added. After 10 minof incubation at room temperature, parasites were precipitated by15 min of centrifugation at 2000g. DNA digestion was conducted5 min at 37°C in 1 mL of MNase lysis buffer (10 mM Tris-HCl at pH8.8, 2 mM CaCl2, 0.6% [v/v] Igepal CA-630, 50 mM NaCl, 2 mMphenylmethylsulfoxide, 20 mM Roche Complete Mini EDTA-freeprotease inhibitor cocktail, N-ethylmaleimide) using 200 units ofMNase (USB Corporation). The amount of MNase that was nec-essary for full mononucleosome purification was optimized in our
Figure 8. Proposed model of chromatin remodeling throughout P.falciparum’s erythrocytic cycle. Genome-wide variations of densities ofcoverage for MAINE-seq (red) and FAIRE-seq (black). After the invasion ofa red blood cell by a parasite at its merozoite morphological stage, his-tones are depleted and chromatin loosens. During the ring stage, tran-scription occurs locally in a regulated manner. At the early trophozoitestage, histones are massively depleted. Replication and transcription fac-tors can freely bind. DNA-related metabolic processes are permitted. Afterreplication, DNA re-packs at the schizont stage and the parasites divideand escape the host as differentiated merozoites that are ready for a newcycle of infection.
Nucleosome positioning in Plasmodium
Genome Research 9www.genome.org
Cold Spring Harbor Laboratory Press on January 11, 2010 - Published by genome.cshlp.orgDownloaded from
conditions (Supplemental Fig. S11). Reaction was stopped by theaddition of EDTA 5 mM, and the MNase lysis buffer was discardedafter 5 min of centrifugation at 16000g. Cell lysis was performed in400 mL of parasite lysis buffer (3.75 M guanidine HCl, 0.625% [v/v]SDS, 250 mg/mL proteinase K) for 1 h at 55°C and then overnight at4°C. DNA was extracted with phenol-chloroform-isoamyl alcohol25:24:1 and precipitated with ethanol.
Sequencing and mapping
The manufacturer’s guidelines were followed for library prepara-tion (starting amount 3 mg of fragmented DNA), cluster genera-tion, and single-read 36-cycle sequencing on the Illumina genomeanalyzer generation I (GAI) (FAIRE experiment), or generation II(GAII) (MAINE experiment). GAI sequencing was performed at theBiomedical Genomics Microarray (BIOGEM) laboratory (Universityof California, San Diego). GAII sequencing was performed at theInstitute for Integrative Genome Biology (University of California,Riverside). Images were processed by the Illumina Pipeline version0.3. The sequence reads generated by the Pipeline were used forP. falciparum’s genome mapping. Mapping was performed withboth ELAND and RMAP software.
Nucleosome mapping
The MAINE-seq data set was used for the mapping of nucleosomesacross the genome throughout the red blood cell cycle. Peaks ofcoverage in the coverage profiles defined the positions of the nu-cleosomes; the maximum of a peak gives the central position ofa 147-bp-long nucleosome.
Measuring regulatory regions availability
The regions located upstream of genes, up to 1 kb long, wereconsidered as putative promoter regions. These regions were di-vided into two equal parts, i.e., the first 500 bp adjacent to the ATG(proximal promoter) and the preceding 500 bp (distal promoter).Intronic regions were also considered as possible regulatory re-gions. The degree of chromatin opening was measured as the log2-transformed ratio between the sum of coverage with FAIRE-seq andthe sum of coverage with MAINE-seq in a given region. Since allintrons have different lengths, their sums of coverage were nor-malized per kilobase pair. Profiles of promoter or regulatory regionavailability across time were built using these log2 ratios. Suchprofiles from proximal promoter regions constituted a data set tobe used for promoter availability analysis.
Analyzing changes in promoter availability
Genes with no coverage, either with FAIRE or MAINE, at any of thetime points were removed from the data set (80 genes total). Mostof these genes are annotated as hypothetical protein, pseudogene,or truncated. One-kilobase-long regions upstream of the ATGswere clustered according to the position of FAIRE-enriched regionsusing K-mean clustering. Three groups of genes were delineated,and their optimized putative regions were defined and used for therest of the analysis. The profiles of coverage within promoters of allgenes across the seven time points were used as input. Genes weregrouped by K-means clustering (k = 4, number of replicates = 1000runs, confidence measurement = silhouette value). The distribu-tion of 15 previously published functional clusters (FC) based onmRNA levels (Le Roch et al. 2003) within our four clusters wasexamined and significant representation of these FCs in our clus-ters was tested using a hypergeometric test. For each FC in a cluster
of interest, a representation score was defined as the log2 ratiobetween the actual gene count and the expected gene count givenby the theoretical distribution.
AcknowledgmentsWe thank Thomas Girke, Tyler Backman, Rebecca Sun, and BarbaraWalter (IIGB UC Riverside) for assistance with Illumina sequencingand Pipeline analysis. 3D7 parasites were obtained through theMR4 (MRA-102) deposited by D.J. Carucci. These studies weresupported in part by NIH grants DK063491, CA023100, andDK080506. Finally, we thank Christian Doerig for his critical re-view and Carol Park for her attentive proofreading.
References
Andersson R, Enroth S, Rada-Iglesias A, Wadelius C, Komorowski J. 2009.Nucleosomes are well positioned in exons and carry characteristichistone modifications. Genome Res 19: 1732–1741.
Balaji S, Babu MM, Iyer LM, Aravind L. 2005. Discovery of the principalspecific transcription factors of Apicomplexa and their implication forthe evolution of the AP2-integrase DNA binding domains. Nucleic AcidsRes 33: 3994–4006.
Bernstein BE, Liu CL, Humphrey EL, Perlstein EO, Schreiber SL. 2004. Globalnucleosome occupancy in yeast. Genome Biol 5: R62. doi: 10.1186/gb-2004-5-9-r62.
Bowman S, Lawson D, Basham D, Brown D, Chillingworth T, Churcher CM,Craig A, Davies RM, Devlin K, Feltwell T, et al. 1999. The completenucleotide sequence of chromosome 3 of Plasmodium falciparum. Nature400: 532–538.
Bozdech Z, Llinas M, Pulliam BL, Wong ED, Zhu J, DeRisi JL. 2003. Thetranscriptome of the intraerythrocytic developmental cycle ofPlasmodium falciparum. PLoS Biol 1: e5. doi: 10.1371/journal.pbio.0000005.
Calderwood MS, Gannoun-Zaki L, Wellems TE, Deitsch KW. 2003.Plasmodium falciparum var genes are regulated by two regions withseparate promoters, one upstream of the coding region and a secondwithin the intron. J Biol Chem 278: 34125–34132.
Carlton JM, Adams JH, Silva JC, Bidwell SL, Lorenzi H, Caler E, Crabtree J,Angiuoli SV, Merino EF, Amedeo P, et al. 2008a. Comparative genomicsof the neglected human malaria parasite Plasmodium vivax. Nature 455:757–763.
Carlton JM, Escalante AA, Neafsey D, Volkman SK. 2008b. Comparativeevolutionary genomics of human malaria parasites. Trends Parasitol 24:545–550.
Cary C, Lamont D, Dalton JP, Doerig C. 1994. Plasmodium falciparumchromatin: Nucleosomal organisation and histone-like proteins.Parasitol Res 80: 255–258.
Chookajorn T, Dzikowski R, Frank M, Li F, Jiwani AZ, Hartl DL, Deitsch KW.2007. Epigenetic memory at malaria virulence genes. Proc Natl Acad Sci104: 899–902.
Coulson RM, Hall N, Ouzounis CA. 2004. Comparative genomics oftranscriptional control in the human malaria parasite Plasmodiumfalciparum. Genome Res 14: 1548–1554.
Daily JP, Le Roch KG, Sarr O, Ndiaye D, Lukens A, Zhou Y, Ndir O, Mboup S,Sultan A, Winzeler EA, et al. 2005. In vivo transcriptome of Plasmodiumfalciparum reveals overexpression of transcripts that encode surfaceproteins. J Infect Dis 191: 1196–1203.
Deitsch KW, Calderwood MS, Wellems TE. 2001. Malaria. Cooperativesilencing elements in var genes. Nature 412: 875–876.
De Silva EK, Gehrke AR, Olszewski K, Leon I, Chahal JS, Bulyk ML, Llinas M.2008. Specific DNA-binding by apicomplexan AP2 transcription factors.Proc Natl Acad Sci 105: 8393–8398.
Duraisingh MT, Voss TS, Marty AJ, Duffy MF, Good RT, Thompson JK,Freitas-Junior LH, Scherf A, Crabb BS, Cowman AF. 2005.Heterochromatin silencing and locus repositioning linked to regulationof virulence genes in Plasmodium falciparum. Cell 121: 13–24.
Dzikowski R, Li F, Amulic B, Eisberg A, Frank M, Patel S, Wellems TE, DeitschKW. 2007. Mechanisms underlying mutually exclusive expression ofvirulence genes by malaria parasites. EMBO Rep 8: 959–965.
Epp C, Li F, Howitt CA, Chookajorn T, Deitsch KW. 2009. Chromatinassociated sense and antisense noncoding RNAs are transcribed from thevar gene family of virulence genes of the malaria parasite Plasmodiumfalciparum. RNA 15: 116–127.
Field Y, Kaplan N, Fondufe-Mittendorf Y, Moore IK, Sharon E, Lubling Y,Widom J, Segal E. 2008. Distinct modes of regulation by chromatin
Ponts et al .
10 Genome Researchwww.genome.org
Cold Spring Harbor Laboratory Press on January 11, 2010 - Published by genome.cshlp.orgDownloaded from
encoded through nucleosome positioning signals. PLoS Comput Biol4: e1000216. doi: 10.1371/journal.pcbi.1000216.
Ganesan K, Ponmee N, Jiang L, Fowble JW, White J, Kamchonwongpaisan S,Yuthavong Y, Wilairat P, Rathod PK. 2008. A genetically hard-wiredmetabolic transcriptome in Plasmodium falciparum fails to mountprotective responses to lethal antifolates. PLoS Pathog 4: e1000214. doi:10.1371/journal.ppat.1000214.
Gardner MJ, Hall N, Fung E, White O, Berriman M, Hyman RW, Carlton JM,Pain A, Nelson KE, Bowman S, et al. 2002. Genome sequence of thehuman malaria parasite Plasmodium falciparum. Nature 419: 498–511.
Giresi PG, Lieb JD. 2009. Isolation of active regulatory elements fromeukaryotic chromatin using FAIRE (formaldehyde assisted isolation ofregulatory elements). Methods 48: 233–239.
Giresi PG, Kim J, McDaniell RM, Iyer VR, Lieb JD. 2007. FAIRE(formaldehyde-assisted isolation of regulatory elements) isolates activeregulatory elements from human chromatin. Genome Res 17: 877–885.
Goodman CD, McFadden GI. 2007. Fatty acid biosynthesis as a drug targetin apicomplexan parasites. Curr Drug Targets 8: 15–30.
Gopalakrishnan AM, Nyindodo LA, Ross Fergus M, Lopez-Estrano C. 2009.Plasmodium falciparum: Preinitiation complex occupancy of active andinactive promoters during erythrocytic stage. Exp Parasitol 121: 46–54.
Gupta S, Dennis J, Thurman RE, Kingston R, Stamatoyannopoulos JA, NobleWS. 2008. Predicting human nucleosome occupancy from primarysequence. PLoS Comput Biol 4: e1000134. doi: 10.1371/journal.pcbi.1000134.
Hogan GJ, Lee CK, Lieb JD. 2006. Cell cycle-specified fluctuation ofnucleosome occupancy at gene promoters. PLoS Genet 2: e158. doi:10.1371/journal.pgen.0020158.
Jason LJ, Finn RM, Lindsey G, Ausio J. 2005. Histone H2A ubiquitinationdoes not preclude histone H1 binding, but it facilitates its associationwith the nucleosome. J Biol Chem 280: 4975–4982.
Kaplan N, Moore IK, Fondufe-Mittendorf Y, Gossett AJ, Tillo D, Field Y,LeProust EM, Hughes TR, Lieb JD, Widom J, et al. 2009. The DNA-encoded nucleosome organization of a eukaryotic genome. Nature 458:362–366.
Kar S, Choi EJ, Guo F, Dimitriadis EK, Kotova SL, Adhya S. 2006. Right-handed DNA supercoiling by an octameric form of histone-like proteinHU: Modulation of cellular transcription. J Biol Chem 281: 40144–40153.
Kelly JM, McRobert L, Baker DA. 2006. Evidence on the chromosomallocation of centromeric DNA in Plasmodium falciparum from etoposide-mediated topoisomerase-II cleavage. Proc Natl Acad Sci 103: 6706–6711.
LaCount DJ, Vignali M, Chettier R, Phansalkar A, Bell R, Hesselberth JR,Schoenfeld LW, Ota I, Sahasrabudhe S, Kurschner C, et al. 2005. Aprotein interaction network of the malaria parasite Plasmodiumfalciparum. Nature 438: 103–107.
Lambros C, Vanderberg JP. 1979. Synchronization of Plasmodium falciparumerythrocytic stages in culture. J Parasitol 65: 418–420.
Le Roch KG, Zhou Y, Blair PL, Grainger M, Moch JK, Haynes JD, De La Vega P,Holder AA, Batalov S, Carucci DJ, et al. 2003. Discovery of gene functionby expression profiling of the malaria parasite life cycle. Science 301:1503–1508.
Le Roch KG, Johnson JR, Florens L, Zhou Y, Santrosyan A, Grainger M, YanSF, Williamson KC, Holder AA, Carucci DJ, et al. 2004. Global analysis oftranscript and protein levels across the Plasmodium falciparum life cycle.Genome Res 14: 2308–2318.
Le Roch KG, Johnson JR, Ahiboh H, Chung DW, Prudhomme J, Plouffe D,Henson K, Zhou Y, Witola W, Yates JR, et al. 2008. A systematic approachto understand the mechanism of action of the bisthiazolium compoundT4 on the human malaria parasite, Plasmodium falciparum. BMCGenomics 9: 513.
Lee W, Tillo D, Bray N, Morse RH, Davis RW, Hughes TR, Nislow C. 2007.A high-resolution atlas of nucleosome occupancy in yeast. Nat Genet39: 1235–1244.
Llinas M, Bozdech Z, Wong ED, Adai AT, DeRisi JL. 2006. Comparativewhole genome transcriptome analysis of three Plasmodium falciparumstrains. Nucleic Acids Res 34: 1166–1173.
Lopez-Rubio JJ, Gontijo AM, Nunes MC, Issar N, Hernandez Rivas R, ScherfA. 2007. 59 Flanking region of var genes nucleate histone modificationpatterns linked to phenotypic inheritance of virulence traits in malariaparasites. Mol Microbiol 66: 1296–1305.
Miele V, Vaillant C, d’Aubenton-Carafa Y, Thermes C, Grange T. 2008. DNAphysical properties determine nucleosome occupancy from yeast to fly.Nucleic Acids Res 36: 3746–3756.
Nagy PL, Cleary ML, Brown PO, Lieb JD. 2003. Genomewide demarcation ofRNA polymerase II transcription units revealed by physical fractionationof chromatin. Proc Natl Acad Sci 100: 6364–6369.
Pasternak ND, Dzikowski R. 2009. PfEMP1: An antigen that plays a keyrole in the pathogenicity and immune evasion of the malariaparasite Plasmodium falciparum. Int J Biochem Cell Biol 41: 1463–1466.
Ralph SA, Scherf A. 2005. The epigenetic control of antigenic variation inPlasmodium falciparum. Curr Opin Microbiol 8: 434–440.
Ram EV, Naik R, Ganguli M, Habib S. 2008. DNA organization by theapicoplast-targeted bacterial histone-like protein of Plasmodiumfalciparum. Nucleic Acids Res 36: 5061–5073.
Salcedo-Amaya AM, van Driel MA, Alako BT, Trelle MB, van den Elzen AM,Cohen AM, Janssen-Megens EM, van de Vegte-Bolmer M, Selzer RR,Iniguez AL, et al. 2009. Dynamic histone H3 epigenome marking duringthe intraerythrocytic cycle of Plasmodium falciparum. Proc Natl Acad Sci106: 9655–9660.
Schwartz S, Meshorer E, Ast G. 2009. Chromatin organization marks exon-intron structure. Nat Struct Mol Biol 16: 990–995.
Segal E, Widom J. 2009a. Poly(dA:dT) tracts: Major determinants ofnucleosome organization. Curr Opin Struct Biol 19: 65–71.
Segal E, Widom J. 2009b. What controls nucleosome positions? Trends Genet25: 335–343.
Shock JL, Fischer KF, DeRisi JL. 2007. Whole-genome analysis of mRNAdecay in Plasmodium falciparum reveals a global lengthening of mRNAhalf-life during the intra-erythrocytic development cycle. Genome Biol8: R134. doi: 10.1186/gb-2007-8-7-r134.
Sims JS, Militello KT, Sims PA, Patel VP, Kasper JM, Wirth DF. 2009. Patternsof gene-specific and total transcriptional activity during the Plasmodiumfalciparum intraerythrocytic developmental cycle. Eukaryot Cell 8: 327–338.
Snow RW, Guerra CA, Noor AM, Myint HY, Hay SI. 2005. The globaldistribution of clinical episodes of Plasmodium falciparum malaria.Nature 434: 214–217.
Tilgner H, Nikolaou C, Althammer S, Sammeth M, Beato M, Valcarcel J,Guigo R. 2009. Nucleosome positioning as a determinant of exonrecognition. Nat Struct Mol Biol 16: 996–1001.
Tolstorukov MY, Choudhary V, Olson WK, Zhurkin VB, Park PJ. 2008.nuScore: A web-interface for nucleosome positioning predictions.Bioinformatics 24: 1456–1458.
Zhou Y, Ramachandran V, Kumar KA, Westenberger S, Refour P, Zhou B, Li F,Young JA, Chen K, Plouffe D, et al. 2008. Evidence-based annotation ofthe malaria parasite’s genome using comparative expression profiling.PLoS One 3: e1570. doi: 10.1371/journal.pone.0001570.
Received September 28, 2009; accepted in revised form November 30, 2009.
Nucleosome positioning in Plasmodium
Genome Research 11www.genome.org
Cold Spring Harbor Laboratory Press on January 11, 2010 - Published by genome.cshlp.orgDownloaded from