ntt data annual report 2019
TRANSCRIPT
NTT DATA ANNUAL REPORT 2019
NTT D
ATA A
NN
UA
L RE
PO
RT 2019
Contents02 Value Creation by NTT DATA 02 NTT DATA’s Businesses 04 Mission Statement / Group Vision / Values 05 Fostered Strengths 06 Value Creation and History of
Self-Transformations 08 NTT DATA’s Value Creation Process 10 Financial / Non-Financial Highlights
12 Message from the CEO
18 Management Strategies 18 Changes in the Growth Strategy and Positioning of the New Medium-Term Management Plan 20 Review of Previous Medium-Term
Management Plan 24 New Medium-Term Management Plan 32 Message from the CFO
(Business Performance Review, Financial and Capital Strategy)
35 M&A Strategy
36 Business Strategies by Segment 36 Summary 38 Public & Social Infrastructure Segment 40 Financial Segment 42 Enterprise & Solutions Segment 44 North America Segment 46 EMEA & LATAM Segment 48 Message from the CEO of NTT DATA Services (Growth Strategy in North America Segment) 49 Business Topics
54 NTT DATA’s ESG Management 56 Sustainable Solutions 58 Human Resource Management 62 Environmental Management 64 Corporate Governance
76 Financials and Others 76 Financial Models of Principal Businesses 78 Analysis of Financial Position and
Business Results Analysis 84 Financial / Non-Financial Values
(Historical Changes) 86 Comparison of Financial Statements of
Two Years 90 Company Information 91 Stock / Credit Rating Information
01 NTT DATA Annual Report 2019
Connection with
Strategies (Story)
Non-Financial
Comprehensiveness
Financial
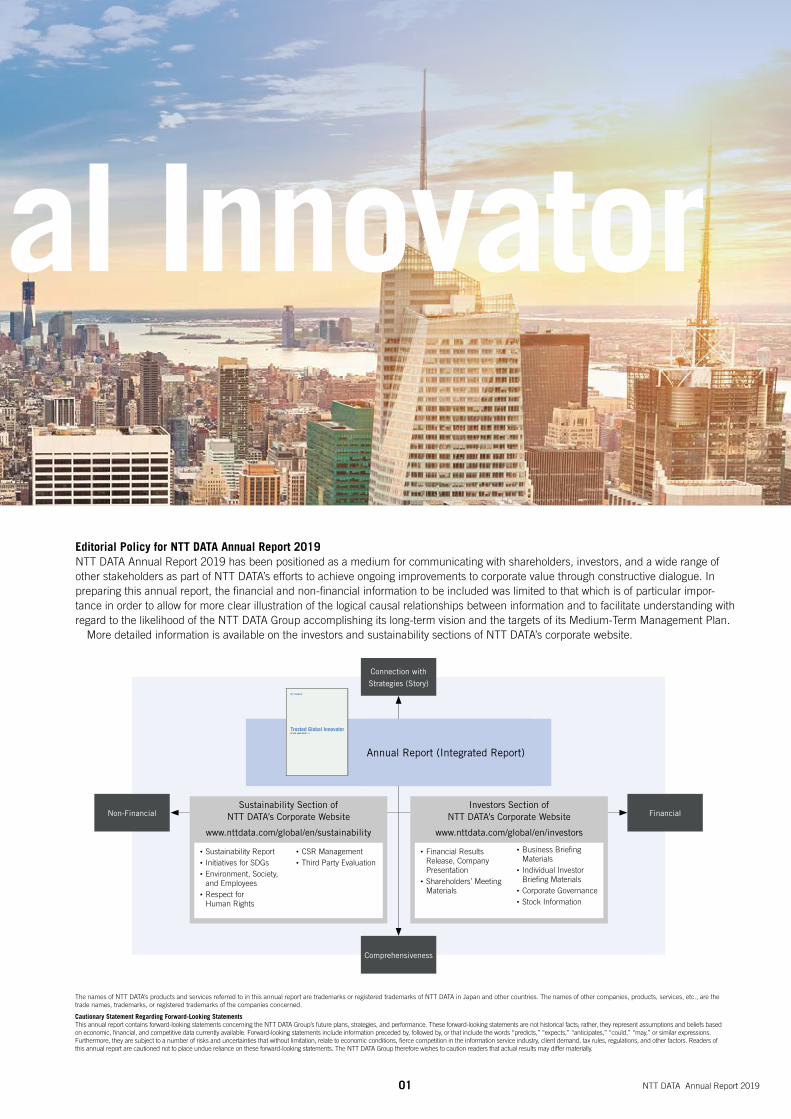
Editorial Policy for NTT DATA Annual Report 2019NTT DATA Annual Report 2019 has been positioned as a medium for communicating with shareholders, investors, and a wide range of other stakeholders as part of NTT DATA’s efforts to achieve ongoing improvements to corporate value through constructive dialogue. In preparing this annual report, the financial and non-financial information to be included was limited to that which is of particular impor-tance in order to allow for more clear illustration of the logical causal relationships between information and to facilitate understanding with regard to the likelihood of the NTT DATA Group accomplishing its long-term vision and the targets of its Medium-Term Management Plan. More detailed information is available on the investors and sustainability sections of NTT DATA’s corporate website.
Annual Report (Integrated Report)
NTT DATA ANNUAL REPORT 2019
NTT D
ATA A
NN
UA
L RE
PO
RT 2019
Sustainability Section of NTT DATA’s Corporate Website
www.nttdata.com/global/en/sustainability
Investors Section of NTT DATA’s Corporate Website
www.nttdata.com/global/en/investors
• Sustainability Report• Initiatives for SDGs• Environment, Society,
and Employees• Respect for
Human Rights
• CSR Management• Third Party Evaluation
• Financial Results Release, Company Presentation
• Shareholders’ Meeting Materials
• Business Briefing Materials
• Individual Investor Briefing Materials
• Corporate Governance• Stock Information
The names of NTT DATA’s products and services referred to in this annual report are trademarks or registered trademarks of NTT DATA in Japan and other countries. The names of other companies, products, services, etc., are the trade names, trademarks, or registered trademarks of the companies concerned.
Cautionary Statement Regarding Forward-Looking StatementsThis annual report contains forward-looking statements concerning the NTT DATA Group’s future plans, strategies, and performance. These forward-looking statements are not historical facts; rather, they represent assumptions and beliefs based on economic, financial, and competitive data currently available. Forward-looking statements include information preceded by, followed by, or that include the words “predicts,” “expects,” “anticipates,” “could,” “may,” or similar expressions. Furthermore, they are subject to a number of risks and uncertainties that without limitation, relate to economic conditions, fierce competition in the information service industry, client demand, tax rules, regulations, and other factors. Readers of this annual report are cautioned not to place undue reliance on these forward-looking statements. The NTT DATA Group therefore wishes to caution readers that actual results may differ materially.
Public SectorEnergy and Utilities
TelecommunicationsHealthcare and Life Sciences
Banking and Financial Services
Insurance
Manufacturing Retail Service Industry Media
02
Hardware manufacturers
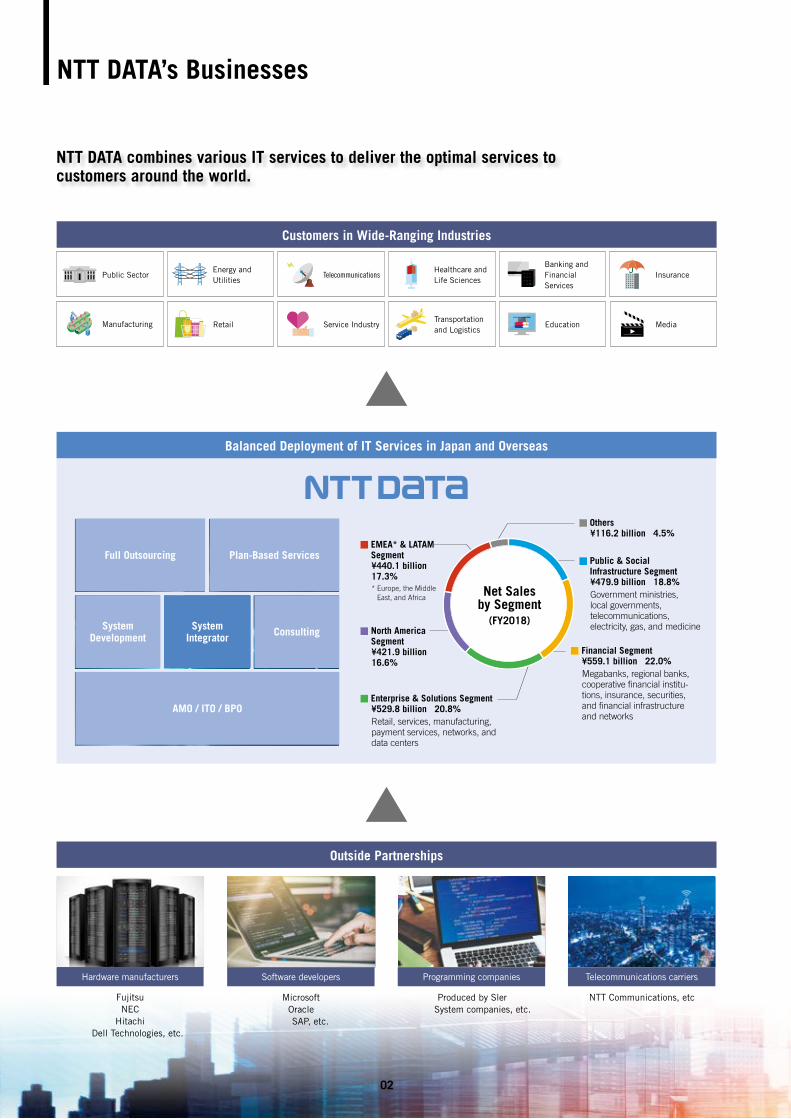
Net Sales by Segment
(FY2018)
Outside Partnerships
Customers in Wide-Ranging Industries
Software developers Programming companies Telecommunications carriers
Balanced Deployment of IT Services in Japan and Overseas
EducationTransportation and Logistics
AMO / ITO / BPO
Full Outsourcing Plan-Based Services
ConsultingSystem Development
System Integrator
EMEA* & LATAM Segment¥440.1 billion17.3%* Europe, the Middle
East, and Africa
North America Segment¥421.9 billion16.6%
NTT DATA’s Businesses
Public & Social Infrastructure Segment¥479.9 billion 18.8%Government ministries, local governments, telecommunications, electricity, gas, and medicine
Others¥116.2 billion 4.5%
Financial Segment¥559.1 billion 22.0%Megabanks, regional banks, cooperative financial institu-tions, insurance, securities, and financial infrastructure and networks
Enterprise & Solutions Segment¥529.8 billion 20.8%Retail, services, manufacturing, payment services, networks, and data centers
NTT DATA combines various IT services to deliver the optimal services to customers around the world.
FujitsuNEC
HitachiDell Technologies, etc.
MicrosoftOracleSAP, etc.
Produced by SlerSystem companies, etc.
NTT Communications, etc
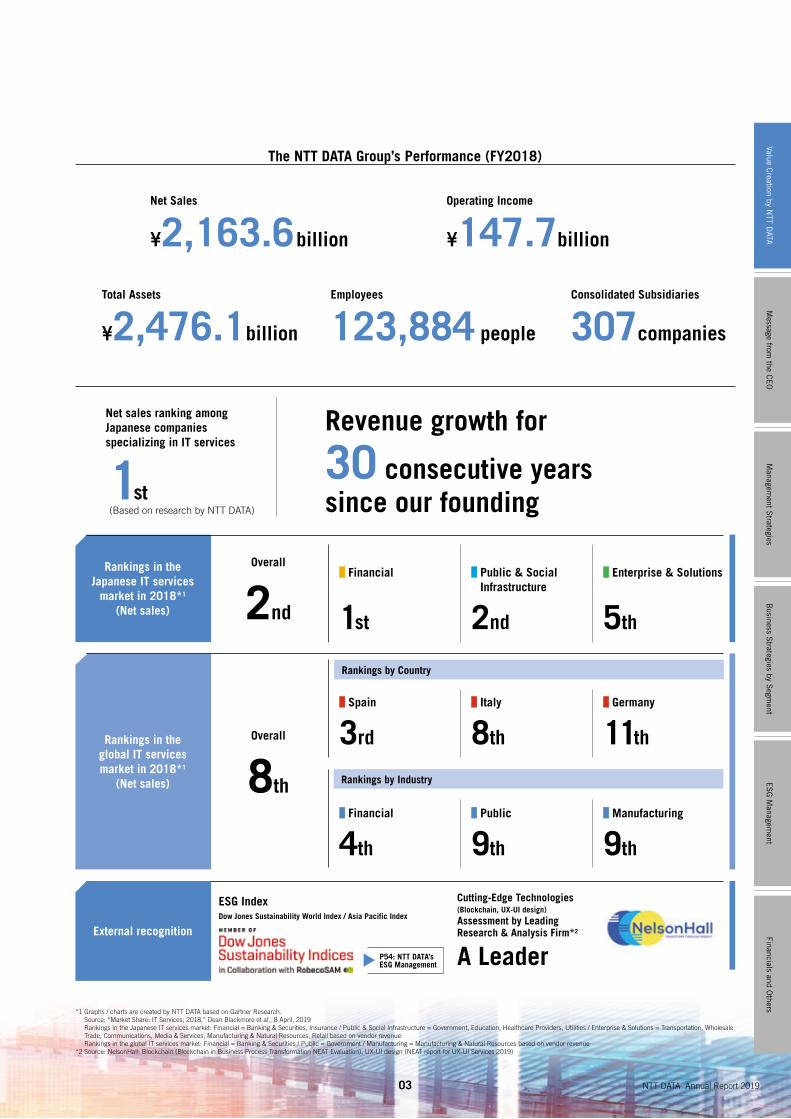
The NTT DATA Group’s Performance (FY2018)
03 NTT DATA Annual Report 2019
Operating Income
¥147.7billion
Net Sales
¥2,163.6billion
Total Assets
¥2,476.1billion
Consolidated Subsidiaries
307companies
Employees
123,884 people
Net sales ranking among Japanese companies specializing in IT services
1st (Based on research by NTT DATA)
Revenue growth for
30 consecutive years since our founding
Rankings in the Japanese IT services
market in 2018*1 (Net sales)
Overall
2nd
External recognition
Financial
1st
Public & Social Infrastructure
2nd
Enterprise & Solutions
5th
Rankings in the global IT services market in 2018*1
(Net sales)
Overall
8th
ESG Index Cutting-Edge Technologies(Blockchain, UX-UI design)
Assessment by Leading Research & Analysis Firm*2
A Leader
Rankings by Country
Rankings by Industry
*1 Graphs / charts are created by NTT DATA based on Gartner Research. Source: “Market Share: IT Services, 2018,” Dean Blackmore et al., 8 April, 2019 Rankings in the Japanese IT services market: Financial = Banking & Securities, Insurance / Public & Social Infrastructure = Government, Education, Healthcare Providers, Utilities / Enterprise & Solutions = Transportation, Wholesale Trade, Communications, Media & Services, Manufacturing & Natural Resources, Retail based on vendor revenue Rankings in the global IT services market: Financial = Banking & Securities / Public = Government / Manufacturing = Manufacturing & Natural Resources based on vendor revenue
*2 Source: NelsonHall: Blockchain (Blockchain in Business Process Transformation NEAT Evaluation), UX-UI design (NEAT report for UX-UI Services 2019)
P54: NTT DATA’s ESG Management
Spain
3rd
Italy
8th
Germany
11th
Financial
4th
Public
9th
Manufacturing
9th
Dow Jones Sustainability World Index / Asia Pacific Index
Managem
ent Strategies
Business S
trategies by Segm
entE
SG
Managem
entFinancials and O
thersValue C
reation by NTT D
ATAM
essage from the C
EO
04
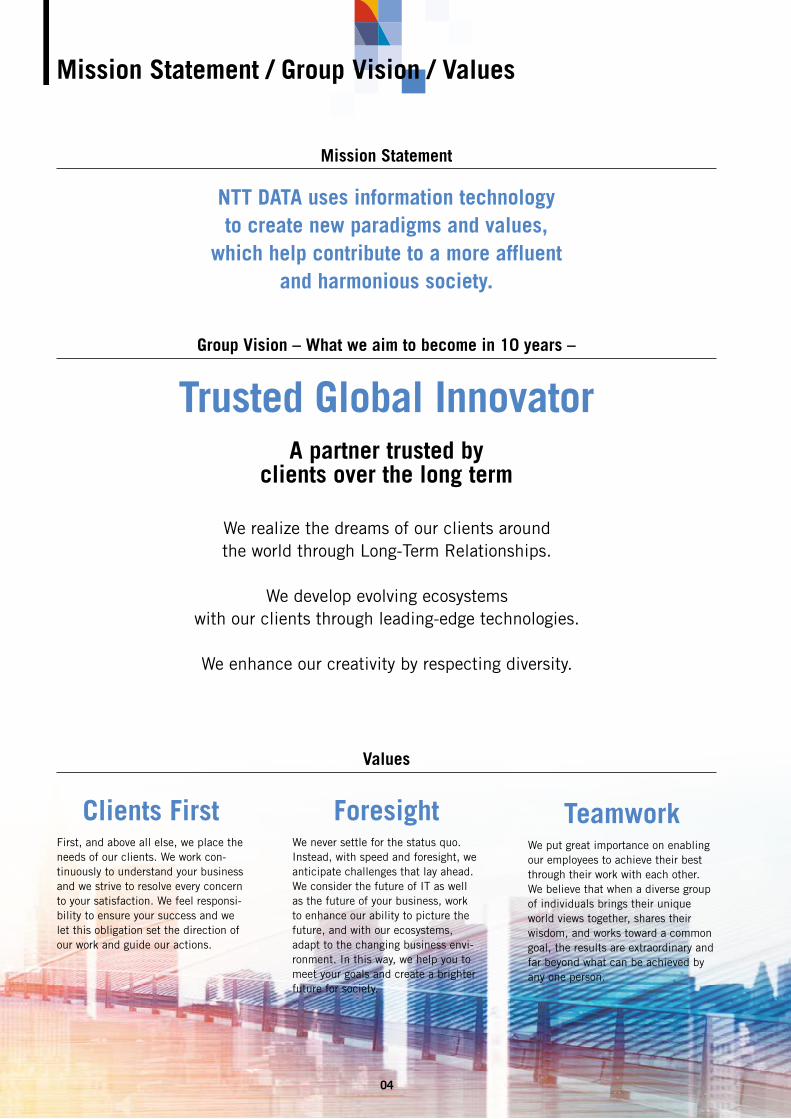
Group Vision – What we aim to become in 10 years –
Trusted Global InnovatorA partner trusted by
clients over the long term
Mission Statement / Group Vision / Values
Values
Clients FirstFirst, and above all else, we place the needs of our clients. We work con-tinuously to understand your business and we strive to resolve every concern to your satisfaction. We feel responsi-bility to ensure your success and we let this obligation set the direction of our work and guide our actions.
ForesightWe never settle for the status quo. Instead, with speed and foresight, we anticipate challenges that lay ahead. We consider the future of IT as well as the future of your business, work to enhance our ability to picture the future, and with our ecosystems, adapt to the changing business envi-ronment. In this way, we help you to meet your goals and create a brighter future for society.
TeamworkWe put great importance on enabling our employees to achieve their best through their work with each other. We believe that when a diverse group of individuals brings their unique world views together, shares their wisdom, and works toward a common goal, the results are extraordinary and far beyond what can be achieved by any one person.
Mission Statement
NTT DATA uses information technology to create new paradigms and values,
which help contribute to a more affluent and harmonious society.
We realize the dreams of our clients around the world through Long-Term Relationships.
We develop evolving ecosystems with our clients through leading-edge technologies.
We enhance our creativity by respecting diversity.
05 NTT DATA Annual Report 2019
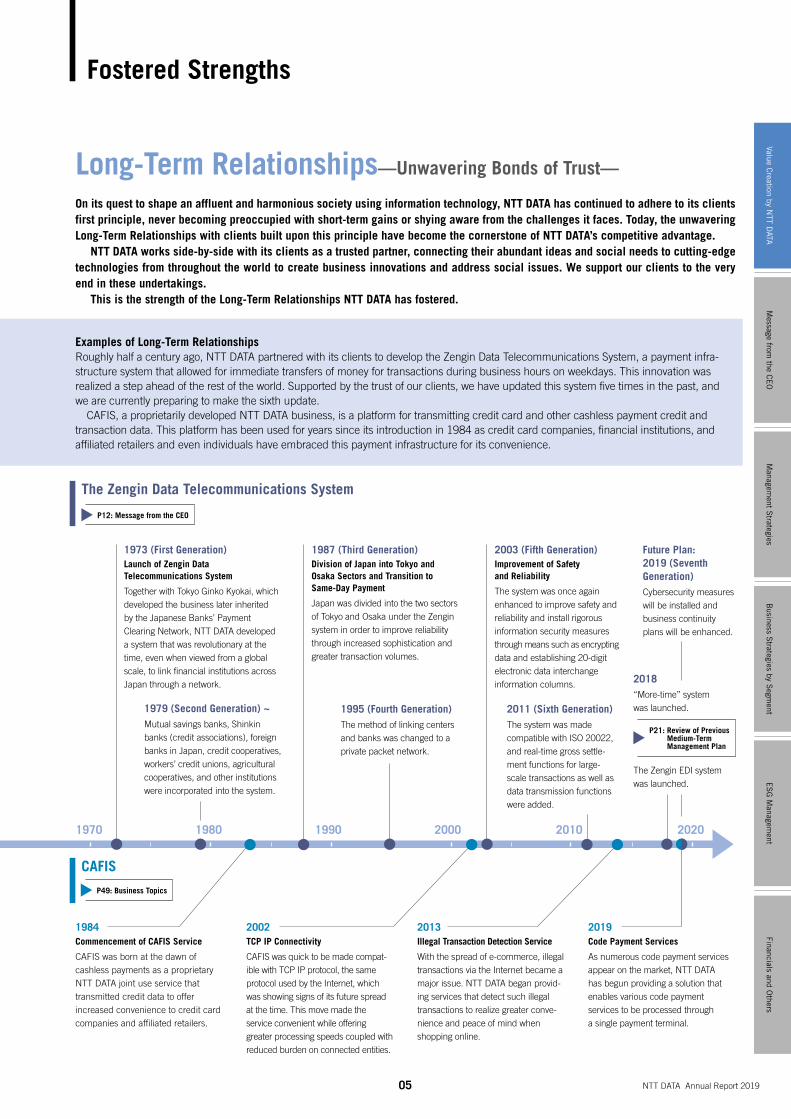
Long-Term Relationships—Unwavering Bonds of Trust—
On its quest to shape an affluent and harmonious society using information technology, NTT DATA has continued to adhere to its clients first principle, never becoming preoccupied with short-term gains or shying aware from the challenges it faces. Today, the unwavering Long-Term Relationships with clients built upon this principle have become the cornerstone of NTT DATA’s competitive advantage. NTT DATA works side-by-side with its clients as a trusted partner, connecting their abundant ideas and social needs to cutting-edge technologies from throughout the world to create business innovations and address social issues. We support our clients to the very end in these undertakings. This is the strength of the Long-Term Relationships NTT DATA has fostered.
1970 1990 2000 2010 2020
The Zengin Data Telecommunications System
CAFIS
1979 (Second Generation) ~Mutual savings banks, Shinkin banks (credit associations), foreign banks in Japan, credit cooperatives, workers’ credit unions, agricultural cooperatives, and other institutions were incorporated into the system.
1973 (First Generation)Launch of Zengin Data Telecommunications System
Together with Tokyo Ginko Kyokai, which developed the business later inherited by the Japanese Banks’ Payment Clearing Network, NTT DATA developed a system that was revolutionary at the time, even when viewed from a global scale, to link financial institutions across Japan through a network.
1987 (Third Generation)Division of Japan into Tokyo and Osaka Sectors and Transition to Same-Day Payment
Japan was divided into the two sectors of Tokyo and Osaka under the Zengin system in order to improve reliability through increased sophistication and greater transaction volumes.
1995 (Fourth Generation)The method of linking centers and banks was changed to a private packet network.
2003 (Fifth Generation)Improvement of Safety and Reliability
The system was once again enhanced to improve safety and reliability and install rigorous information security measures through means such as encrypting data and establishing 20-digit electronic data interchange information columns.
1984Commencement of CAFIS Service
CAFIS was born at the dawn of cashless payments as a proprietary NTT DATA joint use service that transmitted credit data to offer increased convenience to credit card companies and affiliated retailers.
2002TCP IP Connectivity
CAFIS was quick to be made compat-ible with TCP IP protocol, the same protocol used by the Internet, which was showing signs of its future spread at the time. This move made the service convenient while offering greater processing speeds coupled with reduced burden on connected entities.
2013Illegal Transaction Detection Service
With the spread of e-commerce, illegal transactions via the Internet became a major issue. NTT DATA began provid-ing services that detect such illegal transactions to realize greater conve-nience and peace of mind when shopping online.
2019Code Payment Services
As numerous code payment services appear on the market, NTT DATA has begun providing a solution that enables various code payment services to be processed through a single payment terminal.
2011 (Sixth Generation)The system was made compatible with ISO 20022, and real-time gross settle-ment functions for large-scale transactions as well as data transmission functions were added.
Examples of Long-Term RelationshipsRoughly half a century ago, NTT DATA partnered with its clients to develop the Zengin Data Telecommunications System, a payment infra-structure system that allowed for immediate transfers of money for transactions during business hours on weekdays. This innovation was realized a step ahead of the rest of the world. Supported by the trust of our clients, we have updated this system five times in the past, and we are currently preparing to make the sixth update. CAFIS, a proprietarily developed NTT DATA business, is a platform for transmitting credit card and other cashless payment credit and transaction data. This platform has been used for years since its introduction in 1984 as credit card companies, financial institutions, and affiliated retailers and even individuals have embraced this payment infrastructure for its convenience.
P12: Message from the CEO
P49: Business Topics
2018“More-time” system was launched.
The Zengin EDI system was launched.
P21: Review of Previous Medium-Term Management Plan
1980
Future Plan: 2019 (Seventh Generation)Cybersecurity measures will be installed and business continuity plans will be enhanced.
Fostered Strengths
Managem
ent Strategies
Business S
trategies by Segm
entE
SG
Managem
entFinancials and O
thersValue C
reation by NTT D
ATAM
essage from the C
EO
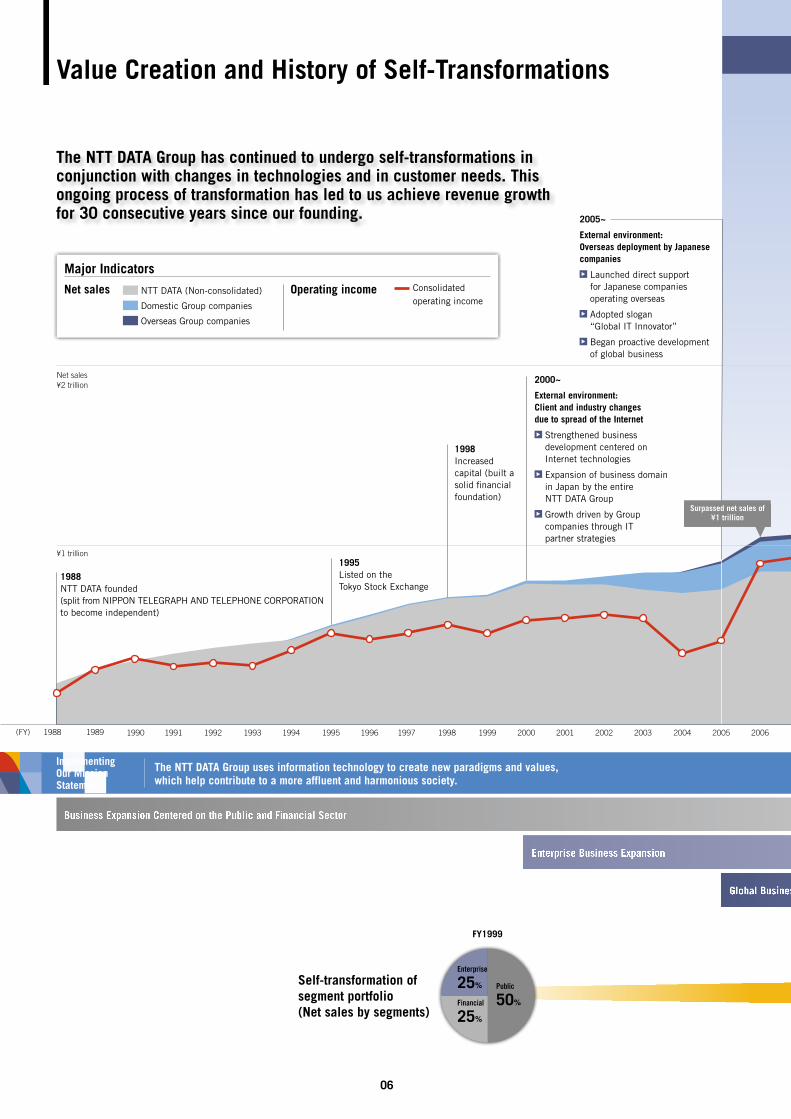
1989 1990 1991 1992 1993 1994 1995 1996 1997 1998 1999 2000 2001 2002 2003 2004 2005 2006(FY) 1988
Net sales¥2 trillion
Value Creation and History of Self-Transformations
2005~
External environment: Overseas deployment by Japanese companies
Launched direct support for Japanese companies operating overseas
Adopted slogan “Global IT Innovator”
Began proactive development of global business
1998Increased capital (built a solid financial foundation)
2000~
External environment: Client and industry changes due to spread of the Internet
Strengthened business development centered on Internet technologies
Expansion of business domain in Japan by the entire NTT DATA Group
Growth driven by Group companies through IT partner strategies
1995 Listed on the Tokyo Stock Exchange
1988NTT DATA founded(split from NIPPON TELEGRAPH AND TELEPHONE CORPORATIONto become independent)
Implementing Our Mission Statement
The NTT DATA Group uses information technology to create new paradigms and values, which help contribute to a more affluent and harmonious society.
Global Business Expansion
Enterprise Business Expansion
Business Expansion Centered on the Public and Financial Sector
The NTT DATA Group has continued to undergo self-transformations in conjunction with changes in technologies and in customer needs. This ongoing process of transformation has led to us achieve revenue growth for 30 consecutive years since our founding.
FY1999
Public
50%
Major Indicators
NTT DATA (Non-consolidated)
Domestic Group companies
Overseas Group companies
Consolidated operating income
Net sales Operating income
¥1 trillion
Financial
25%
Enterprise
25%
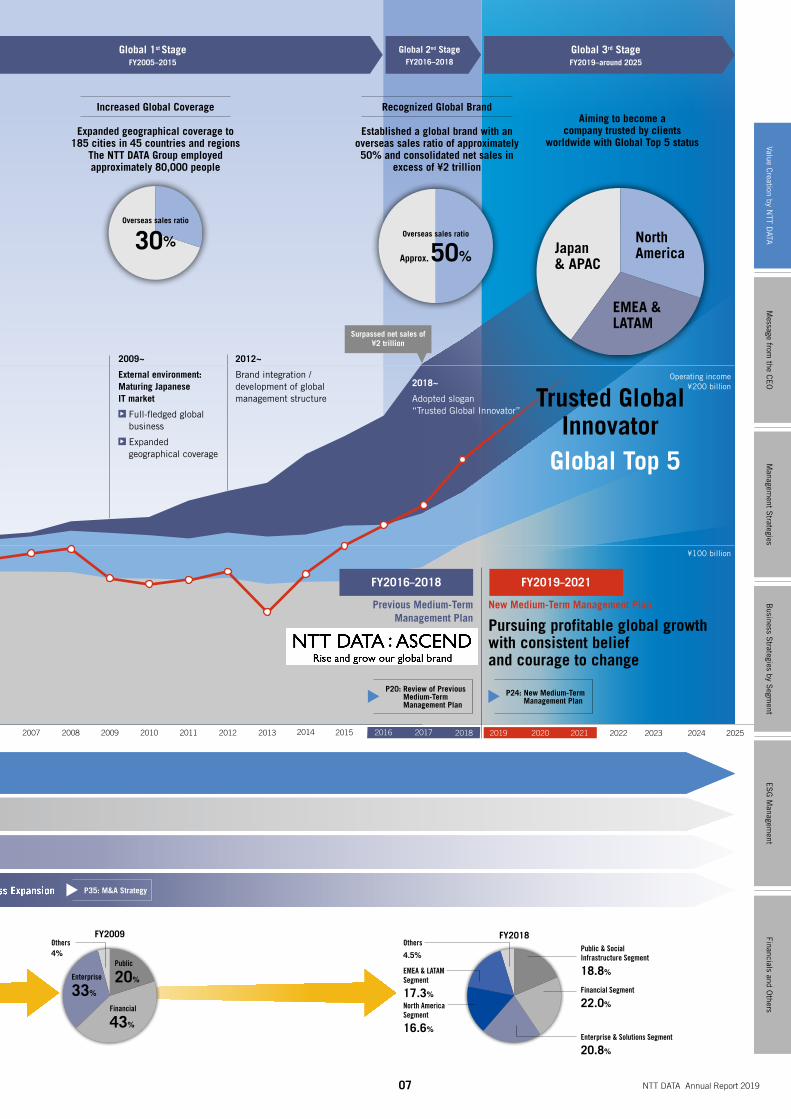
Global 1st StageFY2005–2015
Self-transformation of segment portfolio (Net sales by segments)
Surpassed net sales of ¥1 trillion
06
2007 2008 2009 2010 2011 2012 2013 2014 2015 2016 2018 2019 2020 20212017
Others4%
2022 2023 2024 2025
Global Top 5
FY2019–2021
New Medium-Term Management Plan
Pursuing profitable global growth with consistent belief and courage to change
FY2016–2018
Previous Medium-Term Management Plan
Aiming to become a company trusted by clients
worldwide with Global Top 5 status
Increased Global Coverage Recognized Global Brand
Established a global brand with an overseas sales ratio of approximately 50% and consolidated net sales in
excess of ¥2 trillion
Expanded geographical coverage to 185 cities in 45 countries and regions
The NTT DATA Group employed approximately 80,000 people
2012~
Brand integration / development of global management structure
2018~
Adopted slogan “Trusted Global Innovator”
Global Business Expansion
2009~
External environment: Maturing Japanese IT market
Full-fledged global business
Expanded geographical coverage
FY2018FY2009Others
4.5%
Global 2nd StageFY2016–2018
Operating income¥200 billion
¥100 billion
Financial
43%
Enterprise
33%
Public
20%
Public & Social Infrastructure Segment
18.8%
Financial Segment
22.0%
Enterprise & Solutions Segment
20.8%
North America Segment
16.6%
EMEA & LATAM Segment
17.3%
Global 1st StageFY2005–2015
Global 3rd StageFY2019–around 2025
P20: Review of Previous Medium-Term Management Plan
P24: New Medium-Term Management Plan
P35: M&A Strategy
Overseas sales ratio
Approx. 50%
Overseas sales ratio
30%
Trusted Global Innovator
North America
EMEA & LATAM
Japan & APAC
07 NTT DATA Annual Report 2019
Surpassed net sales of ¥2 trillion
Managem
ent Strategies
Business S
trategies by Segm
entE
SG
Managem
entFinancials and O
thersValue C
reation by NTT D
ATAM
essage from the C
EO
FY2019–2021 New Medium-Term Management Plan
Pursuing profitable global growth with consistent belief and courage to change
Group Vision
Trusted Global Innovator
Values
Clients First
Foresight
Teamwork
Strengths
Long-Term Relationships
Public sector
Energy and utilities
Telecommunications
Healthcare and life sciences
Banking and financial services
Insurance
Manufacturing
Retail
Service industry
Transportation and logistics
Education
MediaP04: Mission Statement / Group Vision / Values
P05: Fostered Strengths
ESG Management at NTT DATA
08
Non-Financial Capital
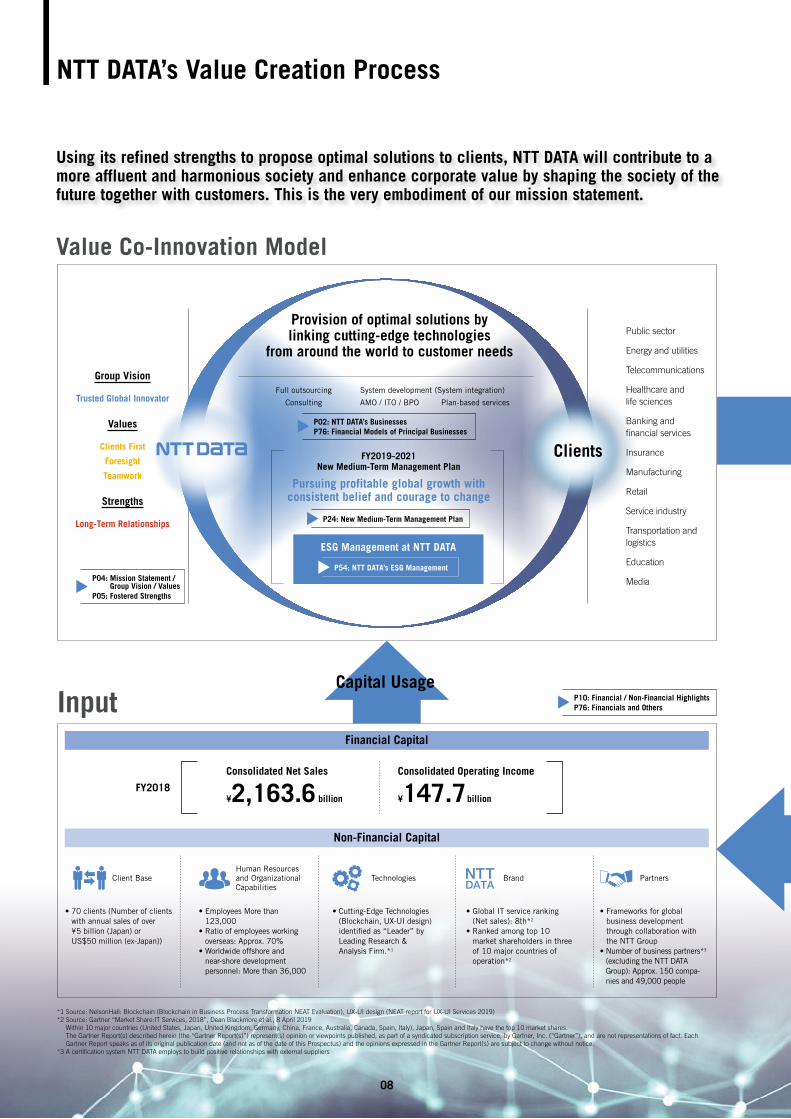
• 70 clients (Number of clients with annual sales of over ¥5 billion (Japan) or US$50 million (ex-Japan))
Client Base
• Cutting-Edge Technologies (Blockchain, UX-UI design) identified as “Leader” by Leading Research & Analysis Firm.*1
Technologies
• Frameworks for global business development through collaboration with the NTT Group
• Number of business partners*3 (excluding the NTT DATA Group): Approx. 150 compa-nies and 49,000 people
Partners
• Global IT service ranking (Net sales): 8th*2
• Ranked among top 10 market shareholders in three of 10 major countries of operation*2
Brand
• Employees More than 123,000
• Ratio of employees working overseas: Approx. 70%
• Worldwide offshore and near-shore development personnel: More than 36,000
Human Resources and Organizational Capabilities
Consolidated Net Sales
¥2,163.6 billionFY2018
Consolidated Operating Income
¥147.7 billion
Financial Capital
NTT DATA’s Value Creation Process
Input
P24: New Medium-Term Management Plan
Capital Usage
P54: NTT DATA’s ESG Management
Using its refined strengths to propose optimal solutions to clients, NTT DATA will contribute to a more affluent and harmonious society and enhance corporate value by shaping the society of the future together with customers. This is the very embodiment of our mission statement.
Value Co-Innovation Model
P10: Financial / Non-Financial HighlightsP76: Financials and Others
P02: NTT DATA’s BusinessesP76: Financial Models of Principal Businesses
Clients
*1 Source: NelsonHall: Blockchain (Blockchain in Business Process Transformation NEAT Evaluation), UX-UI design (NEAT report for UX-UI Services 2019)*2 Source: Gartner “Market Share:IT Services, 2018”, Dean Blackmore et al., 8 April 2019
Within 10 major countries (United States, Japan, United Kingdom, Germany, China, France, Australia, Canada, Spain, Italy), Japan, Spain and Italy have the top 10 market shares. The Gartner Report(s) described herein (the “Gartner Report(s)”) represent(s) opinion or viewpoints published, as part of a syndicated subscription service, by Gartner, Inc. (“Gartner”), and are not representations of fact. Each Gartner Report speaks as of its original publication date (and not as of the date of this Prospectus) and the opinions expressed in the Gartner Report(s) are subject to change without notice.
*3 A certification system NTT DATA employs to build positive relationships with external suppliers
Full outsourcing System development (System integration)
Consulting AMO / ITO / BPO Plan-based services
Provision of optimal solutions by linking cutting-edge technologies
from around the world to customer needs

09 NTT DATA Annual Report 2019
Targets of New Medium-Term Management Plan
Outcome
Realizing a More Affluent and Harmonious Society
Enhancing Corporate Value
• Unleash our employees’ potential to maximize organizational strengths
1. Unleash employees’ potential
2. Digitize our work environment
3. Enhance our governance processes
Human Resources and Organizational Capabilities
• Expand global digital offerings1. Accelerate global
marketing2. Develop digital offerings3. Expand Center of
Excellence (CoE)
Technologies
• Entrench reliable brand image as a “Trusted Global Innovator”
• Aiming for Global Top 5 around 2025
Brand
• Collaboration with the NTT Group through cutting-edge R&D, economies of scale, etc.
• Enhance resources and solutions lineups by reinforcing partnerships with vendors
Partners
Realizing a social foundation with convenience,
safety, and reliability
Creating sustain-able cities and
regions
Lowering environ-mental burdens
Ensuring stable and efficient
energy provision
Realizing society of health and
longevity
Eliminating labor shortages
Developing infrastructure to prevent disasters
and respond to natural disasters
Resolving social issues
Shape the future society with our clients
ReinvestmentP32: Message from the CFO
Non-Financial Capital
Financial Capital
Consolidated Net Sales
¥2.5 trillion
Consolidated Operating Income Margin*4
8 %
Overseas EBITA margin*4
7 %
Client Base*5
Over 80
Non-Financial Capital
*4 Excluding temporary costs such as M&A and structural transformation*5 Clients with annual sales of over ¥5 billion (Japan) or US$50 million (ex-Japan)
Managem
ent Strategies
Business S
trategies by Segm
entE
SG
Managem
entFinancials and O
thersValue C
reation by NTT D
ATAM
essage from the C
EO
10
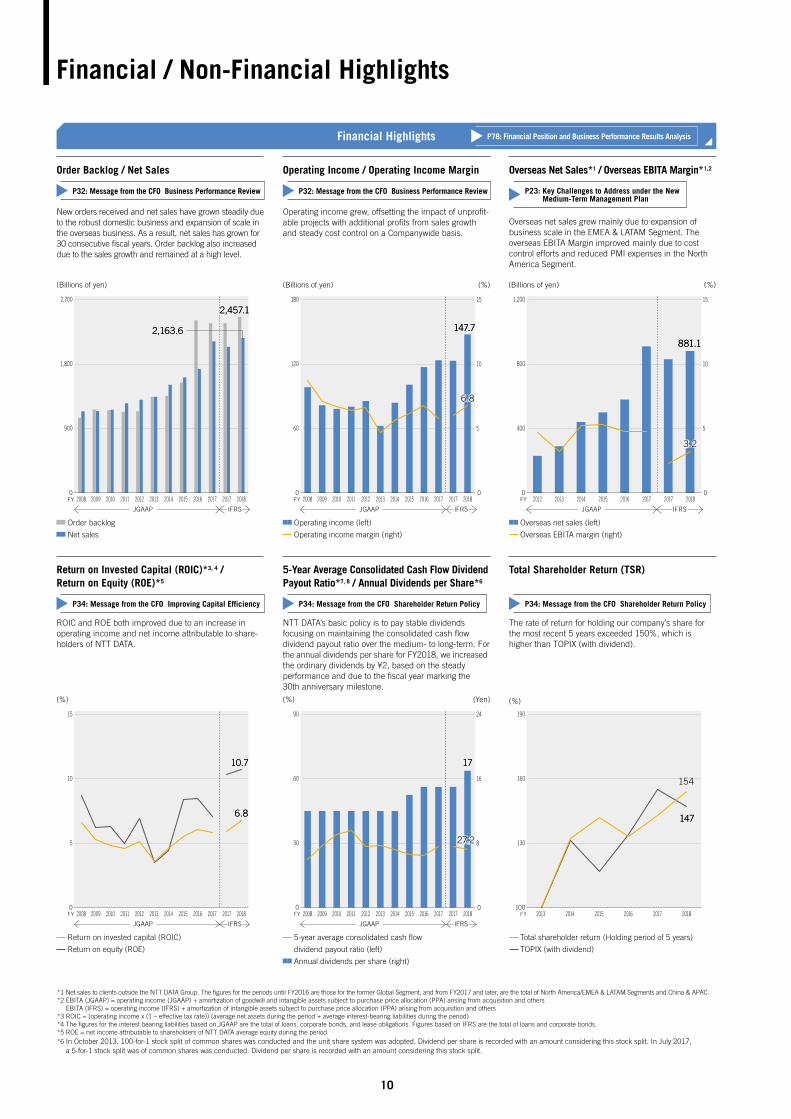
Order Backlog / Net Sales
New orders received and net sales have grown steadily due to the robust domestic business and expansion of scale in the overseas business. As a result, net sales has grown for 30 consecutive fiscal years. Order backlog also increased due to the sales growth and remained at a high level.
Operating Income / Operating Income Margin
Operating income grew, offsetting the impact of unprofit-able projects with additional profits from sales growth and steady cost control on a Companywide basis.
Overseas Net Sales*1 / Overseas EBITA Margin*1,2
Overseas net sales grew mainly due to expansion of business scale in the EMEA & LATAM Segment. The overseas EBITA Margin improved mainly due to cost control efforts and reduced PMI expenses in the North America Segment.
Return on Invested Capital (ROIC)*3, 4 / Return on Equity (ROE)*5
ROIC and ROE both improved due to an increase in operating income and net income attributable to share-holders of NTT DATA.
5-Year Average Consolidated Cash Flow Dividend Payout Ratio*7, 8 / Annual Dividends per Share*6
NTT DATA’s basic policy is to pay stable dividends focusing on maintaining the consolidated cash flow dividend payout ratio over the medium- to long-term. For the annual dividends per share for FY2018, we increased the ordinary dividends by ¥2, based on the steady performance and due to the fiscal year marking the 30th anniversary milestone.
Total Shareholder Return (TSR)
The rate of return for holding our company’s share for the most recent 5 years exceeded 150%, which is higher than TOPIX (with dividend).
*1 Net sales to clients outside the NTT DATA Group. The figures for the periods until FY2016 are those for the former Global Segment, and from FY2017 and later, are the total of North America/EMEA & LATAM Segments and China & APAC.*2 EBITA (JGAAP) = operating income (JGAAP) + amortization of goodwill and intangible assets subject to purchase price allocation (PPA) arising from acquisition and others
EBITA (IFRS) = operating income (IFRS) + amortization of intangible assets subject to purchase price allocation (PPA) arising from acquisition and others*3 ROIC = (operating income x (1 – effective tax rate)) (average net assets during the period + average interest-bearing liabilities during the period)*4 The figures for the interest bearing liabilities based on JGAAP are the total of loans, corporate bonds, and lease obligations. Figures based on IFRS are the total of loans and corporate bonds.*5 ROE = net income attributable to shareholders of NTT DATA average equity during the period*6 In October 2013, 100-for-1 stock split of common shares was conducted and the unit share system was adopted. Dividend per share is recorded with an amount considering this stock split. In July 2017,
a 5-for-1 stock split was of common shares was conducted. Dividend per share is recorded with an amount considering this stock split.
(%) (%) (Yen) (%)
Return on invested capital (ROIC)
Return on equity (ROE)
FY0
5
10
15
2008 2009 2010 2011 2012 2013 2014 2015 2016 2017 2017 2018
10.710.7
6.86.8
5-year average consolidated cash flow
dividend payout ratio (left)
Annual dividends per share (right)
FY0
30
60
90
0
8
16
24
2008 2009 2010 2011 2012 2013 2014 2015 2016 2017 2017 2018
1717
27.227.2
JGAAP IFRS
Total shareholder return (Holding period of 5 years)
TOPIX (with dividend)
FY100
130
160
190
2013 2014 2015 2016 2017 2018
147147
154154
JGAAP IFRS
Order backlog
Net sales
(Billions of yen)
FY0
900
1,800
2,700
2008 2009 2010 2011 2012 2013 2014 2015 2016 2017 2017 2018
2,457.12,457.1
2,163.62,163.6
(Billions of yen) (%) (Billions of yen) (%)
Operating income (left)
Operating income margin (right)
FY0
60
120
180
0
5
10
15
2008 2009 2010 2011 2012 2013 2014 2015 2016 2017 2017 2018
147.7147.7
6.86.8
JGAAP IFRS
Overseas net sales (left)
Overseas EBITA margin (right)
FY0
400
800
1,200
0
5
10
15
2012 2013 2014 2015 2016 2017 2017 2018
881.1881.1
3.23.2
JGAAP IFRSJGAAP IFRS
Financial / Non-Financial Highlights
P32: Message from the CFO Business Performance Review
P34: Message from the CFO Improving Capital Efficiency P34: Message from the CFO Shareholder Return PolicyP34: Message from the CFO Shareholder Return Policy
P32: Message from the CFO Business Performance Review P23: Key Challenges to Address under the New Medium-Term Management Plan
Financial Highlights P78: Financial Position and Business Performance Results Analysis
11 NTT DATA Annual Report 2019
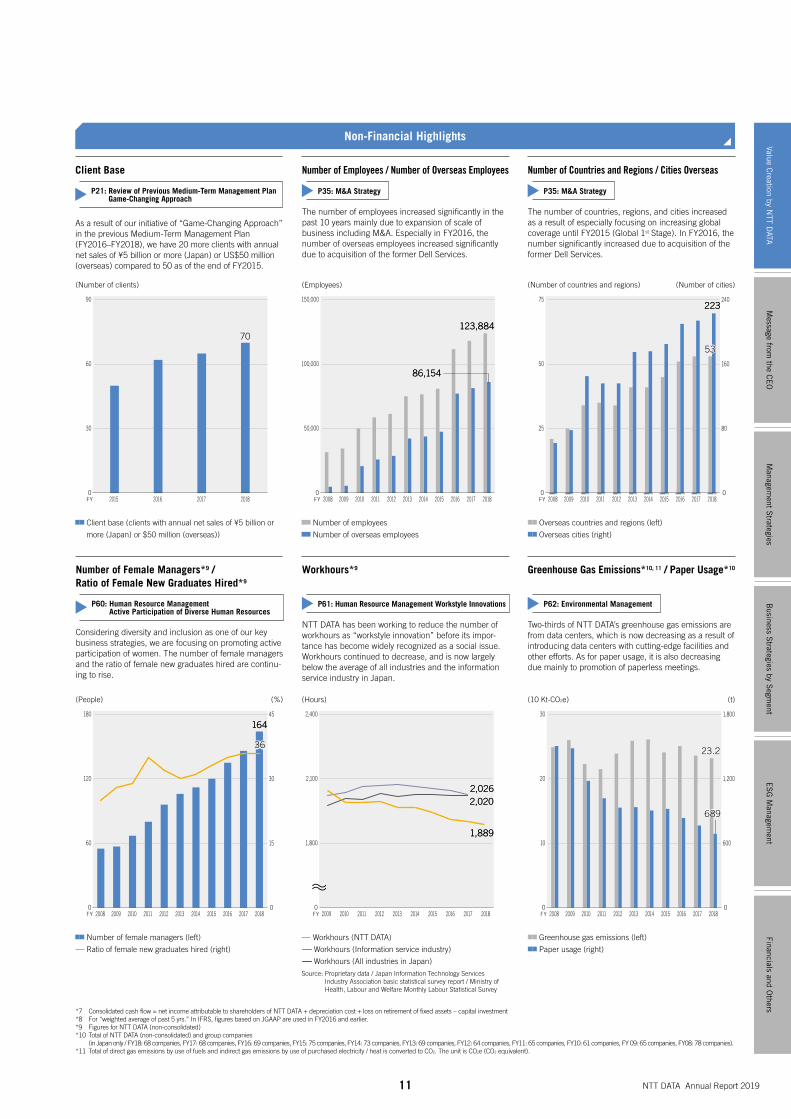
Client Base
As a result of our initiative of “Game-Changing Approach” in the previous Medium-Term Management Plan (FY2016–FY2018), we have 20 more clients with annual net sales of ¥5 billion or more (Japan) or US$50 million (overseas) compared to 50 as of the end of FY2015.
Number of Employees / Number of Overseas Employees
The number of employees increased significantly in the past 10 years mainly due to expansion of scale of business including M&A. Especially in FY2016, the number of overseas employees increased significantly due to acquisition of the former Dell Services.
Number of Countries and Regions / Cities Overseas
The number of countries, regions, and cities increased as a result of especially focusing on increasing global coverage until FY2015 (Global 1st Stage). In FY2016, the number significantly increased due to acquisition of the former Dell Services.
Number of Female Managers*9 / Ratio of Female New Graduates Hired*9
Considering diversity and inclusion as one of our key business strategies, we are focusing on promoting active participation of women. The number of female managers and the ratio of female new graduates hired are continu-ing to rise.
Workhours*9
NTT DATA has been working to reduce the number of workhours as “workstyle innovation” before its impor-tance has become widely recognized as a social issue. Workhours continued to decrease, and is now largely below the average of all industries and the information service industry in Japan.
Greenhouse Gas Emissions*10, 11 / Paper Usage*10
Two-thirds of NTT DATA’s greenhouse gas emissions are from data centers, which is now decreasing as a result of introducing data centers with cutting-edge facilities and other efforts. As for paper usage, it is also decreasing due mainly to promotion of paperless meetings.
Source: Proprietary data / Japan Information Technology Services Industry Association basic statistical survey report / Ministry of Health, Labour and Welfare Monthly Labour Statistical Survey
(Number of clients) (Employees) (Number of countries and regions) (Number of cities)
FY0
30
60
90
2015 2016 2017 2018
70
Number of employees
Number of overseas employees
FY0
50,000
100,000
150,000
20092008 2010 2011 2012 2013 2014 2015 2016 2017 2018
123,884123,884
86,15486,154
Overseas countries and regions (left)
Overseas cities (right)
FY0
25
50
75
20092008 2010 2011 2012 2013 2014 2015 2016 2017 20180
80
160
240
5353
223223
(People) (%) (Hours) (10 Kt-CO2e) (t)
Number of female managers (left)
Ratio of female new graduates hired (right)
FY0
60
120
180
0
15
30
45
20092008 2010 2011 2012 2013 2014 2015 2016 2017 2018
164164
3636
Workhours (NTT DATA)
Workhours (Information service industry)
Workhours (All industries in Japan)
Greenhouse gas emissions (left)
Paper usage (right)
FY0
10
20
30
0
600
1,200
1,800
20092008 2010 2011 2012 2013 2014 2015 2016 2017 2018
689689
23.223.2
P60: Human Resource Management Active Participation of Diverse Human Resources
P61: Human Resource Management Workstyle Innovations P62: Environmental Management
P35: M&A Strategy P35: M&A StrategyP21: Review of Previous Medium-Term Management Plan Game-Changing Approach
Client base (clients with annual net sales of ¥5 billion or
more (Japan) or $50 million (overseas))
Non-Financial Highlights
*7 Consolidated cash flow = net income attributable to shareholders of NTT DATA + depreciation cost + loss on retirement of fixed assets – capital investment*8 For “weighted average of past 5 yrs.” In IFRS, figures based on JGAAP are used in FY2016 and earlier.*9 Figures for NTT DATA (non-consolidated)*10 Total of NTT DATA (non-consolidated) and group companies
(in Japan only / FY18: 68 companies, FY17: 68 companies, FY16: 69 companies, FY15: 75 companies, FY14: 73 companies, FY13: 69 companies, FY12: 64 companies, FY11: 65 companies, FY10: 61 companies, FY 09: 65 companies, FY08: 78 companies).*11 Total of direct gas emissions by use of fuels and indirect gas emissions by use of purchased electricity / heat is converted to CO2. The unit is CO2e (CO2 equivalent).
0
1,800
2,100
2,400
2009 2010 2011 2012 2013 2014 2015 2016 2017 2018FY
2,0202,0202,0262,026
1,8891,889
Managem
ent Strategies
Business S
trategies by Segm
entE
SG
Managem
entFinancials and O
thersValue C
reation by NTT D
ATAM
essage from the C
EO
Message from the CEO
12
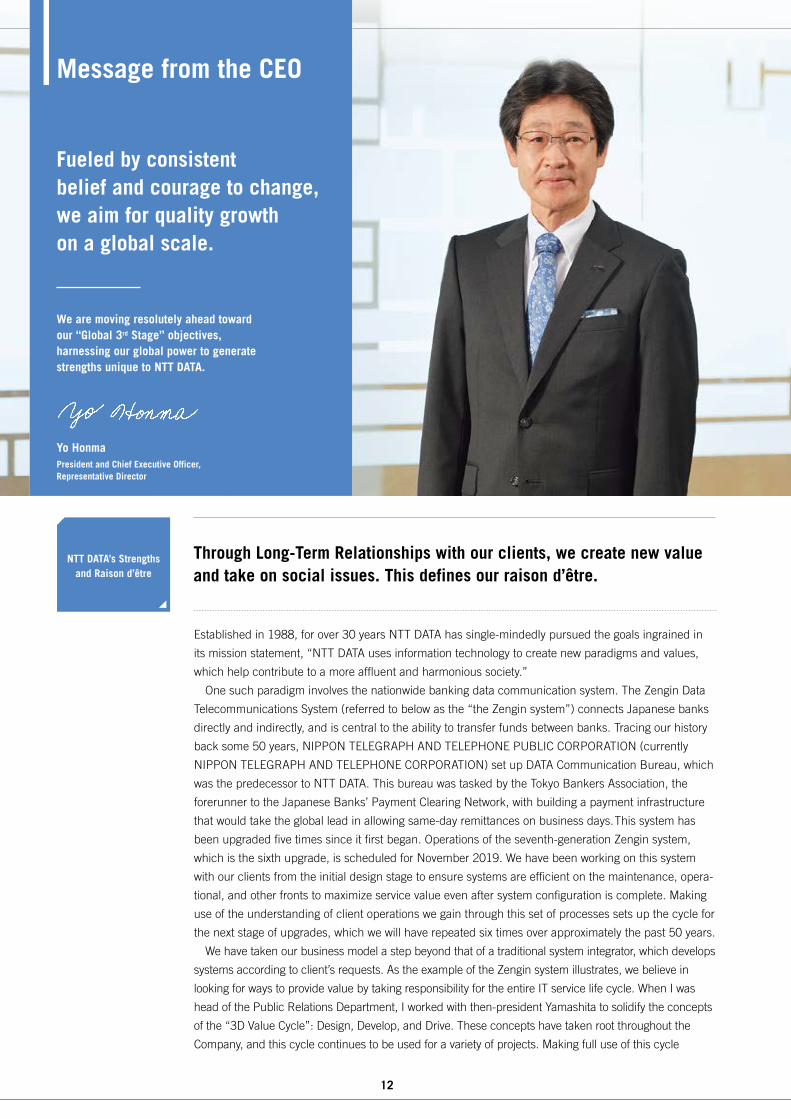
Yo HonmaPresident and Chief Executive Officer, Representative Director
We are moving resolutely ahead toward our “Global 3rd Stage” objectives, harnessing our global power to generate strengths unique to NTT DATA.
Fueled by consistent belief and courage to change, we aim for quality growth on a global scale.
Established in 1988, for over 30 years NTT DATA has single-mindedly pursued the goals ingrained in
its mission statement, “NTT DATA uses information technology to create new paradigms and values,
which help contribute to a more affluent and harmonious society.”
One such paradigm involves the nationwide banking data communication system. The Zengin Data
Telecommunications System (referred to below as the “the Zengin system”) connects Japanese banks
directly and indirectly, and is central to the ability to transfer funds between banks. Tracing our history
back some 50 years, NIPPON TELEGRAPH AND TELEPHONE PUBLIC CORPORATION (currently
NIPPON TELEGRAPH AND TELEPHONE CORPORATION) set up DATA Communication Bureau, which
was the predecessor to NTT DATA. This bureau was tasked by the Tokyo Bankers Association, the
forerunner to the Japanese Banks’ Payment Clearing Network, with building a payment infrastructure
that would take the global lead in allowing same-day remittances on business days. This system has
been upgraded five times since it first began. Operations of the seventh-generation Zengin system,
which is the sixth upgrade, is scheduled for November 2019. We have been working on this system
with our clients from the initial design stage to ensure systems are efficient on the maintenance, opera-
tional, and other fronts to maximize service value even after system configuration is complete. Making
use of the understanding of client operations we gain through this set of processes sets up the cycle for
the next stage of upgrades, which we will have repeated six times over approximately the past 50 years.
We have taken our business model a step beyond that of a traditional system integrator, which develops
systems according to client’s requests. As the example of the Zengin system illustrates, we believe in
looking for ways to provide value by taking responsibility for the entire IT service life cycle. When I was
head of the Public Relations Department, I worked with then-president Yamashita to solidify the concepts
of the “3D Value Cycle”: Design, Develop, and Drive. These concepts have taken root throughout the
Company, and this cycle continues to be used for a variety of projects. Making full use of this cycle
NTT DATA’s Strengths and Raison d’être
Through Long-Term Relationships with our clients, we create new value and take on social issues. This defines our raison d’être.
13 NTT DATA Annual Report 2019
requires, above all, that we maintain Long-Term Relationships with our clients. On the surface, NTT DATA
is a provider of IT services, but what we are really building is trust. A company strength that derives from
our Long-Term Relationships with clients. This was the thinking last year behind the formulation of our
new Group Vision, “Trusted Global Innovator,” to mark the 30th anniversary of our establishment.
Based on Long-Term Relationships, we work with clients to create new paradigms and generate new
value for society, while taking on social issues. This essence describes NTT DATA’s raison d’être, is a
factor that differentiates us in the global market, and points to our path for achieving sustainable
increases in corporate value.
In FY2018, the final year of our previous Medium-Term Management Plan, “NTT DATA: ASCEND Rise
and grow our global brand,” we experienced robust business in Japan and growth abroad. As a result,
we achieved both of the plan’s management objectives: consolidated net sales of over ¥2 trillion and a
50% or higher increase in adjusted operating income*.
Under the previous Medium-Term Management Plan, we used the global coverage we had built to
date to increase our local presence. We formulated “Game-Changing Approach” as a key policy for
realizing this objective. We strengthened our client base by building Long-Term Relationships with
our clients and established a stable business foundation. We achieved significant success as a result,
heightening our presence in eight of the 10 countries representing the world’s largest IT markets and
expanding our customer base over three years by 20 companies, to 70. (We refer here to clients with
annual sales of over ¥5 billion (Japan) or US$50 million (ex-Japan).)
Under another of our key policies, “Breakthrough Technology,” we pursued “production technology
innovation” by standardizing and automating software development, and working to cut costs by boost-
ing productivity. We have been developing and introducing tools for automating software development
since around 2010. The number of projects that apply these tools has now reached around 90%. We
also apply our integrated development cloud (a globally integrated and standardized development envi-
ronment) on some 1,000 projects, including around 100 overseas projects. Furthermore, to leverage
cutting-edge technologies, we established the Center of Excellence (CoE) to consolidate blockchain,
design, artificial intelligence (AI), and other digital technologies and expertise and serve as a research base
to drive global consistency. The center has facilitated the sharing of case studies of these technologies
being applied, which has led to synergies between operations and across countries. We have earned par-
ticularly high marks for our blockchain and design initiatives. a leading research & analysis firm assessed
us as “A Leader” in this area, pointing to our success in globalizing the application of technology.
NTT DATA aims to achieve Global Top 5 status by around 2025. We are positioning this as a Global
3rd Stage objective, under which we are pursuing global development. At the previous stage, our Global
2nd Stage objectives were consolidated net sales of more than ¥2 trillion and overseas business account-
ing for some 50% of net sales. Having achieved both goals during the period of the previous Medium-
Term Management Plan, I believe we have reached the Global 2nd Stage.
The final fiscal year of the previous Medium-Term Management Plan thus came to an excellent conclu-
sion. FY2019 marks the start of the three-year period that is the Global 3rd Stage. This will be an extremely
important period. Based on the new Medium-Term Management Plan we have formulated by taking past
successes and lessons into account, we look forward to making a leap ahead in the next three years.
* Compared to FY2015 (adjusted item: incremental investment in new areas)
Reflecting Back on Our
Previous Medium-Term
Management Plan (FY2016–2018)
We achieved all the management objectives of our previous Medium-Term Management Plan.We are now beginning to move toward our Global 3rd Stage objectives.
P05: Fostered Strengths
P20: Review of Previous Medium-Term Management Plan
Managem
ent Strategies
Business S
trategies by Segm
entE
SG
Managem
entFinancials and O
thersValue C
reation by NTT D
ATAM
essage from the C
EO
14
Message from the CEO
A core concept of our new Medium-Term Management Plan is increasing our strength with four key
factors: growth, earnings, transformation, and synergy—collectively, “GETS.”
Under this plan, “Growth” refers to the ability to increase net sales and expand our customer base to
enter the Global Top 5. By implementing the strategies outlined by the new Medium-Term Management
Plan, we aim to generate consolidated net sales of ¥2.5 trillion and expand our client base from the 70
we reached in FY2018 to 80 or more. These are clients with annual sales over ¥5 billion (Japan) or
US$50 million (ex-Japan), in annual IT spend (net sales).
To enhance “Earnings,” we will work on a global basis to increase
the proportion of our high added value, and highly profitable digital
business. On the cost front, we will pursue further breakthroughs in
production technologies and promote regional efficiencies, aiming
for a consolidated operating income margin of 8%.* We recognize
improving the profitability of our overseas business as a particularly
important management challenge. Through dialogue with our
shareholders and investors, it has become clear that many people
are concerned about the profitability of our overseas business.
Under the new Medium-Term Management Plan, we will continue
to increase net sales. At the same time, the plan clearly spells out
an objective for improving profitability: an overseas EBITA margin of
7%*—our first target of this sort. Along with the consolidated oper-
ating income margin and the overseas EBITA margin, we have set
management objectives “continuing to increase the added value we
provide clients” and “aiming for growth with quality” that clearly
emphasize profit margins rather than amounts.
Meanwhile, given that our operating environment is undergoing significant changes, I believe it is
vital to maintain the “courage to change” things that need to be changed and continue to do so boldly.
With digital transformation accelerating, the use of AI and other digital technologies to drive changes in
business models is gaining momentum. In 2014, digital business accounted for around 10% of the IT
market. This figure is forecast to grow to 35% by 2020, and to above 60% by 2025. Against this back-
drop, in order to continue providing value to clients that are transforming their business models, and to
society, we ourselves must continue to change.
To do so, we must maintain the “courage to change” as we embrace transformations that will
strengthen our “Transformation” and “Synergy.” We will hone NTT DATA-specific strengths that will
enable us to provide high added value. We have summarized the details for achieving these changes
under three strategies, which I would like to explain next.
* Excluding temporary costs such as M&A and structural transformation
Overview of Our New Medium-Term
Management Plan (FY2019–2021)
By reinforcing four key factors, the “GETS,” we aim for growth with quality.
P24: New Medium-Term Management Plan
15 NTT DATA Annual Report 2019
As we step up our “Transformation” and “Synergy,” I am convinced that by harnessing the power of
our 123,000 employees working in 223 cities across 53 countries and regions, we can amass a formi-
dable force that puts us head and shoulders above our competitors. We will implement three strategies
to this end.
Our first strategy is to “expand global digital offerings.” To date, we have focused mainly on leverag-
ing region-specific strengths. Going forward, we will augment this approach by creating globally consis-
tent solutions that highlight our unique strengths, and differentiate us in the global market. We have a
solid reputation with clients in the automotive sector, that are developing their businesses globally, for
the way we develop a team comprising automotive sector specialists from each country. We are also
strong in the healthcare, finance and insurance, telecoms, and retail sectors, among others.
Meanwhile, we are focusing on specific digital technologies, such as the use of AI for analysis and
automation, customer experience enhancement, and IoT. We will create our offerings—globally consis-
tent, superior solutions and platforms—in industries where we are strong, combining these digital
technologies. Leveraging these tools, we plan to build global, industry-specific teams to provide offer-
ings around the world. In R&D, we will further expand CoE to accelerate the consolidation of digital
technologies and expertise and put them to work on a global scale. By aggregating the strength
represented by our global workforce of more than 123,000 people, we will generate synergies to boost
the sum of 1+1 to three or even four. We aim to take full advantage of all aspects of the strengths we
are deploying globally.
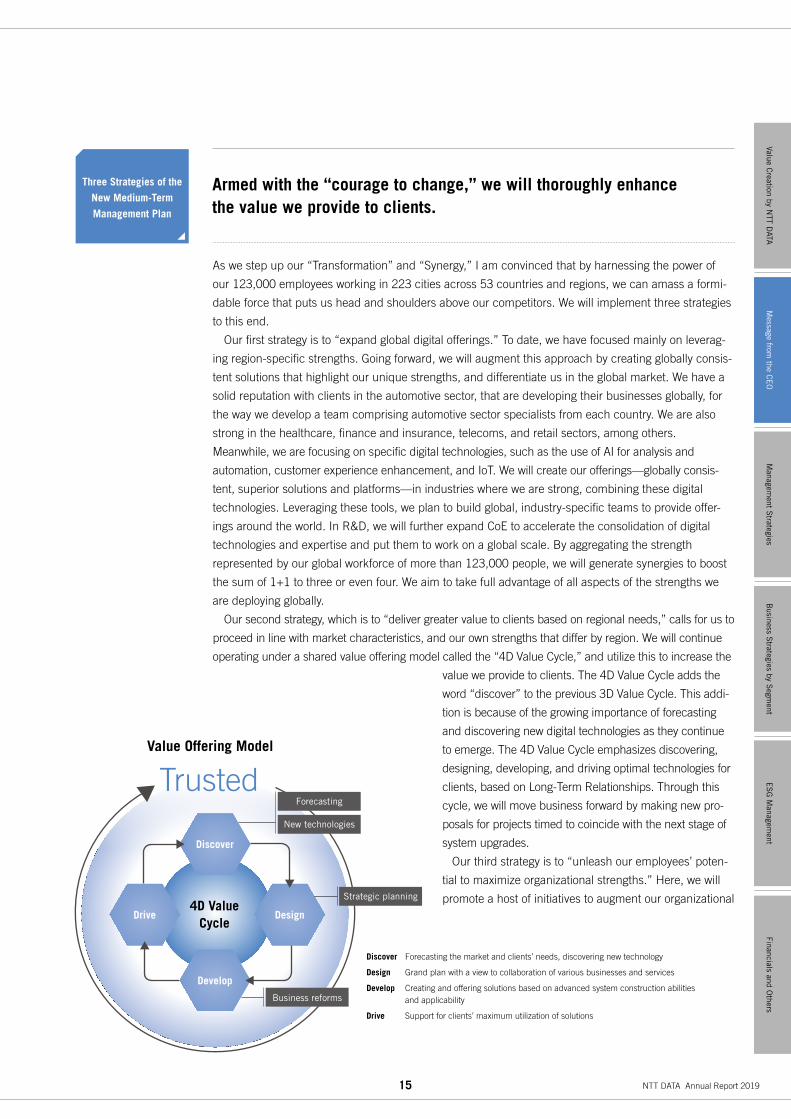
Our second strategy, which is to “deliver greater value to clients based on regional needs,” calls for us to
proceed in line with market characteristics, and our own strengths that differ by region. We will continue
operating under a shared value offering model called the “4D Value Cycle,” and utilize this to increase the
value we provide to clients. The 4D Value Cycle adds the
word “discover” to the previous 3D Value Cycle. This addi-
tion is because of the growing importance of forecasting
and discovering new digital technologies as they continue
to emerge. The 4D Value Cycle emphasizes discovering,
designing, developing, and driving optimal technologies for
clients, based on Long-Term Relationships. Through this
cycle, we will move business forward by making new pro-
posals for projects timed to coincide with the next stage of
system upgrades.
Our third strategy is to “unleash our employees’ poten-
tial to maximize organizational strengths.” Here, we will
promote a host of initiatives to augment our organizational
Three Strategies of the
New Medium-Term
Management Plan
Armed with the “courage to change,” we will thoroughly enhance the value we provide to clients.
Discover Forecasting the market and clients’ needs, discovering new technology
Design Grand plan with a view to collaboration of various businesses and services
Develop Creating and offering solutions based on advanced system construction abilities and applicability
Drive Support for clients’ maximum utilization of solutions
Managem
ent Strategies
Business S
trategies by Segm
entE
SG
Managem
entFinancials and O
thersValue C
reation by NTT D
ATAM
essage from the C
EO
4D Value Cycle
Value Offering Model
Trusted
DesignDrive
Develop
Discover
New technologies
Forecasting
Strategic planning
Business reforms
16
We see restraining unprofitable projects and improving the profitability of overseas businesses as essential
to achieving our management objectives, so we will address these two challenges with focused efforts.
Most of the amount of loss from unprofitable projects we conducted in FY2017 and FY2018 stemmed
from one specific project that required extremely sophisticated technological capabilities. No other proj-
ect was significantly unprofitable, which suggests the Project Review Committee, which we established
in FY2013, is proving effective. In the past, we have screened projects at the order acceptance stage. To
stem major losses of the sort we are experiencing from this one project, we will start screening projects
at the proposal-making stage, particularly for highly complex projects. By revising our order-acceptance
standards, having specialists verify feasibility, and optimizing project manager assignments to match
project complexity and characteristics, we should be able to curtail losses from unprofitable projects to
below 0.3%–0.5% of consolidated net sales each fiscal year.
With regard to improving the profitability of overseas businesses, we are experiencing a recovery in
sales in North America, which dipped temporarily due to our focus on the process of integrating the
former Dell Services. For this reason, in addition to the three globally consistent strategies explained
above, we plan to achieve higher levels of efficiency through selection and concentration on our existing
offerings. By doing so, we aim to boost the overseas EBITA margin from 3.1% in FY2018 to 4.8% in
FY2019, and target 7% for FY2021.
For the past several years, net sales in the EMEA & LATAM Segment have been growing at a signifi-
cantly higher pace than other markets. However, boosting profitability in this area has been a challenge,
due in part to structural inefficiencies, such as the fact that we are operating three companies, and
developing business across more than 40 countries.
Against this backdrop, we will introduce business structure reforms aimed at unification. Through
these efforts, we aim to boost our EBITA margin in the EMEA & LATAM Segment from 3.4% in FY2018
to 7% in FY2021. Specifically, we will shift toward a highly profitable structure by unleashing employees’
Addressing Key
Challenges
We will address focused initiatives to restrain unprofitable projects and improve the profitability of overseas businesses.
capabilities. I view organizational capabilities as the product of employee skills (capabilities), rewarding
work (vitality), and a good working environment (appeal). We aim to augment each of these compo-
nents. Specifically, to unleash employees’ potential we will put in place systems and create an environ-
ment to enhance the digital and global capabilities of all employees. Given the growing importance of
recruiting and maintaining human resources capable of innovation, in December 2018 we introduced
the Advanced Professional System. Under this arrangement, we recruit human resources from outside
with developed skills in AI, IoT, cloud, and other advanced technology domains, compensating them
according to market value. Also, to digitize our work environment, we will introduce a leading-edge
framework for sharing information globally. (Specifically, information on what technologies we are using
to provide what services to what clients in what regions, as well as information about who is an expert
in what areas.) Under this framework, we will introduce initiatives to promote collaboration, transform
workstyles by reviewing business processes, and encourage further increases in productivity through
next-generation production technology. To enhance our governance processes, curtailing unprofitable
projects is a topic of utmost importance, which I will speak about next.
P25: Three Strategies for Maximizing Value for Our Clients
Message from the CEO
17 NTT DATA Annual Report 2019
potential to increase talent for digital disruption, and boosting operational efficiency by revamping our
internal IT systems. The overseas EBITA margin of 7% was determined after thorough discussions with
the top management of each operating company, including how we are going to achieve it, and we are
beginning to see our way toward reaching this goal.
* Excluding temporary costs such as M&A and structural transformation
The Sustainable Development Goals (SDGs) are one example of how companies are being called on to
tackle global social and environmental issues. Our business has traditionally involved using the power
of IT to solve issues faced by clients and society. With today’s rapid advances in technology, we are now
being called on to do more than ever before.
Based on this understanding, in our new Medium-Term Management Plan we have clarified our
perspective on NTT DATA’s ESG management and formulated these ideas into strategies. By working to
provide solutions to promote the sustainable development of clients and society, in addition to creating
the society of the future, we will concentrate on corporate activities in line with the third strategy I have
outlined. We will focus on measures that maximize employees’ potential, such as cultivating human
resources and introducing workstyle reforms. As environmental and social issues grow more important,
tackling them becomes a greater priority. These increasing needs point to the potential expansion of
our business of providing effective solutions. By engaging in corporate activities that maximize consid-
eration for ESG, we can maximize the Company’s potential and minimize risk. For this reason, in addi-
tion to contributing to clients and society, through ESG management we aim to achieve sustainable
increases in NTT DATA’s corporate value.
We will achieve ongoing increases in corporate value by working together with our clients to shape the future society.
“Consistent Belief:”
NTT DATA’s ESG
Management
Through steady implementation of the strategies I have explained above, we will leverage NTT DATA’s
unique strengths to provide added value to clients and society. These efforts should lead naturally to
the achievement of our management objectives. Over the next three years, we will harness our global
power to take the lead in the digital world.
I ask our shareholders and investors for your continued understanding and support.
Over the next three years, we will harness our global power to take the lead in the digital world.
In Closing
P31: Strengthening Responses to Key Challenges under the New Medium-Term Management PlanP44: Business Strategies by Segment (North America Segment, EMEA & LATAM Segment)
P54: NTT DATA’s ESG Management
Managem
ent Strategies
Business S
trategies by Segm
entE
SG
Managem
entFinancials and O
thersValue C
reation by NTT D
ATAM
essage from the C
EO
18
Management Targets
Strategy Overview and Major
Achievements
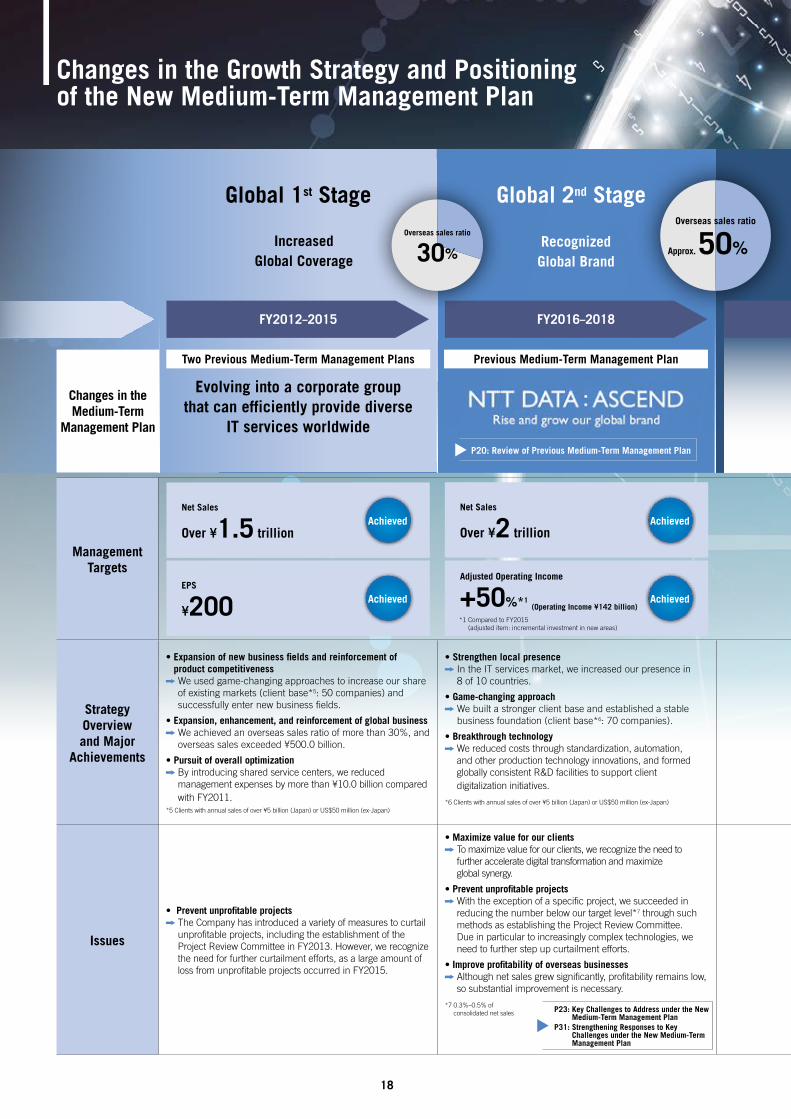
• Expansion of new business fields and reinforcement of product competitiveness We used game-changing approaches to increase our share of existing markets (client base*5: 50 companies) and successfully enter new business fields.
• Expansion, enhancement, and reinforcement of global business We achieved an overseas sales ratio of more than 30%, and overseas sales exceeded ¥500.0 billion.
• Pursuit of overall optimization By introducing shared service centers, we reduced management expenses by more than ¥10.0 billion compared with FY2011.
*5 Clients with annual sales of over ¥5 billion (Japan) or US$50 million (ex-Japan)
• Strengthen local presence In the IT services market, we increased our presence in 8 of 10 countries.
• Game-changing approach We built a stronger client base and established a stable business foundation (client base*6: 70 companies).
• Breakthrough technology We reduced costs through standardization, automation, and other production technology innovations, and formed globally consistent R&D facilities to support client digitalization initiatives.
*6 Clients with annual sales of over ¥5 billion (Japan) or US$50 million (ex-Japan)
Issues
• Prevent unprofitable projects The Company has introduced a variety of measures to curtail unprofitable projects, including the establishment of the Project Review Committee in FY2013. However, we recognize the need for further curtailment efforts, as a large amount of loss from unprofitable projects occurred in FY2015.
• Maximize value for our clients To maximize value for our clients, we recognize the need to further accelerate digital transformation and maximize global synergy.
• Prevent unprofitable projects With the exception of a specific project, we succeeded in reducing the number below our target level*7 through such methods as establishing the Project Review Committee. Due in particular to increasingly complex technologies, we need to further step up curtailment efforts.
• Improve profitability of overseas businesses Although net sales grew significantly, profitability remains low, so substantial improvement is necessary.
*7 0.3%–0.5% of consolidated net sales
Changes in the Growth Strategy and Positioning of the New Medium-Term Management Plan
Evolving into a corporate group that can efficiently provide diverse
IT services worldwide
FY2016–2018
P20: Review of Previous Medium-Term Management Plan
P23: Key Challenges to Address under the New Medium-Term Management Plan
P31: Strengthening Responses to Key Challenges under the New Medium-Term Management Plan
Net Sales
Over ¥1.5 trillion
EPS
¥200
Achieved
Achieved
Net Sales
Over ¥2 trillion
Adjusted Operating Income
+50%*1
*1 Compared to FY2015 (adjusted item: incremental investment in new areas)
Achieved
Achieved
FY2012–2015
(Operating Income ¥142 billion)
Overseas sales ratio
30%
Overseas sales ratio
Approx. 50%
Global 1st Stage Global 2nd Stage
Increased Global Coverage
Recognized Global Brand
Changes in the Medium-Term
Management Plan
Two Previous Medium-Term Management Plans Previous Medium-Term Management Plan
19 NTT DATA Annual Report 2019
Management Targets
Strategy Overview and Major
Achievements
• Expansion of new business fields and reinforcement of product competitiveness We used game-changing approaches to increase our share of existing markets (client base*5: 50 companies) and successfully enter new business fields.
• Expansion, enhancement, and reinforcement of global business We achieved an overseas sales ratio of more than 30%, and overseas sales exceeded ¥500.0 billion.
• Pursuit of overall optimization By introducing shared service centers, we reduced management expenses by more than ¥10.0 billion compared with FY2011.
*5 Clients with annual sales of over ¥5 billion (Japan) or US$50 million (ex-Japan)
• Strengthen local presence In the IT services market, we increased our presence in 8 of 10 countries.
• Game-changing approach We built a stronger client base and established a stable business foundation (client base*6: 70 companies).
• Breakthrough technology We reduced costs through standardization, automation, and other production technology innovations, and formed globally consistent R&D facilities to support client digitalization initiatives.
*6 Clients with annual sales of over ¥5 billion (Japan) or US$50 million (ex-Japan)
Issues
• Prevent unprofitable projects The Company has introduced a variety of measures to curtail unprofitable projects, including the establishment of the Project Review Committee in FY2013. However, we recognize the need for further curtailment efforts, as a large amount of loss from unprofitable projects occurred in FY2015.
• Maximize value for our clients To maximize value for our clients, we recognize the need to further accelerate digital transformation and maximize global synergy.
• Prevent unprofitable projects With the exception of a specific project, we succeeded in reducing the number below our target level*7 through such methods as establishing the Project Review Committee. Due in particular to increasingly complex technologies, we need to further step up curtailment efforts.
• Improve profitability of overseas businesses Although net sales grew significantly, profitability remains low, so substantial improvement is necessary.
*7 0.3%–0.5% of consolidated net sales
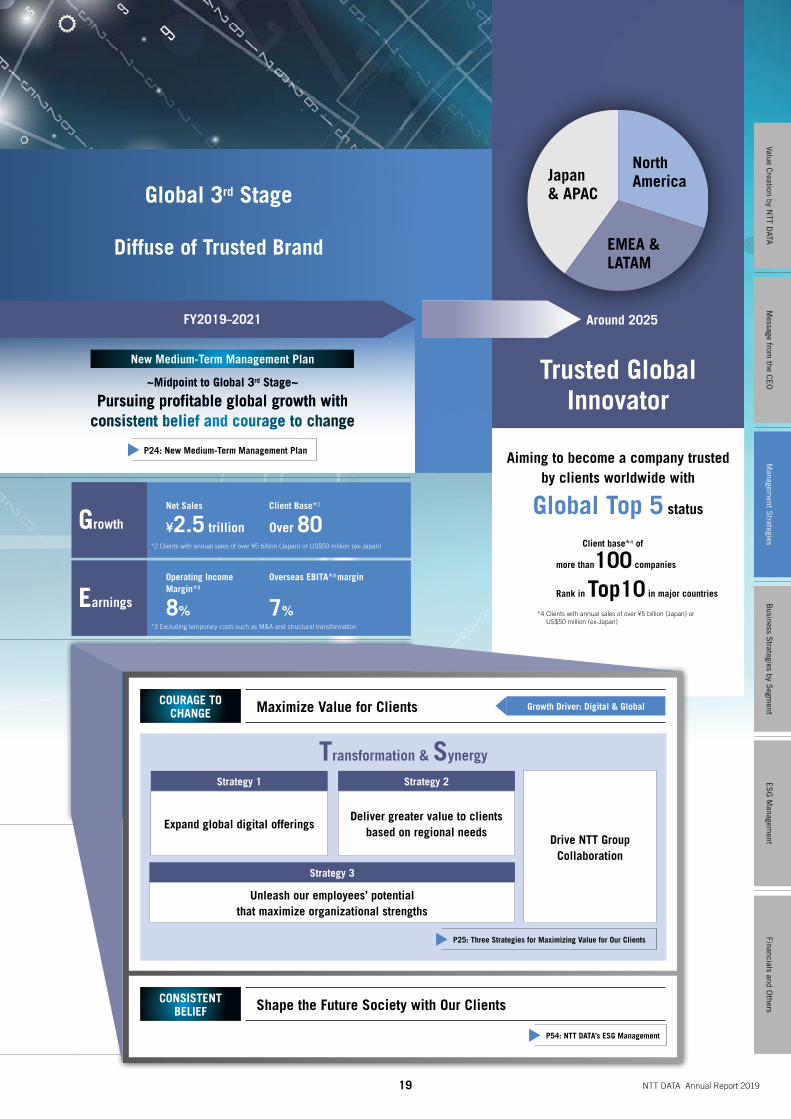
Global 3rd Stage
Diffuse of Trusted Brand
Trusted Global Innovator
EMEA & LATAM
Japan & APAC
North America
Aiming to become a company trusted by clients worldwide with
Global Top 5 status
Client base*4 of
more than100 companies
Rank in Top10 in major countries
*4 Clients with annual sales of over ¥5 billion (Japan) or US$50 million (ex-Japan)
Net Sales
¥2.5 trillion
Client Base*2
Over 80Growth
Earnings
Operating Income Margin*3
8%
Overseas EBITA*3 margin
7%
*2 Clients with annual sales of over ¥5 billion (Japan) or US$50 million (ex-Japan)
*3 Excluding temporary costs such as M&A and structural transformation
Around 2025FY2019–2021
Transformation & Synergy
Strategy 3
Strategy 1
Expand global digital offerings
Unleash our employees’ potential that maximize organizational strengths
Strategy 2
Deliver greater value to clients based on regional needs
Drive NTT Group Collaboration
~Midpoint to Global 3rd Stage~
Pursuing profitable global growth with consistent belief and courage to change
P24: New Medium-Term Management Plan
P25: Three Strategies for Maximizing Value for Our Clients
New Medium-Term Management Plan
Maximize Value for ClientsCOURAGE TO CHANGE
Growth Driver: Digital & Global
Shape the Future Society with Our ClientsCONSISTENT BELIEF
P54: NTT DATA’s ESG Management
Message from
the CE
OB
usiness Strategies by S
egment
ES
G M
anagement
Financials and Others
Value Creation by N
TT DATA
Managem
ent Strategies
20
2015 2016 2017 2018
2,163.6
1,614.8
1,732.4
2,039.7
FY 2015 2016 2017 2018
147.7
100.8117.1 123.1
FY
Review of Previous Medium-Term Management Plan (FY2016–2018)
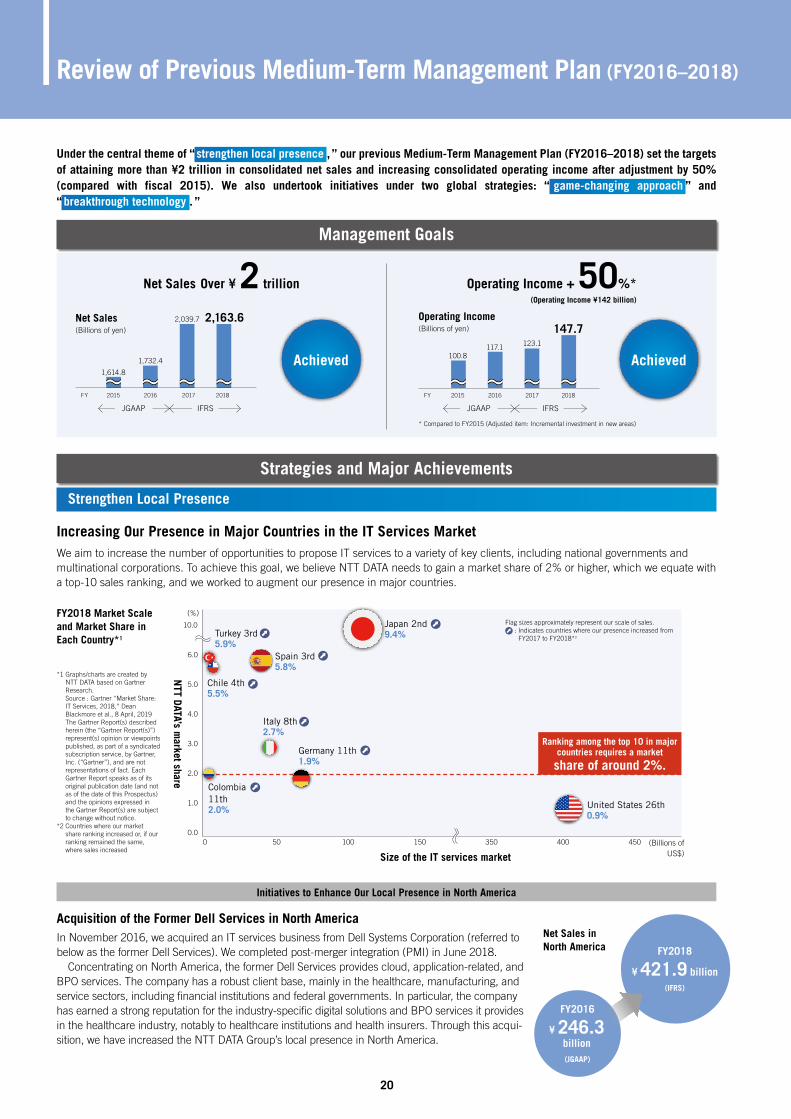
Under the central theme of “ strengthen local presence , ” our previous Medium-Term Management Plan (FY2016–2018) set the targets of attaining more than ¥2 trillion in consolidated net sales and increasing consolidated operating income after adjustment by 50% (compared with fiscal 2015). We also undertook initiatives under two global strategies: “ game-changing approach ” and “ breakthrough technology . ”
Management Goals
Strengthen Local Presence
Net Sales(Billions of yen)
Operating Income(Billions of yen)
Net Sales Over ¥ 2 trillion
Increasing Our Presence in Major Countries in the IT Services MarketWe aim to increase the number of opportunities to propose IT services to a variety of key clients, including national governments and multinational corporations. To achieve this goal, we believe NTT DATA needs to gain a market share of 2% or higher, which we equate with a top-10 sales ranking, and we worked to augment our presence in major countries.
Acquisition of the Former Dell Services in North AmericaIn November 2016, we acquired an IT services business from Dell Systems Corporation (referred to below as the former Dell Services). We completed post-merger integration (PMI) in June 2018. Concentrating on North America, the former Dell Services provides cloud, application-related, and BPO services. The company has a robust client base, mainly in the healthcare, manufacturing, and service sectors, including financial institutions and federal governments. In particular, the company has earned a strong reputation for the industry-specific digital solutions and BPO services it provides in the healthcare industry, notably to healthcare institutions and health insurers. Through this acqui-sition, we have increased the NTT DATA Group’s local presence in North America.
Operating Income + 50%* (Operating Income ¥142 billion)
Initiatives to Enhance Our Local Presence in North America
Achieved Achieved
Net Sales in North America
FY2016
¥ 246.3 billion (JGAAP)
FY2018
¥ 421.9 billion(IFRS)
(%)
(Billions of US$)
0 50 1501000.0
1.0
4.0
3.0
5.0
2.0
Turkey 3rd5.9%
Chile 4th5.5%
Colombia 11th2.0%
Ranking among the top 10 in major countries requires a market
share of around 2%.
Size of the IT services market
6.0
NTT DATA’s m
arket share
Spain 3rd5.8%
350 400 450
10.0
United States 26th0.9%
Japan 2nd9.4%
Italy 8th2.7%
Germany 11th1.9%
* Compared to FY2015 (Adjusted item: Incremental investment in new areas)
Flag sizes approximately represent our scale of sales. : Indicates countries where our presence increased from
FY2017 to FY2018*2
*1 Graphs/charts are created by NTT DATA based on Gartner Research. Source : Gartner “Market Share: IT Services, 2018,” Dean Blackmore et al., 8 April, 2019 The Gartner Report(s) described herein (the “Gartner Report(s)”) represent(s) opinion or viewpoints published, as part of a syndicated subscription service, by Gartner, Inc. (“Gartner”), and are not representations of fact. Each Gartner Report speaks as of its original publication date (and not as of the date of this Prospectus) and the opinions expressed in the Gartner Report(s) are subject to change without notice.
*2 Countries where our market share ranking increased or, if our ranking remained the same, where sales increased
Strategies and Major Achievements
FY2018 Market Scale and Market Share in Each Country*1
JGAAP IFRS JGAAP IFRS
2015 2018
70
50
FY 2015(JGAAP)
2018(IFRS)
2,457.1
1,544.5
FY
21 NTT DATA Annual Report 2019
Game-Changing Approach
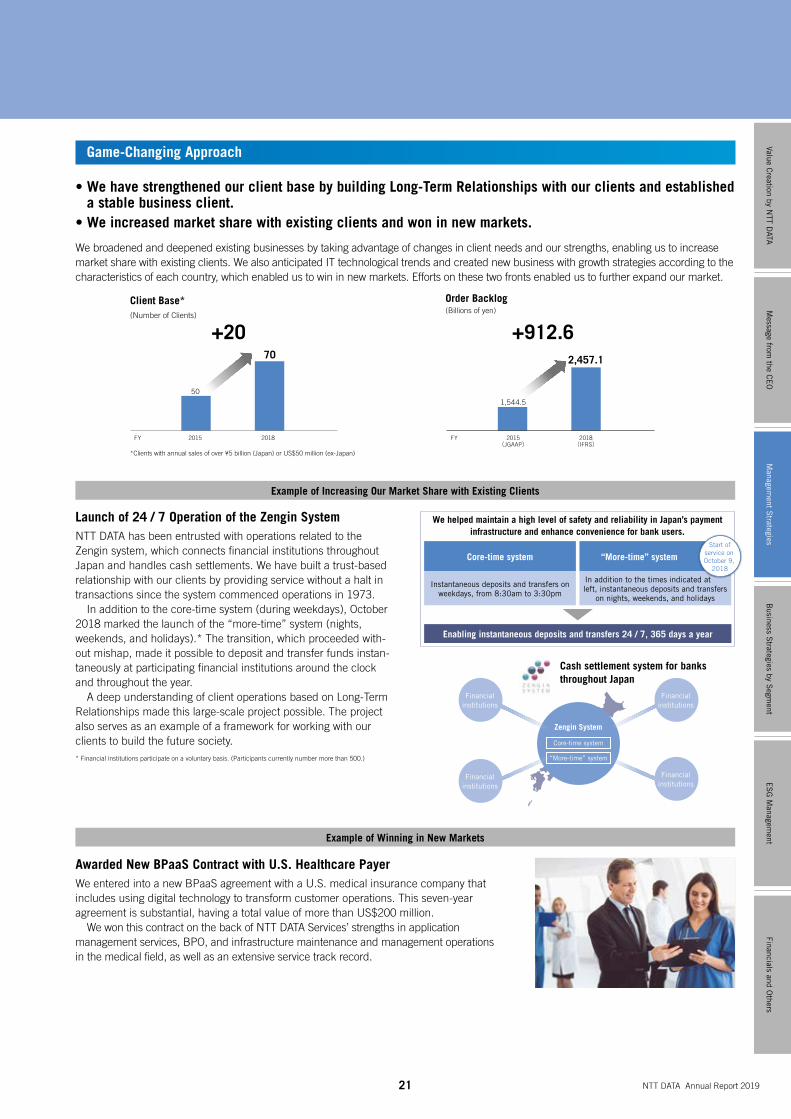
• We have strengthened our client base by building Long-Term Relationships with our clients and established a stable business client.
• We increased market share with existing clients and won in new markets.
We broadened and deepened existing businesses by taking advantage of changes in client needs and our strengths, enabling us to increase market share with existing clients. We also anticipated IT technological trends and created new business with growth strategies according to the characteristics of each country, which enabled us to win in new markets. Efforts on these two fronts enabled us to further expand our market.
Awarded New BPaaS Contract with U.S. Healthcare PayerWe entered into a new BPaaS agreement with a U.S. medical insurance company that includes using digital technology to transform customer operations. This seven-year agreement is substantial, having a total value of more than US$200 million. We won this contract on the back of NTT DATA Services’ strengths in application management services, BPO, and infrastructure maintenance and management operations in the medical field, as well as an extensive service track record.
Client Base*(Number of Clients)
Order Backlog(Billions of yen)
*Clients with annual sales of over ¥5 billion (Japan) or US$50 million (ex-Japan)
+20 +912.6
Zengin System
Financial institutions
Financial institutions
Financial institutions
Financial institutions
Cash settlement system for banks throughout Japan
Launch of 24 / 7 Operation of the Zengin SystemNTT DATA has been entrusted with operations related to the Zengin system, which connects financial institutions throughout Japan and handles cash settlements. We have built a trust-based relationship with our clients by providing service without a halt in transactions since the system commenced operations in 1973. In addition to the core-time system (during weekdays), October 2018 marked the launch of the “more-time” system (nights, weekends, and holidays).* The transition, which proceeded with-out mishap, made it possible to deposit and transfer funds instan-taneously at participating financial institutions around the clock and throughout the year. A deep understanding of client operations based on Long-Term Relationships made this large-scale project possible. The project also serves as an example of a framework for working with our clients to build the future society.* Financial institutions participate on a voluntary basis. (Participants currently number more than 500.)
Example of Increasing Our Market Share with Existing Clients
Example of Winning in New Markets
We helped maintain a high level of safety and reliability in Japan’s payment infrastructure and enhance convenience for bank users.
Core-time system “More-time” system
Instantaneous deposits and transfers on weekdays, from 8:30am to 3:30pm
In addition to the times indicated at left, instantaneous deposits and transfers
on nights, weekends, and holidays
Enabling instantaneous deposits and transfers 24 / 7, 365 days a year
Start of service on October 9,
2018
Core-time system
“More-time” system
Message from
the CE
OB
usiness Strategies by S
egment
ES
G M
anagement
Financials and Others
Value Creation by N
TT DATA
Managem
ent Strategies

22
Production Technology Innovation Utilization of Cutting-Edge Technology
Game-Changing Approach and Breakthrough Technology
• Next-generation core banking
Enhanced Response to Digital Business
• Realization of a connected car society• Trade data sharing platforms using the blockchain• R&D related to quality maintenance technology of prediction models
using AI technology• R&D aimed at turning brain information communications into a business• BPaas business for the insurance industry (GIDP)
Paradigm for Disruptive Innovation
• Business creation activities from open innovation “Toyosu no Minato kara”*
* Initiative to accelerate emergent innovation aimed at creating new business through monthly forums and global business contests between NTT DATA, our clients, and various venture capital firms.
Breakthrough Technology
Promoting Software Development Automation and Making Development Methodology Consistent
We reduced development costs by increasing the use of tools to automate software development and making our develop-ment methodology globally consistent.
Moving the Development Environment onto the Cloud and Aggregating the Development Environment
We expanded application to the development environment in Japan and overseas, and worked to increase application to clients’ commercial environments. The development environment was used in around 1,000 cases, including some 100 overseas.
Initiatives of Investments in New Fields
Necessity of Investments in New Fields• Digitization is causing massive changes in market environments and client IT investment is also changing, from existing business areas
to focusing on digital business areas.• In response to these changes, we conducted proactive upfront investments in order to secure our presence and competitive advantage into
the future in these newly created business areas.
Major Investment Areas• Investments related to a game-changing approach and breakthrough technology based on previous Medium-Term Management Plan strategies• Investments in digital business areas such as AI, IoT, and blockchain and emergent innovations aimed at the Global 3rd Stage
Established global common research base (CoE)In order to promote the concentration and utilization of technology and knowledge on a global level, we established a global common research base (CoE) to support the digiti-zation of customers. The efforts for Blockchain and Digital Design using CoE have earned the reputation of external research companies.The new Medium-Term Management Plan will further accelerate these efforts.
P26: New Medium-Term Management Plan Strategy 1. Expand global digital offerings (Expand CoE)
P41: Open Mission Critical Platform Initiatives
Status of NTT DATA Integrated Development Cloud Applications
Expanding applications in global development environments
Rolling out to client commercial environments
EMEA & LATAM
North America
JapanChina & APAC
Globally standardize software development methods
Standardize and globally deploy basic technologies
Development methodology
Multi-vendor multi-cloud
Software development automation tool
Development environment Aggregation
Adoption case 1,000 cases
Establish a mechanism to globally consolidate and utilize expertise on the latest technologies
Review of Previous Medium-Term Management Plan (FY2016–2018)
• Reducing costs through standardization, automation, and other production technology innovations• Forming globally consistent research hubs and supporting client digitization initiatives
Adoption rate 90%
P51: Blockchain InitiativesP28: Solution for AI Diagnostic Imaging SupportP45: Global Insurance Digital Platform
Blockchain
DevOpS AI
Digital Design
CoE(Center of
Excellence)
Leader evaluation 80 use cases Leader evaluation
FY 201820172016201520142013
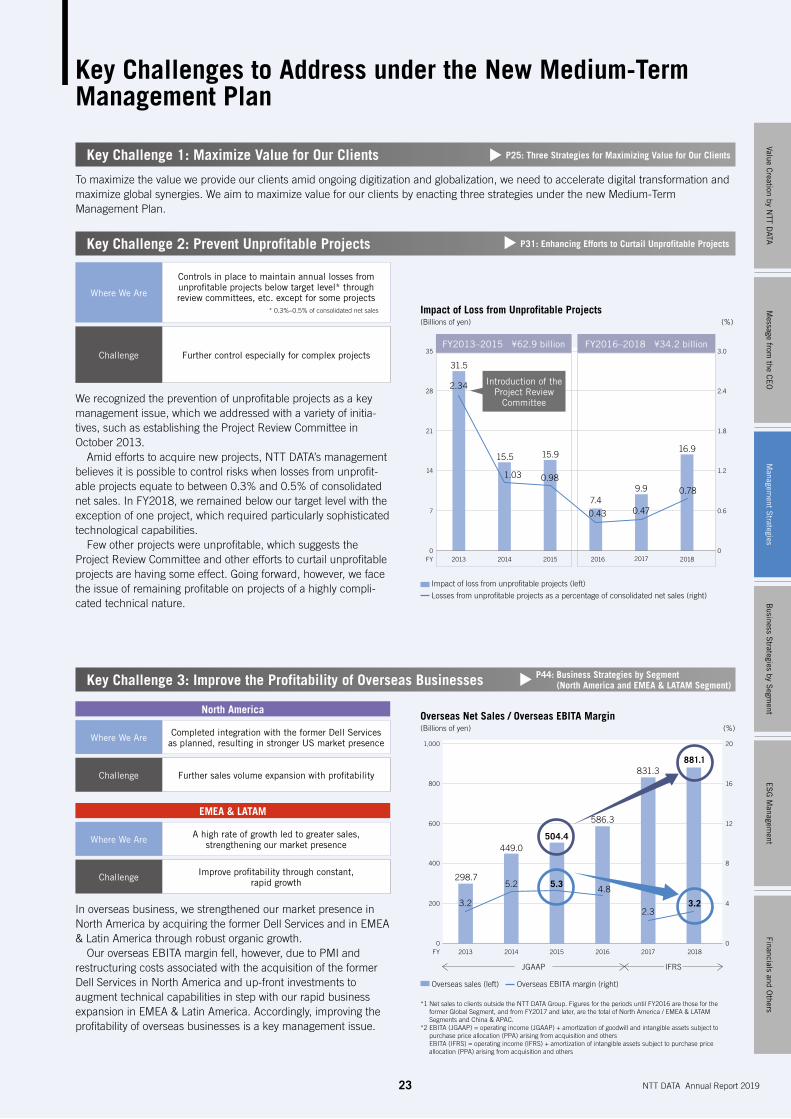
0.78
0.43
1.03
2.34
0.47
0.98
0
7
14
21
28
35
0
0.6
1.2
1.8
2.4
3.0
31.5
15.5 15.9
7.49.9
16.9
23 NTT DATA Annual Report 2019
Key Challenge 1: Maximize Value for Our Clients
To maximize the value we provide our clients amid ongoing digitization and globalization, we need to accelerate digital transformation and maximize global synergies. We aim to maximize value for our clients by enacting three strategies under the new Medium-Term Management Plan.
Key Challenge 2: Prevent Unprofitable Projects
Key Challenge 3: Improve the Profitability of Overseas Businesses
P25: Three Strategies for Maximizing Value for Our Clients
P44: Business Strategies by Segment (North America and EMEA & LATAM Segment)
P31: Enhancing Efforts to Curtail Unprofitable Projects
Key Challenges to Address under the New Medium-Term Management Plan
In overseas business, we strengthened our market presence in North America by acquiring the former Dell Services and in EMEA & Latin America through robust organic growth. Our overseas EBITA margin fell, however, due to PMI and restructuring costs associated with the acquisition of the former Dell Services in North America and up-front investments to augment technical capabilities in step with our rapid business expansion in EMEA & Latin America. Accordingly, improving the profitability of overseas businesses is a key management issue.
Where We Are
Challenge
Completed integration with the former Dell Services as planned, resulting in stronger US market presence
Further sales volume expansion with profitability
North America
Where We Are
Challenge
A high rate of growth led to greater sales, strengthening our market presence
Improve profitability through constant, rapid growth
EMEA & LATAM
Introduction of the Project Review
Committee
FY2013–2015 ¥62.9 billion FY2016–2018 ¥34.2 billion
Where We Are
Challenge
Controls in place to maintain annual losses from unprofitable projects below target level* through review committees, etc. except for some projects
* 0.3%–0.5% of consolidated net sales
Further control especially for complex projects
We recognized the prevention of unprofitable projects as a key management issue, which we addressed with a variety of initia-tives, such as establishing the Project Review Committee in October 2013. Amid efforts to acquire new projects, NTT DATA’s management believes it is possible to control risks when losses from unprofit-able projects equate to between 0.3% and 0.5% of consolidated net sales. In FY2018, we remained below our target level with the exception of one project, which required particularly sophisticated technological capabilities. Few other projects were unprofitable, which suggests the Project Review Committee and other efforts to curtail unprofitable projects are having some effect. Going forward, however, we face the issue of remaining profitable on projects of a highly compli-cated technical nature.
*1 Net sales to clients outside the NTT DATA Group. Figures for the periods until FY2016 are those for the former Global Segment, and from FY2017 and later, are the total of North America / EMEA & LATAM Segments and China & APAC.
*2 EBITA (JGAAP) = operating income (JGAAP) + amortization of goodwill and intangible assets subject to purchase price allocation (PPA) arising from acquisition and others EBITA (IFRS) = operating income (IFRS) + amortization of intangible assets subject to purchase price allocation (PPA) arising from acquisition and others
Message from
the CE
OB
usiness Strategies by S
egment
ES
G M
anagement
Financials and Others
Value Creation by N
TT DATA
Managem
ent Strategies
FY 201820172016201520142013
3.2
4.85.2
3.22.3
5.3
0
200
400
600
800
1,000
0
4
8
12
16
20
298.7
449.0504.4
586.3
831.3881.1
JGAAP IFRS
Overseas Net Sales / Overseas EBITA Margin(Billions of yen) (%)
Overseas sales (left) Overseas EBITA margin (right)
Impact of Loss from Unprofitable Projects(Billions of yen) (%)
Impact of loss from unprofitable projects (left)
Losses from unprofitable projects as a percentage of consolidated net sales (right)
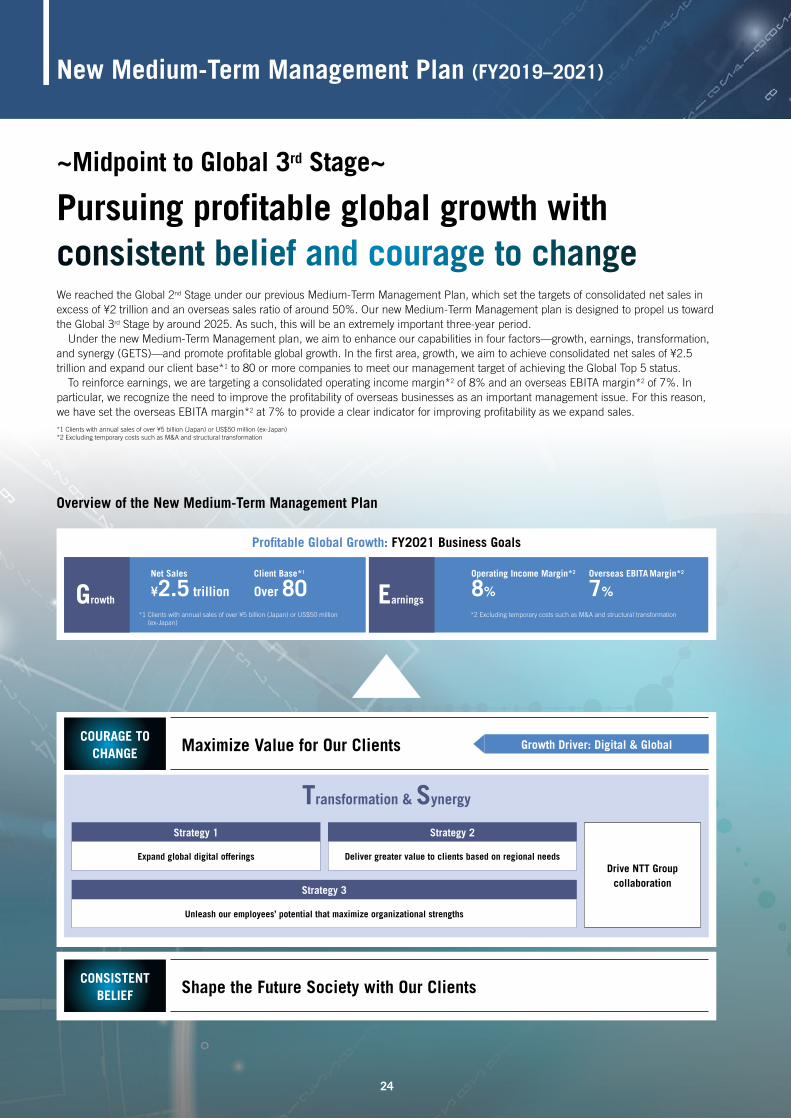
24
We reached the Global 2nd Stage under our previous Medium-Term Management Plan, which set the targets of consolidated net sales in excess of ¥2 trillion and an overseas sales ratio of around 50%. Our new Medium-Term Management plan is designed to propel us toward the Global 3rd Stage by around 2025. As such, this will be an extremely important three-year period. Under the new Medium-Term Management plan, we aim to enhance our capabilities in four factors—growth, earnings, transformation, and synergy (GETS)—and promote profitable global growth. In the first area, growth, we aim to achieve consolidated net sales of ¥2.5 trillion and expand our client base*1 to 80 or more companies to meet our management target of achieving the Global Top 5 status. To reinforce earnings, we are targeting a consolidated operating income margin*2 of 8% and an overseas EBITA margin*2 of 7%. In particular, we recognize the need to improve the profitability of overseas businesses as an important management issue. For this reason, we have set the overseas EBITA margin*2 at 7% to provide a clear indicator for improving profitability as we expand sales.*1 Clients with annual sales of over ¥5 billion (Japan) or US$50 million (ex-Japan)*2 Excluding temporary costs such as M&A and structural transformation
~Midpoint to Global 3rd Stage~
Pursuing profitable global growth with consistent belief and courage to change
New Medium-Term Management Plan (FY2019–2021)
Overview of the New Medium-Term Management Plan
Profitable Global Growth: FY2021 Business Goals
Transformation & Synergy
Strategy 1
Strategy 3
Expand global digital offerings
Unleash our employees’ potential that maximize organizational strengths
Strategy 2
Deliver greater value to clients based on regional needsDrive NTT Group
collaboration
Net Sales
¥2.5 trillionClient Base*1
Over 80Growth Earnings
Operating Income Margin*2
8%Overseas EBITA Margin*2
7%
*2 Excluding temporary costs such as M&A and structural transformation*1 Clients with annual sales of over ¥5 billion (Japan) or US$50 million (ex-Japan)
Maximize Value for Our ClientsCOURAGE TO CHANGE
Shape the Future Society with Our ClientsCONSISTENT BELIEF
Growth Driver: Digital & Global
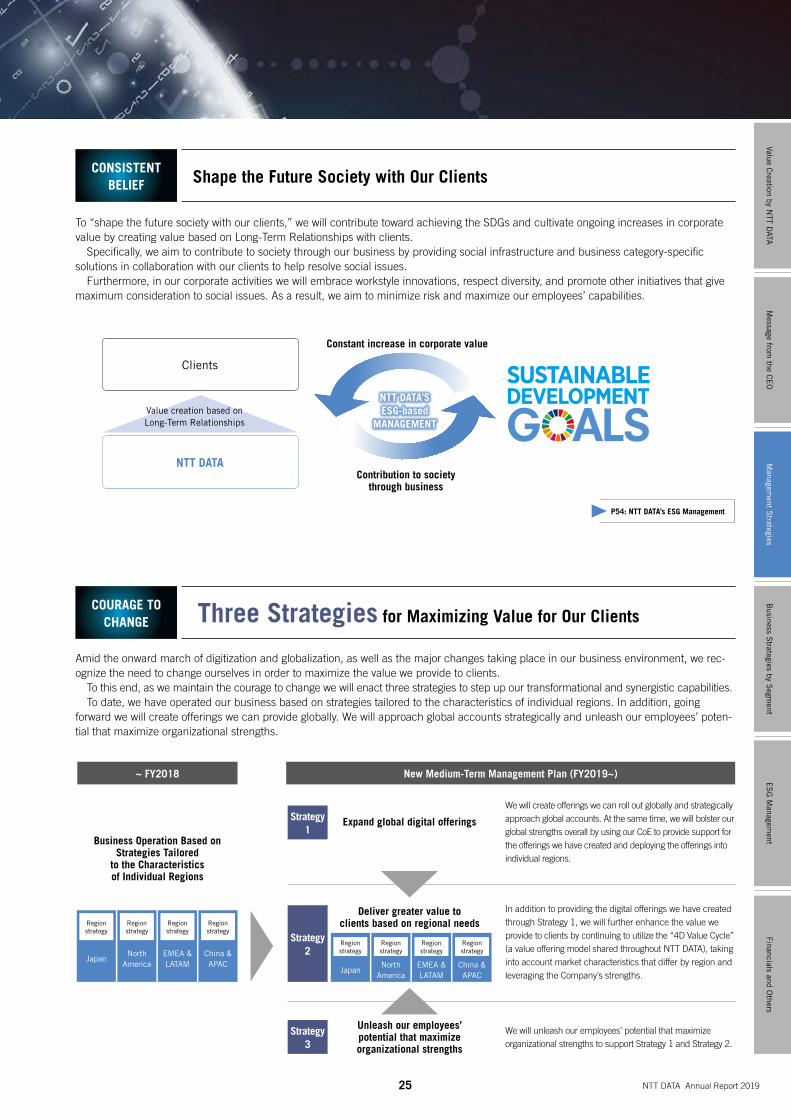
25 NTT DATA Annual Report 2019
Business Operation Based on Strategies Tailored
to the Characteristics of Individual Regions
~ FY2018 New Medium-Term Management Plan (FY2019~)
Japan
Region strategy
North America
Region strategy
EMEA & LATAM
Region strategy
China & APAC
Region strategy
Amid the onward march of digitization and globalization, as well as the major changes taking place in our business environment, we rec-ognize the need to change ourselves in order to maximize the value we provide to clients. To this end, as we maintain the courage to change we will enact three strategies to step up our transformational and synergistic capabilities. To date, we have operated our business based on strategies tailored to the characteristics of individual regions. In addition, going forward we will create offerings we can provide globally. We will approach global accounts strategically and unleash our employees’ poten-tial that maximize organizational strengths.
Strategy 1
Strategy 2
Strategy 3
Expand global digital offerings
Unleash our employees’ potential that maximize organizational strengths
We will create offerings we can roll out globally and strategically approach global accounts. At the same time, we will bolster our global strengths overall by using our CoE to provide support for the offerings we have created and deploying the offerings into individual regions.
In addition to providing the digital offerings we have created through Strategy 1, we will further enhance the value we provide to clients by continuing to utilize the “4D Value Cycle” (a value offering model shared throughout NTT DATA), taking into account market characteristics that differ by region and leveraging the Company’s strengths.
We will unleash our employees’ potential that maximize organizational strengths to support Strategy 1 and Strategy 2.
To “shape the future society with our clients,” we will contribute toward achieving the SDGs and cultivate ongoing increases in corporate value by creating value based on Long-Term Relationships with clients. Specifically, we aim to contribute to society through our business by providing social infrastructure and business category-specific solutions in collaboration with our clients to help resolve social issues. Furthermore, in our corporate activities we will embrace workstyle innovations, respect diversity, and promote other initiatives that give maximum consideration to social issues. As a result, we aim to minimize risk and maximize our employees’ capabilities.
Contribution to society through business
P54: NTT DATA’s ESG Management
Constant increase in corporate value
NTT DATA’S ESG-based
MANAGEMENTValue creation based on Long-Term Relationships
Clients
NTT DATA
Shape the Future Society with Our ClientsCONSISTENT BELIEF
Three Strategies for Maximizing Value for Our ClientsCOURAGE TO
CHANGE
Japan
Region strategy
North America
Region strategy
EMEA & LATAM
Region strategy
China & APAC
Region strategy
Deliver greater value to clients based on regional needs
Message from
the CE
OB
usiness Strategies by S
egment
ES
G M
anagement
Financials and Others
Value Creation by N
TT DATA
Managem
ent Strategies
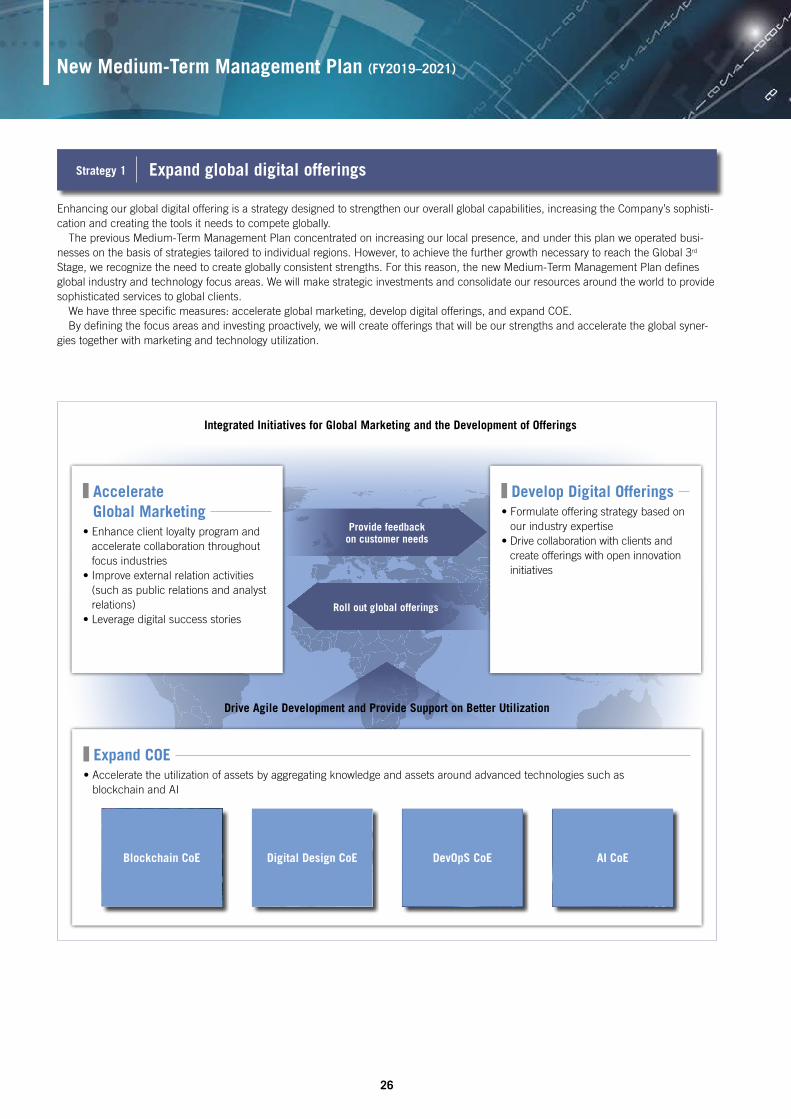
Accelerate Global Marketing
• Enhance client loyalty program and accelerate collaboration throughout focus industries
• Improve external relation activities (such as public relations and analyst relations)
• Leverage digital success storiesRoll out global offerings
Provide feedback on customer needs
Develop Digital Offerings • Formulate offering strategy based on
our industry expertise• Drive collaboration with clients and
create offerings with open innovation initiatives
Expand COE • Accelerate the utilization of assets by aggregating knowledge and assets around advanced technologies such as
blockchain and AI
Integrated Initiatives for Global Marketing and the Development of Offerings
Drive Agile Development and Provide Support on Better Utilization
Blockchain CoE DevOpS CoE AI CoEDigital Design CoE
26
New Medium-Term Management Plan (FY2019–2021)
Enhancing our global digital offering is a strategy designed to strengthen our overall global capabilities, increasing the Company’s sophisti-cation and creating the tools it needs to compete globally. The previous Medium-Term Management Plan concentrated on increasing our local presence, and under this plan we operated busi-nesses on the basis of strategies tailored to individual regions. However, to achieve the further growth necessary to reach the Global 3rd Stage, we recognize the need to create globally consistent strengths. For this reason, the new Medium-Term Management Plan defines global industry and technology focus areas. We will make strategic investments and consolidate our resources around the world to provide sophisticated services to global clients. We have three specific measures: accelerate global marketing, develop digital offerings, and expand COE. By defining the focus areas and investing proactively, we will create offerings that will be our strengths and accelerate the global syner-gies together with marketing and technology utilization.
Strategy 1 Expand global digital offerings
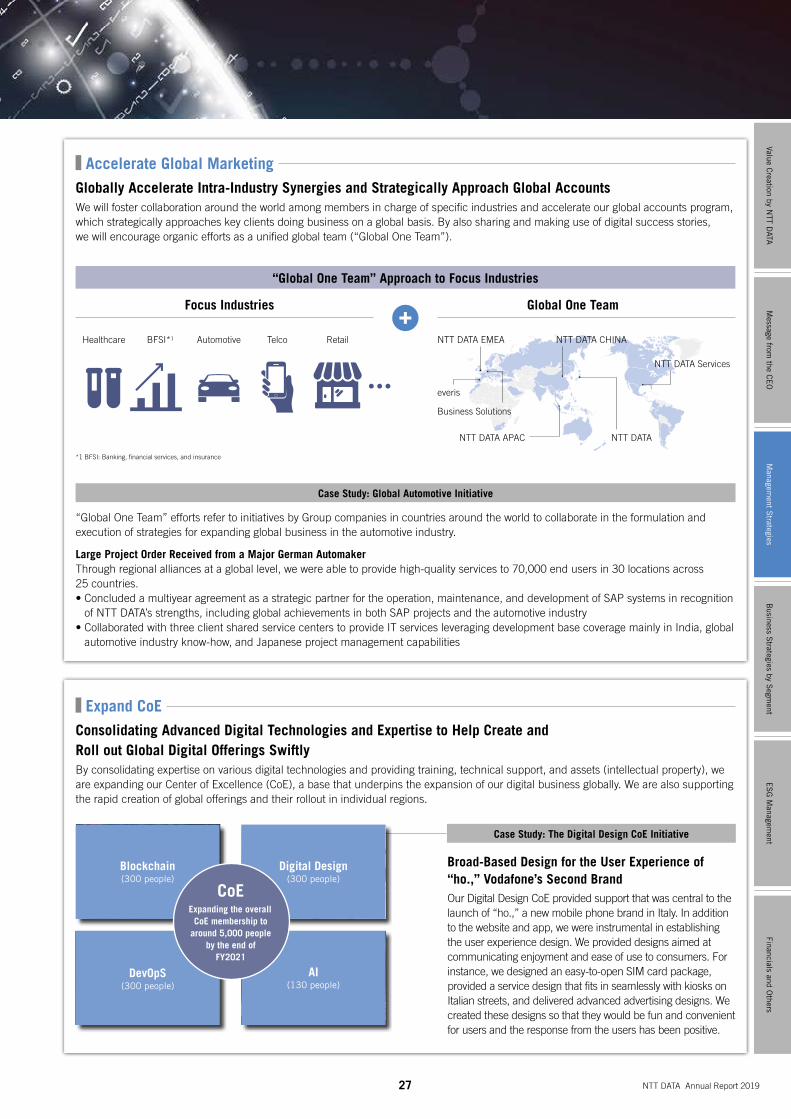
27 NTT DATA Annual Report 2019
Expand CoE Consolidating Advanced Digital Technologies and Expertise to Help Create and Roll out Global Digital Offerings SwiftlyBy consolidating expertise on various digital technologies and providing training, technical support, and assets (intellectual property), we are expanding our Center of Excellence (CoE), a base that underpins the expansion of our digital business globally. We are also supporting the rapid creation of global offerings and their rollout in individual regions.
Accelerate Global Marketing Globally Accelerate Intra-Industry Synergies and Strategically Approach Global AccountsWe will foster collaboration around the world among members in charge of specific industries and accelerate our global accounts program, which strategically approaches key clients doing business on a global basis. By also sharing and making use of digital success stories, we will encourage organic efforts as a unified global team (“Global One Team”).
“Global One Team” efforts refer to initiatives by Group companies in countries around the world to collaborate in the formulation and execution of strategies for expanding global business in the automotive industry.
Large Project Order Received from a Major German AutomakerThrough regional alliances at a global level, we were able to provide high-quality services to 70,000 end users in 30 locations across 25 countries.• Concluded a multiyear agreement as a strategic partner for the operation, maintenance, and development of SAP systems in recognition
of NTT DATA’s strengths, including global achievements in both SAP projects and the automotive industry• Collaborated with three client shared service centers to provide IT services leveraging development base coverage mainly in India, global
automotive industry know-how, and Japanese project management capabilities
Healthcare AutomotiveBFSI*1 Telco Retail
“Global One Team” Approach to Focus Industries
Broad-Based Design for the User Experience of “ho.,” Vodafone’s Second BrandOur Digital Design CoE provided support that was central to the launch of “ho.,” a new mobile phone brand in Italy. In addition to the website and app, we were instrumental in establishing the user experience design. We provided designs aimed at communicating enjoyment and ease of use to consumers. For instance, we designed an easy-to-open SIM card package, provided a service design that fits in seamlessly with kiosks on Italian streets, and delivered advanced advertising designs. We created these designs so that they would be fun and convenient for users and the response from the users has been positive.
Global One TeamFocus Industries
Case Study: Global Automotive Initiative
Blockchain (300 people)
DevOpS (300 people)
AI(130 people)
Digital Design (300 people)
NTT DATA EMEA NTT DATA CHINA
NTT DATA Services
NTT DATANTT DATA APAC
Business Solutions
everis
*1 BFSI: Banking, financial services, and insurance
Case Study: The Digital Design CoE Initiative
CoEExpanding the overall
CoE membership to around 5,000 people
by the end of FY2021
Message from
the CE
OB
usiness Strategies by S
egment
ES
G M
anagement
Financials and Others
Value Creation by N
TT DATA
Managem
ent Strategies

28
New Medium-Term Management Plan (FY2019–2021)
Develop Digital Offerings Creating Tools to Compete at the Global Level by Combining Focus Industries and Digital Focus AreasWe are combining global focus industries and digital focus areas (six specific technology domains, including AI, customer experience, and IoT) to create solutions, platforms, and other offerings that will give us a globally consistent competitive advantage.
Our AI diagnostic imaging solution helps radiologists with diagnostics by using AI technology to analyze patients’ medical images for serious disease. The solution can be used for 12 disease categories, including cerebral hemorrhage. During proof-of-concept (PoC) testing in India, we used CT images to target emphysema and confirmed the solution’s ability to detect a greater number of cases. We will conduct PoC testing in other countries (the United States and Japan) prior to the solution’s global rollout. We expect the solution to generate sales of ¥10.0 billion by 2022.
Data & Intelligence
AI, machine
learning, other
technologies
Focus Industries
Digital Focus Areas
Healthcare BFSI*1 Automotive Telco Retail
Intelligent Automation
RPA, robotics, other
technologies
Customer Experience
Digital design,
VR / AR, other
technologies
Internet of Things
Sensing technology,
edge computing,
other technologies
IT Optimization
DevOps / agile,
legacy
modernization,
other technologies
Cybersecurity
Blockchain,
advanced cyber-
threat detection,
other technologies
Services
We are developing an SaaS-type platform that facilitates low-cost and rapid launch of banking function for companies that wish to provide simple financial services without having to acquire banking licenses and financial institutions that want to provide new financial services while minimizing their impact on existing systems. In addition to the minimal functions required of accounting-type systems for deposits, loans, and remittances, this platform facilitates the ongoing addition of features, including QR code payment data renting and wallet functions. We plan to roll out the platform globally as a light cloud accounting service, providing a common platform for areas without regional color.*2 Banking, financial services, and insurance
Healthcare
Data &
Intelligence
NTT DATA Open Banking Platform
Front-end application
Case Study: Solution for AI Diagnostic Imaging Support Case Study: Open Banking Platform
BFSI*2
Customer Experience
Open API platform
Core banking / information system
Cloud platform
QR code payment
Data lending
Wallet
In addition to the NTT DATA Group’s existing assets, we are collaborating with fintech companies on the additional development of competitive functions.
Narrow down to the minimum required functions
*1 Banking, financial services, and insurance
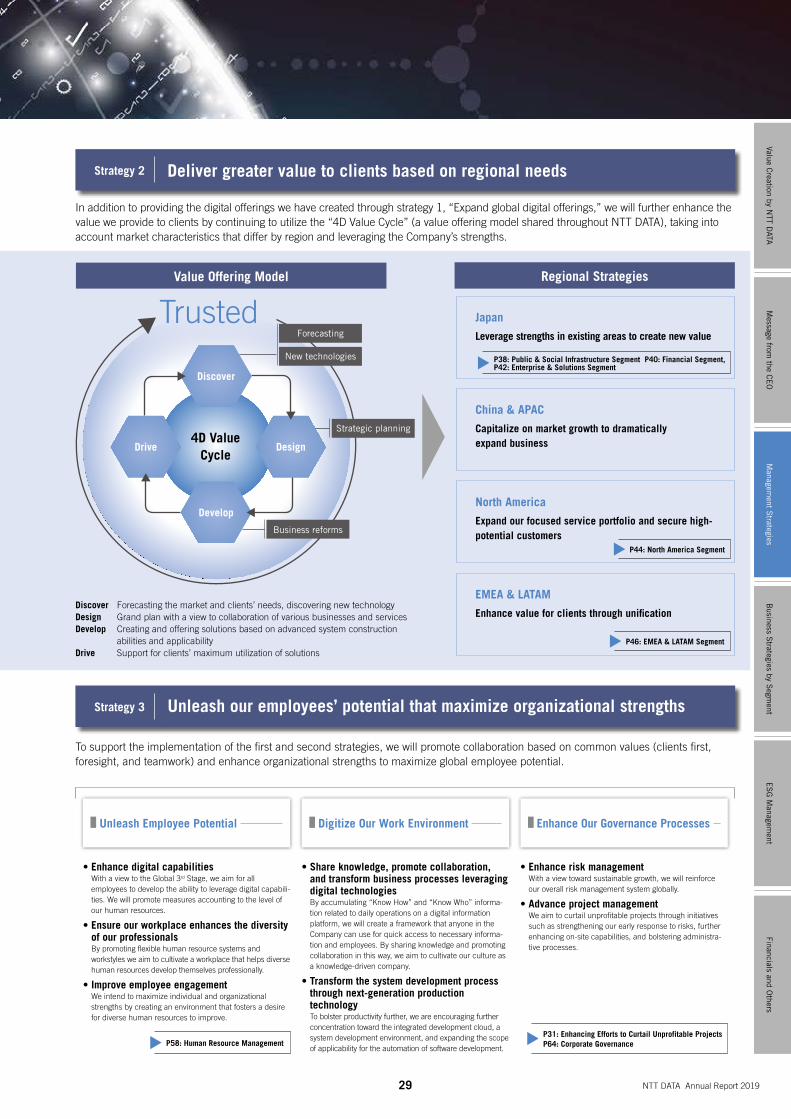
29 NTT DATA Annual Report 2019
In addition to providing the digital offerings we have created through strategy 1, “Expand global digital offerings,” we will further enhance the value we provide to clients by continuing to utilize the “4D Value Cycle” (a value offering model shared throughout NTT DATA), taking into account market characteristics that differ by region and leveraging the Company’s strengths.
To support the implementation of the first and second strategies, we will promote collaboration based on common values (clients first, foresight, and teamwork) and enhance organizational strengths to maximize global employee potential.
Japan
Leverage strengths in existing areas to create new value
EMEA & LATAM
Enhance value for clients through unification
North America
Expand our focused service portfolio and secure high-potential customers
China & APAC
Capitalize on market growth to dramatically expand business
Unleash Employee Potential
• Enhance digital capabilities With a view to the Global 3rd Stage, we aim for all employees to develop the ability to leverage digital capabili-ties. We will promote measures accounting to the level of our human resources.
• Ensure our workplace enhances the diversity of our professionals By promoting flexible human resource systems and workstyles we aim to cultivate a workplace that helps diverse human resources develop themselves professionally.
• Improve employee engagement We intend to maximize individual and organizational strengths by creating an environment that fosters a desire for diverse human resources to improve.
• Share knowledge, promote collaboration, and transform business processes leveraging digital technologies By accumulating “Know How” and “Know Who” informa-tion related to daily operations on a digital information platform, we will create a framework that anyone in the Company can use for quick access to necessary informa-tion and employees. By sharing knowledge and promoting collaboration in this way, we aim to cultivate our culture as a knowledge-driven company.
• Transform the system development process through next-generation production technology To bolster productivity further, we are encouraging further concentration toward the integrated development cloud, a system development environment, and expanding the scope of applicability for the automation of software development.
• Enhance risk management With a view toward sustainable growth, we will reinforce our overall risk management system globally.
• Advance project management We aim to curtail unprofitable projects through initiatives such as strengthening our early response to risks, further enhancing on-site capabilities, and bolstering administra-tive processes.
Value Offering Model Regional Strategies
P44: North America Segment
P46: EMEA & LATAM Segment
P31: Enhancing Efforts to Curtail Unprofitable ProjectsP64: Corporate GovernanceP58: Human Resource Management
P38: Public & Social Infrastructure Segment P40: Financial Segment, P42: Enterprise & Solutions Segment
Digitize Our Work Environment Enhance Our Governance Processes
Strategy 2 Deliver greater value to clients based on regional needs
Strategy 3 Unleash our employees’ potential that maximize organizational strengths
Message from
the CE
OB
usiness Strategies by S
egment
ES
G M
anagement
Financials and Others
Value Creation by N
TT DATA
Managem
ent Strategies
Discover Forecasting the market and clients’ needs, discovering new technologyDesign Grand plan with a view to collaboration of various businesses and servicesDevelop Creating and offering solutions based on advanced system construction
abilities and applicabilityDrive Support for clients’ maximum utilization of solutions
4D Value Cycle
Trusted
DesignDrive
Develop
Discover
New technologies
Forecasting
Strategic planning
Business reforms
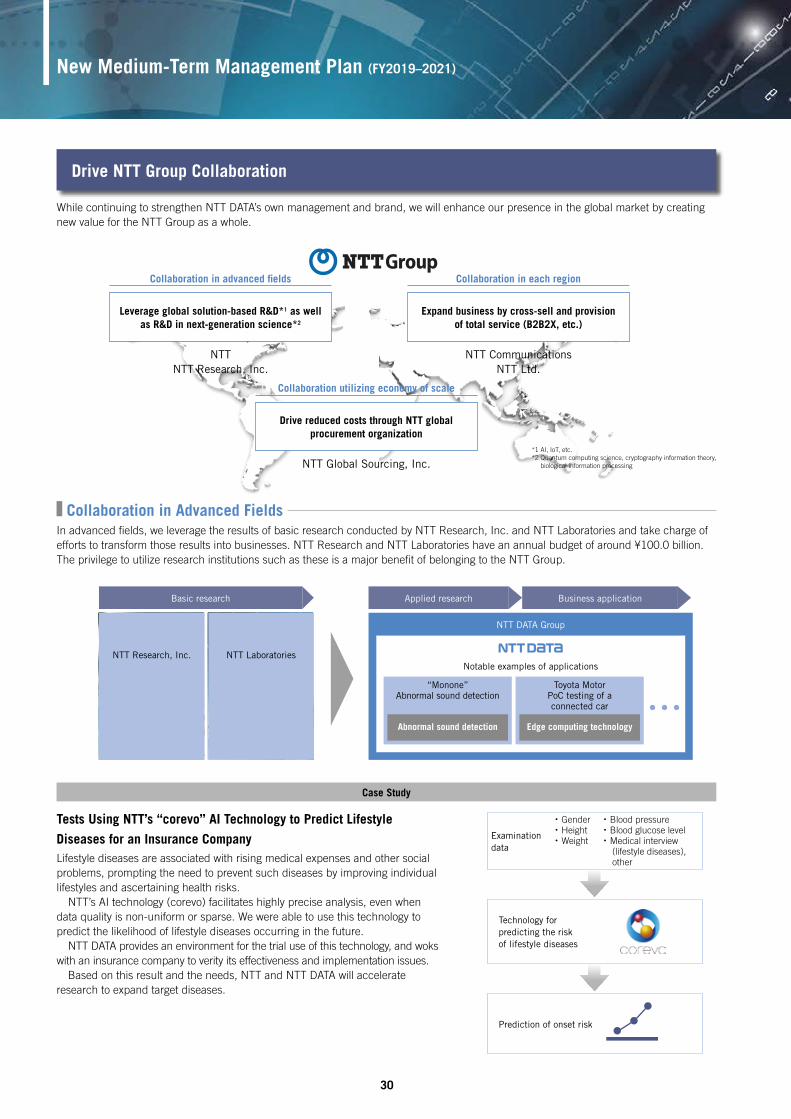
30
While continuing to strengthen NTT DATA’s own management and brand, we will enhance our presence in the global market by creating new value for the NTT Group as a whole.
Collaboration in Advanced Fields In advanced fields, we leverage the results of basic research conducted by NTT Research, Inc. and NTT Laboratories and take charge of efforts to transform those results into businesses. NTT Research and NTT Laboratories have an annual budget of around ¥100.0 billion. The privilege to utilize research institutions such as these is a major benefit of belonging to the NTT Group.
Expand business by cross-sell and provision of total service (B2B2X, etc.)
Leverage global solution-based R&D*1 as well as R&D in next-generation science*2
NTT DATA Group
Drive reduced costs through NTT global procurement organization
Collaboration in each regionCollaboration in advanced fields
Collaboration utilizing economy of scale
NTT CommunicationsNTT Ltd.
NTTNTT Research, Inc.
NTT Global Sourcing, Inc.
Basic research Applied research Business application
“Monone”Abnormal sound detection
Toyota MotorPoC testing of a connected car
Technology for predicting the risk of lifestyle diseases
Examination data
Tests Using NTT’s “corevo” AI Technology to Predict Lifestyle
Diseases for an Insurance CompanyLifestyle diseases are associated with rising medical expenses and other social problems, prompting the need to prevent such diseases by improving individual lifestyles and ascertaining health risks. NTT’s AI technology (corevo) facilitates highly precise analysis, even when data quality is non-uniform or sparse. We were able to use this technology to predict the likelihood of lifestyle diseases occurring in the future. NTT DATA provides an environment for the trial use of this technology, and woks with an insurance company to verity its effectiveness and implementation issues. Based on this result and the needs, NTT and NTT DATA will accelerate research to expand target diseases.
Prediction of onset risk
Notable examples of applications
Edge computing technologyAbnormal sound detection
New Medium-Term Management Plan (FY2019–2021)
Case Study
NTT Research, Inc. NTT Laboratories
*1 AI, IoT, etc.*2 Quantum computing science, cryptography information theory,
biological information processing
・ Gender・ Height・ Weight
・ Blood pressure・ Blood glucose level・ Medical interview
(lifestyle diseases), other
Drive NTT Group Collaboration
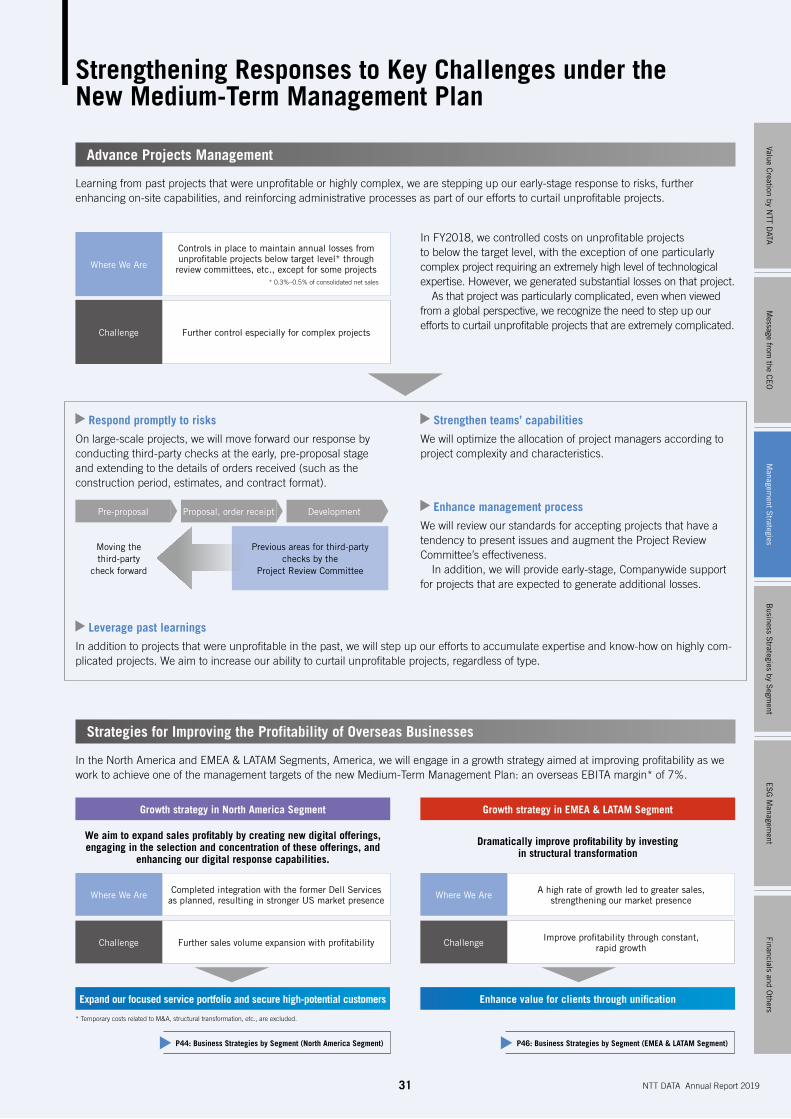
31 NTT DATA Annual Report 2019
Strategies for Improving the Profitability of Overseas Businesses
In the North America and EMEA & LATAM Segments, America, we will engage in a growth strategy aimed at improving profitability as we work to achieve one of the management targets of the new Medium-Term Management Plan: an overseas EBITA margin* of 7%.
We aim to expand sales profitably by creating new digital offerings, engaging in the selection and concentration of these offerings, and
enhancing our digital response capabilities.
Dramatically improve profitability by investing in structural transformation
Moving the third-party
check forward
Pre-proposal Proposal, order receipt Development
Previous areas for third-party checks by the
Project Review Committee
Growth strategy in North America Segment
Expand our focused service portfolio and secure high-potential customers
Growth strategy in EMEA & LATAM Segment
Enhance value for clients through unification
In FY2018, we controlled costs on unprofitable projects to below the target level, with the exception of one particularly complex project requiring an extremely high level of technological expertise. However, we generated substantial losses on that project. As that project was particularly complicated, even when viewed from a global perspective, we recognize the need to step up our efforts to curtail unprofitable projects that are extremely complicated.
Respond promptly to risks
On large-scale projects, we will move forward our response by conducting third-party checks at the early, pre-proposal stage and extending to the details of orders received (such as the construction period, estimates, and contract format).
Leverage past learnings
In addition to projects that were unprofitable in the past, we will step up our efforts to accumulate expertise and know-how on highly com-plicated projects. We aim to increase our ability to curtail unprofitable projects, regardless of type.
Strengthen teams’ capabilities
We will optimize the allocation of project managers according to project complexity and characteristics.
Enhance management process
We will review our standards for accepting projects that have a tendency to present issues and augment the Project Review Committee’s effectiveness. In addition, we will provide early-stage, Companywide support for projects that are expected to generate additional losses.
Advance Projects Management
Learning from past projects that were unprofitable or highly complex, we are stepping up our early-stage response to risks, further enhancing on-site capabilities, and reinforcing administrative processes as part of our efforts to curtail unprofitable projects.
Where We Are
Challenge
Controls in place to maintain annual losses from unprofitable projects below target level* through review committees, etc., except for some projects
* 0.3%–0.5% of consolidated net sales
Further control especially for complex projects
Where We Are
Challenge
Completed integration with the former Dell Services as planned, resulting in stronger US market presence
Further sales volume expansion with profitability
Where We Are
Challenge
A high rate of growth led to greater sales, strengthening our market presence
Improve profitability through constant, rapid growth
P44: Business Strategies by Segment (North America Segment) P46: Business Strategies by Segment (EMEA & LATAM Segment)
Strengthening Responses to Key Challenges under the New Medium-Term Management Plan
* Temporary costs related to M&A, structural transformation, etc., are excluded.
Message from
the CE
OB
usiness Strategies by S
egment
ES
G M
anagement
Financials and Others
Value Creation by N
TT DATA
Managem
ent Strategies
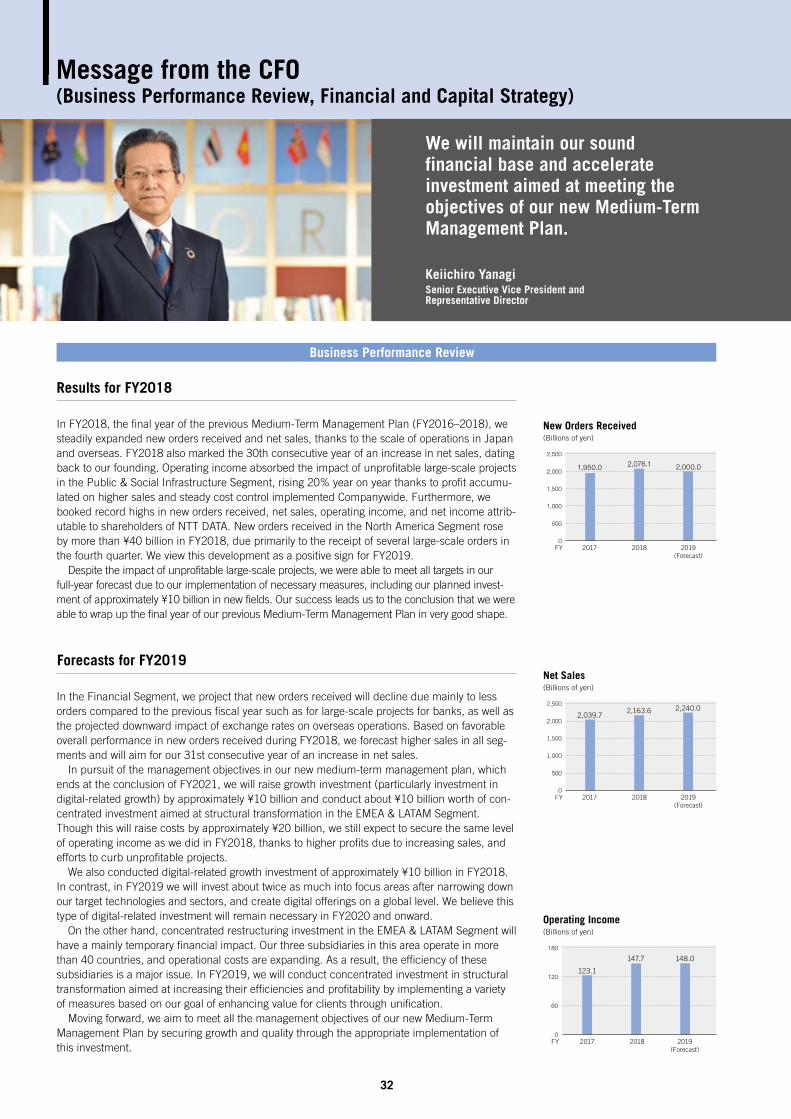
In the Financial Segment, we project that new orders received will decline due mainly to less orders compared to the previous fiscal year such as for large-scale projects for banks, as well as the projected downward impact of exchange rates on overseas operations. Based on favorable overall performance in new orders received during FY2018, we forecast higher sales in all seg-ments and will aim for our 31st consecutive year of an increase in net sales. In pursuit of the management objectives in our new medium-term management plan, which ends at the conclusion of FY2021, we will raise growth investment (particularly investment in digital-related growth) by approximately ¥10 billion and conduct about ¥10 billion worth of con-centrated investment aimed at structural transformation in the EMEA & LATAM Segment. Though this will raise costs by approximately ¥20 billion, we still expect to secure the same level of operating income as we did in FY2018, thanks to higher profits due to increasing sales, and efforts to curb unprofitable projects. We also conducted digital-related growth investment of approximately ¥10 billion in FY2018. In contrast, in FY2019 we will invest about twice as much into focus areas after narrowing down our target technologies and sectors, and create digital offerings on a global level. We believe this type of digital-related investment will remain necessary in FY2020 and onward. On the other hand, concentrated restructuring investment in the EMEA & LATAM Segment will have a mainly temporary financial impact. Our three subsidiaries in this area operate in more than 40 countries, and operational costs are expanding. As a result, the efficiency of these subsidiaries is a major issue. In FY2019, we will conduct concentrated investment in structural transformation aimed at increasing their efficiencies and profitability by implementing a variety of measures based on our goal of enhancing value for clients through unification. Moving forward, we aim to meet all the management objectives of our new Medium-Term Management Plan by securing growth and quality through the appropriate implementation of this investment.
32
Keiichiro YanagiSenior Executive Vice President and Representative Director
We will maintain our sound financial base and accelerate investment aimed at meeting the objectives of our new Medium-Term Management Plan.
Message from the CFO (Business Performance Review, Financial and Capital Strategy)
In FY2018, the final year of the previous Medium-Term Management Plan (FY2016–2018), we steadily expanded new orders received and net sales, thanks to the scale of operations in Japan and overseas. FY2018 also marked the 30th consecutive year of an increase in net sales, dating back to our founding. Operating income absorbed the impact of unprofitable large-scale projects in the Public & Social Infrastructure Segment, rising 20% year on year thanks to profit accumu-lated on higher sales and steady cost control implemented Companywide. Furthermore, we booked record highs in new orders received, net sales, operating income, and net income attrib-utable to shareholders of NTT DATA. New orders received in the North America Segment rose by more than ¥40 billion in FY2018, due primarily to the receipt of several large-scale orders in the fourth quarter. We view this development as a positive sign for FY2019. Despite the impact of unprofitable large-scale projects, we were able to meet all targets in our full-year forecast due to our implementation of necessary measures, including our planned invest-ment of approximately ¥10 billion in new fields. Our success leads us to the conclusion that we were able to wrap up the final year of our previous Medium-Term Management Plan in very good shape.
Business Performance Review
Forecasts for FY2019
Results for FY2018
New Orders Received(Billions of yen)
2017 2018 2019(Forecast)
2,076.11,950.0 2,000.0
0
1,500
1,000
500
2,000
2,500
FY
Net Sales(Billions of yen)
2,163.6 2,240.02,039.7
0
1,500
1,000
500
2,000
2,500
FY 2017 2018 2019(Forecast)
Operating Income(Billions of yen)
148.0147.7
123.1
0
120
60
180
FY 2017 2018 2019(Forecast)
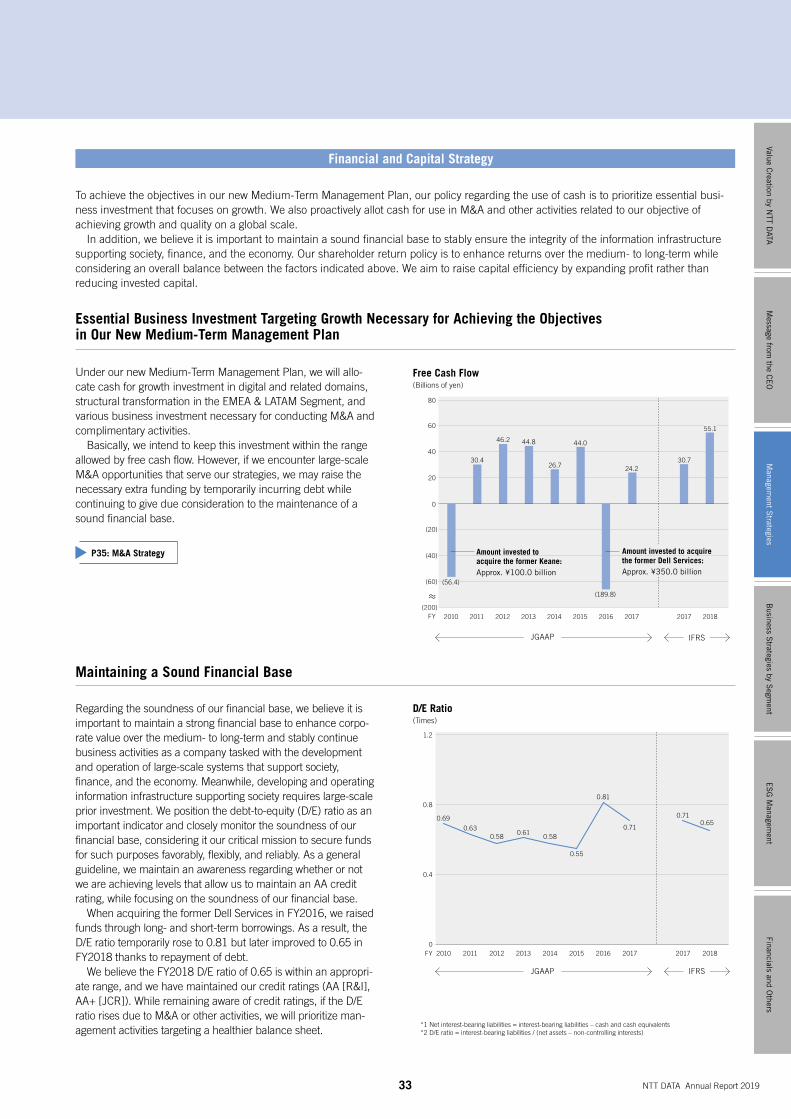
Regarding the soundness of our financial base, we believe it is important to maintain a strong financial base to enhance corpo-rate value over the medium- to long-term and stably continue business activities as a company tasked with the development and operation of large-scale systems that support society, finance, and the economy. Meanwhile, developing and operating information infrastructure supporting society requires large-scale prior investment. We position the debt-to-equity (D/E) ratio as an important indicator and closely monitor the soundness of our financial base, considering it our critical mission to secure funds for such purposes favorably, flexibly, and reliably. As a general guideline, we maintain an awareness regarding whether or not we are achieving levels that allow us to maintain an AA credit rating, while focusing on the soundness of our financial base. When acquiring the former Dell Services in FY2016, we raised funds through long- and short-term borrowings. As a result, the D/E ratio temporarily rose to 0.81 but later improved to 0.65 in FY2018 thanks to repayment of debt. We believe the FY2018 D/E ratio of 0.65 is within an appropri-ate range, and we have maintained our credit ratings (AA [R&I], AA+ [JCR]). While remaining aware of credit ratings, if the D/E ratio rises due to M&A or other activities, we will prioritize man-agement activities targeting a healthier balance sheet.
Maintaining a Sound Financial Base
Under our new Medium-Term Management Plan, we will allo-cate cash for growth investment in digital and related domains, structural transformation in the EMEA & LATAM Segment, and various business investment necessary for conducting M&A and complimentary activities. Basically, we intend to keep this investment within the range allowed by free cash flow. However, if we encounter large-scale M&A opportunities that serve our strategies, we may raise the necessary extra funding by temporarily incurring debt while continuing to give due consideration to the maintenance of a sound financial base.
Essential Business Investment Targeting Growth Necessary for Achieving the Objectives in Our New Medium-Term Management Plan
33 NTT DATA Annual Report 2019
Message from the CFO (Business Performance Review, Financial and Capital Strategy)
To achieve the objectives in our new Medium-Term Management Plan, our policy regarding the use of cash is to prioritize essential busi-ness investment that focuses on growth. We also proactively allot cash for use in M&A and other activities related to our objective of achieving growth and quality on a global scale. In addition, we believe it is important to maintain a sound financial base to stably ensure the integrity of the information infrastructure supporting society, finance, and the economy. Our shareholder return policy is to enhance returns over the medium- to long-term while considering an overall balance between the factors indicated above. We aim to raise capital efficiency by expanding profit rather than reducing invested capital.
Financial and Capital Strategy
P35: M&A Strategy
*1 Net interest-bearing liabilities = interest-bearing liabilities – cash and cash equivalents *2 D/E ratio = interest-bearing liabilities / (net assets – non-controlling interests)
Message from
the CE
OB
usiness Strategies by S
egment
ES
G M
anagement
Financials and Others
Value Creation by N
TT DATA
Managem
ent Strategies
Free Cash Flow(Billions of yen)
FY(200)
(60)
(40)
(20)
0
20
40
60
80
2018201720172016201520142013201220112010
(189.8)
44.0
55.1
30.726.7 24.2
44.846.2
30.4
(56.4)
D/E Ratio(Times)
2018201720172016201520142013201220112010
0.81
0.55
0.580.61
0.580.63
0.69
0
0.4
0.8
1.2
0.71
0.710.65
FY
JGAAP IFRS
JGAAP IFRS
Amount invested to acquire the former Keane: Approx. ¥100.0 billion
Amount invested to acquire the former Dell Services: Approx. ¥350.0 billion
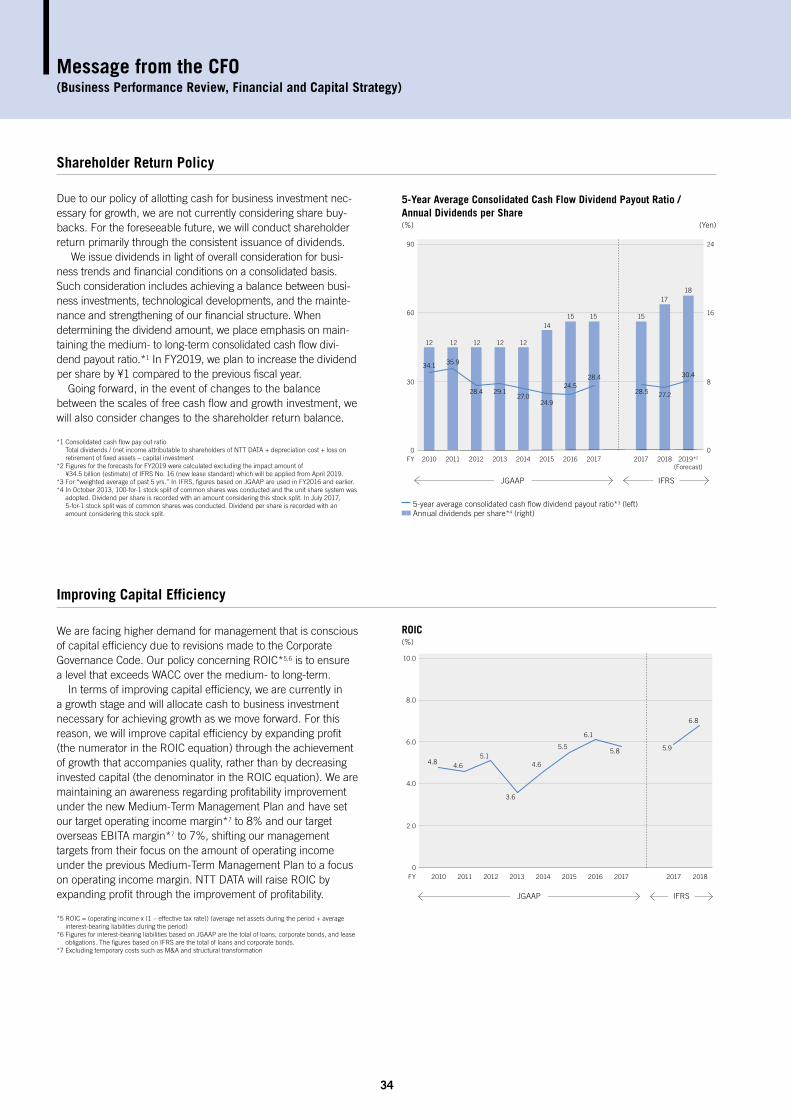
We are facing higher demand for management that is conscious of capital efficiency due to revisions made to the Corporate Governance Code. Our policy concerning ROIC*5,6 is to ensure a level that exceeds WACC over the medium- to long-term. In terms of improving capital efficiency, we are currently in a growth stage and will allocate cash to business investment necessary for achieving growth as we move forward. For this reason, we will improve capital efficiency by expanding profit (the numerator in the ROIC equation) through the achievement of growth that accompanies quality, rather than by decreasing invested capital (the denominator in the ROIC equation). We are maintaining an awareness regarding profitability improvement under the new Medium-Term Management Plan and have set our target operating income margin*7 to 8% and our target overseas EBITA margin*7 to 7%, shifting our management targets from their focus on the amount of operating income under the previous Medium-Term Management Plan to a focus on operating income margin. NTT DATA will raise ROIC by expanding profit through the improvement of profitability.
*5 ROIC = (operating income x (1 – effective tax rate)) (average net assets during the period + average interest-bearing liabilities during the period)
*6 Figures for interest-bearing liabilities based on JGAAP are the total of loans, corporate bonds, and lease obligations. The figures based on IFRS are the total of loans and corporate bonds.
*7 Excluding temporary costs such as M&A and structural transformation
Improving Capital Efficiency
34
Message from the CFO (Business Performance Review, Financial and Capital Strategy)
Due to our policy of allotting cash for business investment nec-essary for growth, we are not currently considering share buy-backs. For the foreseeable future, we will conduct shareholder return primarily through the consistent issuance of dividends. We issue dividends in light of overall consideration for busi-ness trends and financial conditions on a consolidated basis. Such consideration includes achieving a balance between busi-ness investments, technological developments, and the mainte-nance and strengthening of our financial structure. When determining the dividend amount, we place emphasis on main-taining the medium- to long-term consolidated cash flow divi-dend payout ratio.*1 In FY2019, we plan to increase the dividend per share by ¥1 compared to the previous fiscal year. Going forward, in the event of changes to the balance between the scales of free cash flow and growth investment, we will also consider changes to the shareholder return balance.
*1 Consolidated cash flow pay out ratio Total dividends / (net income attributable to shareholders of NTT DATA + depreciation cost + loss on retirement of fixed assets – capital investment
*2 Figures for the forecasts for FY2019 were calculated excluding the impact amount of ¥34.5 billion (estimate) of IFRS No. 16 (new lease standard) which will be applied from April 2019.
*3 For “weighted average of past 5 yrs.” In IFRS, figures based on JGAAP are used in FY2016 and earlier.*4 In October 2013, 100-for-1 stock split of common shares was conducted and the unit share system was
adopted. Dividend per share is recorded with an amount considering this stock split. In July 2017, 5-for-1 stock split was of common shares was conducted. Dividend per share is recorded with an amount considering this stock split.
Shareholder Return Policy
5-year average consolidated cash flow dividend payout ratio*3 (left) Annual dividends per share*4 (right)
5-Year Average Consolidated Cash Flow Dividend Payout Ratio / Annual Dividends per Share(%) (Yen)
FY 2017 2018 2019*2
(Forecast)20172016201520142013201220112010
30.428.4
29.127.0
34.1 35.9
0
30
60
90
0
8
16
24
28.4
24.9
24.528.5 27.2
18181717
1515151515151414
121212121212 12121212
ROIC(%)
FY 2017 201820172016201520142013201220112010
5.95.85.5
5.14.64.8
6.1
4.6
3.6
0
2.0
4.0
6.0
8.0
10.0
6.8
JGAAP IFRS
JGAAP IFRS
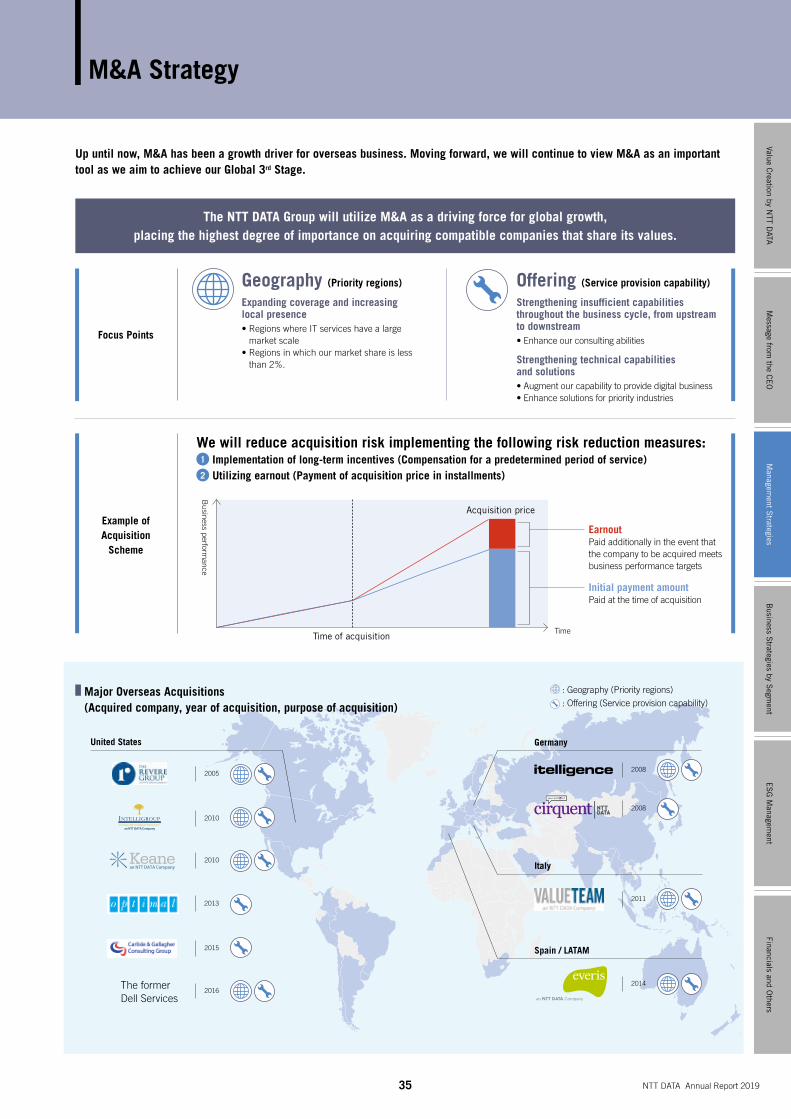
United States Germany
Italy
Spain / LATAM
2011
Major Overseas Acquisitions (Acquired company, year of acquisition, purpose of acquisition)
35 NTT DATA Annual Report 2019
2013
2008
2008
2014
Up until now, M&A has been a growth driver for overseas business. Moving forward, we will continue to view M&A as an important tool as we aim to achieve our Global 3rd Stage.
The NTT DATA Group will utilize M&A as a driving force for global growth, placing the highest degree of importance on acquiring compatible companies that share its values.
M&A Strategy
Focus Points
Example of Acquisition
Scheme
Geography (Priority regions)
Expanding coverage and increasing local presence• Regions where IT services have a large
market scale• Regions in which our market share is less
than 2%.
Offering (Service provision capability)
Strengthening insufficient capabilities throughout the business cycle, from upstream to downstream• Enhance our consulting abilities
Strengthening technical capabilities and solutions• Augment our capability to provide digital business• Enhance solutions for priority industries
We will reduce acquisition risk implementing the following risk reduction measures:1 Implementation of long-term incentives (Compensation for a predetermined period of service)2 Utilizing earnout (Payment of acquisition price in installments)
Time
Business perform
ance
Acquisition price
EarnoutPaid additionally in the event that the company to be acquired meets business performance targets
Time of acquisition
Initial payment amountPaid at the time of acquisition
2005
2015
The former Dell Services
2016
2010
2010
: Geography (Priority regions): Offering (Service provision capability)
Message from
the CE
OB
usiness Strategies by S
egment
ES
G M
anagement
Financials and Others
Value Creation by N
TT DATA
Managem
ent Strategies
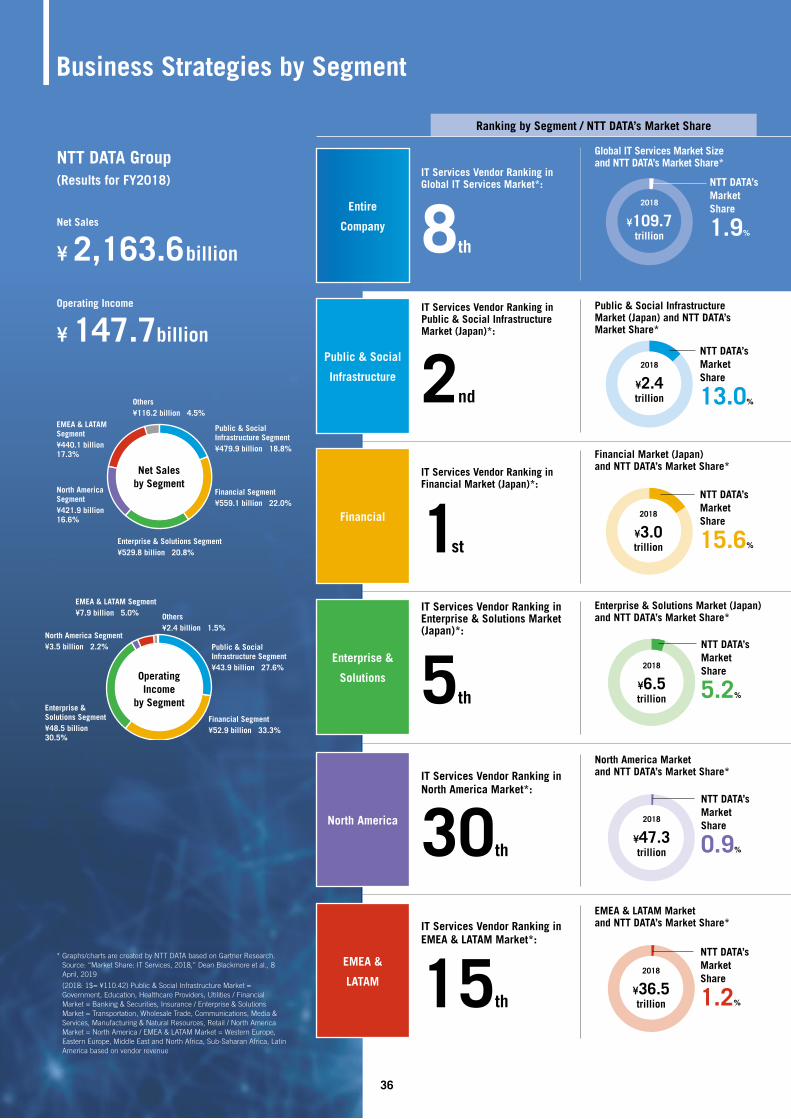
Business Strategies by Segment
Entire
Company
IT Services Vendor Ranking in Global IT Services Market*:
8th
* Graphs/charts are created by NTT DATA based on Gartner Research. Source: “Market Share: IT Services, 2018,” Dean Blackmore et al., 8 April, 2019
(2018: 1$= ¥110.42) Public & Social Infrastructure Market = Government, Education, Healthcare Providers, Utilities / Financial Market = Banking & Securities, Insurance / Enterprise & Solutions Market = Transportation, Wholesale Trade, Communications, Media & Services, Manufacturing & Natural Resources, Retail / North America Market = North America / EMEA & LATAM Market = Western Europe, Eastern Europe, Middle East and North Africa, Sub-Saharan Africa, Latin America based on vendor revenue
NTT DATA Group(Results for FY2018)
Public & Social
Infrastructure
Net Sales
¥ 2,163.6billion
Operating Income
¥ 147.7billion
Net Sales by Segment
North America Segment ¥421.9 billion 16.6%
Financial Segment ¥559.1 billion 22.0%
Public & Social Infrastructure Segment ¥479.9 billion 18.8%
Enterprise & Solutions Segment ¥529.8 billion 20.8%
EMEA & LATAM Segment ¥440.1 billion 17.3%
Public & Social Infrastructure Segment ¥43.9 billion 27.6%
Financial Segment ¥52.9 billion 33.3%
Enterprise & Solutions Segment ¥48.5 billion 30.5%
North America Segment ¥3.5 billion 2.2%
EMEA & LATAM Segment ¥7.9 billion 5.0%
Others ¥116.2 billion 4.5%
Others ¥2.4 billion 1.5%
Financial
Enterprise &
Solutions
North America
EMEA &
LATAM
IT Services Vendor Ranking in Public & Social Infrastructure Market (Japan)*:
2nd
2018
¥2.4 trillion
Public & Social Infrastructure Market (Japan) and NTT DATA’s Market Share*
NTT DATA’s Market Share
13.0%
IT Services Vendor Ranking in EMEA & LATAM Market*:
15th
2018
¥36.5 trillion
NTT DATA’s Market Share
1.2%
IT Services Vendor Ranking in Financial Market (Japan)*:
1st
NTT DATA’s Market Share
15.6%
2018
¥3.0 trillion
Financial Market (Japan) and NTT DATA’s Market Share*
NTT DATA’s Market Share
5.2%
Enterprise & Solutions Market (Japan) and NTT DATA’s Market Share*
North America Market and NTT DATA’s Market Share*
EMEA & LATAM Market and NTT DATA’s Market Share*
IT Services Vendor Ranking in Enterprise & Solutions Market (Japan)*:
5th
2018
¥6.5 trillion
IT Services Vendor Ranking in North America Market*:
30th
2018
¥47.3 trillion
NTT DATA’s Market Share
0.9%
Ranking by Segment / NTT DATA’s Market Share
2018
¥109.7 trillion
NTT DATA’s Market Share
1.9%
Global IT Services Market Size and NTT DATA’s Market Share*
36
Operating Income
by Segment
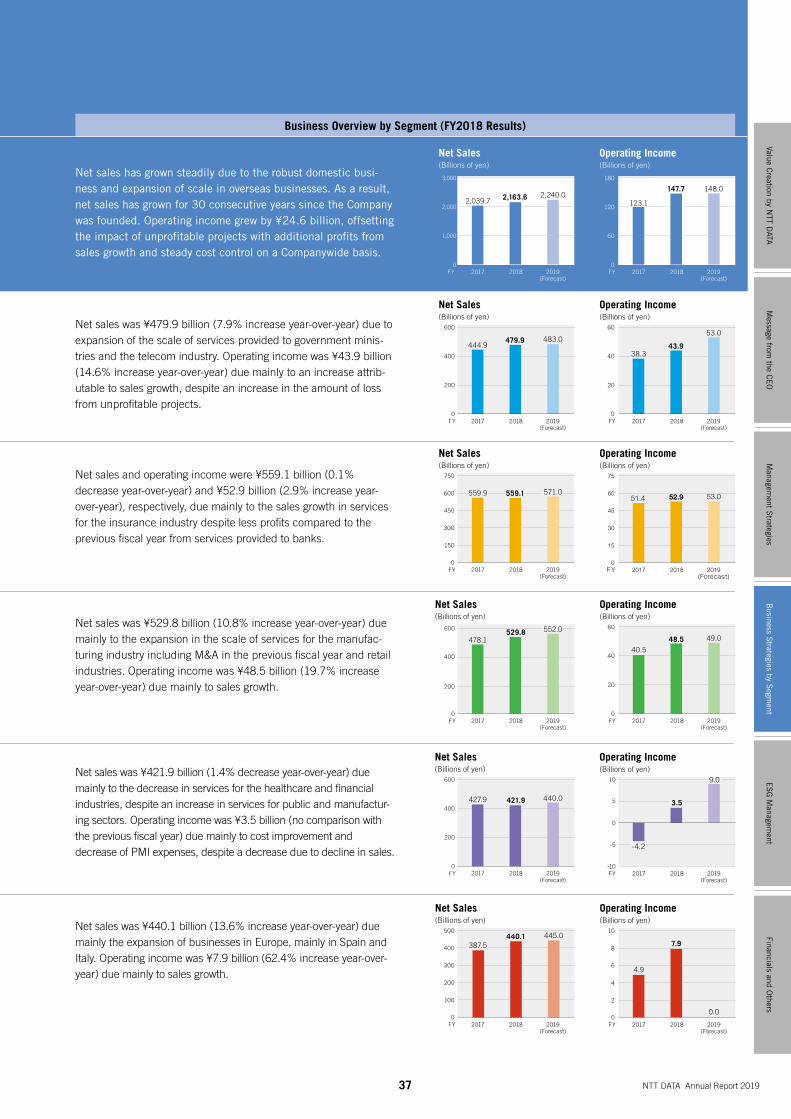
2017 2018 2019(Forecast)
2,163.62,039.72,240.0
0
1,000
2,000
3,000
FY
147.7
123.1
148.0
0
60
120
180
FY 2017 2018 2019(Forecast)
Net sales has grown steadily due to the robust domestic busi-ness and expansion of scale in overseas businesses. As a result, net sales has grown for 30 consecutive years since the Company was founded. Operating income grew by ¥24.6 billion, offsetting the impact of unprofitable projects with additional profits from sales growth and steady cost control on a Companywide basis.
Net Sales(Billions of yen)
Operating Income(Billions of yen)
2017 2018 2019(Forecast)
479.9444.9
483.0
0
200
400
600
FY
Net Sales(Billions of yen)
Operating Income(Billions of yen)
NTT DATA’s Market Share
13.0%
Net Sales(Billions of yen)
440.1387.5
445.0
100
400
300
200
500
0FY 2017 2018 2019
(Forecast)
Operating Income(Billions of yen)
2017 2018 2019(Forecast)
7.9
4.9
0.00
6
8
10
2
4
FY
NTT DATA’s Market Share
1.2%
Net sales was ¥440.1 billion (13.6% increase year-over-year) due mainly the expansion of businesses in Europe, mainly in Spain and Italy. Operating income was ¥7.9 billion (62.4% increase year-over-year) due mainly to sales growth.
Net sales was ¥479.9 billion (7.9% increase year-over-year) due to expansion of the scale of services provided to government minis-tries and the telecom industry. Operating income was ¥43.9 billion (14.6% increase year-over-year) due mainly to an increase attrib-utable to sales growth, despite an increase in the amount of loss from unprofitable projects.
Net Sales(Billions of yen)
559.1559.9 571.0
150
600
450
300
750
0FY 2017 2018 2019
(Forecast)
Operating Income(Billions of yen)
52.951.4 53.0
15
45
60
30
75
0FY 2017 2018 2019
(Forecast)
NTT DATA’s Market Share
15.6%
Net sales and operating income were ¥559.1 billion (0.1% decrease year-over-year) and ¥52.9 billion (2.9% increase year-over-year), respectively, due mainly to the sales growth in services for the insurance industry despite less profits compared to the previous fiscal year from services provided to banks.
Net Sales(Billions of yen)
529.8478.1
552.0
200
400
600
0FY 2017 2018 2019
(Forecast)
Operating Income(Billions of yen)
48.540.5
49.0
20
40
60
0FY 2017 2018 2019
(Forecast)
NTT DATA’s Market Share
5.2%
Net sales was ¥529.8 billion (10.8% increase year-over-year) due mainly to the expansion in the scale of services for the manufac-turing industry including M&A in the previous fiscal year and retail industries. Operating income was ¥48.5 billion (19.7% increase year-over-year) due mainly to sales growth.
Net Sales(Billions of yen)
421.9427.9 440.0
200
400
600
0FY 2017 2018 2019
(Forecast)
Operating Income(Billions of yen)
3.5
-4.2
9.0
-10
5
-5
10
0
FY 2017 2018 2019(Forecast)
NTT DATA’s Market Share
0.9%
Net sales was ¥421.9 billion (1.4% decrease year-over-year) due mainly to the decrease in services for the healthcare and financial industries, despite an increase in services for public and manufactur-ing sectors. Operating income was ¥3.5 billion (no comparison with the previous fiscal year) due mainly to cost improvement and decrease of PMI expenses, despite a decrease due to decline in sales.
Business Overview by Segment (FY2018 Results)
43.938.3
53.0
0
20
40
60
FY 2017 2018 2019(Forecast)
NTT DATA’s Market Share
1.9%
37 NTT DATA Annual Report 2019
Message from
the CE
OM
anagement S
trategiesE
SG
Managem
entFinancials and O
thersValue C
reation by NTT D
ATAB
usiness Strategies by S
egment
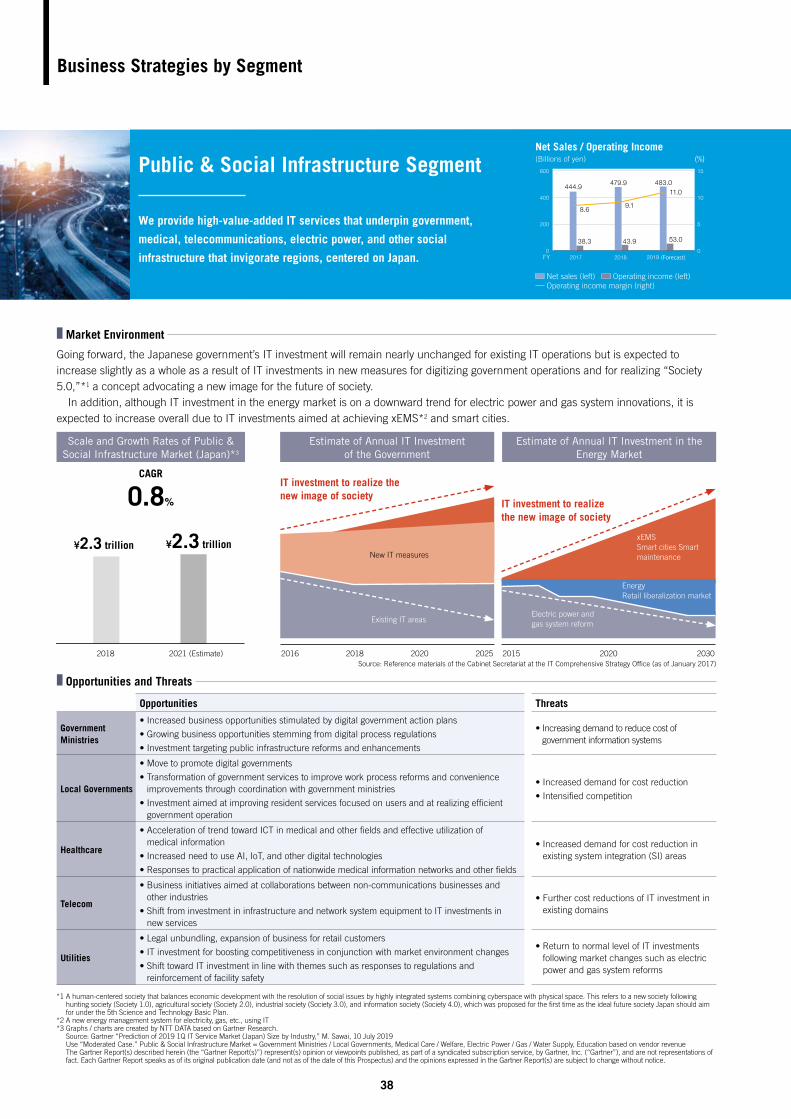
Opportunities Threats
Government Ministries
• Increased business opportunities stimulated by digital government action plans
• Growing business opportunities stemming from digital process regulations
• Investment targeting public infrastructure reforms and enhancements
• Increasing demand to reduce cost of government information systems
Local Governments
• Move to promote digital governments
• Transformation of government services to improve work process reforms and convenience improvements through coordination with government ministries
• Investment aimed at improving resident services focused on users and at realizing efficient government operation
• Increased demand for cost reduction
• Intensified competition
Healthcare
• Acceleration of trend toward ICT in medical and other fields and effective utilization of medical information
• Increased need to use AI, IoT, and other digital technologies
• Responses to practical application of nationwide medical information networks and other fields
• Increased demand for cost reduction in existing system integration (SI) areas
Telecom
• Business initiatives aimed at collaborations between non-communications businesses and other industries
• Shift from investment in infrastructure and network system equipment to IT investments in new services
• Further cost reductions of IT investment in existing domains
Utilities
• Legal unbundling, expansion of business for retail customers
• IT investment for boosting competitiveness in conjunction with market environment changes
• Shift toward IT investment in line with themes such as responses to regulations and reinforcement of facility safety
• Return to normal level of IT investments following market changes such as electric power and gas system reforms
Estimate of Annual IT Investment of the Government
Estimate of Annual IT Investment in the Energy Market
Existing IT areas
New IT measures
Electric power and gas system reform
xEMSSmart cities Smart maintenance
EnergyRetail liberalization market
IT investment to realize the new image of society
2016 20252018 2020 2015 20302020
IT investment to realize the new image of society
Source: Reference materials of the Cabinet Secretariat at the IT Comprehensive Strategy Office (as of January 2017)
38
Business Strategies by Segment
Going forward, the Japanese government’s IT investment will remain nearly unchanged for existing IT operations but is expected to increase slightly as a whole as a result of IT investments in new measures for digitizing government operations and for realizing “Society 5.0,”*1 a concept advocating a new image for the future of society. In addition, although IT investment in the energy market is on a downward trend for electric power and gas system innovations, it is expected to increase overall due to IT investments aimed at achieving xEMS*2 and smart cities.
Scale and Growth Rates of Public & Social Infrastructure Market (Japan)*3
2018
CAGR
0.8%
2021 (Estimate)
¥2.3 trillion ¥2.3 trillion
Market Environment
Opportunities and Threats
*1 A human-centered society that balances economic development with the resolution of social issues by highly integrated systems combining cyberspace with physical space. This refers to a new society following hunting society (Society 1.0), agricultural society (Society 2.0), industrial society (Society 3.0), and information society (Society 4.0), which was proposed for the first time as the ideal future society Japan should aim for under the 5th Science and Technology Basic Plan.
*2 A new energy management system for electricity, gas, etc., using IT*3 Graphs / charts are created by NTT DATA based on Gartner Research.
Source: Gartner “Prediction of 2019 1Q IT Service Market (Japan) Size by Industry,” M. Sawai, 10 July 2019 Use “Moderated Case.” Public & Social Infrastructure Market = Government Ministries / Local Governments, Medical Care / Welfare, Electric Power / Gas / Water Supply, Education based on vendor revenue The Gartner Report(s) described herein (the “Gartner Report(s)”) represent(s) opinion or viewpoints published, as part of a syndicated subscription service, by Gartner, Inc. (“Gartner”), and are not representations of fact. Each Gartner Report speaks as of its original publication date (and not as of the date of this Prospectus) and the opinions expressed in the Gartner Report(s) are subject to change without notice.
Net Sales / Operating Income(Billions of yen) (%)
2017 2018FY 2019 (Forecast)
483.0
53.0
479.9
43.9
444.9
38.3
11.0
9.18.6
0
400
200
600
0
10
5
15
Net sales (left) Operating income (left) Operating income margin (right)
Public & Social Infrastructure Segment
We provide high-value-added IT services that underpin government,
medical, telecommunications, electric power, and other social
infrastructure that invigorate regions, centered on Japan.
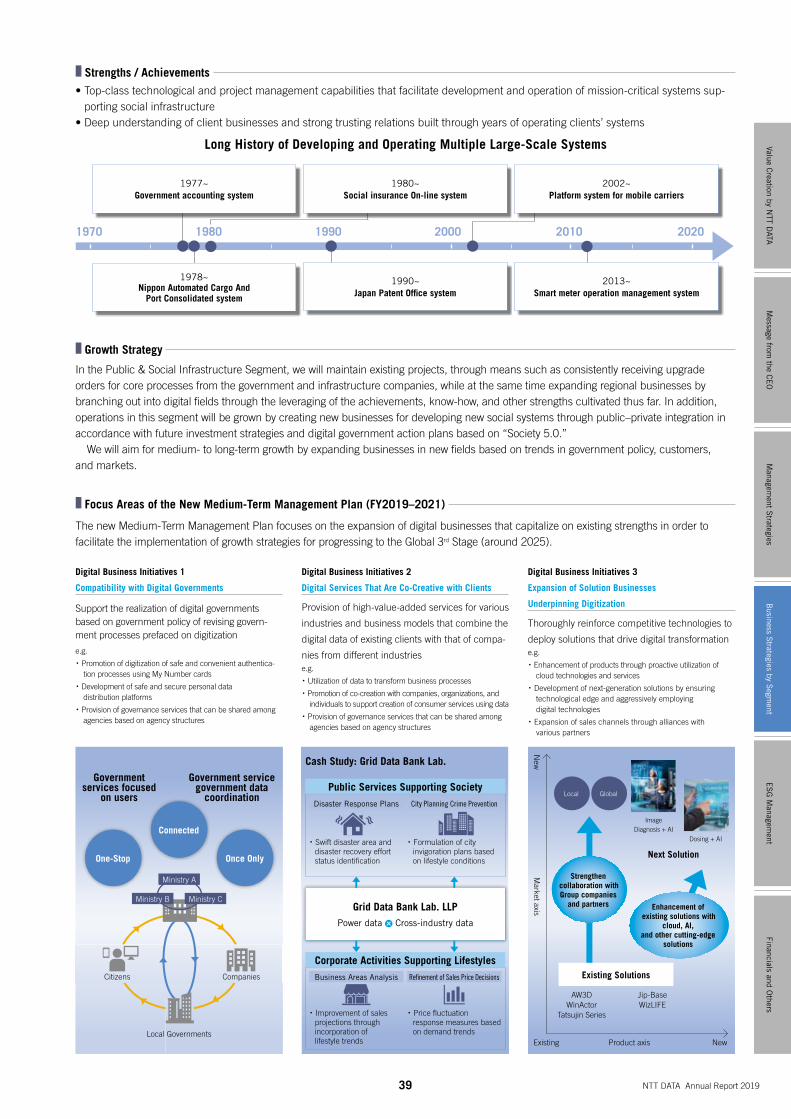
39 NTT DATA Annual Report 2019
1970 1990 2000 2010 20201980
• Top-class technological and project management capabilities that facilitate development and operation of mission-critical systems sup-porting social infrastructure
• Deep understanding of client businesses and strong trusting relations built through years of operating clients’ systems
The new Medium-Term Management Plan focuses on the expansion of digital businesses that capitalize on existing strengths in order to facilitate the implementation of growth strategies for progressing to the Global 3rd Stage (around 2025).
Digital Business Initiatives 1
Compatibility with Digital Governments
Support the realization of digital governments based on government policy of revising govern-ment processes prefaced on digitization
e.g.
・ Promotion of digitization of safe and convenient authentica-tion processes using My Number cards
・ Development of safe and secure personal data distribution platforms
・ Provision of governance services that can be shared among agencies based on agency structures
Digital Business Initiatives 2
Digital Services That Are Co-Creative with Clients
Provision of high-value-added services for various
industries and business models that combine the
digital data of existing clients with that of compa-
nies from different industriese.g.
・ Utilization of data to transform business processes
・ Promotion of co-creation with companies, organizations, and individuals to support creation of consumer services using data
・ Provision of governance services that can be shared among agencies based on agency structures
Digital Business Initiatives 3
Expansion of Solution Businesses
Underpinning Digitization
Thoroughly reinforce competitive technologies to
deploy solutions that drive digital transformatione.g.
・ Enhancement of products through proactive utilization of cloud technologies and services
・ Development of next-generation solutions by ensuring technological edge and aggressively employing digital technologies
・ Expansion of sales channels through alliances with various partners
Long History of Developing and Operating Multiple Large-Scale Systems
1977~Government accounting system
1980~Social insurance On-line system
2002~Platform system for mobile carriers
1978~Nippon Automated Cargo And
Port Consolidated system
1990~Japan Patent Office system
2013~Smart meter operation management system
Government services focused
on users
Citizens Companies
Next Solution
Government service government data
coordination
Grid Data Bank Lab. LLPPower data Cross-industry data
・ Swift disaster area and disaster recovery effort status identification
・ Improvement of sales projections through incorporation of lifestyle trends
・ Formulation of city invigoration plans based on lifestyle conditions
・ Price fluctuation response measures based on demand trends
Public Services Supporting SocietyDisaster Response Plans
Business Areas Analysis
City Planning Crime Prevention
Refinement of Sales Price Decisions
Corporate Activities Supporting Lifestyles
Strengths / Achievements
In the Public & Social Infrastructure Segment, we will maintain existing projects, through means such as consistently receiving upgrade orders for core processes from the government and infrastructure companies, while at the same time expanding regional businesses by branching out into digital fields through the leveraging of the achievements, know-how, and other strengths cultivated thus far. In addition, operations in this segment will be grown by creating new businesses for developing new social systems through public–private integration in accordance with future investment strategies and digital government action plans based on “Society 5.0.” We will aim for medium- to long-term growth by expanding businesses in new fields based on trends in government policy, customers, and markets.
Growth Strategy
Focus Areas of the New Medium-Term Management Plan (FY2019–2021)
AW3DWinActor
Tatsujin Series
Jip-BaseWizLIFE
Image Diagnosis + AI
Dosing + AI
Enhancement of existing solutions with
cloud, AI, and other cutting-edge
solutions
Existing Solutions
Local Global
Strengthen collaboration with Group companies
and partners
Product axis New
New
Market axis
ExistingLocal Governments
Ministry A
Ministry B Ministry C
One-Stop
Connected
Once Only
Message from
the CE
OM
anagement S
trategiesE
SG
Managem
entFinancials and O
thersValue C
reation by NTT D
ATAB
usiness Strategies by S
egment
Cash Study: Grid Data Bank Lab.
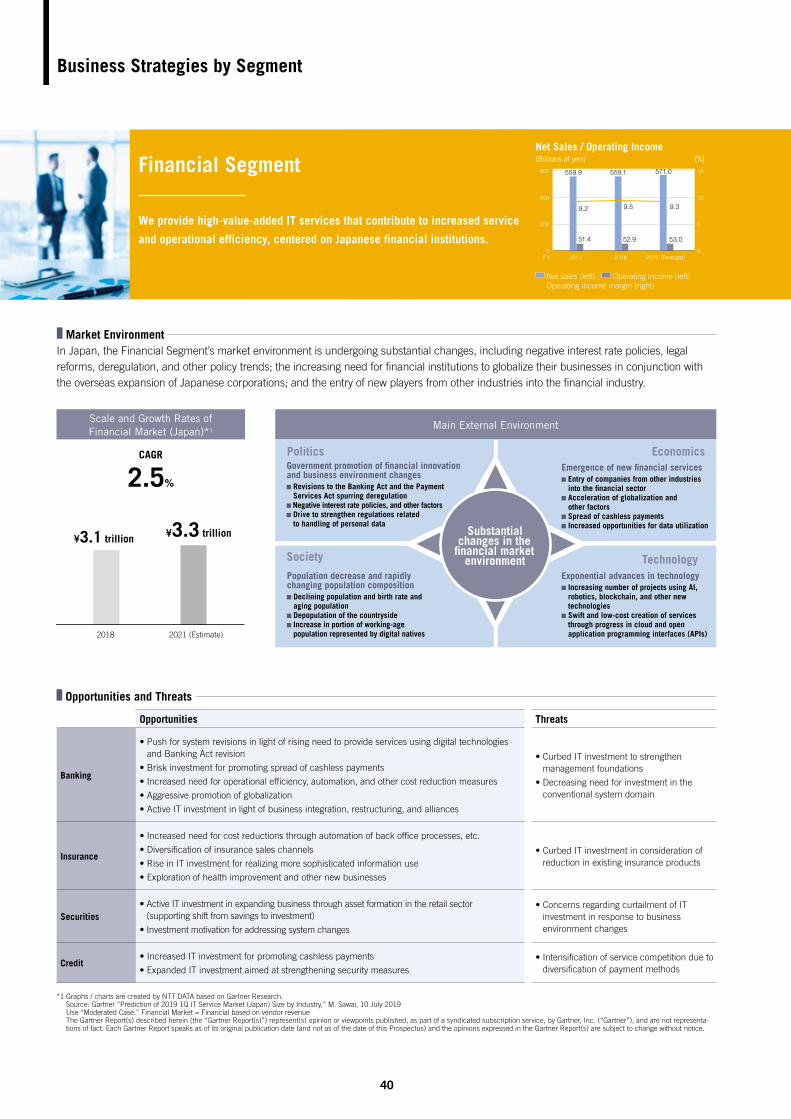
40
Opportunities Threats
Banking
• Push for system revisions in light of rising need to provide services using digital technologies and Banking Act revision
• Brisk investment for promoting spread of cashless payments
• Increased need for operational efficiency, automation, and other cost reduction measures
• Aggressive promotion of globalization
• Active IT investment in light of business integration, restructuring, and alliances
• Curbed IT investment to strengthen management foundations
• Decreasing need for investment in the conventional system domain
Insurance
• Increased need for cost reductions through automation of back office processes, etc.
• Diversification of insurance sales channels
• Rise in IT investment for realizing more sophisticated information use
• Exploration of health improvement and other new businesses
• Curbed IT investment in consideration of reduction in existing insurance products
Securities• Active IT investment in expanding business through asset formation in the retail sector
(supporting shift from savings to investment)
• Investment motivation for addressing system changes
• Concerns regarding curtailment of IT investment in response to business environment changes
Credit• Increased IT investment for promoting cashless payments
• Expanded IT investment aimed at strengthening security measures• Intensification of service competition due to
diversification of payment methods
Business Strategies by Segment
In Japan, the Financial Segment’s market environment is undergoing substantial changes, including negative interest rate policies, legal reforms, deregulation, and other policy trends; the increasing need for financial institutions to globalize their businesses in conjunction with the overseas expansion of Japanese corporations; and the entry of new players from other industries into the financial industry.
Main External Environment
Technology
EconomicsEmergence of new financial services Entry of companies from other industries into the financial sector Acceleration of globalization and other factors Spread of cashless payments Increased opportunities for data utilization
Society
Politics
Exponential advances in technology Increasing number of projects using AI, robotics, blockchain, and other new technologies Swift and low-cost creation of services through progress in cloud and open application programming interfaces (APIs)
Government promotion of financial innovation and business environment changes Revisions to the Banking Act and the Payment Services Act spurring deregulation
Negative interest rate policies, and other factors Drive to strengthen regulations related to handling of personal data
Population decrease and rapidly changing population composition Declining population and birth rate and aging population
Depopulation of the countryside Increase in portion of working-age population represented by digital natives
Substantial changes in the
financial market environment
Opportunities and Threats
2018
CAGR
2.5%
2021 (Estimate)
¥3.1 trillion ¥3.3 trillion
*1 Graphs / charts are created by NTT DATA based on Gartner Research. Source: Gartner “Prediction of 2019 1Q IT Service Market (Japan) Size by Industry,” M. Sawai, 10 July 2019 Use “Moderated Case.” Financial Market = Financial based on vendor revenue The Gartner Report(s) described herein (the “Gartner Report(s)”) represent(s) opinion or viewpoints published, as part of a syndicated subscription service, by Gartner, Inc. (“Gartner”), and are not representa-tions of fact. Each Gartner Report speaks as of its original publication date (and not as of the date of this Prospectus) and the opinions expressed in the Gartner Report(s) are subject to change without notice.
Scale and Growth Rates of Financial Market (Japan)*1
Market Environment
Net Sales / Operating Income(Billions of yen) (%)
2017 2018 2019 (Forecast)
571.0
53.0
559.1
52.9
559.9
0
400
200
600
FY
51.4
9.39.59.2
0
10
5
15
Net sales (left) Operating income (left) Operating income margin (right)
Financial Segment
We provide high-value-added IT services that contribute to increased service
and operational efficiency, centered on Japanese financial institutions.
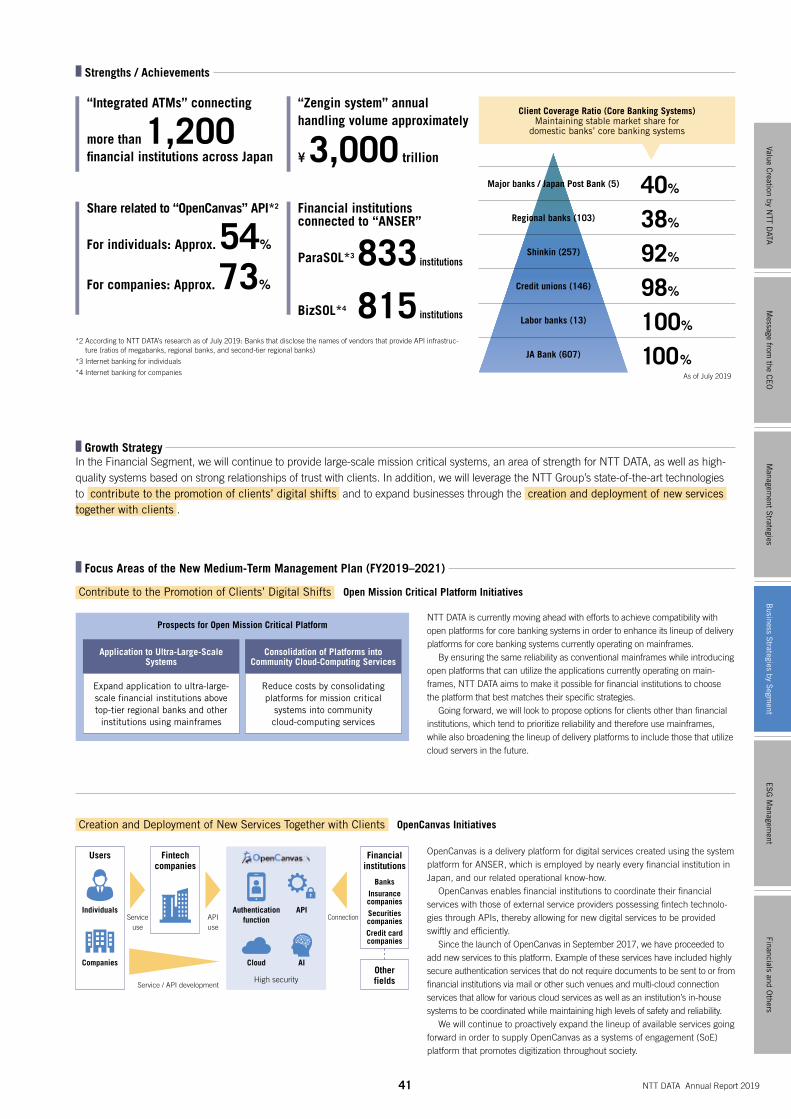
41 NTT DATA Annual Report 2019
In the Financial Segment, we will continue to provide large-scale mission critical systems, an area of strength for NTT DATA, as well as high-quality systems based on strong relationships of trust with clients. In addition, we will leverage the NTT Group’s state-of-the-art technologies to contribute to the promotion of clients’ digital shifts and to expand businesses through the creation and deployment of new services together with clients .
NTT DATA is currently moving ahead with efforts to achieve compatibility with open platforms for core banking systems in order to enhance its lineup of delivery platforms for core banking systems currently operating on mainframes. By ensuring the same reliability as conventional mainframes while introducing open platforms that can utilize the applications currently operating on main-frames, NTT DATA aims to make it possible for financial institutions to choose the platform that best matches their specific strategies. Going forward, we will look to propose options for clients other than financial institutions, which tend to prioritize reliability and therefore use mainframes, while also broadening the lineup of delivery platforms to include those that utilize cloud servers in the future.
OpenCanvas is a delivery platform for digital services created using the system platform for ANSER, which is employed by nearly every financial institution in Japan, and our related operational know-how. OpenCanvas enables financial institutions to coordinate their financial services with those of external service providers possessing fintech technolo-gies through APIs, thereby allowing for new digital services to be provided swiftly and efficiently. Since the launch of OpenCanvas in September 2017, we have proceeded to add new services to this platform. Example of these services have included highly secure authentication services that do not require documents to be sent to or from financial institutions via mail or other such venues and multi-cloud connection services that allow for various cloud services as well as an institution’s in-house systems to be coordinated while maintaining high levels of safety and reliability. We will continue to proactively expand the lineup of available services going forward in order to supply OpenCanvas as a systems of engagement (SoE) platform that promotes digitization throughout society.
“Integrated ATMs” connecting
more than 1,200financial institutions across Japan
Share related to “OpenCanvas” API*2
For individuals: Approx. 54%
For companies: Approx. 73%
Client Coverage Ratio (Core Banking Systems)Maintaining stable market share for
domestic banks’ core banking systems
Major banks / Japan Post Bank (5) 40%
Shinkin (257)
Regional banks (103)
Credit unions (146)
Labor banks (13)
JA Bank (607)
38%
92%
98%
100%
100%
“Zengin system” annualhandling volume approximately
¥ 3,000 trillion
Financial institutions connected to “ANSER”
ParaSOL*3
BizSOL*4
*2 According to NTT DATA’s research as of July 2019: Banks that disclose the names of vendors that provide API infrastruc-ture (ratios of megabanks, regional banks, and second-tier regional banks)
*3 Internet banking for individuals
*4 Internet banking for companies As of July 2019
Growth Strategy
Focus Areas of the New Medium-Term Management Plan (FY2019–2021)
Strengths / Achievements
Prospects for Open Mission Critical Platform
Expand application to ultra-large-scale financial institutions above top-tier regional banks and other
institutions using mainframes
Users Fintech companies
Financial institutions
BanksInsurance companiesSecurities companiesCredit card companies
Other fields
Reduce costs by consolidating platforms for mission critical
systems into community cloud-computing services
Application to Ultra-Large-Scale Systems
Consolidation of Platforms into Community Cloud-Computing Services
Individuals
Companies
Authentication function
API
Cloud AI
Service use
Service / API development
API use
Connection
High security
833 institutions
815 institutions
Message from
the CE
OM
anagement S
trategiesE
SG
Managem
entFinancials and O
thersValue C
reation by NTT D
ATAB
usiness Strategies by S
egment
Contribute to the Promotion of Clients’ Digital Shifts Open Mission Critical Platform Initiatives
Creation and Deployment of New Services Together with Clients OpenCanvas Initiatives
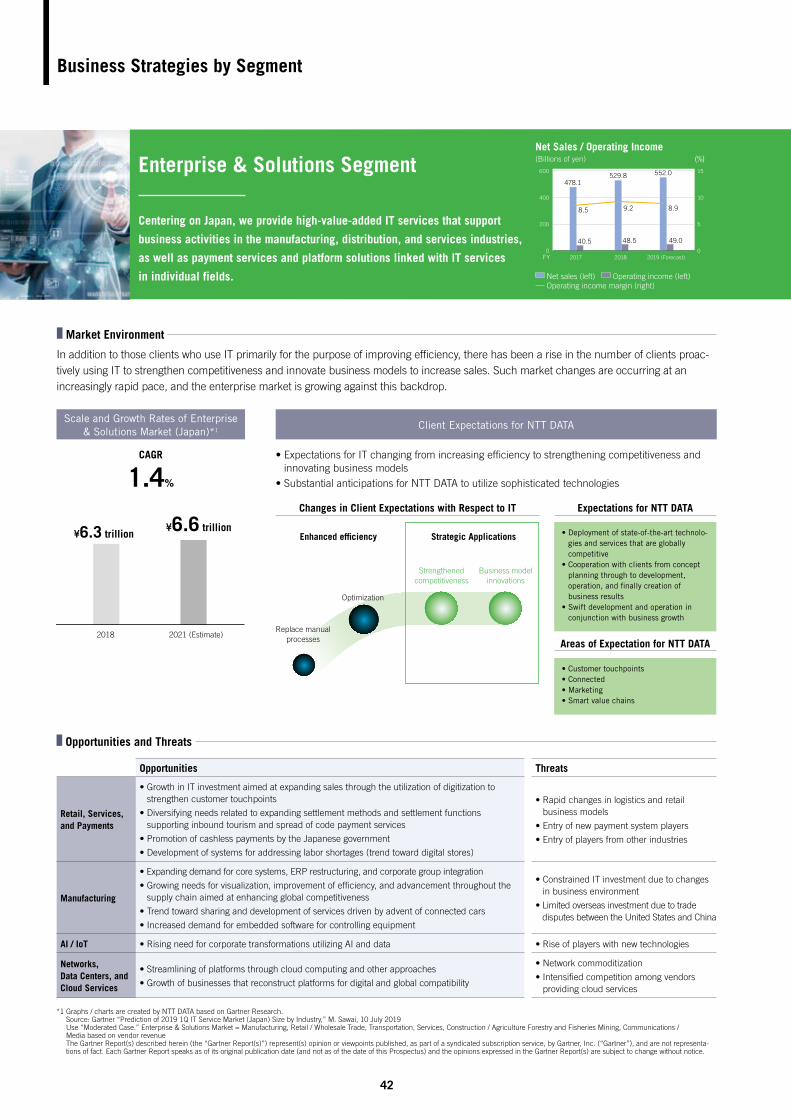
42
• Deployment of state-of-the-art technolo-gies and services that are globally competitive
• Cooperation with clients from concept planning through to development, operation, and finally creation of business results
• Swift development and operation in conjunction with business growth
• Customer touchpoints• Connected• Marketing• Smart value chains
Opportunities Threats
Retail, Services, and Payments
• Growth in IT investment aimed at expanding sales through the utilization of digitization to strengthen customer touchpoints
• Diversifying needs related to expanding settlement methods and settlement functions supporting inbound tourism and spread of code payment services
• Promotion of cashless payments by the Japanese government
• Development of systems for addressing labor shortages (trend toward digital stores)
• Rapid changes in logistics and retail business models
• Entry of new payment system players
• Entry of players from other industries
Manufacturing
• Expanding demand for core systems, ERP restructuring, and corporate group integration
• Growing needs for visualization, improvement of efficiency, and advancement throughout the supply chain aimed at enhancing global competitiveness
• Trend toward sharing and development of services driven by advent of connected cars
• Increased demand for embedded software for controlling equipment
• Constrained IT investment due to changes in business environment
• Limited overseas investment due to trade disputes between the United States and China
AI / IoT • Rising need for corporate transformations utilizing AI and data • Rise of players with new technologies
Networks, Data Centers, and Cloud Services
• Streamlining of platforms through cloud computing and other approaches
• Growth of businesses that reconstruct platforms for digital and global compatibility
• Network commoditization
• Intensified competition among vendors providing cloud services
Business Strategies by Segment
In addition to those clients who use IT primarily for the purpose of improving efficiency, there has been a rise in the number of clients proac-tively using IT to strengthen competitiveness and innovate business models to increase sales. Such market changes are occurring at an increasingly rapid pace, and the enterprise market is growing against this backdrop.
Client Expectations for NTT DATA
Changes in Client Expectations with Respect to IT Expectations for NTT DATA
Areas of Expectation for NTT DATA
• Expectations for IT changing from increasing efficiency to strengthening competitiveness and innovating business models
• Substantial anticipations for NTT DATA to utilize sophisticated technologies
Replace manual processes
Optimization
Business model innovations
Strengthened competitiveness
Enhanced efficiency Strategic Applications
Opportunities and Threats
2018
CAGR
1.4%
2021 (Estimate)
¥6.3 trillion¥6.6 trillion
*1 Graphs / charts are created by NTT DATA based on Gartner Research. Source: Gartner “Prediction of 2019 1Q IT Service Market (Japan) Size by Industry,” M. Sawai, 10 July 2019 Use “Moderated Case.” Enterprise & Solutions Market = Manufacturing, Retail / Wholesale Trade, Transportation, Services, Construction / Agriculture Forestry and Fisheries Mining, Communications / Media based on vendor revenue The Gartner Report(s) described herein (the “Gartner Report(s)”) represent(s) opinion or viewpoints published, as part of a syndicated subscription service, by Gartner, Inc. (“Gartner”), and are not representa-tions of fact. Each Gartner Report speaks as of its original publication date (and not as of the date of this Prospectus) and the opinions expressed in the Gartner Report(s) are subject to change without notice.
Scale and Growth Rates of Enterprise & Solutions Market (Japan)*1
Market Environment
Net Sales / Operating Income(Billions of yen) (%)
2017 20180
FY 2019 (Forecast)
400
200
600 552.0
49.0
529.8
48.5
478.1
40.5
8.99.28.5
0
10
5
15
Net sales (left) Operating income (left) Operating income margin (right)
Enterprise & Solutions Segment
Centering on Japan, we provide high-value-added IT services that support
business activities in the manufacturing, distribution, and services industries,
as well as payment services and platform solutions linked with IT services
in individual fields.
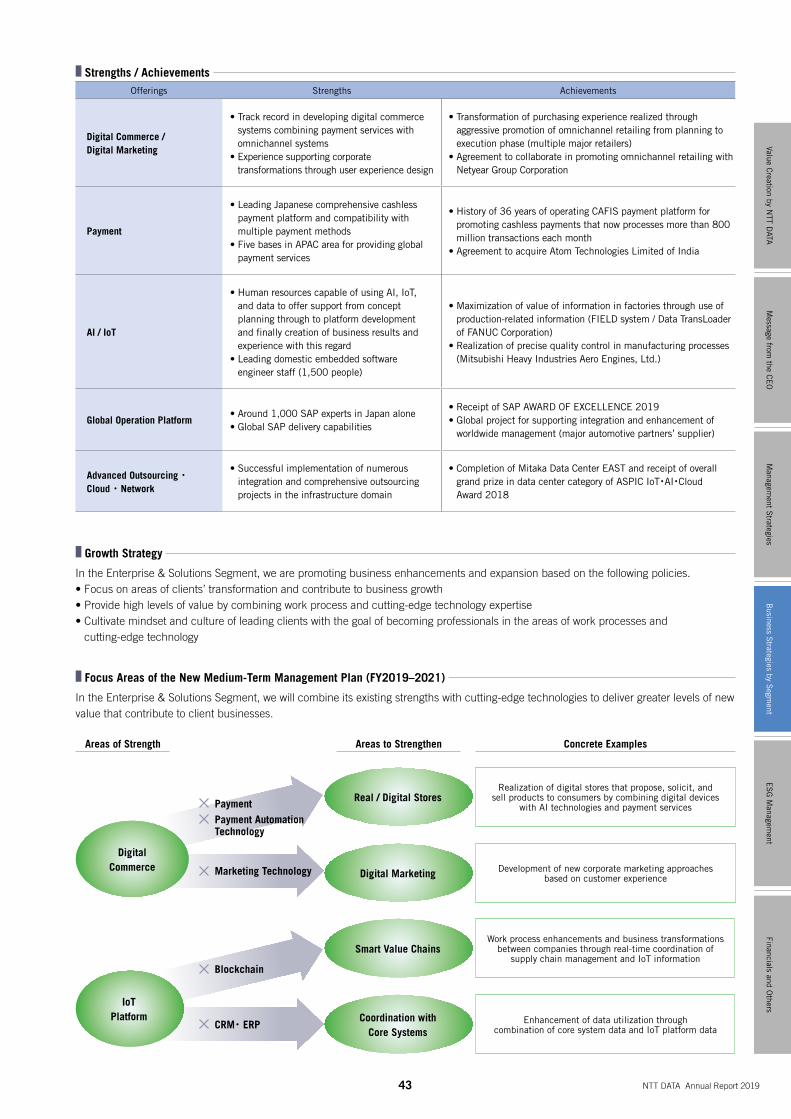
43 NTT DATA Annual Report 2019
In the Enterprise & Solutions Segment, we are promoting business enhancements and expansion based on the following policies.• Focus on areas of clients’ transformation and contribute to business growth• Provide high levels of value by combining work process and cutting-edge technology expertise• Cultivate mindset and culture of leading clients with the goal of becoming professionals in the areas of work processes and
cutting-edge technology
In the Enterprise & Solutions Segment, we will combine its existing strengths with cutting-edge technologies to deliver greater levels of new value that contribute to client businesses.
Marketing Technology
CRM・ ERP
Areas of Strength Areas to Strengthen Concrete Examples
Offerings Strengths Achievements
Digital Commerce / Digital Marketing
• Track record in developing digital commerce systems combining payment services with omnichannel systems
• Experience supporting corporate transformations through user experience design
• Transformation of purchasing experience realized through aggressive promotion of omnichannel retailing from planning to execution phase (multiple major retailers)
• Agreement to collaborate in promoting omnichannel retailing with Netyear Group Corporation
Payment
• Leading Japanese comprehensive cashless payment platform and compatibility with multiple payment methods
• Five bases in APAC area for providing global payment services
• History of 36 years of operating CAFIS payment platform for promoting cashless payments that now processes more than 800 million transactions each month
• Agreement to acquire Atom Technologies Limited of India
AI / IoT
• Human resources capable of using AI, IoT, and data to offer support from concept planning through to platform development and finally creation of business results and experience with this regard
• Leading domestic embedded software engineer staff (1,500 people)
• Maximization of value of information in factories through use of production-related information (FIELD system / Data TransLoader of FANUC Corporation)
• Realization of precise quality control in manufacturing processes (Mitsubishi Heavy Industries Aero Engines, Ltd.)
Global Operation Platform• Around 1,000 SAP experts in Japan alone• Global SAP delivery capabilities
• Receipt of SAP AWARD OF EXCELLENCE 2019• Global project for supporting integration and enhancement of
worldwide management (major automotive partners’ supplier)
Advanced Outsourcing ・ Cloud ・ Network
• Successful implementation of numerous integration and comprehensive outsourcing projects in the infrastructure domain
• Completion of Mitaka Data Center EAST and receipt of overall grand prize in data center category of ASPIC IoT・AI・Cloud Award 2018
DigitalCommerce
Real / Digital Stores
Digital Marketing
Smart Value Chains
Coordination with Core Systems
Realization of digital stores that propose, solicit, and sell products to consumers by combining digital devices
with AI technologies and payment services
Development of new corporate marketing approaches based on customer experience
IoTPlatform
PaymentPayment Automation Technology
Blockchain
Work process enhancements and business transformations between companies through real-time coordination of
supply chain management and IoT information
Enhancement of data utilization through combination of core system data and IoT platform data
Growth Strategy
Focus Areas of the New Medium-Term Management Plan (FY2019–2021)
Strengths / Achievements
Message from
the CE
OM
anagement S
trategiesE
SG
Managem
entFinancials and O
thersValue C
reation by NTT D
ATAB
usiness Strategies by S
egment

Financial & Insurance28.3%
Retail & Logistics14.8%
Healthcare Providers4.7%
Government & Public21.3%Manufacturing
16.0%
Communications & Services14.9%
44
Opportunities Threats
North America
• The onward march of business innovation due to digitization
• Increased investment in AI / IoT, Big Data analytics, mobile technology, cloud computing, etc.
• Demand for updating IT environments at governmental and other institutions in response to the Modernizing Government Technology Act (the modernization of legacy systems and a heightened response to cybersecurity)
• Increased demand for investment contributing to labor saving, automation and operational efficiency improvement in accordance with the rise in personnel, expenses
• Increased demand for outsourcing using cutting-edge technologies
• Increased business opportunity in Canada
• Trend toward insourcing aimed at enhancing high-value-added internal resources in line with rapid digitization
• Rapid vendor consolidation in attempt to thoroughly reduce cost in the outsourcing domain
• Contraction in the conventional infrastructure services market
• Impact on IT spending caused by U.S.–China trade dispute
Business Strategies by Segment
The North America IT market is the world’s largest, accounting for approximately 43% of the global IT market.*1 In terms of the future outlook, this market is expected to grow by ¥8 trillion (CAGR of approximately 5.2%) over three years, from ¥47.3 trillion in 2018 to ¥55.1 trillion in 2021.
We build long-term relationships of trust with clients in various industries by deploying competitive solutions based on our deep knowledge of their businesses.
Healthcare and Life Sciences(Clients)• Approx. 50% of U.S. hospitals• 10 of the top U.S. health insurers
Public Sector(Clients)• More than 50 federal agencies and
military branches• Approx. 25 states and municipalities
Financial Services and Insurance(Clients)• Top 25 leading financial institutions in
North America
Manufacturing(Clients)• Top 10 automotive companies worldwide
Examples of orders received
in Healthcare and Life Sciences field
*1 Graphs / charts are created by NTT DATA based on Gartner Research. Source: “Market Share: IT Services, 2018,” Dean Blackmore et al., 8 April, 2019 North America Market = North America / Financial & Insurance = Banking & Securities, Insurance / Government & Public = Government, Utilities, Education / Manufacturing = Manufacturing & Nature Resources / Communications & Services = Communications, Media & Services / Retail & Logistics = Retail, Transportation, Wholesale Trade / Healthcare Providers = Healthcare Providers based on vendor revenue The Gartner Report(s) described herein (the “Gartner Report(s)”) represent(s) opinion or viewpoints published, as part of a syndicated subscription service, by Gartner, Inc. (“Gartner”), and are not representa-tions of fact. Each Gartner Report speaks as of its original publication date (and not as of the date of this Prospectus) and the opinions expressed in the Gartner Report(s) are subject to change without notice.
*2 Graphs/charts are created by NTT DATA based on Gartner Research. Source: Gartner “Forecast: IT Services, Worldwide, 2017-2023, 2Q19 Update,” Dean Blackmore et al., 26 June 2019 (2018: 1$= ¥110.42 / 2021: 1$= ¥111.29 / CAGR is calculated after converting to Japanese yen.) North America Market = North America based on vendor revenue The Gartner Report(s) described herein (the “Gartner Report(s)”) represent(s) opinion or viewpoints published, as part of a syndicated subscription service, by Gartner, Inc. (“Gartner”), and are not representa-tions of fact. Each Gartner Report speaks as of its original publication date (and not as of the date of this Prospectus) and the opinions expressed in the Gartner Report(s) are subject to change without notice.
カナダアメリカ
5.2% 5.2% 5.5%CAGR(Trillions of yen)
47.355.1
44.852.1
2.6 3.0
20212018 20212018 20212018
P21: Awarded New BPaaS Contract with US Healthcare payerP53: Awarded New Large-Scale IT Service Agreement with British Columbia Health Authorities
Opportunities and Threats
Market Environment
Strength
North America Market 2018 Industry Composition*1 Scale and Growth Rates of North America Market*2
Net Sales / Operating Income / EBITA Margin(Billions of yen) (%)
2017 2018FY 2019 (Forecast)
440.0
9.0
2.0
4.8421.9
3.50.8
3.1
1.6
427.9
(1.0)(4.2)
(300)
300
0
600
-3
3
0
6
Net sales (left) Operating income (left) Operating income margin (right) EBITA margin (right)
North America Segment
We provide high-value-added IT services centering on North America,
taking market characteristics into account.
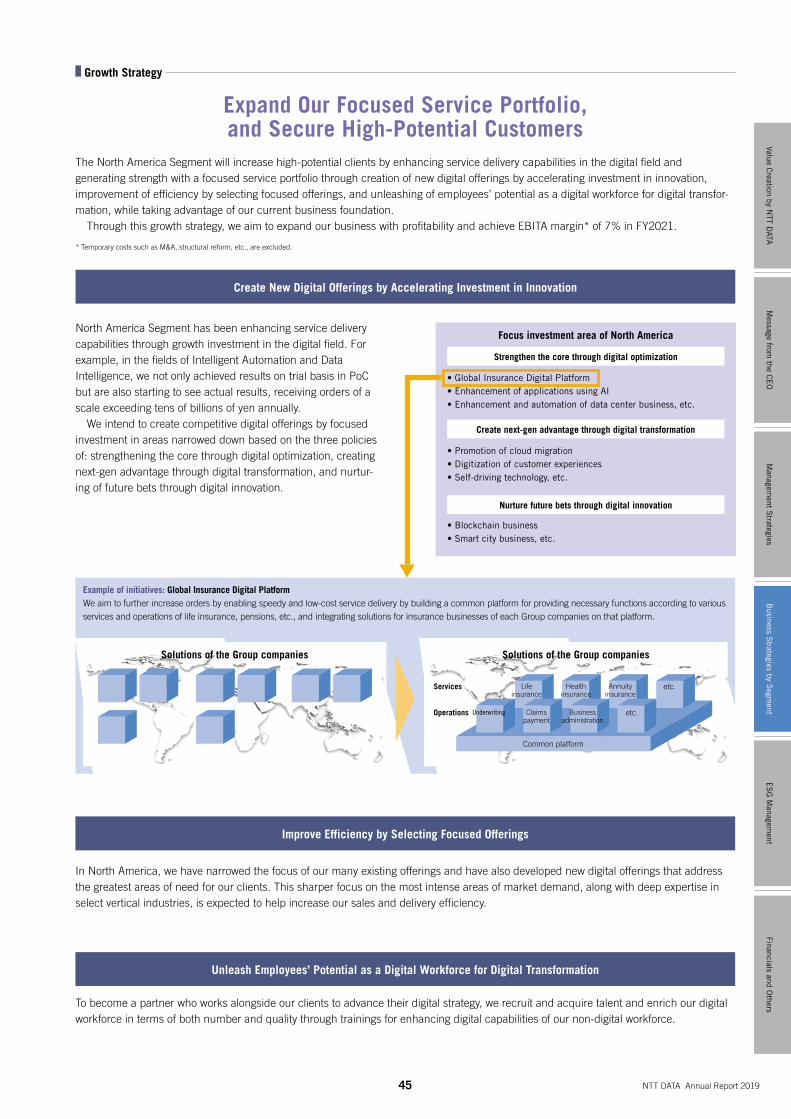
Example of initiatives: Global Insurance Digital PlatformWe aim to further increase orders by enabling speedy and low-cost service delivery by building a common platform for providing necessary functions according to various services and operations of life insurance, pensions, etc., and integrating solutions for insurance businesses of each Group companies on that platform.
45 NTT DATA Annual Report 2019
The North America Segment will increase high-potential clients by enhancing service delivery capabilities in the digital field and generating strength with a focused service portfolio through creation of new digital offerings by accelerating investment in innovation, improvement of efficiency by selecting focused offerings, and unleashing of employees’ potential as a digital workforce for digital transfor-mation, while taking advantage of our current business foundation. Through this growth strategy, we aim to expand our business with profitability and achieve EBITA margin* of 7% in FY2021.
* Temporary costs such as M&A, structural reform, etc., are excluded.
North America Segment has been enhancing service delivery capabilities through growth investment in the digital field. For example, in the fields of Intelligent Automation and Data Intelligence, we not only achieved results on trial basis in PoC but are also starting to see actual results, receiving orders of a scale exceeding tens of billions of yen annually. We intend to create competitive digital offerings by focused investment in areas narrowed down based on the three policies of: strengthening the core through digital optimization, creating next-gen advantage through digital transformation, and nurtur-ing of future bets through digital innovation.
Expand Our Focused Service Portfolio, and Secure High-Potential Customers
Create New Digital Offerings by Accelerating Investment in Innovation
Focus investment area of North America
Strengthen the core through digital optimization
Create next-gen advantage through digital transformation
Nurture future bets through digital innovation
• Global Insurance Digital Platform• Enhancement of applications using AI• Enhancement and automation of data center business, etc.
• Promotion of cloud migration• Digitization of customer experiences• Self-driving technology, etc.
In North America, we have narrowed the focus of our many existing offerings and have also developed new digital offerings that address the greatest areas of need for our clients. This sharper focus on the most intense areas of market demand, along with deep expertise in select vertical industries, is expected to help increase our sales and delivery efficiency.
Improve Efficiency by Selecting Focused Offerings
To become a partner who works alongside our clients to advance their digital strategy, we recruit and acquire talent and enrich our digital workforce in terms of both number and quality through trainings for enhancing digital capabilities of our non-digital workforce.
Unleash Employees’ Potential as a Digital Workforce for Digital Transformation
• Blockchain business• Smart city business, etc.
Growth Strategy
Solutions of the Group companies Solutions of the Group companies
Services
Operations
Life insurance
Underwriting
Annuityinsurance
Business administration
Health insurance
Claims payment
Common platform
etc.
etc.
Message from
the CE
OM
anagement S
trategiesE
SG
Managem
entFinancials and O
thersValue C
reation by NTT D
ATAB
usiness Strategies by S
egment
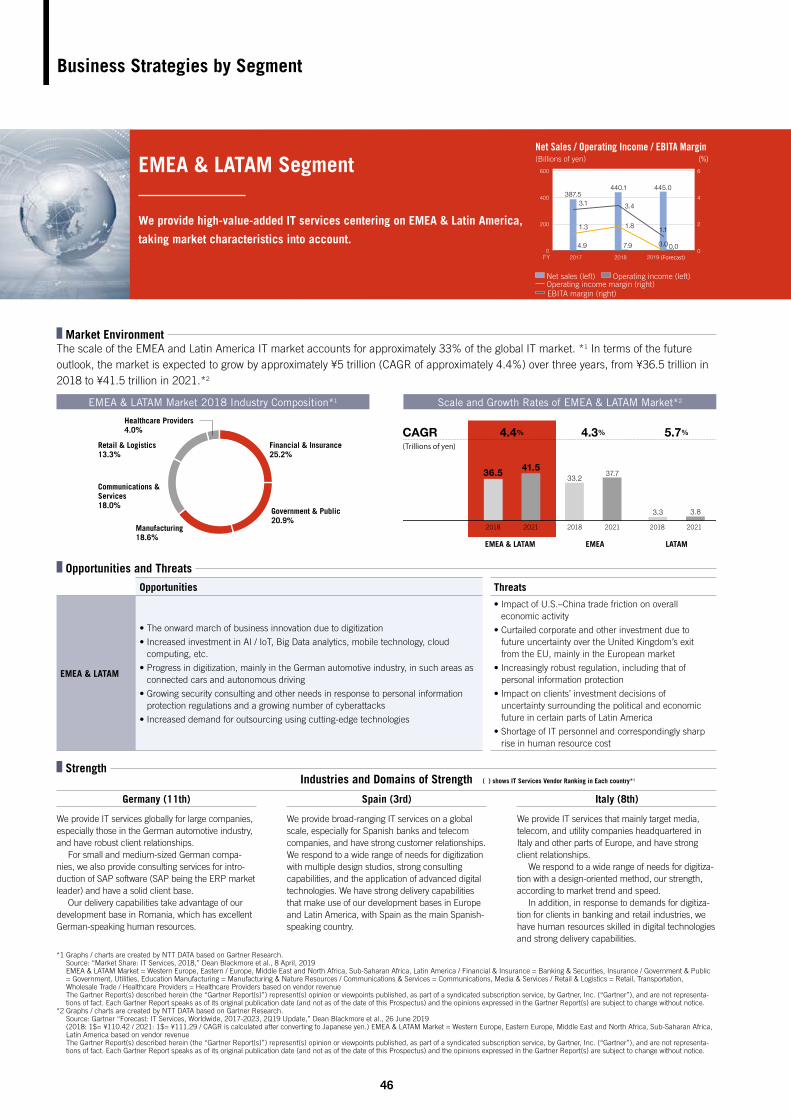
46
Opportunities Threats
EMEA & LATAM
• The onward march of business innovation due to digitization
• Increased investment in AI / IoT, Big Data analytics, mobile technology, cloud computing, etc.
• Progress in digitization, mainly in the German automotive industry, in such areas as connected cars and autonomous driving
• Growing security consulting and other needs in response to personal information protection regulations and a growing number of cyberattacks
• Increased demand for outsourcing using cutting-edge technologies
• Impact of U.S.–China trade friction on overall economic activity
• Curtailed corporate and other investment due to future uncertainty over the United Kingdom’s exit from the EU, mainly in the European market
• Increasingly robust regulation, including that of personal information protection
• Impact on clients’ investment decisions of uncertainty surrounding the political and economic future in certain parts of Latin America
• Shortage of IT personnel and correspondingly sharp rise in human resource cost
Business Strategies by Segment
The scale of the EMEA and Latin America IT market accounts for approximately 33% of the global IT market. *1 In terms of the future outlook, the market is expected to grow by approximately ¥5 trillion (CAGR of approximately 4.4%) over three years, from ¥36.5 trillion in 2018 to ¥41.5 trillion in 2021.*2
Germany (11th) Italy (8th)Spain (3rd)
We provide IT services globally for large companies, especially those in the German automotive industry, and have robust client relationships. For small and medium-sized German compa-nies, we also provide consulting services for intro-duction of SAP software (SAP being the ERP market leader) and have a solid client base. Our delivery capabilities take advantage of our development base in Romania, which has excellent German-speaking human resources.
We provide IT services that mainly target media, telecom, and utility companies headquartered in Italy and other parts of Europe, and have strong client relationships. We respond to a wide range of needs for digitiza-tion with a design-oriented method, our strength, according to market trend and speed. In addition, in response to demands for digitiza-tion for clients in banking and retail industries, we have human resources skilled in digital technologies and strong delivery capabilities.
We provide broad-ranging IT services on a global scale, especially for Spanish banks and telecom companies, and have strong customer relationships. We respond to a wide range of needs for digitization with multiple design studios, strong consulting capabilities, and the application of advanced digital technologies. We have strong delivery capabilities that make use of our development bases in Europe and Latin America, with Spain as the main Spanish-speaking country.
Net Sales / Operating Income / EBITA Margin(Billions of yen) (%)
2017 20180
FY 2019 (Forecast)
445.0
0.0 0.0
1.1
440.1
3.4
387.5400
200
600
1.3
4.9 7.9
3.1
0
4
2
6
1.8
Net sales (left) Operating income (left) Operating income margin (right) EBITA margin (right)
EMEA & LATAM Segment
We provide high-value-added IT services centering on EMEA & Latin America,
taking market characteristics into account.
*1 Graphs / charts are created by NTT DATA based on Gartner Research. Source: “Market Share: IT Services, 2018,” Dean Blackmore et al., 8 April, 2019 EMEA & LATAM Market = Western Europe, Eastern / Europe, Middle East and North Africa, Sub-Saharan Africa, Latin America / Financial & Insurance = Banking & Securities, Insurance / Government & Public = Government, Utilities, Education Manufacturing = Manufacturing & Nature Resources / Communications & Services = Communications, Media & Services / Retail & Logistics = Retail, Transportation, Wholesale Trade / Healthcare Providers = Healthcare Providers based on vendor revenue The Gartner Report(s) described herein (the “Gartner Report(s)”) represent(s) opinion or viewpoints published, as part of a syndicated subscription service, by Gartner, Inc. (“Gartner”), and are not representa-tions of fact. Each Gartner Report speaks as of its original publication date (and not as of the date of this Prospectus) and the opinions expressed in the Gartner Report(s) are subject to change without notice.
*2 Graphs / charts are created by NTT DATA based on Gartner Research. Source: Gartner “Forecast: IT Services, Worldwide, 2017-2023, 2Q19 Update,” Dean Blackmore et al., 26 June 2019 (2018: 1$= ¥110.42 / 2021: 1$= ¥111.29 / CAGR is calculated after converting to Japanese yen.) EMEA & LATAM Market = Western Europe, Eastern Europe, Middle East and North Africa, Sub-Saharan Africa, Latin America based on vendor revenue The Gartner Report(s) described herein (the “Gartner Report(s)”) represent(s) opinion or viewpoints published, as part of a syndicated subscription service, by Gartner, Inc. (“Gartner”), and are not representa-tions of fact. Each Gartner Report speaks as of its original publication date (and not as of the date of this Prospectus) and the opinions expressed in the Gartner Report(s) are subject to change without notice.
Opportunities and Threats
Market Environment
Strength
Financial & Insurance25.2%
Retail & Logistics13.3%
Healthcare Providers4.0%
Government & Public20.9%
Manufacturing18.6%
Communications & Services18.0%
4.4% 4.3% 5.7%
36.5 41.533.2
37.7
3.3 3.8
20212018 20212018 20212018
CAGR(Trillions of yen)
EMEA & LATAM Market 2018 Industry Composition*1 Scale and Growth Rates of EMEA & LATAM Market*2
4.4% 4.3% 5.7%
36.5 41.533.2
37.7
3.3 3.8
20212018 20212018 20212018
CAGR(Trillions of yen)
EMEA & LATAM
4.4% 4.3% 5.7%
36.5 41.533.2
37.7
3.3 3.8
20212018 20212018 20212018
CAGR(Trillions of yen)
EMEA LATAM
( ) shows IT Services Vendor Ranking in Each country*1Industries and Domains of Strength
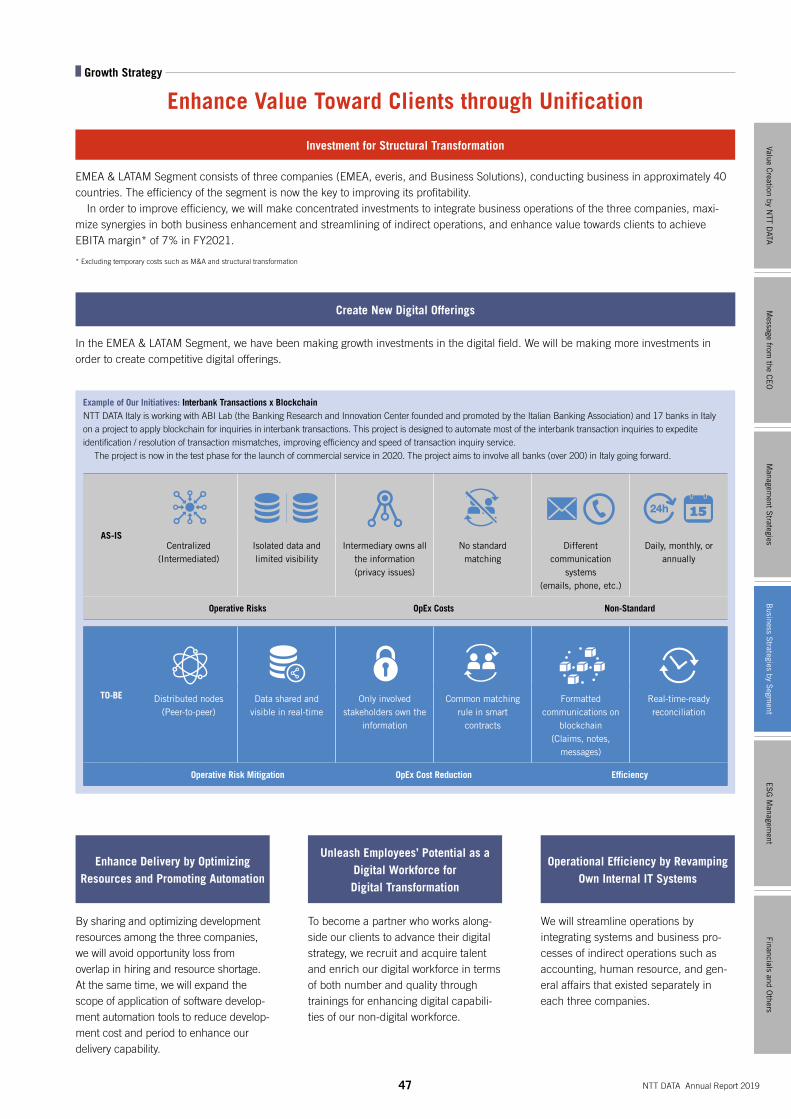
47 NTT DATA Annual Report 2019
By sharing and optimizing development resources among the three companies, we will avoid opportunity loss from overlap in hiring and resource shortage. At the same time, we will expand the scope of application of software develop-ment automation tools to reduce develop-ment cost and period to enhance our delivery capability.
Enhance Value Toward Clients through Unification
Enhance Delivery by Optimizing Resources and Promoting Automation
Unleash Employees’ Potential as a Digital Workforce for Digital Transformation
Operational Efficiency by Revamping Own Internal IT Systems
To become a partner who works along-side our clients to advance their digital strategy, we recruit and acquire talent and enrich our digital workforce in terms of both number and quality through trainings for enhancing digital capabili-ties of our non-digital workforce.
We will streamline operations by integrating systems and business pro-cesses of indirect operations such as accounting, human resource, and gen-eral affairs that existed separately in each three companies.
Growth Strategy
EMEA & LATAM Segment consists of three companies (EMEA, everis, and Business Solutions), conducting business in approximately 40 countries. The efficiency of the segment is now the key to improving its profitability. In order to improve efficiency, we will make concentrated investments to integrate business operations of the three companies, maxi-mize synergies in both business enhancement and streamlining of indirect operations, and enhance value towards clients to achieve EBITA margin* of 7% in FY2021.
* Excluding temporary costs such as M&A and structural transformation
In the EMEA & LATAM Segment, we have been making growth investments in the digital field. We will be making more investments in order to create competitive digital offerings.
Investment for Structural Transformation
Example of Our Initiatives: Interbank Transactions x BlockchainNTT DATA Italy is working with ABI Lab (the Banking Research and Innovation Center founded and promoted by the Italian Banking Association) and 17 banks in Italy on a project to apply blockchain for inquiries in interbank transactions. This project is designed to automate most of the interbank transaction inquiries to expedite identification / resolution of transaction mismatches, improving efficiency and speed of transaction inquiry service. The project is now in the test phase for the launch of commercial service in 2020. The project aims to involve all banks (over 200) in Italy going forward.
Create New Digital Offerings
AS-ISCentralized
(Intermediated)Isolated data and limited visibility
Intermediary owns all the information (privacy issues)
No standard matching
Different communication
systems (emails, phone, etc.)
Daily, monthly, or annually
Operative Risks OpEx Costs Non-Standard
TO-BE Distributed nodes (Peer-to-peer)
Data shared and visible in real-time
Only involved stakeholders own the
information
Common matching rule in smart
contracts
Formatted communications on
blockchain (Claims, notes,
messages)
Real-time-ready reconciliation
Operative Risk Mitigation OpEx Cost Reduction Efficiency
Message from
the CE
OM
anagement S
trategiesE
SG
Managem
entFinancials and O
thersValue C
reation by NTT D
ATAB
usiness Strategies by S
egment

48
Message from the CEO of NTT DATA Services
Growth Strategy in North America Segment (NTT DATA Services)
FY2018 was pivotal for NTT DATA Services as we completed the intense work of recent years to achieve a strong competitive position that
provides tremendous momentum for growth in the marketplace. In particular, the successful integration of the former Dell Services business,
acquired in 2016, has added vital scale, scope, and market recognition for our business.
With this enhanced competitive position, we now present a more comprehensive portfolio to clients, especially with our industry focus and our
strengths in cloud, BPO, infrastructure, and new digital offerings. As a result, we are being considered for more expansive and complex opportu-
nities. We ended the last fiscal year with strong sales momentum, including one of the largest wins in our history.
We have built on this momentum by pursuing additional acquisitions. In 2018, we acquired Sierra Systems, which gives us an expansive
reach across Canada, a large and fast-growing market with similar needs to the United States. The more recent acquisition of Cognosante
Consulting has bolstered our presence in Public Sector healthcare. We intend to continue making acquisitions that align well strategically,
operationally, and financially while accelerating our capabilities to serve our clients.
Looking Back on FY2018
The combination of our legacy capabilities coupled with new digital offerings creates a compelling differentiator for clients. This is especially
true for clients acquiring or divesting businesses that rely upon our deep ERP expertise to modernize and adapt their critical systems for a
rapidly changing marketplace. In addition, I am particularly excited by the increased demand for our services in digital, end user, cloud,
and security.
The core building blocks we need for growth are well established, and I believe we are in a strong competitive position. We are increasingly
perceived as a Trusted Global Innovator that leads and supports clients through transformation. We map their journey to the cloud, empower
automation and digital intelligence, and enable superior customer and employee experiences while protecting our clients’ security. We believe
our investments in these digital domains, business platforms as a service*, and others, will be substantial growth drivers for our business over
the next few years.
* A service model for building various solutions on a platform and delivering as a service to clients.
Future Growth Drivers
Bob Pryor Chief Executive Officer, NTT DATA Services
Bob Pryor has been serving as CEO of NTT DATA Services since 2018.From 2016 to 2018, he served as COO and CIO (Chief Integration Officer) of the Company, overseeing the 22-month integration of the former Dell Services into NTT DATA.Before joining NTT DATA Services, Bob was CEO of Fujitsu Americas, Inc. He has also held senior leadership positions at EY, Capgemini, HP, and Genpact.
I am confident about further enhancing our competitive position, creating differentiated strengths, and growing our profitability. I am also
confident about achieving “an EBITA margin of 7% by FY2021” which is a target of the new Medium-Term Management Plan. We plan to
achieve this through a combination of accretive growth and productivity gains from continued automation and optimization of our business
systems, processes and global delivery model.
In short, I am optimistic about our strong market position, points of differentiation, and our capacity for profitable growth. I credit our
success to the confidence and strong support of the leaders at our parent company as well as the talent and commitment of our people.
For Achieving the Goal of the New Medium-Term Management Plan
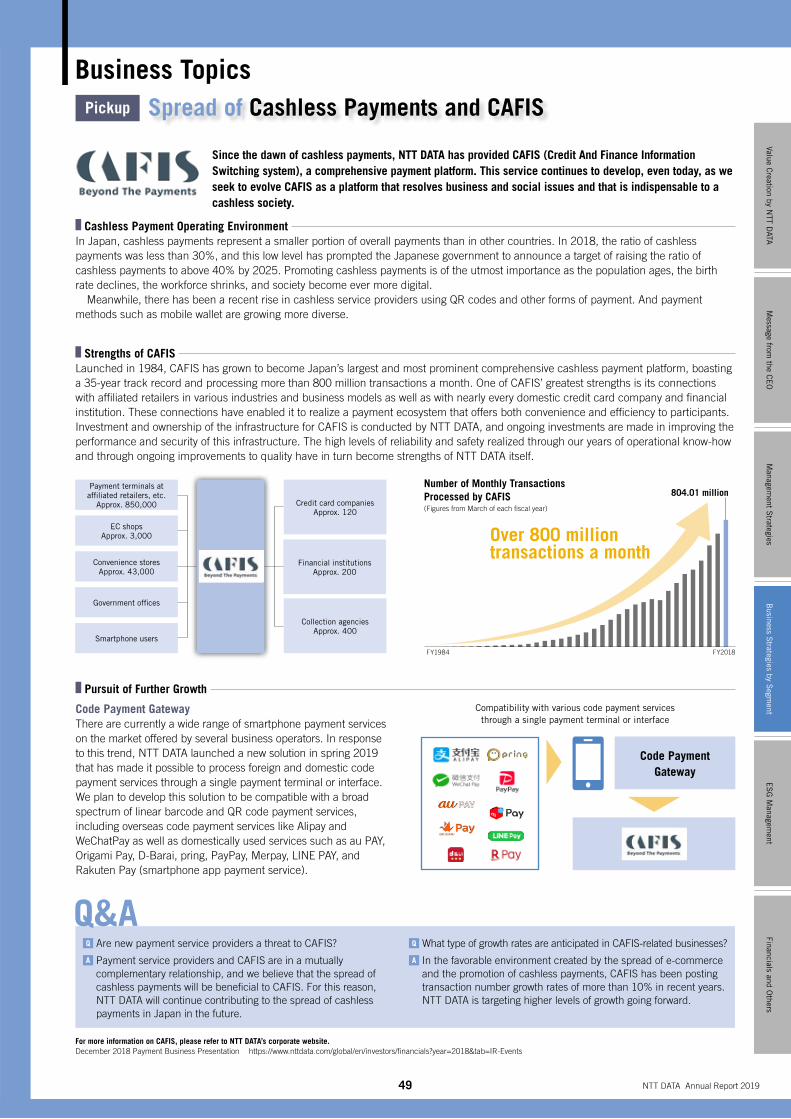
49 NTT DATA Annual Report 2019
Pursuit of Further Growth
Code Payment GatewayThere are currently a wide range of smartphone payment services on the market offered by several business operators. In response to this trend, NTT DATA launched a new solution in spring 2019 that has made it possible to process foreign and domestic code payment services through a single payment terminal or interface. We plan to develop this solution to be compatible with a broad spectrum of linear barcode and QR code payment services, including overseas code payment services like Alipay and WeChatPay as well as domestically used services such as au PAY, Origami Pay, D-Barai, pring, PayPay, Merpay, LINE PAY, and Rakuten Pay (smartphone app payment service).
Q Are new payment service providers a threat to CAFIS?
A Payment service providers and CAFIS are in a mutually complementary relationship, and we believe that the spread of cashless payments will be beneficial to CAFIS. For this reason, NTT DATA will continue contributing to the spread of cashless payments in Japan in the future.
Q What type of growth rates are anticipated in CAFIS-related businesses?
A In the favorable environment created by the spread of e-commerce and the promotion of cashless payments, CAFIS has been posting transaction number growth rates of more than 10% in recent years. NTT DATA is targeting higher levels of growth going forward.
Cashless Payment Operating Environment In Japan, cashless payments represent a smaller portion of overall payments than in other countries. In 2018, the ratio of cashless payments was less than 30%, and this low level has prompted the Japanese government to announce a target of raising the ratio of cashless payments to above 40% by 2025. Promoting cashless payments is of the utmost importance as the population ages, the birth rate declines, the workforce shrinks, and society become ever more digital. Meanwhile, there has been a recent rise in cashless service providers using QR codes and other forms of payment. And payment methods such as mobile wallet are growing more diverse.
Strengths of CAFIS Launched in 1984, CAFIS has grown to become Japan’s largest and most prominent comprehensive cashless payment platform, boasting a 35-year track record and processing more than 800 million transactions a month. One of CAFIS’ greatest strengths is its connections with affiliated retailers in various industries and business models as well as with nearly every domestic credit card company and financial institution. These connections have enabled it to realize a payment ecosystem that offers both convenience and efficiency to participants. Investment and ownership of the infrastructure for CAFIS is conducted by NTT DATA, and ongoing investments are made in improving the performance and security of this infrastructure. The high levels of reliability and safety realized through our years of operational know-how and through ongoing improvements to quality have in turn become strengths of NTT DATA itself.
Code Payment Gateway
Compatibility with various code payment services through a single payment terminal or interface
Payment terminals at affiliated retailers, etc.
Approx. 850,000
EC shopsApprox. 3,000
Convenience storesApprox. 43,000
Government offices
Smartphone users
Credit card companiesApprox. 120
Financial institutionsApprox. 200
Collection agenciesApprox. 400
Pickup Spread of Cashless Payments and CAFIS
Since the dawn of cashless payments, NTT DATA has provided CAFIS (Credit And Finance Information Switching system), a comprehensive payment platform. This service continues to develop, even today, as we seek to evolve CAFIS as a platform that resolves business and social issues and that is indispensable to a cashless society.
For more information on CAFIS, please refer to NTT DATA’s corporate website. December 2018 Payment Business Presentation https://www.nttdata.com/global/en/investors/financials?year=2018&tab=IR-Events
Business Topics
FY1984 FY2018
Number of Monthly Transactions Processed by CAFIS
(Figures from March of each fiscal year)
Over 800 million transactions a month
804.01 million
Message from
the CE
OM
anagement S
trategiesE
SG
Managem
entFinancials and O
thersValue C
reation by NTT D
ATAB
usiness Strategies by S
egment
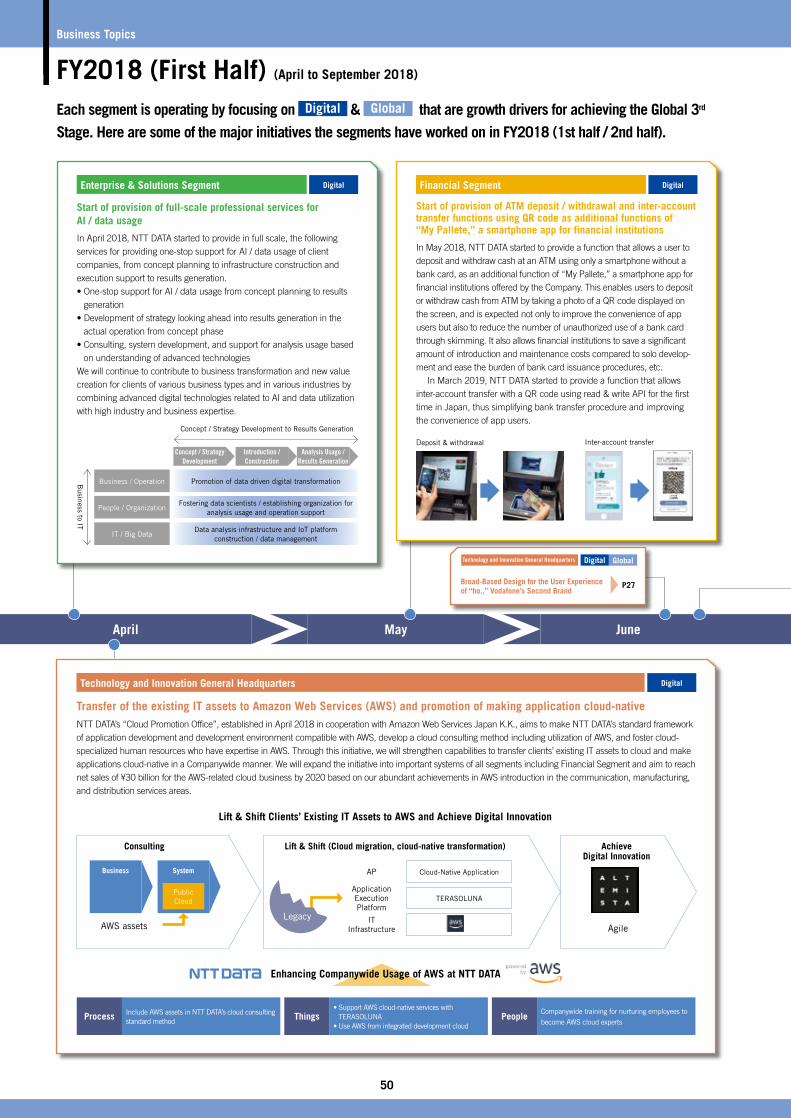
Business Topics
50
Each segment is operating by focusing on Digital & Global that are growth drivers for achieving the Global 3rd Stage. Here are some of the major initiatives the segments have worked on in FY2018 (1st half / 2nd half).
Technology and Innovation General Headquarters
Transfer of the existing IT assets to Amazon Web Services (AWS) and promotion of making application cloud-nativeNTT DATA’s “Cloud Promotion Office”, established in April 2018 in cooperation with Amazon Web Services Japan K.K., aims to make NTT DATA’s standard framework of application development and development environment compatible with AWS, develop a cloud consulting method including utilization of AWS, and foster cloud-specialized human resources who have expertise in AWS. Through this initiative, we will strengthen capabilities to transfer clients’ existing IT assets to cloud and make applications cloud-native in a Companywide manner. We will expand the initiative into important systems of all segments including Financial Segment and aim to reach net sales of ¥30 billion for the AWS-related cloud business by 2020 based on our abundant achievements in AWS introduction in the communication, manufacturing, and distribution services areas.
Financial Segment
Start of provision of ATM deposit / withdrawal and inter-account transfer functions using QR code as additional functions of “My Pallete,” a smartphone app for financial institutions
In May 2018, NTT DATA started to provide a function that allows a user to deposit and withdraw cash at an ATM using only a smartphone without a bank card, as an additional function of “My Pallete,” a smartphone app for financial institutions offered by the Company. This enables users to deposit or withdraw cash from ATM by taking a photo of a QR code displayed on the screen, and is expected not only to improve the convenience of app users but also to reduce the number of unauthorized use of a bank card through skimming. It also allows financial institutions to save a significant amount of introduction and maintenance costs compared to solo develop-ment and ease the burden of bank card issuance procedures, etc. In March 2019, NTT DATA started to provide a function that allows inter-account transfer with a QR code using read & write API for the first time in Japan, thus simplifying bank transfer procedure and improving the convenience of app users.
April May June
FY2018 (First Half) (April to September 2018)
Enterprise & Solutions Segment
Start of provision of full-scale professional services for AI / data usage
In April 2018, NTT DATA started to provide in full scale, the following services for providing one-stop support for AI / data usage of client companies, from concept planning to infrastructure construction and execution support to results generation.• One-stop support for AI / data usage from concept planning to results
generation• Development of strategy looking ahead into results generation in the
actual operation from concept phase • Consulting, system development, and support for analysis usage based
on understanding of advanced technologiesWe will continue to contribute to business transformation and new value creation for clients of various business types and in various industries by combining advanced digital technologies related to AI and data utilization with high industry and business expertise.
Digital
Digital
Digital
Business System Cloud-Native Application
TERASOLUNAPublic Cloud
AWS assets
Concept / Strategy Development
Introduction / Construction
Analysis Usage / Results Generation
Business / Operation
People / Organization
IT / Big Data
Promotion of data driven digital transformation
Fostering data scientists / establishing organization for analysis usage and operation support
Data analysis infrastructure and IoT platform construction / data management
Concept / Strategy Development to Results Generation
Business to IT
Enhancing Companywide Usage of AWS at NTT DATA
Consulting Lift & Shift (Cloud migration, cloud-native transformation)
Lift & Shift Clients’ Existing IT Assets to AWS and Achieve Digital Innovation
Achieve Digital Innovation
AP
Application Execution Platform
IT Infrastructure Agile
Legacy
Broad-Based Design for the User Experience of “ho.,” Vodafone’s Second Brand
P27
Technology and Innovation General Headquarters Digital Global
Include AWS assets in NTT DATA’s cloud consulting standard method
Process• Support AWS cloud-native services with
TERASOLUNA• Use AWS from integrated development cloud
ThingsCompanywide training for nurturing employees to become AWS cloud experts
People
Deposit & withdrawal Inter-account transfer
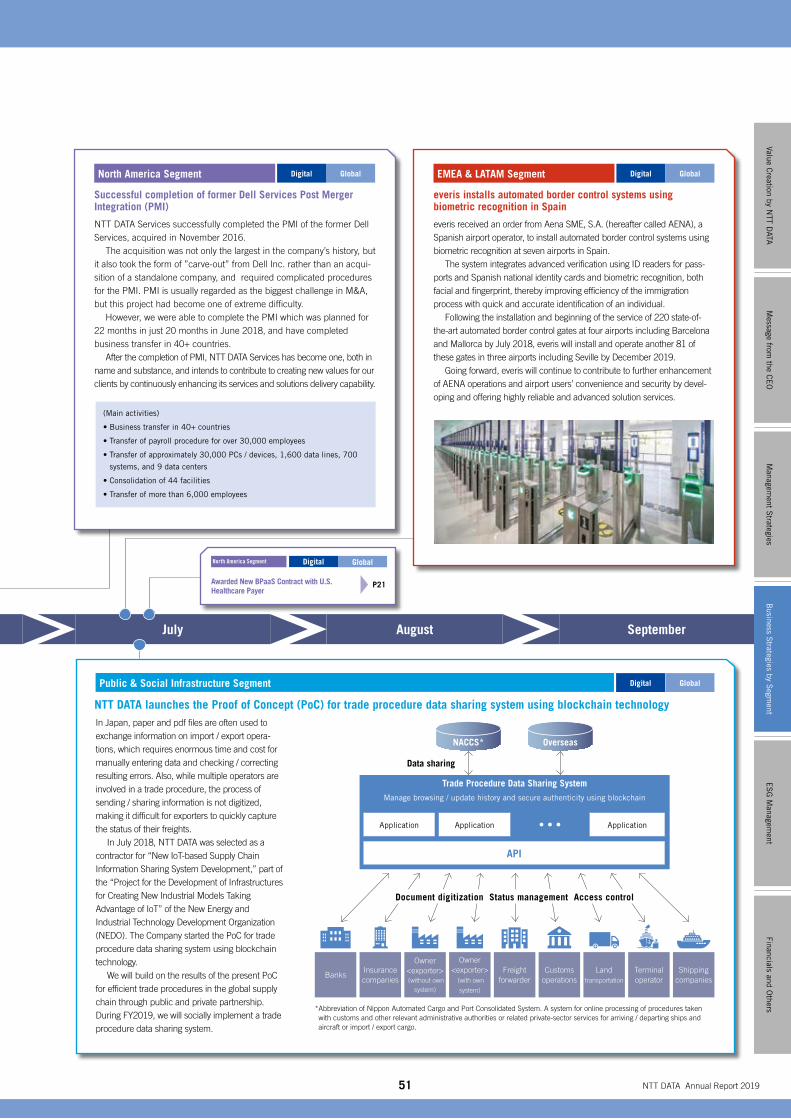
51 NTT DATA Annual Report 2019
Public & Social Infrastructure Segment
July August September
FY2018 (First Half) (April to September 2018)
Digital
EMEA & LATAM Segment
everis installs automated border control systems using biometric recognition in Spain
everis received an order from Aena SME, S.A. (hereafter called AENA), a Spanish airport operator, to install automated border control systems using biometric recognition at seven airports in Spain. The system integrates advanced verification using ID readers for pass-ports and Spanish national identity cards and biometric recognition, both facial and fingerprint, thereby improving efficiency of the immigration process with quick and accurate identification of an individual. Following the installation and beginning of the service of 220 state-of-the-art automated border control gates at four airports including Barcelona and Mallorca by July 2018, everis will install and operate another 81 of these gates in three airports including Seville by December 2019. Going forward, everis will continue to contribute to further enhancement of AENA operations and airport users’ convenience and security by devel-oping and offering highly reliable and advanced solution services.
North America Segment
Successful completion of former Dell Services Post Merger Integration (PMI)
NTT DATA Services successfully completed the PMI of the former Dell Services, acquired in November 2016. The acquisition was not only the largest in the company’s history, but it also took the form of ”carve-out” from Dell Inc. rather than an acqui-sition of a standalone company, and required complicated procedures for the PMI. PMI is usually regarded as the biggest challenge in M&A, but this project had become one of extreme difficulty. However, we were able to complete the PMI which was planned for 22 months in just 20 months in June 2018, and have completed business transfer in 40+ countries. After the completion of PMI, NTT DATA Services has become one, both in name and substance, and intends to contribute to creating new values for our clients by continuously enhancing its services and solutions delivery capability.
(Main activities)
• Business transfer in 40+ countries
• Transfer of payroll procedure for over 30,000 employees
• Transfer of approximately 30,000 PCs / devices, 1,600 data lines, 700
systems, and 9 data centers
• Consolidation of 44 facilities
• Transfer of more than 6,000 employees
Data sharing
Owner <exporter> (without own
system)
NACCS* Overseas
Trade Procedure Data Sharing System
API
Application Application Application
Manage browsing / update history and secure authenticity using blockchain
BanksInsurance companies
Customs operations
Owner <exporter>
(with own
system)
Freight forwarder
Shipping companies
Land
transportation
Terminal operator
Document digitization Status management Access control
Global
Global
DigitalDigital Global
In Japan, paper and pdf files are often used to exchange information on import / export opera-tions, which requires enormous time and cost for manually entering data and checking / correcting resulting errors. Also, while multiple operators are involved in a trade procedure, the process of sending / sharing information is not digitized, making it difficult for exporters to quickly capture the status of their freights. In July 2018, NTT DATA was selected as a contractor for “New IoT-based Supply Chain Information Sharing System Development,” part of the “Project for the Development of Infrastructures for Creating New Industrial Models Taking Advantage of IoT” of the New Energy and Industrial Technology Development Organization (NEDO). The Company started the PoC for trade procedure data sharing system using blockchain technology. We will build on the results of the present PoC for efficient trade procedures in the global supply chain through public and private partnership. During FY2019, we will socially implement a trade procedure data sharing system.
NTT DATA launches the Proof of Concept (PoC) for trade procedure data sharing system using blockchain technology
* Abbreviation of Nippon Automated Cargo and Port Consolidated System. A system for online processing of procedures taken with customs and other relevant administrative authorities or related private-sector services for arriving / departing ships and aircraft or import / export cargo.
Awarded New BPaaS Contract with U.S. Healthcare Payer
P21
North America Segment Digital Global
Message from
the CE
OM
anagement S
trategiesE
SG
Managem
entFinancials and O
thersValue C
reation by NTT D
ATAB
usiness Strategies by S
egment
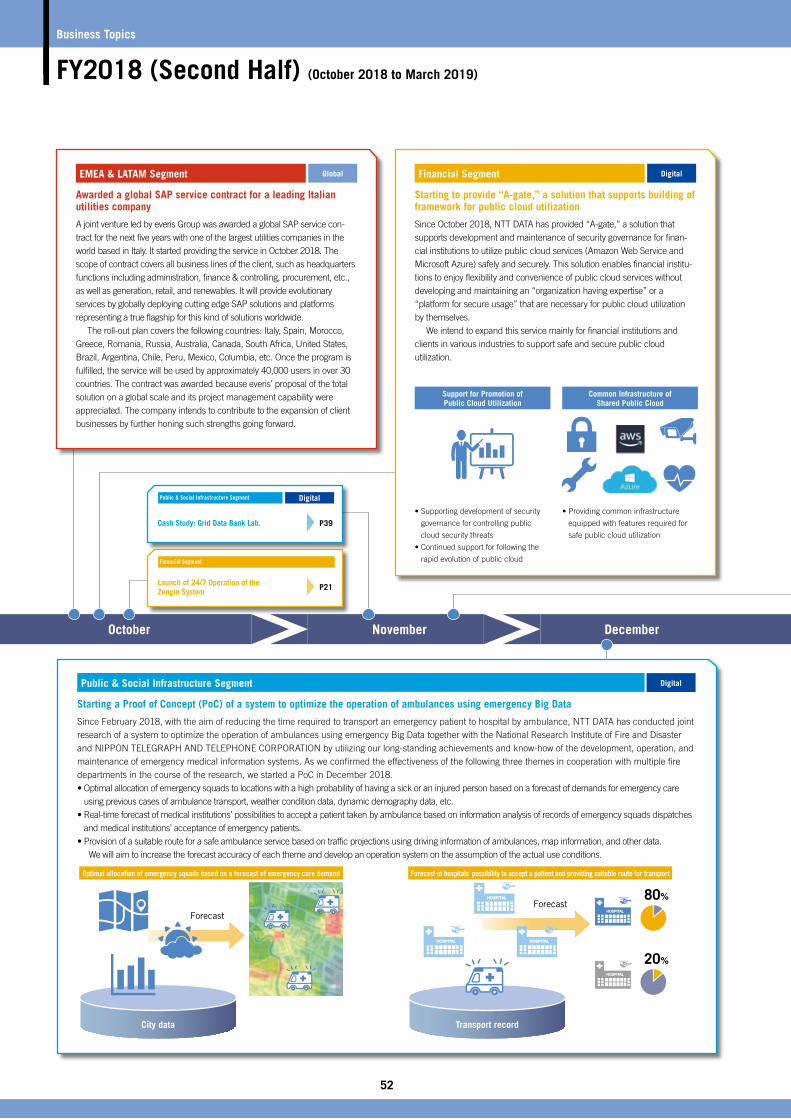
Business Topics
FY2018 (Second Half) (October 2018 to March 2019)
52
EMEA & LATAM Segment
Awarded a global SAP service contract for a leading Italian utilities company
A joint venture led by everis Group was awarded a global SAP service con-tract for the next five years with one of the largest utilities companies in the world based in Italy. It started providing the service in October 2018. The scope of contract covers all business lines of the client, such as headquarters functions including administration, finance & controlling, procurement, etc., as well as generation, retail, and renewables. It will provide evolutionary services by globally deploying cutting edge SAP solutions and platforms representing a true flagship for this kind of solutions worldwide. The roll-out plan covers the following countries: Italy, Spain, Morocco, Greece, Romania, Russia, Australia, Canada, South Africa, United States, Brazil, Argentina, Chile, Peru, Mexico, Columbia, etc. Once the program is fulfilled, the service will be used by approximately 40,000 users in over 30 countries. The contract was awarded because everis’ proposal of the total solution on a global scale and its project management capability were appreciated. The company intends to contribute to the expansion of client businesses by further honing such strengths going forward.
Public & Social Infrastructure Segment
Starting a Proof of Concept (PoC) of a system to optimize the operation of ambulances using emergency Big Data
Since February 2018, with the aim of reducing the time required to transport an emergency patient to hospital by ambulance, NTT DATA has conducted joint research of a system to optimize the operation of ambulances using emergency Big Data together with the National Research Institute of Fire and Disaster and NIPPON TELEGRAPH AND TELEPHONE CORPORATION by utilizing our long-standing achievements and know-how of the development, operation, and maintenance of emergency medical information systems. As we confirmed the effectiveness of the following three themes in cooperation with multiple fire departments in the course of the research, we started a PoC in December 2018.• Optimal allocation of emergency squads to locations with a high probability of having a sick or an injured person based on a forecast of demands for emergency care
using previous cases of ambulance transport, weather condition data, dynamic demography data, etc.• Real-time forecast of medical institutions’ possibilities to accept a patient taken by ambulance based on information analysis of records of emergency squads dispatches
and medical institutions’ acceptance of emergency patients.• Provision of a suitable route for a safe ambulance service based on traffic projections using driving information of ambulances, map information, and other data. We will aim to increase the forecast accuracy of each theme and develop an operation system on the assumption of the actual use conditions.
Optimal allocation of emergency squads based on a forecast of emergency care demand Forecast of hospitals’ possibility to accept a patient and providing suitable route for transport
ForecastForecast
City data Transport record
October November December
20%
80%
Digital
Global
Launch of 24/7 Operation of the Zengin System P21
Financial Segment
Cash Study: Grid Data Bank Lab. P39
Public & Social Infrastructure Segment
Financial Segment
Starting to provide “A-gate,” a solution that supports building of framework for public cloud utilization
Since October 2018, NTT DATA has provided “A-gate,” a solution that supports development and maintenance of security governance for finan-cial institutions to utilize public cloud services (Amazon Web Service and Microsoft Azure) safely and securely. This solution enables financial institu-tions to enjoy flexibility and convenience of public cloud services without developing and maintaining an “organization having expertise” or a “platform for secure usage” that are necessary for public cloud utilization by themselves. We intend to expand this service mainly for financial institutions and clients in various industries to support safe and secure public cloud utilization.
Digital
• Supporting development of security
governance for controlling public
cloud security threats
• Continued support for following the
rapid evolution of public cloud
• Providing common infrastructure
equipped with features required for
safe public cloud utilization
Support for Promotion of Public Cloud Utilization
Common Infrastructure of Shared Public Cloud
Digital
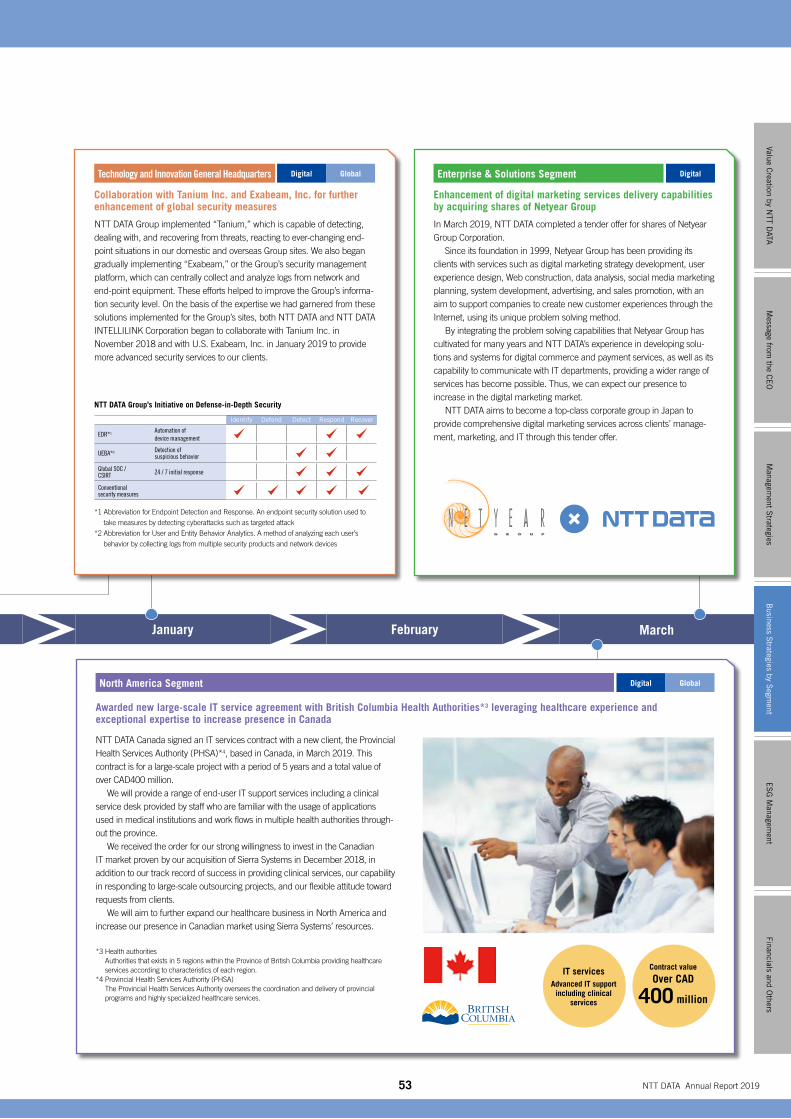
53 NTT DATA Annual Report 2019
North America Segment
NTT DATA Canada signed an IT services contract with a new client, the Provincial Health Services Authority (PHSA)*4, based in Canada, in March 2019. This contract is for a large-scale project with a period of 5 years and a total value of over CAD400 million. We will provide a range of end-user IT support services including a clinical service desk provided by staff who are familiar with the usage of applications used in medical institutions and work flows in multiple health authorities through-out the province. We received the order for our strong willingness to invest in the Canadian IT market proven by our acquisition of Sierra Systems in December 2018, in addition to our track record of success in providing clinical services, our capability in responding to large-scale outsourcing projects, and our flexible attitude toward requests from clients. We will aim to further expand our healthcare business in North America and increase our presence in Canadian market using Sierra Systems’ resources.
*3 Health authorities Authorities that exists in 5 regions within the Province of British Columbia providing healthcare services according to characteristics of each region.
*4 Provincial Health Services Authority (PHSA) The Provincial Health Services Authority oversees the coordination and delivery of provincial programs and highly specialized healthcare services.
January February March
Contract value
Over CAD
400 million
IT services Advanced IT support
including clinical services
Digital
Technology and Innovation General Headquarters
Collaboration with Tanium Inc. and Exabeam, Inc. for further enhancement of global security measures
NTT DATA Group implemented “Tanium,” which is capable of detecting, dealing with, and recovering from threats, reacting to ever-changing end-point situations in our domestic and overseas Group sites. We also began gradually implementing “Exabeam,” or the Group’s security management platform, which can centrally collect and analyze logs from network and end-point equipment. These efforts helped to improve the Group’s informa-tion security level. On the basis of the expertise we had garnered from these solutions implemented for the Group’s sites, both NTT DATA and NTT DATA INTELLILINK Corporation began to collaborate with Tanium Inc. in November 2018 and with U.S. Exabeam, Inc. in January 2019 to provide more advanced security services to our clients.
NTT DATA Group’s Initiative on Defense-in-Depth Security
Identify Defend Detect Respond Recover
EDR*1 Automation of device management
UEBA*2 Detection of suspicious behavior
Global SOC /CSIRT 24 / 7 initial response
Conventional security measures
*1 Abbreviation for Endpoint Detection and Response. An endpoint security solution used to
take measures by detecting cyberattacks such as targeted attack
*2 Abbreviation for User and Entity Behavior Analytics. A method of analyzing each user’s
behavior by collecting logs from multiple security products and network devices
Digital Global
Global
Awarded new large-scale IT service agreement with British Columbia Health Authorities*3 leveraging healthcare experience and exceptional expertise to increase presence in Canada
Enterprise & Solutions Segment
Enhancement of digital marketing services delivery capabilities by acquiring shares of Netyear Group
In March 2019, NTT DATA completed a tender offer for shares of Netyear Group Corporation. Since its foundation in 1999, Netyear Group has been providing its clients with services such as digital marketing strategy development, user experience design, Web construction, data analysis, social media marketing planning, system development, advertising, and sales promotion, with an aim to support companies to create new customer experiences through the Internet, using its unique problem solving method. By integrating the problem solving capabilities that Netyear Group has cultivated for many years and NTT DATA’s experience in developing solu-tions and systems for digital commerce and payment services, as well as its capability to communicate with IT departments, providing a wider range of services has become possible. Thus, we can expect our presence to increase in the digital marketing market. NTT DATA aims to become a top-class corporate group in Japan to provide comprehensive digital marketing services across clients’ manage-ment, marketing, and IT through this tender offer.
Digital
Message from
the CE
OM
anagement S
trategiesE
SG
Managem
entFinancials and O
thersValue C
reation by NTT D
ATAB
usiness Strategies by S
egment
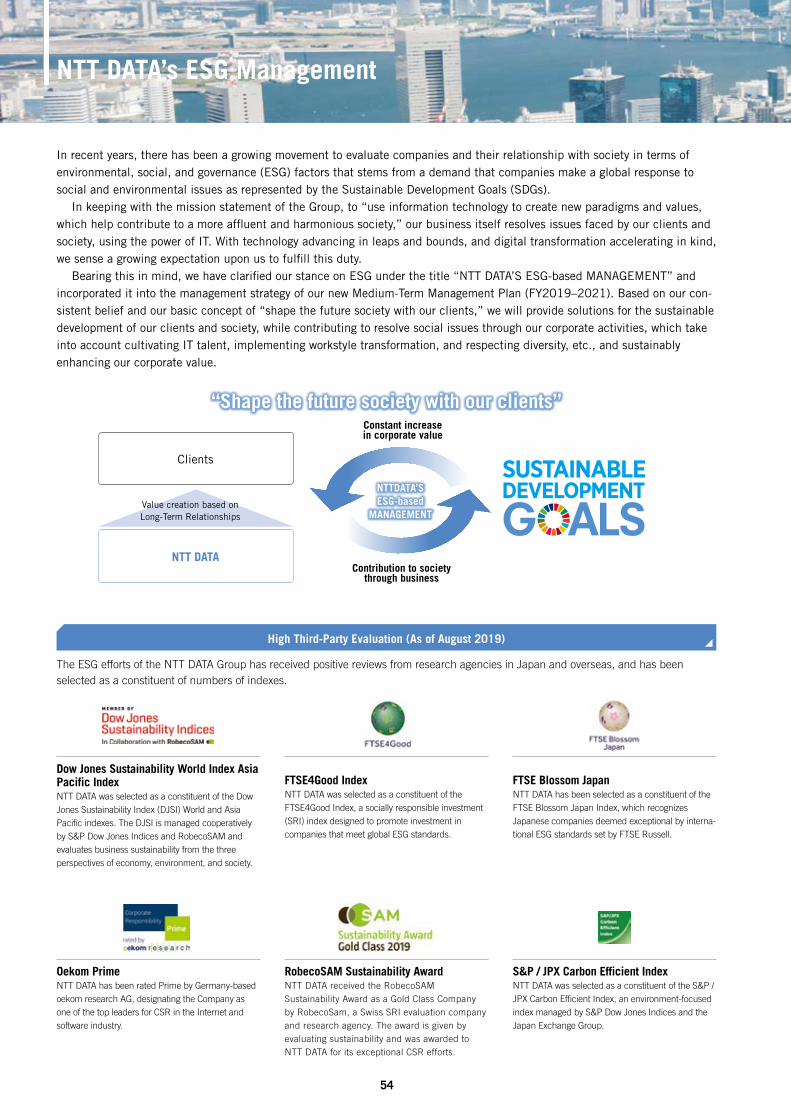
NTT DATA’s ESG Management
54
In recent years, there has been a growing movement to evaluate companies and their relationship with society in terms of environmental, social, and governance (ESG) factors that stems from a demand that companies make a global response to social and environmental issues as represented by the Sustainable Development Goals (SDGs). In keeping with the mission statement of the Group, to “use information technology to create new paradigms and values, which help contribute to a more affluent and harmonious society,” our business itself resolves issues faced by our clients and society, using the power of IT. With technology advancing in leaps and bounds, and digital transformation accelerating in kind, we sense a growing expectation upon us to fulfill this duty. Bearing this in mind, we have clarified our stance on ESG under the title “NTT DATA’S ESG-based MANAGEMENT” and incorporated it into the management strategy of our new Medium-Term Management Plan (FY2019–2021). Based on our con-sistent belief and our basic concept of “shape the future society with our clients,” we will provide solutions for the sustainable development of our clients and society, while contributing to resolve social issues through our corporate activities, which take into account cultivating IT talent, implementing workstyle transformation, and respecting diversity, etc., and sustainably enhancing our corporate value.
The ESG efforts of the NTT DATA Group has received positive reviews from research agencies in Japan and overseas, and has been selected as a constituent of numbers of indexes.
Dow Jones Sustainability World Index Asia Pacific IndexNTT DATA was selected as a constituent of the Dow Jones Sustainability Index (DJSI) World and Asia Pacific indexes. The DJSI is managed cooperatively by S&P Dow Jones Indices and RobecoSAM and evaluates business sustainability from the three perspectives of economy, environment, and society.
FTSE4Good IndexNTT DATA was selected as a constituent of the FTSE4Good Index, a socially responsible investment (SRI) index designed to promote investment in companies that meet global ESG standards.
FTSE Blossom JapanNTT DATA has been selected as a constituent of the FTSE Blossom Japan Index, which recognizes Japanese companies deemed exceptional by interna-tional ESG standards set by FTSE Russell.
Oekom PrimeNTT DATA has been rated Prime by Germany-based oekom research AG, designating the Company as one of the top leaders for CSR in the Internet and software industry.
RobecoSAM Sustainability AwardNTT DATA received the RobecoSAM Sustainability Award as a Gold Class Company by RobecoSam, a Swiss SRI evaluation company and research agency. The award is given by evaluating sustainability and was awarded to NTT DATA for its exceptional CSR efforts.
S&P / JPX Carbon Efficient IndexNTT DATA was selected as a constituent of the S&P / JPX Carbon Efficient Index, an environment-focused index managed by S&P Dow Jones Indices and the Japan Exchange Group.
High Third-Party Evaluation (As of August 2019)
Contribution to society through business
Constant increase in corporate value
NTTDATA’S ESG-based
MANAGEMENTValue creation based on Long-Term Relationships
Clients
NTT DATA
“Shape the future society with our clients”
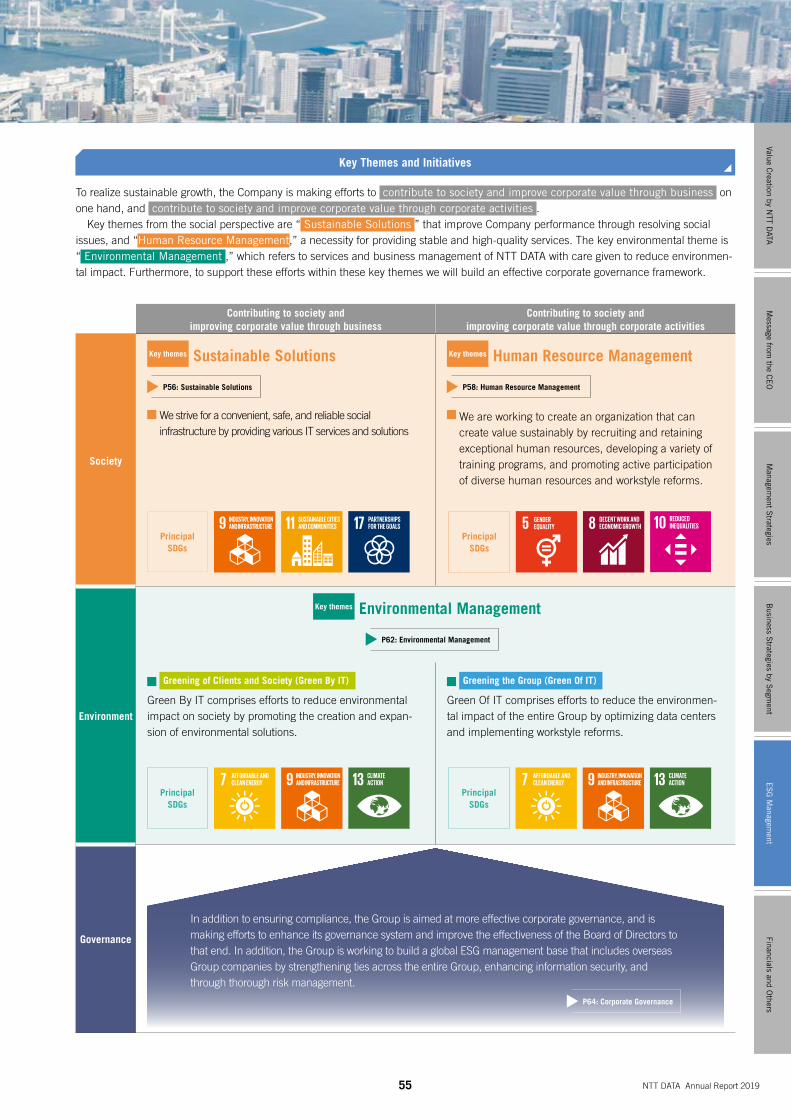
55
Contributing to society and improving corporate value through business
Contributing to society and improving corporate value through corporate activities
Society
Key themes Sustainable Solutions
We strive for a convenient, safe, and reliable social infrastructure by providing various IT services and solutions
Key themes Human Resource Management
We are working to create an organization that can create value sustainably by recruiting and retaining exceptional human resources, developing a variety of training programs, and promoting active participation of diverse human resources and workstyle reforms.
Environment
Key themes Environmental Management
Greening of Clients and Society (Green By IT)
Green By IT comprises efforts to reduce environmental impact on society by promoting the creation and expan-sion of environmental solutions.
Greening the Group (Green Of IT)
Green Of IT comprises efforts to reduce the environmen-tal impact of the entire Group by optimizing data centers and implementing workstyle reforms.
Governance
Principal SDGs
To realize sustainable growth, the Company is making efforts to contribute to society and improve corporate value through business on one hand, and contribute to society and improve corporate value through corporate activities . Key themes from the social perspective are “ Sustainable Solutions ” that improve Company performance through resolving social issues, and “Human Resource Management,” a necessity for providing stable and high-quality services. The key environmental theme is “ Environmental Management ,” which refers to services and business management of NTT DATA with care given to reduce environmen-tal impact. Furthermore, to support these efforts within these key themes we will build an effective corporate governance framework.
NTT DATA Annual Report 2019
Key Themes and Initiatives
In addition to ensuring compliance, the Group is aimed at more effective corporate governance, and is making efforts to enhance its governance system and improve the effectiveness of the Board of Directors to that end. In addition, the Group is working to build a global ESG management base that includes overseas Group companies by strengthening ties across the entire Group, enhancing information security, and through thorough risk management.
P64: Corporate Governance
P62: Environmental Management
P56: Sustainable Solutions P58: Human Resource Management
Principal SDGs
Principal SDGs
Principal SDGs
Message from
the CE
OM
anagement S
trategiesB
usiness Strategies by S
egment
Financials and Others
Value Creation by N
TT DATA
ES
G M
anagement
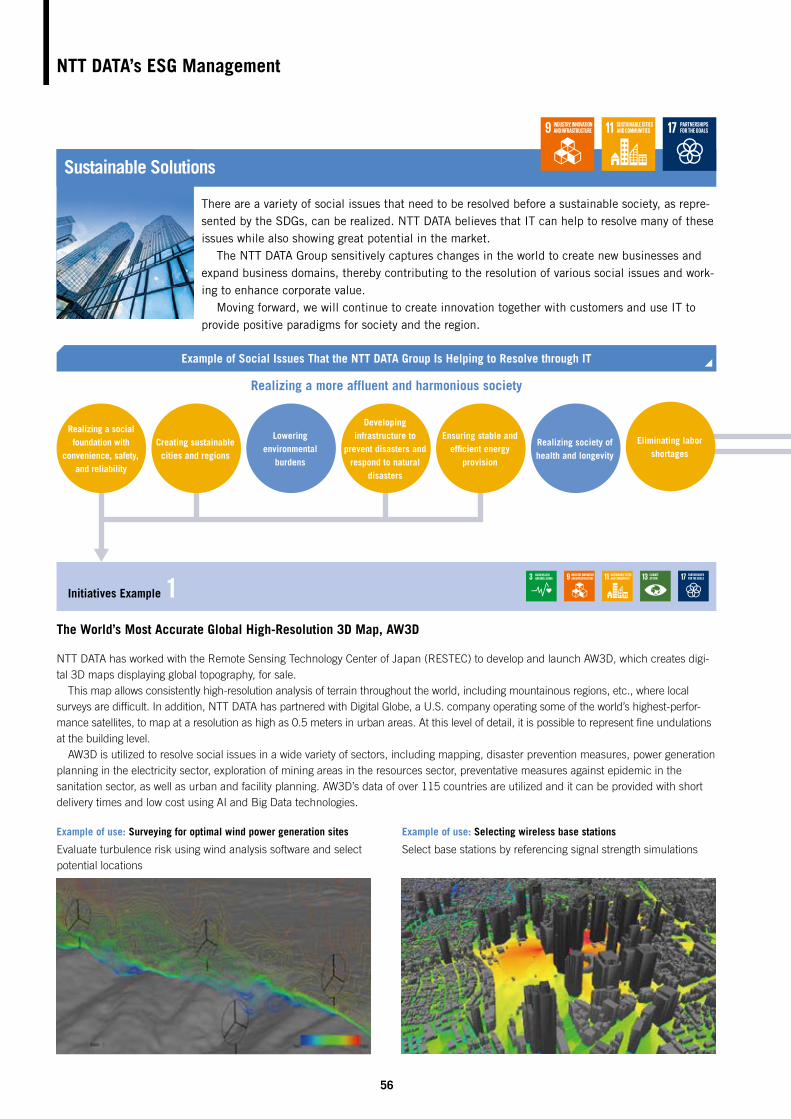
56
There are a variety of social issues that need to be resolved before a sustainable society, as repre-sented by the SDGs, can be realized. NTT DATA believes that IT can help to resolve many of these issues while also showing great potential in the market. The NTT DATA Group sensitively captures changes in the world to create new businesses and expand business domains, thereby contributing to the resolution of various social issues and work-ing to enhance corporate value. Moving forward, we will continue to create innovation together with customers and use IT to provide positive paradigms for society and the region.
Sustainable Solutions
NTT DATA’s ESG Management
Realizing a social foundation with
convenience, safety, and reliability
Creating sustainable cities and regions
Lowering environmental
burdens
Ensuring stable and efficient energy
provision
Realizing society of health and longevity
Eliminating labor shortages
Developing infrastructure to
prevent disasters and respond to natural
disasters
Example of Social Issues That the NTT DATA Group Is Helping to Resolve through IT
Initiatives Example 1
NTT DATA has worked with the Remote Sensing Technology Center of Japan (RESTEC) to develop and launch AW3D, which creates digi-tal 3D maps displaying global topography, for sale. This map allows consistently high-resolution analysis of terrain throughout the world, including mountainous regions, etc., where local surveys are difficult. In addition, NTT DATA has partnered with Digital Globe, a U.S. company operating some of the world’s highest-perfor-mance satellites, to map at a resolution as high as 0.5 meters in urban areas. At this level of detail, it is possible to represent fine undulations at the building level. AW3D is utilized to resolve social issues in a wide variety of sectors, including mapping, disaster prevention measures, power generation planning in the electricity sector, exploration of mining areas in the resources sector, preventative measures against epidemic in the sanitation sector, as well as urban and facility planning. AW3D’s data of over 115 countries are utilized and it can be provided with short delivery times and low cost using AI and Big Data technologies.
The World’s Most Accurate Global High-Resolution 3D Map, AW3D
Example of use: Surveying for optimal wind power generation sites
Evaluate turbulence risk using wind analysis software and select potential locations
Example of use: Selecting wireless base stations
Select base stations by referencing signal strength simulations
Realizing a more affluent and harmonious society
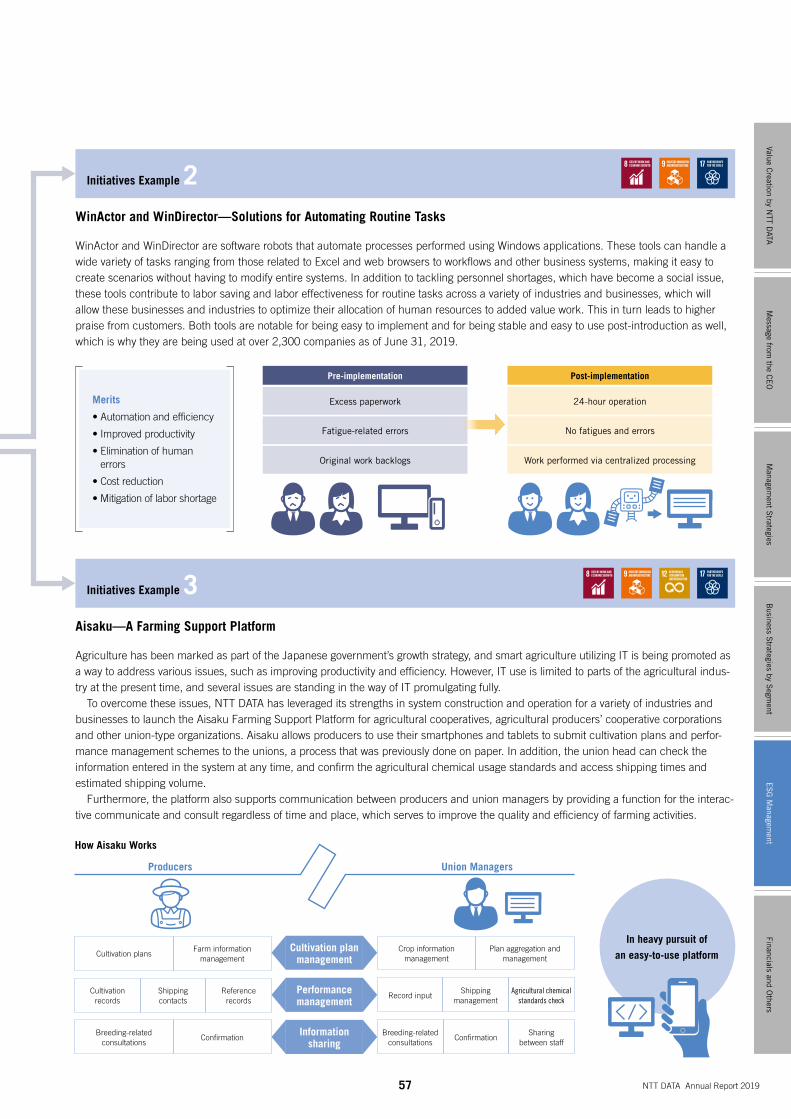
57 NTT DATA Annual Report 2019
Initiatives Example 2
WinActor and WinDirector are software robots that automate processes performed using Windows applications. These tools can handle a wide variety of tasks ranging from those related to Excel and web browsers to workflows and other business systems, making it easy to create scenarios without having to modify entire systems. In addition to tackling personnel shortages, which have become a social issue, these tools contribute to labor saving and labor effectiveness for routine tasks across a variety of industries and businesses, which will allow these businesses and industries to optimize their allocation of human resources to added value work. This in turn leads to higher praise from customers. Both tools are notable for being easy to implement and for being stable and easy to use post-introduction as well, which is why they are being used at over 2,300 companies as of June 31, 2019.
WinActor and WinDirector—Solutions for Automating Routine Tasks
Initiatives Example 3
Agriculture has been marked as part of the Japanese government’s growth strategy, and smart agriculture utilizing IT is being promoted as a way to address various issues, such as improving productivity and efficiency. However, IT use is limited to parts of the agricultural indus-try at the present time, and several issues are standing in the way of IT promulgating fully. To overcome these issues, NTT DATA has leveraged its strengths in system construction and operation for a variety of industries and businesses to launch the Aisaku Farming Support Platform for agricultural cooperatives, agricultural producers’ cooperative corporations and other union-type organizations. Aisaku allows producers to use their smartphones and tablets to submit cultivation plans and perfor-mance management schemes to the unions, a process that was previously done on paper. In addition, the union head can check the information entered in the system at any time, and confirm the agricultural chemical usage standards and access shipping times and estimated shipping volume. Furthermore, the platform also supports communication between producers and union managers by providing a function for the interac-tive communicate and consult regardless of time and place, which serves to improve the quality and efficiency of farming activities.
Aisaku—A Farming Support Platform
Merits
• Automation and efficiency
• Improved productivity
• Elimination of human errors
• Cost reduction
• Mitigation of labor shortage
Post-implementationPre-implementation
Excess paperwork
Fatigue-related errors
Original work backlogs
24-hour operation
No fatigues and errors
Work performed via centralized processing
How Aisaku Works
Cultivation plansFarm information
management
Cultivation records
Shipping contacts
Reference records
Breeding-related consultations
Confirmation
Crop information management
Plan aggregation and management
Record inputShipping
managementAgricultural chemical
standards check
Breeding-related consultations
ConfirmationSharing
between staff
Cultivation plan management
Performance management
Information sharing
Producers Union Managers
In heavy pursuit of
an easy-to-use platform
Message from
the CE
OM
anagement S
trategiesB
usiness Strategies by S
egment
Financials and Others
Value Creation by N
TT DATA
ES
G M
anagement
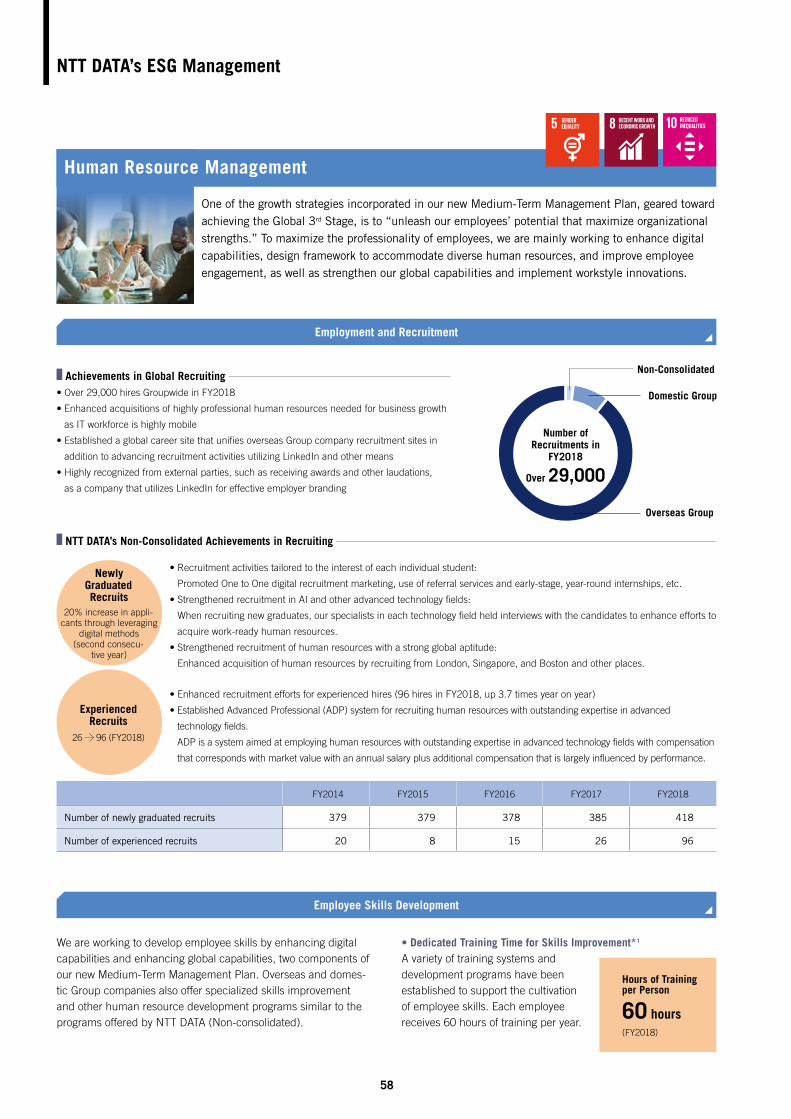
NTT DATA’s ESG Management
58
Achievements in Global Recruiting • Over 29,000 hires Groupwide in FY2018
• Enhanced acquisitions of highly professional human resources needed for business growth
as IT workforce is highly mobile
• Established a global career site that unifies overseas Group company recruitment sites in
addition to advancing recruitment activities utilizing LinkedIn and other means
• Highly recognized from external parties, such as receiving awards and other laudations,
as a company that utilizes LinkedIn for effective employer branding
We are working to develop employee skills by enhancing digital capabilities and enhancing global capabilities, two components of our new Medium-Term Management Plan. Overseas and domes-tic Group companies also offer specialized skills improvement and other human resource development programs similar to the programs offered by NTT DATA (Non-consolidated).
• Dedicated Training Time for Skills Improvement*1
A variety of training systems and development programs have been established to support the cultivation of employee skills. Each employee receives 60 hours of training per year.
• Recruitment activities tailored to the interest of each individual student:
Promoted One to One digital recruitment marketing, use of referral services and early-stage, year-round internships, etc.
• Strengthened recruitment in AI and other advanced technology fields:
When recruiting new graduates, our specialists in each technology field held interviews with the candidates to enhance efforts to
acquire work-ready human resources.
• Strengthened recruitment of human resources with a strong global aptitude:
Enhanced acquisition of human resources by recruiting from London, Singapore, and Boston and other places.
• Enhanced recruitment efforts for experienced hires (96 hires in FY2018, up 3.7 times year on year)
• Established Advanced Professional (ADP) system for recruiting human resources with outstanding expertise in advanced
technology fields.
ADP is a system aimed at employing human resources with outstanding expertise in advanced technology fields with compensation
that corresponds with market value with an annual salary plus additional compensation that is largely influenced by performance.
Employment and Recruitment
当社単体
国内グループ
海外グループ
Newly Graduated Recruits
20% increase in appli-cants through leveraging
digital methods (second consecu-
tive year)
Experienced Recruits
26 96 (FY2018)
Hours of Training per Person
60 hours (FY2018)
Employee Skills Development
Number of Recruitments in
FY2018
Over 29,000
Non-Consolidated
Domestic Group
Overseas Group
NTT DATA’s Non-Consolidated Achievements in Recruiting
FY2014 FY2015 FY2016 FY2017 FY2018
Number of newly graduated recruits 379 379 378 385 418
Number of experienced recruits 20 8 15 26 96
One of the growth strategies incorporated in our new Medium-Term Management Plan, geared toward achieving the Global 3rd Stage, is to “unleash our employees’ potential that maximize organizational strengths.” To maximize the professionality of employees, we are mainly working to enhance digital capabilities, design framework to accommodate diverse human resources, and improve employee engagement, as well as strengthen our global capabilities and implement workstyle innovations.
Human Resource Management
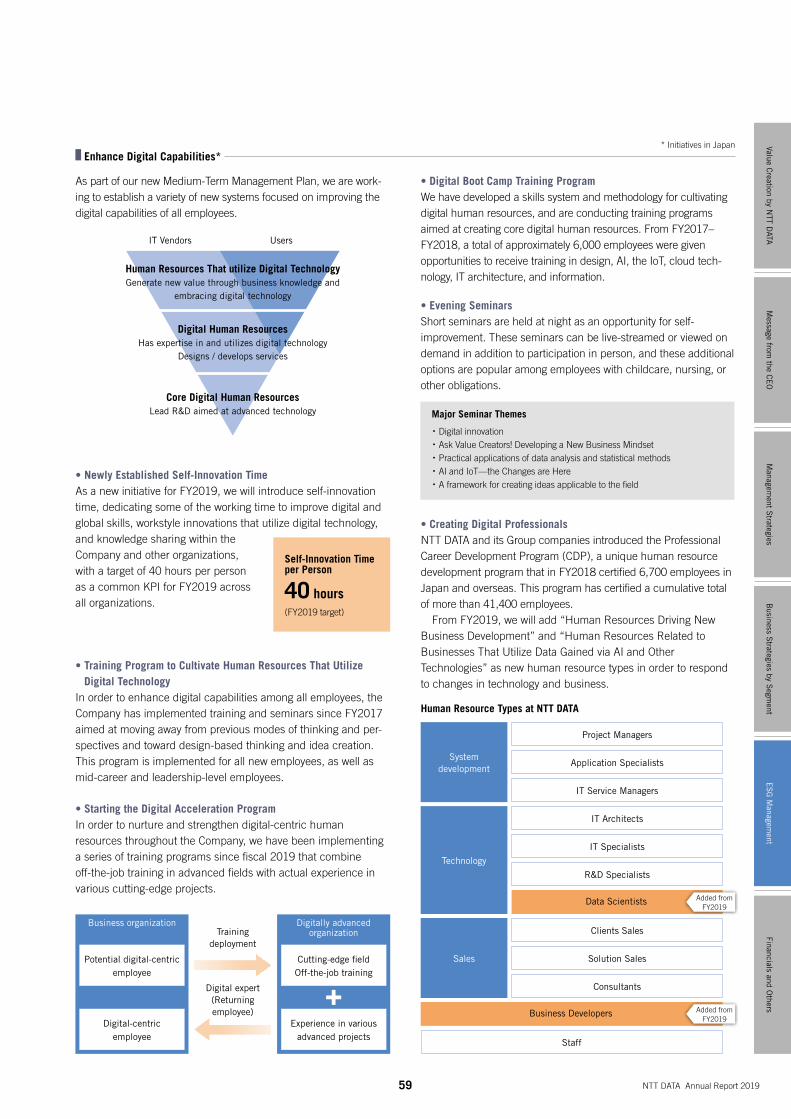
59 NTT DATA Annual Report 2019
• Newly Established Self-Innovation Time As a new initiative for FY2019, we will introduce self-innovation time, dedicating some of the working time to improve digital and global skills, workstyle innovations that utilize digital technology, and knowledge sharing within the Company and other organizations, with a target of 40 hours per person as a common KPI for FY2019 across all organizations.
• Training Program to Cultivate Human Resources That Utilize Digital Technology
In order to enhance digital capabilities among all employees, the Company has implemented training and seminars since FY2017 aimed at moving away from previous modes of thinking and per-spectives and toward design-based thinking and idea creation. This program is implemented for all new employees, as well as mid-career and leadership-level employees.
• Starting the Digital Acceleration Program In order to nurture and strengthen digital-centric human resources throughout the Company, we have been implementing a series of training programs since fiscal 2019 that combine off-the-job training in advanced fields with actual experience in various cutting-edge projects.
As part of our new Medium-Term Management Plan, we are work-ing to establish a variety of new systems focused on improving the digital capabilities of all employees.
• Digital Boot Camp Training ProgramWe have developed a skills system and methodology for cultivating digital human resources, and are conducting training programs aimed at creating core digital human resources. From FY2017–FY2018, a total of approximately 6,000 employees were given opportunities to receive training in design, AI, the IoT, cloud tech-nology, IT architecture, and information.
• Evening Seminars Short seminars are held at night as an opportunity for self-improvement. These seminars can be live-streamed or viewed on demand in addition to participation in person, and these additional options are popular among employees with childcare, nursing, or other obligations.
• Creating Digital Professionals NTT DATA and its Group companies introduced the Professional Career Development Program (CDP), a unique human resource development program that in FY2018 certified 6,700 employees in Japan and overseas. This program has certified a cumulative total of more than 41,400 employees. From FY2019, we will add “Human Resources Driving New Business Development” and “Human Resources Related to Businesses That Utilize Data Gained via AI and Other Technologies” as new human resource types in order to respond to changes in technology and business.
Major Seminar Themes
・ Digital innovation・ Ask Value Creators! Developing a New Business Mindset・ Practical applications of data analysis and statistical methods・ AI and IoT—the Changes are Here・ A framework for creating ideas applicable to the field
Human Resources That utilize Digital TechnologyGenerate new value through business knowledge and
embracing digital technology
IT Vendors Users
Digital Human ResourcesHas expertise in and utilizes digital technology
Designs / develops services
Core Digital Human ResourcesLead R&D aimed at advanced technology
System development
Sales
Technology
Project Managers
Clients Sales
IT Architects
Application Specialists
Solution Sales
Staff
IT Specialists
IT Service Managers
Consultants
Business Developers
R&D Specialists
Data Scientists
Human Resource Types at NTT DATA
Business organization Digitally advanced organization
Potential digital-centric employee
Cutting-edge fieldOff-the-job training
Digital-centric employee
Experience in various advanced projects
Digital expert (Returning employee)
Training deployment
Self-Innovation Time per Person
40 hours (FY2019 target)
Enhance Digital Capabilities*
Added from FY2019
Added from FY2019
* Initiatives in Japan
Message from
the CE
OM
anagement S
trategiesB
usiness Strategies by S
egment
Financials and Others
Value Creation by N
TT DATA
ES
G M
anagement
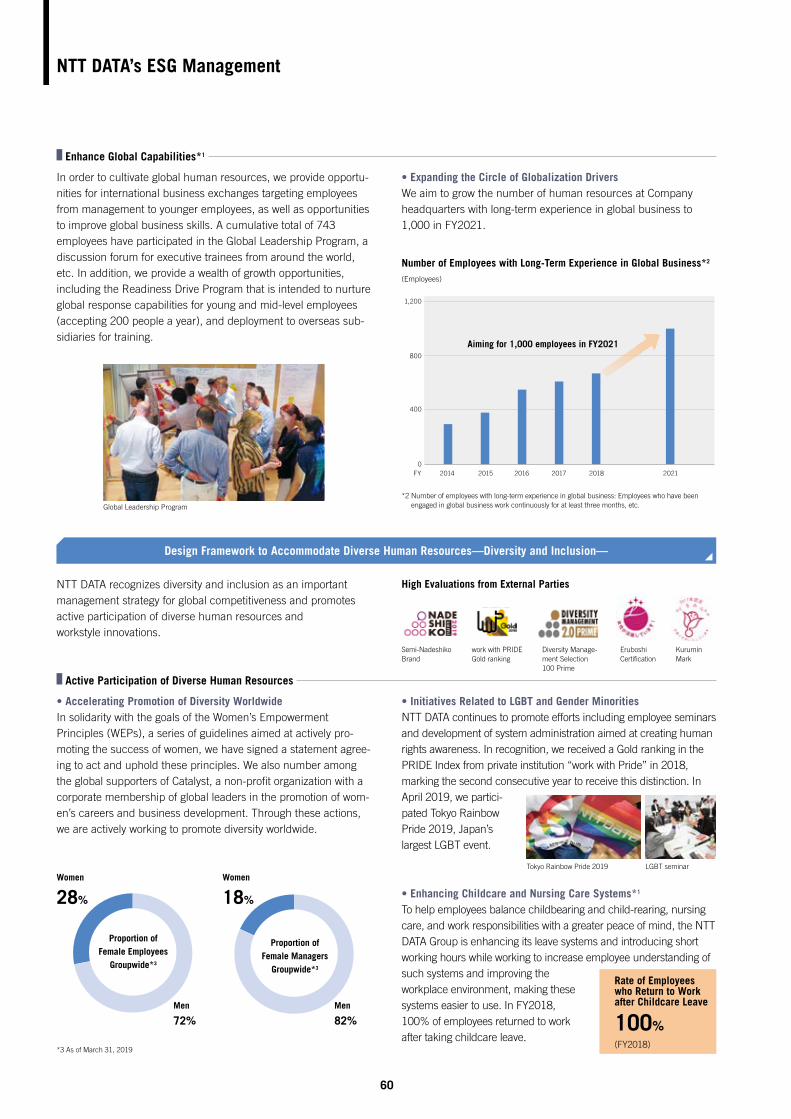
NTT DATA’s ESG Management
Semi-Nadeshiko Brand
work with PRIDE Gold ranking
Diversity Manage-ment Selection 100 Prime
Eruboshi Certification
Kurumin Mark
60
In order to cultivate global human resources, we provide opportu-nities for international business exchanges targeting employees from management to younger employees, as well as opportunities to improve global business skills. A cumulative total of 743 employees have participated in the Global Leadership Program, a discussion forum for executive trainees from around the world, etc. In addition, we provide a wealth of growth opportunities, including the Readiness Drive Program that is intended to nurture global response capabilities for young and mid-level employees (accepting 200 people a year), and deployment to overseas sub-sidiaries for training.
Global Leadership Program
• Expanding the Circle of Globalization Drivers We aim to grow the number of human resources at Company headquarters with long-term experience in global business to 1,000 in FY2021.
• Accelerating Promotion of Diversity Worldwide In solidarity with the goals of the Women’s Empowerment Principles (WEPs), a series of guidelines aimed at actively pro-moting the success of women, we have signed a statement agree-ing to act and uphold these principles. We also number among the global supporters of Catalyst, a non-profit organization with a corporate membership of global leaders in the promotion of wom-en’s careers and business development. Through these actions, we are actively working to promote diversity worldwide.
NTT DATA recognizes diversity and inclusion as an important management strategy for global competitiveness and promotes active participation of diverse human resources and workstyle innovations.
*2 Number of employees with long-term experience in global business: Employees who have been engaged in global business work continuously for at least three months, etc.
• Enhancing Childcare and Nursing Care Systems*1
To help employees balance childbearing and child-rearing, nursing care, and work responsibilities with a greater peace of mind, the NTT DATA Group is enhancing its leave systems and introducing short working hours while working to increase employee understanding of such systems and improving the workplace environment, making these systems easier to use. In FY2018, 100% of employees returned to work after taking childcare leave.
準なでしこ銘柄 100選プライム PRIDEゴールド
●ダイバーシティに関する主な受賞実績●
えるぼし くるみん
Design Framework to Accommodate Diverse Human Resources—Diversity and Inclusion—
*3 As of March 31, 2019
Women
28%
Proportion of Female Employees
Groupwide*3
Proportion of Female Managers
Groupwide*3
Men
72%Men
82%
Women
18%
• Initiatives Related to LGBT and Gender Minorities NTT DATA continues to promote efforts including employee seminars and development of system administration aimed at creating human rights awareness. In recognition, we received a Gold ranking in the PRIDE Index from private institution “work with Pride” in 2018, marking the second consecutive year to receive this distinction. In April 2019, we partici-pated Tokyo Rainbow Pride 2019, Japan’s largest LGBT event.
Tokyo Rainbow Pride 2019 LGBT seminar
Number of Employees with Long-Term Experience in Global Business*2
(Employees)
Rate of Employees who Return to Work after Childcare Leave
100%(FY2018)
FY0
800
400
1,200
2016 2017 2018 202120152014
High Evaluations from External Parties
Enhance Global Capabilities*1
Active Participation of Diverse Human Resources
Aiming for 1,000 employees in FY2021
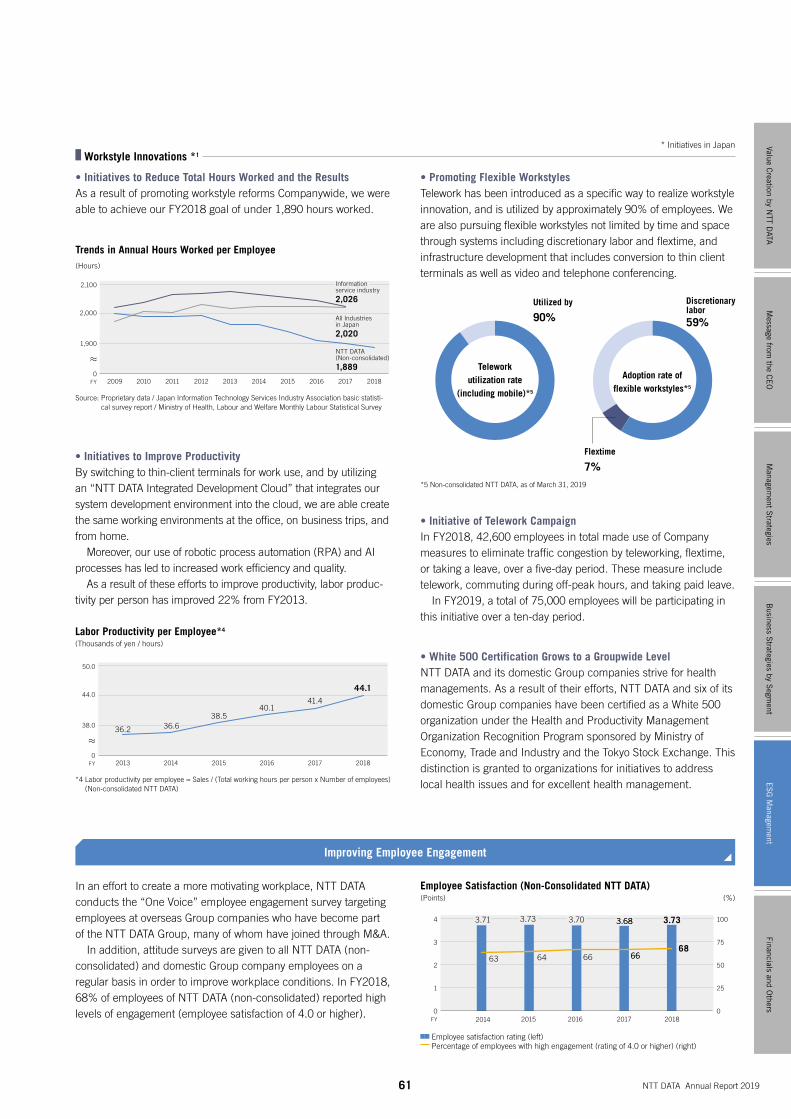
61 NTT DATA Annual Report 2019
• Initiative of Telework CampaignIn FY2018, 42,600 employees in total made use of Company measures to eliminate traffic congestion by teleworking, flextime, or taking a leave, over a five-day period. These measure include telework, commuting during off-peak hours, and taking paid leave. In FY2019, a total of 75,000 employees will be participating in this initiative over a ten-day period.
• White 500 Certification Grows to a Groupwide LevelNTT DATA and its domestic Group companies strive for health managements. As a result of their efforts, NTT DATA and six of its domestic Group companies have been certified as a White 500 organization under the Health and Productivity Management Organization Recognition Program sponsored by Ministry of Economy, Trade and Industry and the Tokyo Stock Exchange. This distinction is granted to organizations for initiatives to address local health issues and for excellent health management.
• Initiatives to Reduce Total Hours Worked and the Results As a result of promoting workstyle reforms Companywide, we were able to achieve our FY2018 goal of under 1,890 hours worked.
• Initiatives to Improve Productivity By switching to thin-client terminals for work use, and by utilizing an “NTT DATA Integrated Development Cloud” that integrates our system development environment into the cloud, we are able create the same working environments at the office, on business trips, and from home. Moreover, our use of robotic process automation (RPA) and AI processes has led to increased work efficiency and quality. As a result of these efforts to improve productivity, labor produc-tivity per person has improved 22% from FY2013.
• Promoting Flexible Workstyles Telework has been introduced as a specific way to realize workstyle innovation, and is utilized by approximately 90% of employees. We are also pursuing flexible workstyles not limited by time and space through systems including discretionary labor and flextime, and infrastructure development that includes conversion to thin client terminals as well as video and telephone conferencing.
FY
All Industries in Japan
2,020
NTT DATA (Non-consolidated)
1,889
2,100
2,000
1,900
02018201720162015201420132012201120102009
Information service industry
2,026
Improving Employee Engagement
In an effort to create a more motivating workplace, NTT DATA conducts the “One Voice” employee engagement survey targeting employees at overseas Group companies who have become part of the NTT DATA Group, many of whom have joined through M&A. In addition, attitude surveys are given to all NTT DATA (non-consolidated) and domestic Group company employees on a regular basis in order to improve workplace conditions. In FY2018, 68% of employees of NTT DATA (non-consolidated) reported high levels of engagement (employee satisfaction of 4.0 or higher).
*5 Non-consolidated NTT DATA, as of March 31, 2019
Discretionary labor59%
Telework utilization rate
(including mobile)*5
Adoption rate of flexible workstyles*5
Flextime
7%
Utilized by
90%
Labor Productivity per Employee*4
(Thousands of yen / hours)
36.2 36.638.5
40.141.4
FY
44.1
50.0
44.0
38.0
0201820172016201520142013
*4 Labor productivity per employee = Sales / (Total working hours per person x Number of employees) (Non-consolidated NTT DATA)
Source: Proprietary data / Japan Information Technology Services Industry Association basic statisti-cal survey report / Ministry of Health, Labour and Welfare Monthly Labour Statistical Survey
Employee Satisfaction (Non-Consolidated NTT DATA)(Points) (%)
FY
4
3
2
1
0
100
75
50
25
0
3.71
20182016 201720152014
6363 6464
3.733.73
6666
3.703.70
6666
3.683.68
6868
3.733.73
Employee satisfaction rating (left) Percentage of employees with high engagement (rating of 4.0 or higher) (right)
Workstyle Innovations *1 * Initiatives in Japan
Message from
the CE
OM
anagement S
trategiesB
usiness Strategies by S
egment
Financials and Others
Value Creation by N
TT DATA
ES
G M
anagement
Trends in Annual Hours Worked per Employee(Hours)
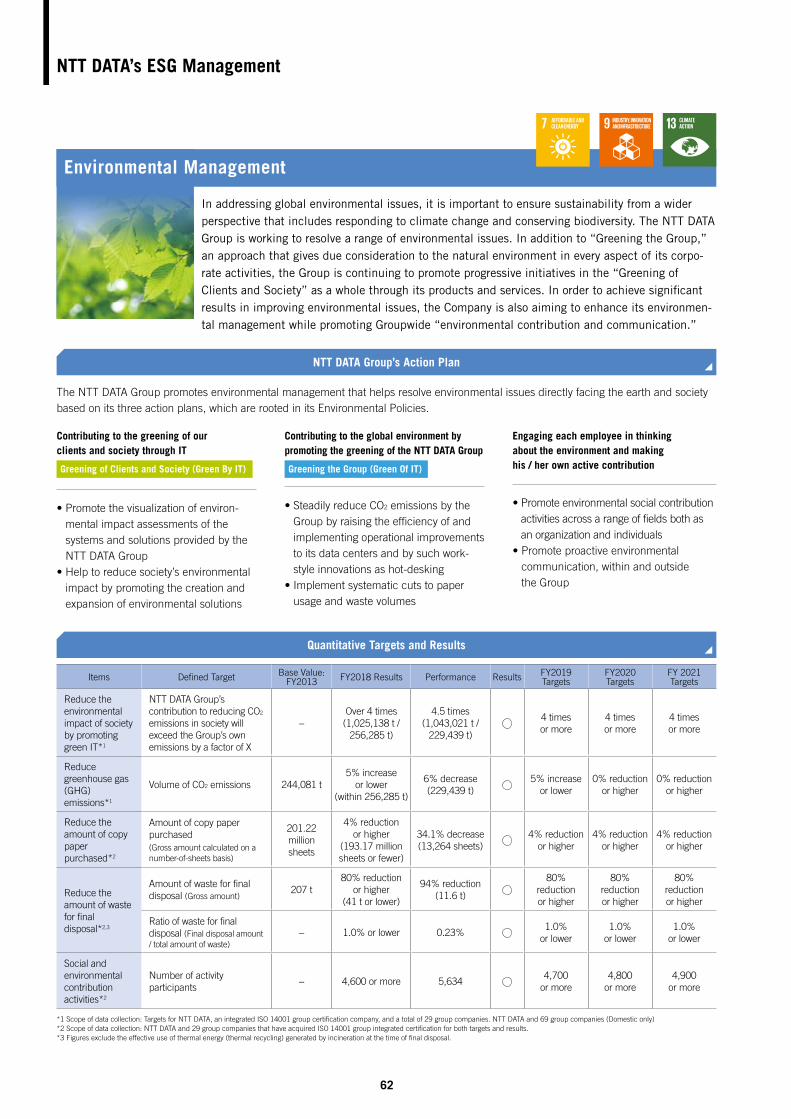
NTT DATA’s ESG Management
62
Contributing to the greening of our clients and society through IT
• Promote the visualization of environ-
mental impact assessments of the systems and solutions provided by the NTT DATA Group
• Help to reduce society’s environmental impact by promoting the creation and expansion of environmental solutions
Contributing to the global environment by promoting the greening of the NTT DATA Group
• Steadily reduce CO2 emissions by the
Group by raising the efficiency of and implementing operational improvements to its data centers and by such work-style innovations as hot-desking
• Implement systematic cuts to paper usage and waste volumes
The NTT DATA Group promotes environmental management that helps resolve environmental issues directly facing the earth and society based on its three action plans, which are rooted in its Environmental Policies.
NTT DATA Group’s Action Plan
Quantitative Targets and Results
Greening of Clients and Society (Green By IT) Greening the Group (Green Of IT)
Items Defined Target Base Value: FY2013 FY2018 Results Performance Results FY2019
TargetsFY2020 Targets
FY 2021 Targets
Reduce the environmental impact of society by promoting green IT*1
NTT DATA Group’s contribution to reducing CO2 emissions in society will exceed the Group’s own emissions by a factor of X
−Over 4 times (1,025,138 t /
256,285 t)
4.5 times(1,043,021 t /
229,439 t)
4 times or more
4 times or more
4 times or more
Reduce greenhouse gas (GHG) emissions*1
Volume of CO2 emissions 244,081 t5% increase
or lower (within 256,285 t)
6% decrease (229,439 t)
5% increase or lower
0% reduction or higher
0% reduction or higher
Reduce the amount of copy paper purchased*2
Amount of copy paper purchased (Gross amount calculated on a number-of-sheets basis)
201.22 million sheets
4% reduction or higher
(193.17 million sheets or fewer)
34.1% decrease (13,264 sheets)
4% reduction or higher
4% reduction or higher
4% reduction or higher
Reduce the amount of waste for final disposal*2,3
Amount of waste for final disposal (Gross amount)
207 t80% reduction
or higher (41 t or lower)
94% reduction (11.6 t)
80% reduction or higher
80% reduction or higher
80% reduction or higher
Ratio of waste for final disposal (Final disposal amount / total amount of waste)
− 1.0% or lower 0.23%1.0%
or lower1.0%
or lower1.0%
or lower
Social and environmental contribution activities*2
Number of activity participants
− 4,600 or more 5,6344,700
or more4,800
or more4,900
or more
*1 Scope of data collection: Targets for NTT DATA, an integrated ISO 14001 group certification company, and a total of 29 group companies. NTT DATA and 69 group companies (Domestic only)*2 Scope of data collection: NTT DATA and 29 group companies that have acquired ISO 14001 group integrated certification for both targets and results.*3 Figures exclude the effective use of thermal energy (thermal recycling) generated by incineration at the time of final disposal.
Engaging each employee in thinking about the environment and making his / her own active contribution
• Promote environmental social contribution
activities across a range of fields both as an organization and individuals
• Promote proactive environmental communication, within and outside the Group
In addressing global environmental issues, it is important to ensure sustainability from a wider perspective that includes responding to climate change and conserving biodiversity. The NTT DATA Group is working to resolve a range of environmental issues. In addition to “Greening the Group,” an approach that gives due consideration to the natural environment in every aspect of its corpo-rate activities, the Group is continuing to promote progressive initiatives in the “Greening of Clients and Society” as a whole through its products and services. In order to achieve significant results in improving environmental issues, the Company is also aiming to enhance its environmen-tal management while promoting Groupwide “environmental contribution and communication.”
Environmental Management
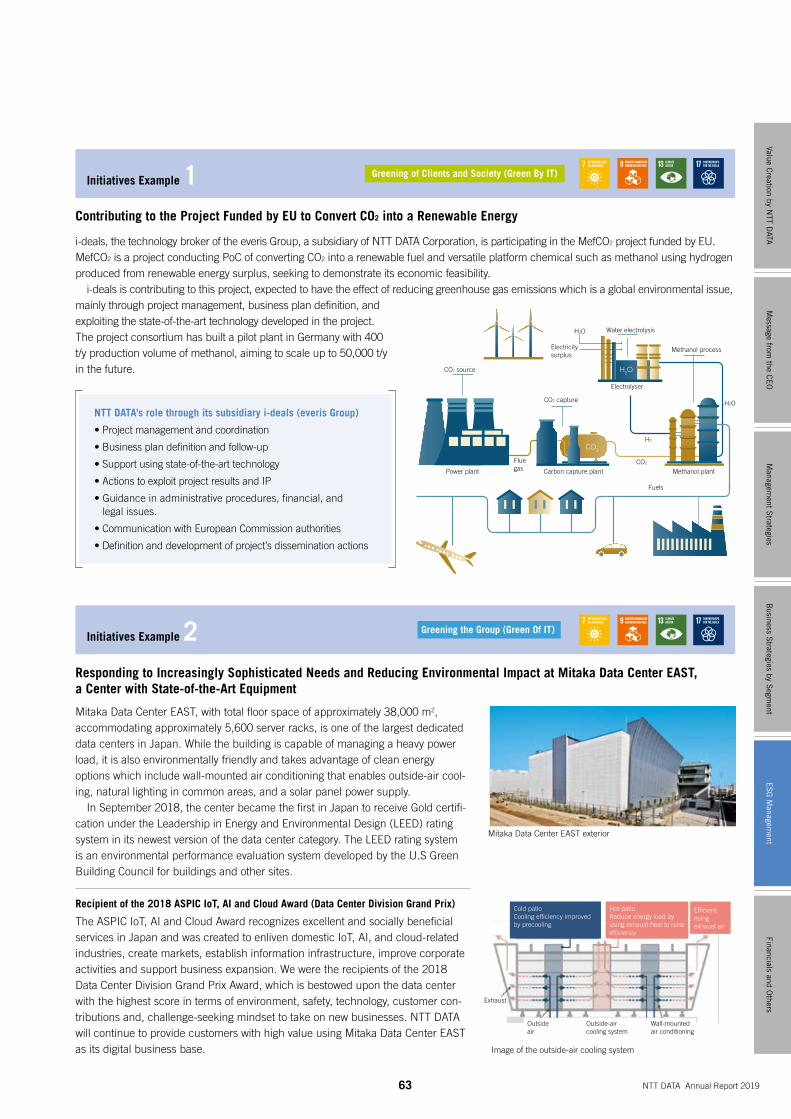
63 NTT DATA Annual Report 2019
Image of the outside-air cooling system
Mitaka Data Center EAST exterior
Cold patioCooling efficiency improved by precooling
Hot patioReduce energy load by using exhaust heat to raise efficiency
Efficient rising exhaust air
Exhaust
Outside air
Outside-air cooling system
Wall-mounted air conditioning
Initiatives Example 2
Recipient of the 2018 ASPIC IoT, AI and Cloud Award (Data Center Division Grand Prix)
The ASPIC IoT, AI and Cloud Award recognizes excellent and socially beneficial services in Japan and was created to enliven domestic IoT, AI, and cloud-related industries, create markets, establish information infrastructure, improve corporate activities and support business expansion. We were the recipients of the 2018 Data Center Division Grand Prix Award, which is bestowed upon the data center with the highest score in terms of environment, safety, technology, customer con-tributions and, challenge-seeking mindset to take on new businesses. NTT DATA will continue to provide customers with high value using Mitaka Data Center EAST as its digital business base.
Mitaka Data Center EAST, with total floor space of approximately 38,000 m2, accommodating approximately 5,600 server racks, is one of the largest dedicated data centers in Japan. While the building is capable of managing a heavy power load, it is also environmentally friendly and takes advantage of clean energy options which include wall-mounted air conditioning that enables outside-air cool-ing, natural lighting in common areas, and a solar panel power supply. In September 2018, the center became the first in Japan to receive Gold certifi-cation under the Leadership in Energy and Environmental Design (LEED) rating system in its newest version of the data center category. The LEED rating system is an environmental performance evaluation system developed by the U.S Green Building Council for buildings and other sites.
Responding to Increasingly Sophisticated Needs and Reducing Environmental Impact at Mitaka Data Center EAST, a Center with State-of-the-Art Equipment
Greening the Group (Green Of IT)
Initiatives Example 1
i-deals, the technology broker of the everis Group, a subsidiary of NTT DATA Corporation, is participating in the MefCO2 project funded by EU.MefCO2 is a project conducting PoC of converting CO2 into a renewable fuel and versatile platform chemical such as methanol using hydrogen produced from renewable energy surplus, seeking to demonstrate its economic feasibility. i-deals is contributing to this project, expected to have the effect of reducing greenhouse gas emissions which is a global environmental issue, mainly through project management, business plan definition, and exploiting the state-of-the-art technology developed in the project.The project consortium has built a pilot plant in Germany with 400 t/y production volume of methanol, aiming to scale up to 50,000 t/y in the future.
Contributing to the Project Funded by EU to Convert CO2 into a Renewable Energy
NTT DATA’s role through its subsidiary i-deals (everis Group)
• Project management and coordination
• Business plan definition and follow-up
• Support using state-of-the-art technology
• Actions to exploit project results and IP
• Guidance in administrative procedures, financial, and legal issues.
• Communication with European Commission authorities
• Definition and development of project’s dissemination actions
H2
H20
2
二酸化炭素発生
発電所
排気ガス
二酸化炭素収集プラント
CO2
二酸化炭素収集
H2O
電解システム
水の電気分解
メタノール生成
燃料
H20
メタノールプラントCO2
電力供給
(METHANOL FUEL FROM CO2) SYNTHESIS OF METHANOL FROM CAPTURED CARBON DIOXIDE USING SURPLUS ELECTRICITY FROM RENEWABLE SOURCES.
Horizon 2020 European Union Funding for Research & Innovation
CO2 capture
Electrolyser
CO2 source
Water electrolysis
Methanol processElectricity surplus
H2O
H2O
CO2
H2
Methanol plantCarbon capture plantPower plant
Flue gas
Fuels
Greening of Clients and Society (Green By IT)
Message from
the CE
OM
anagement S
trategiesB
usiness Strategies by S
egment
Financials and Others
Value Creation by N
TT DATA
ES
G M
anagement
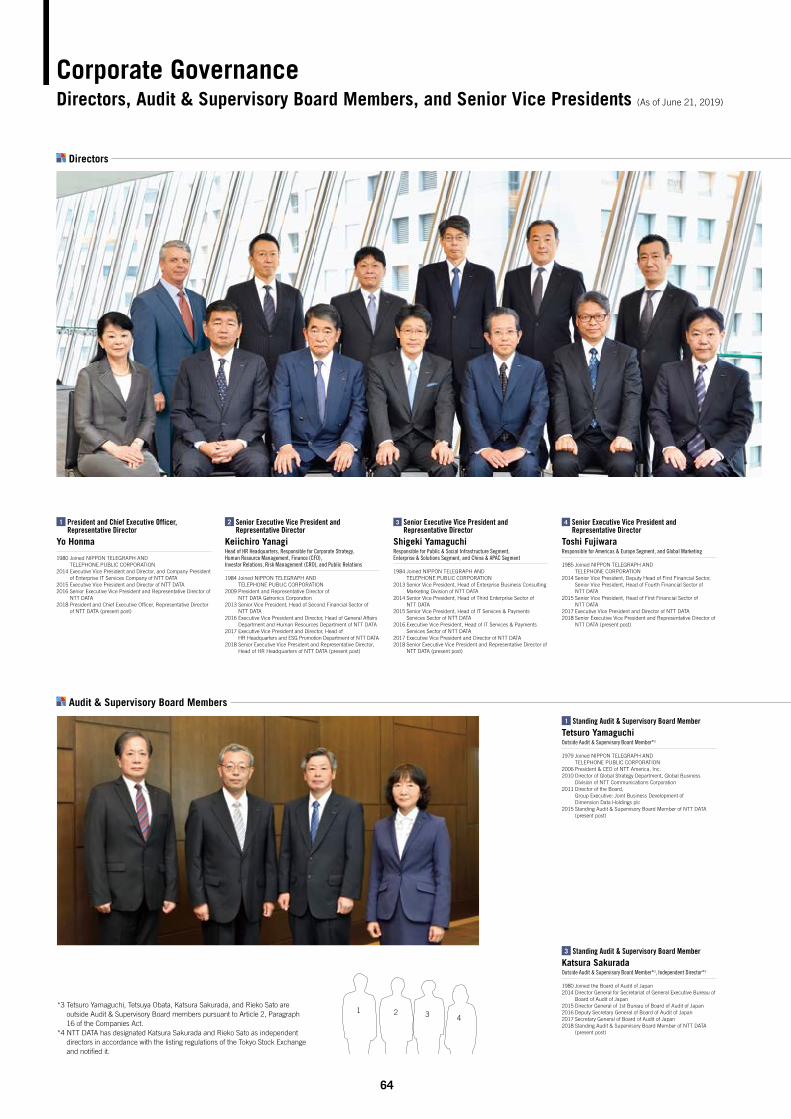
64
Corporate Governance Directors, Audit & Supervisory Board Members, and Senior Vice Presidents (As of June 21, 2019)
1 President and Chief Executive Officer, Representative Director
Yo Honma 1980 Joined NIPPON TELEGRAPH AND
TELEPHONE PUBLIC CORPORATION2014 Executive Vice President and Director, and Company President
of Enterprise IT Services Company of NTT DATA2015 Executive Vice President and Director of NTT DATA2016 Senior Executive Vice President and Representative Director of
NTT DATA2018 President and Chief Executive Officer, Representative Director
of NTT DATA (present post)
2 Senior Executive Vice President and Representative Director
Keiichiro YanagiHead of HR Headquarters, Responsible for Corporate Strategy,Human Resource Management, Finance (CFO),Investor Relations, Risk Management (CRO), and Public Relations 1984 Joined NIPPON TELEGRAPH AND
TELEPHONE PUBLIC CORPORATION2009 President and Representative Director of
NTT DATA Getronics Corporation2013 Senior Vice President, Head of Second Financial Sector of
NTT DATA2016 Executive Vice President and Director, Head of General Affairs
Department and Human Resources Department of NTT DATA2017 Executive Vice President and Director, Head of
HR Headquarters and ESG Promotion Department of NTT DATA2018 Senior Executive Vice President and Representative Director,
Head of HR Headquarters of NTT DATA (present post)
3 Senior Executive Vice President and Representative Director
Shigeki YamaguchiResponsible for Public & Social Infrastructure Segment,Enterprise & Solutions Segment, and China & APAC Segment 1984 Joined NIPPON TELEGRAPH AND
TELEPHONE PUBLIC CORPORATION2013 Senior Vice President, Head of Enterprise Business Consulting
Marketing Division of NTT DATA2014 Senior Vice President, Head of Third Enterprise Sector of
NTT DATA2015 Senior Vice President, Head of IT Services & Payments
Services Sector of NTT DATA2016 Executive Vice President, Head of IT Services & Payments
Services Sector of NTT DATA2017 Executive Vice President and Director of NTT DATA2018 Senior Executive Vice President and Representative Director of
NTT DATA (present post)
4 Senior Executive Vice President and Representative Director
Toshi FujiwaraResponsible for Americas & Europe Segment, and Global Marketing 1985 Joined NIPPON TELEGRAPH AND
TELEPHONE CORPORATION2014 Senior Vice President, Deputy Head of First Financial Sector,
Senior Vice President, Head of Fourth Financial Sector of NTT DATA
2015 Senior Vice President, Head of First Financial Sector of NTT DATA
2017 Executive Vice President and Director of NTT DATA2018 Senior Executive Vice President and Representative Director of
NTT DATA (present post)
Directors
*3 Tetsuro Yamaguchi, Tetsuya Obata, Katsura Sakurada, and Rieko Sato are outside Audit & Supervisory Board members pursuant to Article 2, Paragraph 16 of the Companies Act.
*4 NTT DATA has designated Katsura Sakurada and Rieko Sato as independent directors in accordance with the listing regulations of the Tokyo Stock Exchange and notified it.
3 Standing Audit & Supervisory Board Member
Katsura SakuradaOutside Audit & Supervisory Board Member*3, Independent Director*4
1980 Joined the Board of Audit of Japan2014 Director General for Secretariat of General Executive Bureau of
Board of Audit of Japan2015 Director General of 1st Bureau of Board of Audit of Japan2016 Deputy Secretary General of Board of Audit of Japan2017 Secretary General of Board of Audit of Japan2018 Standing Audit & Supervisory Board Member of NTT DATA
(present post)
1 Standing Audit & Supervisory Board Member
Tetsuro YamaguchiOutside Audit & Supervisory Board Member*3
1979 Joined NIPPON TELEGRAPH AND
TELEPHONE PUBLIC CORPORATION2006 President & CEO of NTT America, Inc.2010 Director of Global Strategy Department, Global Business
Division of NTT Communications Corporation2011 Director of the Board,
Group Executive: Joint Business Development of Dimension Data Holdings plc
2015 Standing Audit & Supervisory Board Member of NTT DATA (present post)
1 324
Audit & Supervisory Board Members
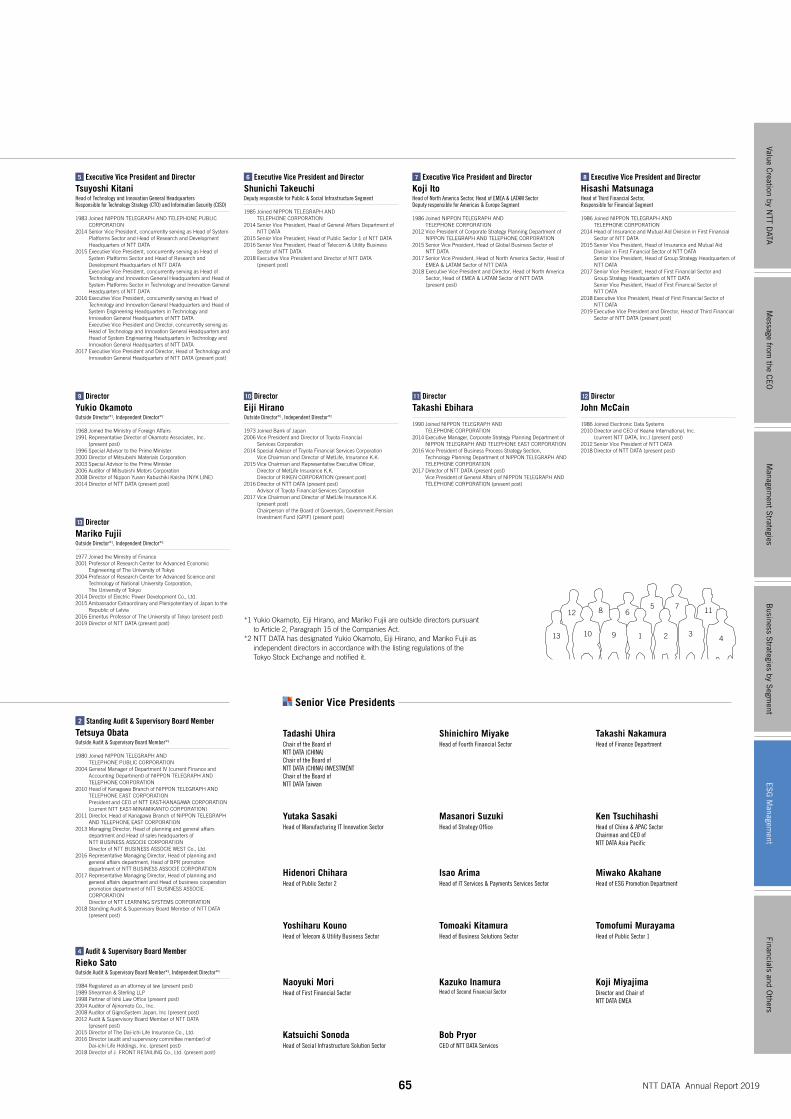
65 NTT DATA Annual Report 2019
10
12
13 31 2 4
11
9
7568
5 Executive Vice President and Director
Tsuyoshi KitaniHead of Technology and Innovation General HeadquartersResponsible for Technology Strategy (CTO) and Information Security (CISO) 1983 Joined NIPPON TELEGRAPH AND TELEPHONE PUBLIC
CORPORATION2014 Senior Vice President, concurrently serving as Head of System
Platforms Sector and Head of Research and Development Headquarters of NTT DATA
2015 Executive Vice President, concurrently serving as Head of System Platforms Sector and Head of Research and Development Headquarters of NTT DATA Executive Vice President, concurrently serving as Head of Technology and Innovation General Headquarters and Head of System Platforms Sector in Technology and Innovation General Headquarters of NTT DATA
2016 Executive Vice President, concurrently serving as Head of Technology and Innovation General Headquarters and Head of System Engineering Headquarters in Technology and Innovation General Headquarters of NTT DATA Executive Vice President and Director, concurrently serving as Head of Technology and Innovation General Headquarters and Head of System Engineering Headquarters in Technology and Innovation General Headquarters of NTT DATA
2017 Executive Vice President and Director, Head of Technology and Innovation General Headquarters of NTT DATA (present post)
6 Executive Vice President and Director
Shunichi TakeuchiDeputy responsible for Public & Social Infrastructure Segment 1985 Joined NIPPON TELEGRAPH AND
TELEPHONE CORPORATION2014 Senior Vice President, Head of General Affairs Department of
NTT DATA2015 Senior Vice President, Head of Public Sector 1 of NTT DATA2016 Senior Vice President, Head of Telecom & Utility Business
Sector of NTT DATA2018 Executive Vice President and Director of NTT DATA
(present post)
9 Director
Yukio OkamotoOutside Director*1, Independent Director*2
1968 Joined the Ministry of Foreign Affairs1991 Representative Director of Okamoto Associates, Inc.
(present post)1996 Special Advisor to the Prime Minister2000 Director of Mitsubishi Materials Corporation2003 Special Advisor to the Prime Minister 2006 Auditor of Mitsubishi Motors Corporation 2008 Director of Nippon Yusen Kabushiki Kaisha (NYK LINE)2014 Director of NTT DATA (present post)
7 Executive Vice President and Director
Koji ItoHead of North America Sector, Head of EMEA & LATAM SectorDeputy responsible for Americas & Europe Segment 1986 Joined NIPPON TELEGRAPH AND
TELEPHONE CORPORATION2012 Vice President of Corporate Strategy Planning Department of
NIPPON TELEGRAPH AND TELEPHONE CORPORATION2015 Senior Vice President, Head of Global Business Sector of
NTT DATA2017 Senior Vice President, Head of North America Sector, Head of
EMEA & LATAM Sector of NTT DATA2018 Executive Vice President and Director, Head of North America
Sector, Head of EMEA & LATAM Sector of NTT DATA (present post)
11 Director
Takashi Ebihara 1990 Joined NIPPON TELEGRAPH AND
TELEPHONE CORPORATION2014 Executive Manager, Corporate Strategy Planning Department of
NIPPON TELEGRAPH AND TELEPHONE EAST CORPORATION2016 Vice President of Business Process Strategy Section,
Technology Planning Department of NIPPON TELEGRAPH AND TELEPHONE CORPORATION
2017 Director of NTT DATA (present post) Vice President of General Affairs of NIPPON TELEGRAPH AND TELEPHONE CORPORATION (present post)
12 Director
John McCain 1986 Joined Electronic Data Systems2010 Director and CEO of Keane International, Inc.
(current NTT DATA, Inc.) (present post)2012 Senior Vice President of NTT DATA2018 Director of NTT DATA (present post)
10 Director
Eiji HiranoOutside Director*1, Independent Director*2
1973 Joined Bank of Japan2006 Vice President and Director of Toyota Financial
Services Corporation2014 Special Advisor of Toyota Financial Services Corporation
Vice Chairman and Director of MetLife, Insurance K.K.2015 Vice Chairman and Representative Executive Officer,
Director of MetLife Insurance K.K. Director of RIKEN CORPORATION (present post)
2016 Director of NTT DATA (present post) Advisor of Toyota Financial Services Corporation
2017 Vice Chairman and Director of MetLife Insurance K.K. (present post) Chairperson of the Board of Governors, Government Pension Investment Fund (GPIF) (present post)
Directors
8 Executive Vice President and Director
Hisashi MatsunagaHead of Third Financial Sector,Responsible for Financial Segment 1986 Joined NIPPON TELEGRAPH AND
TELEPHONE CORPORATION2014 Head of Insurance and Mutual Aid Division in First Financial
Sector of NTT DATA2015 Senior Vice President, Head of Insurance and Mutual Aid
Division in First Financial Sector of NTT DATA Senior Vice President, Head of Group Strategy Headquarters of NTT DATA
2017 Senior Vice President, Head of First Financial Sector and Group Strategy Headquarters of NTT DATA Senior Vice President, Head of First Financial Sector of NTT DATA
2018 Executive Vice President, Head of First Financial Sector of NTT DATA
2019 Executive Vice President and Director, Head of Third Financial Sector of NTT DATA (present post)
13 Director
Mariko FujiiOutside Director*1, Independent Director*2
1977 Joined the Ministry of Finance2001 Professor of Research Center for Advanced Economic
Engineering of The University of Tokyo2004 Professor of Research Center for Advanced Science and
Technology of National University Corporation, The University of Tokyo
2014 Director of Electric Power Development Co., Ltd.2015 Ambassador Extraordinary and Plenipotentiary of Japan to the
Republic of Latvia2016 Emeritus Professor of The University of Tokyo (present post)2019 Director of NTT DATA (present post) *1 Yukio Okamoto, Eiji Hirano, and Mariko Fujii are outside directors pursuant
to Article 2, Paragraph 15 of the Companies Act.*2 NTT DATA has designated Yukio Okamoto, Eiji Hirano, and Mariko Fujii as
independent directors in accordance with the listing regulations of the Tokyo Stock Exchange and notified it.
4 Audit & Supervisory Board Member
Rieko SatoOutside Audit & Supervisory Board Member*3, Independent Director*4
1984 Registered as an attorney at law (present post)1989 Shearman & Sterling LLP1998 Partner of Ishii Law Office (present post)2004 Auditor of Ajinomoto Co., Inc.2008 Auditor of GignoSystem Japan, Inc (present post)2012 Audit & Supervisory Board Member of NTT DATA
(present post)2015 Director of The Dai-ichi Life Insurance Co., Ltd.2016 Director (audit and supervisory committee member) of
Dai-ichi Life Holdings, Inc. (present post)2018 Director of J. FRONT RETAILING Co., Ltd. (present post)
2 Standing Audit & Supervisory Board Member
Tetsuya ObataOutside Audit & Supervisory Board Member*3
1980 Joined NIPPON TELEGRAPH AND
TELEPHONE PUBLIC CORPORATION2004 General Manager of Department IV (current Finance and
Accounting Department) of NIPPON TELEGRAPH AND TELEPHONE CORPORATION
2010 Head of Kanagawa Branch of NIPPON TELEGRAPH AND TELEPHONE EAST CORPORATION President and CEO of NTT EAST-KANAGAWA CORPORATION (current NTT EAST-MINAMIKANTO CORPORATION)
2011 Director, Head of Kanagawa Branch of NIPPON TELEGRAPH AND TELEPHONE EAST CORPORATION
2013 Managing Director, Head of planning and general affairs department and Head of sales headquarters of NTT BUSINESS ASSOCIE CORPORATION Director of NTT BUSINESS ASSOCIE WEST Co., Ltd.
2016 Representative Managing Director, Head of planning and general affairs department, Head of BPR promotion department of NTT BUSINESS ASSOCIE CORPORATION
2017 Representative Managing Director, Head of planning and general affairs department and Head of business cooperation promotion department of NTT BUSINESS ASSOCIE CORPORATION Director of NTT LEARNING SYSTEMS CORPORATION
2018 Standing Audit & Supervisory Board Member of NTT DATA (present post)
Audit & Supervisory Board Members Senior Vice Presidents
Tomoaki KitamuraHead of Business Solutions Sector
Miwako AkahaneHead of ESG Promotion Department
Hidenori ChiharaHead of Public Sector 2
Masanori SuzukiHead of Strategy Office
Takashi NakamuraHead of Finance Department
Tadashi Uhira Chair of the Board of NTT DATA (CHINA)Chair of the Board of NTT DATA (CHINA) INVESTMENTChair of the Board of NTT DATA Taiwan
Naoyuki MoriHead of First Financial Sector
Isao ArimaHead of IT Services & Payments Services Sector
Koji Miyajima Director and Chair of NTT DATA EMEA
Yoshiharu KounoHead of Telecom & Utility Business Sector
Bob PryorCEO of NTT DATA Services
Tomofumi MurayamaHead of Public Sector 1
Shinichiro MiyakeHead of Fourth Financial Sector
Kazuko InamuraHead of Second Financial Sector
Yutaka SasakiHead of Manufacturing IT Innovation Sector
Katsuichi SonodaHead of Social Infrastructure Solution Sector
Ken TsuchihashiHead of China & APAC SectorChairman and CEO of NTT DATA Asia Pacific
Message from
the CE
OM
anagement S
trategiesB
usiness Strategies by S
egment
Financials and Others
Value Creation by N
TT DATA
ES
G M
anagement
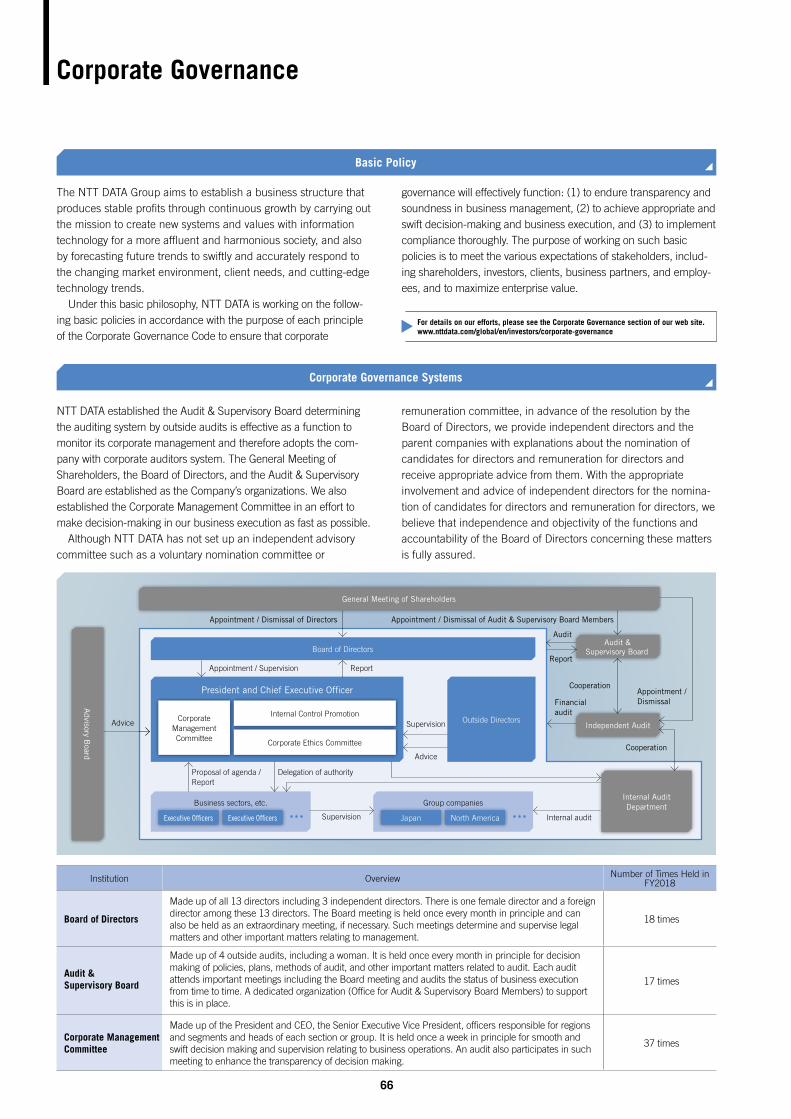
Corporate Governance
66
Institution Overview Number of Times Held in FY2018
Board of Directors
Made up of all 13 directors including 3 independent directors. There is one female director and a foreign director among these 13 directors. The Board meeting is held once every month in principle and can also be held as an extraordinary meeting, if necessary. Such meetings determine and supervise legal matters and other important matters relating to management.
18 times
Audit & Supervisory Board
Made up of 4 outside audits, including a woman. It is held once every month in principle for decision making of policies, plans, methods of audit, and other important matters related to audit. Each audit attends important meetings including the Board meeting and audits the status of business execution from time to time. A dedicated organization (Office for Audit & Supervisory Board Members) to support this is in place.
17 times
Corporate Management Committee
Made up of the President and CEO, the Senior Executive Vice President, officers responsible for regions and segments and heads of each section or group. It is held once a week in principle for smooth and swift decision making and supervision relating to business operations. An audit also participates in such meeting to enhance the transparency of decision making.
37 times
The NTT DATA Group aims to establish a business structure that produces stable profits through continuous growth by carrying out the mission to create new systems and values with information technology for a more affluent and harmonious society, and also by forecasting future trends to swiftly and accurately respond to the changing market environment, client needs, and cutting-edge technology trends. Under this basic philosophy, NTT DATA is working on the follow-ing basic policies in accordance with the purpose of each principle of the Corporate Governance Code to ensure that corporate
governance will effectively function: (1) to endure transparency and soundness in business management, (2) to achieve appropriate and swift decision-making and business execution, and (3) to implement compliance thoroughly. The purpose of working on such basic policies is to meet the various expectations of stakeholders, includ-ing shareholders, investors, clients, business partners, and employ-ees, and to maximize enterprise value.
Advisory B
oard
General Meeting of Shareholders
Board of Directors
President and Chief Executive Officer
Outside Directors
Internal Audit Department
Independent Audit
Audit & Supervisory Board
Corporate Management Committee
Internal Control Promotion
Corporate Ethics Committee
Business sectors, etc.
Executive Officers Executive Officers
Group companies
Japan North America
Appointment / Dismissal of Directors Appointment / Dismissal of Audit & Supervisory Board Members
Appointment / Supervision Report
Audit
Report
CooperationAppointment / DismissalFinancial
audit
Advice
Supervision
Proposal of agenda / Report
Delegation of authority
Internal auditSupervision
Advice
Cooperation
Basic Policy
NTT DATA established the Audit & Supervisory Board determining the auditing system by outside audits is effective as a function to monitor its corporate management and therefore adopts the com-pany with corporate auditors system. The General Meeting of Shareholders, the Board of Directors, and the Audit & Supervisory Board are established as the Company’s organizations. We also established the Corporate Management Committee in an effort to make decision-making in our business execution as fast as possible. Although NTT DATA has not set up an independent advisory committee such as a voluntary nomination committee or
remuneration committee, in advance of the resolution by the Board of Directors, we provide independent directors and the parent companies with explanations about the nomination of candidates for directors and remuneration for directors and receive appropriate advice from them. With the appropriate involvement and advice of independent directors for the nomina-tion of candidates for directors and remuneration for directors, we believe that independence and objectivity of the functions and accountability of the Board of Directors concerning these matters is fully assured.
Corporate Governance Systems
For details on our efforts, please see the Corporate Governance section of our web site. www.nttdata.com/global/en/investors/corporate-governance
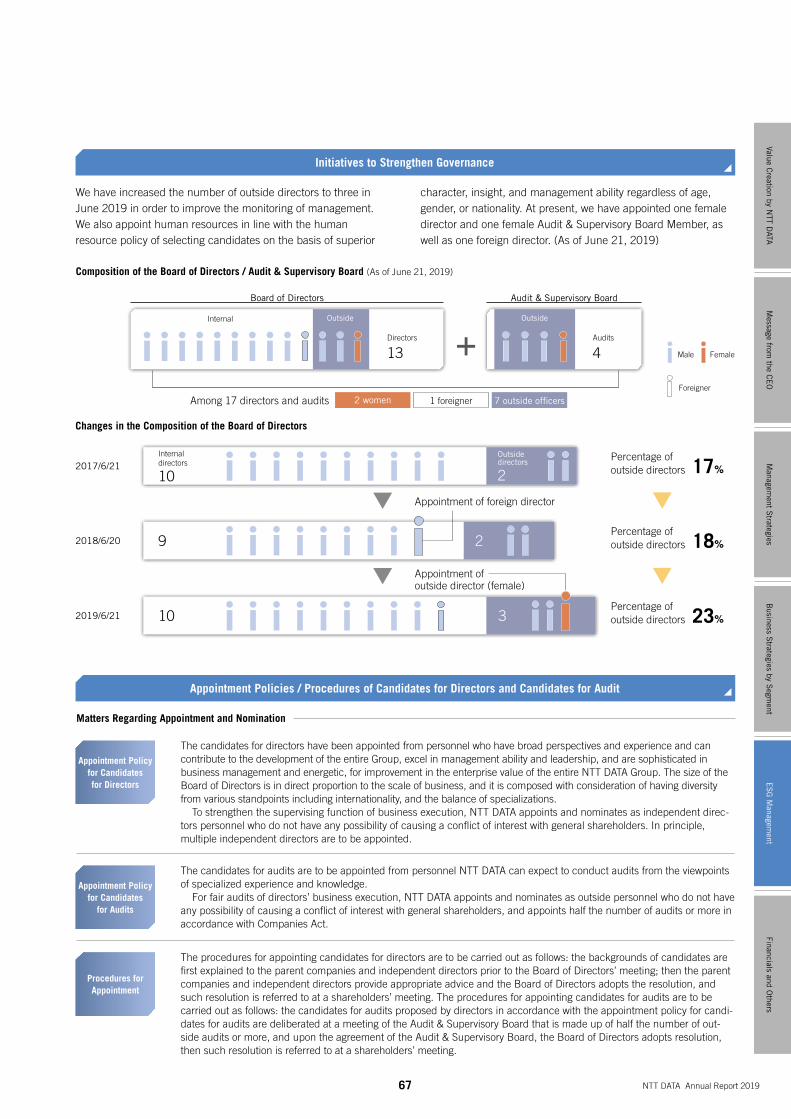
67 NTT DATA Annual Report 2019
Among 17 directors and audits 2 women 1 foreigner 7 outside officers
Changes in the Composition of the Board of Directors
Audits
4
Audit & Supervisory Board
2019/6/21
Matters Regarding Appointment and Nomination
The candidates for audits are to be appointed from personnel NTT DATA can expect to conduct audits from the viewpoints of specialized experience and knowledge. For fair audits of directors’ business execution, NTT DATA appoints and nominates as outside personnel who do not have any possibility of causing a conflict of interest with general shareholders, and appoints half the number of audits or more in accordance with Companies Act.
Appointment Policy for Candidates
for Audits
The procedures for appointing candidates for directors are to be carried out as follows: the backgrounds of candidates are first explained to the parent companies and independent directors prior to the Board of Directors’ meeting; then the parent companies and independent directors provide appropriate advice and the Board of Directors adopts the resolution, and such resolution is referred to at a shareholders’ meeting. The procedures for appointing candidates for audits are to be carried out as follows: the candidates for audits proposed by directors in accordance with the appointment policy for candi-dates for audits are deliberated at a meeting of the Audit & Supervisory Board that is made up of half the number of out-side audits or more, and upon the agreement of the Audit & Supervisory Board, the Board of Directors adopts resolution, then such resolution is referred to at a shareholders’ meeting.
Procedures for Appointment
Directors
13
Internal
Board of Directors
Male Female
Foreigner
Appointment Policy for Candidates for Directors
The candidates for directors have been appointed from personnel who have broad perspectives and experience and can contribute to the development of the entire Group, excel in management ability and leadership, and are sophisticated in business management and energetic, for improvement in the enterprise value of the entire NTT DATA Group. The size of the Board of Directors is in direct proportion to the scale of business, and it is composed with consideration of having diversity from various standpoints including internationality, and the balance of specializations. To strengthen the supervising function of business execution, NTT DATA appoints and nominates as independent direc-tors personnel who do not have any possibility of causing a conflict of interest with general shareholders. In principle, multiple independent directors are to be appointed.
We have increased the number of outside directors to three in June 2019 in order to improve the monitoring of management. We also appoint human resources in line with the human resource policy of selecting candidates on the basis of superior
character, insight, and management ability regardless of age, gender, or nationality. At present, we have appointed one female director and one female Audit & Supervisory Board Member, as well as one foreign director. (As of June 21, 2019)
Initiatives to Strengthen Governance
Appointment Policies / Procedures of Candidates for Directors and Candidates for Audit
Composition of the Board of Directors / Audit & Supervisory Board (As of June 21, 2019)
2017/6/21
2018/6/20
Internal directors
10
9
10
Appointment of foreign director
Appointment of outside director (female)
Outside Outside
Outside directors
2
2
3
17%Percentage of outside directors
18%Percentage of outside directors
23%Percentage of outside directors
Message from
the CE
OM
anagement S
trategiesB
usiness Strategies by S
egment
Financials and Others
Value Creation by N
TT DATA
ES
G M
anagement
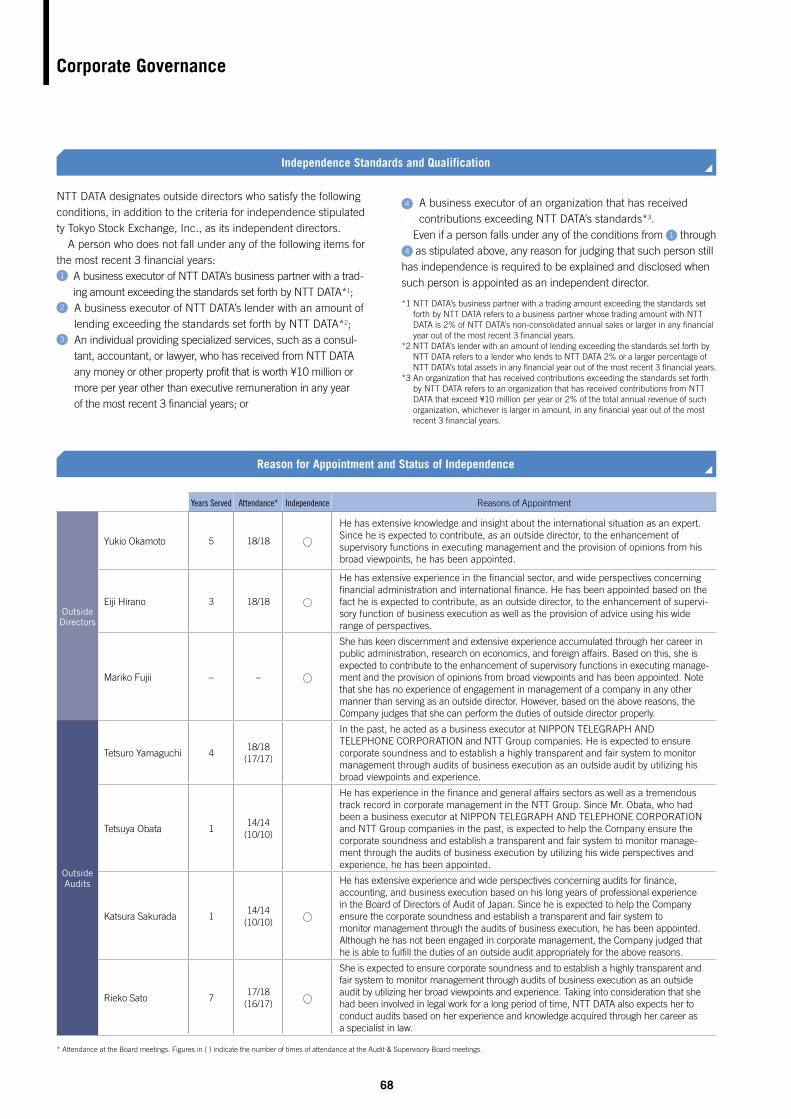
Corporate Governance
68
Years Served Attendance* Independence Reasons of Appointment
Outside Directors
Yukio Okamoto 5 18/18
He has extensive knowledge and insight about the international situation as an expert. Since he is expected to contribute, as an outside director, to the enhancement of supervisory functions in executing management and the provision of opinions from his broad viewpoints, he has been appointed.
Eiji Hirano 3 18/18
He has extensive experience in the financial sector, and wide perspectives concerning financial administration and international finance. He has been appointed based on the fact he is expected to contribute, as an outside director, to the enhancement of supervi-sory function of business execution as well as the provision of advice using his wide range of perspectives.
Mariko Fujii − −
She has keen discernment and extensive experience accumulated through her career in public administration, research on economics, and foreign affairs. Based on this, she is expected to contribute to the enhancement of supervisory functions in executing manage-ment and the provision of opinions from broad viewpoints and has been appointed. Note that she has no experience of engagement in management of a company in any other manner than serving as an outside director. However, based on the above reasons, the Company judges that she can perform the duties of outside director properly.
Outside Audits
Tetsuro Yamaguchi 418/18
(17/17)
In the past, he acted as a business executor at NIPPON TELEGRAPH AND TELEPHONE CORPORATION and NTT Group companies. He is expected to ensure corporate soundness and to establish a highly transparent and fair system to monitor management through audits of business execution as an outside audit by utilizing his broad viewpoints and experience.
Tetsuya Obata 114/14
(10/10)
He has experience in the finance and general affairs sectors as well as a tremendous track record in corporate management in the NTT Group. Since Mr. Obata, who had been a business executor at NIPPON TELEGRAPH AND TELEPHONE CORPORATION and NTT Group companies in the past, is expected to help the Company ensure the corporate soundness and establish a transparent and fair system to monitor manage-ment through the audits of business execution by utilizing his wide perspectives and experience, he has been appointed.
Katsura Sakurada 114/14
(10/10)
He has extensive experience and wide perspectives concerning audits for finance, accounting, and business execution based on his long years of professional experience in the Board of Directors of Audit of Japan. Since he is expected to help the Company ensure the corporate soundness and establish a transparent and fair system to monitor management through the audits of business execution, he has been appointed. Although he has not been engaged in corporate management, the Company judged that he is able to fulfill the duties of an outside audit appropriately for the above reasons.
Rieko Sato 717/18
(16/17)
She is expected to ensure corporate soundness and to establish a highly transparent and fair system to monitor management through audits of business execution as an outside audit by utilizing her broad viewpoints and experience. Taking into consideration that she had been involved in legal work for a long period of time, NTT DATA also expects her to conduct audits based on her experience and knowledge acquired through her career as a specialist in law.
NTT DATA designates outside directors who satisfy the following conditions, in addition to the criteria for independence stipulated ty Tokyo Stock Exchange, Inc., as its independent directors. A person who does not fall under any of the following items for the most recent 3 financial years:1 A business executor of NTT DATA’s business partner with a trad-
ing amount exceeding the standards set forth by NTT DATA*1;2 A business executor of NTT DATA’s lender with an amount of
lending exceeding the standards set forth by NTT DATA*2;3 An individual providing specialized services, such as a consul-
tant, accountant, or lawyer, who has received from NTT DATA any money or other property profit that is worth ¥10 million or more per year other than executive remuneration in any year of the most recent 3 financial years; or
4 A business executor of an organization that has received contributions exceeding NTT DATA’s standards*3.
Even if a person falls under any of the conditions from 1 through 4 as stipulated above, any reason for judging that such person still
has independence is required to be explained and disclosed when such person is appointed as an independent director.
*1 NTT DATA’s business partner with a trading amount exceeding the standards set forth by NTT DATA refers to a business partner whose trading amount with NTT DATA is 2% of NTT DATA’s non-consolidated annual sales or larger in any financial year out of the most recent 3 financial years.
*2 NTT DATA’s lender with an amount of lending exceeding the standards set forth by NTT DATA refers to a lender who lends to NTT DATA 2% or a larger percentage of NTT DATA’s total assets in any financial year out of the most recent 3 financial years.
*3 An organization that has received contributions exceeding the standards set forth by NTT DATA refers to an organization that has received contributions from NTT DATA that exceed ¥10 million per year or 2% of the total annual revenue of such organization, whichever is larger in amount, in any financial year out of the most recent 3 financial years.
Independence Standards and Qualification
Reason for Appointment and Status of Independence
* Attendance at the Board meetings. Figures in ( ) indicate the number of times of attendance at the Audit & Supervisory Board meetings.
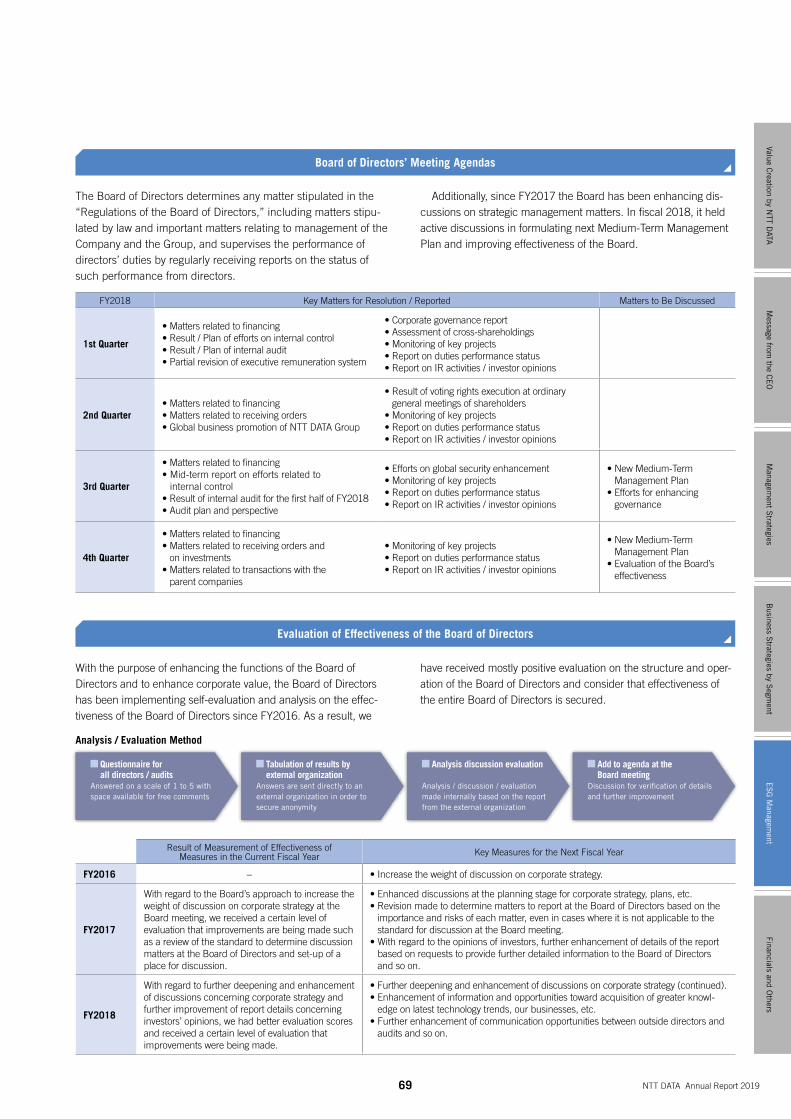
69 NTT DATA Annual Report 2019
Result of Measurement of Effectiveness of Measures in the Current Fiscal Year Key Measures for the Next Fiscal Year
FY2016 − • Increase the weight of discussion on corporate strategy.
FY2017
With regard to the Board’s approach to increase the weight of discussion on corporate strategy at the Board meeting, we received a certain level of evaluation that improvements are being made such as a review of the standard to determine discussion matters at the Board of Directors and set-up of a place for discussion.
• Enhanced discussions at the planning stage for corporate strategy, plans, etc.• Revision made to determine matters to report at the Board of Directors based on the
importance and risks of each matter, even in cases where it is not applicable to the standard for discussion at the Board meeting.
• With regard to the opinions of investors, further enhancement of details of the report based on requests to provide further detailed information to the Board of Directors and so on.
FY2018
With regard to further deepening and enhancement of discussions concerning corporate strategy and further improvement of report details concerning investors’ opinions, we had better evaluation scores and received a certain level of evaluation that improvements were being made.
• Further deepening and enhancement of discussions on corporate strategy (continued).• Enhancement of information and opportunities toward acquisition of greater knowl-
edge on latest technology trends, our businesses, etc.• Further enhancement of communication opportunities between outside directors and
audits and so on.
Analysis / Evaluation Method
Questionnaire for all directors / audits
Answered on a scale of 1 to 5 with space available for free comments
Tabulation of results by external organization
Answers are sent directly to an external organization in order to secure anonymity
Analysis discussion evaluation
Analysis / discussion / evaluation made internally based on the report from the external organization
Add to agenda at the Board meeting
Discussion for verification of details and further improvement
The Board of Directors determines any matter stipulated in the “Regulations of the Board of Directors,” including matters stipu-lated by law and important matters relating to management of the Company and the Group, and supervises the performance of directors’ duties by regularly receiving reports on the status of such performance from directors.
Additionally, since FY2017 the Board has been enhancing dis-cussions on strategic management matters. In fiscal 2018, it held active discussions in formulating next Medium-Term Management Plan and improving effectiveness of the Board.
Board of Directors’ Meeting Agendas
With the purpose of enhancing the functions of the Board of Directors and to enhance corporate value, the Board of Directors has been implementing self-evaluation and analysis on the effec-tiveness of the Board of Directors since FY2016. As a result, we
have received mostly positive evaluation on the structure and oper-ation of the Board of Directors and consider that effectiveness of the entire Board of Directors is secured.
Evaluation of Effectiveness of the Board of Directors
FY2018 Key Matters for Resolution / Reported Matters to Be Discussed
1st Quarter
• Matters related to financing• Result / Plan of efforts on internal control• Result / Plan of internal audit• Partial revision of executive remuneration system
• Corporate governance report• Assessment of cross-shareholdings• Monitoring of key projects• Report on duties performance status• Report on IR activities / investor opinions
2nd Quarter• Matters related to financing• Matters related to receiving orders• Global business promotion of NTT DATA Group
• Result of voting rights execution at ordinary general meetings of shareholders
• Monitoring of key projects• Report on duties performance status• Report on IR activities / investor opinions
3rd Quarter
• Matters related to financing• Mid-term report on efforts related to
internal control• Result of internal audit for the first half of FY2018• Audit plan and perspective
• Efforts on global security enhancement• Monitoring of key projects• Report on duties performance status• Report on IR activities / investor opinions
• New Medium-Term Management Plan
• Efforts for enhancing governance
4th Quarter
• Matters related to financing• Matters related to receiving orders and
on investments• Matters related to transactions with the
parent companies
• Monitoring of key projects• Report on duties performance status• Report on IR activities / investor opinions
• New Medium-Term Management Plan
• Evaluation of the Board’s effectiveness
Message from
the CE
OM
anagement S
trategiesB
usiness Strategies by S
egment
Financials and Others
Value Creation by N
TT DATA
ES
G M
anagement
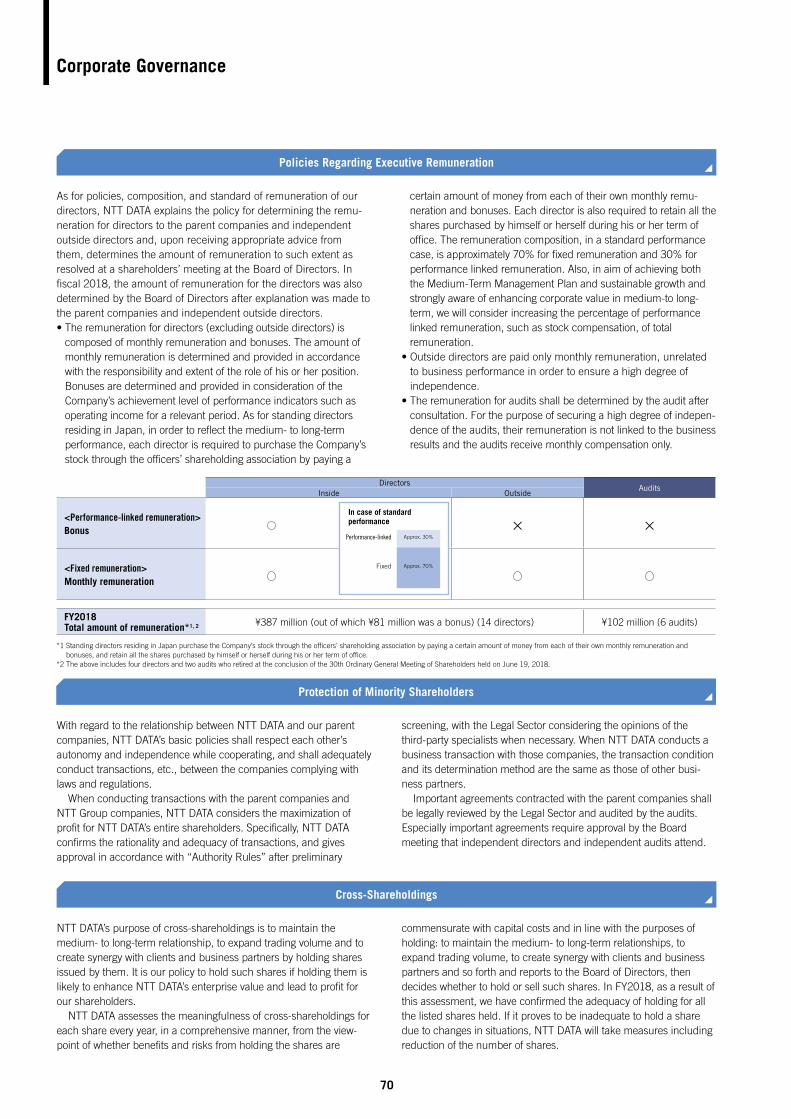
Corporate Governance
70
*1 Standing directors residing in Japan purchase the Company’s stock through the officers’ shareholding association by paying a certain amount of money from each of their own monthly remuneration and bonuses, and retain all the shares purchased by himself or herself during his or her term of office.
*2 The above includes four directors and two audits who retired at the conclusion of the 30th Ordinary General Meeting of Shareholders held on June 19, 2018.
As for policies, composition, and standard of remuneration of our directors, NTT DATA explains the policy for determining the remu-neration for directors to the parent companies and independent outside directors and, upon receiving appropriate advice from them, determines the amount of remuneration to such extent as resolved at a shareholders’ meeting at the Board of Directors. In fiscal 2018, the amount of remuneration for the directors was also determined by the Board of Directors after explanation was made to the parent companies and independent outside directors.• The remuneration for directors (excluding outside directors) is
composed of monthly remuneration and bonuses. The amount of monthly remuneration is determined and provided in accordance with the responsibility and extent of the role of his or her position. Bonuses are determined and provided in consideration of the Company’s achievement level of performance indicators such as operating income for a relevant period. As for standing directors residing in Japan, in order to reflect the medium- to long-term performance, each director is required to purchase the Company’s stock through the officers’ shareholding association by paying a
certain amount of money from each of their own monthly remu-neration and bonuses. Each director is also required to retain all the shares purchased by himself or herself during his or her term of office. The remuneration composition, in a standard performance case, is approximately 70% for fixed remuneration and 30% for performance linked remuneration. Also, in aim of achieving both the Medium-Term Management Plan and sustainable growth and strongly aware of enhancing corporate value in medium-to long-term, we will consider increasing the percentage of performance linked remuneration, such as stock compensation, of total remuneration.
• Outside directors are paid only monthly remuneration, unrelated to business performance in order to ensure a high degree of independence.
• The remuneration for audits shall be determined by the audit after consultation. For the purpose of securing a high degree of indepen-dence of the audits, their remuneration is not linked to the business results and the audits receive monthly compensation only.
Policies Regarding Executive Remuneration
With regard to the relationship between NTT DATA and our parent companies, NTT DATA’s basic policies shall respect each other’s autonomy and independence while cooperating, and shall adequately conduct transactions, etc., between the companies complying with laws and regulations. When conducting transactions with the parent companies and NTT Group companies, NTT DATA considers the maximization of profit for NTT DATA’s entire shareholders. Specifically, NTT DATA confirms the rationality and adequacy of transactions, and gives approval in accordance with “Authority Rules” after preliminary
screening, with the Legal Sector considering the opinions of the third-party specialists when necessary. When NTT DATA conducts a business transaction with those companies, the transaction condition and its determination method are the same as those of other busi-ness partners. Important agreements contracted with the parent companies shall be legally reviewed by the Legal Sector and audited by the audits. Especially important agreements require approval by the Board meeting that independent directors and independent audits attend.
Protection of Minority Shareholders
NTT DATA’s purpose of cross-shareholdings is to maintain the medium- to long-term relationship, to expand trading volume and to create synergy with clients and business partners by holding shares issued by them. It is our policy to hold such shares if holding them is likely to enhance NTT DATA’s enterprise value and lead to profit for our shareholders. NTT DATA assesses the meaningfulness of cross-shareholdings for each share every year, in a comprehensive manner, from the view-point of whether benefits and risks from holding the shares are
commensurate with capital costs and in line with the purposes of holding: to maintain the medium- to long-term relationships, to expand trading volume, to create synergy with clients and business partners and so forth and reports to the Board of Directors, then decides whether to hold or sell such shares. In FY2018, as a result of this assessment, we have confirmed the adequacy of holding for all the listed shares held. If it proves to be inadequate to hold a share due to changes in situations, NTT DATA will take measures including reduction of the number of shares.
Cross-Shareholdings
DirectorsAudits
Inside Outside
<Performance-linked remuneration>Bonus × ×
<Fixed remuneration>Monthly remuneration
FY2018Total amount of remuneration*1, 2 ¥387 million (out of which ¥81 million was a bonus) (14 directors) ¥102 million (6 audits)
Approx. 30%
Approx. 70%
Performance-linked
Fixed
In case of standard performance
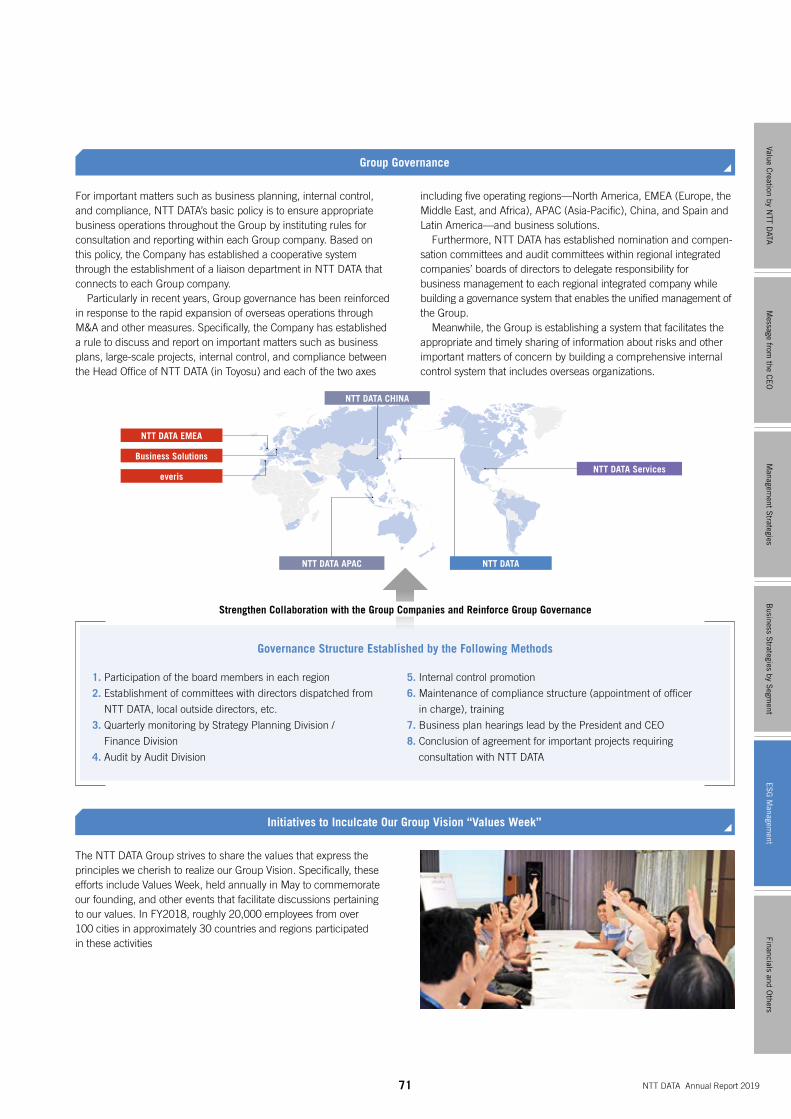
NTT DATANTT DATA APAC
NTT DATA CHINA
NTT DATA Services
NTT DATA EMEA
Business Solutions
everis
71 NTT DATA Annual Report 2019
For important matters such as business planning, internal control, and compliance, NTT DATA’s basic policy is to ensure appropriate business operations throughout the Group by instituting rules for consultation and reporting within each Group company. Based on this policy, the Company has established a cooperative system through the establishment of a liaison department in NTT DATA that connects to each Group company. Particularly in recent years, Group governance has been reinforced in response to the rapid expansion of overseas operations through M&A and other measures. Specifically, the Company has established a rule to discuss and report on important matters such as business plans, large-scale projects, internal control, and compliance between the Head Office of NTT DATA (in Toyosu) and each of the two axes
including five operating regions—North America, EMEA (Europe, the Middle East, and Africa), APAC (Asia-Pacific), China, and Spain and Latin America—and business solutions. Furthermore, NTT DATA has established nomination and compen-sation committees and audit committees within regional integrated companies’ boards of directors to delegate responsibility for business management to each regional integrated company while building a governance system that enables the unified management of the Group. Meanwhile, the Group is establishing a system that facilitates the appropriate and timely sharing of information about risks and other important matters of concern by building a comprehensive internal control system that includes overseas organizations.
Group Governance
The NTT DATA Group strives to share the values that express the principles we cherish to realize our Group Vision. Specifically, these efforts include Values Week, held annually in May to commemorate our founding, and other events that facilitate discussions pertaining to our values. In FY2018, roughly 20,000 employees from over 100 cities in approximately 30 countries and regions participated in these activities
Initiatives to Inculcate Our Group Vision “Values Week”
Strengthen Collaboration with the Group Companies and Reinforce Group Governance
Governance Structure Established by the Following Methods
1. Participation of the board members in each region
2. Establishment of committees with directors dispatched from
NTT DATA, local outside directors, etc.
3. Quarterly monitoring by Strategy Planning Division /
Finance Division
4. Audit by Audit Division
5. Internal control promotion
6. Maintenance of compliance structure (appointment of officer
in charge), training
7. Business plan hearings lead by the President and CEO
8. Conclusion of agreement for important projects requiring
consultation with NTT DATA
Message from
the CE
OM
anagement S
trategiesB
usiness Strategies by S
egment
Financials and Others
Value Creation by N
TT DATA
ES
G M
anagement
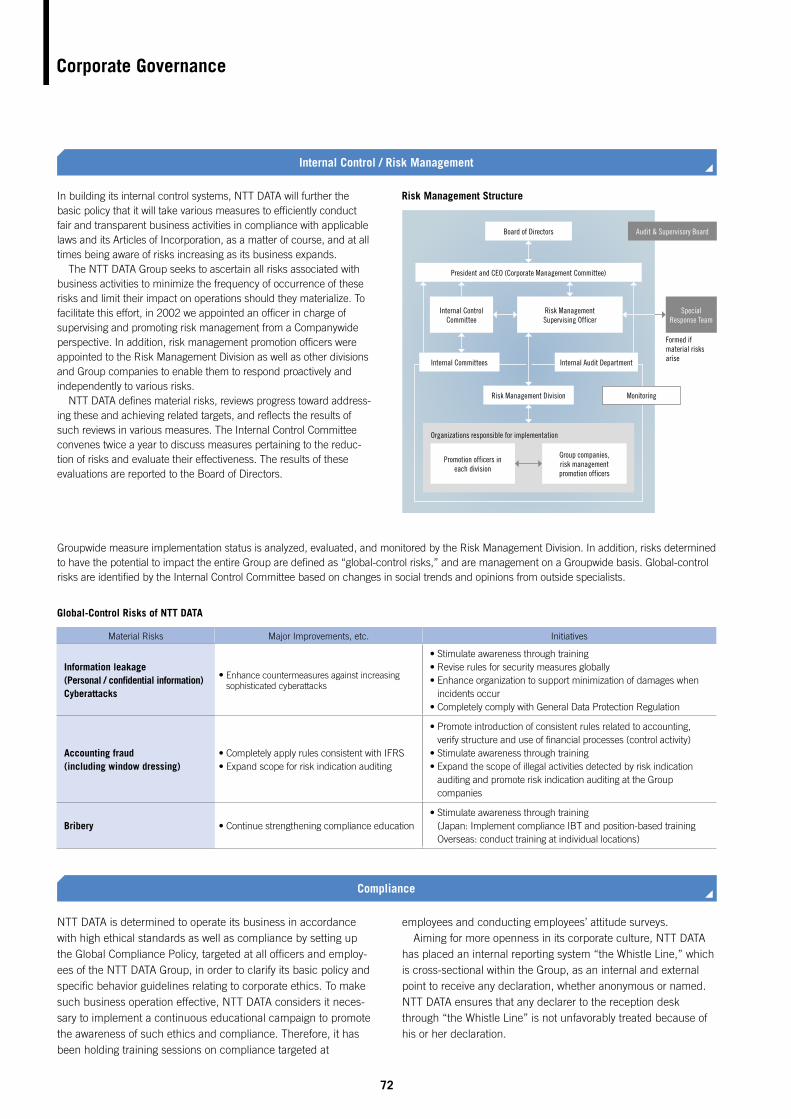
72
In building its internal control systems, NTT DATA will further the basic policy that it will take various measures to efficiently conduct fair and transparent business activities in compliance with applicable laws and its Articles of Incorporation, as a matter of course, and at all times being aware of risks increasing as its business expands. The NTT DATA Group seeks to ascertain all risks associated with business activities to minimize the frequency of occurrence of these risks and limit their impact on operations should they materialize. To facilitate this effort, in 2002 we appointed an officer in charge of supervising and promoting risk management from a Companywide perspective. In addition, risk management promotion officers were appointed to the Risk Management Division as well as other divisions and Group companies to enable them to respond proactively and independently to various risks. NTT DATA defines material risks, reviews progress toward address-ing these and achieving related targets, and reflects the results of such reviews in various measures. The Internal Control Committee convenes twice a year to discuss measures pertaining to the reduc-tion of risks and evaluate their effectiveness. The results of these evaluations are reported to the Board of Directors.
Corporate Governance
Risk Management Structure
Board of Directors
President and CEO (Corporate Management Committee)
Internal Committees Internal Audit Department
Audit & Supervisory Board
Organizations responsible for implementation
Promotion officers in each division
Group companies, risk management promotion officers
Special Response Team
Internal Control Committee
Risk Management Supervising Officer
Risk Management Division Monitoring
Formed if material risks arise
Material Risks Major Improvements, etc. Initiatives
Information leakage (Personal / confidential information) Cyberattacks
• Enhance countermeasures against increasing sophisticated cyberattacks
• Stimulate awareness through training• Revise rules for security measures globally• Enhance organization to support minimization of damages when
incidents occur• Completely comply with General Data Protection Regulation
Accounting fraud (including window dressing)
• Completely apply rules consistent with IFRS• Expand scope for risk indication auditing
• Promote introduction of consistent rules related to accounting, verify structure and use of financial processes (control activity)
• Stimulate awareness through training• Expand the scope of illegal activities detected by risk indication
auditing and promote risk indication auditing at the Group companies
Bribery • Continue strengthening compliance education• Stimulate awareness through training
(Japan: Implement compliance IBT and position-based training Overseas: conduct training at individual locations)
Internal Control / Risk Management
NTT DATA is determined to operate its business in accordance with high ethical standards as well as compliance by setting up the Global Compliance Policy, targeted at all officers and employ-ees of the NTT DATA Group, in order to clarify its basic policy and specific behavior guidelines relating to corporate ethics. To make such business operation effective, NTT DATA considers it neces-sary to implement a continuous educational campaign to promote the awareness of such ethics and compliance. Therefore, it has been holding training sessions on compliance targeted at
employees and conducting employees’ attitude surveys. Aiming for more openness in its corporate culture, NTT DATA has placed an internal reporting system “the Whistle Line,” which is cross-sectional within the Group, as an internal and external point to receive any declaration, whether anonymous or named. NTT DATA ensures that any declarer to the reception desk through “the Whistle Line” is not unfavorably treated because of his or her declaration.
Compliance
Groupwide measure implementation status is analyzed, evaluated, and monitored by the Risk Management Division. In addition, risks determined to have the potential to impact the entire Group are defined as “global-control risks,” and are management on a Groupwide basis. Global-control risks are identified by the Internal Control Committee based on changes in social trends and opinions from outside specialists.
Global-Control Risks of NTT DATA
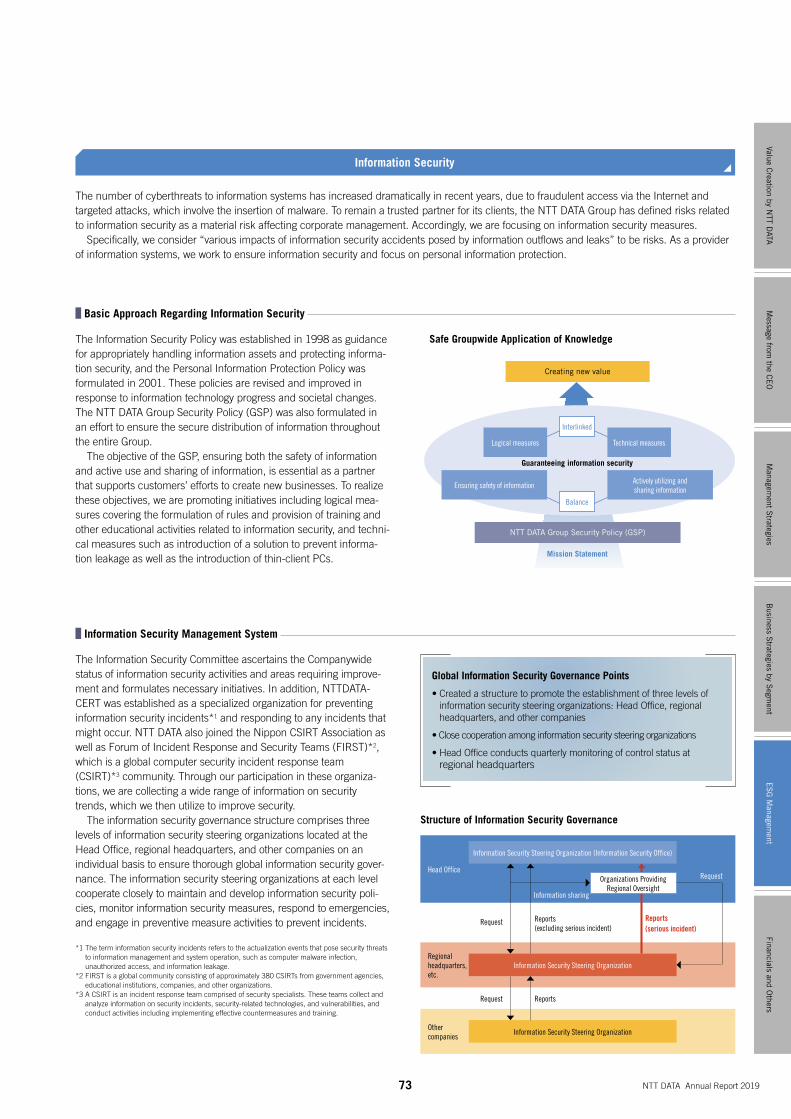
73 NTT DATA Annual Report 2019
The Information Security Policy was established in 1998 as guidance for appropriately handling information assets and protecting informa-tion security, and the Personal Information Protection Policy was formulated in 2001. These policies are revised and improved in response to information technology progress and societal changes. The NTT DATA Group Security Policy (GSP) was also formulated in an effort to ensure the secure distribution of information throughout the entire Group. The objective of the GSP, ensuring both the safety of information and active use and sharing of information, is essential as a partner that supports customers’ efforts to create new businesses. To realize these objectives, we are promoting initiatives including logical mea-sures covering the formulation of rules and provision of training and other educational activities related to information security, and techni-cal measures such as introduction of a solution to prevent informa-tion leakage as well as the introduction of thin-client PCs.
The number of cyberthreats to information systems has increased dramatically in recent years, due to fraudulent access via the Internet and targeted attacks, which involve the insertion of malware. To remain a trusted partner for its clients, the NTT DATA Group has defined risks related to information security as a material risk affecting corporate management. Accordingly, we are focusing on information security measures. Specifically, we consider “various impacts of information security accidents posed by information outflows and leaks” to be risks. As a provider of information systems, we work to ensure information security and focus on personal information protection.
Information Security
Safe Groupwide Application of Knowledge
Creating new value
Guaranteeing information security
NTT DATA Group Security Policy (GSP)
Mission Statement
Technical measuresLogical measures
Interlinked
Ensuring safety of informationActively utilizing and sharing information
Basic Approach Regarding Information Security
The Information Security Committee ascertains the Companywide status of information security activities and areas requiring improve-ment and formulates necessary initiatives. In addition, NTTDATA-CERT was established as a specialized organization for preventing information security incidents*1 and responding to any incidents that might occur. NTT DATA also joined the Nippon CSIRT Association as well as Forum of Incident Response and Security Teams (FIRST)*2, which is a global computer security incident response team (CSIRT)*3 community. Through our participation in these organiza-tions, we are collecting a wide range of information on security trends, which we then utilize to improve security. The information security governance structure comprises three levels of information security steering organizations located at the Head Office, regional headquarters, and other companies on an individual basis to ensure thorough global information security gover-nance. The information security steering organizations at each level cooperate closely to maintain and develop information security poli-cies, monitor information security measures, respond to emergencies, and engage in preventive measure activities to prevent incidents.
*1 The term information security incidents refers to the actualization events that pose security threats to information management and system operation, such as computer malware infection, unauthorized access, and information leakage.
*2 FIRST is a global community consisting of approximately 380 CSIRTs from government agencies, educational institutions, companies, and other organizations.
*3 A CSIRT is an incident response team comprised of security specialists. These teams collect and analyze information on security incidents, security-related technologies, and vulnerabilities, and conduct activities including implementing effective countermeasures and training.
Structure of Information Security Governance
Regional headquarters, etc.
Information Security Steering Organization
Other companies
Information Security Steering Organization
Head Office
Information Security Steering Organization (Information Security Office)
Reports (serious incident)
Organizations Providing Regional Oversight
Reports(excluding serious incident)
Request
Request
Information sharing
Global Information Security Governance Points
• Created a structure to promote the establishment of three levels of information security steering organizations: Head Office, regional headquarters, and other companies
• Close cooperation among information security steering organizations
• Head Office conducts quarterly monitoring of control status at regional headquarters
Information Security Management System
Balance
ReportsRequest
Message from
the CE
OM
anagement S
trategiesB
usiness Strategies by S
egment
Financials and Others
Value Creation by N
TT DATA
ES
G M
anagement
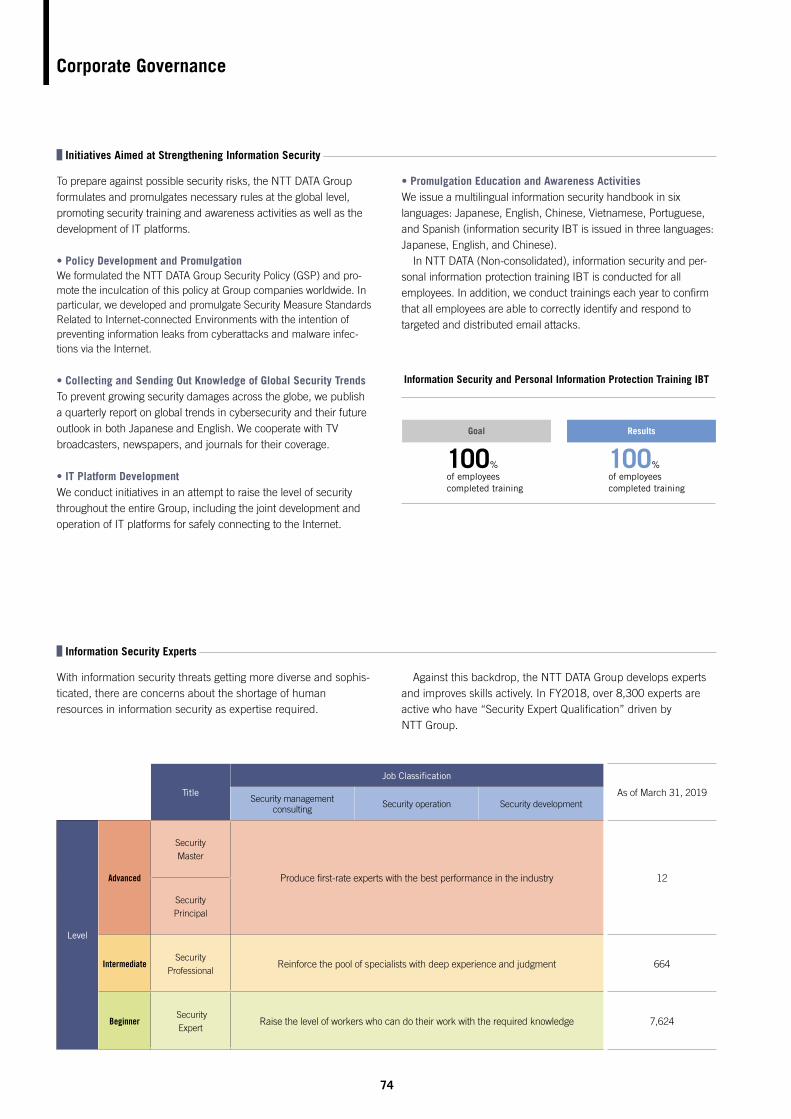
74
To prepare against possible security risks, the NTT DATA Group formulates and promulgates necessary rules at the global level, promoting security training and awareness activities as well as the development of IT platforms.
• Policy Development and PromulgationWe formulated the NTT DATA Group Security Policy (GSP) and pro-mote the inculcation of this policy at Group companies worldwide. In particular, we developed and promulgate Security Measure Standards Related to Internet-connected Environments with the intention of preventing information leaks from cyberattacks and malware infec-tions via the Internet.
• Collecting and Sending Out Knowledge of Global Security TrendsTo prevent growing security damages across the globe, we publish a quarterly report on global trends in cybersecurity and their future outlook in both Japanese and English. We cooperate with TV broadcasters, newspapers, and journals for their coverage.
• IT Platform DevelopmentWe conduct initiatives in an attempt to raise the level of security throughout the entire Group, including the joint development and operation of IT platforms for safely connecting to the Internet.
• Promulgation Education and Awareness ActivitiesWe issue a multilingual information security handbook in six languages: Japanese, English, Chinese, Vietnamese, Portuguese, and Spanish (information security IBT is issued in three languages: Japanese, English, and Chinese). In NTT DATA (Non-consolidated), information security and per-sonal information protection training IBT is conducted for all employees. In addition, we conduct trainings each year to confirm that all employees are able to correctly identify and respond to targeted and distributed email attacks.
Information Security and Personal Information Protection Training IBT
ResultsGoal
100%of employees completed training
Corporate Governance
Title
Job Classification
As of March 31, 2019Security management
consulting Security operation Security development
Level
Advanced
Security Master
Produce first-rate experts with the best performance in the industry 12
Security Principal
IntermediateSecurity
ProfessionalReinforce the pool of specialists with deep experience and judgment 664
Beginner Security Expert
Raise the level of workers who can do their work with the required knowledge 7,624
With information security threats getting more diverse and sophis-ticated, there are concerns about the shortage of human resources in information security as expertise required.
Against this backdrop, the NTT DATA Group develops experts and improves skills actively. In FY2018, over 8,300 experts are active who have “Security Expert Qualification” driven by NTT Group.
Initiatives Aimed at Strengthening Information Security
Information Security Experts
100%of employees completed training
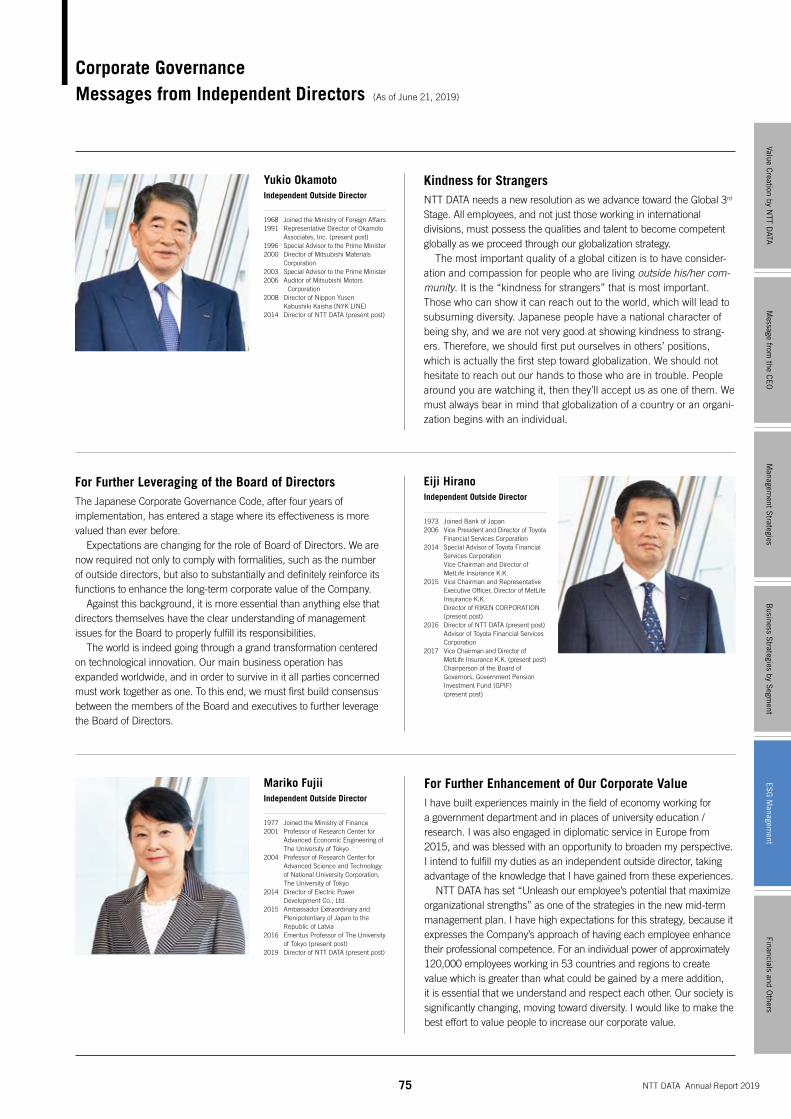
75 NTT DATA Annual Report 2019
Corporate GovernanceMessages from Independent Directors (As of June 21, 2019)
Kindness for StrangersNTT DATA needs a new resolution as we advance toward the Global 3rd Stage. All employees, and not just those working in international divisions, must possess the qualities and talent to become competent globally as we proceed through our globalization strategy. The most important quality of a global citizen is to have consider-ation and compassion for people who are living outside his/her com-munity. It is the “kindness for strangers” that is most important. Those who can show it can reach out to the world, which will lead to subsuming diversity. Japanese people have a national character of being shy, and we are not very good at showing kindness to strang-ers. Therefore, we should first put ourselves in others’ positions, which is actually the first step toward globalization. We should not hesitate to reach out our hands to those who are in trouble. People around you are watching it, then they’ll accept us as one of them. We must always bear in mind that globalization of a country or an organi-zation begins with an individual.
Yukio OkamotoIndependent Outside Director
1968 Joined the Ministry of Foreign Affairs1991 Representative Director of Okamoto
Associates, Inc. (present post)1996 Special Advisor to the Prime Minister2000 Director of Mitsubishi Materials
Corporation2003 Special Advisor to the Prime Minister2006 A uditor of Mitsubishi Motors
Corporation2008 Director of Nippon Yusen
Kabushiki Kaisha (NYK LINE)2014 Director of NTT DATA (present post)
For Further Leveraging of the Board of DirectorsThe Japanese Corporate Governance Code, after four years of implementation, has entered a stage where its effectiveness is more valued than ever before. Expectations are changing for the role of Board of Directors. We are now required not only to comply with formalities, such as the number of outside directors, but also to substantially and definitely reinforce its functions to enhance the long-term corporate value of the Company. Against this background, it is more essential than anything else that directors themselves have the clear understanding of management issues for the Board to properly fulfill its responsibilities. The world is indeed going through a grand transformation centered on technological innovation. Our main business operation has expanded worldwide, and in order to survive in it all parties concerned must work together as one. To this end, we must first build consensus between the members of the Board and executives to further leverage the Board of Directors.
Eiji HiranoIndependent Outside Director
1973 Joined Bank of Japan2006 Vice President and Director of Toyota
Financial Services Corporation2014 Special Advisor of Toyota Financial
Services Corporation Vice Chairman and Director of MetLife Insurance K.K.
2015 Vice Chairman and Representative Executive Officer, Director of MetLife Insurance K.K. Director of RIKEN CORPORATION (present post)
2016 Director of NTT DATA (present post) Advisor of Toyota Financial Services Corporation
2017 Vice Chairman and Director of MetLife Insurance K.K. (present post) Chairperson of the Board of Governors, Government Pension Investment Fund (GPIF) (present post)
For Further Enhancement of Our Corporate ValueI have built experiences mainly in the field of economy working for a government department and in places of university education / research. I was also engaged in diplomatic service in Europe from 2015, and was blessed with an opportunity to broaden my perspective. I intend to fulfill my duties as an independent outside director, taking advantage of the knowledge that I have gained from these experiences. NTT DATA has set “Unleash our employee’s potential that maximize organizational strengths” as one of the strategies in the new mid-term management plan. I have high expectations for this strategy, because it expresses the Company’s approach of having each employee enhance their professional competence. For an individual power of approximately 120,000 employees working in 53 countries and regions to create value which is greater than what could be gained by a mere addition, it is essential that we understand and respect each other. Our society is significantly changing, moving toward diversity. I would like to make the best effort to value people to increase our corporate value.
Mariko FujiiIndependent Outside Director
1977 Joined the Ministry of Finance2001 Professor of Research Center for
Advanced Economic Engineering of The University of Tokyo
2004 Professor of Research Center for Advanced Science and Technology of National University Corporation, The University of Tokyo
2014 Director of Electric Power Development Co., Ltd.
2015 Ambassador Extraordinary and Plenipotentiary of Japan to the Republic of Latvia
2016 Emeritus Professor of The University of Tokyo (present post)
2019 Director of NTT DATA (present post)
Message from
the CE
OM
anagement S
trategiesB
usiness Strategies by S
egment
Financials and Others
Value Creation by N
TT DATA
ES
G M
anagement
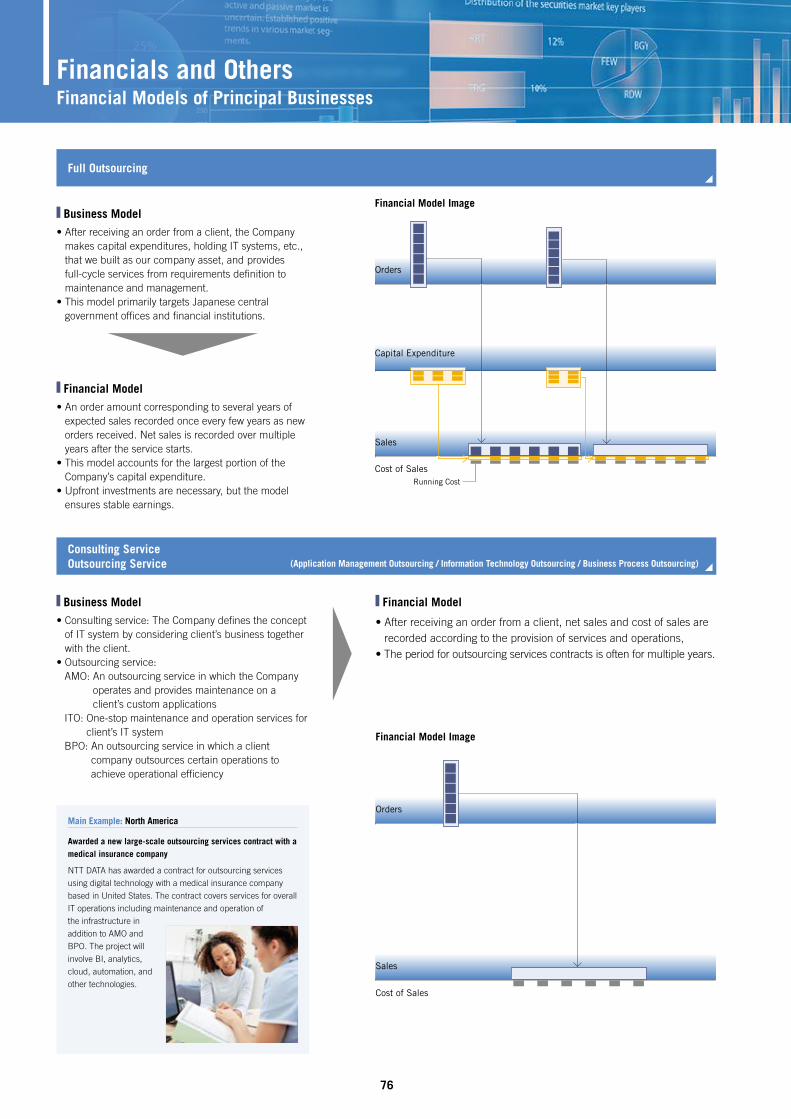
76
Orders
Capital Expenditure
Sales
Cost of SalesRunning Cost
Financials and OthersFinancial Models of Principal Businesses
Financial Model• An order amount corresponding to several years of
expected sales recorded once every few years as new orders received. Net sales is recorded over multiple years after the service starts.
• This model accounts for the largest portion of the Company’s capital expenditure.
• Upfront investments are necessary, but the model ensures stable earnings.
Business Model• After receiving an order from a client, the Company
makes capital expenditures, holding IT systems, etc., that we built as our company asset, and provides full-cycle services from requirements definition to maintenance and management.
• This model primarily targets Japanese central government offices and financial institutions.
Full Outsourcing
Financial Model Image
Financial Model
• After receiving an order from a client, net sales and cost of sales are recorded according to the provision of services and operations,
• The period for outsourcing services contracts is often for multiple years.
Business Model• Consulting service: The Company defines the concept
of IT system by considering client’s business together with the client.
• Outsourcing service: AMO: An outsourcing service in which the Company
operates and provides maintenance on a client’s custom applications
ITO: One-stop maintenance and operation services for client’s IT system
BPO: An outsourcing service in which a client company outsources certain operations to achieve operational efficiency
Main Example: North America
Awarded a new large-scale outsourcing services contract with a medical insurance company
NTT DATA has awarded a contract for outsourcing services
using digital technology with a medical insurance company
based in United States. The contract covers services for overall
IT operations including maintenance and operation of
the infrastructure in
addition to AMO and
BPO. The project will
involve BI, analytics,
cloud, automation, and
other technologies.
Consulting ServiceOutsourcing Service (Application Management Outsourcing / Information Technology Outsourcing / Business Process Outsourcing)
Orders
Sales
Cost of Sales
Financial Model Image
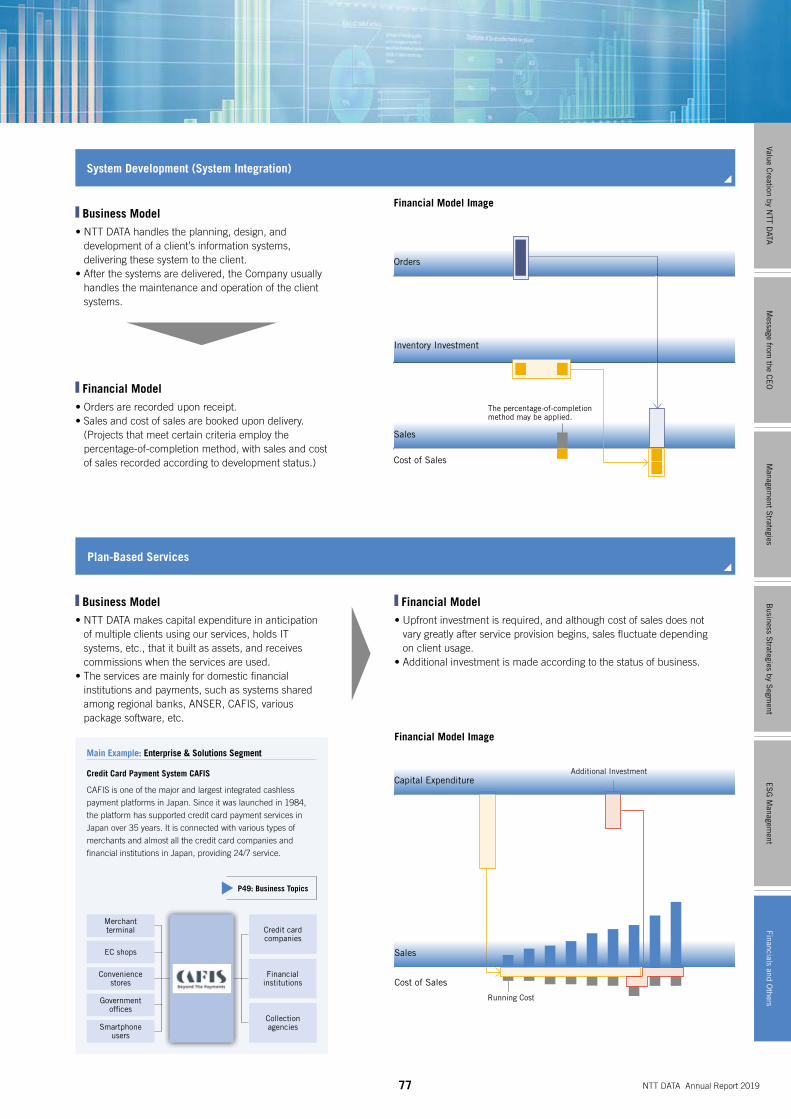
77 NTT DATA Annual Report 2019
Financial Model• Upfront investment is required, and although cost of sales does not
vary greatly after service provision begins, sales fluctuate depending on client usage.
• Additional investment is made according to the status of business.
Business Model• NTT DATA makes capital expenditure in anticipation
of multiple clients using our services, holds IT systems, etc., that it built as assets, and receives commissions when the services are used.
• The services are mainly for domestic financial institutions and payments, such as systems shared among regional banks, ANSER, CAFIS, various package software, etc.
Main Example: Enterprise & Solutions Segment
Credit Card Payment System CAFIS
CAFIS is one of the major and largest integrated cashless
payment platforms in Japan. Since it was launched in 1984,
the platform has supported credit card payment services in
Japan over 35 years. It is connected with various types of
merchants and almost all the credit card companies and
financial institutions in Japan, providing 24/7 service.
Plan-Based Services
Orders
Inventory Investment
Sales
Cost of Sales
The percentage-of-completion method may be applied.
Financial Model• Orders are recorded upon receipt.• Sales and cost of sales are booked upon delivery.
(Projects that meet certain criteria employ the percentage-of-completion method, with sales and cost of sales recorded according to development status.)
Business Model• NTT DATA handles the planning, design, and
development of a client’s information systems, delivering these system to the client.
• After the systems are delivered, the Company usually handles the maintenance and operation of the client systems.
System Development (System Integration)
Financial Model Image
Cost of Sales
Running Cost
Additional Investment
Financial Model Image
Capital Expenditure
Sales
Merchant terminal
EC shops
Convenience stores
Government offices
Smartphone users
Credit card companies
Financial institutions
Collection agencies
P49: Business Topics
Message from
the CE
OM
anagement S
trategiesB
usiness Strategies by S
egment
ES
G M
anagement
Value Creation by N
TT DATA
Financials and Others
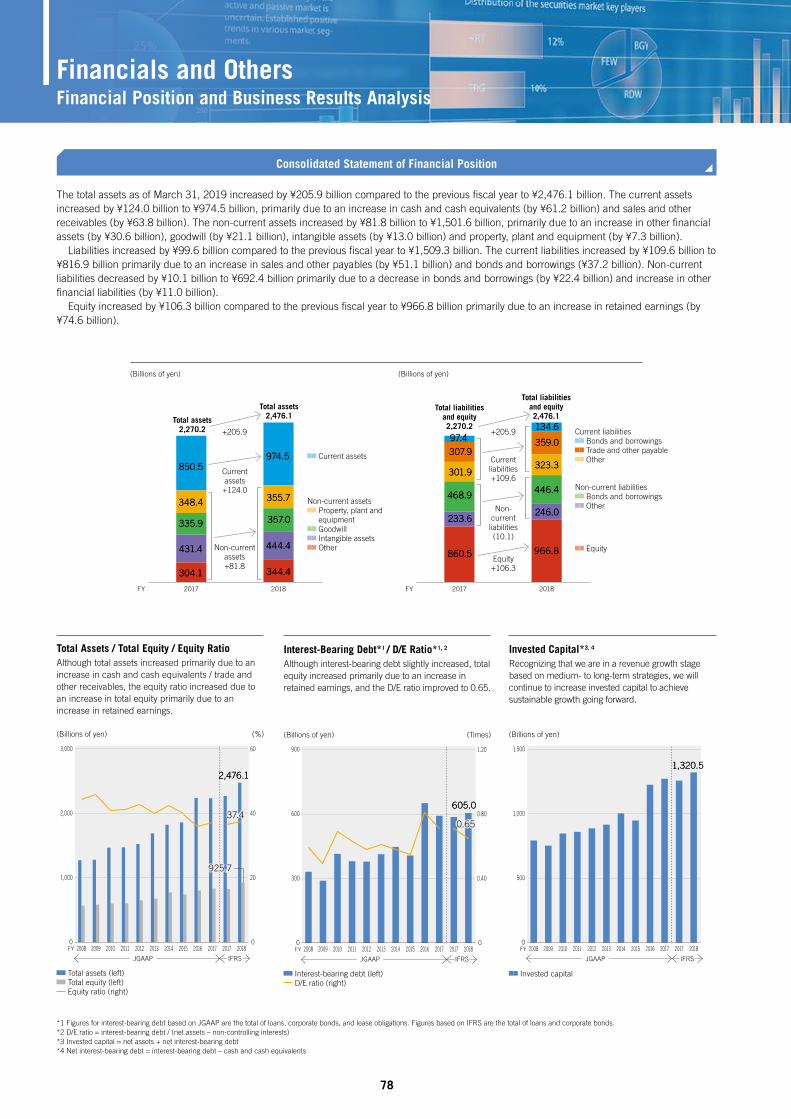
78
The total assets as of March 31, 2019 increased by ¥205.9 billion compared to the previous fiscal year to ¥2,476.1 billion. The current assets increased by ¥124.0 billion to ¥974.5 billion, primarily due to an increase in cash and cash equivalents (by ¥61.2 billion) and sales and other receivables (by ¥63.8 billion). The non-current assets increased by ¥81.8 billion to ¥1,501.6 billion, primarily due to an increase in other financial assets (by ¥30.6 billion), goodwill (by ¥21.1 billion), intangible assets (by ¥13.0 billion) and property, plant and equipment (by ¥7.3 billion). Liabilities increased by ¥99.6 billion compared to the previous fiscal year to ¥1,509.3 billion. The current liabilities increased by ¥109.6 billion to ¥816.9 billion primarily due to an increase in sales and other payables (by ¥51.1 billion) and bonds and borrowings (¥37.2 billion). Non-current liabilities decreased by ¥10.1 billion to ¥692.4 billion primarily due to a decrease in bonds and borrowings (by ¥22.4 billion) and increase in other financial liabilities (by ¥11.0 billion). Equity increased by ¥106.3 billion compared to the previous fiscal year to ¥966.8 billion primarily due to an increase in retained earnings (by ¥74.6 billion).
Consolidated Statement of Financial Position
*1 Figures for interest-bearing debt based on JGAAP are the total of loans, corporate bonds, and lease obligations. Figures based on IFRS are the total of loans and corporate bonds.*2 D/E ratio = interest-bearing debt / (net assets – non-controlling interests)*3 Invested capital = net assets + net interest-bearing debt*4 Net interest-bearing debt = interest-bearing debt – cash and cash equivalents
Total Assets / Total Equity / Equity RatioAlthough total assets increased primarily due to an increase in cash and cash equivalents / trade and other receivables, the equity ratio increased due to an increase in total equity primarily due to an increase in retained earnings.
Total assets (left) Total equity (left) Equity ratio (right)
(Billions of yen) (%)
FY0
1,000
2,000
3,000
0
20
40
60
2,476.12,476.1
2008 2009 2010 2011 2012 2013 2014 2015 2016 2017 2017 2018
925.7925.7
37.437.4
JGAAP IFRS
Interest-Bearing Debt*1 / D/E Ratio*1, 2
Although interest-bearing debt slightly increased, total equity increased primarily due to an increase in retained earnings, and the D/E ratio improved to 0.65.
Interest-bearing debt (left) D/E ratio (right)
Invested capital
(Billions of yen) (Times)
FY0
300
600
900
0
0.40
0.80
1.20
605.0605.0
2008 2009 2010 2011 2012 2013 2014 2015 2016 2017 2017 2018
0.650.65
JGAAP IFRS
Invested Capital*3, 4
Recognizing that we are in a revenue growth stage based on medium- to long-term strategies, we will continue to increase invested capital to achieve sustainable growth going forward.
(Billions of yen)
FY0
500
1,000
1,500
1,320.51,320.5
2008 2009 2010 2011 2012 2013 2014 2015 2016 2017 2017 2018
JGAAP IFRS
Non-current assets Property, plant and equipment Goodwill Intangible assets Other
Non-current liabilities Bonds and borrowings Other
(Billions of yen) (Billions of yen)
20182017
344.4344.4
357.0357.0
444.4444.4
355.7355.7
974.5974.5
304.1304.1
431.4431.4
335.9335.9
348.4348.4
850.5850.5
FY 20182017
359.0359.0
323.3323.3
446.4446.4
134.6134.6
966.8966.8
246.0246.0
307.9307.9
301.9301.9
233.6233.6
468.9468.9
97.497.4
860.5860.5
FY
Non-current assets+81.8
Equity+106.3
Non-current liabilities(10.1)
Current liabilities+109.6
Total assets2,270.2
Total liabilities and equity2,270.2
Total liabilities and equity2,476.1
Total assets2,476.1
Current assets+124.0
+205.9 +205.9
Current assets
Current liabilities Bonds and borrowings Trade and other payable Other
Equity
Financial Position and Business Results Analysis Financials and Others

79 NTT DATA Annual Report 2019
Public & Social Infrastructure Segment Financial Segment Enterprise & Solutions Segment North America Segment EMEA & LATAM Segment
Public & Social Infrastructure Segment Financial Segment Enterprise & Solutions Segment North America Segment EMEA & LATAM Segment
New orders received
Order backlog
Order Backlog
New orders received for FY2018 increased by ¥126.1 billion compared to the previous fiscal year to ¥2,076.1 billion. The year-on-year decrease in the Public & Social Infrastructure Segment may seem significant, but this is due to receiving less orders compared to the previous fiscal year in which there were large orders. Nonetheless, we have won orders steadily. The Financial Segment saw a positive growth because it continued to win projects from banks steadily. In the Enterprise & Solutions Segment, we have been able to maintain the high level of orders as in the previous fiscal year, mainly from the manufacturing industry. The North America Segment won multiple large-scale projects and its new orders received grew by more than ¥40.0 billion compared to the previous fiscal year. The EMEA & LATAM Segment won more contracts especially in Europe, mainly in Spain and Italy.
New Orders Received(Billions of yen) (Billions of yen)
FY0
800
1,600
2,400
2,076.12,076.1
2008 2009 2010 2011 2012 2013 2014 2015 2016 2017 2017 2018
JGAAP IFRS
IFRS
Changes in Order Backlog and Recognition Period of Net Sales (Forecast)The order backlog as of March 31, 2019 increased by ¥87.9 billion to ¥2,457.1 billion primarily due to an increase in orders in each segment. The order backlog is increasing steadily in accordance with expansion of scale of our business, and we have secured the size exceeding a year’s net sales. The size of the order backlog is growing in the order of the Financial Segment, North America Segment, and Public & Social Infrastructure Segment. This reflects the fact that most of the projects in each segment are large-scale and long-term. As for when the order backlog as of March 31, 2018 will be recognized as net sales, a little less than half is expected to be recognized as net sales within a year. Then, we plan to recognize net sales sequentially, in FY2020, FY2021, FY2022, and FY2023 onward. However, as the fiscal year advances, the ratio of composition of net sales by segment will increase in the order of the Financial Segment, North America Segment, followed by Public & Social Infrastructure Segment. This also reflects the fact, as with the case of the order backlog, that projects in each segment are usually large-scale and long-term.
(Billions of yen) (Billions of yen)
FY0
900
1,800
2,700
2,457.12,457.1
2008 2009 2010 2011 2012 2013 2014 2015 2016 2017 2017 2018
JGAAP
20182017
457.4457.4
307.7307.7
427.6427.6
391.1391.1
458.2458.2
385.9385.9
296.5296.5
386.6386.6
446.0446.0
408.5408.5
FY
20182017
282.4282.4
131.0131.0
784.7784.7
416.8416.8
828.8828.8
271.0271.0
123.6123.6
740.6740.6
416.8416.8
808.3808.3
FY
FY0
2,000
1,000
3,000
322.0322.0215.4215.4363.8363.8467.8467.8
Net sales (Forecast) 1,088.1
Net sales (Forecast) 1,088.1
Order backlog2,457.1
Order backlog2,457.1
20192018 2020 2021 2022 2023~
Recognition Period of Net Sales from Order Backlog (Forecast) (Billions of yen)
1,950.0
2,369.2
2,076.1
2,457.1
(54.9)
+126.1
+49.7
+11.2
+41.1
+71.5
+11.4
+44.1
+7.4
+20.5
+0.0
+87.9
(Consolidated) New Orders Received / Order Backlog
Message from
the CE
OM
anagement S
trategiesB
usiness Strategies by S
egment
ES
G M
anagement
Value Creation by N
TT DATA
Financials and Others
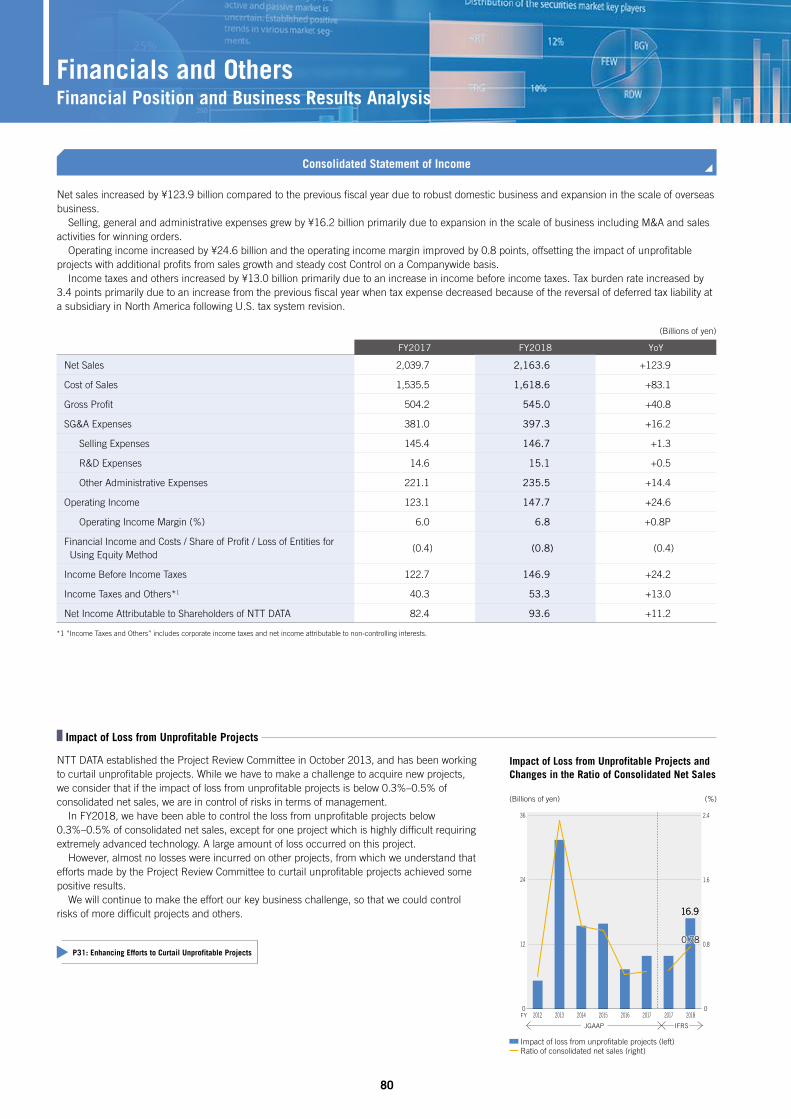
80
Impact of loss from unprofitable projects (left) Ratio of consolidated net sales (right)
JGAAP IFRS
Net sales increased by ¥123.9 billion compared to the previous fiscal year due to robust domestic business and expansion in the scale of overseas business. Selling, general and administrative expenses grew by ¥16.2 billion primarily due to expansion in the scale of business including M&A and sales activities for winning orders. Operating income increased by ¥24.6 billion and the operating income margin improved by 0.8 points, offsetting the impact of unprofitable projects with additional profits from sales growth and steady cost Control on a Companywide basis. Income taxes and others increased by ¥13.0 billion primarily due to an increase in income before income taxes. Tax burden rate increased by 3.4 points primarily due to an increase from the previous fiscal year when tax expense decreased because of the reversal of deferred tax liability at a subsidiary in North America following U.S. tax system revision.
NTT DATA established the Project Review Committee in October 2013, and has been working to curtail unprofitable projects. While we have to make a challenge to acquire new projects, we consider that if the impact of loss from unprofitable projects is below 0.3%–0.5% of consolidated net sales, we are in control of risks in terms of management. In FY2018, we have been able to control the loss from unprofitable projects below 0.3%–0.5% of consolidated net sales, except for one project which is highly difficult requiring extremely advanced technology. A large amount of loss occurred on this project. However, almost no losses were incurred on other projects, from which we understand that efforts made by the Project Review Committee to curtail unprofitable projects achieved some positive results. We will continue to make the effort our key business challenge, so that we could control risks of more difficult projects and others.
(Billions of yen)
FY2017 FY2018 YoY
Net Sales 2,039.7 2,163.6 +123.9
Cost of Sales 1,535.5 1,618.6 +83.1
Gross Profit 504.2 545.0 +40.8
SG&A Expenses 381.0 397.3 +16.2
Selling Expenses 145.4 146.7 +1.3
R&D Expenses 14.6 15.1 +0.5
Other Administrative Expenses 221.1 235.5 +14.4
Operating Income 123.1 147.7 +24.6
Operating Income Margin (%) 6.0 6.8 +0.8P
Financial Income and Costs / Share of Profit / Loss of Entities for Using Equity Method
(0.4) (0.8) (0.4)
Income Before Income Taxes 122.7 146.9 +24.2
Income Taxes and Others*1 40.3 53.3 +13.0
Net Income Attributable to Shareholders of NTT DATA 82.4 93.6 +11.2
*1 “Income Taxes and Others” includes corporate income taxes and net income attributable to non-controlling interests.
Impact of Loss from Unprofitable Projects and Changes in the Ratio of Consolidated Net Sales
(Billions of yen) (%)
FY0
12
24
36
0
0.8
1.6
2.4
2012 2013 2014 2015 2016 2017 2017 2018
16.916.9
0.780.78
Consolidated Statement of Income
Financial Position and Business Results Analysis Financials and Others
P31: Enhancing Efforts to Curtail Unprofitable Projects
Impact of Loss from Unprofitable Projects
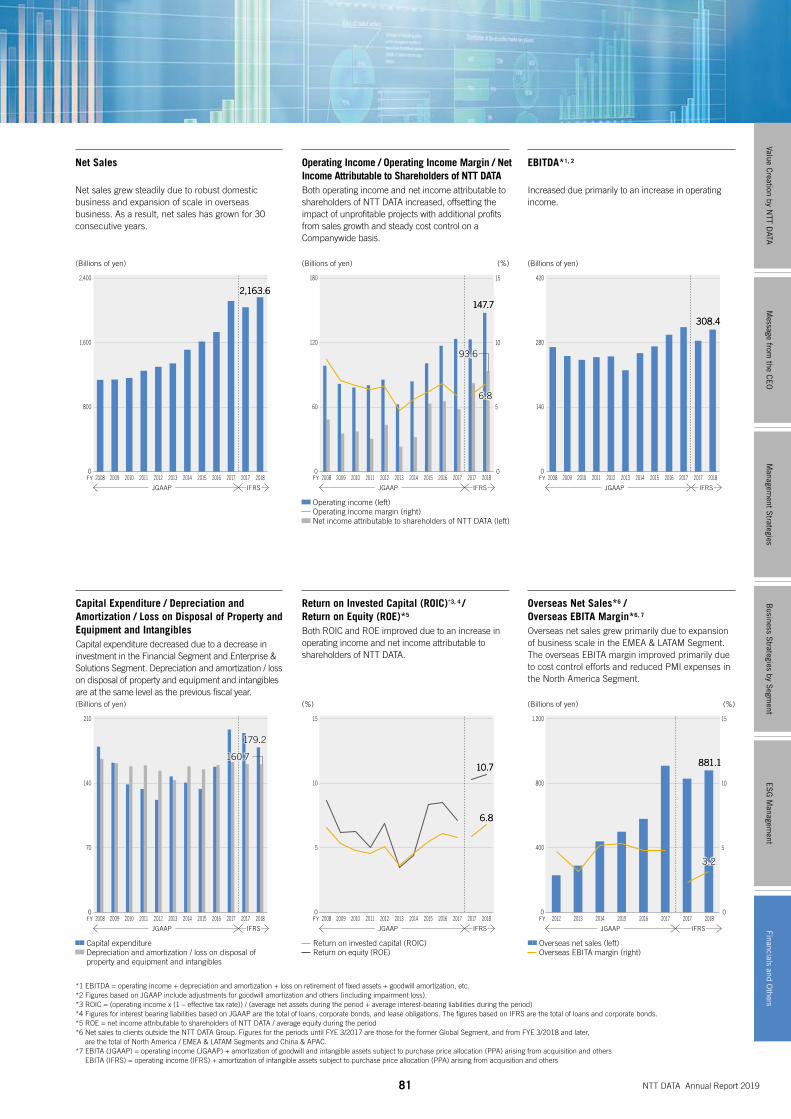
81 NTT DATA Annual Report 2019
Net Sales
Net sales grew steadily due to robust domestic business and expansion of scale in overseas business. As a result, net sales has grown for 30 consecutive years.
(Billions of yen)
Operating Income / Operating Income Margin / Net Income Attributable to Shareholders of NTT DATABoth operating income and net income attributable to shareholders of NTT DATA increased, offsetting the impact of unprofitable projects with additional profits from sales growth and steady cost control on a Companywide basis.
(Billions of yen) (%)
EBITDA*1, 2
Increased due primarily to an increase in operating income.
(Billions of yen)
Capital Expenditure / Depreciation and Amortization / Loss on Disposal of Property and Equipment and IntangiblesCapital expenditure decreased due to a decrease in investment in the Financial Segment and Enterprise & Solutions Segment. Depreciation and amortization / loss on disposal of property and equipment and intangibles are at the same level as the previous fiscal year.(Billions of yen)
Return on Invested Capital (ROIC)*3, 4 / Return on Equity (ROE)*5
Both ROIC and ROE improved due to an increase in operating income and net income attributable to shareholders of NTT DATA.
(%)
Overseas Net Sales*6 / Overseas EBITA Margin*6, 7
Overseas net sales grew primarily due to expansion of business scale in the EMEA & LATAM Segment. The overseas EBITA margin improved primarily due to cost control efforts and reduced PMI expenses in the North America Segment.
(Billions of yen) (%)
FY0
800
1,600
2,400
2,163.62,163.6
2008 2009 2010 2011 2012 2013 2014 2015 2016 2017 2017 2018
Operating income (left) Operating income margin (right) Net income attributable to shareholders of NTT DATA (left)
FY0
60
120
180
0
5
10
15
147.7147.7
2008 2009 2010 2011 2012 2013 2014 2015 2016 2017 2017 2018
6.86.8
93.693.6
JGAAP IFRS
FY0
140
280
420
308.4308.4
2008 2009 2010 2011 2012 2013 2014 2015 2016 2017 2017 2018
JGAAP IFRSJGAAP IFRS
Capital expenditure Depreciation and amortization / loss on disposal of property and equipment and intangibles
FY0
70
140
210
2008 2009 2010 2011 2012 2013 2014 2015 2016 2017 2017 2018
160.7160.7
179.2179.2
JGAAP IFRS
Overseas net sales (left) Overseas EBITA margin (right)
FY0
400
800
1,200
0
5
10
15
2012 2013 2014 2015 2016 2017 2017 2018
881.1881.1
3.23.2
JGAAP IFRSJGAAP IFRS
*1 EBITDA = operating income + depreciation and amortization + loss on retirement of fixed assets + goodwill amortization, etc.*2 Figures based on JGAAP include adjustments for goodwill amortization and others (including impairment loss).*3 ROIC = (operating income x (1 – effective tax rate)) / (average net assets during the period + average interest-bearing liabilities during the period)*4 Figures for interest bearing liabilities based on JGAAP are the total of loans, corporate bonds, and lease obligations. The figures based on IFRS are the total of loans and corporate bonds.*5 ROE = net income attributable to shareholders of NTT DATA / average equity during the period*6 Net sales to clients outside the NTT DATA Group. Figures for the periods until FYE 3/2017 are those for the former Global Segment, and from FYE 3/2018 and later,
are the total of North America / EMEA & LATAM Segments and China & APAC.*7 EBITA (JGAAP) = operating income (JGAAP) + amortization of goodwill and intangible assets subject to purchase price allocation (PPA) arising from acquisition and others
EBITA (IFRS) = operating income (IFRS) + amortization of intangible assets subject to purchase price allocation (PPA) arising from acquisition and others
FY0
5
10
15
2008 2009 2010 2011 2012 2013 2014 2015 2016 2017 2017 2018
10.710.7
6.86.8
Return on invested capital (ROIC) Return on equity (ROE)
Message from
the CE
OM
anagement S
trategiesB
usiness Strategies by S
egment
ES
G M
anagement
Value Creation by N
TT DATA
Financials and Others
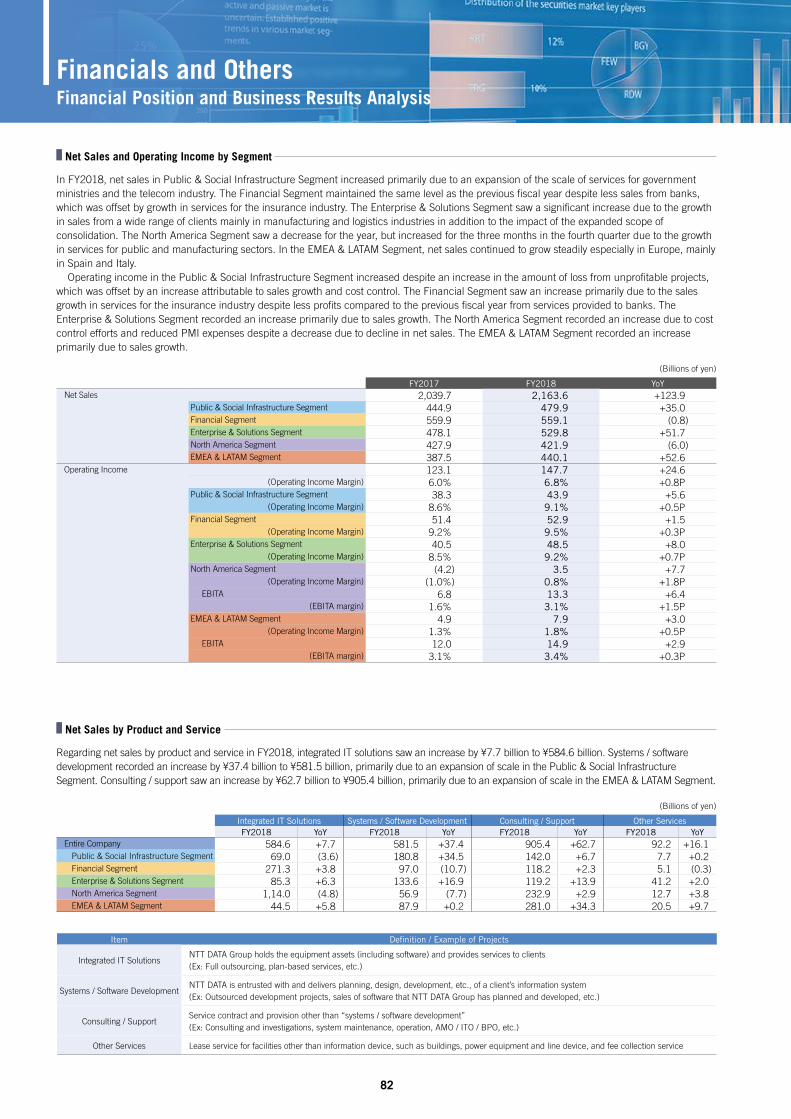
82
In FY2018, net sales in Public & Social Infrastructure Segment increased primarily due to an expansion of the scale of services for government ministries and the telecom industry. The Financial Segment maintained the same level as the previous fiscal year despite less sales from banks, which was offset by growth in services for the insurance industry. The Enterprise & Solutions Segment saw a significant increase due to the growth in sales from a wide range of clients mainly in manufacturing and logistics industries in addition to the impact of the expanded scope of consolidation. The North America Segment saw a decrease for the year, but increased for the three months in the fourth quarter due to the growth in services for public and manufacturing sectors. In the EMEA & LATAM Segment, net sales continued to grow steadily especially in Europe, mainly in Spain and Italy. Operating income in the Public & Social Infrastructure Segment increased despite an increase in the amount of loss from unprofitable projects, which was offset by an increase attributable to sales growth and cost control. The Financial Segment saw an increase primarily due to the sales growth in services for the insurance industry despite less profits compared to the previous fiscal year from services provided to banks. The Enterprise & Solutions Segment recorded an increase primarily due to sales growth. The North America Segment recorded an increase due to cost control efforts and reduced PMI expenses despite a decrease due to decline in net sales. The EMEA & LATAM Segment recorded an increase primarily due to sales growth.
Regarding net sales by product and service in FY2018, integrated IT solutions saw an increase by ¥7.7 billion to ¥584.6 billion. Systems / software development recorded an increase by ¥37.4 billion to ¥581.5 billion, primarily due to an expansion of scale in the Public & Social Infrastructure Segment. Consulting / support saw an increase by ¥62.7 billion to ¥905.4 billion, primarily due to an expansion of scale in the EMEA & LATAM Segment.
(Billions of yen)
FY2017 FY2018 YoYNet Sales 2,039.7 2,163.6 +123.9
Public & Social Infrastructure Segment 444.9 479.9 +35.0Financial Segment 559.9 559.1 (0.8)Enterprise & Solutions Segment 478.1 529.8 +51.7North America Segment 427.9 421.9 (6.0)EMEA & LATAM Segment 387.5 440.1 +52.6
Operating Income 123.1 147.7 +24.6 (Operating Income Margin) 6.0% 6.8% +0.8PPublic & Social Infrastructure Segment 38.3 43.9 +5.6 (Operating Income Margin) 8.6% 9.1% +0.5PFinancial Segment 51.4 52.9 +1.5 (Operating Income Margin) 9.2% 9.5% +0.3PEnterprise & Solutions Segment 40.5 48.5 +8.0 (Operating Income Margin) 8.5% 9.2% +0.7PNorth America Segment (4.2) 3.5 +7.7 (Operating Income Margin) (1.0%) 0.8% +1.8P EBITA 6.8 13.3 +6.4 (EBITA margin) 1.6% 3.1% +1.5PEMEA & LATAM Segment 4.9 7.9 +3.0 (Operating Income Margin) 1.3% 1.8% +0.5P EBITA 12.0 14.9 +2.9 (EBITA margin) 3.1% 3.4% +0.3P
(Billions of yen)
Integrated IT Solutions Systems / Software Development Consulting / Support Other ServicesFY2018 YoY FY2018 YoY FY2018 YoY FY2018 YoY
Entire Company 584.6 +7.7 581.5 +37.4 905.4 +62.7 92.2 +16.1Public & Social Infrastructure Segment 69.0 (3.6) 180.8 +34.5 142.0 +6.7 7.7 +0.2Financial Segment 271.3 +3.8 97.0 (10.7) 118.2 +2.3 5.1 (0.3)Enterprise & Solutions Segment 85.3 +6.3 133.6 +16.9 119.2 +13.9 41.2 +2.0North America Segment 1,14.0 (4.8) 56.9 (7.7) 232.9 +2.9 12.7 +3.8EMEA & LATAM Segment 44.5 +5.8 87.9 +0.2 281.0 +34.3 20.5 +9.7
Item Definition / Example of Projects
Integrated IT SolutionsNTT DATA Group holds the equipment assets (including software) and provides services to clients (Ex: Full outsourcing, plan-based services, etc.)
Systems / Software DevelopmentNTT DATA is entrusted with and delivers planning, design, development, etc., of a client’s information system(Ex: Outsourced development projects, sales of software that NTT DATA Group has planned and developed, etc.)
Consulting / SupportService contract and provision other than “systems / software development”(Ex: Consulting and investigations, system maintenance, operation, AMO / ITO / BPO, etc.)
Other Services Lease service for facilities other than information device, such as buildings, power equipment and line device, and fee collection service
Financial Position and Business Results Analysis Financials and Others
Net Sales and Operating Income by Segment
Net Sales by Product and Service

83 NTT DATA Annual Report 2019
Cash flows from operating activities in the fiscal year was positive at ¥242.0 billion (¥7.3 billion increase compared to the previous fiscal year) primarily due to net income of ¥97.7 billion and depreciation and amortization of ¥158.0 billion, while there was a payment including corporate tax of ¥55.2 billion. Cash flows from investing activities was negative at ¥186.9 billion (¥17.1 billion decrease compared to the previous fiscal year). This was primarily due to a capital investment expenditure of ¥180.0 billion. Overall, the free cash flow of the fiscal year was positive at ¥55.1 billion (¥24.4 billion increase compared to the previous fiscal year). Cash flows from financing activities was positive at ¥5.5 billion (¥96.3 billion increase compared to the previous fiscal year). This was mainly attributable to the increase of interest-bearing liabilities due to financing for acquiring subsidiary stocks despite dividend payments.
Free Cash Flow
(Billions of yen)
FY 2008 2009 2010 2011 2012 2013 2014 2015 2016 2017 2017 2018
55.1
(250)
250
125
(125)
0
JGAAP IFRS
(Billions of yen)
FY2017 FY2018 YoY
Free Cash Flow Cash Flows from Operating Activities 234.7 242.0 +7.3
Cash Flows from Investing Activities (204.0) (186.9) +17.1
30.7 55.1 +24.4
Cash Flows from Financing Activities (90.9) 5.5 +96.3
Cash Flow at End of the Year 190.1 251.3 +61.2
Cash Flows from Operating Activities
(Billions of yen)
FY0
250
500
242.0242.0
2008 2009 2010 2011 2012 2013 2014 2015 2016 2017 2017 2018JGAAP IFRS
Cash Flows from Investing Activities
(Billions of yen)
FY(500)
(250)
0
(186.9)(186.9)
2008 2009 2010 2011 2012 2013 2014 2015 2016 2017 2017 2018JGAAP IFRS
Cash Flows from Financing Activities
(Billions of yen)
FY(150)
150
0
300
5.55.5
2008 2009 2010 2011 2012 2013 2014 2015 2016 2017 2017 2018JGAAP IFRS
Consolidated Cash Flow Statement
Free cash flow
Message from
the CE
OM
anagement S
trategiesB
usiness Strategies by S
egment
ES
G M
anagement
Value Creation by N
TT DATA
Financials and Others
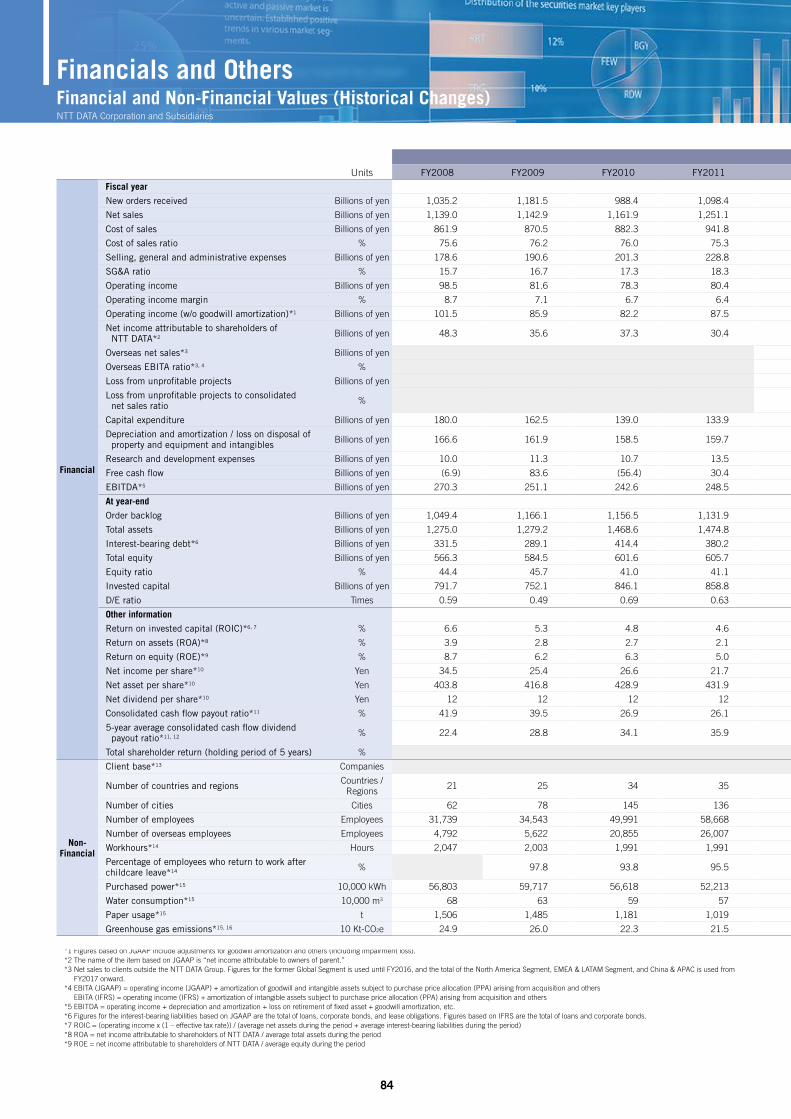
84
*1 Figures based on JGAAP include adjustments for goodwill amortization and others (including impairment loss).*2 The name of the item based on JGAAP is “net income attributable to owners of parent.”*3 Net sales to clients outside the NTT DATA Group. Figures for the former Global Segment is used until FY2016, and the total of the North America Segment, EMEA & LATAM Segment, and China & APAC is used from
FY2017 onward.*4 EBITA (JGAAP) = operating income (JGAAP) + amortization of goodwill and intangible assets subject to purchase price allocation (PPA) arising from acquisition and others
EBITA (IFRS) = operating income (IFRS) + amortization of intangible assets subject to purchase price allocation (PPA) arising from acquisition and others *5 EBITDA = operating income + depreciation and amortization + loss on retirement of fixed asset + goodwill amortization, etc.*6 Figures for the interest-bearing liabilities based on JGAAP are the total of loans, corporate bonds, and lease obligations. Figures based on IFRS are the total of loans and corporate bonds.*7 ROIC = (operating income x (1 – effective tax rate)) / (average net assets during the period + average interest-bearing liabilities during the period)*8 ROA = net income attributable to shareholders of NTT DATA / average total assets during the period*9 ROE = net income attributable to shareholders of NTT DATA / average equity during the period
JGAAP IFRS Units FY2008 FY2009 FY2010 FY2011 FY2012 FY2013 FY2014 FY2015 FY2016 FY2017 FY2017 FY2018
Financial
Fiscal year
New orders received Billions of yen 1,035.2 1,181.5 988.4 1,098.4 1,197.1 1,400.2 1,429.1 1,662.6 1,781.5 2,021.1 1,950.0 2,076.1
Net sales Billions of yen 1,139.0 1,142.9 1,161.9 1,251.1 1,301.9 1,343.7 1,511.8 1,614.8 1,732.4 2,117.1 2,039.7 2,163.6
Cost of sales Billions of yen 861.9 870.5 882.3 941.8 980.5 1,031.2 1,147.3 1,216.7 1,293.6 1,592.7 1,535.5 1,618.6
Cost of sales ratio % 75.6 76.2 76.0 75.3 75.3 76.7 75.8 75.4 74.7 75.2 75.3 74.8
Selling, general and administrative expenses Billions of yen 178.6 190.6 201.3 228.8 235.7 249.9 280.4 297.2 321.7 400.8 381.0 397.3
SG&A ratio % 15.7 16.7 17.3 18.3 18.1 18.6 18.6 18.4 18.6 18.9 18.7 18.4
Operating income Billions of yen 98.5 81.6 78.3 80.4 85.6 62.5 84.0 100.8 117.1 123.5 123.1 147.7
Operating income margin % 8.7 7.1 6.7 6.4 6.6 4.7 5.6 6.2 6.8 5.8 6.0 6.8
Operating income (w/o goodwill amortization)*1 Billions of yen 101.5 85.9 82.2 87.5 96.4 75.2 98.5 112.9 134.3 150.4 — —
Net income attributable to shareholders of NTT DATA*2 Billions of yen 48.3 35.6 37.3 30.4 43.5 23.2 32.1 63.3 65.6 58.1 82.4 93.6
Overseas net sales*3 Billions of yen 231.3 298.7 449.0 504.4 586.3 911.1 831.3 881.1
Overseas EBITA ratio*3, 4 % 4.7 3.2 5.2 5.3 4.8 4.8 2.3 3.2
Loss from unprofitable projects Billions of yen 5.3 31.5 15.5 15.9 7.4 9.9 9.9 16.9
Loss from unprofitable projects to consolidated net sales ratio % 0.41 2.34 1.03 0.98 0.43 0.47 0.49 0.78
Capital expenditure Billions of yen 180.0 162.5 139.0 133.9 122.1 147.7 140.9 134.0 158.1 198.6 194.8 179.2
Depreciation and amortization / loss on disposal of property and equipment and intangibles Billions of yen 166.6 161.9 158.5 159.7 153.8 143.6 158.5 155.2 160.0 163.2 161.1 160.7
Research and development expenses Billions of yen 10.0 11.3 10.7 13.5 12.1 12.8 12.9 12.4 12.3 14.5 14.6 15.1
Free cash flow Billions of yen (6.9) 83.6 (56.4) 30.4 46.2 44.8 26.7 44.0 (189.8) 24.2 30.7 55.1
EBITDA*5 Billions of yen 270.3 251.1 242.6 248.5 250.3 220.2 257.3 272.1 297.1 313.7 284.2 308.4
At year-end
Order backlog Billions of yen 1,049.4 1,166.1 1,156.5 1,131.9 1,140.2 1,341.4 1,355.8 1,544.5 2,411.3 2,371.5 2,369.2 2,457.1
Total assets Billions of yen 1,275.0 1,279.2 1,468.6 1,474.8 1,524.3 1,689.9 1,822.8 1,860.3 2,238.9 2,234.2 2,270.2 2,476.1
Interest-bearing debt*6 Billions of yen 331.5 289.1 414.4 380.2 378.3 412.9 446.9 407.0 650.8 592.0 586.3 605.0
Total equity Billions of yen 566.3 584.5 601.6 605.7 651.3 676.8 773.4 740.9 802.1 833.8 826.2 925.7
Equity ratio % 44.4 45.7 41.0 41.1 42.7 40.1 42.4 39.8 35.8 37.3 36.4 37.4
Invested capital Billions of yen 791.7 752.1 846.1 858.8 885.6 915.5 1,002.3 947.1 1,224.5 1,270.8 1,256.7 1,320.5
D/E ratio Times 0.59 0.49 0.69 0.63 0.58 0.61 0.58 0.55 0.81 0.71 0.71 0.65
Other information
Return on invested capital (ROIC)*6, 7 % 6.6 5.3 4.8 4.6 5.1 3.6 4.6 5.5 6.1 5.8 5.9 6.8
Return on assets (ROA)*8 % 3.9 2.8 2.7 2.1 2.9 1.4 1.8 3.4 3.2 2.6 3.7 3.9
Return on equity (ROE)*9 % 8.7 6.2 6.3 5.0 6.9 3.5 4.4 8.4 8.5 7.1 10.3 10.7
Net income per share*10 Yen 34.5 25.4 26.6 21.7 31.0 16.6 22.9 45.2 46.8 41.5 58.8 66.8
Net asset per share*10 Yen 403.8 416.8 428.9 431.9 464.4 482.6 551.5 528.3 571.9 594.6 589.1 660.0
Net dividend per share*10 Yen 12 12 12 12 12 12 12 14 15 15 15 17
Consolidated cash flow payout ratio*11 % 41.9 39.5 26.9 26.1 19.6 50.6 26.1 19.5 24.0 42.3 43.2 31.7
5-year average consolidated cash flow dividend payout ratio*11, 12 % 22.4 28.8 34.1 35.9 28.4 29.1 27.0 24.9 24.5 28.4 28.5 27.2
Total shareholder return (holding period of 5 years) % 100 132 142 133 143 143 154
Non-Financial
Client base*13 Companies 50 62 65 65 70
Number of countries and regions Countries / Regions 21 25 34 35 34 41 41 45 51 53 53 53
Number of cities Cities 62 78 145 136 136 175 176 185 210 214 214 223
Number of employees Employees 31,739 34,543 49,991 58,668 61,369 75,020 76,642 80,526 111,664 118,006 118,006 123,884
Number of overseas employees Employees 4,792 5,622 20,855 26,007 28,820 42,241 43,781 47,541 77,123 81,362 81,362 86,154
Workhours*14 Hours 2,047 2,003 1,991 1,991 1,996 1,966 1,966 1,941 1,910 1,901 1,901 1,889
Percentage of employees who return to work after childcare leave*14 % 97.8 93.8 95.5 92.5 97.6 98.1 98.3 98.0 97.0 97.0 100.0
Purchased power*15 10,000 kWh 56,803 59,717 56,618 52,213 48,878 48,342 49,169 47,661 49,437 48,063 48,063 47,678
Water consumption*15 10,000 m3 68 63 59 57 59 50 61 34 55 58 58 62
Paper usage*15 t 1,506 1,485 1,181 1,019 932 936 905 920 845 765 765 689
Greenhouse gas emissions*15, 16 10 Kt-CO2e 24.9 26.0 22.3 21.5 23.9 25.9 26.1 24.1 25.1 23.6 23.6 23.2
Financial and Non-Financial Values (Historical Changes)NTT DATA Corporation and Subsidiaries
Financials and Others
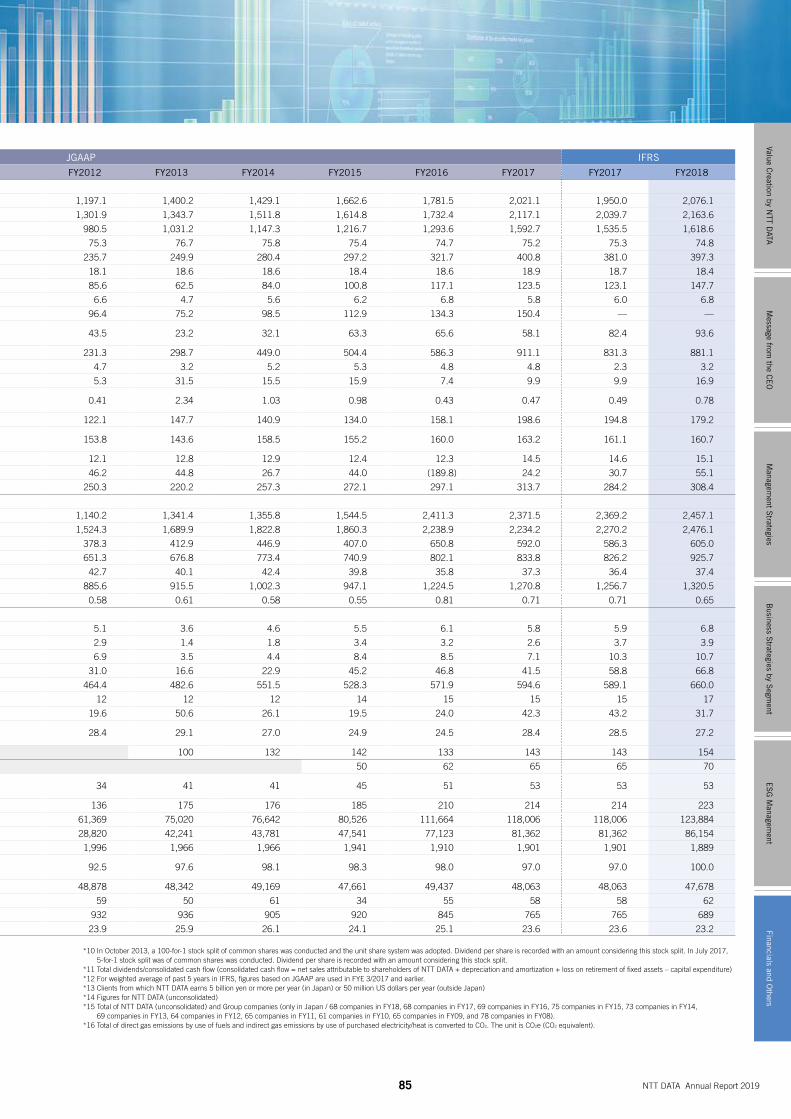
85 NTT DATA Annual Report 2019
JGAAP IFRS Units FY2008 FY2009 FY2010 FY2011 FY2012 FY2013 FY2014 FY2015 FY2016 FY2017 FY2017 FY2018
Financial
Fiscal year
New orders received Billions of yen 1,035.2 1,181.5 988.4 1,098.4 1,197.1 1,400.2 1,429.1 1,662.6 1,781.5 2,021.1 1,950.0 2,076.1
Net sales Billions of yen 1,139.0 1,142.9 1,161.9 1,251.1 1,301.9 1,343.7 1,511.8 1,614.8 1,732.4 2,117.1 2,039.7 2,163.6
Cost of sales Billions of yen 861.9 870.5 882.3 941.8 980.5 1,031.2 1,147.3 1,216.7 1,293.6 1,592.7 1,535.5 1,618.6
Cost of sales ratio % 75.6 76.2 76.0 75.3 75.3 76.7 75.8 75.4 74.7 75.2 75.3 74.8
Selling, general and administrative expenses Billions of yen 178.6 190.6 201.3 228.8 235.7 249.9 280.4 297.2 321.7 400.8 381.0 397.3
SG&A ratio % 15.7 16.7 17.3 18.3 18.1 18.6 18.6 18.4 18.6 18.9 18.7 18.4
Operating income Billions of yen 98.5 81.6 78.3 80.4 85.6 62.5 84.0 100.8 117.1 123.5 123.1 147.7
Operating income margin % 8.7 7.1 6.7 6.4 6.6 4.7 5.6 6.2 6.8 5.8 6.0 6.8
Operating income (w/o goodwill amortization)*1 Billions of yen 101.5 85.9 82.2 87.5 96.4 75.2 98.5 112.9 134.3 150.4 — —
Net income attributable to shareholders of NTT DATA*2 Billions of yen 48.3 35.6 37.3 30.4 43.5 23.2 32.1 63.3 65.6 58.1 82.4 93.6
Overseas net sales*3 Billions of yen 231.3 298.7 449.0 504.4 586.3 911.1 831.3 881.1
Overseas EBITA ratio*3, 4 % 4.7 3.2 5.2 5.3 4.8 4.8 2.3 3.2
Loss from unprofitable projects Billions of yen 5.3 31.5 15.5 15.9 7.4 9.9 9.9 16.9
Loss from unprofitable projects to consolidated net sales ratio % 0.41 2.34 1.03 0.98 0.43 0.47 0.49 0.78
Capital expenditure Billions of yen 180.0 162.5 139.0 133.9 122.1 147.7 140.9 134.0 158.1 198.6 194.8 179.2
Depreciation and amortization / loss on disposal of property and equipment and intangibles Billions of yen 166.6 161.9 158.5 159.7 153.8 143.6 158.5 155.2 160.0 163.2 161.1 160.7
Research and development expenses Billions of yen 10.0 11.3 10.7 13.5 12.1 12.8 12.9 12.4 12.3 14.5 14.6 15.1
Free cash flow Billions of yen (6.9) 83.6 (56.4) 30.4 46.2 44.8 26.7 44.0 (189.8) 24.2 30.7 55.1
EBITDA*5 Billions of yen 270.3 251.1 242.6 248.5 250.3 220.2 257.3 272.1 297.1 313.7 284.2 308.4
At year-end
Order backlog Billions of yen 1,049.4 1,166.1 1,156.5 1,131.9 1,140.2 1,341.4 1,355.8 1,544.5 2,411.3 2,371.5 2,369.2 2,457.1
Total assets Billions of yen 1,275.0 1,279.2 1,468.6 1,474.8 1,524.3 1,689.9 1,822.8 1,860.3 2,238.9 2,234.2 2,270.2 2,476.1
Interest-bearing debt*6 Billions of yen 331.5 289.1 414.4 380.2 378.3 412.9 446.9 407.0 650.8 592.0 586.3 605.0
Total equity Billions of yen 566.3 584.5 601.6 605.7 651.3 676.8 773.4 740.9 802.1 833.8 826.2 925.7
Equity ratio % 44.4 45.7 41.0 41.1 42.7 40.1 42.4 39.8 35.8 37.3 36.4 37.4
Invested capital Billions of yen 791.7 752.1 846.1 858.8 885.6 915.5 1,002.3 947.1 1,224.5 1,270.8 1,256.7 1,320.5
D/E ratio Times 0.59 0.49 0.69 0.63 0.58 0.61 0.58 0.55 0.81 0.71 0.71 0.65
Other information
Return on invested capital (ROIC)*6, 7 % 6.6 5.3 4.8 4.6 5.1 3.6 4.6 5.5 6.1 5.8 5.9 6.8
Return on assets (ROA)*8 % 3.9 2.8 2.7 2.1 2.9 1.4 1.8 3.4 3.2 2.6 3.7 3.9
Return on equity (ROE)*9 % 8.7 6.2 6.3 5.0 6.9 3.5 4.4 8.4 8.5 7.1 10.3 10.7
Net income per share*10 Yen 34.5 25.4 26.6 21.7 31.0 16.6 22.9 45.2 46.8 41.5 58.8 66.8
Net asset per share*10 Yen 403.8 416.8 428.9 431.9 464.4 482.6 551.5 528.3 571.9 594.6 589.1 660.0
Net dividend per share*10 Yen 12 12 12 12 12 12 12 14 15 15 15 17
Consolidated cash flow payout ratio*11 % 41.9 39.5 26.9 26.1 19.6 50.6 26.1 19.5 24.0 42.3 43.2 31.7
5-year average consolidated cash flow dividend payout ratio*11, 12 % 22.4 28.8 34.1 35.9 28.4 29.1 27.0 24.9 24.5 28.4 28.5 27.2
Total shareholder return (holding period of 5 years) % 100 132 142 133 143 143 154
Non-Financial
Client base*13 Companies 50 62 65 65 70
Number of countries and regions Countries / Regions 21 25 34 35 34 41 41 45 51 53 53 53
Number of cities Cities 62 78 145 136 136 175 176 185 210 214 214 223
Number of employees Employees 31,739 34,543 49,991 58,668 61,369 75,020 76,642 80,526 111,664 118,006 118,006 123,884
Number of overseas employees Employees 4,792 5,622 20,855 26,007 28,820 42,241 43,781 47,541 77,123 81,362 81,362 86,154
Workhours*14 Hours 2,047 2,003 1,991 1,991 1,996 1,966 1,966 1,941 1,910 1,901 1,901 1,889
Percentage of employees who return to work after childcare leave*14 % 97.8 93.8 95.5 92.5 97.6 98.1 98.3 98.0 97.0 97.0 100.0
Purchased power*15 10,000 kWh 56,803 59,717 56,618 52,213 48,878 48,342 49,169 47,661 49,437 48,063 48,063 47,678
Water consumption*15 10,000 m3 68 63 59 57 59 50 61 34 55 58 58 62
Paper usage*15 t 1,506 1,485 1,181 1,019 932 936 905 920 845 765 765 689
Greenhouse gas emissions*15, 16 10 Kt-CO2e 24.9 26.0 22.3 21.5 23.9 25.9 26.1 24.1 25.1 23.6 23.6 23.2
*10 In October 2013, a 100-for-1 stock split of common shares was conducted and the unit share system was adopted. Dividend per share is recorded with an amount considering this stock split. In July 2017, 5-for-1 stock split was of common shares was conducted. Dividend per share is recorded with an amount considering this stock split.
*11 Total dividends/consolidated cash flow (consolidated cash flow = net sales attributable to shareholders of NTT DATA + depreciation and amortization + loss on retirement of fixed assets – capital expenditure)*12 For weighted average of past 5 years in IFRS, figures based on JGAAP are used in FYE 3/2017 and earlier.*13 Clients from which NTT DATA earns 5 billion yen or more per year (in Japan) or 50 million US dollars per year (outside Japan)*14 Figures for NTT DATA (unconsolidated)*15 Total of NTT DATA (unconsolidated) and Group companies (only in Japan / 68 companies in FY18, 68 companies in FY17, 69 companies in FY16, 75 companies in FY15, 73 companies in FY14,
69 companies in FY13, 64 companies in FY12, 65 companies in FY11, 61 companies in FY10, 65 companies in FY09, and 78 companies in FY08).*16 Total of direct gas emissions by use of fuels and indirect gas emissions by use of purchased electricity/heat is converted to CO2. The unit is CO2e (CO2 equivalent).
Message from
the CE
OM
anagement S
trategiesB
usiness Strategies by S
egment
ES
G M
anagement
Value Creation by N
TT DATA
Financials and Others
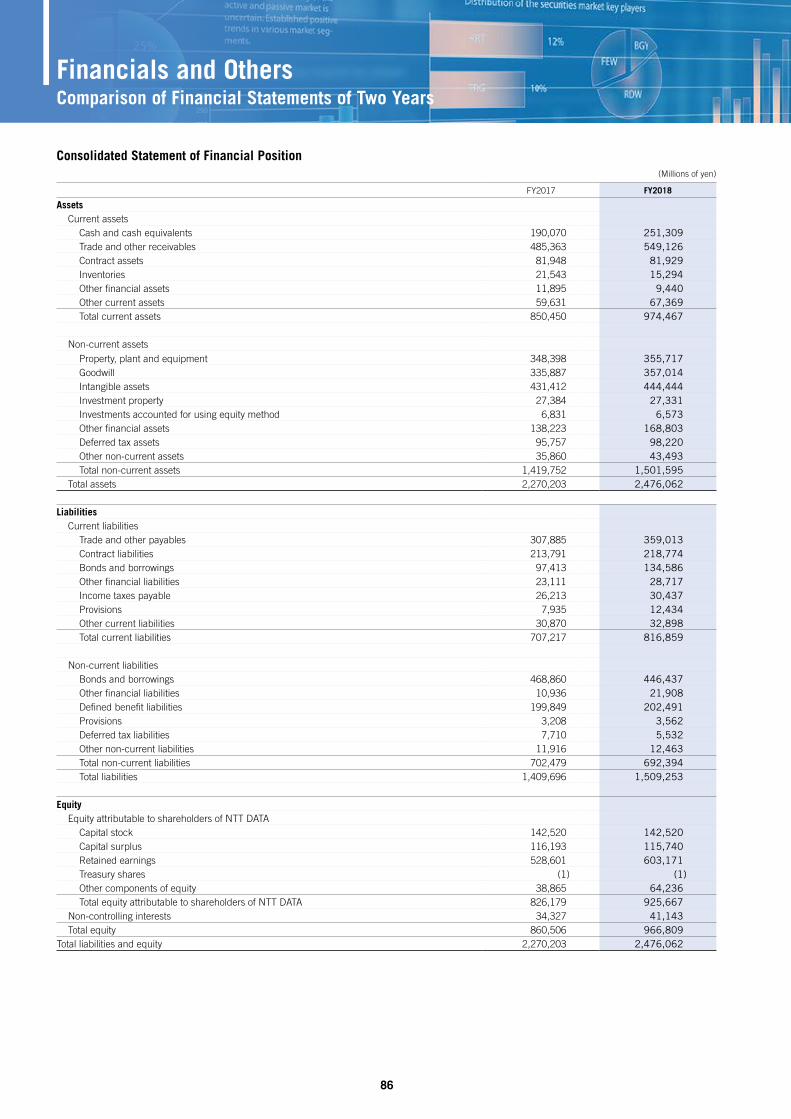
86
Consolidated Statement of Financial Position(Millions of yen)
FY2017 FY2018
AssetsCurrent assets
Cash and cash equivalents 190,070 251,309Trade and other receivables 485,363 549,126Contract assets 81,948 81,929Inventories 21,543 15,294Other financial assets 11,895 9,440Other current assets 59,631 67,369Total current assets 850,450 974,467
Non-current assetsProperty, plant and equipment 348,398 355,717Goodwill 335,887 357,014Intangible assets 431,412 444,444Investment property 27,384 27,331Investments accounted for using equity method 6,831 6,573Other financial assets 138,223 168,803Deferred tax assets 95,757 98,220Other non-current assets 35,860 43,493Total non-current assets 1,419,752 1,501,595
Total assets 2,270,203 2,476,062
LiabilitiesCurrent liabilities
Trade and other payables 307,885 359,013Contract liabilities 213,791 218,774Bonds and borrowings 97,413 134,586Other financial liabilities 23,111 28,717Income taxes payable 26,213 30,437Provisions 7,935 12,434Other current liabilities 30,870 32,898Total current liabilities 707,217 816,859
Non-current liabilitiesBonds and borrowings 468,860 446,437Other financial liabilities 10,936 21,908Defined benefit liabilities 199,849 202,491Provisions 3,208 3,562Deferred tax liabilities 7,710 5,532Other non-current liabilities 11,916 12,463Total non-current liabilities 702,479 692,394Total liabilities 1,409,696 1,509,253
EquityEquity attributable to shareholders of NTT DATA
Capital stock 142,520 142,520Capital surplus 116,193 115,740Retained earnings 528,601 603,171Treasury shares (1) (1)Other components of equity 38,865 64,236Total equity attributable to shareholders of NTT DATA 826,179 925,667
Non-controlling interests 34,327 41,143Total equity 860,506 966,809
Total liabilities and equity 2,270,203 2,476,062
Comparison of Financial Statements of Two YearsFinancials and Others
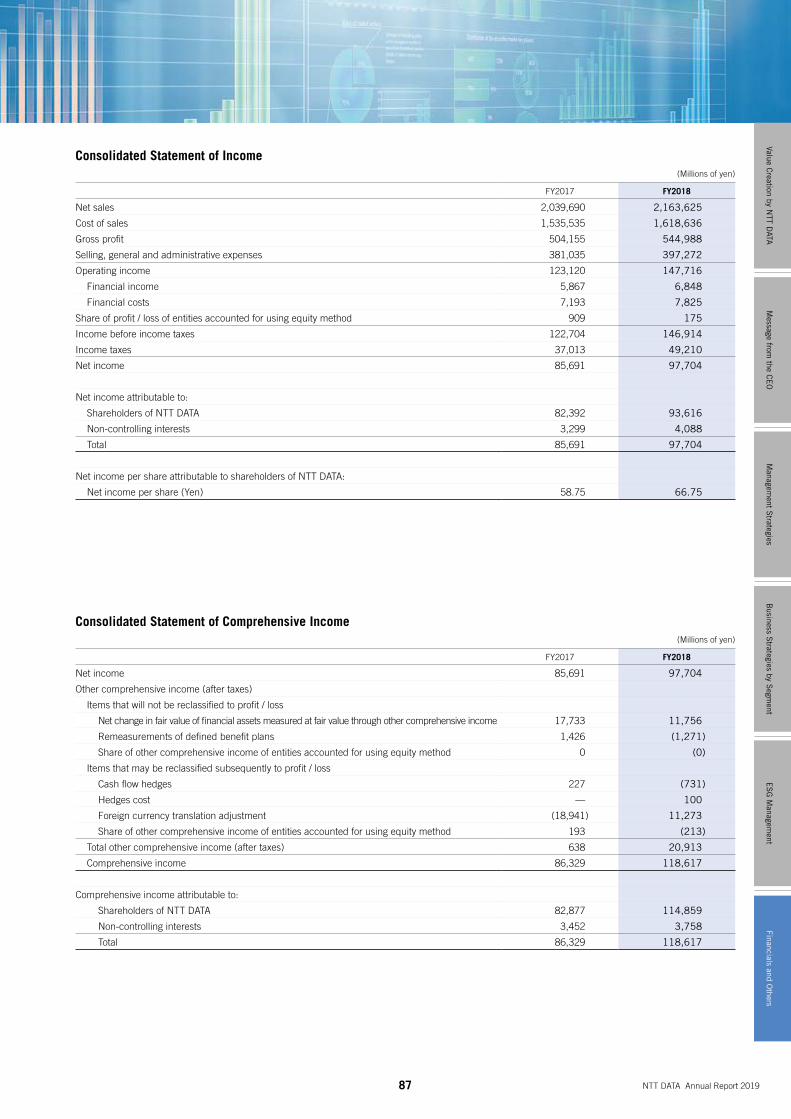
87 NTT DATA Annual Report 2019
Message from
the CE
OM
anagement S
trategiesB
usiness Strategies by S
egment
ES
G M
anagement
Value Creation by N
TT DATA
Financials and Others
Consolidated Statement of Income(Millions of yen)
FY2017 FY2018
Net sales 2,039,690 2,163,625
Cost of sales 1,535,535 1,618,636
Gross profit 504,155 544,988
Selling, general and administrative expenses 381,035 397,272
Operating income 123,120 147,716
Financial income 5,867 6,848
Financial costs 7,193 7,825
Share of profit / loss of entities accounted for using equity method 909 175
Income before income taxes 122,704 146,914
Income taxes 37,013 49,210
Net income 85,691 97,704
Net income attributable to:
Shareholders of NTT DATA 82,392 93,616
Non-controlling interests 3,299 4,088
Total 85,691 97,704
Net income per share attributable to shareholders of NTT DATA:
Net income per share (Yen) 58.75 66.75
Consolidated Statement of Comprehensive Income(Millions of yen)
FY2017 FY2018
Net income 85,691 97,704
Other comprehensive income (after taxes)
Items that will not be reclassified to profit / loss
Net change in fair value of financial assets measured at fair value through other comprehensive income 17,733 11,756
Remeasurements of defined benefit plans 1,426 (1,271)
Share of other comprehensive income of entities accounted for using equity method 0 (0)
Items that may be reclassified subsequently to profit / loss
Cash flow hedges 227 (731)
Hedges cost — 100
Foreign currency translation adjustment (18,941) 11,273
Share of other comprehensive income of entities accounted for using equity method 193 (213)
Total other comprehensive income (after taxes) 638 20,913
Comprehensive income 86,329 118,617
Comprehensive income attributable to:
Shareholders of NTT DATA 82,877 114,859
Non-controlling interests 3,452 3,758
Total 86,329 118,617
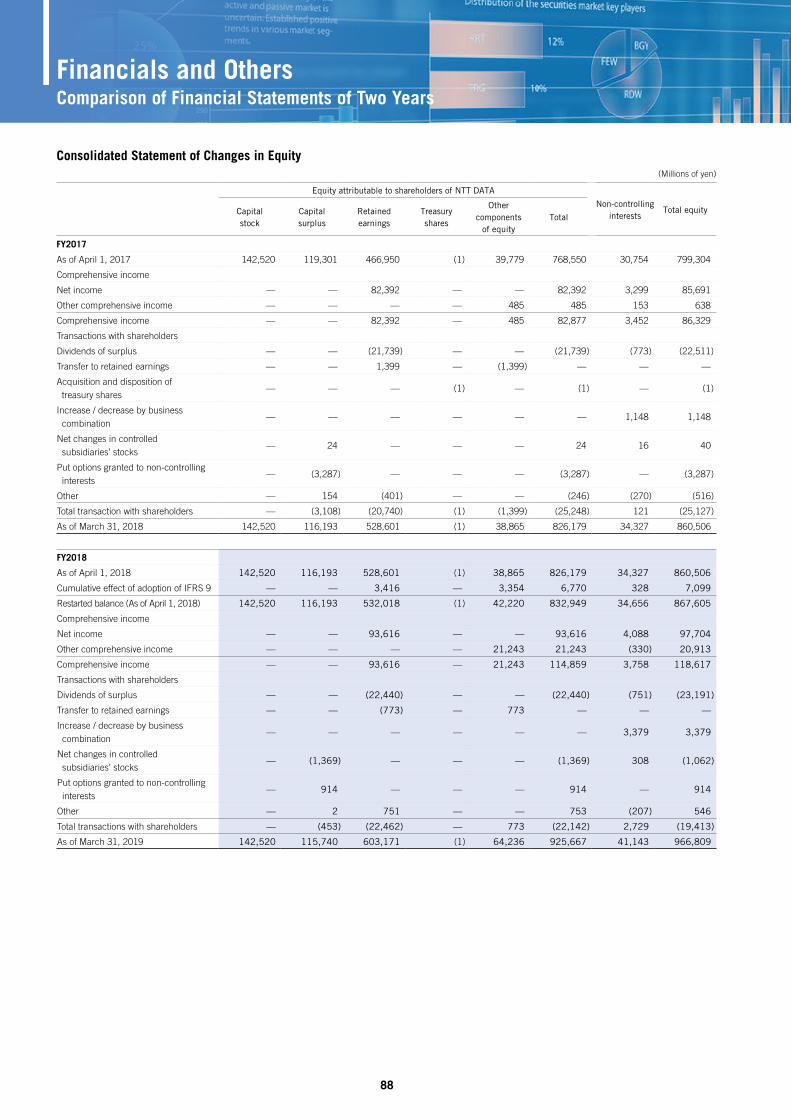
88
Consolidated Statement of Changes in Equity(Millions of yen)
Equity attributable to shareholders of NTT DATA
Non-controlling interests
Total equityCapital stock
Capital surplus
Retained earnings
Treasury shares
Other components
of equityTotal
FY2017
As of April 1, 2017 142,520 119,301 466,950 (1) 39,779 768,550 30,754 799,304
Comprehensive income
Net income — — 82,392 — — 82,392 3,299 85,691
Other comprehensive income — — — — 485 485 153 638
Comprehensive income — — 82,392 — 485 82,877 3,452 86,329
Transactions with shareholders
Dividends of surplus — — (21,739) — — (21,739) (773) (22,511)
Transfer to retained earnings — — 1,399 — (1,399) — — —
Acquisition and disposition of treasury shares
— — — (1) — (1) — (1)
Increase / decrease by business combination
— — — — — — 1,148 1,148
Net changes in controlled subsidiaries’ stocks
— 24 — — — 24 16 40
Put options granted to non-controlling interests
— (3,287) — — — (3,287) — (3,287)
Other — 154 (401) — — (246) (270) (516)
Total transaction with shareholders — (3,108) (20,740) (1) (1,399) (25,248) 121 (25,127)
As of March 31, 2018 142,520 116,193 528,601 (1) 38,865 826,179 34,327 860,506
FY2018
As of April 1, 2018 142,520 116,193 528,601 (1) 38,865 826,179 34,327 860,506
Cumulative effect of adoption of IFRS 9 — — 3,416 — 3,354 6,770 328 7,099
Restarted balance (As of April 1, 2018) 142,520 116,193 532,018 (1) 42,220 832,949 34,656 867,605
Comprehensive income
Net income — — 93,616 — — 93,616 4,088 97,704
Other comprehensive income — — — — 21,243 21,243 (330) 20,913
Comprehensive income — — 93,616 — 21,243 114,859 3,758 118,617
Transactions with shareholders
Dividends of surplus — — (22,440) — — (22,440) (751) (23,191)
Transfer to retained earnings — — (773) — 773 — — —
Increase / decrease by business combination
— — — — — — 3,379 3,379
Net changes in controlled subsidiaries’ stocks
— (1,369) — — — (1,369) 308 (1,062)
Put options granted to non-controlling interests
— 914 — — — 914 — 914
Other — 2 751 — — 753 (207) 546
Total transactions with shareholders — (453) (22,462) — 773 (22,142) 2,729 (19,413)
As of March 31, 2019 142,520 115,740 603,171 (1) 64,236 925,667 41,143 966,809
Comparison of Financial Statements of Two YearsFinancials and Others

89 NTT DATA Annual Report 2019
Consolidated Statement of Cash Flows(Millions of yen)
FY2017 FY2018
Cash Flows from Operating Activities
Net income 85,691 97,704
Depreciation and amortization 158,054 158,038
Financial income and financial costs ( ( ) shows profit) (1,557) 836
Share of (profit) / loss of entities for using equity method (909) (175)
Income tax expenses 37,013 49,210
(Increase) / decrease in trade and other receivables (32,547) (43,290)
(Increase) / decrease in inventories (7,125) 6,257
Increase / (decrease) in trade and other payables 43,116 32,765
Increase / (decrease) in allowance for contract losses 1,911 4,205
Other 13,904 (9,131)
Sub total 297,549 296,420
Interest and dividends received 4,263 4,992
Interest paid (4,555) (4,193)
Income taxes paid (62,565) (55,209)
Net cash provided by (used in) operating activities 234,692 242,009
Cash Flows from Investing Activities
Payments for acquisition of property, plant, equipment, and intangible fixed assets (199,142) (179,986)
Payments from acquisition of other financial assets (21,892) (20,122)
Proceeds from sales and redemption of other financial assets ( ( ) shows redemption) 24,113 23,130
Payments for investments in subsidiaries (4,832) (9,257)
Other (2,245) (645)
Net cash provided by (used in) investing activities (203,998) (186,879)
Cash Flows from Financing Activities
Net increase / (decrease) in short-term borrowings (169,620) 27,674
Net increase / (decrease) in commercial papers 20,000 4,000
Proceeds from long-term debt and issuance of bonds 187,618 40,058
Repayments of long-term borrowings and redemption of bonds at maturity (103,689) (50,967)
Purchase of equity interests of subsidiaries from non-controlling interests (114) (1,312)
Proceeds from sale-and-leaseback — 11,799
Cash dividends paid (21,739) (22,438)
Cash dividends paid to non-controlling interests (773) (751)
Payments for acquisition of treasury stock (1) —
Other (2,536) (2,612)
Net cash provided by (used in) financing activities (90,855) 5,451
Net increase / (decrease) in cash and cash equivalents (60,161) 60,581
Cash and cash equivalents at beginning of period 253,984 190,070
Effect of exchange rate changes on cash and cash equivalents (3,753) 658
Effect of exchange rate changes on cash and cash equivalents ( ( ) shows decrease) 190,070 251,309
Message from
the CE
OM
anagement S
trategiesB
usiness Strategies by S
egment
ES
G M
anagement
Value Creation by N
TT DATA
Financials and Others
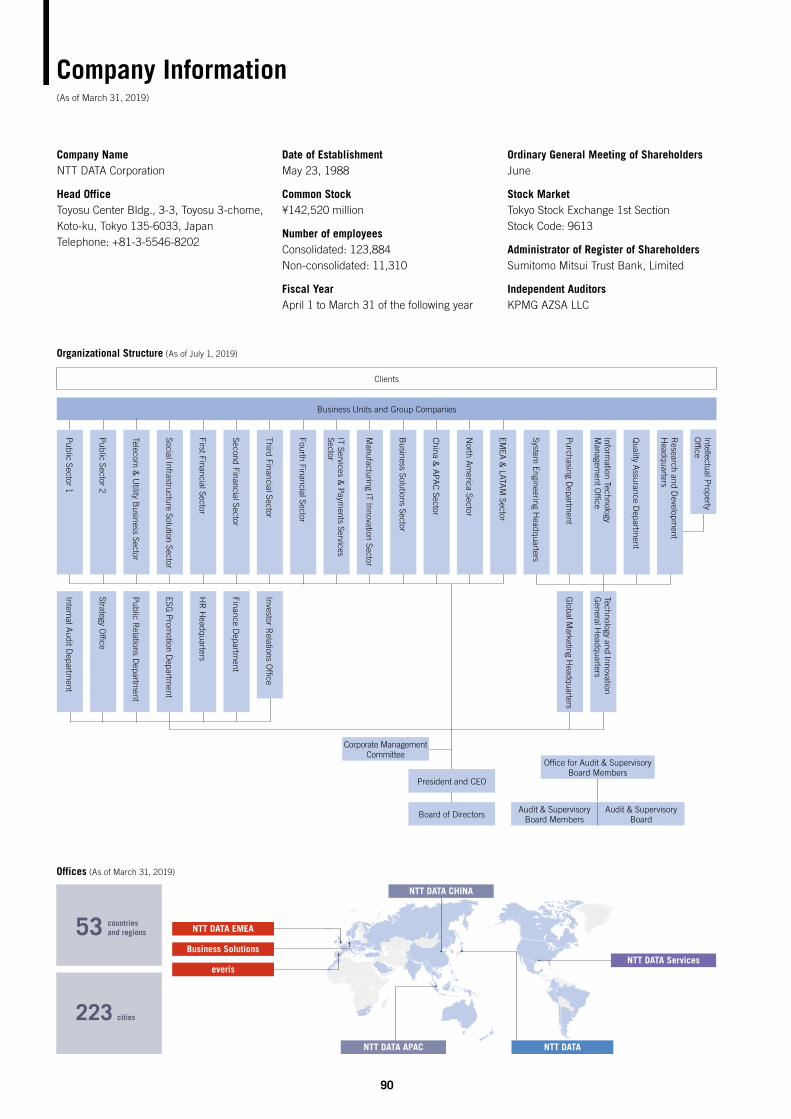
NTT DATANTT DATA APAC
NTT DATA CHINA
NTT DATA EMEA
Business Solutions
everisNTT DATA Services
90
President and CEO
Organizational Structure (As of July 1, 2019)
Clients
Business Units and Group CompaniesM
anufacturing IT Innovation Sector
First Financial Sector
Intellectual Property
Office
System Engineering H
eadquarters
Public Sector 2
Business Solutions Sector
Second Financial Sector
Research and D
evelopment
Headquarters
China &
APA
C Sector
EMEA
& LATA
M Sector
IT Services & P
ayments Services
Sector
Corporate Management Committee
Technology and Innovation G
eneral Headquarters
Audit & Supervisory Board Members
Audit & Supervisory Board
Office for Audit & Supervisory Board Members
Information Technology
Managem
ent Office
Quality A
ssurance Departm
ent
Third Financial Sector
Fourth Financial Sector
Purchasing D
epartment
North A
merica Sector
Global M
arketing Headquarters
Board of Directors
Investor Relations O
ffice
ESG P
romotion D
epartment
Strategy Office
HR
Headquarters
Public R
elations Departm
ent
Finance Departm
ent
Company Name NTT DATA Corporation
Head OfficeToyosu Center Bldg., 3-3, Toyosu 3-chome, Koto-ku, Tokyo 135-6033, JapanTelephone: +81-3-5546-8202
Date of Establishment May 23, 1988
Common Stock¥142,520 million
Number of employeesConsolidated: 123,884Non-consolidated: 11,310
Fiscal YearApril 1 to March 31 of the following year
Ordinary General Meeting of ShareholdersJune
Stock MarketTokyo Stock Exchange 1st SectionStock Code: 9613
Administrator of Register of ShareholdersSumitomo Mitsui Trust Bank, Limited
Independent AuditorsKPMG AZSA LLC
Public Sector 1
Social Infrastructure Solution Sector
Telecom &
Utility B
usiness Sector
Internal Audit D
epartment
Company Information (As of March 31, 2019)
Offices (As of March 31, 2019)
53 countries and regions
223 cities
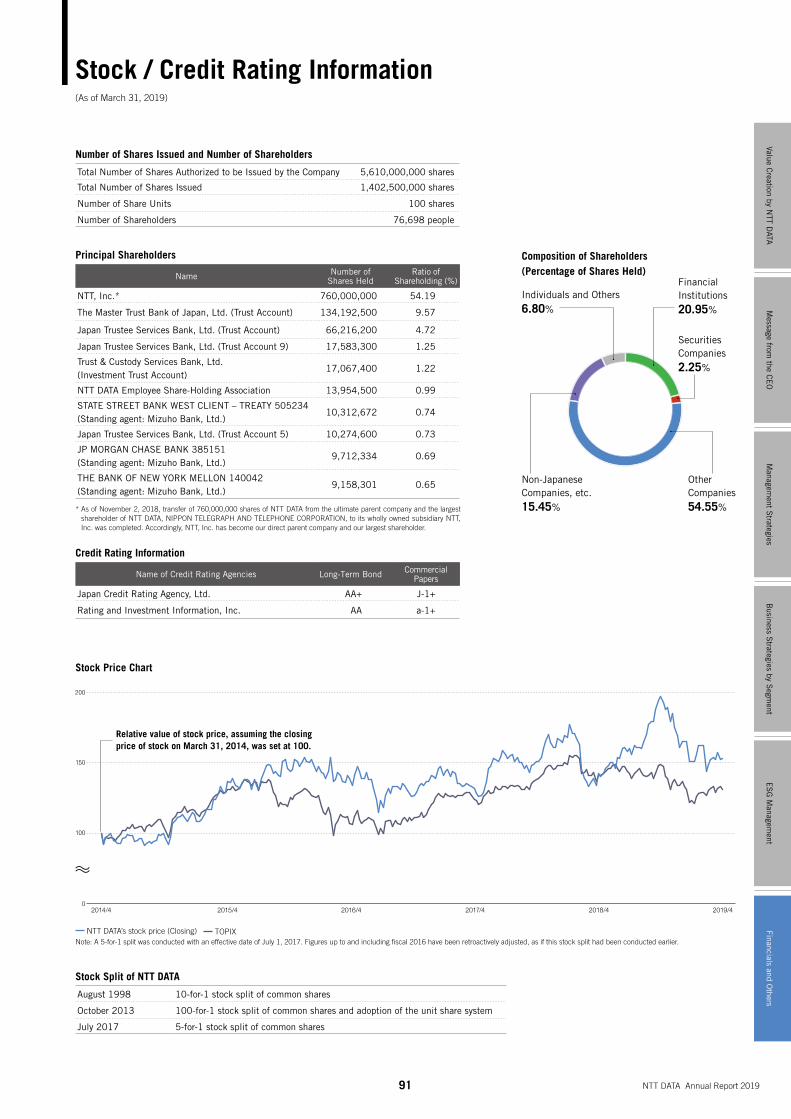
91 NTT DATA Annual Report 2019
Composition of Shareholders(Percentage of Shares Held)
Financial Institutions20.95%
Securities Companies2.25%
Other Companies54.55%
Non-Japanese Companies, etc.15.45%
Individuals and Others6.80%
Number of Shares Issued and Number of Shareholders
Total Number of Shares Authorized to be Issued by the Company 5,610,000,000 shares
Total Number of Shares Issued 1,402,500,000 shares
Number of Share Units 100 shares
Number of Shareholders 76,698 people
Stock Split of NTT DATA
August 1998 10-for-1 stock split of common shares
October 2013 100-for-1 stock split of common shares and adoption of the unit share system
July 2017 5-for-1 stock split of common shares
Stock Price Chart
NTT DATA’s stock price (Closing) TOPIXNote: A 5-for-1 split was conducted with an effective date of July 1, 2017. Figures up to and including fiscal 2016 have been retroactively adjusted, as if this stock split had been conducted earlier.
Relative value of stock price, assuming the closing price of stock on March 31, 2014, was set at 100.
2019/42018/42017/42016/42015/42014/40
100
150
200
250
300
Principal Shareholders
Name Number of Shares Held
Ratio of Shareholding (%)
NTT, Inc.* 760,000,000 54.19
The Master Trust Bank of Japan, Ltd. (Trust Account) 134,192,500 9.57
Japan Trustee Services Bank, Ltd. (Trust Account) 66,216,200 4.72
Japan Trustee Services Bank, Ltd. (Trust Account 9) 17,583,300 1.25
Trust & Custody Services Bank, Ltd. (Investment Trust Account)
17,067,400 1.22
NTT DATA Employee Share-Holding Association 13,954,500 0.99
STATE STREET BANK WEST CLIENT – TREATY 505234(Standing agent: Mizuho Bank, Ltd.)
10,312,672 0.74
Japan Trustee Services Bank, Ltd. (Trust Account 5) 10,274,600 0.73
JP MORGAN CHASE BANK 385151(Standing agent: Mizuho Bank, Ltd.)
9,712,334 0.69
THE BANK OF NEW YORK MELLON 140042(Standing agent: Mizuho Bank, Ltd.)
9,158,301 0.65
* As of November 2, 2018, transfer of 760,000,000 shares of NTT DATA from the ultimate parent company and the largest shareholder of NTT DATA, NIPPON TELEGRAPH AND TELEPHONE CORPORATION, to its wholly owned subsidiary NTT, Inc. was completed. Accordingly, NTT, Inc. has become our direct parent company and our largest shareholder.
Credit Rating Information
Name of Credit Rating Agencies Long-Term Bond Commercial Papers
Japan Credit Rating Agency, Ltd. AA+ J-1+
Rating and Investment Information, Inc. AA a-1+
Stock / Credit Rating Information(As of March 31, 2019)
Message from
the CE
OM
anagement S
trategiesB
usiness Strategies by S
egment
ES
G M
anagement
Value Creation by N
TT DATA
Financials and Others

NTT DATA CorporationToyosu Center Bldg., 3-3, Toyosu 3-chome,Koto-ku, Tokyo 135-6033, JapanTelephone: +81-3-5546-8202URL: http://www.nttdata.com/ Printed in Japan
色指定 / 特色 : Pantone 626C CMYK : C100 M60 Y100 K20 公和印刷株式会社
1C
1C
4C
4C
オンプロダクト-スタンドードタイプ 英語版 オンプロダクト-ミニラベル 英語版(印刷スペースが無い場合)
アイソレーションゾーン
Non-VOC インキロゴ使用ガイド
プロセス4C
ロゴの使用カラー
ミドリ-01C50 Y100
バックに色が入る場合
ミドリ-02C100 M25 Y100 K25
単色
スミ-01K50
スミ-02K100
Non -VOC インキとは?
ロゴの最小サイズ
印刷上、及び判読上の問題を避けるために、ロゴのサイズがW10mmより小さくならないようにして下さい。
アイソレーション
ロゴが独立して見えるように、ロゴの周囲に約 1つ分以上のスペースを設けて下さい。
10mm
Non-VOCインキは、構成成分中の高沸点石油系溶剤を1%未満に抑えたインキで、植物油
インキよりもさらに進んだ環境にやさしいインキです。
NTT D
ATA A
NN
UA
L RE
PO
RT 2019