non-state actors in education
TRANSCRIPT
SustainableDevelopmentGoals
United NationsEducational, Scientific and
Cultural Organization
2021/2G L O B A L E D U C A T I O N M O N I T O R I N G R E P O R T
Non-state actors in educationW H O C H O O S E S ? W H O L O S E S ?
2021/2
G L O B A L E D U C A T I O N M O N I T O R I N G R E P O R T
Non-state actors in educationW H O C H O O S E S ? W H O L O S E S ?
The present licence applies exclusively to the texts. For the use of images, prior permission shall be requested.
UNESCO is an Open Access publisher and all publications are made available on-line, free of charge through UNESCO’s documentary repository. Any commercialization of its publications by UNESCO is for cost-recovery of nominal actual costs for printing or copying content on paper or CDs, and distribution. There is no profit motive.
This publication can be referenced as: UNESCO. 2021. Global Education Monitoring Report 2021/2: Non-state actors in education: Who chooses? Who loses? Paris, UNESCO.
© UNESCO, 2021 First edition Published in 2021 by the United Nations Educational, Scientific and Cultural Organization 7, Place de Fontenoy, 75352 Paris 07 SP, France
Typeset by UNESCO Graphic design by Optima Graphic Design Consultants Ltd Layout by Optima Graphic Design Consultants Ltd
Cover photo: Jaap Joris Vens / Super Formosa PhotographyCaption: Different routes to school, the Netherlands.
Illustrations by HousatonicCartoons by Julio Carrión Cueva (Karry) and Miguel Morales Madrigal
Infographics by Housatonic
ISBN: 978-92-3-100493-3 ISSN 2618-0685
This publication is available in Open Access under the Attribution-ShareAlike 3.0 IGO (CC-BY-SA 3.0 IGO) licence (http://creativecommons.org/licenses/by-sa/3.0/igo/). By using the content of this publication, the users accept to be bound by the terms of use of the UNESCO Open Access Repository (http://www.unesco.org/open-access/ terms-use-ccbysa-en).
The present licence applies exclusively to the text content of the publication. For the use of any material not clearly identified as belonging to UNESCO, prior permission shall be requested from: [email protected] or UNESCO Publishing, 7, place de Fontenoy, 75352 Paris 07 SP France.
This report and all related materials are available for download here: Bit.ly/2021gemreport
iv S U M M A RY
Non-state actors’ role extends beyond provision of schooling to interventions at various education levels and influence spheres. Alongside its review of progress towards SDG 4, including emerging evidence on the COVID-19 pandemic’s impact, the 2021/2 Global Education Monitoring Report urges governments to see all institutions, students and teachers as part of a single system. Standards, information, incentives and accountability should help governments protect, respect and fulfil the right to education of all, without turning their eyes away from privilege or exploitation. Publicly funded education does not have to be publicly provided but disparity in education processes, student outcomes and teacher working conditions must be addressed. Efficiency and innovation, rather than being commercial secrets, should be diffused and practised by all. To that end, transparency and integrity in the public education policy process need to be maintained to block vested interests.
The report’s rallying call – Who chooses? Who loses? – invites policymakers to question relationships with non-state actors in terms of fundamental choices: between equity and freedom of choice; between encouraging initiative and setting standards; between groups of varying means and needs; between immediate commitments under SDG 4 and those to be progressively realized (e.g. post-secondary education); and between education and other social sectors.
Supporting the fifth Global Education Monitoring Report are two online tools: PEER, a policy dialogue resource describing non-state activity and regulations in the world’s education systems; and VIEW, a new website consolidating sources and providing new completion rate estimates over time.
UNESCO is the United Nations Educational, Scientific and Cultural Organization. It seeks to build peace through international cooperation in Education, the Sciences and Culture. UNESCO believes that political and economic arrangements are not enough to secure the lasting and sincere support of the peoples. Peace must be founded upon dialogue and mutual understanding, upon the intellectual and moral solidarity of humanity. In this spirit, UNESCO develops educational tools, cultural and scientific programmes to strengthen bonds among nations, help countries adopt international standards and foster the free flow of ideas and knowledge sharing.
Since wars begin in the minds of men and women, it is in the minds of men and women that the defenses of peace must be constructed
Who chooses? Who loses?A S H O R T S U M M A R Y
350 million children are educated by non-state actors
2 0 2 1 / 2 • G LO BA L E D U C AT I O N M O N I TO R I N G R E P O RT v
vi S U M M A RY
ForewordThe theme of this year’s Global Education Monitoring Report speaks to my entire life trajectory. I am the outcome of a mix of private and public education and life choices. I started my education in a non-state pre-primary and primary school before enrolling in a state secondary school in Sierra Leone, continued through to world-class non-state universities in the United States and then to a multinational company as a research scientist in Kenya. I am now channelling all I learned during these varied experiences into the combined roles I have in the Sierra Leonean government on education and innovation.
With clear oversight of the full range of state and non-state activity in education now as a Cabinet minister, I welcome this report’s emphasis on approaches to system governance all over the world. It acknowledges that distinctions between public and private are increasingly blurred, making the arguments that stake positions on clear dichotomies increasingly irrelevant.
I see my objective as Chief Innovation Officer to facilitate and support a vibrant national innovation and entrepreneurial ecosystem that works for all education actors in Sierra Leone. It echoes the call in this report to ensure that all actors – state and non-state – can work together to build an effective, dynamic and equitable education system for the benefit of all. In that sense, this report reads my mind when it calls on governments to create spaces and set the conditions for a variety of actors to interact, coordinate and cooperate. There is much to be gained from maximizing all parties’ expertise.
The truth of the matter is that public systems need to innovate to remain relevant, and that requires fresh thinking. One of the first things we did when I arrived in the public education system was to put together a new curriculum framework relevant to the 21st century. We built teacher training modules based on real needs. This report calls for all countries to pick up on such practices. Skills development systems that feed on contributions from governments, employers and the workers themselves are far more likely to keep pace with labour market dynamics.
Anyone in the public sector knows that public education is a conventional institution, which, by definition, is not easily reformed. But with the fast and furious shift to digitization and globalization, education systems need to keep up. More than that, they have a lot to gain if they do so. Partnerships with the private sector can help mobilize resources and expertise across the board, and encourage initiatives that can fast-forward progress at a pace governments may be unlikely to achieve on their own. We have recently issued tablets to administrators to help them track grades, attendance and budgets. We have fully digitized school census data going right back to 2015 that we now interrogate to track those left behind. All these enhance our ability to make an impact at scale within the public sector.
Many of our initiatives would not have left the starting block without funds. But this report calls for caution in our haste to follow the money. What strategic interests are our partners putting first? Does their support align with government priorities, does it avoid duplication or distraction, and will it be flexible to our evolving needs? The questions asked in the recommendations are important for all of us to consider. ‘Who is choosing?’, we are asked. Sometimes it might not be clear. ‘Who is losing?’, it asks again. ‘Why is it always the same groups?’
Many people have been pretending that non-state actors do not or should not play a role in education today. This report shows that they do already and will continue to do so tomorrow. Education is about the future. Whether you are in the private or public sector, I encourage you to read the 2021/2 GEM Report’s recommendations to be sure you are not left behind on the vision it has for change.
Dr David Moinina Sengeh Minister of Basic and Senior Secondary Education
and Chief Innovation Officer, Sierra Leone Chair of the GEM Report Advisory Board
2 0 2 1 / 2 • G LO BA L E D U C AT I O N M O N I TO R I N G R E P O RT vii
AcknowledgementsThis report would not have been possible without the valuable contributions of numerous people and institutions. The Global Education Monitoring Report (GEM Report) team would like to acknowledge their support and thank them for their time and effort.
Invaluable input was provided by the GEM Report Advisory Board’s members and its chairperson, David Sengeh. Special thanks also go to our engaged and committed funders, whose financial support makes the GEM Report possible.
We would like to acknowledge the role of UNESCO and its leadership. We are very grateful to many individuals, divisions and units at UNESCO headquarters, notably in the Education Sector and the Bureau for the Management of Support Services, for facilitating our daily work. The UNESCO Institute for Statistics played a key role by supporting access to its data. We would like to thank its director, Silvia Montoya, and her dedicated staff for their close collaboration, notably as part of our partnership on the World Inequality Database on Education and in the framework of the Technical Cooperation Group on the Indicators for SDG 4 – Education 2030, especially in the process of developing national SDG 4 benchmarks. Additional thanks go to colleagues at the UNESCO regional and field office network.
The GEM Report team would like to thank the researchers who produced background papers informing the report’s analyses: Desiree Acholla, Philip G. Altbach, Fabian Barch, Jörg Baten, Karina Batthyány, Hélène Binesse, Xavier Bonal, Francesca Bonomelli Carrasco, Federico Bruno, Dana Brakman Reiser, Mark Bray, Anne Campbell, Alejandro Caravaca, Sebastien Cherng, Lee Crawfurd, Martial Dembélé, Hans de Wit, Jonas Edlund, Brent Edwards, Clara Fontdevila, Ulrike Hanemann, Susannah Hares, Marie-France Lange, Thibaut Lauwerier, Daniel C. Levy, Arvid Lindh, Rita Locatelli, Mohammad Naeim Maleki, Zachariah Mampilly, Tatiana Mikhaylova, Christopher Millora, Adriana Morales-Perlaza, Lara Patil, Valentina Perrotta, Annie Rappeport, Serena Rossignoli, Robin Shields, Renu Singh, Geneviève Sirois, Malini Sivasubramanian, Vanessa Sperduti, James Stanfield, Wondwosen Tamrat, Antoni Verger, Qingru Wang, Anthony Welch, Quentin Wodon and Adrian Zancájo.
We are grateful to several institutions and their research staff who also produced background papers: Bamberg University (Annette Scheunpflug and Mark Wenz in cooperation with Jean Kasereka Lutswamba, Samuel Mutabazi, Frederick Njobati, Claude Ernest Njoya, Christine Nyiramana, Onja Raharijaona and Mimii Brown Rubindamayugi), Cambridge Education (Sophie Archambault and Sabine Kube-Barth), Global Initiative for Economic, Social and Cultural Rights (Sylvain Aubry and Meredith Galloway), International Association for the Evaluation of Educational Achievement (Diego Cortés, Yuan-Ling Liaw, Mojca Rožman and Rolf Strietholt), Network of Education Policy Centers (Lana Jurko and Raffaella d’Apolito), National Foundation for Educational Research (Katarzyna Kubacka, Ahmad Jawad Ashgar, Jenny Price, Gustavo Lopes and Shannon Lindsey), Al Qasimi Foundation for Policy Research (Marvin Erfurth, Janaan Farhat and Natasha Ridge), Right to Education Initiative (Frank Adamson and Delphine Dorsi), SIL Africa Learning & Development (Manasseh Wekundah and Barbara Trudell), Street Child, University of East Anglia (Anna Robinson-Pant) and University of Glasgow (Yulia Nesterova and Queralt Capsada-Munsech).
We are grateful for the engagement and valuable comments of the GEM Report’s Group of Friends, whom we asked to provide feedback on the draft recommendations. We are not listing their names, knowing that nobody will have agreed with them in full on such a difficult topic.
viii S U M M A RY
A group of independent experts reviewed the draft of the GEM Report’s thematic part and provided valuable feedback. For their input we thank Stephen Ball, Gregory Elacqua, Marta Ferreyra, Pooja Gianchandani, Harry Patrinos, Nirmala Rao and Antoni Verger. Prachi Srivastava contributed the think piece that informed the concept note of the report.
Special thanks go to the GEM Report’s fellows, supported by the Foundation to Promote Open Society: Nicolas Buchbinder, Elizabeth Buckner and Wei Zhang (2020 cohort); Leena Bhattacharya, Fernanda Gándara, Emmanuel Manyasa, Muhammad Afzan Munir, Saba Saeed and Danqing Yin (2021 cohort).
The report was edited by Andy Quan, whom we thank for his tireless work.
We also wish to acknowledge those who worked hard to support the design, production, printing and translation of the report within and outside UNESCO, including Rebecca Brite, Erin Crum, Julio Carrión Cueva (Karry), Miguel Morales Madrigal, Housatonic (Cecilia Negri, Elena Vasumini), Optima and Strategic Agenda.
Specific thanks go to Arete Stories, Dean Swift, di:ga and Rooftop for their support to the outreach of the GEM Report, and to UNICEF and Save the Children for extensive use of their photos. Thank you to Blossom (Alberto Zanardo), HiTeki (Hossein Aghvami) and Interactive Things (Gerhard Bliedung, Christian Siegrist and Benjamin Wiederkehr) for their web design and development support to the GEM Report.
Finally, we would like to thank the short-term consultants and interns who provided much input to the GEM Report team: Ritika Agarwal, Marie-Renée Andreescu, Moussa Garba, Sun Min Lee, Aziah-Katiana Tan and Jieyu Wang. Thanks also to the students of the Université Paris 1 Panthéon-Sorbonne, Sorbonne School of Economics, who contributed to the development of country profiles: Camila Araceli Maciel, Manuel Esteban Arias and Jakob Hannerz.
The Global Education Monitoring Report team
Director: Manos Antoninis
Daniel April, Bilal Barakat, Marcela Barrios Rivera, Madeleine Barry, Nicole Bella, Katherine Black, Eugenia Calvo, Daniel Caro, Anna Cristina D’Addio, Dimitra Dafalia, Dmitri Davydov, Ameer Dharamshi, Matthias Eck,
Francesca Endrizzi, Constanza Ginestra, Chandni Jain, Priyadarshani Joshi, Maria-Rafaela Kaldi, Josephine Kiyenje, Craig Laird, Katie Lazaro, Camila Lima De Moraes, Kate Linkins, Kassiani Lythrangomitis, Anissa
Mechtar, Claudine Mukizwa, Yuki Murakami, Manuela Pombo Polanco, Judith Randrianatoavina, Kate Redman, Maria Rojnov, Laura Stipanovic, Morgan Strecker, Ulrich Janse van Vuuren, Juliana Zapata and Lema Zekrya
The Global Education Monitoring Report is an independent annual publication. The GEM Report is funded by a group of governments, multilateral agencies and private foundations and facilitated and supported by UNESCO.
2 0 2 1 / 2 • G LO BA L E D U C AT I O N M O N I TO R I N G R E P O RT ix
Global Education Monitoring Report series
2021/2 Non-state actors in education Who chooses? Who loses?
2020 Inclusion and education: All means all
2019 Migration, displacement and education: Building bridges, not walls
2017/8 Accountability in education: Meeting our commitments
2016 Education for people and planet: Creating sustainable futures for all
EFA Global Monitoring Report series
2015 Education for All 2000–2015: Achievements and challenges
2013/4 Teaching and learning: Achieving quality for all
2012 Youth and skills: Putting education to work
2011 The hidden crisis: Armed conflict and education
2010 Reaching the marginalized
2009 Overcoming inequality: Why governance matters
2008 Education for All by 2015: Will we make it?
2007 Strong foundations: Early childhood care and education
2006 Literacy for life
2005 Education for All: The quality imperative
2003/4 Gender and Education for All: The leap to equality
2002 Education for All: Is the world on track?
For more information, please contact: Global Education Monitoring Report team UNESCO, 7, place de Fontenoy 75352 Paris 07 SP, France Email: [email protected] Tel.: +33 1 45 68 07 41 www.unesco.org/gemreport
Any errors or omissions found subsequent to printing will be corrected in the online version at www.unesco.org/gemreport
The Global Education Monitoring Report is an independent annual publication. The GEM Report is funded by a group of governments, multilateral agencies and private foundations and facilitated and supported by UNESCO.
x S U M M A RY
A short summary . . . . . . . . . . . . . . . . . . . . . . . . . . . . . . . . . . . . . . . . . . . . . . . . . . . . . . . . . . . . . . . . . . . . . . . . . . . . . .v Foreword . . . . . . . . . . . . . . . . . . . . . . . . . . . . . . . . . . . . . . . . . . . . . . . . . . . . . . . . . . . . . . . . . . . . . . . . . . . . . . . . . . . . .viiAcknowledgements. . . . . . . . . . . . . . . . . . . . . . . . . . . . . . . . . . . . . . . . . . . . . . . . . . . . . . . . . . . . . . . . . . . . . . . . . . viiiContents . . . . . . . . . . . . . . . . . . . . . . . . . . . . . . . . . . . . . . . . . . . . . . . . . . . . . . . . . . . . . . . . . . . . . . . . . . . . . . . . . . . . . xiKey Messages . . . . . . . . . . . . . . . . . . . . . . . . . . . . . . . . . . . . . . . . . . . . . . . . . . . . . . . . . . . . . . . . . . . . . . . . . . . . . . . xiv
Contents
Chapter 1. Introduction ................................................................................................................................................................. 2Education is both a public and a private good .............................................................................................................................................................. 5
The right to education involves entitlements and freedoms ................................................................................................................................ 5
Support for public education is strong ............................................................................................................................................................................. 6
Diverse arguments drive debate for or against non-state provision ................................................................................................................ 7
Myths about state and non-state actors in education prevail.......................................................................................................................... 12
Guide to the report ...................................................................................................................................................................................................................17
Recommendations ................................................................................................................................................................................................................... 19
Chapter 2. provision ...................................................................................................................................................................... 26Enrolment in non-state schools has been growing ..................................................................................................................................................28
State and non-state schools differ in student intake and available resources ..........................................................................................36
The impact of non-state schools on individual and system outcomes is contested ..............................................................................43
Non-state actors offer education goods and services other than schooling ............................................................................................ 50
Conclusion .................................................................................................................................................................................................................................... 58
Chapter 3. Governance and regulation..................................................................................................................................... 60Education system governance is often fragmented ...............................................................................................................................................63
Regulations do not focus enough on equity and quality ......................................................................................................................................71
Weak implementation often undermines regulation ..............................................................................................................................................82
Private tutoring regulations tend to be underdeveloped .................................................................................................................................... 86
Conclusion .....................................................................................................................................................................................................................................87
Chapter 4. Finance ......................................................................................................................................................................... 90Governments finance non-state providers directly and indirectly ..................................................................................................................92
Households face significant burdens and tough choices ..................................................................................................................................... 96
Donors are cautious about supporting for-profit education providers ......................................................................................................104
The role of philanthropic and corporate activities in education is evolving .............................................................................................107
Conclusion ..................................................................................................................................................................................................................................110
Chapter 5. Influence ....................................................................................................................................................................112Networks advocate for competing visions of non-state actors in education .........................................................................................114
The business sector exerts strong influence on education ..............................................................................................................................121
International organizations and foundations have particular influence ....................................................................................................123
Conclusion ..................................................................................................................................................................................................................................128
2 0 2 1 / 2 • G LO BA L E D U C AT I O N M O N I TO R I N G R E P O RT xi
Chapter 6. early childhood care and education ................................................................................................................... 130Non-state actors lead care and education services for children under 3 ................................................................................................... 133
Non-state actors are more prominent in pre-primary than in basic education ..................................................................................... 135
Non-state provision challenges governance and regulation ............................................................................................................................ 140
Public funding of non-state provision takes different forms ........................................................................................................................... 146
Non-state actors innovate and advocate for ECCE ............................................................................................................................................... 149
Conclusion .................................................................................................................................................................................................................................. 151
Chapter 7. tertiary education................................................................................................................................................... 154More than one in three tertiary students attend non-state institutions ................................................................................................. 156
Non-state tertiary education regulation varies ...................................................................................................................................................... 166
Financing modalities have quality and equity implications ...............................................................................................................................170
Non-state actors influence tertiary education through multiple mechanisms ......................................................................................174
Conclusion ...................................................................................................................................................................................................................................176
Chapter 8. technical, vocational and adult education ........................................................................................................ 178Apart from entry-level skills, non-state actors dominate technical and vocational education ..................................................... 180
Governing skills development systems with non-state actor participation is challenging .............................................................. 185
The right mix of state and non-state financing can support optimal skills development ................................................................ 188
Non-state actors are a driving force in adult learning and education ......................................................................................................... 191
Conclusion .................................................................................................................................................................................................................................. 196
Chapter 9. Monitoring education in the Sustainable Development Goals .................................................................... 198Countries have submitted national SDG 4 benchmarks ..................................................................................................................................... 200
COVID-19 has affected the prospects of achieving SDG 4 and the means of monitoring progress ............................................ 202
The SDG 4 monitoring framework continues to develop ................................................................................................................................... 205
Guide to the monitoring part............................................................................................................................................................................................ 206
Chapter 10. primary and secondary education ................................................................................................................... 207Access ........................................................................................................................................................................................................................................... 209
Focus 10.1: How do demand factors prevent universal schooling? .............................................................................................................. 213
Learning ....................................................................................................................................................................................................................................... 215
Focus 10.2: Learning does not progress in a linear fashion ............................................................................................................................... 225
COVID-19 ..................................................................................................................................................................................................................................... 227
Chapter 11. early childhood ..................................................................................................................................................... 235Focus 11.1: Early childhood care and education starts at birth ......................................................................................................................242
COVID-19 ..................................................................................................................................................................................................................................... 244
Chapter 12. technical, vocational, tertiary and adult education ..................................................................................... 247Technical and vocational education and training ....................................................................................................................................................249
Tertiary education .................................................................................................................................................................................................................. 252
Focus 12.1: Many families have trouble repaying student debt..................................................................................................................... 254
Adult education ...................................................................................................................................................................................................................... 256
Focus 12.2: Community learning centres have proliferated in many countries ..................................................................................... 259
Focus 12.3: Education leave is a tool to promote adult education in high-income countries ......................................................... 261
COVID-19 ......................................................................................................................................................................................................................................263
xii S U M M A RY
Chapter 13. Skills for work ........................................................................................................................................................ 267Focus 13.1. Computational thinking is an important component of digital literacy ............................................................................272
COVID-19 ......................................................................................................................................................................................................................................274
Chapter 14. equity ...................................................................................................................................................................... 275Focus 14.1. Household wealth does not capture all dimensions of poverty ............................................................................................ 283
Focus 14.2. Many children attend rebel-controlled schools – sometimes their entire school life ................................................ 284
Focus 14.3. More information is becoming available on the number of children taught in their home language ................ 288
COVID-19 ..................................................................................................................................................................................................................................... 292
Chapter 15. Literacy and numeracy ....................................................................................................................................... 295Focus 15.1: Basic numeracy skills have stagnated among Africa’s poorest for decades ................................................................... 302
COVID-19 ..................................................................................................................................................................................................................................... 304
Chapter 16. Sustainable development and global citizenship ......................................................................................... 307Focus 16.1. Climate change education aims to equip populations to cope with and mitigate the effects of climate change ............................................................................................................................................................................................314
COVID-19 ..................................................................................................................................................................................................................................... 318
Chapter 17. education facilities and learning environments ........................................................................................... 319Focus 17.1: School schedules are part of the learning environment – and influence outcomes .....................................................327
Focus 17.2: School infrastructure may be above the minimum standard yet unacceptable and deteriorating .....................329
COVID-19 ......................................................................................................................................................................................................................................332
Chapter 18. Scholarships ........................................................................................................................................................... 333Focus 18.1: Scholarship aid flows are becoming less concentrated ............................................................................................................. 338
COVID-19 ..................................................................................................................................................................................................................................... 342
Chapter 19. teachers .................................................................................................................................................................. 345Focus 19.1. Many teachers are trained and qualified but not for the subject they teach .................................................................353
COVID-19 ..................................................................................................................................................................................................................................... 356
Chapter 20. education in the other SDGs ............................................................................................................................. 359Improved energy and infrastructure support education ................................................................................................................................... 362
Education can support achievement of energy and sustainability objectives ...................................................................................... 363
Conclusion ................................................................................................................................................................................................................................. 366
Chapter 21. Monitoring finance .............................................................................................................................................. 367Public expenditure ...................................................................................................................................................................................................................370
Focus 21.1. Poor countries need to increase tax revenue to fund education ...........................................................................................373
Focus 21.2: Education spending should focus on equity .................................................................................................................................... 377
Aid expenditure ........................................................................................................................................................................................................................ 380
Household expenditure ........................................................................................................................................................................................................392
annexStatistical tables ...................................................................................................................................................................................................................... 396
Aid tables ..................................................................................................................................................................................................................................... 466
2 0 2 1 / 2 • G LO BA L E D U C AT I O N M O N I TO R I N G R E P O RT xiii
Key Messagesthere is no part of education in which non-state actors are not involved.Put simply, without non-state actors, the education of 350 million more children would fall to the responsibility of the state. But non-state engagement also affects the textbooks they use, the food in their canteens, the additional support they get, the skills they learn and much more.
Most people support public education.Three in four people in 34 middle- and high-income countries would prefer more public spending on education, with support increasing the more unequal the country. Almost nine in ten think education should primarily be public.
But such support has gradually eroded in several low- and middle-income countries.Where public schools had been in short supply and their quality had deteriorated, many families voted with their feet. The share of private institutions worldwide increased by 7 percentage points in about 10 years: to 17% by 2013 in primary and to 26% by 2014 in secondary education. It has remained roughly constant since. In Central and Southern Asia the share of private enrolment is 36% in primary and 48% in secondary education.
public education is not free.Households account for 30% of total education spending globally and 39% in low- and lower-middle-income countries. Part is due to wealthier families trying to give their children a competitive advantage. But a large part is spent on pre-primary, primary and secondary education that governments committed to provide free of charge. About 8% of families borrow to pay for education, rising to 12% in low-income countries and 30% or more in Haiti, Kenya, the Philippines and Uganda.
public education is often not inclusive.Many public education systems fail to prevent stratification and segregation. An index of social diversity in schools, based on Programme for International Student Assessment data, found that Argentina, Brazil, Chile and Mexico had similar high levels of segregation in 2018, although only Chile tends to be criticized for the high share of private institutions in its system.
But it is also a myth that private schools serve the poorest and offer better quality than public schools.
Data from 30 low- and middle-income countries show that, once household characteristics are accounted for, the apparent premium from attending private school drops by half to two-thirds. In a sample of 49 countries, the richest are almost ten times likelier than the poor to go to private school. And parents who can choose schools do so because of religious beliefs, convenience and student demographic characteristics rather than quality, about which they rarely have sufficient information.
xiv S U M M A RY
regulatory, monitoring and enforcement capacity tends to be low where the need is high.Analysis of 211 education systems for the PEER website shows that regulations tend to focus registration, approval or licensing (98%), teacher certification (93%), infrastructure (80%) and pupil/teacher ratios (74%). Regulations are least likely to focus on quality or equity: 67% regulate fee setting, e27% ban profit making and only 7% have quotas supporting access of disadvantaged groups. Private tutoring is unregulated in 48% of countries and regulated only in commercial legislation in 11% of countries.
Non-state actors are particularly present in day care and in job-specific, advanced and non-work-related training.
This is sometimes at the expense of equity and quality. In the United States, profit-maximizing universities have been linked with increased scope for corruption. In other cases, incentives are needed to encourage bigger contributions. Less than 2% of firms’ total labour cost in Europe is spent on training.
Governments need to see all education institutions, students and teachers as part of a single system.Standards, information, incentives and accountability should help governments protect, respect and fulfil the right to education of all and should prevent them from turning their eyes away from pockets of privilege or exploitation. Publicly funded education does not have to be publicly provided, but disparity in education processes, student outcomes and teacher working conditions should be addressed head on. Efficiency and innovation should not be a commercial secret; rather, they should be diffused and practised by all. To achieve that, transparency and integrity in the public education policy process need to be maintained to block vested interests.
2 0 2 1 / 2 • G LO BA L E D U C AT I O N M O N I TO R I N G R E P O RT xv
C H A P T E R 1 • IntroductIon
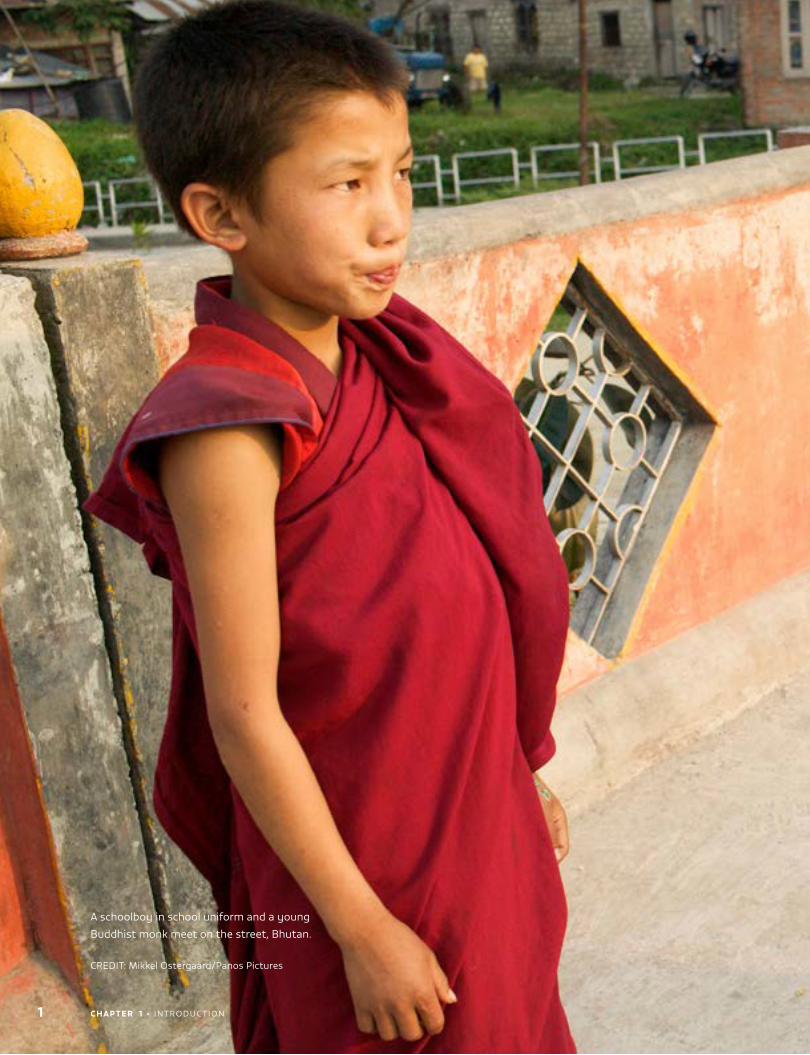
A schoolboy in school uniform and a young
Buddhist monk meet on the street, Bhutan.
crEdIt: Mikkel ostergaard/Panos Pictures
1
1CHAPTER
C H A P T E R 1 • IntroductIon 2
Introduction
K E Y M E S S AG E SNon-state involvement in education generates passionate debate with respect to two questions.
� to what the extent is education a public investment or private consumer good?
� What are the right to education implications regarding state and non-state actors’ responsibilities?
There is strong support for public education.
� In 10 middle- and 25 high-income countries, 75% of respondents favoured more public education spending, from 52% in the czech republic to 95% in the Philippines. Support for more public education spending increases with income inequality.
� overall, 89% said the primary responsibility for providing school education rested with governments. reflecting strong exposure to non-state provision, respondents in India (46%), the Philippines (63%) and chile (76%) expressed the lowest support for public provision.
� Education builds attitudes in support of social cohesion. However, the more educated are often the first to reject public education.
Country experiences with non-state actors’ involvement in education vary widely.
� In some countries, non-state actors have long been a foundation of the education system for cultural, religious and historical reasons.
� In other countries, the role of non-state actors has been limited.
� A few introduced school choice as a conscious strategy to revamp the education system.
� But for many poorer countries, trust in public education was eroded gradually.
Three core issues drive debate for or against non-state provision.
� Proponents argue non-state actors are cost-efficient. opponents argue that even where there is a clear cost advantage, it is because the underlying issues are not addressed directly.
� Proponents say non-state actors fill genuine gaps, while some prefer education to be adapted to their beliefs and principles. opponents cite equity and inclusion risks because disadvantaged populations have less access to the options non-state actors offer.
� Proponents assert that public education systems have grown into large centralized bureaucracies and blunt initiative. opponents argue that non-state innovation is often exaggerated and not replicable.
Recurring myths about state and non-state actors in education are questioned in this report.
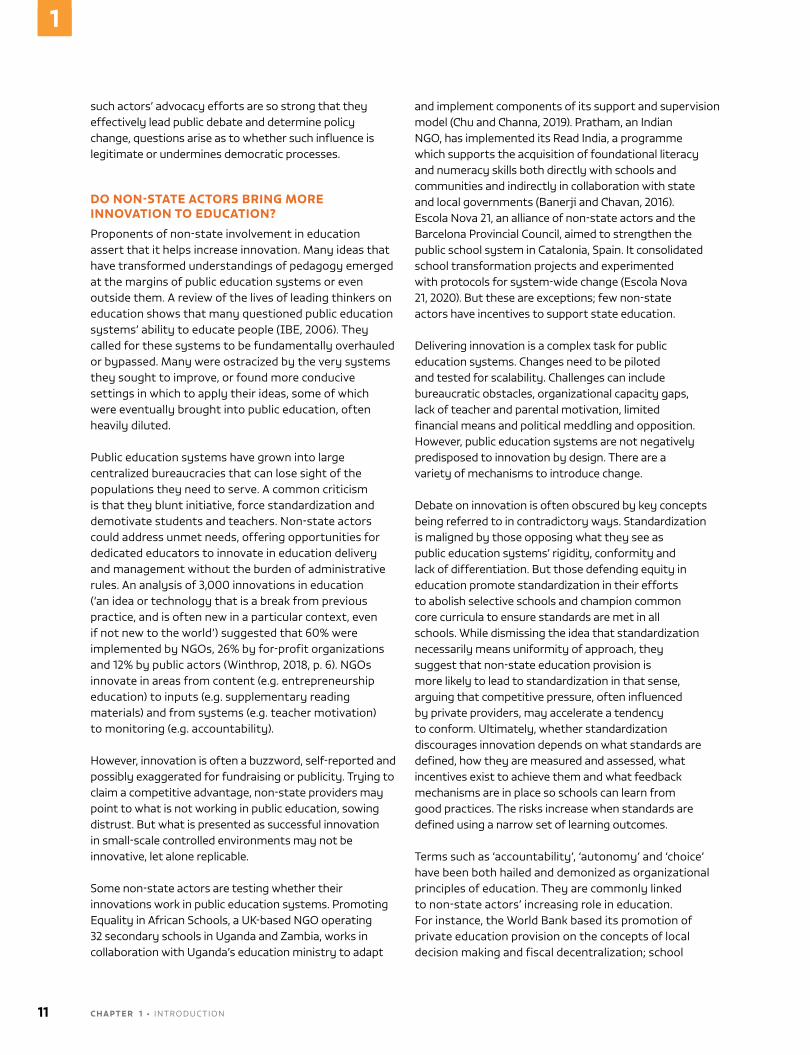
� State and non-state actors can be clearly distinguished.
� the extent of privatization is known.
� the private sector is to blame for privatization in education.
� Public education is equitable.
� Parents base school choice on robust information about quality.
� competition leads to school improvement.
� Private schools and universities are better.
� the private sector is a solution to the out-of-school challenge.
� the private sector is a solution to education financing gaps.
� regulations can address all concerns about non-state provision.
3 C H A P T E R 1 • IntroductIon
1
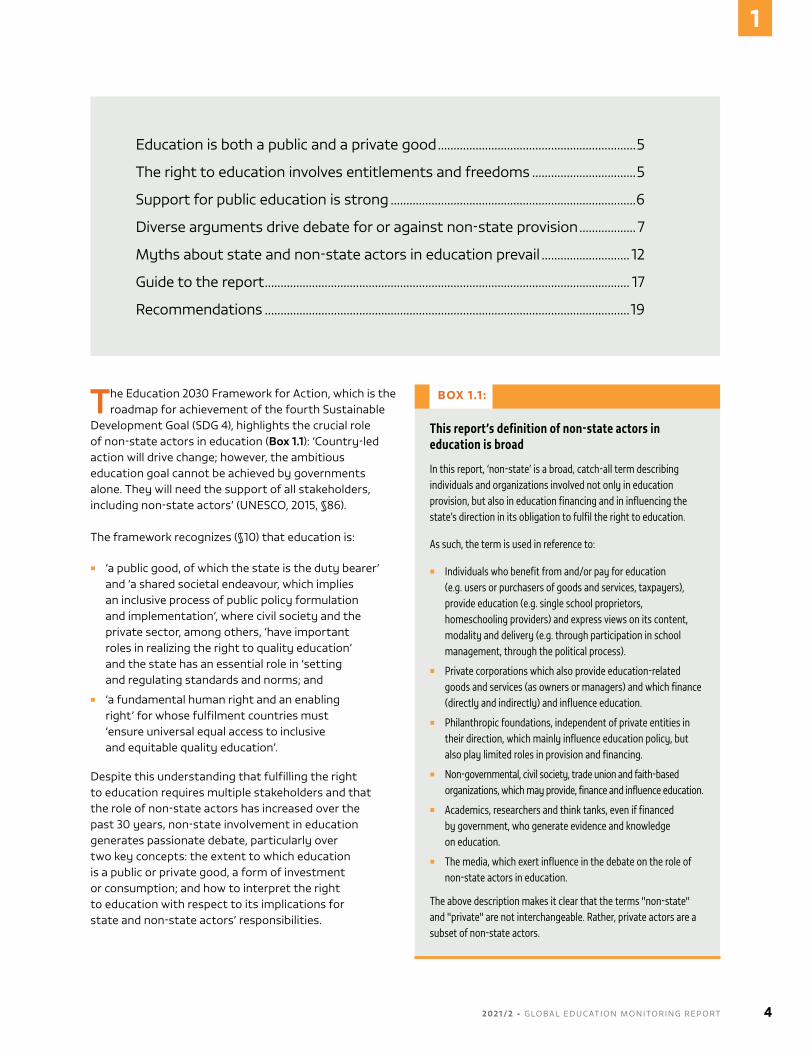
The Education 2030 Framework for Action, which is the roadmap for achievement of the fourth Sustainable
development Goal (SdG 4), highlights the crucial role of non-state actors in education (Box 1.1): ‘country-led action will drive change; however, the ambitious education goal cannot be achieved by governments alone. they will need the support of all stakeholders, including non-state actors’ (unESco, 2015, §86).
the framework recognizes (§10) that education is:
� ‘a public good, of which the state is the duty bearer’ and ‘a shared societal endeavour, which implies an inclusive process of public policy formulation and implementation’, where civil society and the private sector, among others, ‘have important roles in realizing the right to quality education’ and the state has an essential role in ‘setting and regulating standards and norms; and
� ‘a fundamental human right and an enabling right’ for whose fulfilment countries must ‘ensure universal equal access to inclusive and equitable quality education’.
despite this understanding that fulfilling the right to education requires multiple stakeholders and that the role of non-state actors has increased over the past 30 years, non-state involvement in education generates passionate debate, particularly over two key concepts: the extent to which education is a public or private good, a form of investment or consumption; and how to interpret the right to education with respect to its implications for state and non-state actors’ responsibilities.
BOX 1.1 :
This report’s definition of non-state actors in education is broad
In this report, ‘non-state’ is a broad, catch-all term describing individuals and organizations involved not only in education provision, but also in education financing and in influencing the state’s direction in its obligation to fulfil the right to education.
As such, the term is used in reference to:
� Individuals who benefit from and/or pay for education (e.g. users or purchasers of goods and services, taxpayers), provide education (e.g. single school proprietors, homeschooling providers) and express views on its content, modality and delivery (e.g. through participation in school management, through the political process).
� Private corporations which also provide education-related goods and services (as owners or managers) and which finance (directly and indirectly) and influence education.
� Philanthropic foundations, independent of private entities in their direction, which mainly influence education policy, but also play limited roles in provision and financing.
� Non-governmental, civil society, trade union and faith-based organizations, which may provide, finance and influence education.
� Academics, researchers and think tanks, even if financed by government, who generate evidence and knowledge on education.
� The media, which exert influence in the debate on the role of non-state actors in education.
The above description makes it clear that the terms "non-state" and "private" are not interchangeable. Rather, private actors are a subset of non-state actors.
Education is both a public and a private good ...............................................................5
the right to education involves entitlements and freedoms .................................5
Support for public education is strong ..............................................................................6
diverse arguments drive debate for or against non-state provision .................. 7
Myths about state and non-state actors in education prevail ............................ 12
Guide to the report .................................................................................................................... 17
recommendations ....................................................................................................................19
2 0 2 1 / 2 • G LO BA L E D U C AT I O N M O N I TO R I N G R E P O RT 4
1
EDUCATION IS BOTH A PUBLIC AND A PRIVATE GOOD
Governments have not always led education. As a core part of human existence, education historically was organized spontaneously and informally. From the late 18th century in Europe, states saw the opportunity to develop their economies through an educated workforce and to develop and strengthen a sense of national identity through public schools. this was ‘a decisive break with the voluntary and pluralistic form of learning which had preceded them, where church, family and guild had provided for their own needs’ (Green, 2013, p. 12).
Governments were prepared to take on the high cost of delivering a public good because of the wider benefits to societies and economies. Without state provision, individuals might not have invested as much in education, depriving societies of their potential. For newly independent countries in the 20th century, building a public education system was the hallmark of emancipation from colonialism. Public education invariably aimed to promote noble ideals or ruling ideologies. the new structures superseded and absorbed traditional education structures managed by local communities and religious organizations.
Education is also considered a private good. consuming more education improves an individual’s opportunities and may exclude others from them. Education becomes a vehicle for differentiation and advancement: those who manage to climb the education ladder are better placed to achieve a higher standard of living and higher returns. As education systems cannot accommodate everybody on the higher rungs, families do everything they can to ensure that their offspring are the ones who make it to the top.
Such competition generates demand, which in turn leads to the supply of education goods and services. depending on national context and disposition, markets may emerge in direct provision of education or in other services that confer advantage, such as supplementary tuition. Moreover, education is a costly enterprise, and governments have differed in the extent to which they provide sufficient financing. Some have been forced or even actively chosen to downsize public education systems, shifting the burden to households. As a result, around the world, public authority over education differs, as do citizen expectations of government responsibility for education.
THE RIGHT TO EDUCATION INVOLVES ENTITLEMENTS AND FREEDOMS
the right to education has been enshrined in human rights instruments for some 75 years, notably in the 1948 universal declaration of Human rights, the 1966 International covenant on Economic, Social and cultural rights and the 1989 convention on the rights of the child. these texts encompass both entitlements and freedoms. Individuals have the right to free and compulsory primary education, an entitlement that should gradually be extended to higher levels of education as countries’ capacity increases. But also recognized are individuals’ rights to establish schools and to choose the type of school they prefer for their children, in line with their religious and moral convictions, as long as these schools meet minimum government standards. Such standards should ensure that education is directed to full development of the human personality and sense of dignity, strengthens respect for human rights and fundamental freedoms and enables effective participation in a free society. Education should also promote understanding, tolerance and friendship among all nations and all ethnic, racial and religious groups (united nations, 1948; 1966).
In 1999, the committee on Economic, Social and cultural rights issued its General comment no. 13 to elaborate on the right to education and resulting state obligations. It set out four principles: there have to be enough schools with appropriate infrastructure, trained teachers, and teaching and learning materials; the schools have to be accessible to all, without discrimination or physical, technological or financial obstacles; curricula and teaching methods have to be acceptable, relevant, culturally appropriate and of good quality; and education has to be flexible and adaptable to changing societal and community needs (oHCHr, 1999).
Making countries responsible for meeting these principles leaves open several questions on how they should intervene. Should they provide, finance or regulate education? All of these? In what mix? While states have a duty to respect, protect and fulfil their citizens’ right to education, a wide range of non-state actors with a variety of forms, arrangements and motivation, from charity to profit, play a significant role in many education systems. their activities may or may not involve collaboration with the government. Should non-state actors’ participation in education be encouraged, contained or prevented? the answers may be specific to country context, education level and type of activity. Governments may respond to popular demand or steer it.
5 C H A P T E R 1 • IntroductIon
1
SUPPORT FOR PUBLIC EDUCATION IS STRONG
Education choices determine children’s lives. Parents must not only make simple calculations of financial costs and benefits but also take multiple, interrelated factors into account. choices regarding what is taught, how, by whom and where reflect the competing world views and aspirations of parents and of other education stakeholders. they concern two main dimensions: control and distribution of resources (socioeconomic ideology) and values and beliefs for changing society (sociocultural ideology). those who believe that government should have a greater role than market forces in economic governance and distribution, as well as those with liberal rather than conservative values on gender, religion, equality and the environment, tend to support more public spending on education and a primary role for government in education provision.1
Education choices are highly political and are reflected explicitly or implicitly in political agendas. In addition to individual ideological and circumstantial factors, understandings of social challenges and how government, people and institutions should relate to one another vary among countries. these understandings influence attitudes on what policies government should pursue and who should benefit from them.
research on support for public education is overwhelmingly from high-income countries. Among 17 organisation for Economic co-operation and development (oEcd) countries, the majority of respondents in all but Finland preferred increases in public education spending. Higher national levels of socioeconomic inequality were associated with stronger preferences for more public spending, especially among the poorest households. Higher national levels of education inequality corresponded to greater preferences for more public spending among the richest households, as they would stand to benefit first (Busemeyer, 2012).
A recent survey of attitudes in denmark, France, Germany, Ireland, Italy, Spain, Sweden and the united Kingdom confirmed high support for public education spending. It was higher than in other areas: When respondents were asked to prioritize one of eight potential areas for additional spending, education was the top option for 28%, with health care second at 22%. Support varied by education level, being higher
1 the section draws on Edlund and Lindh (2021).
2 the regional edition of this report on non-state actors in education will be dedicated to South Asia.
for primary and secondary education (62%) than for pre-primary (50%) and tertiary (47%). While 77% of respondents supported school choice, over 60% opposed a significant role for private schools in the national education system. Support for private schools averaged 34%, ranging from 14% in Sweden to 49% in Ireland (Busemeyer et al., 2020).
Analysis of the 2016 International Social Survey Programme (ISSP) special module data on the role of government, commissioned for this report, addressed public education support using a sample of 35 countries, including 10 middle-income countries (Edlund and Lindh, 2021). overall, 75% of respondents favoured more spending on education, with country shares ranging from 52% in the czech republic to 95% in the Philippines. Support for more public education spending increases with income inequality (McCall, 2016); the czech republic was among the countries with the lowest inequality and the Philippines among those with the highest. on average, support for more public education spending was stronger in middle-income countries (89%) than in high-income countries (68%) (Figure 1.1).
overall, 89% of adult respondents said the primary responsibility for providing school education rested with governments, while 6% said families and 5% other institutions (private companies and for-profit organizations; non-profit organizations, charities and cooperatives; and religious organizations). respondents in a few countries were outliers. reflecting strong exposure to non-state provision, respondents in India (46%),2 the Philippines (63%) and chile (76%) expressed the lowest support for public provision (Figure 1.2).
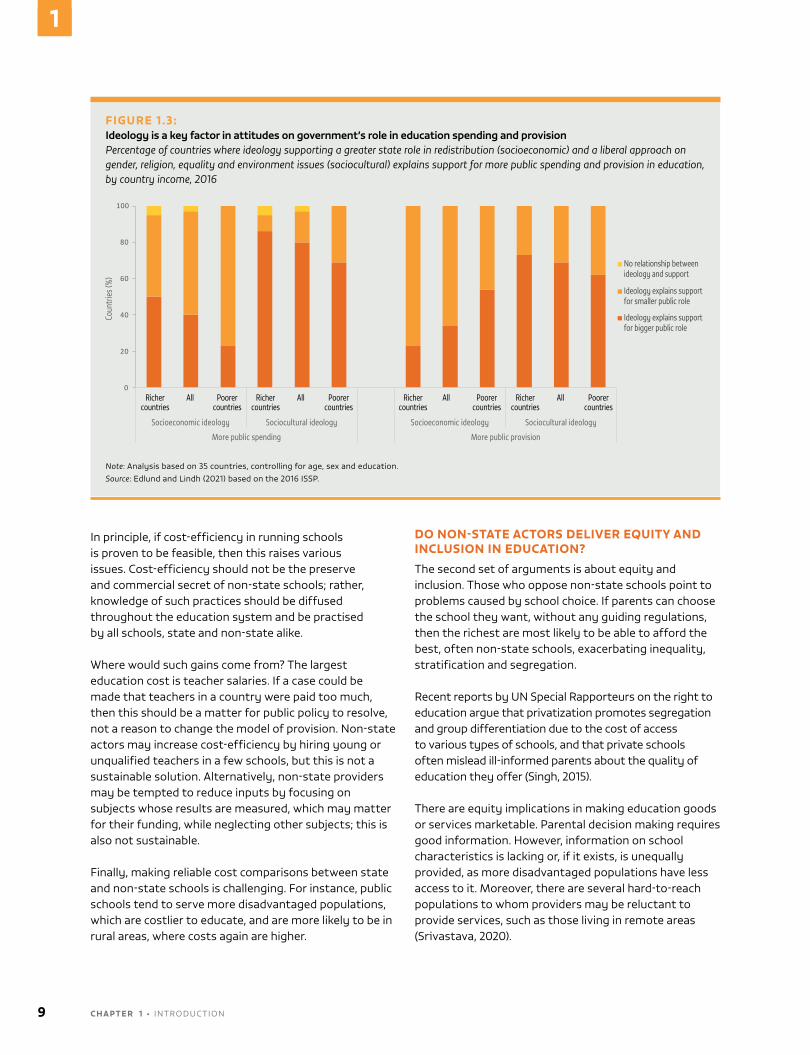
Ideology partly explains attitudes in many countries. Sociocultural ideology is twice as likely as socioeconomic ideology (in 80% of countries vs 40%) to be a significant factor in attitudes on public spending and public provision. In poorer countries, the relationship between socioeconomic ideology and attitudes is weaker for public spending and stronger for public provision (Figure 1.3). the bottom line is that ideology matters. this is why ideas are at the centre of arguments for or against the role of non-state actors in education.
Before exploring three key debates about non-state provision, a finding that merits reflection relates to the role of education itself. In 46% of the countries analysed, a higher level of education was associated with a positive attitude towards more public spending on education,
2 0 2 1 / 2 • G LO BA L E D U C AT I O N M O N I TO R I N G R E P O RT 6
1
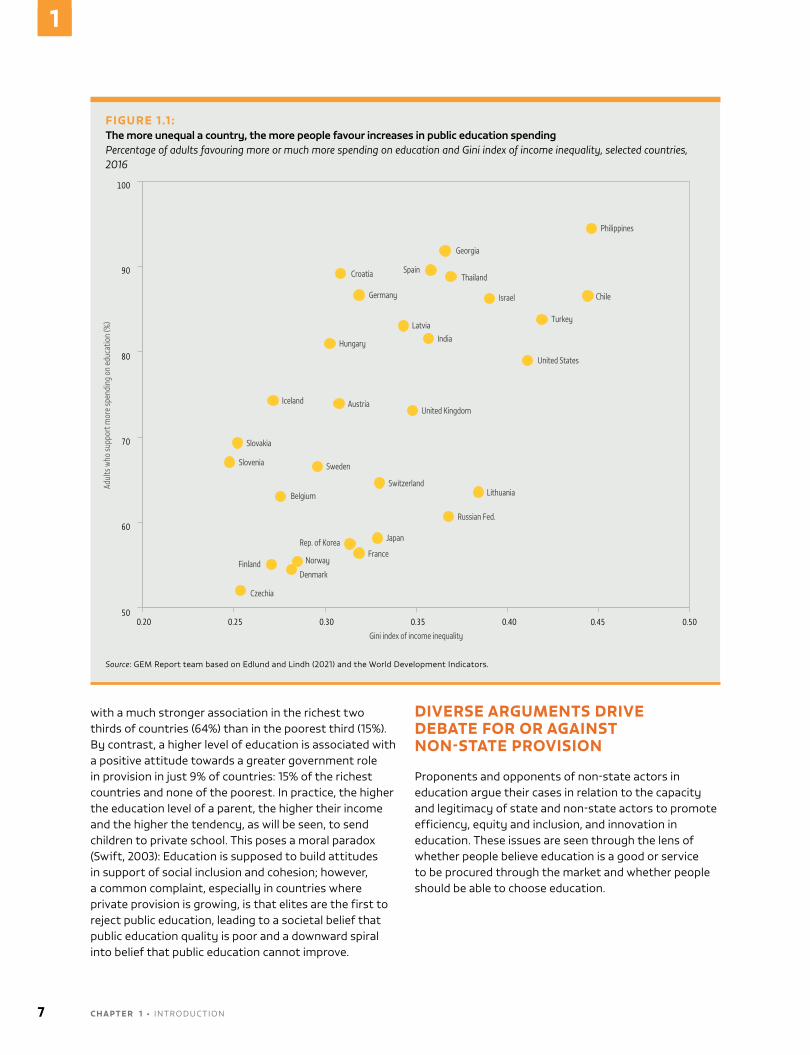
FIGURE 1.1 : The more unequal a country, the more people favour increases in public education spendingPercentage of adults favouring more or much more spending on education and Gini index of income inequality, selected countries, 2016
Czechia
DenmarkFinland Norway
FranceRep. of Korea Japan
Russian Fed.
Belgium LithuaniaSwitzerland
SwedenSlovenia
Slovakia
United KingdomAustriaIceland
United States
Hungary IndiaLatvia
Turkey
Israel ChileGermany
ThailandCroatia Spain
Georgia
Philippines
50
60
70
80
90
100
0.20 0.25 0.30 0.35 0.40 0.45 0.50
Adul
ts w
ho su
ppor
t mor
e sp
endi
ng o
n ed
ucat
ion
(%)
Gini index of income inequality
Source: GEM report team based on Edlund and Lindh (2021) and the World development Indicators.
with a much stronger association in the richest two thirds of countries (64%) than in the poorest third (15%). By contrast, a higher level of education is associated with a positive attitude towards a greater government role in provision in just 9% of countries: 15% of the richest countries and none of the poorest. In practice, the higher the education level of a parent, the higher their income and the higher the tendency, as will be seen, to send children to private school. this poses a moral paradox (Swift, 2003): Education is supposed to build attitudes in support of social inclusion and cohesion; however, a common complaint, especially in countries where private provision is growing, is that elites are the first to reject public education, leading to a societal belief that public education quality is poor and a downward spiral into belief that public education cannot improve.
DIVERSE ARGUMENTS DRIVE DEBATE FOR OR AGAINST NON-STATE PROVISION
Proponents and opponents of non-state actors in education argue their cases in relation to the capacity and legitimacy of state and non-state actors to promote efficiency, equity and inclusion, and innovation in education. these issues are seen through the lens of whether people believe education is a good or service to be procured through the market and whether people should be able to choose education.
7 C H A P T E R 1 • IntroductIon
1
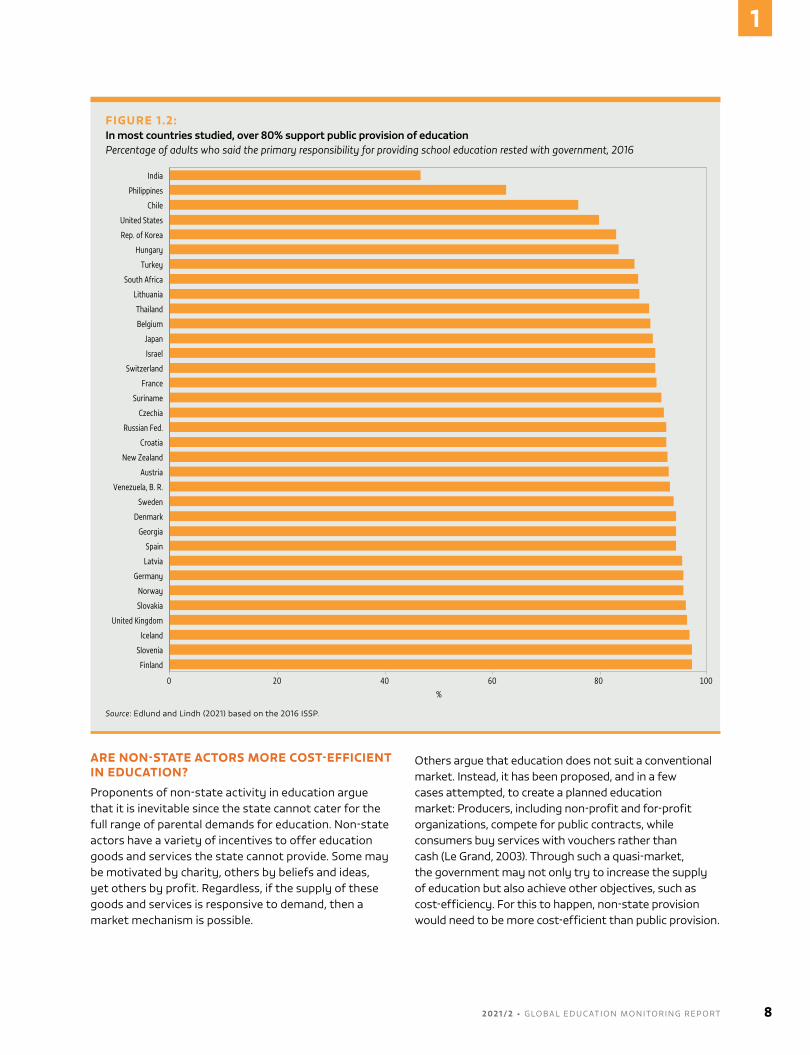
FIGURE 1.2: In most countries studied, over 80% support public provision of educationPercentage of adults who said the primary responsibility for providing school education rested with government, 2016
0 20 40 60 80 100
India
Philippines
Chile
United States
Rep. of Korea
Hungary
Turkey
South Africa
Lithuania
Thailand
Belgium
Japan
Israel
Switzerland
France
Suriname
Czechia
Russian Fed.
Croatia
New Zealand
Austria
Venezuela, B. R.
Sweden
Denmark
Georgia
Spain
Latvia
Germany
Norway
Slovakia
United Kingdom
Iceland
Slovenia
Finland
%
Source: Edlund and Lindh (2021) based on the 2016 ISSP.
ARE NON-STATE ACTORS MORE COST-EFFICIENT IN EDUCATION?
Proponents of non-state activity in education argue that it is inevitable since the state cannot cater for the full range of parental demands for education. non-state actors have a variety of incentives to offer education goods and services the state cannot provide. Some may be motivated by charity, others by beliefs and ideas, yet others by profit. regardless, if the supply of these goods and services is responsive to demand, then a market mechanism is possible.
others argue that education does not suit a conventional market. Instead, it has been proposed, and in a few cases attempted, to create a planned education market: Producers, including non-profit and for-profit organizations, compete for public contracts, while consumers buy services with vouchers rather than cash (Le Grand, 2003). through such a quasi-market, the government may not only try to increase the supply of education but also achieve other objectives, such as cost-efficiency. For this to happen, non-state provision would need to be more cost-efficient than public provision.
2 0 2 1 / 2 • G LO BA L E D U C AT I O N M O N I TO R I N G R E P O RT 8
1
In principle, if cost-efficiency in running schools is proven to be feasible, then this raises various issues. cost-efficiency should not be the preserve and commercial secret of non-state schools; rather, knowledge of such practices should be diffused throughout the education system and be practised by all schools, state and non-state alike.
Where would such gains come from? the largest education cost is teacher salaries. If a case could be made that teachers in a country were paid too much, then this should be a matter for public policy to resolve, not a reason to change the model of provision. non-state actors may increase cost-efficiency by hiring young or unqualified teachers in a few schools, but this is not a sustainable solution. Alternatively, non-state providers may be tempted to reduce inputs by focusing on subjects whose results are measured, which may matter for their funding, while neglecting other subjects; this is also not sustainable.
Finally, making reliable cost comparisons between state and non-state schools is challenging. For instance, public schools tend to serve more disadvantaged populations, which are costlier to educate, and are more likely to be in rural areas, where costs again are higher.
DO NON-STATE ACTORS DELIVER EQUITY AND INCLUSION IN EDUCATION?
the second set of arguments is about equity and inclusion. those who oppose non-state schools point to problems caused by school choice. If parents can choose the school they want, without any guiding regulations, then the richest are most likely to be able to afford the best, often non-state schools, exacerbating inequality, stratification and segregation.
recent reports by un Special rapporteurs on the right to education argue that privatization promotes segregation and group differentiation due to the cost of access to various types of schools, and that private schools often mislead ill-informed parents about the quality of education they offer (Singh, 2015).
there are equity implications in making education goods or services marketable. Parental decision making requires good information. However, information on school characteristics is lacking or, if it exists, is unequally provided, as more disadvantaged populations have less access to it. Moreover, there are several hard-to-reach populations to whom providers may be reluctant to provide services, such as those living in remote areas (Srivastava, 2020).
FIGURE 1.3: Ideology is a key factor in attitudes on government’s role in education spending and provisionPercentage of countries where ideology supporting a greater state role in redistribution (socioeconomic) and a liberal approach on gender, religion, equality and environment issues (sociocultural) explains support for more public spending and provision in education, by country income, 2016
0
20
40
60
80
100
Richer All Poorercountriescountries
Richercountries
All Poorercountries
Richercountries
All Poorercountries
Richercountries
All Poorercountries
Socioeconomic ideology Sociocultural ideology Socioeconomic ideology Sociocultural ideology
More public spending More public provision
Coun
trie
s (%
)
Ideology explains support for smaller public role
No relationship between ideology and support
Ideology explains support for bigger public role
Note: Analysis based on 35 countries, controlling for age, sex and education.Source: Edlund and Lindh (2021) based on the 2016 ISSP.
9 C H A P T E R 1 • IntroductIon
1
In 2019, human rights, academic and advocacy experts formulated 10 ‘guiding principles on the human rights obligations of States to provide public education and to regulate private involvement in education’, known as the Abidjan Principles (Skelton et al., 2019). the principles aim to provide a normative framework to inform debate and assessment of privatization’s role in education so as to guide countries in implementing related international law (Adamson et al., 2021). they accept that governments can fund non-state schools that comply with government standards. Some of the principles call for mechanisms of public accountability, regulation and compliance monitoring.
Proponents of non-state provision support these mechanisms and argue that, far from violating the right to education, non-state providers contribute to its fulfilment. In this view, international law does not prescribe how states must fulfil their education obligation. thus governments can choose a mix of public and private education as long as they assume responsibility for regulation that imposes reasonable obligations (Emmerson, 2020).
In many contexts, non-state actors have filled genuine gaps in education provision, often for disadvantaged groups neglected by public systems. Governments are often reluctant to set up schools in informal settlements. A review of slums/underserved areas in Pakistan’s eight largest cities found that 25% lacked schools; in the rest, 74% of the schools were private (CHIP training and Consulting, 2020). non-state actors also make valuable contributions in crisis and emergency contexts. Following the catastrophic earthquake in nepal in 2015, non-governmental organizations (nGos) provided supplementary education structures in locations the government was slow to reach (Street Child, 2021). In El Salvador, in urban areas afflicted by violence and gangs, the share of enrolment in non-state schools is double the national average (uSAId et al., 2018).
A separate set of considerations relates to inclusion. Some of those who think government should not have a primary role in education provision challenge its authority to decide on education content or its ability to deliver education of a desired standard. reasons include religion, political ideology, mother tongue and accessibility for learners with disabilities. Members of the universal declaration of Human rights drafting committee were influenced by the then-recent memory of how public education was used to indoctrinate youth during the nazi regime in Germany. they wanted to provide a counterpoint to the contested reference to education being compulsory, which had been
approved by only a single vote margin in May 1948. In addition, they were motivated by their national and other contexts. Led by Lebanon, where education was traditionally segregated along sectarian lines, the un General Assembly adopted the paragraph on the parental right ‘to choose the kind of education that shall be given to their children’, albeit by a small margin, 17 votes to 13 (with 7 abstentions), in november 1948 (Stanfield, 2006).
In many countries, some groups would prefer education to be adapted to their beliefs and principles. Parents may make a case for separate and non-state provision due to concern that the local public school threatens the values of the cultural, ethnic, linguistic or religious community in which they want to raise their child. Governments may argue that this conflicts with their commitment to ensure equitable and inclusive education and interferes with their ability to apply uniform standards in an effort to provide the same quality of education to all children, without exception.
nevertheless, governments explicitly or implicitly delegate responsibility to non-state actors for various reasons. In a post-conflict environment, a government may allow non-state actors to provide education as a peacebuilding measure, for instance to an ethnic minority. Governments may allow religious communities to run schools, although some of these schools may controversially seek exceptions from the national curriculum, for instance in science or civic education.
In most countries, education for children with disabilities was historically provided by non-state charitable actors. over time, governments have adopted legislation on inclusive education that expects all children to attend local mainstream schools. But when their transition is not well prepared, these students may suffer from prejudice and stigmatization. Parents who feel public schools are not catering for the needs of their children may place them back into non-state special schools. Who is to blame for parallel education systems? States that inadequately fund mainstream schools, or non-state actors that respond to family demands? conversely, non-state schools reacting to pressure to compete may exclude some students, including children with disabilities, violating core principles of equity and non-discrimination in education.
Last but not least, non-state actors influence equity and inclusion in education in contrasting ways. Several civil society organizations and, recently, philanthropic foundations have advocated for education to be inclusive, supporting legislation and policy changes. But when
2 0 2 1 / 2 • G LO BA L E D U C AT I O N M O N I TO R I N G R E P O RT 10
1
such actors’ advocacy efforts are so strong that they effectively lead public debate and determine policy change, questions arise as to whether such influence is legitimate or undermines democratic processes.
DO NON-STATE ACTORS BRING MORE INNOVATION TO EDUCATION?
Proponents of non-state involvement in education assert that it helps increase innovation. Many ideas that have transformed understandings of pedagogy emerged at the margins of public education systems or even outside them. A review of the lives of leading thinkers on education shows that many questioned public education systems’ ability to educate people (IBE, 2006). they called for these systems to be fundamentally overhauled or bypassed. Many were ostracized by the very systems they sought to improve, or found more conducive settings in which to apply their ideas, some of which were eventually brought into public education, often heavily diluted.
Public education systems have grown into large centralized bureaucracies that can lose sight of the populations they need to serve. A common criticism is that they blunt initiative, force standardization and demotivate students and teachers. non-state actors could address unmet needs, offering opportunities for dedicated educators to innovate in education delivery and management without the burden of administrative rules. An analysis of 3,000 innovations in education (‘an idea or technology that is a break from previous practice, and is often new in a particular context, even if not new to the world’) suggested that 60% were implemented by nGos, 26% by for-profit organizations and 12% by public actors (Winthrop, 2018, p. 6). nGos innovate in areas from content (e.g. entrepreneurship education) to inputs (e.g. supplementary reading materials) and from systems (e.g. teacher motivation) to monitoring (e.g. accountability).
However, innovation is often a buzzword, self-reported and possibly exaggerated for fundraising or publicity. trying to claim a competitive advantage, non-state providers may point to what is not working in public education, sowing distrust. But what is presented as successful innovation in small-scale controlled environments may not be innovative, let alone replicable.
Some non-state actors are testing whether their innovations work in public education systems. Promoting Equality in African Schools, a uK-based nGo operating 32 secondary schools in uganda and Zambia, works in collaboration with uganda’s education ministry to adapt
and implement components of its support and supervision model (Chu and Channa, 2019). Pratham, an Indian nGo, has implemented its read India, a programme which supports the acquisition of foundational literacy and numeracy skills both directly with schools and communities and indirectly in collaboration with state and local governments (Banerji and Chavan, 2016). Escola nova 21, an alliance of non-state actors and the Barcelona Provincial council, aimed to strengthen the public school system in catalonia, Spain. It consolidated school transformation projects and experimented with protocols for system-wide change (Escola nova 21, 2020). But these are exceptions; few non-state actors have incentives to support state education.
delivering innovation is a complex task for public education systems. changes need to be piloted and tested for scalability. challenges can include bureaucratic obstacles, organizational capacity gaps, lack of teacher and parental motivation, limited financial means and political meddling and opposition. However, public education systems are not negatively predisposed to innovation by design. there are a variety of mechanisms to introduce change.
debate on innovation is often obscured by key concepts being referred to in contradictory ways. Standardization is maligned by those opposing what they see as public education systems’ rigidity, conformity and lack of differentiation. But those defending equity in education promote standardization in their efforts to abolish selective schools and champion common core curricula to ensure standards are met in all schools. While dismissing the idea that standardization necessarily means uniformity of approach, they suggest that non-state education provision is more likely to lead to standardization in that sense, arguing that competitive pressure, often influenced by private providers, may accelerate a tendency to conform. ultimately, whether standardization discourages innovation depends on what standards are defined, how they are measured and assessed, what incentives exist to achieve them and what feedback mechanisms are in place so schools can learn from good practices. the risks increase when standards are defined using a narrow set of learning outcomes.
terms such as ‘accountability’, ‘autonomy’ and ‘choice’ have been both hailed and demonized as organizational principles of education. they are commonly linked to non-state actors’ increasing role in education. For instance, the World Bank based its promotion of private education provision on the concepts of local decision making and fiscal decentralization; school
11 C H A P T E R 1 • IntroductIon
1
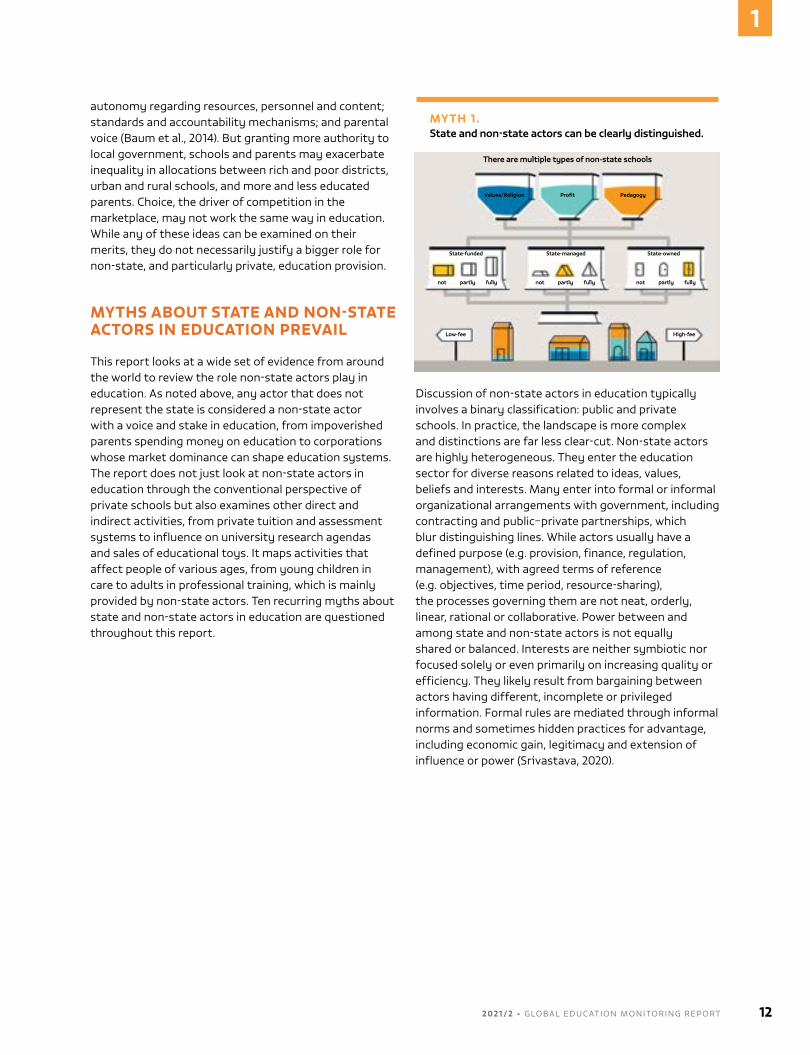
autonomy regarding resources, personnel and content; standards and accountability mechanisms; and parental voice (Baum et al., 2014). But granting more authority to local government, schools and parents may exacerbate inequality in allocations between rich and poor districts, urban and rural schools, and more and less educated parents. choice, the driver of competition in the marketplace, may not work the same way in education. While any of these ideas can be examined on their merits, they do not necessarily justify a bigger role for non-state, and particularly private, education provision.
MYTHS ABOUT STATE AND NON-STATE ACTORS IN EDUCATION PREVAIL
this report looks at a wide set of evidence from around the world to review the role non-state actors play in education. As noted above, any actor that does not represent the state is considered a non-state actor with a voice and stake in education, from impoverished parents spending money on education to corporations whose market dominance can shape education systems. the report does not just look at non-state actors in education through the conventional perspective of private schools but also examines other direct and indirect activities, from private tuition and assessment systems to influence on university research agendas and sales of educational toys. It maps activities that affect people of various ages, from young children in care to adults in professional training, which is mainly provided by non-state actors. ten recurring myths about state and non-state actors in education are questioned throughout this report.
MYTH 1. State and non-state actors can be clearly distinguished.
There are multiple types of non-state schools
Values/Religion
not not notpartly
Low-fee High-fee
partly partly
State-ownedState-managedState-funded
fully fully fully
Profit Pedagogy
discussion of non-state actors in education typically involves a binary classification: public and private schools. In practice, the landscape is more complex and distinctions are far less clear-cut. non-state actors are highly heterogeneous. they enter the education sector for diverse reasons related to ideas, values, beliefs and interests. Many enter into formal or informal organizational arrangements with government, including contracting and public–private partnerships, which blur distinguishing lines. While actors usually have a defined purpose (e.g. provision, finance, regulation, management), with agreed terms of reference (e.g. objectives, time period, resource-sharing), the processes governing them are not neat, orderly, linear, rational or collaborative. Power between and among state and non-state actors is not equally shared or balanced. Interests are neither symbiotic nor focused solely or even primarily on increasing quality or efficiency. they likely result from bargaining between actors having different, incomplete or privileged information. Formal rules are mediated through informal norms and sometimes hidden practices for advantage, including economic gain, legitimacy and extension of influence or power (Srivastava, 2020).
2 0 2 1 / 2 • G LO BA L E D U C AT I O N M O N I TO R I N G R E P O RT 12
1
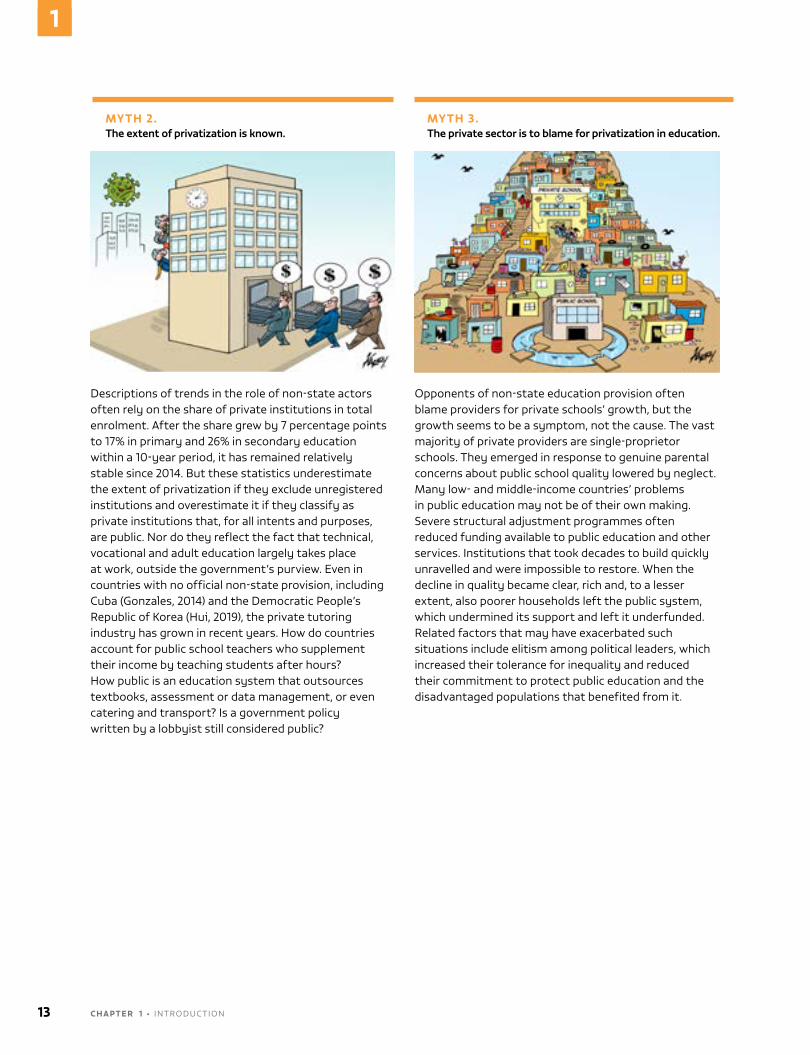
descriptions of trends in the role of non-state actors often rely on the share of private institutions in total enrolment. After the share grew by 7 percentage points to 17% in primary and 26% in secondary education within a 10-year period, it has remained relatively stable since 2014. But these statistics underestimate the extent of privatization if they exclude unregistered institutions and overestimate it if they classify as private institutions that, for all intents and purposes, are public. nor do they reflect the fact that technical, vocational and adult education largely takes place at work, outside the government’s purview. Even in countries with no official non-state provision, including cuba (Gonzales, 2014) and the democratic People’s republic of Korea (Hui, 2019), the private tutoring industry has grown in recent years. How do countries account for public school teachers who supplement their income by teaching students after hours? How public is an education system that outsources textbooks, assessment or data management, or even catering and transport? Is a government policy written by a lobbyist still considered public?
MYTH 2. The extent of privatization is known.
opponents of non-state education provision often blame providers for private schools’ growth, but the growth seems to be a symptom, not the cause. the vast majority of private providers are single-proprietor schools. they emerged in response to genuine parental concerns about public school quality lowered by neglect. Many low- and middle-income countries’ problems in public education may not be of their own making. Severe structural adjustment programmes often reduced funding available to public education and other services. Institutions that took decades to build quickly unravelled and were impossible to restore. When the decline in quality became clear, rich and, to a lesser extent, also poorer households left the public system, which undermined its support and left it underfunded. related factors that may have exacerbated such situations include elitism among political leaders, which increased their tolerance for inequality and reduced their commitment to protect public education and the disadvantaged populations that benefited from it.
MYTH 3. The private sector is to blame for privatization in education.
13 C H A P T E R 1 • IntroductIon
1
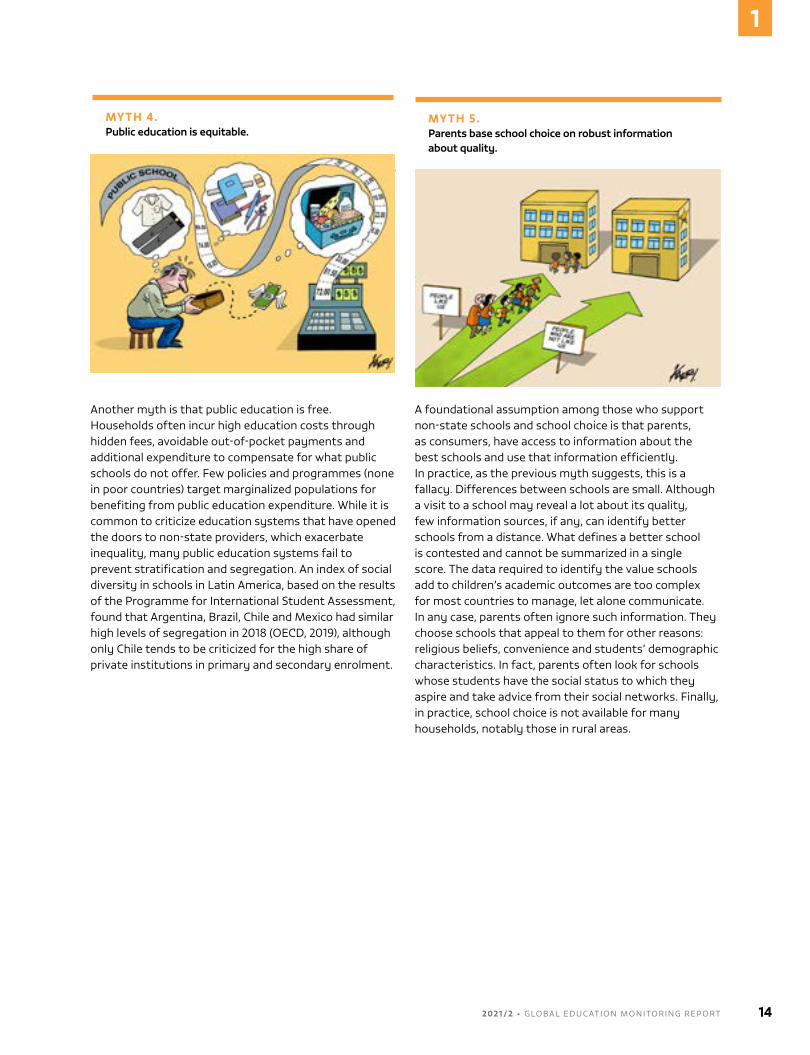
Another myth is that public education is free. Households often incur high education costs through hidden fees, avoidable out-of-pocket payments and additional expenditure to compensate for what public schools do not offer. Few policies and programmes (none in poor countries) target marginalized populations for benefiting from public education expenditure. While it is common to criticize education systems that have opened the doors to non-state providers, which exacerbate inequality, many public education systems fail to prevent stratification and segregation. An index of social diversity in schools in Latin America, based on the results of the Programme for International Student Assessment, found that Argentina, Brazil, chile and Mexico had similar high levels of segregation in 2018 (oECd, 2019), although only chile tends to be criticized for the high share of private institutions in primary and secondary enrolment.
MYTH 4. Public education is equitable.
A foundational assumption among those who support non-state schools and school choice is that parents, as consumers, have access to information about the best schools and use that information efficiently. In practice, as the previous myth suggests, this is a fallacy. differences between schools are small. Although a visit to a school may reveal a lot about its quality, few information sources, if any, can identify better schools from a distance. What defines a better school is contested and cannot be summarized in a single score. the data required to identify the value schools add to children’s academic outcomes are too complex for most countries to manage, let alone communicate. In any case, parents often ignore such information. they choose schools that appeal to them for other reasons: religious beliefs, convenience and students’ demographic characteristics. In fact, parents often look for schools whose students have the social status to which they aspire and take advice from their social networks. Finally, in practice, school choice is not available for many households, notably those in rural areas.
MYTH 5. Parents base school choice on robust information about quality.
2 0 2 1 / 2 • G LO BA L E D U C AT I O N M O N I TO R I N G R E P O RT 14
1
Another tenet of supporters of non-state activity in education is that change is better than the status quo. Public institutions transform slowly; public education institutions are particularly slow to respond to individual and societal demands for relevant skills. civil servants who do not perform are often protected, and vested interests block innovations that could increase efficiency and quality. Alternative providers and the opportunity to choose them should ensure that public schools accelerate needed reforms. In everyday life, accountability and healthy competition motivate some people to improve. In the economic sphere, firms compete to survive, as profit making is why they exist. But it is not clear how such dynamics play out in education. Studies that demonstrate system-wide effects of competition are rare, due to the complexity of the subject matter, and findings have been inconclusive. Worse, competition can lead non-state schools to pander to parents’ aspirations, against good pedagogical practice. For instance, they may choose English as the language of instruction no matter what language learners speak at home.
MYTH 6. Competition leads to school improvement.
Whether private schools and universities are better than public ones is much debated. comparison of public and private school examination pass rates is the usual evidence relied upon for school league tables as reported by the media and read by parents. the same is true of university rankings, which have grown in number and popularity as basic reference points of performance. In practice, comparisons should take into account differences between school and university types. Student intake varies, with better-off, well-educated and highly aspirational parents far more likely to choose a private school. Private schools, in turn, may be able to screen students to maximize the possibility of top results. often (though not always) better resourced, they can more easily fulfil the potential of easy-to-teach students. When such factors are controlled for, the gap between public and private schools is usually slashed or eliminated. And this is just one comparison criterion. Should only final results be compared, not the contribution of each school and university type to improvement of students’ results? Should academic outcomes be compared, but not life skills? At what point in life should results be compared?
MYTH 7. Private schools and universities are better.
15 C H A P T E R 1 • IntroductIon
1
With more than 350 million primary and secondary school students enrolled in private institutions, it is sometimes argued that non-state actors can help increase enrolment levels and contribute to achievement of SdG 4. It is true that crisis is inevitable if these students switch over to the public education system, as happened in countries where students left private schools during the coVId-19 pandemic due to financial issues or dissatisfaction with the schools. However, non-state actors are not operating at the scale necessary to contribute to universal primary and secondary education completion. Private schools are booming in urban areas, where enrolment levels are already close to universal. But they are largely absent in rural areas. And in low- and middle-income countries, children from the richest 20% of households are 10 times more likely to attend a private school than their peers from the poorest 20%. the potential of low-fee private schools to improve equity has been exaggerated.
MYTH 8. The private sector is a solution to the out-of-school challenge.
the Education 2030 Framework for Action holds high hopes that the ‘private sector, philanthropic organizations and foundations can play an important role, using their … business expertise and financial resources to strengthen public education’, because ‘the private sector has emerged as a contributor with significant potential to complement resources for education’. the Global Partnership for Education developed its Private Sector Strategy to ‘engage, co-create and leverage private sector … finance’ to advance its goals. Such documents suggest that private-sector organizations can fill the financing gap to achieve SdG 4. there is no evidence so far that they are willing or able to do so. But the private sector could make many other contributions. the obvious one is paying tax, especially in low- and lower-middle-income countries where domestic revenue mobilization rates are low and opportunities for tax evasion and avoidance are rife. corporations could refrain from corruption and from lobbying that distorts public spending in education. the private sector leads in terms of skills development but could do more. Businesses could take a stronger lead in offering childcare services as required by national regulations.
MYTH 9. The private sector is a solution to education financing gaps.
2 0 2 1 / 2 • G LO BA L E D U C AT I O N M O N I TO R I N G R E P O RT 16
1
there is consensus that non-state activity in education should be regulated. not everyone should be allowed to open a school. not every building is suitable to host students. not every textbook should be used in classrooms. Getting these basic conditions met is challenging, as governments tend to do little monitoring of any regulations imposed. But the main concern is that regulations do not meaningfully address how to promote equity and quality. non-state education activity can have system-wide implications on equity and quality. Yet few governments monitor whether the flight of wealthier households to private schools segregates the education system. Few governments monitor how much money households pay out of pocket for education and what this means for equity. Many governments allow selective school admissions. Few regulate private supplementary tuition or lobbying, which remains largely undefined under the guise of partnerships. Even fewer have the resources to implement and enforce regulations effectively. Finally, regulations cannot fix problems. they provide guidance to actors who have to abide by them to ensure equitable education.
MYTH 10. Regulations can address all concerns about non-state provision.
GUIDE TO THE REPORT
About a quarter of a century ago in the united States, when evidence started emerging about the unequal effects of new organizational forms in public education based on school choice, the authors of an early study aptly summarized the findings with two questions: Who chooses? Who loses? (Fuller and Elmore, 1996). As more evidence accumulates on the mechanics, effectiveness and consequences of school choice around the world, the Global Education Monitoring Report takes these questions to a global audience. recommendations at the end of this chapter refer to the most important debates in relation to achieving SdG 4.
the thematic part of the report is organized into seven chapters. the first four address key aspects of non-state activity in primary and secondary education – provision, regulation, financing and influence – and the last three review these aspects at other education levels, which tend to receive less attention: early childhood education, tertiary education and technical, vocational and adult education.
chapter 2 analyses three kinds of provision of education goods and services. First, core education services are examined. A typology of non-state schools is developed, based on their relationship with the state, motivations of their establishment and costs to households. the prevalence of non-state providers and their key characteristics, such as resources and outcomes, are monitored. Second, other learning-related support goods and services are reviewed, including supplementary private tutoring and textbook publishing. third, the chapter addresses other support goods and services, increasingly procured privately, such as infrastructure and catering. the effects of different kinds of non-state provision on access, equity, inclusion, quality, learning and efficiency are discussed.
17 C H A P T E R 1 • IntroductIon
1
chapter 3 focuses on governance and regulation of non-state actors in education and whether existing mechanisms are fit for purpose. It approaches the issue from a system-wide perspective, recognizing that both public and private actors need to be held accountable for compliance with minimum standards. the analysis covers entry and exit, affordability, teachers and curricula, and quality assurance. It is based on profiles of regulatory practices in 211 education systems, prepared by the GEM report team and available at the Profiles for Enhancing Education reviews (PEEr) website. Special attention is paid to regulation implementation and enforcement.
chapter 4 examines financing aspects of non-state activity in education. It looks at the ways governments support non-state providers, the extent to which households shoulder a share of total education costs, engagement of non-state actors by donors and the role of corporations and philanthropic foundations as education funders.
chapter 5 reviews an often overlooked factor, the role of influence in swaying public opinion and public policy for or against non-state actors in education. It describes diverse channels, such as advocacy, research, funding, lobbying and the selling of goods and services, and various non-state actors, including corporations, teacher unions, civil society organizations, think tanks, private-sector associations and the media.
chapter 6 looks at early childhood care and education, where non-state provision is more prevalent than in primary and secondary education in many countries, and where compliance with standards needs to be closely monitored.
chapter 7 unpacks the special case of tertiary education, where expansion of private provision has been rapid in several countries, posing particular challenges for governments that wish to promote equity and assure quality. Post-secondary teacher training institutions are another area in which non-state provision has emerged.
chapter 8 looks at technical, vocational and adult education and training, where non-state actors are dominant. Public provision is limited to general skills, while public funding mechanisms try to encourage businesses to provide more on-the-job training and individuals to continue developing their skills.
Finally, the monitoring part of the report, chapters 9 to 21, serves two purposes. It updates on progress towards the SDG 4 targets, including the interrelationship of education with three other SDGs and the evolution of education financing, based on data mostly up to 2019. In addition, it summarizes the latest evidence on the impact of COVID-19 on each SdG 4 target. this is the most serious crisis ever to have hit all the world’s education systems at once, and has also negatively affected data systems. As the crisis continues to unfold, insights are emerging from scattered evidence.
2 0 2 1 / 2 • G LO BA L E D U C AT I O N M O N I TO R I N G R E P O RT 18
1
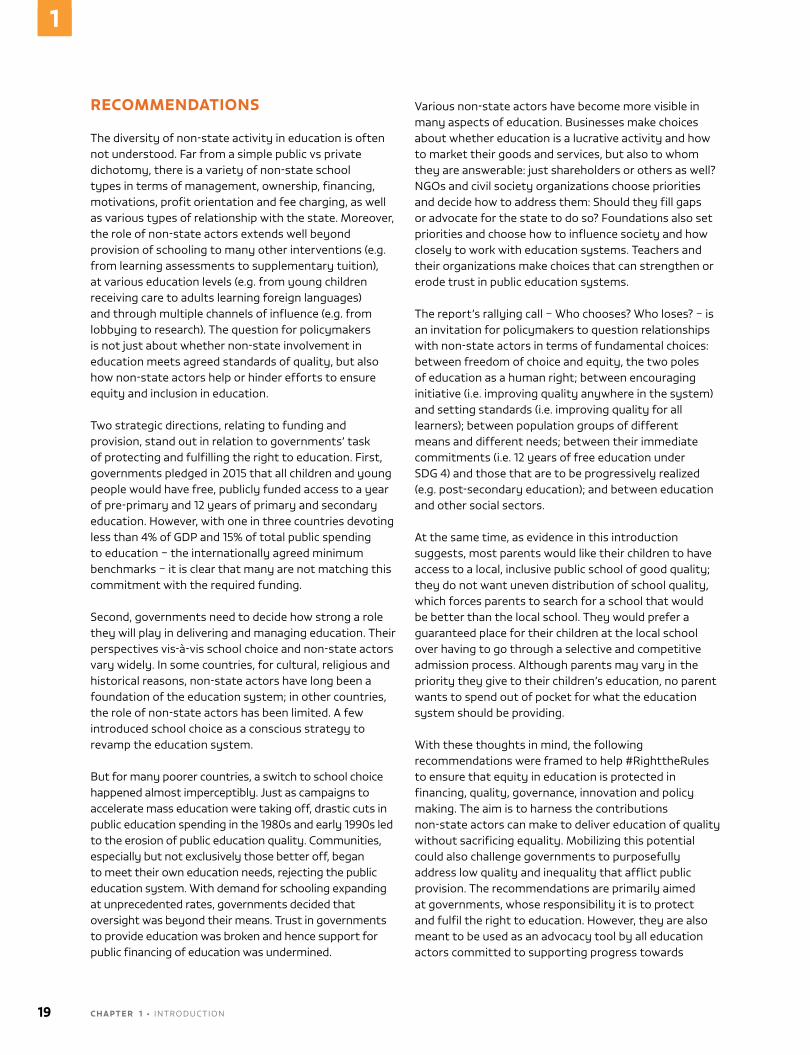
RECOMMENDATIONS
the diversity of non-state activity in education is often not understood. Far from a simple public vs private dichotomy, there is a variety of non-state school types in terms of management, ownership, financing, motivations, profit orientation and fee charging, as well as various types of relationship with the state. Moreover, the role of non-state actors extends well beyond provision of schooling to many other interventions (e.g. from learning assessments to supplementary tuition), at various education levels (e.g. from young children receiving care to adults learning foreign languages) and through multiple channels of influence (e.g. from lobbying to research). the question for policymakers is not just about whether non-state involvement in education meets agreed standards of quality, but also how non-state actors help or hinder efforts to ensure equity and inclusion in education.
two strategic directions, relating to funding and provision, stand out in relation to governments’ task of protecting and fulfilling the right to education. First, governments pledged in 2015 that all children and young people would have free, publicly funded access to a year of pre-primary and 12 years of primary and secondary education. However, with one in three countries devoting less than 4% of GdP and 15% of total public spending to education – the internationally agreed minimum benchmarks – it is clear that many are not matching this commitment with the required funding.
Second, governments need to decide how strong a role they will play in delivering and managing education. their perspectives vis-à-vis school choice and non-state actors vary widely. In some countries, for cultural, religious and historical reasons, non-state actors have long been a foundation of the education system; in other countries, the role of non-state actors has been limited. A few introduced school choice as a conscious strategy to revamp the education system.
But for many poorer countries, a switch to school choice happened almost imperceptibly. Just as campaigns to accelerate mass education were taking off, drastic cuts in public education spending in the 1980s and early 1990s led to the erosion of public education quality. communities, especially but not exclusively those better off, began to meet their own education needs, rejecting the public education system. With demand for schooling expanding at unprecedented rates, governments decided that oversight was beyond their means. trust in governments to provide education was broken and hence support for public financing of education was undermined.
Various non-state actors have become more visible in many aspects of education. Businesses make choices about whether education is a lucrative activity and how to market their goods and services, but also to whom they are answerable: just shareholders or others as well? nGos and civil society organizations choose priorities and decide how to address them: Should they fill gaps or advocate for the state to do so? Foundations also set priorities and choose how to influence society and how closely to work with education systems. teachers and their organizations make choices that can strengthen or erode trust in public education systems.
the report’s rallying call – Who chooses? Who loses? – is an invitation for policymakers to question relationships with non-state actors in terms of fundamental choices: between freedom of choice and equity, the two poles of education as a human right; between encouraging initiative (i.e. improving quality anywhere in the system) and setting standards (i.e. improving quality for all learners); between population groups of different means and different needs; between their immediate commitments (i.e. 12 years of free education under SdG 4) and those that are to be progressively realized (e.g. post-secondary education); and between education and other social sectors.
At the same time, as evidence in this introduction suggests, most parents would like their children to have access to a local, inclusive public school of good quality; they do not want uneven distribution of school quality, which forces parents to search for a school that would be better than the local school. they would prefer a guaranteed place for their children at the local school over having to go through a selective and competitive admission process. Although parents may vary in the priority they give to their children’s education, no parent wants to spend out of pocket for what the education system should be providing.
With these thoughts in mind, the following recommendations were framed to help #righttherules to ensure that equity in education is protected in financing, quality, governance, innovation and policy making. the aim is to harness the contributions non-state actors can make to deliver education of quality without sacrificing equality. Mobilizing this potential could also challenge governments to purposefully address low quality and inequality that afflict public provision. the recommendations are primarily aimed at governments, whose responsibility it is to protect and fulfil the right to education. However, they are also meant to be used as an advocacy tool by all education actors committed to supporting progress towards
19 C H A P T E R 1 • IntroductIon
1
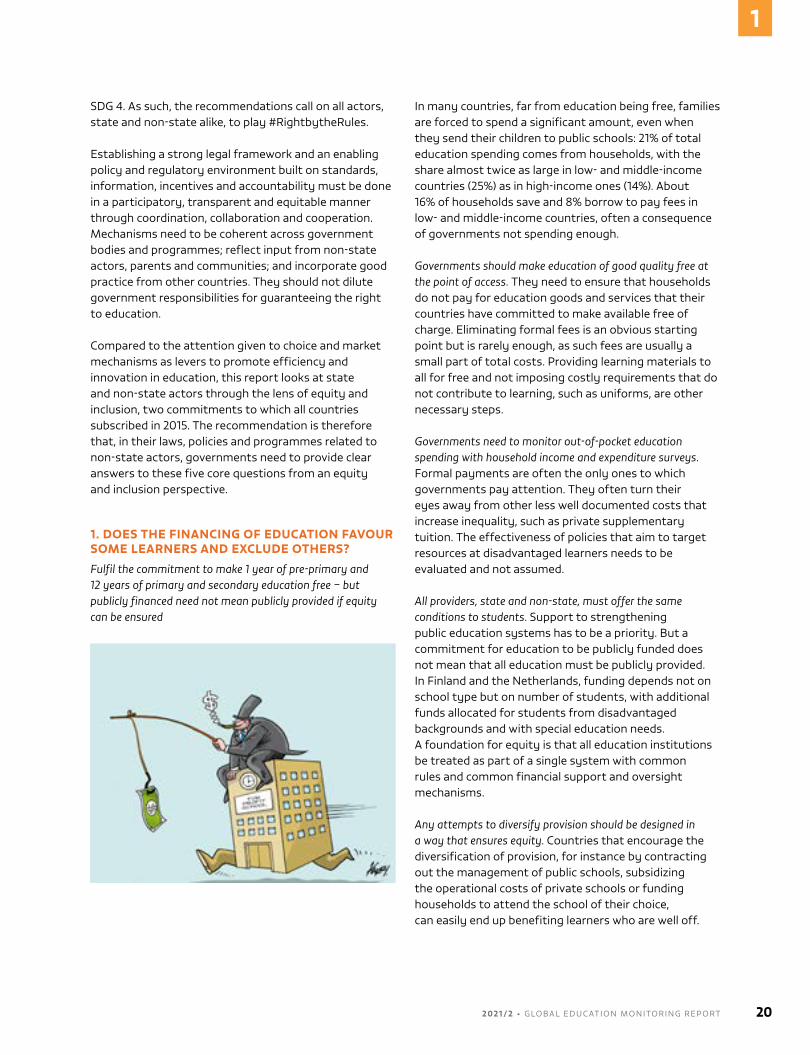
SdG 4. As such, the recommendations call on all actors, state and non-state alike, to play #rightbytherules.
Establishing a strong legal framework and an enabling policy and regulatory environment built on standards, information, incentives and accountability must be done in a participatory, transparent and equitable manner through coordination, collaboration and cooperation. Mechanisms need to be coherent across government bodies and programmes; reflect input from non-state actors, parents and communities; and incorporate good practice from other countries. they should not dilute government responsibilities for guaranteeing the right to education.
compared to the attention given to choice and market mechanisms as levers to promote efficiency and innovation in education, this report looks at state and non-state actors through the lens of equity and inclusion, two commitments to which all countries subscribed in 2015. the recommendation is therefore that, in their laws, policies and programmes related to non-state actors, governments need to provide clear answers to these five core questions from an equity and inclusion perspective.
1. DOES THE FINANCING OF EDUCATION FAVOUR SOME LEARNERS AND EXCLUDE OTHERS?
Fulfil the commitment to make 1 year of pre-primary and 12 years of primary and secondary education free – but publicly financed need not mean publicly provided if equity can be ensured
In many countries, far from education being free, families are forced to spend a significant amount, even when they send their children to public schools: 21% of total education spending comes from households, with the share almost twice as large in low- and middle-income countries (25%) as in high-income ones (14%). About 16% of households save and 8% borrow to pay fees in low- and middle-income countries, often a consequence of governments not spending enough.
Governments should make education of good quality free at the point of access. they need to ensure that households do not pay for education goods and services that their countries have committed to make available free of charge. Eliminating formal fees is an obvious starting point but is rarely enough, as such fees are usually a small part of total costs. Providing learning materials to all for free and not imposing costly requirements that do not contribute to learning, such as uniforms, are other necessary steps.
Governments need to monitor out-of-pocket education spending with household income and expenditure surveys. Formal payments are often the only ones to which governments pay attention. they often turn their eyes away from other less well documented costs that increase inequality, such as private supplementary tuition. the effectiveness of policies that aim to target resources at disadvantaged learners needs to be evaluated and not assumed.
All providers, state and non-state, must offer the same conditions to students. Support to strengthening public education systems has to be a priority. But a commitment for education to be publicly funded does not mean that all education must be publicly provided. In Finland and the netherlands, funding depends not on school type but on number of students, with additional funds allocated for students from disadvantaged backgrounds and with special education needs. A foundation for equity is that all education institutions be treated as part of a single system with common rules and common financial support and oversight mechanisms.
Any attempts to diversify provision should be designed in a way that ensures equity. countries that encourage the diversification of provision, for instance by contracting out the management of public schools, subsidizing the operational costs of private schools or funding households to attend the school of their choice, can easily end up benefiting learners who are well off.
2 0 2 1 / 2 • G LO BA L E D U C AT I O N M O N I TO R I N G R E P O RT 20
1
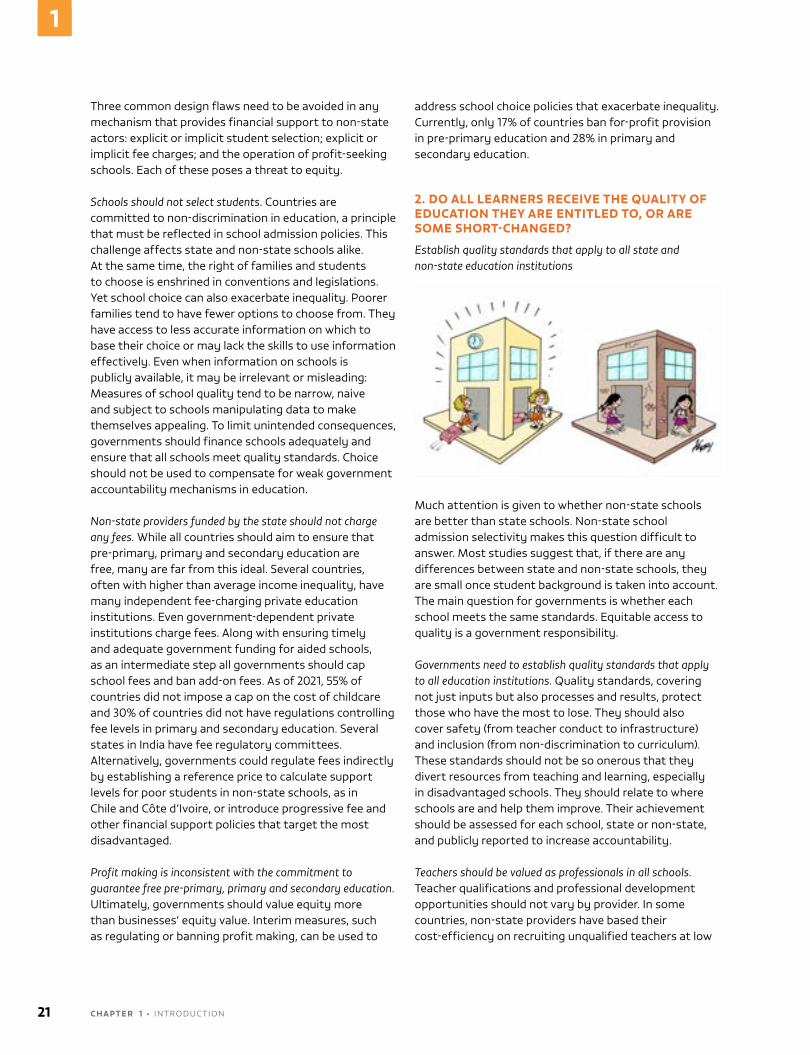
three common design flaws need to be avoided in any mechanism that provides financial support to non-state actors: explicit or implicit student selection; explicit or implicit fee charges; and the operation of profit-seeking schools. Each of these poses a threat to equity.
Schools should not select students. countries are committed to non-discrimination in education, a principle that must be reflected in school admission policies. this challenge affects state and non-state schools alike. At the same time, the right of families and students to choose is enshrined in conventions and legislations. Yet school choice can also exacerbate inequality. Poorer families tend to have fewer options to choose from. they have access to less accurate information on which to base their choice or may lack the skills to use information effectively. Even when information on schools is publicly available, it may be irrelevant or misleading: Measures of school quality tend to be narrow, naive and subject to schools manipulating data to make themselves appealing. to limit unintended consequences, governments should finance schools adequately and ensure that all schools meet quality standards. choice should not be used to compensate for weak government accountability mechanisms in education.
Non-state providers funded by the state should not charge any fees. While all countries should aim to ensure that pre-primary, primary and secondary education are free, many are far from this ideal. Several countries, often with higher than average income inequality, have many independent fee-charging private education institutions. Even government-dependent private institutions charge fees. Along with ensuring timely and adequate government funding for aided schools, as an intermediate step all governments should cap school fees and ban add-on fees. As of 2021, 55% of countries did not impose a cap on the cost of childcare and 30% of countries did not have regulations controlling fee levels in primary and secondary education. Several states in India have fee regulatory committees. Alternatively, governments could regulate fees indirectly by establishing a reference price to calculate support levels for poor students in non-state schools, as in chile and côte d’Ivoire, or introduce progressive fee and other financial support policies that target the most disadvantaged.
Profit making is inconsistent with the commitment to guarantee free pre-primary, primary and secondary education. ultimately, governments should value equity more than businesses’ equity value. Interim measures, such as regulating or banning profit making, can be used to
address school choice policies that exacerbate inequality. currently, only 17% of countries ban for-profit provision in pre-primary education and 28% in primary and secondary education.
2. DO ALL LEARNERS RECEIVE THE QUALITY OF EDUCATION THEY ARE ENTITLED TO, OR ARE SOME SHORT-CHANGED?
Establish quality standards that apply to all state and non-state education institutions
Much attention is given to whether non-state schools are better than state schools. non-state school admission selectivity makes this question difficult to answer. Most studies suggest that, if there are any differences between state and non-state schools, they are small once student background is taken into account. the main question for governments is whether each school meets the same standards. Equitable access to quality is a government responsibility.
Governments need to establish quality standards that apply to all education institutions. Quality standards, covering not just inputs but also processes and results, protect those who have the most to lose. they should also cover safety (from teacher conduct to infrastructure) and inclusion (from non-discrimination to curriculum). these standards should not be so onerous that they divert resources from teaching and learning, especially in disadvantaged schools. they should relate to where schools are and help them improve. their achievement should be assessed for each school, state or non-state, and publicly reported to increase accountability.
Teachers should be valued as professionals in all schools. teacher qualifications and professional development opportunities should not vary by provider. In some countries, non-state providers have based their cost-efficiency on recruiting unqualified teachers at low
21 C H A P T E R 1 • IntroductIon
1
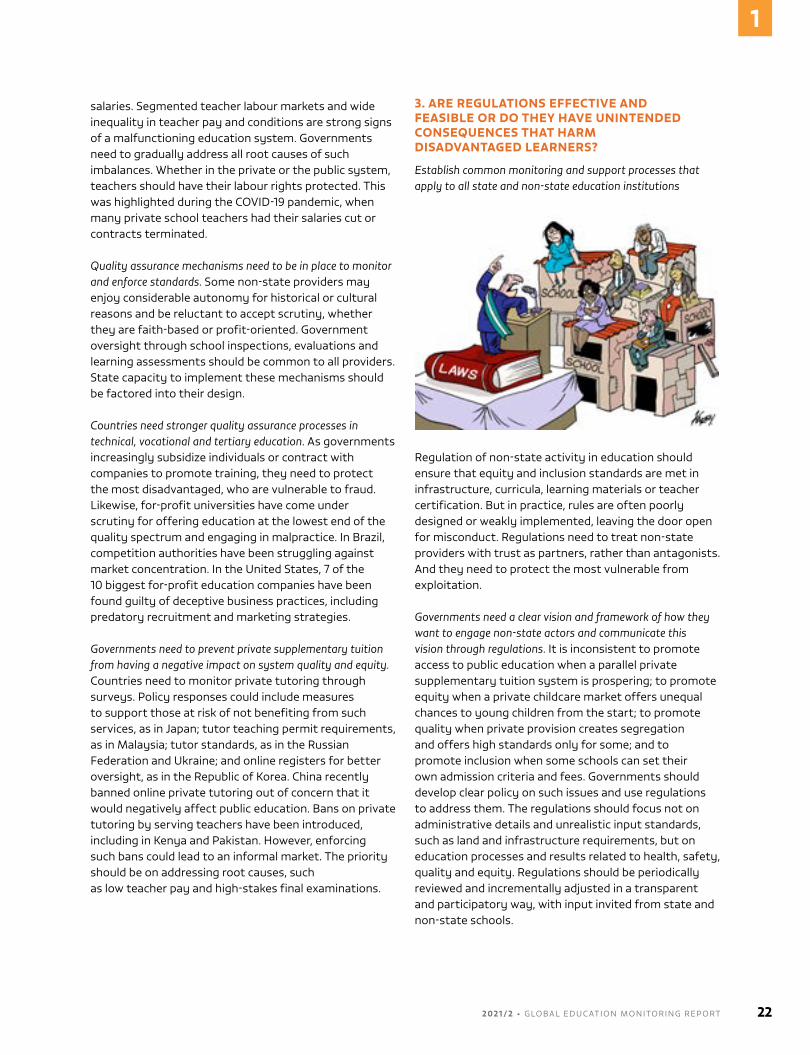
salaries. Segmented teacher labour markets and wide inequality in teacher pay and conditions are strong signs of a malfunctioning education system. Governments need to gradually address all root causes of such imbalances. Whether in the private or the public system, teachers should have their labour rights protected. this was highlighted during the coVId-19 pandemic, when many private school teachers had their salaries cut or contracts terminated.
Quality assurance mechanisms need to be in place to monitor and enforce standards. Some non-state providers may enjoy considerable autonomy for historical or cultural reasons and be reluctant to accept scrutiny, whether they are faith-based or profit-oriented. Government oversight through school inspections, evaluations and learning assessments should be common to all providers. State capacity to implement these mechanisms should be factored into their design.
Countries need stronger quality assurance processes in technical, vocational and tertiary education. As governments increasingly subsidize individuals or contract with companies to promote training, they need to protect the most disadvantaged, who are vulnerable to fraud. Likewise, for-profit universities have come under scrutiny for offering education at the lowest end of the quality spectrum and engaging in malpractice. In Brazil, competition authorities have been struggling against market concentration. In the united States, 7 of the 10 biggest for-profit education companies have been found guilty of deceptive business practices, including predatory recruitment and marketing strategies.
Governments need to prevent private supplementary tuition from having a negative impact on system quality and equity. countries need to monitor private tutoring through surveys. Policy responses could include measures to support those at risk of not benefiting from such services, as in Japan; tutor teaching permit requirements, as in Malaysia; tutor standards, as in the russian Federation and ukraine; and online registers for better oversight, as in the republic of Korea. china recently banned online private tutoring out of concern that it would negatively affect public education. Bans on private tutoring by serving teachers have been introduced, including in Kenya and Pakistan. However, enforcing such bans could lead to an informal market. the priority should be on addressing root causes, such as low teacher pay and high-stakes final examinations.
3. ARE REGULATIONS EFFECTIVE AND FEASIBLE OR DO THEY HAVE UNINTENDED CONSEQUENCES THAT HARM DISADVANTAGED LEARNERS?
Establish common monitoring and support processes that apply to all state and non-state education institutions
regulation of non-state activity in education should ensure that equity and inclusion standards are met in infrastructure, curricula, learning materials or teacher certification. But in practice, rules are often poorly designed or weakly implemented, leaving the door open for misconduct. regulations need to treat non-state providers with trust as partners, rather than antagonists. And they need to protect the most vulnerable from exploitation.
Governments need a clear vision and framework of how they want to engage non-state actors and communicate this vision through regulations. It is inconsistent to promote access to public education when a parallel private supplementary tuition system is prospering; to promote equity when a private childcare market offers unequal chances to young children from the start; to promote quality when private provision creates segregation and offers high standards only for some; and to promote inclusion when some schools can set their own admission criteria and fees. Governments should develop clear policy on such issues and use regulations to address them. the regulations should focus not on administrative details and unrealistic input standards, such as land and infrastructure requirements, but on education processes and results related to health, safety, quality and equity. regulations should be periodically reviewed and incrementally adjusted in a transparent and participatory way, with input invited from state and non-state schools.
2 0 2 1 / 2 • G LO BA L E D U C AT I O N M O N I TO R I N G R E P O RT 22
1
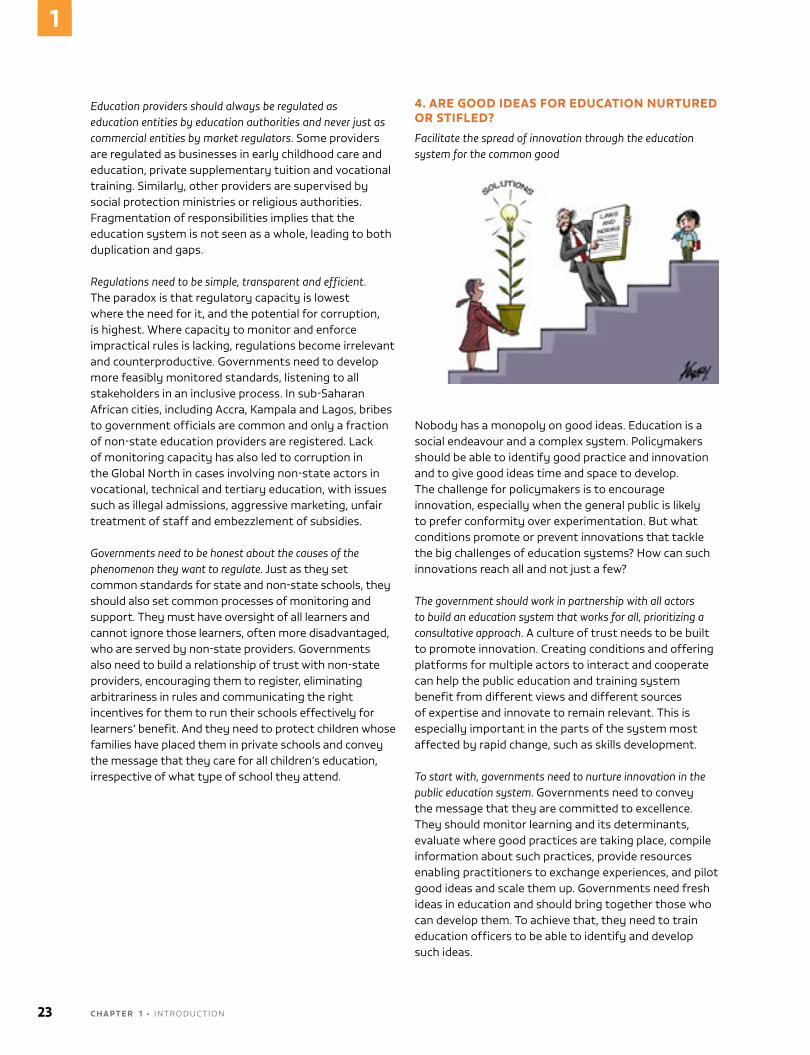
Education providers should always be regulated as education entities by education authorities and never just as commercial entities by market regulators. Some providers are regulated as businesses in early childhood care and education, private supplementary tuition and vocational training. Similarly, other providers are supervised by social protection ministries or religious authorities. Fragmentation of responsibilities implies that the education system is not seen as a whole, leading to both duplication and gaps.
Regulations need to be simple, transparent and efficient. the paradox is that regulatory capacity is lowest where the need for it, and the potential for corruption, is highest. Where capacity to monitor and enforce impractical rules is lacking, regulations become irrelevant and counterproductive. Governments need to develop more feasibly monitored standards, listening to all stakeholders in an inclusive process. In sub-Saharan African cities, including Accra, Kampala and Lagos, bribes to government officials are common and only a fraction of non-state education providers are registered. Lack of monitoring capacity has also led to corruption in the Global north in cases involving non-state actors in vocational, technical and tertiary education, with issues such as illegal admissions, aggressive marketing, unfair treatment of staff and embezzlement of subsidies.
Governments need to be honest about the causes of the phenomenon they want to regulate. Just as they set common standards for state and non-state schools, they should also set common processes of monitoring and support. they must have oversight of all learners and cannot ignore those learners, often more disadvantaged, who are served by non-state providers. Governments also need to build a relationship of trust with non-state providers, encouraging them to register, eliminating arbitrariness in rules and communicating the right incentives for them to run their schools effectively for learners’ benefit. And they need to protect children whose families have placed them in private schools and convey the message that they care for all children’s education, irrespective of what type of school they attend.
4. ARE GOOD IDEAS FOR EDUCATION NURTURED OR STIFLED?
Facilitate the spread of innovation through the education system for the common good
nobody has a monopoly on good ideas. Education is a social endeavour and a complex system. Policymakers should be able to identify good practice and innovation and to give good ideas time and space to develop. the challenge for policymakers is to encourage innovation, especially when the general public is likely to prefer conformity over experimentation. But what conditions promote or prevent innovations that tackle the big challenges of education systems? How can such innovations reach all and not just a few?
The government should work in partnership with all actors to build an education system that works for all, prioritizing a consultative approach. A culture of trust needs to be built to promote innovation. creating conditions and offering platforms for multiple actors to interact and cooperate can help the public education and training system benefit from different views and different sources of expertise and innovate to remain relevant. this is especially important in the parts of the system most affected by rapid change, such as skills development.
To start with, governments need to nurture innovation in the public education system. Governments need to convey the message that they are committed to excellence. they should monitor learning and its determinants, evaluate where good practices are taking place, compile information about such practices, provide resources enabling practitioners to exchange experiences, and pilot good ideas and scale them up. Governments need fresh ideas in education and should bring together those who can develop them. to achieve that, they need to train education officers to be able to identify and develop such ideas.
23 C H A P T E R 1 • IntroductIon
1
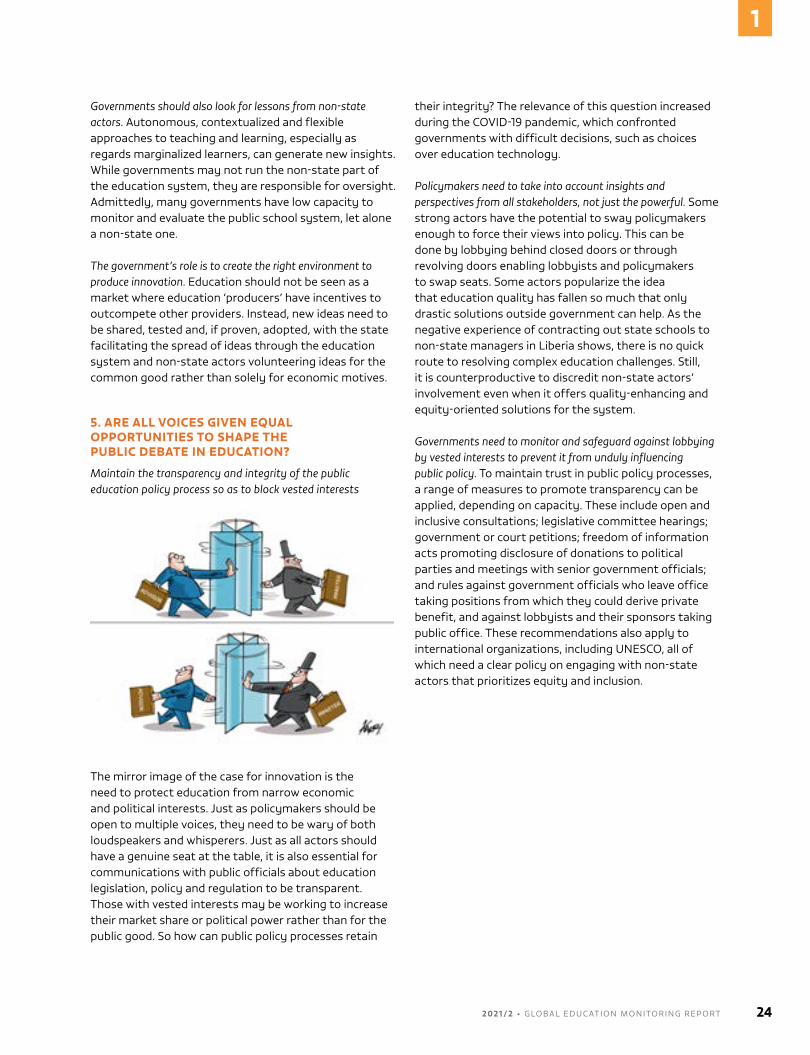
Governments should also look for lessons from non-state actors. Autonomous, contextualized and flexible approaches to teaching and learning, especially as regards marginalized learners, can generate new insights. While governments may not run the non-state part of the education system, they are responsible for oversight. Admittedly, many governments have low capacity to monitor and evaluate the public school system, let alone a non-state one.
The government’s role is to create the right environment to produce innovation. Education should not be seen as a market where education ‘producers’ have incentives to outcompete other providers. Instead, new ideas need to be shared, tested and, if proven, adopted, with the state facilitating the spread of ideas through the education system and non-state actors volunteering ideas for the common good rather than solely for economic motives.
5. ARE ALL VOICES GIVEN EQUAL OPPORTUNITIES TO SHAPE THE PUBLIC DEBATE IN EDUCATION?
Maintain the transparency and integrity of the public education policy process so as to block vested interests
the mirror image of the case for innovation is the need to protect education from narrow economic and political interests. Just as policymakers should be open to multiple voices, they need to be wary of both loudspeakers and whisperers. Just as all actors should have a genuine seat at the table, it is also essential for communications with public officials about education legislation, policy and regulation to be transparent. those with vested interests may be working to increase their market share or political power rather than for the public good. So how can public policy processes retain
their integrity? the relevance of this question increased during the coVId-19 pandemic, which confronted governments with difficult decisions, such as choices over education technology.
Policymakers need to take into account insights and perspectives from all stakeholders, not just the powerful. Some strong actors have the potential to sway policymakers enough to force their views into policy. this can be done by lobbying behind closed doors or through revolving doors enabling lobbyists and policymakers to swap seats. Some actors popularize the idea that education quality has fallen so much that only drastic solutions outside government can help. As the negative experience of contracting out state schools to non-state managers in Liberia shows, there is no quick route to resolving complex education challenges. Still, it is counterproductive to discredit non-state actors’ involvement even when it offers quality-enhancing and equity-oriented solutions for the system.
Governments need to monitor and safeguard against lobbying by vested interests to prevent it from unduly influencing public policy. to maintain trust in public policy processes, a range of measures to promote transparency can be applied, depending on capacity. these include open and inclusive consultations; legislative committee hearings; government or court petitions; freedom of information acts promoting disclosure of donations to political parties and meetings with senior government officials; and rules against government officials who leave office taking positions from which they could derive private benefit, and against lobbyists and their sponsors taking public office. these recommendations also apply to international organizations, including unESco, all of which need a clear policy on engaging with non-state actors that prioritizes equity and inclusion.
2 0 2 1 / 2 • G LO BA L E D U C AT I O N M O N I TO R I N G R E P O RT 24
1
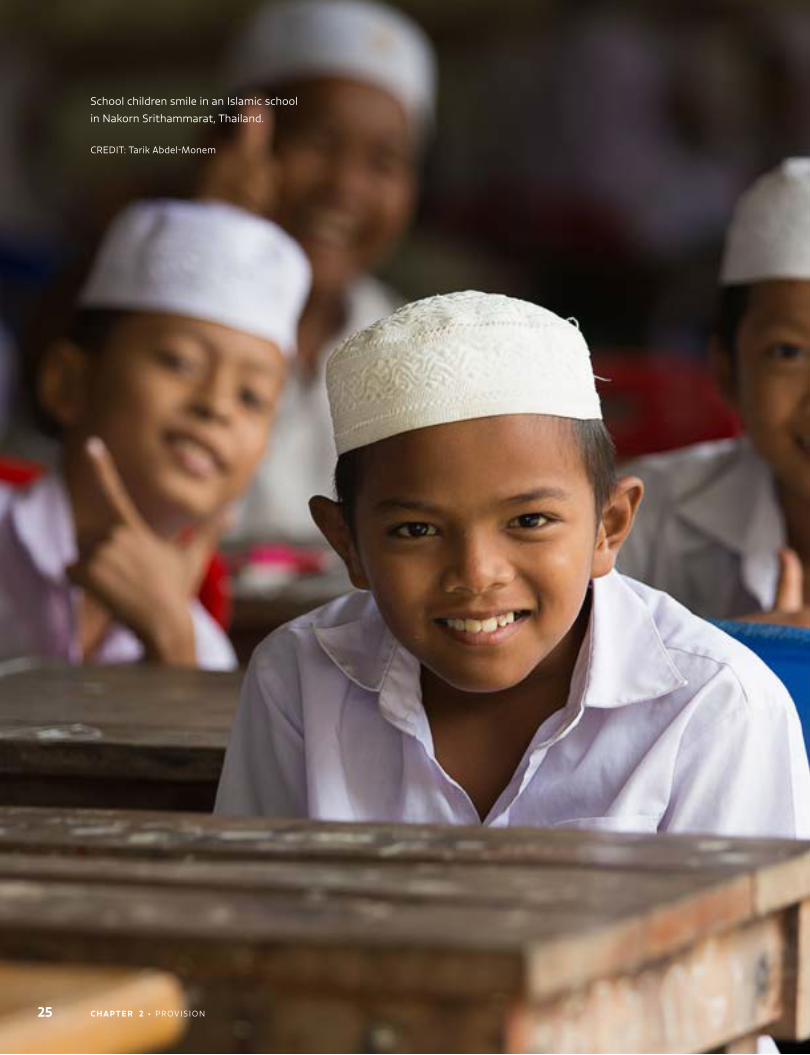
C H A P T E R 2 • Provis ion25
school children smile in an islamic school
in nakorn srithammarat, Thailand.
CrEDiT: Tarik Abdel-Monem
2CHAPTER
C H A P T E R 2 • Provis ion 26
Provision
K E Y M E S S AG E SNon-state actors exist in multiple forms and provide education to 350 million children.
� non-state schools differ by management, financing, values, profit intent and fees charged.
� The shares of private institutions worldwide increased from 10% in 2002 to 17% in 2013 in primary education and from 19% in 2004 to 26% in 2014 in secondary education. They have since remained roughly constant.
� For-profit schools are rare in middle- and high-income countries. Exceptions include Chile, where 26% of 15-year-olds attend such schools, and the United Arab Emirates, at 39%.
� in the last decade, international schools’ numbers have almost doubled. Low-fee private schools are also proliferating. About 18% in Ghana and 70% in Lagos, nigeria, are unregistered.
Private schools tend to have better resources and attract richer students.
� The richest households are 10 times more likely than the poorest to attend private primary school. Accounting for peer effects and selection almost eliminated the private school advantage in 40 richer countries analysed and slashed the premium of attending private school by half to two thirds in 31 low- and middle-income countries.
� in Latin American countries, public school students expect to participate in politics more than their private school peers.
� A review of 14 countries found that the top reasons for choosing a school were academic quality, teacher quality, location and safety. religion, ethnicity and culture also mattered. in seven sub-saharan African countries, parents’ satisfaction rates were higher for faith-based than for public schools.
� Countries with choice policies have seen segregation increase. From 1998 to 2015, segregation of the lowest-income students increased by about 15% in large districts in the United states, partly due to charter school growth.
In addition to provision, non-state actors are involved in ancillary services.
� Private tutoring, which is increasing even in regions where it had been uncommon, such as sub-saharan Africa, affects education system quality, teacher behaviour and equality. in india and Myanmar, teachers offering tutoring put less effort into regular lessons.
� The textbook industry is increasingly commercialized. oversight varies dramatically by country: 12 of 50 countries have no process for approving instructional materials.
� in recent years, many companies have been linking textbooks, assessment systems and online learning. Market concentration can increase inequality and reduce accountability.
� Governments are outsourcing more support services in education, including transport, technology and food, but quality is not always protected. several studies have found that districts in the United states with privately managed cafeterias offer less healthy meals.
27 C H A P T E R 2 • Provis ion
2
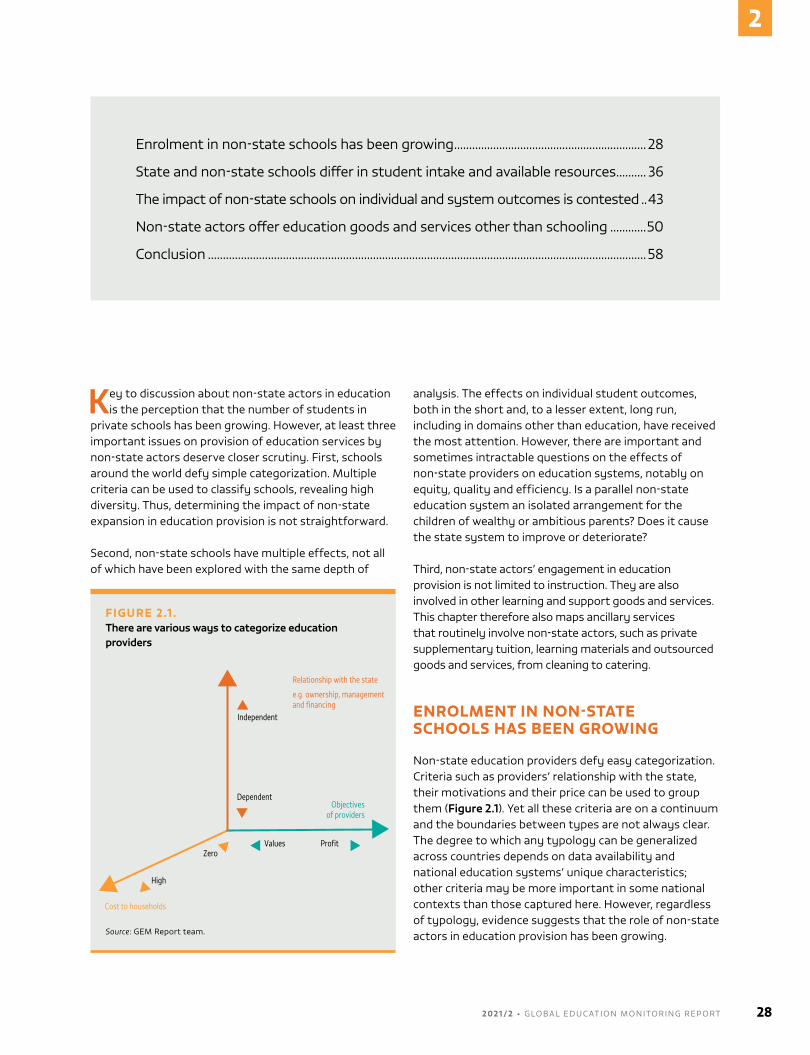
Enrolment in non-state schools has been growing ................................................................ 28
state and non-state schools differ in student intake and available resources .......... 36
The impact of non-state schools on individual and system outcomes is contested ..43
non-state actors offer education goods and services other than schooling ............50
Conclusion ..................................................................................................................................................58
Key to discussion about non-state actors in education is the perception that the number of students in
private schools has been growing. However, at least three important issues on provision of education services by non-state actors deserve closer scrutiny. First, schools around the world defy simple categorization. Multiple criteria can be used to classify schools, revealing high diversity. Thus, determining the impact of non-state expansion in education provision is not straightforward.
second, non-state schools have multiple effects, not all of which have been explored with the same depth of
analysis. The effects on individual student outcomes, both in the short and, to a lesser extent, long run, including in domains other than education, have received the most attention. However, there are important and sometimes intractable questions on the effects of non-state providers on education systems, notably on equity, quality and efficiency. is a parallel non-state education system an isolated arrangement for the children of wealthy or ambitious parents? Does it cause the state system to improve or deteriorate?
Third, non-state actors’ engagement in education provision is not limited to instruction. They are also involved in other learning and support goods and services. This chapter therefore also maps ancillary services that routinely involve non-state actors, such as private supplementary tuition, learning materials and outsourced goods and services, from cleaning to catering.
ENROLMENT IN NON-STATE SCHOOLS HAS BEEN GROWING
non-state education providers defy easy categorization. Criteria such as providers’ relationship with the state, their motivations and their price can be used to group them (Figure 2.1). Yet all these criteria are on a continuum and the boundaries between types are not always clear. The degree to which any typology can be generalized across countries depends on data availability and national education systems’ unique characteristics; other criteria may be more important in some national contexts than those captured here. However, regardless of typology, evidence suggests that the role of non-state actors in education provision has been growing.
FIGURE 2.1 . There are various ways to categorize education providers
Guatemala, 2014
High
Zero
Cost to households
Relationship with the state
e.g. ownership, management and financing
Independent
DependentObjectives
of providers
Values Profit
Source: GEM report team.
2 0 2 1 / 2 • G LO BA L E D U C AT I O N M O N I TO R I N G R E P O RT 28
2
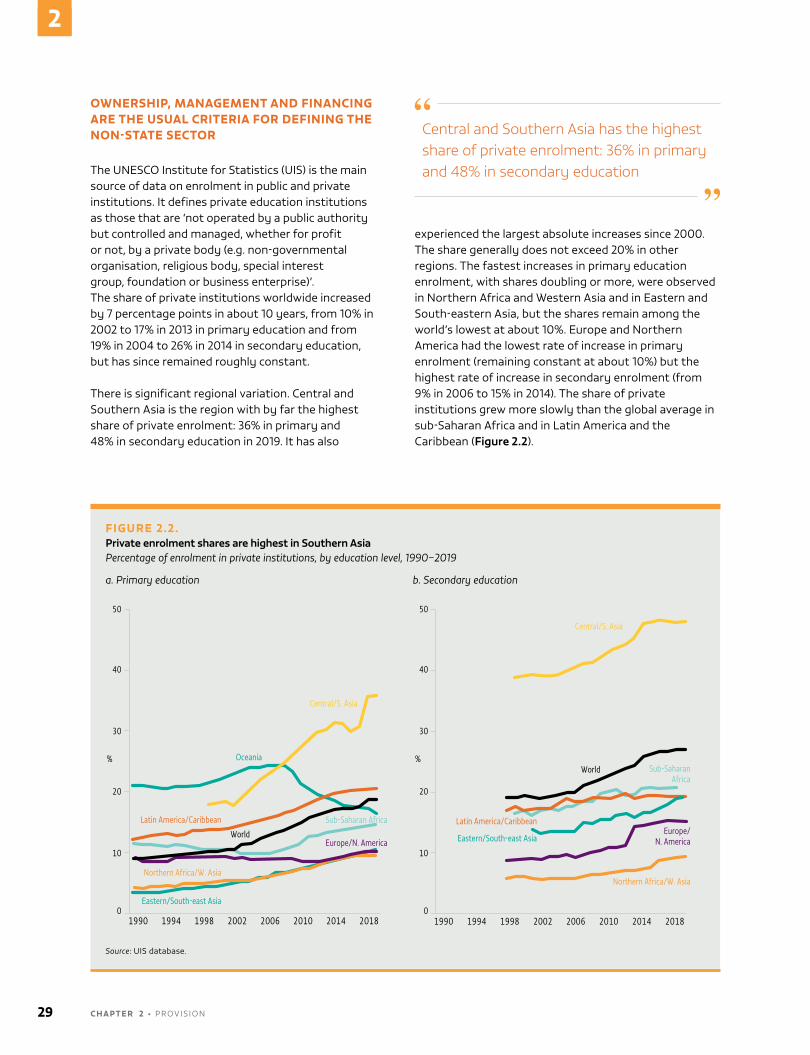
FIGURE 2.2.Private enrolment shares are highest in Southern AsiaPercentage of enrolment in private institutions, by education level, 1990–2019
a. Primary education b. Secondary education
Guatemala, 2014
%
2018
Central/S. Asia
World
Latin America/Caribbean
Sub-Saharan Africa
Eastern/South-east AsiaEurope/
N. America
Northern Africa/W. Asia
50
40
30
20
10
0
50
40
30
20
10
0
%
Eastern/South-east Asia
Northern Africa/W. Asia
Europe/N. AmericaWorld
Sub-Saharan AfricaLatin America/Caribbean
Central/S. Asia
Oceania
Source: Uis database.
OWNERSHIP, MANAGEMENT AND FINANCING ARE THE USUAL CRITERIA FOR DEFINING THE NON-STATE SECTOR
The UnEsCo institute for statistics (Uis) is the main source of data on enrolment in public and private institutions. it defines private education institutions as those that are ‘not operated by a public authority but controlled and managed, whether for profit or not, by a private body (e.g. non-governmental organisation, religious body, special interest group, foundation or business enterprise)’. The share of private institutions worldwide increased by 7 percentage points in about 10 years, from 10% in 2002 to 17% in 2013 in primary education and from 19% in 2004 to 26% in 2014 in secondary education, but has since remained roughly constant.
There is significant regional variation. Central and southern Asia is the region with by far the highest share of private enrolment: 36% in primary and 48% in secondary education in 2019. it has also
Central and Southern Asia has the highest share of private enrolment: 36% in primary and 48% in secondary education
experienced the largest absolute increases since 2000. The share generally does not exceed 20% in other regions. The fastest increases in primary education enrolment, with shares doubling or more, were observed in northern Africa and Western Asia and in Eastern and south-eastern Asia, but the shares remain among the world’s lowest at about 10%. Europe and northern America had the lowest rate of increase in primary enrolment (remaining constant at about 10%) but the highest rate of increase in secondary enrolment (from 9% in 2006 to 15% in 2014). The share of private institutions grew more slowly than the global average in sub-saharan Africa and in Latin America and the Caribbean (Figure 2.2).
29 C H A P T E R 2 • Provis ion
2
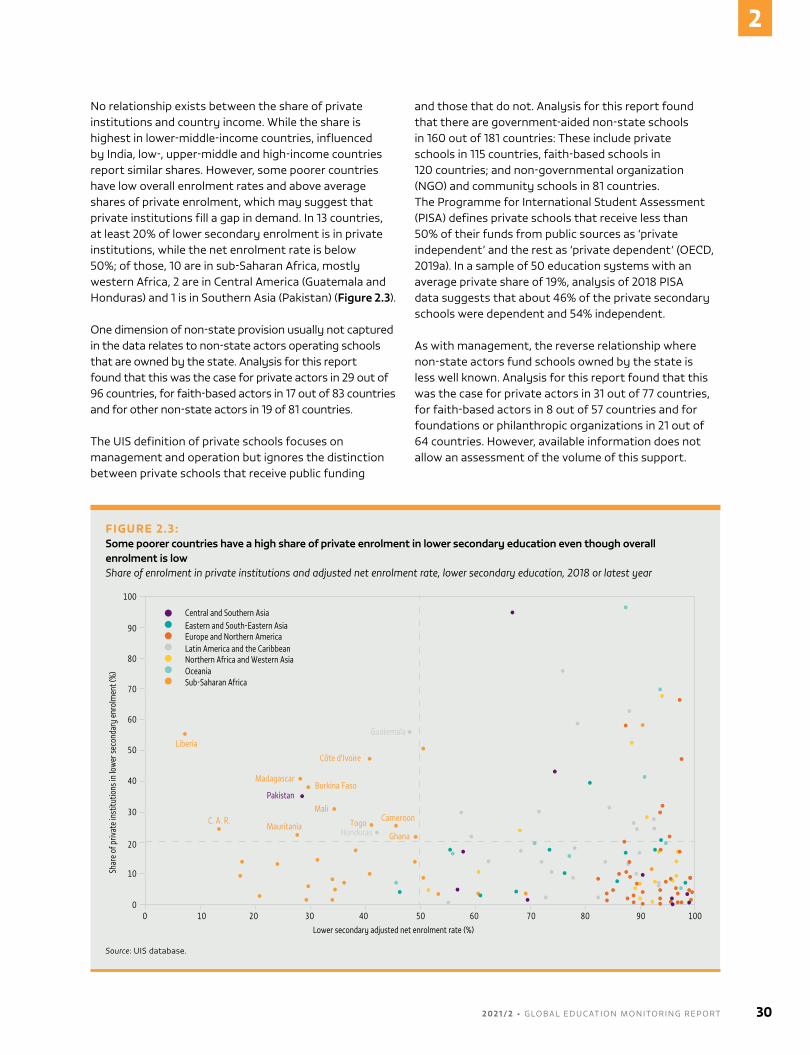
no relationship exists between the share of private institutions and country income. While the share is highest in lower-middle-income countries, influenced by india, low-, upper-middle and high-income countries report similar shares. However, some poorer countries have low overall enrolment rates and above average shares of private enrolment, which may suggest that private institutions fill a gap in demand. in 13 countries, at least 20% of lower secondary enrolment is in private institutions, while the net enrolment rate is below 50%; of those, 10 are in sub-saharan Africa, mostly western Africa, 2 are in Central America (Guatemala and Honduras) and 1 is in southern Asia (Pakistan) (Figure 2.3).
one dimension of non-state provision usually not captured in the data relates to non-state actors operating schools that are owned by the state. Analysis for this report found that this was the case for private actors in 29 out of 96 countries, for faith-based actors in 17 out of 83 countries and for other non-state actors in 19 of 81 countries.
The Uis definition of private schools focuses on management and operation but ignores the distinction between private schools that receive public funding
and those that do not. Analysis for this report found that there are government-aided non-state schools in 160 out of 181 countries: These include private schools in 115 countries, faith-based schools in 120 countries; and non-governmental organization (nGo) and community schools in 81 countries. The Programme for international student Assessment (PisA) defines private schools that receive less than 50% of their funds from public sources as ‘private independent’ and the rest as ‘private dependent’ (oECD, 2019a). in a sample of 50 education systems with an average private share of 19%, analysis of 2018 PisA data suggests that about 46% of the private secondary schools were dependent and 54% independent.
As with management, the reverse relationship where non-state actors fund schools owned by the state is less well known. Analysis for this report found that this was the case for private actors in 31 out of 77 countries, for faith-based actors in 8 out of 57 countries and for foundations or philanthropic organizations in 21 out of 64 countries. However, available information does not allow an assessment of the volume of this support.
FIGURE 2.3:Some poorer countries have a high share of private enrolment in lower secondary education even though overall enrolment is lowShare of enrolment in private institutions and adjusted net enrolment rate, lower secondary education, 2018 or latest year
Guatemala, 2014
2018
Shar
e of
priv
ate
inst
itutio
ns in
low
er se
cond
ary
enro
lmen
t (%
)
Lower secondary adjusted net enrolment rate (%)
Central and Southern AsiaEastern and South-Eastern AsiaEurope and Northern AmericaLatin America and the CaribbeanNorthern Africa and Western AsiaOceaniaSub-Saharan Africa
0 0
10
20
30
40
50
60
70
80
90
100
60 90 50 80 40 70 30 20 10 100
Liberia
Madagascar
Côte d’Ivoire
Burkina Faso
C. A. R.Mali
Mauritania Togo Cameroon
Ghana
Pakistan
Guatemala
Honduras
Source: Uis database.
2 0 2 1 / 2 • G LO BA L E D U C AT I O N M O N I TO R I N G R E P O RT 30
2
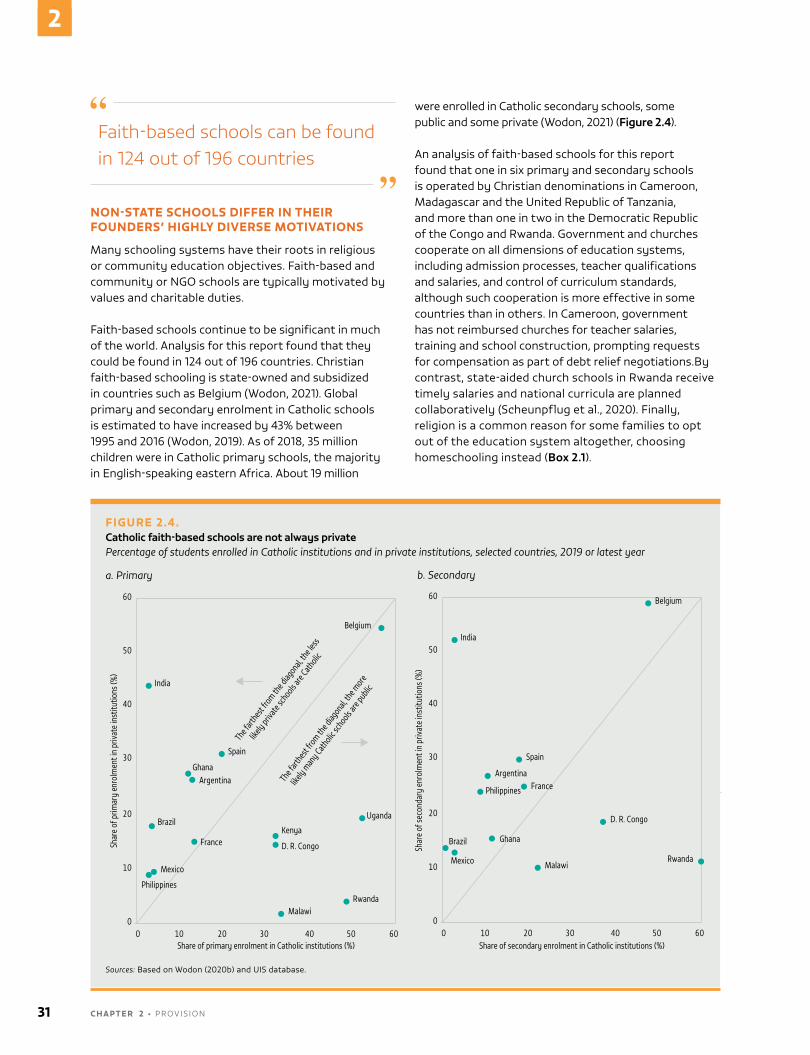
Entre 1995 et 2019, le taux d’achèvement de l’enseignement primaire des filles est passé de 41 % à 66 % en Afrique subsaharienne.ssfvsfGfgfGCBBNZBNN`FN
Faith-based schools can be found in 124 out of 196 countries
NON-STATE SCHOOLS DIFFER IN THEIR FOUNDERS’ HIGHLY DIVERSE MOTIVATIONS
Many schooling systems have their roots in religious or community education objectives. Faith-based and community or nGo schools are typically motivated by values and charitable duties.
Faith-based schools continue to be significant in much of the world. Analysis for this report found that they could be found in 124 out of 196 countries. Christian faith-based schooling is state-owned and subsidized in countries such as Belgium (Wodon, 2021). Global primary and secondary enrolment in Catholic schools is estimated to have increased by 43% between 1995 and 2016 (Wodon, 2019). As of 2018, 35 million children were in Catholic primary schools, the majority in English-speaking eastern Africa. About 19 million
were enrolled in Catholic secondary schools, some public and some private (Wodon, 2021) (Figure 2.4).
An analysis of faith-based schools for this report found that one in six primary and secondary schools is operated by Christian denominations in Cameroon, Madagascar and the United republic of Tanzania, and more than one in two in the Democratic republic of the Congo and rwanda. Government and churches cooperate on all dimensions of education systems, including admission processes, teacher qualifications and salaries, and control of curriculum standards, although such cooperation is more effective in some countries than in others. in Cameroon, government has not reimbursed churches for teacher salaries, training and school construction, prompting requests for compensation as part of debt relief negotiations.By contrast, state-aided church schools in rwanda receive timely salaries and national curricula are planned collaboratively (scheunpflug et al., 2020). Finally, religion is a common reason for some families to opt out of the education system altogether, choosing homeschooling instead (Box 2.1).
FIGURE 2.4.Catholic faith-based schools are not always privatePercentage of students enrolled in Catholic institutions and in private institutions, selected countries, 2019 or latest year
a. Primary b. Secondary
Guatemala, 2014
5040302010
2018
600
50
40
30
20
10
60
0
Share of primary enrolment in Catholic institutions (%)
Shar
e of
prim
ary
enro
lmen
t in
priva
te in
stitu
tions
(%)
Belgium
Uganda
RwandaMalawi
Kenya
D. R. CongoFrance
Mexico
Philippines
Brazil
ArgentinaGhana
Spain
India
5040302010 600
50
40
30
20
10
60
0
Share of secondary enrolment in Catholic institutions (%)
Shar
e of
seco
ndar
y en
rolm
ent i
n pr
ivate
inst
itutio
ns (%
)
Belgium
RwandaMalawi
D. R. Congo
France
Mexico
Philippines
Brazil
Argentina
Ghana
Spain
India
The fart
hest f
rom the d
iagonal,
the l
ess
likely
private
schools a
re Cath
olic
The fart
hest f
rom the d
iagonal,
the m
ore
likely
man
y Catholic
schools a
re public
Sources: Based on Wodon (2020b) and Uis database.
31 C H A P T E R 2 • Provis ion
2
BOX 2.1 :
Some families opt out of state and non-state schools to educate children at home
Parents homeschool when they feel the education system does not fulfil their aspirations for safety, quality or content. It can be motivated by practical concerns, such as remote location or severe disability, but also by philosophical, religious or political reasons. About 3% of the student population in the United States is homeschooled, the world’s largest share (Ray, 2017). A 2016 survey found that the main reasons for homeschooling were concern about school environment (34%), dissatisfaction with academic instruction (17%) and desire to provide religious (16%) and moral (5%) instruction (US Department of Education, 2019).
The evidence base for homeschooling in other contexts is limited, but interest is growing (Kunzman and Gaither, 2020), not least because of advocacy by a global conservative movement (Permoser and Stoeckl, 2020). In Brazil, although homeschooling had been illegal, around 22,000 students were in home education in 2019. A 2018 Supreme Court ruling had declared that it was not unconstitutional but needed further regulation. A draft law allowing homeschooling, a government priority, was approved by the Constitution and Justice Commission of the lower house of the National Congress in July 2021 (Costa, 2021).
Homeschooling can also reflect strong dissatisfaction with mainstream education. In the United Kingdom, a survey found that 24% of home educators had chosen homeschooling because of circumstances such as health reasons or special education needs (Smith and Nelson, 2015). In Australia, the primary motivations appeared to be concerns about school environment and curriculum quality (Jackson, 2017).
Home education was a necessity during the COVID-19 lockdown periods, which exacerbated gender imbalances as mothers took a higher share of responsibility for homeschooling. The US Census Bureau Household Pulse Survey found that homeschooling increased to 5.4% in April/May 2020 and 11% in September/October 2020 (Eggleston and Field, 2021). Homeschooling had adverse employment effects for mothers but not fathers (Petts et al., 2020).
islamic education is provided in formal and non-formal settings at the primary and secondary levels in more than 50 countries with majority and minority Muslim populations, including in western Africa (e.g. nigeria and senegal) (d’Aiglepierre and Bauer, 2018), northern Africa and Western Asia (e.g. Morocco, saudi Arabia and Turkey), southern Asia (e.g. Bangladesh and Pakistan) and south-eastern Asia (e.g. indonesia and Malaysia). As with Christian faith-based schools, madrasas’ organizational arrangements vary from state-owned to private subsidized and private independent, so they cannot all be labelled public or private (Daun, 2018). in Pakistan, 4.1 million students in 2017/18 were studying in more than 31,000 deeni madaris (religious schools), free religious education institutions for the poor from the pre-primary to post-secondary level. They represent 8% of overall enrolment and 18% of enrolment in private education institutions (Pakistan nEMIs and AEPAM, 2021).
In Pakistan, 18% of enrolment in private education institutions is in religious schools
in addition to management and financing, islamic faith-based provision varies considerably in pedagogy and in the balance between teaching of religious and secular content. Until the mid-2000s, Malaysia used to have five types of religious schools: federal, state, state islamic religious Council, people’s and private. The last two taught the national curriculum but were otherwise independent of government. The government has been focusing on the integration of religious and secular education (Hamid, 2017). By 2019, religious schools had been grouped into two broad categories: 314 national primary and secondary religious schools under the Ministry of Education and the state religious Departments, and 221 state-aided religious schools jointly controlled by the ministry and the state religious authority or school board of trustees (PEEr country profiles).
nigeria has a variety of state, state-aided and independent islamic faith-based schools. in 2018, nearly 2 million students were enrolled in islamiyya primary schools (one third of the students were in private schools), 109,000 in islamiyya lower secondary schools (half in private schools) and 364,000 in Tsangaya, or traditional Koranic schools (more than two thirds in private schools) (nigeria UBEC, 2019). The state schools integrate religious and secular
2 0 2 1 / 2 • G LO BA L E D U C AT I O N M O N I TO R I N G R E P O RT 32
2
education and are jointly managed by the government and religious individuals or organizations. state-aided islamiyya schools are also integrated and follow a government-approved curriculum. independent faith-based schools include Tsangaya schools, islamiyya schools with broader coverage of religious issues, and integrated islamiyya schools (PEEr country profiles).
similar variety is observed in nGo schools’ relationships with the state, further defying easy categorization. Analysis for this report found that there were nGo and community schools in 74 out of 196 countries. They tend to operate on the edges of the formal education system and focus on marginalized, out-of-school children, offering flexible approaches to learning (rose, 2007). They may be spontaneous grass-roots interventions or calculated responses to donor funding. in the best cases, successful interventions have eventually been absorbed into the mainstream education system, meeting national standards and complementing public services.
in southern Asia, there are two well-documented cases of large, non-formal, spontaneously developed education systems being gradually mainstreamed. in Bangladesh, after a cyclone, war and famine struck the country in the early to mid-1970s, several nGos began charitable work in rural areas, including non-formal education programmes. By the early 2000s, these reached 1.5 million, or 9%, of the 16 million primary education students. About 70% of those attending nGo schools were girls. The system was gradually formalized, with nGo school students participating in primary education graduation examinations from the early 2010s, enabling them to transition to formal secondary education. By 2018, the system had begun to contract; the 674,000 students in nGo schools represented less than 4% of total enrolment (Bangladesh Directorate of Primary Education, 2019; Campaign for Popular Education, 2005).
in Afghanistan, a community-based education system responded to the major barriers to access for girls and children in remote areas after the end of the 1996–2001 Taliban regime. With collaboration by local government, communities and nGos, the system reached 334,000, or 5%, of the 6.3 million primary education students in 2015. in 2018, a policy was developed to formalize this system. The national Education strategic Plan 2017–21 envisaged expansion
of the system in the short term and its eventual contraction by 2030 (Afghanistan Ministry of Education, 2016; Bakshi, 2020). But the latest political developments in the country put these plans at great risk. Conflicts and crises, often the backdrop of nGo involvement in education, overstretch governments’ limited capacity and their ability to absorb services (Box 2.2).
Community schools were key to education expansion in sub-saharan Africa. some countries’ education systems have a long history of community-operated and -supported schools, such as harambee secondary schools in Kenya and the United republic of Tanzania, and écoles spontanées in Cameroon and Chad (rose 2007; Martin, 2003). in Zambia, after a serious financial crisis followed by structural adjustment policies that constrained the state’s capacity for delivery of essential services, a community school movement emerged, growing from 38 schools in 1996 to more than 2,400 in 2015 and accounting for about 20% of total primary enrolment. only a few became state schools, although all had to follow the national curriculum after 2011 and received limited additional government funding. nGos and local communities are relied upon for financing and management support, infrastructure and capacity development (Bamattre, 2018). The Zambia Community schools secretariat is responsible for coordinating ideas, funding support and curriculum reform with the government (Chilangwa, 2019).
Large-scale interventions are an exception. More commonly, nGos address education of particular groups, such as children with disabilities, for whom public services may be lacking. international nGos, funded from their own resources or from donor programmes, have often initiated education provision through community-based rehabilitation in some poorer countries.
in 2020, Humanity and inclusion, an international nGo advocating for education of children with disabilities, implemented 52 projects in 27 countries (Humanity and Inclusion, 2021). in Central and Eastern Europe and the Caucasus, nGos have led service provision, in some cases transforming and adjusting to the transition from a medical to an inclusive approach to education for children with disabilities. in Armenia, where inclusive education reforms have focused on placing children with disabilities in mainstream public schools, cooperation between local schools and nGos operating at the grass-roots level has
In Zambia, more than 2,400 community schools in 2015 accounted for about 20% of total primary enrolment
33 C H A P T E R 2 • Provis ion
2
been fragmented (nazaryan, 2021). not all nGos manage to make such a transition smoothly and to engage constructively with government services.
nGos have led education provision to excluded populations that the government education system does not serve, such as street children. in Kenya, education of street-connected children is left to nGos, charities and religious groups working locally (Burkholder, 2020). The Consortium of street Children, a global alliance working towards promoting street children’s rights worldwide, has highlighted how formal and non-formal services provided by nGos for street children and families were suspended during CoviD-19, even as informal support networks struggled to cope (Edmonds and Macloed, 2021).
nGos, community-based organizations and donors have been instrumental in advocating for education provision to ethnic and linguistic minorities. in the Plurinational state of Bolivia, Guatemala, Mexico and Peru, over 1 million students from indigenous communities
attend intercultural bilingual schools, with growing government engagement (Cortina, 2017). Guatemala’s Abriendo oportunidades programme, launched by the Population Council and local and international partners, focuses on indigenous girls aged 8 to 18, using a culturally relevant, rights-based curriculum to build life skills and assets and provide hands-on professional training (Population Council, 2020).
For-profit primary and secondary schools are an exception
A fundamental argument against for-profit independent private schools is that they undermine equity and interfere with governments’ role as duty bearers of education. But providers’ profit orientation is often not easy to discern. First, data may not distinguish between for-profit and non-profit (Chapter 3). second, registration requirements may mask differences in actual profitability or wealth. in the United Kingdom, ‘for-profit’ is supposedly a small portion of the education system: 72% of independent schools are registered as charities (IsC, 2021).
BOX 2.2:
Non-state education provision in emergency contexts offers relief, but concerns for sustainability remain
Non-state actors frequently provide education in fragile and conflict-affected countries, e.g. in refugee or internally displaced people’s camps. Most non-state initiatives are relatively small; their scope, scale and long-term sustainability are critical issues, especially as they depend on humanitarian funding, which tends to be short-term and unpredictable (UNESCO, 2019). Strong involvement of non-state actors can even create disincentives for the state to fulfil its responsibilities.
In Afghanistan, Street Child, an NGO, worked with the government to support 100 community education centres in which an accelerated course compressed six years of schooling into three. Students were then referred to local education authorities to prepare for transition to nearby state schools. The centres demonstrated strong continuity, with 90% of students in Kabul’s informal settlements transferring to state schools and 85% retained after one year. Yet the state lacked capacity and did not commit to ensuring that the centres would be absorbed into the state sector (Street Child, 2020).
A significant challenge in emergencies is the extent to which programmes use local NGO capacity, which contributes to long-term national sustainability. US donor agencies, to reduce risk, tend to work with international service providers, selecting local contractors only in countries with higher capacity levels (Harris and Brunjes, 2021). The US Agency for International Development introduced procurement reforms to direct more funding to local contractors. However, because of concern over increased risk, lower accountability and limited control over corruption (Dunning, 2013), the agency still typically works with selected NGO partners, mostly US based (USAID, 2019).
In Haiti, after the 2010 earthquake, the government received only 1% of humanitarian aid; instead, many NGOs and private contractors provided services. The number of NGOs operating in Haiti is unknown. Estimates range from the 343 NGOs registered with the Ministry of Planning to over 10,000, according to the Catholic Institute for International Relations. Criticism of the proliferation of NGOs and private actors has focused on where funding went, how lack of coordination hampered education delivery and the creation of parallel NGO structures, which further weakened government channels (Hsu and Schuller, 2020; Ramachandran and Walz, 2015).
Responses to the Syrian refugee crisis also included substantial non-state activity. A 2016 mapping of NGOs engaged in education found 144 organizations, of which 45% were civil society organizations, 32% businesses and 10% foundations. In total, 61% of the private actors did not have education as their mandate. Greater private participation in Syrian refugee education has resulted in less coordination and overdependence on technology solutions (Menashy and Zakharia, 2017, 2021).
2 0 2 1 / 2 • G LO BA L E D U C AT I O N M O N I TO R I N G R E P O RT 34
2
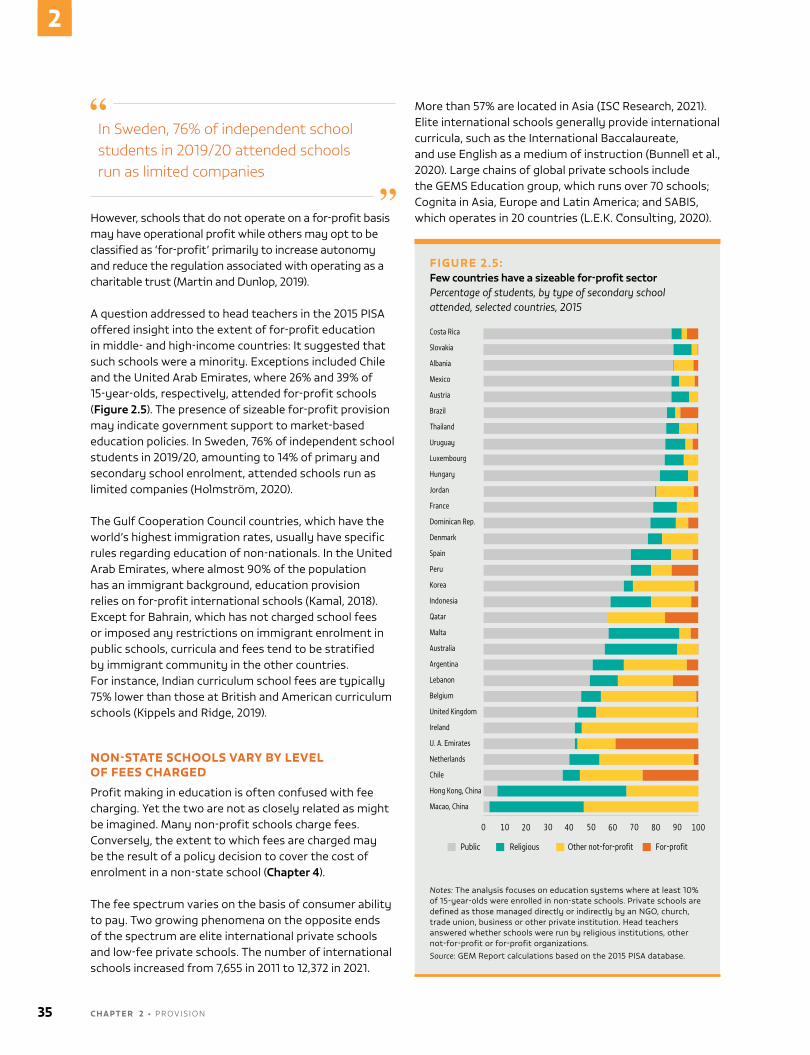
In Sweden, 76% of independent school students in 2019/20 attended schools run as limited companies
However, schools that do not operate on a for-profit basis may have operational profit while others may opt to be classified as ‘for-profit’ primarily to increase autonomy and reduce the regulation associated with operating as a charitable trust (Martin and Dunlop, 2019).
A question addressed to head teachers in the 2015 PisA offered insight into the extent of for-profit education in middle- and high-income countries: it suggested that such schools were a minority. Exceptions included Chile and the United Arab Emirates, where 26% and 39% of 15-year-olds, respectively, attended for-profit schools (Figure 2.5). The presence of sizeable for-profit provision may indicate government support to market-based education policies. in sweden, 76% of independent school students in 2019/20, amounting to 14% of primary and secondary school enrolment, attended schools run as limited companies (Holmström, 2020).
The Gulf Cooperation Council countries, which have the world’s highest immigration rates, usually have specific rules regarding education of non-nationals. in the United Arab Emirates, where almost 90% of the population has an immigrant background, education provision relies on for-profit international schools (Kamal, 2018). Except for Bahrain, which has not charged school fees or imposed any restrictions on immigrant enrolment in public schools, curricula and fees tend to be stratified by immigrant community in the other countries. For instance, indian curriculum school fees are typically 75% lower than those at British and American curriculum schools (Kippels and ridge, 2019).
NON-STATE SCHOOLS VARY BY LEVEL OF FEES CHARGED
Profit making in education is often confused with fee charging. Yet the two are not as closely related as might be imagined. Many non-profit schools charge fees. Conversely, the extent to which fees are charged may be the result of a policy decision to cover the cost of enrolment in a non-state school (Chapter 4).
The fee spectrum varies on the basis of consumer ability to pay. Two growing phenomena on the opposite ends of the spectrum are elite international private schools and low-fee private schools. The number of international schools increased from 7,655 in 2011 to 12,372 in 2021.
More than 57% are located in Asia (IsC research, 2021). Elite international schools generally provide international curricula, such as the international Baccalaureate, and use English as a medium of instruction (Bunnell et al., 2020). Large chains of global private schools include the GEMs Education group, which runs over 70 schools; Cognita in Asia, Europe and Latin America; and sABis, which operates in 20 countries (L.E.K. Consulting, 2020).
FIGURE 2.5:Few countries have a sizeable for-profit sectorPercentage of students, by type of secondary school attended, selected countries, 2015
Guatemala, 2014
2018
Costa Rica
Slovakia
Albania
Mexico
Austria
Brazil
Thailand
Uruguay
Luxembourg
Hungary
Jordan
France
Dominican Rep.
Denmark
Spain
Peru
Korea
Indonesia
Qatar
Malta
Australia
Argentina
Lebanon
Belgium
United Kingdom
Ireland
U. A. Emirates
Netherlands
Chile
Hong Kong, China
Macao, China
0 10 20 30 40 50 60 70 80 90 100
Public Religious Other not-for-profit For-profit
Notes: The analysis focuses on education systems where at least 10% of 15-year-olds were enrolled in non-state schools. Private schools are defined as those managed directly or indirectly by an nGo, church, trade union, business or other private institution. Head teachers answered whether schools were run by religious institutions, other not-for-profit or for-profit organizations.Source: GEM report calculations based on the 2015 PisA database.
35 C H A P T E R 2 • Provis ion
2
In Lagos, Nigeria, only some 30% of private schools were approved
such schools may not integrate fully into national education systems. in saudi Arabia, international schools’ co-educational environments contrast with mainstream schools’ single-sex organization (Hammad and shah, 2018). in sri Lanka, enrolment in international schools increased by 73% between 2017 and 2019, fuelled by the increasing popularity of English instruction and foreign curricula. only 7 of the 389 international schools were registered with the Ministry of Education; the rest were registered as private businesses (Central Bank of sri Lanka, 2020).
‘Low fee’, ‘low cost’ or ‘affordable’ private schools are terms describing a broad range of modestly priced schools in low- and middle-income countries. The terms have also been used to describe the lower-cost end of private schooling in Australia, Canada, the United Kingdom and the United states (Walford, 2011). There is no commonly agreed threshold for a private school to be considered low fee. various qualitative descriptive criteria on ownership structure and quantitative objective criteria on fee levels have been used, although relevant information is usually patchy (Acholla, 2021).
The vast majority of low-fee private schools are single-proprietor schools. Their operational professionalism, infrastructure quality and school manager and proprietor background can differ considerably. Most such schools in urban areas of sub-saharan Africa and south Asia are not registered (Härmä, 2021). in Lagos, nigeria, a 2011 school census found that only 26% of private primary and secondary schools were registered. Even by 2018, only some 30% of private schools were approved (Ugbodaga, 2018). in Ghana, 18% of 36,000 private basic education providers in 2018/19 were not registered (Acholla, 2021).
Larger-scale operations include a variety of arrangements, from partnerships to chain schools. Church organizations, instead of individual entrepreneurs, may establish low-fee private schools, for instance in post-conflict, low-income contexts (Härmä, 2021), accompanying them with significant financing and other support from faith-based financial intermediaries (Acholla, 2021; sivasubramaniam, 2020). Corporate chain schools include small and large national networks (e.g. APEC schools in the Philippines; silverleaf Academy in the United republic of Tanzania; MA ideal schools in Hyderabad, india; and samata schools in nepal); not-for-profit regional and international operator
models (e.g. Promoting Equality in African schools in Uganda and Zambia, the Forum for African Women Educationalists in rwanda and The Citizens Foundation in Pakistan); and international for-profit chains with plans for considerable expansion (e.g. omega schools in Ghana and Bridge international Academies in india’s Andhra Pradesh state as well as Kenya, nigeria and Uganda) (Acholla, 2021). Discussion of low-fee private schools has sometimes exclusively focused on the last model (Espindola, 2019). Even though international chains make up only a small market segment and are unlikely to become major providers in low-income settings (Hares and Crawfurd, 2020), they have been disproportionately emphasized in research and policy discourse due to their profit orientation and potential influence on donor resource allocation decisions (UnEsCo, 2017; verger et al., 2018).
As these qualitative definitions of low-fee private schools have unclear boundaries, quantitative definitions have been proposed to define affordability using fee levels (Table 2.1). The Center for indonesian Policy studies calculated a threshold for Jakarta from the provincial monthly minimum wage (rahman, 2016). india’s national institute of Public Finance and Policy used fee distribution at schools attended by children living in households in the bottom 40% of the consumption expenditure distribution, and identified two thresholds: ‘basic’ schools costing less than Us$115 a year, and ‘standard’ schools costing less than Us$215 a year (Bose et al., 2020).
STATE AND NON-STATE SCHOOLS DIFFER IN STUDENT INTAKE AND AVAILABLE RESOURCES
once policymakers have identified an operational school typology that suits their needs, the key question is what effects non-state schools have on students and the education system. if an analysis is to be meaningful and relevant for policy, it should be noted that state and non-state schools differ in more than just operations, management, financing, motivation and fee levels. state and non-state actors also differ in student intake and access to resources. only if such differences are accounted for can a comparison of state and non-state school performance be accurate.
PUBLIC AND PRIVATE SCHOOLS DIFFER IN STUDENT INTAKEMost households do not get to choose their schools, and few poor children have access to private schools. school and household surveys covering primary schools globally show that for a sample of 42 countries where
2 0 2 1 / 2 • G LO BA L E D U C AT I O N M O N I TO R I N G R E P O RT 36
2
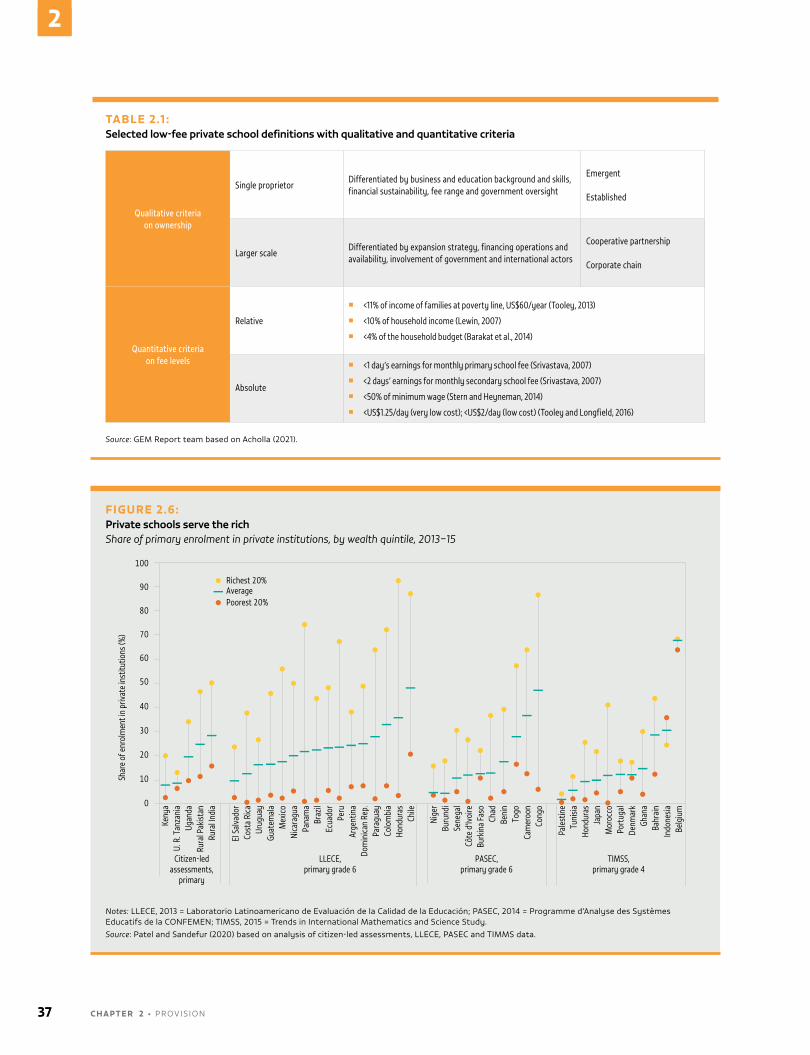
TABLE 2.1 :Selected low-fee private school definitions with qualitative and quantitative criteria
Qualitative criteria on ownership
Single proprietorDifferentiated by business and education background and skills, financial sustainability, fee range and government oversight
Emergent
Established
Larger scaleDifferentiated by expansion strategy, financing operations and availability, involvement of government and international actors
Cooperative partnership
Corporate chain
Quantitative criteria on fee levels
Relative
� <11% of income of families at poverty line, US$60/year (Tooley, 2013) � <10% of household income (Lewin, 2007) � <4% of the household budget (Barakat et al., 2014)
Absolute
� <1 day’s earnings for monthly primary school fee (Srivastava, 2007) � <2 days’ earnings for monthly secondary school fee (Srivastava, 2007) � <50% of minimum wage (Stern and Heyneman, 2014) � <US$1.25/day (very low cost); <US$2/day (low cost) (Tooley and Longfield, 2016)
Source: GEM report team based on Acholla (2021).
FIGURE 2.6:Private schools serve the richShare of primary enrolment in private institutions, by wealth quintile, 2013–15
Guatemala, 2014
2018
Keny
aU.
R. T
anza
nia
Ugan
daRu
ral P
akist
anRu
ral I
ndia
Citizen-ledassessments,
primary
LLECE,primary grade 6
PASEC,primary grade 6
TIMSS,primary grade 4
El S
alva
dor
Cost
a Ri
caUr
ugua
yGu
atem
ala
Mex
icoNi
cara
gua
Pana
ma
Braz
ilEc
uado
rPe
ruAr
gent
ina
Dom
inica
n Re
p.Pa
ragu
ayCo
lom
bia
Hond
uras
Chile
Nige
rBu
rund
iSe
nega
lCô
te d
'Ivoi
reBu
rkin
a Fa
soCh
adBe
nin
Togo
Cam
eroo
nCo
ngo
Pale
stin
eTu
nisia
Hond
uras
Japa
nM
oroc
coPo
rtug
alDe
nmar
kGh
ana
Bahr
ain
Indo
nesia
Belg
ium
100
90
80
70
60
50
40
30
20
10
0
Shar
e of
enr
olm
ent i
n pr
ivate
inst
itutio
ns (%
)
Richest 20%AveragePoorest 20%
Notes: LLECE, 2013 = Laboratorio Latinoamericano de Evaluación de la Calidad de la Educación; PAsEC, 2014 = Programme d’Analyse des systèmes Educatifs de la ConFEMEn; TiMss, 2015 = Trends in international Mathematics and science study.Source: Patel and sandefur (2020) based on analysis of citizen-led assessments, LLECE, PAsEC and TiMMs data.
37 C H A P T E R 2 • Provis ion
2
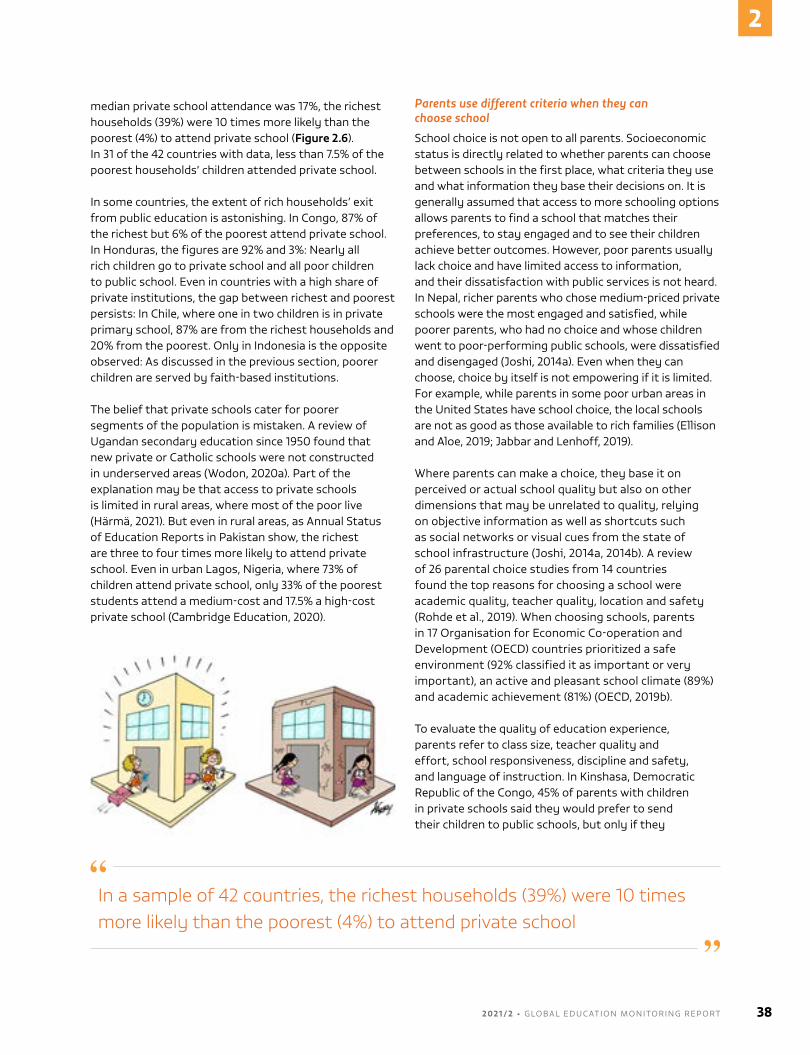
median private school attendance was 17%, the richest households (39%) were 10 times more likely than the poorest (4%) to attend private school (Figure 2.6). in 31 of the 42 countries with data, less than 7.5% of the poorest households’ children attended private school.
in some countries, the extent of rich households’ exit from public education is astonishing. in Congo, 87% of the richest but 6% of the poorest attend private school. in Honduras, the figures are 92% and 3%: nearly all rich children go to private school and all poor children to public school. Even in countries with a high share of private institutions, the gap between richest and poorest persists: in Chile, where one in two children is in private primary school, 87% are from the richest households and 20% from the poorest. only in indonesia is the opposite observed: As discussed in the previous section, poorer children are served by faith-based institutions.
The belief that private schools cater for poorer segments of the population is mistaken. A review of Ugandan secondary education since 1950 found that new private or Catholic schools were not constructed in underserved areas (Wodon, 2020a). Part of the explanation may be that access to private schools is limited in rural areas, where most of the poor live (Härmä, 2021). But even in rural areas, as Annual status of Education reports in Pakistan show, the richest are three to four times more likely to attend private school. Even in urban Lagos, nigeria, where 73% of children attend private school, only 33% of the poorest students attend a medium-cost and 17.5% a high-cost private school (Cambridge Education, 2020).
In a sample of 42 countries, the richest households (39%) were 10 times more likely than the poorest (4%) to attend private school
Parents use different criteria when they can choose school
school choice is not open to all parents. socioeconomic status is directly related to whether parents can choose between schools in the first place, what criteria they use and what information they base their decisions on. it is generally assumed that access to more schooling options allows parents to find a school that matches their preferences, to stay engaged and to see their children achieve better outcomes. However, poor parents usually lack choice and have limited access to information, and their dissatisfaction with public services is not heard. in nepal, richer parents who chose medium-priced private schools were the most engaged and satisfied, while poorer parents, who had no choice and whose children went to poor-performing public schools, were dissatisfied and disengaged (Joshi, 2014a). Even when they can choose, choice by itself is not empowering if it is limited. For example, while parents in some poor urban areas in the United states have school choice, the local schools are not as good as those available to rich families (Ellison and Aloe, 2019; Jabbar and Lenhoff, 2019).
Where parents can make a choice, they base it on perceived or actual school quality but also on other dimensions that may be unrelated to quality, relying on objective information as well as shortcuts such as social networks or visual cues from the state of school infrastructure (Joshi, 2014a, 2014b). A review of 26 parental choice studies from 14 countries found the top reasons for choosing a school were academic quality, teacher quality, location and safety (rohde et al., 2019). When choosing schools, parents in 17 organisation for Economic Co-operation and Development (oECD) countries prioritized a safe environment (92% classified it as important or very important), an active and pleasant school climate (89%) and academic achievement (81%) (oECD, 2019b).
To evaluate the quality of education experience, parents refer to class size, teacher quality and effort, school responsiveness, discipline and safety, and language of instruction. in Kinshasa, Democratic republic of the Congo, 45% of parents with children in private schools said they would prefer to send their children to public schools, but only if they
2 0 2 1 / 2 • G LO BA L E D U C AT I O N M O N I TO R I N G R E P O RT 38
2
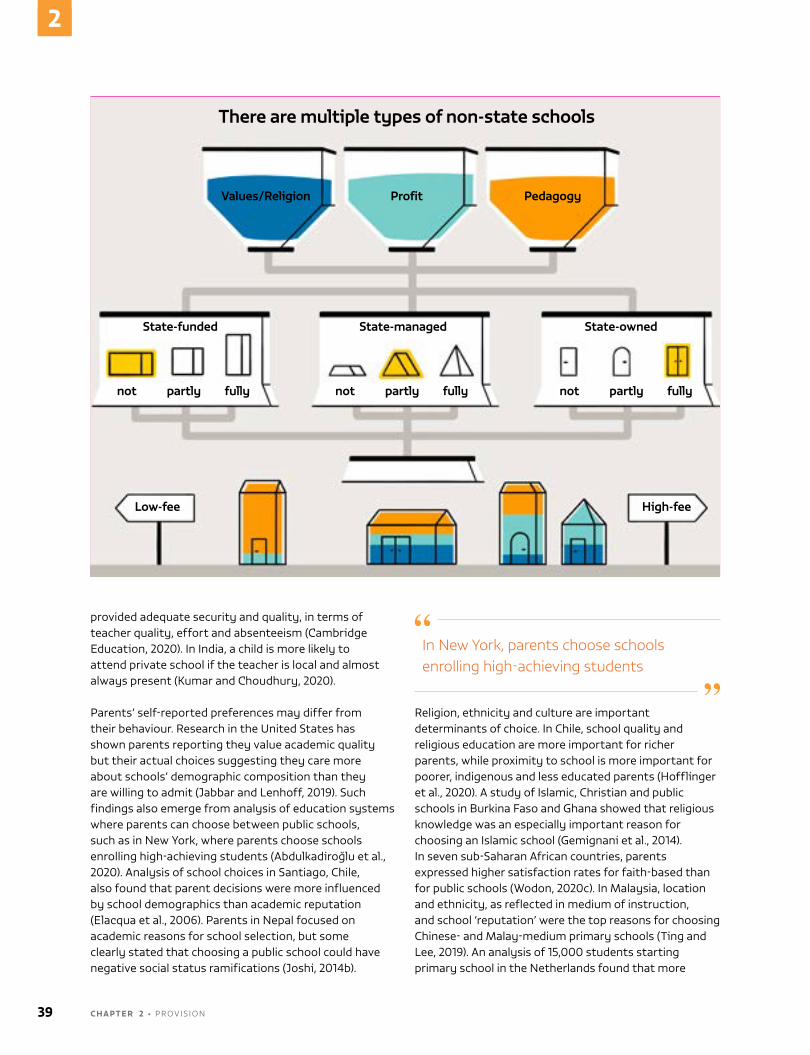
There are multiple types of non-state schools
Values/Religion
not not notpartly
Low-fee High-fee
partly partly
State-ownedState-managedState-funded
fully fully fully
Profi t Pedagogy
provided adequate security and quality, in terms of teacher quality, effort and absenteeism (Cambridge Education, 2020). in india, a child is more likely to attend private school if the teacher is local and almost always present (Kumar and Choudhury, 2020).
Parents’ self-reported preferences may differ from their behaviour. research in the United states has shown parents reporting they value academic quality but their actual choices suggesting they care more about schools’ demographic composition than they are willing to admit (Jabbar and Lenhoff, 2019). such findings also emerge from analysis of education systems where parents can choose between public schools, such as in new York, where parents choose schools enrolling high-achieving students (Abdulkadiroğlu et al., 2020). Analysis of school choices in santiago, Chile, also found that parent decisions were more influenced by school demographics than academic reputation (Elacqua et al., 2006). Parents in nepal focused on academic reasons for school selection, but some clearly stated that choosing a public school could have negative social status ramifications (Joshi, 2014b).
In New York, parents choose schools enrolling high-achieving students
religion, ethnicity and culture are important determinants of choice. in Chile, school quality and religious education are more important for richer parents, while proximity to school is more important for poorer, indigenous and less educated parents (Hofflinger et al., 2020). A study of islamic, Christian and public schools in Burkina Faso and Ghana showed that religious knowledge was an especially important reason for choosing an islamic school (Gemignani et al., 2014). in seven sub-saharan African countries, parents expressed higher satisfaction rates for faith-based than for public schools (Wodon, 2020c). in Malaysia, location and ethnicity, as reflected in medium of instruction, and school ‘reputation’ were the top reasons for choosing Chinese- and Malay-medium primary schools (Ting and Lee, 2019). An analysis of 15,000 students starting primary school in the netherlands found that more
39 C H A P T E R 2 • Provis ion
2
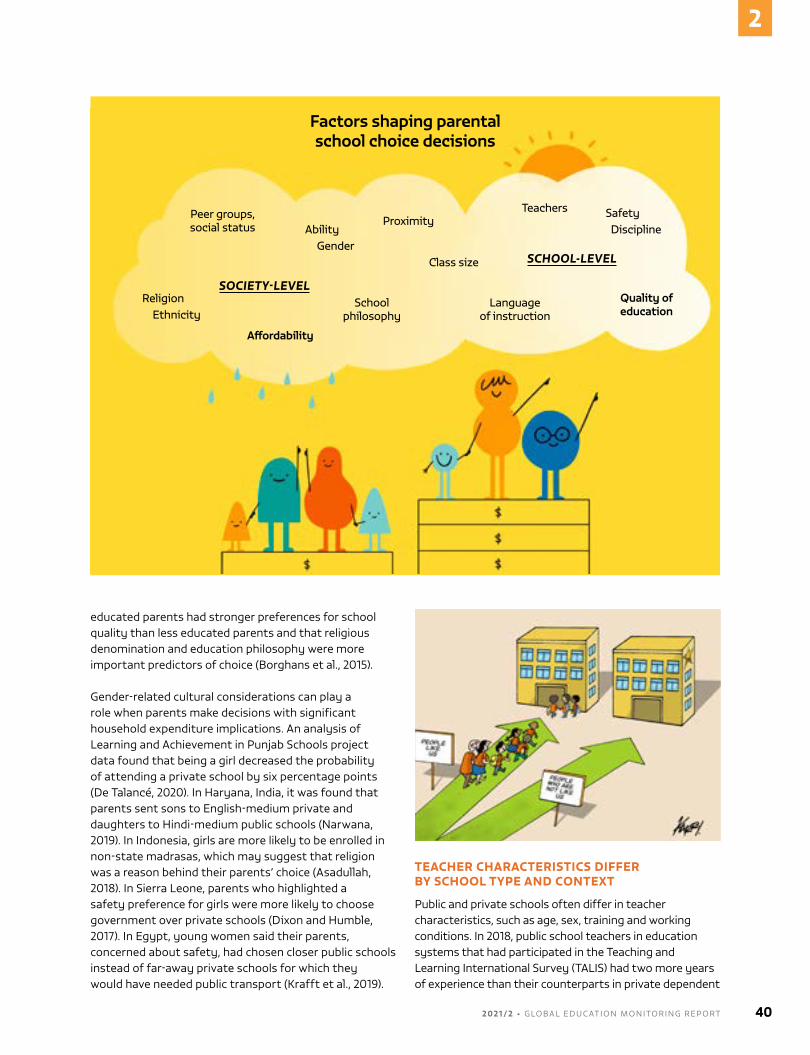
educated parents had stronger preferences for school quality than less educated parents and that religious denomination and education philosophy were more important predictors of choice (Borghans et al., 2015).
Gender-related cultural considerations can play a role when parents make decisions with significant household expenditure implications. An analysis of Learning and Achievement in Punjab schools project data found that being a girl decreased the probability of attending a private school by six percentage points (De Talancé, 2020). in Haryana, india, it was found that parents sent sons to English-medium private and daughters to Hindi-medium public schools (narwana, 2019). in indonesia, girls are more likely to be enrolled in non-state madrasas, which may suggest that religion was a reason behind their parents’ choice (Asadullah, 2018). in sierra Leone, parents who highlighted a safety preference for girls were more likely to choose government over private schools (Dixon and Humble, 2017). in Egypt, young women said their parents, concerned about safety, had chosen closer public schools instead of far-away private schools for which they would have needed public transport (Krafft et al., 2019).
TEACHER CHARACTERISTICS DIFFER BY SCHOOL TYPE AND CONTEXT
Public and private schools often differ in teacher characteristics, such as age, sex, training and working conditions. in 2018, public school teachers in education systems that had participated in the Teaching and Learning international survey (TALis) had two more years of experience than their counterparts in private dependent
Factors shaping parental school choice decisions
Peer groups, social status
Religion Ethnicity
Ability Gender
Schoolphilosophy
Language of instruction
Safety Discipline
Quality of education
A� ordability
SOCIETY-LEVEL
SCHOOL-LEVEL
Proximity
Class size
Teachers
2 0 2 1 / 2 • G LO BA L E D U C AT I O N M O N I TO R I N G R E P O RT 40
2
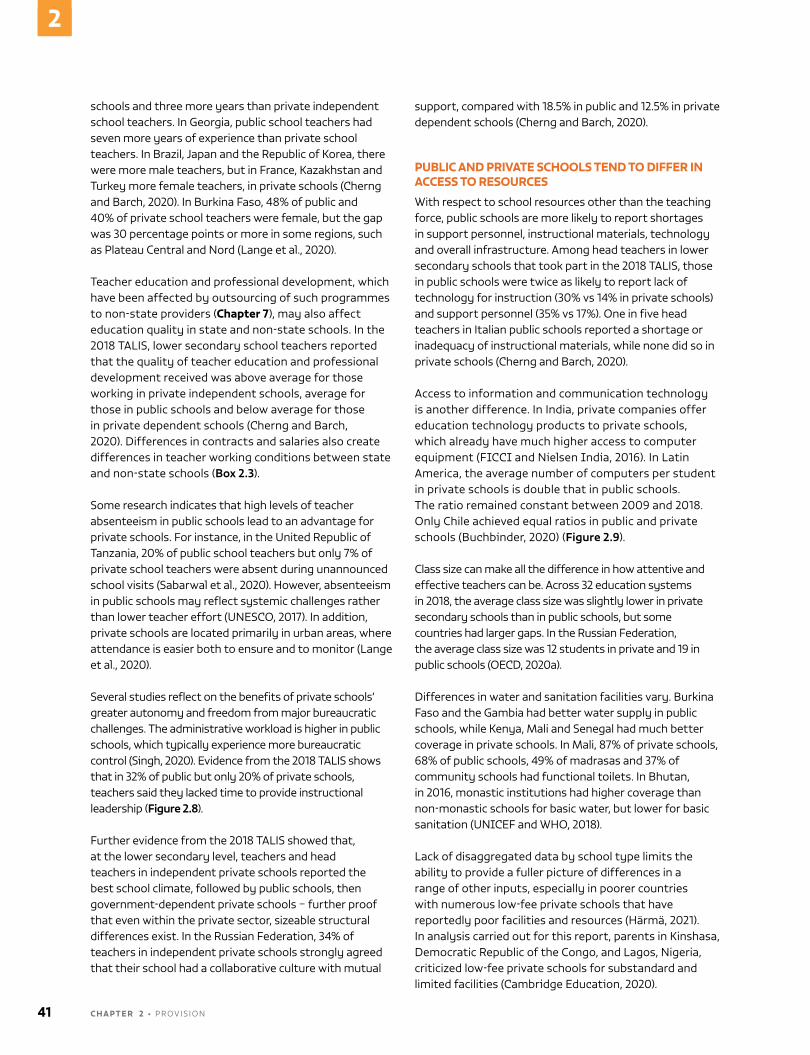
schools and three more years than private independent school teachers. in Georgia, public school teachers had seven more years of experience than private school teachers. in Brazil, Japan and the republic of Korea, there were more male teachers, but in France, Kazakhstan and Turkey more female teachers, in private schools (Cherng and Barch, 2020). in Burkina Faso, 48% of public and 40% of private school teachers were female, but the gap was 30 percentage points or more in some regions, such as Plateau Central and nord (Lange et al., 2020).
Teacher education and professional development, which have been affected by outsourcing of such programmes to non-state providers (Chapter 7), may also affect education quality in state and non-state schools. in the 2018 TALis, lower secondary school teachers reported that the quality of teacher education and professional development received was above average for those working in private independent schools, average for those in public schools and below average for those in private dependent schools (Cherng and Barch, 2020). Differences in contracts and salaries also create differences in teacher working conditions between state and non-state schools (Box 2.3).
some research indicates that high levels of teacher absenteeism in public schools lead to an advantage for private schools. For instance, in the United republic of Tanzania, 20% of public school teachers but only 7% of private school teachers were absent during unannounced school visits (sabarwal et al., 2020). However, absenteeism in public schools may reflect systemic challenges rather than lower teacher effort (UnEsCo, 2017). in addition, private schools are located primarily in urban areas, where attendance is easier both to ensure and to monitor (Lange et al., 2020).
several studies reflect on the benefits of private schools’ greater autonomy and freedom from major bureaucratic challenges. The administrative workload is higher in public schools, which typically experience more bureaucratic control (singh, 2020). Evidence from the 2018 TALis shows that in 32% of public but only 20% of private schools, teachers said they lacked time to provide instructional leadership (Figure 2.8).
Further evidence from the 2018 TALis showed that, at the lower secondary level, teachers and head teachers in independent private schools reported the best school climate, followed by public schools, then government-dependent private schools – further proof that even within the private sector, sizeable structural differences exist. in the russian Federation, 34% of teachers in independent private schools strongly agreed that their school had a collaborative culture with mutual
support, compared with 18.5% in public and 12.5% in private dependent schools (Cherng and Barch, 2020).
PUBLIC AND PRIVATE SCHOOLS TEND TO DIFFER IN ACCESS TO RESOURCES
With respect to school resources other than the teaching force, public schools are more likely to report shortages in support personnel, instructional materials, technology and overall infrastructure. Among head teachers in lower secondary schools that took part in the 2018 TALis, those in public schools were twice as likely to report lack of technology for instruction (30% vs 14% in private schools) and support personnel (35% vs 17%). one in five head teachers in italian public schools reported a shortage or inadequacy of instructional materials, while none did so in private schools (Cherng and Barch, 2020).
Access to information and communication technology is another difference. in india, private companies offer education technology products to private schools, which already have much higher access to computer equipment (FICCI and nielsen India, 2016). in Latin America, the average number of computers per student in private schools is double that in public schools. The ratio remained constant between 2009 and 2018. only Chile achieved equal ratios in public and private schools (Buchbinder, 2020) (Figure 2.9).
Class size can make all the difference in how attentive and effective teachers can be. Across 32 education systems in 2018, the average class size was slightly lower in private secondary schools than in public schools, but some countries had larger gaps. in the russian Federation, the average class size was 12 students in private and 19 in public schools (oECD, 2020a).
Differences in water and sanitation facilities vary. Burkina Faso and the Gambia had better water supply in public schools, while Kenya, Mali and senegal had much better coverage in private schools. in Mali, 87% of private schools, 68% of public schools, 49% of madrasas and 37% of community schools had functional toilets. in Bhutan, in 2016, monastic institutions had higher coverage than non-monastic schools for basic water, but lower for basic sanitation (UnICEF and WHo, 2018).
Lack of disaggregated data by school type limits the ability to provide a fuller picture of differences in a range of other inputs, especially in poorer countries with numerous low-fee private schools that have reportedly poor facilities and resources (Härmä, 2021). in analysis carried out for this report, parents in Kinshasa, Democratic republic of the Congo, and Lagos, nigeria, criticized low-fee private schools for substandard and limited facilities (Cambridge Education, 2020).
41 C H A P T E R 2 • Provis ion
2
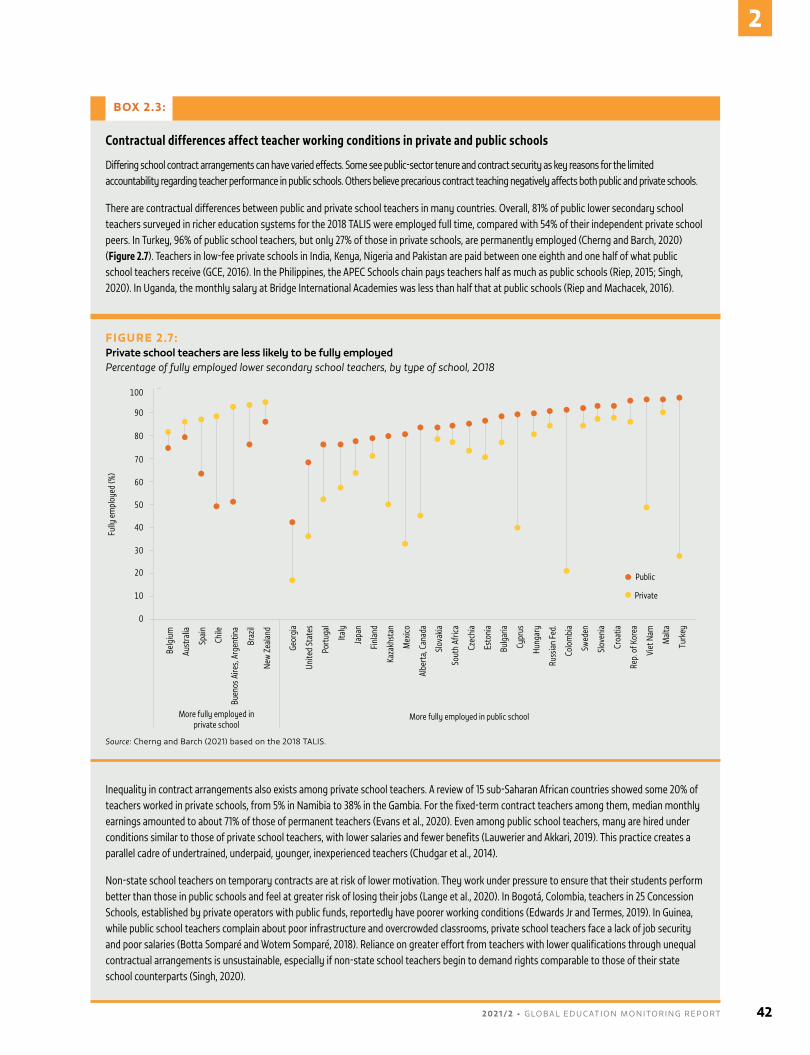
BOX 2.3:
Contractual differences affect teacher working conditions in private and public schools
Differing school contract arrangements can have varied effects. Some see public-sector tenure and contract security as key reasons for the limited accountability regarding teacher performance in public schools. Others believe precarious contract teaching negatively affects both public and private schools.
There are contractual differences between public and private school teachers in many countries. Overall, 81% of public lower secondary school teachers surveyed in richer education systems for the 2018 TALIS were employed full time, compared with 54% of their independent private school peers. In Turkey, 96% of public school teachers, but only 27% of those in private schools, are permanently employed (Cherng and Barch, 2020) (Figure 2.7). Teachers in low-fee private schools in India, Kenya, Nigeria and Pakistan are paid between one eighth and one half of what public school teachers receive (GCE, 2016). In the Philippines, the APEC Schools chain pays teachers half as much as public schools (Riep, 2015; Singh, 2020). In Uganda, the monthly salary at Bridge International Academies was less than half that at public schools (Riep and Machacek, 2016).
FIGURE 2.7:Private school teachers are less likely to be fully employedPercentage of fully employed lower secondary school teachers, by type of school, 2018
Guatemala, 2014
2018
100
90
80
70
60
50
40
30
20
10
0
Belg
ium
Aust
ralia
Spai
n
Chile
Buen
os A
ires,
Arge
ntin
a
Braz
il
New
Zea
land
More fully employed in private school
More fully employed in public school
Geor
gia
Unite
d St
ates
Port
ugal
Italy
Japa
n
Finl
and
Kaza
khst
an
Mex
ico
Albe
rta,
Cana
da
Slov
akia
Sout
h Af
rica
Czec
hia
Esto
nia
Bulg
aria
Cypr
us
Hung
ary
Russ
ian
Fed.
Colo
mbi
a
Swed
en
Slov
enia
Croa
tia
Rep.
of K
orea
Viet
Nam
Mal
ta
Turk
ey
Fully
em
ploy
ed (%
)
Public
Private
Source: Cherng and Barch (2021) based on the 2018 TALis.
Inequality in contract arrangements also exists among private school teachers. A review of 15 sub-Saharan African countries showed some 20% of teachers worked in private schools, from 5% in Namibia to 38% in the Gambia. For the fixed-term contract teachers among them, median monthly earnings amounted to about 71% of those of permanent teachers (Evans et al., 2020). Even among public school teachers, many are hired under conditions similar to those of private school teachers, with lower salaries and fewer benefits (Lauwerier and Akkari, 2019). This practice creates a parallel cadre of undertrained, underpaid, younger, inexperienced teachers (Chudgar et al., 2014).
Non-state school teachers on temporary contracts are at risk of lower motivation. They work under pressure to ensure that their students perform better than those in public schools and feel at greater risk of losing their jobs (Lange et al., 2020). In Bogotá, Colombia, teachers in 25 Concession Schools, established by private operators with public funds, reportedly have poorer working conditions (Edwards Jr and Termes, 2019). In Guinea, while public school teachers complain about poor infrastructure and overcrowded classrooms, private school teachers face a lack of job security and poor salaries (Botta Somparé and Wotem Somparé, 2018). Reliance on greater effort from teachers with lower qualifications through unequal contractual arrangements is unsustainable, especially if non-state school teachers begin to demand rights comparable to those of their state school counterparts (Singh, 2020).
2 0 2 1 / 2 • G LO BA L E D U C AT I O N M O N I TO R I N G R E P O RT 42
2
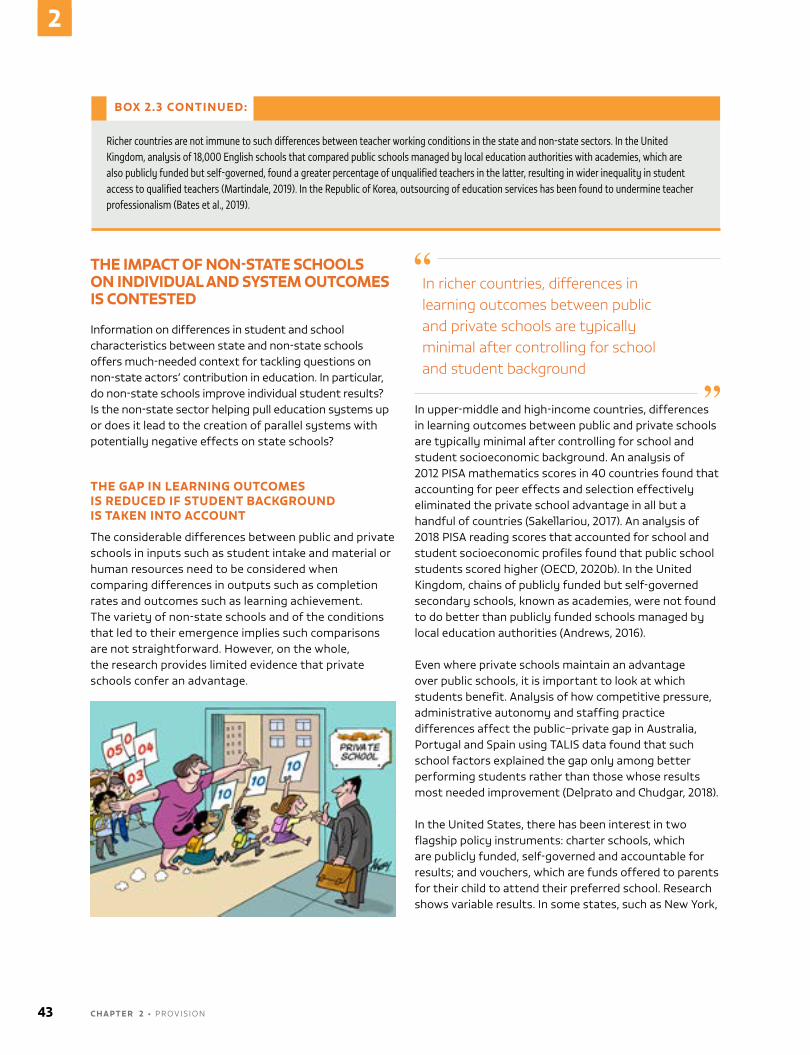
THE IMPACT OF NON-STATE SCHOOLS ON INDIVIDUAL AND SYSTEM OUTCOMES IS CONTESTED
information on differences in student and school characteristics between state and non-state schools offers much-needed context for tackling questions on non-state actors’ contribution in education. in particular, do non-state schools improve individual student results? is the non-state sector helping pull education systems up or does it lead to the creation of parallel systems with potentially negative effects on state schools?
THE GAP IN LEARNING OUTCOMES IS REDUCED IF STUDENT BACKGROUND IS TAKEN INTO ACCOUNT
The considerable differences between public and private schools in inputs such as student intake and material or human resources need to be considered when comparing differences in outputs such as completion rates and outcomes such as learning achievement. The variety of non-state schools and of the conditions that led to their emergence implies such comparisons are not straightforward. However, on the whole, the research provides limited evidence that private schools confer an advantage.
In richer countries, differences in learning outcomes between public and private schools are typically minimal after controlling for school and student background
in upper-middle and high-income countries, differences in learning outcomes between public and private schools are typically minimal after controlling for school and student socioeconomic background. An analysis of 2012 PisA mathematics scores in 40 countries found that accounting for peer effects and selection effectively eliminated the private school advantage in all but a handful of countries (sakellariou, 2017). An analysis of 2018 PisA reading scores that accounted for school and student socioeconomic profiles found that public school students scored higher (oECD, 2020b). in the United Kingdom, chains of publicly funded but self-governed secondary schools, known as academies, were not found to do better than publicly funded schools managed by local education authorities (Andrews, 2016).
Even where private schools maintain an advantage over public schools, it is important to look at which students benefit. Analysis of how competitive pressure, administrative autonomy and staffing practice differences affect the public–private gap in Australia, Portugal and spain using TALis data found that such school factors explained the gap only among better performing students rather than those whose results most needed improvement (Delprato and Chudgar, 2018).
in the United states, there has been interest in two flagship policy instruments: charter schools, which are publicly funded, self-governed and accountable for results; and vouchers, which are funds offered to parents for their child to attend their preferred school. research shows variable results. in some states, such as new York,
BOX 2.3 CONTINUED:
Richer countries are not immune to such differences between teacher working conditions in the state and non-state sectors. In the United Kingdom, analysis of 18,000 English schools that compared public schools managed by local education authorities with academies, which are also publicly funded but self-governed, found a greater percentage of unqualified teachers in the latter, resulting in wider inequality in student access to qualified teachers (Martindale, 2019). In the Republic of Korea, outsourcing of education services has been found to undermine teacher professionalism (Bates et al., 2019).
43 C H A P T E R 2 • Provis ion
2
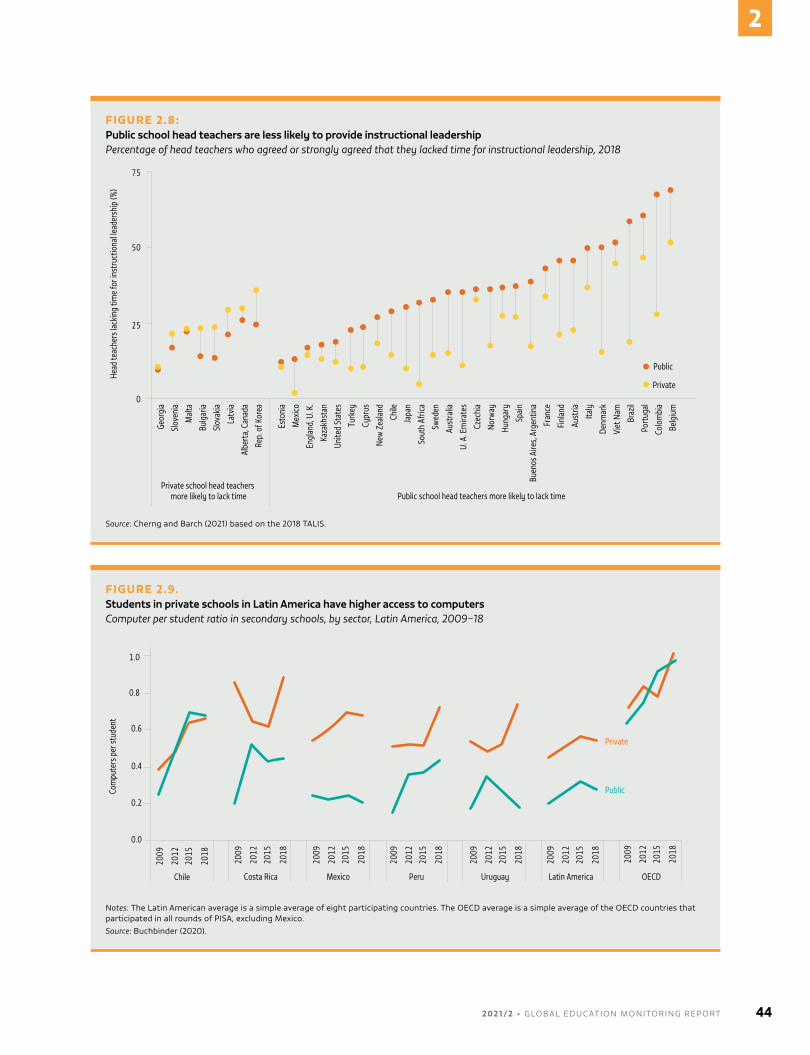
FIGURE 2.8:Public school head teachers are less likely to provide instructional leadershipPercentage of head teachers who agreed or strongly agreed that they lacked time for instructional leadership, 2018
Guatemala, 2014
2018
75
50
25
0
Geor
gia
Slov
enia
Mal
ta
Bulg
aria
Slov
akia
Latv
ia
Albe
rta,
Cana
da
Rep.
of K
orea
Private school head teachers more likely to lack time Public school head teachers more likely to lack time
Esto
nia
Mex
ico
Engl
and,
U. K
.
Kaza
khst
an
Unite
d St
ates
Turk
ey
Cypr
us
New
Zea
land
Chile
Japa
n
Sout
h Af
rica
Swed
en
Aust
ralia
U. A
. Em
irate
s
Czec
hia
Norw
ay
Hung
ary
Spai
n
Buen
os A
ires,
Arge
ntin
a
Fran
ce
Finl
and
Aust
ria
Italy
Denm
ark
Viet
Nam
Braz
il
Port
ugal
Colo
mbi
a
Belg
ium
Head
teac
hers
lack
ing
time
for i
nstr
uctio
nal le
ader
ship
(%)
Public
Private
Source: Cherng and Barch (2021) based on the 2018 TALis.
FIGURE 2.9.Students in private schools in Latin America have higher access to computersComputer per student ratio in secondary schools, by sector, Latin America, 2009–18
Guatemala, 2014
2018
1.0
0.8
0.6
0.4
0.2
0.0
Chile Costa Rica Mexico Peru Uruguay Latin America OECD
2009
2012
2015
2018
2009
2012
2015
2018
2009
2012
2015
2018
2009
2012
2015
2018
2009
2012
2015
2018
2009
2012
2015
2018
2009
2012
2015
2018
Com
pute
rs p
er st
uden
t
Private
Public
Notes: The Latin American average is a simple average of eight participating countries. The oECD average is a simple average of the oECD countries that participated in all rounds of PisA, excluding Mexico.Source: Buchbinder (2020).
2 0 2 1 / 2 • G LO BA L E D U C AT I O N M O N I TO R I N G R E P O RT 44
2
charter schools have improved student achievement, but in others, such as Arizona, there has been no positive impact. virtual charter schools, which use technology to deliver education at students’ homes, are found to have a substantial negative effect on achievement. By contrast, so-called ‘no excuses’ charter schools, which emphasize standardized tests, behavioural standards and longer instruction time, have produced outcome improvements, especially for disadvantaged groups. non-profit charter school networks are more effective than for-profit charter schools at delivering learning gains (Ferrare, 2020). For instance, an analysis of 43 lower secondary schools in the Knowledge is Power Program network found large gains in mathematics and reading (Clark Tuttle et al., 2013).
A survey of studies on small- and large-scale voucher programmes showed mostly no effects on test scores, with some programmes even showing large negative effects, though there was some positive impact on graduation rates for African American students (Epple et al., 2017). A longitudinal analysis found that the better academic, social, psychological and attainment outcomes at age 15 enjoyed by children in private schools disappeared after controlling for student sociodemographic characteristics (Pianta and Ansari, 2018).
in low- and middle-income countries, a 2014 review found moderate evidence that children in non-elite private schools learned more than their peers in government schools (Day Ashley et al., 2014) but a more recent review of 13 studies, mostly from south Asia and sub-saharan Africa, supported the conclusion that effects on learning were mixed (Table 2.2). Furthermore, using data for 31 countries, the analysis showed that the estimated premium from attending private school dropped by one half to two thirds after adjusting for household wealth, which determines who gets selected into the schools (Patel and sandefur, 2020). The overwhelming conclusion was that learning levels were poor overall, raising concerns about the education system that were unrelated to school type.
some results were slightly more positive for private schools. A meta-analysis of 17 studies of different types of non-state provision (government aided and unaided, registered and unregistered, faith-based and nGo) on foundational literacy and numeracy outcomes in south Asia showed a moderately positive effect on learning, larger for language than mathematics, after controlling for household and school factors (UnICEF, 2021).
in sub-saharan Africa, results depended on context and focus. in Kenya, citizen-led learning assessment data showed a significant advantage for private school students in grades 2 to 4, even after controlling for socioeconomic background. A more sophisticated technique found an advantage in mathematics but not in English (Wamalwa and Burns, 2018). But further analysis showed that the poorest were least likely to be learning. in mathematics, the private school advantage for the wealthiest 20% of students was four times that of the poorest 20% (Baum and riley, 2019).
in nigeria, schools in the Bridge Academy chain performed better than similarly priced local private schools in reading but not in mathematics (Lipcan et al., 2018). students at rising Academies, a chain in sierra Leone, performed significantly better than those in other private and public schools in both reading and mathematics (Johnson and Hsieh, 2019). in south Africa, low-fee independent schools appeared to perform better than public schools, but comparing schools in similar fee brackets showed a more mixed impact (van der Berg et al., 2017). An analysis of various providers in Uganda found that students from the Promoting Equality in African schools network performed slightly better than other local public–private partnership schools in terms of value added to test scores (Crawfurd, 2017).
An evaluation of Fe y Alegría faith-based schools in Colombia, where the network originated, found they had a significant positive effect on mathematics test scores, at a cost similar to public schools. in Peru, analysis of a lottery selection process into grade 1 for Fe y Alegría schools found a large positive effect in reading and mathematics (Lavado et al., 2019). in sub-saharan Africa, despite higher parental satisfaction with Catholic schools, test scores in faith-based schools, while higher than in public schools, tended to be lower than in private independent secular schools – but scores overall were low, with school type not making a big difference (Wodon, 2020c).
Learning outcome comparisons in civics and technology are less common
Beyond core subjects such as reading and mathematics, there is little evidence on the impact of private school attendance on other content domains. Analysis for this report of international Civic and Citizenship Education study (iCCs) data, mostly from European countries, shows that civic knowledge and perceptions vary quite significantly between public and private schools, albeit in different ways by country. The iCCs
45 C H A P T E R 2 • Provis ion
2
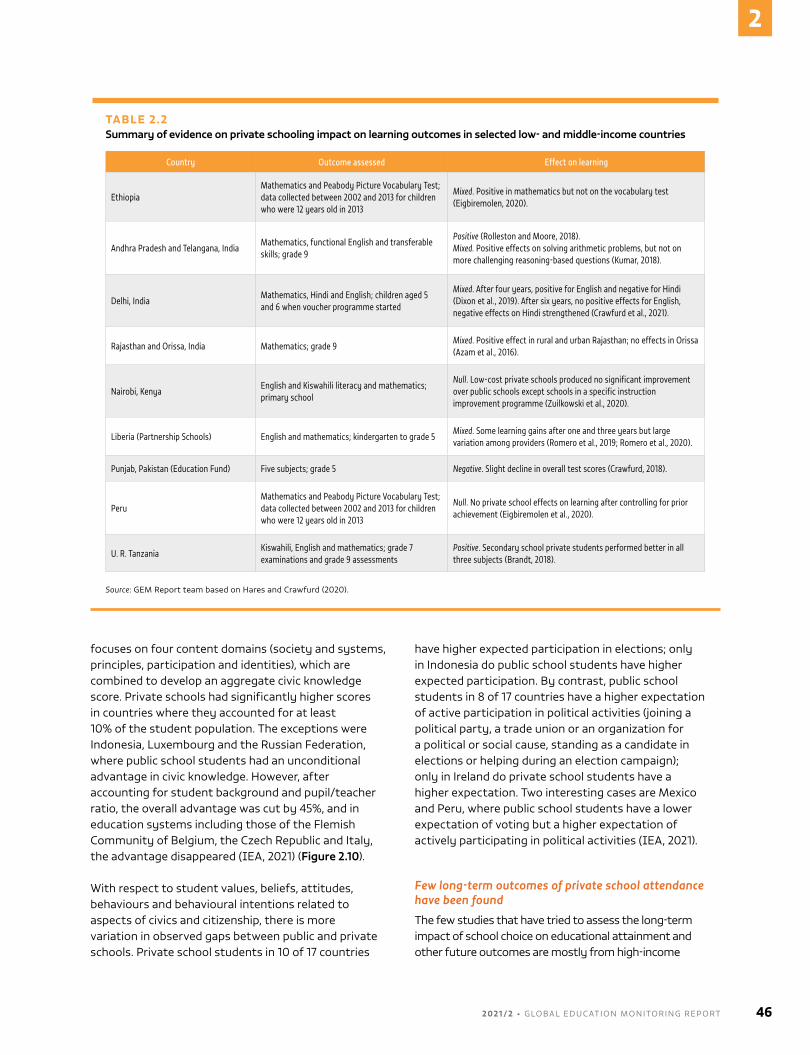
focuses on four content domains (society and systems, principles, participation and identities), which are combined to develop an aggregate civic knowledge score. Private schools had significantly higher scores in countries where they accounted for at least 10% of the student population. The exceptions were indonesia, Luxembourg and the russian Federation, where public school students had an unconditional advantage in civic knowledge. However, after accounting for student background and pupil/teacher ratio, the overall advantage was cut by 45%, and in education systems including those of the Flemish Community of Belgium, the Czech republic and italy, the advantage disappeared (IEA, 2021) (Figure 2.10).
With respect to student values, beliefs, attitudes, behaviours and behavioural intentions related to aspects of civics and citizenship, there is more variation in observed gaps between public and private schools. Private school students in 10 of 17 countries
have higher expected participation in elections; only in indonesia do public school students have higher expected participation. By contrast, public school students in 8 of 17 countries have a higher expectation of active participation in political activities (joining a political party, a trade union or an organization for a political or social cause, standing as a candidate in elections or helping during an election campaign); only in ireland do private school students have a higher expectation. Two interesting cases are Mexico and Peru, where public school students have a lower expectation of voting but a higher expectation of actively participating in political activities (IEA, 2021).
Few long-term outcomes of private school attendance have been found
The few studies that have tried to assess the long-term impact of school choice on educational attainment and other future outcomes are mostly from high-income
TABLE 2.2Summary of evidence on private schooling impact on learning outcomes in selected low- and middle-income countries
Country Outcome assessed Effect on learning
EthiopiaMathematics and Peabody Picture Vocabulary Test; data collected between 2002 and 2013 for children who were 12 years old in 2013
Mixed. Positive in mathematics but not on the vocabulary test (Eigbiremolen, 2020).
Andhra Pradesh and Telangana, IndiaMathematics, functional English and transferable skills; grade 9
Positive (Rolleston and Moore, 2018).Mixed. Positive effects on solving arithmetic problems, but not on more challenging reasoning-based questions (Kumar, 2018).
Delhi, IndiaMathematics, Hindi and English; children aged 5 and 6 when voucher programme started
Mixed. After four years, positive for English and negative for Hindi (Dixon et al., 2019). After six years, no positive effects for English, negative effects on Hindi strengthened (Crawfurd et al., 2021).
Rajasthan and Orissa, India Mathematics; grade 9Mixed. Positive effect in rural and urban Rajasthan; no effects in Orissa (Azam et al., 2016).
Nairobi, KenyaEnglish and Kiswahili literacy and mathematics; primary school
Null. Low-cost private schools produced no significant improvement over public schools except schools in a specific instruction improvement programme (Zuilkowski et al., 2020).
Liberia (Partnership Schools) English and mathematics; kindergarten to grade 5Mixed. Some learning gains after one and three years but large variation among providers (Romero et al., 2019; Romero et al., 2020).
Punjab, Pakistan (Education Fund) Five subjects; grade 5 Negative. Slight decline in overall test scores (Crawfurd, 2018).
PeruMathematics and Peabody Picture Vocabulary Test; data collected between 2002 and 2013 for children who were 12 years old in 2013
Null. No private school effects on learning after controlling for prior achievement (Eigbiremolen et al., 2020).
U. R. TanzaniaKiswahili, English and mathematics; grade 7 examinations and grade 9 assessments
Positive. Secondary school private students performed better in all three subjects (Brandt, 2018).
Source: GEM report team based on Hares and Crawfurd (2020).
2 0 2 1 / 2 • G LO BA L E D U C AT I O N M O N I TO R I N G R E P O RT 46
2
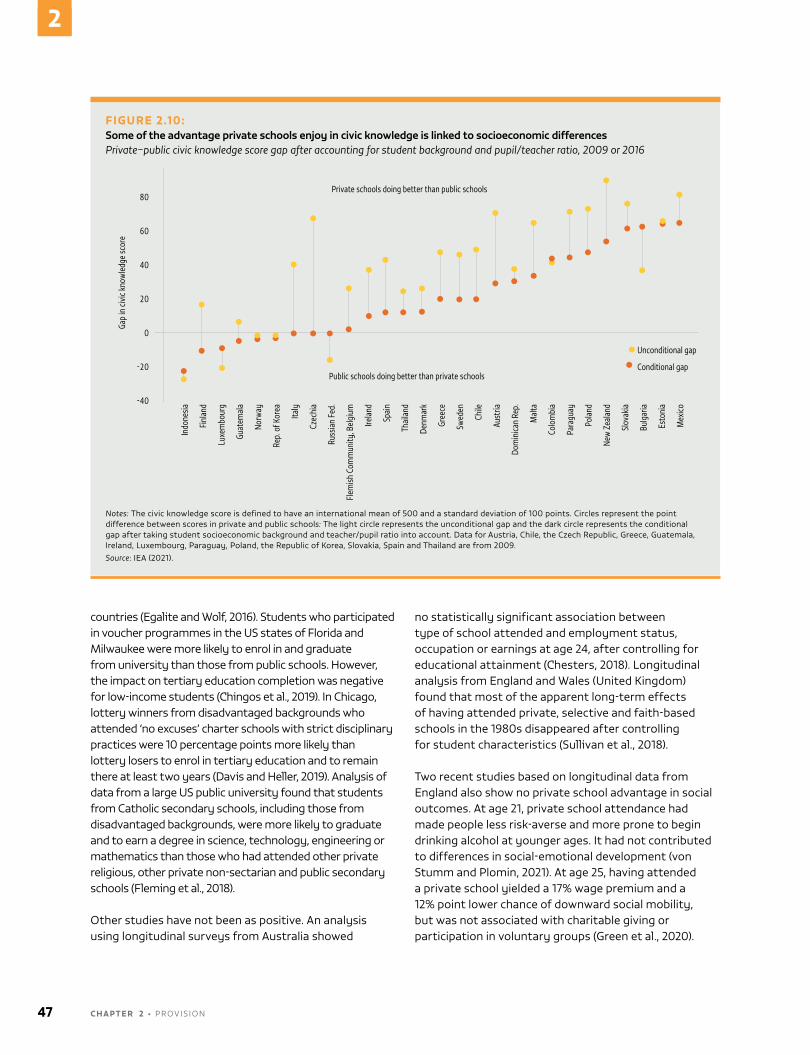
countries (Egalite and Wolf, 2016). students who participated in voucher programmes in the Us states of Florida and Milwaukee were more likely to enrol in and graduate from university than those from public schools. However, the impact on tertiary education completion was negative for low-income students (Chingos et al., 2019). in Chicago, lottery winners from disadvantaged backgrounds who attended ‘no excuses’ charter schools with strict disciplinary practices were 10 percentage points more likely than lottery losers to enrol in tertiary education and to remain there at least two years (Davis and Heller, 2019). Analysis of data from a large Us public university found that students from Catholic secondary schools, including those from disadvantaged backgrounds, were more likely to graduate and to earn a degree in science, technology, engineering or mathematics than those who had attended other private religious, other private non-sectarian and public secondary schools (Fleming et al., 2018).
other studies have not been as positive. An analysis using longitudinal surveys from Australia showed
no statistically significant association between type of school attended and employment status, occupation or earnings at age 24, after controlling for educational attainment (Chesters, 2018). Longitudinal analysis from England and Wales (United Kingdom) found that most of the apparent long-term effects of having attended private, selective and faith-based schools in the 1980s disappeared after controlling for student characteristics (sullivan et al., 2018).
Two recent studies based on longitudinal data from England also show no private school advantage in social outcomes. At age 21, private school attendance had made people less risk-averse and more prone to begin drinking alcohol at younger ages. it had not contributed to differences in social-emotional development (von stumm and Plomin, 2021). At age 25, having attended a private school yielded a 17% wage premium and a 12% point lower chance of downward social mobility, but was not associated with charitable giving or participation in voluntary groups (Green et al., 2020).
FIGURE 2.10:Some of the advantage private schools enjoy in civic knowledge is linked to socioeconomic differencesPrivate–public civic knowledge score gap after accounting for student background and pupil/teacher ratio, 2009 or 2016
Guatemala, 2014
2018
Public schools doing better than private schools
100
80
60
40
20
0
-20
-40
Private schools doing better than public schools
Gap
in ci
vic kn
owle
dge
scor
e
Indo
nesia
Finl
and
Luxe
mbo
urg
Guat
emal
a
Norw
ay
Rep.
of K
orea
Italy
Czec
hia
Russ
ian
Fed.
Flem
ish C
omm
unity
, Bel
gium
Irela
nd
Spai
n
Thai
land
Denm
ark
Gree
ce
Swed
en
Chile
Aust
ria
Dom
inica
n Re
p.
Mal
ta
Colo
mbi
a
Para
guay
Pola
nd
New
Zea
land
Slov
akia
Bulg
aria
Esto
nia
Mex
ico
Unconditional gap
Conditional gap
Notes: The civic knowledge score is defined to have an international mean of 500 and a standard deviation of 100 points. Circles represent the point difference between scores in private and public schools: The light circle represents the unconditional gap and the dark circle represents the conditional gap after taking student socioeconomic background and teacher/pupil ratio into account. Data for Austria, Chile, the Czech republic, Greece, Guatemala, ireland, Luxembourg, Paraguay, Poland, the republic of Korea, slovakia, spain and Thailand are from 2009.Source: iEA (2021).
47 C H A P T E R 2 • Provis ion
2
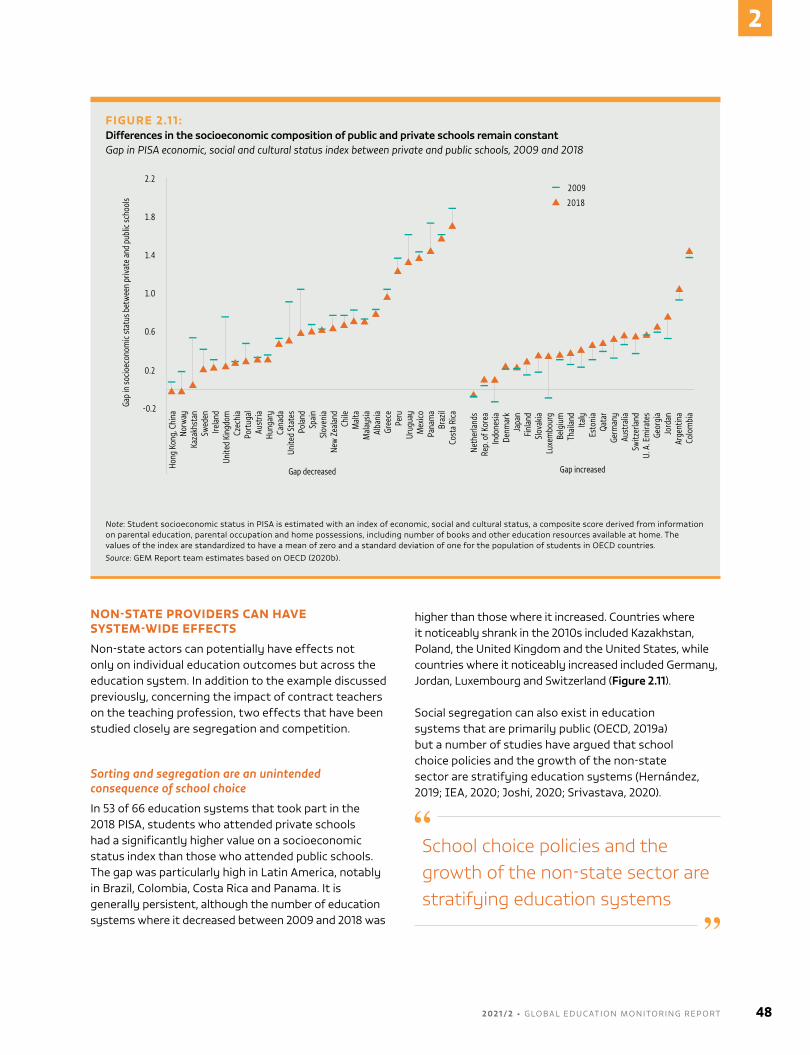
NON-STATE PROVIDERS CAN HAVE SYSTEM-WIDE EFFECTS
non-state actors can potentially have effects not only on individual education outcomes but across the education system. in addition to the example discussed previously, concerning the impact of contract teachers on the teaching profession, two effects that have been studied closely are segregation and competition.
Sorting and segregation are an unintended consequence of school choice
in 53 of 66 education systems that took part in the 2018 PisA, students who attended private schools had a significantly higher value on a socioeconomic status index than those who attended public schools. The gap was particularly high in Latin America, notably in Brazil, Colombia, Costa rica and Panama. it is generally persistent, although the number of education systems where it decreased between 2009 and 2018 was
higher than those where it increased. Countries where it noticeably shrank in the 2010s included Kazakhstan, Poland, the United Kingdom and the United states, while countries where it noticeably increased included Germany, Jordan, Luxembourg and switzerland (Figure 2.11).
social segregation can also exist in education systems that are primarily public (oECD, 2019a) but a number of studies have argued that school choice policies and the growth of the non-state sector are stratifying education systems (Hernández, 2019; IEA, 2020; Joshi, 2020; srivastava, 2020).
School choice policies and the growth of the non-state sector are stratifying education systems
FIGURE 2.11 :Differences in the socioeconomic composition of public and private schools remain constantGap in PISA economic, social and cultural status index between private and public schools, 2009 and 2018
Guatemala, 2014
2018
Hong
Kon
g, C
hina
Norw
ayKa
zakh
stan
Swed
enIre
land
Unite
d Ki
ngdo
mCz
echi
aPo
rtug
alAu
stria
Hung
ary
Cana
daUn
ited
Stat
esPo
land
Spai
nSl
oven
iaNe
w Z
eala
ndCh
ileM
alta
Mal
aysia
Alba
nia
Gree
cePe
ruUr
ugua
yM
exico
Pana
ma
Braz
ilCo
sta
Rica
Gap decreasedNe
ther
land
sRe
p. o
f Kor
eaIn
done
siaDe
nmar
kJa
pan
Finl
and
Slov
akia
Luxe
mbo
urg
Belg
ium
Thai
land
Italy
Esto
nia
Qata
rGe
rman
yAu
stra
liaSw
itzer
land
U. A
. Em
irate
sGe
orgi
aJo
rdan
Arge
ntin
aCo
lom
bia
Gap increased
Gap
in so
cioec
onom
ic st
atus
bet
wee
n pr
ivate
and
pub
lic sc
hool
s
2.2
1.8
1.4
1.0
0.6
0.2
-0.2
2009
2018
Note: student socioeconomic status in PisA is estimated with an index of economic, social and cultural status, a composite score derived from information on parental education, parental occupation and home possessions, including number of books and other education resources available at home. The values of the index are standardized to have a mean of zero and a standard deviation of one for the population of students in oECD countries.Source: GEM report team estimates based on oECD (2020b).
2 0 2 1 / 2 • G LO BA L E D U C AT I O N M O N I TO R I N G R E P O RT 48
2
segregation is viewed as a key consequence of the universal voucher policy in Chile (Zancajo, 2019). school choice exacerbated student segregation beyond levels linked to residential segregation (santos and Elacqua, 2016). in sweden, 29 of 30 municipalities contained strongly segregated lower secondary schools; in 16, segregation appeared to have been largely driven by school choice. Children of foreign-born and/or less educated parents were almost exclusively in municipal schools, while swedish-born and well-educated parents had opted out of municipal schools, choosing independent schools (Kornhall and Bender, 2019). Charter schools in the United states are believed to have exacerbated existing segregation (Wells et al., 2019).District-level data show that segregation of poorest students increased by 15% in large school districts between 1998 and 2015, with the presence of charter schools being a key factor (Marcotte and Dalane, 2019).
Competing with non-state schools may not help improve state schools’ outcomes
one appeal of school choice is the notion that competition will lead public schools to improve. schools may change operations to improve quality, change extracurricular activities, emphasize recruitment and marketing, and even try to attract the best students. However, education has certain characteristics
that make it less conducive to replicating the kind of market competition that may yield benefits in economic activities. Chile’s voucher programme had a negative impact on public schools. in municipalities with a higher share of private school enrolment, public schools had lower test scores, the gap in test scores between elite private and public schools was wider and the socioeconomic gap between public and private school parents was greater (Hsieh and Urquiola, 2006). A comparison of municipality test score performance between 2002 and 2013 found that scores increased with resources, such as parental education, but not with school competition (Hofflinger and von Hippel, 2020). The introduction of targeted vouchers in 2008 prompted schools to compete for students, since targeting made more expensive schools more attractive to poorer students (Urquiola, 2016).
in nepal, public school outcomes did not seem to be associated with the extent of private competition. But the gap between public and private school outcomes was higher in localities with higher growth in private education, suggesting stratification (Joshi, 2020).
By contrast, in sweden, a longitudinal analysis from 1988 to 2009 found that grades by subject and average attainment at age 24 increased with the share of enrolment in independent schools, with competition
49 C H A P T E R 2 • Provis ion
2
having increased productivity instead of resulting in sorting (Böhlmark and Lindahl, 2015). in the Us state of ohio, there was modest improvement in mathematics and reading scores of students who had the option but had not taken up a voucher, a result which could be attributed to the effect of competition (Figlio and Karbownik, 2016). Analysis of the impact of charter schools in new York City, United states, found that positive effects on mathematics and English among traditional public school students were largest when charter schools were in the same location (Cordes, 2018).
The mere presence of private or other schools in near proximity may not be a sufficient incentive for public school authorities to take any action if they do not have financial resources or autonomy to respond. An analysis of the Foundation Assisted schools programme in Pakistan, a public–private partnership, showed that its schools had a negative impact on enrolment at nearby public schools (Ansari, 2021). in new orleans, United states, most school principals felt the large number of charter schools presented strong competition for students. over half reported competing with private schools (Jabbar and Li, 2016).
in some instances, competition may focus on teachers. in the United states, teacher quality declined in difficult-to-staff schools after charter schools were introduced (Austin, 2020). in the state of north Carolina, after a charter school opened nearby, hard-to-staff public schools hired fewer new teachers and experienced small declines in teacher quality. At the same time, schools increased teacher compensation to retain teachers of good quality (Jackson, 2012). in new orleans, major reforms removed teacher bargaining power and protections to enable more flexibility and variation in hiring strategies. The reforms seem to have led to changes in hiring patterns, with charter schools seeking candidates outside the city and public schools looking locally (Jabbar, 2018).
Competition between public and private schools can take several forms, including choice of instruction language. some public schools switch to international languages, a marketing tool commonly used by private schools, but one that represents a negative consequence of competition. such responses have been observed in Lebanon (Bahous et al., 2011), Morocco (Chakrani, 2017), nepal (Joshi, 2016) and the Philippines (Termes et al., 2020).
some limited evidence exists on how expanding public school choice affects private schools. After open enrolment was introduced in the Canadian province of British Columbia, students had greater public school
1 This section draws on Zhang (2020).
choice and could enrol outside their catchment area. This increase in public school competition led to reduced enrolment in private secular and Catholic schools, but did not change demand for other faith and other Christian private schools (Cohn, 2020).
NON-STATE ACTORS OFFER EDUCATION GOODS AND SERVICES OTHER THAN SCHOOLING
non-state actors do not only provide education services. They also provide services that support learning, such as supplementary tuition, and goods used in the classroom, such as teaching and learning materials and technology inputs. This engagement can be significant in some countries, with potential impact on education system performance and development.
SUPPLEMENTARY TUITION IS EDUCATION PRIVATIZATION BY ANOTHER NAME
Demand for supplementary tuition has been associated with students’ need to prepare for high-stakes examinations. Households increasingly resort to such support over longer periods to give children a comparative advantage. This demand is linked to dissatisfaction with the perceived quality of education in public and even private schools.1
Two broad models of provision are teachers and companies. in low- and middle-income countries, including Cambodia, Egypt, Ghana, Myanmar, Turkey and Uzbekistan, teachers are directly involved in tutoring. such services often emerged in rapidly expanding but underfunded education systems, where low salaries led teachers to seek additional income, among other reasons, as in Yangon, Myanmar, where 48% of teachers from eight schools reported that they offered tutoring services (Bray et al., 2020). As the practice of tutoring becomes embedded into the schooling culture, it is often hard to dislodge.
in high-income countries, including Australia, France, Japan, the republic of Korea, the United Kingdom and the United states, enforcement of regulations against teachers offering such services has led to professionalization, with tutoring companies dominating (Zhang, 2020). in some countries, including Australia, parents who might previously have thought it irresponsible to undermine public education are influenced by marketing that has in
In the Russian Federation, 42% of recent school graduates used private tutoring to prepare for university entrance examinations
2 0 2 1 / 2 • G LO BA L E D U C AT I O N M O N I TO R I N G R E P O RT 50
2
effect legitimized tutoring (Doherty and Dooley, 2018). From the teachers’ perspective, income is not the only reason to engage in tutoring. About one third of Czech teachers had an additional job to supplement their income, for example, but younger teachers who moonlighted as private tutors also did so for experience in teaching core subject areas (Šťastný et al., 2021).
While these examples suggest that private tutoring is nearly universal, there is no globally comparable estimate of attendance. This is at least partly because such services are not standardized and vary by provider type (e.g. individual or institutional tutors), form (e.g. offline or online), focus (by subject) and duration (e.g. timing or number of hours). individual country estimates thus remain the main source of information on the scale of the phenomenon. in the russian Federation, 42% of recent school graduates reported using private tutoring services to prepare for university entrance examinations (vCIoM, 2019). Conversely, it is estimated that 28% of teachers provide private lessons (IssEK, 2018). studies typically show that tutoring increases by level of education. in Egypt, 36% of primary, 53% of lower secondary and 84% of general upper secondary students received supplementary tutoring in 2013/14 (sieverding et al., 2019).
The phenomenon is also spreading in regions where it had been uncommon, such as sub-saharan Africa (Box 2.4) and northern Europe. results from a German survey of 4,000 parents in 2014/15 showed some 5% of primary and 18% of secondary school students received tutoring (Klemm and Hollenbach-Biele, 2016). in England and Wales (United Kingdom), 27% of 11- to 16-year-old students, and as many as 41% in London, had received private tutoring at least once in their academic careers (sutton Trust, 2019).
Tutoring prevalence has also increased over time in many countries. in Bangladesh, the share of households that paid for private tutoring increased between 2000 and 2010 from 28% to 54% in rural areas and from 48% to 67% in urban areas (Pallegedara and Mottaleb, 2018). in Cambodia, 18% of primary, 54% of lower secondary and 72% of upper secondary school students received supplementary tutoring in 2015, an average increase of 7 percentage points since 2004 (Marshall and Fukao, 2019).in sri Lanka, the percentage of households spending on tutoring increased between 1995/96 and 2016 from 41% to 65% of urban households and from 19% to 62% of rural households (Abayasekara, 2018). in Ukraine, the share of students who reported private supplementary tutoring from secondary school teachers increased from 34% in 2006 to 53% in 2011 and almost 80% in 2016 (oECD, 2017).
Data from the world’s two most populous countries show variation in tutoring prevalence by education level, location, school type and over time. in China, one third of primary and one half of upper secondary school students receive supplementary tuition; among the latter, students in urban areas are twice as likely to receive tuition as their peers in rural areas. in india, 30% of upper secondary school students receive tuition, with a 10 percentage point gap favouring urban over rural students (Figure 2.12a). in rural india, the prevalence rate increased only slowly between 2010 and 2018, but students from both public and private schools receive supplementary tuition (AsEr, 2019) (Figure 2.12b).
Private tutoring growth is also linked to a rise in individual-driven learning linked to specific skills and an increased desire to learn at one’s own pace. in the republic of Korea, student dissatisfaction with a standardized mathematics curriculum and its pace drove many students to seek customized teaching (Kim and Jung, 2019).
BOX 2.4:
The private tutoring landscape is changing in sub-Saharan Africa
Supplementary tuition has been common mainly in affluent parts of sub-Saharan Africa, such as Mauritius, where 81% of grade 6 students received private tutoring in 2013. While weak household purchasing power was a factor limiting its expansion, data from the Southern and Eastern Africa Consortium for Monitoring Educational Quality (SACMEQ) survey show that such services increased rapidly, from low levels, between 2007 and 2013 even in some of the poorest countries, such as Malawi (from 5% to 14%) and Mozambique (from 10% to 21%). These relatively low averages mask high prevalence in urban areas. In urban Ethiopia, 67% of upper primary students had received private tutoring.
Tutoring may be fuelled by inadequate teacher salaries and high urban unemployment, a context in which private tutoring is temporary employment. In Benin, 60% of tutors were university students, secondary school students, informal sector workers or unemployed. In Ouagadougou, Burkina Faso, the corresponding rate was 49%.
The region’s lower internet penetration and limited use of mobile technology for learning means face-to-face delivery far exceeds technology-based provision. However, a few companies maintained provision during COVID-19 on the internet while physical tutoring centres were shuttered.
Source: Bray (2020).
51 C H A P T E R 2 • Provis ion
2
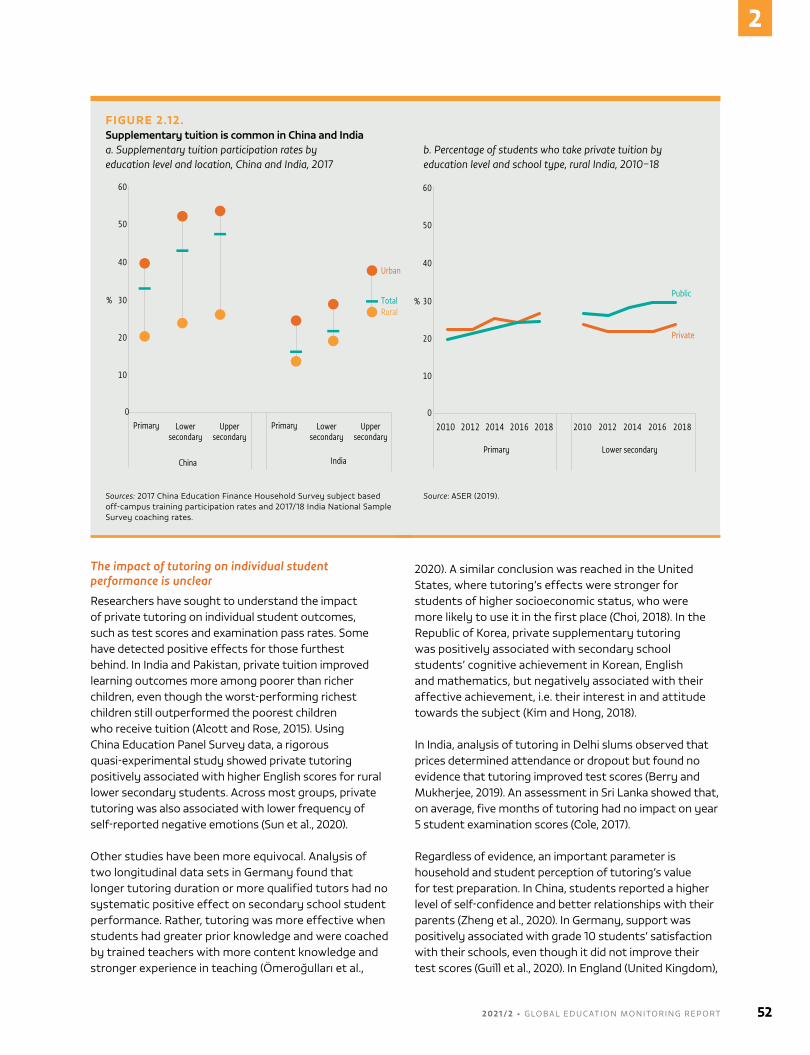
The impact of tutoring on individual student performance is unclear
researchers have sought to understand the impact of private tutoring on individual student outcomes, such as test scores and examination pass rates. some have detected positive effects for those furthest behind. in india and Pakistan, private tuition improved learning outcomes more among poorer than richer children, even though the worst-performing richest children still outperformed the poorest children who receive tuition (Alcott and rose, 2015). Using China Education Panel survey data, a rigorous quasi-experimental study showed private tutoring positively associated with higher English scores for rural lower secondary students. Across most groups, private tutoring was also associated with lower frequency of self-reported negative emotions (sun et al., 2020).
other studies have been more equivocal. Analysis of two longitudinal data sets in Germany found that longer tutoring duration or more qualified tutors had no systematic positive effect on secondary school student performance. rather, tutoring was more effective when students had greater prior knowledge and were coached by trained teachers with more content knowledge and stronger experience in teaching (Ömeroğulları et al.,
2020). A similar conclusion was reached in the United states, where tutoring’s effects were stronger for students of higher socioeconomic status, who were more likely to use it in the first place (Choi, 2018). in the republic of Korea, private supplementary tutoring was positively associated with secondary school students’ cognitive achievement in Korean, English and mathematics, but negatively associated with their affective achievement, i.e. their interest in and attitude towards the subject (Kim and Hong, 2018).
in india, analysis of tutoring in Delhi slums observed that prices determined attendance or dropout but found no evidence that tutoring improved test scores (Berry and Mukherjee, 2019). An assessment in sri Lanka showed that, on average, five months of tutoring had no impact on year 5 student examination scores (Cole, 2017).
regardless of evidence, an important parameter is household and student perception of tutoring’s value for test preparation. in China, students reported a higher level of self-confidence and better relationships with their parents (Zheng et al., 2020). in Germany, support was positively associated with grade 10 students’ satisfaction with their schools, even though it did not improve their test scores (Guill et al., 2020). in England (United Kingdom),
FIGURE 2.12.Supplementary tuition is common in China and Indiaa. Supplementary tuition participation rates by education level and location, China and India, 2017
Guatemala, 2014
2018
%
60
50
40
30
20
10
0
Urban
TotalRural
Primary Lowersecondary
Uppersecondary
Primary Lowersecondary
Uppersecondary
China IndiaPrimary Lower secondary
%
60
50
40
30
20
10
0
Public
Private
Sources: 2017 China Education Finance Household survey subject based off-campus training participation rates and 2017/18 india national sample survey coaching rates.
b. Percentage of students who take private tuition by education level and school type, rural India, 2010–18
Guatemala, 2014
2018
%
60
50
40
30
20
10
0
Urban
TotalRural
Primary Lowersecondary
Uppersecondary
Primary Lowersecondary
Uppersecondary
China IndiaPrimary Lower secondary
%
60
50
40
30
20
10
0
Public
Private
Source: AsEr (2019).
2 0 2 1 / 2 • G LO BA L E D U C AT I O N M O N I TO R I N G R E P O RT 52
2
grade 6 students viewed tutoring initially as a means of passing competitive grammar school examinations and meeting parental expectations but, over time, they noted a positive impact on self-esteem and interest in learning (Hajar, 2018).
Tutoring can undermine education system performanceThere are concerns that instruction-related support services may negatively affect student and teacher behaviour. shadow education, a term used to describe private supplementary tuition, may overshadow core education provision (Bray, 2017). students may prioritize tutoring time and reduce their school attendance before high-stakes examinations. in Egypt, tutoring has become a social norm (sieverding et al., 2019). in india, schools feel intense pressure from private tutoring and coaching institutions. in urban Maharashtra state, children were reportedly more respectful at coaching centres and to tutors than to teachers, and skipped lessons to attend coaching centre classes (Bhorkar and Bray, 2018).
in some countries, teachers favour tutoring over classroom lessons. in Myanmar, teachers often assumed that students who needed extra support would receive it. They put less effort into teaching regular lessons and more into fee-paying work, which led to accusations of favouritism and corruption. Teachers who were tutors were overworked and stressed, which affected their formal teaching time (Bray et al., 2020). in nepal, teachers who offered tutoring covered less material in school to increase demand for tutoring. Poorer students who did not receive tutoring did worse on examinations (Jayachandran, 2014).
Corruption surfaces in other forms. in shanghai, China, schools and tutoring providers collaborated to circumvent rules that prohibited tracking of students into elite and non-elite categories. some elite primary schools contracted with tutoring companies to provide additional lessons for the best-performing students, then secretly sent higher performers to unofficial high-track classes. They colluded with tutoring companies to select a small group of students with the best potential to enter top-ranking secondary schools and gave them much more intensive training (Zhang and Bray, 2018). in an extreme example, many upper secondary schools in Kota, india, only enrol students
so they have the right to sit public examinations; the students attend coaching centres (rao, 2017).
Private tutoring increases the gap between haves and have-nots. in Cambodia, analysis of 138 lower secondary schools found students primarily received tutoring from teachers within the school. Teachers with university education and higher subject matter knowledge were more likely to do fee-based tutoring, charging more per session, thus increasing inequality (Marshall and Fukao, 2019). in shanghai, China, one of the two most popular tutoring companies charged Us$1,200 a month for grade 9 students, effectively excluding most families. An entrance examination excluded low achievers (Zhang and Bray, 2018). in nepal, there are clear signs of major differences in education spending by income quintile, in private vs public schooling access and in access to private tuition (Mottaleb and Pallegedara, 2019). recognizing the potential equity challenges and the need to support low-income communities, Japan has publicly funded after-school programmes. Under the Chiiki Mirai Juku (Community Tutoring school for the Future) programme, municipalities contract non-profit organizations to deliver free tutoring for children in need (Feldhoff, 2017).
TEXTBOOK PROVISION HAS BECOME MORE COMMERCIALIZED
Teaching and learning materials are key for education quality and national identity development. Government’s role in textbook policy, procurement and distribution ranges from acting as a primarily state-owned and -controlled enterprise to being part of a mixed system of public and private publishing. in a few cases, the private sector manages most aspects of the book supply chain.
Analysis of approval processes for reading instruction materials in 50 education systems that took part in the Progress in international reading Literacy study identified 12 with no process for approving instructional materials. They tended to be high-income countries emphasizing school autonomy and leaving textbook production largely to commercial providers, with government involved in providing guidelines and approving proposals. Finland has no approval process and commercially published
Out of 50 education systems, only 12 had no process for approving reading instructional materials
textbooks are the primary teaching and reading materials. in spain, commercial providers produce textbooks
In Egypt, tutoring has become a social norm
53 C H A P T E R 2 • Provis ion
2
under public supervision. The Centre for Educational research and Documentation assists in development and dissemination of curriculum materials and guides (UnEsCo, 2013). Public authorities provide a recommended list but do not prescribe textbooks for use (Mullis et al., 2017). in Latin America and the Caribbean, education ministries develop the curriculum and mostly hire private publishers to develop textbooks (UnEsCo, 2013).
other countries, including in the Arab states, the Caucasus and Central Asia, have a centralized process. The Bahrain Ministry of Education is involved in production, compilation and printing, and provides all public school students with free Arabic-language textbooks. Azerbaijan’s government is legally obliged to prepare, publish and disseminate free textbooks and other materials. The Kazakhstan Ministry of Education approves a list of textbooks from which local education organizations choose, then local executive bodies make the purchases (Mullis et al., 2017).
The perceived sensitivity and importance governments attribute to certain topics affect the extent of the role they take in textbook provision. Governments deem mother tongue, mathematics, social studies and history textbooks to be high priority and may be especially involved in their development. in the republic of Korea, the government provides and more closely controls primary school than secondary school textbooks. singapore’s Ministry of Education publishes textbooks for languages and ethics. in viet nam, the Ministry of Education and Training has published 32 grade 1 textbooks in the general education curriculum, of which 24 were approved by the viet nam Education Publishing House (Trinh, 2019). As part of an effort to decouple textbooks from examinations, a multiple textbook policy has been tried, to promote the role of commercial publishing (smart and Jagannathan, 2018).
in south Asia, textbook development, publishing and printing are transitioning from a relatively tightly state-controlled system to one where corporate publishers are starting to play a major role. in Bangladesh and india, textbooks are free and cheaply manufactured for single use in public schools. But the presence of a large private school sector supports the existence of a commercial publishing sector (smart and Jagannathan, 2018).
Textbook procurement challenges national publishing industries
While the aims of moving from state control to diverse suppliers and open competition are to reduce cost and
improve quality, the transition is not always smooth or linear. in indonesia, after a multiple textbook policy was poorly enforced, it was decided to recentralize textbook publishing in 2013. However, collusive practices with business interests followed, leading to higher prices. The government has therefore considered producing its own textbooks to compete with those developed by private providers (smart and Jagannathan, 2018).
Competition was introduced in the russian Federation in the 1990s. schools could choose from a diverse list of textbooks vetted by the central government (Kaplan, 2004). When the vetting process became stricter in 2013, Prosveshcheniye, the former state-owned publisher, which had been privatized in 2011, re-emerged as a dominant provider (Moskwa, 2019). The company has 40% of the education market and claims its products are in use in every school in the country (Prosveshcheniye, 2017).
in rwanda, publishing houses began producing and distributing textbooks through a tendering process in 2009. in 2017, the Ministry of Education decided textbooks would be produced through the rwanda Education Board rather than independent textbook publishers. The ministry cited delays in textbook delivery, lack of government copyright, quality issues and cost efficiency. its decision jeopardized many independent publishers whose primary business was linked to textbook development (nsabimana, 2018).
india had over 5,000 primary and secondary school textbook publishers in 2015 (FICCI and nielsen India, 2016). The national Council of Educational research and Training (nCErT) publishes textbooks used in public schools. The government recommends nCErT textbooks for public and private schools participating in the Central Board for secondary school examinations and cautions against expensive privately published textbooks. Private schools and parents are sceptical, pointing at production delays, errors and outdated quality on the part of nCErT textbooks as reasons to use other publishers’ books (Frontlist, 2019; Mufti, 2017; vinayashree, 2017). At the same time, parents also express concern that the textbook industry works with private schools to require costly books that increase financial burden (Mishra, 2019).
in sub-saharan Africa, as part of structural adjustment programmes, the World Bank promoted international tenders, which ended textbook publishing monopolies but initially favoured foreign publishers since international languages were used for instruction (Thierry, 2020). A World Bank
2 0 2 1 / 2 • G LO BA L E D U C AT I O N M O N I TO R I N G R E P O RT 54
2
survey of 19 anglophone and francophone countries found that most had engaged private publishers in textbook production (World Bank, 2008).
The interplay between international publishers, donors and local interests has often complicated this transition. Ethiopia’s state-controlled Educational Materials Production and Distribution Agency had provided textbooks since the 1970s, but the Ministry of Education established a procurement process in 2009 with support from development partners. A World Bank analysis found that textbook development, printing and distribution significantly improved as a result of competitive bidding. in 2013/14, the textbook-to-student ratio reached 1:1 for the first time in 7 primary and 13 secondary school subjects. The bidding process and criteria led to the selection of international publishers, since local competitors lacked capacity (Woldetsadik and raysarkar, 2017).
The United republic of Tanzania marketized textbook provision with donor influence in the early 1990s, aiming to build a local publishing industry, but donor practices helped protect multinational companies’ dominant position. Eventually, after corruption scandals involving international publishers, such as oxford University Press and Macmillan in the early 2010s, nine local publishers were selected to supply standard textbooks to schools. But blurred boundaries and tensions between national and international publishers, elite groups and government offices led to collusion in the textbook market. in 2014, the government discontinued the market-based system and moved back to full state control of textbook provision (Languille, 2016). Most textbook publishing in Kenya, rwanda, Uganda and the United republic of Tanzania is now in the hands of regional, African-owned publishers. The international publisher Longman, for instance, sold its Kenyan company and local copyrights to Longhorn, a Kenyan-owned company (read, 2015).
in francophone Africa, the French publishing industry is dominant. Ties between national governments and international publishers make it difficult for local publishers to compete. Gabon’s textbook industry is dominated by Edicef, a textbook publishing arm of French-owned Hachette Livre, one of the world’s largest publishers. Hachette’s local partner is Éditions Gabonaises, which has a monopoly and receives state
subsidies (Gary, 2018). in Cameroon, the official list of recommended textbooks is dominated by French publishing giants such as Edicef, Belin and nathan (nkeck Bidias, 2019). incentives have provided some room, albeit limited, for local publishers. in senegal, policies allow calls for tenders to favour national over international publishers (de Lesseux, 2018). Mali’s government engages in partnerships with private companies to build publishing capacity (Canada Government, 2018).
in Côte d’ivoire, Hachette owns a 70% stake of the leading publishing house nEi-CEDA, formed by a merger of nouvelles Editions ivoiriennes and Centre d'Edition et de Diffusion Africaines in 2011 (Hachette Livre, 2019). Local publishers say the government’s close ties with nEi-CEDA has allowed its continued textbook market domination since the 1980s (niakaté, 2018). The government has allowed national bids to be slightly higher than international ones in recent tenders for projects financed by the World Bank (rogez, 2020). However, an analysis of the list of required textbooks in 2020/21 for this report shows that 56% were still published by nEi-CEDA, despite the presence of other national actors, including Eburnie and Frat-Mat (Cote d'Ivoire Ministry of national Education, 2020).
A few big providers push for digitized and standardized education content
in the larger publishing industry, trends in the textbook publishing market are difficult to detect due to rapid technological developments. Houghton Mifflin Harcourt, Cengage, McGraw Hill, Pearson and scholastic dominate English-language education publishing. individual publishers prominent in other large markets include somos Educação in Brazil, Central China Publishing & Media investment Holding Group Co Ltd, Hachette in France, the s Chand Group in india and Prosveshcheniye in the russian Federation (Wischenbart, 2019). in Brazil, the national competition regulator authorized the takeover of somos Educação by Kroton Educacional, the country’s private education sector market leader, arguing that the transaction would not decrease competition (BsIC, 2018; Competition Policy International, 2018). s Chand provides textbooks and boasts of its national distribution and sales network, including over 5,000 distributors and dealers (s Chand and Company Ltd, 2021).
In Ethiopia, the textbook bidding process and criteria led to the selection of international publishers, since local competitors lacked capacity
55 C H A P T E R 2 • Provis ion
2
in recent years, many of these companies have expanded and modified their roles in education systems by linking textbooks, assessment systems and online learning for students and teachers. in addition, parents have found their focus on customized learning needs appealing (Wischenbart, 2019). in the United states, the five established players are viewed as operating like a cartel. The average school district cost per student per year is around Us$250, a significant amount for poor districts (Zook, 2017). Market concentration can increase inequality. Textbook pricing causes a vicious cycle: schools that cannot afford the latest textbooks, which are the basis for many standardized tests, produce poorer test scores, whereupon school funding is reduced. The major providers are also part of consortiums including companies that develop examinations and grade them. This gives schools and teachers extra incentive to use books from the big publishers (Broussard, 2014). Personalized learning is also being developed although evidence is weak that it is effective (Pane, 2018).
Pearson, the global market leader in education publishing, changed its slogan from ‘world’s largest publisher of textbooks and online teaching materials’ to ‘world’s digital learning company’, with more focus on online schooling and assessment. its immense product range includes English learning apps, learning platforms, tutoring apps, classroom assessment, certification, virtual schools and online learning services (Pearson, 2019). its 2025 digital strategy focuses on routinization of teaching and on expanding complementary teaching expertise to use of technology tools. These developments could diminish the broader purpose of public schooling in favour of personalized learning with education platforms, potentially locking customers into proprietary online services (sellar and Hogan, 2019).
As part of digital expansion strategies, large firms market platforms and applications broadly as ‘solutions’ directed at students, including tutoring, language learning and personalized assessment, and at teachers and school leaders for professional development and teacher training in digital learning. some companies, including somos Educação, provide solutions and platforms relating to core content, digital learning, teacher improvement, bilingual education, social and emotional learning, and e-commerce, reaching over 3,400 private partner schools (Wischenbart,
2019). s Chand is blending online and offline interventions with apps and digital initiatives; its vision includes stronger integration of the provision of analytics and insight, digital content, live classes, assessment and teacher content (s Chand and Company Ltd, 2021).
Beyond textbook publishers, technology giants such as Amazon, Google and Microsoft have entered the online education sector, a trend strengthened by the expansion of online learning during the CoviD-19 pandemic (Williamson and Hogan, 2020).
scripted curricula, with their highly structured lessons, and related technology are the focus of much criticism and concern. Teachers and school leaders in Australia suggest such services are leading to deprofessionalization of public school teachers, reducing their autonomy and increasing their concern over being replaced (Hogan et al., 2018). scripted curricula are viewed as constraining teacher and student intellectual participation in the classroom (Fitz and nikolaidis, 2020). in the Us state of new York, schools offered scripted EngagenY modules to help meet the Common Core state standards. interviewed educators appreciated some aspects of the modules, but were alarmed by the presumption that inequity caused by disability and poverty could be redressed by holding students to high standards (Timberlake et al., 2017).
similar trends can be seen in low- and middle-income countries, where a possible goal of low-fee private schools is to ‘teacher-proof’ lesson plans so that even unqualified people can teach them, as seen in the detailed developed lesson plans of omega schools, rising Academies and Bridge international Academies (Härmä, 2021). Analysis of the Bridge international model has found that it uses scripted lessons, GPs technology and automation to create a market for its schools and reduce teacher autonomy (riep, 2017).
In recent years, many companies have been linking textbooks, assessment systems and online learning for students and teachers
2 0 2 1 / 2 • G LO BA L E D U C AT I O N M O N I TO R I N G R E P O RT 56
2
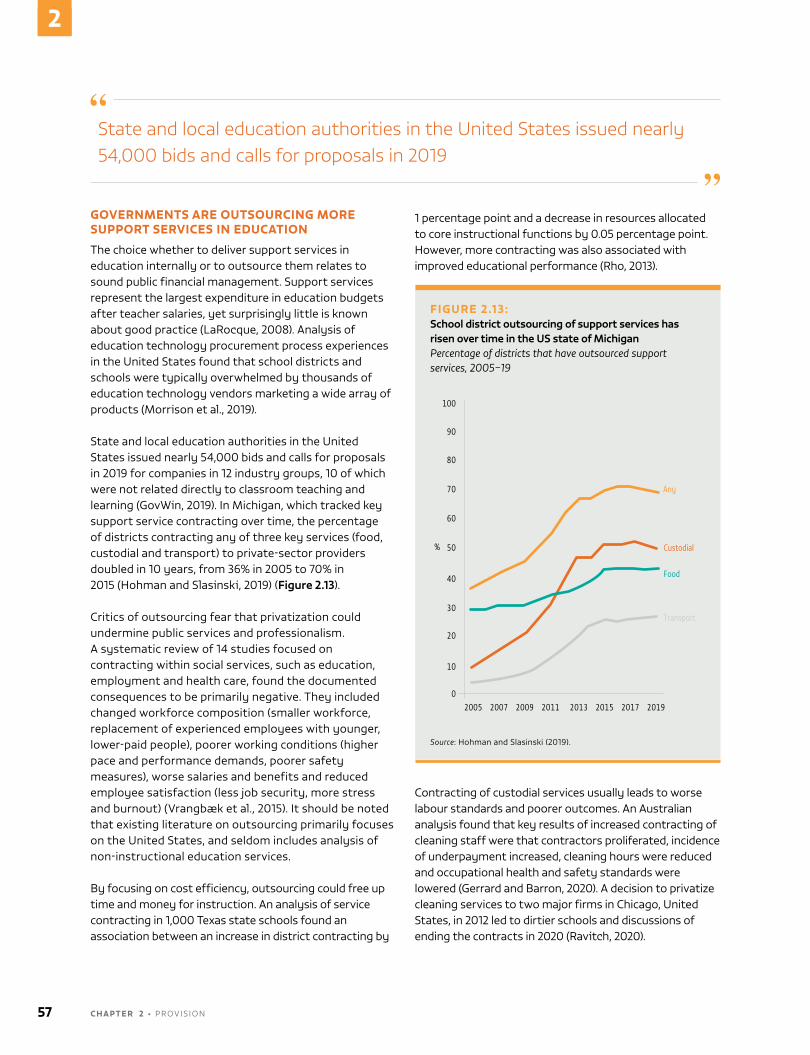
State and local education authorities in the United States issued nearly 54,000 bids and calls for proposals in 2019
GOVERNMENTS ARE OUTSOURCING MORE SUPPORT SERVICES IN EDUCATION
The choice whether to deliver support services in education internally or to outsource them relates to sound public financial management. support services represent the largest expenditure in education budgets after teacher salaries, yet surprisingly little is known about good practice (Larocque, 2008). Analysis of education technology procurement process experiences in the United states found that school districts and schools were typically overwhelmed by thousands of education technology vendors marketing a wide array of products (Morrison et al., 2019).
state and local education authorities in the United states issued nearly 54,000 bids and calls for proposals in 2019 for companies in 12 industry groups, 10 of which were not related directly to classroom teaching and learning (GovWin, 2019). in Michigan, which tracked key support service contracting over time, the percentage of districts contracting any of three key services (food, custodial and transport) to private-sector providers doubled in 10 years, from 36% in 2005 to 70% in 2015 (Hohman and slasinski, 2019) (Figure 2.13).
Critics of outsourcing fear that privatization could undermine public services and professionalism. A systematic review of 14 studies focused on contracting within social services, such as education, employment and health care, found the documented consequences to be primarily negative. They included changed workforce composition (smaller workforce, replacement of experienced employees with younger, lower-paid people), poorer working conditions (higher pace and performance demands, poorer safety measures), worse salaries and benefits and reduced employee satisfaction (less job security, more stress and burnout) (vrangbæk et al., 2015). it should be noted that existing literature on outsourcing primarily focuses on the United states, and seldom includes analysis of non-instructional education services.
By focusing on cost efficiency, outsourcing could free up time and money for instruction. An analysis of service contracting in 1,000 Texas state schools found an association between an increase in district contracting by
1 percentage point and a decrease in resources allocated to core instructional functions by 0.05 percentage point. However, more contracting was also associated with improved educational performance (rho, 2013).
Contracting of custodial services usually leads to worse labour standards and poorer outcomes. An Australian analysis found that key results of increased contracting of cleaning staff were that contractors proliferated, incidence of underpayment increased, cleaning hours were reduced and occupational health and safety standards were lowered (Gerrard and Barron, 2020). A decision to privatize cleaning services to two major firms in Chicago, United states, in 2012 led to dirtier schools and discussions of ending the contracts in 2020 (ravitch, 2020).
FIGURE 2.13:School district outsourcing of support services has risen over time in the US state of MichiganPercentage of districts that have outsourced support services, 2005–19
Guatemala, 2014
2018
2005 2007 2009 2011 2013 2015 2017 2019
100
90
80
70
60
50
40
30
20
10
0
%
Any
Custodial
Food
Transport
Source: Hohman and slasinski (2019).
57 C H A P T E R 2 • Provis ion
2
Food catering contracting has major consequences for student health and labour standards. in the United states, seven states account for nearly 50% of all food service outsourcing in education. school officials cite high labour costs as the main reason for outsourcing. over the 50 years since school systems started outsourcing, key consequences have included declining labour standards, increased use of branded, pre-packaged food and increased marketing in an effort to cultivate lifelong consumers. several studies have found that districts with privately managed cafeterias offer less healthy meals (Gaddis, 2020).
Analysis conducted with 446 social actors responsible for organic food acquisition in santa Catarina, Brazil, perceived outsourcing as hindering programme quality, as it decreased family farm sales and exposed children to food procured by companies (silverio and sousa, 2014). The choice of contractors has a wide-ranging impact. Analysis from the Us state of California found that contracting with healthier school meal providers increased student achievement (Anderson et al., 2018). A study of primary school students in naples, italy, showed that the larger the catering company, the lower student satisfaction with food (Maietta and Gorgitano, 2016).
Children’s health and physical education form another area with substantial outsourcing. Analysis of health and physical education service outsourcing in Australia, ireland, the United Kingdom and the United states, as well as Hong Kong, China, found that schools’ health-related work was highly marketized and networked, which had consequences for teachers’ work (Macdonald et al., 2020). in Australia, for example, involvement of sport organizations gradually changed from providing physical equipment in the 1950s to suggesting curriculum material in the 1990s and, more recently, direct engagement of external institutions in the school system, despite a lack of teaching qualifications. Four in five schools had outsourced some aspects of sports education in Queensland (sperka, 2020).
CONCLUSION
non-state education provision, which has been increasing in much of the world, is an important phenomenon with historical roots. The distinction between state and non-state providers is not always clear. Understanding differences between providers can help improve understanding of trends, impact on students and systems, and appropriate policy responses to improve access, equity and quality.
Comparisons of state and non-state schools’ effectiveness have been inadequate. They have not accounted for diversity in providers’ objectives, schools’ student intake and available resources. After factoring in these differences, non-state schools do not hold a sizeable advantage. Meanwhile, few studies have accounted for the relative cost of education provision or looked beyond the most rudimentary outcomes.
Moreover, the impact of non-state involvement should be examined from the perspective not just of the individual student but also the overall system. While non-state provision of core education can fill gaps in the short or medium term, it leads to segregation and inequality and has not yet convincingly managed to lift the quality of all schools, including public ones.
Beyond core education, ancillary goods and services play diverse, often contrasting roles in challenging, supporting or undermining education system performance and the equity record for teachers and learners. The push for content digitization, led by large publishing and technology companies, is accelerating the need to address equitable access to technology and digital learning.
one of the most valuable lessons from the CoviD-19 crisis is how fragile systems are when governments allow a laissez-faire system to develop, without proper regulation and financing. This jeopardizes the education of many students and teachers’ jobs. Building more crisis-resilient education systems should be a priority.
2 0 2 1 / 2 • G LO BA L E D U C AT I O N M O N I TO R I N G R E P O RT 58
2
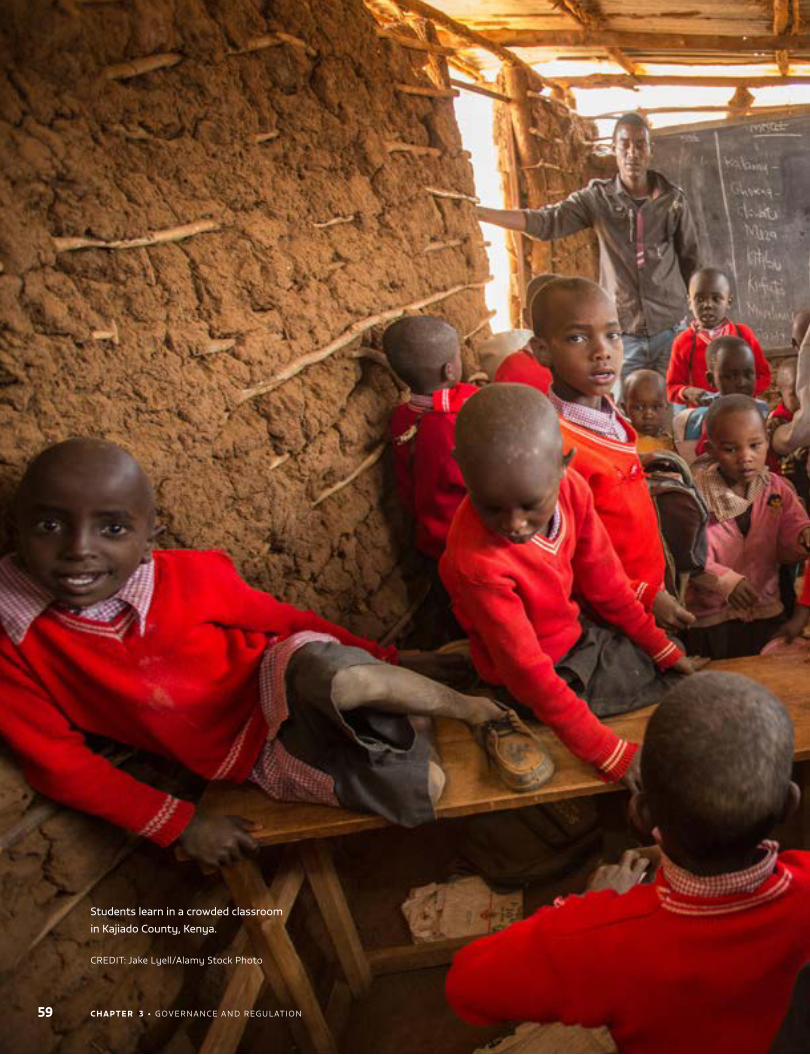
Students learn in a crowded classroom
in Kajiado County, Kenya.
CREDIT: Jake Lyell/Alamy Stock Photo
59 C H A P T E R 3 • GovERnAnCE AnD REGuLATIon
3CHAPTER
60C H A P T E R 3 • GovERnAnCE AnD REGuLATIon
Governance and regulation
K E Y M E S S AG E SGood governance and effective regulation are key for delivering equitable education of good quality.
� In 94 countries, sector plans or strategies envisage intervention by non-state actors in provision or other service delivery.
� Distribution of responsibilities for education provision is often fragmented among ministries and by type of actor. In 13% of countries, multiple authorities share responsibility for quality assurance of non-state activities in education.
� not all approaches to education system governance treat all students, teachers and schools uniformly.
Governance can be affected by funding arrangements.
� In most countries, non-state actors receive government funding, which takes various forms: per-student subsidies in 79% of countries, subsidies to parents in 23%, loans and gifts to schools in 27% and support for teacher salaries or operational expenses in 61%.
� Although public–private partnerships’ impact ultimately depends on their design, a scoping review of 98 studies on partnership modalities found that, in at least two thirds, the impact of subsidy, voucher and charter school programmes on equity was negative.
Equity and quality are often low on any list of regulations’ aims.
� nearly all systems stipulate requirements for entry and operation, including registration and licensing, but only 53% regulate teacher accreditation. About 55% of countries prevent selective admission procedures. Some 27% prohibit profit making in primary and secondary education and 67% cap fees.
� At least 27 countries’ statistics recognize unregistered schools. In uganda, 14% of primary and 13% of secondary schools are unregistered.
Weak implementation and accountability undermine regulations’ effectiveness.
� In some low- and lower-middle income countries, complex, expensive or long registration procedures deter providers from obtaining official recognition. nigeria’s Lagos state government had approved just 1 in 4 of some 20,000 private schools as of 2021.
Governments hold education providers accountable for compliance with standards.
� In 81% of countries, regulations mandate participation by non-state schools in large-scale assessments.
� Almost all countries apply sanctions, school closure or licence withdrawal if non-state schools do not comply with regulations. Some 54% of countries also regulate such closures’ duration.
� About 90 countries have codes of ethics or conduct for teachers and school personnel, which often cover non-state providers.
Private supplementary tutoring is rarely regulated.
� Private tutoring is unregulated in 48% of countries. only 53 countries regulate it in education legislation, while 19 regulate it only under commercial law.
� In 31% of countries, regulations specify tutors’ required qualifications; 10 countries explicitly ban teachers from tutoring.
61 C H A P T E R 3 • GovERnAnCE AnD REGuLATIon
3
Education system governance is often fragmented ..................................................... 63
Regulations do not focus enough on equity and quality ............................................. 71
Weak implementation often undermines regulation .................................................... 82
Private tutoring regulations tend to be underdeveloped ............................................86
Conclusion .......................................................................................................................................... 87
The more non-state activities in education expand, the more the spotlight turns to the role of
government, as the primary duty bearer of the right to education, to ensure education system steering, oversight, monitoring and accountability. Through legislative and policy-setting functions, governments are expected to establish sound regulatory frameworks ensuring that all actors operate under the same conditions, that the right to education can be enjoyed by all and that public funds are used efficiently, effectively and equitably.
The scope of governance in the realm of public goods and services is provision, distribution and regulation. Although it should be noted that regulation also affects provision and distribution, regulation can be defined as the part of governance that deals with the ‘flow of events and behaviour’ (Braithwaite et al., 2007). Just as the 2009 Education for All Global Monitoring Report defined education governance as the ‘processes, policies and institutional arrangements that connect the many actors in education’ (unESCo, 2008), it is clear that governance and regulation capture both formal and informal rules and norms.
Good governance is expected to achieve multiple objectives. Different organizations emphasize different aspects. A recent comprehensive definition includes participation; responsiveness to the public in terms of delivering services and addressing complaints; efficiency and effectiveness; openness and transparency; respect of the rule of law; ethical conduct; development of competence and capacity; innovation and openness to change; sustainability and long-term orientation; sound financial management; promotion of human rights, cultural diversity and social cohesion; and accountability (Council of Europe, 2018).
This chapter addresses good governance with respect to non-state activity in education, paying particular attention to promotion of human rights through regulation. Human rights frameworks enshrine both the right of parents to choose their children’s education and the right of all children to receive education of good quality; at least one year of pre-primary and 12 years of primary and secondary education should be free. Yet these rights may not align with each other. Where parents have unlimited school choice, the most marginalized populations are at risk of segregation and discrimination, amplifying inequality. Where schools are free to apply fees and select their students by setting their own admission criteria, they grant privileges to the wealthiest and the top achievers. The exercise of the liberty to choose, establish and manage schools may fulfil the obligation expressed in Article 13 of the 1966 International Covenant on Economic, Social and Cultural Rights to ‘conform to such minimum standards as may be laid down by the State’, but may contravene education systems’ obligation to pursue equity and inclusion and adhere to the tenets of availability, accessibility, acceptability and adaptability.
not all approaches to education system governance treat all students, teachers and schools uniformly. In some cases, distribution of responsibilities for education provision is fragmented among ministries and by type of actor. Some countries turn a blind eye to regulatory gaps that lead to neglect of equity and quality. others over-regulate non-state actors, at least on paper, but without achieving the results ostensibly desired – and without taking the same approach in oversight of public education institutions. Still others pursue governance approaches where the borders between actors and levels are blurred, with intersecting and overlapping powers, interests and responsibilities
2 0 2 1 / 2 • G LO BA L E D U C AT I O N M O N I TO R I N G R E P O RT 62
3
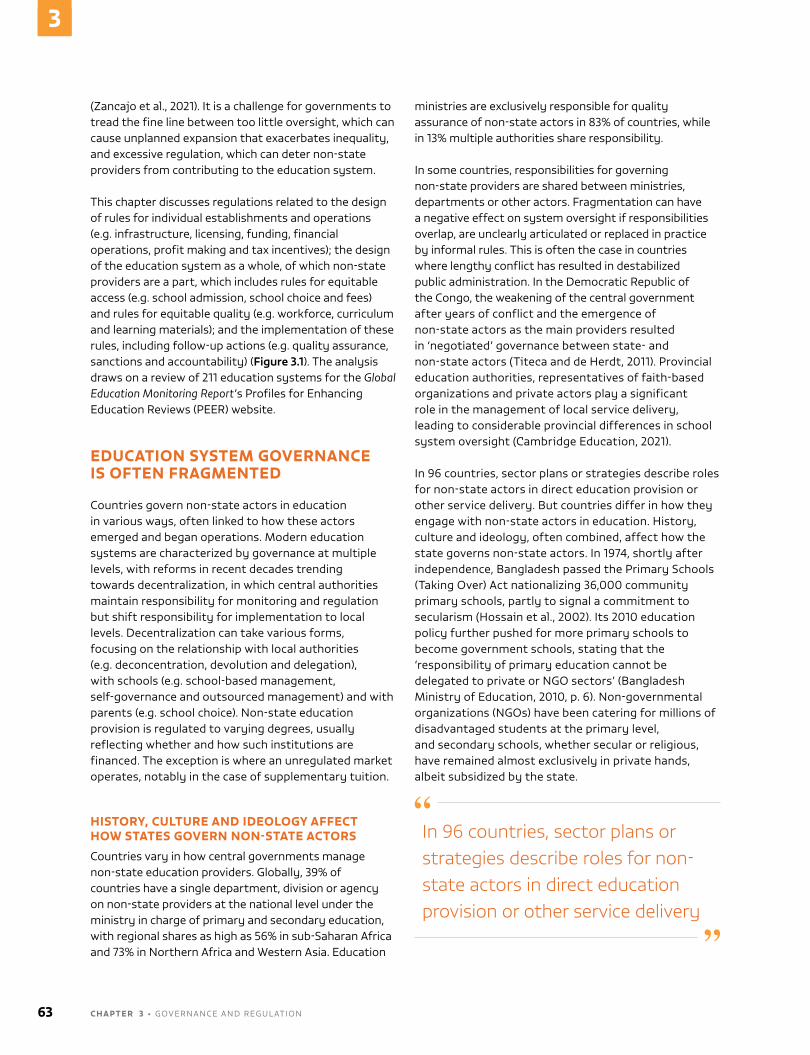
(Zancajo et al., 2021). It is a challenge for governments to tread the fine line between too little oversight, which can cause unplanned expansion that exacerbates inequality, and excessive regulation, which can deter non-state providers from contributing to the education system.
This chapter discusses regulations related to the design of rules for individual establishments and operations (e.g. infrastructure, licensing, funding, financial operations, profit making and tax incentives); the design of the education system as a whole, of which non-state providers are a part, which includes rules for equitable access (e.g. school admission, school choice and fees) and rules for equitable quality (e.g. workforce, curriculum and learning materials); and the implementation of these rules, including follow-up actions (e.g. quality assurance, sanctions and accountability) (Figure 3.1). The analysis draws on a review of 211 education systems for the Global Education Monitoring Report’s Profiles for Enhancing Education Reviews (PEER) website.
EDUCATION SYSTEM GOVERNANCE IS OFTEN FRAGMENTED
Countries govern non-state actors in education in various ways, often linked to how these actors emerged and began operations. Modern education systems are characterized by governance at multiple levels, with reforms in recent decades trending towards decentralization, in which central authorities maintain responsibility for monitoring and regulation but shift responsibility for implementation to local levels. Decentralization can take various forms, focusing on the relationship with local authorities (e.g. deconcentration, devolution and delegation), with schools (e.g. school-based management, self-governance and outsourced management) and with parents (e.g. school choice). non-state education provision is regulated to varying degrees, usually reflecting whether and how such institutions are financed. The exception is where an unregulated market operates, notably in the case of supplementary tuition.
HISTORY, CULTURE AND IDEOLOGY AFFECT HOW STATES GOVERN NON-STATE ACTORS
Countries vary in how central governments manage non-state education providers. Globally, 39% of countries have a single department, division or agency on non-state providers at the national level under the ministry in charge of primary and secondary education, with regional shares as high as 56% in sub-Saharan Africa and 73% in northern Africa and Western Asia. Education
ministries are exclusively responsible for quality assurance of non-state actors in 83% of countries, while in 13% multiple authorities share responsibility.
In some countries, responsibilities for governing non-state providers are shared between ministries, departments or other actors. Fragmentation can have a negative effect on system oversight if responsibilities overlap, are unclearly articulated or replaced in practice by informal rules. This is often the case in countries where lengthy conflict has resulted in destabilized public administration. In the Democratic Republic of the Congo, the weakening of the central government after years of conflict and the emergence of non-state actors as the main providers resulted in ‘negotiated’ governance between state- and non-state actors (Titeca and de Herdt, 2011). Provincial education authorities, representatives of faith-based organizations and private actors play a significant role in the management of local service delivery, leading to considerable provincial differences in school system oversight (Cambridge Education, 2021).
In 96 countries, sector plans or strategies describe roles for non-state actors in direct education provision or other service delivery. But countries differ in how they engage with non-state actors in education. History, culture and ideology, often combined, affect how the state governs non-state actors. In 1974, shortly after independence, Bangladesh passed the Primary Schools (Taking over) Act nationalizing 36,000 community primary schools, partly to signal a commitment to secularism (Hossain et al., 2002). Its 2010 education policy further pushed for more primary schools to become government schools, stating that the ‘responsibility of primary education cannot be delegated to private or nGo sectors’ (Bangladesh Ministry of Education, 2010, p. 6). non-governmental organizations (nGos) have been catering for millions of disadvantaged students at the primary level, and secondary schools, whether secular or religious, have remained almost exclusively in private hands, albeit subsidized by the state.
In 96 countries, sector plans or strategies describe roles for non-state actors in direct education provision or other service delivery
63 C H A P T E R 3 • GovERnAnCE AnD REGuLATIon
3
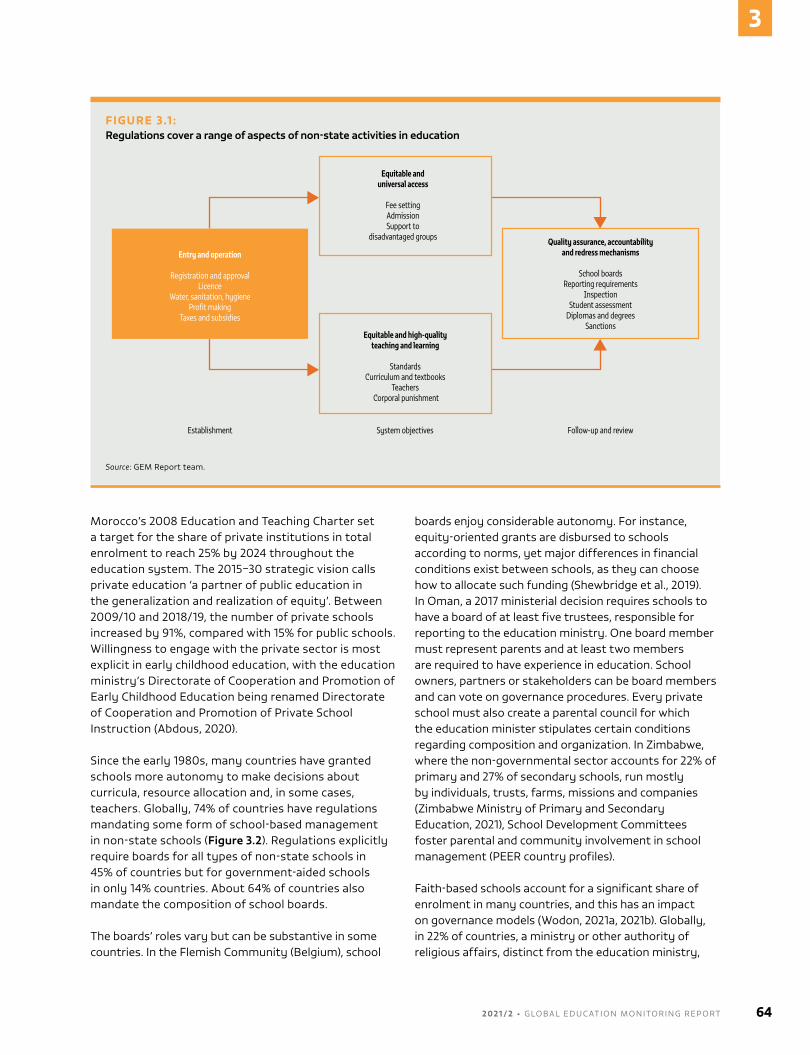
Morocco’s 2008 Education and Teaching Charter set a target for the share of private institutions in total enrolment to reach 25% by 2024 throughout the education system. The 2015–30 strategic vision calls private education ‘a partner of public education in the generalization and realization of equity’. Between 2009/10 and 2018/19, the number of private schools increased by 91%, compared with 15% for public schools. Willingness to engage with the private sector is most explicit in early childhood education, with the education ministry’s Directorate of Cooperation and Promotion of Early Childhood Education being renamed Directorate of Cooperation and Promotion of Private School Instruction (Abdous, 2020).
Since the early 1980s, many countries have granted schools more autonomy to make decisions about curricula, resource allocation and, in some cases, teachers. Globally, 74% of countries have regulations mandating some form of school-based management in non-state schools (Figure 3.2). Regulations explicitly require boards for all types of non-state schools in 45% of countries but for government-aided schools in only 14% countries. About 64% of countries also mandate the composition of school boards.
The boards’ roles vary but can be substantive in some countries. In the Flemish Community (Belgium), school
boards enjoy considerable autonomy. For instance, equity-oriented grants are disbursed to schools according to norms, yet major differences in financial conditions exist between schools, as they can choose how to allocate such funding (Shewbridge et al., 2019). In oman, a 2017 ministerial decision requires schools to have a board of at least five trustees, responsible for reporting to the education ministry. one board member must represent parents and at least two members are required to have experience in education. School owners, partners or stakeholders can be board members and can vote on governance procedures. Every private school must also create a parental council for which the education minister stipulates certain conditions regarding composition and organization. In Zimbabwe, where the non-governmental sector accounts for 22% of primary and 27% of secondary schools, run mostly by individuals, trusts, farms, missions and companies (Zimbabwe Ministry of Primary and Secondary Education, 2021), School Development Committees foster parental and community involvement in school management (PEER country profiles).
Faith-based schools account for a significant share of enrolment in many countries, and this has an impact on governance models (Wodon, 2021a, 2021b). Globally, in 22% of countries, a ministry or other authority of religious affairs, distinct from the education ministry,
FIGURE 3.1 : Regulations cover a range of aspects of non-state activities in education
Establishment System objectives Follow-up and review
Entry and operation
Registration and approvalLicence
Water, sanitation, hygieneProfit making
Taxes and subsidies
Quality assurance, accountability and redress mechanisms
School boardsReporting requirements
InspectionStudent assessment
Diplomas and degreesSanctions
Equitable and universal access
Fee settingAdmissionSupport to
disadvantaged groups
Equitable and high-quality teaching and learning
StandardsCurriculum and textbooks
Teachers Corporal punishment
Source: GEM Report team.
2 0 2 1 / 2 • G LO BA L E D U C AT I O N M O N I TO R I N G R E P O RT 64
3
governs faith-based schools. In northern African and Western Asia (e.g. Egypt and Tunisia), where these tend to be state schools, the share is 70%, while in the rest of Asia it is over 50%. In Cambodia, religious schools must be registered with the Ministry of Cults and Religion and are under the authority of the ministry’s General Inspectorate of national Buddhist Education (unICEF, 2020). In Indonesia, the Ministry of Religious Affairs is responsible for public and private Islamic schools (Jackson, 2016). School policy towards faith-based schools varies in sub-Saharan Africa (Box 3.1).
In discussions about the roles of non-state and state education actors in fragile settings or emergencies, the issues of coordination and support often arise. How can duplication be avoided and gaps identified? After Hurricane Mitch in Honduras in 1998, clear roles and responsibilities contributed to the success of the Honduran Programme of Community Education in delivering education services to rural and deprived areas with direct participation by parents in their administration. The Ministry of Education manages the programme’s coordination, financing and monitoring (Honduras Ministry of Education, 2020).
International NGOs catering for disadvantaged populations make various arrangements with governments, from replacing state services to strengthening the state system
International nGos catering for disadvantaged populations make various arrangements with governments, from replacing state services to strengthening the state system. In Sierra Leone, Street Child, an international nGo, constructed more than 300 schools between 2010 and 2014 in rural and remote areas lacking state provision or oversight. As Street Child increased the scale and scope of its work, concerns about sustainability exposed the limitations of operating outside the state. Street Child has since begun coordinating and collaborating with the state to ensure the schools’ legitimacy, complementarity and ability to respond to crises. More than 30 schools have been approved and adopted by the state and had their infrastructure and staff verified to assure compliance with state standards (Street Child, 2021).
In Somalia, as a result of the civil war and collapse of state authority, former teachers established umbrella associations. In 2018, there were 14 such associations with more than 1,000 affiliated schools serving over 250,000 students, of which the largest were the Formal Private Education network and the Schools Association for Formal Education, established in the 1990s. By contrast, the Ministry of Education, Culture and Higher Education manages 93 schools with 32,000 students. The associations issue certificates and degrees recognized abroad and have helped rebuild the syllabus. Schools need to be registered with the state and comply with association standards to be umbrella members. The ministry established the Department of umbrella and Private Education to regulate the non-state education system and coordinate with private education institutions, while the Curriculum and Quality
FIGURE 3.2: Most countries require non-state schools to have boardsPercentage of countries where non-state schools must have some form of school-based management, by region, 2021
Sub-Saharan Africa
Eastern and South-eastern Asia
Europe and Northern America
World
Northern Africa and Western Asia
Oceania
Central and Southern Asia
Latin America and the Caribbean
8060%
40200 100
Source: GEM Report team analysis based on the PEER country profiles on non-state actors in education.
65 C H A P T E R 3 • GovERnAnCE AnD REGuLATIon
3
Assurance Department has sections on curriculum, teacher management and supervision of both public and private institutions (Altai Consulting, 2018).
In Turkey, non-state organizations and private enterprises set up accredited temporary education centres for Syrian refugees, initially under loose state supervision. In September 2013, a regulatory circular announced that education services, in or out of camps, had to be planned, coordinated and monitored by the Ministry of national Education and staff it appointed locally (Tezel Mccarthy, 2017). In the process, non-state actors operating such centres gained recognition. However,
as the centres’ education quality was questioned, the Ministry of national Education adopted a policy in September 2016 to gradually phase them out and enrol all Syrian students in public schools (unESCo, 2019).
FUNDING OF NON-STATE PROVIDERS CAN AFFECT GOVERNANCE ARRANGEMENTS
In most countries, non-state actors receive government funding, which takes various forms: per student subsidies in 79% of countries, subsidies to parents in 23%, loans and gifts to schools in 27% and support to teacher salaries or operational expenses
BOX 3.1 :
Relations between government and religion on faith-based schools have evolved in sub-Saharan Africa
Public policy towards faith-based schools varies in sub-Saharan Africa (Scheunpflug and Wenz, 2021). In Cameroon, 26% of schools are church-run. The government has not fulfilled a commitment to fund their teachers. As the church education system is dependent on tuition fees, teachers are often not adequately paid, especially in areas where the population is poorer (Lange et al., 2021; Wodon, 2020a). In Comoros, the National Advisory Council on Education reviews all draft laws relating to public or private education, but the ministry in charge of Islamic affairs supports education in Koranic schools. In Djibouti, a 2020 law stipulates that the Ministry of Muslim Affairs, Culture and Waqf Assets ‘elaborates and proposes the basic foundations of Islamic education and the dissemination of Arab-Islamic culture’. In Madagascar, where faith-based schools play an important role in the education system, the education ministry supervises directorates for each of three faiths: Catholic, Protestant and Muslim; the state pays part of teacher salaries.
The Democratic Republic of the Congo nationalized religious schools in 1974, but in 1977 the state and four religious communities – Catholic, Protestant, Kimbanguist and Muslim – signed a convention introducing a state-owned and regulated but jointly managed system (Scheunpflug and Wenz, 2021). The convention divided the public education sector into one state- and four faith-based networks, each with its own administration. Public schools that belong to a faith-based network are run by both a religious and a state education office, complicating management. The networks are indirectly in charge of distributing salaries for more than half the teachers, and can establish schools and recruit staff locally with no state oversight. Religious networks also own private schools, which compete with public schools to attract students. In 2019, the government introduced free education, abolishing all school fees for primary education. Religious networks need to register schools and teachers with the provincial education directorates to receive state funding (Cambridge Education, 2021).
In Kenya, churches transferred their schools to local authorities under the 1968 Education Act, instead becoming sponsors. The 2013 Basic Education Act defines a sponsor as a ‘person or institution who makes a significant contribution and impact on the academic, financial, infrastructural and spiritual development of an institution of basic education’. It increased state authority over schools and gave each new County Education Board the right to name the chairs of schools’ governing boards and the Teachers Service Commission the power to appoint head teachers, as well as a bigger role in their management. While sponsors, such as churches, are consulted over decisions concerning teachers, they no longer have veto power over head teachers and their responsibilities are often limited to issues related to infrastructure and the spiritual care of the students (D’Agostino et al., 2019).
In Rwanda, Catholic schools not run by religious orders were nationalized in 1966, but a smaller number of religious order and Protestant schools were not. Faith-based schools grew in number after the genocide. There is strong cooperation between church and state. The government pays teacher salaries at church-run schools. In primary education and government-aided secondary schools, tuition fees are prohibited. Non-state faith-based schools, categorized as government-aided schools, receive support for construction and renovation. In the United Republic of Tanzania, all schools were nationalized during one-party rule, but Christian schools became independent after 1985.
In most countries, non-state actors receive government funding, which takes various forms
2 0 2 1 / 2 • G LO BA L E D U C AT I O N M O N I TO R I N G R E P O RT 66
3
(e.g. textbooks or technological equipment) in 61%. In 83% of the countries where governments support non-state schools, faith-based schools are among the beneficiaries. Since 1976, El Salvador’s Ministry of Education has paid some Catholic school teacher salaries. The government sets a quota of teaching positions; archdioceses decide how to distribute them among schools. The church typically owns the infrastructure, and it manages the schools through school leadership councils and can hire and fire teachers. However, the government regulates the schools through directives and inspects their operations (uSAID et al., 2018).
non-state and, especially, faith-based schools can be effective in lobbying. In Australia, the school funding mechanism has historically favoured private schools over public schools. Following a major review in 2011, a 2013 education law set the country’s first nationwide minimum capitation grant per student, with a formula to determine additional support to disadvantaged students (affected by poverty, disability, indigeneity and low English proficiency) and schools (rural and small). Private schools’ minimum capitation was to be adjusted downward to take their ability to charge fees into account. However, the reform was diluted. A government commitment that no school would lose resources entrenched historically unequal allocations. The Catholic school sector was given discretion in applying the formula. States were not forced to comply with federal targets. And federal funding that would have helped underfunded schools catch up was postponed by five years, meaning overfunded schools would lose their advantage at a very slow rate (Goss et al., 2016). ultimately, private schools received a larger increase in funding than public schools between 2007/08 and 2016/17 (Baker, 2019).
In most cases, the only education planning criteria for authorizing new, publicly funded private providers is demand. In Pakistan’s Punjab province, the Punjab Education Foundation is a semi-autonomous organization promoting public–private partnerships to expand education access and improve quality. Its programmes include a voucher plan, a private school subsidy programme, a public school management outsourcing mechanism and the new School Program (Ansari, 2020), which offers incentives to individuals and organizations to set up schools, subject to basic conditions related to the applicant’s education level and residence. The schools must be in areas with no
formal school within a one-kilometre radius and serve a population of at least 350 people, as the aim is to reach populations that would not otherwise have access to school. Since 2007, more than 2,500 schools have been established (Punjab Education Foundation, 2021). However, there is a risk that such demand-based approaches in authorizing providers could increase school segregation and social stratification between schools.
In Peru, the government negotiates with selected not-for-profit actors to operate public schools, i.e. schools that either fully operate under education ministry regulations and have their teacher salaries covered by the government (en convenio) or receive some government financial support for general funds, teacher salaries, equipment and buildings (financiación mixta). The schools must have previously obtained formal certification and should respect minimum requirements set in the private education institution regulations. The operating agreement includes regular inspections of facilities, curriculum and learning materials, and a calendar aligned with that of public schools. Funds are transferred not on the basis of the number of students enrolled but on a fixed-fee, case-by-case basis (Rossignoli, 2021).
In uganda, a public–private partnership took the form of a per-student capitation grant to private secondary schools to enrol qualifying students at no added charge. Between 2007 and 2016, 850 schools took part in the programme, which accounted for 46% of enrolment. A 2010 framework policy called for bidding to select schools based on needs identification, value assessment and options analysis, to be followed by negotiation of terms with successful applicants. However, capacity was lacking for this, as well as a clear accountability structure, especially for local authorities that disbursed funds (ISER, 2016, 2017). Moreover, neither the implementation guidelines nor the rationale behind partner school selection was clear to stakeholders interviewed for an evaluation (o’Donoghue et al., 2018). The programme was phased out starting in 2018 (Ahimbisibwe, 2018).
To improve funding of non-state providers, stricter criteria are needed that consider not only the level of education demand but also how schools requesting public funding can improve equity and diversity (Zancajo et al., 2021). In Ireland, public funding for private providers was conditional on basic requirements, such as facility standards and official curriculum implementation (Buchanan and Fox, 2008). Since 2011, the Department
67 C H A P T E R 3 • GovERnAnCE AnD REGuLATIon
3
of Education and Skills has introduced a bidding process for authorizing access to public funding by new private providers. It identifies areas where school supply needs to increase because of demographic change and releases competitive calls. This process allows public authorities to increase control over the publicly funded school supply and to guarantee diversity among new providers (Ireland Department of Education and Skills, 2020).
Procurement or bidding processes have also been used to select new publicly funded providers in the niche area of charter school programmes in some low- and middle-income countries. Competitive calls have focused on selecting organizations to manage publicly owned schools. But implementation problems have been reported. In the Partnership Schools for Liberia (PSL) programme, competitive tenders were adopted because of controversy about an initial agreement between the government and a school chain, Bridge International Academies, that suggested a monopoly on contracting (Romero et al., 2020b). Even so, the bidding process was not considered sufficiently competitive and transparent (Cameron, 2019).
The Education Management organization’s charter school programme in Pakistan’s Sindh province uses a two-phase competitive bidding process. First, bidders’ technical capacity is assessed on the basis of their management experience, proposed work plan, professional profiles and strategies to achieve performance and efficiency targets. Then qualifying organizations are assessed based on financial proposals (LaRocque and Sipahimalani-Rao, 2019).
Public–private partnerships for education are found in relatively few countries: voucher programmes exist in 8 countries, starting with Chile in the 1980s (Elacqua, 2012), while charter schools are found in 14. But there is concern that governance arrangements involving public–private partnerships have a negative impact on equity. Although the impact ultimately depends on their design, a scoping review of 98 studies on public–private partnership modalities found that, in at least two thirds, the impact of subsidy, voucher and charter school programmes on equity was negative (verger et al., 2021). Examples from
England (united Kingdom) (Box 3.2) and the uS state of Louisiana (Box 3.3), where governance reforms transformed most schools into academies and charter schools, respectively, highlight the challenges.
A core argument for public–private partnerships is their perceived cost-effectiveness. But not everyone believes that this is true or that the way they cut costs is worthwhile. As teacher salaries are by far the largest cost item in education, cost-efficiency would need to be driven by lower teacher salaries. But teachers are paid less than other professionals (Chapter 19). A global survey suggested that in 28 of 35 countries, the actual starting wage for teachers was lower than that perceived as fair (Dolton et al., 2018). Still, there are exceptions to this rule: In some countries, large salary gaps between the state and non-state sectors or, within the state sector, between permanent and contract teachers indicate segmented teacher labour markets with some teachers overpaid (Crawfurd and Pugatch, 2020).
Much of the research to this effect comes from South Asia. Teachers in the region make less than other professionals, on average (Beteille et al., 2020), yet there are large pay inequalities among teachers. Employment of young, unqualified female teachers with limited employment alternatives has been recognized as a key reason for the low-cost private school business model in Pakistan (Andrabi et al., 2007). In Punjab province, four public–private partnership programmes paid between uS$3 and uS$9 per student per month, compared with the government cost of uS$9 per student per month in public schools. The lower cost per student was driven by lower salary costs (Crawfurd and Hares, 2020). In India’s Andhra Pradesh state, voucher recipients in private schools were found to perform more or less at par with non-recipients in public schools at less than one third of the unit cost of public schools and one sixth of the teacher salary cost (Muralidharan and Sundararaman, 2015). Still, it remains unclear whether public–private partnerships are an effective way to address a segmented teacher labour market. Effective governance calls for treating the education system as one, finding direct and sustainable ways to address imbalances and inefficiencies.
Public–private partnerships for education are found in relatively few countries
2 0 2 1 / 2 • G LO BA L E D U C AT I O N M O N I TO R I N G R E P O RT 68
3
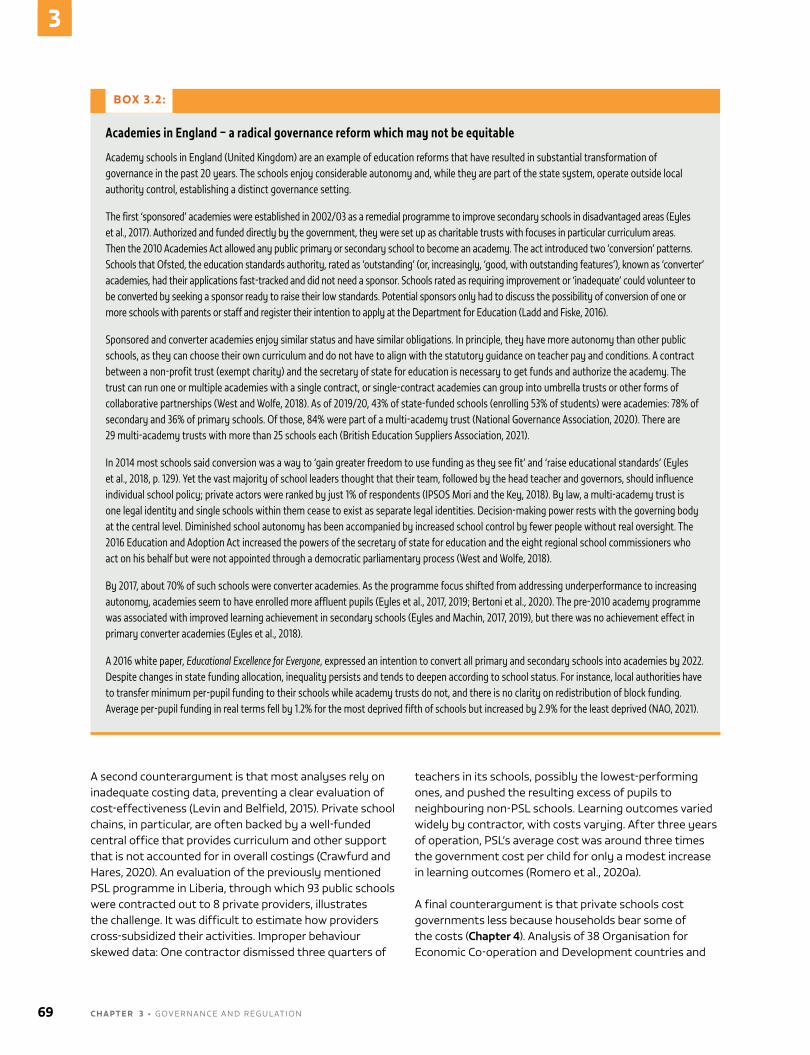
A second counterargument is that most analyses rely on inadequate costing data, preventing a clear evaluation of cost-effectiveness (Levin and Belfield, 2015). Private school chains, in particular, are often backed by a well-funded central office that provides curriculum and other support that is not accounted for in overall costings (Crawfurd and Hares, 2020). An evaluation of the previously mentioned PSL programme in Liberia, through which 93 public schools were contracted out to 8 private providers, illustrates the challenge. It was difficult to estimate how providers cross-subsidized their activities. Improper behaviour skewed data: one contractor dismissed three quarters of
teachers in its schools, possibly the lowest-performing ones, and pushed the resulting excess of pupils to neighbouring non-PSL schools. Learning outcomes varied widely by contractor, with costs varying. After three years of operation, PSL’s average cost was around three times the government cost per child for only a modest increase in learning outcomes (Romero et al., 2020a).
A final counterargument is that private schools cost governments less because households bear some of the costs (Chapter 4). Analysis of 38 organisation for Economic Co-operation and Development countries and
BOX 3.2:
Academies in England – a radical governance reform which may not be equitable
Academy schools in England (United Kingdom) are an example of education reforms that have resulted in substantial transformation of governance in the past 20 years. The schools enjoy considerable autonomy and, while they are part of the state system, operate outside local authority control, establishing a distinct governance setting.
The first ‘sponsored’ academies were established in 2002/03 as a remedial programme to improve secondary schools in disadvantaged areas (Eyles et al., 2017). Authorized and funded directly by the government, they were set up as charitable trusts with focuses in particular curriculum areas. Then the 2010 Academies Act allowed any public primary or secondary school to become an academy. The act introduced two ‘conversion’ patterns. Schools that Ofsted, the education standards authority, rated as ‘outstanding’ (or, increasingly, ‘good, with outstanding features’), known as ‘converter’ academies, had their applications fast-tracked and did not need a sponsor. Schools rated as requiring improvement or ‘inadequate’ could volunteer to be converted by seeking a sponsor ready to raise their low standards. Potential sponsors only had to discuss the possibility of conversion of one or more schools with parents or staff and register their intention to apply at the Department for Education (Ladd and Fiske, 2016).
Sponsored and converter academies enjoy similar status and have similar obligations. In principle, they have more autonomy than other public schools, as they can choose their own curriculum and do not have to align with the statutory guidance on teacher pay and conditions. A contract between a non-profit trust (exempt charity) and the secretary of state for education is necessary to get funds and authorize the academy. The trust can run one or multiple academies with a single contract, or single-contract academies can group into umbrella trusts or other forms of collaborative partnerships (West and Wolfe, 2018). As of 2019/20, 43% of state-funded schools (enrolling 53% of students) were academies: 78% of secondary and 36% of primary schools. Of those, 84% were part of a multi-academy trust (National Governance Association, 2020). There are 29 multi-academy trusts with more than 25 schools each (British Education Suppliers Association, 2021).
In 2014 most schools said conversion was a way to ‘gain greater freedom to use funding as they see fit’ and ‘raise educational standards’ (Eyles et al., 2018, p. 129). Yet the vast majority of school leaders thought that their team, followed by the head teacher and governors, should influence individual school policy; private actors were ranked by just 1% of respondents (IPSOS Mori and the Key, 2018). By law, a multi-academy trust is one legal identity and single schools within them cease to exist as separate legal identities. Decision-making power rests with the governing body at the central level. Diminished school autonomy has been accompanied by increased school control by fewer people without real oversight. The 2016 Education and Adoption Act increased the powers of the secretary of state for education and the eight regional school commissioners who act on his behalf but were not appointed through a democratic parliamentary process (West and Wolfe, 2018).
By 2017, about 70% of such schools were converter academies. As the programme focus shifted from addressing underperformance to increasing autonomy, academies seem to have enrolled more affluent pupils (Eyles et al., 2017, 2019; Bertoni et al., 2020). The pre-2010 academy programme was associated with improved learning achievement in secondary schools (Eyles and Machin, 2017, 2019), but there was no achievement effect in primary converter academies (Eyles et al., 2018).
A 2016 white paper, Educational Excellence for Everyone, expressed an intention to convert all primary and secondary schools into academies by 2022. Despite changes in state funding allocation, inequality persists and tends to deepen according to school status. For instance, local authorities have to transfer minimum per-pupil funding to their schools while academy trusts do not, and there is no clarity on redistribution of block funding. Average per-pupil funding in real terms fell by 1.2% for the most deprived fifth of schools but increased by 2.9% for the least deprived (NAO, 2021).
69 C H A P T E R 3 • GovERnAnCE AnD REGuLATIon
3
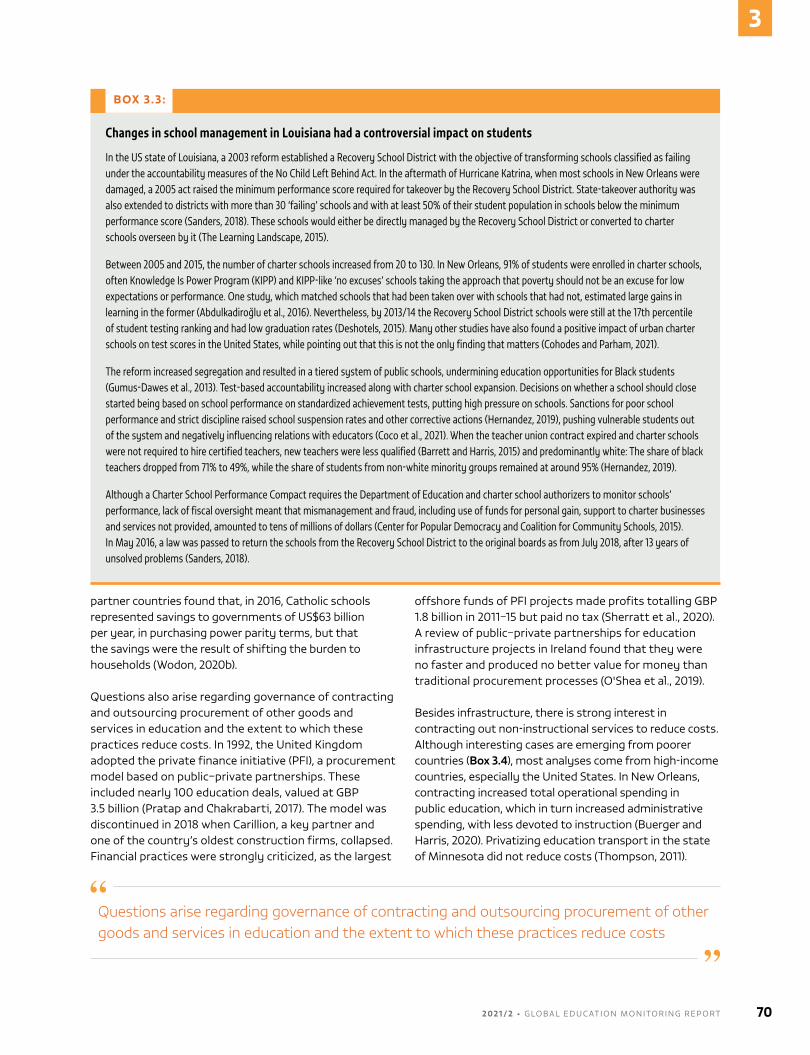
partner countries found that, in 2016, Catholic schools represented savings to governments of uS$63 billion per year, in purchasing power parity terms, but that the savings were the result of shifting the burden to households (Wodon, 2020b).
Questions also arise regarding governance of contracting and outsourcing procurement of other goods and services in education and the extent to which these practices reduce costs. In 1992, the united Kingdom adopted the private finance initiative (PFI), a procurement model based on public–private partnerships. These included nearly 100 education deals, valued at GBP 3.5 billion (Pratap and Chakrabarti, 2017). The model was discontinued in 2018 when Carillion, a key partner and one of the country’s oldest construction firms, collapsed. Financial practices were strongly criticized, as the largest
offshore funds of PFI projects made profits totalling GBP 1.8 billion in 2011–15 but paid no tax (Sherratt et al., 2020). A review of public–private partnerships for education infrastructure projects in Ireland found that they were no faster and produced no better value for money than traditional procurement processes (o'Shea et al., 2019).
Besides infrastructure, there is strong interest in contracting out non-instructional services to reduce costs. Although interesting cases are emerging from poorer countries (Box 3.4), most analyses come from high-income countries, especially the united States. In new orleans, contracting increased total operational spending in public education, which in turn increased administrative spending, with less devoted to instruction (Buerger and Harris, 2020). Privatizing education transport in the state of Minnesota did not reduce costs (Thompson, 2011).
BOX 3.3:
Changes in school management in Louisiana had a controversial impact on students
In the US state of Louisiana, a 2003 reform established a Recovery School District with the objective of transforming schools classified as failing under the accountability measures of the No Child Left Behind Act. In the aftermath of Hurricane Katrina, when most schools in New Orleans were damaged, a 2005 act raised the minimum performance score required for takeover by the Recovery School District. State-takeover authority was also extended to districts with more than 30 ‘failing’ schools and with at least 50% of their student population in schools below the minimum performance score (Sanders, 2018). These schools would either be directly managed by the Recovery School District or converted to charter schools overseen by it (The Learning Landscape, 2015).
Between 2005 and 2015, the number of charter schools increased from 20 to 130. In New Orleans, 91% of students were enrolled in charter schools, often Knowledge Is Power Program (KIPP) and KIPP-like ‘no excuses’ schools taking the approach that poverty should not be an excuse for low expectations or performance. One study, which matched schools that had been taken over with schools that had not, estimated large gains in learning in the former (Abdulkadiroğlu et al., 2016). Nevertheless, by 2013/14 the Recovery School District schools were still at the 17th percentile of student testing ranking and had low graduation rates (Deshotels, 2015). Many other studies have also found a positive impact of urban charter schools on test scores in the United States, while pointing out that this is not the only finding that matters (Cohodes and Parham, 2021).
The reform increased segregation and resulted in a tiered system of public schools, undermining education opportunities for Black students (Gumus-Dawes et al., 2013). Test-based accountability increased along with charter school expansion. Decisions on whether a school should close started being based on school performance on standardized achievement tests, putting high pressure on schools. Sanctions for poor school performance and strict discipline raised school suspension rates and other corrective actions (Hernandez, 2019), pushing vulnerable students out of the system and negatively influencing relations with educators (Coco et al., 2021). When the teacher union contract expired and charter schools were not required to hire certified teachers, new teachers were less qualified (Barrett and Harris, 2015) and predominantly white: The share of black teachers dropped from 71% to 49%, while the share of students from non-white minority groups remained at around 95% (Hernandez, 2019).
Although a Charter School Performance Compact requires the Department of Education and charter school authorizers to monitor schools’ performance, lack of fiscal oversight meant that mismanagement and fraud, including use of funds for personal gain, support to charter businesses and services not provided, amounted to tens of millions of dollars (Center for Popular Democracy and Coalition for Community Schools, 2015). In May 2016, a law was passed to return the schools from the Recovery School District to the original boards as from July 2018, after 13 years of unsolved problems (Sanders, 2018).
Questions arise regarding governance of contracting and outsourcing procurement of other goods and services in education and the extent to which these practices reduce costs
2 0 2 1 / 2 • G LO BA L E D U C AT I O N M O N I TO R I N G R E P O RT 70
3
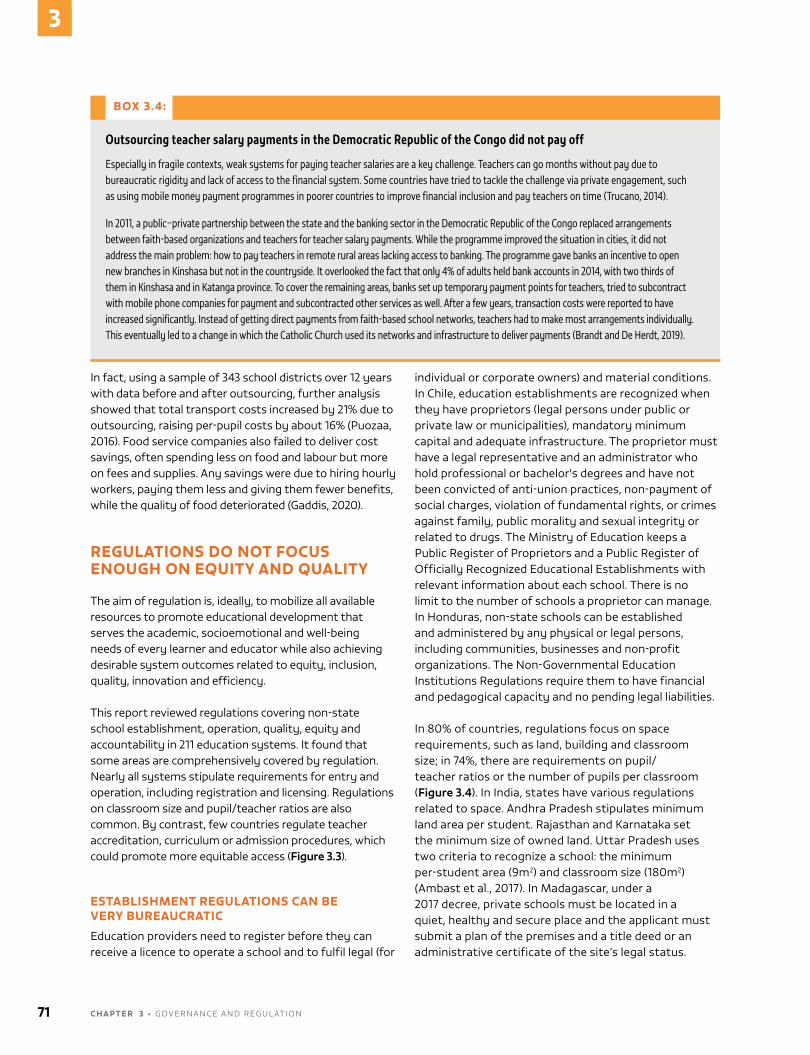
In fact, using a sample of 343 school districts over 12 years with data before and after outsourcing, further analysis showed that total transport costs increased by 21% due to outsourcing, raising per-pupil costs by about 16% (Puozaa, 2016). Food service companies also failed to deliver cost savings, often spending less on food and labour but more on fees and supplies. Any savings were due to hiring hourly workers, paying them less and giving them fewer benefits, while the quality of food deteriorated (Gaddis, 2020).
REGULATIONS DO NOT FOCUS ENOUGH ON EQUITY AND QUALITY
The aim of regulation is, ideally, to mobilize all available resources to promote educational development that serves the academic, socioemotional and well-being needs of every learner and educator while also achieving desirable system outcomes related to equity, inclusion, quality, innovation and efficiency.
This report reviewed regulations covering non-state school establishment, operation, quality, equity and accountability in 211 education systems. It found that some areas are comprehensively covered by regulation. nearly all systems stipulate requirements for entry and operation, including registration and licensing. Regulations on classroom size and pupil/teacher ratios are also common. By contrast, few countries regulate teacher accreditation, curriculum or admission procedures, which could promote more equitable access (Figure 3.3).
ESTABLISHMENT REGULATIONS CAN BE VERY BUREAUCRATIC
Education providers need to register before they can receive a licence to operate a school and to fulfil legal (for
individual or corporate owners) and material conditions. In Chile, education establishments are recognized when they have proprietors (legal persons under public or private law or municipalities), mandatory minimum capital and adequate infrastructure. The proprietor must have a legal representative and an administrator who hold professional or bachelor's degrees and have not been convicted of anti-union practices, non-payment of social charges, violation of fundamental rights, or crimes against family, public morality and sexual integrity or related to drugs. The Ministry of Education keeps a Public Register of Proprietors and a Public Register of officially Recognized Educational Establishments with relevant information about each school. There is no limit to the number of schools a proprietor can manage. In Honduras, non-state schools can be established and administered by any physical or legal persons, including communities, businesses and non-profit organizations. The non-Governmental Education Institutions Regulations require them to have financial and pedagogical capacity and no pending legal liabilities.
In 80% of countries, regulations focus on space requirements, such as land, building and classroom size; in 74%, there are requirements on pupil/teacher ratios or the number of pupils per classroom (Figure 3.4). In India, states have various regulations related to space. Andhra Pradesh stipulates minimum land area per student. Rajasthan and Karnataka set the minimum size of owned land. uttar Pradesh uses two criteria to recognize a school: the minimum per-student area (9m2) and classroom size (180m2) (Ambast et al., 2017). In Madagascar, under a 2017 decree, private schools must be located in a quiet, healthy and secure place and the applicant must submit a plan of the premises and a title deed or an administrative certificate of the site’s legal status.
BOX 3.4:
Outsourcing teacher salary payments in the Democratic Republic of the Congo did not pay off
Especially in fragile contexts, weak systems for paying teacher salaries are a key challenge. Teachers can go months without pay due to bureaucratic rigidity and lack of access to the financial system. Some countries have tried to tackle the challenge via private engagement, such as using mobile money payment programmes in poorer countries to improve financial inclusion and pay teachers on time (Trucano, 2014).
In 2011, a public–private partnership between the state and the banking sector in the Democratic Republic of the Congo replaced arrangements between faith-based organizations and teachers for teacher salary payments. While the programme improved the situation in cities, it did not address the main problem: how to pay teachers in remote rural areas lacking access to banking. The programme gave banks an incentive to open new branches in Kinshasa but not in the countryside. It overlooked the fact that only 4% of adults held bank accounts in 2014, with two thirds of them in Kinshasa and in Katanga province. To cover the remaining areas, banks set up temporary payment points for teachers, tried to subcontract with mobile phone companies for payment and subcontracted other services as well. After a few years, transaction costs were reported to have increased significantly. Instead of getting direct payments from faith-based school networks, teachers had to make most arrangements individually. This eventually led to a change in which the Catholic Church used its networks and infrastructure to deliver payments (Brandt and De Herdt, 2019).
71 C H A P T E R 3 • GovERnAnCE AnD REGuLATIon
3
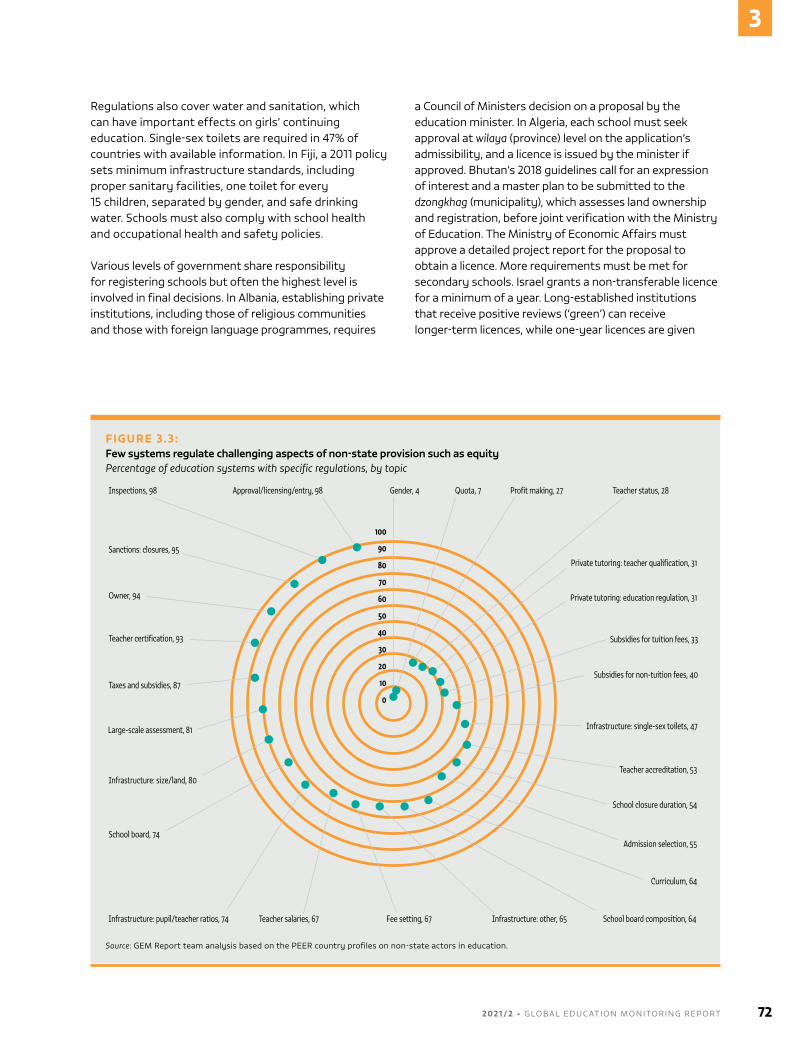
Regulations also cover water and sanitation, which can have important effects on girls’ continuing education. Single-sex toilets are required in 47% of countries with available information. In Fiji, a 2011 policy sets minimum infrastructure standards, including proper sanitary facilities, one toilet for every 15 children, separated by gender, and safe drinking water. Schools must also comply with school health and occupational health and safety policies.
various levels of government share responsibility for registering schools but often the highest level is involved in final decisions. In Albania, establishing private institutions, including those of religious communities and those with foreign language programmes, requires
a Council of Ministers decision on a proposal by the education minister. In Algeria, each school must seek approval at wilaya (province) level on the application’s admissibility, and a licence is issued by the minister if approved. Bhutan’s 2018 guidelines call for an expression of interest and a master plan to be submitted to the dzongkhag (municipality), which assesses land ownership and registration, before joint verification with the Ministry of Education. The Ministry of Economic Affairs must approve a detailed project report for the proposal to obtain a licence. More requirements must be met for secondary schools. Israel grants a non-transferable licence for a minimum of a year. Long-established institutions that receive positive reviews (‘green’) can receive longer-term licences, while one-year licences are given
FIGURE 3.3: Few systems regulate challenging aspects of non-state provision such as equityPercentage of education systems with specific regulations, by topic
100
90
80
70
60
50
40
30
20
10
0
Approval/licensing/entry, 98Inspections, 98
Sanctions: closures, 95
Owner, 94
Teacher certification, 93
Taxes and subsidies, 87
Large-scale assessment, 81
Infrastructure: size/land, 80
School board, 74
Infrastructure: pupil/teacher ratios, 74 Teacher salaries, 67 Fee setting, 67 Infrastructure: other, 65 School board composition, 64
Curriculum, 64
Admission selection, 55
School closure duration, 54
Teacher accreditation, 53
Infrastructure: single-sex toilets, 47
Subsidies for non-tuition fees, 40
Subsidies for tuition fees, 33
Private tutoring: education regulation, 31
Private tutoring: teacher qualification, 31
Teacher status, 28Profit making, 27Quota, 7Gender, 4
Source: GEM Report team analysis based on the PEER country profiles on non-state actors in education.
2 0 2 1 / 2 • G LO BA L E D U C AT I O N M O N I TO R I N G R E P O RT 72
3
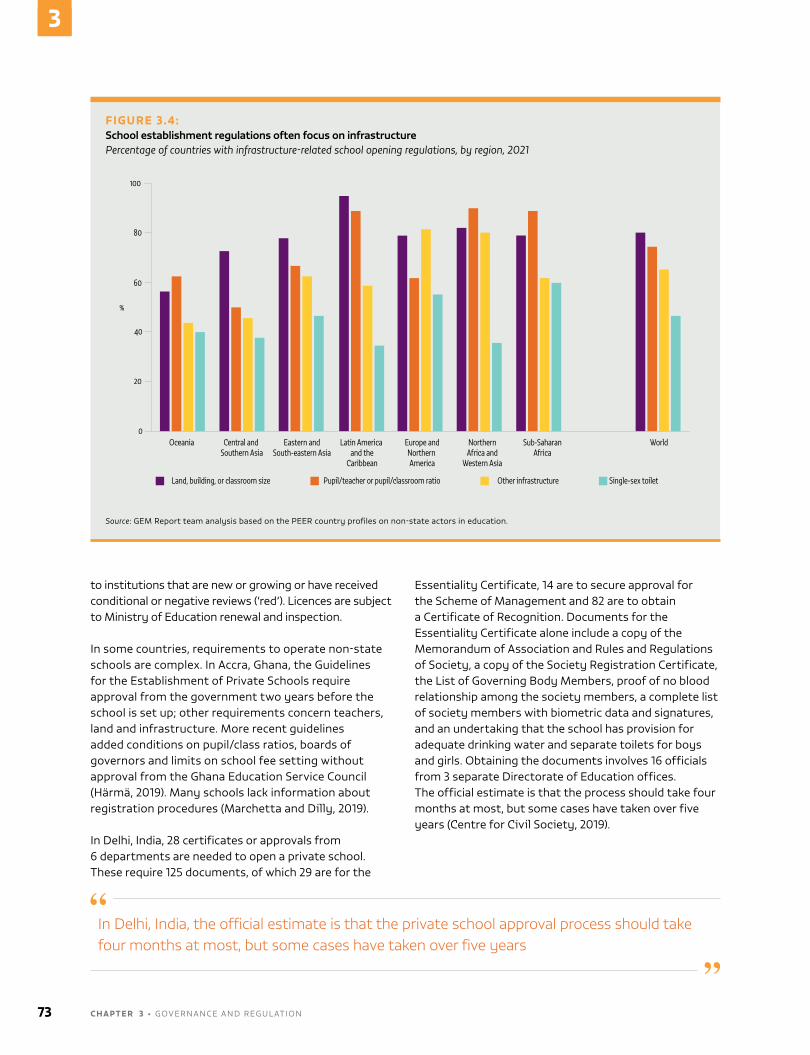
to institutions that are new or growing or have received conditional or negative reviews (‘red’). Licences are subject to Ministry of Education renewal and inspection.
In some countries, requirements to operate non-state schools are complex. In Accra, Ghana, the Guidelines for the Establishment of Private Schools require approval from the government two years before the school is set up; other requirements concern teachers, land and infrastructure. More recent guidelines added conditions on pupil/class ratios, boards of governors and limits on school fee setting without approval from the Ghana Education Service Council (Härmä, 2019). Many schools lack information about registration procedures (Marchetta and Dilly, 2019).
In Delhi, India, 28 certificates or approvals from 6 departments are needed to open a private school. These require 125 documents, of which 29 are for the
Essentiality Certificate, 14 are to secure approval for the Scheme of Management and 82 are to obtain a Certificate of Recognition. Documents for the Essentiality Certificate alone include a copy of the Memorandum of Association and Rules and Regulations of Society, a copy of the Society Registration Certificate, the List of Governing Body Members, proof of no blood relationship among the society members, a complete list of society members with biometric data and signatures, and an undertaking that the school has provision for adequate drinking water and separate toilets for boys and girls. obtaining the documents involves 16 officials from 3 separate Directorate of Education offices. The official estimate is that the process should take four months at most, but some cases have taken over five years (Centre for Civil Society, 2019).
FIGURE 3.4: School establishment regulations often focus on infrastructurePercentage of countries with infrastructure-related school opening regulations, by region, 2021
100
80
60
40
20
0
%
Oceania Central and Southern Asia
Eastern andSouth-eastern Asia
Latin America and the
Caribbean
Europe andNorthern America
NorthernAfrica and
Western Asia
Sub-SaharanAfrica
World
Land, building, or classroom size Pupil/teacher or pupil/classroom ratio Other infrastructure Single-sex toilet
Source: GEM Report team analysis based on the PEER country profiles on non-state actors in education.
In Delhi, India, the official estimate is that the private school approval process should take four months at most, but some cases have taken over five years
73 C H A P T E R 3 • GovERnAnCE AnD REGuLATIon
3
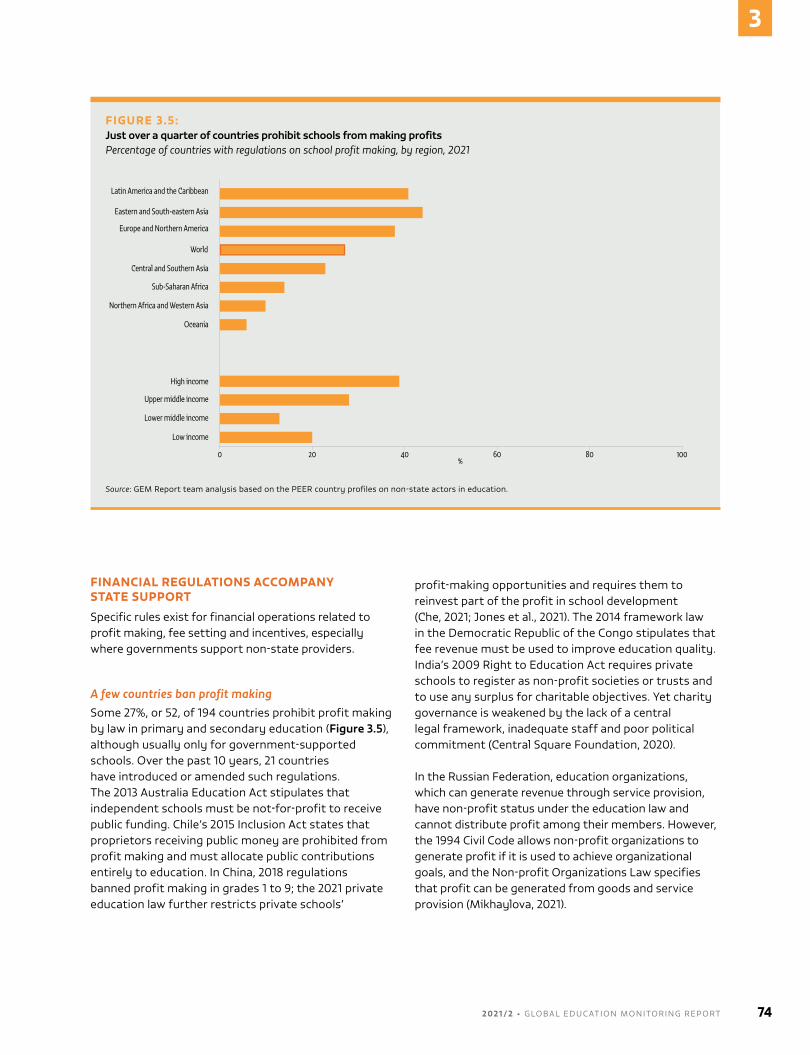
FINANCIAL REGULATIONS ACCOMPANY STATE SUPPORT
Specific rules exist for financial operations related to profit making, fee setting and incentives, especially where governments support non-state providers.
A few countries ban profit makingSome 27%, or 52, of 194 countries prohibit profit making by law in primary and secondary education (Figure 3.5), although usually only for government-supported schools. over the past 10 years, 21 countries have introduced or amended such regulations. The 2013 Australia Education Act stipulates that independent schools must be not-for-profit to receive public funding. Chile’s 2015 Inclusion Act states that proprietors receiving public money are prohibited from profit making and must allocate public contributions entirely to education. In China, 2018 regulations banned profit making in grades 1 to 9; the 2021 private education law further restricts private schools’
profit-making opportunities and requires them to reinvest part of the profit in school development (Che, 2021; Jones et al., 2021). The 2014 framework law in the Democratic Republic of the Congo stipulates that fee revenue must be used to improve education quality. India’s 2009 Right to Education Act requires private schools to register as non-profit societies or trusts and to use any surplus for charitable objectives. Yet charity governance is weakened by the lack of a central legal framework, inadequate staff and poor political commitment (Central Square Foundation, 2020).
In the Russian Federation, education organizations, which can generate revenue through service provision, have non-profit status under the education law and cannot distribute profit among their members. However, the 1994 Civil Code allows non-profit organizations to generate profit if it is used to achieve organizational goals, and the non-profit organizations Law specifies that profit can be generated from goods and service provision (Mikhaylova, 2021).
FIGURE 3.5: Just over a quarter of countries prohibit schools from making profitsPercentage of countries with regulations on school profit making, by region, 2021
0 20 40%
60 80 100
Latin America and the Caribbean
Eastern and South-eastern Asia
Europe and Northern America
World
Central and Southern Asia
Sub-Saharan Africa
Northern Africa and Western Asia
Oceania
High income
Upper middle income
Lower middle income
Low income
Source: GEM Report team analysis based on the PEER country profiles on non-state actors in education.
2 0 2 1 / 2 • G LO BA L E D U C AT I O N M O N I TO R I N G R E P O RT 74
3
Caps and restrictions on non-state school tuition fees exist in 67% of countries
Fee levels are often regulated yet schools are not more accessible
Caps and restrictions on non-state school tuition fees exist in 116, or 67%, of 173 countries. Education ministries often must approve fee increases or can set limits on them. Bhutan’s education ministry must approve private actors’ fees and can specify that the revenue must be spent on, for instance, learning materials or teacher development programmes. In Dominica, private and private-aided schools cannot increase or add fees without the minister’s approval and must give at least one term’s notice. The Dominican Republic Ministry of Education can regulate and set private school fees. In Israel, a 2020 circular on parental payments specified that the ministry approves tuition fees on the basis of enrolment, profile and percentage of budget covered by the government; schools fully funded by the state cannot charge fees. A 2021 circular further mentioned a school may charge payments to purchase voluntary services as to the level approved by the Ministry of Education.
nevertheless, in practice tuition restrictions do not appear to increase the probability of poorer learners having access to non-state schools. In Comoros, where the government had to approve independent private school tuition fees, 2% of students from the poorest households but 24% from the richest attended such schools (ConFEMEn, 2010). Schools in the Partnership Schools for Liberia programme were prohibited from charging fees, including for textbooks and uniforms, yet 48% of parents reported they had paid some fees (Romero et al., 2020b). ugandan private schools taking part in the universal Secondary Education programme were meant to stop charging fees in exchange for the support they received, but continued asking for informal fees and parental contributions for basic services (omoeva and Gale, 2016). Richer households were thus more likely to benefit from the programme: The richest quintile received 20% of the subsidy and the poorest quintile 10% (Wokadala and Barungi, 2015).
In Pakistan, the 1984 Punjab Private Educational Institutions ordinance stipulated that fees could not increase by more than 5% per year without formal provincial government approval. A 2016 amendment further regulated the fee structure, prohibiting schools
from making parents pay extra for uniforms and textbooks from particular providers. But fee paying is an unofficial requirement for receiving vouchers; participating schools charge extra fees for a year before allowing students to apply and possibly be admitted to the voucher programme. Most of these schools’ students can afford to pay some fees (Afridi, 2018; Ansari, 2020).
Most countries grant fiscal and tax advantages to non-state providers
non-state providers enjoy tax exemptions and other fiscal incentives in 173, or 87%, of 200 countries. Pakistan has established five foundations to support the establishment and maintenance of non-state primary and secondary schools through grants, loans, state infrastructure, community facilities and other services. The Philippine government provides grants, subsidies and tax incentives to non-state schools, in the form of vouchers, management contracts, grants, loans and technical assistance. A 1998 act set criteria for receiving support, including tuition fees, school performance and location, and students’ socioeconomic needs. The Department of Education annual madrasa fund also subsidizes private madrasas’ operational costs.
Such incentives can be costly for governments. one estimate suggests that tax incentives result in forgone government revenue of some uS$1.2 billion a year in Ghana, uS$1.1 billion in Kenya, uS$4 billion in Pakistan and uS$272 million in uganda (Balsera, 2017). By contrast, the united Republic of Tanzania recently introduced a 30% income tax for private schools whose revenue exceeds a certain tax-free margin (Rossignoli, 2021).
FEW REGULATIONS AIM TO PROMOTE EQUITABLE ACCESS
Some countries try to prevent selective admission procedures or directly enhance access to non-state schools.
Some regulations deter, but may not prevent, selective admission
Globally, in 78 of 172 countries, or 55%, schools cannot determine their own admission processes (Figure 3.6). This applies to non-state schools in 46 countries, while in 9 countries only for government-aided schools. All countries espouse the principle of non-discrimination to ensure fair access to education, but faith-based schools have more freedom to choose students.
75 C H A P T E R 3 • GovERnAnCE AnD REGuLATIon
3
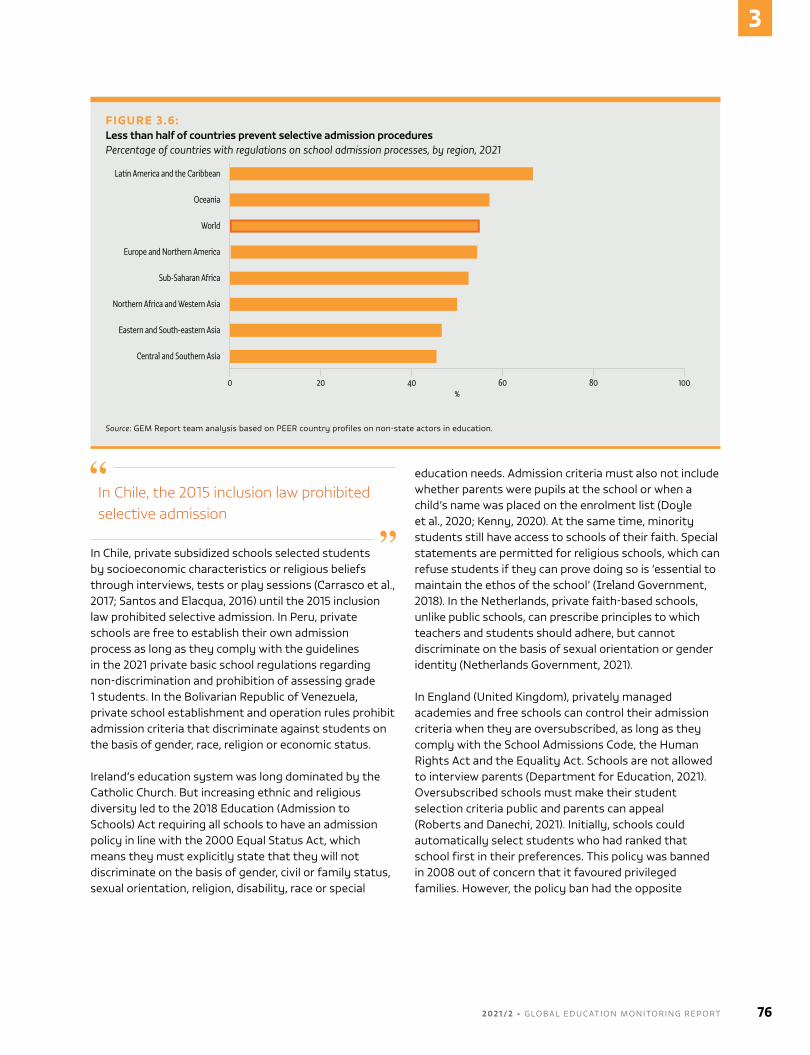
In Chile, the 2015 inclusion law prohibited selective admission
In Chile, private subsidized schools selected students by socioeconomic characteristics or religious beliefs through interviews, tests or play sessions (Carrasco et al., 2017; Santos and Elacqua, 2016) until the 2015 inclusion law prohibited selective admission. In Peru, private schools are free to establish their own admission process as long as they comply with the guidelines in the 2021 private basic school regulations regarding non-discrimination and prohibition of assessing grade 1 students. In the Bolivarian Republic of venezuela, private school establishment and operation rules prohibit admission criteria that discriminate against students on the basis of gender, race, religion or economic status.
Ireland’s education system was long dominated by the Catholic Church. But increasing ethnic and religious diversity led to the 2018 Education (Admission to Schools) Act requiring all schools to have an admission policy in line with the 2000 Equal Status Act, which means they must explicitly state that they will not discriminate on the basis of gender, civil or family status, sexual orientation, religion, disability, race or special
education needs. Admission criteria must also not include whether parents were pupils at the school or when a child’s name was placed on the enrolment list (Doyle et al., 2020; Kenny, 2020). At the same time, minority students still have access to schools of their faith. Special statements are permitted for religious schools, which can refuse students if they can prove doing so is ‘essential to maintain the ethos of the school’ (Ireland Government, 2018). In the netherlands, private faith-based schools, unlike public schools, can prescribe principles to which teachers and students should adhere, but cannot discriminate on the basis of sexual orientation or gender identity (netherlands Government, 2021).
In England (united Kingdom), privately managed academies and free schools can control their admission criteria when they are oversubscribed, as long as they comply with the School Admissions Code, the Human Rights Act and the Equality Act. Schools are not allowed to interview parents (Department for Education, 2021). oversubscribed schools must make their student selection criteria public and parents can appeal (Roberts and Danechi, 2021). Initially, schools could automatically select students who had ranked that school first in their preferences. This policy was banned in 2008 out of concern that it favoured privileged families. However, the policy ban had the opposite
FIGURE 3.6: Less than half of countries prevent selective admission proceduresPercentage of countries with regulations on school admission processes, by region, 2021
0 20 40%
60 80 100
Latin America and the Caribbean
Eastern and South-eastern Asia
Europe and Northern America
World
Central and Southern Asia
Sub-Saharan Africa
Northern Africa and Western Asia
Oceania
Source: GEM Report team analysis based on PEER country profiles on non-state actors in education.
2 0 2 1 / 2 • G LO BA L E D U C AT I O N M O N I TO R I N G R E P O RT 76
3
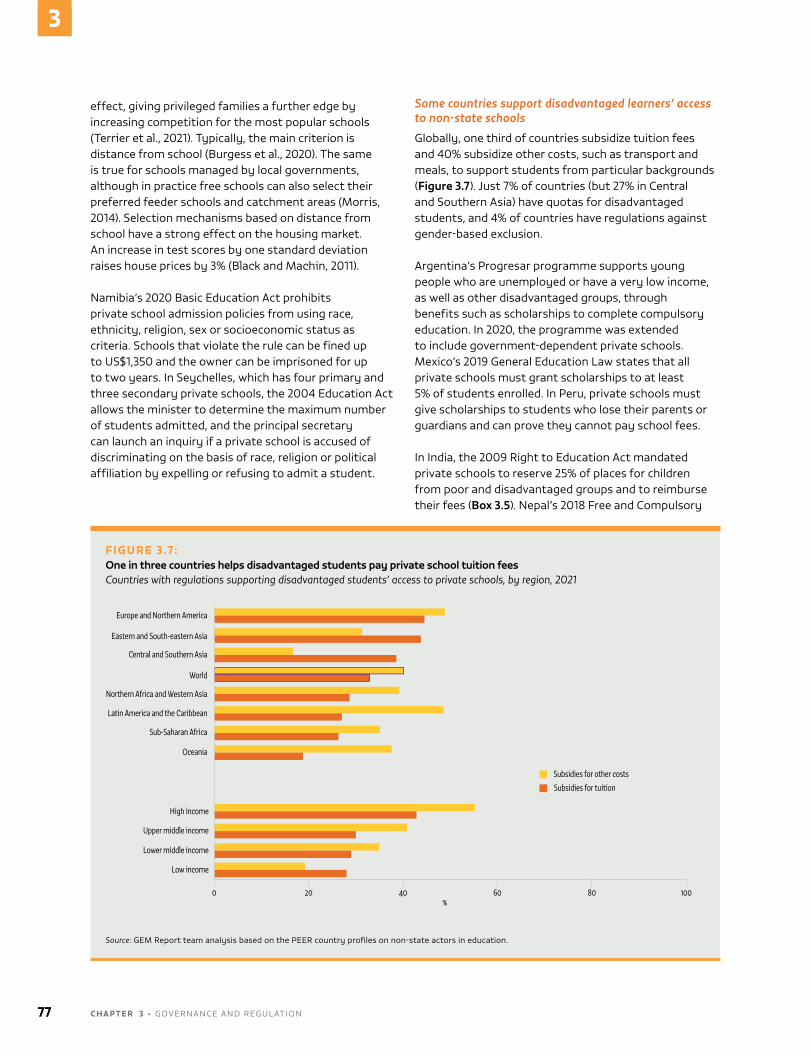
effect, giving privileged families a further edge by increasing competition for the most popular schools (Terrier et al., 2021). Typically, the main criterion is distance from school (Burgess et al., 2020). The same is true for schools managed by local governments, although in practice free schools can also select their preferred feeder schools and catchment areas (Morris, 2014). Selection mechanisms based on distance from school have a strong effect on the housing market. An increase in test scores by one standard deviation raises house prices by 3% (Black and Machin, 2011).
namibia’s 2020 Basic Education Act prohibits private school admission policies from using race, ethnicity, religion, sex or socioeconomic status as criteria. Schools that violate the rule can be fined up to uS$1,350 and the owner can be imprisoned for up to two years. In Seychelles, which has four primary and three secondary private schools, the 2004 Education Act allows the minister to determine the maximum number of students admitted, and the principal secretary can launch an inquiry if a private school is accused of discriminating on the basis of race, religion or political affiliation by expelling or refusing to admit a student.
Some countries support disadvantaged learners’ access to non-state schools
Globally, one third of countries subsidize tuition fees and 40% subsidize other costs, such as transport and meals, to support students from particular backgrounds (Figure 3.7). Just 7% of countries (but 27% in Central and Southern Asia) have quotas for disadvantaged students, and 4% of countries have regulations against gender-based exclusion.
Argentina’s Progresar programme supports young people who are unemployed or have a very low income, as well as other disadvantaged groups, through benefits such as scholarships to complete compulsory education. In 2020, the programme was extended to include government-dependent private schools. Mexico’s 2019 General Education Law states that all private schools must grant scholarships to at least 5% of students enrolled. In Peru, private schools must give scholarships to students who lose their parents or guardians and can prove they cannot pay school fees.
In India, the 2009 Right to Education Act mandated private schools to reserve 25% of places for children from poor and disadvantaged groups and to reimburse their fees (Box 3.5). nepal’s 2018 Free and Compulsory
FIGURE 3.7: One in three countries helps disadvantaged students pay private school tuition feesCountries with regulations supporting disadvantaged students’ access to private schools, by region, 2021
0 20 40%
60 80 100
Latin America and the Caribbean
Eastern and South-eastern Asia
Europe and Northern America
World
Central and Southern Asia
Sub-Saharan Africa
Northern Africa and Western Asia
Oceania
High income
Upper middle income
Lower middle income
Low income
Subsidies for other costs
Subsidies for tuition
Source: GEM Report team analysis based on the PEER country profiles on non-state actors in education.
77 C H A P T E R 3 • GovERnAnCE AnD REGuLATIon
3
Education Act required private schools up to grade 12 to offer scholarships to 10% (for schools with up to 500 students), 12% (between 500 and 800 students) or 15% of their students (above 800 students) (Jha, 2019). However, private schools have contested the law and refused to comply with it (Singh, 2019). In Pakistan, the 2017 national Education Policy stated that all for-profit schools must provide free education to at least 10% of their enrolment, favouring ‘deserving children’; similar commitments were made in provincial laws in the Islamabad Capital Territory in 2011, Sindh in 2013 and Punjab in 2014.
The Philippines has subsidized private school access since the enactment of the 1989 Government Assistance to Students and Teachers in Private Education legislation to support implementation of the 1988 Free Secondary Education Act. Two of its components target students: Education Contracting Services (ESC) and, since 2013, the Senior High School voucher Program (SHS vP). ESC is a tuition fee subsidy, averaging uS$160 per year, which allows students to move from ‘congested’ public to private secondary schools. In 2017/18, it supported 970,000 students in 3,300 private schools. The Private Education Assistance Committee, which implements it,
BOX 3.5:
In India, the ambitious equity objectives of the Right to Education Act provisions on private schools are not yet met
Section 12(1)(c) of the 2009 Right to Education (RTE) Act stated that non-minority private unaided schools in India should reserve at least 25% of seats in entry-level grades for children from poor and disadvantaged backgrounds. State governments were to reimburse schools either the non-state school fees or the state school per child spending, whichever is lower.
The policy ran into several implementation problems (Day Ashley et al., 2020). Between 2010 and 2016, about one quarter of litigation under the act in High Courts and the Supreme Court concerned this provision (Ambast and Gaur, 2017). State education departments have not had enough staff to inform applicants, process applications, monitor private school compliance with infrastructure and teacher norms, and deal with appeals (Mehendale et al., 2015).
Schools have complained that reimbursements are slow, difficult to obtain and below expected levels, leading them to raise fees for the other students. It has also been argued that state governments have underestimated the per-student cost in public schools and not made their calculations public (Kingdon and Muzammil, 2018).
Not only is there lack of awareness with respect to procedures, but also application procedures and eligibility proof have been too complicated, sometimes giving rise to corruption claims (Mehendale et al., 2015). In many states, the admission process takes place through the computerized RTE lottery, which requires successful applicants to approach the schools designated for admission within one or two weeks. Despite trying to reduce schools’ discretion in selecting applicants, the system presents challenges for families as it requires computer proficiency and access to internet (Wad et al., 2017).
By 2021, only 16 of the 36 states and territories were implementing the measure, according to the National Commission for Protection of Child Rights (Sharma, 2021). Maharashtra had 69% of reserved seats filled in 2020, the highest percentage, but only 41% of private unaided schools had registered for RTE admissions. The COVID-19 crisis exacerbated some challenges, with schools not allowing so-called RTE students to join online classes and opposing an order against fee collection during the lockdown (Sarasvati, 2020). Across India, it was estimated that 4.3 million children benefited in 2018/19, although Karnataka, Madhya Pradesh, Rajasthan and Tamil Nadu accounted for 68% of the total. In Uttar Pradesh, no more than 2% of seats were filled (Indus Action, 2018, 2019).
Schools appear to have invested little to ensure integration of children and there are concerns that RTE students may be subject to patronizing attitudes and discrimination (Mehendale et al., 2015). However, there are indications of success in social cohesion (Joshi, 2020) and the measure is generally perceived to have been positive, at least in low-fee if not elite schools. Beneficiary children, while not among the poorest, appear to have ended up in schools they might otherwise not have had access to (Dongre et al., 2019). But concerns remain whether they will have the support they are likely to need in higher grades.
In the Philippines, a 2019 audit found there were no guidelines in the Education Contracting Services programme for targeting disadvantaged students
2 0 2 1 / 2 • G LO BA L E D U C AT I O N M O N I TO R I N G R E P O RT 78
3
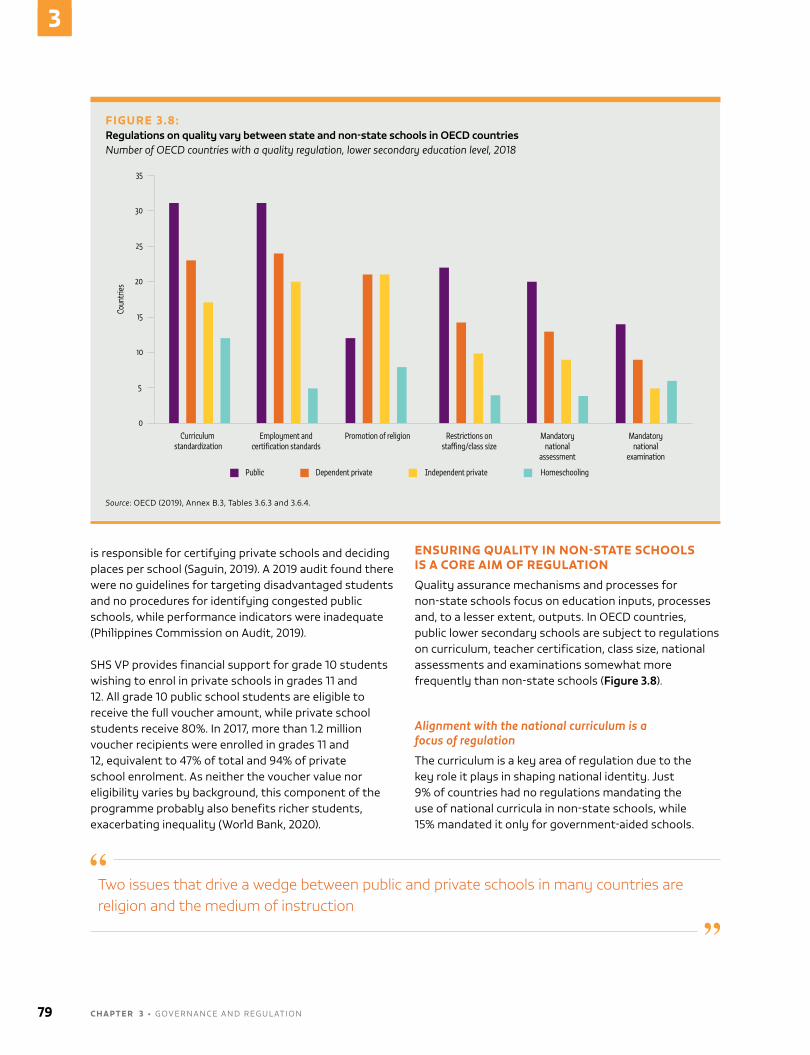
is responsible for certifying private schools and deciding places per school (Saguin, 2019). A 2019 audit found there were no guidelines for targeting disadvantaged students and no procedures for identifying congested public schools, while performance indicators were inadequate (Philippines Commission on Audit, 2019).
SHS vP provides financial support for grade 10 students wishing to enrol in private schools in grades 11 and 12. All grade 10 public school students are eligible to receive the full voucher amount, while private school students receive 80%. In 2017, more than 1.2 million voucher recipients were enrolled in grades 11 and 12, equivalent to 47% of total and 94% of private school enrolment. As neither the voucher value nor eligibility varies by background, this component of the programme probably also benefits richer students, exacerbating inequality (World Bank, 2020).
ENSURING QUALITY IN NON-STATE SCHOOLS IS A CORE AIM OF REGULATION
Quality assurance mechanisms and processes for non-state schools focus on education inputs, processes and, to a lesser extent, outputs. In oECD countries, public lower secondary schools are subject to regulations on curriculum, teacher certification, class size, national assessments and examinations somewhat more frequently than non-state schools (Figure 3.8).
Alignment with the national curriculum is a focus of regulation
The curriculum is a key area of regulation due to the key role it plays in shaping national identity. Just 9% of countries had no regulations mandating the use of national curricula in non-state schools, while 15% mandated it only for government-aided schools.
FIGURE 3.8: Regulations on quality vary between state and non-state schools in OECD countriesNumber of OECD countries with a quality regulation, lower secondary education level, 2018
35
30
25
20
15
10
5
0
Public Dependent private Independent private Homeschooling
Curriculum standardization
Employment andcertification standards
Promotion of religion Restrictions onsta�ng/class size
Mandatorynational
assessment
Mandatorynational
examination
Coun
tries
Source: oECD (2019), Annex B.3, Tables 3.6.3 and 3.6.4.
Two issues that drive a wedge between public and private schools in many countries are religion and the medium of instruction
79 C H A P T E R 3 • GovERnAnCE AnD REGuLATIon
3
Chile has made the curriculum for pre-primary, basic and lower secondary education mandatory for all officially recognized schools. Schools must safeguard the principle of non-discrimination and meet national learning standards. The 2007 general education law provides for schools to develop their own plans and programmes as long as they are in line with the baseline curriculum’s general goals. Private establishments can set complementary aims, such as a third language or emphasis on arts, science or religion, as long as the Ministry of Education approves. China’s 2021 private education law mandates the use of the national curriculum in private schools.
In Australia’s new South Wales state, registered private schools must align their education programme with the Education Standards Authority syllabuses and guidelines approved by the Department of Education. Registered schools not accredited to provide a grade 11 or 12 certificate can seek approval to modify one or more syllabus outcomes. In Queensland state, private schools’ education programmes must be consistent with the Melbourne Declaration on Educational Goals for Young Australians and implement the national curriculum or one recognized by the Australian Curriculum, Assessment and Reporting Authority.
Two issues that drive a wedge between public and private schools in many countries, notably in northern Africa and Western Asia, are religion and the medium of instruction. Although Arabic is the official language of instruction in much of the region, English and French are widely used in private schools. Most countries mandate the teaching of Arabic and Islamic studies, although schools can follow a curriculum of their choice that is accredited elsewhere, subject to approval. In Kuwait, non-state schools must follow the general education objectives, respect Islamic values and teach the local culture and Arabic. In Saudi Arabia, private schools are required to teach Arabic and Islamic studies even when they follow an international curriculum (Arab news, 2013). The united Arab Emirates makes Islamic studies (for Muslim students), Arabic and social studies (for all students) compulsory in private schools. oman and Sudan forbid non-state schools from using reading materials that contradict Islamic values (Al Qasimi Foundation for Policy Research, 2021).
In Lebanon, the national curriculum is delivered in Arabic, with the first foreign language (French or English) introduced from grade 1 and the second from grade 7. Yet in many private schools, the second foreign language starts in the primary grades. After the primary grades, the curriculum is taught in both Arabic
(humanities and social sciences) and the first foreign language (mathematics and sciences) (Zakharia, 2016). In Morocco, Arabic is the official language of instruction, but expensive and selective bilingual private schools (teaching in French and English or Spanish) have emerged to provide a comparative advantage for the well-off in access to tertiary education and more lucrative labour market opportunities (CMEPT, 2014).
Fiji’s non-state schools may follow their own curriculum, subject to ministerial approval, but they must teach specific subjects relating to health, civic education and issues of national interest. In addition, primary schools must teach iTaukei and Fiji Hindi as compulsory subjects. In Pakistan’s Sindh province, non-state schools must teach Sindhi and the curriculum ‘shall be at least, at par with the curriculum approved by Government’ (Sindh Government, 2002, p. 4).
Religion is treated in various ways in education systems, and regulating faith-based schools is often challenging when it comes to issues including curriculum, safety and admissions (Box 3.6). Some countries emphasize secular education in both state and non-state schools. In France, which adheres to the principle of laïcité, religion is not taught as a school subject. Fiji’s 1978 Education Act allows schools to provide non-compulsory religious instruction, but most subjects must remain secular or the institution runs a risk of not being recognized as a school. By contrast, in Tuvalu, the minister approves the curriculum of the two non-government schools after consulting with the Educational Advisory Committee; the director of education may cancel their registration if the curriculum is ‘persistently and materially departed from or religious instruction is not provided as part of the curriculum’.
Regulations also address teacher certification and working conditions
Practically all countries (93%) have regulations on teacher certification or training for primary and secondary school teachers in non-state schools. In the past decade, regulations have been adopted or amended in 80 countries. About 53% of countries have regulations on non-state school teacher accreditation, with regional shares ranging from 30% in northern Africa and Western Asia to 82% in Eastern and South-eastern Asia.
About 53% of countries have regulations on non-state school teacher accreditation
2 0 2 1 / 2 • G LO BA L E D U C AT I O N M O N I TO R I N G R E P O RT 80
3
In Burkina Faso, non-state school teachers must have the required diploma or capacity qualification. In addition, they must receive continuous, certified training. Permission to lead or teach is granted by the regional basic education and literacy director. But in several other sub-Saharan African countries, many private school teachers tend not to receive professional training (Lange et al., 2021). In Guinea, private schools are less demanding about staff qualifications
than public schools (Somparé and Somparé, 2018). Between 80% and 90% of Bridge teachers in uganda were unlicensed (Education International, 2017).
In Gulf Cooperation Council countries, to be eligible for teaching positions teachers must meet ministries’ licence and certification criteria. In Bahrain and the united Arab Emirates, a bachelor’s degree in education is required for primary school teachers
BOX 3.6:
Maintaining faith-based school autonomy and accountability is often a challenge
Faith-based schools, a core part of education in many countries, can be controversial. Opposition to state funding is often strong, as faith-based schools may impose particular religious teachings and be seen as raising barriers between groups, especially through selective admission. Another concern is that religious schools may be less open to scrutiny than others, especially when they do not receive public funding (Maussen and Bader, 2014). Examples from around the world suggest that checks and balances are sometimes insufficient.
Selective admission policies based on religious beliefs are common in faith schools. In England (United Kingdom), such schools can rank applicants by their observed religiosity using complex criteria (Burgess et al., 2020). The Department for Education has published warning notices, for instance, for an Islamic school that had separate entrances for boys and girls and segregated children by sex for all classes and activities (Lowrie, 2017) and a Jewish nursery school that also separated children by sex, reinforcing gender stereotypes (National Secular Society, 2018). In the US state of North Carolina, a Catholic school’s admission policies explicitly excluded families adhering to non-Christian faiths or behaving in ways seen as ‘deviate and perverted’ (Kahlenberg, 2020).
Concerns are often raised about faith-based schools with respect to child protection. Lawsuits for sexual abuse and corporal punishment have been lodged in Argentina and Chile (Bishop Accountability, 2021); in France, where a traditionalist Catholic school was closed after allegations of child abuse (RFI, 2017); the United Kingdom (IICSA, 2019); and the United States (ProPublica, 2021). Accounts of corporal punishment and sex abuse have been reported in Myanmar’s monastic Buddhist schools, which enrol at least 300,000 children and where clerical immunity impedes investigation (Phillips, 2018). Senegal’s Koranic schools, or daaras, remain outside the national education system despite attempts at integration (RFI, 2019). It is estimated that 17 students died from ‘violence, acts of neglect or endangerment’ in 2017–20, leading to calls for teachers to break silence on the issue (Senghor, 2020). Cases of teachers forcing students to beg and subjecting them to severe abuse and neglect were highlighted (Human Rights Watch, 2019).
Corporal punishment is a major concern in South Asia. In Bhutan, a 2010 Ministry of Education assessment found that 11 of 126 monastic schools used punishment such as beating, spanking and whipping. In India, a 2007 Ministry of Women and Child Development survey of children in 11 states found that at least half the girls had experienced some form of violence, including in private and religious schools (UNICEF, 2016). In Pakistan, sexual abuse in schools and madrasas has been a long-standing and pervasive issue (Zafar, 2020), with reports of police being bribed to not pursue justice against clerics (Gannon, 2017).
Tensions often emerge between national curriculum requirements and faith-based schools, particularly in subjects such as religion, science and sexuality education. In England, a report on over 600 faith-based state secondary schools (Catholic, Church of England, Muslim and Jewish) found that in two thirds, sex and relationship education was taught according to religious principles, including that sex outside a religious marriage was wrong, that divorce was not recognized and that homosexuality was wrong (National Secular Society, 2018). In Birmingham, England, a textbook from an unregistered Islamic school advocated killing homosexuals (Titheradge, 2018). In the United States, ultra-Orthodox Jewish yeshivas (private religious schools) provided rudimentary instruction in mathematics, science and English for 90 minutes at the end of the school day, with classes sometimes cancelled on religious occasions (Hassan, 2021; New York Times, 2021).
Religious schools are also scrutinized due to concern that some spread religious hatred and radicalize youth. In Kenya, institutions linked to extremist organizations were found to have used madrasas to disseminate radical jihadist ideology (Mkutu and Opondo, 2019). In Pakistan, a survey of students found that those in madrasas held more extremist views than those in secular schools (Hanif et al., 2021). A survey of madrasa students in Punjab province found that 45% agreed that madrasas took part in political activities and 42% that they were involved in extremist activities (Hussain, 2018).
81 C H A P T E R 3 • GovERnAnCE AnD REGuLATIon
3
and a degree in the subject they are teaching, with a minor in education, for secondary school teachers. Bahrain’s education ministry requires teachers to pass subject proficiency exams. The united Arab Emirates education ministry recently introduced licensing requirements, indicating a move towards greater standardization of teacher training and qualifications (Al Qasimi Foundation for Policy Research, 2021).
About two thirds of countries have regulations on non-state school teacher salaries. But only in 28% of countries are non-state teachers covered under similar laws with state school teachers in terms of working conditions. only in 15 countries do the regulations concern all types of non-state schools. In 23 countries, only teachers working in government-aided schools get equivalent treatment.
In Chile, the 2016 law that introduced the national teacher policy provided for more rigorous entry requirements, regular evaluations and government-supported professional development (Mizala and Schneider, 2019). Despite strong opposition from the private school sector, the final version of the law covered all teachers in both public and private subsidized schools (Treviño et al., 2018) abolishing differences by contract type (public vs private law) under which they had been recruited. But in El Salvador and Guatemala, private school teachers are under the private work law and are not considered civil servants. In the Philippines, non-state schools recruit their own teachers, who must meet a 2011 manual’s qualifications and standards. Teacher employment conditions in non-state schools are regulated through guidelines on salary scales, teaching hours and professional development. unlike teachers in state schools, however, non-state teachers do not have to be trained in the national curriculum and have more freedom regarding their teaching methods.
Francophone sub-Saharan African countries have a variety of teacher working arrangements, but four contract types are generally most common, as in Togo: civil servant, private, temporary, and voluntary or community. Their conditions vary in terms of job security, salary scale, social security and pensions, family benefits and access to continuing professional development. voluntary or community teachers tend to have salaries below the minimum wage and no social security or medical insurance. The number of private school contract teachers has been increasing; such teachers tend to be less qualified, have less teaching experience and be less trained than their public school peers (Lange et al., 2021).
A survey of 1,000 schools in five sub-Saharan African cities found that 56% were unregistered, and one third of those had been operating for at least five years
The Ethiopian government favours granting the right to pensions to all contract teachers in both private and public schools, although private schools have autonomy regarding salaries, which vary widely. In Sudan, 50% of the teachers in private schools are on contract. In the united Republic of Tanzania, independent private schools can set teacher salaries and deploy and dismiss teachers, as outlined in the Education and Training Policy. In uganda, private schools prefer to hire men rather than women. All teachers working in private schools are on contract, most often verbal (International Task Force on Teachers for Education 2030, 2020).
The CovID-19 crisis heavily influenced private-sector teachers’ working conditions. Following school closures and non-payment of school fees, school owners struggled to pay teachers. In India’s Karnataka state, the Associated Management of Primary and Secondary Schools revealed that as of September 2020, 50% of teachers had been fired and the remaining 50% were on half salary (Shrinivasa, 2020). Similar issues were found for Catholic schools in Burkina Faso, Cameroon, Côte d’Ivoire, Senegal and Togo, which faced severe financial constraints leading to serious difficulty in ensuring that teachers were paid (Lange et al., 2021; Wodon, 2020a).
WEAK IMPLEMENTATION OFTEN UNDERMINES REGULATION
Despite the extensive presence of regulations, they often remain largely theoretical, with implementation lagging. Effective complaint and redress mechanisms may not exist or be functional.
MANY NON-STATE SCHOOLS REMAIN UNREGISTERED
As school registration in poor countries is often cumbersome, slow and corruption-prone, many schools operate without a licence and without meeting minimum conditions. An audit of four districts in India’s Jharkhand state found that 352 of 547 private schools in operation had applied for recognition in 2013–15,
2 0 2 1 / 2 • G LO BA L E D U C AT I O N M O N I TO R I N G R E P O RT 82
3
but only 101 met requirements. In mid-2016 their proposals were caught in a bottleneck at the Directorate of Primary Education. In Gujarat state, four years after the 2012 State Right to Education Rules took effect, more than 2,000 independent private schools were operating without a certificate of recognition (India Comptroller and Auditor General, 2017).
The situation is similar in sub-Saharan Africa. As more stringent establishment regulations are introduced, many informal schools remain unregistered or unrecognized, with governments lacking capacity to enforce the rules and resources to staff inspectorates (Baum et al., 2018). A survey of 1,000 schools in five cities found that 56% were unregistered, and one third of those had been operating for at least five years (CapPlus, 2017). In Burkina Faso, government inspection visits in 13 regions revealed that 649 schools did not meet minimum registration criteria. of those, 65% were deemed ‘unrecognized, but recoverable’ with ministry support; the other 35% were ‘unrecognized and irrecoverable’ and ordered to close (ouédraogo, 2018).
nigeria faces considerable challenges with registration. In Lagos state, the number of new private schools registered more than doubled between 2019 and 2020, from 729 to 1,660. But as of 2021, the government had approved just 1 in 4 of about 20,000 private schools in the state (Premium Times, 2021). In a survey of private school head teachers, 62% disagreed or strongly disagreed that the application process was easy, and the share was 57% on a question about most requirements being achievable for all types of schools (Binci et al., 2016). In the Ajeromi-Ifelodun local government area, less than 1% of schools paid the required fees, and 74% of unregistered schools cited lack of purpose-built buildings, inadequate infrastructure and failure to own their land as reasons for their unregistered status (Baum et al., 2018). About 40% of surveyed schools in the Makoko slum said they would remain unregistered, mainly because it was impossible for them to meet the regulations (Härmä and Adefisayo, 2013). In Abuja, Federal Capital Territory, 66% of non-state schools were unregistered in 2016 (Härmä, 2019).
While unregistered schools tend to operate outside the oversight of government authorities and are left out of official administrative data, this report found that at least 27 countries recorded such schools in their statistics. Burkina Faso’s education ministry publishes
an annual list of unauthorized schools and publicizes it through its website, the news media and Facebook (Lange et al., 2021). uganda’s Ministry of Education and Sports categorizes non-state schools by registration status as licensed, registered or unregistered. In 2017, 14% of primary and 13% of secondary schools were documented as unregistered.
Responses have varied, with some countries relaxing registration requirements and assisting schools to meet them, and others ordering unregistered schools to close immediately. In Ghana, policy implementation was flexible, with schools applying for registration after starting operations and attracting students. But at the same time, schools reported that government officials took bribes to overlook serious deficiencies during the application process and routine inspections. About 67% of schools reported having been inspected in 2017 (Härmä, 2019). In uganda, non-state schools are rarely shut for not meeting standards. Government officials help them reach minimum standards and develop a school improvement plan. In addition, minimum land requirements are assessed flexibly, and providers are given extra time to comply with any remaining standards.
By contrast, in Kenya, following a fatal accident in an unregistered school, the government ordered all unregistered schools closed without distinguishing between those that were already halfway through the government registration process and those that had not engaged at all, even with the Teachers Service Commission (Cheruiyot, 2019). In Johannesburg, South Africa, two illegal schools were shut down in 2020 for not having registered with the Gauteng Education Department. In addition, some teachers lacked legal identification documents and the South African Council for Educators documents required to teach (Maphanga, 2020).
Yet countries often lack the capacity to enforce closures, as in nigeria. In Abuja, the Department of Quality Assurance had the authority to close 550 schools for operating illegally but not the resources to carry out the closures and offer other provision (Härmä, 2019). Still, in 2021, the osun state government shut more than 600 nursery and primary schools for failing to meet minimum standards, declaring ‘war on mushroom schools’ and ‘zero tolerance for quacks in the system and schools that do not meet the required standard’.
83 C H A P T E R 3 • GovERnAnCE AnD REGuLATIon
3
Authorities said anyone wishing to establish a new school would need a Teacher’s Registration Council of nigeria certificate (Premium Times, 2021).
QUALITY ASSURANCE AND SANCTION MECHANISMS AIM TO RAISE STANDARDS
Globally, all countries mandate inspection of primary and secondary non-state schools, although only in 81% does this obligation concern all types of non-state schools. Countries often determine the inspection content and standards schools should meet, as well as potential action, from warnings to sanctions. The most extreme form of sanction, school closure or licence withdrawal, is also the most common, available in practically all countries. In 54% of countries, regulations also determine closures’ duration.
In Burkina Faso, a 2004 order allows the education ministry, on advice from the Permanent Commission on Private Education, to close private basic schools that do not meet specifications. Private schools are regularly shut down, with the ministry usually citing conditions such as overcrowded, unsanitary or dangerous premises. Even though teachers do not always have written contracts, are not paid according to official salary scales and are not declared in the social security system, these are not cited among closure reasons (Lauwerier et al., 2021). By contrast, Mauritania has no regulation requiring government-dependent private schools to undergo inspection. Should such schools be inspected, no sanctions based on inspection results can be administered, and they are also exempt from sanctions based on examination results (World Bank, 2016).
In northern Africa and Western Asia, countries including Algeria, Libya and Iraq require non-state schools’ students to take state-level secondary school examinations. That is also the case in Sudan, although it generally exempts international schools from this requirement as the curriculum may require other examinations. In the united Arab Emirates, which has a sizeable non-state education sector, the secondary school completion certificate in non-Arab private schools is equivalent to the national certificate ‘in accordance with the conditions specified by the Ministry’ (united Arab Emirates Cabinet, 2008).
In Bhutan, private schools must assess and review their own performance. Most schools are subject to annual ministry assessments as well, and students sit national
examinations. If the ministry receives notice that a private school has failed to comply with any guidelines, it investigates the concerns, gives the school a written warning if it is found to be non-compliant, and may recommend suspension or termination of the licence and eventual school closure.
India’s 2009 Right to Education Act states that schools cannot be established or recognized unless they fulfil norms and standards in an annex to the act. If non-compliance exceeds three years, the authorities must withdraw recognition, whereupon the owners are liable for substantial fines if they continue to run the school. In Karnataka state, the education minister threatened to close over 1,400 private schools not in compliance with the act (Deccan Chronicle, 2014). In 2016, 1,170 private schools were shut down in Punjab state. The national Independent School Alliance, which represents 55,400 private schools across India, reported that more than 15,000 schools were given closure notifications for non-compliance (Iyer and Counihan, 2018).
In the Philippines, private accreditation has been in effect since the 1970s to address concerns about government regulation. In the past, government could limit the entry of private schools to protect public schools from competition. Recognized non-state schools can voluntarily apply for accreditation, a form of recognized quality certification, under the Federation of Accrediting Agencies of the Philippines. If granted, it can give the school increased autonomy, deregulated status (with schools not subject to periodic evaluations) and state financial aid. The degree of autonomy of private schools, compared with government standards, depends on the level of accreditation they receive. However, accountability issues remained between the federation and the Department of Education (Rossignoli, 2021).
All non-state schools in Fiji are subject to external evaluation by officers authorized by the permanent secretary; they may enter and inspect at any time with or without notice. The 2014 Schools Standard Monitoring and Inspection Policy requires schools also to submit self-assessment reviews to the district education officer, who must verify them at least once every three years. Schools not complying following an official warning may have their registration certificate cancelled or be ordered closed by the permanent secretary. In Georgia, accreditation by the national Centre for Educational Quality Enhancement is voluntary, but required for
2 0 2 1 / 2 • G LO BA L E D U C AT I O N M O N I TO R I N G R E P O RT 84
3
schools to be considered for the government’s voucher programme. Authorized and accredited schools are entitled to issue certificates.
In Bogotá’s Concessionary Schools, the charter school experiment in Colombia, contracts are not renewed if schools do not meet learning outcome standards. of the 25 charter schools that started operating in 2000 under 15-year contracts, 3 had their contracts not renewed after the government’s programme evaluation in 2014; they then came under direct public management (Edwards Jr and Termes, 2018). Ecuador’s national Educational Authority defines education quality standards and indicators to be used for evaluations conducted by the national Institute of Educational Assessment, related student academic performance, alignment with the mandatory national curriculum, and teacher and manager performance. In Peru, although supervision of private schools is a state responsibility, since 2014 education decentralization has challenged the effectiveness of private provider supervision, as local ministry units lack capacity and resources (Balarin, 2015).
Despite such regulations’ validity, sudden closures can put many children’s education at risk, as was seen in countries where financial difficulties caused by the CovID-19 pandemic led to closures. With some students dropping out and others transferring to public institutions, private institutions faced a reduction in tuition revenue (Wodon, 2021c). In India’s Punjab state, the education department warned 38 private schools that charged fees during the lockdown, despite having been ordered not to do so, that their licence would be withdrawn if they did not cancel the fees (Sood and Prakash, 2020).
TEST-BASED ACCOUNTABILITY MAY FAIL IN ITS AIMS
Examination results are one accountability mechanism used to ensure that non-state schools meet standards. But few systems have the capacity to use this mechanism effectively, and test-based accountability is generally plagued by conceptual and practical problems.
In Burundi, all schools are subject to inspection. In addition, private secondary school students have the right to sit national examinations after grades 6 and 10. Private schools with a pass rate of less than 30% at the end of each school year may be closed; in 2016/17, private schools with results below 20% were closed (Agence Bujumbura news, 2017).
In Chile, the 2008 Preferential School Subsidy Law granted extra funding to schools that enrolled disadvantaged students, increasing the voucher’s value if schools adopted tighter accountability measures based on ranking schools and sharing the information publicly. underperforming schools lose autonomy and must contract with external school improvement services. If they do not move to a higher performance category within three years, the ministry can ask families to consider other schooling options. If the situation remains the same for a fourth year, the ministry revokes the licence and withdraws public funding (Elacqua et al., 2018). There is evidence that these provisions led to strategic behaviour, especially among underperforming schools, such as teaching to the test and assigning the best teachers to students who were to be externally evaluated (Elacqua et al., 2019; Falabella, 2020).
In Pakistan, financial assistance under the Punjab Education Foundation’s programme depends on the school’s performance on the annual quality assurance test to hold participating schools accountable. Funding is automatically discontinued if the school fails the test twice in a row (Afridi, 2018; Ansari, 2020; Barrera-osorio and Raju, 2015). In practice, however, the competitive pressures of this test-based funding model have been shown to work against equity. In interviews, providers said the pressure to perform well on the test and minimize the risk of losing government funding led to selecting students exclusively based on academic ability as determined by screening in admissions. About 90% of interviewed providers identified the test as one of the biggest issues limiting access of out-of-school children (Afridi, 2018).
The uS states of Indiana and Louisiana are among 23 states offering private school choice (Cunninghan, 2015; olneck-Brown, 2020). In their voucher programmes,
In Burundi, private schools with national examinations results below 20% were closed in 2016/17
85 C H A P T E R 3 • GovERnAnCE AnD REGuLATIon
3
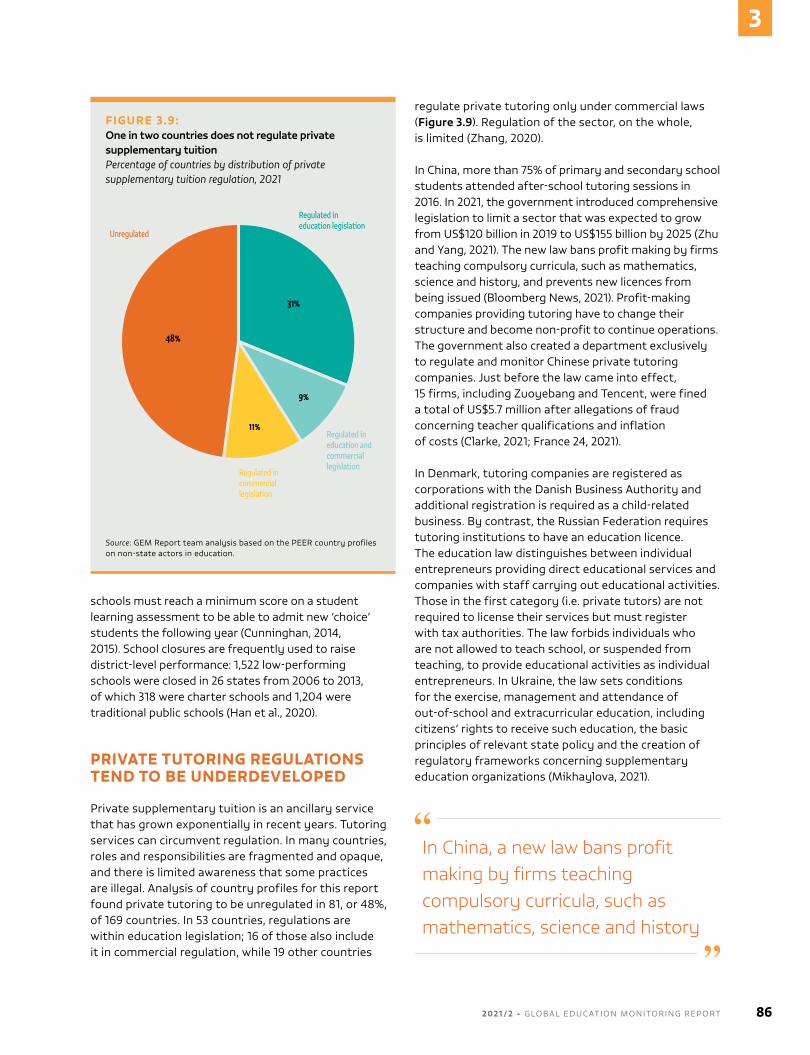
schools must reach a minimum score on a student learning assessment to be able to admit new ‘choice’ students the following year (Cunninghan, 2014, 2015). School closures are frequently used to raise district-level performance: 1,522 low-performing schools were closed in 26 states from 2006 to 2013, of which 318 were charter schools and 1,204 were traditional public schools (Han et al., 2020).
PRIVATE TUTORING REGULATIONS TEND TO BE UNDERDEVELOPED
Private supplementary tuition is an ancillary service that has grown exponentially in recent years. Tutoring services can circumvent regulation. In many countries, roles and responsibilities are fragmented and opaque, and there is limited awareness that some practices are illegal. Analysis of country profiles for this report found private tutoring to be unregulated in 81, or 48%, of 169 countries. In 53 countries, regulations are within education legislation; 16 of those also include it in commercial regulation, while 19 other countries
regulate private tutoring only under commercial laws (Figure 3.9). Regulation of the sector, on the whole, is limited (Zhang, 2020).
In China, more than 75% of primary and secondary school students attended after-school tutoring sessions in 2016. In 2021, the government introduced comprehensive legislation to limit a sector that was expected to grow from uS$120 billion in 2019 to uS$155 billion by 2025 (Zhu and Yang, 2021). The new law bans profit making by firms teaching compulsory curricula, such as mathematics, science and history, and prevents new licences from being issued (Bloomberg news, 2021). Profit-making companies providing tutoring have to change their structure and become non-profit to continue operations. The government also created a department exclusively to regulate and monitor Chinese private tutoring companies. Just before the law came into effect, 15 firms, including Zuoyebang and Tencent, were fined a total of uS$5.7 million after allegations of fraud concerning teacher qualifications and inflation of costs (Clarke, 2021; France 24, 2021).
In Denmark, tutoring companies are registered as corporations with the Danish Business Authority and additional registration is required as a child-related business. By contrast, the Russian Federation requires tutoring institutions to have an education licence. The education law distinguishes between individual entrepreneurs providing direct educational services and companies with staff carrying out educational activities. Those in the first category (i.e. private tutors) are not required to license their services but must register with tax authorities. The law forbids individuals who are not allowed to teach school, or suspended from teaching, to provide educational activities as individual entrepreneurs. In ukraine, the law sets conditions for the exercise, management and attendance of out-of-school and extracurricular education, including citizens’ rights to receive such education, the basic principles of relevant state policy and the creation of regulatory frameworks concerning supplementary education organizations (Mikhaylova, 2021).
In China, a new law bans profit making by firms teaching compulsory curricula, such as mathematics, science and history
FIGURE 3.9:One in two countries does not regulate private supplementary tuitionPercentage of countries by distribution of private supplementary tuition regulation, 2021
Unregulated
Regulated in education legislation
Regulated in commerciallegislation
Regulated ineducation andcommerciallegislation
48%
11%
9%
31%
Source: GEM Report team analysis based on the PEER country profiles on non-state actors in education.
2 0 2 1 / 2 • G LO BA L E D U C AT I O N M O N I TO R I N G R E P O RT 86
3
Regulations cover other aspects of tutoring as well. The Republic of Korea takes into consideration the number of people receiving tutoring and requires registration only for companies, not for the self-employed, though the latter need to meet certain requirements. other regulations concern the premises where tutoring is provided (e.g. in Ethiopia, the Russian Federation and uzbekistan) or the times when it is carried out (e.g. in the Republic of Korea and the Russian Federation). In Kazakhstan and uzbekistan, tutoring institutions must create collegial bodies bringing tutors together for professional development and discussion on curriculum and pedagogy. Some regulations also consider the content of the curriculum delivered (e.g. Kazakhstan and Pakistan).
Regulations on tutors’ qualifications are less common. Analysis of country profiles for this report suggests they exist in 28 of 91 countries. Malaysia requires tutors to have a teaching permit and their managers to have at least three years of teaching experience or at least six months in a related field. Similar requirements exist in the Republic of Korea. The Russian Federation and ukraine require tutors to meet specific standards. In some countries where the market for private tutoring has been expanding, governments have tried to introduce systems to monitor and ensure instruction quality using, for instance, online registers and platforms, as in China and the Republic of Korea (Zhang, 2020). The Australian Tutoring Association’s code of conduct provides guidelines on advertising standards, qualifications, consumer information, refund policies and business ethics (Australian Tutoring Association, 2021). The Japan Juku Association publishes voluntary standards and child and data protection guidelines for use by tutoring companies (Bray and Kwo, 2014). The united Kingdom, The Tutors’ Association was established in 2013 to professionalize the burgeoning industry with a code of ethics for tutors and a code of practice for companies (Tutors' Association, 2021).
on the controversial issue of whether serving public school teachers should be allowed to provide supplementary tutoring, four approaches have been identified to prevent corruption and poor teaching in classrooms: prohibition, discouragement, permission if approved, and laissez faire (Bray and Kwo, 2014; Zhang, 2020). In ukraine, where there is no explicit prohibition of public school teachers tutoring their pupils (oECD, 2017), 36% of students reported receiving private supplementary tutoring by their schoolteachers in 2016 (Civic network opora, 2016). In Mauritius, despite repeated attempts to address the issue, a report called private tutoring a parallel education system with ‘a turnover of billions of rupees’ (Think Mauritius, 2019, p. 42).
Analysis of PEER country profiles shows that 10 countries explicitly ban all teachers from being tutors; 11 other countries ban public school teachers from private tutoring and 10 countries also ban teachers, but the type of teacher remains unclear. In India, steps to ban government teachers from doing private tutoring started in 1996. The High Court in Tripura state banned all teachers in government-dependent and private schools from tutoring in 2015 (Barman, 2020). The Russian Federation’s 2012 education law, amended in 2020, forbids teachers from providing paid education services to pupils of the same school ‘if this leads to a conflict of interest’, which may occur when teachers’ interest in material benefits negatively affects their primary work. Thus teachers in some cases can tutor their own students for a fee.
CONCLUSION
Ensuring inclusive, equitable and good-quality education requires all actors to make a concerted effort to meet their responsibilities. While accountability starts with governments, it is important to recognize the multiplicity and interdependency of actors in education.
How responsibilities in education are shared varies greatly among countries. Improving responsibility sharing can lead to more efficient and equitable education systems. Engaging non-state actors in education has advantages but requires sound governance and regulatory frameworks. Yet in many contexts, regulation is not developed. In others, even when regulations are in place, government has insufficient financial and human resources to ensure compliance. Corruption and bribery take hold, leaving the most vulnerable exposed to the risk of unaffordable and low-quality education. Registration processes that are complex, unaffordable and long can hamper licensing and approval and fuel the operation of unrecognized schools.
ultimately, actors depend on each other to reach shared education goals. Meeting those goals requires collaboration and communication. Governments need to view the education system as a single entity, ensuring that standards are set and applied in both state and non-state schools and that all education actors are held accountable for their activities and results. Effective regulatory frameworks that support compliance and ensure effective complaint and redress mechanisms exist and can be replicated. This is necessary to ensure that every student learns.
87 C H A P T E R 3 • GovERnAnCE AnD REGuLATIon
3

2 0 2 1 / 2 • G LO BA L E D U C AT I O N M O N I TO R I N G R E P O RT 88
3
C H A P T E R 4 • Finance89
a boy waves goodbye to his parents as he
leaves for school, indonesia.
cReDiT: Robbi akbari Kamaruddin/alamy Stock Photo
4
90C H A P T E R 4 • Finance
CHAPTER
Finance
K E Y M E S S AG E SGovernments fund non-state actors in various ways.
� Governments may support none, some or all non-state providers. in canada, government covers 30% of private but 94% of public school expenditure. Sweden covers all expenditure in both private and public schools.
� countries vary in the costs they subsidize. in Bangladesh, the government pays teacher salaries for non-state secondary schools and madrasas, which account for 96% of enrolment. in india, 6% of primary and secondary schools are ‘government aided’, receiving grants for teacher salaries, but only six states cover expenses beyond tuition reimbursement.
� Some governments tax private schools, while others facilitate school choice with financing mechanisms. chile has had a voucher policy since 1981. in 2008, schools received additional funding based on their share of marginalized students. in 2015, chile regulated admission processes and eliminated fee charging for schools receiving subsidies.
Households cover a large share of education financing, particularly in the poorest countries.
� an estimated one third of household education expenditure in low- and middle-income countries comes from households with children in public schools. in 15 countries, 39% of education expenditure by households with children in state schools was for uniforms and supplies.
� Household education spending is unequal. While households in the poorest 20% spent practically nothing on education in argentina, costa Rica, Philippines and Zambia, the richest 20% spent between 0.5% and 1.7% of GDP.
� additional fees are charged in public schools in high-income countries too. according to the 2018 PiSa, public schools took obligatory financial contributions from parents in 7 of 59 countries and voluntary financial contributions in 38 of 59 countries.
� Households are increasingly spending on private tutoring. in the netherlands, household spending on tutoring increased by 160% between 2005 and 2016. in Myanmar, tutoring represented 42% of total household education spending.
Private providers usually rely on household out-of-pocket expenditure.
� Most private secondary schools receive at least 80% of their revenue from fees in 28 of 51 upper-middle- and high-income education systems.
� cOViD-19 challenged private schools that rely on school fees. in Panama, up to 40% of parents could not pay monthly fee instalments. in ecuador, public school enrolment was up by 6.5%, or 120,000 students, at the beginning of the 2020 school year.
� about one in six families save to pay school fees; around 8% of households also borrow, rising above 30% in Haiti, Kenya, the Philippines and Uganda.
Donor strategies envision a strong private sector role but are cautious on for-profit providers.
� The Global Partnership for education, international Finance corporation and european Parliament have recently declared they would not support for-profit actors.
� The World Bank and asian Development Bank support blended financing and public–private partnerships, although evidence of their benefits in education is unclear.
91 C H A P T E R 4 • Finance
4
Governments finance non-state providers directly and indirectly ......................... 92
Households face significant burdens and tough choices ............................................96
Donors are cautious about supporting for-profit education providers ..............104
The role of philanthropic and corporate activities in education is evolving ...... 107
conclusion .........................................................................................................................................110
Many countries are grappling with whether to offer public funds to non-state education
providers and whether such funding compromises equity in education. achievement of Sustainable Development Goal 4 relates to how much money households pay for education and whether it is directly out of pocket or indirectly through taxation. as philanthropic actors gain influence, meanwhile, their methods and motives are being examined.
This chapter analyses government’s role in funding private education institutions through various mechanisms, including public–private partnerships (PPPs), along with the effect of cOViD-19 on non-state education financing. it analyses household contributions and their consequences for inequality. Finally, donor and philanthropic financing of non-state provision and efforts to leverage private finance are discussed.
GOVERNMENTS FINANCE NON-STATE PROVIDERS DIRECTLY AND INDIRECTLY
Governments vary in their decisions whether to fund non-state education providers. They may or may not distinguish between state and non-state schools in their finance allocations. They may or may not subsidize private schools. They may contract out one or more aspects of education management. They may or may not finance students to attend the public or private schools of their choice (Patrinos et al., 2009).
Governments typically fund privately managed schools less, or less often, than publicly managed schools. in 2017, Organisation for economic co-operation and Development (OecD) countries spent US$9,515 per student in public primary and secondary schools,
on average, but US$6,064 per student in private schools. However, there is substantial variation: in canada, government covers 30% of private but 94% of public school expenditure, while Sweden covers all expenditure in both private and public schools (OeCD, 2020a).
no students attended private schools that received at least 80% of their funds from government in 29 of the 68 education systems that took part in the 2018 Programme for international Student assessment (PiSa). in Germany, no students in private schools but 96% of students in public schools attended institutions where government provided at least 80% of funding. all students in Finland attended public or private schools where the government provided at least 80% of the funds (Figure 4.1).
among education systems that have participated in multiple rounds of PiSa, only a few, including those of Peru, Qatar and the United arab emirates, saw the enrolment share increase in independent private schools, which receive less than 50% of their funding from government. More countries experienced increases in the enrolment share of dependent private schools, which receive at least 50% of their funding from government. in chile, Hungary, Sweden and the United Kingdom, enrolment in dependent private schools grew faster than enrolment in public schools. in indonesia and the Republic of Korea, it grew faster than in independent private schools (OeCD, 2020b) (Figure 4.2).
Governments typically fund privately managed schools less, or less often, than publicly managed schools
2 0 2 1 / 2 • G LO BA L E D U C AT I O N M O N I TO R I N G R E P O RT 92
4
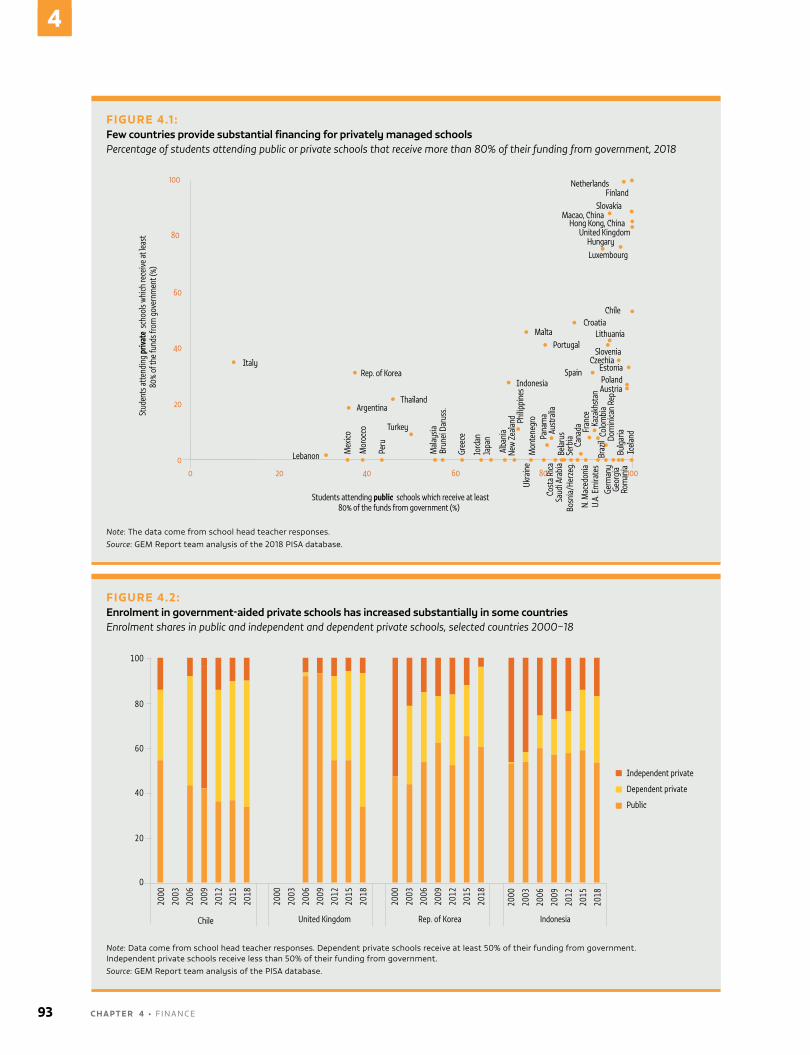
FIGURE 4.1 :Few countries provide substantial financing for privately managed schoolsPercentage of students attending public or private schools that receive more than 80% of their funding from government, 2018
80%
of th
e fun
ds fr
om g
over
nmen
t (%)
80% of the funds from government (%)
100
80
60
40
20
00 20 40 60 80 100
Italy
Lebanon Mex
ico
Mor
occo
Peru
Mala
ysia
Serb
ia
Gree
ce
Brun
ei D
arus
s.
Alba
nia
Jord
anJa
pan
New
Zeala
nd Philip
pine
sUk
rain
e
Cost
a Rica
Saud
i Ara
bia
Bosn
ia/H
erze
g.
Germ
any
N. M
aced
onia
U.A.
Em
irate
s
Geor
gia
Rom
ania
Mon
tene
gro
Pana
ma
Cana
daAust
ralia
Kaza
khst
an
Belar
us
Braz
ilCo
lom
bia
Fran
ce
Bulg
aria
Dom
inica
n Re
p.
Icela
nd
Rep. of Korea
ArgentinaThailand
Turkey
IndonesiaAustriaPoland
Spain EstoniaCzechia
SloveniaPortugal
MaltaCroatia
Chile
Lithuania
LuxembourgHungary
United KingdomHong Kong, China
Macao, ChinaSlovakia
FinlandNetherlands
Stud
ents
atte
ndin
g pr
ivate
sch
ools
which
rece
ive at
leas
t
Students attending public schools which receive at least
Note: The data come from school head teacher responses.Source: GeM Report team analysis of the 2018 PiSa database.
FIGURE 4.2: Enrolment in government-aided private schools has increased substantially in some countriesEnrolment shares in public and independent and dependent private schools, selected countries 2000–18
Rep. of Korea
Public
Dependent private
Independent private
Note: Data come from school head teacher responses. Dependent private schools receive at least 50% of their funding from government. independent private schools receive less than 50% of their funding from government.Source: GeM Report team analysis of the PiSa database.
93 C H A P T E R 4 • Finance
4
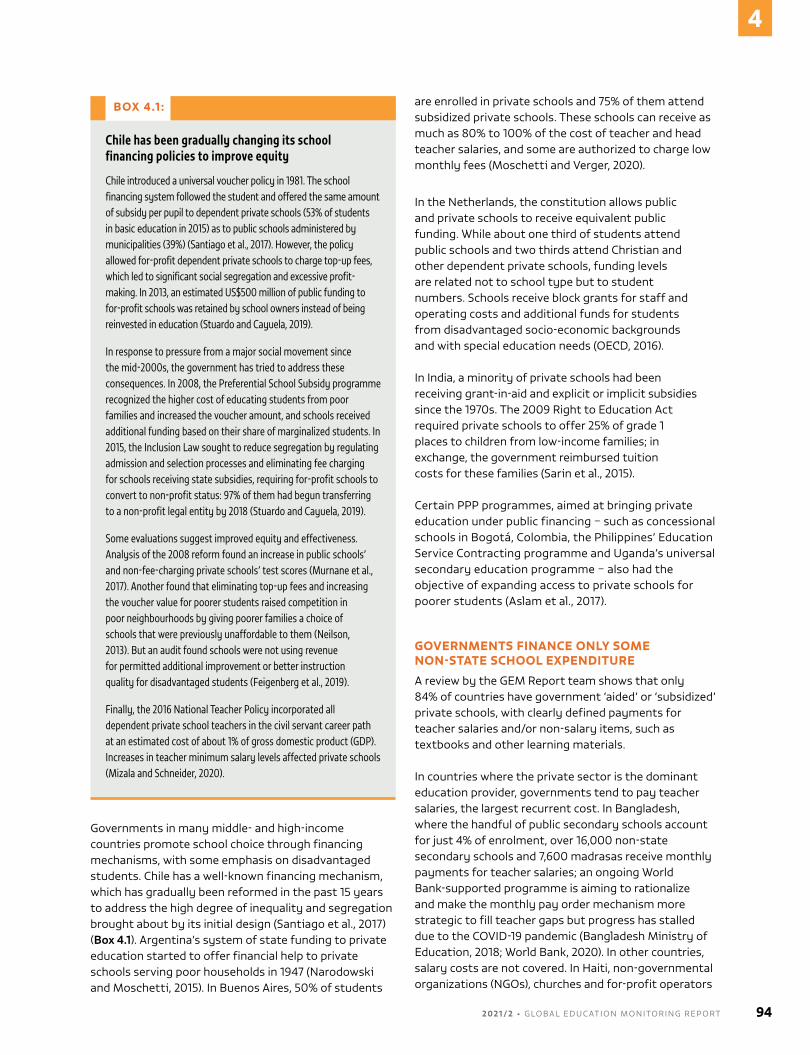
BOX 4.1 :
Chile has been gradually changing its school financing policies to improve equity
Chile introduced a universal voucher policy in 1981. The school financing system followed the student and offered the same amount of subsidy per pupil to dependent private schools (53% of students in basic education in 2015) as to public schools administered by municipalities (39%) (Santiago et al., 2017). However, the policy allowed for-profit dependent private schools to charge top-up fees, which led to significant social segregation and excessive profit-making. In 2013, an estimated US$500 million of public funding to for-profit schools was retained by school owners instead of being reinvested in education (Stuardo and Cayuela, 2019).
In response to pressure from a major social movement since the mid-2000s, the government has tried to address these consequences. In 2008, the Preferential School Subsidy programme recognized the higher cost of educating students from poor families and increased the voucher amount, and schools received additional funding based on their share of marginalized students. In 2015, the Inclusion Law sought to reduce segregation by regulating admission and selection processes and eliminating fee charging for schools receiving state subsidies, requiring for-profit schools to convert to non-profit status: 97% of them had begun transferring to a non-profit legal entity by 2018 (Stuardo and Cayuela, 2019).
Some evaluations suggest improved equity and effectiveness. Analysis of the 2008 reform found an increase in public schools’ and non-fee-charging private schools’ test scores (Murnane et al., 2017). Another found that eliminating top-up fees and increasing the voucher value for poorer students raised competition in poor neighbourhoods by giving poorer families a choice of schools that were previously unaffordable to them (Neilson, 2013). But an audit found schools were not using revenue for permitted additional improvement or better instruction quality for disadvantaged students (Feigenberg et al., 2019).
Finally, the 2016 National Teacher Policy incorporated all dependent private school teachers in the civil servant career path at an estimated cost of about 1% of gross domestic product (GDP). Increases in teacher minimum salary levels affected private schools (Mizala and Schneider, 2020).
Governments in many middle- and high-income countries promote school choice through financing mechanisms, with some emphasis on disadvantaged students. chile has a well-known financing mechanism, which has gradually been reformed in the past 15 years to address the high degree of inequality and segregation brought about by its initial design (Santiago et al., 2017) (Box 4.1). argentina’s system of state funding to private education started to offer financial help to private schools serving poor households in 1947 (narodowski and Moschetti, 2015). in Buenos aires, 50% of students
are enrolled in private schools and 75% of them attend subsidized private schools. These schools can receive as much as 80% to 100% of the cost of teacher and head teacher salaries, and some are authorized to charge low monthly fees (Moschetti and Verger, 2020).
in the netherlands, the constitution allows public and private schools to receive equivalent public funding. While about one third of students attend public schools and two thirds attend christian and other dependent private schools, funding levels are related not to school type but to student numbers. Schools receive block grants for staff and operating costs and additional funds for students from disadvantaged socio-economic backgrounds and with special education needs (OeCD, 2016).
in india, a minority of private schools had been receiving grant-in-aid and explicit or implicit subsidies since the 1970s. The 2009 Right to education act required private schools to offer 25% of grade 1 places to children from low-income families; in exchange, the government reimbursed tuition costs for these families (Sarin et al., 2015).
certain PPP programmes, aimed at bringing private education under public financing – such as concessional schools in Bogotá, colombia, the Philippines’ education Service contracting programme and Uganda’s universal secondary education programme – also had the objective of expanding access to private schools for poorer students (aslam et al., 2017).
GOVERNMENTS FINANCE ONLY SOME NON-STATE SCHOOL EXPENDITURE
a review by the GeM Report team shows that only 84% of countries have government ‘aided’ or ‘subsidized’ private schools, with clearly defined payments for teacher salaries and/or non-salary items, such as textbooks and other learning materials.
in countries where the private sector is the dominant education provider, governments tend to pay teacher salaries, the largest recurrent cost. in Bangladesh, where the handful of public secondary schools account for just 4% of enrolment, over 16,000 non-state secondary schools and 7,600 madrasas receive monthly payments for teacher salaries; an ongoing World Bank-supported programme is aiming to rationalize and make the monthly pay order mechanism more strategic to fill teacher gaps but progress has stalled due to the cOViD-19 pandemic (Bangladesh Ministry of education, 2018; World Bank, 2020). in other countries, salary costs are not covered. in Haiti, non-governmental organizations (nGOs), churches and for-profit operators
2 0 2 1 / 2 • G LO BA L E D U C AT I O N M O N I TO R I N G R E P O RT 94
4
manage over 85% of primary schools (World Bank, 2018). The 2017–27 education plan specifies that public funding can be provided to non-state institutions to subsidize teacher salaries, especially in low-tuition private schools.
access to funding is contingent, among other factors, on performance, school registration status and fee levels (Haiti Ministry of national education and Professional Training, 2018). in practice, however, the system has lacked adequate domestic financing, and donor funds cannot be used for salaries (World Bank, 2018).
The government-aided private sector is much smaller in other countries. in india, 6% of primary and secondary schools – but as much as 22% in Maharashtra, 28% in Meghalaya and 43% in Kerala states – were classified as ‘government aided’ in 2019/20, receiving grants for teacher salaries (India Ministry of education, 2021). However, aided schools have gone for years without non-salary grants, putting their financial sustainability in question (Dore, 2013), as they are not allowed to increase fees to recoup costs. Only six states cover expenses beyond tuition reimbursement, such as textbooks, stationery, uniforms and transport. Reimbursement delays can be lengthy: in Jaipur, Rajasthan, reimbursement processing was six months behind (Sarin et al., 2015).
côte d’ivoire, which had been subsidizing private schools, began in the late 1990s to link subsidies to teacher qualifications, class size, a fee range and exam performance (Sakellariou and Patrinos, 2009). The number of students in subsidized secondary schools quadrupled between 2010/11 and 2017/18 (education Partnerships Group, 2019). But the expansion challenged budgets, while the programme did not target equitable access. Moreover, many private schools have poor facilities and face financial problems due to late payment of subsidies and difficulties in raising tuition fees on time, which affects the timely payment of teacher salaries (Koutou and Goi Bi, 2019).
Governments seldom cover non-state schools’ capital expenditures related to construction, renovation or equipment. Privately managed schools are not eligible for public capital funding in 7 out of 17 OecD education systems (OeCD, 2018c). For others, eligibility and financing varies. in the czech Republic, capital
funding of private schools is left to local authorities’ discretion. in Denmark, private schools receive an activity-based capital grant from central authorities. in Sweden, dependent private schools receive capital funding similar to that of public schools. The Flemish community of Belgium requires private providers to use publicly subsidized facilities for education activities for at least 30 years. They then can opt to sell the building without returning the equity to the government. School facility ownership can thus become a difficult question (nusche et al., 2015; OeCD, 2017, 2018a).
in indonesia, central, provincial and district governments finance basic education through four mechanisms: direct one-off capital investments and ongoing salary payments; subsidies for public utilities such as electricity; grants for selected operational costs; and scholarships or other assistance to poor families. Public schools receive funds from all these mechanisms. But madrasas and islamic boarding schools, known as pesantren, accounting for 35% of all private schools and under the jurisdiction of the Ministry of Religious affairs, have only partial access to funds from the last two mechanisms. They are excluded from province- and district-level funds, which are decentralized by the Ministry of education but not the Ministry of Regional affairs. as a result, madrasas and pesantren raise funds privately and pass on costs to families (Joshi, 2018).
While some countries promote school choice, others treat private schools like companies and tax them. Uganda’s government introduced a corporate tax on private primary and secondary schools in the 2014/15 budget. interviews and focus groups conducted in three districts with proprietors and other stakeholders suggest that the tax led to an increase in school fees (Kasozi-Mulindwa and Okware, 2019).
PRIVATE SCHOOL FUNDING HAS BEEN SUBSTANTIALLY AFFECTED BY COVID-19
The cOViD-19 crisis affected private schools, especially those relying on school fees. an early synthesis of media reports suggested that private school and contract teachers had lost their jobs or experienced salary cuts in at least 25 countries, including cameroon, Mozambique, niger, Viet nam and Zambia (Carvalho and Hares, 2020).
In India, 6% of primary and secondary schools, but 43% in Kerala state, were classified as ‘government aided’ in 2019/20
95 C H A P T E R 4 • Finance
4
Afghanistan, Canada, Ireland, Pakistan and Panama excluded private schools from additional education funds provided as COVID-19 relief
in nigeria, most of the 715 low-fee private schools that received funding from Sustainable education & enterprise Development (SeeD) had not collected fees since school closures began and could not pay rent, thus facing possible eviction (niazi and Doorly, 2020). in the Dominican Republic, ethiopia, Ghana, Mozambique, nigeria, Senegal, Uganda and Zambia, 99% of 657 low-fee private schools reported a significant fall in revenue, 80% on average (Opportunity eduFinance, 2020).
Several countries tried to ensure that private school and contract teachers continued to be paid. nigeria launched a stimulus package with low-interest loans to pay private school teachers. côte d’ivoire agreed to pay more than 10,000 contract teachers who had missed three months of salary (Carvalho and Hares, 2020). in Ghana, private schools received support as part of a generalized programme for small and medium-sized enterprises (niazi and Doorly, 2020). Viet nam expanded cash transfer programmes to cover private school teachers. in Rwanda, private school teachers earning below a given threshold were exempted from personal income taxes (IMF, 2021). The office of the United nations High commissioner for Refugees ensured that teachers still received pay while schools were closed in Burkina Faso, chad, Malawi and Mozambique (Carvalho and Hares, 2020). The Ghana national association of Private Schools successfully advocated for inclusion in support to small and medium-sized enterprises. The Kenya Private Schools association launched an online platform supporting distance learning for all private schools (niazi and Doorly, 2020). Other governments, however, including those of afghanistan, canada, ireland, Pakistan and Panama, excluded private schools from additional education funds provided as cOViD-19 relief (Carvalho and Hares, 2020).
in some countries, governments focused on how to deal with the large transfer of students from private to public schools during the cOViD-19 crisis. in Peru, a survey of 12,000 parents who requested a transfer of their children to public institutions found that one key reason was
objection to the quality of private institutions’ online education services. The Ministry of education added more than 100,000 spaces in public institutions and estimated that over US$19 million would be needed to hire at least 1,700 executives, 1,500 teachers, 2,000 education assistants and 900 administrative staff. it developed an algorithm, based on availability of spaces, to assign students to the closest public school (alvarez et al., 2021).
HOUSEHOLDS FACE SIGNIFICANT BURDENS AND TOUGH CHOICES
Households invest resources to ensure that children have access to education of the highest possible quality and gain a competitive advantage that will improve their life chances. The extent of direct household financial contributions is likely related to the extent of government provision, its focus on equity and taxation’s redistributive effect. The distribution of household burden, along with households’ opportunity to choose, affects the entire education system. Out-of-pocket spending on education may be motivated by low government spending, which forces parents to pay, or by wealth, ambition or peer pressure to pursue advantage for children.
analysis carried out for this report shows that households account for 16% of education expenditure in high-income countries and 36% in low- and middle-income countries. as a share of GDP, this spending amounts to 1% in high-income and 2.3% in low- and middle-income countries (see Chapter 21). in primary and secondary education, it accounts for 1.2% of GDP in el Salvador, 1.5% in Morocco, 1.8% in india and 2.5% in Ghana.
Households account for 10% of primary and secondary education expenditure in high-income countries and 23% in low- and middle-income countries
2 0 2 1 / 2 • G LO BA L E D U C AT I O N M O N I TO R I N G R E P O RT 96
4
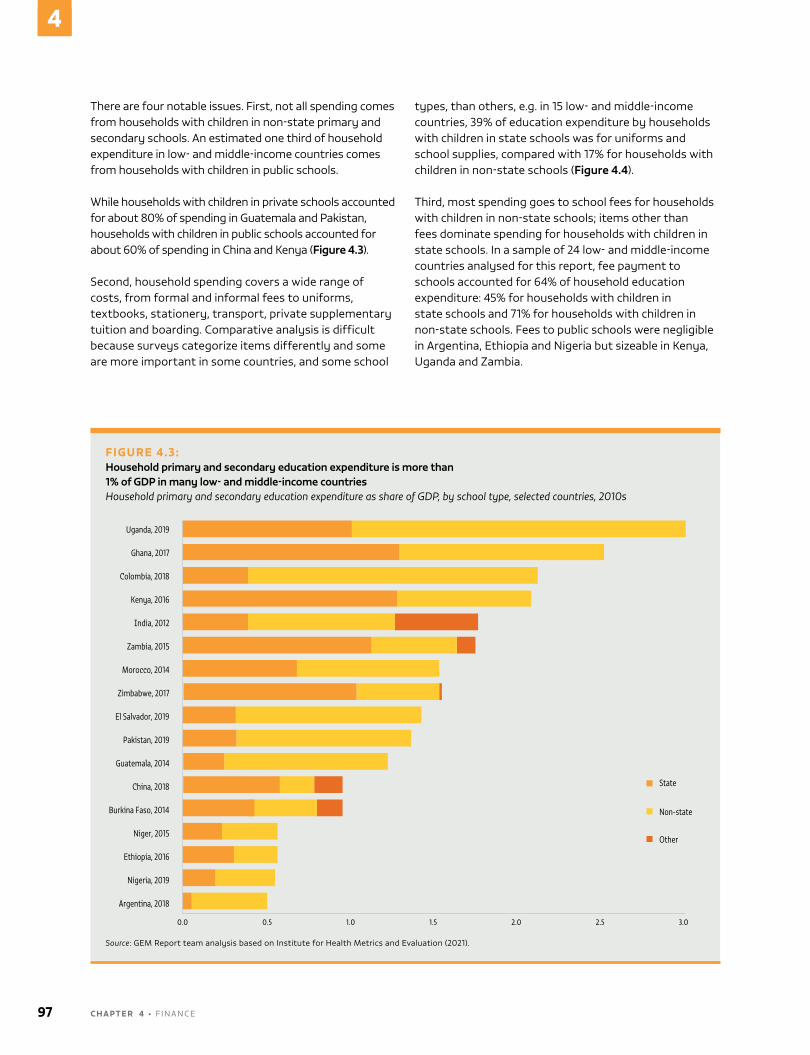
There are four notable issues. First, not all spending comes from households with children in non-state primary and secondary schools. an estimated one third of household expenditure in low- and middle-income countries comes from households with children in public schools.
While households with children in private schools accounted for about 80% of spending in Guatemala and Pakistan, households with children in public schools accounted for about 60% of spending in china and Kenya (Figure 4.3).
Second, household spending covers a wide range of costs, from formal and informal fees to uniforms, textbooks, stationery, transport, private supplementary tuition and boarding. comparative analysis is difficult because surveys categorize items differently and some are more important in some countries, and some school
types, than others, e.g. in 15 low- and middle-income countries, 39% of education expenditure by households with children in state schools was for uniforms and school supplies, compared with 17% for households with children in non-state schools (Figure 4.4).
Third, most spending goes to school fees for households with children in non-state schools; items other than fees dominate spending for households with children in state schools. in a sample of 24 low- and middle-income countries analysed for this report, fee payment to schools accounted for 64% of household education expenditure: 45% for households with children in state schools and 71% for households with children in non-state schools. Fees to public schools were negligible in argentina, ethiopia and nigeria but sizeable in Kenya, Uganda and Zambia.
FIGURE 4.3:Household primary and secondary education expenditure is more than 1% of GDP in many low- and middle-income countriesHousehold primary and secondary education expenditure as share of GDP, by school type, selected countries, 2010s
0.0 1.00.5 1.5
State
Non-state
Other
%
2.0 3.02.5
Argentina, 2018
Nigeria, 2019
Ethiopia, 2016
Niger, 2015
Burkina Faso, 2014
China, 2018
Guatemala, 2014
Pakistan, 2019
El Salvador, 2019
Zimbabwe, 2017
Morocco, 2014
Zambia, 2015
India, 2012
Kenya, 2016
Colombia, 2018
Ghana, 2017
Uganda, 2019
Source: GeM Report team analysis based on institute for Health Metrics and evaluation (2021).
97 C H A P T E R 4 • Finance
4
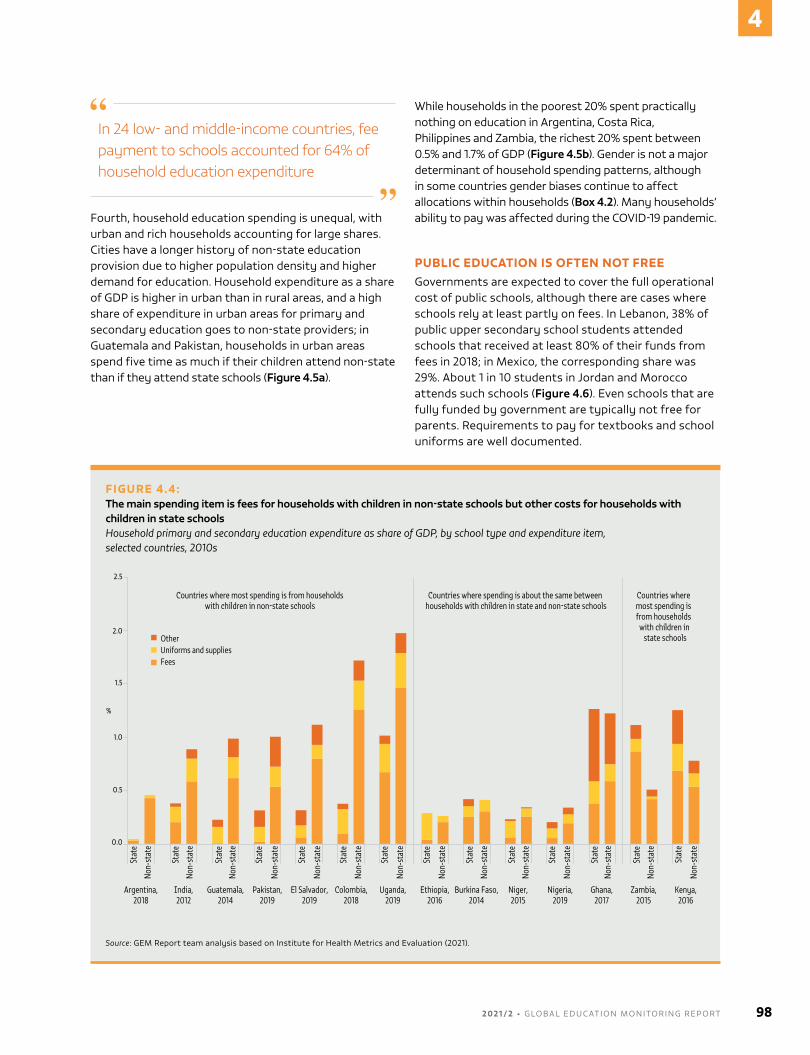
In 24 low- and middle-income countries, fee payment to schools accounted for 64% of household education expenditure
Fourth, household education spending is unequal, with urban and rich households accounting for large shares. cities have a longer history of non-state education provision due to higher population density and higher demand for education. Household expenditure as a share of GDP is higher in urban than in rural areas, and a high share of expenditure in urban areas for primary and secondary education goes to non-state providers; in Guatemala and Pakistan, households in urban areas spend five time as much if their children attend non-state than if they attend state schools (Figure 4.5a).
While households in the poorest 20% spent practically nothing on education in argentina, costa Rica, Philippines and Zambia, the richest 20% spent between 0.5% and 1.7% of GDP (Figure 4.5b). Gender is not a major determinant of household spending patterns, although in some countries gender biases continue to affect allocations within households (Box 4.2). Many households’ ability to pay was affected during the cOViD-19 pandemic.
PUBLIC EDUCATION IS OFTEN NOT FREEGovernments are expected to cover the full operational cost of public schools, although there are cases where schools rely at least partly on fees. in Lebanon, 38% of public upper secondary school students attended schools that received at least 80% of their funds from fees in 2018; in Mexico, the corresponding share was 29%. about 1 in 10 students in Jordan and Morocco attends such schools (Figure 4.6). even schools that are fully funded by government are typically not free for parents. Requirements to pay for textbooks and school uniforms are well documented.
FIGURE 4.4:The main spending item is fees for households with children in non-state schools but other costs for households with children in state schoolsHousehold primary and secondary education expenditure as share of GDP, by school type and expenditure item, selected countries, 2010s
0.0
1.0
%
0.5
1.5
2.0
2.5
Stat
e
Non-
stat
e
OtherUniforms and suppliesFees
Argentina,2018
Stat
e
Non-
stat
e
Nigeria,2019
Stat
e
Non-
stat
e
Ethiopia,2016
Stat
e
Non-
stat
e
Niger,2015
Stat
e
Non-
stat
e
Burkina Faso,2014
Stat
eNo
n-st
ate
Guatemala,2014
Stat
e
Non-
stat
e
Pakistan,2019
Stat
e
Non-
stat
e
El Salvador,2019
Stat
e
Non-
stat
e
Zambia,2015
Stat
e
Non-
stat
e
India,2012
Stat
e
Non-
stat
e
Kenya,2016
Stat
e
Non-
stat
e
Colombia,2018
Stat
eNo
n-st
ate
Ghana,2017
Stat
e
Non-
stat
e
Uganda,2019
Countries where most spending is from householdswith children in non-state schools
Countries where spending is about the same between households with children in state and non-state schools
Countries where most spending is from households with children in state schools
Source: GeM Report team analysis based on institute for Health Metrics and evaluation (2021).
2 0 2 1 / 2 • G LO BA L E D U C AT I O N M O N I TO R I N G R E P O RT 98
4
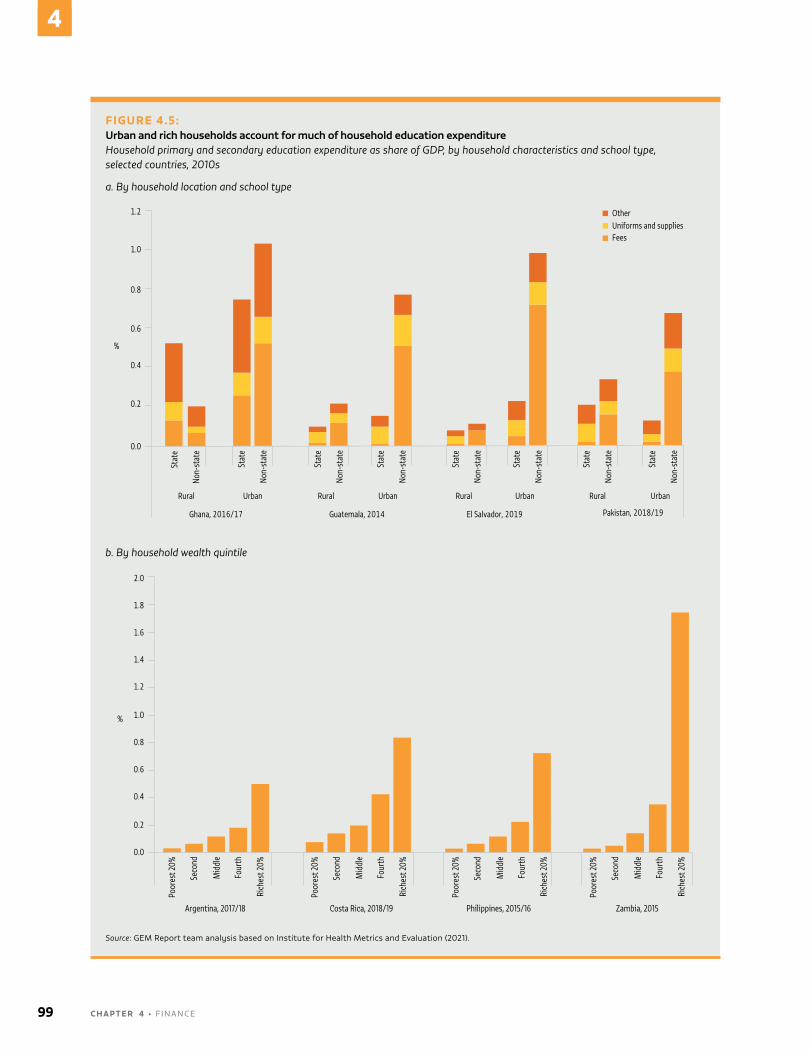
FIGURE 4.5: Urban and rich households account for much of household education expenditureHousehold primary and secondary education expenditure as share of GDP, by household characteristics and school type, selected countries, 2010s
a. By household location and school type
Zambia, 2015Philippines, 2015/16Costa Rica, 2018/19Argentina, 2017/18
Poor
est 2
0%
Seco
nd
Mid
dle
Four
th
Rich
est 2
0%
Poor
est 2
0%
Seco
nd
Mid
dle
Four
th
Rich
est 2
0%
Poor
est 2
0%
Seco
nd
Mid
dle
Four
th
Rich
est 2
0%
Poor
est 2
0%
Seco
nd
Mid
dle
Four
th
Rich
est 2
0%
OtherUniforms and suppliesFees
Urban Urban Urban Urban
Stat
e
Non-
stat
e
Stat
e
Non-
stat
e
Stat
e
Non-
stat
e
Stat
e
Non-
stat
e
Stat
e
Non-
stat
e
Stat
e
Non-
stat
e
Stat
e
Non-
stat
e
Stat
e
Non-
stat
e
b. By household wealth quintile
Zambia, 2015Philippines, 2015/16Costa Rica, 2018/19Argentina, 2017/18
Poor
est 2
0%
Seco
nd
Mid
dle
Four
th
Rich
est 2
0%
Poor
est 2
0%
Seco
nd
Mid
dle
Four
th
Rich
est 2
0%
Poor
est 2
0%
Seco
nd
Mid
dle
Four
th
Rich
est 2
0%
Poor
est 2
0%
Seco
nd
Mid
dle
Four
th
Rich
est 2
0%
OtherUniforms and suppliesFees
Urban Urban Urban Urban
Stat
e
Non-
stat
e
Stat
e
Non-
stat
e
Stat
e
Non-
stat
e
Stat
e
Non-
stat
e
Stat
e
Non-
stat
e
Stat
e
Non-
stat
e
Stat
e
Non-
stat
e
Stat
e
Non-
stat
e
Source: GeM Report team analysis based on institute for Health Metrics and evaluation (2021).
99 C H A P T E R 4 • Finance
4
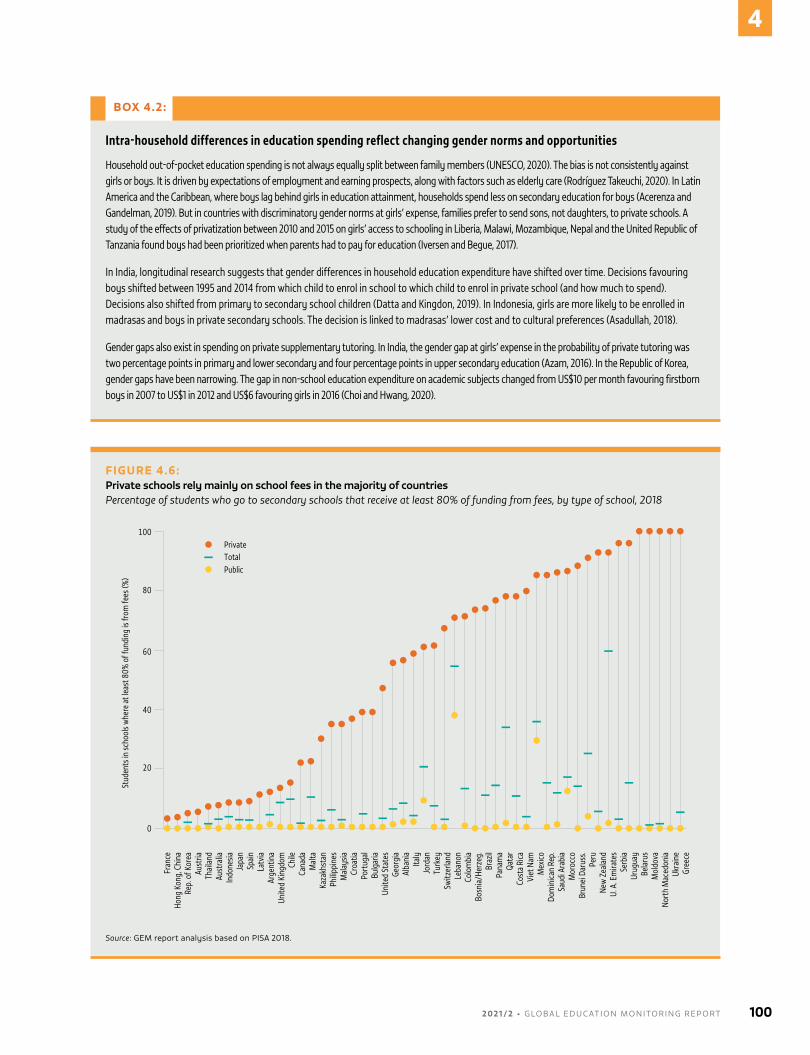
BOX 4.2:
Intra-household differences in education spending reflect changing gender norms and opportunities
Household out-of-pocket education spending is not always equally split between family members (UNESCO, 2020). The bias is not consistently against girls or boys. It is driven by expectations of employment and earning prospects, along with factors such as elderly care (Rodríguez Takeuchi, 2020). In Latin America and the Caribbean, where boys lag behind girls in education attainment, households spend less on secondary education for boys (Acerenza and Gandelman, 2019). But in countries with discriminatory gender norms at girls’ expense, families prefer to send sons, not daughters, to private schools. A study of the effects of privatization between 2010 and 2015 on girls’ access to schooling in Liberia, Malawi, Mozambique, Nepal and the United Republic of Tanzania found boys had been prioritized when parents had to pay for education (Iversen and Begue, 2017).
In India, longitudinal research suggests that gender differences in household education expenditure have shifted over time. Decisions favouring boys shifted between 1995 and 2014 from which child to enrol in school to which child to enrol in private school (and how much to spend). Decisions also shifted from primary to secondary school children (Datta and Kingdon, 2019). In Indonesia, girls are more likely to be enrolled in madrasas and boys in private secondary schools. The decision is linked to madrasas’ lower cost and to cultural preferences (Asadullah, 2018).
Gender gaps also exist in spending on private supplementary tutoring. In India, the gender gap at girls’ expense in the probability of private tutoring was two percentage points in primary and lower secondary and four percentage points in upper secondary education (Azam, 2016). In the Republic of Korea, gender gaps have been narrowing. The gap in non-school education expenditure on academic subjects changed from US$10 per month favouring firstborn boys in 2007 to US$1 in 2012 and US$6 favouring girls in 2016 (Choi and Hwang, 2020).
FIGURE 4.6:Private schools rely mainly on school fees in the majority of countriesPercentage of students who go to secondary schools that receive at least 80% of funding from fees, by type of school, 2018
Rep.
of K
orea
Kaza
khst
an
Turk
ey
Leba
non
Pana
ma
Qata
r
Peru
Urug
uay
Source: GeM report analysis based on PiSa 2018.
2 0 2 1 / 2 • G LO BA L E D U C AT I O N M O N I TO R I N G R E P O RT 100
4
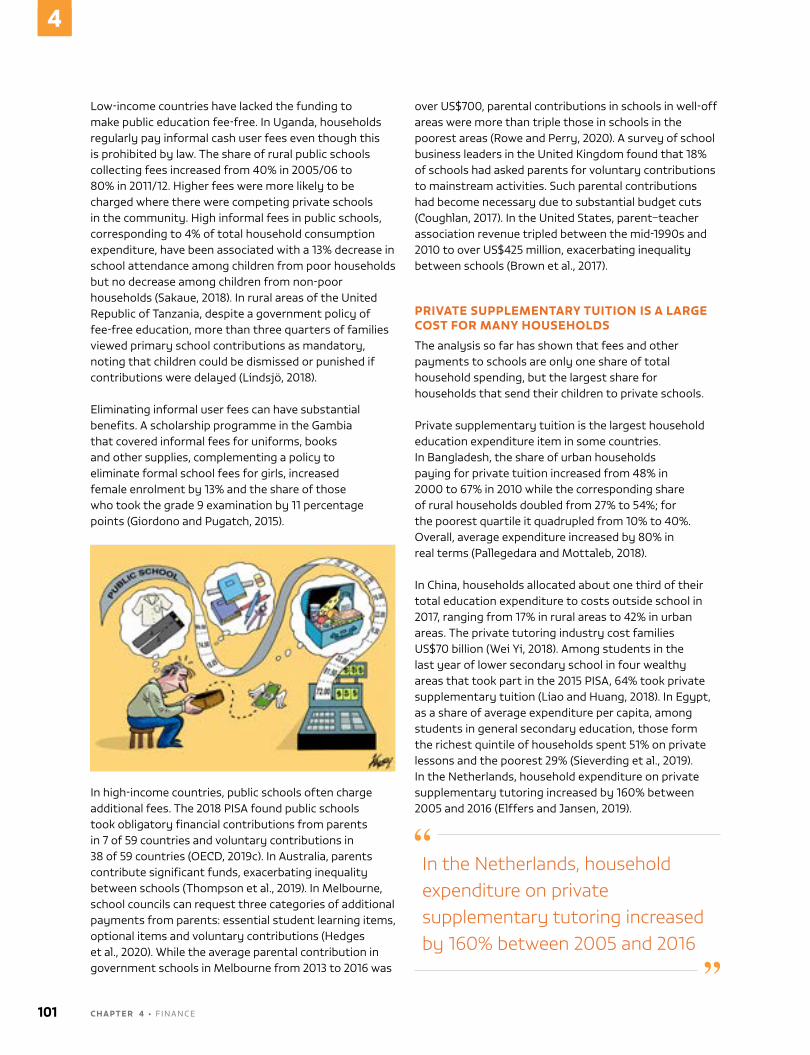
Low-income countries have lacked the funding to make public education fee-free. in Uganda, households regularly pay informal cash user fees even though this is prohibited by law. The share of rural public schools collecting fees increased from 40% in 2005/06 to 80% in 2011/12. Higher fees were more likely to be charged where there were competing private schools in the community. High informal fees in public schools, corresponding to 4% of total household consumption expenditure, have been associated with a 13% decrease in school attendance among children from poor households but no decrease among children from non-poor households (Sakaue, 2018). in rural areas of the United Republic of Tanzania, despite a government policy of fee-free education, more than three quarters of families viewed primary school contributions as mandatory, noting that children could be dismissed or punished if contributions were delayed (Lindsjö, 2018).
eliminating informal user fees can have substantial benefits. a scholarship programme in the Gambia that covered informal fees for uniforms, books and other supplies, complementing a policy to eliminate formal school fees for girls, increased female enrolment by 13% and the share of those who took the grade 9 examination by 11 percentage points (Giordono and Pugatch, 2015).
in high-income countries, public schools often charge additional fees. The 2018 PiSa found public schools took obligatory financial contributions from parents in 7 of 59 countries and voluntary contributions in 38 of 59 countries (OeCD, 2019c). in australia, parents contribute significant funds, exacerbating inequality between schools (Thompson et al., 2019). in Melbourne, school councils can request three categories of additional payments from parents: essential student learning items, optional items and voluntary contributions (Hedges et al., 2020). While the average parental contribution in government schools in Melbourne from 2013 to 2016 was
over US$700, parental contributions in schools in well-off areas were more than triple those in schools in the poorest areas (Rowe and Perry, 2020). a survey of school business leaders in the United Kingdom found that 18% of schools had asked parents for voluntary contributions to mainstream activities. Such parental contributions had become necessary due to substantial budget cuts (Coughlan, 2017). in the United States, parent–teacher association revenue tripled between the mid-1990s and 2010 to over US$425 million, exacerbating inequality between schools (Brown et al., 2017).
PRIVATE SUPPLEMENTARY TUITION IS A LARGE COST FOR MANY HOUSEHOLDS
The analysis so far has shown that fees and other payments to schools are only one share of total household spending, but the largest share for households that send their children to private schools.
Private supplementary tuition is the largest household education expenditure item in some countries. in Bangladesh, the share of urban households paying for private tuition increased from 48% in 2000 to 67% in 2010 while the corresponding share of rural households doubled from 27% to 54%; for the poorest quartile it quadrupled from 10% to 40%. Overall, average expenditure increased by 80% in real terms (Pallegedara and Mottaleb, 2018).
in china, households allocated about one third of their total education expenditure to costs outside school in 2017, ranging from 17% in rural areas to 42% in urban areas. The private tutoring industry cost families US$70 billion (Wei Yi, 2018). among students in the last year of lower secondary school in four wealthy areas that took part in the 2015 PiSa, 64% took private supplementary tuition (Liao and Huang, 2018). in egypt, as a share of average expenditure per capita, among students in general secondary education, those form the richest quintile of households spent 51% on private lessons and the poorest 29% (Sieverding et al., 2019). in the netherlands, household expenditure on private supplementary tutoring increased by 160% between 2005 and 2016 (elffers and Jansen, 2019).
In the Netherlands, household expenditure on private supplementary tutoring increased by 160% between 2005 and 2016
101 C H A P T E R 4 • Finance
4
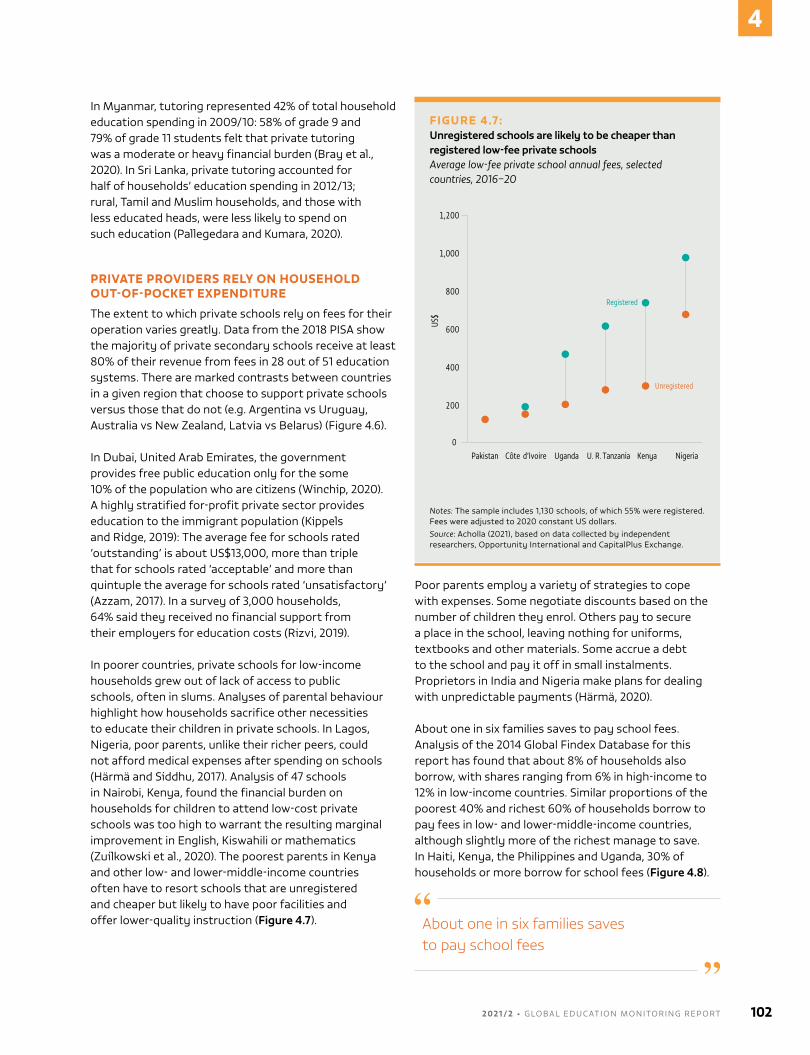
in Myanmar, tutoring represented 42% of total household education spending in 2009/10: 58% of grade 9 and 79% of grade 11 students felt that private tutoring was a moderate or heavy financial burden (Bray et al., 2020). in Sri Lanka, private tutoring accounted for half of households’ education spending in 2012/13; rural, Tamil and Muslim households, and those with less educated heads, were less likely to spend on such education (Pallegedara and Kumara, 2020).
PRIVATE PROVIDERS RELY ON HOUSEHOLD OUT-OF-POCKET EXPENDITURE
The extent to which private schools rely on fees for their operation varies greatly. Data from the 2018 PiSa show the majority of private secondary schools receive at least 80% of their revenue from fees in 28 out of 51 education systems. There are marked contrasts between countries in a given region that choose to support private schools versus those that do not (e.g. argentina vs Uruguay, australia vs new Zealand, Latvia vs Belarus) (Figure 4.6).
in Dubai, United arab emirates, the government provides free public education only for the some 10% of the population who are citizens (Winchip, 2020). a highly stratified for-profit private sector provides education to the immigrant population (Kippels and Ridge, 2019): The average fee for schools rated ‘outstanding’ is about US$13,000, more than triple that for schools rated ‘acceptable’ and more than quintuple the average for schools rated ‘unsatisfactory’ (azzam, 2017). in a survey of 3,000 households, 64% said they received no financial support from their employers for education costs (Rizvi, 2019).
in poorer countries, private schools for low-income households grew out of lack of access to public schools, often in slums. analyses of parental behaviour highlight how households sacrifice other necessities to educate their children in private schools. in Lagos, nigeria, poor parents, unlike their richer peers, could not afford medical expenses after spending on schools (Härmä and Siddhu, 2017). analysis of 47 schools in nairobi, Kenya, found the financial burden on households for children to attend low-cost private schools was too high to warrant the resulting marginal improvement in english, Kiswahili or mathematics (Zuilkowski et al., 2020). The poorest parents in Kenya and other low- and lower-middle-income countries often have to resort schools that are unregistered and cheaper but likely to have poor facilities and offer lower-quality instruction (Figure 4.7).
Poor parents employ a variety of strategies to cope with expenses. Some negotiate discounts based on the number of children they enrol. Others pay to secure a place in the school, leaving nothing for uniforms, textbooks and other materials. Some accrue a debt to the school and pay it off in small instalments. Proprietors in india and nigeria make plans for dealing with unpredictable payments (Härmä, 2020).
about one in six families saves to pay school fees. analysis of the 2014 Global Findex Database for this report has found that about 8% of households also borrow, with shares ranging from 6% in high-income to 12% in low-income countries. Similar proportions of the poorest 40% and richest 60% of households borrow to pay fees in low- and lower-middle-income countries, although slightly more of the richest manage to save. in Haiti, Kenya, the Philippines and Uganda, 30% of households or more borrow for school fees (Figure 4.8).
About one in six families saves to pay school fees
FIGURE 4.7:Unregistered schools are likely to be cheaper than registered low-fee private schoolsAverage low-fee private school annual fees, selected countries, 2016–20
1,200
1,000
800
600
400
200
Uganda U. R. Tanzania Kenya
Notes: The sample includes 1,130 schools, of which 55% were registered. Fees were adjusted to 2020 constant US dollars.Source: acholla (2021), based on data collected by independent researchers, Opportunity international and capitalPlus exchange.
2 0 2 1 / 2 • G LO BA L E D U C AT I O N M O N I TO R I N G R E P O RT 102
4
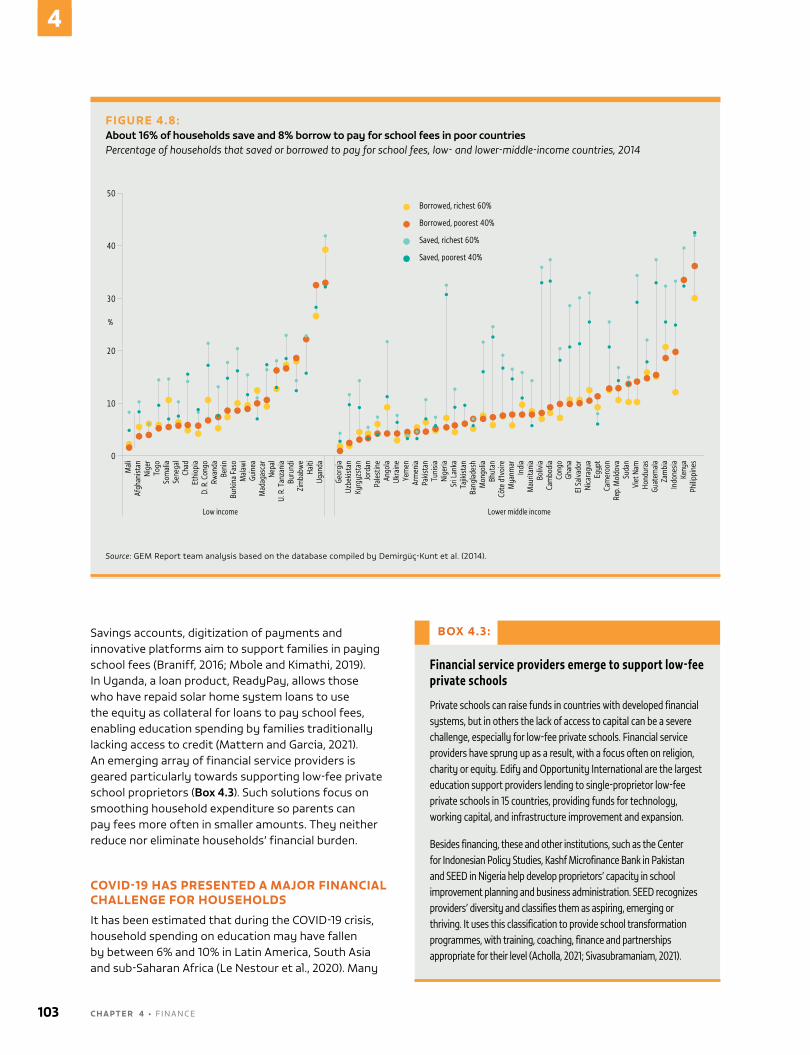
Savings accounts, digitization of payments and innovative platforms aim to support families in paying school fees (Braniff, 2016; Mbole and Kimathi, 2019). in Uganda, a loan product, ReadyPay, allows those who have repaid solar home system loans to use the equity as collateral for loans to pay school fees, enabling education spending by families traditionally lacking access to credit (Mattern and Garcia, 2021). an emerging array of financial service providers is geared particularly towards supporting low-fee private school proprietors (Box 4.3). Such solutions focus on smoothing household expenditure so parents can pay fees more often in smaller amounts. They neither reduce nor eliminate households’ financial burden.
COVID-19 HAS PRESENTED A MAJOR FINANCIAL CHALLENGE FOR HOUSEHOLDS
it has been estimated that during the cOViD-19 crisis, household spending on education may have fallen by between 6% and 10% in Latin america, South asia and sub-Saharan africa (Le nestour et al., 2020). Many
FIGURE 4.8:About 16% of households save and 8% borrow to pay for school fees in poor countriesPercentage of households that saved or borrowed to pay for school fees, low- and lower-middle-income countries, 2014
Kyrg
yzst
an
Yem
en
Bhut
an
Mya
nmar
Ghan
a
Egyp
t
Suda
n
Hond
uras
Keny
a
Togo
Rwan
da
Ugan
da
Source: GeM Report team analysis based on the database compiled by Demirgüç-Kunt et al. (2014).
BOX 4.3:
Financial service providers emerge to support low-fee private schools
Private schools can raise funds in countries with developed financial systems, but in others the lack of access to capital can be a severe challenge, especially for low-fee private schools. Financial service providers have sprung up as a result, with a focus often on religion, charity or equity. Edify and Opportunity International are the largest education support providers lending to single-proprietor low-fee private schools in 15 countries, providing funds for technology, working capital, and infrastructure improvement and expansion.
Besides financing, these and other institutions, such as the Center for Indonesian Policy Studies, Kashf Microfinance Bank in Pakistan and SEED in Nigeria help develop proprietors’ capacity in school improvement planning and business administration. SEED recognizes providers’ diversity and classifies them as aspiring, emerging or thriving. It uses this classification to provide school transformation programmes, with training, coaching, finance and partnerships appropriate for their level (Acholla, 2021; Sivasubramaniam, 2021).
103 C H A P T E R 4 • Finance
4
households, experiencing job and income losses, struggled to pay fees and left private schools. in Panama, private school associations reported that 35% to 40% of parents could not pay monthly fee instalments (alvarez et al., 2021). in ecuador, public school enrolment was up by 6.5%, or 120,000 students, at the beginning of the 2020 school year (Olsen and Prado, 2020).
Some private schools may have been well placed to move to remote and hybrid education. even so, families sometimes felt the service received was not worth the price. in colombia, parents expressed dissatisfaction with teaching quality and sued private schools to demand fee reductions. in Peru, 90% of parents with children in private schools were dissatisfied with virtual classes (alvarez et al., 2021).
india’s Supreme court rejected parents’ plea for more time to pay schools due to cOViD-19 (Thomas, 2020). a survey of 1,052 school proprietors in five states, conducted in February and March 2021, showed that nearly all schools struggled with fee collection; in Haryana state, more than 80% of parents failed to pay fees. School owners surmised that parents had transferred children to public schools or less expensive private schools, or perhaps paid instead for private tutoring and coaching centres (Centre for Civil Society, 2021).
anticipating such challenges, the colombian government extended a credit line in July 2020 for up to six months to address difficulties in paying fees, with high forgiveness percentages for poorer families; however, just 2% of families with children in private schools benefited (alvarez et al., 2021). The Organic Law of Humanitarian Support in ecuador proposed that parents of private school pupils who lost their jobs would receive support of up to 25% of the monthly cost of tuition. Parents who decided to withdraw children from private schools would be guaranteed access to state schools. The Mexico city Federal District government administered a monthly direct payment for any student who moved from a private to a public school (Berlanga et al., 2020). in October 2020, Panama helped private schools by providing direct support to families paying monthly fees, but the amount was only about 3% of the funding requested (alvarez et al., 2021).
DONORS ARE CAUTIOUS ABOUT SUPPORTING FOR-PROFIT EDUCATION PROVIDERS
aid has remained constant as a share of donor countries’ gross national income. as poorer countries grow faster than richer countries, the relative significance of aid as a source of funding, including in education, has been decreasing. Donors are therefore open to ideas that could help improve aid efficiency. While some donors view for-profit providers with caution, a few have been attracted to the idea of non-state provision and its potential to maximize private investment’s effectiveness.
The Japan international cooperation agency’s 2015 position paper noted that more private schools and enhanced private sector and nGO involvement posed the challenge of simultaneously ensuring equitable access and quality. However, it acknowledged that education cooperation was changing to include private sector actors in multi-stakeholder partnerships (JICa, 2015, 2016).
The US agency for international Development has a proactive strategy for private sector engagement in education, which starts from the premise that non-state schools fill a gap in provision. aligned with its overall private sector engagement policy, the strategy describes significant private capital invested in non-state schools and seeks to leverage and shape this investment through strategic partnerships to help reach the most marginalized. non-state schools are viewed as especially important in crisis and conflict contexts (USaID, 2018b) (Box 4.4).
The United Kingdom’s 2018 policy on aid to education notes that non-state actors are a major provider of schooling in sub-Saharan africa and South asia and refers specifically to the Punjab education Fund in Pakistan. The policy aims to support decision makers in developing good regulatory arrangements and to engage PPPs and non-state schools in improving access to poor and marginalized children (DFID, 2018). The cDc Group, the UK development finance institution, has invested about US$60 million or 2% of its portfolio in education; it champions private schools, whether for-profit or not, as part of its impact investment strategy (CDC Group, 2019).
indeed, much support for private actors is provided through the impact investing activities of development finance institutions (Smith and Baker, 2017); the international Finance corporation (iFc), part of the World Bank Group, is the largest. Out of an education portfolio of almost US$1.2 billion, most of its large projects in education technology and tertiary education were directed to
During the COVID-19 crisis, household spending on education may have fallen by up to 10% in Latin America, South Asia and sub-Saharan Africa
2 0 2 1 / 2 • G LO BA L E D U C AT I O N M O N I TO R I N G R E P O RT 104
4
non-state actors, while it allocated 15% to private school chains (Hares and Crawfurd, 2020). However, the iFc froze investment in private, fee-charging pre-primary, primary and secondary schools in 2019. The decision, which covered direct investment, advisory work and indirect investment linked to private equity, resulted from years of pressure from civil society organizations concerned about promotion of private education providers, especially commercial operations such as Bridge international academies (Ron Balsera, 2020). in addition, the compliance advisor Ombudsman, an independent accountability mechanism that evaluates the impact of iFc projects, received complaints from current and former teachers and parents in Kenya (eaCHRights, 2018). The World Bank independent evaluation Group has undertaken a recent evaluation of iFc investment in pre-primary, primary and secondary education, focusing on alignment with the organization’s strategic objectives; results are expected soon. The iFc will continue funding private actors in other parts of its education portfolio (IFC, 2020) (Figure 4.9).
The iFc decision is characteristic of the tension surrounding use of public funds for funding private education, especially in organizations with multiple members. The Global Partnership for education (GPe) has developed a private sector strategy, taking a broad view of private actors and aiming to use its convening power to advance thought leadership, best practices and collaboration with the private sector. However, opposition during negotiation of this strategy led to a clause prohibiting use of GPe funds to support for-profit provision of core education services (GPe, 2019). in 2018, a european Parliament Resolution instructed the european commission to not fund for-profit education actors, making special reference to international commercial operations. The resolution noted the importance of core education – including elements such as school supplies, transport and food – being free of charge (european Parliament, 2018).
In 2018, a European Parliament Resolution instructed the European Commission to not fund for-profit education actors
BOX 4.4:
Donor support to non-state providers in crisis- and conflict-affected contexts struggles to build sustainable service delivery structures
In the absence of a strong national system, donor funding often maintains education continuity in crisis- and conflict-affected contexts. Analysis of policy documents found that 11 of 16 donors listed education as a priority area in their humanitarian and development policies (Dupuy et al., 2020). These arrangements usually involve funding a combination of non-state education providers.
One concern is that donors uncritically engage with the private sector rather than try to improve state education provision (Unterhalter and Robinson, 2020) or build governments’ capacity for supervision of non-state providers (Menashy and Zakharia, 2021). In Haiti, non-governmental and faith-based organizations manage over three quarters of the school system. Donors are a key source of funding for the system. About 20 technical and financing partners invested US$587 million in the education sector between 2010 and 2015, in the aftermath of the 2010 earthquake (USAID, 2018a; World Bank, 2018). A relatively small part went to the fledgling public education system. A US$50 million Inter-American Development Bank project devoted funds to build just 20 public schools (IDB, 2011).
Coordinating and monitoring the work of non-state providers in emergencies can be challenging and negatively affect equity. For instance, teachers of Syrian refugees in Turkey were receiving different salaries depending on which NGO was employing them (Nicolai et al., 2020). Often government leadership in such coordination mechanisms is weak, while different NGOs take the leadership in coordinating education activities in different parts of the country, as a review of such arrangements in the Democratic Republic of the Congo has shown (Khan et al., 2020). In some contexts, international NGOs may undermine the capacity of the state to deliver public services, raising sustainability concerns (Campbell et al., 2019).
Sustainability is also undermined by fragmentation and the small scale of projects involving NGOs. A review of nine NGO-implemented peace education projects to counter violent extremism in Pakistan found that a few had produced valuable education materials, but they were overdependent on aid funding and came to an end when funding dried up, as strong links with the government had not been established (Ahmed and Shahzad, 2021). Fragmentation also results in difficulties to assess the effectiveness of non-state interventions. As non-state actors compete for funds, evidence may be distorted. The results of partnerships with non-state actors in emergency contexts are presented as success stories even when outcome improvements are marginal or, worse, the emergency context is used as an excuse to promote inappropriate solutions, as in the case of technology in the Syrian refugee crisis (Menashy and Zakharia, 2020).
105 C H A P T E R 4 • Finance
4
DONORS ARE EXPERIMENTING WITH PUBLIC-PRIVATE PARTNERSHIPS
Some donors have looked into using their funds as a catalyst to raise financing through PPPs. Such arrangements also attract cash-strapped governments interested in raising private capital to improve and expand public infrastructure. accounting measures allow them to keep costs and liabilities off their balance sheets and postpone recording fiscal costs of infrastructure services (Romero and Vervynckt, 2017). PPP initiatives to reduce infrastructure backlogs and improve schools are under way, for instance, in the Philippines (Philippines Department of education, 2021) and South africa (van Tonder, 2019). egypt’s PPP central Unit approved a project in 2016 for up to 1,000 schools by 2030, but its first phase – 24 schools in 6 governorates – has been delayed (enterprise, 2019).
While PPP advocates argue that contracts lead to improved efficiency, the evidence is not robust. Private finance through infrastructure PPPs in sub-Saharan africa has not played as strong a role as hoped, forcing governments to fill gaps. Former proponents now concede that private partners are unlikely to support activities with a potential poverty-reducing impact unless offered substantial incentives by governments and donors, leading to the conclusion that ‘a government capable of fully playing its role in designing, developing, implementing and regulating PPPs is probably better off using traditional public procurement to achieve the same objectives’ (Leigland, 2018, p. 128). The international Monetary Fund (iMF) acknowledged in 2018 that PPPs might not always be efficient, fiscal risks could be sizeable, and PPPs suffered from the same management challenges as traditional public investment (Irwin et al., 2018). Yet the iMF, World Bank, asian Development Bank and OecD still promote PPPs (Rosell and Saz-Carranza, 2020).
PPPs have also been used to finance social impact bonds, in which a private investor provides capital up front; repayment is contingent on results, such as completion rates or achievement of specific learning outcomes. an example funded by multilateral financial institutions is the Brazil Secondary education Social impact Bond in São Paolo. The india educate Girls Development impact Bond in Rajasthan ran from 2015 to 2018 with a capital commitment of US$280,000 (Gustafsson-Wright et al., 2017; Gustafsson-Wright et al., 2015). india has offered
more opportunities to experiment with impact bonds due to its regulatory environment and incentives for corporate engagement (Box 4.5).
Social impact bonds’ effectiveness has been questioned, however (Dey and Gibbon, 2018), as has the effectiveness of results-based financing in education (UneSCO, 2018). On average, despite optimistic predictions, US$1 of public investment from bilateral and multilateral donors mobilizes only 75 cents of private investment in low- and middle-income countries and just 37 cents in low-income countries. as little of such funding goes to education, better targeting of aid should remain the priority (attridge and engen, 2019).
BOX 4.5:
India has become a laboratory for results-based financing in education
India has served as a testing ground for social impact bonds in education. The Quality Education India (QEI) Development Impact Bond, running from 2018 to 2022, is the largest of its kind in education at a cost of US$11 million. It builds on lessons from the Educate Girls bond, which reached 7,000 children (Edwards, 2019). QEI aims to reach more than 300,000 poor children of primary school age and improve their learning outcomes (Ecorys, 2019b). It includes a broad coalition: The risk investor is the UBS Optimus Foundation, while the British Asian Trust, the Michael and Susan Dell Foundation, Comic Relief, the Mittal Foundation, the Larry Ellison Foundation and British Telecom are the outcome funders. The UK Foreign, Commonwealth and Development Office is providing technical assistance.
The novelty of the funding mechanism and the reputational risks involved led to the choice of providers with a track record: the Kaivalya Education Foundation, Gyan Shala, Society for All Round Development, Educational Initiatives and Pratham Infotech Foundation. An evaluation found significant costs associated with designing and launching the mechanism and fundraising (Ecorys, 2019a, 2019b). First-year results, which found mixed effects on learning, led to some underperforming programmes being dropped, but the results were considered to be on track (Edwards, 2019). Second-year results, released in August 2020, were positive: Learning gains were much higher, with children learning twice as fast as their peers in control schools and substantially outperforming targets (Quality Education India Development Impact Bond, 2020).
More recently, Social Finance India, an impact financing platform launched by the Tata Trusts and the Global Steering Group for Impact Investment, aims to provide US$2 billion by 2030, of which US$1 billion will be directed at non-state education service providers through the India Education Outcomes Fund, and US$1 billion will support the India Impact Fund of Funds to catalyse debt-for-impact in education, health and housing (Mehendale and Singh, 2020).
A few donors have been attracted to the idea of non-state provision
2 0 2 1 / 2 • G LO BA L E D U C AT I O N M O N I TO R I N G R E P O RT 106
4
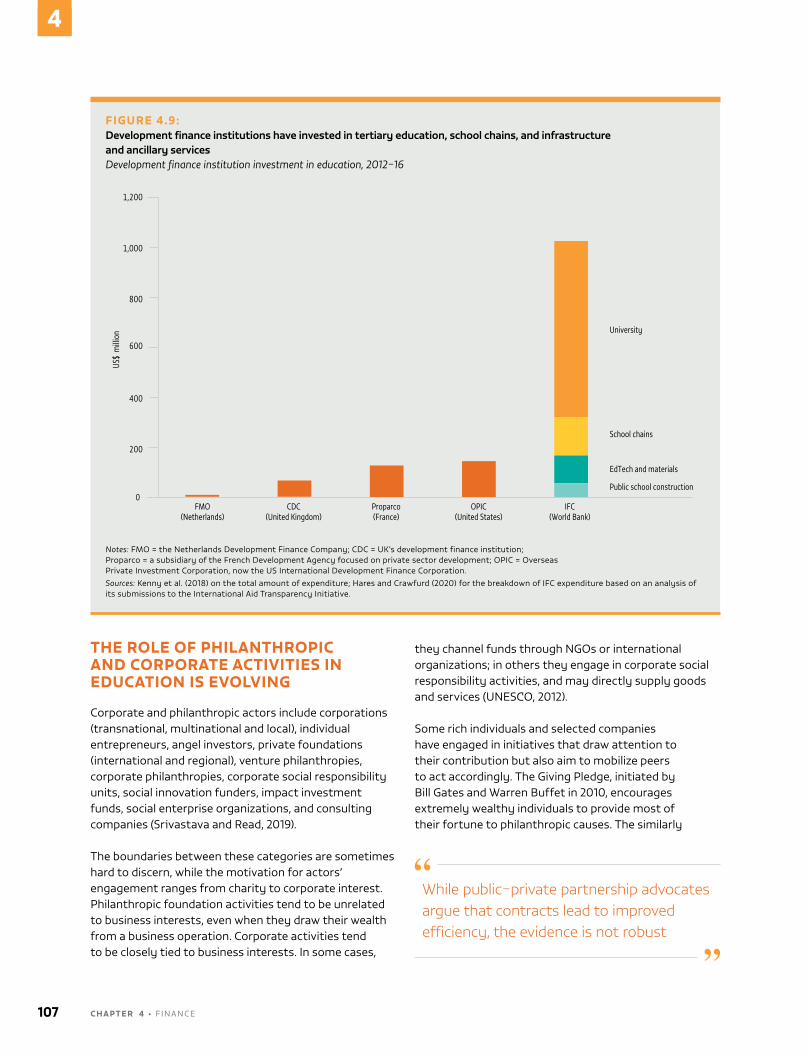
THE ROLE OF PHILANTHROPIC AND CORPORATE ACTIVITIES IN EDUCATION IS EVOLVING
corporate and philanthropic actors include corporations (transnational, multinational and local), individual entrepreneurs, angel investors, private foundations (international and regional), venture philanthropies, corporate philanthropies, corporate social responsibility units, social innovation funders, impact investment funds, social enterprise organizations, and consulting companies (Srivastava and Read, 2019).
The boundaries between these categories are sometimes hard to discern, while the motivation for actors’ engagement ranges from charity to corporate interest. Philanthropic foundation activities tend to be unrelated to business interests, even when they draw their wealth from a business operation. corporate activities tend to be closely tied to business interests. in some cases,
they channel funds through nGOs or international organizations; in others they engage in corporate social responsibility activities, and may directly supply goods and services (UneSCO, 2012).
Some rich individuals and selected companies have engaged in initiatives that draw attention to their contribution but also aim to mobilize peers to act accordingly. The Giving Pledge, initiated by Bill Gates and Warren Buffet in 2010, encourages extremely wealthy individuals to provide most of their fortune to philanthropic causes. The similarly
FIGURE 4.9:Development finance institutions have invested in tertiary education, school chains, and infrastructure and ancillary servicesDevelopment finance institution investment in education, 2012–16
FMO
1,200
1,000
800
600
400
200
Notes: FMO = the netherlands Development Finance company; cDc = UK’s development finance institution; Proparco = a subsidiary of the French Development agency focused on private sector development; OPic = Overseas Private investment corporation, now the US international Development Finance corporation.Sources: Kenny et al. (2018) on the total amount of expenditure; Hares and crawfurd (2020) for the breakdown of iFc expenditure based on an analysis of its submissions to the international aid Transparency initiative.
While public–private partnership advocates argue that contracts lead to improved efficiency, the evidence is not robust
107 C H A P T E R 4 • Finance
4
intended Pledge 1% was initiated by technology corporations, including Salesforce and atlassian, in 2014 (Patil and Brakman Reiser, 2020).
as philanthropic and corporate activity has grown, there is a need to understand how much such non-state actors are providing to support education, along with how they are competing with, complementing or collaborating with governments and donors (see Chapter 5).
PHILANTHROPIC FOUNDATIONS’ SPENDING IS GROWING BUT IS STILL SMALL
Despite perceptions that the amount philanthropic foundations spend on education is growing, it remains relatively insignificant. in 2015, around US$2.6 billion, or 13% of the total Fortune Global 500 companies’ corporate social responsibility budget, was spent on education. Of that, 30% went to primary and secondary education. Spending was mostly linked to companies’ countries of origin and tended to align with their business interests and support their supply chains (Varkey Foundation et al., 2015). a survey of 110 business leaders in 22 middle-income countries noted that half were motivated to provide long-term education solutions to their countries; one fifth cited religious and philosophical motives; another fifth noted the importance of education for their firms’ development objectives. about 6 in 10 had established tax-exempt foundations to promote non-profit education. Several recognized the benefits of such activity for their reputation (Giacomin et al., 2019).
The OecD Global Survey of Private Philanthropy for Development collected information on support to education from 143 foundations. it estimated that education received US$2.1 billion over the three years from 2013 to 2015. This was equivalent to 9% of all philanthropic giving, making education the second-most-supported sector after health. From the 26% that funded basic and secondary education, the top recipients were Brazil, india and Kenya (Figure 4.10) (OeCD, 2019b). a second survey collected information on support to education from 88 foundations. They are estimated to have disbursed a total of US$2.3 billion in 2016–19 or US$580 million per year on average. international philanthropy was allocated to primary and secondary education (37%); post-secondary education (31%); and other education levels and issues (32%). The top 15 foundations education provided 70% of the total, while the most common funding vehicle
was grants. national foundations focus entirely on post-secondary education (OeCD, 2021).
CORPORATE FINANCING OF EDUCATION IS CLOSELY SCRUTINIZED
Large corporations and wealthy individuals are increasingly positioning themselves to influence education systems, including through financing. However, critics say they contribute to erosion of democratic accountability and offer short-term, partial solutions, similar to the unequal distribution of opportunities in social and economic life to which they have contributed (Giridharadas, 2019). conversations about corporate social norms, transparency and tax responsibility have barely begun (McCluskey, 2015; Meiring and Krugel, 2018).
Regarding corporate activity, public education systems might be better funded if governments could rein in large corporations’ tax avoidance and evasion. it is estimated that the global tax system loses US$427 billion a year, of which US$245 billion is linked to corporations transferring profits to tax havens and US$182 billion to private individuals. Low- and lower-middle-income countries lose the equivalent of 5.8% of their collected tax revenue (Tax Justice network, 2020).
Official iMF estimates put the cost of tax havens even higher, between US$500 and US$600 billion a year, taking legal tax evasion into account. The iMF estimated that low- and middle-income countries lost US$200 billion a year in tax revenue, which exceeds total official development assistance (Shaxson, 2019). The agreement reached in July 2021 for a global minimum corporate tax is an important step towards rectifying that situation. But indirect losses are likely even higher. analysis of iMF data revealed that, while total official foreign direct investment in 2017 amounted to US$40 trillion globally, around US$15 trillion was phantom investment in shell corporations with no real activity (Damgaard et al., 2019).
corporations, rather than individuals, are the major donors. Of the top 20 wealthiest individuals in the United States, 10 devoted no more than 0.1% of their net worth to charitable giving in 2018 (Khan, 2020). Tax incentives encouraging corporations to make charitable contributions have led to growth in such giving. in china, the number of chinese foundations increased by 430% between 2006 and 2016 (Global Chinese Philantrhropy Initiative, 2017). corporations
Corporate activities tend to be closely tied to business interests
2 0 2 1 / 2 • G LO BA L E D U C AT I O N M O N I TO R I N G R E P O RT 108
4
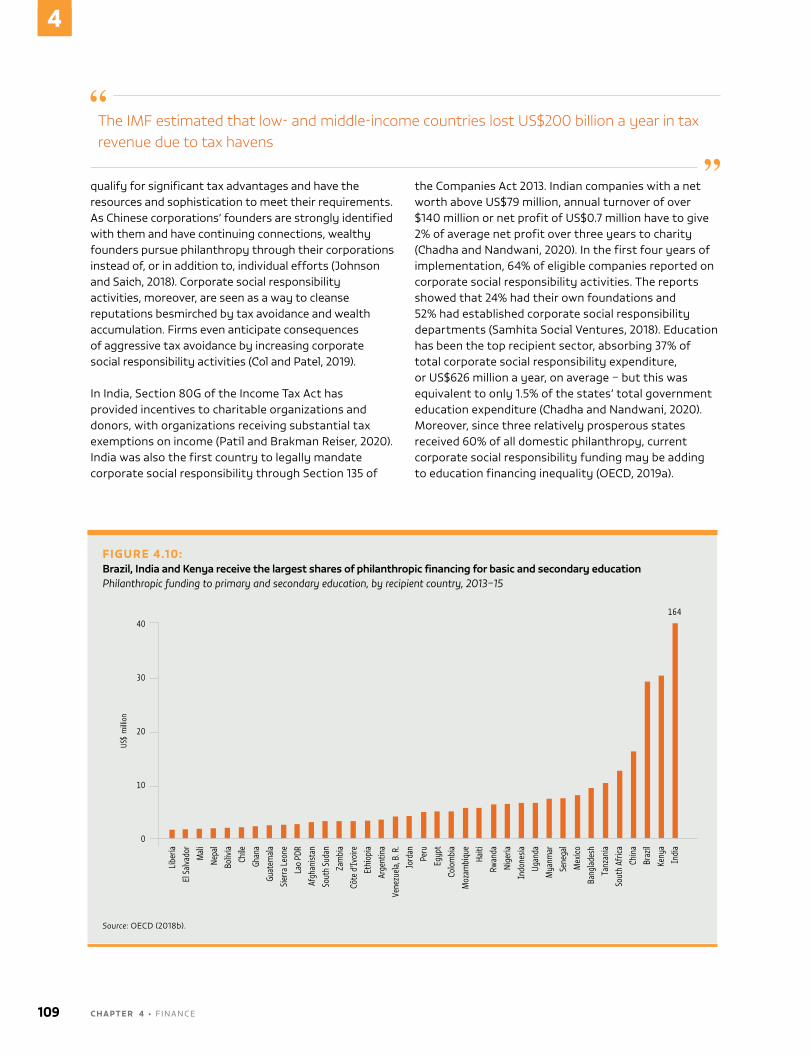
qualify for significant tax advantages and have the resources and sophistication to meet their requirements. as chinese corporations’ founders are strongly identified with them and have continuing connections, wealthy founders pursue philanthropy through their corporations instead of, or in addition to, individual efforts (Johnson and Saich, 2018). corporate social responsibility activities, moreover, are seen as a way to cleanse reputations besmirched by tax avoidance and wealth accumulation. Firms even anticipate consequences of aggressive tax avoidance by increasing corporate social responsibility activities (Col and Patel, 2019).
in india, Section 80G of the income Tax act has provided incentives to charitable organizations and donors, with organizations receiving substantial tax exemptions on income (Patil and Brakman Reiser, 2020). india was also the first country to legally mandate corporate social responsibility through Section 135 of
the companies act 2013. indian companies with a net worth above US$79 million, annual turnover of over $140 million or net profit of US$0.7 million have to give 2% of average net profit over three years to charity (Chadha and nandwani, 2020). in the first four years of implementation, 64% of eligible companies reported on corporate social responsibility activities. The reports showed that 24% had their own foundations and 52% had established corporate social responsibility departments (Samhita Social Ventures, 2018). education has been the top recipient sector, absorbing 37% of total corporate social responsibility expenditure, or US$626 million a year, on average – but this was equivalent to only 1.5% of the states’ total government education expenditure (Chadha and nandwani, 2020). Moreover, since three relatively prosperous states received 60% of all domestic philanthropy, current corporate social responsibility funding may be adding to education financing inequality (OeCD, 2019a).
FIGURE 4.10:Brazil, India and Kenya receive the largest shares of philanthropic financing for basic and secondary educationPhilanthropic funding to primary and secondary education, by recipient country, 2013–15
164
Libe
ria
El S
alva
dor
Mal
i
Nepa
l
Boliv
ia
Chile
Ghan
a
Guat
emal
a
Sier
ra L
eone
Lao
PDR
Afgh
anist
an
Sout
h Su
dan
Zam
bia
Côte
d'Iv
oire
Ethi
opia
Arge
ntin
a
Vene
zuel
a, B.
R.
Jord
an
Peru
Egyp
t
Colo
mbi
a
Moz
ambi
que
Haiti
Rwan
da
Nige
ria
Indo
nesia
Ugan
da
Mya
nmar
Sene
gal
Mex
ico
Bang
lade
sh
Tanz
ania
Sout
h Af
rica
Chin
a
Braz
il
Keny
a
Indi
a
Source: OecD (2018b).
The IMF estimated that low- and middle-income countries lost US$200 billion a year in tax revenue due to tax havens
109 C H A P T E R 4 • Finance
4
CONCLUSION
non-state actors in education receive and disburse funds. Government financial support for non-state providers varies considerably and largely depends on whether governments decide to fund non-state actors at all, a decision shaped by history and politics. Governments may support none, some or all non-state providers and the type of costs they cover may vary. Some high-income countries’ governments have financially supported non-state providers through aid programmes, even when this runs against other aid policy objectives, such as promoting equity.
Some governments have opted to help families pay for private schooling as a way to support school choice policies. Private schools in most countries rely on fees, a fact that became particularly evident during the education crisis brought about by cOViD-19. But households do not pay just for private school tuition. They also incur non-school expenditure, such as supplementary private tuition, and many pay public school fees that are often informal but perceived as obligatory. Richer households are more likely to spend out of pocket, further exacerbating inequality, while the burden is much heavier for poor households that incur such costs.
equality and efficiency are themes that emerge in discussions of the role of philanthropic and corporate financing of education. Public–private partnerships have proved to have less impact than expected in infrastructure projects. There is interest in blended approaches that try to catalyse private funding for achievement of education outcomes, although these are at the experimental stage.
2 0 2 1 / 2 • G LO BA L E D U C AT I O N M O N I TO R I N G R E P O RT 110
4
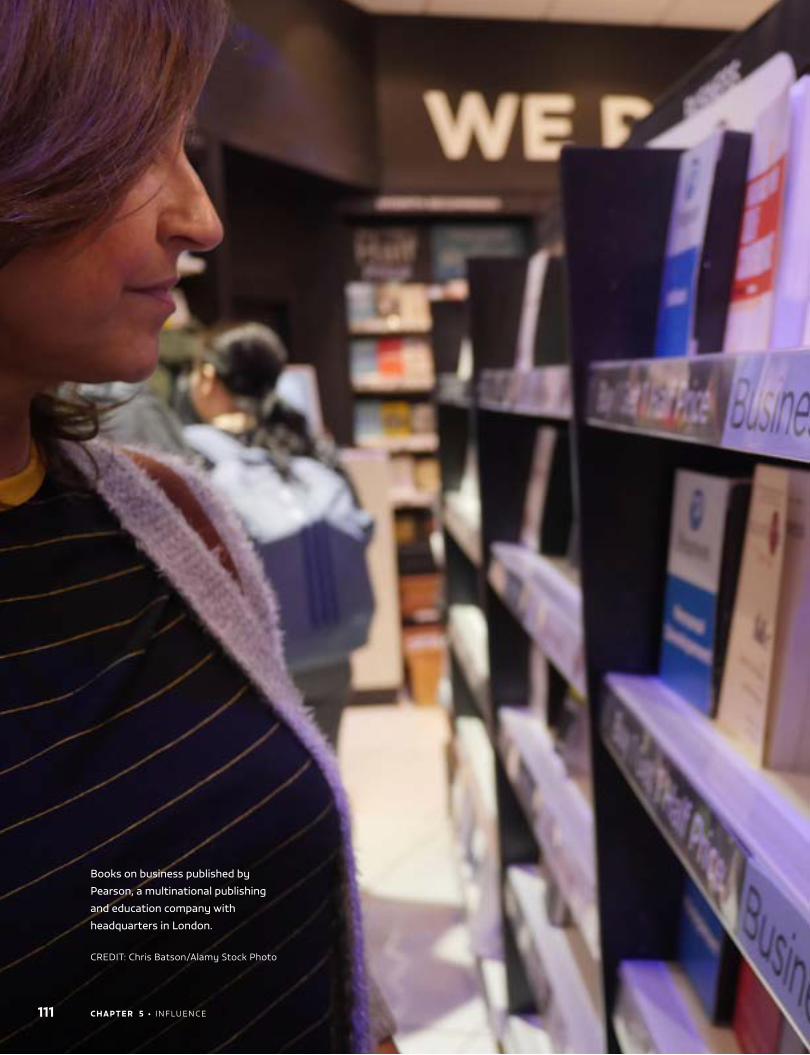
Books on business published by
Pearson, a multinational publishing
and education company with
headquarters in London.
CREDIT: Chris Batson/Alamy Stock Photo
111 C H A P T E R 5 • InfluEnCE

5CHAPTER
112C H A P T E R 5 • InfluEnCE
Influence
K E Y M E S S AG E SActors try to influence education through advocacy, lobbying, research and funding.
� A network led by the International finance Corporation framed its approach on public–private relationships in education by stating that education was a consumer good. But other advocacy networks frame privatization as a threat to the right to education.
No actor group is homogeneous in its attitudes, approaches and influence.
� In a survey of Global Campaign for Education members, 43% expressed a negative view of for-profit provision but 12% were supportive; likewise, 41% expressed a negative view of public–private partnerships, while 20% were supportive. A third expressed a mixed view.
� Among non-state actors that influenced the Indian government’s emphasis on foundational literacy and numeracy, some focused on scaling up interventions in the public education system, while others advocated for an enabling environment for low-fee private schools.
� Teacher unions are leading advocates for public education, questioning the use of public–private partnerships in latin America at the expense of equivalent public institutions. In some countries, unions are criticized as undermining efforts to strengthen public education.
International organizations, foundations and think tanks tread a fine line between pushing their agendas and facilitating dialogue for policymaking.
� The World Bank uses loan conditions, technical assistance, research studies and events to strengthen its position as a knowledge broker. Analysis of its recommendations in 10 countries showed it promoted more private provision in 9 and less regulation in 6.
� In the united States, the Bill and Melinda Gates foundation backed the charter school movement. Brazil’s lemann foundation mobilized broad consultation in pursuit of the goal of national core curricular standards.
� Ark, a manager of 39 schools in England, has an international arm that advises governments how to outsource management of public schools, for instance in liberia and South Africa.
The focus of non-state actors’ influence on national education systems varies.
� faith-based organizations opposed government policies on gender in Peru’s curriculum, affected school meal menu choices in India and lobbied for more public funding in Canada.
� non-profit organizations may facilitate adoption of technology-related innovations, promote standards in financial education or support low-fee private schools.
The business sector exerts strong influence on education.
� Education technology firms are frequently presented as enablers and disruptors. But their claims on products can be misleading. Just 2% of 10,600-plus products reviewed in a uS government clearinghouse were classified as strongly or moderately effective.
� Business organizations often express support for school choice, competition and for-profit education, standardized assessment and publication of results, as in Japan.
� School sponsorships are debated. The benefits of financial or in-kind support can be reversed if accompanied by marketing, as in Australia, China and the Philippines.
113 C H A P T E R 5 • InfluEnCE
5
networks advocate for competing visions of non-state actors in education ..114
The business sector exerts strong influence on education ....................................... 121
International organizations and foundations have particular influence .............123
Conclusion ........................................................................................................................................ 128
Arguments regarding efficiency, innovation and equity are at the core of debates on the role of non-state
actors in education, which are usually characterized by acrimony and mistrust. Two very different views of the world clash and it is rare to see agreement, compromise or admission of error. Civil society organizations, teacher unions, public agencies, international organizations, businesses, non-governmental organizations (nGOs), media, philanthropies, political parties, academics, private sector associations and think tanks are among those trying to shape discourse and influence opinion in favour of or against a stronger role. At the same time, none of these groups are homogeneous.
Actors try to influence education through advocacy and lobbying networks, research, and funding, which is often associated with sales of goods and services. They may use some of these approaches, depending on their comparative advantage, or all of them in some combination. This chapter describes various actors’ attempts to exercise influence, sway views and mobilize support behind competing aspirations and interests. Examples highlight the blurring of identities among actors. Individuals may change hats, switching from representing state organizations to non-state ones. non-state actors may be dedicated to supporting state education. Organizations entrusted with protecting and promoting public education may undermine it with their actions. The same principles are invoked to defend radically opposed perspectives on education, often by manipulating language.
Actors try to influence education through advocacy and lobbying networks, research, and funding
In this competition of political ideas and economic interests, actors seek to form coalitions and make their views authoritative, legitimate and attractive to others to achieve their aims (Hill and Jochim, 2009). But the battle for opinion is often behind the scenes, which is why this report recommends that governments, legislators and the education community at the national and global levels should strive to maintain the transparency and integrity of the public education policy process so as to keep vested interests at bay. Over and above any other consideration, decision makers need to be conscious of every learner’s right to education and take responsibility for fulfilling it. They should not be held hostage by anyone using force, deception, money or other illegitimate means to promote narrow, group-specific interests. ultimately, governments are accountable for ensuring that all views are given a public hearing and are taken into account in decision making.
NETWORKS ADVOCATE FOR COMPETING VISIONS OF NON-STATE ACTORS IN EDUCATION
Advocacy approaches vary in their ambition, sophistication and target audiences. They range from community sensitization by grassroots organizations to organized lobbying by technology corporations. networks frame their approach to the preferred role of non-state actors. for instance, a network led by the World Bank’s International finance Corporation (IfC) framed its approach on public–private relationships in education by stating that ‘education is a consumer good, and that the student is the principal consumer through parents’ (Robertson and Verger, 2012, p. 30). By contrast, other advocacy networks have opposed the privatization and commercialization of education, framing privatization as a threat to the right to education (Brehm and Silova, 2019).
2 0 2 1 / 2 • G LO BA L E D U C AT I O N M O N I TO R I N G R E P O RT 114
5
network members mutually reinforce their messages by cross-referencing each other, exacerbating polarization. At the same time, these networks are accountable to their members, which face differing circumstances in their respective contexts. The case of the Global Campaign for Education (GCE) is interesting in this regard. founded on a rights-based approach to education, it considers ‘strong, public systems’ to be one of its six strategic areas. Its members, however, hold a wider variety of views vis-à-vis non-state and, particularly, private actors than might be thought (Box 5.1).
The People’s Action for learning (PAl) network is an organization whose members, individually and collectively, have been effective in raising awareness of the major education challenges facing African, Asian and latin American countries (PAl network, 2020). Its members implement a variety of national education activities but share a common activity: citizen-led assessments, i.e. household surveys, that measure children’s foundational learning skills and challenge government shortcomings and poor records in collecting and sharing data on education outcomes. While the PAl network is a non-state actor, it includes diverse perspectives on government’s role. Its members vary widely not only by background and their attitude towards assessments, but also by approaches to action and partnerships. In Senegal, members collaborate with the central government and have been drawn into national education reform. In India and Pakistan, members cooperate with regional education authorities. In Mexico, they operate mainly at the local level and independently from education policies (Alcott et al., 2018).
Pratham, an Indian member of the PAl network, has been conducting ASER, the world’s largest citizen-led assessment, since 2005. Its results have made uncomfortable reading for successive governments but its approach to scaling up cost- and education-effective models routinely includes government and is supportive of the public education system. ASER research and data have been used as major advocacy tools in parliamentary discussions and quoted by government sources. They had a major influence over the inclusion in the 2020 national Education Policy of a reference to foundational literacy and numeracy as an ‘urgent and necessary prerequisite’ to learning (India Ministry of Human Resource Development, 2020). The Central Square foundation is another non-state actor that has contributed to the government’s strategic shift of focus. But it has explicitly advocated for an ‘enabling environment for
In 2015, Brazil’s National Confederation of Educational Institutions, which represents private schools, contested obligations under the disability law on inclusion of people with disabilities in mainstream education.
the affordable private school system’ as a key lever of progress towards foundational learning (Central Square foundation, 2020). Both organizations’ board members have almost exclusively private sector backgrounds.
By contrast, private sector backgrounds are markedly absent among the drafting committee members and signatories of the Abidjan Principles on the human rights obligations of States to provide public education and to regulate private involvement in education (Abidjan Principles, 2019). The text, drafted by human rights law experts, was conceived as a response to ‘private involvement in education … which, if left unchecked, could gravely impair the progress made in the realisation of the right to education’. nGOs linked to the principles have been among those that criticized Bridge International Academies, a chain of over 500 for-profit schools then operating in India, Kenya, liberia, nigeria and uganda. They lobbied the Kenyan and ugandan authorities to not allow Bridge to run schools and had successful challenges in both countries’ courts (ActionAid uganda et al., 2018; Ball, 2017). They also lodged a complaint with the Office of the Compliance Advisor Ombudsman, a recourse mechanism for IfC projects, on the grounds that Bridge was violating curriculum, health and safety and labour standards (Chapter 4).
In Buenos Aires, Argentina, private schools, even though they are state-subsidized, screen applicants through interviews and tests. In 2018, the nGO Civil Association for Equality and Justice filed a class action suit against the Ministry of Education of the Autonomous City of Buenos Aires, calling the practices illegal and local governments negligent. In 2015, Brazil’s national Confederation of Educational Institutions, which represents private schools, contested obligations under the disability law on inclusion of people with disabilities in mainstream education. It argued before the Supreme Court that inclusion was a state responsibility and infringed upon its members’ freedom to manage schools. They claimed that non-discrimination was not
115 C H A P T E R 5 • InfluEnCE
5
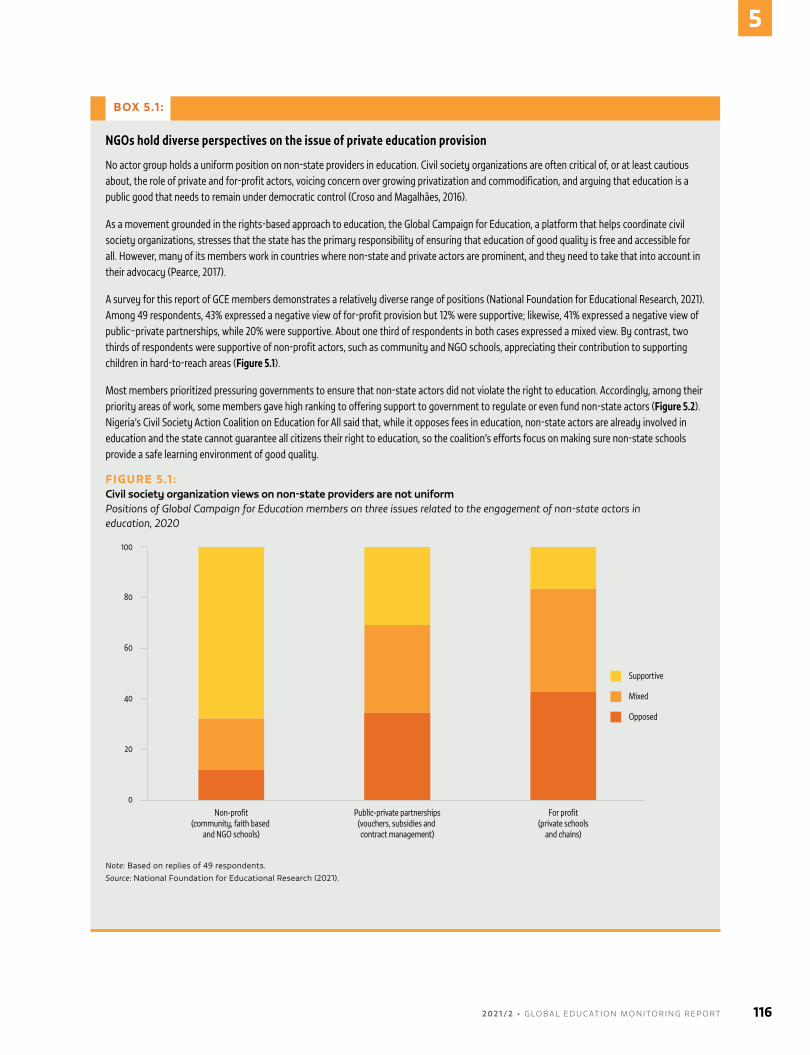
BOX 5.1 :
NGOs hold diverse perspectives on the issue of private education provision
No actor group holds a uniform position on non-state providers in education. Civil society organizations are often critical of, or at least cautious about, the role of private and for-profit actors, voicing concern over growing privatization and commodification, and arguing that education is a public good that needs to remain under democratic control (Croso and Magalhães, 2016).
As a movement grounded in the rights-based approach to education, the Global Campaign for Education, a platform that helps coordinate civil society organizations, stresses that the state has the primary responsibility of ensuring that education of good quality is free and accessible for all. However, many of its members work in countries where non-state and private actors are prominent, and they need to take that into account in their advocacy (Pearce, 2017).
A survey for this report of GCE members demonstrates a relatively diverse range of positions (National Foundation for Educational Research, 2021). Among 49 respondents, 43% expressed a negative view of for-profit provision but 12% were supportive; likewise, 41% expressed a negative view of public–private partnerships, while 20% were supportive. About one third of respondents in both cases expressed a mixed view. By contrast, two thirds of respondents were supportive of non-profit actors, such as community and NGO schools, appreciating their contribution to supporting children in hard-to-reach areas (Figure 5.1).
Most members prioritized pressuring governments to ensure that non-state actors did not violate the right to education. Accordingly, among their priority areas of work, some members gave high ranking to offering support to government to regulate or even fund non-state actors (Figure 5.2). Nigeria’s Civil Society Action Coalition on Education for All said that, while it opposes fees in education, non-state actors are already involved in education and the state cannot guarantee all citizens their right to education, so the coalition’s efforts focus on making sure non-state schools provide a safe learning environment of good quality.
FIGURE 5.1 :Civil society organization views on non-state providers are not uniformPositions of Global Campaign for Education members on three issues related to the engagement of non-state actors in education, 2020
100
80
40
20
60
0
Resp
onde
nts (
%)
Non-profit(community, faith based
and NGO schools)
Public-private partnerships(vouchers, subsidies and contract management)
For profit(private schools
and chains)
Supportive
Mixed
Opposed
Note: Based on replies of 49 respondents.Source: national foundation for Educational Research (2021).
2 0 2 1 / 2 • G LO BA L E D U C AT I O N M O N I TO R I N G R E P O RT 116
5
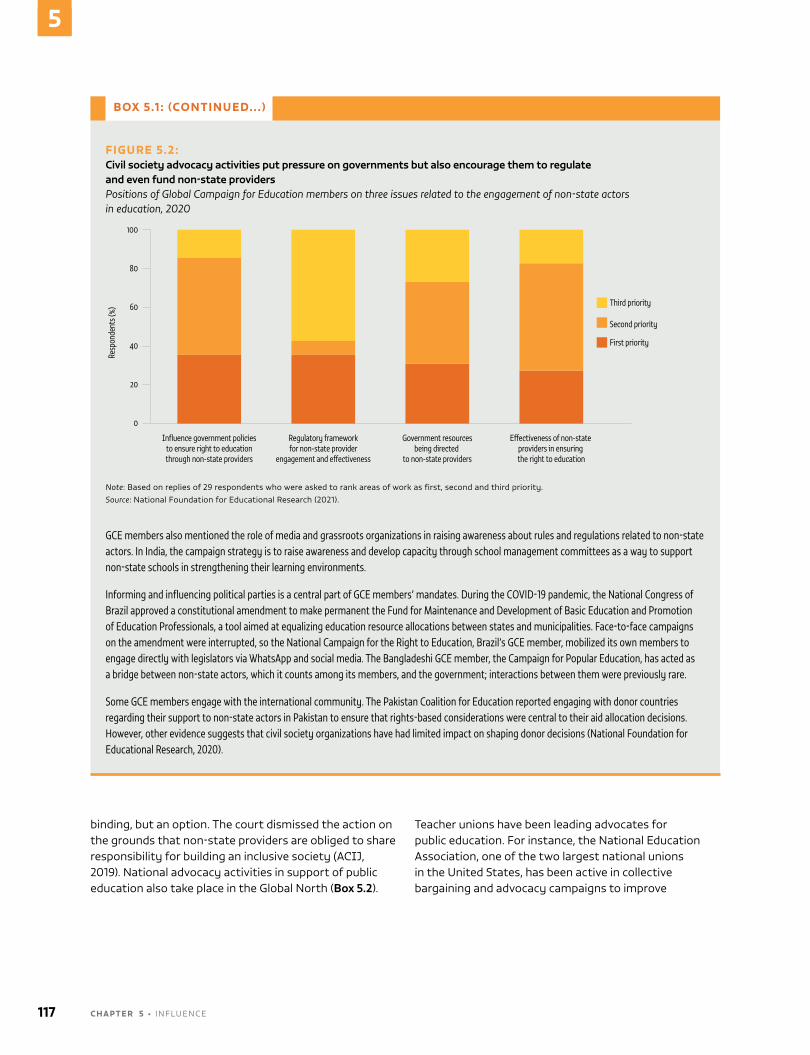
binding, but an option. The court dismissed the action on the grounds that non-state providers are obliged to share responsibility for building an inclusive society (ACIJ, 2019). national advocacy activities in support of public education also take place in the Global north (Box 5.2).
Teacher unions have been leading advocates for public education. for instance, the national Education Association, one of the two largest national unions in the united States, has been active in collective bargaining and advocacy campaigns to improve
BOX 5.1 : (CONTINUED.. . )
FIGURE 5.2:Civil society advocacy activities put pressure on governments but also encourage them to regulate and even fund non-state providersPositions of Global Campaign for Education members on three issues related to the engagement of non-state actors in education, 2020
100
80
40
20
60
0
Resp
onde
nts (
%)
Influence government policiesto ensure right to educationthrough non-state providers
Regulatory frameworkfor non-state provider
engagement and e�ectiveness
Government resourcesbeing directed
to non-state providers
E�ectiveness of non-state providers in ensuring the right to education
Third priority
Second priority
First priority
Note: Based on replies of 29 respondents who were asked to rank areas of work as first, second and third priority.Source: national foundation for Educational Research (2021).
GCE members also mentioned the role of media and grassroots organizations in raising awareness about rules and regulations related to non-state actors. In India, the campaign strategy is to raise awareness and develop capacity through school management committees as a way to support non-state schools in strengthening their learning environments.
Informing and influencing political parties is a central part of GCE members’ mandates. During the COVID-19 pandemic, the National Congress of Brazil approved a constitutional amendment to make permanent the Fund for Maintenance and Development of Basic Education and Promotion of Education Professionals, a tool aimed at equalizing education resource allocations between states and municipalities. Face-to-face campaigns on the amendment were interrupted, so the National Campaign for the Right to Education, Brazil’s GCE member, mobilized its own members to engage directly with legislators via WhatsApp and social media. The Bangladeshi GCE member, the Campaign for Popular Education, has acted as a bridge between non-state actors, which it counts among its members, and the government; interactions between them were previously rare.
Some GCE members engage with the international community. The Pakistan Coalition for Education reported engaging with donor countries regarding their support to non-state actors in Pakistan to ensure that rights-based considerations were central to their aid allocation decisions. However, other evidence suggests that civil society organizations have had limited impact on shaping donor decisions (National Foundation for Educational Research, 2020).
117 C H A P T E R 5 • InfluEnCE
5
teacher working conditions. It has sponsored projects supporting public education through its Great Public Schools fund grant programme, which as of 2018 had awarded 120 grants worth uS$32 million (Coons, 2018). It is also engaged in influencing federal and state politics, contributing to election campaign finance and supporting politicians who oppose policies friendly to school choice and to private education interests, regardless of party affiliation (Marianno, 2018).
Teacher unions have also actively opposed commercialization in public education, which they believe undermines it. Education International, the global teacher union federation, questions the extensive use of public–private partnerships in latin
America instead of equivalent public institutions. It has criticized the relationships of governments in Costa Rica with fundación Omar Dengo, a private foundation selling digital education materials and teacher training services to the education ministry; in the Dominican Republic with Acción Empresarial por la Educación, a business organization providing teacher education courses through the Aprendo project; and in uruguay with fundación Ceibal, a publicly funded centre that has contracted with Global learning network, a company that sells a standardized pedagogical model, teacher training, digital resources and evaluation processes (Education International, 2021a; 2021b; 2021c).
In some countries, unions are criticized as undermining efforts to strengthen public education. Greece is one of three countries in Europe without a teacher appraisal system (European Commission/EACEA/Eurydice, 2018). The use of school inspections as a means of political repression and control tarnished inspections’ reputation and led to their abolition in the 1980s. Successive governments, sometimes on external advice, have tried to establish an alternative support and accountability mechanism but have faced opposition by teacher unions (OECD, 2017; Papakonstantinou and Kolympari, 2019). Opinion polls suggested that 75% of the population agreed with the proposal that teachers should be evaluated by their head teacher and two councillors (Alfavita, 2021). Yet when the government passed a law in 2021 on a new school and teacher evaluation process, the primary school teachers union tried to undermine it by instructing schools to submit an identical school self-assessment and improvement plan; 250 of the country’s 8,300 schools did so (lakasas, 2021).
Another contested issue is the effect of certain union activities on the quality of public education and people’s trust in it. A uS literature review found no significant effect of strike action on student learning (Cowen and Strunk, 2015). Some studies showed that more low-quality teachers are dismissed and more high-quality teachers retained in more unionized districts, raising education outcomes (Han, 2020). In states with laws restricting collective bargaining by public employees, strong unions had a positive impact on student learning (Han and Keefe, 2020). But studies of teacher strikes in Canada (Baker, 2013), Colombia (Alvarado et al., 2021) and South Africa (Wills, 2014) found negative effects on student learning. An analysis of some 1,500 strikes over 32 years in Argentina estimated that exposure to the average strike duration of 88 days during primary school resulted in students’ later earnings
BOX 5.2:
In Quebec, advocates have challenged public funding of private schools and private costs in public schools
In Quebec, Canada, a 2019 bill was aimed at regulating parental financial contributions in public schools (National Assembly of Québec, 2020), which affected at least 20% of children who attended selective public schools (Québec Government, 2020) offering ‘special projects’ (e.g. arts, sport, international). Private schools, attended by 12% of students in the province, remain largely state funded. About 65% of private schools receive direct state subsidies that amount per pupil to about 60% of the subsidy per public school pupil (Québec Ministry of Education, 2021a), but the share rises to 79% when additional allowances for special programmes or educational services and tax credits (Québec Ministry of Education, 2021b) are taken into account (Mouvement l'école ensemble, 2021).
The Commission des droits de la personne et des droits de la jeunesse (Human Rights and Youth Rights Commission) argued against the bill, maintaining that legalization of fees charged to parents since 2007 for participation in ‘special projects’ violated the right to free public education guaranteed by the Charter of Human Rights and Freedoms (Human Rights and Youth Rights Commission, 2020). Mouvement l’école ensemble (School Together Movement), a parents’ initiative, also opposed the bill and called for ending all direct or indirect public funding of private schools, as well as public school selective admissions (Vigneault, 2020). It published a report on equity in Quebec’s education system compared with other Canadian provinces (Mouvement l'école ensemble, 2019). In March 2020, it asked the UN Committee on Economic, Social and Cultural Rights to hold the Quebec government accountable for what amounted to a three-tier school system – private, public and selective public (Vigneault, 2020).
2 0 2 1 / 2 • G LO BA L E D U C AT I O N M O N I TO R I N G R E P O RT 118
5
being reduced by 3% (Jaume and Willén, 2019). Disruption to child care (Jaume and Willén, 2021) had a negative impact on parental perceptions of public education, especially in disadvantaged groups, where parents cited private education’s stability in their decision to move out of public schools (Moschetti and Verger, 2020; narodowski et al., 2016).
Teach for All, a global organization with a network of member organizations in 60 countries, provides high-achieving recent graduates as teachers to under-resourced schools, positioning them as future education leaders and change makers. Of its 83,000 alumni, 73% still work in education (Teach for All, 2021). The uS organization, Teach for America, has served as a training ground for young people who may then enter other careers, for instance in the corporate and philanthropic sector, from where they can also shape public education reforms. In the bitterly divided world of education politics, the organization does not endorse any policy direction and claims independence from its funders, which include the Walton family foundation, a strong supporter of school choice approaches (Sawchuk, 2016). But some point to several charter school networks that have been founded by or in partnership with Teach for America alumni. In new Orleans, where public schools were converted into charter schools (Chapter 3), experienced teachers were replaced with alternatively certified teachers and Teach for America fellows. Critics also question the promotion of ideas developed in the uS context that may not be applicable elsewhere (Crawford-Garrett and Thomas, 2018).
While non-state actors aim to influence policies through advocacy, in some contexts they become de facto policymakers (Moschetti et al., 2019). As a result of education governance reforms in England (united Kingdom) (Chapter 3), Ark has emerged as a manager of 39 schools (Ark, 2021). It engages in policy conversations with governments, contributes technical advice, writes reports, conducts evaluations and proposes solutions (Junemann and Ball, 2013). In 2015, it launched the international Education Partnerships Group, which commissioned a major review of public–private partnerships (Aslam et al., 2017). The group has been involved in high-profile initiatives in Africa and South Asia (EPG, 2021) (Box 5.3), including in designing Partnership Schools for liberia, even carrying out its monitoring due to ‘limited government capacity’ (Ark, 2017).
BOX 5.3:
An exported public–private partnership model – Collaboration Schools in Western Cape province, South Africa
Western Cape outperforms other South African provinces in education, yet significant inequality persists. In one effort to improve the education system, in 2016 the provincial government launched the Collaboration Schools programme, a public–private partnership involving non-profit school operators funding and supporting underperforming no-fee public schools, with support from the Education Partnerships Group (Ark, 2017). The programme started with 5 and expanded to 14 primary and secondary schools in 2019, with a target of covering up to 15% of all public schools in the province (Western Cape Education Department, 2020).
The reform takes two forms. First, poorly performing ‘transition’ schools are handed over to private operators to manage. The intent is to improve learning outcomes through focused additional support, including for more teachers in addition to those already working at the school. Second, new schools are immediately handed over to a school operating partner to manage a block grant for teacher salaries and school management. New teachers in transition and new schools are school employees hired on a contractual basis and no longer considered civil servants.
The funding model borrowed policy elements from India and the United Kingdom (Junemann and Olmedo, 2020). The governance structure required significant legislative changes. Amendments to the Provincial Schools Education Bill included establishment of an independent Schools Evaluation Authority and two new types of schools, Collaboration Schools and donor-funded schools. The bill also provided for representation by Collaboration School Operating Partners on school governing bodies, giving them voting rights of at least 50% and effective control over the schools.
Public hearings were contentious (Parliamentary Monitoring Group, 2018). Opposition was expressed by the teacher union and civil society organizations, which claimed the amendments were inconsistent with the Constitution and the 1996 Schools Act. One argument was that giving the education minister power to identify a school as a Collaboration School entailed a conflict of interest, as the minister would also appoint the Evaluation Authority. Another argument was that a competitive public school policy posed a risk of leaving the most vulnerable behind. In July 2019, the Equal Education Law Centre challenged the amended bill before the Western Cape High Court (Equal Education, 2018). The decision, due in October 2020, has not yet been published.
An important implication of the model is the blurring of lines between state and non-state actors. The responsibility for turning public schools around was handed over by the state to private actors. While the state had the regulatory responsibility to manage the contract, the nature of accountability for public service delivery was changed (Sayed and Soudien, 2021).
119 C H A P T E R 5 • InfluEnCE
5
While non-state actors aim to influence policies through advocacy, in some contexts they become de facto policymakers
The report of a forum it helped organize with the former uK Department for International Development with support from the uBS Optimus foundation to discuss how to expand non-state provision stated: ‘Too often, the debate around the role of non-state provision in basic education has been driven by ideology rather than robust evidence’. It noted that evidence that non-state provision was better or could reach the poorest children was limited (Wilton Park, 2017, p. 1).
Ark, alongside the IDP foundation, Imaginable futures and the Vitol foundation, is a founding member of the Global Schools forum, whose mission is to strengthen and support non-state actors. A global network of 58 members supporting 17,000 schools in 46 countries, it aims to share expertise, knowledge, data and evidence, shaping and influencing global dialogue. It organizes conferences promoting low-fee private schools in the Global South and advocates for them to be elevated on political agendas (Global Schools forum, 2021).
Edify, a faith-based social enterprise that works to improve and expand Christian education globally, also promotes low-fee private schools. It is active in Burkina faso, Ethiopia, Ghana, liberia, Rwanda and uganda, in sub-Saharan Africa; the Dominican Republic, Guatemala and Peru, in latin America; and south-western India. Its pilot programme in uganda, begun in 2019, reaches almost 700 schools (Sivasubramaniam, 2021). Edify Ghana also works with about 700 schools (Brion, 2020) and provides capital for them to expand, partnering with local micro lenders, including Sinapi Aba, a local Christian micro-lending institution. It has also contributed to classroom construction in the Omega private school chain. Edify provides teacher training, and accounting and school leadership training to school proprietors (Sivasubramaniam, 2021).
Members of the faith-based International Society for Krishna Consciousness have held management positions in Akshaya Patra, a non-profit organization that runs the world’s largest non-state school lunch programme,
serving 1.8 million children in 19,000 government and government-aided schools in at least 14 Indian states (Srinivasaraju, 2020). The organization and menus adhere strictly to religious values. Akshaya Patra has been criticized, and entered into disputes with state governments, over allegations that its food is not culturally relevant for the communities served and does not meet contractual nutrition guidelines. nevertheless, state governments continue to contract with the organization, whose advantages include its large scale, competitive prices, donor funding and 20 years of experience (nathan, 2019).
Religion in education is a divisive issue in much of the world. Grassroots religious organizations have emerged to advocate on curriculum and learning materials. In Peru, groups including national Pro-family Coordination and Parents in Action, using the slogan ‘Don’t mess with my children’, demanded the withdrawal of a gender-based national curriculum in 2016 (Muñoz, 2020). In 2012, prior to the curriculum’s introduction, the government had introduced a national textbook repository to which 8,500 private schools were to upload textbooks. But, backed by these grassroots organizations, many schools refused to comply (Ciriaco, 2019).
The Escola sem Partido (non-partisan School) movement in Brazil was begun in 2004 by activists who believe that teachers are too often politically militant and that parents have a right to make sure their children receive a moral and religious education (fernandes and ferreira, 2021). The movement has developed draft legislation for the local, state and federal levels (Escola Sem Partido, 2021), inspiring several municipalities to approve laws prohibiting schools from discussing gender in classrooms (Cancion, 2018). A 2016 Alagoas state law banned political indoctrination in classrooms and introduced ethics courses for teachers (Brazil Ministry of Education and Culture, 2016; Junqueira, 2016). These laws have been challenged in state and federal courts as a form of teacher censorship and judged unconstitutional in some cases (Cancion, 2018; Cappelli, 2020). Still, some politicians have encouraged students to film and report teachers, leading teachers to censor themselves and avoid controversial topics for fear of reprisal (fagundez, 2018).
In the Canadian province of Ontario, various movements and networks have campaigned, so far in vain, to broaden public funding of non-state denominational schools beyond Catholic private schools. In 1985, for historical and constitutional reasons, the government decided to extend public funding to the end of secondary school for Ontario's
2 0 2 1 / 2 • G LO BA L E D U C AT I O N M O N I TO R I N G R E P O RT 120
5
Catholic schools but not those of other religious groups. Despite an appeal to the Supreme Court, the decision was found to be constitutional (Dickinson and Dolmage, 1996; Maclellan, 2012). In the 1980s, the Multi-faith Coalition for Equity in Education brought together Hindu, Sikh, Muslim, Mennonite and Reform Protestant parents, the Canadian Jewish Congress and the Ontario Alliance of Christian Schools to lobby for state funding to be extended to non-Catholic faith-based private schools meeting provincial requirements. Other associations, including the Canadian Civil liberties Association, advocate for constitutional amendments to eliminate public funding to religious schools.
THE BUSINESS SECTOR EXERTS STRONG INFLUENCE ON EDUCATION
In 2013, The Washington Post reported that the investment bank IBIS Capital estimated the size of the ‘global education market’ then at uS$4.4 trillion and projected a value of uS$6.3 trillion by 2017, which was described as ‘[g]ood news for those who see school reform as a way to make big bucks’ (Strauss, 2013). As this report shows (Chapter 4 and Chapter 21), references to global education spending as a market are misleading, as most of it is unrelated to market opportunities: 70% of spending is allocated by governments, mostly to salaries, and much of the remaining 30%, which households spend, goes to routine costs. Textual analysis of reports by leading service providers, such as HolonIQ, EdTechX and Emerge Education, shows that they use language depicting education technology as essential and the firms as enablers and disruptors. When optimistic projections are not fulfilled (e.g. by 2019 the IBIS Capital estimate had reached uS$5.3 trillion), responsibility is implicitly placed on governments (Mármol Queraltó, 2021) as a way of maintaining indirect pressure on them to increase procurement.
Corporate investment in education has been increasing, albeit from a low base. Venture capital investment grew from uS$2 billion in 2014 to uS$4 billion in 2018, concentrated in China (50%), the united States (20%), India (10%) and Europe (8%) (HolonIQ, 2019). Before COVID-19 struck, global primary and secondary education testing and assessment procurement was expected to grow by uS$6 billion between 2020 and 2024 (with some 45% of the growth in northern America) as a result of personalized learning analytics linked with access to big data and collaboration between schools
Corporate providers’ claims on the effectiveness of digital learning products can be misleading
and assessment companies (Technavio Research, 2020). COVID-19 has since been called the ‘mover and shaker’ of the market (Educapital, 2020) and education technology one of the few areas, alongside logistics, entertainment and data protection, that could see increased venture capital interest (KPMG, 2020). Digital learning platform providers responded promptly to support the switch to online learning, especially in richer countries, and helped maintain learning continuity. Governments need to ensure user privacy in this context (Cambridge Assessment, 2021).
Questions remain on the best products for schools and teachers to provide remote learning options during school closures. There is a wider issue as well: Corporate providers’ claims on the effectiveness of digital learning products can be misleading. Government needs to help ensure their quality, especially when public funds are used to help schools procure them. In England (united Kingdom), the British Educational Suppliers Association, with support from the Department for Education, has a website giving schools and educators access to products. Recognizing that ‘finding the right EdTech for your school can be difficult’, it assures users that each featured product ‘comes complete with a case study showcasing how other teachers have used the product’. The website also features products and services for India’s Central Board of Secondary Education (lendED, 2021).
In the united States, the 2002 no Child left Behind Act required districts and schools to use programmes backed by ‘scientifically-based research’ to qualify for federal funding. Its successor, the Every Student Succeeds Act of 2015, added a requirement to use ‘evidence-based interventions’. However, companies exercise strong influence over studies that evaluate their products, then promote their effectiveness through websites, brochures and trade fairs. There is considerable need for independent quality assurance.
The uS government established a What Works Clearinghouse (Mayo-Wilson et al., 2021; Polanin et al., 2021). Such efforts are not without critics. Some raised process issues, questioning the authority of federal
121 C H A P T E R 5 • InfluEnCE
5
In Germany, the civil society initiative Hochschulwatch collates information in a public database on the EUR 1.5 billion that universities receive annually from industry sponsorship and research fundings
agencies, which rely on private contractors, to select which research findings to showcase (Schoenfeld, 2006). Others questioned the ability to draw conclusions from small numbers of studies, even if good standards were respected (Reeves and lin, 2020; Slavin, 2008). A major criticism is that, of the clearinghouse’s 10,600-plus product review studies by early 2020, only 188 products, less than 2%, had been classified as strongly or moderately effective (García Mathewson and Butrymowicz, 2020).
Academic research is expected to generate knowledge that informs debates. However, network analysis of citation patterns suggests research findings’ uptake can be selective and biased (Verger et al., 2019). The framing of research, for instance whether education challenges are presented in terms of a ‘learning crisis’ or a ‘narrowing of education’, and topic selection, such as whether the focus is on teacher accountability or teacher professional development, influence findings.
Policy-oriented research can be heavily influenced by funders (Reckhow and Tompkins-Stange, 2018). While industry funding may be necessary for research, transparency is needed to avoid undue influence. In Germany, the civil society initiative Hochschulwatch (Higher Education Watch) collates information in a public database on the EuR 1.5 billion that universities receive annually from industry sponsorship and research funding, and on industry representation on institutions’ boards (Hochschulwatch, 2021). university sponsorship is unregulated at the federal level. German states take different approaches. north Rhine-Westphalia and Bremen are developing rules for higher education institutions to declare industry partnerships. In Bavaria, universities are expressly excluded from the state’s official report on sponsorship contributions to public budgets. Together with the Stifterverband, an association of corporate, philanthropic and private
research funders, Hochschulwatch develops best practice guidance, awareness building for conflicts of interest, self-audit tools and codes of conduct for sponsored chairs. It aims ultimately to ensure that higher education institutions are included in the remit of public freedom of information and public accountability legislation and that third-party funding agreements are publicly available.
The private sector is a significant player in education in other ways. The Japan Business federation (Keidanren) represents over 1,400 mainly large companies listed on the first Section of the Tokyo Stock Exchange, (Keidanren, 2021). Along with the Japan Chamber of Commerce and Industry and the Japan Association of Corporate Executives, it has a strong influence on policymaking. Keidanren’s vice chairman heads the Central Council for Education under the Ministry of Education, Culture, Sports, Science and Technology (MEXT, 2021). In the mid-2000s, the federation expressed strong support for school choice, competition and for-profit education, along with mandatory standardized assessment and, a proposal opposed by the government, the publication of results to inform consumers (Takayama, 2013). Keidanren’s latest proposals for primary and secondary education reform cover a broad range of issues, from coding to global citizenship (Keidanren, 2020). Its recommendations include greater investment in the GIGA School programme, through which the ministry aims to develop digital talent in collaboration with the private sector to meet the needs of an increasingly diverse society and address widening disparity (MEXT, 2020).
for-profit actors use lobbyists to promote commercial interests in public policy, including through the narrative they use to describe education. Over time, through policy feedback and lock-in effects, the state becomes dependent on these actors. In Sweden, once enacted, deregulation of education led to a self-reinforcing process, changing public opinion on the delivery of public service and giving business instrumental power over public policy (Busemeyer and Thelen, 2020).
School sponsorships are much debated. financial and in-kind contributions can support beneficiary schools, but the benefits can be reversed if marketing accompanies the support (Bakir et al., 2017). In an Australian survey of teachers and head teachers, some
School sponsorships are much debated. Financial and in-kind contributions can support beneficiary schools, but the benefits can be reversed if marketing accompanies the support
2 0 2 1 / 2 • G LO BA L E D U C AT I O N M O N I TO R I N G R E P O RT 122
5
supported in-kind provision of education technology and sports equipment but most opposed financial support from supermarket and fast food chains in exchange for use of companies’ logos (Hogan et al., 2018). In China, the tobacco industry’s corporate social responsibility activities undermine tobacco control efforts. As part of the Project Hope rural development programme, the industry sponsored more than 100 primary schools, with new school buildings featuring company logos and pro-tobacco messages. A study of schools in Yunnan province found that parents and teachers perceived no negative impact on children from such sponsorship (fang et al., 2020).
In the Philippines, the Adopt-a-School programme provides tax incentives to private actors in exchange for financial support to schools. While partner companies, including Coca-Cola, San Miguel and Stanfilco, cannot promote their products in school as signatories of the Philippines Pledge on in-school food marketing, participation criteria do not explicitly prohibit alternative promotion strategies or brand visibility (Reeve et al., 2018). As part of Brigada Eskwela, a government-supported volunteer programme, the snack company Mondelez supports 19 schools but has supplied its products to 40 other schools as part of school feeding initiatives (Vivas, 2020).
The Global Business Coalition for Education (GBC-Education) calls on its more than 200 members’ expertise, leadership and resources to make education politically prominent at the national and global levels. Its areas of interest include early childhood, youth skills, emergencies and disability inclusion. It describes four pathways to business engagement in education: investing financial resources through ‘global funding tools’ and domestic financing for education; delivering in-kind and technical support, including through employee engagement; shaping global strategies and domestic policies to ensure that business has a voice on education; and championing education and becoming thought leaders (Global Business Coalition for Education, 2021). In the area of global financing, GBC-Education has supported efforts by the un Secretary-General’s Special Envoy for Global Education, Gordon Brown, to establish the International finance facility for Education, an innovative approach that would expand development banks’ ability to lend middle-income countries money for education projects and make loan terms more attractive for countries (Global Business Coalition for Education, 2019). Some observers say coalition members’ impact might be greater if they focused on promoting a culture of transparency in tax affairs (ActionAid, 2018) (Chapter 21).
Mobilizing innovative financing is the starting point of the Education Outcomes fund (EOf), an initiative with roots in venture capital and private equity. Supported by the Global Steering Group for Impact Investment (GSG, 2019), it focuses on explaining the advantages of paying for results in education (GSG, 2021). While a results orientation is an aid effectiveness principle, paying for results is not, and it goes against the principle of country ownership (Chapter 21) (Savedoff, 2019). The approach assumes that countries need incentives when in fact they are financially constrained. unlike in other development interventions, where the link between inputs and results is observable, it is not straightforward in education. finally, the potential for unintended consequences is considerable if efforts are focused on one education indicator (unESCO, 2018). unICEf, which has hosted EOf since 2020, has long embraced public–private partnerships. The private sector accounts for 22% of its revenue (unICEf, 2020), including corporate sponsorship.
Cooperation between the united nations and the business sector is based on principles included in two documents: the Global Compact, which provides an overall value framework (human rights, labour standards, environment and anti-corruption), and the Guiding Principles on Business and Human Rights, endorsed by the Human Rights Council (united nations, 2015). Individual un organizations, such as the food and Agriculture Organization and the World Health Organization, have publicly available strategies and guidelines for staff and partners on engagement with non-state actors, including private entities. Such guidance addresses risks, including conflict of interest, influence on norms and standard setting, credibility and reputation, and whitewashing of partners’ image (fAO, 2013; WHO, 2016, 2018a, 2018b). Outside the un framework, the Global Partnership for Education also has a detailed private sector engagement strategy (GPE, 2019).
INTERNATIONAL ORGANIZATIONS AND FOUNDATIONS HAVE PARTICULAR INFLUENCE
The World Bank influences policy design and implementation. World Bank loan conditions have shaped government programme operations, and its pilot projects have influenced other development institutions’ strategies. Regarding private education, World Bank positions have for decades influenced policy directions on school fees and schooling provision by private actors. In the 1980s, fees in public education were seen as desirable. The official World Bank approach
123 C H A P T E R 5 • InfluEnCE
5
The World Bank’s use of technical assistance, project reports, research studies and international events strengthens its position as a knowledge broker
to private participation shifted in the early 2000s, with the group explicitly withdrawing support of school fees after strong opposition from other international actors, notably civil society. With respect to private provision, World Bank education strategies have evolved from strongly endorsing private participation to acknowledging risks but still recommending public–private partnerships as a useful strategy (Edwards Jr et al., 2021).
The World Bank’s use of technical assistance, project reports, research studies and international events strengthens its position as a knowledge broker. A module on private sector engagement, which is among the group’s top 13 policy areas for promoting learning under the Systems Approach for Better Education Results, has as its premise that ‘private educators provide a significant contribution to education and that improved interaction between government and private schools is essential for increasing equity and quality’ (Baum et al., 2014, p. 8). A World Bank analysis of 10 countries recommended expanding private provision in all but Zambia; increasing public funding of private actors in all but Swaziland and Zambia; and reducing regulations in all but Bangladesh, Mauritania, Swaziland and Zambia (DeCoster, 2019).
Philanthropic organizations also influence policy through various means. In the united States they have promoted charter schools through knowledge production, support for advocacy campaigns and dissemination of good practices (Verger et al., 2016). The Bill and Melinda Gates foundation is among those backing the charter school movement; its financial support to the campaign by the Washington Coalition for Public Charter Schools was key to passage of the 2012 charter school ballot initiative in Washington state (Au and lubienski, 2016). Challenges for foundations engaging in education policy include aligning their efforts with national education policy processes (i.e. avoiding being seen as pushing their own agendas), engaging with multiple stakeholders and finding the right political moment. Brazil’s lemann foundation mobilized broad consultation in pursuit of
the goal of national core curricular standards (Box 5.4). An approach in uruguay favoured a greater role for private actors in legislation (Box 5.5).
Various non-profit organizations focus on influencing public education policy concerning innovation. Since 2017, HundrED, a global non-profit organization based
BOX 5.4:
Non-state actors influenced the introduction of minimum standards in Brazil
Brazil has a high degree of socioeconomic and education inequality. A decentralized structure, with responsibility for basic education delivery mostly given to municipalities, means disadvantaged local governments struggle to catch up with richer ones. The seventh goal of the National Education Plan 2014–24 provided an impetus to address this challenge (OECD, 2021).
In 2013, the Lemann Foundation, a Brazilian philanthropic organization, helped establish and fund the Movimento pela Base Nacional Comum (Movement for a National Common Base), which was instrumental in the introduction of national learning standards (Costin and Pontual, 2020). Members succeeded in getting the National Education Plan amended to include a schedule for establishing such standards. The foundation organized events advocating for the standards’ introduction, developed knowledge products and pitched them to officials involved in drafting, and built a network of politicians and experts to support the standards (Tarlau and Moeller, 2019), creating an influential network of policy ideas (Avelar and Ball, 2019). Throughout, the foundation’s favouring of technical over political debate allowed it to influence the process through its expertise (Tarlau and Moeller, 2019).
Proponents of the standards argued that they would lead to high academic expectations for all, fostering equity in education. Opponents maintained that standards alone would not suffice, given the wide inequality in distribution of human and financial resources in the education system (Ready, 2018). The first version of the Base Nacional Comum Curricular (BNCC, National Common Curricular Base) was followed by an online consultation with 12 million contributions (Costin and Pontual, 2020); a technical team of university specialists then integrated comments. The BNCC’s second version was published at the height of a political crisis in 2016. Before the change of government, control over drafting was transferred from the national to regional and local levels, which helped the process survive the change. Local seminars were held to collect teacher feedback. The BNCC was adopted in 2017, offering a strong example of how non-state actors’ influence over education reforms has increased (Avelar and Ball, 2019).
2 0 2 1 / 2 • G LO BA L E D U C AT I O N M O N I TO R I N G R E P O RT 124
5
in finland, has been reviewing, selecting, compiling and disseminating innovations in areas including collaborative learning, creative and critical thinking, project-based learning and play. Each year, it identifies and features 100 innovations for their impact and potential to be scaled up; 69% of those selected in 2021 were from non-profit organizations. HundrED examines what enables efficient adoption of innovations in public education systems and how systems can support innovations’ implementation (HundrED, 2020).
Other organizations focus on enabling system change in various areas. In Côte d’Ivoire, the Jacobs foundation, as part of its Transforming Education in Cocoa Communities programme, worked with the government to scale up a remedial education programme to
improve foundational literacy and numeracy skills (Curtiss Wyss and Perlman Robinson, 2021). In India, Peepul, in a public–private partnership with the Delhi municipal corporations, runs three model schools serving marginalized children to incubate innovative ideas with the aim of eventually testing them in public schools. Three other programmes, also run in partnership with state governments, focus on teacher skills, accountability and incentives, with mentoring a part of the approach (Peepul India, 2020).
Another area in which nGOs have tried to influence public education policy agendas is financial education. In the united States, Jump$tart, a non-profit coalition, has developed financial education standards for primary and secondary education curricula (Alsemgeest, 2015).
BOX 5.5:
Building support for private education in Uruguay
Uruguay’s share of private institutions in enrolment is 12% in secondary education, well below the average globally and for Latin America, perhaps due in part to early separation of church and state. Public schooling has moreover had a strong symbolic role in nation building in a context of high immigration, becoming associated with democratization and social cohesion. Private actors have played little part in education governance. Unlike in Argentina, Chile and Colombia, the regulatory framework has not encouraged participation of private actors in education (Bordoli et al., 2017a, 2017c).
The Administración Nacional de Educación Pública (ANEP, National Public Education Administration), the country’s highest education authority, is an autonomous body established as a guarantor of education planning independence from political meddling. A feature of the governance structure is participation of teacher unions. Unions have blocked private actors’ involvement in education in the past (Marrero, 2014; Moschetti et al., 2019). Critics believe ANEP is not fully autonomous and its purpose is not being served, since political stand-offs affecting education still occur (Bogliaccini and Rodríguez, 2015).
Since the early 2000s, a tax exemption regime has favoured the private sector and new regulations have allowed public–private partnerships relating to education provision, along with a type of indirect public funding for private education actors through tax exemption of donations (Bordoli et al., 2017a, 2017b). These developments have led to opportunities to shift the discourse to support private actors in education.
In recent years, new stakeholders, such as the citizen initiative Eduy21 and the Centre for the Study of Economic and Social Reality (CERES), a think tank with links to the Brookings Institution, a US think tank, have been pressing for market-friendly education policy, maintaining that the public education system has failed to reform to meet contemporary needs (Moschetti et al., 2019). CERES and Eduy21 have organized events at various levels to build a policy network and gather media attention to their narrative that education is in crisis. In 2017, CERES began holding citizen meetings to propose policy solutions on education resulting from policy research seeking evidence for their stance on education reform (Moschetti et al., 2019).
This change in approach is evident in a sweeping July 2020 emergency law, whose 476 articles include 78 on education. The law changed core aspects of education, primarily concerning the approach to public education. For instance, the word ‘public’ no longer appears in references to what is now known as the ‘national education system’. Private actors are now included in coordination mechanisms and departmental education commissions.
Article 14 of the 2008 Education Law stipulated: ‘No agreement or treaty, bilateral or multilateral, will be signed with any State or international organization that directly or indirectly would entail consideration of education as a for-profit service or encouraging its commercialization’ (Uruguay Ministry of Education and Culture, 2008). Article 129 of the new law states: ‘No bilateral or multilateral agreement or treaty shall be signed with States or international organizations that reduce education to the status of for-profit service’ (Uruguay Government, 2020). Other articles restrict participation by social actors in education policy formulation and propose regulating teachers’ work (Martinis, 2020).
125 C H A P T E R 5 • InfluEnCE
5
In 2019, US charitable contributions to education reached US$64 billion
The Council for Economic Education has developed national standards for grades 4, 8 and 12 and has worked with schools and districts to design and implement financial literacy curricula, while providing its own programmes to students and educators (Kasman et al., 2018). As of early 2020, 21 states had included the subject in higher education curricula; about the same number were discussing bills on introducing financial education in schools (Carrns, 2021).
The growth of wealth in some of the world’s largest economies can be linked to technology companies, which place a special emphasis on education. Technology philanthropists, given their firms’ large scale and universal access to their products and platforms, can quickly have a far-reaching impact (Patil and Brakman Reiser, 2021). In 2019, uS charitable contributions to education reached uS$64 billion. In China, education consistently receives the greatest share of philanthropic support. The rapidly growing philanthropic sector is dominated by corporate giving from technology firms, which both contribute funds and use their platforms to engage and encourage donors. Corporate contributions to education reached uS$23 billion in 2017. Charles Chen Yidan, the driving force behind the Tencent foundation and corporate philanthropic activities, focuses on higher education.
Data on philanthropic financial flows (Chapter 4) underestimate philanthropies’ influence and impact in leveraging networks, technology platforms and products for policy advocacy (Patil and Brakman Reiser, 2021). Philanthropic foundations do not just fund specific activities but also have strategic interests. for instance, a survey of 44 foundations found that 39 were also engaged in advocacy. Increasingly, they are interested in long-term impact and sustainability: 14 mentioned that they often collaborated with government and 18 with donors; others transitioned to for-profit models or developed grantee financing models. Philanthropic work has also become much more data-driven and evidence-based: two thirds of the foundations had an evaluation person, unit or department and had conducted monitoring and evaluation on all their programmes and grants. But foundations rarely disclose information readily (OECD, 2018).
In parallel with philanthropic foundations focusing more on non-profit work, corporate activity with philanthropic intent has grown (Srivastava, 2020). In the united States, the philanthropic sector has close ties with the business sector and thus is strongly framed around corporate profitability. ‘Venture philanthropy’ and ‘charitable companies’ are terms used for hybrid forms of funding, combining investment capital logic with philanthropic objectives and activities, such as education. They are characterized by high involvement of investors, who often provide intellectual and social capital on top of financial resources.
The highest-giving venture philanthropies include a broad mix of foundations from family fortunes. These mega-philanthropies fund other education-related venture philanthropies, such as the Charter School Growth fund and the newSchools Venture fund. Venture philanthropies include not only national foundations built on individual family fortunes but also local philanthropic efforts of business leader collectives, such as Chicago’s Renaissance Schools fund (now Kids first Chicago) and the Chicago Public Education fund. The Chan Zuckerberg Initiative focuses heavily on education, particularly personalized, technology-assisted learning. A grantee, Summit Public Schools, has developed project-based teaching and student-directed learning, which have been used by nearly 400 schools in 38 states and the District of Columbia (Pane, 2018; Schultz, 2018).
Some foundations promoting a market approach to education support third-party mobilization, presented falsely as grassroots initiatives. Such front groups claim to represent specific agendas, such as those of parents and students, but in fact pursue the interests of another organization (Camera, 2020). In the united States, Parent Revolution primarily receives philanthropic funding, which is used to hire private firms to collect petitions or parent signatures to lobby for changes in education (lubienski et al., 2012). A project investigating the role of policy advocacy networks in five uS cities showed that funders used intermediary organizations to connect knowledge producers with knowledge users and that various strategies of the networks aimed to incentivize non-state actors’ actions (lubienski, 2019).
non-state actors often target parliamentary committees. In the two uS federal legislative bodies, hearings are a key direct opportunity to influence policy (Wang, 2020). Committees, which are groups of specialist members, and caucuses, whose members are committed to common aims, also review proposed legislation. for instance, the Congressional Caucus on Education
2 0 2 1 / 2 • G LO BA L E D U C AT I O N M O N I TO R I N G R E P O RT 126
5
Innovation and Opportunity ‘seeks to highlight how applying market-based principles to education can enhance student achievement’ (legistorm, 2020). In 2017, the Black Caucus expressed concern that the incoming secretary of education could ‘fundamentally weaken the u.S. public school system’ (Congressional Black Caucus, 2017) because of previous promotion and sponsorship of a policy favouring school choice in Michigan state (Michigan Campaign finance network, 2006). Most lobbying takes place at state level. Coalitions of school choice supporters, mainly foundations and rich donors, and of opponents, largely from the labour movement, have played major roles in state legislation (Kirst, 2007; Vergari, 2007). But various actors’ positions have evolved considerably, especially as more data became available, forcing advocacy to be more evidence-based (DeBray-Pelot and McGuinn, 2009).
Global Home Education Exchange is an international nGO supporting homeschooling (GHEX, 2020). One member, the uS-based Home School legal Defense Association, is the largest such advocacy organization, representing the interests of families who opt for homeschooling. founded in the early 1980s, it assists more than 100,000 member families through personalized support, resources and advocacy. It has a global outreach team mapping relevant legislation (HSlDA, 2021), finances advocacy in various countries (McShane, 2020) and provides technical assistance on drafting legislation. Panama’s January 2021 adoption of a law recognizing home education reportedly followed testimony by association representatives at the national Assembly (Donnelly, 2021; lara, 2021).
In Italy, Agorà della Parità is a forum of more than 50 non-profit organizations of managers and parents in ‘independent schools with parity’, a type of hybrid public–private school whose diplomas are recognized as
equivalent to those of public schools and which serves 10% of the total compulsory school-age population (I.Stat, 2019). In 2021, they campaigned to amend the COVID-19 emergency funds legislation to include non-state schools, as it was initially reserved for the public education system (linkiesta, 2021). As a result, the law allocated EuR 60 million to independent schools with parity, in addition to EuR 350 million for public schools, conditional on transparency measures requiring the schools to publish data on their assets, spending and personnel (Italy Parliament, 2021). Allocation of public funds to independent schools with parity, more than half of which are Catholic, is a divisive subject in Italy. The state does not directly support non-state schools’ expenses, but independent schools with parity have been recognized by law as providers of a public educational service (Huffington Post, 2020).
The media plays a major role in shaping opinion about education policy, representing actors’ interests or serving as channels for them through coverage of events and views, but also through the language they employ, for instance on market opportunities in education (Connell, 2013; Olmedo, 2013). In Chile, two mainstream media outlets, La Tercera and El Mercurio, supported the voucher system (Grau and Olmedo, 2012) and depicted a stronger role for the state as hampering education freedom (Cabalin, 2015). Some media networks have had direct links with the education industry, e.g. the Financial Times and its former owner, the textbook publisher Pearson (Verger et al., 2016). In India, English-language newspapers and the entertainment industry have traditionally reflected affluent audiences’ interests, covering topics such as private school fees and tutoring. English news broadcasts on Indian television often feature experts who support private education and invite private school heads and sector entrepreneurs to comment on national policy (Thapliyal, 2018).
The media plays a major role in shaping opinion about education policy, representing actors’ interests or serving as channels for them through coverage of events and views
127 C H A P T E R 5 • InfluEnCE
5
CONCLUSION
Various actors take part in the often tense debate on public education and non-state provision. The language employed by proponents and opponents of a greater role for non-state actors is carefully selected to appeal to public opinion. using such narratives, actors exercise influence through advocacy, lobbying, research, financing and marketing. The challenging question for government officials is whether sufficient mechanisms are in place to ensure that such activities are legitimate, that the transparency of the public education policy process is not compromised and that narrow vested interests do not gain ground at the expense of equity and inclusion for learners.
2 0 2 1 / 2 • G LO BA L E D U C AT I O N M O N I TO R I N G R E P O RT 128
5
129 C H A P T E R 6 • Early childhood carE and Education
children play and learn at a reading club facilitated by
an preschool teacher from Save the children in a rural
village in Malungon, Mindanao, Philippines.
crEdit: Save the children
6CHAPTER
130C H A P T E R 6 • Early childhood carE and Education
Early childhood care and education
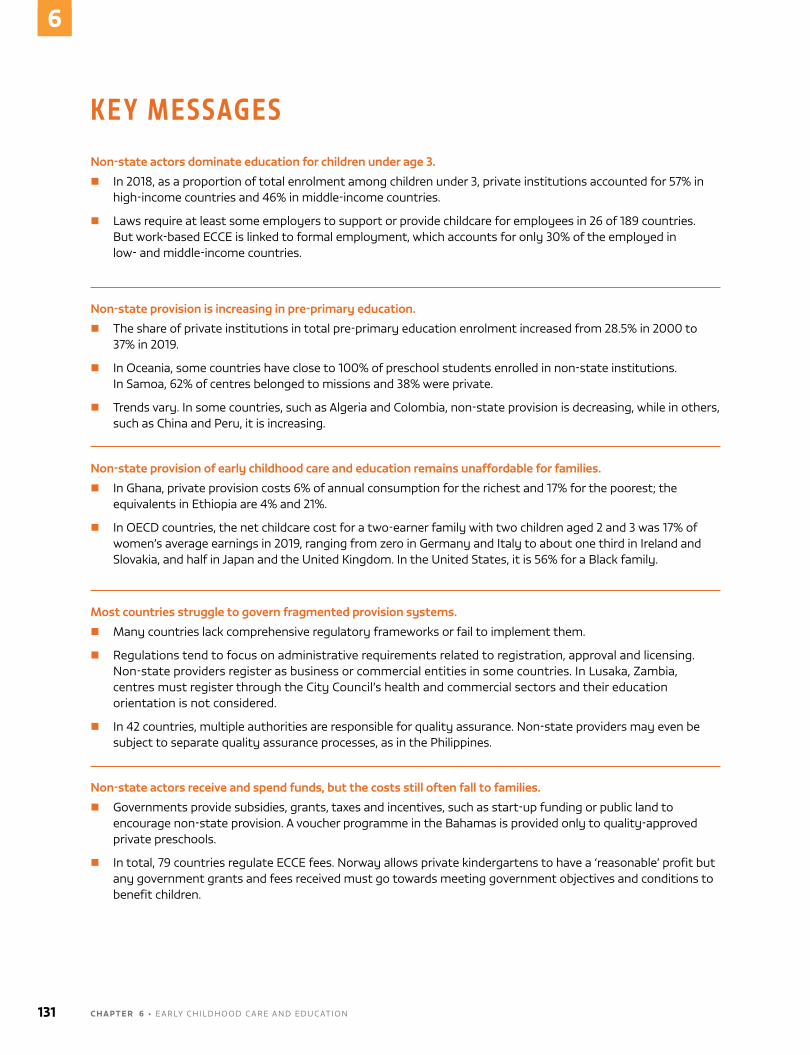
K E Y M E S S AG E SNon-state actors dominate education for children under age 3.
� in 2018, as a proportion of total enrolment among children under 3, private institutions accounted for 57% in high-income countries and 46% in middle-income countries.
� laws require at least some employers to support or provide childcare for employees in 26 of 189 countries. But work-based EccE is linked to formal employment, which accounts for only 30% of the employed in low- and middle-income countries.
Non-state provision is increasing in pre-primary education.
� the share of private institutions in total pre-primary education enrolment increased from 28.5% in 2000 to 37% in 2019.
� in oceania, some countries have close to 100% of preschool students enrolled in non-state institutions. in Samoa, 62% of centres belonged to missions and 38% were private.
� trends vary. in some countries, such as algeria and colombia, non-state provision is decreasing, while in others, such as china and Peru, it is increasing.
Non-state provision of early childhood care and education remains unaffordable for families.
� in Ghana, private provision costs 6% of annual consumption for the richest and 17% for the poorest; the equivalents in Ethiopia are 4% and 21%.
� in oEcd countries, the net childcare cost for a two-earner family with two children aged 2 and 3 was 17% of women’s average earnings in 2019, ranging from zero in Germany and italy to about one third in ireland and Slovakia, and half in Japan and the united Kingdom. in the united States, it is 56% for a Black family.
Most countries struggle to govern fragmented provision systems.
� Many countries lack comprehensive regulatory frameworks or fail to implement them.
� regulations tend to focus on administrative requirements related to registration, approval and licensing. non-state providers register as business or commercial entities in some countries. in lusaka, Zambia, centres must register through the city council’s health and commercial sectors and their education orientation is not considered.
� in 42 countries, multiple authorities are responsible for quality assurance. non-state providers may even be subject to separate quality assurance processes, as in the Philippines.
Non-state actors receive and spend funds, but the costs still often fall to families.
� Governments provide subsidies, grants, taxes and incentives, such as start-up funding or public land to encourage non-state provision. a voucher programme in the Bahamas is provided only to quality-approved private preschools.
� in total, 79 countries regulate EccE fees. norway allows private kindergartens to have a ‘reasonable’ profit but any government grants and fees received must go towards meeting government objectives and conditions to benefit children.
131 C H A P T E R 6 • Early childhood carE and Education
6
non-state actors lead care and education services for children under 3 ............133
non-state actors are more prominent in pre-primary than in basic education 135
non-state provision challenges governance and regulation ....................................140
Public funding of non-state provision takes different forms ................................... 146
non-state actors innovate and advocate for EccE ...................................................... 149
conclusion ......................................................................................................................................... 151
In the first few years after birth, children experience their most rapid growth in cognitive development,
yet are at their most vulnerable and fragile. care and education of young children have traditionally been the responsibility of the family, particularly women. in recent years, however, access to early childhood care and education (EccE) services of good quality has been increasingly recognized as providing children, especially disadvantaged children, with additional developmental benefits, such as socioemotional and cognitive stimulation. EccE services can also free mothers’ time for formal work, making such services’ development even more urgent, given the potential economic gains for families and economies.
By 2030, the number of children up to primary school entry age who need childcare but lack access is expected to increase by 25 million in low- and lower-middle-income countries
By 2030, the number of children up to primary school entry age who need childcare but lack access is expected to increase by 25 million in low- and lower-middle-income countries (devercelli and Beaton-day, 2020). low enrolment in pre-primary education in these countries is linked to lack of supply rather than of demand. Many families are willing to pay for access to EccE services. Gaps in provision have led to the entry of private providers, non-governmental organizations (nGos), faith-based organizations and community groups. But a strong non-state role in EccE provision risks entrenching unequal access at disadvantaged groups’ expense. Governments worldwide are gradually coming to terms with the need to expand free and compulsory EccE to improve access by reducing costs, along with monitoring whether non-state providers meet standards. as EccE services continue to grow, understanding the opportunities and challenges that non-state actors present is critical.
this chapter reflects the themes covered in this report in the context of early childhood. it explores how non-state actors operate as providers, businesses, funders, influencers and innovators. it also discusses the shifting role of government as EccE systems expand. attention is paid to children under age 3 who attend day care, nursery or playgroups and to children from age 3 up to school starting age who attend kindergarten or preschool. dimensions of quality and equity are discussed throughout.
2 0 2 1 / 2 • G LO BA L E D U C AT I O N M O N I TO R I N G R E P O RT 132
6
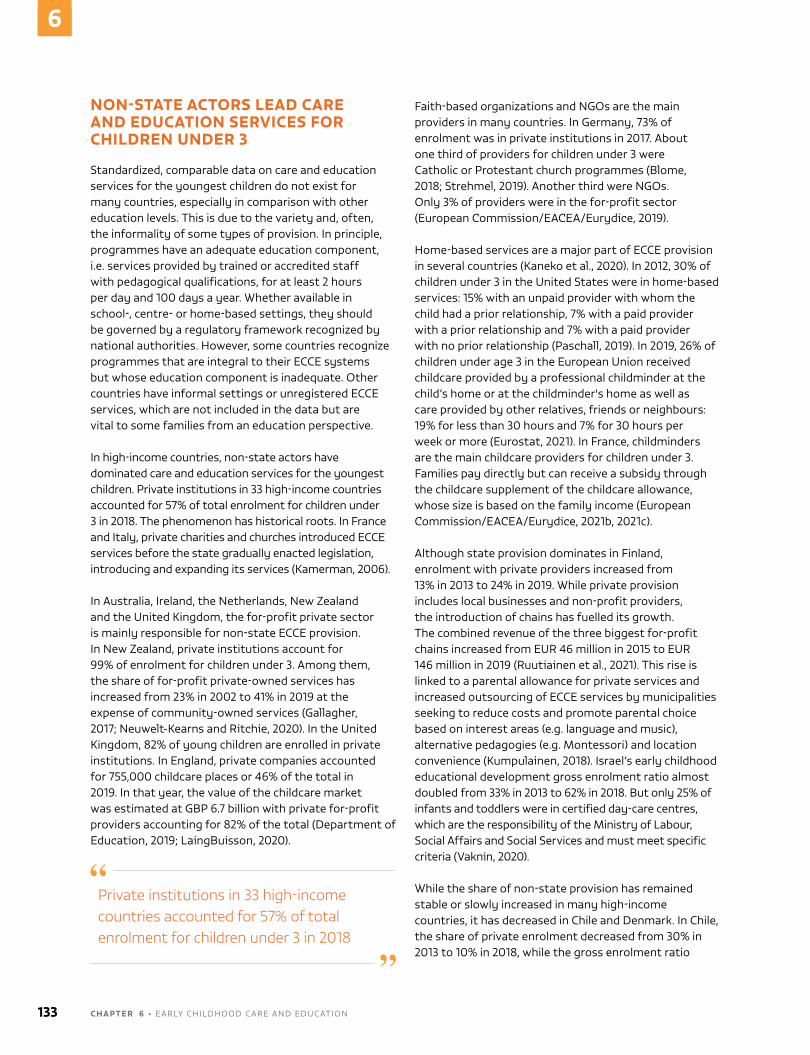
NON-STATE ACTORS LEAD CARE AND EDUCATION SERVICES FOR CHILDREN UNDER 3
Standardized, comparable data on care and education services for the youngest children do not exist for many countries, especially in comparison with other education levels. this is due to the variety and, often, the informality of some types of provision. in principle, programmes have an adequate education component, i.e. services provided by trained or accredited staff with pedagogical qualifications, for at least 2 hours per day and 100 days a year. Whether available in school-, centre- or home-based settings, they should be governed by a regulatory framework recognized by national authorities. however, some countries recognize programmes that are integral to their EccE systems but whose education component is inadequate. other countries have informal settings or unregistered EccE services, which are not included in the data but are vital to some families from an education perspective.
in high-income countries, non-state actors have dominated care and education services for the youngest children. Private institutions in 33 high-income countries accounted for 57% of total enrolment for children under 3 in 2018. the phenomenon has historical roots. in France and italy, private charities and churches introduced EccE services before the state gradually enacted legislation, introducing and expanding its services (Kamerman, 2006).
in australia, ireland, the netherlands, new Zealand and the united Kingdom, the for-profit private sector is mainly responsible for non-state EccE provision. in new Zealand, private institutions account for 99% of enrolment for children under 3. among them, the share of for-profit private-owned services has increased from 23% in 2002 to 41% in 2019 at the expense of community-owned services (Gallagher, 2017; neuwelt-Kearns and ritchie, 2020). in the united Kingdom, 82% of young children are enrolled in private institutions. in England, private companies accounted for 755,000 childcare places or 46% of the total in 2019. in that year, the value of the childcare market was estimated at GBP 6.7 billion with private for-profit providers accounting for 82% of the total (department of Education, 2019; laingBuisson, 2020).
Faith-based organizations and nGos are the main providers in many countries. in Germany, 73% of enrolment was in private institutions in 2017. about one third of providers for children under 3 were catholic or Protestant church programmes (Blome, 2018; Strehmel, 2019). another third were nGos. only 3% of providers were in the for-profit sector (European Commission/EaCEa/Eurydice, 2019).
home-based services are a major part of EccE provision in several countries (Kaneko et al., 2020). in 2012, 30% of children under 3 in the united States were in home-based services: 15% with an unpaid provider with whom the child had a prior relationship, 7% with a paid provider with a prior relationship and 7% with a paid provider with no prior relationship (Paschall, 2019). in 2019, 26% of children under age 3 in the European union received childcare provided by a professional childminder at the child’s home or at the childminder's home as well as care provided by other relatives, friends or neighbours: 19% for less than 30 hours and 7% for 30 hours per week or more (Eurostat, 2021). in France, childminders are the main childcare providers for children under 3. Families pay directly but can receive a subsidy through the childcare supplement of the childcare allowance, whose size is based on the family income (European Commission/EaCEa/Eurydice, 2021b, 2021c).
although state provision dominates in Finland, enrolment with private providers increased from 13% in 2013 to 24% in 2019. While private provision includes local businesses and non-profit providers, the introduction of chains has fuelled its growth. the combined revenue of the three biggest for-profit chains increased from Eur 46 million in 2015 to Eur 146 million in 2019 (ruutiainen et al., 2021). this rise is linked to a parental allowance for private services and increased outsourcing of EccE services by municipalities seeking to reduce costs and promote parental choice based on interest areas (e.g. language and music), alternative pedagogies (e.g. Montessori) and location convenience (Kumpulainen, 2018). israel’s early childhood educational development gross enrolment ratio almost doubled from 33% in 2013 to 62% in 2018. But only 25% of infants and toddlers were in certified day-care centres, which are the responsibility of the Ministry of labour, Social affairs and Social Services and must meet specific criteria (Vaknin, 2020).
While the share of non-state provision has remained stable or slowly increased in many high-income countries, it has decreased in chile and denmark. in chile, the share of private enrolment decreased from 30% in 2013 to 10% in 2018, while the gross enrolment ratio
Private institutions in 33 high-income countries accounted for 57% of total enrolment for children under 3 in 2018
133 C H A P T E R 6 • Early childhood carE and Education
6
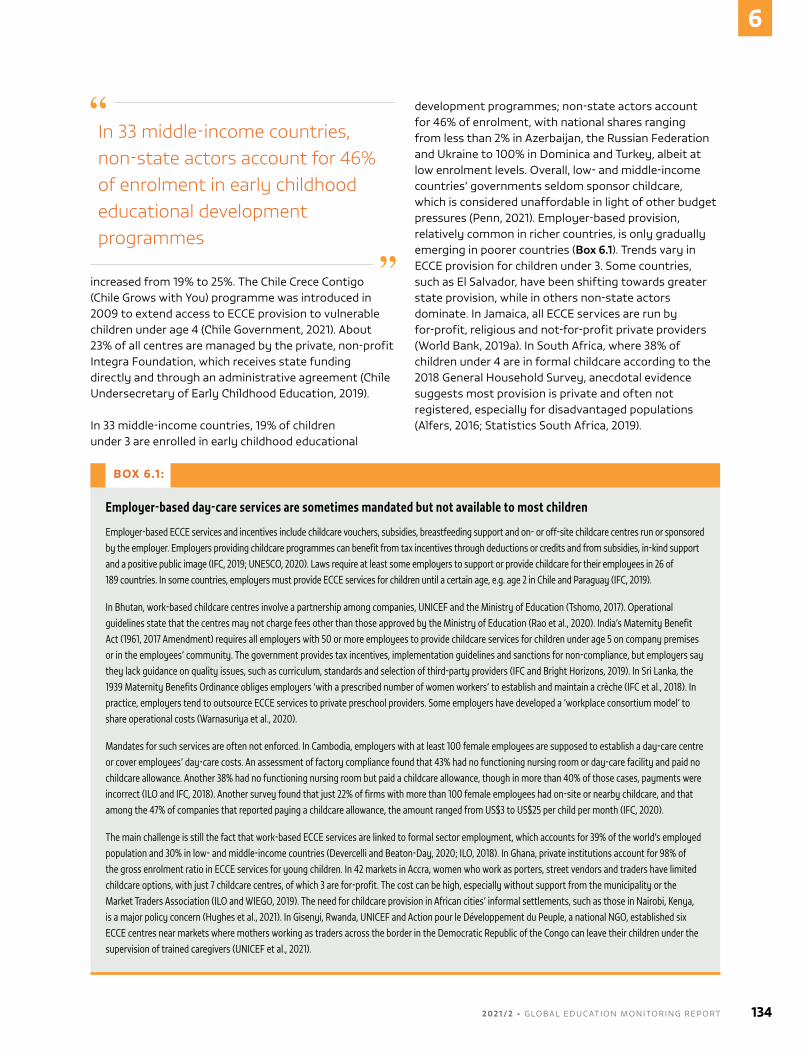
increased from 19% to 25%. the chile crece contigo (chile Grows with you) programme was introduced in 2009 to extend access to EccE provision to vulnerable children under age 4 (Chile Government, 2021). about 23% of all centres are managed by the private, non-profit integra Foundation, which receives state funding directly and through an administrative agreement (Chile undersecretary of Early Childhood Education, 2019).
in 33 middle-income countries, 19% of children under 3 are enrolled in early childhood educational
development programmes; non-state actors account for 46% of enrolment, with national shares ranging from less than 2% in azerbaijan, the russian Federation and ukraine to 100% in dominica and turkey, albeit at low enrolment levels. overall, low- and middle-income countries’ governments seldom sponsor childcare, which is considered unaffordable in light of other budget pressures (Penn, 2021). Employer-based provision, relatively common in richer countries, is only gradually emerging in poorer countries (Box 6.1). trends vary in EccE provision for children under 3. Some countries, such as El Salvador, have been shifting towards greater state provision, while in others non-state actors dominate. in Jamaica, all EccE services are run by for-profit, religious and not-for-profit private providers (World Bank, 2019a). in South africa, where 38% of children under 4 are in formal childcare according to the 2018 General household Survey, anecdotal evidence suggests most provision is private and often not registered, especially for disadvantaged populations (alfers, 2016; Statistics South africa, 2019).
In 33 middle-income countries, non-state actors account for 46% of enrolment in early childhood educational development programmes
BOX 6.1 :
Employer-based day-care services are sometimes mandated but not available to most children
Employer-based ECCE services and incentives include childcare vouchers, subsidies, breastfeeding support and on- or off-site childcare centres run or sponsored by the employer. Employers providing childcare programmes can benefit from tax incentives through deductions or credits and from subsidies, in-kind support and a positive public image (IFC, 2019; UNESCO, 2020). Laws require at least some employers to support or provide childcare for their employees in 26 of 189 countries. In some countries, employers must provide ECCE services for children until a certain age, e.g. age 2 in Chile and Paraguay (IFC, 2019).
In Bhutan, work-based childcare centres involve a partnership among companies, UNICEF and the Ministry of Education (Tshomo, 2017). Operational guidelines state that the centres may not charge fees other than those approved by the Ministry of Education (Rao et al., 2020). India’s Maternity Benefit Act (1961, 2017 Amendment) requires all employers with 50 or more employees to provide childcare services for children under age 5 on company premises or in the employees’ community. The government provides tax incentives, implementation guidelines and sanctions for non-compliance, but employers say they lack guidance on quality issues, such as curriculum, standards and selection of third-party providers (IFC and Bright Horizons, 2019). In Sri Lanka, the 1939 Maternity Benefits Ordinance obliges employers ‘with a prescribed number of women workers’ to establish and maintain a crèche (IFC et al., 2018). In practice, employers tend to outsource ECCE services to private preschool providers. Some employers have developed a ‘workplace consortium model’ to share operational costs (Warnasuriya et al., 2020).
Mandates for such services are often not enforced. In Cambodia, employers with at least 100 female employees are supposed to establish a day-care centre or cover employees’ day-care costs. An assessment of factory compliance found that 43% had no functioning nursing room or day-care facility and paid no childcare allowance. Another 38% had no functioning nursing room but paid a childcare allowance, though in more than 40% of those cases, payments were incorrect (ILO and IFC, 2018). Another survey found that just 22% of firms with more than 100 female employees had on-site or nearby childcare, and that among the 47% of companies that reported paying a childcare allowance, the amount ranged from US$3 to US$25 per child per month (IFC, 2020).
The main challenge is still the fact that work-based ECCE services are linked to formal sector employment, which accounts for 39% of the world’s employed population and 30% in low- and middle-income countries (Devercelli and Beaton-Day, 2020; ILO, 2018). In Ghana, private institutions account for 98% of the gross enrolment ratio in ECCE services for young children. In 42 markets in Accra, women who work as porters, street vendors and traders have limited childcare options, with just 7 childcare centres, of which 3 are for-profit. The cost can be high, especially without support from the municipality or the Market Traders Association (ILO and WIEGO, 2019). The need for childcare provision in African cities’ informal settlements, such as those in Nairobi, Kenya, is a major policy concern (Hughes et al., 2021). In Gisenyi, Rwanda, UNICEF and Action pour le Développement du Peuple, a national NGO, established six ECCE centres near markets where mothers working as traders across the border in the Democratic Republic of the Congo can leave their children under the supervision of trained caregivers (UNICEF et al., 2021).
2 0 2 1 / 2 • G LO BA L E D U C AT I O N M O N I TO R I N G R E P O RT 134
6
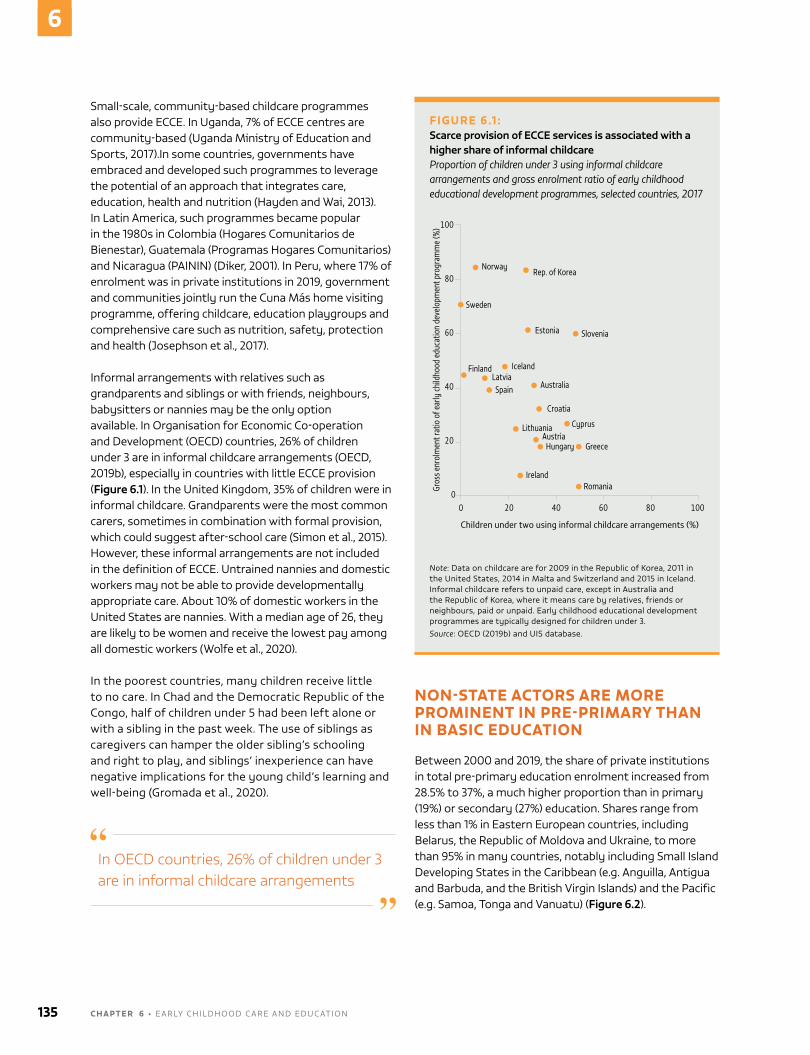
Small-scale, community-based childcare programmes also provide EccE. in uganda, 7% of EccE centres are community-based (uganda Ministry of Education and Sports, 2017).in some countries, governments have embraced and developed such programmes to leverage the potential of an approach that integrates care, education, health and nutrition (hayden and Wai, 2013). in latin america, such programmes became popular in the 1980s in colombia (hogares comunitarios de Bienestar), Guatemala (Programas hogares comunitarios) and nicaragua (Painin) (diker, 2001). in Peru, where 17% of enrolment was in private institutions in 2019, government and communities jointly run the cuna Más home visiting programme, offering childcare, education playgroups and comprehensive care such as nutrition, safety, protection and health (Josephson et al., 2017).
informal arrangements with relatives such as grandparents and siblings or with friends, neighbours, babysitters or nannies may be the only option available. in organisation for Economic co-operation and development (oEcd) countries, 26% of children under 3 are in informal childcare arrangements (oECd, 2019b), especially in countries with little EccE provision (Figure 6.1). in the united Kingdom, 35% of children were in informal childcare. Grandparents were the most common carers, sometimes in combination with formal provision, which could suggest after-school care (Simon et al., 2015). however, these informal arrangements are not included in the definition of EccE. untrained nannies and domestic workers may not be able to provide developmentally appropriate care. about 10% of domestic workers in the united States are nannies. With a median age of 26, they are likely to be women and receive the lowest pay among all domestic workers (Wolfe et al., 2020).
in the poorest countries, many children receive little to no care. in chad and the democratic republic of the congo, half of children under 5 had been left alone or with a sibling in the past week. the use of siblings as caregivers can hamper the older sibling’s schooling and right to play, and siblings’ inexperience can have negative implications for the young child’s learning and well-being (Gromada et al., 2020).
In OECD countries, 26% of children under 3 are in informal childcare arrangements
NON-STATE ACTORS ARE MORE PROMINENT IN PRE-PRIMARY THAN IN BASIC EDUCATION
Between 2000 and 2019, the share of private institutions in total pre-primary education enrolment increased from 28.5% to 37%, a much higher proportion than in primary (19%) or secondary (27%) education. Shares range from less than 1% in Eastern European countries, including Belarus, the republic of Moldova and ukraine, to more than 95% in many countries, notably including Small island developing States in the caribbean (e.g. anguilla, antigua and Barbuda, and the British Virgin islands) and the Pacific (e.g. Samoa, tonga and Vanuatu) (Figure 6.2).
FIGURE 6.1 :Scarce provision of ECCE services is associated with a higher share of informal childcareProportion of children under 3 using informal childcare arrangements and gross enrolment ratio of early childhood educational development programmes, selected countries, 2017
NorwayRep. of Korea
Sweden
Estonia Slovenia
IcelandFinlandLatvia
Spain Australia
Croatia
Lithuania CyprusAustria
Hungary Greece
IrelandRomania
100
80
60
40
20Gr
oss e
nrol
men
t rat
io o
f ear
ly ch
ildho
od e
duca
tion
deve
lopm
ent p
rogr
amm
e (%
)
Children under two using informal childcare arrangements (%)
100806040200
0
Note: data on childcare are for 2009 in the republic of Korea, 2011 in the united States, 2014 in Malta and Switzerland and 2015 in iceland. informal childcare refers to unpaid care, except in australia and the republic of Korea, where it means care by relatives, friends or neighbours, paid or unpaid. Early childhood educational development programmes are typically designed for children under 3.Source: oEcd (2019b) and uiS database.
135 C H A P T E R 6 • Early childhood carE and Education
6
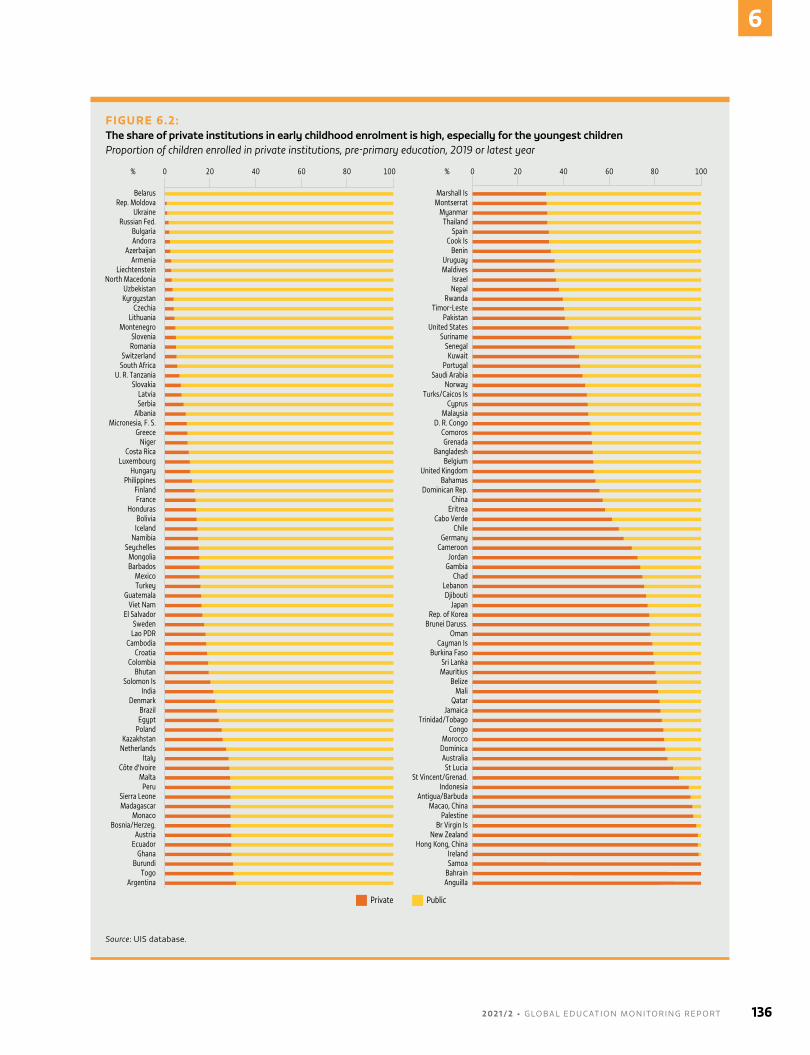
FIGURE 6.2:The share of private institutions in early childhood enrolment is high, especially for the youngest childrenProportion of children enrolled in private institutions, pre-primary education, 2019 or latest year
BelarusRep. Moldova
UkraineRussian Fed.
BulgariaAndorra
AzerbaijanArmenia
LiechtensteinNorth Macedonia
UzbekistanKyrgyzstan
CzechiaLithuania
MontenegroSloveniaRomania
SwitzerlandSouth Africa
U. R. TanzaniaSlovakia
LatviaSerbia
AlbaniaMicronesia, F. S.
GreeceNiger
Costa RicaLuxembourg
HungaryPhilippines
FinlandFrance
HondurasBoliviaIceland
NamibiaSeychelles
MongoliaBarbados
MexicoTurkey
GuatemalaViet Nam
El SalvadorSweden
Lao PDRCambodia
CroatiaColombia
BhutanSolomon Is
IndiaDenmark
BrazilEgypt
PolandKazakhstan
NetherlandsItaly
Côte d'IvoireMalta
PeruSierra LeoneMadagascar
MonacoBosnia/Herzeg.
AustriaEcuador
GhanaBurundi
TogoArgentina
100806040200%
Marshall IsMontserrat
MyanmarThailand
SpainCook Is
BeninUruguayMaldives
IsraelNepal
RwandaTimor-Leste
PakistanUnited States
SurinameSenegalKuwait
PortugalSaudi Arabia
NorwayTurks/Caicos Is
CyprusMalaysia
D. R. CongoComorosGrenada
BangladeshBelgium
United KingdomBahamas
Dominican Rep.China
EritreaCabo Verde
ChileGermany
CameroonJordan
GambiaChad
LebanonDjibouti
JapanRep. of Korea
Brunei Daruss.Oman
Cayman IsBurkina Faso
Sri LankaMauritius
BelizeMali
QatarJamaica
Trinidad/TobagoCongo
MoroccoDominicaAustralia
St LuciaSt Vincent/Grenad.
IndonesiaAntigua/Barbuda
Macao, ChinaPalestine
Br Virgin IsNew Zealand
Hong Kong, ChinaIrelandSamoa
BahrainAnguilla
100806040200%
Private Public
Source: uiS database.
2 0 2 1 / 2 • G LO BA L E D U C AT I O N M O N I TO R I N G R E P O RT 136
6
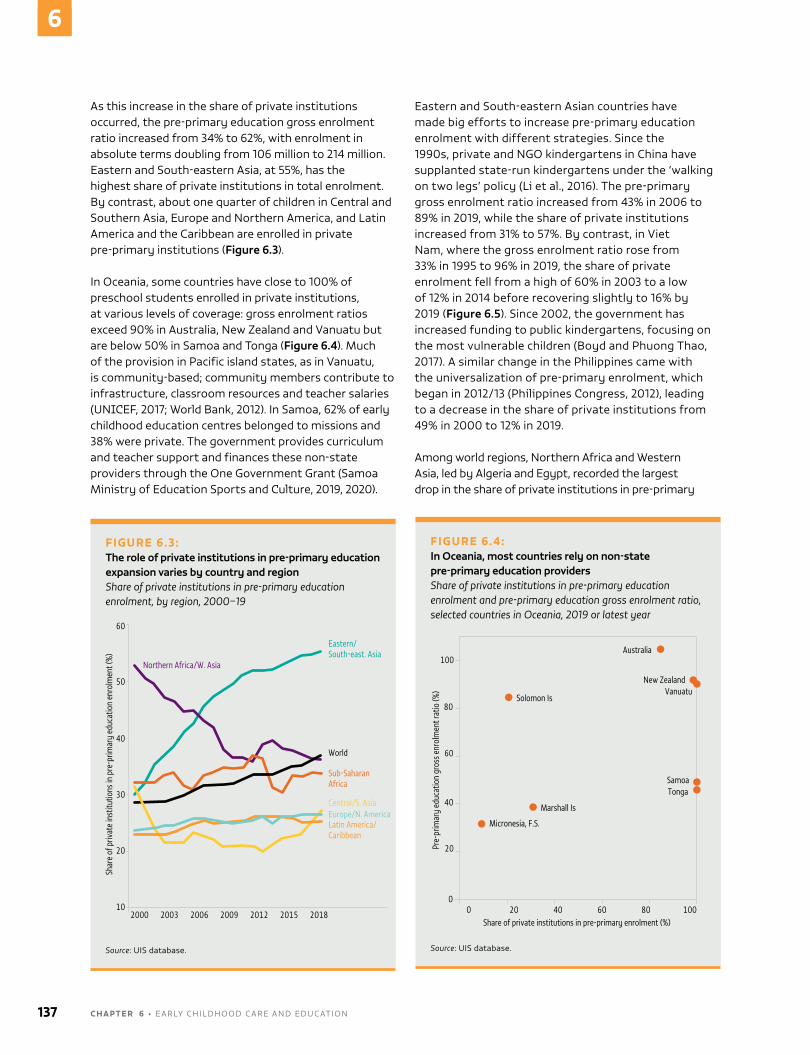
as this increase in the share of private institutions occurred, the pre-primary education gross enrolment ratio increased from 34% to 62%, with enrolment in absolute terms doubling from 106 million to 214 million. Eastern and South-eastern asia, at 55%, has the highest share of private institutions in total enrolment. By contrast, about one quarter of children in central and Southern asia, Europe and northern america, and latin america and the caribbean are enrolled in private pre-primary institutions (Figure 6.3).
in oceania, some countries have close to 100% of preschool students enrolled in private institutions, at various levels of coverage: gross enrolment ratios exceed 90% in australia, new Zealand and Vanuatu but are below 50% in Samoa and tonga (Figure 6.4). Much of the provision in Pacific island states, as in Vanuatu, is community-based; community members contribute to infrastructure, classroom resources and teacher salaries (unICEF, 2017; World Bank, 2012). in Samoa, 62% of early childhood education centres belonged to missions and 38% were private. the government provides curriculum and teacher support and finances these non-state providers through the one Government Grant (Samoa Ministry of Education Sports and Culture, 2019, 2020).
Eastern and South-eastern asian countries have made big efforts to increase pre-primary education enrolment with different strategies. Since the 1990s, private and nGo kindergartens in china have supplanted state-run kindergartens under the ‘walking on two legs’ policy (li et al., 2016). the pre-primary gross enrolment ratio increased from 43% in 2006 to 89% in 2019, while the share of private institutions increased from 31% to 57%. By contrast, in Viet nam, where the gross enrolment ratio rose from 33% in 1995 to 96% in 2019, the share of private enrolment fell from a high of 60% in 2003 to a low of 12% in 2014 before recovering slightly to 16% by 2019 (Figure 6.5). Since 2002, the government has increased funding to public kindergartens, focusing on the most vulnerable children (Boyd and Phuong thao, 2017). a similar change in the Philippines came with the universalization of pre-primary enrolment, which began in 2012/13 (Philippines Congress, 2012), leading to a decrease in the share of private institutions from 49% in 2000 to 12% in 2019.
among world regions, northern africa and Western asia, led by algeria and Egypt, recorded the largest drop in the share of private institutions in pre-primary
FIGURE 6.3:The role of private institutions in pre-primary education expansion varies by country and regionShare of private institutions in pre-primary education enrolment, by region, 2000–19
Shar
e of
priv
ate
inst
itutio
ns in
pre
-prim
ary
educ
atio
n en
rolm
ent (
%)
Eastern/South-east. Asia
World
Northern Africa/W. Asia
Sub-SaharanAfrica
Central/S. AsiaEurope/N. AmericaLatin America/Caribbean
60
50
40
30
20
102000 2003 2006 2009 2012 2015 2018
Source: uiS database.
FIGURE 6.4:In Oceania, most countries rely on non-state pre-primary education providersShare of private institutions in pre-primary education enrolment and pre-primary education gross enrolment ratio, selected countries in Oceania, 2019 or latest year
Pre-
prim
ary
educ
atio
n gr
oss e
nrol
men
t rat
io (%
)
Share of private institutions in pre-primary enrolment (%)
100
80
60
40
20
00 10040 806020
Solomon Is
Marshall Is
Micronesia, F.S.
SamoaTonga
VanuatuNew Zealand
Australia
Source: uiS database.
137 C H A P T E R 6 • Early childhood carE and Education
6
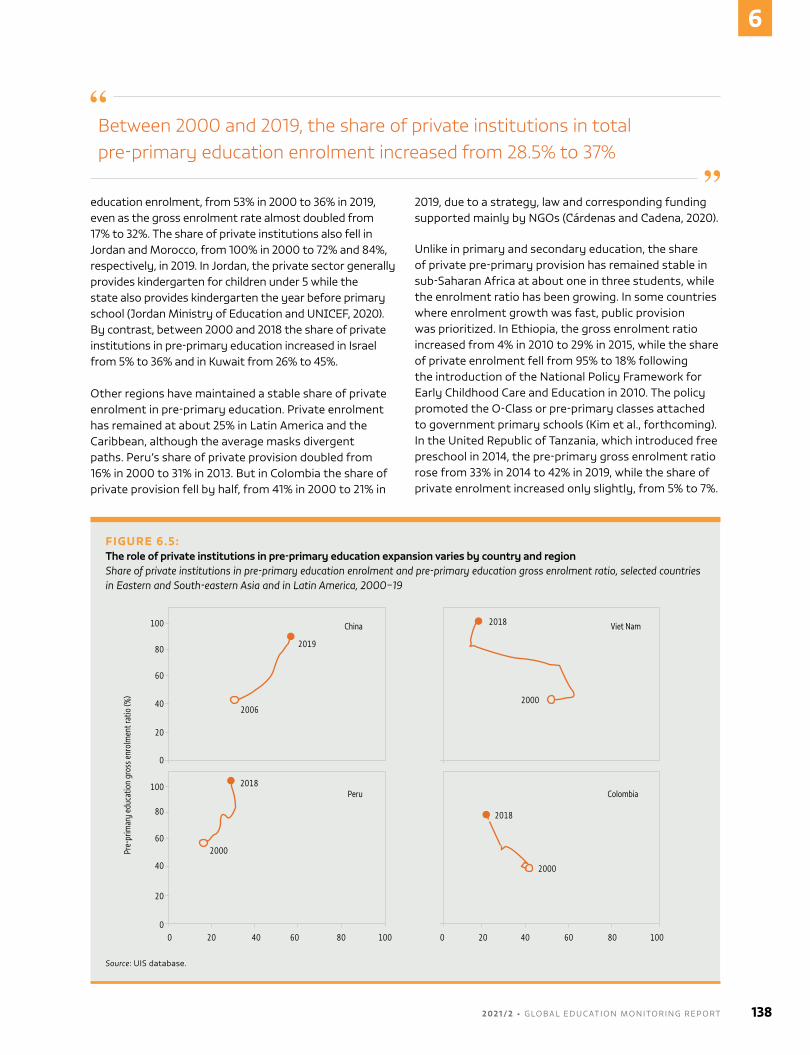
education enrolment, from 53% in 2000 to 36% in 2019, even as the gross enrolment rate almost doubled from 17% to 32%. the share of private institutions also fell in Jordan and Morocco, from 100% in 2000 to 72% and 84%, respectively, in 2019. in Jordan, the private sector generally provides kindergarten for children under 5 while the state also provides kindergarten the year before primary school (Jordan Ministry of Education and unICEF, 2020). By contrast, between 2000 and 2018 the share of private institutions in pre-primary education increased in israel from 5% to 36% and in Kuwait from 26% to 45%.
other regions have maintained a stable share of private enrolment in pre-primary education. Private enrolment has remained at about 25% in latin america and the caribbean, although the average masks divergent paths. Peru’s share of private provision doubled from 16% in 2000 to 31% in 2013. But in colombia the share of private provision fell by half, from 41% in 2000 to 21% in
2019, due to a strategy, law and corresponding funding supported mainly by nGos (Cárdenas and Cadena, 2020).
unlike in primary and secondary education, the share of private pre-primary provision has remained stable in sub-Saharan africa at about one in three students, while the enrolment ratio has been growing. in some countries where enrolment growth was fast, public provision was prioritized. in Ethiopia, the gross enrolment ratio increased from 4% in 2010 to 29% in 2015, while the share of private enrolment fell from 95% to 18% following the introduction of the national Policy Framework for Early childhood care and Education in 2010. the policy promoted the o-class or pre-primary classes attached to government primary schools (Kim et al., forthcoming). in the united republic of tanzania, which introduced free preschool in 2014, the pre-primary gross enrolment ratio rose from 33% in 2014 to 42% in 2019, while the share of private enrolment increased only slightly, from 5% to 7%.
FIGURE 6.5:The role of private institutions in pre-primary education expansion varies by country and regionShare of private institutions in pre-primary education enrolment and pre-primary education gross enrolment ratio, selected countries in Eastern and South-eastern Asia and in Latin America, 2000–19
Pre-
prim
ary
educ
atio
n gr
oss e
nrol
men
t rat
io (%
)
Share of private institutions in pre-primary enrolment (%)
100
80
60
40
20
0
100
80
60
40
20
0
China
Peru Colombia
100806040200
2000
2006
2018
2000
2018
100806040200
Viet Nam
2000
2018
2019
Source: uiS database.
Between 2000 and 2019, the share of private institutions in total pre-primary education enrolment increased from 28.5% to 37%
2 0 2 1 / 2 • G LO BA L E D U C AT I O N M O N I TO R I N G R E P O RT 138
6
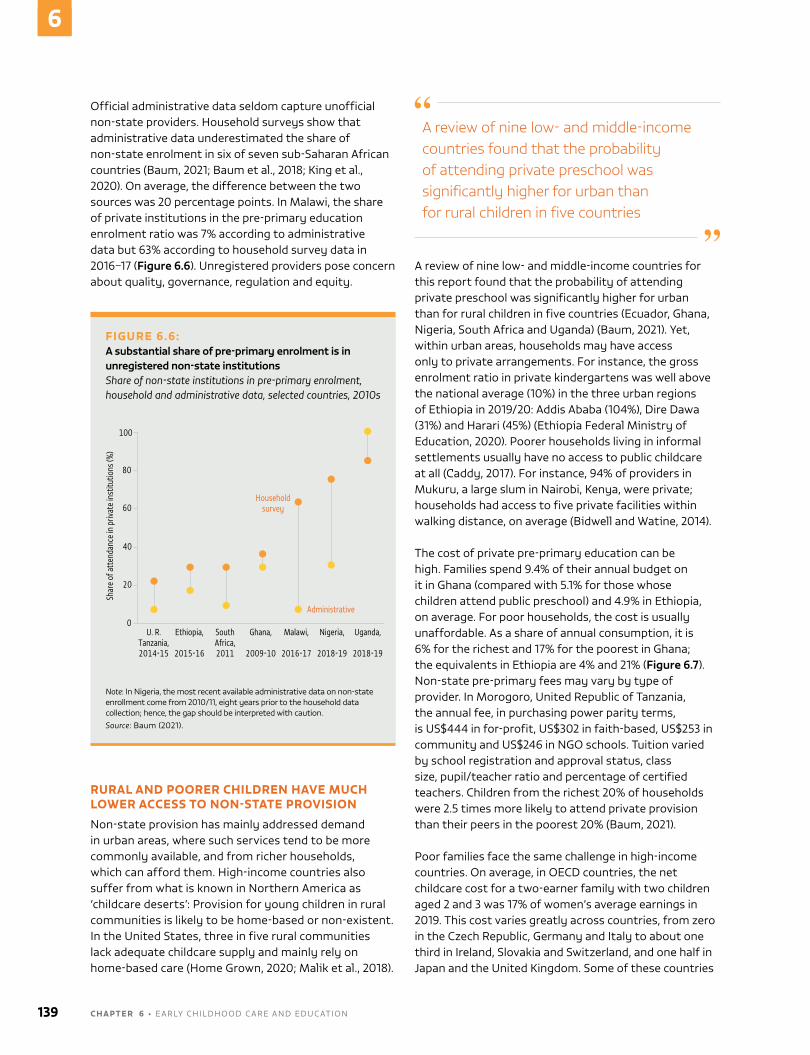
official administrative data seldom capture unofficial non-state providers. household surveys show that administrative data underestimated the share of non-state enrolment in six of seven sub-Saharan african countries (Baum, 2021; Baum et al., 2018; King et al., 2020). on average, the difference between the two sources was 20 percentage points. in Malawi, the share of private institutions in the pre-primary education enrolment ratio was 7% according to administrative data but 63% according to household survey data in 2016–17 (Figure 6.6). unregistered providers pose concern about quality, governance, regulation and equity.
RURAL AND POORER CHILDREN HAVE MUCH LOWER ACCESS TO NON-STATE PROVISION
non-state provision has mainly addressed demand in urban areas, where such services tend to be more commonly available, and from richer households, which can afford them. high-income countries also suffer from what is known in northern america as ‘childcare deserts’: Provision for young children in rural communities is likely to be home-based or non-existent. in the united States, three in five rural communities lack adequate childcare supply and mainly rely on home-based care (home Grown, 2020; Malik et al., 2018).
a review of nine low- and middle-income countries for this report found that the probability of attending private preschool was significantly higher for urban than for rural children in five countries (Ecuador, Ghana, nigeria, South africa and uganda) (Baum, 2021). yet, within urban areas, households may have access only to private arrangements. For instance, the gross enrolment ratio in private kindergartens was well above the national average (10%) in the three urban regions of Ethiopia in 2019/20: addis ababa (104%), dire dawa (31%) and harari (45%) (Ethiopia Federal Ministry of Education, 2020). Poorer households living in informal settlements usually have no access to public childcare at all (Caddy, 2017). For instance, 94% of providers in Mukuru, a large slum in nairobi, Kenya, were private; households had access to five private facilities within walking distance, on average (Bidwell and Watine, 2014).
the cost of private pre-primary education can be high. Families spend 9.4% of their annual budget on it in Ghana (compared with 5.1% for those whose children attend public preschool) and 4.9% in Ethiopia, on average. For poor households, the cost is usually unaffordable. as a share of annual consumption, it is 6% for the richest and 17% for the poorest in Ghana; the equivalents in Ethiopia are 4% and 21% (Figure 6.7). non-state pre-primary fees may vary by type of provider. in Morogoro, united republic of tanzania, the annual fee, in purchasing power parity terms, is uS$444 in for-profit, uS$302 in faith-based, uS$253 in community and uS$246 in nGo schools. tuition varied by school registration and approval status, class size, pupil/teacher ratio and percentage of certified teachers. children from the richest 20% of households were 2.5 times more likely to attend private provision than their peers in the poorest 20% (Baum, 2021).
Poor families face the same challenge in high-income countries. on average, in oEcd countries, the net childcare cost for a two-earner family with two children aged 2 and 3 was 17% of women’s average earnings in 2019. this cost varies greatly across countries, from zero in the czech republic, Germany and italy to about one third in ireland, Slovakia and Switzerland, and one half in Japan and the united Kingdom. Some of these countries
A review of nine low- and middle-income countries found that the probability of attending private preschool was significantly higher for urban than for rural children in five countries
FIGURE 6.6: A substantial share of pre-primary enrolment is in unregistered non-state institutionsShare of non-state institutions in pre-primary enrolment, household and administrative data, selected countries, 2010s
100
Householdsurvey
Shar
e of
att
enda
nce
in p
rivat
e in
stitu
tions
(%)
80
60
40
20
0Administrative
U. R.Tanzania,2014-15
Ethiopia,
2015-16
SouthAfrica,2011
Ghana,
2009-10
Malawi,
2016-17
Nigeria,
2018-19
Uganda,
2018-19
Note: in nigeria, the most recent available administrative data on non-state enrollment come from 2010/11, eight years prior to the household data collection; hence, the gap should be interpreted with caution. Source: Baum (2021).
139 C H A P T E R 6 • Early childhood carE and Education
6
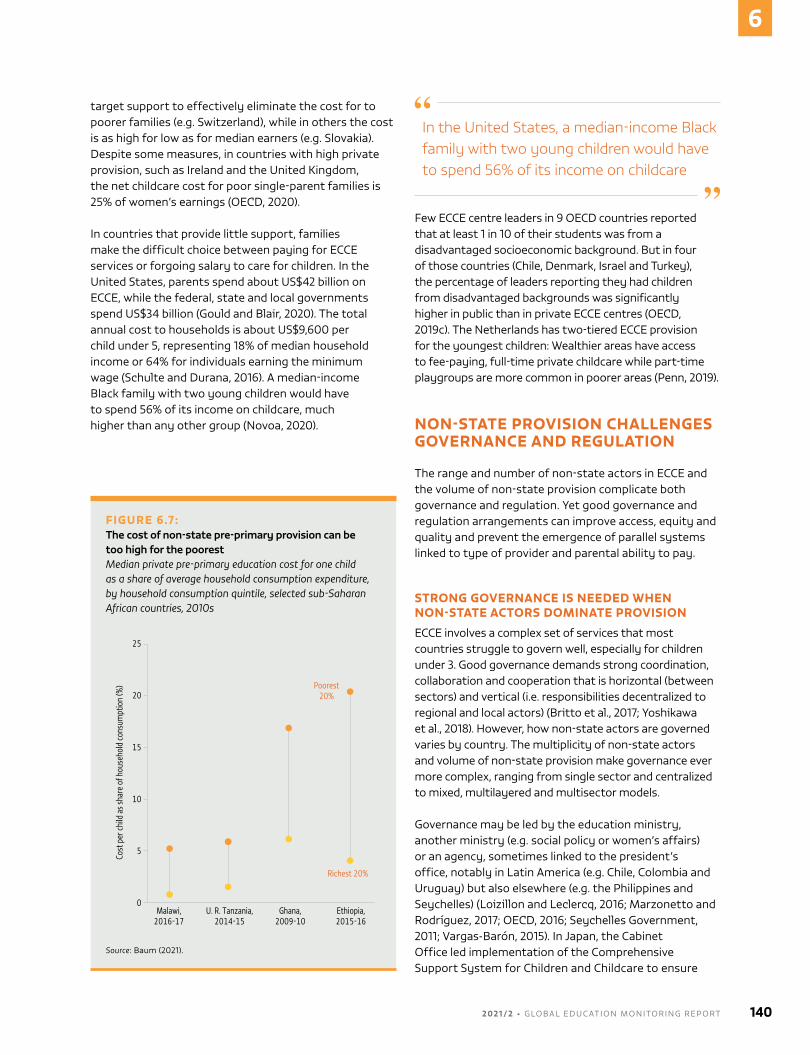
target support to effectively eliminate the cost for to poorer families (e.g. Switzerland), while in others the cost is as high for low as for median earners (e.g. Slovakia). despite some measures, in countries with high private provision, such as ireland and the united Kingdom, the net childcare cost for poor single-parent families is 25% of women’s earnings (oECd, 2020).
in countries that provide little support, families make the difficult choice between paying for EccE services or forgoing salary to care for children. in the united States, parents spend about uS$42 billion on EccE, while the federal, state and local governments spend uS$34 billion (Gould and Blair, 2020). the total annual cost to households is about uS$9,600 per child under 5, representing 18% of median household income or 64% for individuals earning the minimum wage (Schulte and durana, 2016). a median-income Black family with two young children would have to spend 56% of its income on childcare, much higher than any other group (novoa, 2020).
Few EccE centre leaders in 9 oEcd countries reported that at least 1 in 10 of their students was from a disadvantaged socioeconomic background. But in four of those countries (chile, denmark, israel and turkey), the percentage of leaders reporting they had children from disadvantaged backgrounds was significantly higher in public than in private EccE centres (oECd, 2019c). the netherlands has two-tiered EccE provision for the youngest children: Wealthier areas have access to fee-paying, full-time private childcare while part-time playgroups are more common in poorer areas (Penn, 2019).
NON-STATE PROVISION CHALLENGES GOVERNANCE AND REGULATION
the range and number of non-state actors in EccE and the volume of non-state provision complicate both governance and regulation. yet good governance and regulation arrangements can improve access, equity and quality and prevent the emergence of parallel systems linked to type of provider and parental ability to pay.
STRONG GOVERNANCE IS NEEDED WHEN NON-STATE ACTORS DOMINATE PROVISION
EccE involves a complex set of services that most countries struggle to govern well, especially for children under 3. Good governance demands strong coordination, collaboration and cooperation that is horizontal (between sectors) and vertical (i.e. responsibilities decentralized to regional and local actors) (Britto et al., 2017; yoshikawa et al., 2018). however, how non-state actors are governed varies by country. the multiplicity of non-state actors and volume of non-state provision make governance ever more complex, ranging from single sector and centralized to mixed, multilayered and multisector models.
Governance may be led by the education ministry, another ministry (e.g. social policy or women’s affairs) or an agency, sometimes linked to the president’s office, notably in latin america (e.g. chile, colombia and uruguay) but also elsewhere (e.g. the Philippines and Seychelles) (loizillon and leclercq, 2016; Marzonetto and rodríguez, 2017; oECd, 2016; Seychelles Government, 2011; Vargas-Barón, 2015). in Japan, the cabinet office led implementation of the comprehensive Support System for children and childcare to ensure
FIGURE 6.7:The cost of non-state pre-primary provision can be too high for the poorestMedian private pre-primary education cost for one child as a share of average household consumption expenditure, by household consumption quintile, selected sub-Saharan African countries, 2010s
Pre-Primary education gross enrolment ratio (%)
25
Poorest20%
Cost
per
child
as s
hare
of h
ouse
hold
cons
umpt
ion
(%)
20
15
10
5
0
Richest 20%
U. R. Tanzania,2014-15
Ethiopia,2015-16
Ghana,2009-10
Malawi,2016-17
Source: Baum (2021).
In the United States, a median-income Black family with two young children would have to spend 56% of its income on childcare
2 0 2 1 / 2 • G LO BA L E D U C AT I O N M O N I TO R I N G R E P O RT 140
6
consistency between education and health ministry regulations (Japan Government, 2014). in Singapore, the independent Early childhood development agency, overseen by the Ministries of Education and of Social and Family development, governs and regulates non-state provision for children under age 7 in both kindergartens and childcare centres (ECda, 2020).
Faith-based provision often leads to fragmented governance. in Mali, the Ministry of national Education is responsible for preschools while the Ministry of territorial administration and local Government supervises Koranic schools. EccE in Somalia is delivered through traditional Koranic schools, integrated Koranic schools, and privately owned kindergartens and nursery schools run by local nGos and private foundations in large urban centres. the federal Ministry of Education, culture and higher Education is responsible for EccE policy, service standard guidelines, monitoring and evaluation, while the Ministry of religious affairs develops integrated islamic religion-based EccE curriculum and appoints and supports training of EccE trainers (PEEr country profiles).
decentralization adds further complexity. clear roles and responsibilities are needed to avoid overlaps and misalignment. in norway, governance of state and non-state providers is delegated to municipalities, which can decide whether to increase the share of private provision to address parental demand (norway Ministry of Education and research, 2014). in the united States, the fragmented governance structure, coupled with a reliance on private providers, has produced different regulatory frameworks and separate support systems at federal, state and district levels (Karch, 2013; Miller et al., 2017).
Governments engage non-state actors through partnerships. the Bangladesh Early childhood development network, a partnership of 172 members from government, nGos and international organizations, was established in 2005 for advocacy and stronger cooperation through information sharing, technical guidance and capacity building. it helped develop the 2008 operational Framework for universal Pre-primary Education, which included national standards and focused on introducing a year of pre-primary education with clear roles and responsibilities for non-state actors to
complement government capacity (Zahar and Khondker, 2017). in Brazil, rede nacional Primeira infância (national Early childhood network), established in 2007, increased its membership from 10 to more than 200 organizations in about 10 years. it aims to have the national Early childhood Plan referenced at all levels of government by 2022 (rede nacional Primeira Infância, 2018). costa rica’s red nacional de cuido y desarrollo infantil (national care and child development network) was established by law in 2014 to bring together various providers and ministries; however, efforts to ensure cohesion and coordination are still needed (FlaCSo, 2020).
Engaging community-level stakeholders, including parents, can support governance at the local level (Vargas-Barón, 2015). analysis for this report found that several countries, including Bhutan, côte d’ivoire, lesotho, Morocco, new Zealand, niger, the republic of Korea, togo and tunisia, expected EccE centres to include parents in their decision making through management committees or elected representatives.
non-state providers also govern themselves. in France (Fédération Française des Entreprises de Crèches, 2021) and the netherlands (Expertisecentrum Kinderopvang, 2021), associations of non-state providers have created platforms to monitor centres’ quality and track progress. in the united Kingdom, the national day nurseries association, a charity representing private nurseries’ interests, has quality assurance regimes emphasizing regulation compliance, administrative procedures and personal development of staff (national day nurseries association, 2019). in the united States, the national association for the Education of young children accredits programmes through its assessment system to promote quality and improvement of EccE services and inform parents’ choices (naEyC, 2021).
THE QUALITY OF NON-STATE PROVIDERS IS HIGHLY VARIABLE
Quality refers to structural and process factors linked to positive child outcomes. Structural factors are inputs, such as educator/child ratios, class or group sizes, teacher qualifications, materials, physical environments and infrastructure, safety, and attention to water, sanitation and hygiene. Process factors are related to learning and include activities children engage in,
The quality of provision is related not to provider type but to country context and policy environment
141 C H A P T E R 6 • Early childhood carE and Education
6
stimulation and staff–child interactions, all of which are difficult to measure (unESCo, 2016b). the challenge for policymakers is to set standards and ensure they are met so as to minimize variation in quality between types of providers and within each provider type.
Evidence is split on whether non-state providers deliver services of good quality. in practice, the answer is related not to provider type but to country context and policy environment. in Brazil, the value of the infrastructure quality index was significantly higher in private contracted crèches and preschools than in public ones (Evans and Kosec, 2012). By contrast, a study in rural india found more toys and games in public centres (Gupta, 2020). in Mongolia, private kindergartens scored lower on a measure of classroom quality (e.g. programme structure, activities, literacy and math) but higher on a measure of interaction quality (World Bank, 2017). in Portugal and the united States, public provision was characterized by higher levels of process quality (Slot, 2018). Public EccE centres for 3- to 6-year-olds in oEcd countries overall provided better staff–child interactions than private ones (oECd, 2018).
Studies on structural factors in sub-Saharan africa also had contradictory results. a survey of 37 preschools in addis ababa, Ethiopia, found that private preschools, which were in the majority, performed better overall but neither private nor public preschools met standards (admas, 2019). in Ghana, private preschools had better facilities, which could be considered a result of the 2011 national Policy on Public–Private Partnerships (Pesando et al., 2020). in Kenya, no significant differences between public and private centres were found: classroom and furniture quality was substandard in both. Public centres had better water, sanitation and play facilities, however, while private providers did not meet government service standard guidelines (Sitati et al., 2016). in nigeria, for-profit private schools had higher pupil/teacher ratios (Baum, 2021).
high-income countries tend to have regulations on educator qualifications, certification and working conditions. in Finland, the Early childhood Education and care act, which regulates all providers, ensures there are usually no significant differences in workforce education levels between publicly and privately managed centres (Finland Government, 2018). Spain, on the other hand, has introduced minimum qualifications for public but not private centre heads, except in asturias region (European Commission/EaCEa/Eurydice, 2019).
Studies have not reached consistent conclusions on teaching practices. in denmark, staff used more practices associated with process quality in publicly managed preschools than in privately managed facilities. in iceland, less facilitation of numeracy development was reported in public than in private centres (oECd, 2019c).
in many low- and middle-income countries, private EccE educators tend to be less prepared and have fewer professional development opportunities than public-sector peers. only 8% of private but 75% of public kindergarten teachers do the Ghana Education Service’s training programme (Ghana Ministry of Finance, 2019), as there are no minimum requirements for private EccE teachers (Wolf et al, 2018). a study of 139 schools in Punjab, Pakistan, found that more pre-primary teachers in government schools had higher levels of education, even though teachers generally had low levels of education and received little specialized EccE training (Jamil and Saeed, 2018). in Zambia, private preschool teachers increasingly are certified by unaccredited private colleges, while teachers in public preschools must be certified through the Zambia Preschools association (Edwards et al., 2019b).
research on teaching practices is scarce relative to high-income countries. in Ghana, public preschools scored higher for ‘praising children for positive behaviours, stimulating classroom interactions, promoting cooperative learning, and using specific tools to facilitate learning’ (Pesando et al., 2020). there may be differences within the private sector. in Kenya, approved private preschools scored significantly higher than unapproved schools on teacher–student interaction indicators, such as wait time between activities, teachers’ responses to children’s questions, teachers’ use of open-ended questions and teachers helping students work through problems (Baum, 2021).
Many countries aim to ensure that non-state provision complies fully or partially with the national curriculum or learning standards. denmark’s curriculum emphasizes the importance of play, curiosity and social relations and applies to both state and non-state providers (denmark Ministry of Children and Education, 2020). the Philippines encourages use of a holistic curriculum for children up to age 4 (Philippines Congress, 2013; Philippines ECCd Council, 2015) and monitors national standards and competencies through the government-validated Philippine Early childhood development checklist (Philippines ECCd Council, 2019).
2 0 2 1 / 2 • G LO BA L E D U C AT I O N M O N I TO R I N G R E P O RT 142
6
introducing a curriculum appropriate for a given development stage and context is important (Joo et al., 2020). tunisia prohibits formal instruction in private preschools of the kind delivered in primary schools (PEEr country profiles). in india, public preschools used more play-based activities, while private preschools had a more formal instructional style (Gupta, 2020). however, the national Education Policy approved in 2020 introduced a foundational stage for 3- to 8-year-olds, which will include ‘aspects of more formal but interactive classroom learning’ (india Ministry of human resource development, 2020, p. 11).
the use of English as medium of instruction in non-state preschools, often featured in marketing, is another example of tension between developmentally appropriate curricula and popular perceptions of quality. in Brazil, where the common Base national curriculum envisages teaching of a foreign language only from grade 6 onwards, education in English is growing in private early childhood education centres (Padinha and Goia, 2021). in Ghana, most public and private preschools reported English and a local language in their instruction, while 22% of private schools but no public schools reported teaching exclusively in English (Wolf et al., 2018).
REGULATIONS HAVE A WEAK FOCUS ON QUALITYas EccE providers are diverse, regulatory frameworks should aim to define minimum standards and set quality assurance mechanisms to monitor quality and equity of provision (Ponguta et al., 2019; unICEF, 2019). countries increasingly mention non-state actors in their policy documents. a review of regulations for this report looked at their focus on establishment, financing, quality, accountability and sanctions.
Some countries have distinct regulations for provision for children under 3 and age 3 and up. in hong Kong, china, the department of Social Welfare supervises care centres for children under 3 based on regulations of the 1997 child care Services ordinance, amended in 2020, and the 1976 child care Services regulations. the Education Bureau supervises kindergartens for older children, mostly under the 1971 Education ordinance and Education regulations, which are similar to those that apply to schools. in the united republic of tanzania,
non-state provision for children under 4 is regulated by the Ministry of health, community development, Gender, Elderly and children and the 2019 law of the child act, while pre-primary education is regulated by the Ministry of Education, Science and technology and the 1978 national Education act (PEEr country profiles). Multiple sets of regulations from different ministries can be a source of contradiction and discontinuity, for instance in latin america (CladE and oMEP, 2020).
in some countries, non-state EccE provision is regulated within the same framework as higher levels. Bahrain’s Private Educational and training institutions law regulates non-state nurseries, kindergartens, and primary and secondary schools (Bahrain Government, 1998). the regulatory framework for early childhood to secondary education in the dominican republic is defined in the 2000 Private Education institutions regulation and 1997 General Education law (PEEr country profiles). in ukraine, where preschool education covers children aged 1 to 6 and enrolment in private EccE centres is low, non-state providers are governed by the same education law as other levels and school types (PEEr country profiles).
Many countries lack comprehensive regulatory frameworks or fail to implement them. in Eswatini, the Multi-Sectoral Early childhood development and Education Framework 2018–22 contains registration guidelines and minimum standards applicable to all EccE services, irrespective of ownership, but is yet to be formally adopted (Eswatini Government, 2018; World Bank, 2021). in Sri lanka, absence of a multisector regulatory framework means the scope of work of several ministries (education, health, and women and child affairs) and provincial councils overlaps (unESCo, 2016a). high-income countries are not immune to such challenges. a study of 55 childcare providers in new york state, united States, revealed that providers faced conflicting or arbitrary interpretations of regulations by local licensors and inspectors as well as lack of discussion or reconsideration when disagreements emerged (Shdaimah et al., 2018).
Many countries aim to ensure that non-state provision complies fully or partially with the national curriculum or learning standards
143 C H A P T E R 6 • Early childhood carE and Education
6
Regulations tend to focus on administrative requirements
analysis for this report shows that regulations on the registration, approval and licensing of non-state providers exist in at least 181 of 196 countries. Standards and requirements variably cover health and safety standards, teacher qualifications and training requirements, group size or pupil/teacher ratios, financing, and zoning and infrastructure standards.
in australia, a person may apply for provider approval to the regulatory authority of the state or territory and pay the prescribed fees. the person's criminal and financial history are examined to assess character and fitness. the authority must refuse approval if it believes the service would pose an unacceptable risk to children’s safety, health or well-being. once granted, approval remains in force until cancelled in the event of mismanagement, risk to safety or non-compliance with the law. in Bosnia and herzegovina’s Sarajevo canton, a preschool can be established with prior government consent and approval from the Ministry of Education as long as it has enough children to form at least two classes; standard facilities, equipment and teaching aids; employees with standard qualifications; and justification for its establishment, such as a need for a preschool in a particular area.
in Mauritania, the Pre-school Education Service of the Ministry of Social affairs, children and the Family is responsible for registering and approving public and private kindergartens and preschools. applications for private kindergartens must include a request addressed to the ministry, a morality investigation by police, a criminal record review, a medical certificate and a study of the project describing the building, security, equipment and location, ensuring that it is situated far from traffic crossings and petrol stations, and at least 500 metres from the closest similar facility (PEEr country profiles).
in some cases, entry and establishment requirements may differ for children under 3. a review of 100 countries’ regulations on childcare quality and safety standards found them likely to be more comprehensive and focused on quality for children of pre-primary school age than for those under 3 (World Bank, 2019b). israel’s 2018 daycare Supervision law has requirements for obtaining a licence and key conditions for every private day-care centre for children under 3 (the Knesset, 2019).
Entry and operation requirements may differ by provider type. cambodia has separate regulations and decrees for community preschools. in chile, a 2010 decree states
that by 2022, state-subsidized centres must obtain an official recognition certificate and comply with certain technical, pedagogical, legal and infrastructure requirements, while non-aided, independent centres must obtain authorization to operate (PEEr country profiles). in Kyrgyzstan, the government lowered licensing requirements and introduced public–private partnerships and private-sector contracting (un Women, 2019). non-state providers, including part-time preschool programmes in Saskatchewan, canada, and EccE centres in Kazakhstan, may even be exempt from entry and establishment requirements (PEEr country profiles). certain requirements can be counterproductive. in South africa, entry requirements act as a disincentive for potential non-state providers to enter and operate officially, but unregistered operation can lead to quality, safety and equity issues (BrIdGE et al., 2020).
non-state providers register as business or commercial entities in some countries. in lusaka, Zambia, low-fee private centres must register through the city council and its health and commercial sectors. they can operate as ‘commercial enterprises’ whose education orientation is not considered (Edwards et al., 2019).
Quality assurance mechanisms tend to be superficialQuality assurance mechanisms, such as internal and external inspections, can support state and non-state actors in monitoring and strengthening the quality of non-state provision (neuman and devercelli, 2013). analysis for this report shows that the education ministry is responsible for assuring the quality of non-state EccE provision in 162 of 192 countries; in 42 countries, multiple authorities are in fact responsible for quality assurance at this level.
croatia’s Early childhood Education and care act has a quality assurance process that covers state and non-state actors and is used in place of a licensing system. the Ministry of Science and Education carries out centre inspections, including expert pedagogical supervision and health inspections. in the czech republic, registered kindergartens are regularly inspected and must report on enrolment, staff and children (PEEr country profiles).
In 181 out of 196 countries, there are regulations on the registration, approval and licensing of non-state providers
2 0 2 1 / 2 • G LO BA L E D U C AT I O N M O N I TO R I N G R E P O RT 144
6
Singapore’s nurturing Early learners Kindergarten curriculum Framework (revised in 2012), Early years development Framework (launched in 2011) and Singapore Preschool Quality assurance Framework and Quality rating Scale are used to monitor and assess programme quality (tan, 2017). in the united arab Emirates, the Educational inspection directorate (Early childhood Educational institutions) oversees quality assurance and carries out general compliance inspections, focusing on compliance with key regulations on inputs, process and provision quality, and targeted compliance inspections, which respond to complaints or observations (united arab Emirates Ministry of Education, 2018).
While the level of responsibility for assuring quality is usually national, many European countries assign this task locally. local authorities must assess service provider plans before granting operating licences in Germany; they develop regulations and procedures in lithuania. Most European countries also require regular internal evaluations (European Commission/EaCEa/Eurydice, 2019).
child assessment is rarely used. in Belgium, the French community’s reference System of initial Skills proposes learning benchmarks for children aged 2.5 to 5, encouraging evaluation based on observation (European Commission/EaCEa/Eurydice, 2021a; Wallonia-Brussels Federation, 2020). an analysis of 10 South-eastern asian countries found that countries mostly used checklists and observations to assess children’s learning. in Brunei darussalam, children in both state and non-state schools took written and verbal tests (SEaMEo InnotECh, 2020). in South africa, assessment is based on the national integrated Early learning and development Standards and the South african national curriculum Framework for children from Birth to Four, which provide key developmental results in six areas: communication, exploration, well-being, identity and belonging, creativity, and knowledge and understanding (PEEr country profiles).
regulations in low- and middle-income countries generally specify minimum standards, including for learning materials. For instance, nepal’s curriculum development centre must approve books used by non-state centres (PEEr country profiles). But regulations usually do not establish quality assurance mechanisms, and those
that do tend not to focus on outcomes. in Brazil, requirements for teacher qualifications and class size are not actively enforced and many private preschools remain independent and unregulated (Bastos and Straume, 2013). Mongolia inspects private kindergartens to ensure compliance with infrastructure and safety standards, and audits their finances, but pays little attention to the learning environment, teaching practices or quality outcomes (World Bank, 2017).
Some countries have followed a structured approach to regulating, monitoring and facilitating improvement of private EccE provision. in Jamaica, where provision is largely in non-state actors’ hands, the Ministry of Education, youth and information requires inspectors and their senior supervisors to have at least one specialized degree. additional staff make monthly monitoring site visits and conduct teacher training. School oversight focuses on 12 national standards and refers to both structural and process dimensions, including interactions and relationships among children, teachers, parents, caregivers and community members. the Early childhood commission’s information system tracks compliance with the standards (anderson et al., 2017; araujo et al., 2013).
in Sri lanka, 79% of pre-primary education students were in private institutions in 2018. Early childhood development Standards for 3- to 5-year-olds were approved in 2017. the children’s Secretariat trained officers and preschool educators, provided them with detailed guidelines and supported them with a system to assess achievement of learning and developmental milestones, which had been implemented in 3,800 Early childhood development centres by mid-2020 (Warnasuriya et al., 2020).
non-state providers may be subject to separate quality assurance processes. in the Philippines, the recognition and accreditation process of private centres for children under 4 involves a three-month internal assessment and a two-day external assessment that cover health and nutrition, safety, physical environment, interactions and relationships between staff and children, staff qualifications and development, curriculum, parental involvement and centre management (Philippines ECCd Council, 2015). Each centre is rated as satisfactory, very satisfactory or outstanding (PEEr country profiles).
inspection coverage of registered non-state providers varies. in lagos, nigeria, where the quality assurance system covers such providers, the lagos State Ministry of Education’s Quality assurance department has inspected 56% of private preschools, with those charging higher
In 162 of 192 countries, the education ministry is responsible for assuring the quality of non-state ECCE provision
145 C H A P T E R 6 • Early childhood carE and Education
6
fees more likely to have been inspected (68%) than those charging lower fees (48%). in nairobi, Kenya, community schools are inspected more often than religious, charity, or for-profit schools. however, many providers are unregistered and thus not inspected (Baum, 2021).
overall, EccE regulations tend to neglect equity issues. More stringent regulations on quality may even exacerbate inequality. a survey of 141 EccE providers in istanbul, turkey, found that stricter structural regulations, measured by the requirement to have a garden on the premises, was significantly associated with higher fees and lower percentages of children from poorer households enrolled (aran et al., 2016).
Sanctions are applied for violation of standardsanalysis for this report indicates that 148 of 194 countries have regulations to sanction providers that do not comply with government standards. Some include a process allowing providers to redress issues within a certain period; if there is no improvement, their licence can be revoked or centre closed.
in Bahrain, kindergartens violating regulations receive a warning and 10 days for redress. if they fail in this, or repeat the violation, they are placed under Ministry of Education supervision and the provider loses ownership until the violation is corrected. Ecuador requires an annual inspection to assess whether the national curriculum is used and learning objectives are met. if a centre is found to be in violation, sanctions are applied, including written reprimand, temporary suspension, or definitive suspension if children’s rights are violated. in Samoa, the Education act 2009 states that a licence can be withdrawn if a centre no longer meets a registration criterion. the tunisian government may close centres that fail to comply with an obligation in the 2002 Framework law, with moral precepts or with hygiene and safety rules. in uruguay, EccE centres violating legal and regulatory norms are subject to observation, warning, fines, temporary closure, revocation of authorization and closure. once an authorization has been revoked, the centre must close within 10 days (PEEr country profiles).
in new Zealand, a centre operating without a licence can be fined up to uS$35,000. a licence or certification may be suspended or cancelled if the centre is found not to comply with minimum standards set out in the 2020 Education and training act or the 2008 Education (Early childhood Services) or 2008 Education (Playgroups) regulations. a review officer can inspect the office or other premises of any centre-based or home-based EccE
service to assess curriculum delivery, staff qualifications, and health and safety. all adults in home-based centres, whether caregivers or not, are subject to police vetting and document review (PEEr country profiles).
PUBLIC FUNDING OF NON-STATE PROVISION TAKES DIFFERENT FORMS
Globally, EccE expenditure data are scarce; for private expenditure, only data for high-income countries are available. among oEcd countries, only in israel and the united Kingdom do households spend more than governments on early childhood educational development programmes (Figure 6.8a), although fees are a source of EccE centres’ income in most countries. a survey showed that while more than 9 in 10 centres for children under age 3 in israel received fee income, the same was true for 8 in 10 centres in Germany and almost all centres in norway (oECd, 2019c). Government accounted for 83% of total pre-primary education spending in 2016 and for more than 50% in all oEcd countries except Japan (48%), where private expenditure on pre-primary education came from both households (65%) and businesses and foundations (35%) (Figure 6.8b). in response, the government made preschool education free for all children and childcare free for low-income families in 2019 (Suzuki, 2019).
Governments use subsidies, grants, taxes and various incentives, from start-up funding to public land, to encourage non-state providers to operate in the EccE sector. a review of regulations for this report found that 131 of 194 countries offered such incentives. it is estimated that 35% of governments support private childcare centres (Ilo and WIEGo, 2019). in Europe, the private sector in southern countries, such as Portugal and Spain, tends to be self-financing, although Malta’s Free childcare Scheme is applicable to both state and non-state providers, the aim being to provide equitable services to families irrespective of their socioeconomic background. Entitlement to free childcare hours is based on the employment hours of mothers or single fathers (PEEr country profiles).
In 148 of 194 countries, there are regulations to sanction providers that do not comply with government standards
2 0 2 1 / 2 • G LO BA L E D U C AT I O N M O N I TO R I N G R E P O RT 146
6
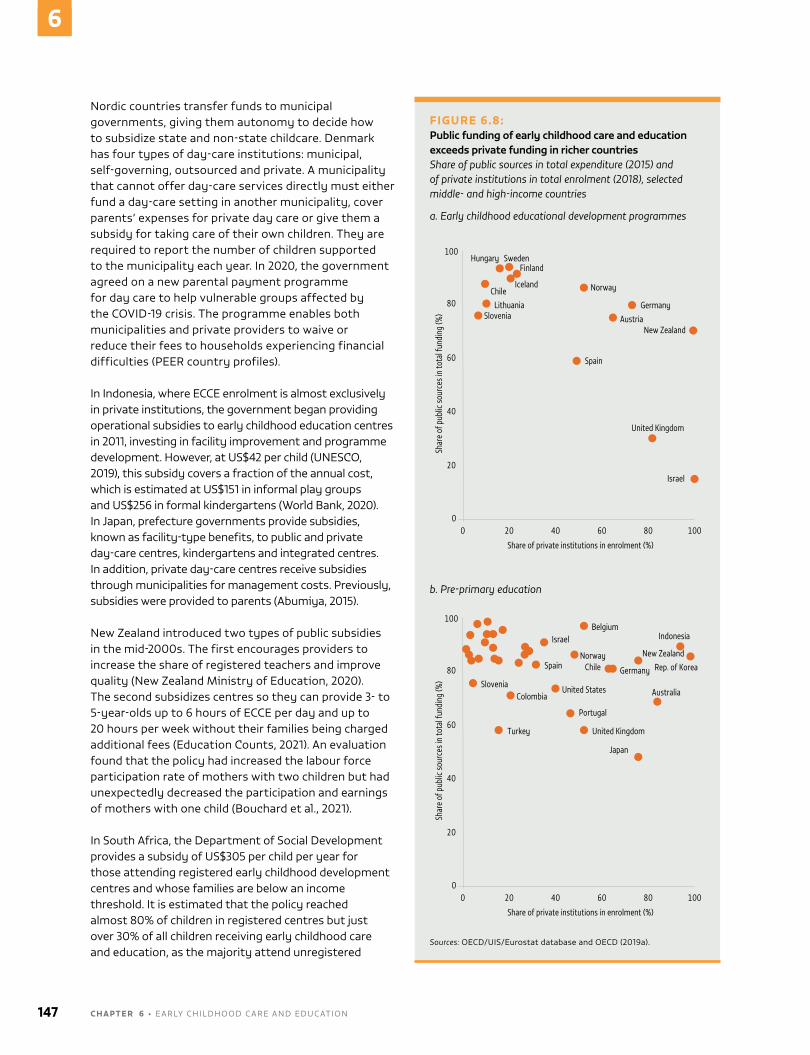
nordic countries transfer funds to municipal governments, giving them autonomy to decide how to subsidize state and non-state childcare. denmark has four types of day-care institutions: municipal, self-governing, outsourced and private. a municipality that cannot offer day-care services directly must either fund a day-care setting in another municipality, cover parents’ expenses for private day care or give them a subsidy for taking care of their own children. they are required to report the number of children supported to the municipality each year. in 2020, the government agreed on a new parental payment programme for day care to help vulnerable groups affected by the coVid-19 crisis. the programme enables both municipalities and private providers to waive or reduce their fees to households experiencing financial difficulties (PEEr country profiles).
in indonesia, where EccE enrolment is almost exclusively in private institutions, the government began providing operational subsidies to early childhood education centres in 2011, investing in facility improvement and programme development. however, at uS$42 per child (unESCo, 2019), this subsidy covers a fraction of the annual cost, which is estimated at uS$151 in informal play groups and uS$256 in formal kindergartens (World Bank, 2020). in Japan, prefecture governments provide subsidies, known as facility-type benefits, to public and private day-care centres, kindergartens and integrated centres. in addition, private day-care centres receive subsidies through municipalities for management costs. Previously, subsidies were provided to parents (abumiya, 2015).
new Zealand introduced two types of public subsidies in the mid-2000s. the first encourages providers to increase the share of registered teachers and improve quality (new Zealand Ministry of Education, 2020). the second subsidizes centres so they can provide 3- to 5-year-olds up to 6 hours of EccE per day and up to 20 hours per week without their families being charged additional fees (Education Counts, 2021). an evaluation found that the policy had increased the labour force participation rate of mothers with two children but had unexpectedly decreased the participation and earnings of mothers with one child (Bouchard et al., 2021).
in South africa, the department of Social development provides a subsidy of uS$305 per child per year for those attending registered early childhood development centres and whose families are below an income threshold. it is estimated that the policy reached almost 80% of children in registered centres but just over 30% of all children receiving early childhood care and education, as the majority attend unregistered
FIGURE 6.8:Public funding of early childhood care and education exceeds private funding in richer countriesShare of public sources in total expenditure (2015) and of private institutions in total enrolment (2018), selected middle- and high-income countries
a. Early childhood educational development programmes
Hungary SwedenFinland
IcelandChile
LithuaniaSlovenia
Norway
Germany
AustriaNew Zealand
Spain
United Kingdom
Israel
Share of private institutions in enrolment (%)
Shar
e of
pub
lic so
urce
s in
tota
l fun
ding
(%)
100
80
60
40
20
0100806040200
b. Pre-primary education
Japan
Share of private institutions in enrolment (%)
Shar
e of
pub
lic so
urce
s in
tota
l fun
ding
(%)
100
80
60
40
20
0100806040200
Turkey United Kingdom
Portugal
ColombiaSlovenia
Spain
United States Australia
Chile Germany
Norway
IsraelBelgium
Indonesia
New Zealand
Rep. of Korea
Sources: oEcd/uiS/Eurostat database and oEcd (2019a).
147 C H A P T E R 6 • Early childhood carE and Education
6
centres, which find registrations conditions onerous (South africa department of Social development, 2020; Wills and Kika-Mistry, 2021). trinidad and tobago’s Ministry of Education operates and/or assists 138 EccE centres and also subsidizes teacher and caregiver salaries in 63 centres managed by Service Volunteered for all, an nGo, which is responsible for the remaining operational and infrastructure costs. no support is provided to 691 private centres (araujo et al., 2013; trinidad and tobago Ministry of Education, 2021).
Some governments may use tax exemptions for certain provider types as an incentive. ukraine’s Ministry of Education and Science plans to expand the network of private preschools by 2024 by making preferential arrangements to pay premises’ rent and giving providers a tax exemption under article 197 of the tax code (PEEr country profiles).
Government contracting is a common way to provide and fund EccE services. in Brazil, 8.2% of children in day-care and pre-primary services attended government-contracted private providers, which accounted for 29% of total private provision (InEP, 2020). in the Philippines, the Eccd Program contracting Scheme enables accredited, community-level private providers to offer services and benefit from subsidies to establish and manage centres and receive technical and operational assistance from the education, social welfare and health departments (PEEr country profiles).
Voucher programmes seek to increase access to pre-primary education through non-state providers. under the Bahamas’ universal Pre-primary Education initiative, when there are no more places in government-operated schools, vouchers worth uS$2,000 are provided for up to 1,000 children per year and paid directly to approved private preschools that meet national standards (Bahamas Ministry of Finance, 2019). in hong Kong, china, the Pre-primary Education Voucher Scheme was found to contribute to inequality (Wong and rao, 2015) and was replaced with the Free Kindergarten Education Policy in 2017, changing it from a demand- to a supply-funded system. Previously, the 84% of kindergartens run by non-profit organizations received per-student vouchers to cover operational costs on condition that fees were regulated. the new policy provides subsidies to kindergartens for half-day services for all 3- to 6-year-olds (rao and lau, 2018).
In total, 79 countries regulate ECCE fees
Government regulations deter non-state providers from charging high fees and taking advantage of families. analysis for this report found that 79 countries regulate EccE fees. Ghana, the Philippines and Viet nam limit the level of tuition and other fees charged by independent private schools that do not receive government subsidies; they also require them to consult the government about any fee increase (PEEr country profiles). in the Philippines, the Early years act requires government to monitor tuition through the Eccd council to ensure fees remain ‘affordable’ and ‘within reasonable limits’, although they do not specify a standard fee (Philippines Congress, 2013). Subnational governments also set such restrictions. in lagos state, nigeria, pre-primary education tuition and other fees may not exceed uS$120 a year (Baum, 2021).
the extent to which profit orientation is tolerated varies. in canada, regulations tend not to cover profit orientation but operators must be not-for-profit corporations to get a licence in newfoundland and labrador province and nunavut territory (PEEr country profiles). in iceland, for-profit provision is allowed only if the profit is reinvested in development of the EccE centre, although loopholes can enable providers to expand activities, for instance through new buildings, that offer other opportunities for profit (dýrfjörð and Magnúsdóttir, 2016). ireland’s 2013 child and Family agency act bans for-profit provision. in Greece, private centres can be established as for-profit or non-profit entities with provisions corresponding to commercial companies, but the government may provide financial assistance only to centres established by non-profit entities (PEEr country profiles). norway’s Kindergarten act allows private kindergartens to have a ‘reasonable’ profit but any government grants and fees received must go towards meeting government objectives and conditions to benefit children. South africa’s 2015 national integrated Early childhood development Policy allows for-profit EccE provision, but such providers qualify for government aid only if they are contracted by the state to provide services to vulnerable groups.
to address equity, some countries implement policies to give children from a specific population or background access to EccE through direct or conditional cash benefits, in-kind payments, vouchers, parental leave and tax credits. the netherlands gives tax credits to parents for non-state EccE (Knijn and lewis, 2017). Saudi arabia introduced income-related vouchers to increase enrolment of children from low-income families in registered private EccE centres; the Qurrah programme allocates childcare vouchers to working women who earn less than uS$2,100 per month (Saudi arabia Government, 2021). however, evidence from Finland, where regulation aims to ensure equity between different types of EccE
2 0 2 1 / 2 • G LO BA L E D U C AT I O N M O N I TO R I N G R E P O RT 148
6
services, shows that admission policies and tuition fees lead to stratification of consumers between the public and private sectors (ruutiainen et al., 2021).
Expanding public provision may be the most direct route to supporting families. in total, 63 countries have legal provisions for free pre-primary education and 51 for compulsory pre-primary education. Most are located in Europe and northern america and in latin america and the caribbean (unESCo, 2021).
NON-STATE ACTORS INNOVATE AND ADVOCATE FOR ECCE
non-state actors, such as civil society, grass-roots organizations, academia, foundations and corporations, contribute to EccE through innovations for access and quality and through profile-raising advocacy.
historically, committed educationists, such as Friedrich Fröbel, Maria Montessori, Johann heinrich Pestalozzi and rudolf Steiner, who built the foundations of early childhood education pedagogy and organization, worked outside or at the margins of the formal public education system to pursue their vision of child-centred and self-directed learning. the groundbreaking reggio Emilia approach, which emerged in northern italy in the late 1940s, stemmed from activities of grass-roots organizations embraced by the local municipality (aljabreen, 2020).
academic researchers in the united States drew attention to early childhood education programmes’ long-term effectiveness, encouraging public authorities to scale up such programmes (Schweinhart, 2016). Scientific research, notably in neuroscience, has confirmed many of the insights of these empirical approaches on developmentally appropriate experiences for young children, notably how life experiences affect the brain and their implications for learning, behaviour and development (Center on the developing Child, 2021; lancet, 2016; Stack, 2013).
In Slovenia, non-state actors push for inclusion of Roma children in preschool education and their smooth transition into primary school
around the world, governments, including those of chile and Jordan, involve external, non-state experts to build consensus and ownership of national EccE strategies and policies under development (herrera et al., 2016; Sultana, 2009). in north Macedonia, a country with major inequality in access to EccE, non-state actors, with European union support, mobilize networks of service providers, civil society, policymakers and teacher training faculties to promote equity and quality in EccE (Step by Step, 2019). in Slovenia, non-state actors push for inclusion of roma children in preschool education and their smooth transition into primary school, with engagement of roma nGos (Ionescu et al., 2019). in the united States, interest groups contribute to EccE policy formation (Karch, 2013). nGos play an important role in promoting EccE for those left behind (Box 6.2).
But not all non-state actors’ influence is positive. Businesses influence families with advertising. Governments do not regulate whether supposed learning products are appropriate for young children’s developmental stage (Box 6.3).
Workforce unions, including those of childcare workers, are another influence on EccE. in canada, the centrale des syndicats du Québec, whose members includes 10,000 home day-care workers, went on strike in September 2020 to demand higher pay; their wages were below those of untrained workers in day-care centres and even below the minimum statutory level (Education International, 2020). in the European union, childcare professional unions are consulted on issues affecting their members as part of European commission efforts to improve employment quality (European Public Service union, 2017). the norwegian union of teachers and union for Kindergarten assistants are among organizations invited to policy discussions on legislative amendments and strategy implementation (norway Ministry of Education and research, 2014). the tanzania teachers union, in collaboration with the international teacher union federation, Education international, and with funding from the international nGo comic relief, implemented a four-year project in two rural districts to develop a competency profile for EccE educators, raise their professional teaching standards and support a cadre of about 350 teachers in earning diplomas (Education International, 2021).
international non-state networks, such as the Early childhood development action network, carry out global advocacy efforts with an engaged membership (Zonji, 2018). these efforts are replicated at regional level by organizations including the africa Early childhood network, the arab network for Early childhood
149 C H A P T E R 6 • Early childhood carE and Education
6
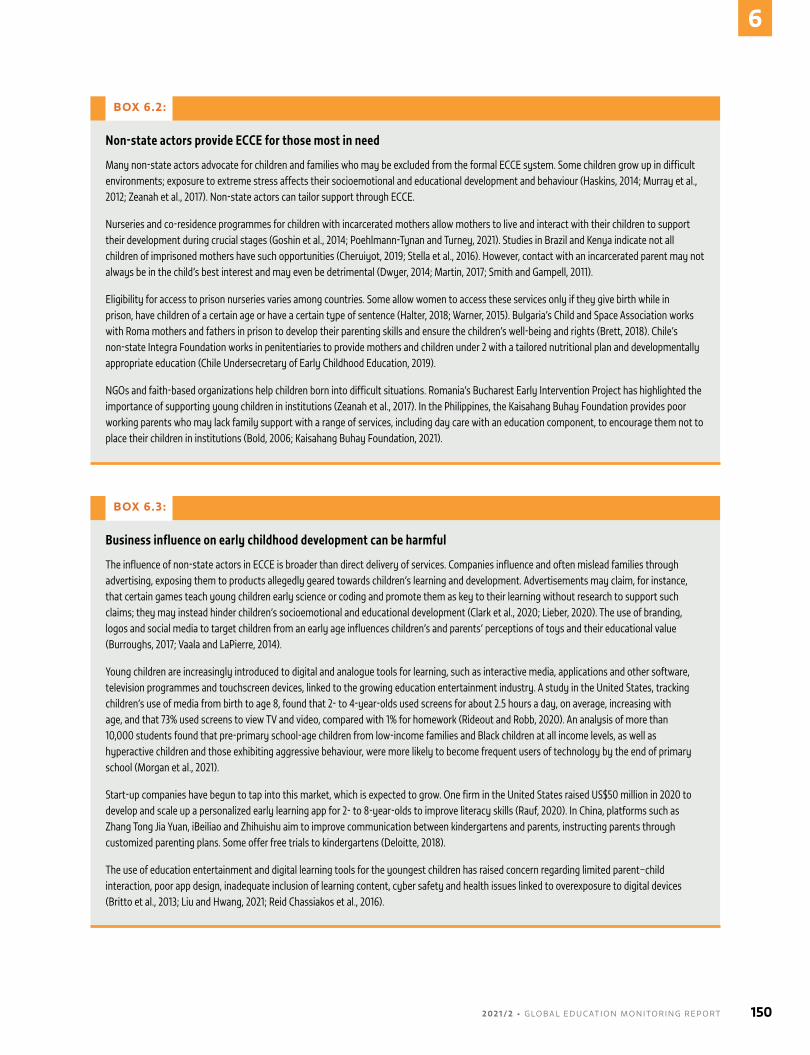
BOX 6.2:
Non-state actors provide ECCE for those most in need
Many non-state actors advocate for children and families who may be excluded from the formal ECCE system. Some children grow up in difficult environments; exposure to extreme stress affects their socioemotional and educational development and behaviour (Haskins, 2014; Murray et al., 2012; Zeanah et al., 2017). Non-state actors can tailor support through ECCE.
Nurseries and co-residence programmes for children with incarcerated mothers allow mothers to live and interact with their children to support their development during crucial stages (Goshin et al., 2014; Poehlmann-Tynan and Turney, 2021). Studies in Brazil and Kenya indicate not all children of imprisoned mothers have such opportunities (Cheruiyot, 2019; Stella et al., 2016). However, contact with an incarcerated parent may not always be in the child’s best interest and may even be detrimental (Dwyer, 2014; Martin, 2017; Smith and Gampell, 2011).
Eligibility for access to prison nurseries varies among countries. Some allow women to access these services only if they give birth while in prison, have children of a certain age or have a certain type of sentence (Halter, 2018; Warner, 2015). Bulgaria’s Child and Space Association works with Roma mothers and fathers in prison to develop their parenting skills and ensure the children’s well-being and rights (Brett, 2018). Chile’s non-state Integra Foundation works in penitentiaries to provide mothers and children under 2 with a tailored nutritional plan and developmentally appropriate education (Chile Undersecretary of Early Childhood Education, 2019).
NGOs and faith-based organizations help children born into difficult situations. Romania’s Bucharest Early Intervention Project has highlighted the importance of supporting young children in institutions (Zeanah et al., 2017). In the Philippines, the Kaisahang Buhay Foundation provides poor working parents who may lack family support with a range of services, including day care with an education component, to encourage them not to place their children in institutions (Bold, 2006; Kaisahang Buhay Foundation, 2021).
BOX 6.3:
Business influence on early childhood development can be harmful
The influence of non-state actors in ECCE is broader than direct delivery of services. Companies influence and often mislead families through advertising, exposing them to products allegedly geared towards children’s learning and development. Advertisements may claim, for instance, that certain games teach young children early science or coding and promote them as key to their learning without research to support such claims; they may instead hinder children’s socioemotional and educational development (Clark et al., 2020; Lieber, 2020). The use of branding, logos and social media to target children from an early age influences children’s and parents’ perceptions of toys and their educational value (Burroughs, 2017; Vaala and LaPierre, 2014).
Young children are increasingly introduced to digital and analogue tools for learning, such as interactive media, applications and other software, television programmes and touchscreen devices, linked to the growing education entertainment industry. A study in the United States, tracking children’s use of media from birth to age 8, found that 2- to 4-year-olds used screens for about 2.5 hours a day, on average, increasing with age, and that 73% used screens to view TV and video, compared with 1% for homework (Rideout and Robb, 2020). An analysis of more than 10,000 students found that pre-primary school-age children from low-income families and Black children at all income levels, as well as hyperactive children and those exhibiting aggressive behaviour, were more likely to become frequent users of technology by the end of primary school (Morgan et al., 2021).
Start-up companies have begun to tap into this market, which is expected to grow. One firm in the United States raised US$50 million in 2020 to develop and scale up a personalized early learning app for 2- to 8-year-olds to improve literacy skills (Rauf, 2020). In China, platforms such as Zhang Tong Jia Yuan, iBeiliao and Zhihuishu aim to improve communication between kindergartens and parents, instructing parents through customized parenting plans. Some offer free trials to kindergartens (Deloitte, 2018).
The use of education entertainment and digital learning tools for the youngest children has raised concern regarding limited parent–child interaction, poor app design, inadequate inclusion of learning content, cyber safety and health issues linked to overexposure to digital devices (Britto et al., 2013; Liu and Hwang, 2021; Reid Chassiakos et al., 2016).
2 0 2 1 / 2 • G LO BA L E D U C AT I O N M O N I TO R I N G R E P O RT 150
6
development and the asia-Pacific regional network for Early childhood, which count non-state actors among their members. they help share information and provide additional capacity, expertise and resources to translate and adapt EccE developments into national contexts (Vargas-Barón, 2015).
Foundations are active in these networks, playing an important role in EccE advocacy. the Bernard van leer Foundation has seven decades of experience in stressing the importance of early years, providing financial support and pooling expertise. its current strategy focuses on parent education, bringing an early childhood focus to urban planning, and advising on scaling up early childhood development initiatives. For instance, it has researched how flagship public programmes such as criança Feliz in Brazil (datla, 2021) and cuna Más in Peru (datla, 2018) can become sustainable, and how to ensure that slums and refugee settlements have close access to EccE (arup and Bernard van leer Foundation, 2020). the aga Khan Foundation, active notably in central asia and Eastern africa, and the open Society Foundations, working especially in central and Eastern Europe and the caucasus through the international Step by Step association, are other examples of non-state actors mobilizing EccE support and advocacy (Vargas-Barón, 2015).
CONCLUSION
Where the public sector has lacked capacity to provide EccE services for families and children from birth to school age, non-state actors have responded to demand. From non-profit, non-governmental, faith-based and community-based organizations to for-profit private actors, non-state actors’ services range from unregistered and informal childminding to formal preschools. yet, despite the presence of this range of providers, access for many disadvantaged families is challenging due to high costs and lack of financial support. Furthermore, quality across the diverse spectrum of state and non-state providers is highly variable, necessitating uniform quality standards and stronger regulation and quality assurance mechanisms.
non-state provision continues to grow in many countries and the role of non-state actors in influencing policy development is evident. While government efforts to expand public provision in pre-primary education have helped enrolment grow in some contexts, governance and monitoring efforts need to be accelerated for the full range of non-state providers and target populations. as coVid-19 continues to cast its shadow on the sector, it will be important to ensure effective arrangements.
Foundations play an important role in ECCE advocacy
151 C H A P T E R 6 • Early childhood carE and Education
6
2 0 2 1 / 2 • G LO BA L E D U C AT I O N M O N I TO R I N G R E P O RT 152
6
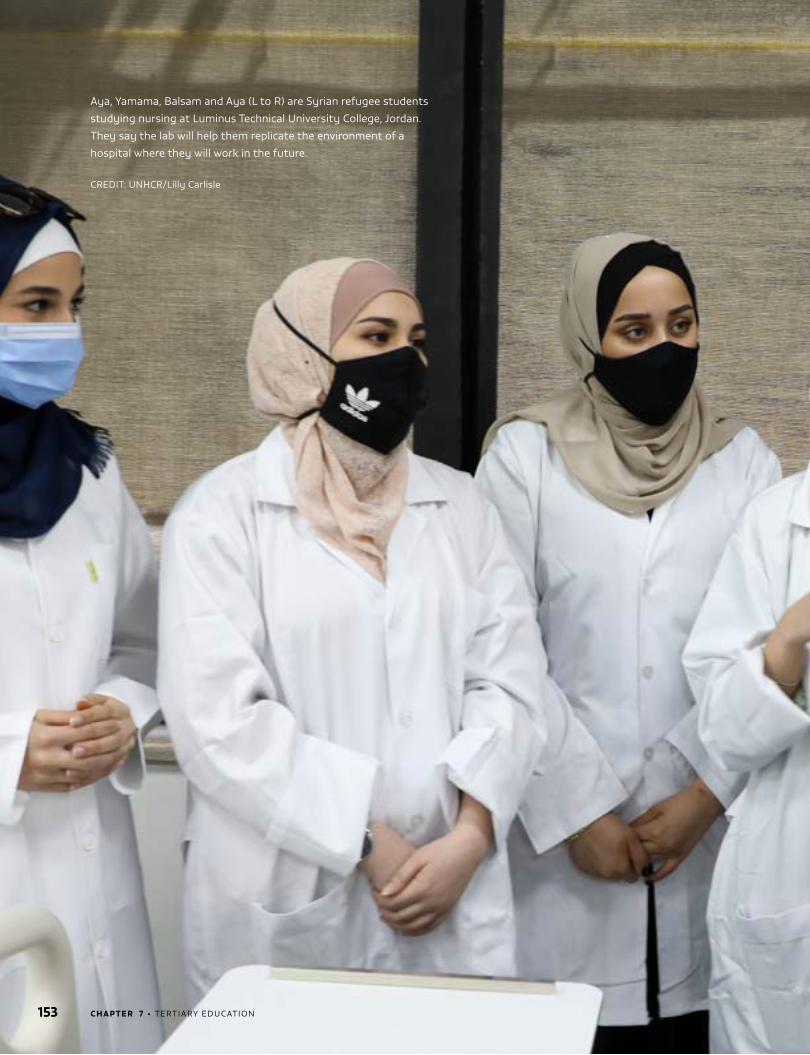
153 C H A P T E R 7 • TerTiary educaTion
aya, yamama, Balsam and aya (L to r) are Syrian refugee students
studying nursing at Luminus Technical university college, Jordan.
They say the lab will help them replicate the environment of a
hospital where they will work in the future.
crediT: unHcr/Lilly carlisle
7
154
CHAPTER
C H A P T E R 7 • TerTiary educaTion
Tertiary education
K E Y M E S S AG E SNon-state actors account for over one third of students in tertiary education, a share that remained stable in the 2010s.
� The private share is higher in tertiary education than in secondary in 96 of 131 countries.
Non-state tertiary education can challenge system quality.
� opinions about the benefits of profit orientation in the sector are split. in the united States, student outcomes deteriorate as the incentive for profit maximization increases.
� non-state institutions’ focus on responding to labour market needs may blunt the drive for innovation. in india, about 40% of private colleges offer only one field of study.
� Substantial numbers of teachers in the Global South are trained in non-state institutions. chile and Mexico have banned this practice due to quality concerns.
� Staff in non-state universities are likely to work only part time, often moonlighting from public institutions, which threatens teaching quality. Mozambique has banned the practice.
Non-state providers may improve or hinder access to tertiary education.
� non-state providers are more likely to select those who can afford to pay. in colombia, the share of students enrolled in non-state institutions was 17 percentage points higher in urban than in rural areas in 2018.
� non-state institutes can provide more flexibility. in Brazil, 68% of students in non-state universities are enrolled in evening classes, which allows them to work during the day.
Regulations can protect quality and affordability, depending on context, capacity and resources.
� Quality assurance mechanisms are recent and tend to focus more on establishment and operation than on quality and results. Bangladesh had no accreditation framework until 2017. Most of Peru’s 32 private institutions were not accredited as of mid-2019.
� equity-promoting regulations are not common, and usually only exist for providers that receive public funding. romania’s government reserves tuition-free places for students from rural secondary schools and roma students, but only in public universities.
The way private tertiary education is financed has implications for equity and quality.
� Governments fund non-state institutions directly, via tax breaks and research grants, or indirectly, through scholarships and student loans. in australia, the government covers 55% of spending on higher education institutions, nearly one-third of which is aid to households.
� non-state institutions also raise income through loans and bonds. university bond issuance had reached uS$11.4 billion by mid-2019, more than doubled from the year before.
Households are taking on larger shares of tertiary education costs.
� over 70 countries operate student loan programmes, most often government-subsidized, which may lead to hikes in tuition fees, as in Brazil.
� Some non-state actors help cover student costs with scholarships and loans. in Bangladesh, non-state universities must earmark 2% to 5% of revenue for scholarships or grants.
155 C H A P T E R 7 • TerTiary educaTion
7
More than one in three tertiary students attend non-state institutions .......... 156
non-state tertiary education regulation varies .............................................................. 166
Financing modalities have quality and equity implications ......................................172
non-state actors influence tertiary education through multiple mechanisms 174
conclusion .........................................................................................................................................176
Nearly all countries ensure tertiary education through a combination of state and non-state
actors. But the participation of non-state actors raises questions and poses challenges to the achievement of quality and affordability, the key dimensions of Sustainable development Goal target 4.3. Moreover, the line between state and non-state tertiary education is blurry, and non-state actors are involved not only in service provision but also in financing and influencing public institutions and the sector as a whole.
non-state institutions have implications for system quality. For instance, if they focus on particular skills to respond to labour market needs, they may blunt innovation. academic staff of non-state institutions are less likely to be full-time professors. non-state institutions also have implications for affordability. For instance, they may target those who can afford to pay for tertiary education, even if, in some cases, they target groups at risk of exclusion.
regulation of non-state tertiary education varies, as does the use of quality assurance mechanisms to ensure minimum standards. equity-promoting regulations are not common. Financing modalities of non-state institutions, such as their access to public funding and the degree to which they depend on fees, also have quality and equity implications. Some institutions are supported by non-state actors beyond fees. in addition, households are supported in taking on a larger share of tertiary education funding, including of non-state institutions, through loans, scholarships and income share agreements.
MORE THAN ONE IN THREE TERTIARY STUDENTS ATTEND NON-STATE INSTITUTIONS
Measuring the extent to which non-state actors are involved in provision of tertiary education is challenging. The diversity of institutions means the distinction between state and non-state provision is blurry. The uneSco institute of Statistics (uiS) defines private institutions as those controlled and managed by a non-governmental organization (nGo) or whose governing board consists mostly of members not selected by a public agency. By this definition, about 33% of students are enrolled in private institutions globally, a number which has remained constant in recent years. The highest shares are in central and Southern asia (49%) and Latin america and the caribbean (54%) (Figure 7.1a). But regional averages mask large differences between countries (Figure 7.1b).
although there are insufficient comparable data to establish a long-term trend, the private share appears to have remained relatively stable in the 2010s. it is increasing in some countries and decreasing in others (Box 7.1). Policies in some countries have focused on expanding public provision of tertiary education, which has reduced the size of the non-state sector. in colombia and the Philippines, expansion of public provision through establishment of new public institutions led to a decrease in the share of students enrolled in non-state education, even if the absolute number continued to rise (Levy, 2015b).
2 0 2 1 / 2 • G LO BA L E D U C AT I O N M O N I TO R I N G R E P O RT 156
7
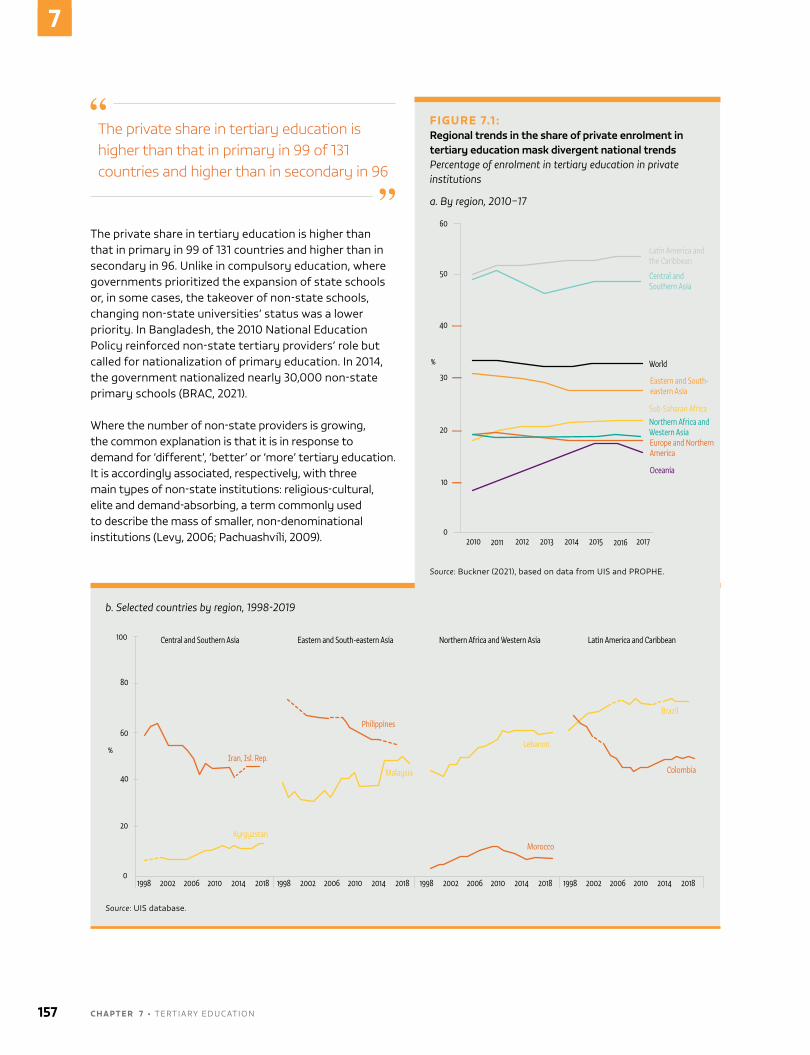
b. Selected countries by region, 1998-2019
Central and Southern Asia Eastern and South-eastern Asia Northern Africa and Western Asia Latin America and Caribbean
1998 1998 1998 19982002 2006 2010 2014 2018 2002 2006 2010 2014 2018 2002 2006 2010 2014 2018 2002 2006 2010 2014 20180
20
40
60
80
100
Iran, Isl. Rep.
Kyrgyzstan
Philippines
Malaysia
Lebanon
Morocco
Colombia
Brazil
%
Source: uiS database.
The private share in tertiary education is higher than that in primary in 99 of 131 countries and higher than in secondary in 96
The private share in tertiary education is higher than that in primary in 99 of 131 countries and higher than in secondary in 96. unlike in compulsory education, where governments prioritized the expansion of state schools or, in some cases, the takeover of non-state schools, changing non-state universities’ status was a lower priority. in Bangladesh, the 2010 national education Policy reinforced non-state tertiary providers’ role but called for nationalization of primary education. in 2014, the government nationalized nearly 30,000 non-state primary schools (BraC, 2021).
Where the number of non-state providers is growing, the common explanation is that it is in response to demand for ‘different’, ‘better’ or ‘more’ tertiary education. it is accordingly associated, respectively, with three main types of non-state institutions: religious-cultural, elite and demand-absorbing, a term commonly used to describe the mass of smaller, non-denominational institutions (Levy, 2006; Pachuashvili, 2009).
FIGURE 7.1 :Regional trends in the share of private enrolment in tertiary education mask divergent national trendsPercentage of enrolment in tertiary education in private institutions
a. By region, 2010–17
10
20
30
40
50
60
2010 2011 2012 2013 2014 2015 2016 20170
Latin America and the Caribbean
Central and Southern Asia
World
Eastern and South-eastern Asia
Sub-Saharan AfricaNorthern Africa and Western AsiaEurope and Northern America
Oceania
%
Source: Buckner (2021), based on data from uiS and ProPHe.
157 C H A P T E R 7 • TerTiary educaTion
7
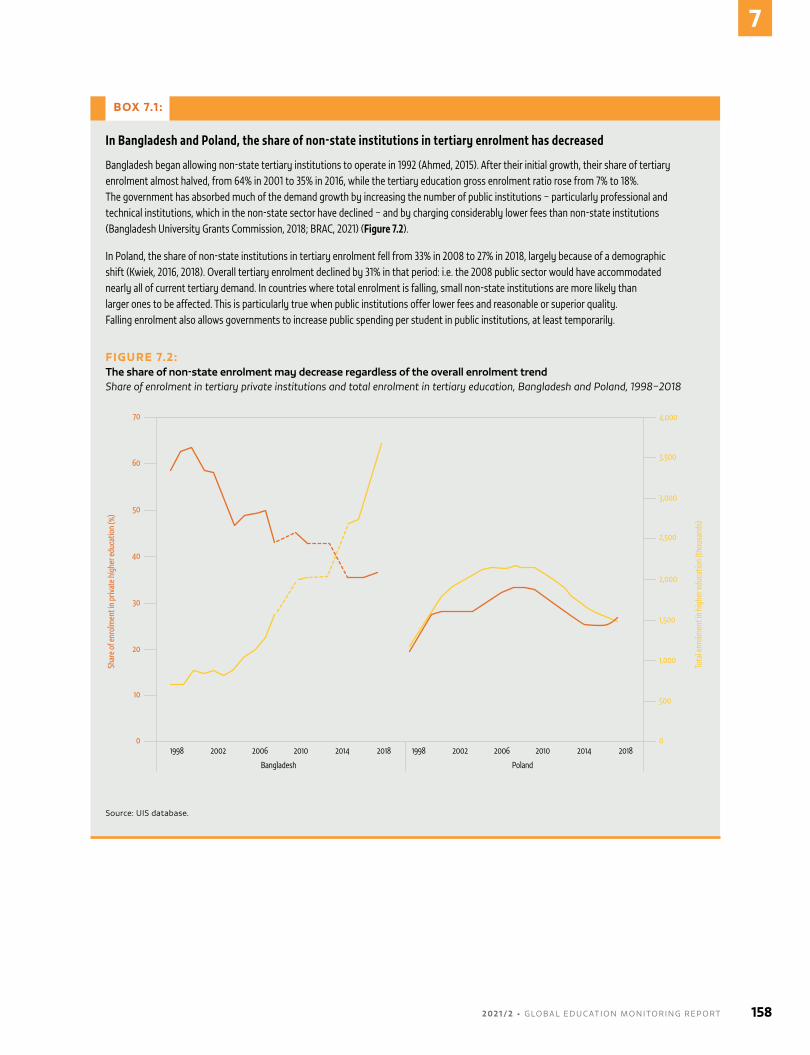
BOX 7.1 :
In Bangladesh and Poland, the share of non-state institutions in tertiary enrolment has decreased
Bangladesh began allowing non-state tertiary institutions to operate in 1992 (Ahmed, 2015). After their initial growth, their share of tertiary enrolment almost halved, from 64% in 2001 to 35% in 2016, while the tertiary education gross enrolment ratio rose from 7% to 18%. The government has absorbed much of the demand growth by increasing the number of public institutions – particularly professional and technical institutions, which in the non-state sector have declined – and by charging considerably lower fees than non-state institutions (Bangladesh University Grants Commission, 2018; BRAC, 2021) (Figure 7.2).
In Poland, the share of non-state institutions in tertiary enrolment fell from 33% in 2008 to 27% in 2018, largely because of a demographic shift (Kwiek, 2016, 2018). Overall tertiary enrolment declined by 31% in that period: i.e. the 2008 public sector would have accommodated nearly all of current tertiary demand. In countries where total enrolment is falling, small non-state institutions are more likely than larger ones to be affected. This is particularly true when public institutions offer lower fees and reasonable or superior quality. Falling enrolment also allows governments to increase public spending per student in public institutions, at least temporarily.
FIGURE 7.2: The share of non-state enrolment may decrease regardless of the overall enrolment trend Share of enrolment in tertiary private institutions and total enrolment in tertiary education, Bangladesh and Poland, 1998–2018
1998 2002 2006 2010 2014 2018 1998 2002 2006 2010 2014 20180
20
40
60
50
70
10
30
4,000
3,500
3,000
2,500
2,000
1,500
1,000
500
0
Bangladesh Poland
Shar
e of e
nrol
men
t in
priva
te h
ighe
r edu
catio
n (%
)
Tota
l enr
olm
ent i
n hi
gher
educ
atio
n (th
ousa
nds)
Source: uiS database.
2 0 2 1 / 2 • G LO BA L E D U C AT I O N M O N I TO R I N G R E P O RT 158
7
RELIGION- OR CULTURE-ORIENTED INSTITUTIONS ARE LINKED TO HISTORY AND TRADITION
religiously affiliated institutions have a long history, in some cases going back to the very origin of universities in europe and asia (altbach et al., 2021). Today, they are still prominent in many countries. in South-eastern asia, where religiously affiliated institutions are common, there are islamic tertiary education institutions in indonesia, catholic institutions in the Philippines and Buddhist institutions in Thailand (asian development Bank, 2012; Welch, 2021).
religious organizations have historically been important non-state providers of tertiary education in Latin america and sub-Saharan africa, with the latter considered a hotspot for the expansion of christian tertiary education today (Carpenter, 2017; durham and Sampaio, 2000; Levy and Tamrat, 2021). in Kenya, missionaries founded the first non-state tertiary education institutions during the colonial period and the country still carries this legacy: Today, most non-state institutions in the country are run by religious organizations (Carpenter, 2017; onsongo, 2007).
culturally oriented non-state institutions have been established by various ethnic groups, particularly in countries with heterogeneous populations. ethnic communities in indonesia and Malaysia own non-state institutions and provide scholarships to members of their communities (asian development Bank, 2012; Welch, 2021). in Malaysia, the establishment of ethnic quotas for public institutions after independence restricted access to non-Bumiputra (ethnic Malay), thus pushing ethnic chinese and indian Malaysians into the non-state sector (Jie, 2018; Welch, 2021). Some estimates indicate 85% of students in public institutions are Bumiputra and over 90% of those in non-state institutions are non-Bumiputra (Welch, 2021).
a population’s ethnic and linguistic heterogeneity can influence governments’ disposition towards non-state education. after regime change in the Baltic countries in 1989, language laws prohibited public sector instruction in languages other than the national language. Hence, most demand for non-state provision in those countries came from russian language providers. Latvia and estonia, which had sizeable russian-speaking minorities, allowed the establishment of russian non-state tertiary institutions soon after the regime change (Pachuashvili, 2011). Language still plays an important role in Latvia’s non-state sector: in 2017, of students in non-tertiary institutions, 29% studied in russian, 19% in english and 10% in multiple languages. in 2018, a new law extended
the national language obligation to non-state institutions, with minor exceptions for eu official languages, effectively excluding russian provision (Kuzmin, 2018).
LIMITED BUDGETS AND MARKET-FRIENDLY POLICIES ENCOURAGE MASSIFICATION
The proliferation of non-state institutions that are neither elite nor religiously or culturally affiliated, often referred to as demand-absorbing institutions, is a relatively recent, fast-growing phenomenon that emerged in response to rising demand and in the context of tight public budgets (Levy, 2013; Welch, 2021). in many low- and middle-income countries, policies promoting non-state involvement in tertiary education became popular in the 1990s, often with the encouragement of international financial institutions (Task Force on Higher education and Society, 2000).
Historically, non-state tertiary education institutions in Latin america were either christian or secular elite institutions. But expansion since the 1960s has been marked by smaller non-state institutions aimed at absorbing excess demand (durham and Sampaio, 2000; Levy, 1986). Two factors contributed to this development. First, governments increased the non-state sector’s flexibility to create institutions or programmes quickly. Second, in an adverse fiscal context, the international Monetary Fund and World Bank recommended reducing public funding for tertiary education (Corbucci et al., 2016; Ferreyra et al., 2017).
a similar pattern has been observed in sub-Saharan africa, especially in anglophone countries (Levy, 2007; Varghese, 2016). after the post-independence nationalization of tertiary education, smaller, non-elite and non-religious institutions have accounted for most of the surge in tertiary enrolment (Irene and Hussain, 2020). Such institutions have also been at the forefront of expansion of the non-state sector in central and eastern europe since the transition in the 1990s, in part because of a market-friendly shift in policies (Kwiek, 2016). Similar factors explain expansion in india since the 1990s, after the post-independence strategy of expanding tertiary education through public institutions was reversed (ravi et al., 2019; Varghese and Panigrahi, 2019).
Religious organizations have been important non-state providers of tertiary education in Latin America and sub-Saharan Africa
159 C H A P T E R 7 • TerTiary educaTion
7
Such institutions have also grown in contexts of crisis or major disruptions in public services. in côte d’ivoire, the political crisis of 2010/11 effectively shut down many public institutions for infrastructure repairs, which fuelled non-state enrolment (World Bank, 2017). Lebanon’s civil war led to major disruptions in the public tertiary education system, leading to dismemberment of the national university in 1974 and the rise of both commercial and religious non-state institutions (Buckner, 2011).
DEMAND FROM PRIVILEGED GROUPS SOMETIMES LEADS TO ELITE NON-STATE INSTITUTIONS
non-state elite institutions may arise in response to perceived decline in quality of public universities, a concern sometimes expressed by the most affluent segments of society, for example, in Latin america in the mid-20th century (durham and Sampaio, 2000; Levy, 2006). in South africa, the expansion of the non-state sector in the mid-1990s has also been partly attributed to demand from the white population for ‘better education’ (Tamrat, 2017).
non-state elite institutions are the rarest type of non-state institution. in most countries, public universities enjoy the highest prestige. Some countries, however, have top-tier non-state universities, such as the ivy League institutions in the united States and catholic universities in Latin america and other parts of the world (altbach et al., 2021). in countries with a long tradition of religious tertiary education, it is common for institutions to be both religiously affiliated and elite. in the democratic republic of the congo, for example, the most prestigious institutions are, and have historically been, religious (Gérard, 2020).
countries’ attempts to increase the prestige of their tertiary education system through non-state institutions is a more recent phenomenon. india’s government introduced a plan to select 20 institutions to become world-class, half of them non-state (Chattopadhyay, 2019). in 2014, the Japanese government began the Top Global university Project to boost the global status of selected universities. among the 37 institutions selected, 14 are non-state (Japan MeXT, 2014). in Morocco, the non-state tertiary education sector, originally composed of small vocation-oriented institutions, is being transformed to cater for national elites, the Moroccan diaspora and international students. The government offers incentives to non-state institutions to follow the american elite university model, requiring them to have a full campus, student dormitories and a research centre (Buckner, 2018).
Some countries have recently attempted to increase the prestige of their tertiary education system through non-state institutions
one recent type of elite institution is the international campus, facilitated by the 1995 General agreement on Trade in Services, which recognized tertiary education as a tradable service and encouraged a wide range of cross-border non-state provision (altbach et al., 2021). This has since been strengthened by the inclusion of tertiary education in other international trade negotiations, including the Trans-Pacific Partnership (australia dFaT, 2016) and comprehensive economic Trade agreement (davies, 2018). after joining the World Trade organization in 2000, china opened its tertiary education market and joined the quest for ‘world-class universities’ by encouraging collaboration between local and leading foreign institutions. The number of institutions based on such efforts grew from 1 in 2004 to 12 in 2019 (Mok, 2021).
LINES BETWEEN STATE AND NON-STATE TERTIARY EDUCATION ARE OFTEN BLURRED
diverse ownership, control and governance arrangements in tertiary education often blur the lines between state and non-state providers. a well-known example is the united Kingdom, where most universities are regarded as public and receive significant government funding but are controlled by non-state actors and therefore considered private in international statistics (Knight, 2006). The university of nairobi, the oldest and biggest public university in Kenya, receives the majority of its funds from private sources and applies a business approach to governance, focused on income generation and increasing the institution’s entrepreneurial practices (Provini, 2019).
The international islamic university Malaysia is a public institution by law but governed by the companies act, with a board of governors that includes five members from Muslim countries and a representative of the organisation of islamic cooperation (Welch, 2021). in Viet nam, a university was founded as a training centre for a subsidiary of a state-owned enterprise. The subsidiary was later privatized, but the university still claims affiliation with the parent state-owned enterprise (Chau et al., 2020).
Within the non-state sector, it is hard to distinguish for-profit from non-profit institutions. in chile, large for-profit multinational companies such as Laureate
2 0 2 1 / 2 • G LO BA L E D U C AT I O N M O N I TO R I N G R E P O RT 160
7
education owned universities, even though the country does not allow for-profit universities (Bernasconi, 2013). a recent decision clarified that universities could be owned and controlled by a for-profit company but could not be operated as for-profit institutions (educación 2020, 2018; Hurtado, 2020). in Malaysia, a for-profit company held by a non-profit entity owns two institutions (Welch, 2021). Many non-profit institutions use loopholes to distribute profit, leading some countries, such as Brazil (since 1997), to permit for-profit institutions to operate in hopes of collecting taxes (almeida de Carvalho, 2013). even within the for-profit sector, ambiguity over what is legally considered a tertiary education institution, rather than a business providing training, hampers regulation, as the former may come under education law and the latter under business law (Levy, 2015a).
The rise in cross-border provision of tertiary education further complicates the lines of ownership and regulation. Branch campuses of public tertiary education institutions in australia, the united Kingdom and the united States are deemed private institutions in Malaysia. in Viet nam, rMiT university and British university Vietnam, operated by public institutions, are considered private universities, while the Vietnamese-German university and the
university of Science and Technology of Hanoi, also known as the Vietnam-France university, are listed as public (Welch, 2021).
THE EMERGENCE OF NON-STATE INSTITUTIONS HAS IMPLICATIONS FOR SYSTEM QUALITY
as with other levels of education, a common argument for non-state actors is that they can increase competition and improve system quality. However, competition in tertiary education is imperfect, as entry costs are high and services are highly differentiated in terms of location, programme type, student ability, fields of study and rigour (Ferreyra et al., 2017). For these and other system-level factors, the potential for improvement may not be fulfilled.
The impact of profit orientation on quality is a subject of intense debate
Supporters of for-profit institutions argue that the need to attract students creates competition and incentives to improve quality. opponents say this mechanism does not work in a market as imperfect as that of tertiary
Within the non-state sector, it is hard to distinguish for-profit from non-profit institutions
161 C H A P T E R 7 • TerTiary educaTion
7
education (altbach et al., 2021). decisions to pursue tertiary studies are determined by short-term financial constraints as well as by information constraints – which also usually work at the expense of disadvantaged students – and not by long-term academic objectives and potential returns (Knobel and Verhine, 2017).
But not all for-profits are the same. different types of providers have different levels of profit-maximizing incentives. at one end of the spectrum, individuals, families and privately held companies may set up for-profit tertiary education institutions with socially responsible or corporate visions that are compatible with prioritizing quality and student outcomes over maximizing profit (Tamrat, 2018). at the other end, publicly traded and private equity-owned firms have stronger incentives to maximize profit because of their payout responsibilities to shareholders and investors (eaton et al., 2018).
in the united States, where the sector is highly subsidized (around 90% of for-profit institutions’ revenue comes from federal grants and federally guaranteed loans), student outcomes deteriorate as the incentive for profit maximization increases. For instance, acquisition of a for-profit institution by a private equity-owned firm led to declines in graduation rates, loan repayment and labour market earnings as a result of several mechanisms, including a decrease in education inputs such as number of faculty per student and the share of expenditure devoted to instruction (eaton et al., 2018).
A focus on skills to respond to labour market needs may blunt innovation
Students in fee-charging institutions may need to learn skills that are rewarded in the labour market to be able to recuperate the cost of their studies after graduation. However, the focus of non-state institutions on providing such skills blunts their drive for innovation (altbach et al., 2021). This can be observed in the fields of study offered and the focus on employability as a marketing strategy and source of legitimacy. Graduate employability is an indicator used in South-eastern asia to rank institutions (Welch, 2021).
demand for specialized and professionally oriented programmes shapes tertiary education growth in many countries (Irene and Hussain, 2020; Muzammil, 2019). Smaller institutions with little capital choose to offer only fields of study that require little upfront investment in infrastructure and are less regulated by governments and professional associations (asian development Bank, 2012; Teixeira et al., 2016). in india, public and government-aided colleges generally provide general education, whereas private colleges provide professional courses. about
40% of private colleges offer only one field of study, mostly education (Muzammil, 2019); 67% of teacher training colleges are private (Henry et al., 2020) (Box 7.2). in indonesia, two thirds of total enrolment in non-state institutions is in education, social sciences or business (Welch, 2021). in Viet nam, state universities offer medicine, engineering or biotechnology, leaving other fields to private universities, which are mostly smaller and more vocation-oriented (altbach et al., 2021; Levy et al., 2020). ethiopia’s government prohibits non-state institutions from offering degrees in fields such as law and teacher education (Tamrat and Levy, 2017).
non-state institutions create networks with employers, e.g. inviting them to teach and working with them to adapt programmes and curricula to improve outcomes for graduates. in Germany, most non-state institutions offer degrees in business administration and communication in close cooperation with the private sector (altbach et al., 2021). in Morocco, cira, one of the largest private education service providers, brings in professionals to lecture so that what is being taught is in line with up-to-date practical knowledge (Kalla, 2021). Similar practices in Senegal lead to programmes changing much more often than at public universities (dia and Goudiaby, 2020). career counselling, job fairs and alumni networks are other ways to connect to the labour market and have been used, for instance, in Kenya, Morocco and Peru (Zuniga et al., 2021). in Saudi arabia, non-state institutions have increased graduates’ employment rate by changing programme types and teaching methods, using english for instruction, and providing structured work experience and career counselling (Jamjoom, 2016).
Academic staff of non-state institutions are less likely to be full-time professors
non-state tertiary education providers tend to rely more than public universities on part-time academic staff (Levy and Tamrat, 2021; Salto, 2018; Welch, 2021). in Senegal, less than 20% of teachers at non-state institutions have full-time permanent contracts (dia and Goudiaby, 2020). in the united States, non-state institutions have higher shares of part-time faculty, on average, and the share grows the more institutions rely on fees (Liu and Zhang, 2013). reliance on part-time staff may reflect these institutions’ stronger link with the labour market, as the emphasis on practical learning can lead them to hire working professionals as lecturers. it can also be a cost-saving strategy (Teixeira et al., 2016).
Working multiple jobs, or moonlighting, is a factor in high shares of part-time contracts. it allows newer and smaller non-state institutions to gain legitimacy by employing respected public university professors.
2 0 2 1 / 2 • G LO BA L E D U C AT I O N M O N I TO R I N G R E P O RT 162
7
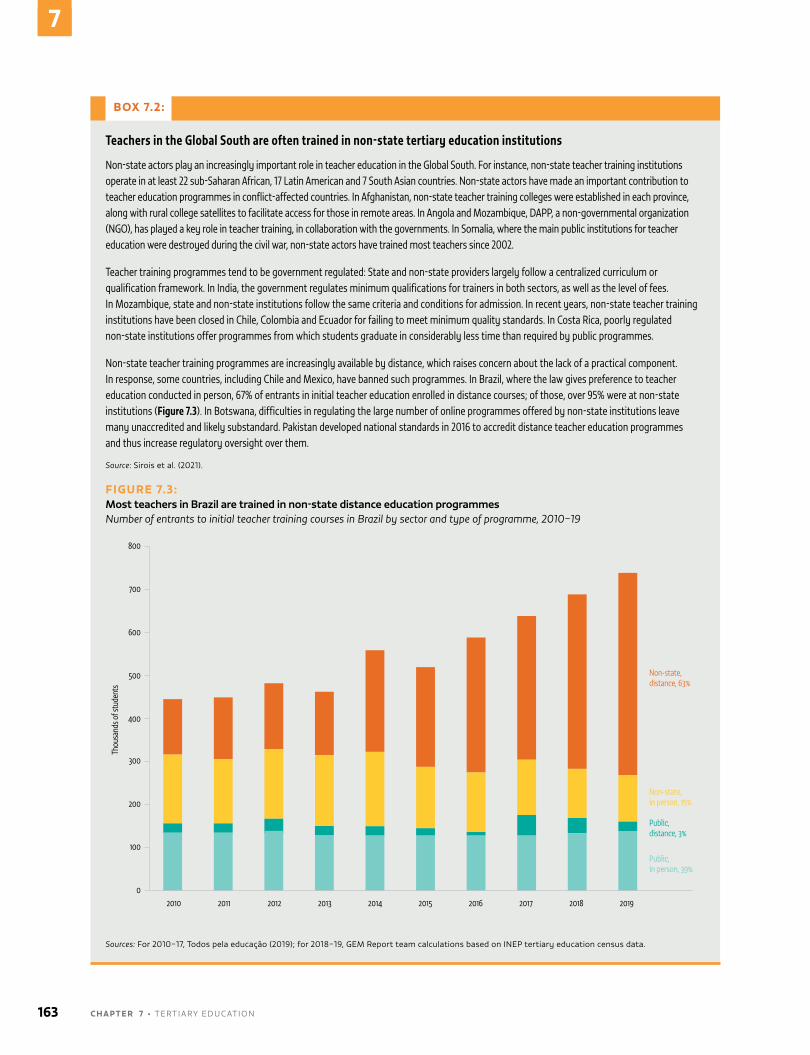
BOX 7.2:
Teachers in the Global South are often trained in non-state tertiary education institutions
Non-state actors play an increasingly important role in teacher education in the Global South. For instance, non-state teacher training institutions operate in at least 22 sub-Saharan African, 17 Latin American and 7 South Asian countries. Non-state actors have made an important contribution to teacher education programmes in conflict-affected countries. In Afghanistan, non-state teacher training colleges were established in each province, along with rural college satellites to facilitate access for those in remote areas. In Angola and Mozambique, DAPP, a non-governmental organization (NGO), has played a key role in teacher training, in collaboration with the governments. In Somalia, where the main public institutions for teacher education were destroyed during the civil war, non-state actors have trained most teachers since 2002.
Teacher training programmes tend to be government regulated: State and non-state providers largely follow a centralized curriculum or qualification framework. In India, the government regulates minimum qualifications for trainers in both sectors, as well as the level of fees. In Mozambique, state and non-state institutions follow the same criteria and conditions for admission. In recent years, non-state teacher training institutions have been closed in Chile, Colombia and Ecuador for failing to meet minimum quality standards. In Costa Rica, poorly regulated non-state institutions offer programmes from which students graduate in considerably less time than required by public programmes.
Non-state teacher training programmes are increasingly available by distance, which raises concern about the lack of a practical component. In response, some countries, including Chile and Mexico, have banned such programmes. In Brazil, where the law gives preference to teacher education conducted in person, 67% of entrants in initial teacher education enrolled in distance courses; of those, over 95% were at non-state institutions (Figure 7.3). In Botswana, difficulties in regulating the large number of online programmes offered by non-state institutions leave many unaccredited and likely substandard. Pakistan developed national standards in 2016 to accredit distance teacher education programmes and thus increase regulatory oversight over them. Source: Sirois et al. (2021).
FIGURE 7.3:Most teachers in Brazil are trained in non-state distance education programmesNumber of entrants to initial teacher training courses in Brazil by sector and type of programme, 2010–19
0
300
400
500
200
100
600
700
800
2010 201820172016201520142013 201920122011
Thou
sand
s of s
tude
nts
Non-state, distance, 63%
Non-state, in person, 15%
Public, distance, 3%
Public, in person, 39%
Sources: For 2010–17, Todos pela educação (2019); for 2018–19, GeM report team calculations based on ineP tertiary education census data.
163 C H A P T E R 7 • TerTiary educaTion
7
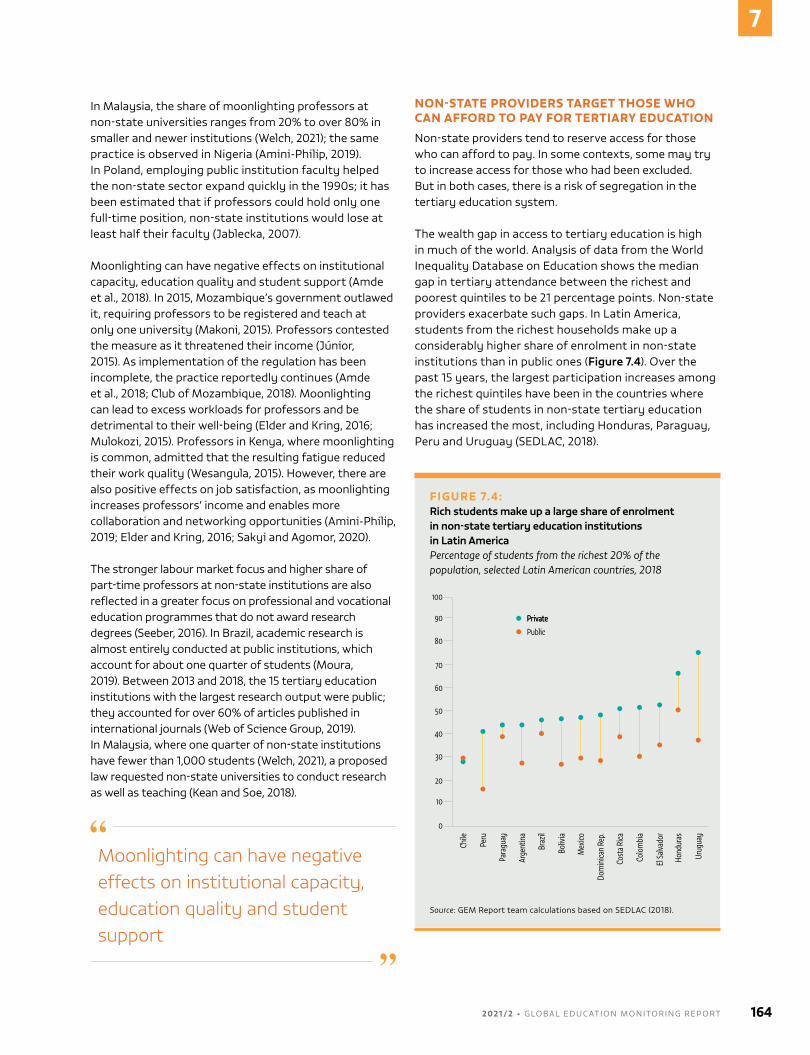
in Malaysia, the share of moonlighting professors at non-state universities ranges from 20% to over 80% in smaller and newer institutions (Welch, 2021); the same practice is observed in nigeria (amini-Philip, 2019). in Poland, employing public institution faculty helped the non-state sector expand quickly in the 1990s; it has been estimated that if professors could hold only one full-time position, non-state institutions would lose at least half their faculty (Jablecka, 2007).
Moonlighting can have negative effects on institutional capacity, education quality and student support (amde et al., 2018). in 2015, Mozambique’s government outlawed it, requiring professors to be registered and teach at only one university (Makoni, 2015). Professors contested the measure as it threatened their income (Júnior, 2015). as implementation of the regulation has been incomplete, the practice reportedly continues (amde et al., 2018; Club of Mozambique, 2018). Moonlighting can lead to excess workloads for professors and be detrimental to their well-being (elder and Kring, 2016; Mulokozi, 2015). Professors in Kenya, where moonlighting is common, admitted that the resulting fatigue reduced their work quality (Wesangula, 2015). However, there are also positive effects on job satisfaction, as moonlighting increases professors’ income and enables more collaboration and networking opportunities (amini-Philip, 2019; elder and Kring, 2016; Sakyi and agomor, 2020).
The stronger labour market focus and higher share of part-time professors at non-state institutions are also reflected in a greater focus on professional and vocational education programmes that do not award research degrees (Seeber, 2016). in Brazil, academic research is almost entirely conducted at public institutions, which account for about one quarter of students (Moura, 2019). Between 2013 and 2018, the 15 tertiary education institutions with the largest research output were public; they accounted for over 60% of articles published in international journals (Web of Science Group, 2019). in Malaysia, where one quarter of non-state institutions have fewer than 1,000 students (Welch, 2021), a proposed law requested non-state universities to conduct research as well as teaching (Kean and Soe, 2018).
Moonlighting can have negative effects on institutional capacity, education quality and student support
NON-STATE PROVIDERS TARGET THOSE WHO CAN AFFORD TO PAY FOR TERTIARY EDUCATION
non-state providers tend to reserve access for those who can afford to pay. in some contexts, some may try to increase access for those who had been excluded. But in both cases, there is a risk of segregation in the tertiary education system.
The wealth gap in access to tertiary education is high in much of the world. analysis of data from the World inequality database on education shows the median gap in tertiary attendance between the richest and poorest quintiles to be 21 percentage points. non-state providers exacerbate such gaps. in Latin america, students from the richest households make up a considerably higher share of enrolment in non-state institutions than in public ones (Figure 7.4). over the past 15 years, the largest participation increases among the richest quintiles have been in the countries where the share of students in non-state tertiary education has increased the most, including Honduras, Paraguay, Peru and uruguay (SedLaC, 2018).
FIGURE 7.4: Rich students make up a large share of enrolment in non-state tertiary education institutions in Latin AmericaPercentage of students from the richest 20% of the population, selected Latin American countries, 2018
100
90
80
70
60
50
40
30
20
10
0
PrivatePrivate
Public
Chile
Urug
uay
Hond
uras
El Sa
lvado
r
Colo
mbi
a
Cost
a Rica
Dom
inica
n Re
p.
Mex
ico
Boliv
ia
Braz
il
Arge
ntin
a
Para
guay
Peru
Source: GeM report team calculations based on SedLac (2018).
2 0 2 1 / 2 • G LO BA L E D U C AT I O N M O N I TO R I N G R E P O RT 164
7
This pattern is also observed in other regions. in china and Viet nam, non-state tertiary education institutions have widened access mostly to wealthier students of lower ability, contributing little to social mobility (Henaff et al., 2020; Welch, 2021; Zha, 2006, 2011). in india, among students enrolled in tertiary institutions in 2014, about 25% from the two poorest quintiles, but 42% from the richest quintile, attended independent private institutions. The vast majority of students from Scheduled Tribes and Scheduled castes attended government institutions or government-dependent private institutions (Henry et al., 2020). india’s non-state sector appears to have increased access for the most privileged groups first, then extended it to the most privileged within each group that benefit from affirmative action in the government-aided institutions, such as Scheduled Tribes and Scheduled castes (Gérard, 2020).
an analysis of the relationship between non-state provision and overall participation in tertiary education around the world, conducted for this report, shows that the relationship varies by country income. a greater share of non-state actors in total enrolment is associated with lower inequality in attendance rates in high-income countries, where enrolment levels are already high, but greater inequality in upper-middle-income countries, where participation among the richest is still not universal. no relationship emerged in low- and lower-middle-income countries, where enrolment levels are very low and where over three quarters of inequality can be explained by differences in secondary completion rates between poorest and richest (Buckner, 2021).
inequality in tertiary education can also manifest in access to education services, conditions for learning and graduating, and labour market outcomes. in many countries, non-state actors establish and reinforce tiers of institutions, e.g. through fee differentiation, as in Mexico (Gérard et al., 2020). a vicious cycle of reinforcing quality differences is created as most institutions targeting poorer students rely almost entirely on student fees, while elite institutions can count on additional sources of revenue, including donations and public funds. in the democratic republic of the congo, small non-state institutions charge uS$150 in annual student fees, while bigger, mostly religion-affiliated universities charge uS$1,000. in Senegal, fees range from
uS$330 outside dakar to uS$4,500 in dakar (Gérard, 2020). non-state institutions outside dakar tend to have academic staff who are less qualified and receive lower, less regular pay (dia and Goudiaby, 2020).
non-state provision tends to be concentrated in urban centres, as can be observed in many countries of sub-Saharan africa, Latin america, South and South-eastern asia, and Western europe (Gérard, 2020; Muzammil, 2019; onsongo, 2007; SedLaC, 2018; Teixeira et al., 2016; Welch, 2021). in Senegal, two thirds of non-state institutions are in dakar (dia and Goudiaby, 2020). in india’s north eastern region, private unsubsidized institutions took in 10% of students in rural areas and 18% of students in urban areas in 2014 (Muzammil, 2019). in colombia, the share of students enrolled in non-state institutions was 17 percentage points higher in urban areas than in rural areas in 2018; in Peru, the difference was 23 percentage points (SedLaC, 2018). richer households that can afford the higher cost of tertiary education live in urban areas and students can more easily find work there while studying or after graduation (ahmad and Shah, 2016).
Some non-state providers target groups at risk of exclusion
despite an overall tendency to favour more privileged students, some non-state institutions provide access to groups that are otherwise discriminated against or excluded from tertiary education as a result of gender, race, poverty, displacement or remoteness. in Kenya, rapid expansion of non-state tertiary education since the 1990s has been associated with increased opportunities for female participation, due partly to perceptions that such institutions are safer and provide more discipline and partly to a focus on the humanities and social sciences, which are popular among female students (onsongo, 2007; Tamrat, 2017). in Saudi arabia, non-state institutions have helped expand access for women by offering female-only courses not available in the public system (Jamjoom, 2016). in South africa, a social entrepreneur founded cida city campus, a low-cost university targeting poor black students, while Tsiba education, a non-profit institution financed by corporate sponsors, offers business programmes to financially and educationally disadvantaged students (Salmi and Sursock, 2018).
A greater share of non-state actors in total enrolment is associated with greater inequality in attendance in upper-middle-income countries
165 C H A P T E R 7 • TerTiary educaTion
7
In Kenya, rapid expansion of non-state tertiary education since the 1990s has been associated with increased opportunities for female participation
in colombia, uniMinuTo, a faith-based university enrolling about 100,000 students, provides access to students in informal settlements, small cities and rural areas (Casanova et al., 2015; unIMInuTo, 2020). Building on this initiative, the government encouraged the creation of over 200 regional centres called cereS, which are partnerships among tertiary education institutions, local government and private companies (Salmi, 2020). a collaborative global partnership, Jesuit Worldwide Learning: Higher education at the Margins, offers an online programme that allows refugees in camps in Kenya to attend tertiary education (Salmi, 2020). Kiron open Higher education, a German non-profit organization, offers refugees a two-year online programme that helps them complete their studies at a host-country institution (unangst, 2017). in Senegal, al-azhar university, open only to students who complete an arabic upper secondary education, has developed an engineering programme that includes a preparatory year to improve students’ French language skills before they follow the official three-year curriculum (dia and Goudiaby, 2020).
non-state providers demonstrate innovation in providing flexibility. in Brazil, 68% of students at non-state universities take evening classes – which allow them to work during the day – compared with 36% at public institutions. Similarly, 56% of non-state institution enrolment is in distance education, compared with 14% for public institutions (IneP, 2020). in argentina, institutions are distinguished by offering flexible hours and distance education (altbach et al., 2021).
despite short-term positive effects of increasing access to tertiary education, creating separate institutions for different groups can jeopardize development of social cohesion. in indonesia, Malaysia and Thailand, concerns have emerged about the rise of extremism in some religion-affiliated non-state tertiary institutions despite government countermeasures (Welch, 2021).
NON-STATE TERTIARY EDUCATION REGULATION VARIES
Tertiary education regulatory frameworks reflect government views of the sector and of non-state actors. countries form a continuum from those
where the government supervises and centrally coordinates non-state providers, assigning them variable roles within an overarching national strategy, to those allowing competition, choice and autonomy for non-state providers, as in chile, colombia, Japan, Malaysia, the Philippines and the republic of Korea (Ferreyra et al., 2017; Welch, 2021).
in countries with historically centralized structures, non-state actors are viewed with mistrust and placed under strict regulations, which often favour public institutions. in argentina, non-state universities need approval from the accreditation agency before being established and the authorization is probationary for up to six years (altbach et al., 2021). azerbaijan’s government controls the types of programmes non-state institutions can offer and even the number of students they can enrol (Salmi, 2017). in ethiopia, non-state providers had a leading role in introducing distance education but in 2012 were banned for two years from offering that mode of study (Tamrat and Teferra, 2019).
By contrast, in Senegal, the government views non-state institutions as complementary and as accessories to the public system. accreditation regulations encourage the establishment of institutions following market principles. nevertheless, the government retains strong control over their operations. For example, it can allocate any number of students who do not qualify for state institutions to non-state institutions, with little say from the students themselves or the receiving institutions (dia and Goudiaby, 2020).
in some cases, there is a gap between the regulations and a country’s discourse on non-state actors. Tunisia’s government has tried to present itself as encouraging of non-state provision, but regulations are quite restrictive. institutions are required to be for profit, cannot have regional branches and can offer only one field of study. The government put new programme approval processes on hold and increased the minimum investment required for new institutions, with little consultation (Buckner, 2018).
In Argentina, non-state universities need approval from the accreditation agency before their creation and the authorization is probationary for up to six years
2 0 2 1 / 2 • G LO BA L E D U C AT I O N M O N I TO R I N G R E P O RT 166
7
Moreover, country views of non-state actors change over time, a fact reflected in their regulatory frameworks, as in Viet nam (Box 7.3). in egypt, the first non-state institutions were viewed as a low-quality last resort for those who could not get into public institutions. in 1970, the legal framework required state approval of institutions’ fee structure, subjects, course content, student cohort size and faculty hires. With time, openness to more elite non-state universities has been matched by an adapted legal framework allowing more flexibility and autonomy (altbach et al., 2021). in post-communist central and eastern europe, non-state institutions emerged in a regulatory vacuum, leading to significant challenges to which governments responded with delay (Levy, 2013) (Box 7.4).
Unaccredited institutions tend to be the ones attended by disadvantaged populations, raising equity concerns
QUALITY ASSURANCE MECHANISMS AIM TO ENSURE MINIMUM STANDARDS
Most countries have regulatory frameworks for the establishment, operation and closure of non-state tertiary education institutions, aimed at ensuring minimum quality standards. in some countries, this is a recent development. Bangladesh had no accreditation framework to assess whether universities or programmes met a minimum quality standard until 2017 (Bangladesh university Grants Commission, 2018). Quality standards for non-state institutions are often different than for public institutions (asian development Bank, 2012; Ferreyra et al., 2017).
in some countries, explosive growth in non-state provision has posed a regulatory challenge when resources to accredit and monitor such institutions are lacking (Levy, 2013). about 90% of indonesia’s 4,500 tertiary education institutions are non-state, enrolling 59% of students as of 2018. a national accreditation board formed in the mid-1990s to accredit only non-state institutions has since assumed responsibility for all programmes. in 2009, there were 3,000 academic programmes to be evaluated; by 2013, some 20% of accreditation decisions were late. emergency measures allowed some institutions to operate without accreditation. in 2017, less than 2% of tertiary education institutions had the highest level of accreditation. Some had no accredited programmes. in late 2018, in an effort to control the growing quality problems in the non-state sector, the government announced that it would revoke the permits of around 1,000 non-state tertiary institutions (dilas et al., 2019). a rapid increase in unaccredited non-state institutions posed similar challenges in Libya, leading the government to close 20 non-state universities and colleges failing to meet quality standards in 2021, a decision with important implications for their students and academic staff (el-Galil, 2021).
Lack of resources or inadequate capacity of regulatory agencies can be a challenge. in the democratic republic of the congo and Mexico, some institutions operate while accreditation is pending or with varying
BOX 7.3:
Non-state tertiary education regulation in Viet Nam has reflected changing attitudes towards private economic activity
The regulation of non-state tertiary education reflects wider political considerations. In Viet Nam, rapidly changing but ambiguous regulations have reflected a gradual embrace of economic privatization (Altbach et al., 2021; Chau et al., 2020). The first non-state university was founded by a group of intellectuals in 1988, two years after the launch of the major market-oriented economic reform called Doi Moi. It took a further five years for the country to regulate non-state tertiary education provision (Quang, 2017).
The first legal frameworks in the early 1990s regulated three types of non-state institutions: ‘people-founded’ institutions established by social and professional associations; state-established but privately financed ‘semi-public institutions’; and ‘private institutions’ set up by individuals or companies. Private institutions effectively began operating only in 2005, and the following year the government outlawed people-founded and semi-public institutions, urging them to adopt the for-profit model. The transition caused regulatory ambiguity and led to many closures (Chau et al., 2020; Quang, 2017). Then, in 2012, non-profit universities were allowed again, sowing confusion among private institutions.
A shift towards a market-friendlier environment gained momentum in the 2010s. A target of the Higher Education Reform Agenda was that 40% of enrolment should be in private institutions by 2020 (Welch, 2021). In 2014, public institutions were encouraged to seek non-state funding under a new financial autonomy programme, which has led fees to increase considerably (Altbach et al., 2021). Today, the country has 65 non-state universities that enrol about 15% of students. Big private corporations and education conglomerates have entered the market, but there are no religious or civil society universities (Chau et al., 2020; Henaff et al., 2020).
167 C H A P T E R 7 • TerTiary educaTion
7
degrees of temporary accreditation (Gérard, 2020). often, unaccredited institutions tend to be the ones attended by disadvantaged populations, raising equity concerns. in Peru, of the 32 non-state institutions attended by relatively less well-off students, most were for-profit and had not obtained accreditation by mid-2019 (Benavides and Hagg Watanabe, 2020). in india and Mexico, government accreditation of non-state institutions is voluntary (Gérard et al., 2020; ravi et al., 2019). in Guatemala, the main public university is in charge of granting licences and overseeing non-state institutions (Ferreyra et al., 2017), raising questions of conflict of interest.
Some countries outsource accreditation to non-state actors. in Mexico, where accreditation is not mandatory, non-state institutions seek accreditation from an association of private tertiary education institutions or accrediting agencies in the united States (Gérard
et al., 2020). The Philippines has several non-state accrediting agencies, including two church-based agencies (Tanhueco-Tumapon, 2020). in the united States, quality assurance has been undertaken by non-state associations since the 19th century (Xiaoying and abbott, 2016). The american Bar association (aBa) does its own accreditation for law schools. in most states, only graduates of an aBa-accredited school are allowed to sit the bar exam (The Princeton review, 2021). Some argue that competition between accrediting agencies may encourage innovation and efficiency, while others point to the advantages of a government-owned quality assurance structure, including harmonization of standards and reduced transaction costs (Xiaoying and abbott, 2016).
once in operation, quality control tends to be input- and output-based, focusing on infrastructure, student numbers and academic staff qualifications. outcome-based quality assurance, focusing on student
BOX 7.4:
In Central and Eastern Europe, the growth of non-state tertiary education was unregulated in the early transition years
The end of state socialism led to unprecedented growth in non-state tertiary education in most countries of Central and Eastern Europe. The rapid shift away from the state-centred model often took place in the absence of a legal framework (Dobbins and Knill, 2009; Slantcheva and Levy, 2007). Within five years after 1989, the share of non-state tertiary education institutions had reached 10% in Bulgaria, Hungary and the Russian Federation and over 20% in Poland (Slantcheva and Levy, 2007). In the Russian Federation, none of the over 150 tertiary education institutions were accredited by 1994 (Tomusk, 2003).
In Albania, the government tried to meet rising demand for tertiary education by expanding the public sector in the 1990s. Insufficient funding, however, and strict control over the number of new public institutions limited the supply. In 2005, a change in government led to market-favourable policies. By 2013, nearly 50 non-state tertiary education institutions had obtained licences (Kajsiu, 2015) and the share of students in non-state institutions rose from 1% in 2004 to 21.5% in 2012. However, this expansion raised concerns over quality and fraud (Clark, 2016; Erebara, 2014; Kajsiu, 2015). After an investigation, 18 non-state institutions suspected of delivering fake or dubious diplomas were closed in 2014 (Erebara, 2014). A 2015 law aimed to merge the state and non-state sectors, make all tertiary education institutions non-profit, increase funding by allowing public institutions to raise fees and enable non-state institutions to compete for public funding. However, several of these aims were not implemented (Raxhimi, 2019).
In Romania, expansion was even more rapid. By 1995, one quarter of tertiary education enrolment was in non-state institutions (Slantcheva and Levy, 2007). Non-state actors initially simply declared themselves to be tertiary education providers. The government did not establish a legal framework for accrediting institutions and recognizing diplomas until 1993, and the law came into effect only in 1996 (Nicolescu, 2007; Vîiu and Miroiu, 2015). In 2000, a regulation imposed a 10% tax on non-state institutions’ revenue (Fried et al., 2007). Later, regulations emphasized the importance of quality assurance mechanisms and allowed non-state institutions to compete for public funds, which led to the closure of several substandard non-state institutions and helped improve the legitimacy of the remaining ones (Korka and Nicolescu, 2007; Vîiu and Miroiu, 2015).
Yet cases of fraud have continued to taint the sector. In 2009, over 100,000 graduates of Spiru Haret University, the largest non-state institution, had their diplomas annulled and labelled as illegally granted after irregularities were exposed (UWN, 2009). In 2019, a Spiru Haret pro-rector was arrested as part of an investigation on fraudulent examinations. Other institutions have been accused of fraudulently granting diplomas to students who did not attend classes and did not speak Romanian (Romania Insider, 2017, 2019). The share of students enrolled in non-state institutions declined from its peak of 42% in 2009 to 13% in 2018. This trend reflected an overall enrolment drop resulting from demographic decline and a decrease in the share of students passing the upper secondary education exit examination, from 81% in 2009 to 44% in 2011, attributed to a series of anti-fraud measures (Salmi et al., 2015).
2 0 2 1 / 2 • G LO BA L E D U C AT I O N M O N I TO R I N G R E P O RT 168
7
assessment, student surveys or research results, is not common and can be controversial. Germany, for instance, has not favoured direct large-scale evaluations of student skills (Pereira et al., 2018). a proposal by the organisation for economic co-operation and development (oecd) for an international higher education student assessment faced strong opposition (altbach, 2015; Van damme, 2015). But in Brazil, a mandatory student exit exam is used to monitor institutions’ quality and allows the government to assign a grade to each programme (Pereira et al., 2018).
outcome-based quality assurance is also more common when it is linked to public funding. in the united States, the 2016 Gainful employment rule introduced graduate employment and student loan repayment rates as part of the criteria for non-state institutions’ eligibility for federal student loans, thus adding a layer of oversight and leading to closures of several for-profit institutions of poor quality (Jakiel, 2016; Kreighbaum, 2019). in Poland, the government began focusing evaluations and funding on variables such as research productivity, partly because non-state institutions were becoming too teaching-oriented and focused only on attracting students (Tarlea, 2017).
regulatory frameworks may increase institutional autonomy in an effort to improve quality. in india, the government approved a plan in 2018 that rewards regulation-compliant state and non-state institutions with more autonomy to create new courses, collaborate with international institutions and enter research collaborations with industry (Chattopadhyay, 2019; Henry et al., 2020). in the Philippines, where the non-state tertiary education sector enrols over half of students, institutions that demonstrate continued adherence to high standards of scholarship, research and instruction are granted special regulatory treatment and autonomy, including financial autonomy in fee setting, through progressive deregulation and reduced government monitoring and evaluation, except where violations or complaints are reported (Peer country profiles, 2021).
regulatory frameworks can also be used to ensure the quality of for-profit institutions and guard against a misalignment between profit maximization and students’ and taxpayers’ interests (eaton et al., 2018). Some countries, including argentina, chile and india, outlaw for-profit tertiary education provision altogether (educación 2020, 2018; Gérard, 2020; Mohanty, 2020).
However, once for-profit provision is established, it becomes difficult to eliminate. in Peru, an initial version of the 2014 tertiary education law proposed outlawing for-profit institutions but was overturned (Gérard, 2020). Profit-making can lower institutional quality through insufficient investment in core services in exchange for higher investor return (eaton et al., 2018). in the Philippines, the commission on Higher education stipulates that 70% of revenue from fees must be allocated to payment of staff salaries and 20% to infrastructure improvement, meaning no more than 10% is to be allocated to return on investment (Peer country profiles, 2021).
For-profit institutions may resort to deceptive business practices, including predatory recruitment and fraudulent marketing strategies. in the united States, 7 of the 10 biggest for-profit companies in the sector have been investigated on allegations (Halperin, 2016) and found to have indulged in such practices: apollo/university of Phoenix (united States Federal Trade Commission, 2019), edMc (united States department of education, 2018), iTT Tech (douglas-Gabriel, 2018), Kaplan (united States department of Justice, 2015), career education corporation (united States attorney General, 2019), deVry (united States Federal Trade Commission, 2016) and Bridgepoint education (united States department of education, 2018). in nigeria, the national university commission helped close many of the country’s illegitimate institutions (Varghese, 2016). in Viet nam, several university officials were recently prosecuted on charges of selling diplomas or other types of corruption and wrongdoing (Tho, 2021).
Quality assurance regulations also need to tackle the rise in fake, unregistered for-profit institutions that often enrol marginalized people. in 2017, Pakistan’s Higher education commission issued a public notice with a list of 153 illegal universities and degree-awarding institutions (Khan, 2017). in South africa, the number of fake and unregistered institutions led the government to launch an awareness campaign and, in 2019, promulgate the national Qualifications Framework amendment act, making it a crime to claim or hold a fraudulent qualification (de Wet, 2019; TimesLiVe, 2018).
Market concentration is another regulatory challenge presented by for-profit institutions that can have major implications for system quality. in Brazil, where
Market concentration is another regulatory challenge presented by for-profit institutions that can have major implications for system quality
169 C H A P T E R 7 • TerTiary educaTion
7
for-profit institutions account for about half of tertiary education enrolment, the 10 largest companies, many of which are international, made up 30% of total tertiary education enrolment and over 60% of enrolment in for-profit institutions (Cunha, 2018; IneP, 2020). That year, the competition regulation authority blocked the acquisition of the second-largest company by the largest, which would have increased market concentration above 30% (Martello, 2017).
EQUITY-PROMOTING REGULATIONS ARE NOT COMMON
in addition to helping ensure minimum quality standards, regulations can help promote equitable access. Many countries have quotas or special admission criteria to improve disadvantaged groups’ access to tertiary education. However, the criteria are not always extended to non-state providers. Brazil’s affirmative action policy, which guarantees 50% of posts to disadvantaged students, applies only to public institutions, which enrol just about one quarter of students (Brazil Ministry of education and Culture, 2021). in indonesia and Viet nam, public universities must provide financial aid grants to at least 20% of their student population and scholarships to at least 10% (Salmi, 2020). romania’s government reserves fee-free places only in public universities for students from rural secondary schools and roma students (altbach et al., 2021).
Where regulations do apply to non-state institutions, they are usually enforced only for non-state providers that receive public funding. in india, quotas reserved for students from Scheduled castes and Scheduled Tribes apply only to public institutions and non-state institutions that receive government funding (Henry et al., 2020; uneSCo, 2017). Supported by the constitution, however, some regions have also applied the quota system to independent non-state institutions. The Bihar state government enforces quotas for women in non-state institutions in addition to categories determined by law (Henry et al., 2020).
Some countries apply admission policies to all non-state tertiary education providers. in the Plurinational State of Bolivia and ecuador, non-state tertiary institutions are required by law to provide scholarships to 10% of students (Ferreyra et al., 2017). non-state universities in Mexico must provide grants or scholarships to at least 5% of students. in england (united Kingdom), institutions must commit to spend a fixed proportion of fee income on scholarships and bursaries (Salmi, 2020).
another equity-related regulation is the capping of fees to keep institutions affordable and accessible to a larger share of the population. This is common for public universities but can also apply in non-state institutions. in india, several states have fee regulatory committees that oversee non-state institutions’ fees to stop them from charging exorbitant amounts (Muzammil, 2019); the same is true in azerbaijan (Salmi, 2020). in Kenya, the regulator rejected a recent request by public and non-state universities for a fee increase because it could restrict access to students from poor families (nganga, 2019). Governments may indirectly regulate fee levels, as in chile and côte d’ivoire, by establishing a reference price that is used to calculate scholarship amounts for poor students in non-state institutions (Salmi, 2020).
FINANCING MODALITIES HAVE QUALITY AND EQUITY IMPLICATIONS
There is heated debate over the degree to which governments and households should share the financing of tertiary education. in most countries, wealthier groups enjoy disproportional access to tertiary education; public financing of tertiary education therefore risks exacerbating inequality. While there are both private and social returns to investment in education, the relative share of returns appropriated by individuals through higher wages is larger in higher education than in basic education. in terms of allocating the education budget, a case can be made for prioritizing pre-tertiary education on equity grounds, letting those who benefit more from tertiary education be responsible, at least in part, for financing it.
opponents of such cost sharing believe government should be responsible and public provision is the best way to guarantee that access to tertiary education does not depend on ability to pay. inequality, in this view, should be addressed by increasing the number of participants in tertiary education; systems require more, not less, government presence (Johnstone, 2004). How these arguments play out depends on countries’ historical, political and economic context. The debate is usually one of degree – it is rare to find advocates of a system financed entirely by the government or by households (altbach et al., 2021).
Most non-state institutions, especially those that are smaller and non-elite, rely on fees for their funding. non-state institutions in some countries, including colombia and Mexico, rely exclusively on households
2 0 2 1 / 2 • G LO BA L E D U C AT I O N M O N I TO R I N G R E P O RT 170
7
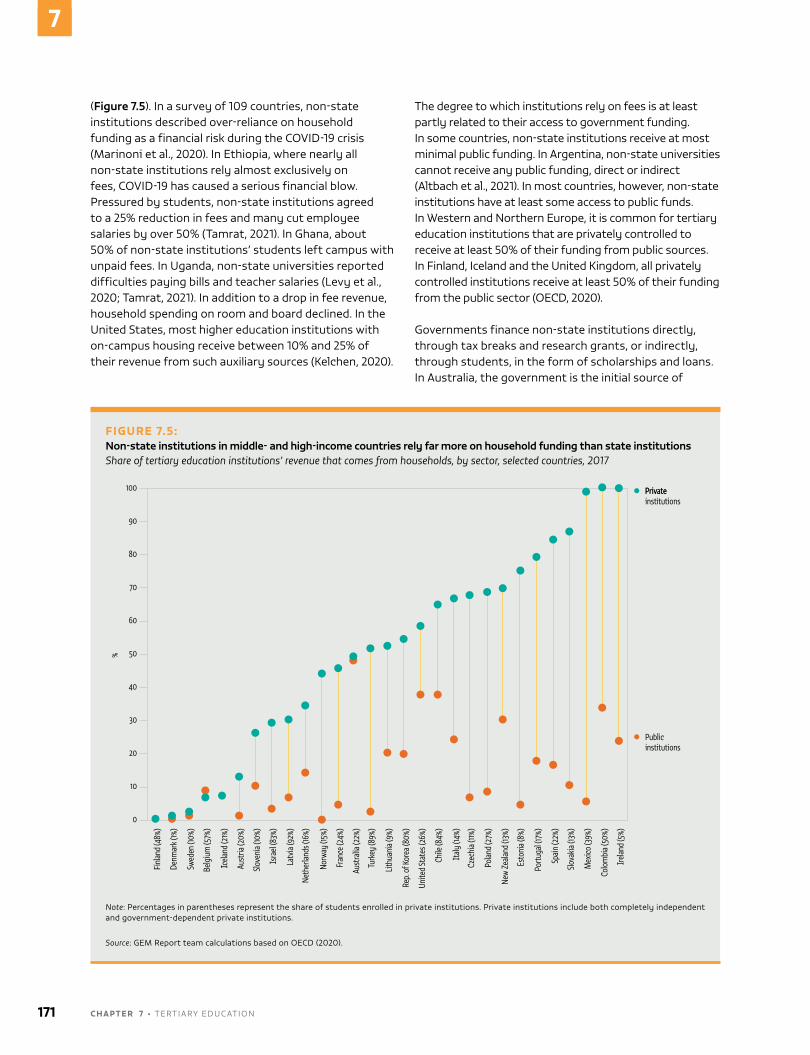
(Figure 7.5). in a survey of 109 countries, non-state institutions described over-reliance on household funding as a financial risk during the coVid-19 crisis (Marinoni et al., 2020). in ethiopia, where nearly all non-state institutions rely almost exclusively on fees, coVid-19 has caused a serious financial blow. Pressured by students, non-state institutions agreed to a 25% reduction in fees and many cut employee salaries by over 50% (Tamrat, 2021). in Ghana, about 50% of non-state institutions’ students left campus with unpaid fees. in uganda, non-state universities reported difficulties paying bills and teacher salaries (Levy et al., 2020; Tamrat, 2021). in addition to a drop in fee revenue, household spending on room and board declined. in the united States, most higher education institutions with on-campus housing receive between 10% and 25% of their revenue from such auxiliary sources (Kelchen, 2020).
The degree to which institutions rely on fees is at least partly related to their access to government funding. in some countries, non-state institutions receive at most minimal public funding. in argentina, non-state universities cannot receive any public funding, direct or indirect (altbach et al., 2021). in most countries, however, non-state institutions have at least some access to public funds. in Western and northern europe, it is common for tertiary education institutions that are privately controlled to receive at least 50% of their funding from public sources. in Finland, iceland and the united Kingdom, all privately controlled institutions receive at least 50% of their funding from the public sector (oeCd, 2020).
Governments finance non-state institutions directly, through tax breaks and research grants, or indirectly, through students, in the form of scholarships and loans. in australia, the government is the initial source of
FIGURE 7.5:Non-state institutions in middle- and high-income countries rely far more on household funding than state institutionsShare of tertiary education institutions’ revenue that comes from households, by sector, selected countries, 2017
100
90
80
70
60
50
40
30
20
10
0
PrivatePrivateinstitutions
Publicinstitutions
%
Finl
and
(48%
)
Denm
ark (
1%)
Swed
en (1
0%)
Belg
ium
(57%
)
Icela
nd (2
1%)
Aust
ria (2
0%)
Slove
nia (
10%)
Isra
el (8
3%)
Latv
ia (9
2%)
Neth
erlan
ds (1
6%)
Norw
ay (1
5%)
Fran
ce (2
4%)
Aust
ralia
(22%
)
Turk
ey (8
9%)
Lithu
ania
(9%)
Rep.
of K
orea
(80%
)
Unite
d St
ates
(26%
)
Chile
(84%
)
Italy
(14%
)
Czec
hia (
11%)
Polan
d (2
7%)
New
Zeala
nd (1
3%)
Esto
nia (
8%)
Portu
gal (
17%)
Spai
n (2
2%)
Slova
kia (1
3%)
Mex
ico (3
9%)
Colo
mbi
a (50
%)
Irelan
d (5
%)
Note: Percentages in parentheses represent the share of students enrolled in private institutions. Private institutions include both completely independent and government-dependent private institutions.
Source: GeM report team calculations based on oecd (2020).
171 C H A P T E R 7 • TerTiary educaTion
7
55% of total spending on tertiary education institutions, with nearly one third of this transferred to households in the form of financial aid (oeCd, 2020). in indonesia, where most students are enrolled in non-state institutions, the government subsidizes a small share of the academic staff as civil servants and allows institutions to compete for public funds. in Malaysia, students enrolled in non-state institutions are eligible for the public student loan programme, which covers about half of these institutions’ income. Thailand’s government has a fund specifically dedicated to non-state tertiary education institutions to help them improve facilities and human resource development (Welch, 2021).
The degree of public funding may also depend on the type of institution. in Belgium, the government subsidizes church-based institutions, which enrol over half of all students. in some Latin american countries, including chile, the dominican republic and nicaragua, the state provides the same level of funding to the oldest non-state universities as to public universities (Salmi, 2020). in Japan and the republic of Korea, prestigious non-state universities receive substantial government funding (Welch, 2021).
access to public funds can help improve the quality of non-state provision. an important example is eligibility for public research grants, which increase the likelihood of non-state institutions engaging in research and, in turn, their ability to attract better-qualified professors (Teixeira et al., 2016). Moves towards competitive neutrality have been made by countries including indonesia and Thailand (Welch, 2021). Governments may also target or condition funds to foster a specific agenda. The university Grants commission in india (India university Grants Commission, 2021) and the Fund for Students with disabilities in ireland (Ireland Higher education authority, 2021; Salmi, 2020) fund both public and non-state institutions to provide services aimed at students with disabilities.
HOUSEHOLDS ARE SUPPORTED IN TAKING ON A LARGER SHARE OF TERTIARY EDUCATION FUNDING
Household funding of tertiary education is increasing for both public and private institutions. yet shifting tertiary education costs to households does not necessarily mean all households ultimately pay, or pay equally. Student financial support systems, whether financed and supported by the government or non-state actors, have major implications for equity (Chapman, 2016).
institutions can be funded directly through fee subsidies, although such aid to students who attend non-state institutions tends to be limited. it usually happens in
countries with larger non-state sectors, where the government provides targeted fee subsidies to students of both state and non-state institutions. in Brazil and chile, where over 70% of students are in non-state institutions, governments offer targeted fee subsidies to low-income students attending selected non-state institutions (Ferreyra et al., 2017; Salmi, 2020).
Some countries, again mainly those with a large non-state sector, channel public funds directly to students of state and non-state institutions through scholarships, grants and loans. in côte d’ivoire, the government offers scholarships for students taking the short professional course towards the Brevet de Technicien Supérieur diploma in non-state institutions (Salmi, 2020). in colombia, the government student loan agency, iceTeX, administers scholarships for underserved groups to attend state and non-state tertiary institutions. The Álvaro ulcué chocué Fund, for instance, supports indigenous groups (ICeTeX, 2020).
over 70 countries operate student loan programmes, most of them government subsidized (Salmi, 2020; Ziderman, 2017). Loans are often available to students of both types of institutions, although borrowing limits can deter enrolment in more expensive institutions. in Viet nam, low-income students from both state and non-state institutions have access to public student loans, although the maximum amount is relatively low, covering about 84% of the education cost in public institutions and 52% in non-state institutions (doan et al., 2020). Loans’ ability to increase equitable access to education is mixed (Chapter 12). Moreover, increased availability of student loans may lead to fee hikes, as in Brazil (de Mello and duarte, 2020) and the united States (eaton et al., 2018; Goldin and Cellini, 2014).
non-state actors can help cover tertiary education costs through scholarships paid for by companies, foundations, nGos, philanthropists and non-state tertiary education institutions themselves. The Strategic Plan for Higher education in Bangladesh: 2018–2030 establishes that non-state institutions must earmark 2% to 5% of their revenue for scholarships or grants (Bangladesh university Grants Commission, 2018). non-state tertiary institutions provide scholarships to up to 30% of their students in uruguay (Ferreyra et al., 2017). in the united
Over 70 countries operate student loan programmes, most of them government subsidized
2 0 2 1 / 2 • G LO BA L E D U C AT I O N M O N I TO R I N G R E P O RT 172
7
States, non-state non-profit institutions have been increasing the share of fee revenue used for financial aid, which reached 46% in 2018 (naCuBo, 2019).
non-state actors also grant student loans. commercial banks, for instance, often disburse and collect loans (Chapman, 2016; Ziderman, 2017). an example of an entirely non-state alternative to financing tertiary education is the nascent development of platforms for peer-to-peer loans, where students borrow directly from an individual without going through a financial institution (assomull et al., 2015). another example is financing education through equity instead of debt, or income share agreements (Box 7.5).
SOME NON-STATE ACTORS FUND INSTITUTIONS BEYOND FEES
non-state tertiary education institutions look for ways to diversify their sources and types of revenue beyond fees. one way is to raise capital through loans. Multinational corporations are important creditors in the tertiary education market, particularly in low- and middle-income countries. The World Bank’s african Higher education centers of excellence project focuses on strengthening selected institutions’ ability to deliver quality and build research capacity in priority areas (Salmi, 2017). The programme was expanded in 2019 to science, technology, engineering and mathematics institutions in Burkina Faso, djibouti, Ghana, Guinea and Senegal; more than uS$450 million will have been disbursed by its end (World Bank, 2019b). The international Finance corporation provides loans specifically to non-state tertiary education institutions. By 2017, it had financed nearly uS$1.4 billion in technical, vocational and tertiary education projects. By far the top recipient region is Latin america and the caribbean (48%), followed by east asia and the Pacific (13%) and europe and central asia (12%) (IFC, 2018).
Besides loans, bonds are increasingly an alternative source of funding for tertiary education institutions (Katsomitros, 2018). The bond market reached record numbers during the coVid-19 crisis. By mid-2020, bond issuance by universities worldwide had reached uS$11.4 billion, more than double the amount in 2019. The main players in the bond market were institutions in australia, Brazil, canada, Singapore and the united States (Bahceli, 2020). access to bond markets, however, may increase the gap between institutions, as those with better reputations and credit ratings are more likely to attract investors. in the united States, for example, public institutions tend to have higher credit ratings than non-state institutions, even if all non-profit institutions benefit from tax exemptions (Howard, 2020).
BOX 7.5:
Income share agreements are a market-based initiative to fund tertiary education
Scholarships and loans may be insufficient to remove all financial barriers to tertiary education. Scholarships require donor funding, are non-refundable, tend to have a limited reach and are often focused on specific groups. Loans require collateral and co-signers may be inaccessible to some students.
Income share agreements were designed to fill the gap. They finance tertiary education through equity instead of debt. Investors fund students’ tertiary education in exchange for a fixed share of their future income for a defined number of years. The period of the payment and share of income depend on the programme’s estimated value. As with income-contingent loans, repayment depends on the graduate’s income, but unlike in loans, the payment is not based on principal that is owed. To avoid exorbitant repayments, many institutions cap total repayment at 1.5 to 2.5 times the initial amount borrowed (Salmon, 2020).
Income share agreements can be made with education providers, potential employers or direct investors, who become asset owners of students’ future earnings. Such agreements are increasingly adopted in Latin America and the United States (Salmon, 2020) and expanding to African countries. Brighter Investment, for example, pools potential donors and connects them to students from developing countries wishing to finance their degree in approved programmes through income share agreements (Salmi, 2017). In 2019, Brighter Investment signed a partnership with Ghana’s government to provide information on top-performing students, facilitate their placement with relevant employers, use tax records and pension savings to locate them and enforce repayments through the Ministry of Finance (Mathot, 2019).
Many income share projects have an equity focus. CHANCEN International, a non-profit based in Germany, offers income share agreements to women who attend the Akilah Institute for Women in Kigali, Rwanda. Graduates who earn above US$80 are expected to repay 9% of their net monthly income for 8 years (CHANCEN, 2021). CHANCEN is raising funds to expand the programme to 10,000 students in sub-Saharan Africa (CHANCEN, 2020).
Proponents of income share agreements note that not only do they provide insurance against uncertain earning prospects, but the risks are taken by investors who then have a strong incentive to help graduates find good jobs. Critics say such agreements restrict opportunities to students and programmes deemed economically valuable. They also call for regulations on tertiary education financing to be updated to cover such agreements (Salmon, 2020).
173 C H A P T E R 7 • TerTiary educaTion
7
By mid-2020, bond issuance by universities worldwide had reached US$11.4 billion, more than double the amount in 2019
Public–private partnerships also diversify tertiary education institutions’ revenue. in china, public tertiary education institutions generate income by partnering with private entrepreneurs to develop and sell housing around the institution (Welch, 2021). in Mexico, public institutions have incorporated non-state institutions into their programmes in exchange for an incorporation fee calculated as a percentage of the non-state institutions’ workforce (Gérard, 2020). in the united States, public and non-state institutions’ endowment funds are so important that they have been called hedge funds with a university on the side (Gilbert and Hrdlicka, 2017). critics say some universities have shifted their priorities towards investment and away from education and research. another criticism is that endowment funds benefit from tax exemptions, and much of their income is used for high compensation packages and bonuses for money managers instead of students, staff or the institution (Samuels, 2013; Taylor, 2016).
Some public universities in sub-Saharan africa have generated income through market activities. The university of Ghana privatized services such as guest houses and land leases for private hostels (Varghese, 2016). in Kenya, the university of nairobi commercialized products (bookstores, restaurants) and services (clinical chemistry, diagnostic radiology, veterinary farm and a funeral parlour) (Provini, 2019). in nigeria, the university of ibadan has offered consulting and set up endowments (Varghese, 2016). Throughout the region, to promote and coordinate their income-generating activities, institutions have established companies, which exert considerable influence on institutional governance (Wangenge-ouma, 2018).
Philanthropic foundations are another direct source of funding to tertiary education institutions. Based on an annual survey by the council for advancement and Support of education, in the united States, foundations gave uS$16.4 billion to tertiary institutions in 2020 and alumni contributed uS$11 billion, jointly making up 56% of the total raised by tertiary institutions overall (Kaplan, 2021). an oecd survey of 143 foundations working in developing countries found that philanthropists donated about uS$549 million between 2013 and 2015 to tertiary
education in the form of scholarships or funding for universities, colleges and polytechnics. a significant proportion of philanthropic funding is channelled through intermediary organizations, such as the World Bank or bilateral donors, in order to pool resources and increase the scale of efforts (oeCd, 2019).
Foundations have also been working with governments to better target financing. education Sub Saharan africa was founded in 2016, using robert Bosch Foundation seed funding, to develop tertiary education in the region with the aim of increasing the visibility of research on education by scholars in sub-Saharan africa, gather evidence on academic staff in tertiary education and assess scholarships’ effectiveness and accessibility. other donors have since joined it, including the Jacobs Foundation, the Mastercard Foundation and the Schaufler Foundation, partnering at the regional and local levels (eSSa, 2019; oeCd, 2019).
NON-STATE ACTORS INFLUENCE TERTIARY EDUCATION THROUGH MULTIPLE MECHANISMS
non-state actors influence tertiary education in many ways. There is concern that commercial private actors can influence non-state tertiary institutions towards their interests, such as research priorities or enrolment expansion, rather than education quality. yet other non-state actors can strengthen equity or the sector overall.
in recent years, many governments have boosted incentives for closer relationships between non-state actors and research. in Bangladesh, the government encourages state and non-state universities to collaborate with industry through collaborative research, contract research and consultancy. While the Strategic Plan for Higher education envisages transparency and ethics guidelines, they are not yet in place (Bangladesh university Grants Commission, 2018; World Bank, 2019a). in France, the 2020 PacTe law, aiming to facilitate private sector access to public research, allows public university researchers to devote 50% of their time to work for a private company and to own up to 32% of its capital (Caulier, 2020). However, non-state funding of tertiary education research is not without controversy. in clinical research sponsored by pharmaceutical or medical device companies, there is an increased likelihood of finding positive results (Lundh et al., 2018). critics have also argued that allowing private companies to contract research on specific topics undermines institutional autonomy (oliveira, 2015).
2 0 2 1 / 2 • G LO BA L E D U C AT I O N M O N I TO R I N G R E P O RT 174
7
The for-profit sector has seen the emergence of powerful publicly traded tertiary education conglomerates with strong lobbying powers
non-state actors lobby for their own operation and expansion. The Brazilian association of non-state tertiary education providers is pressuring government to change the accreditation process so that they can be accredited by a non-state agency (o Sul, 2019). a strategic aim of the international Federation of catholic universities, which has over 200 members, is to engage with international bodies such as the oecd, uneSco and the World economic Forum to increase public support for catholic universities (FIuC, 2021). The influence of non-state actors through funding can also be exerted via participation in discussions and consensus building. Staff of several scholarship programmes, for example, develop long-term relationships and engagement with partner universities and may influence practice, priorities or curricula (Campbell, 2021).
The for-profit sector has seen the emergence of powerful publicly traded tertiary education conglomerates with strong lobbying powers. in the united States, where for-profit enrolment accounts for about 5% of the tertiary education student body (nCeS, 2019), most top donors lobbying on behalf of for-profit education are owners of for-profit tertiary institutions. Politicians have received generous donations from for-profit tertiary education companies (arke, 2020; Halperin, 2016). Since 2010, the shrinking for-profit market has pushed many companies to establish tertiary education institutions in developing countries (Green, 2018; Knobel and Verhine, 2017). at its peak, when it went for a public offering, the biggest tertiary education company in the world, Laureate, based in the united States, had 95% of its 1 million students enrolled abroad (debter, 2017). it has since downsized, having closed or sold foreign units in several countries, such as india and Turkey, and is in the process of selling remaining units in Brazil and the united States: as of mid-2021, 184,000 students were enrolled in Laureate institutions and it planned to maintain just four universities in Mexico and Peru (Laureate, 2021).
indeed, an important destination for such companies has been Brazil (Knobel and Verhine, 2017), where the for-profit sector accounts for over half of tertiary
education enrolment (IneP, 2020). The 10 largest tertiary education companies in Brazil had estimated revenue of over uS$3.3 billion. The largest, Kroton, enrolled over 800,000 students (Cunha, 2018). Tertiary education companies are thought to exert substantial influence over politicians. Before taking office, the finance minister had considerable investment in private education companies, many of which had been investigated under corruption and fraud allegations, while his sister has been vice president of the national association of Private universities (Chiaverini, 2018; Guasco Peixoto, 2018). other politicians across the political spectrum have received sizeable campaign donations from large for-profit companies, raising concerns about potentially undue influence on regulation (Leray de Lima, 2018). The media has questioned donations to candidates who helped increase public student loan availability, which in turn helped institutions increase enrolment (Pompeu et al., 2016).
Governance reforms in several countries reflect a shift towards more businesslike processes and a management style that borrows from the private sector, including in the composition of institutions’ governing boards. as early as 1992, the united Kingdom had reformed the composition of tertiary education governing boards by requiring the majority of members to be independent, with ‘demonstrated capacity in industrial, commercial or employment matters of a given profession’ (Bennett, 2002). The canadian association of university Teachers has expressed concern about the shift towards corporate-like management of universities through the growing presence of board members from the for-profit corporate sector (CauT, 2018).
in ethiopia, addis ababa university introduced a ‘business process re-engineering’ approach to management in an attempt to optimize efficiency and improve work processes. in Kenya, a results-based management approach introduced performance contracts between the state and public institutions that focus on measured performance and outputs. The South african government introduced a performance-based funding framework that set specific enrolment and output targets. The success of such reforms has been mixed. in ethiopia, some scholars disapprove of the shift in attention from academic to operational competence. But in Kenya, the reforms are credited with having propelled the university of nairobi to the top tier of national rankings (Varghese, 2016).
civil society actors have been important advocates for tertiary education reform. The romanian coalition for clean universities, for example, has played an
175 C H A P T E R 7 • TerTiary educaTion
7
important role in monitoring the integrity and transparency of tertiary education institutions and has issued an integrity ranking to increase awareness and accountability (Mungiu-Pippidi and dusu, 2011). non-state actors also head several equity-related advocacy initiatives in tertiary education. in 2016, uniMed, a network of 141 universities in 23 countries, together with the university of rome La Sapienza, the university of Barcelona, campus France, the european university association and the united nations High commissioner for refugees, established the inHere consortium and project to strengthen knowledge and communication on refugees and displaced students (Salmi, 2020).
research networks and academic societies help strengthen the tertiary education sector by organizing conferences and seminars and publishing peer-reviewed journals. Low- and lower-middle-income countries, however, lack such organizations. While research organizations make up about 17% of education non-profit organizations in rich countries, they are virtually non-existent in poor countries (owens, 2017).
CONCLUSION
non-state actors play important roles in the provision,financing and management of tertiary education. in most cases, their roles are so intertwined and interdependent with those of the government that the distinction between the two types of actors is often blurred.
non-state provision of tertiary education accounts for more than one third of students worldwide, a considerably higher share than in primary or secondary education. non-state actors are important players in the financing of tertiary education, not only through increasing participation by households, but also through market mechanisms and public–private partnerships. as a result, these actors play a significant role in influencing regulations and policymaking, and in shaping the tertiary system as a whole.
Participation of non-state actors in tertiary education raises both challenges and opportunities. The same is true regarding their influence on regulation and policymaking. Governments have several tools to ensure that, regardless of how state and non-state actors share responsibility, the tertiary education system continues to strive for more quality and equity.
2 0 2 1 / 2 • G LO BA L E D U C AT I O N M O N I TO R I N G R E P O RT 176
7
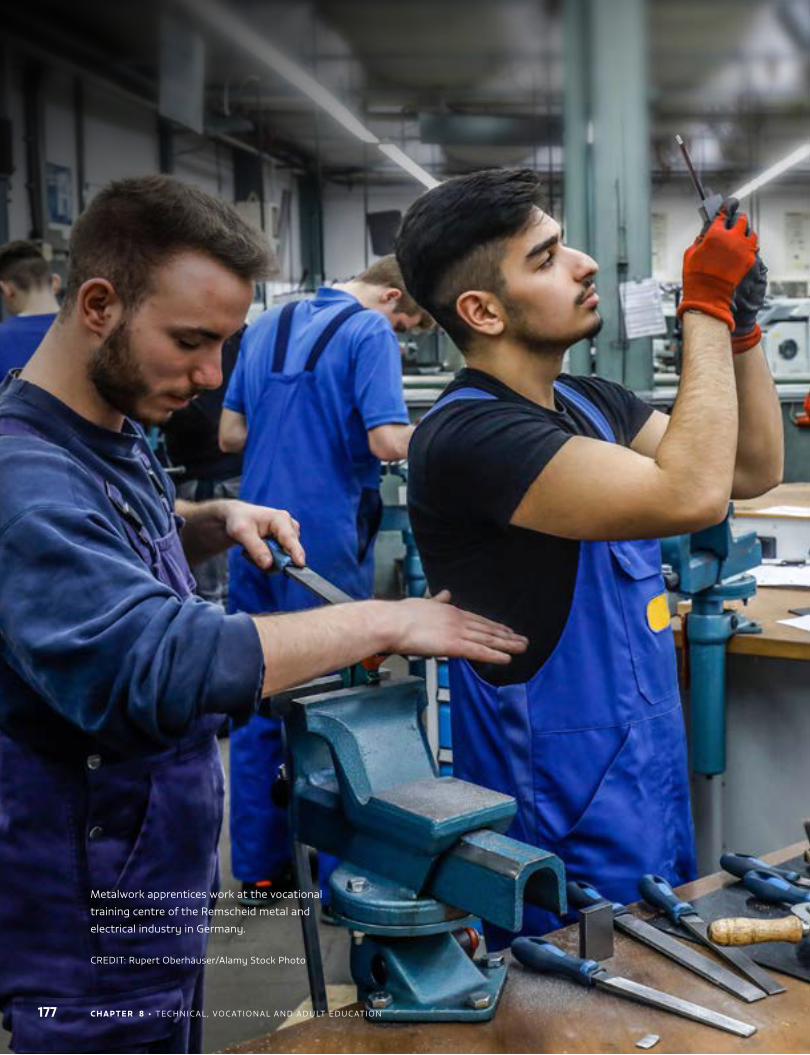
177 C H A P T E R 8 • Technical , vocaTional and adulT educaTion
Metalwork apprentices work at the vocational
training centre of the Remscheid metal and
electrical industry in Germany.
cRediT: Rupert oberhäuser/alamy Stock Photo
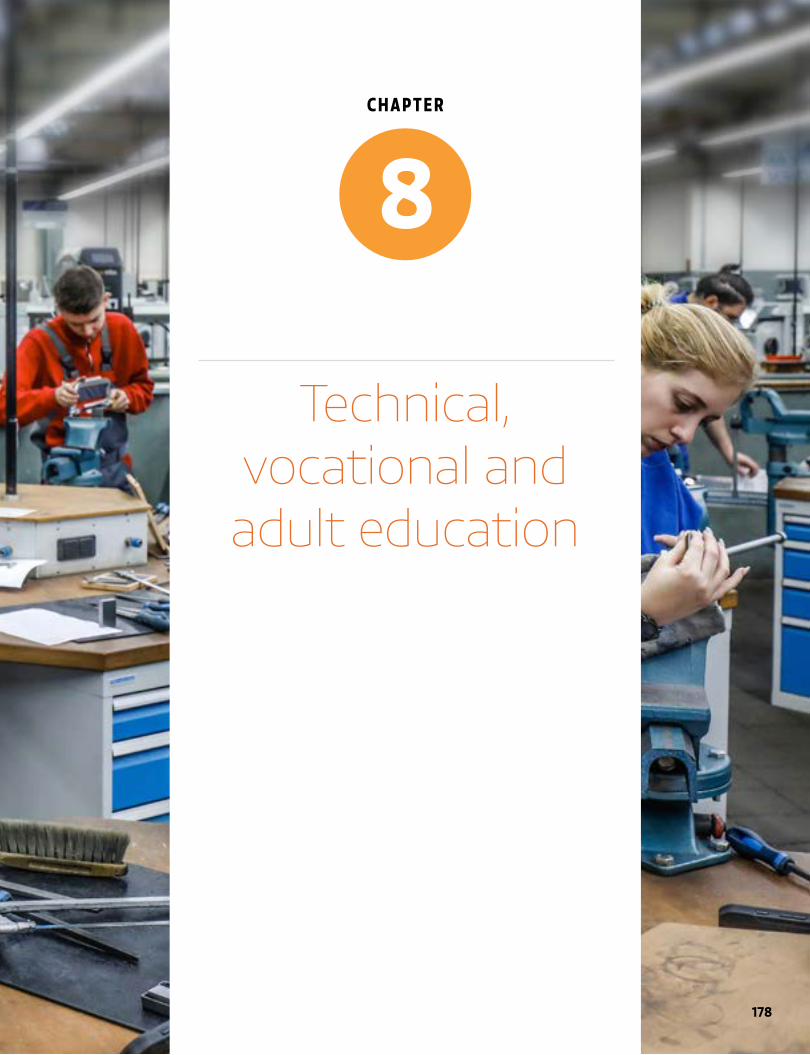
8
178
CHAPTER
C H A P T E R 8 • Technical , vocaTional and adulT educaTion
Technical, vocational and adult education
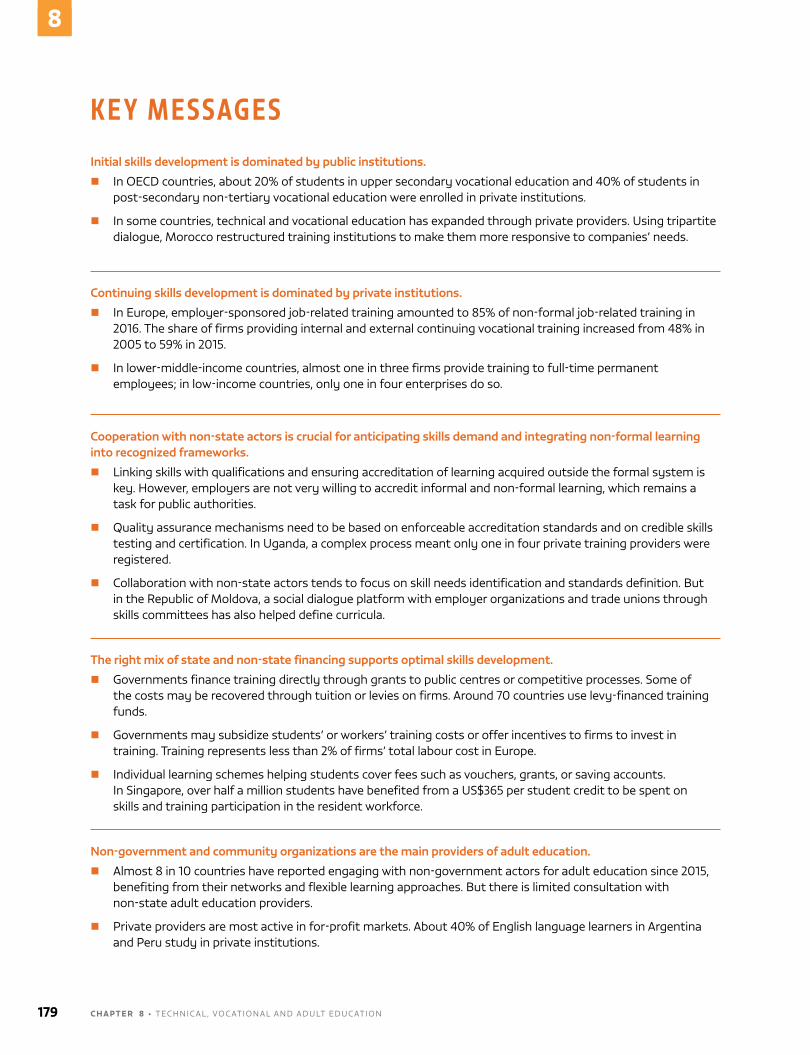
K E Y M E S S AG E SInitial skills development is dominated by public institutions.
� in oecd countries, about 20% of students in upper secondary vocational education and 40% of students in post-secondary non-tertiary vocational education were enrolled in private institutions.
� in some countries, technical and vocational education has expanded through private providers. using tripartite dialogue, Morocco restructured training institutions to make them more responsive to companies’ needs.
Continuing skills development is dominated by private institutions.
� in europe, employer-sponsored job-related training amounted to 85% of non-formal job-related training in 2016. The share of firms providing internal and external continuing vocational training increased from 48% in 2005 to 59% in 2015.
� in lower-middle-income countries, almost one in three firms provide training to full-time permanent employees; in low-income countries, only one in four enterprises do so.
Cooperation with non-state actors is crucial for anticipating skills demand and integrating non-formal learning into recognized frameworks.
� linking skills with qualifications and ensuring accreditation of learning acquired outside the formal system is key. however, employers are not very willing to accredit informal and non-formal learning, which remains a task for public authorities.
� Quality assurance mechanisms need to be based on enforceable accreditation standards and on credible skills testing and certification. in uganda, a complex process meant only one in four private training providers were registered.
� collaboration with non-state actors tends to focus on skill needs identification and standards definition. But in the Republic of Moldova, a social dialogue platform with employer organizations and trade unions through skills committees has also helped define curricula.
The right mix of state and non-state financing supports optimal skills development.
� Governments finance training directly through grants to public centres or competitive processes. Some of the costs may be recovered through tuition or levies on firms. around 70 countries use levy-financed training funds.
� Governments may subsidize students’ or workers’ training costs or offer incentives to firms to invest in training. Training represents less than 2% of firms’ total labour cost in europe.
� individual learning schemes helping students cover fees such as vouchers, grants, or saving accounts. in Singapore, over half a million students have benefited from a uS$365 per student credit to be spent on skills and training participation in the resident workforce.
Non-government and community organizations are the main providers of adult education.
� almost 8 in 10 countries have reported engaging with non-government actors for adult education since 2015, benefiting from their networks and flexible learning approaches. But there is limited consultation with non-state adult education providers.
� Private providers are most active in for-profit markets. about 40% of english language learners in argentina and Peru study in private institutions.
179 C H A P T E R 8 • Technical , vocaTional and adulT educaTion
8
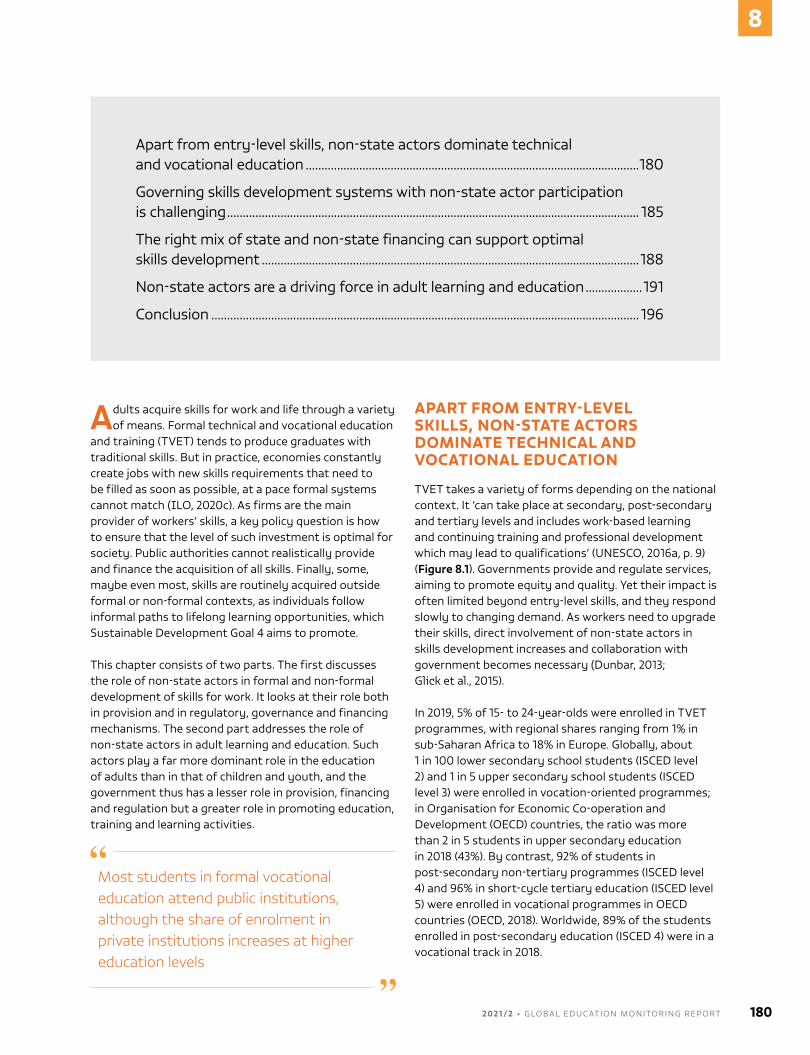
Adults acquire skills for work and life through a variety of means. Formal technical and vocational education
and training (TveT) tends to produce graduates with traditional skills. But in practice, economies constantly create jobs with new skills requirements that need to be filled as soon as possible, at a pace formal systems cannot match (Ilo, 2020c). as firms are the main provider of workers’ skills, a key policy question is how to ensure that the level of such investment is optimal for society. Public authorities cannot realistically provide and finance the acquisition of all skills. Finally, some, maybe even most, skills are routinely acquired outside formal or non-formal contexts, as individuals follow informal paths to lifelong learning opportunities, which Sustainable development Goal 4 aims to promote.
This chapter consists of two parts. The first discusses the role of non-state actors in formal and non-formal development of skills for work. it looks at their role both in provision and in regulatory, governance and financing mechanisms. The second part addresses the role of non-state actors in adult learning and education. Such actors play a far more dominant role in the education of adults than in that of children and youth, and the government thus has a lesser role in provision, financing and regulation but a greater role in promoting education, training and learning activities.
APART FROM ENTRY-LEVEL SKILLS, NON-STATE ACTORS DOMINATE TECHNICAL AND VOCATIONAL EDUCATION
TveT takes a variety of forms depending on the national context. it ‘can take place at secondary, post-secondary and tertiary levels and includes work-based learning and continuing training and professional development which may lead to qualifications’ (uneSco, 2016a, p. 9) (Figure 8.1). Governments provide and regulate services, aiming to promote equity and quality. Yet their impact is often limited beyond entry-level skills, and they respond slowly to changing demand. as workers need to upgrade their skills, direct involvement of non-state actors in skills development increases and collaboration with government becomes necessary (dunbar, 2013; Glick et al., 2015).
in 2019, 5% of 15- to 24-year-olds were enrolled in TveT programmes, with regional shares ranging from 1% in sub-Saharan africa to 18% in europe. Globally, about 1 in 100 lower secondary school students (iSced level 2) and 1 in 5 upper secondary school students (iSced level 3) were enrolled in vocation-oriented programmes; in organisation for economic co-operation and development (oecd) countries, the ratio was more than 2 in 5 students in upper secondary education in 2018 (43%). By contrast, 92% of students in post-secondary non-tertiary programmes (iSced level 4) and 96% in short-cycle tertiary education (iSced level 5) were enrolled in vocational programmes in oecd countries (oeCd, 2018). Worldwide, 89% of the students enrolled in post-secondary education (iSced 4) were in a vocational track in 2018.
apart from entry-level skills, non-state actors dominate technical and vocational education ..........................................................................................................180
Governing skills development systems with non-state actor participation is challenging ................................................................................................................................... 185
The right mix of state and non-state financing can support optimal skills development ........................................................................................................................188
non-state actors are a driving force in adult learning and education ..................191
conclusion ........................................................................................................................................ 196
Most students in formal vocational education attend public institutions, although the share of enrolment in private institutions increases at higher education levels
2 0 2 1 / 2 • G LO BA L E D U C AT I O N M O N I TO R I N G R E P O RT 180
8
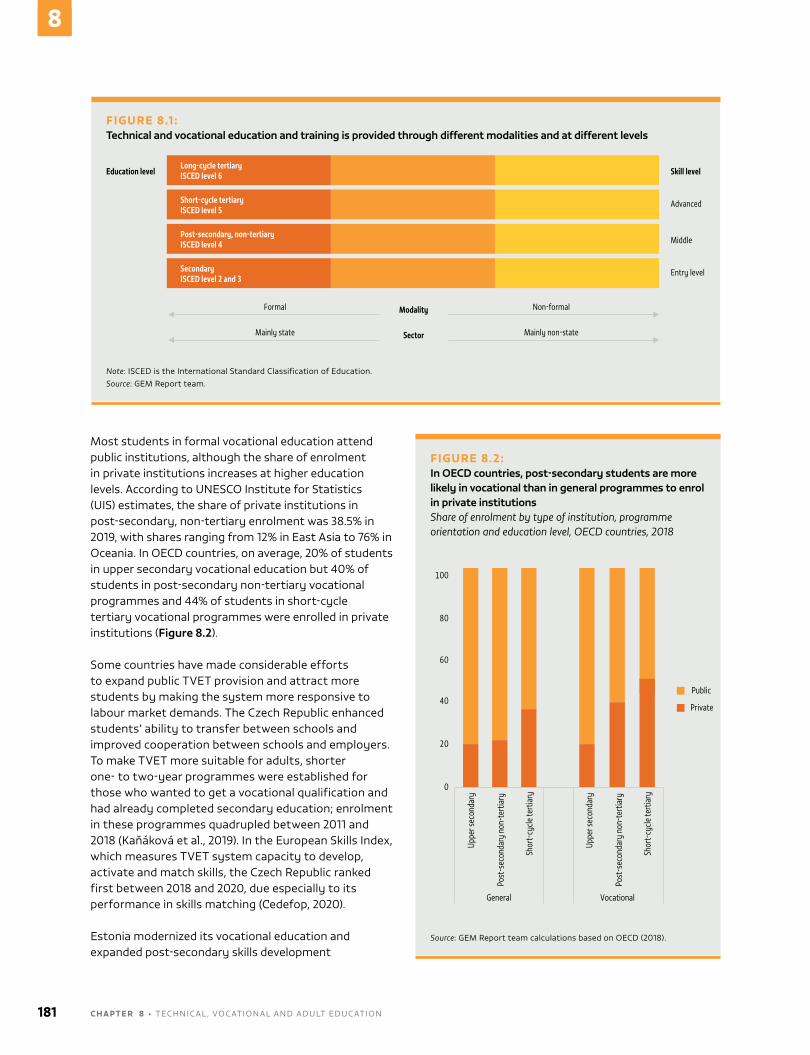
Most students in formal vocational education attend public institutions, although the share of enrolment in private institutions increases at higher education levels. according to uneSco institute for Statistics (uiS) estimates, the share of private institutions in post-secondary, non-tertiary enrolment was 38.5% in 2019, with shares ranging from 12% in east asia to 76% in oceania. in oecd countries, on average, 20% of students in upper secondary vocational education but 40% of students in post-secondary non-tertiary vocational programmes and 44% of students in short-cycle tertiary vocational programmes were enrolled in private institutions (Figure 8.2).
Some countries have made considerable efforts to expand public TveT provision and attract more students by making the system more responsive to labour market demands. The czech Republic enhanced students’ ability to transfer between schools and improved cooperation between schools and employers. To make TveT more suitable for adults, shorter one- to two-year programmes were established for those who wanted to get a vocational qualification and had already completed secondary education; enrolment in these programmes quadrupled between 2011 and 2018 (Kaňáková et al., 2019). in the european Skills index, which measures TveT system capacity to develop, activate and match skills, the czech Republic ranked first between 2018 and 2020, due especially to its performance in skills matching (Cedefop, 2020).
estonia modernized its vocational education and expanded post-secondary skills development
FIGURE 8.1 : Technical and vocational education and training is provided through different modalities and at different levels
Education level Skill levelLong-cycle tertiaryISCED level 6
Short-cycle tertiaryISCED level 5
Post-secondary, non-tertiaryISCED level 4
SecondaryISCED level 2 and 3
Advanced
Middle
Modality Non-formalFormal
Entry level
Sector Mainly non-stateMainly state
Note: iSced is the international Standard classification of education.Source: GeM Report team.
FIGURE 8.2: In OECD countries, post-secondary students are more likely in vocational than in general programmes to enrol in private institutionsShare of enrolment by type of institution, programme orientation and education level, OECD countries, 2018
Public
Private
100
80
60
40
20
0
Uppe
r sec
onda
ry
Post
-sec
onda
ry n
on-t
ertia
ry
Shor
t-cy
cle te
rtia
ry
General
Uppe
r sec
onda
ry
Post
-sec
onda
ry n
on-t
ertia
ry
Shor
t-cy
cle te
rtia
ry
Vocational
Source: GeM Report team calculations based on oecd (2018).
181 C H A P T E R 8 • Technical , vocaTional and adulT educaTion
8
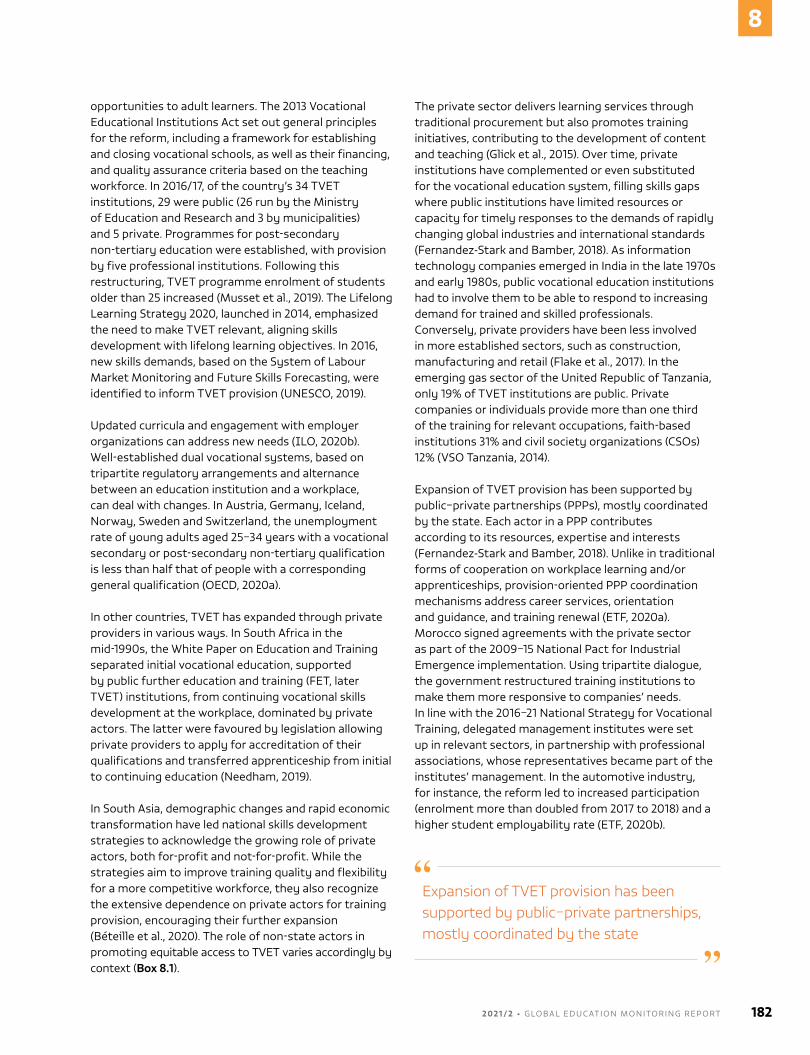
opportunities to adult learners. The 2013 vocational educational institutions act set out general principles for the reform, including a framework for establishing and closing vocational schools, as well as their financing, and quality assurance criteria based on the teaching workforce. in 2016/17, of the country’s 34 TveT institutions, 29 were public (26 run by the Ministry of education and Research and 3 by municipalities) and 5 private. Programmes for post-secondary non-tertiary education were established, with provision by five professional institutions. Following this restructuring, TveT programme enrolment of students older than 25 increased (Musset et al., 2019). The lifelong learning Strategy 2020, launched in 2014, emphasized the need to make TveT relevant, aligning skills development with lifelong learning objectives. in 2016, new skills demands, based on the System of labour Market Monitoring and Future Skills Forecasting, were identified to inform TveT provision (uneSCo, 2019).
updated curricula and engagement with employer organizations can address new needs (Ilo, 2020b). Well-established dual vocational systems, based on tripartite regulatory arrangements and alternance between an education institution and a workplace, can deal with changes. in austria, Germany, iceland, norway, Sweden and Switzerland, the unemployment rate of young adults aged 25–34 years with a vocational secondary or post-secondary non-tertiary qualification is less than half that of people with a corresponding general qualification (oeCd, 2020a).
in other countries, TveT has expanded through private providers in various ways. in South africa in the mid-1990s, the White Paper on education and Training separated initial vocational education, supported by public further education and training (FeT, later TveT) institutions, from continuing vocational skills development at the workplace, dominated by private actors. The latter were favoured by legislation allowing private providers to apply for accreditation of their qualifications and transferred apprenticeship from initial to continuing education (needham, 2019).
in South asia, demographic changes and rapid economic transformation have led national skills development strategies to acknowledge the growing role of private actors, both for-profit and not-for-profit. While the strategies aim to improve training quality and flexibility for a more competitive workforce, they also recognize the extensive dependence on private actors for training provision, encouraging their further expansion (Béteille et al., 2020). The role of non-state actors in promoting equitable access to TveT varies accordingly by context (Box 8.1).
The private sector delivers learning services through traditional procurement but also promotes training initiatives, contributing to the development of content and teaching (Glick et al., 2015). over time, private institutions have complemented or even substituted for the vocational education system, filling skills gaps where public institutions have limited resources or capacity for timely responses to the demands of rapidly changing global industries and international standards (Fernandez-Stark and Bamber, 2018). as information technology companies emerged in india in the late 1970s and early 1980s, public vocational education institutions had to involve them to be able to respond to increasing demand for trained and skilled professionals. conversely, private providers have been less involved in more established sectors, such as construction, manufacturing and retail (Flake et al., 2017). in the emerging gas sector of the united Republic of Tanzania, only 19% of TveT institutions are public. Private companies or individuals provide more than one third of the training for relevant occupations, faith-based institutions 31% and civil society organizations (cSos) 12% (vSo Tanzania, 2014).
expansion of TveT provision has been supported by public–private partnerships (PPPs), mostly coordinated by the state. each actor in a PPP contributes according to its resources, expertise and interests (Fernandez-Stark and Bamber, 2018). unlike in traditional forms of cooperation on workplace learning and/or apprenticeships, provision-oriented PPP coordination mechanisms address career services, orientation and guidance, and training renewal (eTF, 2020a). Morocco signed agreements with the private sector as part of the 2009–15 national Pact for industrial emergence implementation. using tripartite dialogue, the government restructured training institutions to make them more responsive to companies’ needs. in line with the 2016–21 national Strategy for vocational Training, delegated management institutes were set up in relevant sectors, in partnership with professional associations, whose representatives became part of the institutes’ management. in the automotive industry, for instance, the reform led to increased participation (enrolment more than doubled from 2017 to 2018) and a higher student employability rate (eTF, 2020b).
Expansion of TVET provision has been supported by public–private partnerships, mostly coordinated by the state
2 0 2 1 / 2 • G LO BA L E D U C AT I O N M O N I TO R I N G R E P O RT 182
8
EMPLOYERS ENGAGE IN FORMAL AND INFORMAL APPRENTICESHIPS
apprenticeship refers generally to a form of vocational education and training combining on-the-job and off-the-job learning, enabling students to develop knowledge and skills for a specific occupation. engaging private businesses in the design of training through communication with TveT institutions ensures a smoother school-to-work transition, reducing potential skills mismatch (Ilo, 2019b).
Formal apprenticeships are not very widespread. analysis of the international labour organization (ilo) School-to-Work Transition Survey data for this report found that fewer than 1 in 5 of 15- to 35-year-old participants in 33 countries did at least one apprenticeship as part of their education.
Youth from low-income countries are less likely to participate in formal apprenticeships, possibly because
labour markets and training systems tend to be informal (see Chapter 12). informal apprenticeships, for their part, are bound not to a curriculum but to social norms and traditions, and their completion does not lead to officially recognized qualifications (Ilo, 2019b), such as in africa (aFdB, 2020). often the only form of skills acquisition available, informal opportunities are based on an agreement between a master craftsperson and a trainee, who commits to work as an apprentice in exchange for being instructed by the master. in Senegal, informal apprenticeship targets people without education, serving 418,000 youth, compared with 54,000 in formal TveT (World Bank, 2018a).
Fewer than 1 in 5 of 15- to 35-year-olds in 33 countries did at least one apprenticeship as part of their education.
BOX 8.1 :
Depending on the country, non-state actors may encourage or obstruct equity in TVET
The extent to which formal TVET is accessible to groups at risk of exclusion, and hence its impact on their equity, varies by country. In poorer countries, tight entry requirements and inadequate provision mean the few places in formal public TVET tend to be taken by urban, relatively well-off youth. In much of sub-Saharan Africa, rigid academic achievement requirements for access to formal school-based training, combined with a concentration of training institutions in cities, make TVET inaccessible to poor and rural youth (Afeti, 2018). In South Asia, the minimum requirement for formal TVET tends to be eight years of schooling, which excludes the poorest and those living in rural areas (Mehrotra, 2017). In some cases, non-state actors respond to this challenge. In Indonesia, religious institutions, which cater for more disadvantaged populations, have been a partner in education expansion. Formal TVET is provided in both state and religious vocational secondary schools, which all offer national secondary education certification (Triyono and Moses, 2019).
CSOs cater for population groups whose needs are not covered by government policies. A survey of 85 relevant CSOs in Northern Africa and Western Asia showed that most of their activities are dedicated to initial TVET provision and to training for groups in disadvantaged situations, such as vulnerable youth, the unemployed, migrants and refugees, and people with disabilities (Foubert and Folisi, 2019). Non-governmental organizations (NGOs) and private agencies also tend to be important implementing actors in low- and middle-income countries for vocational training programmes that are targeted at women and outsourced by governments. Quality control and monitoring procedures for these programmes are often challenging (Chinen et al., 2017). Some businesses with philanthropic arms try to provide TVET with an equity lens. Google’s philanthropic arm funds provision of digital skills to disadvantaged rural communities in the 10 countries of the Association of Southeast Asian Nations (ASEAN) through the Go Digital ASEAN initiative, launched in 2019 (The Asia Foundation, 2020).
In richer countries, formal TVET tends to target more disadvantaged populations. Yet some students, particularly those with immigrant backgrounds, do not benefit from equal access. Access to apprenticeships, in particular, has discriminated against this group, even in highly regulated dual-system models, where training takes place at both education institutions and workplaces. Enterprises, which make the final selection of apprentices, may contribute to perpetuating discrimination. In Germany and Switzerland, applications of immigrant students, labelled as foreign youth, were more likely to be rejected, especially by small and medium-sized enterprises (Imdorf, 2017). Social partners and NGOs advocate for the relevance of work-based learning and the need for preparatory programmes (Jeon, 2019). In Germany, federal Youth Integration Courses target young migrants and refugees to promote access to TVET. Providers are requested to partner with counselling services to help migrants and refugees receive practical information about further educational, work-related and vocational opportunities and to cooperate with local Youth Migration Services, a social support network whose professionals visit the class at least once a week to build relationships with the participants (Germany Federal Office for Migration and Refugees, 2015).
183 C H A P T E R 8 • Technical , vocaTional and adulT educaTion
8
if not adequately regulated and recognized, the incentives linked to apprenticeship can be eroded, reducing potential participation. in egypt, traditional, mostly informal apprenticeship is associated with cheap labour and is not considered an attractive opportunity. The learning process is reported to be mostly passive and the knowledge transfer from master to apprentice to be weak. Remuneration is extremely low, with no guarantee of employment. The workforce apprenticeship participation rate is estimated at 0.1%, compared, say, with 4.8% in denmark (Chankseliani and anuar, 2019). countries including Botswana, Ghana, Kenya, South africa and Zimbabwe have regulated distinct apprenticeship systems, parallel to other formal TveT programmes. others, such as namibia and Rwanda, have planned or are setting up national apprenticeship and internship frameworks based on employer engagement to make them more attractive and the training more credible (arias et al., 2019).
intermediary organizations can facilitate dialogue with employers to improve learning, providing information and ensuring the right match, especially assisting small and medium-sized enterprises. They may include for-profit and independent agencies or employers’ associations (Ilo, 2019a). denmark’s local Trade committees, which include representatives of employers and employees, ensure close contacts between the parties. The association of German chambers of commerce and industry is in charge of supporting trainees and mediating with firms (Chankseliani et al., 2017). in england (united Kingdom), apprenticeship Training agencies, introduced in 2012, are interim placement agencies that operate for or not for profit. They are responsible for recruiting, employing and arranging training for apprentices on behalf of employers. They are listed on a national registry and are mainly funded by employers, whose payments includes a management fee and apprentice remuneration of at least the minimum apprenticeship wage (Ilo, 2019a).
Beyond facilitating dialogue, intermediary organizations play a significant role in mobilizing parties, especially in countries without a solid apprenticeship tradition. inspired by the Swiss model, the not-for-profit apprenticeship intermediary careerWise aims to engage and connect local employers, apprentices, school districts and government entities to make apprenticeships possible in the uS
state of colorado. The intermediary organization helps attract and mobilize employers to recruit apprentices from schools, assisting them throughout the three-year work-based learning programme and ensuring high retention rates (Katz and elliott, 2020).
PRIVATE BUSINESSES DOMINATE CONTINUING SKILLS DEVELOPMENT
While they have an increasing role in formal TveT, private businesses have always led on continuing training that provides knowledge and skills, or develops, updates and improves existing ones, for youth and adults in the labour market. The role of business has become even more vital in the context of digitalization and globalization, which have brought about an increase in the relative share of both high- and low-skill jobs in industrialized countries, at the expense of middle-skill occupations (nedelkoska and Quintini, 2018). Formal TveT is targeted at low-skill occupations, which are vulnerable to automation and obsolescence (Ilo, 2020b; uneSCo-unevoC et al., 2019).
The adjustment of skills development to current needs is mainly occurring outside traditional education (World Bank, 2019b), with non-formal and employer-sponsored training prevailing over formal education and training. in europe, employer-sponsored job-related training increased between 2007 and 2016, reaching around 85% of non-formal job-related training. adults were about six times likelier to have participated in non-formal training than in formal education in 2016 (eurostat, 2021). The share of enterprises providing internal and external continuing vocational training increased steadily from 48% in 2005 to 59% in 2015, according to the continuing vocational Training Survey (CvTS, 2005, 2015).
in australia, although employers reported being satisfied with the TveT system, one in two preferred unaccredited training to meet their staff skills development needs, mostly without relying on external providers (nCveR, 2019). More employers reported being satisfied with this arrangement than those who had used nationally recognized training. While recognized training is used for professional development and to meet mandatory requirements, non-formal education serves highly specific and relevant training needs, and its delivery is more flexible (White et al., 2018). in Belgium, a 10-year
The adjustment of skills development to current needs is mainly occurring outside traditional education
2 0 2 1 / 2 • G LO BA L E D U C AT I O N M O N I TO R I N G R E P O RT 184
8
study showed that firms that increased the share of employees who participated in on-the-job-training by 10 percentage points saw their productivity grow by between 1.7% and 3.2% (Konings and vanormelingen, 2015).
in lower-middle-income countries, almost one in three firms provide training to full-time permanent employees; in low-income countries, only one in four enterprises provides training (World Bank, 2019a). an employer survey conducted as part of the World Bank's STeP Skills Measurement Program in armenia, azerbaijan, Georgia, Sri lanka, viet nam and china’s Yunnan province showed that employers tended to prefer on-the-job training over external programmes provided by formal public or private providers, especially as both the general and vocational education systems were not perceived as responsive to employers’ skills needs (Sanchez Puerta et al., 2016).
Firm size is correlated with the offer of training. on average across oecd countries, 60% of adults in firms with at least 250 employees participated in at least one non-formal, job-related, employer-sponsored education or training activity, twice the rate for employees in enterprises with fewer than 10 employees (oeCd, 2020a). a study in viet nam found that household firms were less likely to provide vocational training due to their small scale and limited resources (nguyen et al., 2020). Yet traditional measures of training may underestimate families’ informal transfer of knowledge and skills in traditional sectors (Pilz et al., 2015). informal learning can involve family social capital and competitive advantage through passing unique knowledge from one generation to the next. investing in formal training is unattractive where the cost of training is high and employability is ensured despite the informality of skill acquisition (Chankseliani and anuar, 2019).
GOVERNING SKILLS DEVELOPMENT SYSTEMS WITH NON-STATE ACTOR PARTICIPATION IS CHALLENGING
The dominance of non-state actors in provision makes the task of governing and regulating skills development systems challenging (eTF, 2013). Governance refers to how decisions are taken to steer systems towards achieving national economic development priorities, including their ability to match demand with supply, and ensuring quality while achieving social objectives such as equity and inclusion. Governance needs to be integrated: horizontally, bringing state and non-state actors together to communicate and negotiate their respective needs; vertically, articulating the central,
regional and local levels; and over time, meeting the need for initial and continuing skills development over a life cycle (hawley-Woodall et al., 2015).
Formulating and implementing national qualification frameworks has made TveT governance more participatory and fit for purpose, bringing together diverse actors by constituency, sector and government level (eTF, 2013). linking skills with standardized national qualifications helps balance supply and demand, promote quality and ensure a common and consistent mechanism accepted by all parties (uneSCo and Ilo, 2018). Such frameworks have also driven recognition and validation initiatives (Cedefop et al., 2019).
More than 150 countries have developed national qualification frameworks to improve the transparency and relevance of skills and knowledge. countries have also established programmes that acknowledge and promote flexible learning pathways to enable learners to accumulate and apply skills. Making the outcomes of non-formal and informal learning acquired outside formal public settings visible and socially recognized can help reduce the cost of providing continuing training and qualifications to low-skilled workforces (uIl et al., 2019).
Private sector initiatives to validate competencies allow individuals to gain access to new jobs, be more flexible and reposition themselves in the job market (hawley-Woodall, 2019). an inventory of 39 mainly european education systems showed that more than 90% had initiatives to validate competencies generated outside official education and training frameworks. however, non-formal and informal learning acquired in the labour market was still less recognized than learning in formal education, and mostly related to occupational standards. employers are less willing to deal with accreditation of informal and non-formal learning, which remains a task for public authorities (Cedefop et al., 2019).
When individuals change jobs and need to reposition themselves on the labour market by acquiring new skills, it is important to provide processes of assessment and recognition of prior learning, including accreditation (aarkrog and Wahlgren, 2015; uIl et al., 2019). Particularly for workers moving through the labour market without
The dominance of non-state actors in provision makes the task of governing and regulating skills development systems challenging
185 C H A P T E R 8 • Technical , vocaTional and adulT educaTion
8
academic or formal qualifications, accreditation of skills and knowledge gives them an opportunity to gain a qualification and get access to further education and training opportunities (uIl et al., 2015).
To set such processes up and ensure that their results are used, all actors need to work together. in Mauritius, a mechanism recognizes competencies acquired outside formal learning. after a pilot project funded by the national empowerment Foundation, the mechanism was widely accepted, including by trade unions. Skills and knowledge are assessed against defined standards and if the learning requirements are met, the learning outcomes are officially accredited. Through this recognition, validation and accreditation of prior learning, workers can obtain qualifications at levels 2 to 4 of the national qualification framework and re-enter the education and training system at the appropriate level (uIl et al., 2015).
national qualification frameworks may not be effective without quality assurance mechanisms to ensure coherence and build trust in education and training systems’ output. in quality assurance, education and training providers undergo audit, verification and monitoring processes to determine whether specific rules and occupational or educational standards have been respected. Procedures for assessment of achieved outcomes and for accreditation are also controlled (Bateman and Coles, 2013).
a review for this report of quality assurance systems in Bangladesh, china, india, the Philippines, Rwanda, South africa and the united Republic of Tanzania shows that all seven have adopted a centralized approach. While they all supervise accredited providers, the emphasis differs. The Bangladeshi and Tanzanian approaches focus on facilities and equipment, while the chinese, Rwandan and South african approaches focus on teacher qualifications’ suitability for the curriculum and assess teacher quality improvement plans. in Bangladesh, South africa and the united Republic of Tanzania, all providers must use an internal quality assurance mechanism to evaluate their programmes (nesterova and Capsada-Munsech, 2021). But private providers do not always align with the requirements.
Bangladesh’s 2011 skills development policy introduced a quality assurance system to ensure consistent quality standards in training provision and assessment. it consists of registering and auditing public and private training providers and accrediting learning and assessment programmes and centres. To obtain registration by the Bangladesh Technical education Board, providers have to prove their educational, financial and management capacities. in addition, their programme outcomes must be in line with the national Technical and vocational Qualification Framework (Bangladesh Technical education Board, 2012). however, this process applies only to formal TveT programmes. Public, private and nGo-run training programmes can issue certificates independently (haolader et al., 2017). Moreover, only one in four non-state institutions has recognized the qualification framework as a skills development model, thus challenging effective implementation of the quality assurance mechanism (nesterova and Capsada-Munsech, 2021).
To be effective, such processes need to be based on enforceable accreditation standards and on credible skills testing and certification. in uganda, many private providers saw no benefit in registering, as the process was too complex. as a result, only one in four private training providers was registered (arias et al., 2019). The 2011–20 Strategic Plan recognized the limitations of the highly centralized and costly system and the challenges it posed for private institutions (uganda Ministry of education and Sports, 2011). To encourage private providers to apply for formal recognition and to improve training quality, the uganda association of Private vocational institutions was involved in the process. The 2019 TveT policy further simplified governance, merging national assessment bodies into the Technical and vocational assessment Board, which redefined its regulations to make the system clearer and more efficient (uganda Business and Technical examinations Board, 2019; uganda Ministry of education and Sports, 2019).
PARTICIPATORY GOVERNANCE IS OFTEN LIMITED TO DEFINING STANDARDS
The relative degree of engagement of state and non-state actors is one criterion for categorizing approaches to governance of skills development systems in high-income countries. engagement may be low or high on both sides, or one may play a predominant role (Busemeyer and Trampusch, 2012). Private sector and employer involvement in content development has often been considered an opportunity to align skills development systems with labour market needs (dunbar, 2013).
In Uganda, only one in four private training providers was registered
2 0 2 1 / 2 • G LO BA L E D U C AT I O N M O N I TO R I N G R E P O RT 186
8
low- and middle-income countries, however, tend to view state actors as the most important in TveT planning and implementation. The quality assurance systems in Bangladesh, china, india, the Philippines, Rwanda, South africa and the united Republic of Tanzania reviewed for this report have all adopted policies allowing private education institutions to operate, while development plans support the expansion of TveT through PPPs. even so, their TveT systems remain highly centralized, with limited opportunities for non-state actors to shape them (nesterova and Capsada-Munsech, 2021). interactions between businesses and education institutions tend to focus on skills identification rather than on curriculum development (Sanchez Puerta et al., 2016).
There are signs of collaboration in some regions. an assessment of highly centralized models of planning and managing TveT policies and systems in northern africa, central and eastern europe, the caucasus and central asia identifies a weak trend towards more participatory governance approaches. in eight countries reviewed (albania, Jordan, Kazakhstan, Morocco, the Republic of Moldova, Serbia, Tunisia and ukraine), non-state actors, especially employers, were involved in consultative and/or executive advisory functions in tripartite councils (arribas and Papadakis, 2019).
The TveT system in the Republic of Moldova has undergone significant restructuring and modernization to enhance the institutional role of social, regional and local partners in policy formulation. Within a reformed legal framework – consisting of the 2014 education code, 2011–2015 Strategy for consolidated educational development, vocational education and Training development Strategy for 2013–2020 and Small and Medium-sized enterprise development Strategy 2012–2020 – a social dialogue platform for vocational education and training has institutionalized partnerships with employer organizations and trade unions through skills committees, which help define occupational standards and curricula (arribas and Papadakis, 2019).
TveT reform in Mongolia was based on extensive consultation with key stakeholders to inform new legislation and financing mechanisms for a demand-driven system. a memorandum of understanding was signed in 2007 by all social partners, including ministries, employers and trade unions, paving the way for participatory governance at the system level. The 2016 national TveT programme has since tried to strengthen this social partnership to help expand provision and enhance quality (uneSCo and Mongolia Ministry of labor and Social Protection, 2019).
an assessment of 12 eastern and South-eastern asian countries showed that occupational or competency standards had been developed in the vocational and training sector with the involvement of multiple actors. Most countries had engaged with industry representatives (e.g. cambodia, indonesia and the Philippines), tripartite groups of employer and employee organizations (e.g. Republic of Korea) or public and private training institutions and trainers (e.g. Malaysia, Thailand and viet nam) (Bateman and liang, 2016).
in the Philippines, private sector participation is institutionalized in policymaking and the design of industry-based training programmes. Private actors account for 14 of the 22 board members of the Technical education and Skills development authority, the national policymaking body. The authority sets development plans, competency standards, curricula and assessment procedures. The training curriculum for the semiconductor and electronics industry, designed with industry representatives, proved successful in terms of trainee employability (oeCd, 2017).
Skills systems that rely on tripartite approaches, engaging governments, employers and workers, cope well with changing economic and labour market dynamics. employer bodies are more likely to contribute when they are engaged in policy formulation and system development, rather than in an advisory role only. in Singapore, employer organizations are involved in national skills planning as part of the inclusive Future economy council, led by the deputy prime minister and finance minister. all members are involved in defining and adjusting the skills sets that will drive the country’s economic and industrial development over the coming 5 to 10 years (Ilo, 2020a).
With the aim to share capacity and resources, PPPs have been set up to encourage cooperation for a better understanding of the need for labour market competencies and qualifications. in viet nam, the car manufacturer vinFast established a centre in 2018 to train mechanical and mechatronic engineers. Through an agreement with the association of German chambers of commerce and industry, trainers obtain certificates
Interactions between businesses and education institutions tend to focus on skills identification rather than on curriculum development
187 C H A P T E R 8 • Technical , vocaTional and adulT educaTion
8
based on German standards (viet nam news, 2018). The company and government have since initiated a dialogue on developing a joint training programme, funded by the company and implemented at five public vocational colleges (viet nam news, 2020).
in the netherlands, TveT reform in 2010 initially aimed to create two PPPs: centres for innovative craftsmanship in upper secondary vocational education and centres of excellence in higher professional education. While they received grants, companies were invited to co-finance them. This made education institutions responsive to firms’ specific competency needs. The focus is on innovative projects, such as smart organization in home care, three-dimensional printing, digitization in the security sector and skills for the green sector. a regional investment fund helped increase the number of such PPPs, encouraging all TveT centres to compete. Between 2011 and 2019, the number of centres increased from 7 to more than 160, which train about 84,000 students and involve more than 9,800 companies and 5,000 teachers (eTF, 2020b).
Sector skills councils are another kind of cooperation, aimed at improving training quality and relevance, anticipating needs between and within sectors (eTF, 2020a) and fostering social dialogue (Ilo, 2020a). With varying composition and functions, the councils gather actors in a given industry to contribute to the development of skills training and education for the workforce in that sector (Ilo, 2019c). Sector skills councils in Poland, established in 2016, promote cooperation among social partners, entrepreneurs, and public and education institutions. They provide recommendations on skills needed and related learning opportunities, and play an advocacy role for skills use and practices. The sector skills council on finance was involved in implementing the Sectoral Qualification Framework and its inclusion in the integrated Qualification System, in line with european standards (oeCd, 2019c). With support from the european Social Fund, the Polish agency for enterprise development increased the number of councils from 7 sectors to 17 (Chłoń-domińczak et al., 2019; Polish agency for enterprise development, 2021).
THE RIGHT MIX OF STATE AND NON-STATE FINANCING CAN SUPPORT OPTIMAL SKILLS DEVELOPMENT
Skills provision remains below optimal levels, despite the productivity gains it brings and the multiplicity of actors that can be deployed to deliver it. ultimately, this is a
result of insufficient funding. There are several obstacles to overcome. The cost per student in formal initial TveT is generally high, as expert educators are in short supply and expensive equipment quickly becomes obsolete. Firms are reluctant to invest in training out of concern that trained workers may take their skills to competitors offering higher wages. Workers’ investment in training is limited by lack of money and time and by social norms. The situation is unsatisfactory from a social and economic perspective. any solution involves not just more funds but also consensus on how to share costs.
Governments finance TveT directly through grants to public centres or competitive processes, sometimes pitting public TveT centres against private ones. Some of the costs may be recovered through tuition or levies on firms. Governments may subsidize students’ or workers’ training costs or offer incentives to firms to invest in training (Ziderman, 2016) (Figure 8.3).
DIVERSIFYING TRAINING INSTITUTIONS’ FUNDING HAS ADVANTAGES AND RISK
Formal TveT institutions have traditionally been funded through direct government allocations, as in eastern europe, northern africa, Western asia, central asia (arribas and Papadakis, 2019), sub-Saharan africa (arias et al., 2019) and east asia and the Pacific (Palmer, 2017). however, there are signs of diversification.
earmarked training levies on firms are a common complementary source of funding for public and private TveT institutions. They require both a large formal sector to provide enough funds and a strong administration to use them effectively. in Senegal, up to 2015, only 5% of the amount raised by a 3% levy on firms yielded had been transferred to TveT; as little as half of that was allocated to training, as operating costs absorbed the rest (uneSCo, 2018).
Training levies on firms have been used to set up national training or skills development funds that can operate with relative autonomy from the government budget. however, this is often not enough. in the united Republic of Tanzania, more than 80% of the vocational education and Training Fund is financed through a levy. But just one third of the revenue raised goes to the vocational education and Training authority; the rest goes to the general budget. companies with four or more workers contribute 6% of their payroll. employers protested that the levy had been introduced with limited consultation, that it was used to cover expenditure unrelated to training, that public TveT centres were prioritized over other providers and that the private sector had not been engaged in the fund’s management (arias et al., 2019).
2 0 2 1 / 2 • G LO BA L E D U C AT I O N M O N I TO R I N G R E P O RT 188
8
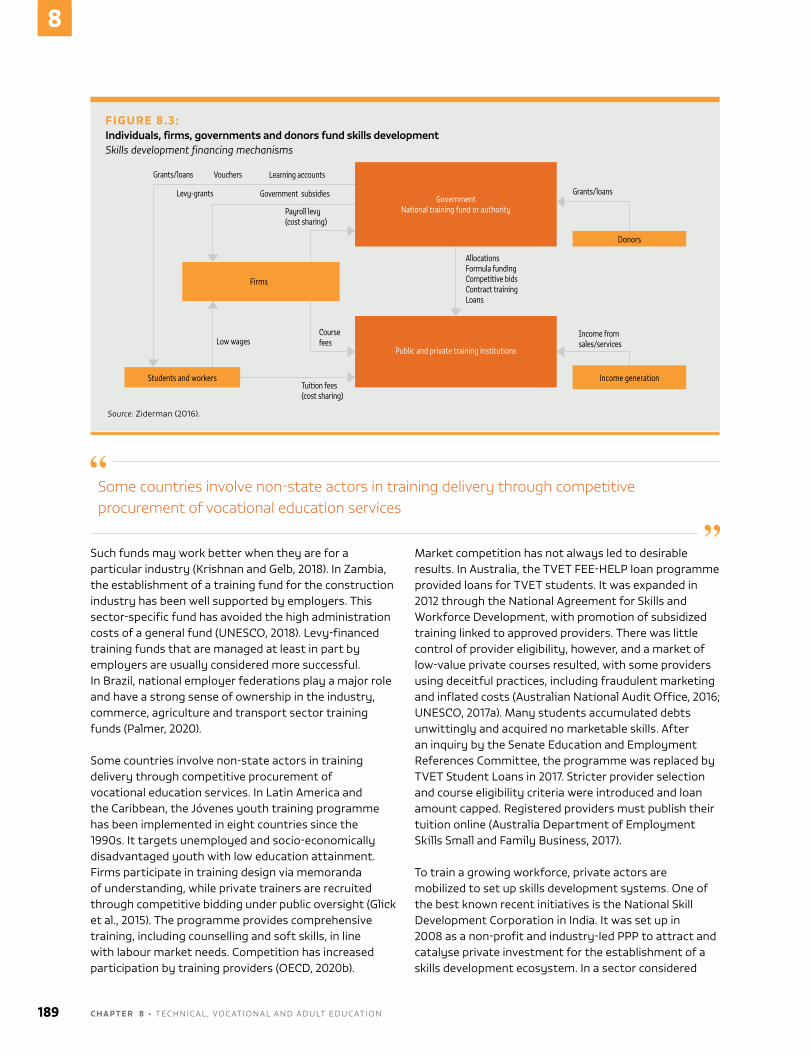
Such funds may work better when they are for a particular industry (Krishnan and Gelb, 2018). in Zambia, the establishment of a training fund for the construction industry has been well supported by employers. This sector-specific fund has avoided the high administration costs of a general fund (uneSCo, 2018). levy-financed training funds that are managed at least in part by employers are usually considered more successful. in Brazil, national employer federations play a major role and have a strong sense of ownership in the industry, commerce, agriculture and transport sector training funds (Palmer, 2020).
Some countries involve non-state actors in training delivery through competitive procurement of vocational education services. in latin america and the caribbean, the Jóvenes youth training programme has been implemented in eight countries since the 1990s. it targets unemployed and socio-economically disadvantaged youth with low education attainment. Firms participate in training design via memoranda of understanding, while private trainers are recruited through competitive bidding under public oversight (Glick et al., 2015). The programme provides comprehensive training, including counselling and soft skills, in line with labour market needs. competition has increased participation by training providers (oeCd, 2020b).
Market competition has not always led to desirable results. in australia, the TveT Fee-helP loan programme provided loans for TveT students. it was expanded in 2012 through the national agreement for Skills and Workforce development, with promotion of subsidized training linked to approved providers. There was little control of provider eligibility, however, and a market of low-value private courses resulted, with some providers using deceitful practices, including fraudulent marketing and inflated costs (australian national audit office, 2016; uneSCo, 2017a). Many students accumulated debts unwittingly and acquired no marketable skills. after an inquiry by the Senate education and employment References committee, the programme was replaced by TveT Student loans in 2017. Stricter provider selection and course eligibility criteria were introduced and loan amount capped. Registered providers must publish their tuition online (australia department of employment Skills Small and Family Business, 2017).
To train a growing workforce, private actors are mobilized to set up skills development systems. one of the best known recent initiatives is the national Skill development corporation in india. it was set up in 2008 as a non-profit and industry-led PPP to attract and catalyse private investment for the establishment of a skills development ecosystem. in a sector considered
FIGURE 8.3:Individuals, firms, governments and donors fund skills developmentSkills development financing mechanisms
GovernmentNational training fund or authority
Donors
Firms
Students and workers
Public and private training institutions
Income generation
Grants/loans Vouchers Learning accounts
Levy-grants Government subsidies
Payroll levy(cost sharing)
Course fees
Tuition fees (cost sharing)
Low wages
Grants/loans
Income from sales/services
AllocationsFormula fundingCompetitive bidsContract trainingLoans
Source: Ziderman (2016).
Some countries involve non-state actors in training delivery through competitive procurement of vocational education services
189 C H A P T E R 8 • Technical , vocaTional and adulT educaTion
8
financially risky and of limited profitability, private training institutions received soft loans to offer training with a low capital investment (nambiar, 2021). Yet the generous government incentives, which covered three quarters of costs for the first three years, have not led to financial engagement and have raised concerns about quality (Mehrotra, 2018). The corporation’s broad, evolving role has hampered its functioning, leading to limited accountability in government fund use and loan disbursements. To overcome these shortcomings, monitoring processes and indicators have been redefined to consider not only trainee numbers but also learning outcomes and student employability. The corporation has also introduced development impact bonds as alternative funding mechanisms linked to measurable objectives (nambiar, 2021).
INCENTIVES TO FIRMS DO NOT HELP BRIDGE THE TRAINING GAP
enterprises tend to underinvest in training. in europe, the continuing vocational Training Survey shows that training accounts for 2% of the total labour cost in firms with 250 or more employees, 1.5% in those with 50 to 249 employees and 1.2% in smaller firms. net contributions to training funds are a tiny part of a company’s total labour cost (CvTS, 2015). investment in training is also limited compared with that for other assets. in 2018, on average across eu countries, the united Kingdom and the united States, only 9% of business investment was allocated to employee training, less than a fifth of the amount spent on machinery and equipment (eIBIS, 2018).
The free-rider problem partly explains this situation. Firms fear losing the return on their investment if the workers trained move to another employer. institutional factors may also play a role. incentives for training are lower when many workers are on temporary contracts. enterprises responding to a european investment Bank survey said they underinvested in training because of lack of need, expectations about public institutions, cost barriers and limited access to credit. Firms in countries with strong investment in research and development and a high share of people with tertiary education tend to invest more in training. even then, the incentive to provide training is consistently lower than that for drawing required skills directly from the labour market (Brunello and Wruuck, 2020; eIBIS, 2018).
levy-grant programmes directly support employers in providing continuing on-the-job training or arranging external training for their workforce. They involve cost reimbursement or exemption from levies (Ziderman,
2016). in Singapore, the Skills development levy is a compulsory monthly payment by companies, proportional to the number of employees – and additional to social contributions – which finances the Skills development Fund. The levy finances workforce continuing education programmes through grants for firms to pay for employees’ external training in the continuing education and Training system. critically, the training must be relevant to the country’s economic development and generate certifiable skills (Kuczera and Field, 2018; SkillsFuture Singapore, 2020a).
in Southern african development community countries, including Botswana, Malawi, Mauritius, namibia and South africa, reimbursement of direct training costs is the most common form of employer training incentive. in South africa, a programme gives employers a grant accounting for 20% of the levy they paid (Palmer, 2020).
France encourages employers to offer apprenticeships through an apprenticeship development fund and a training levy collected through an apprenticeship tax. The funds are distributed to intermediary bodies and regional entities that give employers tax credits of euR 1,600 and allowances of at least euR 1,000 per apprentice. employers also benefit from social security contribution exemption, and can allocate some of their contributions to the apprentice tax to local training institutions (Kuczera and Field, 2018).
PAYMENTS TO STUDENTS AND WORKERS ARE ANOTHER WAY TO INCREASE TRAINING
affordability is a constraint for students and workers who want to invest in training. in east asia and the Pacific, student fees vary greatly within and across countries, depending on the type of provider. in Fiji, Papua new Guinea and Solomon islands, tuition is the largest source of funds for private providers. in the Philippines, student fees make up between 0.5% and 5% of public TveT funding, compared with almost 70% in the for-profit TveT system (Palmer, 2017). Governments can support training through direct payments to individuals, with or without learner contributions.
The incentive to provide training is consistently lower than that for drawing required skills directly from the labour market
2 0 2 1 / 2 • G LO BA L E D U C AT I O N M O N I TO R I N G R E P O RT 190
8
individual learning programmes include individual learning accounts, saving or lifelong learning accounts and entitlements, such as vouchers and grants, covering direct or indirect training costs (Chapter 12).
individual learning accounts allow the right to training to be accumulated over time, with resources mobilized when the individual takes a course. France introduced the compte Personnel de Formation in 2015. Financed through a training levy on firms, it enables individuals to transfer their training rights across jobs, regardless of employment status. all labour force participants are eligible to benefit from the account, which entitles them to euR 500 a year and up to euR 5,000 in all, for certified training. The programme was reformed in 2018 to address persistent inequality in participation and disadvantages linked to employment status. Such accounts allow employees to accumulate resources that employers and sometimes governments complement, when the account holder uses the funds for continuing training (oeCd, 2019a).
in the united States, lifelong learning accounts were established in chicago, new York city and Washington state to help workers take work-related training. another state, Maine, launched lifelong learning accounts in 2005, coordinated by the state department of labor with support from the Maine centers for Women, Work, and community, which help workers with education planning. These accounts are linked to nextGen, a higher education saving programme, which allocates training contributions to low- and middle-income workers (Fitzpayne and Pollack, 2018).
voucher programmes make direct payments to individuals to cover costs such as programme fees, learning materials, and travel or daily allowances, conditional on participation. Singapore’s SkillsFuture credit provides each citizen over age 25 with an opening credit of uS$365 to be spent on skills development (Fitzpayne and Pollack, 2018). individuals can choose among eligible courses in several areas, provided by diverse actors. in 2019, half a million citizens attended continuing training and benefited from the credit (SkillsFuture Singapore, 2020b; SkillsFuture Singapore and Workforce Singapore, 2020). Training participation of the 15- to 64-year-old resident workforce grew from 35% in 2015 to 48.5% in 2019 (Singapore Ministry of Manpower, 2019).
The degree to which individual incentives are effective and equitable depends on the design. in liberia, a project aimed at supporting women’s transition to work, which provided training, job placements, internships and allowances for transport and childcare, increased
employability (elder and Kring, 2016). Proximity, flexible schedules and clear links to employability are needed. in Kenya, half the women participating in a vocational training voucher programme mentioned proximity to a training centre as one of the main reasons for enrolling. Pakistan’s Skills for employability programme failed to attract learners, even though they were entitled to a voucher. daily stipend levels were raised and training was provided in rural centres, but still only one in four of those targeted enrolled (World Bank, 2019b).
NON-STATE ACTORS ARE A DRIVING FORCE IN ADULT LEARNING AND EDUCATION
The 2015 uneSco Recommendation on adult learning and education (ale) states that ale ‘involves sustained activities and processes of acquiring, recognizing, exchanging, and adapting capabilities’ in three domains: literacy and basic skills, continuing training and professional development, and active citizenship, ‘through what is variously known as community, popular or liberal education’ (uneSco, 2016b, pp. 6–7). as with TveT, with which it overlaps to a large extent, ale refers to work- and non-work-related skills that can be acquired through a continuum of formal, non-formal and informal education.
The vast range of opportunities and scarcity of data make it difficult to assess the size of non-state involvement in ale provision. Results from the 2016 adult education Survey in europe show that fewer than one in five adults participated in non-job-related education, compared with four in five who continued learning for work purposes. Most non-formal education and training was delivered by non-state actors, such as employers and employers’ organizations (38%), commercial institutions (10%), non-profit associations (7%) and individuals (5%) (eurostat, 2021).
in oecd countries, 11% of adults had participated at least once in non-job-related non-formal education, while 38.5% took part at least once in job-related training. Respondents in hungary and Switzerland were the most active in non-job-related learning, with one in four engaged. adults in Greece and lithuania were the least likely to be engaged (oeCd, 2021).
In Singapore, half a million citizens attended continuing training and benefited from the SkillsFuture Credit programme in 2019
191 C H A P T E R 8 • Technical , vocaTional and adulT educaTion
8
however, aggregate estimates are less useful to describe specific contexts where non-state actors play a dominant role. Two examples from this vast area are covered here: the role of nGos, cSos and communities in adult literacy, especially in non-dominant languages; and the growing presence of for-profit actors in commercialized fields, such as foreign languages.
NON-GOVERNMENT AND COMMUNITY ORGANIZATIONS DOMINATE ADULT LITERACY PROGRAMMES
non-state actors, such as nGos and cSos, reach out to vulnerable groups of adults traditionally excluded from formal education. Governments often rely on their services to deliver national adult literacy and second chance programmes. nGos played a key role in enhancing adult education centres in Belarus, the Republic of Moldova and ukraine (lukyanova and veramejchyk, 2017). in the democratic Republic of the congo, the government’s 2012 literacy and non-formal education strategy was almost entirely implemented through nGos (uneSCo, 2017b). The islamic Republic of iran reported outsourcing most of its adult education
provision to nGos (uIl, 2019a). Morocco contracted almost 1,200 nGos to provide literacy instruction (uneSCo, 2017b). These organizations engage with communities, mobilizing influential local leaders to identify community needs and encourage participation (Box 8.2). Pakistan’s national literacy Programme, for example, is based on close partnership with communities, which are involved in its development and implementation in community-based adult learning centres (hanemann, 2015).
cSos have historically challenged government literacy policies, bringing about major change to adult education provision, notably in latin america. in Brazil, social movements such as the Movimento de cultura Popular (Popular culture Movement) and Movimento de educação de Base (Basic education Movement) started in the 1960s. They opposed top-down adult education campaigns, arguing for the transformative and creative power of people and communities through popular education. Popular education had clear political connotations, representing emancipation from external imposed pedagogical ideas and the possibility of social transformation (Streck and Zanini Moretti, 2018).
Most non-formal education and training in Europe was delivered by non-state actors, such as employers and employers’ organizations, commercial institutions, non-profit associations and individuals
BOX 8.2:
Communities are instrumental for the development of adult literacy centres
Globally, communities play a major role in adult education. In Indonesia, community learning centres rely on community initiative but need to obtain formal permission from provincial or local government; some are run by NGOs. In Thailand, community and religious leaders participate in community learning centres’ management, following ministerial guidelines and regulations on resources (NILE and UIL, 2016).
In some countries, the state is instrumental in establishing community learning centres and ensuring their financial sustainability. In the Republic of Korea, lifelong learning centres are included in community-based projects and are co-financed by local and national authorities. Mongolian lifelong learning centres may be affiliated with formal education institutions, relying on their facilities and staff (NILE and UIL, 2016). Japanese community learning centres, called kominkan, are mostly funded by local authorities, although it has been possible to open private centres, financed by learner fees, since the 1990s (Stromquist and Lozano, 2018).
Faith-based institutions have played a major role in contexts where they can benefit from strong support by local communities. In Afghanistan, religious literacy has the longest tradition of adult literacy provision, with many mosques engaged in education. The values-oriented courses foster participation for groups that otherwise would be excluded from education opportunities, such as women and villagers. Religious centres are neither monitored nor financed by the state but rely on community support. Religious authorities also play a role in authorizing courses. An NGO or a CSO intending to organize a literacy course in a village may need to obtain agreement and support from the local religious leader, elders and the head of the village (Robinson-Pant et al., 2021).
2 0 2 1 / 2 • G LO BA L E D U C AT I O N M O N I TO R I N G R E P O RT 192
8
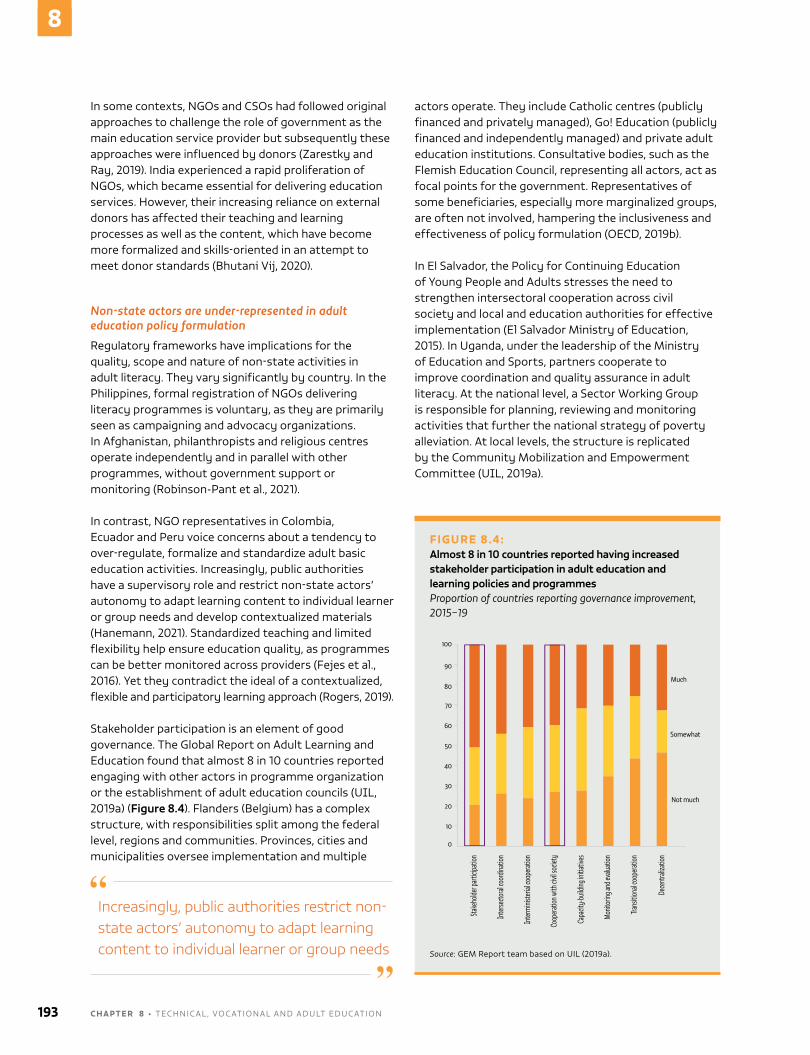
in some contexts, nGos and cSos had followed original approaches to challenge the role of government as the main education service provider but subsequently these approaches were influenced by donors (Zarestky and Ray, 2019). india experienced a rapid proliferation of nGos, which became essential for delivering education services. however, their increasing reliance on external donors has affected their teaching and learning processes as well as the content, which have become more formalized and skills-oriented in an attempt to meet donor standards (Bhutani vij, 2020).
Non-state actors are under-represented in adult education policy formulation
Regulatory frameworks have implications for the quality, scope and nature of non-state activities in adult literacy. They vary significantly by country. in the Philippines, formal registration of nGos delivering literacy programmes is voluntary, as they are primarily seen as campaigning and advocacy organizations. in afghanistan, philanthropists and religious centres operate independently and in parallel with other programmes, without government support or monitoring (Robinson-Pant et al., 2021).
in contrast, nGo representatives in colombia, ecuador and Peru voice concerns about a tendency to over-regulate, formalize and standardize adult basic education activities. increasingly, public authorities have a supervisory role and restrict non-state actors’ autonomy to adapt learning content to individual learner or group needs and develop contextualized materials (hanemann, 2021). Standardized teaching and limited flexibility help ensure education quality, as programmes can be better monitored across providers (Fejes et al., 2016). Yet they contradict the ideal of a contextualized, flexible and participatory learning approach (Rogers, 2019).
Stakeholder participation is an element of good governance. The Global Report on adult learning and education found that almost 8 in 10 countries reported engaging with other actors in programme organization or the establishment of adult education councils (uIl, 2019a) (Figure 8.4). Flanders (Belgium) has a complex structure, with responsibilities split among the federal level, regions and communities. Provinces, cities and municipalities oversee implementation and multiple
actors operate. They include catholic centres (publicly financed and privately managed), Go! education (publicly financed and independently managed) and private adult education institutions. consultative bodies, such as the Flemish education council, representing all actors, act as focal points for the government. Representatives of some beneficiaries, especially more marginalized groups, are often not involved, hampering the inclusiveness and effectiveness of policy formulation (oeCd, 2019b).
in el Salvador, the Policy for continuing education of Young People and adults stresses the need to strengthen intersectoral cooperation across civil society and local and education authorities for effective implementation (el Salvador Ministry of education, 2015). in uganda, under the leadership of the Ministry of education and Sports, partners cooperate to improve coordination and quality assurance in adult literacy. at the national level, a Sector Working Group is responsible for planning, reviewing and monitoring activities that further the national strategy of poverty alleviation. at local levels, the structure is replicated by the community Mobilization and empowerment committee (uIl, 2019a).
Increasingly, public authorities restrict non-state actors’ autonomy to adapt learning content to individual learner or group needs
FIGURE 8.4:Almost 8 in 10 countries reported having increased stakeholder participation in adult education and learning policies and programmesProportion of countries reporting governance improvement, 2015–19
100
90
80
70
60
50
40
30
20
10
0
Much
Somewhat
Not much
Stake
holde
r part
icipa
tion
Inte
rsecto
ral co
ordin
ation
Inte
rmini
steria
l coo
perat
ion
Coop
eratio
n with
civil
socie
ty
Capa
city-
build
ing in
itiati
ves
Monit
oring
and e
valua
tion
Trans
ition
al co
opera
tion
Dece
ntral
izatio
n
Source: GeM Report team based on uil (2019a).
193 C H A P T E R 8 • Technical , vocaTional and adulT educaTion
8
Globally, engagement of actors such as nGos in development of implementation plans has been limited (aitchison, 2017; Rossel and Ceaal, 2017; uIl, 2020). even where participation and dialogue with civil society are institutionalized, as in europe, consultation is limited and held only in the early stages of the policy cycle (hanemann, 2021). Selected non-formal providers in 16 central, eastern and Southern european countries expressed a need for stronger cooperation with civil society in decision making for effective implementation of the european agenda for adult learning (eaea, 2014).
in West and central africa, many countries have adopted the faire-faire decentralization and outsourcing strategy for adult literacy and education. The approach is based on a clearly defined task and role division among government, providers and local communities. While government supervises and distributes resources, provision rests with the other parties (aitchison, 2017). The approach ensures more flexibility in programming, allowing nGos and cSos to tailor education provision to community needs, including local language use (Box 8.3).
nGos and cSos can move and work relatively easily across sectors, exploring learning approaches that can promote understanding, skills and actions in areas such as health, women’s empowerment and the environment. The non-formal approach to adult education provision calls for learning programmes to be flexibly delivered outside formal schooling and across sectors (Rogers,
2019). in Senegal, partnership with nGos within the faire-faire framework had an impact on curriculum and monitoring. The curriculum of the centre d’apprentissage Populaire, an initiative for out-of-school youth run by the nGo alphadev, covered gender-based violence and health. it was partly based on ReFlecT, a participatory approach using Paulo Freire’s principles, linking social literacy and empowerment. in 2018, a positive evaluation of the programme led to inclusion of its literacy outcomes in Senegal’s national statistics. The approach also influenced the design of the national literacy and training programme. collaboration between government and nGos in addressing governance issues contributed to these outcomes (Robinson-Pant et al., 2021).
opening adult education programme implementation to competition through procurement has influenced the sector’s organization. in Sweden, the adult education initiative promoted contracting of adult education services through municipal procurement to increase competition among providers, reduce costs and improve quality and pedagogical innovation. This approach has led to a rapid increase in the presence of non-state providers, mostly for-profit, in education in the last 20 years (Fejes and holmqvist, 2019). Principals of competing folk high schools were increasingly recruited from outside education among professionals who had similar experience in business or the public sector. Teacher contract stability became less certain and teaching methods more standardized (Fejes et al., 2016).
BOX 8.3:
Non-state actors have helped promote non-dominant languages in adult literacy
Non-state actors have played a critical role concerning non-dominant languages and promotion of home languages for instruction in adult education. Thanks to their proximity to communities and their flexible, diverse approach, NGOs and CSOs have been active in promoting local language use in literacy learning.
In Cameroon, the use and promotion of non-dominant languages for literacy activities rely exclusively on initiatives and resources of communities and CSOs.
The National Association of Language Committees includes NGO and community representatives engaged in mother tongue adult literacy, although their scope remains limited without adequate political support and integration into development programmes (Robinson and Vũ, 2019).
Papua New Guinea has more languages than any other country. Its literacy programmes have always dealt with the issue of mother tongue learning. NGOs and CSOs have engaged in development of local languages and communities through literacy projects. The government acknowledges multilingualism’s relevance, but this has not translated into adequate financial commitment. Despite the absence of a formal outsourcing policy, non-state actors have taken over implementation of mother tongue literacy programmes in the country (Robinson, 2019).
Some organizations have advocated for integration of local languages into national literacy programmes. In Chad, the Federation of Associations for the Promotion of the Guéra Languages, a CSO promoting 26 languages and mother tongue literacy projects in the Guéra region, contributed to defining the National Literacy Plan in 2012 and to maintaining a strong focus on each community’s identity (UNESCO, 2017b).
2 0 2 1 / 2 • G LO BA L E D U C AT I O N M O N I TO R I N G R E P O RT 194
8
contracting through procurement requires strong oversight to ensure the quality of new providers (andersson and Muhrman, 2019). in the Philippines, the alternative learning System (alS) is implemented by the department of education through district coordinators; mobile teachers and service providers, including private and public universities; local government agencies; and community groups, within the alS unified contracting Scheme. The department sets minimum requirements for hiring and training facilitators and for monitoring and reporting, but supervision is not equally ensured (World Bank, 2018b). learning facilitators in programmes delivered directly by the department are trained and vetted public employees, who are more likely to be monitored than their peers in procured programmes. While there is no evidence that learning outcomes differ, contracted facilitators are paid substantially less than those in the state-delivered programme and do not benefit from an institutional incentive structure. They tend to be relatively inexperienced young women who aspire to enter the regular teaching profession (Tenazas et al., 2016).
Businesses support adult literacyPrivate companies may engage in adult education through community development, often as part of corporate social responsibility initiatives. For instance, companies in extractive industries do this in response to criticism of their environmental and human rights record. a study of the 10 largest canadian mining companies engaged in adult education programmes suggests that their initial engagement with communities has evolved to a more substantial role in education service provision. limited regulation, however, combined with the voluntary nature of the interventions hampers effective planning, monitoring and reporting, and overall sustainability. in addition, the focus is more likely to be on professional development than on other community needs (Walker and Sarkodie, 2019).
information and communication technology (icT) companies also engage in adult education (hanemann, 2021). Since 2000, Tata consultancy Services, a multinational technology service and consulting firm based in Mumbai, india, has delivered computer-based functional literacy programmes using its multimedia software and e-learning system. Through its centres and local instructors – volunteers trained to use the software and equipment – people take courses to learn to read in their home language. The courses are free and government certified. The programme currently operates in 18 states in india and in Burkina Faso (uIl, 2019b).
in the united States, cell-ed provides literacy and basic skills programmes through mobile phone messages to adult immigrants and to people with limited literacy skills and low income, with financial support from charities and donations. Since it does not require internet connection, it is able to target the most disadvantaged youth and adults (uIl, 2018). its target during the covid-19 crisis was to reach 1 million adults, in partnership with the new York and california state governments, the Barbara Bush Foundation and the dollar General literacy Foundation (Cell-ed, 2020).
THE PRIVATE SECTOR HAS EXPANDED ITS ROLE IN LANGUAGE LEARNING
language learning has become increasingly relevant as part of continuing education, both for personal development and for economic and social growth. english learning is a growing phenomenon, as english is a common language of communication between people with other primary languages. among the estimated 1.5 billion english-language learners worldwide, some 750 million learn english as a foreign language, using it occasionally for work or pleasure, while 375 million speak it daily as a second language (Beare, 2019). The number of people assessed is also increasing. in 2018/19, the British council tested 3.9 million learners, almost 400,000 more than the year before (British Council, 2019). in 2019, learners of French as a foreign language increased by 3.2% from 2018, with 210,000 candidates interested in getting their skills certified, up 3.5% from the previous year (Fondation des alliances Françaises, 2020).
The growing relevance of language learning and assessment has created a market and attracted for-profit firms. Pearson, a British company engaged in the education sector worldwide, purchased one of Brazil’s largest private networks of english language schools in 2013 and bolstered its presence in china by acquiring an english language test preparation provider (Santori et al., 2016). latin american countries have developed strategies and launched public programmes to expand access to english language learning, but the
Contracting adult education through procurement requires strong oversight to ensure the quality of new providers
195 C H A P T E R 8 • Technical , vocaTional and adulT educaTion
8
number of students relying on private instruction is also increasing exponentially. a British council survey found that around 40% of english learners in argentina and Peru studied with private language institutions. cost is the greatest barrier but that has not prevented language academies from proliferating across the region. in Quito, ecuador, private english language institutions increased sixfold in 10 years. Private language schools are responsive, delivering programmes tailored to learners’ level and needs. They usually rely on learning materials and curricula from private providers, including Pearson, McGraw hill and operations affiliated with cambridge and oxford universities (Cronquist and Fiszbein, 2017).
The number of people learning languages through mobile applications has surged, creating a profitable market for icT companies. duolingo, a free language learning application launched in 2012, counted nearly 300 million downloads in 2019. it offers language learning in 36 languages and 180 countries. in 2016, it started working on an assessment tool, the duolingo english Test (deT), aiming to compete with the Test of english as a Foreign language (ToeFl), a proficiency examination taken by foreign students applying to english-language universities. in 2019, more than 180 universities accepted deT as a substitute for ToeFl. duolingo is an example of a private company that parlayed mobile-assisted learning into a larger position on the market for language learning and assessment (adams, 2019).
Studies on the effectiveness of mobile-assisted language learning are limited, however, and existing research has been often commissioned by providers. a recent study on a sample of learners who chose to study Turkish for the first time using duolingo shed light on the advantages and limitations of mobile-assisted language learning. Flexibility of place and time was a clear benefit, but learners’ motivation declined over time. in addition, pedagogical shortcomings hampered acquisition of certain skills. Such applications cannot fully replace instructional expertise (loewen et al., 2019).
CONCLUSION
non-state actors play a major role in TveT and in adult learning and education. cooperation with government is evolving towards more complex mechanisms, such as PPPs and expanded outsourcing strategies, that enable enhanced expertise and resources in response to new education and learning needs.
in TveT, non-state actors play a critical role in providing continuing non-formal training and expanding existing formal vocational education systems. Beyond provision, cooperation with non-state actors has become crucial in understanding labour markets, anticipating skills demand and improving education provision effectiveness through definition of new standards and integration of non-formal and informal learning into recognized frameworks. Mobilization of non-state actors has also led to diversification of TveT financing mechanisms.
nGos and cSos have traditionally been active in ale provision, whether promoting spontaneous initiatives or cooperating with public authorities. new profitable markets are attracting businesses to areas such as language learning. despite their dominant role in provision, regulation and governance, however, ale remains a public prerogative.
Around 40% of English learners in Argentina and Peru studied with private language institutions
2 0 2 1 / 2 • G LO BA L E D U C AT I O N M O N I TO R I N G R E P O RT 196
8
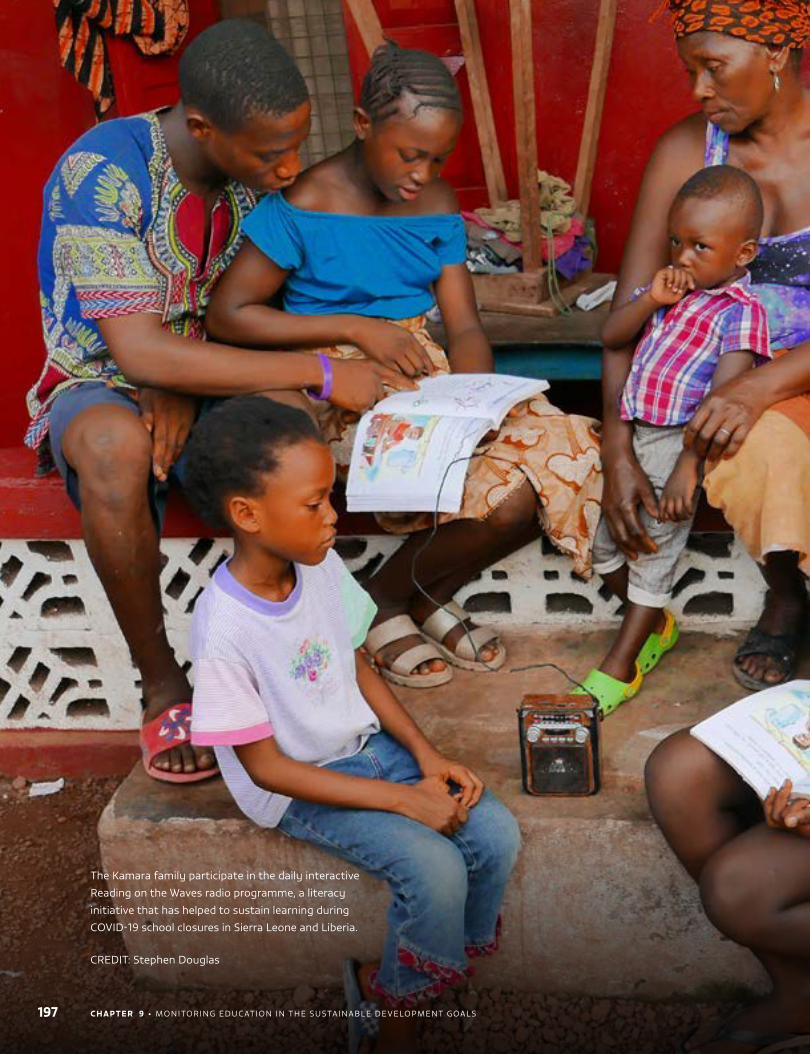
The Kamara family participate in the daily interactive
Reading on the Waves radio programme, a literacy
initiative that has helped to sustain learning during
COVID-19 school closures in Sierra Leone and Liberia.
CREDIT: Stephen Douglas
197 C H A P T E R 9 • MOnITORIng EDuCaTIOn In ThE SuSTaInabLE DEVELOpMEnT gOaLS
9CHAPTER
198C H A P T E R 9 • MOnITORIng EDuCaTIOn In ThE SuSTaInabLE DEVELOpMEnT gOaLS
Monitoring education in
the Sustainable Development Goals
K E Y M E S S AG E SIn 2015, as part of the Education 2030 Framework for Action, countries committed to establishing intermediate benchmarks for SDG 4 indicators. Setting SDG 4 benchmarks serves multiple objectives
� To capture each country’s intended contribution to the global education agenda, following the approach of the climate change agenda’s nationally determined contributions.
� To contextualize progress monitoring, taking into account countries’ various starting points.
� To link monitoring of national, regional and global education agendas to promote coherence.
� To focus attention on data gaps for selected key education indicators.
� To highlight the need to strengthen national plans, which may lack specific targets.
� To support dialogue through the global SDg 4 cooperation mechanism and spur collective action.
The UIS and GEM Report teams have mobilized the international community towards setting benchmarks on seven SDG 4 indicators. By October 2021, responding to an invitation by UNESCO, 39% of countries had submitted national benchmark values, 10% had committed to submit them and 15% had committed as part of the EU and CARICOM regional education monitoring frameworks.
Also by October 2021, schools globally had been at least partially closed for 55% of total days due to the COVID-19 pandemic.
Official SDG 4 statistics still reflect the pre-pandemic situation:
� Two thirds of national education statistics units had to delay data collection or postpone it to the following school year.
� Delays in household survey fieldwork and issues of data interpretation will affect understanding of progress towards SDg 4.
� Learning assessments have been affected as well. For instance, the 2021 round of the programme for International Student assessment was postponed by a year.
Various face-to-face and phone surveys provide initial evidence on potential dropout upon school reopening. In Ethiopia, Ghana and Senegal, dropout rates did not change but repetition increased.
The multiplicity of information sources, coupled with differences in study methodologies, samples, timing and contexts, means understanding the impact of COVID-19 remains challenging.
The UIS, with support from the GEM Report, is reporting the proportion of children who are ‘prepared for the future’, meaning those who have completed primary or lower secondary school and achieved minimum proficiency in reading and mathematics – in other words, a measure combining the two target 4.1 global indicators. In sub-Saharan Africa, while 29% of primary school students meet learning objectives, high dropout rates mean that only 18% of all primary school-age children do.
199 C H A P T E R 9 • MOnITORIng EDuCaTIOn In ThE SuSTaInabLE DEVELOpMEnT gOaLS
9
As the midpoint nears for achieving the 2030 agenda for Sustainable Development, the monitoring
framework development has significantly advanced, and countries have begun setting targets. however, the COVID-19 pandemic has presented major setbacks. not only are the standard tools used to monitor education progress affected, but the targets set may need reconsideration. This introductory chapter presents key issues and provides background on the assessment of global education progress in the 12 chapters that form the monitoring part of this report.
COUNTRIES HAVE SUBMITTED NATIONAL SDG 4 BENCHMARKS
The un Secretary-general’s 2014 Synthesis Report, which provided the foundation for the 2030 agenda for Sustainable Development, called for a ‘culture of shared responsibility, one based on … benchmarking for progress’ (§146). It also requested alignment of the four 2030 agenda monitoring levels: global, regional, thematic and national (united nations, 2014).
The education sector responded in 2015 in the Education 2030 Framework for action, which called on countries to establish ‘appropriate intermediate benchmarks (e.g. for 2020 and 2025)’ for SDg indicators, seeing them as ‘indispensable for addressing the accountability deficit associated with longer-term targets’ (§28) (unESCO, 2015). The framework implicitly recognized that there were known progress rates but also different national starting points: Countries’ progress should be assessed relative to these starting points as well as in terms of whether they can improve on historic progress rates.
The importance of nationally determined contributions, underlined by the climate change agenda, has helped rally countries in recent years. The contributions ‘embody efforts by each country to reduce national emissions and adapt to the impacts of climate change’ (unFCCC, 2021a, 2021b). The SDg 4 benchmarks, envisaged in the Framework for action, bring this approach to education.
Setting SDg 4 benchmarks serves multiple objectives. First, as already noted, benchmarks capture the contribution each country is prepared to make to the global education agenda, given initial conditions. Ideally, national benchmarks should be more ambitious than ‘business as usual’ and ensure that progress be made relative to past trends. Second, they help contextualize the monitoring of progress so that it is related to what countries intend to achieve.
Third, through dialogue with countries and regional organizations, a benchmark-setting process can link national, regional and global education agendas and monitoring frameworks to promote coherence and mutual understanding of different contexts. Fourth, tracking baselines and benchmarks can focus attention on data gaps for selected key education indicators. Fifth, benchmarking can highlight the need to strengthen national plans, which may lack specific targets. Finally, and most importantly, benchmarking is a key tool to support dialogue through the global SDg 4 cooperation mechanism, which is undergoing reform, and to spur collective action.
The unESCO Institute for Statistics (uIS) and the global Education Monitoring (gEM) Report teams have worked to mobilize the international community towards SDg 4 benchmarks. In 2019, at the meeting of the Technical Cooperation group (TCg) on SDg 4 indicators, seven SDg 4 indicators meeting the criteria of policy relevance and data coverage were endorsed for benchmarking (Table 9.1).
In October 2020, the global Education Meeting Declaration urged countries to ‘accelerate the progress and propose relevant and realistic benchmarks of key SDg 4 indicators’ (§10) (unESCO, 2020). The uIS and gEM Report teams led extensive consultations in the first half of 2021, in collaboration with unESCO regional offices in bangkok, beirut and Santiago, as well as regional organizations: the african union, the Caribbean Community (CaRICOM), the Central american Education and Cultural Coordination of the Central american Integration System, the European union (Eu), the pacific Community and the Southeast asian Ministers of Education Organization. This approach has advanced the agenda the gEM Report had proposed on an enhanced role for regional organizations in SDg 4 (unESCO, 2017). The uIS has initiated a series of reports showing the alignment of SDg 4 with regional education monitoring frameworks, such as the Continental Education Strategy for africa 2016–25 (uIS, 2021a); the next reports in the series will cover asia and the pacific, the arab States, Latin america and the Caribbean, and Europe and northern america.
Benchmarks capture the contribution each country is prepared to make to the global education agenda
2 0 2 1 / 2 • G LO BA L E D U C AT I O N M O N I TO R I N G R E P O RT 200
9
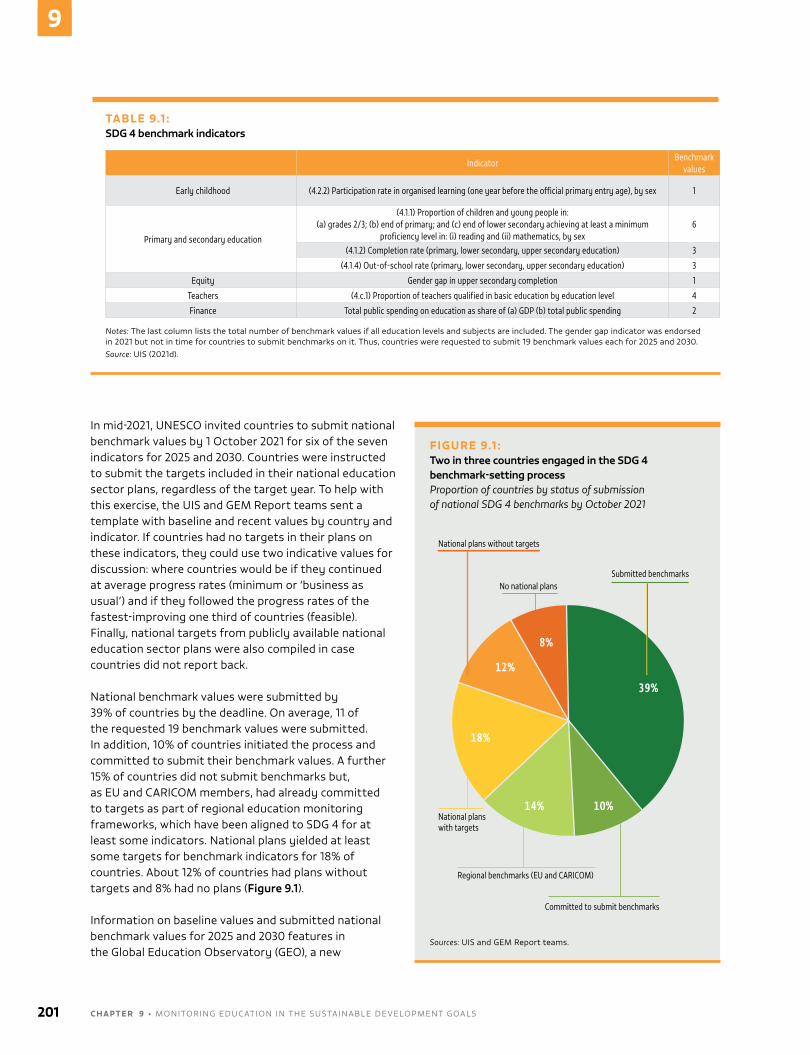
In mid-2021, unESCO invited countries to submit national benchmark values by 1 October 2021 for six of the seven indicators for 2025 and 2030. Countries were instructed to submit the targets included in their national education sector plans, regardless of the target year. To help with this exercise, the uIS and gEM Report teams sent a template with baseline and recent values by country and indicator. If countries had no targets in their plans on these indicators, they could use two indicative values for discussion: where countries would be if they continued at average progress rates (minimum or ‘business as usual’) and if they followed the progress rates of the fastest-improving one third of countries (feasible). Finally, national targets from publicly available national education sector plans were also compiled in case countries did not report back.
national benchmark values were submitted by 39% of countries by the deadline. On average, 11 of the requested 19 benchmark values were submitted. In addition, 10% of countries initiated the process and committed to submit their benchmark values. a further 15% of countries did not submit benchmarks but, as Eu and CaRICOM members, had already committed to targets as part of regional education monitoring frameworks, which have been aligned to SDg 4 for at least some indicators. national plans yielded at least some targets for benchmark indicators for 18% of countries. about 12% of countries had plans without targets and 8% had no plans (Figure 9.1).
Information on baseline values and submitted national benchmark values for 2025 and 2030 features in the global Education Observatory (gEO), a new
TABLE 9.1 : SDG 4 benchmark indicators
Indicator Benchmark
values
Early childhood (4.2.2) Participation rate in organised learning (one year before the official primary entry age), by sex 1
Primary and secondary education
(4.1.1) Proportion of children and young people in:(a) grades 2/3; (b) end of primary; and (c) end of lower secondary achieving at least a minimum
proficiency level in: (i) reading and (ii) mathematics, by sex6
(4.1.2) Completion rate (primary, lower secondary, upper secondary education) 3
(4.1.4) Out-of-school rate (primary, lower secondary, upper secondary education) 3
Equity Gender gap in upper secondary completion 1
Teachers (4.c.1) Proportion of teachers qualified in basic education by education level 4
Finance Total public spending on education as share of (a) GDP (b) total public spending 2 Notes: The last column lists the total number of benchmark values if all education levels and subjects are included. The gender gap indicator was endorsed in 2021 but not in time for countries to submit benchmarks on it. Thus, countries were requested to submit 19 benchmark values each for 2025 and 2030.Source: uIS (2021d).
FIGURE 9.1 : Two in three countries engaged in the SDG 4 benchmark-setting processProportion of countries by status of submission of national SDG 4 benchmarks by October 2021
No national plansSubmitted benchmarks
39%
10%14%
18%
12%
8%
Committed to submit benchmarks
Regional benchmarks (EU and CARICOM)
National plans with targets
National plans without targets
Sources: uIS and gEM Report teams.
201 C H A P T E R 9 • MOnITORIng EDuCaTIOn In ThE SuSTaInabLE DEVELOpMEnT gOaLS
9
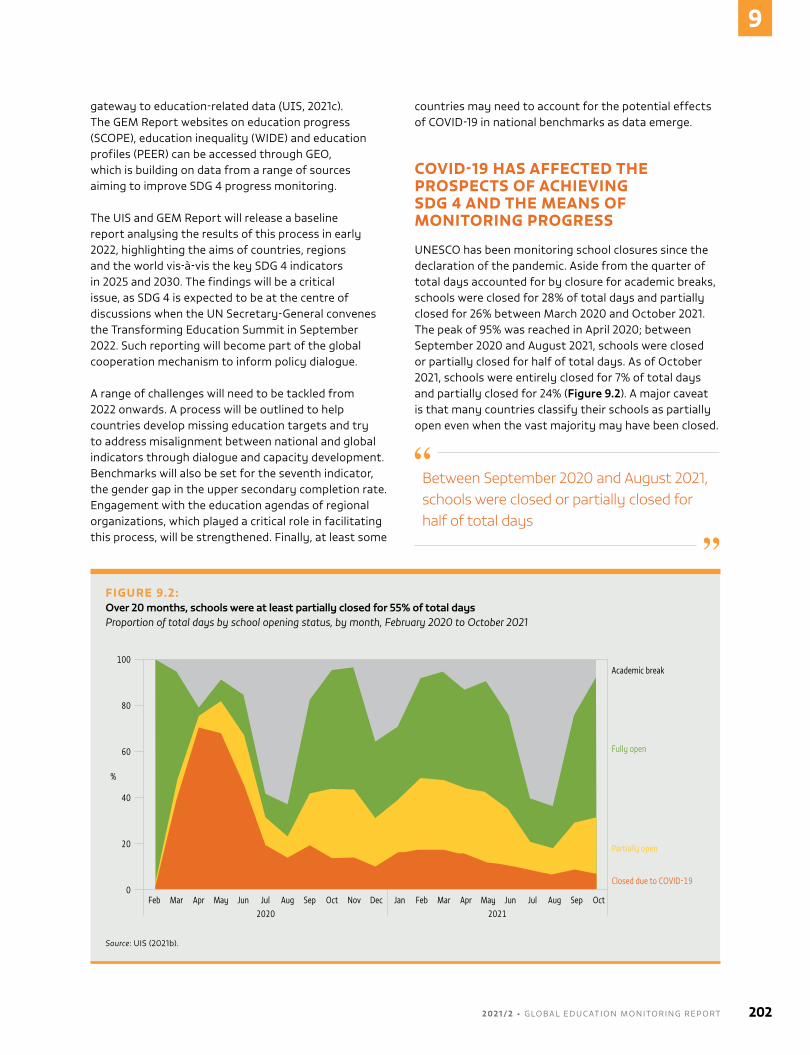
gateway to education-related data (uIS, 2021c). The gEM Report websites on education progress (SCOpE), education inequality (WIDE) and education profiles (pEER) can be accessed through gEO, which is building on data from a range of sources aiming to improve SDg 4 progress monitoring.
The uIS and gEM Report will release a baseline report analysing the results of this process in early 2022, highlighting the aims of countries, regions and the world vis-à-vis the key SDg 4 indicators in 2025 and 2030. The findings will be a critical issue, as SDg 4 is expected to be at the centre of discussions when the un Secretary-general convenes the Transforming Education Summit in September 2022. Such reporting will become part of the global cooperation mechanism to inform policy dialogue.
a range of challenges will need to be tackled from 2022 onwards. a process will be outlined to help countries develop missing education targets and try to address misalignment between national and global indicators through dialogue and capacity development. benchmarks will also be set for the seventh indicator, the gender gap in the upper secondary completion rate. Engagement with the education agendas of regional organizations, which played a critical role in facilitating this process, will be strengthened. Finally, at least some
countries may need to account for the potential effects of COVID-19 in national benchmarks as data emerge.
COVID-19 HAS AFFECTED THE PROSPECTS OF ACHIEVING SDG 4 AND THE MEANS OF MONITORING PROGRESS
unESCO has been monitoring school closures since the declaration of the pandemic. aside from the quarter of total days accounted for by closure for academic breaks, schools were closed for 28% of total days and partially closed for 26% between March 2020 and October 2021. The peak of 95% was reached in april 2020; between September 2020 and august 2021, schools were closed or partially closed for half of total days. as of October 2021, schools were entirely closed for 7% of total days and partially closed for 24% (Figure 9.2). a major caveat is that many countries classify their schools as partially open even when the vast majority may have been closed.
Between September 2020 and August 2021, schools were closed or partially closed for half of total days
FIGURE 9.2: Over 20 months, schools were at least partially closed for 55% of total daysProportion of total days by school opening status, by month, February 2020 to October 2021
80
60
%
40
20
100
0Feb Mar Apr May Jun Jul
2020Aug Sep Oct Nov Dec FebJan Mar Apr May Jun Jul
2021Aug Sep Oct
Closed due to COVID-19
Partially open
Fully open
Academic break
Source: uIS (2021b).
2 0 2 1 / 2 • G LO BA L E D U C AT I O N M O N I TO R I N G R E P O RT 202
9
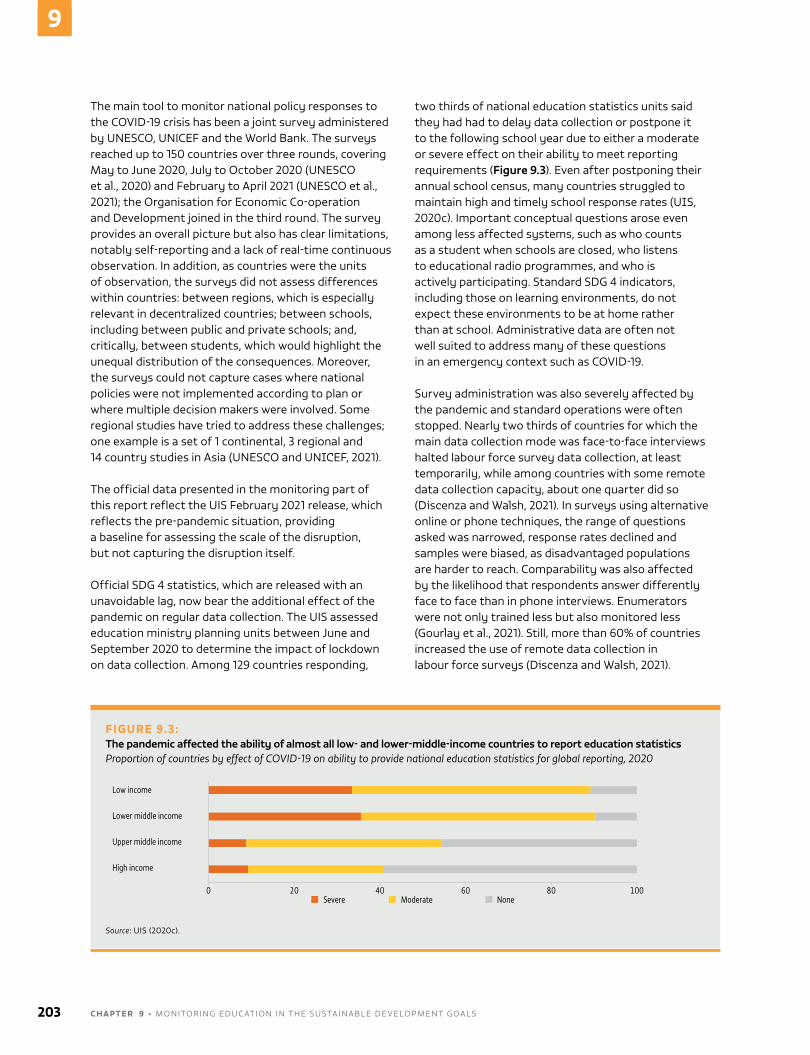
The main tool to monitor national policy responses to the COVID-19 crisis has been a joint survey administered by unESCO, unICEF and the World bank. The surveys reached up to 150 countries over three rounds, covering May to June 2020, July to October 2020 (unESCO et al., 2020) and February to april 2021 (unESCO et al., 2021); the Organisation for Economic Co-operation and Development joined in the third round. The survey provides an overall picture but also has clear limitations, notably self-reporting and a lack of real-time continuous observation. In addition, as countries were the units of observation, the surveys did not assess differences within countries: between regions, which is especially relevant in decentralized countries; between schools, including between public and private schools; and, critically, between students, which would highlight the unequal distribution of the consequences. Moreover, the surveys could not capture cases where national policies were not implemented according to plan or where multiple decision makers were involved. Some regional studies have tried to address these challenges; one example is a set of 1 continental, 3 regional and 14 country studies in asia (unESCO and unICEF, 2021).
The official data presented in the monitoring part of this report reflect the uIS February 2021 release, which reflects the pre-pandemic situation, providing a baseline for assessing the scale of the disruption, but not capturing the disruption itself.
Official SDg 4 statistics, which are released with an unavoidable lag, now bear the additional effect of the pandemic on regular data collection. The uIS assessed education ministry planning units between June and September 2020 to determine the impact of lockdown on data collection. among 129 countries responding,
two thirds of national education statistics units said they had had to delay data collection or postpone it to the following school year due to either a moderate or severe effect on their ability to meet reporting requirements (Figure 9.3). Even after postponing their annual school census, many countries struggled to maintain high and timely school response rates (uIS, 2020c). Important conceptual questions arose even among less affected systems, such as who counts as a student when schools are closed, who listens to educational radio programmes, and who is actively participating. Standard SDg 4 indicators, including those on learning environments, do not expect these environments to be at home rather than at school. administrative data are often not well suited to address many of these questions in an emergency context such as COVID-19.
Survey administration was also severely affected by the pandemic and standard operations were often stopped. nearly two thirds of countries for which the main data collection mode was face-to-face interviews halted labour force survey data collection, at least temporarily, while among countries with some remote data collection capacity, about one quarter did so (Discenza and Walsh, 2021). In surveys using alternative online or phone techniques, the range of questions asked was narrowed, response rates declined and samples were biased, as disadvantaged populations are harder to reach. Comparability was also affected by the likelihood that respondents answer differently face to face than in phone interviews. Enumerators were not only trained less but also monitored less (gourlay et al., 2021). Still, more than 60% of countries increased the use of remote data collection in labour force surveys (Discenza and Walsh, 2021).
FIGURE 9.3: The pandemic affected the ability of almost all low- and lower-middle-income countries to report education statisticsProportion of countries by effect of COVID-19 on ability to provide national education statistics for global reporting, 2020
Low income
Lower middle income
Upper middle income
High income
0 80604020Severe Moderate None
100
Source: uIS (2020c).
203 C H A P T E R 9 • MOnITORIng EDuCaTIOn In ThE SuSTaInabLE DEVELOpMEnT gOaLS
9
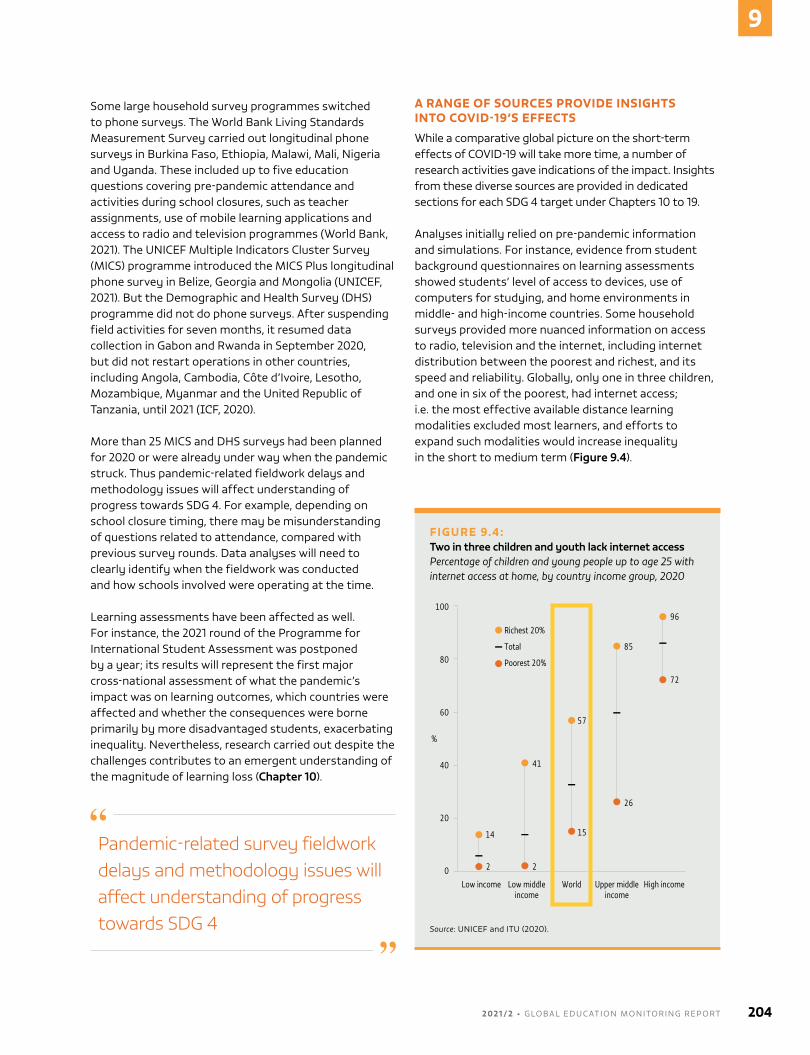
Some large household survey programmes switched to phone surveys. The World bank Living Standards Measurement Survey carried out longitudinal phone surveys in burkina Faso, Ethiopia, Malawi, Mali, nigeria and uganda. These included up to five education questions covering pre-pandemic attendance and activities during school closures, such as teacher assignments, use of mobile learning applications and access to radio and television programmes (World bank, 2021). The unICEF Multiple Indicators Cluster Survey (MICS) programme introduced the MICS plus longitudinal phone survey in belize, georgia and Mongolia (unICEF, 2021). but the Demographic and health Survey (DhS) programme did not do phone surveys. after suspending field activities for seven months, it resumed data collection in gabon and Rwanda in September 2020, but did not restart operations in other countries, including angola, Cambodia, Côte d’Ivoire, Lesotho, Mozambique, Myanmar and the united Republic of Tanzania, until 2021 (ICF, 2020).
More than 25 MICS and DhS surveys had been planned for 2020 or were already under way when the pandemic struck. Thus pandemic-related fieldwork delays and methodology issues will affect understanding of progress towards SDg 4. For example, depending on school closure timing, there may be misunderstanding of questions related to attendance, compared with previous survey rounds. Data analyses will need to clearly identify when the fieldwork was conducted and how schools involved were operating at the time.
Learning assessments have been affected as well. For instance, the 2021 round of the programme for International Student assessment was postponed by a year; its results will represent the first major cross-national assessment of what the pandemic’s impact was on learning outcomes, which countries were affected and whether the consequences were borne primarily by more disadvantaged students, exacerbating inequality. nevertheless, research carried out despite the challenges contributes to an emergent understanding of the magnitude of learning loss (Chapter 10).
Pandemic-related survey fieldwork delays and methodology issues will affect understanding of progress towards SDG 4
A RANGE OF SOURCES PROVIDE INSIGHTS INTO COVID-19’S EFFECTS
While a comparative global picture on the short-term effects of COVID-19 will take more time, a number of research activities gave indications of the impact. Insights from these diverse sources are provided in dedicated sections for each SDg 4 target under Chapters 10 to 19.
analyses initially relied on pre-pandemic information and simulations. For instance, evidence from student background questionnaires on learning assessments showed students’ level of access to devices, use of computers for studying, and home environments in middle- and high-income countries. Some household surveys provided more nuanced information on access to radio, television and the internet, including internet distribution between the poorest and richest, and its speed and reliability. globally, only one in three children, and one in six of the poorest, had internet access; i.e. the most effective available distance learning modalities excluded most learners, and efforts to expand such modalities would increase inequality in the short to medium term (Figure 9.4).
FIGURE 9.4: Two in three children and youth lack internet accessPercentage of children and young people up to age 25 with internet access at home, by country income group, 2020
80
60
%
40
20
100
0Low income Low middle
incomeWorld Upper middle
incomeHigh income
Richest 20%
Total
Poorest 20%
14
2 2
41
15
57
26
85
72
96
Source: unICEF and ITu (2020).
2 0 2 1 / 2 • G LO BA L E D U C AT I O N M O N I TO R I N G R E P O RT 204
9
Studies of the impact on learning of breaks in the academic calendar, whether for recurring reasons such as holiday recess or emergencies such as earthquakes, were used to simulate the potential impact of school closures. Some studies collected teachers’ subjective views. In one such large-scale study of 1,300 primary and 900 secondary schools in England (united Kingdom), 18% of students from the most deprived schools were considered by their teachers to be four to six months behind, compared with 5% from the least deprived schools (Sharp et al., 2020).
as the pandemic unfolded, more sophisticated surveys added insights on time use. For instance, internet surveys highlighted decreases in time spent on education and learning during the first COVID-19 wave – by one half in germany and one third in Italy – and increases in unproductive time spent on-screen, especially if children were low-achieving before the pandemic or did not benefit from parents’ presence; inequality in support packages from schools was also recorded (grewenig et al., 2021; Mangiavacchi et al., 2021). Information from online learning platforms is generally not available due to privacy restrictions. One analysis of user activity log data in Japan showed secondary school students’ study time increased during lockdown but by more for students who had prior access to the platform at home (Ikeda and Yamaguchi, 2021).
a phone survey of children of secondary school age in Ecuador found that 23% of those lacking internet access had spent zero time doing schoolwork, compared with 9% of those with access. The poorest were more likely to be at work than in education and girls were more likely than boys to have spent time doing household chores (asanov et al., 2021). In accra, ghana, private school teachers relied more than public school teachers on online classes (42% vs 6%) and material via Whatsapp (62% vs 16%); by contrast, public school teachers relied on radio and television (78% vs 26%) and hard copy materials (78% vs 32%). private schools were also more likely to organize remedial or after-school classes upon reopening (44% vs 33%) (aurino et al., 2021).
In the Lao people’s Democratic Republic, 45% of all children enrolled in school before the pandemic, but 30% of children from an ethnic minority, were engaged in some education or learning activity during school closure. Of those who were engaged in education and learning, 34% of urban children but 18% of rural children engaged in online learning (World bank, 2020). In Mongolia, schools closed until the end of the academic year 2019/20 and again in February 2021. a phone survey at the time of the second closure
found that only 71% had attended any learning the week before. Of those, 88% attended television lessons and 23% interactive digital lessons (Mongolia national Statistics Office and unICEF, 2021).
Various face-to-face and phone surveys provided initial evidence on potential dropout upon school reopening. In Ethiopia, a survey split between a period of school closure and a period of partial reopening found that, by the second half of november 2020, almost all children had either returned to school or, if not yet, intended to do so when school reopened (agness et al., 2021); these findings were similar to those of a September 2020 survey (akmal et al., 2020). In ghana and Senegal, dropout rates did not change, remaining low at 2%, but repetition tripled in ghana, from 3.5% to 10.5%, and doubled in Senegal, from 6.3% to 11.4% (abreh et al., 2021; Mbaye et al., 2021).
The multiplicity of sources, coupled with differences in study methodologies, samples, timing and contexts, means understanding the impact of COVID-19 remains challenging. Further insights into how different SDg 4 targets have been affected are provided in the following chapters, including a review on the critical issue of learning loss.
THE SDG 4 MONITORING FRAMEWORK CONTINUES TO DEVELOP
Following the 2020 Comprehensive Review by the Inter-agency and Expert group (IaEg) on SDg Indicators, the global indicator set will not change until 2025. Two small but important adjustments were made as a result of the 2020 review. First, the metadata of SDg indicator 4.1.1 were updated so that the minimum proficiency level in reading and mathematics is reported not just as a proportion of students but also as a proportion of the cohort of children who complete each level of education (SDg indicator 4.1.2) and learn (unSD, 2021). For example, the global share of children who achieve the minimum proficiency level in reading is 51% among students but 43% when accounting for children who do not complete primary school. In regions with universal completion, the adjustment has no impact on the indicator, but in sub-Saharan africa, the value of indicator 4.1.1b drops from 29% to 18% (Figure 9.5). The completion rate definition refers to timely completion (i.e. three to five years after official graduation age) but can also be expressed in terms of ultimate completion to include children, notably in the poorest countries, who complete school even later (Chapter 10).
205 C H A P T E R 9 • MOnITORIng EDuCaTIOn In ThE SuSTaInabLE DEVELOpMEnT gOaLS
9
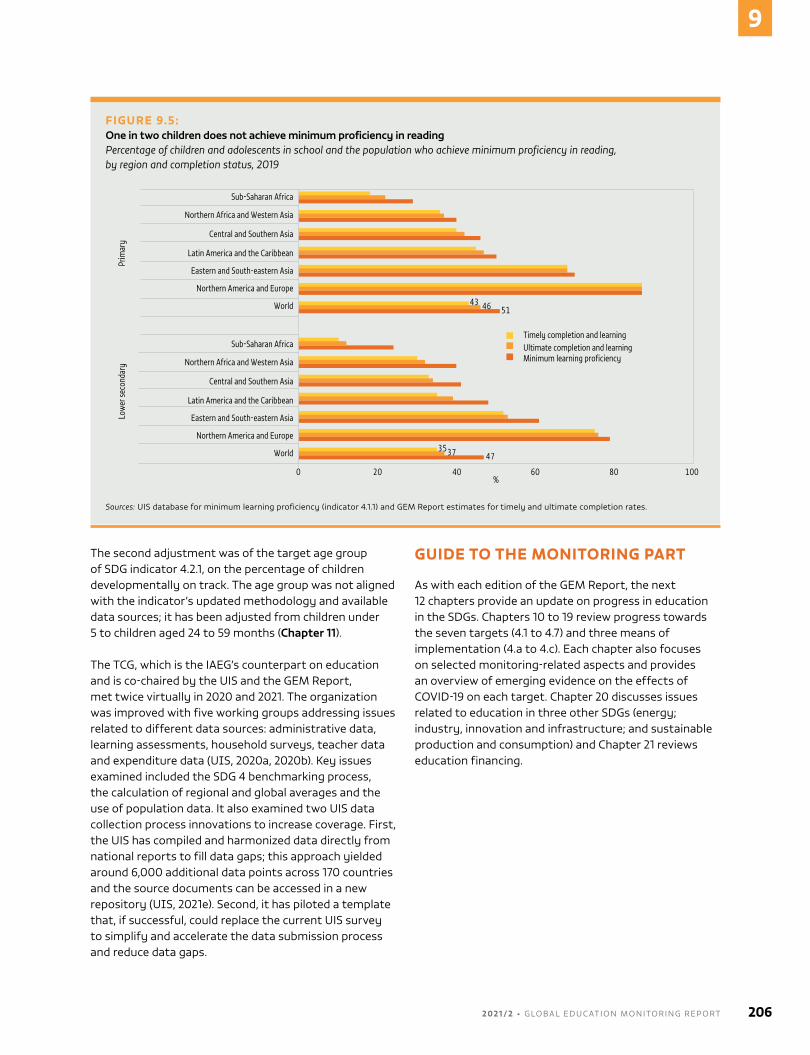
The second adjustment was of the target age group of SDg indicator 4.2.1, on the percentage of children developmentally on track. The age group was not aligned with the indicator’s updated methodology and available data sources; it has been adjusted from children under 5 to children aged 24 to 59 months (Chapter 11).
The TCg, which is the IaEg’s counterpart on education and is co-chaired by the uIS and the gEM Report, met twice virtually in 2020 and 2021. The organization was improved with five working groups addressing issues related to different data sources: administrative data, learning assessments, household surveys, teacher data and expenditure data (uIS, 2020a, 2020b). Key issues examined included the SDg 4 benchmarking process, the calculation of regional and global averages and the use of population data. It also examined two uIS data collection process innovations to increase coverage. First, the uIS has compiled and harmonized data directly from national reports to fill data gaps; this approach yielded around 6,000 additional data points across 170 countries and the source documents can be accessed in a new repository (uIS, 2021e). Second, it has piloted a template that, if successful, could replace the current uIS survey to simplify and accelerate the data submission process and reduce data gaps.
GUIDE TO THE MONITORING PART
as with each edition of the gEM Report, the next 12 chapters provide an update on progress in education in the SDgs. Chapters 10 to 19 review progress towards the seven targets (4.1 to 4.7) and three means of implementation (4.a to 4.c). Each chapter also focuses on selected monitoring-related aspects and provides an overview of emerging evidence on the effects of COVID-19 on each target. Chapter 20 discusses issues related to education in three other SDgs (energy; industry, innovation and infrastructure; and sustainable production and consumption) and Chapter 21 reviews education financing.
FIGURE 9.5: One in two children does not achieve minimum proficiency in readingPercentage of children and adolescents in school and the population who achieve minimum proficiency in reading, by region and completion status, 2019
43 46 51
3537 47
Sub-Saharan Africa
Northern Africa and Western Asia
Central and Southern Asia
Latin America and the Caribbean
Eastern and South-eastern Asia
Northern America and Europe
World
Sub-Saharan Africa
Northern Africa and Western Asia
Central and Southern Asia
Latin America and the Caribbean
Eastern and South-eastern Asia
Northern America and Europe
World
Prim
ary
Low
er se
cond
ary
Timely completion and learningUltimate completion and learningMinimum learning proficiency
0 20 40%
60 80 100
Sources: uIS database for minimum learning proficiency (indicator 4.1.1) and gEM Report estimates for timely and ultimate completion rates.
2 0 2 1 / 2 • G LO BA L E D U C AT I O N M O N I TO R I N G R E P O RT 206
9
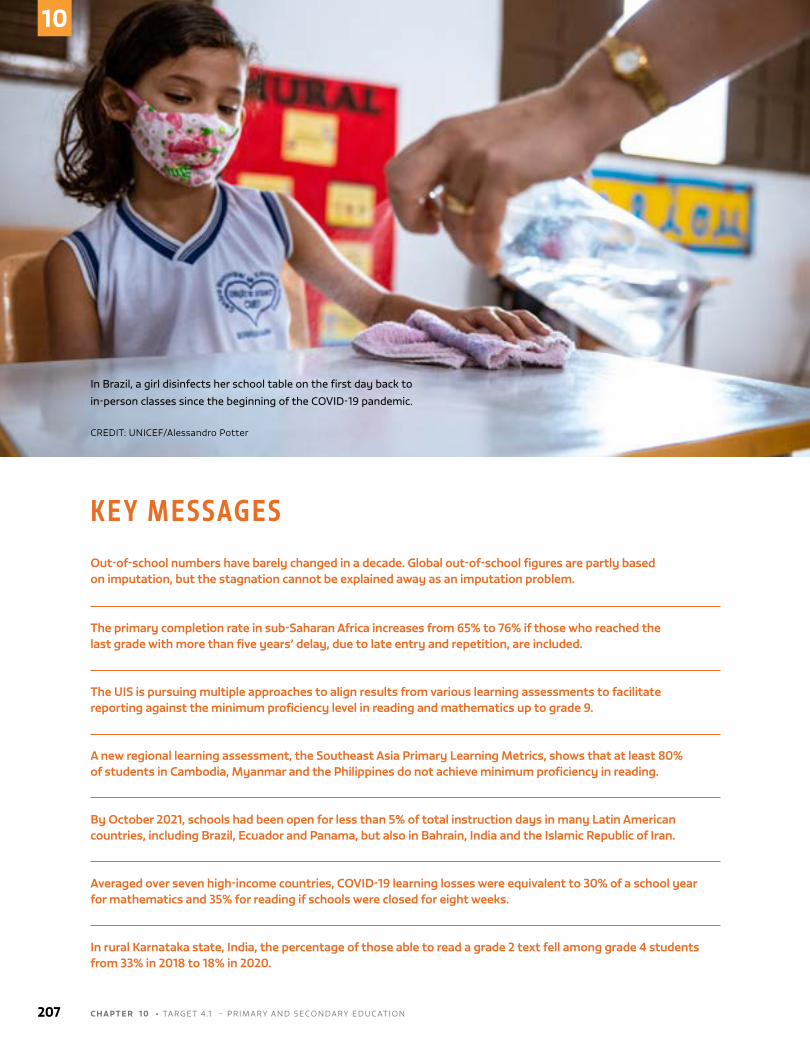
K E Y M E S S AG E SOut-of-school numbers have barely changed in a decade. Global out-of-school figures are partly based on imputation, but the stagnation cannot be explained away as an imputation problem.
The primary completion rate in sub-Saharan Africa increases from 65% to 76% if those who reached the last grade with more than five years’ delay, due to late entry and repetition, are included.
The UIS is pursuing multiple approaches to align results from various learning assessments to facilitate reporting against the minimum proficiency level in reading and mathematics up to grade 9.
A new regional learning assessment, the Southeast Asia Primary Learning Metrics, shows that at least 80% of students in Cambodia, Myanmar and the Philippines do not achieve minimum proficiency in reading.
By October 2021, schools had been open for less than 5% of total instruction days in many Latin American countries, including Brazil, Ecuador and Panama, but also in Bahrain, India and the Islamic Republic of Iran.
Averaged over seven high-income countries, COVID-19 learning losses were equivalent to 30% of a school year for mathematics and 35% for reading if schools were closed for eight weeks.
In rural Karnataka state, India, the percentage of those able to read a grade 2 text fell among grade 4 students from 33% in 2018 to 18% in 2020.
In Brazil, a girl disinfects her school table on the first day back to
in-person classes since the beginning of the COVID-19 pandemic.
CREDIT: UNICEF/Alessandro Potter
207 C H A P T E R 1 0 • TARGET 4.1 – PRImARy AND sECoNDARy EDUCATIoN
10
CHAPTER 10
TARGET 4.1
4.1
By 2030, ensure that all girls and boys complete free, equitable and quality primary and secondary education leading to relevant and effective learning outcomes
GLOBAL INDICATOR
4.1.1 – Proportion of children and young people (a) in Grade 2 or 3; (b) at the end of primary
education; and (c) at the end of lower secondary education achieving at least a minimum
proficiency level in (i) reading and (ii) mathematics, by sex
4.1.2 – Completion rate (primary education, lower secondary education, upper
secondary education)
THEMATIC INDICATORS
4.1.3 – Gross intake ratio to the last grade (primary education, lower secondary education)
4.1.4 – Out-of-school rate (primary education, lower secondary education, upper
secondary education)
4.1.5 – Percentage of children over-age for grade (primary education, lower secondary education)
4.1.6 – Administration of a nationally representative learning assessment (a) in Grade 2 or 3;
(b) at the end of primary education; and (c) at the end of lower secondary education
4.1.7 – Number of years of (a) free and (b) compulsory primary and secondary
Primary and secondary education
2 0 2 1 / 2 • G LO BA L E D U C AT I O N M O N I TO R I N G R E P O RT 208
10
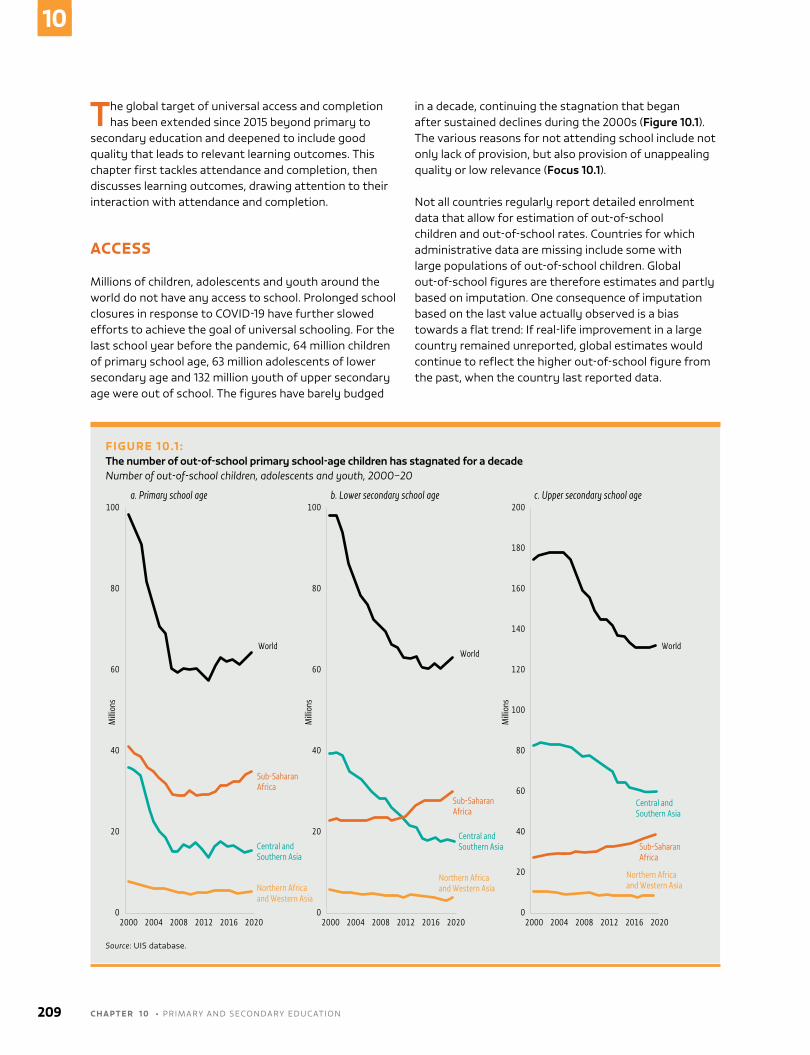
The global target of universal access and completion has been extended since 2015 beyond primary to
secondary education and deepened to include good quality that leads to relevant learning outcomes. This chapter first tackles attendance and completion, then discusses learning outcomes, drawing attention to their interaction with attendance and completion.
ACCESS
millions of children, adolescents and youth around the world do not have any access to school. Prolonged school closures in response to CoVID-19 have further slowed efforts to achieve the goal of universal schooling. For the last school year before the pandemic, 64 million children of primary school age, 63 million adolescents of lower secondary age and 132 million youth of upper secondary age were out of school. The figures have barely budged
in a decade, continuing the stagnation that began after sustained declines during the 2000s (Figure 10.1). The various reasons for not attending school include not only lack of provision, but also provision of unappealing quality or low relevance (Focus 10.1).
Not all countries regularly report detailed enrolment data that allow for estimation of out-of-school children and out-of-school rates. Countries for which administrative data are missing include some with large populations of out-of-school children. Global out-of-school figures are therefore estimates and partly based on imputation. one consequence of imputation based on the last value actually observed is a bias towards a flat trend: If real-life improvement in a large country remained unreported, global estimates would continue to reflect the higher out-of-school figure from the past, when the country last reported data.
FIGURE 10.1 :The number of out-of-school primary school-age children has stagnated for a decadeNumber of out-of-school children, adolescents and youth, 2000–20
80
60
40
20
100
0
Milli
ons
80
60
40
20
100
180
160
140
120
100
80
60
40
20
200
00
Milli
ons
Milli
ons
20162012200820042000 2020 20162012200820042000 2020 20162012200820042000 2020
Sub-Saharan Africa
Central andSouthern Asia
Northern Africaand Western Asia
Northern Africaand Western Asia
Northern Africaand Western Asia
Central andSouthern Asia
Central andSouthern Asia
Sub-Saharan Africa
Sub-Saharan Africa
WorldWorld
World
a. Primary school age b. Lower secondary school age c. Upper secondary school age
Source: UIs database.
209 C H A P T E R 1 0 • PRImARy AND sECoNDARy EDUCATIoN
10
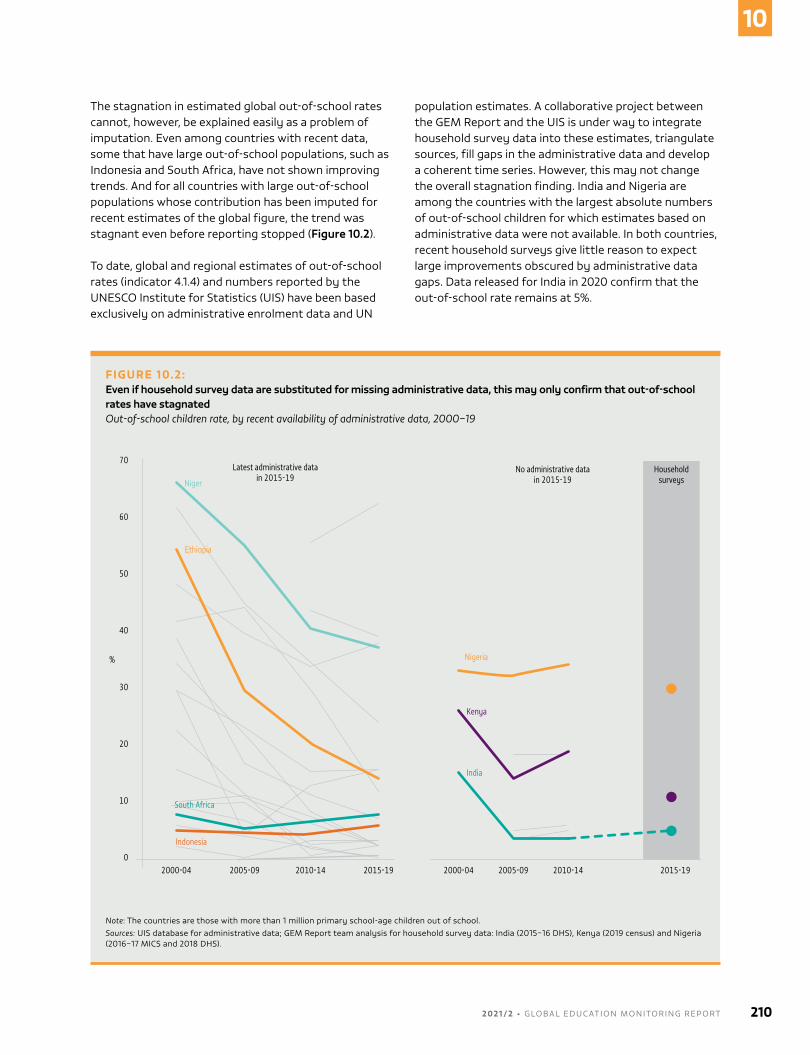
The stagnation in estimated global out-of-school rates cannot, however, be explained easily as a problem of imputation. Even among countries with recent data, some that have large out-of-school populations, such as Indonesia and south Africa, have not shown improving trends. And for all countries with large out-of-school populations whose contribution has been imputed for recent estimates of the global figure, the trend was stagnant even before reporting stopped (Figure 10.2).
To date, global and regional estimates of out-of-school rates (indicator 4.1.4) and numbers reported by the UNEsCo Institute for statistics (UIs) have been based exclusively on administrative enrolment data and UN
population estimates. A collaborative project between the GEm Report and the UIs is under way to integrate household survey data into these estimates, triangulate sources, fill gaps in the administrative data and develop a coherent time series. However, this may not change the overall stagnation finding. India and Nigeria are among the countries with the largest absolute numbers of out-of-school children for which estimates based on administrative data were not available. In both countries, recent household surveys give little reason to expect large improvements obscured by administrative data gaps. Data released for India in 2020 confirm that the out-of-school rate remains at 5%.
FIGURE 10.2:Even if household survey data are substituted for missing administrative data, this may only confirm that out-of-school rates have stagnatedOut-of-school children rate, by recent availability of administrative data, 2000–19
Latest administrative datain 2015-19
No administrative datain 2015-19
60
50
40
30
%
20
10
70
02000-04 2005-09 2010-14 2015-19 2000-04 2005-09 2010-14 2015-19
Household surveys
Nigeria
Kenya
India
Niger
Ethiopia
South Africa
Indonesia
Note: The countries are those with more than 1 million primary school-age children out of school.Sources: UIs database for administrative data; GEm Report team analysis for household survey data: India (2015–16 DHs), Kenya (2019 census) and Nigeria (2016–17 mICs and 2018 DHs).
2 0 2 1 / 2 • G LO BA L E D U C AT I O N M O N I TO R I N G R E P O RT 210
10
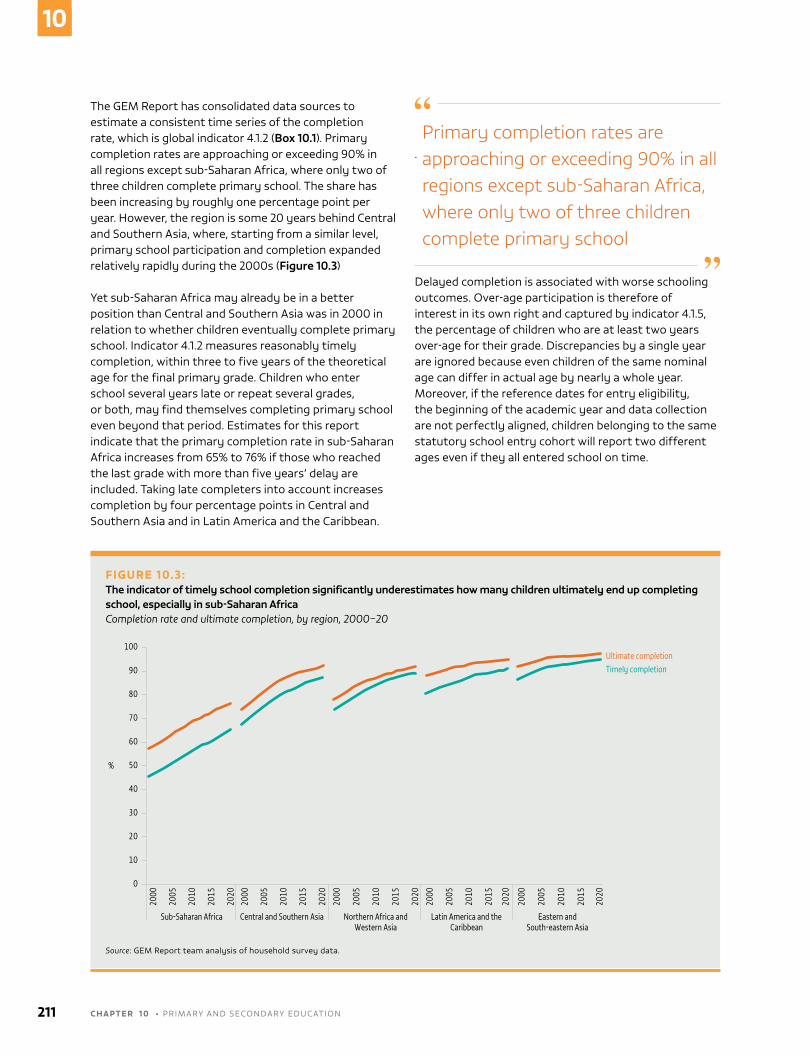
The GEm Report has consolidated data sources to estimate a consistent time series of the completion rate, which is global indicator 4.1.2 (Box 10.1). Primary completion rates are approaching or exceeding 90% in all regions except sub-saharan Africa, where only two of three children complete primary school. The share has been increasing by roughly one percentage point per year. However, the region is some 20 years behind Central and southern Asia, where, starting from a similar level, primary school participation and completion expanded relatively rapidly during the 2000s (Figure 10.3)
yet sub-saharan Africa may already be in a better position than Central and southern Asia was in 2000 in relation to whether children eventually complete primary school. Indicator 4.1.2 measures reasonably timely completion, within three to five years of the theoretical age for the final primary grade. Children who enter school several years late or repeat several grades, or both, may find themselves completing primary school even beyond that period. Estimates for this report indicate that the primary completion rate in sub-saharan Africa increases from 65% to 76% if those who reached the last grade with more than five years’ delay are included. Taking late completers into account increases completion by four percentage points in Central and southern Asia and in Latin America and the Caribbean.
.
Primary completion rates are approaching or exceeding 90% in all regions except sub-Saharan Africa, where only two of three children complete primary school
Delayed completion is associated with worse schooling outcomes. over-age participation is therefore of interest in its own right and captured by indicator 4.1.5, the percentage of children who are at least two years over-age for their grade. Discrepancies by a single year are ignored because even children of the same nominal age can differ in actual age by nearly a whole year. moreover, if the reference dates for entry eligibility, the beginning of the academic year and data collection are not perfectly aligned, children belonging to the same statutory school entry cohort will report two different ages even if they all entered school on time.
FIGURE 10.3:The indicator of timely school completion significantly underestimates how many children ultimately end up completing school, especially in sub-Saharan AfricaCompletion rate and ultimate completion, by region, 2000–20
%
90
80
70
60
50
40
30
20
10
100
0
2015
2010
2005
2000
2020
2015
2010
2005
2000
2020
2015
2010
2005
2000
2020
2015
2010
2005
2000
2020
2015
2010
2005
2000
2020
Sub-Saharan Africa Central and Southern Asia Northern Africa and Western Asia
Latin America and the Caribbean
Eastern and South-eastern Asia
Ultimate completionTimely completion
Source: GEm Report team analysis of household survey data.
211 C H A P T E R 1 0 • PRImARy AND sECoNDARy EDUCATIoN
10
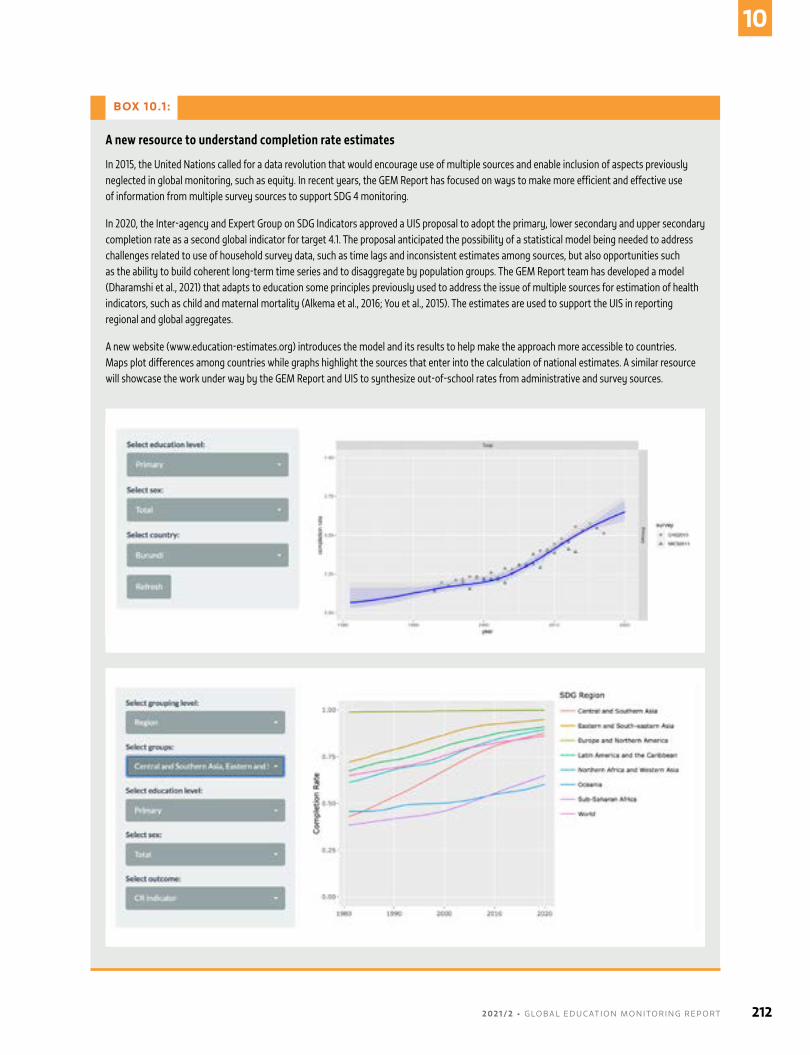
BOX 10.1 :
A new resource to understand completion rate estimates
In 2015, the United Nations called for a data revolution that would encourage use of multiple sources and enable inclusion of aspects previously neglected in global monitoring, such as equity. In recent years, the GEM Report has focused on ways to make more efficient and effective use of information from multiple survey sources to support SDG 4 monitoring.
In 2020, the Inter-agency and Expert Group on SDG Indicators approved a UIS proposal to adopt the primary, lower secondary and upper secondary completion rate as a second global indicator for target 4.1. The proposal anticipated the possibility of a statistical model being needed to address challenges related to use of household survey data, such as time lags and inconsistent estimates among sources, but also opportunities such as the ability to build coherent long-term time series and to disaggregate by population groups. The GEM Report team has developed a model (Dharamshi et al., 2021) that adapts to education some principles previously used to address the issue of multiple sources for estimation of health indicators, such as child and maternal mortality (Alkema et al., 2016; You et al., 2015). The estimates are used to support the UIS in reporting regional and global aggregates.
A new website (www.education-estimates.org) introduces the model and its results to help make the approach more accessible to countries. Maps plot differences among countries while graphs highlight the sources that enter into the calculation of national estimates. A similar resource will showcase the work under way by the GEM Report and UIS to synthesize out-of-school rates from administrative and survey sources.
2 0 2 1 / 2 • G LO BA L E D U C AT I O N M O N I TO R I N G R E P O RT 212
10
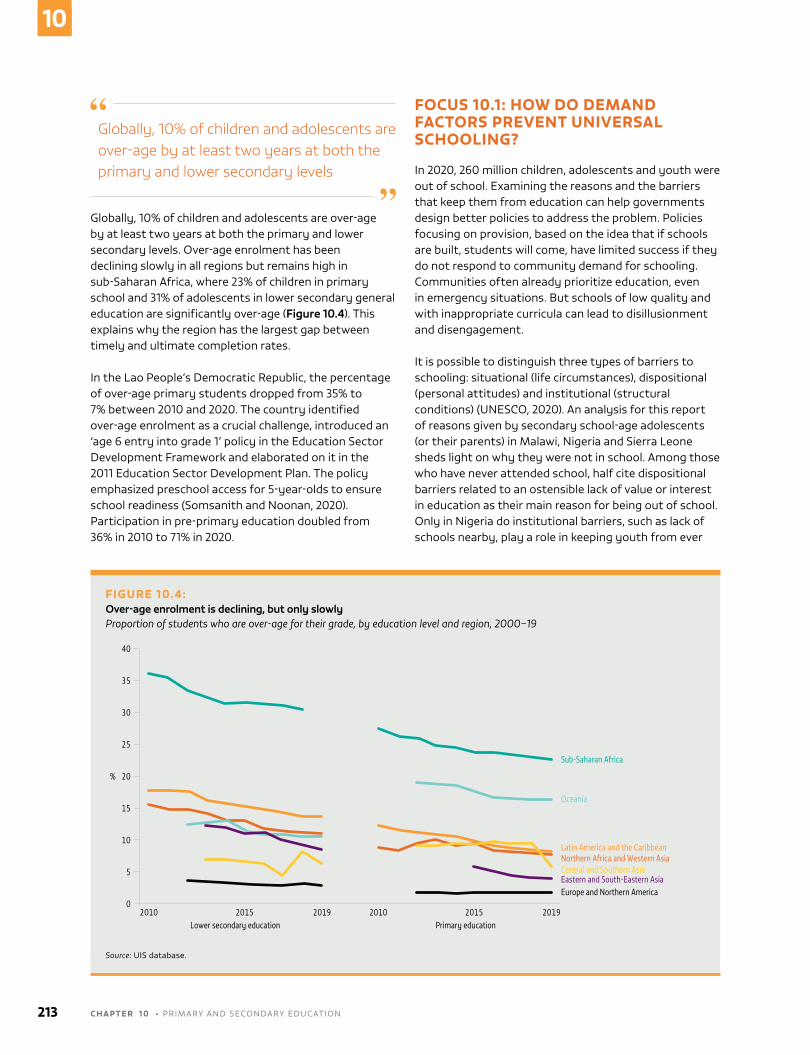
Globally, 10% of children and adolescents are over-age by at least two years at both the primary and lower secondary levels
Globally, 10% of children and adolescents are over-age by at least two years at both the primary and lower secondary levels. over-age enrolment has been declining slowly in all regions but remains high in sub-saharan Africa, where 23% of children in primary school and 31% of adolescents in lower secondary general education are significantly over-age (Figure 10.4). This explains why the region has the largest gap between timely and ultimate completion rates.
In the Lao People’s Democratic Republic, the percentage of over-age primary students dropped from 35% to 7% between 2010 and 2020. The country identified over-age enrolment as a crucial challenge, introduced an ‘age 6 entry into grade 1’ policy in the Education sector Development Framework and elaborated on it in the 2011 Education sector Development Plan. The policy emphasized preschool access for 5-year-olds to ensure school readiness (somsanith and Noonan, 2020). Participation in pre-primary education doubled from 36% in 2010 to 71% in 2020.
FOCUS 10.1: HOW DO DEMAND FACTORS PREVENT UNIVERSAL SCHOOLING?
In 2020, 260 million children, adolescents and youth were out of school. Examining the reasons and the barriers that keep them from education can help governments design better policies to address the problem. Policies focusing on provision, based on the idea that if schools are built, students will come, have limited success if they do not respond to community demand for schooling. Communities often already prioritize education, even in emergency situations. But schools of low quality and with inappropriate curricula can lead to disillusionment and disengagement.
It is possible to distinguish three types of barriers to schooling: situational (life circumstances), dispositional (personal attitudes) and institutional (structural conditions) (UNEsCo, 2020). An analysis for this report of reasons given by secondary school-age adolescents (or their parents) in malawi, Nigeria and sierra Leone sheds light on why they were not in school. Among those who have never attended school, half cite dispositional barriers related to an ostensible lack of value or interest in education as their main reason for being out of school. only in Nigeria do institutional barriers, such as lack of schools nearby, play a role in keeping youth from ever
FIGURE 10.4:Over-age enrolment is declining, but only slowlyProportion of students who are over-age for their grade, by education level and region, 2000–19
35
30
25
20%
15
10
5
40
02010 2015
Lower secondary education Primary education2019 2010 2015 2019
Sub-Saharan Africa
Oceania
Northern Africa and Western AsiaCentral and Southern AsiaEastern and South-Eastern AsiaEurope and Northern America
Latin America and the Caribbean
Source: UIs database.
213 C H A P T E R 1 0 • PRImARy AND sECoNDARy EDUCATIoN
10
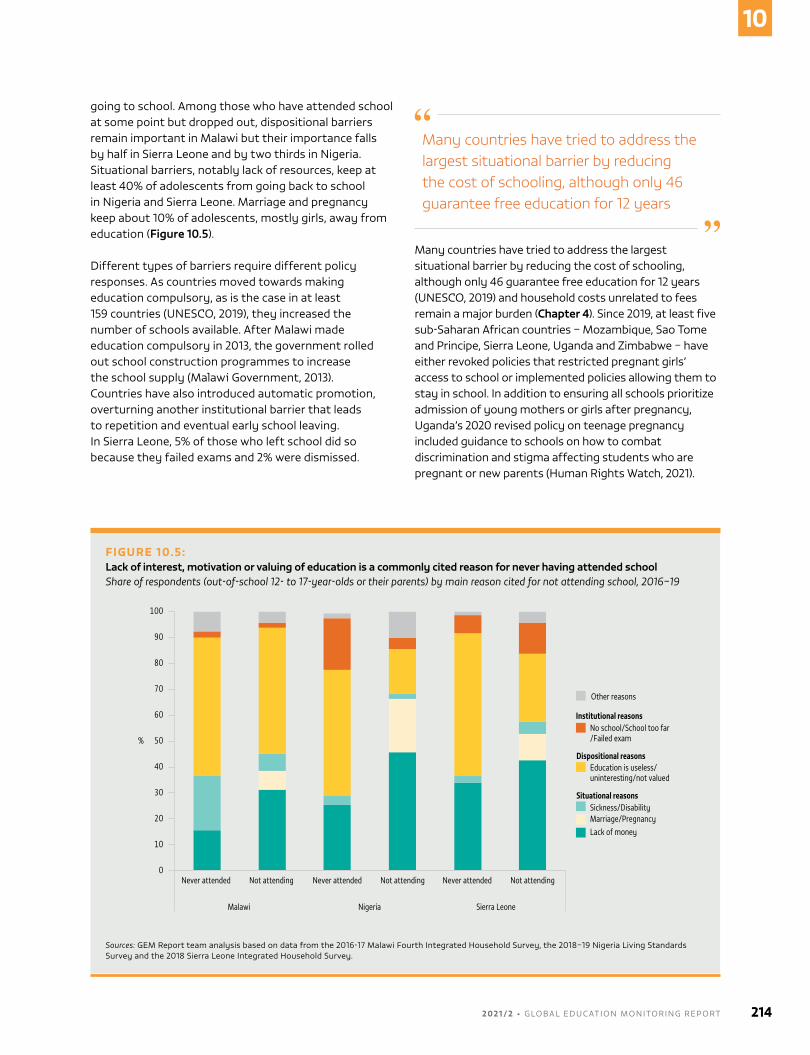
going to school. Among those who have attended school at some point but dropped out, dispositional barriers remain important in malawi but their importance falls by half in sierra Leone and by two thirds in Nigeria. situational barriers, notably lack of resources, keep at least 40% of adolescents from going back to school in Nigeria and sierra Leone. marriage and pregnancy keep about 10% of adolescents, mostly girls, away from education (Figure 10.5).
Different types of barriers require different policy responses. As countries moved towards making education compulsory, as is the case in at least 159 countries (UNEsCo, 2019), they increased the number of schools available. After malawi made education compulsory in 2013, the government rolled out school construction programmes to increase the school supply (malawi Government, 2013). Countries have also introduced automatic promotion, overturning another institutional barrier that leads to repetition and eventual early school leaving. In sierra Leone, 5% of those who left school did so because they failed exams and 2% were dismissed.
Many countries have tried to address the largest situational barrier by reducing the cost of schooling, although only 46 guarantee free education for 12 years
many countries have tried to address the largest situational barrier by reducing the cost of schooling, although only 46 guarantee free education for 12 years (UNEsCo, 2019) and household costs unrelated to fees remain a major burden (Chapter 4). since 2019, at least five sub-saharan African countries – mozambique, sao Tome and Principe, sierra Leone, Uganda and Zimbabwe – have either revoked policies that restricted pregnant girls’ access to school or implemented policies allowing them to stay in school. In addition to ensuring all schools prioritize admission of young mothers or girls after pregnancy, Uganda’s 2020 revised policy on teenage pregnancy included guidance to schools on how to combat discrimination and stigma affecting students who are pregnant or new parents (Human Rights Watch, 2021).
FIGURE 10.5:Lack of interest, motivation or valuing of education is a commonly cited reason for never having attended schoolShare of respondents (out-of-school 12- to 17-year-olds or their parents) by main reason cited for not attending school, 2016–19
Guatemala, 2014
2018
Other reasons
No school/School too far/Failed exam
Education is useless/uninteresting/not valued
Sickness/DisabilityMarriage/Pregnancy
Institutional reasons
Dispositional reasons
Situational reasons
Lack of money
90
80
70
60
50
40
30
20
10
100
0Never attended Not attending
Malawi Nigeria Sierra Leone
Never attended Not attending Never attended Not attending
%
Sources: GEm Report team analysis based on data from the 2016-17 malawi Fourth Integrated Household survey, the 2018–19 Nigeria Living standards survey and the 2018 sierra Leone Integrated Household survey.
2 0 2 1 / 2 • G LO BA L E D U C AT I O N M O N I TO R I N G R E P O RT 214
10
Addressing dispositional barriers can be more challenging. In some contexts, there may not even be recognition that they need to be addressed. A ‘lack of interest’ in education can be used as an excuse to shift the blame for low education achievement from policymakers to individuals, especially members of marginalized groups who are stigmatized as lazy. Dispositional barriers may reflect not lack of demand but rather hidden costs or the poor quality of the schooling on offer. In the Ugandan National Panel survey, the response option ‘Education is not useful’ could be a criticism of education in general or of the specific education provided in the local context – or both (Uganda Bureau of statistics, 2019).
Lack of interest may also reflect negative learning experiences. In south Africa, 23% of students who dropped out before age 18 cited poor academic performance as the main reason (statistics south Africa, 2018). In Nigeria, 7% of children who left school did so because they reportedly ‘could not learn’ (Nigeria National Bureau of statistics, 2019).
Lack of opportunity for continuing education may also explain low motivation. studies have shown that the availability of secondary schools nearby increases the likelihood that students will complete primary education (mukhopadhyay and sahoo, 2016). Even if students can continue their education, though, they may not consider doing so, as research has long shown that students’ socioeconomic backgrounds heavily influence their aspirations (Gölz and Wohlkinger, 2019; Kao and Tienda, 1998). In rural China, migrant children who do not feel capable of achieving educational success are likely to dismiss education as irrelevant (Chen, 2020).
At least partly due to such challenges, dispositional barriers are less often the focus of policies designed to increase attendance. But their prevalence among responses demonstrates that supplying affordable education of good quality is not enough. It is also important to address socioeconomic barriers keeping families and students from wanting to attend or believing they can do so.
LEARNING
sDG global indicator 4.1.1 is the percentage of students meeting a minimum proficiency level in reading and mathematics in grade 2 or 3, at the end of primary and at the end of lower secondary education. Three major cross-national learning assessments were conducted in 2019, just before school closures related to CoVID-19 moved learning to the home for most children and led parents to play a bigger role in their children’s learning. However, parental input into learning has always been substantial, even before school closures (Box 10.2).
Across 15 francophone countries in sub-saharan Africa, the second round of the Programme d’analyse des système éducatifs de la CoNFEmEN (PAsEC) assessed skills in reading and mathematics in grades 2 and 6. The seventh round of the Trends in International mathematics and science study (TImss) assessed grade 4 and 8 students’ skills in 64 middle- and high-income countries. The southeast Asia Primary Learning metrics (sEA-PLm), a new regional learning assessment, tested grade 5 learners in Cambodia, the Lao People's Democratic Republic, malaysia, myanmar, the Philippines and Viet Nam in mathematics, reading, writing and global citizenship skills. The southeast Asian ministers of Education Association and UNICEF initiated sEA-PLm in 2012 but it took eight years of planning, curriculum review, assessment framework development, field trials and data collection before data could be released. In other words, the challenges of creating a cross-country assessment from first principles cannot be underestimated. However, considerable progress has been made in the past three years (Box 10.3).
mathematics results from the three assessments show large differences between countries. Among francophone sub-saharan African countries, in Burkina Faso and senegal 1 in 4 grade 6 students reached the minimum proficiency level, but results were much lower in other countries, notably below 5% in Chad, Côte d’Ivoire and the Democratic Republic of the Congo. In south-eastern Asia, about 1 in 10 grade 5 students in the Lao People’s Democratic Republic and myanmar and about 1 in 6 in Cambodia and the Philippines achieved minimum proficiency, compared with 2 in 3 malaysian and 9 in 10 Vietnamese students.
215 C H A P T E R 1 0 • PRImARy AND sECoNDARy EDUCATIoN
10
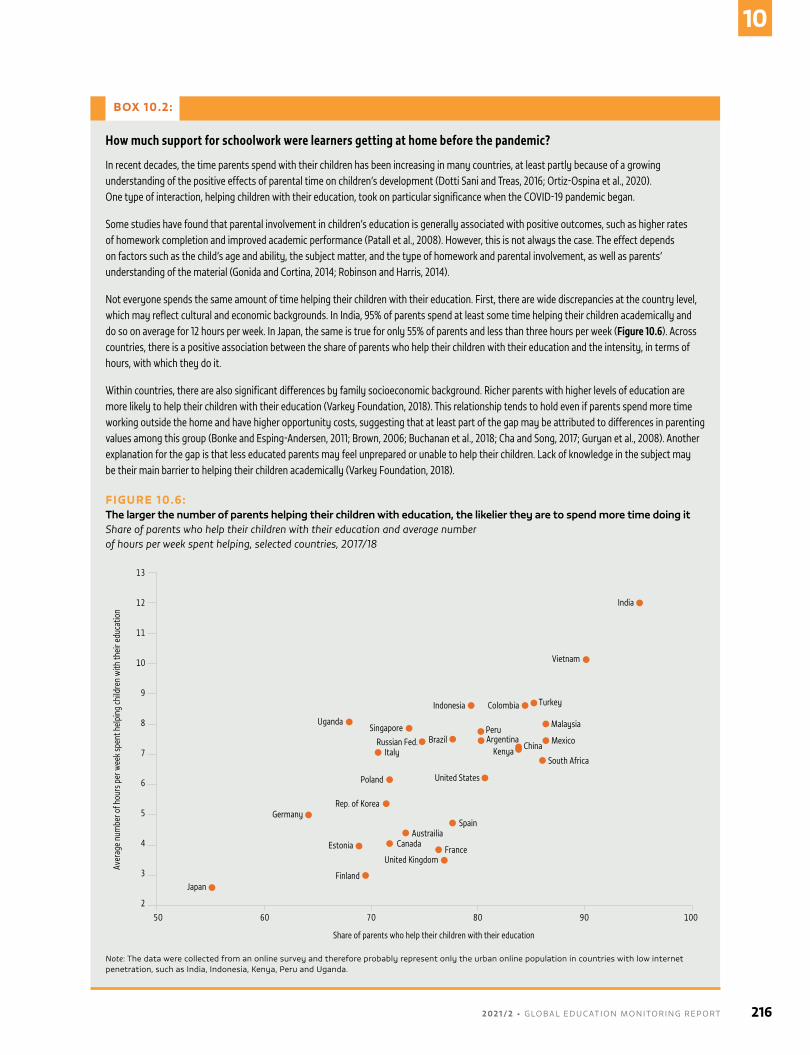
BOX 10.2:
How much support for schoolwork were learners getting at home before the pandemic?
In recent decades, the time parents spend with their children has been increasing in many countries, at least partly because of a growing understanding of the positive effects of parental time on children’s development (Dotti Sani and Treas, 2016; Ortiz-Ospina et al., 2020). One type of interaction, helping children with their education, took on particular significance when the COVID-19 pandemic began.
Some studies have found that parental involvement in children’s education is generally associated with positive outcomes, such as higher rates of homework completion and improved academic performance (Patall et al., 2008). However, this is not always the case. The effect depends on factors such as the child’s age and ability, the subject matter, and the type of homework and parental involvement, as well as parents’ understanding of the material (Gonida and Cortina, 2014; Robinson and Harris, 2014).
Not everyone spends the same amount of time helping their children with their education. First, there are wide discrepancies at the country level, which may reflect cultural and economic backgrounds. In India, 95% of parents spend at least some time helping their children academically and do so on average for 12 hours per week. In Japan, the same is true for only 55% of parents and less than three hours per week (Figure 10.6). Across countries, there is a positive association between the share of parents who help their children with their education and the intensity, in terms of hours, with which they do it.
Within countries, there are also significant differences by family socioeconomic background. Richer parents with higher levels of education are more likely to help their children with their education (Varkey Foundation, 2018). This relationship tends to hold even if parents spend more time working outside the home and have higher opportunity costs, suggesting that at least part of the gap may be attributed to differences in parenting values among this group (Bonke and Esping-Andersen, 2011; Brown, 2006; Buchanan et al., 2018; Cha and Song, 2017; Guryan et al., 2008). Another explanation for the gap is that less educated parents may feel unprepared or unable to help their children. Lack of knowledge in the subject may be their main barrier to helping their children academically (Varkey Foundation, 2018).
FIGURE 10.6:The larger the number of parents helping their children with education, the likelier they are to spend more time doing itShare of parents who help their children with their education and average number of hours per week spent helping, selected countries, 2017/18
Guatemala, 2014
2018
12
11
10
9
8
7
6
5
4
3
13
2
9080706050 100
Share of parents who help their children with their education
Aver
age
num
ber o
f hou
rs p
er w
eek s
pent
hel
ping
child
ren
with
thei
r edu
catio
n
UgandaSingapore
Indonesia Turkey
Vietnam
India
Colombia
Malaysia
MexicoPeruArgentina
Kenya China
South Africa
United States
BrazilItaly
Russian Fed.
Poland
SpainAustrailia
France
Rep. of Korea
United Kingdom
CanadaEstonia
Germany
JapanFinland
Note: The data were collected from an online survey and therefore probably represent only the urban online population in countries with low internet penetration, such as India, Indonesia, Kenya, Peru and Uganda.
2 0 2 1 / 2 • G LO BA L E D U C AT I O N M O N I TO R I N G R E P O RT 216
10
In the global set of countries covered by TImss, results in middle-income countries such as morocco, Pakistan and south Africa were not above those in low-income countries. The proportion of students achieving minimum proficiency in Gulf states ranged from 21% in Kuwait to 53% in the United Arab Emirates. This was below high-income countries but also middle-income countries in the Caucasus and Central Asia, which ranged from 53% in Georgia to 71% in Kazakhstan. other high-income countries that lagged relative to their peers included France and New Zealand, where at least
4 in 10 students did not reach minimum proficiency. By contrast, children in Japan, the Republic of Korea and singapore achieved near universal proficiency.
There was a small gap, on average, in favour of boys. Girls were at a particular disadvantage in Burundi and Gabon. Notable gaps were also observed in Bosnia and Herzegovina, Canada and Chile. But boys performed worse in south-eastern Asian countries, especially Cambodia and malaysia, and in oman, saudi Arabia and south Africa (Figure 10.7).
BOX 10.3:
UIS has been making progress in aligning results of various learning assessments
Over the past few years, the UIS, through the Global Alliance to Monitor Learning, a working group of the Technical Cooperation Group on SDG 4 indicators, has systematically tried to overcome the challenges countries face in reporting on global indicator 4.1.1. Its efforts build on the development of the global proficiency framework, a core concept defining the minimum proficiency levels learners are expected to reach up to grade 9 in reading and mathematics. These proficiency levels build on the Global Content Frameworks of Reference for reading and mathematics, developed by the UNESCO International Bureau of Education, along with national and cross-national content and assessment frameworks (UIS and USAID, 2020a, 2020b).
Since a single test for all learners in the world is neither feasible nor desirable, the UIS has been pursuing multiple approaches, in increasing order of complexity and robustness, to align results from different assessments, on the principle that countries should be able to use any assessment, provided it meets quality criteria.
The first and simplest step was for all major cross-national assessment programmes to agree how their respective proficiency levels aligned with the global minimum proficiency level. The consensus they reached, which is based on a comparison of the narrative descriptions of each proficiency level, is the basis for most data now reported on global indicator 4.1.1 (UIS, 2018).
This agreement does not take into account national assessments, which are not directly comparable because they differ in curriculum coverage and in assessment frameworks and items. Hence the second approach has been to introduce a method allowing countries to link their assessment to the global proficiency framework. Known as ‘policy linking’, the approach includes a workshop at which national curriculum and assessment experts and mainly teachers review how the national assessment items align with the global proficiency levels. Each participant subjectively assesses the level of knowledge and skills required for students to answer each item correctly. Participants then rate whether students who reached the minimum proficiency level would be able to answer each aligned item correctly (UIS and USAID, 2020c; USAID, 2021). This standard-setting exercise allows the estimation of the proportion of students above the minimum proficiency level. More than 10 countries have piloted the approach in primary and lower secondary education, including Bangladesh, Djibouti, India, Lesotho, Nepal and Rwanda.
More sophisticated statistical approaches try to link entire assessments. The third approach involved students from two Latin American countries, Colombia and Guatemala, which took part in the Regional Comparative and Explanatory Study (ERCE), and three francophone African countries, Burundi, Guinea and Senegal, which took part in PASEC. The students also took the Progress in International Reading Literacy Study (PIRLS) and TIMSS assessments, administered by the International Association for the Evaluation of Educational Achievement (IEA). The aim is to equate the ERCE and PASEC scores with the TIMSS and PIRLS scores (UIS, 2020). Results are expected in early 2022.
The fourth approach goes a step further. In the context of Monitoring Impacts on Learning Outcomes (MILO), a project aimed at quantifying the impact of COVID-19 on students at the end of primary school in Africa, an assessment was administered in Burkina Faso, Burundi, Côte d’Ivoire, Kenya, Senegal and Zambia. To measure learning loss, the study linked data from national assessments prior to the pandemic with the MILO assessment, with emphasis on assessing the proportion of students meeting the minimum proficiency level. Results are expected in early 2022. As part of the project, a subset of MILO assessment items was selected from the UIS Global Item Bank, which are linked to the global proficiency framework (ACER and UIS, 2021). Country access to items from the Global Item Bank that are already aligned to the standards will increase their flexibility in continuing to run their national assessments, while ensuring they can report on global indicator 4.1.1.
217 C H A P T E R 1 0 • PRImARy AND sECoNDARy EDUCATIoN
10
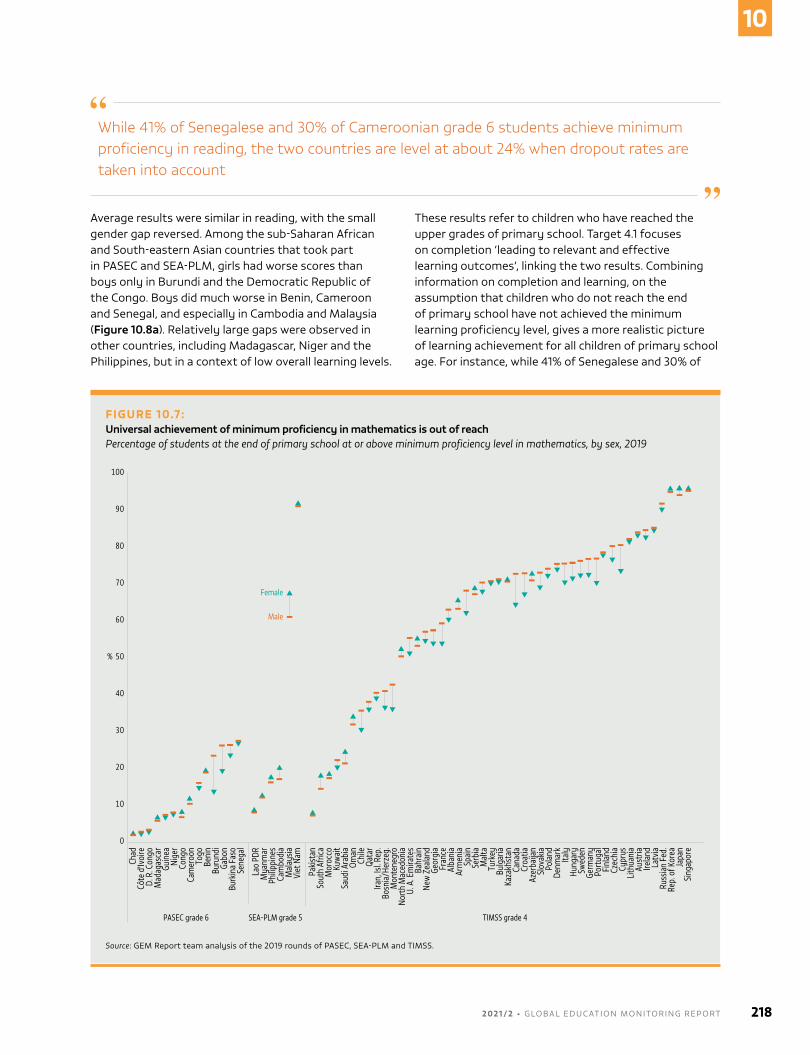
Average results were similar in reading, with the small gender gap reversed. Among the sub-saharan African and south-eastern Asian countries that took part in PAsEC and sEA-PLm, girls had worse scores than boys only in Burundi and the Democratic Republic of the Congo. Boys did much worse in Benin, Cameroon and senegal, and especially in Cambodia and malaysia (Figure 10.8a). Relatively large gaps were observed in other countries, including madagascar, Niger and the Philippines, but in a context of low overall learning levels.
These results refer to children who have reached the upper grades of primary school. Target 4.1 focuses on completion ‘leading to relevant and effective learning outcomes’, linking the two results. Combining information on completion and learning, on the assumption that children who do not reach the end of primary school have not achieved the minimum learning proficiency level, gives a more realistic picture of learning achievement for all children of primary school age. For instance, while 41% of senegalese and 30% of
FIGURE 10.7:Universal achievement of minimum proficiency in mathematics is out of reachPercentage of students at the end of primary school at or above minimum proficiency level in mathematics, by sex, 2019
Guatemala, 2014
2018
Chad
Côte
d'Iv
oire
D. R
. Con
goM
adag
asca
rGu
inea
Nige
rCo
ngo
Cam
eroo
nTo
goBe
nin
Buru
ndi
Gabo
nBu
rkin
a Fa
soSe
nega
l
Lao
PDR
Mya
nmar
Philip
pine
sCa
mbo
dia
Mal
aysia
Viet
Nam
Pakis
tan
Sout
h Af
rica
Mor
occo
Kuw
ait
Saud
i Ara
bia
Oman
Chile
Qata
rIra
n, Is
l. Rep
.Bo
snia
/Her
zeg.
Mon
tene
gro
Nort
h M
aced
onia
U. A
. Em
irate
sBa
hrai
nNe
w Z
eala
ndGe
orgi
aFr
ance
Alba
nia
Arm
enia
Spai
nSe
rbia
Mal
taTu
rkey
Bulg
aria
Kaza
khst
anCa
nada
Croa
tiaAz
erba
ijan
Slov
akia
Pola
ndDe
nmar
kIta
lyHu
ngar
ySw
eden
Germ
any
Port
ugal
Finl
and
Czec
hia
Cypr
usLi
thua
nia
Aust
riaIre
land
Latv
iaRu
ssia
n Fe
d.Re
p. o
f Kor
eaJa
pan
Sing
apor
e
PASEC grade 6 SEA-PLM grade 5 TIMSS grade 4
90
80
70
60
50%
40
30
20
10
100
0
Female
Male
Source: GEm Report team analysis of the 2019 rounds of PAsEC, sEA-PLm and TImss.
While 41% of Senegalese and 30% of Cameroonian grade 6 students achieve minimum proficiency in reading, the two countries are level at about 24% when dropout rates are taken into account
2 0 2 1 / 2 • G LO BA L E D U C AT I O N M O N I TO R I N G R E P O RT 218
10
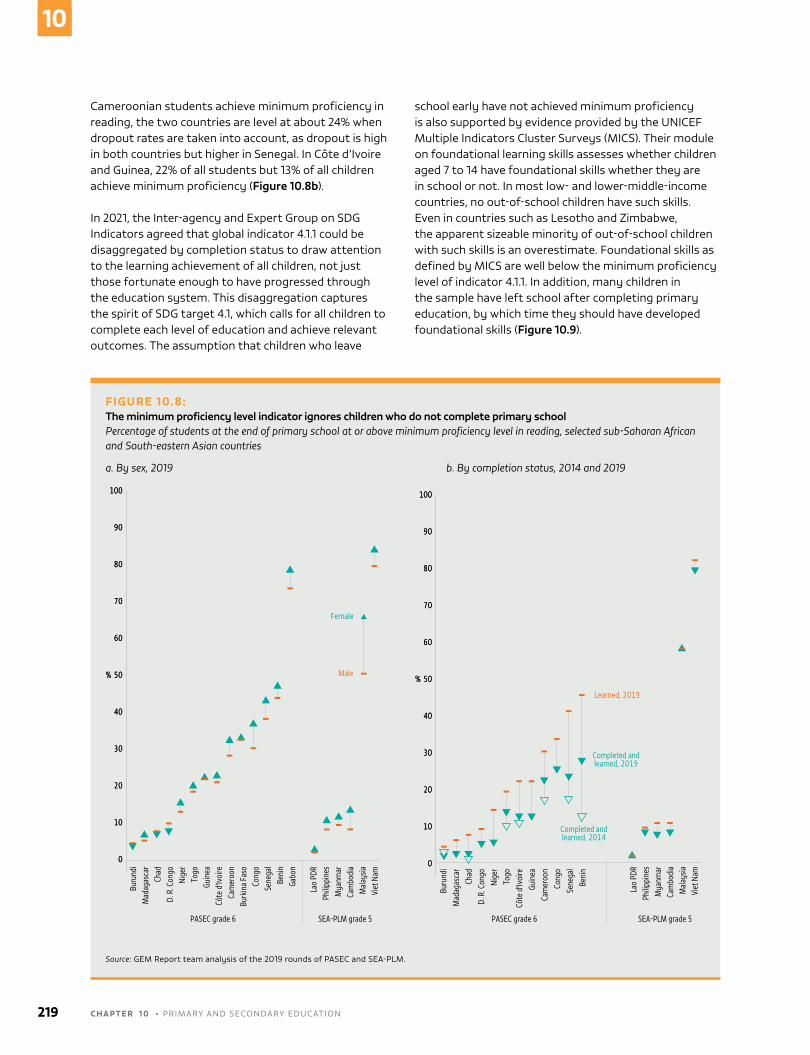
Cameroonian students achieve minimum proficiency in reading, the two countries are level at about 24% when dropout rates are taken into account, as dropout is high in both countries but higher in senegal. In Côte d’Ivoire and Guinea, 22% of all students but 13% of all children achieve minimum proficiency (Figure 10.8b).
In 2021, the Inter-agency and Expert Group on sDG Indicators agreed that global indicator 4.1.1 could be disaggregated by completion status to draw attention to the learning achievement of all children, not just those fortunate enough to have progressed through the education system. This disaggregation captures the spirit of sDG target 4.1, which calls for all children to complete each level of education and achieve relevant outcomes. The assumption that children who leave
school early have not achieved minimum proficiency is also supported by evidence provided by the UNICEF multiple Indicators Cluster surveys (mICs). Their module on foundational learning skills assesses whether children aged 7 to 14 have foundational skills whether they are in school or not. In most low- and lower-middle-income countries, no out-of-school children have such skills. Even in countries such as Lesotho and Zimbabwe, the apparent sizeable minority of out-of-school children with such skills is an overestimate. Foundational skills as defined by mICs are well below the minimum proficiency level of indicator 4.1.1. In addition, many children in the sample have left school after completing primary education, by which time they should have developed foundational skills (Figure 10.9).
FIGURE 10.8:The minimum proficiency level indicator ignores children who do not complete primary schoolPercentage of students at the end of primary school at or above minimum proficiency level in reading, selected sub-Saharan African and South-eastern Asian countries
a. By sex, 2019 b. By completion status, 2014 and 2019
Guatemala, 2014
2018
PASEC grade 6 PASEC grade 6
Learned, 2019
Completed and learned, 2019
Completed and learned, 2014
SEA-PLM grade 5 SEA-PLM grade 5
90
80
70
60
50%
40
30
20
10
100
0
90
80
70
60
50%
40
30
20
10
100
0
90
80
70
60
50%
40
30
20
10
100
0
90
80
70
60
50%
40
30
20
10
100
0
Female
Male
Buru
ndi
Mad
agas
car
Chad
D. R
. Con
goNi
ger
Togo
Guin
eaCô
te d
'Ivoi
reCa
mer
oon
Burk
ina
Faso
Cong
oSe
nega
lBe
nin
Gabo
n
Buru
ndi
Mad
agas
car
Chad
D. R
. Con
goNi
ger
Togo
Côte
d'Iv
oire
Guin
eaCa
mer
oon
Cong
oSe
nega
lBe
nin
Lao
PDR
Philip
pine
sM
yanm
arCa
mbo
dia
Mal
aysia
Viet
Nam
Lao
PDR
Philip
pine
sM
yanm
arCa
mbo
dia
Mal
aysia
Viet
Nam
Source: GEm Report team analysis of the 2019 rounds of PAsEC and sEA-PLm.
219 C H A P T E R 1 0 • PRImARy AND sECoNDARy EDUCATIoN
10
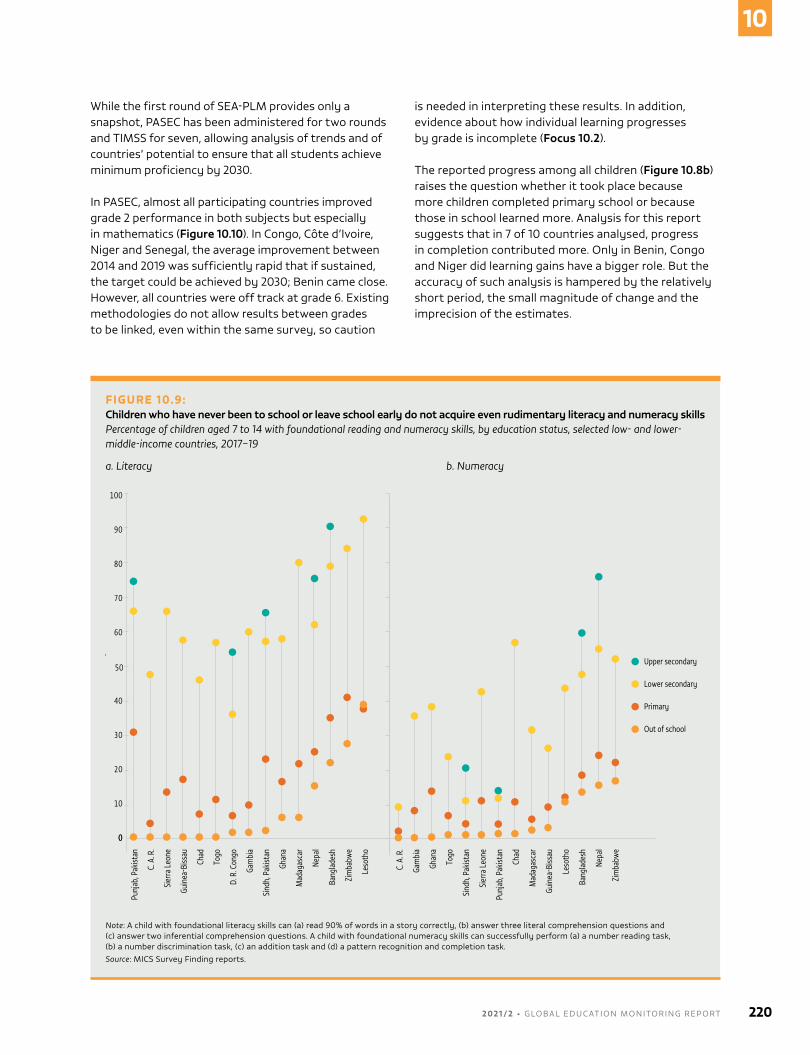
While the first round of sEA-PLm provides only a snapshot, PAsEC has been administered for two rounds and TImss for seven, allowing analysis of trends and of countries’ potential to ensure that all students achieve minimum proficiency by 2030.
In PAsEC, almost all participating countries improved grade 2 performance in both subjects but especially in mathematics (Figure 10.10). In Congo, Côte d’Ivoire, Niger and senegal, the average improvement between 2014 and 2019 was sufficiently rapid that if sustained, the target could be achieved by 2030; Benin came close. However, all countries were off track at grade 6. Existing methodologies do not allow results between grades to be linked, even within the same survey, so caution
is needed in interpreting these results. In addition, evidence about how individual learning progresses by grade is incomplete (Focus 10.2).
The reported progress among all children (Figure 10.8b) raises the question whether it took place because more children completed primary school or because those in school learned more. Analysis for this report suggests that in 7 of 10 countries analysed, progress in completion contributed more. only in Benin, Congo and Niger did learning gains have a bigger role. But the accuracy of such analysis is hampered by the relatively short period, the small magnitude of change and the imprecision of the estimates.
FIGURE 10.9:Children who have never been to school or leave school early do not acquire even rudimentary literacy and numeracy skillsPercentage of children aged 7 to 14 with foundational reading and numeracy skills, by education status, selected low- and lower-middle-income countries, 2017–19
a. Literacy b. Numeracy
Upper secondary
Guatemala, 2014
2018
50
0
90
80
70
60
%
40
30
20
10
100
0
Punj
ab, P
akist
an
C. A
. R.
Sier
ra L
eone
Guin
ea-B
issau
Chad
Togo
D. R
. Con
go
Gam
bia
Sind
h, P
akist
an
Ghan
a
Mad
agas
car
Nepa
l
Bang
lade
sh
Zim
babw
e
Leso
tho
C. A
. R.
Gam
bia
Ghan
a
Togo
Sind
h, P
akist
an
Sier
ra L
eone
Punj
ab, P
akist
an
Chad
Mad
agas
car
Guin
ea-B
issau
Leso
tho
Bang
lade
sh
Nepa
l
Zim
babw
e
Primary
Lower secondary
Out of school
Note: A child with foundational literacy skills can (a) read 90% of words in a story correctly, (b) answer three literal comprehension questions and (c) answer two inferential comprehension questions. A child with foundational numeracy skills can successfully perform (a) a number reading task, (b) a number discrimination task, (c) an addition task and (d) a pattern recognition and completion task.Source: mICs survey Finding reports.
2 0 2 1 / 2 • G LO BA L E D U C AT I O N M O N I TO R I N G R E P O RT 220
10
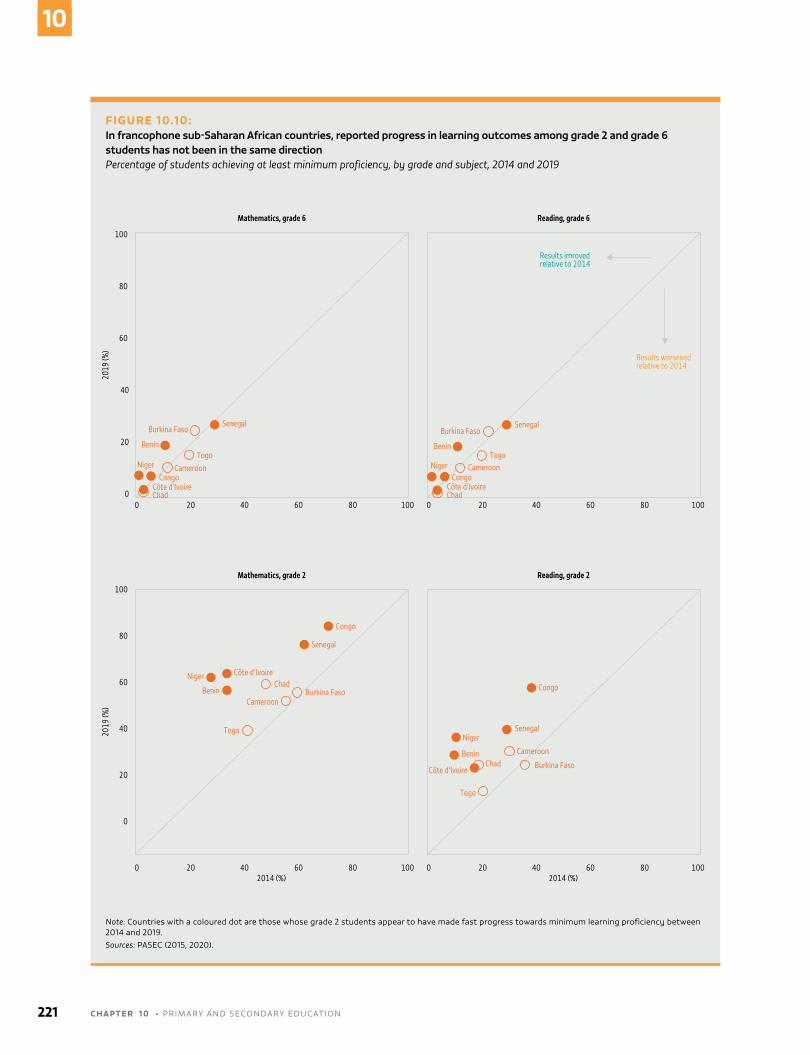
FIGURE 10.10:In francophone sub-Saharan African countries, reported progress in learning outcomes among grade 2 and grade 6 students has not been in the same directionPercentage of students achieving at least minimum proficiency, by grade and subject, 2014 and 2019
Guatemala, 2014
2018
80
80
60
60
40
40
20
20
100
100
0
0
2019
(%)
2019
(%)
2014 (%)
Mathematics, grade 2
80604020 10002014 (%)
Reading, grade 2
80
80
60
60
40
40
20
20
100
1000
0
Mathematics, grade 6
80604020 1000
Reading, grade 6
Burkina FasoSenegal
Benin
Benin
Benin
BeninTogo
Togo
Togo
Niger
Niger
Niger
Cameroon
Cameroon
Cameroon
CongoCôte d’IvoireChad
Burkina Faso
Burkina Faso
Burkina Faso
Senegal
Senegal
Senegal
TogoNiger Cameroon
Congo
Congo
Congo
Côte d’Ivoire
Côte d’Ivoire
Côte d’Ivoire
Chad
Chad
Chad
Results imroved relative to 2014
Results worsened relative to 2014
Note: Countries with a coloured dot are those whose grade 2 students appear to have made fast progress towards minimum learning proficiency between 2014 and 2019.Sources: PAsEC (2015, 2020).
221 C H A P T E R 1 0 • PRImARy AND sECoNDARy EDUCATIoN
10
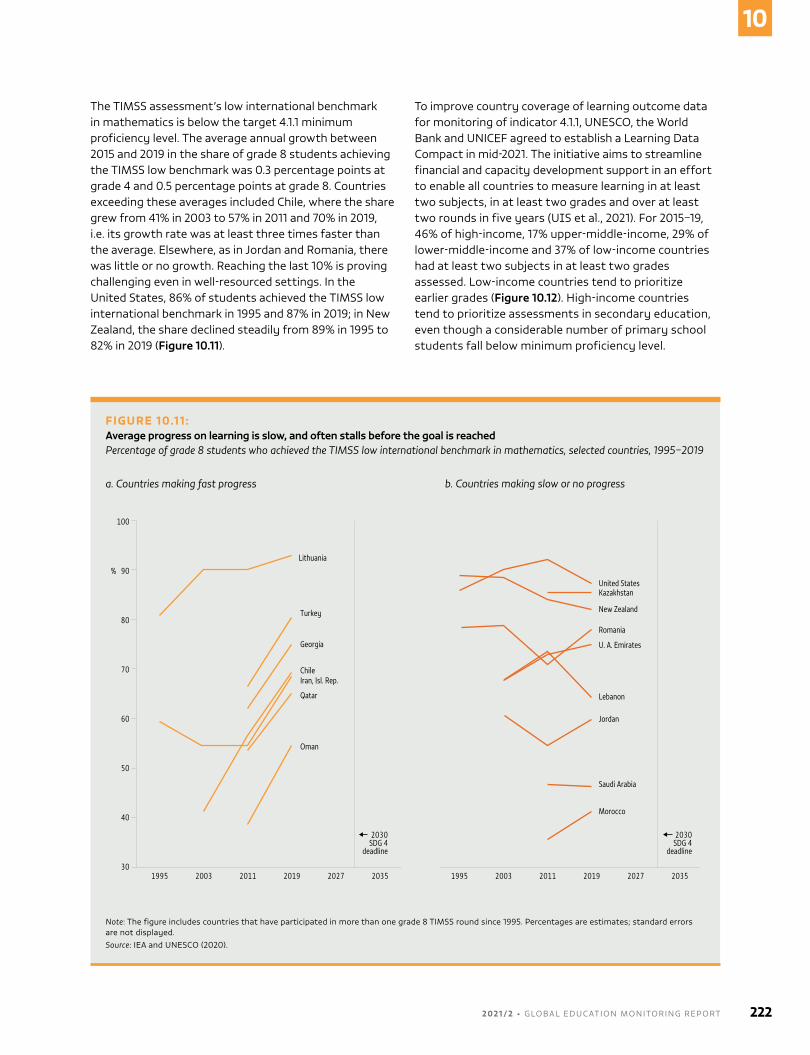
The TImss assessment’s low international benchmark in mathematics is below the target 4.1.1 minimum proficiency level. The average annual growth between 2015 and 2019 in the share of grade 8 students achieving the TImss low benchmark was 0.3 percentage points at grade 4 and 0.5 percentage points at grade 8. Countries exceeding these averages included Chile, where the share grew from 41% in 2003 to 57% in 2011 and 70% in 2019, i.e. its growth rate was at least three times faster than the average. Elsewhere, as in Jordan and Romania, there was little or no growth. Reaching the last 10% is proving challenging even in well-resourced settings. In the United states, 86% of students achieved the TImss low international benchmark in 1995 and 87% in 2019; in New Zealand, the share declined steadily from 89% in 1995 to 82% in 2019 (Figure 10.11).
To improve country coverage of learning outcome data for monitoring of indicator 4.1.1, UNEsCo, the World Bank and UNICEF agreed to establish a Learning Data Compact in mid-2021. The initiative aims to streamline financial and capacity development support in an effort to enable all countries to measure learning in at least two subjects, in at least two grades and over at least two rounds in five years (UIs et al., 2021). For 2015–19, 46% of high-income, 17% upper-middle-income, 29% of lower-middle-income and 37% of low-income countries had at least two subjects in at least two grades assessed. Low-income countries tend to prioritize earlier grades (Figure 10.12). High-income countries tend to prioritize assessments in secondary education, even though a considerable number of primary school students fall below minimum proficiency level.
FIGURE 10.11:Average progress on learning is slow, and often stalls before the goal is reachedPercentage of grade 8 students who achieved the TIMSS low international benchmark in mathematics, selected countries, 1995–2019
a. Countries making fast progress b. Countries making slow or no progress
Guatemala, 2014
2018
90%
80
70
60
50
40
100
3020272019201120031995 2035 20272019201120031995 2035
2030SDG 4
deadline
2030SDG 4
deadline
Lithuania
Turkey
Georgia
ChileIran, Isl. Rep.
Qatar
Oman
United StatesKazakhstan
New Zealand
Romania
U. A. Emirates
Lebanon
Jordan
Saudi Arabia
Morocco
Note: The figure includes countries that have participated in more than one grade 8 TImss round since 1995. Percentages are estimates; standard errors are not displayed.Source: IEA and UNEsCo (2020).
2 0 2 1 / 2 • G LO BA L E D U C AT I O N M O N I TO R I N G R E P O RT 222
10
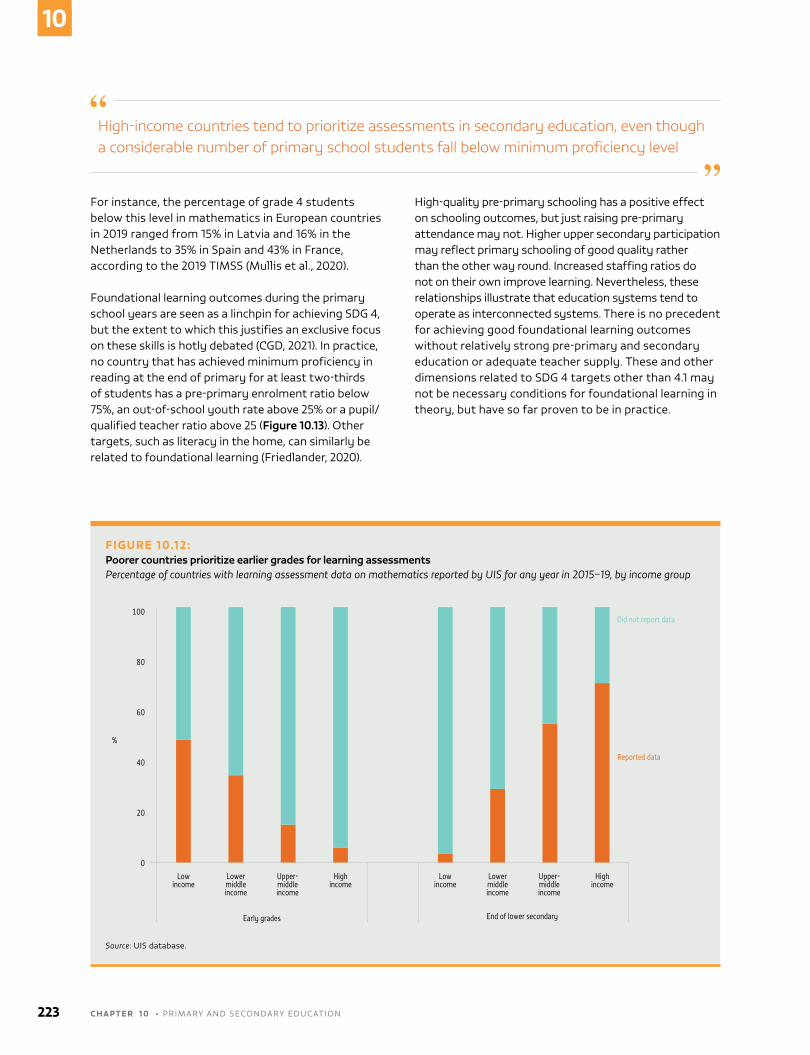
For instance, the percentage of grade 4 students below this level in mathematics in European countries in 2019 ranged from 15% in Latvia and 16% in the Netherlands to 35% in spain and 43% in France, according to the 2019 TImss (mullis et al., 2020).
Foundational learning outcomes during the primary school years are seen as a linchpin for achieving sDG 4, but the extent to which this justifies an exclusive focus on these skills is hotly debated (CGD, 2021). In practice, no country that has achieved minimum proficiency in reading at the end of primary for at least two-thirds of students has a pre-primary enrolment ratio below 75%, an out-of-school youth rate above 25% or a pupil/qualified teacher ratio above 25 (Figure 10.13). other targets, such as literacy in the home, can similarly be related to foundational learning (Friedlander, 2020).
High-quality pre-primary schooling has a positive effect on schooling outcomes, but just raising pre-primary attendance may not. Higher upper secondary participation may reflect primary schooling of good quality rather than the other way round. Increased staffing ratios do not on their own improve learning. Nevertheless, these relationships illustrate that education systems tend to operate as interconnected systems. There is no precedent for achieving good foundational learning outcomes without relatively strong pre-primary and secondary education or adequate teacher supply. These and other dimensions related to sDG 4 targets other than 4.1 may not be necessary conditions for foundational learning in theory, but have so far proven to be in practice.
FIGURE 10.12:Poorer countries prioritize earlier grades for learning assessmentsPercentage of countries with learning assessment data on mathematics reported by UIS for any year in 2015–19, by income group
Guatemala, 2014
2018
80
60
40
20
Low income
Lower middleincome
Early grades End of lower secondary
Reported data
Did not report data
Upper-middleincome
Highincome
Low income
Lower middleincome
Upper-middleincome
Highincome
100
0
%
Source: UIs database.
High-income countries tend to prioritize assessments in secondary education, even though a considerable number of primary school students fall below minimum proficiency level
223 C H A P T E R 1 0 • PRImARy AND sECoNDARy EDUCATIoN
10
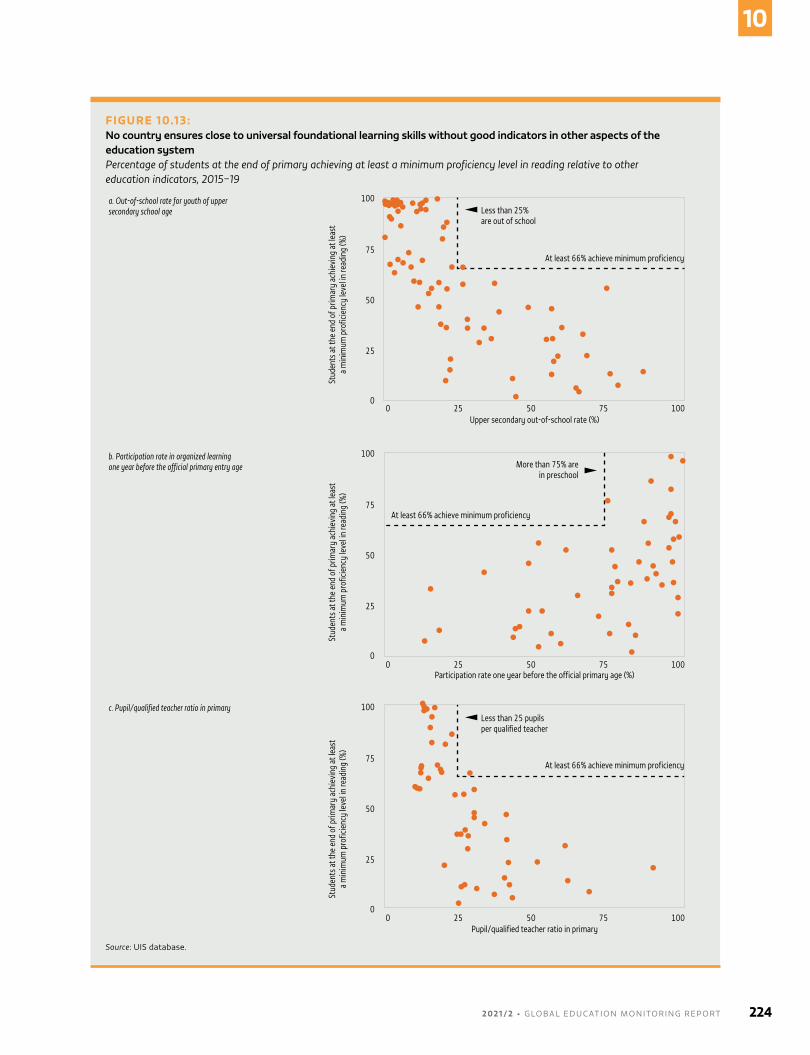
FIGURE 10.13:No country ensures close to universal foundational learning skills without good indicators in other aspects of the education systemPercentage of students at the end of primary achieving at least a minimum proficiency level in reading relative to other education indicators, 2015–19
Guatemala, 2014
2018
Stud
ents
at t
he e
nd o
f prim
ary
achi
evin
g at
leas
t a
min
imum
pro
ficie
ncy
leve
l in re
adin
g (%
)St
uden
ts a
t the
end
of p
rimar
y ac
hiev
ing
at le
ast
a m
inim
um p
rofic
ienc
y le
vel in
read
ing
(%)
100
75
50
25
0
100
75
50
25
0
25 50 75 1000
25 50 75 1000
25 50 75 1000
Upper secondary out-of-school rate (%)
Less than 25% are out of school
Participation rate one year before the official primary age (%)
More than 75% arein preschool
100
75
50
25
0
Stud
ents
at t
he e
nd o
f prim
ary
achi
evin
g at
leas
t a
min
imum
pro
ficie
ncy
leve
l in re
adin
g (%
)
Pupil/qualified teacher ratio in primary
Less than 25 pupilsper qualified teacher
At least 66% achieve minimum proficiency
At least 66% achieve minimum proficiency
At least 66% achieve minimum proficiency
a. Out-of-school rate for youth of upper secondary school age
b. Participation rate in organized learning one year before the official primary entry age
c. Pupil/qualified teacher ratio in primary
Source: UIs database.
2 0 2 1 / 2 • G LO BA L E D U C AT I O N M O N I TO R I N G R E P O RT 224
10
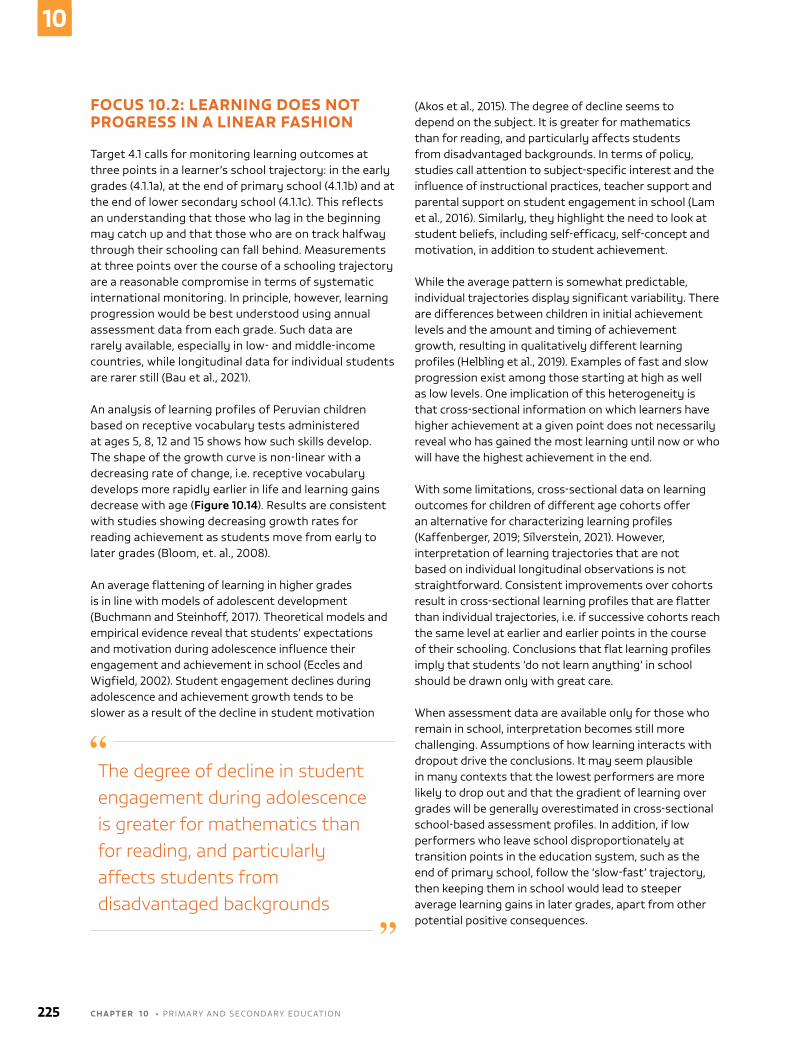
FOCUS 10.2: LEARNING DOES NOT PROGRESS IN A LINEAR FASHION
Target 4.1 calls for monitoring learning outcomes at three points in a learner’s school trajectory: in the early grades (4.1.1a), at the end of primary school (4.1.1b) and at the end of lower secondary school (4.1.1c). This reflects an understanding that those who lag in the beginning may catch up and that those who are on track halfway through their schooling can fall behind. measurements at three points over the course of a schooling trajectory are a reasonable compromise in terms of systematic international monitoring. In principle, however, learning progression would be best understood using annual assessment data from each grade. such data are rarely available, especially in low- and middle-income countries, while longitudinal data for individual students are rarer still (Bau et al., 2021).
An analysis of learning profiles of Peruvian children based on receptive vocabulary tests administered at ages 5, 8, 12 and 15 shows how such skills develop. The shape of the growth curve is non-linear with a decreasing rate of change, i.e. receptive vocabulary develops more rapidly earlier in life and learning gains decrease with age (Figure 10.14). Results are consistent with studies showing decreasing growth rates for reading achievement as students move from early to later grades (Bloom, et. al., 2008).
An average flattening of learning in higher grades is in line with models of adolescent development (Buchmann and steinhoff, 2017). Theoretical models and empirical evidence reveal that students’ expectations and motivation during adolescence influence their engagement and achievement in school (Eccles and Wigfield, 2002). student engagement declines during adolescence and achievement growth tends to be slower as a result of the decline in student motivation
(Akos et al., 2015). The degree of decline seems to depend on the subject. It is greater for mathematics than for reading, and particularly affects students from disadvantaged backgrounds. In terms of policy, studies call attention to subject-specific interest and the influence of instructional practices, teacher support and parental support on student engagement in school (Lam et al., 2016). similarly, they highlight the need to look at student beliefs, including self-efficacy, self-concept and motivation, in addition to student achievement.
While the average pattern is somewhat predictable, individual trajectories display significant variability. There are differences between children in initial achievement levels and the amount and timing of achievement growth, resulting in qualitatively different learning profiles (Helbling et al., 2019). Examples of fast and slow progression exist among those starting at high as well as low levels. one implication of this heterogeneity is that cross-sectional information on which learners have higher achievement at a given point does not necessarily reveal who has gained the most learning until now or who will have the highest achievement in the end.
With some limitations, cross-sectional data on learning outcomes for children of different age cohorts offer an alternative for characterizing learning profiles (Kaffenberger, 2019; silverstein, 2021). However, interpretation of learning trajectories that are not based on individual longitudinal observations is not straightforward. Consistent improvements over cohorts result in cross-sectional learning profiles that are flatter than individual trajectories, i.e. if successive cohorts reach the same level at earlier and earlier points in the course of their schooling. Conclusions that flat learning profiles imply that students ‘do not learn anything’ in school should be drawn only with great care.
When assessment data are available only for those who remain in school, interpretation becomes still more challenging. Assumptions of how learning interacts with dropout drive the conclusions. It may seem plausible in many contexts that the lowest performers are more likely to drop out and that the gradient of learning over grades will be generally overestimated in cross-sectional school-based assessment profiles. In addition, if low performers who leave school disproportionately at transition points in the education system, such as the end of primary school, follow the ‘slow-fast’ trajectory, then keeping them in school would lead to steeper average learning gains in later grades, apart from other potential positive consequences.
The degree of decline in student engagement during adolescence is greater for mathematics than for reading, and particularly affects students from disadvantaged backgrounds
225 C H A P T E R 1 0 • PRImARy AND sECoNDARy EDUCATIoN
10
FIGURE 10.14:Progress in individual learning is not linearReceptive vocabulary score for children assessed at four ages, Peru, 2006–16
Guatemala, 2014
2018
Age
5
0
25
50
75
100
125
8 12 15
Scor
e
Average
Notes: purple line shows the average score. The orange/green line shows examples of fast-slow/slow-fast individual learning trajectories.Source: young Lives.
2 0 2 1 / 2 • G LO BA L E D U C AT I O N M O N I TO R I N G R E P O RT 226
10
COVID-19
As CoVID-19 struck, schools were forced to close all over the world and governments scrambled to respond to the emergency and to prepare for school reopening. A year and a half later, following successive waves of the pandemic, major differences between countries have emerged regarding the percentage of total instruction days when schools were fully or partially closed or open. By the end of october 2021, Bangladesh, Kuwait, the Philippines and the Bolivarian Republic of Venezuela were the countries with the longest duration of full school closures (between 85% and 93% of total instruction days). Wealthier countries, such as Chile, oman, the Republic of Korea and the United states, but also Ghana, had the longest periods of partial school closures (at least 75% of total instruction days). The countries where schools remained fully open for less than 5% of total instruction days are mainly in Latin America (including Brazil, Ecuador and Panama) but also included Bahrain, India and the Islamic Republic of Iran (Figure 10.15). schools in Belize, Jamaica and Uganda were still closed as of November 2021. some countries never closed their schools, including Belarus, Burundi and Tajikistan.
oceania was the region where schools remained open the longest, an average of 85% of regular instruction days, followed by sub-saharan Africa (57%) and Europe and Northern America (53%). Latin America and the Caribbean was the region where schools remained open the least (25%); the next lowest share was that of Northern Africa and Western Asia (31%). overall, instruction days lost did not vary by level of education.
school closures’ duration and the ability of governments, teachers and families to support students during the pandemic varied greatly between and within countries, resulting in differing effects on learning. Nearly all countries turned to some form of remote learning, but availability of and access to such programmes were limited in low- and middle-income countries, particularly in rural areas (UNEsCo et al., 2021b; UNEsCo et al., 2021c) (Chapter 14).
In sub-saharan Africa, phone survey data from six countries showed variation in uptake of various remote learning solutions. Education television and radio programmes were most popular in Burkina Faso, where 40% of households reported their children following them. The same share of households in Ethiopia and Nigeria followed radio alone. No child reported following radio programmes in mali; instead, 35% of children continued their learning through teacher assignments,
even though in all six countries an average of just one contact with the teacher was reported. Tutoring was especially popular in Nigeria (39%). The use of mobile learning apps received much media attention but was the least common remote learning approach, used by no more than 17% of children in Nigeria and 12% in Ethiopia and by barely any in Burkina Faso, malawi, mali and Uganda (Dang et al., 2021).
A case study of sierra Leone found that despite the availability of distance learning modalities, children preferred self-study with familiar resources from school, such as teacher notes and textbooks. As a result of experience with the Ebola outbreak, the country had interactive radio programming that could accommodate local languages. Teachers were retrained and the curriculum was adjusted. But only about one third of students had access to radio lessons, with children from wealthier families (41%) almost three times as likely to tune in as those from poorer families (15%), for whom financial constraints often made radios and batteries unaffordable. In any case, signal and network coverage gaps left one in three children unreachable. The government is procuring more transmitters for universal coverage (sengeh, 2021; sierra Leone ministry of Basic and senior secondary Education, 2021).
In Northern Africa and Western Asia, countries favoured a mix of interventions to ensure learning continuity, which includes face-to-face, hybrid and full remote learning modalities based on different contexts and education levels. For instance, Jordan adopted the blended approach and launched the Learning Bridges learning programme that provided both online and offline educational resources to students in grades 4 to 9. Printed learning materials with a QR code were distributed to students on a weekly basis to access audio content and extra learning resources in addition to textbooks (UNEsCo et al., 2021a).
In Asia, online and television lessons were the most common instruction methods. Internet access varied from 41% in lower-middle to 68% in upper-middle and 86% in high-income countries (ADB, 2021). Countries in southern Asia were particularly affected. Bangladesh’s government made remote learning available through radio, television, mobile phones and the internet. But less than 50% of children aged 5 to 15 had access to a radio, computer or television. About 91% of children in the richest but only 9% in the poorest families had television access (Rahman and Ahmed, 2021). In India, 75% of teachers reported that their biggest challenge was reaching students and 51% maintaining class discipline online (UNEsCo and UNICEF, 2021b). In Nepal, 58% of households had internet
227 C H A P T E R 1 0 • PRImARy AND sECoNDARy EDUCATIoN
10
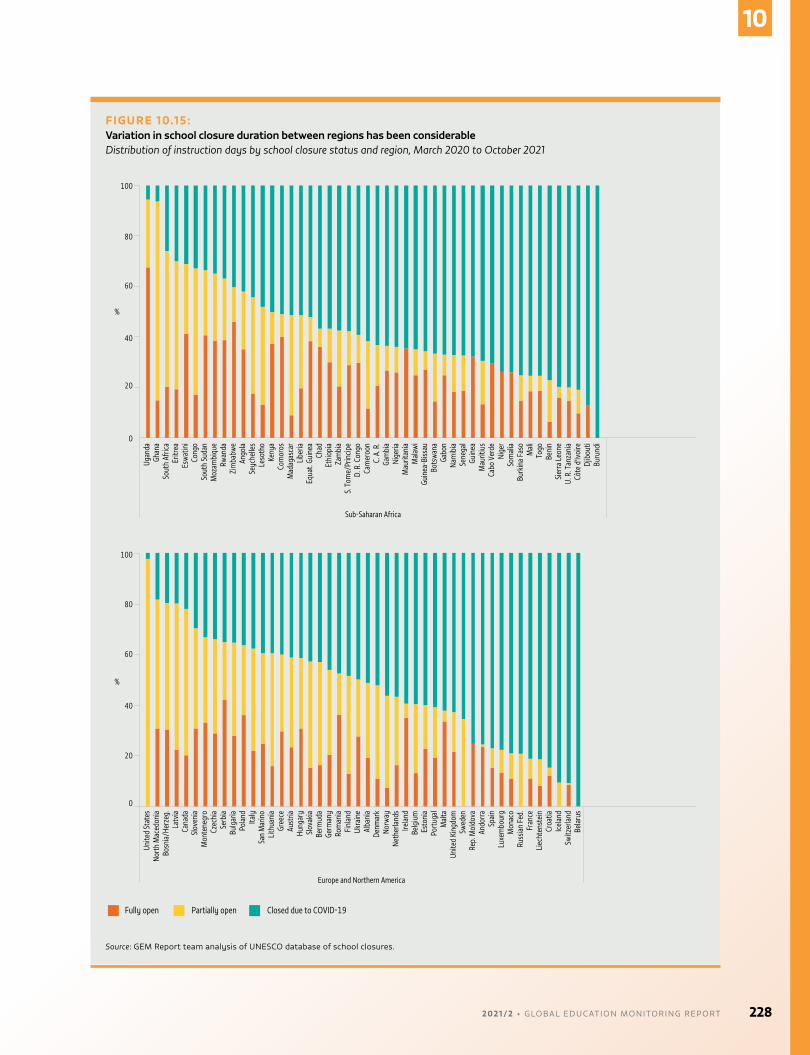
FIGURE 10.15:Variation in school closure duration between regions has been considerableDistribution of instruction days by school closure status and region, March 2020 to October 2021
Ugan
daGh
ana
Sout
h Af
rica
Eritr
eaEs
wat
ini
Cong
oSo
uth
Suda
nM
ozam
biqu
eRw
anda
Zim
babw
eAn
gola
Seyc
helle
sLe
soth
oKe
nya
Com
oros
Mad
agas
car
Libe
riaEq
uat.
Guin
eaCh
adEt
hiop
iaZa
mbi
aS.
Tom
e/Pr
incip
eD.
R. C
ongo
Cam
eroo
nC.
A. R
.Ga
mbi
aNi
geria
Mau
ritan
iaM
alaw
iGu
inea
-Biss
auBo
tsw
ana
Gabo
nNa
mib
iaSe
nega
lGu
inea
Mau
ritiu
sCa
bo V
erde
Nige
rSo
mal
iaBu
rkin
a Fa
soM
ali
Togo
Beni
nSi
erra
Leo
neU.
R. T
anza
nia
Côte
d'Iv
oire
Djib
outi
Buru
ndi
100
80
60
%
40
20
0
Unite
d St
ates
Nort
h M
aced
onia
Bosn
ia/H
erze
g.La
tvia
Cana
daSl
oven
iaM
onte
negr
oCz
echi
aSe
rbia
Bulg
aria
Pola
ndIta
lySa
n M
arin
oLi
thua
nia
Gree
ceAu
stria
Hung
ary
Slov
akia
Berm
uda
Germ
any
Rom
ania
Finl
and
Ukra
ine
Alba
nia
Denm
ark
Norw
ayNe
ther
land
sIre
land
Belg
ium
Esto
nia
Port
ugal
Mal
taUn
ited
King
dom
Swed
enRe
p. M
oldo
vaAn
dorra
Spai
nLu
xem
bour
gM
onac
oRu
ssia
n Fe
d.Fr
ance
Liec
hten
stei
nCr
oatia
Icel
and
Switz
erla
ndBe
laru
s
100
80
Sub-Saharan Africa
Europe and Northern America
60
%
40
20
0
Fully open Partially open Closed due to COVID-19
Source: GEm Report team analysis of UNEsCo database of school closures.
2 0 2 1 / 2 • G LO BA L E D U C AT I O N M O N I TO R I N G R E P O RT 228
10
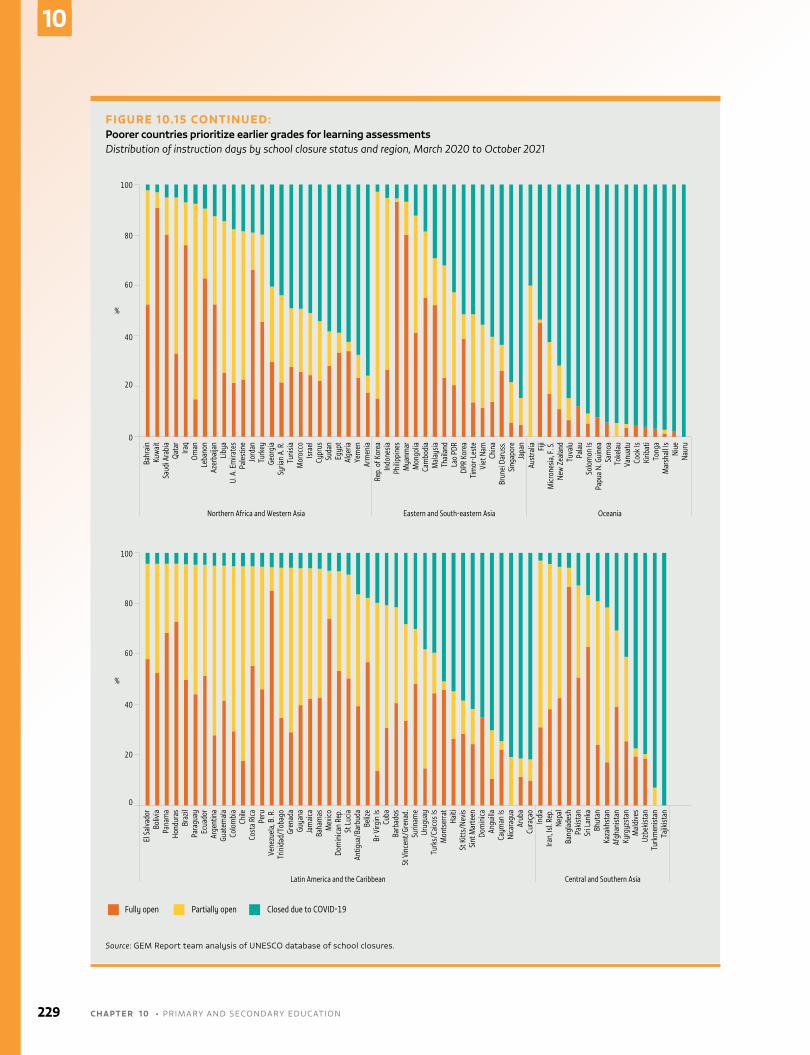
FIGURE 10.15 CONTINUED:Poorer countries prioritize earlier grades for learning assessmentsDistribution of instruction days by school closure status and region, March 2020 to October 2021
Fully open Partially open Closed due to COVID-19
Rep.
of K
orea
Indo
nesia
Philip
pine
sM
yanm
arM
ongo
liaCa
mbo
dia
Mal
aysia
Thai
land
Lao
PDR
DPR
Kore
aTi
mor
-Les
teVi
et N
amCh
ina
Brun
ei D
arus
s.Si
ngap
ore
Japa
nAu
stra
lia Fiji
Micr
ones
ia, F
. S.
New
Zea
land
Tuva
luPa
lau
Solo
mon
IsPa
pua
N. G
uine
aSa
moa
Toke
lau
Vanu
atu
Cook
IsKi
ribat
iTo
nga
Mar
shal
l Is
Niue
Naur
u
Bahr
ain
Kuw
ait
Saud
i Ara
bia
Qata
rIra
qOm
anLe
bano
nAz
erba
ijan
Liby
aU.
A. E
mira
tes
Pale
stin
eJo
rdan
Turk
eyGe
orgi
aSy
rian
A. R
.Tu
nisia
Mor
occo
Israe
lCy
prus
Suda
nEg
ypt
Alge
riaYe
men
Arm
enia
Indi
aIra
n, Is
l. Rep
.Ne
pal
Bang
lade
shPa
kista
nSr
i Lan
kaBh
utan
Kaza
khst
anAf
ghan
istan
Kyrg
yzst
anM
aldi
ves
Uzbe
kista
nTu
rkm
enist
anTa
jikist
an
El S
alva
dor
Boliv
iaPa
nam
aHo
ndur
asBr
azil
Para
guay
Ecua
dor
Arge
ntin
aGu
atem
ala
Colo
mbi
aCh
ileCo
sta
Rica
Peru
Vene
zuel
a, B.
R.
Trin
idad
/Tob
ago
Gren
ada
Guya
naJa
mai
caBa
ham
asM
exico
Dom
inica
n Re
p.St
Luc
iaAn
tigua
/Bar
buda
Beliz
eBr
Virg
in Is
Cuba
Barb
ados
St V
ince
nt/G
rena
d.Su
rinam
eUr
ugua
yTu
rks/
Caico
s Is
Mon
tser
rat
Haiti
St K
itts/
Nevis
Sint
Mar
teen
Dom
inica
Angu
illaCa
yman
IsNi
cara
gua
Arub
aCu
raça
o
Northern Africa and Western Asia Eastern and South-eastern Asia Oceania
Latin America and the Caribbean Central and Southern Asia
100
80
60
%
40
20
0
100
80
60
%
40
20
0
Source: GEm Report team analysis of UNEsCo database of school closures.
229 C H A P T E R 1 0 • PRImARy AND sECoNDARy EDUCATIoN
10
access, but it varied by caste and income; learning relied mostly on textbooks (77%) (Radhakrishnan, et al., 2021). In Pakistan, 60% of households had access to a television but only about half of students watched television lessons (Crawfurd et al., 2021).
Eastern and south-eastern Asia and the Pacific faced CoVID-19 in the middle of rapid technological transformation. Throughout East Asia and the Pacific, it was estimated that 80 million children were not reached by any distance learning modality. In the Lao People’s Democratic Republic, access to the internet via a device at home had increased from less than 2% in 2017 to 43% in 2020. But as only 49% of rural households owned a television, learning was seriously disrupted (UNEsCo and UNICEF, 2021d). The Learning from Home programme was the core of Indonesia’s national response. Concerns that the curriculum was not sufficiently adapted, given that learners were below its standards even during in-person teaching, led to the release of an emergency curriculum in August 2020 that focused on foundation skills (UNEsCo and UNICEF, 2021c).
In China, the number of internet users increased by 86 million in the year to June 2020. Four state-owned mobile operators added base stations to improve network signal coverage and expand bandwidth, and discounted or free internet packages were offered for children from poor families or remote areas. A national programme, Disrupted Classes, Undisrupted Learning, made a range of tools available to students, depending on internet access. The National Network Cloud Platform and National Network of Cloud-based Classrooms offered e-textbooks for Grades 1 to 12 and teacher-developed resources. A public–private partnership arrangement provided free access to 95 companies’ products and services. The curriculum was adapted, balancing time, structure and content of distance learning. China Education Television’s Channel 4 aired 14 hours of programmes per day, covering a population of almost 300 million in rural areas. An assessment of this massive effort identified several potential areas for improvement, including better integration of the online and television modalities and stronger curation of the resource bank, taking into account local needs, teacher capacity and student learning level. The assessment found that the multiplicity of platforms meant a recommended list, supported by operation manuals and training, would have been more efficient (UNEsCo and UNICEF, 2021a).
In Latin America, where schools were closed the longest, countries designed a range of remote learning strategies depending on information and communication technology (ICT) resource availability. yet large gaps between the poorest and richest households were reported in access to the internet (45% vs 98%) and computers (29% vs 94%). Chile, Colombia and Uruguay opted for online learning solutions, whereas countries with less connectivity offered television and radio lessons (IADB, 2020; British Council, 2021).
STUDENT LEARNING IS AT STAKE DUE TO PROLONGED SCHOOL CLOSURES
The costs of CoVID-19 are many, and the lost lives and economic hardship for societies and households have received much attention. yet the potential impact of school closures on young people’s learning could be one of the pandemic’s most costly long-term consequences, potentially spanning generations. many countries are bracing for a major drop in learning levels, as remote learning modalities are only an imperfect substitute for lost classroom instruction time and are not always available, accessible and affordable in the first place.
Evidence on how much school closures have derailed efforts to achieve sDG 4 relied initially on three group of studies. The first drew conclusions from related research on out-of-school contexts, such as effects of summer breaks, school closures due to natural disasters and, more generally, student absenteeism. The second simulated consequences of school closures by postulating scenarios for student learning and the effectiveness of remote programmes during the pandemic. The third was based on survey responses from teachers, families and students, capturing perceptions of school closures’ effects.
simulation exercises have pointed to potentially significant learning losses. one based on Early Grade Reading Assessment data for Ethiopia, Kenya, Liberia, the United Republic of Tanzania and Uganda indicated learning losses caused by a full year of school closure could cumulatively amount to almost three years in the long term (Angrist et al., 2021). Another simulation, using PIsA for Development data, indicated three months of school closures could translate into a year of learning loss (Kaffenberger, 2021). With Progress in International Reading Literacy study data, one set of simulations
2 0 2 1 / 2 • G LO BA L E D U C AT I O N M O N I TO R I N G R E P O RT 230
10
foresaw learning loss exceeding the actual number of schooling days lost by at least 25% in south Africa (Gustafsson and Nuga, 2020). simulations in Asia and the Pacific projected learning losses ranging from 8% of a learning-adjusted year of schooling in the Pacific, where schools mostly stayed open, to 55% in south Asia, where school closures were the longest (ADB, 2021).
As post-CoVID data start trickling in, evaluations of actual changes in student performance observed before and after school closures are emerging. But these studies are not directly comparable. Variation in study design and context restricts what can be learned. some studies look at short-term effects right after students returned to school, while others examine long-term effects as students advanced in school after reopening. studies vary by subject and school level and differ in the contextual information collected from teachers, parents and students, especially on how students continued to learn, which is essential to understand the mechanisms underlying school closures’ impact.
most studies using post-CoVID data have been conducted in high-income countries (Hammerstein et al., 2021; Zierer, 2021). overall, results point to typically – but not exclusively – negative and heterogeneous effects that vary by subject, education level and context. studies from Australia, Belgium, China, Germany, the Netherlands, switzerland and the United states, at an average school closure duration of eight weeks, point to learning losses equivalent to 30% of a school year for mathematics and 35% for reading (Hammerstein et al., 2021), assuming that a year of learning is equivalent to 0.4 standard deviations.
A study in Japan found that grade 4 to 6 students made up short-term learning losses in mathematics by the end of the school year (Asakawa and ohtake, 2021). Evidence of positive effects of remote learning was found in Australia, Germany and the Netherlands (Gore et al., 2021, meeter, 2021, spitzer and musslick, 2020).
However, there is clear evidence that effects differ by education level and socioeconomic status. Primary school students seem to have been more affected than secondary school students, likely due to their less developed self-regulation skills (Tomasik et al., 2020). Likewise, school closures were more detrimental for students from disadvantaged socioeconomic backgrounds, who had less ICT access, lower ICT skills and less support from parents (van de Werfhorst, 2021).
In France, where schools closed for only about two months in 2020, the annual large-scale national assessment after schools reopened for the 2020/21 academic year showed a small decline in learning proficiency among grade 2 students in reading but no effect in mathematics. Among grade 6 students, results in both subjects actually have increased (France ministry of National Education, 2021a; 2021b). A large-scale national assessment in Italy found that the share of secondary school students falling below minimum proficiency grew by 5 percentage points in lower secondary and 9 in upper secondary in both reading and mathematics. Losses were higher among the most disadvantaged students and, within that group, especially among those who initially had a higher level of proficiency (INVALsI, 2021).
There is a dearth of direct learning assessments in low- and middle-income countries. The results of the largest study to date, monitoring Impacts on Learning outcomes, managed by the UIs, are not expected before early 2022. The study assessed students at the end of primary school in Burkina Faso, Burundi, Côte d’Ivoire, Kenya, senegal and Zambia, enabling comparison with national assessments prior to the pandemic (Box 10.3).
Individual country studies have shown that learning slowed down. In Ethiopia, a study assessed about 3,000 grade 6 students who had returned to school and been tested before the pandemic at the beginning and end of grade 4. Their learning level had increased but the sampled students had benefited from 45 days of catch-up classes. The results showed that learning growth was below the level that might have been expected and that the effect was worse in rural areas, widening the urban–rural gap (Kim, et al., 2021). A study of about 1,000 students in rural Kenya found that 53% of students showed declines in mathematics achievement, with an average loss of 1.1 years of learning, affecting grade 4 students (69%) more than grade 8 students (31%) (Whizz Education, 2021). In south Africa, grade 2 and 4 students lost between 57% and 81% of a year of reading skills in 2020, relative to their pre-pandemic peers; the effect was larger for those with a higher initial level of skill (Ardington et al., 2021).
The long-standing Annual status of Education Report (AsER) citizen-led assessments in south Asia show that learning levels have declined in the early grades. In rural Karnataka state, India, the share of grade 3 students unable to read rose from 9% to 17% and those unable to recognize a single-digit number from 5% to 11% between
231 C H A P T E R 1 0 • PRImARy AND sECoNDARy EDUCATIoN
10
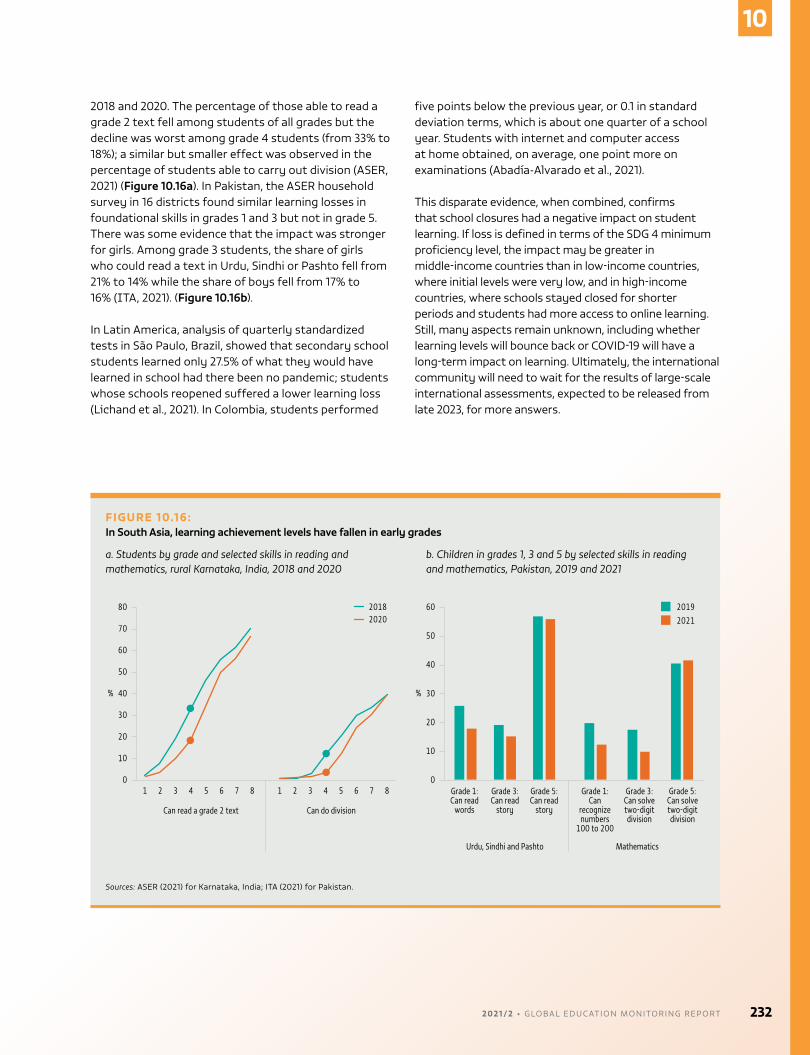
2018 and 2020. The percentage of those able to read a grade 2 text fell among students of all grades but the decline was worst among grade 4 students (from 33% to 18%); a similar but smaller effect was observed in the percentage of students able to carry out division (AsER, 2021) (Figure 10.16a). In Pakistan, the AsER household survey in 16 districts found similar learning losses in foundational skills in grades 1 and 3 but not in grade 5. There was some evidence that the impact was stronger for girls. Among grade 3 students, the share of girls who could read a text in Urdu, sindhi or Pashto fell from 21% to 14% while the share of boys fell from 17% to 16% (ITA, 2021). (Figure 10.16b).
In Latin America, analysis of quarterly standardized tests in são Paulo, Brazil, showed that secondary school students learned only 27.5% of what they would have learned in school had there been no pandemic; students whose schools reopened suffered a lower learning loss (Lichand et al., 2021). In Colombia, students performed
five points below the previous year, or 0.1 in standard deviation terms, which is about one quarter of a school year. students with internet and computer access at home obtained, on average, one point more on examinations (Abadía-Alvarado et al., 2021).
This disparate evidence, when combined, confirms that school closures had a negative impact on student learning. If loss is defined in terms of the sDG 4 minimum proficiency level, the impact may be greater in middle-income countries than in low-income countries, where initial levels were very low, and in high-income countries, where schools stayed closed for shorter periods and students had more access to online learning. still, many aspects remain unknown, including whether learning levels will bounce back or CoVID-19 will have a long-term impact on learning. Ultimately, the international community will need to wait for the results of large-scale international assessments, expected to be released from late 2023, for more answers.
FIGURE 10.16:In South Asia, learning achievement levels have fallen in early grades
a. Students by grade and selected skills in reading and mathematics, rural Karnataka, India, 2018 and 2020
b. Children in grades 1, 3 and 5 by selected skills in reading and mathematics, Pakistan, 2019 and 2021
Guatemala, 2014
2018
Can read a grade 2 text Can do division
80
60
% 40
20
10
30
50
70
1 2 3 4 5 6 7 8 1 2 3 4 5 6 7 80
20182020
Urdu, Sindhi and Pashto Mathematics
Grade 1: Can read
words
Grade 3: Can read
story
Grade 5: Can read
story
Grade 1: Can
recognize numbers
100 to 200
Grade 3: Can solve two-digit division
Grade 5: Can solve two-digit division
60
%
40
20
10
30
50
0
20192021
Sources: AsER (2021) for Karnataka, India; ITA (2021) for Pakistan.
2 0 2 1 / 2 • G LO BA L E D U C AT I O N M O N I TO R I N G R E P O RT 232
10
REMEDIATION MEASURES ARE NEEDED TO SUPPORT DISADVANTAGED STUDENTS
When the pandemic struck, many countries were faced with difficult choices. The Plurinational state of Bolivia cancelled the academic year, as weak connectivity in rural and remote areas made virtual classes impossible (Dube, 2020; Eulich, 2020). Kenya decided in July 2020 that the school year would be repeated but subsequently announced that two terms would be covered by the end of may 2021 so that all learners would complete a new school year between June and December 2021 (New york Times, 2020; oduor and Gikandi, 2020). In 2020, up to 70% of countries had adjusted or planned to adjust instruction time and 24% reported that they would increase class time when schools reopened. Papua New Guinea halved the two-week breaks, while Rwanda shifted the academic from January–December to september–June (Nugroho et al., 2020).
By 2021, 41% of countries reported having extended the academic year, while 42% of countries reported using learning loss mitigation measures, such as prioritizing certain areas of the curriculum or certain skills (UNEsCo et al., 2021). As part of its recovery programme, Bangladesh introduced an abridged syllabus, which will lead to a curriculum and learning assessment reform by 2023 (Daily star, 2021). In India, the Central Board of secondary Education compressed the curriculum by 30% in 2020 and was followed by state education boards such as in odisha (Kalita, 2020). In Pakistan, the curriculum was condensed to a little over half its original size focusing on three subjects (World Bank, 2021a).
As schools re-opened, two thirds of countries reported implementing remedial measures in primary and secondary education (UNEsCo et al., 2021). In Italy, disadvantaged students in lower secondary schools were provided free individual tutoring online during the lockdown. Tutors were university students who volunteered for three to six hours per week. An evaluation found that the programme increased academic performance, especially for more disadvantaged students, and had a positive impact on student socio-emotional skills and psychological well-being, especially for immigrant students (Carlana and La Ferrara, 2021). In 2020, the Department of Education in England, United Kingdom, introduced a GBP1 billion programme. Two thirds of the funds were directed at a universal catch-up premium allocated to schools on a per-pupil basis and the rest to the National Tutoring Programme to support up to 6 million, 15-hour tutoring courses for the most disadvantaged children. An additional GBP700 million were allocated in 2021, including for secondary schools to provide summer schools (House of Commons, 2021).
In Cambodia, remedial learning packages first assess five core competencies in Khmer and mathematics. Based on the results, teachers group students and give them exercises at their respective levels of proficiency for 12 hours per month. In Chile, the national remediation programme consists of three phases: catch-up to grade-level learning, new content learning and formative assessment (World Bank, 2021b). In the Philippines, the Department of Education issued guidelines for six-week remedial classes aimed at students who scored below 75% (Philippines Department of Education, 2021).
233 C H A P T E R 1 0 • PRImARy AND sECoNDARy EDUCATIoN
10

2 0 2 1 / 2 • G LO BA L E D U C AT I O N M O N I TO R I N G R E P O RT 234
10
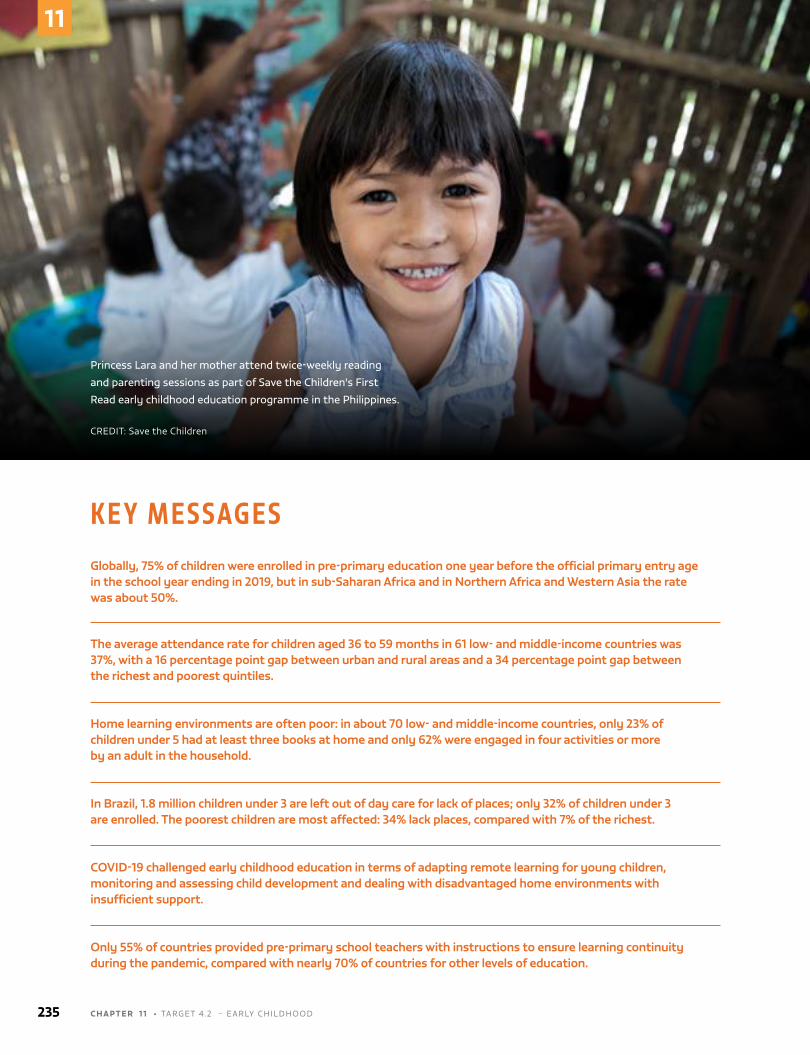
K E Y M E S S AG E SGlobally, 75% of children were enrolled in pre-primary education one year before the official primary entry age in the school year ending in 2019, but in sub-Saharan Africa and in Northern Africa and Western Asia the rate was about 50%.
The average attendance rate for children aged 36 to 59 months in 61 low- and middle-income countries was 37%, with a 16 percentage point gap between urban and rural areas and a 34 percentage point gap between the richest and poorest quintiles.
Home learning environments are often poor: in about 70 low- and middle-income countries, only 23% of children under 5 had at least three books at home and only 62% were engaged in four activities or more by an adult in the household.
In Brazil, 1.8 million children under 3 are left out of day care for lack of places; only 32% of children under 3 are enrolled. The poorest children are most affected: 34% lack places, compared with 7% of the richest.
COVID-19 challenged early childhood education in terms of adapting remote learning for young children, monitoring and assessing child development and dealing with disadvantaged home environments with insufficient support.
Only 55% of countries provided pre-primary school teachers with instructions to ensure learning continuity during the pandemic, compared with nearly 70% of countries for other levels of education.
Princess Lara and her mother attend twice-weekly reading
and parenting sessions as part of Save the Children's First
Read early childhood education programme in the Philippines.
CrEDiT: save the Children
235 C H A P T E R 1 1 • TArGET 4.2 – EArLY CHiLDHooD
11
CHAPTER 11
TARGET 4.2
Early childhood
4.2
By 2030, ensure that all girls and boys have access to quality early childhood development, care and pre-primary education so that they are ready for primary education
GLOBAL INDICATOR
4.2.1 – Proportion of children aged 24–59 months who are developmentally on track in
health, learning and psychosocial well-being, by sex
4.2.2 – Participation rate in organized learning (one year before the official primary entry
age), by sex
THEMATIC INDICATORS
4.2.3 – Percentage of children under 5 years of age experiencing positive and stimulating
home learning environments
4.2.4 – Gross early childhood education enrolment ratio in (a) pre-primary education and
(b) early childhood educational development
4.2.5 – Number of years of (i) free and (ii) compulsory pre-primary education guaranteed
in legal frameworks
2 0 2 1 / 2 • G LO BA L E D U C AT I O N M O N I TO R I N G R E P O RT 236
11
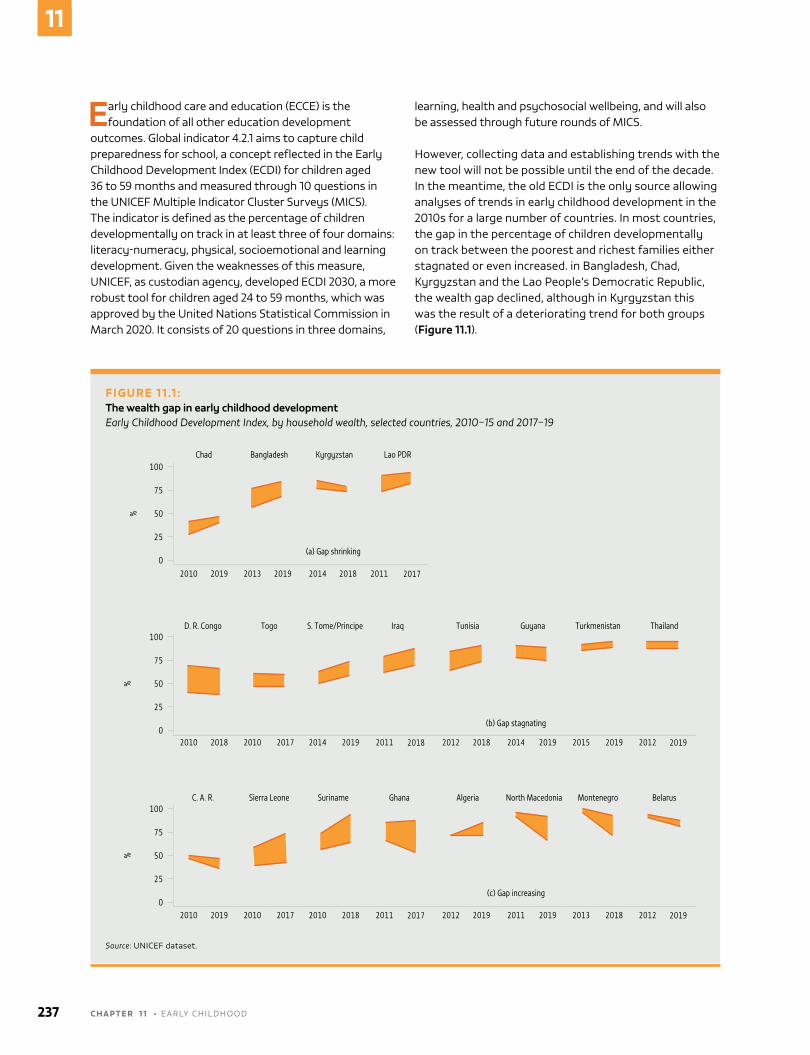
Early childhood care and education (ECCE) is the foundation of all other education development
outcomes. Global indicator 4.2.1 aims to capture child preparedness for school, a concept reflected in the Early Childhood Development index (ECDi) for children aged 36 to 59 months and measured through 10 questions in the UniCEF Multiple indicator Cluster surveys (MiCs). The indicator is defined as the percentage of children developmentally on track in at least three of four domains: literacy-numeracy, physical, socioemotional and learning development. Given the weaknesses of this measure, UniCEF, as custodian agency, developed ECDi 2030, a more robust tool for children aged 24 to 59 months, which was approved by the United nations statistical Commission in March 2020. it consists of 20 questions in three domains,
learning, health and psychosocial wellbeing, and will also be assessed through future rounds of MiCs.
However, collecting data and establishing trends with the new tool will not be possible until the end of the decade. in the meantime, the old ECDi is the only source allowing analyses of trends in early childhood development in the 2010s for a large number of countries. in most countries, the gap in the percentage of children developmentally on track between the poorest and richest families either stagnated or even increased. in Bangladesh, Chad, Kyrgyzstan and the Lao People’s Democratic republic, the wealth gap declined, although in Kyrgyzstan this was the result of a deteriorating trend for both groups (Figure 11.1).
FIGURE 11.1 :The wealth gap in early childhood developmentEarly Childhood Development Index, by household wealth, selected countries, 2010–15 and 2017–19
Guatemala, 2014
2018
2010 2019 2013 2019 2014 2018 2011 2017
2010 2018 2010 2017 2014 2019 2011 2018 2012 2018 2014 2019 2015 2019 2012 2019
2010 2019 2010 2017 2010 2018 2011 2017 2012 2019 2011 2019 2013 2018 2012 2019
%%
%
75
50
25
100
0
75
50
25
100
0
75
50
25
100
0
Chad Bangladesh
(a) Gap shrinking
Kyrgyzstan Lao PDR
D. R. Congo Togo S. Tome/Principe Iraq Tunisia Guyana Turkmenistan Thailand
C. A. R. Sierra Leone Suriname Ghana Algeria North Macedonia Montenegro Belarus
(b) Gap stagnating
(c) Gap increasing
Source: UniCEF dataset.
237 C H A P T E R 1 1 • EArLY CHiLDHooD
11
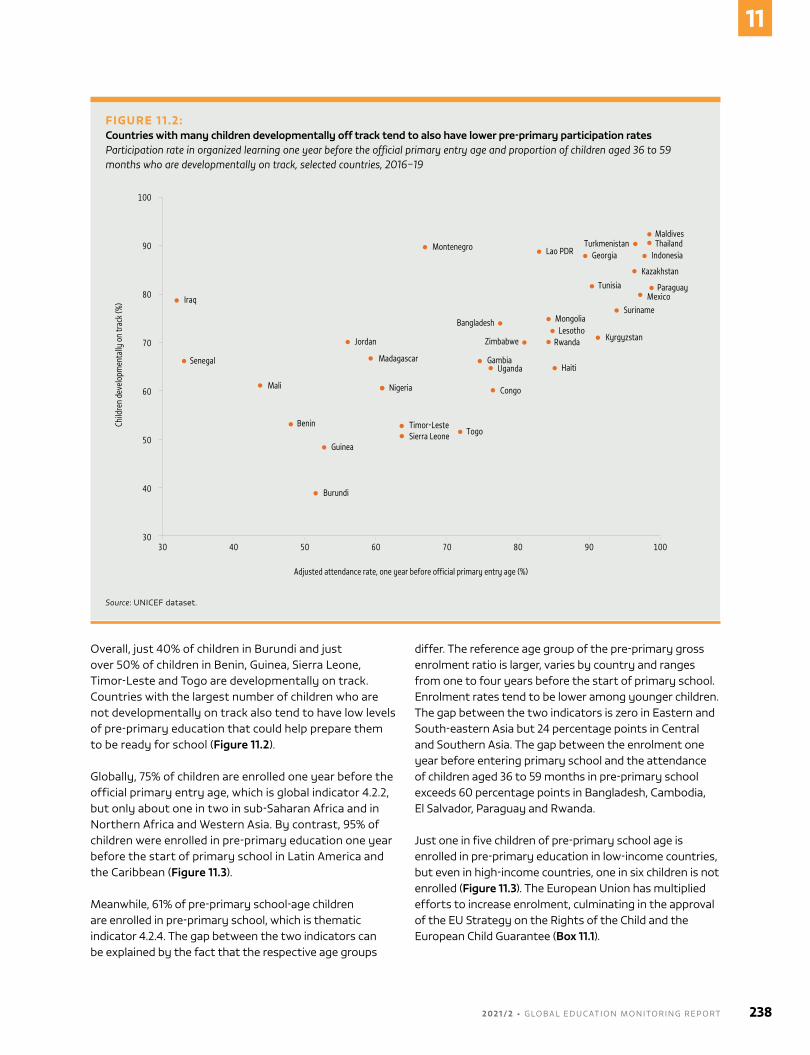
overall, just 40% of children in Burundi and just over 50% of children in Benin, Guinea, sierra Leone, Timor-Leste and Togo are developmentally on track. Countries with the largest number of children who are not developmentally on track also tend to have low levels of pre-primary education that could help prepare them to be ready for school (Figure 11.2).
Globally, 75% of children are enrolled one year before the official primary entry age, which is global indicator 4.2.2, but only about one in two in sub-saharan Africa and in northern Africa and Western Asia. By contrast, 95% of children were enrolled in pre-primary education one year before the start of primary school in Latin America and the Caribbean (Figure 11.3).
Meanwhile, 61% of pre-primary school-age children are enrolled in pre-primary school, which is thematic indicator 4.2.4. The gap between the two indicators can be explained by the fact that the respective age groups
differ. The reference age group of the pre-primary gross enrolment ratio is larger, varies by country and ranges from one to four years before the start of primary school. Enrolment rates tend to be lower among younger children. The gap between the two indicators is zero in Eastern and south-eastern Asia but 24 percentage points in Central and southern Asia. The gap between the enrolment one year before entering primary school and the attendance of children aged 36 to 59 months in pre-primary school exceeds 60 percentage points in Bangladesh, Cambodia, El salvador, Paraguay and rwanda.
Just one in five children of pre-primary school age is enrolled in pre-primary education in low-income countries, but even in high-income countries, one in six children is not enrolled (Figure 11.3). The European Union has multiplied efforts to increase enrolment, culminating in the approval of the EU strategy on the rights of the Child and the European Child Guarantee (Box 11.1).
FIGURE 11.2:Countries with many children developmentally off track tend to also have lower pre-primary participation ratesParticipation rate in organized learning one year before the official primary entry age and proportion of children aged 36 to 59 months who are developmentally on track, selected countries, 2016–19
Guatemala, 2014
2018
90
80
70
60
50
40
100
3090807060504030 100
Adjusted attendance rate, one year before official primary entry age (%)
Child
ren
deve
lopm
enta
lly o
n tr
ack (
%) Iraq
Senegal
Mali
Burundi
Guinea
BeninSierra Leone
Madagascar
Jordan
Montenegro
Nigeria
Timor-LesteTogo
Gambia
Bangladesh
Lao PDR
Zimbabwe
Congo
Uganda Haiti
RwandaLesotho
Kyrgyzstan
MongoliaSuriname
MexicoTunisia
Kazakhstan
GeorgiaTurkmenistan
MaldivesThailand
Indonesia
Paraguay
Source: UniCEF dataset.
2 0 2 1 / 2 • G LO BA L E D U C AT I O N M O N I TO R I N G R E P O RT 238
11
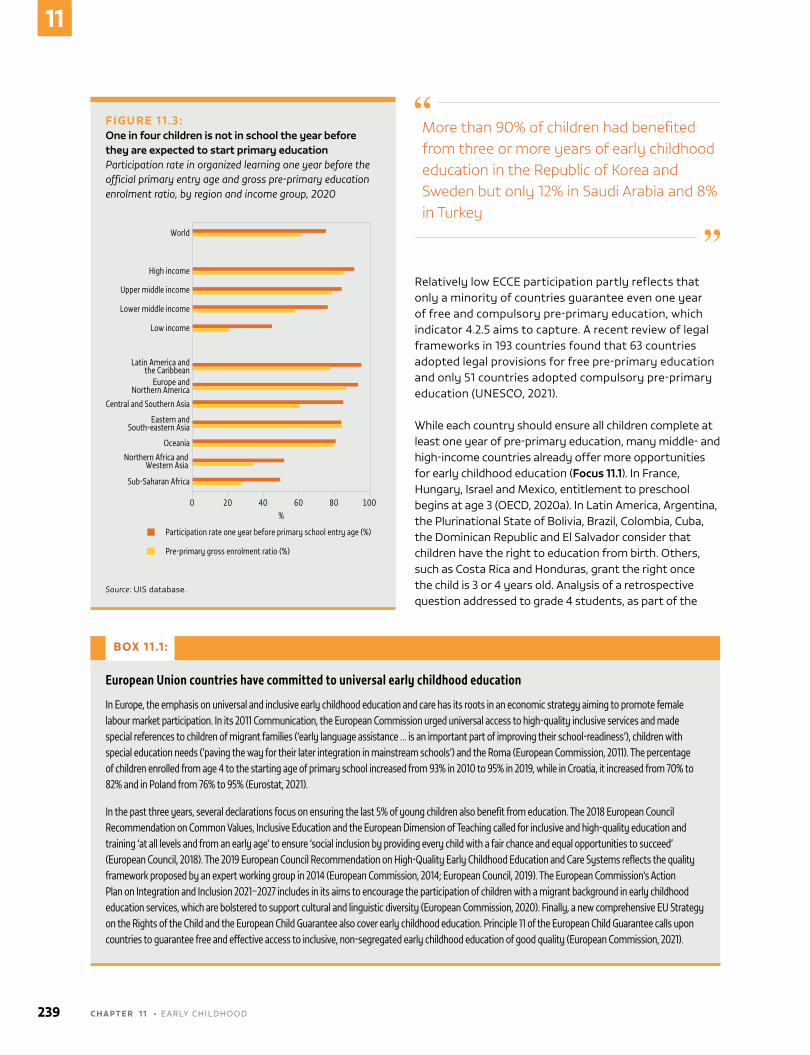
relatively low ECCE participation partly reflects that only a minority of countries guarantee even one year of free and compulsory pre-primary education, which indicator 4.2.5 aims to capture. A recent review of legal frameworks in 193 countries found that 63 countries adopted legal provisions for free pre-primary education and only 51 countries adopted compulsory pre-primary education (UnEsCo, 2021).
While each country should ensure all children complete at least one year of pre-primary education, many middle- and high-income countries already offer more opportunities for early childhood education (Focus 11.1). in France, Hungary, israel and Mexico, entitlement to preschool begins at age 3 (oECD, 2020a). in Latin America, Argentina, the Plurinational state of Bolivia, Brazil, Colombia, Cuba, the Dominican republic and El salvador consider that children have the right to education from birth. others, such as Costa rica and Honduras, grant the right once the child is 3 or 4 years old. Analysis of a retrospective question addressed to grade 4 students, as part of the
More than 90% of children had benefited from three or more years of early childhood education in the Republic of Korea and Sweden but only 12% in Saudi Arabia and 8% in Turkey
BOX 11.1 :
European Union countries have committed to universal early childhood education
In Europe, the emphasis on universal and inclusive early childhood education and care has its roots in an economic strategy aiming to promote female labour market participation. In its 2011 Communication, the European Commission urged universal access to high-quality inclusive services and made special references to children of migrant families (‘early language assistance … is an important part of improving their school-readiness’), children with special education needs (‘paving the way for their later integration in mainstream schools’) and the Roma (European Commission, 2011). The percentage of children enrolled from age 4 to the starting age of primary school increased from 93% in 2010 to 95% in 2019, while in Croatia, it increased from 70% to 82% and in Poland from 76% to 95% (Eurostat, 2021).
In the past three years, several declarations focus on ensuring the last 5% of young children also benefit from education. The 2018 European Council Recommendation on Common Values, Inclusive Education and the European Dimension of Teaching called for inclusive and high-quality education and training ‘at all levels and from an early age’ to ensure ‘social inclusion by providing every child with a fair chance and equal opportunities to succeed’ (European Council, 2018). The 2019 European Council Recommendation on High-Quality Early Childhood Education and Care Systems reflects the quality framework proposed by an expert working group in 2014 (European Commission, 2014; European Council, 2019). The European Commission’s Action Plan on Integration and Inclusion 2021–2027 includes in its aims to encourage the participation of children with a migrant background in early childhood education services, which are bolstered to support cultural and linguistic diversity (European Commission, 2020). Finally, a new comprehensive EU Strategy on the Rights of the Child and the European Child Guarantee also cover early childhood education. Principle 11 of the European Child Guarantee calls upon countries to guarantee free and effective access to inclusive, non-segregated early childhood education of good quality (European Commission, 2021).
FIGURE 11.3:One in four children is not in school the year before they are expected to start primary educationParticipation rate in organized learning one year before the official primary entry age and gross pre-primary education enrolment ratio, by region and income group, 2020
Guatemala, 2014
2018
World
Sub-Saharan Africa
Participation rate one year before primary school entry age (%)
%806040200 100
Pre-primary gross enrolment ratio (%)
Northern Africa and Western Asia
Oceania
Eastern and South-eastern Asia
Central and Southern Asia
Europe and Northern America
Latin America and the Caribbean
Lower middle income
Upper middle income
High income
Low income
Source: Uis database.
239 C H A P T E R 1 1 • EArLY CHiLDHooD
11
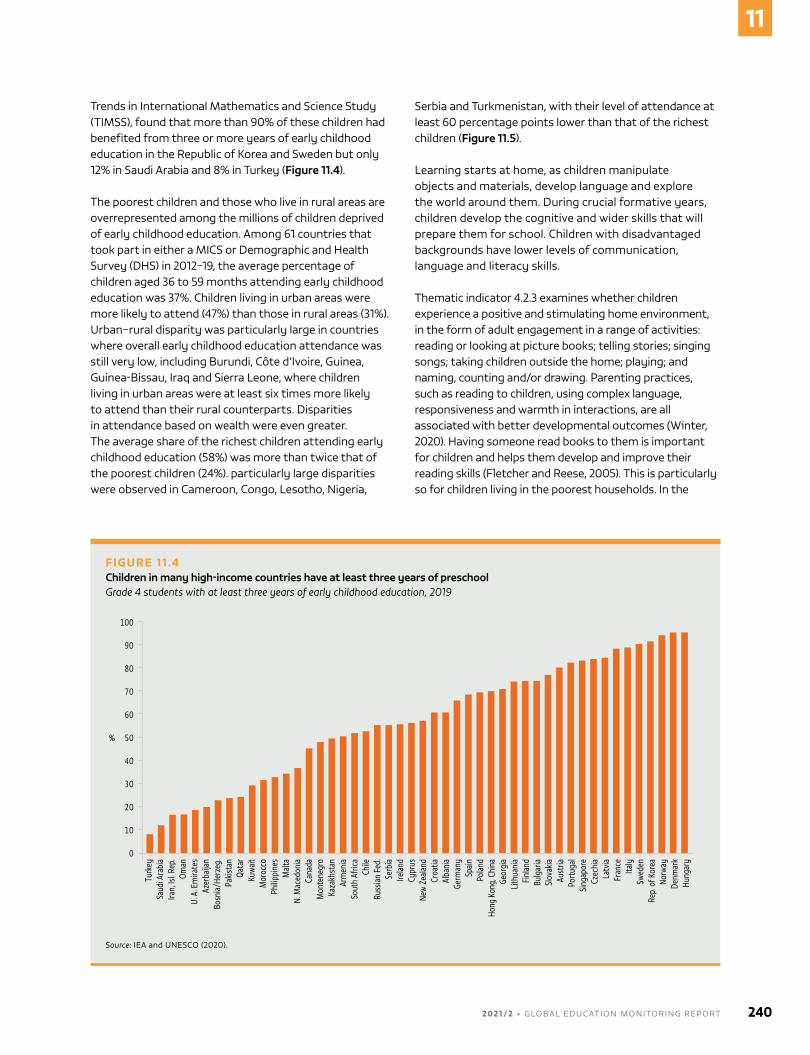
FIGURE 11.4Children in many high-income countries have at least three years of preschoolGrade 4 students with at least three years of early childhood education, 2019
Guatemala, 2014
2018
90
80
70
60
50%
40
30
20
10
100
0
Turk
eySa
udi A
rabi
aIra
n, Is
l. Rep
.Om
anU.
A. E
mira
tes
Azer
baija
nBo
snia
/Her
zeg.
Pakis
tan
Qata
rKu
wai
tM
oroc
coPh
ilippi
nes
Mal
taN.
Mac
edon
iaCa
nada
Mon
tene
gro
Kaza
khst
anAr
men
iaSo
uth
Afric
aCh
ileRu
ssia
n Fe
d.Se
rbia
Irela
ndCy
prus
New
Zea
land
Croa
tiaAl
bani
aGe
rman
ySp
ain
Pola
ndHo
ng K
ong,
Chi
naGe
orgi
aLi
thua
nia
Finl
and
Bulg
aria
Slov
akia
Aust
riaPo
rtug
alSi
ngap
ore
Czec
hia
Latv
iaFr
ance
Italy
Swed
enRe
p. o
f Kor
eaNo
rway
Denm
ark
Hung
ary
Source: iEA and UnEsCo (2020).
Trends in international Mathematics and science study (TiMss), found that more than 90% of these children had benefited from three or more years of early childhood education in the republic of Korea and sweden but only 12% in saudi Arabia and 8% in Turkey (Figure 11.4).
The poorest children and those who live in rural areas are overrepresented among the millions of children deprived of early childhood education. Among 61 countries that took part in either a MiCs or Demographic and Health survey (DHs) in 2012–19, the average percentage of children aged 36 to 59 months attending early childhood education was 37%. Children living in urban areas were more likely to attend (47%) than those in rural areas (31%). Urban–rural disparity was particularly large in countries where overall early childhood education attendance was still very low, including Burundi, Côte d’ivoire, Guinea, Guinea-Bissau, iraq and sierra Leone, where children living in urban areas were at least six times more likely to attend than their rural counterparts. Disparities in attendance based on wealth were even greater. The average share of the richest children attending early childhood education (58%) was more than twice that of the poorest children (24%). particularly large disparities were observed in Cameroon, Congo, Lesotho, nigeria,
serbia and Turkmenistan, with their level of attendance at least 60 percentage points lower than that of the richest children (Figure 11.5).
Learning starts at home, as children manipulate objects and materials, develop language and explore the world around them. During crucial formative years, children develop the cognitive and wider skills that will prepare them for school. Children with disadvantaged backgrounds have lower levels of communication, language and literacy skills.
Thematic indicator 4.2.3 examines whether children experience a positive and stimulating home environment, in the form of adult engagement in a range of activities: reading or looking at picture books; telling stories; singing songs; taking children outside the home; playing; and naming, counting and/or drawing. Parenting practices, such as reading to children, using complex language, responsiveness and warmth in interactions, are all associated with better developmental outcomes (Winter, 2020). Having someone read books to them is important for children and helps them develop and improve their reading skills (Fletcher and reese, 2005). This is particularly so for children living in the poorest households. in the
2 0 2 1 / 2 • G LO BA L E D U C AT I O N M O N I TO R I N G R E P O RT 240
11
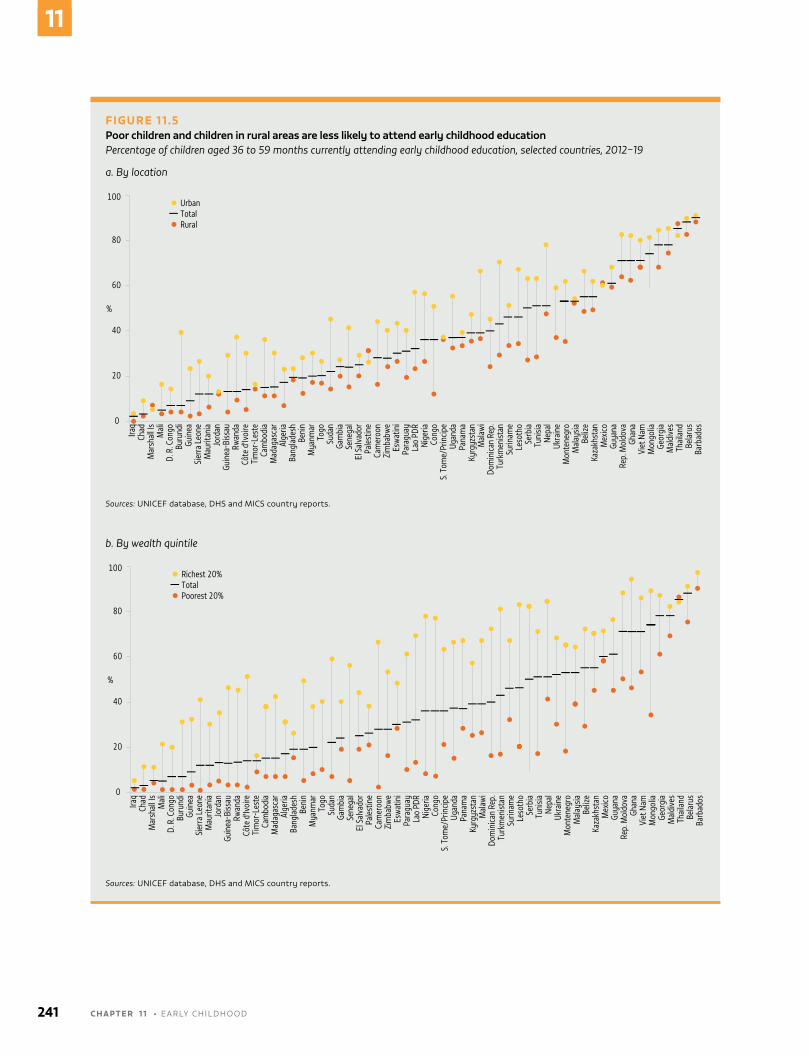
FIGURE 11.5Poor children and children in rural areas are less likely to attend early childhood educationPercentage of children aged 36 to 59 months currently attending early childhood education, selected countries, 2012–19
a. By location
Guatemala, 2014
2018
80
60
%
40
20
100
0
Iraq
Chad
Mar
shal
l Is
Mal
iD.
R. C
ongo
Buru
ndi
Guin
eaSi
erra
Leo
neM
aurit
ania
Jord
anGu
inea
-Biss
auRw
anda
Côte
d'Iv
oire
Tim
or-L
este
Cam
bodi
aM
adag
asca
rAl
geria
Bang
lade
shBe
nin
Mya
nmar
Togo
Suda
nGa
mbi
aSe
nega
lEl
Sal
vado
rPa
lest
ine
Cam
eroo
nZi
mba
bwe
Esw
atin
iPa
ragu
ayLa
o PD
R Ni
geria
Cong
oS.
Tom
e/Pr
incip
eUg
anda
Pana
ma
Kyrg
yzst
anM
alaw
iDo
min
ican
Rep.
Turk
men
istan
Surin
ame
Leso
tho
Serb
iaTu
nisia
Nepa
lUk
rain
eM
onte
negr
oM
alay
siaBe
lize
Kaza
khst
anM
exico
Guya
naRe
p. M
oldo
vaGh
ana
Viet
Nam
Mon
golia
Geor
gia
Mal
dive
sTh
aila
ndBe
laru
sBa
rbad
os
TotalRural
Urban
Sources: UniCEF database, DHs and MiCs country reports.
b. By wealth quintile
Guatemala, 2014
2018
80
60
%
40
20
100
0
Iraq
Chad
Mar
shal
l Is
Mal
iD.
R. C
ongo
Buru
ndi
Guin
eaSi
erra
Leo
neM
aurit
ania
Jord
anGu
inea
-Biss
auRw
anda
Côte
d'Iv
oire
Tim
or-L
este
Cam
bodi
aM
adag
asca
rAl
geria
Bang
lade
shBe
nin
Mya
nmar
Togo
Suda
nGa
mbi
aSe
nega
lEl
Sal
vado
rPa
lest
ine
Cam
eroo
nZi
mba
bwe
Esw
atin
iPa
ragu
ayLa
o PD
R Ni
geria
Cong
oS.
Tom
e/Pr
incip
eUg
anda
Pana
ma
Kyrg
yzst
anM
alaw
iDo
min
ican
Rep.
Turk
men
istan
Surin
ame
Leso
tho
Serb
iaTu
nisia
Nepa
lUk
rain
eM
onte
negr
oM
alay
siaBe
lize
Kaza
khst
anM
exico
Guya
naRe
p. M
oldo
vaGh
ana
Viet
Nam
Mon
golia
Geor
gia
Mal
dive
sTh
aila
ndBe
laru
sBa
rbad
os
TotalPoorest 20%
Richest 20%
Sources: UniCEF database, DHs and MiCs country reports.
241 C H A P T E R 1 1 • EArLY CHiLDHooD
11
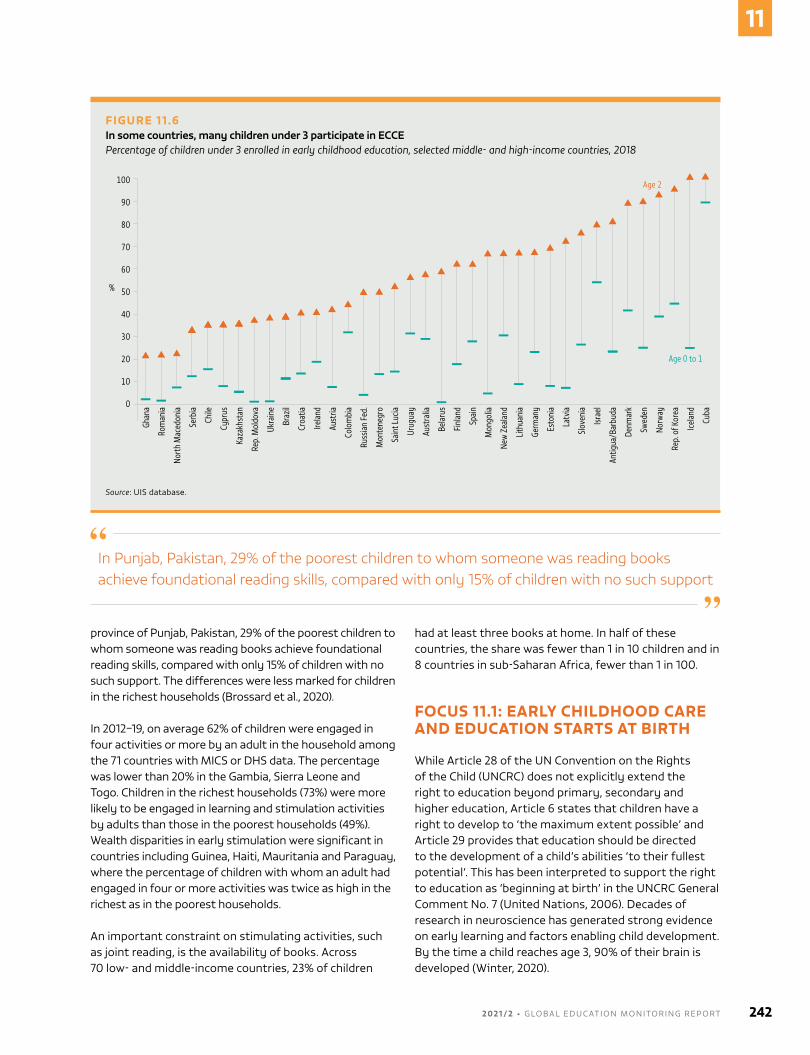
FIGURE 11.6In some countries, many children under 3 participate in ECCEPercentage of children under 3 enrolled in early childhood education, selected middle- and high-income countries, 2018
Guatemala, 2014
2018
80
60
%
40
20
100
0
Ghan
a
Rom
ania
Nort
h M
aced
onia
Serb
ia
Chile
Cypr
us
Kaza
khst
an
Rep.
Mol
dova
Ukra
ine
Braz
il
Croa
tia
Irela
nd
Aust
ria
Colo
mbi
a
Russ
ian
Fed.
Mon
tene
gro
Sain
t Luc
ia
Urug
uay
Aust
ralia
Bela
rus
Finl
and
Spai
n
Mon
golia
New
Zea
land
Lith
uani
a
Germ
any
Esto
nia
Latv
ia
Slov
enia
Israe
l
Antig
ua/B
arbu
da
Denm
ark
Swed
en
Norw
ay
Rep.
of K
orea
Icel
and
Cuba
90
50
70
30
10
Age 2
Age 0 to 1
Source: Uis database.
province of Punjab, Pakistan, 29% of the poorest children to whom someone was reading books achieve foundational reading skills, compared with only 15% of children with no such support. The differences were less marked for children in the richest households (Brossard et al., 2020).
in 2012–19, on average 62% of children were engaged in four activities or more by an adult in the household among the 71 countries with MiCs or DHs data. The percentage was lower than 20% in the Gambia, sierra Leone and Togo. Children in the richest households (73%) were more likely to be engaged in learning and stimulation activities by adults than those in the poorest households (49%). Wealth disparities in early stimulation were significant in countries including Guinea, Haiti, Mauritania and Paraguay, where the percentage of children with whom an adult had engaged in four or more activities was twice as high in the richest as in the poorest households.
An important constraint on stimulating activities, such as joint reading, is the availability of books. Across 70 low- and middle-income countries, 23% of children
had at least three books at home. in half of these countries, the share was fewer than 1 in 10 children and in 8 countries in sub-saharan Africa, fewer than 1 in 100.
FOCUS 11.1: EARLY CHILDHOOD CARE AND EDUCATION STARTS AT BIRTH
While Article 28 of the Un Convention on the rights of the Child (UnCrC) does not explicitly extend the right to education beyond primary, secondary and higher education, Article 6 states that children have a right to develop to ‘the maximum extent possible’ and Article 29 provides that education should be directed to the development of a child’s abilities ‘to their fullest potential’. This has been interpreted to support the right to education as ‘beginning at birth’ in the UnCrC General Comment no. 7 (United nations, 2006). Decades of research in neuroscience has generated strong evidence on early learning and factors enabling child development. By the time a child reaches age 3, 90% of their brain is developed (Winter, 2020).
In Punjab, Pakistan, 29% of the poorest children to whom someone was reading books achieve foundational reading skills, compared with only 15% of children with no such support
2 0 2 1 / 2 • G LO BA L E D U C AT I O N M O N I TO R I N G R E P O RT 242
11
Participation of children under 3 in ECCE programmes tends to be limited, though it reaches over 20% for ages 0 to 1 and over 60% for age 2 in several middle- and high-income countries (Figure 11.6). in Cuba, where ECCE programmes have been a priority for over 50 years, more than 80% of 0- to 1-year-olds and 100% of 2-year-olds are enrolled. strong intersectoral interventions focusing on education, health and child protection are available from pregnancy, and strong community and family involvement, particularly through the Educate Your Child programme, increase the reach of ECCE in rural or remote areas (Laire, 2016).
other countries have tried to increase access through regulation. Denmark, Estonia, Finland, Germany, Latvia, norway and slovenia guarantee places in ECCE in their regulatory frameworks for all children after the end of parental leave (oECD, 2020b). Ghana and Mozambique have included the right to ECCE access from birth in policy objectives, to be accomplished gradually (Ghana Ministry of Women and Children’s Affairs, 2004; Mozambique Ministry of Education and Human Development, 2020).
Affordability of ECCE for the youngest is a challenge; private sources account for a considerable share of spending (Chapter 6). in Colombia and israel, private sources account for over 80% of spending in early childhood educational development programmes, compared with less than 30% for pre-primary (oECD, 2021). Especially for children under 3, demand exceeds public supply in most countries, and public subsidies may not be granted from birth. in slovenia, preschool is free of charge for all children aged 3 to 6. Luxembourg offers free preschool from age 3, and since october 2017, a voucher system finances 20 hours of free childcare in the non-formal education sector to children aged 1 to 4 (Luxembourg national Youth services, 2020).
in Brazil, 1.8 million children under 3 are left out of day care for lack of places; only 32% of children under 3 are enrolled (IBGE, 2018b). The poorest children are most affected, with 34% lacking ECCE places, compared with 7% of the richest (IBGE, 2018a). in rio de Janeiro, where a lottery system was introduced to increase access in low-income neighbourhoods, access remains a major challenge. initiatives are being taken to address this by increasing the use of community mothers and informal childcare (Attanasio, 2017; Walker, 2019).
In Brazil, 34% of the poorest children lack ECCE places, compared with 7% of the richest
Even in high-income countries, access to ECCE still depends very much on socioeconomic background. in France and ireland, the difference in participation between 0- to 2-year-olds in low- and high-income households is over 50 percentage points. in Denmark and sweden, by contrast, only 2% of low-income households report wanting more access to childcare but being unable to afford it (oECD, 2020c). Local policies can help. Aarhus, Denmark, ran the project A safe start in Life in 2014–17 to develop cooperation between health visitors and nursery educators to support parents with newborn children, enhancing their trust and knowledge on activities that can enhance their children’s well-being (European Commission, 2021).
Types of participation vary. in many countries, programmes for the youngest are available only part time, even just a few hours per week. in the netherlands and the United Kingdom, children under 3 participate in ECCE services for less than 20 hours a week, on average (oECD, 2017). Although evidence on the benefits of full-time vs part-time for the youngest children is not conclusive, the number of hours per week that children under 3 spend in ECCE programmes can play an important role in parents’ labour market participation. in high-income countries, this number is closely correlated with women’s full-time employment rates (oECD, 2018).
official participation figures, however, tell only part of the story. An ECCE programme must meet criteria regarding intensity, intentional education objectives and staff to be considered in the international standard Classification of Education (isCED). isCED level 0 has two subcategories: isCED 01 covers early childhood education development programmes, generally for children up to age 2, while isCED 02 is pre-primary education, generally from age 3 to the start of primary school. Especially for the youngest children, participation may be high in registered programmes that offer formal services outside the scope of isCED, such as crèches in France or amas in Portugal. in Japan, 2% of children under 3 are enrolled in isCED 01 while 32% are enrolled in registered programmes outside isCED’s scope (oECD, 2021).
ECCE for the youngest often lacks formal recognition and may not be fully captured in data. The issue of unregistered non-state providers, particularly of services for children under 3, has been recognized in many countries, from pre-primary education in nepal (World Bank and UnICEF, 2020) to unlicensed home childcare in Canada (varmuza et al., 2019). in india, the large number of unregistered non-state ECCE centres poses a challenge regarding accountability and administrative data collection (rao et al., 2021).
243 C H A P T E R 1 1 • EArLY CHiLDHooD
11
COVID-19
At the height of preschool and kindergarten closures in early April 2020, more than 180 million children had their pre-primary schooling disrupted (UnEsCo, 2020). on average, preschools were closed for 78 days in 2020, ranging from 46 days in high-income countries to 122 days in lower-middle-income countries (UnEsCo et al., 2021). one study estimated that closures between March 2020 and February 2021, equivalent to 19 billion person-days of instruction lost, would result in 11 million more children being developmentally off track, with losses concentrated in low- and lower-middle-income countries, exacerbating existing global inequity (McCoy et al., 2021).
By mid-2021, over 60 countries had not fully reopened pre-primary schools. Although they lost more instruction days in 2020 than primary and secondary school students, the youngest learners in low- and middle-income countries were less likely to have access to remote learning opportunities (nugroho et al., 2021). Globally, 46% of countries reported that at least 75% of pre-primary students followed remote education when schools were closed in 2020, well below the 64% of countries reporting the same for primary education students (UnEsCo et al., 2021). A survey of 26 low- and middle-income countries found that 19 had national online learning platforms and 14 had learning content for young children but just 6 had guidance or training for teachers, and only Pakistan monitored participation (Galevski et al., 2021). it was reported that, in well-resourced settings, early childhood educators adapted to distance teaching and gained in confidence even with limited or no guidance (McKenna et al., 2021). But in most countries, there were too many obstacles to ensure learning continuity.
Even where remote learning was available, challenges included a lack of teacher training, difficulties in adapting remote learning for young children, and disadvantaged home environments with insufficient support. Pre-primary teachers received instructions to ensure continuity of learning in 55% of countries, compared with nearly 70% of countries for other levels of education (UnEsCo et al., 2021). Lack of preparation for distance teaching was a major challenge, especially how to use technology for developmentally appropriate activities, but also how to work with caregivers who may be unable to provide feedback on how well their children are responding and learning (Atiles et al., 2021). in remote mode, teachers only receive activity results, such as images of drawings, videos and activity sheets, but cannot monitor and assess child development in person (oktavianingsih and Arifiyanti, 2021). in an online survey of early childhood educators, 58% in Asia and the Pacific could
not monitor learning progress, making this their biggest challenge after lack of internet and devices; in sub-saharan Africa, 46% of educators reported this challenge (UnEsCo Bangkok and UnEsCo Dakar, 2021).
Where instruction was moved online, educators noted that young children lacked the self-regulation and skills to look at a screen for long periods and that it was challenging to explain activities. A survey of parents in China showed that, while they used free online learning resources guided by preschool teachers, 85% said their children spent no more than 30 minutes at a time, with about one third spending less than 15 minutes online per day (Dong et al., 2020). remote learning classroom size played a significant role: A study in the United states found that in classes of more than 10 pupils, children had fewer turns, were less actively engaged and lost interest sooner. Toddlers could remain engaged for sessions of 15 to 20 minutes and preschool-aged children for up to 30 minutes. Children responded well in both age groups to songs, engaging stories and music/movement (szente, 2020).
Policies and measures to support parents and caregivers were put in place in about three quarters of countries: 62% of countries reported providing materials to guide parents in home-based learning, but only 44% of low-income countries provided such materials to at least some parents, compared with 71% of high-income countries. Among the most frequently used measures were provision of guidance, tips or materials for continued learning at home. Parental guidelines to support learning at home were reinforced through regular phone follow-up conducted by schools in 45% of high-income but just 22% of low-income countries (UnEsCo et al, 2020).
Beyond the long-term impact on learning, the closure of early education facilities and limited interactions with extended families deprived children of social and cognitive stimulation beyond their homes (Yoshikawa et al., 2020), a lack that has been likened to a ‘shadow pandemic’ (Howard-Jones et al., 2021). Children thrive in the company of other children and responsive adults, and remote learning cannot replace those experiences (Pascal and Bertram, 2021). Many children faced social isolation and increased stress levels. A study in the Us state of Massachusetts found that 61% of parents noticed a negative impact on children’s socioemotional development and 53% of early childhood educators noticed behavioural changes; of those educators, 77% reported negative changes, such as increased temper tantrums, crying and difficulty separating from parents, and 23% reported positive changes related to adaptability and resilience (Hanno et al., 2021).
2 0 2 1 / 2 • G LO BA L E D U C AT I O N M O N I TO R I N G R E P O RT 244
11
increased stress is particularly critical for children with disabilities and mental health issues and those exposed to protection risks. in the United states, while almost half of educators surveyed said they used strategies to engage differently with children at risk or with special needs, only 6% collaborated with service providers such as speech therapists (McKenna et al., 2021). reaching vulnerable students remotely would require a multi-stakeholder approach and collaborations between teachers and specialized institutions. in Cameroon and north Macedonia, radio and television programmes and printed learning materials were not adapted for children with visual and hearing impairments (Galevski et al., 2021). For some children, losing access to teachers meant a risk to their safety. Analysis of data on domestic violence victims reported to the Mexico City attorney general’s office showed a decline in the incidence of child maltreatment reports by 21% to 30%, with larger reductions in poor municipalities, which could be attributed to the role educators play in early detection and reporting (Cabrera-Hernandez and Padilla-romo 2020).
245 C H A P T E R 1 1 • EArLY CHiLDHooD
11
2 0 2 1 / 2 • G LO BA L E D U C AT I O N M O N I TO R I N G R E P O RT 246
11
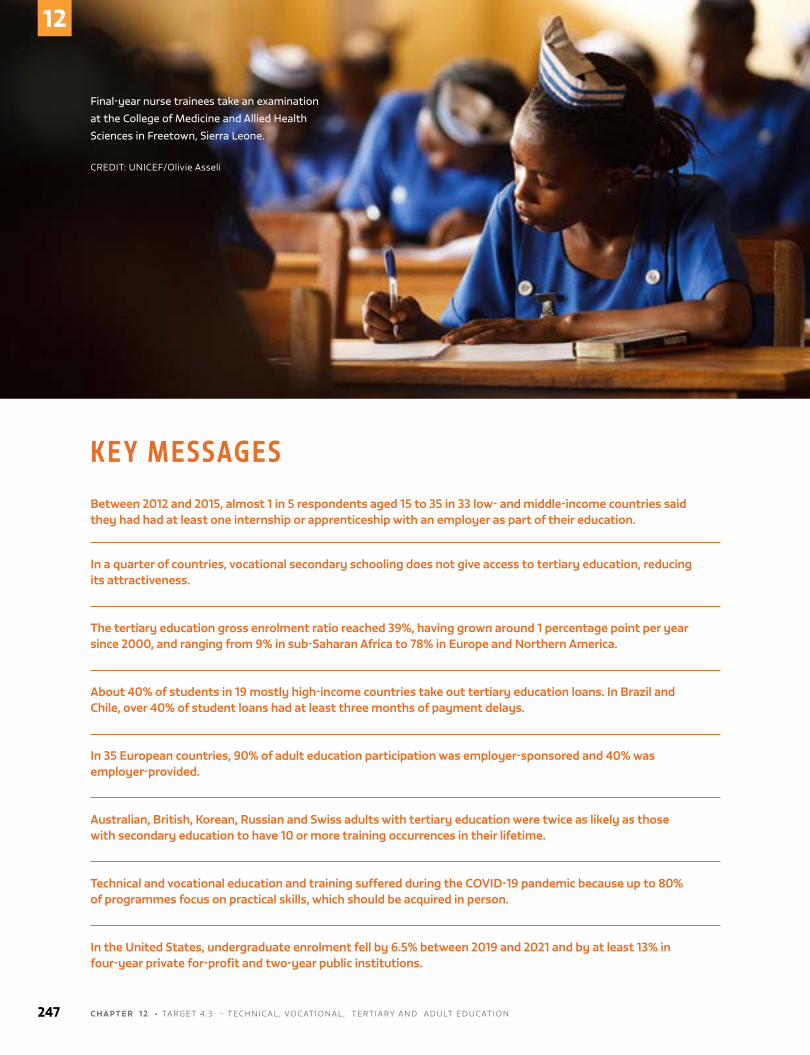
K E Y M E S S AG E SBetween 2012 and 2015, almost 1 in 5 respondents aged 15 to 35 in 33 low- and middle-income countries said they had had at least one internship or apprenticeship with an employer as part of their education.
In a quarter of countries, vocational secondary schooling does not give access to tertiary education, reducing its attractiveness.
The tertiary education gross enrolment ratio reached 39%, having grown around 1 percentage point per year since 2000, and ranging from 9% in sub-Saharan Africa to 78% in Europe and Northern America.
About 40% of students in 19 mostly high-income countries take out tertiary education loans. In Brazil and Chile, over 40% of student loans had at least three months of payment delays.
In 35 European countries, 90% of adult education participation was employer-sponsored and 40% was employer-provided.
Australian, British, Korean, Russian and Swiss adults with tertiary education were twice as likely as those with secondary education to have 10 or more training occurrences in their lifetime.
Technical and vocational education and training suffered during the COVID-19 pandemic because up to 80% of programmes focus on practical skills, which should be acquired in person.
In the United States, undergraduate enrolment fell by 6.5% between 2019 and 2021 and by at least 13% in four-year private for-profit and two-year public institutions.
Final-year nurse trainees take an examination
at the College of Medicine and Allied Health
Sciences in Freetown, Sierra Leone.
CREDIT: UNICEF/Olivie Asseli
247 C H A P T E R 1 2 • TARGET 4.3 – TEChNICAl , vOCATIONAl, TERTIARy AND ADUlT EDUCATION
12
CHAPTER 12
TARGET 4.3
4.3
By 2030, ensure equal access for all women and men to affordable and quality technical, vocational and tertiary education, including university
GLOBAL INDICATOR
4.3.1 – Participation rate of youth and adults in formal and non-formal education and
training in the previous 12 months, by sex
THEMATIC INDICATORS
4.3.2 – Gross enrolment ratio for tertiary education by sex
4.3.3 – Participation rate in technical-vocational programmes (15- to 24-year-olds) by sex
Technical, vocational, tertiary and adult education
2 0 2 1 / 2 • G LO BA L E D U C AT I O N M O N I TO R I N G R E P O RT 248
12
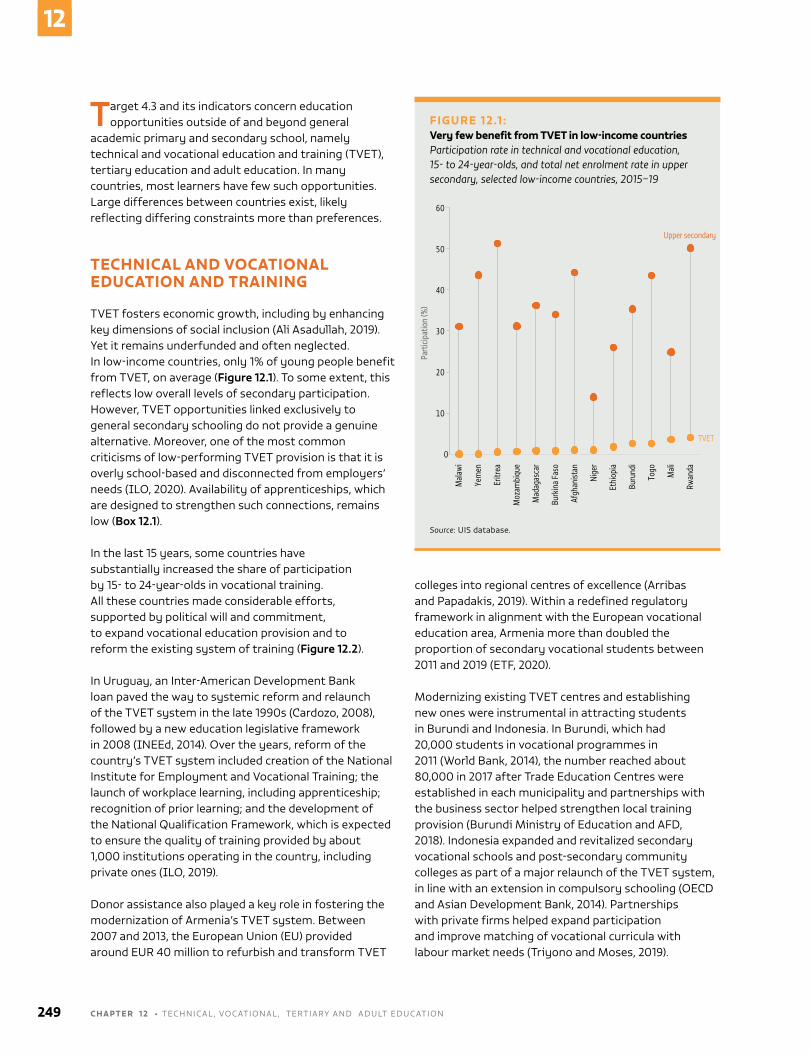
Target 4.3 and its indicators concern education opportunities outside of and beyond general
academic primary and secondary school, namely technical and vocational education and training (TvET), tertiary education and adult education. In many countries, most learners have few such opportunities. large differences between countries exist, likely reflecting differing constraints more than preferences.
TECHNICAL AND VOCATIONAL EDUCATION AND TRAINING
TvET fosters economic growth, including by enhancing key dimensions of social inclusion (Ali Asadullah, 2019). yet it remains underfunded and often neglected. In low-income countries, only 1% of young people benefit from TvET, on average (Figure 12.1). To some extent, this reflects low overall levels of secondary participation. however, TvET opportunities linked exclusively to general secondary schooling do not provide a genuine alternative. Moreover, one of the most common criticisms of low-performing TvET provision is that it is overly school-based and disconnected from employers’ needs (IlO, 2020). Availability of apprenticeships, which are designed to strengthen such connections, remains low (Box 12.1).
In the last 15 years, some countries have substantially increased the share of participation by 15- to 24-year-olds in vocational training. All these countries made considerable efforts, supported by political will and commitment, to expand vocational education provision and to reform the existing system of training (Figure 12.2).
In Uruguay, an Inter-American Development Bank loan paved the way to systemic reform and relaunch of the TvET system in the late 1990s (Cardozo, 2008), followed by a new education legislative framework in 2008 (INEEd, 2014). Over the years, reform of the country’s TvET system included creation of the National Institute for Employment and vocational Training; the launch of workplace learning, including apprenticeship; recognition of prior learning; and the development of the National Qualification Framework, which is expected to ensure the quality of training provided by about 1,000 institutions operating in the country, including private ones (IlO, 2019).
Donor assistance also played a key role in fostering the modernization of Armenia’s TvET system. Between 2007 and 2013, the European Union (EU) provided around EUR 40 million to refurbish and transform TvET
colleges into regional centres of excellence (Arribas and Papadakis, 2019). Within a redefined regulatory framework in alignment with the European vocational education area, Armenia more than doubled the proportion of secondary vocational students between 2011 and 2019 (ETF, 2020).
Modernizing existing TvET centres and establishing new ones were instrumental in attracting students in Burundi and Indonesia. In Burundi, which had 20,000 students in vocational programmes in 2011 (World Bank, 2014), the number reached about 80,000 in 2017 after Trade Education Centres were established in each municipality and partnerships with the business sector helped strengthen local training provision (Burundi Ministry of Education and AFD, 2018). Indonesia expanded and revitalized secondary vocational schools and post-secondary community colleges as part of a major relaunch of the TvET system, in line with an extension in compulsory schooling (OECD and Asian Development Bank, 2014). Partnerships with private firms helped expand participation and improve matching of vocational curricula with labour market needs (Triyono and Moses, 2019).
FIGURE 12.1 :Very few benefit from TVET in low-income countriesParticipation rate in technical and vocational education, 15- to 24-year-olds, and total net enrolment rate in upper secondary, selected low-income countries, 2015–19
TVET
Upper secondary
0
10
20
30
40
50
60
Mal
awi
Yem
en
Eritr
ea
Moz
ambi
que
Mad
agas
car
Burk
ina
Faso
Afgh
anist
an
Nige
r
Ethi
opia
Buru
ndi
Togo Mal
i
Rwan
da
Part
icipa
tion
(%)
Source: UIS database.
249 C H A P T E R 1 2 • TEChNICAl , vOCATIONAl, TERTIARy AND ADUlT EDUCATION
12
As in Indonesia, compulsory schooling extension required a substantial increase in the number of vocational schools in Costa Rica (OECD, 2017). The rise of TvET participation was also an outcome of increased funding and new coordination mechanisms engaging social and economic parties. Entry requirements became less rigid (Guzmán, 2011) and provision was expanded through new technical services and specializations (Alvarado Calderón and Mora hernández, 2020; Beirute Brealey, 2018). As a result, the percentage of students enrolled in the public Colegios Técnicos Profesionales increased from 22% in 2010 to 32% in 2018 (Camacho-Calvo et al., 2019).
Strong cooperation across sectors and an emphasis on students from the most disadvantaged households
characterized the relaunch of vocational training in Brazil. Set up in 2011, the Programa Nacional de Acesso ao Ensino Técnico e Emprego (PRONATEC) provided free vocational courses in federal institutes and financed training and apprenticeship experiences to address the persistence of dropout and low training participation (Rambla et al., 2020). PRONATEC aimed to foster cooperation across ministries, which could request provision of specific training programmes in various sectors. however, training tended to reflect training providers’ capacity, rather than identified needs (OECD, 2020); expected participation and quality were not reached (OECD, 2015). In 2014, the government began reducing PRONATEC’s funding (UNESCO-UNEvOC and National Council for the Federal Network of vocational Institutions, 2018).
BOX 12.1 :
Apprenticeships remain rare in low- and middle-income countries
Apprenticeships are one way to deliver TVET outside the school environment.1 Well-designed apprenticeships can respond to skills shortages, support youth in acquiring complex skill sets, smooth school-to-work transitions and, ultimately, reduce youth unemployment (Aivazova, 2013). Austria, Germany and Switzerland, which have a strong apprenticeship tradition, have managed to maintain high youth employment rates. All three countries use vocational training programmes efficiently, with a special focus on potential school dropouts (Dolado, 2015).
In many low- and middle-income countries, apprenticeships are less common and less formalized, in line with high levels of labour market informality, as well as less connected with school-based TVET. As a consequence, few statistics on their prevalence are available. One possible source is the School to Work Transition Survey, which the International Labour Organization (ILO) carried out in 33 countries between 2012 and 2015. It included the question: ‘Did you have one (or more) internship(s)/apprenticeship(s) with an employer as part of your education?’ On average, almost 1 in 5 respondents aged 15 to 35 said they had.
Prevalence tended to be higher in upper-middle-income countries in Central and Eastern Europe. In the Republic of Moldova, Serbia and Ukraine, between 40% and 50% of young adults had had an internship or apprenticeship. Prevalence varied by self-assessed poverty. In households that reported themselves as poor, 11% did an internship or apprenticeship, compared with 28% in well-off households. In high-income countries such as the United Kingdom, high-status internships are one strategy allowing privileged young people to mobilize family resources to get ahead of their peers (Wright and Mulvey, 2021).
The percentage of people having done an internship or apprenticeship increases to, then peaks around, age 30. Gender differences are minimal, on average, though men are twice as likely as women to report an internship or apprenticeship in Liberia (15% of men and 7% of women) and Malawi (9.5% of men and 4% of women).
Some evidence indicated that apprenticeships served as an alternative to formal TVET. They were least common among graduates of vocational secondary (8%) and post-secondary education (11%). Possibly due to conflation with internships, they were much more common among those with general secondary (36%) or post-secondary education (23%) than among those with only primary education (19%). The percentage of people who did an apprenticeship or internship was much higher for those working in the formal sector.
A subsample of respondents completed a diary describing their complete history of labour market activities that lasted longer than three months. While this record still conflated apprenticeships and internships, the minimum three-month duration, together with the fact that training undergone while studying was excluded, likely filtered out internships. Using this stricter criterion, the prevalence of apprenticeship was only 2% of the small sample of diary completers, which does not allow for further disaggregation. However these data are considered, apprenticeship training does not yet deliver on its potential in low- and middle-income countries.
1 This box is based on Bonomelli Carrasco (2021).
2 0 2 1 / 2 • G LO BA L E D U C AT I O N M O N I TO R I N G R E P O RT 250
12
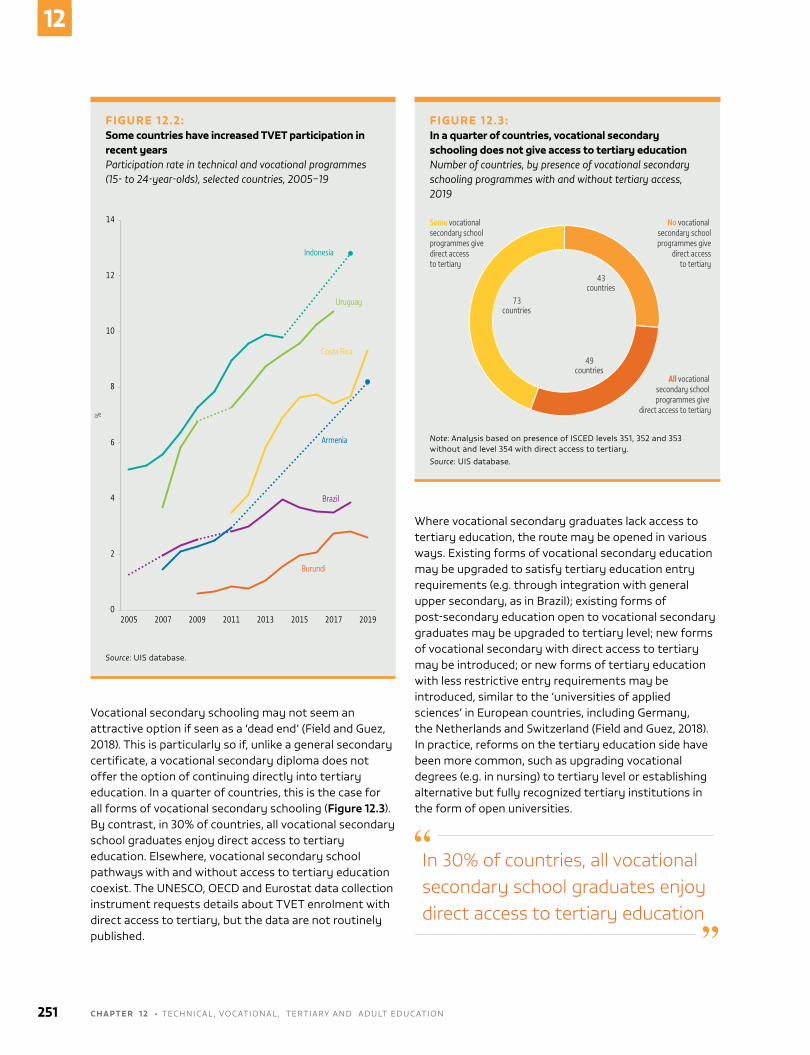
vocational secondary schooling may not seem an attractive option if seen as a ‘dead end’ (Field and Guez, 2018). This is particularly so if, unlike a general secondary certificate, a vocational secondary diploma does not offer the option of continuing directly into tertiary education. In a quarter of countries, this is the case for all forms of vocational secondary schooling (Figure 12.3). By contrast, in 30% of countries, all vocational secondary school graduates enjoy direct access to tertiary education. Elsewhere, vocational secondary school pathways with and without access to tertiary education coexist. The UNESCO, OECD and Eurostat data collection instrument requests details about TvET enrolment with direct access to tertiary, but the data are not routinely published.
FIGURE 12.3:In a quarter of countries, vocational secondary schooling does not give access to tertiary educationNumber of countries, by presence of vocational secondary schooling programmes with and without tertiary access, 2019
43countries
49countries
73countries
Some vocationalsecondary school programmes give direct access to tertiary
All vocational secondary school programmes give
direct access to tertiary
No vocational secondary school
programmes give direct access
to tertiary
Note: Analysis based on presence of ISCED levels 351, 352 and 353 without and level 354 with direct access to tertiary.Source: UIS database.
Where vocational secondary graduates lack access to tertiary education, the route may be opened in various ways. Existing forms of vocational secondary education may be upgraded to satisfy tertiary education entry requirements (e.g. through integration with general upper secondary, as in Brazil); existing forms of post-secondary education open to vocational secondary graduates may be upgraded to tertiary level; new forms of vocational secondary with direct access to tertiary may be introduced; or new forms of tertiary education with less restrictive entry requirements may be introduced, similar to the ‘universities of applied sciences’ in European countries, including Germany, the Netherlands and Switzerland (Field and Guez, 2018). In practice, reforms on the tertiary education side have been more common, such as upgrading vocational degrees (e.g. in nursing) to tertiary level or establishing alternative but fully recognized tertiary institutions in the form of open universities.
In 30% of countries, all vocational secondary school graduates enjoy direct access to tertiary education
FIGURE 12.2:Some countries have increased TVET participation in recent yearsParticipation rate in technical and vocational programmes (15- to 24-year-olds), selected countries, 2005–19
0
2
4
6
8
10
12
14
2005 2007 2009 2011 2013 2015 2017 2019
%
Indonesia
Uruguay
Costa Rica
Armenia
Brazil
Burundi
Source: UIS database.
251 C H A P T E R 1 2 • TEChNICAl , vOCATIONAl, TERTIARy AND ADUlT EDUCATION
12
In Tajikistan, a public university with a technology specialization created a lycée within the university structure in the 1990s to provide basic technical education for students in grades 9 and 10. The final exam doubled as an exam for admission to the university (Sabzalieva, 2020). More recently, Denmark’s EUX programme, piloted in 2010 and expanded to 24 occupations in 2015, created a vocational pathway into university (Jørgensen, 2015). This hybrid programme improved on a previous initiative that conferred both vocational and tertiary education access qualifications but was seen as saving too little time compared with obtaining the qualifications one after the other. The existence of pathways is insufficient, however. EUX is demanding, and reaches only 2% of TvET students (Jørgensen, 2017). In Estonia, pathways are open in principle, but in 2016, only 21 TvET students took advantage of an extra year leading to a higher education entrance qualification (Musset et al., 2019).
TERTIARY EDUCATION
Global participation in tertiary education reached 118 million women and 110 million men in 2019. The gross enrolment ratio for tertiary education was 39%, continuing a steady average growth of around one percentage point per year since 2000. Regional values ranged from 9% in sub-Saharan Africa to 78% in Europe and Northern America.
These figures derive from administrative data on tertiary enrolment. Survey data on attendance paint a different picture in many countries (Figure 12.4). Aside from errors in either enrolment or attendance data, enrolment may underestimate attendance if many students attend institutions that are not counted in official statistics because, for example, they lack recognition or accreditation. Conversely, enrolment may overestimate attendance if a significant number of people are enrolled only nominally, especially where tuition is free and student status comes with perks such as subsidized transport. In some German states, the introduction of fees and subsequent reintroduction of tuition-free tertiary education over the past 20 years was accompanied by debates about nominal but inactive enrolment, including the legal and practical advantages and disadvantages of enrolling purely to benefit from perks related to student status. In Germany, in the open-inscription degree subject of physics, less than 30% of new entrants
in the summer terms 2013, 2014 and 2015 attended courses or sat exams (Düchs and Ingold, 2016).
Gross participation ratios compare the number of people of any age enrolled at, or attending, a given level of education with the size of the corresponding age group. Where available, net ratios that consider enrolment and attendance only by individuals of the appropriate age are preferred, and have all but replaced gross participation ratios in primary and secondary education. But in tertiary education, enrolment data by age are rarely available for international statistics, so net enrolment ratios cannot be calculated. Moreover, unlike at lower levels of schooling, especially compulsory, the normative expectation of enrolment at a specific age is much weaker. For purposes of gross participation ratios in tertiary education, the five years immediately following the upper secondary age bracket are customarily used.
however, tertiary study at higher ages is common. In many countries in sub-Saharan Africa, young people are more likely to be attending tertiary education after the conventional five-year age bracket than even two years into it (Figure 12.5). In half the countries with recent data, attendance in the older age group is twice as high or even more. Attendance at older ages can reflect delayed graduation, but also result from later entry, which is not inherently problematic. however, large differences in the age profile of new and continuing students in tertiary education can distort comparisons of gross participation ratios.
Target 4.3 calls for tertiary education to be affordable. Unlike lower levels of schooling, where private providers are often publicly funded or directly contracted by the public sector, private tertiary education almost always requires students or their families to cover the full cost of provision. Even high tuition is often seen as a worthwhile investment, given the promise of higher lifetime incomes – although this promise is not met for all. however, being able to afford tertiary education from a lifetime perspective does not make it affordable upfront. The economics case for cost sharing in tertiary education depends crucially on prospective entrants not facing credit constraints. Student loans of various kinds have grown into a trillion-dollar market. however, they do not always fulfil their purpose in practice. Poorly designed student loan or equivalent arrangements may be not just unsustainable for many graduates but also a poor revenue stream for the government (Focus 12.1).
2 0 2 1 / 2 • G LO BA L E D U C AT I O N M O N I TO R I N G R E P O RT 252
12
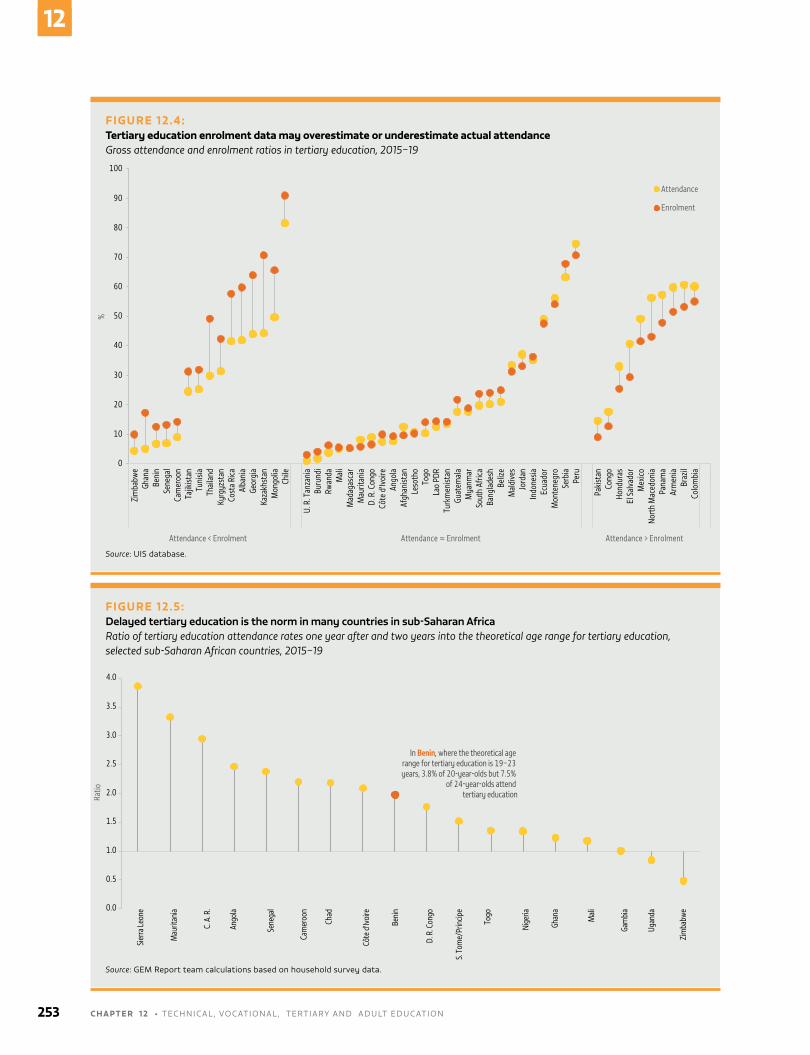
FIGURE 12.4:Tertiary education enrolment data may overestimate or underestimate actual attendanceGross attendance and enrolment ratios in tertiary education, 2015–19
0
10
20
30
40
50
60
70
80
90
100
Zim
babw
eGh
ana
Beni
nSe
nega
lCa
mer
oon
Tajik
istan
Tuni
siaTh
aila
ndKy
rgyz
stan
Cost
a Ri
caAl
bani
aGe
orgi
aKa
zakh
stan
Mon
golia
Chile
U. R
. Tan
zani
aBu
rund
iRw
anda
Mal
iM
adag
asca
rM
aurit
ania
D. R
. Con
goCô
te d
'Ivoi
reAn
gola
Afgh
anist
anLe
soth
oTo
goLa
o PD
RTu
rkm
enist
anGu
atem
ala
Mya
nmar
Sout
h Af
rica
Bang
lade
shBe
lize
Mal
dive
sJo
rdan
Indo
nesia
Ecua
dor
Mon
tene
gro
Serb
iaPe
ru
Pakis
tan
Cong
oHo
ndur
asEl
Sal
vado
rM
exico
Nort
h M
aced
onia
Pana
ma
Arm
enia
Braz
ilCo
lom
bia
Attendance < Enrolment Attendance ≈ Enrolment Attendance > Enrolment
%
Attendance
Enrolment
Source: UIS database.
FIGURE 12.5: Delayed tertiary education is the norm in many countries in sub-Saharan AfricaRatio of tertiary education attendance rates one year after and two years into the theoretical age range for tertiary education, selected sub-Saharan African countries, 2015–19
0.0
0.5
1.0
1.5
2.0
2.5
3.0
3.5
4.0
Sierra
Leon
e
Mau
ritan
ia
C. A
. R.
Ango
la
Sene
gal
Cam
eroo
n
Chad
Côte
d'Iv
oire
Beni
n
D. R
. Con
go
S. To
me/
Prin
cipe
Togo
Nige
ria
Ghan
a
Mali
Gam
bia
Ugan
da
Zim
babw
e
Ratio
In Benin, where the theoretical age range for tertiary education is 19–23 years, 3.8% of 20-year-olds but 7.5%
of 24-year-olds attend tertiary education
Source: GEM Report team calculations based on household survey data.
253 C H A P T E R 1 2 • TEChNICAl , vOCATIONAl, TERTIARy AND ADUlT EDUCATION
12
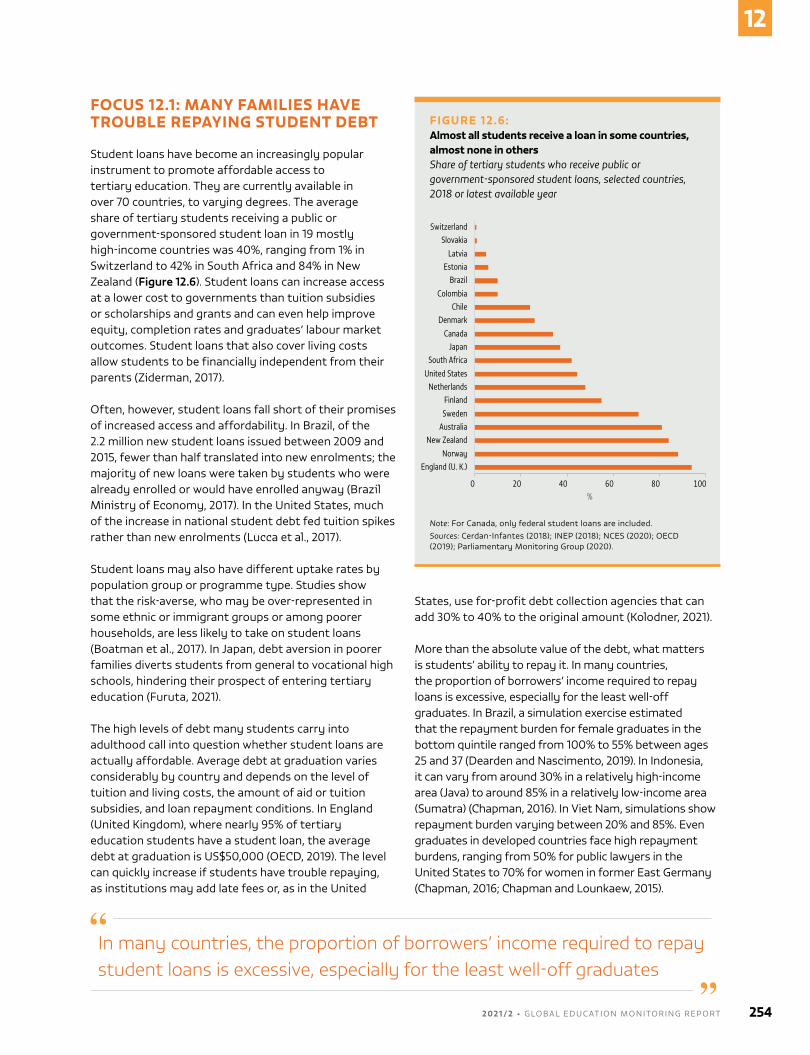
FOCUS 12.1: MANY FAMILIES HAVE TROUBLE REPAYING STUDENT DEBT
Student loans have become an increasingly popular instrument to promote affordable access to tertiary education. They are currently available in over 70 countries, to varying degrees. The average share of tertiary students receiving a public or government-sponsored student loan in 19 mostly high-income countries was 40%, ranging from 1% in Switzerland to 42% in South Africa and 84% in New Zealand (Figure 12.6). Student loans can increase access at a lower cost to governments than tuition subsidies or scholarships and grants and can even help improve equity, completion rates and graduates’ labour market outcomes. Student loans that also cover living costs allow students to be financially independent from their parents (Ziderman, 2017).
Often, however, student loans fall short of their promises of increased access and affordability. In Brazil, of the 2.2 million new student loans issued between 2009 and 2015, fewer than half translated into new enrolments; the majority of new loans were taken by students who were already enrolled or would have enrolled anyway (Brazil Ministry of Economy, 2017). In the United States, much of the increase in national student debt fed tuition spikes rather than new enrolments (lucca et al., 2017).
Student loans may also have different uptake rates by population group or programme type. Studies show that the risk-averse, who may be over-represented in some ethnic or immigrant groups or among poorer households, are less likely to take on student loans (Boatman et al., 2017). In Japan, debt aversion in poorer families diverts students from general to vocational high schools, hindering their prospect of entering tertiary education (Furuta, 2021).
The high levels of debt many students carry into adulthood call into question whether student loans are actually affordable. Average debt at graduation varies considerably by country and depends on the level of tuition and living costs, the amount of aid or tuition subsidies, and loan repayment conditions. In England (United Kingdom), where nearly 95% of tertiary education students have a student loan, the average debt at graduation is US$50,000 (OECD, 2019). The level can quickly increase if students have trouble repaying, as institutions may add late fees or, as in the United
States, use for-profit debt collection agencies that can add 30% to 40% to the original amount (Kolodner, 2021).
More than the absolute value of the debt, what matters is students’ ability to repay it. In many countries, the proportion of borrowers’ income required to repay loans is excessive, especially for the least well-off graduates. In Brazil, a simulation exercise estimated that the repayment burden for female graduates in the bottom quintile ranged from 100% to 55% between ages 25 and 37 (Dearden and Nascimento, 2019). In Indonesia, it can vary from around 30% in a relatively high-income area (Java) to around 85% in a relatively low-income area (Sumatra) (Chapman, 2016). In viet Nam, simulations show repayment burden varying between 20% and 85%. Even graduates in developed countries face high repayment burdens, ranging from 50% for public lawyers in the United States to 70% for women in former East Germany (Chapman, 2016; Chapman and lounkaew, 2015).
FIGURE 12.6:Almost all students receive a loan in some countries, almost none in othersShare of tertiary students who receive public or government-sponsored student loans, selected countries, 2018 or latest available year
0.0
0.5
1.0
1.5
2.0
2.5
3.0
3.5
4.0
Sierra
Leon
e
Mau
ritan
ia
C. A
. R.
Ango
la
Sene
gal
Cam
eroo
n
Chad
Côte
d'Iv
oire
Beni
n
D. R
. Con
go
S. To
me/
Prin
cipe
Togo
Nige
ria
Ghan
a
Mali
Gam
bia
Ugan
da
Zim
babw
e
Ratio
In Benin, where the theoretical age range for tertiary education is 19–23 years, 3.8% of 20-year-olds but 7.5%
of 24-year-olds attend tertiary education
0 20 40 60 80 100
England (U. K.)Norway
New ZealandAustralia
Sweden
FinlandNetherlands
United States
South AfricaJapan
Canada
DenmarkChile
Colombia
BrazilEstonia
Latvia
SlovakiaSwitzerland
%
Note: For Canada, only federal student loans are included.Sources: Cerdan-Infantes (2018); INEP (2018); NCES (2020); OECD (2019); Parliamentary Monitoring Group (2020).
In many countries, the proportion of borrowers’ income required to repay student loans is excessive, especially for the least well-off graduates
2 0 2 1 / 2 • G LO BA L E D U C AT I O N M O N I TO R I N G R E P O RT 254
12
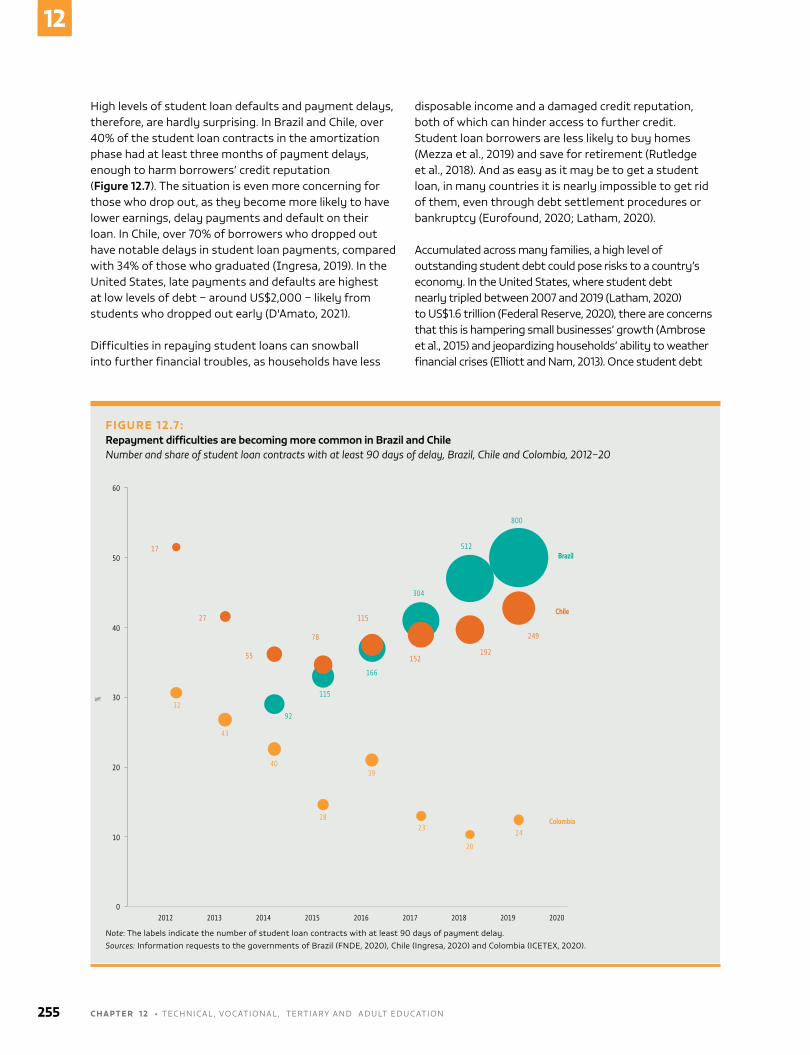
high levels of student loan defaults and payment delays, therefore, are hardly surprising. In Brazil and Chile, over 40% of the student loan contracts in the amortization phase had at least three months of payment delays, enough to harm borrowers’ credit reputation (Figure 12.7). The situation is even more concerning for those who drop out, as they become more likely to have lower earnings, delay payments and default on their loan. In Chile, over 70% of borrowers who dropped out have notable delays in student loan payments, compared with 34% of those who graduated (Ingresa, 2019). In the United States, late payments and defaults are highest at low levels of debt – around US$2,000 – likely from students who dropped out early (D'Amato, 2021).
Difficulties in repaying student loans can snowball into further financial troubles, as households have less
disposable income and a damaged credit reputation, both of which can hinder access to further credit. Student loan borrowers are less likely to buy homes (Mezza et al., 2019) and save for retirement (Rutledge et al., 2018). And as easy as it may be to get a student loan, in many countries it is nearly impossible to get rid of them, even through debt settlement procedures or bankruptcy (Eurofound, 2020; latham, 2020).
Accumulated across many families, a high level of outstanding student debt could pose risks to a country’s economy. In the United States, where student debt nearly tripled between 2007 and 2019 (latham, 2020) to US$1.6 trillion (Federal Reserve, 2020), there are concerns that this is hampering small businesses’ growth (Ambrose et al., 2015) and jeopardizing households’ ability to weather financial crises (Elliott and Nam, 2013). Once student debt
FIGURE 12.7:Repayment difficulties are becoming more common in Brazil and ChileNumber and share of student loan contracts with at least 90 days of delay, Brazil, Chile and Colombia, 2012–20
92
115
166
304
512
800
17
27
55
78
115
152192
249
32
43
40
28
39
23
20
24
0
10
20
30
40
50
60
2012 2013 2014 2015 2016 2017 2018 2019 2020
%
Colombia
Chile
Brazil
Note: The labels indicate the number of student loan contracts with at least 90 days of payment delay.Sources: Information requests to the governments of Brazil (FNDE, 2020), Chile (Ingresa, 2020) and Colombia (ICETEX, 2020).
255 C H A P T E R 1 2 • TEChNICAl , vOCATIONAl, TERTIARy AND ADUlT EDUCATION
12
has ballooned, there is no easy way out for governments, as forgiveness programmes may be considered regressive and unfair, and may lead to increases in tertiary education costs (D'Amato, 2021; lowrey, 2020).
Some countries have tried to address these concerns by imposing a debt ceiling, but maximum loan amounts are often not enough to cover both fees and living costs. Under-borrowing can cause its own problems, such as lowering access to loans. It may also push students to work longer hours (Black et al., 2020), which can have perverse effects on academic performance (Callender, 2008; Kalenkoski and Pabilonia, 2010), physical and mental health (Oviatt et al., 2017) and completion time (Darolia, 2014). In the United States, student loan caps have led parents to increasingly take on debt to help finance their children’s education – usually at a time in their lives when income is stagnant and soon to decline as they enter retirement. Between 2014 and 2019, the number of recipients of the federal loan programme Parent PlUS increased by 13% and the amount borrowed by 36%. The increase in borrowing has been accompanied by a rise in defaults: In 2019, US$96 billion was outstanding from 3.6 million parents (Fletcher et al., 2020).
A more promising policy reform has been a shift from the widely used time-based repayment loans (mortgage style) to income-contingent loans. A growing number of countries have adopted full or partial income-contingent loan systems, including Australia, Ethiopia, hungary, the Netherlands, New Zealand, the Republic of Korea, South Africa, the United States and England (United Kingdom) (Britton et al., 2019; yizengaw, 2007; Ziderman, 2017).
In addition to lowering administrative costs for governments, income-contingent loans fix repayment burdens to reduce the possibility of facing repayment hardships in the future. Australia set the maximum repayment proportion of annual income for such loans at 8%, New Zealand at 9% and England and Wales (United Kingdom) at 10%. By providing insurance against low earnings or unemployment, the introduction of such loans has increased overall access to tertiary education in some countries. In Australia, the introduction of tuition fees combined with income-contingent loans increased overall tertiary enrolment, including for students from low-income households (Chapman, 2016).
Success stories in high-income countries have helped advance this type of loan reform in low- and middle-income countries. Experts from Australia and the United Kingdom, for example, helped develop income-contingent loan proposals adopted in Brazil and
Ethiopia, and are involved in public debates on the topic in Colombia and Malaysia (Chapman and Dearden, 2018; Filizola, 2019; IPEA, 2019; Woodhall, 2007). however, the suitability of income-contingent loans in less developed countries is debated. Income-contingent loans require a universal regime of income taxation or social security collection that identifies, tracks and collects repayments (Ziderman, 2017). Poorer countries face challenges such as large informal sectors or insufficient short-term government funding of the type needed for such programmes. In Ethiopia, the graduate tax (a modified type of income-contingent loan) introduced in 2003 has had low cost recovery (Portela and Gebremedhin, 2020), likely due to the federal system’s weak collection capacity, lower-than-expected graduate earnings and high levels of brain drain (Woldegiorgis, 2008).
Student loans can be a powerful tool to alleviate financial constraints and increase access to tertiary education, but policies and design features have important implications for programmes’ ability to make tertiary education affordable and increase access equitably.
ADULT EDUCATION
Indicator 4.3.1 refers to participation in formal and non-formal adult education and training in the past 12 months. A long-standing challenge is poor data coverage outside Europe, combined with limited comparability of alternative data sources, especially where they refer to participation in the past month instead.
Although participation in adult education is significantly higher in high-income countries, most of it is sponsored by an employer. In 35 European countries, employer-sponsored training accounted for nearly 90% of the total (Figure 12.8). But employer sponsorship alone does not overcome other constraints, such as childcare needs, or cover all direct costs. Accordingly, not all sponsorship that is offered is used (Pulkkinen, 2021).
A more promising policy reform has been a shift from the widely used time-based repayment loans to income-contingent loans
2 0 2 1 / 2 • G LO BA L E D U C AT I O N M O N I TO R I N G R E P O RT 256
12
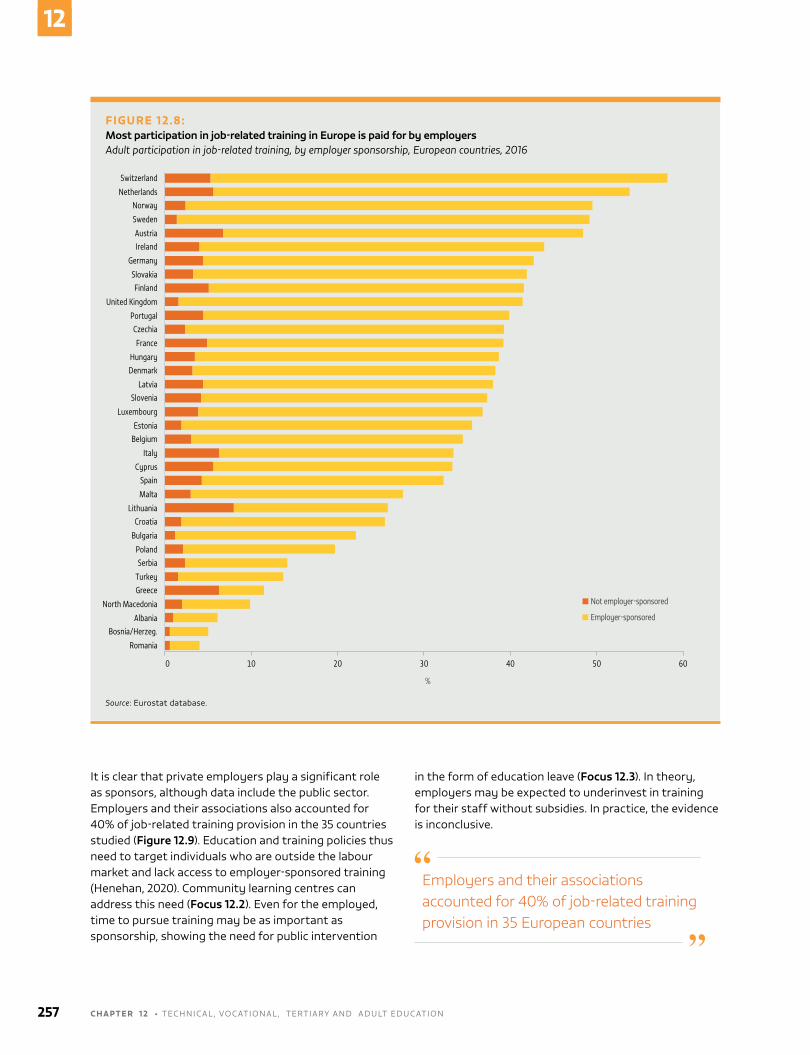
It is clear that private employers play a significant role as sponsors, although data include the public sector. Employers and their associations also accounted for 40% of job-related training provision in the 35 countries studied (Figure 12.9). Education and training policies thus need to target individuals who are outside the labour market and lack access to employer-sponsored training (henehan, 2020). Community learning centres can address this need (Focus 12.2). Even for the employed, time to pursue training may be as important as sponsorship, showing the need for public intervention
in the form of education leave (Focus 12.3). In theory, employers may be expected to underinvest in training for their staff without subsidies. In practice, the evidence is inconclusive.
Employers and their associations accounted for 40% of job-related training provision in 35 European countries
FIGURE 12.8:Most participation in job-related training in Europe is paid for by employersAdult participation in job-related training, by employer sponsorship, European countries, 2016
0 10 20 30 40 50 60
Romania
Bosnia/Herzeg.Albania
North Macedonia
GreeceTurkey
SerbiaPoland
Bulgaria
CroatiaLithuania
Malta
SpainCyprus
Italy
BelgiumEstonia
Luxembourg
SloveniaLatvia
DenmarkHungary
France
CzechiaPortugal
United Kingdom
FinlandSlovakia
Germany
IrelandAustria
Sweden
NorwayNetherlands
Switzerland
%
Not employer-sponsored
Employer-sponsored
Source: Eurostat database.
257 C H A P T E R 1 2 • TEChNICAl , vOCATIONAl, TERTIARy AND ADUlT EDUCATION
12
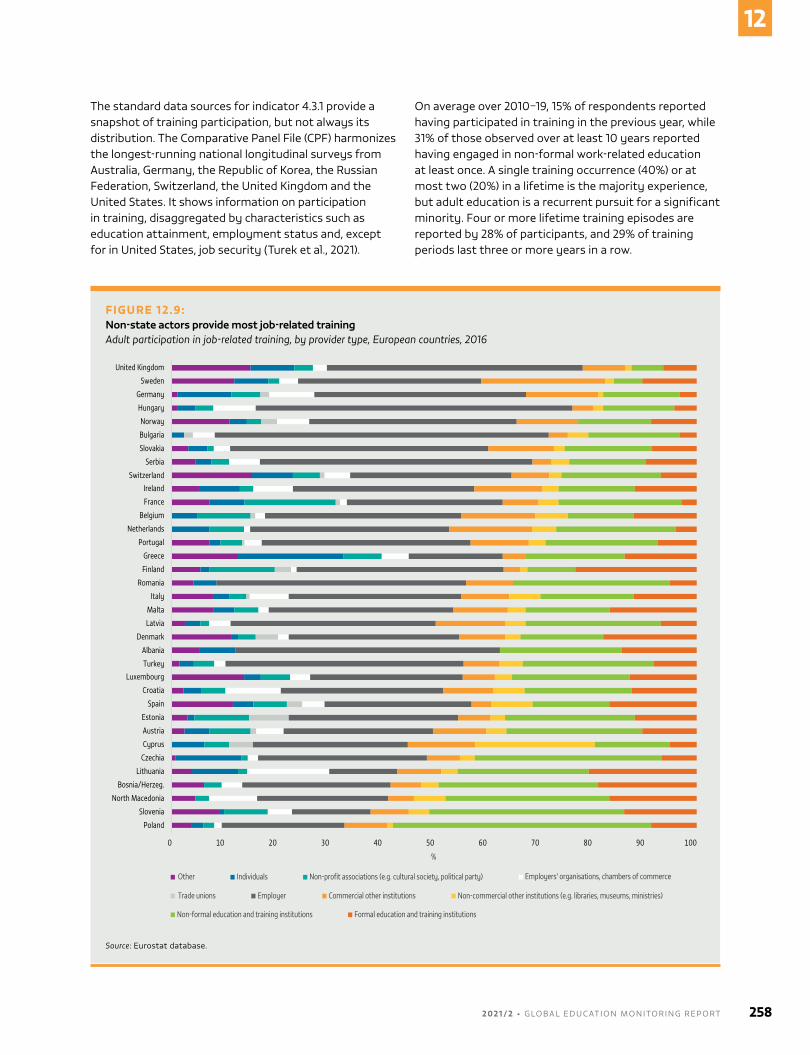
The standard data sources for indicator 4.3.1 provide a snapshot of training participation, but not always its distribution. The Comparative Panel File (CPF) harmonizes the longest-running national longitudinal surveys from Australia, Germany, the Republic of Korea, the Russian Federation, Switzerland, the United Kingdom and the United States. It shows information on participation in training, disaggregated by characteristics such as education attainment, employment status and, except for in United States, job security (Turek et al., 2021).
On average over 2010–19, 15% of respondents reported having participated in training in the previous year, while 31% of those observed over at least 10 years reported having engaged in non-formal work-related education at least once. A single training occurrence (40%) or at most two (20%) in a lifetime is the majority experience, but adult education is a recurrent pursuit for a significant minority. Four or more lifetime training episodes are reported by 28% of participants, and 29% of training periods last three or more years in a row.
FIGURE 12.9:Non-state actors provide most job-related trainingAdult participation in job-related training, by provider type, European countries, 2016
0 10 20 30 40 50 60 70 80 90 100
Poland
Slovenia
North Macedonia
Bosnia/Herzeg.
Lithuania
Czechia
Cyprus
Austria
Estonia
Spain
Croatia
Luxembourg
Turkey
Albania
Denmark
Latvia
Malta
Italy
Romania
Finland
Greece
Portugal
Netherlands
Belgium
France
Ireland
Switzerland
Serbia
Slovakia
Bulgaria
Norway
Hungary
Germany
Sweden
United Kingdom
%
Other Individuals Non-profit associations (e.g. cultural society, political party)
Trade unions
Employers' organisations, chambers of commerce
Employer Commercial other institutions Non-commercial other institutions (e.g. libraries, museums, ministries)
Non-formal education and training institutions Formal education and training institutions
Source: Eurostat database.
2 0 2 1 / 2 • G LO BA L E D U C AT I O N M O N I TO R I N G R E P O RT 258
12
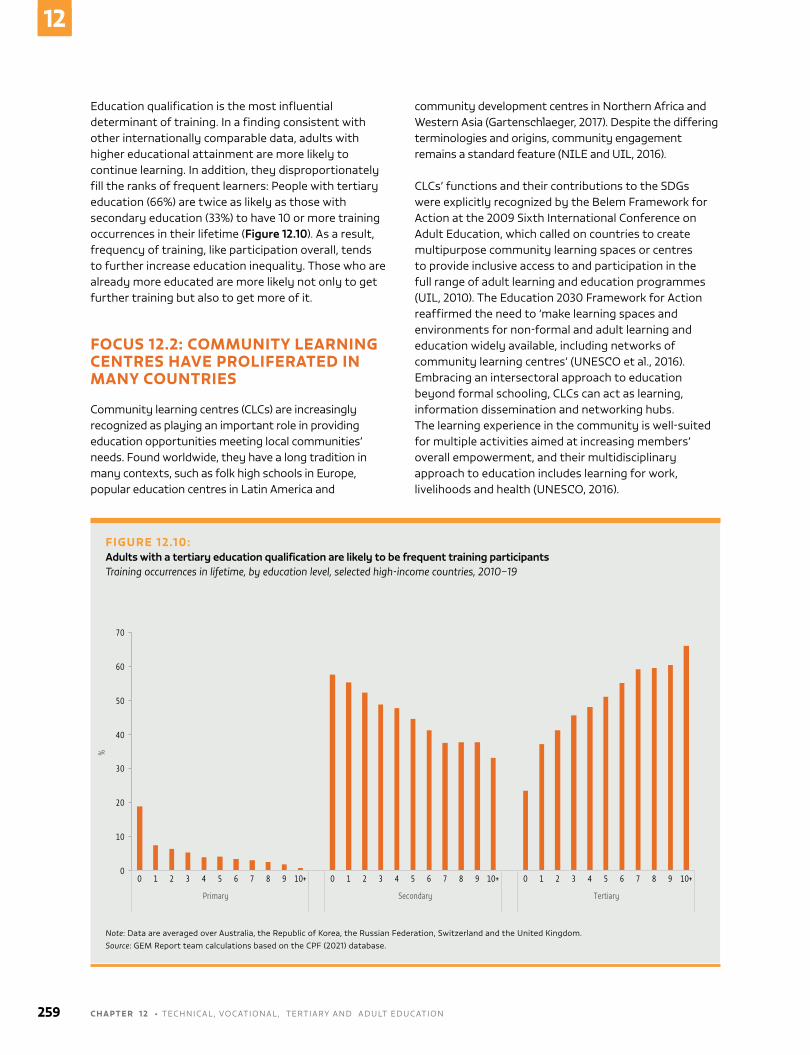
Education qualification is the most influential determinant of training. In a finding consistent with other internationally comparable data, adults with higher educational attainment are more likely to continue learning. In addition, they disproportionately fill the ranks of frequent learners: People with tertiary education (66%) are twice as likely as those with secondary education (33%) to have 10 or more training occurrences in their lifetime (Figure 12.10). As a result, frequency of training, like participation overall, tends to further increase education inequality. Those who are already more educated are more likely not only to get further training but also to get more of it.
FOCUS 12.2: COMMUNITY LEARNING CENTRES HAVE PROLIFERATED IN MANY COUNTRIES
Community learning centres (ClCs) are increasingly recognized as playing an important role in providing education opportunities meeting local communities’ needs. Found worldwide, they have a long tradition in many contexts, such as folk high schools in Europe, popular education centres in latin America and
community development centres in Northern Africa and Western Asia (Gartenschlaeger, 2017). Despite the differing terminologies and origins, community engagement remains a standard feature (NIlE and UIl, 2016).
ClCs’ functions and their contributions to the SDGs were explicitly recognized by the Belem Framework for Action at the 2009 Sixth International Conference on Adult Education, which called on countries to create multipurpose community learning spaces or centres to provide inclusive access to and participation in the full range of adult learning and education programmes (UIl, 2010). The Education 2030 Framework for Action reaffirmed the need to ‘make learning spaces and environments for non-formal and adult learning and education widely available, including networks of community learning centres’ (UNESCO et al., 2016). Embracing an intersectoral approach to education beyond formal schooling, ClCs can act as learning, information dissemination and networking hubs. The learning experience in the community is well-suited for multiple activities aimed at increasing members’ overall empowerment, and their multidisciplinary approach to education includes learning for work, livelihoods and health (UNESCO, 2016).
FIGURE 12.10:Adults with a tertiary education qualification are likely to be frequent training participantsTraining occurrences in lifetime, by education level, selected high-income countries, 2010–19
0
10
20
30
40
50
60
70
0 1 2 3 4 5 6 7 8 9 10+ 0 1 2 3 4 5 6 7 8 9 10+ 0 1 2 3 4 5 6 7 8 9 10+
Primary Secondary Tertiary
%
Note: Data are averaged over Australia, the Republic of Korea, the Russian Federation, Switzerland and the United Kingdom.Source: GEM Report team calculations based on the CPF (2021) database.
259 C H A P T E R 1 2 • TEChNICAl , vOCATIONAl, TERTIARy AND ADUlT EDUCATION
12
In Indonesia, most community learning centres are led by non-state initiatives, often NGOs
Since 2000, the number of ClCs worldwide has grown rapidly, particularly in Asia. In viet Nam, their number rose more than 14-fold between 2002 and 2010; by 2014/15, there were 11,000 centres (NIlE and UIl, 2016). Nepal experienced similar exponential growth, from fewer than 20 ClCs in 2000 to 1,900 in 2012 (Govinda, 2017).
The establishment and management of ClCs has been bolstered by local and national government authorities and non-state actors, such as non-governmental organizations (NGOs), which have supported community engagement with financial and human resources. In some countries, the role of non-state actors is more prominent. In Indonesia, most ClCs are led by non-state initiatives, often NGOs. Similarly, NGOs run all 5,000 or so centres in Bangladesh (NIlE and UIl, 2016).
Despite their growth, ClCs vary in distribution. In Nepal, an evaluation of the national literacy campaign pointed out that progress in literacy strategy implementation had been hampered by lack of funding to local ClCs and consequent limited availability of classes in rural areas (Nepal Ministry of Education and UNESCO, 2017). By contrast, every subdistrict in Thailand has a ClC that acts as an information hub and education institution, providing non-formal education, including cultural activities, vocational training, disaster prevention courses and environmental preservation training. In Cambodia, local communities managed to keep ClCs active, despite limited financial support, to deliver training in tailoring, traditional music, hairdressing, stone carving, weaving, carpentry, information and communication technology (ICT) and English. Aiming to provide training even to remote areas, ClCs launched the initiative Mobile life Skills, delivering training by van (Govinda, 2017).
In contexts where communities were unserved, centres have been set up to pursue knowledge at the local level. Morocco has more than 16,500 literacy centres, but only 8,700 in rural areas. To meet the need for a variety of courses in rural areas, 200 ClCs have been set up across the country, delivering literacy and post-literacy classes, mostly for women, along with professional training and preschool classes (Chaker, 2017). In Ukraine, adult
education centres were concentrated in big cities on state education institutions’ premises. Parallel centres run by NGOs have been established to provide local communities with vocation-oriented programmes and with cultural and leisure courses (lukyanova and veramejchyk, 2017).
In Indonesia, besides ClCs, community-based vocational Training Centres (Balai latihan Kerja) were relaunched as part of a Ministry of Manpower programme in 2017 to encourage vocational education in remote areas and to train and reskill qualified workers. As of 2020, 2,127 centres had been established nationally and 787 more were planned in 2021 (Chau, 2021). Developed in the 1970s and 1980s to address manufacturing sector needs, they provide non-formal automotive, textile, electronics and ICT courses for jobseekers and students and for workers as part of their professional development. however, participation lags behind expectations due to concerns about infrastructure, equipment and staff quality (OECD and Asian Development Bank, 2020).
ClCs are characterized by broad-spectrum learning provision that adapts to local needs. In the United Republic of Tanzania, Folk Development Colleges, founded in the 1970s, provide adult education, community development and vocational training. They offer one- to two-year vocational programmes, recognized and validated by the Tanzanian vocational Education and Training Authority, as well as short courses on campus and in the community. Each college addresses community needs, making its resources and facilities available to members (Rogers, 2019).
ClCs in Myanmar are involved in multiple learning activities, including second-chance education and thematic training on issues such as health, communication skills in family relationships, and agricultural techniques and practices, which are of particular relevance for farmers. The centres also act as a multilevel network enabling social contacts between villages and external actors, with whom they can share knowledge and skills and mobilize resources (Pham le, 2018). In other contexts, they may respond to emerging and specific needs, relying on their ability to reach people in the most marginalized areas. In Mexico, 32 Digital Inclusion Centres (Puntos Mexico Conectado – Centros de Inclusión Digital) have been established, one in each state and Mexico City, to provide free basic digital skills programmes and entrepreneurship courses, especially to youth and girls (OECD, 2020).
2 0 2 1 / 2 • G LO BA L E D U C AT I O N M O N I TO R I N G R E P O RT 260
12
FOCUS 12.3: EDUCATION LEAVE IS A TOOL TO PROMOTE ADULT EDUCATION IN HIGH-INCOME COUNTRIES
SDG 4 aims to promote ‘lifelong learning opportunities for all’ and global indicator 4.3.1 aims to capture that aspect, which, somewhat surprisingly, is not explicitly included in any individual target. however, apart from the fact that there remain considerable data gaps for this indicator, it is important to directly monitor the extent to which all adults enjoy the opportunity to participate in education and training.1
Time and cost constraints have been found to impede workers’ access to continuing training. Paid study leave is an instrument enabling workers to dedicate more time to training without losing their jobs and income. Accordingly, the IlO considers study leave a key tool to promote the right to continuing education. IlO Convention 140 on paid study leave, approved in 1974 and ratified by 35 countries, defines it as leave granted to workers for educational purposes, for a specified period, during working hours and with payment of adequate financial entitlements.
No systematic cross-country comparative information on the regulation of education leave exists outside of a dated overview for Europe (Cedefop, 2012). Most countries regulate study leave through legislation, although a few, such as the Netherlands, rely almost entirely on collective bargaining agreements, of which there may be hundreds, with varying rules. Even where study leave is regulated through national legislation and paid for by the state, statistics on take-up at the national level may be unavailable, especially in federal states such as Germany and Mexico.
To fill this data gap, a study for this report analysed the situation in 27 countries where data could be obtained. Countries can be classified into four groups according to the level at which they protect workers’ right to training, depending on the existence of specific normative instruments, payment during the leave and the breadth of eligibility criteria determining which workers have the right to such leave. Universally, benefits such as employer financing and guaranteed return to employment are tied to criteria such as minimum job tenure, although the cut-off periods differ widely.
1 This section is based on Batthyány et al. (2021).
The first group of countries does not guarantee the right to such leave. Agreements regarding it may exist, but there is no regulation of an entitlement. The second group has restricted rights to study leave. Canada and Costa Rica offer leave only for public workers. In Chile, only people between ages 18 and 24 are eligible to request unpaid study leave. In the United Kingdom, only workers in companies with more than 250 employees are eligible and study leave is unpaid. In the third group, with moderate rights to study leave, countries have regulations for paid leave but distinguish between various groups (such as public vs private sector), regions or industries, and typically limit duration to no more than 30 days per year. The fourth group, with highly protected rights to study leave, comprises countries with universal entitlements to paid leave, including of long duration. In Austria, it can last up to one year, Finland up to two and Norway up to three, while Sweden has no defined limits. In Finland, large positive effects of study leave participation on education attainment are observed, especially for the less educated (Kauhanen, 2021).
There is no clear relationship between study leave regulation and overall participation in adult education and training. This is unsurprising, since even the most generous programmes reach only a small fraction of workers. Austria is one of the few countries with publicly available, disaggregated data on study leave take-up. In 2019, 21,147 individuals benefited, almost 60% of them women. however, this amounts to less than 0.5% of a labour force of around 4.5 million. Only 41,440 participated in training leave in France in 2013, out of a labour force of around 30 million, or 0.13%. however, even such low annual participation rates could amount to 5% to 20% participation over the course of a working life.
Indicator 4.3.1 is dominated by participation in non-formal education. Typically, certification requirements exist for course attendance or exams taken to qualify for study leave. A more direct comparison is with the share of employed persons participating in formal education and training. The EU average is only 4.2% (Eurostat, 2021b). It is likely that the contribution of education leave to full-time participation in courses of long duration is higher, especially for freely chosen courses.
261 C H A P T E R 1 2 • TEChNICAl , vOCATIONAl, TERTIARy AND ADUlT EDUCATION
12
Indicator 4.3.1 also includes training carried out by employers themselves. On average, 70% of enterprises in the EU provide continuous vocational training to their employees (Eurostat, 2021a). In some countries, including Slovenia, study leave can be used only for courses or studies that are of interest to the employer. Even where choice of course is more flexible in principle, employers’ discretionary agreement is typically required, although employees may have a right of appeal to regulatory bodies or unions. France offers exceptionally strong protection: Employers cannot refuse eligible requests for individual training leave up to a year. Even there, however, employers may delay the leave’s start by nine months, requiring workers to make their plans almost a year in advance.
Reliance on employer goodwill and support may result in too little take-up of education leave. Collective bargaining agreements enable flexibility that allows employers and workers to jointly agree on how leave should be
offered, depending on the organization of the sector, profession or company. In some countries, costs are assumed through dedicated funds. In Austria, they are covered by funds provided by employers, government and workers. Similarly, in France, a tripartite body collects funds paid by private employers for worker training.
In Uruguay, while workers have access to relatively short study leave, especially in the private sector (9 days per year for employees working between 36 and 48 hours per week), this entitlement enjoys exceptionally strong legal protection. Workers become eligible after six months of employment. Employers cannot refuse and must pay the full salary during the leave. The combination of modest entitlements and strong protection represents a feasible strategy for resource-constrained settings. Increasing the duration of study leave as economic development allows is thus a matter of incremental change rather than introducing a new instrument.
In Uruguay, while workers have access to relatively short study leave, especially in the private sector, this entitlement enjoys exceptionally strong legal protection
2 0 2 1 / 2 • G LO BA L E D U C AT I O N M O N I TO R I N G R E P O RT 262
12
COVID-19
TVET was severely affected by COvID-19. A May 2020 global survey found that 90% of respondents had experienced school closures and 98% a disruption of work-based learning. One in two low-income and one in three lower-middle-income countries had to cancel all training. Among 92 countries, in 13 a majority of respondents had used distance learning regularly prior to the pandemic; during the pandemic, the number reached 46, or 50%, ranging from 12% of low-income to 72% of high-income countries. Almost three quarters of respondents reported that certification tests were also delayed (IlO et al., 2020).
Remote teaching presents challenges in TvET. Up to 80% of programmes focus on practical and soft skills, which should be acquired in person (Commonwealth of learning, 2020). A survey of 27 OECD countries showed that some forms of work-based learning and apprenticeships continued despite the pandemic, and some countries prioritized vocational education when education institutions reopened. In the Netherlands, vocational secondary school students continued learning at school. In Poland, practical classes took place in person with some restrictions, while theoretical classes moved online. About 81% of countries made physical adjustments to schools or classrooms, while in 73% of countries the return to school was in hybrid mode (OECD, 2021a). In Ecuador, students carried out practical activities at home and sent pictures and videos of their finished work to be assessed (hoftijzer et al., 2021).
Preparing teachers has been a major issue. Palestine focused efforts on TvET teachers’ capacity to deliver distance learning, while recognizing the lack of a relevant competency framework (Samara, 2021). A South African capacity development programme, aimed at professionalizing TvET lecturer education, had to adapt its approach to online seminars while addressing unequal access to the internet and devices (Scheepers and Gebhardt, 2021). But in some cases, the pandemic did not interrupt longer-term efforts to upgrade vocational education. Indonesia was in the middle of a reform that included a process for professionalizing vocational teacher education and introducing an in-service modality for practising but uncertified teachers. An online platform has enabled this reform to continue through a learning management system (Setiawan and hamdani, 2021).
Access to devices and the internet is a hurdle in low- and middle-income countries, including in sub-Saharan Africa (Kamaté and Siahoué, 2020). In Sri lanka, the share of TvET institutions providing distance learning increased from 36% before the pandemic to 92% providing at least one online course during the pandemic. however, only one in five households owned a desktop or laptop computer and 96% of students able to attend online classes did so mostly with low-tech solutions (hayashi et al., 2021). Thus it is important for delivery of distance learning to use multiple approaches and not rely solely on high-tech solutions. In India, Swayam Prabha Direct-to-home television channels offer vocational education classes. In Rwanda, even before the pandemic, non-smart mobile phones combined with interactive voice response were used in training community health workers (hoftijzer et al., 2020).
Collaboration between government and non-state service providers grew during the pandemic as some countries encouraged remote training provision, using digital tools and platforms, by private companies (OECD, 2020b). Armenia’s National Network for Distance learning, an NGO, trains trainers at technical colleges and schools for the National Centre for Educational Technology Development. Collaboration with unions has supported training of frontline staff. The United Kingdom’s NhS Professionals, an association of health and social sector workers, and Skills for health, the sector skills council for health, established a free online training course on COvID-19 (Skills for health, 2020).
The pandemic demonstrated that jobs in highly affected sectors crucial to the economy rely on vocational training, which can meet urgent demand as well as build resilience to crises. The Dominican Republic’s National Institute for Technical and vocational Training launched a course on new health-related protocols for the tourism industry (IlO/Cinterfor, 2020).
Tertiary education students were more exposed to remote learning than students at other education levels prior to the pandemic, even if many, including TvET students, also did practical courses. In a survey of 53 countries, only 3 reported switching fully to online higher education, 19 had primarily online modalities and 28 used a hybrid approach of remote and face-to-face learning (UNESCO, 2021). But a sub-Saharan African survey found that by mid-2020 over 80% of students
263 C H A P T E R 1 2 • TEChNICAl , vOCATIONAl, TERTIARy AND ADUlT EDUCATION
12
had experienced course interruptions and only 39% were enrolled in institutions offering remote learning options, with the latter share as low as 17% in western Africa (Mawazo Institute, 2020).
Countries varied in their choice of online platforms. In latin America, 60% of universities adopted Moodle, followed by Google Classroom (30%), own-developed platforms (21%) and Blackboard (7%) (IESAlC, 2021). Many universities in the Arab States used Moodle or social media, including Facebook and youTube, to teach lessons based on electronic publications sent through the university website (lassoued et al., 2020). Colombia created CO-lAB, a collaborative platform to share good pedagogical practices and digital resources among universities. Egypt launched its first digital platform for university distance learning in partnership with Microsoft. The Russian Federation launched a platform called University 20.35 (OECD, 2021b). In China, universities offered 24,000 online courses on 22 platforms, including 1,291 competitive high-quality courses selected by the Ministry of Education and 401 courses featuring virtual experimental simulations (Sun et al., 2020).
Preparedness for switching to online learning can be evaluated in terms of at least 10 factors: a business continuity plan, emergency management offices, electricity, internet, a learning management system, videoconferencing, digital content resources, teaching and learning units, trained instructors and cybersecurity (Salmi, 2020). Before the pandemic, 80% of latin American universities had learning management systems and online platforms suitable for distance education, while 8% implemented them after the crisis. however, only 68% of teachers regularly connected to the platforms, compared with 80% of students (IESAlC, 2021). In viet Nam, only 2% of tertiary education students engaged in distance learning in 2016, mostly because regulations prevented tertiary institutions from offering courses exclusively online. During the pandemic, 110 of more than 200 institutions moved online. Older teachers received support in using online platforms and WhatsApp groups for discussion and sharing assignments (Pham and ho, 2020).
The move to remote learning was most challenging for practical courses requiring site-based resources. In India, 65% of medical students missed being able to take traditional anatomy based on dissection,
models, microscopic slides and interaction with mentors; in addition, 83% said they lacked devices and internet bandwidth (Singal et al., 2021). In anglophone sub-Saharan Africa, 73% of students engaged in research reported that laboratory or field research activities had been suspended (Mawazo Institute, 2020). veterinary courses moved online, showing procedures via video and sometimes with 3D virtual tools (Mahdy, 2020). In pathology, microscope visualizations were used as an alternative to hybrid modes, where students were allowed into laboratories under social distancing rules (Kwon et al., 2020).
The impact of the pandemic on enrolment was ambiguous. Contrary to what is often perceived, enrolment tends to expand when economic opportunities shrink, as experience in the United States from the 2007/08 financial crisis showed (Barr and Turner, 2013). But the challenges of attending university under lockdown restrictions may have had the opposite effect. The latest evidence from the United States suggests that undergraduate enrolment fell by 6.5% between 2019 and 2021 but the effect was highly unequal: Enrolment in four-year private for-profit and two-year public institutions fell by at least 13% while in highly selective universities and in graduate courses enrolment rose despite the potential impact of reduced international student mobility (Figure 12.11). A global review of 57 countries, based on non-comparable data, suggested no clear pattern; the number of countries reporting increases in enrolment was roughly equal to the number reporting decreases for 2019 and 2020. however, Armenia, hungary and the Bolivarian Republic of venezuela reported decreases of at least 20% (UNESCO, 2021). The Brazilian university entry examination saw the fewest applicants since 2007, especially among black, brown and indigenous students (Pinheiro, 2021).
The unequal impact of the pandemic extended beyond enrolment and access to living conditions. In EU countries, 41% of students who worked during their studies lost their jobs, 29% temporarily and 12% permanently; 20% of students had financial concerns about cost of living. yet tuition levels remained unchanged for 75% of students; only 16% benefited from flexible payment plans or cancellation of payments (Farnell et al., 2021). In latin America, more than 60% of public and 90% of private higher education institutions provided tuition discounts (IESAlC, 2021).
2 0 2 1 / 2 • G LO BA L E D U C AT I O N M O N I TO R I N G R E P O RT 264
12
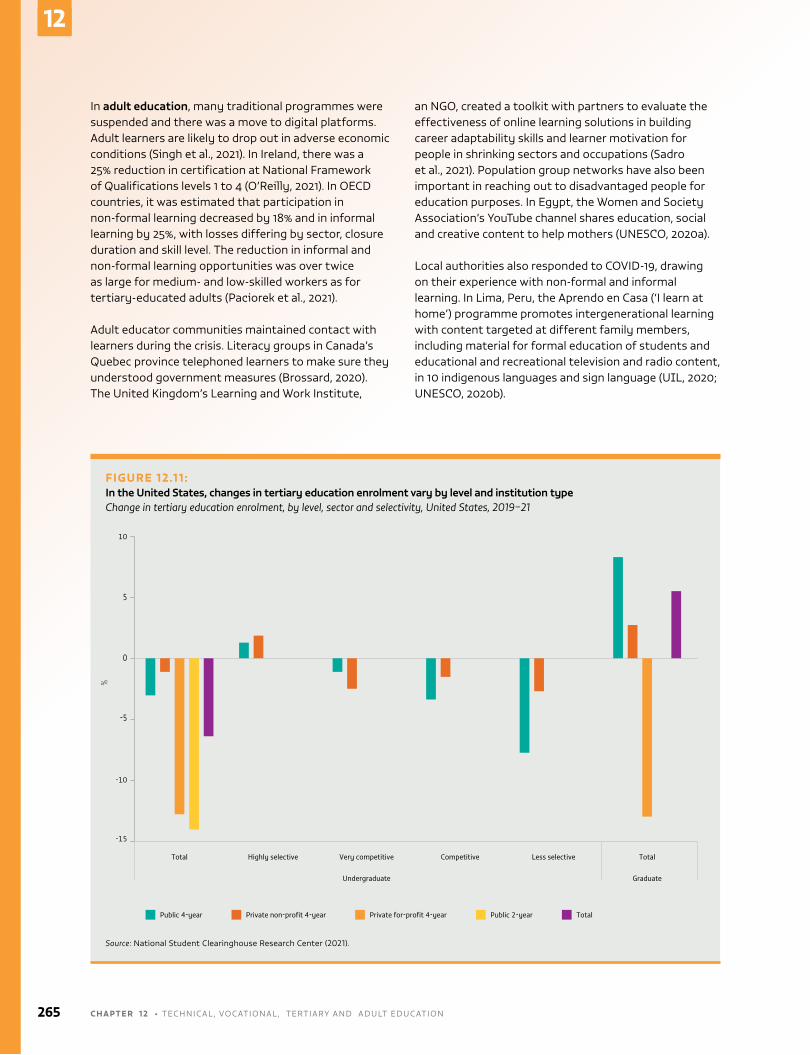
In adult education, many traditional programmes were suspended and there was a move to digital platforms. Adult learners are likely to drop out in adverse economic conditions (Singh et al., 2021). In Ireland, there was a 25% reduction in certification at National Framework of Qualifications levels 1 to 4 (O’Reilly, 2021). In OECD countries, it was estimated that participation in non-formal learning decreased by 18% and in informal learning by 25%, with losses differing by sector, closure duration and skill level. The reduction in informal and non-formal learning opportunities was over twice as large for medium- and low-skilled workers as for tertiary-educated adults (Paciorek et al., 2021).
Adult educator communities maintained contact with learners during the crisis. literacy groups in Canada’s Quebec province telephoned learners to make sure they understood government measures (Brossard, 2020). The United Kingdom’s learning and Work Institute,
an NGO, created a toolkit with partners to evaluate the effectiveness of online learning solutions in building career adaptability skills and learner motivation for people in shrinking sectors and occupations (Sadro et al., 2021). Population group networks have also been important in reaching out to disadvantaged people for education purposes. In Egypt, the Women and Society Association’s youTube channel shares education, social and creative content to help mothers (UNESCO, 2020a).
local authorities also responded to COvID-19, drawing on their experience with non-formal and informal learning. In lima, Peru, the Aprendo en Casa (‘I learn at home’) programme promotes intergenerational learning with content targeted at different family members, including material for formal education of students and educational and recreational television and radio content, in 10 indigenous languages and sign language (UIl, 2020; UNESCO, 2020b).
FIGURE 12.11 :In the United States, changes in tertiary education enrolment vary by level and institution typeChange in tertiary education enrolment, by level, sector and selectivity, United States, 2019–21
Total Highly selective Less selectiveVery competitive
Undergraduate
Total
Graduate
Competitive
0
5
-5
10
-10
-15
%
Public 4-year Public 2-year TotalPrivate non-profit 4-year Private for-profit 4-year
Source: National Student Clearinghouse Research Center (2021).
265 C H A P T E R 1 2 • TEChNICAl , vOCATIONAl, TERTIARy AND ADUlT EDUCATION
12
Where infrastructure existed for digital learning, positive outcomes were reported from continuing online learning. Across OECD countries, the flexibility and continuity of online learning led to more participation in some adult education courses. Governments supported such learning though free or subsidized courses, often in partnership with other actors targeting learners and teachers. The Ontario School Board in Canada partnered with Apple to provide teachers with digital teaching materials, including free virtual coaching sessions (OECD, 2020a).
however, connectivity, digital skills and availability of adequate devices do not always ensure access to online learning. In some cases, migration to telephone applications filled the gap. Globally, in 2017–18, there were 7.5 times more mobile phone subscriptions than fixed broadband subscriptions, on average (Kovacevic and Jahic, 2020). To address the connectivity challenge, Media Works Cape, a private South African provider of adult education, delivered courses through WhatsApp, which facilitated virtual learning by allowing learners to ask questions and share videos (Carroll, 2020). Before the pandemic, studies showed WhatsApp to be the preferred communication application for learning in sub-Saharan Africa whereas, for example, Facebook consumes more data and thus is more expensive (Madge et al., 2019).
2 0 2 1 / 2 • G LO BA L E D U C AT I O N M O N I TO R I N G R E P O RT 266
12
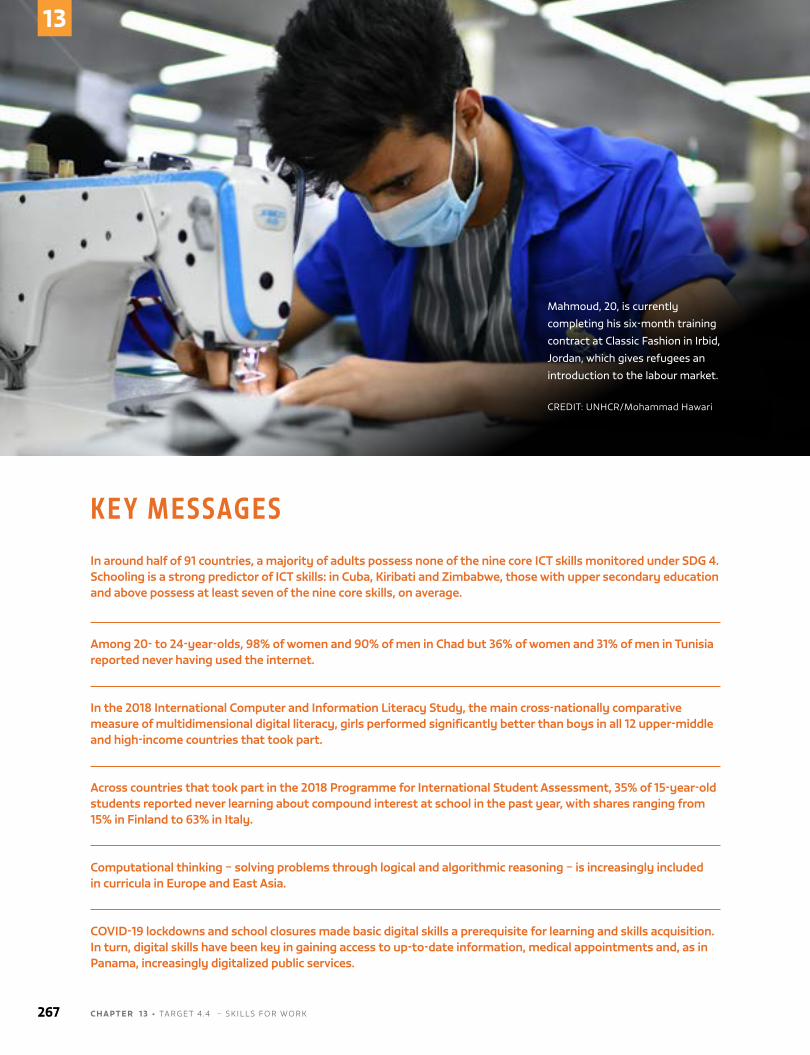
K E Y M E S S AG E SIn around half of 91 countries, a majority of adults possess none of the nine core ICT skills monitored under SDG 4. Schooling is a strong predictor of ICT skills: in Cuba, Kiribati and Zimbabwe, those with upper secondary education and above possess at least seven of the nine core skills, on average.
Among 20- to 24-year-olds, 98% of women and 90% of men in Chad but 36% of women and 31% of men in Tunisia reported never having used the internet.
In the 2018 International Computer and Information Literacy Study, the main cross-nationally comparative measure of multidimensional digital literacy, girls performed significantly better than boys in all 12 upper-middle and high-income countries that took part.
Across countries that took part in the 2018 Programme for International Student Assessment, 35% of 15-year-old students reported never learning about compound interest at school in the past year, with shares ranging from 15% in Finland to 63% in Italy.
Computational thinking – solving problems through logical and algorithmic reasoning – is increasingly included in curricula in Europe and East Asia.
COVID-19 lockdowns and school closures made basic digital skills a prerequisite for learning and skills acquisition. In turn, digital skills have been key in gaining access to up-to-date information, medical appointments and, as in Panama, increasingly digitalized public services.
Mahmoud, 20, is currently
completing his six-month training
contract at Classic Fashion in Irbid,
Jordan, which gives refugees an
introduction to the labour market.
CrEDiT: UnHCr/Mohammad Hawari
267 C H A P T E R 1 3 • TArGET 4.4 – sKiLLs For WorK
13
CHAPTER 13
TARGET 4.4
Skills for work
4.4
By 2030, substantially increase the number of youth and adults who have relevant skills, including technical and vocational skills, for employment, decent jobs and entrepreneurship
GLOBAL INDICATOR
4.4.1 – Percentage of youth/adults with information and communications technology (ICT)
skills, by type of skill
THEMATIC INDICATORS
4.4.2 – Percentage of youth/adults who have achieved at least a minimum level of
proficiency in digital literacy skills
4.4.3 – Youth/adult educational attainment rates by age group and level of education
2 0 2 1 / 2 • G LO BA L E D U C AT I O N M O N I TO R I N G R E P O RT 268
13
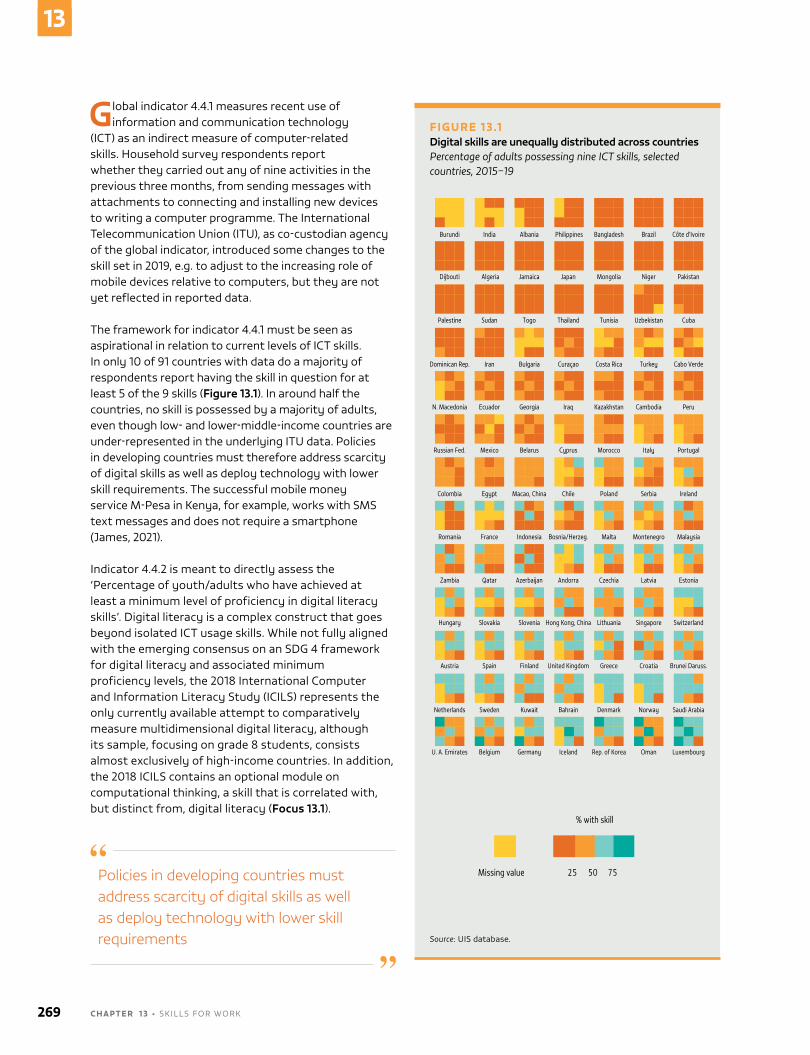
Global indicator 4.4.1 measures recent use of information and communication technology
(iCT) as an indirect measure of computer-related skills. Household survey respondents report whether they carried out any of nine activities in the previous three months, from sending messages with attachments to connecting and installing new devices to writing a computer programme. The international Telecommunication Union (iTU), as co-custodian agency of the global indicator, introduced some changes to the skill set in 2019, e.g. to adjust to the increasing role of mobile devices relative to computers, but they are not yet reflected in reported data.
The framework for indicator 4.4.1 must be seen as aspirational in relation to current levels of iCT skills. in only 10 of 91 countries with data do a majority of respondents report having the skill in question for at least 5 of the 9 skills (Figure 13.1). in around half the countries, no skill is possessed by a majority of adults, even though low- and lower-middle-income countries are under-represented in the underlying iTU data. Policies in developing countries must therefore address scarcity of digital skills as well as deploy technology with lower skill requirements. The successful mobile money service M-Pesa in Kenya, for example, works with sMs text messages and does not require a smartphone (James, 2021).
indicator 4.4.2 is meant to directly assess the ‘Percentage of youth/adults who have achieved at least a minimum level of proficiency in digital literacy skills’. Digital literacy is a complex construct that goes beyond isolated iCT usage skills. While not fully aligned with the emerging consensus on an sDG 4 framework for digital literacy and associated minimum proficiency levels, the 2018 international Computer and information Literacy study (iCiLs) represents the only currently available attempt to comparatively measure multidimensional digital literacy, although its sample, focusing on grade 8 students, consists almost exclusively of high-income countries. in addition, the 2018 iCiLs contains an optional module on computational thinking, a skill that is correlated with, but distinct from, digital literacy (Focus 13.1).
Policies in developing countries must address scarcity of digital skills as well as deploy technology with lower skill requirements
FIGURE 13.1Digital skills are unequally distributed across countriesPercentage of adults possessing nine ICT skills, selected countries, 2015–19
Guatemala, 2014
2018
Burundi
Dijbouti
Palestine Sudan Togo Thailand Tunisia Uzbekistan Cuba
Dominican Rep. Iran Bulgaria Curaçao Costa Rica Turkey Cabo Verde
N. Macedonia Ecuador Georgia Iraq Kazakhstan Cambodia Peru
Russian Fed. Mexico Belarus Cyprus Morocco Italy Portugal
Colombia Egypt Macao, China Chile Poland Serbia Ireland
Romania France Indonesia Bosnia/Herzeg. Malta Montenegro Malaysia
Zambia Qatar Azerbaijan Andorra Czechia Latvia Estonia
Hungary Slovakia Slovenia Hong Kong, China Lithuania Singapore Switzerland
Austria Spain Finland United Kingdom Greece Croatia Brunei Daruss.
Netherlands Sweden Kuwait Bahrain Denmark Norway Saudi Arabia
U. A. Emirates Belgium Germany Iceland
75
Rep. of Korea Oman Luxembourg
Algeria Jamaica Japan Mongolia Niger Pakistan
India Albania Philippines Bangladesh Brazil Côte d’Ivoire
5025Missing value
% with skill
Source: Uis database.
269 C H A P T E R 1 3 • sKiLLs For WorK
13
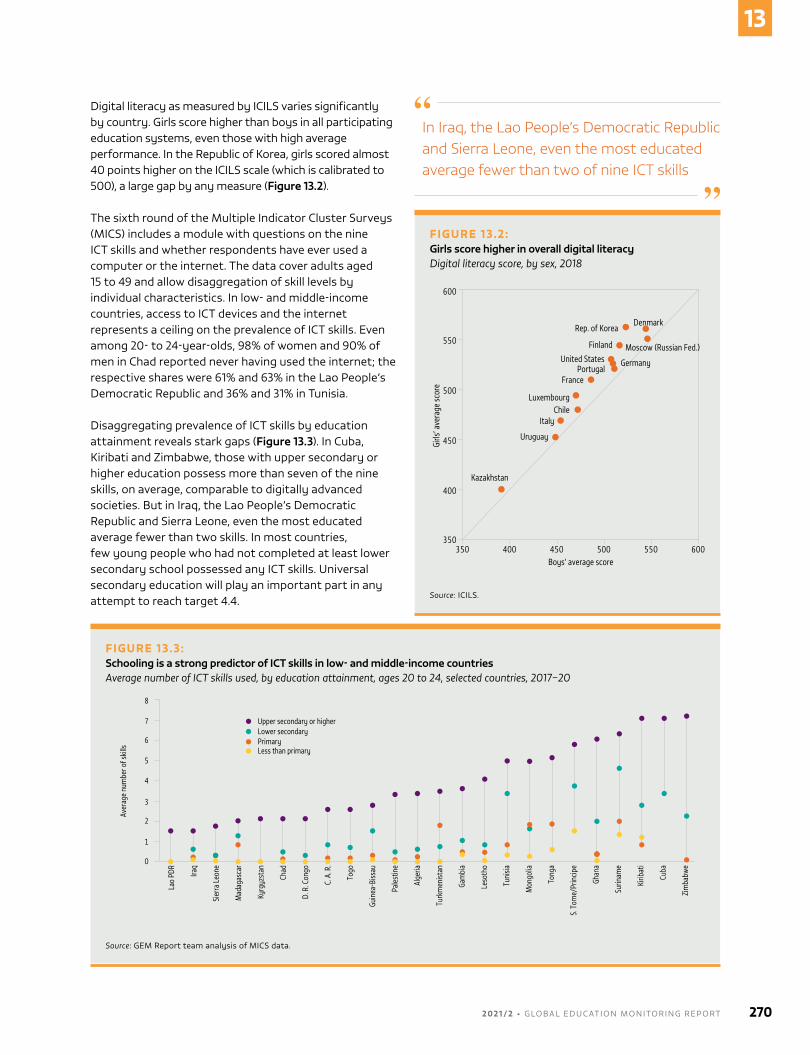
Digital literacy as measured by iCiLs varies significantly by country. Girls score higher than boys in all participating education systems, even those with high average performance. in the republic of Korea, girls scored almost 40 points higher on the iCiLs scale (which is calibrated to 500), a large gap by any measure (Figure 13.2).
The sixth round of the Multiple indicator Cluster surveys (MiCs) includes a module with questions on the nine iCT skills and whether respondents have ever used a computer or the internet. The data cover adults aged 15 to 49 and allow disaggregation of skill levels by individual characteristics. in low- and middle-income countries, access to iCT devices and the internet represents a ceiling on the prevalence of iCT skills. Even among 20- to 24-year-olds, 98% of women and 90% of men in Chad reported never having used the internet; the respective shares were 61% and 63% in the Lao People’s Democratic republic and 36% and 31% in Tunisia.
Disaggregating prevalence of iCT skills by education attainment reveals stark gaps (Figure 13.3). in Cuba, Kiribati and Zimbabwe, those with upper secondary or higher education possess more than seven of the nine skills, on average, comparable to digitally advanced societies. But in iraq, the Lao People’s Democratic republic and sierra Leone, even the most educated average fewer than two skills. in most countries, few young people who had not completed at least lower secondary school possessed any iCT skills. Universal secondary education will play an important part in any attempt to reach target 4.4.
In Iraq, the Lao People’s Democratic Republic and Sierra Leone, even the most educated average fewer than two of nine ICT skills
FIGURE 13.3:Schooling is a strong predictor of ICT skills in low- and middle-income countriesAverage number of ICT skills used, by education attainment, ages 20 to 24, selected countries, 2017–20
Guatemala, 2014
2018
Lao
PDR
Iraq
Sier
ra L
eone
Mad
agas
car
Kyrg
yzst
an
Chad
D. R
. Con
go
C. A
. R.
Togo
Guin
ea-B
issau
Pale
stin
e
Alge
ria
Turk
men
istan
Gam
bia
Leso
tho
Tuni
sia
Mon
golia
Tong
a
S. T
ome/
Prin
cipe
Ghan
a
Surin
ame
Kirib
ati
Cuba
Zim
babw
e
Upper secondary or higher
Aver
age
num
ber o
f skil
ls
Lower secondaryPrimaryLess than primary
8
7
6
5
4
3
2
1
0
Source: GEM report team analysis of MiCs data.
FIGURE 13.2:Girls score higher in overall digital literacyDigital literacy score, by sex, 2018
Guatemala, 2014
2018
600
550
500
450
400
350350 400 450 500 550 600
Boys’ average score
Kazakhstan
Uruguay
ItalyChile
Luxembourg
FrancePortugal
GermanyUnited States
Finland
Rep. of KoreaDenmark
Moscow (Russian Fed.)
Girls
’ ave
rage
scor
e
Source: iCiLs.
2 0 2 1 / 2 • G LO BA L E D U C AT I O N M O N I TO R I N G R E P O RT 270
13
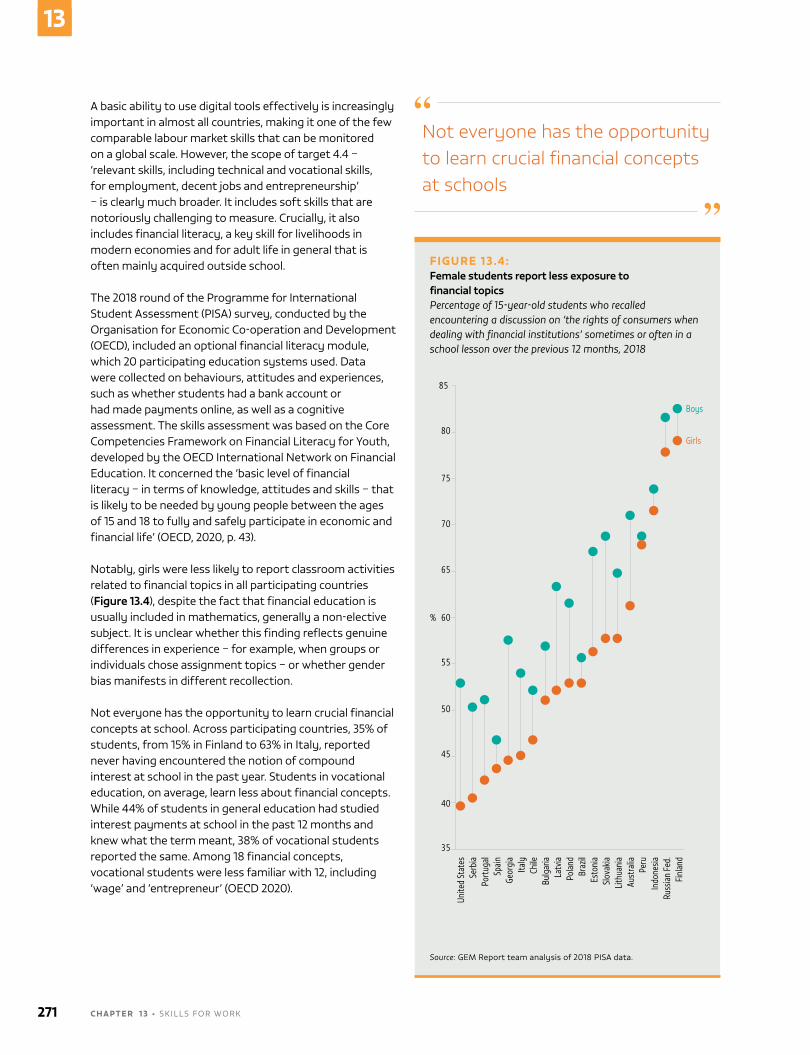
A basic ability to use digital tools effectively is increasingly important in almost all countries, making it one of the few comparable labour market skills that can be monitored on a global scale. However, the scope of target 4.4 – ‘relevant skills, including technical and vocational skills, for employment, decent jobs and entrepreneurship’ – is clearly much broader. it includes soft skills that are notoriously challenging to measure. Crucially, it also includes financial literacy, a key skill for livelihoods in modern economies and for adult life in general that is often mainly acquired outside school.
The 2018 round of the Programme for international student Assessment (PisA) survey, conducted by the organisation for Economic Co-operation and Development (oECD), included an optional financial literacy module, which 20 participating education systems used. Data were collected on behaviours, attitudes and experiences, such as whether students had a bank account or had made payments online, as well as a cognitive assessment. The skills assessment was based on the Core Competencies Framework on Financial Literacy for Youth, developed by the oECD international network on Financial Education. it concerned the ‘basic level of financial literacy – in terms of knowledge, attitudes and skills – that is likely to be needed by young people between the ages of 15 and 18 to fully and safely participate in economic and financial life’ (oECD, 2020, p. 43).
notably, girls were less likely to report classroom activities related to financial topics in all participating countries (Figure 13.4), despite the fact that financial education is usually included in mathematics, generally a non-elective subject. it is unclear whether this finding reflects genuine differences in experience – for example, when groups or individuals chose assignment topics – or whether gender bias manifests in different recollection.
not everyone has the opportunity to learn crucial financial concepts at school. Across participating countries, 35% of students, from 15% in Finland to 63% in italy, reported never having encountered the notion of compound interest at school in the past year. students in vocational education, on average, learn less about financial concepts. While 44% of students in general education had studied interest payments at school in the past 12 months and knew what the term meant, 38% of vocational students reported the same. Among 18 financial concepts, vocational students were less familiar with 12, including ‘wage’ and ‘entrepreneur’ (oECD 2020).
Not everyone has the opportunity to learn crucial financial concepts at schools
FIGURE 13.4:Female students report less exposure to financial topicsPercentage of 15-year-old students who recalled encountering a discussion on ‘the rights of consumers when dealing with financial institutions’ sometimes or often in a school lesson over the previous 12 months, 2018
Guatemala, 2014
2018
Unite
d St
ates
Serb
iaPo
rtuga
lSp
ain
Geor
gia
Italy
Chile
Bulg
aria
Latv
iaPo
land
Braz
ilEs
toni
aSl
ovak
iaLi
thua
nia
Aust
ralia
Peru
Indo
nesia
Russ
ian
Fed.
Finl
and
Boys
Girls
85
80
75
70
65
60%
55
50
45
40
35
Source: GEM report team analysis of 2018 PisA data.
271 C H A P T E R 1 3 • sKiLLs For WorK
13
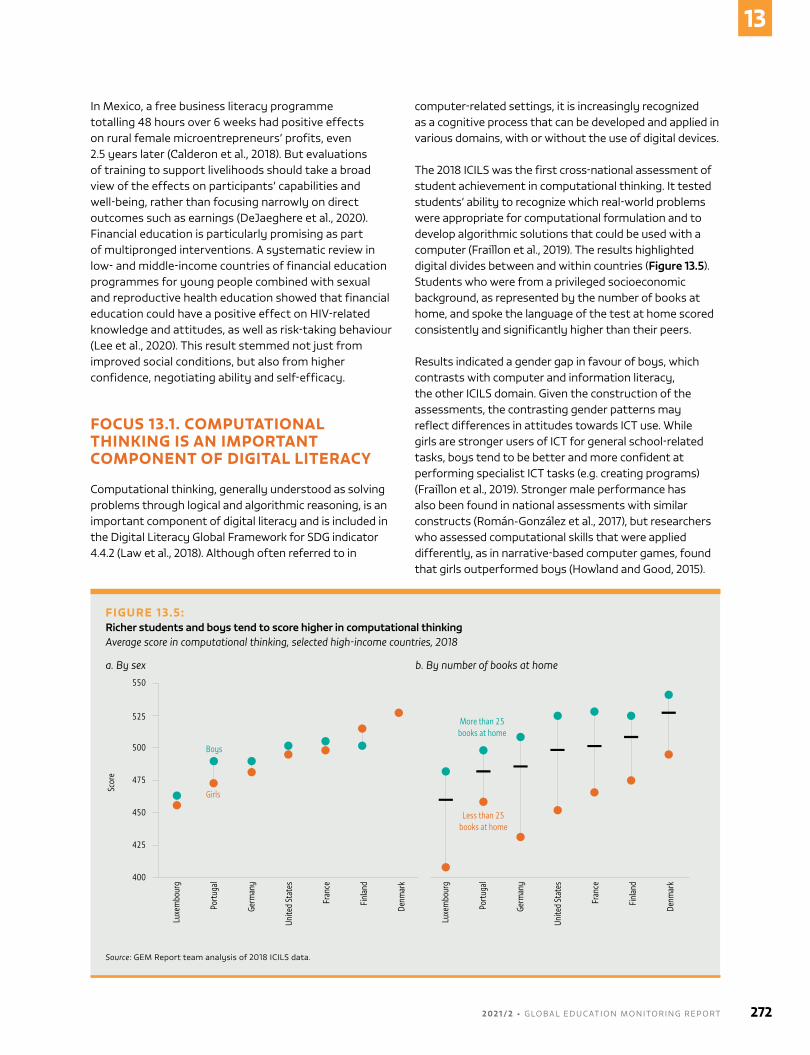
in Mexico, a free business literacy programme totalling 48 hours over 6 weeks had positive effects on rural female microentrepreneurs’ profits, even 2.5 years later (Calderon et al., 2018). But evaluations of training to support livelihoods should take a broad view of the effects on participants’ capabilities and well-being, rather than focusing narrowly on direct outcomes such as earnings (DeJaeghere et al., 2020). Financial education is particularly promising as part of multipronged interventions. A systematic review in low- and middle-income countries of financial education programmes for young people combined with sexual and reproductive health education showed that financial education could have a positive effect on Hiv-related knowledge and attitudes, as well as risk-taking behaviour (Lee et al., 2020). This result stemmed not just from improved social conditions, but also from higher confidence, negotiating ability and self-efficacy.
FOCUS 13.1. COMPUTATIONAL THINKING IS AN IMPORTANT COMPONENT OF DIGITAL LITERACY
Computational thinking, generally understood as solving problems through logical and algorithmic reasoning, is an important component of digital literacy and is included in the Digital Literacy Global Framework for sDG indicator 4.4.2 (Law et al., 2018). Although often referred to in
computer-related settings, it is increasingly recognized as a cognitive process that can be developed and applied in various domains, with or without the use of digital devices.
The 2018 iCiLs was the first cross-national assessment of student achievement in computational thinking. it tested students’ ability to recognize which real-world problems were appropriate for computational formulation and to develop algorithmic solutions that could be used with a computer (Fraillon et al., 2019). The results highlighted digital divides between and within countries (Figure 13.5). students who were from a privileged socioeconomic background, as represented by the number of books at home, and spoke the language of the test at home scored consistently and significantly higher than their peers.
results indicated a gender gap in favour of boys, which contrasts with computer and information literacy, the other iCiLs domain. Given the construction of the assessments, the contrasting gender patterns may reflect differences in attitudes towards iCT use. While girls are stronger users of iCT for general school-related tasks, boys tend to be better and more confident at performing specialist iCT tasks (e.g. creating programs) (Fraillon et al., 2019). stronger male performance has also been found in national assessments with similar constructs (román-González et al., 2017), but researchers who assessed computational skills that were applied differently, as in narrative-based computer games, found that girls outperformed boys (Howland and Good, 2015).
FIGURE 13.5:Richer students and boys tend to score higher in computational thinkingAverage score in computational thinking, selected high-income countries, 2018
a. By sex b. By number of books at home
Guatemala, 2014
2018
Boys
Girls
Less than 25 books at home
More than 25 books at home
Scor
e
550
525
500
475
450
425
400
Luxe
mbo
urg
Port
ugal
Germ
any
Unite
d St
ates
Fran
ce
Finl
and
Denm
ark
Luxe
mbo
urg
Port
ugal
Germ
any
Unite
d St
ates
Fran
ce
Finl
and
Denm
ark
Source: GEM report team analysis of 2018 iCiLs data.
2 0 2 1 / 2 • G LO BA L E D U C AT I O N M O N I TO R I N G R E P O RT 272
13
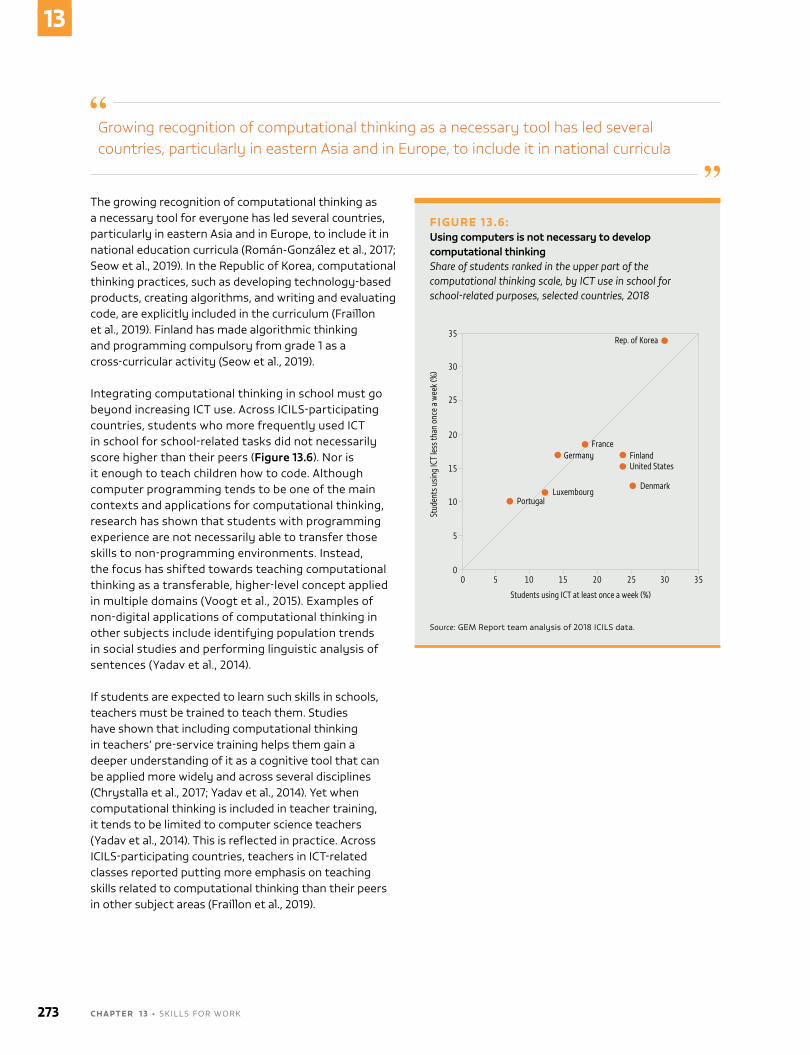
The growing recognition of computational thinking as a necessary tool for everyone has led several countries, particularly in eastern Asia and in Europe, to include it in national education curricula (román-González et al., 2017; seow et al., 2019). in the republic of Korea, computational thinking practices, such as developing technology-based products, creating algorithms, and writing and evaluating code, are explicitly included in the curriculum (Fraillon et al., 2019). Finland has made algorithmic thinking and programming compulsory from grade 1 as a cross-curricular activity (seow et al., 2019).
integrating computational thinking in school must go beyond increasing iCT use. Across iCiLs-participating countries, students who more frequently used iCT in school for school-related tasks did not necessarily score higher than their peers (Figure 13.6). nor is it enough to teach children how to code. Although computer programming tends to be one of the main contexts and applications for computational thinking, research has shown that students with programming experience are not necessarily able to transfer those skills to non-programming environments. instead, the focus has shifted towards teaching computational thinking as a transferable, higher-level concept applied in multiple domains (voogt et al., 2015). Examples of non-digital applications of computational thinking in other subjects include identifying population trends in social studies and performing linguistic analysis of sentences (Yadav et al., 2014).
if students are expected to learn such skills in schools, teachers must be trained to teach them. studies have shown that including computational thinking in teachers’ pre-service training helps them gain a deeper understanding of it as a cognitive tool that can be applied more widely and across several disciplines (Chrystalla et al., 2017; Yadav et al., 2014). Yet when computational thinking is included in teacher training, it tends to be limited to computer science teachers (Yadav et al., 2014). This is reflected in practice. Across iCiLs-participating countries, teachers in iCT-related classes reported putting more emphasis on teaching skills related to computational thinking than their peers in other subject areas (Fraillon et al., 2019).
Growing recognition of computational thinking as a necessary tool has led several countries, particularly in eastern Asia and in Europe, to include it in national curricula
FIGURE 13.6:Using computers is not necessary to develop computational thinkingShare of students ranked in the upper part of the computational thinking scale, by ICT use in school for school-related purposes, selected countries, 2018
Guatemala, 2014
2018
35
30
25
20
15
10
5
00 5 10 15 20 25 30 35
Students using ICT at least once a week (%)
Rep. of Korea
Stud
ents
usin
g IC
T le
ss th
an o
nce
a w
eek (
%)
PortugalLuxembourg
GermanyFrance
Denmark
United StatesFinland
Source: GEM report team analysis of 2018 iCiLs data.
273 C H A P T E R 1 3 • sKiLLs For WorK
13
COVID-19
Demand for digital skills has soared since the pandemic began, making them a core priority of education, training and skills building. CoviD-19 has accelerated the digital transformation in labour markets, with the digital economy expanding and the nature of work rapidly changing (ILo, 2020). in a survey of multinational and large national companies, 84% reported being ready to digitalize work processes, potentially moving 44% of their workforce to remote operations (World Economic Forum, 2020).
CoviD-19 has also led to increasing digitalization of society more broadly, from social connections to product purchase and delivery, and even the fight against the pandemic itself. Digital skills have been key in gaining access to up-to-date information, booking medical appointments and using mobile applications for contact tracing (Binda, 2020). Digitalization of public services has also gained speed. in Panama, where the renewal process for citizen iDs required two in-person visits, the government trialled an online platform for a remote renewal process and created an in-kind transfer that delivers digital vouchers linked to iD cards, thus turning them into debit cards for essential purchases during the pandemic (reyes et al., 2021). Lockdowns and school closures made basic digital skills a prerequisite for learning and skills acquisition.
For some, the unprecedented increase in demand resulted in accelerated digital skills acquisition. The African Development Bank’s Coding for Employment platform saw a 40% increase in users within a week after the pandemic hit (Doroba et al., 2020). The focus on improving digital skills can be even stronger among the unemployed. Analysis of the online learning platform Coursera indicates that while the increase in participation of employed learners focused on personal development courses, unemployed learners focused on acquiring new digital skills, such as data analysis, computer science and information technology (World Economic Forum, 2020).
But digital skills-building opportunities were not equally available for those lacking basic literacy or access to the internet and devices. in nigeria, while private school teachers received devices and training to help them move towards remote teaching, public school teachers only received the schedules of learning programmes available on Tv and radio (Azubuike, 2021). in refugee camps, such as that in Kakuma, Kenya, lockdowns halted programmes that delivered digital skills training to young people with no internet connectivity (ILo, 2020). older adults, who are less likely to be digitally proficient,
have also been hit particularly hard by the accelerated digitalization of society. A survey of 17 European countries showed that even in high-income settings, less than half those aged 50 or older used the internet before the pandemic (seifert, 2020). And those without basic skills were left further behind. A study of digital literacy among the elderly in Mexico found that those enrolled in basic levels did not have the necessary skills to continue with the training during the pandemic, leading to a dropout rate of nearly 80%. Those in more advanced levels were able to continue and effectively improve their skills (Martínez-Alcalá et al., 2021).
Governments are being called on to play a larger a role. only 21% of businesses reporting to the World Economic Forum had access to public funds to support employee reskilling or upskilling (World Economic Forum, 2020). improving digital skills and closing the digital divide may also require reforms in education and training systems. in 2020, south Africa’s Department of Communications and Digital Technologies proposed reviewing the basic education curriculum to include computing, coding and a wide range of digital skills (BusinessTech, 2020). As part of the European Union (EU) Digital Education Action Plan (2021–2027), countries aim to establish common guidelines for teachers on fostering digital literacy, to collect data on student digital skills and to introduce an EU target for student digital competence (European Commission, 2021). regulations and the coordination of global efforts to curb risks associated with the rush in digital upskilling, such as bullying, technology addiction and misinformation, have also gained new urgency (Jackman et al., 2021).
non-state actors have stepped in as well. over 30 million people enrolled in free online courses delivered by Linkedin Learning, Microsoft Learn and GitHub Learning Lab – some of the most popular of which were related to the digital transformation (smith, 2021). Microsoft also collaborated with local partners, such as the African banking group Ecobank, to provide small and medium-sized enterprises with the necessary digital skills to transition into the ever more digital world (Monteiro, 2021). Mastercard collaborated with UsAiD to launch Project Kirana in india, aimed at providing digital literacy skills to expand the access of female-owned shops to financial and digital services (Corneille, 2020). in Chile, a public–private partnership, Digital Talent for Chile, was launched in 2019 with the aim of training 16,000 disadvantaged people in skills related to the digital economy; it provided 3,000 scholarships for people who lost their jobs during the pandemic (Fundación Chile, 2020).
2 0 2 1 / 2 • G LO BA L E D U C AT I O N M O N I TO R I N G R E P O RT 274
13
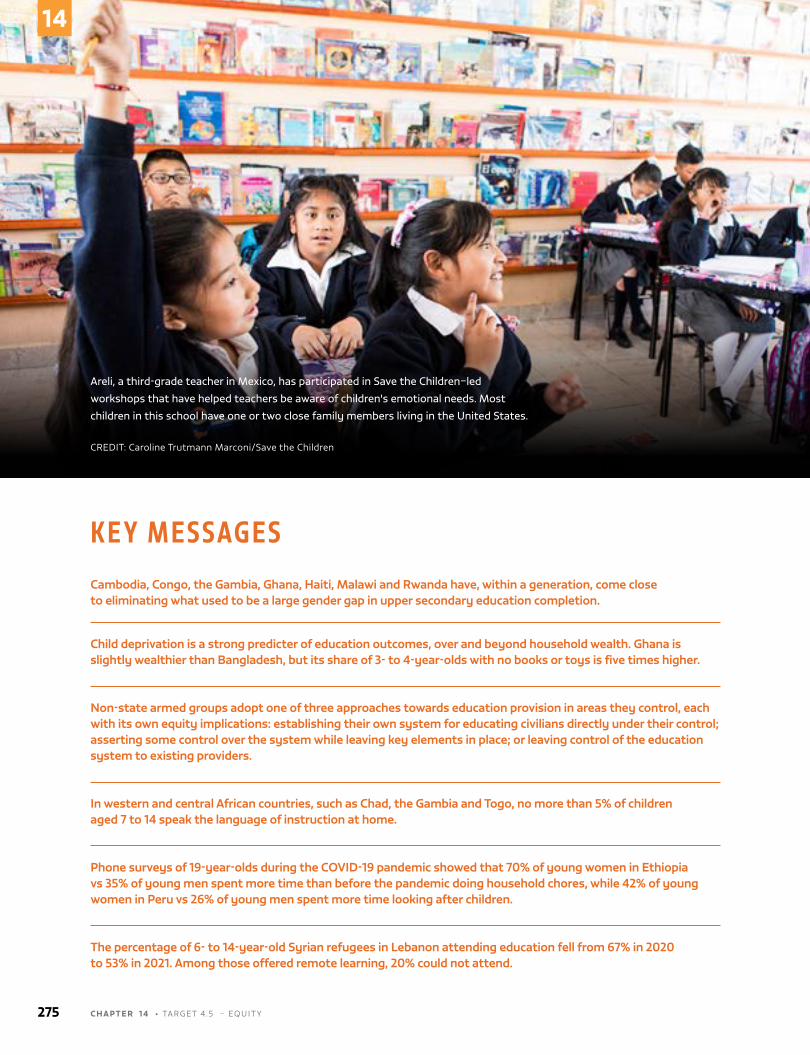
K E Y M E S S AG E SCambodia, Congo, the Gambia, Ghana, Haiti, Malawi and Rwanda have, within a generation, come close to eliminating what used to be a large gender gap in upper secondary education completion.
Child deprivation is a strong predicter of education outcomes, over and beyond household wealth. Ghana is slightly wealthier than Bangladesh, but its share of 3- to 4-year-olds with no books or toys is five times higher.
Non-state armed groups adopt one of three approaches towards education provision in areas they control, each with its own equity implications: establishing their own system for educating civilians directly under their control; asserting some control over the system while leaving key elements in place; or leaving control of the education system to existing providers.
In western and central African countries, such as Chad, the Gambia and Togo, no more than 5% of children aged 7 to 14 speak the language of instruction at home.
Phone surveys of 19-year-olds during the COVID-19 pandemic showed that 70% of young women in Ethiopia vs 35% of young men spent more time than before the pandemic doing household chores, while 42% of young women in Peru vs 26% of young men spent more time looking after children.
The percentage of 6- to 14-year-old Syrian refugees in Lebanon attending education fell from 67% in 2020 to 53% in 2021. Among those offered remote learning, 20% could not attend.
Areli, a third-grade teacher in Mexico, has participated in Save the Children–led
workshops that have helped teachers be aware of children's emotional needs. Most
children in this school have one or two close family members living in the United States.
CrEDiT: Caroline Trutmann Marconi/save the Children
275 C H A P T E R 1 4 • TArGET 4.5 – EQUiTY
14
CHAPTER 14
TARGET 4.5
Equity
4.5
By 2030, eliminate gender disparities in education and ensure equal access to all levels of education and vocational training for the vulnerable, including persons with disabilities, indigenous peoples and children in vulnerable situations
GLOBAL INDICATOR
4.5.1 – Parity indices (female/male, rural/urban, bottom/top wealth quintile and others
such as disability status, indigenous peoples and conflict-affected, as data become
available) for all education indicators on this list that can be disaggregated
THEMATIC INDICATORS
4.5.2 – Percentage of students in primary education whose first or home language is the
language of instruction
4.5.3 – Extent to which explicit formula-based policies reallocate education resources to
disadvantaged populations
4.5.4 – Education expenditure per student by level of education and source of funding
4.5.5 – Percentage of total aid to education allocated to least developed countries
2 0 2 1 / 2 • G LO BA L E D U C AT I O N M O N I TO R I N G R E P O RT 276
14
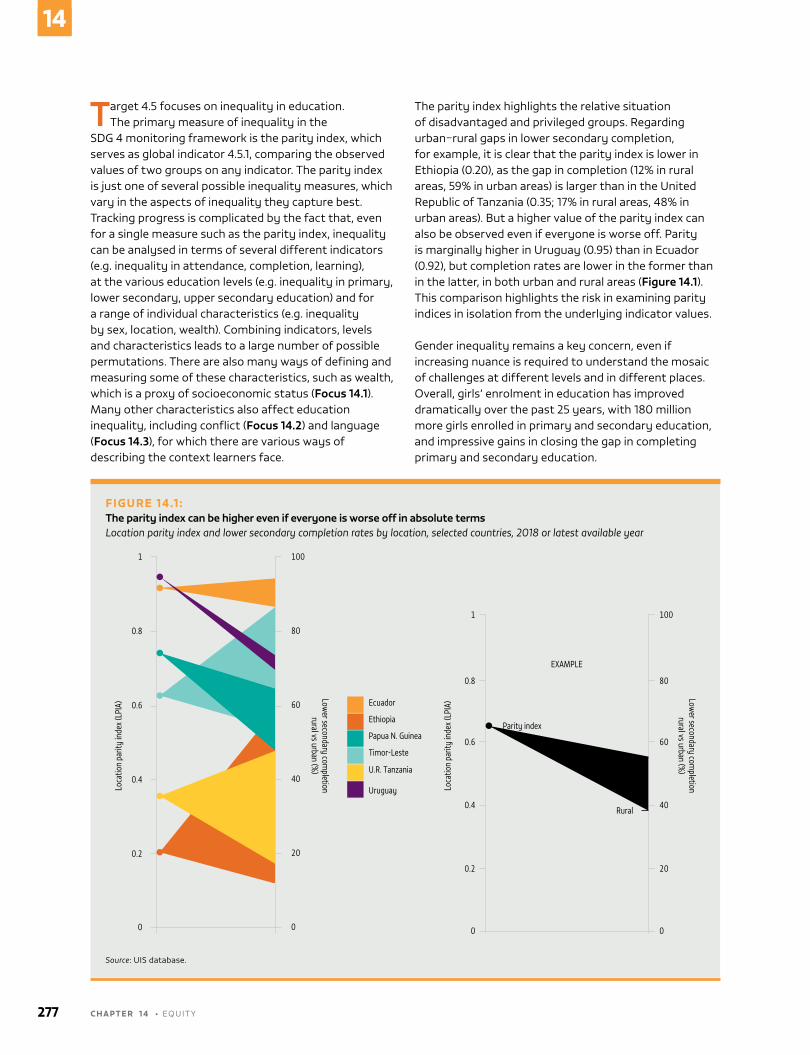
Target 4.5 focuses on inequality in education. The primary measure of inequality in the
sDG 4 monitoring framework is the parity index, which serves as global indicator 4.5.1, comparing the observed values of two groups on any indicator. The parity index is just one of several possible inequality measures, which vary in the aspects of inequality they capture best. Tracking progress is complicated by the fact that, even for a single measure such as the parity index, inequality can be analysed in terms of several different indicators (e.g. inequality in attendance, completion, learning), at the various education levels (e.g. inequality in primary, lower secondary, upper secondary education) and for a range of individual characteristics (e.g. inequality by sex, location, wealth). Combining indicators, levels and characteristics leads to a large number of possible permutations. There are also many ways of defining and measuring some of these characteristics, such as wealth, which is a proxy of socioeconomic status (Focus 14.1). Many other characteristics also affect education inequality, including conflict (Focus 14.2) and language (Focus 14.3), for which there are various ways of describing the context learners face.
The parity index highlights the relative situation of disadvantaged and privileged groups. regarding urban–rural gaps in lower secondary completion, for example, it is clear that the parity index is lower in Ethiopia (0.20), as the gap in completion (12% in rural areas, 59% in urban areas) is larger than in the United republic of Tanzania (0.35; 17% in rural areas, 48% in urban areas). But a higher value of the parity index can also be observed even if everyone is worse off. Parity is marginally higher in Uruguay (0.95) than in Ecuador (0.92), but completion rates are lower in the former than in the latter, in both urban and rural areas (Figure 14.1). This comparison highlights the risk in examining parity indices in isolation from the underlying indicator values.
Gender inequality remains a key concern, even if increasing nuance is required to understand the mosaic of challenges at different levels and in different places. overall, girls’ enrolment in education has improved dramatically over the past 25 years, with 180 million more girls enrolled in primary and secondary education, and impressive gains in closing the gap in completing primary and secondary education.
FIGURE 14.1 :The parity index can be higher even if everyone is worse off in absolute termsLocation parity index and lower secondary completion rates by location, selected countries, 2018 or latest available year
Guatemala, 2014
2018
1
0.8
0.6
0.4
0.2
0
0.8
1
0.6
0.4
0.2
0
80
100
60
40
20
0
80
100
60
40
20
0
Ecuador
Ethiopia
Papua N. Guinea
Timor-Leste
U.R. Tanzania
UruguayLoca
tion
parit
y in
dex (
LPIA
)
Loca
tion
parit
y in
dex (
LPIA
) Lower secondary com
pletionrural vs urban (%
)
Lower secondary com
pletionrural vs urban (%
)
EXAMPLE
Parity index
Rural
Urban
Source: Uis database.
277 C H A P T E R 1 4 • EQUiTY
14
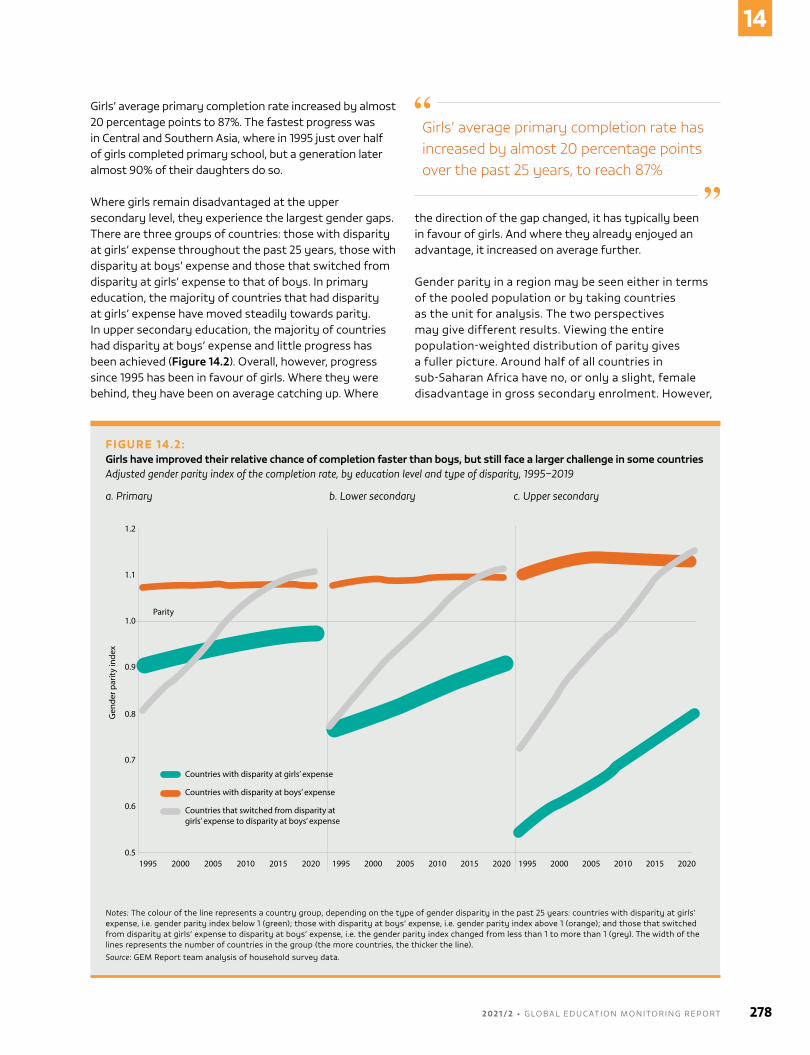
Girls’ average primary completion rate increased by almost 20 percentage points to 87%. The fastest progress was in Central and southern Asia, where in 1995 just over half of girls completed primary school, but a generation later almost 90% of their daughters do so.
Where girls remain disadvantaged at the upper secondary level, they experience the largest gender gaps. There are three groups of countries: those with disparity at girls’ expense throughout the past 25 years, those with disparity at boys’ expense and those that switched from disparity at girls’ expense to that of boys. in primary education, the majority of countries that had disparity at girls’ expense have moved steadily towards parity. in upper secondary education, the majority of countries had disparity at boys’ expense and little progress has been achieved (Figure 14.2). overall, however, progress since 1995 has been in favour of girls. Where they were behind, they have been on average catching up. Where
the direction of the gap changed, it has typically been in favour of girls. And where they already enjoyed an advantage, it increased on average further.
Gender parity in a region may be seen either in terms of the pooled population or by taking countries as the unit for analysis. The two perspectives may give different results. viewing the entire population-weighted distribution of parity gives a fuller picture. Around half of all countries in sub-saharan Africa have no, or only a slight, female disadvantage in gross secondary enrolment. However,
Girls’ average primary completion rate has increased by almost 20 percentage points over the past 25 years, to reach 87%
FIGURE 14.2:Girls have improved their relative chance of completion faster than boys, but still face a larger challenge in some countriesAdjusted gender parity index of the completion rate, by education level and type of disparity, 1995–2019
a. Primary b. Lower secondary c. Upper secondary
Gen
der p
arity
inde
x
Guatemala, 2014
2018
Parity
1.2
1.1
1.0
0.9
0.8
0.7
0.6
0.51995 2000 2005 2010 2015 2020 1995 2000 2005 2010 2015 2020 1995 2000 2005 2010 2015 2020
Countries with disparity at girls’ expense
Countries with disparity at boys’ expense
Countries that switched from disparity at girls’ expense to disparity at boys’ expense
Notes: The colour of the line represents a country group, depending on the type of gender disparity in the past 25 years: countries with disparity at girls’ expense, i.e. gender parity index below 1 (green); those with disparity at boys’ expense, i.e. gender parity index above 1 (orange); and those that switched from disparity at girls’ expense to disparity at boys’ expense, i.e. the gender parity index changed from less than 1 to more than 1 (grey). The width of the lines represents the number of countries in the group (the more countries, the thicker the line).Source: GEM report team analysis of household survey data.
2 0 2 1 / 2 • G LO BA L E D U C AT I O N M O N I TO R I N G R E P O RT 278
14
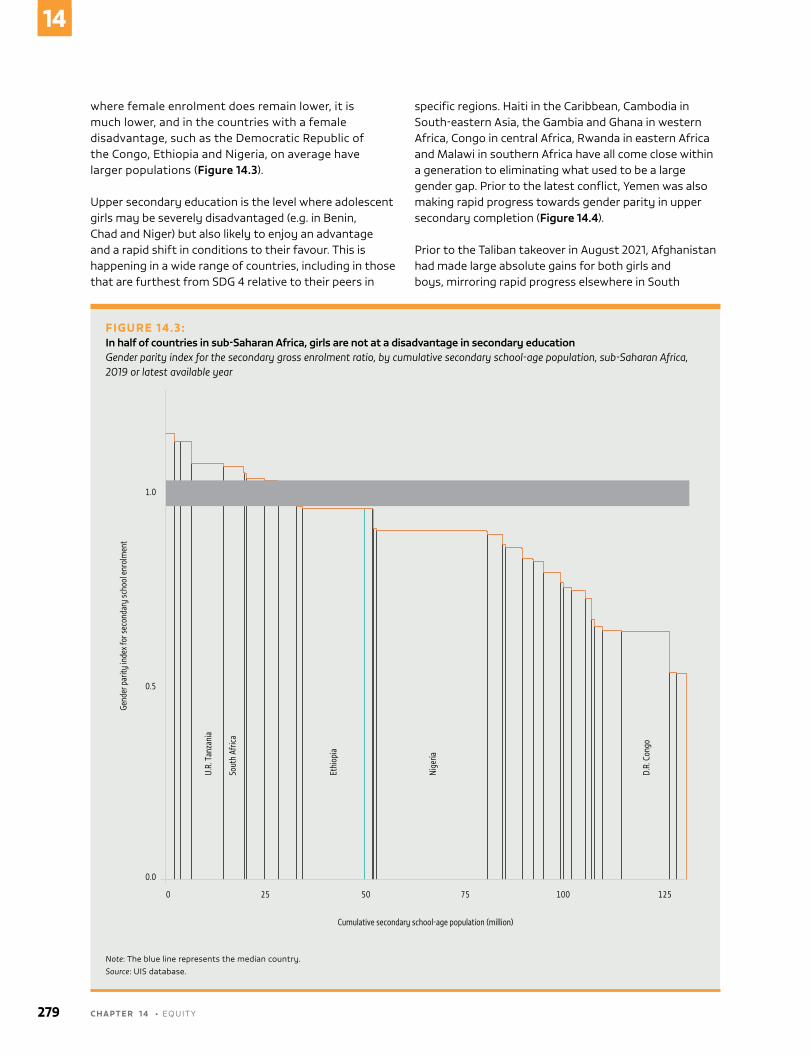
where female enrolment does remain lower, it is much lower, and in the countries with a female disadvantage, such as the Democratic republic of the Congo, Ethiopia and nigeria, on average have larger populations (Figure 14.3).
Upper secondary education is the level where adolescent girls may be severely disadvantaged (e.g. in Benin, Chad and niger) but also likely to enjoy an advantage and a rapid shift in conditions to their favour. This is happening in a wide range of countries, including in those that are furthest from sDG 4 relative to their peers in
specific regions. Haiti in the Caribbean, Cambodia in south-eastern Asia, the Gambia and Ghana in western Africa, Congo in central Africa, rwanda in eastern Africa and Malawi in southern Africa have all come close within a generation to eliminating what used to be a large gender gap. Prior to the latest conflict, Yemen was also making rapid progress towards gender parity in upper secondary completion (Figure 14.4).
Prior to the Taliban takeover in August 2021, Afghanistan had made large absolute gains for both girls and boys, mirroring rapid progress elsewhere in south
FIGURE 14.3:In half of countries in sub-Saharan Africa, girls are not at a disadvantage in secondary educationGender parity index for the secondary gross enrolment ratio, by cumulative secondary school-age population, sub-Saharan Africa, 2019 or latest available year
Guatemala, 2014
2018
0
0.0
0.5
1.0
25 50 75 100 125
Gend
er p
arity
inde
x for
seco
ndar
y sc
hool
enr
olm
ent
U.R.
Tan
zani
a
Sout
h Af
rica
Ethi
opia
Nige
ria
D.R.
Con
go
Cumulative secondary school-age population (million)
Note: The blue line represents the median country.Source: Uis database.
279 C H A P T E R 1 4 • EQUiTY
14
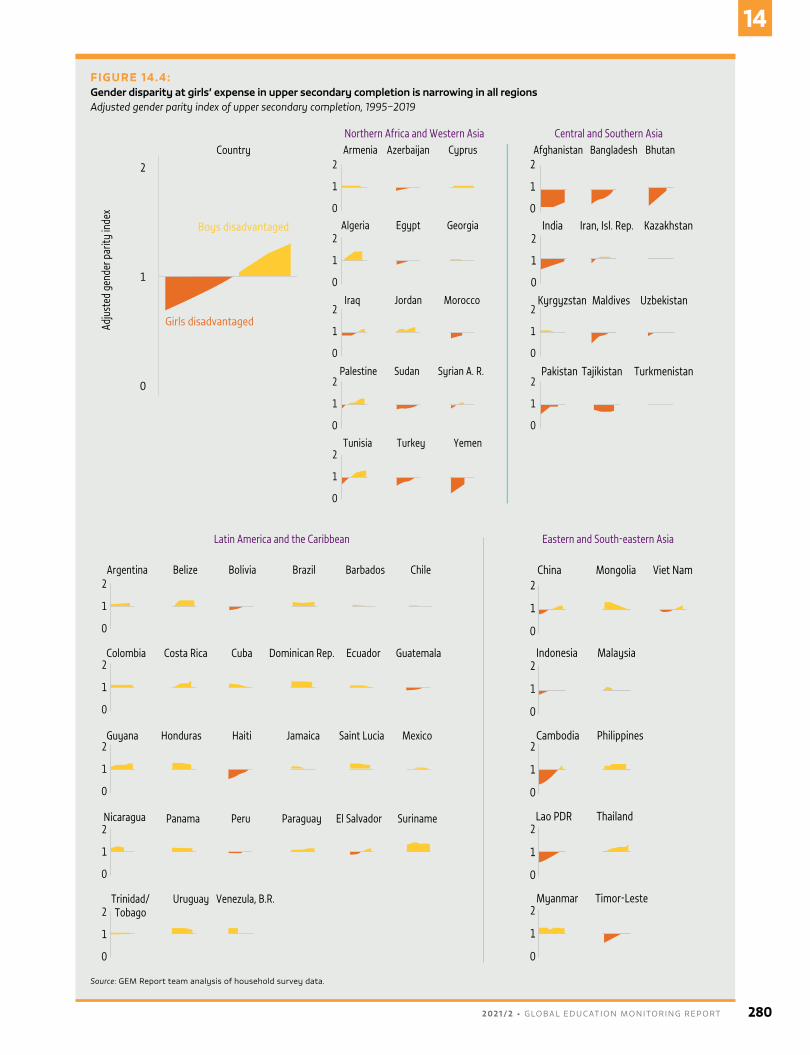
FIGURE 14.4:Gender disparity at girls’ expense in upper secondary completion is narrowing in all regionsAdjusted gender parity index of upper secondary completion, 1995–2019
Guatemala, 2014
2018
2
1
0
Trinidad/ Tobago
Uruguay Venezula, B.R.
2
1
0
Argentina Belize Bolivia Brazil Barbados Chile
2
1
0
Colombia Costa Rica Cuba Dominican Rep. Ecuador Guatemala
2
1
0
Guyana Honduras Haiti Jamaica Saint Lucia Mexico
2
1
0
Nicaragua Panama Peru Paraguay El Salvador Suriname
Viet Nam2
1
0
China Mongolia
2
1
0
Indonesia Malaysia
2
1
0
Cambodia Philippines
2
1
0
Lao PDR Thailand
2
1
0
Myanmar Timor-Leste
Central and Southern AsiaNorthern Africa and Western Asia
Latin America and the Caribbean Eastern and South-eastern Asia
2
1
0
Country
Boys disadvantaged
Girls disadvantagedAdju
sted
gen
der p
arity
inde
x
2
1
0
2
1
0
2
1
0
2
1
0
2
1
0
Armenia
Algeria
Iraq
Palestine
Tunisia
Azerbaijan
Egypt
Jordan
Sudan
Turkey
2
1
0
Cyprus
Georgia
Morocco
Syrian A. R.
Yemen
Afghanistan
India
Kyrgyzstan
Pakistan
Bangladesh
Iran, Isl. Rep.
Maldives
Tajikistan
2
1
0
2
1
0
Bhutan
Kazakhstan
Uzbekistan
Turkmenistan
2
1
0
Source: GEM report team analysis of household survey data.
2 0 2 1 / 2 • G LO BA L E D U C AT I O N M O N I TO R I N G R E P O RT 280
14
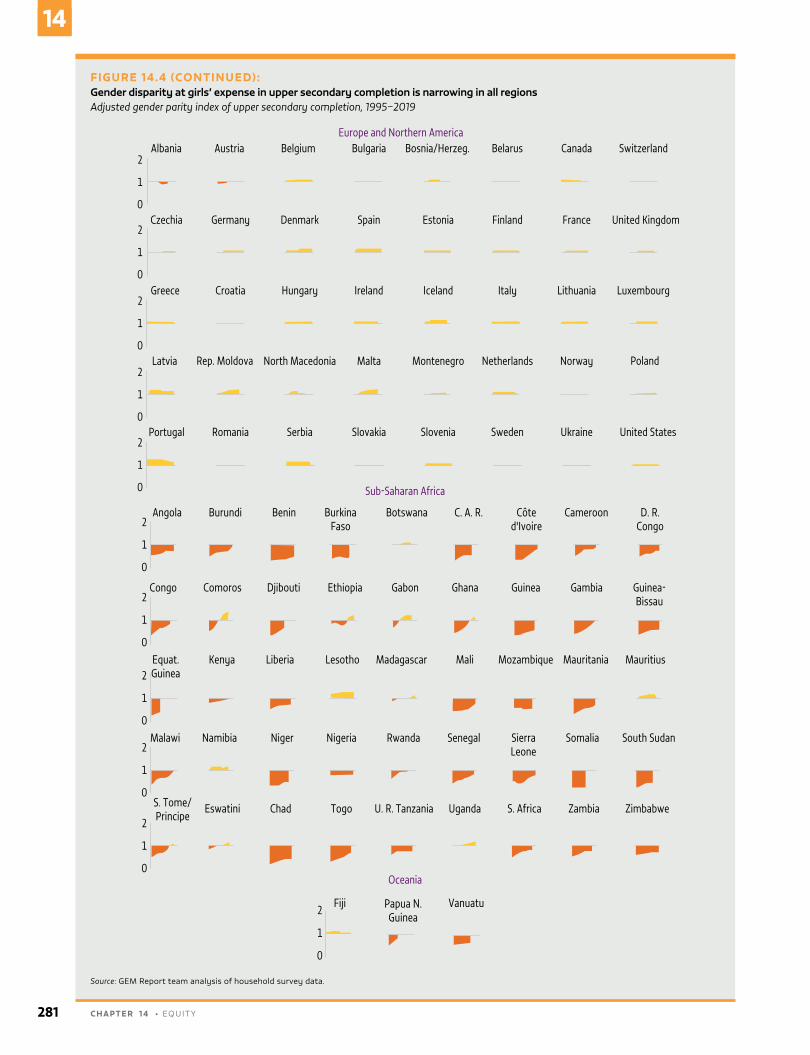
Entre 1995 et 2019, le taux d’achèvement de l’enseignement primaire des filles est passé de 41 % à 66 % en Afrique subsaharienne.ssfvsfGfgfGCBBNZBNN`FN
FIGURE 14.4 (CONTINUED):Gender disparity at girls’ expense in upper secondary completion is narrowing in all regionsAdjusted gender parity index of upper secondary completion, 1995–2019
2
1
0
Fiji Papua N.Guinea
Vanuatu
2
1
0
Albania
2
1
0
Czechia
2
1
0
Greece
2
1
0
Latvia
2
1
0
Portugal
Austria
Germany
Croatia
Rep. Moldova
Romania
Belgium
Denmark
Hungary
North Macedonia
Serbia
Bulgaria
Spain
Ireland
Malta
Slovakia
Bosnia/Herzeg.
Estonia
Iceland
Montenegro
Slovenia
Belarus
Finland
Italy
Netherlands
Sweden
Canada
France
Lithuania
Norway
Ukraine
Switzerland
United Kingdom
Luxembourg
Poland
United States
2
1
0
Angola Burundi Benin Burkina Faso
Botswana C. A. R. Côte d'Ivoire
Cameroon D. R. Congo
2
1
0
Congo Comoros Djibouti Ethiopia Gabon Ghana Guinea Gambia Guinea-Bissau
2
1
0
Equat.Guinea
Kenya Liberia Lesotho Madagascar Mali Mozambique Mauritania Mauritius
2
1
0
Malawi Namibia Niger Nigeria Rwanda Senegal SierraLeone
Somalia South Sudan
2
1
0
S. Tome/Principe
Eswatini Chad Togo U. R. Tanzania Uganda S. Africa Zambia Zimbabwe
Sub-Saharan Africa
Oceania
Europe and Northern America
Source: GEM report team analysis of household survey data.
281 C H A P T E R 1 4 • EQUiTY
14
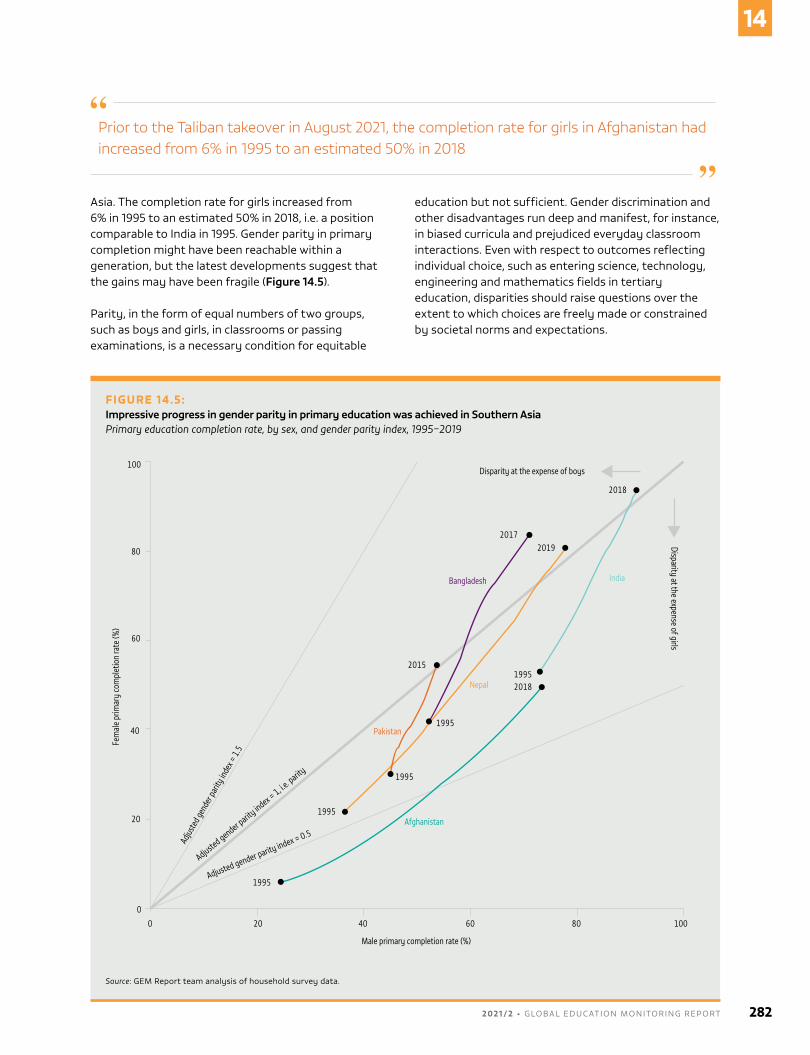
Asia. The completion rate for girls increased from 6% in 1995 to an estimated 50% in 2018, i.e. a position comparable to india in 1995. Gender parity in primary completion might have been reachable within a generation, but the latest developments suggest that the gains may have been fragile (Figure 14.5).
Parity, in the form of equal numbers of two groups, such as boys and girls, in classrooms or passing examinations, is a necessary condition for equitable
education but not sufficient. Gender discrimination and other disadvantages run deep and manifest, for instance, in biased curricula and prejudiced everyday classroom interactions. Even with respect to outcomes reflecting individual choice, such as entering science, technology, engineering and mathematics fields in tertiary education, disparities should raise questions over the extent to which choices are freely made or constrained by societal norms and expectations.
Prior to the Taliban takeover in August 2021, the completion rate for girls in Afghanistan had increased from 6% in 1995 to an estimated 50% in 2018
FIGURE 14.5:Impressive progress in gender parity in primary education was achieved in Southern AsiaPrimary education completion rate, by sex, and gender parity index, 1995–2019
Guatemala, 2014
2018
0
0 20
20
40
40
60
60
80
80
100
100
Male primary completion rate (%)
Afghanistan
Bangladesh
Pakistan
India
Nepal
Fem
ale
prim
ary
com
plet
ion
rate
(%)
Adjus
ted g
ende
r par
ity in
dex =
1.5
1995
1995
1995
1995
19952015
2018
20172019
2018
Disparity at the expense of boys
Disparity at the expense of girls
Adjusted gender parity index = 0.5
Adjusted gender parity
index = 1, i.e. parity
Source: GEM report team analysis of household survey data.
2 0 2 1 / 2 • G LO BA L E D U C AT I O N M O N I TO R I N G R E P O RT 282
14
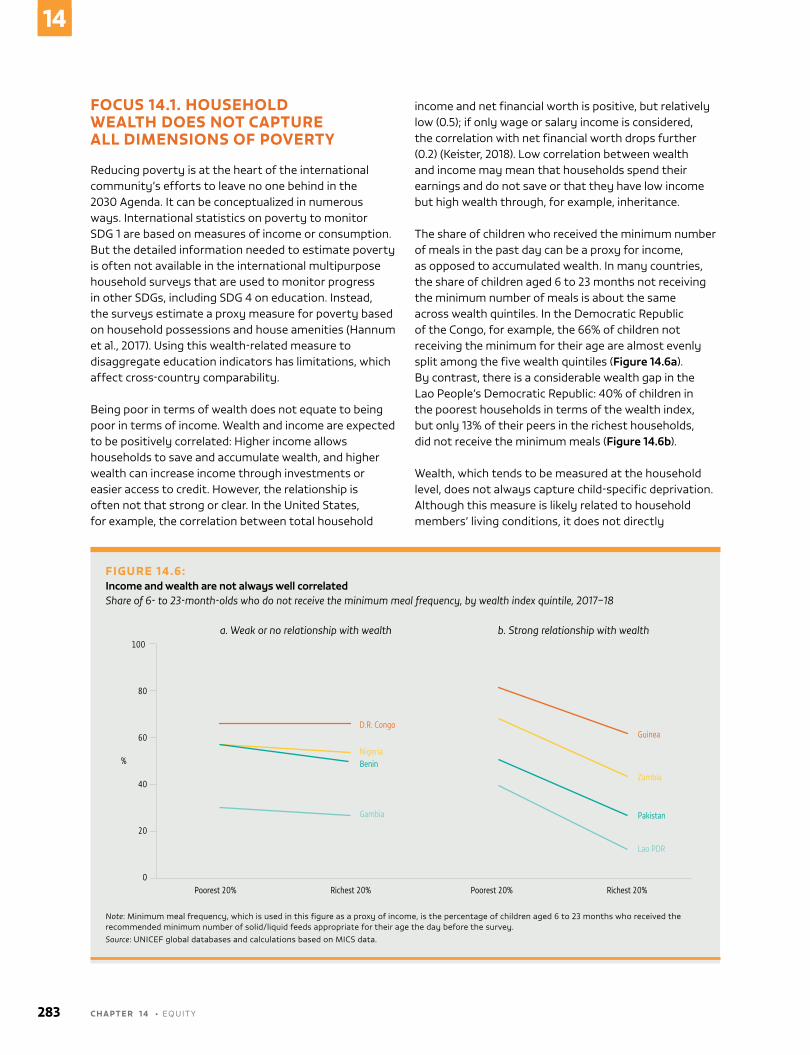
FOCUS 14.1. HOUSEHOLD WEALTH DOES NOT CAPTURE ALL DIMENSIONS OF POVERTY
reducing poverty is at the heart of the international community’s efforts to leave no one behind in the 2030 Agenda. it can be conceptualized in numerous ways. international statistics on poverty to monitor sDG 1 are based on measures of income or consumption. But the detailed information needed to estimate poverty is often not available in the international multipurpose household surveys that are used to monitor progress in other sDGs, including sDG 4 on education. instead, the surveys estimate a proxy measure for poverty based on household possessions and house amenities (Hannum et al., 2017). Using this wealth-related measure to disaggregate education indicators has limitations, which affect cross-country comparability.
Being poor in terms of wealth does not equate to being poor in terms of income. Wealth and income are expected to be positively correlated: Higher income allows households to save and accumulate wealth, and higher wealth can increase income through investments or easier access to credit. However, the relationship is often not that strong or clear. in the United states, for example, the correlation between total household
income and net financial worth is positive, but relatively low (0.5); if only wage or salary income is considered, the correlation with net financial worth drops further (0.2) (Keister, 2018). Low correlation between wealth and income may mean that households spend their earnings and do not save or that they have low income but high wealth through, for example, inheritance.
The share of children who received the minimum number of meals in the past day can be a proxy for income, as opposed to accumulated wealth. in many countries, the share of children aged 6 to 23 months not receiving the minimum number of meals is about the same across wealth quintiles. in the Democratic republic of the Congo, for example, the 66% of children not receiving the minimum for their age are almost evenly split among the five wealth quintiles (Figure 14.6a). By contrast, there is a considerable wealth gap in the Lao People’s Democratic republic: 40% of children in the poorest households in terms of the wealth index, but only 13% of their peers in the richest households, did not receive the minimum meals (Figure 14.6b).
Wealth, which tends to be measured at the household level, does not always capture child-specific deprivation. Although this measure is likely related to household members’ living conditions, it does not directly
FIGURE 14.6:Income and wealth are not always well correlatedShare of 6- to 23-month-olds who do not receive the minimum meal frequency, by wealth index quintile, 2017–18
a. Weak or no relationship with wealth b. Strong relationship with wealth
Guatemala, 2014
2018
100
80
60
40
20
0
%
Poorest 20% Richest 20% Poorest 20% Richest 20%
D.R. Congo
NigeriaBenin
Gambia
Guinea
Zambia
Pakistan
Lao PDR
Note: Minimum meal frequency, which is used in this figure as a proxy of income, is the percentage of children aged 6 to 23 months who received the recommended minimum number of solid/liquid feeds appropriate for their age the day before the survey.Source: UniCEF global databases and calculations based on MiCs data.
283 C H A P T E R 1 4 • EQUiTY
14
translate to the individual level. This is particularly true for children, for whom resource allocation may be particularly unequal (Hannum et al., 2017). sDG target 1.2 is the first global poverty target explicitly mentioning children. Growing recognition that children’s needs and living standards can differ from those of adults in the same household has led to development of measures of children-specific deprivation (Guio et al., 2018). in the EU survey of income and Living Conditions 2009 and 2014, ad hoc modules on deprivation contained questions on children-specific goods, such as shoes, clothes and books, as well as participation in social activities, such as celebrations, school trips and holidays (Eurostat, 2014).
Another example is UniCEF’s Multidimensional overlapping Deprivation Analysis, aimed at identifying and quantifying child poverty through various dimensions, including availability of books and toys. The share of deprived 3- to 4-year-olds varies considerably across low- and lower-middle-income countries and is not determined by the country’s wealth. Ghana’s GDP per capita, for example, is slightly higher than that of Bangladesh, but its share of 3- to 4-year-olds with no books or toys is nearly five times higher (33% vs 7%) (Figure 14.7a). Within countries, the prevalence of child deprivation is again not fully determined by household wealth. regarding the population of deprived children, 78% live in the country’s poorest households in Palestine, but only 27% in Chad. indeed, in several countries, 10% of deprived children are in the richest households and over 30% of children in the poorest households are not deprived (Figure 14.7b).
As with household wealth, the level of child deprivation can be an additional strong predictor of education outcomes. in Togo, 3- to 4-year-olds who have no books or toys are significantly less likely to have attended early childhood education than those with at least one such item. About 40% of 3- to 4-year-olds in the country are deprived of both items, and there is no significant difference between their probability of attending early childhood education and that of children living in the 40% poorest households. But controlling for household wealth, being deprived of books and toys in Togo further decreases the probability of having attended early childhood education by four percentage points, on average across wealth levels.
1 This section is based on Mampilly (2021).
The effect is strongest for children in the richest households, where being deprived is associated with a decrease in probability of six percentage points (from 32% to 26%) (Figure 14.8). Together, different measures provide a fuller understanding of households’ economic situation.
FOCUS 14.2. MANY CHILDREN ATTEND REBEL-CONTROLLED SCHOOLS – SOMETIMES THEIR ENTIRE SCHOOL LIFE
Target 4.5 calls for monitoring the education of children in vulnerable situations, including those exposed to violent conflict.1 To date, attention has focused on the number of out-of-school children in conflict-affected countries and on attacks on students, teachers and education facilities. Less attention has been paid to how education provision is itself affected by conflict, especially when it falls under the control of rebels, i.e. non-state armed groups.
Estimating the number of children attending schools controlled by non-state armed groups is a challenge due to data reliability issues. Moreover, rebels’ territorial control frequently shifts, and their education provision, even in territory directly under their control, is rarely uniform but more like a patchwork of widely varying initiatives. in addition, for children and educators in settings of violent conflict, not only access to education but also the meaning attached to it is affected. For groups opposing the government, sustaining schooling outside government reach may serve as an act of resistance (selvik, 2021).
rebel governance refers to public service provision, institution building, norms and rules, and symbolic appeals developed by non-state armed groups in interactions with civilian populations and international actors (Branch and Mampilly, 2005; Kasfir, 2005; Mampilly, 2011). non-state armed groups have numerous reasons for choosing to govern and provide public goods, especially education, to civilians; among these are the possibility of material benefits, risk of defection, their own ideological beliefs and, perhaps most importantly, pressure from local communities or international actors (Huang and sullivan, 2020).
Wealth, which tends to be measured at the household level, does not always capture child-specific deprivation
2 0 2 1 / 2 • G LO BA L E D U C AT I O N M O N I TO R I N G R E P O RT 284
14
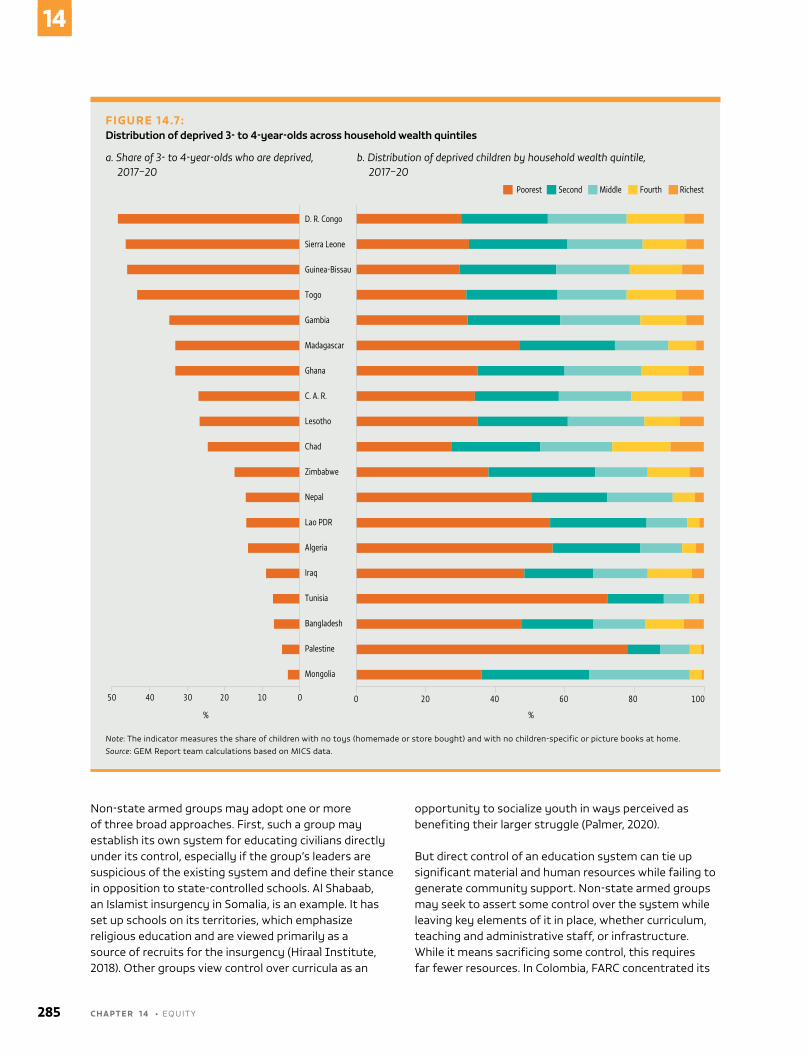
non-state armed groups may adopt one or more of three broad approaches. First, such a group may establish its own system for educating civilians directly under its control, especially if the group’s leaders are suspicious of the existing system and define their stance in opposition to state-controlled schools. Al shabaab, an islamist insurgency in somalia, is an example. it has set up schools on its territories, which emphasize religious education and are viewed primarily as a source of recruits for the insurgency (Hiraal Institute, 2018). other groups view control over curricula as an
opportunity to socialize youth in ways perceived as benefiting their larger struggle (Palmer, 2020).
But direct control of an education system can tie up significant material and human resources while failing to generate community support. non-state armed groups may seek to assert some control over the system while leaving key elements of it in place, whether curriculum, teaching and administrative staff, or infrastructure. While it means sacrificing some control, this requires far fewer resources. in Colombia, FArC concentrated its
FIGURE 14.7:Distribution of deprived 3- to 4-year-olds across household wealth quintiles
a. Share of 3- to 4-year-olds who are deprived, b. Distribution of deprived children by household wealth quintile, 2017–20 2017–20
Guatemala, 2014
2018
D. R. Congo
Sierra Leone
Guinea-Bissau
Togo
Gambia
Madagascar
Ghana
C. A. R.
Lesotho
Chad
Zimbabwe
Nepal
Lao PDR
Algeria
Iraq
Tunisia
Bangladesh
Palestine
Mongolia
0 20 40 60 80 100
Poorest Second Middle Fourth Richest
50 40 30 20 10 0
% %
Note: The indicator measures the share of children with no toys (homemade or store bought) and with no children-specific or picture books at home.Source: GEM report team calculations based on MiCs data.
285 C H A P T E R 1 4 • EQUiTY
14
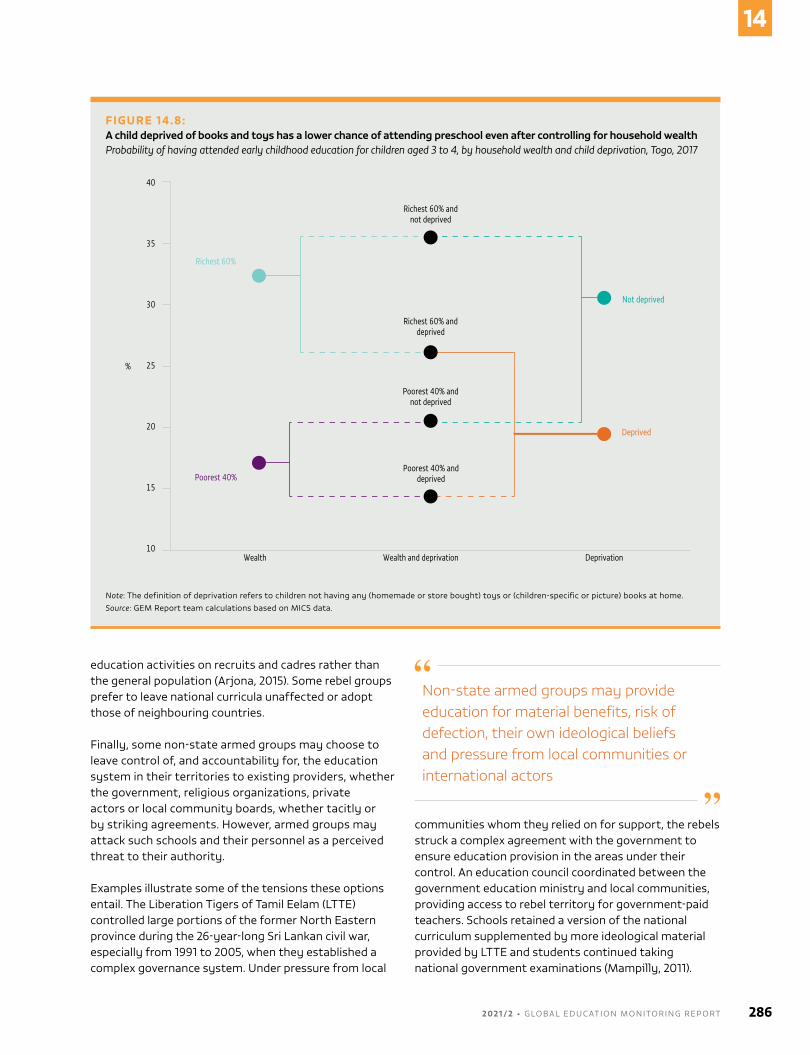
education activities on recruits and cadres rather than the general population (Arjona, 2015). some rebel groups prefer to leave national curricula unaffected or adopt those of neighbouring countries.
Finally, some non-state armed groups may choose to leave control of, and accountability for, the education system in their territories to existing providers, whether the government, religious organizations, private actors or local community boards, whether tacitly or by striking agreements. However, armed groups may attack such schools and their personnel as a perceived threat to their authority.
Examples illustrate some of the tensions these options entail. The Liberation Tigers of Tamil Eelam (LTTE) controlled large portions of the former north Eastern province during the 26-year-long sri Lankan civil war, especially from 1991 to 2005, when they established a complex governance system. Under pressure from local
communities whom they relied on for support, the rebels struck a complex agreement with the government to ensure education provision in the areas under their control. An education council coordinated between the government education ministry and local communities, providing access to rebel territory for government-paid teachers. schools retained a version of the national curriculum supplemented by more ideological material provided by LTTE and students continued taking national government examinations (Mampilly, 2011).
FIGURE 14.8:A child deprived of books and toys has a lower chance of attending preschool even after controlling for household wealthProbability of having attended early childhood education for children aged 3 to 4, by household wealth and child deprivation, Togo, 2017
Guatemala, 2014
2018
40
35
30
25
20
15
10Wealth
Poorest 40%
Deprived
Not deprived
Richest 60%
Richest 60% andnot deprived
Poorest 40% andnot deprived
Richest 60% anddeprived
Poorest 40% anddeprived
DeprivationWealth and deprivation
%
Note: The definition of deprivation refers to children not having any (homemade or store bought) toys or (children-specific or picture) books at home.Source: GEM report team calculations based on MiCs data.
Non-state armed groups may provide education for material benefits, risk of defection, their own ideological beliefs and pressure from local communities or international actors
2 0 2 1 / 2 • G LO BA L E D U C AT I O N M O N I TO R I N G R E P O RT 286
14
Even at the high point of LTTE territorial control in 2002, the government retained a large presence in urban areas with LTTE controlling more remote rural areas. in 2003, it was estimated that there were 648,000 school-age children in the north Eastern province, with a dropout rate of 15%, four times the national average but still low considering the intensity of the violence (nrC, 2005).
For the resource-poor sudan People’s Liberation Movement (sPLM), creating an education system from scratch was beyond its capacity, especially when the collapse of the Derg regime in Ethiopia in 1987 and the closing of refugee camps there triggered a massive influx of civilians into territories the sPLM controlled. instead, the organization reached out to non-governmental organizations (nGos) and international agencies. nGos were required to sign a memorandum of understanding, pledging to follow sPLM rules on where they could open schools and which populations would be eligible to participate. Generally, schools were expected to adhere to the Kenyan or Ugandan curricula, not the sudanese one. Local communities working with nGos and overseen by non-military sPLM personnel determined the form of education provision in rebel territories (Mampilly, 2011). Disputed census counts and large refugee movements led to much uncertainty around population levels in south sudan during the war. Around 2000, the number of primary school-age children was estimated at 1.06 million, with only 318,000 enrolled (Deng, 2003).
An important question is how to promote engagement between state and non-state actors for co-ordination in service delivery. With support from the Myanmar Education Consortium and the World Bank, the Myanmar Education Partnerships Project was initiated in 2018 to overcome a legacy of distrust and promote dialogue between the Ministry of Education and Ethnic Basic Education Providers (EBEPs), non-state actors providing education services to over 420,000 children (Myanmar Ministry of Education, 2020). Through a series of inclusive, participatory and conflict-sensitive workshops, the initiative sought to facilitate, advise and support dialogue for a partnership framework and associated roadmaps towards collaboration between the ministry and two EBEPs: the Karen Education and Culture Department and the Mon national Education Committee. Through the initiative, the role of EBEPs in education provision in Myanmar would be recognized and the needs of children they served reflected in national planning. Dialogue focused on development of structures for accountable coordination and communication, and quality standards to support recognition of teachers, curriculum and student learning in EBEP-administered schools.
in Afghanistan, after the Taliban’s fall from power in 2001, they started opening schools in areas under their control in 2007 due to local community pressure, reflecting the presence of pragmatic voices alongside traditionalist hardliners (Jackson, 2018). They vetted teachers and controlled the curriculum, excluding textbooks on the Afghan culture, constitution and law (Amiri and Jackson, 2021). They established education commissions in Quetta in 2006 and Peshawar in 2007 (Jackson and Amiri, 2019). They also began prohibiting attacks against government-run schools, which had led to the closing of some 4,000 schools during the first 15 years of the Taliban movement. in 2010, they even began negotiations with the education ministry to develop a framework for reopening schools (Giustozzi and Franco, 2011, 2013). in December 2020, a few months before assuming control over the entire country following the Us troop withdrawal, the Taliban had reached agreement with the Un to establish community-based education in the four provinces they controlled: Faryab, Helmand, Kandahar and Uruzgan. The programme was intended to increase the number of such schools to 4,000 and reach up to 140,000 children (UnICEF, 2020).
The example of the Taliban shows that non-state armed groups alone do not determine the nature and scope of education provision. rather, they face both opportunities and constraints from a wide variety of actors. Education is among the most prized services demanded by civilians; failure to provide it can lead to resentment from local communities.
Even during the darkest days of Taliban rule, local commanders faced pressure from civilian communities, resulting in schools operating in open defiance of the central committee’s rules (Feroz and Lakanwal, 2020). nuanced if potentially controversial engagement with non-state armed groups by governments and the international community can improve education opportunities. While such engagement clearly poses some risk, the benefits for school-age populations may be worth it – especially where whole generations of children would otherwise be left out of education.
Nuanced if potentially controversial engagement with non-state armed groups by governments and the international community can improve education opportunities
287 C H A P T E R 1 4 • EQUiTY
14
FOCUS 14.3. MORE INFORMATION IS BECOMING AVAILABLE ON THE NUMBER OF CHILDREN TAUGHT IN THEIR HOME LANGUAGE
indicator 4.5.2, the percentage of students in primary education whose first or home language is the language of instruction, recognizes the challenges of linguistic diversity in education. Many education systems favour the use of national or colonial languages, despite the benefits of local languages as documented by the theory and practice of multilingual learning. Experiencing a language disconnect has detrimental social and cognitive consequences for learners (Adamson, 2020). Home language instruction, especially in the early years of schooling, contributes to cognitive, identity and cultural development and provides a strong foundation for learning of other languages and for use of mathematics (outhwaite et al., 2020).
Usage of ‘first language’ and ‘home language’ is ambiguous and it is not clear whether the terms can be considered interchangeable. intuitively, home language is the language spoken in the community or household, but multiple languages can be spoken in the same household. The Technical Cooperation Group on sDG 4 indicators defined ‘home language’ as the ‘most used language at home’ and ‘language of instruction’ as the ‘language used most frequently in teaching in the classroom’ (UIs, 2018).
However, classroom reality cannot be neatly captured by indicator 4.5.2. For instance, a common, spontaneous, teacher-specific classroom language practice is code-switching or alternating between languages. some education systems transition from one language to another at a given grade. in such transitional approaches, the use of home language in instruction may be over- or underestimated if the point of measurement is a lower or upper primary school grade, affecting data interpretation. Focusing on the first four years of primary school would be recommended, as that is when the pedagogical advantage of home language instruction is greatest.
To maintain the positive effects of teaching and learning in the home language, the child's home language needs to be sufficiently developed before any transition to second language instruction. in Ghana, during the 2016/17 school year, the 40,000 children who enrolled
in the mother tongue–based Complementary Basic Education programme and transitioned to government schools faced different literacy trajectories. Those who transitioned to government schools where the language of instruction was English lost some of the skills acquired through the accelerated mother tongue programme and hence did not perform as well in literacy as their peers who continued their education in their home language (Carter et al., 2020).
Political concerns further complicate practice. in india, the three-language formula, an ambitious language policy adopted in 1968 and reaffirmed in the 2020 national Education Policy, calls on all students to learn three languages in school, at least two of which should be native to india. However, the policy has yielded only limited results. The percentage of indians who could speak 2 of the 22 scheduled languages increased from 12% in 1971 to 25% in 2011, with large differences among states. in Uttar Pradesh, the percentage increased from 24% to 33%, while in Tamil nadu it remained constant at 2%. Measuring progress towards indicator 4.5.2 needs to take into account policy factors that affect choices of language as compulsory school subjects (Bhattacharya and Chandrasekhar, 2020).
A question in the Foundational Learning skills module, introduced in the sixth round of the UniCEF Multiple indicator Cluster surveys (MiCs), provides rich insights. Children are asked whether the language their teachers use in class is the one they speak at home (Hattori et al., 2017). in western and central African countries, such as Chad, the Gambia and Togo, no more than 5% of children aged 7 to 14 speak the language of instruction at home (Figure 14.9). in many countries, wealth is negatively associated with the probability that a child speaks the language of instruction. This may be because poorer children tend to live in linguistically homogeneous rural areas where teachers use the local language, while richer children tend to live in linguistically fragmented urban areas where teachers use a national language (Figure 14.10a). in some countries, the percentage of children who speak the language of instruction at home falls between primary and lower secondary school, usually reflecting national policy. For instance, Kiribati adopted a language policy in 2012 for children to transition from te-Kiribati to English in grade 3 (Kiribati Government, 2016) (Figure 14.10b).
2 0 2 1 / 2 • G LO BA L E D U C AT I O N M O N I TO R I N G R E P O RT 288
14
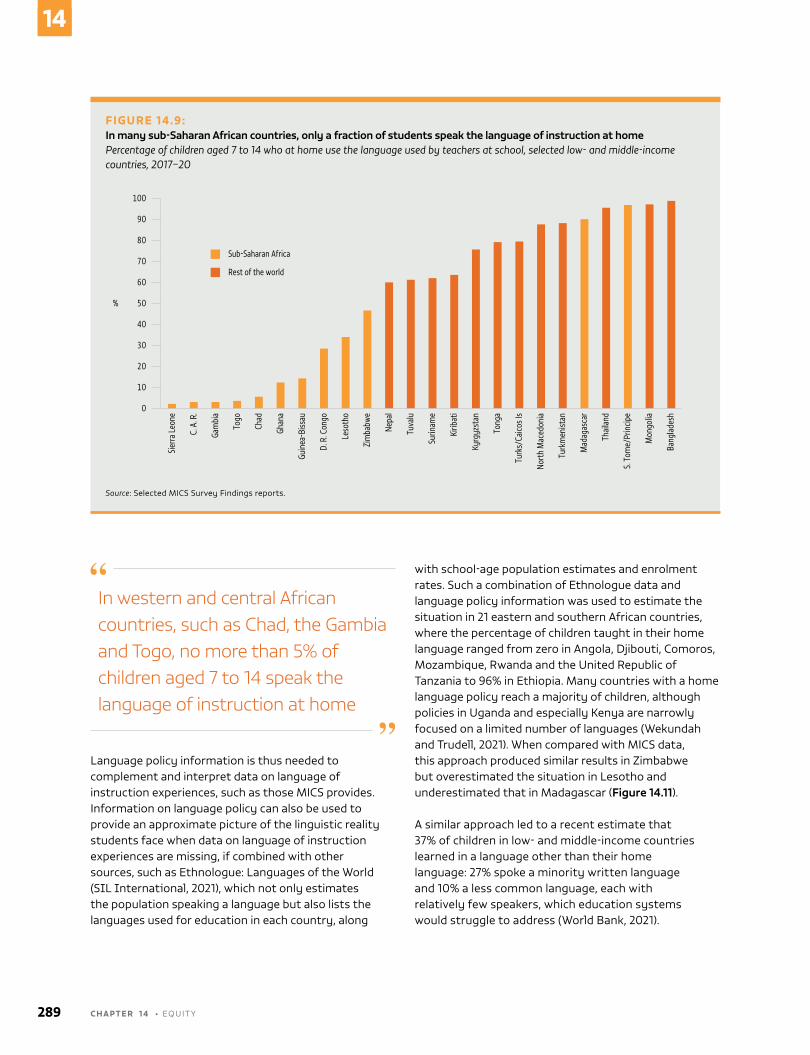
Language policy information is thus needed to complement and interpret data on language of instruction experiences, such as those MiCs provides. information on language policy can also be used to provide an approximate picture of the linguistic reality students face when data on language of instruction experiences are missing, if combined with other sources, such as Ethnologue: Languages of the World (sIL International, 2021), which not only estimates the population speaking a language but also lists the languages used for education in each country, along
with school-age population estimates and enrolment rates. such a combination of Ethnologue data and language policy information was used to estimate the situation in 21 eastern and southern African countries, where the percentage of children taught in their home language ranged from zero in Angola, Djibouti, Comoros, Mozambique, rwanda and the United republic of Tanzania to 96% in Ethiopia. Many countries with a home language policy reach a majority of children, although policies in Uganda and especially Kenya are narrowly focused on a limited number of languages (Wekundah and Trudell, 2021). When compared with MiCs data, this approach produced similar results in Zimbabwe but overestimated the situation in Lesotho and underestimated that in Madagascar (Figure 14.11).
A similar approach led to a recent estimate that 37% of children in low- and middle-income countries learned in a language other than their home language: 27% spoke a minority written language and 10% a less common language, each with relatively few speakers, which education systems would struggle to address (World Bank, 2021).
FIGURE 14.9:In many sub-Saharan African countries, only a fraction of students speak the language of instruction at homePercentage of children aged 7 to 14 who at home use the language used by teachers at school, selected low- and middle-income countries, 2017–20
Guatemala, 2014
2018
Sier
ra L
eone
C. A
. R.
Gam
bia
Togo
Chad
Ghan
a
Guin
ea-B
issau
D. R
. Con
go
Leso
tho
Zim
babw
e
Nepa
l
Tuva
lu
Surin
ame
Kirib
ati
Kyrg
yzst
an
Tong
a
Turk
s/Ca
icos I
s
Nort
h M
aced
onia
Turk
men
istan
Mad
agas
car
Thai
land
S. T
ome/
Prin
cipe
Mon
golia
Bang
lade
sh
Sub-Saharan Africa
Rest of the world
90
80
70
60
50%
40
30
20
10
100
0
Source: selected MiCs survey Findings reports.
In western and central African countries, such as Chad, the Gambia and Togo, no more than 5% of children aged 7 to 14 speak the language of instruction at home
289 C H A P T E R 1 4 • EQUiTY
14
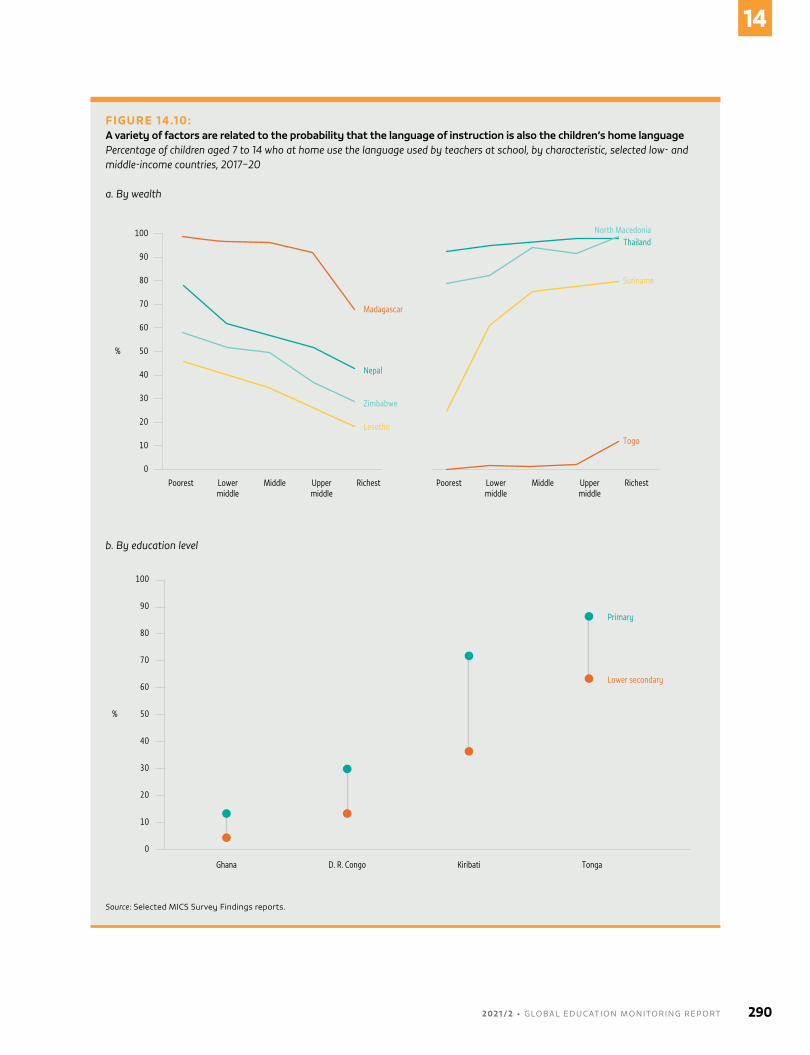
FIGURE 14.10:A variety of factors are related to the probability that the language of instruction is also the children’s home languagePercentage of children aged 7 to 14 who at home use the language used by teachers at school, by characteristic, selected low- and middle-income countries, 2017–20 a. By wealth
Guatemala, 2014
2018
90
80
70
60
50%
40
30
20
10
100
0
Poorest Lowermiddle
Middle Upper middle
Richest Poorest Lowermiddle
Middle Upper middle
Richest
Madagascar
Togo
Nepal
Thailand
Zimbabwe
North Macedonia
Lesotho
Suriname
b. By education level
Guatemala, 2014
2018
90
80
70
60
50%
40
30
20
10
100
0
Ghana D. R. Congo Kiribati Tonga
Primary
Lower secondary
Source: selected MiCs survey Findings reports.
2 0 2 1 / 2 • G LO BA L E D U C AT I O N M O N I TO R I N G R E P O RT 290
14
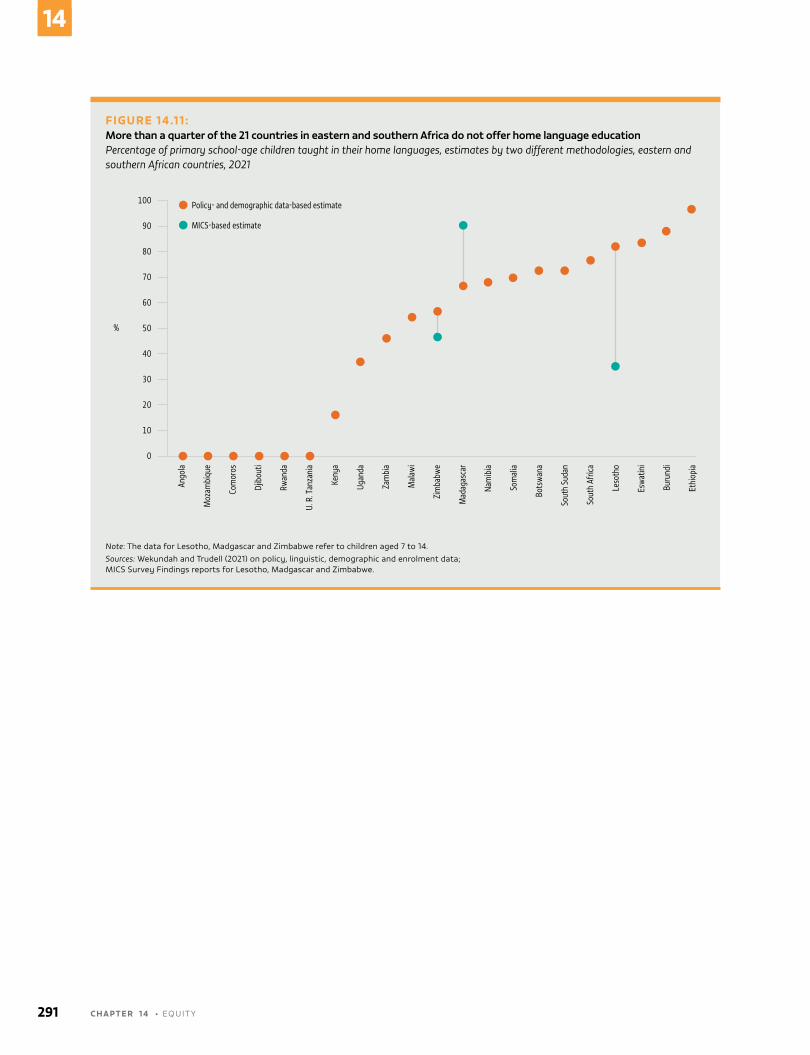
FIGURE 14.11 :More than a quarter of the 21 countries in eastern and southern Africa do not offer home language educationPercentage of primary school-age children taught in their home languages, estimates by two different methodologies, eastern and southern African countries, 2021
Guatemala, 2014
2018
90
80
70
60
50%
40
30
20
10
100
0
Ango
la
Moz
ambi
que
Com
oros
Djib
outi
Rwan
da
U. R
. Tan
zani
a
Keny
a
Ugan
da
Zam
bia
Mal
awi
Zim
babw
e
Mad
agas
car
Nam
ibia
Som
alia
Bots
wan
a
Sout
h Su
dan
Sout
h Af
rica
Leso
tho
Esw
atin
i
Buru
ndi
Ethi
opia
Policy- and demographic data-based estimate
MICS-based estimate
Note: The data for Lesotho, Madgascar and Zimbabwe refer to children aged 7 to 14.Sources: Wekundah and Trudell (2021) on policy, linguistic, demographic and enrolment data; MiCs survey Findings reports for Lesotho, Madgascar and Zimbabwe.
291 C H A P T E R 1 4 • EQUiTY
14
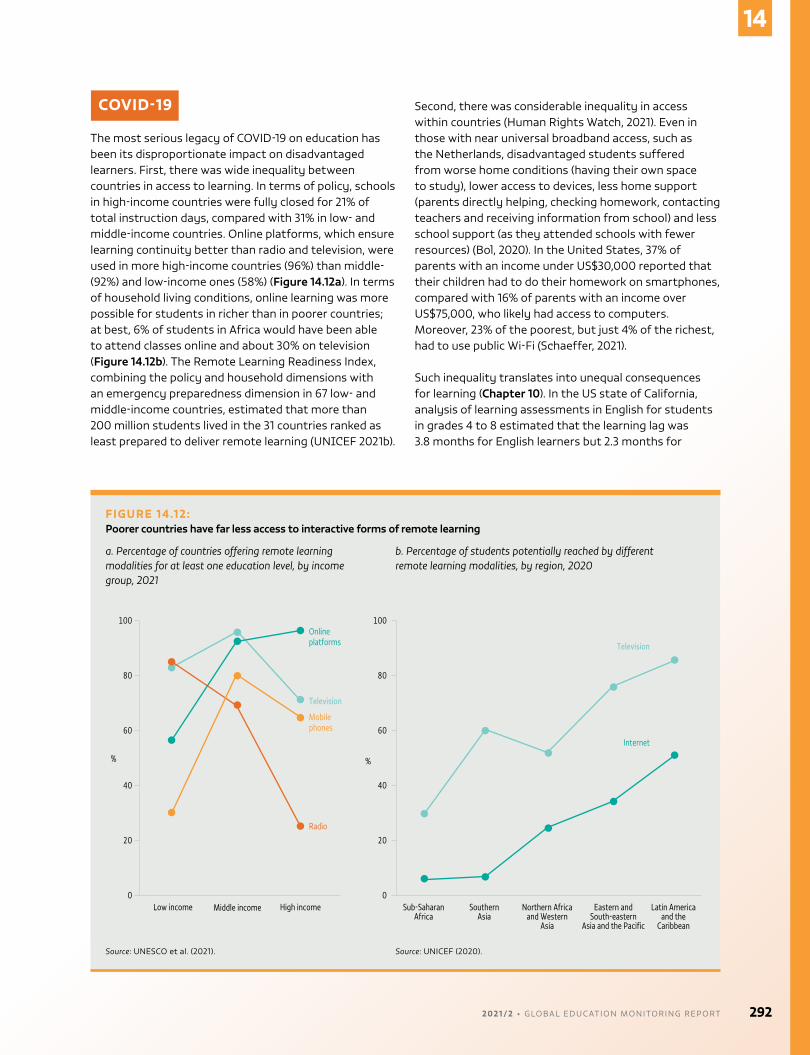
COVID-19
The most serious legacy of CoviD-19 on education has been its disproportionate impact on disadvantaged learners. First, there was wide inequality between countries in access to learning. in terms of policy, schools in high-income countries were fully closed for 21% of total instruction days, compared with 31% in low- and middle-income countries. online platforms, which ensure learning continuity better than radio and television, were used in more high-income countries (96%) than middle- (92%) and low-income ones (58%) (Figure 14.12a). in terms of household living conditions, online learning was more possible for students in richer than in poorer countries; at best, 6% of students in Africa would have been able to attend classes online and about 30% on television (Figure 14.12b). The remote Learning readiness index, combining the policy and household dimensions with an emergency preparedness dimension in 67 low- and middle-income countries, estimated that more than 200 million students lived in the 31 countries ranked as least prepared to deliver remote learning (UnICEF 2021b).
second, there was considerable inequality in access within countries (Human rights Watch, 2021). Even in those with near universal broadband access, such as the netherlands, disadvantaged students suffered from worse home conditions (having their own space to study), lower access to devices, less home support (parents directly helping, checking homework, contacting teachers and receiving information from school) and less school support (as they attended schools with fewer resources) (Bol, 2020). in the United states, 37% of parents with an income under Us$30,000 reported that their children had to do their homework on smartphones, compared with 16% of parents with an income over Us$75,000, who likely had access to computers. Moreover, 23% of the poorest, but just 4% of the richest, had to use public Wi-Fi (schaeffer, 2021).
such inequality translates into unequal consequences for learning (Chapter 10). in the Us state of California, analysis of learning assessments in English for students in grades 4 to 8 estimated that the learning lag was 3.8 months for English learners but 2.3 months for
FIGURE 14.12:Poorer countries have far less access to interactive forms of remote learning
a. Percentage of countries offering remote learning b. Percentage of students potentially reached by different modalities for at least one education level, by income remote learning modalities, by region, 2020 group, 2021
Guatemala, 2014
2018
80
60
%
40
20
100
0Low income Middle income High income Sub-Saharan
AfricaSouthern
AsiaNorthern Africa
and WesternAsia
Eastern and South-eastern
Asia and the Pacific
Latin America and the
Caribbean
Radio
Online platforms
Internet
Television
Television
Mobile phones
80
60
%
40
20
100
0
Source: UnEsCo et al. (2021). Source: UniCEF (2020).
2 0 2 1 / 2 • G LO BA L E D U C AT I O N M O N I TO R I N G R E P O RT 292
14
English native speakers, and 3.3 months for poor students but 1.2 months for the non-poor (Pier et al., 2021). Analysis of remote learning’s impact on grade 3 to 8 students’ examination pass rates in 12 states showed that moving from in-person to fully hybrid or virtual mode exacerbated the negative impact by an average of 10 percentage points in mathematics and 4 percentage points in English. For a district with no Black or Hispanic students, the switch to fully hybrid or virtual mode lowered pass rates by 4 percentage points; for a district with a 50% Black and Hispanic student population, the effect amounted to 9 percentage points (Halloran et al., 2021).
recovery may also be inequitable. only one in four countries is providing incentives, such as cash, food, transport or fee waivers, to help girls or children from disadvantaged families return to school (UnEsCo et al., 2021).
Boys and girls may not face the same consequences in terms of access to devices, time use and early pregnancy risks. some parents in Bangladesh, Jordan and Pakistan expressed reluctance to give girls access to smartphones (UnEsCo, 2021). Phone surveys of 19-year-olds during the pandemic showed that 61% of young women in india (vs 35% of young men) and 70% in Ethiopia (vs 35%) spent more time than before the pandemic doing household chores. Likewise, 46% of young women in viet nam (vs 34% of young men) and 42% in Peru (vs 26%) spent more time looking after children (Ford, 2021). Few studies have compared early pregnancies before and during the pandemic. Checking antenatal visit records from clinics is thwarted by the estimated 39% decline in such visits due to lockdowns and related restrictions (Townsend et al., 2021). in a Kenyan study, teenage girls’ antenatal visits fell by 16% between March 2020 and February 2021 compared with the year before the pandemic (UnEsCo, 2021). A related concern is the increase in incidence of gender-related domestic violence reported through hotlines worldwide (viero et al., 2021).
remote learning arrangements often left learners with disabilities unsupported. A global survey of parents of children with disabilities found that only 19% of those in need had access to sign language interpretation, yet remote learning programmes were often not available in sign languages. only 23% had access to transcripts of audio sessions (World Bank and IEI, 2020). A survey in 37 countries found that 38% of parents of children with disabilities were unable to help their children learn, as opposed to 28% of parents of children without disabilities (save the Children, 2021). Carers’ ability to earn and provide for families with children with disabilities was also severely affected (Mbazzi et al., 2020). Finally, the mental toll of school closures, deeply felt by students all over the world, was particularly strong for learners with disabilities. in the United states, the number of university students with disabilities reporting major depressive disorders was roughly twice that of students without disabilities (sutton, 2021).
Migrant and refugee communities have been severely affected. A survey of indian domestic migrants found that school closures increased the number of children forced to accompany parents to brick kiln worksites by 67% (Aide et Action, 2021). in some cases, this was because the seasonal hostels set up to support these children had been forced to close (suffian, 2021). refugee children were affected in various ways. As learning centres for the rohingya in Bangladesh remained closed for 18 months, some humanitarian organizations switched to caregiver-led approaches with small groups of up to five learners (Australian Humanitarian Partnership, 2021). Enrolment in save the Children’s programmes in the northern syrian Arab republic fell by 30% (save the Children, 2020). A vulnerability assessment of syrian refugees in Lebanon, a country that has been affected by multiple economic, social and political crises, found that just the percentage of 6- to 14-year-olds attending education fell from 67% in 2020 to 53% in 2021, and 20% of those offered remote learning were not able to follow it (UnICEF et al., 2021).
293 C H A P T E R 1 4 • EQUiTY
14

2 0 2 1 / 2 • G LO BA L E D U C AT I O N M O N I TO R I N G R E P O RT 294
14
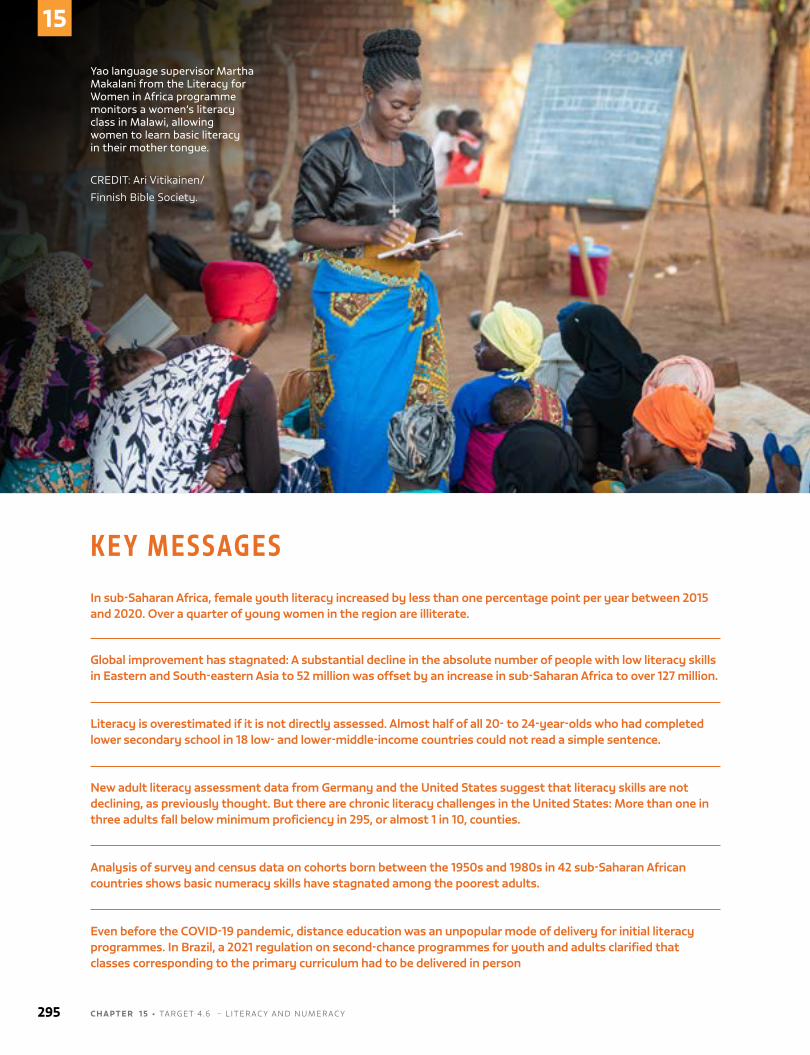
Caption.
CREDIT: UNICEF/Brown
K E Y M E S S AG E SIn sub-Saharan Africa, female youth literacy increased by less than one percentage point per year between 2015 and 2020. Over a quarter of young women in the region are illiterate.
Global improvement has stagnated: A substantial decline in the absolute number of people with low literacy skills in Eastern and South-eastern Asia to 52 million was offset by an increase in sub-Saharan Africa to over 127 million.
Literacy is overestimated if it is not directly assessed. Almost half of all 20- to 24-year-olds who had completed lower secondary school in 18 low- and lower-middle-income countries could not read a simple sentence.
New adult literacy assessment data from Germany and the United States suggest that literacy skills are not declining, as previously thought. But there are chronic literacy challenges in the United States: More than one in three adults fall below minimum proficiency in 295, or almost 1 in 10, counties.
Analysis of survey and census data on cohorts born between the 1950s and 1980s in 42 sub-Saharan African countries shows basic numeracy skills have stagnated among the poorest adults.
Even before the COVID-19 pandemic, distance education was an unpopular mode of delivery for initial literacy programmes. In Brazil, a 2021 regulation on second-chance programmes for youth and adults clarified that classes corresponding to the primary curriculum had to be delivered in person
Yao language supervisor Martha Makalani from the Literacy for Women in Africa programme monitors a women’s literacy class in Malawi, allowing women to learn basic literacy in their mother tongue.
CrEDiT: Ari vitikainen/
Finnish Bible society.
295 C H A P T E R 1 5 • TArGET 4.6 – L iTErACY AnD nUMErACY
15
CHAPTER 15
TARGET 4.6
Literacy and numeracy
4.6
By 2030, ensure that all youth and a substantial proportion of adults, both men and women, achieve literacy and numeracy
GLOBAL INDICATOR
4.6.1 – Percentage of population in a given age group achieving at least a fixed level of
proficiency in functional (a) literacy and (b) numeracy skills, by sex
THEMATIC INDICATORS
4.6.2 – Youth/adult literacy rate
4.6.3 – Participation rate of illiterate youth/adults in literacy programmes
2 0 2 1 / 2 • G LO BA L E D U C AT I O N M O N I TO R I N G R E P O RT 296
15
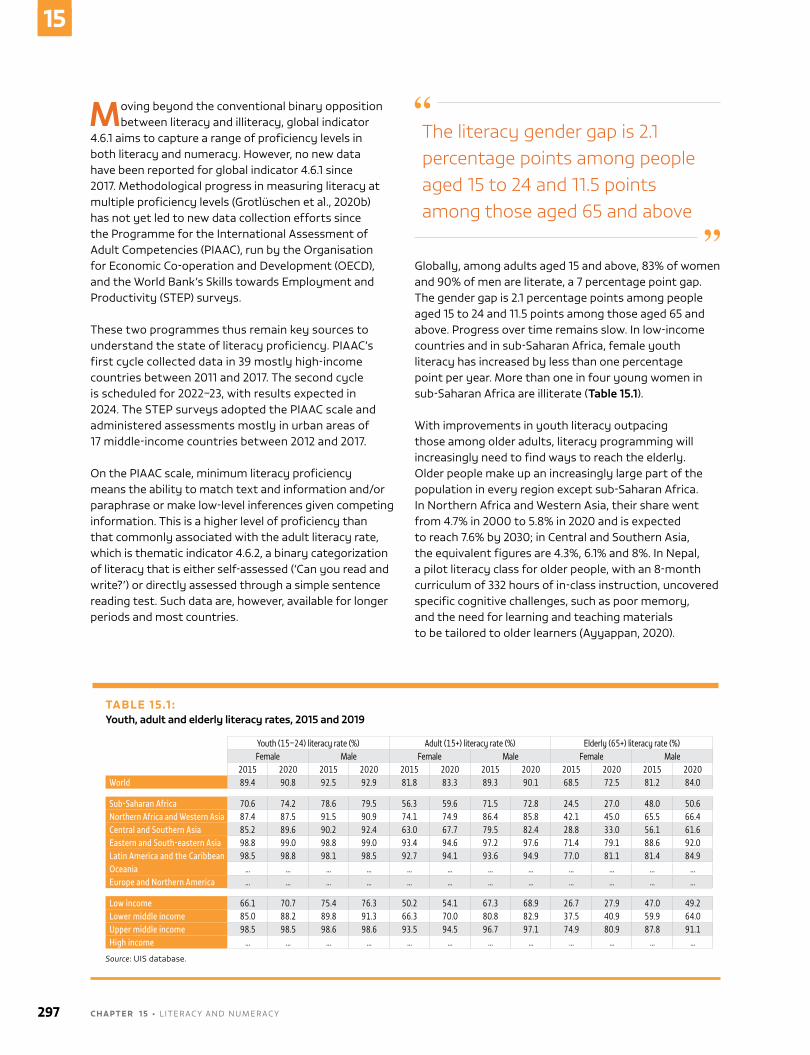
Moving beyond the conventional binary opposition between literacy and illiteracy, global indicator
4.6.1 aims to capture a range of proficiency levels in both literacy and numeracy. However, no new data have been reported for global indicator 4.6.1 since 2017. Methodological progress in measuring literacy at multiple proficiency levels (Grotlüschen et al., 2020b) has not yet led to new data collection efforts since the Programme for the international Assessment of Adult Competencies (PiAAC), run by the organisation for Economic Co-operation and Development (oECD), and the World Bank’s skills towards Employment and Productivity (sTEP) surveys.
These two programmes thus remain key sources to understand the state of literacy proficiency. PiAAC’s first cycle collected data in 39 mostly high-income countries between 2011 and 2017. The second cycle is scheduled for 2022–23, with results expected in 2024. The sTEP surveys adopted the PiAAC scale and administered assessments mostly in urban areas of 17 middle-income countries between 2012 and 2017.
on the PiAAC scale, minimum literacy proficiency means the ability to match text and information and/or paraphrase or make low-level inferences given competing information. This is a higher level of proficiency than that commonly associated with the adult literacy rate, which is thematic indicator 4.6.2, a binary categorization of literacy that is either self-assessed (‘Can you read and write?’) or directly assessed through a simple sentence reading test. such data are, however, available for longer periods and most countries.
Globally, among adults aged 15 and above, 83% of women and 90% of men are literate, a 7 percentage point gap. The gender gap is 2.1 percentage points among people aged 15 to 24 and 11.5 points among those aged 65 and above. Progress over time remains slow. in low-income countries and in sub-saharan Africa, female youth literacy has increased by less than one percentage point per year. More than one in four young women in sub-saharan Africa are illiterate (Table 15.1).
With improvements in youth literacy outpacing those among older adults, literacy programming will increasingly need to find ways to reach the elderly. older people make up an increasingly large part of the population in every region except sub-saharan Africa. in northern Africa and Western Asia, their share went from 4.7% in 2000 to 5.8% in 2020 and is expected to reach 7.6% by 2030; in Central and southern Asia, the equivalent figures are 4.3%, 6.1% and 8%. in nepal, a pilot literacy class for older people, with an 8-month curriculum of 332 hours of in-class instruction, uncovered specific cognitive challenges, such as poor memory, and the need for learning and teaching materials to be tailored to older learners (Ayyappan, 2020).
The literacy gender gap is 2.1 percentage points among people aged 15 to 24 and 11.5 points among those aged 65 and above
TABLE 15.1 :Youth, adult and elderly literacy rates, 2015 and 2019
Youth (15–24) literacy rate (%) Adult (15+) literacy rate (%) Elderly (65+) literacy rate (%)Female Male Female Male Female Male
2015 2020 2015 2020 2015 2020 2015 2020 2015 2020 2015 2020World 89.4 90.8 92.5 92.9 81.8 83.3 89.3 90.1 68.5 72.5 81.2 84.0
Sub-Saharan Africa 70.6 74.2 78.6 79.5 56.3 59.6 71.5 72.8 24.5 27.0 48.0 50.6Northern Africa and Western Asia 87.4 87.5 91.5 90.9 74.1 74.9 86.4 85.8 42.1 45.0 65.5 66.4Central and Southern Asia 85.2 89.6 90.2 92.4 63.0 67.7 79.5 82.4 28.8 33.0 56.1 61.6Eastern and South-eastern Asia 98.8 99.0 98.8 99.0 93.4 94.6 97.2 97.6 71.4 79.1 88.6 92.0Latin America and the Caribbean 98.5 98.8 98.1 98.5 92.7 94.1 93.6 94.9 77.0 81.1 81.4 84.9Oceania ... ... ... ... ... ... ... ... ... ... ... ...Europe and Northern America ... ... ... ... ... ... ... ... ... ... ... ...
Low income 66.1 70.7 75.4 76.3 50.2 54.1 67.3 68.9 26.7 27.9 47.0 49.2Lower middle income 85.0 88.2 89.8 91.3 66.3 70.0 80.8 82.9 37.5 40.9 59.9 64.0Upper middle income 98.5 98.5 98.6 98.6 93.5 94.5 96.7 97.1 74.9 80.9 87.8 91.1High income ... ... ... ... ... ... ... ... ... ... ... ...
Source: Uis database.
297 C H A P T E R 1 5 • LiTErACY AnD nUMErACY
15
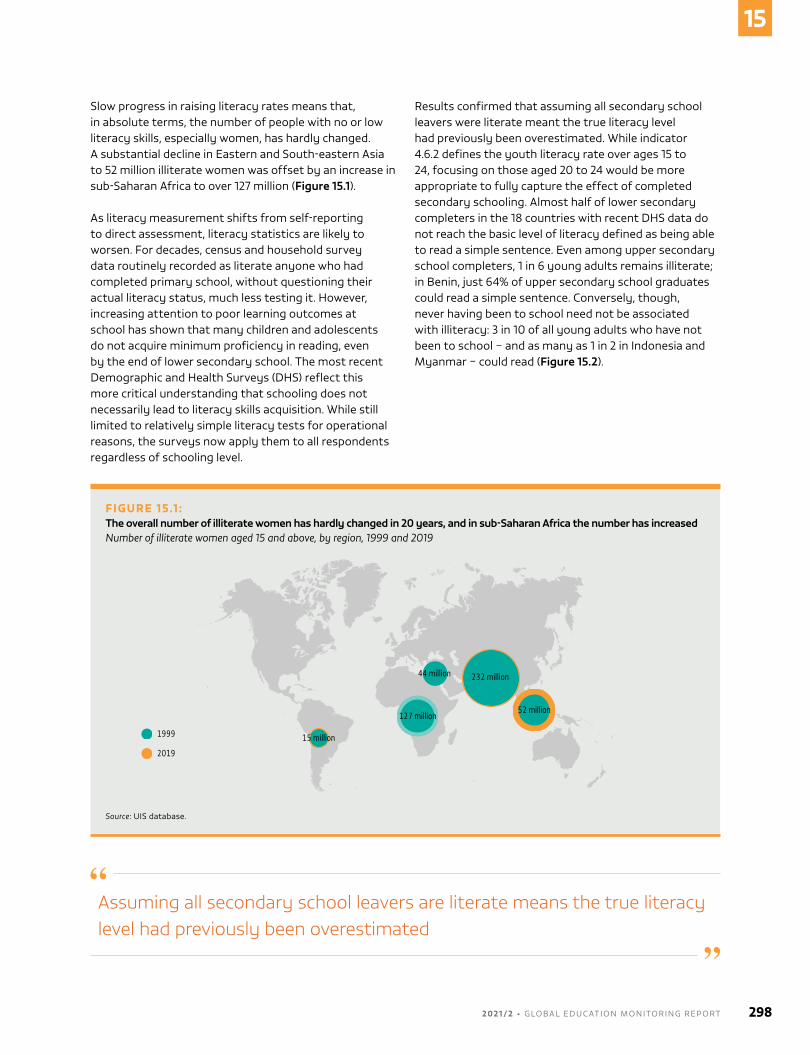
slow progress in raising literacy rates means that, in absolute terms, the number of people with no or low literacy skills, especially women, has hardly changed. A substantial decline in Eastern and south-eastern Asia to 52 million illiterate women was offset by an increase in sub-saharan Africa to over 127 million (Figure 15.1).
As literacy measurement shifts from self-reporting to direct assessment, literacy statistics are likely to worsen. For decades, census and household survey data routinely recorded as literate anyone who had completed primary school, without questioning their actual literacy status, much less testing it. However, increasing attention to poor learning outcomes at school has shown that many children and adolescents do not acquire minimum proficiency in reading, even by the end of lower secondary school. The most recent Demographic and Health surveys (DHs) reflect this more critical understanding that schooling does not necessarily lead to literacy skills acquisition. While still limited to relatively simple literacy tests for operational reasons, the surveys now apply them to all respondents regardless of schooling level.
results confirmed that assuming all secondary school leavers were literate meant the true literacy level had previously been overestimated. While indicator 4.6.2 defines the youth literacy rate over ages 15 to 24, focusing on those aged 20 to 24 would be more appropriate to fully capture the effect of completed secondary schooling. Almost half of lower secondary completers in the 18 countries with recent DHs data do not reach the basic level of literacy defined as being able to read a simple sentence. Even among upper secondary school completers, 1 in 6 young adults remains illiterate; in Benin, just 64% of upper secondary school graduates could read a simple sentence. Conversely, though, never having been to school need not be associated with illiteracy: 3 in 10 of all young adults who have not been to school – and as many as 1 in 2 in indonesia and Myanmar – could read (Figure 15.2).
Assuming all secondary school leavers are literate means the true literacy level had previously been overestimated
FIGURE 15.1 :The overall number of illiterate women has hardly changed in 20 years, and in sub-Saharan Africa the number has increasedNumber of illiterate women aged 15 and above, by region, 1999 and 2019
Guatemala, 2014
2018
1999
2019
15 million
127 million52 million
44 million 232 million
Source: Uis database.
2 0 2 1 / 2 • G LO BA L E D U C AT I O N M O N I TO R I N G R E P O RT 298
15
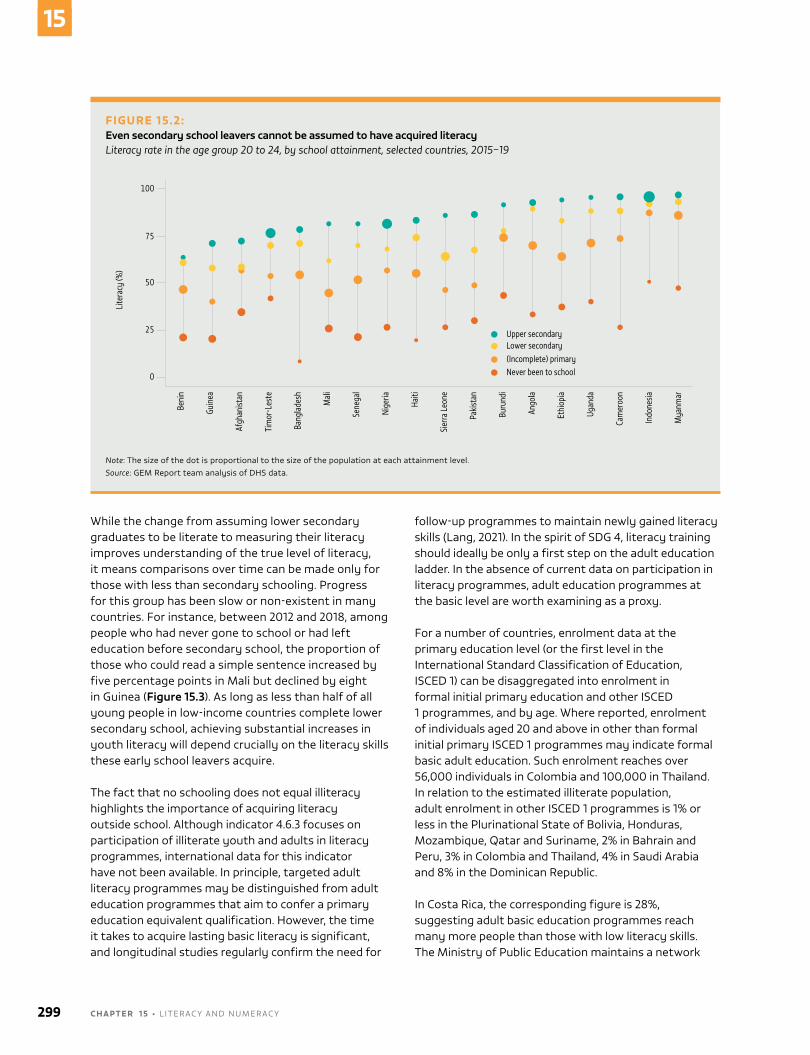
While the change from assuming lower secondary graduates to be literate to measuring their literacy improves understanding of the true level of literacy, it means comparisons over time can be made only for those with less than secondary schooling. Progress for this group has been slow or non-existent in many countries. For instance, between 2012 and 2018, among people who had never gone to school or had left education before secondary school, the proportion of those who could read a simple sentence increased by five percentage points in Mali but declined by eight in Guinea (Figure 15.3). As long as less than half of all young people in low-income countries complete lower secondary school, achieving substantial increases in youth literacy will depend crucially on the literacy skills these early school leavers acquire.
The fact that no schooling does not equal illiteracy highlights the importance of acquiring literacy outside school. Although indicator 4.6.3 focuses on participation of illiterate youth and adults in literacy programmes, international data for this indicator have not been available. in principle, targeted adult literacy programmes may be distinguished from adult education programmes that aim to confer a primary education equivalent qualification. However, the time it takes to acquire lasting basic literacy is significant, and longitudinal studies regularly confirm the need for
follow-up programmes to maintain newly gained literacy skills (Lang, 2021). in the spirit of sDG 4, literacy training should ideally be only a first step on the adult education ladder. in the absence of current data on participation in literacy programmes, adult education programmes at the basic level are worth examining as a proxy.
For a number of countries, enrolment data at the primary education level (or the first level in the international standard Classification of Education, isCED 1) can be disaggregated into enrolment in formal initial primary education and other isCED 1 programmes, and by age. Where reported, enrolment of individuals aged 20 and above in other than formal initial primary isCED 1 programmes may indicate formal basic adult education. such enrolment reaches over 56,000 individuals in Colombia and 100,000 in Thailand. in relation to the estimated illiterate population, adult enrolment in other isCED 1 programmes is 1% or less in the Plurinational state of Bolivia, Honduras, Mozambique, Qatar and suriname, 2% in Bahrain and Peru, 3% in Colombia and Thailand, 4% in saudi Arabia and 8% in the Dominican republic.
in Costa rica, the corresponding figure is 28%, suggesting adult basic education programmes reach many more people than those with low literacy skills. The Ministry of Public Education maintains a network
FIGURE 15.2:Even secondary school leavers cannot be assumed to have acquired literacyLiteracy rate in the age group 20 to 24, by school attainment, selected countries, 2015–19
Guatemala, 2014
2018
Beni
n
Guin
ea
Afgh
anist
an
Tim
or-L
este
Bang
lade
sh
Mal
i
Sene
gal
Nige
ria
Haiti
Sier
ra L
eone
Pakis
tan
Buru
ndi
Ango
la
Ethi
opia
Ugan
da
Cam
eroo
n
Indo
nesia
Mya
nmar
Upper secondaryLower secondary(Incomplete) primaryNever been to school
100
75
50
25
0
Lite
racy
(%)
Note: The size of the dot is proportional to the size of the population at each attainment level.Source: GEM report team analysis of DHs data.
299 C H A P T E R 1 5 • LiTErACY AnD nUMErACY
15
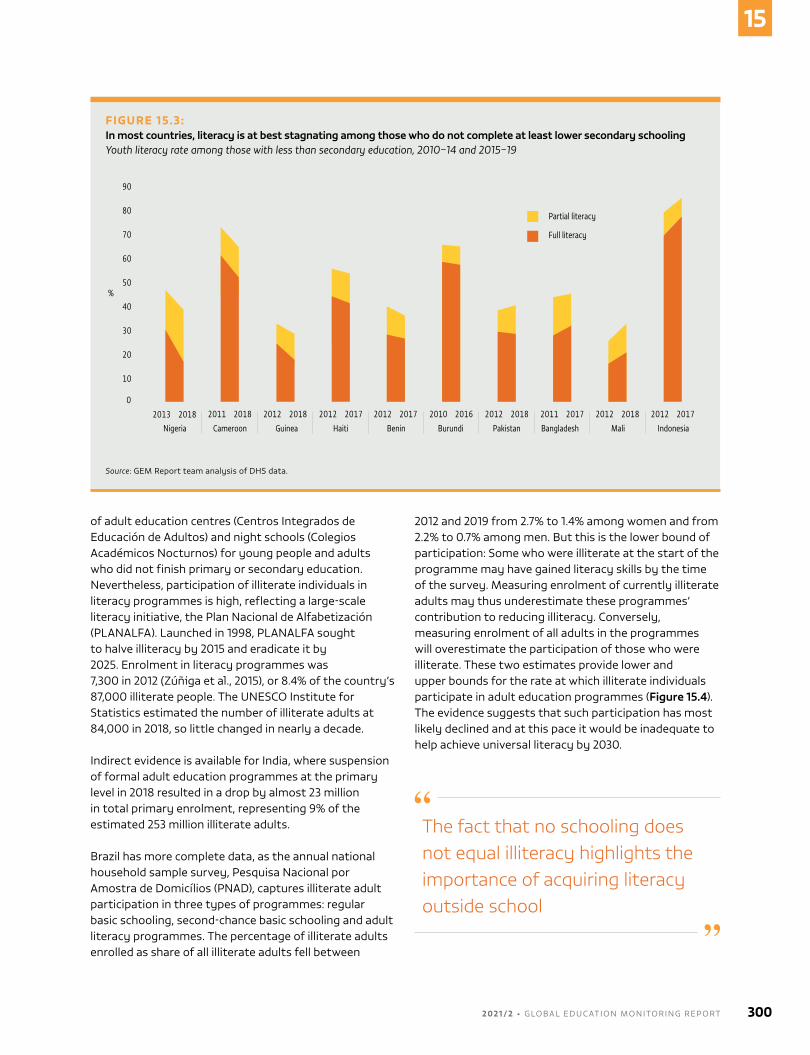
of adult education centres (Centros integrados de Educación de Adultos) and night schools (Colegios Académicos nocturnos) for young people and adults who did not finish primary or secondary education. nevertheless, participation of illiterate individuals in literacy programmes is high, reflecting a large-scale literacy initiative, the Plan nacional de Alfabetización (PLAnALFA). Launched in 1998, PLAnALFA sought to halve illiteracy by 2015 and eradicate it by 2025. Enrolment in literacy programmes was 7,300 in 2012 (Zúñiga et al., 2015), or 8.4% of the country’s 87,000 illiterate people. The UnEsCo institute for statistics estimated the number of illiterate adults at 84,000 in 2018, so little changed in nearly a decade.
indirect evidence is available for india, where suspension of formal adult education programmes at the primary level in 2018 resulted in a drop by almost 23 million in total primary enrolment, representing 9% of the estimated 253 million illiterate adults.
Brazil has more complete data, as the annual national household sample survey, Pesquisa nacional por Amostra de Domicílios (PnAD), captures illiterate adult participation in three types of programmes: regular basic schooling, second-chance basic schooling and adult literacy programmes. The percentage of illiterate adults enrolled as share of all illiterate adults fell between
2012 and 2019 from 2.7% to 1.4% among women and from 2.2% to 0.7% among men. But this is the lower bound of participation: some who were illiterate at the start of the programme may have gained literacy skills by the time of the survey. Measuring enrolment of currently illiterate adults may thus underestimate these programmes’ contribution to reducing illiteracy. Conversely, measuring enrolment of all adults in the programmes will overestimate the participation of those who were illiterate. These two estimates provide lower and upper bounds for the rate at which illiterate individuals participate in adult education programmes (Figure 15.4). The evidence suggests that such participation has most likely declined and at this pace it would be inadequate to help achieve universal literacy by 2030.
FIGURE 15.3:In most countries, literacy is at best stagnating among those who do not complete at least lower secondary schoolingYouth literacy rate among those with less than secondary education, 2010–14 and 2015–19
Guatemala, 2014
2018
90
80
70
60
50
40
30
20
10
0
%
Partial literacy
Full literacy
2013 2018 2011 2018 2012 2018 2012 2017 2012 2017 2010 2016 2012 2018 2011 2017 2012 2018 2012 2017
Nigeria Cameroon Guinea Haiti Benin Burundi Pakistan Bangladesh Mali Indonesia
Source: GEM report team analysis of DHs data.
The fact that no schooling does not equal illiteracy highlights the importance of acquiring literacy outside school
2 0 2 1 / 2 • G LO BA L E D U C AT I O N M O N I TO R I N G R E P O RT 300
15
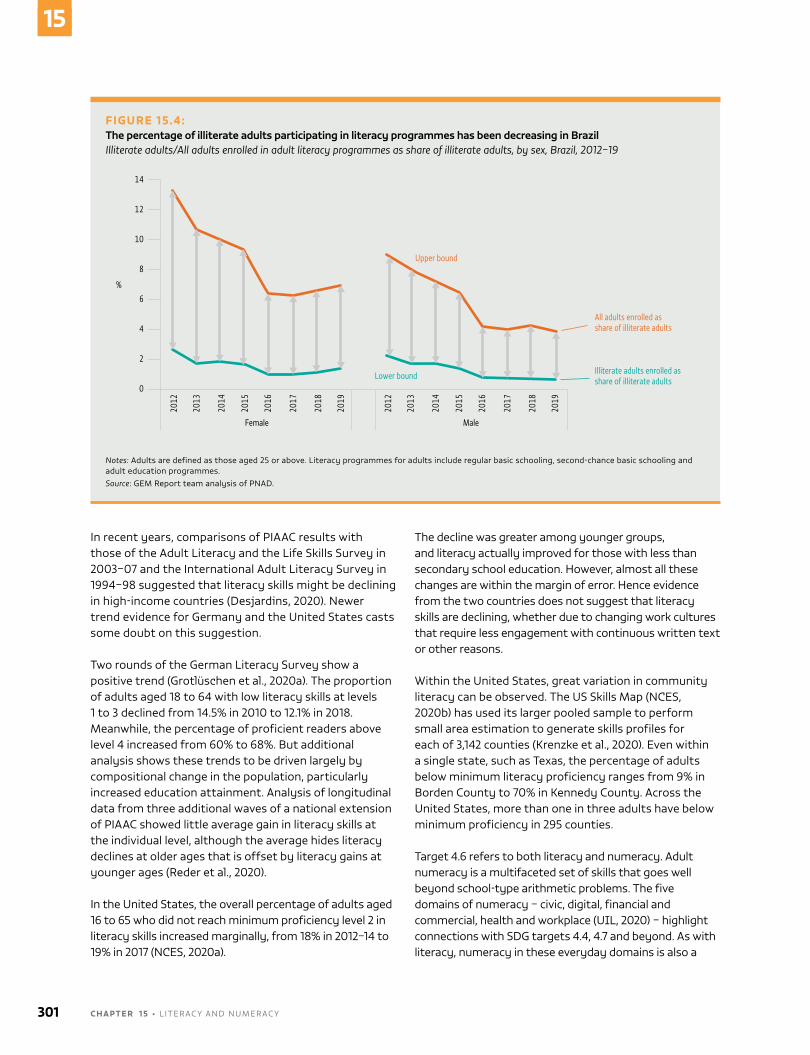
in recent years, comparisons of PiAAC results with those of the Adult Literacy and the Life skills survey in 2003–07 and the international Adult Literacy survey in 1994–98 suggested that literacy skills might be declining in high-income countries (Desjardins, 2020). newer trend evidence for Germany and the United states casts some doubt on this suggestion.
Two rounds of the German Literacy survey show a positive trend (Grotlüschen et al., 2020a). The proportion of adults aged 18 to 64 with low literacy skills at levels 1 to 3 declined from 14.5% in 2010 to 12.1% in 2018. Meanwhile, the percentage of proficient readers above level 4 increased from 60% to 68%. But additional analysis shows these trends to be driven largely by compositional change in the population, particularly increased education attainment. Analysis of longitudinal data from three additional waves of a national extension of PiAAC showed little average gain in literacy skills at the individual level, although the average hides literacy declines at older ages that is offset by literacy gains at younger ages (reder et al., 2020).
in the United states, the overall percentage of adults aged 16 to 65 who did not reach minimum proficiency level 2 in literacy skills increased marginally, from 18% in 2012–14 to 19% in 2017 (nCEs, 2020a).
The decline was greater among younger groups, and literacy actually improved for those with less than secondary school education. However, almost all these changes are within the margin of error. Hence evidence from the two countries does not suggest that literacy skills are declining, whether due to changing work cultures that require less engagement with continuous written text or other reasons.
Within the United states, great variation in community literacy can be observed. The Us skills Map (nCEs, 2020b) has used its larger pooled sample to perform small area estimation to generate skills profiles for each of 3,142 counties (Krenzke et al., 2020). Even within a single state, such as Texas, the percentage of adults below minimum literacy proficiency ranges from 9% in Borden County to 70% in Kennedy County. Across the United states, more than one in three adults have below minimum proficiency in 295 counties.
Target 4.6 refers to both literacy and numeracy. Adult numeracy is a multifaceted set of skills that goes well beyond school-type arithmetic problems. The five domains of numeracy – civic, digital, financial and commercial, health and workplace (UIL, 2020) – highlight connections with sDG targets 4.4, 4.7 and beyond. As with literacy, numeracy in these everyday domains is also a
FIGURE 15.4:The percentage of illiterate adults participating in literacy programmes has been decreasing in BrazilIlliterate adults/All adults enrolled in adult literacy programmes as share of illiterate adults, by sex, Brazil, 2012–19
Guatemala, 2014
2018
2012
2013
2014
2015
2016
2017
2018
2019
Female
2012
2013
2014
2015
2016
2017
2018
2019
Male
12
10
8
6
4
2
14
0
%
Upper bound
Lower bound
All adults enrolled as share of illiterate adults
Illiterate adults enrolled as share of illiterate adults
Notes: Adults are defined as those aged 25 or above. Literacy programmes for adults include regular basic schooling, second-chance basic schooling and adult education programmes.Source: GEM report team analysis of PnAD.
301 C H A P T E R 1 5 • LiTErACY AnD nUMErACY
15
social practice. For example, adults with low numeracy skills may apply various strategies, such as counting pills to adhere to treatment protocols (Chamberlin, 2019).
However, even simple numeracy skills data are scarce. Aside from the PiAAC surveys, there is no source of internationally comparable adult numeracy skills. Unlike for literacy, where basic data for some countries date back over a hundred years, no directly measured numeracy skills time series exist. nevertheless, indirect measures can provide a sense of inequality and numeracy trends over time (Focus 15.1).
FOCUS 15.1: BASIC NUMERACY SKILLS HAVE STAGNATED AMONG AFRICA’S POOREST FOR DECADES
numeracy is important. Calculating numbers and proportions is crucial for many activities in production and trade, and even in household activities and agriculture (Tollnek and Baten, 2017).1 Health-related activities similarly require numerical judgements about proportions and the exact use of time. overall, numerical abilities have a positive impact on economic growth, and also on the economic success of migrants in major destination countries (Hanushek and Woessmann, 2012). Despite its importance, numeracy has been evaluated much less than literacy, not least because of data scarcity (Lilenstein, 2018; Pritchett, 2013). This is especially true for sub-saharan Africa and for disadvantaged populations.
Learning assessments such as the Programme d'analyse des systèmes éducatifs de la ConFEMEn (PAsEC) have filled data gaps on numeracy of schoolchildren, although they have been limited by changes in countries participating and measurement methodology over the years (Dickerson et al., 2015). Most recently, the UniCEF Multiple indicators Cluster surveys (MiCs) have included foundational numeracy assessments for children, and work is progressing on the People’s Action for Learning network’s international Common Assessment of numeracy, a citizen-led assessment.
However, these initiatives do not provide information on adult numeracy and trends over past decades. Unlike for literacy, there has been no tradition of including numeracy information in censuses.
There are, however, techniques for extracting indirect estimates of numeracy from past surveys and censuses, even when they did not explicitly include assessments or questions about numeracy. in particular, it is well established that the amount of age heaping in such data provides viable indirect estimates of basic numeracy (A'Hearn et al., 2009; Tollnek and Baten, 2016). Age heaping is a particular kind of age misreporting, where less numerate survey respondents round their age, typically to multiples of five. A proxy measure of basic numeracy can be calculated as the percentage stating their age correctly, after estimating the number of round ages exceeding what would be expected based on demographic patterns.
This measure correlates consistently with other measures of education and learning across cultures, periods and regions, including for developing countries after 1950 (Crayen and Baten, 2010), and even going back to roman antiquity and the inca before European contact (Juif and Baten, 2013). This basic indicator reflects the ability to work with simple, low integers, well below even minimum proficiency in the sense of sDG 4. Accordingly, most cross this threshold, even among the poorest. nevertheless, it is suited for examining historical numeracy trends.
An analysis for this report of MiCs and population census data allows the numeracy of cohorts born between the 1960s and the 2010s to be traced for 42 sub-saharan African countries. The indirect measure of numeracy based on age heaping is highly correlated at the subnational level with results from school-based numeracy assessments (Figure 15.5), confirming both numeracy deficits’ persistence and the proxy measure’s validity. Across all PAsEC countries in western and central Africa, the correlation is as high as 0.8, reaching 0.95 in niger. The high degree of persistence has also been observed in Europe and Latin America (Baten and Hippe, 2018; Baten and Juif, 2014).
sizeable socioeconomic differences in numeracy are especially seen in Cameroon, the Gambia, Mali, Mauritania, nigeria, sudan and sierra Leone. The difference is as large as 19 percentage points in nigeria among 50- to 59-year-olds, with 44% numeracy among the poorest compared with 63% among the richest. on average, improvements over time have been marginal and not sustained among the poorest (Figure 15.6).
Even simple numeracy skills data are scarce
1. This section is based on Baten (2021).
2 0 2 1 / 2 • G LO BA L E D U C AT I O N M O N I TO R I N G R E P O RT 302
15
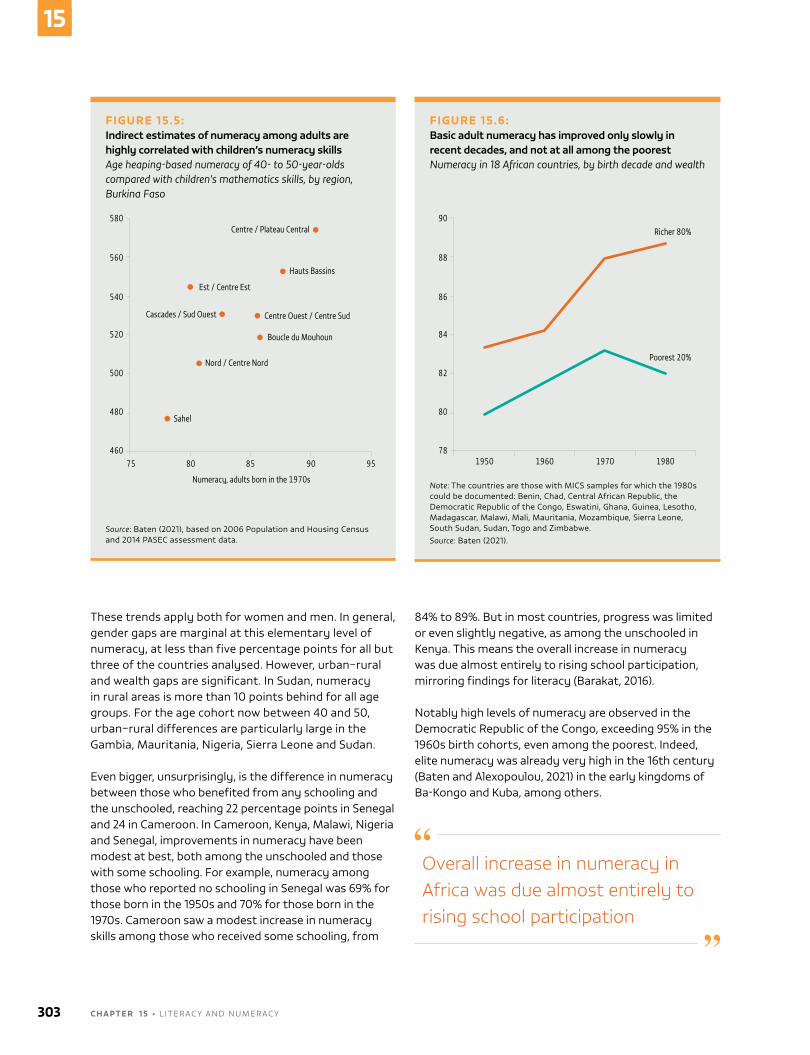
These trends apply both for women and men. in general, gender gaps are marginal at this elementary level of numeracy, at less than five percentage points for all but three of the countries analysed. However, urban–rural and wealth gaps are significant. in sudan, numeracy in rural areas is more than 10 points behind for all age groups. For the age cohort now between 40 and 50, urban–rural differences are particularly large in the Gambia, Mauritania, nigeria, sierra Leone and sudan.
Even bigger, unsurprisingly, is the difference in numeracy between those who benefited from any schooling and the unschooled, reaching 22 percentage points in senegal and 24 in Cameroon. in Cameroon, Kenya, Malawi, nigeria and senegal, improvements in numeracy have been modest at best, both among the unschooled and those with some schooling. For example, numeracy among those who reported no schooling in senegal was 69% for those born in the 1950s and 70% for those born in the 1970s. Cameroon saw a modest increase in numeracy skills among those who received some schooling, from
84% to 89%. But in most countries, progress was limited or even slightly negative, as among the unschooled in Kenya. This means the overall increase in numeracy was due almost entirely to rising school participation, mirroring findings for literacy (Barakat, 2016).
notably high levels of numeracy are observed in the Democratic republic of the Congo, exceeding 95% in the 1960s birth cohorts, even among the poorest. indeed, elite numeracy was already very high in the 16th century (Baten and Alexopoulou, 2021) in the early kingdoms of Ba-Kongo and Kuba, among others.
Overall increase in numeracy in Africa was due almost entirely to rising school participation
FIGURE 15.5:Indirect estimates of numeracy among adults are highly correlated with children’s numeracy skillsAge heaping-based numeracy of 40- to 50-year-olds compared with children’s mathematics skills, by region, Burkina Faso
Guatemala, 2014
2018
580
560
540
520
500
480
46075 80 85 90 95
Numeracy, adults born in the 1970s
Num
erac
y PA
SEC
Sahel
Nord / Centre Nord
Cascades / Sud Ouest
Est / Centre Est
Centre / Plateau Central
Hauts Bassins
Centre Ouest / Centre Sud
Boucle du Mouhoun
Source: Baten (2021), based on 2006 Population and Housing Census and 2014 PAsEC assessment data.
FIGURE 15.6:Basic adult numeracy has improved only slowly in recent decades, and not at all among the poorestNumeracy in 18 African countries, by birth decade and wealth
Guatemala, 2014
2018
1950 1960 1970 1980
Richer 80%
Poorest 20%Num
erac
y (%
)
90
88
86
84
82
80
78
Note: The countries are those with MiCs samples for which the 1980s could be documented: Benin, Chad, Central African republic, the Democratic republic of the Congo, Eswatini, Ghana, Guinea, Lesotho, Madagascar, Malawi, Mali, Mauritania, Mozambique, sierra Leone, south sudan, sudan, Togo and Zimbabwe.Source: Baten (2021).
303 C H A P T E R 1 5 • LiTErACY AnD nUMErACY
15
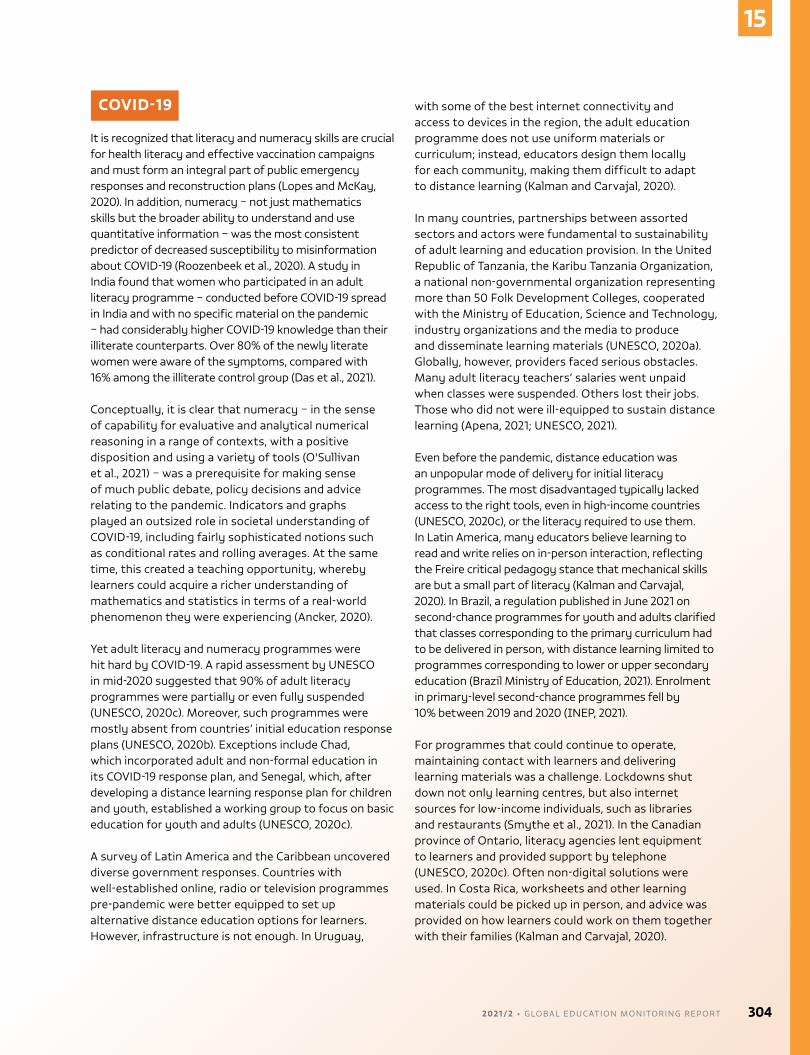
COVID-19
it is recognized that literacy and numeracy skills are crucial for health literacy and effective vaccination campaigns and must form an integral part of public emergency responses and reconstruction plans (Lopes and McKay, 2020). in addition, numeracy – not just mathematics skills but the broader ability to understand and use quantitative information – was the most consistent predictor of decreased susceptibility to misinformation about CoviD-19 (roozenbeek et al., 2020). A study in india found that women who participated in an adult literacy programme – conducted before CoviD-19 spread in india and with no specific material on the pandemic – had considerably higher CoviD-19 knowledge than their illiterate counterparts. over 80% of the newly literate women were aware of the symptoms, compared with 16% among the illiterate control group (Das et al., 2021).
Conceptually, it is clear that numeracy – in the sense of capability for evaluative and analytical numerical reasoning in a range of contexts, with a positive disposition and using a variety of tools (o'sullivan et al., 2021) – was a prerequisite for making sense of much public debate, policy decisions and advice relating to the pandemic. indicators and graphs played an outsized role in societal understanding of CoviD-19, including fairly sophisticated notions such as conditional rates and rolling averages. At the same time, this created a teaching opportunity, whereby learners could acquire a richer understanding of mathematics and statistics in terms of a real-world phenomenon they were experiencing (Ancker, 2020).
Yet adult literacy and numeracy programmes were hit hard by CoviD-19. A rapid assessment by UnEsCo in mid-2020 suggested that 90% of adult literacy programmes were partially or even fully suspended (UnEsCo, 2020c). Moreover, such programmes were mostly absent from countries’ initial education response plans (UnEsCo, 2020b). Exceptions include Chad, which incorporated adult and non-formal education in its CoviD-19 response plan, and senegal, which, after developing a distance learning response plan for children and youth, established a working group to focus on basic education for youth and adults (UnEsCo, 2020c).
A survey of Latin America and the Caribbean uncovered diverse government responses. Countries with well-established online, radio or television programmes pre-pandemic were better equipped to set up alternative distance education options for learners. However, infrastructure is not enough. in Uruguay,
with some of the best internet connectivity and access to devices in the region, the adult education programme does not use uniform materials or curriculum; instead, educators design them locally for each community, making them difficult to adapt to distance learning (Kalman and Carvajal, 2020).
in many countries, partnerships between assorted sectors and actors were fundamental to sustainability of adult learning and education provision. in the United republic of Tanzania, the Karibu Tanzania organization, a national non-governmental organization representing more than 50 Folk Development Colleges, cooperated with the Ministry of Education, science and Technology, industry organizations and the media to produce and disseminate learning materials (UnEsCo, 2020a). Globally, however, providers faced serious obstacles. Many adult literacy teachers’ salaries went unpaid when classes were suspended. others lost their jobs. Those who did not were ill-equipped to sustain distance learning (Apena, 2021; UnEsCo, 2021).
Even before the pandemic, distance education was an unpopular mode of delivery for initial literacy programmes. The most disadvantaged typically lacked access to the right tools, even in high-income countries (UnEsCo, 2020c), or the literacy required to use them. in Latin America, many educators believe learning to read and write relies on in-person interaction, reflecting the Freire critical pedagogy stance that mechanical skills are but a small part of literacy (Kalman and Carvajal, 2020). in Brazil, a regulation published in June 2021 on second-chance programmes for youth and adults clarified that classes corresponding to the primary curriculum had to be delivered in person, with distance learning limited to programmes corresponding to lower or upper secondary education (Brazil Ministry of Education, 2021). Enrolment in primary-level second-chance programmes fell by 10% between 2019 and 2020 (InEP, 2021).
For programmes that could continue to operate, maintaining contact with learners and delivering learning materials was a challenge. Lockdowns shut down not only learning centres, but also internet sources for low-income individuals, such as libraries and restaurants (smythe et al., 2021). in the Canadian province of ontario, literacy agencies lent equipment to learners and provided support by telephone (UnEsCo, 2020c). often non-digital solutions were used. in Costa rica, worksheets and other learning materials could be picked up in person, and advice was provided on how learners could work on them together with their families (Kalman and Carvajal, 2020).
2 0 2 1 / 2 • G LO BA L E D U C AT I O N M O N I TO R I N G R E P O RT 304
15
Another challenge has been keeping learners engaged amid competing priorities. increased childcare responsibilities during school closures and the need to work extra hours to compensate for lost wages make it difficult for many to continue their studies. in sierra Leone, a local adult education programme teaching basic literacy and numeracy to first-time learners addressed this challenge by establishing a community bank within the programme. The bank aimed to ease financial pressure, particularly on women, by providing loans, supporting students’ businesses and encouraging saving (Partners in Health, 2021).
Adult literacy and numeracy programmes are likely to become even more important in the post-pandemic period. school closures and ensuing dropout may increase demand for second-chance programmes. in the United states, participation in adult education programmes has historically risen during recessions and is likely to rise after the pandemic (Lotas, 2021). in Latin America, one estimate suggested demand could increase by 17%, projecting that up to 1 million students might drop out of school (Kalman and Carvajal, 2020).
305 C H A P T E R 1 5 • LiTErACY AnD nUMErACY
15

2 0 2 1 / 2 • G LO BA L E D U C AT I O N M O N I TO R I N G R E P O RT 306
15
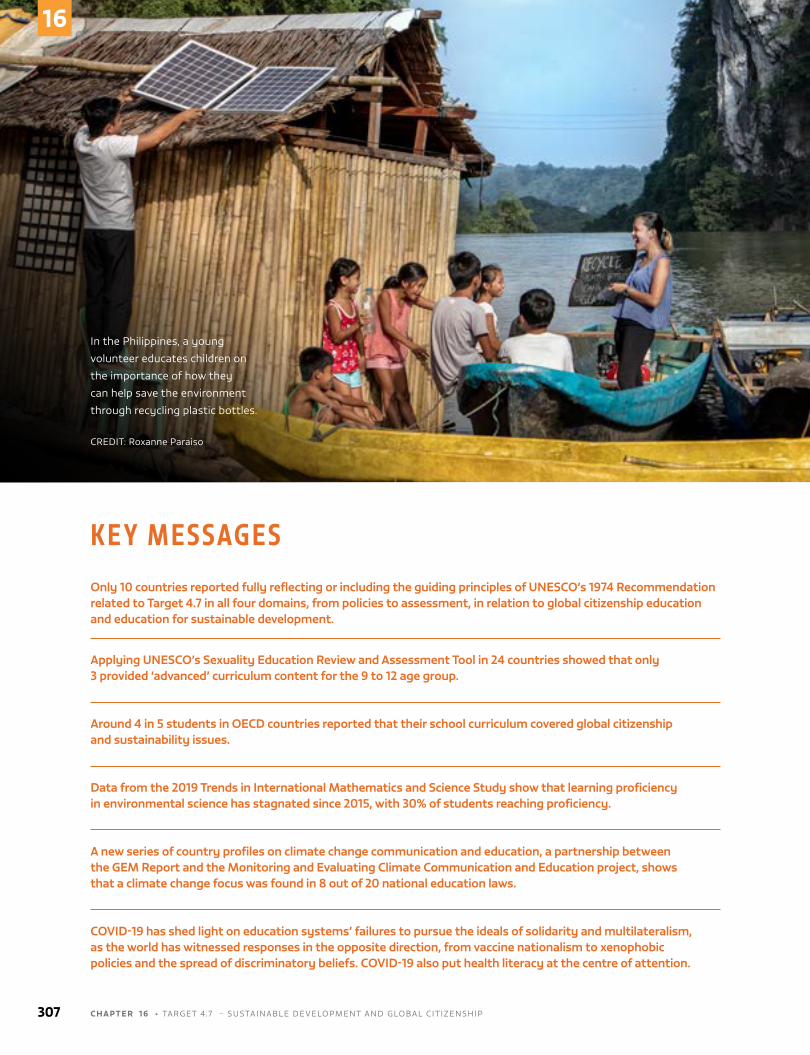
K E Y M E S S AG E SOnly 10 countries reported fully reflecting or including the guiding principles of UNESCO’s 1974 Recommendation related to Target 4.7 in all four domains, from policies to assessment, in relation to global citizenship education and education for sustainable development.
Applying UNESCO’s Sexuality Education Review and Assessment Tool in 24 countries showed that only 3 provided ‘advanced’ curriculum content for the 9 to 12 age group.
Around 4 in 5 students in OECD countries reported that their school curriculum covered global citizenship and sustainability issues.
Data from the 2019 Trends in International Mathematics and Science Study show that learning proficiency in environmental science has stagnated since 2015, with 30% of students reaching proficiency.
A new series of country profiles on climate change communication and education, a partnership between the GEM Report and the Monitoring and Evaluating Climate Communication and Education project, shows that a climate change focus was found in 8 out of 20 national education laws.
COVID-19 has shed light on education systems’ failures to pursue the ideals of solidarity and multilateralism, as the world has witnessed responses in the opposite direction, from vaccine nationalism to xenophobic policies and the spread of discriminatory beliefs. COVID-19 also put health literacy at the centre of attention.
In the Philippines, a young
volunteer educates children on
the importance of how they
can help save the environment
through recycling plastic bottles.
CREDIT: Roxanne Paraiso
307 C H A P T E R 1 6 • TARGET 4.7 – SuSTAInAblE DEvEloPmEnT AnD GlobAl C IT IzEnShIP
16
CHAPTER 16
TARGET 4.7
4.7
By 2030, ensure that all learners acquire the knowledge and skills needed to promote
sustainable development, including, among others, through education for sustainable
development and sustainable lifestyles, human rights, gender equality, promotion
of a culture of peace and non-violence, global citizenship and appreciation of cultural
diversity and of culture’s contribution to sustainable development
GLOBAL INDICATOR
4.7.1 – Extent to which (i) global citizenship education and (ii) education for sustainable development are
mainstreamed in: (a) national education policies, (b) curricula, (c) teacher education and (d) student assessment
THEMATIC INDICATORS
4.7.2 – Percentage of schools that provide life skills-based HIV and sexuality education
4.7.3 – Extent to which the framework on the World Programme on Human Rights Education is implemented
nationally (as per the UNGA Resolution 59/113)
4.7.4 – Percentage of students by age group (or education level) showing adequate understanding of issues
relating to global citizenship and sustainability
4.7.5 – Percentage of students in the final grade of lower secondary education showing proficiency in knowledge
of environmental science and geoscience
4.7.6 - Extent to which national education policies and education sector plans recognize a breadth of skills that
needs to be enhanced in national education systems
Sustainable development and global citizenship
2 0 2 1 / 2 • G LO BA L E D U C AT I O N M O N I TO R I N G R E P O RT 308
16
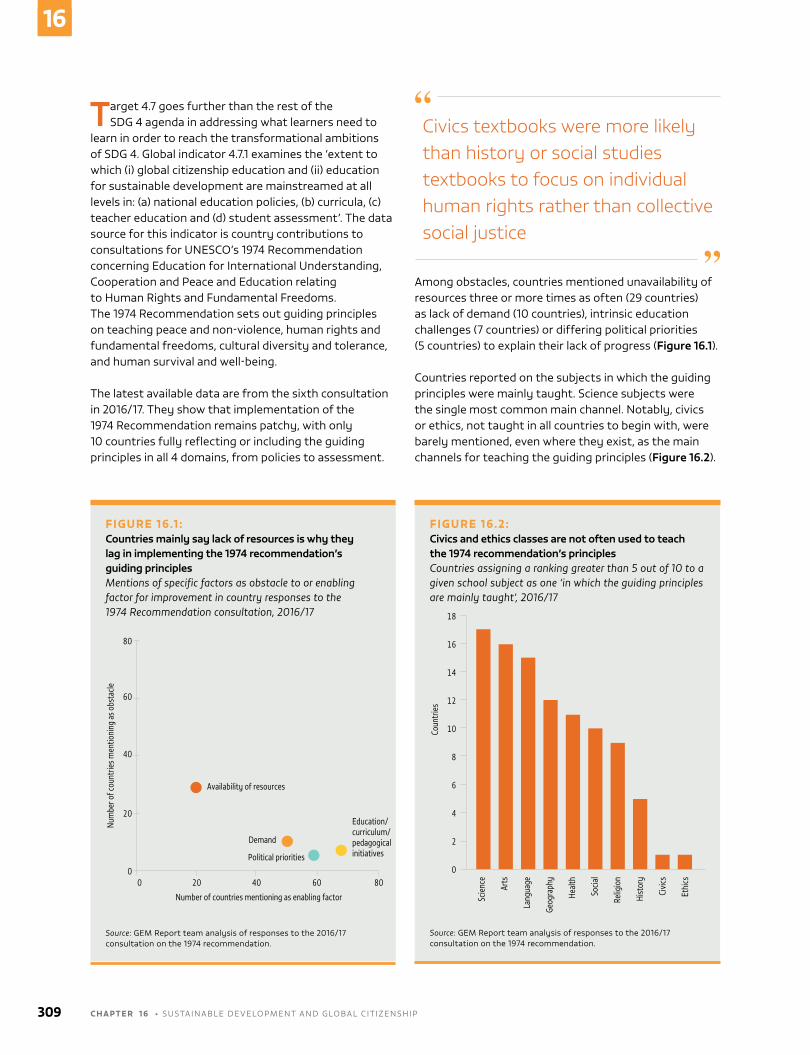
Target 4.7 goes further than the rest of the SDG 4 agenda in addressing what learners need to
learn in order to reach the transformational ambitions of SDG 4. Global indicator 4.7.1 examines the ‘extent to which (i) global citizenship education and (ii) education for sustainable development are mainstreamed at all levels in: (a) national education policies, (b) curricula, (c) teacher education and (d) student assessment’. The data source for this indicator is country contributions to consultations for unESCo’s 1974 Recommendation concerning Education for International understanding, Cooperation and Peace and Education relating to human Rights and Fundamental Freedoms. The 1974 Recommendation sets out guiding principles on teaching peace and non-violence, human rights and fundamental freedoms, cultural diversity and tolerance, and human survival and well-being.
The latest available data are from the sixth consultation in 2016/17. They show that implementation of the 1974 Recommendation remains patchy, with only 10 countries fully reflecting or including the guiding principles in all 4 domains, from policies to assessment.
Among obstacles, countries mentioned unavailability of resources three or more times as often (29 countries) as lack of demand (10 countries), intrinsic education challenges (7 countries) or differing political priorities (5 countries) to explain their lack of progress (Figure 16.1).
Countries reported on the subjects in which the guiding principles were mainly taught. Science subjects were the single most common main channel. notably, civics or ethics, not taught in all countries to begin with, were barely mentioned, even where they exist, as the main channels for teaching the guiding principles (Figure 16.2).
Civics textbooks were more likely than history or social studies textbooks to focus on individual human rights rather than collective social justice
FIGURE 16.1 :Countries mainly say lack of resources is why they lag in implementing the 1974 recommendation’s guiding principlesMentions of specific factors as obstacle to or enabling factor for improvement in country responses to the 1974 Recommendation consultation, 2016/17
Guatemala, 2014
2018
Availability of resources
Demand
80
60
60
40
40
20
200
0
Political priorities
Education/curriculum/pedagogical initiatives
Number of countries mentioning as enabling factor
Num
ber o
f cou
ntrie
s men
tioni
ng a
s obs
tacle
80
Source: GEm Report team analysis of responses to the 2016/17 consultation on the 1974 recommendation.
FIGURE 16.2:Civics and ethics classes are not often used to teach the 1974 recommendation’s principlesCountries assigning a ranking greater than 5 out of 10 to a given school subject as one ‘in which the guiding principles are mainly taught’, 2016/17
Guatemala, 2014
2018
Scie
nce
Arts
Lang
uage
Geog
raph
y
Heal
th
Socia
l
Relig
ion
Hist
ory
Civic
s
Ethi
cs
16
14
12
10
8
6
4
2
18
0
Coun
trie
s
Source: GEm Report team analysis of responses to the 2016/17 consultation on the 1974 recommendation.
309 C H A P T E R 1 6 • SuSTAInAblE DEvEloPmEnT AnD GlobAl C IT IzEnShIP
16
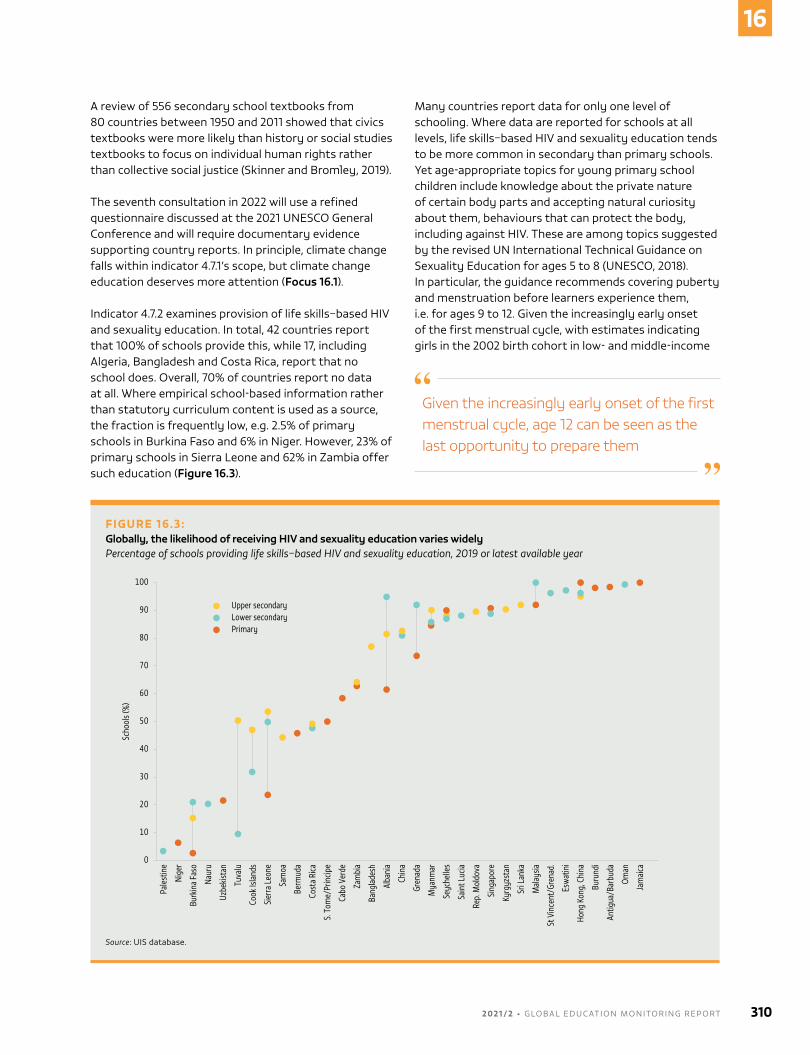
A review of 556 secondary school textbooks from 80 countries between 1950 and 2011 showed that civics textbooks were more likely than history or social studies textbooks to focus on individual human rights rather than collective social justice (Skinner and bromley, 2019).
The seventh consultation in 2022 will use a refined questionnaire discussed at the 2021 unESCo General Conference and will require documentary evidence supporting country reports. In principle, climate change falls within indicator 4.7.1’s scope, but climate change education deserves more attention (Focus 16.1).
Indicator 4.7.2 examines provision of life skills–based hIv and sexuality education. In total, 42 countries report that 100% of schools provide this, while 17, including Algeria, bangladesh and Costa Rica, report that no school does. overall, 70% of countries report no data at all. Where empirical school-based information rather than statutory curriculum content is used as a source, the fraction is frequently low, e.g. 2.5% of primary schools in burkina Faso and 6% in niger. however, 23% of primary schools in Sierra leone and 62% in zambia offer such education (Figure 16.3).
many countries report data for only one level of schooling. Where data are reported for schools at all levels, life skills–based hIv and sexuality education tends to be more common in secondary than primary schools. Yet age-appropriate topics for young primary school children include knowledge about the private nature of certain body parts and accepting natural curiosity about them, behaviours that can protect the body, including against hIv. These are among topics suggested by the revised un International Technical Guidance on Sexuality Education for ages 5 to 8 (unESCo, 2018). In particular, the guidance recommends covering puberty and menstruation before learners experience them, i.e. for ages 9 to 12. Given the increasingly early onset of the first menstrual cycle, with estimates indicating girls in the 2002 birth cohort in low- and middle-income
Given the increasingly early onset of the first menstrual cycle, age 12 can be seen as the last opportunity to prepare them
FIGURE 16.3:Globally, the likelihood of receiving HIV and sexuality education varies widelyPercentage of schools providing life skills–based HIV and sexuality education, 2019 or latest available year
Guatemala, 2014
2018
Pale
stin
e
Nige
r
Burk
ina
Faso
Naur
u
Uzbe
kista
n
Tuva
lu
Cook
Isla
nds
Sier
ra L
eone
Sam
oa
Berm
uda
Cost
a Ri
ca
S. T
ome/
Prin
cipe
Cabo
Ver
de
Zam
bia
Bang
lade
sh
Alba
nia
Chin
a
Gren
ada
Mya
nmar
Seyc
helle
s
Sain
t Luc
ia
Rep.
Mol
dova
Sing
apor
e
Kyrg
yzst
an
Sri L
anka
Mal
aysia
St V
ince
nt/G
rena
d.
Esw
atin
i
Hong
Kon
g, C
hina
Buru
ndi
Antig
ua/B
arbu
da
Oman
Jam
aica
90
80
70
60
50
40
30
20
10
100
0
Scho
ols (
%)
Upper secondaryLower secondaryPrimary
Source: uIS database.
2 0 2 1 / 2 • G LO BA L E D U C AT I O N M O N I TO R I N G R E P O RT 310
16
countries experienced menarche before their 13th birthday, on average (leone and brown, 2020), age 12 can be seen as the last opportunity to prepare them.
unESCo’s Sexuality Education Review and Assessment Tool (SERAT), developed in 2012, has been revised to reflect the updated International Technical Guidance. SERAT underlies a recent global progress report on comprehensive sexuality education (unESCo, 2021b) and provides a more in-depth review of comprehensive sexuality education provision than the single indicator summary of 4.7.2, including by age and specific topics. Among 24 countries, only 3 are assessed as providing ‘advanced’ curriculum content on sexual and reproductive health for ages 9 to 12, and 5 countries as having ‘established’ content. Even in countries scoring relatively high, gaps remain. In malawi, with advanced curricular content both on sexuality and sexual behaviour and on sexual and reproductive health, 9- to 12-year-olds receive little detail on contraceptives or the use of pregnancy tests. Some countries, including uganda, have a high-quality curriculum but it only begins at age 15, an age by which many of the girls most at risk of early pregnancy have dropped out of school.
While indicators 4.7.1 and 4.7.2 address provision, the monitoring framework for target 4.7 also aims to measure the resulting knowledge outcomes. In particular, it asks what percentage of students show ‘an adequate understanding of issues relating to global citizenship and sustainability’ (4.7.4) and ‘proficiency in knowledge of environmental science and geoscience’ (4.7.5). both indicators are monitored at the lower secondary school level. Following a review, including of alignment with the target 4.7 global content framework, as well as an agreement on minimum proficiency levels, the unESCo Institute for Statistics (uIS) now reports values for these indicators based on cross-national assessments (Sandoval-hernandez and Carrasco, 2020). both indicators have been defined as composites of one cognitive and multiple non-cognitive dimensions.
Data for indicator 4.7.4 draw on the 2016 International Civic and Citizenship Education Study (ICCS) and are reported for 23 upper-middle- and high-income countries. The percentage of students with adequate understanding, based on one cognitive component (consisting of four civic knowledge content domains: society and systems, principles, participation, and identities) and seven non-cognitive components (global-local, multiculturalism, gender equality, peace,
freedom, social justice, sustainable development), ranges from around 40% in the Dominican Republic, latvia and the netherlands to almost 70% in Croatia, the Republic of Korea and Sweden. however, the seven non-cognitive components are not all positively correlated with the cognitive component. For instance, a higher cognitive score is positively correlated with attitudes of students who are better at identifying what is good for democracy (e.g. electing political leaders, protesting an unfair law) and what is bad for democracy (e.g. media concentration, nepotism in government, influence of government over the judiciary). but it is negatively correlated with expression of highly positive attitudes towards one’s country of residence (global-local) (Figure 16.4).
The 2018 Programme for International Student Assessment (PISA) of the organisation for Economic Co-operation and Development (oECD) collected information on cognitive and non-cognitive dimensions of ‘global competence’ that overlapped partly with the notion of global citizenship addressed by indicator 4.7.4, although uIS did not include it in its reporting because, unlike ICCS, this PISA module is not expected to be regularly repeated. on average, some four in five students in oECD countries reported that their school curriculum covered global issues (oECD, 2020). Gathering information on both learning opportunities and outcomes makes it possible to examine their relationship. Consistently across countries, student awareness, agency and self-efficacy regarding global issues were higher when the number of related learning activities was higher, even after accounting for socioeconomic effects. These positive effects remained small overall, though, and almost half of all learners, on average, failed to demonstrate minimum ‘global competence’. on many measures, there was a large gap between students with low and high socioeconomic status, not just in aspects of knowledge or cognitive performance, but also regarding perceptions of agency, awareness, interest and practical action. Such education cannot succeed if it is perceived as only of concern for the better off.
Education for global competences cannot succeed if it is perceived as only of concern for the better off
311 C H A P T E R 1 6 • SuSTAInAblE DEvEloPmEnT AnD GlobAl C IT IzEnShIP
16
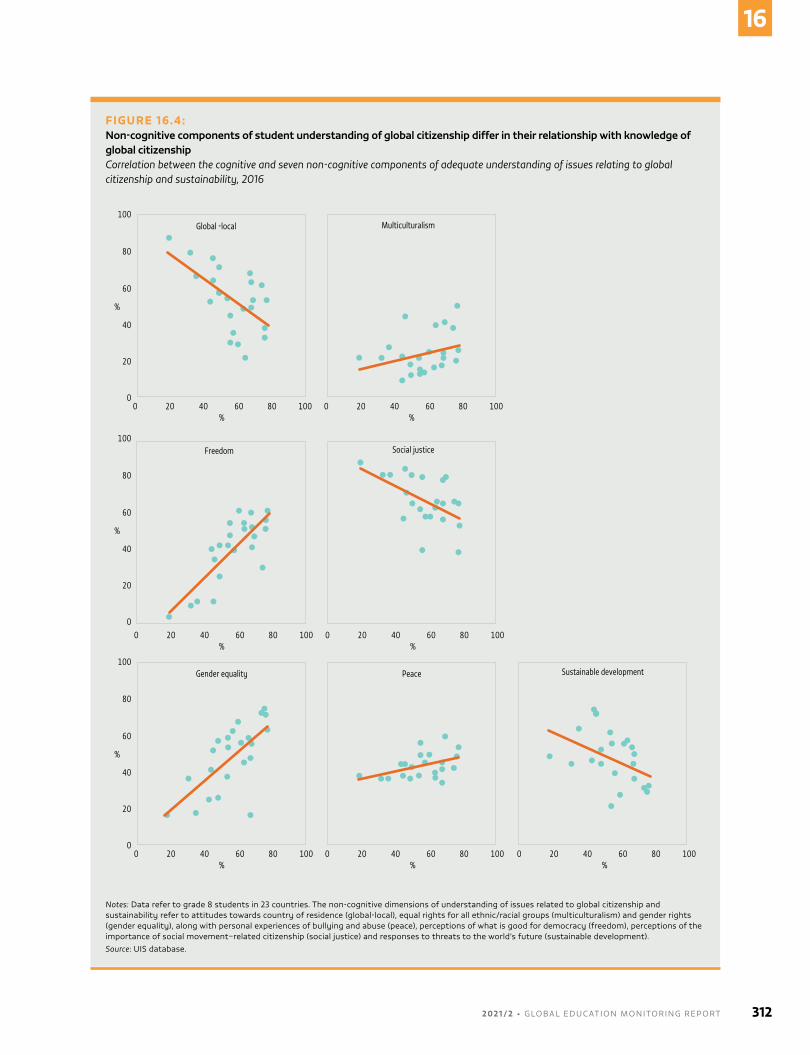
FIGURE 16.4:Non-cognitive components of student understanding of global citizenship differ in their relationship with knowledge of global citizenshipCorrelation between the cognitive and seven non-cognitive components of adequate understanding of issues relating to global citizenship and sustainability, 2016
Guatemala, 2014
2018
100
80
60
%
40
20
00 20 40 60 80 100
Global -local
0 20 40 60 80 100%
Multiculturalism
100
80
60
%
40
20
00 20 40 60 80 100
%
Gender equality
20 40 60 80 100%
0
Peace
%
100
80
60
%
40
20
00 20 40 60 80 100
%
Freedom
0 20 40 60 80 100%
Social justice
0 20 40 60 80 100%
Sustainable development
Notes: Data refer to grade 8 students in 23 countries. The non-cognitive dimensions of understanding of issues related to global citizenship and sustainability refer to attitudes towards country of residence (global-local), equal rights for all ethnic/racial groups (multiculturalism) and gender rights (gender equality), along with personal experiences of bullying and abuse (peace), perceptions of what is good for democracy (freedom), perceptions of the importance of social movement–related citizenship (social justice) and responses to threats to the world’s future (sustainable development).Source: uIS database.
2 0 2 1 / 2 • G LO BA L E D U C AT I O N M O N I TO R I N G R E P O RT 312
16
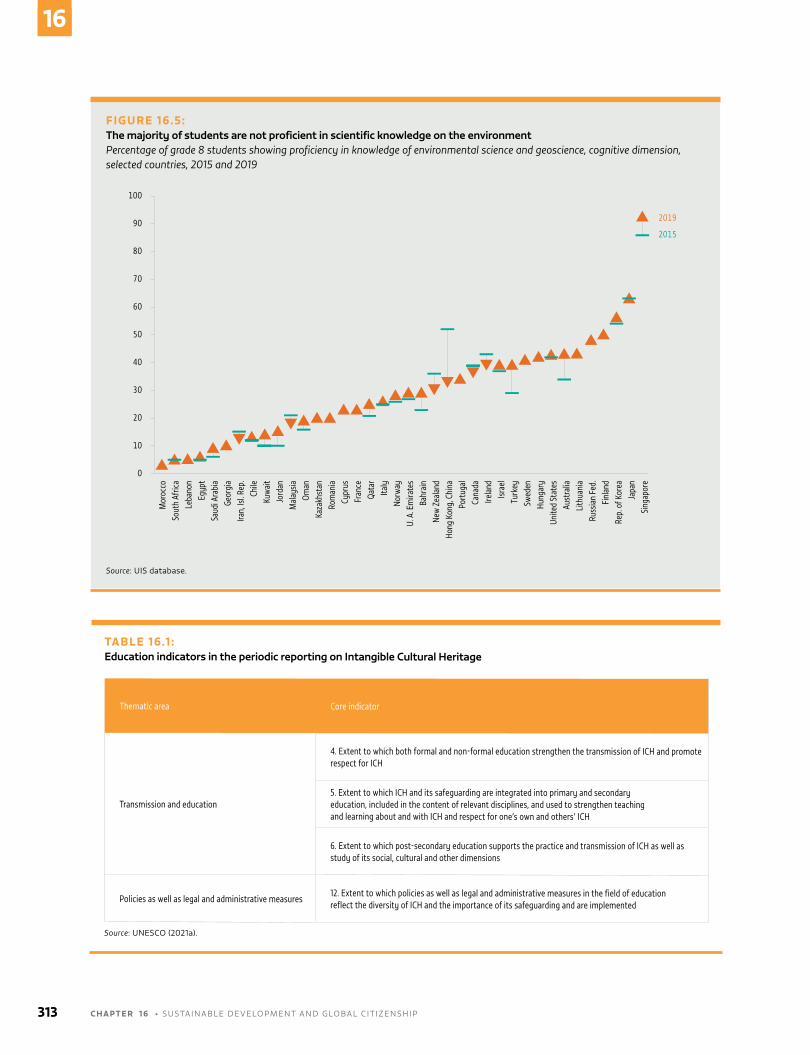
FIGURE 16.5:The majority of students are not proficient in scientific knowledge on the environmentPercentage of grade 8 students showing proficiency in knowledge of environmental science and geoscience, cognitive dimension, selected countries, 2015 and 2019
Guatemala, 2014
2018
Mor
occo
Sout
h Af
rica
Leba
non
Egyp
tSa
udi A
rabi
aGe
orgi
aIra
n, Is
l. Rep
.Ch
ileKu
wai
tJo
rdan
Mal
aysia
Oman
Kaza
khst
anRo
man
iaCy
prus
Fran
ceQa
tar
Italy
Norw
ayU.
A. E
mira
tes
Bahr
ain
New
Zea
land
Hong
Kon
g, C
hina
Port
ugal
Cana
daIre
land
Israe
lTu
rkey
Swed
enHu
ngar
yUn
ited
Stat
esAu
stra
liaLi
thua
nia
Russ
ian
Fed.
Finl
and
Rep.
of K
orea
Japa
nSi
ngap
ore
2019
201590
80
70
60
50
40
30
20
10
100
0
Source: uIS database.
TABLE 16.1 :Education indicators in the periodic reporting on Intangible Cultural Heritage
Thematic area Core indicator
Transmission and education
4. Extent to which both formal and non-formal education strengthen the transmission of ICH and promote respect for ICH
5. Extent to which ICH and its safeguarding are integrated into primary and secondary education, included in the content of relevant disciplines, and used to strengthen teaching and learning about and with ICH and respect for one’s own and others’ ICH
6. Extent to which post-secondary education supports the practice and transmission of ICH as well as study of its social, cultural and other dimensions
Policies as well as legal and administrative measures12. Extent to which policies as well as legal and administrative measures in the field of education reflect the diversity of ICH and the importance of its safeguarding and are implemented
Source: unESCo (2021a).
313 C H A P T E R 1 6 • SuSTAInAblE DEvEloPmEnT AnD GlobAl C IT IzEnShIP
16
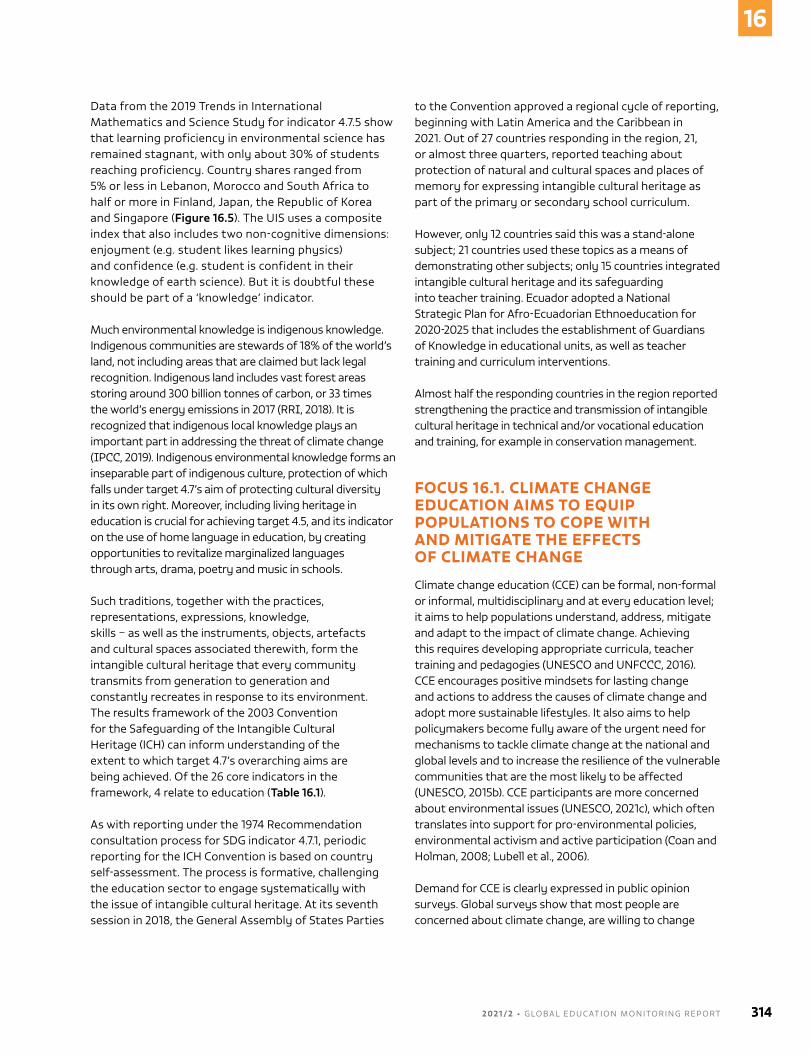
Data from the 2019 Trends in International mathematics and Science Study for indicator 4.7.5 show that learning proficiency in environmental science has remained stagnant, with only about 30% of students reaching proficiency. Country shares ranged from 5% or less in lebanon, morocco and South Africa to half or more in Finland, Japan, the Republic of Korea and Singapore (Figure 16.5). The uIS uses a composite index that also includes two non-cognitive dimensions: enjoyment (e.g. student likes learning physics) and confidence (e.g. student is confident in their knowledge of earth science). but it is doubtful these should be part of a ‘knowledge’ indicator.
much environmental knowledge is indigenous knowledge. Indigenous communities are stewards of 18% of the world’s land, not including areas that are claimed but lack legal recognition. Indigenous land includes vast forest areas storing around 300 billion tonnes of carbon, or 33 times the world’s energy emissions in 2017 (RRI, 2018). It is recognized that indigenous local knowledge plays an important part in addressing the threat of climate change (IPCC, 2019). Indigenous environmental knowledge forms an inseparable part of indigenous culture, protection of which falls under target 4.7’s aim of protecting cultural diversity in its own right. moreover, including living heritage in education is crucial for achieving target 4.5, and its indicator on the use of home language in education, by creating opportunities to revitalize marginalized languages through arts, drama, poetry and music in schools.
Such traditions, together with the practices, representations, expressions, knowledge, skills – as well as the instruments, objects, artefacts and cultural spaces associated therewith, form the intangible cultural heritage that every community transmits from generation to generation and constantly recreates in response to its environment. The results framework of the 2003 Convention for the Safeguarding of the Intangible Cultural heritage (ICh) can inform understanding of the extent to which target 4.7’s overarching aims are being achieved. of the 26 core indicators in the framework, 4 relate to education (Table 16.1).
As with reporting under the 1974 Recommendation consultation process for SDG indicator 4.7.1, periodic reporting for the ICh Convention is based on country self-assessment. The process is formative, challenging the education sector to engage systematically with the issue of intangible cultural heritage. At its seventh session in 2018, the General Assembly of States Parties
to the Convention approved a regional cycle of reporting, beginning with latin America and the Caribbean in 2021. out of 27 countries responding in the region, 21, or almost three quarters, reported teaching about protection of natural and cultural spaces and places of memory for expressing intangible cultural heritage as part of the primary or secondary school curriculum.
however, only 12 countries said this was a stand-alone subject; 21 countries used these topics as a means of demonstrating other subjects; only 15 countries integrated intangible cultural heritage and its safeguarding into teacher training. Ecuador adopted a national Strategic Plan for Afro-Ecuadorian Ethnoeducation for 2020-2025 that includes the establishment of Guardians of Knowledge in educational units, as well as teacher training and curriculum interventions.
Almost half the responding countries in the region reported strengthening the practice and transmission of intangible cultural heritage in technical and/or vocational education and training, for example in conservation management.
FOCUS 16.1. CLIMATE CHANGE EDUCATION AIMS TO EQUIP POPULATIONS TO COPE WITH AND MITIGATE THE EFFECTS OF CLIMATE CHANGE
Climate change education (CCE) can be formal, non-formal or informal, multidisciplinary and at every education level; it aims to help populations understand, address, mitigate and adapt to the impact of climate change. Achieving this requires developing appropriate curricula, teacher training and pedagogies (unESCo and unFCCC, 2016). CCE encourages positive mindsets for lasting change and actions to address the causes of climate change and adopt more sustainable lifestyles. It also aims to help policymakers become fully aware of the urgent need for mechanisms to tackle climate change at the national and global levels and to increase the resilience of the vulnerable communities that are the most likely to be affected (unESCo, 2015b). CCE participants are more concerned about environmental issues (unESCo, 2021c), which often translates into support for pro-environmental policies, environmental activism and active participation (Coan and holman, 2008; lubell et al., 2006).
Demand for CCE is clearly expressed in public opinion surveys. Global surveys show that most people are concerned about climate change, are willing to change
2 0 2 1 / 2 • G LO BA L E D U C AT I O N M O N I TO R I N G R E P O RT 314
16
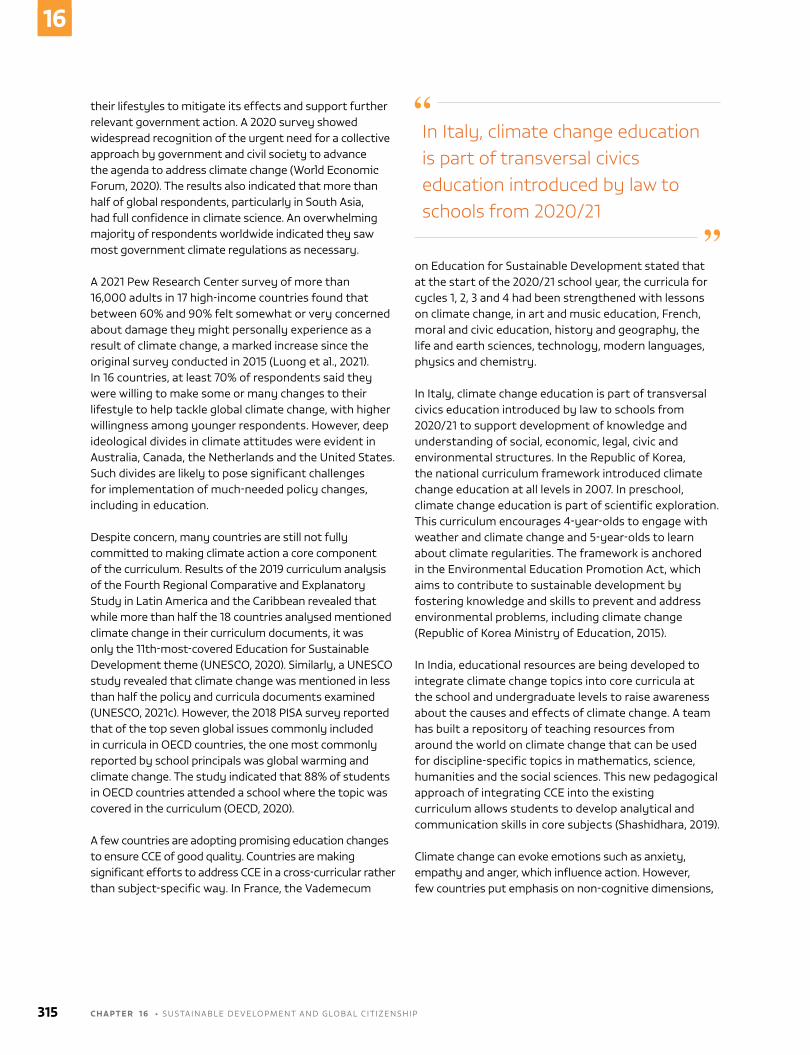
their lifestyles to mitigate its effects and support further relevant government action. A 2020 survey showed widespread recognition of the urgent need for a collective approach by government and civil society to advance the agenda to address climate change (World Economic Forum, 2020). The results also indicated that more than half of global respondents, particularly in South Asia, had full confidence in climate science. An overwhelming majority of respondents worldwide indicated they saw most government climate regulations as necessary.
A 2021 Pew Research Center survey of more than 16,000 adults in 17 high-income countries found that between 60% and 90% felt somewhat or very concerned about damage they might personally experience as a result of climate change, a marked increase since the original survey conducted in 2015 (luong et al., 2021). In 16 countries, at least 70% of respondents said they were willing to make some or many changes to their lifestyle to help tackle global climate change, with higher willingness among younger respondents. however, deep ideological divides in climate attitudes were evident in Australia, Canada, the netherlands and the united States. Such divides are likely to pose significant challenges for implementation of much-needed policy changes, including in education.
Despite concern, many countries are still not fully committed to making climate action a core component of the curriculum. Results of the 2019 curriculum analysis of the Fourth Regional Comparative and Explanatory Study in latin America and the Caribbean revealed that while more than half the 18 countries analysed mentioned climate change in their curriculum documents, it was only the 11th-most-covered Education for Sustainable Development theme (unESCo, 2020). Similarly, a unESCo study revealed that climate change was mentioned in less than half the policy and curricula documents examined (unESCo, 2021c). however, the 2018 PISA survey reported that of the top seven global issues commonly included in curricula in oECD countries, the one most commonly reported by school principals was global warming and climate change. The study indicated that 88% of students in oECD countries attended a school where the topic was covered in the curriculum (oECD, 2020).
A few countries are adopting promising education changes to ensure CCE of good quality. Countries are making significant efforts to address CCE in a cross-curricular rather than subject-specific way. In France, the vademecum
on Education for Sustainable Development stated that at the start of the 2020/21 school year, the curricula for cycles 1, 2, 3 and 4 had been strengthened with lessons on climate change, in art and music education, French, moral and civic education, history and geography, the life and earth sciences, technology, modern languages, physics and chemistry.
In Italy, climate change education is part of transversal civics education introduced by law to schools from 2020/21 to support development of knowledge and understanding of social, economic, legal, civic and environmental structures. In the Republic of Korea, the national curriculum framework introduced climate change education at all levels in 2007. In preschool, climate change education is part of scientific exploration. This curriculum encourages 4-year-olds to engage with weather and climate change and 5-year-olds to learn about climate regularities. The framework is anchored in the Environmental Education Promotion Act, which aims to contribute to sustainable development by fostering knowledge and skills to prevent and address environmental problems, including climate change (Republic of Korea ministry of Education, 2015).
In India, educational resources are being developed to integrate climate change topics into core curricula at the school and undergraduate levels to raise awareness about the causes and effects of climate change. A team has built a repository of teaching resources from around the world on climate change that can be used for discipline-specific topics in mathematics, science, humanities and the social sciences. This new pedagogical approach of integrating CCE into the existing curriculum allows students to develop analytical and communication skills in core subjects (Shashidhara, 2019).
Climate change can evoke emotions such as anxiety, empathy and anger, which influence action. however, few countries put emphasis on non-cognitive dimensions,
In Italy, climate change education is part of transversal civics education introduced by law to schools from 2020/21
315 C H A P T E R 1 6 • SuSTAInAblE DEvEloPmEnT AnD GlobAl C IT IzEnShIP
16
such as social and emotional components and values. In Rwanda, the 2015 national curriculum framework integrates climate change, environment and sustainability into learning materials that are also meant to develop values for sustainable living, an intention confirmed in the 2019–24 Education Sector Strategic Plan.
many countries have incorporated CCE in their curricula, both in theory and practice (Chiba et al., 2021), with solution-oriented and participatory approaches to empower learners to be agents of change (unESCo, 2015b). Successful approaches in Erasmus+ projects on education for sustainable development often include physical activities, such as collecting waste, planting trees and organizing environmental campaigns (European Commission, 2021). Since the mid-1990s, Colombia’s ministry of national Education has managed School Environmental Projects that identify environmental priority situations and focus on actions adapted to school realities, integrating various fields of knowledge, disciplines and skills for interdisciplinary problem solving (Colombia ministry of national Education, 2005; mora-ortiz, 2015).
Strong connections to the environment and climate result in more intentions to act and willingness to change behaviour (Dietz et al., 2020; zelenika et al., 2018). hence countries try to prioritize action-oriented teaching and place-based learning, especially in upper secondary education (unESCo, 2021c). In England (united Kingdom), the youth-led Teach the Future campaign aims for all school buildings to have a net-zero carbon footprint by 2030. To this end, the Department for Education is providing funding to help schools become more sustainable (burns, 2020).
overall, in terms of pedagogy, an effective CCE approach would aim to achieve a balance between developing learners who can think critically about CCE and empathetic
students who are committed to taking action to improve their living environment (Chang, 2015). It would promote collaboration with peers and interactions to inspire change. Promising initiatives require a long-term perspective to be able to trigger behaviour change. There is little robust cross-national information on where countries stand on addressing climate change in education systems, as much of the information appears in national documents rather than in nationally Determined Contributions to the un Framework Convention on Climate Change Secretariat (SEPn, 2020).
A new series of country profiles on climate change communication and education at the Profiles Enhancing Education Reviews (PEER) website aims to improve the evidence basis. It is the result of a partnership between the Global Education Monitoring Report and the monitoring and Evaluating Climate Communication and Education (mECCE) project, hosted by the Sustainability and Education Policy network and financed by the Social Sciences and humanities Research Council of Canada. It offers a comparative perspective of countries’ progress on Article 6 of the united nations Framework Convention on Climate Change and Article 12 of the Paris Agreement (Action for Climate Empowerment), and SDG target 4.7. A first set of 20 country profiles was published in november 2021, covering all world regions and country income groups. A second set of up to 50 profiles is scheduled to be published in 2022.
These profiles present content on climate change contexts; climate change education (policy, curriculum, teacher education and assessment) in primary, secondary, technical, vocational, higher, teacher and adult education; climate change communication (public awareness, public access to education, public participation); and monitoring. Initial analysis suggests that in all but 1 of the 20 countries analysed, education ministries work on climate change; all but 2 have a national climate change law, strategy or plan that includes education content; and all but 3 have monitoring mechanisms to track progress in CCE. Yet a climate change focus was found in only 40% of national education laws and 45% of education sector plans or strategies. national curriculum frameworks refer to climate change in 75% of countries and just over one third have a law or plan with a clear focus on CCE. Efforts focus on the primary and secondary education levels in 90% of countries; on technical, vocational and higher education in 70%; and on teacher education in 55% (Figure 16.6).
In a sample of 20 countries, a climate change focus was found in only 40% of national education laws
2 0 2 1 / 2 • G LO BA L E D U C AT I O N M O N I TO R I N G R E P O RT 316
16
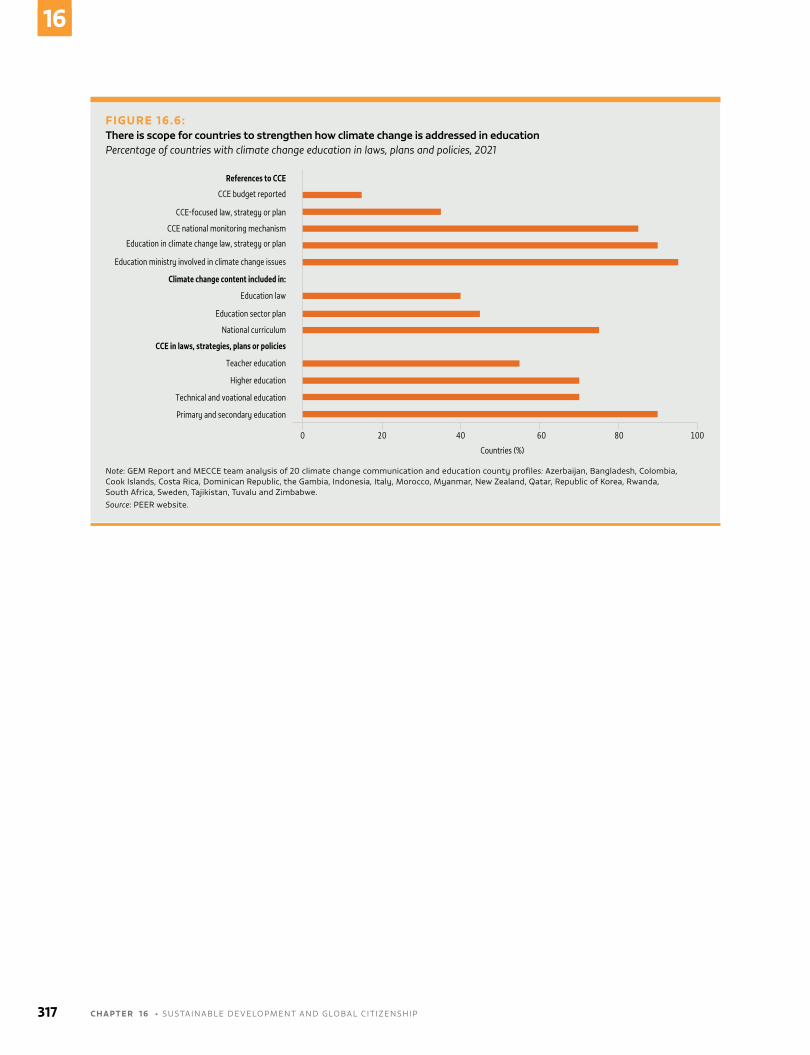
FIGURE 16.6: There is scope for countries to strengthen how climate change is addressed in educationPercentage of countries with climate change education in laws, plans and policies, 2021
Guatemala, 2014
2018
References to CCE
CCE budget reported
CCE-focused law, strategy or plan
CCE national monitoring mechanism
Education in climate change law, strategy or plan
Education ministry involved in climate change issues
Climate change content included in:
Education law
Education sector plan
National curriculum
CCE in laws, strategies, plans or policies
Teacher education
Higher education
Technical and voational education
Primary and secondary education
0 20 40 60 80 100
Countries (%)
Note: GEm Report and mECCE team analysis of 20 climate change communication and education county profiles: Azerbaijan, bangladesh, Colombia, Cook Islands, Costa Rica, Dominican Republic, the Gambia, Indonesia, Italy, morocco, myanmar, new zealand, Qatar, Republic of Korea, Rwanda, South Africa, Sweden, Tajikistan, Tuvalu and zimbabwe.Source: PEER website.
317 C H A P T E R 1 6 • SuSTAInAblE DEvEloPmEnT AnD GlobAl C IT IzEnShIP
16
COVID-19
Education for sustainable development and global citizenship education is a response to the challenges of a planet that is increasingly interconnected but whose future is at stake. It is meant to enable learners to actively engage in developing more inclusive and secure societies (unESCo, 2015a). Yet CovID-19 has shed light on systems’ failures to pursue the ideals of solidarity and multilateralism, and growing inequality within and between countries raises moral concerns. Even as the nature of the pandemic, with rapid contagion and variant development, requires global solutions, the world has witnessed many responses that go in the opposite direction, from vaccine nationalism to xenophobic policies and the spread of discriminatory beliefs (Farge, 2021; united nations, 2020).
CovID-19 put health literacy at the centre of attention. The well-known link between education and health awareness was confirmed during the pandemic. In Saudi Arabia, individuals with higher education attainment were more aware and more likely to follow personal protective measures (bazaid et al., 2020). health literacy is connected with making decisions based on health care providers’ advice (Turhan et al., 2021). It is also linked with lower vaccine hesitancy (biasio, 2017), a key factor for slowing down CovID-19 contagion rates. Calls to include health literacy as a compulsory subject in basic education curricula have gained ground (molnar, 2021). The county of San Diego, united States, pledged uSD$2 million to improve health literacy in schools (San Diego County office of Education, 2021).
Just as such issues have become more urgent, however, the pandemic has led many governments to increase the curricular focus on ‘core’ subjects to minimize learning losses in literacy or numeracy. Yet there is danger of this narrowing of focus undermining education’s broad humanistic dimension (International Commission on the Futures of Education, 2020). over 20% of low-income countries and over 40% of lower- and upper-middle-income countries planned to reduce the content of instruction as part of their CovID-19 response (uIS, 2020). In Afghanistan, the CovID-19 response plan envisaged core subjects being continued through distance learning and social science subjects being ‘self-learned’ (Afghanistan ministry of Education, 2020). In England (united Kingdom), the Department for Education announced that non-core subjects had to be dropped in favour of English and maths for the 2020/21 academic year (Staton and hughes, 2020).
health literacy can also be pursued through informal and non-formal adult education initiatives. In South Africa, participants in a large adult literacy campaign with a health literacy dimension improved their ability to understand health messages (lopes and mcKay, 2020). Initiatives must not only provide accurate health information, but also foster long-term improvement in health literacy through a variety of actors, including health care organizations, community-based partnerships and cross-sector collaborations (Damian and Gallo, 2020). In 2021, the uS Department of health and human Services distributed uSD$250 million in grants to 73 local governments to improve health literacy among underserved populations by working with local community-based organizations (uS Department of health and human Services, 2021).
2 0 2 1 / 2 • G LO BA L E D U C AT I O N M O N I TO R I N G R E P O RT 318
16
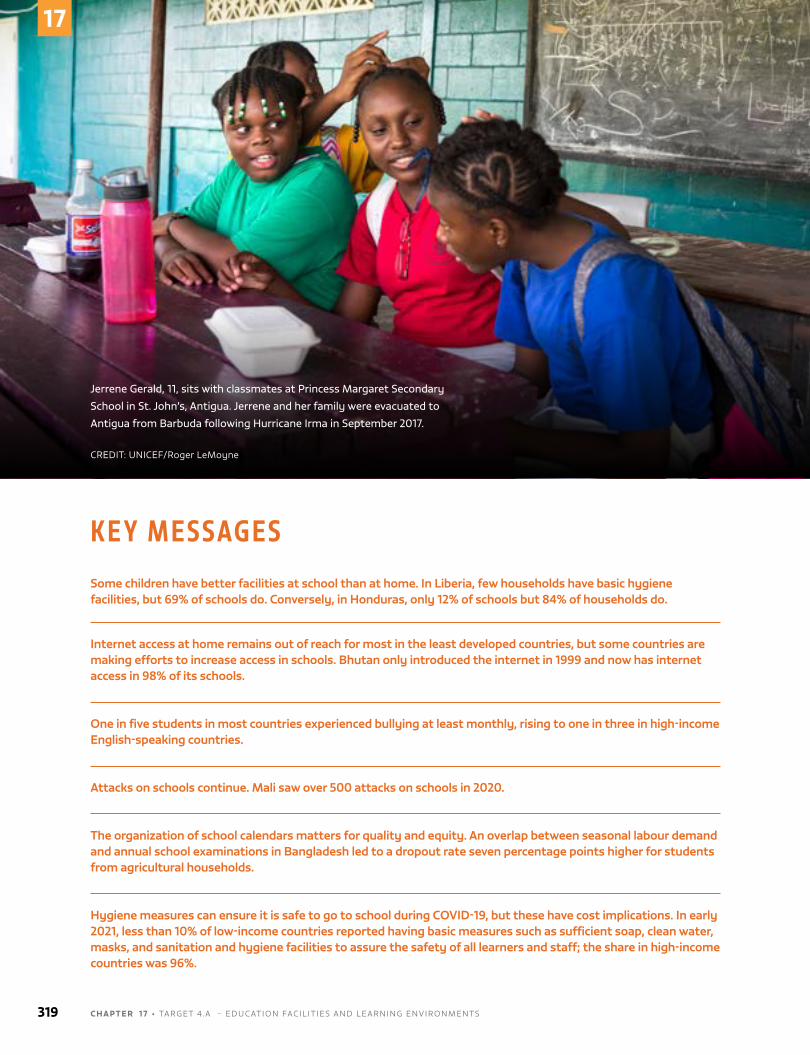
K E Y M E S S AG E SSome children have better facilities at school than at home. In Liberia, few households have basic hygiene facilities, but 69% of schools do. Conversely, in Honduras, only 12% of schools but 84% of households do.
Internet access at home remains out of reach for most in the least developed countries, but some countries are making efforts to increase access in schools. Bhutan only introduced the internet in 1999 and now has internet access in 98% of its schools.
One in five students in most countries experienced bullying at least monthly, rising to one in three in high-income English-speaking countries.
Attacks on schools continue. Mali saw over 500 attacks on schools in 2020.
The organization of school calendars matters for quality and equity. An overlap between seasonal labour demand and annual school examinations in Bangladesh led to a dropout rate seven percentage points higher for students from agricultural households.
Hygiene measures can ensure it is safe to go to school during COVID-19, but these have cost implications. In early 2021, less than 10% of low-income countries reported having basic measures such as sufficient soap, clean water, masks, and sanitation and hygiene facilities to assure the safety of all learners and staff; the share in high-income countries was 96%.
Jerrene Gerald, 11, sits with classmates at Princess Margaret Secondary
School in St. John’s, Antigua. Jerrene and her family were evacuated to
Antigua from Barbuda following Hurricane Irma in September 2017.
CREDIT: unICEF/Roger lemoyne
319 C H A P T E R 1 7 • TARGET 4.A – EDuCATIon FACIl IT IES AnD lEARnInG EnvIRonmEnTS
17
CHAPTER 17
TARGET 4.a
4.a
Build and upgrade education facilities that are child, disability and gender sensitive and provide safe, non-violent, inclusive and effective learning environments for all.
GLOBAL INDICATOR
4.a.1 - Proportion of schools offering basic services, by type of service
THEMATIC INDICATORS
4.a.2 - Percentage of students experiencing bullying in the last 12 months
4.a.3 - Number of attacks on students, personnel and institutions
Education facilities and learning
environments
2 0 2 1 / 2 • G LO BA L E D U C AT I O N M O N I TO R I N G R E P O RT 320
17
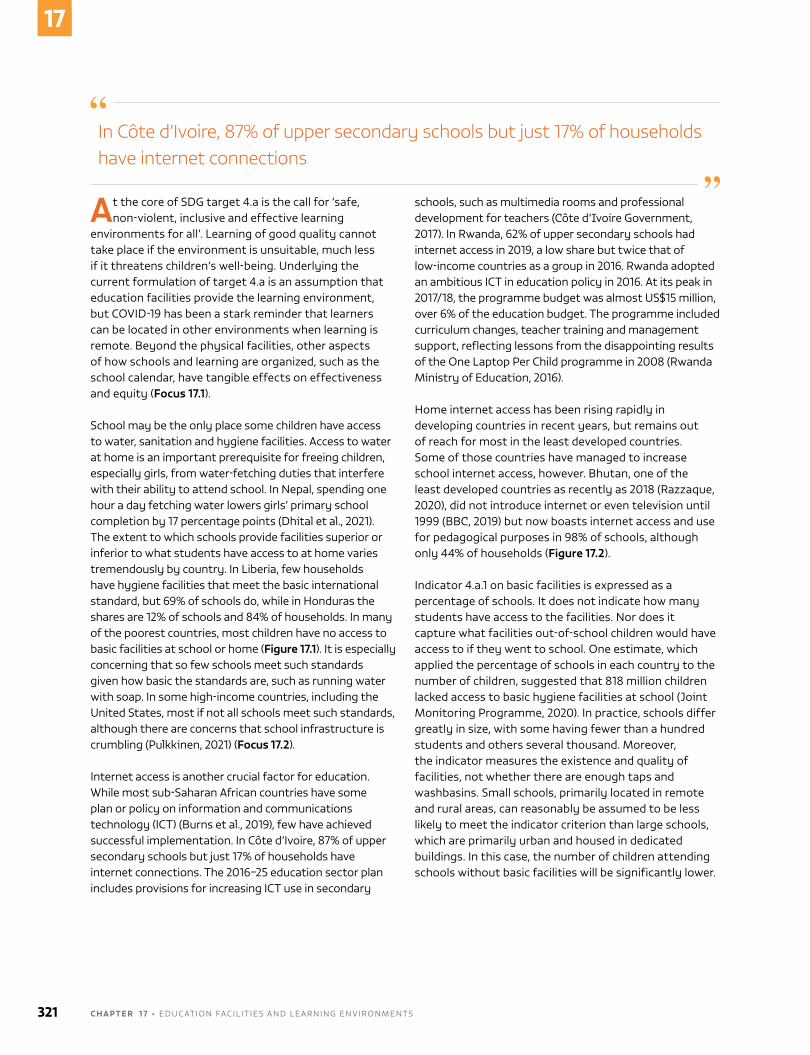
At the core of SDG target 4.a is the call for ‘safe, non-violent, inclusive and effective learning
environments for all’. learning of good quality cannot take place if the environment is unsuitable, much less if it threatens children’s well-being. underlying the current formulation of target 4.a is an assumption that education facilities provide the learning environment, but CovID-19 has been a stark reminder that learners can be located in other environments when learning is remote. beyond the physical facilities, other aspects of how schools and learning are organized, such as the school calendar, have tangible effects on effectiveness and equity (Focus 17.1).
School may be the only place some children have access to water, sanitation and hygiene facilities. Access to water at home is an important prerequisite for freeing children, especially girls, from water-fetching duties that interfere with their ability to attend school. In nepal, spending one hour a day fetching water lowers girls’ primary school completion by 17 percentage points (Dhital et al., 2021). The extent to which schools provide facilities superior or inferior to what students have access to at home varies tremendously by country. In liberia, few households have hygiene facilities that meet the basic international standard, but 69% of schools do, while in honduras the shares are 12% of schools and 84% of households. In many of the poorest countries, most children have no access to basic facilities at school or home (Figure 17.1). It is especially concerning that so few schools meet such standards given how basic the standards are, such as running water with soap. In some high-income countries, including the united States, most if not all schools meet such standards, although there are concerns that school infrastructure is crumbling (Pulkkinen, 2021) (Focus 17.2).
Internet access is another crucial factor for education. While most sub-Saharan African countries have some plan or policy on information and communications technology (ICT) (burns et al., 2019), few have achieved successful implementation. In Côte d’Ivoire, 87% of upper secondary schools but just 17% of households have internet connections. The 2016–25 education sector plan includes provisions for increasing ICT use in secondary
schools, such as multimedia rooms and professional development for teachers (Côte d’Ivoire Government, 2017). In Rwanda, 62% of upper secondary schools had internet access in 2019, a low share but twice that of low-income countries as a group in 2016. Rwanda adopted an ambitious ICT in education policy in 2016. At its peak in 2017/18, the programme budget was almost uS$15 million, over 6% of the education budget. The programme included curriculum changes, teacher training and management support, reflecting lessons from the disappointing results of the one laptop Per Child programme in 2008 (Rwanda ministry of Education, 2016).
home internet access has been rising rapidly in developing countries in recent years, but remains out of reach for most in the least developed countries. Some of those countries have managed to increase school internet access, however. bhutan, one of the least developed countries as recently as 2018 (Razzaque, 2020), did not introduce internet or even television until 1999 (bbC, 2019) but now boasts internet access and use for pedagogical purposes in 98% of schools, although only 44% of households (Figure 17.2).
Indicator 4.a.1 on basic facilities is expressed as a percentage of schools. It does not indicate how many students have access to the facilities. nor does it capture what facilities out-of-school children would have access to if they went to school. one estimate, which applied the percentage of schools in each country to the number of children, suggested that 818 million children lacked access to basic hygiene facilities at school (Joint monitoring Programme, 2020). In practice, schools differ greatly in size, with some having fewer than a hundred students and others several thousand. moreover, the indicator measures the existence and quality of facilities, not whether there are enough taps and washbasins. Small schools, primarily located in remote and rural areas, can reasonably be assumed to be less likely to meet the indicator criterion than large schools, which are primarily urban and housed in dedicated buildings. In this case, the number of children attending schools without basic facilities will be significantly lower.
In Côte d’Ivoire, 87% of upper secondary schools but just 17% of households have internet connections
321 C H A P T E R 1 7 • EDuCATIon FACIl IT IES AnD lEARnInG EnvIRonmEnTS
17
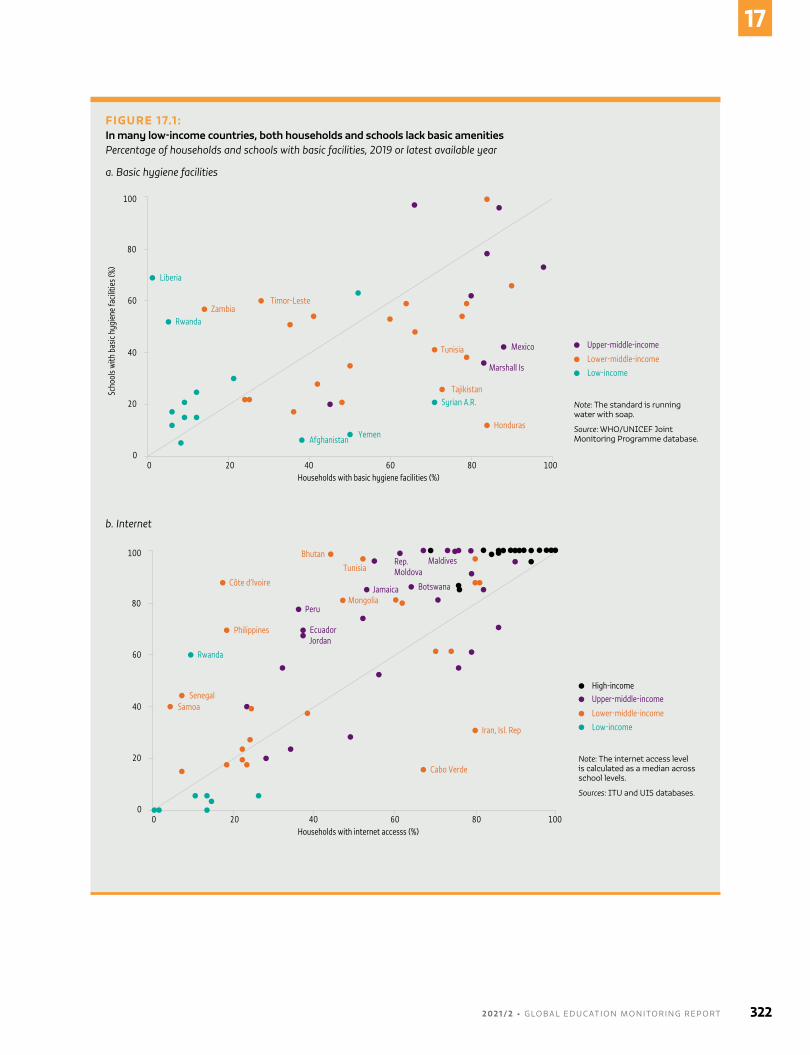
FIGURE 17.1 :In many low-income countries, both households and schools lack basic amenitiesPercentage of households and schools with basic facilities, 2019 or latest available year
a. Basic hygiene facilities
Guatemala, 2014
2018
Scho
ols w
ith b
asic
hygi
ene
facil
ities
(%)
Households with basic hygiene facilities (%)
Upper-middle-income
Lower-middle-income
Low-income
Liberia
RwandaZambia
Timor-Leste
Tunisia
Tajikistan
Honduras
AfghanistanYemen
Syrian A.R.
Marshall Is
Mexico
00
20
20 40 60 80 100
40
60
80
100
Note: The standard is running water with soap.
Source: WHO/UNICEF Joint Monitoring Programme database.
b. Internet
00
20
20 40 60 80 100
40
60
80
100
Guatemala, 2014
2018
Scho
ols w
ith in
tern
et a
cces
s (%
)
Households with internet accesss (%)
Upper-middle-income
Lower-middle-income
Low-income
High-income
Cabo Verde
Iran, Isl. Rep
SamoaSenegal
Philippines
Côte d’Ivoire
Bhutan
Tunisia
Mongolia
JordanEcuador
Peru
Jamaica
Rep. Moldova
Maldives
Botswana
Rwanda
Note: The internet access level is calculated as a median across school levels.
Sources: ITU and UIS databases.
2 0 2 1 / 2 • G LO BA L E D U C AT I O N M O N I TO R I N G R E P O RT 322
17
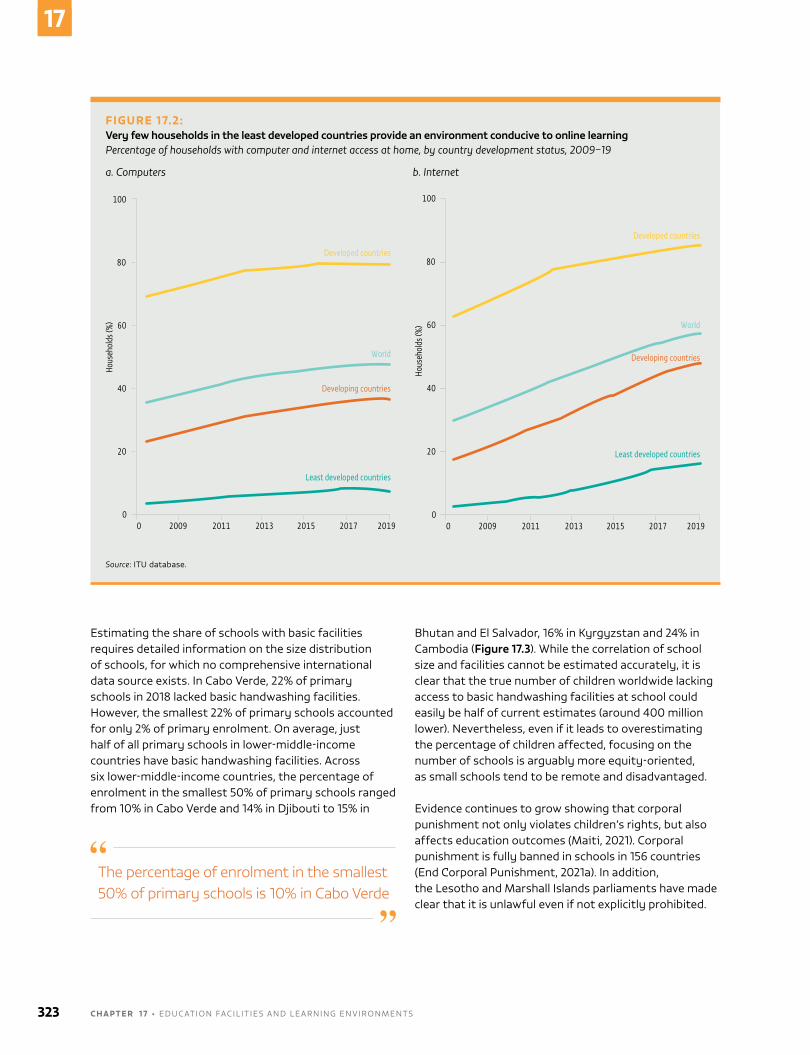
Estimating the share of schools with basic facilities requires detailed information on the size distribution of schools, for which no comprehensive international data source exists. In Cabo verde, 22% of primary schools in 2018 lacked basic handwashing facilities. however, the smallest 22% of primary schools accounted for only 2% of primary enrolment. on average, just half of all primary schools in lower-middle-income countries have basic handwashing facilities. Across six lower-middle-income countries, the percentage of enrolment in the smallest 50% of primary schools ranged from 10% in Cabo verde and 14% in Djibouti to 15% in
bhutan and El Salvador, 16% in Kyrgyzstan and 24% in Cambodia (Figure 17.3). While the correlation of school size and facilities cannot be estimated accurately, it is clear that the true number of children worldwide lacking access to basic handwashing facilities at school could easily be half of current estimates (around 400 million lower). nevertheless, even if it leads to overestimating the percentage of children affected, focusing on the number of schools is arguably more equity-oriented, as small schools tend to be remote and disadvantaged.
Evidence continues to grow showing that corporal punishment not only violates children’s rights, but also affects education outcomes (maiti, 2021). Corporal punishment is fully banned in schools in 156 countries (End Corporal Punishment, 2021a). In addition, the lesotho and marshall Islands parliaments have made clear that it is unlawful even if not explicitly prohibited.
The percentage of enrolment in the smallest 50% of primary schools is 10% in Cabo Verde
FIGURE 17.2:Very few households in the least developed countries provide an environment conducive to online learningPercentage of households with computer and internet access at home, by country development status, 2009–19
a. Computers
Guatemala, 2014
2018Ho
useh
olds
(%)
00
20
2009 2011 2013 2015 20192017
40
60
80
100
Developed countries
World
Developing countries
Least developed countries
b. Internet
Guatemala, 2014
2018
Hous
ehol
ds (%
)
00
20
2009 2011 2013 2015 20192017
40
60
80
100
Developed countries
World
Developing countries
Least developed countries
Source: ITu database.
323 C H A P T E R 1 7 • EDuCATIon FACIl IT IES AnD lEARnInG EnvIRonmEnTS
17
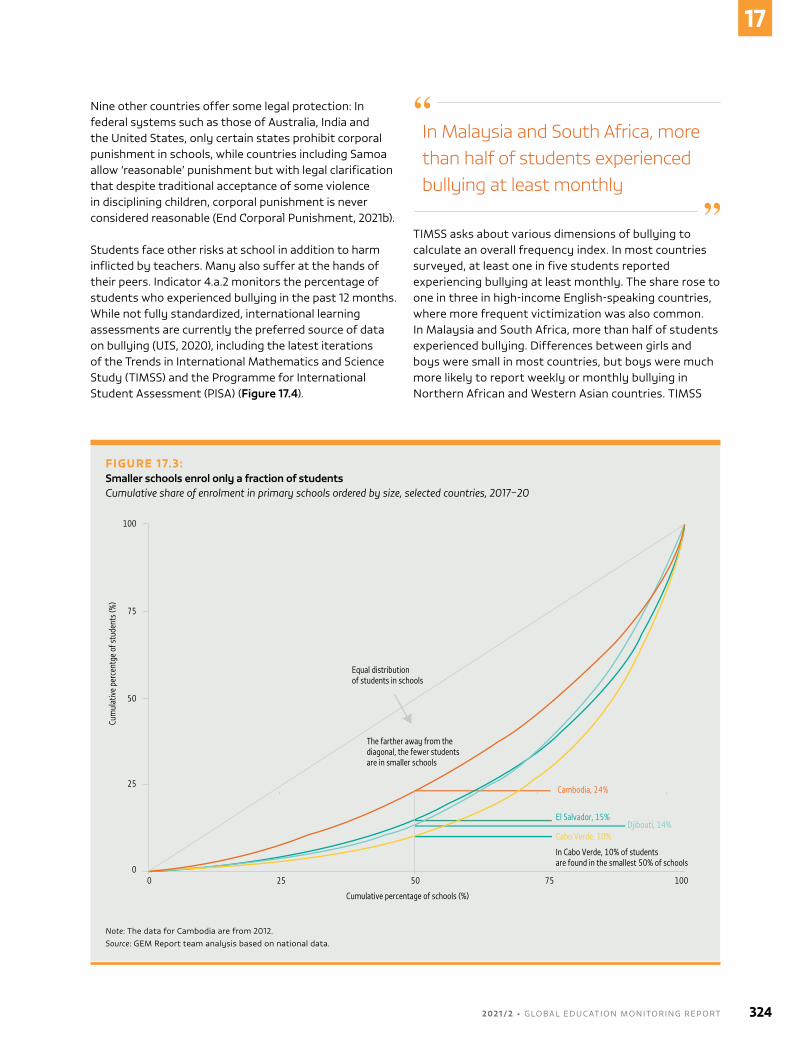
FIGURE 17.3:Smaller schools enrol only a fraction of studentsCumulative share of enrolment in primary schools ordered by size, selected countries, 2017–20
Guatemala, 2014
2018
100
75
50
25
00 25 50 75 100
Cumulative percentage of schools (%)
Cum
ulat
ive p
erce
ntge
of s
tude
nts (
%)
Equal distributionof students in schools
The farther away from the diagonal, the fewer students are in smaller schools
Cambodia, 24%
El Salvador, 15%Djibouti, 14%
Cabo Verde, 10%
In Cabo Verde, 10% of studentsare found in the smallest 50% of schools
Note: The data for Cambodia are from 2012.Source: GEm Report team analysis based on national data.
nine other countries offer some legal protection: In federal systems such as those of Australia, India and the united States, only certain states prohibit corporal punishment in schools, while countries including Samoa allow ‘reasonable’ punishment but with legal clarification that despite traditional acceptance of some violence in disciplining children, corporal punishment is never considered reasonable (End Corporal Punishment, 2021b).
Students face other risks at school in addition to harm inflicted by teachers. many also suffer at the hands of their peers. Indicator 4.a.2 monitors the percentage of students who experienced bullying in the past 12 months. While not fully standardized, international learning assessments are currently the preferred source of data on bullying (uIS, 2020), including the latest iterations of the Trends in International mathematics and Science Study (TImSS) and the Programme for International Student Assessment (PISA) (Figure 17.4).
TImSS asks about various dimensions of bullying to calculate an overall frequency index. In most countries surveyed, at least one in five students reported experiencing bullying at least monthly. The share rose to one in three in high-income English-speaking countries, where more frequent victimization was also common. In malaysia and South Africa, more than half of students experienced bullying. Differences between girls and boys were small in most countries, but boys were much more likely to report weekly or monthly bullying in northern African and Western Asian countries. TImSS
In Malaysia and South Africa, more than half of students experienced bullying at least monthly
2 0 2 1 / 2 • G LO BA L E D U C AT I O N M O N I TO R I N G R E P O RT 324
17
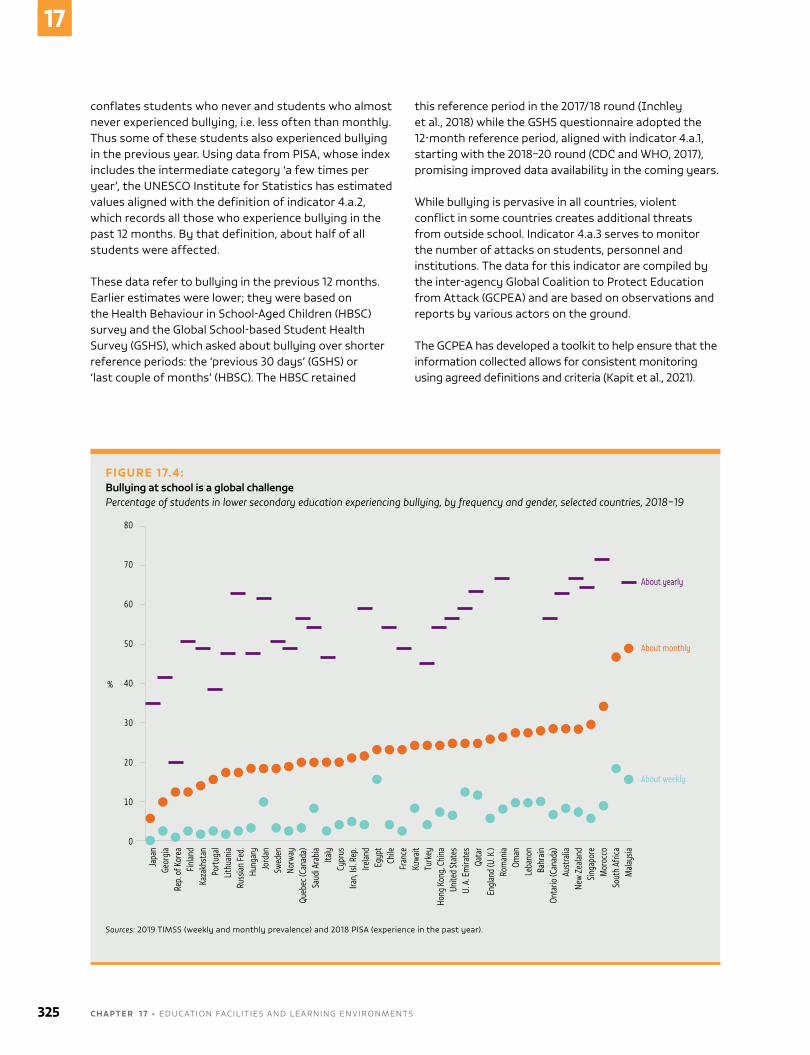
conflates students who never and students who almost never experienced bullying, i.e. less often than monthly. Thus some of these students also experienced bullying in the previous year. using data from PISA, whose index includes the intermediate category ‘a few times per year’, the unESCo Institute for Statistics has estimated values aligned with the definition of indicator 4.a.2, which records all those who experience bullying in the past 12 months. by that definition, about half of all students were affected.
These data refer to bullying in the previous 12 months. Earlier estimates were lower; they were based on the health behaviour in School-Aged Children (hbSC) survey and the Global School-based Student health Survey (GShS), which asked about bullying over shorter reference periods: the ‘previous 30 days’ (GShS) or ‘last couple of months’ (hbSC). The hbSC retained
this reference period in the 2017/18 round (Inchley et al., 2018) while the GShS questionnaire adopted the 12-month reference period, aligned with indicator 4.a.1, starting with the 2018–20 round (CDC and Who, 2017), promising improved data availability in the coming years.
While bullying is pervasive in all countries, violent conflict in some countries creates additional threats from outside school. Indicator 4.a.3 serves to monitor the number of attacks on students, personnel and institutions. The data for this indicator are compiled by the inter-agency Global Coalition to Protect Education from Attack (GCPEA) and are based on observations and reports by various actors on the ground.
The GCPEA has developed a toolkit to help ensure that the information collected allows for consistent monitoring using agreed definitions and criteria (Kapit et al., 2021).
FIGURE 17.4:Bullying at school is a global challengePercentage of students in lower secondary education experiencing bullying, by frequency and gender, selected countries, 2018–19
Guatemala, 2014
2018
Japa
nGe
orgi
aRe
p. o
f Kor
eaFi
nlan
dKa
zakh
stan
Portu
gal
Lithu
ania
Russ
ian Fe
d.Hu
ngar
yJo
rdan
Swed
enNo
rway
Queb
ec (C
anad
a)Sa
udi A
rabi
aIta
lyCy
prus
Iran,
Isl. R
ep.
Irelan
dEg
ypt
Chile
Fran
ceKu
wait
Turk
eyHo
ng K
ong,
Chi
naUn
ited
Stat
esU.
A. E
mira
tes
Qata
rEn
glan
d (U
. K.)
Rom
ania
Oman
Leba
non
Bahr
ainOn
tario
(Can
ada)
Aust
ralia
New
Zeala
ndSin
gapo
reM
oroc
coSo
uth
Afric
aM
alays
ia
80
70
60
50
40
30
20
10
0
%
About yearly
About monthly
About weekly
Sources: 2019 TImSS (weekly and monthly prevalence) and 2018 PISA (experience in the past year).
325 C H A P T E R 1 7 • EDuCATIon FACIl IT IES AnD lEARnInG EnvIRonmEnTS
17
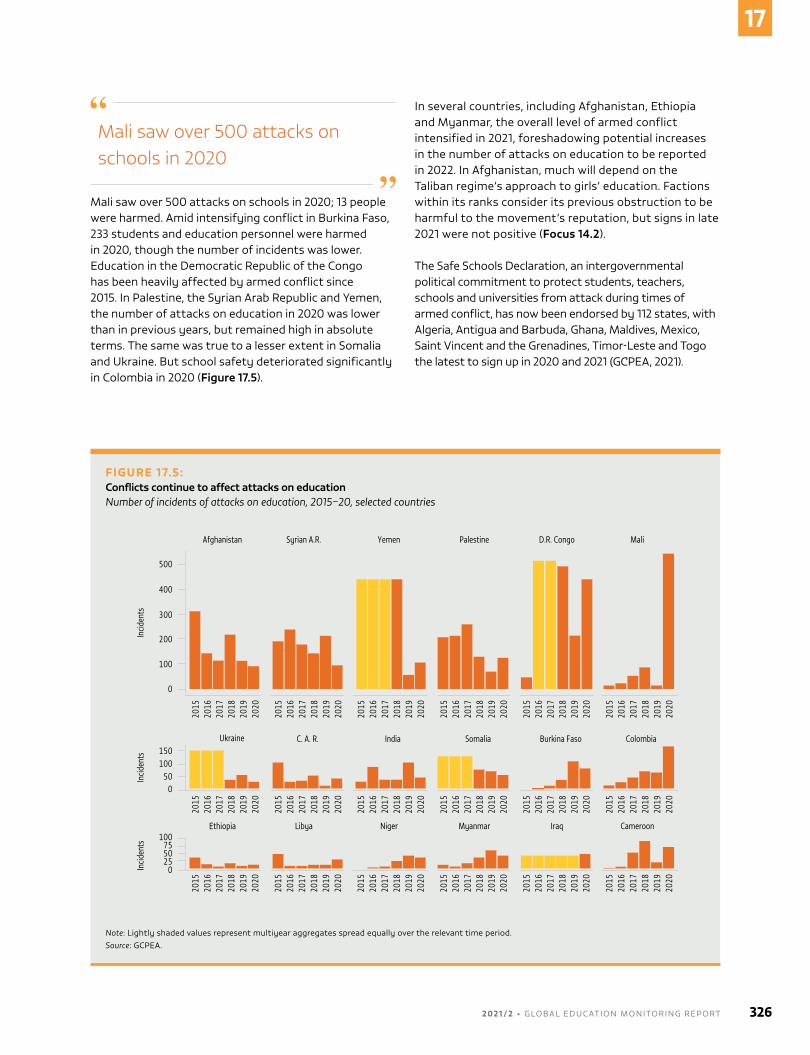
mali saw over 500 attacks on schools in 2020; 13 people were harmed. Amid intensifying conflict in burkina Faso, 233 students and education personnel were harmed in 2020, though the number of incidents was lower. Education in the Democratic Republic of the Congo has been heavily affected by armed conflict since 2015. In Palestine, the Syrian Arab Republic and Yemen, the number of attacks on education in 2020 was lower than in previous years, but remained high in absolute terms. The same was true to a lesser extent in Somalia and ukraine. but school safety deteriorated significantly in Colombia in 2020 (Figure 17.5).
In several countries, including Afghanistan, Ethiopia and myanmar, the overall level of armed conflict intensified in 2021, foreshadowing potential increases in the number of attacks on education to be reported in 2022. In Afghanistan, much will depend on the Taliban regime’s approach to girls’ education. Factions within its ranks consider its previous obstruction to be harmful to the movement’s reputation, but signs in late 2021 were not positive (Focus 14.2).
The Safe Schools Declaration, an intergovernmental political commitment to protect students, teachers, schools and universities from attack during times of armed conflict, has now been endorsed by 112 states, with Algeria, Antigua and barbuda, Ghana, maldives, mexico, Saint vincent and the Grenadines, Timor-leste and Togo the latest to sign up in 2020 and 2021 (GCPEA, 2021).
FIGURE 17.5: Conflicts continue to affect attacks on educationNumber of incidents of attacks on education, 2015–20, selected countries
Guatemala, 2014
2018
Afghanistan Syrian A.R. Yemen Palestine D.R. Congo Mali
Ukraine C. A. R. India Somalia Burkina Faso Colombia
Ethiopia Libya Niger Myanmar Iraq Cameroon
2015
2016
2017
2018
2019
2020
2015
2016
2017
2018
2019
2020
2015
2016
2017
2018
2019
2020
2015
2016
2017
2018
2019
2020
2015
2016
2017
2018
2019
2020
2015
2016
2017
2018
2019
2020
2015
2016
2017
2018
2019
2020
2015
2016
2017
2018
2019
2020
2015
2016
2017
2018
2019
2020
2015
2016
2017
2018
2019
2020
2015
2016
2017
2018
2019
2020
2015
2016
2017
2018
2019
2020
2015
2016
2017
2018
2019
2020
2015
2016
2017
2018
2019
2020
2015
2016
2017
2018
2019
2020
2015
2016
2017
2018
2019
2020
2015
2016
2017
2018
2019
2020
2015
2016
2017
2018
2019
2020
Incid
ents
Incid
ents
Incid
ents
500
400
300
200
100
0
100150
500
75100
5025
0
Note: lightly shaded values represent multiyear aggregates spread equally over the relevant time period.Source: GCPEA.
Mali saw over 500 attacks on schools in 2020
2 0 2 1 / 2 • G LO BA L E D U C AT I O N M O N I TO R I N G R E P O RT 326
17
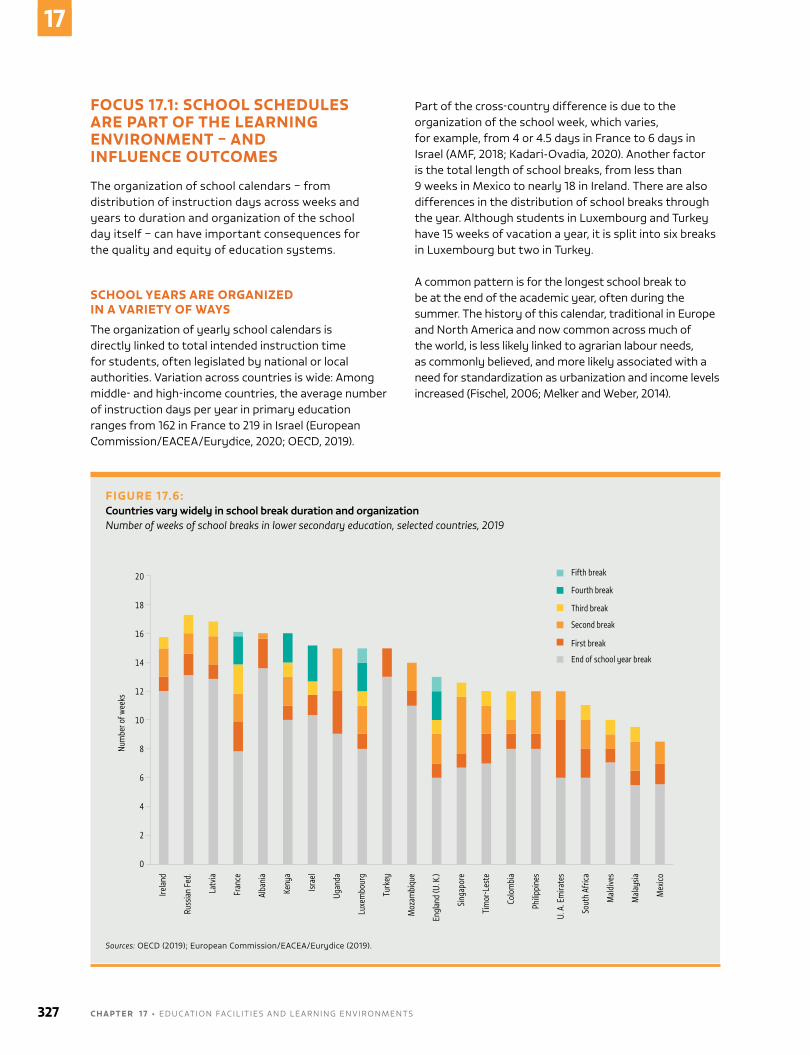
FOCUS 17.1: SCHOOL SCHEDULES ARE PART OF THE LEARNING ENVIRONMENT – AND INFLUENCE OUTCOMES
The organization of school calendars – from distribution of instruction days across weeks and years to duration and organization of the school day itself – can have important consequences for the quality and equity of education systems.
SCHOOL YEARS ARE ORGANIZED IN A VARIETY OF WAYS
The organization of yearly school calendars is directly linked to total intended instruction time for students, often legislated by national or local authorities. variation across countries is wide: Among middle- and high-income countries, the average number of instruction days per year in primary education ranges from 162 in France to 219 in Israel (European Commission/EACEA/Eurydice, 2020; oECD, 2019).
Part of the cross-country difference is due to the organization of the school week, which varies, for example, from 4 or 4.5 days in France to 6 days in Israel (AmF, 2018; Kadari-ovadia, 2020). Another factor is the total length of school breaks, from less than 9 weeks in mexico to nearly 18 in Ireland. There are also differences in the distribution of school breaks through the year. Although students in luxembourg and Turkey have 15 weeks of vacation a year, it is split into six breaks in luxembourg but two in Turkey.
A common pattern is for the longest school break to be at the end of the academic year, often during the summer. The history of this calendar, traditional in Europe and north America and now common across much of the world, is less likely linked to agrarian labour needs, as commonly believed, and more likely associated with a need for standardization as urbanization and income levels increased (Fischel, 2006; melker and Weber, 2014).
FIGURE 17.6: Countries vary widely in school break duration and organizationNumber of weeks of school breaks in lower secondary education, selected countries, 2019
Guatemala, 2014
2018
Irela
nd
Russ
ian
Fed.
Latv
ia
Fran
ce
Alba
nia
Keny
a
Israe
l
Ugan
da
Luxe
mbo
urg
Turk
ey
Moz
ambi
que
Engl
and
(U. K
.)
Sing
apor
e
Tim
or-L
este
Colo
mbi
a
Philip
pine
s
U. A
. Em
irate
s
Sout
h Af
rica
Mal
dive
s
Mal
aysia
Mex
ico
20
0
2
4
6
8
10
12
14
16
18
Num
ber o
f wee
ks
Fifth break
Fourth break
Third break
Second break
First break
End of school year break
Sources: oECD (2019); European Commission/EACEA/Eurydice (2019).
327 C H A P T E R 1 7 • EDuCATIon FACIl IT IES AnD lEARnInG EnvIRonmEnTS
17
many countries’ school calendar’s structure is due more to the influence of colonialism than seasons. The bangladesh school calendar dates to the british colonial period and is not aligned with local agricultural cycles, requiring students to take exams during the peak wet-season harvest period (Ito and Shonchoy, 2020). Schools in Somalia run from September to June, likely an influence of british and Italian rule, unaligned with the country’s warmer months and the school year in neighbouring countries, such as Kenya and uganda (Kenya ministry of Education, 2018; uganda ministry of Education and Sports, 2018; Wickman, 2011). Schools in southern hemisphere territories, such as American Samoa and French Polynesia, follow the northern hemisphere calendar, unlike most of their neighbours (Fischel, 2006).
School calendars are also influenced by cultural and religious practices. It is common for countries with a Christian background to have institutionalized breaks around Christmas and Easter, even if they are increasingly referred to as winter and spring breaks (burke and Segall, 2011). In muslim countries, school calendars may change every year to adapt to the moving Ramadan dates (Ito and Shonchoy, 2020). Indigenous schools in Canada, Peru and the united States use ancestral calendars that may take into account moon and seasonal cycles or cultural practices (Sumida huaman, 2020).
School calendars may even differ within a given country. breaks may vary among subnational units, due either to autonomous decisions or to purposeful staggering by the central authority (European Commission/EACEA/Eurydice, 2020). Staggered calendars within a single school can allow groups of students go on vacation at different times.
Adaptation of school calendars to local contexts can have important equity implications. using a natural experiment in calendar shifts, a study showed that the overlap between seasonal labour demand and annual school examinations in bangladesh led to a dropout rate seven percentage points higher for students from agricultural households. In India, the difference was estimated to be from five to seven percentage points. During peak harvest seasons, not only were students from agricultural households more likely to miss class, but also fatigue and injuries from field work hindered exam preparation (Ito and Shonchoy, 2020). School calendars’ lack of resonance with local cultures has contributed to higher teacher absenteeism and lower attendance rates among children from Scheduled Tribes in India (brahmanandam and bosu babu, 2016; Sujatha, 2002).
Some argue school calendars may also influence learning outcomes, especially for poorer students. The idea of the ‘summer slide’, a drop in achievement due to the long period away from classes, has led several schools to adopt year-round education that distributes school days more evenly throughout the year. Insufficient evidence makes it difficult to assess the impact of this change on overall performance, and some have questioned the magnitude of summer learning loss compared with loss distributed across the shorter breaks (Finnie et al., 2019; von hippel and hamrock, 2019).
The organization of the school day also mattersAlong with the number of school days, their length determines learners’ total instruction time. Again, wide variation exists within and between countries – from an average of fewer than 600 hours of compulsory instruction per year in primary education in latvia and the Russian Federation to over 1,000 hours in Chile, Costa Rica and Denmark (oECD, 2019). Differences across countries have likely been exacerbated by the CovID-19 pandemic. Students in many countries have received fewer instruction hours due to staggering of classes to reduce class size. In England (united Kingdom), by contrast, the government will extend the secondary-level school day to help make up for lost time (hazell, 2021).
more instruction time is broadly associated with better student performance, but the effect tends to be mediated by factors such as instruction quality, classroom environment, school autonomy and accountability (lavy, 2015; Woessmann, 2016; Yeşil Dağlı, 2019). It also depends on what ‘more’ means. Adding a few extra minutes may not make a difference; adding an hour may help; adding three may be counterproductive (barshay, 2021). If well-used, more instruction time can help foster equity. Across a subset of PISA countries, more instruction time was associated with a greater likelihood of disadvantaged students succeeding academically (Agasisti et al., 2021). more and longer school days are also associated with increased participation of mothers in the labour market (Duchini and Effenterre, 2017; Shure, 2019).
over time, there has been a global shift towards providing full-day education. Although double-shifting, where schools take in different groups of students for morning and afternoon sessions, remains common in latin America and Africa, many countries, including Chile and Ghana, have moved to phase it out or abolish it (Ashong-Katai, 2013; Parente, 2020). In namibia,
2 0 2 1 / 2 • G LO BA L E D U C AT I O N M O N I TO R I N G R E P O RT 328
17
the government’s plans to phase out double shifting were hampered by CovID-19, which pushed many reopening schools back to it (nakale, 2020; Rasmeni, 2017).
Increasing the length of the school day increases costs. In addition to requiring more school buildings, more teachers and longer work contracts, there may be significant infrastructure implications for existing schools. In Germany, primary schools traditionally offered classes only in the morning and so did not need to provide meals. As the country undertook nationwide reform to increase school days’ duration over the past 15 years, many schools had to build cafeterias. Those that could not do so were often unable to change their schedules (Shure, 2019).
beyond duration, school starting times also matter. A growing body of literature points to benefits from delaying starting times, particularly at the secondary level. In addition to allowing more sleep time, later starts appear to align better with adolescents’ circadian rhythm, with peak alertness in the late morning and evening (Kelley et al., 2015; Kirby et al., 2011). A study using students’ random assignments to earlier or later classes in the united States found that delaying the starting time by 50 minutes led to a significant improvement in student performance for all courses, not just the first period (Carrell et al., 2011). Some studies found even short delays helpful. In hong Kong, China, a 15-minute delay from 7:45am to 8am was associated with greater attentiveness, fewer behavioural difficulties and better peer relationships between secondary school students (Chan et al., 2017). others support pushing starting time much later. In the united Kingdom, a change from 8:50am to 10am was associated with fewer absences due to illness and improved academic performance (Kelley et al., 2017).
Finally, the organization of the school day is not only about instruction time. Recess has been shown to improve students’ level of physical activity, memory and concentration, as well as their socioemotional development and academic performance (haapala et al., 2017; zavacky and michael, 2017). Some countries consider breaks to be part of compulsory instruction time. Denmark and some Spanish regions and autonomous communities regulate recess time by law (oECD, 2019). Still, as daily recess is often seen as a waste of time, many schools do not offer it. In the
united States, in the first five years after the 2001 no Child left behind Act, which focused on standardized testing, most districts increased time for tested subjects and 20% of districts decreased recess time by an average of 50 minutes per week (mcmurrer, 2007). more recently, recess suffered another blow with CovID-19 as reopening schools tried to make up for lost time and found it hard to maintain physical distancing during free time. In Angola, the modified scheduled for the return of primary classes during the pandemic excluded recess (AnGoP, 2021).
FOCUS 17.2: SCHOOL INFRASTRUCTURE MAY BE ABOVE THE MINIMUM STANDARD YET UNACCEPTABLE AND DETERIORATING
Policymakers should not consider investment in school infrastructure and the physical conditions for learning as secondary. This is recognized through SDG target 4.a and its global indicator that monitors school facilities, such as electricity, internet, drinking water and sanitation. however, given the variety of facilities and equipment that can affect learning, indicator 4.a.1 cannot offer a comprehensive basis for monitoring the adequacy of physical conditions within schools. Thus other indicators and potential information sources are needed.
Surveys that sample schools are one potential source of relevant data. TImSS surveys head teachers on the extent to which inadequate physical conditions harm instruction quality. In nine countries that participated in the 2019 round, over a third of primary school head teachers reported that inadequate buildings or instruction space strongly affected instruction. In the latter case, the share exceeded 50% in Kuwait, Saudi Arabia and Turkey (Figure 17.7).
Even among organisation for Economic Co-operation and Development (oECD) countries, head teachers reported that inadequate buildings or instruction space significantly hindered learning. over 20% did so in Chile and Slovakia, and over 10% in Finland, France, hungary, new zealand and Sweden. Generally, head teachers in high-income countries are more likely to report a negative impact on learning from inadequate buildings and instruction space than from inadequate instructional
Delaying the starting time by 50 minutes led to a significant improvement in student performance
329 C H A P T E R 1 7 • EDuCATIon FACIl IT IES AnD lEARnInG EnvIRonmEnTS
17
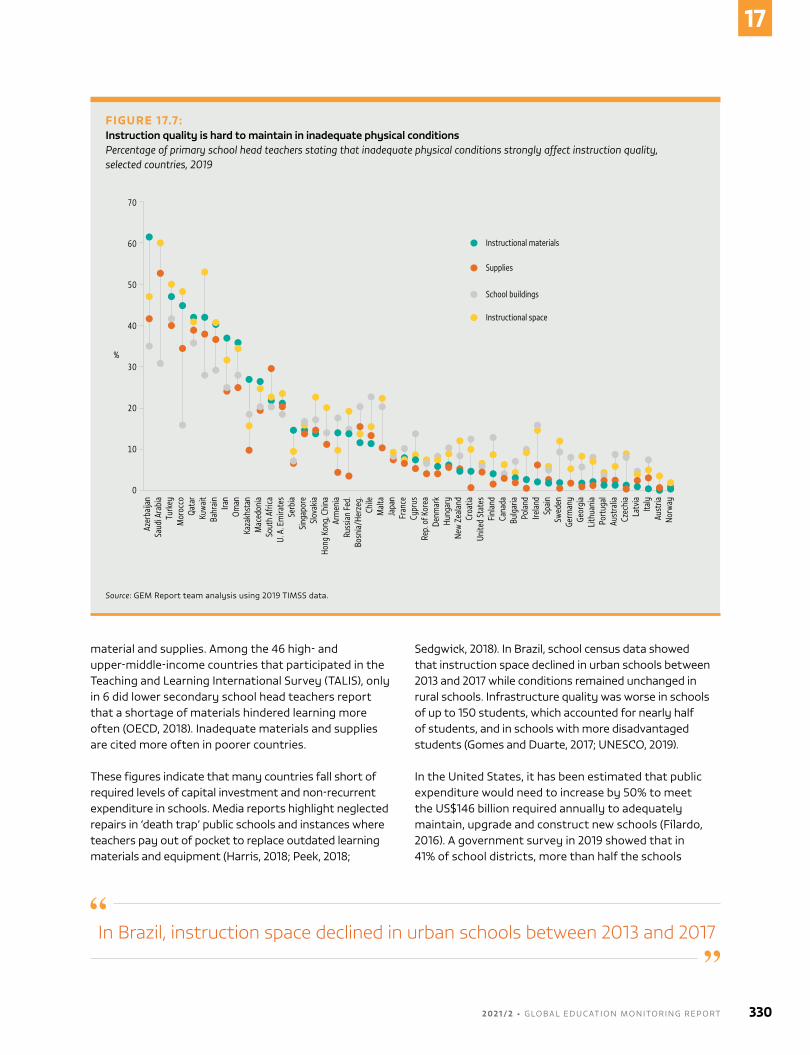
material and supplies. Among the 46 high- and upper-middle-income countries that participated in the Teaching and learning International Survey (TAlIS), only in 6 did lower secondary school head teachers report that a shortage of materials hindered learning more often (oECD, 2018). Inadequate materials and supplies are cited more often in poorer countries.
These figures indicate that many countries fall short of required levels of capital investment and non-recurrent expenditure in schools. media reports highlight neglected repairs in ‘death trap’ public schools and instances where teachers pay out of pocket to replace outdated learning materials and equipment (harris, 2018; Peek, 2018;
Sedgwick, 2018). In brazil, school census data showed that instruction space declined in urban schools between 2013 and 2017 while conditions remained unchanged in rural schools. Infrastructure quality was worse in schools of up to 150 students, which accounted for nearly half of students, and in schools with more disadvantaged students (Gomes and Duarte, 2017; unESCo, 2019).
In the united States, it has been estimated that public expenditure would need to increase by 50% to meet the uS$146 billion required annually to adequately maintain, upgrade and construct new schools (Filardo, 2016). A government survey in 2019 showed that in 41% of school districts, more than half the schools
FIGURE 17.7: Instruction quality is hard to maintain in inadequate physical conditionsPercentage of primary school head teachers stating that inadequate physical conditions strongly affect instruction quality, selected countries, 2019
Guatemala, 2014
2018
Azer
baija
nSa
udi A
rabi
aTu
rkey
Mor
occo
Qata
rKu
wai
tBa
hrai
nIra
nOm
anKa
zakh
stan
Mac
edon
iaSo
uth
Afric
aU.
A. E
mira
tes
Serb
iaSi
ngap
ore
Slov
akia
Hong
Kon
g, C
hina
Arm
enia
Russ
ian
Fed.
Bosn
ia/H
erze
g.Ch
ileM
alta
Japa
nFr
ance
Cypr
usRe
p. o
f Kor
eaDe
nmar
kHu
ngar
yNe
w Z
eala
ndCr
oatia
Unite
d St
ates
Finl
and
Cana
daBu
lgar
iaPo
land
Irela
ndSp
ain
Swed
enGe
rman
yGe
orgi
aLi
thua
nia
Port
ugal
Aust
ralia
Czec
hia
Latv
iaIta
lyAu
stria
Norw
ay
70
0
10
20
30
40
50
60
%
Fifth Break
Fourth Break
Third Break
Second Break
First Break
School buildings
Instructional space
Supplies
Instructional materials
Source: GEm Report team analysis using 2019 TImSS data.
In Brazil, instruction space declined in urban schools between 2013 and 2017
2 0 2 1 / 2 • G LO BA L E D U C AT I O N M O N I TO R I N G R E P O RT 330
17
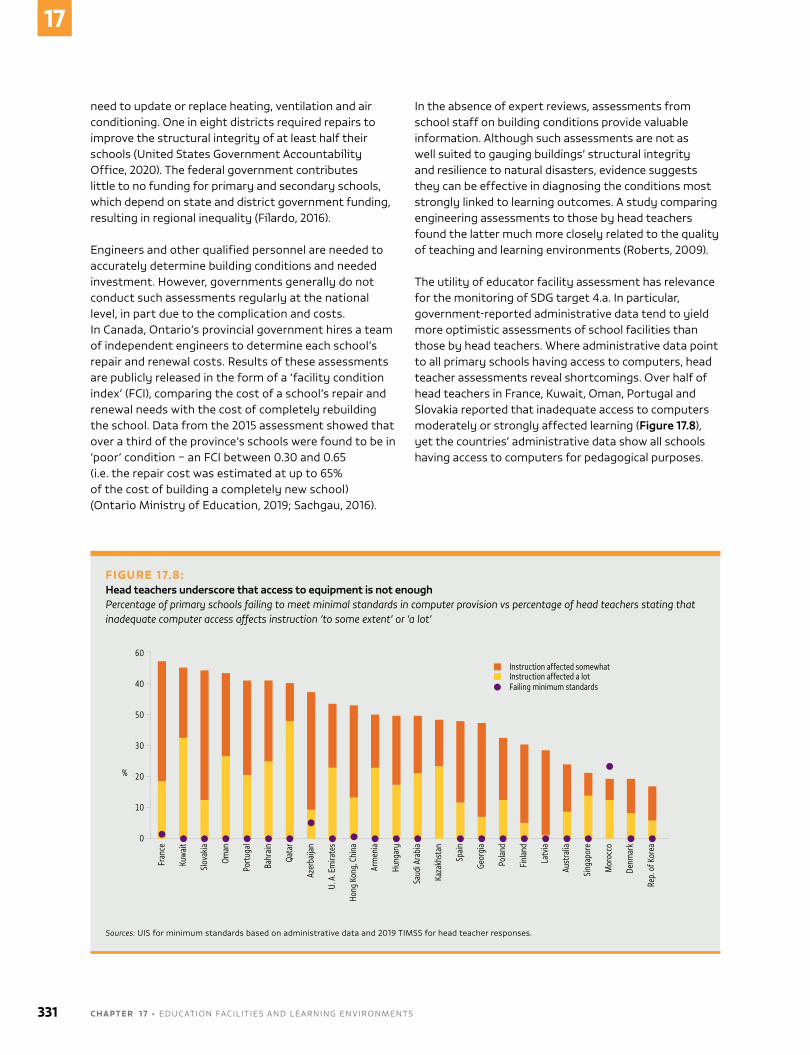
need to update or replace heating, ventilation and air conditioning. one in eight districts required repairs to improve the structural integrity of at least half their schools (united States Government Accountability office, 2020). The federal government contributes little to no funding for primary and secondary schools, which depend on state and district government funding, resulting in regional inequality (Filardo, 2016).
Engineers and other qualified personnel are needed to accurately determine building conditions and needed investment. however, governments generally do not conduct such assessments regularly at the national level, in part due to the complication and costs. In Canada, ontario’s provincial government hires a team of independent engineers to determine each school’s repair and renewal costs. Results of these assessments are publicly released in the form of a ‘facility condition index’ (FCI), comparing the cost of a school’s repair and renewal needs with the cost of completely rebuilding the school. Data from the 2015 assessment showed that over a third of the province’s schools were found to be in ‘poor’ condition – an FCI between 0.30 and 0.65 (i.e. the repair cost was estimated at up to 65% of the cost of building a completely new school) (ontario ministry of Education, 2019; Sachgau, 2016).
In the absence of expert reviews, assessments from school staff on building conditions provide valuable information. Although such assessments are not as well suited to gauging buildings’ structural integrity and resilience to natural disasters, evidence suggests they can be effective in diagnosing the conditions most strongly linked to learning outcomes. A study comparing engineering assessments to those by head teachers found the latter much more closely related to the quality of teaching and learning environments (Roberts, 2009).
The utility of educator facility assessment has relevance for the monitoring of SDG target 4.a. In particular, government-reported administrative data tend to yield more optimistic assessments of school facilities than those by head teachers. Where administrative data point to all primary schools having access to computers, head teacher assessments reveal shortcomings. over half of head teachers in France, Kuwait, oman, Portugal and Slovakia reported that inadequate access to computers moderately or strongly affected learning (Figure 17.8), yet the countries’ administrative data show all schools having access to computers for pedagogical purposes.
FIGURE 17.8: Head teachers underscore that access to equipment is not enoughPercentage of primary schools failing to meet minimal standards in computer provision vs percentage of head teachers stating that inadequate computer access affects instruction ‘to some extent’ or ‘a lot’
Guatemala, 2014
2018
Fran
ce
Kuw
ait
Slov
akia
Oman
Port
ugal
Bahr
ain
Qata
r
Azer
baija
n
U. A
. Em
irate
s
Hong
Kon
g, C
hina
Arm
enia
Hung
ary
Saud
i Ara
bia
Kaza
khst
an
Spai
n
Geor
gia
Pola
nd
Finl
and
Latv
ia
Aust
ralia
Sing
apor
e
Mor
occo
Denm
ark
Rep.
of K
orea
60
0
10
20
30
40
50
Instruction affected somewhatInstruction affected a lotFailing minimum standards
%
Sources: uIS for minimum standards based on administrative data and 2019 TImSS for head teacher responses.
331 C H A P T E R 1 7 • EDuCATIon FACIl IT IES AnD lEARnInG EnvIRonmEnTS
17
COVID-19
A central dilemma of the pandemic, as yet unresolved, has been whether it is safe for children to go to school. Without preventive measures, schools are likely to be environments promoting infection, where large proportions of the population spend long hours together in relatively crowded indoor spaces, at an age where those infected are least likely to display recognizable symptoms. Still, almost two years into the pandemic, the net effect of school closures and reopenings on infection dynamics at the societal level remains inconclusive. In oECD countries, infection rates in the population appeared unrelated to the numbers of days schools were closed (oECD, 2021).
What has become clear is that minimizing infection risk in schools is possible. A study closely tracking infections in a large school in Chicago, united States, revealed a lower infection rate for students and staff participating in in-person learning than in the community overall (Fricchione et al., 2021). Adapting the school environment is crucial to providing a safe space for students. The cumulative global experience has resulted in guidance on processes that countries may go through when they reopen schools (unESCo, 2021). These measures go well beyond the now everyday protective measures of masking, distancing and handwashing. logical extensions of this hygiene regime include discouraging the sharing of objects and cleaning and disinfecting touched surfaces frequently. Applied conscientiously, these basic measures can significantly reduce infections (Asanati et al., 2021; Park et al., 2021).
other school measures concern infrastructure use or additions. Even in normal times, lighting, temperature and air quality are sufficiently important to account in some contexts for half of learning outcome improvement (barrett et al., 2019). With respect to CovID-19, temperature and air quality are even more crucial, as they affect the virus’s survival rate and subsequent transmission rates (huang et al., 2020). low-tech solutions for improved ventilation include using outdoor spaces and opening windows, where seasonally appropriate, preferably with cross-ventilation. Even natural ventilation can significantly lower the infection risk, especially in combination with masks (Park et al., 2021).
In colder environments, high-efficiency particulate air (hEPA) filters can lower concentrations of viral aerosols. Retrofitting air filters is lengthy and cumbersome and few attempts have been made to deploy hEPA systems in schools at scale, even in high-income countries.
however, they could be an important tool where ventilation is impossible or in classrooms with high-risk individuals. If retrofitting hEPA filters is not possible, portable filters can be used while developing guidelines for effective school ventilation and air filtration based on room volume, number and age of occupants and type of activity (Asanati et al., 2021).
Testing regimes vary. vienna, Austria, took a test-intensive approach in 2021/22, with all students and teachers submitting saliva samples for lab-based polymerase chain reaction (PCR) testing several times a week (Stadt Wien, 2021). Just as important as testing capacity is what happens when infections are detected. To encourage compliance and buy-in from families, rules on quarantine triggered by CovID-19 cases in schools must strike a careful balance between complete closure and full opening, between accurate epidemiological evidence and messaging that is straightforward and simple to understand, and between school autonomy fitting the local context and consistent policy among schools.
Costly measures are difficult to implement in developing countries. In the early phase of the pandemic in 2020, a quarter of all countries – but half of all low-income countries – reported not having enough resources to ensure the safety of all learners and school staff (unESCo et al., 2020). In early 2021, less than 10% of low-income countries reported having basic measures such as sufficient soap, clean water, masks, and sanitation and hygiene facilities to assure the safety of all learners and staff; the share in high-income countries was 96% (unESCo et al., 2021). About 80% of low-income countries said external donors provided the funds to implement such measures.
In addition to measures to prevent transmission, extra support is needed to create safe environments, particularly for disadvantaged students, to address their mental health and gender-based violence and other issues that may have arisen or escalated during school closures or face students returning to school (unESCo et al., 2021). Although systematic data are lacking, qualitative research shows instances of children reporting that school closures removed them from harm, such as bullying by peers (Klein, 2021), while other children faced increased harm being away from school and under restrictions. School reopening must not only minimize the infection risk, but also ensure that students return to a learning environment that is safe for all.
2 0 2 1 / 2 • G LO BA L E D U C AT I O N M O N I TO R I N G R E P O RT 332
17
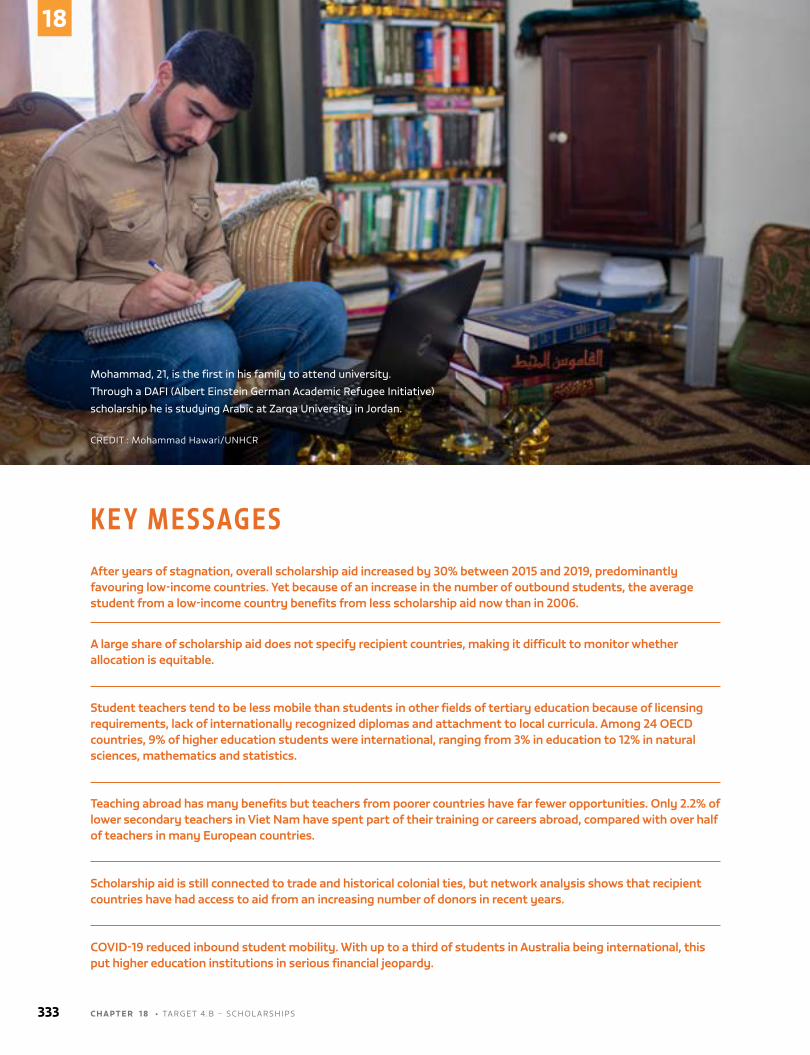
K E Y M E S S AG E SAfter years of stagnation, overall scholarship aid increased by 30% between 2015 and 2019, predominantly favouring low-income countries. Yet because of an increase in the number of outbound students, the average student from a low-income country benefits from less scholarship aid now than in 2006.
A large share of scholarship aid does not specify recipient countries, making it difficult to monitor whether allocation is equitable.
Student teachers tend to be less mobile than students in other fields of tertiary education because of licensing requirements, lack of internationally recognized diplomas and attachment to local curricula. Among 24 OECD countries, 9% of higher education students were international, ranging from 3% in education to 12% in natural sciences, mathematics and statistics.
Teaching abroad has many benefits but teachers from poorer countries have far fewer opportunities. Only 2.2% of lower secondary teachers in Viet Nam have spent part of their training or careers abroad, compared with over half of teachers in many European countries.
Scholarship aid is still connected to trade and historical colonial ties, but network analysis shows that recipient countries have had access to aid from an increasing number of donors in recent years.
COVID-19 reduced inbound student mobility. With up to a third of students in Australia being international, this put higher education institutions in serious financial jeopardy.
Mohammad, 21, is the first in his family to attend university.
Through a DAFI (Albert Einstein German Academic Refugee Initiative)
scholarship he is studying Arabic at Zarqa University in Jordan.
CREDIT : mohammad hawari/unhCR
333 C H A P T E R 1 8 • TARGET 4.b – SCholARShIPS
18
CHAPTER 18
TARGET 4.b
Scholarships
4.b
By 2020, substantially expand globally the number of scholarships available to developing countries, in particular least developed countries, small island developing States and African countries, for enrolment in higher education, including vocational training and information and communications technology, technical, engineering and scientific programmes, in developed countries and other developing countries
GLOBAL INDICATOR
4.b.1 - Volume of official development assistance flows for scholarships,
by sector and type of study
2 0 2 1 / 2 • G LO BA L E D U C AT I O N M O N I TO R I N G R E P O RT 334
18
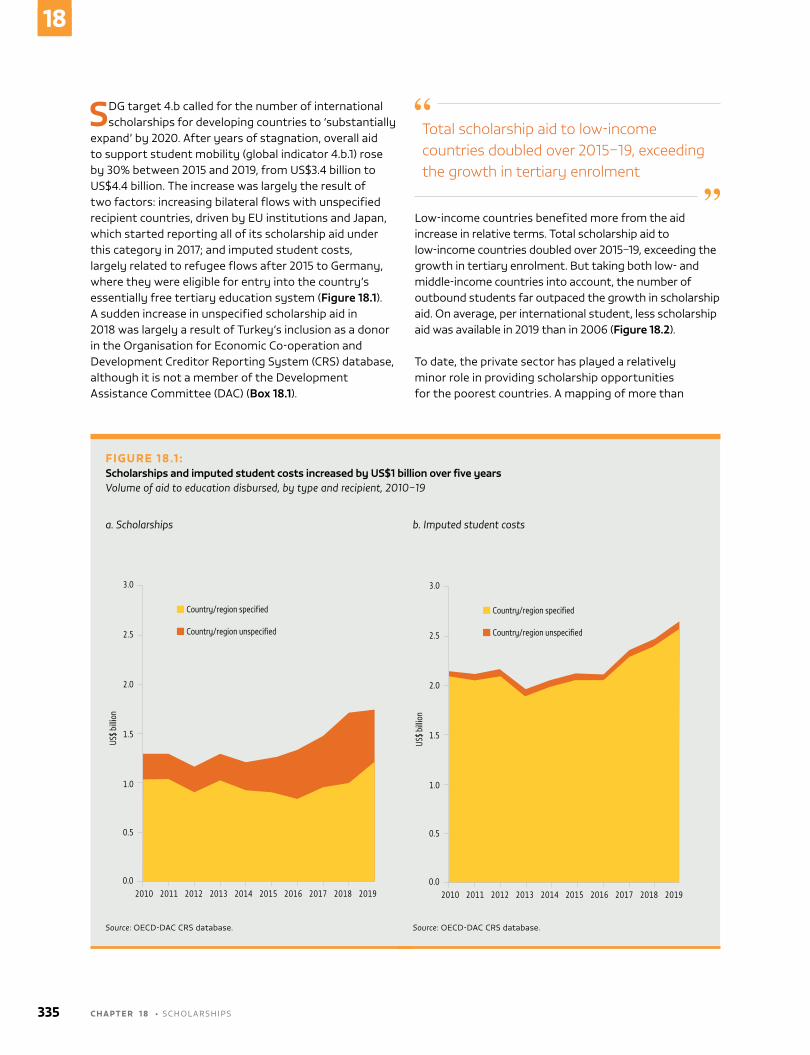
SDG target 4.b called for the number of international scholarships for developing countries to ‘substantially
expand’ by 2020. After years of stagnation, overall aid to support student mobility (global indicator 4.b.1) rose by 30% between 2015 and 2019, from uS$3.4 billion to uS$4.4 billion. The increase was largely the result of two factors: increasing bilateral flows with unspecified recipient countries, driven by Eu institutions and Japan, which started reporting all of its scholarship aid under this category in 2017; and imputed student costs, largely related to refugee flows after 2015 to Germany, where they were eligible for entry into the country’s essentially free tertiary education system (Figure 18.1). A sudden increase in unspecified scholarship aid in 2018 was largely a result of Turkey’s inclusion as a donor in the organisation for Economic Co-operation and Development Creditor Reporting System (CRS) database, although it is not a member of the Development Assistance Committee (DAC) (Box 18.1).
Total scholarship aid to low-income countries doubled over 2015–19, exceeding the growth in tertiary enrolment
low-income countries benefited more from the aid increase in relative terms. Total scholarship aid to low-income countries doubled over 2015–19, exceeding the growth in tertiary enrolment. but taking both low- and middle-income countries into account, the number of outbound students far outpaced the growth in scholarship aid. on average, per international student, less scholarship aid was available in 2019 than in 2006 (Figure 18.2).
To date, the private sector has played a relatively minor role in providing scholarship opportunities for the poorest countries. A mapping of more than
FIGURE 18.1 :Scholarships and imputed student costs increased by US$1 billion over five yearsVolume of aid to education disbursed, by type and recipient, 2010–19
a. Scholarships
Guatemala, 2014
2018
Instruction affected somewhat
2010 2011 2012 2013 2014 2015 2016 2017 2018 2019
3.0
2.5
2.0
1.5
1.0
0.5
0.0
Country/region specified
Country/region unspecified
US$
billio
n
Source: oECD-DAC CRS database.
b. Imputed student costs
Guatemala, 2014
2018
Instruction affected somewhat
2010 2011 2012 2013 2014 2015 2016 2017 2018 2019
3.0
2.5
2.0
1.5
1.0
0.5
0.0
Country/region specified
Country/region unspecified
US$
billio
n
Source: oECD-DAC CRS database.
335 C H A P T E R 1 8 • SCholARShIPS
18
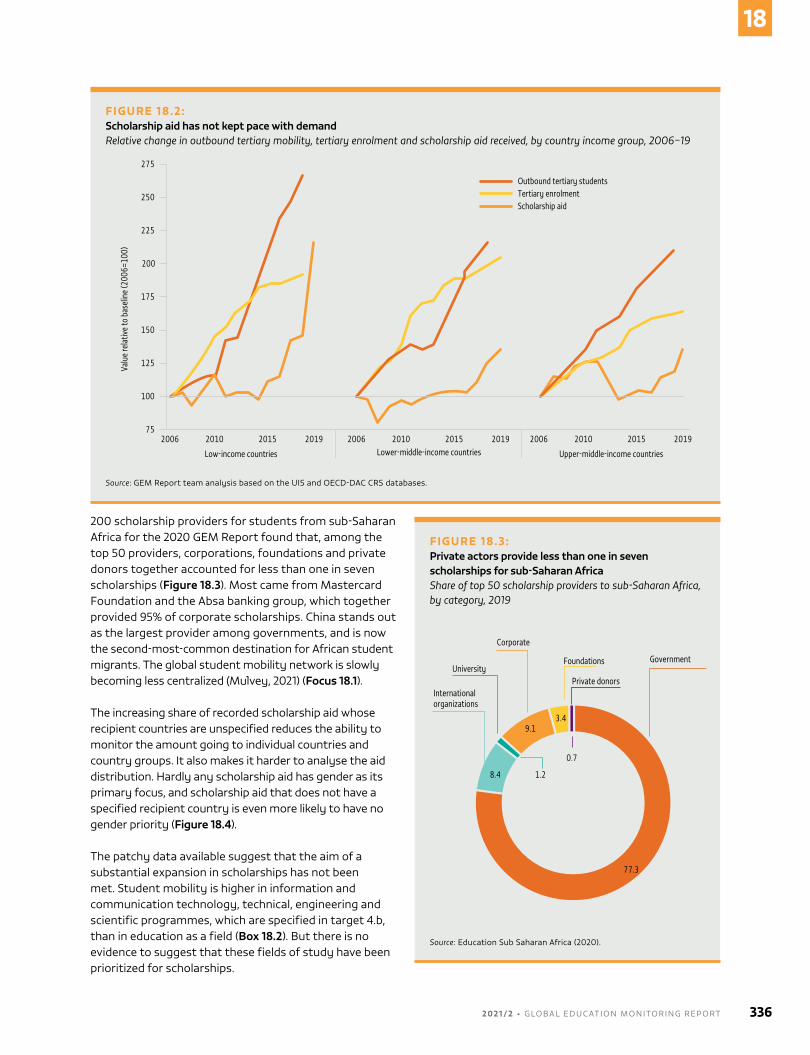
200 scholarship providers for students from sub-Saharan Africa for the 2020 GEm Report found that, among the top 50 providers, corporations, foundations and private donors together accounted for less than one in seven scholarships (Figure 18.3). most came from mastercard Foundation and the Absa banking group, which together provided 95% of corporate scholarships. China stands out as the largest provider among governments, and is now the second-most-common destination for African student migrants. The global student mobility network is slowly becoming less centralized (mulvey, 2021) (Focus 18.1).
The increasing share of recorded scholarship aid whose recipient countries are unspecified reduces the ability to monitor the amount going to individual countries and country groups. It also makes it harder to analyse the aid distribution. hardly any scholarship aid has gender as its primary focus, and scholarship aid that does not have a specified recipient country is even more likely to have no gender priority (Figure 18.4).
The patchy data available suggest that the aim of a substantial expansion in scholarships has not been met. Student mobility is higher in information and communication technology, technical, engineering and scientific programmes, which are specified in target 4.b, than in education as a field (Box 18.2). but there is no evidence to suggest that these fields of study have been prioritized for scholarships.
FIGURE 18.2:Scholarship aid has not kept pace with demandRelative change in outbound tertiary mobility, tertiary enrolment and scholarship aid received, by country income group, 2006–19
Guatemala, 2014
2018
Low-income countries Lower-middle-income countries Upper-middle-income countries
275
250
225
200
175
150
125
100
75
Valu
e re
lativ
e to
bas
elin
e (2
006=
100)
Outbound tertiary studentsTertiary enrolmentScholarship aid
2006 2010 2015 2019 2006 2010 2015 2019 2006 2010 2015 2019
Source: GEm Report team analysis based on the uIS and oECD-DAC CRS databases.
FIGURE 18.3:Private actors provide less than one in seven scholarships for sub-Saharan AfricaShare of top 50 scholarship providers to sub-Saharan Africa, by category, 2019
Guatemala, 2014
2018
Private donors
Foundations
Corporate
University
Internationalorganizations
Government
0.7
1.28.4
9.13.4
77.3
Source: Education Sub Saharan Africa (2020).
2 0 2 1 / 2 • G LO BA L E D U C AT I O N M O N I TO R I N G R E P O RT 336
18
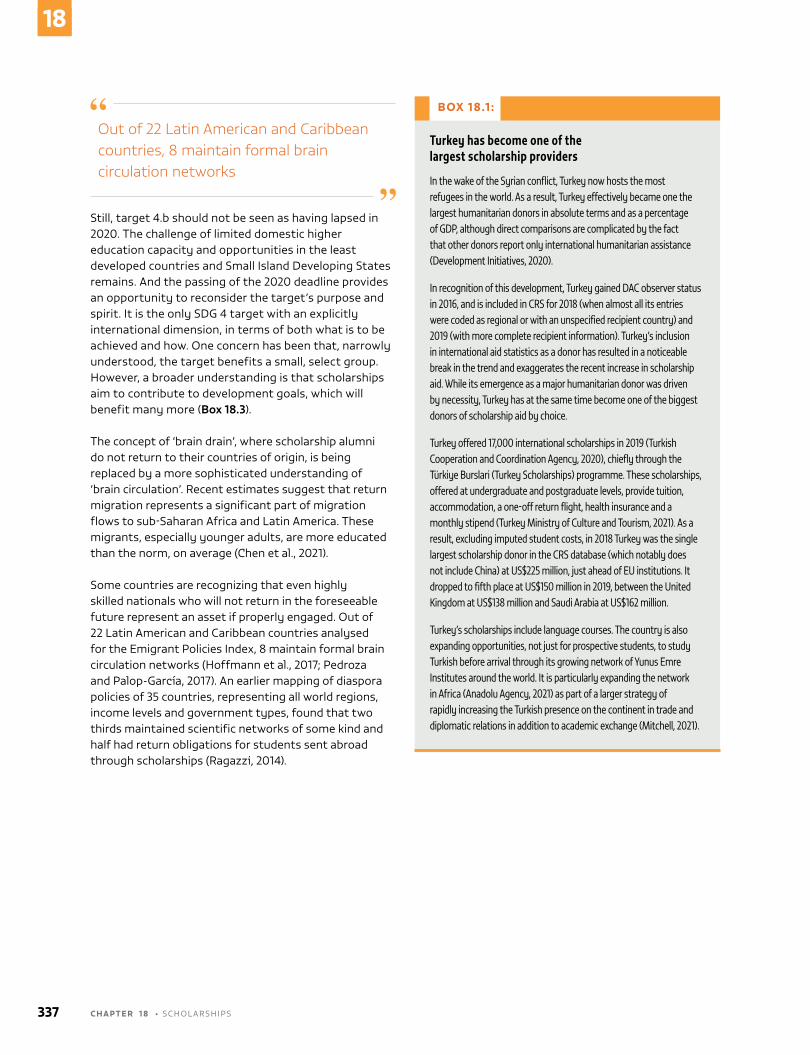
Out of 22 Latin American and Caribbean countries, 8 maintain formal brain circulation networks
Still, target 4.b should not be seen as having lapsed in 2020. The challenge of limited domestic higher education capacity and opportunities in the least developed countries and Small Island Developing States remains. And the passing of the 2020 deadline provides an opportunity to reconsider the target’s purpose and spirit. It is the only SDG 4 target with an explicitly international dimension, in terms of both what is to be achieved and how. one concern has been that, narrowly understood, the target benefits a small, select group. however, a broader understanding is that scholarships aim to contribute to development goals, which will benefit many more (Box 18.3).
The concept of ‘brain drain’, where scholarship alumni do not return to their countries of origin, is being replaced by a more sophisticated understanding of ‘brain circulation’. Recent estimates suggest that return migration represents a significant part of migration flows to sub-Saharan Africa and latin America. These migrants, especially younger adults, are more educated than the norm, on average (Chen et al., 2021).
Some countries are recognizing that even highly skilled nationals who will not return in the foreseeable future represent an asset if properly engaged. out of 22 latin American and Caribbean countries analysed for the Emigrant Policies Index, 8 maintain formal brain circulation networks (hoffmann et al., 2017; Pedroza and Palop-García, 2017). An earlier mapping of diaspora policies of 35 countries, representing all world regions, income levels and government types, found that two thirds maintained scientific networks of some kind and half had return obligations for students sent abroad through scholarships (Ragazzi, 2014).
BOX 18.1 :
Turkey has become one of the largest scholarship providers
In the wake of the Syrian conflict, Turkey now hosts the most refugees in the world. As a result, Turkey effectively became one the largest humanitarian donors in absolute terms and as a percentage of GDP, although direct comparisons are complicated by the fact that other donors report only international humanitarian assistance (Development Initiatives, 2020).
In recognition of this development, Turkey gained DAC observer status in 2016, and is included in CRS for 2018 (when almost all its entries were coded as regional or with an unspecified recipient country) and 2019 (with more complete recipient information). Turkey’s inclusion in international aid statistics as a donor has resulted in a noticeable break in the trend and exaggerates the recent increase in scholarship aid. While its emergence as a major humanitarian donor was driven by necessity, Turkey has at the same time become one of the biggest donors of scholarship aid by choice.
Turkey offered 17,000 international scholarships in 2019 (Turkish Cooperation and Coordination Agency, 2020), chiefly through the Türkiye Burslari (Turkey Scholarships) programme. These scholarships, offered at undergraduate and postgraduate levels, provide tuition, accommodation, a one-off return flight, health insurance and a monthly stipend (Turkey Ministry of Culture and Tourism, 2021). As a result, excluding imputed student costs, in 2018 Turkey was the single largest scholarship donor in the CRS database (which notably does not include China) at US$225 million, just ahead of EU institutions. It dropped to fifth place at US$150 million in 2019, between the United Kingdom at US$138 million and Saudi Arabia at US$162 million.
Turkey’s scholarships include language courses. The country is also expanding opportunities, not just for prospective students, to study Turkish before arrival through its growing network of Yunus Emre Institutes around the world. It is particularly expanding the network in Africa (Anadolu Agency, 2021) as part of a larger strategy of rapidly increasing the Turkish presence on the continent in trade and diplomatic relations in addition to academic exchange (Mitchell, 2021).
337 C H A P T E R 1 8 • SCholARShIPS
18
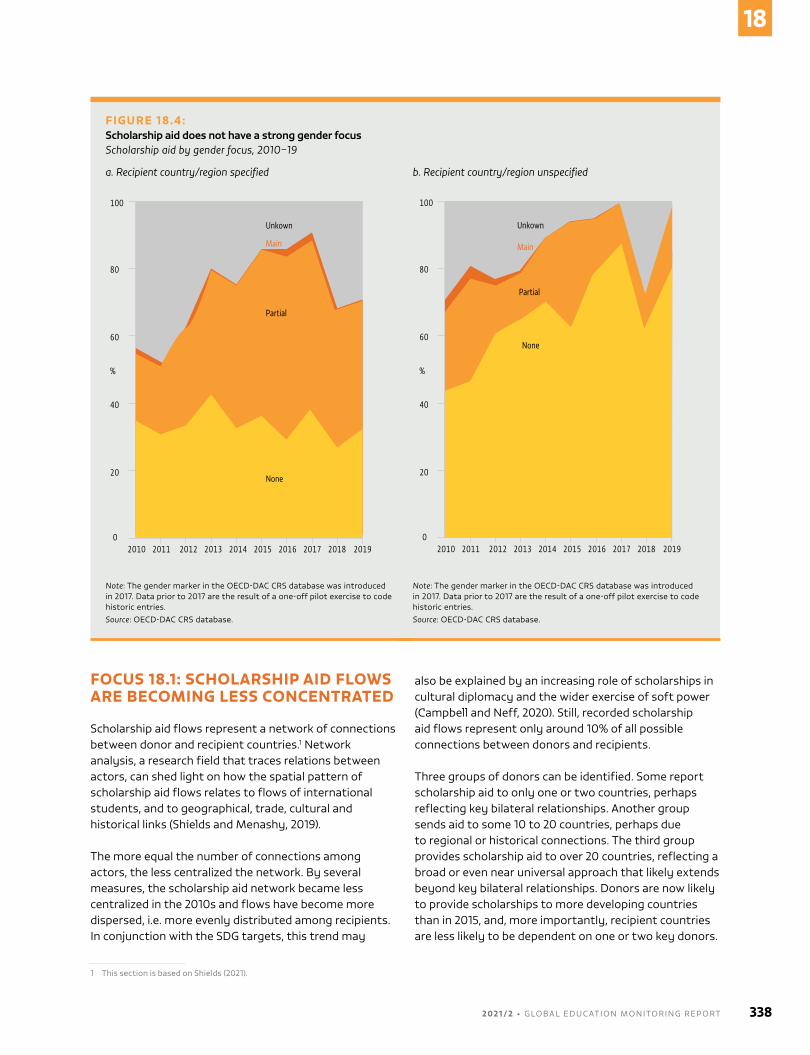
FOCUS 18.1: SCHOLARSHIP AID FLOWS ARE BECOMING LESS CONCENTRATED
Scholarship aid flows represent a network of connections between donor and recipient countries.1 network analysis, a research field that traces relations between actors, can shed light on how the spatial pattern of scholarship aid flows relates to flows of international students, and to geographical, trade, cultural and historical links (Shields and menashy, 2019).
The more equal the number of connections among actors, the less centralized the network. by several measures, the scholarship aid network became less centralized in the 2010s and flows have become more dispersed, i.e. more evenly distributed among recipients. In conjunction with the SDG targets, this trend may
1 This section is based on Shields (2021).
also be explained by an increasing role of scholarships in cultural diplomacy and the wider exercise of soft power (Campbell and neff, 2020). Still, recorded scholarship aid flows represent only around 10% of all possible connections between donors and recipients.
Three groups of donors can be identified. Some report scholarship aid to only one or two countries, perhaps reflecting key bilateral relationships. Another group sends aid to some 10 to 20 countries, perhaps due to regional or historical connections. The third group provides scholarship aid to over 20 countries, reflecting a broad or even near universal approach that likely extends beyond key bilateral relationships. Donors are now likely to provide scholarships to more developing countries than in 2015, and, more importantly, recipient countries are less likely to be dependent on one or two key donors.
FIGURE 18.4:Scholarship aid does not have a strong gender focusScholarship aid by gender focus, 2010–19
a. Recipient country/region specified
Guatemala, 2014
2018
Instruction affected somewhat
100
80
60
40
20
02010 2011 2012 2013 2014 2015 2016 2017 2018 2019
Unkown
Main
Partial
None
%
Note: The gender marker in the oECD-DAC CRS database was introduced in 2017. Data prior to 2017 are the result of a one-off pilot exercise to code historic entries.Source: oECD-DAC CRS database.
b. Recipient country/region unspecified
Guatemala, 2014
2018
100
80
60
40
20
02010 2011 2012 2013 2014 2015 2016 2017 2018 2019
Unkown
Main
Partial
None
%
Note: The gender marker in the oECD-DAC CRS database was introduced in 2017. Data prior to 2017 are the result of a one-off pilot exercise to code historic entries.Source: oECD-DAC CRS database.
2 0 2 1 / 2 • G LO BA L E D U C AT I O N M O N I TO R I N G R E P O RT 338
18
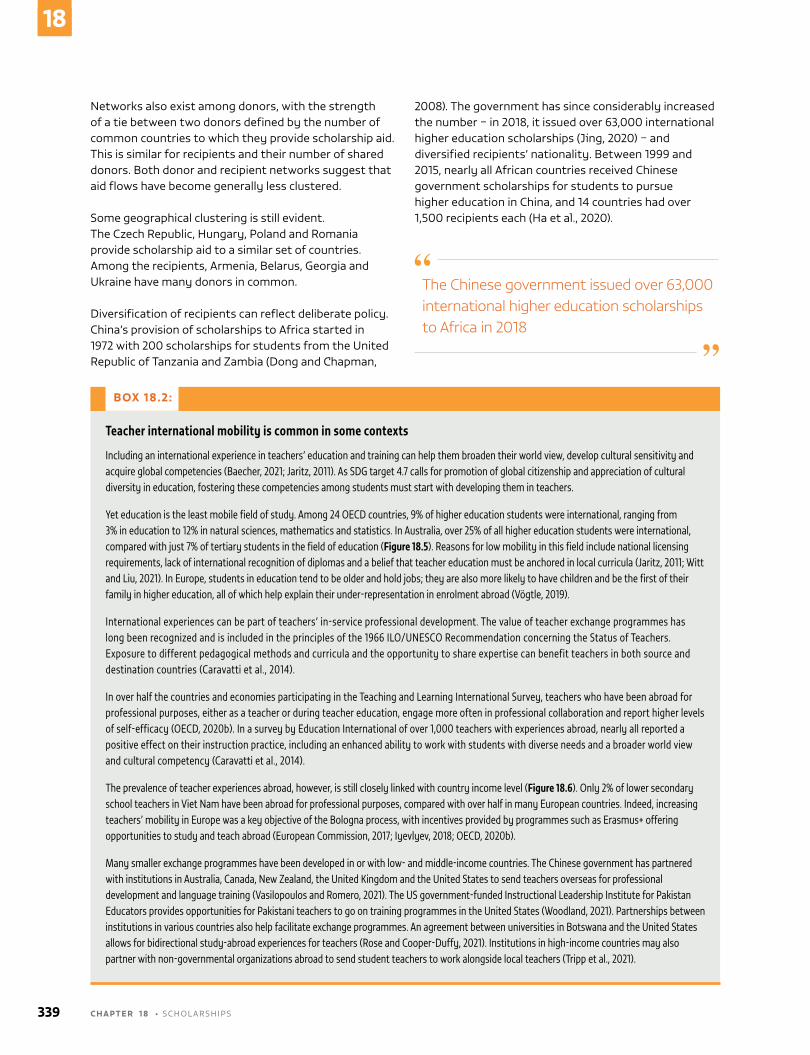
BOX 18.2:
Teacher international mobility is common in some contexts
Including an international experience in teachers’ education and training can help them broaden their world view, develop cultural sensitivity and acquire global competencies (Baecher, 2021; Jaritz, 2011). As SDG target 4.7 calls for promotion of global citizenship and appreciation of cultural diversity in education, fostering these competencies among students must start with developing them in teachers.
Yet education is the least mobile field of study. Among 24 OECD countries, 9% of higher education students were international, ranging from 3% in education to 12% in natural sciences, mathematics and statistics. In Australia, over 25% of all higher education students were international, compared with just 7% of tertiary students in the field of education (Figure 18.5). Reasons for low mobility in this field include national licensing requirements, lack of international recognition of diplomas and a belief that teacher education must be anchored in local curricula (Jaritz, 2011; Witt and Liu, 2021). In Europe, students in education tend to be older and hold jobs; they are also more likely to have children and be the first of their family in higher education, all of which help explain their under-representation in enrolment abroad (Vögtle, 2019).
International experiences can be part of teachers’ in-service professional development. The value of teacher exchange programmes has long been recognized and is included in the principles of the 1966 ILO/UNESCO Recommendation concerning the Status of Teachers. Exposure to different pedagogical methods and curricula and the opportunity to share expertise can benefit teachers in both source and destination countries (Caravatti et al., 2014).
In over half the countries and economies participating in the Teaching and Learning International Survey, teachers who have been abroad for professional purposes, either as a teacher or during teacher education, engage more often in professional collaboration and report higher levels of self-efficacy (OECD, 2020b). In a survey by Education International of over 1,000 teachers with experiences abroad, nearly all reported a positive effect on their instruction practice, including an enhanced ability to work with students with diverse needs and a broader world view and cultural competency (Caravatti et al., 2014).
The prevalence of teacher experiences abroad, however, is still closely linked with country income level (Figure 18.6). Only 2% of lower secondary school teachers in Viet Nam have been abroad for professional purposes, compared with over half in many European countries. Indeed, increasing teachers’ mobility in Europe was a key objective of the Bologna process, with incentives provided by programmes such as Erasmus+ offering opportunities to study and teach abroad (European Commission, 2017; Iyevlyev, 2018; OECD, 2020b).
Many smaller exchange programmes have been developed in or with low- and middle-income countries. The Chinese government has partnered with institutions in Australia, Canada, New Zealand, the United Kingdom and the United States to send teachers overseas for professional development and language training (Vasilopoulos and Romero, 2021). The US government-funded Instructional Leadership Institute for Pakistan Educators provides opportunities for Pakistani teachers to go on training programmes in the United States (Woodland, 2021). Partnerships between institutions in various countries also help facilitate exchange programmes. An agreement between universities in Botswana and the United States allows for bidirectional study-abroad experiences for teachers (Rose and Cooper-Duffy, 2021). Institutions in high-income countries may also partner with non-governmental organizations abroad to send student teachers to work alongside local teachers (Tripp et al., 2021).
networks also exist among donors, with the strength of a tie between two donors defined by the number of common countries to which they provide scholarship aid. This is similar for recipients and their number of shared donors. both donor and recipient networks suggest that aid flows have become generally less clustered.
Some geographical clustering is still evident. The Czech Republic, hungary, Poland and Romania provide scholarship aid to a similar set of countries. Among the recipients, Armenia, belarus, Georgia and ukraine have many donors in common.
Diversification of recipients can reflect deliberate policy. China’s provision of scholarships to Africa started in 1972 with 200 scholarships for students from the united Republic of Tanzania and zambia (Dong and Chapman,
2008). The government has since considerably increased the number – in 2018, it issued over 63,000 international higher education scholarships (Jing, 2020) – and diversified recipients’ nationality. between 1999 and 2015, nearly all African countries received Chinese government scholarships for students to pursue higher education in China, and 14 countries had over 1,500 recipients each (ha et al., 2020).
The Chinese government issued over 63,000 international higher education scholarships to Africa in 2018
339 C H A P T E R 1 8 • SCholARShIPS
18
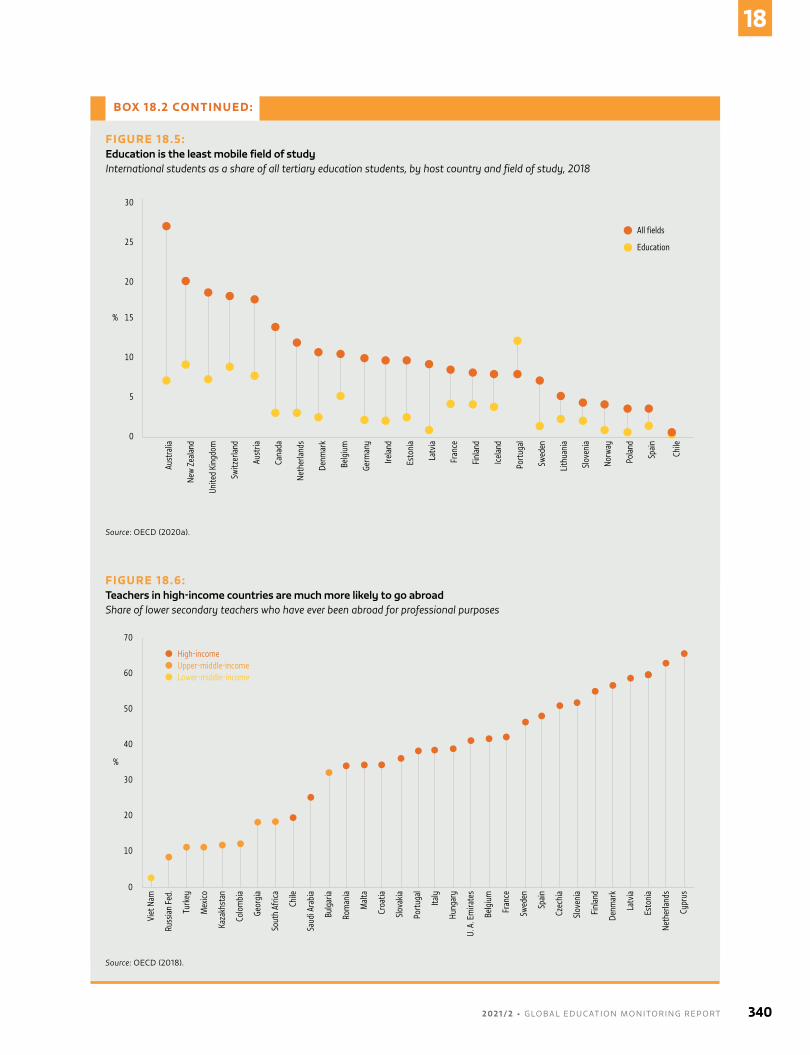
BOX 18.2 CONTINUED:
FIGURE 18.5:Education is the least mobile field of studyInternational students as a share of all tertiary education students, by host country and field of study, 2018
Guatemala, 2014
2018
Aust
ralia
New
Zea
land
Unite
d Ki
ngdo
m
Switz
erla
nd
Aust
ria
Cana
da
Neth
erla
nds
Denm
ark
Belg
ium
Germ
any
Irela
nd
Esto
nia
Latv
ia
Fran
ce
Finl
and
Icel
and
Port
ugal
Swed
en
Lith
uani
a
Slov
enia
Norw
ay
Pola
nd
Spai
n
Chile
All fields
Education
30
25
20
15
10
5
0
%
Source: oECD (2020a).
FIGURE 18.6:Teachers in high-income countries are much more likely to go abroadShare of lower secondary teachers who have ever been abroad for professional purposes
Guatemala, 2014
2018
Viet
Nam
Russ
ian
Fed.
Turk
ey
Mex
ico
Kaza
khst
an
Colo
mbi
a
Geor
gia
Sout
h Af
rica
Chile
Saud
i Ara
bia
Bulg
aria
Rom
ania
Mal
ta
Croa
tia
Slov
akia
Port
ugal
Italy
Hung
ary
U. A
. Em
irate
s
Belg
ium
Fran
ce
Swed
en
Spai
n
Czec
hia
Slov
enia
Finl
and
Denm
ark
Latv
ia
Esto
nia
Neth
erla
nds
Cypr
us
70
60
50
40
30
20
10
0
%
High-incomeUpper-middle-incomeLower-middle-income
Source: oECD (2018).
2 0 2 1 / 2 • G LO BA L E D U C AT I O N M O N I TO R I N G R E P O RT 340
18
Chinese scholarship programmes are also open to applicants from any developing country, including specific scholarships for nationals of countries in the Association of Southeast Asian nations and the European union, along with Pacific Island states (China Scholarship Council, 2020). Still, bilateral trade and diplomatic relations are strong predictors of China’s international scholarship recipients’ nationalities (ha et al., 2020).
Indeed, analysis of how bilateral scholarship aid relates to other networks shows that it tends to be more frequent between countries where international student mobility is generally higher, to countries where donors export goods or services, and to former colonies. The direction of some of these associations is ambiguous. For example, increased scholarship aid may be both an outcome of high levels of student mobility and a contributing factor. The continued association between scholarship aid and past colonial ties should prompt critical discussions on the decolonization of higher education. In some cases, the link is intentional, as with Commonwealth Scholarships offered by the united Kingdom. by contrast, Turkey explicitly views its lack of colonial history as an asset in expanding its ties in Africa (Ünveren, 2021), including by providing scholarships (box 18.1).
Another interesting question is which recipient countries receive scholarship aid above what would be expected from their position in trade, mobility, cultural and other networks. Some of the least developed countries, including mali and mauritania, along with Small Island Developing States such as Comoros and Samoa, attract relatively high scholarship aid.
overall, application of social network perspectives provides greater insights into scholarship aid trends than would be possible through aggregated trend analysis alone. The social network between donors and recipients is complex and changing rapidly. While the analysis shows that scholarship aid is still connected to trade and historical colonial ties, it also shows that recipient countries have access to aid from an increasing number of donors. This trend represents at least qualitative progress towards target 4.b.
BOX 18.3:
Scholarships should benefit more than just the scholars
Target 4.b is a ‘means of implementation’ rather than an end, and it is important to ask how international scholarships for students from low-income countries contribute to sustainable development generally, and SDG 4 in particular.
Beyond individual benefits, research on scholarships has examined their contribution at higher levels (Mawer, 2018). Assessing their impact often relies on graduates’ subjective self-reporting. Robust evaluation requires long-term tracking, which can be difficult and costly. One successful example is the Ford Foundation’s 10-year Alumni Tracking Study, administered by the Institute of International Education, with reports and briefs available online. Germany has tracked how scholarship programme alumni experiences compare with the 2030 Agenda (GIZ, 2020). Some alumni associations have built effective networks of advocates for change, affecting policy in the home country (Campbell and Baxter, 2019; Martel, 2017).
Many subject-specific scholarships contribute to technical capacity building in support of SDGs, such as SDG 7 on renewable energy. Some scholarship programmes are not limited to technical subjects; the Rotary Foundation master's in peace studies fellowship is aligned with SDG 16, for instance. Research conducted with scholarship providers for the GEM Report suggests that many applicants are motivated by the SDGs and seek courses aligned with them (Campbell, 2021).
Support given to alumni in terms of professional development, internships and networking opportunities prepares them more ambitiously to contribute to their countries’ economic development, hire others and usher innovative ideas to specific fields, contributing to SDG 9. Ghanaian and Nigerian scholarship alumni of the Ford Foundation’s International Fellowships Program contribute to teaching new curricula at university level in their home countries (Campbell et al., 2021).
Outside of professional activities, alumni activities and networks contribute to the SDGs through campaigns and volunteer projects, such as mentoring youth in entrepreneurship initiatives. Other scholarship alumni volunteer in activities such as educating citizens on voters’ rights, the rule of law and tolerance, thereby contributing to the focus of SDG target 16.6 on developing effective, accountable and transparent institutions at all levels. Indeed, international student mobility creates ‘foreign-educated individual actors’ (Chankseliani, 2018, p. 281) who can help increase levels of democracy and participation. An alumni association in Ghana ‘established working groups around thematic areas, tying many of the focal areas’ to the SDGs (Campbell and Lavallee, 2020, p. 416) . Some scholarship providers support their alumni in their activities, e.g. by providing small grants for alumni projects (Campbell and Baxter, 2019).
341 C H A P T E R 1 8 • SCholARShIPS
18
COVID-19
Travel restrictions related to CovID-19 reduced international student mobility and financial stability, affecting scholarship aid opportunities. Graduate students were particularly affected (mercado, 2020). over 60% of international students at graduate level in the united States depend on international funds (Di maria, 2020), a situation also typical for other host countries. both inbound and outbound mobility were affected. In Finland, 48% of international students returned home, and 53% of Finnish students abroad returned to Finland (Finnish national Agency for Education, 2020).
Early evidence suggests the high infection rates in the united States dissuaded students from applying for scholarships at uS universities (Reardon, 2020), as did concerns about racial discrimination against Chinese people (Peters et al., 2021). other popular anglophone international student destinations, such as Australia, new zealand and the united Kingdom, also experienced decreased inbound mobility. With up to a third of students in Australia being international, this put Australian higher education institutions in serious financial jeopardy (Waters, 2021). The loss in income from fee-paying international students reduces funds available for institutional scholarships for students from poor countries who cannot pay their own tuition.
China was affected by CovID-19 early and imposed strict containment measures, including stopping international travel. This had a significant impact on target 4.b. In recent years, China had become the third-largest receiving country of international students (Waters, 2021). For African students, the decision to study in China strongly reflects scholarship availability and the relative affordability of tuition and living costs (lei et al., 2021).
not only were many students no longer able to accept scholarships, but other students and graduates were stranded in host countries when they were expected or expecting to return to their home countries. This happened in Turkey, which has recently adopted ambitious, proactive policies, projects and efforts to attract international students (Peters et al., 2021), but lacked an ecosystem of support networks and services.
many scholarships do not cover all expenses, and students, including scholarship holders, often rely on part-time work to fully fund their studies and living. Such students were dealt a major financial blow with
the closure of bars, restaurants and libraries where many students worked, while others lost their part-time jobs due to the general economic downturn (bilecen, 2020).
Some universities in the united States, such as the university of oklahoma, set up pandemic scholarships designed to provide relief to international students financially affected by CovID-19 or associated restrictions (university of oklahoma, 2020). The Institute of International Education’s Emergency Student Fund helped unemployed international students who struggled to pay for food, shelter and medical care during the pandemic (IIE, 2020).
Some scholarship opportunities disappeared because they would have required physical travel to the host country campuses. Sport scholarships, for instance, provide a route into higher education for disadvantaged groups not only domestically, but also internationally. Kenyan students reported being able to study in neither the united States nor in neighbouring ugandan universities when sports scholarships were cancelled (odhiambo, 2020).
Distance learning has enabled developing country international students with decent internet and computer access to take up scholarship opportunities for higher education institutions and degree courses abroad despite the pandemic. however, they do not benefit from the cultural enrichment of living abroad, and have lost opportunities to find jobs in host countries through visa programmes enabling students to stay for work upon graduation (Yıldırım et al., 2021). many students from developing countries view the higher fees in host countries as an investment to recoup through a job at host country salary levels. host countries differ in their plans to revise or keep such visa programmes in place (bilecen, 2020).
As universities reopen campuses, they need such visa programmes and student social safety nets to regain their attractiveness for international students and affordability for scholarship holders. CovID-19 may end up resulting in a more permanent shift to online learning for some courses and programmes, coupled with reduced fees (Waters, 2021), making programmes more accessible.
Even with such changes, mobility of students from South Asian and sub-Saharan African countries will take the longest to recover (marginson, 2020), not least because of global vaccine inequality. Young people in these countries are likely to be last in line for vaccination, which may be required for international travel or university admission.
2 0 2 1 / 2 • G LO BA L E D U C AT I O N M O N I TO R I N G R E P O RT 342
18
Discriminatory practices, such as the united Kingdom’s refusal to accept vaccinations performed in certain countries, even with vaccines donated by CovAX, the global vaccine-sharing initiative that is also financed by the united Kingdom itself, created additional obstacles (Princewill, 2021).
monitoring of target 4.b is also affected by constrained student mobility. First, comparisons over time must carefully distinguish between direct scholarship aid and imputed student costs if the pandemic’s effects are to be properly understood. In 2019, 62% of international aid for higher education students represented imputed costs of students from developing countries attending higher education in donor countries with tuition-free systems, notably France and Germany, rather than scholarships. As imputed student costs arise at the point and time of delivery, reduced international student flows to fee-free destinations automatically reduce this aid component, while scholarships can continue to be awarded during the pandemic, even if actual travel is deferred.
Second, target 4.b calls for increased provision of scholarships enabling ‘enrolment … in developed countries and other developing countries’. The pandemic is likely to accelerate trends towards remote delivery of higher education and phenomena such as local branch campuses of institutions from donor countries. Thus it will be increasingly necessary to clarify the status of scholarship recipients who remain in their home countries but enrol in developed country institutions, either remotely or in person at a branch campus.
343 C H A P T E R 1 8 • SCholARShIPS
18
2 0 2 1 / 2 • G LO BA L E D U C AT I O N M O N I TO R I N G R E P O RT 344
18
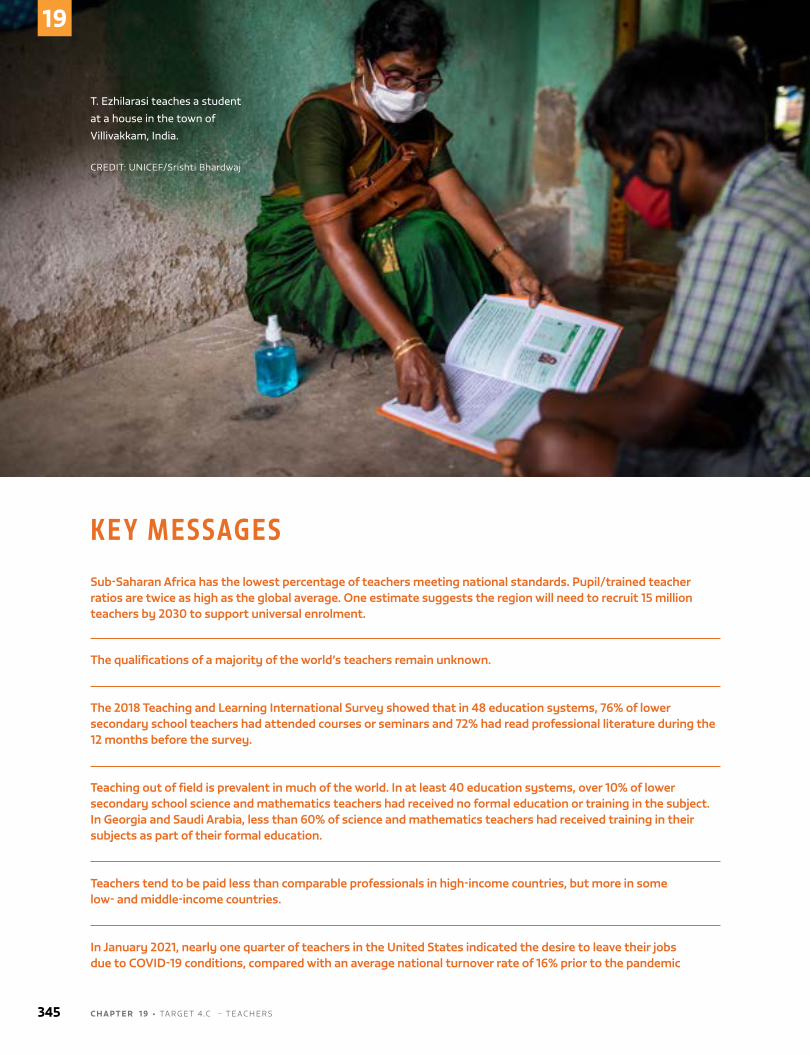
K E Y M E S S AG E SSub-Saharan Africa has the lowest percentage of teachers meeting national standards. Pupil/trained teacher ratios are twice as high as the global average. One estimate suggests the region will need to recruit 15 million teachers by 2030 to support universal enrolment.
The qualifications of a majority of the world’s teachers remain unknown.
The 2018 Teaching and Learning International Survey showed that in 48 education systems, 76% of lower secondary school teachers had attended courses or seminars and 72% had read professional literature during the 12 months before the survey.
Teaching out of field is prevalent in much of the world. In at least 40 education systems, over 10% of lower secondary school science and mathematics teachers had received no formal education or training in the subject. In Georgia and Saudi Arabia, less than 60% of science and mathematics teachers had received training in their subjects as part of their formal education.
Teachers tend to be paid less than comparable professionals in high-income countries, but more in some low- and middle-income countries.
In January 2021, nearly one quarter of teachers in the United States indicated the desire to leave their jobs due to COVID-19 conditions, compared with an average national turnover rate of 16% prior to the pandemic
T. Ezhilarasi teaches a student
at a house in the town of
Villivakkam, India.
CREDIT: unICEF/Srishti bhardwaj
345 C H A P T E R 1 9 • TARGET 4.C – TEAChERS
19
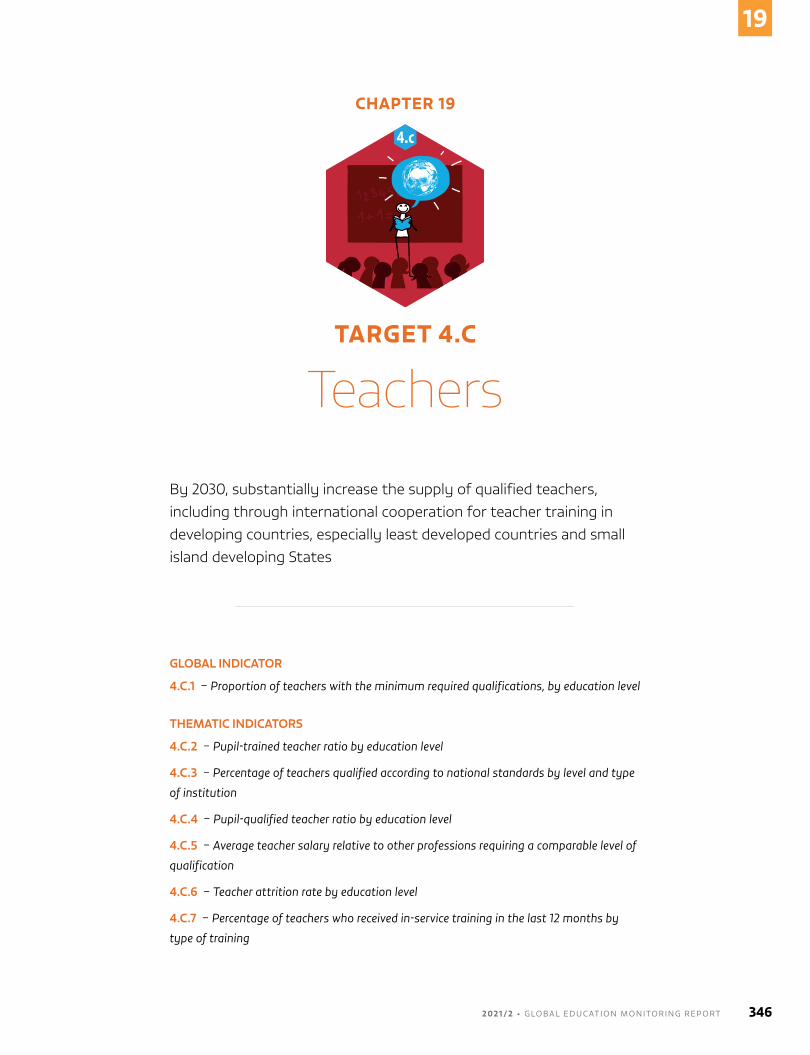
CHAPTER 19
TARGET 4.C
Teachers
4.c
By 2030, substantially increase the supply of qualified teachers, including through international cooperation for teacher training in developing countries, especially least developed countries and small island developing States
GLOBAL INDICATOR
4.C.1 – Proportion of teachers with the minimum required qualifications, by education level
THEMATIC INDICATORS
4.C.2 – Pupil-trained teacher ratio by education level
4.C.3 – Percentage of teachers qualified according to national standards by level and type
of institution
4.C.4 – Pupil-qualified teacher ratio by education level
4.C.5 – Average teacher salary relative to other professions requiring a comparable level of
qualification
4.C.6 – Teacher attrition rate by education level
4.C.7 – Percentage of teachers who received in-service training in the last 12 months by
type of training
2 0 2 1 / 2 • G LO BA L E D U C AT I O N M O N I TO R I N G R E P O RT 346
19
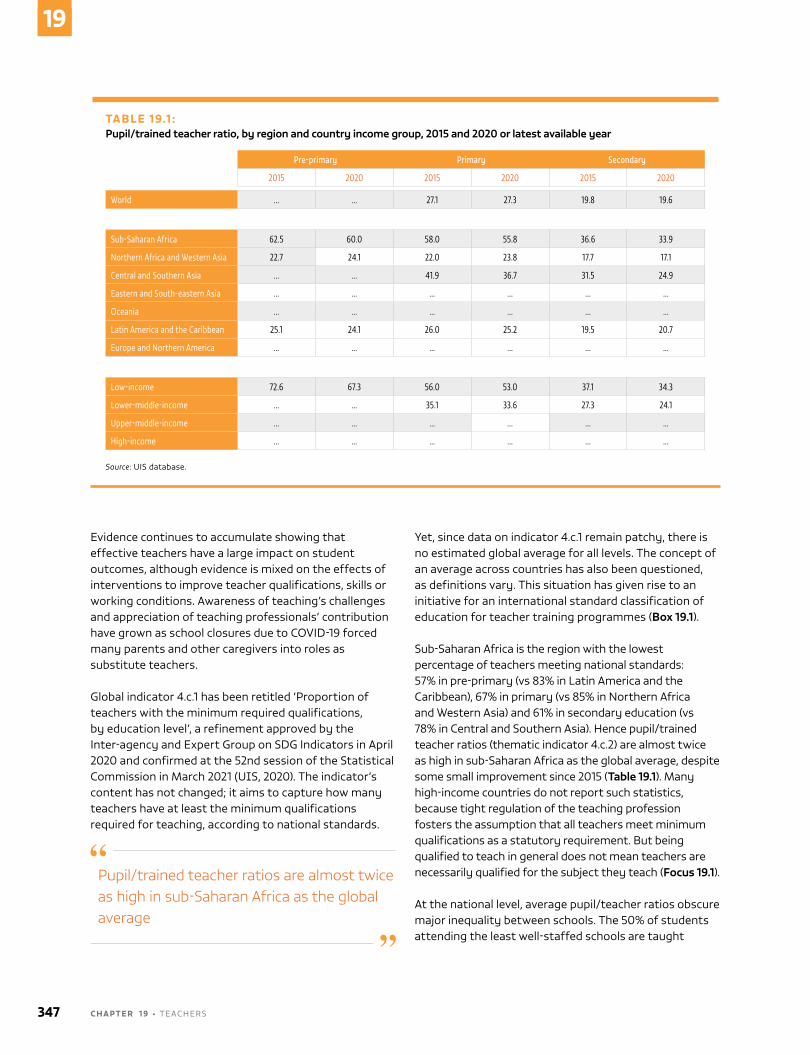
Evidence continues to accumulate showing that effective teachers have a large impact on student outcomes, although evidence is mixed on the effects of interventions to improve teacher qualifications, skills or working conditions. Awareness of teaching’s challenges and appreciation of teaching professionals’ contribution have grown as school closures due to CovID-19 forced many parents and other caregivers into roles as substitute teachers.
Global indicator 4.c.1 has been retitled ‘Proportion of teachers with the minimum required qualifications, by education level’, a refinement approved by the Inter-agency and Expert Group on SDG Indicators in April 2020 and confirmed at the 52nd session of the Statistical Commission in march 2021 (uIS, 2020). The indicator’s content has not changed; it aims to capture how many teachers have at least the minimum qualifications required for teaching, according to national standards.
Pupil/trained teacher ratios are almost twice as high in sub-Saharan Africa as the global average
Yet, since data on indicator 4.c.1 remain patchy, there is no estimated global average for all levels. The concept of an average across countries has also been questioned, as definitions vary. This situation has given rise to an initiative for an international standard classification of education for teacher training programmes (Box 19.1).
Sub-Saharan Africa is the region with the lowest percentage of teachers meeting national standards: 57% in pre-primary (vs 83% in latin America and the Caribbean), 67% in primary (vs 85% in northern Africa and Western Asia) and 61% in secondary education (vs 78% in Central and Southern Asia). hence pupil/trained teacher ratios (thematic indicator 4.c.2) are almost twice as high in sub-Saharan Africa as the global average, despite some small improvement since 2015 (Table 19.1). many high-income countries do not report such statistics, because tight regulation of the teaching profession fosters the assumption that all teachers meet minimum qualifications as a statutory requirement. but being qualified to teach in general does not mean teachers are necessarily qualified for the subject they teach (Focus 19.1).
At the national level, average pupil/teacher ratios obscure major inequality between schools. The 50% of students attending the least well-staffed schools are taught
TABLE 19.1 :Pupil/trained teacher ratio, by region and country income group, 2015 and 2020 or latest available year
Pre-primary Primary Secondary
2015 2020 2015 2020 2015 2020
World ... ... 27.1 27.3 19.8 19.6
Sub-Saharan Africa 62.5 60.0 58.0 55.8 36.6 33.9
Northern Africa and Western Asia 22.7 24.1 22.0 23.8 17.7 17.1
Central and Southern Asia ... ... 41.9 36.7 31.5 24.9
Eastern and South-eastern Asia ... ... ... ... ... ...
Oceania ... ... ... ... ... ...
Latin America and the Caribbean 25.1 24.1 26.0 25.2 19.5 20.7
Europe and Northern America ... ... ... ... ... ...
Low-income 72.6 67.3 56.0 53.0 37.1 34.3
Lower-middle-income ... ... 35.1 33.6 27.3 24.1
Upper-middle-income ... ... ... ... ... ...
High-income ... ... ... ... ... ...
Source: uIS database.
347 C H A P T E R 1 9 • TEAChERS
19
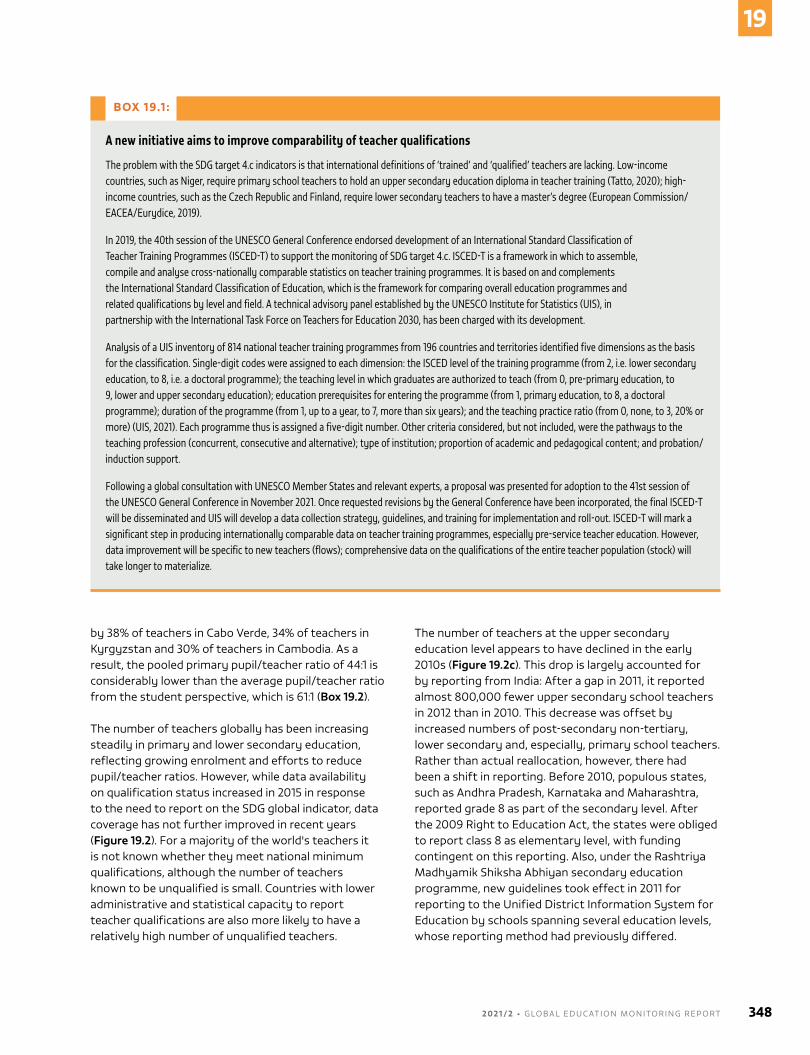
BOX 19.1 :
A new initiative aims to improve comparability of teacher qualifications
The problem with the SDG target 4.c indicators is that international definitions of ‘trained’ and ‘qualified’ teachers are lacking. Low-income countries, such as Niger, require primary school teachers to hold an upper secondary education diploma in teacher training (Tatto, 2020); high-income countries, such as the Czech Republic and Finland, require lower secondary teachers to have a master’s degree (European Commission/EACEA/Eurydice, 2019).
In 2019, the 40th session of the UNESCO General Conference endorsed development of an International Standard Classification of Teacher Training Programmes (ISCED-T) to support the monitoring of SDG target 4.c. ISCED-T is a framework in which to assemble, compile and analyse cross-nationally comparable statistics on teacher training programmes. It is based on and complements the International Standard Classification of Education, which is the framework for comparing overall education programmes and related qualifications by level and field. A technical advisory panel established by the UNESCO Institute for Statistics (UIS), in partnership with the International Task Force on Teachers for Education 2030, has been charged with its development.
Analysis of a UIS inventory of 814 national teacher training programmes from 196 countries and territories identified five dimensions as the basis for the classification. Single-digit codes were assigned to each dimension: the ISCED level of the training programme (from 2, i.e. lower secondary education, to 8, i.e. a doctoral programme); the teaching level in which graduates are authorized to teach (from 0, pre-primary education, to 9, lower and upper secondary education); education prerequisites for entering the programme (from 1, primary education, to 8, a doctoral programme); duration of the programme (from 1, up to a year, to 7, more than six years); and the teaching practice ratio (from 0, none, to 3, 20% or more) (UIS, 2021). Each programme thus is assigned a five-digit number. Other criteria considered, but not included, were the pathways to the teaching profession (concurrent, consecutive and alternative); type of institution; proportion of academic and pedagogical content; and probation/induction support.
Following a global consultation with UNESCO Member States and relevant experts, a proposal was presented for adoption to the 41st session of the UNESCO General Conference in November 2021. Once requested revisions by the General Conference have been incorporated, the final ISCED-T will be disseminated and UIS will develop a data collection strategy, guidelines, and training for implementation and roll-out. ISCED-T will mark a significant step in producing internationally comparable data on teacher training programmes, especially pre-service teacher education. However, data improvement will be specific to new teachers (flows); comprehensive data on the qualifications of the entire teacher population (stock) will take longer to materialize.
by 38% of teachers in Cabo verde, 34% of teachers in Kyrgyzstan and 30% of teachers in Cambodia. As a result, the pooled primary pupil/teacher ratio of 44:1 is considerably lower than the average pupil/teacher ratio from the student perspective, which is 61:1 (Box 19.2).
The number of teachers globally has been increasing steadily in primary and lower secondary education, reflecting growing enrolment and efforts to reduce pupil/teacher ratios. however, while data availability on qualification status increased in 2015 in response to the need to report on the SDG global indicator, data coverage has not further improved in recent years (Figure 19.2). For a majority of the world's teachers it is not known whether they meet national minimum qualifications, although the number of teachers known to be unqualified is small. Countries with lower administrative and statistical capacity to report teacher qualifications are also more likely to have a relatively high number of unqualified teachers.
The number of teachers at the upper secondary education level appears to have declined in the early 2010s (Figure 19.2c). This drop is largely accounted for by reporting from India: After a gap in 2011, it reported almost 800,000 fewer upper secondary school teachers in 2012 than in 2010. This decrease was offset by increased numbers of post-secondary non-tertiary, lower secondary and, especially, primary school teachers. Rather than actual reallocation, however, there had been a shift in reporting. before 2010, populous states, such as Andhra Pradesh, Karnataka and maharashtra, reported grade 8 as part of the secondary level. After the 2009 Right to Education Act, the states were obliged to report class 8 as elementary level, with funding contingent on this reporting. Also, under the Rashtriya madhyamik Shiksha Abhiyan secondary education programme, new guidelines took effect in 2011 for reporting to the unified District Information System for Education by schools spanning several education levels, whose reporting method had previously differed.
2 0 2 1 / 2 • G LO BA L E D U C AT I O N M O N I TO R I N G R E P O RT 348
19
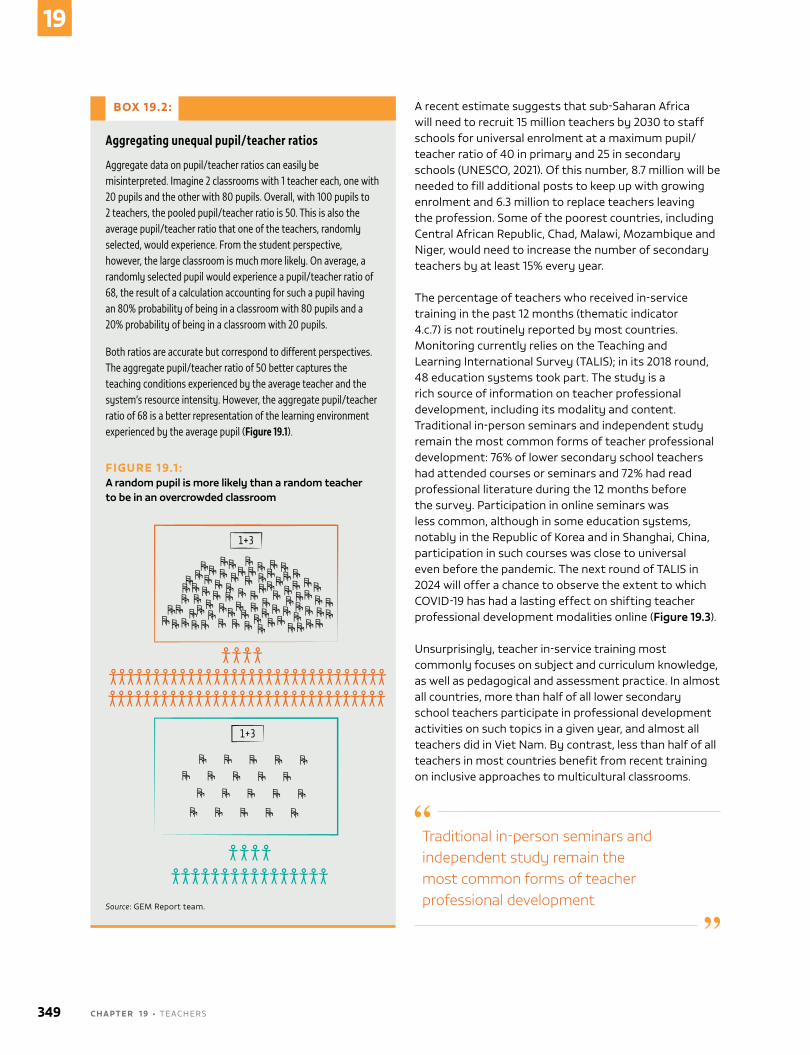
A recent estimate suggests that sub-Saharan Africa will need to recruit 15 million teachers by 2030 to staff schools for universal enrolment at a maximum pupil/teacher ratio of 40 in primary and 25 in secondary schools (unESCo, 2021). of this number, 8.7 million will be needed to fill additional posts to keep up with growing enrolment and 6.3 million to replace teachers leaving the profession. Some of the poorest countries, including Central African Republic, Chad, malawi, mozambique and niger, would need to increase the number of secondary teachers by at least 15% every year.
The percentage of teachers who received in-service training in the past 12 months (thematic indicator 4.c.7) is not routinely reported by most countries. monitoring currently relies on the Teaching and learning International Survey (TAlIS); in its 2018 round, 48 education systems took part. The study is a rich source of information on teacher professional development, including its modality and content. Traditional in-person seminars and independent study remain the most common forms of teacher professional development: 76% of lower secondary school teachers had attended courses or seminars and 72% had read professional literature during the 12 months before the survey. Participation in online seminars was less common, although in some education systems, notably in the Republic of Korea and in Shanghai, China, participation in such courses was close to universal even before the pandemic. The next round of TAlIS in 2024 will offer a chance to observe the extent to which CovID-19 has had a lasting effect on shifting teacher professional development modalities online (Figure 19.3).
unsurprisingly, teacher in-service training most commonly focuses on subject and curriculum knowledge, as well as pedagogical and assessment practice. In almost all countries, more than half of all lower secondary school teachers participate in professional development activities on such topics in a given year, and almost all teachers did in viet nam. by contrast, less than half of all teachers in most countries benefit from recent training on inclusive approaches to multicultural classrooms.
BOX 19.2:
Aggregating unequal pupil/teacher ratios
Aggregate data on pupil/teacher ratios can easily be misinterpreted. Imagine 2 classrooms with 1 teacher each, one with 20 pupils and the other with 80 pupils. Overall, with 100 pupils to 2 teachers, the pooled pupil/teacher ratio is 50. This is also the average pupil/teacher ratio that one of the teachers, randomly selected, would experience. From the student perspective, however, the large classroom is much more likely. On average, a randomly selected pupil would experience a pupil/teacher ratio of 68, the result of a calculation accounting for such a pupil having an 80% probability of being in a classroom with 80 pupils and a 20% probability of being in a classroom with 20 pupils.
Both ratios are accurate but correspond to different perspectives. The aggregate pupil/teacher ratio of 50 better captures the teaching conditions experienced by the average teacher and the system’s resource intensity. However, the aggregate pupil/teacher ratio of 68 is a better representation of the learning environment experienced by the average pupil (Figure 19.1).
FIGURE 19.1 :A random pupil is more likely than a random teacher to be in an overcrowded classroom
Guatemala, 2014
201880
32 per line
1+3
1+3
Source: GEm Report team.
Traditional in-person seminars and independent study remain the most common forms of teacher professional development
349 C H A P T E R 1 9 • TEAChERS
19
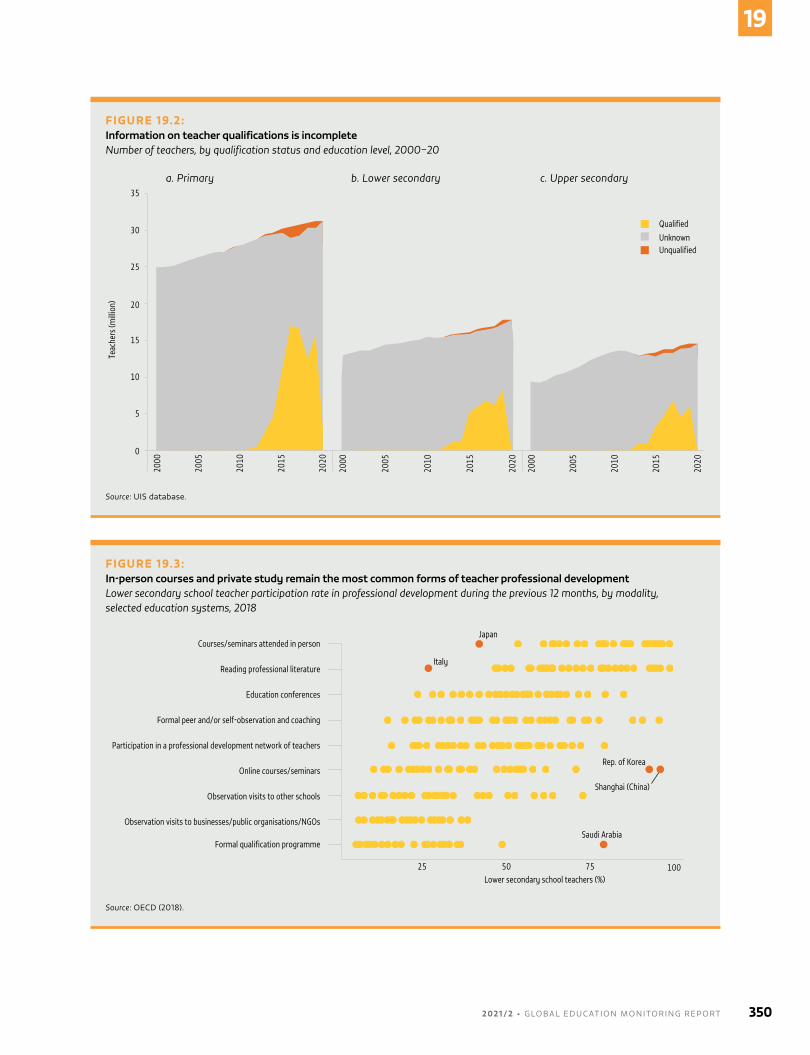
FIGURE 19.2:Information on teacher qualifications is incompleteNumber of teachers, by qualification status and education level, 2000–20
Guatemala, 2014
2018
c. Upper secondaryb. Lower secondarya. Primary
QualifiedUnknownUnqualified
2000
2005
2010
2015
2020
Teac
hers
(milli
on)
35
30
25
20
15
10
5
0
2000
2005
2010
2015
2020
2000
2005
2010
2015
2020
Source: uIS database.
FIGURE 19.3:In-person courses and private study remain the most common forms of teacher professional developmentLower secondary school teacher participation rate in professional development during the previous 12 months, by modality, selected education systems, 2018
Guatemala, 2014
2018
Instruction affected somewhat
Courses/seminars attended in person
Reading professional literature
Education conferences
Formal peer and/or self-observation and coaching
Participation in a professional development network of teachers
Online courses/seminars
Observation visits to other schools
Observation visits to businesses/public organisations/NGOs
Formal qualification programme
Italy
Japan
Rep. of Korea
Shanghai (China)
Saudi Arabia
25 50 75 100Lower secondary school teachers (%)
Source: oECD (2018).
2 0 2 1 / 2 • G LO BA L E D U C AT I O N M O N I TO R I N G R E P O RT 350
19
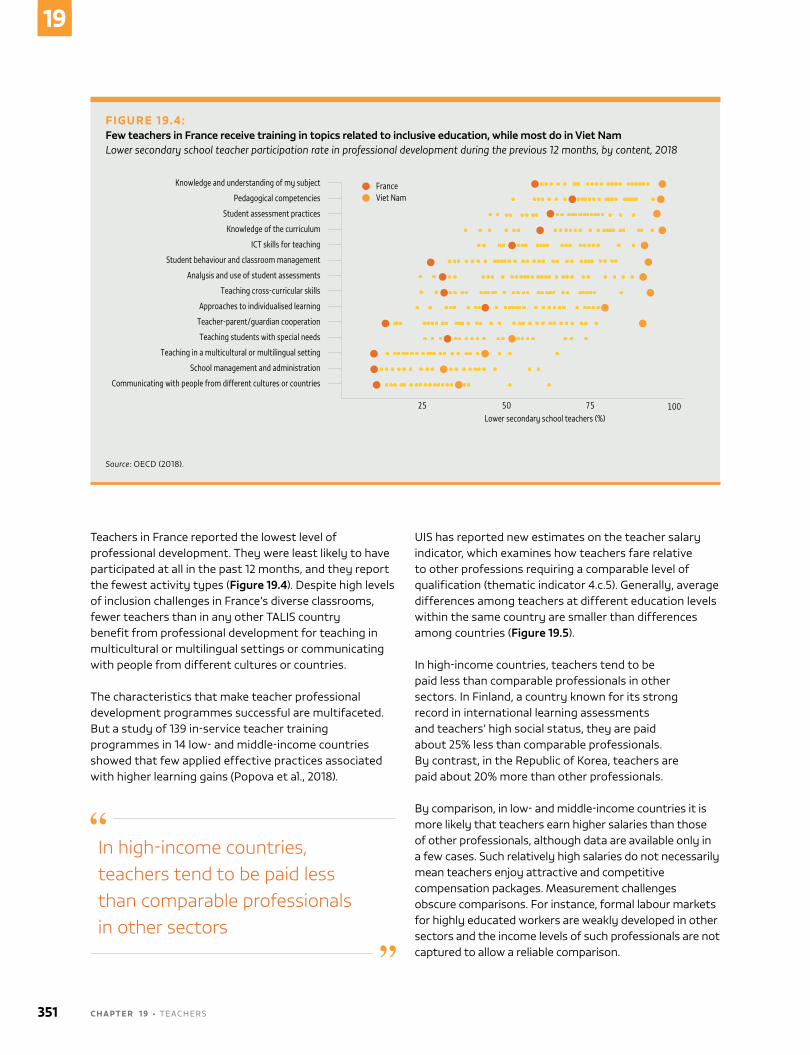
Teachers in France reported the lowest level of professional development. They were least likely to have participated at all in the past 12 months, and they report the fewest activity types (Figure 19.4). Despite high levels of inclusion challenges in France’s diverse classrooms, fewer teachers than in any other TAlIS country benefit from professional development for teaching in multicultural or multilingual settings or communicating with people from different cultures or countries.
The characteristics that make teacher professional development programmes successful are multifaceted. but a study of 139 in-service teacher training programmes in 14 low- and middle-income countries showed that few applied effective practices associated with higher learning gains (Popova et al., 2018).
In high-income countries, teachers tend to be paid less than comparable professionals in other sectors
uIS has reported new estimates on the teacher salary indicator, which examines how teachers fare relative to other professions requiring a comparable level of qualification (thematic indicator 4.c.5). Generally, average differences among teachers at different education levels within the same country are smaller than differences among countries (Figure 19.5).
In high-income countries, teachers tend to be paid less than comparable professionals in other sectors. In Finland, a country known for its strong record in international learning assessments and teachers’ high social status, they are paid about 25% less than comparable professionals. by contrast, in the Republic of Korea, teachers are paid about 20% more than other professionals.
by comparison, in low- and middle-income countries it is more likely that teachers earn higher salaries than those of other professionals, although data are available only in a few cases. Such relatively high salaries do not necessarily mean teachers enjoy attractive and competitive compensation packages. measurement challenges obscure comparisons. For instance, formal labour markets for highly educated workers are weakly developed in other sectors and the income levels of such professionals are not captured to allow a reliable comparison.
FIGURE 19.4:Few teachers in France receive training in topics related to inclusive education, while most do in Viet NamLower secondary school teacher participation rate in professional development during the previous 12 months, by content, 2018
Guatemala, 2014
2018
Instruction affected somewhatKnowledge and understanding of my subject
Pedagogical competencies
Student assessment practices
Knowledge of the curriculum
ICT skills for teaching
Student behaviour and classroom management
Analysis and use of student assessments
Teaching cross-curricular skills
Approaches to individualised learning
Teacher-parent/guardian cooperation
Teaching students with special needs
Teaching in a multicultural or multilingual setting
School management and administration
Communicating with people from different cultures or countries
France
25 50 75 100Lower secondary school teachers (%)
Viet Nam
Source: oECD (2018).
351 C H A P T E R 1 9 • TEAChERS
19
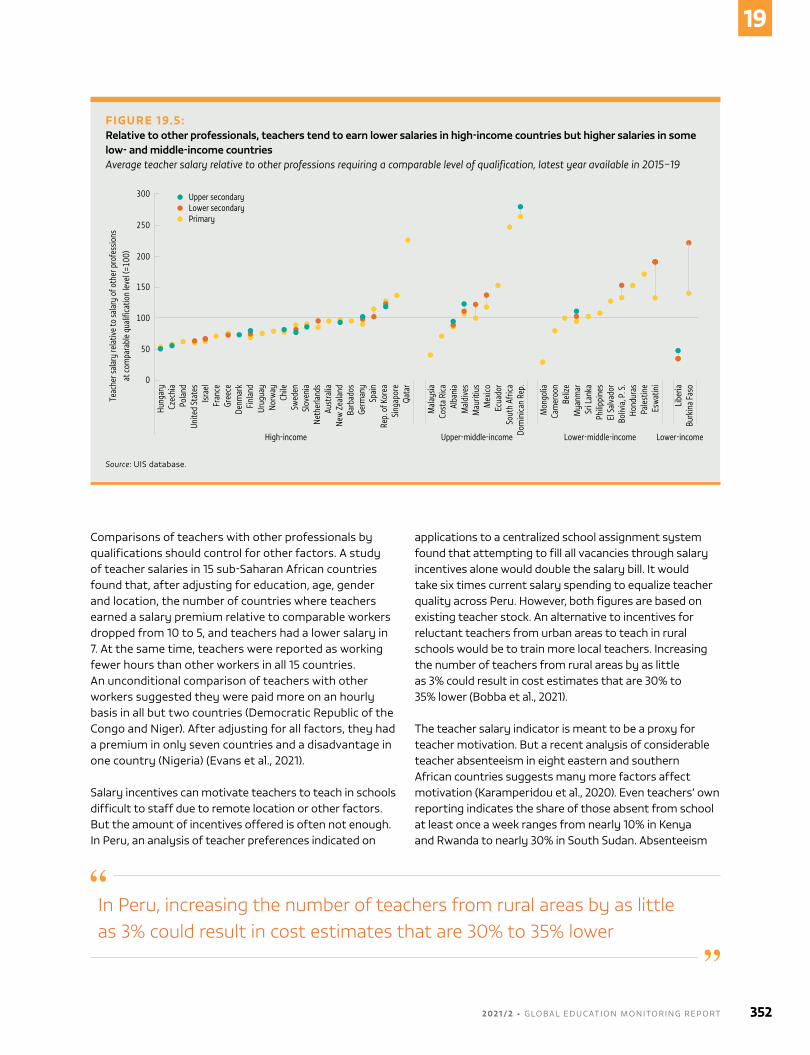
Comparisons of teachers with other professionals by qualifications should control for other factors. A study of teacher salaries in 15 sub-Saharan African countries found that, after adjusting for education, age, gender and location, the number of countries where teachers earned a salary premium relative to comparable workers dropped from 10 to 5, and teachers had a lower salary in 7. At the same time, teachers were reported as working fewer hours than other workers in all 15 countries. An unconditional comparison of teachers with other workers suggested they were paid more on an hourly basis in all but two countries (Democratic Republic of the Congo and niger). After adjusting for all factors, they had a premium in only seven countries and a disadvantage in one country (nigeria) (Evans et al., 2021).
Salary incentives can motivate teachers to teach in schools difficult to staff due to remote location or other factors. but the amount of incentives offered is often not enough. In Peru, an analysis of teacher preferences indicated on
applications to a centralized school assignment system found that attempting to fill all vacancies through salary incentives alone would double the salary bill. It would take six times current salary spending to equalize teacher quality across Peru. however, both figures are based on existing teacher stock. An alternative to incentives for reluctant teachers from urban areas to teach in rural schools would be to train more local teachers. Increasing the number of teachers from rural areas by as little as 3% could result in cost estimates that are 30% to 35% lower (bobba et al., 2021).
The teacher salary indicator is meant to be a proxy for teacher motivation. but a recent analysis of considerable teacher absenteeism in eight eastern and southern African countries suggests many more factors affect motivation (Karamperidou et al., 2020). Even teachers’ own reporting indicates the share of those absent from school at least once a week ranges from nearly 10% in Kenya and Rwanda to nearly 30% in South Sudan. Absenteeism
FIGURE 19.5:Relative to other professionals, teachers tend to earn lower salaries in high-income countries but higher salaries in some low- and middle-income countriesAverage teacher salary relative to other professions requiring a comparable level of qualification, latest year available in 2015–19
Guatemala, 2014
2018
Instruction affected somewhat
300
250
200
150
100
50
0
Teac
her s
alar
y re
lativ
e to
sala
ry o
f oth
er p
rofe
ssio
nsat
com
para
ble
qual
ifica
tion
leve
l (=1
00)
Hung
ary
Czec
hia
Pola
ndUn
ited
Stat
esIsr
ael
Fran
ceGr
eece
Denm
ark
Finl
and
Urug
uay
Norw
ayCh
ileSw
eden
Slov
enia
Neth
erla
nds
Aust
ralia
New
Zea
land
Barb
ados
Germ
any
Spai
nRe
p. o
f Kor
eaSi
ngap
ore
Qata
r
Mal
aysia
Cost
a Ri
caAl
bani
aM
aldi
ves
Mau
ritiu
sM
exico
Ecua
dor
Sout
h Af
rica
Dom
inica
n Re
p.
Mon
golia
Cam
eroo
nBe
lize
Mya
nmar
Sri L
anka
Philip
pine
sEl
Sal
vado
rBo
livia
, P. S
.Ho
ndur
asPa
lest
ine
Esw
atin
i
Libe
riaBu
rkin
a Fa
so
High-income Upper-middle-income Lower-middle-income Lower-income
Upper secondaryLower secondaryPrimary
Source: uIS database.
In Peru, increasing the number of teachers from rural areas by as little as 3% could result in cost estimates that are 30% to 35% lower
2 0 2 1 / 2 • G LO BA L E D U C AT I O N M O N I TO R I N G R E P O RT 352
19
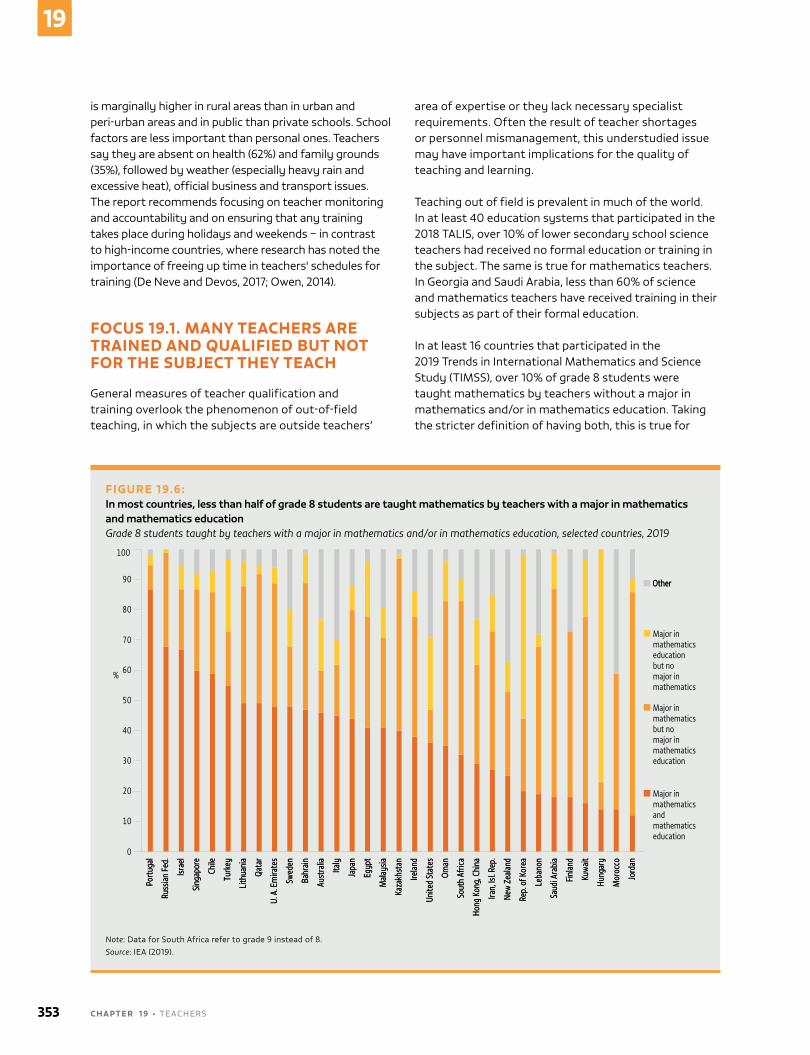
is marginally higher in rural areas than in urban and peri-urban areas and in public than private schools. School factors are less important than personal ones. Teachers say they are absent on health (62%) and family grounds (35%), followed by weather (especially heavy rain and excessive heat), official business and transport issues. The report recommends focusing on teacher monitoring and accountability and on ensuring that any training takes place during holidays and weekends – in contrast to high-income countries, where research has noted the importance of freeing up time in teachers' schedules for training (De neve and Devos, 2017; owen, 2014).
FOCUS 19.1. MANY TEACHERS ARE TRAINED AND QUALIFIED BUT NOT FOR THE SUBJECT THEY TEACH
General measures of teacher qualification and training overlook the phenomenon of out-of-field teaching, in which the subjects are outside teachers’
area of expertise or they lack necessary specialist requirements. often the result of teacher shortages or personnel mismanagement, this understudied issue may have important implications for the quality of teaching and learning.
Teaching out of field is prevalent in much of the world. In at least 40 education systems that participated in the 2018 TAlIS, over 10% of lower secondary school science teachers had received no formal education or training in the subject. The same is true for mathematics teachers. In Georgia and Saudi Arabia, less than 60% of science and mathematics teachers have received training in their subjects as part of their formal education.
In at least 16 countries that participated in the 2019 Trends in International mathematics and Science Study (TImSS), over 10% of grade 8 students were taught mathematics by teachers without a major in mathematics and/or in mathematics education. Taking the stricter definition of having both, this is true for
FIGURE 19.6:In most countries, less than half of grade 8 students are taught mathematics by teachers with a major in mathematics and mathematics educationGrade 8 students taught by teachers with a major in mathematics and/or in mathematics education, selected countries, 2019
Guatemala, 2014
2018
Other
Port
ugal
Russ
ian
Fed.
Israe
l
Sing
apor
e
Chile
Turk
ey
Lith
uani
a
Qata
r
U. A
. Em
irate
s
Swed
en
Bahr
ain
Aust
ralia
Italy
Japa
n
Egyp
t
Mal
aysia
Kaza
khst
an
Irela
nd
Unite
d St
ates
Oman
Sout
h Af
rica
Hong
Kon
g, C
hina
Iran,
Isl. R
ep.
New
Zea
land
Rep.
of K
orea
Leba
non
Saud
i Ara
bia
Finl
and
Kuw
ait
Hung
ary
Mor
occo
Jord
an
10
Guatemala, 2014
2018
Other
Port
ugal
Russ
ian
Fed.
Israe
l
Sing
apor
e
Chile
Turk
ey
Lith
uani
a
Qata
r
U. A
. Em
irate
s
Swed
en
Bahr
ain
Aust
ralia
Italy
Japa
n
Egyp
t
Mal
aysia
Kaza
khst
an
Irela
nd
Unite
d St
ates
Oman
Sout
h Af
rica
Hong
Kon
g, C
hina
Iran,
Isl. R
ep.
New
Zea
land
Rep.
of K
orea
Leba
non
Saud
i Ara
bia
Finl
and
Kuw
ait
Hung
ary
Mor
occo
Jord
an
100
90
80
70
60
50
40
30
20
0
Major in mathematicseducation but no major in mathematics
Major in mathematicsbut no major in mathematics education
Major in mathematicsand mathematics education
%
Note: Data for South Africa refer to grade 9 instead of 8.Source: IEA (2019).
353 C H A P T E R 1 9 • TEAChERS
19
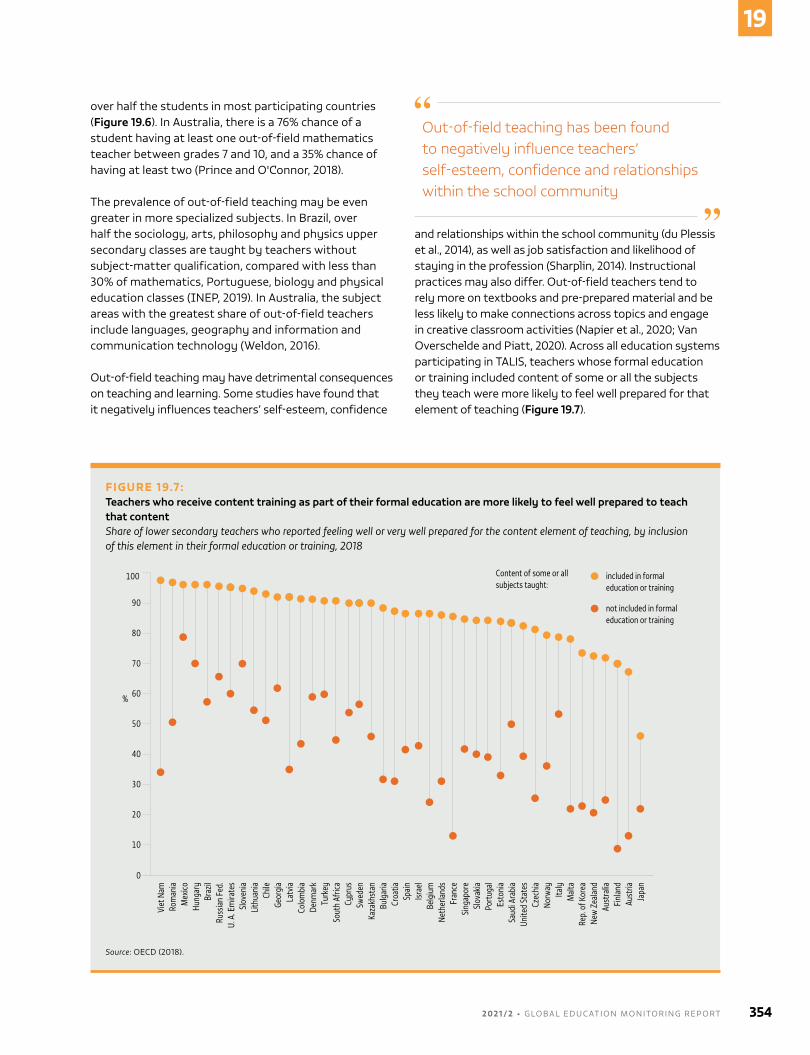
over half the students in most participating countries (Figure 19.6). In Australia, there is a 76% chance of a student having at least one out-of-field mathematics teacher between grades 7 and 10, and a 35% chance of having at least two (Prince and o'Connor, 2018).
The prevalence of out-of-field teaching may be even greater in more specialized subjects. In brazil, over half the sociology, arts, philosophy and physics upper secondary classes are taught by teachers without subject-matter qualification, compared with less than 30% of mathematics, Portuguese, biology and physical education classes (InEP, 2019). In Australia, the subject areas with the greatest share of out-of-field teachers include languages, geography and information and communication technology (Weldon, 2016).
out-of-field teaching may have detrimental consequences on teaching and learning. Some studies have found that it negatively influences teachers’ self-esteem, confidence
and relationships within the school community (du Plessis et al., 2014), as well as job satisfaction and likelihood of staying in the profession (Sharplin, 2014). Instructional practices may also differ. out-of-field teachers tend to rely more on textbooks and pre-prepared material and be less likely to make connections across topics and engage in creative classroom activities (napier et al., 2020; van overschelde and Piatt, 2020). Across all education systems participating in TAlIS, teachers whose formal education or training included content of some or all the subjects they teach were more likely to feel well prepared for that element of teaching (Figure 19.7).
FIGURE 19.7:Teachers who receive content training as part of their formal education are more likely to feel well prepared to teach that contentShare of lower secondary teachers who reported feeling well or very well prepared for the content element of teaching, by inclusion of this element in their formal education or training, 2018
Guatemala, 2014
2018
10
Guatemala, 2014
2018
Viet
Nam
Rom
ania
Mex
icoHu
ngar
yBr
azil
Russ
ian
Fed.
U. A
. Em
irate
sSl
oven
iaLi
thua
nia
Chile
Geor
gia
Latv
iaCo
lom
bia
Denm
ark
Turk
eySo
uth
Afric
aCy
prus
Swed
enKa
zakh
stan
Bulg
aria
Croa
tiaSp
ain
Israe
lBe
lgiu
mNe
ther
land
sFr
ance
Sing
apor
eSl
ovak
iaPo
rtug
alEs
toni
aSa
udi A
rabi
aUn
ited
Stat
esCz
echi
aNo
rway
Italy
Mal
taRe
p. o
f Kor
eaNe
w Z
eala
ndAu
stra
liaFi
nlan
dAu
stria
Japa
n
100
90
80
70
60
50
40
30
20
0
%
not included in formal education or training
included in formal education or training
Content of some or all subjects taught:
Source: oECD (2018).
Out-of-field teaching has been found to negatively influence teachers’ self-esteem, confidence and relationships within the school community
2 0 2 1 / 2 • G LO BA L E D U C AT I O N M O N I TO R I N G R E P O RT 354
19
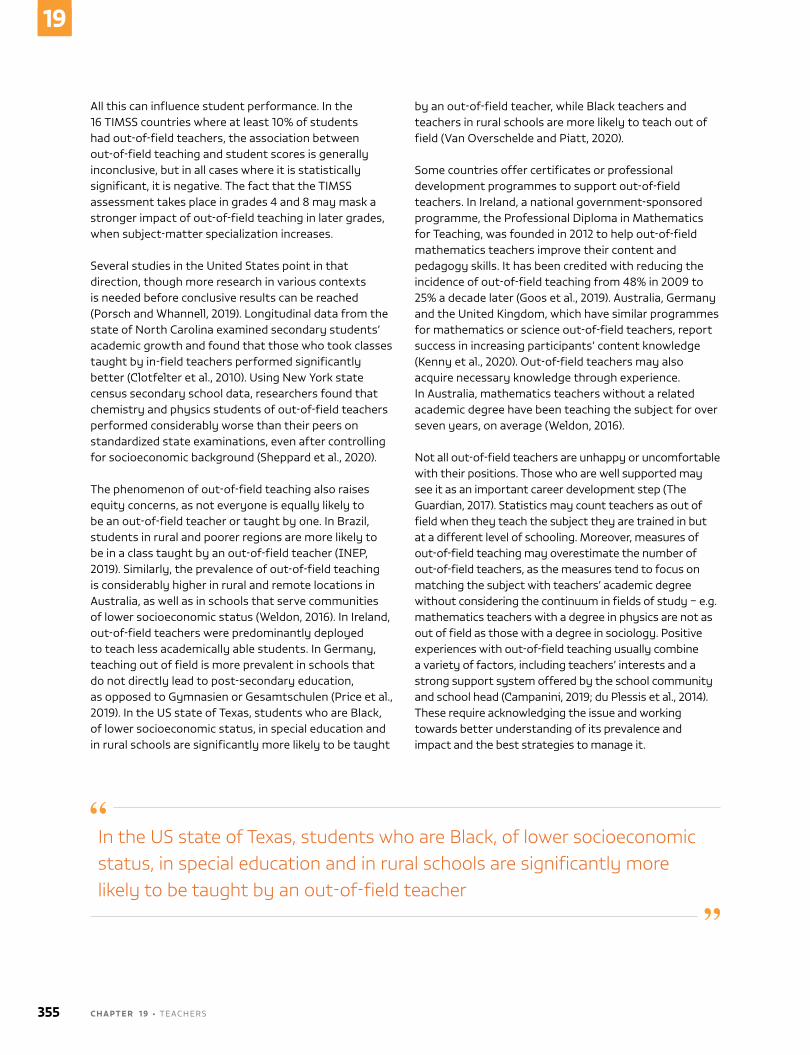
All this can influence student performance. In the 16 TImSS countries where at least 10% of students had out-of-field teachers, the association between out-of-field teaching and student scores is generally inconclusive, but in all cases where it is statistically significant, it is negative. The fact that the TImSS assessment takes place in grades 4 and 8 may mask a stronger impact of out-of-field teaching in later grades, when subject-matter specialization increases.
Several studies in the united States point in that direction, though more research in various contexts is needed before conclusive results can be reached (Porsch and Whannell, 2019). longitudinal data from the state of north Carolina examined secondary students’ academic growth and found that those who took classes taught by in-field teachers performed significantly better (Clotfelter et al., 2010). using new York state census secondary school data, researchers found that chemistry and physics students of out-of-field teachers performed considerably worse than their peers on standardized state examinations, even after controlling for socioeconomic background (Sheppard et al., 2020).
The phenomenon of out-of-field teaching also raises equity concerns, as not everyone is equally likely to be an out-of-field teacher or taught by one. In brazil, students in rural and poorer regions are more likely to be in a class taught by an out-of-field teacher (InEP, 2019). Similarly, the prevalence of out-of-field teaching is considerably higher in rural and remote locations in Australia, as well as in schools that serve communities of lower socioeconomic status (Weldon, 2016). In Ireland, out-of-field teachers were predominantly deployed to teach less academically able students. In Germany, teaching out of field is more prevalent in schools that do not directly lead to post-secondary education, as opposed to Gymnasien or Gesamtschulen (Price et al., 2019). In the uS state of Texas, students who are black, of lower socioeconomic status, in special education and in rural schools are significantly more likely to be taught
by an out-of-field teacher, while black teachers and teachers in rural schools are more likely to teach out of field (van overschelde and Piatt, 2020).
Some countries offer certificates or professional development programmes to support out-of-field teachers. In Ireland, a national government-sponsored programme, the Professional Diploma in mathematics for Teaching, was founded in 2012 to help out-of-field mathematics teachers improve their content and pedagogy skills. It has been credited with reducing the incidence of out-of-field teaching from 48% in 2009 to 25% a decade later (Goos et al., 2019). Australia, Germany and the united Kingdom, which have similar programmes for mathematics or science out-of-field teachers, report success in increasing participants’ content knowledge (Kenny et al., 2020). out-of-field teachers may also acquire necessary knowledge through experience. In Australia, mathematics teachers without a related academic degree have been teaching the subject for over seven years, on average (Weldon, 2016).
not all out-of-field teachers are unhappy or uncomfortable with their positions. Those who are well supported may see it as an important career development step (The Guardian, 2017). Statistics may count teachers as out of field when they teach the subject they are trained in but at a different level of schooling. moreover, measures of out-of-field teaching may overestimate the number of out-of-field teachers, as the measures tend to focus on matching the subject with teachers’ academic degree without considering the continuum in fields of study – e.g. mathematics teachers with a degree in physics are not as out of field as those with a degree in sociology. Positive experiences with out-of-field teaching usually combine a variety of factors, including teachers’ interests and a strong support system offered by the school community and school head (Campanini, 2019; du Plessis et al., 2014). These require acknowledging the issue and working towards better understanding of its prevalence and impact and the best strategies to manage it.
In the US state of Texas, students who are Black, of lower socioeconomic status, in special education and in rural schools are significantly more likely to be taught by an out-of-field teacher
355 C H A P T E R 1 9 • TEAChERS
19
COVID-19
Around the world, teachers have been directly affected by the CovID-19 pandemic. In the united States, well over 1,000 educators had died as of September 2021 (maxwell, 2021). In India’s uttar Pradesh state and in South Africa, more than 1,600 teachers died (ndaba, 2021; Rashid, 2021). The pandemic has also posed unprecedented challenges to teachers’ professional lives. School closures found many teachers unprepared for the move to remote learning, uncertain about their role and unfamiliar with the technology. School reopenings found teachers without clear support in making up for loss of instructional time, protecting their own health and taking measures to protect students’ health.
Countries have differed in their designation of teachers as key or front line workers and in the related consequences. Teachers are particularly exposed to CovID-19 infection, sharing a closed room for hours with large numbers of children who are not likely to be vaccinated. Teachers may face distinct requirements for using masks and being tested or vaccinated in the interest of a safe school environment. Prioritizing teachers in national CovID-19 vaccine roll-out plans is essential to making school reopenings possible and safe.
on the supply side, about two thirds of countries reported that teachers were or would be a priority target for vaccination against CovID-19, either through national immunization measures (59%) or the CovAX initiative (7%), which applies to low- and middle-income countries (unESCo et al., 2021). however, vaccine hesitancy has affected demand. In Ethiopia, a country with limited vaccine supply that has not prioritized teachers, a study in the city of Gondar found that only 55% of teachers would accept the vaccine (handebo et al., 2021). In the Canadian province of british Columbia, 90% of over 5,000 teachers reported they were likely or very likely to accept a CovID-19 vaccine (Racey et al., 2021).
In high-income countries, the question of whether to include teachers among occupations for which vaccination is mandatory is politically disputed as a potential human rights violation (Dzehtsiarou, 2021). The few countries and territories to have taken that step include new zealand and the Australian state of new South Wales (new South Wales Government, 2021; new zealand Government, 2021). In the united States, 10 states, the District of Columbia and Puerto Rico have introduced vaccination requirements. In hawaii, the policy helped increase the vaccination rate from 80% to 89%. In addition, the federal
government requires teachers at federally run schools and in the federally funded head Start and Early head Start programmes to be vaccinated (White house, 2021). Some education authorities, on the other hand, have introduced frequent testing for unvaccinated teachers, as in hong Kong, China (Cheung, 2021).
one way to limit infection in schools is to reduce the number of students sharing a classroom. About 3 in 10 countries in 2020 and 4 in 10 in 2021 reported recruiting additional teachers to support school reopening efforts (unESCo et al., 2021). In sub-Saharan Africa, 26% of countries reported hiring more teachers (ADEA et al., 2021). however, the size of such recruitment drives is unclear, as is whether they were intended to support smaller classrooms. They may instead have reflected the resumption of hiring processes that were frozen in 2020, as in uganda, or replacement of teachers who died or resigned, as in South Africa’s Eastern Cape province (Funani, 2021; Xinhua, 2021). Where reductions in class size were achieved, it was not by reducing the pupil/teacher headcount ratio but by double-shifting, as in Rwanda, reducing the number of in-person teaching hours, as in mozambique, and making adjustments such as moving learning outdoors or using other school facilities (ADEA et al., 2021).
more generally, however, evidence on teacher attrition has been mixed. In the united Kingdom, the primary and secondary school teacher leaving rates fell by 17% between 2019 and 2020. School closures and lockdowns in march 2020 hindered teacher interviewing, making moving jobs challenging and teachers reluctant to leave due to uncertain prospects in a recession (Worth, 2021). In the uS state of north Carolina, average teacher attrition was lower, as is common during recessions, but attrition was higher among teachers close to retirement age, in schools serving disadvantaged students and in schools using hybrid rather than remote modality (bastian and Crittenden Fuller, 2021). In the state of California, an increase in retirements, resignations and leaves of absence since the onset of the pandemic has caused severe shortages in small, rural districts, particularly in subjects such as mathematics and science (Carver-Thomas et al., 2021).
Absence of attrition in the short term does not mean increased stress and burnout will not take their toll in the medium to long run in low-, middle- and high-income countries (Goldberg, 2021; mwesigwa, 2021; Reid and Cranston, 2021). A nationally representative study in the united States found in January 2021 that nearly
2 0 2 1 / 2 • G LO BA L E D U C AT I O N M O N I TO R I N G R E P O RT 356
19
25% of teachers indicated a desire to leave their jobs at the end of the school year, compared with an average national turnover rate of 16% prior to the pandemic (Steiner and Woo, 2021; zamarro et al., 2021). In a survey of over 20,000 teachers in 165 countries, 39% stated that their physical, mental and emotional well-being had suffered during the pandemic. on the other hand, 50% of respondents stated that they felt more enthusiastic about their vocation (Pota et al., 2021).
Teacher education has also been affected by school closures and the limitations of remote learning. In some cases, where the infrastructure was available, there were new opportunities. Israel’s ministry of Education set up an initial teacher education programme to attract unemployed graduates to teaching, granting autonomy to training institutes to develop their own programmes. After an initial three-month online training period, trainees started teaching, while their education continued for a year. The ability to teach remotely made the profession more attractive to this target group (Ramot and Donitsa-Schmidt, 2021).
but in most cases, the challenges increased. In Australia and Chile, student teachers expressed concerns about lack of interaction with peers, trainers and students,
along with a sense of isolation and the potential effect on their professional development (blackley et al., 2021; Sepulveda-Escobar and morrison, 2020). As pre-service programmes moved online, trainees lost their practical classroom experience, as in Ireland (White and mcSharry, 2021). In the Russian Federation, only the largest of the country’s 300 teacher education institutions had the resources to change their organization, teaching management and online learning platforms (valeeva and Kalimullin, 2021). In middle-income countries, such as Ghana, online modalities were introduced but could not be rolled out effectively because of trainees’ lack of preparedness and access to technology (Salifu and Todd, 2020).
The crisis has raised questions over shifts needed in the content of teacher education. In Germany, young teachers with digital skills adapted more easily to online teaching (König et al., 2020). but beyond technological knowledge, teachers need to respond to new social-emotional and academic needs of students. mentoring that supports teachers in learning to play these new roles will be needed, along with time for collaboration among educators (Darling-hammond and hyler, 2020).
357 C H A P T E R 1 9 • TEAChERS
19

2 0 2 1 / 2 • G LO BA L E D U C AT I O N M O N I TO R I N G R E P O RT 358
19
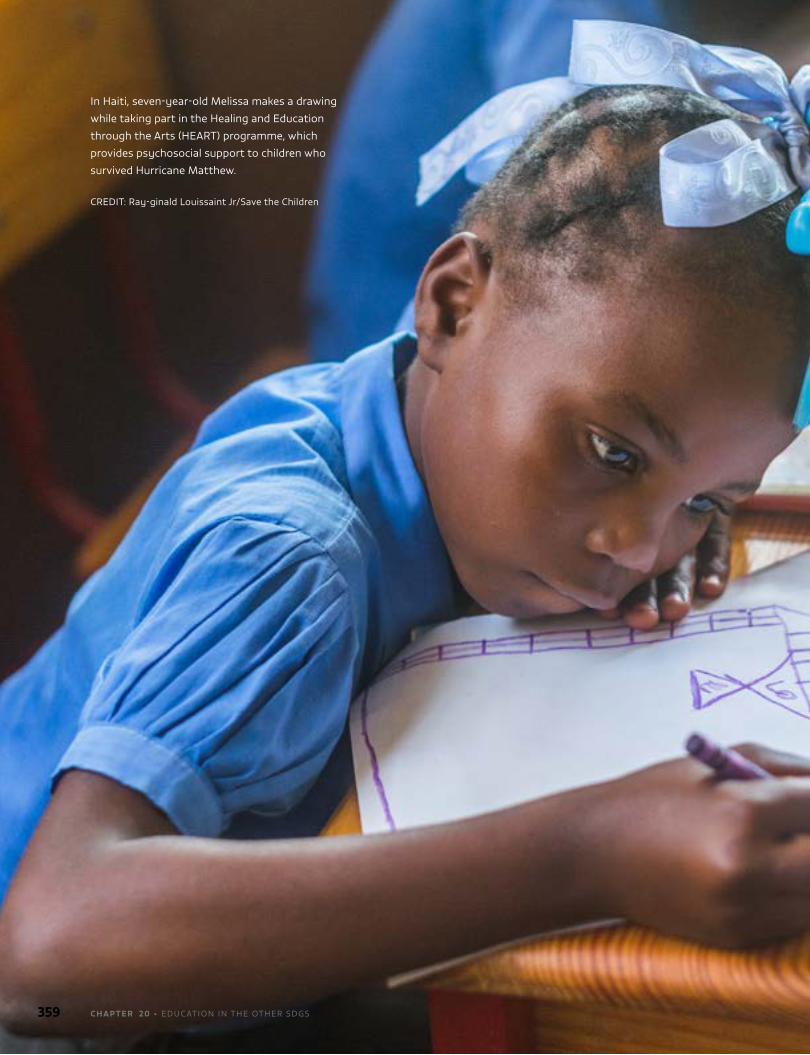
359 C H A P T E R 2 0 • EDuCATIon In ThE oThER SDGS
In haiti, seven-year-old melissa makes a drawing
while taking part in the healing and Education
through the Arts (hEART) programme, which
provides psychosocial support to children who
survived hurricane matthew.
CREDIT: Ray-ginald louissaint Jr/Save the Children
20
360C H A P T E R 2 0 • EDuCATIon In ThE oThER SDGS
CHAPTER
Education in the other SDGs
A focus on energy, infrastructure and sustainable consumption
(Global indicators from goals other than SDG 4 that are education-related)
GLOBAL INDICATOR
1.A.2 – Proportion of total government spending on essential services (education,
health and social protection)
5.6.2 – Number of countries with laws and regulations that guarantee full and
equal access to women and men aged 15 years and older to sexual and reproductive
health care, information and education
8.6.1 – Proportion of youth (aged 15–24 years) not in education, employment
or training
4.7.1/12.8.1/13.3.1 – Extent to which (i) global citizenship education and (ii)
education for sustainable development are mainstreamed in (a) national education
policies, (b) curricula, (c) teacher education, and (d) student assessment
K E Y M E S S AG E SEducation is substantially affected by access to electricity, energy and internet connectivity. A review of 50 impact evaluations, mostly from India and Peru, found that electrification led to a 7% increase in school enrolment, with greater benefits for girls than for boys.
A study of education choices linked to 115,000 roads built in India’s flagship road construction programme between 2001 and 2015 found that connecting a village with a new paved road caused a 7% increase in lower secondary school enrolment over the following three years.
A household survey in Nepal found that a literate household head reduced the household’s firewood demand by around 8% compared with a non-literate household, possibly because of knowledge of the negative impact of smoke pollution.
Analysis of household choice of solar energy for domestic purposes in Ethiopia, Kenya and Uganda found that education level was among key factors encouraging adoption.
Curricular interventions can improve sustainable consumption and production practices. The Sustainable Energy Network supports teaching on sustainable energy in upper secondary and tertiary education through topics such as renewable and alternative energy systems.
A workforce with new skills and specializations is needed to address sustainability challenges. It has been estimated that building a fully renewable energy sector would require 43 million jobs to be created by 2050.
361 C H A P T E R 2 0 • EDuCATIon In ThE oThER SDGS
20
Sustainable Development Goals 7 (energy), 9 (infrastructure, industrialization and innovation)
and 12 (sustainable consumption and production) contribute to efforts towards sustainable economic growth through clean industry and circular economy principles. Progress in some of these areas can also support education. At the same time, improvements in education help countries achieve energy, industrialization and sustainable consumption objectives, particularly development of professional capacity to meet countries’ technological advancement needs.
IMPROVED ENERGY AND INFRASTRUCTURE SUPPORT EDUCATION
of the 759 million people in the world who lacked access to electricity in 2019, 84% lived in rural areas (IEA et al., 2021). Education is substantially affected by access to electricity, a fact that the CovID-19 pandemic has further emphasized. A review of 50 impact evaluations, mostly from India and Peru, found that electrification led to a 7% increase in school enrolment, with greater benefits for girls than for boys. Similarly affected were years of schooling, attendance, literacy and time allocated to study at home (Jimenez, 2017). A comparison of time usage data among households with and without electricity access in burkina Faso, Rwanda and Senegal shows that children shifted study time from day to night with electrification, and study time increased cumulatively in Senegal (Peters and Sievert, 2016).
Access to energy at home can play a significant role in allowing children to participate in education activities. In South Asia, women and girls spend one hour a day gathering fuel and around four hours a day cooking (bloomfield, 2014). being able to shift from procuring fuel and cooking with inefficient stoves to attending school and studying enabled positive educational outcomes. bhutan’s rural electrification programme helped reduce fuelwood use and led to 0.8 more years of schooling, with stronger effects for girls than boys, potentially due to reduced time burden for girls’ chores (litzow et al., 2019). Energy poverty in the lao People’s Democratic Republic had a negative impact on households’ average years of schooling (oum, 2019). In nigeria, school enrolment increased, particularly for girls, among households with access to electricity (nano, 2021).
Access to energy in schools can help improve the learning environment and expand access to learning resources (Chapter 17). The Energy Sector management Assistance Program with support from the Sustainable Energy for All initiative surveyed education facility electrification status in Cambodia, Ethiopia, Kenya, myanmar, nepal and niger. They found, for instance, that 72% of schools in Kenya, but only 22% in Ethiopia, had access to the national public grid. new country surveys and data are to be made systematically available by 2024 (IEA et al., 2020).
Improvements to mobile networks, internet connectivity and road infrastructure can also help improve access to education if support measures are taken. Analysis of staggered entry of 3G into brazil’s 5,570 municipalities showed mobile internet had no effects on test scores for grade 5 and 9 students, suggesting that high-speed internet was not sufficient to improve education outcomes (bessone et al., 2021). however, a separate analysis of internet access showed possible improvement in test scores if policy initiatives focused on both school and home internet access and incorporated internet-based educational tools (badasyan and Silva, 2018).
Analysis of 173 classrooms in 15 predominantly rural school districts in the uS state of michigan found that students who lacked internet access at home or depended on mobile phones had worse digital skills, were less likely to complete homework and had worse standardized test scores than peers with home internet. They were less likely to consider post-secondary education and had less interest in careers in science, technology, engineering and mathematics (hampton et al., 2020).
Roads help alleviate poverty and promote economic and social development, including education outcomes. In brazil’s Tocantins state, improved roads led to higher attendance by girls in two regions and a decline in the perception that road conditions prevent school access (Iimi et al., 2015). In the Colombian department of Antioquia, improved rural roads were associated with improved education performance for rural students (hincapie-velez et al., 2017). Residents of peri-urban areas around Accra, Ghana, and Kisumu, Kenya, agreed that primary school accessibility improved substantially after road expansion (Khanani et al., 2021).
Access to energy at home can play a significant role in allowing children to participate in education activities
2 0 2 1 / 2 • G LO BA L E D U C AT I O N M O N I TO R I N G R E P O RT 362
20
A study of education choices linked to 115,000 roads built in India’s flagship road construction programme between 2001 and 2015 found that connecting a village with a new paved road caused a 7% increase in lower secondary school enrolment over the following three years and that children stayed in school longer and performed better on standardized examinations (Adukia et al., 2020). however, another study cautioned that improved access to urban markets improved enrolment of younger children but offered older children an incentive to leave school early to join the labour force (Aggarwal, 2018).
EDUCATION CAN SUPPORT ACHIEVEMENT OF ENERGY AND SUSTAINABILITY OBJECTIVES
Education has the potential to help people and societies make better choices regarding energy and sustainable consumption, although many questions remain about what type of education is most effective in achieving these results and the channels through which knowledge changes not just attitudes but also behaviour.
A systematic review of 160 studies on cooking energy found that education, along with income, influenced the adoption of modern cooking energy sources (ESmAP, 2021). A household survey in nepal found that a literate household head reduced its firewood demand by around 8% compared with a non-literate household, possibly because of knowledge of the negative impact of smoke pollution (Sharma, 2018). Similarly, education attainment was a driver for changing fuel source in households in Delhi, India, even after controlling for fuel prices and electricity access (Ahmad and Puppim de oliveira, 2015). A large survey in India’s Kerala and Rajasthan states found that education was a predictor of clean cooking fuel adoption, although not as a result of attitudinal changes (Gould and urpelainen, 2020). Analysis of household choice of solar energy for domestic purposes in Ethiopia, Kenya and uganda found that education level was among key factors encouraging adoption (Rahut et al., 2018).
Analysis of data across OECD countries showed that education increased environmental awareness among citizens and could reduce carbon emissions
Analysis of data from 1990 to 2015 across organisation for Economic Co-operation and Development countries showed that education increased environmental awareness among citizens and could reduce carbon emissions (zafar et al., 2020). In Europe, analysis of two waves of Eurobarometer surveys found that education increased individuals’ awareness of the need for more environment-friendly behaviour (meyer, 2015). Analysis of utility-level data from across the united States found education to be a key factor in demand for green electricity (Conte and Jacobsen, 2016). In China, household survey analysis showed that for each additional year of household education, the expressed willingness to pay for environmental protection increased by nearly 30% (Tianyu and meng, 2020).
The education level and awareness of corporate leaders is a key driver of sustainable production practices (Reisch et al., 2016). An online survey of 766 chief executive officers (CEos) in nearly 100 countries found that they viewed education as the most critical development issue for the success of their business and for development of skills, knowledge and mindset in the next generation of business leaders to accelerate integration of sustainability into core business (lacy et al., 2012).
Analysis of Chinese enterprises from 2008 to 2017 found that enterprises with highly educated CEos were more likely to engage in environmental innovation, particularly in regions with strict environmental pressures (zhou et al., 2021). In Denmark, analysis of the effect of CEo education on green orientation in private life and corporate decisions found that better-educated CEos expressed more concern for climate change, were more likely to own energy-efficient cars and helped improve sustainability in corporate actions (Amore et al., 2019). In viet nam, an analysis of 810 small and medium-sized enterprises found that CEo education level was positively related to corporate environmental performance (Tran and Pham, 2020). An analysis of pollution-intensive companies in Thailand found education level positively correlated with environmental information disclosure (li et al., 2019).
363 C H A P T E R 2 0 • EDuCATIon In ThE oThER SDGS
20
AWARENESS CAMPAIGNS CAN PLAY AN IMPORTANT ROLE
Awareness campaigns, a form of adult education, can foster behaviour change that contributes to sustainability. For instance, while governments may supply renewable energy infrastructure, households may not demand such energy because of lack of awareness and the cost of switching. In bangladesh, the government-owned Infrastructure Development Company limited launched an intensive customer awareness campaign in 2017, which increased mini-solar grid uptake by 500% (IEA et al., 2020).
In recent years, meat consumption has been acknowledged as a key contributor to greenhouse gas emissions (Rust et al., 2020). A diet with less meat is viewed as the single biggest way individuals can reduce their environmental impact (Poore and nemecek, 2018). meat is also related to some types of ill health, so changes in consumption may be difficult to associate with a specific motivation. overall, education tends to be associated with lower meat consumption. In belgium’s Flanders region, having secondary rather than higher education doubled the probability of being a meat eater rather than a flexitarian (De backer and hudders, 2015). In Germany, both individual and average household education levels were associated with reduced meat consumption, an effect stronger for younger households (Einhorn, 2020). In Chile, people who cited environmental reasons for their decision to stop eating meat tended to be more educated (Giacoman et al., 2021).
Responsiveness to public information can also be related to education. A study of consumption patterns in Italy, following a public health warning, showed that educated households reduced their long-term red meat consumption (Carrieri and Principe, 2020). however, a systematic review of 59 interventions found that providing information about the health or environmental consequences of eating meat did not reduce meat consumption, on average; campaigns emphasizing animal welfare were more effective (bianchi et al., 2018). Slow Food, a grass-roots organization in 160 countries that opposes overproduction and food waste, launched the meat the Change campaign in January 2020 to change meat-eating habits, promoting sustainable farming and less meat consumption (Slow Food International, 2020).
Waste reduction, especially as regards food, plastic and clothing, is another imperative. Save Food, an initiative of the Food and Agriculture organization
of the united nations and messe Düsseldorf, aims to reduce food loss and waste by encouraging dialogue among industry, research, politicians and civil society. one of its projects, focusing on developing educational packages so teachers could teach young people to value food and reduce its loss, involved primary and secondary age groups in Albania, Croatia, hungary, Turkey and ukraine. Another project raised awareness and built capacity among small-scale entrepreneurs in Timor-leste for use of good practice in processing, packing and labelling their products (FAo, 2017).
In the clothing industry, non-governmental organizations generate awareness of the clothing value chain’s negative environmental and societal impact. They challenge industry to find systemic solutions to overconsumption, including through production technology and development of materials that pollute less than those now used (Ellen macArthur Foundation, 2017). The un Alliance for Sustainable Fashion, launched in 2018 by seven un agencies in nairobi, Kenya, maps initiatives and partnerships addressing interlinkage between sustainable fashion and the 17 SDGs. Those related to SDG 4 include initiatives by the International labour organization and partners to advance working conditions, labour rights and competitiveness (meier, 2021). The 2020 Circular Fashion System Commitment, introduced by the Global Fashion Agenda, aims to foster circular economy principles; 94 companies representing around 12.5% of the global fashion market have signed on (Wu and li, 2019).
EDUCATION INSTITUTIONS NEED TO IMPROVE UNDERSTANDING OF ENERGY, TRANSPORT AND OTHER SUSTAINABILITY CHALLENGES
There have been many attempts to frame the curricular challenge of sustainability, as well as suggestions for specific curricular interventions related to sustainable consumption and production practices, including on energy, diet and waste. The Sustainable Energy network, established by the un initiative Future Earth, is a framework based on teaching programmes and interdisciplinary textbooks to support teaching on sustainable energy in upper secondary and tertiary education through topics such as renewable and alternative energy systems (nowotny et al., 2018). national curricula incorporating energy education include the national Energy Education Development Project in the united States, with topics such as energy sources, electricity, transport, efficiency and
2 0 2 1 / 2 • G LO BA L E D U C AT I O N M O N I TO R I N G R E P O RT 364
20
conservation (nEED, 2021). Education programmes promoting efficient cooking technology also need to include aspects of sustainable energy use. An analysis of 200 households in rural namibia showed that such interventions can affect energy-related attitudes and behaviours, including openness to solar energy as an alternative to biomass (lindgren, 2021a, 2021b).
A review of 58 sustainable consumption teaching initiatives by the Sustainable Consumption Research and Action Initiative found that most undergraduate and graduate courses were offered in European countries, often as part of environmental science programmes. many courses had a holistic, system-wide perspective and goals for transformative social change (Sahakian and Seyfang, 2018).
universities are critical not only for technology development but also for contributing to its assimilation and absorption. The economic, health and environmental benefits of a rapid transition to clean energy have been promoted through research and dissemination by prominent universities and think tanks (Esposito, 2021). higher education institutions globally also function as exemplars, leading the implementation of renewable energy and energy efficiency initiatives. An analysis of 157 universities in 13 latin American countries found that more than 80% incorporated sustainability initiatives, with an emphasis on campus operations (leal Filho et al., 2021). The better buildings Alliance includes 31 colleges and universities that share best practice to advance energy savings (u.S. Department of Energy, 2021).
EDUCATION INSTITUTIONS NEED TO CONTRIBUTE PROFESSIONAL CAPACITY TO ADDRESS SUSTAINABILITY CHALLENGES
Delivering transformation for equitable access to sustainable energy, infrastructure and production requires a professional workforce with new skills and specializations. For instance, achieving the Paris Agreement target of limiting global warming by 2050 to 1.5°C requires professionals with diverse profiles to implement unprecedented energy transition strategies. The necessary skills, of varying levels of complexity, can partly come from existing industries, but new skill development policies will also be needed. Science, technology, engineering and mathematics professionals will need to collaborate with experts in law, logistics and market regulation. Retraining can help redeploy construction workers and technicians for the manufacture, installation and maintenance of solar water heaters and wind turbines. In the ambitious scenario, the number of jobs in renewable energy
has grown from 7.3 million in 2012 to 16.5 million in 2021 and will need to reach 38 million in 2030 before stabilizing to 43 million in 2050 out of 122 million jobs in the energy sector. The share of renewable energy in total jobs in the energy sector will therefore be 35% in 2050 or double the level in 2021 (IREnA, 2021).
Assessments show substantial skills gaps in developing, designing, financing, building, operating and maintaining renewable energy projects (oECD, 2020). General education curricula will need to instil appreciation of the challenge and interest in renewable energy careers from a young age, and technical, vocational and higher education curricula will need to be adjusted to focus on development of higher skills, notably in engineering (WFEo, 2018).
An assessment of 150 decentralized renewable energy sector companies in India, Kenya and nigeria showed 210,000 informal jobs in India (vs 95,000 formal jobs), 15,000 in Kenya (vs 10,000 formal) and 9,000 in nigeria (vs 4,000 formal) (Power for All et al., 2019). Consultations with surveyed companies highlighted the need to significantly improve training in managerial, finance, legal and sales roles to improve the extent to which these jobs are filled locally and absorbed in the formal labour market (Power dor All, 2020).
Accelerated design and implementation of capacity development plans are needed. Poor countries lack capacity to absorb skills in the clean energy transition and thus cannot participate equally in low-carbon energy technology value chains. A global review of skills for green jobs showed that the skills gaps will lead to project delays or cancellations, excessive costs and faulty installations (hafner and Tagliapietra, 2020). A review of 46 countries that submitted voluntary national reviews featuring energy sector analyses to the 2018 high-level Political Forum found that only about a third outlined plans to scale up capacity and education to develop the skills to support energy sector transformation. Togo planned to create solar academies
An analysis of 157 universities in 13 Latin American countries found that more than 80% incorporated sustainability initiatives, with an emphasis on campus operations
365 C H A P T E R 2 0 • EDuCATIon In ThE oThER SDGS
20
to train 3,000 technicians in 2017–18 (unDESA, 2018). but a mapping of 32 countries’ nationally Determined Contributions, which are non-binding plans with public policies and measures in response to climate change, showed that almost 75% included training or capacity building measures (Ilo, 2020).
Several global partnerships finance capacity-building projects to help countries achieve their sustainable energy goals. The Energy Sector management Assistance Program, a partnership of the World bank and 19 other entities, supports energy transition activities in low- and middle-income countries, including on clean cooking, renewables, electricity access, accelerated decarbonization and gender gap reduction. In Tuvalu, the programme supported a study on variable renewable energy and integration, and organized workshops to develop the national utility’s technical and institutional capacity (ESmAP, 2020). The International Renewable Energy Agency trained national experts in Eswatini to help develop the Energy masterplan 2034 and a roadmap to a sustainable energy future (KfW Development bank et al., 2021).
Improved coordination is often needed between the renewable energy industry and education institutions to develop effective curricula and support vocational training courses and apprenticeships (IREnA et al., 2018). As part of morocco’s nooro I solar power project, the university of ouarzazate introduced curricula on renewables to develop local research capacity but none of the 100 students who graduated with a degree in renewables found jobs matching their qualifications during the project construction phase (Wuppertal Institute and Germanwatch, 2015).
Even high-income countries face challenges. For instance, Canada is one of the countries that joined the Clean Energy Education and Empowerment initiative, which aims to promote gender equality in the energy sector
and increase education and employment opportunities for women. Singapore has instituted a vocational training programme to build the technical competence of the local workforce (unDESA, 2018). In the united Kingdom, a green apprenticeship fund for small and medium-sized enterprises has been proposed to help fill an expected green skills gap in construction (Watkins and hochlaf, 2021). The uS Department of Energy is promoting workforce development with improved science curricula in education and training systems through the better buildings Workforce Accelerator (uS Department of Energy, 2021). The national Center for Sustainable Transportation, a consortium of leading uS universities, is developing strategies to make careers and training in transport more attractive through first-person testimonies about work in the sector (mcRae et al., 2019).
CONCLUSION
In the race to achieve the SDGs by 2030, there has been laudable progress in improving renewable energy technology, supported by major investment in the transition to solar and wind power. There is also growing awareness of the need to consume and produce sustainably. however, improvement in areas of goals that are not as market oriented – e.g. equitable access to clean cooking technology, expertise on renewables, financial assistance to the least developed countries for capacity building, diverse and equitable workforce development – has been marked by struggle.
Education supports the achievement of sustainability objectives. Education institutions need to improve students’ understanding of energy and other sustainability challenges. Public awareness can contribute to broader social change. Professional capacity development needs to take place at an unprecedented pace to support the green transition.
Improved coordination is often needed between the renewable energy industry and education institutions to develop effective curricula
2 0 2 1 / 2 • G LO BA L E D U C AT I O N M O N I TO R I N G R E P O RT 366
20
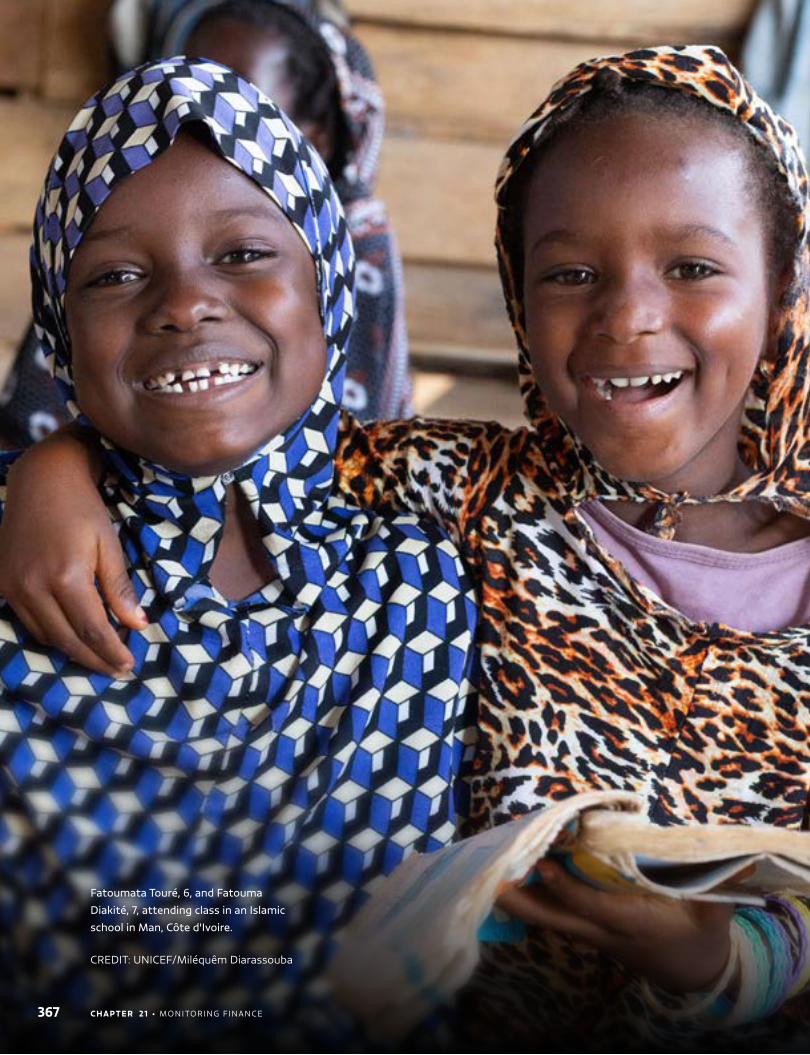
Fatoumata Touré, 6, and Fatouma
Diakité, 7, attending class in an Islamic
school in Man, Côte d'Ivoire.
CREDIT: unICEF/miléquêm Diarassouba
C H A P T E R 2 1 • monIToRInG F InAnCE367
21CHAPTER
368C H A P T E R 2 1 • monIToRInG F InAnCE
Monitoring finance
K E Y M E S S AG E SEducation’s share of total public expenditure grew from 13.8% in 2000 to 14.1% in 2019. Recent data for 71 countries suggest the share decreased to 13.5% in 2021, suggesting a strong COVID-19 impact.
The cost per student in tertiary education is 93% of GDP per capita in low-income and 41% in lower-middle-income countries, but about 25% in upper-middle- and high-income countries.
About US$483 billion is lost to cross-border corporate tax abuse by multinational enterprises and offshore tax evasion by wealthy individuals, of which US$40 billion is lost to poorer countries.
Some countries are quite effective in rolling out programmes that reach the most disadvantaged. Algeria offers an annual education allowance, equivalent to US$23, to 3 million primary and secondary school students: 38% of the poorest but 10% of the richest receive support.
Aid effectiveness means different things to different people. One definition focuses on country ownership and results, transparency and mutual accountability, and inclusive development partnerships. The share of direct budget support in total aid fell from 6.6% in 2002 to 2.5% in 2019.
Analysis of household budget survey reports from about 100 low- and middle-income countries in the 2010s found that education accounted for 3.2% of total household expenditure, ranging as high as 6% or more in Haiti and Lebanon and in sub-Saharan African countries, including Rwanda, Uganda and Zambia.
369 C H A P T E R 2 1 • monIToRInG F InAnCE
21
The Global Education Monitoring Report team has long argued that to understand global education spending,
the three main sources of education financing – domestic public financing, external public financing and private financing – must be examined jointly. In 2021, the team partnered with the World bank on Education Finance Watch, a new annual report series that reviews the main trends on education spending and complements this chapter (World bank and unESCo, 2021).
PUBLIC EXPENDITURE
The Education 2030 Framework for Action called on countries to spend at least 4% of gross domestic product (GDP) and 15% of total public spending on education. While countries are meeting the first benchmark globally – public education expenditure stands at 4.4% of GDP – they are not meeting the second. Education’s share of total public spending has remained stagnant over the past 20 years. It grew from 13.8% in 2000 to 14.1% in 2019; in contrast, health’s share of spending grew from 9.8% to 10.6%. While the increased priority on health may be the result of rising longevity and costlier medical technology for the elderly, education needs have also been growing due to larger school-age population cohorts and ambitious education targets.
At the country level, of 151 countries with data for 2014–19, 48 countries, or 32%, from all regions missed both benchmarks. The 10 countries with the highest education share in government expenditure are low- or middle-income countries, mainly in sub-Saharan Africa (burkina Faso, Eswatini, Ethiopia and Sierra leone) and Central America (Costa Rica, Guatemala, honduras and nicaragua). Tunisia and uzbekistan complete the list (Figure 21.1a).
on average, governments in poorer countries with small budgets but large cohorts of children tend to spend less on education as a share of GDP but more as a share of total government spending. Sub-Saharan Africa has the highest share of government spending on education (16.8%) but is slightly below the education spending benchmark as a share of GDP (3.8%). Conversely, Europe and northern America meets the benchmark as a share of GDP (4.7%) but allocates a low share of total spending to education (11.9%). latin America and the Caribbean
and Central and Southern Asia are the only regions to meet both benchmarks (Figure 21.1b).
Despite education being a greater budget priority, poorer countries spend less on education as a percentage of GDP because of lower capacity to raise revenue (Figure 21.2). In these countries, reaching the share of GDP benchmark for education spending requires more domestic resources. For example, given current levels of total government spending, uganda would have to increase the share of education in its budget from 11.5% to 25% to reach the benchmark of 4% of GDP. more effective and fair taxation can contribute to resource mobilization (Focus 21.1).
The CovID-19 pandemic and its aftermath threaten to squeeze education budgets through a combination of reduced revenue and increased demands from other sectors. Strong calls have been made during the CovID-19 crisis to protect spending on education, which is as important as other sectors that have benefited from government support packages. helping keep schools open and offering remedial classes to children whose learning has suffered represents an investment that will avert future social costs from increased early school leaving and lower learning achievement (unESCo, 2020). Indeed, the equity focus of national education financing policies is slowly gaining more attention (unESCo, 2021) (Focus 21.2).
As countries’ financial years differ, budgets were approved at different times relative to the onset of the first CovID-19 wave, hampering estimation of the CovID-19 impact on spending. Analysis of the first post-CovID budgets in 29 countries representing 54% of the school-age population found that education’s share in total spending did not change much in relative terms. In absolute terms, budgets increased by 4% post-CovID compared with 1.1% pre-CovID. While 65% of low- and lower-middle-income countries in the sample reduced spending, only 33% of upper-middle- and high-income countries did so. These trends suggest that richer countries were able to increase their total spending (World bank and unESCo, 2021). but more recent data collected by the unESCo Institute for Statistics (uIS) for 71 countries suggest that the median education share in total spending decreased by 0.3 percentage points per year between 2019 and 2021, from 14.1% to 13.5%, suggesting a stronger impact of CovID-19 than first predicted (uIS, 2021) (Figure 21.3).
2 0 2 1 / 2 • G LO BA L E D U C AT I O N M O N I TO R I N G R E P O RT 370
21
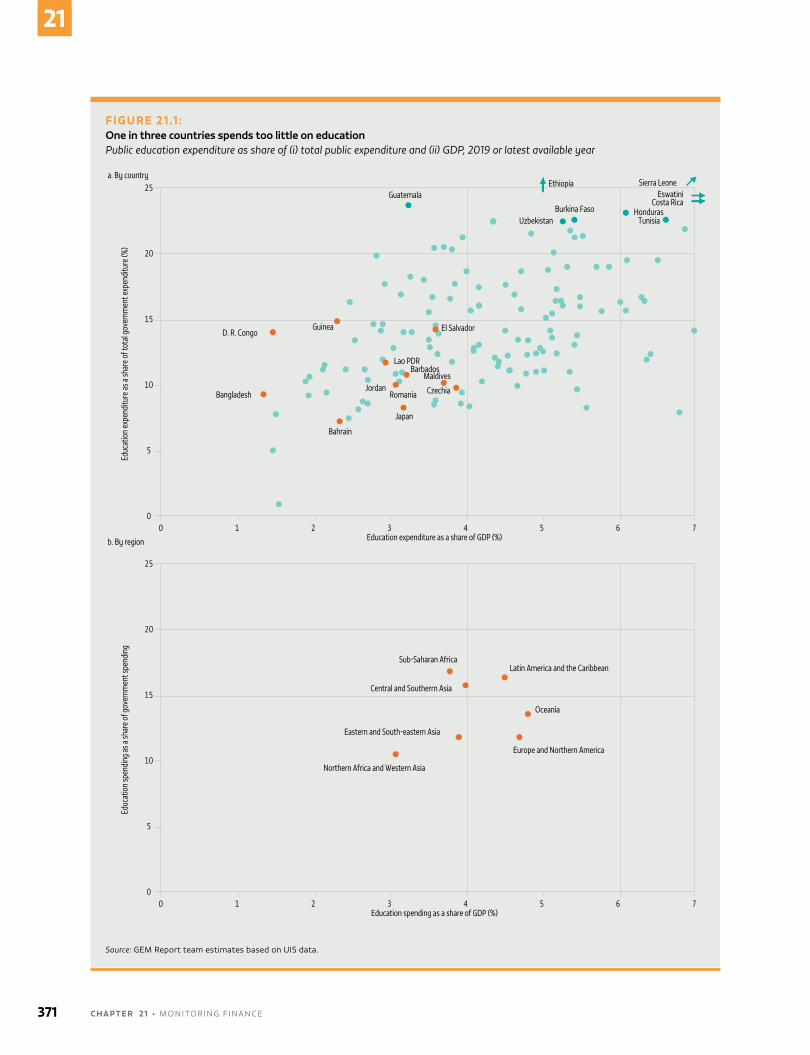
FIGURE 21.1 : One in three countries spends too little on educationPublic education expenditure as share of (i) total public expenditure and (ii) GDP, 2019 or latest available year
Upper secondary
6543210
20
15
10
5
0
25
7Education expenditure as a share of GDP (%)
Educ
atio
n ex
pend
iture
as a
shar
e of t
otal
gove
rnm
ent e
xpen
ditu
re (%
)
D. R. Congo
Bangladesh
Bahrain
Guinea
Jordan
Japan
Czechia
Lao PDRBarbados
Maldives
El Salvador
Guatemala
UzbekistanBurkina Faso
Ethiopia Sierra LeoneEswatini
Costa RicaHonduras
Tunisia
Romania
6543210
20
15
10
5
0
25
7Education spending as a share of GDP (%)
Educ
atio
n sp
endi
ng as
a sh
are o
f gov
ernm
ent s
pend
ing
Sub-Saharan Africa
Central and Southerrn Asia
Eastern and South-eastern Asia
Northern Africa and Western Asia
Europe and Northern America
Oceania
Latin America and the Caribbean
a. By country
b. By region
Source: GEm Report team estimates based on uIS data.
371 C H A P T E R 2 1 • monIToRInG F InAnCE
21
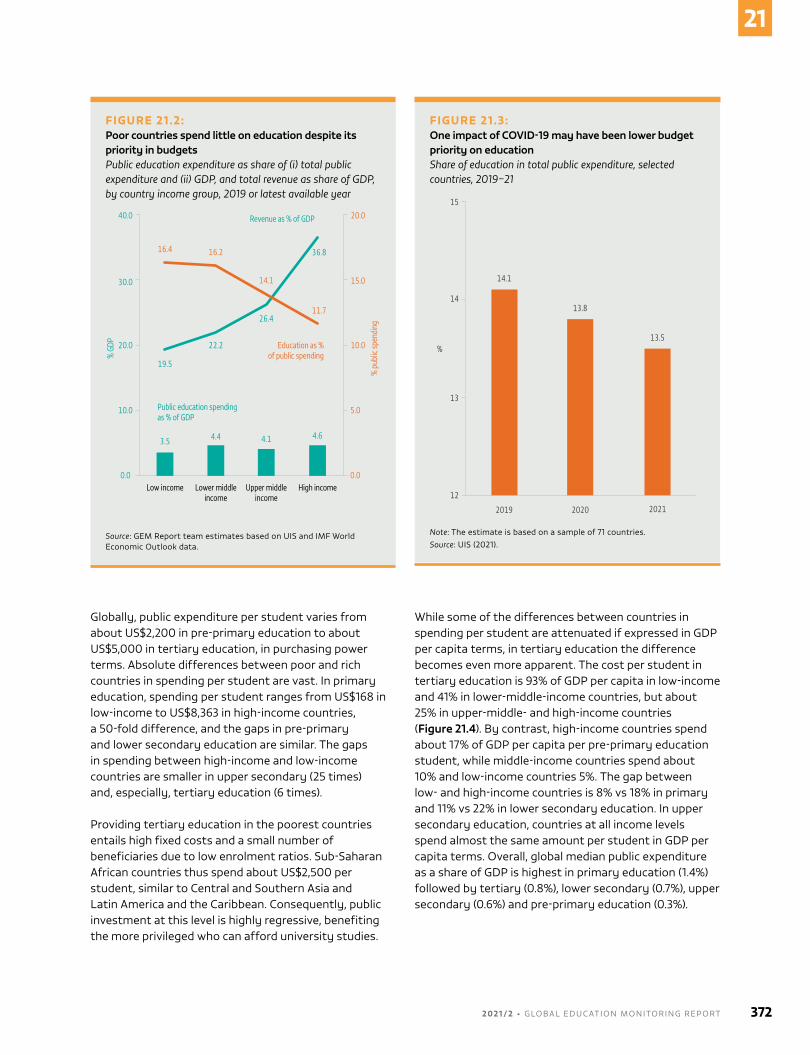
Globally, public expenditure per student varies from about uS$2,200 in pre-primary education to about uS$5,000 in tertiary education, in purchasing power terms. Absolute differences between poor and rich countries in spending per student are vast. In primary education, spending per student ranges from uS$168 in low-income to uS$8,363 in high-income countries, a 50-fold difference, and the gaps in pre-primary and lower secondary education are similar. The gaps in spending between high-income and low-income countries are smaller in upper secondary (25 times) and, especially, tertiary education (6 times).
Providing tertiary education in the poorest countries entails high fixed costs and a small number of beneficiaries due to low enrolment ratios. Sub-Saharan African countries thus spend about uS$2,500 per student, similar to Central and Southern Asia and latin America and the Caribbean. Consequently, public investment at this level is highly regressive, benefiting the more privileged who can afford university studies.
While some of the differences between countries in spending per student are attenuated if expressed in GDP per capita terms, in tertiary education the difference becomes even more apparent. The cost per student in tertiary education is 93% of GDP per capita in low-income and 41% in lower-middle-income countries, but about 25% in upper-middle- and high-income countries (Figure 21.4). by contrast, high-income countries spend about 17% of GDP per capita per pre-primary education student, while middle-income countries spend about 10% and low-income countries 5%. The gap between low- and high-income countries is 8% vs 18% in primary and 11% vs 22% in lower secondary education. In upper secondary education, countries at all income levels spend almost the same amount per student in GDP per capita terms. overall, global median public expenditure as a share of GDP is highest in primary education (1.4%) followed by tertiary (0.8%), lower secondary (0.7%), upper secondary (0.6%) and pre-primary education (0.3%).
FIGURE 21.2:Poor countries spend little on education despite its priority in budgetsPublic education expenditure as share of (i) total public expenditure and (ii) GDP, and total revenue as share of GDP, by country income group, 2019 or latest available year
Upper secondary
Low income
3.5 4.4 4.1 4.6
Public education spendingas % of GDP
Education as %of public spending
% p
ublic
spen
ding
% G
DP
40.0
30.0
20.0
10.0
0.0
20.0
15.0
10.0
5.0
0.0Lower middle
incomeUpper middle
incomeHigh income
Revenue as % of GDP
16.4 16.2
14.1
11.7
19.5
22.2
26.4
36.8
Source: GEm Report team estimates based on uIS and ImF World Economic outlook data.
FIGURE 21.3:One impact of COVID-19 may have been lower budget priority on educationShare of education in total public expenditure, selected countries, 2019–21
Upper secondary
15
12
13
%
14.1
2019 2020 2021
13.8
13.5
14
Note: The estimate is based on a sample of 71 countries.Source: uIS (2021).
2 0 2 1 / 2 • G LO BA L E D U C AT I O N M O N I TO R I N G R E P O RT 372
21
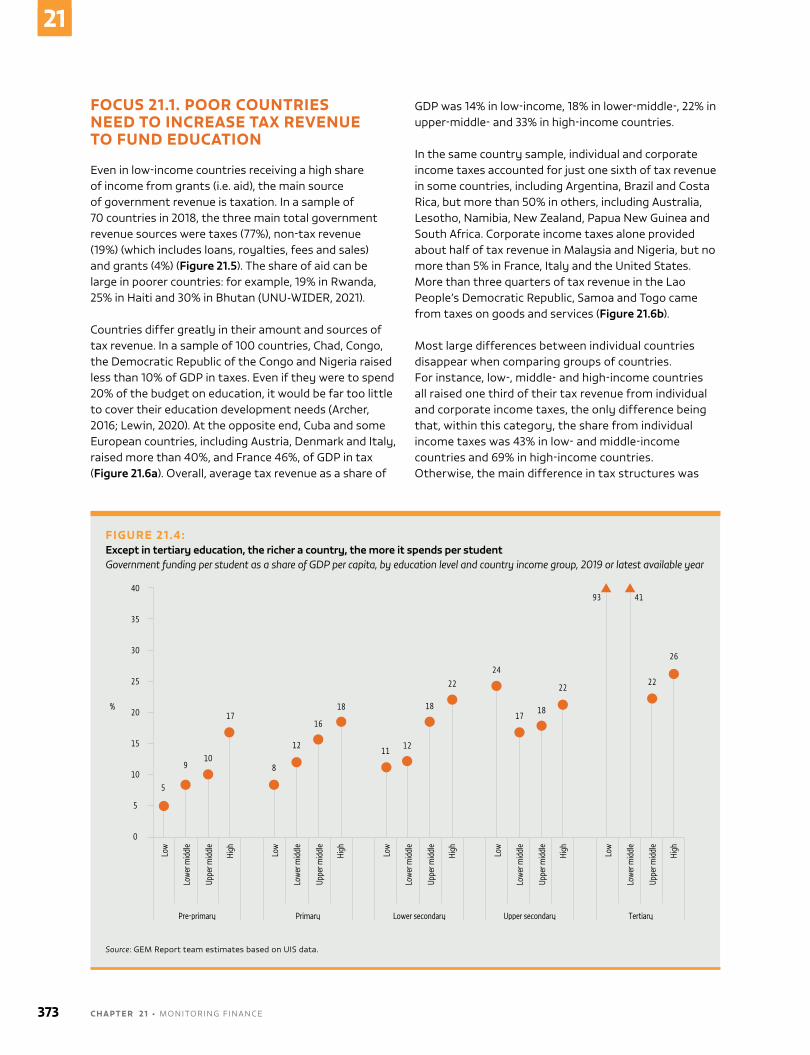
FOCUS 21.1. POOR COUNTRIES NEED TO INCREASE TAX REVENUE TO FUND EDUCATION
Even in low-income countries receiving a high share of income from grants (i.e. aid), the main source of government revenue is taxation. In a sample of 70 countries in 2018, the three main total government revenue sources were taxes (77%), non-tax revenue (19%) (which includes loans, royalties, fees and sales) and grants (4%) (Figure 21.5). The share of aid can be large in poorer countries: for example, 19% in Rwanda, 25% in haiti and 30% in bhutan (unu-WIDER, 2021).
Countries differ greatly in their amount and sources of tax revenue. In a sample of 100 countries, Chad, Congo, the Democratic Republic of the Congo and nigeria raised less than 10% of GDP in taxes. Even if they were to spend 20% of the budget on education, it would be far too little to cover their education development needs (Archer, 2016; lewin, 2020). At the opposite end, Cuba and some European countries, including Austria, Denmark and Italy, raised more than 40%, and France 46%, of GDP in tax (Figure 21.6a). overall, average tax revenue as a share of
GDP was 14% in low-income, 18% in lower-middle-, 22% in upper-middle- and 33% in high-income countries.
In the same country sample, individual and corporate income taxes accounted for just one sixth of tax revenue in some countries, including Argentina, brazil and Costa Rica, but more than 50% in others, including Australia, lesotho, namibia, new zealand, Papua new Guinea and South Africa. Corporate income taxes alone provided about half of tax revenue in malaysia and nigeria, but no more than 5% in France, Italy and the united States. more than three quarters of tax revenue in the lao People’s Democratic Republic, Samoa and Togo came from taxes on goods and services (Figure 21.6b).
most large differences between individual countries disappear when comparing groups of countries. For instance, low-, middle- and high-income countries all raised one third of their tax revenue from individual and corporate income taxes, the only difference being that, within this category, the share from individual income taxes was 43% in low- and middle-income countries and 69% in high-income countries. otherwise, the main difference in tax structures was
FIGURE 21.4: Except in tertiary education, the richer a country, the more it spends per studentGovernment funding per student as a share of GDP per capita, by education level and country income group, 2019 or latest available year
Upper secondary
Low
Lowe
r mid
dle
Uppe
r mid
dle
High Low
Lowe
r mid
dle
Uppe
r mid
dle
High Low
Lowe
r mid
dle
Uppe
r mid
dle
High Low
Lowe
r mid
dle
Uppe
r mid
dle
High Low
Lowe
r mid
dle
Uppe
r mid
dle
High
Pre-primary Primary Lower secondary Upper secondary Tertiary
35
30
25
20
15
10
5
40
5
9
17
8
12
16
18
1112
18
22
24
1718
22
93 41
22
26
10
0
%
Source: GEm Report team estimates based on uIS data.
373 C H A P T E R 2 1 • monIToRInG F InAnCE
21
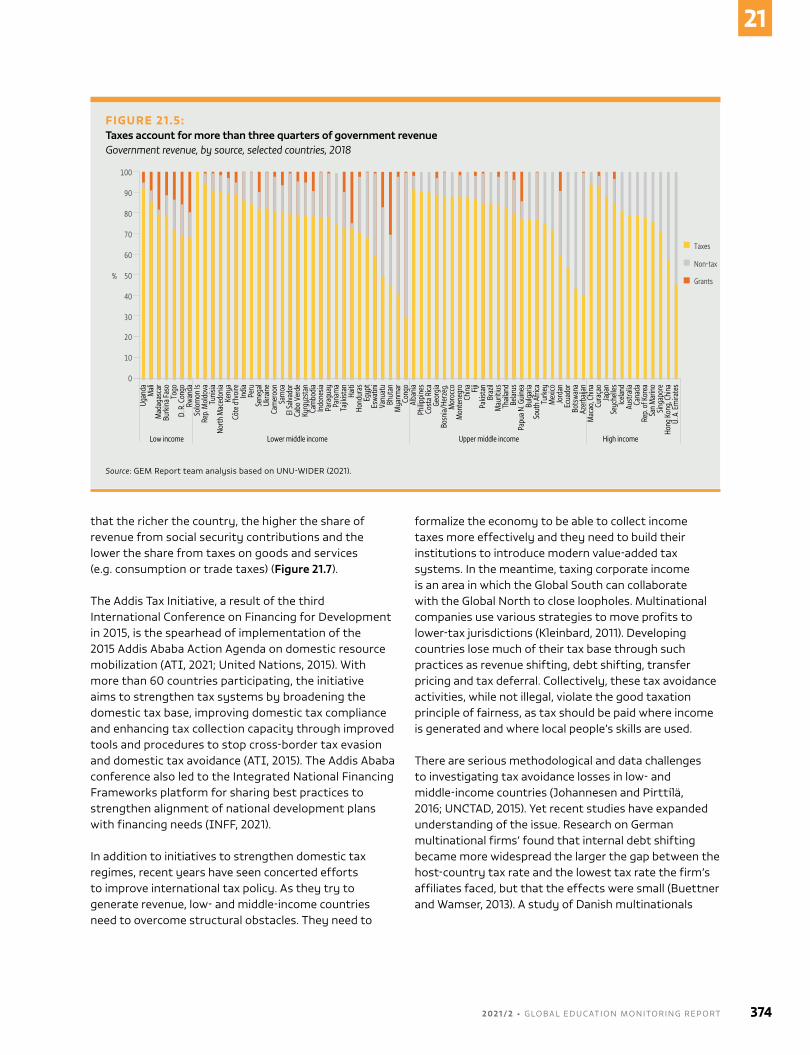
that the richer the country, the higher the share of revenue from social security contributions and the lower the share from taxes on goods and services (e.g. consumption or trade taxes) (Figure 21.7).
The Addis Tax Initiative, a result of the third International Conference on Financing for Development in 2015, is the spearhead of implementation of the 2015 Addis Ababa Action Agenda on domestic resource mobilization (ATI, 2021; united nations, 2015). With more than 60 countries participating, the initiative aims to strengthen tax systems by broadening the domestic tax base, improving domestic tax compliance and enhancing tax collection capacity through improved tools and procedures to stop cross-border tax evasion and domestic tax avoidance (ATI, 2015). The Addis Ababa conference also led to the Integrated national Financing Frameworks platform for sharing best practices to strengthen alignment of national development plans with financing needs (InFF, 2021).
In addition to initiatives to strengthen domestic tax regimes, recent years have seen concerted efforts to improve international tax policy. As they try to generate revenue, low- and middle-income countries need to overcome structural obstacles. They need to
formalize the economy to be able to collect income taxes more effectively and they need to build their institutions to introduce modern value-added tax systems. In the meantime, taxing corporate income is an area in which the Global South can collaborate with the Global north to close loopholes. multinational companies use various strategies to move profits to lower-tax jurisdictions (Kleinbard, 2011). Developing countries lose much of their tax base through such practices as revenue shifting, debt shifting, transfer pricing and tax deferral. Collectively, these tax avoidance activities, while not illegal, violate the good taxation principle of fairness, as tax should be paid where income is generated and where local people’s skills are used.
There are serious methodological and data challenges to investigating tax avoidance losses in low- and middle-income countries (Johannesen and Pirttilä, 2016; unCTAD, 2015). Yet recent studies have expanded understanding of the issue. Research on German multinational firms’ found that internal debt shifting became more widespread the larger the gap between the host-country tax rate and the lowest tax rate the firm’s affiliates faced, but that the effects were small (buettner and Wamser, 2013). A study of Danish multinationals
FIGURE 21.5: Taxes account for more than three quarters of government revenueGovernment revenue, by source, selected countries, 2018
Upper secondary
Ugan
daM
aliM
adag
asca
rBu
rkin
a Fas
oTo
goD.
R. C
ongo
Rwan
daSo
lom
on Is
Rep.
Mol
dova
Tuni
siaNo
rth M
aced
onia
Keny
aCô
te d
'Ivoi
reIn
dia
Peru
Sene
gal
Ukra
ine
Cam
eroo
nSa
moa
El Sa
lvado
rCa
bo V
erde
Kyrg
yzst
anCa
mbo
dia
Indo
nesia
Para
guay
Pana
ma
Tajik
istan
Haiti
Hond
uras
Egyp
tEs
watin
iVa
nuat
uBh
utan
Mya
nmar
Cong
oAl
bani
aPh
ilippi
nes
Cost
a Rica
Geor
gia
Bosn
ia/He
rzeg
.M
oroc
coM
onte
negr
oCh
ina Fiji
Pakis
tan
Braz
ilM
aurit
ius
Thail
and
Belar
usPa
pua N
. Gui
nea
Bulg
aria
Sout
h Af
rica
Turk
eyM
exico
Jord
anEc
uado
rBo
tswa
naAz
erba
ijan
Mac
ao, C
hina
Cura
çao
Japa
nSe
yche
lles
Icelan
dAu
stra
liaCa
nada
Rep.
of K
orea
San
Mar
ino
Singa
pore
Hong
Kon
g, C
hina
U. A
. Em
irate
s
Low income Lower middle income Upper middle income High income
90
80
70
60
50%
40
30
20
10
100
0
Taxes
Non-tax
Grants
Source: GEm Report team analysis based on unu-WIDER (2021).
2 0 2 1 / 2 • G LO BA L E D U C AT I O N M O N I TO R I N G R E P O RT 374
21
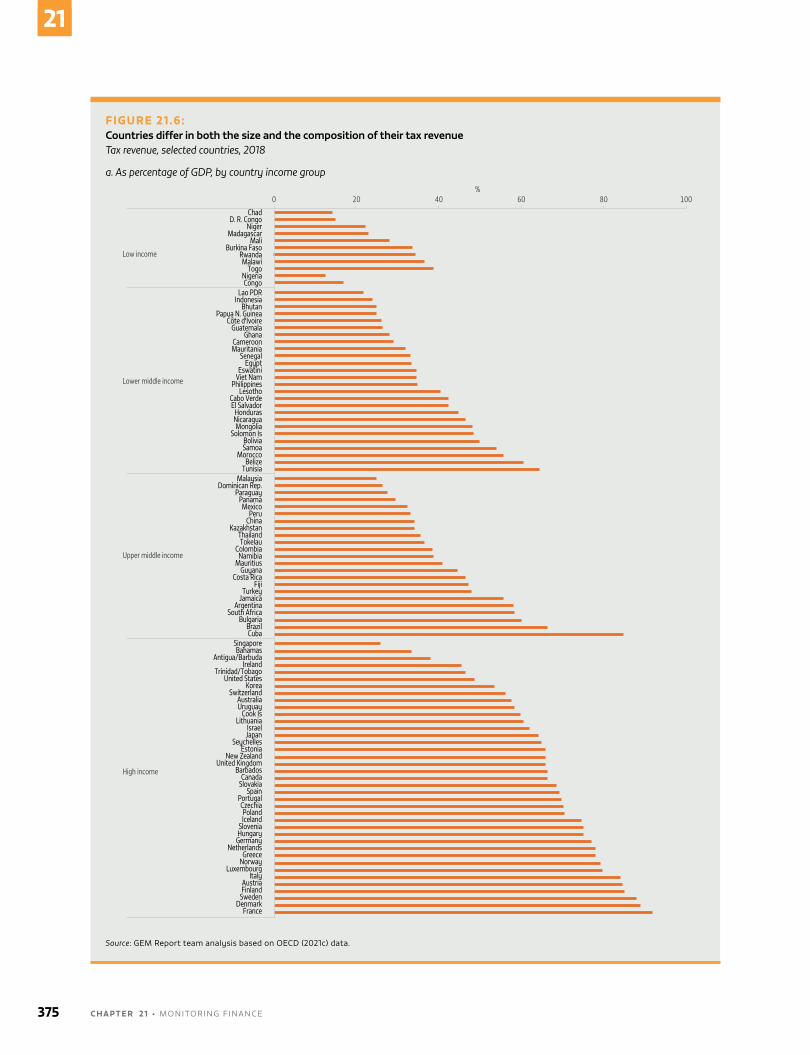
FIGURE 21.6: Countries differ in both the size and the composition of their tax revenueTax revenue, selected countries, 2018
a. As percentage of GDP, by country income group
Upper secondary
Low income
Lower middle income
Upper middle income
High income
403020 %100 50
806040%
200 100
ChadD. R. Congo
NigerMadagascar
MaliBurkina Faso
RwandaMalawi
TogoNigeriaCongo
Lao PDRIndonesia
BhutanPapua N. Guinea
Côte d'IvoireGuatemala
GhanaCameroonMauritania
SenegalEgypt
EswatiniViet Nam
PhilippinesLesotho
Cabo VerdeEl Salvador
HondurasNicaraguaMongolia
Solomon IsBoliviaSamoa
MoroccoBelize
TunisiaMalaysia
Dominican Rep.Paraguay
PanamaMexico
PeruChina
KazakhstanThailandTokelau
ColombiaNamibia
MauritiusGuyana
Costa RicaFiji
TurkeyJamaica
ArgentinaSouth Africa
BulgariaBrazilCuba
SingaporeBahamas
Antigua/BarbudaIreland
Trinidad/TobagoUnited States
KoreaSwitzerland
AustraliaUruguay
Cook IsLithuania
IsraelJapan
SeychellesEstonia
New ZealandUnited Kingdom
BarbadosCanada
SlovakiaSpain
PortugalCzechiaPolandIceland
SloveniaHungary
GermanyNetherlands
GreeceNorway
LuxembourgItaly
AustriaFinland
SwedenDenmark
France
Source: GEm Report team analysis based on oECD (2021c) data.
375 C H A P T E R 2 1 • monIToRInG F InAnCE
21
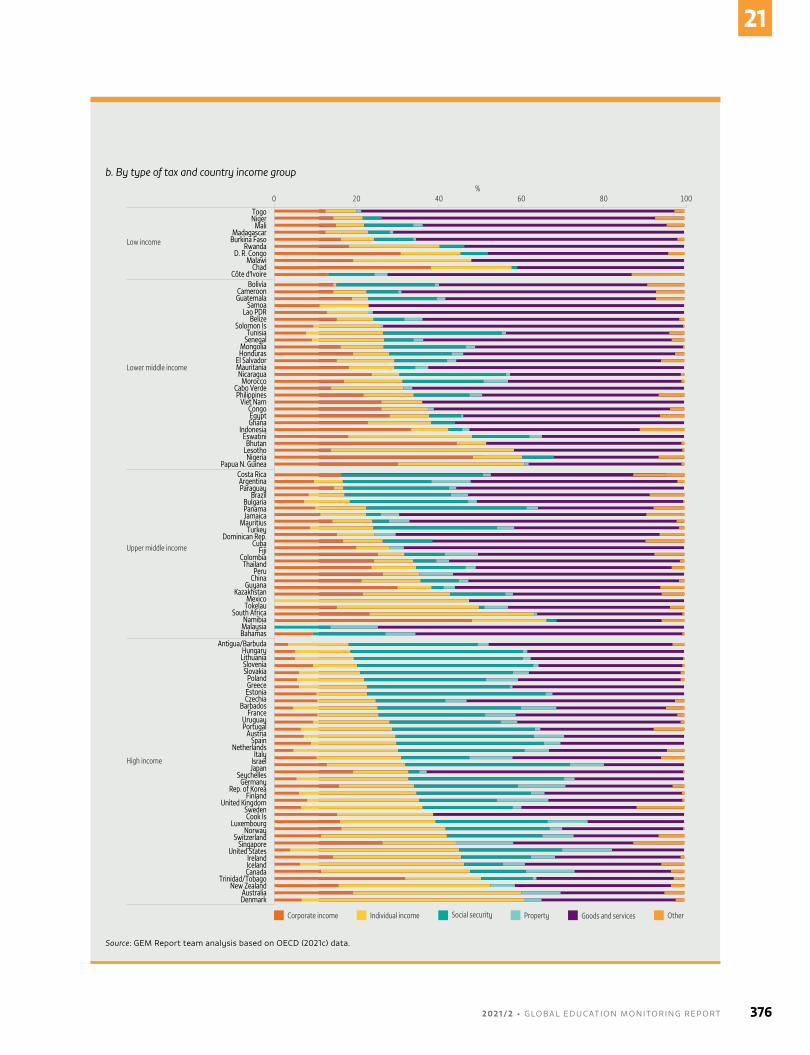
b. By type of tax and country income group
Upper secondary
Low income
Lower middle income
Upper middle income
High income
806040%
200 100
TogoNiger
MaliMadagascar
Burkina FasoRwanda
D. R. CongoMalawi
ChadCôte d'Ivoire
BoliviaCameroonGuatemala
SamoaLao PDR
BelizeSolomon Is
TunisiaSenegal
MongoliaHonduras
El SalvadorMauritaniaNicaragua
MoroccoCabo VerdePhilippines
Viet NamCongoEgyptGhana
IndonesiaEswatini
BhutanLesothoNigeria
Papua N. GuineaCosta RicaArgentinaParaguay
BrazilBulgariaPanamaJamaica
MauritiusTurkey
Dominican Rep.Cuba
FijiColombiaThailand
PeruChina
GuyanaKazakhstan
MexicoTokelau
South AfricaNamibia
MalaysiaBahamas
Antigua/BarbudaHungary
LithuaniaSloveniaSlovakia
PolandGreece
EstoniaCzechia
BarbadosFrance
UruguayPortugal
AustriaSpain
NetherlandsItaly
IsraelJapan
SeychellesGermany
Rep. of KoreaFinland
United KingdomSwedenCook Is
LuxembourgNorway
SwitzerlandSingapore
United StatesIrelandIcelandCanada
Trinidad/TobagoNew Zealand
AustraliaDenmark
Goods and servicesPropertySocial securityIndividual incomeCorporate income Other
Source: GEm Report team analysis based on oECD (2021c) data.
2 0 2 1 / 2 • G LO BA L E D U C AT I O N M O N I TO R I N G R E P O RT 376
21
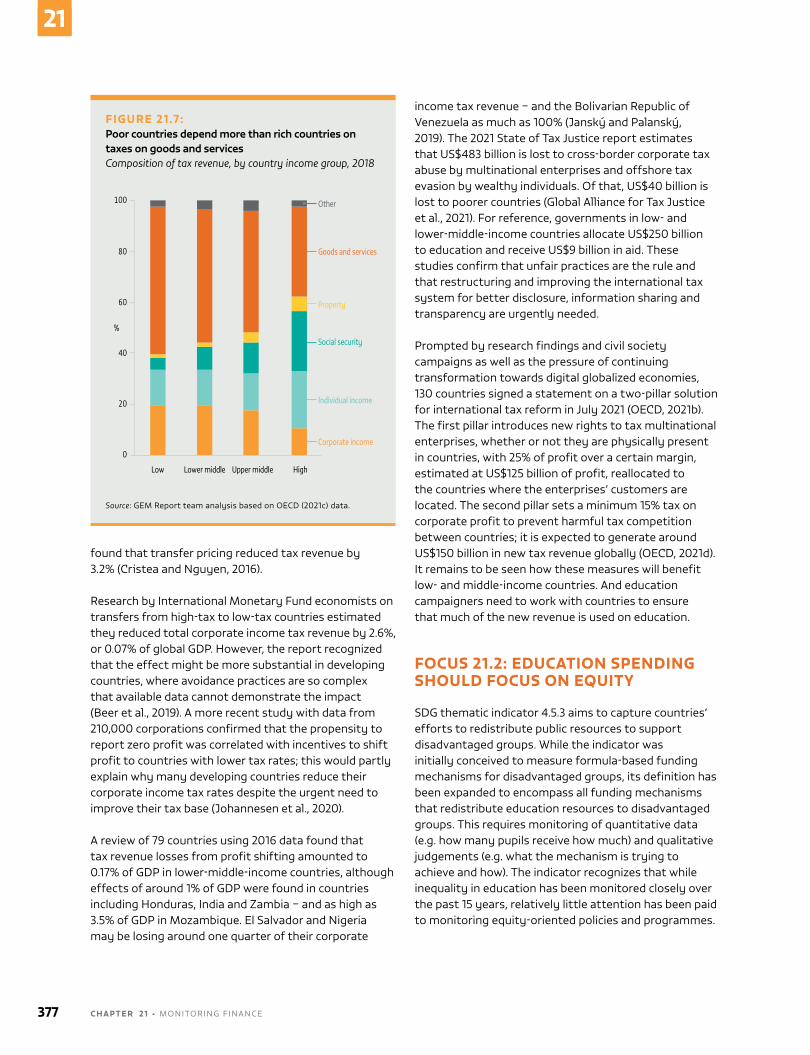
found that transfer pricing reduced tax revenue by 3.2% (Cristea and nguyen, 2016).
Research by International monetary Fund economists on transfers from high-tax to low-tax countries estimated they reduced total corporate income tax revenue by 2.6%, or 0.07% of global GDP. however, the report recognized that the effect might be more substantial in developing countries, where avoidance practices are so complex that available data cannot demonstrate the impact (beer et al., 2019). A more recent study with data from 210,000 corporations confirmed that the propensity to report zero profit was correlated with incentives to shift profit to countries with lower tax rates; this would partly explain why many developing countries reduce their corporate income tax rates despite the urgent need to improve their tax base (Johannesen et al., 2020).
A review of 79 countries using 2016 data found that tax revenue losses from profit shifting amounted to 0.17% of GDP in lower-middle-income countries, although effects of around 1% of GDP were found in countries including honduras, India and zambia – and as high as 3.5% of GDP in mozambique. El Salvador and nigeria may be losing around one quarter of their corporate
income tax revenue – and the bolivarian Republic of venezuela as much as 100% (Janský and Palanský, 2019). The 2021 State of Tax Justice report estimates that uS$483 billion is lost to cross-border corporate tax abuse by multinational enterprises and offshore tax evasion by wealthy individuals. of that, uS$40 billion is lost to poorer countries (Global Alliance for Tax Justice et al., 2021). For reference, governments in low- and lower-middle-income countries allocate uS$250 billion to education and receive uS$9 billion in aid. These studies confirm that unfair practices are the rule and that restructuring and improving the international tax system for better disclosure, information sharing and transparency are urgently needed.
Prompted by research findings and civil society campaigns as well as the pressure of continuing transformation towards digital globalized economies, 130 countries signed a statement on a two-pillar solution for international tax reform in July 2021 (oECD, 2021b). The first pillar introduces new rights to tax multinational enterprises, whether or not they are physically present in countries, with 25% of profit over a certain margin, estimated at uS$125 billion of profit, reallocated to the countries where the enterprises’ customers are located. The second pillar sets a minimum 15% tax on corporate profit to prevent harmful tax competition between countries; it is expected to generate around uS$150 billion in new tax revenue globally (oECD, 2021d). It remains to be seen how these measures will benefit low- and middle-income countries. And education campaigners need to work with countries to ensure that much of the new revenue is used on education.
FOCUS 21.2: EDUCATION SPENDING SHOULD FOCUS ON EQUITY
SDG thematic indicator 4.5.3 aims to capture countries’ efforts to redistribute public resources to support disadvantaged groups. While the indicator was initially conceived to measure formula-based funding mechanisms for disadvantaged groups, its definition has been expanded to encompass all funding mechanisms that redistribute education resources to disadvantaged groups. This requires monitoring of quantitative data (e.g. how many pupils receive how much) and qualitative judgements (e.g. what the mechanism is trying to achieve and how). The indicator recognizes that while inequality in education has been monitored closely over the past 15 years, relatively little attention has been paid to monitoring equity-oriented policies and programmes.
FIGURE 21.7:Poor countries depend more than rich countries on taxes on goods and servicesComposition of tax revenue, by country income group, 2018
Upper secondary
100
60
%
40
20
80
0
Low Lower middle Upper middle High
Other
Goods and services
Property
Social security
Individual income
Corporate income
Source: GEm Report team analysis based on oECD (2021c) data.
377 C H A P T E R 2 1 • monIToRInG F InAnCE
21
Countries vary in their approaches to mitigating the impact on education of factors such as poverty, gender, ethnicity, disability and remoteness. Drawing on the PEER website, the GEm Report team collected information from 78 low- and middle-income countries covering all SDG regions except Europe and northern America. The team identified four mechanisms to assess the equity focus of financing policies and programmes and provide a definition for indicator 4.5.3: overall education financing mechanisms, notably from central to local governments; allocations to schools, which take into account their characteristics; education resources to students, such as scholarships; and social policies and programmes targeting students and their families, such as social transfers. For each mechanism, three dimensions – comprehensiveness, coverage and volume – helped characterize the country’s efforts to promote equity in education. The analysis concluded that 17 of the 78 countries, or only 1 in 5, maintained a strong equity focus through financing policies; they were mostly upper-middle-income and latin American countries (unESCo, 2021).
more than half of low- and middle-income countries’ financing mechanisms do not consider sufficiently that some local authorities are more disadvantaged than others. A common mechanism to allocate funds to districts or schools is through capitation grants, i.e. tied to the number of students enrolled. In myanmar, a formula has been used since 2009 to transfer resources to states and regions based on the number of students and teachers and the budget execution rate in the previous three years (unICEF, 2018). The government developed and shared operational guidelines with local education officers and head teachers. Grants to schools ranged from uS$400 to uS$15,000 in 2017/18, depending on size. but the formula is not sensitive to the higher needs of remote schools, for instance, to cover high transport costs. Schools have had limited autonomy in use of the grant (World bank, 2018).
Tajikistan strengthened its education management information system and introduced a per capita financing system in 2010. Schools receive a grant consisting of a fixed component related to type (‘minimum standard’, which takes into account recurrent expenditure) and a variable component related to number of students, adjusted by type of school. The formula is further adjusted by location (accounting for the district budget) and available school facilities. The grant covers teacher salaries, maintenance and other
operational costs. Although schools have autonomy in budget execution, no component promoting equity other than school location has been incorporated in the formula. making funding proportional to need has resulted in more equitable allocation in terms of pupil/teacher ratios. but the mechanism has not fully addressed inequality related to districts’ inability to raise enough resources, even if they benefit from central government transfers (GPE, 2019; IsDb, 2019).
While donors have introduced various types of school grants in low- and middle-income countries, focusing on school improvement or school-based management, such grants have not become part of the public budget and sustained after the programmes end. For example, donor-funded programmes in Cambodia supported additional grants in 2009–12 (marshall and bunly, 2017) and 2013–16 (unESCo bangkok, 2017) but were not sustained. nor were supplementary school-based management grants in the Philippines, which were piloted in selected districts, taking school locations into account (Philippines Department of Education, 2015; World bank, 2020).
Scholarships to students tend to be awarded on the basis of academic performance, which usually exacerbates inequality. Some countries take socioeconomic status into account. In nepal, where it is estimated that households contribute 49% of total education expenditure, equity is one of five foundations of the School Sector Development Programme. There are scholarship programmes for vulnerable groups, notably girls and Dalits. however, with the number of recipients in 2016 reaching 2.8 million, or 37% of total primary and secondary school enrolment, scholarship amounts are tiny, ranging from uS$3.60 to uS$4.90 per student per year (nepal Department of Education, 2016; vertex Consult, 2016).
other government expenditure besides the education budget can affect equity in education. Conditional and unconditional cash transfer programmes targeting the poor exist in much of the world, often inspired by the experience of latin American countries. In Indonesia, Program Keluarga harapan (Family hope Programme) began providing quarterly cash transfers to very poor households in 2008. Initially equivalent to 15% to 20% of income, their real value fell to 7% within six years. Eligible households’ demographic characteristics include having children under age 15 or children aged 16 to 18 who have not completed nine years of education. Conditions for payment include an 85% school attendance rate.
2 0 2 1 / 2 • G LO BA L E D U C AT I O N M O N I TO R I N G R E P O RT 378
21
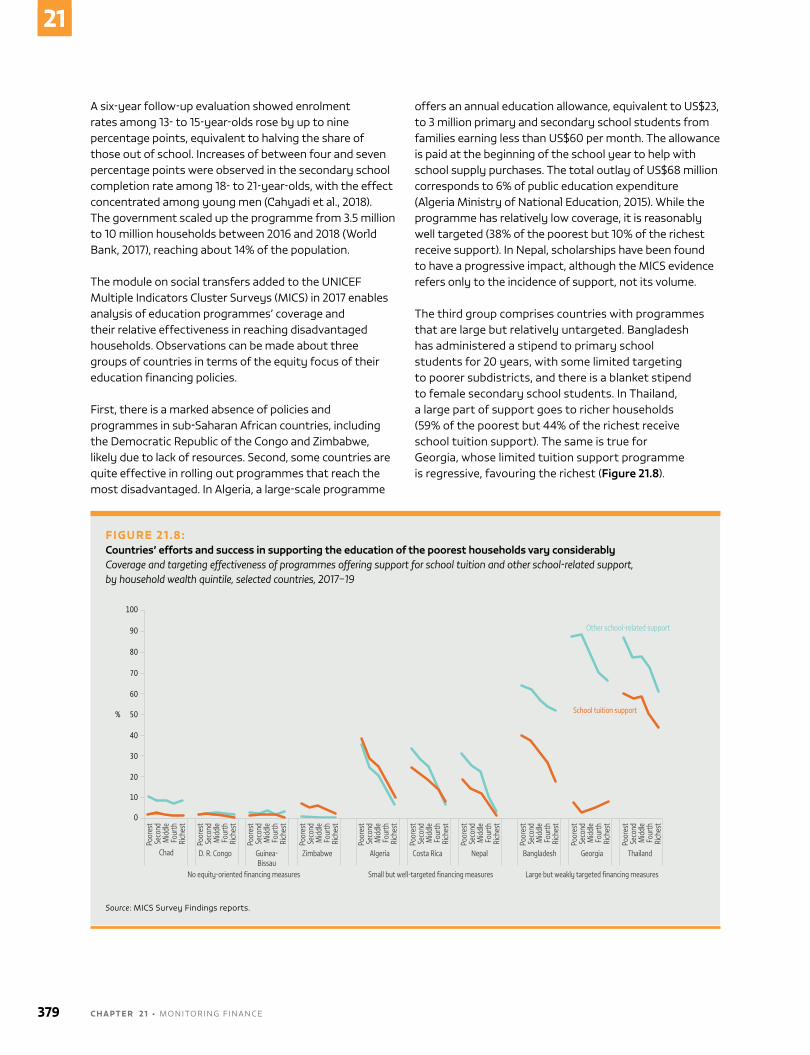
A six-year follow-up evaluation showed enrolment rates among 13- to 15-year-olds rose by up to nine percentage points, equivalent to halving the share of those out of school. Increases of between four and seven percentage points were observed in the secondary school completion rate among 18- to 21-year-olds, with the effect concentrated among young men (Cahyadi et al., 2018). The government scaled up the programme from 3.5 million to 10 million households between 2016 and 2018 (World bank, 2017), reaching about 14% of the population.
The module on social transfers added to the unICEF multiple Indicators Cluster Surveys (mICS) in 2017 enables analysis of education programmes’ coverage and their relative effectiveness in reaching disadvantaged households. observations can be made about three groups of countries in terms of the equity focus of their education financing policies.
First, there is a marked absence of policies and programmes in sub-Saharan African countries, including the Democratic Republic of the Congo and zimbabwe, likely due to lack of resources. Second, some countries are quite effective in rolling out programmes that reach the most disadvantaged. In Algeria, a large-scale programme
offers an annual education allowance, equivalent to uS$23, to 3 million primary and secondary school students from families earning less than uS$60 per month. The allowance is paid at the beginning of the school year to help with school supply purchases. The total outlay of uS$68 million corresponds to 6% of public education expenditure (Algeria ministry of national Education, 2015). While the programme has relatively low coverage, it is reasonably well targeted (38% of the poorest but 10% of the richest receive support). In nepal, scholarships have been found to have a progressive impact, although the mICS evidence refers only to the incidence of support, not its volume.
The third group comprises countries with programmes that are large but relatively untargeted. bangladesh has administered a stipend to primary school students for 20 years, with some limited targeting to poorer subdistricts, and there is a blanket stipend to female secondary school students. In Thailand, a large part of support goes to richer households (59% of the poorest but 44% of the richest receive school tuition support). The same is true for Georgia, whose limited tuition support programme is regressive, favouring the richest (Figure 21.8).
FIGURE 21.8: Countries’ efforts and success in supporting the education of the poorest households vary considerablyCoverage and targeting effectiveness of programmes offering support for school tuition and other school-related support, by household wealth quintile, selected countries, 2017–19
Upper secondary
100
60
%
40
20
80
90
70
50
30
10
0
Poor
est
Seco
ndM
iddl
eFo
urth
Rich
est
Poor
est
Seco
ndM
iddl
eFo
urth
Rich
est
Poor
est
Seco
ndM
iddl
eFo
urth
Rich
est
Poor
est
Seco
ndM
iddl
eFo
urth
Rich
est
Poor
est
Seco
ndM
iddl
eFo
urth
Rich
est
Poor
est
Seco
ndM
iddl
eFo
urth
Rich
est
Poor
est
Seco
ndM
iddl
eFo
urth
Rich
est
Poor
est
Seco
ndM
iddl
eFo
urth
Rich
est
Poor
est
Seco
ndM
iddl
eFo
urth
Rich
est
Poor
est
Seco
ndM
iddl
eFo
urth
Rich
est
Chad D. R. Congo Guinea-Bissau
Zimbabwe Algeria Costa Rica Nepal Bangladesh Georgia Thailand
No equity-oriented financing measures Small but well-targeted financing measures Large but weakly targeted financing measures
Other school-related support
School tuition support
Source: mICS Survey Findings reports.
379 C H A P T E R 2 1 • monIToRInG F InAnCE
21
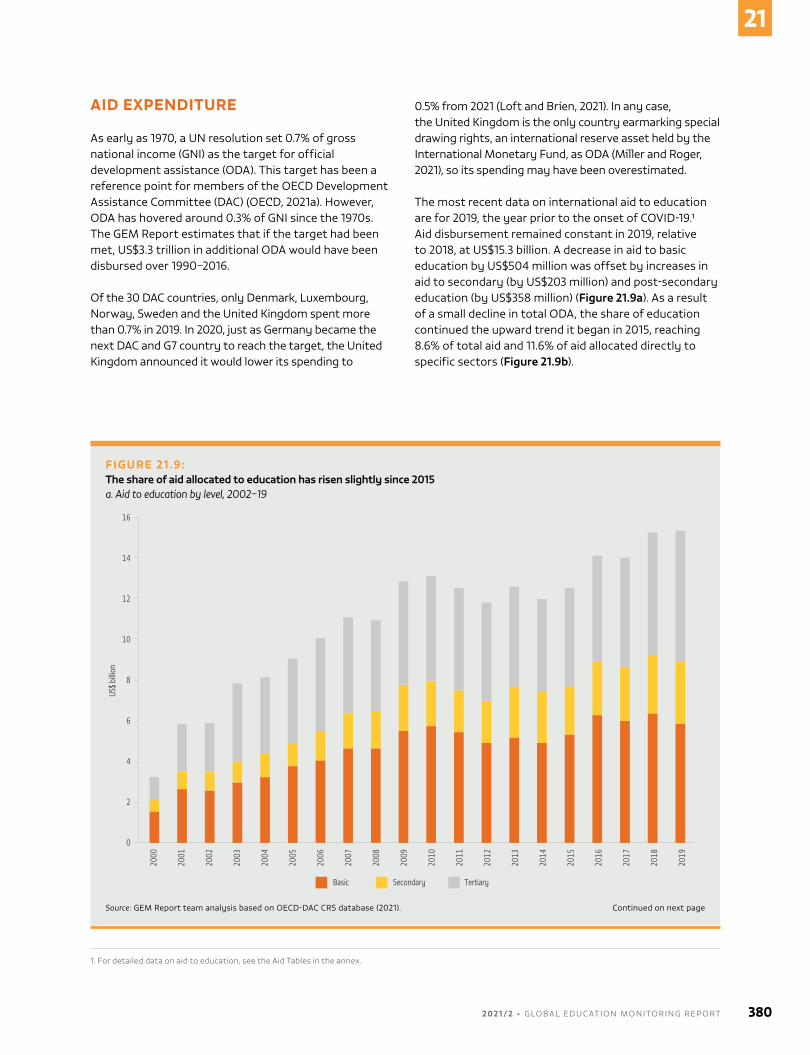
AID EXPENDITURE
As early as 1970, a un resolution set 0.7% of gross national income (GnI) as the target for official development assistance (oDA). This target has been a reference point for members of the oECD Development Assistance Committee (DAC) (oECD, 2021a). however, oDA has hovered around 0.3% of GnI since the 1970s. The GEm Report estimates that if the target had been met, uS$3.3 trillion in additional oDA would have been disbursed over 1990–2016.
of the 30 DAC countries, only Denmark, luxembourg, norway, Sweden and the united Kingdom spent more than 0.7% in 2019. In 2020, just as Germany became the next DAC and G7 country to reach the target, the united Kingdom announced it would lower its spending to
0.5% from 2021 (loft and brien, 2021). In any case, the united Kingdom is the only country earmarking special drawing rights, an international reserve asset held by the International monetary Fund, as oDA (miller and Roger, 2021), so its spending may have been overestimated.
The most recent data on international aid to education are for 2019, the year prior to the onset of CovID-19.1 Aid disbursement remained constant in 2019, relative to 2018, at uS$15.3 billion. A decrease in aid to basic education by uS$504 million was offset by increases in aid to secondary (by uS$203 million) and post-secondary education (by uS$358 million) (Figure 21.9a). As a result of a small decline in total oDA, the share of education continued the upward trend it began in 2015, reaching 8.6% of total aid and 11.6% of aid allocated directly to specific sectors (Figure 21.9b).
FIGURE 21.9: The share of aid allocated to education has risen slightly since 2015a. Aid to education by level, 2002–19
Upper secondary
2000
2001
2002
2003
2004
2005
2006
2007
2008
2009
2010
2011
2012
2013
2014
2015
2016
2017
2018
2019
US$ b
illion
16
14
12
10
8
6
4
2
0
Basic Secondary Tertiary
Source: GEm Report team analysis based on oECD-DAC CRS database (2021). Continued on next page
1. For detailed data on aid to education, see the Aid Tables in the annex.
2 0 2 1 / 2 • G LO BA L E D U C AT I O N M O N I TO R I N G R E P O RT 380
21
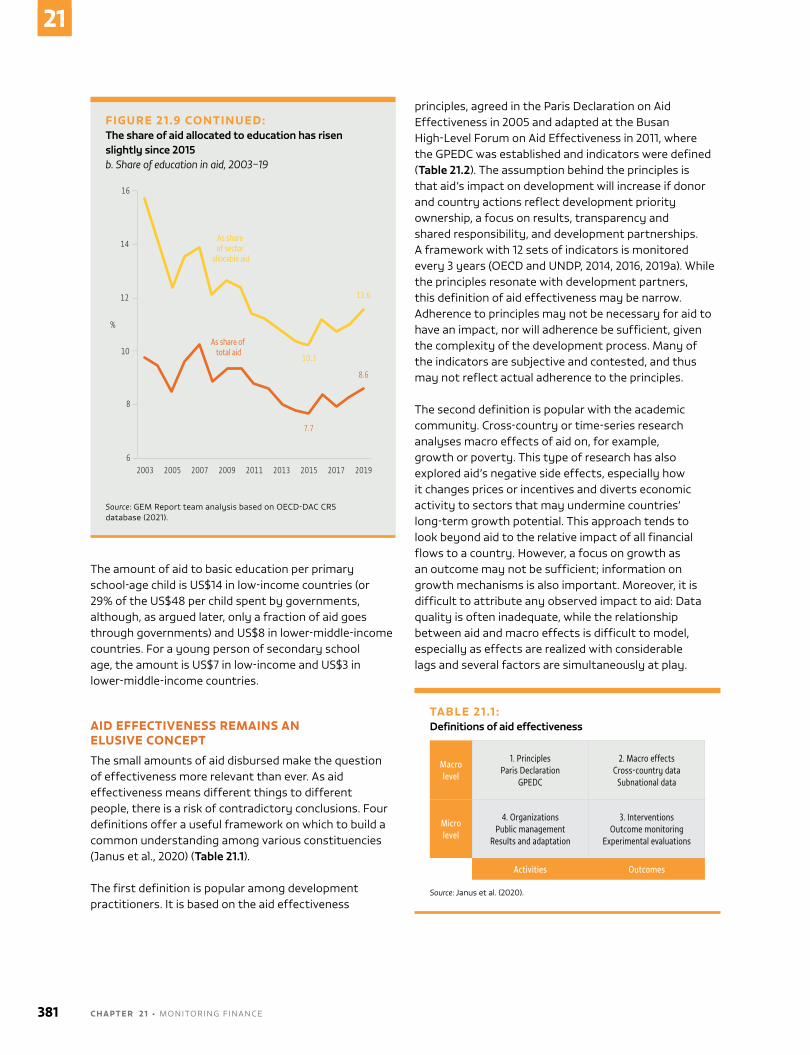
The amount of aid to basic education per primary school-age child is uS$14 in low-income countries (or 29% of the uS$48 per child spent by governments, although, as argued later, only a fraction of aid goes through governments) and uS$8 in lower-middle-income countries. For a young person of secondary school age, the amount is uS$7 in low-income and uS$3 in lower-middle-income countries.
AID EFFECTIVENESS REMAINS AN ELUSIVE CONCEPT
The small amounts of aid disbursed make the question of effectiveness more relevant than ever. As aid effectiveness means different things to different people, there is a risk of contradictory conclusions. Four definitions offer a useful framework on which to build a common understanding among various constituencies (Janus et al., 2020) (Table 21.1).
The first definition is popular among development practitioners. It is based on the aid effectiveness
principles, agreed in the Paris Declaration on Aid Effectiveness in 2005 and adapted at the busan high-level Forum on Aid Effectiveness in 2011, where the GPEDC was established and indicators were defined (Table 21.2). The assumption behind the principles is that aid’s impact on development will increase if donor and country actions reflect development priority ownership, a focus on results, transparency and shared responsibility, and development partnerships. A framework with 12 sets of indicators is monitored every 3 years (oECD and unDP, 2014, 2016, 2019a). While the principles resonate with development partners, this definition of aid effectiveness may be narrow. Adherence to principles may not be necessary for aid to have an impact, nor will adherence be sufficient, given the complexity of the development process. many of the indicators are subjective and contested, and thus may not reflect actual adherence to the principles.
The second definition is popular with the academic community. Cross-country or time-series research analyses macro effects of aid on, for example, growth or poverty. This type of research has also explored aid’s negative side effects, especially how it changes prices or incentives and diverts economic activity to sectors that may undermine countries’ long-term growth potential. This approach tends to look beyond aid to the relative impact of all financial flows to a country. however, a focus on growth as an outcome may not be sufficient; information on growth mechanisms is also important. moreover, it is difficult to attribute any observed impact to aid: Data quality is often inadequate, while the relationship between aid and macro effects is difficult to model, especially as effects are realized with considerable lags and several factors are simultaneously at play.
FIGURE 21.9 CONTINUED: The share of aid allocated to education has risen slightly since 2015b. Share of education in aid, 2003–19
Upper secondary
2003 2005 2007 2009 2011 2013 2015 2017 2019
16
14
12
%
10
8
6
As share of sector
allocable aid
As share of total aid
11.6
10.3
7.7
8.6
Source: GEm Report team analysis based on oECD-DAC CRS database (2021).
TABLE 21.1 :Definitions of aid effectiveness
Macro level
1. PrinciplesParis Declaration
GPEDC
2. Macro effects Cross-country data
Subnational data
Micro level
4. Organizations Public management
Results and adaptation
3. Interventions Outcome monitoring
Experimental evaluations
Activities Outcomes
Source: Janus et al. (2020).
381 C H A P T E R 2 1 • monIToRInG F InAnCE
21
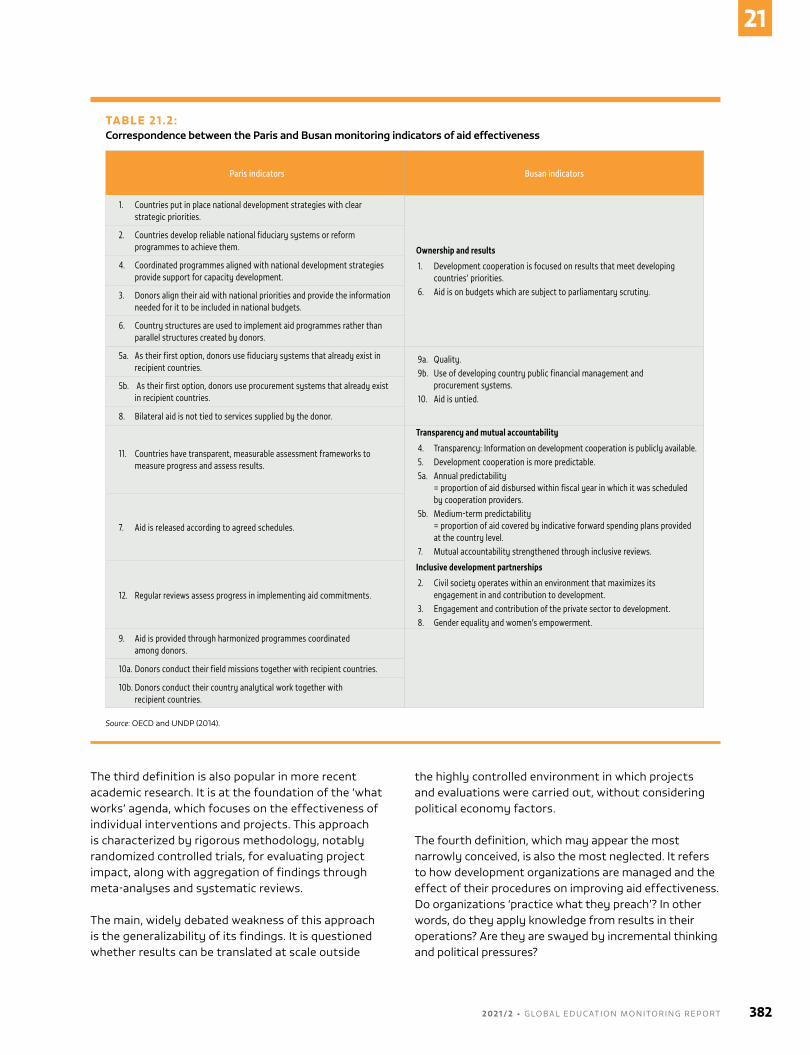
The third definition is also popular in more recent academic research. It is at the foundation of the ‘what works’ agenda, which focuses on the effectiveness of individual interventions and projects. This approach is characterized by rigorous methodology, notably randomized controlled trials, for evaluating project impact, along with aggregation of findings through meta-analyses and systematic reviews.
The main, widely debated weakness of this approach is the generalizability of its findings. It is questioned whether results can be translated at scale outside
the highly controlled environment in which projects and evaluations were carried out, without considering political economy factors.
The fourth definition, which may appear the most narrowly conceived, is also the most neglected. It refers to how development organizations are managed and the effect of their procedures on improving aid effectiveness. Do organizations ‘practice what they preach’? In other words, do they apply knowledge from results in their operations? Are they are swayed by incremental thinking and political pressures?
TABLE 21.2:Correspondence between the Paris and Busan monitoring indicators of aid effectiveness
Paris indicators Busan indicators
1. Countries put in place national development strategies with clear strategic priorities.
Ownership and results
1. Development cooperation is focused on results that meet developing countries’ priorities.
6. Aid is on budgets which are subject to parliamentary scrutiny.
2. Countries develop reliable national fiduciary systems or reform programmes to achieve them.
4. Coordinated programmes aligned with national development strategies provide support for capacity development.
3. Donors align their aid with national priorities and provide the information needed for it to be included in national budgets.
6. Country structures are used to implement aid programmes rather than parallel structures created by donors.
5a. As their first option, donors use fiduciary systems that already exist in recipient countries.
9a. Quality.9b. Use of developing country public financial management and
procurement systems.10. Aid is untied.
5b. As their first option, donors use procurement systems that already exist in recipient countries.
8. Bilateral aid is not tied to services supplied by the donor.
11. Countries have transparent, measurable assessment frameworks to measure progress and assess results.
Transparency and mutual accountability
4. Transparency: Information on development cooperation is publicly available.5. Development cooperation is more predictable.5a. Annual predictability
= proportion of aid disbursed within fiscal year in which it was scheduled by cooperation providers.
5b. Medium-term predictability = proportion of aid covered by indicative forward spending plans provided at the country level.
7. Mutual accountability strengthened through inclusive reviews.
Inclusive development partnerships
2. Civil society operates within an environment that maximizes its engagement in and contribution to development.
3. Engagement and contribution of the private sector to development.8. Gender equality and women’s empowerment.
7. Aid is released according to agreed schedules.
12. Regular reviews assess progress in implementing aid commitments.
9. Aid is provided through harmonized programmes coordinated among donors.
10a. Donors conduct their field missions together with recipient countries.
10b. Donors conduct their country analytical work together with recipient countries.
Source: oECD and unDP (2014).
2 0 2 1 / 2 • G LO BA L E D U C AT I O N M O N I TO R I N G R E P O RT 382
21
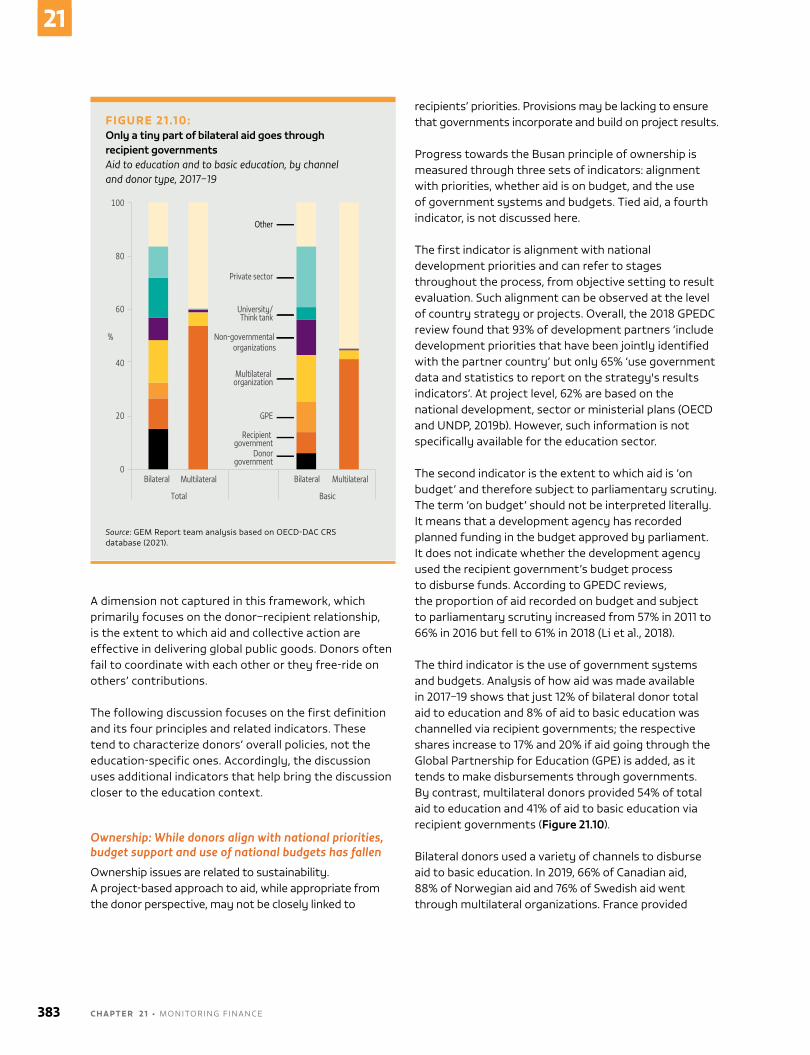
A dimension not captured in this framework, which primarily focuses on the donor–recipient relationship, is the extent to which aid and collective action are effective in delivering global public goods. Donors often fail to coordinate with each other or they free-ride on others’ contributions.
The following discussion focuses on the first definition and its four principles and related indicators. These tend to characterize donors’ overall policies, not the education-specific ones. Accordingly, the discussion uses additional indicators that help bring the discussion closer to the education context.
Ownership: While donors align with national priorities, budget support and use of national budgets has fallen
ownership issues are related to sustainability. A project-based approach to aid, while appropriate from the donor perspective, may not be closely linked to
recipients’ priorities. Provisions may be lacking to ensure that governments incorporate and build on project results.
Progress towards the busan principle of ownership is measured through three sets of indicators: alignment with priorities, whether aid is on budget, and the use of government systems and budgets. Tied aid, a fourth indicator, is not discussed here.
The first indicator is alignment with national development priorities and can refer to stages throughout the process, from objective setting to result evaluation. Such alignment can be observed at the level of country strategy or projects. overall, the 2018 GPEDC review found that 93% of development partners ‘include development priorities that have been jointly identified with the partner country’ but only 65% ‘use government data and statistics to report on the strategy's results indicators’. At project level, 62% are based on the national development, sector or ministerial plans (oECD and unDP, 2019b). however, such information is not specifically available for the education sector.
The second indicator is the extent to which aid is ‘on budget’ and therefore subject to parliamentary scrutiny. The term ‘on budget’ should not be interpreted literally. It means that a development agency has recorded planned funding in the budget approved by parliament. It does not indicate whether the development agency used the recipient government’s budget process to disburse funds. According to GPEDC reviews, the proportion of aid recorded on budget and subject to parliamentary scrutiny increased from 57% in 2011 to 66% in 2016 but fell to 61% in 2018 (li et al., 2018).
The third indicator is the use of government systems and budgets. Analysis of how aid was made available in 2017–19 shows that just 12% of bilateral donor total aid to education and 8% of aid to basic education was channelled via recipient governments; the respective shares increase to 17% and 20% if aid going through the Global Partnership for Education (GPE) is added, as it tends to make disbursements through governments. by contrast, multilateral donors provided 54% of total aid to education and 41% of aid to basic education via recipient governments (Figure 21.10).
bilateral donors used a variety of channels to disburse aid to basic education. In 2019, 66% of Canadian aid, 88% of norwegian aid and 76% of Swedish aid went through multilateral organizations. France provided
FIGURE 21.10:Only a tiny part of bilateral aid goes through recipient governmentsAid to education and to basic education, by channel and donor type, 2017–19
Upper secondary
Other
Private sector
University/Think tank
Non-governmental organizations
Multilateral organization
GPE
Recipient government
Donorgovernment
Bilateral Multilateral
Total
Bilateral Multilateral
Basic
%
100
80
60
40
20
0
Source: GEm Report team analysis based on oECD-DAC CRS database (2021).
383 C H A P T E R 2 1 • monIToRInG F InAnCE
21
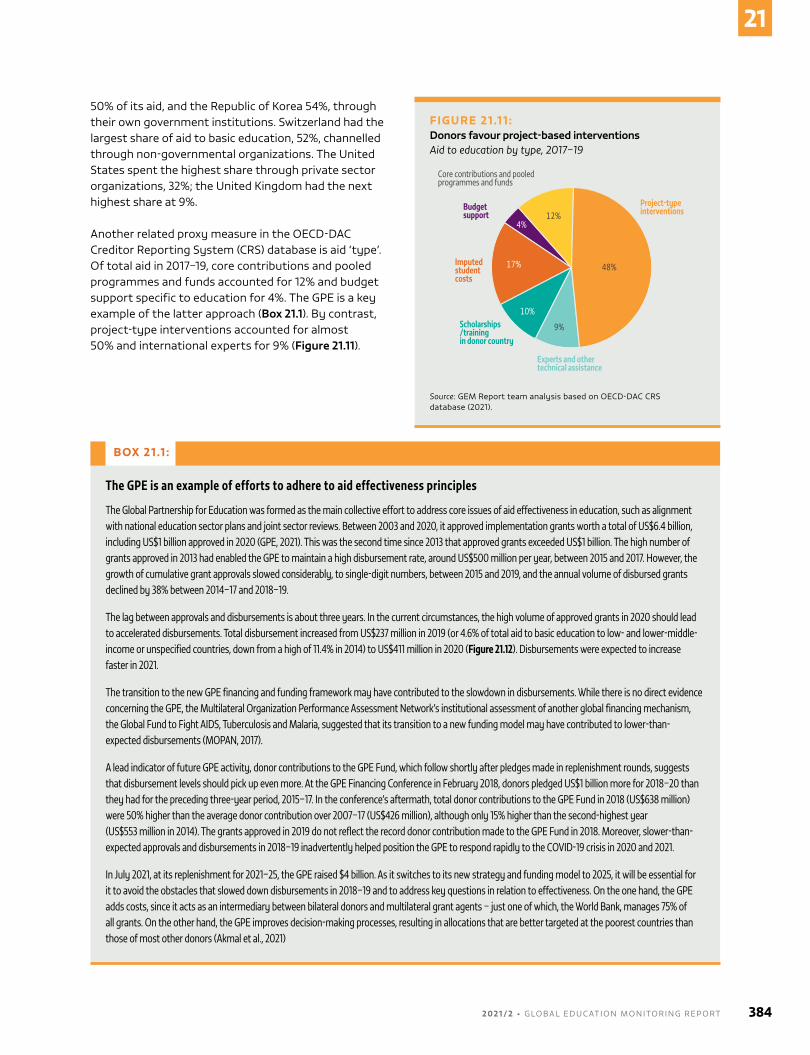
50% of its aid, and the Republic of Korea 54%, through their own government institutions. Switzerland had the largest share of aid to basic education, 52%, channelled through non-governmental organizations. The united States spent the highest share through private sector organizations, 32%; the united Kingdom had the next highest share at 9%.
Another related proxy measure in the oECD-DAC Creditor Reporting System (CRS) database is aid ‘type’. of total aid in 2017–19, core contributions and pooled programmes and funds accounted for 12% and budget support specific to education for 4%. The GPE is a key example of the latter approach (Box 21.1). by contrast, project-type interventions accounted for almost 50% and international experts for 9% (Figure 21.11).
FIGURE 21.11 :Donors favour project-based interventionsAid to education by type, 2017–19
12%
48%
4%
17%
10%
9%
Core contributions and pooledprogrammes and funds
Budgetsupport
Imputed studentcosts
Scholarships/trainingin donor country
Experts and othertechnical assistance
Project-typeinterventions
Upper secondary
Source: GEm Report team analysis based on oECD-DAC CRS database (2021).
BOX 21.1 :
The GPE is an example of efforts to adhere to aid effectiveness principles
The Global Partnership for Education was formed as the main collective effort to address core issues of aid effectiveness in education, such as alignment with national education sector plans and joint sector reviews. Between 2003 and 2020, it approved implementation grants worth a total of US$6.4 billion, including US$1 billion approved in 2020 (GPE, 2021). This was the second time since 2013 that approved grants exceeded US$1 billion. The high number of grants approved in 2013 had enabled the GPE to maintain a high disbursement rate, around US$500 million per year, between 2015 and 2017. However, the growth of cumulative grant approvals slowed considerably, to single-digit numbers, between 2015 and 2019, and the annual volume of disbursed grants declined by 38% between 2014–17 and 2018–19.
The lag between approvals and disbursements is about three years. In the current circumstances, the high volume of approved grants in 2020 should lead to accelerated disbursements. Total disbursement increased from US$237 million in 2019 (or 4.6% of total aid to basic education to low- and lower-middle-income or unspecified countries, down from a high of 11.4% in 2014) to US$411 million in 2020 (Figure 21.12). Disbursements were expected to increase faster in 2021.
The transition to the new GPE financing and funding framework may have contributed to the slowdown in disbursements. While there is no direct evidence concerning the GPE, the Multilateral Organization Performance Assessment Network’s institutional assessment of another global financing mechanism, the Global Fund to Fight AIDS, Tuberculosis and Malaria, suggested that its transition to a new funding model may have contributed to lower-than-expected disbursements (MOPAN, 2017).
A lead indicator of future GPE activity, donor contributions to the GPE Fund, which follow shortly after pledges made in replenishment rounds, suggests that disbursement levels should pick up even more. At the GPE Financing Conference in February 2018, donors pledged US$1 billion more for 2018–20 than they had for the preceding three-year period, 2015–17. In the conference’s aftermath, total donor contributions to the GPE Fund in 2018 (US$638 million) were 50% higher than the average donor contribution over 2007–17 (US$426 million), although only 15% higher than the second-highest year (US$553 million in 2014). The grants approved in 2019 do not reflect the record donor contribution made to the GPE Fund in 2018. Moreover, slower-than-expected approvals and disbursements in 2018–19 inadvertently helped position the GPE to respond rapidly to the COVID-19 crisis in 2020 and 2021.
In July 2021, at its replenishment for 2021–25, the GPE raised $4 billion. As it switches to its new strategy and funding model to 2025, it will be essential for it to avoid the obstacles that slowed down disbursements in 2018–19 and to address key questions in relation to effectiveness. On the one hand, the GPE adds costs, since it acts as an intermediary between bilateral donors and multilateral grant agents – just one of which, the World Bank, manages 75% of all grants. On the other hand, the GPE improves decision-making processes, resulting in allocations that are better targeted at the poorest countries than those of most other donors (Akmal et al., 2021)
2 0 2 1 / 2 • G LO BA L E D U C AT I O N M O N I TO R I N G R E P O RT 384
21
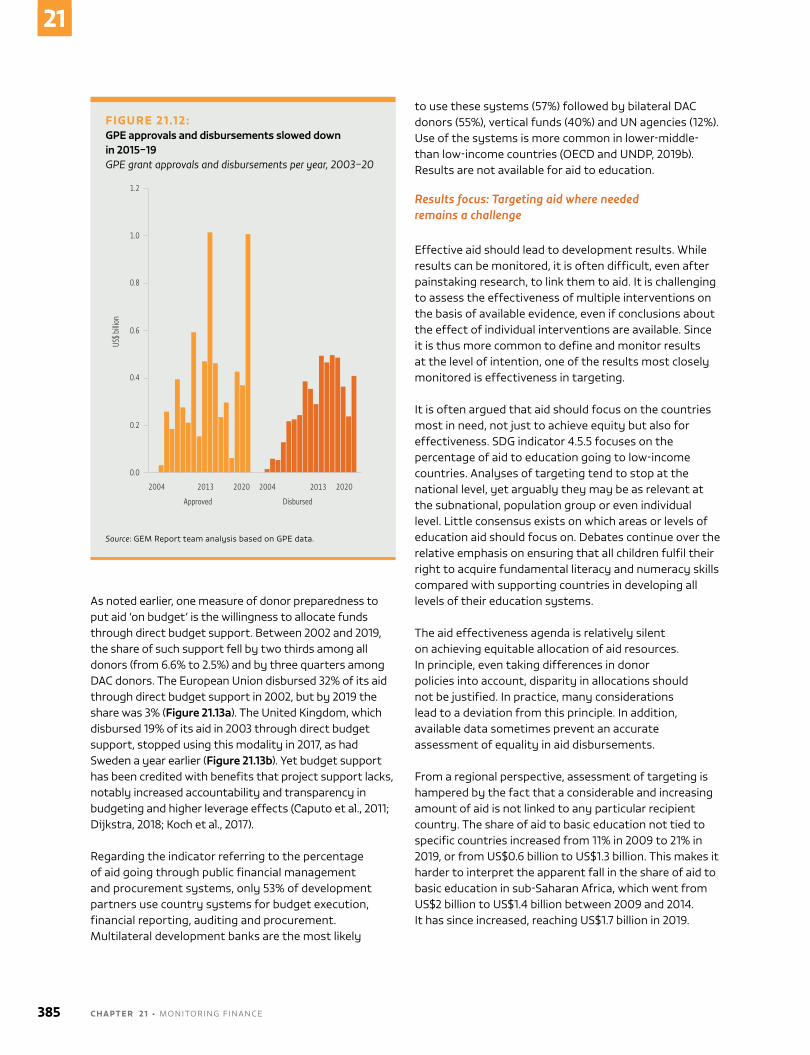
As noted earlier, one measure of donor preparedness to put aid ‘on budget’ is the willingness to allocate funds through direct budget support. between 2002 and 2019, the share of such support fell by two thirds among all donors (from 6.6% to 2.5%) and by three quarters among DAC donors. The European union disbursed 32% of its aid through direct budget support in 2002, but by 2019 the share was 3% (Figure 21.13a). The united Kingdom, which disbursed 19% of its aid in 2003 through direct budget support, stopped using this modality in 2017, as had Sweden a year earlier (Figure 21.13b). Yet budget support has been credited with benefits that project support lacks, notably increased accountability and transparency in budgeting and higher leverage effects (Caputo et al., 2011; Dijkstra, 2018; Koch et al., 2017).
Regarding the indicator referring to the percentage of aid going through public financial management and procurement systems, only 53% of development partners use country systems for budget execution, financial reporting, auditing and procurement. multilateral development banks are the most likely
to use these systems (57%) followed by bilateral DAC donors (55%), vertical funds (40%) and un agencies (12%). use of the systems is more common in lower-middle- than low-income countries (oECD and unDP, 2019b). Results are not available for aid to education.
Results focus: Targeting aid where needed remains a challenge
Effective aid should lead to development results. While results can be monitored, it is often difficult, even after painstaking research, to link them to aid. It is challenging to assess the effectiveness of multiple interventions on the basis of available evidence, even if conclusions about the effect of individual interventions are available. Since it is thus more common to define and monitor results at the level of intention, one of the results most closely monitored is effectiveness in targeting.
It is often argued that aid should focus on the countries most in need, not just to achieve equity but also for effectiveness. SDG indicator 4.5.5 focuses on the percentage of aid to education going to low-income countries. Analyses of targeting tend to stop at the national level, yet arguably they may be as relevant at the subnational, population group or even individual level. little consensus exists on which areas or levels of education aid should focus on. Debates continue over the relative emphasis on ensuring that all children fulfil their right to acquire fundamental literacy and numeracy skills compared with supporting countries in developing all levels of their education systems.
The aid effectiveness agenda is relatively silent on achieving equitable allocation of aid resources. In principle, even taking differences in donor policies into account, disparity in allocations should not be justified. In practice, many considerations lead to a deviation from this principle. In addition, available data sometimes prevent an accurate assessment of equality in aid disbursements.
From a regional perspective, assessment of targeting is hampered by the fact that a considerable and increasing amount of aid is not linked to any particular recipient country. The share of aid to basic education not tied to specific countries increased from 11% in 2009 to 21% in 2019, or from uS$0.6 billion to uS$1.3 billion. This makes it harder to interpret the apparent fall in the share of aid to basic education in sub-Saharan Africa, which went from uS$2 billion to uS$1.4 billion between 2009 and 2014. It has since increased, reaching uS$1.7 billion in 2019.
FIGURE 21.12:GPE approvals and disbursements slowed down in 2015–19GPE grant approvals and disbursements per year, 2003–20
Upper secondary
1.2
1.0
0.8
0.6
0.4
0.2
0.0
US$ b
illion
2004 2013 2020 2004 2013 2020
Approved Disbursed
Source: GEm Report team analysis based on GPE data.
385 C H A P T E R 2 1 • monIToRInG F InAnCE
21
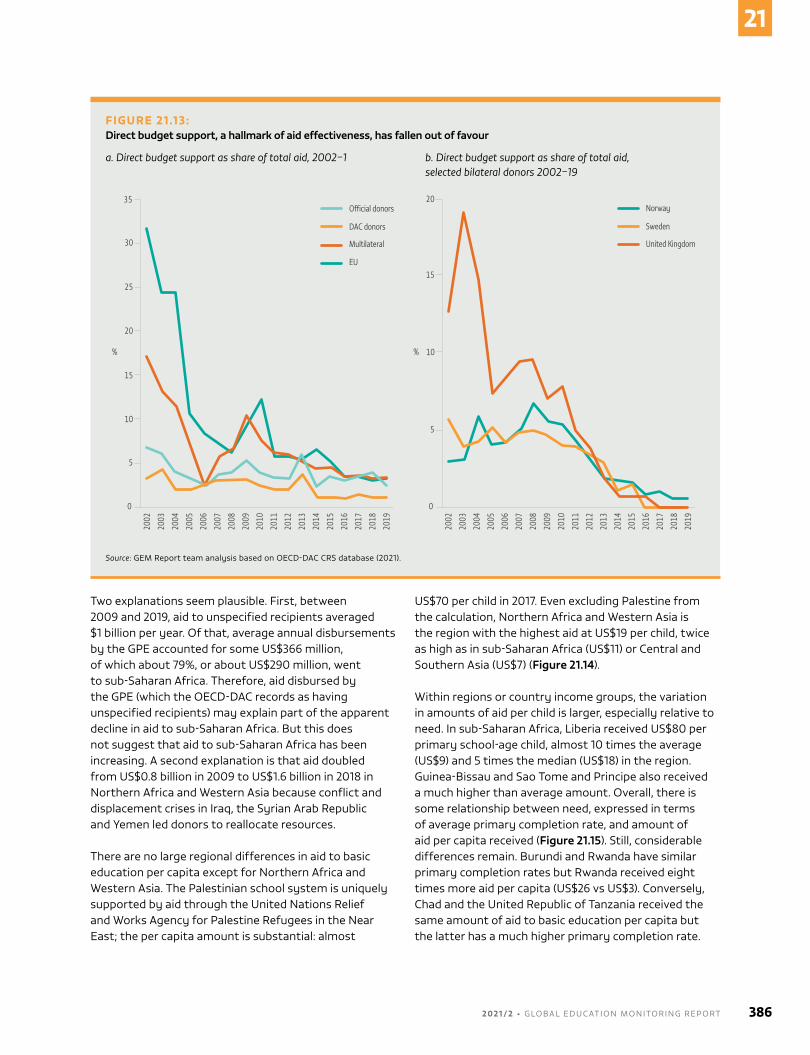
Two explanations seem plausible. First, between 2009 and 2019, aid to unspecified recipients averaged $1 billion per year. of that, average annual disbursements by the GPE accounted for some uS$366 million, of which about 79%, or about uS$290 million, went to sub-Saharan Africa. Therefore, aid disbursed by the GPE (which the oECD-DAC records as having unspecified recipients) may explain part of the apparent decline in aid to sub-Saharan Africa. but this does not suggest that aid to sub-Saharan Africa has been increasing. A second explanation is that aid doubled from uS$0.8 billion in 2009 to uS$1.6 billion in 2018 in northern Africa and Western Asia because conflict and displacement crises in Iraq, the Syrian Arab Republic and Yemen led donors to reallocate resources.
There are no large regional differences in aid to basic education per capita except for northern Africa and Western Asia. The Palestinian school system is uniquely supported by aid through the united nations Relief and Works Agency for Palestine Refugees in the near East; the per capita amount is substantial: almost
uS$70 per child in 2017. Even excluding Palestine from the calculation, northern Africa and Western Asia is the region with the highest aid at uS$19 per child, twice as high as in sub-Saharan Africa (uS$11) or Central and Southern Asia (uS$7) (Figure 21.14).
Within regions or country income groups, the variation in amounts of aid per child is larger, especially relative to need. In sub-Saharan Africa, liberia received uS$80 per primary school-age child, almost 10 times the average (uS$9) and 5 times the median (uS$18) in the region. Guinea-bissau and Sao Tome and Principe also received a much higher than average amount. overall, there is some relationship between need, expressed in terms of average primary completion rate, and amount of aid per capita received (Figure 21.15). Still, considerable differences remain. burundi and Rwanda have similar primary completion rates but Rwanda received eight times more aid per capita (uS$26 vs uS$3). Conversely, Chad and the united Republic of Tanzania received the same amount of aid to basic education per capita but the latter has a much higher primary completion rate.
FIGURE 21.13:Direct budget support, a hallmark of aid effectiveness, has fallen out of favour
a. Direct budget support as share of total aid, 2002–1 b. Direct budget support as share of total aid, selected bilateral donors 2002–19
35
30
25
20
15
10
5
0
%
2002
2003
2004
2005
2006
2007
2008
2009
2010
2012
2011
2013
2014
2015
2016
2017
2018
2019
Official donors
DAC donors
Multilateral
EU
20
15
10
5
0
%
2002
2003
2004
2005
2006
2007
2008
2009
2010
2012
2011
2013
2014
2015
2016
2017
2018
2019
Norway
Sweden
United Kingdom
Source: GEm Report team analysis based on oECD-DAC CRS database (2021).
2 0 2 1 / 2 • G LO BA L E D U C AT I O N M O N I TO R I N G R E P O RT 386
21
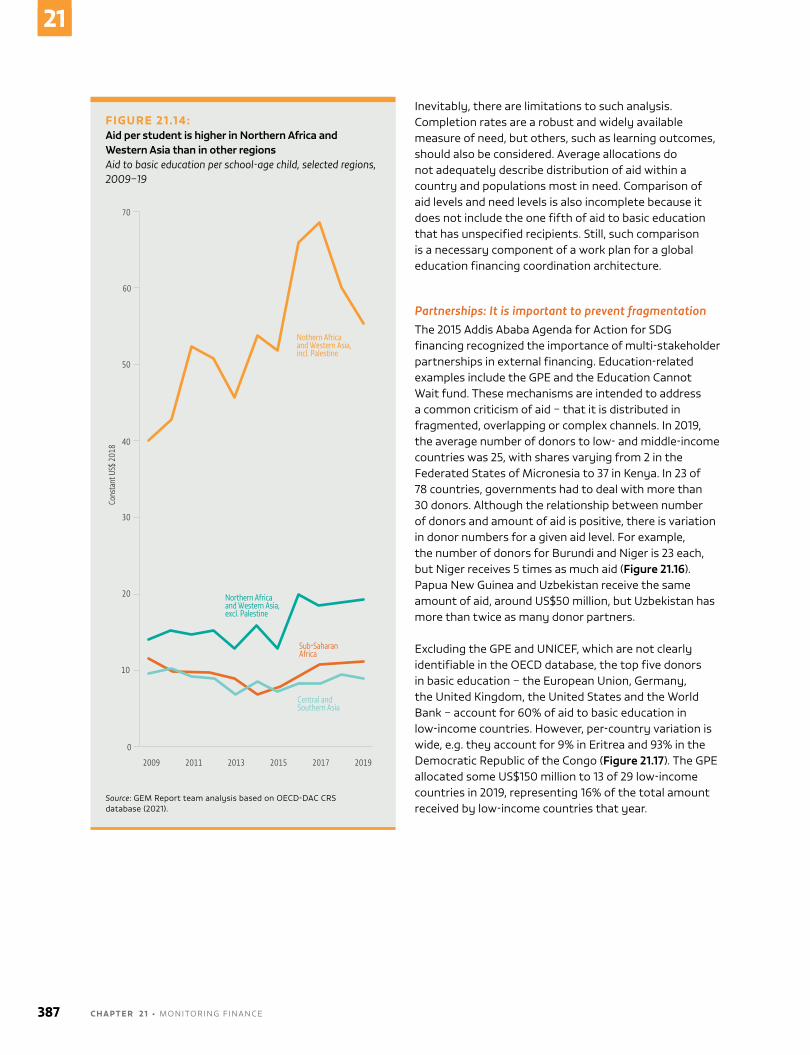
Inevitably, there are limitations to such analysis. Completion rates are a robust and widely available measure of need, but others, such as learning outcomes, should also be considered. Average allocations do not adequately describe distribution of aid within a country and populations most in need. Comparison of aid levels and need levels is also incomplete because it does not include the one fifth of aid to basic education that has unspecified recipients. Still, such comparison is a necessary component of a work plan for a global education financing coordination architecture.
Partnerships: It is important to prevent fragmentationThe 2015 Addis Ababa Agenda for Action for SDG financing recognized the importance of multi-stakeholder partnerships in external financing. Education-related examples include the GPE and the Education Cannot Wait fund. These mechanisms are intended to address a common criticism of aid – that it is distributed in fragmented, overlapping or complex channels. In 2019, the average number of donors to low- and middle-income countries was 25, with shares varying from 2 in the Federated States of micronesia to 37 in Kenya. In 23 of 78 countries, governments had to deal with more than 30 donors. Although the relationship between number of donors and amount of aid is positive, there is variation in donor numbers for a given aid level. For example, the number of donors for burundi and niger is 23 each, but niger receives 5 times as much aid (Figure 21.16). Papua new Guinea and uzbekistan receive the same amount of aid, around uS$50 million, but uzbekistan has more than twice as many donor partners.
Excluding the GPE and unICEF, which are not clearly identifiable in the oECD database, the top five donors in basic education – the European union, Germany, the united Kingdom, the united States and the World bank – account for 60% of aid to basic education in low-income countries. however, per-country variation is wide, e.g. they account for 9% in Eritrea and 93% in the Democratic Republic of the Congo (Figure 21.17). The GPE allocated some uS$150 million to 13 of 29 low-income countries in 2019, representing 16% of the total amount received by low-income countries that year.
FIGURE 21.14:Aid per student is higher in Northern Africa and Western Asia than in other regionsAid to basic education per school-age child, selected regions, 2009–19
Upper secondary
Lorem
10
0
20
30
40
50
60
70
Cons
tant
US$
201
8
2009 2011 2013 2015 2017 2019
Nothern Africa and Western Asia,incl. Palestine
Northern Africaand Western Asia,excl. Palestine
Sub-SaharanAfrica
Central and Southern Asia
Source: GEm Report team analysis based on oECD-DAC CRS database (2021).
387 C H A P T E R 2 1 • monIToRInG F InAnCE
21
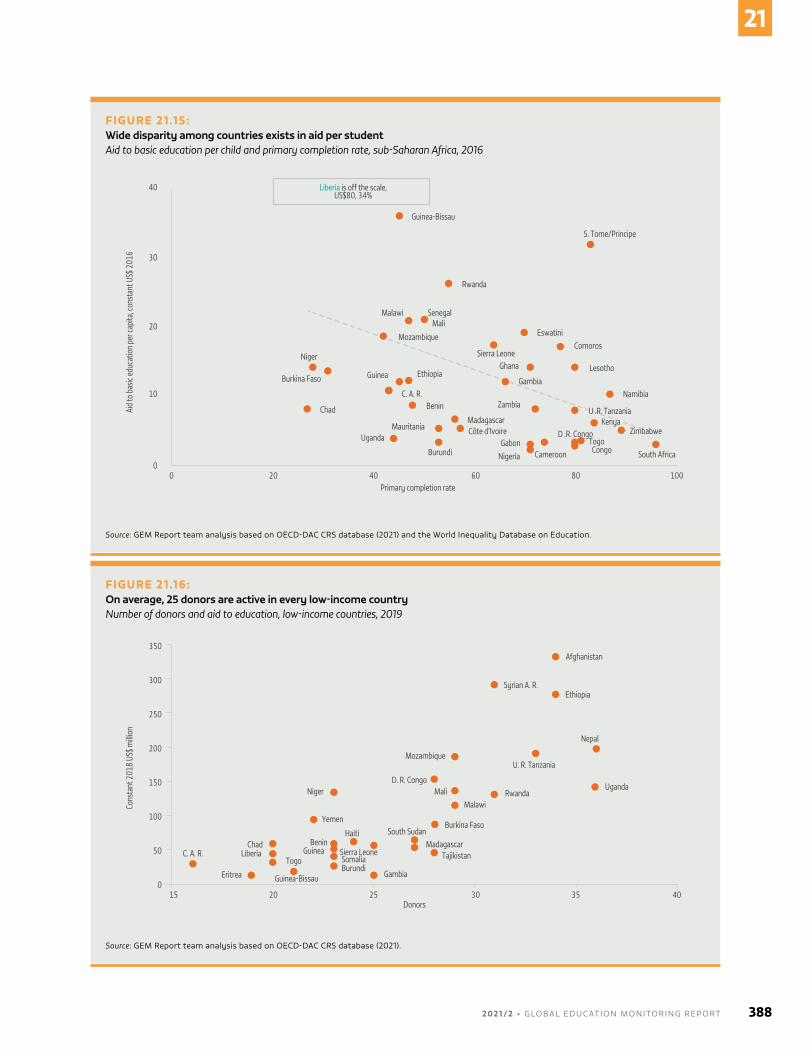
FIGURE 21.15: Wide disparity among countries exists in aid per studentAid to basic education per child and primary completion rate, sub-Saharan Africa, 2016
Upper secondary
Lorem
0 20 40 60 80 1000
10
20
30
40
Aid
to b
asic
educ
atio
n pe
r cap
ita, c
onst
ant U
S$ 2
016
Primary completion rate
Liberia is off the scale,US$80, 34%
Guinea-Bissau
S. Tome/Principe
Rwanda
SenegalMali
Malawi
Mozambique EswatiniComoros
LesothoGambia
Sierra LeoneGhana
Namibia
U .R. TanzaniaKenya
Zimbabwe
Niger
Burkina Faso
Chad
Guinea
C. A. R.
MauritaniaUganda
Burundi Nigeria
Zambia
Ethiopia
Benin
MadagascarCôte d’Ivoire
GabonD .R. Congo
TogoCongoCameroon South Africa
Source: GEm Report team analysis based on oECD-DAC CRS database (2021) and the World Inequality Database on Education.
FIGURE 21.16: On average, 25 donors are active in every low-income countryNumber of donors and aid to education, low-income countries, 2019
Upper secondary
Lorem
15 20 25 30 35 400
50
100
200
300
150
250
350
Cons
tant
201
8 US
$ milli
on
Donors
C. A. R.Chad
Liberia
Eritrea Guinea-Bissau
Togo
Niger
Yemen
HaitiBenin
Guinea Sierra LeoneSomaliaBurundi
Gambia
South Sudan
D. R. Congo
Mozambique
MaliMalawi
Burkina Faso
Madagascar Tajikistan
Rwanda
U. R. Tanzania
Syrian A. R. Ethiopia
Nepal
Uganda
Afghanistan
Source: GEm Report team analysis based on oECD-DAC CRS database (2021).
2 0 2 1 / 2 • G LO BA L E D U C AT I O N M O N I TO R I N G R E P O RT 388
21
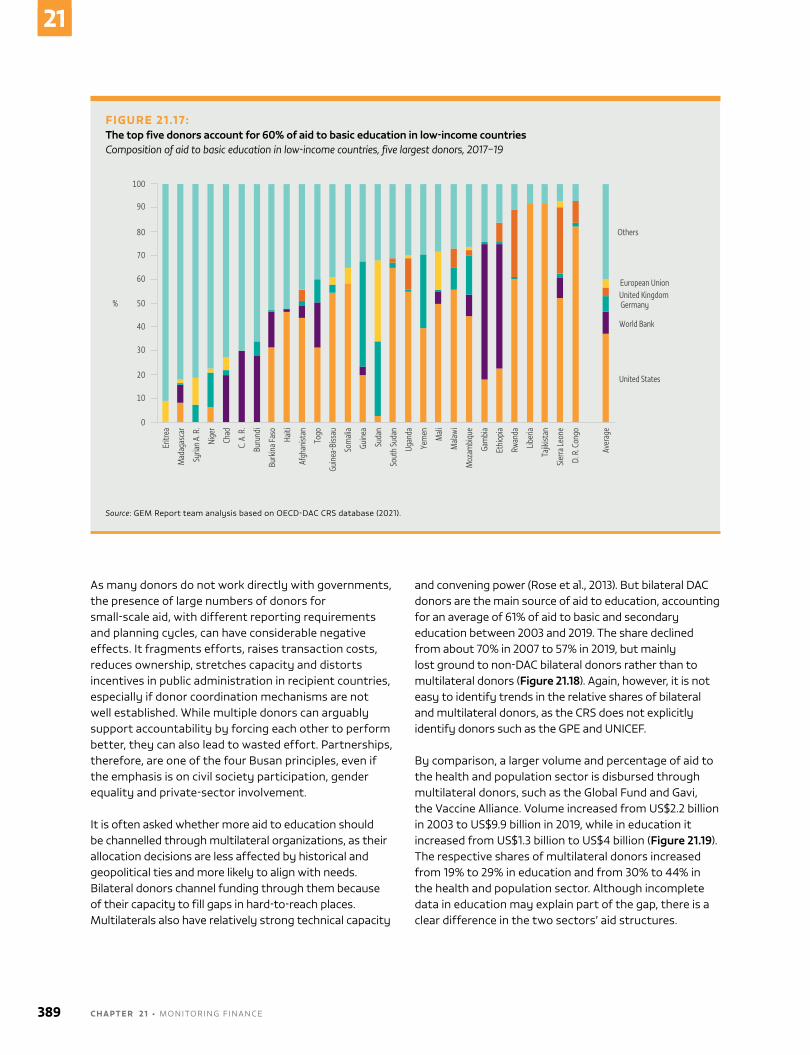
As many donors do not work directly with governments, the presence of large numbers of donors for small-scale aid, with different reporting requirements and planning cycles, can have considerable negative effects. It fragments efforts, raises transaction costs, reduces ownership, stretches capacity and distorts incentives in public administration in recipient countries, especially if donor coordination mechanisms are not well established. While multiple donors can arguably support accountability by forcing each other to perform better, they can also lead to wasted effort. Partnerships, therefore, are one of the four busan principles, even if the emphasis is on civil society participation, gender equality and private-sector involvement.
It is often asked whether more aid to education should be channelled through multilateral organizations, as their allocation decisions are less affected by historical and geopolitical ties and more likely to align with needs. bilateral donors channel funding through them because of their capacity to fill gaps in hard-to-reach places. multilaterals also have relatively strong technical capacity
and convening power (Rose et al., 2013). but bilateral DAC donors are the main source of aid to education, accounting for an average of 61% of aid to basic and secondary education between 2003 and 2019. The share declined from about 70% in 2007 to 57% in 2019, but mainly lost ground to non-DAC bilateral donors rather than to multilateral donors (Figure 21.18). Again, however, it is not easy to identify trends in the relative shares of bilateral and multilateral donors, as the CRS does not explicitly identify donors such as the GPE and unICEF.
by comparison, a larger volume and percentage of aid to the health and population sector is disbursed through multilateral donors, such as the Global Fund and Gavi, the vaccine Alliance. volume increased from uS$2.2 billion in 2003 to uS$9.9 billion in 2019, while in education it increased from uS$1.3 billion to uS$4 billion (Figure 21.19). The respective shares of multilateral donors increased from 19% to 29% in education and from 30% to 44% in the health and population sector. Although incomplete data in education may explain part of the gap, there is a clear difference in the two sectors’ aid structures.
FIGURE 21.17: The top five donors account for 60% of aid to basic education in low-income countriesComposition of aid to basic education in low-income countries, five largest donors, 2017–19
Upper secondary
Lorem
Eritr
ea
Mad
agas
car
Syria
n A.
R.
Nige
r
Chad
C. A
. R.
Buru
ndi
Burk
ina F
aso
Haiti
Afgh
anist
an
Togo
Guin
ea-B
issau
Som
alia
Guin
ea
Suda
n
Sout
h Su
dan
Ugan
da
Yem
en
Mali
Mala
wi
Moz
ambi
que
Gam
bia
Ethi
opia
Rwan
da
Liber
ia
Tajik
istan
Sierra
Leon
e
D. R
. Con
go
Aver
age
Others
European UnionUnited KingdomGermany
World Bank
United States
100
90
80
70
60
50
40
30
20
10
0
%
Source: GEm Report team analysis based on oECD-DAC CRS database (2021).
389 C H A P T E R 2 1 • monIToRInG F InAnCE
21
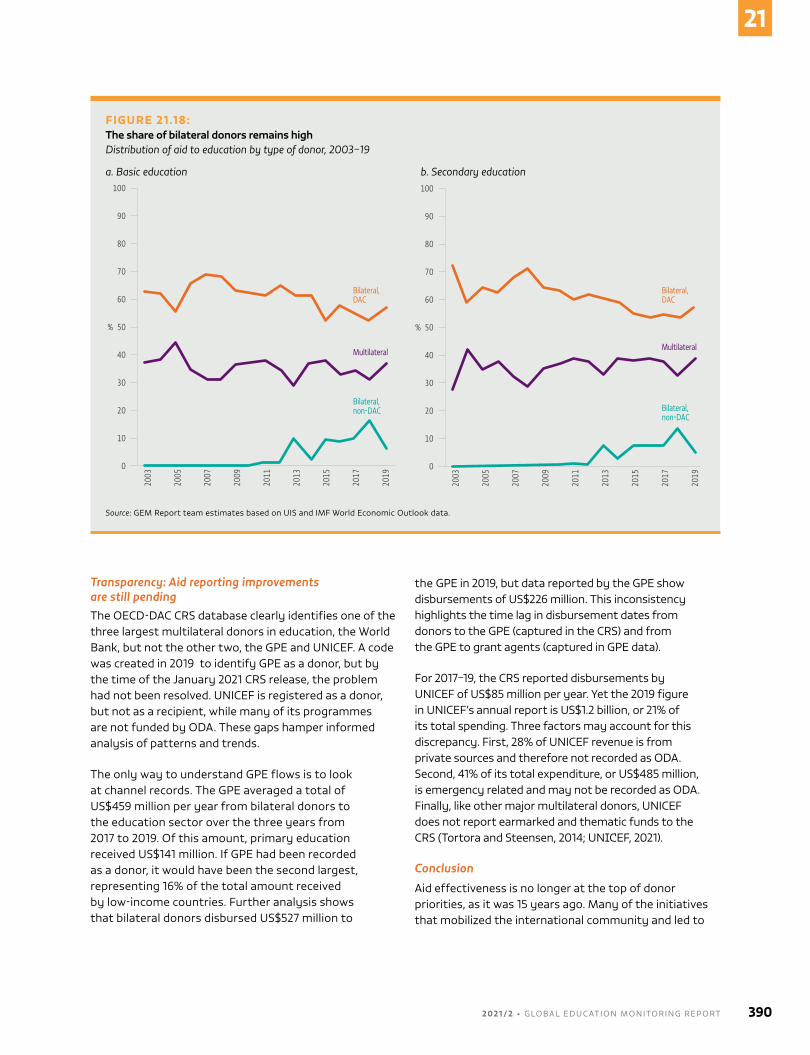
Transparency: Aid reporting improvements are still pendingThe oECD-DAC CRS database clearly identifies one of the three largest multilateral donors in education, the World bank, but not the other two, the GPE and unICEF. A code was created in 2019 to identify GPE as a donor, but by the time of the January 2021 CRS release, the problem had not been resolved. unICEF is registered as a donor, but not as a recipient, while many of its programmes are not funded by oDA. These gaps hamper informed analysis of patterns and trends.
The only way to understand GPE flows is to look at channel records. The GPE averaged a total of uS$459 million per year from bilateral donors to the education sector over the three years from 2017 to 2019. of this amount, primary education received uS$141 million. If GPE had been recorded as a donor, it would have been the second largest, representing 16% of the total amount received by low-income countries. Further analysis shows that bilateral donors disbursed uS$527 million to
the GPE in 2019, but data reported by the GPE show disbursements of uS$226 million. This inconsistency highlights the time lag in disbursement dates from donors to the GPE (captured in the CRS) and from the GPE to grant agents (captured in GPE data).
For 2017–19, the CRS reported disbursements by unICEF of uS$85 million per year. Yet the 2019 figure in unICEF’s annual report is uS$1.2 billion, or 21% of its total spending. Three factors may account for this discrepancy. First, 28% of unICEF revenue is from private sources and therefore not recorded as oDA. Second, 41% of its total expenditure, or uS$485 million, is emergency related and may not be recorded as oDA. Finally, like other major multilateral donors, unICEF does not report earmarked and thematic funds to the CRS (Tortora and Steensen, 2014; unICEF, 2021).
Conclusion
Aid effectiveness is no longer at the top of donor priorities, as it was 15 years ago. many of the initiatives that mobilized the international community and led to
FIGURE 21.18:The share of bilateral donors remains highDistribution of aid to education by type of donor, 2003–19
a. Basic education b. Secondary education
Upper secondary
100
90
80
70
60
50
40
30
20
10
0
%
2003
2005
2007
2009
2011
2013
2015
2017
2019
Bilateral,DAC
Multilateral
Bilateral,non-DAC
100
90
80
70
60
50
40
30
20
10
0
%
2003
2005
2007
2009
2011
2013
2015
2017
2019
Bilateral,DAC
Multilateral
Bilateral,non-DAC
Source: GEm Report team estimates based on uIS and ImF World Economic outlook data.
2 0 2 1 / 2 • G LO BA L E D U C AT I O N M O N I TO R I N G R E P O RT 390
21
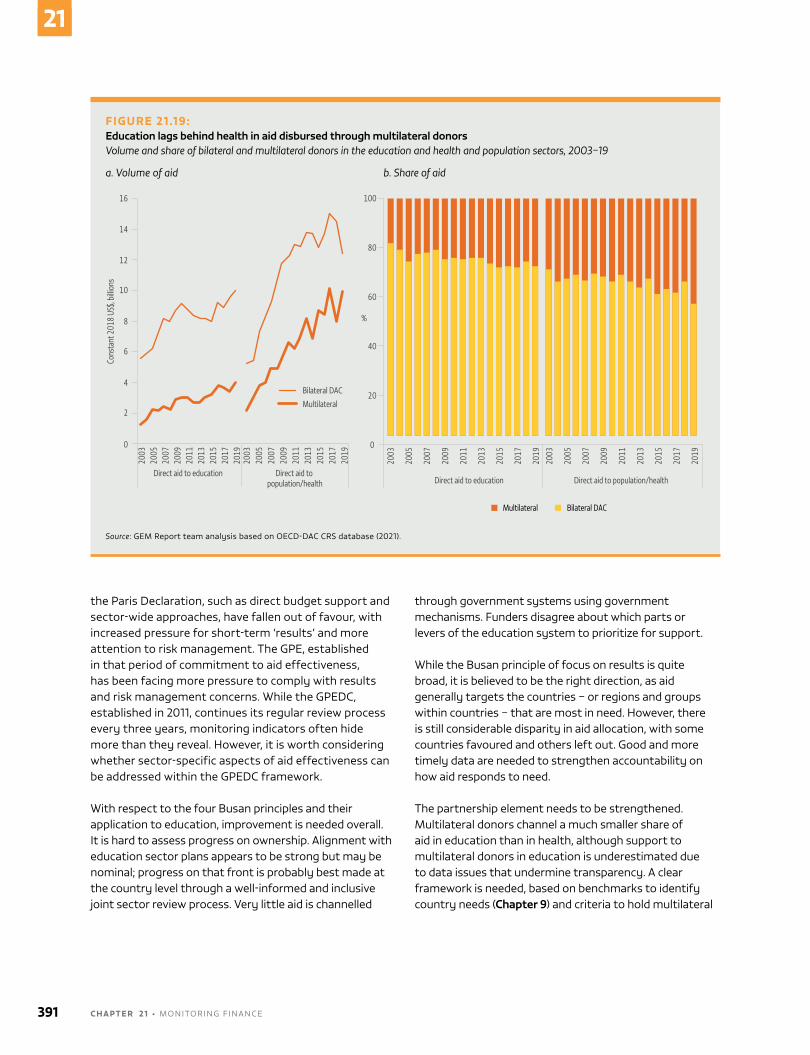
the Paris Declaration, such as direct budget support and sector-wide approaches, have fallen out of favour, with increased pressure for short-term ‘results’ and more attention to risk management. The GPE, established in that period of commitment to aid effectiveness, has been facing more pressure to comply with results and risk management concerns. While the GPEDC, established in 2011, continues its regular review process every three years, monitoring indicators often hide more than they reveal. however, it is worth considering whether sector-specific aspects of aid effectiveness can be addressed within the GPEDC framework.
With respect to the four busan principles and their application to education, improvement is needed overall. It is hard to assess progress on ownership. Alignment with education sector plans appears to be strong but may be nominal; progress on that front is probably best made at the country level through a well-informed and inclusive joint sector review process. very little aid is channelled
through government systems using government mechanisms. Funders disagree about which parts or levers of the education system to prioritize for support.
While the busan principle of focus on results is quite broad, it is believed to be the right direction, as aid generally targets the countries – or regions and groups within countries – that are most in need. however, there is still considerable disparity in aid allocation, with some countries favoured and others left out. Good and more timely data are needed to strengthen accountability on how aid responds to need.
The partnership element needs to be strengthened. multilateral donors channel a much smaller share of aid in education than in health, although support to multilateral donors in education is underestimated due to data issues that undermine transparency. A clear framework is needed, based on benchmarks to identify country needs (Chapter 9) and criteria to hold multilateral
FIGURE 21.19: Education lags behind health in aid disbursed through multilateral donorsVolume and share of bilateral and multilateral donors in the education and health and population sectors, 2003–19
a. Volume of aid b. Share of aid
Upper secondary
2003
2005
2007
2009
2011
2013
2015
2017
2019
2003
2005
2007
2009
2011
2013
2015
2017
2019
Direct aid to education Direct aid to population/health
Cons
tant
201
8 US
$, bi
llions
16
14
12
10
8
6
4
2
0
Bilateral DAC
Multilateral
2003
2005
2007
2009
2011
2013
2015
2017
2019
2003
2005
2007
2009
2011
2013
2015
2017
2019
Direct aid to education Direct aid to population/health
100
80
60
40
20
0
%
Multilateral Bilateral DAC
Source: GEm Report team analysis based on oECD-DAC CRS database (2021).
391 C H A P T E R 2 1 • monIToRInG F InAnCE
21
donors accountable for resource allocation decisions (for which they have their own governing bodies) and their ability to coordinate support for achieving benchmarks. Ensuring provision of the most basic of all global public goods, i.e. regular data of high quality on a core set of SDG 4 indicators, is a worthy objective but it has been a prominent example of aid effectiveness failure. Resolving the challenge of data collection, based on a common plan, would be a quick win and would boost confidence in what a coordination mechanism could achieve.
ultimately, though, the most important question is whether aid is relevant and focuses on the right priorities through the right approaches. These are difficult, politically charged questions, which require strong leadership to achieve consensus.
HOUSEHOLD EXPENDITURE
households spend a significant amount to support their children’s education – and more so in poorer than in richer countries. however, it is not easy to piece together evidence to understand these out-of-pocket contributions. The uIS asks countries to submit estimates of household education spending, but for 2012–18 only 68 countries, or 33%, provided at least one observation. of those, 38 were high-income countries; no data were available for more than 3 in 4 low- and middle-income countries.
The source of information is household income and expenditure (or budget) surveys. The vast majority of countries conduct such surveys. They form the basis for estimating comparable macroeconomic indicators, such as inflation and poverty, and tend to follow common principles. but data sets vary in accessibility and quality. Significant resources are required to standardize them so that comparable data on issues such as education expenditure can be extracted (Chapter 4).
To fill this gap, the GEm Report team relied on the fact that, unlike the data sets, the household budget survey reports are publicly available. In most cases, they include a summary table of how households allocate expenditure to various purposes. Almost all countries separate out the share of education in household consumption expenditure. There are often significant differences between countries in the questions asked, which can affect the estimated shares. For instance, some countries direct questions to the entire household,
while others collect information on individual members. The list of items included, how they are grouped and recall periods also differ. however, averaging over many thousands of households cancels out some of these potential biases and errors.
Analysis of reports from about 100 low- and middle-income countries between 2009 and 2020 found that, on average, households allocated 3.2% of their total expenditure to education. The share varied from less than 1% in some south-eastern European countries, including bosnia and herzegovina, north macedonia and Romania, and in several sub-Saharan African countries, including burundi, Ethiopia and lesotho, to more than 6% in countries with a high percentage of private schools, such as haiti and lebanon, and in other sub-Saharan African countries, including Rwanda, uganda and zambia. The country with the largest share was Ghana, where three successive rounds of the living Standards Survey found that the share of education spending was not only the world’s largest but had increased from 8.9% in 2005/06 to 10.6% in 2012/13 and 13.1% in 2016/17 (Ghana Statistical Service, 2008, 2016, 2019).
household education expenditure as a share of GDP can be estimated by multiplying the share of education in household consumption expenditure with data on household consumption expenditure as a share of GDP. The latter varies by country because of considerable differences in economic, social and political conditions. Globally, household consumption as a share of GDP was 59% in 2020, with shares ranging from less than 40% in oil-producing countries, including oman, Saudi Arabia and the united Arab Emirates, to close to or even exceeding 100% in poor countries that rely on remittances, such as haiti, liberia and Somalia (World bank, 2021).
This indirect estimate of household education expenditure as a share of GDP can be complemented with direct estimates provided by the uIS and oECD, generating a data set of almost 150 countries. on average, households spend 1.9% of GDP on education, compared with the average 4.5% of GDP by governments; this means households account for 30% of total education spending. Regional shares range from 16% in high-income to 39% in low- and lower-middle-income countries, reaching 37% in Central and Southern Asia and in latin America and the Caribbean, and 39% in sub-Saharan Africa, but only 12% in Europe and northern America (Figure 21.20).
2 0 2 1 / 2 • G LO BA L E D U C AT I O N M O N I TO R I N G R E P O RT 392
21
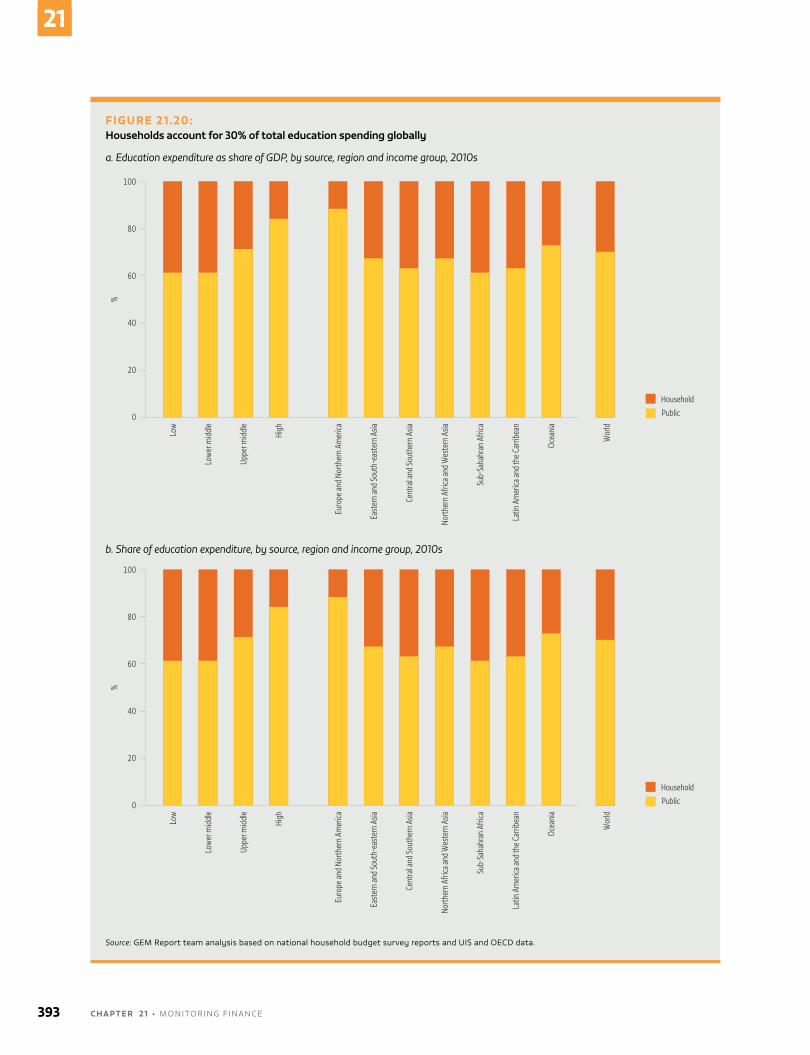
FIGURE 21.20: Households account for 30% of total education spending globally
a. Education expenditure as share of GDP, by source, region and income group, 2010s
8
7
6
5
4
3
2
1
0
Household
Public
GDP
(%)
Household
Public
100
80
60
40
20
0
%
Low
Lowe
r mid
dle
Uppe
r mid
dle
High
Euro
pe an
d No
rther
n Am
erica
East
ern
and
Sout
h-ea
ster
n As
ia
Cent
ral a
nd So
uthe
rn A
sia
North
ern
Afric
a and
Wes
tern
Asia
Sub-
Saha
hran
Afri
ca
Latin
Am
erica
and
the C
arrib
ean
Ocea
nia
Wor
ld
b. Share of education expenditure, by source, region and income group, 2010s
8
7
6
5
4
3
2
1
0
Household
Public
GDP
(%)
Household
Public
100
80
60
40
20
0
%
Low
Lowe
r mid
dle
Uppe
r mid
dle
High
Euro
pe an
d No
rther
n Am
erica
East
ern
and
Sout
h-ea
ster
n As
ia
Cent
ral a
nd So
uthe
rn A
sia
North
ern
Afric
a and
Wes
tern
Asia
Sub-
Saha
hran
Afri
ca
Latin
Am
erica
and
the C
arrib
ean
Ocea
nia
Wor
ld
Source: GEm Report team analysis based on national household budget survey reports and uIS and oECD data.
393 C H A P T E R 2 1 • monIToRInG F InAnCE
21
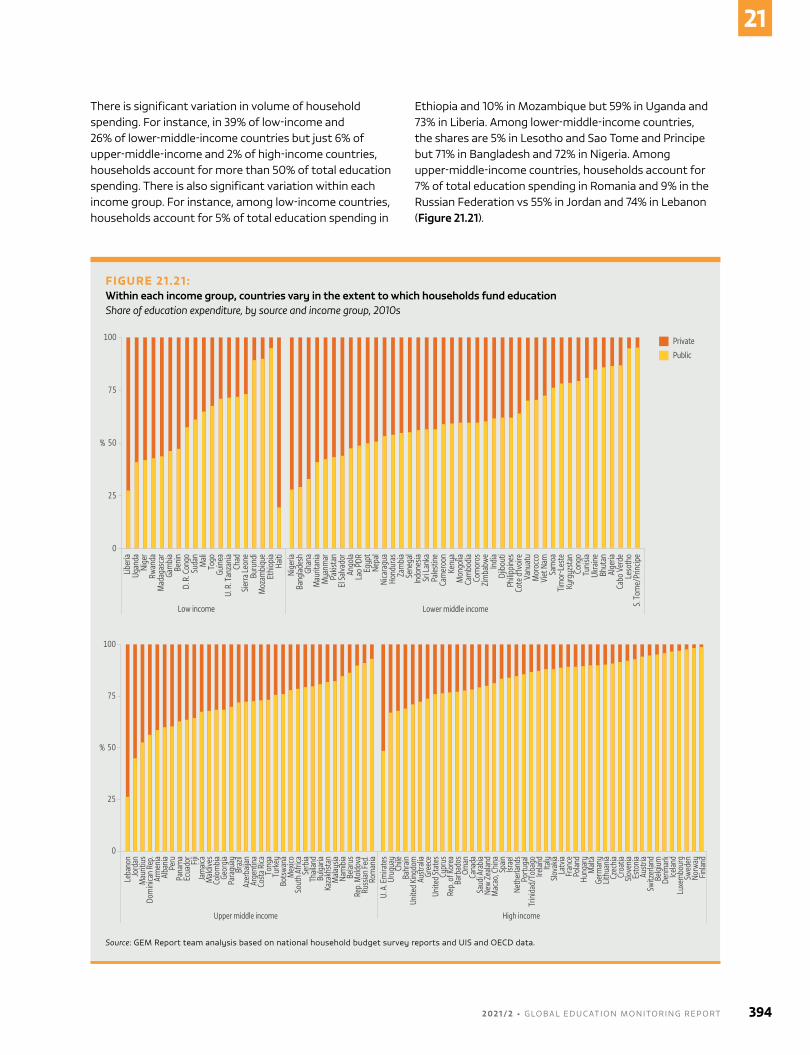
There is significant variation in volume of household spending. For instance, in 39% of low-income and 26% of lower-middle-income countries but just 6% of upper-middle-income and 2% of high-income countries, households account for more than 50% of total education spending. There is also significant variation within each income group. For instance, among low-income countries, households account for 5% of total education spending in
Ethiopia and 10% in mozambique but 59% in uganda and 73% in liberia. Among lower-middle-income countries, the shares are 5% in lesotho and Sao Tome and Principe but 71% in bangladesh and 72% in nigeria. Among upper-middle-income countries, households account for 7% of total education spending in Romania and 9% in the Russian Federation vs 55% in Jordan and 74% in lebanon (Figure 21.21).
FIGURE 21.21: Within each income group, countries vary in the extent to which households fund educationShare of education expenditure, by source and income group, 2010s
Upper secondary
Lorem
%
Liber
iaUg
anda
Nige
rRw
anda
Mad
agas
car
Gam
bia
Beni
nD.
R. C
ongo
Suda
nM
aliTo
goGu
inea
U. R
. Tan
zani
aCh
adSie
rra Le
one
Buru
ndi
Moz
ambi
que
Ethi
opia
Haiti
Nige
riaBa
nglad
esh
Ghan
aM
aurit
ania
Mya
nmar
Pakis
tan
El Sa
lvado
rAn
gola
Lao
PDR
Egyp
tNe
pal
Nica
ragu
aHo
ndur
asZa
mbi
aSe
nega
lIn
done
siaSr
i Lan
kaPa
lestin
eCa
mer
oon
Keny
aM
ongo
liaCa
mbo
dia
Com
oros
Zim
babw
eIn
dia
Djib
outi
Philip
pine
sCo
te d
'Ivoi
reVa
nuat
uM
oroc
coVi
et N
amSa
moa
Tim
or-L
este
Kyrg
yzst
anCo
ngo
Tuni
siaUk
rain
eBh
utan
Alge
riaCa
bo V
erde
Leso
tho
S. To
me/
Prin
cipe
Low income Lower middle income
Private
Public
100
75
25
0
50%
Upper secondary
Lorem
100
75
25
0
%
Leba
non
Jord
anM
aurit
ius
Dom
inica
n Re
p.Ar
men
iaAl
bani
aPe
ruPa
nam
aEc
uado
rFij
iJa
maic
aM
aldive
sCo
lom
bia
Geor
gia
Para
guay
Braz
ilAz
erba
ijan
Arge
ntin
aCo
sta R
icaTo
nga
Turk
eyBo
tswa
naM
exico
Sout
h Af
rica
Serb
iaTh
ailan
dBu
lgar
iaKa
zakh
stan
Mala
ysia
Nam
ibia
Belar
usRe
p. M
oldo
vaRu
ssian
Fed.
Rom
ania
U. A
. Em
irate
sUr
ugua
yCh
ileBa
hrain
Unite
d Ki
ngdo
mAu
stra
liaGr
eece
Unite
d St
ates
Cypr
usRe
p. o
f Kor
eaBa
rbad
osOm
anCa
nada
Saud
i Ara
bia
New
Zeala
ndM
acao
, Chi
naSp
ainIsr
ael
Neth
erlan
dsPo
rtuga
lTr
inid
ad/T
obag
oIre
land
Italy
Slova
kiaLa
tvia
Fran
cePo
land
Hung
ary
Malt
aGe
rman
yLit
huan
iaCz
echi
aCr
oatia
Slove
nia
Esto
nia
Aust
riaSw
itzer
land
Belg
ium
Denm
ark
Icelan
dLu
xem
bour
gSw
eden
Norw
ayFin
land
Upper middle income High incomePrivatePublic
50%
Source: GEm Report team analysis based on national household budget survey reports and uIS and oECD data.
2 0 2 1 / 2 • G LO BA L E D U C AT I O N M O N I TO R I N G R E P O RT 394
21
Two small children play with toy xylophones at the Sayariy Warmi early childhood development (ECD) centre in Sucre, Bolivia.
CREDIT: unICEF/GIAComo PIRozzI
A N N E X • STATISTICAl TAblES 395
Statistical Tables1
1 The statistical tables are accessible on the GEm Report website at https://en.unesco.org/gem-report/statistical-tables.
2 The Inter-agency and Expert Group on SDG Indicators proposed the 11 SDG 4 global indicators. The un Statistical Commission adopted them at its 48th session, in march 2017. The united nations Economic and Social Council adopted them in June 2017. The completion rate (indicator 4.1.2) was added to the list in march 2021 following the 2020 Comprehensive Review.
3 The Technical Advisory Group on post-2015 education indicators originally proposed the 43 indicators. The Technical Cooperation Group (TCG), whose secretariat is at the uIS, endorsed them, with some changes, to monitor progress towards the SDG 4 targets. Information on indicator methodological developments is accessible at the TCG website, http://tcg.uis.unesco.org/.
4 This means 2018/19 for countries with a school year that overlaps two calendar years, and 2019 for those with a calendar school year. The most recent reference year for education finance for the uoE countries is the year ending in 2017.
5 The countries concerned are most European countries, non-European oECD countries, and a changing set of other countries.
6 Where obvious inconsistencies exist between enrolment reported by countries and the united nations population data, the uIS may decide not to calculate or publish enrolment ratios for some or all levels of education.
Table 1 presents basic information on demographic and education system characteristics as well as on domestic education finance. Tables 2–7 are organized by each of the seven SDG 4 targets (4.1–4.7) and three means of implementation (4.a–4.c). The tables mainly focus on the SDG 4 monitoring framework of 43 internationally comparable indicators: 12 global and 31 thematic indicators. An additional indicator, ‘Proportion of children/young people prepared for the future, by sex’, is the product of the two global indicators of SDG target 4.1. The unESCo Institute for Statistics (uIS) reported on all indicators in 2021 except indicator 4.7.3 (Table I.1).2,3 The tables also include additional indicators, such as transition from primary to secondary education and student mobility, which are not formally part of the SDG 4 monitoring framework.
METHODOLOGICAL NOTES
most data in the statistical tables come from the uIS. Where the statistical tables include data from other sources, these are mentioned in footnotes. The most recent uIS data on pupils, students, teachers and education expenditure presented in the tables are from the February 2021 release and refer to the school year or financial year ending in 2019.4 These statistics refer to formal education, both public and private, by level of education. The statistical tables list 209 countries and territories, all of which are unESCo member States or associate members. most report their data to the uIS using standard questionnaires issued by the uIS itself. For 46 countries, education data are collected by the uIS via the uIS/oECD/Eurostat (uoE) questionnaires.5
POPULATION DATAThe population-related indicators used in the statistical tables, including enrolment ratios, number of out-of-school children, adolescents and youth, and number of youth and adults, are based on the 2019 revision of population estimates produced by the un Population Division (unPD). because of possible differences between national population estimates and those of the united nations, these indicators may differ from those published by individual countries or by other organizations.6 In the 2019 revision, the unPD does not provide population data by single years of age for countries with total population of less than 90,000. For these countries, as well as some special cases, population estimates are derived from Eurostat (Demographic Statistics), the Secretariat of the Pacific Community (Statistics and Demography Programme) or national statistical offices.
ISCED CLASSIFICATIONEducation data reported to the uIS are in conformity with the International Standard Classification of Education (ISCED), revised in 2011. Countries may have their own definitions of education levels that do not correspond to ISCED 2011. Differences between nationally and internationally reported education statistics may be due to the use of nationally defined education levels rather than the ISCED level, in addition to the population issue raised above.
2 0 2 1 / 2 • G LO BA L E D U C AT I O N M O N I TO R I N G R E P O RT 396
ESTIMATES AND MISSING DATARegarding statistics produced by the uIS, both observed and estimated education data are presented throughout the statistical tables. The latter are marked with subscript (i). Wherever possible, the uIS encourages countries to make their own estimates. Where this does not happen, the uIS may make its own estimates if sufficient supplementary information is available. Gaps in the tables may arise where data submitted by a country are found to be inconsistent. The uIS makes every attempt to resolve such problems with the countries concerned, but reserves the final decision on omitting data it regards as problematic. If information for the year ending in 2019 is not available, data for earlier or later years are used. Such cases are indicated by footnotes.
AGGREGATESFigures for regional and other aggregates represent either sums, the percentage of countries meeting some condition, medians or weighted averages, as indicated in the tables, depending on the indicator. Weighted averages take into account the relative size of the relevant population of each country, or more generally of the denominator in the case of indicators that are ratios. The aggregates are derived from both published data and imputed values, for countries for which no recent data or reliable publishable data are available. Aggregates marked with (i) in the tables are based on incomplete country coverage of reliable data (between 33% and 60% of the population [or aggregate denominator value] of a given region or country grouping). GEm Report calculated sums are flagged for incomplete coverage if less than 95% of the population of a given region or country income group is represented among the countries for which data are available.
REGIONAL AND COUNTRY INCOME GROUPSIn terms of regional groups, the statistical tables use the SDG regional classification of the united nations Statistical Division (unSD), with some adjustments. The unSD classification includes all territories, whether independent national entities or parts of bigger entities. however, the list of countries presented in the statistical tables includes only full unESCo member States and associate members, as well as bermuda and Turks and Caicos Islands, non-member states that were included in the EFA statistical tables. The uIS does not collect data for the Faroe Islands, so this territory is not included in the GEm Report despite its status as a unESCo associate member. In terms of country income groups, the statistical tables use the World bank groups, which are updated each year on 1 July.
SYMBOLS USED IN THE STATISTICAL TABLES ± n Reference year differs
(e.g. -2: reference year 2017 instead of 2019)
i Estimate and/or partial coverage
- magnitude nil or negligible
… Data not available or category not applicable
notes by indicator (Table I.2), footnotes to the tables and a glossary provide additional help to interpret the data.
A N N E X • STATISTICAl TAblES 397
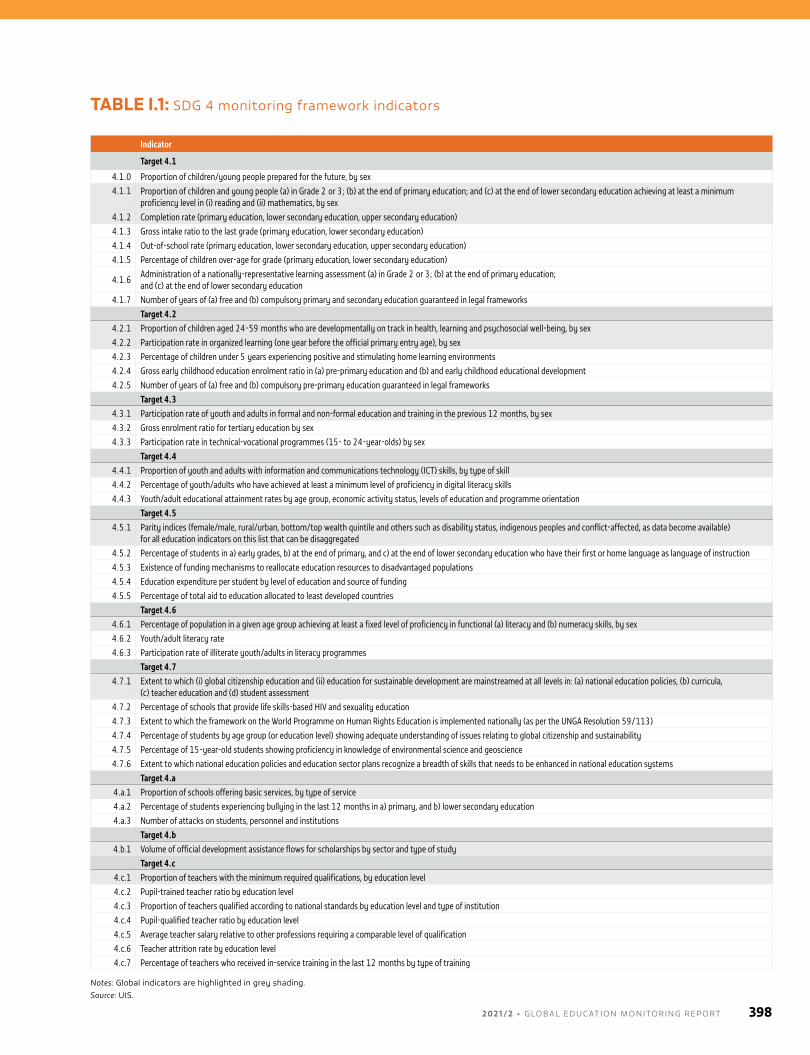
TABLE I.1: SDG 4 monitoring framework indicators
Indicator
Target 4.1
4.1.0 Proportion of children/young people prepared for the future, by sex4.1.1 Proportion of children and young people (a) in Grade 2 or 3; (b) at the end of primary education; and (c) at the end of lower secondary education achieving at least a minimum
proficiency level in (i) reading and (ii) mathematics, by sex4.1.2 Completion rate (primary education, lower secondary education, upper secondary education)4.1.3 Gross intake ratio to the last grade (primary education, lower secondary education)4.1.4 Out-of-school rate (primary education, lower secondary education, upper secondary education)4.1.5 Percentage of children over-age for grade (primary education, lower secondary education)
4.1.6Administration of a nationally-representative learning assessment (a) in Grade 2 or 3; (b) at the end of primary education; and (c) at the end of lower secondary education
4.1.7 Number of years of (a) free and (b) compulsory primary and secondary education guaranteed in legal frameworksTarget 4.2
4.2.1 Proportion of children aged 24-59 months who are developmentally on track in health, learning and psychosocial well-being, by sex4.2.2 Participation rate in organized learning (one year before the official primary entry age), by sex4.2.3 Percentage of children under 5 years experiencing positive and stimulating home learning environments4.2.4 Gross early childhood education enrolment ratio in (a) pre-primary education and (b) and early childhood educational development4.2.5 Number of years of (a) free and (b) compulsory pre-primary education guaranteed in legal frameworks
Target 4.34.3.1 Participation rate of youth and adults in formal and non-formal education and training in the previous 12 months, by sex4.3.2 Gross enrolment ratio for tertiary education by sex4.3.3 Participation rate in technical-vocational programmes (15- to 24-year-olds) by sex
Target 4.44.4.1 Proportion of youth and adults with information and communications technology (ICT) skills, by type of skill4.4.2 Percentage of youth/adults who have achieved at least a minimum level of proficiency in digital literacy skills4.4.3 Youth/adult educational attainment rates by age group, economic activity status, levels of education and programme orientation
Target 4.54.5.1 Parity indices (female/male, rural/urban, bottom/top wealth quintile and others such as disability status, indigenous peoples and conflict-affected, as data become available)
for all education indicators on this list that can be disaggregated4.5.2 Percentage of students in a) early grades, b) at the end of primary, and c) at the end of lower secondary education who have their first or home language as language of instruction4.5.3 Existence of funding mechanisms to reallocate education resources to disadvantaged populations4.5.4 Education expenditure per student by level of education and source of funding4.5.5 Percentage of total aid to education allocated to least developed countries
Target 4.64.6.1 Percentage of population in a given age group achieving at least a fixed level of proficiency in functional (a) literacy and (b) numeracy skills, by sex4.6.2 Youth/adult literacy rate4.6.3 Participation rate of illiterate youth/adults in literacy programmes
Target 4.74.7.1 Extent to which (i) global citizenship education and (ii) education for sustainable development are mainstreamed at all levels in: (a) national education policies, (b) curricula,
(c) teacher education and (d) student assessment4.7.2 Percentage of schools that provide life skills-based HIV and sexuality education4.7.3 Extent to which the framework on the World Programme on Human Rights Education is implemented nationally (as per the UNGA Resolution 59/113)4.7.4 Percentage of students by age group (or education level) showing adequate understanding of issues relating to global citizenship and sustainability4.7.5 Percentage of 15-year-old students showing proficiency in knowledge of environmental science and geoscience4.7.6 Extent to which national education policies and education sector plans recognize a breadth of skills that needs to be enhanced in national education systems
Target 4.a4.a.1 Proportion of schools offering basic services, by type of service4.a.2 Percentage of students experiencing bullying in the last 12 months in a) primary, and b) lower secondary education4.a.3 Number of attacks on students, personnel and institutions
Target 4.b4.b.1 Volume of official development assistance flows for scholarships by sector and type of study
Target 4.c4.c.1 Proportion of teachers with the minimum required qualifications, by education level4.c.2 Pupil-trained teacher ratio by education level4.c.3 Proportion of teachers qualified according to national standards by education level and type of institution4.c.4 Pupil-qualified teacher ratio by education level4.c.5 Average teacher salary relative to other professions requiring a comparable level of qualification4.c.6 Teacher attrition rate by education level4.c.7 Percentage of teachers who received in-service training in the last 12 months by type of training
Notes: Global indicators are highlighted in grey shading. Source: uIS.
2 0 2 1 / 2 • G LO BA L E D U C AT I O N M O N I TO R I N G R E P O RT 398
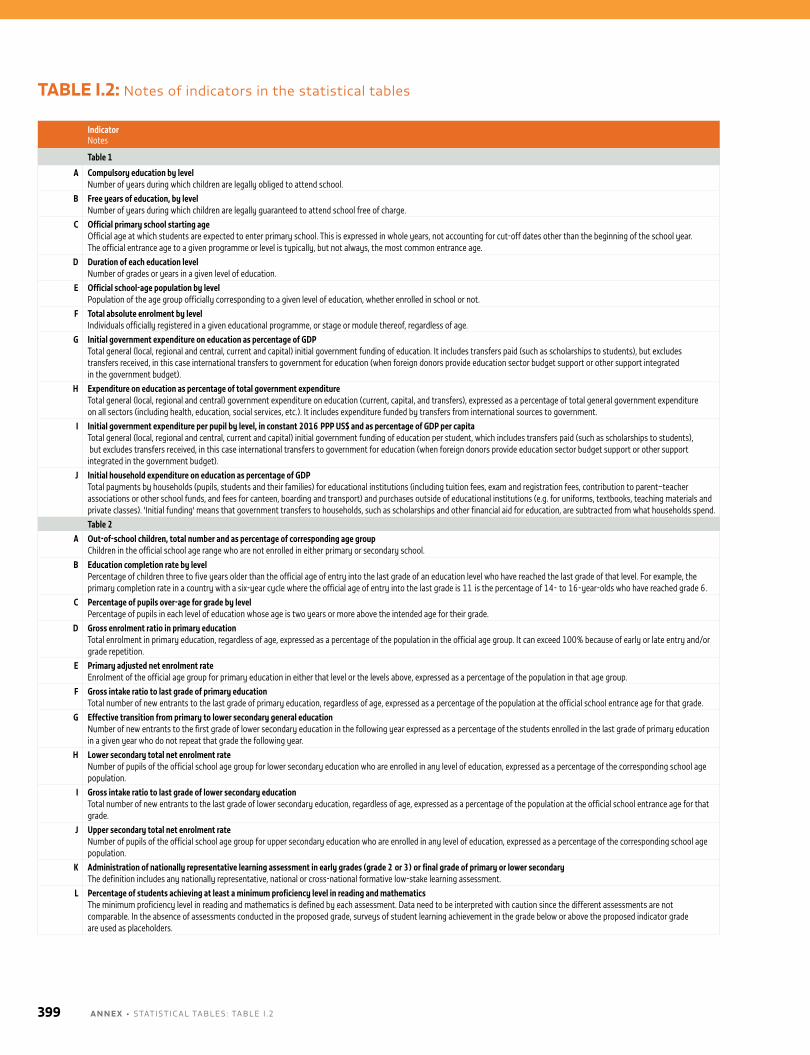
TABLE I.2: notes of indicators in the statistical tables
Indicator Notes
Table 1
A Compulsory education by level Number of years during which children are legally obliged to attend school.
B Free years of education, by level Number of years during which children are legally guaranteed to attend school free of charge.
C Official primary school starting age Official age at which students are expected to enter primary school. This is expressed in whole years, not accounting for cut-off dates other than the beginning of the school year. The official entrance age to a given programme or level is typically, but not always, the most common entrance age.
D Duration of each education level Number of grades or years in a given level of education.
E Official school-age population by level Population of the age group officially corresponding to a given level of education, whether enrolled in school or not.
F Total absolute enrolment by level Individuals officially registered in a given educational programme, or stage or module thereof, regardless of age.
G Initial government expenditure on education as percentage of GDP Total general (local, regional and central, current and capital) initial government funding of education. It includes transfers paid (such as scholarships to students), but excludes transfers received, in this case international transfers to government for education (when foreign donors provide education sector budget support or other support integrated in the government budget).
H Expenditure on education as percentage of total government expenditure Total general (local, regional and central) government expenditure on education (current, capital, and transfers), expressed as a percentage of total general government expenditure on all sectors (including health, education, social services, etc.). It includes expenditure funded by transfers from international sources to government.
I Initial government expenditure per pupil by level, in constant 2016 PPP US$ and as percentage of GDP per capita Total general (local, regional and central, current and capital) initial government funding of education per student, which includes transfers paid (such as scholarships to students), but excludes transfers received, in this case international transfers to government for education (when foreign donors provide education sector budget support or other support integrated in the government budget).
J Initial household expenditure on education as percentage of GDP Total payments by households (pupils, students and their families) for educational institutions (including tuition fees, exam and registration fees, contribution to parent–teacher associations or other school funds, and fees for canteen, boarding and transport) and purchases outside of educational institutions (e.g. for uniforms, textbooks, teaching materials and private classes). 'Initial funding' means that government transfers to households, such as scholarships and other financial aid for education, are subtracted from what households spend.Table 2
A Out-of-school children, total number and as percentage of corresponding age group Children in the official school age range who are not enrolled in either primary or secondary school.
B Education completion rate by level Percentage of children three to five years older than the official age of entry into the last grade of an education level who have reached the last grade of that level. For example, the primary completion rate in a country with a six-year cycle where the official age of entry into the last grade is 11 is the percentage of 14- to 16-year-olds who have reached grade 6.
C Percentage of pupils over-age for grade by level Percentage of pupils in each level of education whose age is two years or more above the intended age for their grade.
D Gross enrolment ratio in primary education Total enrolment in primary education, regardless of age, expressed as a percentage of the population in the official age group. It can exceed 100% because of early or late entry and/or grade repetition.
E Primary adjusted net enrolment rate Enrolment of the official age group for primary education in either that level or the levels above, expressed as a percentage of the population in that age group.
F Gross intake ratio to last grade of primary education Total number of new entrants to the last grade of primary education, regardless of age, expressed as a percentage of the population at the official school entrance age for that grade.
G Effective transition from primary to lower secondary general education Number of new entrants to the first grade of lower secondary education in the following year expressed as a percentage of the students enrolled in the last grade of primary education in a given year who do not repeat that grade the following year.
H Lower secondary total net enrolment rate Number of pupils of the official school age group for lower secondary education who are enrolled in any level of education, expressed as a percentage of the corresponding school age population.
I Gross intake ratio to last grade of lower secondary education Total number of new entrants to the last grade of lower secondary education, regardless of age, expressed as a percentage of the population at the official school entrance age for that grade.
J Upper secondary total net enrolment rate Number of pupils of the official school age group for upper secondary education who are enrolled in any level of education, expressed as a percentage of the corresponding school age population.
K Administration of nationally representative learning assessment in early grades (grade 2 or 3) or final grade of primary or lower secondary The definition includes any nationally representative, national or cross-national formative low-stake learning assessment.
L Percentage of students achieving at least a minimum proficiency level in reading and mathematics The minimum proficiency level in reading and mathematics is defined by each assessment. Data need to be interpreted with caution since the different assessments are not comparable. In the absence of assessments conducted in the proposed grade, surveys of student learning achievement in the grade below or above the proposed indicator grade are used as placeholders.
A N N E X • STATISTICAl TAblES : TAblE I .2399
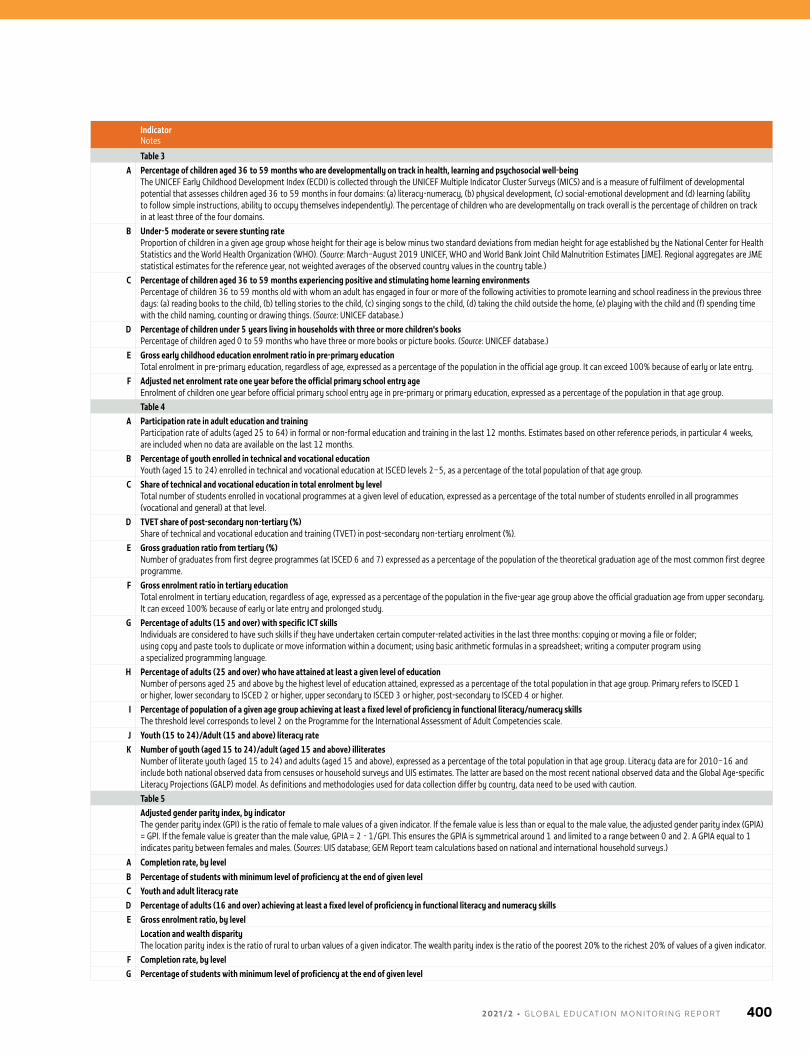
Indicator Notes
Table 3A Percentage of children aged 36 to 59 months who are developmentally on track in health, learning and psychosocial well-being
The UNICEF Early Childhood Development Index (ECDI) is collected through the UNICEF Multiple Indicator Cluster Surveys (MICS) and is a measure of fulfilment of developmental potential that assesses children aged 36 to 59 months in four domains: (a) literacy-numeracy, (b) physical development, (c) social-emotional development and (d) learning (ability to follow simple instructions, ability to occupy themselves independently). The percentage of children who are developmentally on track overall is the percentage of children on track in at least three of the four domains.
B Under-5 moderate or severe stunting rate Proportion of children in a given age group whose height for their age is below minus two standard deviations from median height for age established by the National Center for Health Statistics and the World Health Organization (WHO). (Source: March–August 2019 UNICEF, WHO and World Bank Joint Child Malnutrition Estimates [JME]. Regional aggregates are JME statistical estimates for the reference year, not weighted averages of the observed country values in the country table.)
C Percentage of children aged 36 to 59 months experiencing positive and stimulating home learning environments Percentage of children 36 to 59 months old with whom an adult has engaged in four or more of the following activities to promote learning and school readiness in the previous three days: (a) reading books to the child, (b) telling stories to the child, (c) singing songs to the child, (d) taking the child outside the home, (e) playing with the child and (f) spending time with the child naming, counting or drawing things. (Source: UNICEF database.)
D Percentage of children under 5 years living in households with three or more children's books Percentage of children aged 0 to 59 months who have three or more books or picture books. (Source: UNICEF database.)
E Gross early childhood education enrolment ratio in pre-primary education Total enrolment in pre-primary education, regardless of age, expressed as a percentage of the population in the official age group. It can exceed 100% because of early or late entry.
F Adjusted net enrolment rate one year before the official primary school entry age Enrolment of children one year before official primary school entry age in pre-primary or primary education, expressed as a percentage of the population in that age group.Table 4
A Participation rate in adult education and training Participation rate of adults (aged 25 to 64) in formal or non-formal education and training in the last 12 months. Estimates based on other reference periods, in particular 4 weeks, are included when no data are available on the last 12 months.
B Percentage of youth enrolled in technical and vocational education Youth (aged 15 to 24) enrolled in technical and vocational education at ISCED levels 2–5, as a percentage of the total population of that age group.
C Share of technical and vocational education in total enrolment by level Total number of students enrolled in vocational programmes at a given level of education, expressed as a percentage of the total number of students enrolled in all programmes (vocational and general) at that level.
D TVET share of post-secondary non-tertiary (%) Share of technical and vocational education and training (TVET) in post-secondary non-tertiary enrolment (%).
E Gross graduation ratio from tertiary (%) Number of graduates from first degree programmes (at ISCED 6 and 7) expressed as a percentage of the population of the theoretical graduation age of the most common first degree programme.
F Gross enrolment ratio in tertiary education Total enrolment in tertiary education, regardless of age, expressed as a percentage of the population in the five-year age group above the official graduation age from upper secondary. It can exceed 100% because of early or late entry and prolonged study.
G Percentage of adults (15 and over) with specific ICT skills Individuals are considered to have such skills if they have undertaken certain computer-related activities in the last three months: copying or moving a file or folder; using copy and paste tools to duplicate or move information within a document; using basic arithmetic formulas in a spreadsheet; writing a computer program using a specialized programming language.
H Percentage of adults (25 and over) who have attained at least a given level of education Number of persons aged 25 and above by the highest level of education attained, expressed as a percentage of the total population in that age group. Primary refers to ISCED 1 or higher, lower secondary to ISCED 2 or higher, upper secondary to ISCED 3 or higher, post-secondary to ISCED 4 or higher.
I Percentage of population of a given age group achieving at least a fixed level of proficiency in functional literacy/numeracy skills The threshold level corresponds to level 2 on the Programme for the International Assessment of Adult Competencies scale.
J Youth (15 to 24)/Adult (15 and above) literacy rateK Number of youth (aged 15 to 24)/adult (aged 15 and above) illiterates
Number of literate youth (aged 15 to 24) and adults (aged 15 and above), expressed as a percentage of the total population in that age group. Literacy data are for 2010–16 and include both national observed data from censuses or household surveys and UIS estimates. The latter are based on the most recent national observed data and the Global Age-specific Literacy Projections (GALP) model. As definitions and methodologies used for data collection differ by country, data need to be used with caution.Table 5Adjusted gender parity index, by indicator The gender parity index (GPI) is the ratio of female to male values of a given indicator. If the female value is less than or equal to the male value, the adjusted gender parity index (GPIA) = GPI. If the female value is greater than the male value, GPIA = 2 - 1/GPI. This ensures the GPIA is symmetrical around 1 and limited to a range between 0 and 2. A GPIA equal to 1 indicates parity between females and males. (Sources: UIS database; GEM Report team calculations based on national and international household surveys.)
A Completion rate, by levelB Percentage of students with minimum level of proficiency at the end of given levelC Youth and adult literacy rateD Percentage of adults (16 and over) achieving at least a fixed level of proficiency in functional literacy and numeracy skillsE Gross enrolment ratio, by level
Location and wealth disparity The location parity index is the ratio of rural to urban values of a given indicator. The wealth parity index is the ratio of the poorest 20% to the richest 20% of values of a given indicator.
F Completion rate, by levelG Percentage of students with minimum level of proficiency at the end of given level
2 0 2 1 / 2 • G LO BA L E D U C AT I O N M O N I TO R I N G R E P O RT 400
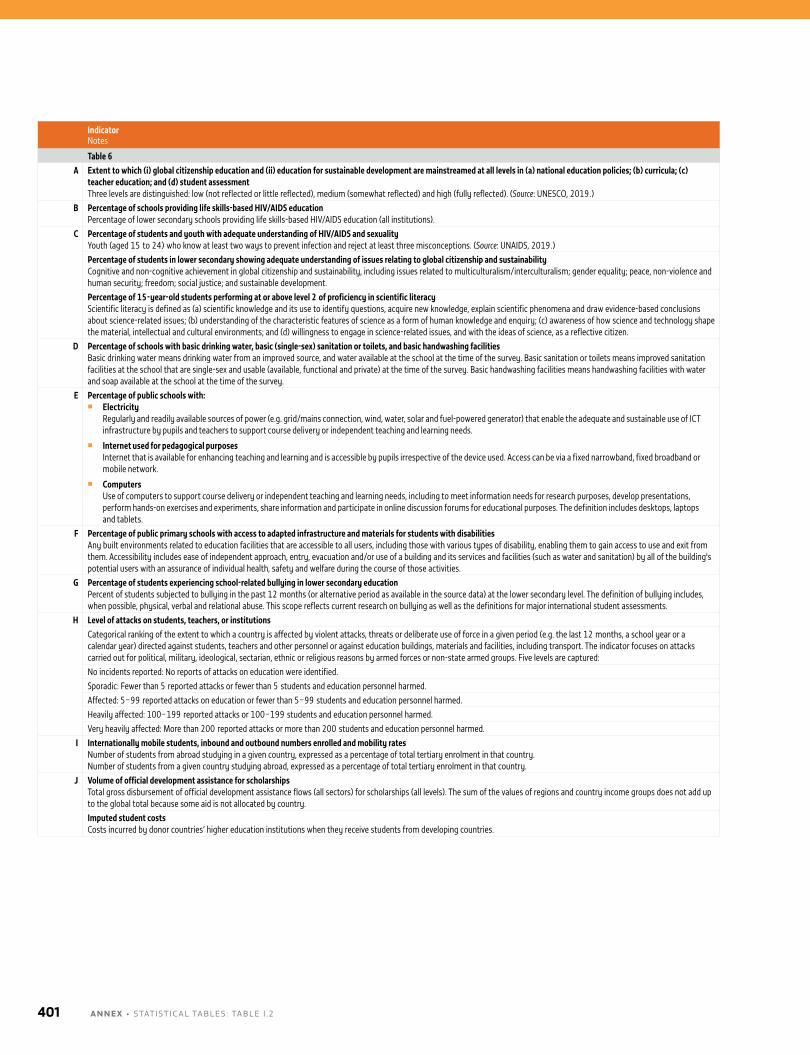
Indicator Notes
Table 6A Extent to which (i) global citizenship education and (ii) education for sustainable development are mainstreamed at all levels in (a) national education policies; (b) curricula; (c)
teacher education; and (d) student assessment Three levels are distinguished: low (not reflected or little reflected), medium (somewhat reflected) and high (fully reflected). (Source: UNESCO, 2019.)
B Percentage of schools providing life skills-based HIV/AIDS education Percentage of lower secondary schools providing life skills-based HIV/AIDS education (all institutions).
C Percentage of students and youth with adequate understanding of HIV/AIDS and sexuality Youth (aged 15 to 24) who know at least two ways to prevent infection and reject at least three misconceptions. (Source: UNAIDS, 2019.)Percentage of students in lower secondary showing adequate understanding of issues relating to global citizenship and sustainability Cognitive and non-cognitive achievement in global citizenship and sustainability, including issues related to multiculturalism/interculturalism; gender equality; peace, non-violence and human security; freedom; social justice; and sustainable development.Percentage of 15-year-old students performing at or above level 2 of proficiency in scientific literacy Scientific literacy is defined as (a) scientific knowledge and its use to identify questions, acquire new knowledge, explain scientific phenomena and draw evidence-based conclusions about science-related issues; (b) understanding of the characteristic features of science as a form of human knowledge and enquiry; (c) awareness of how science and technology shape the material, intellectual and cultural environments; and (d) willingness to engage in science-related issues, and with the ideas of science, as a reflective citizen.
D Percentage of schools with basic drinking water, basic (single-sex) sanitation or toilets, and basic handwashing facilities Basic drinking water means drinking water from an improved source, and water available at the school at the time of the survey. Basic sanitation or toilets means improved sanitation facilities at the school that are single-sex and usable (available, functional and private) at the time of the survey. Basic handwashing facilities means handwashing facilities with water and soap available at the school at the time of the survey.
E Percentage of public schools with: � Electricity
Regularly and readily available sources of power (e.g. grid/mains connection, wind, water, solar and fuel-powered generator) that enable the adequate and sustainable use of ICT infrastructure by pupils and teachers to support course delivery or independent teaching and learning needs.
� Internet used for pedagogical purposes Internet that is available for enhancing teaching and learning and is accessible by pupils irrespective of the device used. Access can be via a fixed narrowband, fixed broadband or mobile network.
� Computers Use of computers to support course delivery or independent teaching and learning needs, including to meet information needs for research purposes, develop presentations, perform hands-on exercises and experiments, share information and participate in online discussion forums for educational purposes. The definition includes desktops, laptops and tablets.
F Percentage of public primary schools with access to adapted infrastructure and materials for students with disabilities Any built environments related to education facilities that are accessible to all users, including those with various types of disability, enabling them to gain access to use and exit from them. Accessibility includes ease of independent approach, entry, evacuation and/or use of a building and its services and facilities (such as water and sanitation) by all of the building's potential users with an assurance of individual health, safety and welfare during the course of those activities.
G Percentage of students experiencing school-related bullying in lower secondary education Percent of students subjected to bullying in the past 12 months (or alternative period as available in the source data) at the lower secondary level. The definition of bullying includes, when possible, physical, verbal and relational abuse. This scope reflects current research on bullying as well as the definitions for major international student assessments.
H Level of attacks on students, teachers, or institutionsCategorical ranking of the extent to which a country is affected by violent attacks, threats or deliberate use of force in a given period (e.g. the last 12 months, a school year or a calendar year) directed against students, teachers and other personnel or against education buildings, materials and facilities, including transport. The indicator focuses on attacks carried out for political, military, ideological, sectarian, ethnic or religious reasons by armed forces or non-state armed groups. Five levels are captured:No incidents reported: No reports of attacks on education were identified.Sporadic: Fewer than 5 reported attacks or fewer than 5 students and education personnel harmed.Affected: 5–99 reported attacks on education or fewer than 5–99 students and education personnel harmed. Heavily affected: 100–199 reported attacks or 100–199 students and education personnel harmed.Very heavily affected: More than 200 reported attacks or more than 200 students and education personnel harmed.
I Internationally mobile students, inbound and outbound numbers enrolled and mobility rates Number of students from abroad studying in a given country, expressed as a percentage of total tertiary enrolment in that country.Number of students from a given country studying abroad, expressed as a percentage of total tertiary enrolment in that country.
J Volume of official development assistance for scholarships Total gross disbursement of official development assistance flows (all sectors) for scholarships (all levels). The sum of the values of regions and country income groups does not add up to the global total because some aid is not allocated by country.Imputed student costs Costs incurred by donor countries’ higher education institutions when they receive students from developing countries.
A N N E X • STATISTICAl TAblES : TAblE I .2401
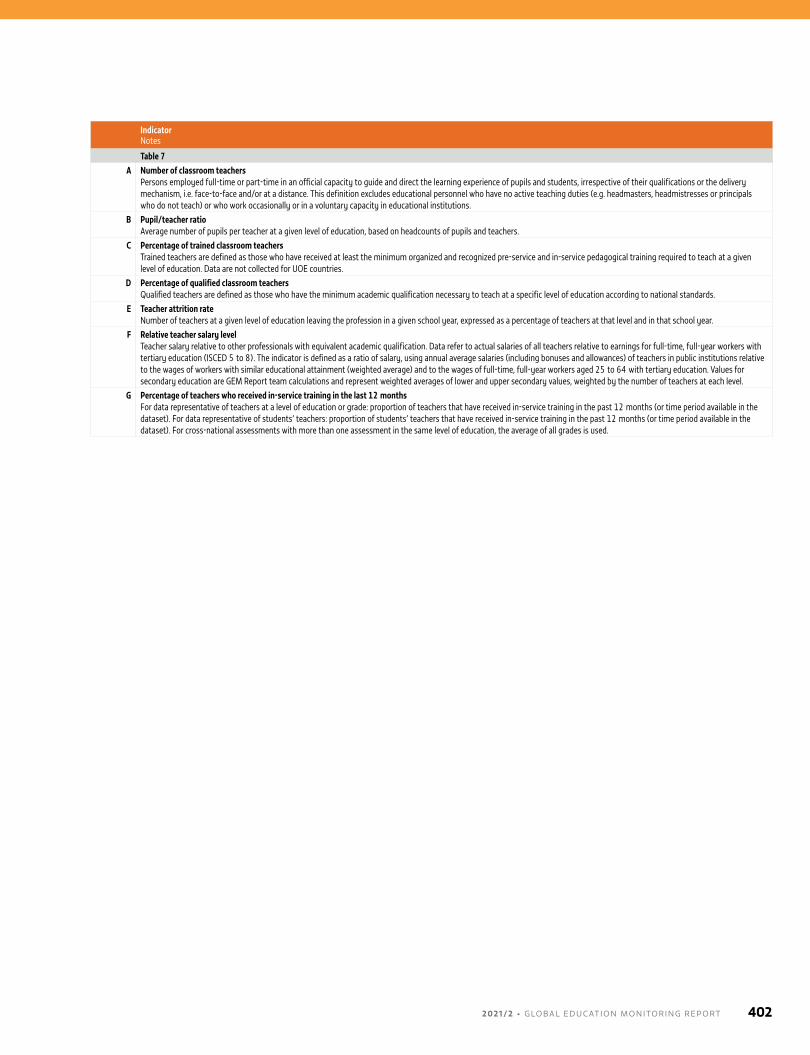
Indicator Notes
Table 7A Number of classroom teachers
Persons employed full-time or part-time in an official capacity to guide and direct the learning experience of pupils and students, irrespective of their qualifications or the delivery mechanism, i.e. face-to-face and/or at a distance. This definition excludes educational personnel who have no active teaching duties (e.g. headmasters, headmistresses or principals who do not teach) or who work occasionally or in a voluntary capacity in educational institutions.
B Pupil/teacher ratio Average number of pupils per teacher at a given level of education, based on headcounts of pupils and teachers.
C Percentage of trained classroom teachers Trained teachers are defined as those who have received at least the minimum organized and recognized pre-service and in-service pedagogical training required to teach at a given level of education. Data are not collected for UOE countries.
D Percentage of qualified classroom teachers Qualified teachers are defined as those who have the minimum academic qualification necessary to teach at a specific level of education according to national standards.
E Teacher attrition rate Number of teachers at a given level of education leaving the profession in a given school year, expressed as a percentage of teachers at that level and in that school year.
F Relative teacher salary level Teacher salary relative to other professionals with equivalent academic qualification. Data refer to actual salaries of all teachers relative to earnings for full-time, full-year workers with tertiary education (ISCED 5 to 8). The indicator is defined as a ratio of salary, using annual average salaries (including bonuses and allowances) of teachers in public institutions relative to the wages of workers with similar educational attainment (weighted average) and to the wages of full-time, full-year workers aged 25 to 64 with tertiary education. Values for secondary education are GEM Report team calculations and represent weighted averages of lower and upper secondary values, weighted by the number of teachers at each level.
G Percentage of teachers who received in-service training in the last 12 months For data representative of teachers at a level of education or grade: proportion of teachers that have received in-service training in the past 12 months (or time period available in the dataset). For data representative of students’ teachers: proportion of students’ teachers that have received in-service training in the past 12 months (or time period available in the dataset). For cross-national assessments with more than one assessment in the same level of education, the average of all grades is used.
2 0 2 1 / 2 • G LO BA L E D U C AT I O N M O N I TO R I N G R E P O RT 402
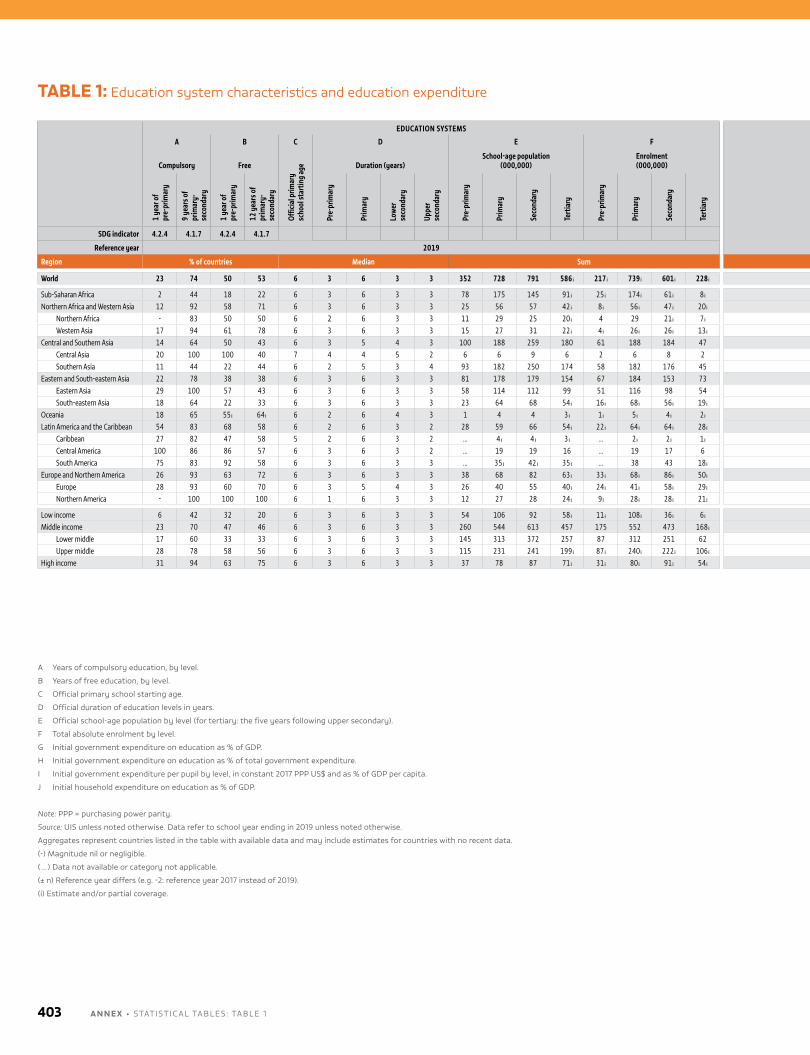
TABLE 1: Education system characteristics and education expenditure
EDUCATION SYSTEMS FINANCE
A B C D E F G H I J
Compulsory Free
Offic
ial p
rimar
y
scho
ol st
artin
g ag
e Duration (years)School-age population
(000,000)Enrolment (000,000)
Gove
rnm
ent e
duca
tion
expe
nditu
re (%
of G
DP)
Educ
atio
n sh
are o
f to
tal g
over
nmen
t ex
pend
iture
(%)
Government education expenditure per pupil
Hous
ehol
d ed
ucat
ion
expe
nditu
re
(% o
f GDP
)
2017 PPP US$ % of GDP per capita
1 ye
ar o
f
pre-
prim
ary
9 ye
ars o
f pr
imar
y-se
cond
ary
1 ye
ar o
f pr
e-pr
imar
y
12 y
ears
of
prim
ary-
seco
ndar
y
Pre-
prim
ary
Prim
ary
Low
er
seco
ndar
y
Uppe
r se
cond
ary
Pre-
prim
ary
Prim
ary
Seco
ndar
y
Tert
iary
Pre-
prim
ary
Prim
ary
Seco
ndar
y
Tert
iary
Pre-
prim
ary
Prim
ary
Seco
ndar
y
Tert
iary
Pre-
prim
ary
Prim
ary
Seco
ndar
y
Tert
iary
SDG indicator 4.2.4 4.1.7 4.2.4 4.1.7 1.a.2 4.5.4
Reference year 2019 2019
Region % of countries Median Sum Median
World 23 74 50 53 6 3 6 3 3 352 728 791 586 ᵢ 217 ᵢ 739 ᵢ 601 ᵢ 228 ᵢ 4.4 14.1 2,140 ᵢ 3,133 ᵢ 4,152 ᵢ 5,382 ᵢ 12 ᵢ 16 ᵢ 20 ᵢ 25 ᵢ 1.6
Sub-Saharan Africa 2 44 18 22 6 3 6 3 3 78 175 145 91 ᵢ 25 ᵢ 174 ᵢ 61 ᵢ 8 ᵢ 3.8 16.8 80 ᵢ 279 ᵢ 443 ᵢ 2,722 ᵢ 3 ᵢ 12 ᵢ 17 ᵢ 74 ᵢ 2.4Northern Africa and Western Asia 12 92 58 71 6 3 6 3 3 25 56 57 42 ᵢ 8 ᵢ 56 ᵢ 47 ᵢ 20 ᵢ 3.1 ᵢ 10.4 ᵢ … … … 4,567 ᵢ … … … 21 ᵢ 1.6
Northern Africa - 83 50 50 6 2 6 3 3 11 29 25 20 ᵢ 4 29 21 ᵢ 7 ᵢ … … … … 3,491 ᵢ … … … 32 ᵢ …Western Asia 17 94 61 78 6 3 6 3 3 15 27 31 22 ᵢ 4 ᵢ 26 ᵢ 26 ᵢ 13 ᵢ 3.1 ᵢ 10.3 ᵢ 2,190 ᵢ 6,337 ᵢ … 3,241 ᵢ 11 ᵢ 18 ᵢ … 20 ᵢ
Central and Southern Asia 14 64 50 43 6 3 5 4 3 100 188 259 180 61 188 184 47 4.0 15.7 149 ᵢ 350 ᵢ 887 ᵢ 1,584 ᵢ 2 ᵢ 10 ᵢ 16 ᵢ 22 ᵢ 2.4Central Asia 20 100 100 40 7 4 4 5 2 6 6 9 6 2 6 8 2 5.3 16.4 1,150 ᵢ … … 565 ᵢ 22 ᵢ … … 8 ᵢSouthern Asia 11 44 22 44 6 2 5 3 4 93 182 250 174 58 182 176 45 3.8 14.3 29 626 778 2,973 ᵢ 1 11 14 25 ᵢ
Eastern and South-eastern Asia 22 78 38 38 6 3 6 3 3 81 178 179 154 67 184 153 73 3.9 12.6 ᵢ 2,728 ᵢ 5,604 ᵢ 10,497 ᵢ 7,739 ᵢ 10 ᵢ 14 ᵢ 21 ᵢ 21 ᵢ 1.9Eastern Asia 29 100 57 43 6 3 6 3 3 58 114 112 99 51 116 98 54 3.8 13.5 ᵢ 4,948 ᵢ 8,932 ᵢ 11,329 ᵢ 8,274 12 ᵢ 15 ᵢ … 17 ᵢSouth-eastern Asia 18 64 22 33 6 3 6 3 3 23 64 68 54 ᵢ 16 ᵢ 68 ᵢ 56 ᵢ 19 ᵢ 4.2 ᵢ 11.4 ᵢ … 4,343 ᵢ 5,573 ᵢ 7,204 ᵢ … 13 ᵢ 19 ᵢ 25 ᵢ
Oceania 18 65 55 ᵢ 64 ᵢ 6 2 6 4 3 1 4 4 3 ᵢ 1 ᵢ 5 ᵢ 4 ᵢ 2 ᵢ 4.5 ᵢ 13.6 ᵢ … … … … … … … … 2.1Latin America and the Caribbean 54 83 68 58 6 2 6 3 2 28 59 66 54 ᵢ 22 ᵢ 64 ᵢ 64 ᵢ 28 ᵢ 4.7 16.3 ᵢ 1,336 ᵢ 2,239 ᵢ 2,780 ᵢ 2,287 ᵢ 11 ᵢ 14 ᵢ 17 ᵢ 25 ᵢ 2.5
Caribbean 27 82 47 58 5 2 6 3 2 … 4 ᵢ 4 ᵢ 3 ᵢ … 2 ᵢ 2 ᵢ 1 ᵢ 3.2 ᵢ 14.1 ᵢ … 2,222 ᵢ 2,911 ᵢ … 7 ᵢ 14 ᵢ 20 ᵢ 21 ᵢCentral America 100 86 86 57 6 3 6 3 2 … 19 19 16 … 19 17 6 4.4 22.8 1,049 ᵢ 2,001 ᵢ 1,968 ᵢ 2,214 11 ᵢ 14 ᵢ 14 ᵢ 25South America 75 83 92 58 6 3 6 3 3 … 35 ᵢ 42 ᵢ 35 ᵢ … 38 43 18 ᵢ 5.0 16.3 2,399 2,906 2,906 4,291 15 15 17 23
Europe and Northern America 26 93 63 72 6 3 6 3 3 38 68 82 63 ᵢ 33 ᵢ 68 ᵢ 86 ᵢ 50 ᵢ 4.7 11.9 6,492 8,223 9,255 8,839 18 21 23 26 0.5Europe 28 93 60 70 6 3 5 4 3 26 40 55 40 ᵢ 24 ᵢ 41 ᵢ 58 ᵢ 29 ᵢ 4.7 11.9 6,475 8,171 8,985 8,597 18 21 23 26Northern America - 100 100 100 6 1 6 3 3 12 27 28 24 ᵢ 9 ᵢ 28 ᵢ 28 ᵢ 21 ᵢ 1.5 ᵢ 7.8 ᵢ 7,179 ᵢ 10,145 13,386 ᵢ 14,741 15 18 17 28
Low income 6 42 32 20 6 3 6 3 3 54 106 92 58 ᵢ 11 ᵢ 108 ᵢ 36 ᵢ 6 ᵢ 3.6 16.4 59 ᵢ 201 ᵢ 266 ᵢ … 2 ᵢ 9 ᵢ 14 ᵢ … 2.1Middle income 23 70 47 46 6 3 6 3 3 260 544 613 457 175 552 473 168 ᵢ 4.2 ᵢ 15.6 1,083 ᵢ 1,443 ᵢ 2,481 ᵢ 2,973 ᵢ 10 ᵢ 13 ᵢ 19 ᵢ 24 ᵢ 2.1
Lower middle 17 60 33 33 6 3 6 3 3 145 313 372 257 87 312 251 62 4.5 16.3 … 563 ᵢ 994 ᵢ 2,610 ᵢ … 13 ᵢ 18 ᵢ 38 ᵢ 2.4Upper middle 28 78 58 56 6 3 6 3 3 115 231 241 199 ᵢ 87 ᵢ 240 ᵢ 222 ᵢ 106 ᵢ 4.1 ᵢ 14.1 ᵢ 1,240 ᵢ 2,231 ᵢ 2,839 ᵢ 3,319 ᵢ 9 ᵢ 16 ᵢ 19 ᵢ 21 ᵢ 1.7
High income 31 94 63 75 6 3 6 3 3 37 78 87 71 ᵢ 31 ᵢ 80 ᵢ 91 ᵢ 54 ᵢ 4.6 11.8 6,186 ᵢ 8,380 9,408 ᵢ 12,697 17 19 21 26 0.7
A Years of compulsory education, by level.
b Years of free education, by level.
C official primary school starting age.
D official duration of education levels in years.
E official school-age population by level (for tertiary: the five years following upper secondary).
F Total absolute enrolment by level.
G Initial government expenditure on education as % of GDP.
h Initial government expenditure on education as % of total government expenditure.
I Initial government expenditure per pupil by level, in constant 2017 PPP uS$ and as % of GDP per capita.
J Initial household expenditure on education as % of GDP.
Note: PPP = purchasing power parity.
Source: uIS unless noted otherwise. Data refer to school year ending in 2019 unless noted otherwise.
Aggregates represent countries listed in the table with available data and may include estimates for countries with no recent data.
(-) magnitude nil or negligible.
( … ) Data not available or category not applicable.
(± n) Reference year differs (e.g. -2: reference year 2017 instead of 2019).
(i) Estimate and/or partial coverage.
A N N E X • STATISTICAl TAblES : TAblE 1403
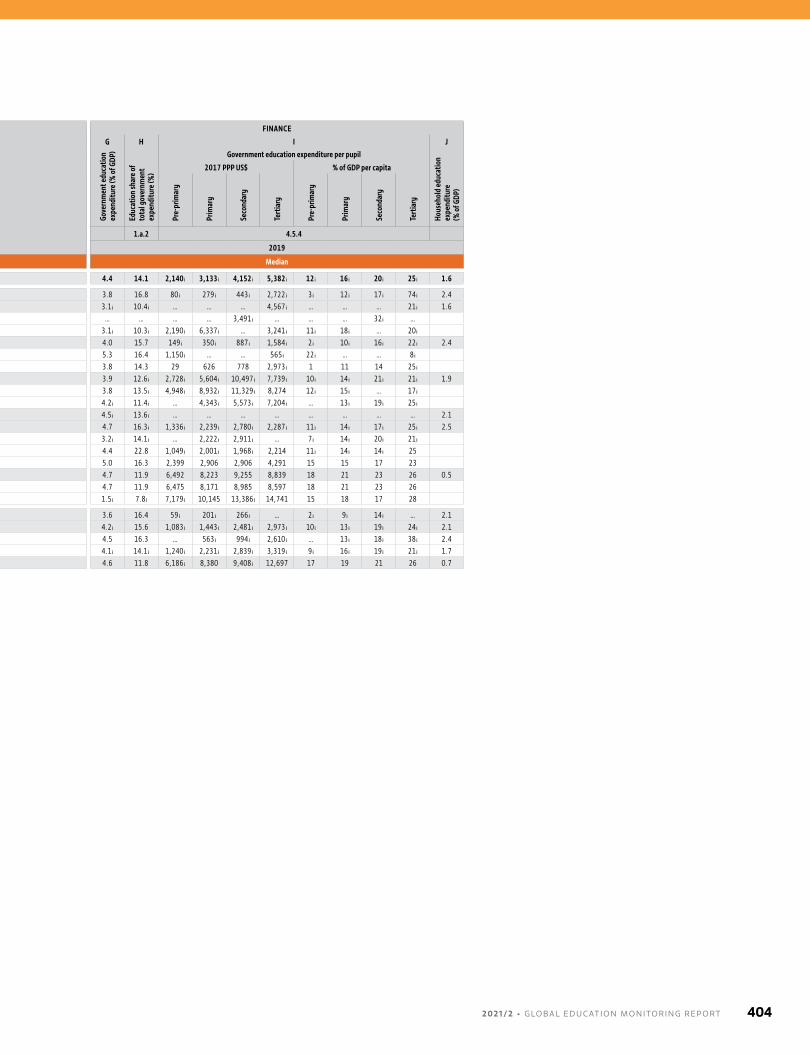
EDUCATION SYSTEMS FINANCE
A B C D E F G H I J
Compulsory Free
Offic
ial p
rimar
y
scho
ol st
artin
g ag
e Duration (years)School-age population
(000,000)Enrolment (000,000)
Gove
rnm
ent e
duca
tion
expe
nditu
re (%
of G
DP)
Educ
atio
n sh
are o
f to
tal g
over
nmen
t ex
pend
iture
(%)
Government education expenditure per pupil
Hous
ehol
d ed
ucat
ion
expe
nditu
re
(% o
f GDP
)
2017 PPP US$ % of GDP per capita
1 ye
ar o
f
pre-
prim
ary
9 ye
ars o
f pr
imar
y-se
cond
ary
1 ye
ar o
f pr
e-pr
imar
y
12 y
ears
of
prim
ary-
seco
ndar
y
Pre-
prim
ary
Prim
ary
Low
er
seco
ndar
y
Uppe
r se
cond
ary
Pre-
prim
ary
Prim
ary
Seco
ndar
y
Tert
iary
Pre-
prim
ary
Prim
ary
Seco
ndar
y
Tert
iary
Pre-
prim
ary
Prim
ary
Seco
ndar
y
Tert
iary
Pre-
prim
ary
Prim
ary
Seco
ndar
y
Tert
iary
SDG indicator 4.2.4 4.1.7 4.2.4 4.1.7 1.a.2 4.5.4
Reference year 2019 2019
Region % of countries Median Sum Median
World 23 74 50 53 6 3 6 3 3 352 728 791 586 ᵢ 217 ᵢ 739 ᵢ 601 ᵢ 228 ᵢ 4.4 14.1 2,140 ᵢ 3,133 ᵢ 4,152 ᵢ 5,382 ᵢ 12 ᵢ 16 ᵢ 20 ᵢ 25 ᵢ 1.6
Sub-Saharan Africa 2 44 18 22 6 3 6 3 3 78 175 145 91 ᵢ 25 ᵢ 174 ᵢ 61 ᵢ 8 ᵢ 3.8 16.8 80 ᵢ 279 ᵢ 443 ᵢ 2,722 ᵢ 3 ᵢ 12 ᵢ 17 ᵢ 74 ᵢ 2.4Northern Africa and Western Asia 12 92 58 71 6 3 6 3 3 25 56 57 42 ᵢ 8 ᵢ 56 ᵢ 47 ᵢ 20 ᵢ 3.1 ᵢ 10.4 ᵢ … … … 4,567 ᵢ … … … 21 ᵢ 1.6
Northern Africa - 83 50 50 6 2 6 3 3 11 29 25 20 ᵢ 4 29 21 ᵢ 7 ᵢ … … … … 3,491 ᵢ … … … 32 ᵢ …Western Asia 17 94 61 78 6 3 6 3 3 15 27 31 22 ᵢ 4 ᵢ 26 ᵢ 26 ᵢ 13 ᵢ 3.1 ᵢ 10.3 ᵢ 2,190 ᵢ 6,337 ᵢ … 3,241 ᵢ 11 ᵢ 18 ᵢ … 20 ᵢ
Central and Southern Asia 14 64 50 43 6 3 5 4 3 100 188 259 180 61 188 184 47 4.0 15.7 149 ᵢ 350 ᵢ 887 ᵢ 1,584 ᵢ 2 ᵢ 10 ᵢ 16 ᵢ 22 ᵢ 2.4Central Asia 20 100 100 40 7 4 4 5 2 6 6 9 6 2 6 8 2 5.3 16.4 1,150 ᵢ … … 565 ᵢ 22 ᵢ … … 8 ᵢSouthern Asia 11 44 22 44 6 2 5 3 4 93 182 250 174 58 182 176 45 3.8 14.3 29 626 778 2,973 ᵢ 1 11 14 25 ᵢ
Eastern and South-eastern Asia 22 78 38 38 6 3 6 3 3 81 178 179 154 67 184 153 73 3.9 12.6 ᵢ 2,728 ᵢ 5,604 ᵢ 10,497 ᵢ 7,739 ᵢ 10 ᵢ 14 ᵢ 21 ᵢ 21 ᵢ 1.9Eastern Asia 29 100 57 43 6 3 6 3 3 58 114 112 99 51 116 98 54 3.8 13.5 ᵢ 4,948 ᵢ 8,932 ᵢ 11,329 ᵢ 8,274 12 ᵢ 15 ᵢ … 17 ᵢSouth-eastern Asia 18 64 22 33 6 3 6 3 3 23 64 68 54 ᵢ 16 ᵢ 68 ᵢ 56 ᵢ 19 ᵢ 4.2 ᵢ 11.4 ᵢ … 4,343 ᵢ 5,573 ᵢ 7,204 ᵢ … 13 ᵢ 19 ᵢ 25 ᵢ
Oceania 18 65 55 ᵢ 64 ᵢ 6 2 6 4 3 1 4 4 3 ᵢ 1 ᵢ 5 ᵢ 4 ᵢ 2 ᵢ 4.5 ᵢ 13.6 ᵢ … … … … … … … … 2.1Latin America and the Caribbean 54 83 68 58 6 2 6 3 2 28 59 66 54 ᵢ 22 ᵢ 64 ᵢ 64 ᵢ 28 ᵢ 4.7 16.3 ᵢ 1,336 ᵢ 2,239 ᵢ 2,780 ᵢ 2,287 ᵢ 11 ᵢ 14 ᵢ 17 ᵢ 25 ᵢ 2.5
Caribbean 27 82 47 58 5 2 6 3 2 … 4 ᵢ 4 ᵢ 3 ᵢ … 2 ᵢ 2 ᵢ 1 ᵢ 3.2 ᵢ 14.1 ᵢ … 2,222 ᵢ 2,911 ᵢ … 7 ᵢ 14 ᵢ 20 ᵢ 21 ᵢCentral America 100 86 86 57 6 3 6 3 2 … 19 19 16 … 19 17 6 4.4 22.8 1,049 ᵢ 2,001 ᵢ 1,968 ᵢ 2,214 11 ᵢ 14 ᵢ 14 ᵢ 25South America 75 83 92 58 6 3 6 3 3 … 35 ᵢ 42 ᵢ 35 ᵢ … 38 43 18 ᵢ 5.0 16.3 2,399 2,906 2,906 4,291 15 15 17 23
Europe and Northern America 26 93 63 72 6 3 6 3 3 38 68 82 63 ᵢ 33 ᵢ 68 ᵢ 86 ᵢ 50 ᵢ 4.7 11.9 6,492 8,223 9,255 8,839 18 21 23 26 0.5Europe 28 93 60 70 6 3 5 4 3 26 40 55 40 ᵢ 24 ᵢ 41 ᵢ 58 ᵢ 29 ᵢ 4.7 11.9 6,475 8,171 8,985 8,597 18 21 23 26Northern America - 100 100 100 6 1 6 3 3 12 27 28 24 ᵢ 9 ᵢ 28 ᵢ 28 ᵢ 21 ᵢ 1.5 ᵢ 7.8 ᵢ 7,179 ᵢ 10,145 13,386 ᵢ 14,741 15 18 17 28
Low income 6 42 32 20 6 3 6 3 3 54 106 92 58 ᵢ 11 ᵢ 108 ᵢ 36 ᵢ 6 ᵢ 3.6 16.4 59 ᵢ 201 ᵢ 266 ᵢ … 2 ᵢ 9 ᵢ 14 ᵢ … 2.1Middle income 23 70 47 46 6 3 6 3 3 260 544 613 457 175 552 473 168 ᵢ 4.2 ᵢ 15.6 1,083 ᵢ 1,443 ᵢ 2,481 ᵢ 2,973 ᵢ 10 ᵢ 13 ᵢ 19 ᵢ 24 ᵢ 2.1
Lower middle 17 60 33 33 6 3 6 3 3 145 313 372 257 87 312 251 62 4.5 16.3 … 563 ᵢ 994 ᵢ 2,610 ᵢ … 13 ᵢ 18 ᵢ 38 ᵢ 2.4Upper middle 28 78 58 56 6 3 6 3 3 115 231 241 199 ᵢ 87 ᵢ 240 ᵢ 222 ᵢ 106 ᵢ 4.1 ᵢ 14.1 ᵢ 1,240 ᵢ 2,231 ᵢ 2,839 ᵢ 3,319 ᵢ 9 ᵢ 16 ᵢ 19 ᵢ 21 ᵢ 1.7
High income 31 94 63 75 6 3 6 3 3 37 78 87 71 ᵢ 31 ᵢ 80 ᵢ 91 ᵢ 54 ᵢ 4.6 11.8 6,186 ᵢ 8,380 9,408 ᵢ 12,697 17 19 21 26 0.7
2 0 2 1 / 2 • G LO BA L E D U C AT I O N M O N I TO R I N G R E P O RT 404
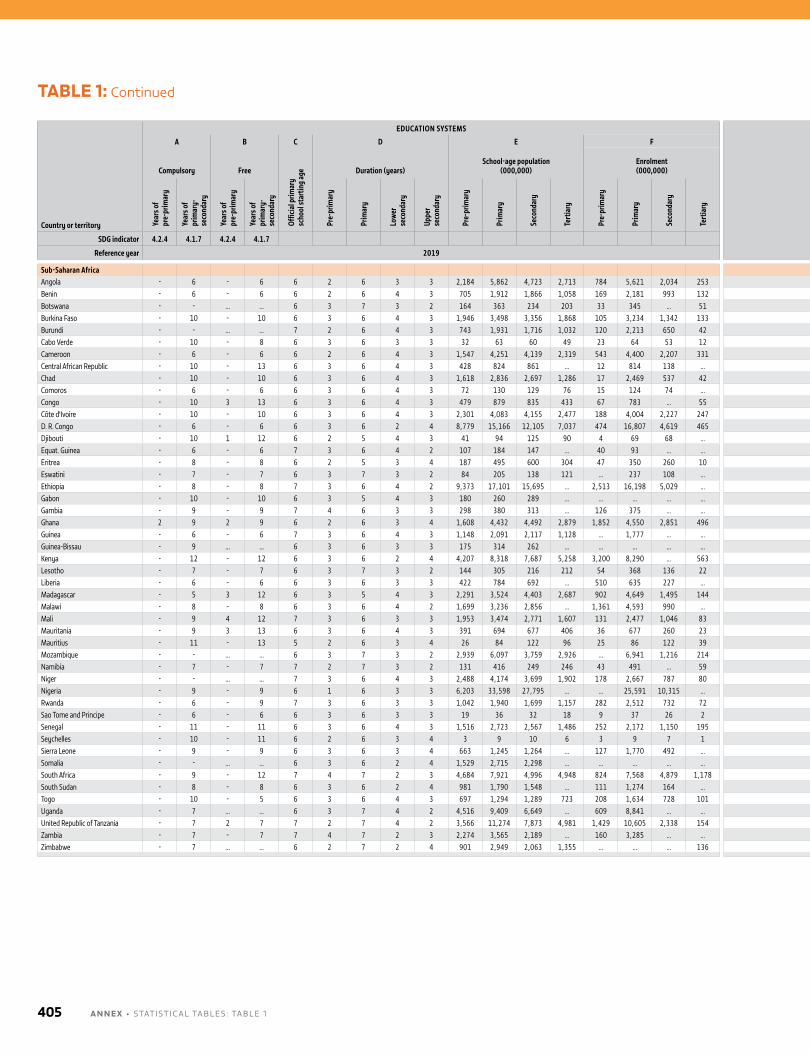
Country or territory
EDUCATION SYSTEMS FINANCE
A B C D E F G H I J
Compulsory Free
Offic
ial p
rimar
y
scho
ol st
artin
g ag
e Duration (years)School-age population
(000,000)Enrolment (000,000)
Gove
rnm
ent e
duca
tion
expe
nditu
re (%
of G
DP)
Educ
atio
n sh
are o
f to
tal g
over
nmen
t ex
pend
iture
(%)
Government education expenditure per pupil
Hous
ehol
d ed
ucat
ion
expe
nditu
re
(% o
f GDP
)
Coun
try
code
2017 PPP US$ % of GDP per capita
Year
s of
pr
e-pr
imar
y
Year
s of
prim
ary-
seco
ndar
y
Year
s of
pr
e-pr
imar
y
Year
s of
prim
ary-
seco
ndar
y
Pre-
prim
ary
Prim
ary
Low
er
seco
ndar
y
Uppe
r se
cond
ary
Pre-
prim
ary
Prim
ary
Seco
ndar
y
Tert
iary
Pre-
prim
ary
Prim
ary
Seco
ndar
y
Tert
iary
Pre-
prim
ary
Prim
ary
Seco
ndar
y
Tert
iary
Pre-
prim
ary
Prim
ary
Seco
ndar
y
Tert
iary
SDG indicator 4.2.4 4.1.7 4.2.4 4.1.7 1.a.2 4.5.4
Reference year 2019 2019
Sub-Saharan AfricaAngola - 6 - 6 6 2 6 3 3 2,184 5,862 4,723 2,713 784 5,621 2,034 253 … … … … … … … … … … 2.3 AGOBenin - 6 - 6 6 2 6 4 3 705 1,912 1,866 1,058 169 2,181 993 132 2.9₋₁ᵢ 17.7₋₁ᵢ 261₋₄ 201₋₄ 238₋₄ 1,603₋₄ 9₋₄ 7₋₄ 8₋₄ 53₋₄ 3.7 BENBotswana - - … … 6 3 7 3 2 164 363 234 203 33 345 … 51 … … … … … … … … … … 2.4 BWABurkina Faso - 10 - 10 6 3 6 4 3 1,946 3,498 3,356 1,868 105 3,234 1,342 133 5.4₋₁ᵢ 22.7₋₁ᵢ 165₋₃ 279₋₄ 321₋₃ 6,083₋₃ 8₋₃ 14₋₄ 16₋₃ 298₋₃ BFABurundi - - … … 7 2 6 4 3 743 1,931 1,716 1,032 120 2,213 650 42 5.1₋₁ 18.8₋₁ … … … … … … … … 0.7 BDICabo Verde - 10 - 8 6 3 6 3 3 32 63 60 49 23 64 53 12 5.2₋₂ 16.4₋₂ 84₋₂ 1,135₋₂ 1,339₋₂ 2,610₋₂ 1₋₂ 17₋₂ 20₋₂ 38₋₂ 0.7 CPVCameroon - 6 - 6 6 2 6 4 3 1,547 4,251 4,139 2,319 543 4,400 2,207 331 3.1₋₁ᵢ 16.9₋₁ᵢ … … … … … … … … 1.9 CMRCentral African Republic - 10 - 13 6 3 6 4 3 428 824 861 … 12 814 138 … … … … … … … … … … … CAFChad - 10 - 10 6 3 6 4 3 1,618 2,836 2,697 1,286 17 2,469 537 42 2.5₋₂ᵢ 16.4₋₂ᵢ … 106₋₁ 218₋₁ … … 7₋₁ 14₋₁ … 0.9 TCDComoros - 6 - 6 6 3 6 4 3 72 130 129 76 15 124 74 … 2.5₋₄ 13.4₋₄ … … … … … … … … 1.8 COMCongo - 10 3 13 6 3 6 4 3 479 879 835 433 67 783 … 55 3.5₋₁ᵢ 15.6₋₁ᵢ … … … … … … … … 1.1 COGCôte d'Ivoire - 10 - 10 6 3 6 4 3 2,301 4,083 4,155 2,477 188 4,004 2,227 247 3.3₋₁ 18.3₋₁ 806₋₁ 508₋₁ 702₋₁ 5,491₋₂ 16₋₁ 10₋₁ 14₋₁ 111₋₂ 2.3 CIVD. R. Congo - 6 - 6 6 3 6 2 4 8,779 15,166 12,105 7,037 474 16,807 4,619 465 1.5₋₂ᵢ 14.0₋₂ᵢ -₋₄ … … … -₋₄ … … … 1.5 CODDjibouti - 10 1 12 6 2 5 4 3 41 94 125 90 4 69 68 … 3.6₋₁ᵢ 14.0₋₁ᵢ … … … … … 25₋₃ … … 2.3 DJIEquat. Guinea - 6 - 6 7 3 6 4 2 107 184 147 … 40 93 … … … … … … … … … … … … GNQEritrea - 8 - 8 6 2 5 3 4 187 495 600 304 47 350 260 10 … … … … … … … … … … ERIEswatini - 7 - 7 6 3 7 3 2 84 205 138 121 … 237 108 … … … … … … … … … … … SWZEthiopia - 8 - 8 7 3 6 4 2 9,373 17,101 15,695 … 2,513 16,198 5,029 … 4.7₋₄ 27.1₋₄ 59₋₄ 130₋₄ 278₋₄ … 4₋₄ 8₋₄ 17₋₄ … 0.3 ETHGabon - 10 - 10 6 3 5 4 3 180 260 289 … … … … … … … … … … … … … … … GABGambia - 9 - 9 7 4 6 3 3 298 380 313 … 126 375 … … 2.4₋₁ᵢ 11.2₋₁ᵢ -₋₄ 178₋₄ … … -₋₄ 8₋₄ … … 2.5 GMBGhana 2 9 2 9 6 2 6 3 4 1,608 4,432 4,492 2,879 1,852 4,550 2,851 496 4.0₋₁ᵢ 18.6₋₁ᵢ … … … … … … … … 9.2 GHAGuinea - 6 - 6 7 3 6 4 3 1,148 2,091 2,117 1,128 … 1,777 … … 2.3₋₁ 14.9₋₁ … 157₋₃ … … … 7₋₃ … … 1.0 GINGuinea-Bissau - 9 … … 6 3 6 3 3 175 314 262 … … … … … … … … … … … … … … … GNBKenya - 12 - 12 6 3 6 2 4 4,207 8,318 7,687 5,258 3,200 8,290 … 563 5.3₋₁ᵢ 19.0₋₁ᵢ 51₋₄ 406₋₄ … 2,835₋₄ 1₋₄ 11₋₄ … 76₋₄ 3.7 KENLesotho - 7 - 7 6 3 7 3 2 144 305 216 212 54 368 136 22 7.0₋₁ 14.1₋₁ … 618₋₁ 896₋₁ 1,334₋₁ … 22₋₁ 32₋₁ 48₋₁ 0.4 LSOLiberia - 6 - 6 6 3 6 3 3 422 784 692 … 510 635 227 … 2.6₋₁ᵢ 8.1₋₁ᵢ 155₋₃ 229₋₃ 287₋₄ … 10₋₃ 14₋₃ 18₋₄ … 5.7 LBRMadagascar - 5 3 12 6 3 5 4 3 2,291 3,524 4,403 2,687 902 4,649 1,495 144 2.8₋₁ᵢ 19.8₋₁ᵢ … … … 1₋₃ … … … -₋₃ 3.0 MDGMalawi - 8 - 8 6 3 6 4 2 1,699 3,236 2,856 … 1,361 4,593 990 … 4.7₋₁ᵢ 15.8₋₁ᵢ -₋₃ 84₋₃ 247₋₃ … -₋₃ 8₋₃ 24₋₃ … MWIMali - 9 4 12 7 3 6 3 3 1,953 3,474 2,771 1,607 131 2,477 1,046 83 3.8₋₂ 16.5₋₂ 41₋₂ 281₋₂ 583₋₂ 3,610₋₄ 2₋₂ 12₋₂ 25₋₂ 165₋₄ 1.9 MLIMauritania - 9 3 13 6 3 6 4 3 391 694 677 406 36 677 260 23 1.9 10.2 … 330 464 3,619 … 6 9 68 3.3 MRTMauritius - 11 - 13 5 2 6 3 4 26 84 122 96 25 86 122 39 4.7 18.7 663 3,511 6,757 1,977₋₂ 3 16 30 10₋₂ 4.5 MUSMozambique - - … … 6 3 7 3 2 2,939 6,097 3,759 2,926 … 6,941 1,216 214 5.5₋₁ᵢ 16.7₋₁ᵢ … … … … … … … … 0.8 MOZNamibia - 7 - 7 7 2 7 3 2 131 416 249 246 43 491 … 59 … … … … … … … … … … 1.8 NAMNiger - - … … 7 3 6 4 3 2,488 4,174 3,699 1,902 178 2,667 787 80 3.5₋₁ᵢ 16.8₋₁ᵢ 403₋₂ 114₋₂ 139₋₂ 2,254₋₂ 34₋₂ 10₋₂ 12₋₂ 190₋₂ 3.6 NERNigeria - 9 - 9 6 1 6 3 3 6,203 33,598 27,795 … … 25,591 10,315 … … … … … … … … … … … 4.4 NGARwanda - 6 - 9 7 3 6 3 3 1,042 1,940 1,699 1,157 282 2,512 732 72 3.1₋₁ 10.8₋₁ 41₋₁ 83₋₁ 423₋₁ 1,904₋₁ 2₋₁ 4₋₁ 21₋₁ 96₋₁ 5.9 RWASao Tome and Principe - 6 - 6 6 3 6 3 3 19 36 32 18 9 37 26 2 5.1₋₁ᵢ 20.1₋₁ᵢ … … … … … … … … 0.3 STPSenegal - 11 - 11 6 3 6 4 3 1,516 2,723 2,567 1,486 252 2,172 1,150 195 4.8₋₁ 21.5₋₁ 460₋₄ 417₋₄ 624₋₄ 4,618₋₁ 15₋₄ 14₋₄ 21₋₄ 136₋₁ 4.0 SENSeychelles - 10 - 11 6 2 6 3 4 3 9 10 6 3 9 7 1 4.4₋₃ 11.7₋₃ 3,277₋₃ 3,842₋₃ 4,140₋₃ 19,135₋₃ 12₋₃ 14₋₃ 15₋₃ 71₋₃ SYCSierra Leone - 9 - 9 6 3 6 3 4 663 1,245 1,264 … 127 1,770 492 … 7.7 35.5 - 232 240₋₂ … - 13 14₋₂ … 2.6 SLESomalia - - … … 6 3 6 2 4 1,529 2,715 2,298 … … … … … … … … … … … … … … … SOMSouth Africa - 9 - 12 7 4 7 2 3 4,684 7,921 4,996 4,948 824 7,568 4,879 1,178 6.5 19.6 818 2,352 2,897 7,027 6 19 23 56 1.6 ZAFSouth Sudan - 8 - 8 6 3 6 2 4 981 1,790 1,548 … 111 1,274 164 … 1.5₋₃ 0.9₋₁ᵢ … … … … 0.4₋₃ 5₋₃ 12₋₃ … SSDTogo - 10 - 5 6 3 6 4 3 697 1,294 1,289 723 208 1,634 728 101 5.4₋₁ᵢ 21.8₋₁ᵢ 76₋₄ 243₋₃ … 1,187₋₂ 5₋₄ 16₋₃ … 76₋₂ 2.4 TGOUganda - 7 … … 6 3 7 4 2 4,516 9,409 6,649 … 609 8,841 … … 2.1₋₁ᵢ 11.5₋₁ᵢ … … … … … … … … 3.2 UGAUnited Republic of Tanzania - 7 2 7 7 2 7 4 2 3,566 11,274 7,873 4,981 1,429 10,605 2,338 154 3.7₋₁ᵢ 20.5₋₁ᵢ … … … … … … … … 1.4 TZAZambia - 7 - 7 7 4 7 2 3 2,274 3,565 2,189 … 160 3,285 … … 4.6₋₁ᵢ 16.9₋₁ᵢ 67₋₃ 460₋₂ … … 2₋₃ 13₋₂ … … 3.8 ZMBZimbabwe - 7 … … 6 2 7 2 4 901 2,949 2,063 1,355 … … … 136 5.9₋₁ᵢ 19.0₋₁ᵢ … … … … … … … … 3.6 ZWE
TABLE 1: Continued
A N N E X • STATISTICAl TAblES : TAblE 1405
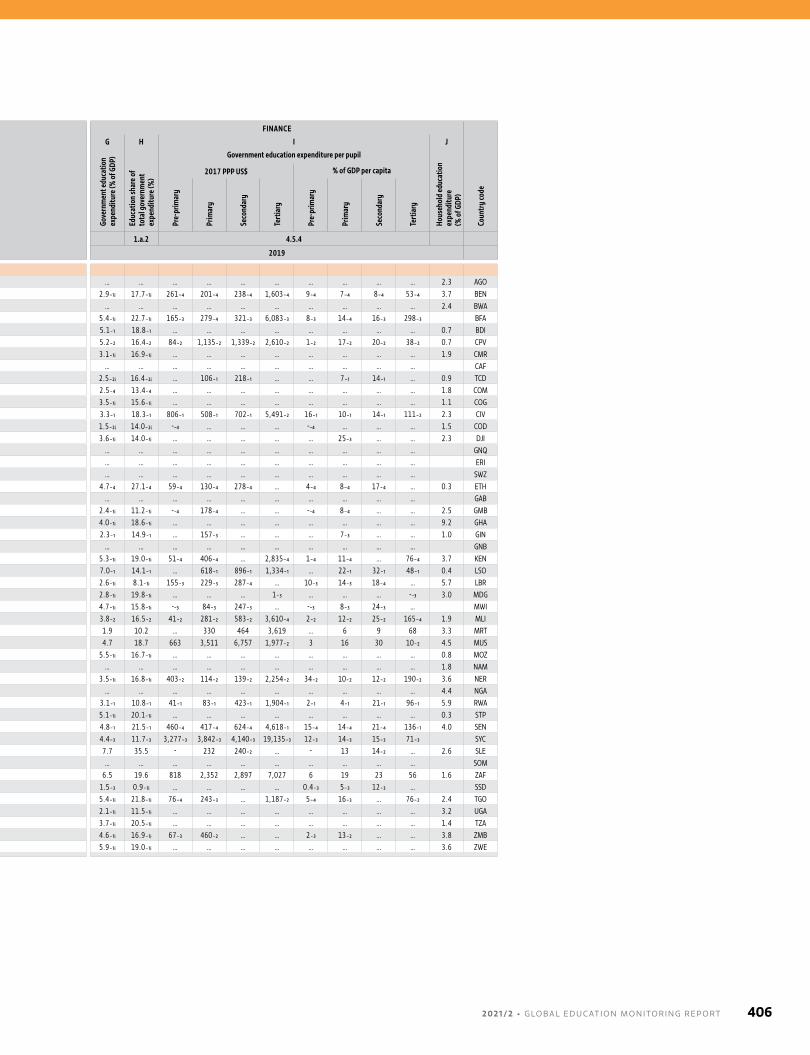
Country or territory
EDUCATION SYSTEMS FINANCE
A B C D E F G H I J
Compulsory Free
Offic
ial p
rimar
y
scho
ol st
artin
g ag
e Duration (years)School-age population
(000,000)Enrolment (000,000)
Gove
rnm
ent e
duca
tion
expe
nditu
re (%
of G
DP)
Educ
atio
n sh
are o
f to
tal g
over
nmen
t ex
pend
iture
(%)
Government education expenditure per pupil
Hous
ehol
d ed
ucat
ion
expe
nditu
re
(% o
f GDP
)
Coun
try
code
2017 PPP US$ % of GDP per capita
Year
s of
pr
e-pr
imar
y
Year
s of
prim
ary-
seco
ndar
y
Year
s of
pr
e-pr
imar
y
Year
s of
prim
ary-
seco
ndar
y
Pre-
prim
ary
Prim
ary
Low
er
seco
ndar
y
Uppe
r se
cond
ary
Pre-
prim
ary
Prim
ary
Seco
ndar
y
Tert
iary
Pre-
prim
ary
Prim
ary
Seco
ndar
y
Tert
iary
Pre-
prim
ary
Prim
ary
Seco
ndar
y
Tert
iary
Pre-
prim
ary
Prim
ary
Seco
ndar
y
Tert
iary
SDG indicator 4.2.4 4.1.7 4.2.4 4.1.7 1.a.2 4.5.4
Reference year 2019 2019
Sub-Saharan AfricaAngola - 6 - 6 6 2 6 3 3 2,184 5,862 4,723 2,713 784 5,621 2,034 253 … … … … … … … … … … 2.3 AGOBenin - 6 - 6 6 2 6 4 3 705 1,912 1,866 1,058 169 2,181 993 132 2.9₋₁ᵢ 17.7₋₁ᵢ 261₋₄ 201₋₄ 238₋₄ 1,603₋₄ 9₋₄ 7₋₄ 8₋₄ 53₋₄ 3.7 BENBotswana - - … … 6 3 7 3 2 164 363 234 203 33 345 … 51 … … … … … … … … … … 2.4 BWABurkina Faso - 10 - 10 6 3 6 4 3 1,946 3,498 3,356 1,868 105 3,234 1,342 133 5.4₋₁ᵢ 22.7₋₁ᵢ 165₋₃ 279₋₄ 321₋₃ 6,083₋₃ 8₋₃ 14₋₄ 16₋₃ 298₋₃ BFABurundi - - … … 7 2 6 4 3 743 1,931 1,716 1,032 120 2,213 650 42 5.1₋₁ 18.8₋₁ … … … … … … … … 0.7 BDICabo Verde - 10 - 8 6 3 6 3 3 32 63 60 49 23 64 53 12 5.2₋₂ 16.4₋₂ 84₋₂ 1,135₋₂ 1,339₋₂ 2,610₋₂ 1₋₂ 17₋₂ 20₋₂ 38₋₂ 0.7 CPVCameroon - 6 - 6 6 2 6 4 3 1,547 4,251 4,139 2,319 543 4,400 2,207 331 3.1₋₁ᵢ 16.9₋₁ᵢ … … … … … … … … 1.9 CMRCentral African Republic - 10 - 13 6 3 6 4 3 428 824 861 … 12 814 138 … … … … … … … … … … … CAFChad - 10 - 10 6 3 6 4 3 1,618 2,836 2,697 1,286 17 2,469 537 42 2.5₋₂ᵢ 16.4₋₂ᵢ … 106₋₁ 218₋₁ … … 7₋₁ 14₋₁ … 0.9 TCDComoros - 6 - 6 6 3 6 4 3 72 130 129 76 15 124 74 … 2.5₋₄ 13.4₋₄ … … … … … … … … 1.8 COMCongo - 10 3 13 6 3 6 4 3 479 879 835 433 67 783 … 55 3.5₋₁ᵢ 15.6₋₁ᵢ … … … … … … … … 1.1 COGCôte d'Ivoire - 10 - 10 6 3 6 4 3 2,301 4,083 4,155 2,477 188 4,004 2,227 247 3.3₋₁ 18.3₋₁ 806₋₁ 508₋₁ 702₋₁ 5,491₋₂ 16₋₁ 10₋₁ 14₋₁ 111₋₂ 2.3 CIVD. R. Congo - 6 - 6 6 3 6 2 4 8,779 15,166 12,105 7,037 474 16,807 4,619 465 1.5₋₂ᵢ 14.0₋₂ᵢ -₋₄ … … … -₋₄ … … … 1.5 CODDjibouti - 10 1 12 6 2 5 4 3 41 94 125 90 4 69 68 … 3.6₋₁ᵢ 14.0₋₁ᵢ … … … … … 25₋₃ … … 2.3 DJIEquat. Guinea - 6 - 6 7 3 6 4 2 107 184 147 … 40 93 … … … … … … … … … … … … GNQEritrea - 8 - 8 6 2 5 3 4 187 495 600 304 47 350 260 10 … … … … … … … … … … ERIEswatini - 7 - 7 6 3 7 3 2 84 205 138 121 … 237 108 … … … … … … … … … … … SWZEthiopia - 8 - 8 7 3 6 4 2 9,373 17,101 15,695 … 2,513 16,198 5,029 … 4.7₋₄ 27.1₋₄ 59₋₄ 130₋₄ 278₋₄ … 4₋₄ 8₋₄ 17₋₄ … 0.3 ETHGabon - 10 - 10 6 3 5 4 3 180 260 289 … … … … … … … … … … … … … … … GABGambia - 9 - 9 7 4 6 3 3 298 380 313 … 126 375 … … 2.4₋₁ᵢ 11.2₋₁ᵢ -₋₄ 178₋₄ … … -₋₄ 8₋₄ … … 2.5 GMBGhana 2 9 2 9 6 2 6 3 4 1,608 4,432 4,492 2,879 1,852 4,550 2,851 496 4.0₋₁ᵢ 18.6₋₁ᵢ … … … … … … … … 9.2 GHAGuinea - 6 - 6 7 3 6 4 3 1,148 2,091 2,117 1,128 … 1,777 … … 2.3₋₁ 14.9₋₁ … 157₋₃ … … … 7₋₃ … … 1.0 GINGuinea-Bissau - 9 … … 6 3 6 3 3 175 314 262 … … … … … … … … … … … … … … … GNBKenya - 12 - 12 6 3 6 2 4 4,207 8,318 7,687 5,258 3,200 8,290 … 563 5.3₋₁ᵢ 19.0₋₁ᵢ 51₋₄ 406₋₄ … 2,835₋₄ 1₋₄ 11₋₄ … 76₋₄ 3.7 KENLesotho - 7 - 7 6 3 7 3 2 144 305 216 212 54 368 136 22 7.0₋₁ 14.1₋₁ … 618₋₁ 896₋₁ 1,334₋₁ … 22₋₁ 32₋₁ 48₋₁ 0.4 LSOLiberia - 6 - 6 6 3 6 3 3 422 784 692 … 510 635 227 … 2.6₋₁ᵢ 8.1₋₁ᵢ 155₋₃ 229₋₃ 287₋₄ … 10₋₃ 14₋₃ 18₋₄ … 5.7 LBRMadagascar - 5 3 12 6 3 5 4 3 2,291 3,524 4,403 2,687 902 4,649 1,495 144 2.8₋₁ᵢ 19.8₋₁ᵢ … … … 1₋₃ … … … -₋₃ 3.0 MDGMalawi - 8 - 8 6 3 6 4 2 1,699 3,236 2,856 … 1,361 4,593 990 … 4.7₋₁ᵢ 15.8₋₁ᵢ -₋₃ 84₋₃ 247₋₃ … -₋₃ 8₋₃ 24₋₃ … MWIMali - 9 4 12 7 3 6 3 3 1,953 3,474 2,771 1,607 131 2,477 1,046 83 3.8₋₂ 16.5₋₂ 41₋₂ 281₋₂ 583₋₂ 3,610₋₄ 2₋₂ 12₋₂ 25₋₂ 165₋₄ 1.9 MLIMauritania - 9 3 13 6 3 6 4 3 391 694 677 406 36 677 260 23 1.9 10.2 … 330 464 3,619 … 6 9 68 3.3 MRTMauritius - 11 - 13 5 2 6 3 4 26 84 122 96 25 86 122 39 4.7 18.7 663 3,511 6,757 1,977₋₂ 3 16 30 10₋₂ 4.5 MUSMozambique - - … … 6 3 7 3 2 2,939 6,097 3,759 2,926 … 6,941 1,216 214 5.5₋₁ᵢ 16.7₋₁ᵢ … … … … … … … … 0.8 MOZNamibia - 7 - 7 7 2 7 3 2 131 416 249 246 43 491 … 59 … … … … … … … … … … 1.8 NAMNiger - - … … 7 3 6 4 3 2,488 4,174 3,699 1,902 178 2,667 787 80 3.5₋₁ᵢ 16.8₋₁ᵢ 403₋₂ 114₋₂ 139₋₂ 2,254₋₂ 34₋₂ 10₋₂ 12₋₂ 190₋₂ 3.6 NERNigeria - 9 - 9 6 1 6 3 3 6,203 33,598 27,795 … … 25,591 10,315 … … … … … … … … … … … 4.4 NGARwanda - 6 - 9 7 3 6 3 3 1,042 1,940 1,699 1,157 282 2,512 732 72 3.1₋₁ 10.8₋₁ 41₋₁ 83₋₁ 423₋₁ 1,904₋₁ 2₋₁ 4₋₁ 21₋₁ 96₋₁ 5.9 RWASao Tome and Principe - 6 - 6 6 3 6 3 3 19 36 32 18 9 37 26 2 5.1₋₁ᵢ 20.1₋₁ᵢ … … … … … … … … 0.3 STPSenegal - 11 - 11 6 3 6 4 3 1,516 2,723 2,567 1,486 252 2,172 1,150 195 4.8₋₁ 21.5₋₁ 460₋₄ 417₋₄ 624₋₄ 4,618₋₁ 15₋₄ 14₋₄ 21₋₄ 136₋₁ 4.0 SENSeychelles - 10 - 11 6 2 6 3 4 3 9 10 6 3 9 7 1 4.4₋₃ 11.7₋₃ 3,277₋₃ 3,842₋₃ 4,140₋₃ 19,135₋₃ 12₋₃ 14₋₃ 15₋₃ 71₋₃ SYCSierra Leone - 9 - 9 6 3 6 3 4 663 1,245 1,264 … 127 1,770 492 … 7.7 35.5 - 232 240₋₂ … - 13 14₋₂ … 2.6 SLESomalia - - … … 6 3 6 2 4 1,529 2,715 2,298 … … … … … … … … … … … … … … … SOMSouth Africa - 9 - 12 7 4 7 2 3 4,684 7,921 4,996 4,948 824 7,568 4,879 1,178 6.5 19.6 818 2,352 2,897 7,027 6 19 23 56 1.6 ZAFSouth Sudan - 8 - 8 6 3 6 2 4 981 1,790 1,548 … 111 1,274 164 … 1.5₋₃ 0.9₋₁ᵢ … … … … 0.4₋₃ 5₋₃ 12₋₃ … SSDTogo - 10 - 5 6 3 6 4 3 697 1,294 1,289 723 208 1,634 728 101 5.4₋₁ᵢ 21.8₋₁ᵢ 76₋₄ 243₋₃ … 1,187₋₂ 5₋₄ 16₋₃ … 76₋₂ 2.4 TGOUganda - 7 … … 6 3 7 4 2 4,516 9,409 6,649 … 609 8,841 … … 2.1₋₁ᵢ 11.5₋₁ᵢ … … … … … … … … 3.2 UGAUnited Republic of Tanzania - 7 2 7 7 2 7 4 2 3,566 11,274 7,873 4,981 1,429 10,605 2,338 154 3.7₋₁ᵢ 20.5₋₁ᵢ … … … … … … … … 1.4 TZAZambia - 7 - 7 7 4 7 2 3 2,274 3,565 2,189 … 160 3,285 … … 4.6₋₁ᵢ 16.9₋₁ᵢ 67₋₃ 460₋₂ … … 2₋₃ 13₋₂ … … 3.8 ZMBZimbabwe - 7 … … 6 2 7 2 4 901 2,949 2,063 1,355 … … … 136 5.9₋₁ᵢ 19.0₋₁ᵢ … … … … … … … … 3.6 ZWE
2 0 2 1 / 2 • G LO BA L E D U C AT I O N M O N I TO R I N G R E P O RT 406
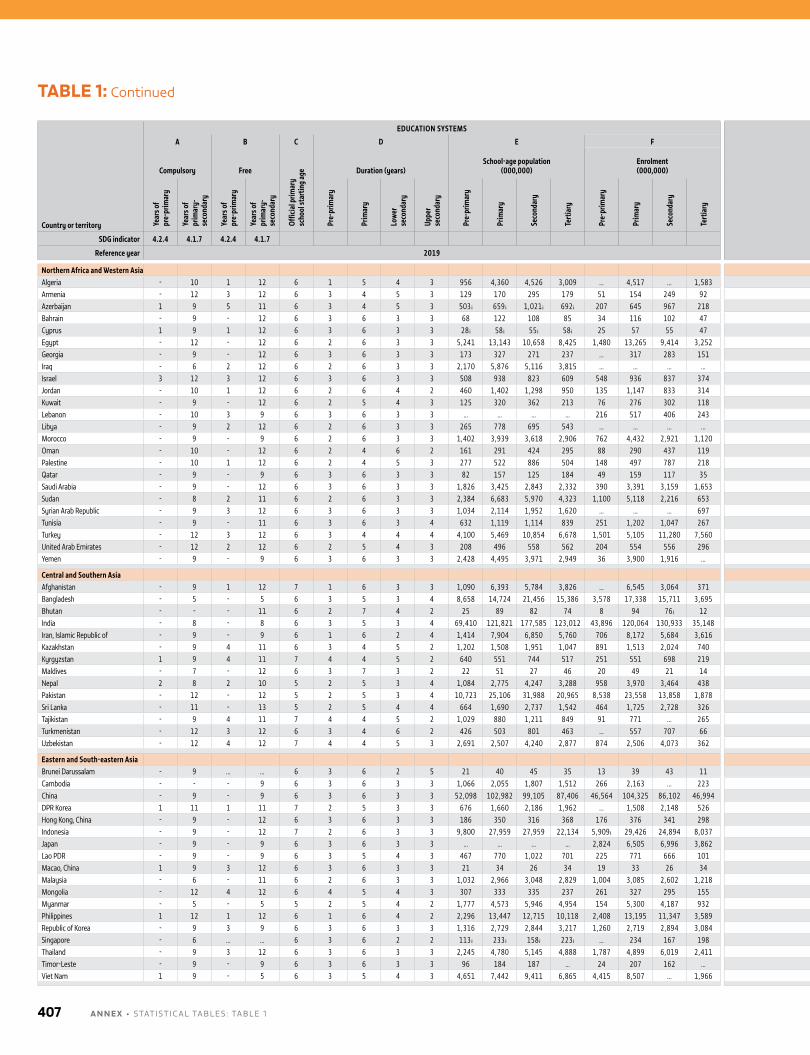
Country or territory
EDUCATION SYSTEMS FINANCE
A B C D E F G H I J
Compulsory Free
Offic
ial p
rimar
y
scho
ol st
artin
g ag
e Duration (years)School-age population
(000,000)Enrolment (000,000)
Gove
rnm
ent e
duca
tion
expe
nditu
re (%
of G
DP)
Educ
atio
n sh
are o
f to
tal g
over
nmen
t ex
pend
iture
(%)
Government education expenditure per pupil
Hous
ehol
d ed
ucat
ion
expe
nditu
re
(% o
f GDP
)
Coun
try
code
2017 PPP US$ % of GDP per capita
Year
s of
pr
e-pr
imar
y
Year
s of
prim
ary-
seco
ndar
y
Year
s of
pr
e-pr
imar
y
Year
s of
prim
ary-
seco
ndar
y
Pre-
prim
ary
Prim
ary
Low
er
seco
ndar
y
Uppe
r se
cond
ary
Pre-
prim
ary
Prim
ary
Seco
ndar
y
Tert
iary
Pre-
prim
ary
Prim
ary
Seco
ndar
y
Tert
iary
Pre-
prim
ary
Prim
ary
Seco
ndar
y
Tert
iary
Pre-
prim
ary
Prim
ary
Seco
ndar
y
Tert
iary
SDG indicator 4.2.4 4.1.7 4.2.4 4.1.7 1.a.2 4.5.4
Reference year 2019 2019
Northern Africa and Western AsiaAlgeria - 10 1 12 6 1 5 4 3 956 4,360 4,526 3,009 … 4,517 … 1,583 … … … … … … … … … … 1.0 DZAArmenia - 12 3 12 6 3 4 5 3 129 170 295 179 51 154 249 92 2.7₋₂ 10.4₋₂ 2,467₋₂ 1,259₋₂ … 1,225₋₂ 20₋₂ 10₋₂ … 10₋₂ 1.9 ARMAzerbaijan 1 9 5 11 6 3 4 5 3 503 ᵢ 659 ᵢ 1,021 ᵢ 692 ᵢ 207 645 967 218 2.5₋₁ 7.4₋₁ 1,543₋₁ … … 3,241₋₁ 11₋₁ … … 22₋₁ 1.0 AZEBahrain - 9 - 12 6 3 6 3 3 68 122 108 85 34 116 102 47 2.3₋₂ 7.2₋₂ … 5,520₋₄ 8,657₋₄ … … 11₋₄ 18₋₄ … 1.1 BHRCyprus 1 9 1 12 6 3 6 3 3 28 ᵢ 58 ᵢ 55 ᵢ 58 ᵢ 25 57 55 47 5.8₋₂ 15.7₋₂ 4,322₋₂ 11,104₋₂ 14,461₋₂ 8,403₋₂ 11₋₂ 29₋₂ 37₋₂ 22₋₂ 2.0 CYPEgypt - 12 - 12 6 2 6 3 3 5,241 13,143 10,658 8,425 1,480 13,265 9,414 3,252 … … 718 744 1,343 … 6 7 12 … 4.0 EGYGeorgia - 9 - 12 6 3 6 3 3 173 327 271 237 … 317 283 151 3.5₋₁ 13.0₋₁ … … … 1,517₋₁ … … … 10₋₁ 1.8 GEOIraq - 6 2 12 6 2 6 3 3 2,170 5,876 5,116 3,815 … … … … … … … … … … … … … … 0.3 IRQIsrael 3 12 3 12 6 3 6 3 3 508 938 823 609 548 936 837 374 6.1₋₂ 15.7₋₂ 5,607₋₂ 8,945₋₂ 7,712₋₂ 7,885₋₂ 14₋₂ 23₋₂ 19₋₂ 20₋₂ 1.2 ISRJordan - 10 1 12 6 2 6 4 2 460 1,402 1,298 950 135 1,147 833 314 3.1 10.0 76 1,330 1,575 952 1 13 16 9 3.9 JORKuwait - 9 - 12 6 2 5 4 3 125 320 362 213 76 276 302 118 … … … … … … … … … … KWTLebanon - 10 3 9 6 3 6 3 3 … … … … 216 517 406 243 … … … … … … … … … … 6.1 LBNLibya - 9 2 12 6 2 6 3 3 265 778 695 543 … … … … … … … … … … … … … … LBYMorocco - 9 - 9 6 2 6 3 3 1,402 3,939 3,618 2,906 762 4,432 2,921 1,120 … … … … … … … … … … 2.2 MAROman - 10 - 12 6 2 4 6 2 161 291 424 295 88 290 437 119 … … 1,913 7,155 7,708 13,556₋₃ 7 25 27 44₋₃ 1.6 OMNPalestine - 10 1 12 6 2 4 5 3 277 522 886 504 148 497 787 218 5.3₋₂ 16.1₋₂ … … … … … … … … 3.6 PSEQatar - 9 - 9 6 3 6 3 3 82 157 125 184 49 159 117 35 2.7 8.6 … … … … … … … … QATSaudi Arabia - 9 - 12 6 3 6 3 3 1,826 3,425 2,843 2,332 390 3,391 3,159 1,653 … … … … … … … … … … 1.6 SAUSudan - 8 2 11 6 2 6 3 3 2,384 6,683 5,970 4,323 1,100 5,118 2,216 653 … … … … … … … … … … 1.4 SDNSyrian Arab Republic - 9 3 12 6 3 6 3 3 1,034 2,114 1,952 1,620 … … … 697 … … … … … … … … … … SYRTunisia - 9 - 11 6 3 6 3 4 632 1,119 1,114 839 251 1,202 1,047 267 6.6₋₄ 22.7₋₄ … … 5,640₋₄ 5,892₋₄ … … 52₋₄ 55₋₄ 1.6 TUNTurkey - 12 3 12 6 3 4 4 4 4,100 5,469 10,854 6,678 1,501 5,105 11,280 7,560 … … … … … … … … … … 1.4 TURUnited Arab Emirates - 12 2 12 6 2 5 4 3 208 496 558 562 204 554 556 296 3.1 10.2 … … … … … … … … 3.3 AREYemen - 9 - 9 6 3 6 3 3 2,428 4,495 3,971 2,949 36 3,900 1,916 … … … … … … … … … … … YEM
Central and Southern AsiaAfghanistan - 9 1 12 7 1 6 3 3 1,090 6,393 5,784 3,826 … 6,545 3,064 371 4.1₋₂ᵢ 15.7₋₂ᵢ -₋₂ 231₋₂ 255₋₂ … -₋₂ 10₋₂ 11₋₂ … AFGBangladesh - 5 - 5 6 3 5 3 4 8,658 14,724 21,456 15,386 3,578 17,338 15,711 3,695 1.3 9.3 … … 381 885 … … 9 20 3.7 BGDBhutan - - - 11 6 2 7 4 2 25 89 82 74 8 94 76 ᵢ 12 6.9₋₁ᵢ 21.9₋₁ᵢ -₋₄ … 2,921₋₄ … -₋₄ … 31₋₄ … 1.2 BTNIndia - 8 - 8 6 3 5 3 4 69,410 121,821 177,585 123,012 43,896 120,064 130,933 35,148 … … … … … … … … … … 2.4 INDIran, Islamic Republic of - 9 - 9 6 1 6 2 4 1,414 7,904 6,850 5,760 706 8,172 5,684 3,616 4.0₋₁ 21.3 149₋₃ 1,579₋₂ 2,490₋₂ 3,622₋₁ 1₋₃ 11₋₂ 18₋₂ 25₋₁ IRNKazakhstan - 9 4 11 6 3 4 5 2 1,202 1,508 1,951 1,047 891 1,513 2,024 740 2.9 14.1 1,765₋₃ 70 5,256₋₃ 2,283 7₋₃ 0.3 21₋₃ 8 0.6 KAZKyrgyzstan 1 9 4 11 7 4 4 5 2 640 551 744 517 251 551 698 219 6.0₋₂ 16.3₋₂ 1,150₋₂ … … 253₋₂ 22₋₂ … … 5₋₂ 1.8 KGZMaldives - 7 - 12 6 3 7 3 2 22 51 27 46 20 49 21 14 3.7₋₃ 10.2₋₃ 2,279 3,036 4,164 … 12 16 22 … 1.8 MDVNepal 2 8 2 10 5 2 5 3 4 1,084 2,775 4,247 3,288 958 3,970 3,464 438 5.1₋₁ 14.1₋₁ 59₋₄ 350₋₄ 296₋₄ᵢ 684₋₄ 2₋₄ 12₋₄ 10₋₄ᵢ 24₋₄ 3.2 NPLPakistan - 12 - 12 5 2 5 3 4 10,723 25,106 31,988 20,965 8,538 23,558 13,858 1,878 2.9₋₂ 14.5₋₂ … 338₋₄ 668₋₄ 2,973₋₂ … 8₋₄ 16₋₄ 67₋₂ 3.3 PAKSri Lanka - 11 - 13 5 2 5 4 4 664 1,690 2,737 1,542 464 1,725 2,728 326 2.1₋₁ 11.3₋₁ - 901₋₁ 887₋₁ 3,726₋₁ - 7₋₁ 7₋₁ 28₋₁ 2.7 LKATajikistan - 9 4 11 7 4 4 5 2 1,029 880 1,211 849 91 771 … 265 5.2₋₄ 16.4₋₄ 795₋₄ … … 565₋₄ 28₋₄ … … 20₋₄ TJKTurkmenistan - 12 3 12 6 3 4 6 2 426 503 801 463 … 557 707 66 … 23.0 … … … … … … … … TKMUzbekistan - 12 4 12 7 4 4 5 3 2,691 2,507 4,240 2,877 874 2,506 4,073 362 5.3₋₂ᵢ 22.5₋₂ᵢ … … … … … … … … UZB
Eastern and South-eastern AsiaBrunei Darussalam - 9 … … 6 3 6 2 5 21 40 45 35 13 39 43 11 4.4₋₃ 11.4₋₃ 644₋₃ 5,604₋₃ 14,931₋₃ 20,162₋₃ 1₋₃ 9₋₃ 24₋₃ 32₋₃ BRNCambodia - - - 9 6 3 6 3 3 1,066 2,055 1,807 1,512 266 2,163 … 223 2.2₋₁ 9.4₋₁ … … … … … … … … 1.4 KHMChina - 9 - 9 6 3 6 3 3 52,098 102,982 99,105 87,406 46,564 104,325 86,102 46,994 … … … … … … … … … … CHNDPR Korea 1 11 1 11 7 2 5 3 3 676 1,660 2,186 1,962 … 1,508 2,148 526 … … … … … … … … … … PRKHong Kong, China - 9 - 12 6 3 6 3 3 186 350 316 368 176 376 341 298 3.8 20.3 6,035 9,162 13,851 20,281 10 15 23 33 HKGIndonesia - 9 - 12 7 2 6 3 3 9,800 27,959 27,959 22,134 5,909 ᵢ 29,426 24,894 8,037 3.6₋₄ 20.5₋₄ … 1,380₋₄ 1,093₋₄ 2,158₋₄ … 13₋₄ 11₋₄ 21₋₄ 2.5 IDNJapan - 9 - 9 6 3 6 3 3 … … … … 2,824 6,505 6,996 3,862 3.2₋₂ 8.4₋₂ 3,862₋₂ 8,702₋₂ 9,664₋₂ 8,274₋₂ 10₋₂ … … … 1.1 JPNLao PDR - 9 - 9 6 3 5 4 3 467 770 1,022 701 225 771 666 101 … … … … … … … … … … 3.1 LAOMacao, China 1 9 3 12 6 3 6 3 3 21 34 26 34 19 33 26 34 2.7₋₁ 14.4₋₁ … … … 27,151₋₁ … … … 20₋₁ 0.6 MACMalaysia - 6 - 11 6 2 6 3 3 1,032 2,966 3,048 2,829 1,004 3,085 2,602 1,218 4.2 17.4 1,240 4,343₋₂ 5,573 7,204 4 16₋₂ 19 25 0.9 MYSMongolia - 12 4 12 6 4 5 4 3 307 333 335 237 261 327 295 155 4.1₋₂ 12.6₋₂ 1,594₋₂ 1,517₋₂ … 368₋₂ 14₋₂ 13₋₂ … 3₋₂ 3.5 MNGMyanmar - 5 - 5 5 2 5 4 2 1,777 4,573 5,946 4,954 154 5,300 4,187 932 1.9 10.6 … 361₋₁ 476₋₁ 771₋₁ … 8₋₁ 10₋₁ 16₋₁ 2.8 MMRPhilippines 1 12 1 12 6 1 6 4 2 2,296 13,447 12,715 10,118 2,408 13,195 11,347 3,589 … … … … … … … … … … 1.9 PHLRepublic of Korea - 9 3 9 6 3 6 3 3 1,316 2,729 2,844 3,217 1,260 2,719 2,894 3,084 4.6₋₂ … 6,255₋₂ 11,229₋₂ 11,329₋₂ 5,773₋₂ 16₋₂ 28₋₂ 28₋₂ 14₋₂ 1.3 KORSingapore - 6 … … 6 3 6 2 2 113 ᵢ 233 ᵢ 158 ᵢ 223 ᵢ … 234 167 198 … … … 16,528₋₁ 20,284₋₁ 23,903₋₁ … 17₋₁ 21₋₁ 25₋₁ SGPThailand - 9 3 12 6 3 6 3 3 2,245 4,780 5,145 4,888 1,787 4,899 6,019 2,411 … … … … … … … … … … 0.8 THATimor-Leste - 9 - 9 6 3 6 3 3 96 184 187 … 24 207 162 … 6.8₋₁ᵢ 7.9₋₁ᵢ … … … … … … … … 2.8 TLSViet Nam 1 9 - 5 6 3 5 4 3 4,651 7,442 9,411 6,865 4,415 8,507 … 1,966 4.2₋₁ 16.1₋₁ … … … … … … … … 2.1 VNM
TABLE 1: Continued
A N N E X • STATISTICAl TAblES : TAblE 1407
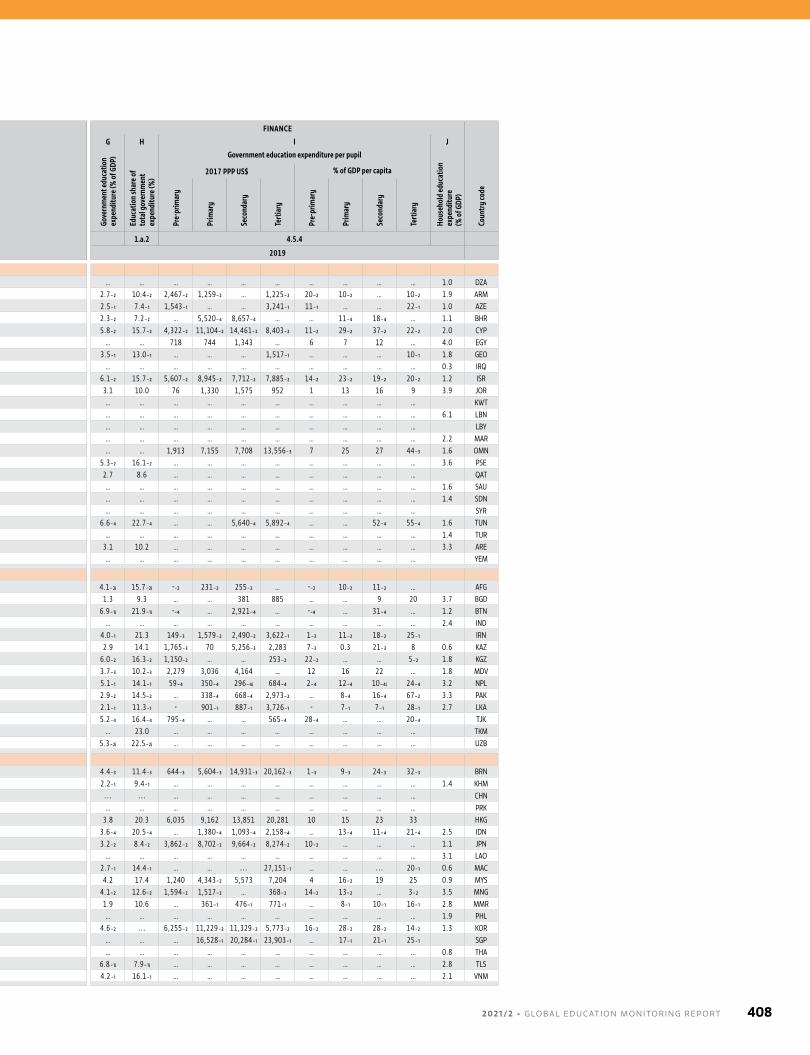
Country or territory
EDUCATION SYSTEMS FINANCE
A B C D E F G H I J
Compulsory Free
Offic
ial p
rimar
y
scho
ol st
artin
g ag
e Duration (years)School-age population
(000,000)Enrolment (000,000)
Gove
rnm
ent e
duca
tion
expe
nditu
re (%
of G
DP)
Educ
atio
n sh
are o
f to
tal g
over
nmen
t ex
pend
iture
(%)
Government education expenditure per pupil
Hous
ehol
d ed
ucat
ion
expe
nditu
re
(% o
f GDP
)
Coun
try
code
2017 PPP US$ % of GDP per capita
Year
s of
pr
e-pr
imar
y
Year
s of
prim
ary-
seco
ndar
y
Year
s of
pr
e-pr
imar
y
Year
s of
prim
ary-
seco
ndar
y
Pre-
prim
ary
Prim
ary
Low
er
seco
ndar
y
Uppe
r se
cond
ary
Pre-
prim
ary
Prim
ary
Seco
ndar
y
Tert
iary
Pre-
prim
ary
Prim
ary
Seco
ndar
y
Tert
iary
Pre-
prim
ary
Prim
ary
Seco
ndar
y
Tert
iary
Pre-
prim
ary
Prim
ary
Seco
ndar
y
Tert
iary
SDG indicator 4.2.4 4.1.7 4.2.4 4.1.7 1.a.2 4.5.4
Reference year 2019 2019
Northern Africa and Western AsiaAlgeria - 10 1 12 6 1 5 4 3 956 4,360 4,526 3,009 … 4,517 … 1,583 … … … … … … … … … … 1.0 DZAArmenia - 12 3 12 6 3 4 5 3 129 170 295 179 51 154 249 92 2.7₋₂ 10.4₋₂ 2,467₋₂ 1,259₋₂ … 1,225₋₂ 20₋₂ 10₋₂ … 10₋₂ 1.9 ARMAzerbaijan 1 9 5 11 6 3 4 5 3 503 ᵢ 659 ᵢ 1,021 ᵢ 692 ᵢ 207 645 967 218 2.5₋₁ 7.4₋₁ 1,543₋₁ … … 3,241₋₁ 11₋₁ … … 22₋₁ 1.0 AZEBahrain - 9 - 12 6 3 6 3 3 68 122 108 85 34 116 102 47 2.3₋₂ 7.2₋₂ … 5,520₋₄ 8,657₋₄ … … 11₋₄ 18₋₄ … 1.1 BHRCyprus 1 9 1 12 6 3 6 3 3 28 ᵢ 58 ᵢ 55 ᵢ 58 ᵢ 25 57 55 47 5.8₋₂ 15.7₋₂ 4,322₋₂ 11,104₋₂ 14,461₋₂ 8,403₋₂ 11₋₂ 29₋₂ 37₋₂ 22₋₂ 2.0 CYPEgypt - 12 - 12 6 2 6 3 3 5,241 13,143 10,658 8,425 1,480 13,265 9,414 3,252 … … 718 744 1,343 … 6 7 12 … 4.0 EGYGeorgia - 9 - 12 6 3 6 3 3 173 327 271 237 … 317 283 151 3.5₋₁ 13.0₋₁ … … … 1,517₋₁ … … … 10₋₁ 1.8 GEOIraq - 6 2 12 6 2 6 3 3 2,170 5,876 5,116 3,815 … … … … … … … … … … … … … … 0.3 IRQIsrael 3 12 3 12 6 3 6 3 3 508 938 823 609 548 936 837 374 6.1₋₂ 15.7₋₂ 5,607₋₂ 8,945₋₂ 7,712₋₂ 7,885₋₂ 14₋₂ 23₋₂ 19₋₂ 20₋₂ 1.2 ISRJordan - 10 1 12 6 2 6 4 2 460 1,402 1,298 950 135 1,147 833 314 3.1 10.0 76 1,330 1,575 952 1 13 16 9 3.9 JORKuwait - 9 - 12 6 2 5 4 3 125 320 362 213 76 276 302 118 … … … … … … … … … … KWTLebanon - 10 3 9 6 3 6 3 3 … … … … 216 517 406 243 … … … … … … … … … … 6.1 LBNLibya - 9 2 12 6 2 6 3 3 265 778 695 543 … … … … … … … … … … … … … … LBYMorocco - 9 - 9 6 2 6 3 3 1,402 3,939 3,618 2,906 762 4,432 2,921 1,120 … … … … … … … … … … 2.2 MAROman - 10 - 12 6 2 4 6 2 161 291 424 295 88 290 437 119 … … 1,913 7,155 7,708 13,556₋₃ 7 25 27 44₋₃ 1.6 OMNPalestine - 10 1 12 6 2 4 5 3 277 522 886 504 148 497 787 218 5.3₋₂ 16.1₋₂ … … … … … … … … 3.6 PSEQatar - 9 - 9 6 3 6 3 3 82 157 125 184 49 159 117 35 2.7 8.6 … … … … … … … … QATSaudi Arabia - 9 - 12 6 3 6 3 3 1,826 3,425 2,843 2,332 390 3,391 3,159 1,653 … … … … … … … … … … 1.6 SAUSudan - 8 2 11 6 2 6 3 3 2,384 6,683 5,970 4,323 1,100 5,118 2,216 653 … … … … … … … … … … 1.4 SDNSyrian Arab Republic - 9 3 12 6 3 6 3 3 1,034 2,114 1,952 1,620 … … … 697 … … … … … … … … … … SYRTunisia - 9 - 11 6 3 6 3 4 632 1,119 1,114 839 251 1,202 1,047 267 6.6₋₄ 22.7₋₄ … … 5,640₋₄ 5,892₋₄ … … 52₋₄ 55₋₄ 1.6 TUNTurkey - 12 3 12 6 3 4 4 4 4,100 5,469 10,854 6,678 1,501 5,105 11,280 7,560 … … … … … … … … … … 1.4 TURUnited Arab Emirates - 12 2 12 6 2 5 4 3 208 496 558 562 204 554 556 296 3.1 10.2 … … … … … … … … 3.3 AREYemen - 9 - 9 6 3 6 3 3 2,428 4,495 3,971 2,949 36 3,900 1,916 … … … … … … … … … … … YEM
Central and Southern AsiaAfghanistan - 9 1 12 7 1 6 3 3 1,090 6,393 5,784 3,826 … 6,545 3,064 371 4.1₋₂ᵢ 15.7₋₂ᵢ -₋₂ 231₋₂ 255₋₂ … -₋₂ 10₋₂ 11₋₂ … AFGBangladesh - 5 - 5 6 3 5 3 4 8,658 14,724 21,456 15,386 3,578 17,338 15,711 3,695 1.3 9.3 … … 381 885 … … 9 20 3.7 BGDBhutan - - - 11 6 2 7 4 2 25 89 82 74 8 94 76 ᵢ 12 6.9₋₁ᵢ 21.9₋₁ᵢ -₋₄ … 2,921₋₄ … -₋₄ … 31₋₄ … 1.2 BTNIndia - 8 - 8 6 3 5 3 4 69,410 121,821 177,585 123,012 43,896 120,064 130,933 35,148 … … … … … … … … … … 2.4 INDIran, Islamic Republic of - 9 - 9 6 1 6 2 4 1,414 7,904 6,850 5,760 706 8,172 5,684 3,616 4.0₋₁ 21.3 149₋₃ 1,579₋₂ 2,490₋₂ 3,622₋₁ 1₋₃ 11₋₂ 18₋₂ 25₋₁ IRNKazakhstan - 9 4 11 6 3 4 5 2 1,202 1,508 1,951 1,047 891 1,513 2,024 740 2.9 14.1 1,765₋₃ 70 5,256₋₃ 2,283 7₋₃ 0.3 21₋₃ 8 0.6 KAZKyrgyzstan 1 9 4 11 7 4 4 5 2 640 551 744 517 251 551 698 219 6.0₋₂ 16.3₋₂ 1,150₋₂ … … 253₋₂ 22₋₂ … … 5₋₂ 1.8 KGZMaldives - 7 - 12 6 3 7 3 2 22 51 27 46 20 49 21 14 3.7₋₃ 10.2₋₃ 2,279 3,036 4,164 … 12 16 22 … 1.8 MDVNepal 2 8 2 10 5 2 5 3 4 1,084 2,775 4,247 3,288 958 3,970 3,464 438 5.1₋₁ 14.1₋₁ 59₋₄ 350₋₄ 296₋₄ᵢ 684₋₄ 2₋₄ 12₋₄ 10₋₄ᵢ 24₋₄ 3.2 NPLPakistan - 12 - 12 5 2 5 3 4 10,723 25,106 31,988 20,965 8,538 23,558 13,858 1,878 2.9₋₂ 14.5₋₂ … 338₋₄ 668₋₄ 2,973₋₂ … 8₋₄ 16₋₄ 67₋₂ 3.3 PAKSri Lanka - 11 - 13 5 2 5 4 4 664 1,690 2,737 1,542 464 1,725 2,728 326 2.1₋₁ 11.3₋₁ - 901₋₁ 887₋₁ 3,726₋₁ - 7₋₁ 7₋₁ 28₋₁ 2.7 LKATajikistan - 9 4 11 7 4 4 5 2 1,029 880 1,211 849 91 771 … 265 5.2₋₄ 16.4₋₄ 795₋₄ … … 565₋₄ 28₋₄ … … 20₋₄ TJKTurkmenistan - 12 3 12 6 3 4 6 2 426 503 801 463 … 557 707 66 … 23.0 … … … … … … … … TKMUzbekistan - 12 4 12 7 4 4 5 3 2,691 2,507 4,240 2,877 874 2,506 4,073 362 5.3₋₂ᵢ 22.5₋₂ᵢ … … … … … … … … UZB
Eastern and South-eastern AsiaBrunei Darussalam - 9 … … 6 3 6 2 5 21 40 45 35 13 39 43 11 4.4₋₃ 11.4₋₃ 644₋₃ 5,604₋₃ 14,931₋₃ 20,162₋₃ 1₋₃ 9₋₃ 24₋₃ 32₋₃ BRNCambodia - - - 9 6 3 6 3 3 1,066 2,055 1,807 1,512 266 2,163 … 223 2.2₋₁ 9.4₋₁ … … … … … … … … 1.4 KHMChina - 9 - 9 6 3 6 3 3 52,098 102,982 99,105 87,406 46,564 104,325 86,102 46,994 … … … … … … … … … … CHNDPR Korea 1 11 1 11 7 2 5 3 3 676 1,660 2,186 1,962 … 1,508 2,148 526 … … … … … … … … … … PRKHong Kong, China - 9 - 12 6 3 6 3 3 186 350 316 368 176 376 341 298 3.8 20.3 6,035 9,162 13,851 20,281 10 15 23 33 HKGIndonesia - 9 - 12 7 2 6 3 3 9,800 27,959 27,959 22,134 5,909 ᵢ 29,426 24,894 8,037 3.6₋₄ 20.5₋₄ … 1,380₋₄ 1,093₋₄ 2,158₋₄ … 13₋₄ 11₋₄ 21₋₄ 2.5 IDNJapan - 9 - 9 6 3 6 3 3 … … … … 2,824 6,505 6,996 3,862 3.2₋₂ 8.4₋₂ 3,862₋₂ 8,702₋₂ 9,664₋₂ 8,274₋₂ 10₋₂ … … … 1.1 JPNLao PDR - 9 - 9 6 3 5 4 3 467 770 1,022 701 225 771 666 101 … … … … … … … … … … 3.1 LAOMacao, China 1 9 3 12 6 3 6 3 3 21 34 26 34 19 33 26 34 2.7₋₁ 14.4₋₁ … … … 27,151₋₁ … … … 20₋₁ 0.6 MACMalaysia - 6 - 11 6 2 6 3 3 1,032 2,966 3,048 2,829 1,004 3,085 2,602 1,218 4.2 17.4 1,240 4,343₋₂ 5,573 7,204 4 16₋₂ 19 25 0.9 MYSMongolia - 12 4 12 6 4 5 4 3 307 333 335 237 261 327 295 155 4.1₋₂ 12.6₋₂ 1,594₋₂ 1,517₋₂ … 368₋₂ 14₋₂ 13₋₂ … 3₋₂ 3.5 MNGMyanmar - 5 - 5 5 2 5 4 2 1,777 4,573 5,946 4,954 154 5,300 4,187 932 1.9 10.6 … 361₋₁ 476₋₁ 771₋₁ … 8₋₁ 10₋₁ 16₋₁ 2.8 MMRPhilippines 1 12 1 12 6 1 6 4 2 2,296 13,447 12,715 10,118 2,408 13,195 11,347 3,589 … … … … … … … … … … 1.9 PHLRepublic of Korea - 9 3 9 6 3 6 3 3 1,316 2,729 2,844 3,217 1,260 2,719 2,894 3,084 4.6₋₂ … 6,255₋₂ 11,229₋₂ 11,329₋₂ 5,773₋₂ 16₋₂ 28₋₂ 28₋₂ 14₋₂ 1.3 KORSingapore - 6 … … 6 3 6 2 2 113 ᵢ 233 ᵢ 158 ᵢ 223 ᵢ … 234 167 198 … … … 16,528₋₁ 20,284₋₁ 23,903₋₁ … 17₋₁ 21₋₁ 25₋₁ SGPThailand - 9 3 12 6 3 6 3 3 2,245 4,780 5,145 4,888 1,787 4,899 6,019 2,411 … … … … … … … … … … 0.8 THATimor-Leste - 9 - 9 6 3 6 3 3 96 184 187 … 24 207 162 … 6.8₋₁ᵢ 7.9₋₁ᵢ … … … … … … … … 2.8 TLSViet Nam 1 9 - 5 6 3 5 4 3 4,651 7,442 9,411 6,865 4,415 8,507 … 1,966 4.2₋₁ 16.1₋₁ … … … … … … … … 2.1 VNM
2 0 2 1 / 2 • G LO BA L E D U C AT I O N M O N I TO R I N G R E P O RT 408
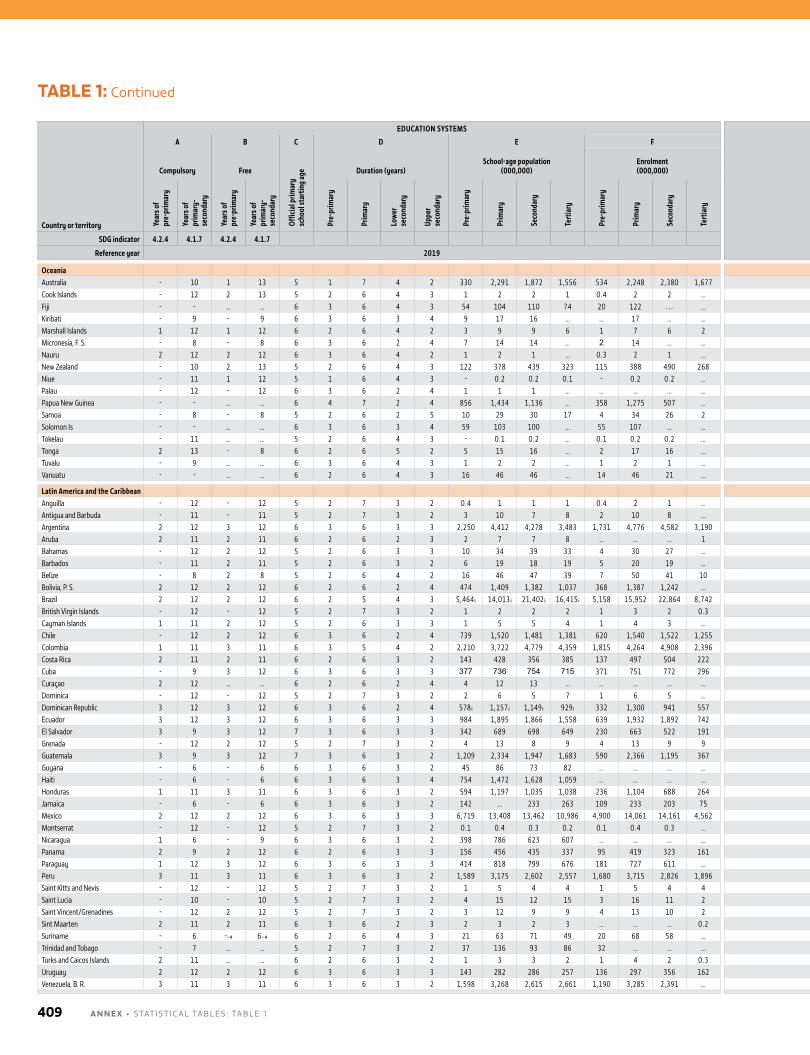
Country or territory
EDUCATION SYSTEMS FINANCE
A B C D E F G H I J
Compulsory Free
Offic
ial p
rimar
y
scho
ol st
artin
g ag
e Duration (years)School-age population
(000,000)Enrolment (000,000)
Gove
rnm
ent e
duca
tion
expe
nditu
re (%
of G
DP)
Educ
atio
n sh
are o
f to
tal g
over
nmen
t ex
pend
iture
(%)
Government education expenditure per pupil
Hous
ehol
d ed
ucat
ion
expe
nditu
re
(% o
f GDP
)
Coun
try
code
2017 PPP US$ % of GDP per capita
Year
s of
pr
e-pr
imar
y
Year
s of
prim
ary-
seco
ndar
y
Year
s of
pr
e-pr
imar
y
Year
s of
prim
ary-
seco
ndar
y
Pre-
prim
ary
Prim
ary
Low
er
seco
ndar
y
Uppe
r se
cond
ary
Pre-
prim
ary
Prim
ary
Seco
ndar
y
Tert
iary
Pre-
prim
ary
Prim
ary
Seco
ndar
y
Tert
iary
Pre-
prim
ary
Prim
ary
Seco
ndar
y
Tert
iary
Pre-
prim
ary
Prim
ary
Seco
ndar
y
Tert
iary
SDG indicator 4.2.4 4.1.7 4.2.4 4.1.7 1.a.2 4.5.4
Reference year 2019 2019
OceaniaAustralia - 10 1 13 5 1 7 4 2 330 2,291 1,872 1,556 534 2,248 2,380 1,677 5.1₋₂ 13.6₋₂ 5,402₋₂ 9,521₋₂ 7,734₋₂ 8,981₋₂ 11₋₂ 19₋₂ 15₋₂ 18₋₂ 2.0 AUSCook Islands - 12 2 13 5 2 6 4 3 1 2 2 1 0.4 2 2 … 4.4₋₃ … … … … … … … … … COKFiji - - … … 6 3 6 4 3 54 104 110 74 20 122 … … … … … … … … … … … … 2.8 FJIKiribati - 9 - 9 6 3 6 3 4 9 17 16 … … 17 … … … … … … … … … … … … KIRMarshall Islands 1 12 1 12 6 2 6 4 2 3 9 9 6 1 7 6 2 … 14.7 … … … … … … … … MHLMicronesia, F. S. - 8 - 8 6 3 6 2 4 7 14 14 … 2 14 … … 12.4₋₄ 22.3₋₄ … … … … … … … … FSMNauru 2 12 2 12 6 3 6 4 2 1 2 1 … 0.3 2 1 … … … … … … … … … … … NRUNew Zealand - 10 2 13 5 2 6 4 3 122 378 439 323 115 388 490 268 6.3₋₂ 16.7₋₂ 8,175₋₂ 8,130₋₂ 8,757₋₂ 10,472₋₂ 20₋₂ 20₋₂ 21₋₂ 25₋₂ 1.5 NZLNiue - 11 1 12 5 1 6 4 3 - 0.2 0.2 0.1 - 0.2 0.2 … … … … … … -₋₂ … … … -₋₂ NIUPalau - 12 - 12 6 3 6 2 4 1 1 1 … … … … … … … … … … … … … … … PLWPapua New Guinea - - … … 6 4 7 2 4 856 1,434 1,136 … 358 1,275 507 … 1.9₋₁ᵢ 9.2₋₁ᵢ … … … … … … … … PNGSamoa - 8 - 8 5 2 6 2 5 10 29 30 17 4 34 26 2 4.2₋₃ 13.0₋₃ 106₋₃ 549₋₃ 797₋₃ … 2₋₃ 9₋₃ 13₋₃ … 1.4 WSMSolomon Is - - … … 6 3 6 3 4 59 103 100 … 55 107 … … … … … … … … … … … … SLBTokelau - 11 … … 5 2 6 4 3 - 0.1 0.2 … 0.1 0.2 0.2 … … … … … … … … … … … TKLTonga 2 13 - 8 6 2 6 5 2 5 15 16 … 2 17 16 … … … … … … … … … … … 2.3 TONTuvalu - 9 … … 6 3 6 4 3 1 2 2 … 1 2 1 … … … … … … … … … … … TUVVanuatu - - … … 6 2 6 4 3 16 46 46 … 14 46 21 … 4.5₋₂ 12.2₋₂ 3₋₄ 409₋₄ 636₋₄ … 0.1₋₄ 13₋₄ 20₋₄ … 2.2 VUT
Latin America and the CaribbeanAnguilla - 12 - 12 5 2 7 3 2 0.4 1 1 1 0.4 2 1 … … … … … … … … … … … AIAAntigua and Barbuda - 11 - 11 5 2 7 3 2 3 10 7 8 2 10 8 … … … … … … … … … … … ATGArgentina 2 12 3 12 6 3 6 3 3 2,250 4,412 4,278 3,483 1,731 4,776 4,582 3,190 4.9₋₁ 12.5₋₁ 3,296₋₁ 3,131₋₁ 4,066₋₁ 3,653₋₁ 14₋₁ 13₋₁ 17₋₁ 16₋₁ 2.1 ARGAruba 2 11 2 11 6 2 6 2 3 2 7 7 8 … … … 1 5.5₋₃ 21.4₋₃ … … … … … … … 88₋₃ ABWBahamas - 12 2 12 5 2 6 3 3 10 34 39 33 4 30 27 … … … … … … … … … … … BHSBarbados - 11 2 11 5 2 6 3 2 6 19 18 19 5 20 19 … 3.2 10.8 … 3,532 3,157 … … 23 20 … 1.5 BRBBelize - 8 2 8 5 2 6 4 2 16 46 47 39 7 50 41 10 7.6₋₁ 22.1₋₁ 1,277₋₁ 1,245₋₁ 2,017₋₁ 1,998₋₁ 18₋₁ 18₋₁ 28₋₁ 28₋₁ BLZBolivia, P. S. 2 12 2 12 6 2 6 2 4 474 1,409 1,382 1,037 368 1,387 1,242 … … … … … … … … … … … 1.9 BOLBrazil 2 12 2 12 6 2 5 4 3 5,464 ᵢ 14,013 ᵢ 21,402 ᵢ 16,415 ᵢ 5,158 15,952 22,864 8,742 6.3₋₂ 16.5₋₂ … 3,025₋₂ 3,243₋₂ 5,480₋₂ … 20₋₂ 22₋₂ 37₋₂ 2.5 BRABritish Virgin Islands - 12 - 12 5 2 7 3 2 1 2 2 2 1 3 2 0.3 2.5₋₁ … … … … … 0.1₋₄ 8₋₁ 16₋₁ 71₋₁ VGBCayman Islands 1 11 2 12 5 2 6 3 3 1 5 5 4 1 4 3 … … … … … … … … … … … CYMChile - 12 2 12 6 3 6 2 4 739 1,520 1,481 1,381 620 1,540 1,522 1,255 5.4₋₂ 21.3₋₂ 5,411₋₂ 4,450₋₂ 4,521₋₂ 4,928₋₂ 22₋₂ 18₋₂ 19₋₂ 20₋₂ 2.6 CHLColombia 1 11 3 11 6 3 5 4 2 2,210 3,722 4,779 4,359 1,815 4,264 4,908 2,396 4.5 14.1 1,117 2,906 2,906 2,360 7 19 19 15 2.1 COLCosta Rica 2 11 2 11 6 2 6 3 2 143 428 356 385 137 497 504 222 7.0 24.6 2,140 4,270 4,845 7,178 11 21 24 36 2.5 CRICuba - 9 3 12 6 3 6 3 3 377 736 754 715 371 751 772 296 … … … … … … … … … … CUBCuraçao 2 12 … … 6 2 6 2 4 4 12 13 … … … … … … … … … … … … … … … CUWDominica - 12 - 12 5 2 7 3 2 2 6 5 7 1 6 5 … 5.6 8.3 1,168 2,431 3,041 - 10 21 26 - DMADominican Republic 3 12 3 12 6 3 6 2 4 578 ᵢ 1,157 ᵢ 1,149 ᵢ 929 ᵢ 332 1,300 941 557 … … 1,446 3,135 2,472 … 8 17 13 … 3.1 DOMEcuador 3 12 3 12 6 3 6 3 3 984 1,895 1,866 1,558 639 1,932 1,892 742 5.0₋₄ 12.6₋₄ 3,695₋₁ 1,328₋₁ 797₋₁ 6,414₋₄ 31₋₁ 11₋₁ 7₋₁ 53₋₄ 2.7 ECUEl Salvador 3 9 3 12 7 3 6 3 3 342 689 698 649 230 663 522 191 3.6₋₁ 14.3₋₁ 859₋₁ 1,347₋₁ 1,254₋₁ 978₋₁ 10₋₁ 15₋₁ 14₋₁ 11₋₁ 4.3 SLVGrenada - 12 2 12 5 2 7 3 2 4 13 8 9 4 13 9 9 3.2₋₂ 14.0₋₂ 976₋₂ 1,359₋₂ 1,810₋₂ 864₋₂ 6₋₂ 8₋₂ 11₋₂ 5₋₂ GRDGuatemala 3 9 3 12 7 3 6 3 2 1,209 2,334 1,947 1,683 590 2,366 1,195 367 3.2 23.8 1,049 1,140 491 1,475₋₄ 12 13 6 18₋₄ GTMGuyana - 6 - 6 6 3 6 3 2 45 86 73 82 … … … … 5.5₋₁ᵢ 16.0₋₁ᵢ … … … … … … … … GUYHaiti - 6 - 6 6 3 6 3 4 754 1,472 1,628 1,059 … … … … 2.8₋₁ 14.6₋₁ … … … … … … … … 6.9 HTIHonduras 1 11 3 11 6 3 6 3 2 594 1,197 1,035 1,038 236 1,104 688 264 6.1₋₁ 23.2₋₁ … … … 2,214₋₄ … … … 41₋₄ 5.5 HNDJamaica - 6 - 6 6 3 6 3 2 142 … 233 263 109 233 203 75 5.2 17.3 524 2,206 2,780 3,397₋₄ 5 23 29 36₋₄ 2.6 JAMMexico 2 12 2 12 6 3 6 3 3 6,719 13,408 13,462 10,986 4,900 14,061 14,161 4,562 4.5₋₂ 17.6₋₂ … 2,655₋₂ 2,682₋₂ 5,123₋₂ … 13₋₂ 13₋₂ 25₋₂ 1.2 MEXMontserrat - 12 - 12 5 2 7 3 2 0.1 0.4 0.3 0.2 0.1 0.4 0.3 … 8.8 … … … … … 32 14 30 … MSRNicaragua 1 6 - 9 6 3 6 3 2 398 786 623 607 … … … … 4.4₋₂ 22.4₋₂ … … … … … … … … 3.6 NICPanama 2 9 2 12 6 2 6 3 3 156 456 435 337 95 419 323 161 … … … … … … … … … … 1.7 PANParaguay 1 12 3 12 6 3 6 3 3 414 818 799 676 181 727 611 … 3.4₋₃ 18.2₋₃ 1,394₋₃ 1,440₋₃ 1,477₋₃ … 11₋₃ 12₋₃ 12₋₃ … 1.2 PRYPeru 3 11 3 11 6 3 6 3 2 1,589 3,175 2,602 2,557 1,680 3,715 2,826 1,896 3.8 17.8 1,543 1,446 1,945 1,381₋₂ 12 11 15 11₋₂ 2.6 PERSaint Kitts and Nevis - 12 - 12 5 2 7 3 2 1 5 4 4 1 5 4 4 2.6₋₄ 8.6₋₄ 3,340₋₄ 1,386₋₄ 4,626₋₃ 1,551₋₄ 13₋₄ 5₋₄ 17₋₃ 6₋₄ KNASaint Lucia - 10 - 10 5 2 7 3 2 4 15 12 15 3 16 11 2 3.3 14.1 -₋₁ 1,995 3,185 -₋₁ -₋₁ 13 21 -₋₁ LCASaint Vincent/Grenadines - 12 2 12 5 2 7 3 2 3 12 9 9 4 13 10 2 5.7₋₁ 19.0₋₁ 391₋₄ 2,239₋₁ 2,576₋₁ … 3₋₄ 18₋₁ 20₋₁ … VCTSint Maarten 2 11 2 11 6 3 6 2 3 2 3 2 3 … … … 0.2 … … … … … … … … … … SXMSuriname - 6 -₋₄ 6₋₄ 6 2 6 4 3 21 63 71 49 20 68 58 … … … … … … … … … … … SURTrinidad and Tobago - 7 … … 5 2 7 3 2 37 136 93 86 32 … … … … … … … … … … … … … 0.7 TTOTurks and Caicos Islands 2 11 … … 6 2 6 3 2 1 3 3 2 1 4 2 0.3 2.9₋₁ 11.9₋₁ … … … … 17₋₁ 6₋₁ 18₋₁ 88₋₄ TCAUruguay 2 12 2 12 6 3 6 3 3 143 282 286 257 136 297 356 162 5.0₋₁ 15.2₋₁ 3,255₋₁ 2,965₋₁ 3,549₋₁ 5,542₋₂ 15₋₁ 13₋₁ 16₋₁ 25₋₂ 2.2 URYVenezuela, B. R. 3 11 3 11 6 3 6 3 2 1,598 3,268 2,615 2,661 1,190 3,285 2,391 … … … … … … … 18₋₄ 18₋₄ 15₋₄ … VEN
TABLE 1: Continued
A N N E X • STATISTICAl TAblES : TAblE 1409
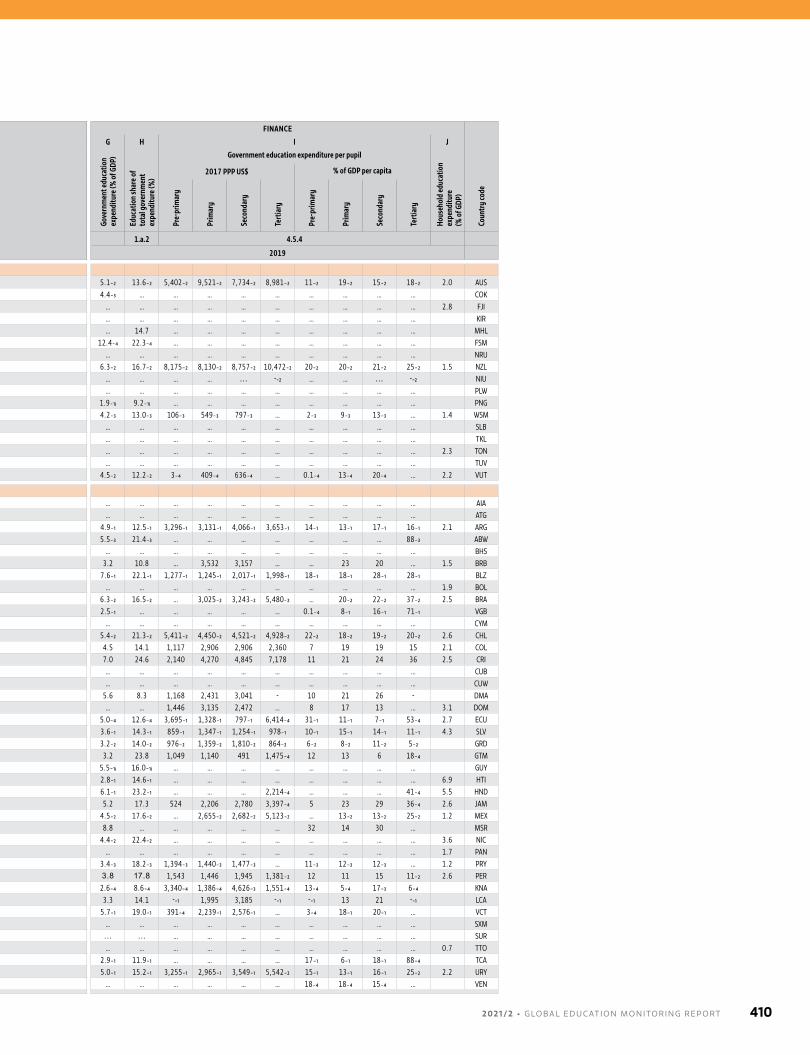
Country or territory
EDUCATION SYSTEMS FINANCE
A B C D E F G H I J
Compulsory Free
Offic
ial p
rimar
y
scho
ol st
artin
g ag
e Duration (years)School-age population
(000,000)Enrolment (000,000)
Gove
rnm
ent e
duca
tion
expe
nditu
re (%
of G
DP)
Educ
atio
n sh
are o
f to
tal g
over
nmen
t ex
pend
iture
(%)
Government education expenditure per pupil
Hous
ehol
d ed
ucat
ion
expe
nditu
re
(% o
f GDP
)
Coun
try
code
2017 PPP US$ % of GDP per capita
Year
s of
pr
e-pr
imar
y
Year
s of
prim
ary-
seco
ndar
y
Year
s of
pr
e-pr
imar
y
Year
s of
prim
ary-
seco
ndar
y
Pre-
prim
ary
Prim
ary
Low
er
seco
ndar
y
Uppe
r se
cond
ary
Pre-
prim
ary
Prim
ary
Seco
ndar
y
Tert
iary
Pre-
prim
ary
Prim
ary
Seco
ndar
y
Tert
iary
Pre-
prim
ary
Prim
ary
Seco
ndar
y
Tert
iary
Pre-
prim
ary
Prim
ary
Seco
ndar
y
Tert
iary
SDG indicator 4.2.4 4.1.7 4.2.4 4.1.7 1.a.2 4.5.4
Reference year 2019 2019
OceaniaAustralia - 10 1 13 5 1 7 4 2 330 2,291 1,872 1,556 534 2,248 2,380 1,677 5.1₋₂ 13.6₋₂ 5,402₋₂ 9,521₋₂ 7,734₋₂ 8,981₋₂ 11₋₂ 19₋₂ 15₋₂ 18₋₂ 2.0 AUSCook Islands - 12 2 13 5 2 6 4 3 1 2 2 1 0.4 2 2 … 4.4₋₃ … … … … … … … … … COKFiji - - … … 6 3 6 4 3 54 104 110 74 20 122 … … … … … … … … … … … … 2.8 FJIKiribati - 9 - 9 6 3 6 3 4 9 17 16 … … 17 … … … … … … … … … … … … KIRMarshall Islands 1 12 1 12 6 2 6 4 2 3 9 9 6 1 7 6 2 … 14.7 … … … … … … … … MHLMicronesia, F. S. - 8 - 8 6 3 6 2 4 7 14 14 … 2 14 … … 12.4₋₄ 22.3₋₄ … … … … … … … … FSMNauru 2 12 2 12 6 3 6 4 2 1 2 1 … 0.3 2 1 … … … … … … … … … … … NRUNew Zealand - 10 2 13 5 2 6 4 3 122 378 439 323 115 388 490 268 6.3₋₂ 16.7₋₂ 8,175₋₂ 8,130₋₂ 8,757₋₂ 10,472₋₂ 20₋₂ 20₋₂ 21₋₂ 25₋₂ 1.5 NZLNiue - 11 1 12 5 1 6 4 3 - 0.2 0.2 0.1 - 0.2 0.2 … … … … … … -₋₂ … … … -₋₂ NIUPalau - 12 - 12 6 3 6 2 4 1 1 1 … … … … … … … … … … … … … … … PLWPapua New Guinea - - … … 6 4 7 2 4 856 1,434 1,136 … 358 1,275 507 … 1.9₋₁ᵢ 9.2₋₁ᵢ … … … … … … … … PNGSamoa - 8 - 8 5 2 6 2 5 10 29 30 17 4 34 26 2 4.2₋₃ 13.0₋₃ 106₋₃ 549₋₃ 797₋₃ … 2₋₃ 9₋₃ 13₋₃ … 1.4 WSMSolomon Is - - … … 6 3 6 3 4 59 103 100 … 55 107 … … … … … … … … … … … … SLBTokelau - 11 … … 5 2 6 4 3 - 0.1 0.2 … 0.1 0.2 0.2 … … … … … … … … … … … TKLTonga 2 13 - 8 6 2 6 5 2 5 15 16 … 2 17 16 … … … … … … … … … … … 2.3 TONTuvalu - 9 … … 6 3 6 4 3 1 2 2 … 1 2 1 … … … … … … … … … … … TUVVanuatu - - … … 6 2 6 4 3 16 46 46 … 14 46 21 … 4.5₋₂ 12.2₋₂ 3₋₄ 409₋₄ 636₋₄ … 0.1₋₄ 13₋₄ 20₋₄ … 2.2 VUT
Latin America and the CaribbeanAnguilla - 12 - 12 5 2 7 3 2 0.4 1 1 1 0.4 2 1 … … … … … … … … … … … AIAAntigua and Barbuda - 11 - 11 5 2 7 3 2 3 10 7 8 2 10 8 … … … … … … … … … … … ATGArgentina 2 12 3 12 6 3 6 3 3 2,250 4,412 4,278 3,483 1,731 4,776 4,582 3,190 4.9₋₁ 12.5₋₁ 3,296₋₁ 3,131₋₁ 4,066₋₁ 3,653₋₁ 14₋₁ 13₋₁ 17₋₁ 16₋₁ 2.1 ARGAruba 2 11 2 11 6 2 6 2 3 2 7 7 8 … … … 1 5.5₋₃ 21.4₋₃ … … … … … … … 88₋₃ ABWBahamas - 12 2 12 5 2 6 3 3 10 34 39 33 4 30 27 … … … … … … … … … … … BHSBarbados - 11 2 11 5 2 6 3 2 6 19 18 19 5 20 19 … 3.2 10.8 … 3,532 3,157 … … 23 20 … 1.5 BRBBelize - 8 2 8 5 2 6 4 2 16 46 47 39 7 50 41 10 7.6₋₁ 22.1₋₁ 1,277₋₁ 1,245₋₁ 2,017₋₁ 1,998₋₁ 18₋₁ 18₋₁ 28₋₁ 28₋₁ BLZBolivia, P. S. 2 12 2 12 6 2 6 2 4 474 1,409 1,382 1,037 368 1,387 1,242 … … … … … … … … … … … 1.9 BOLBrazil 2 12 2 12 6 2 5 4 3 5,464 ᵢ 14,013 ᵢ 21,402 ᵢ 16,415 ᵢ 5,158 15,952 22,864 8,742 6.3₋₂ 16.5₋₂ … 3,025₋₂ 3,243₋₂ 5,480₋₂ … 20₋₂ 22₋₂ 37₋₂ 2.5 BRABritish Virgin Islands - 12 - 12 5 2 7 3 2 1 2 2 2 1 3 2 0.3 2.5₋₁ … … … … … 0.1₋₄ 8₋₁ 16₋₁ 71₋₁ VGBCayman Islands 1 11 2 12 5 2 6 3 3 1 5 5 4 1 4 3 … … … … … … … … … … … CYMChile - 12 2 12 6 3 6 2 4 739 1,520 1,481 1,381 620 1,540 1,522 1,255 5.4₋₂ 21.3₋₂ 5,411₋₂ 4,450₋₂ 4,521₋₂ 4,928₋₂ 22₋₂ 18₋₂ 19₋₂ 20₋₂ 2.6 CHLColombia 1 11 3 11 6 3 5 4 2 2,210 3,722 4,779 4,359 1,815 4,264 4,908 2,396 4.5 14.1 1,117 2,906 2,906 2,360 7 19 19 15 2.1 COLCosta Rica 2 11 2 11 6 2 6 3 2 143 428 356 385 137 497 504 222 7.0 24.6 2,140 4,270 4,845 7,178 11 21 24 36 2.5 CRICuba - 9 3 12 6 3 6 3 3 377 736 754 715 371 751 772 296 … … … … … … … … … … CUBCuraçao 2 12 … … 6 2 6 2 4 4 12 13 … … … … … … … … … … … … … … … CUWDominica - 12 - 12 5 2 7 3 2 2 6 5 7 1 6 5 … 5.6 8.3 1,168 2,431 3,041 - 10 21 26 - DMADominican Republic 3 12 3 12 6 3 6 2 4 578 ᵢ 1,157 ᵢ 1,149 ᵢ 929 ᵢ 332 1,300 941 557 … … 1,446 3,135 2,472 … 8 17 13 … 3.1 DOMEcuador 3 12 3 12 6 3 6 3 3 984 1,895 1,866 1,558 639 1,932 1,892 742 5.0₋₄ 12.6₋₄ 3,695₋₁ 1,328₋₁ 797₋₁ 6,414₋₄ 31₋₁ 11₋₁ 7₋₁ 53₋₄ 2.7 ECUEl Salvador 3 9 3 12 7 3 6 3 3 342 689 698 649 230 663 522 191 3.6₋₁ 14.3₋₁ 859₋₁ 1,347₋₁ 1,254₋₁ 978₋₁ 10₋₁ 15₋₁ 14₋₁ 11₋₁ 4.3 SLVGrenada - 12 2 12 5 2 7 3 2 4 13 8 9 4 13 9 9 3.2₋₂ 14.0₋₂ 976₋₂ 1,359₋₂ 1,810₋₂ 864₋₂ 6₋₂ 8₋₂ 11₋₂ 5₋₂ GRDGuatemala 3 9 3 12 7 3 6 3 2 1,209 2,334 1,947 1,683 590 2,366 1,195 367 3.2 23.8 1,049 1,140 491 1,475₋₄ 12 13 6 18₋₄ GTMGuyana - 6 - 6 6 3 6 3 2 45 86 73 82 … … … … 5.5₋₁ᵢ 16.0₋₁ᵢ … … … … … … … … GUYHaiti - 6 - 6 6 3 6 3 4 754 1,472 1,628 1,059 … … … … 2.8₋₁ 14.6₋₁ … … … … … … … … 6.9 HTIHonduras 1 11 3 11 6 3 6 3 2 594 1,197 1,035 1,038 236 1,104 688 264 6.1₋₁ 23.2₋₁ … … … 2,214₋₄ … … … 41₋₄ 5.5 HNDJamaica - 6 - 6 6 3 6 3 2 142 … 233 263 109 233 203 75 5.2 17.3 524 2,206 2,780 3,397₋₄ 5 23 29 36₋₄ 2.6 JAMMexico 2 12 2 12 6 3 6 3 3 6,719 13,408 13,462 10,986 4,900 14,061 14,161 4,562 4.5₋₂ 17.6₋₂ … 2,655₋₂ 2,682₋₂ 5,123₋₂ … 13₋₂ 13₋₂ 25₋₂ 1.2 MEXMontserrat - 12 - 12 5 2 7 3 2 0.1 0.4 0.3 0.2 0.1 0.4 0.3 … 8.8 … … … … … 32 14 30 … MSRNicaragua 1 6 - 9 6 3 6 3 2 398 786 623 607 … … … … 4.4₋₂ 22.4₋₂ … … … … … … … … 3.6 NICPanama 2 9 2 12 6 2 6 3 3 156 456 435 337 95 419 323 161 … … … … … … … … … … 1.7 PANParaguay 1 12 3 12 6 3 6 3 3 414 818 799 676 181 727 611 … 3.4₋₃ 18.2₋₃ 1,394₋₃ 1,440₋₃ 1,477₋₃ … 11₋₃ 12₋₃ 12₋₃ … 1.2 PRYPeru 3 11 3 11 6 3 6 3 2 1,589 3,175 2,602 2,557 1,680 3,715 2,826 1,896 3.8 17.8 1,543 1,446 1,945 1,381₋₂ 12 11 15 11₋₂ 2.6 PERSaint Kitts and Nevis - 12 - 12 5 2 7 3 2 1 5 4 4 1 5 4 4 2.6₋₄ 8.6₋₄ 3,340₋₄ 1,386₋₄ 4,626₋₃ 1,551₋₄ 13₋₄ 5₋₄ 17₋₃ 6₋₄ KNASaint Lucia - 10 - 10 5 2 7 3 2 4 15 12 15 3 16 11 2 3.3 14.1 -₋₁ 1,995 3,185 -₋₁ -₋₁ 13 21 -₋₁ LCASaint Vincent/Grenadines - 12 2 12 5 2 7 3 2 3 12 9 9 4 13 10 2 5.7₋₁ 19.0₋₁ 391₋₄ 2,239₋₁ 2,576₋₁ … 3₋₄ 18₋₁ 20₋₁ … VCTSint Maarten 2 11 2 11 6 3 6 2 3 2 3 2 3 … … … 0.2 … … … … … … … … … … SXMSuriname - 6 -₋₄ 6₋₄ 6 2 6 4 3 21 63 71 49 20 68 58 … … … … … … … … … … … SURTrinidad and Tobago - 7 … … 5 2 7 3 2 37 136 93 86 32 … … … … … … … … … … … … … 0.7 TTOTurks and Caicos Islands 2 11 … … 6 2 6 3 2 1 3 3 2 1 4 2 0.3 2.9₋₁ 11.9₋₁ … … … … 17₋₁ 6₋₁ 18₋₁ 88₋₄ TCAUruguay 2 12 2 12 6 3 6 3 3 143 282 286 257 136 297 356 162 5.0₋₁ 15.2₋₁ 3,255₋₁ 2,965₋₁ 3,549₋₁ 5,542₋₂ 15₋₁ 13₋₁ 16₋₁ 25₋₂ 2.2 URYVenezuela, B. R. 3 11 3 11 6 3 6 3 2 1,598 3,268 2,615 2,661 1,190 3,285 2,391 … … … … … … … 18₋₄ 18₋₄ 15₋₄ … VEN
2 0 2 1 / 2 • G LO BA L E D U C AT I O N M O N I TO R I N G R E P O RT 410
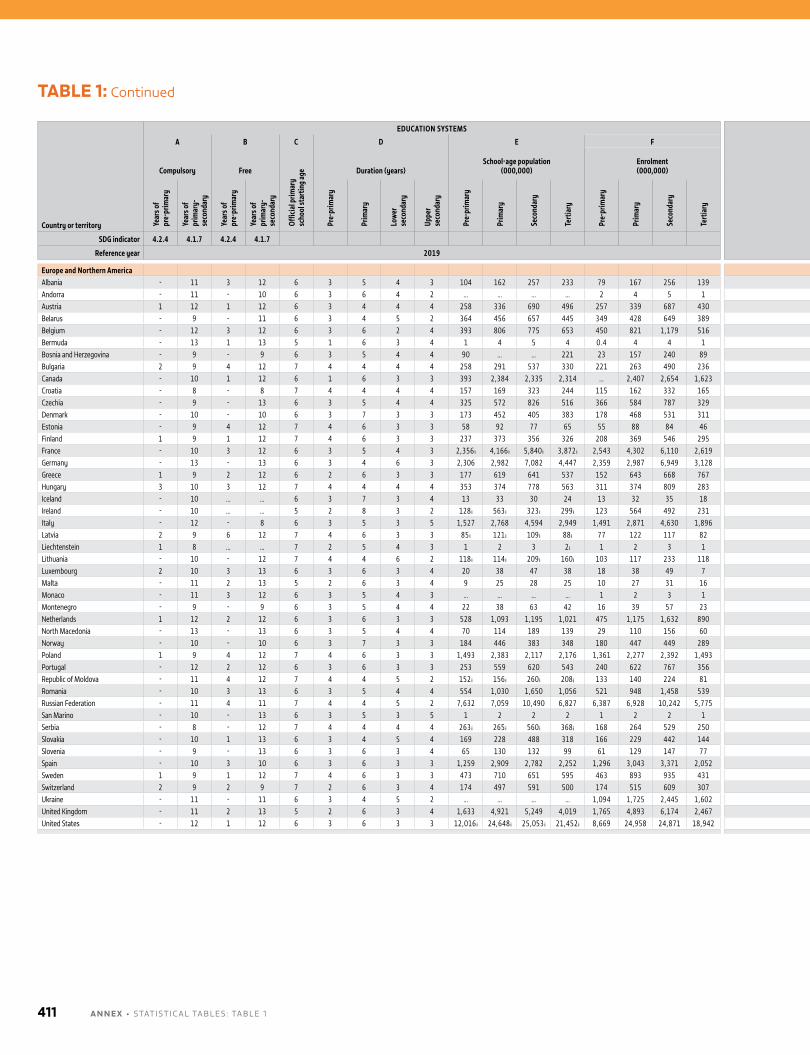
Country or territory
EDUCATION SYSTEMS FINANCE
A B C D E F G H I J
Compulsory Free
Offic
ial p
rimar
y
scho
ol st
artin
g ag
e Duration (years)School-age population
(000,000)Enrolment (000,000)
Gove
rnm
ent e
duca
tion
expe
nditu
re (%
of G
DP)
Educ
atio
n sh
are o
f to
tal g
over
nmen
t ex
pend
iture
(%)
Government education expenditure per pupil
Hous
ehol
d ed
ucat
ion
expe
nditu
re
(% o
f GDP
)
Coun
try
code
2017 PPP US$ % of GDP per capita
Year
s of
pr
e-pr
imar
y
Year
s of
prim
ary-
seco
ndar
y
Year
s of
pr
e-pr
imar
y
Year
s of
prim
ary-
seco
ndar
y
Pre-
prim
ary
Prim
ary
Low
er
seco
ndar
y
Uppe
r se
cond
ary
Pre-
prim
ary
Prim
ary
Seco
ndar
y
Tert
iary
Pre-
prim
ary
Prim
ary
Seco
ndar
y
Tert
iary
Pre-
prim
ary
Prim
ary
Seco
ndar
y
Tert
iary
Pre-
prim
ary
Prim
ary
Seco
ndar
y
Tert
iary
SDG indicator 4.2.4 4.1.7 4.2.4 4.1.7 1.a.2 4.5.4
Reference year 2019 2019
Europe and Northern AmericaAlbania - 11 3 12 6 3 5 4 3 104 162 257 233 79 167 256 139 3.6₋₂ 12.4₋₂ … 4,534₋₂ 1,058₋₂ 1,829₋₂ … 34₋₂ 8₋₂ 14₋₂ 2.5 ALBAndorra - 11 - 10 6 3 6 4 2 … … … … 2 4 5 1 3.2 10.9 … … … … 14 12 14 16 ANDAustria 1 12 1 12 6 3 4 4 4 258 336 690 496 257 339 687 430 5.4₋₂ 11.0₋₂ 10,028₋₂ 12,872₋₂ 15,101₋₂ 19,478₋₂ 18₋₂ 23₋₂ 27₋₂ 35₋₂ 0.3 AUTBelarus - 9 - 11 6 3 4 5 2 364 456 657 445 349 428 649 389 4.8₋₂ 12.3₋₂ 6,016₋₂ … 6,674₋₂ 3,354₋₂ 32₋₂ … 36₋₂ 18₋₂ 0.9 BLRBelgium - 12 3 12 6 3 6 2 4 393 806 775 653 450 821 1,179 516 6.4₋₂ 12.4₋₂ 8,866₋₂ 10,978₋₂ … 16,480₋₂ 17₋₂ 21₋₂ … 32₋₂ 0.3 BELBermuda - 13 1 13 5 1 6 3 4 1 4 5 4 0.4 4 4 1 1.5₋₂ 7.8₋₂ … … … … 17₋₄ 8₋₄ 12₋₄ 24₋₂ BMUBosnia and Herzegovina - 9 - 9 6 3 5 4 4 90 … … 221 23 157 240 89 … … … … … 3,284₋₃ … … … 24₋₃ 0.5 BIHBulgaria 2 9 4 12 7 4 4 4 4 258 291 537 330 221 263 490 236 4.1₋₂ 12.7₋₂ 6,459₋₂ 4,529₋₂ 4,711₋₂ 4,894₋₂ 30₋₂ 21₋₂ 22₋₂ 22₋₂ 0.9 BGRCanada - 10 1 12 6 1 6 3 3 393 2,384 2,335 2,314 … 2,407 2,654 1,623 … … … 8,380₋₄ … 15,509₋₂ … 18₋₄ … 33₋₂ 1.4 CANCroatia - 8 - 8 7 4 4 4 4 157 169 323 244 115 162 332 165 3.9₋₂ 8.6₋₂ 5,152₋₂ 11,226₋₂ … 5,689₋₂ 19₋₂ 41₋₂ … 21₋₂ 0.4 HRVCzechia - 9 - 13 6 3 5 4 4 325 572 826 516 366 584 787 329 3.9₋₂ 9.8₋₂ 6,033₋₂ 5,860₋₂ 9,255₋₂ 8,526₋₂ 15₋₂ 15₋₂ 23₋₂ 22₋₂ 0.4 CZEDenmark - 10 - 10 6 3 7 3 3 173 452 405 383 178 468 531 311 7.8₋₂ 15.3₋₂ 15,033₋₂ 13,286₋₂ 12,852₋₂ 25,477₋₂ 27₋₂ 24₋₂ 23₋₂ 45₋₂ 0.3 DNKEstonia - 9 4 12 7 4 6 3 3 58 92 77 65 55 88 84 46 5.0₋₂ 12.8₋₂ … 6,653₋₂ 6,308₋₃ 11,838₋₃ … 19₋₂ 19₋₃ 36₋₃ 0.4 ESTFinland 1 9 1 12 7 4 6 3 3 237 373 356 326 208 369 546 295 6.4₋₂ 11.9₋₂ 10,296₋₂ 9,820₋₂ 11,024₋₂ 15,029₋₂ 21₋₂ 20₋₂ 23₋₂ 31₋₂ 0.1 FINFrance - 10 3 12 6 3 5 4 3 2,356 ᵢ 4,166 ᵢ 5,840 ᵢ 3,872 ᵢ 2,543 4,302 6,110 2,619 5.5₋₂ 9.7₋₂ 8,505₋₂ 8,171₋₂ 11,894₋₂ 14,196₋₂ 19₋₂ 18₋₂ 26₋₂ 31₋₂ 0.7 FRAGermany - 13 - 13 6 3 4 6 3 2,306 2,982 7,082 4,447 2,359 2,987 6,949 3,128 4.9₋₂ 11.0₋₂ 9,439₋₂ 9,469₋₂ 12,593₋₂ 17,933₋₂ 18₋₂ 18₋₂ 23₋₂ 33₋₂ 0.6 DEUGreece 1 9 2 12 6 2 6 3 3 177 619 641 537 152 643 668 767 … … 5,157₋₂ 5,745₋₂ 6,402₋₂ 2,576₋₂ 17₋₂ 19₋₂ 22₋₂ 9₋₂ 1.3 GRCHungary 3 10 3 12 7 4 4 4 4 353 374 778 563 311 374 809 283 4.7₋₂ 9.9₋₂ 6,688₋₂ 5,154₋₂ 6,332₋₂ 8,269₋₂ 22₋₂ 17₋₂ 21₋₂ 28₋₂ 0.6 HUNIceland - 10 … … 6 3 7 3 4 13 33 30 24 13 32 35 18 7.7₋₂ 17.8₋₂ 13,544₋₂ 13,560₋₂ 11,748₋₂ 15,063₋₂ 24₋₂ 24₋₂ 21₋₂ 26₋₂ 0.2 ISLIreland - 10 … … 5 2 8 3 2 128 ᵢ 563 ᵢ 323 ᵢ 299 ᵢ 123 564 492 231 3.5₋₂ 13.4₋₂ 3,196₋₄ 8,223₋₂ 8,716₋₂ 16,415₋₂ 4₋₄ 10₋₂ 11₋₂ 21₋₂ 0.5 IRLItaly - 12 - 8 6 3 5 3 5 1,527 2,768 4,594 2,949 1,491 2,871 4,630 1,896 4.0₋₂ 8.3₋₂ 7,981₋₂ 8,728₋₂ 9,381₋₄ 10,384₋₂ 19₋₂ 21₋₂ 23₋₄ 24₋₂ 0.6 ITALatvia 2 9 6 12 7 4 6 3 3 85 ᵢ 121 ᵢ 109 ᵢ 88 ᵢ 77 122 117 82 4.4₋₂ 12.0₋₂ 6,117₋₂ 6,270₋₂ 6,867₋₂ 4,314₋₂ 21₋₂ 22₋₂ 24₋₂ 15₋₂ 0.5 LVALiechtenstein 1 8 … … 7 2 5 4 3 1 2 3 2 ᵢ 1 2 3 1 … … … … … … … … … … LIELithuania - 10 - 12 7 4 4 6 2 118 ᵢ 114 ᵢ 209 ᵢ 160 ᵢ 103 117 233 118 3.8₋₂ 11.8₋₂ 5,779₋₂ 6,194₋₂ 5,788₋₂ 5,382₋₂ 17₋₂ 18₋₂ 17₋₂ 16₋₂ 0.4 LTULuxembourg 2 10 3 13 6 3 6 3 4 20 38 47 38 18 38 49 7 3.6₋₂ 8.5₋₂ 18,904₋₂ 19,023₋₂ 22,417₋₂ 45,567₋₂ 16₋₂ 16₋₂ 19₋₂ 39₋₂ 0.1 LUXMalta - 11 2 13 5 2 6 3 4 9 25 28 25 10 27 31 16 4.8₋₂ 13.4₋₂ 7,439₋₂ 7,183₋₂ 12,270₋₂ 17,038₋₂ 18₋₂ 17₋₂ 29₋₂ 41₋₂ 0.7 MLTMonaco - 11 3 12 6 3 5 4 3 … … … … 1 2 3 1 1.5₋₂ 5.0 … … … … 2₋₃ 3₋₃ 5₋₃ … MCOMontenegro - 9 - 9 6 3 5 4 4 22 38 63 42 16 39 57 23 … … … … … … … … … … 1.6 MNENetherlands 1 12 2 12 6 3 6 3 3 528 1,093 1,195 1,021 475 1,175 1,632 890 5.2₋₂ 12.4₋₂ 6,492₋₂ 9,410₋₂ 12,378₋₂ 17,897₋₂ 12₋₂ 17₋₂ 22₋₂ 32₋₂ 0.9 NLDNorth Macedonia - 13 - 13 6 3 5 4 4 70 114 189 139 29 110 156 60 … … … … … … … … … … 0.1 MKDNorway - 10 - 10 6 3 7 3 3 184 446 383 348 180 447 449 289 7.9₋₂ 15.9₋₂ 14,091₋₂ 14,851₋₂ 17,548₋₂ 26,184₋₂ 21₋₂ 22₋₂ 26₋₂ 39₋₂ 0.1 NORPoland 1 9 4 12 7 4 6 3 3 1,493 2,383 2,117 2,176 1,361 2,277 2,392 1,493 4.6₋₂ 11.1₋₂ 5,721₋₂ 7,055₋₂ 6,321₋₂ 8,062₋₂ 19₋₂ 23₋₂ 21₋₂ 27₋₂ 0.6 POLPortugal - 12 2 12 6 3 6 3 3 253 559 620 543 240 622 767 356 5.0₋₂ 11.1₋₂ 5,489₋₂ 8,094₋₂ 9,902₋₂ 7,759₋₂ 16₋₂ 24₋₂ 30₋₂ 23₋₂ 0.8 PRTRepublic of Moldova - 11 4 12 7 4 4 5 2 152 ᵢ 156 ᵢ 260 ᵢ 208 ᵢ 133 140 224 81 6.1 19.5 3,852 3,423 3,223 4,177 29 26 24 31 0.7 MDARomania - 10 3 13 6 3 5 4 4 554 1,030 1,650 1,056 521 948 1,458 539 3.1₋₂ 10.1₋₂ 3,284₋₂ 2,223₋₂ 4,555₋₂ 7,301₋₂ 12₋₂ 8₋₂ 16₋₂ 26₋₂ 0.2 ROURussian Federation - 11 4 11 7 4 4 5 2 7,632 7,059 10,490 6,827 6,387 6,928 10,242 5,775 4.7₋₂ 13.5₋₂ … … … 5,510₋₂ … … … 20₋₂ 0.5 RUSSan Marino - 10 - 13 6 3 5 3 5 1 2 2 2 1 2 2 1 3.6₋₁ 14.5₋₁ 15,595₋₁ 14,810₋₁ 14,180₋₁ 6,566₋₁ 26₋₁ 24₋₁ 23₋₁ 11₋₁ SMRSerbia - 8 - 12 7 4 4 4 4 263 ᵢ 265 ᵢ 560 ᵢ 368 ᵢ 168 264 529 250 3.6₋₁ 8.8₋₁ 457₋₁ 6,854₋₄ 5,720₋₁ 4,738₋₁ 3₋₁ 44₋₄ 33₋₁ 27₋₁ 1.0 SRBSlovakia - 10 1 13 6 3 4 5 4 169 228 488 318 166 229 442 144 3.9₋₂ 9.5₋₂ 5,373₋₂ 6,536₋₂ 6,485₋₂ 8,285₋₂ 17₋₂ 21₋₂ 21₋₂ 26₋₂ 0.5 SVKSlovenia - 9 - 13 6 3 6 3 4 65 130 132 99 61 129 147 77 4.8₋₂ 10.9₋₂ 6,654₋₂ 8,347₋₂ 8,516₋₂ 9,010₋₂ 18₋₂ 22₋₂ 23₋₂ 24₋₂ 0.4 SVNSpain - 10 3 10 6 3 6 3 3 1,259 2,909 2,782 2,252 1,296 3,043 3,371 2,052 4.2₋₂ 10.2₋₂ 6,264₋₂ 6,772₋₂ 7,588₋₂ 8,668₋₂ 16₋₂ 17₋₂ 19₋₂ 22₋₂ 0.8 ESPSweden 1 9 1 12 7 4 6 3 3 473 710 651 595 463 893 935 431 7.6₋₂ 15.7₋₂ 14,030₋₂ 11,564₋₂ 12,499₋₂ 22,510₋₂ 26₋₂ 22₋₂ 23₋₂ 42₋₂ 0.2 SWESwitzerland 2 9 2 9 7 2 6 3 4 174 497 591 500 174 515 609 307 5.1₋₂ 15.5₋₂ 13,693₋₂ 16,954₋₂ 16,808₋₂ 25,713₋₂ 20₋₂ 25₋₂ 25₋₂ 38₋₂ 0.3 CHEUkraine - 11 - 11 6 3 4 5 2 … … … … 1,094 1,725 2,445 1,602 5.4₋₂ 13.1₋₂ 4,412₋₂ 3,684₋₂ 3,678₋₂ 4,188₋₂ 36₋₂ 30₋₂ 30₋₂ 34₋₂ 1.0 UKRUnited Kingdom - 11 2 13 5 2 6 3 4 1,633 4,921 5,249 4,019 1,765 4,893 6,174 2,467 5.4₋₂ 13.8₋₂ 3,754₋₂ 10,614₋₂ 9,436₋₂ 17,558₋₂ 8₋₂ 23₋₂ 21₋₂ 39₋₂ 2.1 GBRUnited States - 12 1 12 6 3 6 3 3 12,016 ᵢ 24,648 ᵢ 25,053 ᵢ 21,452 ᵢ 8,669 24,958 24,871 18,942 … … 7,179₋₂ 11,910₋₂ 13,386₋₂ 13,974₋₂ 12₋₂ 20₋₂ 23₋₂ … 1.9 USA
TABLE 1: Continued
A N N E X • STATISTICAl TAblES : TAblE 1411
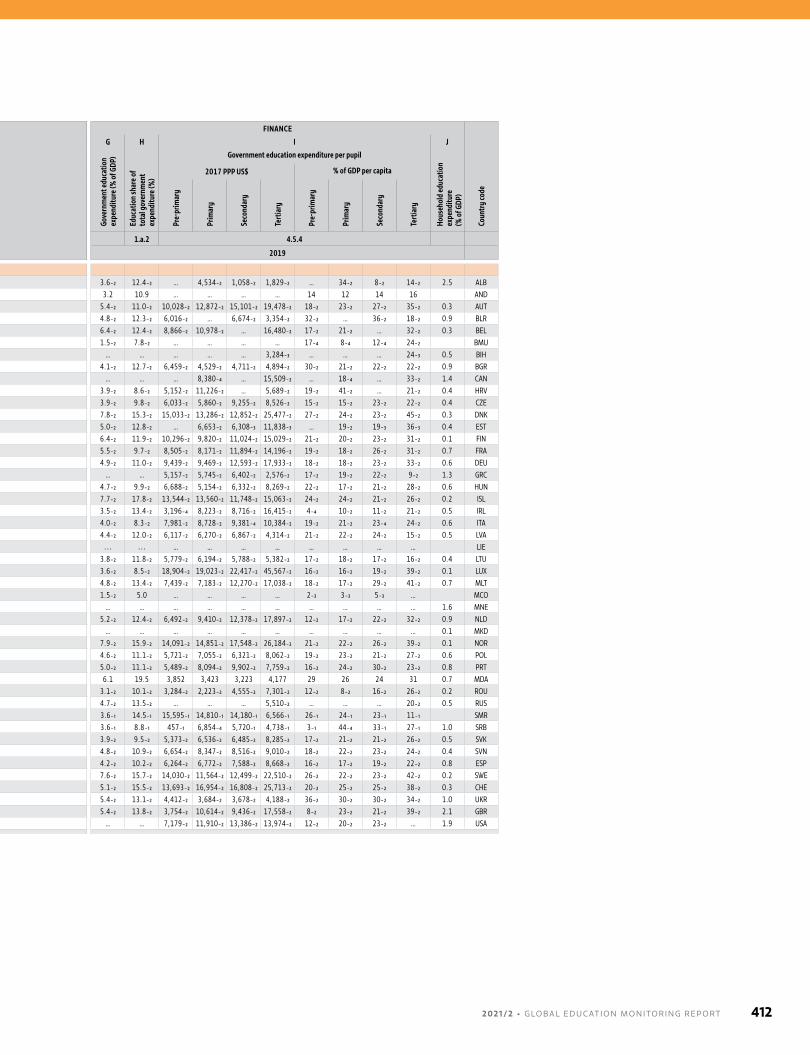
Country or territory
EDUCATION SYSTEMS FINANCE
A B C D E F G H I J
Compulsory Free
Offic
ial p
rimar
y
scho
ol st
artin
g ag
e Duration (years)School-age population
(000,000)Enrolment (000,000)
Gove
rnm
ent e
duca
tion
expe
nditu
re (%
of G
DP)
Educ
atio
n sh
are o
f to
tal g
over
nmen
t ex
pend
iture
(%)
Government education expenditure per pupil
Hous
ehol
d ed
ucat
ion
expe
nditu
re
(% o
f GDP
)
Coun
try
code
2017 PPP US$ % of GDP per capita
Year
s of
pr
e-pr
imar
y
Year
s of
prim
ary-
seco
ndar
y
Year
s of
pr
e-pr
imar
y
Year
s of
prim
ary-
seco
ndar
y
Pre-
prim
ary
Prim
ary
Low
er
seco
ndar
y
Uppe
r se
cond
ary
Pre-
prim
ary
Prim
ary
Seco
ndar
y
Tert
iary
Pre-
prim
ary
Prim
ary
Seco
ndar
y
Tert
iary
Pre-
prim
ary
Prim
ary
Seco
ndar
y
Tert
iary
Pre-
prim
ary
Prim
ary
Seco
ndar
y
Tert
iary
SDG indicator 4.2.4 4.1.7 4.2.4 4.1.7 1.a.2 4.5.4
Reference year 2019 2019
Europe and Northern AmericaAlbania - 11 3 12 6 3 5 4 3 104 162 257 233 79 167 256 139 3.6₋₂ 12.4₋₂ … 4,534₋₂ 1,058₋₂ 1,829₋₂ … 34₋₂ 8₋₂ 14₋₂ 2.5 ALBAndorra - 11 - 10 6 3 6 4 2 … … … … 2 4 5 1 3.2 10.9 … … … … 14 12 14 16 ANDAustria 1 12 1 12 6 3 4 4 4 258 336 690 496 257 339 687 430 5.4₋₂ 11.0₋₂ 10,028₋₂ 12,872₋₂ 15,101₋₂ 19,478₋₂ 18₋₂ 23₋₂ 27₋₂ 35₋₂ 0.3 AUTBelarus - 9 - 11 6 3 4 5 2 364 456 657 445 349 428 649 389 4.8₋₂ 12.3₋₂ 6,016₋₂ … 6,674₋₂ 3,354₋₂ 32₋₂ … 36₋₂ 18₋₂ 0.9 BLRBelgium - 12 3 12 6 3 6 2 4 393 806 775 653 450 821 1,179 516 6.4₋₂ 12.4₋₂ 8,866₋₂ 10,978₋₂ … 16,480₋₂ 17₋₂ 21₋₂ … 32₋₂ 0.3 BELBermuda - 13 1 13 5 1 6 3 4 1 4 5 4 0.4 4 4 1 1.5₋₂ 7.8₋₂ … … … … 17₋₄ 8₋₄ 12₋₄ 24₋₂ BMUBosnia and Herzegovina - 9 - 9 6 3 5 4 4 90 … … 221 23 157 240 89 … … … … … 3,284₋₃ … … … 24₋₃ 0.5 BIHBulgaria 2 9 4 12 7 4 4 4 4 258 291 537 330 221 263 490 236 4.1₋₂ 12.7₋₂ 6,459₋₂ 4,529₋₂ 4,711₋₂ 4,894₋₂ 30₋₂ 21₋₂ 22₋₂ 22₋₂ 0.9 BGRCanada - 10 1 12 6 1 6 3 3 393 2,384 2,335 2,314 … 2,407 2,654 1,623 … … … 8,380₋₄ … 15,509₋₂ … 18₋₄ … 33₋₂ 1.4 CANCroatia - 8 - 8 7 4 4 4 4 157 169 323 244 115 162 332 165 3.9₋₂ 8.6₋₂ 5,152₋₂ 11,226₋₂ … 5,689₋₂ 19₋₂ 41₋₂ … 21₋₂ 0.4 HRVCzechia - 9 - 13 6 3 5 4 4 325 572 826 516 366 584 787 329 3.9₋₂ 9.8₋₂ 6,033₋₂ 5,860₋₂ 9,255₋₂ 8,526₋₂ 15₋₂ 15₋₂ 23₋₂ 22₋₂ 0.4 CZEDenmark - 10 - 10 6 3 7 3 3 173 452 405 383 178 468 531 311 7.8₋₂ 15.3₋₂ 15,033₋₂ 13,286₋₂ 12,852₋₂ 25,477₋₂ 27₋₂ 24₋₂ 23₋₂ 45₋₂ 0.3 DNKEstonia - 9 4 12 7 4 6 3 3 58 92 77 65 55 88 84 46 5.0₋₂ 12.8₋₂ … 6,653₋₂ 6,308₋₃ 11,838₋₃ … 19₋₂ 19₋₃ 36₋₃ 0.4 ESTFinland 1 9 1 12 7 4 6 3 3 237 373 356 326 208 369 546 295 6.4₋₂ 11.9₋₂ 10,296₋₂ 9,820₋₂ 11,024₋₂ 15,029₋₂ 21₋₂ 20₋₂ 23₋₂ 31₋₂ 0.1 FINFrance - 10 3 12 6 3 5 4 3 2,356 ᵢ 4,166 ᵢ 5,840 ᵢ 3,872 ᵢ 2,543 4,302 6,110 2,619 5.5₋₂ 9.7₋₂ 8,505₋₂ 8,171₋₂ 11,894₋₂ 14,196₋₂ 19₋₂ 18₋₂ 26₋₂ 31₋₂ 0.7 FRAGermany - 13 - 13 6 3 4 6 3 2,306 2,982 7,082 4,447 2,359 2,987 6,949 3,128 4.9₋₂ 11.0₋₂ 9,439₋₂ 9,469₋₂ 12,593₋₂ 17,933₋₂ 18₋₂ 18₋₂ 23₋₂ 33₋₂ 0.6 DEUGreece 1 9 2 12 6 2 6 3 3 177 619 641 537 152 643 668 767 … … 5,157₋₂ 5,745₋₂ 6,402₋₂ 2,576₋₂ 17₋₂ 19₋₂ 22₋₂ 9₋₂ 1.3 GRCHungary 3 10 3 12 7 4 4 4 4 353 374 778 563 311 374 809 283 4.7₋₂ 9.9₋₂ 6,688₋₂ 5,154₋₂ 6,332₋₂ 8,269₋₂ 22₋₂ 17₋₂ 21₋₂ 28₋₂ 0.6 HUNIceland - 10 … … 6 3 7 3 4 13 33 30 24 13 32 35 18 7.7₋₂ 17.8₋₂ 13,544₋₂ 13,560₋₂ 11,748₋₂ 15,063₋₂ 24₋₂ 24₋₂ 21₋₂ 26₋₂ 0.2 ISLIreland - 10 … … 5 2 8 3 2 128 ᵢ 563 ᵢ 323 ᵢ 299 ᵢ 123 564 492 231 3.5₋₂ 13.4₋₂ 3,196₋₄ 8,223₋₂ 8,716₋₂ 16,415₋₂ 4₋₄ 10₋₂ 11₋₂ 21₋₂ 0.5 IRLItaly - 12 - 8 6 3 5 3 5 1,527 2,768 4,594 2,949 1,491 2,871 4,630 1,896 4.0₋₂ 8.3₋₂ 7,981₋₂ 8,728₋₂ 9,381₋₄ 10,384₋₂ 19₋₂ 21₋₂ 23₋₄ 24₋₂ 0.6 ITALatvia 2 9 6 12 7 4 6 3 3 85 ᵢ 121 ᵢ 109 ᵢ 88 ᵢ 77 122 117 82 4.4₋₂ 12.0₋₂ 6,117₋₂ 6,270₋₂ 6,867₋₂ 4,314₋₂ 21₋₂ 22₋₂ 24₋₂ 15₋₂ 0.5 LVALiechtenstein 1 8 … … 7 2 5 4 3 1 2 3 2 ᵢ 1 2 3 1 … … … … … … … … … … LIELithuania - 10 - 12 7 4 4 6 2 118 ᵢ 114 ᵢ 209 ᵢ 160 ᵢ 103 117 233 118 3.8₋₂ 11.8₋₂ 5,779₋₂ 6,194₋₂ 5,788₋₂ 5,382₋₂ 17₋₂ 18₋₂ 17₋₂ 16₋₂ 0.4 LTULuxembourg 2 10 3 13 6 3 6 3 4 20 38 47 38 18 38 49 7 3.6₋₂ 8.5₋₂ 18,904₋₂ 19,023₋₂ 22,417₋₂ 45,567₋₂ 16₋₂ 16₋₂ 19₋₂ 39₋₂ 0.1 LUXMalta - 11 2 13 5 2 6 3 4 9 25 28 25 10 27 31 16 4.8₋₂ 13.4₋₂ 7,439₋₂ 7,183₋₂ 12,270₋₂ 17,038₋₂ 18₋₂ 17₋₂ 29₋₂ 41₋₂ 0.7 MLTMonaco - 11 3 12 6 3 5 4 3 … … … … 1 2 3 1 1.5₋₂ 5.0 … … … … 2₋₃ 3₋₃ 5₋₃ … MCOMontenegro - 9 - 9 6 3 5 4 4 22 38 63 42 16 39 57 23 … … … … … … … … … … 1.6 MNENetherlands 1 12 2 12 6 3 6 3 3 528 1,093 1,195 1,021 475 1,175 1,632 890 5.2₋₂ 12.4₋₂ 6,492₋₂ 9,410₋₂ 12,378₋₂ 17,897₋₂ 12₋₂ 17₋₂ 22₋₂ 32₋₂ 0.9 NLDNorth Macedonia - 13 - 13 6 3 5 4 4 70 114 189 139 29 110 156 60 … … … … … … … … … … 0.1 MKDNorway - 10 - 10 6 3 7 3 3 184 446 383 348 180 447 449 289 7.9₋₂ 15.9₋₂ 14,091₋₂ 14,851₋₂ 17,548₋₂ 26,184₋₂ 21₋₂ 22₋₂ 26₋₂ 39₋₂ 0.1 NORPoland 1 9 4 12 7 4 6 3 3 1,493 2,383 2,117 2,176 1,361 2,277 2,392 1,493 4.6₋₂ 11.1₋₂ 5,721₋₂ 7,055₋₂ 6,321₋₂ 8,062₋₂ 19₋₂ 23₋₂ 21₋₂ 27₋₂ 0.6 POLPortugal - 12 2 12 6 3 6 3 3 253 559 620 543 240 622 767 356 5.0₋₂ 11.1₋₂ 5,489₋₂ 8,094₋₂ 9,902₋₂ 7,759₋₂ 16₋₂ 24₋₂ 30₋₂ 23₋₂ 0.8 PRTRepublic of Moldova - 11 4 12 7 4 4 5 2 152 ᵢ 156 ᵢ 260 ᵢ 208 ᵢ 133 140 224 81 6.1 19.5 3,852 3,423 3,223 4,177 29 26 24 31 0.7 MDARomania - 10 3 13 6 3 5 4 4 554 1,030 1,650 1,056 521 948 1,458 539 3.1₋₂ 10.1₋₂ 3,284₋₂ 2,223₋₂ 4,555₋₂ 7,301₋₂ 12₋₂ 8₋₂ 16₋₂ 26₋₂ 0.2 ROURussian Federation - 11 4 11 7 4 4 5 2 7,632 7,059 10,490 6,827 6,387 6,928 10,242 5,775 4.7₋₂ 13.5₋₂ … … … 5,510₋₂ … … … 20₋₂ 0.5 RUSSan Marino - 10 - 13 6 3 5 3 5 1 2 2 2 1 2 2 1 3.6₋₁ 14.5₋₁ 15,595₋₁ 14,810₋₁ 14,180₋₁ 6,566₋₁ 26₋₁ 24₋₁ 23₋₁ 11₋₁ SMRSerbia - 8 - 12 7 4 4 4 4 263 ᵢ 265 ᵢ 560 ᵢ 368 ᵢ 168 264 529 250 3.6₋₁ 8.8₋₁ 457₋₁ 6,854₋₄ 5,720₋₁ 4,738₋₁ 3₋₁ 44₋₄ 33₋₁ 27₋₁ 1.0 SRBSlovakia - 10 1 13 6 3 4 5 4 169 228 488 318 166 229 442 144 3.9₋₂ 9.5₋₂ 5,373₋₂ 6,536₋₂ 6,485₋₂ 8,285₋₂ 17₋₂ 21₋₂ 21₋₂ 26₋₂ 0.5 SVKSlovenia - 9 - 13 6 3 6 3 4 65 130 132 99 61 129 147 77 4.8₋₂ 10.9₋₂ 6,654₋₂ 8,347₋₂ 8,516₋₂ 9,010₋₂ 18₋₂ 22₋₂ 23₋₂ 24₋₂ 0.4 SVNSpain - 10 3 10 6 3 6 3 3 1,259 2,909 2,782 2,252 1,296 3,043 3,371 2,052 4.2₋₂ 10.2₋₂ 6,264₋₂ 6,772₋₂ 7,588₋₂ 8,668₋₂ 16₋₂ 17₋₂ 19₋₂ 22₋₂ 0.8 ESPSweden 1 9 1 12 7 4 6 3 3 473 710 651 595 463 893 935 431 7.6₋₂ 15.7₋₂ 14,030₋₂ 11,564₋₂ 12,499₋₂ 22,510₋₂ 26₋₂ 22₋₂ 23₋₂ 42₋₂ 0.2 SWESwitzerland 2 9 2 9 7 2 6 3 4 174 497 591 500 174 515 609 307 5.1₋₂ 15.5₋₂ 13,693₋₂ 16,954₋₂ 16,808₋₂ 25,713₋₂ 20₋₂ 25₋₂ 25₋₂ 38₋₂ 0.3 CHEUkraine - 11 - 11 6 3 4 5 2 … … … … 1,094 1,725 2,445 1,602 5.4₋₂ 13.1₋₂ 4,412₋₂ 3,684₋₂ 3,678₋₂ 4,188₋₂ 36₋₂ 30₋₂ 30₋₂ 34₋₂ 1.0 UKRUnited Kingdom - 11 2 13 5 2 6 3 4 1,633 4,921 5,249 4,019 1,765 4,893 6,174 2,467 5.4₋₂ 13.8₋₂ 3,754₋₂ 10,614₋₂ 9,436₋₂ 17,558₋₂ 8₋₂ 23₋₂ 21₋₂ 39₋₂ 2.1 GBRUnited States - 12 1 12 6 3 6 3 3 12,016 ᵢ 24,648 ᵢ 25,053 ᵢ 21,452 ᵢ 8,669 24,958 24,871 18,942 … … 7,179₋₂ 11,910₋₂ 13,386₋₂ 13,974₋₂ 12₋₂ 20₋₂ 23₋₂ … 1.9 USA
2 0 2 1 / 2 • G LO BA L E D U C AT I O N M O N I TO R I N G R E P O RT 412
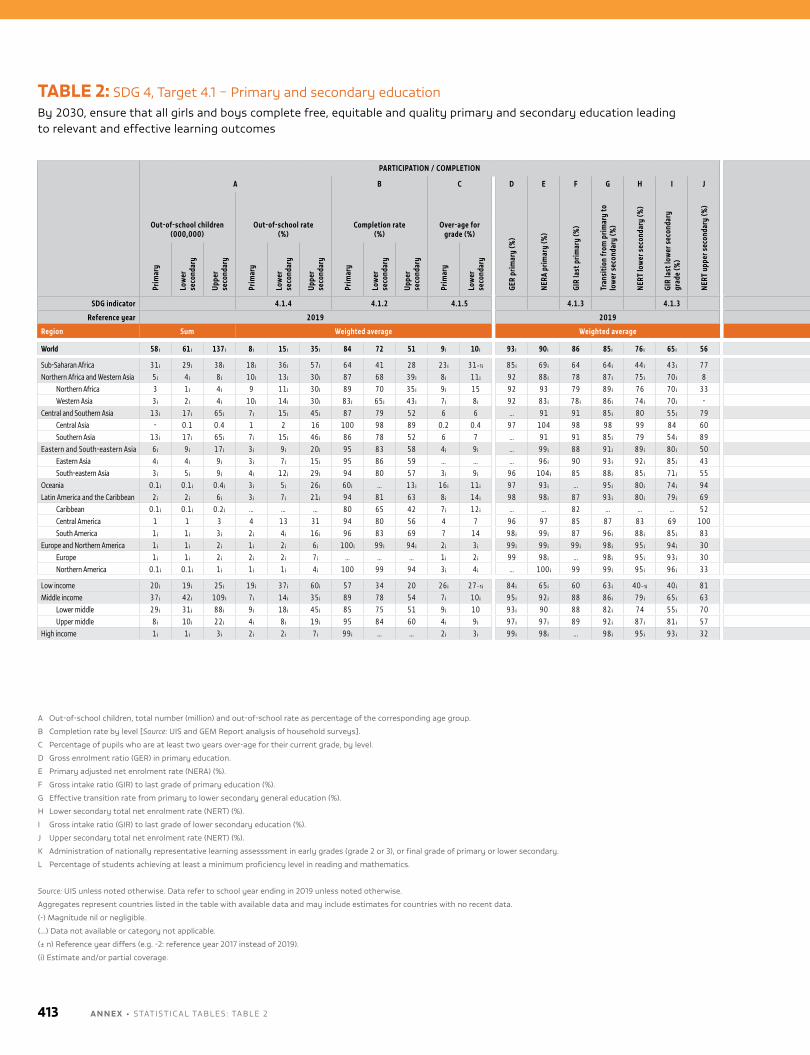
PARTICIPATION / COMPLETION LEARNING
A B C D E F G H I J K L
Out-of-school children (000,000)
Out-of-school rate (%)
Completion rate (%)
Over-age for grade (%)
GER
prim
ary
(%)
NERA
prim
ary
(%)
GIR
last
prim
ary
(%)
Tran
sitio
n fr
om p
rimar
y to
lo
wer
sec
onda
ry (%
)
NERT
low
er s
econ
dary
(%)
GIR
last
low
er s
econ
dary
gr
ade
(%)
NERT
upp
er s
econ
dary
(%)
Administration of nationally representative learning assessment
Achieving minimum proficiency (%)
Early grades End of primaryEnd of lower
secondary Early grades End of primaryEnd of lower
secondary
Prim
ary
Low
er
seco
ndar
y
Uppe
r se
cond
ary
Prim
ary
Low
er
seco
ndar
y
Uppe
r se
cond
ary
Prim
ary
Low
er
seco
ndar
y
Uppe
r se
cond
ary
Prim
ary
Low
er
seco
ndar
y
Read
ing
Mat
hem
atic
s
Read
ing
Mat
hem
atic
s
Read
ing
Mat
hem
atic
s
Read
ing
Mat
hem
atic
s
Read
ing
Mat
hem
atic
s
Read
ing
Mat
hem
atic
s
SDG indicator 4.1.4 4.1.2 4.1.5 4.1.3 4.1.3 4.1.6 4.1.1
Reference year 2019 2019 2019
Region Sum Weighted average Weighted average % of countries Weighted average
World 58 ᵢ 61 ᵢ 137 ᵢ 8 ᵢ 15 ᵢ 35 ᵢ 84 72 51 9 ᵢ 10 ᵢ 93 ᵢ 90 ᵢ 86 85 ᵢ 76 ᵢ 65 ᵢ 56 56 55 79 82 79 83 … … … … … …
Sub-Saharan Africa 31 ᵢ 29 ᵢ 38 ᵢ 18 ᵢ 36 ᵢ 57 ᵢ 64 41 28 23 ᵢ 31₋₁ ᵢ 85 ᵢ 69 ᵢ 64 64 ᵢ 44 ᵢ 43 ᵢ 77 77 75 88 85 90 92 … … … … … …Northern Africa and Western Asia 5 ᵢ 4 ᵢ 8 ᵢ 10 ᵢ 13 ᵢ 30 ᵢ 87 68 39 ᵢ 8 ᵢ 11 ᵢ 92 88 ᵢ 78 87 ᵢ 75 ᵢ 70 ᵢ 8 8 - 50 75 58 83 … … … … … …
Northern Africa 3 1 ᵢ 4 ᵢ 9 11 ᵢ 30 ᵢ 89 70 35 ᵢ 9 ᵢ 15 92 93 79 89 ᵢ 76 70 ᵢ 33 33 - 17 67 50 67 … … … … … …Western Asia 3 ᵢ 2 ᵢ 4 ᵢ 10 ᵢ 14 ᵢ 30 ᵢ 83 ᵢ 65 ᵢ 43 ᵢ 7 ᵢ 8 ᵢ 92 83 ᵢ 78 ᵢ 86 ᵢ 74 ᵢ 70 ᵢ - - - 61 78 61 89 … … … … … …
Central and Southern Asia 13 ᵢ 17 ᵢ 65 ᵢ 7 ᵢ 15 ᵢ 45 ᵢ 87 79 52 6 6 … 91 91 85 ᵢ 80 55 ᵢ 79 79 71 79 79 64 71 … … … … … …Central Asia - 0.1 0.4 1 2 16 100 98 89 0.2 0.4 97 104 98 98 99 84 60 60 40 40 40 40 40 … … … … … …Southern Asia 13 ᵢ 17 ᵢ 65 ᵢ 7 ᵢ 15 ᵢ 46 ᵢ 86 78 52 6 7 … 91 91 85 ᵢ 79 54 ᵢ 89 89 89 100 100 78 89 … … … … … …
Eastern and South-eastern Asia 6 ᵢ 9 ᵢ 17 ᵢ 3 ᵢ 9 ᵢ 20 ᵢ 95 83 58 4 ᵢ 9 ᵢ … 99 ᵢ 88 91 ᵢ 89 ᵢ 80 ᵢ 50 50 39 83 83 83 83 … … … … … …Eastern Asia 4 ᵢ 4 ᵢ 9 ᵢ 3 ᵢ 7 ᵢ 15 ᵢ 95 86 59 … … … 96 ᵢ 90 93 ᵢ 92 ᵢ 85 ᵢ 43 43 43 57 57 86 86 … … … … … …South-eastern Asia 3 ᵢ 5 ᵢ 9 ᵢ 4 ᵢ 12 ᵢ 29 ᵢ 94 80 57 3 ᵢ 9 ᵢ 96 104 ᵢ 85 88 ᵢ 85 ᵢ 71 ᵢ 55 55 36 100 100 82 82 … … … … … …
Oceania 0.1 ᵢ 0.1 ᵢ 0.4 ᵢ 3 ᵢ 5 ᵢ 26 ᵢ 60 ᵢ … 13 ᵢ 16 ᵢ 11 ᵢ 97 93 ᵢ … 95 ᵢ 80 ᵢ 74 ᵢ 94 94 94 100 100 94 94 … … … … … …Latin America and the Caribbean 2 ᵢ 2 ᵢ 6 ᵢ 3 ᵢ 7 ᵢ 21 ᵢ 94 81 63 8 ᵢ 14 ᵢ 98 98 ᵢ 87 93 ᵢ 80 ᵢ 79 ᵢ 69 69 71 74 69 60 62 … … … … … …
Caribbean 0.1 ᵢ 0.1 ᵢ 0.2 ᵢ … … … 80 65 42 7 ᵢ 12 ᵢ … … 82 … … … 52 52 57 57 52 39 43 … … … … … …Central America 1 1 3 4 13 31 94 80 56 4 7 96 97 85 87 83 69 100 100 100 100 100 100 100 … … … … … …South America 1 ᵢ 1 ᵢ 3 ᵢ 2 ᵢ 4 ᵢ 16 ᵢ 96 83 69 7 14 98 ᵢ 99 ᵢ 87 96 ᵢ 88 ᵢ 85 ᵢ 83 83 83 92 83 75 75 … … … … … …
Europe and Northern America 1 ᵢ 1 ᵢ 2 ᵢ 1 ᵢ 2 ᵢ 6 ᵢ 100 ᵢ 99 ᵢ 94 ᵢ 2 ᵢ 3 ᵢ 99 ᵢ 99 ᵢ 99 ᵢ 98 ᵢ 95 ᵢ 94 ᵢ 30 30 33 83 87 93 93 … … … … … …Europe 1 ᵢ 1 ᵢ 2 ᵢ 2 ᵢ 2 ᵢ 7 ᵢ … … … 1 ᵢ 2 ᵢ 99 98 ᵢ … 98 ᵢ 95 ᵢ 93 ᵢ 30 30 35 84 88 95 95 … … … … … …Northern America 0.1 ᵢ 0.1 ᵢ 1 ᵢ 1 ᵢ 1 ᵢ 4 ᵢ 100 99 94 3 ᵢ 4 ᵢ … 100 ᵢ 99 99 ᵢ 95 ᵢ 96 ᵢ 33 33 - 67 67 67 67 … … … … … …
Low income 20 ᵢ 19 ᵢ 25 ᵢ 19 ᵢ 37 ᵢ 60 ᵢ 57 34 20 26 ᵢ 27₋₁ ᵢ 84 ᵢ 65 ᵢ 60 63 ᵢ 40₋₁ ᵢ 40 ᵢ 81 81 74 71 74 77 81 … … … … … …Middle income 37 ᵢ 42 ᵢ 109 ᵢ 7 ᵢ 14 ᵢ 35 ᵢ 89 78 54 7 ᵢ 10 ᵢ 95 ᵢ 92 ᵢ 88 86 ᵢ 79 ᵢ 65 ᵢ 63 63 59 80 84 79 84 … … … … … …
Lower middle 29 ᵢ 31 ᵢ 88 ᵢ 9 ᵢ 18 ᵢ 45 ᵢ 85 75 51 9 ᵢ 10 93 ᵢ 90 88 82 ᵢ 74 55 ᵢ 70 70 62 85 87 79 83 … … … … … …Upper middle 8 ᵢ 10 ᵢ 22 ᵢ 4 ᵢ 8 ᵢ 19 ᵢ 95 84 60 4 ᵢ 9 ᵢ 97 ᵢ 97 ᵢ 89 92 ᵢ 87 ᵢ 81 ᵢ 57 57 57 76 81 79 84 … … … … … …
High income 1 ᵢ 1 ᵢ 3 ᵢ 2 ᵢ 2 ᵢ 7 ᵢ 99 ᵢ … … 2 ᵢ 3 ᵢ 99 ᵢ 98 ᵢ … 98 ᵢ 95 ᵢ 93 ᵢ 32 32 35 81 81 79 84 … … … … … …
TABLE 2: SDG 4, Target 4.1 – Primary and secondary educationby 2030, ensure that all girls and boys complete free, equitable and quality primary and secondary education leading to relevant and effective learning outcomes
A out-of-school children, total number (million) and out-of-school rate as percentage of the corresponding age group.
b Completion rate by level [Source: uIS and GEm Report analysis of household surveys].
C Percentage of pupils who are at least two years over-age for their current grade, by level.
D Gross enrolment ratio (GER) in primary education.
E Primary adjusted net enrolment rate (nERA) (%).
F Gross intake ratio (GIR) to last grade of primary education (%).
G Effective transition rate from primary to lower secondary general education (%).
h lower secondary total net enrolment rate (nERT) (%).
I Gross intake ratio (GIR) to last grade of lower secondary education (%).
J upper secondary total net enrolment rate (nERT) (%).
K Administration of nationally representative learning assesssment in early grades (grade 2 or 3), or final grade of primary or lower secondary.
l Percentage of students achieving at least a minimum proficiency level in reading and mathematics.
Source: uIS unless noted otherwise. Data refer to school year ending in 2019 unless noted otherwise.
Aggregates represent countries listed in the table with available data and may include estimates for countries with no recent data.
(-) magnitude nil or negligible.
(…) Data not available or category not applicable.
(± n) Reference year differs (e.g. -2: reference year 2017 instead of 2019).
(i) Estimate and/or partial coverage.
A N N E X • STATISTICAl TAblES : TAblE 2413
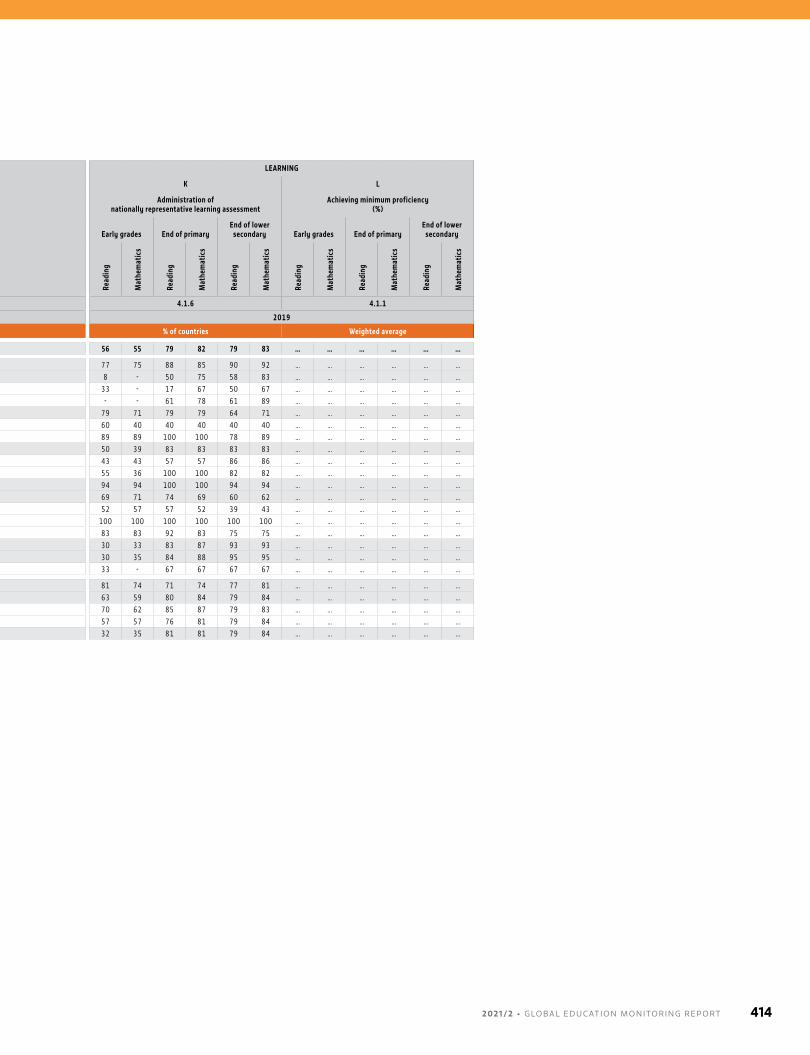
PARTICIPATION / COMPLETION LEARNING
A B C D E F G H I J K L
Out-of-school children (000,000)
Out-of-school rate (%)
Completion rate (%)
Over-age for grade (%)
GER
prim
ary
(%)
NERA
prim
ary
(%)
GIR
last
prim
ary
(%)
Tran
sitio
n fr
om p
rimar
y to
lo
wer
sec
onda
ry (%
)
NERT
low
er s
econ
dary
(%)
GIR
last
low
er s
econ
dary
gr
ade
(%)
NERT
upp
er s
econ
dary
(%)
Administration of nationally representative learning assessment
Achieving minimum proficiency (%)
Early grades End of primaryEnd of lower
secondary Early grades End of primaryEnd of lower
secondary
Prim
ary
Low
er
seco
ndar
y
Uppe
r se
cond
ary
Prim
ary
Low
er
seco
ndar
y
Uppe
r se
cond
ary
Prim
ary
Low
er
seco
ndar
y
Uppe
r se
cond
ary
Prim
ary
Low
er
seco
ndar
y
Read
ing
Mat
hem
atic
s
Read
ing
Mat
hem
atic
s
Read
ing
Mat
hem
atic
s
Read
ing
Mat
hem
atic
s
Read
ing
Mat
hem
atic
s
Read
ing
Mat
hem
atic
s
SDG indicator 4.1.4 4.1.2 4.1.5 4.1.3 4.1.3 4.1.6 4.1.1
Reference year 2019 2019 2019
Region Sum Weighted average Weighted average % of countries Weighted average
World 58 ᵢ 61 ᵢ 137 ᵢ 8 ᵢ 15 ᵢ 35 ᵢ 84 72 51 9 ᵢ 10 ᵢ 93 ᵢ 90 ᵢ 86 85 ᵢ 76 ᵢ 65 ᵢ 56 56 55 79 82 79 83 … … … … … …
Sub-Saharan Africa 31 ᵢ 29 ᵢ 38 ᵢ 18 ᵢ 36 ᵢ 57 ᵢ 64 41 28 23 ᵢ 31₋₁ ᵢ 85 ᵢ 69 ᵢ 64 64 ᵢ 44 ᵢ 43 ᵢ 77 77 75 88 85 90 92 … … … … … …Northern Africa and Western Asia 5 ᵢ 4 ᵢ 8 ᵢ 10 ᵢ 13 ᵢ 30 ᵢ 87 68 39 ᵢ 8 ᵢ 11 ᵢ 92 88 ᵢ 78 87 ᵢ 75 ᵢ 70 ᵢ 8 8 - 50 75 58 83 … … … … … …
Northern Africa 3 1 ᵢ 4 ᵢ 9 11 ᵢ 30 ᵢ 89 70 35 ᵢ 9 ᵢ 15 92 93 79 89 ᵢ 76 70 ᵢ 33 33 - 17 67 50 67 … … … … … …Western Asia 3 ᵢ 2 ᵢ 4 ᵢ 10 ᵢ 14 ᵢ 30 ᵢ 83 ᵢ 65 ᵢ 43 ᵢ 7 ᵢ 8 ᵢ 92 83 ᵢ 78 ᵢ 86 ᵢ 74 ᵢ 70 ᵢ - - - 61 78 61 89 … … … … … …
Central and Southern Asia 13 ᵢ 17 ᵢ 65 ᵢ 7 ᵢ 15 ᵢ 45 ᵢ 87 79 52 6 6 … 91 91 85 ᵢ 80 55 ᵢ 79 79 71 79 79 64 71 … … … … … …Central Asia - 0.1 0.4 1 2 16 100 98 89 0.2 0.4 97 104 98 98 99 84 60 60 40 40 40 40 40 … … … … … …Southern Asia 13 ᵢ 17 ᵢ 65 ᵢ 7 ᵢ 15 ᵢ 46 ᵢ 86 78 52 6 7 … 91 91 85 ᵢ 79 54 ᵢ 89 89 89 100 100 78 89 … … … … … …
Eastern and South-eastern Asia 6 ᵢ 9 ᵢ 17 ᵢ 3 ᵢ 9 ᵢ 20 ᵢ 95 83 58 4 ᵢ 9 ᵢ … 99 ᵢ 88 91 ᵢ 89 ᵢ 80 ᵢ 50 50 39 83 83 83 83 … … … … … …Eastern Asia 4 ᵢ 4 ᵢ 9 ᵢ 3 ᵢ 7 ᵢ 15 ᵢ 95 86 59 … … … 96 ᵢ 90 93 ᵢ 92 ᵢ 85 ᵢ 43 43 43 57 57 86 86 … … … … … …South-eastern Asia 3 ᵢ 5 ᵢ 9 ᵢ 4 ᵢ 12 ᵢ 29 ᵢ 94 80 57 3 ᵢ 9 ᵢ 96 104 ᵢ 85 88 ᵢ 85 ᵢ 71 ᵢ 55 55 36 100 100 82 82 … … … … … …
Oceania 0.1 ᵢ 0.1 ᵢ 0.4 ᵢ 3 ᵢ 5 ᵢ 26 ᵢ 60 ᵢ … 13 ᵢ 16 ᵢ 11 ᵢ 97 93 ᵢ … 95 ᵢ 80 ᵢ 74 ᵢ 94 94 94 100 100 94 94 … … … … … …Latin America and the Caribbean 2 ᵢ 2 ᵢ 6 ᵢ 3 ᵢ 7 ᵢ 21 ᵢ 94 81 63 8 ᵢ 14 ᵢ 98 98 ᵢ 87 93 ᵢ 80 ᵢ 79 ᵢ 69 69 71 74 69 60 62 … … … … … …
Caribbean 0.1 ᵢ 0.1 ᵢ 0.2 ᵢ … … … 80 65 42 7 ᵢ 12 ᵢ … … 82 … … … 52 52 57 57 52 39 43 … … … … … …Central America 1 1 3 4 13 31 94 80 56 4 7 96 97 85 87 83 69 100 100 100 100 100 100 100 … … … … … …South America 1 ᵢ 1 ᵢ 3 ᵢ 2 ᵢ 4 ᵢ 16 ᵢ 96 83 69 7 14 98 ᵢ 99 ᵢ 87 96 ᵢ 88 ᵢ 85 ᵢ 83 83 83 92 83 75 75 … … … … … …
Europe and Northern America 1 ᵢ 1 ᵢ 2 ᵢ 1 ᵢ 2 ᵢ 6 ᵢ 100 ᵢ 99 ᵢ 94 ᵢ 2 ᵢ 3 ᵢ 99 ᵢ 99 ᵢ 99 ᵢ 98 ᵢ 95 ᵢ 94 ᵢ 30 30 33 83 87 93 93 … … … … … …Europe 1 ᵢ 1 ᵢ 2 ᵢ 2 ᵢ 2 ᵢ 7 ᵢ … … … 1 ᵢ 2 ᵢ 99 98 ᵢ … 98 ᵢ 95 ᵢ 93 ᵢ 30 30 35 84 88 95 95 … … … … … …Northern America 0.1 ᵢ 0.1 ᵢ 1 ᵢ 1 ᵢ 1 ᵢ 4 ᵢ 100 99 94 3 ᵢ 4 ᵢ … 100 ᵢ 99 99 ᵢ 95 ᵢ 96 ᵢ 33 33 - 67 67 67 67 … … … … … …
Low income 20 ᵢ 19 ᵢ 25 ᵢ 19 ᵢ 37 ᵢ 60 ᵢ 57 34 20 26 ᵢ 27₋₁ ᵢ 84 ᵢ 65 ᵢ 60 63 ᵢ 40₋₁ ᵢ 40 ᵢ 81 81 74 71 74 77 81 … … … … … …Middle income 37 ᵢ 42 ᵢ 109 ᵢ 7 ᵢ 14 ᵢ 35 ᵢ 89 78 54 7 ᵢ 10 ᵢ 95 ᵢ 92 ᵢ 88 86 ᵢ 79 ᵢ 65 ᵢ 63 63 59 80 84 79 84 … … … … … …
Lower middle 29 ᵢ 31 ᵢ 88 ᵢ 9 ᵢ 18 ᵢ 45 ᵢ 85 75 51 9 ᵢ 10 93 ᵢ 90 88 82 ᵢ 74 55 ᵢ 70 70 62 85 87 79 83 … … … … … …Upper middle 8 ᵢ 10 ᵢ 22 ᵢ 4 ᵢ 8 ᵢ 19 ᵢ 95 84 60 4 ᵢ 9 ᵢ 97 ᵢ 97 ᵢ 89 92 ᵢ 87 ᵢ 81 ᵢ 57 57 57 76 81 79 84 … … … … … …
High income 1 ᵢ 1 ᵢ 3 ᵢ 2 ᵢ 2 ᵢ 7 ᵢ 99 ᵢ … … 2 ᵢ 3 ᵢ 99 ᵢ 98 ᵢ … 98 ᵢ 95 ᵢ 93 ᵢ 32 32 35 81 81 79 84 … … … … … …
2 0 2 1 / 2 • G LO BA L E D U C AT I O N M O N I TO R I N G R E P O RT 414
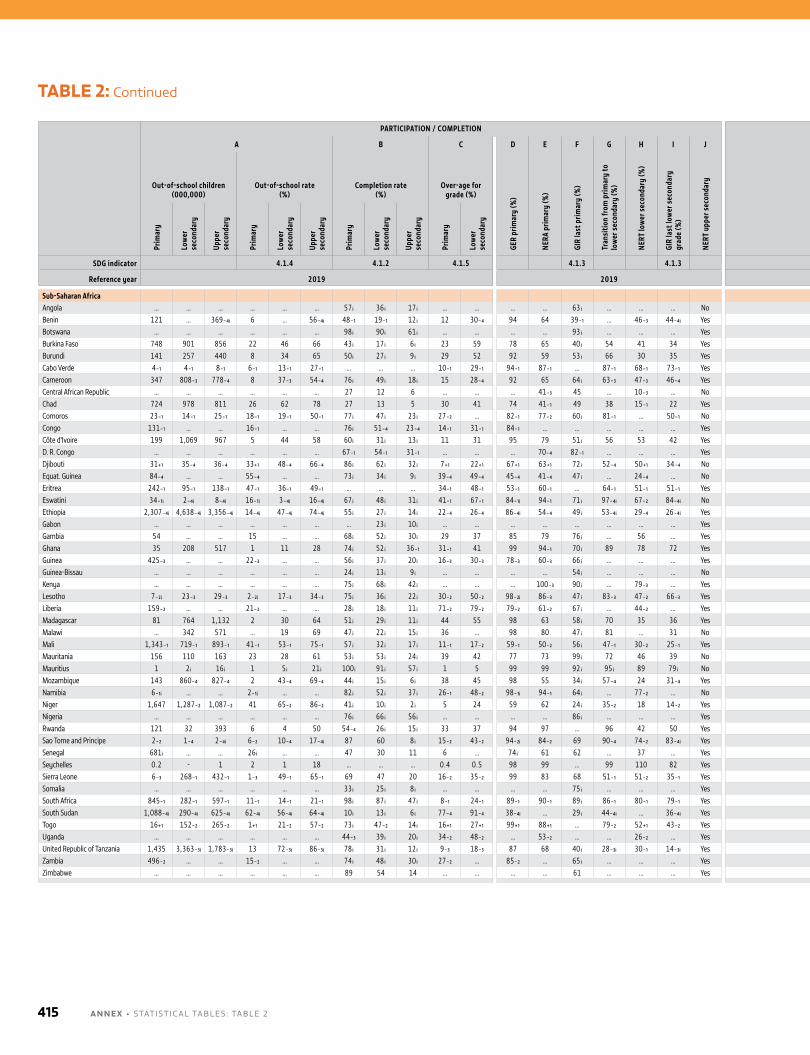
TABLE 2: Continued
PARTICIPATION / COMPLETION LEARNING
A B C D E F G H I J K L
Out-of-school children (000,000)
Out-of-school rate (%)
Completion rate (%)
Over-age for grade (%)
GER
prim
ary
(%)
NERA
prim
ary
(%)
GIR
last
prim
ary
(%)
Tran
sitio
n fr
om p
rimar
y to
lo
wer
sec
onda
ry (%
)
NERT
low
er s
econ
dary
(%)
GIR
last
low
er s
econ
dary
gr
ade
(%)
NERT
upp
er s
econ
dary
Administration of nationally representative learning assessment
Achieving minimum proficiency (%)
Early grades End of primaryEnd of lower
secondary Early grades End of primaryEnd of lower
secondary
Prim
ary
Low
er
seco
ndar
y
Uppe
r se
cond
ary
Prim
ary
Low
er
seco
ndar
y
Uppe
r se
cond
ary
Prim
ary
Low
er
seco
ndar
y
Uppe
r se
cond
ary
Prim
ary
Low
er
seco
ndar
y
Read
ing
Mat
hem
atic
s
Read
ing
Mat
hem
atic
s
Read
ing
Mat
hem
atic
s
Read
ing
Mat
hem
atic
s
Read
ing
Mat
hem
atic
s
Read
ing
Mat
hem
atic
s
Coun
try
code
SDG indicator 4.1.4 4.1.2 4.1.5 4.1.3 4.1.3 4.1.6 4.1.1
Reference year 2019 2019 2019
Sub-Saharan AfricaAngola … … … … … … 57 ᵢ 36 ᵢ 17 ᵢ … … … … 63 ᵢ … … … No No No No No No No … … … … … … AGOBenin 121 … 369₋₄ᵢ 6 … 56₋₄ᵢ 48₋₁ 19₋₁ 12 ᵢ 12 30₋₄ 94 64 39₋₁ … 46₋₃ 44₋₄ᵢ Yes Yes Yes Yes Yes Yes Yes 38 62 46 19 … … BENBotswana … … … … … … 98 ᵢ 90 ᵢ 61 ᵢ … … … … 93 ᵢ … … … Yes Yes Yes Yes Yes Yes Yes … … … … … … BWABurkina Faso 748 901 856 22 46 66 43 ᵢ 17 ᵢ 6 ᵢ 23 59 78 65 40 ᵢ 54 41 34 Yes Yes Yes Yes Yes Yes Yes 34 61 33 25 … … BFABurundi 141 257 440 8 34 65 50 ᵢ 27 ᵢ 9 ᵢ 29 52 92 59 53 ᵢ 66 30 35 Yes Yes Yes Yes Yes Yes Yes 79 99 4 18 … … BDICabo Verde 4₋₁ 4₋₁ 8₋₁ 6₋₁ 13₋₁ 27₋₁ … … … 10₋₁ 29₋₁ 94₋₁ 87₋₁ … 87₋₁ 68₋₁ 73₋₁ Yes Yes Yes Yes Yes Yes Yes … … … … … … CPVCameroon 347 808₋₃ 778₋₄ 8 37₋₃ 54₋₄ 76 ᵢ 49 ᵢ 18 ᵢ 15 28₋₄ 92 65 64 ᵢ 63₋₃ 47₋₃ 46₋₄ Yes Yes Yes Yes Yes Yes Yes 39 58 30 11 … … CMRCentral African Republic … … … … … … 27 12 6 … … … 41₋₃ 45 … 10₋₃ … No No No Yes Yes Yes Yes … … … … … … CAFChad 724 978 811 26 62 78 27 13 5 30 41 74 41₋₁ 49 38 15₋₁ 22 Yes Yes Yes Yes Yes Yes Yes 34 64 8 2 … … TCDComoros 23₋₁ 14₋₁ 25₋₁ 18₋₁ 19₋₁ 50₋₁ 77 ᵢ 47 ᵢ 23 ᵢ 27₋₂ … 82₋₁ 77₋₂ 60 ᵢ 81₋₁ … 50₋₁ No No No Yes Yes Yes Yes … … … … … … COMCongo 131₋₁ … … 16₋₁ … … 76 ᵢ 51₋₄ 23₋₄ 14₋₁ 31₋₁ 84₋₁ … … … … … Yes Yes Yes Yes Yes Yes Yes 63 86 34 8 … … COGCôte d'Ivoire 199 1,069 967 5 44 58 60 ᵢ 31 ᵢ 13 ᵢ 11 31 95 79 51 ᵢ 56 53 42 Yes Yes Yes Yes Yes Yes Yes 33 68 22 3 … … CIVD. R. Congo … … … … … … 67₋₁ 54₋₁ 31₋₁ … … … 70₋₄ 82₋₁ … … … Yes Yes Yes Yes Yes No No 42 77 9 3 … … CODDjibouti 31₊₁ 35₋₄ 36₋₄ 33₊₁ 48₋₄ 66₋₄ 86 ᵢ 62 ᵢ 32 ᵢ 7₊₁ 22₊₁ 67₊₁ 63₊₁ 72 ᵢ 52₋₄ 50₊₁ 34₋₄ No No No No No No No … … … … … … DJIEquat. Guinea 84₋₄ … … 55₋₄ … … 73 ᵢ 34 ᵢ 9 ᵢ 39₋₄ 49₋₄ 45₋₄ 41₋₄ 47 ᵢ … 24₋₄ … No No No Yes Yes Yes Yes … … … … … … GNQEritrea 242₋₁ 95₋₁ 138₋₁ 47₋₁ 36₋₁ 49₋₁ … … … 34₋₁ 48₋₁ 53₋₁ 60₋₁ … 64₋₁ 51₋₁ 51₋₁ Yes Yes Yes Yes Yes Yes Yes … … … … … … ERIEswatini 34₋₁ᵢ 2₋₄ᵢ 8₋₄ᵢ 16₋₁ᵢ 3₋₄ᵢ 16₋₄ᵢ 67 ᵢ 48 ᵢ 31 ᵢ 41₋₁ 67₋₁ 84₋₁ᵢ 94₋₁ 71 ᵢ 97₋₄ᵢ 67₋₂ 84₋₄ᵢ No No No Yes Yes Yes Yes … … … … … … SWZEthiopia 2,307₋₄ᵢ 4,638₋₄ᵢ 3,356₋₄ᵢ 14₋₄ᵢ 47₋₄ᵢ 74₋₄ᵢ 55 ᵢ 27 ᵢ 14 ᵢ 22₋₄ 26₋₄ 86₋₄ᵢ 54₋₄ 49 ᵢ 53₋₄ᵢ 29₋₄ 26₋₄ᵢ Yes Yes Yes Yes Yes Yes Yes … … 55₋₃ 73₋₃ 29₋₃ 18₋₃ ETHGabon … … … … … … … 23 ᵢ 10 ᵢ … … … … … … … … Yes Yes Yes Yes Yes Yes Yes 66 88 76 23 … … GABGambia 54 … … 15 … … 68 ᵢ 52 ᵢ 30 ᵢ 29 37 85 79 76 ᵢ … 56 … Yes Yes Yes Yes Yes Yes Yes 5₋₁ 4₋₁ … … … … GMBGhana 35 208 517 1 11 28 74 ᵢ 52 ᵢ 36₋₁ 31₋₁ 41 99 94₋₁ 70 ᵢ 89 78 72 Yes Yes Yes Yes Yes Yes Yes 6₋₂ 8₋₂ … … … … GHAGuinea 425₋₃ … … 22₋₃ … … 56 ᵢ 37 ᵢ 20 ᵢ 16₋₃ 30₋₃ 78₋₃ 60₋₃ 66 ᵢ … … … Yes Yes Yes Yes Yes Yes Yes 23 60 22 7 … … GINGuinea-Bissau … … … … … … 24 ᵢ 13 ᵢ 9 ᵢ … … … … 54 ᵢ … … … No No No No No Yes Yes … … … … … … GNBKenya … … … … … … 75 ᵢ 68 ᵢ 42 ᵢ … … … 100₋₃ 90 ᵢ … 79₋₃ … Yes Yes Yes Yes Yes Yes Yes 53₋₁ 42₋₁ 44₋₁ 29₋₁ … … KENLesotho 7₋₂ᵢ 23₋₃ 29₋₃ 2₋₂ᵢ 17₋₃ 34₋₃ 75 ᵢ 36 ᵢ 22 ᵢ 30₋₂ 50₋₂ 98₋₂ᵢ 86₋₃ 47 ᵢ 83₋₃ 47₋₂ 66₋₃ Yes Yes Yes Yes Yes Yes Yes 13₋₁ 1₋₁ … … … … LSOLiberia 159₋₂ … … 21₋₂ … … 28 ᵢ 18 ᵢ 11 ᵢ 71₋₂ 79₋₂ 79₋₂ 61₋₂ 67 ᵢ … 44₋₂ … Yes Yes Yes No No Yes Yes … … … … … … LBRMadagascar 81 764 1,132 2 30 64 51 ᵢ 29 ᵢ 11 ᵢ 44 55 98 63 58 ᵢ 70 35 36 Yes Yes Yes Yes Yes Yes Yes 13₋₁ 4₋₁ 6 6 … … MDGMalawi … 342 571 … 19 69 47 ᵢ 22 ᵢ 15 ᵢ 36 … 98 80 47 ᵢ 81 … 31 No No No Yes Yes Yes Yes … … … … … … MWIMali 1,343₋₁ 719₋₁ 893₋₁ 41₋₁ 53₋₁ 75₋₁ 57 ᵢ 32 ᵢ 17 ᵢ 11₋₁ 17₋₂ 59₋₁ 50₋₂ 56 ᵢ 47₋₁ 30₋₂ 25₋₁ Yes Yes Yes Yes Yes Yes Yes … … … … … … MLIMauritania 156 110 163 23 28 61 53 ᵢ 53 ᵢ 24 ᵢ 39 42 77 73 99 ᵢ 72 46 39 No No No Yes No No No … … … … … … MRTMauritius 1 2 ᵢ 16 ᵢ 1 5 ᵢ 21 ᵢ 100 ᵢ 91 ᵢ 57 ᵢ 1 5 99 99 92 ᵢ 95 ᵢ 89 79 ᵢ No No No Yes Yes Yes Yes … … … … … … MUSMozambique 143 860₋₄ 827₋₄ 2 43₋₄ 69₋₄ 44 ᵢ 15 ᵢ 6 ᵢ 38 45 98 55 34 ᵢ 57₋₄ 24 31₋₄ Yes Yes Yes Yes Yes Yes Yes … … … … … … MOZNamibia 6₋₁ᵢ … … 2₋₁ᵢ … … 82 ᵢ 52 ᵢ 37 ᵢ 26₋₁ 48₋₂ 98₋₁ᵢ 94₋₁ 64 ᵢ … 77₋₂ … No No No Yes Yes Yes Yes … … … … … … NAMNiger 1,647 1,287₋₂ 1,087₋₂ 41 65₋₂ 86₋₂ 41 ᵢ 10 ᵢ 2 ᵢ 5 24 59 62 24 ᵢ 35₋₂ 18 14₋₂ Yes Yes Yes Yes Yes Yes Yes 44 67 14 8 … … NERNigeria … … … … … … 76 ᵢ 66 ᵢ 56 ᵢ … … … … 86 ᵢ … … … Yes Yes Yes Yes Yes Yes Yes 17₋₂ 11₋₂ … … … … NGARwanda 121 32 393 6 4 50 54₋₄ 26 ᵢ 15 ᵢ 33 37 94 97 … 96 42 50 Yes Yes Yes Yes Yes Yes Yes … … … … … … RWASao Tome and Principe 2₋₂ 1₋₄ 2₋₄ᵢ 6₋₂ 10₋₄ 17₋₄ᵢ 87 60 8 ᵢ 15₋₂ 43₋₂ 94₋₂ᵢ 84₋₂ 69 90₋₄ 74₋₂ 83₋₄ᵢ Yes Yes Yes Yes Yes Yes Yes … … … … … … STPSenegal 681 ᵢ … … 26 ᵢ … … 47 30 11 6 … 74 ᵢ 61 62 … 37 … Yes Yes Yes Yes Yes Yes Yes 48 79 41 27 9₋₄ 8₋₄ SENSeychelles 0.2 - 1 2 1 18 … … … 0.4 0.5 98 99 … 99 110 82 Yes Yes Yes Yes Yes Yes Yes … … … … … … SYCSierra Leone 6₋₃ 268₋₁ 432₋₁ 1₋₃ 49₋₁ 65₋₁ 69 47 20 16₋₂ 35₋₂ 99 83 68 51₋₁ 51₋₂ 35₋₁ Yes Yes Yes Yes Yes Yes Yes 6₋₂ 6₋₂ … … … … SLESomalia … … … … … … 33 ᵢ 25 ᵢ 8 ᵢ … … … … 75 ᵢ … … … Yes Yes No No No Yes Yes … … … … … … SOMSouth Africa 845₋₁ 282₋₁ 597₋₁ 11₋₁ 14₋₁ 21₋₁ 98 ᵢ 87 ᵢ 47 ᵢ 8₋₁ 24₋₁ 89₋₁ 90₋₁ 89 ᵢ 86₋₁ 80₋₁ 79₋₁ Yes Yes Yes Yes Yes No Yes 22₋₃ 16 … … … … ZAFSouth Sudan 1,088₋₄ᵢ 290₋₄ᵢ 625₋₄ᵢ 62₋₄ᵢ 56₋₄ᵢ 64₋₄ᵢ 10 ᵢ 13 ᵢ 6 ᵢ 77₋₄ 91₋₄ 38₋₄ᵢ … 29 ᵢ 44₋₄ᵢ … 36₋₄ᵢ Yes Yes Yes No No Yes Yes … … … … … … SSDTogo 16₊₁ 152₋₂ 265₋₂ 1₊₁ 21₋₂ 57₋₂ 73 ᵢ 47₋₂ 14 ᵢ 16₊₁ 27₊₁ 99₊₁ 88₊₁ … 79₋₂ 52₊₁ 43₋₂ Yes Yes Yes Yes Yes Yes Yes 24 47 19 16 … … TGOUganda … … … … … … 44₋₃ 39 ᵢ 20 ᵢ 34₋₂ 48₋₂ … 53₋₂ … … 26₋₂ … Yes Yes Yes Yes Yes Yes Yes 33₋₄ 21₋₄ 52₋₄ 53₋₄ … … UGAUnited Republic of Tanzania 1,435 3,363₋₃ᵢ 1,783₋₃ᵢ 13 72₋₃ᵢ 86₋₃ᵢ 78 ᵢ 31 ᵢ 12 ᵢ 9₋₃ 18₋₃ 87 68 40 ᵢ 28₋₃ᵢ 30₋₁ 14₋₃ᵢ Yes Yes Yes Yes Yes Yes Yes 56₋₃ 35₋₃ … … … … TZAZambia 496₋₂ … … 15₋₂ … … 74 ᵢ 48 ᵢ 30 ᵢ 27₋₂ … 85₋₂ … 65 ᵢ … … … Yes Yes Yes Yes Yes Yes Yes … … … … 5₋₄ 2₋₄ ZMBZimbabwe … … … … … … 89 54 14 … … … … 61 … … … Yes Yes Yes Yes Yes Yes Yes 20 5 … … … … ZWE
A N N E X • STATISTICAl TAblES : TAblE 2415
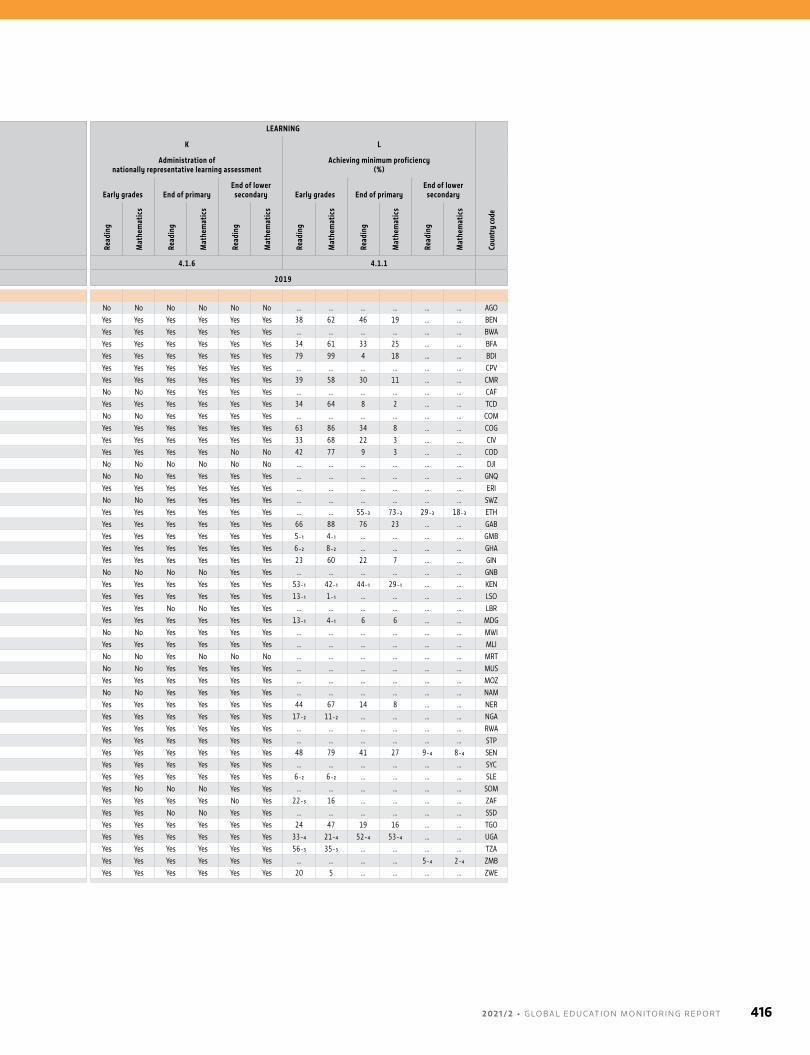
PARTICIPATION / COMPLETION LEARNING
A B C D E F G H I J K L
Out-of-school children (000,000)
Out-of-school rate (%)
Completion rate (%)
Over-age for grade (%)
GER
prim
ary
(%)
NERA
prim
ary
(%)
GIR
last
prim
ary
(%)
Tran
sitio
n fr
om p
rimar
y to
lo
wer
sec
onda
ry (%
)
NERT
low
er s
econ
dary
(%)
GIR
last
low
er s
econ
dary
gr
ade
(%)
NERT
upp
er s
econ
dary
Administration of nationally representative learning assessment
Achieving minimum proficiency (%)
Early grades End of primaryEnd of lower
secondary Early grades End of primaryEnd of lower
secondary
Prim
ary
Low
er
seco
ndar
y
Uppe
r se
cond
ary
Prim
ary
Low
er
seco
ndar
y
Uppe
r se
cond
ary
Prim
ary
Low
er
seco
ndar
y
Uppe
r se
cond
ary
Prim
ary
Low
er
seco
ndar
y
Read
ing
Mat
hem
atic
s
Read
ing
Mat
hem
atic
s
Read
ing
Mat
hem
atic
s
Read
ing
Mat
hem
atic
s
Read
ing
Mat
hem
atic
s
Read
ing
Mat
hem
atic
s
Coun
try
code
SDG indicator 4.1.4 4.1.2 4.1.5 4.1.3 4.1.3 4.1.6 4.1.1
Reference year 2019 2019 2019
Sub-Saharan AfricaAngola … … … … … … 57 ᵢ 36 ᵢ 17 ᵢ … … … … 63 ᵢ … … … No No No No No No No … … … … … … AGOBenin 121 … 369₋₄ᵢ 6 … 56₋₄ᵢ 48₋₁ 19₋₁ 12 ᵢ 12 30₋₄ 94 64 39₋₁ … 46₋₃ 44₋₄ᵢ Yes Yes Yes Yes Yes Yes Yes 38 62 46 19 … … BENBotswana … … … … … … 98 ᵢ 90 ᵢ 61 ᵢ … … … … 93 ᵢ … … … Yes Yes Yes Yes Yes Yes Yes … … … … … … BWABurkina Faso 748 901 856 22 46 66 43 ᵢ 17 ᵢ 6 ᵢ 23 59 78 65 40 ᵢ 54 41 34 Yes Yes Yes Yes Yes Yes Yes 34 61 33 25 … … BFABurundi 141 257 440 8 34 65 50 ᵢ 27 ᵢ 9 ᵢ 29 52 92 59 53 ᵢ 66 30 35 Yes Yes Yes Yes Yes Yes Yes 79 99 4 18 … … BDICabo Verde 4₋₁ 4₋₁ 8₋₁ 6₋₁ 13₋₁ 27₋₁ … … … 10₋₁ 29₋₁ 94₋₁ 87₋₁ … 87₋₁ 68₋₁ 73₋₁ Yes Yes Yes Yes Yes Yes Yes … … … … … … CPVCameroon 347 808₋₃ 778₋₄ 8 37₋₃ 54₋₄ 76 ᵢ 49 ᵢ 18 ᵢ 15 28₋₄ 92 65 64 ᵢ 63₋₃ 47₋₃ 46₋₄ Yes Yes Yes Yes Yes Yes Yes 39 58 30 11 … … CMRCentral African Republic … … … … … … 27 12 6 … … … 41₋₃ 45 … 10₋₃ … No No No Yes Yes Yes Yes … … … … … … CAFChad 724 978 811 26 62 78 27 13 5 30 41 74 41₋₁ 49 38 15₋₁ 22 Yes Yes Yes Yes Yes Yes Yes 34 64 8 2 … … TCDComoros 23₋₁ 14₋₁ 25₋₁ 18₋₁ 19₋₁ 50₋₁ 77 ᵢ 47 ᵢ 23 ᵢ 27₋₂ … 82₋₁ 77₋₂ 60 ᵢ 81₋₁ … 50₋₁ No No No Yes Yes Yes Yes … … … … … … COMCongo 131₋₁ … … 16₋₁ … … 76 ᵢ 51₋₄ 23₋₄ 14₋₁ 31₋₁ 84₋₁ … … … … … Yes Yes Yes Yes Yes Yes Yes 63 86 34 8 … … COGCôte d'Ivoire 199 1,069 967 5 44 58 60 ᵢ 31 ᵢ 13 ᵢ 11 31 95 79 51 ᵢ 56 53 42 Yes Yes Yes Yes Yes Yes Yes 33 68 22 3 … … CIVD. R. Congo … … … … … … 67₋₁ 54₋₁ 31₋₁ … … … 70₋₄ 82₋₁ … … … Yes Yes Yes Yes Yes No No 42 77 9 3 … … CODDjibouti 31₊₁ 35₋₄ 36₋₄ 33₊₁ 48₋₄ 66₋₄ 86 ᵢ 62 ᵢ 32 ᵢ 7₊₁ 22₊₁ 67₊₁ 63₊₁ 72 ᵢ 52₋₄ 50₊₁ 34₋₄ No No No No No No No … … … … … … DJIEquat. Guinea 84₋₄ … … 55₋₄ … … 73 ᵢ 34 ᵢ 9 ᵢ 39₋₄ 49₋₄ 45₋₄ 41₋₄ 47 ᵢ … 24₋₄ … No No No Yes Yes Yes Yes … … … … … … GNQEritrea 242₋₁ 95₋₁ 138₋₁ 47₋₁ 36₋₁ 49₋₁ … … … 34₋₁ 48₋₁ 53₋₁ 60₋₁ … 64₋₁ 51₋₁ 51₋₁ Yes Yes Yes Yes Yes Yes Yes … … … … … … ERIEswatini 34₋₁ᵢ 2₋₄ᵢ 8₋₄ᵢ 16₋₁ᵢ 3₋₄ᵢ 16₋₄ᵢ 67 ᵢ 48 ᵢ 31 ᵢ 41₋₁ 67₋₁ 84₋₁ᵢ 94₋₁ 71 ᵢ 97₋₄ᵢ 67₋₂ 84₋₄ᵢ No No No Yes Yes Yes Yes … … … … … … SWZEthiopia 2,307₋₄ᵢ 4,638₋₄ᵢ 3,356₋₄ᵢ 14₋₄ᵢ 47₋₄ᵢ 74₋₄ᵢ 55 ᵢ 27 ᵢ 14 ᵢ 22₋₄ 26₋₄ 86₋₄ᵢ 54₋₄ 49 ᵢ 53₋₄ᵢ 29₋₄ 26₋₄ᵢ Yes Yes Yes Yes Yes Yes Yes … … 55₋₃ 73₋₃ 29₋₃ 18₋₃ ETHGabon … … … … … … … 23 ᵢ 10 ᵢ … … … … … … … … Yes Yes Yes Yes Yes Yes Yes 66 88 76 23 … … GABGambia 54 … … 15 … … 68 ᵢ 52 ᵢ 30 ᵢ 29 37 85 79 76 ᵢ … 56 … Yes Yes Yes Yes Yes Yes Yes 5₋₁ 4₋₁ … … … … GMBGhana 35 208 517 1 11 28 74 ᵢ 52 ᵢ 36₋₁ 31₋₁ 41 99 94₋₁ 70 ᵢ 89 78 72 Yes Yes Yes Yes Yes Yes Yes 6₋₂ 8₋₂ … … … … GHAGuinea 425₋₃ … … 22₋₃ … … 56 ᵢ 37 ᵢ 20 ᵢ 16₋₃ 30₋₃ 78₋₃ 60₋₃ 66 ᵢ … … … Yes Yes Yes Yes Yes Yes Yes 23 60 22 7 … … GINGuinea-Bissau … … … … … … 24 ᵢ 13 ᵢ 9 ᵢ … … … … 54 ᵢ … … … No No No No No Yes Yes … … … … … … GNBKenya … … … … … … 75 ᵢ 68 ᵢ 42 ᵢ … … … 100₋₃ 90 ᵢ … 79₋₃ … Yes Yes Yes Yes Yes Yes Yes 53₋₁ 42₋₁ 44₋₁ 29₋₁ … … KENLesotho 7₋₂ᵢ 23₋₃ 29₋₃ 2₋₂ᵢ 17₋₃ 34₋₃ 75 ᵢ 36 ᵢ 22 ᵢ 30₋₂ 50₋₂ 98₋₂ᵢ 86₋₃ 47 ᵢ 83₋₃ 47₋₂ 66₋₃ Yes Yes Yes Yes Yes Yes Yes 13₋₁ 1₋₁ … … … … LSOLiberia 159₋₂ … … 21₋₂ … … 28 ᵢ 18 ᵢ 11 ᵢ 71₋₂ 79₋₂ 79₋₂ 61₋₂ 67 ᵢ … 44₋₂ … Yes Yes Yes No No Yes Yes … … … … … … LBRMadagascar 81 764 1,132 2 30 64 51 ᵢ 29 ᵢ 11 ᵢ 44 55 98 63 58 ᵢ 70 35 36 Yes Yes Yes Yes Yes Yes Yes 13₋₁ 4₋₁ 6 6 … … MDGMalawi … 342 571 … 19 69 47 ᵢ 22 ᵢ 15 ᵢ 36 … 98 80 47 ᵢ 81 … 31 No No No Yes Yes Yes Yes … … … … … … MWIMali 1,343₋₁ 719₋₁ 893₋₁ 41₋₁ 53₋₁ 75₋₁ 57 ᵢ 32 ᵢ 17 ᵢ 11₋₁ 17₋₂ 59₋₁ 50₋₂ 56 ᵢ 47₋₁ 30₋₂ 25₋₁ Yes Yes Yes Yes Yes Yes Yes … … … … … … MLIMauritania 156 110 163 23 28 61 53 ᵢ 53 ᵢ 24 ᵢ 39 42 77 73 99 ᵢ 72 46 39 No No No Yes No No No … … … … … … MRTMauritius 1 2 ᵢ 16 ᵢ 1 5 ᵢ 21 ᵢ 100 ᵢ 91 ᵢ 57 ᵢ 1 5 99 99 92 ᵢ 95 ᵢ 89 79 ᵢ No No No Yes Yes Yes Yes … … … … … … MUSMozambique 143 860₋₄ 827₋₄ 2 43₋₄ 69₋₄ 44 ᵢ 15 ᵢ 6 ᵢ 38 45 98 55 34 ᵢ 57₋₄ 24 31₋₄ Yes Yes Yes Yes Yes Yes Yes … … … … … … MOZNamibia 6₋₁ᵢ … … 2₋₁ᵢ … … 82 ᵢ 52 ᵢ 37 ᵢ 26₋₁ 48₋₂ 98₋₁ᵢ 94₋₁ 64 ᵢ … 77₋₂ … No No No Yes Yes Yes Yes … … … … … … NAMNiger 1,647 1,287₋₂ 1,087₋₂ 41 65₋₂ 86₋₂ 41 ᵢ 10 ᵢ 2 ᵢ 5 24 59 62 24 ᵢ 35₋₂ 18 14₋₂ Yes Yes Yes Yes Yes Yes Yes 44 67 14 8 … … NERNigeria … … … … … … 76 ᵢ 66 ᵢ 56 ᵢ … … … … 86 ᵢ … … … Yes Yes Yes Yes Yes Yes Yes 17₋₂ 11₋₂ … … … … NGARwanda 121 32 393 6 4 50 54₋₄ 26 ᵢ 15 ᵢ 33 37 94 97 … 96 42 50 Yes Yes Yes Yes Yes Yes Yes … … … … … … RWASao Tome and Principe 2₋₂ 1₋₄ 2₋₄ᵢ 6₋₂ 10₋₄ 17₋₄ᵢ 87 60 8 ᵢ 15₋₂ 43₋₂ 94₋₂ᵢ 84₋₂ 69 90₋₄ 74₋₂ 83₋₄ᵢ Yes Yes Yes Yes Yes Yes Yes … … … … … … STPSenegal 681 ᵢ … … 26 ᵢ … … 47 30 11 6 … 74 ᵢ 61 62 … 37 … Yes Yes Yes Yes Yes Yes Yes 48 79 41 27 9₋₄ 8₋₄ SENSeychelles 0.2 - 1 2 1 18 … … … 0.4 0.5 98 99 … 99 110 82 Yes Yes Yes Yes Yes Yes Yes … … … … … … SYCSierra Leone 6₋₃ 268₋₁ 432₋₁ 1₋₃ 49₋₁ 65₋₁ 69 47 20 16₋₂ 35₋₂ 99 83 68 51₋₁ 51₋₂ 35₋₁ Yes Yes Yes Yes Yes Yes Yes 6₋₂ 6₋₂ … … … … SLESomalia … … … … … … 33 ᵢ 25 ᵢ 8 ᵢ … … … … 75 ᵢ … … … Yes Yes No No No Yes Yes … … … … … … SOMSouth Africa 845₋₁ 282₋₁ 597₋₁ 11₋₁ 14₋₁ 21₋₁ 98 ᵢ 87 ᵢ 47 ᵢ 8₋₁ 24₋₁ 89₋₁ 90₋₁ 89 ᵢ 86₋₁ 80₋₁ 79₋₁ Yes Yes Yes Yes Yes No Yes 22₋₃ 16 … … … … ZAFSouth Sudan 1,088₋₄ᵢ 290₋₄ᵢ 625₋₄ᵢ 62₋₄ᵢ 56₋₄ᵢ 64₋₄ᵢ 10 ᵢ 13 ᵢ 6 ᵢ 77₋₄ 91₋₄ 38₋₄ᵢ … 29 ᵢ 44₋₄ᵢ … 36₋₄ᵢ Yes Yes Yes No No Yes Yes … … … … … … SSDTogo 16₊₁ 152₋₂ 265₋₂ 1₊₁ 21₋₂ 57₋₂ 73 ᵢ 47₋₂ 14 ᵢ 16₊₁ 27₊₁ 99₊₁ 88₊₁ … 79₋₂ 52₊₁ 43₋₂ Yes Yes Yes Yes Yes Yes Yes 24 47 19 16 … … TGOUganda … … … … … … 44₋₃ 39 ᵢ 20 ᵢ 34₋₂ 48₋₂ … 53₋₂ … … 26₋₂ … Yes Yes Yes Yes Yes Yes Yes 33₋₄ 21₋₄ 52₋₄ 53₋₄ … … UGAUnited Republic of Tanzania 1,435 3,363₋₃ᵢ 1,783₋₃ᵢ 13 72₋₃ᵢ 86₋₃ᵢ 78 ᵢ 31 ᵢ 12 ᵢ 9₋₃ 18₋₃ 87 68 40 ᵢ 28₋₃ᵢ 30₋₁ 14₋₃ᵢ Yes Yes Yes Yes Yes Yes Yes 56₋₃ 35₋₃ … … … … TZAZambia 496₋₂ … … 15₋₂ … … 74 ᵢ 48 ᵢ 30 ᵢ 27₋₂ … 85₋₂ … 65 ᵢ … … … Yes Yes Yes Yes Yes Yes Yes … … … … 5₋₄ 2₋₄ ZMBZimbabwe … … … … … … 89 54 14 … … … … 61 … … … Yes Yes Yes Yes Yes Yes Yes 20 5 … … … … ZWE
2 0 2 1 / 2 • G LO BA L E D U C AT I O N M O N I TO R I N G R E P O RT 416
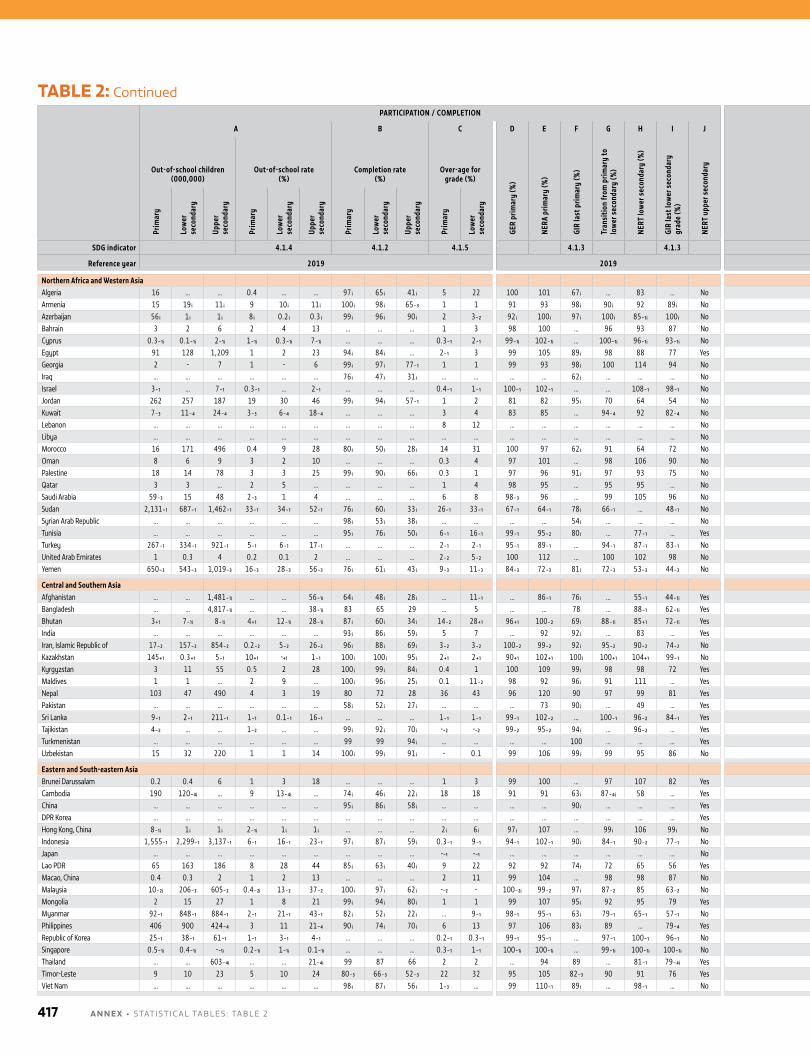
PARTICIPATION / COMPLETION LEARNING
A B C D E F G H I J K L
Out-of-school children (000,000)
Out-of-school rate (%)
Completion rate (%)
Over-age for grade (%)
GER
prim
ary
(%)
NERA
prim
ary
(%)
GIR
last
prim
ary
(%)
Tran
sitio
n fr
om p
rimar
y to
lo
wer
sec
onda
ry (%
)
NERT
low
er s
econ
dary
(%)
GIR
last
low
er s
econ
dary
gr
ade
(%)
NERT
upp
er s
econ
dary
Administration of nationally representative learning assessment
Achieving minimum proficiency (%)
Early grades End of primaryEnd of lower
secondary Early grades End of primaryEnd of lower
secondary
Prim
ary
Low
er
seco
ndar
y
Uppe
r se
cond
ary
Prim
ary
Low
er
seco
ndar
y
Uppe
r se
cond
ary
Prim
ary
Low
er
seco
ndar
y
Uppe
r se
cond
ary
Prim
ary
Low
er
seco
ndar
y
Read
ing
Mat
hem
atic
s
Read
ing
Mat
hem
atic
s
Read
ing
Mat
hem
atic
s
Read
ing
Mat
hem
atic
s
Read
ing
Mat
hem
atic
s
Read
ing
Mat
hem
atic
s
Coun
try
code
SDG indicator 4.1.4 4.1.2 4.1.5 4.1.3 4.1.3 4.1.6 4.1.1
Reference year 2019 2019 2019
Northern Africa and Western AsiaAlgeria 16 … … 0.4 … … 97 ᵢ 65 ᵢ 41 ᵢ 5 22 100 101 67 ᵢ … 83 … No No No No Yes Yes Yes … … … … 21₋₄ 19₋₄ DZAArmenia 15 19 ᵢ 11 ᵢ 9 10 ᵢ 11 ᵢ 100 ᵢ 98 ᵢ 65₋₃ 1 1 91 93 98 ᵢ 90 ᵢ 92 89 ᵢ No No No No Yes Yes Yes … … … 64 … 50₋₄ ARMAzerbaijan 56 ᵢ 1 ᵢ 1 ᵢ 8 ᵢ 0.2 ᵢ 0.3 ᵢ 99 ᵢ 96 ᵢ 90 ᵢ 2 3₋₂ 92 ᵢ 100 ᵢ 97 ᵢ 100 ᵢ 85₋₁ᵢ 100 ᵢ No No No Yes Yes Yes Yes … … 81₋₃ 72 … … AZEBahrain 3 2 6 2 4 13 … … … 1 3 98 100 … 96 93 87 No No No Yes Yes No Yes … … 69₋₃ 54 … 55 BHRCyprus 0.3₋₁ᵢ 0.1₋₁ᵢ 2₋₁ᵢ 1₋₁ᵢ 0.3₋₁ᵢ 7₋₁ᵢ … … … 0.3₋₁ 2₋₁ 99₋₁ᵢ 102₋₁ᵢ … 100₋₁ᵢ 96₋₁ᵢ 93₋₁ᵢ No No No Yes Yes Yes Yes … … … 77 56₋₁ 63 CYPEgypt 91 128 1,209 1 2 23 94 ᵢ 84 ᵢ … 2₋₁ 3 99 105 89 ᵢ 98 88 77 Yes Yes No No Yes No Yes … … … 27 … 21₋₄ EGYGeorgia 2 - 7 1 - 6 99 ᵢ 97 ᵢ 77₋₁ 1 1 99 93 98 ᵢ 100 114 94 No No No Yes Yes Yes Yes … … 86₋₃ 56 36₋₁ 39₋₁ GEOIraq … … … … … … 76 ᵢ 47 ᵢ 31 ᵢ … … … … 62 ᵢ … … … No No No No No No No … … … … … … IRQIsrael 3₋₁ … 7₋₁ 0.3₋₁ … 2₋₁ … … … 0.4₋₁ 1₋₁ 100₋₁ 102₋₁ … … 108₋₁ 98₋₁ No No No Yes Yes Yes Yes … … 91₋₃ … 69₋₁ 66₋₁ ISRJordan 262 257 187 19 30 46 99 ᵢ 94 ᵢ 57₋₁ 1 2 81 82 95 ᵢ 70 64 54 No No No No No Yes Yes … … … … 59₋₁ 41₋₁ JORKuwait 7₋₃ 11₋₄ 24₋₄ 3₋₃ 6₋₄ 18₋₄ … … … 3 4 83 85 … 94₋₄ 92 82₋₄ No No No Yes Yes No Yes … … … 21 … 21 KWTLebanon … … … … … … … … … 8 12 … … … … … … No No No No Yes Yes Yes … … … 27 32₋₁ 35₋₄ LBNLibya … … … … … … … … … … … … … … … … … No No No No No No No … … … … … … LBYMorocco 16 171 496 0.4 9 28 80 ᵢ 50 ᵢ 28 ᵢ 14 31 100 97 62 ᵢ 91 64 72 No No No Yes Yes Yes Yes … … 36₋₃ 18 27₋₁ 12 MAROman 8 6 9 3 2 10 … … … 0.3 4 97 101 … 98 106 90 No No No Yes Yes No Yes … … 59₋₃ 33 … 27 OMNPalestine 18 14 78 3 3 25 99 ᵢ 90 ᵢ 66 ᵢ 0.3 1 97 96 91 ᵢ 97 93 75 No No No No No No Yes … … … … … … PSEQatar 3 3 … 2 5 … … … … 1 4 98 95 … 95 95 … No No No Yes Yes Yes Yes … … 66₋₃ 40 49₋₁ 37 QATSaudi Arabia 59₋₃ 15 48 2₋₃ 1 4 … … … 6 8 98₋₃ 96 … 99 105 96 No No No Yes Yes Yes Yes … … 63₋₃ 23 48₋₁ 15 SAUSudan 2,131₋₁ 687₋₁ 1,462₋₁ 33₋₁ 34₋₁ 52₋₁ 76 ᵢ 60 ᵢ 33 ᵢ 26₋₁ 33₋₁ 67₋₁ 64₋₁ 78 ᵢ 66₋₁ … 48₋₁ No No No No No No No … … … … … … SDNSyrian Arab Republic … … … … … … 98 ᵢ 53 ᵢ 38 ᵢ … … … … 54 ᵢ … … … No No No No No No Yes … … … … … … SYRTunisia … … … … … … 95 ᵢ 76 ᵢ 50 ᵢ 6₋₁ 16₋₁ 99₋₁ 95₋₂ 80 ᵢ … 77₋₁ … Yes Yes No No Yes Yes Yes 47₋₁ … … … 28₋₄ 25₋₄ TUNTurkey 267₋₁ 334₋₁ 921₋₁ 5₋₁ 6₋₁ 17₋₁ … … … 2₋₁ 2₋₁ 95₋₁ 89₋₁ … 94₋₁ 87₋₁ 83₋₁ No No No Yes Yes Yes Yes … … … 70 74₋₁ 56 TURUnited Arab Emirates 1 0.3 4 0.2 0.1 2 … … … 2₋₂ 5₋₂ 100 112 … 100 102 98 No No No Yes Yes Yes Yes … … 68₋₃ 53 57₋₁ 50 AREYemen 650₋₃ 543₋₃ 1,019₋₃ 16₋₃ 28₋₃ 56₋₃ 76 ᵢ 61 ᵢ 43 ᵢ 9₋₃ 11₋₃ 84₋₃ 72₋₃ 81 ᵢ 72₋₃ 53₋₃ 44₋₃ No No No No Yes No No … … … … … … YEM
Central and Southern AsiaAfghanistan … … 1,481₋₁ᵢ … … 56₋₁ᵢ 64 ᵢ 48 ᵢ 28 ᵢ … 11₋₁ … 86₋₁ 76 ᵢ … 55₋₁ 44₋₁ᵢ Yes Yes Yes Yes Yes No No 22₋₃ 24₋₃ … … … … AFGBangladesh … … 4,817₋₁ᵢ … … 38₋₁ᵢ 83 65 29 … 5 … … 78 … 88₋₁ 62₋₁ᵢ Yes Yes Yes Yes Yes Yes Yes 47₋₂ 34₋₂ 44₋₂ 32₋₂ 54₋₄ 57₋₄ BGDBhutan 3₊₁ 7₋₁ᵢ 8₋₁ᵢ 4₊₁ 12₋₁ᵢ 28₋₁ᵢ 87 ᵢ 60 ᵢ 34 ᵢ 14₋₂ 28₊₁ 96₊₁ 100₋₂ 69 ᵢ 88₋₁ᵢ 85₊₁ 72₋₁ᵢ Yes Yes Yes Yes Yes Yes Yes … … … … 56₋₄ … BTNIndia … … … … … … 93 ᵢ 86 ᵢ 59 ᵢ 5 7 … 92 92 ᵢ … 83 … Yes Yes Yes Yes Yes Yes Yes 47₋₂ 53₋₂ 46₋₂ 44₋₂ 38₋₂ 40₋₂ INDIran, Islamic Republic of 17₋₂ 157₋₂ 854₋₂ 0.2₋₂ 5₋₂ 26₋₂ 96 ᵢ 88 ᵢ 69 ᵢ 3₋₂ 3₋₂ 100₋₂ 99₋₂ 92 ᵢ 95₋₂ 90₋₂ 74₋₂ No No No Yes Yes No Yes … … 66₋₃ 39 … 37 IRNKazakhstan 145₊₁ 0.3₊₁ 5₋₁ 10₊₁ -₊₁ 1₋₁ 100 ᵢ 100 ᵢ 95 ᵢ 2₊₁ 2₊₁ 90₊₁ 102₊₁ 100 ᵢ 100₊₁ 104₊₁ 99₋₁ No No No Yes Yes Yes Yes … … 98₋₃ 71 36₋₁ 51₋₁ KAZKyrgyzstan 3 11 55 0.5 2 28 100 ᵢ 99 ᵢ 84 ᵢ 0.4 1 100 109 99 ᵢ 98 98 72 Yes Yes Yes Yes Yes Yes Yes 39₋₁ 30₋₁ 40₋₂ 40₋₂ 48₋₂ 35₋₂ KGZMaldives 1 1 … 2 9 … 100 ᵢ 96 ᵢ 25 ᵢ 0.1 11₋₂ 98 92 96 ᵢ 91 111 … Yes Yes Yes Yes Yes Yes Yes … … … … … … MDVNepal 103 47 490 4 3 19 80 72 28 36 43 96 120 90 97 99 81 Yes Yes Yes Yes Yes Yes Yes … … 80₋₁ 68₋₁ 100₋₂ 98₋₂ NPLPakistan … … … … … … 58 ᵢ 52 ᵢ 27 ᵢ … … … 73 90 ᵢ … 49 … Yes Yes Yes Yes Yes Yes Yes … 14₋₃ 52₋₃ 8 … … PAKSri Lanka 9₋₁ 2₋₁ 211₋₁ 1₋₁ 0.1₋₁ 16₋₁ … … … 1₋₁ 1₋₁ 99₋₁ 102₋₂ … 100₋₁ 96₋₂ 84₋₁ Yes Yes Yes Yes Yes Yes Yes … … 55₋₄ 73₋₄ 21₋₃ 51₋₃ LKATajikistan 4₋₂ … … 1₋₂ … … 99 ᵢ 92 ᵢ 70 ᵢ -₋₂ -₋₂ 99₋₂ 95₋₂ 94 ᵢ … 96₋₂ … Yes Yes No No No No No … … … … … … TJKTurkmenistan … … … … … … 99 99 94 ᵢ … … … … 100 … … … Yes Yes Yes No No No No 71 53 … … … … TKMUzbekistan 15 32 220 1 1 14 100 ᵢ 99 ᵢ 91 ᵢ - 0.1 99 106 99 ᵢ 99 95 86 No No No No No No No … … … … … … UZB
Eastern and South-eastern AsiaBrunei Darussalam 0.2 0.4 6 1 3 18 … … … 1 3 99 100 … 97 107 82 Yes Yes Yes Yes Yes Yes Yes … … … … 48₋₁ 52₋₁ BRNCambodia 190 120₋₄ᵢ … 9 13₋₄ᵢ … 74 ᵢ 46 ᵢ 22 ᵢ 18 18 91 91 63 ᵢ 87₋₄ᵢ 58 … Yes Yes Yes Yes Yes Yes Yes … … 11 19 8₋₄ 10₋₄ KHMChina … … … … … … 95 ᵢ 86 ᵢ 58 ᵢ … … … … 90 ᵢ … … … Yes Yes Yes No No Yes Yes 82₋₃ 85₋₄ … … 80₋₃ 79₋₄ CHNDPR Korea … … … … … … … … … … … … … … … … … Yes Yes Yes No No No No 94₋₂ 83₋₂ … … … … PRKHong Kong, China 8₋₁ᵢ 1 ᵢ 1 ᵢ 2₋₁ᵢ 1 ᵢ 1 ᵢ … … … 2 ᵢ 6 ᵢ 97 ᵢ 107 … 99 ᵢ 106 99 ᵢ No No No Yes Yes Yes Yes … … 99₋₃ 96 87₋₁ 91₋₁ HKGIndonesia 1,555₋₁ 2,299₋₁ 3,137₋₁ 6₋₁ 16₋₁ 23₋₁ 97 ᵢ 87 ᵢ 59 ᵢ 0.3₋₁ 9₋₁ 94₋₁ 102₋₁ 90 ᵢ 84₋₁ 90₋₂ 77₋₁ No No No Yes Yes Yes Yes … … … 18₋₄ 30₋₁ 28₋₁ IDNJapan … … … … … … … … … -₋₁ -₋₁ … … … … … … No No Yes Yes Yes Yes Yes … … … … … … JPNLao PDR 65 163 186 8 28 44 85 ᵢ 63 ᵢ 40 ᵢ 9 22 92 92 74 ᵢ 72 65 56 Yes Yes Yes Yes Yes No No … … 2 8 … … LAOMacao, China 0.4 0.3 2 1 2 13 … … … 2 11 99 104 … 98 98 87 No No No Yes No Yes Yes … … 98₋₃ … 89₋₁ 95₋₁ MACMalaysia 10₋₂ᵢ 206₋₂ 605₋₂ 0.4₋₂ᵢ 13₋₂ 37₋₂ 100 ᵢ 97 ᵢ 62 ᵢ -₋₂ - 100₋₂ᵢ 99₋₂ 97 ᵢ 87₋₂ 85 63₋₂ No No No Yes Yes Yes Yes … … 58 64 54₋₁ 59₋₁ MYSMongolia 2 15 27 1 8 21 99 ᵢ 94 ᵢ 80 ᵢ 1 1 99 107 95 ᵢ 92 95 79 Yes Yes No Yes Yes Yes Yes 44₋₁ … … … … … MNGMyanmar 92₋₁ 848₋₁ 884₋₁ 2₋₁ 21₋₁ 43₋₁ 82 ᵢ 52 ᵢ 22 ᵢ … 9₋₁ 98₋₁ 95₋₁ 63 ᵢ 79₋₁ 65₋₁ 57₋₁ No No No Yes Yes No No … … 11 12 … … MMRPhilippines 406 900 424₋₄ 3 11 21₋₄ 90 ᵢ 74 ᵢ 70 ᵢ 6 13 97 106 83 ᵢ 89 … 79₋₄ Yes Yes No Yes Yes Yes Yes … … 10 17 19₋₁ … PHLRepublic of Korea 25₋₁ 38₋₁ 61₋₁ 1₋₁ 3₋₁ 4₋₁ … … … 0.2₋₁ 0.3₋₁ 99₋₁ 95₋₁ … 97₋₁ 100₋₁ 96₋₁ No No No No Yes Yes Yes … … … 95 85₋₁ 85₋₁ KORSingapore 0.5₋₁ᵢ 0.4₋₁ᵢ -₋₁ᵢ 0.2₋₁ᵢ 1₋₁ᵢ 0.1₋₁ᵢ … … … 0.3₋₁ 1₋₁ 100₋₁ᵢ 100₋₁ᵢ … 99₋₁ᵢ 100₋₁ᵢ 100₋₁ᵢ No No No Yes Yes Yes Yes … … 97₋₃ 96 89₋₁ 92 SGPThailand … … 603₋₄ᵢ … … 21₋₄ᵢ 99 87 66 2 2 … 94 89 … 81₋₁ 79₋₄ᵢ Yes Yes No Yes Yes Yes Yes … … … … 40₋₁ 47₋₁ THATimor-Leste 9 10 23 5 10 24 80₋₃ 66₋₃ 52₋₃ 22 32 95 105 82₋₃ 90 91 76 Yes Yes Yes Yes Yes Yes Yes … … … … … … TLSViet Nam … … … … … … 98 ᵢ 87 ᵢ 56 ᵢ 1₋₃ … 99 110₋₁ 89 ᵢ … 98₋₁ … No No No Yes Yes Yes Yes … … 82 92 86₋₄ 81₋₄ VNM
TABLE 2: Continued
A N N E X • STATISTICAl TAblES : TAblE 2417
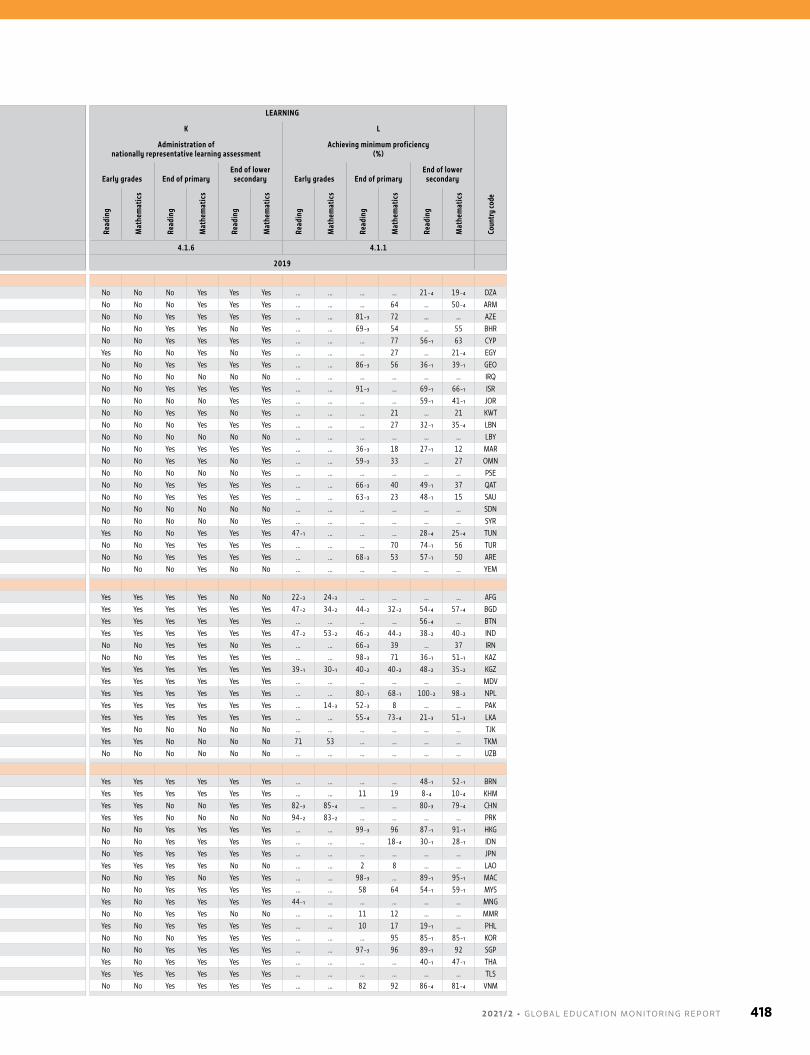
PARTICIPATION / COMPLETION LEARNING
A B C D E F G H I J K L
Out-of-school children (000,000)
Out-of-school rate (%)
Completion rate (%)
Over-age for grade (%)
GER
prim
ary
(%)
NERA
prim
ary
(%)
GIR
last
prim
ary
(%)
Tran
sitio
n fr
om p
rimar
y to
lo
wer
sec
onda
ry (%
)
NERT
low
er s
econ
dary
(%)
GIR
last
low
er s
econ
dary
gr
ade
(%)
NERT
upp
er s
econ
dary
Administration of nationally representative learning assessment
Achieving minimum proficiency (%)
Early grades End of primaryEnd of lower
secondary Early grades End of primaryEnd of lower
secondary
Prim
ary
Low
er
seco
ndar
y
Uppe
r se
cond
ary
Prim
ary
Low
er
seco
ndar
y
Uppe
r se
cond
ary
Prim
ary
Low
er
seco
ndar
y
Uppe
r se
cond
ary
Prim
ary
Low
er
seco
ndar
y
Read
ing
Mat
hem
atic
s
Read
ing
Mat
hem
atic
s
Read
ing
Mat
hem
atic
s
Read
ing
Mat
hem
atic
s
Read
ing
Mat
hem
atic
s
Read
ing
Mat
hem
atic
s
Coun
try
code
SDG indicator 4.1.4 4.1.2 4.1.5 4.1.3 4.1.3 4.1.6 4.1.1
Reference year 2019 2019 2019
Northern Africa and Western AsiaAlgeria 16 … … 0.4 … … 97 ᵢ 65 ᵢ 41 ᵢ 5 22 100 101 67 ᵢ … 83 … No No No No Yes Yes Yes … … … … 21₋₄ 19₋₄ DZAArmenia 15 19 ᵢ 11 ᵢ 9 10 ᵢ 11 ᵢ 100 ᵢ 98 ᵢ 65₋₃ 1 1 91 93 98 ᵢ 90 ᵢ 92 89 ᵢ No No No No Yes Yes Yes … … … 64 … 50₋₄ ARMAzerbaijan 56 ᵢ 1 ᵢ 1 ᵢ 8 ᵢ 0.2 ᵢ 0.3 ᵢ 99 ᵢ 96 ᵢ 90 ᵢ 2 3₋₂ 92 ᵢ 100 ᵢ 97 ᵢ 100 ᵢ 85₋₁ᵢ 100 ᵢ No No No Yes Yes Yes Yes … … 81₋₃ 72 … … AZEBahrain 3 2 6 2 4 13 … … … 1 3 98 100 … 96 93 87 No No No Yes Yes No Yes … … 69₋₃ 54 … 55 BHRCyprus 0.3₋₁ᵢ 0.1₋₁ᵢ 2₋₁ᵢ 1₋₁ᵢ 0.3₋₁ᵢ 7₋₁ᵢ … … … 0.3₋₁ 2₋₁ 99₋₁ᵢ 102₋₁ᵢ … 100₋₁ᵢ 96₋₁ᵢ 93₋₁ᵢ No No No Yes Yes Yes Yes … … … 77 56₋₁ 63 CYPEgypt 91 128 1,209 1 2 23 94 ᵢ 84 ᵢ … 2₋₁ 3 99 105 89 ᵢ 98 88 77 Yes Yes No No Yes No Yes … … … 27 … 21₋₄ EGYGeorgia 2 - 7 1 - 6 99 ᵢ 97 ᵢ 77₋₁ 1 1 99 93 98 ᵢ 100 114 94 No No No Yes Yes Yes Yes … … 86₋₃ 56 36₋₁ 39₋₁ GEOIraq … … … … … … 76 ᵢ 47 ᵢ 31 ᵢ … … … … 62 ᵢ … … … No No No No No No No … … … … … … IRQIsrael 3₋₁ … 7₋₁ 0.3₋₁ … 2₋₁ … … … 0.4₋₁ 1₋₁ 100₋₁ 102₋₁ … … 108₋₁ 98₋₁ No No No Yes Yes Yes Yes … … 91₋₃ … 69₋₁ 66₋₁ ISRJordan 262 257 187 19 30 46 99 ᵢ 94 ᵢ 57₋₁ 1 2 81 82 95 ᵢ 70 64 54 No No No No No Yes Yes … … … … 59₋₁ 41₋₁ JORKuwait 7₋₃ 11₋₄ 24₋₄ 3₋₃ 6₋₄ 18₋₄ … … … 3 4 83 85 … 94₋₄ 92 82₋₄ No No No Yes Yes No Yes … … … 21 … 21 KWTLebanon … … … … … … … … … 8 12 … … … … … … No No No No Yes Yes Yes … … … 27 32₋₁ 35₋₄ LBNLibya … … … … … … … … … … … … … … … … … No No No No No No No … … … … … … LBYMorocco 16 171 496 0.4 9 28 80 ᵢ 50 ᵢ 28 ᵢ 14 31 100 97 62 ᵢ 91 64 72 No No No Yes Yes Yes Yes … … 36₋₃ 18 27₋₁ 12 MAROman 8 6 9 3 2 10 … … … 0.3 4 97 101 … 98 106 90 No No No Yes Yes No Yes … … 59₋₃ 33 … 27 OMNPalestine 18 14 78 3 3 25 99 ᵢ 90 ᵢ 66 ᵢ 0.3 1 97 96 91 ᵢ 97 93 75 No No No No No No Yes … … … … … … PSEQatar 3 3 … 2 5 … … … … 1 4 98 95 … 95 95 … No No No Yes Yes Yes Yes … … 66₋₃ 40 49₋₁ 37 QATSaudi Arabia 59₋₃ 15 48 2₋₃ 1 4 … … … 6 8 98₋₃ 96 … 99 105 96 No No No Yes Yes Yes Yes … … 63₋₃ 23 48₋₁ 15 SAUSudan 2,131₋₁ 687₋₁ 1,462₋₁ 33₋₁ 34₋₁ 52₋₁ 76 ᵢ 60 ᵢ 33 ᵢ 26₋₁ 33₋₁ 67₋₁ 64₋₁ 78 ᵢ 66₋₁ … 48₋₁ No No No No No No No … … … … … … SDNSyrian Arab Republic … … … … … … 98 ᵢ 53 ᵢ 38 ᵢ … … … … 54 ᵢ … … … No No No No No No Yes … … … … … … SYRTunisia … … … … … … 95 ᵢ 76 ᵢ 50 ᵢ 6₋₁ 16₋₁ 99₋₁ 95₋₂ 80 ᵢ … 77₋₁ … Yes Yes No No Yes Yes Yes 47₋₁ … … … 28₋₄ 25₋₄ TUNTurkey 267₋₁ 334₋₁ 921₋₁ 5₋₁ 6₋₁ 17₋₁ … … … 2₋₁ 2₋₁ 95₋₁ 89₋₁ … 94₋₁ 87₋₁ 83₋₁ No No No Yes Yes Yes Yes … … … 70 74₋₁ 56 TURUnited Arab Emirates 1 0.3 4 0.2 0.1 2 … … … 2₋₂ 5₋₂ 100 112 … 100 102 98 No No No Yes Yes Yes Yes … … 68₋₃ 53 57₋₁ 50 AREYemen 650₋₃ 543₋₃ 1,019₋₃ 16₋₃ 28₋₃ 56₋₃ 76 ᵢ 61 ᵢ 43 ᵢ 9₋₃ 11₋₃ 84₋₃ 72₋₃ 81 ᵢ 72₋₃ 53₋₃ 44₋₃ No No No No Yes No No … … … … … … YEM
Central and Southern AsiaAfghanistan … … 1,481₋₁ᵢ … … 56₋₁ᵢ 64 ᵢ 48 ᵢ 28 ᵢ … 11₋₁ … 86₋₁ 76 ᵢ … 55₋₁ 44₋₁ᵢ Yes Yes Yes Yes Yes No No 22₋₃ 24₋₃ … … … … AFGBangladesh … … 4,817₋₁ᵢ … … 38₋₁ᵢ 83 65 29 … 5 … … 78 … 88₋₁ 62₋₁ᵢ Yes Yes Yes Yes Yes Yes Yes 47₋₂ 34₋₂ 44₋₂ 32₋₂ 54₋₄ 57₋₄ BGDBhutan 3₊₁ 7₋₁ᵢ 8₋₁ᵢ 4₊₁ 12₋₁ᵢ 28₋₁ᵢ 87 ᵢ 60 ᵢ 34 ᵢ 14₋₂ 28₊₁ 96₊₁ 100₋₂ 69 ᵢ 88₋₁ᵢ 85₊₁ 72₋₁ᵢ Yes Yes Yes Yes Yes Yes Yes … … … … 56₋₄ … BTNIndia … … … … … … 93 ᵢ 86 ᵢ 59 ᵢ 5 7 … 92 92 ᵢ … 83 … Yes Yes Yes Yes Yes Yes Yes 47₋₂ 53₋₂ 46₋₂ 44₋₂ 38₋₂ 40₋₂ INDIran, Islamic Republic of 17₋₂ 157₋₂ 854₋₂ 0.2₋₂ 5₋₂ 26₋₂ 96 ᵢ 88 ᵢ 69 ᵢ 3₋₂ 3₋₂ 100₋₂ 99₋₂ 92 ᵢ 95₋₂ 90₋₂ 74₋₂ No No No Yes Yes No Yes … … 66₋₃ 39 … 37 IRNKazakhstan 145₊₁ 0.3₊₁ 5₋₁ 10₊₁ -₊₁ 1₋₁ 100 ᵢ 100 ᵢ 95 ᵢ 2₊₁ 2₊₁ 90₊₁ 102₊₁ 100 ᵢ 100₊₁ 104₊₁ 99₋₁ No No No Yes Yes Yes Yes … … 98₋₃ 71 36₋₁ 51₋₁ KAZKyrgyzstan 3 11 55 0.5 2 28 100 ᵢ 99 ᵢ 84 ᵢ 0.4 1 100 109 99 ᵢ 98 98 72 Yes Yes Yes Yes Yes Yes Yes 39₋₁ 30₋₁ 40₋₂ 40₋₂ 48₋₂ 35₋₂ KGZMaldives 1 1 … 2 9 … 100 ᵢ 96 ᵢ 25 ᵢ 0.1 11₋₂ 98 92 96 ᵢ 91 111 … Yes Yes Yes Yes Yes Yes Yes … … … … … … MDVNepal 103 47 490 4 3 19 80 72 28 36 43 96 120 90 97 99 81 Yes Yes Yes Yes Yes Yes Yes … … 80₋₁ 68₋₁ 100₋₂ 98₋₂ NPLPakistan … … … … … … 58 ᵢ 52 ᵢ 27 ᵢ … … … 73 90 ᵢ … 49 … Yes Yes Yes Yes Yes Yes Yes … 14₋₃ 52₋₃ 8 … … PAKSri Lanka 9₋₁ 2₋₁ 211₋₁ 1₋₁ 0.1₋₁ 16₋₁ … … … 1₋₁ 1₋₁ 99₋₁ 102₋₂ … 100₋₁ 96₋₂ 84₋₁ Yes Yes Yes Yes Yes Yes Yes … … 55₋₄ 73₋₄ 21₋₃ 51₋₃ LKATajikistan 4₋₂ … … 1₋₂ … … 99 ᵢ 92 ᵢ 70 ᵢ -₋₂ -₋₂ 99₋₂ 95₋₂ 94 ᵢ … 96₋₂ … Yes Yes No No No No No … … … … … … TJKTurkmenistan … … … … … … 99 99 94 ᵢ … … … … 100 … … … Yes Yes Yes No No No No 71 53 … … … … TKMUzbekistan 15 32 220 1 1 14 100 ᵢ 99 ᵢ 91 ᵢ - 0.1 99 106 99 ᵢ 99 95 86 No No No No No No No … … … … … … UZB
Eastern and South-eastern AsiaBrunei Darussalam 0.2 0.4 6 1 3 18 … … … 1 3 99 100 … 97 107 82 Yes Yes Yes Yes Yes Yes Yes … … … … 48₋₁ 52₋₁ BRNCambodia 190 120₋₄ᵢ … 9 13₋₄ᵢ … 74 ᵢ 46 ᵢ 22 ᵢ 18 18 91 91 63 ᵢ 87₋₄ᵢ 58 … Yes Yes Yes Yes Yes Yes Yes … … 11 19 8₋₄ 10₋₄ KHMChina … … … … … … 95 ᵢ 86 ᵢ 58 ᵢ … … … … 90 ᵢ … … … Yes Yes Yes No No Yes Yes 82₋₃ 85₋₄ … … 80₋₃ 79₋₄ CHNDPR Korea … … … … … … … … … … … … … … … … … Yes Yes Yes No No No No 94₋₂ 83₋₂ … … … … PRKHong Kong, China 8₋₁ᵢ 1 ᵢ 1 ᵢ 2₋₁ᵢ 1 ᵢ 1 ᵢ … … … 2 ᵢ 6 ᵢ 97 ᵢ 107 … 99 ᵢ 106 99 ᵢ No No No Yes Yes Yes Yes … … 99₋₃ 96 87₋₁ 91₋₁ HKGIndonesia 1,555₋₁ 2,299₋₁ 3,137₋₁ 6₋₁ 16₋₁ 23₋₁ 97 ᵢ 87 ᵢ 59 ᵢ 0.3₋₁ 9₋₁ 94₋₁ 102₋₁ 90 ᵢ 84₋₁ 90₋₂ 77₋₁ No No No Yes Yes Yes Yes … … … 18₋₄ 30₋₁ 28₋₁ IDNJapan … … … … … … … … … -₋₁ -₋₁ … … … … … … No No Yes Yes Yes Yes Yes … … … … … … JPNLao PDR 65 163 186 8 28 44 85 ᵢ 63 ᵢ 40 ᵢ 9 22 92 92 74 ᵢ 72 65 56 Yes Yes Yes Yes Yes No No … … 2 8 … … LAOMacao, China 0.4 0.3 2 1 2 13 … … … 2 11 99 104 … 98 98 87 No No No Yes No Yes Yes … … 98₋₃ … 89₋₁ 95₋₁ MACMalaysia 10₋₂ᵢ 206₋₂ 605₋₂ 0.4₋₂ᵢ 13₋₂ 37₋₂ 100 ᵢ 97 ᵢ 62 ᵢ -₋₂ - 100₋₂ᵢ 99₋₂ 97 ᵢ 87₋₂ 85 63₋₂ No No No Yes Yes Yes Yes … … 58 64 54₋₁ 59₋₁ MYSMongolia 2 15 27 1 8 21 99 ᵢ 94 ᵢ 80 ᵢ 1 1 99 107 95 ᵢ 92 95 79 Yes Yes No Yes Yes Yes Yes 44₋₁ … … … … … MNGMyanmar 92₋₁ 848₋₁ 884₋₁ 2₋₁ 21₋₁ 43₋₁ 82 ᵢ 52 ᵢ 22 ᵢ … 9₋₁ 98₋₁ 95₋₁ 63 ᵢ 79₋₁ 65₋₁ 57₋₁ No No No Yes Yes No No … … 11 12 … … MMRPhilippines 406 900 424₋₄ 3 11 21₋₄ 90 ᵢ 74 ᵢ 70 ᵢ 6 13 97 106 83 ᵢ 89 … 79₋₄ Yes Yes No Yes Yes Yes Yes … … 10 17 19₋₁ … PHLRepublic of Korea 25₋₁ 38₋₁ 61₋₁ 1₋₁ 3₋₁ 4₋₁ … … … 0.2₋₁ 0.3₋₁ 99₋₁ 95₋₁ … 97₋₁ 100₋₁ 96₋₁ No No No No Yes Yes Yes … … … 95 85₋₁ 85₋₁ KORSingapore 0.5₋₁ᵢ 0.4₋₁ᵢ -₋₁ᵢ 0.2₋₁ᵢ 1₋₁ᵢ 0.1₋₁ᵢ … … … 0.3₋₁ 1₋₁ 100₋₁ᵢ 100₋₁ᵢ … 99₋₁ᵢ 100₋₁ᵢ 100₋₁ᵢ No No No Yes Yes Yes Yes … … 97₋₃ 96 89₋₁ 92 SGPThailand … … 603₋₄ᵢ … … 21₋₄ᵢ 99 87 66 2 2 … 94 89 … 81₋₁ 79₋₄ᵢ Yes Yes No Yes Yes Yes Yes … … … … 40₋₁ 47₋₁ THATimor-Leste 9 10 23 5 10 24 80₋₃ 66₋₃ 52₋₃ 22 32 95 105 82₋₃ 90 91 76 Yes Yes Yes Yes Yes Yes Yes … … … … … … TLSViet Nam … … … … … … 98 ᵢ 87 ᵢ 56 ᵢ 1₋₃ … 99 110₋₁ 89 ᵢ … 98₋₁ … No No No Yes Yes Yes Yes … … 82 92 86₋₄ 81₋₄ VNM
2 0 2 1 / 2 • G LO BA L E D U C AT I O N M O N I TO R I N G R E P O RT 418
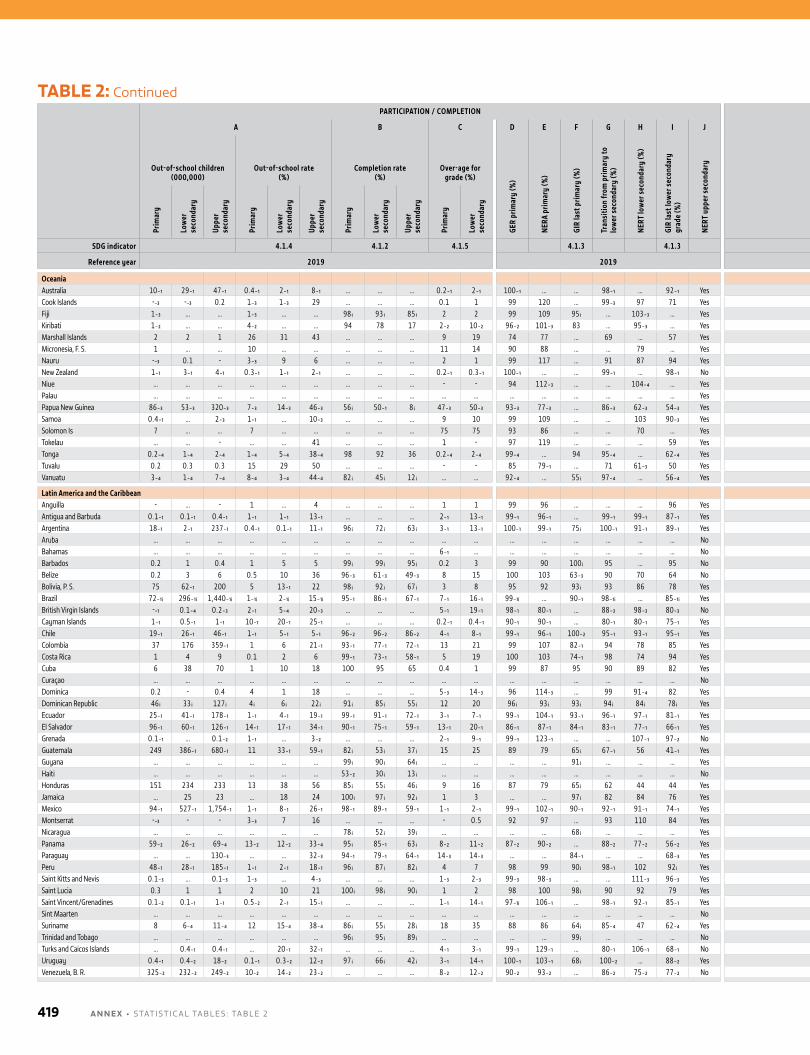
PARTICIPATION / COMPLETION LEARNING
A B C D E F G H I J K L
Out-of-school children (000,000)
Out-of-school rate (%)
Completion rate (%)
Over-age for grade (%)
GER
prim
ary
(%)
NERA
prim
ary
(%)
GIR
last
prim
ary
(%)
Tran
sitio
n fr
om p
rimar
y to
lo
wer
sec
onda
ry (%
)
NERT
low
er s
econ
dary
(%)
GIR
last
low
er s
econ
dary
gr
ade
(%)
NERT
upp
er s
econ
dary
Administration of nationally representative learning assessment
Achieving minimum proficiency (%)
Early grades End of primaryEnd of lower
secondary Early grades End of primaryEnd of lower
secondary
Prim
ary
Low
er
seco
ndar
y
Uppe
r se
cond
ary
Prim
ary
Low
er
seco
ndar
y
Uppe
r se
cond
ary
Prim
ary
Low
er
seco
ndar
y
Uppe
r se
cond
ary
Prim
ary
Low
er
seco
ndar
y
Read
ing
Mat
hem
atic
s
Read
ing
Mat
hem
atic
s
Read
ing
Mat
hem
atic
s
Read
ing
Mat
hem
atic
s
Read
ing
Mat
hem
atic
s
Read
ing
Mat
hem
atic
s
Coun
try
code
SDG indicator 4.1.4 4.1.2 4.1.5 4.1.3 4.1.3 4.1.6 4.1.1
Reference year 2019 2019 2019
OceaniaAustralia 10₋₁ 29₋₁ 47₋₁ 0.4₋₁ 2₋₁ 8₋₁ … … … 0.2₋₁ 2₋₁ 100₋₁ … … 98₋₁ … 92₋₁ Yes Yes Yes Yes Yes Yes Yes 94₋₃ 70 … 68 80₋₁ 78₋₁ AUSCook Islands -₋₃ -₋₃ 0.2 1₋₃ 1₋₃ 29 … … … 0.1 1 99 120 … 99₋₃ 97 71 Yes Yes Yes Yes Yes Yes Yes … … … … … … COKFiji 1₋₃ … … 1₋₃ … … 98 ᵢ 93 ᵢ 85 ᵢ 2 2 99 109 95 ᵢ … 103₋₃ … Yes Yes Yes Yes Yes Yes Yes … … … … … … FJIKiribati 1₋₂ … … 4₋₂ … … 94 78 17 2₋₂ 10₋₂ 96₋₂ 101₋₃ 83 … 95₋₃ … Yes Yes Yes Yes Yes Yes Yes 29₋₁ 12₋₁ … … … … KIRMarshall Islands 2 2 1 26 31 43 … … … 9 19 74 77 … 69 … 57 Yes Yes Yes Yes Yes Yes Yes … … … … … … MHLMicronesia, F. S. 1 … … 10 … … … … … 11 14 90 88 … … 79 … Yes Yes Yes Yes Yes Yes Yes … … … … … … FSMNauru -₋₃ 0.1 - 3₋₃ 9 6 … … … 2 1 99 117 … 91 87 94 Yes Yes Yes Yes Yes Yes Yes … … … … … … NRUNew Zealand 1₋₁ 3₋₁ 4₋₁ 0.3₋₁ 1₋₁ 2₋₁ … … … 0.2₋₁ 0.3₋₁ 100₋₁ … … 99₋₁ … 98₋₁ No No No Yes Yes Yes Yes … … 90₋₃ 56 81₋₁ 78₋₁ NZLNiue … … … … … … … … … - - 94 112₋₃ … … 104₋₄ … Yes Yes Yes Yes Yes No No … … … … … … NIUPalau … … … … … … … … … … … … … … … … … Yes Yes Yes Yes Yes Yes Yes … … … … … … PLWPapua New Guinea 86₋₃ 53₋₃ 320₋₃ 7₋₃ 14₋₃ 46₋₃ 56 ᵢ 50₋₁ 8 ᵢ 47₋₃ 50₋₃ 93₋₃ 77₋₃ … 86₋₃ 62₋₃ 54₋₃ Yes Yes Yes Yes Yes Yes Yes … … … … … … PNGSamoa 0.4₋₁ … 2₋₃ 1₋₁ … 10₋₃ … … … 9 10 99 109 … … 103 90₋₃ Yes Yes Yes Yes Yes Yes Yes 12 22 … … … … WSMSolomon Is 7 … … 7 … … … … … 75 75 93 86 … … 70 … Yes Yes Yes Yes Yes Yes Yes 71₋₄ 76₋₄ 58₋₄ 90₋₄ … … SLBTokelau … … - … … 41 … … … 1 - 97 119 … … … 59 Yes Yes Yes Yes Yes Yes Yes … … … … … … TKLTonga 0.2₋₄ 1₋₄ 2₋₄ 1₋₄ 5₋₄ 38₋₄ 98 92 36 0.2₋₄ 2₋₄ 99₋₄ … 94 95₋₄ … 62₋₄ Yes Yes Yes Yes Yes Yes Yes … … … … … … TONTuvalu 0.2 0.3 0.3 15 29 50 … … … - - 85 79₋₁ … 71 61₋₃ 50 Yes Yes Yes Yes Yes Yes Yes … … … … … … TUVVanuatu 3₋₄ 1₋₄ 7₋₄ 8₋₄ 3₋₄ 44₋₄ 82 ᵢ 45 ᵢ 12 ᵢ … … 92₋₄ … 55 ᵢ 97₋₄ … 56₋₄ Yes Yes Yes Yes Yes Yes Yes … … … … … … VUT
Latin America and the CaribbeanAnguilla - … - 1 … 4 … … … 1 1 99 96 … … … 96 Yes Yes Yes Yes Yes Yes Yes … … … … … … AIAAntigua and Barbuda 0.1₋₁ 0.1₋₁ 0.4₋₁ 1₋₁ 1₋₁ 13₋₁ … … … 2₋₁ 13₋₁ 99₋₁ 96₋₁ … 99₋₁ 99₋₁ 87₋₁ Yes Yes Yes Yes Yes Yes Yes … … … … … … ATGArgentina 18₋₁ 2₋₁ 237₋₁ 0.4₋₁ 0.1₋₁ 11₋₁ 96 ᵢ 72 ᵢ 63 ᵢ 3₋₁ 13₋₁ 100₋₁ 99₋₁ 75 ᵢ 100₋₁ 91₋₁ 89₋₁ Yes Yes Yes Yes Yes Yes Yes … … … … 48₋₁ 31₋₁ ARGAruba … … … … … … … … … … … … … … … … … No No No No No No No … … … … … … ABWBahamas … … … … … … … … … 6₋₁ … … … … … … … No No No No No No No … … … … … … BHSBarbados 0.2 1 0.4 1 5 5 99 ᵢ 99 ᵢ 95 ᵢ 0.2 3 99 90 100 ᵢ 95 … 95 No No No Yes Yes No No … … … … … … BRBBelize 0.2 3 6 0.5 10 36 96₋₃ 61₋₃ 49₋₃ 8 15 100 103 63₋₃ 90 70 64 No No No Yes No No No … … … … … … BLZBolivia, P. S. 75 62₋₁ 200 5 13₋₁ 22 98 ᵢ 92 ᵢ 67 ᵢ 3 8 95 92 93 ᵢ 93 86 78 Yes Yes Yes Yes Yes No No 48₋₄ 38₋₄ 15₋₄ 8₋₄ … … BOLBrazil 72₋₁ᵢ 296₋₁ᵢ 1,440₋₁ᵢ 1₋₁ᵢ 2₋₁ᵢ 15₋₁ᵢ 95₋₁ 86₋₁ 67₋₁ 7₋₁ 16₋₁ 99₋₁ᵢ … 90₋₁ 98₋₁ᵢ … 85₋₁ᵢ Yes Yes Yes Yes Yes Yes Yes … … … … 50₋₁ 32₋₁ BRABritish Virgin Islands -₋₁ 0.1₋₄ 0.2₋₃ 2₋₁ 5₋₄ 20₋₃ … … … 5₋₁ 19₋₁ 98₋₁ 80₋₁ … 88₋₃ 98₋₃ 80₋₃ No No No No No No No … … … … … … VGBCayman Islands 1₋₁ 0.5₋₁ 1₋₁ 10₋₁ 20₋₁ 25₋₁ … … … 0.2₋₁ 0.4₋₁ 90₋₁ 90₋₁ … 80₋₁ 80₋₁ 75₋₁ Yes Yes Yes Yes Yes Yes Yes … … … … … … CYMChile 19₋₁ 26₋₁ 46₋₁ 1₋₁ 5₋₁ 5₋₁ 96₋₂ 96₋₂ 86₋₂ 4₋₁ 8₋₁ 99₋₁ 96₋₁ 100₋₂ 95₋₁ 93₋₁ 95₋₁ Yes Yes Yes Yes Yes Yes Yes … … … … 68₋₁ 33 CHLColombia 37 176 359₋₁ 1 6 21₋₁ 93₋₁ 77₋₁ 72₋₁ 13 21 99 107 82₋₁ 94 78 85 Yes Yes Yes Yes Yes Yes Yes … … … … 50₋₁ 35₋₁ COLCosta Rica 1 4 9 0.1 2 6 99₋₁ 73₋₁ 58₋₁ 5 19 100 103 74₋₁ 98 74 94 Yes Yes Yes Yes Yes Yes Yes … … … … 58₋₁ 40₋₁ CRICuba 6 38 70 1 10 18 100 95 65 0.4 1 99 87 95 90 89 82 Yes Yes Yes Yes Yes Yes Yes 97 97 100 100 100 100 CUBCuraçao … … … … … … … … … … … … … … … … … No No No No No No No … … … … … … CUWDominica 0.2 - 0.4 4 1 18 … … … 5₋₃ 14₋₃ 96 114₋₃ … 99 91₋₄ 82 Yes Yes Yes Yes Yes No No … … … … … … DMADominican Republic 46 ᵢ 33 ᵢ 127 ᵢ 4 ᵢ 6 ᵢ 22 ᵢ 91 ᵢ 85 ᵢ 55 ᵢ 12 20 96 ᵢ 93 ᵢ 93 ᵢ 94 ᵢ 84 ᵢ 78 ᵢ Yes Yes Yes Yes Yes Yes Yes … … … … 21₋₁ 9₋₁ DOMEcuador 25₋₁ 41₋₁ 178₋₁ 1₋₁ 4₋₁ 19₋₁ 99₋₁ 91₋₁ 72₋₁ 3₋₁ 7₋₁ 99₋₁ 104₋₁ 93₋₁ 96₋₁ 97₋₁ 81₋₁ Yes Yes Yes Yes Yes Yes Yes … … … … 49₋₄ 29₋₄ ECUEl Salvador 96₋₁ 60₋₁ 126₋₁ 14₋₁ 17₋₁ 34₋₁ 90₋₁ 75₋₁ 59₋₁ 13₋₁ 20₋₁ 86₋₁ 87₋₁ 84₋₁ 83₋₁ 77₋₁ 66₋₁ Yes Yes Yes Yes Yes Yes Yes … … … … … … SLVGrenada 0.1₋₁ … 0.1₋₂ 1₋₁ … 3₋₂ … … … 2₋₁ 9₋₁ 99₋₁ 123₋₁ … … 107₋₁ 97₋₂ No No No No No No No … … … … … … GRDGuatemala 249 386₋₁ 680₋₁ 11 33₋₁ 59₋₁ 82 ᵢ 53 ᵢ 37 ᵢ 15 25 89 79 65 ᵢ 67₋₁ 56 41₋₁ Yes Yes Yes Yes Yes Yes Yes … … … … 30₋₄ 11₋₄ GTMGuyana … … … … … … 99 ᵢ 90 ᵢ 64 ᵢ … … … … 91 ᵢ … … … Yes Yes Yes Yes Yes Yes Yes … … … … … … GUYHaiti … … … … … … 53₋₂ 30 ᵢ 13 ᵢ … … … … … … … … No No No No No No No … … … … … … HTIHonduras 151 234 233 13 38 56 85 ᵢ 55 ᵢ 46 ᵢ 9 16 87 79 65 ᵢ 62 44 44 Yes Yes Yes Yes Yes Yes Yes … … … … 30₋₄ 15₋₄ HNDJamaica … 25 23 … 18 24 100 ᵢ 97 ᵢ 92 ᵢ 1 3 … … 97 ᵢ 82 84 76 Yes Yes Yes Yes Yes Yes Yes 85₋₂ 67₋₂ … … … … JAMMexico 94₋₁ 527₋₁ 1,754₋₁ 1₋₁ 8₋₁ 26₋₁ 98₋₁ 89₋₁ 59₋₁ 1₋₁ 2₋₁ 99₋₁ 102₋₁ 90₋₁ 92₋₁ 91₋₁ 74₋₁ Yes Yes Yes Yes Yes Yes Yes … … … … 55₋₁ 44₋₁ MEXMontserrat -₋₃ - - 3₋₃ 7 16 … … … - 0.5 92 97 … 93 110 84 Yes Yes Yes Yes Yes Yes Yes … … … … … … MSRNicaragua … … … … … … 78 ᵢ 52 ᵢ 39 ᵢ … … … … 68 ᵢ … … … Yes Yes Yes Yes Yes Yes Yes … … … … … … NICPanama 59₋₂ 26₋₂ 69₋₄ 13₋₂ 12₋₂ 33₋₄ 95 ᵢ 85₋₁ 63 ᵢ 8₋₂ 11₋₂ 87₋₂ 90₋₂ … 88₋₂ 77₋₂ 56₋₂ Yes Yes Yes Yes Yes Yes Yes … … … … 36₋₁ 19₋₁ PANParaguay … … 130₋₃ … … 32₋₃ 94₋₁ 79₋₁ 64₋₁ 14₋₃ 14₋₃ … … 84₋₁ … … 68₋₃ Yes Yes Yes Yes Yes Yes Yes … … … … 32₋₄ 8₋₄ PRYPeru 48₋₁ 28₋₁ 185₋₁ 1₋₁ 2₋₁ 18₋₁ 96 ᵢ 87 ᵢ 82 ᵢ 4 7 98 99 90 ᵢ 98₋₁ 102 92 ᵢ Yes Yes Yes Yes Yes Yes Yes … … … … … … PERSaint Kitts and Nevis 0.1₋₃ … 0.1₋₃ 1₋₃ … 4₋₃ … … … 1₋₃ 2₋₃ 99₋₃ 98₋₃ … … 111₋₃ 96₋₃ Yes Yes Yes Yes Yes Yes Yes … … … … … … KNASaint Lucia 0.3 1 1 2 10 21 100 ᵢ 98 ᵢ 90 ᵢ 1 2 98 100 98 ᵢ 90 92 79 Yes Yes Yes No No No No … … … … … … LCASaint Vincent/Grenadines 0.1₋₂ 0.1₋₁ 1₋₁ 0.5₋₂ 2₋₁ 15₋₁ … … … 1₋₁ 14₋₁ 97₋₁ᵢ 106₋₁ … 98₋₁ 92₋₁ 85₋₁ Yes Yes Yes Yes Yes No No … … … … … … VCTSint Maarten … … … … … … … … … … … … … … … … … No No No No No No No … … … … … … SXMSuriname 8 6₋₄ 11₋₄ 12 15₋₄ 38₋₄ 86 ᵢ 55 ᵢ 28 ᵢ 18 35 88 86 64 ᵢ 85₋₄ 47 62₋₄ Yes Yes Yes Yes No No Yes 30₋₁ 12₋₁ … … … … SURTrinidad and Tobago … … … … … … 96 ᵢ 95 ᵢ 89 ᵢ … … … … 99 ᵢ … … … No No Yes Yes Yes Yes Yes … … 80₋₃ … 58₋₄ 48₋₄ TTOTurks and Caicos Islands … 0.4₋₁ 0.4₋₁ … 20₋₁ 32₋₁ … … … 4₋₁ 3₋₁ 99₋₁ 129₋₁ … 80₋₁ 106₋₁ 68₋₁ No No No No No No No … … … … … … TCAUruguay 0.4₋₁ 0.4₋₂ 18₋₂ 0.1₋₁ 0.3₋₂ 12₋₂ 97 ᵢ 66 ᵢ 42 ᵢ 3₋₁ 14₋₁ 100₋₁ 103₋₁ 68 ᵢ 100₋₂ … 88₋₂ Yes Yes Yes Yes Yes Yes Yes … … … … 58₋₁ 49₋₁ URYVenezuela, B. R. 325₋₂ 232₋₂ 249₋₂ 10₋₂ 14₋₂ 23₋₂ … … … 8₋₂ 12₋₂ 90₋₂ 93₋₂ … 86₋₂ 75₋₂ 77₋₂ No No No No No No No … … … … … … VEN
TABLE 2: Continued
A N N E X • STATISTICAl TAblES : TAblE 2419
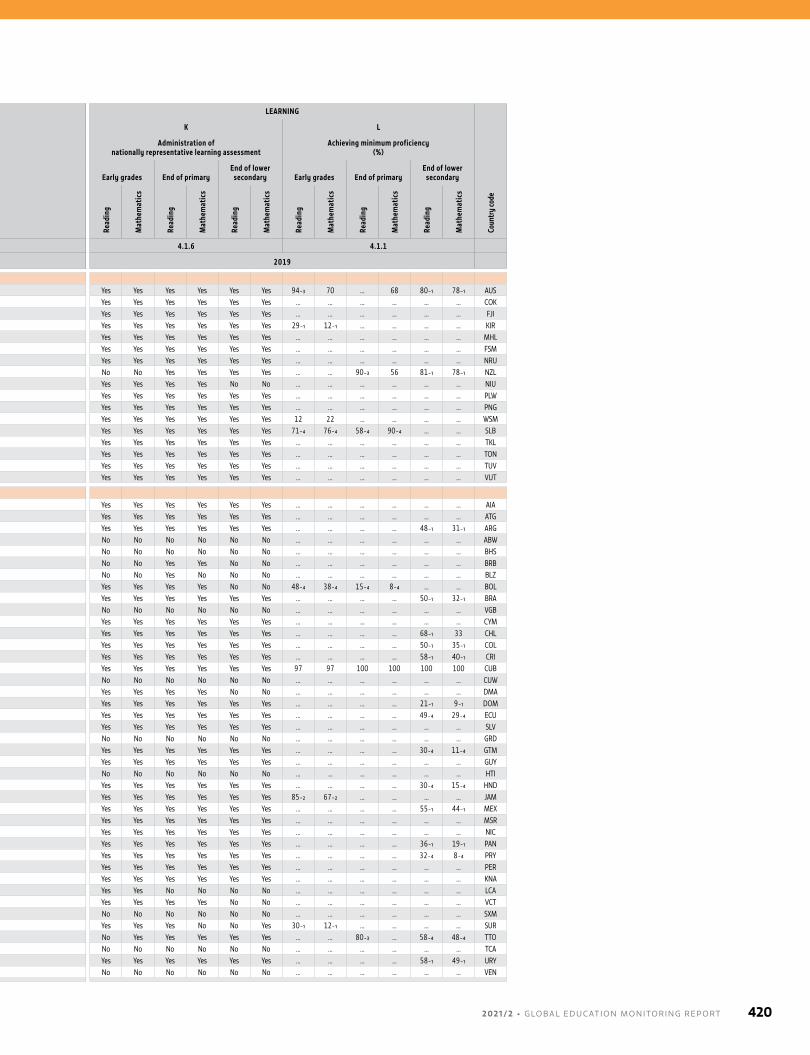
PARTICIPATION / COMPLETION LEARNING
A B C D E F G H I J K L
Out-of-school children (000,000)
Out-of-school rate (%)
Completion rate (%)
Over-age for grade (%)
GER
prim
ary
(%)
NERA
prim
ary
(%)
GIR
last
prim
ary
(%)
Tran
sitio
n fr
om p
rimar
y to
lo
wer
sec
onda
ry (%
)
NERT
low
er s
econ
dary
(%)
GIR
last
low
er s
econ
dary
gr
ade
(%)
NERT
upp
er s
econ
dary
Administration of nationally representative learning assessment
Achieving minimum proficiency (%)
Early grades End of primaryEnd of lower
secondary Early grades End of primaryEnd of lower
secondary
Prim
ary
Low
er
seco
ndar
y
Uppe
r se
cond
ary
Prim
ary
Low
er
seco
ndar
y
Uppe
r se
cond
ary
Prim
ary
Low
er
seco
ndar
y
Uppe
r se
cond
ary
Prim
ary
Low
er
seco
ndar
y
Read
ing
Mat
hem
atic
s
Read
ing
Mat
hem
atic
s
Read
ing
Mat
hem
atic
s
Read
ing
Mat
hem
atic
s
Read
ing
Mat
hem
atic
s
Read
ing
Mat
hem
atic
s
Coun
try
code
SDG indicator 4.1.4 4.1.2 4.1.5 4.1.3 4.1.3 4.1.6 4.1.1
Reference year 2019 2019 2019
OceaniaAustralia 10₋₁ 29₋₁ 47₋₁ 0.4₋₁ 2₋₁ 8₋₁ … … … 0.2₋₁ 2₋₁ 100₋₁ … … 98₋₁ … 92₋₁ Yes Yes Yes Yes Yes Yes Yes 94₋₃ 70 … 68 80₋₁ 78₋₁ AUSCook Islands -₋₃ -₋₃ 0.2 1₋₃ 1₋₃ 29 … … … 0.1 1 99 120 … 99₋₃ 97 71 Yes Yes Yes Yes Yes Yes Yes … … … … … … COKFiji 1₋₃ … … 1₋₃ … … 98 ᵢ 93 ᵢ 85 ᵢ 2 2 99 109 95 ᵢ … 103₋₃ … Yes Yes Yes Yes Yes Yes Yes … … … … … … FJIKiribati 1₋₂ … … 4₋₂ … … 94 78 17 2₋₂ 10₋₂ 96₋₂ 101₋₃ 83 … 95₋₃ … Yes Yes Yes Yes Yes Yes Yes 29₋₁ 12₋₁ … … … … KIRMarshall Islands 2 2 1 26 31 43 … … … 9 19 74 77 … 69 … 57 Yes Yes Yes Yes Yes Yes Yes … … … … … … MHLMicronesia, F. S. 1 … … 10 … … … … … 11 14 90 88 … … 79 … Yes Yes Yes Yes Yes Yes Yes … … … … … … FSMNauru -₋₃ 0.1 - 3₋₃ 9 6 … … … 2 1 99 117 … 91 87 94 Yes Yes Yes Yes Yes Yes Yes … … … … … … NRUNew Zealand 1₋₁ 3₋₁ 4₋₁ 0.3₋₁ 1₋₁ 2₋₁ … … … 0.2₋₁ 0.3₋₁ 100₋₁ … … 99₋₁ … 98₋₁ No No No Yes Yes Yes Yes … … 90₋₃ 56 81₋₁ 78₋₁ NZLNiue … … … … … … … … … - - 94 112₋₃ … … 104₋₄ … Yes Yes Yes Yes Yes No No … … … … … … NIUPalau … … … … … … … … … … … … … … … … … Yes Yes Yes Yes Yes Yes Yes … … … … … … PLWPapua New Guinea 86₋₃ 53₋₃ 320₋₃ 7₋₃ 14₋₃ 46₋₃ 56 ᵢ 50₋₁ 8 ᵢ 47₋₃ 50₋₃ 93₋₃ 77₋₃ … 86₋₃ 62₋₃ 54₋₃ Yes Yes Yes Yes Yes Yes Yes … … … … … … PNGSamoa 0.4₋₁ … 2₋₃ 1₋₁ … 10₋₃ … … … 9 10 99 109 … … 103 90₋₃ Yes Yes Yes Yes Yes Yes Yes 12 22 … … … … WSMSolomon Is 7 … … 7 … … … … … 75 75 93 86 … … 70 … Yes Yes Yes Yes Yes Yes Yes 71₋₄ 76₋₄ 58₋₄ 90₋₄ … … SLBTokelau … … - … … 41 … … … 1 - 97 119 … … … 59 Yes Yes Yes Yes Yes Yes Yes … … … … … … TKLTonga 0.2₋₄ 1₋₄ 2₋₄ 1₋₄ 5₋₄ 38₋₄ 98 92 36 0.2₋₄ 2₋₄ 99₋₄ … 94 95₋₄ … 62₋₄ Yes Yes Yes Yes Yes Yes Yes … … … … … … TONTuvalu 0.2 0.3 0.3 15 29 50 … … … - - 85 79₋₁ … 71 61₋₃ 50 Yes Yes Yes Yes Yes Yes Yes … … … … … … TUVVanuatu 3₋₄ 1₋₄ 7₋₄ 8₋₄ 3₋₄ 44₋₄ 82 ᵢ 45 ᵢ 12 ᵢ … … 92₋₄ … 55 ᵢ 97₋₄ … 56₋₄ Yes Yes Yes Yes Yes Yes Yes … … … … … … VUT
Latin America and the CaribbeanAnguilla - … - 1 … 4 … … … 1 1 99 96 … … … 96 Yes Yes Yes Yes Yes Yes Yes … … … … … … AIAAntigua and Barbuda 0.1₋₁ 0.1₋₁ 0.4₋₁ 1₋₁ 1₋₁ 13₋₁ … … … 2₋₁ 13₋₁ 99₋₁ 96₋₁ … 99₋₁ 99₋₁ 87₋₁ Yes Yes Yes Yes Yes Yes Yes … … … … … … ATGArgentina 18₋₁ 2₋₁ 237₋₁ 0.4₋₁ 0.1₋₁ 11₋₁ 96 ᵢ 72 ᵢ 63 ᵢ 3₋₁ 13₋₁ 100₋₁ 99₋₁ 75 ᵢ 100₋₁ 91₋₁ 89₋₁ Yes Yes Yes Yes Yes Yes Yes … … … … 48₋₁ 31₋₁ ARGAruba … … … … … … … … … … … … … … … … … No No No No No No No … … … … … … ABWBahamas … … … … … … … … … 6₋₁ … … … … … … … No No No No No No No … … … … … … BHSBarbados 0.2 1 0.4 1 5 5 99 ᵢ 99 ᵢ 95 ᵢ 0.2 3 99 90 100 ᵢ 95 … 95 No No No Yes Yes No No … … … … … … BRBBelize 0.2 3 6 0.5 10 36 96₋₃ 61₋₃ 49₋₃ 8 15 100 103 63₋₃ 90 70 64 No No No Yes No No No … … … … … … BLZBolivia, P. S. 75 62₋₁ 200 5 13₋₁ 22 98 ᵢ 92 ᵢ 67 ᵢ 3 8 95 92 93 ᵢ 93 86 78 Yes Yes Yes Yes Yes No No 48₋₄ 38₋₄ 15₋₄ 8₋₄ … … BOLBrazil 72₋₁ᵢ 296₋₁ᵢ 1,440₋₁ᵢ 1₋₁ᵢ 2₋₁ᵢ 15₋₁ᵢ 95₋₁ 86₋₁ 67₋₁ 7₋₁ 16₋₁ 99₋₁ᵢ … 90₋₁ 98₋₁ᵢ … 85₋₁ᵢ Yes Yes Yes Yes Yes Yes Yes … … … … 50₋₁ 32₋₁ BRABritish Virgin Islands -₋₁ 0.1₋₄ 0.2₋₃ 2₋₁ 5₋₄ 20₋₃ … … … 5₋₁ 19₋₁ 98₋₁ 80₋₁ … 88₋₃ 98₋₃ 80₋₃ No No No No No No No … … … … … … VGBCayman Islands 1₋₁ 0.5₋₁ 1₋₁ 10₋₁ 20₋₁ 25₋₁ … … … 0.2₋₁ 0.4₋₁ 90₋₁ 90₋₁ … 80₋₁ 80₋₁ 75₋₁ Yes Yes Yes Yes Yes Yes Yes … … … … … … CYMChile 19₋₁ 26₋₁ 46₋₁ 1₋₁ 5₋₁ 5₋₁ 96₋₂ 96₋₂ 86₋₂ 4₋₁ 8₋₁ 99₋₁ 96₋₁ 100₋₂ 95₋₁ 93₋₁ 95₋₁ Yes Yes Yes Yes Yes Yes Yes … … … … 68₋₁ 33 CHLColombia 37 176 359₋₁ 1 6 21₋₁ 93₋₁ 77₋₁ 72₋₁ 13 21 99 107 82₋₁ 94 78 85 Yes Yes Yes Yes Yes Yes Yes … … … … 50₋₁ 35₋₁ COLCosta Rica 1 4 9 0.1 2 6 99₋₁ 73₋₁ 58₋₁ 5 19 100 103 74₋₁ 98 74 94 Yes Yes Yes Yes Yes Yes Yes … … … … 58₋₁ 40₋₁ CRICuba 6 38 70 1 10 18 100 95 65 0.4 1 99 87 95 90 89 82 Yes Yes Yes Yes Yes Yes Yes 97 97 100 100 100 100 CUBCuraçao … … … … … … … … … … … … … … … … … No No No No No No No … … … … … … CUWDominica 0.2 - 0.4 4 1 18 … … … 5₋₃ 14₋₃ 96 114₋₃ … 99 91₋₄ 82 Yes Yes Yes Yes Yes No No … … … … … … DMADominican Republic 46 ᵢ 33 ᵢ 127 ᵢ 4 ᵢ 6 ᵢ 22 ᵢ 91 ᵢ 85 ᵢ 55 ᵢ 12 20 96 ᵢ 93 ᵢ 93 ᵢ 94 ᵢ 84 ᵢ 78 ᵢ Yes Yes Yes Yes Yes Yes Yes … … … … 21₋₁ 9₋₁ DOMEcuador 25₋₁ 41₋₁ 178₋₁ 1₋₁ 4₋₁ 19₋₁ 99₋₁ 91₋₁ 72₋₁ 3₋₁ 7₋₁ 99₋₁ 104₋₁ 93₋₁ 96₋₁ 97₋₁ 81₋₁ Yes Yes Yes Yes Yes Yes Yes … … … … 49₋₄ 29₋₄ ECUEl Salvador 96₋₁ 60₋₁ 126₋₁ 14₋₁ 17₋₁ 34₋₁ 90₋₁ 75₋₁ 59₋₁ 13₋₁ 20₋₁ 86₋₁ 87₋₁ 84₋₁ 83₋₁ 77₋₁ 66₋₁ Yes Yes Yes Yes Yes Yes Yes … … … … … … SLVGrenada 0.1₋₁ … 0.1₋₂ 1₋₁ … 3₋₂ … … … 2₋₁ 9₋₁ 99₋₁ 123₋₁ … … 107₋₁ 97₋₂ No No No No No No No … … … … … … GRDGuatemala 249 386₋₁ 680₋₁ 11 33₋₁ 59₋₁ 82 ᵢ 53 ᵢ 37 ᵢ 15 25 89 79 65 ᵢ 67₋₁ 56 41₋₁ Yes Yes Yes Yes Yes Yes Yes … … … … 30₋₄ 11₋₄ GTMGuyana … … … … … … 99 ᵢ 90 ᵢ 64 ᵢ … … … … 91 ᵢ … … … Yes Yes Yes Yes Yes Yes Yes … … … … … … GUYHaiti … … … … … … 53₋₂ 30 ᵢ 13 ᵢ … … … … … … … … No No No No No No No … … … … … … HTIHonduras 151 234 233 13 38 56 85 ᵢ 55 ᵢ 46 ᵢ 9 16 87 79 65 ᵢ 62 44 44 Yes Yes Yes Yes Yes Yes Yes … … … … 30₋₄ 15₋₄ HNDJamaica … 25 23 … 18 24 100 ᵢ 97 ᵢ 92 ᵢ 1 3 … … 97 ᵢ 82 84 76 Yes Yes Yes Yes Yes Yes Yes 85₋₂ 67₋₂ … … … … JAMMexico 94₋₁ 527₋₁ 1,754₋₁ 1₋₁ 8₋₁ 26₋₁ 98₋₁ 89₋₁ 59₋₁ 1₋₁ 2₋₁ 99₋₁ 102₋₁ 90₋₁ 92₋₁ 91₋₁ 74₋₁ Yes Yes Yes Yes Yes Yes Yes … … … … 55₋₁ 44₋₁ MEXMontserrat -₋₃ - - 3₋₃ 7 16 … … … - 0.5 92 97 … 93 110 84 Yes Yes Yes Yes Yes Yes Yes … … … … … … MSRNicaragua … … … … … … 78 ᵢ 52 ᵢ 39 ᵢ … … … … 68 ᵢ … … … Yes Yes Yes Yes Yes Yes Yes … … … … … … NICPanama 59₋₂ 26₋₂ 69₋₄ 13₋₂ 12₋₂ 33₋₄ 95 ᵢ 85₋₁ 63 ᵢ 8₋₂ 11₋₂ 87₋₂ 90₋₂ … 88₋₂ 77₋₂ 56₋₂ Yes Yes Yes Yes Yes Yes Yes … … … … 36₋₁ 19₋₁ PANParaguay … … 130₋₃ … … 32₋₃ 94₋₁ 79₋₁ 64₋₁ 14₋₃ 14₋₃ … … 84₋₁ … … 68₋₃ Yes Yes Yes Yes Yes Yes Yes … … … … 32₋₄ 8₋₄ PRYPeru 48₋₁ 28₋₁ 185₋₁ 1₋₁ 2₋₁ 18₋₁ 96 ᵢ 87 ᵢ 82 ᵢ 4 7 98 99 90 ᵢ 98₋₁ 102 92 ᵢ Yes Yes Yes Yes Yes Yes Yes … … … … … … PERSaint Kitts and Nevis 0.1₋₃ … 0.1₋₃ 1₋₃ … 4₋₃ … … … 1₋₃ 2₋₃ 99₋₃ 98₋₃ … … 111₋₃ 96₋₃ Yes Yes Yes Yes Yes Yes Yes … … … … … … KNASaint Lucia 0.3 1 1 2 10 21 100 ᵢ 98 ᵢ 90 ᵢ 1 2 98 100 98 ᵢ 90 92 79 Yes Yes Yes No No No No … … … … … … LCASaint Vincent/Grenadines 0.1₋₂ 0.1₋₁ 1₋₁ 0.5₋₂ 2₋₁ 15₋₁ … … … 1₋₁ 14₋₁ 97₋₁ᵢ 106₋₁ … 98₋₁ 92₋₁ 85₋₁ Yes Yes Yes Yes Yes No No … … … … … … VCTSint Maarten … … … … … … … … … … … … … … … … … No No No No No No No … … … … … … SXMSuriname 8 6₋₄ 11₋₄ 12 15₋₄ 38₋₄ 86 ᵢ 55 ᵢ 28 ᵢ 18 35 88 86 64 ᵢ 85₋₄ 47 62₋₄ Yes Yes Yes Yes No No Yes 30₋₁ 12₋₁ … … … … SURTrinidad and Tobago … … … … … … 96 ᵢ 95 ᵢ 89 ᵢ … … … … 99 ᵢ … … … No No Yes Yes Yes Yes Yes … … 80₋₃ … 58₋₄ 48₋₄ TTOTurks and Caicos Islands … 0.4₋₁ 0.4₋₁ … 20₋₁ 32₋₁ … … … 4₋₁ 3₋₁ 99₋₁ 129₋₁ … 80₋₁ 106₋₁ 68₋₁ No No No No No No No … … … … … … TCAUruguay 0.4₋₁ 0.4₋₂ 18₋₂ 0.1₋₁ 0.3₋₂ 12₋₂ 97 ᵢ 66 ᵢ 42 ᵢ 3₋₁ 14₋₁ 100₋₁ 103₋₁ 68 ᵢ 100₋₂ … 88₋₂ Yes Yes Yes Yes Yes Yes Yes … … … … 58₋₁ 49₋₁ URYVenezuela, B. R. 325₋₂ 232₋₂ 249₋₂ 10₋₂ 14₋₂ 23₋₂ … … … 8₋₂ 12₋₂ 90₋₂ 93₋₂ … 86₋₂ 75₋₂ 77₋₂ No No No No No No No … … … … … … VEN
2 0 2 1 / 2 • G LO BA L E D U C AT I O N M O N I TO R I N G R E P O RT 420
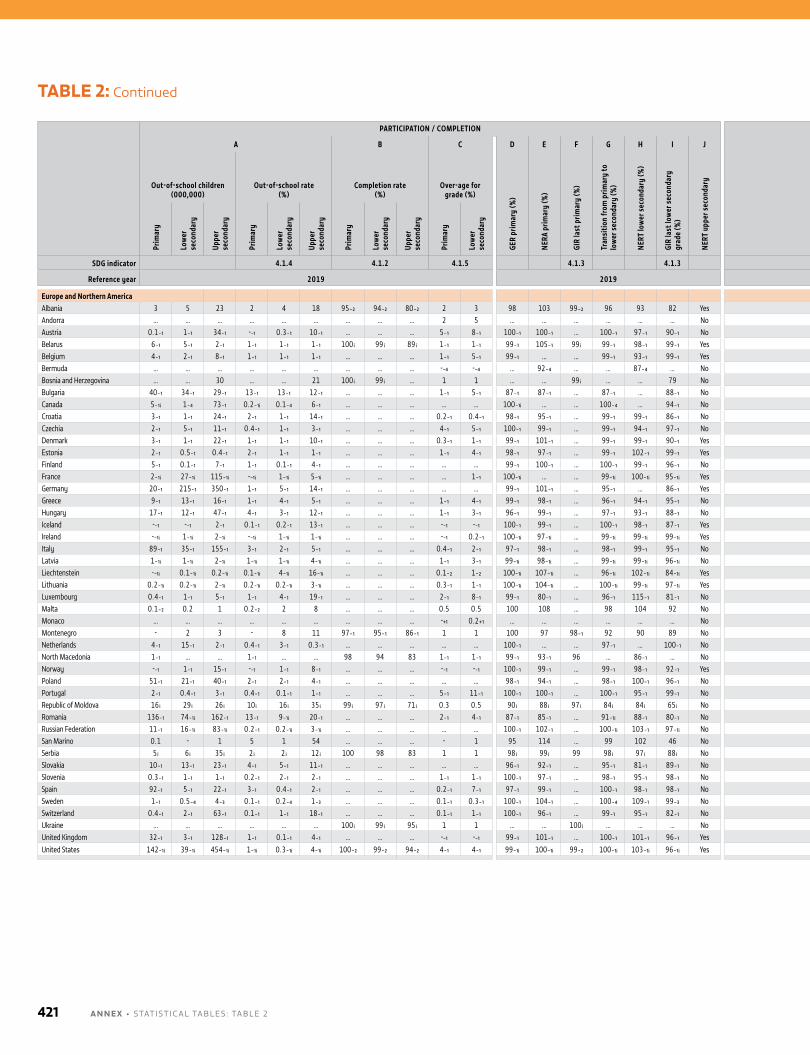
PARTICIPATION / COMPLETION LEARNING
A B C D E F G H I J K L
Out-of-school children (000,000)
Out-of-school rate (%)
Completion rate (%)
Over-age for grade (%)
GER
prim
ary
(%)
NERA
prim
ary
(%)
GIR
last
prim
ary
(%)
Tran
sitio
n fr
om p
rimar
y to
lo
wer
sec
onda
ry (%
)
NERT
low
er s
econ
dary
(%)
GIR
last
low
er s
econ
dary
gr
ade
(%)
NERT
upp
er s
econ
dary
Administration of nationally representative learning assessment
Achieving minimum proficiency (%)
Early grades End of primaryEnd of lower
secondary Early grades End of primaryEnd of lower
secondary
Prim
ary
Low
er
seco
ndar
y
Uppe
r se
cond
ary
Prim
ary
Low
er
seco
ndar
y
Uppe
r se
cond
ary
Prim
ary
Low
er
seco
ndar
y
Uppe
r se
cond
ary
Prim
ary
Low
er
seco
ndar
y
Read
ing
Mat
hem
atic
s
Read
ing
Mat
hem
atic
s
Read
ing
Mat
hem
atic
s
Read
ing
Mat
hem
atic
s
Read
ing
Mat
hem
atic
s
Read
ing
Mat
hem
atic
s
Coun
try
code
SDG indicator 4.1.4 4.1.2 4.1.5 4.1.3 4.1.3 4.1.6 4.1.1
Reference year 2019 2019 2019
Europe and Northern AmericaAlbania 3 5 23 2 4 18 95₋₂ 94₋₂ 80₋₂ 2 3 98 103 99₋₂ 96 93 82 Yes Yes Yes Yes Yes Yes Yes … … … 62 48₋₁ 58₋₁ ALBAndorra … … … … … … … … … 2 5 … … … … … … No No No No No No No … … … … … … ANDAustria 0.1₋₁ 1₋₁ 34₋₁ -₋₁ 0.3₋₁ 10₋₁ … … … 5₋₁ 8₋₁ 100₋₁ 100₋₁ … 100₋₁ 97₋₁ 90₋₁ No No No Yes Yes Yes Yes … … 98₋₃ 84 76₋₁ 79₋₁ AUTBelarus 6₋₁ 5₋₁ 2₋₁ 1₋₁ 1₋₁ 1₋₁ 100 ᵢ 99 ᵢ 89 ᵢ 1₋₁ 1₋₁ 99₋₁ 105₋₁ 99 ᵢ 99₋₁ 98₋₁ 99₋₁ Yes Yes Yes Yes No Yes Yes 82 73 … … 77₋₁ 71₋₁ BLRBelgium 4₋₁ 2₋₁ 8₋₁ 1₋₁ 1₋₁ 1₋₁ … … … 1₋₁ 5₋₁ 99₋₁ … … 99₋₁ 93₋₁ 99₋₁ Yes Yes Yes Yes Yes Yes Yes … … 97₋₃ 80 79₋₁ 80₋₁ BELBermuda … … … … … … … … … -₋₄ -₋₄ … 92₋₄ … … 87₋₄ … No No No No No No No … … … … … … BMUBosnia and Herzegovina … … 30 … … 21 100 ᵢ 99 ᵢ … 1 1 … … 99 ᵢ … … 79 No No No No Yes Yes Yes … … … 40 46₋₁ … BIHBulgaria 40₋₁ 34₋₁ 29₋₁ 13₋₁ 13₋₁ 12₋₁ … … … 1₋₁ 5₋₁ 87₋₁ 87₋₁ … 87₋₁ … 88₋₁ No No No Yes Yes Yes Yes … … 95₋₃ 71 53₋₁ 56₋₁ BGRCanada 5₋₁ᵢ 1₋₄ 73₋₁ 0.2₋₁ᵢ 0.1₋₄ 6₋₁ … … … … … 100₋₁ᵢ … … 100₋₄ … 94₋₁ No No No Yes Yes Yes Yes … … 96₋₃ 69 86₋₁ 84₋₁ CANCroatia 3₋₁ 1₋₁ 24₋₁ 2₋₁ 1₋₁ 14₋₁ … … … 0.2₋₁ 0.4₋₁ 98₋₁ 95₋₁ … 99₋₁ 99₋₁ 86₋₁ No No No Yes Yes Yes Yes … … … 70 78₋₁ 69₋₁ HRVCzechia 2₋₁ 5₋₁ 11₋₁ 0.4₋₁ 1₋₁ 3₋₁ … … … 4₋₁ 5₋₁ 100₋₁ 99₋₁ … 99₋₁ 94₋₁ 97₋₁ No No No Yes Yes Yes Yes … … 97₋₃ 78 79₋₁ 80₋₁ CZEDenmark 3₋₁ 1₋₁ 22₋₁ 1₋₁ 1₋₁ 10₋₁ … … … 0.3₋₁ 1₋₁ 99₋₁ 101₋₁ … 99₋₁ 99₋₁ 90₋₁ Yes Yes Yes Yes Yes Yes Yes 97₋₃ 75 … … 84₋₁ 85₋₁ DNKEstonia 2₋₁ 0.5₋₁ 0.4₋₁ 2₋₁ 1₋₁ 1₋₁ … … … 1₋₁ 4₋₁ 98₋₁ 97₋₁ … 99₋₁ 102₋₁ 99₋₁ Yes Yes Yes Yes Yes Yes Yes … … … … 89₋₁ 90₋₁ ESTFinland 5₋₁ 0.1₋₁ 7₋₁ 1₋₁ 0.1₋₁ 4₋₁ … … … … … 99₋₁ 100₋₁ … 100₋₁ 99₋₁ 96₋₁ No No No Yes Yes Yes Yes … … 98₋₃ 78 86₋₁ 85₋₁ FINFrance 2₋₁ᵢ 27₋₁ᵢ 115₋₁ᵢ -₋₁ᵢ 1₋₁ᵢ 5₋₁ᵢ … … … … 1₋₁ 100₋₁ᵢ … … 99₋₁ᵢ 100₋₁ᵢ 95₋₁ᵢ Yes Yes Yes Yes Yes Yes Yes … … 94₋₃ 57 79₋₁ 79₋₁ FRAGermany 20₋₁ 215₋₁ 350₋₁ 1₋₁ 5₋₁ 14₋₁ … … … … … 99₋₁ 101₋₁ … 95₋₁ … 86₋₁ Yes Yes Yes Yes Yes Yes Yes … … 95₋₃ 75 79₋₁ 79₋₁ DEUGreece 9₋₁ 13₋₁ 16₋₁ 1₋₁ 4₋₁ 5₋₁ … … … 1₋₁ 4₋₁ 99₋₁ 98₋₁ … 96₋₁ 94₋₁ 95₋₁ No No No Yes Yes Yes Yes … … … … 69₋₁ 64₋₁ GRCHungary 17₋₁ 12₋₁ 47₋₁ 4₋₁ 3₋₁ 12₋₁ … … … 1₋₁ 3₋₁ 96₋₁ 99₋₁ … 97₋₁ 93₋₁ 88₋₁ No No No Yes Yes Yes Yes … … 97₋₃ 74 75₋₁ 68 HUNIceland -₋₁ -₋₁ 2₋₁ 0.1₋₁ 0.2₋₁ 13₋₁ … … … -₋₁ -₋₁ 100₋₁ 99₋₁ … 100₋₁ 98₋₁ 87₋₁ Yes Yes Yes Yes Yes Yes Yes … … … … 74₋₁ 79₋₁ ISLIreland -₋₁ᵢ 1₋₁ᵢ 2₋₁ᵢ -₋₁ᵢ 1₋₁ᵢ 1₋₁ᵢ … … … -₋₁ 0.2₋₁ 100₋₁ᵢ 97₋₁ᵢ … 99₋₁ᵢ 99₋₁ᵢ 99₋₁ᵢ Yes Yes Yes Yes Yes Yes Yes 98₋₃ 84 … … 88₋₁ 84₋₁ IRLItaly 89₋₁ 35₋₁ 155₋₁ 3₋₁ 2₋₁ 5₋₁ … … … 0.4₋₁ 2₋₁ 97₋₁ 98₋₁ … 98₋₁ 99₋₁ 95₋₁ No No No Yes Yes Yes Yes … … 98₋₃ 73 77₋₁ 62 ITALatvia 1₋₁ᵢ 1₋₁ᵢ 2₋₁ᵢ 1₋₁ᵢ 1₋₁ᵢ 4₋₁ᵢ … … … 1₋₁ 3₋₁ 99₋₁ᵢ 98₋₁ᵢ … 99₋₁ᵢ 99₋₁ᵢ 96₋₁ᵢ No No No Yes Yes Yes Yes … … 99₋₃ 85 78₋₁ 83₋₁ LVALiechtenstein -₋₁ᵢ 0.1₋₁ᵢ 0.2₋₁ᵢ 0.1₋₁ᵢ 4₋₁ᵢ 16₋₁ᵢ … … … 0.1₋₂ 1₋₂ 100₋₁ᵢ 107₋₁ᵢ … 96₋₁ᵢ 102₋₁ᵢ 84₋₁ᵢ Yes Yes Yes Yes Yes Yes Yes … … … … … … LIELithuania 0.2₋₁ᵢ 0.2₋₁ᵢ 2₋₁ᵢ 0.2₋₁ᵢ 0.2₋₁ᵢ 3₋₁ᵢ … … … 0.3₋₁ 1₋₁ 100₋₁ᵢ 104₋₁ᵢ … 100₋₁ᵢ 99₋₁ᵢ 97₋₁ᵢ Yes Yes Yes Yes Yes Yes Yes … … 97₋₃ 81 76₋₁ 74₋₁ LTULuxembourg 0.4₋₁ 1₋₁ 5₋₁ 1₋₁ 4₋₁ 19₋₁ … … … 2₋₁ 8₋₁ 99₋₁ 80₋₁ … 96₋₁ 115₋₁ 81₋₁ No No Yes Yes Yes Yes Yes … … … … 71₋₁ 73₋₁ LUXMalta 0.1₋₂ 0.2 1 0.2₋₂ 2 8 … … … 0.5 0.5 100 108 … 98 104 92 No No No Yes Yes Yes Yes … … 73₋₃ 69 64₋₁ 62₋₄ MLTMonaco … … … … … … … … … -₊₁ 0.2₊₁ … … … … … … No No No No No Yes Yes … … … … … … MCOMontenegro - 2 3 - 8 11 97₋₁ 95₋₁ 86₋₁ 1 1 100 97 98₋₁ 92 90 89 No No No No Yes Yes Yes … … … 43 56₋₁ 54₋₁ MNENetherlands 4₋₁ 15₋₁ 2₋₁ 0.4₋₁ 3₋₁ 0.3₋₁ … … … … … 100₋₁ … … 97₋₁ … 100₋₁ No No No Yes Yes Yes Yes … … 99₋₃ 84 76₋₁ 84₋₁ NLDNorth Macedonia 1₋₁ … … 1₋₁ … … 98 94 83 1₋₁ 1₋₁ 99₋₁ 93₋₁ 96 … 86₋₁ … No No Yes Yes Yes Yes Yes … … … 52 45₋₁ 39₋₁ MKDNorway -₋₁ 1₋₁ 15₋₁ -₋₁ 1₋₁ 8₋₁ … … … -₋₁ -₋₁ 100₋₁ 99₋₁ … 99₋₁ 98₋₁ 92₋₁ Yes Yes Yes Yes Yes Yes Yes 99₋₃ 82 … 65 81₋₁ 81₋₁ NORPoland 51₋₁ 21₋₁ 40₋₁ 2₋₁ 2₋₁ 4₋₁ … … … … … 98₋₁ 94₋₁ … 98₋₁ 100₋₁ 96₋₁ No No No Yes Yes Yes Yes … … 98₋₃ 73 85₋₁ 85₋₁ POLPortugal 2₋₁ 0.4₋₁ 3₋₁ 0.4₋₁ 0.1₋₁ 1₋₁ … … … 5₋₁ 11₋₁ 100₋₁ 100₋₁ … 100₋₁ 95₋₁ 99₋₁ No No No Yes Yes Yes Yes … … 97₋₃ 74 80₋₁ 77₋₁ PRTRepublic of Moldova 16 ᵢ 29 ᵢ 26 ᵢ 10 ᵢ 16 ᵢ 35 ᵢ 99 ᵢ 97 ᵢ 71 ᵢ 0.3 0.5 90 ᵢ 88 ᵢ 97 ᵢ 84 ᵢ 84 ᵢ 65 ᵢ No No No Yes Yes Yes Yes … … … … 57₋₁ 50₋₁ MDARomania 136₋₁ 74₋₁ᵢ 162₋₁ 13₋₁ 9₋₁ᵢ 20₋₁ … … … 2₋₁ 4₋₁ 87₋₁ 85₋₁ … 91₋₁ᵢ 88₋₁ 80₋₁ No No No Yes Yes Yes Yes … … … … 59₋₁ 53₋₁ ROURussian Federation 11₋₁ 16₋₁ᵢ 83₋₁ᵢ 0.2₋₁ 0.2₋₁ᵢ 3₋₁ᵢ … … … … … 100₋₁ 102₋₁ … 100₋₁ᵢ 103₋₁ 97₋₁ᵢ No No No Yes Yes Yes Yes … … 99₋₃ 91 78₋₁ 78₋₁ RUSSan Marino 0.1 - 1 5 1 54 … … … - 1 95 114 … 99 102 46 No No No No No No No … … … … … … SMRSerbia 5 ᵢ 6 ᵢ 35 ᵢ 2 ᵢ 2 ᵢ 12 ᵢ 100 98 83 1 1 98 ᵢ 99 ᵢ 99 98 ᵢ 97 ᵢ 88 ᵢ No No No No Yes Yes Yes … … … 68 62₋₁ 60₋₁ SRBSlovakia 10₋₁ 13₋₁ 23₋₁ 4₋₁ 5₋₁ 11₋₁ … … … … … 96₋₁ 92₋₁ … 95₋₁ 81₋₁ 89₋₁ No No No Yes Yes Yes Yes … … 93₋₃ 71 69₋₁ 75₋₁ SVKSlovenia 0.3₋₁ 1₋₁ 1₋₁ 0.2₋₁ 2₋₁ 2₋₁ … … … 1₋₁ 1₋₁ 100₋₁ 97₋₁ … 98₋₁ 95₋₁ 98₋₁ No No No Yes Yes Yes Yes … … 96₋₃ 75₋₄ 82₋₁ 84₋₁ SVNSpain 92₋₁ 5₋₁ 22₋₁ 3₋₁ 0.4₋₁ 2₋₁ … … … 0.2₋₁ 7₋₁ 97₋₁ 99₋₁ … 100₋₁ 98₋₁ 98₋₁ No No No Yes Yes Yes Yes … … 97₋₃ 65 84₋₄ 75₋₁ ESPSweden 1₋₁ 0.5₋₄ 4₋₃ 0.1₋₁ 0.2₋₄ 1₋₃ … … … 0.1₋₁ 0.3₋₁ 100₋₁ 104₋₁ … 100₋₄ 109₋₁ 99₋₃ No No No Yes Yes Yes Yes … … 98₋₃ 74 82₋₁ 81₋₁ SWESwitzerland 0.4₋₁ 2₋₁ 63₋₁ 0.1₋₁ 1₋₁ 18₋₁ … … … 0.1₋₁ 1₋₁ 100₋₁ 96₋₁ … 99₋₁ 95₋₁ 82₋₁ No No No No No Yes Yes … … … … 76₋₁ 83₋₁ CHEUkraine … … … … … … 100 ᵢ 99 ᵢ 95 ᵢ 1 1 … … 100 ᵢ … … … No No No Yes Yes Yes Yes … … … … 74₋₁ … UKRUnited Kingdom 32₋₁ 3₋₁ 128₋₁ 1₋₁ 0.1₋₁ 4₋₁ … … … -₋₁ -₋₁ 99₋₁ 101₋₁ … 100₋₁ 101₋₁ 96₋₁ Yes Yes Yes Yes Yes Yes Yes … … 97₋₃ 83 83₋₁ 81₋₁ GBRUnited States 142₋₁ᵢ 39₋₁ᵢ 454₋₁ᵢ 1₋₁ᵢ 0.3₋₁ᵢ 4₋₁ᵢ 100₋₂ 99₋₂ 94₋₂ 4₋₁ 4₋₁ 99₋₁ᵢ 100₋₁ᵢ 99₋₂ 100₋₁ᵢ 103₋₁ᵢ 96₋₁ᵢ Yes Yes No Yes Yes Yes Yes … … 96₋₃ 77 81₋₁ 73₋₁ USA
TABLE 2: Continued
A N N E X • STATISTICAl TAblES : TAblE 2421
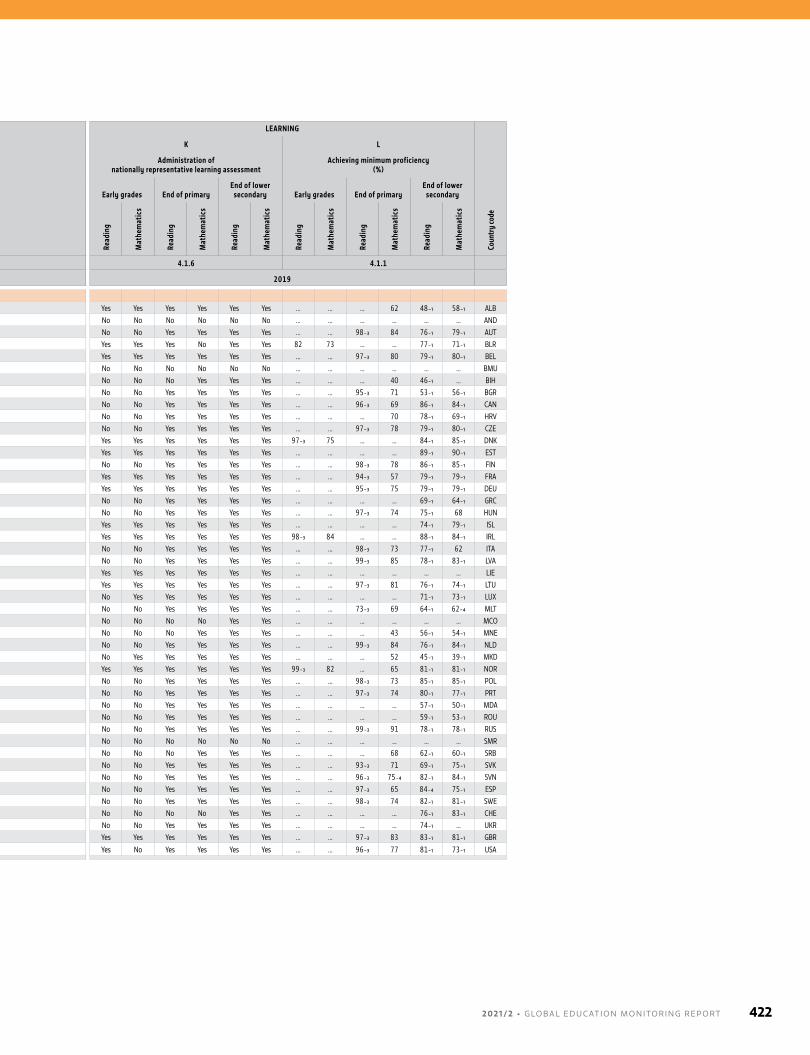
PARTICIPATION / COMPLETION LEARNING
A B C D E F G H I J K L
Out-of-school children (000,000)
Out-of-school rate (%)
Completion rate (%)
Over-age for grade (%)
GER
prim
ary
(%)
NERA
prim
ary
(%)
GIR
last
prim
ary
(%)
Tran
sitio
n fr
om p
rimar
y to
lo
wer
sec
onda
ry (%
)
NERT
low
er s
econ
dary
(%)
GIR
last
low
er s
econ
dary
gr
ade
(%)
NERT
upp
er s
econ
dary
Administration of nationally representative learning assessment
Achieving minimum proficiency (%)
Early grades End of primaryEnd of lower
secondary Early grades End of primaryEnd of lower
secondary
Prim
ary
Low
er
seco
ndar
y
Uppe
r se
cond
ary
Prim
ary
Low
er
seco
ndar
y
Uppe
r se
cond
ary
Prim
ary
Low
er
seco
ndar
y
Uppe
r se
cond
ary
Prim
ary
Low
er
seco
ndar
y
Read
ing
Mat
hem
atic
s
Read
ing
Mat
hem
atic
s
Read
ing
Mat
hem
atic
s
Read
ing
Mat
hem
atic
s
Read
ing
Mat
hem
atic
s
Read
ing
Mat
hem
atic
s
Coun
try
code
SDG indicator 4.1.4 4.1.2 4.1.5 4.1.3 4.1.3 4.1.6 4.1.1
Reference year 2019 2019 2019
Europe and Northern AmericaAlbania 3 5 23 2 4 18 95₋₂ 94₋₂ 80₋₂ 2 3 98 103 99₋₂ 96 93 82 Yes Yes Yes Yes Yes Yes Yes … … … 62 48₋₁ 58₋₁ ALBAndorra … … … … … … … … … 2 5 … … … … … … No No No No No No No … … … … … … ANDAustria 0.1₋₁ 1₋₁ 34₋₁ -₋₁ 0.3₋₁ 10₋₁ … … … 5₋₁ 8₋₁ 100₋₁ 100₋₁ … 100₋₁ 97₋₁ 90₋₁ No No No Yes Yes Yes Yes … … 98₋₃ 84 76₋₁ 79₋₁ AUTBelarus 6₋₁ 5₋₁ 2₋₁ 1₋₁ 1₋₁ 1₋₁ 100 ᵢ 99 ᵢ 89 ᵢ 1₋₁ 1₋₁ 99₋₁ 105₋₁ 99 ᵢ 99₋₁ 98₋₁ 99₋₁ Yes Yes Yes Yes No Yes Yes 82 73 … … 77₋₁ 71₋₁ BLRBelgium 4₋₁ 2₋₁ 8₋₁ 1₋₁ 1₋₁ 1₋₁ … … … 1₋₁ 5₋₁ 99₋₁ … … 99₋₁ 93₋₁ 99₋₁ Yes Yes Yes Yes Yes Yes Yes … … 97₋₃ 80 79₋₁ 80₋₁ BELBermuda … … … … … … … … … -₋₄ -₋₄ … 92₋₄ … … 87₋₄ … No No No No No No No … … … … … … BMUBosnia and Herzegovina … … 30 … … 21 100 ᵢ 99 ᵢ … 1 1 … … 99 ᵢ … … 79 No No No No Yes Yes Yes … … … 40 46₋₁ … BIHBulgaria 40₋₁ 34₋₁ 29₋₁ 13₋₁ 13₋₁ 12₋₁ … … … 1₋₁ 5₋₁ 87₋₁ 87₋₁ … 87₋₁ … 88₋₁ No No No Yes Yes Yes Yes … … 95₋₃ 71 53₋₁ 56₋₁ BGRCanada 5₋₁ᵢ 1₋₄ 73₋₁ 0.2₋₁ᵢ 0.1₋₄ 6₋₁ … … … … … 100₋₁ᵢ … … 100₋₄ … 94₋₁ No No No Yes Yes Yes Yes … … 96₋₃ 69 86₋₁ 84₋₁ CANCroatia 3₋₁ 1₋₁ 24₋₁ 2₋₁ 1₋₁ 14₋₁ … … … 0.2₋₁ 0.4₋₁ 98₋₁ 95₋₁ … 99₋₁ 99₋₁ 86₋₁ No No No Yes Yes Yes Yes … … … 70 78₋₁ 69₋₁ HRVCzechia 2₋₁ 5₋₁ 11₋₁ 0.4₋₁ 1₋₁ 3₋₁ … … … 4₋₁ 5₋₁ 100₋₁ 99₋₁ … 99₋₁ 94₋₁ 97₋₁ No No No Yes Yes Yes Yes … … 97₋₃ 78 79₋₁ 80₋₁ CZEDenmark 3₋₁ 1₋₁ 22₋₁ 1₋₁ 1₋₁ 10₋₁ … … … 0.3₋₁ 1₋₁ 99₋₁ 101₋₁ … 99₋₁ 99₋₁ 90₋₁ Yes Yes Yes Yes Yes Yes Yes 97₋₃ 75 … … 84₋₁ 85₋₁ DNKEstonia 2₋₁ 0.5₋₁ 0.4₋₁ 2₋₁ 1₋₁ 1₋₁ … … … 1₋₁ 4₋₁ 98₋₁ 97₋₁ … 99₋₁ 102₋₁ 99₋₁ Yes Yes Yes Yes Yes Yes Yes … … … … 89₋₁ 90₋₁ ESTFinland 5₋₁ 0.1₋₁ 7₋₁ 1₋₁ 0.1₋₁ 4₋₁ … … … … … 99₋₁ 100₋₁ … 100₋₁ 99₋₁ 96₋₁ No No No Yes Yes Yes Yes … … 98₋₃ 78 86₋₁ 85₋₁ FINFrance 2₋₁ᵢ 27₋₁ᵢ 115₋₁ᵢ -₋₁ᵢ 1₋₁ᵢ 5₋₁ᵢ … … … … 1₋₁ 100₋₁ᵢ … … 99₋₁ᵢ 100₋₁ᵢ 95₋₁ᵢ Yes Yes Yes Yes Yes Yes Yes … … 94₋₃ 57 79₋₁ 79₋₁ FRAGermany 20₋₁ 215₋₁ 350₋₁ 1₋₁ 5₋₁ 14₋₁ … … … … … 99₋₁ 101₋₁ … 95₋₁ … 86₋₁ Yes Yes Yes Yes Yes Yes Yes … … 95₋₃ 75 79₋₁ 79₋₁ DEUGreece 9₋₁ 13₋₁ 16₋₁ 1₋₁ 4₋₁ 5₋₁ … … … 1₋₁ 4₋₁ 99₋₁ 98₋₁ … 96₋₁ 94₋₁ 95₋₁ No No No Yes Yes Yes Yes … … … … 69₋₁ 64₋₁ GRCHungary 17₋₁ 12₋₁ 47₋₁ 4₋₁ 3₋₁ 12₋₁ … … … 1₋₁ 3₋₁ 96₋₁ 99₋₁ … 97₋₁ 93₋₁ 88₋₁ No No No Yes Yes Yes Yes … … 97₋₃ 74 75₋₁ 68 HUNIceland -₋₁ -₋₁ 2₋₁ 0.1₋₁ 0.2₋₁ 13₋₁ … … … -₋₁ -₋₁ 100₋₁ 99₋₁ … 100₋₁ 98₋₁ 87₋₁ Yes Yes Yes Yes Yes Yes Yes … … … … 74₋₁ 79₋₁ ISLIreland -₋₁ᵢ 1₋₁ᵢ 2₋₁ᵢ -₋₁ᵢ 1₋₁ᵢ 1₋₁ᵢ … … … -₋₁ 0.2₋₁ 100₋₁ᵢ 97₋₁ᵢ … 99₋₁ᵢ 99₋₁ᵢ 99₋₁ᵢ Yes Yes Yes Yes Yes Yes Yes 98₋₃ 84 … … 88₋₁ 84₋₁ IRLItaly 89₋₁ 35₋₁ 155₋₁ 3₋₁ 2₋₁ 5₋₁ … … … 0.4₋₁ 2₋₁ 97₋₁ 98₋₁ … 98₋₁ 99₋₁ 95₋₁ No No No Yes Yes Yes Yes … … 98₋₃ 73 77₋₁ 62 ITALatvia 1₋₁ᵢ 1₋₁ᵢ 2₋₁ᵢ 1₋₁ᵢ 1₋₁ᵢ 4₋₁ᵢ … … … 1₋₁ 3₋₁ 99₋₁ᵢ 98₋₁ᵢ … 99₋₁ᵢ 99₋₁ᵢ 96₋₁ᵢ No No No Yes Yes Yes Yes … … 99₋₃ 85 78₋₁ 83₋₁ LVALiechtenstein -₋₁ᵢ 0.1₋₁ᵢ 0.2₋₁ᵢ 0.1₋₁ᵢ 4₋₁ᵢ 16₋₁ᵢ … … … 0.1₋₂ 1₋₂ 100₋₁ᵢ 107₋₁ᵢ … 96₋₁ᵢ 102₋₁ᵢ 84₋₁ᵢ Yes Yes Yes Yes Yes Yes Yes … … … … … … LIELithuania 0.2₋₁ᵢ 0.2₋₁ᵢ 2₋₁ᵢ 0.2₋₁ᵢ 0.2₋₁ᵢ 3₋₁ᵢ … … … 0.3₋₁ 1₋₁ 100₋₁ᵢ 104₋₁ᵢ … 100₋₁ᵢ 99₋₁ᵢ 97₋₁ᵢ Yes Yes Yes Yes Yes Yes Yes … … 97₋₃ 81 76₋₁ 74₋₁ LTULuxembourg 0.4₋₁ 1₋₁ 5₋₁ 1₋₁ 4₋₁ 19₋₁ … … … 2₋₁ 8₋₁ 99₋₁ 80₋₁ … 96₋₁ 115₋₁ 81₋₁ No No Yes Yes Yes Yes Yes … … … … 71₋₁ 73₋₁ LUXMalta 0.1₋₂ 0.2 1 0.2₋₂ 2 8 … … … 0.5 0.5 100 108 … 98 104 92 No No No Yes Yes Yes Yes … … 73₋₃ 69 64₋₁ 62₋₄ MLTMonaco … … … … … … … … … -₊₁ 0.2₊₁ … … … … … … No No No No No Yes Yes … … … … … … MCOMontenegro - 2 3 - 8 11 97₋₁ 95₋₁ 86₋₁ 1 1 100 97 98₋₁ 92 90 89 No No No No Yes Yes Yes … … … 43 56₋₁ 54₋₁ MNENetherlands 4₋₁ 15₋₁ 2₋₁ 0.4₋₁ 3₋₁ 0.3₋₁ … … … … … 100₋₁ … … 97₋₁ … 100₋₁ No No No Yes Yes Yes Yes … … 99₋₃ 84 76₋₁ 84₋₁ NLDNorth Macedonia 1₋₁ … … 1₋₁ … … 98 94 83 1₋₁ 1₋₁ 99₋₁ 93₋₁ 96 … 86₋₁ … No No Yes Yes Yes Yes Yes … … … 52 45₋₁ 39₋₁ MKDNorway -₋₁ 1₋₁ 15₋₁ -₋₁ 1₋₁ 8₋₁ … … … -₋₁ -₋₁ 100₋₁ 99₋₁ … 99₋₁ 98₋₁ 92₋₁ Yes Yes Yes Yes Yes Yes Yes 99₋₃ 82 … 65 81₋₁ 81₋₁ NORPoland 51₋₁ 21₋₁ 40₋₁ 2₋₁ 2₋₁ 4₋₁ … … … … … 98₋₁ 94₋₁ … 98₋₁ 100₋₁ 96₋₁ No No No Yes Yes Yes Yes … … 98₋₃ 73 85₋₁ 85₋₁ POLPortugal 2₋₁ 0.4₋₁ 3₋₁ 0.4₋₁ 0.1₋₁ 1₋₁ … … … 5₋₁ 11₋₁ 100₋₁ 100₋₁ … 100₋₁ 95₋₁ 99₋₁ No No No Yes Yes Yes Yes … … 97₋₃ 74 80₋₁ 77₋₁ PRTRepublic of Moldova 16 ᵢ 29 ᵢ 26 ᵢ 10 ᵢ 16 ᵢ 35 ᵢ 99 ᵢ 97 ᵢ 71 ᵢ 0.3 0.5 90 ᵢ 88 ᵢ 97 ᵢ 84 ᵢ 84 ᵢ 65 ᵢ No No No Yes Yes Yes Yes … … … … 57₋₁ 50₋₁ MDARomania 136₋₁ 74₋₁ᵢ 162₋₁ 13₋₁ 9₋₁ᵢ 20₋₁ … … … 2₋₁ 4₋₁ 87₋₁ 85₋₁ … 91₋₁ᵢ 88₋₁ 80₋₁ No No No Yes Yes Yes Yes … … … … 59₋₁ 53₋₁ ROURussian Federation 11₋₁ 16₋₁ᵢ 83₋₁ᵢ 0.2₋₁ 0.2₋₁ᵢ 3₋₁ᵢ … … … … … 100₋₁ 102₋₁ … 100₋₁ᵢ 103₋₁ 97₋₁ᵢ No No No Yes Yes Yes Yes … … 99₋₃ 91 78₋₁ 78₋₁ RUSSan Marino 0.1 - 1 5 1 54 … … … - 1 95 114 … 99 102 46 No No No No No No No … … … … … … SMRSerbia 5 ᵢ 6 ᵢ 35 ᵢ 2 ᵢ 2 ᵢ 12 ᵢ 100 98 83 1 1 98 ᵢ 99 ᵢ 99 98 ᵢ 97 ᵢ 88 ᵢ No No No No Yes Yes Yes … … … 68 62₋₁ 60₋₁ SRBSlovakia 10₋₁ 13₋₁ 23₋₁ 4₋₁ 5₋₁ 11₋₁ … … … … … 96₋₁ 92₋₁ … 95₋₁ 81₋₁ 89₋₁ No No No Yes Yes Yes Yes … … 93₋₃ 71 69₋₁ 75₋₁ SVKSlovenia 0.3₋₁ 1₋₁ 1₋₁ 0.2₋₁ 2₋₁ 2₋₁ … … … 1₋₁ 1₋₁ 100₋₁ 97₋₁ … 98₋₁ 95₋₁ 98₋₁ No No No Yes Yes Yes Yes … … 96₋₃ 75₋₄ 82₋₁ 84₋₁ SVNSpain 92₋₁ 5₋₁ 22₋₁ 3₋₁ 0.4₋₁ 2₋₁ … … … 0.2₋₁ 7₋₁ 97₋₁ 99₋₁ … 100₋₁ 98₋₁ 98₋₁ No No No Yes Yes Yes Yes … … 97₋₃ 65 84₋₄ 75₋₁ ESPSweden 1₋₁ 0.5₋₄ 4₋₃ 0.1₋₁ 0.2₋₄ 1₋₃ … … … 0.1₋₁ 0.3₋₁ 100₋₁ 104₋₁ … 100₋₄ 109₋₁ 99₋₃ No No No Yes Yes Yes Yes … … 98₋₃ 74 82₋₁ 81₋₁ SWESwitzerland 0.4₋₁ 2₋₁ 63₋₁ 0.1₋₁ 1₋₁ 18₋₁ … … … 0.1₋₁ 1₋₁ 100₋₁ 96₋₁ … 99₋₁ 95₋₁ 82₋₁ No No No No No Yes Yes … … … … 76₋₁ 83₋₁ CHEUkraine … … … … … … 100 ᵢ 99 ᵢ 95 ᵢ 1 1 … … 100 ᵢ … … … No No No Yes Yes Yes Yes … … … … 74₋₁ … UKRUnited Kingdom 32₋₁ 3₋₁ 128₋₁ 1₋₁ 0.1₋₁ 4₋₁ … … … -₋₁ -₋₁ 99₋₁ 101₋₁ … 100₋₁ 101₋₁ 96₋₁ Yes Yes Yes Yes Yes Yes Yes … … 97₋₃ 83 83₋₁ 81₋₁ GBRUnited States 142₋₁ᵢ 39₋₁ᵢ 454₋₁ᵢ 1₋₁ᵢ 0.3₋₁ᵢ 4₋₁ᵢ 100₋₂ 99₋₂ 94₋₂ 4₋₁ 4₋₁ 99₋₁ᵢ 100₋₁ᵢ 99₋₂ 100₋₁ᵢ 103₋₁ᵢ 96₋₁ᵢ Yes Yes No Yes Yes Yes Yes … … 96₋₃ 77 81₋₁ 73₋₁ USA
2 0 2 1 / 2 • G LO BA L E D U C AT I O N M O N I TO R I N G R E P O RT 422
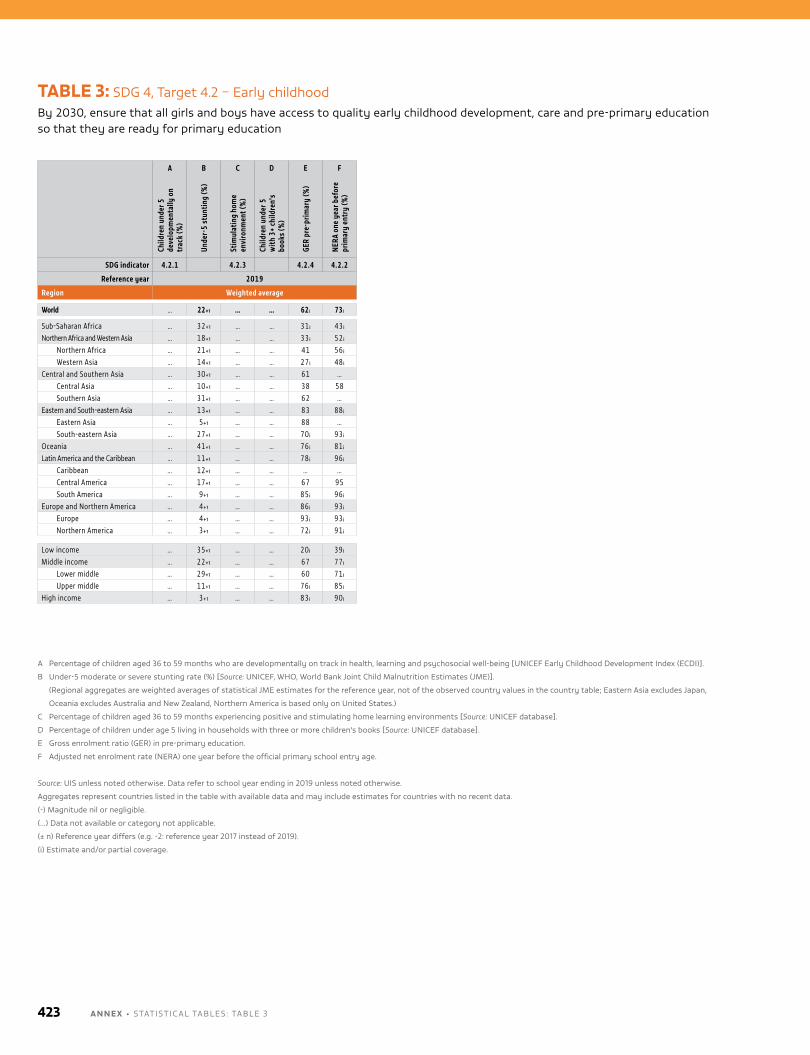
TABLE 3: SDG 4, Target 4.2 – Early childhoodby 2030, ensure that all girls and boys have access to quality early childhood development, care and pre-primary education so that they are ready for primary education
A B C D E FCh
ildre
n un
der 5
de
velo
pmen
tally
on
trac
k (%
)
Unde
r-5
stun
ting
(%)
Stim
ulat
ing
hom
e en
viro
nmen
t (%
)
Child
ren
unde
r 5
with
3+
child
ren'
s bo
oks
(%)
GER
pre-
prim
ary
(%)
NERA
one
yea
r bef
ore
prim
ary
entr
y (%
)
SDG indicator 4.2.1 4.2.3 4.2.4 4.2.2
Reference year 2019
Region Weighted average
World … 22₊₁ … … 62 ᵢ 73 ᵢ
Sub-Saharan Africa … 32₊₁ … … 31 ᵢ 43 ᵢNorthern Africa and Western Asia … 18₊₁ … … 33 ᵢ 52 ᵢ
Northern Africa … 21₊₁ … … 41 56 ᵢWestern Asia … 14₊₁ … … 27 ᵢ 48 ᵢ
Central and Southern Asia … 30₊₁ … … 61 …Central Asia … 10₊₁ … … 38 58Southern Asia … 31₊₁ … … 62 …
Eastern and South-eastern Asia … 13₊₁ … … 83 88 ᵢEastern Asia … 5₊₁ … … 88 …South-eastern Asia … 27₊₁ … … 70 ᵢ 93 ᵢ
Oceania … 41₊₁ … … 76 ᵢ 81 ᵢLatin America and the Caribbean … 11₊₁ … … 78 ᵢ 96 ᵢ
Caribbean … 12₊₁ … … … …Central America … 17₊₁ … … 67 95South America … 9₊₁ … … 85 ᵢ 96 ᵢ
Europe and Northern America … 4₊₁ … … 86 ᵢ 93 ᵢEurope … 4₊₁ … … 93 ᵢ 93 ᵢNorthern America … 3₊₁ … … 72 ᵢ 91 ᵢ
Low income … 35₊₁ … … 20 ᵢ 39 ᵢMiddle income … 22₊₁ … … 67 77 ᵢ
Lower middle … 29₊₁ … … 60 71 ᵢUpper middle … 11₊₁ … … 76 ᵢ 85 ᵢ
High income … 3₊₁ … … 83 ᵢ 90 ᵢ
A Percentage of children aged 36 to 59 months who are developmentally on track in health, learning and psychosocial well-being [unICEF Early Childhood Development Index (ECDI)].
b under-5 moderate or severe stunting rate (%) [Source: unICEF, Who, World bank Joint Child malnutrition Estimates (JmE)].
(Regional aggregates are weighted averages of statistical JmE estimates for the reference year, not of the observed country values in the country table; Eastern Asia excludes Japan,
oceania excludes Australia and new zealand, northern America is based only on united States.)
C Percentage of children aged 36 to 59 months experiencing positive and stimulating home learning environments [Source: unICEF database].
D Percentage of children under age 5 living in households with three or more children's books [Source: unICEF database].
E Gross enrolment ratio (GER) in pre-primary education.
F Adjusted net enrolment rate (nERA) one year before the official primary school entry age.
Source: uIS unless noted otherwise. Data refer to school year ending in 2019 unless noted otherwise.
Aggregates represent countries listed in the table with available data and may include estimates for countries with no recent data.
(-) magnitude nil or negligible.
(…) Data not available or category not applicable.
(± n) Reference year differs (e.g. -2: reference year 2017 instead of 2019).
(i) Estimate and/or partial coverage.
A N N E X • STATISTICAl TAblES : TAblE 3423
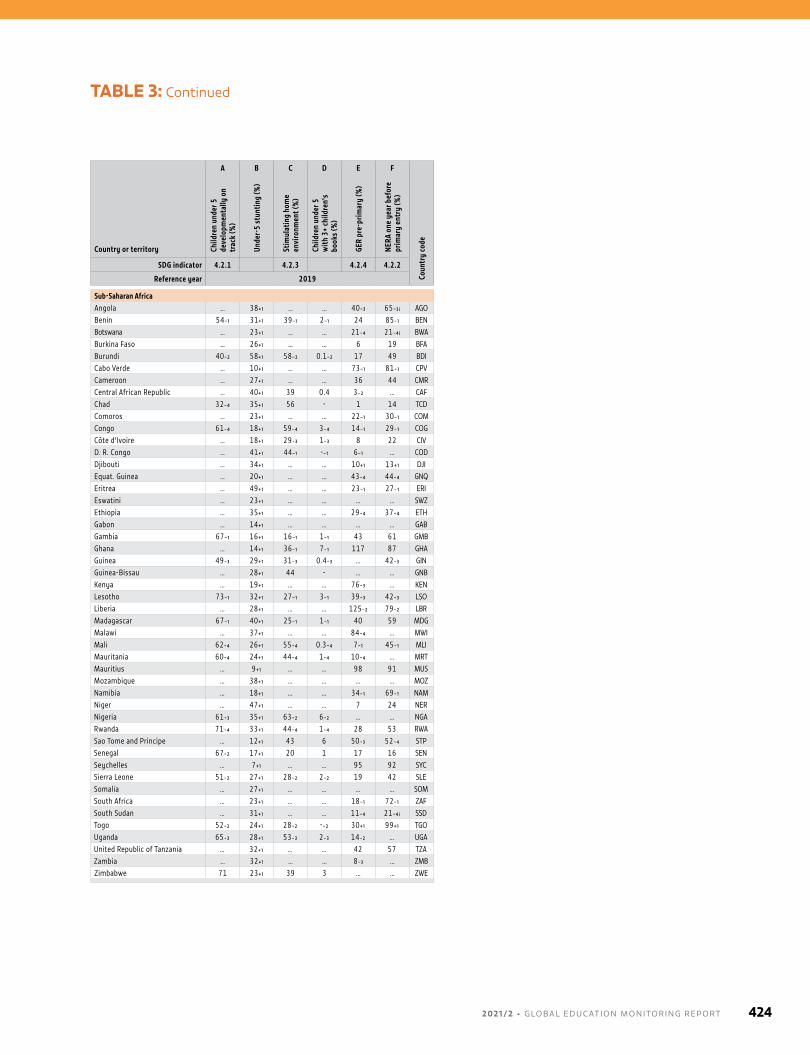
TABLE 3: Continued
Country or territory
A B C D E F
Coun
try
code
Child
ren
unde
r 5
deve
lopm
enta
lly o
n tr
ack
(%)
Unde
r-5
stun
ting
(%)
Stim
ulat
ing
hom
e en
viro
nmen
t (%
)
Child
ren
unde
r 5
with
3+
child
ren'
s bo
oks
(%)
GER
pre-
prim
ary
(%)
NERA
one
yea
r bef
ore
prim
ary
entr
y (%
)
SDG indicator 4.2.1 4.2.3 4.2.4 4.2.2
Reference year 2019
Sub-Saharan AfricaAngola … 38₊₁ … … 40₋₃ 65₋₃ ᵢ AGOBenin 54₋₁ 31₊₁ 39₋₁ 2₋₁ 24 85₋₁ BENBotswana … 23₊₁ … … 21₋₄ 21₋₄ ᵢ BWABurkina Faso … 26₊₁ … … 6 19 BFABurundi 40₋₂ 58₊₁ 58₋₂ 0.1₋₂ 17 49 BDICabo Verde … 10₊₁ … … 73₋₁ 81₋₁ CPVCameroon … 27₊₁ … … 36 44 CMRCentral African Republic … 40₊₁ 39 0.4 3₋₂ … CAFChad 32₋₄ 35₊₁ 56 - 1 14 TCDComoros … 23₊₁ … … 22₋₁ 30₋₁ COMCongo 61₋₄ 18₊₁ 59₋₄ 3₋₄ 14₋₁ 29₋₁ COGCôte d'Ivoire … 18₊₁ 29₋₃ 1₋₃ 8 22 CIVD. R. Congo … 41₊₁ 44₋₁ -₋₁ 6₋₁ … CODDjibouti … 34₊₁ … … 10₊₁ 13₊₁ DJIEquat. Guinea … 20₊₁ … … 43₋₄ 44₋₄ GNQEritrea … 49₊₁ … … 23₋₁ 27₋₁ ERIEswatini … 23₊₁ … … … … SWZEthiopia … 35₊₁ … … 29₋₄ 37₋₄ ETHGabon … 14₊₁ … … … … GABGambia 67₋₁ 16₊₁ 16₋₁ 1₋₁ 43 61 GMBGhana … 14₊₁ 36₋₁ 7₋₁ 117 87 GHAGuinea 49₋₃ 29₊₁ 31₋₃ 0.4₋₃ … 42₋₃ GINGuinea-Bissau … 28₊₁ 44 - … … GNBKenya … 19₊₁ … … 76₋₃ … KENLesotho 73₋₁ 32₊₁ 27₋₁ 3₋₁ 39₋₃ 42₋₃ LSOLiberia … 28₊₁ … … 125₋₂ 79₋₂ LBRMadagascar 67₋₁ 40₊₁ 25₋₁ 1₋₁ 40 59 MDGMalawi … 37₊₁ … … 84₋₄ … MWIMali 62₋₄ 26₊₁ 55₋₄ 0.3₋₄ 7₋₁ 45₋₁ MLIMauritania 60₋₄ 24₊₁ 44₋₄ 1₋₄ 10₋₄ … MRTMauritius … 9₊₁ … … 98 91 MUSMozambique … 38₊₁ … … … … MOZNamibia … 18₊₁ … … 34₋₁ 69₋₁ NAMNiger … 47₊₁ … … 7 24 NERNigeria 61₋₃ 35₊₁ 63₋₂ 6₋₂ … … NGARwanda 71₋₄ 33₊₁ 44₋₄ 1₋₄ 28 53 RWASao Tome and Principe … 12₊₁ 43 6 50₋₃ 52₋₄ STPSenegal 67₋₂ 17₊₁ 20 1 17 16 SENSeychelles … 7₊₁ … … 95 92 SYCSierra Leone 51₋₂ 27₊₁ 28₋₂ 2₋₂ 19 42 SLESomalia … 27₊₁ … … … … SOMSouth Africa … 23₊₁ … … 18₋₁ 72₋₁ ZAFSouth Sudan … 31₊₁ … … 11₋₄ 21₋₄ ᵢ SSDTogo 52₋₂ 24₊₁ 28₋₂ -₋₂ 30₊₁ 99₊₁ TGOUganda 65₋₃ 28₊₁ 53₋₃ 2₋₃ 14₋₂ … UGAUnited Republic of Tanzania … 32₊₁ … … 42 57 TZAZambia … 32₊₁ … … 8₋₃ … ZMBZimbabwe 71 23₊₁ 39 3 … … ZWE
2 0 2 1 / 2 • G LO BA L E D U C AT I O N M O N I TO R I N G R E P O RT 424
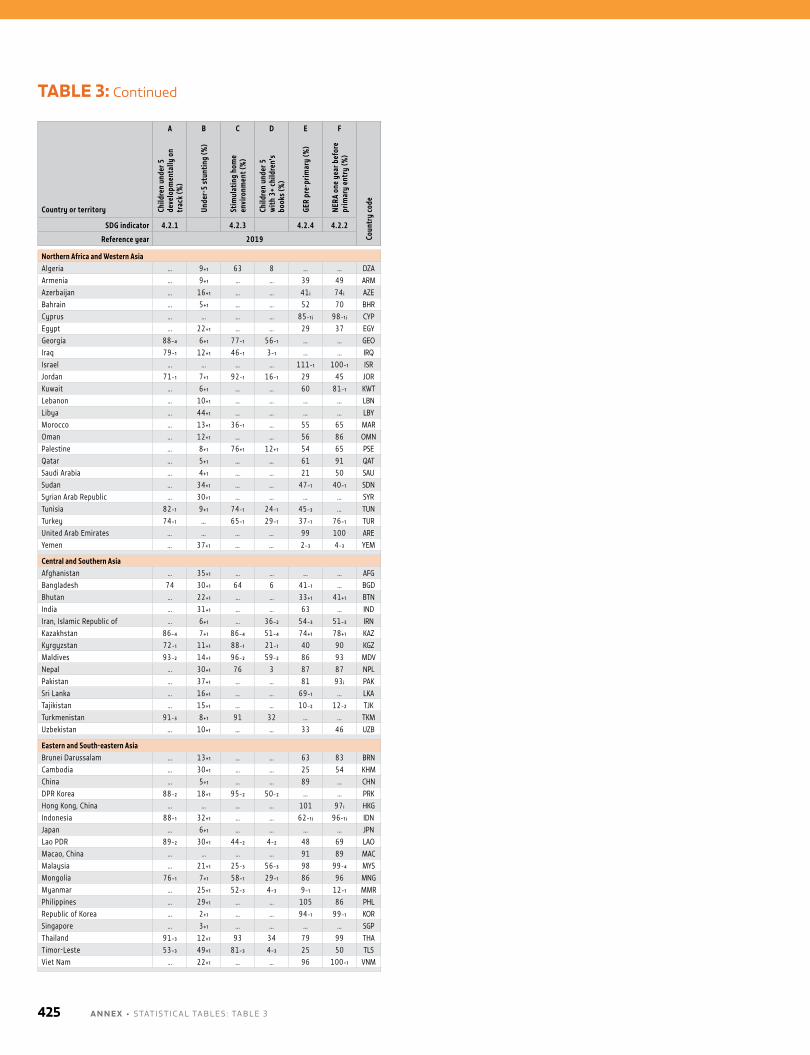
TABLE 3: Continued
Country or territory
A B C D E F
Coun
try
code
Child
ren
unde
r 5
deve
lopm
enta
lly o
n tr
ack
(%)
Unde
r-5
stun
ting
(%)
Stim
ulat
ing
hom
e en
viro
nmen
t (%
)
Child
ren
unde
r 5
with
3+
child
ren'
s bo
oks
(%)
GER
pre-
prim
ary
(%)
NERA
one
yea
r bef
ore
prim
ary
entr
y (%
)
SDG indicator 4.2.1 4.2.3 4.2.4 4.2.2
Reference year 2019
Northern Africa and Western AsiaAlgeria … 9₊₁ 63 8 … … DZAArmenia … 9₊₁ … … 39 49 ARMAzerbaijan … 16₊₁ … … 41 ᵢ 74 ᵢ AZEBahrain … 5₊₁ … … 52 70 BHRCyprus … … … … 85₋₁ ᵢ 98₋₁ ᵢ CYPEgypt … 22₊₁ … … 29 37 EGYGeorgia 88₋₄ 6₊₁ 77₋₁ 56₋₁ … … GEOIraq 79₋₁ 12₊₁ 46₋₁ 3₋₁ … … IRQIsrael … … … … 111₋₁ 100₋₁ ISRJordan 71₋₁ 7₊₁ 92₋₁ 16₋₁ 29 45 JORKuwait … 6₊₁ … … 60 81₋₁ KWTLebanon … 10₊₁ … … … … LBNLibya … 44₊₁ … … … … LBYMorocco … 13₊₁ 36₋₁ … 55 65 MAROman … 12₊₁ … … 56 86 OMNPalestine … 8₊₁ 76₊₁ 12₊₁ 54 65 PSEQatar … 5₊₁ … … 61 91 QATSaudi Arabia … 4₊₁ … … 21 50 SAUSudan … 34₊₁ … … 47₋₁ 40₋₁ SDNSyrian Arab Republic … 30₊₁ … … … … SYRTunisia 82₋₁ 9₊₁ 74₋₁ 24₋₁ 45₋₃ … TUNTurkey 74₋₁ … 65₋₁ 29₋₁ 37₋₁ 76₋₁ TURUnited Arab Emirates … … … … 99 100 AREYemen … 37₊₁ … … 2₋₃ 4₋₃ YEM
Central and Southern AsiaAfghanistan … 35₊₁ … … … … AFGBangladesh 74 30₊₁ 64 6 41₋₁ … BGDBhutan … 22₊₁ … … 33₊₁ 41₊₁ BTNIndia … 31₊₁ … … 63 … INDIran, Islamic Republic of … 6₊₁ … 36₋₂ 54₋₃ 51₋₃ IRNKazakhstan 86₋₄ 7₊₁ 86₋₄ 51₋₄ 74₊₁ 78₊₁ KAZKyrgyzstan 72₋₁ 11₊₁ 88₋₁ 21₋₁ 40 90 KGZMaldives 93₋₂ 14₊₁ 96₋₂ 59₋₂ 86 93 MDVNepal … 30₊₁ 76 3 87 87 NPLPakistan … 37₊₁ … … 81 93 ᵢ PAKSri Lanka … 16₊₁ … … 69₋₁ … LKATajikistan … 15₊₁ … … 10₋₂ 12₋₂ TJKTurkmenistan 91₋₃ 8₊₁ 91 32 … … TKMUzbekistan … 10₊₁ … … 33 46 UZB
Eastern and South-eastern AsiaBrunei Darussalam … 13₊₁ … … 63 83 BRNCambodia … 30₊₁ … … 25 54 KHMChina … 5₊₁ … … 89 … CHNDPR Korea 88₋₂ 18₊₁ 95₋₂ 50₋₂ … … PRKHong Kong, China … … … … 101 97 ᵢ HKGIndonesia 88₋₁ 32₊₁ … … 62₋₁ ᵢ 96₋₁ ᵢ IDNJapan … 6₊₁ … … … … JPNLao PDR 89₋₂ 30₊₁ 44₋₂ 4₋₂ 48 69 LAOMacao, China … … … … 91 89 MACMalaysia … 21₊₁ 25₋₃ 56₋₃ 98 99₋₄ MYSMongolia 76₋₁ 7₊₁ 58₋₁ 29₋₁ 86 96 MNGMyanmar … 25₊₁ 52₋₃ 4₋₃ 9₋₁ 12₋₁ MMRPhilippines … 29₊₁ … … 105 86 PHLRepublic of Korea … 2₊₁ … … 94₋₁ 99₋₁ KORSingapore … 3₊₁ … … … … SGPThailand 91₋₃ 12₊₁ 93 34 79 99 THATimor-Leste 53₋₃ 49₊₁ 81₋₃ 4₋₃ 25 50 TLSViet Nam … 22₊₁ … … 96 100₋₁ VNM
A N N E X • STATISTICAl TAblES : TAblE 3425
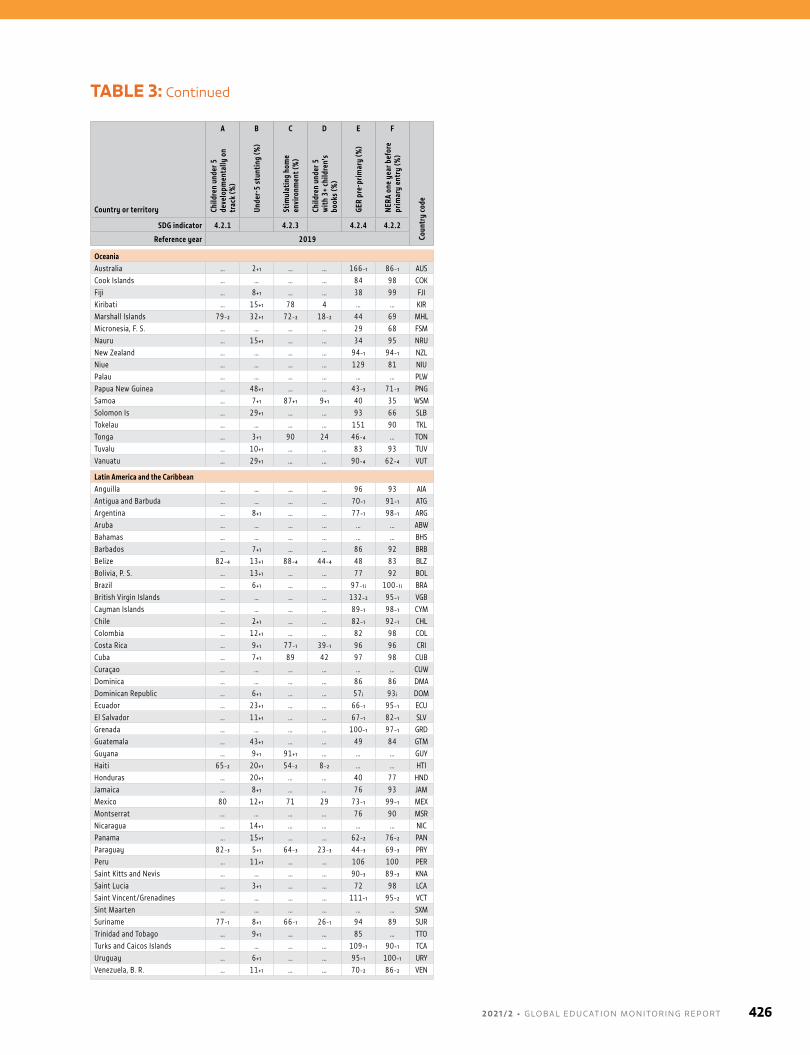
TABLE 3: Continued
Country or territory
A B C D E F
Coun
try
code
Child
ren
unde
r 5
deve
lopm
enta
lly o
n tr
ack
(%)
Unde
r-5
stun
ting
(%)
Stim
ulat
ing
hom
e en
viro
nmen
t (%
)
Child
ren
unde
r 5
with
3+
child
ren'
s bo
oks
(%)
GER
pre-
prim
ary
(%)
NERA
one
yea
r bef
ore
prim
ary
entr
y (%
)
SDG indicator 4.2.1 4.2.3 4.2.4 4.2.2
Reference year 2019
OceaniaAustralia … 2₊₁ … … 166₋₁ 86₋₁ AUSCook Islands … … … … 84 98 COKFiji … 8₊₁ … … 38 99 FJIKiribati … 15₊₁ 78 4 … … KIRMarshall Islands 79₋₂ 32₊₁ 72₋₂ 18₋₂ 44 69 MHLMicronesia, F. S. … … … … 29 68 FSMNauru … 15₊₁ … … 34 95 NRUNew Zealand … … … … 94₋₁ 94₋₁ NZLNiue … … … … 129 81 NIUPalau … … … … … … PLWPapua New Guinea … 48₊₁ … … 43₋₃ 71₋₃ PNGSamoa … 7₊₁ 87₊₁ 9₊₁ 40 35 WSMSolomon Is … 29₊₁ … … 93 66 SLBTokelau … … … … 151 90 TKLTonga … 3₊₁ 90 24 46₋₄ … TONTuvalu … 10₊₁ … … 83 93 TUVVanuatu … 29₊₁ … … 90₋₄ 62₋₄ VUT
Latin America and the CaribbeanAnguilla … … … … 96 93 AIAAntigua and Barbuda … … … … 70₋₁ 91₋₁ ATGArgentina … 8₊₁ … … 77₋₁ 98₋₁ ARGAruba … … … … … … ABWBahamas … … … … … … BHSBarbados … 7₊₁ … … 86 92 BRBBelize 82₋₄ 13₊₁ 88₋₄ 44₋₄ 48 83 BLZBolivia, P. S. … 13₊₁ … … 77 92 BOLBrazil … 6₊₁ … … 97₋₁ ᵢ 100₋₁ ᵢ BRABritish Virgin Islands … … … … 132₋₂ 95₋₁ VGBCayman Islands … … … … 89₋₁ 98₋₁ CYMChile … 2₊₁ … … 82₋₁ 92₋₁ CHLColombia … 12₊₁ … … 82 98 COLCosta Rica … 9₊₁ 77₋₁ 39₋₁ 96 96 CRICuba … 7₊₁ 89 42 97 98 CUBCuraçao … … … … … … CUWDominica … … … … 86 86 DMADominican Republic … 6₊₁ … … 57 ᵢ 93 ᵢ DOMEcuador … 23₊₁ … … 66₋₁ 95₋₁ ECUEl Salvador … 11₊₁ … … 67₋₁ 82₋₁ SLVGrenada … … … … 100₋₁ 97₋₁ GRDGuatemala … 43₊₁ … … 49 84 GTMGuyana … 9₊₁ 91₊₁ … … … GUYHaiti 65₋₂ 20₊₁ 54₋₂ 8₋₂ … … HTIHonduras … 20₊₁ … … 40 77 HNDJamaica … 8₊₁ … … 76 93 JAMMexico 80 12₊₁ 71 29 73₋₁ 99₋₁ MEXMontserrat … … … … 76 90 MSRNicaragua … 14₊₁ … … … … NICPanama … 15₊₁ … … 62₋₂ 76₋₂ PANParaguay 82₋₃ 5₊₁ 64₋₃ 23₋₃ 44₋₃ 69₋₃ PRYPeru … 11₊₁ … … 106 100 PERSaint Kitts and Nevis … … … … 90₋₃ 89₋₃ KNASaint Lucia … 3₊₁ … … 72 98 LCASaint Vincent/Grenadines … … … … 111₋₁ 95₋₂ VCTSint Maarten … … … … … … SXMSuriname 77₋₁ 8₊₁ 66₋₁ 26₋₁ 94 89 SURTrinidad and Tobago … 9₊₁ … … 85 … TTOTurks and Caicos Islands … … … … 109₋₁ 90₋₁ TCAUruguay … 6₊₁ … … 95₋₁ 100₋₁ URYVenezuela, B. R. … 11₊₁ … … 70₋₂ 86₋₂ VEN
2 0 2 1 / 2 • G LO BA L E D U C AT I O N M O N I TO R I N G R E P O RT 426
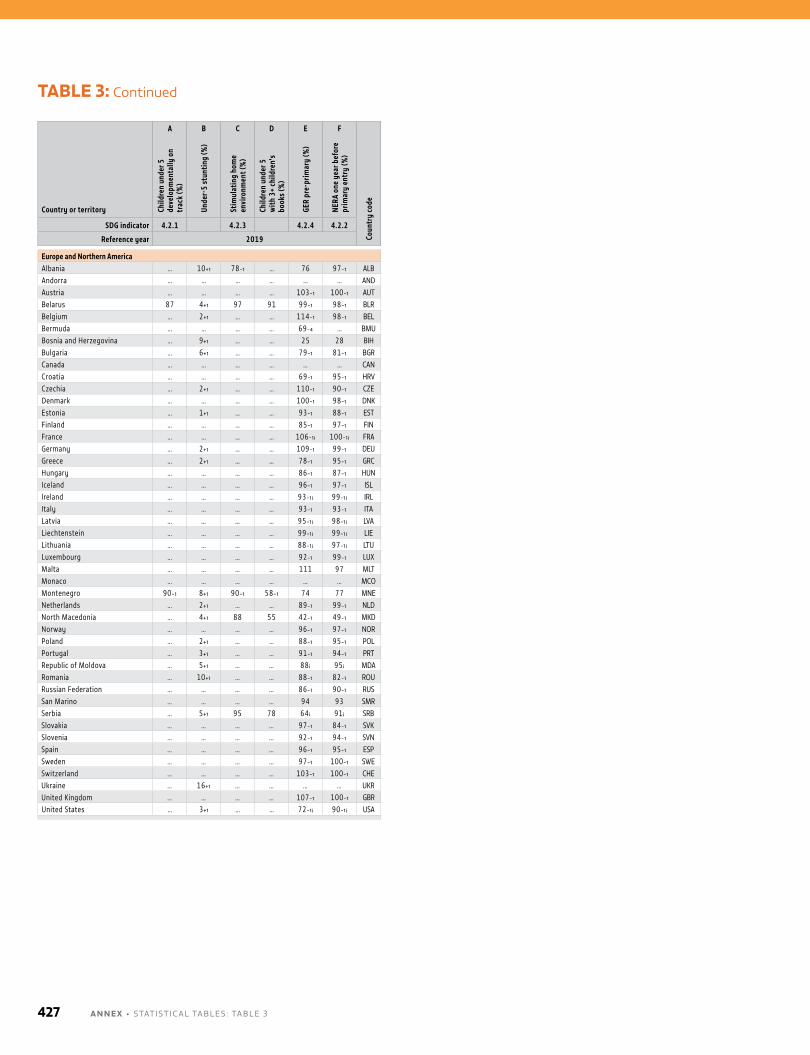
TABLE 3: Continued
Country or territory
A B C D E F
Coun
try
code
Child
ren
unde
r 5
deve
lopm
enta
lly o
n tr
ack
(%)
Unde
r-5
stun
ting
(%)
Stim
ulat
ing
hom
e en
viro
nmen
t (%
)
Child
ren
unde
r 5
with
3+
child
ren'
s bo
oks
(%)
GER
pre-
prim
ary
(%)
NERA
one
yea
r bef
ore
prim
ary
entr
y (%
)
SDG indicator 4.2.1 4.2.3 4.2.4 4.2.2
Reference year 2019
Europe and Northern AmericaAlbania … 10₊₁ 78₋₁ … 76 97₋₁ ALBAndorra … … … … … … ANDAustria … … … … 103₋₁ 100₋₁ AUTBelarus 87 4₊₁ 97 91 99₋₁ 98₋₁ BLRBelgium … 2₊₁ … … 114₋₁ 98₋₁ BELBermuda … … … … 69₋₄ … BMUBosnia and Herzegovina … 9₊₁ … … 25 28 BIHBulgaria … 6₊₁ … … 79₋₁ 81₋₁ BGRCanada … … … … … … CANCroatia … … … … 69₋₁ 95₋₁ HRVCzechia … 2₊₁ … … 110₋₁ 90₋₁ CZEDenmark … … … … 100₋₁ 98₋₁ DNKEstonia … 1₊₁ … … 93₋₁ 88₋₁ ESTFinland … … … … 85₋₁ 97₋₁ FINFrance … … … … 106₋₁ ᵢ 100₋₁ ᵢ FRAGermany … 2₊₁ … … 109₋₁ 99₋₁ DEUGreece … 2₊₁ … … 78₋₁ 95₋₁ GRCHungary … … … … 86₋₁ 87₋₁ HUNIceland … … … … 96₋₁ 97₋₁ ISLIreland … … … … 93₋₁ ᵢ 99₋₁ ᵢ IRLItaly … … … … 93₋₁ 93₋₁ ITALatvia … … … … 95₋₁ ᵢ 98₋₁ ᵢ LVALiechtenstein … … … … 99₋₁ ᵢ 99₋₁ ᵢ LIELithuania … … … … 88₋₁ ᵢ 97₋₁ ᵢ LTULuxembourg … … … … 92₋₁ 99₋₁ LUXMalta … … … … 111 97 MLTMonaco … … … … … … MCOMontenegro 90₋₁ 8₊₁ 90₋₁ 58₋₁ 74 77 MNENetherlands … 2₊₁ … … 89₋₁ 99₋₁ NLDNorth Macedonia … 4₊₁ 88 55 42₋₁ 49₋₁ MKDNorway … … … … 96₋₁ 97₋₁ NORPoland … 2₊₁ … … 88₋₁ 95₋₁ POLPortugal … 3₊₁ … … 91₋₁ 94₋₁ PRTRepublic of Moldova … 5₊₁ … … 88 ᵢ 95 ᵢ MDARomania … 10₊₁ … … 88₋₁ 82₋₁ ROURussian Federation … … … … 86₋₁ 90₋₁ RUSSan Marino … … … … 94 93 SMRSerbia … 5₊₁ 95 78 64 ᵢ 91 ᵢ SRBSlovakia … … … … 97₋₁ 84₋₁ SVKSlovenia … … … … 92₋₁ 94₋₁ SVNSpain … … … … 96₋₁ 95₋₁ ESPSweden … … … … 97₋₁ 100₋₁ SWESwitzerland … … … … 103₋₁ 100₋₁ CHEUkraine … 16₊₁ … … … … UKRUnited Kingdom … … … … 107₋₁ 100₋₁ GBRUnited States … 3₊₁ … … 72₋₁ ᵢ 90₋₁ ᵢ USA
A N N E X • STATISTICAl TAblES : TAblE 3427

2 0 2 1 / 2 • G LO BA L E D U C AT I O N M O N I TO R I N G R E P O RT 428
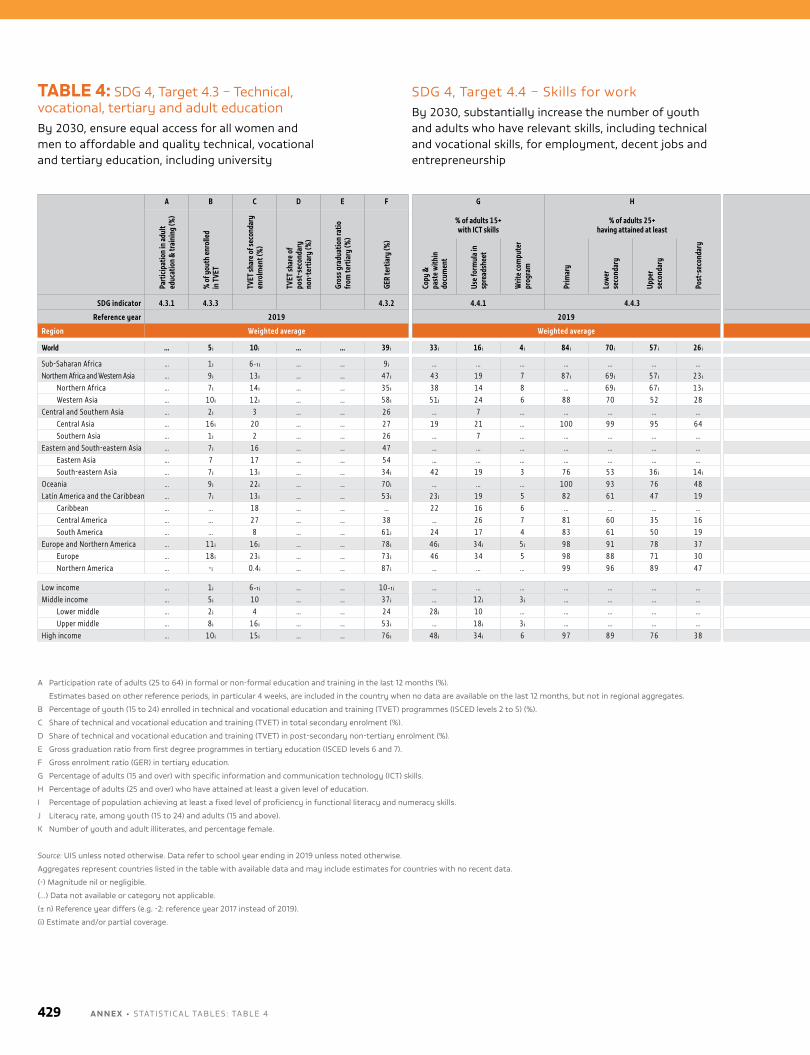
TABLE 4: SDG 4, Target 4.3 – Technical, vocational, tertiary and adult education by 2030, ensure equal access for all women and men to affordable and quality technical, vocational and tertiary education, including university
SDG 4, Target 4.4 – Skills for work by 2030, substantially increase the number of youth and adults who have relevant skills, including technical and vocational skills, for employment, decent jobs and entrepreneurship
A B C D E F G H I J K
Part
icipa
tion
in ad
ult
educ
atio
n &
trai
ning
(%)
% o
f you
th en
rolle
d in
TVE
T
TVET
shar
e of s
econ
dary
en
rolm
ent (
%)
TVET
shar
e of
post
-sec
onda
ry
non-
tert
iary
(%)
Gros
s gra
duat
ion
ratio
fro
m te
rtia
ry (%
)
GER
tert
iary
(%)
% of adults 15+ with ICT skills
% of adults 25+ having attained at least
% achieving proficiency in Literacy rate (%) Illiterates
Copy
&
past
e with
in
docu
men
t
Use f
orm
ula i
n sp
read
shee
t
Writ
e com
pute
r pr
ogra
m
Prim
ary
Low
er
seco
ndar
y
Uppe
r se
cond
ary
Post
-sec
onda
ry
Literacy Numeracy Youth Adults
% femaleNumber
(000,000)
Youth Adults Youth Adults
SDG indicator 4.3.1 4.3.3 4.3.2 4.4.1 4.4.3 4.6.1 4.6.2
Reference year 2019 2019 2019
Region Weighted average Weighted average Weighted average Sum
World … 5 ᵢ 10 ᵢ … … 39 ᵢ 33 ᵢ 16 ᵢ 4 ᵢ 84 ᵢ 70 ᵢ 57 ᵢ 26 ᵢ … … 92 86 55 63 99 773
Sub-Saharan Africa … 1 ᵢ 6₋₁ ᵢ … … 9 ᵢ … … … … … … … … … 76 66 56 60 50 211Northern Africa and Western Asia … 9 ᵢ 13 ᵢ … … 47 ᵢ 43 19 7 87 ᵢ 69 ᵢ 57 ᵢ 23 ᵢ … … 89 80 57 63 9 71
Northern Africa … 7 ᵢ 14 ᵢ … … 35 ᵢ 38 14 8 … 69 ᵢ 67 ᵢ 13 ᵢ … … 89 73 51 62 4 44Western Asia … 10 ᵢ 12 ᵢ … … 58 ᵢ 51 ᵢ 24 6 88 70 52 28 55 ᵢ 50 ᵢ 89 86 62 63 5 27
Central and Southern Asia … 2 ᵢ 3 … … 26 … 7 … … … … … … … 91 75 56 64 34 365Central Asia … 16 ᵢ 20 … … 27 19 21 … 100 99 95 64 … … 100 100 45 64 - 0.1Southern Asia … 1 ᵢ 2 … … 26 … 7 … … … … … … … 90 74 56 64 34 365
Eastern and South-eastern Asia … 7 ᵢ 16 … … 47 … … … … … … … … … 99 96 48 69 3 75Eastern Asia … 7 17 … … 54 … … … … … … … … … 100 97 46 73 1 45South-eastern Asia … 7 ᵢ 13 ᵢ … … 34 ᵢ 42 19 3 76 53 36 ᵢ 14 ᵢ … … 98 94 48 64 3 30
Oceania … 9 ᵢ 22 ᵢ … … 70 ᵢ … … … 100 93 76 48 … … … … … … - ᵢ - ᵢLatin America and the Caribbean … 7 ᵢ 13 ᵢ … … 53 ᵢ 23 ᵢ 19 5 82 61 47 19 … … 99 94 43 55 2 28
Caribbean … … 18 … … … 22 16 6 … … … … … … … … … … … 3 ᵢCentral America … … 27 … … 38 … 26 7 81 60 35 16 49 40 99 94 … … 0.4 ᵢ 7 ᵢSouth America … … 8 … … 61 ᵢ 24 17 4 83 61 50 19 … … 99 95 … … 1 18
Europe and Northern America … 11 ᵢ 16 ᵢ … … 78 ᵢ 46 ᵢ 34 ᵢ 5 ᵢ 98 91 78 37 … … … … … … … …Europe … 18 ᵢ 23 ᵢ … … 73 ᵢ 46 34 5 98 88 71 30 … … 100 ᵢ 98 ᵢ 46 ᵢ … 0.4 ᵢ 2 ᵢNorthern America … - ᵢ 0.4 ᵢ … … 87 ᵢ … … … 99 96 89 47 81 71 … … … … … …
Low income … 1 ᵢ 6₋₁ ᵢ … … 10₋₁ ᵢ … … … … … … … … … 73 ᵢ 61 ᵢ 55 ᵢ 60 ᵢ 36 ᵢ 152 ᵢMiddle income … 5 ᵢ 10 … … 37 ᵢ … 12 ᵢ 3 ᵢ … … … … … … 93 86 55 64 62 587
Lower middle … 2 ᵢ 4 … … 24 28 ᵢ 10 … … … … … … … 89 76 56 63 56 488Upper middle … 8 ᵢ 16 ᵢ … … 53 ᵢ … 18 ᵢ 3 ᵢ … … … … … … 99 96 49 66 6 100
High income … 10 ᵢ 15 ᵢ … … 76 ᵢ 48 ᵢ 34 ᵢ 6 97 89 76 38 … … … … … … 0.1 ᵢ 5 ᵢ
A Participation rate of adults (25 to 64) in formal or non-formal education and training in the last 12 months (%).
Estimates based on other reference periods, in particular 4 weeks, are included in the country when no data are available on the last 12 months, but not in regional aggregates.
b Percentage of youth (15 to 24) enrolled in technical and vocational education and training (TvET) programmes (ISCED levels 2 to 5) (%).
C Share of technical and vocational education and training (TvET) in total secondary enrolment (%).
D Share of technical and vocational education and training (TvET) in post-secondary non-tertiary enrolment (%).
E Gross graduation ratio from first degree programmes in tertiary education (ISCED levels 6 and 7).
F Gross enrolment ratio (GER) in tertiary education.
G Percentage of adults (15 and over) with specific information and communication technology (ICT) skills.
h Percentage of adults (25 and over) who have attained at least a given level of education.
I Percentage of population achieving at least a fixed level of proficiency in functional literacy and numeracy skills.
J literacy rate, among youth (15 to 24) and adults (15 and above).
K number of youth and adult illiterates, and percentage female.
Source: uIS unless noted otherwise. Data refer to school year ending in 2019 unless noted otherwise.
Aggregates represent countries listed in the table with available data and may include estimates for countries with no recent data.
(-) magnitude nil or negligible.
(…) Data not available or category not applicable.
(± n) Reference year differs (e.g. -2: reference year 2017 instead of 2019).
(i) Estimate and/or partial coverage.
A N N E X • STATISTICAl TAblES : TAblE 4429
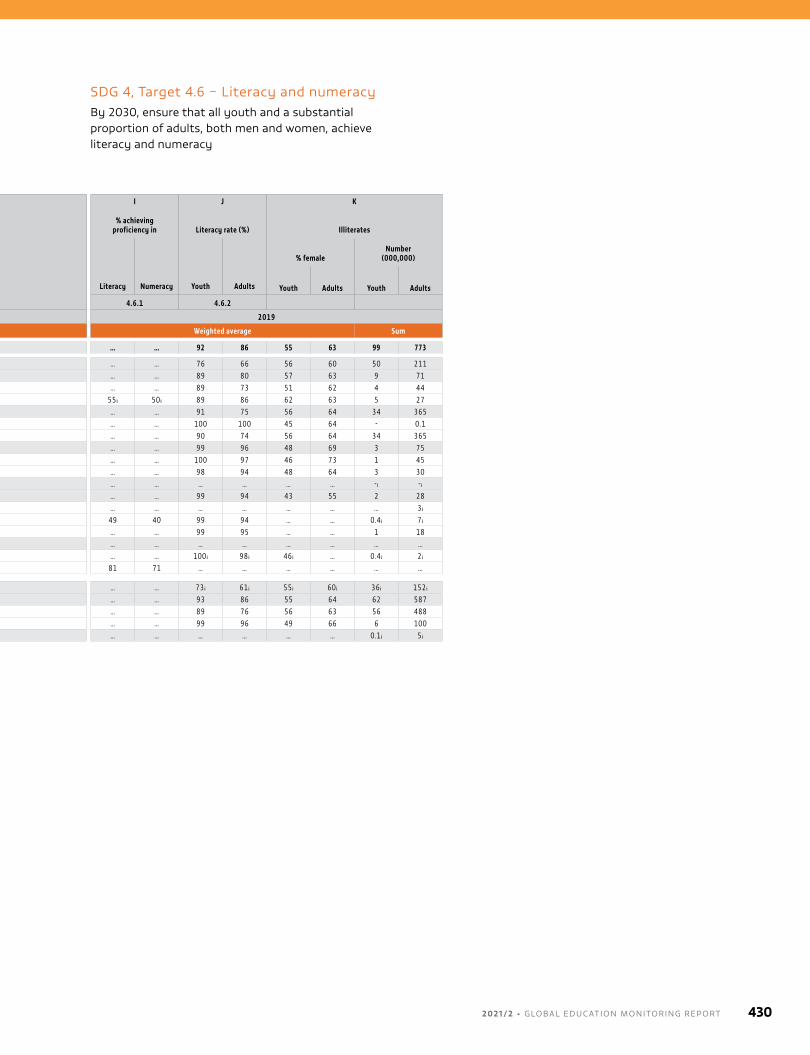
A B C D E F G H I J K
Part
icipa
tion
in ad
ult
educ
atio
n &
trai
ning
(%)
% o
f you
th en
rolle
d in
TVE
T
TVET
shar
e of s
econ
dary
en
rolm
ent (
%)
TVET
shar
e of
post
-sec
onda
ry
non-
tert
iary
(%)
Gros
s gra
duat
ion
ratio
fro
m te
rtia
ry (%
)
GER
tert
iary
(%)
% of adults 15+ with ICT skills
% of adults 25+ having attained at least
% achieving proficiency in Literacy rate (%) Illiterates
Copy
&
past
e with
in
docu
men
t
Use f
orm
ula i
n sp
read
shee
t
Writ
e com
pute
r pr
ogra
m
Prim
ary
Low
er
seco
ndar
y
Uppe
r se
cond
ary
Post
-sec
onda
ry
Literacy Numeracy Youth Adults
% femaleNumber
(000,000)
Youth Adults Youth Adults
SDG indicator 4.3.1 4.3.3 4.3.2 4.4.1 4.4.3 4.6.1 4.6.2
Reference year 2019 2019 2019
Region Weighted average Weighted average Weighted average Sum
World … 5 ᵢ 10 ᵢ … … 39 ᵢ 33 ᵢ 16 ᵢ 4 ᵢ 84 ᵢ 70 ᵢ 57 ᵢ 26 ᵢ … … 92 86 55 63 99 773
Sub-Saharan Africa … 1 ᵢ 6₋₁ ᵢ … … 9 ᵢ … … … … … … … … … 76 66 56 60 50 211Northern Africa and Western Asia … 9 ᵢ 13 ᵢ … … 47 ᵢ 43 19 7 87 ᵢ 69 ᵢ 57 ᵢ 23 ᵢ … … 89 80 57 63 9 71
Northern Africa … 7 ᵢ 14 ᵢ … … 35 ᵢ 38 14 8 … 69 ᵢ 67 ᵢ 13 ᵢ … … 89 73 51 62 4 44Western Asia … 10 ᵢ 12 ᵢ … … 58 ᵢ 51 ᵢ 24 6 88 70 52 28 55 ᵢ 50 ᵢ 89 86 62 63 5 27
Central and Southern Asia … 2 ᵢ 3 … … 26 … 7 … … … … … … … 91 75 56 64 34 365Central Asia … 16 ᵢ 20 … … 27 19 21 … 100 99 95 64 … … 100 100 45 64 - 0.1Southern Asia … 1 ᵢ 2 … … 26 … 7 … … … … … … … 90 74 56 64 34 365
Eastern and South-eastern Asia … 7 ᵢ 16 … … 47 … … … … … … … … … 99 96 48 69 3 75Eastern Asia … 7 17 … … 54 … … … … … … … … … 100 97 46 73 1 45South-eastern Asia … 7 ᵢ 13 ᵢ … … 34 ᵢ 42 19 3 76 53 36 ᵢ 14 ᵢ … … 98 94 48 64 3 30
Oceania … 9 ᵢ 22 ᵢ … … 70 ᵢ … … … 100 93 76 48 … … … … … … - ᵢ - ᵢLatin America and the Caribbean … 7 ᵢ 13 ᵢ … … 53 ᵢ 23 ᵢ 19 5 82 61 47 19 … … 99 94 43 55 2 28
Caribbean … … 18 … … … 22 16 6 … … … … … … … … … … … 3 ᵢCentral America … … 27 … … 38 … 26 7 81 60 35 16 49 40 99 94 … … 0.4 ᵢ 7 ᵢSouth America … … 8 … … 61 ᵢ 24 17 4 83 61 50 19 … … 99 95 … … 1 18
Europe and Northern America … 11 ᵢ 16 ᵢ … … 78 ᵢ 46 ᵢ 34 ᵢ 5 ᵢ 98 91 78 37 … … … … … … … …Europe … 18 ᵢ 23 ᵢ … … 73 ᵢ 46 34 5 98 88 71 30 … … 100 ᵢ 98 ᵢ 46 ᵢ … 0.4 ᵢ 2 ᵢNorthern America … - ᵢ 0.4 ᵢ … … 87 ᵢ … … … 99 96 89 47 81 71 … … … … … …
Low income … 1 ᵢ 6₋₁ ᵢ … … 10₋₁ ᵢ … … … … … … … … … 73 ᵢ 61 ᵢ 55 ᵢ 60 ᵢ 36 ᵢ 152 ᵢMiddle income … 5 ᵢ 10 … … 37 ᵢ … 12 ᵢ 3 ᵢ … … … … … … 93 86 55 64 62 587
Lower middle … 2 ᵢ 4 … … 24 28 ᵢ 10 … … … … … … … 89 76 56 63 56 488Upper middle … 8 ᵢ 16 ᵢ … … 53 ᵢ … 18 ᵢ 3 ᵢ … … … … … … 99 96 49 66 6 100
High income … 10 ᵢ 15 ᵢ … … 76 ᵢ 48 ᵢ 34 ᵢ 6 97 89 76 38 … … … … … … 0.1 ᵢ 5 ᵢ
SDG 4, Target 4.6 – literacy and numeracy by 2030, ensure that all youth and a substantial proportion of adults, both men and women, achieve literacy and numeracy
2 0 2 1 / 2 • G LO BA L E D U C AT I O N M O N I TO R I N G R E P O RT 430
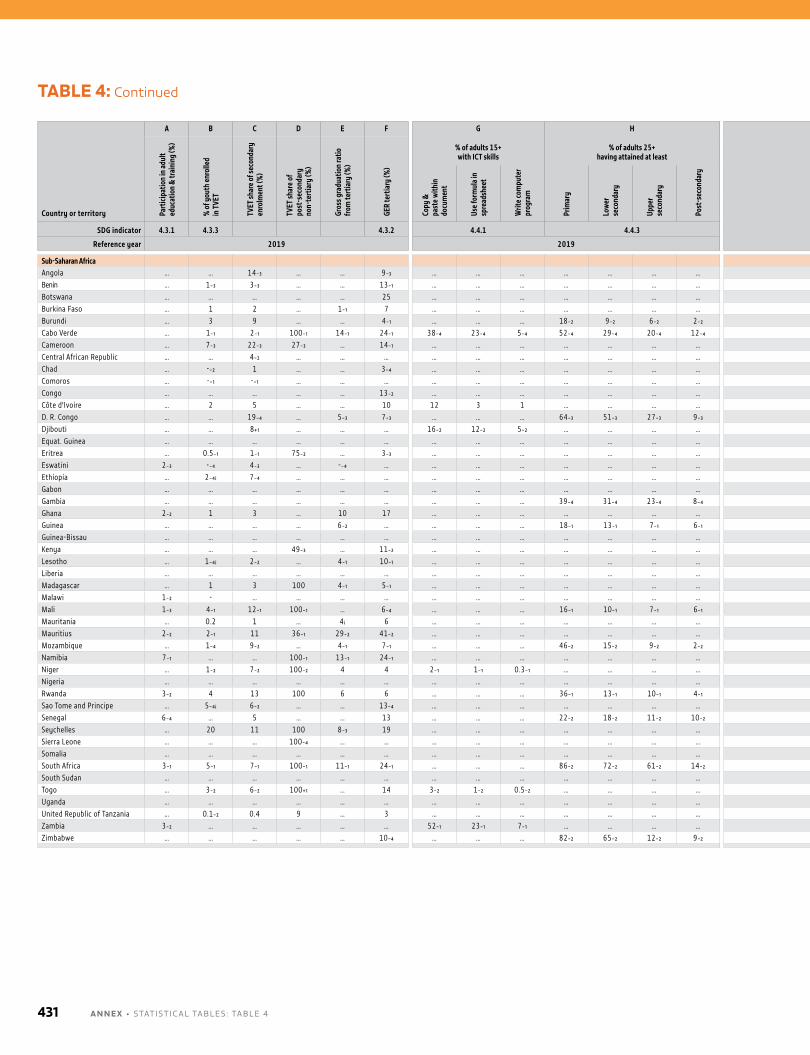
TABLE 4: Continued
Country or territory
A B C D E F G H I J K
Coun
try
code
Part
icipa
tion
in ad
ult
educ
atio
n &
trai
ning
(%)
% o
f you
th en
rolle
d in
TVE
T
TVET
shar
e of s
econ
dary
en
rolm
ent (
%)
TVET
shar
e of
post
-sec
onda
ry
non-
tert
iary
(%)
Gros
s gra
duat
ion
ratio
fro
m te
rtia
ry (%
)
GER
tert
iary
(%)
% of adults 15+ with ICT skills
% of adults 25+ having attained at least
% achieving proficiency in Literacy rate (%) Illiterates
Copy
&
past
e with
in
docu
men
t
Use f
orm
ula i
n sp
read
shee
t
Writ
e com
pute
r pr
ogra
m
Prim
ary
Low
er
seco
ndar
y
Uppe
r se
cond
ary
Post
-sec
onda
ry
Literacy Numeracy Youth Adults
% femaleNumber
(000,000)
Youth Adults Youth Adults
SDG indicator 4.3.1 4.3.3 4.3.2 4.4.1 4.4.3 4.6.1 4.6.2
Reference year 2019 2019 2019
Sub-Saharan AfricaAngola … … 14₋₃ … … 9₋₃ … … … … … … … … … … … … … … … AGOBenin … 1₋₃ 3₋₃ … … 13₋₁ … … … … … … … … … 61₋₁ ᵢ 42₋₁ ᵢ 61₋₁ ᵢ 61₋₁ ᵢ 890₋₁ ᵢ 3,810₋₁ ᵢ BENBotswana … … … … … 25 … … … … … … … … … … … … … … … BWABurkina Faso … 1 2 … 1₋₁ 7 … … … … … … … … … 58₋₁ ᵢ 41₋₁ ᵢ 53₋₁ ᵢ 58₋₁ ᵢ 1,652₋₁ ᵢ 6,391₋₁ ᵢ BFABurundi … 3 9 … … 4₋₁ … … … 18₋₂ 9₋₂ 6₋₂ 2₋₂ … … 88₋₂ 68₋₂ 62₋₂ 63₋₂ 248₋₂ 1,851₋₂ BDICabo Verde … 1₋₁ 2₋₁ 100₋₁ 14₋₁ 24₋₁ 38₋₄ 23₋₄ 5₋₄ 52₋₄ 29₋₄ 20₋₄ 12₋₄ … … 98₋₄ 87₋₄ 34₋₄ 68₋₄ 2₋₄ 48₋₄ CPVCameroon … 7₋₃ 22₋₃ 27₋₃ … 14₋₁ … … … … … … … … … 85₋₁ ᵢ 77₋₁ ᵢ 59₋₁ ᵢ 62₋₁ ᵢ 745₋₁ ᵢ 3,317₋₁ ᵢ CMRCentral African Republic … … 4₋₂ … … … … … … … … … … … … 38₋₁ ᵢ 37₋₁ ᵢ 58₋₁ ᵢ 60₋₁ ᵢ 623₋₁ ᵢ 1,627₋₁ ᵢ CAFChad … -₋₂ 1 … … 3₋₄ … … … … … … … … … 31₋₃ 22₋₃ 57₋₃ 56₋₃ 2,021₋₃ 5,903₋₃ TCDComoros … -₋₁ -₋₁ … … … … … … … … … … … … 78₋₁ ᵢ 59₋₁ ᵢ 49₋₁ ᵢ 57₋₁ ᵢ 35₋₁ ᵢ 207₋₁ ᵢ COMCongo … … … … … 13₋₂ … … … … … … … … … 82₋₁ ᵢ 80₋₁ ᵢ 59₋₁ ᵢ 65₋₁ ᵢ 176₋₁ ᵢ 602₋₁ ᵢ COGCôte d'Ivoire … 2 5 … … 10 12 3 1 … … … … … … 58₋₁ ᵢ 47₋₁ ᵢ 57₋₁ ᵢ 56₋₁ ᵢ 2,154₋₁ ᵢ 7,691₋₁ ᵢ CIVD. R. Congo … … 19₋₄ … 5₋₃ 7₋₃ … … … 64₋₃ 51₋₃ 27₋₃ 9₋₃ … … 85₋₃ 77₋₃ 69₋₃ 75₋₃ 2,181₋₃ 9,561₋₃ CODDjibouti … … 8₊₁ … … … 16₋₂ 12₋₂ 5₋₂ … … … … … … … … … … … … DJIEquat. Guinea … … … … … … … … … … … … … … … … … … … … … GNQEritrea … 0.5₋₁ 1₋₁ 75₋₂ … 3₋₃ … … … … … … … … … 93₋₁ ᵢ 77₋₁ ᵢ 54₋₁ ᵢ 67₋₁ ᵢ 42₋₁ ᵢ 470₋₁ ᵢ ERIEswatini 2₋₃ -₋₄ 4₋₃ … -₋₄ … … … … … … … … … … 95₋₁ ᵢ 88₋₁ ᵢ 36₋₁ ᵢ 52₋₁ ᵢ 11₋₁ ᵢ 81₋₁ ᵢ SWZEthiopia … 2₋₄ ᵢ 7₋₄ … … … … … … … … … … … … 73₋₂ ᵢ 52₋₂ ᵢ 51₋₂ ᵢ 58₋₂ ᵢ 6,273₋₂ ᵢ 30,147₋₂ ᵢ ETHGabon … … … … … … … … … … … … … … … 90₋₁ ᵢ 85₋₁ ᵢ 42₋₁ ᵢ 53₋₁ ᵢ 37₋₁ ᵢ 205₋₁ ᵢ GABGambia … … … … … … … … … 39₋₄ 31₋₄ 23₋₄ 8₋₄ … … 67₋₄ 51₋₄ 55₋₄ 61₋₄ 140₋₄ 562₋₄ GMBGhana 2₋₂ 1 3 … 10 17 … … … … … … … … … 92₋₁ ᵢ 79₋₁ ᵢ 51₋₁ ᵢ 60₋₁ ᵢ 435₋₁ ᵢ 3,894₋₁ ᵢ GHAGuinea … … … … 6₋₂ … … … … 18₋₁ 13₋₁ 7₋₁ 6₋₁ … … 54₋₁ 40₋₁ 65₋₁ 65₋₁ 1,151₋₁ 4,174₋₁ GINGuinea-Bissau … … … … … … … … … … … … … … … … … … … … … GNBKenya … … … 49₋₃ … 11₋₂ … … … … … … … … … 88₋₁ ᵢ 82₋₁ ᵢ 49₋₁ ᵢ 60₋₁ ᵢ 1,291₋₁ ᵢ 5,714₋₁ ᵢ KENLesotho … 1₋₄ ᵢ 2₋₂ … 4₋₁ 10₋₁ … … … … … … … … … … … … … … … LSOLiberia … … … … … … … … … … … … … … … 55₋₂ ᵢ 48₋₂ ᵢ 60₋₂ ᵢ 64₋₂ ᵢ 409₋₂ ᵢ 1,423₋₂ ᵢ LBRMadagascar … 1 3 100 4₋₁ 5₋₁ … … … … … … … … … 81₋₁ ᵢ 75₋₁ ᵢ 51₋₁ ᵢ 55₋₁ ᵢ 1,017₋₁ ᵢ 3,926₋₁ ᵢ MDGMalawi 1₋₂ - … … … … … … … … … … … … … 73₋₄ ᵢ 62₋₄ ᵢ 50₋₄ ᵢ 61₋₄ ᵢ 934₋₄ ᵢ 3,471₋₄ ᵢ MWIMali 1₋₃ 4₋₁ 12₋₁ 100₋₁ … 6₋₄ … … … 16₋₁ 10₋₁ 7₋₁ 6₋₁ … … 50₋₁ 35₋₁ 57₋₁ 59₋₁ 1,831₋₁ 6,422₋₁ MLIMauritania … 0.2 1 … 4 ᵢ 6 … … … … … … … … … 64₋₂ ᵢ 53₋₂ ᵢ 59₋₂ ᵢ 61₋₂ ᵢ 297₋₂ ᵢ 1,190₋₂ ᵢ MRTMauritius 2₋₂ 2₋₁ 11 36₋₁ 29₋₂ 41₋₂ … … … … … … … … … 99₋₁ ᵢ 91₋₁ ᵢ 33₋₁ ᵢ 62₋₁ ᵢ 2₋₁ ᵢ 90₋₁ ᵢ MUSMozambique … 1₋₄ 9₋₂ … 4₋₁ 7₋₁ … … … 46₋₂ 15₋₂ 9₋₂ 2₋₂ … … 71₋₂ 61₋₂ 61₋₂ 67₋₂ 1,659₋₂ 6,178₋₂ MOZNamibia 7₋₁ … … 100₋₁ 13₋₁ 24₋₁ … … … … … … … … … 95₋₁ ᵢ 92₋₁ ᵢ 40₋₁ ᵢ 53₋₁ ᵢ 24₋₁ ᵢ 131₋₁ ᵢ NAMNiger … 1₋₂ 7₋₂ 100₋₂ 4 4 2₋₁ 1₋₁ 0.3₋₁ … … … … … … 43₋₁ ᵢ 35₋₁ ᵢ 56₋₁ ᵢ 57₋₁ ᵢ 2,440₋₁ ᵢ 7,291₋₁ ᵢ NERNigeria … … … … … … … … … … … … … … … 75₋₁ ᵢ 62₋₁ ᵢ 63₋₁ ᵢ 62₋₁ ᵢ 9,365₋₁ ᵢ 41,764₋₁ ᵢ NGARwanda 3₋₂ 4 13 100 6 6 … … … 36₋₁ 13₋₁ 10₋₁ 4₋₁ … … 86₋₁ 73₋₁ 43₋₁ 59₋₁ 327₋₁ 1,968₋₁ RWASao Tome and Principe … 5₋₄ ᵢ 6₋₂ … … 13₋₄ … … … … … … … … … 98₋₁ ᵢ 93₋₁ ᵢ 48₋₁ ᵢ 73₋₁ ᵢ 1₋₁ ᵢ 9₋₁ ᵢ STPSenegal 6₋₄ … 5 … … 13 … … … 22₋₂ 18₋₂ 11₋₂ 10₋₂ … … 69₋₂ 52₋₂ 60₋₂ 66₋₂ 923₋₂ 4,236₋₂ SENSeychelles … 20 11 100 8₋₃ 19 … … … … … … … … … 99₋₁ ᵢ 96₋₁ ᵢ 21₋₁ ᵢ 43₋₁ ᵢ 0.1₋₁ ᵢ 3₋₁ ᵢ SYCSierra Leone … … … 100₋₄ … … … … … … … … … … … 67₋₁ ᵢ 43₋₁ ᵢ 56₋₁ ᵢ 58₋₁ ᵢ 518₋₁ ᵢ 2,561₋₁ ᵢ SLESomalia … … … … … … … … … … … … … … … … … … … … … SOMSouth Africa 3₋₁ 5₋₁ 7₋₁ 100₋₁ 11₋₁ 24₋₁ … … … 86₋₂ 72₋₂ 61₋₂ 14₋₂ 87₋₂ 98₋₂ 95₋₂ 87₋₂ 33₋₂ 54₋₂ 464₋₂ 5,229₋₂ ZAFSouth Sudan … … … … … … … … … … … … … … … 48₋₁ ᵢ 35₋₁ ᵢ 50₋₁ ᵢ 55₋₁ ᵢ 1,157₋₁ ᵢ 4,181₋₁ ᵢ SSDTogo … 3₋₂ 6₋₂ 100₊₁ … 14 3₋₂ 1₋₂ 0.5₋₂ … … … … … … 84₋₄ 64₋₄ 68₋₄ 69₋₄ 224₋₄ 1,522₋₄ TGOUganda … … … … … … … … … … … … … … … 89₋₁ ᵢ 77₋₁ ᵢ 48₋₁ ᵢ 64₋₁ ᵢ 940₋₁ ᵢ 5,323₋₁ ᵢ UGAUnited Republic of Tanzania … 0.1₋₂ 0.4 9 … 3 … … … … … … … … … 86₋₄ 78₋₄ 54₋₄ 62₋₄ 1,417₋₄ 6,240₋₄ TZAZambia 3₋₂ … … … … … 52₋₁ 23₋₁ 7₋₁ … … … … … … 92₋₁ ᵢ 87₋₁ ᵢ 53₋₁ ᵢ 65₋₁ ᵢ 285₋₁ ᵢ 1,266₋₁ ᵢ ZMBZimbabwe … … … … … 10₋₄ … … … 82₋₂ 65₋₂ 12₋₂ 9₋₂ … … … … … … … … ZWE
A N N E X • STATISTICAl TAblES : TAblE 4431
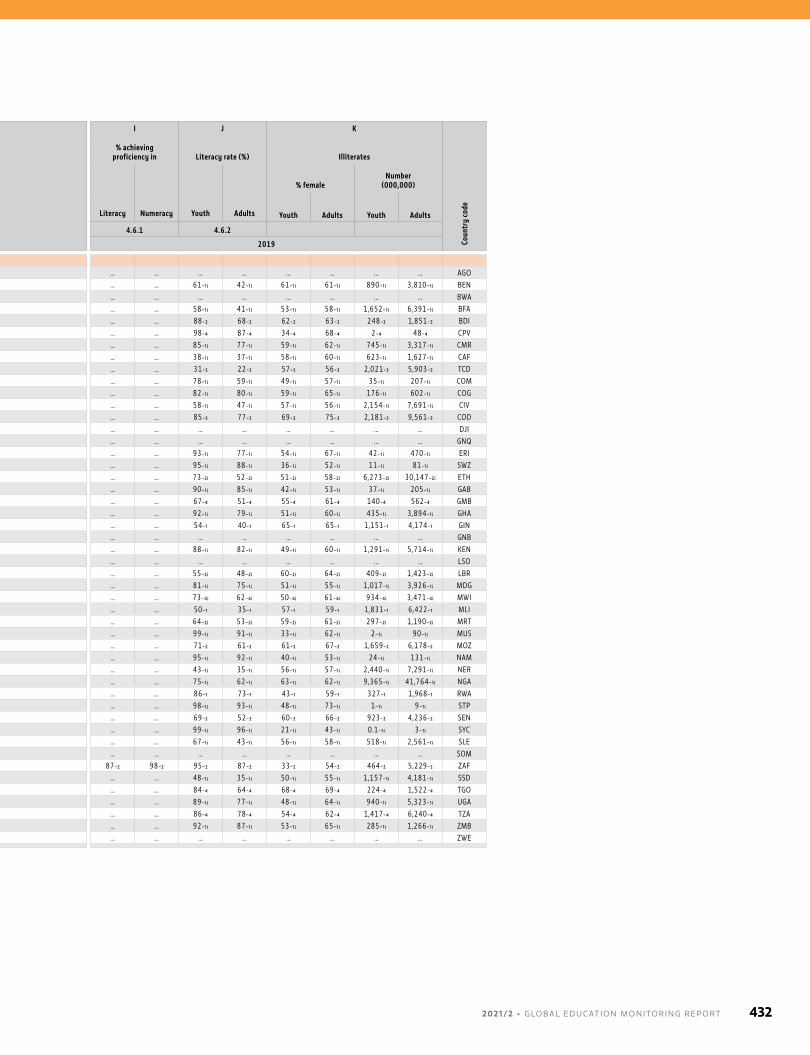
Country or territory
A B C D E F G H I J K
Coun
try
code
Part
icipa
tion
in ad
ult
educ
atio
n &
trai
ning
(%)
% o
f you
th en
rolle
d in
TVE
T
TVET
shar
e of s
econ
dary
en
rolm
ent (
%)
TVET
shar
e of
post
-sec
onda
ry
non-
tert
iary
(%)
Gros
s gra
duat
ion
ratio
fro
m te
rtia
ry (%
)
GER
tert
iary
(%)
% of adults 15+ with ICT skills
% of adults 25+ having attained at least
% achieving proficiency in Literacy rate (%) Illiterates
Copy
&
past
e with
in
docu
men
t
Use f
orm
ula i
n sp
read
shee
t
Writ
e com
pute
r pr
ogra
m
Prim
ary
Low
er
seco
ndar
y
Uppe
r se
cond
ary
Post
-sec
onda
ry
Literacy Numeracy Youth Adults
% femaleNumber
(000,000)
Youth Adults Youth Adults
SDG indicator 4.3.1 4.3.3 4.3.2 4.4.1 4.4.3 4.6.1 4.6.2
Reference year 2019 2019 2019
Sub-Saharan AfricaAngola … … 14₋₃ … … 9₋₃ … … … … … … … … … … … … … … … AGOBenin … 1₋₃ 3₋₃ … … 13₋₁ … … … … … … … … … 61₋₁ ᵢ 42₋₁ ᵢ 61₋₁ ᵢ 61₋₁ ᵢ 890₋₁ ᵢ 3,810₋₁ ᵢ BENBotswana … … … … … 25 … … … … … … … … … … … … … … … BWABurkina Faso … 1 2 … 1₋₁ 7 … … … … … … … … … 58₋₁ ᵢ 41₋₁ ᵢ 53₋₁ ᵢ 58₋₁ ᵢ 1,652₋₁ ᵢ 6,391₋₁ ᵢ BFABurundi … 3 9 … … 4₋₁ … … … 18₋₂ 9₋₂ 6₋₂ 2₋₂ … … 88₋₂ 68₋₂ 62₋₂ 63₋₂ 248₋₂ 1,851₋₂ BDICabo Verde … 1₋₁ 2₋₁ 100₋₁ 14₋₁ 24₋₁ 38₋₄ 23₋₄ 5₋₄ 52₋₄ 29₋₄ 20₋₄ 12₋₄ … … 98₋₄ 87₋₄ 34₋₄ 68₋₄ 2₋₄ 48₋₄ CPVCameroon … 7₋₃ 22₋₃ 27₋₃ … 14₋₁ … … … … … … … … … 85₋₁ ᵢ 77₋₁ ᵢ 59₋₁ ᵢ 62₋₁ ᵢ 745₋₁ ᵢ 3,317₋₁ ᵢ CMRCentral African Republic … … 4₋₂ … … … … … … … … … … … … 38₋₁ ᵢ 37₋₁ ᵢ 58₋₁ ᵢ 60₋₁ ᵢ 623₋₁ ᵢ 1,627₋₁ ᵢ CAFChad … -₋₂ 1 … … 3₋₄ … … … … … … … … … 31₋₃ 22₋₃ 57₋₃ 56₋₃ 2,021₋₃ 5,903₋₃ TCDComoros … -₋₁ -₋₁ … … … … … … … … … … … … 78₋₁ ᵢ 59₋₁ ᵢ 49₋₁ ᵢ 57₋₁ ᵢ 35₋₁ ᵢ 207₋₁ ᵢ COMCongo … … … … … 13₋₂ … … … … … … … … … 82₋₁ ᵢ 80₋₁ ᵢ 59₋₁ ᵢ 65₋₁ ᵢ 176₋₁ ᵢ 602₋₁ ᵢ COGCôte d'Ivoire … 2 5 … … 10 12 3 1 … … … … … … 58₋₁ ᵢ 47₋₁ ᵢ 57₋₁ ᵢ 56₋₁ ᵢ 2,154₋₁ ᵢ 7,691₋₁ ᵢ CIVD. R. Congo … … 19₋₄ … 5₋₃ 7₋₃ … … … 64₋₃ 51₋₃ 27₋₃ 9₋₃ … … 85₋₃ 77₋₃ 69₋₃ 75₋₃ 2,181₋₃ 9,561₋₃ CODDjibouti … … 8₊₁ … … … 16₋₂ 12₋₂ 5₋₂ … … … … … … … … … … … … DJIEquat. Guinea … … … … … … … … … … … … … … … … … … … … … GNQEritrea … 0.5₋₁ 1₋₁ 75₋₂ … 3₋₃ … … … … … … … … … 93₋₁ ᵢ 77₋₁ ᵢ 54₋₁ ᵢ 67₋₁ ᵢ 42₋₁ ᵢ 470₋₁ ᵢ ERIEswatini 2₋₃ -₋₄ 4₋₃ … -₋₄ … … … … … … … … … … 95₋₁ ᵢ 88₋₁ ᵢ 36₋₁ ᵢ 52₋₁ ᵢ 11₋₁ ᵢ 81₋₁ ᵢ SWZEthiopia … 2₋₄ ᵢ 7₋₄ … … … … … … … … … … … … 73₋₂ ᵢ 52₋₂ ᵢ 51₋₂ ᵢ 58₋₂ ᵢ 6,273₋₂ ᵢ 30,147₋₂ ᵢ ETHGabon … … … … … … … … … … … … … … … 90₋₁ ᵢ 85₋₁ ᵢ 42₋₁ ᵢ 53₋₁ ᵢ 37₋₁ ᵢ 205₋₁ ᵢ GABGambia … … … … … … … … … 39₋₄ 31₋₄ 23₋₄ 8₋₄ … … 67₋₄ 51₋₄ 55₋₄ 61₋₄ 140₋₄ 562₋₄ GMBGhana 2₋₂ 1 3 … 10 17 … … … … … … … … … 92₋₁ ᵢ 79₋₁ ᵢ 51₋₁ ᵢ 60₋₁ ᵢ 435₋₁ ᵢ 3,894₋₁ ᵢ GHAGuinea … … … … 6₋₂ … … … … 18₋₁ 13₋₁ 7₋₁ 6₋₁ … … 54₋₁ 40₋₁ 65₋₁ 65₋₁ 1,151₋₁ 4,174₋₁ GINGuinea-Bissau … … … … … … … … … … … … … … … … … … … … … GNBKenya … … … 49₋₃ … 11₋₂ … … … … … … … … … 88₋₁ ᵢ 82₋₁ ᵢ 49₋₁ ᵢ 60₋₁ ᵢ 1,291₋₁ ᵢ 5,714₋₁ ᵢ KENLesotho … 1₋₄ ᵢ 2₋₂ … 4₋₁ 10₋₁ … … … … … … … … … … … … … … … LSOLiberia … … … … … … … … … … … … … … … 55₋₂ ᵢ 48₋₂ ᵢ 60₋₂ ᵢ 64₋₂ ᵢ 409₋₂ ᵢ 1,423₋₂ ᵢ LBRMadagascar … 1 3 100 4₋₁ 5₋₁ … … … … … … … … … 81₋₁ ᵢ 75₋₁ ᵢ 51₋₁ ᵢ 55₋₁ ᵢ 1,017₋₁ ᵢ 3,926₋₁ ᵢ MDGMalawi 1₋₂ - … … … … … … … … … … … … … 73₋₄ ᵢ 62₋₄ ᵢ 50₋₄ ᵢ 61₋₄ ᵢ 934₋₄ ᵢ 3,471₋₄ ᵢ MWIMali 1₋₃ 4₋₁ 12₋₁ 100₋₁ … 6₋₄ … … … 16₋₁ 10₋₁ 7₋₁ 6₋₁ … … 50₋₁ 35₋₁ 57₋₁ 59₋₁ 1,831₋₁ 6,422₋₁ MLIMauritania … 0.2 1 … 4 ᵢ 6 … … … … … … … … … 64₋₂ ᵢ 53₋₂ ᵢ 59₋₂ ᵢ 61₋₂ ᵢ 297₋₂ ᵢ 1,190₋₂ ᵢ MRTMauritius 2₋₂ 2₋₁ 11 36₋₁ 29₋₂ 41₋₂ … … … … … … … … … 99₋₁ ᵢ 91₋₁ ᵢ 33₋₁ ᵢ 62₋₁ ᵢ 2₋₁ ᵢ 90₋₁ ᵢ MUSMozambique … 1₋₄ 9₋₂ … 4₋₁ 7₋₁ … … … 46₋₂ 15₋₂ 9₋₂ 2₋₂ … … 71₋₂ 61₋₂ 61₋₂ 67₋₂ 1,659₋₂ 6,178₋₂ MOZNamibia 7₋₁ … … 100₋₁ 13₋₁ 24₋₁ … … … … … … … … … 95₋₁ ᵢ 92₋₁ ᵢ 40₋₁ ᵢ 53₋₁ ᵢ 24₋₁ ᵢ 131₋₁ ᵢ NAMNiger … 1₋₂ 7₋₂ 100₋₂ 4 4 2₋₁ 1₋₁ 0.3₋₁ … … … … … … 43₋₁ ᵢ 35₋₁ ᵢ 56₋₁ ᵢ 57₋₁ ᵢ 2,440₋₁ ᵢ 7,291₋₁ ᵢ NERNigeria … … … … … … … … … … … … … … … 75₋₁ ᵢ 62₋₁ ᵢ 63₋₁ ᵢ 62₋₁ ᵢ 9,365₋₁ ᵢ 41,764₋₁ ᵢ NGARwanda 3₋₂ 4 13 100 6 6 … … … 36₋₁ 13₋₁ 10₋₁ 4₋₁ … … 86₋₁ 73₋₁ 43₋₁ 59₋₁ 327₋₁ 1,968₋₁ RWASao Tome and Principe … 5₋₄ ᵢ 6₋₂ … … 13₋₄ … … … … … … … … … 98₋₁ ᵢ 93₋₁ ᵢ 48₋₁ ᵢ 73₋₁ ᵢ 1₋₁ ᵢ 9₋₁ ᵢ STPSenegal 6₋₄ … 5 … … 13 … … … 22₋₂ 18₋₂ 11₋₂ 10₋₂ … … 69₋₂ 52₋₂ 60₋₂ 66₋₂ 923₋₂ 4,236₋₂ SENSeychelles … 20 11 100 8₋₃ 19 … … … … … … … … … 99₋₁ ᵢ 96₋₁ ᵢ 21₋₁ ᵢ 43₋₁ ᵢ 0.1₋₁ ᵢ 3₋₁ ᵢ SYCSierra Leone … … … 100₋₄ … … … … … … … … … … … 67₋₁ ᵢ 43₋₁ ᵢ 56₋₁ ᵢ 58₋₁ ᵢ 518₋₁ ᵢ 2,561₋₁ ᵢ SLESomalia … … … … … … … … … … … … … … … … … … … … … SOMSouth Africa 3₋₁ 5₋₁ 7₋₁ 100₋₁ 11₋₁ 24₋₁ … … … 86₋₂ 72₋₂ 61₋₂ 14₋₂ 87₋₂ 98₋₂ 95₋₂ 87₋₂ 33₋₂ 54₋₂ 464₋₂ 5,229₋₂ ZAFSouth Sudan … … … … … … … … … … … … … … … 48₋₁ ᵢ 35₋₁ ᵢ 50₋₁ ᵢ 55₋₁ ᵢ 1,157₋₁ ᵢ 4,181₋₁ ᵢ SSDTogo … 3₋₂ 6₋₂ 100₊₁ … 14 3₋₂ 1₋₂ 0.5₋₂ … … … … … … 84₋₄ 64₋₄ 68₋₄ 69₋₄ 224₋₄ 1,522₋₄ TGOUganda … … … … … … … … … … … … … … … 89₋₁ ᵢ 77₋₁ ᵢ 48₋₁ ᵢ 64₋₁ ᵢ 940₋₁ ᵢ 5,323₋₁ ᵢ UGAUnited Republic of Tanzania … 0.1₋₂ 0.4 9 … 3 … … … … … … … … … 86₋₄ 78₋₄ 54₋₄ 62₋₄ 1,417₋₄ 6,240₋₄ TZAZambia 3₋₂ … … … … … 52₋₁ 23₋₁ 7₋₁ … … … … … … 92₋₁ ᵢ 87₋₁ ᵢ 53₋₁ ᵢ 65₋₁ ᵢ 285₋₁ ᵢ 1,266₋₁ ᵢ ZMBZimbabwe … … … … … 10₋₄ … … … 82₋₂ 65₋₂ 12₋₂ 9₋₂ … … … … … … … … ZWE
2 0 2 1 / 2 • G LO BA L E D U C AT I O N M O N I TO R I N G R E P O RT 432
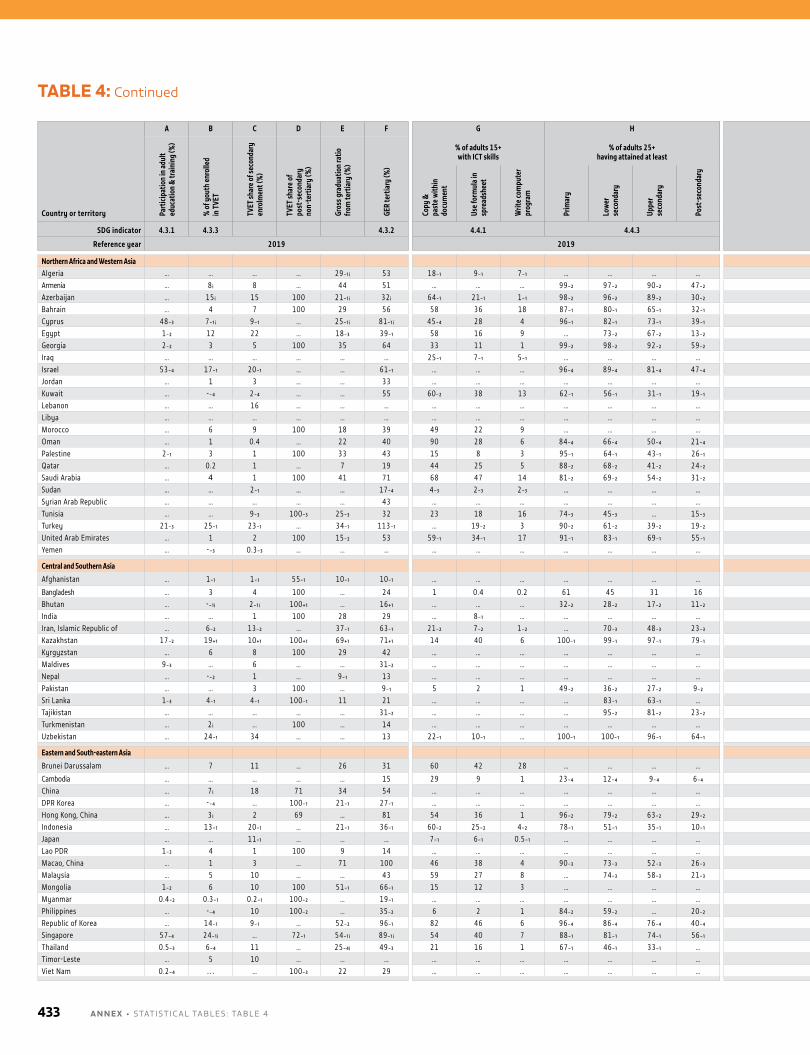
Country or territory
A B C D E F G H I J K
Coun
try
code
Part
icipa
tion
in ad
ult
educ
atio
n &
trai
ning
(%)
% o
f you
th en
rolle
d in
TVE
T
TVET
shar
e of s
econ
dary
en
rolm
ent (
%)
TVET
shar
e of
post
-sec
onda
ry
non-
tert
iary
(%)
Gros
s gra
duat
ion
ratio
fro
m te
rtia
ry (%
)
GER
tert
iary
(%)
% of adults 15+ with ICT skills
% of adults 25+ having attained at least
% achieving proficiency in Literacy rate (%) Illiterates
Copy
&
past
e with
in
docu
men
t
Use f
orm
ula i
n sp
read
shee
t
Writ
e com
pute
r pr
ogra
m
Prim
ary
Low
er
seco
ndar
y
Uppe
r se
cond
ary
Post
-sec
onda
ry
Literacy Numeracy Youth Adults
% femaleNumber
(000,000)
Youth Adults Youth Adults
SDG indicator 4.3.1 4.3.3 4.3.2 4.4.1 4.4.3 4.6.1 4.6.2
Reference year 2019 2019 2019
Northern Africa and Western AsiaAlgeria … … … … 29₋₁ ᵢ 53 18₋₁ 9₋₁ 7₋₁ … … … … … … 97₋₁ ᵢ 81₋₁ ᵢ 52₋₁ ᵢ 66₋₁ ᵢ 156₋₁ ᵢ 5,484₋₁ ᵢ DZAArmenia … 8 ᵢ 8 … 44 51 … … … 99₋₂ 97₋₂ 90₋₂ 47₋₂ … … 100₋₂ 100₋₂ 40₋₂ 67₋₂ 1₋₂ 6₋₂ ARMAzerbaijan … 15 ᵢ 15 100 21₋₁ ᵢ 32 ᵢ 64₋₁ 21₋₁ 1₋₁ 98₋₂ 96₋₂ 89₋₂ 30₋₂ … … 100₋₂ 100₋₂ 67₋₂ 68₋₂ 1₋₂ 16₋₂ AZEBahrain … 4 7 100 29 56 58 36 18 87₋₁ 80₋₁ 65₋₁ 32₋₁ … … 100₋₁ 97₋₁ 96₋₁ 67₋₁ 1₋₁ 32₋₁ BHRCyprus 48₋₃ 7₋₁ ᵢ 9₋₁ … 25₋₁ ᵢ 81₋₁ ᵢ 45₋₄ 28 4 96₋₁ 82₋₁ 73₋₁ 39₋₁ … … … … … … … … CYPEgypt 1₋₂ 12 22 … 18₋₃ 39₋₁ 58 16 9 … 73₋₂ 67₋₂ 13₋₂ … … 88₋₂ 71₋₂ 54₋₂ 59₋₂ 1,976₋₂ 18,519₋₂ EGYGeorgia 2₋₂ 3 5 100 35 64 33 11 1 99₋₂ 98₋₂ 92₋₂ 59₋₂ … … 100₋₂ 99₋₂ 67₋₂ 59₋₂ 2₋₂ 21₋₂ GEOIraq … … … … … … 25₋₁ 7₋₁ 5₋₁ … … … … … … 94₋₂ 86₋₂ 60₋₂ 69₋₂ 487₋₂ 3,321₋₂ IRQIsrael 53₋₄ 17₋₁ 20₋₁ … … 61₋₁ … … … 96₋₄ 89₋₄ 81₋₄ 47₋₄ 72₋₄ 68₋₄ … … … … … … ISRJordan … 1 3 … … 33 … … … … … … … … … 99₋₁ ᵢ 98₋₁ ᵢ 38₋₁ ᵢ 61₋₁ ᵢ 13₋₁ ᵢ 116₋₁ ᵢ JORKuwait … -₋₄ 2₋₄ … … 55 60₋₂ 38 13 62₋₁ 56₋₁ 31₋₁ 19₋₁ … … 99₋₁ 96₋₁ 25₋₁ 48₋₁ 4₋₁ 130₋₁ KWTLebanon … … 16 … … … … … … … … … … … … 100₋₁ ᵢ 95₋₁ ᵢ 33₋₁ ᵢ 68₋₁ ᵢ 3₋₁ ᵢ 250₋₁ ᵢ LBNLibya … … … … … … … … … … … … … … … … … … … … … LBYMorocco … 6 9 100 18 39 49 22 9 … … … … … … 98₋₁ ᵢ 74₋₁ ᵢ 56₋₁ ᵢ 69₋₁ ᵢ 134₋₁ ᵢ 6,885₋₁ ᵢ MAROman … 1 0.4 … 22 40 90 28 6 84₋₄ 66₋₄ 50₋₄ 21₋₄ … … 99₋₁ 96₋₁ 29₋₁ 51₋₁ 9₋₁ 161₋₁ OMNPalestine 2₋₁ 3 1 100 33 43 15 8 3 95₋₁ 64₋₁ 43₋₁ 26₋₁ … … 99 97 52 77 7 80 PSEQatar … 0.2 1 … 7 19 44 25 5 88₋₂ 68₋₂ 41₋₂ 24₋₂ … … 95₋₂ ᵢ 93₋₂ ᵢ 17₋₂ ᵢ 17₋₂ ᵢ 21₋₂ ᵢ 154₋₂ ᵢ QATSaudi Arabia … 4 1 100 41 71 68 47 14 81₋₂ 69₋₂ 54₋₂ 31₋₂ … … 99₋₂ 95₋₂ 50₋₂ 63₋₂ 34₋₂ 1,157₋₂ SAUSudan … … 2₋₁ … … 17₋₄ 4₋₃ 2₋₃ 2₋₃ … … … … … … 73₋₁ ᵢ 61₋₁ ᵢ 49₋₁ ᵢ 57₋₁ ᵢ 2,296₋₁ ᵢ 9,774₋₁ ᵢ SDNSyrian Arab Republic … … … … … 43 … … … … … … … … … … … … … … … SYRTunisia … … 9₋₃ 100₋₃ 25₋₃ 32 23 18 16 74₋₃ 45₋₃ … 15₋₃ … … … … … … … … TUNTurkey 21₋₃ 25₋₁ 23₋₁ … 34₋₁ 113₋₁ … 19₋₂ 3 90₋₂ 61₋₂ 39₋₂ 19₋₂ 53₋₄ 49₋₄ 100₋₂ 96₋₂ 81₋₂ 85₋₂ 33₋₂ 2,380₋₂ TURUnited Arab Emirates … 1 2 100 15₋₂ 53 59₋₁ 34₋₁ 17 91₋₁ 83₋₁ 69₋₁ 55₋₁ … … 99₋₄ ᵢ 93₋₄ ᵢ 62₋₄ ᵢ 19₋₄ ᵢ 6₋₄ ᵢ 539₋₄ ᵢ AREYemen … -₋₃ 0.3₋₃ … … … … … … … … … … … … … … … … … … YEM
Central and Southern Asia
Afghanistan … 1₋₁ 1₋₁ 55₋₁ 10₋₁ 10₋₁ … … … … … … … … … 65₋₁ ᵢ 43₋₁ ᵢ 61₋₁ ᵢ 60₋₁ ᵢ 2,791₋₁ ᵢ 12,054₋₁ ᵢ AFG
Bangladesh … 3 4 100 … 24 1 0.4 0.2 61 45 31 16 … … 95 75 37 55 1,581 30,005 BGDBhutan … -₋₁ ᵢ 2₋₁ ᵢ 100₊₁ … 16₊₁ … … … 32₋₂ 28₋₂ 17₋₂ 11₋₂ … … 93₋₂ 67₋₂ 49₋₂ 60₋₂ 10₋₂ 183₋₂ BTNIndia … … 1 100 28 29 … 8₋₁ … … … … … … … 92₋₁ ᵢ 74₋₁ ᵢ 56₋₁ ᵢ 64₋₁ ᵢ 20,538₋₁ ᵢ 252,864₋₁ ᵢ INDIran, Islamic Republic of … 6₋₂ 13₋₂ … 37₋₁ 63₋₁ 21₋₂ 7₋₂ 1₋₂ … 70₋₃ 48₋₃ 23₋₃ … … 98₋₃ 86₋₃ 54₋₃ 66₋₃ 229₋₃ 8,700₋₃ IRNKazakhstan 17₋₂ 19₊₁ 10₊₁ 100₊₁ 69₊₁ 71₊₁ 14 40 6 100₋₁ 99₋₁ 97₋₁ 79₋₁ 74₋₂ 73₋₂ 100₋₁ ᵢ 100₋₁ ᵢ 70₋₁ ᵢ 63₋₁ ᵢ 2₋₁ ᵢ 29₋₁ ᵢ KAZKyrgyzstan … 6 8 100 29 42 … … … … … … … … … 100₋₁ ᵢ 100₋₁ ᵢ 37₋₁ ᵢ 62₋₁ ᵢ 3₋₁ ᵢ 18₋₁ ᵢ KGZMaldives 9₋₃ … 6 … … 31₋₂ … … … … … … … … … 99₋₃ 98₋₃ 24₋₃ 29₋₃ 1₋₃ 9₋₃ MDVNepal … -₋₂ 1 … 9₋₁ 13 … … … … … … … … … 92₋₁ ᵢ 68₋₁ ᵢ 62₋₁ ᵢ 71₋₁ ᵢ 481₋₁ ᵢ 6,275₋₁ ᵢ NPLPakistan … … 3 100 … 9₋₁ 5 2 1 49₋₂ 36₋₂ 27₋₂ 9₋₂ … … 75₋₂ 59₋₂ 62₋₂ 64₋₂ 10,534₋₂ 54,876₋₂ PAKSri Lanka 1₋₃ 4₋₁ 4₋₁ 100₋₁ 11 21 … … … … 83₋₁ 63₋₁ … … … 99₋₁ 92₋₁ 39₋₁ 59₋₁ 38₋₁ 1,331₋₁ LKATajikistan … … … … … 31₋₂ … … … … 95₋₂ 81₋₂ 23₋₂ … … … … … … … … TJKTurkmenistan … 2 ᵢ … 100 … 14 … … … … … … … … … … … … … … … TKMUzbekistan … 24₋₁ 34 … … 13 22₋₁ 10₋₁ … 100₋₁ 100₋₁ 96₋₁ 64₋₁ … … 100₋₁ 100₋₁ 50₋₁ 100₋₁ -₋₁ 2₋₁ UZB
Eastern and South-eastern Asia
Brunei Darussalam … 7 11 … 26 31 60 42 28 … … … … … … 100₋₁ ᵢ 97₋₁ ᵢ 35₋₁ ᵢ 64₋₁ ᵢ 0.2₋₁ ᵢ 9₋₁ ᵢ BRN
Cambodia … … … … … 15 29 9 1 23₋₄ 12₋₄ 9₋₄ 6₋₄ … … 92₋₄ 81₋₄ 47₋₄ 67₋₄ 249₋₄ 2,067₋₄ KHMChina … 7 ᵢ 18 71 34 54 … … … … … … … … … 100₋₁ ᵢ 97₋₁ ᵢ 47₋₁ ᵢ 75₋₁ ᵢ 375₋₁ ᵢ 37,038₋₁ ᵢ CHNDPR Korea … -₋₄ … 100₋₁ 21₋₁ 27₋₁ … … … … … … … … … … … … … … … PRKHong Kong, China … 3 ᵢ 2 69 … 81 54 36 1 96₋₂ 79₋₂ 63₋₂ 29₋₂ … … … … … … … … HKGIndonesia … 13₋₁ 20₋₁ … 21₋₁ 36₋₁ 60₋₂ 25₋₂ 4₋₂ 78₋₁ 51₋₁ 35₋₁ 10₋₁ … … 100₋₁ 96₋₁ 50₋₁ 69₋₁ 133₋₁ 8,527₋₁ IDNJapan … … 11₋₁ … … … 7₋₁ 6₋₁ 0.5₋₁ … … … … … … … … … … … … JPNLao PDR 1₋₂ 4 1 100 9 14 … … … … … … … … … 92₋₄ 85₋₄ 63₋₄ 67₋₄ 106₋₄ 687₋₄ LAOMacao, China … 1 3 … 71 100 46 38 4 90₋₃ 73₋₃ 52₋₃ 26₋₃ … … 100₋₃ 97₋₃ 32₋₃ 75₋₃ 0.2₋₃ 19₋₃ MACMalaysia … 5 10 … … 43 59 27 8 … 74₋₃ 58₋₃ 21₋₃ … … 97₋₁ 95₋₁ 46₋₁ 61₋₁ 177₋₁ 1,234₋₁ MYSMongolia 1₋₂ 6 10 100 51₋₁ 66₋₁ 15 12 3 … … … … … … 99₋₁ ᵢ 98₋₁ ᵢ 33₋₁ ᵢ 44₋₁ ᵢ 6₋₁ ᵢ 35₋₁ ᵢ MNGMyanmar 0.4₋₂ 0.3₋₁ 0.2₋₁ 100₋₂ … 19₋₁ … … … … … … … … … 85₋₃ ᵢ 76₋₃ ᵢ 51₋₃ ᵢ 61₋₃ ᵢ 1,468₋₃ ᵢ 9,360₋₃ ᵢ MMRPhilippines … -₋₄ 10 100₋₂ … 35₋₂ 6 2 1 84₋₂ 59₋₂ … 20₋₂ … … 99₋₄ 98₋₄ 39₋₄ 49₋₄ 182₋₄ 1,257₋₄ PHLRepublic of Korea … 14₋₁ 9₋₁ … 52₋₂ 96₋₁ 82 46 6 96₋₄ 86₋₄ 76₋₄ 40₋₄ … … … … … … … … KORSingapore 57₋₄ 24₋₁ ᵢ … 72₋₁ 54₋₁ ᵢ 89₋₁ ᵢ 54 40 7 88₋₁ 81₋₁ 74₋₁ 56₋₁ 74₋₄ 72₋₄ 100₋₁ 97₋₁ 37₋₁ 76₋₁ 1₋₁ 128₋₁ SGPThailand 0.5₋₃ 6₋₄ 11 … 25₋₄ ᵢ 49₋₃ 21 16 1 67₋₁ 46₋₁ 33₋₁ … … … 98₋₁ 94₋₁ 37₋₁ 63₋₁ 176₋₁ 3,589₋₁ THATimor-Leste … 5 10 … … … … … … … … … … … … 84₋₁ ᵢ 68₋₁ ᵢ 46₋₁ ᵢ 56₋₁ ᵢ 45₋₁ ᵢ 252₋₁ ᵢ TLSViet Nam 0.2₋₄ … … 100₋₃ 22 29 … … … … … … … … … 98₋₁ ᵢ 95₋₁ ᵢ 50₋₁ ᵢ 65₋₁ ᵢ 224₋₁ ᵢ 3,670₋₁ ᵢ VNM
TABLE 4: Continued
A N N E X • STATISTICAl TAblES : TAblE 4433
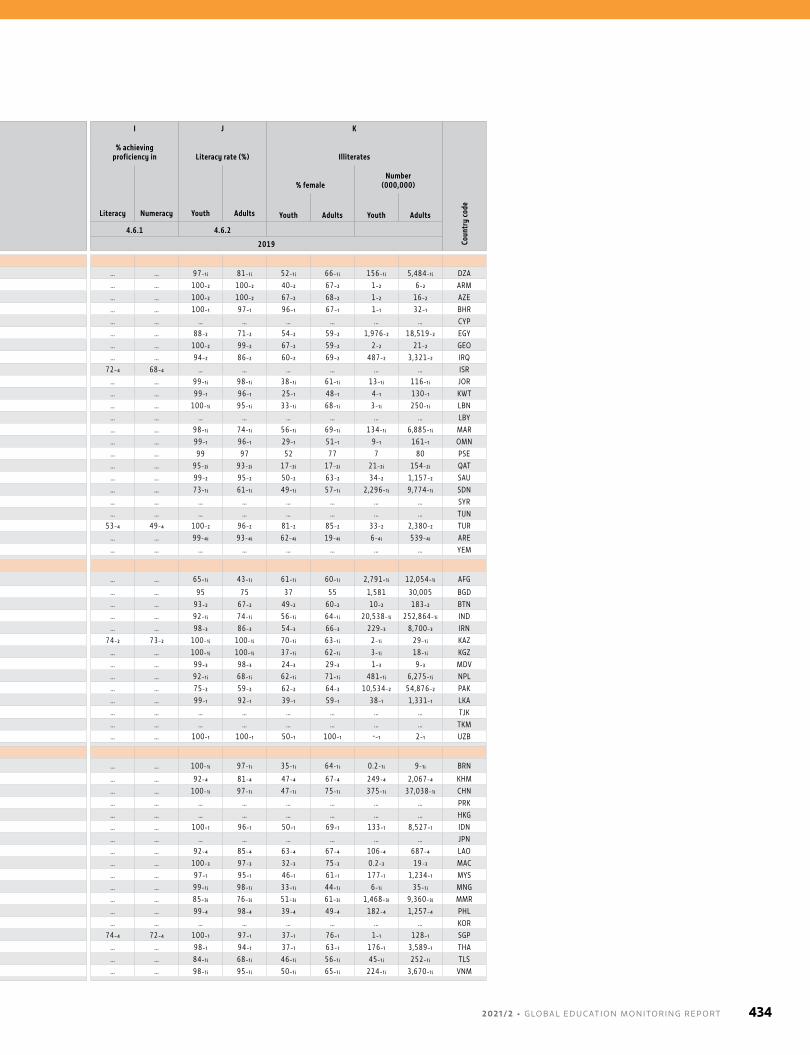
Country or territory
A B C D E F G H I J K
Coun
try
code
Part
icipa
tion
in ad
ult
educ
atio
n &
trai
ning
(%)
% o
f you
th en
rolle
d in
TVE
T
TVET
shar
e of s
econ
dary
en
rolm
ent (
%)
TVET
shar
e of
post
-sec
onda
ry
non-
tert
iary
(%)
Gros
s gra
duat
ion
ratio
fro
m te
rtia
ry (%
)
GER
tert
iary
(%)
% of adults 15+ with ICT skills
% of adults 25+ having attained at least
% achieving proficiency in Literacy rate (%) Illiterates
Copy
&
past
e with
in
docu
men
t
Use f
orm
ula i
n sp
read
shee
t
Writ
e com
pute
r pr
ogra
m
Prim
ary
Low
er
seco
ndar
y
Uppe
r se
cond
ary
Post
-sec
onda
ry
Literacy Numeracy Youth Adults
% femaleNumber
(000,000)
Youth Adults Youth Adults
SDG indicator 4.3.1 4.3.3 4.3.2 4.4.1 4.4.3 4.6.1 4.6.2
Reference year 2019 2019 2019
Northern Africa and Western AsiaAlgeria … … … … 29₋₁ ᵢ 53 18₋₁ 9₋₁ 7₋₁ … … … … … … 97₋₁ ᵢ 81₋₁ ᵢ 52₋₁ ᵢ 66₋₁ ᵢ 156₋₁ ᵢ 5,484₋₁ ᵢ DZAArmenia … 8 ᵢ 8 … 44 51 … … … 99₋₂ 97₋₂ 90₋₂ 47₋₂ … … 100₋₂ 100₋₂ 40₋₂ 67₋₂ 1₋₂ 6₋₂ ARMAzerbaijan … 15 ᵢ 15 100 21₋₁ ᵢ 32 ᵢ 64₋₁ 21₋₁ 1₋₁ 98₋₂ 96₋₂ 89₋₂ 30₋₂ … … 100₋₂ 100₋₂ 67₋₂ 68₋₂ 1₋₂ 16₋₂ AZEBahrain … 4 7 100 29 56 58 36 18 87₋₁ 80₋₁ 65₋₁ 32₋₁ … … 100₋₁ 97₋₁ 96₋₁ 67₋₁ 1₋₁ 32₋₁ BHRCyprus 48₋₃ 7₋₁ ᵢ 9₋₁ … 25₋₁ ᵢ 81₋₁ ᵢ 45₋₄ 28 4 96₋₁ 82₋₁ 73₋₁ 39₋₁ … … … … … … … … CYPEgypt 1₋₂ 12 22 … 18₋₃ 39₋₁ 58 16 9 … 73₋₂ 67₋₂ 13₋₂ … … 88₋₂ 71₋₂ 54₋₂ 59₋₂ 1,976₋₂ 18,519₋₂ EGYGeorgia 2₋₂ 3 5 100 35 64 33 11 1 99₋₂ 98₋₂ 92₋₂ 59₋₂ … … 100₋₂ 99₋₂ 67₋₂ 59₋₂ 2₋₂ 21₋₂ GEOIraq … … … … … … 25₋₁ 7₋₁ 5₋₁ … … … … … … 94₋₂ 86₋₂ 60₋₂ 69₋₂ 487₋₂ 3,321₋₂ IRQIsrael 53₋₄ 17₋₁ 20₋₁ … … 61₋₁ … … … 96₋₄ 89₋₄ 81₋₄ 47₋₄ 72₋₄ 68₋₄ … … … … … … ISRJordan … 1 3 … … 33 … … … … … … … … … 99₋₁ ᵢ 98₋₁ ᵢ 38₋₁ ᵢ 61₋₁ ᵢ 13₋₁ ᵢ 116₋₁ ᵢ JORKuwait … -₋₄ 2₋₄ … … 55 60₋₂ 38 13 62₋₁ 56₋₁ 31₋₁ 19₋₁ … … 99₋₁ 96₋₁ 25₋₁ 48₋₁ 4₋₁ 130₋₁ KWTLebanon … … 16 … … … … … … … … … … … … 100₋₁ ᵢ 95₋₁ ᵢ 33₋₁ ᵢ 68₋₁ ᵢ 3₋₁ ᵢ 250₋₁ ᵢ LBNLibya … … … … … … … … … … … … … … … … … … … … … LBYMorocco … 6 9 100 18 39 49 22 9 … … … … … … 98₋₁ ᵢ 74₋₁ ᵢ 56₋₁ ᵢ 69₋₁ ᵢ 134₋₁ ᵢ 6,885₋₁ ᵢ MAROman … 1 0.4 … 22 40 90 28 6 84₋₄ 66₋₄ 50₋₄ 21₋₄ … … 99₋₁ 96₋₁ 29₋₁ 51₋₁ 9₋₁ 161₋₁ OMNPalestine 2₋₁ 3 1 100 33 43 15 8 3 95₋₁ 64₋₁ 43₋₁ 26₋₁ … … 99 97 52 77 7 80 PSEQatar … 0.2 1 … 7 19 44 25 5 88₋₂ 68₋₂ 41₋₂ 24₋₂ … … 95₋₂ ᵢ 93₋₂ ᵢ 17₋₂ ᵢ 17₋₂ ᵢ 21₋₂ ᵢ 154₋₂ ᵢ QATSaudi Arabia … 4 1 100 41 71 68 47 14 81₋₂ 69₋₂ 54₋₂ 31₋₂ … … 99₋₂ 95₋₂ 50₋₂ 63₋₂ 34₋₂ 1,157₋₂ SAUSudan … … 2₋₁ … … 17₋₄ 4₋₃ 2₋₃ 2₋₃ … … … … … … 73₋₁ ᵢ 61₋₁ ᵢ 49₋₁ ᵢ 57₋₁ ᵢ 2,296₋₁ ᵢ 9,774₋₁ ᵢ SDNSyrian Arab Republic … … … … … 43 … … … … … … … … … … … … … … … SYRTunisia … … 9₋₃ 100₋₃ 25₋₃ 32 23 18 16 74₋₃ 45₋₃ … 15₋₃ … … … … … … … … TUNTurkey 21₋₃ 25₋₁ 23₋₁ … 34₋₁ 113₋₁ … 19₋₂ 3 90₋₂ 61₋₂ 39₋₂ 19₋₂ 53₋₄ 49₋₄ 100₋₂ 96₋₂ 81₋₂ 85₋₂ 33₋₂ 2,380₋₂ TURUnited Arab Emirates … 1 2 100 15₋₂ 53 59₋₁ 34₋₁ 17 91₋₁ 83₋₁ 69₋₁ 55₋₁ … … 99₋₄ ᵢ 93₋₄ ᵢ 62₋₄ ᵢ 19₋₄ ᵢ 6₋₄ ᵢ 539₋₄ ᵢ AREYemen … -₋₃ 0.3₋₃ … … … … … … … … … … … … … … … … … … YEM
Central and Southern Asia
Afghanistan … 1₋₁ 1₋₁ 55₋₁ 10₋₁ 10₋₁ … … … … … … … … … 65₋₁ ᵢ 43₋₁ ᵢ 61₋₁ ᵢ 60₋₁ ᵢ 2,791₋₁ ᵢ 12,054₋₁ ᵢ AFG
Bangladesh … 3 4 100 … 24 1 0.4 0.2 61 45 31 16 … … 95 75 37 55 1,581 30,005 BGDBhutan … -₋₁ ᵢ 2₋₁ ᵢ 100₊₁ … 16₊₁ … … … 32₋₂ 28₋₂ 17₋₂ 11₋₂ … … 93₋₂ 67₋₂ 49₋₂ 60₋₂ 10₋₂ 183₋₂ BTNIndia … … 1 100 28 29 … 8₋₁ … … … … … … … 92₋₁ ᵢ 74₋₁ ᵢ 56₋₁ ᵢ 64₋₁ ᵢ 20,538₋₁ ᵢ 252,864₋₁ ᵢ INDIran, Islamic Republic of … 6₋₂ 13₋₂ … 37₋₁ 63₋₁ 21₋₂ 7₋₂ 1₋₂ … 70₋₃ 48₋₃ 23₋₃ … … 98₋₃ 86₋₃ 54₋₃ 66₋₃ 229₋₃ 8,700₋₃ IRNKazakhstan 17₋₂ 19₊₁ 10₊₁ 100₊₁ 69₊₁ 71₊₁ 14 40 6 100₋₁ 99₋₁ 97₋₁ 79₋₁ 74₋₂ 73₋₂ 100₋₁ ᵢ 100₋₁ ᵢ 70₋₁ ᵢ 63₋₁ ᵢ 2₋₁ ᵢ 29₋₁ ᵢ KAZKyrgyzstan … 6 8 100 29 42 … … … … … … … … … 100₋₁ ᵢ 100₋₁ ᵢ 37₋₁ ᵢ 62₋₁ ᵢ 3₋₁ ᵢ 18₋₁ ᵢ KGZMaldives 9₋₃ … 6 … … 31₋₂ … … … … … … … … … 99₋₃ 98₋₃ 24₋₃ 29₋₃ 1₋₃ 9₋₃ MDVNepal … -₋₂ 1 … 9₋₁ 13 … … … … … … … … … 92₋₁ ᵢ 68₋₁ ᵢ 62₋₁ ᵢ 71₋₁ ᵢ 481₋₁ ᵢ 6,275₋₁ ᵢ NPLPakistan … … 3 100 … 9₋₁ 5 2 1 49₋₂ 36₋₂ 27₋₂ 9₋₂ … … 75₋₂ 59₋₂ 62₋₂ 64₋₂ 10,534₋₂ 54,876₋₂ PAKSri Lanka 1₋₃ 4₋₁ 4₋₁ 100₋₁ 11 21 … … … … 83₋₁ 63₋₁ … … … 99₋₁ 92₋₁ 39₋₁ 59₋₁ 38₋₁ 1,331₋₁ LKATajikistan … … … … … 31₋₂ … … … … 95₋₂ 81₋₂ 23₋₂ … … … … … … … … TJKTurkmenistan … 2 ᵢ … 100 … 14 … … … … … … … … … … … … … … … TKMUzbekistan … 24₋₁ 34 … … 13 22₋₁ 10₋₁ … 100₋₁ 100₋₁ 96₋₁ 64₋₁ … … 100₋₁ 100₋₁ 50₋₁ 100₋₁ -₋₁ 2₋₁ UZB
Eastern and South-eastern Asia
Brunei Darussalam … 7 11 … 26 31 60 42 28 … … … … … … 100₋₁ ᵢ 97₋₁ ᵢ 35₋₁ ᵢ 64₋₁ ᵢ 0.2₋₁ ᵢ 9₋₁ ᵢ BRN
Cambodia … … … … … 15 29 9 1 23₋₄ 12₋₄ 9₋₄ 6₋₄ … … 92₋₄ 81₋₄ 47₋₄ 67₋₄ 249₋₄ 2,067₋₄ KHMChina … 7 ᵢ 18 71 34 54 … … … … … … … … … 100₋₁ ᵢ 97₋₁ ᵢ 47₋₁ ᵢ 75₋₁ ᵢ 375₋₁ ᵢ 37,038₋₁ ᵢ CHNDPR Korea … -₋₄ … 100₋₁ 21₋₁ 27₋₁ … … … … … … … … … … … … … … … PRKHong Kong, China … 3 ᵢ 2 69 … 81 54 36 1 96₋₂ 79₋₂ 63₋₂ 29₋₂ … … … … … … … … HKGIndonesia … 13₋₁ 20₋₁ … 21₋₁ 36₋₁ 60₋₂ 25₋₂ 4₋₂ 78₋₁ 51₋₁ 35₋₁ 10₋₁ … … 100₋₁ 96₋₁ 50₋₁ 69₋₁ 133₋₁ 8,527₋₁ IDNJapan … … 11₋₁ … … … 7₋₁ 6₋₁ 0.5₋₁ … … … … … … … … … … … … JPNLao PDR 1₋₂ 4 1 100 9 14 … … … … … … … … … 92₋₄ 85₋₄ 63₋₄ 67₋₄ 106₋₄ 687₋₄ LAOMacao, China … 1 3 … 71 100 46 38 4 90₋₃ 73₋₃ 52₋₃ 26₋₃ … … 100₋₃ 97₋₃ 32₋₃ 75₋₃ 0.2₋₃ 19₋₃ MACMalaysia … 5 10 … … 43 59 27 8 … 74₋₃ 58₋₃ 21₋₃ … … 97₋₁ 95₋₁ 46₋₁ 61₋₁ 177₋₁ 1,234₋₁ MYSMongolia 1₋₂ 6 10 100 51₋₁ 66₋₁ 15 12 3 … … … … … … 99₋₁ ᵢ 98₋₁ ᵢ 33₋₁ ᵢ 44₋₁ ᵢ 6₋₁ ᵢ 35₋₁ ᵢ MNGMyanmar 0.4₋₂ 0.3₋₁ 0.2₋₁ 100₋₂ … 19₋₁ … … … … … … … … … 85₋₃ ᵢ 76₋₃ ᵢ 51₋₃ ᵢ 61₋₃ ᵢ 1,468₋₃ ᵢ 9,360₋₃ ᵢ MMRPhilippines … -₋₄ 10 100₋₂ … 35₋₂ 6 2 1 84₋₂ 59₋₂ … 20₋₂ … … 99₋₄ 98₋₄ 39₋₄ 49₋₄ 182₋₄ 1,257₋₄ PHLRepublic of Korea … 14₋₁ 9₋₁ … 52₋₂ 96₋₁ 82 46 6 96₋₄ 86₋₄ 76₋₄ 40₋₄ … … … … … … … … KORSingapore 57₋₄ 24₋₁ ᵢ … 72₋₁ 54₋₁ ᵢ 89₋₁ ᵢ 54 40 7 88₋₁ 81₋₁ 74₋₁ 56₋₁ 74₋₄ 72₋₄ 100₋₁ 97₋₁ 37₋₁ 76₋₁ 1₋₁ 128₋₁ SGPThailand 0.5₋₃ 6₋₄ 11 … 25₋₄ ᵢ 49₋₃ 21 16 1 67₋₁ 46₋₁ 33₋₁ … … … 98₋₁ 94₋₁ 37₋₁ 63₋₁ 176₋₁ 3,589₋₁ THATimor-Leste … 5 10 … … … … … … … … … … … … 84₋₁ ᵢ 68₋₁ ᵢ 46₋₁ ᵢ 56₋₁ ᵢ 45₋₁ ᵢ 252₋₁ ᵢ TLSViet Nam 0.2₋₄ … … 100₋₃ 22 29 … … … … … … … … … 98₋₁ ᵢ 95₋₁ ᵢ 50₋₁ ᵢ 65₋₁ ᵢ 224₋₁ ᵢ 3,670₋₁ ᵢ VNM
2 0 2 1 / 2 • G LO BA L E D U C AT I O N M O N I TO R I N G R E P O RT 434
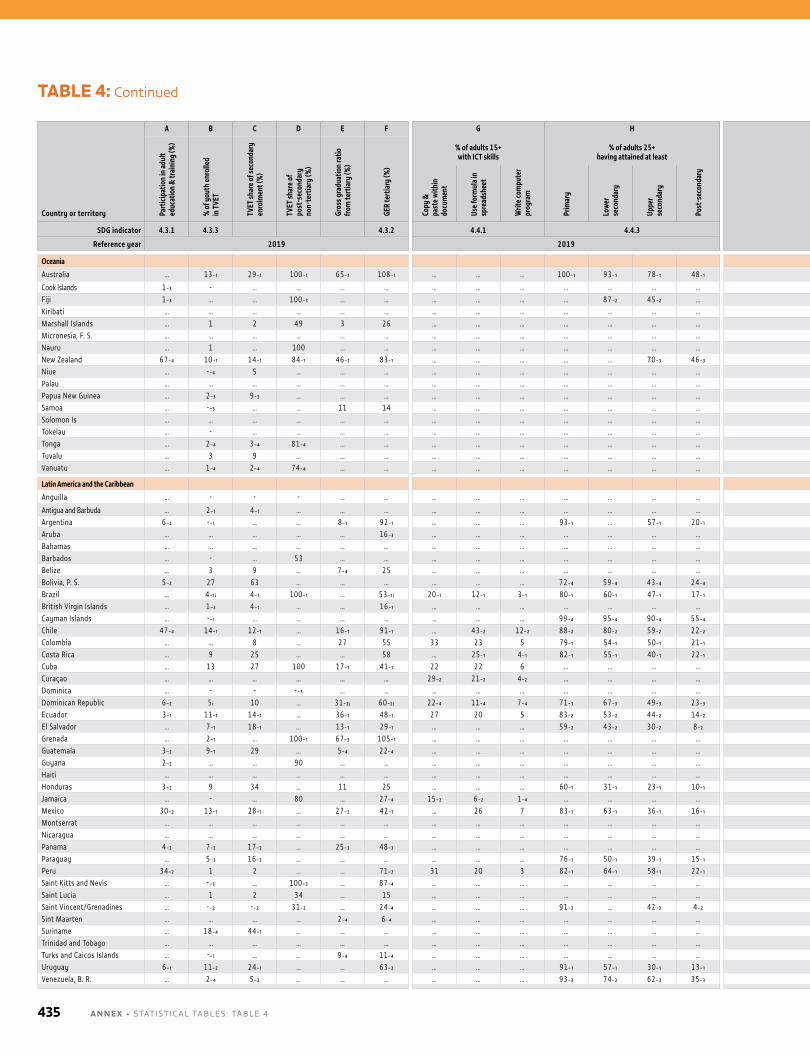
TABLE 4: Continued
Country or territory
A B C D E F G H I J K
Coun
try
code
Part
icipa
tion
in ad
ult
educ
atio
n &
trai
ning
(%)
% o
f you
th en
rolle
d in
TVE
T
TVET
shar
e of s
econ
dary
en
rolm
ent (
%)
TVET
shar
e of
post
-sec
onda
ry
non-
tert
iary
(%)
Gros
s gra
duat
ion
ratio
fro
m te
rtia
ry (%
)
GER
tert
iary
(%)
% of adults 15+ with ICT skills
% of adults 25+ having attained at least
% achieving proficiency in Literacy rate (%) Illiterates
Copy
&
past
e with
in
docu
men
t
Use f
orm
ula i
n sp
read
shee
t
Writ
e com
pute
r pr
ogra
m
Prim
ary
Low
er
seco
ndar
y
Uppe
r se
cond
ary
Post
-sec
onda
ry
Literacy Numeracy Youth Adults
% femaleNumber
(000,000)
Youth Adults Youth Adults
SDG indicator 4.3.1 4.3.3 4.3.2 4.4.1 4.4.3 4.6.1 4.6.2
Reference year 2019 2019 2019
Oceania
Australia … 13₋₁ 29₋₁ 100₋₁ 65₋₁ 108₋₁ … … … 100₋₁ 93₋₁ 78₋₁ 48₋₁ … … … … … … … … AUS
Cook Islands 1₋₃ - … … … … … … … … … … … … … … … … … … … COKFiji 1₋₃ … … 100₋₃ … … … … … … 87₋₂ 45₋₂ … … … 100₋₂ 99₋₂ 36₋₂ 49₋₂ 0.4₋₂ 6₋₂ FJIKiribati … … … … … … … … … … … … … … … … … … … … … KIRMarshall Islands … 1 2 49 3 26 … … … … … … … … … … … … … … … MHLMicronesia, F. S. … … … … … … … … … … … … … … … … … … … … … FSMNauru … 1 … 100 … … … … … … … … … … … … … … … … … NRUNew Zealand 67₋₄ 10₋₁ 14₋₁ 84₋₁ 46₋₁ 83₋₁ … … … … … 70₋₃ 46₋₃ … … … … … … … … NZLNiue … -₋₄ 5 … … … … … … … … … … … … … … … … … … NIUPalau … … … … … … … … … … … … … … … 99₋₄ 97₋₄ 29₋₄ 50₋₄ -₋₄ 0.5₋₄ PLWPapua New Guinea … 2₋₃ 9₋₃ … … … … … … … … … … … … … … … … … … PNGSamoa … -₋₃ … … 11 14 … … … … … … … … … 99₋₁ ᵢ 99₋₁ ᵢ 31₋₁ ᵢ 40₋₁ ᵢ 0.3₋₁ ᵢ 1₋₁ ᵢ WSMSolomon Is … … … … … … … … … … … … … … … … … … … … … SLBTokelau … - … … … … … … … … … … … … … … … … … … … TKLTonga … 2₋₄ 3₋₄ 81₋₄ … … … … … … … … … … … 99₋₁ ᵢ 99₋₁ ᵢ 40₋₁ ᵢ 46₋₁ ᵢ 0.1₋₁ ᵢ 0.4₋₁ ᵢ TONTuvalu … 3 9 … … … … … … … … … … … … … … … … … … TUVVanuatu … 1₋₄ 2₋₄ 74₋₄ … … … … … … … … … … … 96₋₁ ᵢ 88₋₁ ᵢ 45₋₁ ᵢ 53₋₁ ᵢ 2₋₁ ᵢ 22₋₁ ᵢ VUT
Latin America and the Caribbean
Anguilla … - - - … … … … … … … … … … … … … … … … … AIA
Antigua and Barbuda … 2₋₁ 4₋₁ … … … … … … … … … … … … … 99₋₄ … 29₋₄ … 1₋₄ ATGArgentina 6₋₂ -₋₁ … … 8₋₁ 92₋₁ … … … 93₋₁ … 57₋₁ 20₋₁ … … 100₋₁ 99₋₁ 24₋₁ 49₋₁ 35₋₁ 333₋₁ ARGAruba … … … … … 16₋₃ … … … … … … … … … 100₋₁ ᵢ 98₋₁ ᵢ 60₋₁ ᵢ 53₋₁ ᵢ 0.1₋₁ ᵢ 2₋₁ ᵢ ABWBahamas … … … … … … … … … … … … … … … … … … … … … BHSBarbados … - … 53 … … … … … … … … … … … … … … … … … BRBBelize … 3 9 … 7₋₄ 25 … … … … … … … … … … … … … … … BLZBolivia, P. S. 5₋₂ 27 63 … … … … … … 72₋₄ 59₋₄ 43₋₄ 24₋₄ … … 99₋₄ 92₋₄ 49₋₄ 77₋₄ 13₋₄ 548₋₄ BOLBrazil … 4₋₁ ᵢ 4₋₁ 100₋₁ … 53₋₁ ᵢ 20₋₁ 12₋₁ 3₋₁ 80₋₁ 60₋₁ 47₋₁ 17₋₁ … … 99₋₁ 93₋₁ 35₋₁ 50₋₁ 270₋₁ 11,168₋₁ BRABritish Virgin Islands … 1₋₃ 4₋₁ … … 16₋₁ … … … … … … … … … … … … … … … VGBCayman Islands … -₋₁ … … … … … … … 99₋₄ 95₋₄ 90₋₄ 55₋₄ … … … … … … … … CYMChile 47₋₄ 14₋₁ 12₋₁ … 16₋₁ 91₋₁ … 43₋₂ 12₋₂ 88₋₂ 80₋₂ 59₋₂ 22₋₂ 46₋₄ 38₋₄ 99₋₂ 96₋₂ 49₋₂ 52₋₂ 28₋₂ 531₋₂ CHLColombia … … 8 … 27 55 33 23 5 79₋₁ 54₋₁ 50₋₁ 21₋₁ … … 99₋₁ 95₋₁ 40₋₁ 49₋₁ 100₋₁ 1,875₋₁ COLCosta Rica … 9 25 … … 58 … 25₋₁ 4₋₁ 82₋₁ 55₋₁ 40₋₁ 22₋₁ … … 99₋₁ ᵢ 98₋₁ ᵢ 41₋₁ ᵢ 49₋₁ ᵢ 4₋₁ ᵢ 84₋₁ ᵢ CRICuba … 13 27 100 17₋₁ 41₋₁ 22 22 6 … … … … … … … … … … … … CUBCuraçao … … … … … … 29₋₂ 21₋₂ 4₋₂ … … … … … … … … … … … … CUWDominica … - - -₋₃ … … … … … … … … … … … … … … … … … DMADominican Republic 6₋₂ 5 ᵢ 10 … 31₋₂ ᵢ 60₋₂ ᵢ 22₋₄ 11₋₄ 7₋₄ 71₋₃ 67₋₃ 49₋₃ 23₋₃ … … 99₋₃ 94₋₃ 48₋₃ 50₋₃ 22₋₃ 462₋₃ DOMEcuador 3₋₁ 11₋₁ 14₋₁ … 36₋₁ 48₋₁ 27 20 5 83₋₂ 53₋₂ 44₋₂ 14₋₂ 28₋₂ 23₋₂ 99₋₂ 93₋₂ 39₋₂ 56₋₂ 23₋₂ 851₋₂ ECUEl Salvador … 7₋₁ 18₋₁ … 13₋₁ 29₋₁ … … … 59₋₂ 43₋₂ 30₋₂ 8₋₂ … … 98₋₁ 89₋₁ 44₋₁ 63₋₁ 26₋₁ 515₋₁ SLVGrenada … 2₋₁ … 100₋₁ 67₋₃ 105₋₁ … … … … … … … … … … … … … … … GRDGuatemala 3₋₂ 9₋₁ 29 … 5₋₄ 22₋₄ … … … … … … … … … … … … … … … GTMGuyana 2₋₂ … … 90 … … … … … … … … … … … … … … … … … GUYHaiti … … … … … … … … … … … … … … … 83₋₃ ᵢ 62₋₃ ᵢ 51₋₃ ᵢ 56₋₃ ᵢ 366₋₃ ᵢ 2,741₋₃ ᵢ HTIHonduras 3₋₂ 9 34 … 11 25 … … … 60₋₁ 31₋₁ 23₋₁ 10₋₁ … … 97₋₁ 87₋₁ 26₋₁ 50₋₁ 71₋₁ 838₋₁ HNDJamaica … - … 80 … 27₋₄ 15₋₂ 6₋₂ 1₋₄ … … … … … … … … … … … … JAMMexico 30₋₂ 13₋₁ 28₋₁ … 27₋₂ 42₋₁ … 26 7 83₋₁ 63₋₁ 36₋₁ 16₋₁ 49₋₂ 40₋₂ 99₋₁ 95₋₁ 44₋₁ 61₋₁ 151₋₁ 4,273₋₁ MEXMontserrat … … … … … … … … … … … … … … … … … … … … … MSRNicaragua … … … … … … … … … … … … … … … 92₋₄ ᵢ 83₋₄ ᵢ 37₋₄ ᵢ 51₋₄ ᵢ 102₋₄ ᵢ 744₋₄ ᵢ NICPanama 4₋₂ 7₋₂ 17₋₂ … 25₋₃ 48₋₃ … … … … … … … … … 99₋₁ 95₋₁ 61₋₁ 56₋₁ 6₋₁ 139₋₁ PANParaguay … 5₋₃ 16₋₃ … … … … … … 76₋₁ 50₋₁ 39₋₁ 15₋₁ … … 98₋₁ 94₋₁ 32₋₁ 53₋₁ 23₋₁ 293₋₁ PRYPeru 34₋₂ 1 2 … … 71₋₂ 31 20 3 82₋₁ 64₋₁ 58₋₁ 22₋₁ 29₋₂ 25₋₂ 99₋₁ 94₋₁ 54₋₁ 75₋₁ 52₋₁ 1,334₋₁ PERSaint Kitts and Nevis … -₋₃ … 100₋₃ … 87₋₄ … … … … … … … … … … … … … … … KNASaint Lucia … 1 2 34 … 15 … … … … … … … … … … … … … … … LCASaint Vincent/Grenadines … -₋₂ -₋₂ 31₋₂ … 24₋₄ … … … 91₋₂ … 42₋₂ 4₋₂ … … … … … … … … VCTSint Maarten … … … … 2₋₄ 6₋₄ … … … … … … … … … … … … … … … SXMSuriname … 18₋₄ 44₋₁ … … … … … … … … … … … … 99₋₁ ᵢ 94₋₁ ᵢ 57₋₁ ᵢ 65₋₁ ᵢ 1₋₁ ᵢ 24₋₁ ᵢ SURTrinidad and Tobago … … … … … … … … … … … … … … … … … … … … … TTOTurks and Caicos Islands … -₋₁ … … 9₋₄ 11₋₄ … … … … … … … … … … … … … … … TCAUruguay 6₋₁ 11₋₂ 24₋₁ … … 63₋₂ … … … 91₋₁ 57₋₁ 30₋₁ 13₋₁ 99₋₃ … 99₋₁ 99₋₁ 37₋₁ 40₋₁ 6₋₁ 35₋₁ URYVenezuela, B. R. … 2₋₄ 5₋₂ … … … … … … 93₋₃ 74₋₃ 62₋₃ 35₋₃ … … 99₋₃ 97₋₃ 36₋₃ 49₋₃ 63₋₃ 615₋₃ VEN
A N N E X • STATISTICAl TAblES : TAblE 4435
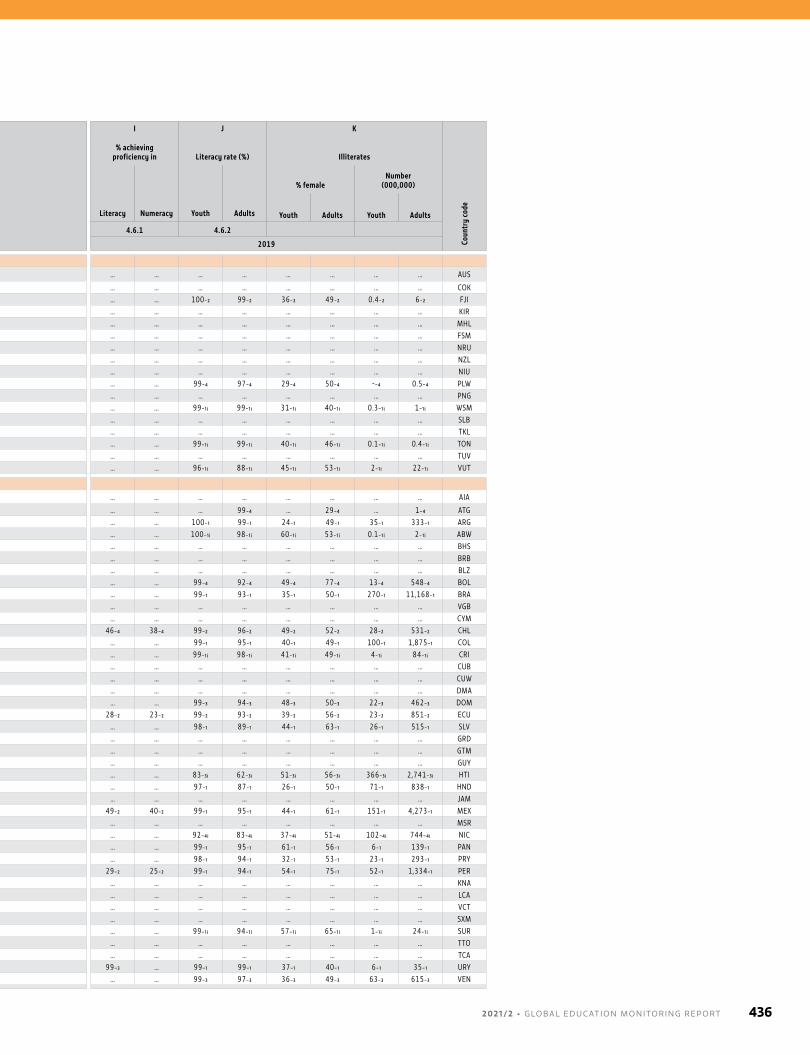
Country or territory
A B C D E F G H I J K
Coun
try
code
Part
icipa
tion
in ad
ult
educ
atio
n &
trai
ning
(%)
% o
f you
th en
rolle
d in
TVE
T
TVET
shar
e of s
econ
dary
en
rolm
ent (
%)
TVET
shar
e of
post
-sec
onda
ry
non-
tert
iary
(%)
Gros
s gra
duat
ion
ratio
fro
m te
rtia
ry (%
)
GER
tert
iary
(%)
% of adults 15+ with ICT skills
% of adults 25+ having attained at least
% achieving proficiency in Literacy rate (%) Illiterates
Copy
&
past
e with
in
docu
men
t
Use f
orm
ula i
n sp
read
shee
t
Writ
e com
pute
r pr
ogra
m
Prim
ary
Low
er
seco
ndar
y
Uppe
r se
cond
ary
Post
-sec
onda
ry
Literacy Numeracy Youth Adults
% femaleNumber
(000,000)
Youth Adults Youth Adults
SDG indicator 4.3.1 4.3.3 4.3.2 4.4.1 4.4.3 4.6.1 4.6.2
Reference year 2019 2019 2019
Oceania
Australia … 13₋₁ 29₋₁ 100₋₁ 65₋₁ 108₋₁ … … … 100₋₁ 93₋₁ 78₋₁ 48₋₁ … … … … … … … … AUS
Cook Islands 1₋₃ - … … … … … … … … … … … … … … … … … … … COKFiji 1₋₃ … … 100₋₃ … … … … … … 87₋₂ 45₋₂ … … … 100₋₂ 99₋₂ 36₋₂ 49₋₂ 0.4₋₂ 6₋₂ FJIKiribati … … … … … … … … … … … … … … … … … … … … … KIRMarshall Islands … 1 2 49 3 26 … … … … … … … … … … … … … … … MHLMicronesia, F. S. … … … … … … … … … … … … … … … … … … … … … FSMNauru … 1 … 100 … … … … … … … … … … … … … … … … … NRUNew Zealand 67₋₄ 10₋₁ 14₋₁ 84₋₁ 46₋₁ 83₋₁ … … … … … 70₋₃ 46₋₃ … … … … … … … … NZLNiue … -₋₄ 5 … … … … … … … … … … … … … … … … … … NIUPalau … … … … … … … … … … … … … … … 99₋₄ 97₋₄ 29₋₄ 50₋₄ -₋₄ 0.5₋₄ PLWPapua New Guinea … 2₋₃ 9₋₃ … … … … … … … … … … … … … … … … … … PNGSamoa … -₋₃ … … 11 14 … … … … … … … … … 99₋₁ ᵢ 99₋₁ ᵢ 31₋₁ ᵢ 40₋₁ ᵢ 0.3₋₁ ᵢ 1₋₁ ᵢ WSMSolomon Is … … … … … … … … … … … … … … … … … … … … … SLBTokelau … - … … … … … … … … … … … … … … … … … … … TKLTonga … 2₋₄ 3₋₄ 81₋₄ … … … … … … … … … … … 99₋₁ ᵢ 99₋₁ ᵢ 40₋₁ ᵢ 46₋₁ ᵢ 0.1₋₁ ᵢ 0.4₋₁ ᵢ TONTuvalu … 3 9 … … … … … … … … … … … … … … … … … … TUVVanuatu … 1₋₄ 2₋₄ 74₋₄ … … … … … … … … … … … 96₋₁ ᵢ 88₋₁ ᵢ 45₋₁ ᵢ 53₋₁ ᵢ 2₋₁ ᵢ 22₋₁ ᵢ VUT
Latin America and the Caribbean
Anguilla … - - - … … … … … … … … … … … … … … … … … AIA
Antigua and Barbuda … 2₋₁ 4₋₁ … … … … … … … … … … … … … 99₋₄ … 29₋₄ … 1₋₄ ATGArgentina 6₋₂ -₋₁ … … 8₋₁ 92₋₁ … … … 93₋₁ … 57₋₁ 20₋₁ … … 100₋₁ 99₋₁ 24₋₁ 49₋₁ 35₋₁ 333₋₁ ARGAruba … … … … … 16₋₃ … … … … … … … … … 100₋₁ ᵢ 98₋₁ ᵢ 60₋₁ ᵢ 53₋₁ ᵢ 0.1₋₁ ᵢ 2₋₁ ᵢ ABWBahamas … … … … … … … … … … … … … … … … … … … … … BHSBarbados … - … 53 … … … … … … … … … … … … … … … … … BRBBelize … 3 9 … 7₋₄ 25 … … … … … … … … … … … … … … … BLZBolivia, P. S. 5₋₂ 27 63 … … … … … … 72₋₄ 59₋₄ 43₋₄ 24₋₄ … … 99₋₄ 92₋₄ 49₋₄ 77₋₄ 13₋₄ 548₋₄ BOLBrazil … 4₋₁ ᵢ 4₋₁ 100₋₁ … 53₋₁ ᵢ 20₋₁ 12₋₁ 3₋₁ 80₋₁ 60₋₁ 47₋₁ 17₋₁ … … 99₋₁ 93₋₁ 35₋₁ 50₋₁ 270₋₁ 11,168₋₁ BRABritish Virgin Islands … 1₋₃ 4₋₁ … … 16₋₁ … … … … … … … … … … … … … … … VGBCayman Islands … -₋₁ … … … … … … … 99₋₄ 95₋₄ 90₋₄ 55₋₄ … … … … … … … … CYMChile 47₋₄ 14₋₁ 12₋₁ … 16₋₁ 91₋₁ … 43₋₂ 12₋₂ 88₋₂ 80₋₂ 59₋₂ 22₋₂ 46₋₄ 38₋₄ 99₋₂ 96₋₂ 49₋₂ 52₋₂ 28₋₂ 531₋₂ CHLColombia … … 8 … 27 55 33 23 5 79₋₁ 54₋₁ 50₋₁ 21₋₁ … … 99₋₁ 95₋₁ 40₋₁ 49₋₁ 100₋₁ 1,875₋₁ COLCosta Rica … 9 25 … … 58 … 25₋₁ 4₋₁ 82₋₁ 55₋₁ 40₋₁ 22₋₁ … … 99₋₁ ᵢ 98₋₁ ᵢ 41₋₁ ᵢ 49₋₁ ᵢ 4₋₁ ᵢ 84₋₁ ᵢ CRICuba … 13 27 100 17₋₁ 41₋₁ 22 22 6 … … … … … … … … … … … … CUBCuraçao … … … … … … 29₋₂ 21₋₂ 4₋₂ … … … … … … … … … … … … CUWDominica … - - -₋₃ … … … … … … … … … … … … … … … … … DMADominican Republic 6₋₂ 5 ᵢ 10 … 31₋₂ ᵢ 60₋₂ ᵢ 22₋₄ 11₋₄ 7₋₄ 71₋₃ 67₋₃ 49₋₃ 23₋₃ … … 99₋₃ 94₋₃ 48₋₃ 50₋₃ 22₋₃ 462₋₃ DOMEcuador 3₋₁ 11₋₁ 14₋₁ … 36₋₁ 48₋₁ 27 20 5 83₋₂ 53₋₂ 44₋₂ 14₋₂ 28₋₂ 23₋₂ 99₋₂ 93₋₂ 39₋₂ 56₋₂ 23₋₂ 851₋₂ ECUEl Salvador … 7₋₁ 18₋₁ … 13₋₁ 29₋₁ … … … 59₋₂ 43₋₂ 30₋₂ 8₋₂ … … 98₋₁ 89₋₁ 44₋₁ 63₋₁ 26₋₁ 515₋₁ SLVGrenada … 2₋₁ … 100₋₁ 67₋₃ 105₋₁ … … … … … … … … … … … … … … … GRDGuatemala 3₋₂ 9₋₁ 29 … 5₋₄ 22₋₄ … … … … … … … … … … … … … … … GTMGuyana 2₋₂ … … 90 … … … … … … … … … … … … … … … … … GUYHaiti … … … … … … … … … … … … … … … 83₋₃ ᵢ 62₋₃ ᵢ 51₋₃ ᵢ 56₋₃ ᵢ 366₋₃ ᵢ 2,741₋₃ ᵢ HTIHonduras 3₋₂ 9 34 … 11 25 … … … 60₋₁ 31₋₁ 23₋₁ 10₋₁ … … 97₋₁ 87₋₁ 26₋₁ 50₋₁ 71₋₁ 838₋₁ HNDJamaica … - … 80 … 27₋₄ 15₋₂ 6₋₂ 1₋₄ … … … … … … … … … … … … JAMMexico 30₋₂ 13₋₁ 28₋₁ … 27₋₂ 42₋₁ … 26 7 83₋₁ 63₋₁ 36₋₁ 16₋₁ 49₋₂ 40₋₂ 99₋₁ 95₋₁ 44₋₁ 61₋₁ 151₋₁ 4,273₋₁ MEXMontserrat … … … … … … … … … … … … … … … … … … … … … MSRNicaragua … … … … … … … … … … … … … … … 92₋₄ ᵢ 83₋₄ ᵢ 37₋₄ ᵢ 51₋₄ ᵢ 102₋₄ ᵢ 744₋₄ ᵢ NICPanama 4₋₂ 7₋₂ 17₋₂ … 25₋₃ 48₋₃ … … … … … … … … … 99₋₁ 95₋₁ 61₋₁ 56₋₁ 6₋₁ 139₋₁ PANParaguay … 5₋₃ 16₋₃ … … … … … … 76₋₁ 50₋₁ 39₋₁ 15₋₁ … … 98₋₁ 94₋₁ 32₋₁ 53₋₁ 23₋₁ 293₋₁ PRYPeru 34₋₂ 1 2 … … 71₋₂ 31 20 3 82₋₁ 64₋₁ 58₋₁ 22₋₁ 29₋₂ 25₋₂ 99₋₁ 94₋₁ 54₋₁ 75₋₁ 52₋₁ 1,334₋₁ PERSaint Kitts and Nevis … -₋₃ … 100₋₃ … 87₋₄ … … … … … … … … … … … … … … … KNASaint Lucia … 1 2 34 … 15 … … … … … … … … … … … … … … … LCASaint Vincent/Grenadines … -₋₂ -₋₂ 31₋₂ … 24₋₄ … … … 91₋₂ … 42₋₂ 4₋₂ … … … … … … … … VCTSint Maarten … … … … 2₋₄ 6₋₄ … … … … … … … … … … … … … … … SXMSuriname … 18₋₄ 44₋₁ … … … … … … … … … … … … 99₋₁ ᵢ 94₋₁ ᵢ 57₋₁ ᵢ 65₋₁ ᵢ 1₋₁ ᵢ 24₋₁ ᵢ SURTrinidad and Tobago … … … … … … … … … … … … … … … … … … … … … TTOTurks and Caicos Islands … -₋₁ … … 9₋₄ 11₋₄ … … … … … … … … … … … … … … … TCAUruguay 6₋₁ 11₋₂ 24₋₁ … … 63₋₂ … … … 91₋₁ 57₋₁ 30₋₁ 13₋₁ 99₋₃ … 99₋₁ 99₋₁ 37₋₁ 40₋₁ 6₋₁ 35₋₁ URYVenezuela, B. R. … 2₋₄ 5₋₂ … … … … … … 93₋₃ 74₋₃ 62₋₃ 35₋₃ … … 99₋₃ 97₋₃ 36₋₃ 49₋₃ 63₋₃ 615₋₃ VEN
2 0 2 1 / 2 • G LO BA L E D U C AT I O N M O N I TO R I N G R E P O RT 436
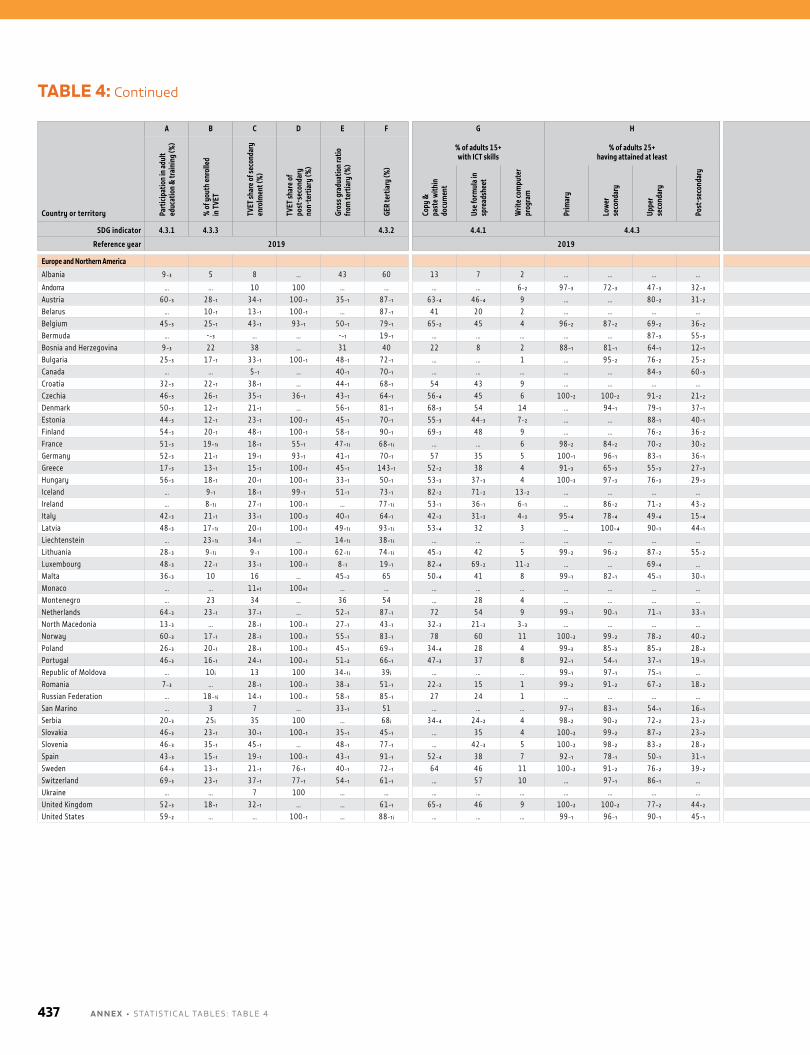
TABLE 4: Continued
Country or territory
A B C D E F G H I J K
Coun
try
code
Part
icipa
tion
in ad
ult
educ
atio
n &
trai
ning
(%)
% o
f you
th en
rolle
d in
TVE
T
TVET
shar
e of s
econ
dary
en
rolm
ent (
%)
TVET
shar
e of
post
-sec
onda
ry
non-
tert
iary
(%)
Gros
s gra
duat
ion
ratio
fro
m te
rtia
ry (%
)
GER
tert
iary
(%)
% of adults 15+ with ICT skills
% of adults 25+ having attained at least
% achieving proficiency in Literacy rate (%) Illiterates
Copy
&
past
e with
in
docu
men
t
Use f
orm
ula i
n sp
read
shee
t
Writ
e com
pute
r pr
ogra
m
Prim
ary
Low
er
seco
ndar
y
Uppe
r se
cond
ary
Post
-sec
onda
ry
Literacy Numeracy Youth Adults
% femaleNumber
(000,000)
Youth Adults Youth Adults
SDG indicator 4.3.1 4.3.3 4.3.2 4.4.1 4.4.3 4.6.1 4.6.2
Reference year 2019 2019 2019
Europe and Northern America
Albania 9₋₃ 5 8 … 43 60 13 7 2 … … … … … … 99₋₁ ᵢ 98₋₁ ᵢ 26₋₁ ᵢ 60₋₁ ᵢ 3₋₁ ᵢ 44₋₁ ᵢ ALB
Andorra … … 10 100 … … … … 6₋₂ 97₋₃ 72₋₃ 47₋₃ 32₋₃ … … … … … … … … ANDAustria 60₋₃ 28₋₁ 34₋₁ 100₋₁ 35₋₁ 87₋₁ 63₋₄ 46₋₄ 9 … … 80₋₂ 31₋₂ … … … … … … … … AUTBelarus … 10₋₁ 13₋₁ 100₋₁ … 87₋₁ 41 20 2 … … … … … … 100₋₁ ᵢ 100₋₁ ᵢ 42₋₁ ᵢ 61₋₁ ᵢ 1₋₁ ᵢ 19₋₁ ᵢ BLRBelgium 45₋₃ 25₋₁ 43₋₁ 93₋₁ 50₋₁ 79₋₁ 65₋₂ 45 4 96₋₂ 87₋₂ 69₋₂ 36₋₂ … … … … … … … … BELBermuda … -₋₃ … … -₋₁ 19₋₁ … … … … … 87₋₃ 55₋₃ … … … … … … … … BMUBosnia and Herzegovina 9₋₃ 22 38 … 31 40 22 8 2 88₋₁ 81₋₁ 64₋₁ 12₋₁ … … … … … … … … BIHBulgaria 25₋₃ 17₋₁ 33₋₁ 100₋₁ 48₋₁ 72₋₁ … … 1 … 95₋₂ 76₋₂ 25₋₂ … … … … … … … … BGRCanada … … 5₋₁ … 40₋₁ 70₋₁ … … … … … 84₋₃ 60₋₃ … … … … … … … … CANCroatia 32₋₃ 22₋₁ 38₋₁ … 44₋₁ 68₋₁ 54 43 9 … … … … … … … … … … … … HRVCzechia 46₋₃ 26₋₁ 35₋₁ 36₋₁ 43₋₁ 64₋₁ 56₋₄ 45 6 100₋₂ 100₋₂ 91₋₂ 21₋₂ … … 100₋₃ 100₋₃ 36₋₃ 40₋₃ 2₋₃ 15₋₃ CZEDenmark 50₋₃ 12₋₁ 21₋₁ … 56₋₁ 81₋₁ 68₋₃ 54 14 … 94₋₁ 79₋₁ 37₋₁ … … … … … … … … DNKEstonia 44₋₃ 12₋₁ 23₋₁ 100₋₁ 45₋₁ 70₋₁ 55₋₃ 44₋₃ 7₋₂ … … 88₋₁ 40₋₁ … … … … … … … … ESTFinland 54₋₃ 20₋₁ 48₋₁ 100₋₁ 58₋₁ 90₋₁ 69₋₃ 48 9 … … 76₋₂ 36₋₂ … … … … … … … … FINFrance 51₋₃ 19₋₁ ᵢ 18₋₁ 55₋₁ 47₋₁ ᵢ 68₋₁ ᵢ … … 6 98₋₂ 84₋₂ 70₋₂ 30₋₂ … … … … … … … … FRAGermany 52₋₃ 21₋₁ 19₋₁ 93₋₁ 41₋₁ 70₋₁ 57 35 5 100₋₁ 96₋₁ 83₋₁ 36₋₁ … … … … … … … … DEUGreece 17₋₃ 13₋₁ 15₋₁ 100₋₁ 45₋₁ 143₋₁ 52₋₂ 38 4 91₋₃ 65₋₃ 55₋₃ 27₋₃ 73₋₄ 71₋₄ 99₋₁ ᵢ 98₋₁ ᵢ 54₋₁ ᵢ 65₋₁ ᵢ 9₋₁ ᵢ 187₋₁ ᵢ GRCHungary 56₋₃ 18₋₁ 20₋₁ 100₋₁ 33₋₁ 50₋₁ 53₋₃ 37₋₃ 4 100₋₃ 97₋₃ 76₋₃ 29₋₃ 81₋₂ 82₋₂ … … … … … … HUNIceland … 9₋₁ 18₋₁ 99₋₁ 51₋₁ 73₋₁ 82₋₂ 71₋₂ 13₋₂ … … … … … … … … … … … … ISLIreland … 8₋₁ ᵢ 27₋₁ 100₋₁ … 77₋₁ ᵢ 53₋₁ 36₋₁ 6₋₁ … 86₋₂ 71₋₂ 43₋₂ … … … … … … … … IRLItaly 42₋₃ 21₋₁ 33₋₁ 100₋₃ 40₋₁ 64₋₁ 42₋₃ 31₋₃ 4₋₃ 95₋₄ 78₋₄ 49₋₄ 15₋₄ … … 100₋₁ ᵢ 99₋₁ ᵢ 37₋₁ ᵢ 63₋₁ ᵢ 4₋₁ ᵢ 444₋₁ ᵢ ITALatvia 48₋₃ 17₋₁ ᵢ 20₋₁ 100₋₁ 49₋₁ ᵢ 93₋₁ ᵢ 53₋₄ 32 3 … 100₋₄ 90₋₁ 44₋₁ … … 100₋₁ ᵢ 100₋₁ ᵢ 37₋₁ ᵢ 47₋₁ ᵢ 0.3₋₁ ᵢ 2₋₁ ᵢ LVALiechtenstein … 23₋₁ ᵢ 34₋₁ … 14₋₁ ᵢ 38₋₁ ᵢ … … … … … … … … … … … … … … … LIELithuania 28₋₃ 9₋₁ ᵢ 9₋₁ 100₋₁ 62₋₁ ᵢ 74₋₁ ᵢ 45₋₃ 42 5 99₋₂ 96₋₂ 87₋₂ 55₋₂ 84₋₄ 82₋₄ … … … … … … LTULuxembourg 48₋₃ 22₋₁ 33₋₁ 100₋₁ 8₋₁ 19₋₁ 82₋₄ 69₋₂ 11₋₂ … … 69₋₄ … … … … … … … … … LUXMalta 36₋₃ 10 16 … 45₋₂ 65 50₋₄ 41 8 99₋₁ 82₋₁ 45₋₁ 30₋₁ … … 99₋₁ ᵢ 95₋₁ ᵢ 30₋₁ ᵢ 37₋₁ ᵢ 0.3₋₁ ᵢ 21₋₁ ᵢ MLTMonaco … … 11₊₁ 100₊₁ … … … … … … … … … … … … … … … … … MCOMontenegro … 23 34 … 36 54 … 28 4 … … … … … … 99₋₁ ᵢ 99₋₁ ᵢ 55₋₁ ᵢ 77₋₁ ᵢ 1₋₁ ᵢ 6₋₁ ᵢ MNENetherlands 64₋₃ 23₋₁ 37₋₁ … 52₋₁ 87₋₁ 72 54 9 99₋₁ 90₋₁ 71₋₁ 33₋₁ … … … … … … … … NLDNorth Macedonia 13₋₃ … 28₋₁ 100₋₁ 27₋₁ 43₋₁ 32₋₃ 21₋₃ 3₋₃ … … … … … … … … … … … … MKDNorway 60₋₃ 17₋₁ 28₋₁ 100₋₁ 55₋₁ 83₋₁ 78 60 11 100₋₂ 99₋₂ 78₋₂ 40₋₂ … … … … … … … … NORPoland 26₋₃ 20₋₁ 28₋₁ 100₋₁ 45₋₁ 69₋₁ 34₋₄ 28 4 99₋₃ 85₋₃ 85₋₃ 28₋₃ … … … … … … … … POLPortugal 46₋₃ 16₋₁ 24₋₁ 100₋₁ 51₋₂ 66₋₁ 47₋₃ 37 8 92₋₁ 54₋₁ 37₋₁ 19₋₁ … … 100₋₁ ᵢ 96₋₁ ᵢ 44₋₁ ᵢ 68₋₁ ᵢ 4₋₁ ᵢ 343₋₁ ᵢ PRTRepublic of Moldova … 10 ᵢ 13 100 34₋₁ ᵢ 39 ᵢ … … … 99₋₁ 97₋₁ 75₋₁ … … … … … … … … … MDARomania 7₋₃ … 28₋₁ 100₋₁ 38₋₃ 51₋₁ 22₋₂ 15 1 99₋₂ 91₋₂ 67₋₂ 18₋₂ … … 99₋₁ ᵢ 99₋₁ ᵢ 47₋₁ ᵢ 63₋₁ ᵢ 12₋₁ ᵢ 190₋₁ ᵢ ROURussian Federation … 18₋₁ ᵢ 14₋₁ 100₋₁ 58₋₁ 85₋₁ 27 24 1 … … … … … … 100₋₁ ᵢ 100₋₁ ᵢ 41₋₁ ᵢ 54₋₁ ᵢ 42₋₁ ᵢ 323₋₁ ᵢ RUSSan Marino … 3 7 … 33₋₁ 51 … … … 97₋₁ 83₋₁ 54₋₁ 16₋₁ … … 100₋₁ 100₋₁ 32₋₁ 59₋₁ -₋₁ -₋₁ SMRSerbia 20₋₃ 25 ᵢ 35 100 … 68 ᵢ 34₋₄ 24₋₂ 4 98₋₂ 90₋₂ 72₋₂ 23₋₂ … … 100₋₃ 99₋₃ 48₋₃ 79₋₃ 3₋₃ 86₋₃ SRBSlovakia 46₋₃ 23₋₁ 30₋₁ 100₋₁ 35₋₁ 45₋₁ … 35 4 100₋₂ 99₋₂ 87₋₂ 23₋₂ … … … … … … … … SVKSlovenia 46₋₃ 35₋₁ 45₋₁ … 48₋₁ 77₋₁ … 42₋₃ 5 100₋₂ 98₋₂ 83₋₂ 28₋₂ 75₋₄ 74₋₄ … … … … … … SVNSpain 43₋₃ 15₋₁ 19₋₁ 100₋₁ 43₋₁ 91₋₁ 52₋₄ 38 7 92₋₁ 78₋₁ 50₋₁ 31₋₁ … … 100₋₁ 98₋₁ 44₋₁ 67₋₁ 13₋₁ 623₋₁ ESPSweden 64₋₃ 13₋₁ 21₋₁ 76₋₁ 40₋₁ 72₋₁ 64 46 11 100₋₂ 91₋₂ 76₋₂ 39₋₂ … … … … … … … … SWESwitzerland 69₋₃ 23₋₁ 37₋₁ 77₋₁ 54₋₁ 61₋₁ … 57 10 … 97₋₁ 86₋₁ … … … … … … … … … CHEUkraine … … 7 100 … … … … … … … … … … … … … … … … … UKRUnited Kingdom 52₋₃ 18₋₁ 32₋₁ … … 61₋₁ 65₋₂ 46 9 100₋₂ 100₋₂ 77₋₂ 44₋₂ … … … … … … … … GBRUnited States 59₋₂ … … 100₋₁ … 88₋₁ ᵢ … … … 99₋₁ 96₋₁ 90₋₁ 45₋₁ 81₋₂ 71₋₂ … … … … … … USA
A N N E X • STATISTICAl TAblES : TAblE 4437
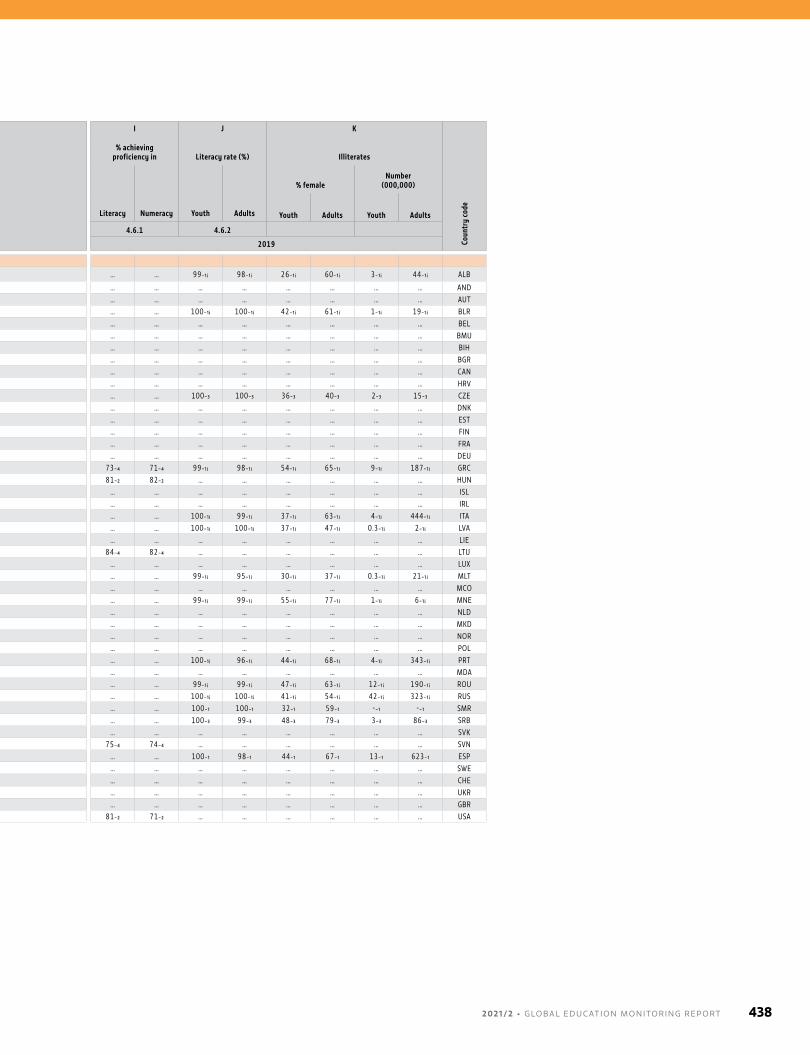
Country or territory
A B C D E F G H I J K
Coun
try
code
Part
icipa
tion
in ad
ult
educ
atio
n &
trai
ning
(%)
% o
f you
th en
rolle
d in
TVE
T
TVET
shar
e of s
econ
dary
en
rolm
ent (
%)
TVET
shar
e of
post
-sec
onda
ry
non-
tert
iary
(%)
Gros
s gra
duat
ion
ratio
fro
m te
rtia
ry (%
)
GER
tert
iary
(%)
% of adults 15+ with ICT skills
% of adults 25+ having attained at least
% achieving proficiency in Literacy rate (%) Illiterates
Copy
&
past
e with
in
docu
men
t
Use f
orm
ula i
n sp
read
shee
t
Writ
e com
pute
r pr
ogra
m
Prim
ary
Low
er
seco
ndar
y
Uppe
r se
cond
ary
Post
-sec
onda
ry
Literacy Numeracy Youth Adults
% femaleNumber
(000,000)
Youth Adults Youth Adults
SDG indicator 4.3.1 4.3.3 4.3.2 4.4.1 4.4.3 4.6.1 4.6.2
Reference year 2019 2019 2019
Europe and Northern America
Albania 9₋₃ 5 8 … 43 60 13 7 2 … … … … … … 99₋₁ ᵢ 98₋₁ ᵢ 26₋₁ ᵢ 60₋₁ ᵢ 3₋₁ ᵢ 44₋₁ ᵢ ALB
Andorra … … 10 100 … … … … 6₋₂ 97₋₃ 72₋₃ 47₋₃ 32₋₃ … … … … … … … … ANDAustria 60₋₃ 28₋₁ 34₋₁ 100₋₁ 35₋₁ 87₋₁ 63₋₄ 46₋₄ 9 … … 80₋₂ 31₋₂ … … … … … … … … AUTBelarus … 10₋₁ 13₋₁ 100₋₁ … 87₋₁ 41 20 2 … … … … … … 100₋₁ ᵢ 100₋₁ ᵢ 42₋₁ ᵢ 61₋₁ ᵢ 1₋₁ ᵢ 19₋₁ ᵢ BLRBelgium 45₋₃ 25₋₁ 43₋₁ 93₋₁ 50₋₁ 79₋₁ 65₋₂ 45 4 96₋₂ 87₋₂ 69₋₂ 36₋₂ … … … … … … … … BELBermuda … -₋₃ … … -₋₁ 19₋₁ … … … … … 87₋₃ 55₋₃ … … … … … … … … BMUBosnia and Herzegovina 9₋₃ 22 38 … 31 40 22 8 2 88₋₁ 81₋₁ 64₋₁ 12₋₁ … … … … … … … … BIHBulgaria 25₋₃ 17₋₁ 33₋₁ 100₋₁ 48₋₁ 72₋₁ … … 1 … 95₋₂ 76₋₂ 25₋₂ … … … … … … … … BGRCanada … … 5₋₁ … 40₋₁ 70₋₁ … … … … … 84₋₃ 60₋₃ … … … … … … … … CANCroatia 32₋₃ 22₋₁ 38₋₁ … 44₋₁ 68₋₁ 54 43 9 … … … … … … … … … … … … HRVCzechia 46₋₃ 26₋₁ 35₋₁ 36₋₁ 43₋₁ 64₋₁ 56₋₄ 45 6 100₋₂ 100₋₂ 91₋₂ 21₋₂ … … 100₋₃ 100₋₃ 36₋₃ 40₋₃ 2₋₃ 15₋₃ CZEDenmark 50₋₃ 12₋₁ 21₋₁ … 56₋₁ 81₋₁ 68₋₃ 54 14 … 94₋₁ 79₋₁ 37₋₁ … … … … … … … … DNKEstonia 44₋₃ 12₋₁ 23₋₁ 100₋₁ 45₋₁ 70₋₁ 55₋₃ 44₋₃ 7₋₂ … … 88₋₁ 40₋₁ … … … … … … … … ESTFinland 54₋₃ 20₋₁ 48₋₁ 100₋₁ 58₋₁ 90₋₁ 69₋₃ 48 9 … … 76₋₂ 36₋₂ … … … … … … … … FINFrance 51₋₃ 19₋₁ ᵢ 18₋₁ 55₋₁ 47₋₁ ᵢ 68₋₁ ᵢ … … 6 98₋₂ 84₋₂ 70₋₂ 30₋₂ … … … … … … … … FRAGermany 52₋₃ 21₋₁ 19₋₁ 93₋₁ 41₋₁ 70₋₁ 57 35 5 100₋₁ 96₋₁ 83₋₁ 36₋₁ … … … … … … … … DEUGreece 17₋₃ 13₋₁ 15₋₁ 100₋₁ 45₋₁ 143₋₁ 52₋₂ 38 4 91₋₃ 65₋₃ 55₋₃ 27₋₃ 73₋₄ 71₋₄ 99₋₁ ᵢ 98₋₁ ᵢ 54₋₁ ᵢ 65₋₁ ᵢ 9₋₁ ᵢ 187₋₁ ᵢ GRCHungary 56₋₃ 18₋₁ 20₋₁ 100₋₁ 33₋₁ 50₋₁ 53₋₃ 37₋₃ 4 100₋₃ 97₋₃ 76₋₃ 29₋₃ 81₋₂ 82₋₂ … … … … … … HUNIceland … 9₋₁ 18₋₁ 99₋₁ 51₋₁ 73₋₁ 82₋₂ 71₋₂ 13₋₂ … … … … … … … … … … … … ISLIreland … 8₋₁ ᵢ 27₋₁ 100₋₁ … 77₋₁ ᵢ 53₋₁ 36₋₁ 6₋₁ … 86₋₂ 71₋₂ 43₋₂ … … … … … … … … IRLItaly 42₋₃ 21₋₁ 33₋₁ 100₋₃ 40₋₁ 64₋₁ 42₋₃ 31₋₃ 4₋₃ 95₋₄ 78₋₄ 49₋₄ 15₋₄ … … 100₋₁ ᵢ 99₋₁ ᵢ 37₋₁ ᵢ 63₋₁ ᵢ 4₋₁ ᵢ 444₋₁ ᵢ ITALatvia 48₋₃ 17₋₁ ᵢ 20₋₁ 100₋₁ 49₋₁ ᵢ 93₋₁ ᵢ 53₋₄ 32 3 … 100₋₄ 90₋₁ 44₋₁ … … 100₋₁ ᵢ 100₋₁ ᵢ 37₋₁ ᵢ 47₋₁ ᵢ 0.3₋₁ ᵢ 2₋₁ ᵢ LVALiechtenstein … 23₋₁ ᵢ 34₋₁ … 14₋₁ ᵢ 38₋₁ ᵢ … … … … … … … … … … … … … … … LIELithuania 28₋₃ 9₋₁ ᵢ 9₋₁ 100₋₁ 62₋₁ ᵢ 74₋₁ ᵢ 45₋₃ 42 5 99₋₂ 96₋₂ 87₋₂ 55₋₂ 84₋₄ 82₋₄ … … … … … … LTULuxembourg 48₋₃ 22₋₁ 33₋₁ 100₋₁ 8₋₁ 19₋₁ 82₋₄ 69₋₂ 11₋₂ … … 69₋₄ … … … … … … … … … LUXMalta 36₋₃ 10 16 … 45₋₂ 65 50₋₄ 41 8 99₋₁ 82₋₁ 45₋₁ 30₋₁ … … 99₋₁ ᵢ 95₋₁ ᵢ 30₋₁ ᵢ 37₋₁ ᵢ 0.3₋₁ ᵢ 21₋₁ ᵢ MLTMonaco … … 11₊₁ 100₊₁ … … … … … … … … … … … … … … … … … MCOMontenegro … 23 34 … 36 54 … 28 4 … … … … … … 99₋₁ ᵢ 99₋₁ ᵢ 55₋₁ ᵢ 77₋₁ ᵢ 1₋₁ ᵢ 6₋₁ ᵢ MNENetherlands 64₋₃ 23₋₁ 37₋₁ … 52₋₁ 87₋₁ 72 54 9 99₋₁ 90₋₁ 71₋₁ 33₋₁ … … … … … … … … NLDNorth Macedonia 13₋₃ … 28₋₁ 100₋₁ 27₋₁ 43₋₁ 32₋₃ 21₋₃ 3₋₃ … … … … … … … … … … … … MKDNorway 60₋₃ 17₋₁ 28₋₁ 100₋₁ 55₋₁ 83₋₁ 78 60 11 100₋₂ 99₋₂ 78₋₂ 40₋₂ … … … … … … … … NORPoland 26₋₃ 20₋₁ 28₋₁ 100₋₁ 45₋₁ 69₋₁ 34₋₄ 28 4 99₋₃ 85₋₃ 85₋₃ 28₋₃ … … … … … … … … POLPortugal 46₋₃ 16₋₁ 24₋₁ 100₋₁ 51₋₂ 66₋₁ 47₋₃ 37 8 92₋₁ 54₋₁ 37₋₁ 19₋₁ … … 100₋₁ ᵢ 96₋₁ ᵢ 44₋₁ ᵢ 68₋₁ ᵢ 4₋₁ ᵢ 343₋₁ ᵢ PRTRepublic of Moldova … 10 ᵢ 13 100 34₋₁ ᵢ 39 ᵢ … … … 99₋₁ 97₋₁ 75₋₁ … … … … … … … … … MDARomania 7₋₃ … 28₋₁ 100₋₁ 38₋₃ 51₋₁ 22₋₂ 15 1 99₋₂ 91₋₂ 67₋₂ 18₋₂ … … 99₋₁ ᵢ 99₋₁ ᵢ 47₋₁ ᵢ 63₋₁ ᵢ 12₋₁ ᵢ 190₋₁ ᵢ ROURussian Federation … 18₋₁ ᵢ 14₋₁ 100₋₁ 58₋₁ 85₋₁ 27 24 1 … … … … … … 100₋₁ ᵢ 100₋₁ ᵢ 41₋₁ ᵢ 54₋₁ ᵢ 42₋₁ ᵢ 323₋₁ ᵢ RUSSan Marino … 3 7 … 33₋₁ 51 … … … 97₋₁ 83₋₁ 54₋₁ 16₋₁ … … 100₋₁ 100₋₁ 32₋₁ 59₋₁ -₋₁ -₋₁ SMRSerbia 20₋₃ 25 ᵢ 35 100 … 68 ᵢ 34₋₄ 24₋₂ 4 98₋₂ 90₋₂ 72₋₂ 23₋₂ … … 100₋₃ 99₋₃ 48₋₃ 79₋₃ 3₋₃ 86₋₃ SRBSlovakia 46₋₃ 23₋₁ 30₋₁ 100₋₁ 35₋₁ 45₋₁ … 35 4 100₋₂ 99₋₂ 87₋₂ 23₋₂ … … … … … … … … SVKSlovenia 46₋₃ 35₋₁ 45₋₁ … 48₋₁ 77₋₁ … 42₋₃ 5 100₋₂ 98₋₂ 83₋₂ 28₋₂ 75₋₄ 74₋₄ … … … … … … SVNSpain 43₋₃ 15₋₁ 19₋₁ 100₋₁ 43₋₁ 91₋₁ 52₋₄ 38 7 92₋₁ 78₋₁ 50₋₁ 31₋₁ … … 100₋₁ 98₋₁ 44₋₁ 67₋₁ 13₋₁ 623₋₁ ESPSweden 64₋₃ 13₋₁ 21₋₁ 76₋₁ 40₋₁ 72₋₁ 64 46 11 100₋₂ 91₋₂ 76₋₂ 39₋₂ … … … … … … … … SWESwitzerland 69₋₃ 23₋₁ 37₋₁ 77₋₁ 54₋₁ 61₋₁ … 57 10 … 97₋₁ 86₋₁ … … … … … … … … … CHEUkraine … … 7 100 … … … … … … … … … … … … … … … … … UKRUnited Kingdom 52₋₃ 18₋₁ 32₋₁ … … 61₋₁ 65₋₂ 46 9 100₋₂ 100₋₂ 77₋₂ 44₋₂ … … … … … … … … GBRUnited States 59₋₂ … … 100₋₁ … 88₋₁ ᵢ … … … 99₋₁ 96₋₁ 90₋₁ 45₋₁ 81₋₂ 71₋₂ … … … … … … USA
2 0 2 1 / 2 • G LO BA L E D U C AT I O N M O N I TO R I N G R E P O RT 438
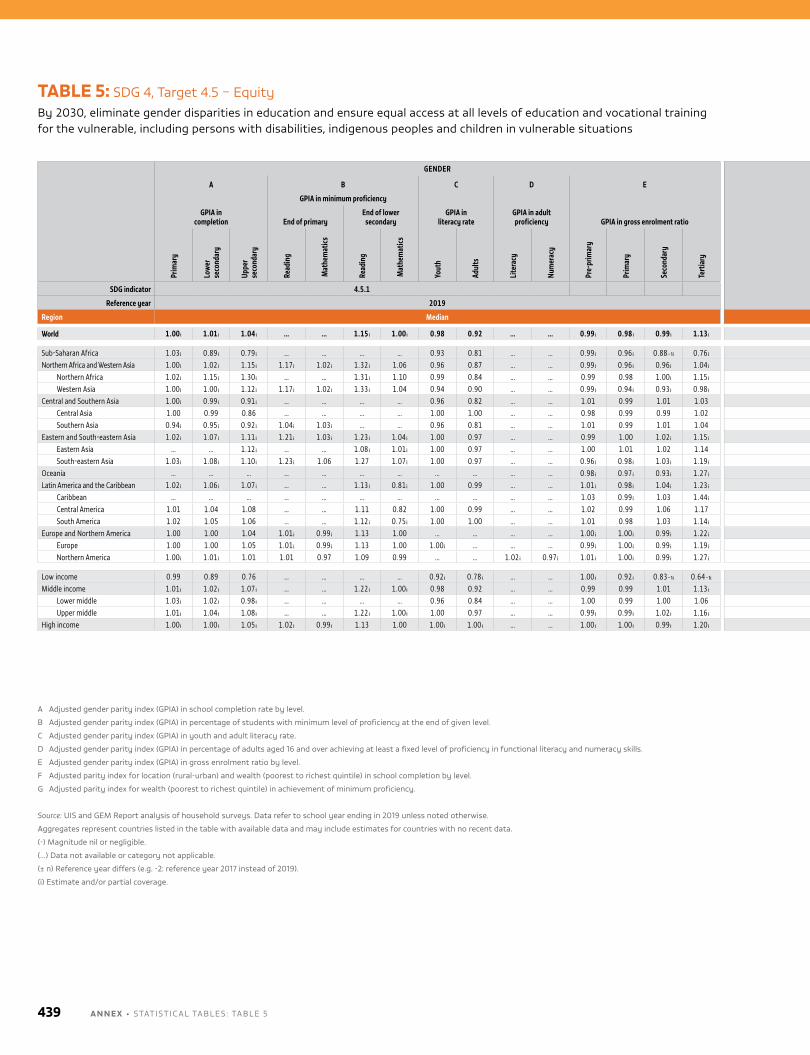
GENDER LOCATION/WEALTH
A B C D E F G
GPIA in completion
GPIA in minimum proficiency
GPIA in literacy rate
GPIA in adult proficiency GPIA in gross enrolment ratio
Disparity in primary completion Disparity in lower secondary completion Disparity in upper secondary completion Wealth disparity in minimum proficiency
End of primaryEnd of lower
secondary Adjusted parity index% of poorest completing Adjusted parity index
% of poorest completing Adjusted parity index
% of poorest completing End of primary
End of lower secondary
Prim
ary
Low
er
seco
ndar
y
Uppe
r se
cond
ary
Read
ing
Mat
hem
atics
Read
ing
Mat
hem
atics
Yout
h
Adul
ts
Lite
racy
Num
erac
y
Pre-
prim
ary
Prim
ary
Seco
ndar
y
Tert
iary
Loca
tion
Wea
lth
M F Loca
tion
Wea
lth
M F Loca
tion
Wea
lth
M F Read
ing
Mat
hem
atics
Read
ing
Mat
hem
atics
SDG indicator 4.5.1 4.5.1
Reference year 2019 2019
Region Median Median
World 1.00 ᵢ 1.01 ᵢ 1.04 ᵢ … … 1.15 ᵢ 1.00 ᵢ 0.98 0.92 … … 0.99 ᵢ 0.98 ᵢ 0.99 ᵢ 1.13 ᵢ 0.97 ᵢ 0.92 ᵢ 73 ᵢ 80 ᵢ 0.90 ᵢ 0.74 ᵢ 39 ᵢ … 0.70 ᵢ 0.51 ᵢ … … … … 0.61 ᵢ 0.59 ᵢ
Sub-Saharan Africa 1.03 ᵢ 0.89 ᵢ 0.79 ᵢ … … … … 0.93 0.81 … … 0.99 ᵢ 0.96 ᵢ 0.88₋₁ᵢ 0.76 ᵢ 0.65 0.35 ᵢ 31 ᵢ 32 ᵢ 0.40 0.15 ᵢ 11 ᵢ 7 ᵢ 0.27 ᵢ 0.07 ᵢ 3 ᵢ 1 ᵢ … … … …Northern Africa and Western Asia 1.00 ᵢ 1.02 ᵢ 1.15 ᵢ 1.17 ᵢ 1.02 ᵢ 1.32 ᵢ 1.06 0.96 0.87 … … 0.99 ᵢ 0.96 ᵢ 0.96 ᵢ 1.04 ᵢ 1.00 ᵢ 0.96 ᵢ … … 0.97 ᵢ 0.82 ᵢ … … 0.84 ᵢ 0.69 ᵢ … … 0.80 ᵢ 0.65 ᵢ 0.47 ᵢ 0.52
Northern Africa 1.02 ᵢ 1.15 ᵢ 1.30 ᵢ … … 1.31 ᵢ 1.10 0.99 0.84 … … 0.99 0.98 1.00 ᵢ 1.15 ᵢ 0.98 ᵢ 0.92 ᵢ … … 0.83 ᵢ 0.57 ᵢ … … 0.69 ᵢ 0.37 ᵢ … … … … 0.34 ᵢ 0.40Western Asia 1.00 ᵢ 1.00 ᵢ 1.12 ᵢ 1.17 ᵢ 1.02 ᵢ 1.33 ᵢ 1.04 0.94 0.90 … … 0.99 ᵢ 0.94 ᵢ 0.93 ᵢ 0.98 ᵢ 1.00 ᵢ 0.99 ᵢ … … 0.98 ᵢ 0.93 ᵢ … … 0.86 ᵢ 0.71 ᵢ … … 0.80 ᵢ 0.66 ᵢ 0.48 ᵢ 0.53
Central and Southern Asia 1.00 ᵢ 0.99 ᵢ 0.91 ᵢ … … … … 0.96 0.82 … … 1.01 0.99 1.01 1.03 0.99 ᵢ 0.92 89 89 0.95 ᵢ 0.74 69 74 0.65 ᵢ 0.29 ᵢ 21 ᵢ 22 ᵢ … … … …Central Asia 1.00 0.99 0.86 … … … … 1.00 1.00 … … 0.98 0.99 0.99 1.02 1.00 1.00 99 100 1.00 0.98 97 97 0.92 0.81 81 85 … … … …Southern Asia 0.94 ᵢ 0.95 ᵢ 0.92 ᵢ 1.04 ᵢ 1.03 ᵢ … … 0.96 0.81 … … 1.01 0.99 1.01 1.04 0.97 ᵢ 0.79 72 79 0.92 ᵢ 0.57 47 53 0.49 ᵢ 0.24 ᵢ 16 ᵢ 8 ᵢ … … … …
Eastern and South-eastern Asia 1.02 ᵢ 1.07 ᵢ 1.11 ᵢ 1.21 ᵢ 1.03 ᵢ 1.23 ᵢ 1.04 ᵢ 1.00 0.97 … … 0.99 1.00 1.02 ᵢ 1.15 ᵢ 0.96 ᵢ 0.86 ᵢ 71 ᵢ 89 ᵢ 0.89 ᵢ 0.61 ᵢ 40 ᵢ 68 ᵢ 0.68 ᵢ 0.49 ᵢ 31 ᵢ 32 ᵢ … … 0.45 ᵢ 0.51 ᵢEastern Asia … … 1.12 ᵢ … … 1.08 ᵢ 1.01 ᵢ 1.00 0.97 … … 1.00 1.01 1.02 1.14 … … … … … … … … 0.80 ᵢ 0.75 ᵢ … … … … 0.89 ᵢ 0.89 ᵢSouth-eastern Asia 1.03 ᵢ 1.08 ᵢ 1.10 ᵢ 1.23 ᵢ 1.06 1.27 1.07 ᵢ 1.00 0.97 … … 0.96 ᵢ 0.98 ᵢ 1.03 ᵢ 1.19 ᵢ 0.94 ᵢ 0.75 ᵢ 69 ᵢ 77 ᵢ 0.76 ᵢ 0.46 ᵢ 36 ᵢ 51 ᵢ 0.58 ᵢ 0.29 ᵢ 24 ᵢ 26 ᵢ … … 0.41 0.47 ᵢ
Oceania … … … … … … … … … … … 0.98 ᵢ 0.97 ᵢ 0.93 ᵢ 1.27 ᵢ … … … … … … … … … … … … … … … …Latin America and the Caribbean 1.02 ᵢ 1.06 ᵢ 1.07 ᵢ … … 1.13 ᵢ 0.81 ᵢ 1.00 0.99 … … 1.01 ᵢ 0.98 ᵢ 1.04 ᵢ 1.23 ᵢ 0.97 ᵢ 0.95 ᵢ 89 ᵢ 93 ᵢ 0.88 ᵢ 0.75 ᵢ 65 ᵢ 68 ᵢ 0.70 ᵢ 0.47 ᵢ 38 ᵢ 37 ᵢ … … 0.43 ᵢ 0.26 ᵢ
Caribbean … … … … … … … … … … … 1.03 0.99 ᵢ 1.03 1.44 ᵢ … … … … … … … … … … … … … … … …Central America 1.01 1.04 1.08 … … 1.11 0.82 1.00 0.99 … … 1.02 0.99 1.06 1.17 0.93 0.88 86 88 0.80 0.65 56 57 0.63 0.36 25 30 … … 0.35 0.20South America 1.02 1.05 1.06 … … 1.12 ᵢ 0.75 ᵢ 1.00 1.00 … … 1.01 0.98 1.03 1.14 ᵢ 0.99 0.96 93 94 0.90 0.79 68 80 0.74 0.62 49 52 … … 0.44 ᵢ 0.27 ᵢ
Europe and Northern America 1.00 1.00 1.04 1.01 ᵢ 0.99 ᵢ 1.13 1.00 … … … … 1.00 ᵢ 1.00 ᵢ 0.99 ᵢ 1.22 ᵢ 1.00 ᵢ 1.00 ᵢ … … 1.00 ᵢ 0.97 … … 0.97 ᵢ 0.88 … … 0.93 ᵢ 0.78 ᵢ 0.70 0.68Europe 1.00 1.00 1.05 1.01 ᵢ 0.99 ᵢ 1.13 1.00 1.00 ᵢ … … … 0.99 ᵢ 1.00 ᵢ 0.99 ᵢ 1.19 ᵢ 1.00 ᵢ 1.00 ᵢ … … 1.00 ᵢ 0.97 … … 0.98 ᵢ 0.85 … … 0.93 ᵢ 0.79 ᵢ 0.70 0.68Northern America 1.00 ᵢ 1.01 ᵢ 1.01 1.01 0.97 1.09 0.99 … … 1.02 ᵢ 0.97 ᵢ 1.01 ᵢ 1.00 ᵢ 0.99 ᵢ 1.27 ᵢ … 1.00 ᵢ … … … 0.99 ᵢ … … 0.95 ᵢ 0.93 … … 0.92 0.70 0.81 0.71
Low income 0.99 0.89 0.76 … … … … 0.92 ᵢ 0.78 ᵢ … … 1.00 ᵢ 0.92 ᵢ 0.83₋₁ᵢ 0.64₋₁ᵢ 0.63 0.35 29 ᵢ 32 ᵢ 0.38 0.13 ᵢ 10 ᵢ 9 ᵢ 0.27 ᵢ 0.07 ᵢ 2 ᵢ 1 ᵢ … … … …Middle income 1.01 ᵢ 1.02 ᵢ 1.07 ᵢ … … 1.22 ᵢ 1.00 ᵢ 0.98 0.92 … … 0.99 0.99 1.01 1.13 ᵢ 0.97 ᵢ 0.92 ᵢ 84 ᵢ 92 ᵢ 0.89 ᵢ 0.68 ᵢ 55 ᵢ 62 ᵢ 0.68 ᵢ 0.39 ᵢ 21 ᵢ 31 ᵢ … … 0.44 ᵢ 0.40 ᵢ
Lower middle 1.03 ᵢ 1.02 ᵢ 0.98 ᵢ … … … … 0.96 0.84 … … 1.00 0.99 1.00 1.06 0.89 ᵢ 0.73 ᵢ 62 ᵢ 65 ᵢ 0.61 ᵢ 0.33 ᵢ 23 ᵢ 24 ᵢ 0.45 ᵢ 0.20 ᵢ 13 ᵢ 9 ᵢ … … … …Upper middle 1.01 ᵢ 1.04 ᵢ 1.08 ᵢ … … 1.22 ᵢ 1.00 ᵢ 1.00 0.97 … … 0.99 ᵢ 0.99 ᵢ 1.02 ᵢ 1.16 ᵢ 0.99 ᵢ 0.96 ᵢ 94 ᵢ 95 ᵢ 0.93 ᵢ 0.82 ᵢ 75 ᵢ 80 ᵢ 0.80 ᵢ 0.56 ᵢ 41 ᵢ 48 ᵢ … … 0.46 ᵢ 0.45 ᵢ
High income 1.00 ᵢ 1.00 ᵢ 1.05 ᵢ 1.02 ᵢ 0.99 ᵢ 1.13 1.00 1.00 ᵢ 1.00 ᵢ … … 1.00 ᵢ 1.00 ᵢ 0.99 ᵢ 1.20 ᵢ 1.00 ᵢ 1.00 ᵢ … … 1.00 ᵢ 0.98 ᵢ … … 0.95 ᵢ 0.90 ᵢ … … 0.92 ᵢ 0.76 ᵢ 0.72 0.68
TABLE 5: SDG 4, Target 4.5 – Equityby 2030, eliminate gender disparities in education and ensure equal access at all levels of education and vocational training for the vulnerable, including persons with disabilities, indigenous peoples and children in vulnerable situations
A Adjusted gender parity index (GPIA) in school completion rate by level.
b Adjusted gender parity index (GPIA) in percentage of students with minimum level of proficiency at the end of given level.
C Adjusted gender parity index (GPIA) in youth and adult literacy rate.
D Adjusted gender parity index (GPIA) in percentage of adults aged 16 and over achieving at least a fixed level of proficiency in functional literacy and numeracy skills.
E Adjusted gender parity index (GPIA) in gross enrolment ratio by level.
F Adjusted parity index for location (rural-urban) and wealth (poorest to richest quintile) in school completion by level.
G Adjusted parity index for wealth (poorest to richest quintile) in achievement of minimum proficiency.
Source: uIS and GEm Report analysis of household surveys. Data refer to school year ending in 2019 unless noted otherwise.
Aggregates represent countries listed in the table with available data and may include estimates for countries with no recent data.
(-) magnitude nil or negligible.
(…) Data not available or category not applicable.
(± n) Reference year differs (e.g. -2: reference year 2017 instead of 2019).
(i) Estimate and/or partial coverage.
A N N E X • STATISTICAl TAblES : TAblE 5439
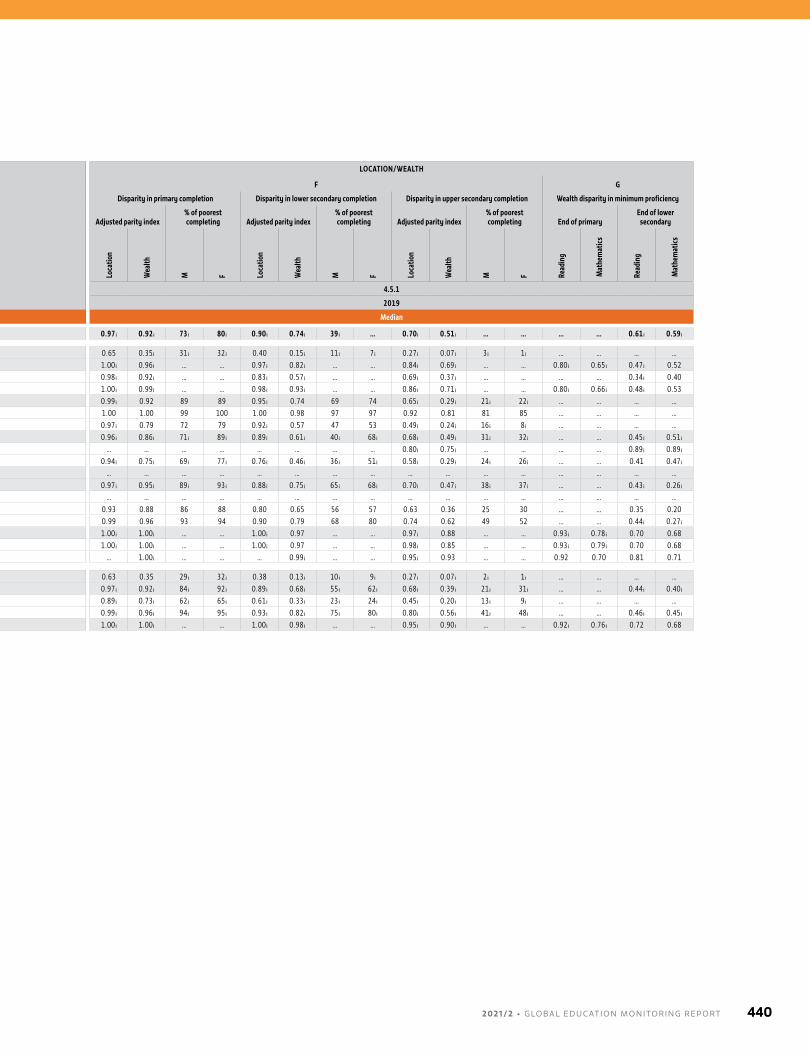
GENDER LOCATION/WEALTH
A B C D E F G
GPIA in completion
GPIA in minimum proficiency
GPIA in literacy rate
GPIA in adult proficiency GPIA in gross enrolment ratio
Disparity in primary completion Disparity in lower secondary completion Disparity in upper secondary completion Wealth disparity in minimum proficiency
End of primaryEnd of lower
secondary Adjusted parity index% of poorest completing Adjusted parity index
% of poorest completing Adjusted parity index
% of poorest completing End of primary
End of lower secondary
Prim
ary
Low
er
seco
ndar
y
Uppe
r se
cond
ary
Read
ing
Mat
hem
atics
Read
ing
Mat
hem
atics
Yout
h
Adul
ts
Lite
racy
Num
erac
y
Pre-
prim
ary
Prim
ary
Seco
ndar
y
Tert
iary
Loca
tion
Wea
lth
M F Loca
tion
Wea
lth
M F Loca
tion
Wea
lth
M F Read
ing
Mat
hem
atics
Read
ing
Mat
hem
atics
SDG indicator 4.5.1 4.5.1
Reference year 2019 2019
Region Median Median
World 1.00 ᵢ 1.01 ᵢ 1.04 ᵢ … … 1.15 ᵢ 1.00 ᵢ 0.98 0.92 … … 0.99 ᵢ 0.98 ᵢ 0.99 ᵢ 1.13 ᵢ 0.97 ᵢ 0.92 ᵢ 73 ᵢ 80 ᵢ 0.90 ᵢ 0.74 ᵢ 39 ᵢ … 0.70 ᵢ 0.51 ᵢ … … … … 0.61 ᵢ 0.59 ᵢ
Sub-Saharan Africa 1.03 ᵢ 0.89 ᵢ 0.79 ᵢ … … … … 0.93 0.81 … … 0.99 ᵢ 0.96 ᵢ 0.88₋₁ᵢ 0.76 ᵢ 0.65 0.35 ᵢ 31 ᵢ 32 ᵢ 0.40 0.15 ᵢ 11 ᵢ 7 ᵢ 0.27 ᵢ 0.07 ᵢ 3 ᵢ 1 ᵢ … … … …Northern Africa and Western Asia 1.00 ᵢ 1.02 ᵢ 1.15 ᵢ 1.17 ᵢ 1.02 ᵢ 1.32 ᵢ 1.06 0.96 0.87 … … 0.99 ᵢ 0.96 ᵢ 0.96 ᵢ 1.04 ᵢ 1.00 ᵢ 0.96 ᵢ … … 0.97 ᵢ 0.82 ᵢ … … 0.84 ᵢ 0.69 ᵢ … … 0.80 ᵢ 0.65 ᵢ 0.47 ᵢ 0.52
Northern Africa 1.02 ᵢ 1.15 ᵢ 1.30 ᵢ … … 1.31 ᵢ 1.10 0.99 0.84 … … 0.99 0.98 1.00 ᵢ 1.15 ᵢ 0.98 ᵢ 0.92 ᵢ … … 0.83 ᵢ 0.57 ᵢ … … 0.69 ᵢ 0.37 ᵢ … … … … 0.34 ᵢ 0.40Western Asia 1.00 ᵢ 1.00 ᵢ 1.12 ᵢ 1.17 ᵢ 1.02 ᵢ 1.33 ᵢ 1.04 0.94 0.90 … … 0.99 ᵢ 0.94 ᵢ 0.93 ᵢ 0.98 ᵢ 1.00 ᵢ 0.99 ᵢ … … 0.98 ᵢ 0.93 ᵢ … … 0.86 ᵢ 0.71 ᵢ … … 0.80 ᵢ 0.66 ᵢ 0.48 ᵢ 0.53
Central and Southern Asia 1.00 ᵢ 0.99 ᵢ 0.91 ᵢ … … … … 0.96 0.82 … … 1.01 0.99 1.01 1.03 0.99 ᵢ 0.92 89 89 0.95 ᵢ 0.74 69 74 0.65 ᵢ 0.29 ᵢ 21 ᵢ 22 ᵢ … … … …Central Asia 1.00 0.99 0.86 … … … … 1.00 1.00 … … 0.98 0.99 0.99 1.02 1.00 1.00 99 100 1.00 0.98 97 97 0.92 0.81 81 85 … … … …Southern Asia 0.94 ᵢ 0.95 ᵢ 0.92 ᵢ 1.04 ᵢ 1.03 ᵢ … … 0.96 0.81 … … 1.01 0.99 1.01 1.04 0.97 ᵢ 0.79 72 79 0.92 ᵢ 0.57 47 53 0.49 ᵢ 0.24 ᵢ 16 ᵢ 8 ᵢ … … … …
Eastern and South-eastern Asia 1.02 ᵢ 1.07 ᵢ 1.11 ᵢ 1.21 ᵢ 1.03 ᵢ 1.23 ᵢ 1.04 ᵢ 1.00 0.97 … … 0.99 1.00 1.02 ᵢ 1.15 ᵢ 0.96 ᵢ 0.86 ᵢ 71 ᵢ 89 ᵢ 0.89 ᵢ 0.61 ᵢ 40 ᵢ 68 ᵢ 0.68 ᵢ 0.49 ᵢ 31 ᵢ 32 ᵢ … … 0.45 ᵢ 0.51 ᵢEastern Asia … … 1.12 ᵢ … … 1.08 ᵢ 1.01 ᵢ 1.00 0.97 … … 1.00 1.01 1.02 1.14 … … … … … … … … 0.80 ᵢ 0.75 ᵢ … … … … 0.89 ᵢ 0.89 ᵢSouth-eastern Asia 1.03 ᵢ 1.08 ᵢ 1.10 ᵢ 1.23 ᵢ 1.06 1.27 1.07 ᵢ 1.00 0.97 … … 0.96 ᵢ 0.98 ᵢ 1.03 ᵢ 1.19 ᵢ 0.94 ᵢ 0.75 ᵢ 69 ᵢ 77 ᵢ 0.76 ᵢ 0.46 ᵢ 36 ᵢ 51 ᵢ 0.58 ᵢ 0.29 ᵢ 24 ᵢ 26 ᵢ … … 0.41 0.47 ᵢ
Oceania … … … … … … … … … … … 0.98 ᵢ 0.97 ᵢ 0.93 ᵢ 1.27 ᵢ … … … … … … … … … … … … … … … …Latin America and the Caribbean 1.02 ᵢ 1.06 ᵢ 1.07 ᵢ … … 1.13 ᵢ 0.81 ᵢ 1.00 0.99 … … 1.01 ᵢ 0.98 ᵢ 1.04 ᵢ 1.23 ᵢ 0.97 ᵢ 0.95 ᵢ 89 ᵢ 93 ᵢ 0.88 ᵢ 0.75 ᵢ 65 ᵢ 68 ᵢ 0.70 ᵢ 0.47 ᵢ 38 ᵢ 37 ᵢ … … 0.43 ᵢ 0.26 ᵢ
Caribbean … … … … … … … … … … … 1.03 0.99 ᵢ 1.03 1.44 ᵢ … … … … … … … … … … … … … … … …Central America 1.01 1.04 1.08 … … 1.11 0.82 1.00 0.99 … … 1.02 0.99 1.06 1.17 0.93 0.88 86 88 0.80 0.65 56 57 0.63 0.36 25 30 … … 0.35 0.20South America 1.02 1.05 1.06 … … 1.12 ᵢ 0.75 ᵢ 1.00 1.00 … … 1.01 0.98 1.03 1.14 ᵢ 0.99 0.96 93 94 0.90 0.79 68 80 0.74 0.62 49 52 … … 0.44 ᵢ 0.27 ᵢ
Europe and Northern America 1.00 1.00 1.04 1.01 ᵢ 0.99 ᵢ 1.13 1.00 … … … … 1.00 ᵢ 1.00 ᵢ 0.99 ᵢ 1.22 ᵢ 1.00 ᵢ 1.00 ᵢ … … 1.00 ᵢ 0.97 … … 0.97 ᵢ 0.88 … … 0.93 ᵢ 0.78 ᵢ 0.70 0.68Europe 1.00 1.00 1.05 1.01 ᵢ 0.99 ᵢ 1.13 1.00 1.00 ᵢ … … … 0.99 ᵢ 1.00 ᵢ 0.99 ᵢ 1.19 ᵢ 1.00 ᵢ 1.00 ᵢ … … 1.00 ᵢ 0.97 … … 0.98 ᵢ 0.85 … … 0.93 ᵢ 0.79 ᵢ 0.70 0.68Northern America 1.00 ᵢ 1.01 ᵢ 1.01 1.01 0.97 1.09 0.99 … … 1.02 ᵢ 0.97 ᵢ 1.01 ᵢ 1.00 ᵢ 0.99 ᵢ 1.27 ᵢ … 1.00 ᵢ … … … 0.99 ᵢ … … 0.95 ᵢ 0.93 … … 0.92 0.70 0.81 0.71
Low income 0.99 0.89 0.76 … … … … 0.92 ᵢ 0.78 ᵢ … … 1.00 ᵢ 0.92 ᵢ 0.83₋₁ᵢ 0.64₋₁ᵢ 0.63 0.35 29 ᵢ 32 ᵢ 0.38 0.13 ᵢ 10 ᵢ 9 ᵢ 0.27 ᵢ 0.07 ᵢ 2 ᵢ 1 ᵢ … … … …Middle income 1.01 ᵢ 1.02 ᵢ 1.07 ᵢ … … 1.22 ᵢ 1.00 ᵢ 0.98 0.92 … … 0.99 0.99 1.01 1.13 ᵢ 0.97 ᵢ 0.92 ᵢ 84 ᵢ 92 ᵢ 0.89 ᵢ 0.68 ᵢ 55 ᵢ 62 ᵢ 0.68 ᵢ 0.39 ᵢ 21 ᵢ 31 ᵢ … … 0.44 ᵢ 0.40 ᵢ
Lower middle 1.03 ᵢ 1.02 ᵢ 0.98 ᵢ … … … … 0.96 0.84 … … 1.00 0.99 1.00 1.06 0.89 ᵢ 0.73 ᵢ 62 ᵢ 65 ᵢ 0.61 ᵢ 0.33 ᵢ 23 ᵢ 24 ᵢ 0.45 ᵢ 0.20 ᵢ 13 ᵢ 9 ᵢ … … … …Upper middle 1.01 ᵢ 1.04 ᵢ 1.08 ᵢ … … 1.22 ᵢ 1.00 ᵢ 1.00 0.97 … … 0.99 ᵢ 0.99 ᵢ 1.02 ᵢ 1.16 ᵢ 0.99 ᵢ 0.96 ᵢ 94 ᵢ 95 ᵢ 0.93 ᵢ 0.82 ᵢ 75 ᵢ 80 ᵢ 0.80 ᵢ 0.56 ᵢ 41 ᵢ 48 ᵢ … … 0.46 ᵢ 0.45 ᵢ
High income 1.00 ᵢ 1.00 ᵢ 1.05 ᵢ 1.02 ᵢ 0.99 ᵢ 1.13 1.00 1.00 ᵢ 1.00 ᵢ … … 1.00 ᵢ 1.00 ᵢ 0.99 ᵢ 1.20 ᵢ 1.00 ᵢ 1.00 ᵢ … … 1.00 ᵢ 0.98 ᵢ … … 0.95 ᵢ 0.90 ᵢ … … 0.92 ᵢ 0.76 ᵢ 0.72 0.68
2 0 2 1 / 2 • G LO BA L E D U C AT I O N M O N I TO R I N G R E P O RT 440
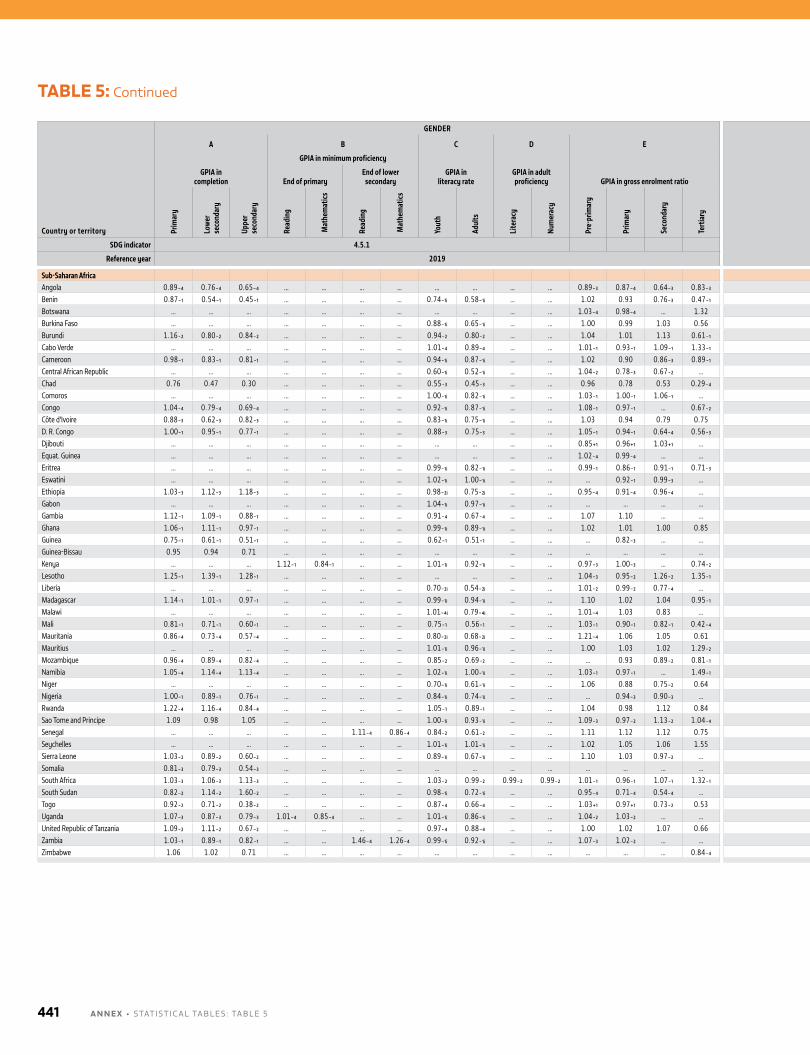
TABLE 5: Continued
Country or territory
GENDER LOCATION/WEALTH
Coun
try
code
A B C D E F G
GPIA in completion
GPIA in minimum proficiency
GPIA in literacy rate
GPIA in adult proficiency GPIA in gross enrolment ratio
Disparity in primary completion Disparity in lower secondary completion Disparity in upper secondary completion Wealth disparity in minimum proficiency
End of primaryEnd of lower
secondary Adjusted parity index% of poorest completing Adjusted parity index
% of poorest completing Adjusted parity index
% of poorest completing End of primary
End of lower secondary
Prim
ary
Low
er
seco
ndar
y
Uppe
r se
cond
ary
Read
ing
Mat
hem
atics
Read
ing
Mat
hem
atics
Yout
h
Adul
ts
Lite
racy
Num
erac
y
Pre-
prim
ary
Prim
ary
Seco
ndar
y
Tert
iary
Loca
tion
Wea
lth
M F Loca
tion
Wea
lth
M F Loca
tion
Wea
lth
M F Read
ing
Mat
hem
atics
Read
ing
Mat
hem
atics
SDG indicator 4.5.1 4.5.1
Reference year 2019 2019
Sub-Saharan AfricaAngola 0.89₋₄ 0.76₋₄ 0.65₋₄ … … … … … … … … 0.89₋₃ 0.87₋₄ 0.64₋₃ 0.83₋₃ 0.37₋₄ 0.21₋₄ 21₋₄ 17₋₄ 0.20₋₄ 0.06₋₄ 5₋₄ 3₋₄ 0.17₋₄ 0.04₋₄ 2₋₄ 1₋₄ … … … … AGOBenin 0.87₋₁ 0.54₋₁ 0.45₋₁ … … … … 0.74₋₁ᵢ 0.58₋₁ᵢ … … 1.02 0.93 0.76₋₃ 0.47₋₁ 0.70₋₁ 0.28₋₁ 24₋₁ 18₋₁ 0.43₋₁ 0.08₋₁ 5₋₁ 3₋₁ 0.25₋₁ 0.02₋₁ 1₋₁ 0.2₋₁ … … … … BENBotswana … … … … … … … … … … … 1.03₋₄ 0.98₋₄ … 1.32 … … … … … … … … … … … … … … … … BWABurkina Faso … … … … … … … 0.88₋₁ᵢ 0.65₋₁ᵢ … … 1.00 0.99 1.03 0.56 … … … … … … … … … … … … … … … … BFABurundi 1.16₋₂ 0.80₋₂ 0.84₋₂ … … … … 0.94₋₂ 0.80₋₂ … … 1.04 1.01 1.13 0.61₋₁ 0.69₋₂ 0.45₋₂ 24₋₂ 32₋₂ 0.49₋₂ 0.20₋₂ 12₋₂ … 0.23₋₂ 0.05₋₂ … … … … … … BDICabo Verde … … … … … … … 1.01₋₄ 0.89₋₄ … … 1.01₋₁ 0.93₋₁ 1.09₋₁ 1.33₋₁ … … … … … … … … … … … … … … … … CPVCameroon 0.98₋₁ 0.83₋₁ 0.81₋₁ … … … … 0.94₋₁ᵢ 0.87₋₁ᵢ … … 1.02 0.90 0.86₋₃ 0.89₋₁ 0.66₋₁ 0.35₋₁ 36₋₁ 30₋₁ 0.41₋₁ 0.11₋₁ 13₋₁ 5₋₁ 0.21₋₁ 0.02₋₁ 3₋₁ 0.3₋₁ … … … … CMRCentral African Republic … … … … … … … 0.60₋₁ᵢ 0.52₋₁ᵢ … … 1.04₋₂ 0.78₋₃ 0.67₋₂ … … … … … … … … … … … … … … … … … CAFChad 0.76 0.47 0.30 … … … … 0.55₋₃ 0.45₋₃ … … 0.96 0.78 0.53 0.29₋₄ 0.42 0.19 … … 0.25 0.08 … … 0.15 0.04 … … … … … … TCDComoros … … … … … … … 1.00₋₁ᵢ 0.82₋₁ᵢ … … 1.03₋₁ 1.00₋₁ 1.06₋₁ … … … … … … … … … … … … … … … … … COMCongo 1.04₋₄ 0.79₋₄ 0.69₋₄ … … … … 0.92₋₁ᵢ 0.87₋₁ᵢ … … 1.08₋₁ 0.97₋₁ … 0.67₋₂ 0.61₋₄ 0.43₋₄ 42₋₄ 40₋₄ 0.30₋₄ 0.08₋₄ 7₋₄ 6₋₄ 0.09₋₄ 0.01₋₄ 1₋₄ 0.2₋₄ … … … … COGCôte d'Ivoire 0.88₋₃ 0.62₋₃ 0.82₋₃ … … … … 0.83₋₁ᵢ 0.75₋₁ᵢ … … 1.03 0.94 0.79 0.75 0.56₋₃ 0.32₋₃ 30₋₃ 16₋₃ 0.27₋₃ 0.08₋₃ 8₋₃ 2₋₃ 0.13₋₃ 0.05₋₃ 4₋₃ -₋₃ … … … … CIVD. R. Congo 1.00₋₁ 0.95₋₁ 0.77₋₁ … … … … 0.88₋₃ 0.75₋₃ … … 1.05₋₁ 0.94₋₁ 0.64₋₄ 0.56₋₃ 0.79₋₁ 0.65₋₁ 44₋₁ 39₋₁ 0.66₋₁ 0.48₋₁ 31₋₁ 31₋₁ 0.38₋₁ 0.25₋₁ 10₋₁ … … … … … CODDjibouti … … … … … … … … … … … 0.85₊₁ 0.96₊₁ 1.03₊₁ … … … … … … … … … … … … … … … … … DJIEquat. Guinea … … … … … … … … … … … 1.02₋₄ 0.99₋₄ … … … … … … … … … … … … … … … … … … GNQEritrea … … … … … … … 0.99₋₁ᵢ 0.82₋₁ᵢ … … 0.99₋₁ 0.86₋₁ 0.91₋₁ 0.71₋₃ … … … … … … … … … … … … … … … … ERIEswatini … … … … … … … 1.02₋₁ᵢ 1.00₋₁ᵢ … … … 0.92₋₁ 0.99₋₃ … … … … … … … … … … … … … … … … … SWZEthiopia 1.03₋₃ 1.12₋₃ 1.18₋₃ … … … … 0.98₋₂ᵢ 0.75₋₂ᵢ … … 0.95₋₄ 0.91₋₄ 0.96₋₄ … 0.50₋₃ 0.33₋₃ 28₋₃ 28₋₃ 0.19₋₃ 0.08₋₃ 3₋₃ 5₋₃ 0.13₋₃ 0.06₋₃ 1₋₃ 2₋₃ … … … … ETHGabon … … … … … … … 1.04₋₁ᵢ 0.97₋₁ᵢ … … … … … … … … … … … … … … … … … … … … … … GABGambia 1.12₋₁ 1.09₋₁ 0.88₋₁ … … … … 0.91₋₄ 0.67₋₄ … … 1.07 1.10 … … 0.63₋₁ 0.55₋₁ 42₋₁ 50₋₁ 0.40₋₁ 0.29₋₁ 18₋₁ 22₋₁ 0.27₋₁ 0.17₋₁ … … … … … … GMBGhana 1.06₋₁ 1.11₋₁ 0.97₋₁ … … … … 0.99₋₁ᵢ 0.89₋₁ᵢ … … 1.02 1.01 1.00 0.85 0.82₋₁ 0.61₋₁ 51₋₁ 54₋₁ 0.60₋₁ 0.29₋₁ 21₋₁ 25₋₁ 0.46₋₁ 0.14₋₁ 10₋₁ 10₋₁ … … … … GHAGuinea 0.75₋₁ 0.61₋₁ 0.51₋₁ … … … … 0.62₋₁ 0.51₋₁ … … … 0.82₋₃ … … 0.40₋₁ 0.20₋₁ 23₋₁ … 0.16₋₁ … … … … … … -₋₃ … … … … GINGuinea-Bissau 0.95 0.94 0.71 … … … … … … … … … … … … 0.48 0.32 … … 0.32 0.18 … … 0.32 0.17 … … … … … … GNBKenya … … … 1.12₋₁ 0.84₋₁ … … 1.01₋₁ᵢ 0.92₋₁ᵢ … … 0.97₋₃ 1.00₋₃ … 0.74₋₂ … … … … … … … … … … … … … … … … KENLesotho 1.25₋₁ 1.39₋₁ 1.28₋₁ … … … … … … … … 1.04₋₃ 0.95₋₂ 1.26₋₂ 1.35₋₁ 0.80₋₁ 0.60₋₁ 40₋₁ 79₋₁ 0.46₋₁ 0.16₋₁ … 19₋₁ 0.41₋₁ … … … … … … … LSOLiberia … … … … … … … 0.70₋₂ᵢ 0.54₋₂ᵢ … … 1.01₋₂ 0.99₋₂ 0.77₋₄ … … … … … … … … … … … … … … … … … LBRMadagascar 1.14₋₁ 1.01₋₁ 0.97₋₁ … … … … 0.99₋₁ᵢ 0.94₋₁ᵢ … … 1.10 1.02 1.04 0.95₋₁ 0.68₋₁ 0.20₋₁ 14₋₁ 21₋₁ 0.38₋₁ 0.04₋₁ 4₋₁ … 0.34₋₁ … … … … … … … MDGMalawi … … … … … … … 1.01₋₄ᵢ 0.79₋₄ᵢ … … 1.01₋₄ 1.03 0.83 … 0.58₋₃ 0.35₋₃ 22₋₃ 29₋₃ 0.31₋₃ 0.11₋₃ 7₋₃ 5₋₃ 0.28₋₃ 0.07₋₃ 4₋₃ 2₋₃ … … … … MWIMali 0.81₋₁ 0.71₋₁ 0.60₋₁ … … … … 0.75₋₁ 0.56₋₁ … … 1.03₋₁ 0.90₋₁ 0.82₋₁ 0.42₋₄ 0.50₋₁ 0.32₋₁ 29₋₁ 21₋₁ 0.30₋₁ 0.14₋₁ … … 0.22₋₁ … … 0.2₋₄ … … … … MLIMauritania 0.86₋₄ 0.73₋₄ 0.57₋₄ … … … … 0.80₋₂ᵢ 0.68₋₂ᵢ … … 1.21₋₄ 1.06 1.05 0.61 0.58₋₄ 0.32₋₄ 34₋₄ 21₋₄ 0.52₋₄ 0.26₋₄ 19₋₄ 24₋₄ 0.35₋₄ 0.13₋₄ 9₋₄ 5₋₄ … … … … MRTMauritius … … … … … … … 1.01₋₁ᵢ 0.96₋₁ᵢ … … 1.00 1.03 1.02 1.29₋₂ … … … … … … … … … … … … … … … … MUSMozambique 0.96₋₄ 0.89₋₄ 0.82₋₄ … … … … 0.85₋₂ 0.69₋₂ … … … 0.93 0.89₋₂ 0.81₋₁ 0.40₋₄ 0.08₋₄ … … 0.23₋₄ 0.03₋₄ … … 0.09₋₄ -₋₄ … … … … … … MOZNamibia 1.05₋₄ 1.14₋₄ 1.13₋₄ … … … … 1.02₋₁ᵢ 1.00₋₁ᵢ … … 1.03₋₁ 0.97₋₁ … 1.49₋₁ 0.92₋₄ 0.86₋₄ … … 0.82₋₄ 0.72₋₄ … … 0.64₋₄ 0.41₋₄ … … … … … … NAMNiger … … … … … … … 0.70₋₁ᵢ 0.61₋₁ᵢ … … 1.06 0.88 0.75₋₂ 0.64 … … … … … … … … … … … … … … … … NERNigeria 1.00₋₁ 0.89₋₁ 0.76₋₁ … … … … 0.84₋₁ᵢ 0.74₋₁ᵢ … … … 0.94₋₃ 0.90₋₃ … 0.65₋₁ 0.28₋₁ 26₋₁ 27₋₁ 0.58₋₁ 0.19₋₁ 21₋₁ 14₋₁ 0.48₋₁ 0.13₋₁ 18₋₁ 6₋₁ … … … … NGARwanda 1.22₋₄ 1.16₋₄ 0.84₋₄ … … … … 1.05₋₁ 0.89₋₁ … … 1.04 0.98 1.12 0.84 0.76₋₄ 0.48₋₄ 26₋₄ 38₋₄ 0.49₋₄ 0.24₋₄ 11₋₄ 12₋₄ 0.30₋₄ 0.08₋₄ 2₋₄ 4₋₄ … … … … RWASao Tome and Principe 1.09 0.98 1.05 … … … … 1.00₋₁ᵢ 0.93₋₁ᵢ … … 1.09₋₃ 0.97₋₂ 1.13₋₂ 1.04₋₄ 0.99 0.81 … … 0.94 0.47 … … 0.89 0.33 … … … … … … STPSenegal … … … … … 1.11₋₄ 0.86₋₄ 0.84₋₂ 0.61₋₂ … … 1.11 1.12 1.12 0.75 0.54 0.35 26 27 0.29 0.12 11 3 0.23 0.07 3 -₋₂ … … 0.28₋₄ 0.36₋₄ SENSeychelles … … … … … … … 1.01₋₁ᵢ 1.01₋₁ᵢ … … 1.02 1.05 1.06 1.55 … … … … … … … … … … … … … … … … SYCSierra Leone 1.03₋₂ 0.89₋₂ 0.60₋₂ … … … … 0.89₋₁ᵢ 0.67₋₁ᵢ … … 1.10 1.03 0.97₋₂ … 0.54₋₂ 0.37₋₂ 31₋₂ 34₋₂ 0.30₋₂ 0.11₋₂ 10₋₂ 7₋₂ 0.16₋₂ 0.03₋₂ 2₋₂ 1₋₂ … … … … SLESomalia 0.81₋₃ 0.79₋₃ 0.54₋₃ … … … … … … … … … … … … 0.67₋₃ … … … 0.59₋₃ … … … 0.10₋₃ … … … … … … … SOMSouth Africa 1.03₋₃ 1.06₋₃ 1.13₋₃ … … … … 1.03₋₂ 0.99₋₂ 0.99₋₂ 0.99₋₂ 1.01₋₁ 0.96₋₁ 1.07₋₁ 1.32₋₁ 0.96₋₃ 0.92₋₃ 88₋₃ 94₋₃ 0.91₋₃ 0.74₋₃ 70₋₃ 74₋₃ 0.61₋₃ 0.26₋₃ 18₋₃ 24₋₃ … … … … ZAFSouth Sudan 0.82₋₂ 1.14₋₂ 1.60₋₂ … … … … 0.98₋₁ᵢ 0.72₋₁ᵢ … … 0.95₋₄ 0.71₋₄ 0.54₋₄ … … … … … … … … … … … … … … … … … SSDTogo 0.92₋₂ 0.71₋₂ 0.38₋₂ … … … … 0.87₋₄ 0.66₋₄ … … 1.03₊₁ 0.97₊₁ 0.73₋₂ 0.53 0.88₋₂ 0.71₋₂ 67₋₂ 55₋₂ 0.60₋₂ 0.33₋₂ 30₋₂ … 0.29₋₂ … … … … … … … TGOUganda 1.07₋₃ 0.87₋₃ 0.79₋₃ 1.01₋₄ 0.85₋₄ … … 1.01₋₁ᵢ 0.86₋₁ᵢ … … 1.04₋₂ 1.03₋₂ … … 0.59₋₃ 0.26₋₃ 20₋₃ 17₋₃ 0.38₋₃ 0.12₋₃ 10₋₃ 4₋₃ 0.34₋₃ 0.07₋₃ 3₋₃ 3₋₃ … … … … UGAUnited Republic of Tanzania 1.09₋₂ 1.11₋₂ 0.67₋₂ … … … … 0.97₋₄ 0.88₋₄ … … 1.00 1.02 1.07 0.66 0.81₋₂ 0.64₋₄ 54₋₄ 67₋₄ 0.32₋₂ 0.12₋₄ 9₋₄ 5₋₄ 0.14₋₂ 0.01₋₄ 0.4₋₄ -₋₄ … … … … TZAZambia 1.03₋₁ 0.89₋₁ 0.82₋₁ … … 1.46₋₄ 1.26₋₄ 0.99₋₁ᵢ 0.92₋₁ᵢ … … 1.07₋₃ 1.02₋₂ … … 0.69₋₁ 0.42₋₁ 38₋₁ 40₋₁ 0.46₋₁ 0.17₋₁ 20₋₁ 12₋₁ 0.27₋₁ … … … … … 0.04₋₄ 0.04₋₄ ZMBZimbabwe 1.06 1.02 0.71 … … … … … … … … … … … 0.84₋₄ 0.88 0.79 75 81 0.51 0.22 20 18 0.21 … … … … … … … ZWE
A N N E X • STATISTICAl TAblES : TAblE 5441
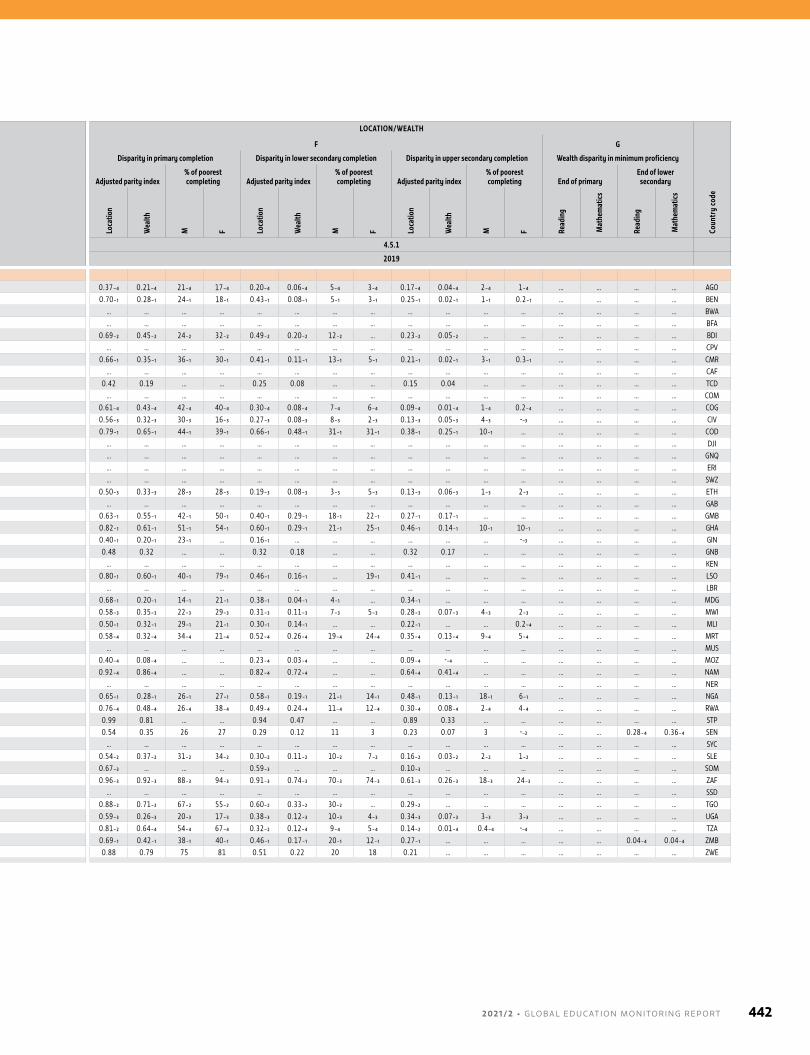
Country or territory
GENDER LOCATION/WEALTH
Coun
try
code
A B C D E F G
GPIA in completion
GPIA in minimum proficiency
GPIA in literacy rate
GPIA in adult proficiency GPIA in gross enrolment ratio
Disparity in primary completion Disparity in lower secondary completion Disparity in upper secondary completion Wealth disparity in minimum proficiency
End of primaryEnd of lower
secondary Adjusted parity index% of poorest completing Adjusted parity index
% of poorest completing Adjusted parity index
% of poorest completing End of primary
End of lower secondary
Prim
ary
Low
er
seco
ndar
y
Uppe
r se
cond
ary
Read
ing
Mat
hem
atics
Read
ing
Mat
hem
atics
Yout
h
Adul
ts
Lite
racy
Num
erac
y
Pre-
prim
ary
Prim
ary
Seco
ndar
y
Tert
iary
Loca
tion
Wea
lth
M F Loca
tion
Wea
lth
M F Loca
tion
Wea
lth
M F Read
ing
Mat
hem
atics
Read
ing
Mat
hem
atics
SDG indicator 4.5.1 4.5.1
Reference year 2019 2019
Sub-Saharan AfricaAngola 0.89₋₄ 0.76₋₄ 0.65₋₄ … … … … … … … … 0.89₋₃ 0.87₋₄ 0.64₋₃ 0.83₋₃ 0.37₋₄ 0.21₋₄ 21₋₄ 17₋₄ 0.20₋₄ 0.06₋₄ 5₋₄ 3₋₄ 0.17₋₄ 0.04₋₄ 2₋₄ 1₋₄ … … … … AGOBenin 0.87₋₁ 0.54₋₁ 0.45₋₁ … … … … 0.74₋₁ᵢ 0.58₋₁ᵢ … … 1.02 0.93 0.76₋₃ 0.47₋₁ 0.70₋₁ 0.28₋₁ 24₋₁ 18₋₁ 0.43₋₁ 0.08₋₁ 5₋₁ 3₋₁ 0.25₋₁ 0.02₋₁ 1₋₁ 0.2₋₁ … … … … BENBotswana … … … … … … … … … … … 1.03₋₄ 0.98₋₄ … 1.32 … … … … … … … … … … … … … … … … BWABurkina Faso … … … … … … … 0.88₋₁ᵢ 0.65₋₁ᵢ … … 1.00 0.99 1.03 0.56 … … … … … … … … … … … … … … … … BFABurundi 1.16₋₂ 0.80₋₂ 0.84₋₂ … … … … 0.94₋₂ 0.80₋₂ … … 1.04 1.01 1.13 0.61₋₁ 0.69₋₂ 0.45₋₂ 24₋₂ 32₋₂ 0.49₋₂ 0.20₋₂ 12₋₂ … 0.23₋₂ 0.05₋₂ … … … … … … BDICabo Verde … … … … … … … 1.01₋₄ 0.89₋₄ … … 1.01₋₁ 0.93₋₁ 1.09₋₁ 1.33₋₁ … … … … … … … … … … … … … … … … CPVCameroon 0.98₋₁ 0.83₋₁ 0.81₋₁ … … … … 0.94₋₁ᵢ 0.87₋₁ᵢ … … 1.02 0.90 0.86₋₃ 0.89₋₁ 0.66₋₁ 0.35₋₁ 36₋₁ 30₋₁ 0.41₋₁ 0.11₋₁ 13₋₁ 5₋₁ 0.21₋₁ 0.02₋₁ 3₋₁ 0.3₋₁ … … … … CMRCentral African Republic … … … … … … … 0.60₋₁ᵢ 0.52₋₁ᵢ … … 1.04₋₂ 0.78₋₃ 0.67₋₂ … … … … … … … … … … … … … … … … … CAFChad 0.76 0.47 0.30 … … … … 0.55₋₃ 0.45₋₃ … … 0.96 0.78 0.53 0.29₋₄ 0.42 0.19 … … 0.25 0.08 … … 0.15 0.04 … … … … … … TCDComoros … … … … … … … 1.00₋₁ᵢ 0.82₋₁ᵢ … … 1.03₋₁ 1.00₋₁ 1.06₋₁ … … … … … … … … … … … … … … … … … COMCongo 1.04₋₄ 0.79₋₄ 0.69₋₄ … … … … 0.92₋₁ᵢ 0.87₋₁ᵢ … … 1.08₋₁ 0.97₋₁ … 0.67₋₂ 0.61₋₄ 0.43₋₄ 42₋₄ 40₋₄ 0.30₋₄ 0.08₋₄ 7₋₄ 6₋₄ 0.09₋₄ 0.01₋₄ 1₋₄ 0.2₋₄ … … … … COGCôte d'Ivoire 0.88₋₃ 0.62₋₃ 0.82₋₃ … … … … 0.83₋₁ᵢ 0.75₋₁ᵢ … … 1.03 0.94 0.79 0.75 0.56₋₃ 0.32₋₃ 30₋₃ 16₋₃ 0.27₋₃ 0.08₋₃ 8₋₃ 2₋₃ 0.13₋₃ 0.05₋₃ 4₋₃ -₋₃ … … … … CIVD. R. Congo 1.00₋₁ 0.95₋₁ 0.77₋₁ … … … … 0.88₋₃ 0.75₋₃ … … 1.05₋₁ 0.94₋₁ 0.64₋₄ 0.56₋₃ 0.79₋₁ 0.65₋₁ 44₋₁ 39₋₁ 0.66₋₁ 0.48₋₁ 31₋₁ 31₋₁ 0.38₋₁ 0.25₋₁ 10₋₁ … … … … … CODDjibouti … … … … … … … … … … … 0.85₊₁ 0.96₊₁ 1.03₊₁ … … … … … … … … … … … … … … … … … DJIEquat. Guinea … … … … … … … … … … … 1.02₋₄ 0.99₋₄ … … … … … … … … … … … … … … … … … … GNQEritrea … … … … … … … 0.99₋₁ᵢ 0.82₋₁ᵢ … … 0.99₋₁ 0.86₋₁ 0.91₋₁ 0.71₋₃ … … … … … … … … … … … … … … … … ERIEswatini … … … … … … … 1.02₋₁ᵢ 1.00₋₁ᵢ … … … 0.92₋₁ 0.99₋₃ … … … … … … … … … … … … … … … … … SWZEthiopia 1.03₋₃ 1.12₋₃ 1.18₋₃ … … … … 0.98₋₂ᵢ 0.75₋₂ᵢ … … 0.95₋₄ 0.91₋₄ 0.96₋₄ … 0.50₋₃ 0.33₋₃ 28₋₃ 28₋₃ 0.19₋₃ 0.08₋₃ 3₋₃ 5₋₃ 0.13₋₃ 0.06₋₃ 1₋₃ 2₋₃ … … … … ETHGabon … … … … … … … 1.04₋₁ᵢ 0.97₋₁ᵢ … … … … … … … … … … … … … … … … … … … … … … GABGambia 1.12₋₁ 1.09₋₁ 0.88₋₁ … … … … 0.91₋₄ 0.67₋₄ … … 1.07 1.10 … … 0.63₋₁ 0.55₋₁ 42₋₁ 50₋₁ 0.40₋₁ 0.29₋₁ 18₋₁ 22₋₁ 0.27₋₁ 0.17₋₁ … … … … … … GMBGhana 1.06₋₁ 1.11₋₁ 0.97₋₁ … … … … 0.99₋₁ᵢ 0.89₋₁ᵢ … … 1.02 1.01 1.00 0.85 0.82₋₁ 0.61₋₁ 51₋₁ 54₋₁ 0.60₋₁ 0.29₋₁ 21₋₁ 25₋₁ 0.46₋₁ 0.14₋₁ 10₋₁ 10₋₁ … … … … GHAGuinea 0.75₋₁ 0.61₋₁ 0.51₋₁ … … … … 0.62₋₁ 0.51₋₁ … … … 0.82₋₃ … … 0.40₋₁ 0.20₋₁ 23₋₁ … 0.16₋₁ … … … … … … -₋₃ … … … … GINGuinea-Bissau 0.95 0.94 0.71 … … … … … … … … … … … … 0.48 0.32 … … 0.32 0.18 … … 0.32 0.17 … … … … … … GNBKenya … … … 1.12₋₁ 0.84₋₁ … … 1.01₋₁ᵢ 0.92₋₁ᵢ … … 0.97₋₃ 1.00₋₃ … 0.74₋₂ … … … … … … … … … … … … … … … … KENLesotho 1.25₋₁ 1.39₋₁ 1.28₋₁ … … … … … … … … 1.04₋₃ 0.95₋₂ 1.26₋₂ 1.35₋₁ 0.80₋₁ 0.60₋₁ 40₋₁ 79₋₁ 0.46₋₁ 0.16₋₁ … 19₋₁ 0.41₋₁ … … … … … … … LSOLiberia … … … … … … … 0.70₋₂ᵢ 0.54₋₂ᵢ … … 1.01₋₂ 0.99₋₂ 0.77₋₄ … … … … … … … … … … … … … … … … … LBRMadagascar 1.14₋₁ 1.01₋₁ 0.97₋₁ … … … … 0.99₋₁ᵢ 0.94₋₁ᵢ … … 1.10 1.02 1.04 0.95₋₁ 0.68₋₁ 0.20₋₁ 14₋₁ 21₋₁ 0.38₋₁ 0.04₋₁ 4₋₁ … 0.34₋₁ … … … … … … … MDGMalawi … … … … … … … 1.01₋₄ᵢ 0.79₋₄ᵢ … … 1.01₋₄ 1.03 0.83 … 0.58₋₃ 0.35₋₃ 22₋₃ 29₋₃ 0.31₋₃ 0.11₋₃ 7₋₃ 5₋₃ 0.28₋₃ 0.07₋₃ 4₋₃ 2₋₃ … … … … MWIMali 0.81₋₁ 0.71₋₁ 0.60₋₁ … … … … 0.75₋₁ 0.56₋₁ … … 1.03₋₁ 0.90₋₁ 0.82₋₁ 0.42₋₄ 0.50₋₁ 0.32₋₁ 29₋₁ 21₋₁ 0.30₋₁ 0.14₋₁ … … 0.22₋₁ … … 0.2₋₄ … … … … MLIMauritania 0.86₋₄ 0.73₋₄ 0.57₋₄ … … … … 0.80₋₂ᵢ 0.68₋₂ᵢ … … 1.21₋₄ 1.06 1.05 0.61 0.58₋₄ 0.32₋₄ 34₋₄ 21₋₄ 0.52₋₄ 0.26₋₄ 19₋₄ 24₋₄ 0.35₋₄ 0.13₋₄ 9₋₄ 5₋₄ … … … … MRTMauritius … … … … … … … 1.01₋₁ᵢ 0.96₋₁ᵢ … … 1.00 1.03 1.02 1.29₋₂ … … … … … … … … … … … … … … … … MUSMozambique 0.96₋₄ 0.89₋₄ 0.82₋₄ … … … … 0.85₋₂ 0.69₋₂ … … … 0.93 0.89₋₂ 0.81₋₁ 0.40₋₄ 0.08₋₄ … … 0.23₋₄ 0.03₋₄ … … 0.09₋₄ -₋₄ … … … … … … MOZNamibia 1.05₋₄ 1.14₋₄ 1.13₋₄ … … … … 1.02₋₁ᵢ 1.00₋₁ᵢ … … 1.03₋₁ 0.97₋₁ … 1.49₋₁ 0.92₋₄ 0.86₋₄ … … 0.82₋₄ 0.72₋₄ … … 0.64₋₄ 0.41₋₄ … … … … … … NAMNiger … … … … … … … 0.70₋₁ᵢ 0.61₋₁ᵢ … … 1.06 0.88 0.75₋₂ 0.64 … … … … … … … … … … … … … … … … NERNigeria 1.00₋₁ 0.89₋₁ 0.76₋₁ … … … … 0.84₋₁ᵢ 0.74₋₁ᵢ … … … 0.94₋₃ 0.90₋₃ … 0.65₋₁ 0.28₋₁ 26₋₁ 27₋₁ 0.58₋₁ 0.19₋₁ 21₋₁ 14₋₁ 0.48₋₁ 0.13₋₁ 18₋₁ 6₋₁ … … … … NGARwanda 1.22₋₄ 1.16₋₄ 0.84₋₄ … … … … 1.05₋₁ 0.89₋₁ … … 1.04 0.98 1.12 0.84 0.76₋₄ 0.48₋₄ 26₋₄ 38₋₄ 0.49₋₄ 0.24₋₄ 11₋₄ 12₋₄ 0.30₋₄ 0.08₋₄ 2₋₄ 4₋₄ … … … … RWASao Tome and Principe 1.09 0.98 1.05 … … … … 1.00₋₁ᵢ 0.93₋₁ᵢ … … 1.09₋₃ 0.97₋₂ 1.13₋₂ 1.04₋₄ 0.99 0.81 … … 0.94 0.47 … … 0.89 0.33 … … … … … … STPSenegal … … … … … 1.11₋₄ 0.86₋₄ 0.84₋₂ 0.61₋₂ … … 1.11 1.12 1.12 0.75 0.54 0.35 26 27 0.29 0.12 11 3 0.23 0.07 3 -₋₂ … … 0.28₋₄ 0.36₋₄ SENSeychelles … … … … … … … 1.01₋₁ᵢ 1.01₋₁ᵢ … … 1.02 1.05 1.06 1.55 … … … … … … … … … … … … … … … … SYCSierra Leone 1.03₋₂ 0.89₋₂ 0.60₋₂ … … … … 0.89₋₁ᵢ 0.67₋₁ᵢ … … 1.10 1.03 0.97₋₂ … 0.54₋₂ 0.37₋₂ 31₋₂ 34₋₂ 0.30₋₂ 0.11₋₂ 10₋₂ 7₋₂ 0.16₋₂ 0.03₋₂ 2₋₂ 1₋₂ … … … … SLESomalia 0.81₋₃ 0.79₋₃ 0.54₋₃ … … … … … … … … … … … … 0.67₋₃ … … … 0.59₋₃ … … … 0.10₋₃ … … … … … … … SOMSouth Africa 1.03₋₃ 1.06₋₃ 1.13₋₃ … … … … 1.03₋₂ 0.99₋₂ 0.99₋₂ 0.99₋₂ 1.01₋₁ 0.96₋₁ 1.07₋₁ 1.32₋₁ 0.96₋₃ 0.92₋₃ 88₋₃ 94₋₃ 0.91₋₃ 0.74₋₃ 70₋₃ 74₋₃ 0.61₋₃ 0.26₋₃ 18₋₃ 24₋₃ … … … … ZAFSouth Sudan 0.82₋₂ 1.14₋₂ 1.60₋₂ … … … … 0.98₋₁ᵢ 0.72₋₁ᵢ … … 0.95₋₄ 0.71₋₄ 0.54₋₄ … … … … … … … … … … … … … … … … … SSDTogo 0.92₋₂ 0.71₋₂ 0.38₋₂ … … … … 0.87₋₄ 0.66₋₄ … … 1.03₊₁ 0.97₊₁ 0.73₋₂ 0.53 0.88₋₂ 0.71₋₂ 67₋₂ 55₋₂ 0.60₋₂ 0.33₋₂ 30₋₂ … 0.29₋₂ … … … … … … … TGOUganda 1.07₋₃ 0.87₋₃ 0.79₋₃ 1.01₋₄ 0.85₋₄ … … 1.01₋₁ᵢ 0.86₋₁ᵢ … … 1.04₋₂ 1.03₋₂ … … 0.59₋₃ 0.26₋₃ 20₋₃ 17₋₃ 0.38₋₃ 0.12₋₃ 10₋₃ 4₋₃ 0.34₋₃ 0.07₋₃ 3₋₃ 3₋₃ … … … … UGAUnited Republic of Tanzania 1.09₋₂ 1.11₋₂ 0.67₋₂ … … … … 0.97₋₄ 0.88₋₄ … … 1.00 1.02 1.07 0.66 0.81₋₂ 0.64₋₄ 54₋₄ 67₋₄ 0.32₋₂ 0.12₋₄ 9₋₄ 5₋₄ 0.14₋₂ 0.01₋₄ 0.4₋₄ -₋₄ … … … … TZAZambia 1.03₋₁ 0.89₋₁ 0.82₋₁ … … 1.46₋₄ 1.26₋₄ 0.99₋₁ᵢ 0.92₋₁ᵢ … … 1.07₋₃ 1.02₋₂ … … 0.69₋₁ 0.42₋₁ 38₋₁ 40₋₁ 0.46₋₁ 0.17₋₁ 20₋₁ 12₋₁ 0.27₋₁ … … … … … 0.04₋₄ 0.04₋₄ ZMBZimbabwe 1.06 1.02 0.71 … … … … … … … … … … … 0.84₋₄ 0.88 0.79 75 81 0.51 0.22 20 18 0.21 … … … … … … … ZWE
2 0 2 1 / 2 • G LO BA L E D U C AT I O N M O N I TO R I N G R E P O RT 442
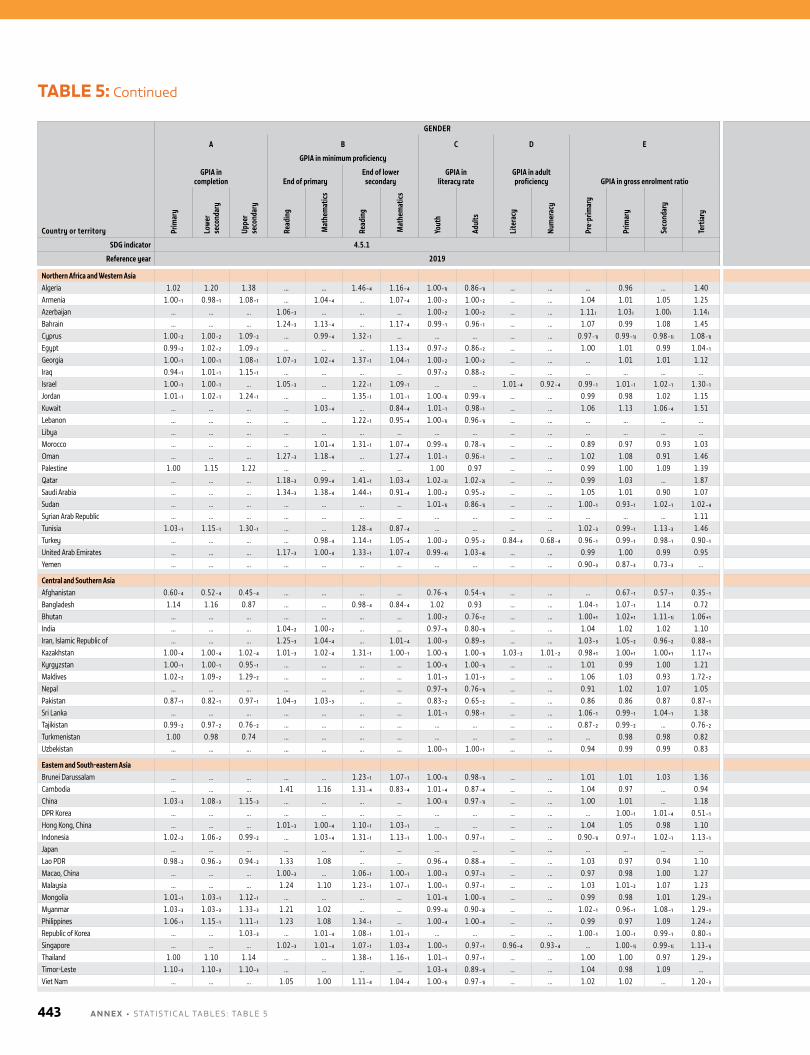
Country or territory
GENDER LOCATION/WEALTH
Coun
try
code
A B C D E F G
GPIA in completion
GPIA in minimum proficiency
GPIA in literacy rate
GPIA in adult proficiency GPIA in gross enrolment ratio
Disparity in primary completion Disparity in lower secondary completion Disparity in upper secondary completion Wealth disparity in minimum proficiency
End of primaryEnd of lower
secondary Adjusted parity index% of poorest completing Adjusted parity index
% of poorest completing Adjusted parity index
% of poorest completing End of primary
End of lower secondary
Prim
ary
Low
er
seco
ndar
y
Uppe
r se
cond
ary
Read
ing
Mat
hem
atics
Read
ing
Mat
hem
atics
Yout
h
Adul
ts
Lite
racy
Num
erac
y
Pre-
prim
ary
Prim
ary
Seco
ndar
y
Tert
iary
Loca
tion
Wea
lth
M F Loca
tion
Wea
lth
M F Loca
tion
Wea
lth
M F Read
ing
Mat
hem
atics
Read
ing
Mat
hem
atics
SDG indicator 4.5.1 4.5.1
Reference year 2019 2019
Northern Africa and Western AsiaAlgeria 1.02 1.20 1.38 … … 1.46₋₄ 1.16₋₄ 1.00₋₁ᵢ 0.86₋₁ᵢ … … … 0.96 … 1.40 0.98 0.92 … … 0.83 0.57 … … 0.69 0.37 … … … … 0.61₋₄ 0.49₋₄ DZAArmenia 1.00₋₁ 0.98₋₁ 1.08₋₁ … 1.04₋₄ … 1.07₋₄ 1.00₋₂ 1.00₋₂ … … 1.04 1.01 1.05 1.25 1.00₋₁ 0.99₋₁ 99₋₃ 99₋₃ 0.98₋₁ 0.98₋₁ 85₋₃ 99₋₃ 0.84₋₁ 0.91₋₁ 45₋₃ 55₋₃ … 0.94₋₄ … 0.99₋₄ ARMAzerbaijan … … … 1.06₋₃ … … … 1.00₋₂ 1.00₋₂ … … 1.11 ᵢ 1.03 ᵢ 1.00 ᵢ 1.14 ᵢ … … … … … … … … … … … … 0.90₋₃ … … … AZEBahrain … … … 1.24₋₃ 1.13₋₄ … 1.17₋₄ 0.99₋₁ 0.96₋₁ … … 1.07 0.99 1.08 1.45 … … … … … … … … … … … … 0.72₋₃ 0.66₋₄ … 0.69₋₄ BHRCyprus 1.00₋₂ 1.00₋₂ 1.09₋₂ … 0.99₋₄ 1.32₋₁ … … … … … 0.97₋₁ᵢ 0.99₋₁ᵢ 0.98₋₁ᵢ 1.08₋₁ᵢ 1.00₋₂ 0.99₋₂ … … 1.01₋₂ 0.99₋₂ … … 0.92₋₂ 0.73₋₂ … … … 0.79₋₄ 0.58₋₁ … CYPEgypt 0.99₋₂ 1.02₋₂ 1.09₋₂ … … … 1.13₋₄ 0.97₋₂ 0.86₋₂ … … 1.00 1.01 0.99 1.04₋₁ 0.99₋₂ 0.92₋₂ … … 0.92₋₂ 0.77₋₂ … … 0.87₋₂ 0.71₋₂ … … … … … 0.66₋₄ EGYGeorgia 1.00₋₁ 1.00₋₁ 1.08₋₁ 1.07₋₃ 1.02₋₄ 1.37₋₁ 1.04₋₁ 1.00₋₂ 1.00₋₂ … … … 1.01 1.01 1.12 1.00₋₁ 1.00₋₁ 100₋₁ 100₋₁ 0.96₋₁ 0.93₋₁ 95₋₁ 91₋₁ 0.84₋₁ 0.69₋₁ 54₋₁ 52₋₁ 0.97₋₃ 0.65₋₄ 0.39₋₁ 0.40₋₁ GEOIraq 0.94₋₁ 1.01₋₁ 1.15₋₁ … … … … 0.97₋₂ 0.88₋₂ … … … … … … 0.87₋₁ 0.58₋₁ 62₋₁ 45₋₁ 0.76₋₁ 0.32₋₁ 26₋₁ 19₋₁ 0.80₋₁ 0.24₋₁ 15₋₁ 11₋₁ … … … … IRQIsrael 1.00₋₁ 1.00₋₁ … 1.05₋₃ … 1.22₋₁ 1.09₋₁ … … 1.01₋₄ 0.92₋₄ 0.99₋₁ 1.01₋₁ 1.02₋₁ 1.30₋₁ 1.00₋₁ 1.00₋₁ … … 1.00₋₁ 0.99₋₁ … … … … … … 0.77₋₃ … 0.57₋₁ 0.53₋₁ ISRJordan 1.01₋₁ 1.02₋₁ 1.24₋₁ … … 1.35₋₁ 1.01₋₁ 1.00₋₁ᵢ 0.99₋₁ᵢ … … 0.99 0.98 1.02 1.15 1.01₋₁ 0.92₋₁ 88₋₁ 93₋₁ 1.02₋₁ 0.66₋₁ 64₋₁ 66₋₁ 0.88₋₁ 0.31₋₁ 20₋₁ 31₋₁ … … 0.60₋₁ 0.52₋₁ JORKuwait … … … … 1.03₋₄ … 0.84₋₄ 1.01₋₁ 0.98₋₁ … … 1.06 1.13 1.06₋₄ 1.51 … … … … … … … … … … … … … 0.36₋₄ … 0.44₋₄ KWTLebanon … … … … … 1.22₋₁ 0.95₋₄ 1.00₋₁ᵢ 0.96₋₁ᵢ … … … … … … … … … … … … … … … … … … … … 0.25₋₁ 0.52₋₄ LBNLibya … … … … … … … … … … … … … … … … … … … … … … … … … … … … … … … LBYMorocco … … … … 1.01₋₄ 1.31₋₁ 1.07₋₄ 0.99₋₁ᵢ 0.78₋₁ᵢ … … 0.89 0.97 0.93 1.03 … … … … … … … … … … … … … 0.32₋₄ 0.33₋₁ 0.27₋₄ MAROman … … … 1.27₋₃ 1.18₋₄ … 1.27₋₄ 1.01₋₁ 0.96₋₁ … … 1.02 1.08 0.91 1.46 … … … … … … … … … … … … 0.79₋₃ 0.95₋₄ … 0.70₋₄ OMNPalestine 1.00 1.15 1.22 … … … … 1.00 0.97 … … 0.99 1.00 1.09 1.39 1.00 0.99 … … 0.97 0.87 … … 0.96 0.74 … … … … … … PSEQatar … … … 1.18₋₃ 0.99₋₄ 1.41₋₁ 1.03₋₄ 1.02₋₂ᵢ 1.02₋₂ᵢ … … 0.99 1.03 … 1.87 … … … … … … … … … … … … 0.86₋₃ 0.85₋₄ 0.46₋₁ 0.76₋₄ QATSaudi Arabia … … … 1.34₋₃ 1.38₋₄ 1.44₋₁ 0.91₋₄ 1.00₋₂ 0.95₋₂ … … 1.05 1.01 0.90 1.07 … … … … … … … … … … … … 0.76₋₃ 0.38₋₄ 0.42₋₁ 0.24₋₄ SAUSudan … … … … … … … 1.01₋₁ᵢ 0.86₋₁ᵢ … … 1.00₋₁ 0.93₋₁ 1.02₋₁ 1.02₋₄ … … … … … … … … … … … … … … … … SDNSyrian Arab Republic … … … … … … … … … … … … … … 1.11 … … … … … … … … … … … … … … … … SYRTunisia 1.03₋₁ 1.15₋₁ 1.30₋₁ … … 1.28₋₄ 0.87₋₄ … … … … 1.02₋₃ 0.99₋₁ 1.13₋₃ 1.46 0.93₋₁ 0.89₋₁ 85₋₁ 92₋₁ 0.72₋₁ 0.55₋₁ 49₋₁ 56₋₁ 0.52₋₁ 0.30₋₁ 17₋₁ 32₋₁ … … 0.34₋₄ 0.31₋₄ TUNTurkey … … … … 0.98₋₄ 1.14₋₁ 1.05₋₄ 1.00₋₂ 0.95₋₂ 0.84₋₄ 0.68₋₄ 0.96₋₁ 0.99₋₁ 0.98₋₁ 0.90₋₁ … … … … … … … … … … … … … 0.63₋₄ 0.71₋₁ 0.52₋₄ TURUnited Arab Emirates … … … 1.17₋₃ 1.00₋₄ 1.33₋₁ 1.07₋₄ 0.99₋₄ᵢ 1.03₋₄ᵢ … … 0.99 1.00 0.99 0.95 … … … … … … … … … … … … 0.80₋₃ 0.51₋₄ 0.48₋₁ 0.58₋₄ AREYemen … … … … … … … … … … … 0.90₋₃ 0.87₋₃ 0.73₋₃ … … … … … … … … … … … … … … … … … YEM
Central and Southern AsiaAfghanistan 0.60₋₄ 0.52₋₄ 0.45₋₄ … … … … 0.76₋₁ᵢ 0.54₋₁ᵢ … … … 0.67₋₁ 0.57₋₁ 0.35₋₁ 0.68₋₄ 0.60₋₄ 56₋₄ 32₋₄ 0.56₋₄ 0.41₋₄ 36₋₄ 13₋₄ 0.46₋₄ 0.29₋₄ 21₋₄ 5₋₄ … … … … AFGBangladesh 1.14 1.16 0.87 … … 0.98₋₄ 0.84₋₄ 1.02 0.93 … … 1.04₋₁ 1.07₋₁ 1.14 0.72 0.99 0.77 62 79 0.95 0.52 38 49 0.78 0.24 16 8 … … … … BGDBhutan … … … … … … … 1.00₋₂ 0.76₋₂ … … 1.00₊₁ 1.02₊₁ 1.11₋₁ᵢ 1.06₊₁ … … … … … … … … … … … … … … … … BTNIndia … … … 1.04₋₂ 1.00₋₂ … … 0.97₋₁ᵢ 0.80₋₁ᵢ … … 1.04 1.02 1.02 1.10 0.97₋₃ 0.82₋₃ 81₋₃ 80₋₃ 0.92₋₃ 0.62₋₃ 62₋₃ 56₋₃ 0.65₋₃ 0.18₋₃ 18₋₃ 9₋₃ … … … … INDIran, Islamic Republic of … … … 1.25₋₃ 1.04₋₄ … 1.01₋₄ 1.00₋₃ 0.89₋₃ … … 1.03₋₃ 1.05₋₂ 0.96₋₂ 0.88₋₁ … … … … … … … … … … … … 0.70₋₃ 0.59₋₄ … 0.34₋₄ IRNKazakhstan 1.00₋₄ 1.00₋₄ 1.02₋₄ 1.01₋₃ 1.02₋₄ 1.31₋₁ 1.00₋₁ 1.00₋₁ᵢ 1.00₋₁ᵢ 1.03₋₂ 1.01₋₂ 0.98₊₁ 1.00₊₁ 1.00₊₁ 1.17₊₁ 1.00₋₄ 1.00₋₄ 100₋₄ 100₋₄ 1.00₋₄ 0.99₋₄ 100₋₄ 99₋₄ 0.96₋₄ 0.90₋₄ 88₋₄ 89₋₄ 1.00₋₃ 0.82₋₄ 0.56₋₁ 0.75₋₁ KAZKyrgyzstan 1.00₋₁ 1.00₋₁ 0.95₋₁ … … … … 1.00₋₁ᵢ 1.00₋₁ᵢ … … 1.01 0.99 1.00 1.21 1.00₋₁ 1.01₋₁ 100₋₁ 100₋₁ 0.99₋₁ 0.97₋₁ 96₋₁ 97₋₁ 0.92₋₁ 0.81₋₁ 74₋₁ 81₋₁ … … … … KGZMaldives 1.02₋₂ 1.09₋₂ 1.29₋₂ … … … … 1.01₋₃ 1.01₋₃ … … 1.06 1.03 0.93 1.72₋₂ 0.98₋₂ 0.98₋₂ 96₋₂ 97₋₂ 0.93₋₂ 0.86₋₂ 75₋₂ 89₋₂ 0.49₋₂ 0.34₋₂ 16₋₂ 22₋₂ … … … … MDVNepal … … … … … … … 0.97₋₁ᵢ 0.76₋₁ᵢ … … 0.91 1.02 1.07 1.05 … 0.86₋₃ 83₋₃ 81₋₃ … 0.62₋₃ 56₋₃ 59₋₃ … … … … … … … … NPLPakistan 0.87₋₁ 0.82₋₁ 0.97₋₁ 1.04₋₃ 1.03₋₃ … … 0.83₋₂ 0.65₋₂ … … 0.86 0.86 0.87 0.87₋₁ 0.68₋₁ 0.31₋₁ 39₋₁ 19₋₁ 0.59₋₁ 0.15₋₁ 22₋₁ 4₋₁ 0.44₋₁ 0.03₋₁ 3₋₁ 1₋₁ 0.72₋₃ 0.72₋₃ … … PAKSri Lanka … … … … … … … 1.01₋₁ 0.98₋₁ … … 1.06₋₁ 0.99₋₁ 1.04₋₁ 1.38 … … … … … … … … … … … … … … … … LKATajikistan 0.99₋₂ 0.97₋₂ 0.76₋₂ … … … … … … … … 0.87₋₂ 0.99₋₂ … 0.76₋₂ 1.00₋₂ 0.99₋₂ 99₋₂ 96₋₂ 0.98₋₂ 0.96₋₂ 95₋₂ 95₋₂ 0.93₋₂ 0.82₋₂ 77₋₂ 55₋₂ … … … … TJKTurkmenistan 1.00 0.98 0.74 … … … … … … … … … 0.98 0.98 0.82 1.00 1.00 98 99 1.04 1.08 98 97 0.30 0.17 86₋₃ 95₋₃ … … … … TKMUzbekistan … … … … … … … 1.00₋₁ 1.00₋₁ … … 0.94 0.99 0.99 0.83 … … … … … … … … … … … … … … … … UZB
Eastern and South-eastern AsiaBrunei Darussalam … … … … … 1.23₋₁ 1.07₋₁ 1.00₋₁ᵢ 0.98₋₁ᵢ … … 1.01 1.01 1.03 1.36 … … … … … … … … … … … … … … 0.40₋₁ 0.47₋₁ BRNCambodia … … … 1.41 1.16 1.31₋₄ 0.83₋₄ 1.01₋₄ 0.87₋₄ … … 1.04 0.97 … 0.94 … … … … … … … … … … … … … … 0.22₋₄ 0.19₋₄ KHMChina 1.03₋₃ 1.08₋₃ 1.15₋₃ … … … … 1.00₋₁ᵢ 0.97₋₁ᵢ … … 1.00 1.01 … 1.18 0.95₋₃ 0.96₋₃ … … 0.88₋₃ 0.89₋₃ … … 0.80₋₃ 0.75₋₃ … … … … … … CHNDPR Korea … … … … … … … … … … … … 1.00₋₁ 1.01₋₄ 0.51₋₁ … … … … … … … … … … … … … … … … PRKHong Kong, China … … … 1.01₋₃ 1.00₋₄ 1.10₋₁ 1.03₋₁ … … … … 1.04 1.05 0.98 1.10 … … … … … … … … … … … … 1.00₋₃ 0.96₋₄ 0.89₋₁ 0.89₋₁ HKGIndonesia 1.02₋₂ 1.06₋₂ 0.99₋₂ … 1.03₋₄ 1.31₋₁ 1.13₋₁ 1.00₋₁ 0.97₋₁ … … 0.90₋₁ᵢ 0.97₋₁ 1.02₋₁ 1.13₋₁ 0.97₋₂ 0.91₋₂ 87₋₂ 94₋₂ 0.89₋₂ 0.68₋₂ 64₋₂ 69₋₂ 0.68₋₂ 0.35₋₂ 31₋₂ 32₋₂ … 0.44₋₄ 0.39₋₁ 0.37₋₁ IDNJapan … … … … … … … … … … … … … … … … … … … … … … … … … … … … … … … JPNLao PDR 0.98₋₂ 0.96₋₂ 0.94₋₂ 1.33 1.08 … … 0.96₋₄ 0.88₋₄ … … 1.03 0.97 0.94 1.10 0.85₋₂ 0.64₋₂ 67₋₂ 58₋₂ 0.56₋₂ 0.19₋₂ 21₋₂ 12₋₂ 0.36₋₂ 0.07₋₂ 5₋₂ 4₋₂ … … … … LAOMacao, China … … … 1.00₋₃ … 1.06₋₁ 1.00₋₁ 1.00₋₃ 0.97₋₃ … … 0.97 0.98 1.00 1.27 … … … … … … … … … … … … 0.99₋₃ … 0.96₋₁ 0.96₋₁ MACMalaysia … … … 1.24 1.10 1.23₋₁ 1.07₋₁ 1.00₋₁ 0.97₋₁ … … 1.03 1.01₋₂ 1.07 1.23 … … … … … … … … … … … … … … 0.45₋₁ 0.48₋₁ MYSMongolia 1.01₋₁ 1.03₋₁ 1.12₋₁ … … … … 1.01₋₁ᵢ 1.00₋₁ᵢ … … 0.99 0.98 1.01 1.29₋₁ 0.99₋₁ 0.97₋₁ 95₋₁ 98₋₁ 0.89₋₁ 0.84₋₁ 79₋₁ 90₋₁ 0.68₋₁ 0.53₋₁ 44₋₁ 61₋₁ … … … … MNGMyanmar 1.03₋₃ 1.03₋₃ 1.33₋₃ 1.21 1.02 … … 0.99₋₃ᵢ 0.90₋₃ᵢ … … 1.02₋₁ 0.96₋₁ 1.08₋₁ 1.29₋₁ 0.91₋₃ 0.70₋₃ 64₋₃ 65₋₃ 0.47₋₃ 0.18₋₃ 18₋₃ 9₋₃ 0.31₋₃ 0.04₋₃ 1₋₃ 2₋₃ … … … … MMRPhilippines 1.06₋₁ 1.15₋₁ 1.11₋₁ 1.23 1.08 1.34₋₁ … 1.00₋₄ 1.00₋₄ … … 0.99 0.97 1.09 1.24₋₂ 0.98₋₁ 0.81₋₁ 71₋₁ 89₋₁ 0.92₋₁ 0.54₋₁ 40₋₁ 68₋₁ 0.89₋₁ 0.51₋₁ 42₋₁ 56₋₁ … … 0.11₋₁ … PHLRepublic of Korea … … 1.03₋₃ … 1.01₋₄ 1.08₋₁ 1.01₋₁ … … … … 1.00₋₁ 1.00₋₁ 0.99₋₁ 0.80₋₁ … … … … … … … … 0.99₋₃ 0.93₋₃ … … … 0.93₋₄ 0.82₋₁ 0.80₋₁ KORSingapore … … … 1.02₋₃ 1.01₋₄ 1.07₋₁ 1.03₋₄ 1.00₋₁ 0.97₋₁ 0.96₋₄ 0.93₋₄ … 1.00₋₁ᵢ 0.99₋₁ᵢ 1.13₋₁ᵢ … … … … … … … … … … … … 0.92₋₃ 0.85₋₄ 0.83₋₁ 0.28₋₄ SGPThailand 1.00 1.10 1.14 … … 1.38₋₁ 1.16₋₁ 1.01₋₁ 0.97₋₁ … … 1.00 1.00 0.97 1.29₋₃ 0.99 1.00 96 99 0.95 0.73 63 74 0.82 0.49 33 49 … … 0.41₋₁ 0.54₋₁ THATimor-Leste 1.10₋₃ 1.10₋₃ 1.10₋₃ … … … … 1.03₋₁ᵢ 0.89₋₁ᵢ … … 1.04 0.98 1.09 … 0.82₋₃ 0.62₋₃ 57₋₃ 63₋₃ 0.63₋₃ 0.37₋₃ 33₋₃ 35₋₃ 0.48₋₃ 0.23₋₃ 18₋₃ 20₋₃ … … … … TLSViet Nam … … … 1.05 1.00 1.11₋₄ 1.04₋₄ 1.00₋₁ᵢ 0.97₋₁ᵢ … … 1.02 1.02 … 1.20₋₃ … … … … … … … … … … … … … … 0.84₋₄ 0.78₋₄ VNM
TABLE 5: Continued
A N N E X • STATISTICAl TAblES : TAblE 5443
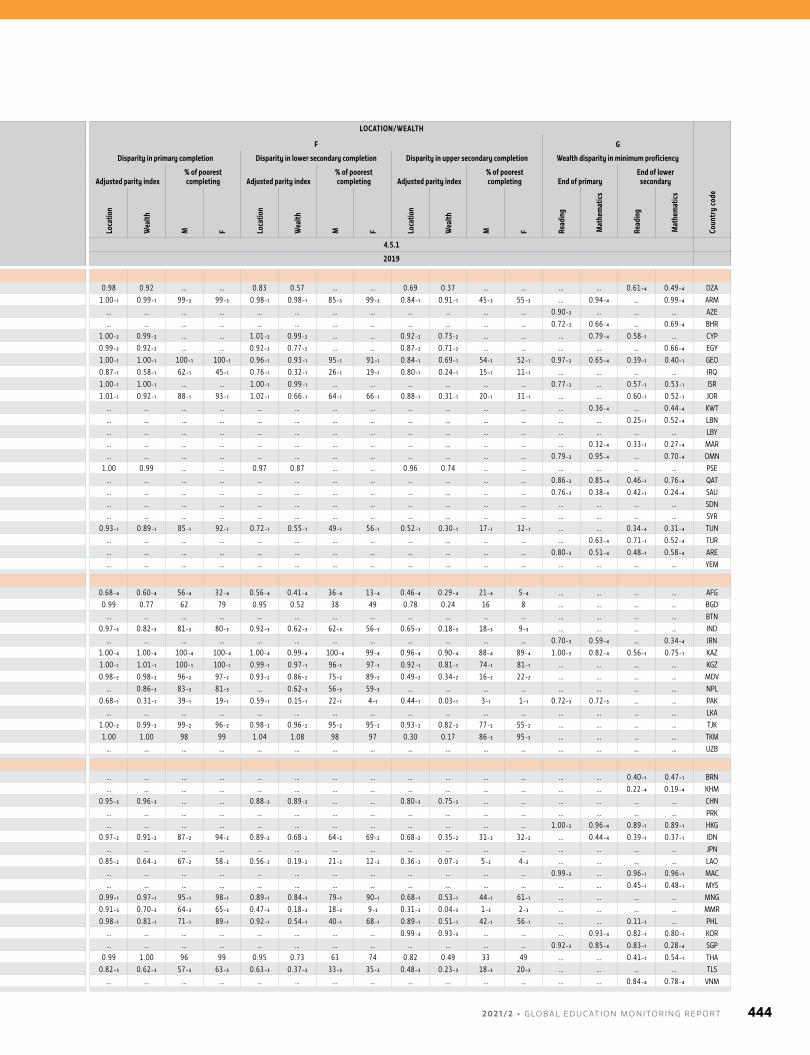
Country or territory
GENDER LOCATION/WEALTH
Coun
try
code
A B C D E F G
GPIA in completion
GPIA in minimum proficiency
GPIA in literacy rate
GPIA in adult proficiency GPIA in gross enrolment ratio
Disparity in primary completion Disparity in lower secondary completion Disparity in upper secondary completion Wealth disparity in minimum proficiency
End of primaryEnd of lower
secondary Adjusted parity index% of poorest completing Adjusted parity index
% of poorest completing Adjusted parity index
% of poorest completing End of primary
End of lower secondary
Prim
ary
Low
er
seco
ndar
y
Uppe
r se
cond
ary
Read
ing
Mat
hem
atics
Read
ing
Mat
hem
atics
Yout
h
Adul
ts
Lite
racy
Num
erac
y
Pre-
prim
ary
Prim
ary
Seco
ndar
y
Tert
iary
Loca
tion
Wea
lth
M F Loca
tion
Wea
lth
M F Loca
tion
Wea
lth
M F Read
ing
Mat
hem
atics
Read
ing
Mat
hem
atics
SDG indicator 4.5.1 4.5.1
Reference year 2019 2019
Northern Africa and Western AsiaAlgeria 1.02 1.20 1.38 … … 1.46₋₄ 1.16₋₄ 1.00₋₁ᵢ 0.86₋₁ᵢ … … … 0.96 … 1.40 0.98 0.92 … … 0.83 0.57 … … 0.69 0.37 … … … … 0.61₋₄ 0.49₋₄ DZAArmenia 1.00₋₁ 0.98₋₁ 1.08₋₁ … 1.04₋₄ … 1.07₋₄ 1.00₋₂ 1.00₋₂ … … 1.04 1.01 1.05 1.25 1.00₋₁ 0.99₋₁ 99₋₃ 99₋₃ 0.98₋₁ 0.98₋₁ 85₋₃ 99₋₃ 0.84₋₁ 0.91₋₁ 45₋₃ 55₋₃ … 0.94₋₄ … 0.99₋₄ ARMAzerbaijan … … … 1.06₋₃ … … … 1.00₋₂ 1.00₋₂ … … 1.11 ᵢ 1.03 ᵢ 1.00 ᵢ 1.14 ᵢ … … … … … … … … … … … … 0.90₋₃ … … … AZEBahrain … … … 1.24₋₃ 1.13₋₄ … 1.17₋₄ 0.99₋₁ 0.96₋₁ … … 1.07 0.99 1.08 1.45 … … … … … … … … … … … … 0.72₋₃ 0.66₋₄ … 0.69₋₄ BHRCyprus 1.00₋₂ 1.00₋₂ 1.09₋₂ … 0.99₋₄ 1.32₋₁ … … … … … 0.97₋₁ᵢ 0.99₋₁ᵢ 0.98₋₁ᵢ 1.08₋₁ᵢ 1.00₋₂ 0.99₋₂ … … 1.01₋₂ 0.99₋₂ … … 0.92₋₂ 0.73₋₂ … … … 0.79₋₄ 0.58₋₁ … CYPEgypt 0.99₋₂ 1.02₋₂ 1.09₋₂ … … … 1.13₋₄ 0.97₋₂ 0.86₋₂ … … 1.00 1.01 0.99 1.04₋₁ 0.99₋₂ 0.92₋₂ … … 0.92₋₂ 0.77₋₂ … … 0.87₋₂ 0.71₋₂ … … … … … 0.66₋₄ EGYGeorgia 1.00₋₁ 1.00₋₁ 1.08₋₁ 1.07₋₃ 1.02₋₄ 1.37₋₁ 1.04₋₁ 1.00₋₂ 1.00₋₂ … … … 1.01 1.01 1.12 1.00₋₁ 1.00₋₁ 100₋₁ 100₋₁ 0.96₋₁ 0.93₋₁ 95₋₁ 91₋₁ 0.84₋₁ 0.69₋₁ 54₋₁ 52₋₁ 0.97₋₃ 0.65₋₄ 0.39₋₁ 0.40₋₁ GEOIraq 0.94₋₁ 1.01₋₁ 1.15₋₁ … … … … 0.97₋₂ 0.88₋₂ … … … … … … 0.87₋₁ 0.58₋₁ 62₋₁ 45₋₁ 0.76₋₁ 0.32₋₁ 26₋₁ 19₋₁ 0.80₋₁ 0.24₋₁ 15₋₁ 11₋₁ … … … … IRQIsrael 1.00₋₁ 1.00₋₁ … 1.05₋₃ … 1.22₋₁ 1.09₋₁ … … 1.01₋₄ 0.92₋₄ 0.99₋₁ 1.01₋₁ 1.02₋₁ 1.30₋₁ 1.00₋₁ 1.00₋₁ … … 1.00₋₁ 0.99₋₁ … … … … … … 0.77₋₃ … 0.57₋₁ 0.53₋₁ ISRJordan 1.01₋₁ 1.02₋₁ 1.24₋₁ … … 1.35₋₁ 1.01₋₁ 1.00₋₁ᵢ 0.99₋₁ᵢ … … 0.99 0.98 1.02 1.15 1.01₋₁ 0.92₋₁ 88₋₁ 93₋₁ 1.02₋₁ 0.66₋₁ 64₋₁ 66₋₁ 0.88₋₁ 0.31₋₁ 20₋₁ 31₋₁ … … 0.60₋₁ 0.52₋₁ JORKuwait … … … … 1.03₋₄ … 0.84₋₄ 1.01₋₁ 0.98₋₁ … … 1.06 1.13 1.06₋₄ 1.51 … … … … … … … … … … … … … 0.36₋₄ … 0.44₋₄ KWTLebanon … … … … … 1.22₋₁ 0.95₋₄ 1.00₋₁ᵢ 0.96₋₁ᵢ … … … … … … … … … … … … … … … … … … … … 0.25₋₁ 0.52₋₄ LBNLibya … … … … … … … … … … … … … … … … … … … … … … … … … … … … … … … LBYMorocco … … … … 1.01₋₄ 1.31₋₁ 1.07₋₄ 0.99₋₁ᵢ 0.78₋₁ᵢ … … 0.89 0.97 0.93 1.03 … … … … … … … … … … … … … 0.32₋₄ 0.33₋₁ 0.27₋₄ MAROman … … … 1.27₋₃ 1.18₋₄ … 1.27₋₄ 1.01₋₁ 0.96₋₁ … … 1.02 1.08 0.91 1.46 … … … … … … … … … … … … 0.79₋₃ 0.95₋₄ … 0.70₋₄ OMNPalestine 1.00 1.15 1.22 … … … … 1.00 0.97 … … 0.99 1.00 1.09 1.39 1.00 0.99 … … 0.97 0.87 … … 0.96 0.74 … … … … … … PSEQatar … … … 1.18₋₃ 0.99₋₄ 1.41₋₁ 1.03₋₄ 1.02₋₂ᵢ 1.02₋₂ᵢ … … 0.99 1.03 … 1.87 … … … … … … … … … … … … 0.86₋₃ 0.85₋₄ 0.46₋₁ 0.76₋₄ QATSaudi Arabia … … … 1.34₋₃ 1.38₋₄ 1.44₋₁ 0.91₋₄ 1.00₋₂ 0.95₋₂ … … 1.05 1.01 0.90 1.07 … … … … … … … … … … … … 0.76₋₃ 0.38₋₄ 0.42₋₁ 0.24₋₄ SAUSudan … … … … … … … 1.01₋₁ᵢ 0.86₋₁ᵢ … … 1.00₋₁ 0.93₋₁ 1.02₋₁ 1.02₋₄ … … … … … … … … … … … … … … … … SDNSyrian Arab Republic … … … … … … … … … … … … … … 1.11 … … … … … … … … … … … … … … … … SYRTunisia 1.03₋₁ 1.15₋₁ 1.30₋₁ … … 1.28₋₄ 0.87₋₄ … … … … 1.02₋₃ 0.99₋₁ 1.13₋₃ 1.46 0.93₋₁ 0.89₋₁ 85₋₁ 92₋₁ 0.72₋₁ 0.55₋₁ 49₋₁ 56₋₁ 0.52₋₁ 0.30₋₁ 17₋₁ 32₋₁ … … 0.34₋₄ 0.31₋₄ TUNTurkey … … … … 0.98₋₄ 1.14₋₁ 1.05₋₄ 1.00₋₂ 0.95₋₂ 0.84₋₄ 0.68₋₄ 0.96₋₁ 0.99₋₁ 0.98₋₁ 0.90₋₁ … … … … … … … … … … … … … 0.63₋₄ 0.71₋₁ 0.52₋₄ TURUnited Arab Emirates … … … 1.17₋₃ 1.00₋₄ 1.33₋₁ 1.07₋₄ 0.99₋₄ᵢ 1.03₋₄ᵢ … … 0.99 1.00 0.99 0.95 … … … … … … … … … … … … 0.80₋₃ 0.51₋₄ 0.48₋₁ 0.58₋₄ AREYemen … … … … … … … … … … … 0.90₋₃ 0.87₋₃ 0.73₋₃ … … … … … … … … … … … … … … … … … YEM
Central and Southern AsiaAfghanistan 0.60₋₄ 0.52₋₄ 0.45₋₄ … … … … 0.76₋₁ᵢ 0.54₋₁ᵢ … … … 0.67₋₁ 0.57₋₁ 0.35₋₁ 0.68₋₄ 0.60₋₄ 56₋₄ 32₋₄ 0.56₋₄ 0.41₋₄ 36₋₄ 13₋₄ 0.46₋₄ 0.29₋₄ 21₋₄ 5₋₄ … … … … AFGBangladesh 1.14 1.16 0.87 … … 0.98₋₄ 0.84₋₄ 1.02 0.93 … … 1.04₋₁ 1.07₋₁ 1.14 0.72 0.99 0.77 62 79 0.95 0.52 38 49 0.78 0.24 16 8 … … … … BGDBhutan … … … … … … … 1.00₋₂ 0.76₋₂ … … 1.00₊₁ 1.02₊₁ 1.11₋₁ᵢ 1.06₊₁ … … … … … … … … … … … … … … … … BTNIndia … … … 1.04₋₂ 1.00₋₂ … … 0.97₋₁ᵢ 0.80₋₁ᵢ … … 1.04 1.02 1.02 1.10 0.97₋₃ 0.82₋₃ 81₋₃ 80₋₃ 0.92₋₃ 0.62₋₃ 62₋₃ 56₋₃ 0.65₋₃ 0.18₋₃ 18₋₃ 9₋₃ … … … … INDIran, Islamic Republic of … … … 1.25₋₃ 1.04₋₄ … 1.01₋₄ 1.00₋₃ 0.89₋₃ … … 1.03₋₃ 1.05₋₂ 0.96₋₂ 0.88₋₁ … … … … … … … … … … … … 0.70₋₃ 0.59₋₄ … 0.34₋₄ IRNKazakhstan 1.00₋₄ 1.00₋₄ 1.02₋₄ 1.01₋₃ 1.02₋₄ 1.31₋₁ 1.00₋₁ 1.00₋₁ᵢ 1.00₋₁ᵢ 1.03₋₂ 1.01₋₂ 0.98₊₁ 1.00₊₁ 1.00₊₁ 1.17₊₁ 1.00₋₄ 1.00₋₄ 100₋₄ 100₋₄ 1.00₋₄ 0.99₋₄ 100₋₄ 99₋₄ 0.96₋₄ 0.90₋₄ 88₋₄ 89₋₄ 1.00₋₃ 0.82₋₄ 0.56₋₁ 0.75₋₁ KAZKyrgyzstan 1.00₋₁ 1.00₋₁ 0.95₋₁ … … … … 1.00₋₁ᵢ 1.00₋₁ᵢ … … 1.01 0.99 1.00 1.21 1.00₋₁ 1.01₋₁ 100₋₁ 100₋₁ 0.99₋₁ 0.97₋₁ 96₋₁ 97₋₁ 0.92₋₁ 0.81₋₁ 74₋₁ 81₋₁ … … … … KGZMaldives 1.02₋₂ 1.09₋₂ 1.29₋₂ … … … … 1.01₋₃ 1.01₋₃ … … 1.06 1.03 0.93 1.72₋₂ 0.98₋₂ 0.98₋₂ 96₋₂ 97₋₂ 0.93₋₂ 0.86₋₂ 75₋₂ 89₋₂ 0.49₋₂ 0.34₋₂ 16₋₂ 22₋₂ … … … … MDVNepal … … … … … … … 0.97₋₁ᵢ 0.76₋₁ᵢ … … 0.91 1.02 1.07 1.05 … 0.86₋₃ 83₋₃ 81₋₃ … 0.62₋₃ 56₋₃ 59₋₃ … … … … … … … … NPLPakistan 0.87₋₁ 0.82₋₁ 0.97₋₁ 1.04₋₃ 1.03₋₃ … … 0.83₋₂ 0.65₋₂ … … 0.86 0.86 0.87 0.87₋₁ 0.68₋₁ 0.31₋₁ 39₋₁ 19₋₁ 0.59₋₁ 0.15₋₁ 22₋₁ 4₋₁ 0.44₋₁ 0.03₋₁ 3₋₁ 1₋₁ 0.72₋₃ 0.72₋₃ … … PAKSri Lanka … … … … … … … 1.01₋₁ 0.98₋₁ … … 1.06₋₁ 0.99₋₁ 1.04₋₁ 1.38 … … … … … … … … … … … … … … … … LKATajikistan 0.99₋₂ 0.97₋₂ 0.76₋₂ … … … … … … … … 0.87₋₂ 0.99₋₂ … 0.76₋₂ 1.00₋₂ 0.99₋₂ 99₋₂ 96₋₂ 0.98₋₂ 0.96₋₂ 95₋₂ 95₋₂ 0.93₋₂ 0.82₋₂ 77₋₂ 55₋₂ … … … … TJKTurkmenistan 1.00 0.98 0.74 … … … … … … … … … 0.98 0.98 0.82 1.00 1.00 98 99 1.04 1.08 98 97 0.30 0.17 86₋₃ 95₋₃ … … … … TKMUzbekistan … … … … … … … 1.00₋₁ 1.00₋₁ … … 0.94 0.99 0.99 0.83 … … … … … … … … … … … … … … … … UZB
Eastern and South-eastern AsiaBrunei Darussalam … … … … … 1.23₋₁ 1.07₋₁ 1.00₋₁ᵢ 0.98₋₁ᵢ … … 1.01 1.01 1.03 1.36 … … … … … … … … … … … … … … 0.40₋₁ 0.47₋₁ BRNCambodia … … … 1.41 1.16 1.31₋₄ 0.83₋₄ 1.01₋₄ 0.87₋₄ … … 1.04 0.97 … 0.94 … … … … … … … … … … … … … … 0.22₋₄ 0.19₋₄ KHMChina 1.03₋₃ 1.08₋₃ 1.15₋₃ … … … … 1.00₋₁ᵢ 0.97₋₁ᵢ … … 1.00 1.01 … 1.18 0.95₋₃ 0.96₋₃ … … 0.88₋₃ 0.89₋₃ … … 0.80₋₃ 0.75₋₃ … … … … … … CHNDPR Korea … … … … … … … … … … … … 1.00₋₁ 1.01₋₄ 0.51₋₁ … … … … … … … … … … … … … … … … PRKHong Kong, China … … … 1.01₋₃ 1.00₋₄ 1.10₋₁ 1.03₋₁ … … … … 1.04 1.05 0.98 1.10 … … … … … … … … … … … … 1.00₋₃ 0.96₋₄ 0.89₋₁ 0.89₋₁ HKGIndonesia 1.02₋₂ 1.06₋₂ 0.99₋₂ … 1.03₋₄ 1.31₋₁ 1.13₋₁ 1.00₋₁ 0.97₋₁ … … 0.90₋₁ᵢ 0.97₋₁ 1.02₋₁ 1.13₋₁ 0.97₋₂ 0.91₋₂ 87₋₂ 94₋₂ 0.89₋₂ 0.68₋₂ 64₋₂ 69₋₂ 0.68₋₂ 0.35₋₂ 31₋₂ 32₋₂ … 0.44₋₄ 0.39₋₁ 0.37₋₁ IDNJapan … … … … … … … … … … … … … … … … … … … … … … … … … … … … … … … JPNLao PDR 0.98₋₂ 0.96₋₂ 0.94₋₂ 1.33 1.08 … … 0.96₋₄ 0.88₋₄ … … 1.03 0.97 0.94 1.10 0.85₋₂ 0.64₋₂ 67₋₂ 58₋₂ 0.56₋₂ 0.19₋₂ 21₋₂ 12₋₂ 0.36₋₂ 0.07₋₂ 5₋₂ 4₋₂ … … … … LAOMacao, China … … … 1.00₋₃ … 1.06₋₁ 1.00₋₁ 1.00₋₃ 0.97₋₃ … … 0.97 0.98 1.00 1.27 … … … … … … … … … … … … 0.99₋₃ … 0.96₋₁ 0.96₋₁ MACMalaysia … … … 1.24 1.10 1.23₋₁ 1.07₋₁ 1.00₋₁ 0.97₋₁ … … 1.03 1.01₋₂ 1.07 1.23 … … … … … … … … … … … … … … 0.45₋₁ 0.48₋₁ MYSMongolia 1.01₋₁ 1.03₋₁ 1.12₋₁ … … … … 1.01₋₁ᵢ 1.00₋₁ᵢ … … 0.99 0.98 1.01 1.29₋₁ 0.99₋₁ 0.97₋₁ 95₋₁ 98₋₁ 0.89₋₁ 0.84₋₁ 79₋₁ 90₋₁ 0.68₋₁ 0.53₋₁ 44₋₁ 61₋₁ … … … … MNGMyanmar 1.03₋₃ 1.03₋₃ 1.33₋₃ 1.21 1.02 … … 0.99₋₃ᵢ 0.90₋₃ᵢ … … 1.02₋₁ 0.96₋₁ 1.08₋₁ 1.29₋₁ 0.91₋₃ 0.70₋₃ 64₋₃ 65₋₃ 0.47₋₃ 0.18₋₃ 18₋₃ 9₋₃ 0.31₋₃ 0.04₋₃ 1₋₃ 2₋₃ … … … … MMRPhilippines 1.06₋₁ 1.15₋₁ 1.11₋₁ 1.23 1.08 1.34₋₁ … 1.00₋₄ 1.00₋₄ … … 0.99 0.97 1.09 1.24₋₂ 0.98₋₁ 0.81₋₁ 71₋₁ 89₋₁ 0.92₋₁ 0.54₋₁ 40₋₁ 68₋₁ 0.89₋₁ 0.51₋₁ 42₋₁ 56₋₁ … … 0.11₋₁ … PHLRepublic of Korea … … 1.03₋₃ … 1.01₋₄ 1.08₋₁ 1.01₋₁ … … … … 1.00₋₁ 1.00₋₁ 0.99₋₁ 0.80₋₁ … … … … … … … … 0.99₋₃ 0.93₋₃ … … … 0.93₋₄ 0.82₋₁ 0.80₋₁ KORSingapore … … … 1.02₋₃ 1.01₋₄ 1.07₋₁ 1.03₋₄ 1.00₋₁ 0.97₋₁ 0.96₋₄ 0.93₋₄ … 1.00₋₁ᵢ 0.99₋₁ᵢ 1.13₋₁ᵢ … … … … … … … … … … … … 0.92₋₃ 0.85₋₄ 0.83₋₁ 0.28₋₄ SGPThailand 1.00 1.10 1.14 … … 1.38₋₁ 1.16₋₁ 1.01₋₁ 0.97₋₁ … … 1.00 1.00 0.97 1.29₋₃ 0.99 1.00 96 99 0.95 0.73 63 74 0.82 0.49 33 49 … … 0.41₋₁ 0.54₋₁ THATimor-Leste 1.10₋₃ 1.10₋₃ 1.10₋₃ … … … … 1.03₋₁ᵢ 0.89₋₁ᵢ … … 1.04 0.98 1.09 … 0.82₋₃ 0.62₋₃ 57₋₃ 63₋₃ 0.63₋₃ 0.37₋₃ 33₋₃ 35₋₃ 0.48₋₃ 0.23₋₃ 18₋₃ 20₋₃ … … … … TLSViet Nam … … … 1.05 1.00 1.11₋₄ 1.04₋₄ 1.00₋₁ᵢ 0.97₋₁ᵢ … … 1.02 1.02 … 1.20₋₃ … … … … … … … … … … … … … … 0.84₋₄ 0.78₋₄ VNM
2 0 2 1 / 2 • G LO BA L E D U C AT I O N M O N I TO R I N G R E P O RT 444
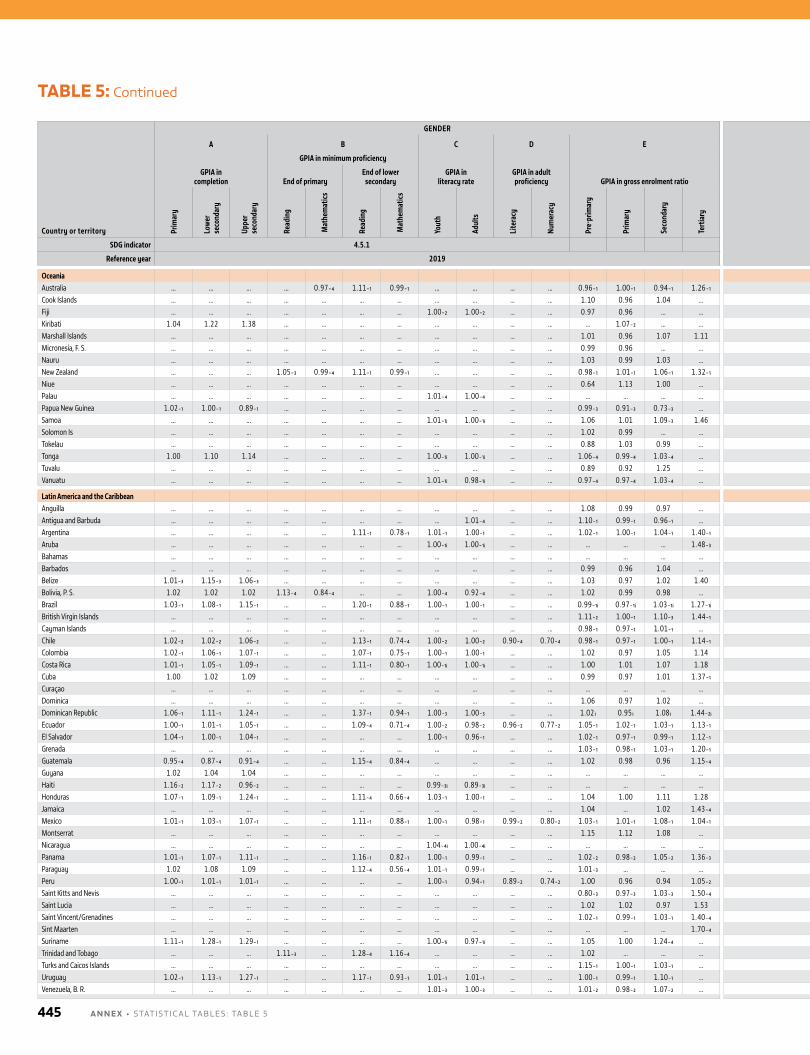
Country or territory
GENDER LOCATION/WEALTH
Coun
try
code
A B C D E F G
GPIA in completion
GPIA in minimum proficiency
GPIA in literacy rate
GPIA in adult proficiency GPIA in gross enrolment ratio
Disparity in primary completion Disparity in lower secondary completion Disparity in upper secondary completion Wealth disparity in minimum proficiency
End of primaryEnd of lower
secondary Adjusted parity index% of poorest completing Adjusted parity index
% of poorest completing Adjusted parity index
% of poorest completing End of primary
End of lower secondary
Prim
ary
Low
er
seco
ndar
y
Uppe
r se
cond
ary
Read
ing
Mat
hem
atics
Read
ing
Mat
hem
atics
Yout
h
Adul
ts
Lite
racy
Num
erac
y
Pre-
prim
ary
Prim
ary
Seco
ndar
y
Tert
iary
Loca
tion
Wea
lth
M F Loca
tion
Wea
lth
M F Loca
tion
Wea
lth
M F Read
ing
Mat
hem
atics
Read
ing
Mat
hem
atics
SDG indicator 4.5.1 4.5.1
Reference year 2019 2019
OceaniaAustralia … … … … 0.97₋₄ 1.11₋₁ 0.99₋₁ … … … … 0.96₋₁ 1.00₋₁ 0.94₋₁ 1.26₋₁ … … … … … … … … … … … … … 0.52₋₄ 0.76₋₁ 0.71₋₁ AUSCook Islands … … … … … … … … … … … 1.10 0.96 1.04 … … … … … … … … … … … … … … … … … COKFiji … … … … … … … 1.00₋₂ 1.00₋₂ … … 0.97 0.96 … … … … … … … … … … … … … … … … … … FJIKiribati 1.04 1.22 1.38 … … … … … … … … … 1.07₋₂ … … 0.97 0.92 85 93 0.85 0.69 52 75 0.28 … … … … … … … KIRMarshall Islands … … … … … … … … … … … 1.01 0.96 1.07 1.11 … … … … … … … … … … … … … … … … MHLMicronesia, F. S. … … … … … … … … … … … 0.99 0.96 … … … … … … … … … … … … … … … … … … FSMNauru … … … … … … … … … … … 1.03 0.99 1.03 … … … … … … … … … … … … … … … … … NRUNew Zealand … … … 1.05₋₃ 0.99₋₄ 1.11₋₁ 0.99₋₁ … … … … 0.98₋₁ 1.01₋₁ 1.06₋₁ 1.32₋₁ … … … … … … … … … … … … 0.83₋₃ 0.41₋₄ 0.75₋₁ 0.70₋₁ NZLNiue … … … … … … … … … … … 0.64 1.13 1.00 … … … … … … … … … … … … … … … … … NIUPalau … … … … … … … 1.01₋₄ 1.00₋₄ … … … … … … … … … … … … … … … … … … … … … … PLWPapua New Guinea 1.02₋₁ 1.00₋₁ 0.89₋₁ … … … … … … … … 0.99₋₃ 0.91₋₃ 0.73₋₃ … 0.74₋₁ 0.45₋₁ 41₋₁ 36₋₁ 0.74₋₁ 0.33₋₁ 31₋₁ 20₋₁ 0.41₋₁ … … … … … … … PNGSamoa … … … … … … … 1.01₋₁ᵢ 1.00₋₁ᵢ … … 1.06 1.01 1.09₋₃ 1.46 … … … … … … … … … … … … … … … … WSMSolomon Is … … … … … … … … … … … 1.02 0.99 … … … … … … … … … … … … … … … … … … SLBTokelau … … … … … … … … … … … 0.88 1.03 0.99 … … … … … … … … … … … … … … … … … TKLTonga 1.00 1.10 1.14 … … … … 1.00₋₁ᵢ 1.00₋₁ᵢ … … 1.06₋₄ 0.99₋₄ 1.03₋₄ … 1.00 1.00 97 97 0.95 0.74 88 86 0.99 0.71 5 23 … … … … TONTuvalu … … … … … … … … … … … 0.89 0.92 1.25 … … … … … … … … … … … … … … … … … TUVVanuatu … … … … … … … 1.01₋₁ᵢ 0.98₋₁ᵢ … … 0.97₋₄ 0.97₋₄ 1.03₋₄ … … … … … … … … … … … … … … … … … VUT
Latin America and the CaribbeanAnguilla … … … … … … … … … … … 1.08 0.99 0.97 … … … … … … … … … … … … … … … … … AIAAntigua and Barbuda … … … … … … … … 1.01₋₄ … … 1.10₋₁ 0.99₋₁ 0.96₋₁ … … … … … … … … … … … … … … … … … ATGArgentina … … … … … 1.11₋₁ 0.78₋₁ 1.01₋₁ 1.00₋₁ … … 1.02₋₁ 1.00₋₁ 1.04₋₁ 1.40₋₁ … … … … … … … … … … … … … … 0.36₋₁ 0.20₋₁ ARGAruba … … … … … … … 1.00₋₁ᵢ 1.00₋₁ᵢ … … … … … 1.48₋₃ … … … … … … … … … … … … … … … … ABWBahamas … … … … … … … … … … … … … … … … … … … … … … … … … … … … … … … BHSBarbados … … … … … … … … … … … 0.99 0.96 1.04 … … … … … … … … … … … … … … … … … BRBBelize 1.01₋₃ 1.15₋₃ 1.06₋₃ … … … … … … … … 1.03 0.97 1.02 1.40 0.99₋₃ 0.92₋₃ 88₋₃ 94₋₃ 0.68₋₃ 0.38₋₃ 23₋₃ 44₋₃ 0.69₋₃ 0.25₋₃ 16₋₃ 21₋₃ … … … … BLZBolivia, P. S. 1.02 1.02 1.02 1.13₋₄ 0.84₋₄ … … 1.00₋₄ 0.92₋₄ … … 1.02 0.99 0.98 … 1.03 0.96 95₋₁ 97₋₁ 1.10 0.90 87₋₁ 88₋₁ 1.40 0.67 59₋₁ 55₋₁ … … … … BOLBrazil 1.03₋₁ 1.08₋₁ 1.15₋₁ … … 1.20₋₁ 0.88₋₁ 1.00₋₁ 1.00₋₁ … … 0.99₋₁ᵢ 0.97₋₁ᵢ 1.03₋₁ᵢ 1.27₋₁ᵢ 0.96₋₁ 0.93₋₁ 89₋₁ 94₋₁ 0.87₋₁ 0.76₋₁ 68₋₁ 80₋₁ 0.68₋₁ 0.46₋₁ 38₋₁ 47₋₁ … … 0.45₋₁ 0.26₋₁ BRABritish Virgin Islands … … … … … … … … … … … 1.11₋₂ 1.00₋₁ 1.10₋₃ 1.44₋₁ … … … … … … … … … … … … … … … … VGBCayman Islands … … … … … … … … … … … 0.98₋₁ 0.97₋₁ 1.01₋₁ … … … … … … … … … … … … … … … … … CYMChile 1.02₋₂ 1.02₋₂ 1.06₋₂ … … 1.13₋₁ 0.74₋₄ 1.00₋₂ 1.00₋₂ 0.90₋₄ 0.70₋₄ 0.98₋₁ 0.97₋₁ 1.00₋₁ 1.14₋₁ 0.99₋₂ 0.95₋₂ 93₋₂ 96₋₂ 0.99₋₂ 0.94₋₂ 91₋₂ 95₋₂ 0.91₋₂ 0.82₋₂ 75₋₂ 79₋₂ … … 0.63₋₁ 0.28₋₄ CHLColombia 1.02₋₁ 1.06₋₁ 1.07₋₁ … … 1.07₋₁ 0.75₋₁ 1.00₋₁ 1.00₋₁ … … 1.02 0.97 1.05 1.14 0.95₋₁ 0.98₋₁ 84₋₁ 91₋₁ 0.79₋₁ 0.76₋₁ 55₋₁ 67₋₁ 0.64₋₁ 0.62₋₁ 49₋₁ 52₋₁ … … 0.44₋₁ 0.34₋₁ COLCosta Rica 1.01₋₁ 1.05₋₁ 1.09₋₁ … … 1.11₋₁ 0.80₋₁ 1.00₋₁ᵢ 1.00₋₁ᵢ … … 1.00 1.01 1.07 1.18 1.00₋₁ 0.96₋₁ 95₋₁ 95₋₁ 0.93₋₁ 0.63₋₁ 48₋₁ 55₋₁ 0.88₋₁ 0.38₋₁ 22₋₁ 29₋₁ … … 0.50₋₁ 0.37₋₁ CRICuba 1.00 1.02 1.09 … … … … … … … … 0.99 0.97 1.01 1.37₋₁ 1.00 1.00 … … 0.96 1.14 … … 0.79 1.49 … … … … … … CUBCuraçao … … … … … … … … … … … … … … … … … … … … … … … … … … … … … … … CUWDominica … … … … … … … … … … … 1.06 0.97 1.02 … … … … … … … … … … … … … … … … … DMADominican Republic 1.06₋₁ 1.11₋₁ 1.24₋₁ … … 1.37₋₁ 0.94₋₁ 1.00₋₃ 1.00₋₃ … … 1.02 ᵢ 0.95 ᵢ 1.08 ᵢ 1.44₋₂ᵢ 0.98₋₁ 0.94₋₁ 88₋₁ 96₋₁ 0.93₋₁ 0.90₋₁ 78₋₁ 86₋₁ 0.72₋₁ 0.56₋₁ 40₋₁ 47₋₁ … … 0.22₋₁ 0.12₋₁ DOMEcuador 1.00₋₁ 1.01₋₁ 1.05₋₁ … … 1.09₋₄ 0.71₋₄ 1.00₋₂ 0.98₋₂ 0.96₋₂ 0.77₋₂ 1.05₋₁ 1.02₋₁ 1.03₋₁ 1.13₋₁ 0.99₋₁ 0.99₋₁ 98₋₁ 98₋₁ 0.92₋₁ 0.86₋₁ 83₋₁ 85₋₁ 0.72₋₁ 0.62₋₁ 55₋₁ 57₋₁ … … 0.41₋₄ 0.27₋₄ ECUEl Salvador 1.04₋₁ 1.00₋₁ 1.04₋₁ … … … … 1.00₋₁ 0.96₋₁ … … 1.02₋₁ 0.97₋₁ 0.99₋₁ 1.12₋₁ 0.92₋₁ 0.86₋₁ 83₋₁ 85₋₁ 0.76₋₁ 0.67₋₁ 64₋₁ 58₋₁ 0.58₋₁ 0.35₋₁ 28₋₁ 32₋₁ … … … … SLVGrenada … … … … … … … … … … … 1.03₋₁ 0.98₋₁ 1.03₋₁ 1.20₋₁ … … … … … … … … … … … … … … … … GRDGuatemala 0.95₋₄ 0.87₋₄ 0.91₋₄ … … 1.15₋₄ 0.84₋₄ … … … … 1.02 0.98 0.96 1.15₋₄ 0.83₋₄ 0.58₋₄ 58₋₄ 54₋₄ 0.55₋₄ 0.17₋₄ 21₋₄ 10₋₄ 0.43₋₄ 0.06₋₄ 7₋₄ 3₋₄ … … 0.25₋₄ 0.10₋₄ GTMGuyana 1.02 1.04 1.04 … … … … … … … … … … … … 0.99 0.97 … … 0.97 0.91 … … 0.97 0.93 … … … … … … GUYHaiti 1.16₋₂ 1.17₋₂ 0.96₋₂ … … … … 0.99₋₃ᵢ 0.89₋₃ᵢ … … … … … … 0.61₋₂ 0.26₋₂ 17₋₂ 24₋₂ 0.46₋₂ 0.12₋₂ 7₋₂ 9₋₂ 0.30₋₂ 0.02₋₂ 1₋₂ 1₋₂ … … … … HTIHonduras 1.07₋₁ 1.09₋₁ 1.24₋₁ … … 1.11₋₄ 0.66₋₄ 1.03₋₁ 1.00₋₁ … … 1.04 1.00 1.11 1.28 0.91₋₁ 0.76₋₁ 73₋₁ 76₋₁ 0.45₋₁ 0.32₋₁ 25₋₁ 29₋₁ 0.39₋₁ 0.20₋₁ 10₋₁ 16₋₁ … … 0.35₋₄ 0.20₋₄ HNDJamaica … … … … … … … … … … … 1.04 … 1.02 1.43₋₄ … … … … … … … … … … … … … … … … JAMMexico 1.01₋₁ 1.03₋₁ 1.07₋₁ … … 1.11₋₁ 0.88₋₁ 1.00₋₁ 0.98₋₁ 0.99₋₂ 0.80₋₂ 1.03₋₁ 1.01₋₁ 1.08₋₁ 1.04₋₁ 0.99₋₁ 0.97₋₁ 94₋₁ 97₋₁ 0.90₋₁ 0.82₋₁ 78₋₁ 78₋₁ 0.67₋₁ 0.47₋₁ 38₋₁ 37₋₁ … … 0.47₋₁ 0.44₋₁ MEXMontserrat … … … … … … … … … … … 1.15 1.12 1.08 … … … … … … … … … … … … … … … … … MSRNicaragua … … … … … … … 1.04₋₄ᵢ 1.00₋₄ᵢ … … … … … … … … … … … … … … … … … … … … … … NICPanama 1.01₋₁ 1.07₋₁ 1.11₋₁ … … 1.16₋₁ 0.82₋₁ 1.00₋₁ 0.99₋₁ … … 1.02₋₂ 0.98₋₂ 1.05₋₂ 1.36₋₃ 0.94₋₁ 0.91₋₁ 89₋₁ 91₋₁ 0.83₋₁ 0.72₋₁ 66₋₁ 75₋₁ 0.70₋₁ 0.45₋₁ 39₋₁ 41₋₁ … … 0.27₋₁ 0.15₋₁ PANParaguay 1.02 1.08 1.09 … … 1.12₋₄ 0.56₋₄ 1.01₋₁ 0.99₋₁ … … 1.01₋₃ … … … 0.97 0.92 86₋₁ 93₋₁ 0.82 0.74 67₋₁ 69₋₁ 0.65 0.48 41₋₁ 36₋₁ … … 0.34₋₄ 0.15₋₄ PRYPeru 1.00₋₁ 1.01₋₁ 1.01₋₁ … … … … 1.00₋₁ 0.94₋₁ 0.89₋₂ 0.74₋₂ 1.00 0.96 0.94 1.05₋₂ 0.97₋₁ 0.95₋₁ 95₋₁ 93₋₁ 0.89₋₁ 0.83₋₁ 82₋₁ 80₋₁ 0.82₋₁ 0.73₋₁ 71₋₁ 69₋₁ … … … … PERSaint Kitts and Nevis … … … … … … … … … … … 0.80₋₃ 0.97₋₃ 1.03₋₃ 1.50₋₄ … … … … … … … … … … … … … … … … KNASaint Lucia … … … … … … … … … … … 1.02 1.02 0.97 1.53 … … … … … … … … … … … … … … … … LCASaint Vincent/Grenadines … … … … … … … … … … … 1.02₋₁ 0.99₋₁ 1.03₋₁ 1.40₋₄ … … … … … … … … … … … … … … … … VCTSint Maarten … … … … … … … … … … … … … … 1.70₋₄ … … … … … … … … … … … … … … … … SXMSuriname 1.11₋₁ 1.28₋₁ 1.29₋₁ … … … … 1.00₋₁ᵢ 0.97₋₁ᵢ … … 1.05 1.00 1.24₋₄ … 0.88₋₁ 0.69₋₁ 60₋₁ 77₋₁ 0.67₋₁ 0.30₋₁ 16₋₁ 32₋₁ 0.49₋₁ … … … … … … … SURTrinidad and Tobago … … … 1.11₋₃ … 1.28₋₄ 1.16₋₄ … … … … 1.02 … … … … … … … … … … … … … … … 0.82₋₃ … 0.60₋₄ 0.51₋₄ TTOTurks and Caicos Islands … … … … … … … … … … … 1.15₋₁ 1.00₋₁ 1.03₋₁ … … … … … … … … … … … … … … … … … TCAUruguay 1.02₋₁ 1.13₋₁ 1.27₋₁ … … 1.17₋₁ 0.93₋₁ 1.01₋₁ 1.01₋₁ … … 1.00₋₁ 0.99₋₁ 1.10₋₁ … 1.01₋₁ 0.98₋₁ 96₋₁ 97₋₁ 0.95₋₁ 0.53₋₁ 46₋₁ 58₋₁ 0.75₋₁ 0.18₋₁ 10₋₁ 17₋₁ … … 0.46₋₁ 0.39₋₁ URYVenezuela, B. R. … … … … … … … 1.01₋₃ 1.00₋₃ … … 1.01₋₂ 0.98₋₂ 1.07₋₂ … … … … … … … … … … … … … … … … … VEN
TABLE 5: Continued
A N N E X • STATISTICAl TAblES : TAblE 5445
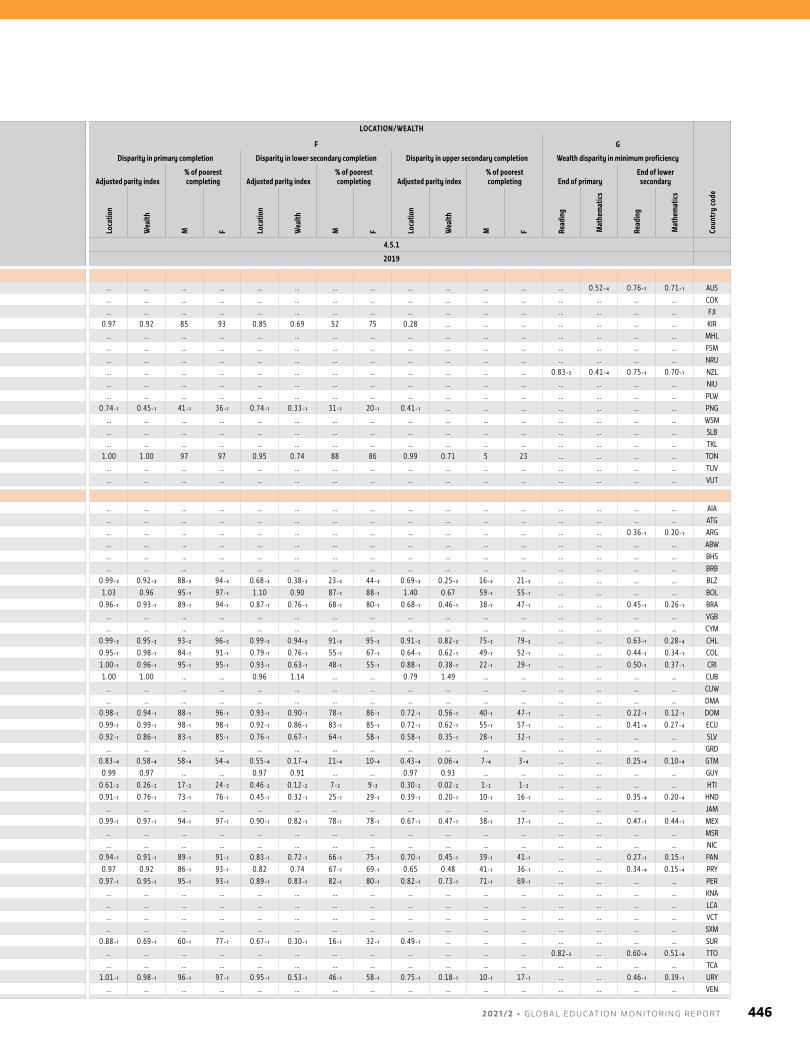
Country or territory
GENDER LOCATION/WEALTH
Coun
try
code
A B C D E F G
GPIA in completion
GPIA in minimum proficiency
GPIA in literacy rate
GPIA in adult proficiency GPIA in gross enrolment ratio
Disparity in primary completion Disparity in lower secondary completion Disparity in upper secondary completion Wealth disparity in minimum proficiency
End of primaryEnd of lower
secondary Adjusted parity index% of poorest completing Adjusted parity index
% of poorest completing Adjusted parity index
% of poorest completing End of primary
End of lower secondary
Prim
ary
Low
er
seco
ndar
y
Uppe
r se
cond
ary
Read
ing
Mat
hem
atics
Read
ing
Mat
hem
atics
Yout
h
Adul
ts
Lite
racy
Num
erac
y
Pre-
prim
ary
Prim
ary
Seco
ndar
y
Tert
iary
Loca
tion
Wea
lth
M F Loca
tion
Wea
lth
M F Loca
tion
Wea
lth
M F Read
ing
Mat
hem
atics
Read
ing
Mat
hem
atics
SDG indicator 4.5.1 4.5.1
Reference year 2019 2019
OceaniaAustralia … … … … 0.97₋₄ 1.11₋₁ 0.99₋₁ … … … … 0.96₋₁ 1.00₋₁ 0.94₋₁ 1.26₋₁ … … … … … … … … … … … … … 0.52₋₄ 0.76₋₁ 0.71₋₁ AUSCook Islands … … … … … … … … … … … 1.10 0.96 1.04 … … … … … … … … … … … … … … … … … COKFiji … … … … … … … 1.00₋₂ 1.00₋₂ … … 0.97 0.96 … … … … … … … … … … … … … … … … … … FJIKiribati 1.04 1.22 1.38 … … … … … … … … … 1.07₋₂ … … 0.97 0.92 85 93 0.85 0.69 52 75 0.28 … … … … … … … KIRMarshall Islands … … … … … … … … … … … 1.01 0.96 1.07 1.11 … … … … … … … … … … … … … … … … MHLMicronesia, F. S. … … … … … … … … … … … 0.99 0.96 … … … … … … … … … … … … … … … … … … FSMNauru … … … … … … … … … … … 1.03 0.99 1.03 … … … … … … … … … … … … … … … … … NRUNew Zealand … … … 1.05₋₃ 0.99₋₄ 1.11₋₁ 0.99₋₁ … … … … 0.98₋₁ 1.01₋₁ 1.06₋₁ 1.32₋₁ … … … … … … … … … … … … 0.83₋₃ 0.41₋₄ 0.75₋₁ 0.70₋₁ NZLNiue … … … … … … … … … … … 0.64 1.13 1.00 … … … … … … … … … … … … … … … … … NIUPalau … … … … … … … 1.01₋₄ 1.00₋₄ … … … … … … … … … … … … … … … … … … … … … … PLWPapua New Guinea 1.02₋₁ 1.00₋₁ 0.89₋₁ … … … … … … … … 0.99₋₃ 0.91₋₃ 0.73₋₃ … 0.74₋₁ 0.45₋₁ 41₋₁ 36₋₁ 0.74₋₁ 0.33₋₁ 31₋₁ 20₋₁ 0.41₋₁ … … … … … … … PNGSamoa … … … … … … … 1.01₋₁ᵢ 1.00₋₁ᵢ … … 1.06 1.01 1.09₋₃ 1.46 … … … … … … … … … … … … … … … … WSMSolomon Is … … … … … … … … … … … 1.02 0.99 … … … … … … … … … … … … … … … … … … SLBTokelau … … … … … … … … … … … 0.88 1.03 0.99 … … … … … … … … … … … … … … … … … TKLTonga 1.00 1.10 1.14 … … … … 1.00₋₁ᵢ 1.00₋₁ᵢ … … 1.06₋₄ 0.99₋₄ 1.03₋₄ … 1.00 1.00 97 97 0.95 0.74 88 86 0.99 0.71 5 23 … … … … TONTuvalu … … … … … … … … … … … 0.89 0.92 1.25 … … … … … … … … … … … … … … … … … TUVVanuatu … … … … … … … 1.01₋₁ᵢ 0.98₋₁ᵢ … … 0.97₋₄ 0.97₋₄ 1.03₋₄ … … … … … … … … … … … … … … … … … VUT
Latin America and the CaribbeanAnguilla … … … … … … … … … … … 1.08 0.99 0.97 … … … … … … … … … … … … … … … … … AIAAntigua and Barbuda … … … … … … … … 1.01₋₄ … … 1.10₋₁ 0.99₋₁ 0.96₋₁ … … … … … … … … … … … … … … … … … ATGArgentina … … … … … 1.11₋₁ 0.78₋₁ 1.01₋₁ 1.00₋₁ … … 1.02₋₁ 1.00₋₁ 1.04₋₁ 1.40₋₁ … … … … … … … … … … … … … … 0.36₋₁ 0.20₋₁ ARGAruba … … … … … … … 1.00₋₁ᵢ 1.00₋₁ᵢ … … … … … 1.48₋₃ … … … … … … … … … … … … … … … … ABWBahamas … … … … … … … … … … … … … … … … … … … … … … … … … … … … … … … BHSBarbados … … … … … … … … … … … 0.99 0.96 1.04 … … … … … … … … … … … … … … … … … BRBBelize 1.01₋₃ 1.15₋₃ 1.06₋₃ … … … … … … … … 1.03 0.97 1.02 1.40 0.99₋₃ 0.92₋₃ 88₋₃ 94₋₃ 0.68₋₃ 0.38₋₃ 23₋₃ 44₋₃ 0.69₋₃ 0.25₋₃ 16₋₃ 21₋₃ … … … … BLZBolivia, P. S. 1.02 1.02 1.02 1.13₋₄ 0.84₋₄ … … 1.00₋₄ 0.92₋₄ … … 1.02 0.99 0.98 … 1.03 0.96 95₋₁ 97₋₁ 1.10 0.90 87₋₁ 88₋₁ 1.40 0.67 59₋₁ 55₋₁ … … … … BOLBrazil 1.03₋₁ 1.08₋₁ 1.15₋₁ … … 1.20₋₁ 0.88₋₁ 1.00₋₁ 1.00₋₁ … … 0.99₋₁ᵢ 0.97₋₁ᵢ 1.03₋₁ᵢ 1.27₋₁ᵢ 0.96₋₁ 0.93₋₁ 89₋₁ 94₋₁ 0.87₋₁ 0.76₋₁ 68₋₁ 80₋₁ 0.68₋₁ 0.46₋₁ 38₋₁ 47₋₁ … … 0.45₋₁ 0.26₋₁ BRABritish Virgin Islands … … … … … … … … … … … 1.11₋₂ 1.00₋₁ 1.10₋₃ 1.44₋₁ … … … … … … … … … … … … … … … … VGBCayman Islands … … … … … … … … … … … 0.98₋₁ 0.97₋₁ 1.01₋₁ … … … … … … … … … … … … … … … … … CYMChile 1.02₋₂ 1.02₋₂ 1.06₋₂ … … 1.13₋₁ 0.74₋₄ 1.00₋₂ 1.00₋₂ 0.90₋₄ 0.70₋₄ 0.98₋₁ 0.97₋₁ 1.00₋₁ 1.14₋₁ 0.99₋₂ 0.95₋₂ 93₋₂ 96₋₂ 0.99₋₂ 0.94₋₂ 91₋₂ 95₋₂ 0.91₋₂ 0.82₋₂ 75₋₂ 79₋₂ … … 0.63₋₁ 0.28₋₄ CHLColombia 1.02₋₁ 1.06₋₁ 1.07₋₁ … … 1.07₋₁ 0.75₋₁ 1.00₋₁ 1.00₋₁ … … 1.02 0.97 1.05 1.14 0.95₋₁ 0.98₋₁ 84₋₁ 91₋₁ 0.79₋₁ 0.76₋₁ 55₋₁ 67₋₁ 0.64₋₁ 0.62₋₁ 49₋₁ 52₋₁ … … 0.44₋₁ 0.34₋₁ COLCosta Rica 1.01₋₁ 1.05₋₁ 1.09₋₁ … … 1.11₋₁ 0.80₋₁ 1.00₋₁ᵢ 1.00₋₁ᵢ … … 1.00 1.01 1.07 1.18 1.00₋₁ 0.96₋₁ 95₋₁ 95₋₁ 0.93₋₁ 0.63₋₁ 48₋₁ 55₋₁ 0.88₋₁ 0.38₋₁ 22₋₁ 29₋₁ … … 0.50₋₁ 0.37₋₁ CRICuba 1.00 1.02 1.09 … … … … … … … … 0.99 0.97 1.01 1.37₋₁ 1.00 1.00 … … 0.96 1.14 … … 0.79 1.49 … … … … … … CUBCuraçao … … … … … … … … … … … … … … … … … … … … … … … … … … … … … … … CUWDominica … … … … … … … … … … … 1.06 0.97 1.02 … … … … … … … … … … … … … … … … … DMADominican Republic 1.06₋₁ 1.11₋₁ 1.24₋₁ … … 1.37₋₁ 0.94₋₁ 1.00₋₃ 1.00₋₃ … … 1.02 ᵢ 0.95 ᵢ 1.08 ᵢ 1.44₋₂ᵢ 0.98₋₁ 0.94₋₁ 88₋₁ 96₋₁ 0.93₋₁ 0.90₋₁ 78₋₁ 86₋₁ 0.72₋₁ 0.56₋₁ 40₋₁ 47₋₁ … … 0.22₋₁ 0.12₋₁ DOMEcuador 1.00₋₁ 1.01₋₁ 1.05₋₁ … … 1.09₋₄ 0.71₋₄ 1.00₋₂ 0.98₋₂ 0.96₋₂ 0.77₋₂ 1.05₋₁ 1.02₋₁ 1.03₋₁ 1.13₋₁ 0.99₋₁ 0.99₋₁ 98₋₁ 98₋₁ 0.92₋₁ 0.86₋₁ 83₋₁ 85₋₁ 0.72₋₁ 0.62₋₁ 55₋₁ 57₋₁ … … 0.41₋₄ 0.27₋₄ ECUEl Salvador 1.04₋₁ 1.00₋₁ 1.04₋₁ … … … … 1.00₋₁ 0.96₋₁ … … 1.02₋₁ 0.97₋₁ 0.99₋₁ 1.12₋₁ 0.92₋₁ 0.86₋₁ 83₋₁ 85₋₁ 0.76₋₁ 0.67₋₁ 64₋₁ 58₋₁ 0.58₋₁ 0.35₋₁ 28₋₁ 32₋₁ … … … … SLVGrenada … … … … … … … … … … … 1.03₋₁ 0.98₋₁ 1.03₋₁ 1.20₋₁ … … … … … … … … … … … … … … … … GRDGuatemala 0.95₋₄ 0.87₋₄ 0.91₋₄ … … 1.15₋₄ 0.84₋₄ … … … … 1.02 0.98 0.96 1.15₋₄ 0.83₋₄ 0.58₋₄ 58₋₄ 54₋₄ 0.55₋₄ 0.17₋₄ 21₋₄ 10₋₄ 0.43₋₄ 0.06₋₄ 7₋₄ 3₋₄ … … 0.25₋₄ 0.10₋₄ GTMGuyana 1.02 1.04 1.04 … … … … … … … … … … … … 0.99 0.97 … … 0.97 0.91 … … 0.97 0.93 … … … … … … GUYHaiti 1.16₋₂ 1.17₋₂ 0.96₋₂ … … … … 0.99₋₃ᵢ 0.89₋₃ᵢ … … … … … … 0.61₋₂ 0.26₋₂ 17₋₂ 24₋₂ 0.46₋₂ 0.12₋₂ 7₋₂ 9₋₂ 0.30₋₂ 0.02₋₂ 1₋₂ 1₋₂ … … … … HTIHonduras 1.07₋₁ 1.09₋₁ 1.24₋₁ … … 1.11₋₄ 0.66₋₄ 1.03₋₁ 1.00₋₁ … … 1.04 1.00 1.11 1.28 0.91₋₁ 0.76₋₁ 73₋₁ 76₋₁ 0.45₋₁ 0.32₋₁ 25₋₁ 29₋₁ 0.39₋₁ 0.20₋₁ 10₋₁ 16₋₁ … … 0.35₋₄ 0.20₋₄ HNDJamaica … … … … … … … … … … … 1.04 … 1.02 1.43₋₄ … … … … … … … … … … … … … … … … JAMMexico 1.01₋₁ 1.03₋₁ 1.07₋₁ … … 1.11₋₁ 0.88₋₁ 1.00₋₁ 0.98₋₁ 0.99₋₂ 0.80₋₂ 1.03₋₁ 1.01₋₁ 1.08₋₁ 1.04₋₁ 0.99₋₁ 0.97₋₁ 94₋₁ 97₋₁ 0.90₋₁ 0.82₋₁ 78₋₁ 78₋₁ 0.67₋₁ 0.47₋₁ 38₋₁ 37₋₁ … … 0.47₋₁ 0.44₋₁ MEXMontserrat … … … … … … … … … … … 1.15 1.12 1.08 … … … … … … … … … … … … … … … … … MSRNicaragua … … … … … … … 1.04₋₄ᵢ 1.00₋₄ᵢ … … … … … … … … … … … … … … … … … … … … … … NICPanama 1.01₋₁ 1.07₋₁ 1.11₋₁ … … 1.16₋₁ 0.82₋₁ 1.00₋₁ 0.99₋₁ … … 1.02₋₂ 0.98₋₂ 1.05₋₂ 1.36₋₃ 0.94₋₁ 0.91₋₁ 89₋₁ 91₋₁ 0.83₋₁ 0.72₋₁ 66₋₁ 75₋₁ 0.70₋₁ 0.45₋₁ 39₋₁ 41₋₁ … … 0.27₋₁ 0.15₋₁ PANParaguay 1.02 1.08 1.09 … … 1.12₋₄ 0.56₋₄ 1.01₋₁ 0.99₋₁ … … 1.01₋₃ … … … 0.97 0.92 86₋₁ 93₋₁ 0.82 0.74 67₋₁ 69₋₁ 0.65 0.48 41₋₁ 36₋₁ … … 0.34₋₄ 0.15₋₄ PRYPeru 1.00₋₁ 1.01₋₁ 1.01₋₁ … … … … 1.00₋₁ 0.94₋₁ 0.89₋₂ 0.74₋₂ 1.00 0.96 0.94 1.05₋₂ 0.97₋₁ 0.95₋₁ 95₋₁ 93₋₁ 0.89₋₁ 0.83₋₁ 82₋₁ 80₋₁ 0.82₋₁ 0.73₋₁ 71₋₁ 69₋₁ … … … … PERSaint Kitts and Nevis … … … … … … … … … … … 0.80₋₃ 0.97₋₃ 1.03₋₃ 1.50₋₄ … … … … … … … … … … … … … … … … KNASaint Lucia … … … … … … … … … … … 1.02 1.02 0.97 1.53 … … … … … … … … … … … … … … … … LCASaint Vincent/Grenadines … … … … … … … … … … … 1.02₋₁ 0.99₋₁ 1.03₋₁ 1.40₋₄ … … … … … … … … … … … … … … … … VCTSint Maarten … … … … … … … … … … … … … … 1.70₋₄ … … … … … … … … … … … … … … … … SXMSuriname 1.11₋₁ 1.28₋₁ 1.29₋₁ … … … … 1.00₋₁ᵢ 0.97₋₁ᵢ … … 1.05 1.00 1.24₋₄ … 0.88₋₁ 0.69₋₁ 60₋₁ 77₋₁ 0.67₋₁ 0.30₋₁ 16₋₁ 32₋₁ 0.49₋₁ … … … … … … … SURTrinidad and Tobago … … … 1.11₋₃ … 1.28₋₄ 1.16₋₄ … … … … 1.02 … … … … … … … … … … … … … … … 0.82₋₃ … 0.60₋₄ 0.51₋₄ TTOTurks and Caicos Islands … … … … … … … … … … … 1.15₋₁ 1.00₋₁ 1.03₋₁ … … … … … … … … … … … … … … … … … TCAUruguay 1.02₋₁ 1.13₋₁ 1.27₋₁ … … 1.17₋₁ 0.93₋₁ 1.01₋₁ 1.01₋₁ … … 1.00₋₁ 0.99₋₁ 1.10₋₁ … 1.01₋₁ 0.98₋₁ 96₋₁ 97₋₁ 0.95₋₁ 0.53₋₁ 46₋₁ 58₋₁ 0.75₋₁ 0.18₋₁ 10₋₁ 17₋₁ … … 0.46₋₁ 0.39₋₁ URYVenezuela, B. R. … … … … … … … 1.01₋₃ 1.00₋₃ … … 1.01₋₂ 0.98₋₂ 1.07₋₂ … … … … … … … … … … … … … … … … … VEN
2 0 2 1 / 2 • G LO BA L E D U C AT I O N M O N I TO R I N G R E P O RT 446
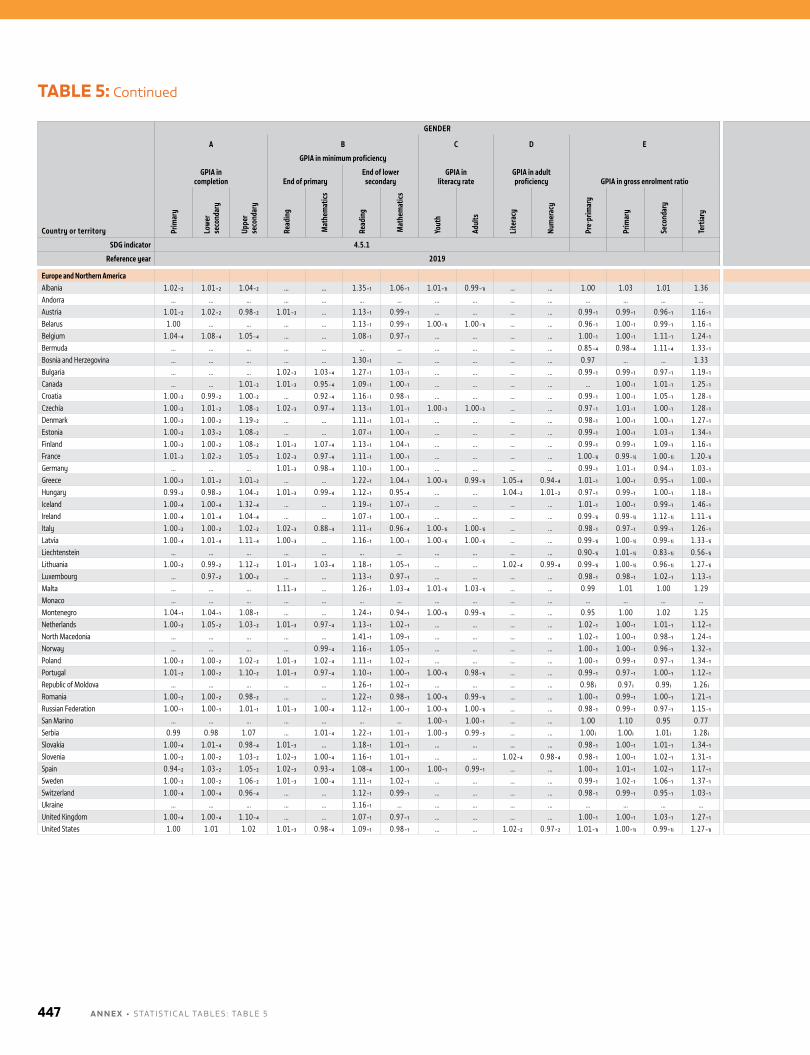
Country or territory
GENDER LOCATION/WEALTH
Coun
try
code
A B C D E F G
GPIA in completion
GPIA in minimum proficiency
GPIA in literacy rate
GPIA in adult proficiency GPIA in gross enrolment ratio
Disparity in primary completion Disparity in lower secondary completion Disparity in upper secondary completion Wealth disparity in minimum proficiency
End of primaryEnd of lower
secondary Adjusted parity index% of poorest completing Adjusted parity index
% of poorest completing Adjusted parity index
% of poorest completing End of primary
End of lower secondary
Prim
ary
Low
er
seco
ndar
y
Uppe
r se
cond
ary
Read
ing
Mat
hem
atics
Read
ing
Mat
hem
atics
Yout
h
Adul
ts
Lite
racy
Num
erac
y
Pre-
prim
ary
Prim
ary
Seco
ndar
y
Tert
iary
Loca
tion
Wea
lth
M F Loca
tion
Wea
lth
M F Loca
tion
Wea
lth
M F Read
ing
Mat
hem
atics
Read
ing
Mat
hem
atics
SDG indicator 4.5.1 4.5.1
Reference year 2019 2019
Europe and Northern AmericaAlbania 1.02₋₂ 1.01₋₂ 1.04₋₂ … … 1.35₋₁ 1.06₋₁ 1.01₋₁ᵢ 0.99₋₁ᵢ … … 1.00 1.03 1.01 1.36 0.97₋₂ 0.94₋₂ 91₋₂ 96₋₂ 0.99₋₂ 0.88₋₂ 89₋₂ 86₋₂ 0.85₋₂ 0.62₋₂ 60₋₂ 60₋₂ … … 0.51₋₁ 0.75₋₁ ALBAndorra … … … … … … … … … … … … … … … … … … … … … … … … … … … … … … … ANDAustria 1.01₋₂ 1.02₋₂ 0.98₋₂ 1.01₋₃ … 1.13₋₁ 0.99₋₁ … … … … 0.99₋₁ 0.99₋₁ 0.96₋₁ 1.16₋₁ 1.00₋₂ … … … 0.99₋₂ 0.85₋₂ … … 1.11₋₂ 0.75₋₂ … … 0.92₋₃ … 0.70₋₁ 0.70₋₁ AUTBelarus 1.00 … … … … 1.13₋₁ 0.99₋₁ 1.00₋₁ᵢ 1.00₋₁ᵢ … … 0.96₋₁ 1.00₋₁ 0.99₋₁ 1.16₋₁ 1.00 1.00 … … … … … … … … … … … … 0.61₋₁ 0.54₋₁ BLRBelgium 1.04₋₄ 1.08₋₄ 1.05₋₄ … … 1.08₋₁ 0.97₋₁ … … … … 1.00₋₁ 1.00₋₁ 1.11₋₁ 1.24₋₁ … … … … 0.94₋₄ 0.93₋₄ … … 0.94₋₄ 0.84₋₄ … … … … 0.68₋₁ 0.67₋₁ BELBermuda … … … … … … … … … … … 0.85₋₄ 0.98₋₄ 1.11₋₄ 1.33₋₁ … … … … … … … … … … … … … … … … BMUBosnia and Herzegovina … … … … … 1.30₋₁ … … … … … 0.97 … … 1.33 … … … … … … … … … … … … … … 0.50₋₁ … BIHBulgaria … … … 1.02₋₃ 1.03₋₄ 1.27₋₁ 1.03₋₁ … … … … 0.99₋₁ 0.99₋₁ 0.97₋₁ 1.19₋₁ … … … … … … … … … … … … 0.91₋₃ 0.70₋₄ 0.40₋₁ 0.45₋₁ BGRCanada … … 1.01₋₂ 1.01₋₃ 0.95₋₄ 1.09₋₁ 1.00₋₁ … … … … … 1.00₋₁ 1.01₋₁ 1.25₋₁ … … … … … … … … 0.95₋₂ 0.94₋₂ … … 0.89₋₃ 0.70₋₄ 0.85₋₁ 0.81₋₁ CANCroatia 1.00₋₂ 0.99₋₂ 1.00₋₂ … 0.92₋₄ 1.16₋₁ 0.98₋₁ … … … … 0.99₋₁ 1.00₋₁ 1.05₋₁ 1.28₋₁ 1.01₋₂ 1.00₋₂ … … 1.01₋₂ 1.00₋₂ … … 0.98₋₂ 0.90₋₂ … … … 0.83₋₄ 0.80₋₁ 0.68₋₁ HRVCzechia 1.00₋₂ 1.01₋₂ 1.08₋₂ 1.02₋₃ 0.97₋₄ 1.13₋₁ 1.01₋₁ 1.00₋₃ 1.00₋₃ … … 0.97₋₁ 1.01₋₁ 1.00₋₁ 1.28₋₁ 1.01₋₂ 0.98₋₂ … … 1.01₋₂ 0.96₋₂ … … 1.00₋₂ 0.81₋₂ … … 0.86₋₃ 0.69₋₄ 0.68₋₁ 0.66₋₁ CZEDenmark 1.00₋₂ 1.00₋₂ 1.19₋₂ … … 1.11₋₁ 1.01₋₁ … … … … 0.98₋₁ 1.00₋₁ 1.00₋₁ 1.27₋₁ 1.00₋₂ 0.99₋₂ … … 1.01₋₂ 0.98₋₂ … … 0.86₋₂ 1.11₋₂ … … … … 0.78₋₁ 0.80₋₁ DNKEstonia 1.00₋₂ 1.03₋₂ 1.08₋₂ … … 1.07₋₁ 1.00₋₁ … … … … 0.99₋₁ 1.00₋₁ 1.03₋₁ 1.34₋₁ 1.00₋₂ 1.00₋₂ … … 0.98₋₂ 1.02₋₂ … … 0.97₋₂ 1.07₋₂ … … … … 0.90₋₁ 0.88₋₁ ESTFinland 1.00₋₂ 1.00₋₂ 1.08₋₂ 1.01₋₃ 1.07₋₄ 1.13₋₁ 1.04₋₁ … … … … 0.99₋₁ 0.99₋₁ 1.09₋₁ 1.16₋₁ 1.00₋₂ 1.00₋₂ … … 1.00₋₂ 1.00₋₂ … … 0.84₋₂ 1.03₋₂ … … 0.98₋₃ 1.03₋₄ 0.85₋₁ 0.80₋₁ FINFrance 1.01₋₂ 1.02₋₂ 1.05₋₂ 1.02₋₃ 0.97₋₄ 1.11₋₁ 1.00₋₁ … … … … 1.00₋₁ᵢ 0.99₋₁ᵢ 1.00₋₁ᵢ 1.20₋₁ᵢ 1.00₋₂ 0.98₋₂ … … 1.01₋₂ 0.96₋₂ … … 1.02₋₂ 0.80₋₂ … … 0.92₋₃ 0.52₋₄ 0.70₋₁ 0.64₋₁ FRAGermany … … … 1.01₋₃ 0.98₋₄ 1.10₋₁ 1.00₋₁ … … … … 0.99₋₁ 1.01₋₁ 0.94₋₁ 1.03₋₁ … … … … … … … … … … … … 0.82₋₃ 0.68₋₄ 0.70₋₁ 0.68₋₁ DEUGreece 1.00₋₂ 1.01₋₂ 1.01₋₂ … … 1.22₋₁ 1.04₋₁ 1.00₋₁ᵢ 0.99₋₁ᵢ 1.05₋₄ 0.94₋₄ 1.01₋₁ 1.00₋₁ 0.95₋₁ 1.00₋₁ 1.00₋₂ 1.00₋₂ … … 1.01₋₂ 0.97₋₂ … … 0.94₋₂ 0.96₋₂ … … … … 0.63₋₁ 0.57₋₁ GRCHungary 0.99₋₂ 0.98₋₂ 1.04₋₂ 1.01₋₃ 0.99₋₄ 1.12₋₁ 0.95₋₄ … … 1.04₋₂ 1.01₋₂ 0.97₋₁ 0.99₋₁ 1.00₋₁ 1.18₋₁ 1.01₋₂ 1.00₋₂ … … 1.02₋₂ 0.99₋₂ … … 0.92₋₂ 0.95₋₂ … … 0.94₋₃ 0.60₋₄ 0.58₋₁ 0.53₋₄ HUNIceland 1.00₋₄ 1.00₋₄ 1.32₋₄ … … 1.19₋₁ 1.07₋₁ … … … … 1.01₋₁ 1.00₋₁ 0.99₋₁ 1.46₋₁ 1.00₋₄ 1.00₋₄ … … 1.00₋₄ 1.00₋₄ … … 0.65₋₄ 0.86₋₄ … … … … 0.73₋₁ 0.76₋₁ ISLIreland 1.00₋₄ 1.01₋₄ 1.04₋₄ … … 1.07₋₁ 1.00₋₁ … … … … 0.99₋₁ᵢ 0.99₋₁ᵢ 1.12₋₁ᵢ 1.11₋₁ᵢ 1.00₋₄ 1.00₋₄ … … 1.01₋₄ 1.00₋₄ … … 1.05₋₄ 0.94₋₄ … … … … 0.84₋₁ 0.78₋₁ IRLItaly 1.00₋₂ 1.00₋₂ 1.02₋₂ 1.02₋₃ 0.88₋₄ 1.11₋₁ 0.96₋₄ 1.00₋₁ᵢ 1.00₋₁ᵢ … … 0.98₋₁ 0.97₋₁ 0.99₋₁ 1.26₋₁ 1.00₋₂ 1.00₋₂ … … 1.00₋₂ 1.00₋₂ … … 1.01₋₂ 0.76₋₂ … … 0.98₋₃ 0.76₋₄ 0.72₋₁ 0.64₋₄ ITALatvia 1.00₋₄ 1.01₋₄ 1.11₋₄ 1.00₋₃ … 1.16₋₁ 1.00₋₁ 1.00₋₁ᵢ 1.00₋₁ᵢ … … 0.99₋₁ᵢ 1.00₋₁ᵢ 0.99₋₁ᵢ 1.33₋₁ᵢ 1.00₋₄ 1.00₋₄ … … 1.01₋₄ 0.99₋₄ … … 0.94₋₄ 0.59₋₄ … … 0.98₋₃ … 0.78₋₁ 0.78₋₁ LVALiechtenstein … … … … … … … … … … … 0.90₋₁ᵢ 1.01₋₁ᵢ 0.83₋₁ᵢ 0.56₋₁ᵢ … … … … … … … … … … … … … … … … LIELithuania 1.00₋₂ 0.99₋₂ 1.12₋₂ 1.01₋₃ 1.03₋₄ 1.18₋₁ 1.05₋₁ … … 1.02₋₄ 0.99₋₄ 0.99₋₁ᵢ 1.00₋₁ᵢ 0.96₋₁ᵢ 1.27₋₁ᵢ 0.98₋₂ 0.99₋₂ … … 0.96₋₂ 0.98₋₂ … … 0.83₋₂ … … … 0.91₋₃ 0.79₋₄ 0.68₋₁ 0.65₋₁ LTULuxembourg … 0.97₋₂ 1.00₋₂ … … 1.13₋₁ 0.97₋₁ … … … … 0.98₋₁ 0.98₋₁ 1.02₋₁ 1.13₋₁ … … … … 1.04₋₂ 0.90₋₂ … … 1.10₋₂ 0.75₋₂ … … … … 0.58₋₁ 0.59₋₁ LUXMalta … … … 1.11₋₃ … 1.26₋₁ 1.03₋₄ 1.01₋₁ᵢ 1.03₋₁ᵢ … … 0.99 1.01 1.00 1.29 … … … … … … … … … … … … 0.93₋₃ … 0.64₋₁ … MLTMonaco … … … … … … … … … … … … … … … … … … … … … … … … … … … … … … … MCOMontenegro 1.04₋₁ 1.04₋₁ 1.08₋₁ … … 1.24₋₁ 0.94₋₁ 1.00₋₁ᵢ 0.99₋₁ᵢ … … 0.95 1.00 1.02 1.25 1.02₋₁ 0.89₋₁ 84₋₁ 94₋₁ 1.03₋₁ 0.78₋₁ 70₋₁ 86₋₁ 1.00₋₁ 0.54₋₁ 52₋₁ 58₋₁ … … 0.63₋₁ 0.60₋₁ MNENetherlands 1.00₋₂ 1.05₋₂ 1.03₋₂ 1.01₋₃ 0.97₋₄ 1.13₋₁ 1.02₋₁ … … … … 1.02₋₁ 1.00₋₁ 1.01₋₁ 1.12₋₁ … … … … … 0.93₋₂ … … … 1.02₋₂ … … 0.92₋₃ 0.94₋₄ 0.73₋₁ 0.78₋₁ NLDNorth Macedonia … … … … … 1.41₋₁ 1.09₋₁ … … … … 1.02₋₁ 1.00₋₁ 0.98₋₁ 1.24₋₁ 1.02 0.97 97 98 1.03 0.84 79 88 1.02 0.56 63 49 … … 0.45₋₁ 0.39₋₁ MKDNorway … … … … 0.99₋₄ 1.16₋₁ 1.05₋₁ … … … … 1.00₋₁ 1.00₋₁ 0.96₋₁ 1.32₋₁ … … … … … … … … … … … … … 0.79₋₄ 0.81₋₁ 0.78₋₁ NORPoland 1.00₋₂ 1.00₋₂ 1.02₋₂ 1.01₋₃ 1.02₋₄ 1.11₋₁ 1.02₋₁ … … … … 1.00₋₁ 0.99₋₁ 0.97₋₁ 1.34₋₁ 1.00₋₂ 1.00₋₂ … … 0.98₋₂ 0.97₋₂ … … 0.97₋₂ 1.02₋₂ … … 0.96₋₃ 0.81₋₄ 0.81₋₁ 0.78₋₁ POLPortugal 1.01₋₂ 1.00₋₂ 1.10₋₂ 1.01₋₃ 0.97₋₄ 1.10₋₁ 1.00₋₁ 1.00₋₁ᵢ 0.98₋₁ᵢ … … 0.99₋₁ 0.97₋₁ 1.00₋₁ 1.12₋₁ 1.01₋₂ 1.00₋₂ … … 1.00₋₂ 0.86₋₂ … … 0.93₋₂ 0.79₋₂ … … 0.97₋₃ 0.85₋₄ 0.71₋₁ 0.65₋₁ PRTRepublic of Moldova … … … … … 1.26₋₁ 1.02₋₁ … … … … 0.98 ᵢ 0.97 ᵢ 0.99 ᵢ 1.26 ᵢ … … … … … … … … … … … … … … 0.44₋₁ 0.38₋₁ MDARomania 1.00₋₂ 1.00₋₂ 0.98₋₂ … … 1.22₋₁ 0.98₋₁ 1.00₋₁ᵢ 0.99₋₁ᵢ … … 1.00₋₁ 0.99₋₁ 1.00₋₁ 1.21₋₁ 0.99₋₂ 0.98₋₂ … … 0.98₋₂ 0.96₋₂ … … 0.83₋₂ 0.63₋₂ … … … … 0.47₋₁ 0.40₋₁ ROURussian Federation 1.00₋₁ 1.00₋₁ 1.01₋₁ 1.01₋₃ 1.00₋₄ 1.12₋₁ 1.00₋₁ 1.00₋₁ᵢ 1.00₋₁ᵢ … … 0.98₋₁ 0.99₋₁ 0.97₋₁ 1.15₋₁ 1.00₋₁ … … … 1.00₋₁ … … … 0.98₋₁ 1.00₋₁ … … 0.99₋₃ 0.96₋₄ 0.79₋₁ 0.76₋₁ RUSSan Marino … … … … … … … 1.00₋₁ 1.00₋₁ … … 1.00 1.10 0.95 0.77 … … … … … … … … … … … … … … … … SMRSerbia 0.99 0.98 1.07 … 1.01₋₄ 1.22₋₁ 1.01₋₁ 1.00₋₃ 0.99₋₃ … … 1.00 ᵢ 1.00 ᵢ 1.01 ᵢ 1.28 ᵢ … 0.97 100 93 … 0.93 95 92 … 0.64 63 59 … 0.89₋₄ 0.62₋₁ 0.60₋₁ SRBSlovakia 1.00₋₄ 1.01₋₄ 0.98₋₄ 1.01₋₃ … 1.18₋₁ 1.01₋₁ … … … … 0.98₋₁ 1.00₋₁ 1.01₋₁ 1.34₋₁ 1.00₋₄ 0.98₋₄ … … 1.00₋₄ 0.97₋₄ … … 1.02₋₄ 0.77₋₄ … … 0.59₋₃ … 0.56₋₁ 0.57₋₁ SVKSlovenia 1.00₋₂ 1.00₋₂ 1.03₋₂ 1.02₋₃ 1.00₋₄ 1.16₋₁ 1.01₋₁ … … 1.02₋₄ 0.98₋₄ 0.98₋₁ 1.00₋₁ 1.02₋₁ 1.31₋₁ … 1.00₋₂ … … … 1.00₋₂ … … … 0.90₋₂ … … 0.99₋₃ 0.99₋₄ 0.79₋₁ 0.77₋₁ SVNSpain 0.94₋₂ 1.03₋₂ 1.05₋₂ 1.02₋₃ 0.93₋₄ 1.08₋₄ 1.00₋₁ 1.00₋₁ 0.99₋₁ … … 1.00₋₁ 1.01₋₁ 1.02₋₁ 1.17₋₁ … … … … 0.97₋₂ 0.88₋₂ … … 0.83₋₂ 0.51₋₂ … … 0.96₋₃ 0.57₋₄ 0.77₋₄ 0.68₋₁ ESPSweden 1.00₋₂ 1.00₋₂ 1.06₋₂ 1.01₋₃ 1.00₋₄ 1.11₋₁ 1.02₋₁ … … … … 0.99₋₁ 1.02₋₁ 1.06₋₁ 1.37₋₁ 1.00₋₂ 1.00₋₂ … … 1.00₋₂ 1.00₋₂ … … 1.04₋₂ 0.96₋₂ … … 0.93₋₃ 0.63₋₄ 0.77₋₁ 0.73₋₁ SWESwitzerland 1.00₋₄ 1.00₋₄ 0.96₋₄ … … 1.12₋₁ 0.99₋₁ … … … … 0.98₋₁ 0.99₋₁ 0.95₋₁ 1.03₋₁ 1.00₋₄ 1.00₋₄ … … 1.01₋₄ 1.00₋₄ … … 1.11₋₄ 0.93₋₄ … … … … 0.68₋₁ 0.76₋₁ CHEUkraine … … … … … 1.16₋₁ … … … … … … … … … … … … … … … … … … … … … … … 0.63₋₁ … UKRUnited Kingdom 1.00₋₄ 1.00₋₄ 1.10₋₄ … … 1.07₋₁ 0.97₋₁ … … … … 1.00₋₁ 1.00₋₁ 1.03₋₁ 1.27₋₁ 1.00₋₄ 1.00₋₄ … … 1.00₋₄ 1.00₋₄ … … 1.02₋₄ 0.90₋₄ … … … … 0.81₋₁ 0.76₋₁ GBRUnited States 1.00 1.01 1.02 1.01₋₃ 0.98₋₄ 1.09₋₁ 0.98₋₁ … … 1.02₋₂ 0.97₋₂ 1.01₋₁ᵢ 1.00₋₁ᵢ 0.99₋₁ᵢ 1.27₋₁ᵢ … 1.00 … … … 0.99 … … … 0.92 … … 0.96₋₃ 0.71₋₄ 0.76₋₁ 0.62₋₁ USA
TABLE 5: Continued
A N N E X • STATISTICAl TAblES : TAblE 5447
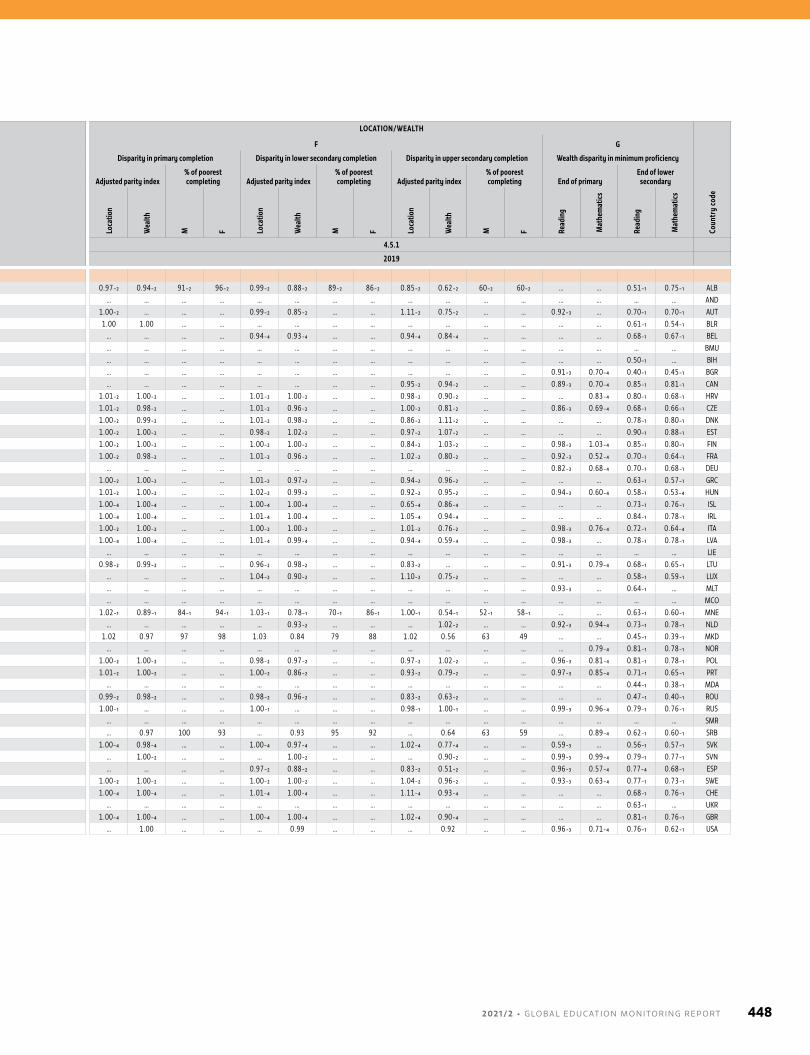
Country or territory
GENDER LOCATION/WEALTH
Coun
try
code
A B C D E F G
GPIA in completion
GPIA in minimum proficiency
GPIA in literacy rate
GPIA in adult proficiency GPIA in gross enrolment ratio
Disparity in primary completion Disparity in lower secondary completion Disparity in upper secondary completion Wealth disparity in minimum proficiency
End of primaryEnd of lower
secondary Adjusted parity index% of poorest completing Adjusted parity index
% of poorest completing Adjusted parity index
% of poorest completing End of primary
End of lower secondary
Prim
ary
Low
er
seco
ndar
y
Uppe
r se
cond
ary
Read
ing
Mat
hem
atics
Read
ing
Mat
hem
atics
Yout
h
Adul
ts
Lite
racy
Num
erac
y
Pre-
prim
ary
Prim
ary
Seco
ndar
y
Tert
iary
Loca
tion
Wea
lth
M F Loca
tion
Wea
lth
M F Loca
tion
Wea
lth
M F Read
ing
Mat
hem
atics
Read
ing
Mat
hem
atics
SDG indicator 4.5.1 4.5.1
Reference year 2019 2019
Europe and Northern AmericaAlbania 1.02₋₂ 1.01₋₂ 1.04₋₂ … … 1.35₋₁ 1.06₋₁ 1.01₋₁ᵢ 0.99₋₁ᵢ … … 1.00 1.03 1.01 1.36 0.97₋₂ 0.94₋₂ 91₋₂ 96₋₂ 0.99₋₂ 0.88₋₂ 89₋₂ 86₋₂ 0.85₋₂ 0.62₋₂ 60₋₂ 60₋₂ … … 0.51₋₁ 0.75₋₁ ALBAndorra … … … … … … … … … … … … … … … … … … … … … … … … … … … … … … … ANDAustria 1.01₋₂ 1.02₋₂ 0.98₋₂ 1.01₋₃ … 1.13₋₁ 0.99₋₁ … … … … 0.99₋₁ 0.99₋₁ 0.96₋₁ 1.16₋₁ 1.00₋₂ … … … 0.99₋₂ 0.85₋₂ … … 1.11₋₂ 0.75₋₂ … … 0.92₋₃ … 0.70₋₁ 0.70₋₁ AUTBelarus 1.00 … … … … 1.13₋₁ 0.99₋₁ 1.00₋₁ᵢ 1.00₋₁ᵢ … … 0.96₋₁ 1.00₋₁ 0.99₋₁ 1.16₋₁ 1.00 1.00 … … … … … … … … … … … … 0.61₋₁ 0.54₋₁ BLRBelgium 1.04₋₄ 1.08₋₄ 1.05₋₄ … … 1.08₋₁ 0.97₋₁ … … … … 1.00₋₁ 1.00₋₁ 1.11₋₁ 1.24₋₁ … … … … 0.94₋₄ 0.93₋₄ … … 0.94₋₄ 0.84₋₄ … … … … 0.68₋₁ 0.67₋₁ BELBermuda … … … … … … … … … … … 0.85₋₄ 0.98₋₄ 1.11₋₄ 1.33₋₁ … … … … … … … … … … … … … … … … BMUBosnia and Herzegovina … … … … … 1.30₋₁ … … … … … 0.97 … … 1.33 … … … … … … … … … … … … … … 0.50₋₁ … BIHBulgaria … … … 1.02₋₃ 1.03₋₄ 1.27₋₁ 1.03₋₁ … … … … 0.99₋₁ 0.99₋₁ 0.97₋₁ 1.19₋₁ … … … … … … … … … … … … 0.91₋₃ 0.70₋₄ 0.40₋₁ 0.45₋₁ BGRCanada … … 1.01₋₂ 1.01₋₃ 0.95₋₄ 1.09₋₁ 1.00₋₁ … … … … … 1.00₋₁ 1.01₋₁ 1.25₋₁ … … … … … … … … 0.95₋₂ 0.94₋₂ … … 0.89₋₃ 0.70₋₄ 0.85₋₁ 0.81₋₁ CANCroatia 1.00₋₂ 0.99₋₂ 1.00₋₂ … 0.92₋₄ 1.16₋₁ 0.98₋₁ … … … … 0.99₋₁ 1.00₋₁ 1.05₋₁ 1.28₋₁ 1.01₋₂ 1.00₋₂ … … 1.01₋₂ 1.00₋₂ … … 0.98₋₂ 0.90₋₂ … … … 0.83₋₄ 0.80₋₁ 0.68₋₁ HRVCzechia 1.00₋₂ 1.01₋₂ 1.08₋₂ 1.02₋₃ 0.97₋₄ 1.13₋₁ 1.01₋₁ 1.00₋₃ 1.00₋₃ … … 0.97₋₁ 1.01₋₁ 1.00₋₁ 1.28₋₁ 1.01₋₂ 0.98₋₂ … … 1.01₋₂ 0.96₋₂ … … 1.00₋₂ 0.81₋₂ … … 0.86₋₃ 0.69₋₄ 0.68₋₁ 0.66₋₁ CZEDenmark 1.00₋₂ 1.00₋₂ 1.19₋₂ … … 1.11₋₁ 1.01₋₁ … … … … 0.98₋₁ 1.00₋₁ 1.00₋₁ 1.27₋₁ 1.00₋₂ 0.99₋₂ … … 1.01₋₂ 0.98₋₂ … … 0.86₋₂ 1.11₋₂ … … … … 0.78₋₁ 0.80₋₁ DNKEstonia 1.00₋₂ 1.03₋₂ 1.08₋₂ … … 1.07₋₁ 1.00₋₁ … … … … 0.99₋₁ 1.00₋₁ 1.03₋₁ 1.34₋₁ 1.00₋₂ 1.00₋₂ … … 0.98₋₂ 1.02₋₂ … … 0.97₋₂ 1.07₋₂ … … … … 0.90₋₁ 0.88₋₁ ESTFinland 1.00₋₂ 1.00₋₂ 1.08₋₂ 1.01₋₃ 1.07₋₄ 1.13₋₁ 1.04₋₁ … … … … 0.99₋₁ 0.99₋₁ 1.09₋₁ 1.16₋₁ 1.00₋₂ 1.00₋₂ … … 1.00₋₂ 1.00₋₂ … … 0.84₋₂ 1.03₋₂ … … 0.98₋₃ 1.03₋₄ 0.85₋₁ 0.80₋₁ FINFrance 1.01₋₂ 1.02₋₂ 1.05₋₂ 1.02₋₃ 0.97₋₄ 1.11₋₁ 1.00₋₁ … … … … 1.00₋₁ᵢ 0.99₋₁ᵢ 1.00₋₁ᵢ 1.20₋₁ᵢ 1.00₋₂ 0.98₋₂ … … 1.01₋₂ 0.96₋₂ … … 1.02₋₂ 0.80₋₂ … … 0.92₋₃ 0.52₋₄ 0.70₋₁ 0.64₋₁ FRAGermany … … … 1.01₋₃ 0.98₋₄ 1.10₋₁ 1.00₋₁ … … … … 0.99₋₁ 1.01₋₁ 0.94₋₁ 1.03₋₁ … … … … … … … … … … … … 0.82₋₃ 0.68₋₄ 0.70₋₁ 0.68₋₁ DEUGreece 1.00₋₂ 1.01₋₂ 1.01₋₂ … … 1.22₋₁ 1.04₋₁ 1.00₋₁ᵢ 0.99₋₁ᵢ 1.05₋₄ 0.94₋₄ 1.01₋₁ 1.00₋₁ 0.95₋₁ 1.00₋₁ 1.00₋₂ 1.00₋₂ … … 1.01₋₂ 0.97₋₂ … … 0.94₋₂ 0.96₋₂ … … … … 0.63₋₁ 0.57₋₁ GRCHungary 0.99₋₂ 0.98₋₂ 1.04₋₂ 1.01₋₃ 0.99₋₄ 1.12₋₁ 0.95₋₄ … … 1.04₋₂ 1.01₋₂ 0.97₋₁ 0.99₋₁ 1.00₋₁ 1.18₋₁ 1.01₋₂ 1.00₋₂ … … 1.02₋₂ 0.99₋₂ … … 0.92₋₂ 0.95₋₂ … … 0.94₋₃ 0.60₋₄ 0.58₋₁ 0.53₋₄ HUNIceland 1.00₋₄ 1.00₋₄ 1.32₋₄ … … 1.19₋₁ 1.07₋₁ … … … … 1.01₋₁ 1.00₋₁ 0.99₋₁ 1.46₋₁ 1.00₋₄ 1.00₋₄ … … 1.00₋₄ 1.00₋₄ … … 0.65₋₄ 0.86₋₄ … … … … 0.73₋₁ 0.76₋₁ ISLIreland 1.00₋₄ 1.01₋₄ 1.04₋₄ … … 1.07₋₁ 1.00₋₁ … … … … 0.99₋₁ᵢ 0.99₋₁ᵢ 1.12₋₁ᵢ 1.11₋₁ᵢ 1.00₋₄ 1.00₋₄ … … 1.01₋₄ 1.00₋₄ … … 1.05₋₄ 0.94₋₄ … … … … 0.84₋₁ 0.78₋₁ IRLItaly 1.00₋₂ 1.00₋₂ 1.02₋₂ 1.02₋₃ 0.88₋₄ 1.11₋₁ 0.96₋₄ 1.00₋₁ᵢ 1.00₋₁ᵢ … … 0.98₋₁ 0.97₋₁ 0.99₋₁ 1.26₋₁ 1.00₋₂ 1.00₋₂ … … 1.00₋₂ 1.00₋₂ … … 1.01₋₂ 0.76₋₂ … … 0.98₋₃ 0.76₋₄ 0.72₋₁ 0.64₋₄ ITALatvia 1.00₋₄ 1.01₋₄ 1.11₋₄ 1.00₋₃ … 1.16₋₁ 1.00₋₁ 1.00₋₁ᵢ 1.00₋₁ᵢ … … 0.99₋₁ᵢ 1.00₋₁ᵢ 0.99₋₁ᵢ 1.33₋₁ᵢ 1.00₋₄ 1.00₋₄ … … 1.01₋₄ 0.99₋₄ … … 0.94₋₄ 0.59₋₄ … … 0.98₋₃ … 0.78₋₁ 0.78₋₁ LVALiechtenstein … … … … … … … … … … … 0.90₋₁ᵢ 1.01₋₁ᵢ 0.83₋₁ᵢ 0.56₋₁ᵢ … … … … … … … … … … … … … … … … LIELithuania 1.00₋₂ 0.99₋₂ 1.12₋₂ 1.01₋₃ 1.03₋₄ 1.18₋₁ 1.05₋₁ … … 1.02₋₄ 0.99₋₄ 0.99₋₁ᵢ 1.00₋₁ᵢ 0.96₋₁ᵢ 1.27₋₁ᵢ 0.98₋₂ 0.99₋₂ … … 0.96₋₂ 0.98₋₂ … … 0.83₋₂ … … … 0.91₋₃ 0.79₋₄ 0.68₋₁ 0.65₋₁ LTULuxembourg … 0.97₋₂ 1.00₋₂ … … 1.13₋₁ 0.97₋₁ … … … … 0.98₋₁ 0.98₋₁ 1.02₋₁ 1.13₋₁ … … … … 1.04₋₂ 0.90₋₂ … … 1.10₋₂ 0.75₋₂ … … … … 0.58₋₁ 0.59₋₁ LUXMalta … … … 1.11₋₃ … 1.26₋₁ 1.03₋₄ 1.01₋₁ᵢ 1.03₋₁ᵢ … … 0.99 1.01 1.00 1.29 … … … … … … … … … … … … 0.93₋₃ … 0.64₋₁ … MLTMonaco … … … … … … … … … … … … … … … … … … … … … … … … … … … … … … … MCOMontenegro 1.04₋₁ 1.04₋₁ 1.08₋₁ … … 1.24₋₁ 0.94₋₁ 1.00₋₁ᵢ 0.99₋₁ᵢ … … 0.95 1.00 1.02 1.25 1.02₋₁ 0.89₋₁ 84₋₁ 94₋₁ 1.03₋₁ 0.78₋₁ 70₋₁ 86₋₁ 1.00₋₁ 0.54₋₁ 52₋₁ 58₋₁ … … 0.63₋₁ 0.60₋₁ MNENetherlands 1.00₋₂ 1.05₋₂ 1.03₋₂ 1.01₋₃ 0.97₋₄ 1.13₋₁ 1.02₋₁ … … … … 1.02₋₁ 1.00₋₁ 1.01₋₁ 1.12₋₁ … … … … … 0.93₋₂ … … … 1.02₋₂ … … 0.92₋₃ 0.94₋₄ 0.73₋₁ 0.78₋₁ NLDNorth Macedonia … … … … … 1.41₋₁ 1.09₋₁ … … … … 1.02₋₁ 1.00₋₁ 0.98₋₁ 1.24₋₁ 1.02 0.97 97 98 1.03 0.84 79 88 1.02 0.56 63 49 … … 0.45₋₁ 0.39₋₁ MKDNorway … … … … 0.99₋₄ 1.16₋₁ 1.05₋₁ … … … … 1.00₋₁ 1.00₋₁ 0.96₋₁ 1.32₋₁ … … … … … … … … … … … … … 0.79₋₄ 0.81₋₁ 0.78₋₁ NORPoland 1.00₋₂ 1.00₋₂ 1.02₋₂ 1.01₋₃ 1.02₋₄ 1.11₋₁ 1.02₋₁ … … … … 1.00₋₁ 0.99₋₁ 0.97₋₁ 1.34₋₁ 1.00₋₂ 1.00₋₂ … … 0.98₋₂ 0.97₋₂ … … 0.97₋₂ 1.02₋₂ … … 0.96₋₃ 0.81₋₄ 0.81₋₁ 0.78₋₁ POLPortugal 1.01₋₂ 1.00₋₂ 1.10₋₂ 1.01₋₃ 0.97₋₄ 1.10₋₁ 1.00₋₁ 1.00₋₁ᵢ 0.98₋₁ᵢ … … 0.99₋₁ 0.97₋₁ 1.00₋₁ 1.12₋₁ 1.01₋₂ 1.00₋₂ … … 1.00₋₂ 0.86₋₂ … … 0.93₋₂ 0.79₋₂ … … 0.97₋₃ 0.85₋₄ 0.71₋₁ 0.65₋₁ PRTRepublic of Moldova … … … … … 1.26₋₁ 1.02₋₁ … … … … 0.98 ᵢ 0.97 ᵢ 0.99 ᵢ 1.26 ᵢ … … … … … … … … … … … … … … 0.44₋₁ 0.38₋₁ MDARomania 1.00₋₂ 1.00₋₂ 0.98₋₂ … … 1.22₋₁ 0.98₋₁ 1.00₋₁ᵢ 0.99₋₁ᵢ … … 1.00₋₁ 0.99₋₁ 1.00₋₁ 1.21₋₁ 0.99₋₂ 0.98₋₂ … … 0.98₋₂ 0.96₋₂ … … 0.83₋₂ 0.63₋₂ … … … … 0.47₋₁ 0.40₋₁ ROURussian Federation 1.00₋₁ 1.00₋₁ 1.01₋₁ 1.01₋₃ 1.00₋₄ 1.12₋₁ 1.00₋₁ 1.00₋₁ᵢ 1.00₋₁ᵢ … … 0.98₋₁ 0.99₋₁ 0.97₋₁ 1.15₋₁ 1.00₋₁ … … … 1.00₋₁ … … … 0.98₋₁ 1.00₋₁ … … 0.99₋₃ 0.96₋₄ 0.79₋₁ 0.76₋₁ RUSSan Marino … … … … … … … 1.00₋₁ 1.00₋₁ … … 1.00 1.10 0.95 0.77 … … … … … … … … … … … … … … … … SMRSerbia 0.99 0.98 1.07 … 1.01₋₄ 1.22₋₁ 1.01₋₁ 1.00₋₃ 0.99₋₃ … … 1.00 ᵢ 1.00 ᵢ 1.01 ᵢ 1.28 ᵢ … 0.97 100 93 … 0.93 95 92 … 0.64 63 59 … 0.89₋₄ 0.62₋₁ 0.60₋₁ SRBSlovakia 1.00₋₄ 1.01₋₄ 0.98₋₄ 1.01₋₃ … 1.18₋₁ 1.01₋₁ … … … … 0.98₋₁ 1.00₋₁ 1.01₋₁ 1.34₋₁ 1.00₋₄ 0.98₋₄ … … 1.00₋₄ 0.97₋₄ … … 1.02₋₄ 0.77₋₄ … … 0.59₋₃ … 0.56₋₁ 0.57₋₁ SVKSlovenia 1.00₋₂ 1.00₋₂ 1.03₋₂ 1.02₋₃ 1.00₋₄ 1.16₋₁ 1.01₋₁ … … 1.02₋₄ 0.98₋₄ 0.98₋₁ 1.00₋₁ 1.02₋₁ 1.31₋₁ … 1.00₋₂ … … … 1.00₋₂ … … … 0.90₋₂ … … 0.99₋₃ 0.99₋₄ 0.79₋₁ 0.77₋₁ SVNSpain 0.94₋₂ 1.03₋₂ 1.05₋₂ 1.02₋₃ 0.93₋₄ 1.08₋₄ 1.00₋₁ 1.00₋₁ 0.99₋₁ … … 1.00₋₁ 1.01₋₁ 1.02₋₁ 1.17₋₁ … … … … 0.97₋₂ 0.88₋₂ … … 0.83₋₂ 0.51₋₂ … … 0.96₋₃ 0.57₋₄ 0.77₋₄ 0.68₋₁ ESPSweden 1.00₋₂ 1.00₋₂ 1.06₋₂ 1.01₋₃ 1.00₋₄ 1.11₋₁ 1.02₋₁ … … … … 0.99₋₁ 1.02₋₁ 1.06₋₁ 1.37₋₁ 1.00₋₂ 1.00₋₂ … … 1.00₋₂ 1.00₋₂ … … 1.04₋₂ 0.96₋₂ … … 0.93₋₃ 0.63₋₄ 0.77₋₁ 0.73₋₁ SWESwitzerland 1.00₋₄ 1.00₋₄ 0.96₋₄ … … 1.12₋₁ 0.99₋₁ … … … … 0.98₋₁ 0.99₋₁ 0.95₋₁ 1.03₋₁ 1.00₋₄ 1.00₋₄ … … 1.01₋₄ 1.00₋₄ … … 1.11₋₄ 0.93₋₄ … … … … 0.68₋₁ 0.76₋₁ CHEUkraine … … … … … 1.16₋₁ … … … … … … … … … … … … … … … … … … … … … … … 0.63₋₁ … UKRUnited Kingdom 1.00₋₄ 1.00₋₄ 1.10₋₄ … … 1.07₋₁ 0.97₋₁ … … … … 1.00₋₁ 1.00₋₁ 1.03₋₁ 1.27₋₁ 1.00₋₄ 1.00₋₄ … … 1.00₋₄ 1.00₋₄ … … 1.02₋₄ 0.90₋₄ … … … … 0.81₋₁ 0.76₋₁ GBRUnited States 1.00 1.01 1.02 1.01₋₃ 0.98₋₄ 1.09₋₁ 0.98₋₁ … … 1.02₋₂ 0.97₋₂ 1.01₋₁ᵢ 1.00₋₁ᵢ 0.99₋₁ᵢ 1.27₋₁ᵢ … 1.00 … … … 0.99 … … … 0.92 … … 0.96₋₃ 0.71₋₄ 0.76₋₁ 0.62₋₁ USA
2 0 2 1 / 2 • G LO BA L E D U C AT I O N M O N I TO R I N G R E P O RT 448
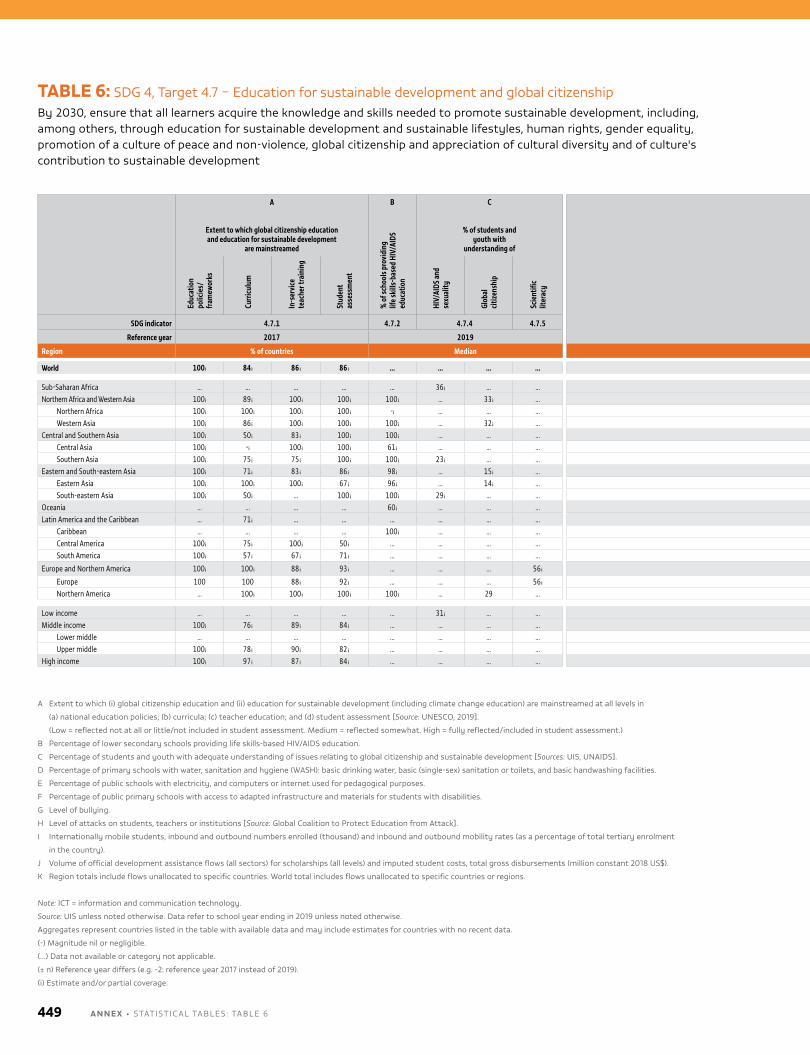
TABLE 6: SDG 4, Target 4.7 – Education for sustainable development and global citizenshipby 2030, ensure that all learners acquire the knowledge and skills needed to promote sustainable development, including, among others, through education for sustainable development and sustainable lifestyles, human rights, gender equality, promotion of a culture of peace and non-violence, global citizenship and appreciation of cultural diversity and of culture's contribution to sustainable development
A Extent to which (i) global citizenship education and (ii) education for sustainable development (including climate change education) are mainstreamed at all levels in
(a) national education policies; (b) curricula; (c) teacher education; and (d) student assessment [Source: unESCo, 2019].
(low = reflected not at all or little/not included in student assessment. medium = reflected somewhat. high = fully reflected/included in student assessment.)
b Percentage of lower secondary schools providing life skills-based hIv/AIDS education.
C Percentage of students and youth with adequate understanding of issues relating to global citizenship and sustainable development [Sources: uIS, unAIDS].
D Percentage of primary schools with water, sanitation and hygiene (WASh): basic drinking water, basic (single-sex) sanitation or toilets, and basic handwashing facilities.
E Percentage of public schools with electricity, and computers or internet used for pedagogical purposes.
F Percentage of public primary schools with access to adapted infrastructure and materials for students with disabilities.
G level of bullying.
h level of attacks on students, teachers or institutions [Source: Global Coalition to Protect Education from Attack].
I Internationally mobile students, inbound and outbound numbers enrolled (thousand) and inbound and outbound mobility rates (as a percentage of total tertiary enrolment
in the country).
J volume of official development assistance flows (all sectors) for scholarships (all levels) and imputed student costs, total gross disbursements (million constant 2018 uS$).
K Region totals include flows unallocated to specific countries. World total includes flows unallocated to specific countries or regions.
Note: ICT = information and communication technology.
Source: uIS unless noted otherwise. Data refer to school year ending in 2019 unless noted otherwise.
Aggregates represent countries listed in the table with available data and may include estimates for countries with no recent data.
(-) magnitude nil or negligible.
(…) Data not available or category not applicable.
(± n) Reference year differs (e.g. -2: reference year 2017 instead of 2019).
(i) Estimate and/or partial coverage.
A B C D E F G H I J
Extent to which global citizenship education and education for sustainable development
are mainstreamed
% o
f sch
ools
prov
idin
g
life s
kills
-bas
ed H
IV/A
IDS
educ
atio
n
% of students and youth with
understanding of % of schools with WASH facilities% of schools with ICT for
pedagogical purposes
% o
f sch
ools
with
adap
ted
infra
stru
ctur
e and
mat
eria
ls fo
r st
uden
ts w
ith d
isabi
litie
s
Leve
l of b
ully
ing
Leve
l of a
ttac
ks o
n ed
ucat
ion
Internationally mobile tertiary students Official development
assistance, in US$ (000,000)
Mobility rate (%)
Number (000)
Educ
atio
n po
licie
s/fra
mew
orks
Curr
iculu
m
In-s
ervi
ce
teac
her t
rain
ing
Stud
ent
asse
ssm
ent
HIV/
AIDS
and
sexu
ality
Glob
al
citize
nshi
p
Scie
ntifi
c lit
erac
y
Basic
dr
inki
ng w
ater
Basic
sani
tatio
n or
toile
ts
Basic
ha
ndw
ashi
ng
Elec
trici
ty
Inte
rnet
Com
pute
rs
Inbo
und
Outb
ound
Inbo
und
Outb
ound
Scho
lars
hips
Impu
ted
stud
ent c
osts
SDG indicator 4.7.1 4.7.2 4.7.4 4.7.5 4.a.1 4.a.2 4.a.3 4.b.1
Reference year 2017 2019 2019 2019
Region % of countries Median Median — Median Sum
World 100 ᵢ 84 ᵢ 86 ᵢ 86 ᵢ … … … … 78 ᵢ 78 ᵢ 66₋₁ᵢ 73 ᵢ 40 ᵢ 48 ᵢ … … … 2₋₁ 2₋₁ 5,571₋₁ 5,571₋₁ 1,035 ᵢ 2,549 ᵢ
Sub-Saharan Africa … … … … … 36 ᵢ … … 44₋₂ᵢ 64 ᵢ 37₋₂ᵢ 31 ᵢ 4 ᵢ 13 ᵢ … … … 2₋₁ᵢ 5₋₁ᵢ 138₋₁ᵢ 390₋₁ 154 340Northern Africa and Western Asia 100 ᵢ 89 ᵢ 100 ᵢ 100 ᵢ 100 ᵢ … 33 ᵢ … 87₋₂ᵢ 90₋₂ᵢ 93₋₂ᵢ 88₋₂ᵢ 80 ᵢ 85 ᵢ … … … 3₋₁ᵢ 3₋₁ᵢ 514₋₁ 658₋₁ 151 ᵢ 750 ᵢ
Northern Africa 100 ᵢ 100 ᵢ 100 ᵢ 100 ᵢ -ᵢ … … … 85₋₂ᵢ 89₋₂ᵢ 94₋₂ᵢ 86₋₂ᵢ 77 ᵢ 86 ᵢ … … … 1₋₁ᵢ 2₋₁ᵢ 86₋₁ᵢ 168₋₁ 71 391Western Asia 100 ᵢ 86 ᵢ 100 ᵢ 100 ᵢ 100 ᵢ … 32 ᵢ … 89 ᵢ 90 ᵢ 92 ᵢ 91 ᵢ 83 ᵢ 84 ᵢ 100 ᵢ … … 3₋₁ 4₋₁ 428₋₁ 490₋₁ 80 ᵢ 359 ᵢ
Central and Southern Asia 100 ᵢ 50 ᵢ 83 ᵢ 100 ᵢ 100 ᵢ … … … 84 79 52₋₁ᵢ 56₋₁ 12 22 … … … 0.2₋₁ 2₋₁ 104₋₁ 880₋₁ 94 404Central Asia 100 ᵢ -ᵢ 100 ᵢ 100 ᵢ 61 ᵢ … … … 95₋₁ᵢ 92 ᵢ 93 ᵢ 100 70 ᵢ 96 ᵢ 17 ᵢ … … 2₋₁ 13₋₁ 34₋₁ 196₋₁ 20 28Southern Asia 100 ᵢ 75 ᵢ 75 ᵢ 100 ᵢ 100 ᵢ 23 ᵢ … … 84 78 51₋₁ᵢ 55₋₁ 11 20 … … … 0.2₋₁ 2₋₁ 70₋₁ 684₋₁ 74 376
Eastern and South-eastern Asia 100 ᵢ 71 ᵢ 83 ᵢ 86 ᵢ 98 ᵢ … 15 ᵢ … 79 ᵢ 74 ᵢ 82 ᵢ 90 ᵢ 77 ᵢ 69 ᵢ 59 ᵢ … … 1₋₁ 2₋₁ 694₋₁ 1,504₋₁ 164 ᵢ 517 ᵢEastern Asia 100 ᵢ 100 ᵢ 100 ᵢ 67 ᵢ 96 ᵢ … 14 ᵢ … 97 97 96 97 95 95 … … … 1₋₁ 2₋₁ 501₋₁ 1,180₋₁ 35 ᵢ 383 ᵢSouth-eastern Asia 100 ᵢ 50 ᵢ … 100 ᵢ 100 ᵢ 29 ᵢ … … 67 ᵢ 59 ᵢ 73 ᵢ 85 ᵢ 66 ᵢ 53 ᵢ 23 ᵢ … … 1₋₁ᵢ 2₋₁ᵢ 192₋₁ᵢ 324₋₁ 129 ᵢ 134 ᵢ
Oceania … … … … 60 ᵢ … … … 87₋₂ᵢ 86₋₂ᵢ 95₋₂ᵢ 92₋₂ᵢ 62₋₂ᵢ 75₋₂ᵢ 18 ᵢ … … 26₋₁ 2₋₁ 505₋₁ 31₋₁ 36 ᵢ 2 ᵢLatin America and the Caribbean … 71 ᵢ … … … … … … 100 ᵢ 83₋₂ᵢ 100 ᵢ 89₋₁ᵢ 43₋₁ᵢ 61₋₁ᵢ 32 ᵢ … … 1₋₁ 1₋₁ 190₋₁ 356₋₁ 67 ᵢ 184 ᵢ
Caribbean … … … … 100 ᵢ … … … 100 ᵢ 100 ᵢ 100 ᵢ 100 ᵢ 99 ᵢ 100 ᵢ 62 ᵢ … … … 20 ᵢ … 35 ᵢ 11 ᵢ 10 ᵢCentral America 100 ᵢ 75 ᵢ 100 ᵢ 50 ᵢ … … … … 88 ᵢ 75 ᵢ … 98 ᵢ 23 38 ᵢ 30 ᵢ … … 1 ᵢ 2 10 ᵢ 58 ᵢ 14 46South America 100 ᵢ 57 ᵢ 67 ᵢ 71 ᵢ … … … … 67 ᵢ … … 96 43 ᵢ 75 ᵢ … … … 0.5 ᵢ 2 148 ᵢ 260 ᵢ 42 ᵢ 128 ᵢ
Europe and Northern America 100 ᵢ 100 ᵢ 88 ᵢ 93 ᵢ … … … 56 ᵢ 98 ᵢ 99 ᵢ 96 ᵢ 100 ᵢ 100 ᵢ 100 ᵢ … … … 7₋₁ 2₋₁ 3,426₋₁ 1,135₋₁ … …
Europe 100 100 88 ᵢ 92 ᵢ … … … 56 ᵢ 97₋₂ᵢ 99 ᵢ 97₋₂ᵢ 100₋₂ᵢ 100 ᵢ 100 ᵢ … … … 8₋₁ 3₋₁ 2,214₋₁ 1,001₋₁ … …Northern America … 100 ᵢ 100 ᵢ 100 ᵢ 100 ᵢ … 29 … … … 100 ᵢ 100 ᵢ 100 ᵢ 100 ᵢ 100 ᵢ … … 6₋₁ 1₋₁ 1,212₋₁ 134₋₁ … …
Low income … … … … … 31 ᵢ … … 49₋₂ᵢ 62₋₂ᵢ 43₋₂ᵢ 32₋₁ᵢ … 2 ᵢ … … … 1 ᵢ 5₋₁ᵢ 47 ᵢ 273₋₁ 99 293Middle income 100 ᵢ 76 ᵢ 89 ᵢ 84 ᵢ … … … … 78 ᵢ 77 ᵢ 63₋₁ᵢ 73 ᵢ 33 ᵢ 42 ᵢ … … … 1₋₁ 2₋₁ 1,380₋₁ 3,351₋₁ 601 2,164 ᵢ
Lower middle … … … … … … … … 78 ᵢ 76 ᵢ 53₋₁ᵢ 55₋₁ᵢ 16 ᵢ 27 ᵢ … … … 0.5₋₁ 2₋₁ 275₋₁ 1,360₋₁ 350 1,038Upper middle 100 ᵢ 78 ᵢ 90 ᵢ 82 ᵢ … … … … 79 ᵢ 79 ᵢ 81 ᵢ 94 ᵢ 62₋₁ᵢ 67 ᵢ … … … 1₋₁ 2₋₁ 1,105₋₁ 1,991₋₁ 252 ᵢ 1,126 ᵢ
High income 100 ᵢ 97 ᵢ 87 ᵢ 84 ᵢ … … … … 96₋₂ᵢ 97₋₂ᵢ 95₋₂ᵢ 98₋₂ᵢ 100 ᵢ 100 ᵢ … … … 8₋₁ 2₋₁ 4,141₋₁ 1,331₋₁ … …
A N N E X • STATISTICAl TAblES : TAblE 6449
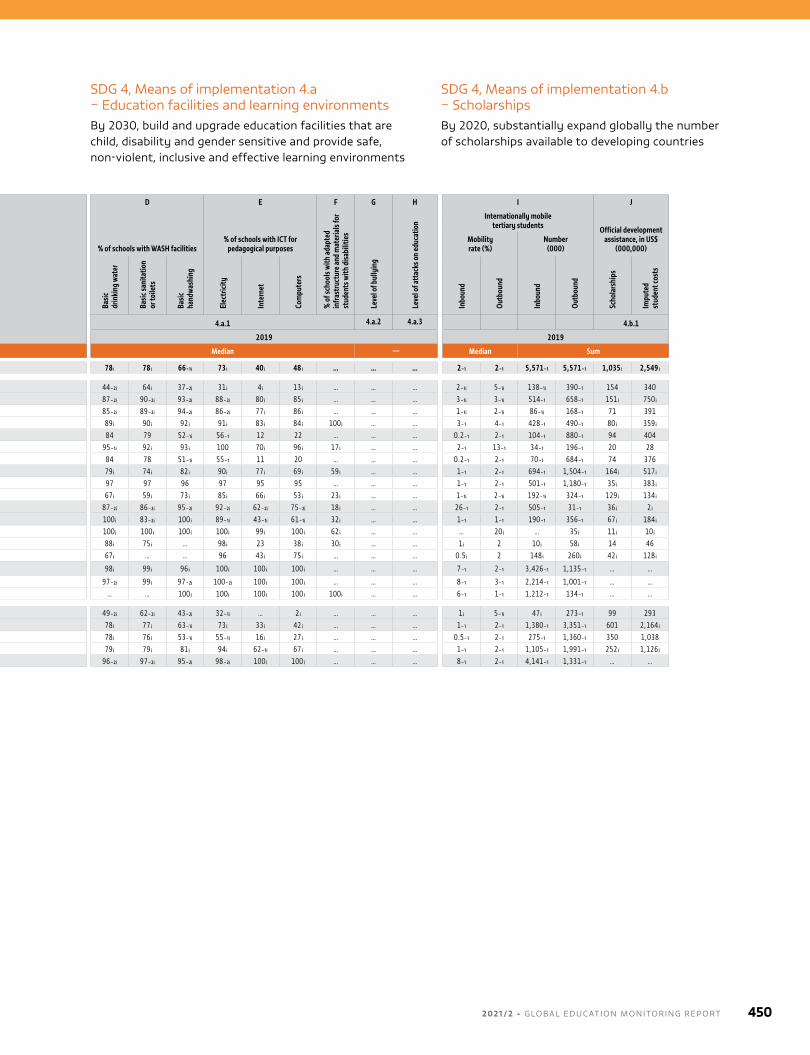
SDG 4, means of implementation 4.a – Education facilities and learning environmentsby 2030, build and upgrade education facilities that are child, disability and gender sensitive and provide safe, non-violent, inclusive and effective learning environments
SDG 4, means of implementation 4.b – Scholarshipsby 2020, substantially expand globally the number of scholarships available to developing countries
A B C D E F G H I J
Extent to which global citizenship education and education for sustainable development
are mainstreamed
% o
f sch
ools
prov
idin
g
life s
kills
-bas
ed H
IV/A
IDS
educ
atio
n
% of students and youth with
understanding of % of schools with WASH facilities% of schools with ICT for
pedagogical purposes
% o
f sch
ools
with
adap
ted
infra
stru
ctur
e and
mat
eria
ls fo
r st
uden
ts w
ith d
isabi
litie
s
Leve
l of b
ully
ing
Leve
l of a
ttac
ks o
n ed
ucat
ion
Internationally mobile tertiary students Official development
assistance, in US$ (000,000)
Mobility rate (%)
Number (000)
Educ
atio
n po
licie
s/fra
mew
orks
Curr
iculu
m
In-s
ervi
ce
teac
her t
rain
ing
Stud
ent
asse
ssm
ent
HIV/
AIDS
and
sexu
ality
Glob
al
citize
nshi
p
Scie
ntifi
c lit
erac
y
Basic
dr
inki
ng w
ater
Basic
sani
tatio
n or
toile
ts
Basic
ha
ndw
ashi
ng
Elec
trici
ty
Inte
rnet
Com
pute
rs
Inbo
und
Outb
ound
Inbo
und
Outb
ound
Scho
lars
hips
Impu
ted
stud
ent c
osts
SDG indicator 4.7.1 4.7.2 4.7.4 4.7.5 4.a.1 4.a.2 4.a.3 4.b.1
Reference year 2017 2019 2019 2019
Region % of countries Median Median — Median Sum
World 100 ᵢ 84 ᵢ 86 ᵢ 86 ᵢ … … … … 78 ᵢ 78 ᵢ 66₋₁ᵢ 73 ᵢ 40 ᵢ 48 ᵢ … … … 2₋₁ 2₋₁ 5,571₋₁ 5,571₋₁ 1,035 ᵢ 2,549 ᵢ
Sub-Saharan Africa … … … … … 36 ᵢ … … 44₋₂ᵢ 64 ᵢ 37₋₂ᵢ 31 ᵢ 4 ᵢ 13 ᵢ … … … 2₋₁ᵢ 5₋₁ᵢ 138₋₁ᵢ 390₋₁ 154 340Northern Africa and Western Asia 100 ᵢ 89 ᵢ 100 ᵢ 100 ᵢ 100 ᵢ … 33 ᵢ … 87₋₂ᵢ 90₋₂ᵢ 93₋₂ᵢ 88₋₂ᵢ 80 ᵢ 85 ᵢ … … … 3₋₁ᵢ 3₋₁ᵢ 514₋₁ 658₋₁ 151 ᵢ 750 ᵢ
Northern Africa 100 ᵢ 100 ᵢ 100 ᵢ 100 ᵢ -ᵢ … … … 85₋₂ᵢ 89₋₂ᵢ 94₋₂ᵢ 86₋₂ᵢ 77 ᵢ 86 ᵢ … … … 1₋₁ᵢ 2₋₁ᵢ 86₋₁ᵢ 168₋₁ 71 391Western Asia 100 ᵢ 86 ᵢ 100 ᵢ 100 ᵢ 100 ᵢ … 32 ᵢ … 89 ᵢ 90 ᵢ 92 ᵢ 91 ᵢ 83 ᵢ 84 ᵢ 100 ᵢ … … 3₋₁ 4₋₁ 428₋₁ 490₋₁ 80 ᵢ 359 ᵢ
Central and Southern Asia 100 ᵢ 50 ᵢ 83 ᵢ 100 ᵢ 100 ᵢ … … … 84 79 52₋₁ᵢ 56₋₁ 12 22 … … … 0.2₋₁ 2₋₁ 104₋₁ 880₋₁ 94 404Central Asia 100 ᵢ -ᵢ 100 ᵢ 100 ᵢ 61 ᵢ … … … 95₋₁ᵢ 92 ᵢ 93 ᵢ 100 70 ᵢ 96 ᵢ 17 ᵢ … … 2₋₁ 13₋₁ 34₋₁ 196₋₁ 20 28Southern Asia 100 ᵢ 75 ᵢ 75 ᵢ 100 ᵢ 100 ᵢ 23 ᵢ … … 84 78 51₋₁ᵢ 55₋₁ 11 20 … … … 0.2₋₁ 2₋₁ 70₋₁ 684₋₁ 74 376
Eastern and South-eastern Asia 100 ᵢ 71 ᵢ 83 ᵢ 86 ᵢ 98 ᵢ … 15 ᵢ … 79 ᵢ 74 ᵢ 82 ᵢ 90 ᵢ 77 ᵢ 69 ᵢ 59 ᵢ … … 1₋₁ 2₋₁ 694₋₁ 1,504₋₁ 164 ᵢ 517 ᵢEastern Asia 100 ᵢ 100 ᵢ 100 ᵢ 67 ᵢ 96 ᵢ … 14 ᵢ … 97 97 96 97 95 95 … … … 1₋₁ 2₋₁ 501₋₁ 1,180₋₁ 35 ᵢ 383 ᵢSouth-eastern Asia 100 ᵢ 50 ᵢ … 100 ᵢ 100 ᵢ 29 ᵢ … … 67 ᵢ 59 ᵢ 73 ᵢ 85 ᵢ 66 ᵢ 53 ᵢ 23 ᵢ … … 1₋₁ᵢ 2₋₁ᵢ 192₋₁ᵢ 324₋₁ 129 ᵢ 134 ᵢ
Oceania … … … … 60 ᵢ … … … 87₋₂ᵢ 86₋₂ᵢ 95₋₂ᵢ 92₋₂ᵢ 62₋₂ᵢ 75₋₂ᵢ 18 ᵢ … … 26₋₁ 2₋₁ 505₋₁ 31₋₁ 36 ᵢ 2 ᵢLatin America and the Caribbean … 71 ᵢ … … … … … … 100 ᵢ 83₋₂ᵢ 100 ᵢ 89₋₁ᵢ 43₋₁ᵢ 61₋₁ᵢ 32 ᵢ … … 1₋₁ 1₋₁ 190₋₁ 356₋₁ 67 ᵢ 184 ᵢ
Caribbean … … … … 100 ᵢ … … … 100 ᵢ 100 ᵢ 100 ᵢ 100 ᵢ 99 ᵢ 100 ᵢ 62 ᵢ … … … 20 ᵢ … 35 ᵢ 11 ᵢ 10 ᵢCentral America 100 ᵢ 75 ᵢ 100 ᵢ 50 ᵢ … … … … 88 ᵢ 75 ᵢ … 98 ᵢ 23 38 ᵢ 30 ᵢ … … 1 ᵢ 2 10 ᵢ 58 ᵢ 14 46South America 100 ᵢ 57 ᵢ 67 ᵢ 71 ᵢ … … … … 67 ᵢ … … 96 43 ᵢ 75 ᵢ … … … 0.5 ᵢ 2 148 ᵢ 260 ᵢ 42 ᵢ 128 ᵢ
Europe and Northern America 100 ᵢ 100 ᵢ 88 ᵢ 93 ᵢ … … … 56 ᵢ 98 ᵢ 99 ᵢ 96 ᵢ 100 ᵢ 100 ᵢ 100 ᵢ … … … 7₋₁ 2₋₁ 3,426₋₁ 1,135₋₁ … …
Europe 100 100 88 ᵢ 92 ᵢ … … … 56 ᵢ 97₋₂ᵢ 99 ᵢ 97₋₂ᵢ 100₋₂ᵢ 100 ᵢ 100 ᵢ … … … 8₋₁ 3₋₁ 2,214₋₁ 1,001₋₁ … …Northern America … 100 ᵢ 100 ᵢ 100 ᵢ 100 ᵢ … 29 … … … 100 ᵢ 100 ᵢ 100 ᵢ 100 ᵢ 100 ᵢ … … 6₋₁ 1₋₁ 1,212₋₁ 134₋₁ … …
Low income … … … … … 31 ᵢ … … 49₋₂ᵢ 62₋₂ᵢ 43₋₂ᵢ 32₋₁ᵢ … 2 ᵢ … … … 1 ᵢ 5₋₁ᵢ 47 ᵢ 273₋₁ 99 293Middle income 100 ᵢ 76 ᵢ 89 ᵢ 84 ᵢ … … … … 78 ᵢ 77 ᵢ 63₋₁ᵢ 73 ᵢ 33 ᵢ 42 ᵢ … … … 1₋₁ 2₋₁ 1,380₋₁ 3,351₋₁ 601 2,164 ᵢ
Lower middle … … … … … … … … 78 ᵢ 76 ᵢ 53₋₁ᵢ 55₋₁ᵢ 16 ᵢ 27 ᵢ … … … 0.5₋₁ 2₋₁ 275₋₁ 1,360₋₁ 350 1,038Upper middle 100 ᵢ 78 ᵢ 90 ᵢ 82 ᵢ … … … … 79 ᵢ 79 ᵢ 81 ᵢ 94 ᵢ 62₋₁ᵢ 67 ᵢ … … … 1₋₁ 2₋₁ 1,105₋₁ 1,991₋₁ 252 ᵢ 1,126 ᵢ
High income 100 ᵢ 97 ᵢ 87 ᵢ 84 ᵢ … … … … 96₋₂ᵢ 97₋₂ᵢ 95₋₂ᵢ 98₋₂ᵢ 100 ᵢ 100 ᵢ … … … 8₋₁ 2₋₁ 4,141₋₁ 1,331₋₁ … …
2 0 2 1 / 2 • G LO BA L E D U C AT I O N M O N I TO R I N G R E P O RT 450
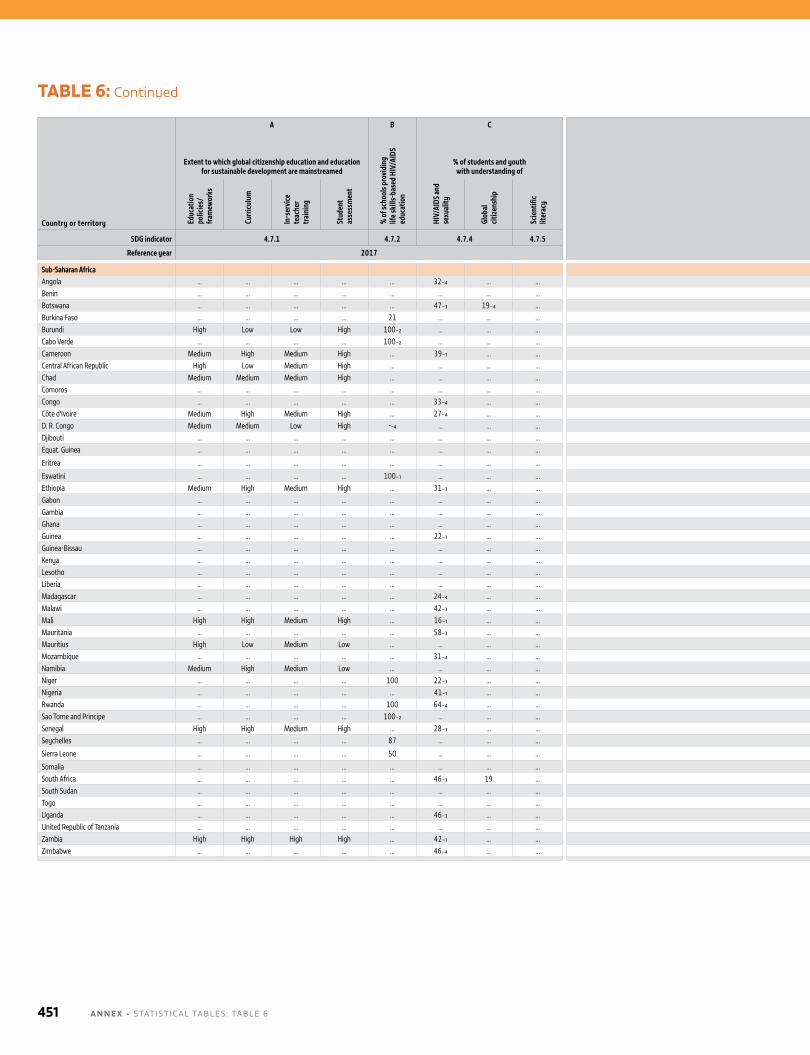
TABLE 6: Continued
Country or territory
A B C D E F G H I J
Coun
try
code
Extent to which global citizenship education and education for sustainable development are mainstreamed
% o
f sch
ools
prov
idin
g
life s
kills
-bas
ed H
IV/A
IDS
educ
atio
n
% of students and youth with understanding of % of schools with WASH facilities
% of schools with ICT for pedagogical purposes
% o
f sch
ools
with
adap
ted
infra
stru
ctur
e and
mat
eria
ls fo
r stu
dent
s with
disa
bilit
ies
Leve
l of b
ully
ing
Leve
l of a
ttac
ks o
n ed
ucat
ion Internationally mobile
tertiary students Official development assistance, in US$
(000,000)Mobility rate (%)
Number (000)
Educ
atio
n po
licie
s/fra
mew
orks
Curr
iculu
m
In-s
ervi
ce
teac
her
trai
ning
Stud
ent
asse
ssm
ent
HIV/
AIDS
and
sexu
ality
Glob
al
citize
nshi
p
Scie
ntifi
c lit
erac
y
Basic
dr
inki
ng
wat
er
Basic
sa
nita
tion
or
toile
ts
Basic
ha
ndw
ashi
ng
Elec
trici
ty
Inte
rnet
Com
pute
rs
Inbo
und
Outb
ound
Inbo
und
Outb
ound
Scho
lars
hips
Impu
ted
stud
ent
cost
s
SDG indicator 4.7.1 4.7.2 4.7.4 4.7.5 4.a.1 4.a.2 4.a.3 4.b.1
Reference year 2017 2019 2019
Sub-Saharan AfricaAngola … … … … … 32₋₄ … … 20₋₃ … … 22₋₃ 3₋₃ 7₋₃ … … … … 6₋₃ … 13₋₁ᵢ 3 2 AGOBenin … … … … … … … … 40 … … 28 … … … 49₋₃ Sporadic₊₁ 5₋₁ 6₋₁ᵢ 6₋₁ 8₋₁ᵢ 2 11 BENBotswana … … … … … 47₋₃ 19₋₄ … … … … … … … … 95₋₄ Affected₊₁ 2 5₋₂ 1 3₋₁ᵢ 1 0.1 BWABurkina Faso … … … … 21 … … … 59 60 29 21 0.2 6 38 … Very heavy₊₁ 2 5₋₁ᵢ 3 6₋₁ᵢ 2 7 BFABurundi High Low Low High 100₋₂ … … … 39 35 20 9 - - - … Affected₊₁ 5₋₁ 8₋₁ᵢ 2₋₁ 4₋₁ᵢ 1 2 BDICabo Verde … … … … 100₋₂ … … … 99₋₁ 92₋₁ 78₋₁ 79₋₁ 16₋₁ 42₋₁ … … … 1₋₁ 32₋₁ᵢ 0.2₋₁ 4₋₁ᵢ 2 7 CPVCameroon Medium High Medium High … 39₋₁ … … 34₋₂ 39₋₂ … 31 … … … … Heavy₊₁ 3₋₁ 8₋₁ᵢ 9₋₁ 26₋₁ᵢ 11 64 CMRCentral African Republic High Low Medium High … … … … … … … 4₋₃ … … … … Affected₊₁ … … … 2₋₁ᵢ 2 2 CAFChad Medium Medium Medium High … … … … 15₋₁ … 20 3 … … … … Affected₊₁ … 14₋₄ … 6₋₁ᵢ 1 4 TCDComoros … … … … … … … … … … … 41₋₂ 8₋₂ 31₋₂ … … … … … … 6₋₁ᵢ 5 5 COMCongo … … … … … 33₋₄ … … … … … 24₋₁ … 12₋₁ … … … … 18₋₂ … 10₋₁ᵢ 6 12 COGCôte d'Ivoire Medium High Medium High … 27₋₄ … … 42 … 31 46 … … … … Affected₊₁ 2₋₂ 6₋₂ 7 14₋₁ᵢ 5 23 CIVD. R. Congo Medium Medium Low High -₋₄ … … … -₋₄ … -₋₄ 9₋₄ -₋₄ -₋₄ -₋₄ … Very heavy₊₁ 0.4₋₃ 2₋₃ 2₋₃ 12₋₁ᵢ 5 5 CODDjibouti … … … … … … … … 91₊₁ 96₊₁ 91₊₁ 95₋₂ … … … … … … … … 2₋₁ᵢ 1 3 DJIEquat. Guinea … … … … … … … … … … … … … … … … … … … … 1₋₁ᵢ 0.5 0.2 GNQ
Eritrea … … … … … … … … … 26₋₁ 3₋₁ 29₋₁ … … … … Sporadic₊₁ … 20₋₃ … 2₋₁ᵢ 2 1 ERI
Eswatini … … … … 100₋₁ … … … 79₋₂ 100₋₃ … 100₋₁ 16₋₃ 15₋₃ 12₋₃ … … … … -₋₄ 2₋₁ᵢ 0.5 0.1 SWZEthiopia Medium High Medium High … 31₋₃ … … … … … … … … … … Heavy₊₁ … … … 8₋₁ᵢ 13 6 ETHGabon … … … … … … … … … … … … … … … … … … … … 7₋₁ᵢ 3 14 GABGambia … … … … … … … … 84₋₁ 84₋₁ … 34 … 21 … … … … … … 2₋₁ᵢ 1 0.4 GMBGhana … … … … … … … … 33₋₁ 91₋₂ 35₋₁ 25₋₁ 8₋₁ 3₋₁ … … Sporadic₊₁ 1 4₋₁ᵢ 7 16₋₁ᵢ 10 13 GHAGuinea … … … … … 22₋₁ … … 25₋₃ … 85₋₃ 14₋₃ -₋₃ -₋₃ … … Affected₊₁ … … 0.4₋₂ 9₋₁ᵢ 4 15 GINGuinea-Bissau … … … … … … … … … … … … … … … … … … … … 3₋₁ᵢ 1 8 GNBKenya … … … … … … … … … … … 83₋₃ … … … … Affected₊₁ 1₋₂ 3₋₂ 7 16₋₁ᵢ 8 7 KENLesotho … … … … … … … … … … … … … … … … … 0.4₋₁ 14₋₁ᵢ 0.1₋₁ 3₋₁ᵢ 0.4 - LSOLiberia … … … … … … … … 59₋₂ 28₋₃ 62₋₂ 10₋₂ … … … … Sporadic₊₁ … … … 1₋₁ᵢ 1 0.1 LBRMadagascar … … … … … 24₋₄ … … … … … 8 0.1 1 … … Sporadic₊₁ 1₋₁ 3₋₁ᵢ 2₋₁ 5₋₁ᵢ 3 8 MDGMalawi … … … … … 42₋₃ … … 87₋₂ 72₋₃ᵢ 28₋₂ 27 … 9 … … Affected₊₁ … … … 4₋₁ᵢ 2 0.3 MWIMali High High Medium High … 16₋₁ … … … 17₋₃ᵢ … 16₋₂ … … … … Very heavy₊₁ 1₋₄ 10₋₄ 1₋₄ 10₋₁ᵢ 3 9 MLIMauritania … … … … … 58₋₃ … … 51 28 … 44 … 14₋₂ … … Affected₊₁ 1₋₂ 24₋₁ᵢ 0.3 5₋₁ᵢ 1 4 MRTMauritius High Low Medium Low … … … … 100 100 91 100 40 100 29 … … 5₋₂ 22₋₂ 2₋₂ 8₋₁ᵢ 2 6 MUSMozambique … … … … … 31₋₄ … … … 48₋₃ᵢ 15₋₃ᵢ … … … … 45₋₄ Affected₊₁ 0.4₋₁ 1₋₁ᵢ 1₋₁ 3₋₁ᵢ 3 4 MOZNamibia Medium High Medium Low … … … … … … … 73₋₁ … … … … … 6₋₂ 9₋₂ 3₋₁ 5₋₁ᵢ 1 1 NAMNiger … … … … 100 22₋₃ … … 14 20 17 7 1 2 -₋₃ … Affected₊₁ 5 6₋₁ᵢ 4 5₋₁ᵢ 1 3 NERNigeria … … … … … 41₋₁ … … … … … … … … … … Very heavy₊₁ … … … 76₋₁ᵢ 9 26 NGARwanda … … … … 100 64₋₄ … … 52 71 67 61 35 83 23 … Sporadic₊₁ 4 6₋₁ᵢ 3 5₋₁ᵢ 4 3 RWASao Tome and Principe … … … … 100₋₂ … … … 88₋₂ 72₋₂ 88₋₂ 87₋₂ … 59₋₂ … … … … 28₋₄ᵢ … 1₋₁ᵢ 1 1 STPSenegal High High Medium High … 28₋₃ … … 78 … 40 44 13 27 … … Sporadic₊₁ 8 8₋₁ᵢ 15 14₋₁ᵢ 6 39 SENSeychelles … … … … 87 … … … 100 100 100 100 100 100 7 47₋₄ … - 48₋₁ᵢ - 1₋₁ᵢ … … SYC
Sierra Leone … … … … 50 … … … 32 64 55 13 1 2 10 … Affected₊₁ … … … 1₋₁ᵢ 0.4 0.4 SLE
Somalia … … … … … … … … … … … … … … … … Affected₊₁ … … … 7₋₁ᵢ 1 1 SOMSouth Africa … … … … … 46₋₃ 19 … … … … … … … … 92₋₄ Affected₊₁ 4₋₁ 1₋₁ᵢ 42₋₁ 9₋₁ᵢ 8 3 ZAFSouth Sudan … … … … … … … … … … … … … … … … Affected₊₁ … … … 1₋₁ᵢ 0.4 0.1 SSDTogo … … … … … … … … 40₊₁ 64 19₊₁ 23₊₁ 0.5₊₁ 2₊₁ 2₊₁ … Sporadic₊₁ … 7₋₁ᵢ … 7₋₁ᵢ 2 10 TGOUganda … … … … … 46₋₃ … … … … 41₋₂ … … … … … Affected₊₁ … … … 6₋₁ᵢ 4 2 UGAUnited Republic of Tanzania … … … … … … … … … … 20₋₃ᵢ 37 … 100 … 27 … … 4₋₃ … 7₋₁ᵢ 5 2 TZAZambia High High High High … 42₋₁ … … 82₋₂ … 68₋₃ 36₋₂ 6₋₂ 85₋₂ 4₋₃ … Sporadic₊₁ … … … 5₋₁ᵢ 3 1 ZMBZimbabwe … … … … … 46₋₄ … … … … … … … … … … Affected₊₁ 0.5₋₄ 13₋₄ 1₋₄ 20₋₁ᵢ 3 3 ZWE
A N N E X • STATISTICAl TAblES : TAblE 6451
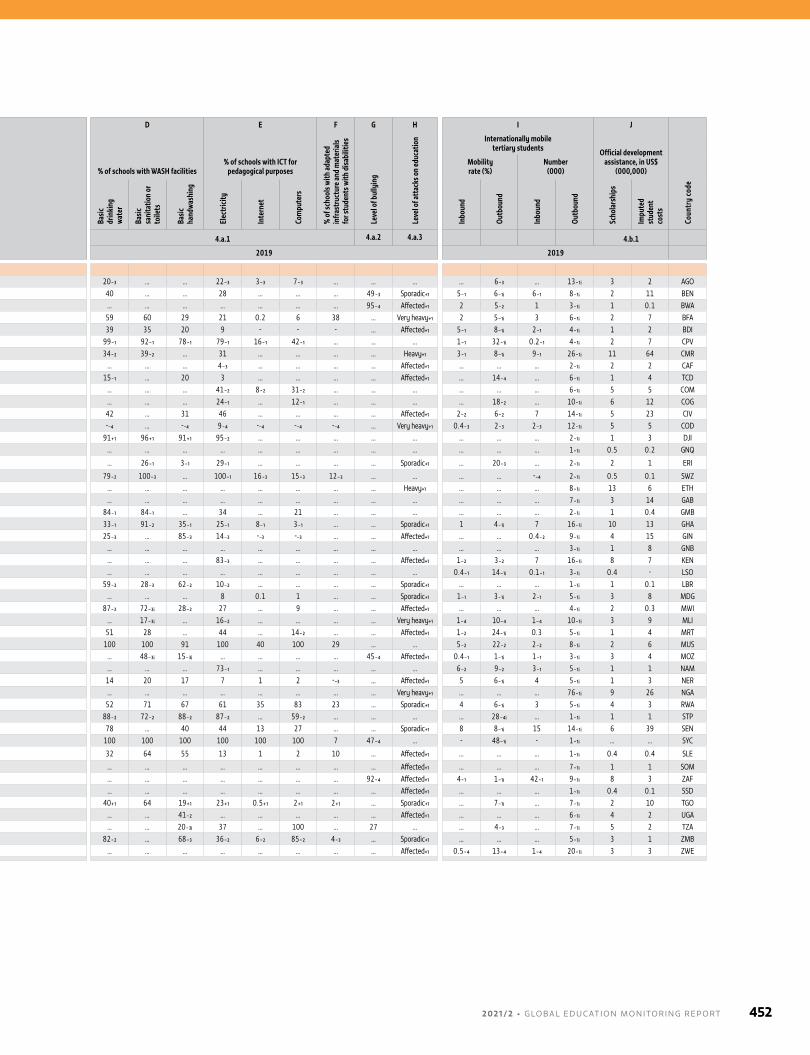
Country or territory
A B C D E F G H I J
Coun
try
code
Extent to which global citizenship education and education for sustainable development are mainstreamed
% o
f sch
ools
prov
idin
g
life s
kills
-bas
ed H
IV/A
IDS
educ
atio
n
% of students and youth with understanding of % of schools with WASH facilities
% of schools with ICT for pedagogical purposes
% o
f sch
ools
with
adap
ted
infra
stru
ctur
e and
mat
eria
ls fo
r stu
dent
s with
disa
bilit
ies
Leve
l of b
ully
ing
Leve
l of a
ttac
ks o
n ed
ucat
ion Internationally mobile
tertiary students Official development assistance, in US$
(000,000)Mobility rate (%)
Number (000)
Educ
atio
n po
licie
s/fra
mew
orks
Curr
iculu
m
In-s
ervi
ce
teac
her
trai
ning
Stud
ent
asse
ssm
ent
HIV/
AIDS
and
sexu
ality
Glob
al
citize
nshi
p
Scie
ntifi
c lit
erac
y
Basic
dr
inki
ng
wat
er
Basic
sa
nita
tion
or
toile
ts
Basic
ha
ndw
ashi
ng
Elec
trici
ty
Inte
rnet
Com
pute
rs
Inbo
und
Outb
ound
Inbo
und
Outb
ound
Scho
lars
hips
Impu
ted
stud
ent
cost
s
SDG indicator 4.7.1 4.7.2 4.7.4 4.7.5 4.a.1 4.a.2 4.a.3 4.b.1
Reference year 2017 2019 2019
Sub-Saharan AfricaAngola … … … … … 32₋₄ … … 20₋₃ … … 22₋₃ 3₋₃ 7₋₃ … … … … 6₋₃ … 13₋₁ᵢ 3 2 AGOBenin … … … … … … … … 40 … … 28 … … … 49₋₃ Sporadic₊₁ 5₋₁ 6₋₁ᵢ 6₋₁ 8₋₁ᵢ 2 11 BENBotswana … … … … … 47₋₃ 19₋₄ … … … … … … … … 95₋₄ Affected₊₁ 2 5₋₂ 1 3₋₁ᵢ 1 0.1 BWABurkina Faso … … … … 21 … … … 59 60 29 21 0.2 6 38 … Very heavy₊₁ 2 5₋₁ᵢ 3 6₋₁ᵢ 2 7 BFABurundi High Low Low High 100₋₂ … … … 39 35 20 9 - - - … Affected₊₁ 5₋₁ 8₋₁ᵢ 2₋₁ 4₋₁ᵢ 1 2 BDICabo Verde … … … … 100₋₂ … … … 99₋₁ 92₋₁ 78₋₁ 79₋₁ 16₋₁ 42₋₁ … … … 1₋₁ 32₋₁ᵢ 0.2₋₁ 4₋₁ᵢ 2 7 CPVCameroon Medium High Medium High … 39₋₁ … … 34₋₂ 39₋₂ … 31 … … … … Heavy₊₁ 3₋₁ 8₋₁ᵢ 9₋₁ 26₋₁ᵢ 11 64 CMRCentral African Republic High Low Medium High … … … … … … … 4₋₃ … … … … Affected₊₁ … … … 2₋₁ᵢ 2 2 CAFChad Medium Medium Medium High … … … … 15₋₁ … 20 3 … … … … Affected₊₁ … 14₋₄ … 6₋₁ᵢ 1 4 TCDComoros … … … … … … … … … … … 41₋₂ 8₋₂ 31₋₂ … … … … … … 6₋₁ᵢ 5 5 COMCongo … … … … … 33₋₄ … … … … … 24₋₁ … 12₋₁ … … … … 18₋₂ … 10₋₁ᵢ 6 12 COGCôte d'Ivoire Medium High Medium High … 27₋₄ … … 42 … 31 46 … … … … Affected₊₁ 2₋₂ 6₋₂ 7 14₋₁ᵢ 5 23 CIVD. R. Congo Medium Medium Low High -₋₄ … … … -₋₄ … -₋₄ 9₋₄ -₋₄ -₋₄ -₋₄ … Very heavy₊₁ 0.4₋₃ 2₋₃ 2₋₃ 12₋₁ᵢ 5 5 CODDjibouti … … … … … … … … 91₊₁ 96₊₁ 91₊₁ 95₋₂ … … … … … … … … 2₋₁ᵢ 1 3 DJIEquat. Guinea … … … … … … … … … … … … … … … … … … … … 1₋₁ᵢ 0.5 0.2 GNQ
Eritrea … … … … … … … … … 26₋₁ 3₋₁ 29₋₁ … … … … Sporadic₊₁ … 20₋₃ … 2₋₁ᵢ 2 1 ERI
Eswatini … … … … 100₋₁ … … … 79₋₂ 100₋₃ … 100₋₁ 16₋₃ 15₋₃ 12₋₃ … … … … -₋₄ 2₋₁ᵢ 0.5 0.1 SWZEthiopia Medium High Medium High … 31₋₃ … … … … … … … … … … Heavy₊₁ … … … 8₋₁ᵢ 13 6 ETHGabon … … … … … … … … … … … … … … … … … … … … 7₋₁ᵢ 3 14 GABGambia … … … … … … … … 84₋₁ 84₋₁ … 34 … 21 … … … … … … 2₋₁ᵢ 1 0.4 GMBGhana … … … … … … … … 33₋₁ 91₋₂ 35₋₁ 25₋₁ 8₋₁ 3₋₁ … … Sporadic₊₁ 1 4₋₁ᵢ 7 16₋₁ᵢ 10 13 GHAGuinea … … … … … 22₋₁ … … 25₋₃ … 85₋₃ 14₋₃ -₋₃ -₋₃ … … Affected₊₁ … … 0.4₋₂ 9₋₁ᵢ 4 15 GINGuinea-Bissau … … … … … … … … … … … … … … … … … … … … 3₋₁ᵢ 1 8 GNBKenya … … … … … … … … … … … 83₋₃ … … … … Affected₊₁ 1₋₂ 3₋₂ 7 16₋₁ᵢ 8 7 KENLesotho … … … … … … … … … … … … … … … … … 0.4₋₁ 14₋₁ᵢ 0.1₋₁ 3₋₁ᵢ 0.4 - LSOLiberia … … … … … … … … 59₋₂ 28₋₃ 62₋₂ 10₋₂ … … … … Sporadic₊₁ … … … 1₋₁ᵢ 1 0.1 LBRMadagascar … … … … … 24₋₄ … … … … … 8 0.1 1 … … Sporadic₊₁ 1₋₁ 3₋₁ᵢ 2₋₁ 5₋₁ᵢ 3 8 MDGMalawi … … … … … 42₋₃ … … 87₋₂ 72₋₃ᵢ 28₋₂ 27 … 9 … … Affected₊₁ … … … 4₋₁ᵢ 2 0.3 MWIMali High High Medium High … 16₋₁ … … … 17₋₃ᵢ … 16₋₂ … … … … Very heavy₊₁ 1₋₄ 10₋₄ 1₋₄ 10₋₁ᵢ 3 9 MLIMauritania … … … … … 58₋₃ … … 51 28 … 44 … 14₋₂ … … Affected₊₁ 1₋₂ 24₋₁ᵢ 0.3 5₋₁ᵢ 1 4 MRTMauritius High Low Medium Low … … … … 100 100 91 100 40 100 29 … … 5₋₂ 22₋₂ 2₋₂ 8₋₁ᵢ 2 6 MUSMozambique … … … … … 31₋₄ … … … 48₋₃ᵢ 15₋₃ᵢ … … … … 45₋₄ Affected₊₁ 0.4₋₁ 1₋₁ᵢ 1₋₁ 3₋₁ᵢ 3 4 MOZNamibia Medium High Medium Low … … … … … … … 73₋₁ … … … … … 6₋₂ 9₋₂ 3₋₁ 5₋₁ᵢ 1 1 NAMNiger … … … … 100 22₋₃ … … 14 20 17 7 1 2 -₋₃ … Affected₊₁ 5 6₋₁ᵢ 4 5₋₁ᵢ 1 3 NERNigeria … … … … … 41₋₁ … … … … … … … … … … Very heavy₊₁ … … … 76₋₁ᵢ 9 26 NGARwanda … … … … 100 64₋₄ … … 52 71 67 61 35 83 23 … Sporadic₊₁ 4 6₋₁ᵢ 3 5₋₁ᵢ 4 3 RWASao Tome and Principe … … … … 100₋₂ … … … 88₋₂ 72₋₂ 88₋₂ 87₋₂ … 59₋₂ … … … … 28₋₄ᵢ … 1₋₁ᵢ 1 1 STPSenegal High High Medium High … 28₋₃ … … 78 … 40 44 13 27 … … Sporadic₊₁ 8 8₋₁ᵢ 15 14₋₁ᵢ 6 39 SENSeychelles … … … … 87 … … … 100 100 100 100 100 100 7 47₋₄ … - 48₋₁ᵢ - 1₋₁ᵢ … … SYC
Sierra Leone … … … … 50 … … … 32 64 55 13 1 2 10 … Affected₊₁ … … … 1₋₁ᵢ 0.4 0.4 SLE
Somalia … … … … … … … … … … … … … … … … Affected₊₁ … … … 7₋₁ᵢ 1 1 SOMSouth Africa … … … … … 46₋₃ 19 … … … … … … … … 92₋₄ Affected₊₁ 4₋₁ 1₋₁ᵢ 42₋₁ 9₋₁ᵢ 8 3 ZAFSouth Sudan … … … … … … … … … … … … … … … … Affected₊₁ … … … 1₋₁ᵢ 0.4 0.1 SSDTogo … … … … … … … … 40₊₁ 64 19₊₁ 23₊₁ 0.5₊₁ 2₊₁ 2₊₁ … Sporadic₊₁ … 7₋₁ᵢ … 7₋₁ᵢ 2 10 TGOUganda … … … … … 46₋₃ … … … … 41₋₂ … … … … … Affected₊₁ … … … 6₋₁ᵢ 4 2 UGAUnited Republic of Tanzania … … … … … … … … … … 20₋₃ᵢ 37 … 100 … 27 … … 4₋₃ … 7₋₁ᵢ 5 2 TZAZambia High High High High … 42₋₁ … … 82₋₂ … 68₋₃ 36₋₂ 6₋₂ 85₋₂ 4₋₃ … Sporadic₊₁ … … … 5₋₁ᵢ 3 1 ZMBZimbabwe … … … … … 46₋₄ … … … … … … … … … … Affected₊₁ 0.5₋₄ 13₋₄ 1₋₄ 20₋₁ᵢ 3 3 ZWE
2 0 2 1 / 2 • G LO BA L E D U C AT I O N M O N I TO R I N G R E P O RT 452
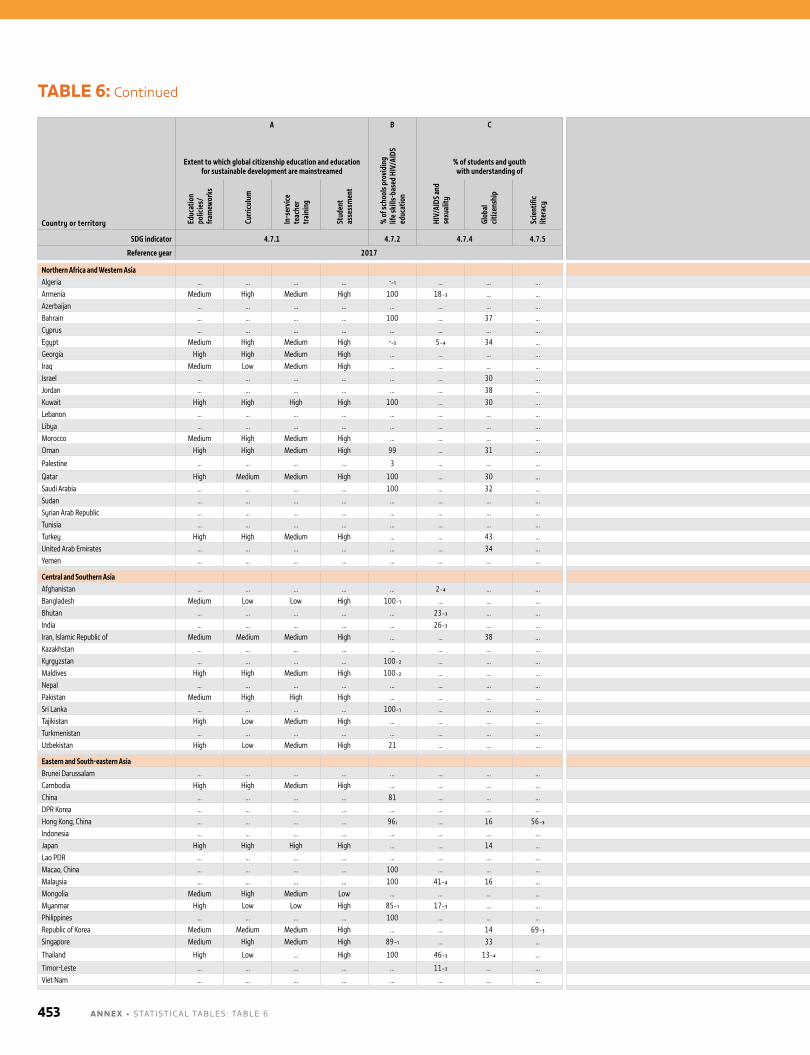
TABLE 6: Continued
Country or territory
A B C D E F G H I J
Coun
try
code
Extent to which global citizenship education and education for sustainable development are mainstreamed
% o
f sch
ools
prov
idin
g
life s
kills
-bas
ed H
IV/A
IDS
educ
atio
n
% of students and youth with understanding of % of schools with WASH facilities
% of schools with ICT for pedagogical purposes
% o
f sch
ools
with
adap
ted
infra
stru
ctur
e and
mat
eria
ls fo
r stu
dent
s with
disa
bilit
ies
Leve
l of b
ully
ing
Leve
l of a
ttac
ks o
n ed
ucat
ion Internationally mobile
tertiary students Official development assistance, in US$
(000,000)Mobility rate (%)
Number (000)
Educ
atio
n po
licie
s/fra
mew
orks
Curr
iculu
m
In-s
ervi
ce
teac
her
trai
ning
Stud
ent
asse
ssm
ent
HIV/
AIDS
and
sexu
ality
Glob
al
citize
nshi
p
Scie
ntifi
c lit
erac
y
Basic
dr
inki
ng
wat
er
Basic
sa
nita
tion
or
toile
ts
Basic
ha
ndw
ashi
ng
Elec
trici
ty
Inte
rnet
Com
pute
rs
Inbo
und
Outb
ound
Inbo
und
Outb
ound
Scho
lars
hips
Impu
ted
stud
ent
cost
s
SDG indicator 4.7.1 4.7.2 4.7.4 4.7.5 4.a.1 4.a.2 4.a.3 4.b.1
Reference year 2017 2019 2019
Northern Africa and Western AsiaAlgeria … … … … -₋₁ … … … … … … … … … … … Affected₊₁ 1₋₁ 2₋₁ᵢ 8 30₋₁ᵢ 19 103 DZAArmenia Medium High Medium High 100 18₋₃ … … 100 … … 100 100 100 … 40₋₃ Sporadic₊₁ 6 5₋₁ᵢ 5 5₋₁ᵢ 5 10 ARMAzerbaijan … … … … … … … … 100 100 100 100 54 95 … … Affected₊₁ 2 22₋₁ᵢ 5 44₋₁ᵢ 8 12 AZEBahrain … … … … 100 … 37 … 100 100 100 100 100 100 100 29₋₃ … 14 13₋₁ᵢ 7 6₋₁ᵢ … … BHRCyprus … … … … … … … … … … … … … … … … … 24₋₁ 56₋₁ᵢ 11₋₁ 26₋₁ᵢ … … CYPEgypt Medium High Medium High -₋₃ 5₋₄ 34 … … 100₋₃ 100₋₃ 100₋₃ 71 95 … 75₋₄ Sporadic₊₁ 2₋₃ 1₋₂ 51₋₃ 39₋₁ᵢ 13 52 EGYGeorgia High High Medium High … … … … 100 100 100 100 100 100 … 42₋₁ … 8 8₋₁ᵢ 12 11₋₁ᵢ 5 18 GEOIraq Medium Low Medium High … … … … … … … … … … … … Affected₊₁ … … … 32₋₁ᵢ 6 10 IRQIsrael … … … … … … 30 … 100₋₃ 100₋₃ 100₋₃ 100₋₃ 85₋₃ᵢ 85₋₃ᵢ … 24 … … 4₋₁ᵢ … 16₋₁ᵢ … … ISRJordan … … … … … … 38 … 36 36 36₋₁ 36 13 13 … 62₋₁ … 14₋₁ 8₋₁ᵢ 41 26₋₁ᵢ 14 16 JORKuwait High High High High 100 … 30 … 100 100 100 100 100 100 100 79₋₄ … … 21₋₁ᵢ … 25₋₁ᵢ … … KWTLebanon … … … … … … … … 60₋₃ᵢ 92₋₃ᵢ 100 100 91 67 … 18₋₂ Sporadic₊₁ 10 8₋₁ᵢ 23 18₋₁ᵢ 4 28 LBNLibya … … … … … … … … … … … … … … … … Affected₊₁ … … … 10₋₁ᵢ 1 7 LBYMorocco Medium High Medium High … … … … 76 91 81 96 83 76 20 71₋₁ Affected₊₁ 2 5₋₁ᵢ 22 52₋₁ᵢ 22 141 MAROman High High Medium High 99 … 31 … 100 100 100 100 100 100 … 86₋₄ … 3 14₋₁ᵢ 3 16₋₁ᵢ … … OMN
Palestine … … … … 3 … … … 99 100 100 100 91 94 59 … Heavy₊₁ - 12₋₁ᵢ - 27₋₁ᵢ 5 21 PSE
Qatar High Medium Medium High 100 … 30 … 100 100 100 100 100 100 100 64₋₁ … 35 27₋₁ᵢ 12 9₋₁ᵢ … … QATSaudi Arabia … … … … 100 … 32 … 100 100 100 100 100 100 100 54₋₁ … 4 5₋₁ᵢ 73 77₋₁ᵢ … … SAUSudan … … … … … … … … 93₋₃ 73₋₃ … 54₋₃ … … … … Affected₊₁ … 2₋₄ … 13₋₁ᵢ 3 5 SDNSyrian Arab Republic … … … … … … … … … … … … … … … … Heavy₊₁ … 7₋₃ … 64₋₁ᵢ 15 142 SYRTunisia … … … … … … … … 98₋₁ 100₋₂ 100₋₁ 100₋₁ 49₋₁ 96₋₁ … … Sporadic₊₁ 2₋₁ 9₋₁ᵢ 6₋₁ 24₋₁ᵢ 13 84 TUNTurkey High High Medium High … … 43 … … … … … … … … 45₋₁ Heavy₊₁ 2₋₁ 1₋₁ᵢ 125₋₁ 48₋₁ᵢ 17 87 TURUnited Arab Emirates … … … … … … 34 … 100 100 100 100 100 100 100 59₋₁ … 49₋₃ 6₋₂ 225 12₋₁ᵢ … … AREYemen … … … … … … … … … … … … … … … 42 Heavy₊₁ … … … 26₋₁ᵢ 2 15 YEM
Central and Southern AsiaAfghanistan … … … … … 2₋₄ … … 60₋₁ 26₋₁ 5₋₁ … … … … 44 Heavy₊₁ … 8₋₁ᵢ … 30₋₁ᵢ 6 8 AFGBangladesh Medium Low Low High 100₋₁ … … … 79₋₃ 37₋₃ 29₋₃ 43₋₃ 4₋₃ 18₋₃ … 24 Affected₊₁ … 2₋₁ᵢ … 50₋₁ᵢ 8 26 BGDBhutan … … … … … 23₋₃ … … 80₊₁ … … 95₊₁ 61₊₁ 21₊₁ … 30₋₃ … … 38₋₁ᵢ … 5₋₁ᵢ 2 0.2 BTNIndia … … … … … 26₋₃ … … 94 89 86 65 6 17 69 … Very heavy₊₁ 0.1 1₋₁ᵢ 47 375₋₁ᵢ 19 180 INDIran, Islamic Republic of Medium Medium Medium High … … 38 … … … … … … … … 77₋₄ Sporadic₊₁ 1₋₁ 2₋₁ᵢ 21₋₁ 56₋₁ᵢ 12 93 IRNKazakhstan … … … … … … … … … … … 100₊₁ … … 7₋₁ 49₋₁ Sporadic₊₁ 3 13₋₁ᵢ 41₊₁ 84₋₁ᵢ 8 13 KAZKyrgyzstan … … … … 100₋₂ … … … … … 100₋₂ 100₋₂ 41₋₂ 89₋₂ … … Sporadic₊₁ 9 5₋₁ᵢ 20 11₋₁ᵢ 5 4 KGZMaldives High High Medium High 100₋₂ … … … 100₋₂ 100₋₂ 100₋₂ 100 99 73 100₋₂ 30 … … 20₋₂ … 3₋₁ᵢ 1 0.1 MDVNepal … … … … … … … … 39₋₃ᵢ … … … … … … 51₋₄ Sporadic₊₁ … 20₋₁ᵢ … 82₋₁ᵢ 6 14 NPLPakistan Medium High High High … … … … 52₋₃ᵢ … … … … … … … Very heavy₊₁ … 3₋₁ᵢ … 59₋₁ᵢ 15 50 PAKSri Lanka … … … … 100₋₁ … … … 87₋₁ 90₋₁ 87₋₁ 100₋₁ 16₋₁ 51₋₁ … 39₋₃ Sporadic₊₁ 0.5 8₋₁ᵢ 2 24₋₁ᵢ 7 3 LKATajikistan High Low Medium High … … … … … … … … … … … … … 1₋₂ 7₋₂ 2₋₂ 20₋₁ᵢ 2 2 TJKTurkmenistan … … … … … … … … 100 100 100 100 28 99 … … Sporadic₊₁ 0.3 … 0.2 45₋₁ᵢ 1 1 TKMUzbekistan High Low Medium High 21 … … … 90₋₁ 85 85 100 87 97₋₁ 27 … … 0.2₋₁ 12₋₁ᵢ 1₋₁ 37₋₁ᵢ 4 7 UZB
Eastern and South-eastern AsiaBrunei Darussalam … … … … … … … … … 100 100 100 … … … 81₋₁ … 3 25₋₁ᵢ 0.4 3₋₁ᵢ … … BRNCambodia High High Medium High … … … … … 48₋₃ᵢ 49₋₃ᵢ … … … … … … … 3₋₁ᵢ … 6₋₁ᵢ 13 3 KHMChina … … … … 81 … … … 100 99 98 99 98 98 … … Affected₊₁ 0.4 2₋₁ 201 993₋₁ 23 376 CHNDPR Korea … … … … … … … … … … … … … … … … Sporadic₊₁ … 0.3₋₁ᵢ … 1₋₁ᵢ 0.1 0.4 PRKHong Kong, China … … … … 96 ᵢ … 16 56₋₃ 100 100 100 100 99 ᵢ 99 ᵢ 95 ᵢ 54₋₁ … 14 12₋₁ᵢ 43 36₋₁ᵢ … … HKGIndonesia … … … … … … … … 58₋₁ 50₋₁ 69₋₁ 93₋₁ … 40₋₁ … 66₋₁ Sporadic₊₁ 0.1₋₁ 1₋₁ᵢ 8₋₁ 50₋₁ᵢ 36 45 IDNJapan High High High High … … 14 … … … … … … … … 35₋₁ … 5₋₁ 1₋₁ᵢ 183₋₁ 32₋₁ᵢ … … JPNLao PDR … … … … … … … … … … … 50 … … … 13₋₄ … 0.5 6₋₁ᵢ 0.5 7₋₁ᵢ 11 0.4 LAOMacao, China … … … … 100 … … … 100 100 100 100 100 100 78 58₋₁ … 52 8₋₁ᵢ 18 3₋₁ᵢ … … MACMalaysia … … … … 100 41₋₄ 16 … 92₋₁ 100₋₁ 92₋₁ 93 92 100₋₂ 40₋₁ 66₋₁ … 7 5₋₁ᵢ 82 62₋₁ᵢ 5 14 MYSMongolia Medium High Medium Low … … … … … … … … 71₋₃ … … … … 1₋₁ 8₋₁ᵢ 2₋₁ 12₋₁ᵢ 13 6 MNGMyanmar High Low Low High 85₋₁ 17₋₃ … … 75₋₁ 64₋₁ 56₋₁ 27₋₂ 0.2₋₁ 1₋₁ 1₋₁ 50₋₃ Affected₊₁ -₋₁ 1₋₁ᵢ 0.5₋₁ 10₋₁ᵢ 15 1 MMRPhilippines … … … … 100 … … … 59 58 83 96 29 78 6 88₋₁ Affected₊₁ … 0.5₋₂ … 19₋₁ᵢ 11 4 PHLRepublic of Korea Medium Medium Medium High … … 14 69₋₃ 100₋₃ 100₋₃ 100₋₃ 100₋₃ 100₋₃ 100₋₃ … 20₋₁ … 3₋₁ 3₋₁ᵢ 85₋₁ 102₋₁ᵢ … … KORSingapore Medium High Medium High 89₋₁ … 33 … 100₋₁ 100₋₁ 100₋₁ 100₋₁ 100₋₁ 100₋₁ 93₋₁ 64₋₁ … … … 52₋₁ 24₋₁ᵢ … … SGP
Thailand High Low … High 100 46₋₃ 13₋₄ … 100 … 100 100 100 100 … 50₋₁ Affected₊₁ 1₋₃ 1₋₃ 32₋₃ 33₋₁ᵢ 6 10 THA
Timor-Leste … … … … … 11₋₃ … … 68 … 68 84 … … … 31₋₄ … … … … 3₋₁ᵢ 5 2 TLSViet Nam … … … … … … … … … … … … … … … 62₋₁ … 0.4 4₋₃ 7 109₋₁ᵢ 26 56 VNM
A N N E X • STATISTICAl TAblES : TAblE 6453
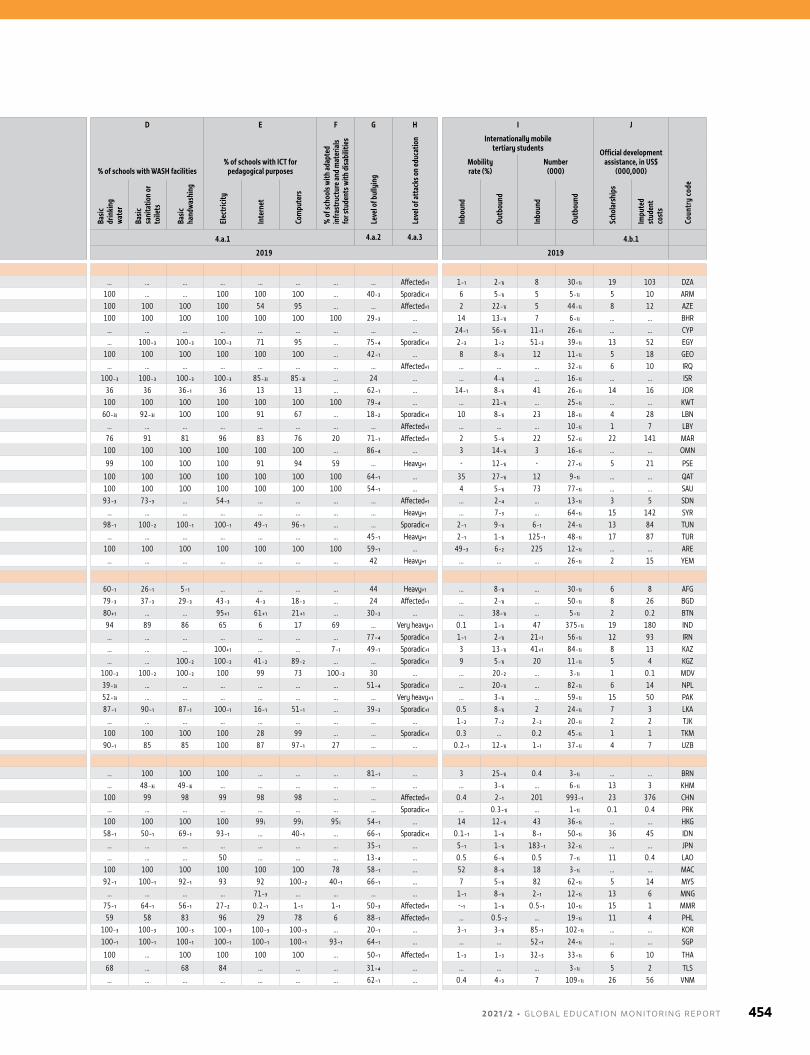
Country or territory
A B C D E F G H I J
Coun
try
code
Extent to which global citizenship education and education for sustainable development are mainstreamed
% o
f sch
ools
prov
idin
g
life s
kills
-bas
ed H
IV/A
IDS
educ
atio
n
% of students and youth with understanding of % of schools with WASH facilities
% of schools with ICT for pedagogical purposes
% o
f sch
ools
with
adap
ted
infra
stru
ctur
e and
mat
eria
ls fo
r stu
dent
s with
disa
bilit
ies
Leve
l of b
ully
ing
Leve
l of a
ttac
ks o
n ed
ucat
ion Internationally mobile
tertiary students Official development assistance, in US$
(000,000)Mobility rate (%)
Number (000)
Educ
atio
n po
licie
s/fra
mew
orks
Curr
iculu
m
In-s
ervi
ce
teac
her
trai
ning
Stud
ent
asse
ssm
ent
HIV/
AIDS
and
sexu
ality
Glob
al
citize
nshi
p
Scie
ntifi
c lit
erac
y
Basic
dr
inki
ng
wat
er
Basic
sa
nita
tion
or
toile
ts
Basic
ha
ndw
ashi
ng
Elec
trici
ty
Inte
rnet
Com
pute
rs
Inbo
und
Outb
ound
Inbo
und
Outb
ound
Scho
lars
hips
Impu
ted
stud
ent
cost
s
SDG indicator 4.7.1 4.7.2 4.7.4 4.7.5 4.a.1 4.a.2 4.a.3 4.b.1
Reference year 2017 2019 2019
Northern Africa and Western AsiaAlgeria … … … … -₋₁ … … … … … … … … … … … Affected₊₁ 1₋₁ 2₋₁ᵢ 8 30₋₁ᵢ 19 103 DZAArmenia Medium High Medium High 100 18₋₃ … … 100 … … 100 100 100 … 40₋₃ Sporadic₊₁ 6 5₋₁ᵢ 5 5₋₁ᵢ 5 10 ARMAzerbaijan … … … … … … … … 100 100 100 100 54 95 … … Affected₊₁ 2 22₋₁ᵢ 5 44₋₁ᵢ 8 12 AZEBahrain … … … … 100 … 37 … 100 100 100 100 100 100 100 29₋₃ … 14 13₋₁ᵢ 7 6₋₁ᵢ … … BHRCyprus … … … … … … … … … … … … … … … … … 24₋₁ 56₋₁ᵢ 11₋₁ 26₋₁ᵢ … … CYPEgypt Medium High Medium High -₋₃ 5₋₄ 34 … … 100₋₃ 100₋₃ 100₋₃ 71 95 … 75₋₄ Sporadic₊₁ 2₋₃ 1₋₂ 51₋₃ 39₋₁ᵢ 13 52 EGYGeorgia High High Medium High … … … … 100 100 100 100 100 100 … 42₋₁ … 8 8₋₁ᵢ 12 11₋₁ᵢ 5 18 GEOIraq Medium Low Medium High … … … … … … … … … … … … Affected₊₁ … … … 32₋₁ᵢ 6 10 IRQIsrael … … … … … … 30 … 100₋₃ 100₋₃ 100₋₃ 100₋₃ 85₋₃ᵢ 85₋₃ᵢ … 24 … … 4₋₁ᵢ … 16₋₁ᵢ … … ISRJordan … … … … … … 38 … 36 36 36₋₁ 36 13 13 … 62₋₁ … 14₋₁ 8₋₁ᵢ 41 26₋₁ᵢ 14 16 JORKuwait High High High High 100 … 30 … 100 100 100 100 100 100 100 79₋₄ … … 21₋₁ᵢ … 25₋₁ᵢ … … KWTLebanon … … … … … … … … 60₋₃ᵢ 92₋₃ᵢ 100 100 91 67 … 18₋₂ Sporadic₊₁ 10 8₋₁ᵢ 23 18₋₁ᵢ 4 28 LBNLibya … … … … … … … … … … … … … … … … Affected₊₁ … … … 10₋₁ᵢ 1 7 LBYMorocco Medium High Medium High … … … … 76 91 81 96 83 76 20 71₋₁ Affected₊₁ 2 5₋₁ᵢ 22 52₋₁ᵢ 22 141 MAROman High High Medium High 99 … 31 … 100 100 100 100 100 100 … 86₋₄ … 3 14₋₁ᵢ 3 16₋₁ᵢ … … OMN
Palestine … … … … 3 … … … 99 100 100 100 91 94 59 … Heavy₊₁ - 12₋₁ᵢ - 27₋₁ᵢ 5 21 PSE
Qatar High Medium Medium High 100 … 30 … 100 100 100 100 100 100 100 64₋₁ … 35 27₋₁ᵢ 12 9₋₁ᵢ … … QATSaudi Arabia … … … … 100 … 32 … 100 100 100 100 100 100 100 54₋₁ … 4 5₋₁ᵢ 73 77₋₁ᵢ … … SAUSudan … … … … … … … … 93₋₃ 73₋₃ … 54₋₃ … … … … Affected₊₁ … 2₋₄ … 13₋₁ᵢ 3 5 SDNSyrian Arab Republic … … … … … … … … … … … … … … … … Heavy₊₁ … 7₋₃ … 64₋₁ᵢ 15 142 SYRTunisia … … … … … … … … 98₋₁ 100₋₂ 100₋₁ 100₋₁ 49₋₁ 96₋₁ … … Sporadic₊₁ 2₋₁ 9₋₁ᵢ 6₋₁ 24₋₁ᵢ 13 84 TUNTurkey High High Medium High … … 43 … … … … … … … … 45₋₁ Heavy₊₁ 2₋₁ 1₋₁ᵢ 125₋₁ 48₋₁ᵢ 17 87 TURUnited Arab Emirates … … … … … … 34 … 100 100 100 100 100 100 100 59₋₁ … 49₋₃ 6₋₂ 225 12₋₁ᵢ … … AREYemen … … … … … … … … … … … … … … … 42 Heavy₊₁ … … … 26₋₁ᵢ 2 15 YEM
Central and Southern AsiaAfghanistan … … … … … 2₋₄ … … 60₋₁ 26₋₁ 5₋₁ … … … … 44 Heavy₊₁ … 8₋₁ᵢ … 30₋₁ᵢ 6 8 AFGBangladesh Medium Low Low High 100₋₁ … … … 79₋₃ 37₋₃ 29₋₃ 43₋₃ 4₋₃ 18₋₃ … 24 Affected₊₁ … 2₋₁ᵢ … 50₋₁ᵢ 8 26 BGDBhutan … … … … … 23₋₃ … … 80₊₁ … … 95₊₁ 61₊₁ 21₊₁ … 30₋₃ … … 38₋₁ᵢ … 5₋₁ᵢ 2 0.2 BTNIndia … … … … … 26₋₃ … … 94 89 86 65 6 17 69 … Very heavy₊₁ 0.1 1₋₁ᵢ 47 375₋₁ᵢ 19 180 INDIran, Islamic Republic of Medium Medium Medium High … … 38 … … … … … … … … 77₋₄ Sporadic₊₁ 1₋₁ 2₋₁ᵢ 21₋₁ 56₋₁ᵢ 12 93 IRNKazakhstan … … … … … … … … … … … 100₊₁ … … 7₋₁ 49₋₁ Sporadic₊₁ 3 13₋₁ᵢ 41₊₁ 84₋₁ᵢ 8 13 KAZKyrgyzstan … … … … 100₋₂ … … … … … 100₋₂ 100₋₂ 41₋₂ 89₋₂ … … Sporadic₊₁ 9 5₋₁ᵢ 20 11₋₁ᵢ 5 4 KGZMaldives High High Medium High 100₋₂ … … … 100₋₂ 100₋₂ 100₋₂ 100 99 73 100₋₂ 30 … … 20₋₂ … 3₋₁ᵢ 1 0.1 MDVNepal … … … … … … … … 39₋₃ᵢ … … … … … … 51₋₄ Sporadic₊₁ … 20₋₁ᵢ … 82₋₁ᵢ 6 14 NPLPakistan Medium High High High … … … … 52₋₃ᵢ … … … … … … … Very heavy₊₁ … 3₋₁ᵢ … 59₋₁ᵢ 15 50 PAKSri Lanka … … … … 100₋₁ … … … 87₋₁ 90₋₁ 87₋₁ 100₋₁ 16₋₁ 51₋₁ … 39₋₃ Sporadic₊₁ 0.5 8₋₁ᵢ 2 24₋₁ᵢ 7 3 LKATajikistan High Low Medium High … … … … … … … … … … … … … 1₋₂ 7₋₂ 2₋₂ 20₋₁ᵢ 2 2 TJKTurkmenistan … … … … … … … … 100 100 100 100 28 99 … … Sporadic₊₁ 0.3 … 0.2 45₋₁ᵢ 1 1 TKMUzbekistan High Low Medium High 21 … … … 90₋₁ 85 85 100 87 97₋₁ 27 … … 0.2₋₁ 12₋₁ᵢ 1₋₁ 37₋₁ᵢ 4 7 UZB
Eastern and South-eastern AsiaBrunei Darussalam … … … … … … … … … 100 100 100 … … … 81₋₁ … 3 25₋₁ᵢ 0.4 3₋₁ᵢ … … BRNCambodia High High Medium High … … … … … 48₋₃ᵢ 49₋₃ᵢ … … … … … … … 3₋₁ᵢ … 6₋₁ᵢ 13 3 KHMChina … … … … 81 … … … 100 99 98 99 98 98 … … Affected₊₁ 0.4 2₋₁ 201 993₋₁ 23 376 CHNDPR Korea … … … … … … … … … … … … … … … … Sporadic₊₁ … 0.3₋₁ᵢ … 1₋₁ᵢ 0.1 0.4 PRKHong Kong, China … … … … 96 ᵢ … 16 56₋₃ 100 100 100 100 99 ᵢ 99 ᵢ 95 ᵢ 54₋₁ … 14 12₋₁ᵢ 43 36₋₁ᵢ … … HKGIndonesia … … … … … … … … 58₋₁ 50₋₁ 69₋₁ 93₋₁ … 40₋₁ … 66₋₁ Sporadic₊₁ 0.1₋₁ 1₋₁ᵢ 8₋₁ 50₋₁ᵢ 36 45 IDNJapan High High High High … … 14 … … … … … … … … 35₋₁ … 5₋₁ 1₋₁ᵢ 183₋₁ 32₋₁ᵢ … … JPNLao PDR … … … … … … … … … … … 50 … … … 13₋₄ … 0.5 6₋₁ᵢ 0.5 7₋₁ᵢ 11 0.4 LAOMacao, China … … … … 100 … … … 100 100 100 100 100 100 78 58₋₁ … 52 8₋₁ᵢ 18 3₋₁ᵢ … … MACMalaysia … … … … 100 41₋₄ 16 … 92₋₁ 100₋₁ 92₋₁ 93 92 100₋₂ 40₋₁ 66₋₁ … 7 5₋₁ᵢ 82 62₋₁ᵢ 5 14 MYSMongolia Medium High Medium Low … … … … … … … … 71₋₃ … … … … 1₋₁ 8₋₁ᵢ 2₋₁ 12₋₁ᵢ 13 6 MNGMyanmar High Low Low High 85₋₁ 17₋₃ … … 75₋₁ 64₋₁ 56₋₁ 27₋₂ 0.2₋₁ 1₋₁ 1₋₁ 50₋₃ Affected₊₁ -₋₁ 1₋₁ᵢ 0.5₋₁ 10₋₁ᵢ 15 1 MMRPhilippines … … … … 100 … … … 59 58 83 96 29 78 6 88₋₁ Affected₊₁ … 0.5₋₂ … 19₋₁ᵢ 11 4 PHLRepublic of Korea Medium Medium Medium High … … 14 69₋₃ 100₋₃ 100₋₃ 100₋₃ 100₋₃ 100₋₃ 100₋₃ … 20₋₁ … 3₋₁ 3₋₁ᵢ 85₋₁ 102₋₁ᵢ … … KORSingapore Medium High Medium High 89₋₁ … 33 … 100₋₁ 100₋₁ 100₋₁ 100₋₁ 100₋₁ 100₋₁ 93₋₁ 64₋₁ … … … 52₋₁ 24₋₁ᵢ … … SGP
Thailand High Low … High 100 46₋₃ 13₋₄ … 100 … 100 100 100 100 … 50₋₁ Affected₊₁ 1₋₃ 1₋₃ 32₋₃ 33₋₁ᵢ 6 10 THA
Timor-Leste … … … … … 11₋₃ … … 68 … 68 84 … … … 31₋₄ … … … … 3₋₁ᵢ 5 2 TLSViet Nam … … … … … … … … … … … … … … … 62₋₁ … 0.4 4₋₃ 7 109₋₁ᵢ 26 56 VNM
2 0 2 1 / 2 • G LO BA L E D U C AT I O N M O N I TO R I N G R E P O RT 454
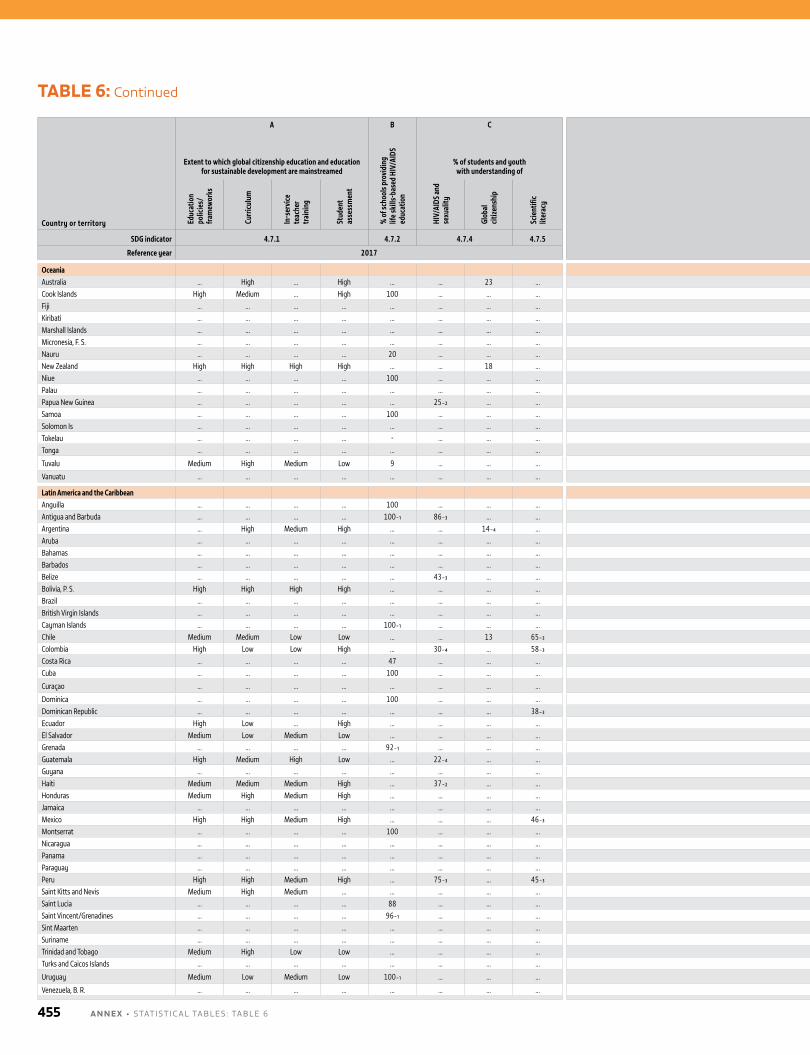
TABLE 6: Continued
Country or territory
A B C D E F G H I J
Coun
try
code
Extent to which global citizenship education and education for sustainable development are mainstreamed
% o
f sch
ools
prov
idin
g
life s
kills
-bas
ed H
IV/A
IDS
educ
atio
n
% of students and youth with understanding of % of schools with WASH facilities
% of schools with ICT for pedagogical purposes
% o
f sch
ools
with
adap
ted
infra
stru
ctur
e and
mat
eria
ls fo
r stu
dent
s with
disa
bilit
ies
Leve
l of b
ully
ing
Leve
l of a
ttac
ks o
n ed
ucat
ion Internationally mobile
tertiary students Official development assistance, in US$
(000,000)Mobility rate (%)
Number (000)
Educ
atio
n po
licie
s/fra
mew
orks
Curr
iculu
m
In-s
ervi
ce
teac
her
trai
ning
Stud
ent
asse
ssm
ent
HIV/
AIDS
and
sexu
ality
Glob
al
citize
nshi
p
Scie
ntifi
c lit
erac
y
Basic
dr
inki
ng
wat
er
Basic
sa
nita
tion
or
toile
ts
Basic
ha
ndw
ashi
ng
Elec
trici
ty
Inte
rnet
Com
pute
rs
Inbo
und
Outb
ound
Inbo
und
Outb
ound
Scho
lars
hips
Impu
ted
stud
ent
cost
s
SDG indicator 4.7.1 4.7.2 4.7.4 4.7.5 4.a.1 4.a.2 4.a.3 4.b.1
Reference year 2017 2019 2019
OceaniaAustralia … High … High … … 23 … 100₋₃ 100₋₃ 100₋₃ 100₋₃ 100₋₃ 100₋₃ … 63₋₁ … 27₋₁ 1₋₁ᵢ 445₋₁ 13₋₁ᵢ … … AUSCook Islands High Medium … High 100 … … … 100 22 100 100 100 100 100 31₋₄ … … … … 0.2₋₁ᵢ 0.1 - COKFiji … … … … … … … … … … … 98₋₃ … … … 30₋₃ … … … … 1₋₁ᵢ 4 0.1 FJIKiribati … … … … … … … … … … … … … … … … … … … … 1₋₁ᵢ 3 - KIRMarshall Islands … … … … … … … … 68 65 63 74 30 93 21₋₃ … … 6 … 0.1 0.3₋₁ᵢ - - MHLMicronesia, F. S. … … … … … … … … … … … … … … … … … … … … 0.2₋₁ᵢ 0.2 … FSMNauru … … … … 20 … … … 100 100 75 100 … 100 … … … … … … 0.1₋₁ᵢ 1 … NRUNew Zealand High High High High … … 18 … … … … … … … … 67₋₁ … 20₋₁ 2₋₁ᵢ 53₋₁ 5₋₁ᵢ … … NZLNiue … … … … 100 … … … 100 100 100 100 100 100 100 … … … … … -₋₁ᵢ 0.4 … NIUPalau … … … … … … … … … … … … … … … … … … … … 0.1₋₁ᵢ 0.1 - PLWPapua New Guinea … … … … … 25₋₂ … … … … … … … … … … … … … … 1₋₁ᵢ 10 0.1 PNGSamoa … … … … 100 … … … 100 100 100 100 33 15 15 … … 4₋₁ 44₋₁ᵢ 0.1 1₋₁ᵢ 7 … WSMSolomon Is … … … … … … … … 46 … … 56 2 13 … … … … … … 3₋₁ᵢ 5 - SLBTokelau … … … … - … … … 100 100 100 100 - 100 - 40 … … … … 0.1₋₁ᵢ - - TKLTonga … … … … … … … … … … … … … … … 38₋₂ … … … … 1₋₁ᵢ 3 - TON
Tuvalu Medium High Medium Low 9 … … … 50 70 100 100 - 70 - … … … … … 0.4₋₁ᵢ 1 - TUV
Vanuatu … … … … … … … … … … … … … … … … … … … … 2₋₁ᵢ 2 2 VUT
Latin America and the CaribbeanAnguilla … … … … 100 … … … 100 100 100 100 100 100 100 26₋₃ … … … … 0.1₋₁ᵢ … … AIAAntigua and Barbuda … … … … 100₋₁ 86₋₃ … … 100₋₁ 100₋₁ 100₋₁ 100₋₁ 90₋₁ 90₋₁ 5₋₁ … … … … … 1₋₁ᵢ 0.2 - ATGArgentina … High Medium High … … 14₋₄ … … … … 97₋₁ 43₋₁ 65₋₁ … 62₋₁ … 3₋₂ 0.3₋₂ 109₋₁ 9₋₁ᵢ 4 9 ARGAruba … … … … … … … … … … … … … … … … … 28₋₃ 20₋₃ 0.3₋₃ 0.4₋₁ᵢ … … ABWBahamas … … … … … … … … … … … … … … … … … … … … 4₋₁ᵢ … … BHSBarbados … … … … … … … … 100 100 100 100 … … … … … … … … 1₋₁ᵢ … … BRBBelize … … … … … 43₋₃ … … … … … … … … … … … … 9₋₁ᵢ … 1₋₁ᵢ 0.3 0.1 BLZBolivia, P. S. High High High High … … … … … … … … … … … … … … … … 20₋₁ᵢ 1 3 BOLBrazil … … … … … … … … … … 95₋₂ 96₋₂ 62₋₂ 54₋₂ 28₋₂ 56₋₁ … 0.2₋₁ 1₋₁ᵢ 21₋₁ 67₋₁ᵢ 18 48 BRABritish Virgin Islands … … … … … … … … 100₋₁ 100₋₁ 91₋₁ 100₋₁ 100₋₁ 100₋₁ 26₋₁ … … 17₋₃ 103₋₁ᵢ 0.1₋₃ 0.4₋₁ᵢ … … VGBCayman Islands … … … … 100₋₁ … … … 100₋₁ 100₋₁ 100₋₁ 100₋₁ 100₋₁ 100₋₁ 100₋₁ … … … … … 1₋₁ᵢ … … CYMChile Medium Medium Low Low … … 13 65₋₃ … … … … … … … 54₋₁ … 0.5₋₁ 1₋₁ᵢ 6₋₁ 17₋₁ᵢ … … CHLColombia High Low Low High … 30₋₄ … 58₋₃ … … … 100 37 94 … 59₋₁ Heavy₊₁ 0.2₋₁ 2₋₁ᵢ 5 47₋₁ᵢ 8 37 COLCosta Rica … … … … 47 … … … 91 73 85 99 84 95 65 52₋₁ … … 2₋₁ᵢ … 3₋₁ᵢ 1 3 CRICuba … … … … 100 … … … 100₋₁ 100₋₁ 100 100 16 100 … … … … 1₋₁ᵢ … 2₋₁ᵢ 2 2 CUB
Curaçao … … … … … … … … … … … … … … … … … … … … 0.2₋₁ᵢ … … CUW
Dominica … … … … 100 … … … 100 100 100 100 100 100 100 … … … … … 1₋₁ᵢ 1 0.2 DMADominican Republic … … … … … … … 38₋₃ … 90₋₃ᵢ … … 23₋₃ … … 66₋₁ … 2₋₂ 1₋₂ 10₋₂ 4₋₁ᵢ 1 1 DOMEcuador High Low … High … … … … 40₋₁ 83₋₃ᵢ 83₋₁ 79₋₁ 39₋₁ 75₋₁ … … … 1₋₄ 3₋₄ 6₋₁ 23₋₁ᵢ 3 9 ECUEl Salvador Medium Low Medium Low … … … … 82₋₂ … … 98₋₁ 23₋₁ 61₋₁ 30₋₁ … … 1₋₁ 2₋₁ᵢ 1₋₁ 5₋₁ᵢ 1 2 SLVGrenada … … … … 92₋₁ … … … 100₋₁ … 100₋₁ 100₋₁ 72₋₁ 72₋₁ 22₋₁ … … 85₋₁ 5₋₁ᵢ 8₋₁ 0.5₋₁ᵢ - - GRDGuatemala High Medium High Low … 22₋₄ … … … 76₋₃ᵢ … … 9₋₃ 12₋₃ … 23₋₄ … … 1₋₄ … 4₋₁ᵢ 1 2 GTMGuyana … … … … … … … … … … … … … … … … … … … … 2₋₁ᵢ 1 0.1 GUYHaiti Medium Medium Medium High … 37₋₂ … … … … … … … … … … Sporadic₊₁ … … … 10₋₁ᵢ 5 6 HTIHonduras Medium High Medium High … … … … 88 … … 91 16₋₃ 16₋₃ 5₋₃ … … 1₋₁ 2₋₁ᵢ 2 5₋₁ᵢ 1 1 HNDJamaica … … … … … … … … 90 95 100 100 79 85 12₋₂ 26₋₂ … … 6₋₄ … 5₋₁ᵢ 1 0.5 JAMMexico High High Medium High … … … 46₋₃ … 75₋₃ᵢ … … 39₋₃ … … 51₋₁ … 0.2₋₁ 1₋₁ᵢ 7₋₁ 34₋₁ᵢ 9 36 MEXMontserrat … … … … 100 … … … 100 100 100 100 100 100 - … … … … … -₋₁ᵢ 0.1 … MSRNicaragua … … … … … … … … … … … … … … … … … … … … 3₋₁ᵢ 1 1 NICPanama … … … … … … … … … 82₋₃ᵢ … … … … … 57₋₁ … … 2₋₃ … 4₋₁ᵢ 1 1 PANParaguay … … … … … … … … 67₋₃ … 62₋₃ 94₋₃ 5₋₃ 5₋₃ … 17₋₂ … … … … 14₋₁ᵢ 1 1 PRYPeru High High Medium High … 75₋₃ … 45₋₃ 55₋₁ … … 89 50 76 33 52₋₁ … … 2₋₂ … 34₋₁ᵢ 4 13 PERSaint Kitts and Nevis Medium High Medium … … … … … 79₋₃ … 79₋₃ 100₋₃ … … … … … … 13₋₄ᵢ … 1₋₁ᵢ … … KNASaint Lucia … … … … 88 … … … 99 99 99 99 99 99 98 … … 18 46₋₁ᵢ 0.4 1₋₁ᵢ 1 0.1 LCASaint Vincent/Grenadines … … … … 96₋₁ … … … 100₋₁ 100₋₁ 100₋₁ 100₋₁ 100₋₁ 100₋₁ 100₋₁ … … … 33₋₄ᵢ … 1₋₁ᵢ 0.2 - VCTSint Maarten … … … … … … … … … … … … … … … … … 36₋₄ 49₋₄ᵢ 0.1₋₄ 0.1₋₁ᵢ … … SXMSuriname … … … … … … … … … … … … … … … … … … … … 1₋₁ᵢ 1 0.1 SURTrinidad and Tobago Medium High Low Low … … … … … … … … … … … … … … … … 3₋₁ᵢ … … TTOTurks and Caicos Islands … … … … … … … … 100₋₁ 100₋₁ 100₋₁ 100₋₁ 93₋₁ 97₋₁ … … … … 54₋₄ᵢ … 0.2₋₁ᵢ … … TCA
Uruguay Medium Low Medium Low 100₋₁ … … … 100₋₁ 83₋₃ᵢ … 100₋₁ 100₋₁ 100₋₁ 100₋₁ 55₋₁ … … 3₋₂ … 5₋₁ᵢ … … URY
Venezuela, B. R. … … … … … … … … 97₋₃ 90₋₃ … 99₋₃ … … … … Sporadic₊₁ … … … 21₋₁ᵢ 2 8 VEN
A N N E X • STATISTICAl TAblES : TAblE 6455
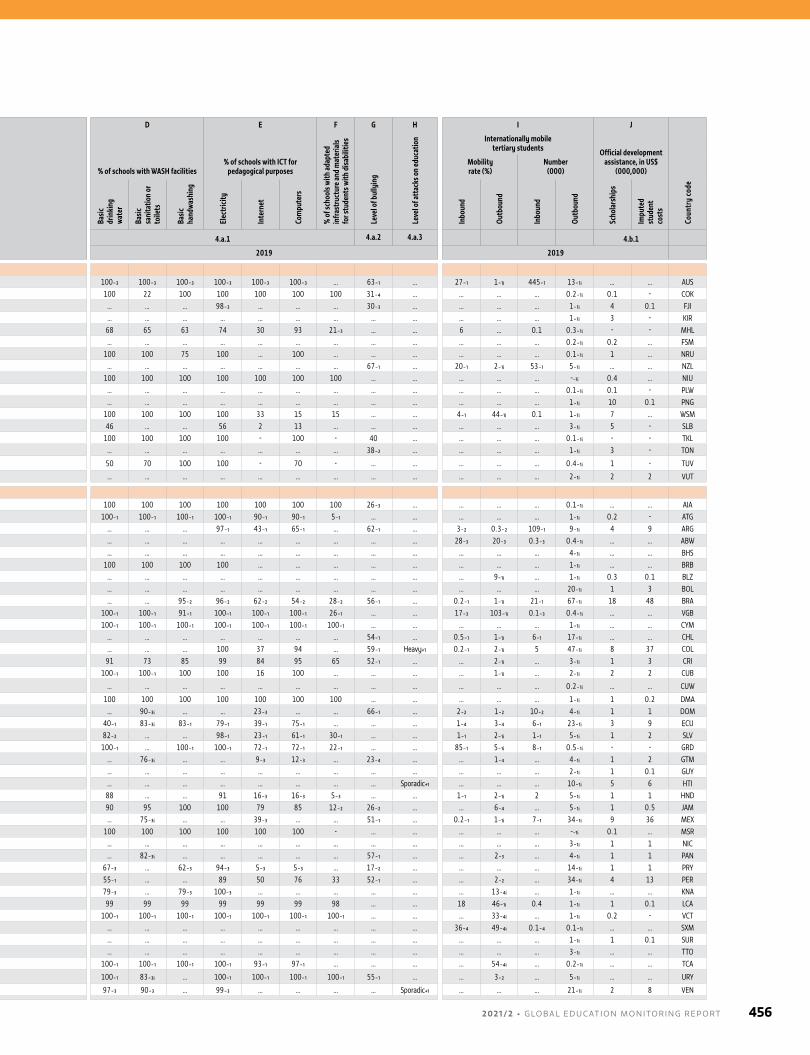
Country or territory
A B C D E F G H I J
Coun
try
code
Extent to which global citizenship education and education for sustainable development are mainstreamed
% o
f sch
ools
prov
idin
g
life s
kills
-bas
ed H
IV/A
IDS
educ
atio
n
% of students and youth with understanding of % of schools with WASH facilities
% of schools with ICT for pedagogical purposes
% o
f sch
ools
with
adap
ted
infra
stru
ctur
e and
mat
eria
ls fo
r stu
dent
s with
disa
bilit
ies
Leve
l of b
ully
ing
Leve
l of a
ttac
ks o
n ed
ucat
ion Internationally mobile
tertiary students Official development assistance, in US$
(000,000)Mobility rate (%)
Number (000)
Educ
atio
n po
licie
s/fra
mew
orks
Curr
iculu
m
In-s
ervi
ce
teac
her
trai
ning
Stud
ent
asse
ssm
ent
HIV/
AIDS
and
sexu
ality
Glob
al
citize
nshi
p
Scie
ntifi
c lit
erac
y
Basic
dr
inki
ng
wat
er
Basic
sa
nita
tion
or
toile
ts
Basic
ha
ndw
ashi
ng
Elec
trici
ty
Inte
rnet
Com
pute
rs
Inbo
und
Outb
ound
Inbo
und
Outb
ound
Scho
lars
hips
Impu
ted
stud
ent
cost
s
SDG indicator 4.7.1 4.7.2 4.7.4 4.7.5 4.a.1 4.a.2 4.a.3 4.b.1
Reference year 2017 2019 2019
OceaniaAustralia … High … High … … 23 … 100₋₃ 100₋₃ 100₋₃ 100₋₃ 100₋₃ 100₋₃ … 63₋₁ … 27₋₁ 1₋₁ᵢ 445₋₁ 13₋₁ᵢ … … AUSCook Islands High Medium … High 100 … … … 100 22 100 100 100 100 100 31₋₄ … … … … 0.2₋₁ᵢ 0.1 - COKFiji … … … … … … … … … … … 98₋₃ … … … 30₋₃ … … … … 1₋₁ᵢ 4 0.1 FJIKiribati … … … … … … … … … … … … … … … … … … … … 1₋₁ᵢ 3 - KIRMarshall Islands … … … … … … … … 68 65 63 74 30 93 21₋₃ … … 6 … 0.1 0.3₋₁ᵢ - - MHLMicronesia, F. S. … … … … … … … … … … … … … … … … … … … … 0.2₋₁ᵢ 0.2 … FSMNauru … … … … 20 … … … 100 100 75 100 … 100 … … … … … … 0.1₋₁ᵢ 1 … NRUNew Zealand High High High High … … 18 … … … … … … … … 67₋₁ … 20₋₁ 2₋₁ᵢ 53₋₁ 5₋₁ᵢ … … NZLNiue … … … … 100 … … … 100 100 100 100 100 100 100 … … … … … -₋₁ᵢ 0.4 … NIUPalau … … … … … … … … … … … … … … … … … … … … 0.1₋₁ᵢ 0.1 - PLWPapua New Guinea … … … … … 25₋₂ … … … … … … … … … … … … … … 1₋₁ᵢ 10 0.1 PNGSamoa … … … … 100 … … … 100 100 100 100 33 15 15 … … 4₋₁ 44₋₁ᵢ 0.1 1₋₁ᵢ 7 … WSMSolomon Is … … … … … … … … 46 … … 56 2 13 … … … … … … 3₋₁ᵢ 5 - SLBTokelau … … … … - … … … 100 100 100 100 - 100 - 40 … … … … 0.1₋₁ᵢ - - TKLTonga … … … … … … … … … … … … … … … 38₋₂ … … … … 1₋₁ᵢ 3 - TON
Tuvalu Medium High Medium Low 9 … … … 50 70 100 100 - 70 - … … … … … 0.4₋₁ᵢ 1 - TUV
Vanuatu … … … … … … … … … … … … … … … … … … … … 2₋₁ᵢ 2 2 VUT
Latin America and the CaribbeanAnguilla … … … … 100 … … … 100 100 100 100 100 100 100 26₋₃ … … … … 0.1₋₁ᵢ … … AIAAntigua and Barbuda … … … … 100₋₁ 86₋₃ … … 100₋₁ 100₋₁ 100₋₁ 100₋₁ 90₋₁ 90₋₁ 5₋₁ … … … … … 1₋₁ᵢ 0.2 - ATGArgentina … High Medium High … … 14₋₄ … … … … 97₋₁ 43₋₁ 65₋₁ … 62₋₁ … 3₋₂ 0.3₋₂ 109₋₁ 9₋₁ᵢ 4 9 ARGAruba … … … … … … … … … … … … … … … … … 28₋₃ 20₋₃ 0.3₋₃ 0.4₋₁ᵢ … … ABWBahamas … … … … … … … … … … … … … … … … … … … … 4₋₁ᵢ … … BHSBarbados … … … … … … … … 100 100 100 100 … … … … … … … … 1₋₁ᵢ … … BRBBelize … … … … … 43₋₃ … … … … … … … … … … … … 9₋₁ᵢ … 1₋₁ᵢ 0.3 0.1 BLZBolivia, P. S. High High High High … … … … … … … … … … … … … … … … 20₋₁ᵢ 1 3 BOLBrazil … … … … … … … … … … 95₋₂ 96₋₂ 62₋₂ 54₋₂ 28₋₂ 56₋₁ … 0.2₋₁ 1₋₁ᵢ 21₋₁ 67₋₁ᵢ 18 48 BRABritish Virgin Islands … … … … … … … … 100₋₁ 100₋₁ 91₋₁ 100₋₁ 100₋₁ 100₋₁ 26₋₁ … … 17₋₃ 103₋₁ᵢ 0.1₋₃ 0.4₋₁ᵢ … … VGBCayman Islands … … … … 100₋₁ … … … 100₋₁ 100₋₁ 100₋₁ 100₋₁ 100₋₁ 100₋₁ 100₋₁ … … … … … 1₋₁ᵢ … … CYMChile Medium Medium Low Low … … 13 65₋₃ … … … … … … … 54₋₁ … 0.5₋₁ 1₋₁ᵢ 6₋₁ 17₋₁ᵢ … … CHLColombia High Low Low High … 30₋₄ … 58₋₃ … … … 100 37 94 … 59₋₁ Heavy₊₁ 0.2₋₁ 2₋₁ᵢ 5 47₋₁ᵢ 8 37 COLCosta Rica … … … … 47 … … … 91 73 85 99 84 95 65 52₋₁ … … 2₋₁ᵢ … 3₋₁ᵢ 1 3 CRICuba … … … … 100 … … … 100₋₁ 100₋₁ 100 100 16 100 … … … … 1₋₁ᵢ … 2₋₁ᵢ 2 2 CUB
Curaçao … … … … … … … … … … … … … … … … … … … … 0.2₋₁ᵢ … … CUW
Dominica … … … … 100 … … … 100 100 100 100 100 100 100 … … … … … 1₋₁ᵢ 1 0.2 DMADominican Republic … … … … … … … 38₋₃ … 90₋₃ᵢ … … 23₋₃ … … 66₋₁ … 2₋₂ 1₋₂ 10₋₂ 4₋₁ᵢ 1 1 DOMEcuador High Low … High … … … … 40₋₁ 83₋₃ᵢ 83₋₁ 79₋₁ 39₋₁ 75₋₁ … … … 1₋₄ 3₋₄ 6₋₁ 23₋₁ᵢ 3 9 ECUEl Salvador Medium Low Medium Low … … … … 82₋₂ … … 98₋₁ 23₋₁ 61₋₁ 30₋₁ … … 1₋₁ 2₋₁ᵢ 1₋₁ 5₋₁ᵢ 1 2 SLVGrenada … … … … 92₋₁ … … … 100₋₁ … 100₋₁ 100₋₁ 72₋₁ 72₋₁ 22₋₁ … … 85₋₁ 5₋₁ᵢ 8₋₁ 0.5₋₁ᵢ - - GRDGuatemala High Medium High Low … 22₋₄ … … … 76₋₃ᵢ … … 9₋₃ 12₋₃ … 23₋₄ … … 1₋₄ … 4₋₁ᵢ 1 2 GTMGuyana … … … … … … … … … … … … … … … … … … … … 2₋₁ᵢ 1 0.1 GUYHaiti Medium Medium Medium High … 37₋₂ … … … … … … … … … … Sporadic₊₁ … … … 10₋₁ᵢ 5 6 HTIHonduras Medium High Medium High … … … … 88 … … 91 16₋₃ 16₋₃ 5₋₃ … … 1₋₁ 2₋₁ᵢ 2 5₋₁ᵢ 1 1 HNDJamaica … … … … … … … … 90 95 100 100 79 85 12₋₂ 26₋₂ … … 6₋₄ … 5₋₁ᵢ 1 0.5 JAMMexico High High Medium High … … … 46₋₃ … 75₋₃ᵢ … … 39₋₃ … … 51₋₁ … 0.2₋₁ 1₋₁ᵢ 7₋₁ 34₋₁ᵢ 9 36 MEXMontserrat … … … … 100 … … … 100 100 100 100 100 100 - … … … … … -₋₁ᵢ 0.1 … MSRNicaragua … … … … … … … … … … … … … … … … … … … … 3₋₁ᵢ 1 1 NICPanama … … … … … … … … … 82₋₃ᵢ … … … … … 57₋₁ … … 2₋₃ … 4₋₁ᵢ 1 1 PANParaguay … … … … … … … … 67₋₃ … 62₋₃ 94₋₃ 5₋₃ 5₋₃ … 17₋₂ … … … … 14₋₁ᵢ 1 1 PRYPeru High High Medium High … 75₋₃ … 45₋₃ 55₋₁ … … 89 50 76 33 52₋₁ … … 2₋₂ … 34₋₁ᵢ 4 13 PERSaint Kitts and Nevis Medium High Medium … … … … … 79₋₃ … 79₋₃ 100₋₃ … … … … … … 13₋₄ᵢ … 1₋₁ᵢ … … KNASaint Lucia … … … … 88 … … … 99 99 99 99 99 99 98 … … 18 46₋₁ᵢ 0.4 1₋₁ᵢ 1 0.1 LCASaint Vincent/Grenadines … … … … 96₋₁ … … … 100₋₁ 100₋₁ 100₋₁ 100₋₁ 100₋₁ 100₋₁ 100₋₁ … … … 33₋₄ᵢ … 1₋₁ᵢ 0.2 - VCTSint Maarten … … … … … … … … … … … … … … … … … 36₋₄ 49₋₄ᵢ 0.1₋₄ 0.1₋₁ᵢ … … SXMSuriname … … … … … … … … … … … … … … … … … … … … 1₋₁ᵢ 1 0.1 SURTrinidad and Tobago Medium High Low Low … … … … … … … … … … … … … … … … 3₋₁ᵢ … … TTOTurks and Caicos Islands … … … … … … … … 100₋₁ 100₋₁ 100₋₁ 100₋₁ 93₋₁ 97₋₁ … … … … 54₋₄ᵢ … 0.2₋₁ᵢ … … TCA
Uruguay Medium Low Medium Low 100₋₁ … … … 100₋₁ 83₋₃ᵢ … 100₋₁ 100₋₁ 100₋₁ 100₋₁ 55₋₁ … … 3₋₂ … 5₋₁ᵢ … … URY
Venezuela, B. R. … … … … … … … … 97₋₃ 90₋₃ … 99₋₃ … … … … Sporadic₊₁ … … … 21₋₁ᵢ 2 8 VEN
2 0 2 1 / 2 • G LO BA L E D U C AT I O N M O N I TO R I N G R E P O RT 456
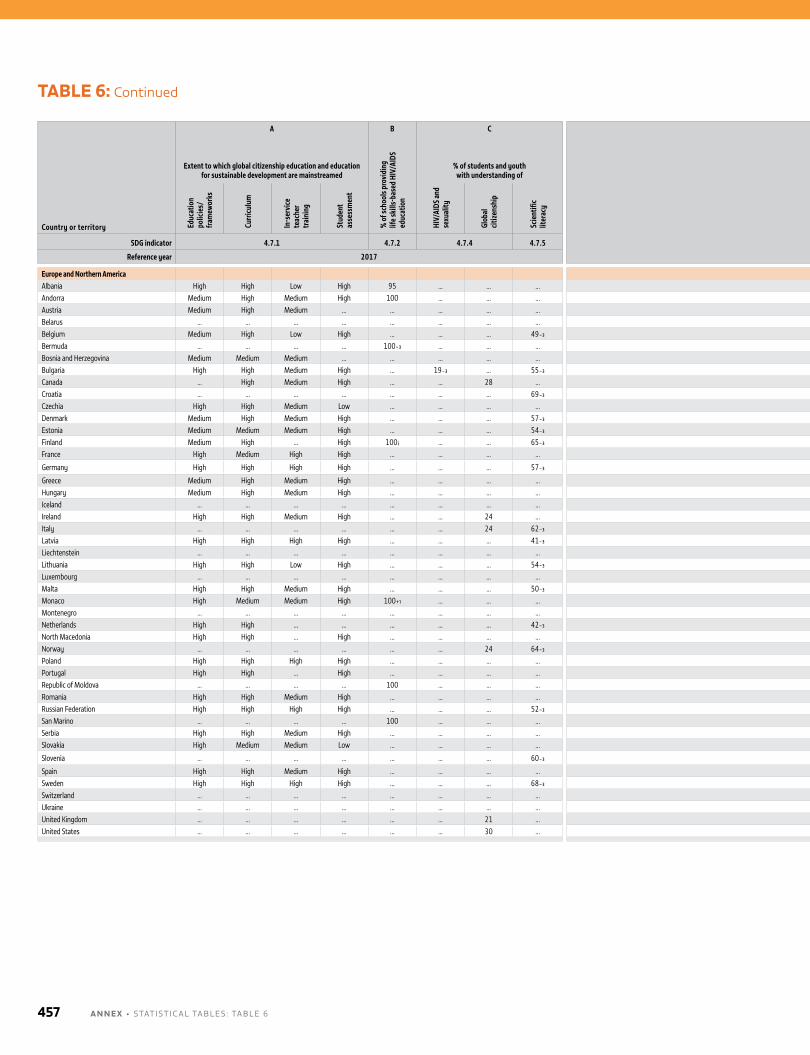
TABLE 6: Continued
Country or territory
A B C D E F G H I J
Coun
try
code
Extent to which global citizenship education and education for sustainable development are mainstreamed
% o
f sch
ools
prov
idin
g
life s
kills
-bas
ed H
IV/A
IDS
educ
atio
n
% of students and youth with understanding of % of schools with WASH facilities
% of schools with ICT for pedagogical purposes
% o
f sch
ools
with
adap
ted
infra
stru
ctur
e and
mat
eria
ls fo
r stu
dent
s with
disa
bilit
ies
Leve
l of b
ully
ing
Leve
l of a
ttac
ks o
n ed
ucat
ion Internationally mobile
tertiary students Official development assistance, in US$
(000,000)Mobility rate (%)
Number (000)
Educ
atio
n po
licie
s/fra
mew
orks
Curr
iculu
m
In-s
ervi
ce
teac
her
trai
ning
Stud
ent
asse
ssm
ent
HIV/
AIDS
and
sexu
ality
Glob
al
citize
nshi
p
Scie
ntifi
c lit
erac
y
Basic
dr
inki
ng
wat
er
Basic
sa
nita
tion
or
toile
ts
Basic
ha
ndw
ashi
ng
Elec
trici
ty
Inte
rnet
Com
pute
rs
Inbo
und
Outb
ound
Inbo
und
Outb
ound
Scho
lars
hips
Impu
ted
stud
ent
cost
s
SDG indicator 4.7.1 4.7.2 4.7.4 4.7.5 4.a.1 4.a.2 4.a.3 4.b.1
Reference year 2017 2019 2019
Europe and Northern AmericaAlbania High High Low High 95 … … … 53 74 63 98 51 49 7 49₋₁ … 2 14₋₁ᵢ 2 18₋₁ᵢ 7 28 ALBAndorra Medium High Medium High 100 … … … 100 100 100 100 100 100 100 … … 41 245₋₁ᵢ 0.3 2₋₁ᵢ … … ANDAustria Medium High Medium … … … … … … … … … … … … 53₋₁ … 17₋₁ 5₋₁ᵢ 75₋₁ 22₋₁ᵢ … … AUTBelarus … … … … … … … … 100₋₁ 100₋₁ 100₋₁ 100₋₁ 87₋₁ 100₋₁ … 42₋₁ … 4₋₁ 6₋₁ᵢ 17₋₁ 23₋₁ᵢ 3 35 BLRBelgium Medium High Low High … … … 49₋₃ 100₋₁ … 100₋₁ 100₋₁ 100₋₁ 100₋₁ … 54₋₁ … 10₋₁ 3₋₁ᵢ 54₋₁ 16₋₁ᵢ … … BELBermuda … … … … 100₋₃ … … … … … 100₋₃ 100₋₃ 100₋₃ 100₋₃ 100₋₃ … … 10₋₁ 225₋₁ᵢ 0.1₋₁ 2₋₁ᵢ … … BMUBosnia and Herzegovina Medium Medium Medium … … … … … … … … … … … … 45₋₁ … 7 16₋₁ᵢ 6 15₋₁ᵢ 3 31 BIHBulgaria High High Medium High … 19₋₃ … 55₋₃ … … … … … … … 56₋₁ … 6₋₁ 11₋₁ᵢ 15₋₁ 25₋₁ᵢ … … BGRCanada … High Medium High … … 28 … … … … … … … … 57₋₁ … 14₋₁ 3₋₁ᵢ 225₋₁ 48₋₁ᵢ … … CANCroatia … … … … … … … 69₋₃ … … … … … … … 42₋₁ … 3₋₁ 6₋₁ᵢ 5₋₁ 10₋₁ᵢ … … HRVCzechia High High Medium Low … … … … … … … … … … … 58₋₁ … 14₋₁ 4₋₁ᵢ 45₋₁ 12₋₁ᵢ … … CZEDenmark Medium High Medium High … … … 57₋₃ 100₋₃ 100₋₃ 100₋₃ 100₋₃ 100₋₃ 100₋₃ … 61₋₁ … 11₋₁ 2₋₁ᵢ 33₋₁ 6₋₁ᵢ … … DNKEstonia Medium Medium Medium High … … … 54₋₃ 100₋₃ 100₋₃ 100₋₃ 100₋₃ 100₋₃ 100₋₃ … 55₋₁ … 10₋₁ 8₋₁ᵢ 4₋₁ 4₋₁ᵢ … … ESTFinland Medium High … High 100 ᵢ … … 65₋₃ 100 ᵢ 100 ᵢ 100 ᵢ 100 ᵢ 100 ᵢ 100 ᵢ 100 ᵢ 51₋₁ … 8₋₁ 4₋₁ᵢ 24₋₁ 11₋₁ᵢ … … FINFrance High Medium High High … … … … 100₋₁ 100₋₁ 100₋₁ 100₋₁ 98₋₂ᵢ 99₋₂ᵢ … 49₋₁ Affected₊₁ 9₋₁ 4₋₁ᵢ 230₋₁ 99₋₁ᵢ … … FRA
Germany High High High High … … … 57₋₃ 100₋₁ 100₋₁ 100₋₁ 100₋₁ … … … 57₋₁ … 10₋₁ 4₋₁ᵢ 312₋₁ 123₋₁ᵢ … … DEU
Greece Medium High Medium High … … … … … … … … … … … 52₋₁ Affected₊₁ 3₋₁ 5₋₁ᵢ 26₋₁ 39₋₁ᵢ … … GRCHungary Medium High Medium High … … … … 100₋₃ 100₋₃ 100₋₃ 100₋₃ 100₋₃ 100₋₃ … 47₋₁ … 11₋₁ 5₋₁ᵢ 32₋₁ 13₋₁ᵢ … … HUNIceland … … … … … … … … … … … … … … … 37₋₁ … 8₋₁ 19₋₁ᵢ 1₋₁ 3₋₁ᵢ … … ISLIreland High High Medium High … … 24 … … … … … … … … 59₋₁ … 10₋₁ 6₋₁ᵢ 22₋₁ 15₋₁ᵢ … … IRLItaly … … … … … … 24 62₋₃ 100₋₃ 100₋₃ 100₋₃ 100₋₃ 70₋₃ᵢ … … 47₋₁ … 6₋₁ 4₋₁ᵢ 107₋₁ 76₋₁ᵢ … … ITALatvia High High High High … … … 41₋₃ 100₋₃ 100₋₃ 100₋₃ 100₋₃ 100₋₃ 100₋₃ 18₋₃ 71₋₁ … 9₋₁ 6₋₁ᵢ 8₋₁ 5₋₁ᵢ … … LVALiechtenstein … … … … … … … … … … … … … … … … … 88₋₁ 128₋₁ᵢ 1₋₁ 1₋₁ᵢ … … LIELithuania High High Low High … … … 54₋₃ … … … … … … … 48₋₁ … 5₋₁ 9₋₁ᵢ 6₋₁ 10₋₁ᵢ … … LTULuxembourg … … … … … … … … … … … … … … … 52₋₁ … 48₋₁ 164₋₁ᵢ 3₋₁ 12₋₁ᵢ … … LUXMalta High High Medium High … … … 50₋₃ … … … … … … … 63₋₁ … 10₋₁ 7₋₁ᵢ 2 1₋₁ᵢ … … MLTMonaco High Medium Medium High 100₊₁ … … … 100₊₁ 100₊₁ 100₊₁ 100₊₁ 100₊₁ 100₊₁ 100₊₁ … … 25₊₁ 39₋₁ᵢ 0.2₊₁ 0.4₋₁ᵢ … … MCOMontenegro … … … … … … … … … … … … … … … 45₋₁ … … 22₋₁ᵢ … 5₋₁ᵢ 1 3 MNENetherlands High High … … … … … 42₋₃ 100 100 100 100 100 100 … 46₋₁ … 12₋₁ 2₋₁ᵢ 104₋₁ 18₋₁ᵢ … … NLDNorth Macedonia High High … High … … … … … … … … … … … 23 … 5₋₁ 9₋₁ᵢ 3₋₁ 6₋₁ᵢ 2 11 MKDNorway … … … … … … 24 64₋₃ 100₊₁ 100₊₁ 100₊₁ 100₊₁ 100₊₁ 100₊₁ … 49₋₁ … 4₋₁ 6₋₁ᵢ 12₋₁ 17₋₁ᵢ … … NORPoland High High High High … … … … 100₋₃ 100₋₃ 100₋₃ 100₋₃ 100₋₃ 100₋₃ … 57₋₁ … 4₋₁ᵢ 2₋₁ᵢ 54₋₁ᵢ 26₋₁ᵢ … … POLPortugal High High … High … … … … 100₋₁ 100₋₁ 100₋₁ 100₋₁ 100₋₁ 100₋₁ … 39₋₁ … 8₋₁ 4₋₁ᵢ 28₋₁ 15₋₁ᵢ … … PRTRepublic of Moldova … … … … 100 … … … 100 100 100 100 99 100 … 60₋₁ … 6 22₋₁ᵢ 5 19₋₁ᵢ 2 6 MDARomania High High Medium High … … … … … … … … … … … 67₋₁ … 5₋₁ 7₋₁ᵢ 29₋₁ 38₋₁ᵢ … … ROURussian Federation High High High High … … … 52₋₃ … … … … … … … 63₋₁ Sporadic₊₁ 5₋₁ 1₋₁ᵢ 262₋₁ 58₋₁ᵢ … … RUSSan Marino … … … … 100 … … … 100 100 100 100 100 100 100 … … 88 129₋₁ᵢ 1 1₋₁ᵢ … … SMRSerbia High High Medium High … … … … … … … … … … … 43₋₁ … 5 6₋₁ᵢ 12 16₋₁ᵢ 9 23 SRBSlovakia High Medium Medium Low … … … … 100₋₃ 100₋₃ 100₋₃ 100₋₃ 100₋₃ᵢ 100₋₃ᵢ 14₋₃ᵢ 56₋₁ … 8₋₁ 22₋₁ᵢ 12₋₁ 31₋₁ᵢ … … SVK
Slovenia … … … … … … … 60₋₃ 100₋₃ 100₋₃ 100₋₃ 100₋₃ 100₋₃ 100₋₃ … 48₋₁ … 4₋₁ 4₋₁ᵢ 3₋₁ 3₋₁ᵢ … … SVN
Spain High High Medium High … … … … 100₊₁ 100₊₁ 100₊₁ 100₊₁ 100₊₁ 100₊₁ … 44₋₁ … 3₋₁ 2₋₁ᵢ 71₋₁ 42₋₁ᵢ … … ESPSweden High High High High … … … 68₋₃ … … … … … … … 50₋₁ … 7₋₁ 4₋₁ᵢ 31₋₁ 16₋₁ᵢ … … SWESwitzerland … … … … … … … … 100₋₃ 100₋₃ 100₋₃ 100₋₃ 100₋₃ 100₋₃ … 56₋₁ … 18₋₁ 5₋₁ᵢ 54₋₁ 16₋₁ᵢ … … CHEUkraine … … … … … … … … … … 81 100 79 94 64 52₋₁ Affected₊₁ 3 4₋₁ᵢ 55 72₋₁ᵢ 10 125 UKRUnited Kingdom … … … … … … 21 … … … … … … … … 62₋₁ Sporadic₊₁ 18₋₁ 2₋₁ᵢ 452₋₁ 39₋₁ᵢ … … GBRUnited States … … … … … … 30 … … … … … … … … 57₋₁ … 5₋₁ 0.4₋₁ᵢ 987₋₁ 84₋₁ᵢ … … USA
A N N E X • STATISTICAl TAblES : TAblE 6457
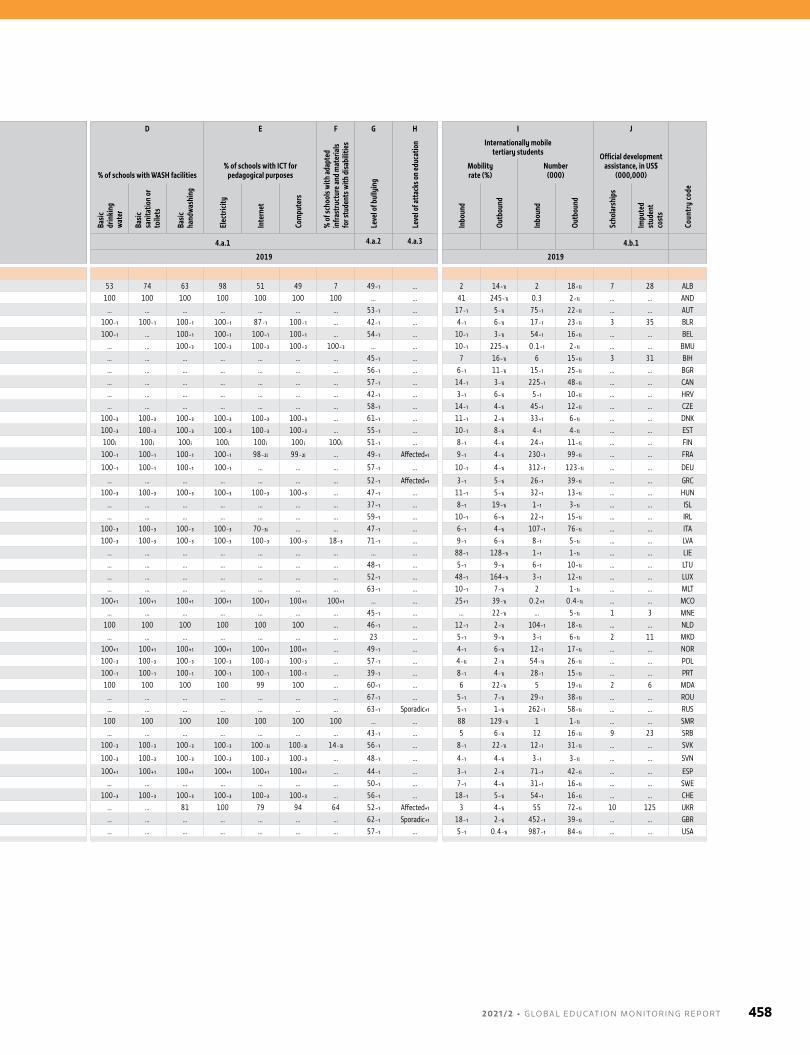
Country or territory
A B C D E F G H I J
Coun
try
code
Extent to which global citizenship education and education for sustainable development are mainstreamed
% o
f sch
ools
prov
idin
g
life s
kills
-bas
ed H
IV/A
IDS
educ
atio
n
% of students and youth with understanding of % of schools with WASH facilities
% of schools with ICT for pedagogical purposes
% o
f sch
ools
with
adap
ted
infra
stru
ctur
e and
mat
eria
ls fo
r stu
dent
s with
disa
bilit
ies
Leve
l of b
ully
ing
Leve
l of a
ttac
ks o
n ed
ucat
ion Internationally mobile
tertiary students Official development assistance, in US$
(000,000)Mobility rate (%)
Number (000)
Educ
atio
n po
licie
s/fra
mew
orks
Curr
iculu
m
In-s
ervi
ce
teac
her
trai
ning
Stud
ent
asse
ssm
ent
HIV/
AIDS
and
sexu
ality
Glob
al
citize
nshi
p
Scie
ntifi
c lit
erac
y
Basic
dr
inki
ng
wat
er
Basic
sa
nita
tion
or
toile
ts
Basic
ha
ndw
ashi
ng
Elec
trici
ty
Inte
rnet
Com
pute
rs
Inbo
und
Outb
ound
Inbo
und
Outb
ound
Scho
lars
hips
Impu
ted
stud
ent
cost
s
SDG indicator 4.7.1 4.7.2 4.7.4 4.7.5 4.a.1 4.a.2 4.a.3 4.b.1
Reference year 2017 2019 2019
Europe and Northern AmericaAlbania High High Low High 95 … … … 53 74 63 98 51 49 7 49₋₁ … 2 14₋₁ᵢ 2 18₋₁ᵢ 7 28 ALBAndorra Medium High Medium High 100 … … … 100 100 100 100 100 100 100 … … 41 245₋₁ᵢ 0.3 2₋₁ᵢ … … ANDAustria Medium High Medium … … … … … … … … … … … … 53₋₁ … 17₋₁ 5₋₁ᵢ 75₋₁ 22₋₁ᵢ … … AUTBelarus … … … … … … … … 100₋₁ 100₋₁ 100₋₁ 100₋₁ 87₋₁ 100₋₁ … 42₋₁ … 4₋₁ 6₋₁ᵢ 17₋₁ 23₋₁ᵢ 3 35 BLRBelgium Medium High Low High … … … 49₋₃ 100₋₁ … 100₋₁ 100₋₁ 100₋₁ 100₋₁ … 54₋₁ … 10₋₁ 3₋₁ᵢ 54₋₁ 16₋₁ᵢ … … BELBermuda … … … … 100₋₃ … … … … … 100₋₃ 100₋₃ 100₋₃ 100₋₃ 100₋₃ … … 10₋₁ 225₋₁ᵢ 0.1₋₁ 2₋₁ᵢ … … BMUBosnia and Herzegovina Medium Medium Medium … … … … … … … … … … … … 45₋₁ … 7 16₋₁ᵢ 6 15₋₁ᵢ 3 31 BIHBulgaria High High Medium High … 19₋₃ … 55₋₃ … … … … … … … 56₋₁ … 6₋₁ 11₋₁ᵢ 15₋₁ 25₋₁ᵢ … … BGRCanada … High Medium High … … 28 … … … … … … … … 57₋₁ … 14₋₁ 3₋₁ᵢ 225₋₁ 48₋₁ᵢ … … CANCroatia … … … … … … … 69₋₃ … … … … … … … 42₋₁ … 3₋₁ 6₋₁ᵢ 5₋₁ 10₋₁ᵢ … … HRVCzechia High High Medium Low … … … … … … … … … … … 58₋₁ … 14₋₁ 4₋₁ᵢ 45₋₁ 12₋₁ᵢ … … CZEDenmark Medium High Medium High … … … 57₋₃ 100₋₃ 100₋₃ 100₋₃ 100₋₃ 100₋₃ 100₋₃ … 61₋₁ … 11₋₁ 2₋₁ᵢ 33₋₁ 6₋₁ᵢ … … DNKEstonia Medium Medium Medium High … … … 54₋₃ 100₋₃ 100₋₃ 100₋₃ 100₋₃ 100₋₃ 100₋₃ … 55₋₁ … 10₋₁ 8₋₁ᵢ 4₋₁ 4₋₁ᵢ … … ESTFinland Medium High … High 100 ᵢ … … 65₋₃ 100 ᵢ 100 ᵢ 100 ᵢ 100 ᵢ 100 ᵢ 100 ᵢ 100 ᵢ 51₋₁ … 8₋₁ 4₋₁ᵢ 24₋₁ 11₋₁ᵢ … … FINFrance High Medium High High … … … … 100₋₁ 100₋₁ 100₋₁ 100₋₁ 98₋₂ᵢ 99₋₂ᵢ … 49₋₁ Affected₊₁ 9₋₁ 4₋₁ᵢ 230₋₁ 99₋₁ᵢ … … FRA
Germany High High High High … … … 57₋₃ 100₋₁ 100₋₁ 100₋₁ 100₋₁ … … … 57₋₁ … 10₋₁ 4₋₁ᵢ 312₋₁ 123₋₁ᵢ … … DEU
Greece Medium High Medium High … … … … … … … … … … … 52₋₁ Affected₊₁ 3₋₁ 5₋₁ᵢ 26₋₁ 39₋₁ᵢ … … GRCHungary Medium High Medium High … … … … 100₋₃ 100₋₃ 100₋₃ 100₋₃ 100₋₃ 100₋₃ … 47₋₁ … 11₋₁ 5₋₁ᵢ 32₋₁ 13₋₁ᵢ … … HUNIceland … … … … … … … … … … … … … … … 37₋₁ … 8₋₁ 19₋₁ᵢ 1₋₁ 3₋₁ᵢ … … ISLIreland High High Medium High … … 24 … … … … … … … … 59₋₁ … 10₋₁ 6₋₁ᵢ 22₋₁ 15₋₁ᵢ … … IRLItaly … … … … … … 24 62₋₃ 100₋₃ 100₋₃ 100₋₃ 100₋₃ 70₋₃ᵢ … … 47₋₁ … 6₋₁ 4₋₁ᵢ 107₋₁ 76₋₁ᵢ … … ITALatvia High High High High … … … 41₋₃ 100₋₃ 100₋₃ 100₋₃ 100₋₃ 100₋₃ 100₋₃ 18₋₃ 71₋₁ … 9₋₁ 6₋₁ᵢ 8₋₁ 5₋₁ᵢ … … LVALiechtenstein … … … … … … … … … … … … … … … … … 88₋₁ 128₋₁ᵢ 1₋₁ 1₋₁ᵢ … … LIELithuania High High Low High … … … 54₋₃ … … … … … … … 48₋₁ … 5₋₁ 9₋₁ᵢ 6₋₁ 10₋₁ᵢ … … LTULuxembourg … … … … … … … … … … … … … … … 52₋₁ … 48₋₁ 164₋₁ᵢ 3₋₁ 12₋₁ᵢ … … LUXMalta High High Medium High … … … 50₋₃ … … … … … … … 63₋₁ … 10₋₁ 7₋₁ᵢ 2 1₋₁ᵢ … … MLTMonaco High Medium Medium High 100₊₁ … … … 100₊₁ 100₊₁ 100₊₁ 100₊₁ 100₊₁ 100₊₁ 100₊₁ … … 25₊₁ 39₋₁ᵢ 0.2₊₁ 0.4₋₁ᵢ … … MCOMontenegro … … … … … … … … … … … … … … … 45₋₁ … … 22₋₁ᵢ … 5₋₁ᵢ 1 3 MNENetherlands High High … … … … … 42₋₃ 100 100 100 100 100 100 … 46₋₁ … 12₋₁ 2₋₁ᵢ 104₋₁ 18₋₁ᵢ … … NLDNorth Macedonia High High … High … … … … … … … … … … … 23 … 5₋₁ 9₋₁ᵢ 3₋₁ 6₋₁ᵢ 2 11 MKDNorway … … … … … … 24 64₋₃ 100₊₁ 100₊₁ 100₊₁ 100₊₁ 100₊₁ 100₊₁ … 49₋₁ … 4₋₁ 6₋₁ᵢ 12₋₁ 17₋₁ᵢ … … NORPoland High High High High … … … … 100₋₃ 100₋₃ 100₋₃ 100₋₃ 100₋₃ 100₋₃ … 57₋₁ … 4₋₁ᵢ 2₋₁ᵢ 54₋₁ᵢ 26₋₁ᵢ … … POLPortugal High High … High … … … … 100₋₁ 100₋₁ 100₋₁ 100₋₁ 100₋₁ 100₋₁ … 39₋₁ … 8₋₁ 4₋₁ᵢ 28₋₁ 15₋₁ᵢ … … PRTRepublic of Moldova … … … … 100 … … … 100 100 100 100 99 100 … 60₋₁ … 6 22₋₁ᵢ 5 19₋₁ᵢ 2 6 MDARomania High High Medium High … … … … … … … … … … … 67₋₁ … 5₋₁ 7₋₁ᵢ 29₋₁ 38₋₁ᵢ … … ROURussian Federation High High High High … … … 52₋₃ … … … … … … … 63₋₁ Sporadic₊₁ 5₋₁ 1₋₁ᵢ 262₋₁ 58₋₁ᵢ … … RUSSan Marino … … … … 100 … … … 100 100 100 100 100 100 100 … … 88 129₋₁ᵢ 1 1₋₁ᵢ … … SMRSerbia High High Medium High … … … … … … … … … … … 43₋₁ … 5 6₋₁ᵢ 12 16₋₁ᵢ 9 23 SRBSlovakia High Medium Medium Low … … … … 100₋₃ 100₋₃ 100₋₃ 100₋₃ 100₋₃ᵢ 100₋₃ᵢ 14₋₃ᵢ 56₋₁ … 8₋₁ 22₋₁ᵢ 12₋₁ 31₋₁ᵢ … … SVK
Slovenia … … … … … … … 60₋₃ 100₋₃ 100₋₃ 100₋₃ 100₋₃ 100₋₃ 100₋₃ … 48₋₁ … 4₋₁ 4₋₁ᵢ 3₋₁ 3₋₁ᵢ … … SVN
Spain High High Medium High … … … … 100₊₁ 100₊₁ 100₊₁ 100₊₁ 100₊₁ 100₊₁ … 44₋₁ … 3₋₁ 2₋₁ᵢ 71₋₁ 42₋₁ᵢ … … ESPSweden High High High High … … … 68₋₃ … … … … … … … 50₋₁ … 7₋₁ 4₋₁ᵢ 31₋₁ 16₋₁ᵢ … … SWESwitzerland … … … … … … … … 100₋₃ 100₋₃ 100₋₃ 100₋₃ 100₋₃ 100₋₃ … 56₋₁ … 18₋₁ 5₋₁ᵢ 54₋₁ 16₋₁ᵢ … … CHEUkraine … … … … … … … … … … 81 100 79 94 64 52₋₁ Affected₊₁ 3 4₋₁ᵢ 55 72₋₁ᵢ 10 125 UKRUnited Kingdom … … … … … … 21 … … … … … … … … 62₋₁ Sporadic₊₁ 18₋₁ 2₋₁ᵢ 452₋₁ 39₋₁ᵢ … … GBRUnited States … … … … … … 30 … … … … … … … … 57₋₁ … 5₋₁ 0.4₋₁ᵢ 987₋₁ 84₋₁ᵢ … … USA
2 0 2 1 / 2 • G LO BA L E D U C AT I O N M O N I TO R I N G R E P O RT 458
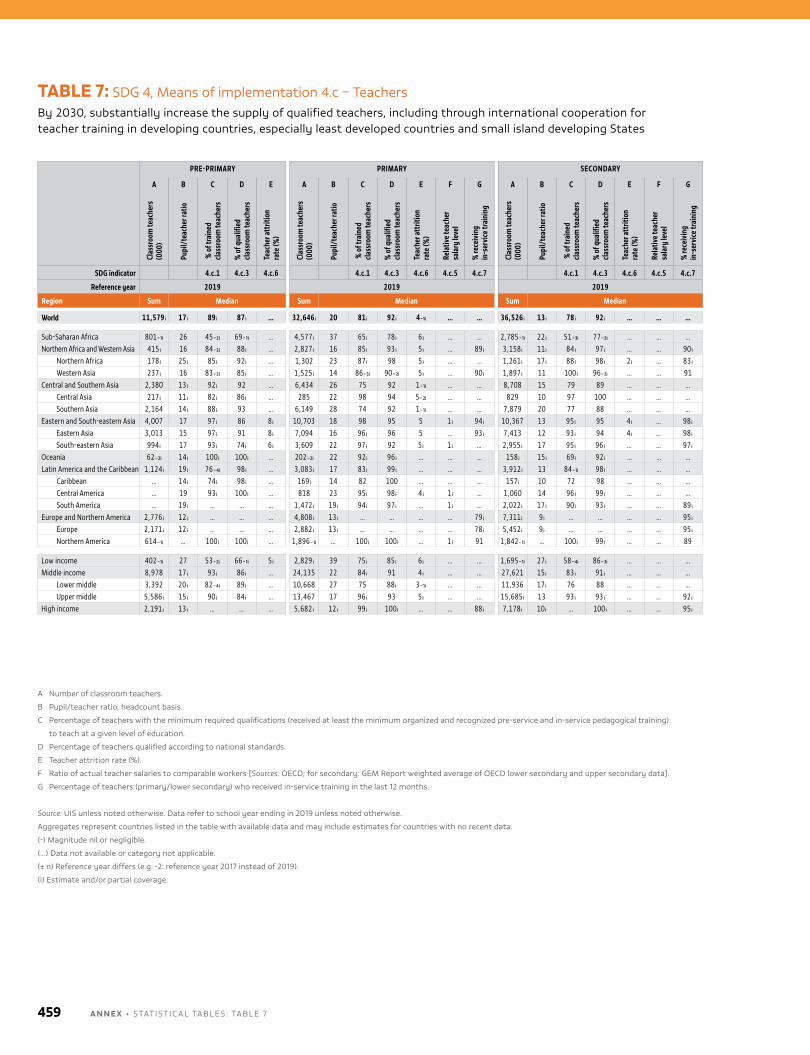
TABLE 7: SDG 4, means of implementation 4.c – Teachers by 2030, substantially increase the supply of qualified teachers, including through international cooperation for teacher training in developing countries, especially least developed countries and small island developing States
A number of classroom teachers.
b Pupil/teacher ratio, headcount basis.
C Percentage of teachers with the minimum required qualifications (received at least the minimum organized and recognized pre-service and in-service pedagogical training)
to teach at a given level of education.
D Percentage of teachers qualified according to national standards.
E Teacher attrition rate (%).
F Ratio of actual teacher salaries to comparable workers [Sources: oECD; for secondary: GEm Report weighted average of oECD lower secondary and upper secondary data].
G Percentage of teachers (primary/lower secondary) who received in-service training in the last 12 months.
Source: uIS unless noted otherwise. Data refer to school year ending in 2019 unless noted otherwise.
Aggregates represent countries listed in the table with available data and may include estimates for countries with no recent data.
(-) magnitude nil or negligible.
(…) Data not available or category not applicable.
(± n) Reference year differs (e.g. -2: reference year 2017 instead of 2019).
(i) Estimate and/or partial coverage.
PRE-PRIMARY PRIMARY SECONDARY
A B C D E A B C D E F G A B C D E F G
Clas
sroo
m te
ache
rs
(000
)
Pupi
l/te
ache
r rat
io
% o
f tra
ined
cla
ssro
om te
ache
rs
% o
f qua
lifie
d cla
ssro
om te
ache
rs
Teac
her a
ttrit
ion
rate
(%)
Clas
sroo
m te
ache
rs
(000
)
Pupi
l/te
ache
r rat
io
% o
f tra
ined
cla
ssro
om te
ache
rs
% o
f qua
lifie
d cla
ssro
om te
ache
rs
Teac
her a
ttrit
ion
rate
(%)
Rela
tive t
each
er
sala
ry le
vel
% re
ceiv
ing
in
-ser
vice
trai
ning
Clas
sroo
m te
ache
rs
(000
)
Pupi
l/te
ache
r rat
io
% o
f tra
ined
cla
ssro
om te
ache
rs
% o
f qua
lifie
d cla
ssro
om te
ache
rs
Teac
her a
ttrit
ion
rate
(%)
Rela
tive t
each
er
sala
ry le
vel
% re
ceiv
ing
in
-ser
vice
trai
ning
SDG indicator 4.c.1 4.c.3 4.c.6 4.c.1 4.c.3 4.c.6 4.c.5 4.c.7 4.c.1 4.c.3 4.c.6 4.c.5 4.c.7
Reference year 2019 2019 2019
Region Sum Median Sum Median Sum Median
World 11,579 ᵢ 17 ᵢ 89 ᵢ 87 ᵢ … 32,646 ᵢ 20 81 ᵢ 92 ᵢ 4₋₁ᵢ … … 36,526 ᵢ 13 ᵢ 78 ᵢ 92 ᵢ … … …
Sub-Saharan Africa 801₋₁ᵢ 26 45₋₂ᵢ 69₋₁ᵢ … 4,577 ᵢ 37 65 ᵢ 78 ᵢ 6 ᵢ … … 2,785₋₁ᵢ 22 ᵢ 51₋₃ᵢ 77₋₂ᵢ … … …Northern Africa and Western Asia 415 ᵢ 16 84₋₂ᵢ 88 ᵢ … 2,827 ᵢ 16 85 ᵢ 93 ᵢ 5 ᵢ … 89 ᵢ 3,158 ᵢ 11 ᵢ 84 ᵢ 97 ᵢ … … 90 ᵢ
Northern Africa 178 ᵢ 25 ᵢ 85 ᵢ 92 ᵢ … 1,302 23 87 ᵢ 98 5 ᵢ … … 1,261 ᵢ 17 ᵢ 88 ᵢ 98 ᵢ 2 ᵢ … 83 ᵢWestern Asia 237 ᵢ 16 83₋₂ᵢ 85 ᵢ … 1,525 ᵢ 14 86₋₃ᵢ 90₋₂ᵢ 5 ᵢ … 90 ᵢ 1,897 ᵢ 11 100 ᵢ 96₋₂ᵢ … … 91
Central and Southern Asia 2,380 13 ᵢ 92 ᵢ 92 … 6,434 26 75 92 1₋₁ᵢ … … 8,708 15 79 89 … … …Central Asia 217 ᵢ 11 ᵢ 82 ᵢ 86 ᵢ … 285 22 98 94 5₋₂ᵢ … … 829 10 97 100 … … …Southern Asia 2,164 14 ᵢ 88 ᵢ 93 … 6,149 28 74 92 1₋₁ᵢ … … 7,879 20 77 88 … … …
Eastern and South-eastern Asia 4,007 17 97 ᵢ 86 8 ᵢ 10,703 18 98 95 5 1 ᵢ 94 ᵢ 10,367 13 95 ᵢ 95 4 ᵢ … 98 ᵢEastern Asia 3,013 15 97 ᵢ 91 8 ᵢ 7,094 16 96 ᵢ 96 5 … 93 ᵢ 7,413 12 93 ᵢ 94 4 ᵢ … 98 ᵢSouth-eastern Asia 994 ᵢ 17 93 ᵢ 74 ᵢ 6 ᵢ 3,609 22 97 ᵢ 92 5 ᵢ 1 ᵢ … 2,955 ᵢ 17 95 ᵢ 96 ᵢ … … 97 ᵢ
Oceania 62₋₂ᵢ 14 ᵢ 100 ᵢ 100 ᵢ … 202₋₂ᵢ 22 92 ᵢ 96 ᵢ … … … 158 ᵢ 15 ᵢ 69 ᵢ 92 ᵢ … … …Latin America and the Caribbean 1,124 ᵢ 19 ᵢ 76₋₄ᵢ 98 ᵢ … 3,083 ᵢ 17 83 ᵢ 99 ᵢ … … … 3,912 ᵢ 13 84₋₁ᵢ 98 ᵢ … … …
Caribbean … 14 ᵢ 74 ᵢ 98 ᵢ … 169 ᵢ 14 82 100 … … … 157 ᵢ 10 72 98 … … …Central America … 19 93 ᵢ 100 ᵢ … 818 23 95 ᵢ 98 ᵢ 4 ᵢ 1 ᵢ … 1,060 14 96 ᵢ 99 ᵢ … … …South America … 19 ᵢ … … … 1,472 ᵢ 19 ᵢ 94 ᵢ 97 ᵢ … 1 ᵢ … 2,022 ᵢ 17 ᵢ 90 ᵢ 93 ᵢ … … 89 ᵢ
Europe and Northern America 2,776 ᵢ 12 ᵢ … … … 4,808 ᵢ 13 ᵢ … … … … 79 ᵢ 7,311 ᵢ 9 ᵢ … … … … 95 ᵢEurope 2,171 ᵢ 12 ᵢ … … … 2,882 ᵢ 13 ᵢ … … … … 78 ᵢ 5,452 ᵢ 9 ᵢ … … … … 95 ᵢNorthern America 614₋₁ᵢ … 100 ᵢ 100 ᵢ … 1,896₋₁ᵢ … 100 ᵢ 100 ᵢ … 1 ᵢ 91 1,842₋₁ᵢ … 100 ᵢ 99 ᵢ … … 89
Low income 402₋₁ᵢ 27 53₋₂ᵢ 66₋₁ᵢ 5 ᵢ 2,829 ᵢ 39 75 ᵢ 85 ᵢ 6 ᵢ … … 1,695₋₁ᵢ 27 ᵢ 58₋₄ᵢ 86₋₃ᵢ … … …Middle income 8,978 17 ᵢ 93 ᵢ 86 ᵢ … 24,135 22 84 ᵢ 91 4 ᵢ … … 27,621 15 ᵢ 83 ᵢ 91 ᵢ … … …
Lower middle 3,392 20 ᵢ 82₋₄ᵢ 89 ᵢ … 10,668 27 75 88 ᵢ 3₋₁ᵢ … … 11,936 17 ᵢ 76 88 … … …Upper middle 5,586 ᵢ 15 ᵢ 90 ᵢ 84 ᵢ … 13,467 17 96 ᵢ 93 5 ᵢ … … 15,685 ᵢ 13 93 ᵢ 93 ᵢ … … 92 ᵢ
High income 2,191 ᵢ 13 ᵢ … … … 5,682 ᵢ 12 ᵢ 99 ᵢ 100 ᵢ … … 88 ᵢ 7,178 ᵢ 10 ᵢ … 100 ᵢ … … 95 ᵢ
A N N E X • STATISTICAl TAblES : TAblE 7459
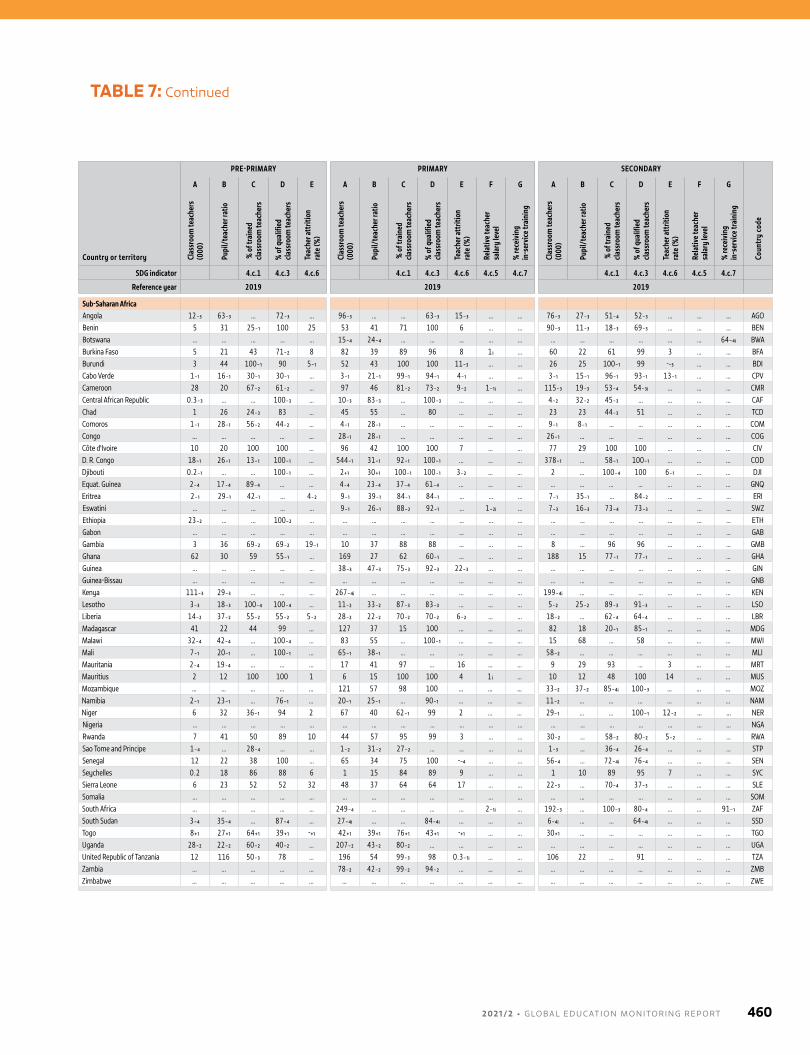
TABLE 7: Continued
Country or territory
PRE-PRIMARY PRIMARY SECONDARY
Coun
try
code
A B C D E A B C D E F G A B C D E F GCl
assr
oom
teac
hers
(0
00)
Pupi
l/te
ache
r rat
io
% o
f tra
ined
cla
ssro
om te
ache
rs
% o
f qua
lifie
d cla
ssro
om te
ache
rs
Teac
her a
ttrit
ion
rate
(%)
Clas
sroo
m te
ache
rs
(000
)
Pupi
l/te
ache
r rat
io
% o
f tra
ined
cla
ssro
om te
ache
rs
% o
f qua
lifie
d cla
ssro
om te
ache
rs
Teac
her a
ttrit
ion
rate
(%)
Rela
tive t
each
er
sala
ry le
vel
% re
ceiv
ing
in
-ser
vice
trai
ning
Clas
sroo
m te
ache
rs
(000
)
Pupi
l/te
ache
r rat
io
% o
f tra
ined
cla
ssro
om te
ache
rs
% o
f qua
lifie
d cla
ssro
om te
ache
rs
Teac
her a
ttrit
ion
rate
(%)
Rela
tive t
each
er
sala
ry le
vel
% re
ceiv
ing
in
-ser
vice
trai
ning
SDG indicator 4.c.1 4.c.3 4.c.6 4.c.1 4.c.3 4.c.6 4.c.5 4.c.7 4.c.1 4.c.3 4.c.6 4.c.5 4.c.7
Reference year 2019 2019 2019
Sub-Saharan AfricaAngola 12₋₃ 63₋₃ … 72₋₃ … 96₋₃ … … 63₋₃ 15₋₃ … … 76₋₃ 27₋₃ 51₋₄ 52₋₃ … … … AGOBenin 5 31 25₋₁ 100 25 53 41 71 100 6 … … 90₋₃ 11₋₃ 18₋₃ 69₋₃ … … … BENBotswana … … … … … 15₋₄ 24₋₄ … … … … … … … … … … … 64₋₄ᵢ BWABurkina Faso 5 21 43 71₋₂ 8 82 39 89 96 8 1 ᵢ … 60 22 61 99 3 … … BFABurundi 3 44 100₋₁ 90 5₋₁ 52 43 100 100 11₋₃ … … 26 25 100₋₁ 99 -₋₃ … … BDICabo Verde 1₋₁ 16₋₁ 30₋₁ 30₋₁ … 3₋₁ 21₋₁ 99₋₁ 94₋₁ 4₋₁ … … 3₋₁ 15₋₁ 96₋₁ 93₋₁ 13₋₁ … … CPVCameroon 28 20 67₋₂ 61₋₂ … 97 46 81₋₂ 73₋₂ 9₋₂ 1₋₁ᵢ … 115₋₃ 19₋₃ 53₋₄ 54₋₃ᵢ … … … CMRCentral African Republic 0.3₋₃ … … 100₋₃ … 10₋₃ 83₋₃ … 100₋₃ … … … 4₋₂ 32₋₂ 45₋₃ … … … … CAFChad 1 26 24₋₃ 83 … 45 55 … 80 … … … 23 23 44₋₃ 51 … … … TCDComoros 1₋₁ 28₋₁ 56₋₂ 44₋₂ … 4₋₁ 28₋₁ … … … … … 9₋₁ 8₋₁ … … … … … COMCongo … … … … … 28₋₁ 28₋₁ … … … … … 26₋₁ … … … … … … COGCôte d'Ivoire 10 20 100 100 … 96 42 100 100 7 … … 77 29 100 100 … … … CIVD. R. Congo 18₋₁ 26₋₁ 13₋₁ 100₋₁ … 544₋₁ 31₋₁ 92₋₁ 100₋₁ … … … 378₋₁ … 58₋₁ 100₋₁ … … … CODDjibouti 0.2₋₁ … … 100₋₁ … 2₊₁ 30₊₁ 100₋₁ 100₋₁ 3₋₂ … … 2 … 100₋₄ 100 6₋₁ … … DJIEquat. Guinea 2₋₄ 17₋₄ 89₋₄ … … 4₋₄ 23₋₄ 37₋₄ 61₋₄ … … … … … … … … … … GNQEritrea 2₋₁ 29₋₁ 42₋₁ … 4₋₂ 9₋₁ 39₋₁ 84₋₁ 84₋₁ … … … 7₋₁ 35₋₁ … 84₋₂ … … … ERIEswatini … … … … … 9₋₁ 26₋₁ 88₋₂ 92₋₁ … 1₋₂ᵢ … 7₋₃ 16₋₃ 73₋₄ 73₋₃ … … … SWZEthiopia 23₋₂ … … 100₋₂ … … … … … … … … … … … … … … … ETHGabon … … … … … … … … … … … … … … … … … … … GABGambia 3 36 69₋₂ 69₋₂ 19₋₁ 10 37 88 88 … … … 8 … 96 96 … … … GMBGhana 62 30 59 55₋₁ … 169 27 62 60₋₁ … … … 188 15 77₋₁ 77₋₁ … … … GHAGuinea … … … … … 38₋₃ 47₋₃ 75₋₃ 92₋₃ 22₋₃ … … … … … … … … … GINGuinea-Bissau … … … … … … … … … … … … … … … … … … … GNBKenya 111₋₃ 29₋₃ … … … 267₋₄ᵢ … … … … … … 199₋₄ᵢ … … … … … … KENLesotho 3₋₃ 18₋₃ 100₋₄ 100₋₄ … 11₋₂ 33₋₂ 87₋₃ 83₋₃ … … … 5₋₂ 25₋₂ 89₋₃ 91₋₃ … … … LSOLiberia 14₋₂ 37₋₂ 55₋₂ 55₋₂ 5₋₂ 28₋₂ 22₋₂ 70₋₂ 70₋₂ 6₋₂ … … 18₋₂ … 62₋₄ 64₋₄ … … … LBRMadagascar 41 22 44 99 … 127 37 15 100 … … … 82 18 20₋₁ 85₋₁ … … … MDGMalawi 32₋₄ 42₋₄ … 100₋₄ … 83 55 … 100₋₁ … … … 15 68 … 58 … … … MWIMali 7₋₁ 20₋₁ … 100₋₁ … 65₋₁ 38₋₁ … … … … … 58₋₂ … … … … … … MLIMauritania 2₋₄ 19₋₄ … … … 17 41 97 … 16 … … 9 29 93 … 3 … … MRTMauritius 2 12 100 100 1 6 15 100 100 4 1 ᵢ … 10 12 48 100 14 … … MUSMozambique … … … … … 121 57 98 100 … … … 33₋₂ 37₋₂ 85₋₄ᵢ 100₋₃ … … … MOZNamibia 2₋₁ 23₋₁ … 76₋₁ … 20₋₁ 25₋₁ … 90₋₁ … … … 11₋₂ … … … … … … NAMNiger 6 32 36₋₁ 94 2 67 40 62₋₁ 99 2 … … 29₋₁ … … 100₋₁ 12₋₂ … … NERNigeria … … … … … … … … … … … … … … … … … … … NGARwanda 7 41 50 89 10 44 57 95 99 3 … … 30₋₂ … 58₋₂ 80₋₂ 5₋₂ … … RWASao Tome and Principe 1₋₄ … 28₋₄ … … 1₋₂ 31₋₂ 27₋₂ … … … … 1₋₃ … 36₋₄ 26₋₄ … … … STPSenegal 12 22 38 100 … 65 34 75 100 -₋₄ … … 56₋₄ … 72₋₄ᵢ 76₋₄ … … … SENSeychelles 0.2 18 86 88 6 1 15 84 89 9 … … 1 10 89 95 7 … … SYCSierra Leone 6 23 52 52 32 48 37 64 64 17 … … 22₋₃ … 70₋₄ 37₋₃ … … … SLESomalia … … … … … … … … … … … … … … … … … … … SOMSouth Africa … … … … … 249₋₄ … … … … 2₋₁ᵢ … 192₋₃ … 100₋₃ 80₋₄ … … 91₋₁ ZAFSouth Sudan 3₋₄ 35₋₄ … 87₋₄ … 27₋₄ᵢ … … 84₋₄ᵢ … … … 6₋₄ᵢ … … 64₋₄ᵢ … … … SSDTogo 8₊₁ 27₊₁ 64₊₁ 39₊₁ -₊₁ 42₊₁ 39₊₁ 76₊₁ 43₊₁ -₊₁ … … 30₊₁ … … … … … … TGOUganda 28₋₂ 22₋₂ 60₋₂ 40₋₂ … 207₋₂ 43₋₂ 80₋₂ … … … … … … … … … … … UGAUnited Republic of Tanzania 12 116 50₋₃ 78 … 196 54 99₋₃ 98 0.3₋₁ᵢ … … 106 22 … 91 … … … TZAZambia … … … … … 78₋₂ 42₋₂ 99₋₂ 94₋₂ … … … … … … … … … … ZMBZimbabwe … … … … … … … … … … … … … … … … … … … ZWE
2 0 2 1 / 2 • G LO BA L E D U C AT I O N M O N I TO R I N G R E P O RT 460
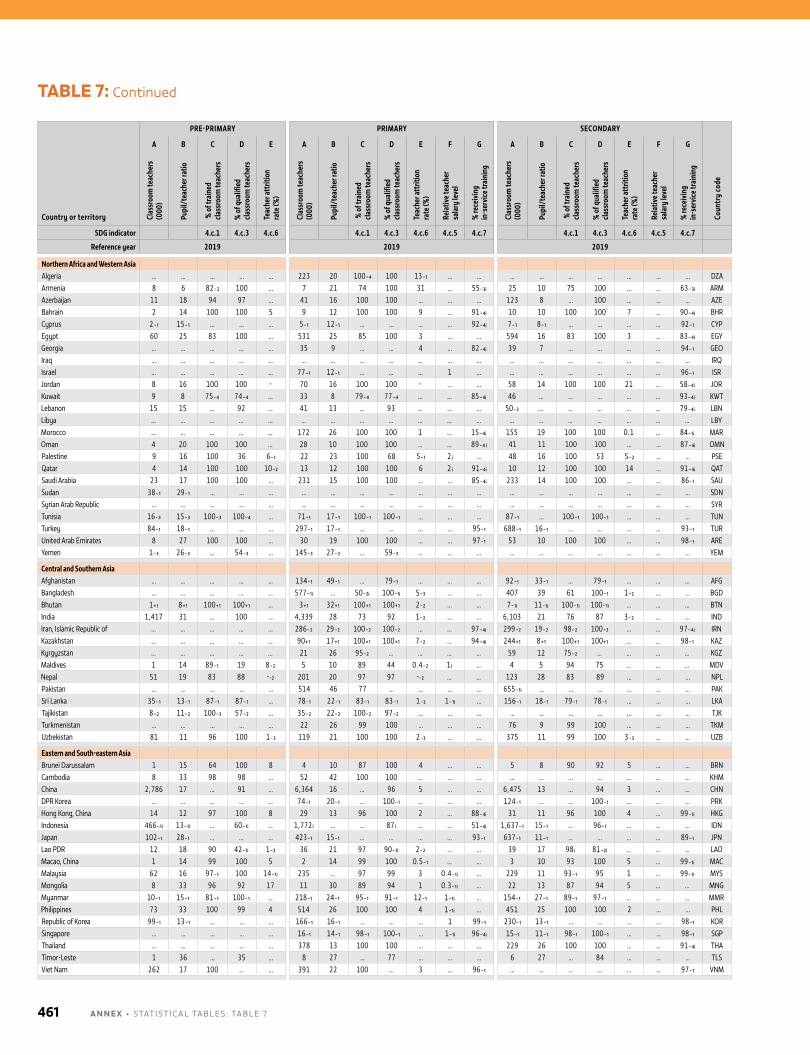
TABLE 7: Continued
Country or territory
PRE-PRIMARY PRIMARY SECONDARY
Coun
try
code
A B C D E A B C D E F G A B C D E F GCl
assr
oom
teac
hers
(0
00)
Pupi
l/te
ache
r rat
io
% o
f tra
ined
cla
ssro
om te
ache
rs
% o
f qua
lifie
d cla
ssro
om te
ache
rs
Teac
her a
ttrit
ion
rate
(%)
Clas
sroo
m te
ache
rs
(000
)
Pupi
l/te
ache
r rat
io
% o
f tra
ined
cla
ssro
om te
ache
rs
% o
f qua
lifie
d cla
ssro
om te
ache
rs
Teac
her a
ttrit
ion
rate
(%)
Rela
tive t
each
er
sala
ry le
vel
% re
ceiv
ing
in
-ser
vice
trai
ning
Clas
sroo
m te
ache
rs
(000
)
Pupi
l/te
ache
r rat
io
% o
f tra
ined
cla
ssro
om te
ache
rs
% o
f qua
lifie
d cla
ssro
om te
ache
rs
Teac
her a
ttrit
ion
rate
(%)
Rela
tive t
each
er
sala
ry le
vel
% re
ceiv
ing
in
-ser
vice
trai
ning
SDG indicator 4.c.1 4.c.3 4.c.6 4.c.1 4.c.3 4.c.6 4.c.5 4.c.7 4.c.1 4.c.3 4.c.6 4.c.5 4.c.7
Reference year 2019 2019 2019
Northern Africa and Western AsiaAlgeria … … … … … 223 20 100₋₄ 100 13₋₁ … … … … … … … … … DZAArmenia 8 6 82₋₂ 100 … 7 21 74 100 31 … 55₋₃ᵢ 25 10 75 100 … … 63₋₃ᵢ ARMAzerbaijan 11 18 94 97 … 41 16 100 100 … … … 123 8 … 100 … … … AZEBahrain 2 14 100 100 5 9 12 100 100 9 … 91₋₄ᵢ 10 10 100 100 7 … 90₋₄ᵢ BHRCyprus 2₋₁ 15₋₁ … … … 5₋₁ 12₋₁ … … … … 92₋₄ᵢ 7₋₁ 8₋₁ … … … … 92₋₁ CYPEgypt 60 25 83 100 … 531 25 85 100 3 … … 594 16 83 100 3 … 83₋₄ᵢ EGYGeorgia … … … … … 35 9 … … 4 … 82₋₄ᵢ 39 7 … … … … 94₋₁ GEOIraq … … … … … … … … … … … … … … … … … … … IRQIsrael … … … … … 77₋₁ 12₋₁ … … … 1 … … … … … … … 96₋₁ ISRJordan 8 16 100 100 - 70 16 100 100 - … … 58 14 100 100 21 … 58₋₄ᵢ JORKuwait 9 8 75₋₄ 74₋₄ … 33 8 79₋₄ 77₋₄ … … 85₋₄ᵢ 46 … … … … … 93₋₄ᵢ KWTLebanon 15 15 … 92 … 41 13 … 93 … … … 50₋₃ … … … … … 79₋₄ᵢ LBNLibya … … … … … … … … … … … … … … … … … … … LBYMorocco … … … … … 172 26 100 100 1 … 15₋₄ᵢ 155 19 100 100 0.1 … 84₋₁ᵢ MAROman 4 20 100 100 … 28 10 100 100 … … 89₋₄ ᵢ 41 11 100 100 … … 87₋₄ᵢ OMNPalestine 9 16 100 36 6₋₁ 22 23 100 68 5₋₁ 2 ᵢ … 48 16 100 53 5₋₂ … … PSEQatar 4 14 100 100 10₋₂ 13 12 100 100 6 2 ᵢ 91₋₄ᵢ 10 12 100 100 14 … 91₋₄ᵢ QATSaudi Arabia 23 17 100 100 … 231 15 100 100 … … 85₋₄ᵢ 233 14 100 100 … … 86₋₁ SAUSudan 38₋₁ 29₋₁ … … … … … … … … … … … … … … … … … SDNSyrian Arab Republic … … … … … … … … … … … … … … … … … … … SYRTunisia 16₋₃ 15₋₃ 100₋₃ 100₋₄ … 71₋₁ 17₋₁ 100₋₁ 100₋₁ … … … 87₋₁ … 100₋₁ 100₋₁ … … … TUNTurkey 84₋₁ 18₋₁ … … … 297₋₁ 17₋₁ … … … … 95₋₁ 688₋₁ 16₋₁ … … … … 93₋₁ TURUnited Arab Emirates 8 27 100 100 … 30 19 100 100 … … 97₋₁ 53 10 100 100 … … 98₋₁ AREYemen 1₋₃ 26₋₃ … 54₋₃ … 145₋₃ 27₋₃ … 59₋₃ … … … … … … … … … … YEM
Central and Southern AsiaAfghanistan … … … … … 134₋₁ 49₋₁ … 79₋₁ … … … 92₋₁ 33₋₁ … 79₋₁ … … … AFGBangladesh … … … … … 577₋₁ᵢ … 50₋₂ᵢ 100₋₁ᵢ 5₋₃ … … 407 39 61 100₋₁ 1₋₂ … … BGDBhutan 1₊₁ 8₊₁ 100₊₁ 100₊₁ … 3₊₁ 32₊₁ 100₊₁ 100₊₁ 2₋₂ … … 7₋₁ᵢ 11₋₁ᵢ 100₋₁ᵢ 100₋₁ᵢ … … … BTNIndia 1,417 31 … 100 … 4,339 28 73 92 1₋₂ … … 6,103 21 76 87 3₋₂ … … INDIran, Islamic Republic of … … … … … 286₋₂ 29₋₂ 100₋₂ 100₋₂ … … 97₋₄ᵢ 299₋₂ 19₋₂ 98₋₂ 100₋₂ … … 97₋₄ᵢ IRNKazakhstan … … … … … 90₊₁ 17₊₁ 100₊₁ 100₊₁ 7₋₂ … 94₋₄ᵢ 244₊₁ 8₊₁ 100₊₁ 100₊₁ … … 98₋₁ KAZKyrgyzstan … … … … … 21 26 95₋₂ … … … … 59 12 75₋₂ … … … … KGZMaldives 1 14 89₋₁ 19 8₋₂ 5 10 89 44 0.4₋₂ 1 ᵢ … 4 5 94 75 … … … MDVNepal 51 19 83 88 -₋₂ 201 20 97 97 -₋₂ … … 123 28 83 89 … … … NPLPakistan … … … … … 514 46 77 … … … … 655₋₁ᵢ … … … … … … PAKSri Lanka 35₋₁ 13₋₁ 87₋₁ 87₋₁ … 78₋₁ 22₋₁ 83₋₁ 83₋₁ 1₋₂ 1₋₁ᵢ … 156₋₁ 18₋₁ 79₋₁ 78₋₁ … … … LKATajikistan 8₋₂ 11₋₂ 100₋₃ 57₋₂ … 35₋₂ 22₋₂ 100₋₂ 97₋₂ … … … … … … … … … … TJKTurkmenistan … … … … … 22 26 99 100 … … … 76 9 99 100 … … … TKMUzbekistan 81 11 96 100 1₋₃ 119 21 100 100 2₋₃ … … 375 11 99 100 3₋₃ … … UZB
Eastern and South-eastern AsiaBrunei Darussalam 1 15 64 100 8 4 10 87 100 4 … … 5 8 90 92 5 … … BRNCambodia 8 33 98 98 … 52 42 100 100 … … … … … … … … … … KHMChina 2,786 17 … 91 … 6,364 16 … 96 5 … … 6,475 13 … 94 3 … … CHNDPR Korea … … … … … 74₋₁ 20₋₁ … 100₋₁ … … … 124₋₁ … … 100₋₁ … … … PRKHong Kong, China 14 12 97 100 8 29 13 96 100 2 … 88₋₄ᵢ 31 11 96 100 4 … 99₋₁ᵢ HKGIndonesia 466₋₁ᵢ 13₋₁ᵢ … 60₋₁ᵢ … 1,772 ᵢ … … 87 ᵢ … … 51₋₄ᵢ 1,637₋₁ 15₋₁ … 96₋₁ … … … IDNJapan 102₋₁ 28₋₁ … … … 423₋₁ 15₋₁ … … … … 93₋₁ 637₋₁ 11₋₁ … … … … 89₋₁ JPNLao PDR 12 18 90 42₋₁ᵢ 1₋₂ 36 21 97 90₋₁ᵢ 2₋₂ … … 39 17 98 ᵢ 81₋₂ᵢ … … … LAOMacao, China 1 14 99 100 5 2 14 99 100 0.5₋₁ … … 3 10 93 100 5 … 99₋₁ᵢ MACMalaysia 62 16 97₋₁ 100 14₋₁ᵢ 235 … 97 99 3 0.4₋₁ᵢ … 229 11 93₋₁ 95 1 … 99₋₁ᵢ MYSMongolia 8 33 96 92 17 11 30 89 94 1 0.3₋₁ᵢ … 22 13 87 94 5 … … MNGMyanmar 10₋₁ 15₋₁ 81₋₁ 100₋₁ … 218₋₁ 24₋₁ 95₋₁ 91₋₁ 12₋₁ 1₋₁ᵢ … 154₋₁ 27₋₁ 89₋₁ 97₋₁ … … … MMRPhilippines 73 33 100 99 4 514 26 100 100 4 1₋₁ᵢ … 451 25 100 100 2 … … PHLRepublic of Korea 99₋₁ 13₋₁ … … … 166₋₁ 16₋₁ … … … 1 99₋₁ 230₋₁ 13₋₁ … … … … 98₋₁ KORSingapore … … … … … 16₋₁ 14₋₁ 98₋₁ 100₋₁ … 1₋₁ᵢ 96₋₄ᵢ 15₋₁ 11₋₁ 98₋₁ 100₋₁ … … 98₋₁ SGPThailand … … … … … 378 13 100 100 … … … 229 26 100 100 … … 91₋₄ᵢ THATimor-Leste 1 36 … 35 … 8 27 … 77 … … … 6 27 … 84 … … … TLSViet Nam 262 17 100 … … 391 22 100 … 3 … 96₋₁ … … … … … … 97₋₁ VNM
A N N E X • STATISTICAl TAblES : TAblE 7461
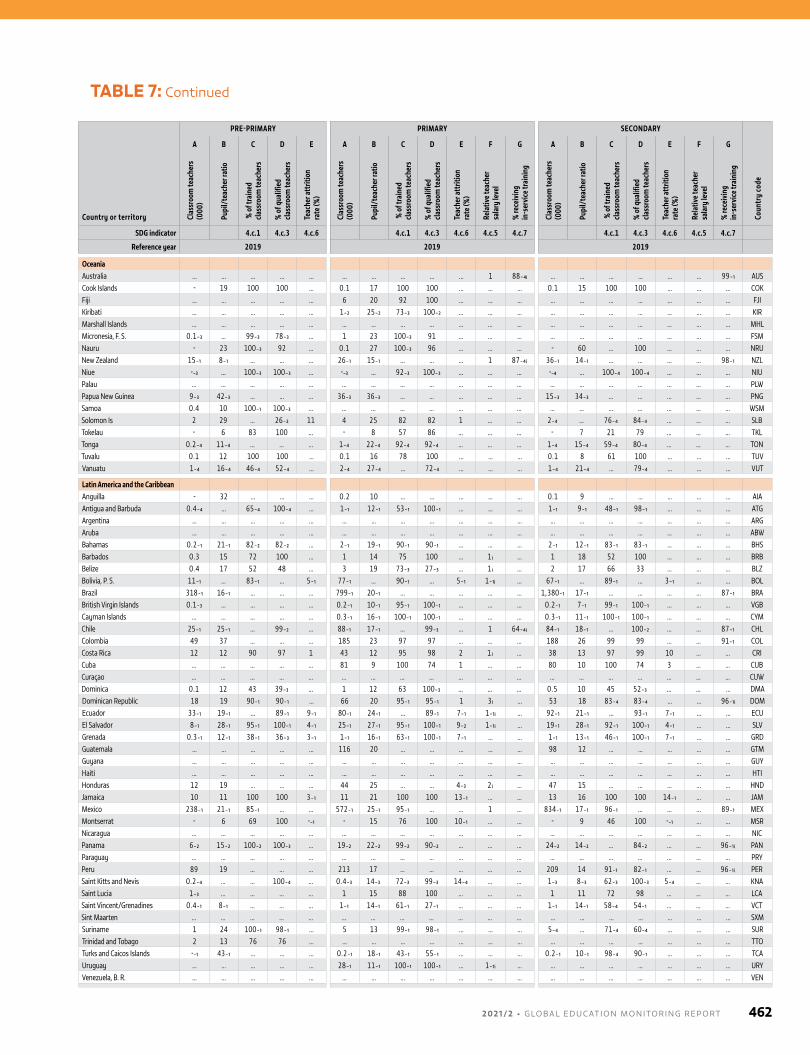
Country or territory
PRE-PRIMARY PRIMARY SECONDARY
Coun
try
code
A B C D E A B C D E F G A B C D E F G
Clas
sroo
m te
ache
rs
(000
)
Pupi
l/te
ache
r rat
io
% o
f tra
ined
cla
ssro
om te
ache
rs
% o
f qua
lifie
d cla
ssro
om te
ache
rs
Teac
her a
ttrit
ion
rate
(%)
Clas
sroo
m te
ache
rs
(000
)
Pupi
l/te
ache
r rat
io
% o
f tra
ined
cla
ssro
om te
ache
rs
% o
f qua
lifie
d cla
ssro
om te
ache
rs
Teac
her a
ttrit
ion
rate
(%)
Rela
tive t
each
er
sala
ry le
vel
% re
ceiv
ing
in
-ser
vice
trai
ning
Clas
sroo
m te
ache
rs
(000
)
Pupi
l/te
ache
r rat
io
% o
f tra
ined
cla
ssro
om te
ache
rs
% o
f qua
lifie
d cla
ssro
om te
ache
rs
Teac
her a
ttrit
ion
rate
(%)
Rela
tive t
each
er
sala
ry le
vel
% re
ceiv
ing
in
-ser
vice
trai
ning
SDG indicator 4.c.1 4.c.3 4.c.6 4.c.1 4.c.3 4.c.6 4.c.5 4.c.7 4.c.1 4.c.3 4.c.6 4.c.5 4.c.7
Reference year 2019 2019 2019
OceaniaAustralia … … … … … … … … … … 1 88₋₄ᵢ … … … … … … 99₋₁ AUSCook Islands - 19 100 100 … 0.1 17 100 100 … … … 0.1 15 100 100 … … … COKFiji … … … … … 6 20 92 100 … … … … … … … … … … FJIKiribati … … … … … 1₋₂ 25₋₂ 73₋₃ 100₋₂ … … … … … … … … … … KIRMarshall Islands … … … … … … … … … … … … … … … … … … … MHLMicronesia, F. S. 0.1₋₃ … 99₋₃ 78₋₃ … 1 23 100₋₃ 91 … … … … … … … … … … FSMNauru - 23 100₋₃ 92 … 0.1 27 100₋₃ 96 … … … - 60 … 100 … … … NRUNew Zealand 15₋₁ 8₋₁ … … … 26₋₁ 15₋₁ … … … 1 87₋₄ᵢ 36₋₁ 14₋₁ … … … … 98₋₁ NZLNiue -₋₃ … 100₋₃ 100₋₃ … -₋₃ … 92₋₃ 100₋₃ … … … -₋₄ … 100₋₄ 100₋₄ … … … NIUPalau … … … … … … … … … … … … … … … … … … … PLWPapua New Guinea 9₋₃ 42₋₃ … … … 36₋₃ 36₋₃ … … … … … 15₋₃ 34₋₃ … … … … … PNGSamoa 0.4 10 100₋₁ 100₋₃ … … … … … … … … … … … … … … … WSMSolomon Is 2 29 … 26₋₂ 11 4 25 82 82 1 … … 2₋₄ … 76₋₄ 84₋₄ … … … SLBTokelau - 6 83 100 … - 8 57 86 … … … - 7 21 79 … … … TKLTonga 0.2₋₄ 11₋₄ … … … 1₋₄ 22₋₄ 92₋₄ 92₋₄ … … … 1₋₄ 15₋₄ 59₋₄ 80₋₄ … … … TONTuvalu 0.1 12 100 100 … 0.1 16 78 100 … … … 0.1 8 61 100 … … … TUVVanuatu 1₋₄ 16₋₄ 46₋₄ 52₋₄ … 2₋₄ 27₋₄ … 72₋₄ … … … 1₋₄ 21₋₄ … 79₋₄ … … … VUT
Latin America and the CaribbeanAnguilla - 32 … … … 0.2 10 … … … … … 0.1 9 … … … … … AIAAntigua and Barbuda 0.4₋₄ … 65₋₄ 100₋₄ … 1₋₁ 12₋₁ 53₋₁ 100₋₁ … … … 1₋₁ 9₋₁ 48₋₁ 98₋₁ … … … ATGArgentina … … … … … … … … … … … … … … … … … … … ARGAruba … … … … … … … … … … … … … … … … … … … ABWBahamas 0.2₋₁ 21₋₁ 82₋₂ 82₋₂ … 2₋₁ 19₋₁ 90₋₁ 90₋₁ … … … 2₋₁ 12₋₁ 83₋₁ 83₋₁ … … … BHSBarbados 0.3 15 72 100 … 1 14 75 100 … 1 ᵢ … 1 18 52 100 … … … BRBBelize 0.4 17 52 48 … 3 19 73₋₃ 27₋₃ … 1 ᵢ … 2 17 66 33 … … … BLZBolivia, P. S. 11₋₁ … 83₋₁ … 5₋₁ 77₋₁ … 90₋₁ … 5₋₁ 1₋₁ᵢ … 67₋₁ … 89₋₁ … 3₋₁ … … BOLBrazil 318₋₁ 16₋₁ … … … 799₋₁ 20₋₁ … … … … … 1,380₋₁ 17₋₁ … … … … 87₋₁ BRABritish Virgin Islands 0.1₋₃ … … … … 0.2₋₁ 10₋₁ 95₋₁ 100₋₁ … … … 0.2₋₁ 7₋₁ 99₋₁ 100₋₁ … … … VGBCayman Islands … … … … … 0.3₋₁ 16₋₁ 100₋₁ 100₋₁ … … … 0.3₋₁ 11₋₁ 100₋₁ 100₋₁ … … … CYMChile 25₋₁ 25₋₁ … 99₋₂ … 88₋₁ 17₋₁ … 99₋₃ … 1 64₋₄ᵢ 84₋₁ 18₋₁ … 100₋₂ … … 87₋₁ CHLColombia 49 37 … … … 185 23 97 97 … … … 188 26 99 99 … … 91₋₁ COLCosta Rica 12 12 90 97 1 43 12 95 98 2 1 ᵢ … 38 13 97 99 10 … … CRICuba … … … … … 81 9 100 74 1 … … 80 10 100 74 3 … … CUBCuraçao … … … … … … … … … … … … … … … … … … … CUWDominica 0.1 12 43 39₋₃ … 1 12 63 100₋₃ … … … 0.5 10 45 52₋₃ … … … DMADominican Republic 18 19 90₋₁ 90₋₁ … 66 20 95₋₁ 95₋₁ 1 3 ᵢ … 53 18 83₋₄ 83₋₄ … … 96₋₁ᵢ DOMEcuador 33₋₁ 19₋₁ … 89₋₁ 9₋₁ 80₋₁ 24₋₁ … 89₋₁ 7₋₁ 1₋₁ᵢ … 92₋₁ 21₋₁ … 93₋₁ 7₋₁ … … ECUEl Salvador 8₋₁ 28₋₁ 95₋₁ 100₋₁ 4₋₁ 25₋₁ 27₋₁ 95₋₁ 100₋₁ 9₋₂ 1₋₁ᵢ … 19₋₁ 28₋₁ 92₋₁ 100₋₁ 4₋₁ … … SLVGrenada 0.3₋₁ 12₋₁ 38₋₁ 36₋₃ 3₋₁ 1₋₁ 16₋₁ 63₋₁ 100₋₁ 7₋₁ … … 1₋₁ 13₋₁ 46₋₁ 100₋₁ 7₋₁ … … GRDGuatemala … … … … … 116 20 … … … … … 98 12 … … … … … GTMGuyana … … … … … … … … … … … … … … … … … … … GUYHaiti … … … … … … … … … … … … … … … … … … … HTIHonduras 12 19 … … … 44 25 … … 4₋₃ 2 ᵢ … 47 15 … … … … … HNDJamaica 10 11 100 100 3₋₁ 11 21 100 100 13₋₁ … … 13 16 100 100 14₋₁ … … JAMMexico 238₋₁ 21₋₁ 85₋₁ … … 572₋₁ 25₋₁ 95₋₁ … … 1 … 834₋₁ 17₋₁ 96₋₁ … … … 89₋₁ MEXMontserrat - 6 69 100 -₋₁ - 15 76 100 10₋₁ … … - 9 46 100 -₋₁ … … MSRNicaragua … … … … … … … … … … … … … … … … … … … NICPanama 6₋₂ 15₋₂ 100₋₂ 100₋₃ … 19₋₂ 22₋₂ 99₋₂ 90₋₂ … … … 24₋₂ 14₋₂ … 84₋₂ … … 96₋₁ᵢ PANParaguay … … … … … … … … … … … … … … … … … … … PRYPeru 89 19 … … … 213 17 … … … … … 209 14 91₋₁ 82₋₁ … … 96₋₁ᵢ PERSaint Kitts and Nevis 0.2₋₄ … … 100₋₄ … 0.4₋₃ 14₋₃ 72₋₃ 99₋₃ 14₋₄ … … 1₋₃ 8₋₃ 62₋₃ 100₋₃ 5₋₄ … … KNASaint Lucia 1₋₃ … … … … 1 15 88 100 … … … 1 11 72 98 … … … LCASaint Vincent/Grenadines 0.4₋₁ 8₋₁ … … … 1₋₁ 14₋₁ 61₋₁ 27₋₁ … … … 1₋₁ 14₋₁ 58₋₄ 54₋₁ … … … VCTSint Maarten … … … … … … … … … … … … … … … … … … … SXMSuriname 1 24 100₋₁ 98₋₁ … 5 13 99₋₁ 98₋₁ … … … 5₋₄ … 71₋₄ 60₋₄ … … … SURTrinidad and Tobago 2 13 76 76 … … … … … … … … … … … … … … … TTOTurks and Caicos Islands -₋₁ 43₋₁ … … … 0.2₋₁ 18₋₁ 43₋₁ 55₋₁ … … … 0.2₋₁ 10₋₁ 98₋₄ 90₋₁ … … … TCAUruguay … … … … … 28₋₁ 11₋₁ 100₋₁ 100₋₁ … 1₋₁ᵢ … … … … … … … … URYVenezuela, B. R. … … … … … … … … … … … … … … … … … … … VEN
TABLE 7: Continued
2 0 2 1 / 2 • G LO BA L E D U C AT I O N M O N I TO R I N G R E P O RT 462
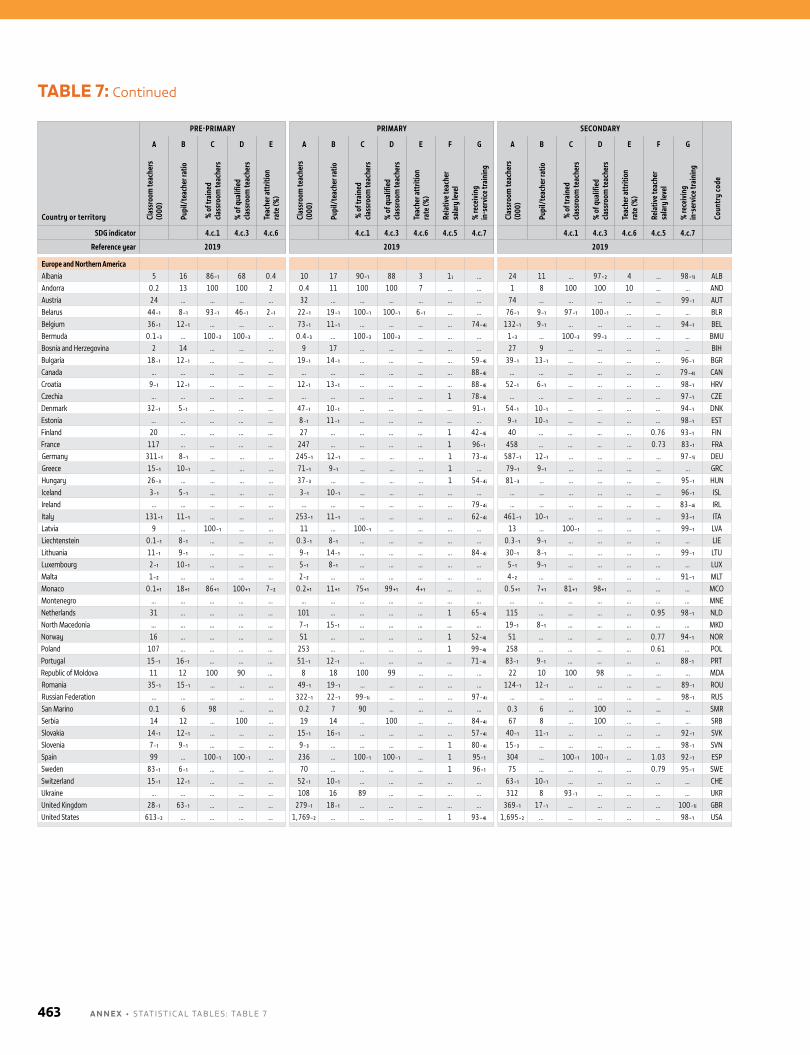
TABLE 7: Continued
Country or territory
PRE-PRIMARY PRIMARY SECONDARY
Coun
try
code
A B C D E A B C D E F G A B C D E F GCl
assr
oom
teac
hers
(0
00)
Pupi
l/te
ache
r rat
io
% o
f tra
ined
cla
ssro
om te
ache
rs
% o
f qua
lifie
d cla
ssro
om te
ache
rs
Teac
her a
ttrit
ion
rate
(%)
Clas
sroo
m te
ache
rs
(000
)
Pupi
l/te
ache
r rat
io
% o
f tra
ined
cla
ssro
om te
ache
rs
% o
f qua
lifie
d cla
ssro
om te
ache
rs
Teac
her a
ttrit
ion
rate
(%)
Rela
tive t
each
er
sala
ry le
vel
% re
ceiv
ing
in
-ser
vice
trai
ning
Clas
sroo
m te
ache
rs
(000
)
Pupi
l/te
ache
r rat
io
% o
f tra
ined
cla
ssro
om te
ache
rs
% o
f qua
lifie
d cla
ssro
om te
ache
rs
Teac
her a
ttrit
ion
rate
(%)
Rela
tive t
each
er
sala
ry le
vel
% re
ceiv
ing
in
-ser
vice
trai
ning
SDG indicator 4.c.1 4.c.3 4.c.6 4.c.1 4.c.3 4.c.6 4.c.5 4.c.7 4.c.1 4.c.3 4.c.6 4.c.5 4.c.7
Reference year 2019 2019 2019
Europe and Northern AmericaAlbania 5 16 86₋₁ 68 0.4 10 17 90₋₁ 88 3 1 ᵢ … 24 11 … 97₋₂ 4 … 98₋₁ᵢ ALBAndorra 0.2 13 100 100 2 0.4 11 100 100 7 … … 1 8 100 100 10 … … ANDAustria 24 … … … … 32 … … … … … … 74 … … … … … 99₋₁ AUTBelarus 44₋₁ 8₋₁ 93₋₁ 46₋₁ 2₋₁ 22₋₁ 19₋₁ 100₋₁ 100₋₁ 6₋₁ … … 76₋₁ 9₋₁ 97₋₁ 100₋₁ … … … BLRBelgium 36₋₁ 12₋₁ … … … 73₋₁ 11₋₁ … … … … 74₋₄ᵢ 132₋₁ 9₋₁ … … … … 94₋₁ BELBermuda 0.1₋₃ … 100₋₃ 100₋₃ … 0.4₋₃ … 100₋₃ 100₋₃ … … … 1₋₃ … 100₋₃ 99₋₃ … … … BMUBosnia and Herzegovina 2 14 … … … 9 17 … … … … … 27 9 … … … … … BIHBulgaria 18₋₁ 12₋₁ … … … 19₋₁ 14₋₁ … … … … 59₋₄ᵢ 39₋₁ 13₋₁ … … … … 96₋₁ BGRCanada … … … … … … … … … … … 88₋₄ᵢ … … … … … … 79₋₄ᵢ CANCroatia 9₋₁ 12₋₁ … … … 12₋₁ 13₋₁ … … … … 88₋₄ᵢ 52₋₁ 6₋₁ … … … … 98₋₁ HRVCzechia … … … … … … … … … … 1 78₋₄ᵢ … … … … … … 97₋₁ CZEDenmark 32₋₁ 5₋₁ … … … 47₋₁ 10₋₁ … … … … 91₋₁ 54₋₁ 10₋₁ … … … … 94₋₁ DNKEstonia … … … … … 8₋₁ 11₋₁ … … … … … 9₋₁ 10₋₁ … … … … 98₋₁ ESTFinland 20 … … … … 27 … … … … 1 42₋₄ᵢ 40 … … … … 0.76 93₋₁ FINFrance 117 … … … … 247 … … … … 1 96₋₁ 458 … … … … 0.73 83₋₁ FRAGermany 311₋₁ 8₋₁ … … … 245₋₁ 12₋₁ … … … 1 73₋₄ᵢ 587₋₁ 12₋₁ … … … … 97₋₁ᵢ DEUGreece 15₋₁ 10₋₁ … … … 71₋₁ 9₋₁ … … … 1 … 79₋₁ 9₋₁ … … … … … GRCHungary 26₋₃ … … … … 37₋₃ … … … … 1 54₋₄ᵢ 81₋₃ … … … … … 95₋₁ HUNIceland 3₋₁ 5₋₁ … … … 3₋₁ 10₋₁ … … … … … … … … … … … 96₋₁ ISLIreland … … … … … … … … … … … 79₋₄ᵢ … … … … … … 83₋₄ᵢ IRLItaly 131₋₁ 11₋₁ … … … 253₋₁ 11₋₁ … … … … 62₋₄ᵢ 461₋₁ 10₋₁ … … … … 93₋₁ ITALatvia 9 … 100₋₁ … … 11 … 100₋₁ … … … … 13 … 100₋₁ … … … 99₋₁ LVALiechtenstein 0.1₋₁ 8₋₁ … … … 0.3₋₁ 8₋₁ … … … … … 0.3₋₁ 9₋₁ … … … … … LIELithuania 11₋₁ 9₋₁ … … … 9₋₁ 14₋₁ … … … … 84₋₄ᵢ 30₋₁ 8₋₁ … … … … 99₋₁ LTULuxembourg 2₋₁ 10₋₁ … … … 5₋₁ 8₋₁ … … … … … 5₋₁ 9₋₁ … … … … … LUXMalta 1₋₂ … … … … 2₋₂ … … … … … … 4₋₂ … … … … … 91₋₁ MLTMonaco 0.1₊₁ 18₊₁ 86₊₁ 100₊₁ 7₋₂ 0.2₊₁ 11₊₁ 75₊₁ 99₊₁ 4₊₁ … … 0.5₊₁ 7₊₁ 81₊₁ 98₊₁ … … … MCOMontenegro … … … … … … … … … … … … … … … … … … … MNENetherlands 31 … … … … 101 … … … … 1 65₋₄ᵢ 115 … … … … 0.95 98₋₁ NLDNorth Macedonia … … … … … 7₋₁ 15₋₁ … … … … … 19₋₁ 8₋₁ … … … … … MKDNorway 16 … … … … 51 … … … … 1 52₋₄ᵢ 51 … … … … 0.77 94₋₁ NORPoland 107 … … … … 253 … … … … 1 99₋₄ᵢ 258 … … … … 0.61 … POLPortugal 15₋₁ 16₋₁ … … … 51₋₁ 12₋₁ … … … … 71₋₄ᵢ 83₋₁ 9₋₁ … … … … 88₋₁ PRTRepublic of Moldova 11 12 100 90 … 8 18 100 99 … … … 22 10 100 98 … … … MDARomania 35₋₁ 15₋₁ … … … 49₋₁ 19₋₁ … … … … … 124₋₁ 12₋₁ … … … … 89₋₁ ROURussian Federation … … … … … 322₋₁ 22₋₁ 99₋₁ᵢ … … … 97₋₄ᵢ … … … … … … 98₋₁ RUSSan Marino 0.1 6 98 … … 0.2 7 90 … … … … 0.3 6 … 100 … … … SMRSerbia 14 12 … 100 … 19 14 … 100 … … 84₋₄ᵢ 67 8 … 100 … … … SRBSlovakia 14₋₁ 12₋₁ … … … 15₋₁ 16₋₁ … … … … 57₋₄ᵢ 40₋₁ 11₋₁ … … … … 92₋₁ SVKSlovenia 7₋₁ 9₋₁ … … … 9₋₃ … … … … 1 80₋₄ᵢ 15₋₃ … … … … … 98₋₁ SVNSpain 99 … 100₋₁ 100₋₁ … 236 … 100₋₁ 100₋₁ … 1 95₋₁ 304 … 100₋₁ 100₋₁ … 1.03 92₋₁ ESPSweden 83₋₁ 6₋₁ … … … 70 … … … … 1 96₋₁ 75 … … … … 0.79 95₋₁ SWESwitzerland 15₋₁ 12₋₁ … … … 52₋₁ 10₋₁ … … … … … 63₋₁ 10₋₁ … … … … … CHEUkraine … … … … … 108 16 89 … … … … 312 8 93₋₁ … … … … UKRUnited Kingdom 28₋₁ 63₋₁ … … … 279₋₁ 18₋₁ … … … … … 369₋₁ 17₋₁ … … … … 100₋₁ᵢ GBRUnited States 613₋₂ … … … … 1,769₋₂ … … … … 1 93₋₄ᵢ 1,695₋₂ … … … … … 98₋₁ USA
A N N E X • STATISTICAl TAblES : TAblE 7463
2 0 2 1 / 2 • G LO BA L E D U C AT I O N M O N I TO R I N G R E P O RT 464
Rima, 13, goes to school in bethlehem, Palestine. her education is frequently disrupted but she has never lost hope of building a better future.
CREDIT: Jonathan hyams/Save the Children
465 A N N E X • A ID TAblES
Aid tables
INTRODUCTIONData in the following four tables on official development assistance (oDA) are derived from the International Development Statistics (IDS) database of the organisation for Economic Co-operation and Development (oECD). The IDS database records information provided annually by all members of the oECD Development Assistance Committee (DAC), as well as a growing number of non-DAC donors. Figures for oDA come from the DAC database, while figures for aid to education come from the Creditor Reporting System (CRS), a database of individual projects. Figures in the DAC and CRS databases are expressed in constant 2019 uS dollars. The DAC and CRS databases are available at www.oecd.org/dac/stats/idsonline.htm.
In 2019, the methodology of defining oDA changed:
� The cash-flow approach, used for Tables 2 to 4, includes both grants and loans that (a) are undertaken by the official sector, (b) have promotion of economic development and welfare as their main objective and, for loans, (c) are at concessional financial terms (having a grant element of at least 25%).
� The new grant-equivalent approach, which is used for Table 1, counts only grants and the grant element of concessional loans as oDA.
The DAC glossary of terms and concepts is available at www.oecd.org/dac/financing-sustainable-development/development-finance-data/dac-glossary.htm.
AID RECIPIENTS AND DONORS
The DAC list of oDA recipients consists of all low- and middle-income countries, based on the World bank income classification.For further information, see www.oecd.org/development/financing-sustainable-development/development-finance-standards/historyofdaclistsofaidrecipientcountries.htm.
Bilateral donors are countries that provide development assistance directly to recipient countries. most are DAC
members. bilateral donors also contribute substantially to the financing of multilateral donors through contributions recorded as multilateral oDA.
Multilateral donors are international institutions with government membership that conduct many or all of their activities supporting development and aid recipient countries. They include multilateral development banks (e.g. World bank, regional development banks), un agencies and regional agencies.
� ‘bilateral flows’ refers to bilateral donors contracting with multilateral donors to deliver a programme.
� ‘multilateral flows’ refers to bilateral donor contributions pooled with other contributions and disbursed at the discretion of the multilateral donor to fund its own programmes and running costs.
For a list of bilateral and multilateral donors, see the ‘Donors’ worksheet at www.oecd.org/dac/financing- sustainable-development/development-finance-standards/DAC-CRS-CoDES.xls.
TABLE 1: DEVELOPMENT AND HUMANITARIAN ASSISTANCE
oDA comprises bilateral and multilateral development assistance, both sector allocable and non-allocable (e.g. general budget support, humanitarian aid, debt relief). oDA disbursements are reported as follows:
� Total oDA
� As volume, in million uS dollars
� As share of gross national income (GnI)
� Contributions to multilateral donors (a subset of total oDA)
� As volume, in million uS dollars
� As share of total oDA disbursements.
Reported humanitarian assistance is a subset of total oDA from the oECD CRS database. It has been estimated using the cash-flow approach.
2 0 2 1 / 2 • G lo bA l E D u C AT I o n m o n I To R I n G R E P o RT 466
TABLES 2 AND 3: DEVELOPMENT ASSISTANCE TO EDUCATION BY DONOR AND BY RECIPIENT
Direct aid to education is aid reported in the CRS database as direct allocations to the education sector. Four education levels are distinguished:
� Basic covers primary education, basic life skills for youth and adults, and early childhood education.
� Secondary covers general secondary education and vocational training.
� Post-secondary covers tertiary education as well as advanced technical and managerial training.
� Level unspecified refers to any activity that cannot be attributed solely to the development of a particular level of education, such as education research and teacher training. General education programme support is often reported in this subcategory.
Total aid to education adds to direct aid a component of general budget support (i.e. aid provided to governments without being earmarked for specific projects or sectors). It is reported as follows:
� Total aid to education is direct aid to education plus 20% of general budget support.
� Total aid to basic education is direct aid to basic education plus 50% of ‘level unspecified’ and 10% of general budget support.
� Total aid to secondary education is direct aid to secondary education plus 25% of ‘level unspecified’ and 5% of general budget support.
� Total aid to post-secondary education is direct aid to post-secondary education plus 25% of ‘level unspecified’ and 5% of general budget support.
The share of education in total ODA is calculated using total oDA as reported in Table 1.
TABLE 4: DEVELOPMENT ASSISTANCE TO EDUCATION BY DONOR – TOP 3 RECIPIENTS
This table reports the amount and share of bilateral and multilateral donor assistance to education and to basic education allocated to the top three recipients of assistance from each donor.
467 A N N E X • A ID TAblES
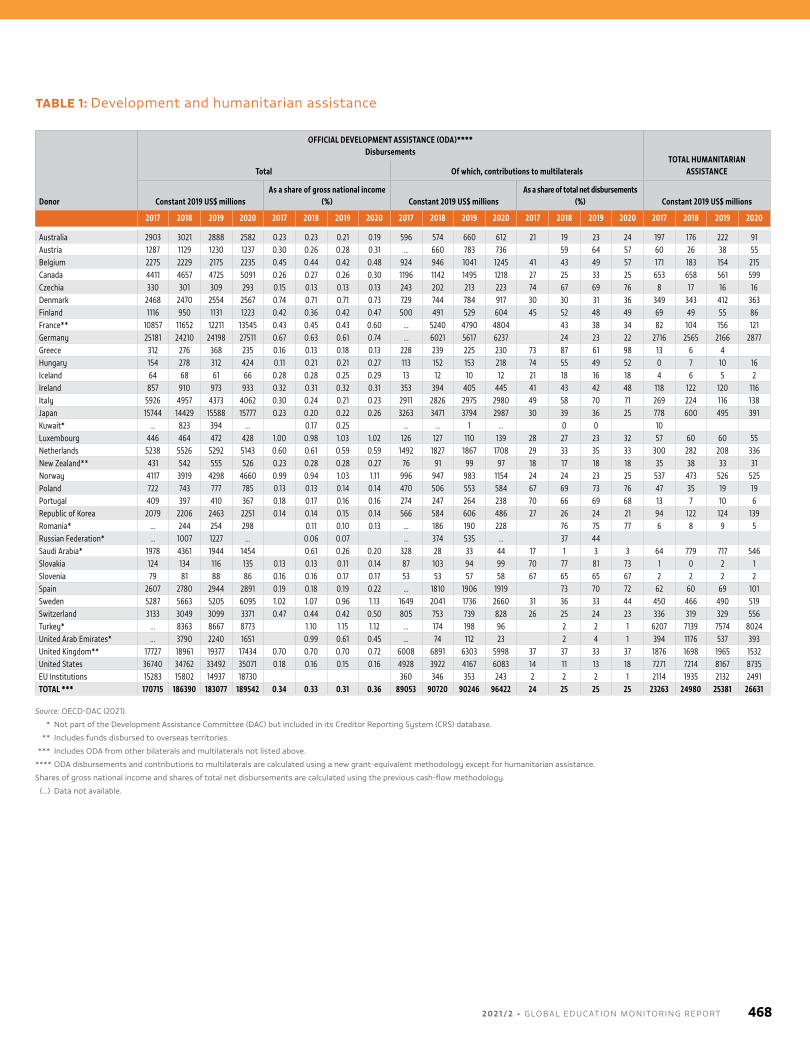
TABLE 1: Development and humanitarian assistance
Donor
OFFICIAL DEVELOPMENT ASSISTANCE (ODA)****Disbursements
TOTAL HUMANITARIAN ASSISTANCETotal Of which, contributions to multilaterals
Constant 2019 US$ millionsAs a share of gross national income
(%) Constant 2019 US$ millionsAs a share of total net disbursements
(%) Constant 2019 US$ millions
2017 2018 2019 2020 2017 2018 2019 2020 2017 2018 2019 2020 2017 2018 2019 2020 2017 2018 2019 2020
Australia 2903 3021 2888 2582 0.23 0.23 0.21 0.19 596 574 660 612 21 19 23 24 197 176 222 91Austria 1287 1129 1230 1237 0.30 0.26 0.28 0.31 ... 660 783 736 59 64 57 60 26 38 55Belgium 2275 2229 2175 2235 0.45 0.44 0.42 0.48 924 946 1041 1245 41 43 49 57 171 183 154 215Canada 4411 4657 4725 5091 0.26 0.27 0.26 0.30 1196 1142 1495 1218 27 25 33 25 653 658 561 599Czechia 330 301 309 293 0.15 0.13 0.13 0.13 243 202 213 223 74 67 69 76 8 17 16 16Denmark 2468 2470 2554 2567 0.74 0.71 0.71 0.73 729 744 784 917 30 30 31 36 349 343 412 363Finland 1116 950 1131 1223 0.42 0.36 0.42 0.47 500 491 529 604 45 52 48 49 69 49 55 86France** 10857 11652 12211 13545 0.43 0.45 0.43 0.60 ... 5240 4790 4804 43 38 34 82 104 156 121Germany 25181 24210 24198 27511 0.67 0.63 0.61 0.74 ... 6021 5617 6237 24 23 22 2716 2565 2166 2877Greece 312 276 368 235 0.16 0.13 0.18 0.13 228 239 225 230 73 87 61 98 13 6 4Hungary 154 278 312 424 0.11 0.21 0.21 0.27 113 152 153 218 74 55 49 52 0 7 10 16Iceland 64 68 61 66 0.28 0.28 0.25 0.29 13 12 10 12 21 18 16 18 4 6 5 2Ireland 857 910 973 933 0.32 0.31 0.32 0.31 353 394 405 445 41 43 42 48 118 122 120 116Italy 5926 4957 4373 4062 0.30 0.24 0.21 0.23 2911 2826 2975 2980 49 58 70 71 269 224 116 138Japan 15744 14429 15588 15777 0.23 0.20 0.22 0.26 3263 3471 3794 2987 30 39 36 25 778 600 495 391Kuwait* ... 823 394 ... 0.17 0.25 ... ... 1 ... 0 0 10Luxembourg 446 464 472 428 1.00 0.98 1.03 1.02 126 127 110 139 28 27 23 32 57 60 60 55Netherlands 5238 5526 5292 5143 0.60 0.61 0.59 0.59 1492 1827 1867 1708 29 33 35 33 300 282 208 336New Zealand** 431 542 555 526 0.23 0.28 0.28 0.27 76 91 99 97 18 17 18 18 35 38 33 31Norway 4117 3919 4298 4660 0.99 0.94 1.03 1.11 996 947 983 1154 24 24 23 25 537 473 526 525Poland 722 743 777 785 0.13 0.13 0.14 0.14 470 506 553 584 67 69 73 76 47 35 19 19Portugal 409 397 410 367 0.18 0.17 0.16 0.16 274 247 264 238 70 66 69 68 13 7 10 6Republic of Korea 2079 2206 2463 2251 0.14 0.14 0.15 0.14 566 584 606 486 27 26 24 21 94 122 124 139Romania* ... 244 254 298 0.11 0.10 0.13 ... 186 190 228 76 75 77 6 8 9 5Russian Federation* ... 1007 1227 ... 0.06 0.07 ... 374 535 ... 37 44Saudi Arabia* 1978 4361 1944 1454 0.61 0.26 0.20 328 28 33 44 17 1 3 3 64 779 717 546Slovakia 124 134 116 135 0.13 0.13 0.11 0.14 87 103 94 99 70 77 81 73 1 0 2 1Slovenia 79 81 88 86 0.16 0.16 0.17 0.17 53 53 57 58 67 65 65 67 2 2 2 2Spain 2607 2780 2944 2891 0.19 0.18 0.19 0.22 ... 1810 1906 1919 73 70 72 62 60 69 101Sweden 5287 5663 5205 6095 1.02 1.07 0.96 1.13 1649 2041 1736 2660 31 36 33 44 450 466 490 519Switzerland 3133 3049 3099 3371 0.47 0.44 0.42 0.50 805 753 739 828 26 25 24 23 336 319 329 556Turkey* ... 8363 8667 8773 1.10 1.15 1.12 ... 174 198 96 2 2 1 6207 7139 7574 8024United Arab Emirates* ... 3790 2240 1651 0.99 0.61 0.45 ... 74 112 23 2 4 1 394 1176 537 393United Kingdom** 17727 18961 19377 17434 0.70 0.70 0.70 0.72 6008 6891 6303 5998 37 37 33 37 1876 1698 1965 1532United States 36740 34762 33492 35071 0.18 0.16 0.15 0.16 4928 3922 4167 6083 14 11 13 18 7271 7214 8167 8735EU Institutions 15283 15802 14937 18730 360 346 353 243 2 2 2 1 2114 1935 2132 2491TOTAL *** 170715 186390 183077 189542 0.34 0.33 0.31 0.36 89053 90720 90246 96422 24 25 25 25 23263 24980 25381 26631
Source: oECD-DAC (2021).
* not part of the Development Assistance Committee (DAC) but included in its Creditor Reporting System (CRS) database.
** Includes funds disbursed to overseas territories.
*** Includes oDA from other bilaterals and multilaterals not listed above.
**** oDA disbursements and contributions to multilaterals are calculated using a new grant-equivalent methodology except for humanitarian assistance.
Shares of gross national income and shares of total net disbursements are calculated using the previous cash-flow methodology.
(…) Data not available.
2 0 2 1 / 2 • G lo bA l E D u C AT I o n m o n I To R I n G R E P o RT 468
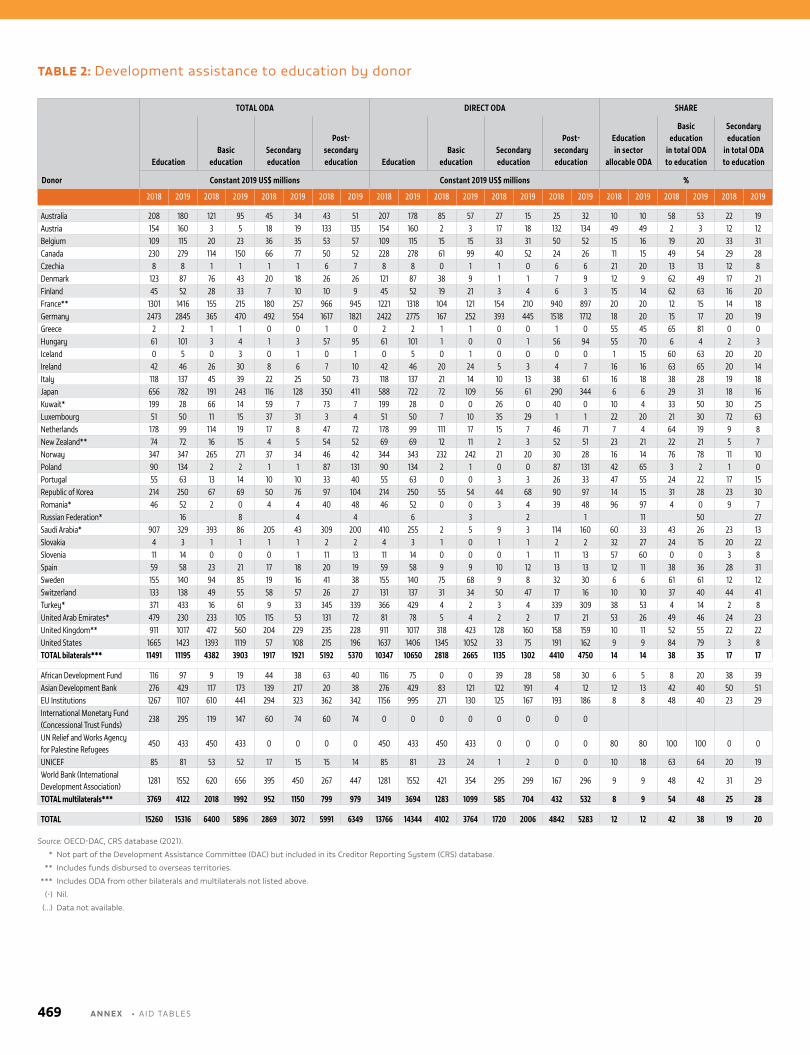
TABLE 2: Development assistance to education by donor
Donor
TOTAL ODA DIRECT ODA SHARE
EducationBasic
educationSecondary education
Post-secondary education Education
Basic education
Secondary education
Post-secondary education
Education in sector
allocable ODA
Basic education
in total ODA to education
Secondary education
in total ODA to education
Constant 2019 US$ millions Constant 2019 US$ millions %
2018 2019 2018 2019 2018 2019 2018 2019 2018 2019 2018 2019 2018 2019 2018 2019 2018 2019 2018 2019 2018 2019
Australia 208 180 121 95 45 34 43 51 207 178 85 57 27 15 25 32 10 10 58 53 22 19Austria 154 160 3 5 18 19 133 135 154 160 2 3 17 18 132 134 49 49 2 3 12 12Belgium 109 115 20 23 36 35 53 57 109 115 15 15 33 31 50 52 15 16 19 20 33 31Canada 230 279 114 150 66 77 50 52 228 278 61 99 40 52 24 26 11 15 49 54 29 28Czechia 8 8 1 1 1 1 6 7 8 8 0 1 1 0 6 6 21 20 13 13 12 8Denmark 123 87 76 43 20 18 26 26 121 87 38 9 1 1 7 9 12 9 62 49 17 21Finland 45 52 28 33 7 10 10 9 45 52 19 21 3 4 6 3 15 14 62 63 16 20France** 1301 1416 155 215 180 257 966 945 1221 1318 104 121 154 210 940 897 20 20 12 15 14 18Germany 2473 2845 365 470 492 554 1617 1821 2422 2775 167 252 393 445 1518 1712 18 20 15 17 20 19Greece 2 2 1 1 0 0 1 0 2 2 1 1 0 0 1 0 55 45 65 81 0 0Hungary 61 101 3 4 1 3 57 95 61 101 1 0 0 1 56 94 55 70 6 4 2 3Iceland 0 5 0 3 0 1 0 1 0 5 0 1 0 0 0 0 1 15 60 63 20 20Ireland 42 46 26 30 8 6 7 10 42 46 20 24 5 3 4 7 16 16 63 65 20 14Italy 118 137 45 39 22 25 50 73 118 137 21 14 10 13 38 61 16 18 38 28 19 18Japan 656 782 191 243 116 128 350 411 588 722 72 109 56 61 290 344 6 6 29 31 18 16Kuwait* 199 28 66 14 59 7 73 7 199 28 0 0 26 0 40 0 10 4 33 50 30 25Luxembourg 51 50 11 15 37 31 3 4 51 50 7 10 35 29 1 1 22 20 21 30 72 63Netherlands 178 99 114 19 17 8 47 72 178 99 111 17 15 7 46 71 7 4 64 19 9 8New Zealand** 74 72 16 15 4 5 54 52 69 69 12 11 2 3 52 51 23 21 22 21 5 7Norway 347 347 265 271 37 34 46 42 344 343 232 242 21 20 30 28 16 14 76 78 11 10Poland 90 134 2 2 1 1 87 131 90 134 2 1 0 0 87 131 42 65 3 2 1 0Portugal 55 63 13 14 10 10 33 40 55 63 0 0 3 3 26 33 47 55 24 22 17 15Republic of Korea 214 250 67 69 50 76 97 104 214 250 55 54 44 68 90 97 14 15 31 28 23 30Romania* 46 52 2 0 4 4 40 48 46 52 0 0 3 4 39 48 96 97 4 0 9 7Russian Federation* 16 8 4 4 6 3 2 1 11 50 27Saudi Arabia* 907 329 393 86 205 43 309 200 410 255 2 5 9 3 114 160 60 33 43 26 23 13Slovakia 4 3 1 1 1 1 2 2 4 3 1 0 1 1 2 2 32 27 24 15 20 22Slovenia 11 14 0 0 0 1 11 13 11 14 0 0 0 1 11 13 57 60 0 0 3 8Spain 59 58 23 21 17 18 20 19 59 58 9 9 10 12 13 13 12 11 38 36 28 31Sweden 155 140 94 85 19 16 41 38 155 140 75 68 9 8 32 30 6 6 61 61 12 12Switzerland 133 138 49 55 58 57 26 27 131 137 31 34 50 47 17 16 10 10 37 40 44 41Turkey* 371 433 16 61 9 33 345 339 366 429 4 2 3 4 339 309 38 53 4 14 2 8United Arab Emirates* 479 230 233 105 115 53 131 72 81 78 5 4 2 2 17 21 53 26 49 46 24 23United Kingdom** 911 1017 472 560 204 229 235 228 911 1017 318 423 128 160 158 159 10 11 52 55 22 22United States 1665 1423 1393 1119 57 108 215 196 1637 1406 1345 1052 33 75 191 162 9 9 84 79 3 8TOTAL bilaterals*** 11491 11195 4382 3903 1917 1921 5192 5370 10347 10650 2818 2665 1135 1302 4410 4750 14 14 38 35 17 17
African Development Fund 116 97 9 19 44 38 63 40 116 75 0 0 39 28 58 30 6 5 8 20 38 39Asian Development Bank 276 429 117 173 139 217 20 38 276 429 83 121 122 191 4 12 12 13 42 40 50 51EU Institutions 1267 1107 610 441 294 323 362 342 1156 995 271 130 125 167 193 186 8 8 48 40 23 29International Monetary Fund (Concessional Trust Funds)
238 295 119 147 60 74 60 74 0 0 0 0 0 0 0 0
UN Relief and Works Agency for Palestine Refugees
450 433 450 433 0 0 0 0 450 433 450 433 0 0 0 0 80 80 100 100 0 0
UNICEF 85 81 53 52 17 15 15 14 85 81 23 24 1 2 0 0 10 18 63 64 20 19World Bank (International Development Association)
1281 1552 620 656 395 450 267 447 1281 1552 421 354 295 299 167 296 9 9 48 42 31 29
TOTAL multilaterals*** 3769 4122 2018 1992 952 1150 799 979 3419 3694 1283 1099 585 704 432 532 8 9 54 48 25 28
TOTAL 15260 15316 6400 5896 2869 3072 5991 6349 13766 14344 4102 3764 1720 2006 4842 5283 12 12 42 38 19 20
Source: oECD-DAC, CRS database (2021).
* not part of the Development Assistance Committee (DAC) but included in its Creditor Reporting System (CRS) database.
** Includes funds disbursed to overseas territories.
*** Includes oDA from other bilaterals and multilaterals not listed above.
(-) nil.
(…) Data not available.
469 A N N E X • A ID TAblES
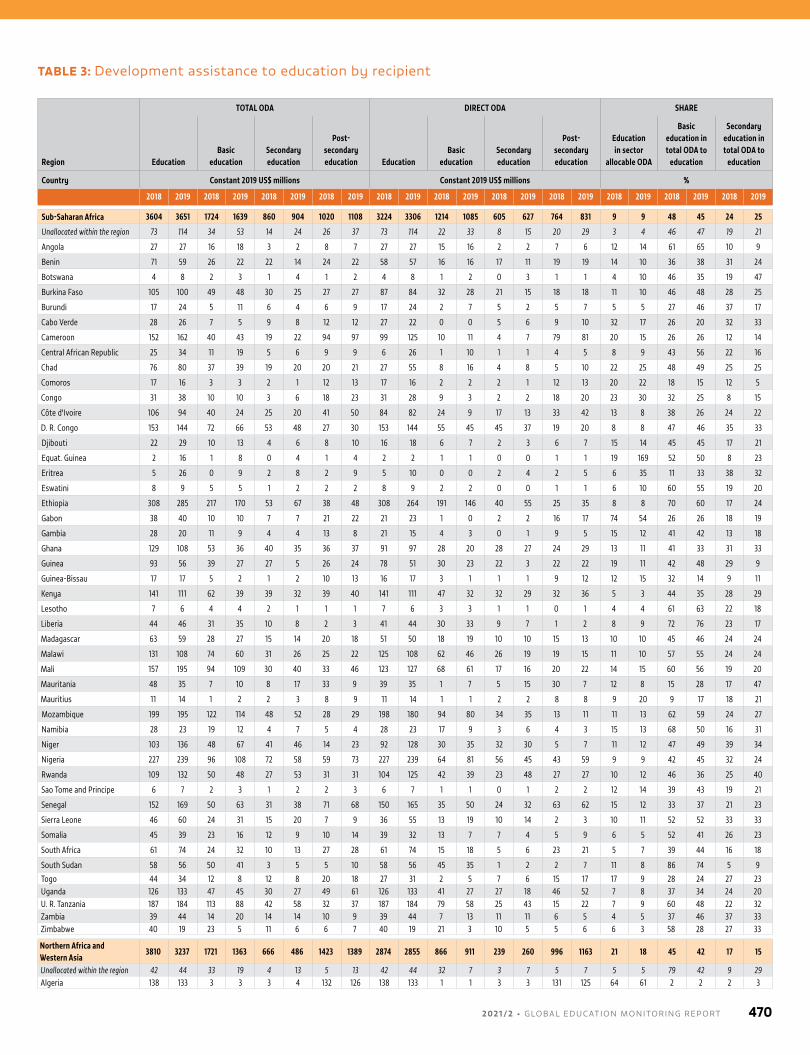
TABLE 3: Development assistance to education by recipient
Region
TOTAL ODA DIRECT ODA SHARE
EducationBasic
educationSecondary education
Post-secondary education Education
Basic education
Secondary education
Post-secondary education
Education in sector
allocable ODA
Basic education in total ODA to
education
Secondary education in total ODA to
education
Country Constant 2019 US$ millions Constant 2019 US$ millions %
2018 2019 2018 2019 2018 2019 2018 2019 2018 2019 2018 2019 2018 2019 2018 2019 2018 2019 2018 2019 2018 2019
Sub-Saharan Africa 3604 3651 1724 1639 860 904 1020 1108 3224 3306 1214 1085 605 627 764 831 9 9 48 45 24 25
Unallocated within the region 73 114 34 53 14 24 26 37 73 114 22 33 8 15 20 29 3 4 46 47 19 21
Angola 27 27 16 18 3 2 8 7 27 27 15 16 2 2 7 6 12 14 61 65 10 9
Benin 71 59 26 22 22 14 24 22 58 57 16 16 17 11 19 19 14 10 36 38 31 24
Botswana 4 8 2 3 1 4 1 2 4 8 1 2 0 3 1 1 4 10 46 35 19 47
Burkina Faso 105 100 49 48 30 25 27 27 87 84 32 28 21 15 18 18 11 10 46 48 28 25
Burundi 17 24 5 11 6 4 6 9 17 24 2 7 5 2 5 7 5 5 27 46 37 17
Cabo Verde 28 26 7 5 9 8 12 12 27 22 0 0 5 6 9 10 32 17 26 20 32 33
Cameroon 152 162 40 43 19 22 94 97 99 125 10 11 4 7 79 81 20 15 26 26 12 14
Central African Republic 25 34 11 19 5 6 9 9 6 26 1 10 1 1 4 5 8 9 43 56 22 16
Chad 76 80 37 39 19 20 20 21 27 55 8 16 4 8 5 10 22 25 48 49 25 25
Comoros 17 16 3 3 2 1 12 13 17 16 2 2 2 1 12 13 20 22 18 15 12 5
Congo 31 38 10 10 3 6 18 23 31 28 9 3 2 2 18 20 23 30 32 25 8 15
Côte d'Ivoire 106 94 40 24 25 20 41 50 84 82 24 9 17 13 33 42 13 8 38 26 24 22
D. R. Congo 153 144 72 66 53 48 27 30 153 144 55 45 45 37 19 20 8 8 47 46 35 33
Djibouti 22 29 10 13 4 6 8 10 16 18 6 7 2 3 6 7 15 14 45 45 17 21
Equat. Guinea 2 16 1 8 0 4 1 4 2 2 1 1 0 0 1 1 19 169 52 50 8 23
Eritrea 5 26 0 9 2 8 2 9 5 10 0 0 2 4 2 5 6 35 11 33 38 32
Eswatini 8 9 5 5 1 2 2 2 8 9 2 2 0 0 1 1 6 10 60 55 19 20
Ethiopia 308 285 217 170 53 67 38 48 308 264 191 146 40 55 25 35 8 8 70 60 17 24
Gabon 38 40 10 10 7 7 21 22 21 23 1 0 2 2 16 17 74 54 26 26 18 19
Gambia 28 20 11 9 4 4 13 8 21 15 4 3 0 1 9 5 15 12 41 42 13 18
Ghana 129 108 53 36 40 35 36 37 91 97 28 20 28 27 24 29 13 11 41 33 31 33
Guinea 93 56 39 27 27 5 26 24 78 51 30 23 22 3 22 22 19 11 42 48 29 9
Guinea-Bissau 17 17 5 2 1 2 10 13 16 17 3 1 1 1 9 12 12 15 32 14 9 11
Kenya 141 111 62 39 39 32 39 40 141 111 47 32 32 29 32 36 5 3 44 35 28 29
Lesotho 7 6 4 4 2 1 1 1 7 6 3 3 1 1 0 1 4 4 61 63 22 18
Liberia 44 46 31 35 10 8 2 3 41 44 30 33 9 7 1 2 8 9 72 76 23 17
Madagascar 63 59 28 27 15 14 20 18 51 50 18 19 10 10 15 13 10 10 45 46 24 24
Malawi 131 108 74 60 31 26 25 22 125 108 62 46 26 19 19 15 11 10 57 55 24 24
Mali 157 195 94 109 30 40 33 46 123 127 68 61 17 16 20 22 14 15 60 56 19 20
Mauritania 48 35 7 10 8 17 33 9 39 35 1 7 5 15 30 7 12 8 15 28 17 47
Mauritius 11 14 1 2 2 3 8 9 11 14 1 1 2 2 8 8 9 20 9 17 18 21
Mozambique 199 195 122 114 48 52 28 29 198 180 94 80 34 35 13 11 11 13 62 59 24 27
Namibia 28 23 19 12 4 7 5 4 28 23 17 9 3 6 4 3 15 13 68 50 16 31
Niger 103 136 48 67 41 46 14 23 92 128 30 35 32 30 5 7 11 12 47 49 39 34
Nigeria 227 239 96 108 72 58 59 73 227 239 64 81 56 45 43 59 9 9 42 45 32 24
Rwanda 109 132 50 48 27 53 31 31 104 125 42 39 23 48 27 27 10 12 46 36 25 40
Sao Tome and Principe 6 7 2 3 1 2 2 3 6 7 1 1 0 1 2 2 12 14 39 43 19 21
Senegal 152 169 50 63 31 38 71 68 150 165 35 50 24 32 63 62 15 12 33 37 21 23
Sierra Leone 46 60 24 31 15 20 7 9 36 55 13 19 10 14 2 3 10 11 52 52 33 33
Somalia 45 39 23 16 12 9 10 14 39 32 13 7 7 4 5 9 6 5 52 41 26 23
South Africa 61 74 24 32 10 13 27 28 61 74 15 18 5 6 23 21 5 7 39 44 16 18
South Sudan 58 56 50 41 3 5 5 10 58 56 45 35 1 2 2 7 11 8 86 74 5 9
Togo 44 34 12 8 12 8 20 18 27 31 2 5 7 6 15 17 17 9 28 24 27 23Uganda 126 133 47 45 30 27 49 61 126 133 41 27 27 18 46 52 7 8 37 34 24 20U. R. Tanzania 187 184 113 88 42 58 32 37 187 184 79 58 25 43 15 22 7 9 60 48 22 32Zambia 39 44 14 20 14 14 10 9 39 44 7 13 11 11 6 5 4 5 37 46 37 33Zimbabwe 40 19 23 5 11 6 6 7 40 19 21 3 10 5 5 6 6 3 58 28 27 33
Northern Africa and Western Asia
3810 3237 1721 1363 666 486 1423 1389 2874 2855 866 911 239 260 996 1163 21 18 45 42 17 15
Unallocated within the region 42 44 33 19 4 13 5 13 42 44 32 7 3 7 5 7 5 5 79 42 9 29Algeria 138 133 3 3 3 4 132 126 138 133 1 1 3 3 131 125 64 61 2 2 2 3
2 0 2 1 / 2 • G LO BA L E D U C AT I O N M O N I TO R I N G R E P O RT 470
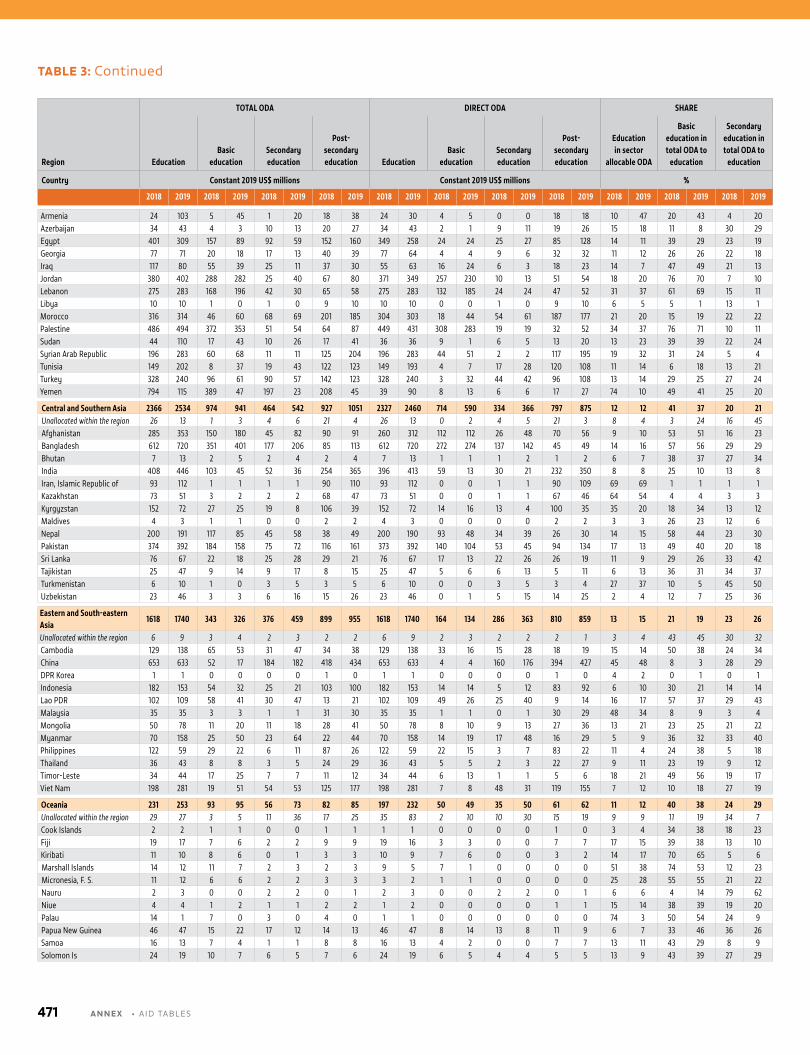
TABLE 3: Continued
Region
TOTAL ODA DIRECT ODA SHARE
EducationBasic
educationSecondary education
Post-secondary education Education
Basic education
Secondary education
Post-secondary education
Education in sector
allocable ODA
Basic education in total ODA to
education
Secondary education in total ODA to
education
Country Constant 2019 US$ millions Constant 2019 US$ millions %
2018 2019 2018 2019 2018 2019 2018 2019 2018 2019 2018 2019 2018 2019 2018 2019 2018 2019 2018 2019 2018 2019
Armenia 24 103 5 45 1 20 18 38 24 30 4 5 0 0 18 18 10 47 20 43 4 20Azerbaijan 34 43 4 3 10 13 20 27 34 43 2 1 9 11 19 26 15 18 11 8 30 29Egypt 401 309 157 89 92 59 152 160 349 258 24 24 25 27 85 128 14 11 39 29 23 19Georgia 77 71 20 18 17 13 40 39 77 64 4 4 9 6 32 32 11 12 26 26 22 18Iraq 117 80 55 39 25 11 37 30 55 63 16 24 6 3 18 23 14 7 47 49 21 13Jordan 380 402 288 282 25 40 67 80 371 349 257 230 10 13 51 54 18 20 76 70 7 10Lebanon 275 283 168 196 42 30 65 58 275 283 132 185 24 24 47 52 31 37 61 69 15 11Libya 10 10 1 0 1 0 9 10 10 10 0 0 1 0 9 10 6 5 5 1 13 1Morocco 316 314 46 60 68 69 201 185 304 303 18 44 54 61 187 177 21 20 15 19 22 22Palestine 486 494 372 353 51 54 64 87 449 431 308 283 19 19 32 52 34 37 76 71 10 11Sudan 44 110 17 43 10 26 17 41 36 36 9 1 6 5 13 20 13 23 39 39 22 24Syrian Arab Republic 196 283 60 68 11 11 125 204 196 283 44 51 2 2 117 195 19 32 31 24 5 4Tunisia 149 202 8 37 19 43 122 123 149 193 4 7 17 28 120 108 11 14 6 18 13 21Turkey 328 240 96 61 90 57 142 123 328 240 3 32 44 42 96 108 13 14 29 25 27 24Yemen 794 115 389 47 197 23 208 45 39 90 8 13 6 6 17 27 74 10 49 41 25 20
Central and Southern Asia 2366 2534 974 941 464 542 927 1051 2327 2460 714 590 334 366 797 875 12 12 41 37 20 21Unallocated within the region 26 13 1 3 4 6 21 4 26 13 0 2 4 5 21 3 8 4 3 24 16 45Afghanistan 285 353 150 180 45 82 90 91 260 312 112 112 26 48 70 56 9 10 53 51 16 23Bangladesh 612 720 351 401 177 206 85 113 612 720 272 274 137 142 45 49 14 16 57 56 29 29Bhutan 7 13 2 5 2 4 2 4 7 13 1 1 1 2 1 2 6 7 38 37 27 34India 408 446 103 45 52 36 254 365 396 413 59 13 30 21 232 350 8 8 25 10 13 8Iran, Islamic Republic of 93 112 1 1 1 1 90 110 93 112 0 0 1 1 90 109 69 69 1 1 1 1Kazakhstan 73 51 3 2 2 2 68 47 73 51 0 0 1 1 67 46 64 54 4 4 3 3Kyrgyzstan 152 72 27 25 19 8 106 39 152 72 14 16 13 4 100 35 35 20 18 34 13 12Maldives 4 3 1 1 0 0 2 2 4 3 0 0 0 0 2 2 3 3 26 23 12 6Nepal 200 191 117 85 45 58 38 49 200 190 93 48 34 39 26 30 14 15 58 44 23 30Pakistan 374 392 184 158 75 72 116 161 373 392 140 104 53 45 94 134 17 13 49 40 20 18Sri Lanka 76 67 22 18 25 28 29 21 76 67 17 13 22 26 26 19 11 9 29 26 33 42Tajikistan 25 47 9 14 9 17 8 15 25 47 5 6 6 13 5 11 6 13 36 31 34 37Turkmenistan 6 10 1 0 3 5 3 5 6 10 0 0 3 5 3 4 27 37 10 5 45 50Uzbekistan 23 46 3 3 6 16 15 26 23 46 0 1 5 15 14 25 2 4 12 7 25 36
Eastern and South-eastern Asia
1618 1740 343 326 376 459 899 955 1618 1740 164 134 286 363 810 859 13 15 21 19 23 26
Unallocated within the region 6 9 3 4 2 3 2 2 6 9 2 3 2 2 2 1 3 4 43 45 30 32Cambodia 129 138 65 53 31 47 34 38 129 138 33 16 15 28 18 19 15 14 50 38 24 34China 653 633 52 17 184 182 418 434 653 633 4 4 160 176 394 427 45 48 8 3 28 29DPR Korea 1 1 0 0 0 0 1 0 1 1 0 0 0 0 1 0 4 2 0 1 0 1Indonesia 182 153 54 32 25 21 103 100 182 153 14 14 5 12 83 92 6 10 30 21 14 14Lao PDR 102 109 58 41 30 47 13 21 102 109 49 26 25 40 9 14 16 17 57 37 29 43Malaysia 35 35 3 3 1 1 31 30 35 35 1 1 0 1 30 29 48 34 8 9 3 4Mongolia 50 78 11 20 11 18 28 41 50 78 8 10 9 13 27 36 13 21 23 25 21 22Myanmar 70 158 25 50 23 64 22 44 70 158 14 19 17 48 16 29 5 9 36 32 33 40Philippines 122 59 29 22 6 11 87 26 122 59 22 15 3 7 83 22 11 4 24 38 5 18Thailand 36 43 8 8 3 5 24 29 36 43 5 5 2 3 22 27 9 11 23 19 9 12Timor-Leste 34 44 17 25 7 7 11 12 34 44 6 13 1 1 5 6 18 21 49 56 19 17Viet Nam 198 281 19 51 54 53 125 177 198 281 7 8 48 31 119 155 7 12 10 18 27 19
Oceania 231 253 93 95 56 73 82 85 197 232 50 49 35 50 61 62 11 12 40 38 24 29Unallocated within the region 29 27 3 5 11 36 17 25 35 83 2 10 10 30 15 19 9 9 11 19 34 7Cook Islands 2 2 1 1 0 0 1 1 1 1 0 0 0 0 1 0 3 4 34 38 18 23Fiji 19 17 7 6 2 2 9 9 19 16 3 3 0 0 7 7 17 15 39 38 13 10Kiribati 11 10 8 6 0 1 3 3 10 9 7 6 0 0 3 2 14 17 70 65 5 6Marshall Islands 14 12 11 7 2 3 2 3 9 5 7 1 0 0 0 0 51 38 74 53 12 23Micronesia, F. S. 11 12 6 6 2 2 3 3 3 2 1 1 0 0 0 0 25 28 55 55 21 22Nauru 2 3 0 0 2 2 0 1 2 3 0 0 2 2 0 1 6 6 4 14 79 62Niue 4 4 1 2 1 1 2 2 1 2 0 0 0 0 1 1 15 14 38 39 19 20Palau 14 1 7 0 3 0 4 0 1 1 0 0 0 0 0 0 74 3 50 54 24 9Papua New Guinea 46 47 15 22 17 12 14 13 46 47 8 14 13 8 11 9 6 7 33 46 36 26Samoa 16 13 7 4 1 1 8 8 16 13 4 2 0 0 7 7 13 11 43 29 8 9Solomon Is 24 19 10 7 6 5 7 6 24 19 6 5 4 4 5 5 13 9 43 39 27 29
471 A N N E X • A ID TAblES
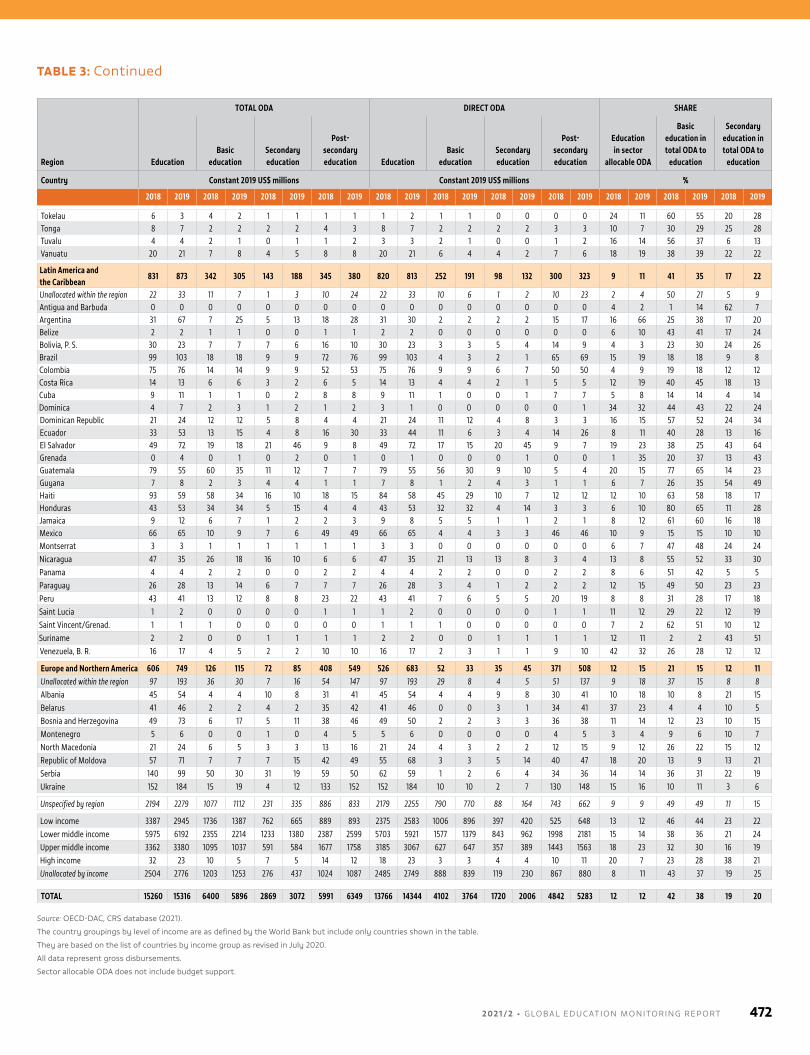
TABLE 3: Continued
Region
TOTAL ODA DIRECT ODA SHARE
EducationBasic
educationSecondary education
Post-secondary education Education
Basic education
Secondary education
Post-secondary education
Education in sector
allocable ODA
Basic education in total ODA to
education
Secondary education in total ODA to
education
Country Constant 2019 US$ millions Constant 2019 US$ millions %
2018 2019 2018 2019 2018 2019 2018 2019 2018 2019 2018 2019 2018 2019 2018 2019 2018 2019 2018 2019 2018 2019
Tokelau 6 3 4 2 1 1 1 1 1 2 1 1 0 0 0 0 24 11 60 55 20 28Tonga 8 7 2 2 2 2 4 3 8 7 2 2 2 2 3 3 10 7 30 29 25 28Tuvalu 4 4 2 1 0 1 1 2 3 3 2 1 0 0 1 2 16 14 56 37 6 13Vanuatu 20 21 7 8 4 5 8 8 20 21 6 4 4 2 7 6 18 19 38 39 22 22
Latin America and the Caribbean
831 873 342 305 143 188 345 380 820 813 252 191 98 132 300 323 9 11 41 35 17 22
Unallocated within the region 22 33 11 7 1 3 10 24 22 33 10 6 1 2 10 23 2 4 50 21 5 9Antigua and Barbuda 0 0 0 0 0 0 0 0 0 0 0 0 0 0 0 0 4 2 1 14 62 7Argentina 31 67 7 25 5 13 18 28 31 30 2 2 2 2 15 17 16 66 25 38 17 20Belize 2 2 1 1 0 0 1 1 2 2 0 0 0 0 0 0 6 10 43 41 17 24Bolivia, P. S. 30 23 7 7 7 6 16 10 30 23 3 3 5 4 14 9 4 3 23 30 24 26Brazil 99 103 18 18 9 9 72 76 99 103 4 3 2 1 65 69 15 19 18 18 9 8Colombia 75 76 14 14 9 9 52 53 75 76 9 9 6 7 50 50 4 9 19 18 12 12Costa Rica 14 13 6 6 3 2 6 5 14 13 4 4 2 1 5 5 12 19 40 45 18 13Cuba 9 11 1 1 0 2 8 8 9 11 1 0 0 1 7 7 5 8 14 14 4 14Dominica 4 7 2 3 1 2 1 2 3 1 0 0 0 0 0 1 34 32 44 43 22 24Dominican Republic 21 24 12 12 5 8 4 4 21 24 11 12 4 8 3 3 16 15 57 52 24 34Ecuador 33 53 13 15 4 8 16 30 33 44 11 6 3 4 14 26 8 11 40 28 13 16El Salvador 49 72 19 18 21 46 9 8 49 72 17 15 20 45 9 7 19 23 38 25 43 64Grenada 0 4 0 1 0 2 0 1 0 1 0 0 0 1 0 0 1 35 20 37 13 43Guatemala 79 55 60 35 11 12 7 7 79 55 56 30 9 10 5 4 20 15 77 65 14 23Guyana 7 8 2 3 4 4 1 1 7 8 1 2 4 3 1 1 6 7 26 35 54 49Haiti 93 59 58 34 16 10 18 15 84 58 45 29 10 7 12 12 12 10 63 58 18 17Honduras 43 53 34 34 5 15 4 4 43 53 32 32 4 14 3 3 6 10 80 65 11 28Jamaica 9 12 6 7 1 2 2 3 9 8 5 5 1 1 2 1 8 12 61 60 16 18Mexico 66 65 10 9 7 6 49 49 66 65 4 4 3 3 46 46 10 9 15 15 10 10Montserrat 3 3 1 1 1 1 1 1 3 3 0 0 0 0 0 0 6 7 47 48 24 24Nicaragua 47 35 26 18 16 10 6 6 47 35 21 13 13 8 3 4 13 8 55 52 33 30Panama 4 4 2 2 0 0 2 2 4 4 2 2 0 0 2 2 8 6 51 42 5 5Paraguay 26 28 13 14 6 7 7 7 26 28 3 4 1 2 2 2 12 15 49 50 23 23Peru 43 41 13 12 8 8 23 22 43 41 7 6 5 5 20 19 8 8 31 28 17 18Saint Lucia 1 2 0 0 0 0 1 1 1 2 0 0 0 0 1 1 11 12 29 22 12 19Saint Vincent/Grenad. 1 1 1 0 0 0 0 0 1 1 1 0 0 0 0 0 7 2 62 51 10 12Suriname 2 2 0 0 1 1 1 1 2 2 0 0 1 1 1 1 12 11 2 2 43 51Venezuela, B. R. 16 17 4 5 2 2 10 10 16 17 2 3 1 1 9 10 42 32 26 28 12 12
Europe and Northern America 606 749 126 115 72 85 408 549 526 683 52 33 35 45 371 508 12 15 21 15 12 11Unallocated within the region 97 193 36 30 7 16 54 147 97 193 29 8 4 5 51 137 9 18 37 15 8 8Albania 45 54 4 4 10 8 31 41 45 54 4 4 9 8 30 41 10 18 10 8 21 15Belarus 41 46 2 2 4 2 35 42 41 46 0 0 3 1 34 41 37 23 4 4 10 5Bosnia and Herzegovina 49 73 6 17 5 11 38 46 49 50 2 2 3 3 36 38 11 14 12 23 10 15Montenegro 5 6 0 0 1 0 4 5 5 6 0 0 0 0 4 5 3 4 9 6 10 7North Macedonia 21 24 6 5 3 3 13 16 21 24 4 3 2 2 12 15 9 12 26 22 15 12Republic of Moldova 57 71 7 7 7 15 42 49 55 68 3 3 5 14 40 47 18 20 13 9 13 21Serbia 140 99 50 30 31 19 59 50 62 59 1 2 6 4 34 36 14 14 36 31 22 19Ukraine 152 184 15 19 4 12 133 152 152 184 10 10 2 7 130 148 15 16 10 11 3 6
Unspecified by region 2194 2279 1077 1112 231 335 886 833 2179 2255 790 770 88 164 743 662 9 9 49 49 11 15
Low income 3387 2945 1736 1387 762 665 889 893 2375 2583 1006 896 397 420 525 648 13 12 46 44 23 22Lower middle income 5975 6192 2355 2214 1233 1380 2387 2599 5703 5921 1577 1379 843 962 1998 2181 15 14 38 36 21 24Upper middle income 3362 3380 1095 1037 591 584 1677 1758 3185 3067 627 647 357 389 1443 1563 18 23 32 30 16 19High income 32 23 10 5 7 5 14 12 18 23 3 3 4 4 10 11 20 7 23 28 38 21Unallocated by income 2504 2776 1203 1253 276 437 1024 1087 2485 2749 888 839 119 230 867 880 8 11 43 37 19 25
TOTAL 15260 15316 6400 5896 2869 3072 5991 6349 13766 14344 4102 3764 1720 2006 4842 5283 12 12 42 38 19 20
Source: oECD-DAC, CRS database (2021).
The country groupings by level of income are as defined by the World bank but include only countries shown in the table.
They are based on the list of countries by income group as revised in July 2020.
All data represent gross disbursements.
Sector allocable oDA does not include budget support.
2 0 2 1 / 2 • G LO BA L E D U C AT I O N M O N I TO R I N G R E P O RT 472
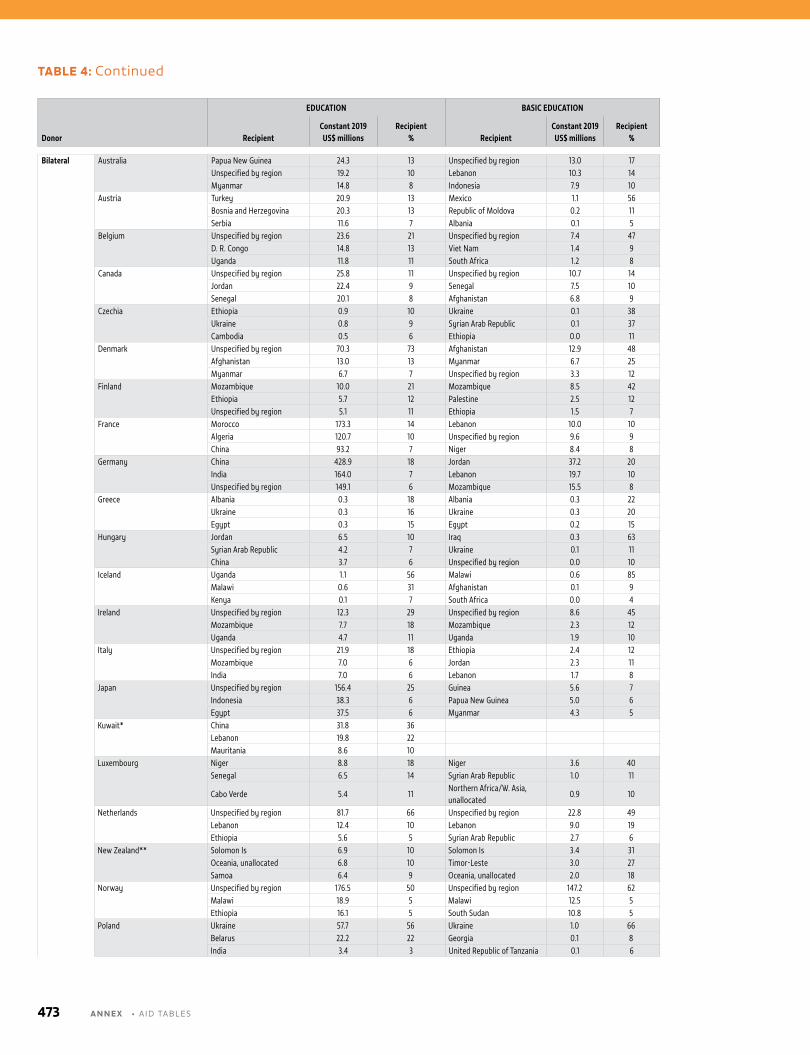
Donor
EDUCATION BASIC EDUCATION
RecipientConstant 2019
US$ millionsRecipient
% RecipientConstant 2019
US$ millionsRecipient
%
Bilateral Australia Papua New Guinea 24.3 13 Unspecified by region 13.0 17Unspecified by region 19.2 10 Lebanon 10.3 14Myanmar 14.8 8 Indonesia 7.9 10
Austria Turkey 20.9 13 Mexico 1.1 56Bosnia and Herzegovina 20.3 13 Republic of Moldova 0.2 11Serbia 11.6 7 Albania 0.1 5
Belgium Unspecified by region 23.6 21 Unspecified by region 7.4 47D. R. Congo 14.8 13 Viet Nam 1.4 9Uganda 11.8 11 South Africa 1.2 8
Canada Unspecified by region 25.8 11 Unspecified by region 10.7 14Jordan 22.4 9 Senegal 7.5 10Senegal 20.1 8 Afghanistan 6.8 9
Czechia Ethiopia 0.9 10 Ukraine 0.1 38Ukraine 0.8 9 Syrian Arab Republic 0.1 37Cambodia 0.5 6 Ethiopia 0.0 11
Denmark Unspecified by region 70.3 73 Afghanistan 12.9 48Afghanistan 13.0 13 Myanmar 6.7 25Myanmar 6.7 7 Unspecified by region 3.3 12
Finland Mozambique 10.0 21 Mozambique 8.5 42Ethiopia 5.7 12 Palestine 2.5 12Unspecified by region 5.1 11 Ethiopia 1.5 7
France Morocco 173.3 14 Lebanon 10.0 10Algeria 120.7 10 Unspecified by region 9.6 9China 93.2 7 Niger 8.4 8
Germany China 428.9 18 Jordan 37.2 20India 164.0 7 Lebanon 19.7 10Unspecified by region 149.1 6 Mozambique 15.5 8
Greece Albania 0.3 18 Albania 0.3 22Ukraine 0.3 16 Ukraine 0.3 20Egypt 0.3 15 Egypt 0.2 15
Hungary Jordan 6.5 10 Iraq 0.3 63Syrian Arab Republic 4.2 7 Ukraine 0.1 11China 3.7 6 Unspecified by region 0.0 10
Iceland Uganda 1.1 56 Malawi 0.6 85Malawi 0.6 31 Afghanistan 0.1 9Kenya 0.1 7 South Africa 0.0 4
Ireland Unspecified by region 12.3 29 Unspecified by region 8.6 45Mozambique 7.7 18 Mozambique 2.3 12Uganda 4.7 11 Uganda 1.9 10
Italy Unspecified by region 21.9 18 Ethiopia 2.4 12Mozambique 7.0 6 Jordan 2.3 11India 7.0 6 Lebanon 1.7 8
Japan Unspecified by region 156.4 25 Guinea 5.6 7Indonesia 38.3 6 Papua New Guinea 5.0 6Egypt 37.5 6 Myanmar 4.3 5
Kuwait* China 31.8 36Lebanon 19.8 22Mauritania 8.6 10
Luxembourg Niger 8.8 18 Niger 3.6 40Senegal 6.5 14 Syrian Arab Republic 1.0 11
Cabo Verde 5.4 11Northern Africa/W. Asia, unallocated
0.9 10
Netherlands Unspecified by region 81.7 66 Unspecified by region 22.8 49Lebanon 12.4 10 Lebanon 9.0 19Ethiopia 5.6 5 Syrian Arab Republic 2.7 6
New Zealand** Solomon Is 6.9 10 Solomon Is 3.4 31Oceania, unallocated 6.8 10 Timor-Leste 3.0 27Samoa 6.4 9 Oceania, unallocated 2.0 18
Norway Unspecified by region 176.5 50 Unspecified by region 147.2 62Malawi 18.9 5 Malawi 12.5 5Ethiopia 16.1 5 South Sudan 10.8 5
Poland Ukraine 57.7 56 Ukraine 1.0 66Belarus 22.2 22 Georgia 0.1 8India 3.4 3 United Republic of Tanzania 0.1 6
TABLE 4: Continued
473 A N N E X • A ID TAblES
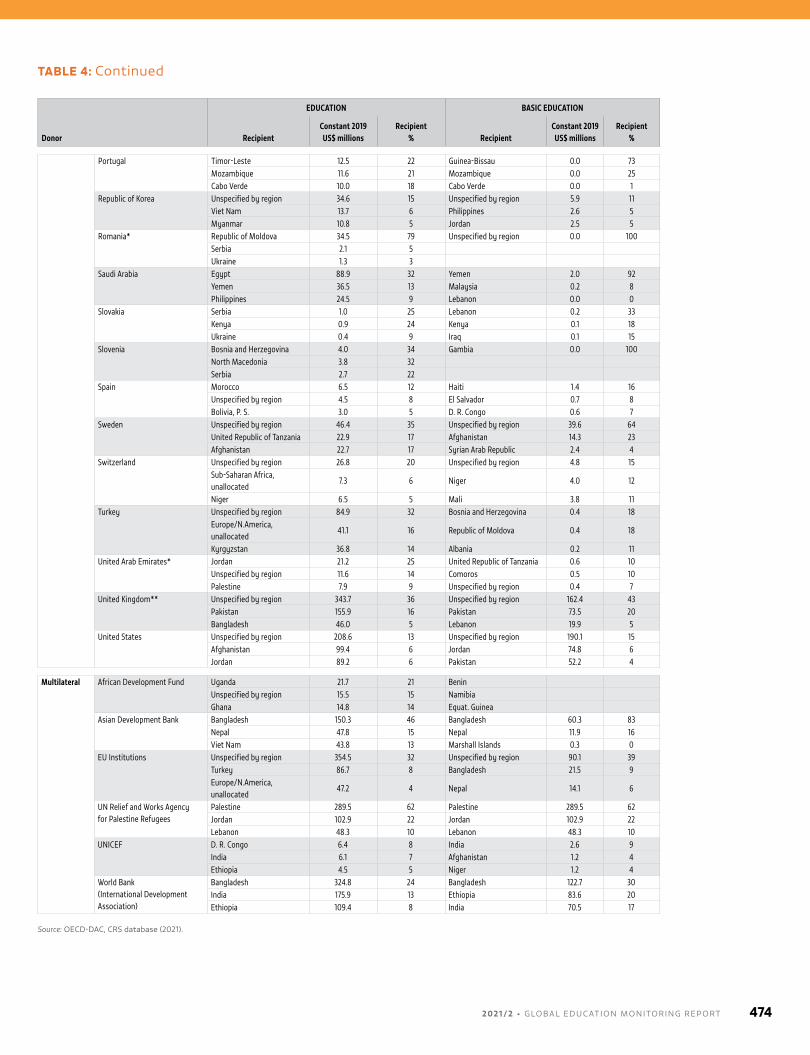
Donor
EDUCATION BASIC EDUCATION
RecipientConstant 2019
US$ millionsRecipient
% RecipientConstant 2019
US$ millionsRecipient
%
Portugal Timor-Leste 12.5 22 Guinea-Bissau 0.0 73Mozambique 11.6 21 Mozambique 0.0 25Cabo Verde 10.0 18 Cabo Verde 0.0 1
Republic of Korea Unspecified by region 34.6 15 Unspecified by region 5.9 11Viet Nam 13.7 6 Philippines 2.6 5Myanmar 10.8 5 Jordan 2.5 5
Romania* Republic of Moldova 34.5 79 Unspecified by region 0.0 100Serbia 2.1 5Ukraine 1.3 3
Saudi Arabia Egypt 88.9 32 Yemen 2.0 92Yemen 36.5 13 Malaysia 0.2 8Philippines 24.5 9 Lebanon 0.0 0
Slovakia Serbia 1.0 25 Lebanon 0.2 33Kenya 0.9 24 Kenya 0.1 18Ukraine 0.4 9 Iraq 0.1 15
Slovenia Bosnia and Herzegovina 4.0 34 Gambia 0.0 100North Macedonia 3.8 32Serbia 2.7 22
Spain Morocco 6.5 12 Haiti 1.4 16Unspecified by region 4.5 8 El Salvador 0.7 8Bolivia, P. S. 3.0 5 D. R. Congo 0.6 7
Sweden Unspecified by region 46.4 35 Unspecified by region 39.6 64United Republic of Tanzania 22.9 17 Afghanistan 14.3 23Afghanistan 22.7 17 Syrian Arab Republic 2.4 4
Switzerland Unspecified by region 26.8 20 Unspecified by region 4.8 15Sub-Saharan Africa, unallocated
7.3 6 Niger 4.0 12
Niger 6.5 5 Mali 3.8 11Turkey Unspecified by region 84.9 32 Bosnia and Herzegovina 0.4 18
Europe/N.America, unallocated
41.1 16 Republic of Moldova 0.4 18
Kyrgyzstan 36.8 14 Albania 0.2 11United Arab Emirates* Jordan 21.2 25 United Republic of Tanzania 0.6 10
Unspecified by region 11.6 14 Comoros 0.5 10Palestine 7.9 9 Unspecified by region 0.4 7
United Kingdom** Unspecified by region 343.7 36 Unspecified by region 162.4 43Pakistan 155.9 16 Pakistan 73.5 20Bangladesh 46.0 5 Lebanon 19.9 5
United States Unspecified by region 208.6 13 Unspecified by region 190.1 15Afghanistan 99.4 6 Jordan 74.8 6Jordan 89.2 6 Pakistan 52.2 4
Multilateral African Development Fund Uganda 21.7 21 BeninUnspecified by region 15.5 15 NamibiaGhana 14.8 14 Equat. Guinea
Asian Development Bank Bangladesh 150.3 46 Bangladesh 60.3 83Nepal 47.8 15 Nepal 11.9 16Viet Nam 43.8 13 Marshall Islands 0.3 0
EU Institutions Unspecified by region 354.5 32 Unspecified by region 90.1 39Turkey 86.7 8 Bangladesh 21.5 9Europe/N.America, unallocated
47.2 4 Nepal 14.1 6
UN Relief and Works Agency for Palestine Refugees
Palestine 289.5 62 Palestine 289.5 62Jordan 102.9 22 Jordan 102.9 22Lebanon 48.3 10 Lebanon 48.3 10
UNICEF D. R. Congo 6.4 8 India 2.6 9India 6.1 7 Afghanistan 1.2 4Ethiopia 4.5 5 Niger 1.2 4
World Bank (International Development Association)
Bangladesh 324.8 24 Bangladesh 122.7 30India 175.9 13 Ethiopia 83.6 20Ethiopia 109.4 8 India 70.5 17
Source: oECD-DAC, CRS database (2021).
TABLE 4: Continued
2 0 2 1 / 2 • G LO BA L E D U C AT I O N M O N I TO R I N G R E P O RT 474
www.unesco.org/publishing • www.unesco.org/gemreport
Non-state actors’ role extends beyond provision of schooling to interventions at various education levels and influence spheres. Alongside its review of progress towards SDG 4, including emerging evidence on the COVID-19 pandemic’s impact, the 2021/2 Global Education Monitoring Report urges governments to see all institutions, students and teachers as part of a single system. Standards, information, incentives and accountability should help governments protect, respect and fulfil the right to education of all, without turning their eyes away from privilege or exploitation. Publicly funded education does not have to be publicly provided but disparity in education processes, student outcomes and teacher working conditions must be addressed. Efficiency and innovation, rather than being commercial secrets, should be diffused and practised by all. To that end, transparency and integrity in the public education policy process need to be maintained to block vested interests.
The report’s rallying call – Who chooses? Who loses? – invites policymakers to question relationships with non-state actors in terms of fundamental choices: between equity and freedom of choice; between encouraging initiative and setting standards; between groups of varying means and needs; between immediate commitments under SDG 4 and those to be progressively realized (e.g. post-secondary education); and between education and other social sectors.
Supporting the fifth Global Education Monitoring Report are two online tools: PEER, a policy dialogue resource describing non-state activity and regulations in the world’s education systems; and VIEW, a new website consolidating sources and providing new completion rate estimates over time.
Non-state actors in educationW H O C H O O S E S ? W H O L O S E S ?
www.unesco.org/publishing • www.unesco.org/gemreport
Sustainable DevelopmentGoals
9 789231 004933