non-fluent speech in frontotemporal lobar degeneration
TRANSCRIPT
Journal of Neurolinguistics 22 (2009) 370–383
Contents lists available at ScienceDirect
Journal of Neurolinguisticsjournal homepage: www.elsevier .com/locate/
jneurol ing
Non-fluent speech in frontotemporal lobar degeneration
Sharon Ash a,*, Peachie Moore a, Luisa Vesely a, Delani Gunawardena a,Corey McMillan a, Chivon Anderson a, Brian Avants b, Murray Grossman a
a Department of Neurology, University of Pennsylvania School of Medicine, Philadelphia, PA, USAb Department of Radiology, University of Pennsylvania School of Medicine, Philadelphia, PA, USA
a r t i c l e i n f o
Article history:Received 12 May 2008Received in revised form 2 December 2008Accepted 3 December 2008
Keywords:Frontotemporal dementiaProgressive aphasiaMRISpeech fluency
* Corresponding author. Department of NeuroloStreet, Philadelphia, PA 19104-4283, USA. Tel.: þ1
E-mail address: [email protected] (S. A
0911-6044/$ – see front matter � 2008 Elsevier Ltdoi:10.1016/j.jneuroling.2008.12.001
a b s t r a c t
We investigated the cognitive and neural bases of impaired speechfluency, a central feature of primary progressive aphasia. Speechfluency was assessed in 35 patients with frontotemporal lobardegeneration (FTLD) who presented with progressive non-fluentaphasia (PNFA, n ¼ 11), semantic dementia (SemD, n ¼ 12), ora social and executive disorder without aphasia (SOC/EXEC,n ¼ 12). Fluency was quantified as the number of words perminute in an extended, semi-structured speech sample. This wasrelated to language characteristics of the speech sample and toneuropsychological measures. PNFA patients were significantlyless fluent than controls and other FTLD patients. Fluency corre-lated with grammatical expression but not with speech errors orexecutive difficulty. SemD and SOC/EXEC patients were also lessfluent than controls. In SemD, fluency was associated withsemantically limited content. In SOC/EXEC, fluency was associatedwith executive limitations. Voxel-based morphometry analyses ofhigh-resolution MRI related fluency to gray matter volume in leftinferior frontal, insula, and superior temporal regions for the entirecohort of FTLD patients. This region overlapped partially distinctatrophic areas in each FTLD subgroup. It thus appears to playa crucial role in speech fluency, which can be interrupted indifferent ways in different FTLD subgroups.
� 2008 Elsevier Ltd. All rights reserved.
gy, 3 West Gates, Hospital of the University of Pennsylvania, 3400 Spruce215 615 3427; fax: þ1 215 349 8260.sh).
d. All rights reserved.
S. Ash et al. / Journal of Neurolinguistics 22 (2009) 370–383 371
1. Introduction
Fluency in spoken language is the ability to produce conversational speech in a continuous, flowing,effortless stream. It relies on a complex process composed of several elements, such as rapidlyretrieving words from the mental lexicon, structuring these words into a grammatical sentence, andimplementing a motor speech program that allows smooth articulation. It is readily observed thatpatients with neurodegenerative diseases most often speak with a reduced speech rate compared tohealthy adults. Indeed, impaired fluency is so prominent that it is used to distinguish major phenotypicvariants of frontotemporal lobar degeneration (FTLD) (Grossman & Ash, 2004; Snowden, Neary, &Mann, 1996). However, the cognitive and neuroanatomic bases for the symptom of non-fluent speechare not known. Linguistic features that are associated with impaired speech production includeagrammatism, phonetic and phonological speech production errors, and word-finding difficulty thatproduces hesitations, pauses, and multiple attempts at production. Cognitive factors may includeexecutive and semantic limitations. The neuroanatomic substrate of fluency is attributed to variousfrontal lobe structures, including inferior frontal cortex (IFC) (Alexander, Naeser, & Palumbo, 1990),insula and frontal operculum (INS) (Dronkers, 1996), dorsal anterior cingulate and medial frontal cortex(ACC) (Alexander, Benson, & Stuss, 1989), dorsolateral prefrontal cortex (dlPFC) (Stuss & Benson, 1984),and the basal ganglia (BG) (Lieberman et al., 1992). Yet contrasting hypotheses about the linguistic,cognitive and neuroanatomic correlates of non-fluent speech have not been evaluated empirically inpatients with FTLD. The purpose of this investigation is to assess the clinical and neuroanatomicfeatures that contribute to impaired speech fluency in FTLD.
We investigated speech fluency in three phenotypic subgroups of FTLD. One group consists ofpatients with progressive non-fluent aphasia (PNFA) (Grossman et al., 1996; Thompson, Ballard, Tait,Weintraub, & Mesulam, 1997). This syndrome is characterized by grammatical simplification (Gross-man et al., 1996; Grossman, Rhee, & Antiquena, 2005); dysarthria and speech production errors knownas apraxia of speech (AOS), which is defined as an impairment of articulatory planning (Josephs et al.,2006; Ogar, Dronkers, Brambati, Miller, & Gorno-Tempini, 2007); and a limitation of executiveresources (Libon et al., 2007; Weintraub, Rubin, & Mesulam, 1990). However, empirical studies directlyrelating these characteristics to the core PNFA feature of non-fluent speech have not been performed.The PNFA syndrome is associated with PET hypometabolism (Grossman et al., 1996; Nestor et al., 2003)and MRI structural atrophy (Gorno-Tempini et al., 2004; Grossman & Ash, 2004; Peelle et al., 2008) inthe frontal lobe. Agrammatic speech (Grossman et al., 1996; Turner, Kenyon, Trojanowski, Gonatas, &Grossman, 1996) and mutism and AOS (Gorno-Tempini et al., 2006; Ogar et al., 2007) occur in patientswith disease in left IFC, INS, and BG, but we are not aware of studies directly correlating quantifiedspeech rate with a neuroanatomic substrate in PNFA.
A second progressive aphasic syndrome known as semantic dementia (SemD) entails impairmentsof naming, word comprehension, and object knowledge, despite preserved grammatical speech(Hodges & Patterson, 2007; Snowden, Goulding, & Neary, 1989). Word-finding difficulty, caused bythese patients’ lexical semantic impairment, may slow speech in SemD, although this hypothesisremains to be tested. Many studies identify atrophy in anterior portions of the left temporal lobe inSemD (Gorno-Tempini et al., 2004; Grossman et al., 2004; Lambon Ralph, Graham, Ellis, & Hodges,1998), but the role of this area in reduced speech fluency has not been assessed empirically.
A third clinical FTLD syndrome involves a deficit of social comportment and personality, charac-terized by loss of insight, social disinhibition, and apathy (Rosen et al., 2005; Snowden et al., 1996). Thisoften co-occurs with a disorder of attention, planning, and inhibitory control (Kramer, Jurik, & Sha,2003; Libon et al., 2007), so we refer to these patients as having a social/executive (SOC/EXEC) disorder.Although these patients are not obviously aphasic, their discourse is poorly organized (Ash et al., 2006),which is related in part to their executive limitations. Frontal and temporal atrophy is seen in thesepatients (Grossman et al., 2004; Rosen et al., 2005). However, empirical assessments have not directlyexamined the contribution of executive limitations or of gray matter atrophy to their reduced speechfluency.
In the present study, we quantified speech fluency in an extended, semi-structured speech sampleand related this to other aspects of speech and cognitive functioning such as simplified grammar,lexical retrieval deficits, speech errors, and executive limitations. We used voxel-based morphometry
S. Ash et al. / Journal of Neurolinguistics 22 (2009) 370–383372
(VBM) to relate reduced speech fluency directly to gray matter volume in FTLD. This is meaningful onlyin areas that are significantly diseased in patient groups, reflected by cortical atrophy. Thus, directevidence for the neuroanatomic basis of slowed speech in FTLD would come from an area of significantcortical atrophy in an FTLD subgroup that overlaps with the cortical association of non-fluent speech.
2. Methods
2.1. Subjects
We studied 35 patients with FTLD, diagnosed by an experienced neurologist (MG) in the cognitiveneurology clinic of the Department of Neurology at the University of Pennsylvania according to pub-lished criteria (McKhann et al., 2001; The Lund and Manchester Group, 1994). This included 11 patientswith PNFA, 12 patients with SemD, and 12 patients with SOC/EXEC. We also assessed 10 healthyseniors. Patients were assigned to FTLD subgroups using a consensus evaluation based on a modifi-cation of published criteria (Grossman & Ash, 2004; Neary et al., 1998) that entailed two independentraters reviewing a semi-structured neurologic history, a complete neurologic exam, and a detailedmental status exam. Patients with a logopenic form of progressive aphasia were excluded because theirsmall number precluded statistical analysis and because of the hypothesized association with differentunderlying pathology (Josephs et al., 2008). Exclusionary criteria included other causes of dementia,such as metabolic, endocrine, vascular, structural, nutritional, and infectious etiologies, and primarypsychiatric disorders. We also excluded patients who had visual-perceptual difficulty that could limittheir ability to perceive the pictures of the story. Demographic features are summarized in Table 1. Thepatients were mildly impaired according to the Mini Mental State Exam (MMSE) (Folstein, Folstein, &McHugh, 1975). One-way ANOVAs indicated that the four subject groups were matched for age andeducation, and all patient groups had a significantly lower MMSE than controls (each contrastsignificant at least at the p < 0.05 level, according to t-tests). All subjects completed an informedconsent procedure in accordance with the Declaration of Helsinki and approved by the InstitutionalReview Board of the University of Pennsylvania.
All of the PNFA patients exhibited hesitant, effortful speech. Nine of the 11 made numerous phonetic(apraxic) and phonological (paraphasic) errors (Canter, Trost, & Burns, 1985). Two patients did notmake such errors, but their speech was slow and effortful, with many utterance-internal pauses of 2 sor more, editing breaks, incomplete words, and incomplete utterances. The SemD patients exhibitedvery few phonetic errors and a small number of phonological errors but produced fewer nouns. TheSOC/EXEC patients produced very few phonetic or phonological errors and had no noticeable word-finding difficulty.
2.2. Materials
The subjects’ task was to tell the story of the wordless children’s picture book, Frog, Where Are You(Mayer, 1969). An outline of the story is given elsewhere (Ash et al., 2006). We elected to study speechproduction in this manner to minimize the interruptions of turn-taking that occur in free conversation.We used the book’s sequence of 24 drawings to elicit an extended speech sample with a known targetthat was comparable in content across subjects in order to give patients an opportunity to demonstratethe full breadth of their language production capability.
Table 1Mean � standard deviation demographic and clinical characteristics of patients with frontotemporal lobar degeneration andcontrols.
PNFA SemD SOC/EXEC Controls
N (male/female) 4/7 8/4 7/5 2/8Age (years) 70.7 � 9.3 66.8 � 7.3 64.8 � 13.2 69.5 � 5.1Education (years) 14.5 � 2.8 15.8 � 2.8 16.0 � 3.0 16.7 � 2.6MMSE (max ¼ 30) 23.9 � 5.5 22.5 � 8.2 25.3 � 6.5 30.0 � 0.0Disease duration (years) 2.9 � 1.4 5.2 � 2.3 4.1 � 1.6 –
S. Ash et al. / Journal of Neurolinguistics 22 (2009) 370–383 373
2.3. Narrative procedure
Each subject was asked to look through the book to become familiar with the story. When ready, thesubject was asked to start at the beginning and narrate the story as if telling it to a child. Due tothe nature of the task, there was no influence of the examiner on the time taken by the subjects to tellthe story. The subjects’ narrations were digitally recorded. Thirty-one narrations were recorded ona Macintosh Powerbook G3 laptop computer using the Macintosh external microphone (part #590-0670) and the computer program SoundEdit 16, v. 2, with 16-bit recording at a sampling frequency of44.1 kHz. Eight were recorded on a Dell Inspiron 2200 PC using the signal processing software Praat(Boersma and Weenink, 1992–2000, http://www.praat.org) with 16-bit recording at a sampling rate of22.05 kHz, using a Radio Shack omnidirectional lavaliere electret condenser microphone. Six wererecorded on a Marantz PMD 670 digital recorder with 16-bit recording at a sampling frequency of32 kHz, using a Sennheiser MKE2 omnidirectional lavaliere condenser microphone.
The recordings of the narratives were transcribed in detail by trained transcribers using the signalprocessing software Praat (Boersma & Weenink, 1992–2000). The transcription conventions used tocapture the irregularities in patients’ speech are defined elsewhere (Ash et al., 2006). All transcriptionswere checked by two independent reviewers. Samples of the speech of the three patient groups aregiven in Appendix A. The narratives were scored from the transcripts by two independent, trainedjudges, referring to the original speech files as needed. All coding was checked by a linguist (SA) withexpertise in grammatical and phonetic analysis. The narratives were analyzed for fluency, quantified ascomplete words per minute; speech errors per utterance; grammatical structure; and content featuressuch as mean length (words) per utterance, complex grammatical structures per utterance, semanti-cally limited (existential) sentences, and verbs and nouns per utterance. The detailed coding for thesevariables is described in Appendix B.
2.4. Neuropsychological evaluation
All patients underwent neuropsychological testing within an average of 155 (�99) days of the dateof recording. We calculated Pearson correlation coefficients of subjects’ speech fluency with theirability to comprehend a range of syntactic constructions in a test of complex sentence comprehension.In the comprehension task, a sentence was presented orally, followed by a query targeting the subjector object of the matrix sentence or the embedded relative clause. There were six sentences in each ofthe eight categories defined by three oppositions: it-clefted or not; subject relative vs. object relativesubordinate clause; and active vs. passive probe sentence. The dependent measure was the number ofcorrect responses. We also correlated speech rate with tests of executive function. These included thefollowing: reverse digit span, a measure of working memory involving repetition of a sequence ofnumbers in an order reversing the order of presentation, where the dependent measure was thelongest sequence repeated correctly in the reverse order (Wechsler, 1987); stroop, a measure ofinhibitory control, in which subjects were asked to name the color of ink in which a word was printed,rather than read the word, which spelled a different color, where the dependent measure was thenumber of seconds required to complete the 80 items, up to 300 s (Spreen & Strauss, 1991); andcategory naming fluency, for which subjects named as many different animals as possible in 60 s(Lezak, 1983).
2.5. Imaging methods
High resolution structural MRI scans were available for a subset of 22 FTLD patients (six PNFA,seven SemD, nine SOC/EXEC) to establish cortical atrophy using a modulated version of optimizedvoxel-based morphometry (VBM). Images were acquired by a GE Horizon Echospeed 1.5T MRIscanner in five patients and by a SIEMENS Trio 3T MRI scanner in 17 patients. A novel symmetricdiffeomorphism procedure was used to normalize high-resolution T1-weighted MR images for shapeand intensity (Avants & Gee, 2004) using a large local template consisting of 25 healthy seniors and75 focal neurodegenerative disease patients. We used high dimensional normalization and template-based cortical segmentation to quantify gray matter changes. The brain image was modeled as
S. Ash et al. / Journal of Neurolinguistics 22 (2009) 370–383374
a dense continuum, sampled at individual voxels, that was accompanied by a transformation modelthat preserved neighborhood relationships among voxels even under very large deformations. Thisstrategy provided a high resolution, smoothly flowing deformation of these voxels into the corre-sponding voxels of the template and was able to capture both large-scale atrophy and subtle focaldisease effects. A bidirectional algorithm was used to build maps from the set of experimental brainsinto a template and simultaneously from the template into the population of experimental brains.We also used these methods to estimate an unbiased local template. This approach allowed us toperform statistical contrasts between groups at a high spatial resolution and with less smoothingbecause both neighboring voxels and large-scale features are maintained, while at the same timethere is reduced variance in the estimated location of the neuroanatomy. The resulting images wereskull-stripped using BET2 (Smith, 2002) then segmented using FMRIB’s Automated SegmentationTool (FAST) (Zhang, Brady, & Smith, 2000), which labeled the brain volumes as gray matter, whitematter, CSF, and ‘‘other’’ with inhomogeneity correction. Gray matter images were then multiplied bythe logarithm of their corresponding jacobian registrations to template space, which resulted innormalized, spatially varying estimates of gray matter volume for each subject (Avants & Gee, 2004).Gray matter images were subsampled to 2 mm � 2 mm voxel sizes and then warped into MNI spaceusing the log-jacobians of the MNI space-warped template. Images were smoothed with an 8 mmFWHM Gaussian filter and contrasted with a cohort of 31 age-matched controls using a two-samplet-test in SPM5, as described elsewhere (Grossman et al., 2007). The analysis included all voxelscontaining any gray matter in the volume, thus resulting in a true whole brain analysis. Explicitmasking was accomplished by generating a mean gray matter image from all subjects’ modulatedgray matter images in order to limit the analysis to voxelwise comparisons within regions of graymatter. Global calculation was omitted. Cortical regions were identified as significantly atrophicusing a p < 0.001 height threshold and a 100 voxel extent criterion, and which survived a clusterlevel criterion of p < 0.05 (corrected for multiple comparisons). The regression module in SPM5 wasused to relate fluency to cortical volume. For this analysis we used a statistical height threshold ofp < 0.025, a 100 voxel extent, and only accepted clusters which survived a peak voxel level ofp < 0.0001 (z > 3.72).
3. Results
3.1. Progressive non-fluent aphasia
Table 2 presents the measures of language production and cognitive functioning in patients andcontrols. PNFA patients had the most impaired speech fluency, with a speech rate one-third that ofcontrols. PNFA were also significantly less fluent than SemD and SOC/EXEC (p < 0.05). PNFA alsoproduced significantly more speech errors than SemD, SOC/EXEC, and controls. They were significantlyimpaired on measures of grammar and sentence structure, with reduced mean length of utterance(MLU) and reduced frequency of grammatically complex utterances, and they produced significantlyfewer verbs and nouns per utterance. PNFA patients were also impaired relative to controls onmeasures of sentence comprehension and executive functioning.
Table 3 shows the correlations of speech fluency with language and cognitive measures that weresignificantly impaired. Non-fluent speech in PNFA correlated significantly with several measures ofstructure, including shorter MLU and fewer grammatically complex sentences. Reduced fluency alsocorrelated significantly with fewer verbs per utterance but not with nouns per utterance. While speecherrors were a prominent feature of PNFA patients, we did not find a correlation between fluency (wordsper minute) and the frequency of speech errors. Likewise, there was no significant correlation betweenfluency and sentence comprehension or executive measures in PNFA.
Fig. 1 Panel A illustrates the anatomic distribution of gray matter atrophy in PNFA, and the anatomicloci of the peaks of these clusters are summarized in Table 4. Statistically significant gray matteratrophy was seen in inferior frontal, insula, and superior occipital regions of the left hemisphere. Fig. 1Panel A and Table 4 also indicate the area of cortical volume related to non-fluent speech across thecohort of all FTLD patients. This included left inferior frontal and superior temporal cortex. This areaoverlaps a region of cortical atrophy in PNFA involving left inferior frontal cortex.
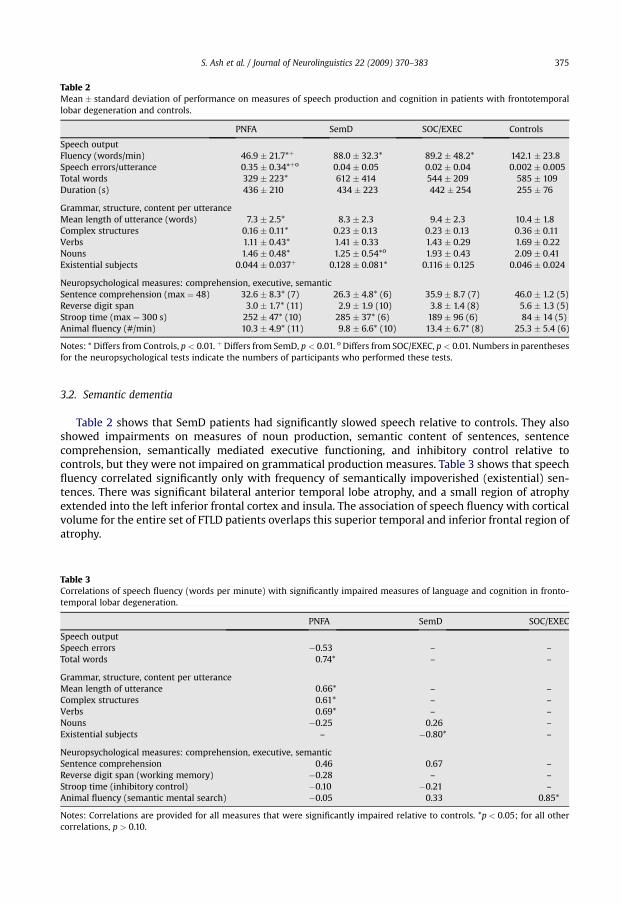
Table 2Mean � standard deviation of performance on measures of speech production and cognition in patients with frontotemporallobar degeneration and controls.
PNFA SemD SOC/EXEC Controls
Speech outputFluency (words/min) 46.9 � 21.7*þ 88.0 � 32.3* 89.2 � 48.2* 142.1 � 23.8Speech errors/utterance 0.35 � 0.34*þo 0.04 � 0.05 0.02 � 0.04 0.002 � 0.005Total words 329 � 223* 612 � 414 544 � 209 585 � 109Duration (s) 436 � 210 434 � 223 442 � 254 255 � 76
Grammar, structure, content per utteranceMean length of utterance (words) 7.3 � 2.5* 8.3 � 2.3 9.4 � 2.3 10.4 � 1.8Complex structures 0.16 � 0.11* 0.23 � 0.13 0.23 � 0.13 0.36 � 0.11Verbs 1.11 � 0.43* 1.41 � 0.33 1.43 � 0.29 1.69 � 0.22Nouns 1.46 � 0.48* 1.25 � 0.54*o 1.93 � 0.43 2.09 � 0.41Existential subjects 0.044 � 0.037þ 0.128 � 0.081* 0.116 � 0.125 0.046 � 0.024
Neuropsychological measures: comprehension, executive, semanticSentence comprehension (max ¼ 48) 32.6 � 8.3* (7) 26.3 � 4.8* (6) 35.9 � 8.7 (7) 46.0 � 1.2 (5)Reverse digit span 3.0 � 1.7* (11) 2.9 � 1.9 (10) 3.8 � 1.4 (8) 5.6 � 1.3 (5)Stroop time (max ¼ 300 s) 252 � 47* (10) 285 � 37* (6) 189 � 96 (6) 84 � 14 (5)Animal fluency (#/min) 10.3 � 4.9* (11) 9.8 � 6.6* (10) 13.4 � 6.7* (8) 25.3 � 5.4 (6)
Notes: * Differs from Controls, p < 0.01. þ Differs from SemD, p < 0.01. o Differs from SOC/EXEC, p < 0.01. Numbers in parenthesesfor the neuropsychological tests indicate the numbers of participants who performed these tests.
S. Ash et al. / Journal of Neurolinguistics 22 (2009) 370–383 375
3.2. Semantic dementia
Table 2 shows that SemD patients had significantly slowed speech relative to controls. They alsoshowed impairments on measures of noun production, semantic content of sentences, sentencecomprehension, semantically mediated executive functioning, and inhibitory control relative tocontrols, but they were not impaired on grammatical production measures. Table 3 shows that speechfluency correlated significantly only with frequency of semantically impoverished (existential) sen-tences. There was significant bilateral anterior temporal lobe atrophy, and a small region of atrophyextended into the left inferior frontal cortex and insula. The association of speech fluency with corticalvolume for the entire set of FTLD patients overlaps this superior temporal and inferior frontal region ofatrophy.
Table 3Correlations of speech fluency (words per minute) with significantly impaired measures of language and cognition in fronto-temporal lobar degeneration.
PNFA SemD SOC/EXEC
Speech outputSpeech errors �0.53 – –Total words 0.74* – –
Grammar, structure, content per utteranceMean length of utterance 0.66* – –Complex structures 0.61* – –Verbs 0.69* – –Nouns �0.25 0.26 –Existential subjects – �0.80* –
Neuropsychological measures: comprehension, executive, semanticSentence comprehension 0.46 0.67 –Reverse digit span (working memory) �0.28 – –Stroop time (inhibitory control) �0.10 �0.21 –Animal fluency (semantic mental search) �0.05 0.33 0.85*
Notes: Correlations are provided for all measures that were significantly impaired relative to controls. *p < 0.05; for all othercorrelations, p > 0.10.
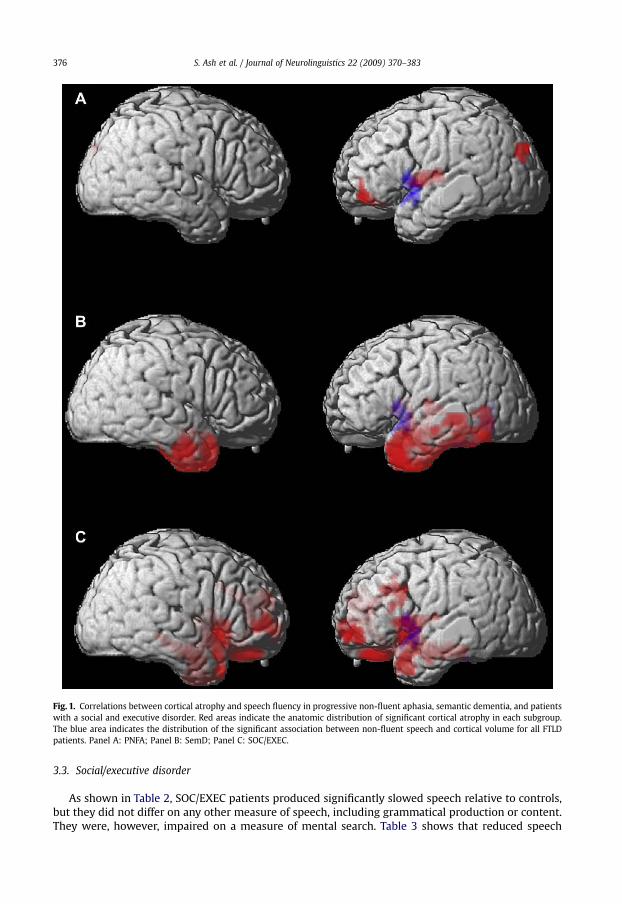
Fig. 1. Correlations between cortical atrophy and speech fluency in progressive non-fluent aphasia, semantic dementia, and patientswith a social and executive disorder. Red areas indicate the anatomic distribution of significant cortical atrophy in each subgroup.The blue area indicates the distribution of the significant association between non-fluent speech and cortical volume for all FTLDpatients. Panel A: PNFA; Panel B: SemD; Panel C: SOC/EXEC.
S. Ash et al. / Journal of Neurolinguistics 22 (2009) 370–383376
3.3. Social/executive disorder
As shown in Table 2, SOC/EXEC patients produced significantly slowed speech relative to controls,but they did not differ on any other measure of speech, including grammatical production or content.They were, however, impaired on a measure of mental search. Table 3 shows that reduced speech
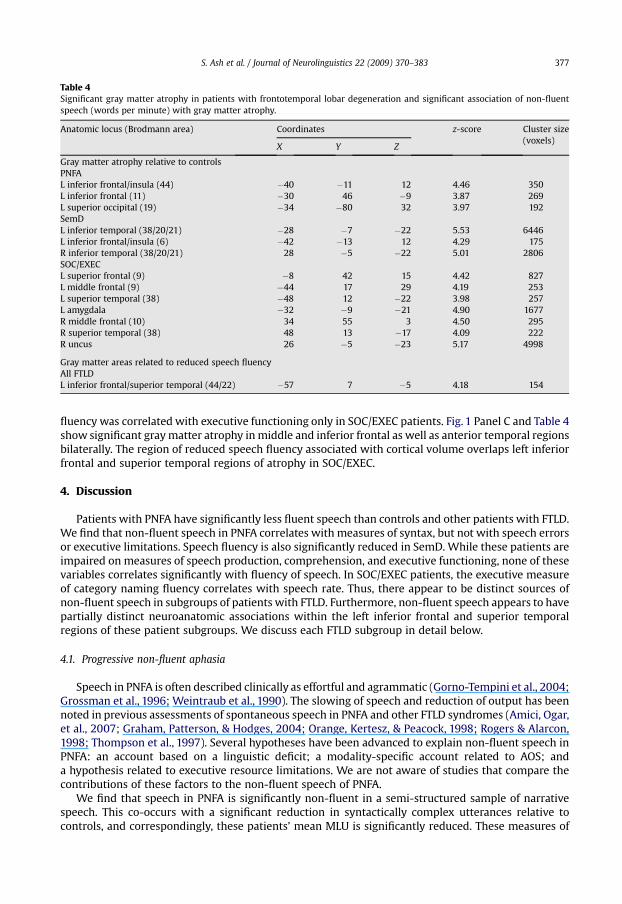
Table 4Significant gray matter atrophy in patients with frontotemporal lobar degeneration and significant association of non-fluentspeech (words per minute) with gray matter atrophy.
Anatomic locus (Brodmann area) Coordinates z-score Cluster size(voxels)
X Y Z
Gray matter atrophy relative to controlsPNFAL inferior frontal/insula (44) �40 �11 12 4.46 350L inferior frontal (11) �30 46 �9 3.87 269L superior occipital (19) �34 �80 32 3.97 192SemDL inferior temporal (38/20/21) �28 �7 �22 5.53 6446L inferior frontal/insula (6) �42 �13 12 4.29 175R inferior temporal (38/20/21) 28 �5 �22 5.01 2806SOC/EXECL superior frontal (9) �8 42 15 4.42 827L middle frontal (9) �44 17 29 4.19 253L superior temporal (38) �48 12 �22 3.98 257L amygdala �32 �9 �21 4.90 1677R middle frontal (10) 34 55 3 4.50 295R superior temporal (38) 48 13 �17 4.09 222R uncus 26 �5 �23 5.17 4998
Gray matter areas related to reduced speech fluencyAll FTLDL inferior frontal/superior temporal (44/22) �57 7 �5 4.18 154
S. Ash et al. / Journal of Neurolinguistics 22 (2009) 370–383 377
fluency was correlated with executive functioning only in SOC/EXEC patients. Fig. 1 Panel C and Table 4show significant gray matter atrophy in middle and inferior frontal as well as anterior temporal regionsbilaterally. The region of reduced speech fluency associated with cortical volume overlaps left inferiorfrontal and superior temporal regions of atrophy in SOC/EXEC.
4. Discussion
Patients with PNFA have significantly less fluent speech than controls and other patients with FTLD.We find that non-fluent speech in PNFA correlates with measures of syntax, but not with speech errorsor executive limitations. Speech fluency is also significantly reduced in SemD. While these patients areimpaired on measures of speech production, comprehension, and executive functioning, none of thesevariables correlates significantly with fluency of speech. In SOC/EXEC patients, the executive measureof category naming fluency correlates with speech rate. Thus, there appear to be distinct sources ofnon-fluent speech in subgroups of patients with FTLD. Furthermore, non-fluent speech appears to havepartially distinct neuroanatomic associations within the left inferior frontal and superior temporalregions of these patient subgroups. We discuss each FTLD subgroup in detail below.
4.1. Progressive non-fluent aphasia
Speech in PNFA is often described clinically as effortful and agrammatic (Gorno-Tempini et al., 2004;Grossman et al., 1996; Weintraub et al., 1990). The slowing of speech and reduction of output has beennoted in previous assessments of spontaneous speech in PNFA and other FTLD syndromes (Amici, Ogar,et al., 2007; Graham, Patterson, & Hodges, 2004; Orange, Kertesz, & Peacock, 1998; Rogers & Alarcon,1998; Thompson et al., 1997). Several hypotheses have been advanced to explain non-fluent speech inPNFA: an account based on a linguistic deficit; a modality-specific account related to AOS; anda hypothesis related to executive resource limitations. We are not aware of studies that compare thecontributions of these factors to the non-fluent speech of PNFA.
We find that speech in PNFA is significantly non-fluent in a semi-structured sample of narrativespeech. This co-occurs with a significant reduction in syntactically complex utterances relative tocontrols, and correspondingly, these patients’ mean MLU is significantly reduced. These measures of
S. Ash et al. / Journal of Neurolinguistics 22 (2009) 370–383378
syntactic complexity correlate significantly with non-fluent speech in PNFA. However, we find thatnon-fluent speech is not related to sentence comprehension in PNFA, although this may depend in parton the specific measure used to assess grammatical comprehension (Amici, Brambati, et al., 2007).Studies of Broca’s aphasia following stroke also dissociate non-fluent and agrammatic speech froma disorder of sentence comprehension (Miceli, Mazzucchi, Menn, & Goodglass, 1983). This observationof a modality-specific deficit at first appears to be consistent with a deficit that compromises wordformation and articulation as a consequence of AOS (Josephs et al., 2006; Ogar et al., 2007). It isfrequently remarked that PNFA patients produce many speech errors. This characteristic has beennoted in previous work (Gorno-Tempini et al., 2006; Josephs et al., 2006; Ogar et al., 2007), and we findthat it is statistically robust in our sample in comparison to other FTLD patients. Among the speecherrors observed in PNFA are simple sound substitutions, approximations of phonemes that miss thephonetic target, and instances where the speaker’s intended target cannot be determined. However,the frequency of speech errors does not correlate with reduced rate of speech in PNFA. Thus errors inproduction do not account for the slowed speech of these patients.
Our observations may be most consistent with an account of non-fluent speech that invokesa syntactic deficit (Grossman et al., 1996; Grossman et al., 2005; Peelle, Cooke, Moore, Vesely, &Grossman, 2007), by which speech may be non-fluent in PNFA because the rules governing long-distance syntactic dependencies are degraded. A related observation is that PNFA patients also showreduced verb production in their speech samples. Previous work has shown that confrontation namingof action verbs is impaired in PNFA (Hillis, Oh, & Ken, 2004; Hillis, Tuffiash, & Caramazza, 2002). Thepresent study extends the observation of limited verb use to a semi-structured sample of spontaneousspeech and shows that verb production correlates with speech rate in PNFA. Reduced verb use may alsocontribute to the syntactic difficulty in PNFA because verbs play a crucial role in structuring sentences.Verbs appear to be more difficult to process than nouns in PNFA (Rhee, Antiquena, & Grossman, 2001),again linking language processing to a resource limitation. PNFA patients also produce fewer nouns,but this does not correlate with reduced speech fluency, possibly reflecting the lesser contribution ofnouns to grammatical structure.
It is also possible that a disorder of executive functioning may interfere with planning in language aswell as in other cognitive domains (Kramer et al., 2003; Libon et al., 2007; Weintraub et al., 1990).Category naming assesses a form of fluency that has little bearing on the production of connectedspeech; hence it is unsurprising that category naming fluency does not correlate with speech rate.However, executive resources appear to support the processing of syntactic dependencies withinsentences, and it may be a limitation of these resources that compromises syntactic processing in PNFA.For example, slowed information processing speed appears to play a role in the impairment of syntacticprocessing mediated by working memory (Peelle et al., 2007).
The present study found significant left inferior frontal and insula atrophy in PNFA. Left frontaldisease has been reported in previous imaging (Gorno-Tempini et al., 2004; Grossman et al., 1996;Nestor et al., 2003) and clinical-pathological (Josephs et al., 2006) studies of PNFA, although thesefindings have not been directly related to speech rate. Additionally, there appears to be some leftoccipital atrophy, perhaps reflecting the presence of corticobasal degeneration that is associated withPNFA (Murray et al., 2007).
The whole-brain VBM analysis in this study was unbiased by a priori hypotheses that select a regionof interest. The analysis associated non-fluent speech with left inferior frontal and superior temporalcortical volume in FTLD. This observation agrees in part with a report of cortical volume related tofluency as measured by the Western Aphasia Battery semi-quantitative assessment of spontaneousspeech fluency in a large set (N ¼ 51) of patients with FTLD, Alzheimer’s disease, and corticobasaldegeneration (Amici, Ogar, et al., 2007). Previous work has related effortful speech in non-fluent strokeaphasics to left inferior frontal cortex (Alexander et al., 1989, 1990; Mohr & Whitaker, 1976). Weobserved that the area that correlated with speech rate overlaps the area of left inferior frontal atrophyin PNFA. While other areas of significant atrophy are apparent in PNFA, it is likely that this left inferiorfrontal region is specifically implicated in the non-fluent speech of these patients because of theoverlapping distributions of brain-behavior functioning and subgroup atrophy. We found left occipitalatrophy in PNFA as well, but this does not overlap with the area related to non-fluent speech and is thusless likely to be involved in this aspect of PNFA behavior. Given the association of non-fluent speech
S. Ash et al. / Journal of Neurolinguistics 22 (2009) 370–383 379
with limitations in syntax and verb use in speech production, left inferior frontal cortex may beinvoked in syntactic processing during fluent speech production. Recent fMRI work associates this areawith the recruitment of working memory during grammatical processing (Cooke et al., 2005). Addi-tional work is needed to establish more precisely the basis for non-fluent speech in PNFA.
4.2. Semantic dementia
Speech fluency is reduced in SemD, although not to the same extent as in PNFA. Speech in SemD isclinically characterized by circumlocutions and word-finding pauses (Hodges & Patterson, 2007). Thismay be due in part to a deficit in the representation of word meaning that interferes with lexicalretrieval (Grossman et al., 2004), but quantitative documentation of this association is lacking. In thepresent study, SemD produced significantly fewer content words per utterance than controls, andreduced speech fluency correlated with the frequency of existential subjects, which representsemantically impoverished content.
Significant bilateral anterior temporal atrophy was found in SemD (Gorno-Tempini et al., 2004;Grossman et al., 2004). The atrophy was more extensive in the left hemisphere than the right hemi-sphere and extended superiorly to involve a modest area of the left inferior frontal and insula region.We may have observed this superior extension because the SemD patients participating in this studyhad their disease on average for longer than did the patients in the other groups. Alternatively, thesensitivity of our novel imaging technique may have significantly improved our ability to ascertain thedistribution of cortical atrophy in these patients.
Cortical atrophy in SemD overlapped the area of cortical volume that correlated with non-fluentspeech in left superior temporal and inferior frontal cortex. The association of non-fluent speech withleft anterior superior temporal regions is consistent with evidence suggesting that this region plays animportant role in word-level processes (Indefrey & Levelt, 2004; Scott & Wise, 2004), in comprehen-sion of syntax (Friederici, Meyer, & von Cramon, 2000; Friederici, Ruschemeyer, Hahne, & Fiebach,2003), and in construction of basic phrase structures in speech production (Hickok & Poeppel, 2007;Humphries, Love, Swinney, & Hickok, 2005). The partial overlap with atrophy in left inferior frontalcortex also seen in PNFA calls into question the precise basis for this association. fMRI studies of healthyadults relate left inferior frontal cortex to resources involved in selection from semantic memory(Thompson-Schill, D’Esposito, Aguirre, & Farah, 1997; Wagner, Pare-Blagoev, Clark, & Poldrack, 2001).This suggests that left inferior frontal cortex may support executive resources that contribute to taskssuch as production of syntax and lexical semantic selection, and the specific manifestation of disease inthis area depends on the large-scale network that is otherwise interrupted in each of these groups.Using diffusion tensor imaging, we find that PNFA and SemD have distinct patterns of abnormal whitematter projections (Asmuth, Zhang, & Grossman, 2008). PNFA appear to have abnormalities inprojections posteriorly through the superior frontal-occipital fasciculus and contralaterally through thecorpus callosum, while SemD have abnormal projections posteriorly through the inferior frontal-occipital fasciculus and the arcuate fasciculus. Additional work is needed to relate non-fluent speech todiffusion tensor imaging studies of PNFA and SemD.
4.3. Social/executive disorder
Patients with a SOC/EXEC disorder have reduced speech fluency relative to controls, although theyare not aphasic, and this correlates with their impaired category naming fluency. SOC/EXEC alsodemonstrate impaired discourse, in which expression is poorly organized, often wandering from themain topic, and interspersed with irrelevant material (Ash et al., 2006). This is related to a limitation ofexecutive functioning as well (Ash et al., 2006). It seems possible that features such as apathy (Rosenet al., 2005) or poor mental organization (Libon et al., 2007) may contribute to reduced fluency in thesepatients. Additional work is needed to determine why impaired category naming fluency correlateswith reduced speech fluency only in patients with a SOC/EXEC disorder.
We found extensive bilateral frontal and temporal cortical atrophy in SOC/EXEC patients, in keepingwith previous observations (Grossman et al., 2004; Rosen et al., 2005). Atrophy in these brain regionsmay contribute to limited planning and organization in the speech of these patients at the level of
S. Ash et al. / Journal of Neurolinguistics 22 (2009) 370–383380
narrative (Ash et al., 2006). Even though the anatomic distribution of disease overlaps in left inferiorfrontal cortex in SOC/EXEC and PNFA, speech fluency in SOC/EXEC patients is not as compromised as inPNFA. This may be due in part to the different distributions of abnormal white matter projections inSOC/EXEC compared to PNFA (Asmuth et al., 2008). Additional work is needed to establish the basis forreduced fluency in these patients.
Acknowledgments
This work was supported by the National Institutes of Health (AG17586, AG15116, NS44266,NS53488) and the Charles Dana Foundation.
Appendix A
A.1 Speech samples
A 79-year-old woman with a 4-year history of PNFA symptoms began her narrative as follows:
(1) Here is a boy(H)e looks /lak eed {like he’d} em an r-r-r/ all nightThe vrog, i? in a bottle {rising pitch}And they were eh- outside.The moon uh, shaying, eh djeh, �zanning I 3 window.See you ss. see-e-u. (h)e- (h)e is using 3 off..and they ge?. a frog g-g-gets out of the b-barrel {Ex: m-hm}. glass barrel. (10 sec)And the dog 3 stands on a, is quite use {voiceless} (t)o with tha?, a baz view. (4 sec)HaaowraaanhThere your dog k-ch-ch/ow lay 3 zeey/ and is I::, is in 3 is in 3 bottle..A:n /k sow bam/. his clothes (8 sec)and he looks out of the windowDog go- goes..and dth3 {the} (h)is (h)ead’s still in /ba:w:/, in the glass /ba:w:/ {bottle} (4 sec)And 3 {eh} when he pick3s up, the dog, he licks him (16 sec)You gonna /viygs/ {fix} m now
A sample of speech from a 69-year-old SemD patient with a 7-year history of symptoms illustratesthe paucity of lexicon in spontaneous speech:
(2) And he was sleeping with two animalsand one animal woke him upand he had his shoes or something on.Another animal, the other animal got his head in a glass and a bottle, whatever it’s called.I’m sorry.And then he fell outside with it and broke itand he went out and got him.Then they were outside taking a look at the uh weather, him and his dogand then the animal came up out of the groundand the dog was after the animaland the son went up on a, uh, tree.Fell down off the tree because there was a . bird that got him.
An 86-year-old man with a 3-year history of SOC/EXEC symptoms provides an example of thesepatients’ difficulty in appreciating the elements relevant to the story line in a sequence of scenes. Thespeaker here is talking about the first three pages of the story. In the first picture, a boy and his dog are
S. Ash et al. / Journal of Neurolinguistics 22 (2009) 370–383 381
looking at a frog in a jar in the boy’s bedroom. In the second picture, the frog climbs out of the jar whilethe boy and dog are sleeping, and in the third, it is morning, and the boy and dog are looking withsurprise and dismay at the empty jar.
(3) The boy and the dog (2 sec) looking in, {chuckling} into a jar with a frogand this is in their bedroom.The boy is asleep in his bed.The frog is in a jar.And his {chuckling}.. his.. his boots are on the floor, nex- next to his uh . next to his shirt.Boy’s in bed (2 sec) next to his dog.His boots are on the floor..and so are his sandals.. and an empty jar, and his shirt.The boy’s in his bedroom.
Appendix B
B.1 Language variables
Total words produced: Our principal measure of speech fluency is based on a word count. Wecounted every complete word in the narrative, including repetitions.
Speech fluency: We divided the total word output by the duration of the narrative to derivea measure of words per minute (WPM) reflecting speech fluency.
Number of utterances: An utterance was defined as a T-unit (Hunt, 1965), which consists of anindependent clause and all clauses or phrases dependent on it. Thus a series of three independentclauses conjoined by and is counted as three utterances. A stretch of speech that formed an incompleteT-unit was also counted as an utterance.
Speech errors: We counted the number of occurrences per utterance of subjects’ productions ofdeviant speech sounds. Suprasegmental vocalizations, such as tongue clicking, creaky voice, orbreathiness, were disregarded; only segmental phonemic productions (vowels and consonants) wereconsidered in the tabulation of speech errors. For purposes of this report, we did not classify errors anyfurther by attempting to discriminate among apraxia of speech, phonological paraphasias, and otherpossible types of errors. A detailed analysis of speech errors will be reported separately.
Nouns: All nouns were counted, regardless of function or position as subject, object, extraposition, etc.Verbs: Both finite and non-finite verb forms were included. Finite verb forms are those marked for
number, tense, and aspect. Non-finite verbs are infinitives and participles that are used in a verbalsense, not a nominal sense. For example, the main verb is trying and the infinitive to reach occur in‘‘Spot is trying to reach the beehive.’’ In ‘‘[The deer] carries little Joe to the edge of the cliff, with Spotfollowing, barking all the way,’’ there is one inflected verb, carries, and two non-finite verb forms,following and barking. But in ‘‘Joe heard the barking of a dog,’’ barking is a gerund, serving the functionof a noun, and is not counted as a verb.
The presence of a verb in an utterance reflects both access to semantics and competence in syntax.Because of the heavy load of grammatical marking on the finite verb, including number, tense, andaspect, the core of the structure of a sentence or clause is borne by the inflected verb.
Complex sentences: These are utterances that include either or both of dependent clauses or phrasaladjuncts, as follows:
Dependent clause: A dependent clause is defined as a phrase containing a subject and a predicate thatcannot stand alone by virtue of being introduced by a subordinating conjunction (while, when, because,than, etc.), a relativizer (who, which, why, that, etc.) or a complementizer (that, as in ‘‘The boy thoughtthat the frog might be inside the log.’’). Some authors consider phrases introduced by an infinitive ora participle to constitute dependent clauses, but in the present study we followed the convention ofrequiring that a phrase contain a subject and an inflected verb in order to be considered as constitutinga clause.
S. Ash et al. / Journal of Neurolinguistics 22 (2009) 370–383382
Phrasal adjunct: A phrasal adjunct is a phrase that is outside the subject noun phrase and outside theverb phrase: the content applies to the sentence as a whole. Frequently, a phrasal adjunct is introducedby an infinitive verb or a gerund:
They went out in the woods to see if they could find a frog.They went along, looking for the frog.
A phrasal adjunct may also set the stage by giving time or place:At that point, the frog took off to go outside and go somewhere else.
It is characteristic of a phrasal adjunct that it can be moved within the sentence:To see if they could find a frog, they went out in the woods.Looking for the frog, they went along (the path).The frog took off to go outside and go somewhere else at that point.
Existential subjects: These are utterances in which the subject has no semantic content but holds theplace of the grammatical subject, as in ‘‘There’s a young guy,’’ or ‘‘And here’s a dog.’’
References
Alexander, M. P., Benson, D. F., & Stuss, D. T. (1989). Frontal lobes and language. Brain and Language, 37, 656–691.Alexander, M. P., Naeser, M. A., & Palumbo, C. (1990). Broca’s area aphasia: aphasia after lesions including the frontal operculum.
Neurology, 40, 353–362.Amici, S., Brambati, S. M., Wilkins, D. P., Ogar, J., Dronkers, N. L., Miller, B. L., et al. (2007). Anatomical correlates of sentence
comprehension and verbal working memory in neurodegenerative disease. Journal of Neuroscience, 27(23), 6282–6290.Amici, S., Ogar, J., Brambati, S. M., Miller, B. L., Neuhaus, J., Dronkers, N. L., et al. (2007). Performance in specific language tasks
correlates with regional volume changes in progressive aphasia. Cognitive and Behavioral Neurology, 20(4), 203–211.Ash, S., Moore, P., Antani, S., McCawley, G., Work, M., & Grossman, M. (2006). Trying to tell a tale: Discourse impairments in
progressive aphasia and frontotemporal dementia. Neurology, 66, 1405–1413.Asmuth, J., Zhang, H., & Grossman, M. (2008). DTI analysis of white matter deficits in frontotemporal lobar dementia. Neurology,
70, A452.Avants, B., & Gee, J. C. (2004). Geodesic estimation for large deformation anatomical shape and intensity averaging. Neuroimage,
23, S139–S150.Boersma, P., & Weenink, D. (1992–2000). Praat, v. 4.3.27: Institute of Phonetic Sciences, University of Amsterdam.Canter, G. J., Trost, J. E., & Burns, M. S. (1985). Contrasting speech patterns in apraxia of speech and phonemic paraphasia. Brain
and Language, 24(2), 204–222.Cooke, A., DeVita, C., Gonzalez-Atavales, J., Moore, P., Chen, W., Gee, J. C., et al. (2005). Large-scale neural network for sentence
processing. Brain and Language, 96, 14–36.Dronkers, N. F. (1996). A new brain region for coordinating speech articulation. Nature, 384, 159–161.Folstein, M. F., Folstein, S. F., & McHugh, P. R. (1975). ‘‘Mini Mental State.’’ A practical method for grading the cognitive state of
patients for the clinician. Journal of Psychiatric Research, 12, 189–198.Friederici, A. D., Meyer, M., & von Cramon, D. Y. (2000). Auditory language comprehension: an event-related fMRI study on the
processing of syntactic and lexical information. Brain and Language, 74(2), 289–300.Friederici, A. D., Ruschemeyer, S. A., Hahne, A., & Fiebach, C. J. (2003). The role of left inferior frontal and superior temporal
cortex in sentence comprehension: localizing syntactic and semantic processes. Cerebral Cortex, 13, 170–177.Gorno-Tempini, M. L., Dronkers, N. F., Rankin, K. P., Ogar, J. M., Phengrasamy, L., Rosen, H. J., et al. (2004). Cognition and anatomy
in three variants of primary progressive aphasia. Annals of Neurology, 55(3), 335–346.Gorno-Tempini, M. L., Ogar, J. M., Brambati, S. M., Wang, P., Jeong, J. H., Rankin, K., et al. (2006). Anatomical correlates of early
mutism in progressive nonfluent aphasia. Neurology, 67, 1849–1851.Graham, N. L., Patterson, K., & Hodges, J. R. (2004). When more yields less: speaking and writing deficits in nonfluent
progressive aphasia. Neurocase, 10(2), 141–155.Grossman, M., & Ash, S. (2004). Primary progressive aphasia: a review. Neurocase, 10, 3–18.Grossman, M., Libon, D. J., Forman, M. S., Massimo, L., Wood, E., Moore, P., et al. (2007). Distinct antemortem profiles in
pathologically defined patients with frontotemporal dementia. Archives of Neurology, 64, 1601–1609.Grossman, M., McMillan, C., Moore, P., Ding, L., Glosser, G., Work, M., et al. (2004). What’s in a name: Voxel-based morphometric
analyses of MRI and naming difficulty in Alzheimer’s disease, frontotemporal dementia, and corticobasal degeneration.Brain, 127, 628–649.
Grossman, M., Mickanin, J., Onishi, K., Hughes, E., D’Esposito, M., Ding, X. S., et al. (1996). Progressive nonfluent aphasia: language,cognitive and PET measures contrasted with probable Alzheimer’s disease. Journal of Cognitive Neuroscience, 8(2), 135–154.
Grossman, M., Rhee, J., & Antiquena, P. (2005). Sentence processing in frontotemporal dementia. Cortex, 41, 764–777.Hickok, G., & Poeppel, D. (2007). The cortical organization of speech processing. Nature Reviews Neuroscience, 8, 393–402.Hillis, A. E., Oh, S., & Ken, L. (2004). Deterioration of naming nouns versus verbs in primary progressive aphasia. Annals of
Neurology, 55, 268–275.Hillis, A. E., Tuffiash, E., & Caramazza, A. (2002). Modality-specific deterioration in naming verbs in nonfluent primary
progressive aphasia. The Journal of Cognitive Neuroscience, 14, 1099–1108.Hodges, J. R., & Patterson, K. (2007). Semantic dementia: a unique clinicopathological syndrome. Lancet Neurology, 6, 1004–1014.Humphries, C., Love, T., Swinney, D., & Hickok, G. (2005). Response of anterior temporal cortex to syntactic and prosodic
manipulations during sentence processing. Hum Brain Mapping, 26(2), 128–138.
S. Ash et al. / Journal of Neurolinguistics 22 (2009) 370–383 383
Hunt, K. W. (1965). Grammatical structures written at three grade levels. Champaign, IL: National Council of Teachers of English.Indefrey, P., & Levelt, W. J. M. (2004). The spatial and temporal signatures of word production components. Cognition, 92, 101–144.Josephs, K. A., Duffy, J. R., Strand, E. A., Whitwell, J. L., Layton, K. F., Parisi, J. E., et al. (2006). Clinicopathological and imaging
correlates of progressive aphasia and apraxia of speech. Brain, 129, 1385–1398.Josephs, K. A., Whitwell, J. L., Duffy, J. R., Vanvoorst, W. A., Strand, E. A., Hu, W. T., et al. (2008). Progressive aphasia secondary to
Alzheimer disease vs FTLD pathology. Neurology, 70(1), 25–34.Kramer, J. H., Jurik, J., & Sha, S. J. (2003). Distinctive neuropsychological patterns of frontotemporal dementia, semantic
dementia, and Alzheimer’s Disease. Cognitive and Behavioral Neurology, 16, 211–218.Lambon Ralph, M. A., Graham, K. S., Ellis, A. W., & Hodges, J. R. (1998). Naming in semantic dementia – what matters?
Neuropsychologia, 36, 775–784.Lezak, M. (1983). Neuropsychological assessment. Oxford: Oxford University Press.Libon, D. J., Xie, S. X., Moore, P., Farmer, J., Antani, S., McCawley, G., et al. (2007). Patterns of neuropsychological impairment in
frontotemporal dementia. Neurology, 68, 369–375.Lieberman, P., Kako, E., Friedman, J., Tajchman, G., Feldman, L. S., & Jiminez, E. B. (1992). Speech production, syntax compre-
hension, and cognitive deficits in Parkinson’s disease. Brain and Language, 43, 169–189.Mayer, M. (1969). Frog, where Are You? New York: Penguin Books.McKhann, G., Trojanowski, J. Q., Grossman, M., Miller, B. L., Dickson, D., & Albert, M. (2001). Clinical and pathological diagnosis
of frontotemporal dementia: report of a work group on frontotemporal dementia and Pick’s disease. Archives of Neurology,58, 1803–1809.
Miceli, G., Mazzucchi, A., Menn, L., & Goodglass, H. (1983). Contrasting cases of Italian agrammatic aphasia without compre-hension disorder. Brain and Language, 19, 65–97.
Mohr, J. P., & Whitaker, H. (1976). Broca’s area and Broca’s aphasia. InStudies in neurolinguistics, volume 1 New York: AcademicPress.
Murray, R., Neumann, M., Forman, M. S., Farmer, J., Massimo, L., Rice, A., et al. (2007). Cognitive and motor assessment inautopsy-proven corticobasal degeneration. Neurology, 68, 1274–1283.
Neary, D., Snowden, J. S., Gustafson, L., Passant, U., Stuss, D., Black, S., et al. (1998). Frontotemporal lobar degeneration:a consensus on clinical diagnostic criteria. Neurology, 51, 1546–1554.
Nestor, P. J., Graham, N. L., Fryer, T. D., Williams, G. B., Patterson, K., & Hodges, J. R. (2003). Progressive non-fluent aphasia isassociated with hypometabolism centred on the left anterior insula. Brain, 126, 2406–2418.
Ogar, J. M., Dronkers, N., Brambati, S. M., Miller, B., & Gorno-Tempini, M. (2007). Progressive nonfluent aphasia and itscharacteristic motor deficits. Alzheimer’s Disease and Associated Disorders, 21, S23–S30.
Orange, J. B., Kertesz, A., & Peacock, J. (1998). Pragmatics in frontal lobe dementia and primary progressive aphasia. Journal ofNeurolinguistics, 11(1-2), 25.
Peelle, J., Cooke, A., Moore, P., Vesely, L., & Grossman, M. (2007). Syntactic and thematic components of sentence processing inprogressive nonfluent aphasia and nonaphasic frontotemporal dementia. Journal of Neurolinguistics, 20, 482–494.
Peelle, J., Troiani, V., Gee, J., Moore, P., McMillan, C., Vesely, L., et al. (2008). Sentence comprehension and voxel-basedmorphometry in progressive nonfluent aphasia, semantic dementia, and nonaphasic frontotemporal dementia. Journal ofNeurolinguistics, 21, 418–432.
Rhee, J., Antiquena, P., & Grossman, M. (2001). Verb comprehension in frontotemporal degeneration: the role of grammatical,semantic and executive components. Neurocase, 7(2), 173–184.
Rogers, M. A., & Alarcon, N. B. (1998). Dissolution of spoken language in primary progressive aphasia. Aphasiology, 12(7/8), 16.Rosen, H. J., Allison, S. C., Schauer, G. F., Gorno-Tempini, M. L., Weiner, M. W., & Miller, B. L. (2005). Neuroanatomical correlates of
behavioural disorders in dementia. Brain, 128, 2612–2625.Scott, S. K., & Wise, R. J. (2004). The functional neuroanatomy of prelexical processing in speech perception. Cognition, 92(1-2),
13–45.Smith, S. M. (2002). Fast robust automated brain extraction. Hum Brain Mapping, 17(3), 143–155.Snowden, J. S., Goulding, P. J., & Neary, D. (1989). Semantic dementia: a form of circumscribed cerebral atrophy. Behavioral
Neurology, 2, 167–182.Snowden, J. S., Neary, D., & Mann, D. M. (1996). Fronto-temporal lobar degeneration: fronto-temporal dementia, progressive
aphasia, semantic dementia. New York: Churchill Livingstone.Spreen, O., & Strauss, E. (1991). A compendium of neuropsychological tests. New York: Oxford University Press.Stuss, D. T., & Benson, D. F. (1984). Neuropsychological studies of the frontal lobes. Psychological Bulletin, 95, 3–28.The Lund and Manchester Group, A. (1994). Clinical and neuropathological criteria for frontotemporal dementia. Journal of
Neurology, Neurosurgery, and Psychiatry, 57, 416–418.Thompson, C. K., Ballard, K. J., Tait, M. E., Weintraub, S., & Mesulam, M. (1997). Patterns of language decline in non-fluent
primary progressive aphasia. Aphasiology, 11, 297–331.Thompson-Schill, S. L., D’Esposito, M., Aguirre, G., & Farah, M. J. (1997). Role of left inferior prefrontal cortex in retrieval of
semantic knowledge: a reevaluation. Proceedings of the National Academy of Sciences of the USA, 94, 14792–14797.Turner, R. S., Kenyon, L. C., Trojanowski, J. Q., Gonatas, N., & Grossman, M. (1996). Clinical, neuroimaging, and pathologic features
of progressive non-fluent aphasia. Annals of Neurology, 39, 166–173.Wagner, A. D., Pare-Blagoev, E. J., Clark, J., & Poldrack, R. A. (2001). Recovering meaning: left prefrontal cortex guides controlled
semantic retrieval. Neuron, 31, 329–336.Wechsler, D. (1987). Wechsler memory scale – revised. San Antonio: The Psychological Corporation.Weintraub, S., Rubin, N. P., & Mesulam, M. M. (1990). Primary progressive aphasia: longitudinal course, neuropsychological
profile, and language features. Archives of Neurology, 47, 1329–1335.Zhang, Y., Brady, M., & Smith, S. (2000). Hidden Markov random field model for segmentation of brain MR images. SPIE
Proceedings, 3979, 1126–1138.