nodal patterns of floaters in surface waves
TRANSCRIPT
Eur. Phys. J. Special Topics 145, 125–136 (2007)c© EDP Sciences, Springer-Verlag 2007DOI: 10.1140/epjst/e2007-00151-6
THE EUROPEANPHYSICAL JOURNALSPECIAL TOPICS
Nodal patterns of floaters in surface waves
S. Lukaschuk1,a, P. Denissenko1, and G. Falkovich2
1 Fluid Dynamics Laboratory, The University of Hull, Hull HU6 7RX, UK2 Physics of Complex Systems, The Weizmann Institute of Science, Rehovot 76100, Israel
Abstract. We argue theoretically and demonstrate experimentally that in a stand-ing wave floating particles drift towards the nodes or anti-nodes depending ontheir hydrophilic or hydrophobic properties. We explain this effect as the break-down of Archimedes’ law by a surface tension, which creates a difference betweenthe masses of the floater and displaced liquid, making the particle effectivelyinertial. We describe analytically the motion of a small floating particle in asmall-amplitude wave and show that the drift appears as a second order effectin wave amplitude. We confirm experimentally that indeed the clustering rateis proportional to the square of the wave amplitude. In the case of surface ran-dom waves we show experimentally that the inertial effects significantly changethe statistics of floater distribution on a liquid surface. The analysis of particleconcentration moments and probability distribution functions shows that particleconcentrate on a multi-fractal set with caustics.
1 Introduction
How do small particles behave in an oscillating environment? Historically the first answer tothis question was obtained in 1787 by the German physicist Chladni for particles on a solidsurface, that oscillate in a standing wave. The Chladni figures consist of nodal lines which areformed by sprinkling fine sand on a vibrating surface which jumps away from the areas withlarge vibration amplitude and remains in the nodal areas where the amplitude is nearly zero.In this way, Chladni invented a technique to visualize mechanical vibration modes of a rigidplate. In some cases particles on the vibrating plate can gather in anti-nodes. In 1827 Savart [1]described an experiment where he observed that very fine powder, such as lycopodium, settlesin the antinodes instead of nodes. As it was explained later by M. Faraday [2] this is due to theaction of the air currents – lycopodium powder returns to the nodes in a vacuum.The second case was discovered one hundred years after Chladni: in 1866 Kundt demon-
strated visualization of a standing acoustic wave in a long tube whose interior walls were coveredby fine light powder or dust. When the sound wave was excited in a gas filling the tube, thedust particles assembled into the heaps at the wave nodes. Besides the visualization of soundwaves, the Kund effect also provided a possibility to measure the velocity of sound in gases.The nature of the Kundt effect is different from that of Chladni. In the Kundt case the particlemovement is due a nonuniform acoustic radiation pressure in a standing wave [3]. The sameforce is responsible for the clustering of small particles by a standing ultrasound wave in a liquidsuspension [4].One may find it hard to believe that the third case (of nodal patterns created by particles
on an oscillating liquid surface) was discovered more that hundred years after Kundt [5]. In asmall-amplitude wave floaters do not jump so that the Chladni effect is absent. On the otherhand, the pressure is uniform over the surface so that the Kundt effect is absent too. The
a e-mail: [email protected]
126 The European Physical Journal Special Topics
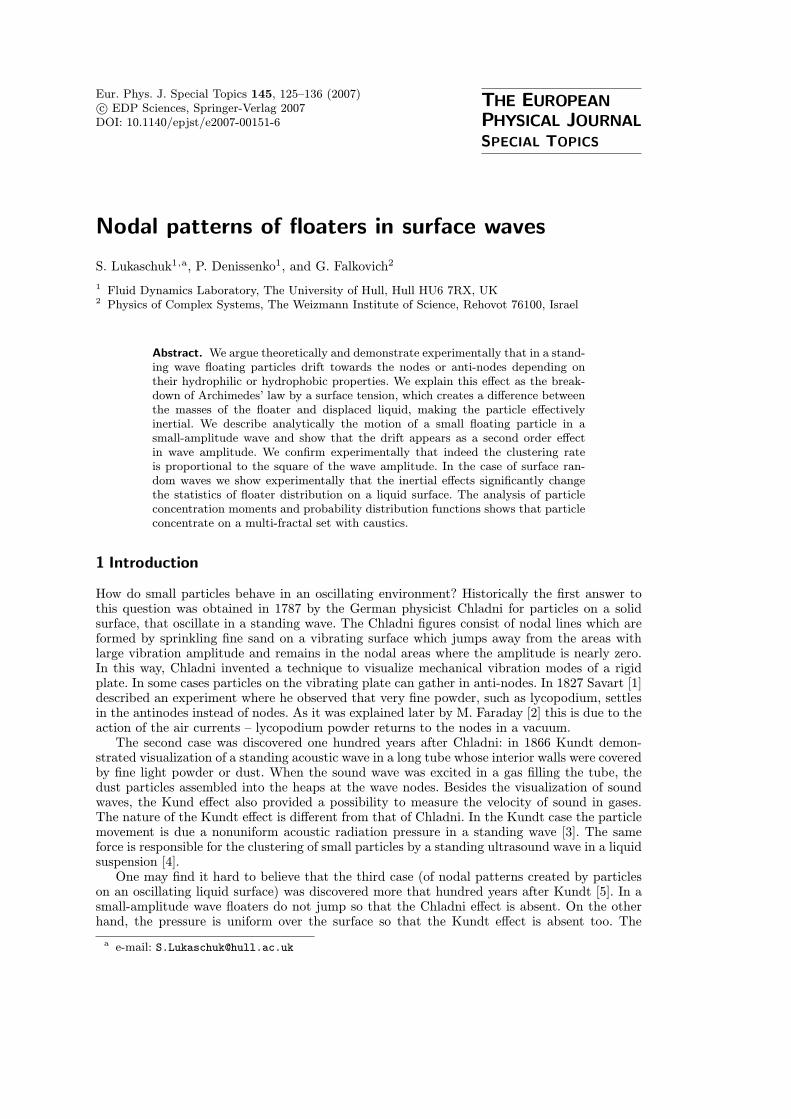
absence of particle bouncing and the pressure gradient created a widespread perception thatsmall particles just stick to a liquid surface and move with it. What is missing from this pictureis the account of surface tension, which is important precisely for small particles. The surfacetension changes a submersion depth and makes a particle lighter or heavier than the displacedliquid. That means that small floaters are inertial so that they can move relative to the fluid.Indeed, a small floater on a stationary inclined liquid surface (formed, say, near boundaries)drifts along the slope [7,8]. On an inclined surface of water, a hydrophobic particle (a smallpiece of plastic, pollen grain or even a drop of oil) slides down, while a hydrophilic particle(glass hollow sphere) climbs up. In a standing wave, particle inertia produces a well noticeableparticle clustering correlated with a wave nodal pattern, see Fig. 1.
Fig. 1. Clustering of suspension offloating particles in capillary waves.The particles are 30 µm hollowglass spheres of density 0.6 g/cm3
deposited on a surface of a waterfilled Petri dish. The capillary wavesare excited by vertical vibrations.
It should be noted that the deformation of the liquid surface caused by floaters andcapillarity-induced drift along the slope cause the interaction between floaters. On a horizontalsurface two identical floating spheres will attract each other with force proportional to theirdiameter in power six [9]. This interaction force is rather weak for small particles and theirclustering can be easily destroyed by weak shear flow. An estimation shows that the attractionforce between hollow glass spheres (density - 0.6 g/cm
3, diameter 100 µm, contact angle - zero)
is less than the Stokes drag generated by a shear flow with the velocity gradient 2 · 10−5 s−1.To explain the drift of a single particle in a standing surface wave one needs to take into
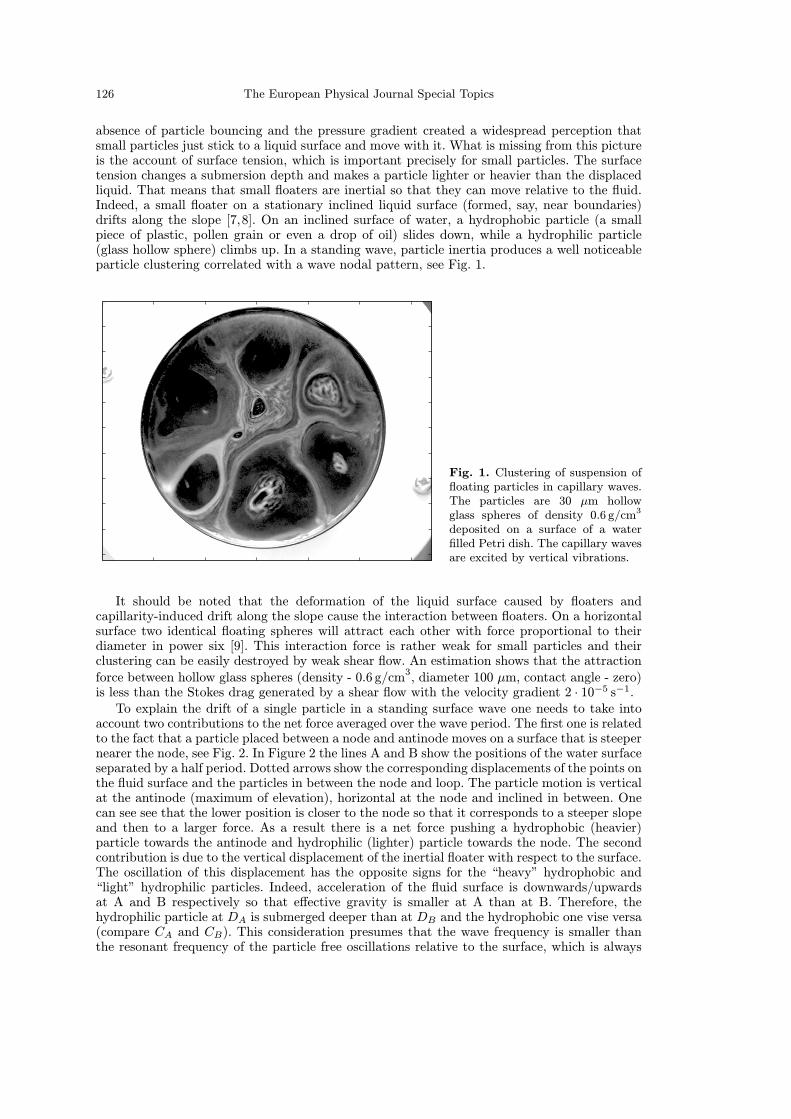
account two contributions to the net force averaged over the wave period. The first one is relatedto the fact that a particle placed between a node and antinode moves on a surface that is steepernearer the node, see Fig. 2. In Figure 2 the lines A and B show the positions of the water surfaceseparated by a half period. Dotted arrows show the corresponding displacements of the points onthe fluid surface and the particles in between the node and loop. The particle motion is verticalat the antinode (maximum of elevation), horizontal at the node and inclined in between. Onecan see see that the lower position is closer to the node so that it corresponds to a steeper slopeand then to a larger force. As a result there is a net force pushing a hydrophobic (heavier)particle towards the antinode and hydrophilic (lighter) particle towards the node. The secondcontribution is due to the vertical displacement of the inertial floater with respect to the surface.The oscillation of this displacement has the opposite signs for the “heavy” hydrophobic and“light” hydrophilic particles. Indeed, acceleration of the fluid surface is downwards/upwardsat A and B respectively so that effective gravity is smaller at A than at B. Therefore, thehydrophilic particle at DA is submerged deeper than at DB and the hydrophobic one vise versa(compare CA and CB). This consideration presumes that the wave frequency is smaller thanthe resonant frequency of the particle free oscillations relative to the surface, which is always
Nodal Patterns in Physics and Mathematics 127
Fig. 2. Positions and net forces of hydrophobic (CA, CB) and hydrophilic (DA,DB) particles separatedby a half-period of a standing wave.
the case for small enough particles. Both mechanisms produce a force difference proportionalto the squared wave amplitude, making it a nonlinear effect. This conclusion is supported byanalytical calculations in the next section [10].
2 Dynamics of a floating particle on a standing wave: The model
The model considers the particle drift as a function of four parameters: the wave length andamplitude, surface tension coefficient and particle mass. Consider a standing wave with a hor-izontal surface velocity u(x, t) = u0 sinωkt cos kx, vertical velocity w(x, t) = u0 sinωkt sin kxand elevation ζ(x, t) = −(u0/ωk) cosωkt sin kx, and with a small amplitude: ε = ku0/ωk 1.We see that the points of the surface move by straight lines with the inclination w/u = tan kx.For a particle of the mass M floating on a liquid with the density ρ and viscosity ν, the depthof the submerged part, δ, satisfies the vertical component of the equation of motion [11,12]
M
(d2δ
dt2+ γv
dδ
dt
)= F (δ) = (g + ζ)[M −md(δ)] + Fc(δ) . (1)
Here md = πρ(aδ2 − δ3/3) is the mass of the displaced fluid, and a is the particle radius
presumed much smaller than the wavelength. The capillary force is given by the formula Fc(δ) =
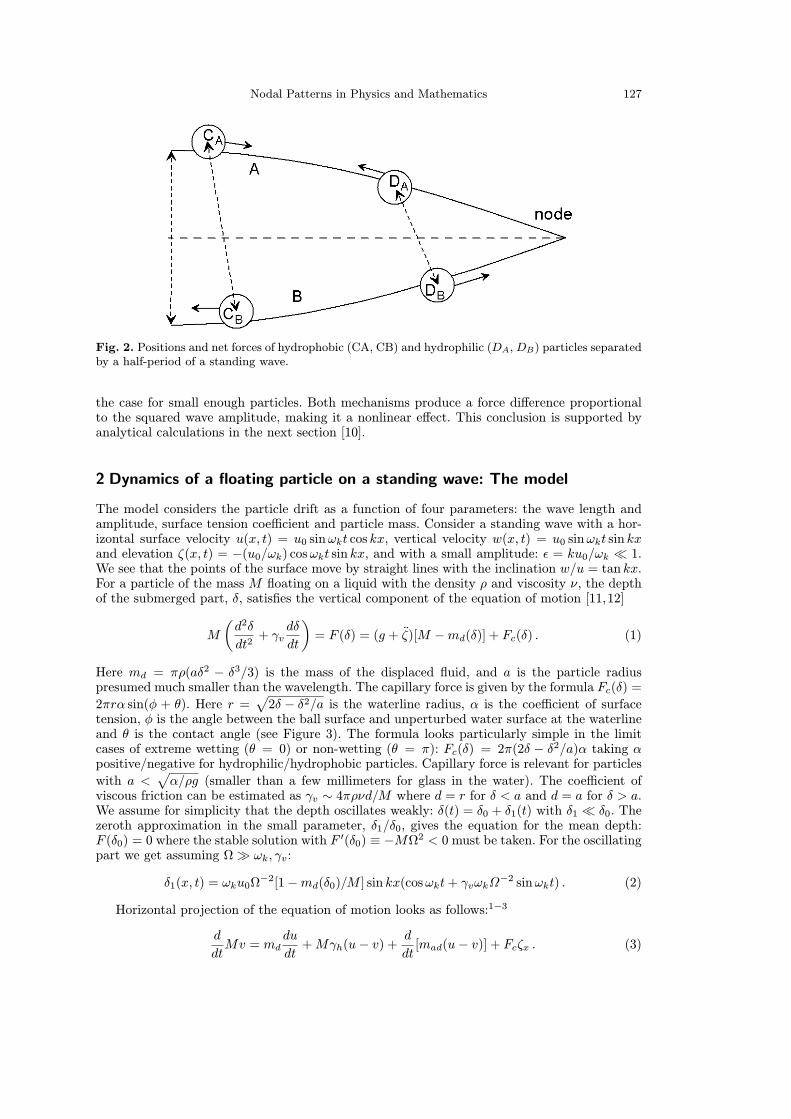
2πrα sin(φ + θ). Here r =√2δ − δ2/a is the waterline radius, α is the coefficient of surface
tension, φ is the angle between the ball surface and unperturbed water surface at the waterlineand θ is the contact angle (see Figure 3). The formula looks particularly simple in the limitcases of extreme wetting (θ = 0) or non-wetting (θ = π): Fc(δ) = 2π(2δ − δ2/a)α taking αpositive/negative for hydrophilic/hydrophobic particles. Capillary force is relevant for particles
with a <√α/ρg (smaller than a few millimeters for glass in the water). The coefficient of
viscous friction can be estimated as γv ∼ 4πρνd/M where d = r for δ < a and d = a for δ > a.We assume for simplicity that the depth oscillates weakly: δ(t) = δ0 + δ1(t) with δ1 δ0. Thezeroth approximation in the small parameter, δ1/δ0, gives the equation for the mean depth:F (δ0) = 0 where the stable solution with F
′(δ0) ≡ −MΩ2 < 0 must be taken. For the oscillatingpart we get assuming Ω ωk, γv:
δ1(x, t) = ωku0Ω−2[1−md(δ0)/M ] sin kx(cosωkt+ γvωkΩ−2 sinωkt) . (2)
Horizontal projection of the equation of motion looks as follows:1−3
d
dtMv = md
du
dt+Mγh(u− v) + d
dt[mad(u− v)] + Fcζx . (3)
128 The European Physical Journal Special Topics
Fig. 3. Spherical particle on the inclined water surface. Notations and the direction of the capillaryforce Fc.
In the right hand side, the first term is the force that would act on the particle if it moveswith the fluid (what Batchelor calls an effective “buoyancy” force2), the second term is dueto the relative motion with mad and γh being respectively the added (virtual) mass and thehorizontal friction rate, both generally dependent on δ(x, t). Note that mad ∝ md. The lastterm in (3) appears because the capillary force is perpendicular to the water surface so that ithas horizontal projection proportional to the inclination angle ζx ≡ dζ/dx. We presumed theparticle sliding rather than rolling which requires δ0 > aζ
2x/2.
We rewrite the equation (3) in the following form[Mγh +
d
dt(M +mad)
](v − u) = f(x, t) =
[md(δ)−M − Fc(δ)k
ω2
]du(x, t)
dt. (4)
The general solution of the equation (4) needs expanding the rhs both with respect to δ and
with respect to x = x0+∫ tv(t′)dt′. Here we consider the simplest cases when in the first order
v ≈ u and there is no need to expand with respect to x. First, this is so in the case of longgravity waves when gζx = −du/dt and ω2 = gk. In this case, (4) takes the form[
Mγh +d
dt(M +mad)
](v − u) = f(x, t) =
(md −M − Fc
g
)du
dt= (M −md) ζ
g
du
dt. (5)
Here we substituted (1) assuming Ω ωk γv. We see that the force f(x, t), which causes thehorizontal motion of the particle relative to the fluid, appears, as expected, in the second orderwith respect to the wave amplitude. We disregarded the nonlinearity of the wave itself whichcontributes the net drift of the particles only in the next order in ε. The net force (averagedover the wave period) is nonzero:
f(x) ≡2π/ωk∫0
f(x, t) dt = ku20(M −md) sin 2kx/2. (6)
For the case of a strong horizontal friction, also in the first order v ≈ u so that the first-orderterm coming from expansion with respect to x gives zero net effect. The drift is determined bythe net force which now takes the form
f(x, t) =(M −md)ω2
[1 +m′d(ω
2 − gk)MΩ2k
]ζ u =
1
2ku20(M −md)
[1 +m′d(ω
2 − gk)MΩ2k
]sin(2kx).
(7)
Generally, one also needs to account for the relative motion already in the first order.Consider the case of weak friction where the net force
f(x) =(M −md)(gk − ω2)
ω(x− x0) ∂
∂x
du(x, t)
dt+(M −md)ω2
[1 +m′d(ω
2 − gk)MΩ2k
]ζ u. (8)
Nodal Patterns in Physics and Mathematics 129
Here the particle displacement x− x0 =∫ tv(t′) dt′ and the velocity is taken in the first order
(M +mad)v ≈[(M −md) gk
ω2k+md +mad
]u. (9)
Note that generally ω2k ≥ gk so that the velocity of a light hydrophilic particle (M < md)exceeds fluid velocity while a heavy hydrophobic particle moves slower. Substituting (9) into(8) we get
f(x) =1
2ku20 (M −md) sin 2kx ·
[1 +m′d(ω
2 − gk)MΩ2k
− ω2 − gkω2
(1− M −md
M
ω2 − gkω2
)].
(10)
We see that in all cases the net force is a gradient of potential energy, f(x) = −dU/dx,where U(x) ∝ (M − md) cos 2kx. In a system with a friction, particles settle into the min-ima of the potential energy. The positions of the minima depend on the sign of M − md,which is negative/positive for hydrophilic/hydrophobic particles. We thus conclude thathydrophilic/hydrophobic particles must settle into the nodes/antinodes of the standingsurface wave.We conclude that the effect appears in the second order with respect to the wave amplitude.
We disregarded the nonlinearity of the wave itself which contributes the net drift of the particlesonly in the next order in ε.
3 The experimental set up and procedures
A convenient way to generate a standing wave is to use a parametric Faraday instability [2].A vertically oscillating fluid layer with a free surface becomes unstable when the oscillationamplitude A becomes greater than a critical value Ac. In a bounded cell a standing wavepattern is formed at a small super-criticality, A−Ac. A manifold of the arising wave patternsis well documented experimentally, see for example [13] for the wave pattern study in a lowaspect ratio cell.Our experimental set-up is similar to that used and described by Gollub and co-workers
[14] and is shown schematically in Fig. 4. Standing waves are generated in a small rectangularcell (C) with horizontal dimension 58×9.6mm and depth 10mm. The cell walls are made fromacrylic glass and the bottom and cover are from glass providing enhanced optical quality.Precision of horizontal alignment of the cell and its edges was up to 3′. The cell is sealed toavoid surface contamination and evaporation of liquid. A thermo-stabilization to the level 0.2 Cwas implemented in long run experiments. The vertical vibrations of the cell were provided byan electromagnetic shaker V (V20, Gearing and Watson Electronics Ltd) whose oscillationamplitude and frequency are controlled by a digital synthesizer (Wavetek 81). The shakergenerates sinusoidal oscillations in the frequency range 5–400Hz and with amplitudes up to50m/sec
2. The amplitude is measured by an MEMS accelerometer (ADXL150, Analog Device)
attached to the moving frame. A 16-bit multifunction digital acquisition board NI-PCI-6035Ewith LabView software is used to digitize the signal from the accelerometer and calculate theamplitude of acceleration. All mechanical and optical parts of the set-up are mounted on amassive pneumo-isolated optical table.The cell is filled with purified water (resistivity > 18MΩ · cm). Water wets the acrylic walls.
A meniscus appearing due to the boundaries on a static surface produces harmonic modesduring oscillations [13]. In addition, a static surface inclination causes particle drift towardsthe walls or to the center of the cell depending on particle wetting. This drift may destroy theinitial distribution of particles. To eliminate the meniscus effects we used pinned, brim-full,boundary conditions filling the cell precisely up to the level of the edge of lateral walls. Thelevel of water was adjusted through a capillary tube at the bottom of the cell. The flatness ofthe static liquid surface was monitored optically, using a wide collimated laser beam from CWlaser. These measures allow to adjust a level of water in the cell with the precision about 20µm.
130 The European Physical Journal Special Topics
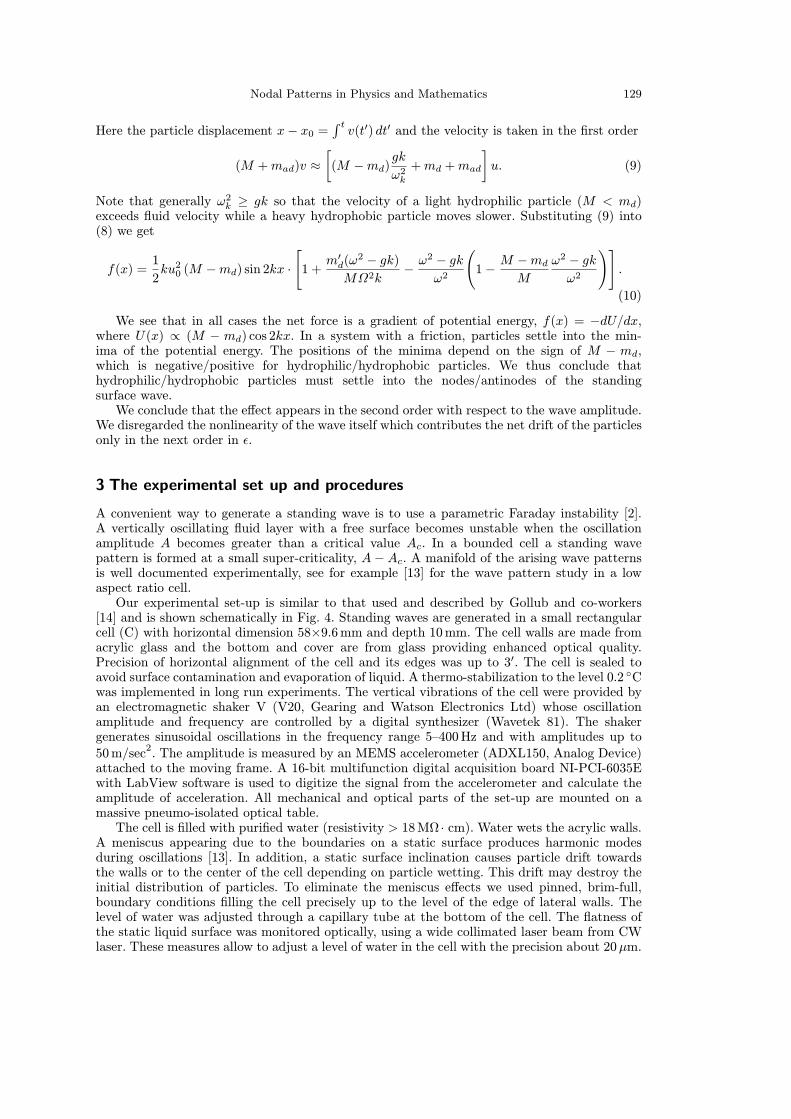
Fig. 4. Experimental set-up. The cell C filled with water is driven by an electromagnetic shaker Vand is illuminated from below by a continuous (CW) or pulsed (PW) lasers. The lens L1, L2 and thepin-holes P1, P2 expand the laser beam to the diameter of 50mm. The lens L3 with the pin-hole P3 inthe focal plane of L3 form the image of surface wave anti-nodes on the screen S. The CCD2 is inclinedto the main optical axis by the angle 10. Pulsed Yag laser, PW, is used for recording the images withmoving particles.
A droplet of suspension of particles is gently put on the surface of water just before sealingthe cell and final water level adjustment. To observe the particle clustering on a standing wavewe used hydrophilic particles with average diameter 30µm and density 0.6 g/cm3. The particleswere sifted from the powder of glass bubbles (S60HS, 3M ScotchLite), separated by flotation
in acetone (density 0.78 g/cm3) and washed in pure water.
Illuminating optics was built on the shadowgraph principle and combines the light from thecontinuous 20mW He-Ne laser CW and pulsed 120mJ Yag laser PW. The cell was illuminatedfrom bellow by an expanded collimated laser beam formed by the pin-hole P1 and lenses L1-L2. The continuous laser was used for the cell adjustment and visualization of wave patterns.The pulsed laser was used to record images of particle distribution. The parallel rays passingthrough the cell are refracted by waves and collected by the lens L3 of focal length 250mm. Ascreen P2, positioned at focal plane of L3, has a 0.1mm pin-hole centered at the system opticalaxis, such that the non-refracted light will pass through the pin-hole and form an image ofantinodes on the screen S. The refracted light from CW laser illuminates an area in the focalplane P2. The size of this area on the image integrated with an exposure time greater than oneperiod of the wave is proportional to the wave amplitude.
Two high-resolution (2048 × 2048 pixels) cameras CCD1 and CCD2 from Dantec PIVsystem were used to record the wave pattern and particle distribution simultaneously. Thecamera CCD1 collects images of anti-nodes. The camera CCD2 collects the light scatteredby the particles on the surface. The camera CCD3 (not shown on the scheme) has resolution720 × 480 and records images from the plane P2 used for wave amplitude measurements.The axes of CCD2 and CCD3 are inclined to the main optical axis at the angle 10 degrees.A calibration procedure was applied to compensate image distortions due to this inclination.CCD1 shutter is open for a time equal to the one period of the parametric wave. CCD2 camerais positioned off axis (and inclined) to avoid straight laser light and its shutter was opened fora shorter time (∼ 1ms) to prevent smearing of particles in the images. In addition the CCD2shutter is synchronized in phase with the cell oscillations such that the shutter is opened when
Nodal Patterns in Physics and Mathematics 131
the liquid surface is nearly flat. This allows to keep CCD2 at a minimal angle to the system’soptical axis. The optical axis of CCD2 is perpendicular to the cell long axis.
4 Clustering of particles floating on a standing wave
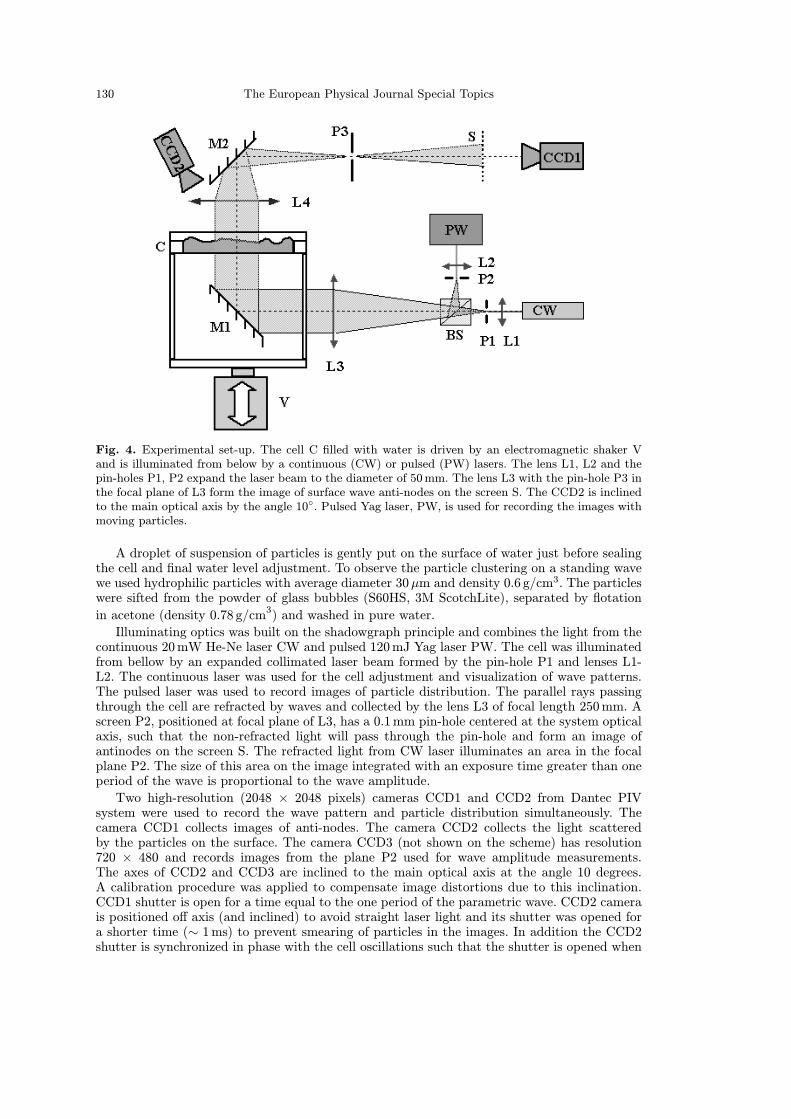
We found it relatively easy to observe the drift of hydrophilic (wetted) particles in a stationarystanding wave. An initially dispersed suspension of hollow glass spheres concentrates in thenodes of the surface wave during 2–100 seconds depending on the wave amplitude and frequencyand remains there indefinitely long, Fig. 5.
Fig. 5. Formation of particle clusters and wave pattern: a) initial particle distribution on a flat watersurface, b) particle clusters in the nodes of the standing wave, c) anti-nodal pattern of the standingwave. The images in a) and b) were recorded by CCD2 and in c) by CCD1.
Since we found it impossible to mix particles without destroying the surface pattern, ourprocedure for measuring the clustering time for different amplitudes and frequencies was asfollows. For each frequency and wave pattern we determined a threshold Ac for parametricinstability and found an interval of oscillation amplitudes with a stationary surface wave patternand particle clusters distribution on it. We observed that particles start to move a bit earlier, atless oscillation amplitudes, and before a non-stationarity in the wave pattern becomes visible.Each experimental run has been started from the mixing: the shaker amplitude was kept atA ∼ 5Ac for a couple minutes and then lowered to A ∼ 0.9Ac. Next, a desired amplitude ofvibration Ai > Ac is set and the acquisition of images by both CCD1 and CCD2 is started.The unstable parametric wave appears after a time delay with an amplitude growing up toa stationary value proportional (Ai − Ac)2. A set of collected images always starts from themoment when there are neither waves nor particle motion and ends when a new stationary stateis reached with the developed wave and stationary particle clusters. After the parametric waveappears, the homogeneous area in CCD1 images is replaced by a network of lines correspondingto the wave anti-nodes, see Fig. 5(c). The width of the the lines decreases as the wave amplitudeincreases, and the maximum of intensity is constant across the line. So the variance of the lightintensity averaged over an image area can be chosen as an indicator of moments when the wavesappear and become stationary. The number of frames collected for each camera is 100 and theframe rate is adjusted using preliminary test runs.A time interval between the moment when the wave appears (the variance of intensity
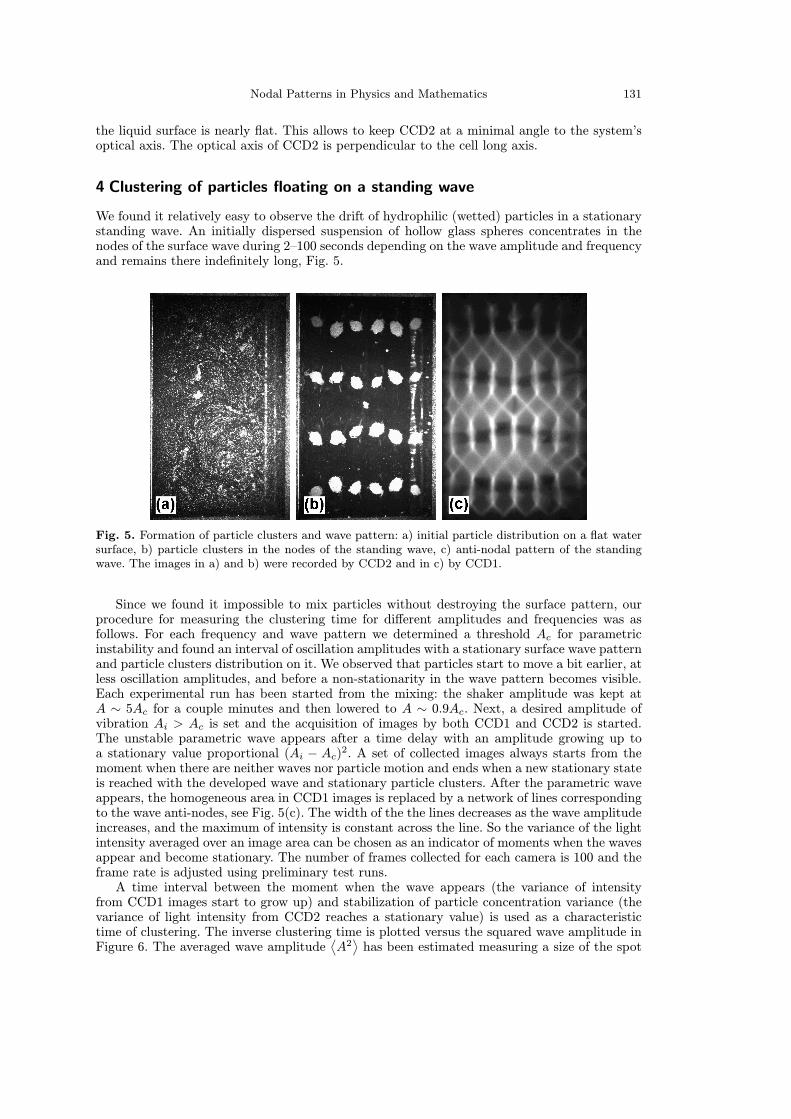
from CCD1 images start to grow up) and stabilization of particle concentration variance (thevariance of light intensity from CCD2 reaches a stationary value) is used as a characteristictime of clustering. The inverse clustering time is plotted versus the squared wave amplitude inFigure 6. The averaged wave amplitude
⟨A2⟩has been estimated measuring a size of the spot
132 The European Physical Journal Special Topics
Fig. 6. Clustering rate vs wave amplitude.Quadratic dependence of inverse clusteringtime on A agrees with formula (10).
Sx, Sy in the focal plane P2 of the lens L3. The spot images were recorded by CCD3. For therefractive index of water 1.33 and small wave amplitudes, the angles Sy/F and Sx/F (where Fis the focal length of L3) are equal to one third of the maximum surface inclination. It followsfrom Fig. 6 that within 10% the inverse clustering time is proportional to the square of thewave amplitude, as predicted by the model Eq. (10).Specific characteristics of hydrophobic particles forced us to change experimental conditions.
We did not have the hydrophobic hollow spheres to prepare the suspension and then usedlarge heavy spheres, 1.6mm PTFE balls with specific gravity 2.2, and observed their drift asan individual particle. The oscillation and drift of such a sphere is shown on Fig. 7 madeby stroboscopic method. The stroboscope frequency was twice the frequency of the surfacewave (12.6Hz) and the phase of flashes was adjusted to see the maximal and minimal surfacepositions. The ball can be moved without noticeable wave distortion using a thin metal needletouching the liquid surface near the ball. A meniscus formed by the needle generates a repulsiveforce that can be used to move the ball. Initially a PTFE ball was position near the wave node.After release the ball moves towards the anti-node, from the left to the right in Fig. 7. The timeinterval to reach the anti-node depends on wave amplitude and ranges from 2 to 20 seconds.
5 Statistics of floater distribution in chaotic waves
Quasi-linear standing waves exist only when shaker vibration amplitudes are small enough.At higher amplitudes, the standing wave loses stability and chaotic spatio-temporal regimesarise [13,14]. Chaotic waves generate random compressible flow on the liquid surface, which isexpected to produce a very inhomogeneous particle distribution [15–19]. Clustering in a smoothrandom flow is expected to result in a multi-fractal distribution [18]. In addition, inertia of thefloaters may lead to the crossing of different particle paths and creation of caustics [22,23].Consider a number of particles inside a circle of radius r around the point x: nr(x). How do
the statistics of the random field nr(x) change with the scale of resolution r? Such a change canbe characterized by the scaling exponents, ζm, of the moments: 〈nmr 〉 ∝ rζm . Note that ζ0 = 0and ζ1 = 2. When the distribution is smooth on a surface, one expects ζm = 2m. When thisequality breaks for somem, one usually calls the distribution fractal. A recent theory for a short-correlated compressible flow [15,18] gives the set of the exponents ζm depending nonlinearlyon m, which corresponds to a multi-fractal distribution (those theoretical formulas give theLagrangian exponents which in our notations are ζn+1 − 2). Multifractality of the measuremeans that the statistics are not scale-invariant: strong fluctuations of particle concentration

Nodal Patterns in Physics and Mathematics 133
10 mmFig. 7. Hydrophobic teflon ball of 1.6mmdiameter placed gently on a water surfacemoves towards the antinode, from the rightto the left, on the standing wave.
are getting more probable as one goes to smaller scales (increasing resolution). The fractal(information) dimension for a random surface flow has been measured by Sommerer and Ott,who found non-integer d = dζm/dm|m=0 [19]. Additionally, the scaling of the second momenthas been found and related to the correlation dimension (again non-integer) [20,21]. Therefore,fractality of the distribution has been established in [19–21]. To the best of our knowledge,different dimensions have not been compared for the same flow (when found different, thatdemonstrates multifractality as in our measurements presented below).
In the second part of the experiment we measured the moments of the concentration perunit area (defined as nrr
−2) for the suspension of small hydrophilic particles mixed by a randomflow of surface waves (at the driving amplitude ∼ 2Ac). Note that at such an amplitude, it isnot yet developed turbulence but rather few interacting modes that provide for a Lagrangianchaos. The experiment has been done for the set of the oscillation frequencies from 30 to 220Hzand the amplitudes 1.8−2.5Ac. We reproduce here a typical result for the parametric wave with
Fig. 8. A snapshot of particle distribution in random waves. The number of particles is 920. The wavefrequency is 32Hz. The image size is 17× 17mm. The left inset shows a zoomed-in image of the markedparticle cluster. The right inset shows the result of particle recognition procedure.
134 The European Physical Journal Special Topics
10 100 1000
1
2
3
4
5
6
7
8
log 1
0M
i
BoxSize in pixels
⟨
⟨
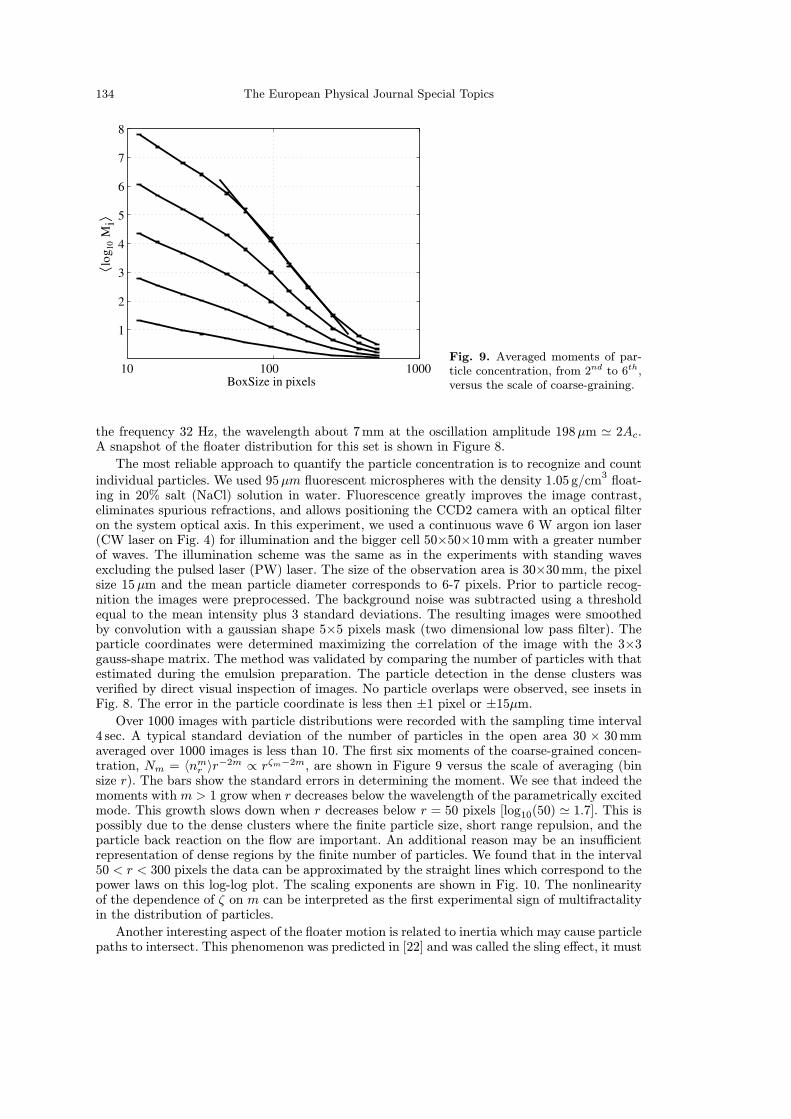
Fig. 9. Averaged moments of par-ticle concentration, from 2nd to 6th,versus the scale of coarse-graining.
the frequency 32 Hz, the wavelength about 7mm at the oscillation amplitude 198µm 2Ac.A snapshot of the floater distribution for this set is shown in Figure 8.
The most reliable approach to quantify the particle concentration is to recognize and countindividual particles. We used 95µm fluorescent microspheres with the density 1.05 g/cm
3float-
ing in 20% salt (NaCl) solution in water. Fluorescence greatly improves the image contrast,eliminates spurious refractions, and allows positioning the CCD2 camera with an optical filteron the system optical axis. In this experiment, we used a continuous wave 6 W argon ion laser(CW laser on Fig. 4) for illumination and the bigger cell 50×50×10mm with a greater numberof waves. The illumination scheme was the same as in the experiments with standing wavesexcluding the pulsed laser (PW) laser. The size of the observation area is 30×30mm, the pixelsize 15µm and the mean particle diameter corresponds to 6-7 pixels. Prior to particle recog-nition the images were preprocessed. The background noise was subtracted using a thresholdequal to the mean intensity plus 3 standard deviations. The resulting images were smoothedby convolution with a gaussian shape 5×5 pixels mask (two dimensional low pass filter). Theparticle coordinates were determined maximizing the correlation of the image with the 3×3gauss-shape matrix. The method was validated by comparing the number of particles with thatestimated during the emulsion preparation. The particle detection in the dense clusters wasverified by direct visual inspection of images. No particle overlaps were observed, see insets inFig. 8. The error in the particle coordinate is less then ±1 pixel or ±15µm.Over 1000 images with particle distributions were recorded with the sampling time interval
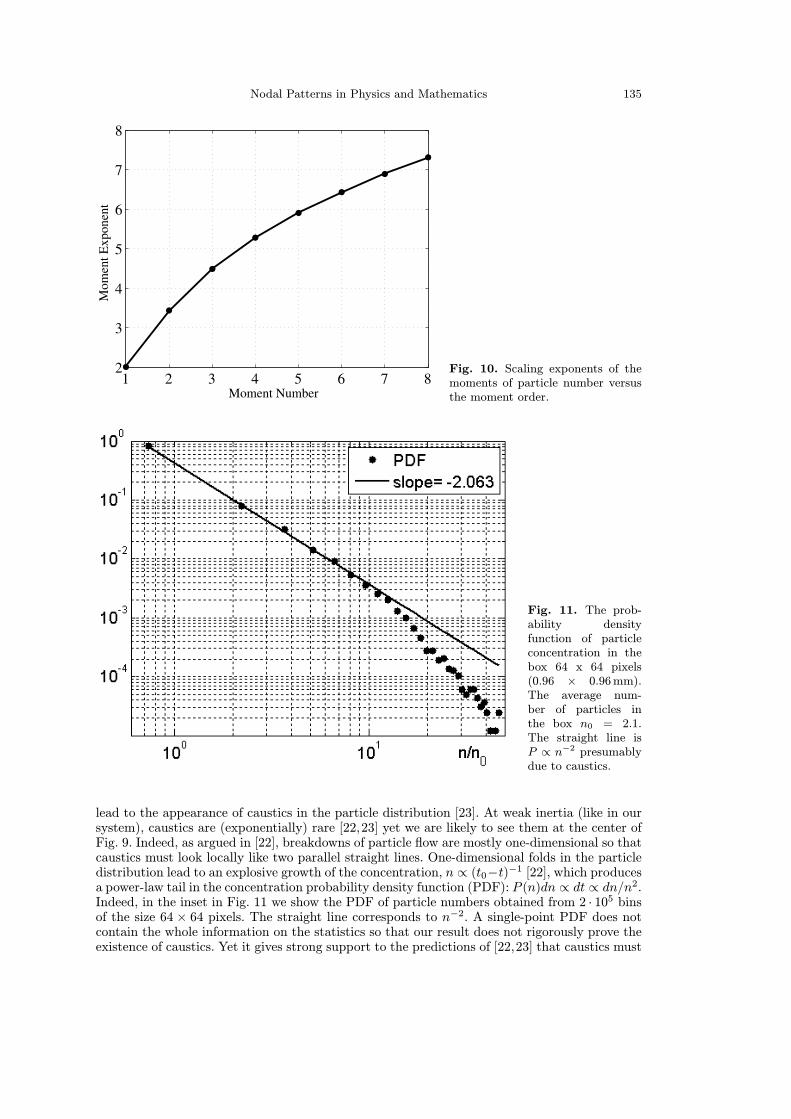
4 sec. A typical standard deviation of the number of particles in the open area 30 × 30mmaveraged over 1000 images is less than 10. The first six moments of the coarse-grained concen-tration, Nm = 〈nmr 〉r−2m ∝ rζm−2m, are shown in Figure 9 versus the scale of averaging (binsize r). The bars show the standard errors in determining the moment. We see that indeed themoments with m > 1 grow when r decreases below the wavelength of the parametrically excitedmode. This growth slows down when r decreases below r = 50 pixels [log10(50) 1.7]. This ispossibly due to the dense clusters where the finite particle size, short range repulsion, and theparticle back reaction on the flow are important. An additional reason may be an insufficientrepresentation of dense regions by the finite number of particles. We found that in the interval50 < r < 300 pixels the data can be approximated by the straight lines which correspond to thepower laws on this log-log plot. The scaling exponents are shown in Fig. 10. The nonlinearityof the dependence of ζ on m can be interpreted as the first experimental sign of multifractalityin the distribution of particles.
Another interesting aspect of the floater motion is related to inertia which may cause particlepaths to intersect. This phenomenon was predicted in [22] and was called the sling effect, it must
Nodal Patterns in Physics and Mathematics 135
1 2 3 4 5 6 7 82
3
4
5
6
7
8
Moment Number
Mom
ent E
xpon
ent
Fig. 10. Scaling exponents of themoments of particle number versusthe moment order.
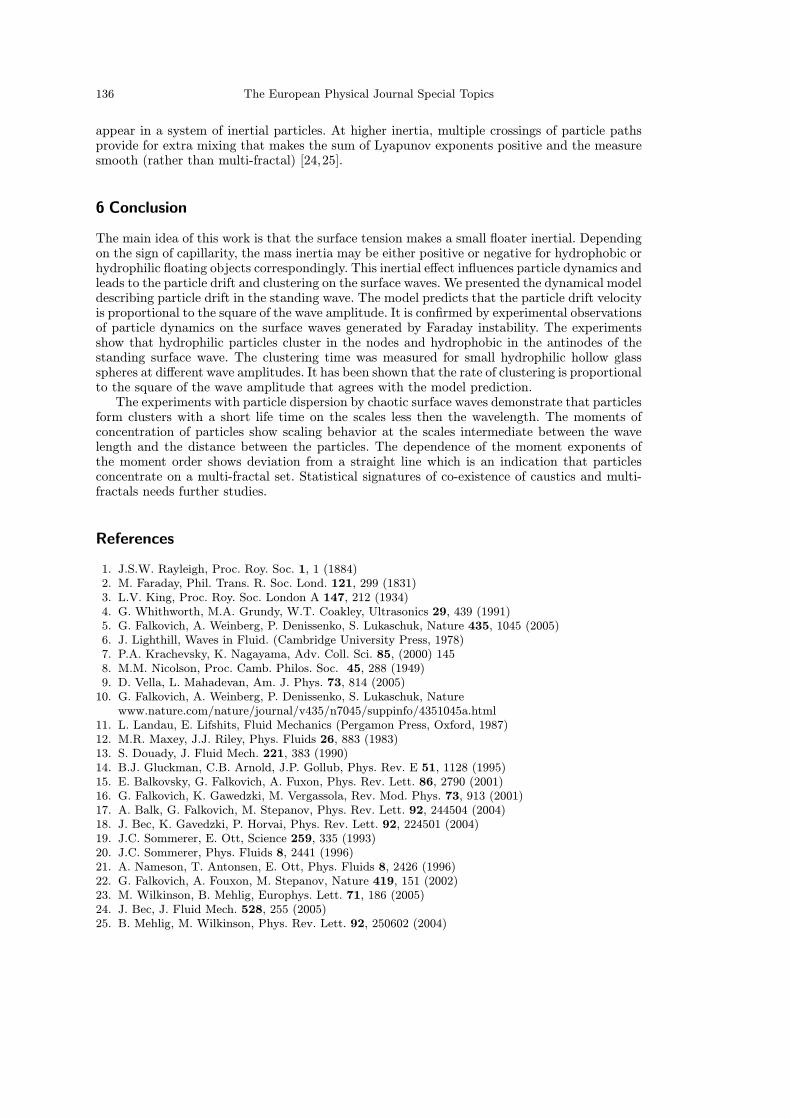
Fig. 11. The prob-ability densityfunction of particleconcentration in thebox 64 x 64 pixels(0.96 × 0.96mm).The average num-ber of particles inthe box n0 = 2.1.The straight line isP ∝ n−2 presumablydue to caustics.
lead to the appearance of caustics in the particle distribution [23]. At weak inertia (like in oursystem), caustics are (exponentially) rare [22,23] yet we are likely to see them at the center ofFig. 9. Indeed, as argued in [22], breakdowns of particle flow are mostly one-dimensional so thatcaustics must look locally like two parallel straight lines. One-dimensional folds in the particledistribution lead to an explosive growth of the concentration, n ∝ (t0−t)−1 [22], which producesa power-law tail in the concentration probability density function (PDF): P (n)dn ∝ dt ∝ dn/n2.Indeed, in the inset in Fig. 11 we show the PDF of particle numbers obtained from 2 · 105 binsof the size 64 × 64 pixels. The straight line corresponds to n−2. A single-point PDF does notcontain the whole information on the statistics so that our result does not rigorously prove theexistence of caustics. Yet it gives strong support to the predictions of [22,23] that caustics must
136 The European Physical Journal Special Topics
appear in a system of inertial particles. At higher inertia, multiple crossings of particle pathsprovide for extra mixing that makes the sum of Lyapunov exponents positive and the measuresmooth (rather than multi-fractal) [24,25].
6 Conclusion
The main idea of this work is that the surface tension makes a small floater inertial. Dependingon the sign of capillarity, the mass inertia may be either positive or negative for hydrophobic orhydrophilic floating objects correspondingly. This inertial effect influences particle dynamics andleads to the particle drift and clustering on the surface waves. We presented the dynamical modeldescribing particle drift in the standing wave. The model predicts that the particle drift velocityis proportional to the square of the wave amplitude. It is confirmed by experimental observationsof particle dynamics on the surface waves generated by Faraday instability. The experimentsshow that hydrophilic particles cluster in the nodes and hydrophobic in the antinodes of thestanding surface wave. The clustering time was measured for small hydrophilic hollow glassspheres at different wave amplitudes. It has been shown that the rate of clustering is proportionalto the square of the wave amplitude that agrees with the model prediction.The experiments with particle dispersion by chaotic surface waves demonstrate that particles
form clusters with a short life time on the scales less then the wavelength. The moments ofconcentration of particles show scaling behavior at the scales intermediate between the wavelength and the distance between the particles. The dependence of the moment exponents ofthe moment order shows deviation from a straight line which is an indication that particlesconcentrate on a multi-fractal set. Statistical signatures of co-existence of caustics and multi-fractals needs further studies.
References
1. J.S.W. Rayleigh, Proc. Roy. Soc. 1, 1 (1884)2. M. Faraday, Phil. Trans. R. Soc. Lond. 121, 299 (1831)3. L.V. King, Proc. Roy. Soc. London A 147, 212 (1934)4. G. Whithworth, M.A. Grundy, W.T. Coakley, Ultrasonics 29, 439 (1991)5. G. Falkovich, A. Weinberg, P. Denissenko, S. Lukaschuk, Nature 435, 1045 (2005)6. J. Lighthill, Waves in Fluid. (Cambridge University Press, 1978)7. P.A. Krachevsky, K. Nagayama, Adv. Coll. Sci. 85, (2000) 1458. M.M. Nicolson, Proc. Camb. Philos. Soc. 45, 288 (1949)9. D. Vella, L. Mahadevan, Am. J. Phys. 73, 814 (2005)10. G. Falkovich, A. Weinberg, P. Denissenko, S. Lukaschuk, Naturewww.nature.com/nature/journal/v435/n7045/suppinfo/4351045a.html
11. L. Landau, E. Lifshits, Fluid Mechanics (Pergamon Press, Oxford, 1987)12. M.R. Maxey, J.J. Riley, Phys. Fluids 26, 883 (1983)13. S. Douady, J. Fluid Mech. 221, 383 (1990)14. B.J. Gluckman, C.B. Arnold, J.P. Gollub, Phys. Rev. E 51, 1128 (1995)15. E. Balkovsky, G. Falkovich, A. Fuxon, Phys. Rev. Lett. 86, 2790 (2001)16. G. Falkovich, K. Gawedzki, M. Vergassola, Rev. Mod. Phys. 73, 913 (2001)17. A. Balk, G. Falkovich, M. Stepanov, Phys. Rev. Lett. 92, 244504 (2004)18. J. Bec, K. Gavedzki, P. Horvai, Phys. Rev. Lett. 92, 224501 (2004)19. J.C. Sommerer, E. Ott, Science 259, 335 (1993)20. J.C. Sommerer, Phys. Fluids 8, 2441 (1996)21. A. Nameson, T. Antonsen, E. Ott, Phys. Fluids 8, 2426 (1996)22. G. Falkovich, A. Fouxon, M. Stepanov, Nature 419, 151 (2002)23. M. Wilkinson, B. Mehlig, Europhys. Lett. 71, 186 (2005)24. J. Bec, J. Fluid Mech. 528, 255 (2005)25. B. Mehlig, M. Wilkinson, Phys. Rev. Lett. 92, 250602 (2004)