noble mineral resources ltd - annual report 2011 - asx
TRANSCRIPT

Annual Report 2011
Noble Mineral Resources Ltd
For
per
sona
l use
onl
y

Noble Mineral Resources Ltd - ANNUAL REPORT 2011
Noble Mineral Resources Ltd
ABN 36 124 893 465
DirectorsHRH Tunku Naquiyuddin ChairmanMr Wayne David Norris Managing DirectorMr Brian David Thomas Non-Executive DirectorMr Duncan James Coutts Non-Executive Director → resigned 8th July 2011
Company SecretaryMr Anthony Ho
Registered Office and Principal Place of Business15 Bowman Street
South Perth, Western Australia, 6151Telephone: +61 (0)8 9474 6771
Ghanaian Office6 Sunflower RoadEast Legon, Accra
Ghana
Share RegistryComputershare Investor Services Pty Ltd
45 St George’s TerracePerth, Western Australia, 6000
Telephone: +61 (0)8 9323 2000
AuditorErnst & Young
11 Mounts Bay RoadPerth, Western Australia, 6000
SolicitorsNorton Rose
Level 39, BankWest Tower108 St Georges Terrace
Perth, Western Australia, 6000
BankersAustralia and New Zealand Banking Group Limited
486 Albany HighwayEast Victoria Park, Western Australia, 6101
Stock ExchangeASX Limited
Exchange Plaza, 2 The EsplanadePerth, Western Australia, 6000
ASX Code NMG NMGOA
For
per
sona
l use
onl
y

3
Contents
Company Profile 4Managing Director’s Overview 5Highlights 6Projects 7Bibiani Process Plant Refurbishment and Upgrade 8Exploration/Geology 9Community Relations 10Competent Person’s Statement 12Forward Looking Statements 12Financial Report 2011 13
For
per
sona
l use
onl
y

Company ProfileNoble Mineral Resources Limited (ASX: NMG) is an ASX-listed company which is exploring for, and developing, large-scale gold deposits in the world-class goldfields of Ghana, West Africa. Production is set to commence at the company’s flagship Bibiani Gold Project during the fourth quarter of 2011, ramping up to a stable production rate of +150,000ozpa by 2012, propelling Noble into the ranks of West Africa’s mid-tier gold producers.
Bibiani is located in the Sefwi-Bibiani Gold Belt in Ghana, which boasts a total gold endowment of more than 30 mil-lion ounces and hosts the world-class Ahafo (16Moz) and Chirano (5Moz) gold mines. Bibiani has a JORC-compliant resource inventory of 2.0Moz, including 790,000oz of re-serves, and a 3Mtpa Carbon-in-Leach (CIL) gold processing facility. The Project has a 10-year mine life based on current mining parameters.
An aggressive exploration program is also underway to add substantially to the existing resource base at Bibiani, with
recent drilling returning spectacular high-grade results from near-mine targets. In addition to the Bibiani Project, Noble holds the Cape Three Points and Tumentu Gold Projects, both located within the southern extension of the Ashanti Gold Belt.
Noble Mineral Resources Ltd - ANNUAL REPORT 2011
Company ProfileNoble Mineral Resources Limited (ASX: NMG) is an ASX-listed company which is exploring for, and developing, large-scale gold deposits in the world-class goldfields of Ghana, West Africa. Production is set to commence at the company’s flagship Bibi-ani Gold Project during the fourth quarter of 2011, ramping up to a stable production rate of +150,000ozpa by 2012, propelling Noble into the ranks of West Africa’s mid-tier gold producers.
Bibiani is located in the Sefwi-Bibiani Gold Belt in Ghana, which boasts a total gold en-dowment of more than 30 million ounces and hosts the world-class Ahafo (16Moz) and
Chirano (5Moz) gold mines. Bibiani has a JORC-compliant resource inventory of 2.0Moz, including 790,000oz of reserves, and a 3Mtpa Carbon-in-Leach (CIL) gold process-ing facility. The Project has a 10-year mine life based on current mining parameters.
An aggressive exploration program is also underway to add substantially to the exist-ing resource base at Bibiani, with recent drill-ing returning spectacular high-grade results from near-mine targets. In addition to the Bibiani Project, Noble holds the Cape Three Points and Tumentu Gold Projects, both lo-cated within the southern extension of the Ashanti Gold Belt.
For
per
sona
l use
onl
y

5
Managing Director’s Overview
On the Cusp of Production and Cashflow
Preparations for the start of production have been the central focus of everyone working for Noble Mineral Resources over the past fi-nancial year. Every plan, task and vision has been directed towards securing the neces-sary equipment and processes ready for com-missioning of the refurbished and upgraded plant and first gold production. This activity has been extremely successful to date, with the start of commissioning and first gold pour set to take place in the December Quar-ter of 2011.
In addition to the enormous amount of work undertaken on the plant, Noble has also kept up with the aggressive drilling campaign in and around the main pit in Bibiani and at the satellite deposits. This has returned spectacu-lar results that further highlight the immense potential of Bibiani. The Bibiani Main Pit re-serve was updated to 790,000oz and at the time of writing, a further upgrade in the re-source-reserve base is pending. This will take into account the recent strong drilling results from around the Walsh and Strauss satellite pits.
In order to accelerate the process of re-source-reserve upgrades, Noble has commis-sioned Performance Laboratories to establish a commercial laboratory just off the mine site at Bibiani. This laboratory will give Noble samples priority treatment, slashing the turn-around times for assays from the current 4-6 weeks to only 5 days while still maintaining the independence necessary for JORC Code-compliant results.
Having a strong relationship with the local community in the Bibiani area has always been very important to Noble, the company has taken several measures to ensure that this relationship is maintained. In addition to forming a committee to act as a conduit for two-way information flow between the com-pany and the local community and setting up an Information Centre in the Bibiani Town-ship.
Noble has also embarked on a promising mos-quito reduction program. A newly discovered biolarvicide, Mousticide, is used to restrict the spread of Malaria by destroying mosquito larvae. The trial was successfully carried out in two phases in June and August coinciding with the wet season and the peak for Malaria epidemics. The trial was a success with results showing 100% larval mortality within the first 24 hours, achieving high residual effect of at least 3 weeks and noticeable reduction in the mosquito population.
Noble has enjoyed an extremely successful year which has set up the Company for pro-duction, cash flow and further exploration success. With these solid foundations now in place, I look forward to our imminent transi-tion to a substantial mid-tier gold producer.
Wayne NorrisManaging Director
For
per
sona
l use
onl
y

Noble Mineral Resources Ltd - ANNUAL REPORT 2011
Bibiani AcquisitionNoble Mineral Resources Ltd completed the ac-quisition of Bibiani Gold Mine in Ghana, West Africa in July 2010. The company’s focus during 2010-2011 has been to undertake the exten-sive drilling needed to grow the resource-reserve base. At the same time, work has been under-way to resume mining. This will enable the Com-pany to take advantage of the current strong gold price.
Plant Refurbishment and UpgradeA thorough refurbishment of the existing pro-cessing plant started immediately after the pur-chase was finalised. A detailed refurbishment plan was created with the support of Mineral Processors (WA) Pty Ltd and the plant’s capac-ity has now been upgraded from 2.7Mtpa to 3Mtpa.
Drilling CampaignNoble’s aggressive drilling campaign has gener-ated some outstanding results over the past year. The reserve for Bibiani Main Pit has been upgrad-ed from 605,000oz to 790,000oz. Drilling in the Walsh and Strauss satellite deposits has given the company reason to believe that the mineralisa-tion might be a continuous system and possibly form a super pit.
On Site LaboratoryPerformance Laboratories has been commis-sioned to establish a certified analytical labora-tory on site in Bibiani. The laboratory equipment procurement and site infrastructure construction are well underway. At the time of writing, total capability commissioning completion was sched-uled for late October 2011.
Highlights
For
per
sona
l use
onl
y

7
Projects Bibiani Gold Mine. Ghana, West AfricaBibiani is Noble’s flagship project, with first gold production scheduled for the end of the calen-dar year 2011. The Bibiani Main Pit currently has 1.98Moz in resources and 790,000oz in re-serves. The preliminary two-year mine plan deliv-ers 243,000oz, generating revenue of US$350M based on a gold price of US$1450/oz.
Noble has also put in place an aggressive drilling campaign to grow the project resource base and has received outstanding results so far. Explora-tion drilling has been designed for the Elizabeth project between the Main and Walsh pits, the west of the Main pit on the soil anomaly un-der the waste dump on the Chirano trend and the Little Mug project to the north of the Main Pit along strike. This in addition to the ongoing drilling of the west wall of the Main Pit cutback, which to date has delivered encouraging but patchy results.
With the purchase of the Bibiani gold mine, the Company also acquired extensive infrastructure, accommodation facilities and a gold processing facility, all of which are undergoing refurbishment and upgrades in readiness for commissioning and production in the December Quarter of 2011.
Exploration ProjectsNoble’s exploration projects outside of Bibiani are Cape Three Points, Brotet and Tumentu. All are located in Ghana and have been given a lower priority while the works at Bibiani have been un-derway. However, these projects are important to the future expansion of Noble’s resource base and its production profile. Drilling in these areas will resume before the end of 2011.
Noble also owns the Bindi Bindi West prospect in Western Australia, where only minimal explora-tion has been carried out to date. The plan is to increase exploration activity at Bindi Bindi in the 2011-12 financial year.
For
per
sona
l use
onl
y

Noble Mineral Resources Ltd - ANNUAL REPORT 2011
Noble acquired a 2.7mtpa gold processing plant and associated infrastructure with the Bibiani project. At the time, the plant was under care and maintenance.
Noble has since embarked on an extensive re-furbishment and upgrade of the plant following equipment condition monitoring, increased pro-duction potential and flow sheet capability im-provements. Expected plant throughput capacity following the works program and post commis-sioning ramp up is 3Mtpa.
Completion Milestone Dates
October 2011 - Expected EPA permit approval - Projected ore mining commencement
December 2011 - 7/12: Crusher ready to receive ore - 8/12: Grinding mills ready to receive ore - 12/12: First production gold pour (from commissioning materia)
Bibiani Process Plant Refurbishment and Upgrade
A dedicated Plant Project management and con-struction team was assembled, construction con-tracts let and initiatives put in place to minimize the project schedule in readiness for production. This included double shift construction teams on multiple work headings and minimizing offshore structural and fabrication works.
In May 2011, the final budget was set to com-plete the plant refurbishment and upgrade project and was estimated at about $25M.
For
per
sona
l use
onl
y

9
Focus on Satellite Pits trend- Immediately accessible - No community infrastructure constraints- Geological assessment, targeted drilling campaigns, preliminary resource modelling and mine planning along and adjacent to the Walsh-Strauss satellite pits trend (NE)- Satellite pits currently excluded from overall Bibiani JORC resource and reserve estimate- Satellite trend has demonstrated extremely high prospectivity following initial targeted drilling campaigns by Noble- A shorter term pathway to gold production on the back of an increasing resources base- Noble’s two drilling rigs and multiple drilling service contractors completing the drilling campaign, with a third Noble rig to commence early in the December quarter of 2011.
Exploration/Geology
Resources/Reserves- Continuous successful high grade drilling results along the Satellite pits trend- Maiden JORC Resource and Reserve statements issued by Noble for these extensive mineralized zones with independently validated JORC resource and reserve reports expected December Quarter 2011- Preliminary in-house geological models generated - In-house mine ore inventories determined utilising US$1250 gold price- 16,500m infill resource drilling program focusing on Walsh-Strauss area and also main pit Northern Extension- A maiden Indicated Resource statement released for the Aheman (15,500 oz) and Historic Tailings-Levee deposits (63,800oz) - Main Pit JORC Reserve upgraded from 605koz to 790koz June 2011
Proved and Probable Ore Reserves Main Pit as at June 2011
Derived from Measured and Indicated Mineral Resources using a cut-off grade of 0.6g/t and a gold price of US$1,250/oz.
For
per
sona
l use
onl
y

Noble Mineral Resources Ltd - ANNUAL REPORT 2011
A strong relationship with the local community at Bibiani has always been important for Noble and the company has continued to support the people through a range of health, education and sporting measures.
Informing the CommunityIn order to recommence mining, Noble has start-ed the process of obtaining an Environmental Permit from the Ghana Environmental Protec-tion Agency (EPA). A part of this process involves conducting a Public Hearing. In preparation for this, Noble met a number of community groups, which gave strong support to the Company and the Project. However, concerns regarding some issues (crop compensation, unemployment and training for the members of the community) were expressed.
Noble proceeded to form a Community/Mine Consultative Committee (CMCC) made up of community leaders and chaired by the Bibiani Mine Manager Mr Henry Ayisi Tandoh. The ob-jective of the CMCC is to act as a conduit for two-way information flows. Noble has also set up an Information Centre in the Bibiani Town-ship.
Health, Infrastructure and EducationNoble has been involved in assisting the commu-nity in various ways, including:
• CompletionofaNurserySchoolBlockforthe Company School • SupportfortheDistrictHealthAdministration 2nd Round of National Polio Immunization 12-14 May 2011 • Monthlyfreeservicingofcommunityfiretender and use of the Company fire hydrants • Pataboso Community to repair portions of their road network between Patabaso Junction and Patabaso
• Sponsorshipof theBibiani-Anhwiaso-Bekwai District Zonal Division Two Board during the Zonal Amateur Football Competition• Presenting a cheque at the Queens’ Senior High School Anhwiaso for scholarships to in-need students• Installingandcarryingoutrepairsatanumber of local water supply infrastructure locations, facilitating waste disposal operations and servicing the community firefighting infrastructure
Community Relations
For
per
sona
l use
onl
y

11
Mosquito and Malaria ControlMousticide is a newly discovered natural biolarvi-cide that has proven ability to manage mosquito populations and reduce Malaria. Laboratory re-sults prove that the product is user-friendly, ca-pable, effective on two types of mosquitoes in Ghana and it had been approved for use by the Ghanaian EPA.
Entogenex Industries Sdn Bhd introduced Mous-ticide into Africa in collaboration with Treds En-vitech Ltd, a wholly owned Ghanaian company. Noble assigned Treds Envitech Ltd to undertake a testing program aimed at reducing, if not elimi-nating, malaria within the Bibiani community.
In May 2011, a baseline survey was undertaken in 23 communities in the Bibiani district with a population of 30,000 people. Most of the settle-ments in the region are filled with stagnant water bodies, chocked gutters and refuse dump sites (crude dumping) making it a highly prone mos-quito area. Major stakeholders and inhabitants were interviewed and numerous samples col-lected from stagnant water bodies. All samples were found to contain heavy amounts of larvae, proving the severity of mosquito infestation in the communities.
It was decided that the best time to test Mous-ticide would be in June and July as this is the peak of the wet season as well as the Malaria epidemics. The first phase of the treatment was carried out in June covering the mine site and surrounding communities with the second phase following in August 2011.
After the treatments were carried out an evalu-ation report was prepared by Noguchi Memorial Institute of Medical Research from the University of Ghana. The study concluded that Mousticide provides 100% larval mortality even within the first 24 hours and achieves high residual effect of at least 3 weeks. This indicates that the prod-uct used together with other means of mosquito control can help reduce malaria and mosquito bites.
In addition to the Noguchi Memorial Institute re-search report, Treds Envitech conducted a series of interviews in the community to understand the mosquito density before and after the trial. The mosquito population within the community was stated as high at the start. After the trial 89.6% of the respondents agreed that there was a significant improvement in the situation and mosquito population was significantly less than before.
For
per
sona
l use
onl
y

Noble Mineral Resources Ltd - ANNUAL REPORT 2011
The information in this announcement that re-lates to Mineral Resource and Ore Reserve esti-mates is based on information compiled by Mr Phillip Schiemer (BSc (Hons), Geology and Geo-physics), who is a Corporate Member of the Aus-tralasian Institute of Mining and Metallurgy and a member of the Australian Institute of Geosci-entists. Mr Schiemer is employed by Noble Min-eral Resources Ltd, and has sufficient experience which is relevant to the style of mineralisation
being reported herein as Mineral Resources, Ore Reserves and Exploration Results to qualify as a Competent Person as defined in the 2004 edi-tion of the ‘Australasian Code for Reporting of Exploration Results, Mineral Resources and Ore Reserves’ (JORC Code). Mr Schiemer consents to the inclusion in this report of the matters based on his information in the form and content in which it appears.
Competent Person’s Statement
The information in this announcement may con-tain forward looking statements, estimates of fu-ture earnings, the sensitivity of earnings to gold price and gold recovery rates, future gold pro-duction and sales, capital expenditure and esti-mates of resources and reserves and statements regarding future exploration results and the re-placement of reserves (“Projections”). Any such Projections are based on assumptions which may differ materially from the actual circumstances
Forward Looking Statementswhich may rise. Past performance is no guaran-tee of future performance. Any estimates or Pro-jections as to events that may occur in the future are based upon the best judgement of Noble Mineral Resources Ltd and there is no guarantee that any of these estimates or Projections will be achieved. Actual results will vary from the Projec-tions and such variations may be material.
For
per
sona
l use
onl
y

ABN 36 124 893 465
ANNUAL FINANCIAL REPORT
30 JUNE 2011
For
per
sona
l use
onl
y

P a g e | 2
Contents
Corporate information 3Directors’ report 4Remuneration report (audited) 20Corporate governance statement 26Consolidated statement of financial position 35Consolidated statement of comprehensive income 36Consolidated statement of changes in equity 37Consolidated statement of cash flows 38Notes to the consolidated financial statements 391 Corporate information 392 Summary of significant accounting policies 393 Business combinations – acquisitions 584 Operating segments 605 Revenue and other income 636 General and administrative expenses 637 Borrowing costs 648 Income tax 649 Losses per share 6510 Exploration and evaluation assets 6611 Property, plant and equipment 6712 Mine properties 6813 Consumables 6814 Trade and other receivables 6815 Cash and cash equivalents 6916 Other assets 6917 Issued capital 7018 Interest-bearing loans and borrowings 7219 Provisions 7320 Accounts payable and other payables 7421 Reserves 7422 Capital commitments and other contingencies 7523 Related party disclosures 7724 Share based payments 8125 Financial risk management objectives and policies 8226 Capital management 8627 Derivative financial instruments 8728 Auditors’ remuneration 8729 Cash flow statement reconciliation 8830 Events after the reporting date 8931 Parent entity information 89Directors’ declaration 91Independent auditor’s report 92
For
per
sona
l use
onl
y

P a g e | 3
Corporate information
ABN 36 124 893 465
DirectorsHRH Tunku Naquiyuddin ChairmanMr Wayne David Norris Managing DirectorMr Brian David Thomas Non-Executive DirectorMr Duncan James Coutts Non-Executive Director – resigned 8
thJuly 201
Company SecretaryMr Anthony Ho
Registered Office and Principal Place of Business15 Bowman StreetSouth Perth, Western Australia, 6151Telephone: 61 8 9474 6771
Ghanaian Office6 Sunflower RoadEast Legon, AccraGhana
Share RegistryComputershare Investor Services Pty Ltd45 St George's TerracePerth, Western Australia, 6000Telephone: 61 8 9323 2000
AuditorErnst & Young11 Mounts Bay RoadPerth, Western Australia, 6000
SolicitorsNorton RoseLevel 39, BankWest Tower108 St Georges TerracePerth, Western Australia, 6000
BankersAustralia and New Zealand Banking Group Limited486 Albany HighwayEast Victoria Park, Western Australia, 6101
Stock ExchangeASX LimitedExchange Plaza, 2 The EsplanadePerth, Western Australia, 6000
ASX Code: NMGNMGOA
For
per
sona
l use
onl
y

P a g e | 4
Directors’ report
Your directors submit their report for the year ended 30 June 2011.
Directors
The names and details of the Company's directors in office during the financial year and until the date of thisreport are as follows. Directors were in office for this entire period unless otherwise stated.
HRH Tunku Naquiyuddin
Chairman, Non-Executive Director – Appointed 7 January 2009
Tunku Naquiyuddin (BSc Econs. Hons) is a prominent Malaysian businessman and is presently the Chairman ofSino Hua-An International Berhad, a company listed on Bursa Malaysia (formerly known as the Kuala LumpurStock Exchange) with a substantial business in China. He is also the chairman of the Board of Kian Joo CanFactory Berhad, a company which is also listed on Bursa Malaysia.
Tunku Naquiyuddin was a former diplomat and represented the foreign mission of Malaysia in Paris. He is alsoa keen environmentalist and was a Committee Member for the World Wide Fund for Nature (Malaysia) and acouncil member of the Business Council for Sustainable Development in Geneva.
Tunku Naquiyuddin’s interests include being a founding chairman of The Federation of Public ListedCompanies Berhad in Malaysia. He was also the head of the Malaysia-France Economic and Trade Associationfor 8 years. As chairman of the Alliance Francaise in Malaysia for over 18 years, he was instrumental in thepromotion of Malaysia-France cultural and business links. He was nominated by the Malaysian Minister ofFinance to sit on the Committee of the Kuala Lumpur Stock Exchange in 1989 for five years.
During the past 3 years HRH Tunku Naquiyuddin has also served as a director of the following other listedcompanies:
Global Gold Holdings Limited * – appointed 20 June 2007
* Denotes current directorship
Mr Wayne David Norris
Managing Director – Appointed 13 April 2007
Mr Norris has more than 25 years’ experience in the field of metallurgical processing and commissioning. Hiscareer spans from process operating to senior management of the successful Sally Malay 750,000 TPA nickelsulphide recovery plant. More recently, Mr Norris was a member of the senior management team of the OM(Manganese) Limited’s Bootu Creek manganese project in the Northern Territory.
Mr Norris has been involved at senior management levels in the commissioning of five processing facilities inAustralia, being the Haveluck Gold Mine in Meekatharra WA, the Ranger Uranium Mines project at Jabiru inthe Northern Territory, the Mt Todd Gold Mines Stage 1 and 2 in the Northern Territory, the Sally Malayproject for Kimberley Nickel Mines in Western Australia and the OMH OM (Manganese) Limited Manganeseproject in the Northern Territory. His extensive metallurgical knowledge has included the training of nationalsin Ghana at the Damang mine site for two years for Goldfields Ghana Ltd.
For
per
sona
l use
onl
y

P a g e | 5
Directors’ report (continued)
Mr Brian David Thomas
Non-Executive Director – Appointed 6 April 2010
Mr Thomas is a geologist and mineral economist (BSc, MBA, SAFin, MAusIMM, MAICD) with more than 20years of mining and exploration industry experience in a broad range of commodities from precious and basemetals, bulk and industrial minerals, diamonds plus oil and gas. This is complemented by 12 years in theAustralian financial services sector working in corporate stock broking, investment banking, fundsmanagement and with an Australian commercial bank, sourcing mining finance opportunities.
Mr Thomas will be seeking re-election by shareholders in the 2011 annual general meeting.
During the past 3 years Mr Thomas has also served as a director of the following other listed companies:
Condoto Platinum NL (formerly Bailey Minerals NL) * – appointed 21 May 2008 Charter Pacific Corporation Ltd * – appointed 24 March 2011 Transit Holdings Limited * – appointed 9 June 2010 Strickland Resources Limited * - appointed 31 March 2011 Parker Resources NL * - appointed 10 January 2011 Aragon Resources Limited – appointed 10 June 2005; resigned 23 May 2011 White Cliff Nickel Limited – appointed 14 August 2007; resigned 22 February 2010 Pacific Niugini Limited – appointed 22 November 2004; resigned 3 November 2009 Namibian Copper NL – appointed 17 August 2007; resigned 30 March 2009
* Denotes current directorship
Mr Duncan Coutts
Non-Executive Director – Appointed 8 April 2011; resigned 8 July 2011
Mr Duncan Coutts is a qualified mining engineer with more than 19 years experience. He holds a Bachelor ofEngineering degree in Mining Engineering with honours from the WA School of Mines. Mr Coutts has extensiveoperational, technical and managerial experience, particularly in underground mining operations. He wasformerly the COO and Director for the WA and PNG operations of Harmony Gold Australia. More recently, MrCoutts has held positions as Chief Development Officer with Metals X Limited (ASX:MLX), and providedbusiness development consulting services to Galaxy Resources Limited (ASX:GXY). Mr Coutts recently joinedGalaxy Resources Limited in a full time capacity in the role of General Manager Development, retaining a focuson Business Readiness.
Mr Alan Taylor
Executive Director – Appointed 30 July 2007; resigned 11 October 2010
Mr Taylor completed a Bachelor of Business from Curtin University in 1984 and is a Chartered Accountant withover 22 years’ experience in providing taxation and accounting advice to the corporate and business sector. Heworked for the Australian Taxation Office for eight years. Mr Taylor holds a Graduate Diploma in Finance andInvestment from the Securities Institute of Australia. He is currently the principal of a public practicespecialising in tax and corporate services. Prior to commencing public practice, Mr Taylor was a seniormanager with KPMG and the taxation principal of a West Perth accounting practice.
For
per
sona
l use
onl
y

P a g e | 6
Directors’ report (continued)
Directors’ interests
As at the date of this report, the interests of the directors in the shares and options of Noble MineralResources Limited were:
Number of Number of optionsordinary shares over ordinary shares
Tunku Naquiyuddin - -Wayne Norris 43,140,000 9,666,250Brian Thomas 125,000 25,000
Company Secretary
Mr Anthony Ho has been the Company Secretary of Noble Mineral Resources Limited since his appointment inApril 2008. Mr Ho graduated in 1980 with a Bachelor of Commerce from the University of Western Australia.He qualified as a Chartered Accountant in 1983 with Deloittes. Mr Ho is presently the principal of aconsultancy practice, specialising in providing corporate and financial services to ASX-listed companies.
Principal activities
The principal activity of the Group during the financial year was the completion of the acquisition of the Bibianiproject in Ghana, the subsequent refurbishment of the processing plant and the undertaking of a feasibilitystudy of the project, including an aggressive drilling campaign at Bibiani.
Operating and financial review
Group overview
Bibiani Gold Mine, Ghana
Noble Mineral Resources Limited (‘Noble’) is poised to commence the company’s first gold production at thehistoric Bibiani gold mine in the western region of Ghana during the 2011 calendar year. This follows anexhaustive assessment and redevelopment phase being undertaken since acquiring the Bibiani gold mine andassets in July 2010. (Noble Gold Bibiani Limited, ‘NGBL’)
The Bibiani Main Pit contains a JORC compliant 1.98Moz Resource and 0.60Moz Reserve, based onindependent (SEMS 2010) evaluations at an $1100 per oz gold price. A prefeasibility level life of mine plan(SEMS 2010) was developed from this and was the subsequent cornerstone for Noble’s investment and futuredevelopment plans.
The company also acquired extensive infrastructure, accommodation facilities and a gold processing facility, allof which are undergoing extensive refurbishment and upgrades, in readiness for recommencement of goldproduction.
The company’s focus during 2010-2011 has been to grow the Bibiani project resource-reserve base andredevelop the mine and process plant back into production to take advantage of the present historically highgold prices. The Main Pit JORC Reserve was updated to 790koz during June 2011.
A master Bibiani project schedule was generated to assist in tracking the key project activities and to ensurecritical path tasks and priority interfacing issues were covered, in readiness for recommencement ofoperations. The Preliminary 2 Year Mine Plan delivers 243koz for revenue of US$350M based on a gold price of$1450/oz.
For
per
sona
l use
onl
y

P a g e | 7
Directors’ report (continued)
Operating and financial review (continued)
Exploration/Geology:
Due to more immediate Bibiani Main Pit near-mine community infrastructure constraints and limited shorterterm ore production access, Noble has initially been focusing on geological assessment, targeted drillingcampaigns, preliminary resource modelling and mine planning along and adjacent to the more immediatelyaccessible Satellite Pits (Walsh-Strauss) trend (NE).
The Satellite Pits trend does not presently contain independently verified JORC compliant Resources orReserves, however has demonstrated extremely high prospectivity following initial targeted drilling campaignsby Noble and remains the focus of a shorter term pathway to gold production on the back of an increasingresources base. Noble has purchased 2 drilling rigs and engaged multiple drilling service contractors tocomplete this drilling campaign.
Noble have committed to the purchase and construction of a certified analytical laboratory on site to ensureshort turn-around times for exploration resource work, plus mine and mill production requirements. TheLaboratory equipment procurement and site infrastructure construction are well underway. Total capabilitycommissioning completion is scheduled for October 2011, however shorter pathways to provide earlieranalytical service to the exploration effort by September are being closely assessed.
For
per
sona
l use
onl
y

P a g e | 8
Directors’ report (continued)
Operating and financial review (continued)
Resources/Reserves:
This mine based exploration work has resulted in a very high confidence level of the Company issuing maidenJORC Resource and Reserve statements for these extensive mineralized zones and as a function of thecontinuous successful high grade drilling results along the Satellite pits trend. Preliminary in house geologicalmodels have been generated and mine ore inventories have been determined utilising US$1250 gold price.
The infill resource drilling and independently validated JORC Resource and Reserve reports are expected to becompleted September-October 2011, following completion of the current 16,500 meter infill program. TheWalsh-Strauss area has been the focus, however the program will also include main pit Northern Extensionupdates.
A maiden Indicated Resource statement was released for the Aheman and Historic Tailings-Levee deposits,containing 15,500 and 63,800 oz respectively.
The Main Pit JORC Reserve was recently upgraded from 605koz to 790koz June 2011 by independently re-optimising and re-designing the pit cutback using a US$1250 gold price cf previous case US$1100 pit shell in2010 (SEMS).
Proved and Probable Ore Reserves Main Pit as at June 2011
EPA Permit:
The successful execution of the Preliminary 2 Year Mine Plan relies on first satisfying the EPA regulatoryprocess to obtain a project Permit renewal, which gives approval to commence operations at the mine andprocessing plant, including the tailings storage facility.
The current EPA-permitting process is well advanced and the schedule indicates permit approval September2011, with mining planned to commence October.
Bibiani Open Pit Detailed Design Cutback Proved and Probable Ore Reserves – June 2011
Oxide Fresh Fill Total
Tonnes Grade Ounces Tonnes Grade Ounces Tonnes Grade Ounces Tonnes Grade Ounces
Mt G/t Mozs Mt G/t Mozs Mt G/t Mozs Mt G/t Mozs
Proved ‐ ‐ ‐ 5.02 2.17 0.349 ‐ ‐ ‐ 5.02 2.16 0.349
Probable 0.36 1.34 0.016 6.28 2.02 0.407 0.34 1.73 0.019 6.98 1.97 0.441
Total 0.36 1.34 0.016 11.30 2.08 0.756 0.34 1.73 0.019 12.00 2.05 0.790
Derived from Measured and Indicated Mineral Resources using a cut‐off grade of 0.6g/t
For
per
sona
l use
onl
y

P a g e | 9
Directors’ report (continued)
Operating and financial review (continued)
Mine Plan:
An interim Preliminary 2 Year Mine Plan has been formulated via a schedule of ore sources free from existinginfrastructure constraints, including Main Pit northern extensions, the Satellite Pits trend; consisting of Walsh,Strauss, Aheman and Grasshopper pit cutbacks, plus Historic levees/tailings reclamation.
The projected ore mining commencement date is October 2011 following EPA Permit approvals in Septemberand readiness of mining equipment. The mining schedule will also accommodate the TSF-raise waste rockrequirements.
The 2 year mining schedule produces 3.5Mt of ore at 2.1gm/t and 1.9Mt old levee-tails at 0.7gm/t for a total of5.4Mt at a grade of 1.6gm/t. The ore:waste strip ratio is 11.
The Preliminary 2 Year Mine Plan (Mine Plan) currently delivers a circa 307 koz ore inventory, although not allyet achieving full JORC Reserve classification.
The Mine Plan will be updated and ore schedules revised as a function of the Resource and Reserve extensionsexpected September-October 2011, with a target to also extend to a 3 years production plan in the mediumterm, ahead of redeveloping the Main Pit.
Preliminary 2 Year Mine Plan Ore Inventory:
Pit name Ore Tonnes Grade In Situ-Gold Waste SR
Strauss 172,757 3.28 18,232 2,211,024 12.8Walsh 631,958 4.06 82,495 7,169,371 11.3Grasshopper 12,074 1.03 401 16,876 1.4Aheman 64,331 1.44 2,977 465,073 7.2
Subtotal 881,120 104,106 9,862,344 11.2
Main Pit North 2,275,842 1.58 115,270 27,327,105 12.0South Pit 374,334 1.44 17,380 1,548,915 4.1
Subtotal 2,650,176 132,650 28,876,020 10.9
Total Pits 3,531,296 2.09 236,756 38,738,364 11.0
Dam 1 and 2 855,256 0.75 20,623South Pit 2,004,965 0.67 43,189
Total Dam and Levee 2,860,220 0.69 63,812
Low grade stockpile 300,000 0.70 6,752
Total gold inventory 307,320 oz
For
per
sona
l use
onl
y

P a g e | 10
Directors’ report (continued)
Operating and financial review (continued)
Mining Fleet:
Various options to acquire the mining fleet equipment have been considered and explored, so as to meet thefirst 2 year mine schedule in a staged manner. Two new PC1250 excavators were purchased and funded byNoble and arrived to site in June 2011.
The strategy to complete delivery of the Stage 1 mining fleet for Sept 2011 readiness, is to combine thepurchase of second hand in-country mining equipment (haul trucks, dozers, grader, service vehicles, etc) withdry hire of available in-country contractor equipment, plus initiate commitments for the manufacture of thenew fleet. This initiative has been commenced and commitments made.
Equipment rebuilds and refurbishments are a part of this lower capital cost-shorter time line strategy.
Stage 2 involves the delivery of the additional new fleet required as the mine ramps up to full productionduring the first half of 2012, including excavators and haul trucks.
Process Plant Refurbishment and Upgrade:
Noble acquired a circa 2.7mtpa gold processing plant and associated infrastructure with the Bibiani project,which was at the time being held under care and maintenance by the previous owners.
Noble has since embarked on an extensive refurbishment and upgrade of the plant following equipmentcondition monitoring, increased production potential and flow sheet capability improvements.
This has resulted in the addition of both new and reconditioned mechanical and electrical equipment,equipment upgrades, corrosion rehabilitation works, process de-bottle necking modifications and technologyimprovements for process efficiency and safety.
Expected plant throughput capacity following the works program and post commissioning ramp up is 3Mtpa.
A dedicated Plant Project management and construction team was assembled, construction contracts let andinitiatives put in place to minimize the project schedule in readiness for production. This included double shiftconstruction teams on multiple work headings and minimizing offshore structural and fabrication works.
In May 2011 the final budget was set to complete the plant refurbishment and upgrade project and wasestimated at circa $25M. As of end June 2011, the plant project progress spend was circa $8M.
As of end June 2011, the detailed construction schedule update provided completion milestone dates asfollows:
Crusher ready to receive ore: 7 December 2011 Grinding mills ready to receive ore: 8 December 2011 First production gold pour (gravity/historic tailings): 12 December 2011F
or p
erso
nal u
se o
nly

P a g e | 11
Directors’ report (continued)
Operating and financial review (continued)
Achieving the earlier re-commissioning targets has been very challenging due to the extent of remedial andupgrade works committed and these more recent projections have been based on the latest vendorequipment delivery schedules and construction activities progress.
Following commissioning, the 2 year mine plan produces 270koz at a projected average gold recovery of87.7%.
Faster track pathways to earlier gold production via historic levee-tails reclamation and treatment through thepartially completed plant utilising ball milling and CIL have also been assessed, in relationship to critical pathflow sheet/circuit requirements to achieve this. A tailings pre treatment-wash plant has been procured andwill be delivered to the mine site in October following refurbishment.
Cape Three Points / Brotet / Tumentu projects
The exploration projects at Cape Three Points, Brotet and Tumentu have been given a lower priority while theBibiani resource definition work has been underway, but the projects are important areas for the futureexpansion of Noble's resources base and growth of the company. Exploration drilling campaigns have beendesigned for each of the projects and permanent full time staff have been assigned to the base camp nearAdiawso.These exploration programs are planned to commence before the end of this year as drill rigs becomeavailable, with contract drill rigs being sourced and the preliminary work already underway.
For
per
sona
l use
onl
y

P a g e | 12
Directors’ report (continued)
Operating and financial review (continued)
Cape Three Points, Morrison
The modelling of the aeromagnetic data collected in 2008 has generated several targets around magneticprofiles, as the wallrock alteration of the mineralisation in this area is known to contain magnetite. The first ofthese to be tested are three that have been defined at the Morrison prospect, the site of first pass drilling in2008 and 2009 that generated significant but sporadic intersections. In addition, the core drilling done at thattime defined significant alteration.
A program of 4,000m of RC drilling has been proposed for Morrison. This is targeted at the 3D modelling of themagnetic profiles and essentially results in infill of the first pass drilling with better targeted depths andazimuths.
Cape Three Points, Bartie
The Bartie prospect lies in the southeast of the concession, and is an area where we have a magnetic anomalyon the contact of sediments with an intermediate feldspar porphyry intrusive. There is an historic adit at theeastern end of this anomaly and a small pit excavated in the vicinity of the adit returned rock chip samples of28.95g/t and 4.09g/t Au from an oxidised sulphidic shear with arsenopyrite.
The drilling proposed for Bartie is 2,700m, comprised of nine short fences of holes at 100m intervals along themagnetic anomaly, including two holes into the area under the exposed pit. This is first pass drilling, previousworkers had focussed on the area to the north of the adit and not the southwest, and no drilling had beenundertaken.
Cape Three Points, Plantation
The Plantation target is a combination of geology and soil sampling, with the dominant target being agranodiorite contact with andesites and tuffs near the edge of a major granite. Two different soils campaignsfrom different operators show an anomaly over the same contact.
The area is under oil palm and rubber crops, hence the name. The physiography of the area is high ground onthe side of the andesites where the duricrust has resisted erosion, and lower relief on the granodiorite side asthis has weathered to sandy clays. The soils are strongly elevated with results up to 1.5g/t Au, and the targetarea for the drilling is 1100m long.
Cape Three Points, Nkoroba
The Nkoroba area is underlain by strongly laterised dunites and pyroxenites, with some serpentinite and talcschist. This area is currently being examined for its potential for nickel mineralisation, firstly as lateriteenrichment in the weathering profile and secondly for primary nickel sulphide mineralisation. Preliminary soilsampling is under way and the first samples have been submitted to the laboratory.
Tumentu
The Tumentu lease lies on the Salman Shear, host to Resolute Ltd's Obotan deposit to the north and Adamus'Nzema deposit to the south. Resolute conducted an aeromagnetic survey and identified magnetic anomalies invariably graphitic phyllites on the property, and Noble identified elevated gold in soils over these anomalieswith sampling conducted in 2008, in spite of the area being within a low-energy river valley system andsuffering cover by sheetwash deposition.
For
per
sona
l use
onl
y

P a g e | 13
Directors’ report (continued)
Operating and financial review (continued)
Hornfelsed marine sediments trapped in shear zones hosted by mafic lavas have been mapped, and these alsorepresent a possible site for mineralisation.
These geochemical/geophysical targets have been proposed for drilling and given the restricted field season atTumentu due to the high rainfall in the area, the drilling there is a high priority.
In addition at Tumentu the higher ground on the east of the valley that lies within the concession is being soilsampled. Ancient workings at the base of the duricrust layer have been identified and this gives an indicationthe area is mineralised.
Brotet
The boundary of the Brotet concession lies along the strike of the Morrison trend, and one of the threemagnetic profiles modelled at Morrison is within the Brotet lease. This is targeted by several RC holes,conforming with the drilling already present as for Morrison.
This target is in addition to the Brotet trend that parallels the Morrison trend to the east at a distance ofseveral hundred metres, which will be separately explored. Brotet already has significant soil anomalismestablished and is a high priority target area for Noble.
Bindi Bindi East, Western Australia
Minimal exploration work was performed on the tenure in Western Australia. It is planned to increaseexploration in the current financial year.
For
per
sona
l use
onl
y

P a g e | 14
Directors’ report (continued)
Operating and financial review (continued)
Competent Person’s Statement
The information in this announcement that relates to Mineral Resource and Ore Reserve estimates is basedon information compiled by Mr Phillip Schiemer (BSc (Hons), Geology and Geophysics), who is a CorporateMember of the Australasian Institute of Mining and Metallurgy and a member of the Australian Institute ofGeoscientists. Mr Schiemer is employed by Noble Mineral Resources Ltd, and has sufficient experience whichis relevant to the style of mineralisation being reported herein as Mineral Resources, Ore Reserves andExploration Results to qualify as a Competent Person as defined in the 2004 edition of the ‘Australasian Codefor Reporting of Exploration Results, Mineral Resources and Ore Reserves’ (JORC Code). Mr Schiemerconsents to the inclusion in this report of the matters based on his information in the form and content inwhich it appears.
Operating results for the year
The Group incurred a loss of $20,717,000 (2010: $2,690,000) for the year ended 30 June 2011. This lossincludes $16,757,000 as a result of the acquisition of Noble Gold Bibiani Limited during the year, and $177,000(2010: $518,000) exploration and evaluation expenditure written off in accordance with the Group’saccounting policies.
The Group finished the year with cash or cash equivalents of US $9,430,000, plus a further $2,730,000 of fundson deposit securing environmental obligations.
A summary of operating results are as follows:2011 2010
US $ (000) US $ (000)Operating segmentsBibiani (16,757) (33)Cape Three Points 539 (959)
(16,218) (992)Consolidated entity adjustments (300) (149)Non-segment and unallocated revenues and expenses (4,199) (1,549)
Consolidated entity loss for the year (20,717) (2,690)
Review of financial condition
Liquidity and capital resources
The consolidated cash flow statement illustrates that there was a decrease in cash and cash equivalents in theyear ended 30 June 2011 of $21,459,000 (2010: $27,775,000 cash increase). The decrease in cash inflow incomparison with the prior year is caused by the acquisition of the Bibiani project in July 2010, which has todate required significant capital expenditure to refurbish the Plant and bring the Mine to an operatingcapability. Operating activities consumed $21,387,000 (2010: $2,302,000) of net cash flows. The increase islargely due to the working capital requirements of the Bibiani Mine. There has also been a net increase in theamount of cash used for investing activities to $34,457,000 (2010: $6,495,000), which was mainly attributableto purchases of property, plant and equipment, and exploration and evaluation costs. There was also a$31,883,000 cash inflow (2010: $34,812,000 cash inflow) which can be attributed to an equity raising that wasundertaken during the latter half of the 2010 calendar year.
For
per
sona
l use
onl
y

P a g e | 15
Directors’ report (continued)
Operating and financial review (continued)
Asset and capital structure2011 2010
US $ (000) US $ (000)Debts:Trade and other payables 13,647 548Interest bearing loans and borrowings 34,646 -Cash and short-term deposits (9,430) (30,889)
Net debt 38,863 (30,341)Total equity 53,617 37,375
Total capital employed 92,480 7,034
Gearing 42% (431%)
Profile of debts
The profile of the Group’s debt finance is as follows:2011 2010
US $ (000) US $ (000)CurrentBank overdrafts 52 -Other loans 34,646 -
34,698 -Non-currentOther loans - -
- -
The Group’s debts have increased this year, mainly due to the existing facility ($32,000,000) that was assumedwith the acquisition of Noble Gold Bibiani in July 2010. The Group anticipates that its debts will decrease overthe coming year as repayments commence on this $32,000,000 facility. Of the Group’s debts, 100% isrepayable within one year of 30 June 2011 (2010: Nil). Due to being unable to recommence mining operationsby the Operational Date (30 May 2011) as agreed with Investec Bank Limited on the acquisition of the BibianiMine, Noble Gold Bibiani Limited was in breach of the facility at 30 June 2011 and in accordance withAustralian Accounting Standards, the facility has been classified as current. Noble are in the process ofrenegotiating the terms and conditions of the facility, to defer the operational date to 30 October 2011 for theoutstanding principal to be repaid under the original repayment terms.
Capital expenditure
There has been an increase in cash used to purchase property, plant and equipment in 2011 to $23,557,000from $46,000 for the year ended 30 June 2010. Further capital commitments of $10,007,000 existed at thereporting date, principally relating to the completion of the Bibiani mine plant refurbishment and associatedproduction critical plant and equipment.
For
per
sona
l use
onl
y

P a g e | 16
Directors’ report (continued)
Operating and financial review (continued)
Risk management
The Group takes a proactive approach to risk management. The board is responsible for ensuring that risks,and also opportunities, are identified on a timely basis and that the Group's objectives and activities arealigned with the risks and opportunities identified by the board.
The board has a number of mechanisms in place to ensure that management's objectives and activities arealigned with the risks identified by the board. These include the following:
Board approval of a strategic plan, which encompasses the Group's vision, mission and strategystatements, designed to meet stakeholders' needs and manage business risk.
Implementation of board approved operating plans and budgets and board monitoring ofprogress against these budgets, including the establishment and monitoring of KPIs of both afinancial and nonfinancial nature.
The establishment of committees to report on specific business risks, including for examplesuch matters as environmental issues and occupational health and safety.
Significant changes in the state of affairs
In July 2010, the Company finalised the acquisition of Noble Gold Bibiani Limited (‘NGBL’) [formerly CentralAfrican Gold Ghana Limited], a company registered in Ghana. NGBL owns the Bibiani Gold Mine (Bibiani) andtwo contiguous exploration licences in the Sefwi Bibiani Gold Belt in Central Ghana. The Bibiani acquisitionincluded a processing plant with an annual capacity of 2.7 million tonnes and a significant mining fleet, as wellas a fully operational mine site with mine workshops, accommodation, a hospital, a school and a working fleetof light vehicles. As part of the consideration for the acquisition of the 100% interest in NGBL, the Companyissued 4,000,000 shares and 6,000,000 options to Investec Bank Limited (‘Investec’) in July 2010. A further6,000,000 shares were issued to Investec in May 2011 as a restructuring fee on the existing debt facility heldby NGBL.
One of the conditions of the acquisition was that Noble assume the existing obligations of NGBL, includingensuring that suitable arrangements were made with NGBL’s unsecured trade creditors. Those arrangementsresulted in the issuance of a further 5,788,341 shares in August 2010 and January 2011 in satisfaction ofcertain of the debts owed.
The Company undertook a bonus issue of options to shareholders in July 2010, issuing 74,433,069 optionsexpiring on 21 July 2011 at an exercise price of A $0.30 each (ASX: NMGO) and 74,433,069 options expiring 21July 2013 at an exercise price of A $0.35 each (ASX: NMGOA) to eligible shareholders. The bonus issue wasmade on a 4-for-1 basis, with shareholders receiving one NMGO option and one NMGOA option for every 4ordinary shares held.
In late 2010 and early 2011, the Company successfully completed a share placement through the issue of77,000,000 shares at A $0.39 each, raising A $30,030,000 in cash.
Throughout the course of the year, a total of 9,168,229 NMGO options (exercise price: A $0.30 each) and82,827 NMGOA options (exercise price: $0.35 each) were exercised, raising a further A $2,779,458 in cash.
There were a total of 395,770,881 shares on issue at 30 June 2011.
For
per
sona
l use
onl
y

P a g e | 17
Directors’ report (continued)
Significant events after the balance date
In July 2011, one of the Company’s classes of listed options (ASX: NMGO) expired. Of the 65,264,840 NMGOoptions on issue at 30 June 2011, a total of 64,518,051 were subsequently exercised, raising A$19,355,415 incash. The remaining 746,789 unexercised options (ASX: NMGO) lapsed on 21 July 2011.
In September 2011, the Company received commitments from sophisticated and institutional investors for theissue of approximately 60 million shares at A$0.55 per share, to raise A$33,000,000.
Likely developments and expected results
The director’s are confident that the commissioning phase of the Bibiani Mine will be delivered on time and asper the schedule advised in the Operating Review. The ramp up in mining and production activities willcommence from October 2011, with the first gold pour expected to be on schedule in mid December 2011.
Additionally, the company expects no delays in the installation of Noble’s dedicated assay laboratory,scheduled for Q4. This will speed up the exploration and resource/reserve definition process and will givegreater certainty to the timing of expected future resource/reserve upgrades.
Environmental regulation and performance
The Group is subject to environmental regulation in respect of its exploration activities in Ghana and iscommitted to undertaking its operations in that country in an environmentally responsible manner.
The Group’s operations are also subject to environmental regulations in Australia under Commonwealth andState legislation. The Directors believe that the Group has adequate systems in place for the management ofthe requirements under those regulations, and are not aware of any breach of such requirements as theyapply to the Group.
Share options
Unissued shares
As at the date of this report, there were 86,580,607 unissued ordinary shares under option as follows:
Expiry Exercise Number ofClass Date Price Options
Listed Options (NMGOA) 21 July 2013 A $0.35 74,330,607Unlisted Options 8 July 2014 A $0.20 6,000,000Unlisted Options 19 August 2014 A $0.40 6,250,000
Option holders do not have any right, by virtue of the option, to participate in any share issue of the companyor any related body corporate.
Shares issued as a result of the exercise of options
During or since the end of the year, the following shares were issued as a result of the exercise of options overunissued ordinary shares:
Expiry Exercise Number ofClass Date Price Options
Listed Options (NMGO) 21 July 2011 A $0.30 64,518,051Listed Options (NMGOA) 21 July 2013 A $0.35 19,635
For
per
sona
l use
onl
y

P a g e | 18
Directors’ report (continued)
Indemnification and insurance of directors and officers
The Company has agreed to indemnify the current directors of the Company against all liabilities to anotherperson (other than the Company or a related body corporate) that may arise from their position as directors ofthe Company, except where the liability arises out of conduct involving a lack of good faith. The agreementstipulates that the Company will meet the full amount of any such liabilities, including costs and expenses.
The Company paid a premium during the year in respect of a director and officer liability insurance policy,insuring the directors of the Company, the company secretary, and all executive officers of the Companyagainst a liability incurred as such a director, secretary or executive officer to the extent permitted by theCorporations Act 2001. The directors have not included details of the nature of the liabilities covered or theamount of the premium paid in respect of the directors’ and officers’ liability and legal expenses’ insurancecontracts, as such disclosure is prohibited under the terms of the contract.
Directors’ meetings
The number of meetings of directors (including meetings of committees of directors) held during the year andthe number of meetings attended by each director were as follows:
Meeting of committeesNomination Audit
Directors’ and andmeetings Remuneration Risk
Number of meetings held: 7 1 -Number of meeting attended:
Tunku Naquiyuddin 7 1 -Wayne Norris 7 - -Brian Thomas 7 1 -Alan Taylor 3 - -Duncan Coutts 2 - -
All directors were eligible to attend all meetings held, except for:
- Duncan Coutts, who was eligible to attend 2 directors’ meetings;- Alan Taylor, who was eligible to attend 3 directors’ meetings; and- Brian Thomas, who replaced Alan Taylor upon his resignation on 11 October 2010 as a member of the
Nomination and Remuneration committee and Audit and Risk Committee.
Committee membership
As at the date of this report, the company had an Audit and Risk committee, and a Nomination andRemuneration Committee of the board of directors.
Members acting on the committees of the board during the year were:
Nomination and Remuneration Audit and RiskTunku Naquiyuddin (chairman) Brian Thomas (chairman) – appointed 11
thOctober 2010
Alan Taylor – resigned 11th
October 2010 Alan Taylor (chairman) – resigned 11th
October 2010Brian Thomas – appointed 11
thOctober 2010 Tunku Naquiyuddin
For
per
sona
l use
onl
y

P a g e | 19
Directors’ report (continued)
Rounding
The amounts contained in this report and in the financial report have been rounded to the nearest $1,000(where rounding is applicable and where noted ($’000)) under the option available to the company underASIC CO 98/0100. The company is an entity to which the Class Order applies.
Non-audit services
The following non-audit services were provided by the entity's auditor, Ernst & Young. The directors aresatisfied that the provision of non-audit services is compatible with the general standard of independence forauditors imposed by the Corporations Act 2001. The nature and scope of each type of non-audit serviceprovided means that auditor independence was not compromised.
Ernst & Young received or are due to receive the following amounts for the provision of non-audit services:
US$Tax compliance services 24,273
Auditor independence and non-audit services
The auditor’s independence declaration for the year ended 30 June 2011 has been received and is located withthe Independent Auditor’s Report on page 92.
For
per
sona
l use
onl
y

P a g e | 20
Directors’ report (continued)
Remuneration report (audited)
This remuneration report for the year ended 30 June 2011 outlines the remuneration arrangements of theCompany and the Group in accordance with the requirements of the Corporations Act 2001 (the Act) and itsregulations. This information has been audited as required by section 308(3C) of the Act.
The remuneration report details the remuneration arrangements for key management personnel (KMP) whoare defined as those persons having authority and responsibility for planning, directing and controlling themajor activities of the Company and the Group, directly or indirectly, including any director (whether executiveor otherwise) of the parent company, and includes the five executives in the Parent and the Group receivingthe highest remuneration.
For the purposes of this report, the term ‘executive’ includes executive directors, senior executives, generalmanagers and secretaries of the Parent and the Group and the term ‘director’ refers to non-executivedirectors only.
The remuneration report is presented under the following sections:1. Individual key management personnel disclosures2. Remuneration at a glance3. Board oversight of remuneration4. Non-executive director remuneration arrangements5. Executive remuneration arrangements6. Company performance and the link to remuneration7. Executive contractual arrangements8. Equity instruments disclosures9. Schedule of remuneration of key management personnel
1. Individual key management personnel disclosures
Details of KMP including the top five remunerated executives of the Parent and Group are set out below.
Key management personnel
(i) DirectorsTunku Naquiyuddin Chairman (non-executive)Wayne Norris Managing DirectorAlan Taylor Finance Director – resigned 11
thOctober 2010
Brian Thomas Director (non-executive)Duncan Coutts Director (non-executive) – resigned 8
thJuly 2011
(ii) ExecutivesDavid Leavy Chief Financial OfficerPeter Johnston Chief Operating OfficerBrian Dunn Managing Director of Noble Gold Bibiani LimitedAnthony Ho Company Secretary
Other than the resignation of Duncan Coutts, there were no other changes to KMP after reporting date andbefore the date the financial report was authorised for issue.
For
per
sona
l use
onl
y

P a g e | 21
Directors’ report (continued)
Remuneration report (audited) (continued)
2. Remuneration at a glance
Noble Mineral Resources Limited’s remuneration strategy is designed to attract, motivate and retainemployees and NEDs by identifying and rewarding high performers and recognising the contribution of eachemployee to the continued growth and success of the Group.
The remuneration structures take into account:
the capability and experience of the key management personnel; the key management personnel’s ability to control the achievement of strategic objectives; the Group’s performance including:
- the growth in share price; and- the amount of incentives within each key management person’s compensation.
Given the evaluation and developmental nature of the Group’s principal activity, the overall level ofcompensation does not have regard to the earnings of the Group.
There has been no material change to the short-term incentive bonus plan or the long-term incentive rewards.Bonuses were paid to Wayne Norris, Alan Taylor and Tunku Naquiyuddin as disclosed in the RemunerationReport.
The remuneration of non-executive directors of the Company consists only of directors’ fees, committee feesand consulting fees for duties performed over and above agreed duties. Director fees were maintained at thesame level as the prior year.
3. Board oversight of remuneration
The Nomination and Remuneration Committee of the Board of Directors of the Company is responsible fordetermining and reviewing remuneration policies for the directors and executives. If necessary, theNomination and Remuneration Committee obtains independent advice on the appropriateness ofremuneration packages given trends in comparable companies and in accordance with the objectives of theconsolidated entity
4. Non-executive director remuneration arrangements
The Constitution and the ASX Listing Rules specify that the aggregate remuneration of non-executive directorsshall be determined from time to time by a general meeting. Total remuneration for all non-executivedirectors, last voted upon by shareholders at the 2008 General Meeting, is not to exceed US$203,180(A$200,000) per annum. Directors’ fees cover all main board activities and membership of committees.
Non-executive directors do not receive any retirement benefits, other than statutory superannuation, nor dothey receive any performance related compensation.
5. Executive remuneration arrangements
Remuneration for executives is set out in employment agreements. The Group has entered into employmentagreements with each executive key management person which outline the components of compensationpaid. The agreements do not prescribe how compensation levels are modified year to year. Compensationlevels are reviewed on an annual basis through a process that considers individual and overall performance ofthe Group, taking into account any change in the scope of the role performed by the executives and anychanges required to meet the principles of the Group’s compensation policy.
For
per
sona
l use
onl
y

P a g e | 22
Directors’ report (continued)
Remuneration report (audited) (continued)
5. Executive remuneration arrangements (continued)
Executive directors may receive performance related compensation but do not receive any retirementbenefits, other than statutory superannuation.
Fixed remuneration consists of base compensation (which is calculated on a total cost basis and includes anyFBT charges related to employee benefits including motor vehicles) as well as employer contributions tosuperannuation funds. Key management personnel may also receive benefits such as travel allowances. Cashbonuses are awarded at the discretion of the Company.
Long-term incentives (LTI) may be provided to key management personnel via the Noble Mineral ResourcesEmployee Share Option Plan (ESOP). The LTI are provided as options over ordinary shares of the Company tokey management personnel based on their position within the Group. Vesting conditions may be imposed onany LTI grants if considered appropriate, in accordance with the ESOP’s terms and conditions.
LTI are considered to promote continuity of employment and provide additional incentive to recipients toincrease shareholder wealth. Options may only be issued to directors subject to approval by shareholders ingeneral meeting.
The Company has introduced a policy that prohibits employees and directors of the Group from entering intotransactions that operate or are intended to operate to limit the economic risk or are designed or intended tohedge exposure to unvested Company securities. This includes entering into arrangements to hedge theirexposure to LTI granted as part of their remuneration package. This policy may be enforced by requestingemployees and directors to confirm compliance.
6. Company performance and the link to remuneration
In considering the Group’s performance and benefits for shareholder wealth, the directors have regard to thefollowing information in respect of the current and previous financial years:
2011 2010 2009 2008*
Net consolidated loss for the year (US$ 000) (20,717) (2,690) (1,861) (338)Dividends paid Nil Nil Nil NilChange in share price (A$) A$ 0.295 A$ 0.135 (A$ 0.19) A$ 0.34
Share price at beginning of the period (A$) A$ 0.285 A$ 0.15 A$ 0.34 -Share price at the end of the period (A$) A$0.58 A$0.285 A$ 0.15 A$ 0.34
Loss per share (US cents) (5.87) (1.68) (1.34) (0.66)
* The Company listed on the Australian Stock Exchange on 27th
June 2008.
As the Group did not commence the production phase during the year, its earnings are not considered to be aprinciple performance indicator. However, the overall level of key management personnel remuneration takesinto account the achievement of strategic objectives, service criteria and growth in share price. There were noperformance related remuneration transactions during the financial year (2010: nil).F
or p
erso
nal u
se o
nly

P a g e | 23
Directors’ report (continued)
Remuneration report (audited) (continued)
7. Executive contractual arrangements
The Company has entered into an employment agreement with Mr Wayne Norris, Managing Director. TheEmployment Agreement specifies the duties and obligations to be fulfilled by the Managing Director. The termof the Employment Agreement is 3 years.
The Employment Agreement is terminable after its initial term by either the Company or Mr Norris givingwritten notice. Mr Norris has no entitlement to termination payment in the event of removal for misconduct.
The Company has entered into employment agreements with other key management personnel;
Peter Johnston, Group Chief Operating Officer (dated 31 January 2011) David Leavy, Group Chief Financial Officer (dated 11 June 2010) Brian Dunn, Managing Director of Noble Gold Bibiani Limited (updated 14 January 2011)
The Employment Agreement’s specify the duties and obligations to be fulfilled by the executives. The terms ofall Employment Agreements above are 3 years.
The Employment Agreements are terminable after its initial term by either the Company or the individualexecutives giving written notice. They have no entitlement to termination payment in the event of removal formisconduct.
8. Equity instruments disclosures
Shares, Options and rights over equity instruments granted as compensation
500,000 unlisted options expiring on 19 August 2014 were issued on 19 August 2010 to Brian Dunn. Therewere no performance conditions, because they were awarded in recognition of the efforts of Mr Dunn withregards to the Company’s capital raising objectives, and are exercisable immediately. The options areexercisable at A $0.40 each and entitle Mr Dunn to one Ordinary Share in the Company once exercised (2010:Nil). The total fair value of the options at the grant date was US$43,226, the options are fully vested.
No options have been exercised or forfeited during the year and up to the date of this report.
There were no LTI awarded during or since the end of the financial year.
Modification of terms of equity-settled share-based payment transactions
No terms of equity-settled share-based payment transactions (including options and rights granted ascompensation to a key management person) have been altered or modified by the issuing entity during thereporting period or the prior period.
9. Bonus disclosures
A cash bonus was paid to Wayne Norris, Alan Taylor and Tunku Naquiyuddin on successful acquisition of NobleGold Bibiani Limited. The bonus was paid in full during the reporting period. The total bonus was US$746,795(2010: Nil), dissected as follows:
US$Wayne Norris 477,858Alan Taylor 209,495Tunku Naquiyuddin 59,442
For
per
sona
l use
onl
y

P a g e | 24
Directors’ report (continued)
Remuneration report (audited) (continued)
10. Schedule of remuneration of key management personnel
For the year ended 30 June 2011Short Post Shareterm employment based Value Performance
benefits benefits payment Total of options related
Salary Cash Super-and fees bonus annuation Options
US $ US $ US $ US $ US $ % %
Non-executive directorsTunku Naquiyuddin 63,704 59,442 - - 123,146 - -Brian Thomas 39,298 - 4,447 - 43,746 - -Duncan Coutts
19,060 - 830 - 9,890 - -
Executive directorsAlan Taylor
283,138 209,495 23,803 - 316,436 - -
Wayne Norris 414,073 477,858 25,004 - 916,934 - -
Total all directors 609,273 746,795 54,084 - 1,410,152 - -
Other key managementpersonnelDavid Leavy 245,268 - 20,649 - 265,917 - -Peter Johnston
3116,721 - 10,507 - 127,228 - -
Brian Dunn4
250,000 - - 43,226 293,226 14.74% 14.74%Anthony Ho 143,498 - - - 143,498 - -
Total executive KMP 755,487 - 31,156 43,226 829,869 5.21% 5.21%
Totals 1,364,760 746,794 85,240 43,226 2,240,021 1.93% 1.93%
Notes in relation to the table of remuneration:
1. Appointed 8 April 2011; retired 8 July 2011.2. Retired 11 October 2010.3. Appointed 31 January 2011.4. 500,000 unlisted options (refer 8 Equity instrument disclosures in Remuneration Report).
For
per
sona
l use
onl
y

P a g e | 25
Directors’ report (continued)
Remuneration report (audited) (continued)
10. Schedule of remuneration of key management personnel (continued)
For the year ended 30 June 2010Short Post Shareterm employment based Value Performance
benefits benefits payment Total of options related
Salary Cash Super-and fees bonus annuation
US$ US$ US$ US$ US$ % %
Non-executive directorsTunku Naquiyuddin 27,126 - - - 27,126 - -Brian Thomas
58,225 - 741 - 8,966 - -
Executive directorsAlan Taylor 10,369 - 933 - 11,302 - -Wayne Norris 246,797 - 22,485 - 269,282 - -
Total all directors 292,517 - 24,159 - 316,676 - -
Other key managementpersonnelDavid Leavy
611,645 - 1,048 - 12,693 - -
Anthony Ho 46,636 - - - 46,636 - -
Total executive KMP 58,281 - 1,048 - 59,329 - -
Totals 350,798 - 25,207 - 376,005 - -
Notes in relation to the table of remuneration:
5. Appointed 6 April 2010.6. Appointed 11 June 2010.
End of Remuneration Report (Audited)
For
per
sona
l use
onl
y

P a g e | 26
Corporate governance statement
The board of directors of Noble Mineral Resources Limited is responsible for establishing the corporategovernance framework of the Group having regard to the ASX Corporate Governance Council (CGC) publishedguidelines as well as its corporate governance principles and recommendations. The board guides andmonitors the business and affairs of Noble Mineral Resources Limited on behalf of the shareholders by whomthey are elected and to whom they are accountable.
The table below summarises the Company's compliance with the CGC's recommendations.
ASX ListingComply Reference / Rule / CGC
Recommendation Yes / No explanation recommendations
Principle 1 — Lay solid foundations for management and oversight
1.1 Companies should establish the functions reserved to the Yes Page 29 ASX CGC 1.1board and those delegated to senior executives and disclosethose functions.
1.2 Companies should disclose the process for evaluating the Yes Page 29 ASX CGC 1.2performance of senior executives.
1.3 Companies should provide the information indicated in the Yes Page 29 ASX CGC 1.3guide to reporting on Principle 1.
Principle 2 — Structure the board to add value
2.1 A majority of the board should be independent directors. No Page 30 ASX CGC 2.1
2.2 The chair should be an independent director. No Page 30 ASX CGC 2.2
2.3 The roles of chair and chief executive officer (CEO) should No Page 30 ASX CGC 2.3not be exercised by the same individual.
2.4 The board should establish a nomination committee. Yes Page 30 ASX CGC 2.4
2.5 Companies should disclose the process for evaluating the Yes Page 30 ASX CGC 2.5performance of the board, its committees and individualdirectors.
2.6 Companies should provide the information indicated in the Yes Page 30 ASX CGC 2.6guide to reporting on Principle 2.
Principle 3 — Promote ethical and responsible decision-making
3.1 Companies should establish a code of conduct and disclose Yes Website ASX CGC 3.1the code or a summary of the code as to: The practices necessary to maintain confidence in the
company's integrity; The practices necessary to take into account their legal
obligations and the reasonable expectations of theirstakeholders; and
The responsibility and accountability of individuals forreporting and investigating reports of unethical practices
For
per
sona
l use
onl
y

P a g e | 27
Corporate governance statement (continued)ASX Listing
Comply Reference / Rule / CGCRecommendation Yes / No explanation recommendations
3.2 Companies should establish a policy concerning diversity No Page 31 ASX CGC 3.2and disclose the policy or a summary of that policy. Thepolicy should include requirements for the board toestablish measurable objectives for achieving genderdiversity for the board to assess annually both the objectivesand progress in achieving them.
3.3 Companies should disclose in each annual report the No Page 31 ASX CGC 3.3measurable objectives for achieving gender diversity setby the board in accordance with the diversity policy andprogress towards achieving them.
3.4 Companies should disclose in each annual report the No Page 31 ASX CGC 3.4proportion of women employees in the wholeorganisation, women in senior executive positions andwomen on the board.
3.5 Companies should provide the information indicated in the Yes Page 31 ASX CGC 3.3guide to reporting on Principle 3.
Principle 4 — Safeguard integrity in financial reporting
4.1 The board should establish an audit committee. Yes Page 31 ASX CGC 4.1
4.2 The audit committee should be structured so that it: Yes Page 31 ASX CGC 4.2 Consists only of non-executive directors ASX LR 12.7 Consists of a majority of independent directors Is chaired by an independent chair, who is not chair
of the board Has at least three members
4.3 The audit committee should have a formal charter. Yes Page 31 ASX CGC 4.3
4.4 Companies should provide the information indicated in the Yes Website ASX CGC 4.4guide to reporting on Principle 4.
Principle 5 — Make timely and balanced disclosure
5.1 Companies should establish written policies designed to Yes Website ASX CGC 5.1ensure compliance with ASX Listing Rule disclosurerequirements and to ensure accountability at a seniorexecutive level for that compliance and disclose thosepolicies or a summary of those policies.
5.2 Companies should provide the information indicated in the Yes Page 34 ASX CGC 5.2guide to reporting on Principle 5.
For
per
sona
l use
onl
y

P a g e | 28
Corporate governance statement (continued)ASX Listing
Comply Reference / Rule / CGCRecommendation Yes / No explanation recommendations
Principle 6 — Respect the rights of shareholders
6.1 Companies should design a communications policy for Yes Page 34 ASX CGC 6.1promoting effective communication with shareholders andencouraging their participation at general meetings anddisclose their policy or a summary of that policy.
6.2 Companies should provide the information indicated in the Yes Page 34 ASX CGC 6.2guide to reporting on Principle 6.
Principle 7 — Recognise and manage risk
7.1 Companies should establish policies for the oversight and Yes Page 32 ASX CGC 7.1management of material business risks and disclose asummary of those policies.
7.2 The board should require management to design and Yes Page 32 ASX CGC 7.2implement the risk management and internal controlsystem to manage the company's material business risksand report to it on whether those risks are being managedeffectively. The board should disclose that managementhas reported to it as to the effectiveness of the company'smanagement of its material business risks.
7.3 The board should disclose whether it has received assurance Yes Page 32 ASX CGC 7.3from the CEO [or equivalent] and the Chief Financial Officer(CFO) [or equivalent] that the declaration provided inaccordance with section 295A of the Corporations Act isfounded on a sound system of risk management and internalcontrol and that the system is operating effectively in allmaterial respects in relation to financial reporting risks.
7.4 Companies should provide the information indicated in the Yes Page 32 ASX CGC 7.4guide to reporting on Principle 7.
Principle 8 — Remunerate fairly and responsibly
8.1 The board should establish a remuneration committee. Yes Page 33 ASX CGC 8.1
8.2 The remuneration committee should be structured so that it: No Page 33 ASX CGC 8.2 Consists of a majority of independent directors Is chaired by an independent chair Has at least three members
8.3 Companies should clearly distinguish the structure of Yes Refer to ASX CGC 8.3non-executive directors' remuneration from that of executive remunerationdirectors and senior executives. report
8.4 Companies should provide the information indicated in the Yes Page 33 ASX CGC 8.4guide to reporting on Principle 8.
For
per
sona
l use
onl
y

P a g e | 29
Corporate governance statement (continued)
Noble Mineral Resources Limited's corporate governance practices were in place throughout the year ended30 June 2011.
Various corporate governance practices are discussed within this statement. For further information oncorporate governance policies adopted by Noble Mineral Resources Limited, refer to our website:www.nobleminres.com.au/live/about/corporate-governance/
Board functions
The board seeks to identify the expectations of the shareholders, as well as other regulatory and ethicalexpectations and obligations. In addition, the board is responsible for identifying areas of significant businessrisk and ensuring arrangements are in place to adequately manage those risks.
To ensure that the board is well equipped to discharge its responsibilities it has established guidelines for thenomination and selection of directors and for the operation of the board.
The responsibility for the operation and administration of the Group is delegated, by the board, to the MD andthe executive management team. The board ensures that this team is appropriately qualified and experiencedto discharge their responsibilities and has in place procedures to assess the performance of the MD and theexecutive management team.
Whilst at all times the board retains full responsibility for guiding and monitoring the Group, in discharging itsstewardship it makes use of sub-committees. Specialist sub-committees are able to focus on a particularresponsibility and provide informed feedback to the board.
To this end the board has established the following committees:
Audit and Risk Nomination and Remuneration
The roles and responsibilities of these committees are discussed throughout this corporate governancestatement.
The board is responsible for ensuring that management's objectives and activities are aligned with theexpectations and risks identified by the board. The board has a number of mechanisms in place to ensure thisis achieved including:
Board approval of a strategic plan designed to meet stakeholders' needs and manage business risk Ongoing development of the strategic plan and approving initiatives and strategies designed to
ensure the continued growth and success of the entity Implementation of budgets by management and monitoring progress against budget — via the
establishment and reporting of both financial and non-financial key performance indicators
Other functions reserved to the board include:
Approval of the annual and half-yearly financial reports Approving and monitoring the progress of major capital expenditure, capital management, and
acquisitions and divestitures Ensuring that any significant risks that arise are identified, assessed, appropriately managed and
monitored Reporting to shareholders
For
per
sona
l use
onl
y

P a g e | 30
Corporate governance statement (continued)
Structure of the board
The skills, experience and expertise relevant to the position of director held by each director in office at thedate of the annual report are included in the directors’ report. Directors of Noble Mineral Resources Limitedare considered to be independent when they are independent of management and free from any business orother relationship that could materially interfere with — or could reasonably be perceived to materiallyinterfere with — the exercise of their unfettered and independent judgement.
In the context of director independence, ‘materiality’ is considered from both the Group and individualdirector perspective. The determination of materiality requires consideration of both quantitative andqualitative elements. An item is presumed to be quantitatively immaterial if it is equal to or less than 5% of theappropriate base amount. It is presumed to be material (unless there is qualitative evidence to the contrary) ifit is equal to or greater than 10% of the appropriate base amount.
Qualitative factors considered include whether a relationship is strategically important, the competitivelandscape, the nature of the relationship and the contractual or other arrangements governing it and otherfactors that point to the actual ability of the director in question to shape the direction of the Group's loyalty.
In accordance with the definition of independence above, and the materiality thresholds set, the followingdirectors of Noble Mineral Resources Limited are considered to be independent:
Name PositionBrian Thomas Non-executive director
Mr Thomas holds 100,000 fully paid ordinary shares in the Company, the Board considers this immaterial.
The board recognises the Corporate Governance Council’s recommendation that the Chair should be anindependent director. The Chairman, HRH Tunku Naquiyuddin, does not satisfy the tests of independence asdetailed in the Recommendations. The board believes that HRH Tunku Naquiyuddin is the most appropriateperson to lead the board and that he is able to and does bring quality and independent judgement to allrelevant issues falling within the scope of the role of Chairman and that the Group as a whole benefits from hislong standing experience of its operations and business relationships and hence is considered independent.
There are procedures in place, agreed by the board, to enable directors in furtherance of their duties to seekindependent professional advice at the Company's expense.
The term in office held by each director in the office as the date of this report is as follows:
Name Term in officeHRH Tunku Naquiyuddin 3 yearsWayne Norris 3 yearsBrian Thomas 1 year
For additional details regarding board appointments, please refer to our website.
Performance
The performance of the board and key executives are reviewed in accordance with the PerformanceEvaluation Process. During the reporting period, the nomination committee conducted performanceevaluations that involved an assessment of each board member's and key executive's performance againstspecific and measurable qualitative and quantitative performance criteria.
For
per
sona
l use
onl
y

P a g e | 31
Corporate governance statement (continued)
The performance criteria against which directors and executives are assessed are aligned with the financial andnon-financial objectives of Noble Mineral Resources Limited.
Directors whose performance is consistently unsatisfactory may be asked to retire.
Diversity Policy
The Company has not yet established a Diversity Policy. The board will give consideration to the ASXrecommendation during the 2011/12 financial year.
Nomination and Remuneration committee
The board has established a nomination committee, which meets at least annually, to ensure that the boardcontinues to operate within the established guidelines, including when necessary, selecting candidates for theposition of director. The nomination committee comprises non-executive directors. The nominationcommittee comprised the following members throughout the year:
HRH Tunku Naquiyuddin (Committee Chairman)Brian Thomas (from 11 October 2010)Alan Taylor (up to 11 October 2010)
For details of directors' attendance at meetings of the nomination committee, refer to the directors' report
For additional details regarding the nomination committee including its charter please refer to our website.
The Company is at variance with Recommendation 2.4 in that the Nomination and Remuneration Committeeonly has two members. The board considers that this composition is appropriate given the current size of theCompany and board structure.
Audit and Risk committee
The board has established an audit and risk committee, which operates under a charter approved by theboard. It is the board's responsibility to ensure that an effective internal control framework exists within theentity. This includes internal controls to deal with both the effectiveness and efficiency of significant businessprocesses, the safeguarding of assets, the maintenance of proper accounting records, and the reliability offinancial information as well as non-financial considerations such as the benchmarking of operational keyperformance indicators. The board has delegated responsibility for establishing and maintaining a frameworkof internal control and ethical standards to the audit and remuneration committee.
The committee also provides the board with additional assurance regarding the reliability of financialinformation for inclusion in the financial reports. Each of the current members of the audit committee arenon-executive directors. Prior to Alan Taylor’s resignation in October 2010, the committee comprised oneexecutive and one non-executive director.
The members of the audit committee during the year were:
Brian Thomas (from 11 October 2010) (Committee Chairman)Alan Taylor (up to 11 October 2010) (Committee Chairman)HRH Tunku Naquiyuddin
For
per
sona
l use
onl
y

P a g e | 32
Corporate governance statement (continued)
Qualifications of audit committee members
HRH Tunku Naquiyuddin is presently the Chairman of Sino Hua-An International Berhad, a company listed onBursa Malaysia (formerly known as the Kuala Lumpur Stock Exchange) with a substantial business in China. Heis also the chairman of the Board of Kian Joo Can Factory Berhad, a company which is also listed on BursaMalaysia.
Mr Brian Thomas is a geologist (BSc, MBA, SAFin, MAusIMM, MAICD) with more than 20 years of mining andexploration industry experience. This is complemented by 12 years in the Australian financial services sectorworking in corporate stock broking, investment banking, funds management and with an Australiancommercial bank, sourcing mining finance opportunities.
For details on the number of meetings of the audit committee held during the year and the attendees at thosemeetings, refer to the directors’ report.
The Company is at variance with Recommendation 4.2 in that the Audit and Risk Committee only has twomembers. The Board considers that this composition is appropriate given the current size of the Company.Furthermore, the board considers that the Audit and Risk Committee is of a sufficient size and independenceand possesses sufficient technical expertise to discharge its mandate effectively.
Risk
The board has continued its proactive approach to risk management. The identification and effectivemanagement of risk, including calculated risk-taking is viewed as an essential part of the Company's approachto creating long-term shareholder value.
In recognition of this, the board determines the company's risk profile and is responsible for overseeing andapproving risk management strategy and policies, internal compliance and internal control. In doing so theboard has taken the view that it is crucial for all board members to be a part of this process and as such, hasnot established a separate risk management committee.
The board oversees an annual assessment of the effectiveness of risk management and Internal complianceand control. The tasks of undertaking and assessing risk management and internal control effectiveness aredelegated to management through the Managing Director, including responsibility for the day to day designand implementation of the company's risk management and internal control system. Management reports tothe board on the company’s key risks and the extent to which it believes these risks are being adequatelymanaged. The reporting on risk by management is a standing agenda item at board meetings.
MD and CFO certification
In accordance with section 295A of the Corporations Act, the MD and CFO have provided a written statementto the board that:
Their view provided on the Company's financial report is founded on a sound system of riskmanagement and internal compliance and control which implements the financial policies adoptedby the board
The Company's risk management and internal compliance and control system is operatingeffectively in all material respects
For
per
sona
l use
onl
y

P a g e | 33
Corporate governance statement (continued)
The board agrees with the views of the ASX on this matter and notes that due to its nature, internal controlassurance from the MD and CFO can only be reasonable rather than absolute. This is due to such factors as theneed for judgement, the use of testing on a sample basis, the inherent limitations in internal control andbecause much of the evidence available is persuasive rather than conclusive and therefore is not and cannotbe designed to detect all weaknesses in control procedures.
Remuneration
It is the Company's objective to provide maximum stakeholder benefit from the retention of a high qualityboard and executive team by remunerating directors and key executives fairly and appropriately withreference to relevant employment market conditions. The expected outcomes of the remuneration structureare:
Retention and motivation of key executives Attraction of high quality management to the Company Performance incentives that allow executives to share in the success of Noble Mineral Resources
Limited
For a discussion of the Company's remuneration philosophy and framework and the remuneration received bydirectors and executives in the current period please refer to the remuneration report, which is containedwithin the directors’ report.
There is no scheme to provide retirement benefits to non-executive directors.
The board is responsible for determining and reviewing compensation arrangements for the directorsthemselves, the MD and executive team. The board has established a remuneration committee, comprisingtwo non-executive directors. Members of the remuneration committee throughout the year were:
HRH Tunku Naquiyuddin (Committee Chairman)Brian Thomas (from 11 October 2010)Alan Taylor (up to 11 October 2010)
For details on the number of meetings of the remuneration committee held during the year and the attendeesat those meetings, refer to the directors’ report.
For additional details regarding the remuneration committee, including a copy of its charter, please refer toour website.
The Company is at variance with Recommendation 8.1 in that the Remuneration Committee only has twomembers, and is not chaired by an independent director. The Board considers that this composition isappropriate given the current size of the Company and board structure.
For
per
sona
l use
onl
y

P a g e | 34
Corporate governance statement (continued)
Shareholder communication policy
Pursuant to Principle 6, Noble’s objective is to promote effective communication with Its shareholders at alltimes.
Noble Mineral Resources Limited is committed to:
Ensuring that shareholders and the financial markets are provided with full and timely informationabout Noble’s activities in a balanced and understandable way
Complying with continuous disclosure obligations contained in the ASX listing rules and theCorporations Act in Australia
Communicating effectively with its shareholders and making it easier for shareholders tocommunicate with Noble Mineral Resources Limited
To promote effective communication with shareholders and encourage effective participation at generalmeetings, information is communicated to shareholders:
Through the release of information to the market via the ASX Through the distribution of the annual report and notices of annual general meeting Through shareholder meetings and investor relations presentations Through letters and other forms of communications directly to shareholders By posting relevant information on Noble’s website:
www.nobleminres.com.au
The Company’s website www.nobleminres.com.au has a dedicated investor relations section for the purposeof publishing all important company information and relevant announcements made to the market.
The external auditors are required to attend the annual general meeting and are available to answer anyshareholder questions about the conduct of the audit and preparation of the audit report.
For
per
sona
l use
onl
y

P a g e | 35
Consolidated statement of financial position
As at 30 June 2011
ConsolidatedNote As at
1 July2010 2009
2011 restated restatedUS $ (000) US $ (000) US $ (000)
ASSETSCurrent AssetsCash and cash equivalents 15 9,430 30,889 3,114Consumables 13 5,022 - -Trade and other receivables 14 1,025 111 29Other assets 16 9,430 178 -
Total current assets 24,907 31,178 3,143
Non-current assetsExploration and evaluation assets 10 4,765 514 493Property, plant and equipment 11 81,764 134 202Mine properties 12 9,918 - -Trade and other receivables 14 - 6,155 10Other assets 16 2,888 8 -
Total non-current assets 99,335 6,811 705
TOTAL ASSETS 124,242 37,989 3,848
LIABILITIESCurrent LiabilitiesTrade and other payables 20 13,647 548 259Interest-bearing loans and borrowings 18 34,646 - -Provisions 19 1,590 66 19Derivative financial instruments 27 2,947 -
Total current liabilities 52,830 614 278
Non-current liabilitiesProvisions 19 9,481 - -
Deferred tax liability 8 8,314 - -
Loans and borrowings - - 2,081
Total non-current liabilities 17,795 - 2,081
TOTAL LIABILITIES 70,625 614 2,359
NET ASSETS 53,617 37,375 1,489
EQUITYIssued capital 17 78,373 41,954 4,339Reserves 21 850 310 (651)Accumulated losses (25,606) (4,889) (2,199)
TOTAL EQUITY 53,617 37,375 1,489
For
per
sona
l use
onl
y

P a g e | 36
Consolidated statement of comprehensive income
For the year ended 30 June 2011
Consolidated
Note 20102011 restated
US $ (000) US $ (000)
Revenue 5 568 190
Other income 5 2,731 16
General and administrative expenses 6 (21,719) (1,861)
Exploration and evaluation expenses written off (177) (518)Borrowing expenses 7 (121) (517)Loss on derivative financial instruments 27 (1,999) -Other expenses - -
Loss before income tax (20,717) (2,690)
Income tax 8 - -
Net loss for the period (20,717) (2,690)
Other comprehensive incomeExchange differences arising on translation of operations - 961
Total other comprehensive income - 961
Total comprehensive loss for the period (20,717) (1,729)
Cents CentsLosses per share for loss from continuing operationsattributable to the ordinary equity holders:
Basic losses per share 9 (5.87) (1.68)
Diluted losses per share 9 (5.87) (1.68)
For
per
sona
l use
onl
y

P a g e | 37
Consolidated statement of changes in equity
For the year ended 30 June 2011
ForeignCurrency
Issued Translation Option AccumulatedCapital Reserve Reserve Losses Total
US $ (000) US $ (000) US $ (000) US $ (000) US $ (000)
Balance as at 1 July 2010 41,954 310 - (4,889) 37,375Net profit (loss) for the period - - - (20,717) (20,717)Other comprehensive income - - - - -
Total comprehensive profit (loss) for the period - - - (20,717) (20,717)Issue of share capital 35,474 - - - 35,474Share based payments - - 540 - 540Exercise of options 2,945 - - - 2,945Share issue costs (2,000) - - - (2,000)
Balance as at 30 June 2011 78,373 310 540 (25,606) 53,617
Balance as at 1 July 2009 4,339 (651) - (2,199) 1,489Net profit (loss) for the period - - - (2,690) (2,690)Other comprehensive income - 961 - - 961
Total comprehensive profit (loss) for the period - 961 - (2,690) (1,729)Issue of share capital 39,283 - - - 39,283Share issue costs (1,668) - - - (1,668)
Balance as at 30 June 2010 41,954 310 - (4,889) 37,375For
per
sona
l use
onl
y

P a g e | 38
Consolidated statement of cash flows
For the year ended 30 June 2011
Consolidated
Note 2011 2010US $ (000) US $ (000)
Cash flows from operating activitiesInterest income received 568 103Interest expense paid (87) (486)Payments to suppliers and employees (21,691) (1,374)Payments for exploration and evaluation expenditure (177) (545)
Net cash flows used in operating activities 29 (21,387) (2,302)
Cash flows from investing activitiesProceeds from sale of property, plant and equipment 10 49Purchase of property, plant and equipment (19,261) (46)Prepayments on property, plant and equipment (8,588) -Payments for exploration and evaluation assets (4,251) -Advancement of loans to subsidiary prior to acquisition (5,491) (6,498)
Cash acquired on acquisition of subsidiary 3 3,124 -
Net cash flows used in investing activities (34,457) (6,495)
Cash flows from financing activitiesProceeds from issue of share capital 32,461 39,283Share issue costs (1,459) (1,668)Proceeds from borrowings 1,100 -Repayment of borrowings (616) (2,803)Other 397 -
Net cash flows from financing activities 31,883 34,812
Net increase (decrease) in cash and cash equivalents (23,961) 26,015Net foreign exchange differences 2,450 1,760Cash and cash equivalents at the beginning of the period 30,889 3,114
Cash and cash equivalents at the end of the period 9,378 30,889
Analysis of balances of cash and cash equivalents:
Cash at bank and in hand 9,392 7,077Short-term deposits 38 23,812
Cash and cash equivalents as statedIn the statement of financial position 15 9,430 30,889Overdraft 20 (52) -
Cash and cash equivalents as statedIn the statement of cash flows 9,378 30,889
For
per
sona
l use
onl
y

P a g e | 39
Notes to the consolidated financial statements
For the year ended 30 June 2011
1. Corporate information
The consolidated financial statements of Noble Mineral Resources Limited (‘Noble’) for the year ended 30 June2011 were authorised for issue in accordance with a resolution of the directors on 30 September 2011. Nobleis a limited company incorporated and domiciled in Australia whose shares are publicly traded on theAustralian Stock Exchange.
The principal activities of the Group are the exploration for, development and production of gold.2.
2.1. Basis of preparation
The consolidated financial statements of Noble and all its subsidiaries (the ‘Group’) are general purposefinancial reports which have been prepared in accordance with the requirements of the Corporations Act 2001,Australian Accounting Standards and other authoritative pronouncements of the Australian AccountingStandards Board.
The consolidated financial statements have been prepared on a historical cost basis, except for derivativefinancial instruments that have been measured at fair value. The consolidated financial statements arepresented in US dollars and all values are rounded to the nearest million (US$ thousand) except whenotherwise indicated.
Compliance with IFRS
The financial report also complies with International Financial Reporting Standards (IFRS) as issued by theInternational Accounting Standards Board.
Basis of consolidation
The consolidated financial statements comprise the financial statements of the Group as at 30 June 2011.Subsidiaries are fully consolidated from the date of acquisition, being the date on which the Group obtainscontrol, and continue to be consolidated until the date when such control ceases. The financial statements ofthe subsidiaries are prepared for the same reporting period as the parent company, using consistentaccounting policies.
All intra-group balances, transactions, unrealised gains and losses resulting from intra-group transactions anddividends are eliminated in full. Where the ownership of a subsidiary is less than 100%, and therefore a non-controlling interest/s exists, any losses of that subsidiary are attributed to the non-controlling interest/s even ifthat results in a deficit balance.
(a)(i) Bibiani Project – Future cash flow requirements
During the year ended 30 June 2011, the consolidated entity (‘the Group’) incurred net losses of $20.717m(2010: $2.690m) and had a net cash outflow of $23.961m (2010: $26.015m inflow).
At 30 June 2011, the delay in the commencement of production at the Bibiani Gold Mine resulted in an eventof breach on the Investec loan facility. This in turn necessitated the Investec loan facility being classified as acurrent liability as the Group did not have the unconditional right to defer settlement of the loan for a periodgreater than 12 months. At balance date the Group had a net working capital deficiency of $38.6m.
For
per
sona
l use
onl
y

P a g e | 40
Notes to the consolidated financial statements (continued)
For the year ended 30 June 2011
2.1. Basis of preparation (continued)
The Group requires approximately $41.7m in additional capital to support the Group‘s ongoing working capitalrequirements which are sensitive to the time it will take to get the Bibiani Gold Mine ready for start up, thetime it will take to achieve plant optimisation and ultimately the assumed ounces of gold to be produced on amonthly basis. Any material delays in getting the plant ready for start up could materially impact the Group’sfuture cash flow requirements.
Notwithstanding the above, the Directors’ are of the opinion that, at the date of signing the financial report,the Group is a going concern having regard to the following pertinent matters:
As set out in Note 30, subsequent to 30 June 2011, the Group raised $20.3m from the conversion of its shareoptions. BGF Equities Pty Limited have been mandated to place 60m Noble shares at A$0.55 per share, toraise A$33,000,000 and at the date of this report, the Group has received firm, unconditional and irrevocablecommitments of $25.5m from sophisticated and institutional investors to participate in this share placement,the funds for which are anticipated to be received by 11 October 2011.
2.2. Significant accounting judgements, estimates and assumptions
The preparation of the Group’s consolidated financial statements requires management to make judgments,estimates and assumptions that affect the reported amounts of assets, liabilities and contingent liabilities atthe date of the consolidated financial statements and reported amounts of revenues and expenses during thereporting period. Estimates and assumptions are continuously evaluated and are based on management’sexperience and other factors, including expectations of future events that are believed to be reasonable underthe circumstances. However, actual outcomes can differ from these estimates.
In particular, information about significant areas of estimation uncertainty considered by management inpreparing the consolidated financial statements is described below.
Mine rehabilitation
The Group assesses its mine rehabilitation provision annually. Significant estimates and assumptions are madein determining the provision for mine rehabilitation as there are numerous factors that will affect the ultimateliability payable. These factors include estimates of the extent and costs of rehabilitation activities,technological changes, regulatory changes, cost increases as compared to the inflation rates (3% (2010: 2%)),and changes in discount rates (7.5% (2010: 8%)). These uncertainties may result in future actual expenditurediffering from the amounts currently provided. The provision at reporting date represents management’s bestestimate of the present value of the future rehabilitation costs required. Changes to estimated future costs arerecognised in the statement of financial position by either increasing or decreasing the rehabilitation liabilityand related asset if the initial estimate was originally recognised as part of an asset. Any reduction in therehabilitation liability and therefore any deduction from the related asset may not exceed the carrying amountof that asset. If it does, any excess over the carrying value is taken immediately to profit or loss.
If the change in estimate results in an increase in the rehabilitation liability and therefore an addition to thecarrying value of the asset, the entity is required to consider whether this is an indication of impairment of theasset as a whole and test for impairment. If, for mature mines, the revised mine assets net of rehabilitationprovisions exceeds the recoverable value, that portion of the increase is charged directly to expense. Forclosed sites, changes to estimated costs are recognised immediately in profit or loss. Also, rehabilitationobligations that arose as a result of the production phase of a mine, should be expensed as incurred.
For
per
sona
l use
onl
y

P a g e | 41
Notes to the consolidated financial statements (continued)
For the year ended 30 June 2011
2.2. Significant accounting judgements, estimates and assumptions (continued)
Ore reserve and resource estimates
Ore reserves are estimates of the amount of ore that can be economically and legally extracted from theGroup’s mining properties. The Group estimates its ore reserves and mineral resources based on informationcompiled by appropriately qualified persons relating to the geological data on the size, depth and shape of theore body, and requires complex geological judgments to interpret the data.
The estimation of recoverable reserves is based upon factors such as estimates of foreign exchange rates,commodity prices, future capital requirements, and production costs along with geological assumptions andjudgments made in estimating the size and grade of the ore body. Changes in the reserve or resourceestimates may impact upon the carrying value of exploration and evaluation assets, mine properties, property,plant and equipment, goodwill, provision for rehabilitation, recognition of deferred tax assets, anddepreciation and amortisation charges.
Exploration and evaluation expenditure (Note 10)
The application of the Group’s accounting policy for exploration and evaluation expenditure requires judgmentin determining whether it is likely that future economic benefits are likely either from future exploitation orsale. The determination of a Joint Ore Reserves Committee (JORC) resource is itself an estimation process thatrequires varying degrees of uncertainty depending on sub-classification and these estimates directly impactthe point of deferral of exploration and evaluation expenditure. The deferral policy requires management tomake certain estimates and assumptions about future events or circumstances, in particular whether aneconomically viable extraction operation can be established. Estimates and assumptions made may change ifnew information becomes available. If, after expenditure is capitalised, information becomes availablesuggesting that the recovery of expenditure is unlikely, the amount capitalised is written off in profit or loss inthe period when the new information becomes available.
Impairment of assets
The Group assesses each cash generating unit annually to determine whether any indication of impairmentexists. Where an indicator of impairment exists, a formal estimate of the recoverable amount is made, which isconsidered to be the higher of the fair value less costs to sell and value in use. These assessments require theuse of estimates and assumptions such as long-term commodity prices, discount rates, future capitalrequirements, exploration potential and operating performance. Fair value is determined as the amount thatwould be obtained from the sale of the asset in an arm’s length transaction between knowledgeable andwilling parties. Fair value for mineral assets is generally determined as the present value of estimated futurecash flows arising from the continued use of the asset, which includes estimates such as the cost of futureexpansion plans and eventual disposal, using assumptions that an independent market participant may takeinto account. Cash flows are discounted to their present value using a pre-tax discount rate that reflectscurrent market assessments of the time value of money and the risks specific to the asset. Management hasassessed its cash generating units as being an individual mine site, which is the lowest level for which cashinflows are largely independent of those of other assets.
Contingencies (Note 22)
By their nature, contingencies will only be resolved when one or more uncertain future events occur or fail tooccur. The assessment of contingencies inherently involves the exercise of significant judgment and estimatesof the outcome of future events.
For
per
sona
l use
onl
y
P a g e | 42
Notes to the consolidated financial statements (continued)
For the year ended 30 June 2011
2.2. Significant accounting judgements, estimates and assumptions (continued)
Production start date
The Group assesses the stage of the mine under construction to determine when the mine moves into theproduction stage being when the mine is substantially complete and ready for its intended use. The criteriaused to assess the start date are determined based on the unique nature of the mine construction project,such as the complexity of a plant and its location.
The Group considers various relevant criteria to assess when the production phases is considered tocommence and all related amounts are reclassified from ’Mines under construction’ to ’Producing mines’ and’Property, plant and equipment’. Some of the criteria used will include, but are not limited to, the following:
Level of capital expenditure incurred compared to the original construction cost estimates Completion of a reasonable period of testing of the mine plant and equipment Ability to produce gold in saleable form (within specifications) Ability to sustain ongoing production of gold
When the mine development / construction project moves into the production stage, the capitalisation ofcertain mine development / construction costs ceases and costs are either regarded as forming part of the costof inventory or expensed, except for costs that qualify for capitalisation relating to mining asset additions orimprovements, underground mine development or mineable reserve development. It is also at this point thatdepreciation / amortisation commences.
Recovery of deferred tax assets (Note 8)
Judgment is required in determining whether deferred tax assets are recognised on the statement of financialposition. Deferred tax assets, including those arising from un-utilised tax losses, require management to assessthe likelihood that the Group will generate taxable earnings in future periods, in order to utilise recogniseddeferred tax assets. Estimates of future taxable income are based on forecast cash flows from operations andthe application of existing tax laws in each jurisdiction. To the extent that future cash flows and taxable incomediffer significantly from estimates, the ability of the Group to realise the net deferred tax assets recorded atthe reporting date could be impacted.
Additionally, future changes in tax laws in the jurisdictions in which the Group operates could limit the abilityof the Group to obtain tax deductions in future periods.
2.3. Changes in accounting policies and disclosures
The accounting policies adopted are consistent with those of the previous financial year except as disclosedbelow:
(i) Adoption of new and amended accounting standards and interpretations
The Group has adopted all new and amended Accounting Standards and Interpretations effective from 1July 2010.
When the adoption of the Standard or Interpretation is deemed to have an impact on the financialstatements or performance of the Group, its impact is described below:
For
per
sona
l use
onl
y

P a g e | 43
Notes to the consolidated financial statements (continued)
For the year ended 30 June 2011
2.3. Changes in accounting policies and disclosures (continued)
AASB 2009-10 Amendments to Australian Accounting Standards – Classification of Rights Issues
The amendment clarifies that rights, options or warrants to acquire a fixed number of an entity’s ownequity instruments for a fixed amount in any currency are equity instruments if the entity offers therights, options or warrants pro rata to all existing owners of the same class of its own non-derivativeequity instruments, accordingly pro rata options issued during the year with an exercise price ofAustralian Dollars have been classified as equity. Refer Issued capital (note 17).
AASB 107 Statement of Cash Flows
The amendment to the Standard arising from the Annual Improvement Project requires that onlyexpenditure resulting in the recognition of an asset in the Statement of Financial Position is eligible forclassification as investing activities in the Statement of Cash Flows. The adoption of the amendment hasresulted in the reclassification of exploration and evaluation expenditure amounting to $177,000 (2010:$545,000) from investing to operating activities in the consolidated Cash Flow Statement.
(ii) Change in functional and presentation currency
An entity’s functional currency is the currency of the primary economic environment in which the entityoperates. Following the acquisition of Noble Gold Bibiani Limited (formerly Central African Gold GhanaLimited) in July 2010, Noble Mineral Resources Limited now has over 80% of its net assets denominatedin US dollars. The majority of the Company’s funding and expenditures will be denominated in US dollarsgoing forward. Consequently, the Company announced on 27 January 2011 that the directors haddetermined that the functional currency of the Company is US dollars. The change in functional currencyhas been applied with effect from 1 July 2010 in accordance with the requirements of the AccountingStandards.
Following the change in functional currency, Noble Mineral Resources Limited has elected to change itspresentation currency from Australian dollars to US dollars. The directors believe that changing thepresentation currency to US dollars will provide shareholders with a more accurate reflection of theGroup’s underlying financial performance and position. The change in presentation currency representsa voluntary change in accounting policy, which has been applied retrospectively.
To give effect to the change in functional currency, the assets and liabilities of the Company at 30 June2010 were converted to US dollars at a fixed exchange rate on 1 July 2010 of US$1:A$1.1678 and thecontributed equity, reserves and retained earnings were converted at applicable historical rates. In orderto derive US dollar comparatives (presentation currency), the Australian dollar functional currency assetsand liabilities at 30 June 2010 were converted at the spot rate of US$1:A$1.1678 (2009: US$1:A$1.2165)on the reporting date, revenue and expenses for the year ended 30 June 2010 were converted at theaverage exchange rate of US$1:A$1.1059 for the reporting period, or at the exchange rates ruling at thedate of the transaction to the extent practicable, and equity balances were converted at applicablehistorical rates.
The above stated procedures resulted in a foreign currency translation reserve of US$310,000 on 1 July2010 (1 July 2009: (US$651,000)). Earnings per share for the year ended 30 June 2010 has also beenrestated in US dollars to reflect the change in the presentation currency.
All amounts are presented in US dollars and rounded to the nearest thousand unless otherwise indicated.
For
per
sona
l use
onl
y

P a g e | 44
Notes to the consolidated financial statements (continued)
For the year ended 30 June 2011
2.4. Summary of significant accounting policies
(a) Business combinations and goodwill
Business combinations are accounted for using the acquisition method. The cost of an acquisition is measuredas the aggregate of the consideration transferred, measured at acquisition date fair value and the amount ofany non-controlling interest in the acquiree. For each business combination, the acquirer measures the non-controlling interest in the acquiree either at fair value or at the proportionate share of the acquiree’sidentifiable net assets. Acquisition costs incurred are expensed and included in administrative expenses.
When the Group acquires a business, it assesses the financial assets and liabilities assumed for appropriateclassification and designation in accordance with the contractual terms, economic circumstances and pertinentconditions as at the acquisition date. This includes the separation of embedded derivatives in host contracts bythe acquiree.
If the business combination is achieved in stages, the acquisition date fair value of the acquirer’s previouslyheld equity interest in the acquiree is remeasured to fair value as at the acquisition date through profit or loss.
Any contingent consideration to be transferred by the acquirer will be recognised at fair value at theacquisition date. Subsequent changes to the fair value of the contingent consideration which is deemed to bean asset or liability, will be recognised in accordance with AASB 139 either in profit or loss or as change toother comprehensive income. If the contingent consideration is classified as equity, it shall not be remeasureduntil it is finally settled within equity.
Goodwill is initially measured at cost being the excess of the aggregate of the consideration transferred andthe amount recognised for non-controlling interest over the fair value of the net identifiable assets acquiredand liabilities assumed. If this consideration is lower than the fair value of the net identifiable assets of thesubsidiary acquired, the difference is recognised in profit or loss.
After initial recognition, goodwill is measured at cost less any accumulated impairment losses. For the purposeof impairment testing, goodwill acquired in a business combination is, from the acquisition date, allocated toeach of the Group’s cash-generating units that are expected to benefit from the combination, irrespective ofwhether other assets or liabilities of the acquiree are assigned to those units.
Where goodwill forms part of a cash-generating unit and part of the operation within that unit is disposed of,the goodwill associated with the operation disposed of is included in the carrying amount of the operationthen determining the gain or loss on disposal of the operation. Goodwill disposed of in this circumstance ismeasured based on the relative values of the operation disposed of and the portion of the cash-generatingunit retained.
(b) Mineral exploration, evaluation and development expenditure
Pre-licence costs
Pre-licence costs are expensed in the period in which they are incurred.
Exploration and evaluation costs
Costs related to the acquisition of licences are capitalised until the viability of the area of interest isdetermined.
For
per
sona
l use
onl
y

P a g e | 45
Notes to the consolidated financial statements (continued)
For the year ended 30 June 2011
2.4. Summary of significant accounting policies (continued)
(b) Mineral exploration, evaluation and development expenditure (continued)
Exploration and evaluation expenditure incurred on licences where a JORC compliant resource has not yetbeen established is expensed as incurred until sufficient evaluation has occurred in order to establish a JORCcompliant resource. Costs expensed during this phase are included in ‘exploration expenditure’ in profit orloss. These costs include materials and fuel used, surveying costs, drilling costs and payments made tocontractors.
Upon the establishment of a JORC compliant resource (at which point, the Group considers it probable thateconomic benefits will be realised), the Group capitalises any further evaluation costs incurred for theparticular licence to exploration and evaluation assets up to the point when a JORC compliant reserve isestablished.
In evaluating if expenditures meet the criteria to be capitalised, several different sources of information areutilised. The information that is used to determine the probability of future benefits depends on the extent ofexploration and evaluation that has been performed.
Exploration and evaluation assets acquired in a business combination are initially recognised at fair value. Theyare subsequently measured at cost less accumulated impairment. Once JORC compliant reserves areestablished and development is sanctioned, exploration and evaluation assets are tested for impairment andtransferred to ‘Mines under construction’. No amortisation is charged during the exploration and evaluationphase.
A regular review is undertaken of each area of interest to determine the appropriateness of continuing to carryforward costs in relation to that area of interest.
The accounting policy note has been updated to reflect the accounting treatment consistently applied in prioryears.
Mine properties
Upon transfer of ‘Exploration and evaluation costs’ into ‘Mine properties’, all subsequent expenditure on theconstruction, installation or completion of infrastructure facilities is capitalised within ‘Mine properties.’Development expenditure is net of proceeds from all but the incidental sale of ore extracted during thedevelopment phase.
(c) Property, plant and equipment
Plant and equipment is stated at historical cost less accumulated depreciation and any accumulatedimpairment losses. Such cost includes the cost of replacing parts that are eligible for capitalisation when thecost of replacing the parts is incurred. Similarly, when each major inspection is performed, its cost isrecognised in the carrying amount of the plant and equipment as a replacement only if it is eligible forcapitalisation. All other repairs and maintenance are recognised in profit or loss as incurred.
For
per
sona
l use
onl
y

P a g e | 46
Notes to the consolidated financial statements (continued)
For the year ended 30 June 2011
2.4. Summary of significant accounting policies (continued)
(c) Property, plant and equipment (continued)
Depreciation / amortisation
The depreciable amount of all fixed assets including buildings and capitalised leased assets, but excludingfreehold land, is depreciated on a straight line basis over their useful lives to the Company commencing fromthe time the asset is held ready for use. The asset’s residual value and useful lives are reviewed and adjusted ifappropriate, at each statement of financial position date.
The premium paid in excess of the intrinsic value of land to gain access is amortised over the life of mine.
Other plant and equipment such as mobile mine equipment is generally depreciated on a straight-line basisover their estimated useful lives as follows:
Concession land and buildings 10 years Leasehold land and buildings 10 years Mining plant and equipment 5 years Motor vehicles 2 to 4 years Furniture and fittings 3 to 5 years Computer equipment 2 to 3 years
An item of property, plant and equipment and any significant part initially recognised is derecognised upondisposal or when no future economic benefits are expected from its use or disposal. Any gain or loss arising onderecognition of the asset (calculated as the difference between the net disposal proceeds and the carryingamount of the asset) is included in profit or loss when the asset is derecognised.
The asset’s residual values, useful lives and methods of depreciation/amortisation are reviewed at eachreporting period, and adjusted prospectively if appropriate.
Major maintenance and repairs
Expenditure on major maintenance refits or repairs comprises the cost of replacement assets or parts of assetsand overhaul costs. Where an asset or part of an asset that was separately depreciated and is now written offis replaced, and it is probable that future economic benefits associated with the item will flow to the Groupthrough an extended life, the expenditure is capitalised.
Where part of the asset was not separately considered as a component, the replacement value is used toestimate the carrying amount of the replaced assets which is immediately written off. All other day to daymaintenance costs are expensed as incurred.
(d) Impairment of non-financial assets
The Group assesses at each reporting date whether there is an indication that an asset may be impaired. If anyindication exists, or when annual impairment testing for an asset is required, the Group estimates the asset’srecoverable amount. An asset’s recoverable amount is the higher of an asset’s or cash-generating unit’s (CGU)fair value less costs to sell and its value in use and is determined for an individual asset, unless the asset doesnot generate cash inflows that are largely independent of those from other assets or groups of assets, in whichcase the asset is tested as part of a larger CGU.
For
per
sona
l use
onl
y

P a g e | 47
Notes to the consolidated financial statements (continued)
For the year ended 30 June 2011
2.4. Summary of significant accounting policies (continued)
(d) Impairment of non-financial assets (continued)
Where the carrying amount of an asset or CGU exceeds its recoverable amount, the asset is consideredimpaired and is written down to its recoverable amount. In assessing value in use, the estimated future cashflows are discounted to their present value using a pre-tax discount rate that reflects current marketassessments of the time value of money and the risks specific to the asset. In determining fair value less coststo sell, recent market transactions are taken into account, if available. If no such transactions can be identified,an appropriate valuation model is used. These calculations are corroborated by valuation multiples, quotedshare prices for publicly traded subsidiaries or other available fair value indicators.
The Group bases its impairment calculation on detailed budgets and forecast calculations which are preparedseparately for each of the Group’s cash-generating units to which the individual assets are allocated.
Impairment losses of continuing operations, including impairment of inventories, are recognised in profit orloss in those expense categories consistent with the function of the impaired asset, except for a propertypreviously revalued where the revaluation was taken to other comprehensive income. In this case, theimpairment is also recognised in other comprehensive income up to the amount of any previous revaluation.
For assets, an assessment is made at each reporting date as to whether there is any indication that previouslyrecognised impairment losses may no longer exist or may have decreased. If such indication exists, the Groupestimates the asset’s or cash-generating unit’s recoverable amount. A previously recognised impairment loss isreversed only if there has been a change in the assumptions used to determine the asset’s recoverable amountsince the last impairment loss was recognised. The reversal is limited so that the carrying amount of the assetdoes not exceed its recoverable amount, nor exceed the carrying amount that would have been determined,net of depreciation, had no impairment loss been recognised for the asset in prior years. Such reversal isrecognised in profit or loss.
(e) Financial instruments – initial recognition and subsequent measurement
i) Financial assets
Initial recognition and measurement
Financial assets are classified as financial assets at fair value through profit or loss, loans and receivables,held-to-maturity investments, available-for-sale financial assets, or as derivatives designated as hedginginstruments in an effective hedge, as appropriate. The Group determines the classification of its financialassets at initial recognition. All financial assets are recognised initially at fair value plus, in the case ofinvestments not at fair value through profit or loss, directly attributable transaction costs.
Purchases or sales of financial assets that require delivery of assets within a time frame established byregulation or convention in the marketplace (regular way trades) are recognised on the trade date, i.e.,the date that the Group commits to purchase or sell the asset.
The Group’s financial assets include cash and short-term deposits, trade and other receivables and loansand other receivables.
For
per
sona
l use
onl
y

P a g e | 48
Notes to the consolidated financial statements (continued)
For the year ended 30 June 2011
2.4. Summary of significant accounting policies (continued)
(e) Financial instruments – initial recognition and subsequent measurement (continued)
Subsequent measurement
The subsequent measurement of financial assets depends on their classification as follows:
Loans and receivables
Loans and receivables are non-derivative financial assets with fixed or determinable payments that arenot quoted in an active market. After initial measurement, such financial assets are subsequentlymeasured at amortised cost using the effective interest rate method (EIR), less impairment. Amortisedcost is calculated by taking into account any discount or premium on acquisition and fees or costs thatare an integral part of the EIR. The EIR amortisation is included in finance income in profit or loss. Thelosses arising from impairment are recognised in profit or loss in finance costs.
Collectability of loans and receivables are reviewed on an ongoing basis. Individual debts that are knownto be uncollectible are written off when identified. An impairment provision is recognised when there isobjective evidence that the Group will not be able to collect the receivable. Financial difficulties of thedebtor, default payments or debts more than 60 days overdue are considered objective evidence ofimpairment. The amount of the impairment loss is the receivable carrying amount compared to thepresent value of estimated future cash flows, discounted at the original effective interest rate.
ii) Financial liabilities
Initial recognition and measurement
Financial liabilities are classified as financial liabilities at fair value through profit or loss or as loans andborrowings at amortised cost. The Group determines the classification of its financial liabilities at initialrecognition.
All financial liabilities are recognised initially at fair value and in the case of loans and borrowings, plusdirectly attributable transaction costs.
The Group’s financial liabilities include trade and other payables, bank overdrafts, loans and borrowings,and derivative financial instruments.
Subsequent measurement
The measurement of financial liabilities depends on their classification as follows:
Interest-bearing loans and borrowings
After initial recognition, interest-bearing loans and borrowings are subsequently measured at amortisedcost using the effective interest rate (EIR) method. Gains and losses are recognised in profit or loss whenthe liabilities are derecognised, as well as through the EIR amortisation process.
Amortised cost is calculated by taking into account any discount or premium on acquisition and fees orcosts that are an integral part of the EIR. The EIR amortisation is included in finance costs in profit or loss.
For
per
sona
l use
onl
y

P a g e | 49
Notes to the consolidated financial statements (continued)
For the year ended 30 June 2011
2.4. Summary of significant accounting policies (continued)
(e) Financial instruments – initial recognition and subsequent measurement (continued)
Derivative financial instruments
Derivative financial instruments are initially stated at their fair value on the date a derivative contract isexecuted and are subsequently remeasured at each reporting date. The resulting gain or loss isrecognised in the statement of comprehensive income during each reporting period.
Derecognition
A financial liability is derecognised when the obligation under the liability is discharged or cancelled orexpires. When an existing financial liability is replaced by another from the same lender on substantiallydifferent terms, or the terms of an existing liability are substantially modified, such an exchange ormodification is treated as a derecognition of the original liability and the recognition of a new liability,and the difference in the respective carrying amounts is recognised in the statement of comprehensiveincome.
iii) Offsetting of financial instruments
Financial assets and financial liabilities are offset and the net amount reported in the consolidatedstatement of financial position if, and only if, there is a currently enforceable legal right to offset therecognised amounts and there is an intention to settle on a net basis, or to realise the assets and settlethe liabilities simultaneously.
iv) Fair value of financial instruments
The fair value of financial instruments that are traded in active markets at each reporting date isdetermined by reference to quoted market prices or dealer price quotations (bid price for long positionsand ask price for short positions), without any deduction for transaction costs.
For financial instruments not traded in an active market, the fair value is determined using appropriatevaluation techniques. Such techniques may include using recent arm’s length market transactions;reference to the current fair value of another instrument that is substantially the same; a discounted cashflow analysis or other valuation models.An analysis of fair values of financial instruments and further details as to how they are measured areprovided in Note 27.
v) Cash and short-term deposits
Cash and cash equivalents in the statement of financial position comprise cash at banks and at hand andshort-term deposits with an original maturity of three months or less.
For the purpose of the consolidated statement of cash flows, cash and cash equivalents consist of cashand cash equivalents as defined above, net of outstanding bank overdrafts.
For
per
sona
l use
onl
y

P a g e | 50
Notes to the consolidated financial statements (continued)
For the year ended 30 June 2011
2.4. Summary of significant accounting policies (continued)
(f) Consumables
Materials and supplies are valued at the lower of cost or net realisable value. Any provision for obsolescence isdetermined by reference to specific items of stock. A regular review is undertaken to determine the extent ofany provision for obsolescence.
Consumables are measured using weighted average costs.
(g) Leases
The determination of whether an arrangement is, or contains, a lease is based on the substance of thearrangement at inception date: whether fulfilment of the arrangement is dependent on the use of a specificasset or assets or the arrangement conveys a right to use the asset, even if that right is not explicitly specifiedin an arrangement.
Group as a lessee
Operating lease payments are recognised as an operating expense in profit or loss on a straight-line basis overthe lease term.
(h) Provisions
General
Provisions are recognised when the Group has a present obligation (legal or constructive) as a result of a pastevent, it is probable that an outflow of resources embodying economic benefits will be required to settle theobligation and a reliable estimate can be made of the amount of the obligation. Where the Group expectssome or all of a provision to be reimbursed, for example under an insurance contract, the reimbursement isrecognised as a separate asset but only when the reimbursement is virtually certain. The expense relating toany provision is presented in profit or loss net of any reimbursement. If the effect of the time value of moneyis material, provisions are discounted using a current pre-tax rate that reflects where appropriate, the risksspecific to the liability. Where discounting is used, the increase in the provision due to the passage of time isrecognised as finance cost.
Rehabilitation and decommissioning provision
The Group records the present value of estimated costs of legal and constructive obligations required torestore operating locations in the period in which the obligation is incurred. The nature of these restorationactivities includes dismantling and removing structures, rehabilitating mines and tailings dams, dismantlingoperating facilities, closure of plant and waste sites, and restoration, reclamation and re-vegetation of affectedareas.
The obligation generally arises when the asset is installed or the ground / environment is disturbed at theproduction location. When the liability is initially recognised, the present value of the estimated costs iscapitalised by increasing the carrying amount of the related mining assets to the extent that it was incurred bythe development / construction of the mine. Over time, the discounted liability is increased for the change inpresent value based on the discount rates that reflect current market assessments and the risks specific to theliability.
For
per
sona
l use
onl
y

P a g e | 51
Notes to the consolidated financial statements (continued)
For the year ended 30 June 2011
2.4. Summary of significant accounting policies (continued)
(h) Provisions (continued)
The periodic unwinding of the discount is recognised in profit or loss as a finance cost. Additional disturbancesor changes in rehabilitation costs will be recognised as additions or charges to the corresponding assets andrehabilitation liability when they occur.
Employee benefits
Liabilities for wages and salaries, including non-monetary benefits, annual leave and accumulating sick leavedue to be settled within 12 months of the reporting date are recognised in respect of employees' services upto the reporting date. They are measured at the amounts expected to be paid when the liabilities are settled.Expenses for non-accumulating sick leave are recognised when the leave is taken and are measured at therates paid or payable.
Long service leave
The liability for long service leave is recognised and measured as the present value of expected futurepayments to be made in respect of services provided by employees up to the reporting date using theprojected unit credit method. Consideration is given to expected future wage and salary levels, experience ofemployee departures, and periods of service. Expected future payments are discounted using market yields atthe reporting date on national government bonds with terms to maturity and currencies that match, as closelyas possible, the estimated future cash outflows.
(i) Taxes
Current income tax
Current income tax assets and liabilities for the current period are measured at the amount expected to berecovered from or paid to the taxation authorities. The tax rates and tax laws used to compute the amount arethose that are enacted or substantively enacted, at the reporting date, in the countries where the Groupoperates and generates taxable income.
Current income tax relating to items recognised directly in other comprehensive income or equity isrecognised in other comprehensive income or equity and not in profit or loss . Management periodicallyevaluates positions taken in the tax returns with respect to situations in which applicable tax regulations aresubject to interpretation and establishes provisions where appropriate.
Deferred income tax
Deferred income tax is provided using the balance sheet method on temporary differences at the reportingdate between the tax bases of assets and liabilities and their carrying amounts for financial reporting purposes.F
or p
erso
nal u
se o
nly

P a g e | 52
Notes to the consolidated financial statements (continued)
For the year ended 30 June 2011
2.4. Summary of significant accounting policies (continued)
(i) Taxes (continued)
Deferred income tax liabilities are recognised for all taxable temporary differences, except:
Where the deferred income tax liability arises from the initial recognition of goodwill or of anasset or liability in a transaction that is not a business combination and, at the time of thetransaction, affects neither the accounting profit nor taxable profit; and
In respect of taxable temporary differences associated with investments in subsidiaries,associates and interests in joint ventures, where the timing of the reversal of the temporarydifferences can be controlled by the parent, investor or venturer and it is probable that thetemporary differences will not reverse in the foreseeable future.
Deferred income tax assets are recognised for all deductible temporary differences, carry forward of unusedtax credits and unused tax losses, to the extent that it is probable that taxable profit will be available againstwhich the deductible temporary differences, and the carry forward of unused tax credits and unused tax lossescan be utilised, except:
Where the deferred income tax asset relating to the deductible temporary difference arisesfrom the initial recognition of an asset or liability in a transaction that is not a businesscombination and, at the time of the transaction, affects neither the accounting profit nortaxable profit or loss; and
In respect of deductible temporary differences associated with investments in subsidiaries,associates and interests in joint ventures, deferred income tax assets are recognised only to theextent that it is probable that the temporary differences will reverse in the foreseeable futureand taxable profit will be available against which the temporary differences can be utilised
The Group recognises neither the deferred tax asset regarding the temporary difference on the rehabilitationliability, nor the corresponding deferred tax liability regarding the temporary difference on the rehabilitationasset.
The carrying amount of deferred income tax assets is reviewed at the end of each reporting period andreduced to the extent that it is no longer probable that sufficient taxable profit will be available to allow all orpart of the deferred income tax asset to be utilised. Unrecognised deferred income tax assets are reassessedat the end of each reporting period and are recognised to the extent that it has become probable that futuretaxable profit will be available to allow the deferred tax asset to be recovered.
Deferred income tax assets and liabilities are measured at the tax rates that are expected to apply to the yearwhen the asset is realised or the liability is settled, based on tax rates (and tax laws) that have been enacted orsubstantively enacted by the end of the reporting period.
Deferred income tax assets and deferred income tax liabilities are offset, if a legally enforceable right exists toset off current tax assets against current income tax liabilities and the deferred income taxes relate to thesame taxable entity and the same taxation authority.
Tax benefits acquired as part of a business combination, but not satisfying the criteria for separate recognitionat that date, would be recognised subsequently if new information about facts and circumstances arose.
For
per
sona
l use
onl
y

P a g e | 53
Notes to the consolidated financial statements (continued)
For the year ended 30 June 2011
2.4. Summary of significant accounting policies (continued)
(j) Revenue recognition
Revenue is recognised to the extent it is probable that the economic benefits will flow to the Group and therevenue can be reliably measured. Revenue is measured at the fair value of the consideration received andreceivable.
The following criteria are also applicable to other specific revenue transactions:
Interest revenue
For all financial instruments measured at amortised cost and interest bearing financial assets classified asavailable for sale, interest income or expense is recorded using the effective interest rate (EIR), which is therate that exactly discounts the estimated future cash payments or receipts through the expected life of thefinancial instrument or a shorter period, where appropriate, to the net carrying amount of the financial assetor liability.
Interest income is included in finance income in profit or loss.
(k) Borrowing costs
Borrowing costs directly attributable to the acquisition, construction or production of an asset that necessarilytakes a substantial period of time to get ready for its intended use or sale are capitalised as part of the cost ofthe respective assets. All other borrowing costs are expensed in the period they occur. Borrowing costs consistof interest and other costs that an entity incurs in connection with the borrowing of funds.
The Group capitalises borrowing costs where funds are borrowed specifically to finance a project, the amountcapitalised represents the actual borrowing costs incurred. Where surplus funds are available for a short termout of money borrowed specifically to finance a project, the income generated from the temporary investmentof such amounts is also capitalised and deducted from the total capitalised borrowing cost.
(l) Share-based payment transactions
The consolidated entity measures the cost of equity-settled transactions with consultants and financiers byreference to the fair value of the equity instruments at the date at which they were issued. The fair value isdetermined using the Binomial option pricing model using relevant input assumptions including the price ofthe underlying security, life of the equity instrument, expected volatility of the underlying security and the risk-free rate on interest.
For
per
sona
l use
onl
y

P a g e | 54
Notes to the consolidated financial statements (continued)
For the year ended 30 June 2011
2.5. Standards and interpretations issued but not yet effective
Standards issued but not yet effective up to the date of issuance of the Group’s financial statements are listedbelow. This listing is of standards and interpretations issued, which the Group reasonably expects to beapplicable at a future date. The Group intends to adopt those standards when they become effective. TheGroup has not yet assessed the impact the changes will have on the financial statements.
AASB 9 Financial Instruments
AASB 9 includes requirements for the classification and measurement of financial assets resulting from the firstpart of Phase 1 of the IASB’s project to replace IAS 39 Financial Instruments: Recognition and Measurement(AASB 139 Financial Instruments: Recognition and Measurement).
These requirements improve and simplify the approach for classification and measurement of financial assetscompared with the requirements of AASB 139. The main changes from AASB 139 are described below.
(a) Financial assets are classified based on (1) the objective of the entity’s business model for managing thefinancial assets; (2) the characteristics of the contractual cash flows. This replaces the numerouscategories of financial assets in AASB 139, each of which had its own classification criteria.
(b) IFRS 9 allows an irrevocable election on initial recognition to present gains and losses on investments inequity instruments that are not held for trading in other comprehensive income. Dividends in respect ofthese investments that are a return on investment can be recognised in profit or loss and there is noimpairment or recycling on disposal of the instrument.
(c) Financial assets can be designated and measured at fair value through profit or loss at initial recognition ifdoing so eliminates or significantly reduces a measurement or recognition inconsistency that would arisefrom measuring assets or liabilities, or recognising the gains and losses on them, on different bases.
AASB 2009 – 11 Amendments to Australian Accounting Standards arising from AASB 9
These amendments arise from the issuance of AASB 9 Financial Instruments that sets out requirements for theclassification and measurement of financial assets. The requirements in AASB 9 form part of the first phase ofthe International Accounting Standards Board’s project to replace IAS 39 Financial Instruments: Recognitionand Measurement. This Standard shall be applied when AASB 9 is applied.
AASB 124 (Revised) Related Party Disclosures
The revised AASB 124 simplifies the definition of a related party, clarifying its intended meaning andeliminating inconsistencies from the definition, including:
(a) The definition now identifies a subsidiary and an associate with the same investor as related parties ofeach other.
(b) Entities significantly influenced by one person and entities significantly influenced by a close member ofthe family of that person are no longer related parties of each other.
(c) The definition now identifies that, whenever a person or entity has both joint control over a second entityand joint control or significant influence over a third party, the second and third entities are related toeach other.
A partial exemption is also provided from the disclosure requirements for government-related entities.Entities that are related by virtue of being controlled by the same government can provide reduced relatedparty disclosures.
For
per
sona
l use
onl
y
P a g e | 55
Notes to the consolidated financial statements (continued)
For the year ended 30 June 2011
2.5. Standards and interpretations issued but not yet effective (continued)
AASB 1054 Australian Additional Disclosures
This standard is as a consequence of phase 1 of the joint Trans-Tasman Convergence project of the AASB andFRSB.
This standard relocates all Australian specific disclosures from other standards to one place and revisesdisclosures in the following areas:
(a) Compliance with Australian Accounting Standards(b) The statutory basis or reporting framework for financial statements(c) Whether the financial statements are general purpose or special purpose(d) Audit fees(e) Imputation credits
AASB 2010 – 4 Further Amendments to Australian Accounting Standards arising from the AnnualImprovements Project
Emphasises the interaction between quantitative and qualitative AASB 7 disclosures and the nature and extentof risks associated with financial instruments.
Clarifies that an entity will present an analysis of other comprehensive income for each component of equity,either in the statement of changes in equity or in the notes to the financial statements.
Provides guidance to illustrate how to apply disclosure principles in AASB 134 for significant events andtransactions.
Clarifies that when the fair value of award credits is measured based on the value of the awards for which theycould be redeemed, the amount of discounts or incentives otherwise granted to customers not participating inthe award credit scheme, is to be taken into account.
AASB 2010-7 Amendments to Australian Accounting Standards arising from AASB 9 (December 2010)
The requirements for classifying and measuring financial liabilities were added to AASB 9. The existingrequirements for the classification of financial liabilities and the ability to use the fair value option have beenretained. However, where the fair value option is used for financial liabilities the change in fair value isaccounted for as follows:
The change attributable to changes in credit risk are presented in other comprehensive income(OCI)
The remaining change is presented in profit or loss
If this approach creates or enlarges an accounting mismatch in the profit or loss, the effect of the changes incredit risk are also presented in profit or loss.F
or p
erso
nal u
se o
nly

P a g e | 56
Notes to the consolidated financial statements (continued)
For the year ended 30 June 2011
2.5. Standards and interpretations issued but not yet effective (continued)
AASB 10 Consolidated Financial Statements
AASB 10 establishes a new control model that applies to all entities. It replaces parts of AASB 127Consolidated and Separate Financial Statements dealing with the accounting for consolidated financialstatements and Interpretation 112 Consolidation – Special Purpose Entities.
The new control model broadens the situations when an entity is considered to be controlled by anotherentity and includes new guidance for applying the model to specific situations, including when acting as amanager may give control, the impact of potential voting rights and when holding less than a majority votingrights may give control.
AASB 11 Joint Arrangements
AASB 11 replaces AASB 131 Interests in Joint Ventures and Interpretation 113 Jointly- controlled Entities – Non-monetary Contributions by Ventures. AASB 11 uses the principle of control in AASB 10 to define joint control,and therefore the determination of whether joint control exists may change. In addition AASB 11 removes theoption to account for jointly controlled entities (JCEs) using proportionate consolidation. Instead, accountingfor a joint arrangement is dependent on the nature of the rights and obligations arising from the arrangement.Joint operations that give the venturers a right to the underlying assets and obligations themselves isaccounted for by recognising the share of those assets and obligations. Joint ventures that give the venturersa right to the net assets is accounted for using the equity method. This may result in a change in theaccounting for the joint arrangements held by the group.
AASB 12 Disclosure if Interests in Other Entities
AASB 12 includes all disclosures relating to an entity’s interests in subsidiaries, joint arrangements, associatesand structures entities. New disclosures have been introduced about the judgements made by management todetermine whether control exists, and to require summarised information about any joint arrangements,associates and structured entities and subsidiaries with non-controlling interests.
AASB 2011 – 7 Amendments to Australian Accounting Standards arising from the Consolidation and JointArrangement Standards
Consequential amendments to AASB 127 Separate Financial Statements and AASB 128 Investments inAssociates as a result of the adoption of AASB 10 Consolidated Financial Statements, AASB 11 JointArrangements and AASB 12 Disclosure of Interests in Other Entities.
AASB 13 Fair Value Measurement
AASB 13 establishes a single source of guidance under Australian Accounting Standards for determining thefair value of assets and liabilities. AASB 13 does not change when an entity is required to use fair value, butrather, provides guidance on how to determine fair value under Australian Accounting Standards when fairvalue is required or permitted by Australian Accounting Standards. Application of this definition may result indifferent fair values being determined for the relevant assets. AASB 13 also expands the disclosurerequirements for all assets or liabilities carried at fair value. This includes information about the assumptionsmade and the qualitative impact of those assumptions on the fair value determined.
For
per
sona
l use
onl
y

P a g e | 57
Notes to the consolidated financial statements (continued)
For the year ended 30 June 2011
2.5. Standards and interpretations issued but not yet effective (continued)
AASB 2011 – 7 Amendments to Australian Accounting Standards arising from the Fair Value MeasurementStandard
Consequential amendments to existing Australian Accounting Standards as a result of the adoption of AASB 13Fair Value Measurement.
AASB 2011 – 9 Amendments to Australian Accounting Standards -Presentation of Items of OtherComprehensive Income
The main change resulting from the amendments relates to the Statement of Comprehensive Income and therequirement for entities to group items presented in other comprehensive income on the basis of whetherthey are potentially reclassifiable to profit or loss subsequently (reclassification adjustments). Theamendments do not remove the option to present profit or loss and other comprehensive income in twostatements.
The amendments do not change the option to present items of OCI either before tax or net of tax. However, ifthe items are presented before tax then the tax related to each of the two groups of OCI items (those thatmight be reclassified to profit or loss and those that will not be reclassified) must be shown separately.
AASB 119 (Revised)
The main amendments to the standard relating to defined benefit plans are as follows:-
Elimination of the option to defer the recognition of actuarial gains and losses (the ‘corridormethod’);
Re-measurements (essentially actuarial gains and losses) to be presented in othercomprehensive income;
Past service cost will be expensed when the plan amendments occur regardless of whether ornot they are vested; and
Enhanced disclosures for Tier 1 entities.
The distinction between short-term and other long-term employee benefits under the revised standard is nowbased on expected timing of settlement rather than employee entitlement.
The revised standard also requires termination benefits (outside of a wider restructuring) to be recognisedonly when the offer becomes legally binding and cannot be withdrawn.
For
per
sona
l use
onl
y

P a g e | 58
Notes to the consolidated financial statements (continued)
For the year ended 30 June 2011
3. Business combinations – acquisitions
On 27 July 2010, Noble Mineral Resources Limited, through its wholly owned subsidiary, Noble Mining GhanaLimited (‘NMGL’), and pursuant to a share sale agreement dated 20 November 2009 (‘Agreement’), acquired100% of the issued capital of Noble Gold Bibiani Limited (‘NGBL’) [formerly Central African Gold GhanaLimited], owner of the Bibiani Gold Mine (‘Bibiani’) and two contiguous exploration licences in the SefwiBibiani Gold Belt in Central Ghana. The vendor of NGBL was Investec Bank Limited (‘Investec’). The acquisitionwas subject to a number of conditions, including relevant Ghanaian authority approval and suitablearrangements being concluded between NGBL and its unsecured trade creditors, all of which were fulfilled.
The purpose of the acquisition was to transform Noble into a substantial producer with significant mine lifeand exploration potential through the existing Bibiani Mine and contiguous exploration licences totalling 100square kilometres.
The consideration for the acquisition of NGBL comprised the following:
A $1 for all of the share capital of NGBL (90,000 shares); and A $1 for all of the loan claims that Investec held against NGBL, except for the Project Loan
Facility between Investec and NGBL of US$33,465,457 (‘Senior Debt’).
In addition to the above, the Agreement contained the following consideration to be paid:
(i) 4,000,000 fully paid ordinary shares in Noble,(ii) 6,000,000 options, exercisable at A $0.20 each on or before 8 July 2014, and(iii) a cash payment of A $2,000,000 or the issue of 6 million shares in Noble, at Investec’s election,
payable within 18 months of the date of signing the Agreement, being 20 November 2009.
The Company has recognised the fair values and identifiable assets and liabilities of Noble Gold Bibiani Limitedas follows:
Fair value at Carryingacquisition date value
US $ (000) US $ (000)AssetsProperty, plant and equipment 65,947 34,258Mine properties 4,349 5,033Cash and cash equivalents 3,124 3,124Consumables 4,687 6,565EPA reclamation bond 2,729 2,729Trade and other receivables 1,685 1,685
82,521 53,394
LiabilitiesTrade and other payables 15,904 17,571Deferred tax liability 8,314 17Provision for rehabilitation and decommissioning 10,484 7,136Loans and borrowings 43,933 43,933
78,635 68,567
Total identifiable net assets at fair value 3,886
For
per
sona
l use
onl
y

P a g e | 59
Notes to the consolidated financial statements (continued)
For the year ended 30 June 2011
3. Business combinations – acquisitions (continued)
Fair value atacquisition date
US $ (000)
Acquisition-date fair-value of consideration transferred:Shares and options issued, at fair value 1,838Deferred consideration liability 2,048
3,886
The cash inflow on acquisition is as follows:Net cash acquired with the subsidiary 3,124Cash paid -
3,124
The assessed fair values of shares issued as consideration were determined by the prevailing share price onthe date of acquisition. The fair values of the share options have been determined using a Binomial model,taking into account the exercise price, term of option, the share price at grant date, expected price volatility ofthe underlying share, expected dividend yield and the risk-free interest rate for the term of the option. Thedeferred consideration is the present value of the cash consideration and the option to receive shares insteadof cash.
The consolidated statement of comprehensive income includes a net loss for the year ended 30 June 2011 of$16,757,000 as a result of the acquisition of Noble Gold Bibiani Limited (‘NGBL’) [formerly Central African GoldGhana Limited]. Had the acquisition of NGBL occurred at the beginning of the reporting period, theconsolidated statement of comprehensive income would have included a net loss of $17,414,000. There is norevenue contribution from the acquisition.
Included in the business acquired were receivables with a gross contractual and fair value of $1,685,000.
For
per
sona
l use
onl
y

P a g e | 60
Notes to the consolidated financial statements (continued)
For the year ended 30 June 2011
4. Operating segments
The Group has identified its operating segments based on the internal reports that are reviewed and used bythe executive management team (the chief operating decision makers) in assessing performance and indetermining the allocation of resources.
The operating segments are identified by management based on a geographical basis as the risks are affectedpredominantly by differences in the geographical areas in which the Group operates. Discrete financialinformation about each of these operating businesses is reported to the executive management team on atleast a monthly basis.
The Group has the following segments:
Bibiani Mineral exploration and development activitiesCape Three Points Mineral exploration activities
Accounting policies and inter-segment transactions
The accounting policies used by the Group in reporting segments internally are the same as those contained innote 2 to the accounts:
Corporate chargesCorporate charges comprise non-segmental expenses such as head office expenses and interest. Corporatecharges are not allocated to a segment.
Inter-entity transactionsInter-entity management fees are recognised on an arm’s length basis for services provided by the parentcompany to each segment.
Segment loans payable and loans receivableSegment loans are initially recognised at the consideration received excluding transaction costs. Intersegmentloans receivable and loans payable that earn or incur non-market interest are not adjusted to fair value basedon market interest rates.
Unallocated itemsThe following items and associated assets and liabilities are not allocated to operating segments as they arenot considered part of the core operations of any segment:
Corporate interest revenue and corporate expenditure Fair value losses on derivative financial instruments Corporate assets and liabilities Deferred tax liabilities on business combinations Fair value uplift on business combinationsF
or p
erso
nal u
se o
nly

P a g e | 61
Notes to the consolidated financial statements (continued)
For the year ended 30 June 2011
4. Operating segments (continued)
Bibiani Cape Three Points Total2011 2010 2011 2010 2011 2010
US $(000) US $(000) US $(000) US $(000) US $(000) US $(000)
Interest income 2 - - - 2 -
Total segment revenue 2 - - - 2 -
Corporate and other unallocated interest income1
566 190
Total revenue per the statement of comprehensive income 568 190
ResultSegment result (16,757) (33) 539 (959) (16,218) (992)
Inter-segment eliminations (300) (149)Corporate and other unallocated (4,199) (1,549)
Net profit (loss) before tax as per thestatement of comprehensive income (20,717) (2,690)
Notes in relation to the table of operating segments:
1. All revenue was earned in Australia.
For
per
sona
l use
onl
y

P a g e | 62
Notes to the consolidated financial statements (continued)
For the year ended 30 June 2011
4. Operating segments (continued)
Bibiani Cape Three Points Total2011 2010 2011 2010 2011 2010
US $(000) US $(000) US $(000) US $(000) US $(000) US $(000)
Segment assetsSegment assets 126,531 6,890 6,830 187 133,361 7,077
Inter-segment eliminations:Inter-entity loans (51,390) (313)Corporate and unallocated assets 42,271 31,225
Total assets per the statement of financial position 124,242 37,989
Segment assets reconciliation to the statement of financial position
The analysis of the location of non-current assets other than financial instruments and deferred tax assets is as follows:Australia 733 569Ghana 98,602 86
Segment liabilitiesSegment liabilities 220,578 6,834 8,234 2,139 228,812 8,973
Inter-segment eliminations:Inter-entity loans (170,301) (8,795)Corporate and unallocated liabilities 12,114 436
Total liabilities per the statement of financial position 70,625 614
For
per
sona
l use
onl
y

P a g e | 63
Notes to the consolidated financial statements (continued)
For the year ended 30 June 2011
5. Revenue and other incomeConsolidated
2011 2010US $ (000) US $ (000)
(a) Revenue
Interest income 568 190
(b) Other income
Foreign currency gains 2,715 16
Profit on sale of plant and equipment 10 -
Other 6 -
2,731 16
6. General and administrative expenses
An analysis of general and administrative expenses is as follows:Consolidated
2011 2010US $ (000) US $ (000)
(a) Employee benefits expenseWages and salaries 7,123 371Superannuation costs 363 25Non-executive directors’ fees 172 46
7,658 442
(b) Depreciation included in the statement
of comprehensive income
Depreciation 794 64
(c) Lease payments and other expenses included
in the statement of comprehensive income
Minimum lease payments – operating lease 59 58
(d) Other material expenses included in the
statement of comprehensive income
Electricity 971 2
Insurance 1,281 17
Maintenance of plant, equipment and other 2,046 -
Security 666 -
Travel and accommodation 1,141 334
6,105 353
For
per
sona
l use
onl
y

P a g e | 64
Notes to the consolidated financial statements (continued)
For the year ended 30 June 2011
7. Borrowing costsConsolidated
2011 2010US $ (000) US $ (000)
Borrowing costs 1,579 517
Amounts capitalised to mine properties (1,458) -
121 517
8. Income taxConsolidated
2011 2010US $ (000) US $ (000)
(a) Income tax benefit - -
(b) Reconciliations between tax benefit and pre-tax net loss
Loss before income tax benefit (20,717) (2,690)
Income tax calculated at 30% (6,215) (807)Tax effect of:
- Sundry amounts 108 (143)- Provisions 1,005 15- Depreciation 1,523 -- Foreign exchange differences (83) (5)- Capital raising costs deduction (272) (127)- Loan restructuring costs 359 -- Loss on revaluation of share options 579 -- Adjustment in respect of previous years 444 -
Future income tax benefit not brought to account 2,552 1,067
- -
(c) Tax lossesUnused tax losses for which no deferred tax asset has beenRecognised (as recovery is not probable)
Potential at 30% (i) 31,229 1,706
(i) Includes Noble Gold Bibiani Limited accumulated losses prior to the Group acquiring Noble GoldBibiani Limited. These losses are uncertain, with the relevant tax returns not lodged at the date ofthis report.
For
per
sona
l use
onl
y

P a g e | 65
Notes to the consolidated financial statements (continued)
For the year ended 30 June 2011
8. Income tax (continued)Consolidated
2011 2010US $ (000) US $ (000)
(d) Unrecognised temporary differences
Temporary differences for which deferred tax assets have notbeen recognised:
- Provisions 2,087 21- Unrealised foreign exchange gain (loss) 1,098 -- Capital raising costs - 360
Unrecognised deferred tax assets relating to the abovetemporary differences 3,185 381
(e) Deferred tax liabilities
Opening balance - -Acquisition of Noble Gold Bibiani Limited 8,314 -
Closing balance 8,314 -
(f) Tax rates
The potential tax benefit at 30 June 2011 in respect of tax losses not brought to account has been calculated at30% (2010: 30%).
9. Losses per share
Basic earnings per share amounts are calculated by dividing the net profit for the year by the weighted averagenumber of ordinary shares outstanding during the year.
Consolidated2011 2010
Net profit attributable to ordinary shareholders (US $ 000) (20,717) (2,690)Weighted average number of ordinary shares (number of shares - millions) 352.75 160.12Basic and diluted earnings per ordinary share (US cents) (5.87) (1.68)
The total number of share options and conversion options outstanding at reporting date, but not consideredto be dilutive is 151,865,082. The total number of shares issued after the reporting date as a result of theexercise of listed options is:
Listed options (ASX: NMGO) 64,518,051Listed options (ASX: NMGOA) 19,635
64,537,686
There have been no other transactions involving ordinary shares or potential ordinary shares between thereporting date and the date of completion of these financial statements.
For
per
sona
l use
onl
y

P a g e | 66
Notes to the consolidated financial statements (continued)
For the year ended 30 June 2011
10. Exploration and evaluation assetsUS $ (000)
Cost as at 1 July 2009 514
Cost as at 30 June 2010 514
Additions 4,251
Cost as at 30 June 2011 4,765
Provision for impairment as at 1 July 2009 -Impairment charge for the year -Reversal of previously booked impairments -
Provision for impairment as at 30 June 2010 -
Impairment charge for the year -Reversal of previously booked impairments -
Provision for impairment as at 30 June 2011 -
Net book value as at 30 June 2010 514Net book value as at 30 June 2011 4,765
Exploration and evaluation expenditure immediately expensed in profit or loss as per note 2.4(b) amount toUS$177,000 (2010: US$518,000). The value of the Group’s interest in exploration and evaluations assets isdependent upon the continuance of the Group’s rights to tenure of the areas of interest, the results of futureexploration and the recoupment of costs through successful development and exploitation of the areas ofinterest, or alternatively, by their sale.
On 30 November 2010, the Company received regulatory approval from the Minerals Commission and
Minister of Mines Ghana for the agreement entered into with Consolidated Minerals Limited (Ghana)
[“ConsMin”] for the Company to earn a 100% interest in the Cape Three Points Concession. $225,000
consideration has been paid to ConsMin under the terms of the agreement.
For
per
sona
l use
onl
y

P a g e | 67
Notes to the consolidated financial statements (continued)
For the year ended 30 June 2011
11. Property, plant and equipmentFurniture
Work in Underground Decomm- Land and Plant and Motor and Computerprogress development issioning Infrastructure buildings equipment vehicles fittings equipment Total
US $ (000) US $ (000) US $ (000) US $ (000) US $ (000) US $ (000) US $ (000) US $ (000) US $ (000) US $ (000)
CostAs at 1 July 2009 - - - - - 13 88 16 131 248Addition - - - - - 6 5 2 22 35Disposals - - - - - - - - (47) (47)
As at 30 June 2010 - - - - - 19 93 18 106 236Additions 13,316 - - 409 22 5,476 762 73 472 20,530Acquisition of Bibiani 709 16,039 1,756 1,497 7,253 38,028 629 2 34 65,947Disposals - - - - - (10) - - - (10)
As at 30 June 2011 14,025 16,039 1,756 1,906 7,275 43,513 1,484 93 612 86,703
DepreciationAs at 1 July 2009 - - - - - - (20) (4) (14) (38)Depreciation charge for the year - - - - - (4) (25) (6) (29) (64)Disposals - - - - - - - - - -
As at 30 June 2010 - - - - - (4) (45) (10) (43) (102)Depreciation charge for the year - - - - - (408) (233) (33) (121) (795)Capitalised to mine development - - (250) (128) (388) (3,276) - - - (4,042)Disposals - - - - - - - - - -
As at 30 June 2011 - - (250) (128) (388) (3,688) (278) (43) (164) (4,939)
Net book value:At 30 June 2010 - - - - - 15 48 8 63 134At 30 June 2011 14,025 16,039 1,506 1,778 6,887 39,825 1,206 50 448 81,764
For
per
sona
l use
onl
y

P a g e | 68
Notes to the consolidated financial statements (continued)
For the year ended 30 June 2011
12. Mine propertiesConsolidated
2011 2010US $ (000) US $ (000)
At cost:Additions 5,645 -Acquisition of Bibiani 4,349 -Expenditure written off (76) -
9,918 -
13. ConsumablesConsolidated
2011 2010US $ (000) US $ (000)
At cost:Materials and supplies 5,022 -
5,022 -
14. Trade and other receivablesConsolidated
2011 2010US $ (000) US $ (000)
CurrentInterest income receivable - 83Taxes recoverable (i) 824 23Other receivables 201 5
1,025 111
(i) Taxes recoverable relate to Australian GST, Ghanaian VAT and Ghanaian Withholding Tax.
The carrying value of trade and other receivables approximate their fair value.
Non-currentUnsecured loan (ii) - 6,155
- 6,155
(ii) Pursuant to an agreement to acquire Noble Gold Bibiani Limited (‘NGBL’) [formerly Central
African Gold Ghana Limited], the Company advanced funds to NGBL as a term loan facility
to pay NGBL’s monthly operating costs and other working capital requirements. The loan
was unsecured for a period of one year at the LIBOR interest rate (set by reference to
Reuters or, if not available, on the basis of rates provided by agreed Reference Banks).
Upon the acquisition of 100% of the issued capital of NBGL the unsecured loan has been
eliminated in full on consolidation of NGBL.
For
per
sona
l use
onl
y

P a g e | 69
Notes to the consolidated financial statements (continued)
For the year ended 30 June 2011
15. Cash and cash equivalents
Consolidated2011 2010
US $ (000) US $ (000)
Cash at bank and in hand 9,392 7,077Short-term deposits 38 23,812
9,430 30,889
Cash at banks earns interest at floating rates based on daily bank deposit rates. Short-term deposits are madefor varying periods, depending on the immediate cash requirements of the Group, and earn interest at therespective short-term deposit rates. The fair value of cash and short-term deposits is US$9,430,000 (2010:US$30,889,000).
The Group only deposits cash surpluses with major banks of high quality credit standing.
At 30 June 2011, the Group did not have available any undrawn committed borrowing facilities in respect ofwhich all conditions precedent had been met.
16. Other assets
Consolidated2011 2010
US $ (000) US $ (000)CurrentBorrowing costs (i) 15 -Prepayments (ii) 9,415 178
9,430 178
(i) Borrowing costs include charges imposed by financial institutions on letter of credit
applications associated with prepayments at (ii).
(ii) Prepayments represent advanced payments to suppliers, prepaid insurance costs and
plant and equipment and capital expenditure related to the mine refurbishment.
Non-current
Rental bond 8 8
Foreign withholding tax credits 150 -
EPA reclamation bond (i) 2,730 -
2,888 8
(i) The EPA Reclamation Bond is an amount held in the joint name of Noble Gold Bibiani Ltd
(formerly Central African Gold Ghana Limited) and Environmental Protection Agency
(Ghana) with Barclays Bank (GH) Limited in relation to the rehabilitation provision.
For
per
sona
l use
onl
y

P a g e | 70
Notes to the consolidated financial statements (continued)
For the year ended 30 June 2011
17. Issued capital
AuthorisedConsolidated
2011 2010US $ (000) US $ (000)
Ordinary share capital 78,373 41,954
(a) Ordinary shares issued and fully paid Number US $ (000)
As at 1 July 2009 138,370,000 4,339Issued during the year 155,361,484 37,615
At 30 June 2010 293,731,484 41,954Shares issued for subsidiary (i) 10,000,000 4,632Shares issued to creditors (ii) 5,788,341 1,326Share placement (iii) 77,000,000 29,516Exercise of options (iv) 9,251,056 2,945Transaction costs (v) - (2,000)
As at 30 June 2011 395,770,881 78,373
(i) 10,000,000 shares were issued to Investec Bank Limited, including the 6,000,000 sharesissued for settlement of deferred considerations (refer note 3), as part of the acquisitionof a 100% interest in Noble Gold Bibiani Limited (formerly Central African Gold GhanaLimited).
(ii) 5,788,341 shares were issued to unsecured creditors of Noble Gold Bibiani Limited(formerly Central African Gold Ghana Limited), in consideration of certain outstandingdebts owed to those creditors.
(iii) 77,000,000 shares were issued at A $0.39 each during November 2010, December 2010and January 2011.
(iv) 9,168,229 options expiring 21 July 2011 and 82,827 options expiring 21 July 2013 wereexercised during the period at A $0.30 and A $0.35 respectively.
(v) The transaction costs represent the costs of issuing options and shares and the costsassociated with the share placements and share purchase plan offer.
Fully paid ordinary shares carry one vote per share and carry the right to dividends.
(b) Options
(i) Listed share options expiring 21 July 2011Exercise price – A $0.30 Number
As at 1 July 2010 -Option issue (i) 74,433,069Exercise of options (9,168,229)
65,264,840
For
per
sona
l use
onl
y

P a g e | 71
Notes to the consolidated financial statements (continued)
For the year ended 30 June 2011
17. Issued capital (continued)
(i) Listed share options expiring 21 July 2013Exercise price – A $0.35 Number
As at 1 July 2010 -Option issue (ii) 74,433,069Exercise of options (82,827)
74,350,242
(ii) Unlisted share options expiring 8 July 2014Exercise price – A $0.20 Number
As at 1 July 2010 -Option issue (iii) 6,000,000
6,000,000
(iii) Unlisted share options expiring 19 August 2014Exercise price – A $0.40 Number
As at 1 July 2010 -Option issue (iv) 6,250,000
6,250,000
(i) 74,433,069 bonus share options expiring on 21 July 2011 were issued to eligibleshareholders who were registered on 14 July 2010, 5pm WST (‘Record Date’). For every 4ordinary shares held as at the Record Date, the Company issued 1 option for free. Theoptions are exercisable at A $0.30 each and entitle the holder one Ordinary Share in theCompany once exercised.
(ii) 74,433,069 bonus share options expiring on 21 July 2013 were issued to eligibleshareholders who were registered on 14 July 2010, 5pm WST (‘Record Date’). For every 4ordinary shares held as at the Record Date, the Company issued 1 option for free. Theoptions are exercisable at A $0.35 each and entitle the holder one Ordinary Share in theCompany once exercised.
(iii) 6,000,000 unlisted options expiring on 8 July 2014 were issued on 8 July 2010 to Investecas part of the acquisition of a 100% interest in Noble Gold Bibiani Ltd (formerly CentralAfrican Gold Ghana Limited). The options are exercisable at A $0.20 each and entitle theholder one Ordinary Share in the Company once exercised. These options have beenaccounted for as a derivative liability as the liability is ultimately deliverable in a currency(A$) different to that of the Group’s functional currency (US$).
(iv) 6,250,000 unlisted options expiring on 19 August 2014 were issued on 19 August 2010 toconsultants to the Company in recognition of the efforts with the Company’s capitalraising objectives. The options are exercisable at A $0.40 each and entitle the holder oneOrdinary Share in the Company once exercised.
For
per
sona
l use
onl
y

P a g e | 72
Notes to the consolidated financial statements (continued)
For the year ended 30 June 2011
18. Interest-bearing loans and borrowings
Effectiveinterest
rate 2011 2010% Maturity US $ (000) US $ (000)
CurrentUS$1.1m bank loan facility(2010: -) 9.0 Jun-12 484 -US$32m bank loan facility(2010: -) LIBOR + 4.0 Jun-12 34,162 -
34,646 -
US$1.1 million bank loanThe loan is schedule for final loan repayment in June 2012.
US$32 million bank loanThe Secured loan is a term loan obtained from Investec Bank Limited for partial financing and capital
development for the Bibiani Gold Mine in 2007. The first capital repayment of $3,128,823 is due by 1 March
2012. Subsequent payments of $3,128,823 are due quarterly on 1 September, 1 December, 1 March and 1
June each year, until the date of the final capital repayment, which is due by 1 September 2014. The facility is
secured by:
- Pledge of 100% of the shares in Noble Gold Bibiani Limited, who control the mine. Noble
Mineral Resources Limited controls 100% of shares in Noble Mining Ghana Limited, who
subsequently hold 100% of the issued capital Noble Gold Bibiani Limited.
- Debenture over all the assets of Noble Gold Bibiani Limited.
- Guarantee on loan exposure from Noble Mineral Resources Limited.
Due to being unable to recommence mining operations by the Operational Date (30 May 2011) as agreed withInvestec Bank Limited on the acquisition of the Bibiani Mine, Noble Gold Bibiani Limited was in breach of thefacility at 30 June 2011 and in accordance with Australian Accounting Standards, the facility has been classifiedas current. Noble are in the process of renegotiating the terms and conditions of the facility, to defer theoperational date to 30 October 2011 for the outstanding principal to be repaid under the original repaymentterms.
For
per
sona
l use
onl
y

P a g e | 73
Notes to the consolidated financial statements (continued)
For the year ended 30 June 2011
19. Provisions
Rehabilitationand
decommissioning Other TotalUS $ (000) US $ (000) US $ (000)
As at 1 July 2010 - 66 66Acquisition of a subsidiary 10,484 - 10,484Arising during the year - 521 521
At 30 June 2011 10,484 587 11,071
Comprising:Current 2011 1,003 587 1,590Non-current 2011 9,481 - 9,481
10,484 587 11,071
Current 2010 - 66 66Non-current 2010 - - -
- 66 66
Rehabilitation provisionThe Group makes full provision for the future cost of rehabilitating mine sites and related production facilitieson a discounted basis at the time of developing the mines and installing and using those facilities. Therehabilitation provision represents the present value of rehabilitation costs relating to mine sites. Theseprovisions have been created based on work conducted by African Environmental Research ConsultingCompany Limited (‘AERC’). Assumptions, based on the current economic environment, have been made whichmanagement believes are a reasonable basis upon which to estimate the future liability. These estimates arereviewed regularly to take into account any material changes to the assumptions. However, actualrehabilitation costs will ultimately depend upon future market prices for the necessary decommissioningworks required which will reflect market conditions at the relevant time. Furthermore, the timing ofrehabilitation is likely to depend on when the mines cease to produce at economically viable rates. This, inturn, will depend upon the future gold price, which is inherently uncertain.
Other provisionsOther provisions comprise provisions for employee benefits.
For
per
sona
l use
onl
y

P a g e | 74
Notes to the consolidated financial statements (continued)
For the year ended 30 June 2011
20. Accounts payable and other payables
Consolidated2011 2010
US $ (000) US $ (000)CurrentOverdraft 52 -Trade payables 12,939 548Accrued liabilities 181 -Taxes payable 475 -
13,647 548
The carrying value of trade and other payables approximate their fair value.
Terms and conditions of the above financial liabilities:
Trade payables are non-interest bearing and are normally settled on terms ranging from C.O.Dto 30-day terms.
Taxes (Australian GST, Ghanaian VAT and Ghanaian Withholding Tax) are paid when due ineach jurisdiction.
21. ReservesConsolidated
ForeignCurrency
Translation OptionReserve Reserve Total
US $ (000) US $ (000) US $ (000)
As at 1 July 2010 310 - 310Unlisted option issue – share-based payments - 540 540
310 540 850
Nature and purpose of reserves:
Foreign currency translation reserveThis reserve is used to record exchange differences arising on translation of the group entities that do not havea functional currency of US dollars and have been translated for presentation purposes, as described in Note2.3(ii).
Option reserveThe reserve is used to record the value of equity benefits provided to consultants as part of theirremuneration. Refer to Note 24 for further details on share-based payments.
For
per
sona
l use
onl
y

P a g e | 75
Notes to the consolidated financial statements (continued)
For the year ended 30 June 2011
22. Capital commitments and other contingencies
Operating lease commitments – Group as lessee
The Company leases its offices in South Perth. The lease is for a 3 year period from 1 October 2009. Theoperating lease rentals are payable as follows:
Consolidated2011 2010
US $ (000) US $ (000)
Within one year 50 39After one year but not more than five years 12 48More than five years - -
62 87
Capital commitmentsConsolidated
2011 2010US $ (000) US $ (000)
Within one year 9,715 -After one year but not more than five years - -More than five years - -
9,715 -
Exploration commitmentsConsolidated
2011 2010US $ (000) US $ (000)
Within one year 364 72After one year but not more than five years - -After more than five years - -
364 72
The Company has certain obligations to perform minimum exploration work on mineral leases held. Theseobligations may vary over time, depending on the Company’s exploration program and priorities. Theseobligations are also subject to variations by negotiation, joint venturing or relinquishing some of the relevanttenements.F
or p
erso
nal u
se o
nly

P a g e | 76
Notes to the consolidated financial statements (continued)
For the year ended 30 June 2011
22. Capital commitments and other contingencies (continued)
Project commitments
Cape Three Points Concession
The Company acquired a joint venture interest from Axmin Limited (‘Axmin’) with Consolidated MineralsLimited (‘ConsMin’) for a project consisting of a concession located in the Republic of Ghana (‘Cape ThreePoints Concession’). In consideration for the acquisition of Axmin rights, interests and obligations in and to theCape Three Points Concession, Noble must pay Axmin 1.5% of the gross smelter returns from the disposition ofconcentrates derived from ore mined from the Cape Three Points Concession and milled or concentrated byNoble.
The Company acquired the joint venture interest from ConsMin in December 2010. In consideration for therights, interests and obligations to the Cape Three Points Concession, Noble must pay ConsMinUS$10,000 onevery anniversary of the agreement for so long as Noble is in the process of exploration on the Concession,and 1% net refinery returns from the sale or other disposition of all gold produced from the property.
Remuneration commitmentsConsolidated
2011 2010US $ (000) US $ (000)
Commitments for the payment of salaries and other remunerationunder long-term employment contracts in existence at the reportingdate but not recognised as liabilities, payable:Within one year 859 262After one year but not more than five years 1,388 24After more than five years - -
2,247 286
Amounts disclosed as remuneration commitments include commitments arising from the service contracts ofdirectors and executives referred to in the remuneration report of the directors’ report that are not recognisedas liabilities and are not included in the compensation of KMP.
Contingencies
The Group does not have any contingent liabilities at the balance date.
For
per
sona
l use
onl
y

P a g e | 77
Notes to the consolidated financial statements (continued)
For the year ended 30 June 2011
23. Related party disclosures
The consolidated financial statements include the financial statements of Noble Mineral Resources and thesubsidiaries listed in the following table:
Country of % equity interestincorporation 2011 2010
Noble Mineral Resources Ghana Limited Ghana 100% 100%Noble Mining Ghana Limited Ghana 100% 100%Noble Gold Bibiani Limited (i) Ghana 100% -Drilling and Mining Services Limited Ghana 100% -
(i) Noble Mining Ghana Limited is the parent of Noble Gold Bibiani Limited
Noble Mineral Resources Limited is the ultimate parent of the consolidated entity.
(a) Compensation of key management personnel of the Group
Consolidated2011 2010
US $ (000) US $ (000)
Short-term employee benefits 2,112 351Post-employment benefits 85 25Share based payments 43 -
Total compensation paid to key management personnel 2,240 376
For
per
sona
l use
onl
y

P a g e | 78
Notes to the consolidated financial statements (continued)
For the year ended 30 June 2011
23. Related party disclosures (continued)
(b) Option holdings of key management personnel
Vested at 30 June 2011Balance at Balance atbeginning Granted Pro-rata Net end ofof period as bonus Options change period Not
30 June 2011 1 July 2010 remuneration issue exercised other 30 June 2011 Total Exercisable exercisable
DirectorsTunku Naquiyuddin - - - - - - - - -Alan Taylor - - 395,625 - (395,625) - - - -Brian Thomas - - 50,000 - - 50,000 50,000 50,000 -Duncan Coutts - - - - - - - - -Wayne Norris - - 21,570,000 - (9,902,500) 11,667,500 11,667,500 11,667,500 -
ExecutivesDavid Leavy - - 27,000 (13,500) - 13,500 13,500 13,500 -Peter Johnston - - - - - - - - -Brian Dunn
1- 500,000 241,750 - (241,750) 500,000 500,000 500,000 -
Anthony Ho - - 280,000 - (265,000) 15,000 15,000 15,000 -
Total - 500,000 22,564,375 (13,500) (10,804,875) 12,246,000 12,246,000 12,246,000 -
1. 500,000 unlisted options expiring on 19 August 2014 were issued on 19 August 2010 to Brian Dunn in recognition of the efforts with the Company’s capitalraising objectives. The options are exercisable at A $0.40 each and entitle Mr Dunn to one Ordinary Share in the Company once exercised.
There were no options over ordinary held by key management personnel during the year ended 30 June 2010.
For
per
sona
l use
onl
y

P a g e | 79
Notes to the consolidated financial statements (continued)
For the year ended 30 June 2011
23. Related party disclosures (continued)
(c) Shareholdings of key management personnel
Shares in Noble Mineral Resources Limited (number)
Balance at Balance atbeginning Granted Net end ofof period as Options change period
30 June 2011 1 July 2010 remuneration exercised other 30 June 2011
DirectorsTunku Naquiyuddin - - - - -Alan Taylor 791,250 - - (791,250) -Brian Thomas 100,000 - - - 100,000Duncan Coutts - - - - -Wayne Norris 43,140,000 - - - 43,140,000
ExecutivesDavid Leavy 54,000 - 13,500 - 67,500Peter Johnston - - - - -Brian Dunn 483,500 - - (43,500) 440,000Anthony Ho 560,000 - - (500,000) 60,000
Total 45,128,750 - 13,500 (1,334,750) 43,807,500
For
per
sona
l use
onl
y
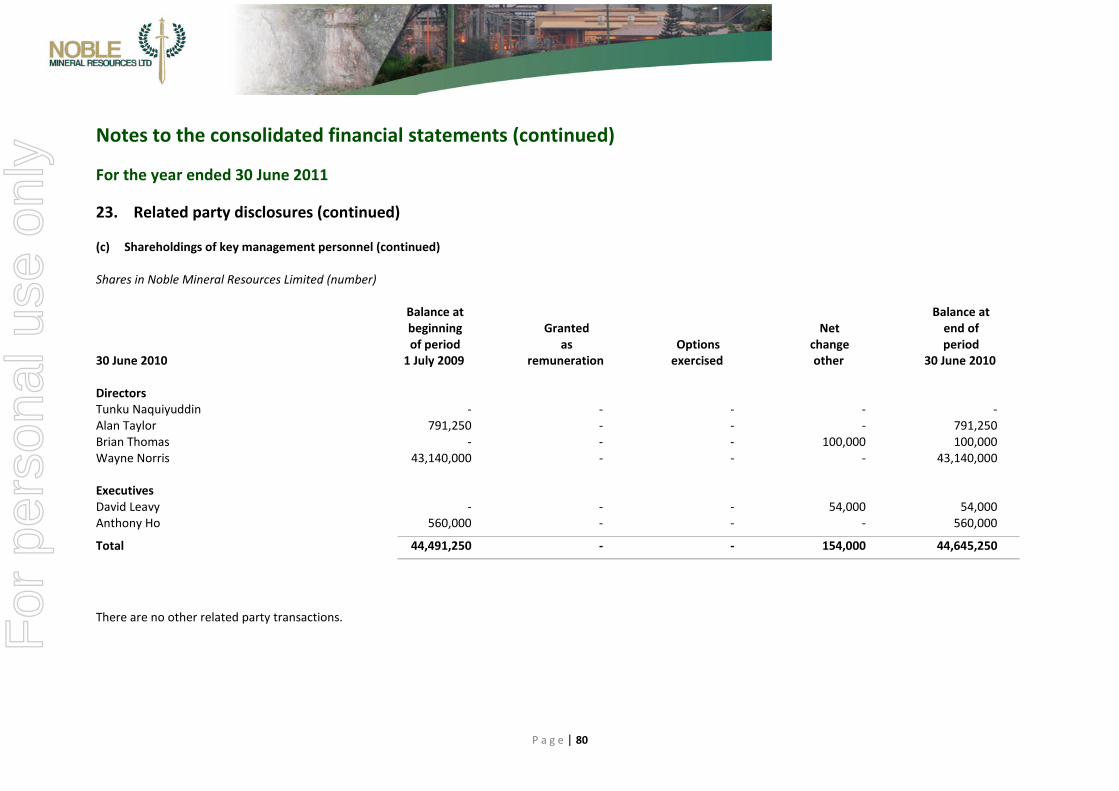
P a g e | 80
Notes to the consolidated financial statements (continued)
For the year ended 30 June 2011
23. Related party disclosures (continued)
(c) Shareholdings of key management personnel (continued)
Shares in Noble Mineral Resources Limited (number)
Balance at Balance atbeginning Granted Net end ofof period as Options change period
30 June 2010 1 July 2009 remuneration exercised other 30 June 2010
DirectorsTunku Naquiyuddin - - - - -Alan Taylor 791,250 - - - 791,250Brian Thomas - - - 100,000 100,000Wayne Norris 43,140,000 - - - 43,140,000
ExecutivesDavid Leavy - - - 54,000 54,000Anthony Ho 560,000 - - - 560,000
Total 44,491,250 - - 154,000 44,645,250
There are no other related party transactions.For
per
sona
l use
onl
y

P a g e | 81
Notes to the consolidated financial statements (continued)
For the year ended 30 June 2011
24. Share based payments
Summaries of options granted
The following table illustrates the number and weighted average exercise prices (‘WAEP’) of, and movementsin, share options issued in lieu of remuneration during the year:
2011 20102011 WAEP 2010 WAEP
Number A$ Number A$
Outstanding at 1 July - - - -Granted during the year 6,250,000 0.40 - -Exercised during the year - - - -
Exercised during the year 6,250,000 0.40 - -
Exercisable at 30 June 6,250,000 0.40 - -
The outstanding balance at 30 June 2011 is represented by:
Exerciseprice
A$ NumberOptions expiring on or before:19 August 2014 0.40 6,250,000
Weighted average remaining contractual life
The weighted average remaining contractual life for the share options outstanding at 30 June 2011 is 3.14years (2010: nil).
Range of exercise price
The exercise price for options outstanding at the end of the financial year was A$0.40 (2010: nil).
Weighted average fair value
The weighted average fair value of options granted during the year was US$0.09 (2010: nil).
For
per
sona
l use
onl
y

P a g e | 82
Notes to the consolidated financial statements (continued)
For the year ended 30 June 2011
24. Share based payments (continued)
Option pricing model
The fair value of options issued are estimated at the date of grant using the Binomial option pricing model.The following table sets out the assumptions made in determining the fair value of the options granted duringthe period.
19 August 2010 grant
Fair value at grant date (US$) 540,324Option exercise price (A$) 0.40Grant date 19 August 2010Dividend yield -Expected volatility 90%Risk-free interest rate 4.27%Expected life 4 yearsShare price on date of grant (A$) 0.25
25. Financial risk management objectives and policies
The Group’s principal financial instruments comprise financial liabilities and financial assets. The Group’sprincipal financial liabilities, other than derivatives, comprise accounts payable, bank loans and overdrafts. Themain purpose of these financial instruments is to manage short term cash flow and raise finance for theGroup’s capital expenditure program. The Group has various financial assets such as accounts receivable andcash and short-term deposits.
Risk exposures and responses
The Group manages its exposure to key financial risks in accordance with the Group’s financial riskmanagement policy. The objective of the policy is to support the delivery of the Group’s financial targets whileprotecting future financial security. The main risks that could adversely affect the Group’s financial assets,liabilities or future cash flows are market risks, comprising commodity price risk, cash flow interest rate riskand foreign currency risk and liquidity risk and credit risk. Management reviews and agrees policies formanaging each of these risks which are summarised below.
The Group’s senior management oversees the management of financial risks. The Group’s senior managementis supported by a risk committee that advises on financial risks and the appropriate financial risk governanceframework for the Group. The risk committee provides assurance to the Group’s senior management that theGroup’s financial risk-taking activities are governed by appropriate policies and procedures and that financialrisks are identified, measured and managed in accordance with Group policies and the Group’s risk appetite.All derivative activities for risk management purposes are to be carried out by specialist teams that have theappropriate skills, experience and supervision. It is the Group’s policy that no trading in derivatives forspeculative purposes shall be undertaken. At this stage, the Group does not currently apply any form of hedgeaccounting.
The Board of Directors reviews and agrees policies for managing each of these risks which are summarisedfollowing.
For
per
sona
l use
onl
y

P a g e | 83
Notes to the consolidated financial statements (continued)
For the year ended 30 June 2011
25. Financial risk management objectives and policies (continued)
Market risk
Market risk is the risk that the fair value of future cash flows of a financial instrument will fluctuate because ofchanges in market prices. Market prices comprise three types of risk: commodity price risk, equity price risk,interest rate risk and currency risk. Financial instruments affected by market risk include loans and borrowings,deposits, accounts receivable, accounts payable, accrued liabilities, and derivative financial instruments.
The sensitivity analyses have been prepared on the basis that the amount of net debt, the ratio of fixed tofloating interest rates on the debt and derivatives and the proportion of financial instruments in foreigncurrencies are all constant.
Equity price risk
The Group is exposed to the risk of changes in the Company’s share price as it relates to the value of theGroup’s financial derivative liability obligations (note 27).
The following table demonstrates the sensitivity to a reasonable possible change in the Company’s share price,with all other variables held constant, of the Group’s profit before tax through the impact on floating rateborrowings and cash and cash equivalents. The impact on equity is the same as the impact on profit beforetax.
Effect on profit Effect on profitbefore tax and equity before tax and equity
for the year ended for the year ended30 June 2011 30 June 2010
Increase/decrease share price Increase/(Decrease) Increase/(Decrease)US $ (000) US $ (000)
+ A$0.10 (620) -- A$0.10 1,222 -
Interest rate risk
The Group’s exposure to the risk of changes in market interest rates relates primarily to the Group’s long-termdebt obligations with floating interest rates. The Board does not consider the Group to be materially exposedto changes in market interest rates. As a result, the Group does not currently seek to mitigate its interest rateexposures.
The following table demonstrates the sensitivity to a reasonably possible change in interest rates asdetermined based on a review of the last two years historical and economic forecaster’s expectations, with allother variables held constant, of the Group’s profit before tax through the impact on floating rate borrowingsand cash and cash equivalents. The impact on equity is the same as the impact on profit before tax.
For
per
sona
l use
onl
y

P a g e | 84
Notes to the consolidated financial statements (continued)
For the year ended 30 June 2011
25. Financial risk management objectives and policies (continued)
Effect on profit Effect on profitbefore tax and equity before tax and equity
for the year ended for the year ended30 June 2011 30 June 2010
Increase/decrease interest rate Increase/(Decrease) Increase/(Decrease)US $ (000) US $ (000)
+ 1.0 % (336) (326)- 1.0 % 336 326
Foreign currency risk
Ongoing
The Group has transactional currency exposures. Such exposures arise from purchases in currencies other thanthe respective functional currencies. Approximately 44% of costs are denominated in currencies other than thefunctional currencies of the entities within the Group. This 44% comprises Euro (10%), GB Pound (9%), GhanaCedi (9%), SA Rand (10%), Australian Dollar (5%) and Canadian Dollar (1%).
The Group is materially exposed to movements in the AUD:USD foreign exchange rate. In order to mitigatethis risk, the Group seeks to convert the majority of its Australian Dollar cash holdings into the functionalcurrency of the Group, United States Dollars.
Exposure at the balance date
The Group’s exposure to A$ : US$ foreign currency risk at the balance date:
2011A $ (000)
A$ : US$Cash and cash equivalents 6,069Trade and other receivables 4Overdrafts (47)Trade and other payables (55)Derivative financial instruments (2,685)
Net statement of financial position exposure 3,286
2010US $ (000)
US$ : A$Trade and other receivables 72Trade and other payables (177)
Net statement of financial position exposure 105
For
per
sona
l use
onl
y

P a g e | 85
Notes to the consolidated financial statements (continued)
For the year ended 30 June 2011
25. Financial risk management objectives and policies (continued)
Sensitivity analysis
Based on the financial instruments held at 30 June 2011, a 25% strengthening/weakening of the United StatesDollar against the Australian Dollar at 30 June would have reduced the profit for the year by $902,000 (2010:increase by $23,000) and increased the profit by $721,000 (2010: reduced by $18,000) respectively. Due tothe change in functional currency during the financial year, the sensitivity analysis is denominated in A$:US$ in2011, and reversed to US$:A$ in 2010, being the prevailing functional currency at that balance date. Theimpact on equity is the same as the impact on profit before tax.
The foreign exchange movement for the above sensitivity analysis was based on foreign exchange riskexposures at the balance date.
Liquidity risk
The Group monitors its risk of a shortage of funds by monitoring its debt rating and the maturity dates ofexisting debt and other payables.
The Group’s objective is to maintain a balance between continuity of funding and flexibility through the use ofbank overdrafts and bank loans. As at 30 June 2011, the Group did not have any undrawn committedborrowing facilities (2010: Nil). 96% of the Group’s debt will mature in less than one year at 30 June 2011(2010: 100%) based on the balances reflected in the financial statements.
The table below summarises the maturity profile of the Group’s financial liabilities based on contractualundiscounted payments.
Year ended 30 June 2011 Ondemand < 1 year 1-2 years 2-5 years > 5 years Total
US $ (000) US $ (000) US $ (000) US $ (000) US $ (000) US $ (000)Interest-bearing loansand borrowings 34,162 484 - - - 34,646Accounts payable andaccrued liabilities 196 11,823 1,628 - - 13,647
34,358 12,307 1,628 - - 48,293
Year ended 30 June 2010 Ondemand < 1 year 1-2 years 2-5 years > 5 years Total
US $ (000) US $ (000) US $ (000) US $ (000) US $ (000) US $ (000)Interest-bearing loansand borrowings - - - - - -Accounts payable andaccrued liabilities - 548 - - - 548
- 548 - - - 548
For
per
sona
l use
onl
y

P a g e | 86
Notes to the consolidated financial statements (continued)
For the year ended 30 June 2011
25. Financial risk management objectives and policies (continued)
Fair value
The Group uses various methods in estimating the fair value of a financial instrument. The methods comprise:
Level 1: the fair value is calculated using quoted prices in active markets.Level 2: the fair value is estimated using inputs other than quoted prices included in Level 1 that are
observable for the asset or liability, either directly (as prices) or indirectly (derived from prices).Level 3: the fair value is estimated using inputs for the asset or liability that are not based on market data.
The level 2 method was used in calculating the fair value of the derivative financial instruments using aBinomial option pricing model, which includes Noble’s share prices at reporting date, time to expiry and therisk free rate as key inputs. All of the Group’s other financial liabilities are carried at amortised cost, where thecarrying value approximates the fair value.
26. Capital management
The primary objective of the Group’s capital management is to ensure that it maintains healthy capital ratios inorder to support its business and maximise shareholder value. The Group manages its capital structure andmakes adjustments to it, in light of changes in economic conditions. To maintain or adjust the capital structure,the Group may issue new shares. No changes were made in the objectives, policies or processes during theyears ended 30 June 2011 and 30 June 2010.
The Group monitors capital using a gearing ratio, which is net debt divided by equity plus net debt. The Groupincludes within net debt, interest-bearing loans and borrowings, trade and other payables, less cash and shortterm deposits.
The Group is exposed to the following externally imposed capital requirements:
Forecast debt service cover ratio of greater than 1.5. Reserve tail for any forecast period of at least 40%. Maximum debt : equity ratio of 1 : 1. Fully funded development plan at all times.
Consolidated2011 2010
US $ (000) US $ (000)
Interest-bearing loans and borrowings 34,646 -Accounts payable and accrued liabilities 13,595 548Overdrafts 52 -Less cash and short term deposits (9,430) (30,889)
Net debt 38,863 (30,341)
Capital:Equity 53,617 37,375
Capital and net debt 92,480 7,034
Gearing ratio 44% (431%)
For
per
sona
l use
onl
y

P a g e | 87
Notes to the consolidated financial statements (continued)
For the year ended 30 June 2011
27. Derivative financial instruments
The Group has entered into the following derivative contracts that have not been designated as hedges:
Consolidated2011 2010
US $ (000) US $ (000)
Option derivatives at fair value (i) 2,947 -
2,947 -
(i) 6,000,000 unlisted options expiring on 8 July 2014 were issued on 8 July 2010 to Investec BankLimited as part of the acquisition of a 100% interest in Noble Gold Bibiani Ltd (formerly CentralAfrican Gold Ghana Limited). The options are exercisable at A $0.20 each and entitle theholder one Ordinary Share in the Company once exercised.
The resulting US$2,947,000 (2010: US$: Nil) fair market value of these options has been recognised on thestatement of financial position as derivative financial instruments.
The change in the fair value of these derivatives of US$1,999,000 loss (2010: Nil) has been recognised in profitor loss during the year as loss on derivative financial instruments. The fair value at inception ($948,000)
formed part of the consideration of the acquisition of Noble Gold Bibiani Limited (note 3).
28. Auditors’ remuneration
The auditor of Noble Mineral Resources Limited is Ernst & Young.
Consolidated2011 2010US$ US$
Amounts received or due and receivable by Ernst & Young (Australia)for:
An audit or review of the financial report of the entity andany other entity in the consolidated group 43,764 -
Other services in relation to the entity and any other entityin the consolidated group
- Tax compliance 24,273 -- Assurance related - -
68,037 -Amounts received or due and receivable by related practices ofErnst & Young (Australia) for:
Due diligence services provided by overseas Ernst & Young firm 5,000 6,996
5,000 6,996
For
per
sona
l use
onl
y

P a g e | 88
Notes to the consolidated financial statements (continued)
For the year ended 30 June 2011
28. Auditors’ remuneration (continued)Consolidated
2011 2010US$ US$
Amounts received or due and receivable by non Ernst & Young auditfirms for:
Review of financial report 9,969 19,717 Taxation services - - Other non-audit services 18,464 -
28,433 19,717
Amounts received or due and receivable by related parties of nonErnst & Young audit firms for:
Other non-audit services - -
29. Cash flow statement reconciliationConsolidated
2011 2010US$ (000) US$ (000)
Reconciliation of net loss to net cash flows from operations
Net profit (20,717) (2,690)
Adjustments for:Depreciation 794 66Foreign exchange gain (loss) (2,715) (16)Loss on derivatives 1,999 -
Changes in assets and liabilities:Decrease (increase) in other assets (887) 2Decrease (increase) in consumables (355) -Decrease (increase) in trade and other receivables (914) (261)Increase (decrease) in trade and other payables 887 548Increase (decrease) in provisions 521 49
(21,387) (2,302)
For
per
sona
l use
onl
y

P a g e | 89
Notes to the consolidated financial statements (continued)
For the year ended 30 June 2011
30. Events after the reporting date
In July 2011, one of the Company’s classes of listed options (ASX: NMGO) expired. Of the 65,265,840 NMGOoptions on issue at 30 June 2011, a total of 64,518,051 were subsequently exercised, raising US$20,625,790(A$19,355,415) in cash. The remaining 746,789 unexercised options lapsed on 21 July 2011. This represented aconversion rate in excess of 99%.
On 29th
July 2011, the Company announced a reserve uplift of 185,000oz to 790,000oz. The combined Provedand Probable Ore Reserves for the Bibiani Main Pit at a gold price of US$1,250/oz is 12,000,000 tonnes at agrade of 2.05g/t containing 790,000oz gold (see Director’s report). The figure released in March 2010(605,000oz) was optimised using a gold price of US$900/oz.
In September 2011, the Company received commitments from sophisticated and institutional investors for theissue of approximately 60 million shares at A$0.55 per share, to raise A$33,000,000.
31. Parent entity information2010 2009
2011 restated restatedUS $ (000) US $ (000) US $ (000)
Information relating to Noble Mineral Resources LimitedCurrent assets 11,118 30,656 2,997Total assets 74,222 38,080 3,515Current liabilities (3,817) (436) 72Total liabilities (3,817) (436) 2,153
Net assets 70,405 37,644 1,362
Issued capital 78,373 41,954 4,339Option reserve 540 - -Foreign currency translation reserve (427) (427) (509)Retained earnings (8,081) (3,883) (2,335)
Total shareholders’ equity 70,405 37,644 1,495
Loss of the parent entity (4,198) (1,547) (2,264)Total comprehensive loss of the parent entity (4,198) (1,629) (2,014)
Guarantees entered into by the parent entity inrelation to debts of its subsidiaries
Consolidated2011 2010
US $ (000) US $ (000)
Guarantees provided for Noble Gold Bibiani Limited’s Investec Bank facility 25,000 -For
per
sona
l use
onl
y

P a g e | 90
Notes to the consolidated financial statements (continued)
For the year ended 30 June 2011
31. Parent entity information (continued)
Commitments and contingencies of the parent entity
Included in Note 22 are commitments and contingencies as follows:
Operating lease commitmentsConsolidated
2011 2010US $ (000) US $ (000)
Within one year 50 39After one year but not more than five years 12 48More than five years - -
62 87
Exploration commitments of the parent entity
The Company has certain obligations to perform minimum exploration work on mineral leases held. Theseobligations may vary over time, depending on the Company’s exploration program and priorities. Theseobligations are also subject to variations by negotiation, joint venturing or relinquishing some of the relevanttenements. At the balance date, total exploration expenditure commitments of the Company which have notbeen provided for in the financial statements amount to A$66,000 per annum.
Remuneration commitments of the parent entityConsolidated
2011 2010US $ (000) US $ (000)
Commitments for the payment of salaries and other remunerationunder long-term employment contracts in existence at the reportingdate but not recognised as liabilities, payable:Within one year (A$) 609 262After one year but not more than five years (A$) 1,013 24After more than five years (A$) - -
1,622 286
Contingencies of the parent entity
The Company does not have any contingent liabilities at the balance date.
For
per
sona
l use
onl
y

P a g e | 91
Directors’ declaration
In accordance with a resolution of the directors of Noble Mineral Resources Limited, I state that:
1. In the opinion of the directors:
a) The financial statements and notes of the consolidated entity for the financial year ended 30 June2011 are in accordance with the Corporations Act 2001, including:
i. Giving a true and fair view of the financial position as at 30 June 2011 andperformance
ii. Complying with Accounting Standards (including the Australian AccountingInterpretations) and the Corporations Regulations 2001
b) The financial statements and notes also comply with International Financial Reporting Standards as
disclosed in note 2.
c) There are reasonable grounds to believe that the Company will be able to pay its debts as and whenthey become due and payable.
2. This declaration has been made after receiving the declarations required to be made to the Directors inaccordance with section 295A of the Corporations Act 2001 for the financial year ended 30 June 2011.
On behalf of the board
W. NorrisManaging Director30 September 2011
For
per
sona
l use
onl
y

Liability limited by a scheme approvedunder Professional Standards Legislation
GHM:MJ:Noble:013
Independent audit report to members of Noble Mineral Resources Ltd
Report on the financial report
We have audited the accompanying financial report of Noble Mineral Resources Ltd, which comprises theconsolidated statement of financial position as at 30 June 2011, the consolidated statement ofcomprehensive income, the consolidated statement of changes in equity and the consolidated statementof cash flows for the year then ended, notes comprising a summary of significant accounting policies andother explanatory information, and the directors' declaration of the consolidated entity comprising thecompany and the entities it controlled at the year's end or from time to time during the financial year.
Directors’ Responsibility for the Financial Report
The directors of the company are responsible for the preparation of the financial report that gives a trueand fair view in accordance with Australian Accounting Standards and the Corporations Act 2001 and forsuch internal controls as the directors determine are necessary to enable the preparation of the financialreport that is free from material misstatement, whether due to fraud or error. In Note 2, the directors alsostate, in accordance with Accounting Standard AASB 101 Presentation of Financial Statements, that thefinancial statements comply with International Financial Reporting Standards.
Auditor’s Responsibility
Our responsibility is to express an opinion on the financial report based on our audit. We conducted ouraudit in accordance with Australian Auditing Standards. Those standards require that we comply withrelevant ethical requirements relating to audit engagements and plan and perform the audit to obtainreasonable assurance about whether the financial report is free from material misstatement.
An audit involves performing procedures to obtain audit evidence about the amounts and disclosures inthe financial report. The procedures selected depend on the auditor's judgment, including the assessmentof the risks of material misstatement of the financial report, whether due to fraud or error. In makingthose risk assessments, the auditor considers internal controls relevant to the entity's preparation andfair presentation of the financial report in order to design audit procedures that are appropriate in thecircumstances, but not for the purpose of expressing an opinion on the effectiveness of the entity'sinternal controls. An audit also includes evaluating the appropriateness of accounting policies used andthe reasonableness of accounting estimates made by the directors, as well as evaluating the overallpresentation of the financial report.
We believe that the audit evidence we have obtained is sufficient and appropriate to provide a basis forour audit opinion.
Independence
In conducting our audit we have met the independence requirements of the Corporations Act 2001. Wehave given to the directors of the company a written Auditor’s Independence Declaration, a copy of whichis included in the directors’ report.
For
per
sona
l use
onl
y

GHM:MJ:Noble:013
Auditor’s Opinion
In our opinion:
a. the financial report of Noble Mineral Resources Ltd is in accordance with the Corporations Act2001, including:
i giving a true and fair view of the consolidated entity's financial position as at 30 June 2011and of its performance for the year ended on that date; and
ii complying with Australian Accounting Standards and the Corporations Regulations 2001;and
b. the financial report also complies with International Financial Reporting Standards as disclosedin Note 2.
Report on the Remuneration Report
We have audited the Remuneration Report included in the directors’ report for the year ended 30 June2011. The directors of the company are responsible for the preparation and presentation of theRemuneration Report in accordance with section 300A of the Corporations Act 2001. Our responsibilityis to express an opinion on the Remuneration Report, based on our audit conducted in accordance withAustralian Auditing Standards.
Auditor’s Opinion
In our opinion, the Remuneration Report of Noble Mineral Resources Ltd for the year ended 30 June2011, complies with section 300A of the Corporations Act 2001.
Ernst & Young
G H MeyerowitzPartnerPerth30 September 2011F
or p
erso
nal u
se o
nly

GHM :NR:Nob le:010
Au d itor’s In d ep en d en ce Declarat ion t o t h e Directors of Noble Min eralRes ou rces Ltd
In relation to our auditofth e financialreport ofN ob le M ineralResources Ltd for th e financialyear ended3 0 June 2011, to th e b estofmy know ledge and b elief, th ere h ave b een no contraventions ofth e auditorindependence requirements ofth e C orporations A ct 2 0 0 1 or any applicab le code ofprofessionalconduct.
Ernst& Y oung
G H M eyerow itzPartnerPerth3 0 S eptemb er 2011
For
per
sona
l use
onl
y

ASX additional information Additional information required by the Australian Stock Exchange Ltd and not shown elsewhere in this report is as follows. The information is current as at 30 September 2011. (a) Distribution of equity securities (i) Ordinary share capital
460,308,567 fully paid ordinary shares are held by 1,560 individual shareholders. All issued ordinary shares carry one vote per share and carry the rights to dividends.
(ii) Options
86,580,607 options are held by 755 individual option holders. Options do not carry a right to vote.
The numbers of shareholders, by size of holding, in each class are: Fully paid Options (A$0.35) Options (A$0.20) Options (A$0.40) ordinary shares Exp 21.7.2013 Expiry 8.7.2014 Exp 19.8.2014 1 – 1000 232 240 - - 1,001 – 5,000 281 151 - - 5,001 – 10,000 193 91 - - 10,001 – 100,000 679 189 - - 100,000 and over 175 78 1 5
1,560 749 1 5
Holding less than a marketable parcel
- Fully paid ordinary shares 223 - Options expiring 21 July 2013 247
(b) Substantial shareholders Fully paid Number Percentage Wei Ann Developments Limited 71,766,534 15.59 Global Gold Holdings Limited 69,062,500 15.00
140,829,034 30.59
For
per
sona
l use
onl
y

ASX additional information (continued) (c) Twenty largest shareholders of quoted equity securities (i) Fully paid ordinary shares Fully paid Number Percentage 1 Wei Ann Developments Limited 71,766,534 15.59 2 Global Gold Holdings Limited 69,062,500 15.00 3 Citicorp Nominees Pty Limited 40,796,072 8.86 4 Mr Wayne Norris <The Ausgold A/C> 27,000,000 5.87 5 National Nominees Limited 26,617,675 5.78 6 ABN Amro Clearing Sydney Nominees Pty Limited >Custodian A/C> 23,183,942 5.04 7 Sino Portfolio International Limited 20,000,000 4.34 8 Platinum Parade Snd Bhd 17,203,777 3.74 9 HSBC Custody Nominees (Australia) Limited 16,093,202 3.50 10 UBS Nominees Pty Ltd 10,500,996 2.28 11 Syarikat Pesaka Antah Sdn Bhd 8,332,500 1.81 12 Merril Lynch (Australia) Nominees Pty Limited 7,196,540 1.56 13 J P Morgan Nominees Australia Limited 7,034,103 1.53 14 Phillip Securities (Hong Kong) Ltd <Client A/C> 6,091,903 1.32 15 J P Morgan Nominees Australia Limited <Cash income A/C> 5,986,363 1.30 16 Mr Wayne David Norris 5,700,000 1.24 17 Credit Suisse Securities (Europe) Ltd <Collateral A/C> 5,370,000 1.17 18 Mr Wayne David Norris <Ausgold Super Fund A/C> 5,000,000 1.09 19 Mr Amit Eliyahu 3,212,500 0.70 20 Mrs Barbara Melva Norris 2,585,000 0.56
378,733,607 82.28
(ii) Listed share options expiring 21 July 2013 1 Global Gold Holdings Limited 13,812,500 18.58 2 Mr Wayne Norris <The Ausgold A/C> 6,750,000 9.08 3 HSBC Custody Nominees (Australia) Limited 6,303,749 8.48 4 Citicorp Nominees Pty Limited 5,689,589 7.65 5 ABN Amro Clearing Sydney Nominees Pty Limited >Custodian A/C> 3,938,492 5.30 6 Wei Ann Developments Limited 3,333,334 4.48 7 Platinum Parade Snd Bhd 2,582,756 3.47 8 Syarikat Pesaka Antah Sdn Bhd 1,666,500 2.24 9 Mr Amit Eliyahu 1,425,000 1.92 10 Mr Wayne David Norris 1,425,000 1.92 11 Mr Wayne David Norris <Ausgold Super Fund A/C> 1,250,000 1.68 12 Lampsac Pty Ltd <Central Coast Superfund A/C> 1,135,513 1.53 13 Mr Jackie Au Yeung 1,118,750 1.51 14 Forsyth Barr Custodians Limited <Forsyth Barr Ltd-Nominee A/C> 1,023,141 1.38 15 Talent Lane Limited 845,313 1.14 16 SHL Pty Ltd 833,334 1.12 17 Merril Lynch (Australia) Nominees Pty Limited 822,670 1.11 18 Serng Yee Liew 762,501 1.03 19 J P Morgan Nominees Australia Limited 745,840 1.00 20 Mr Terry Stark 566,500 0.76
56,030,482 75.38
For
per
sona
l use
onl
y
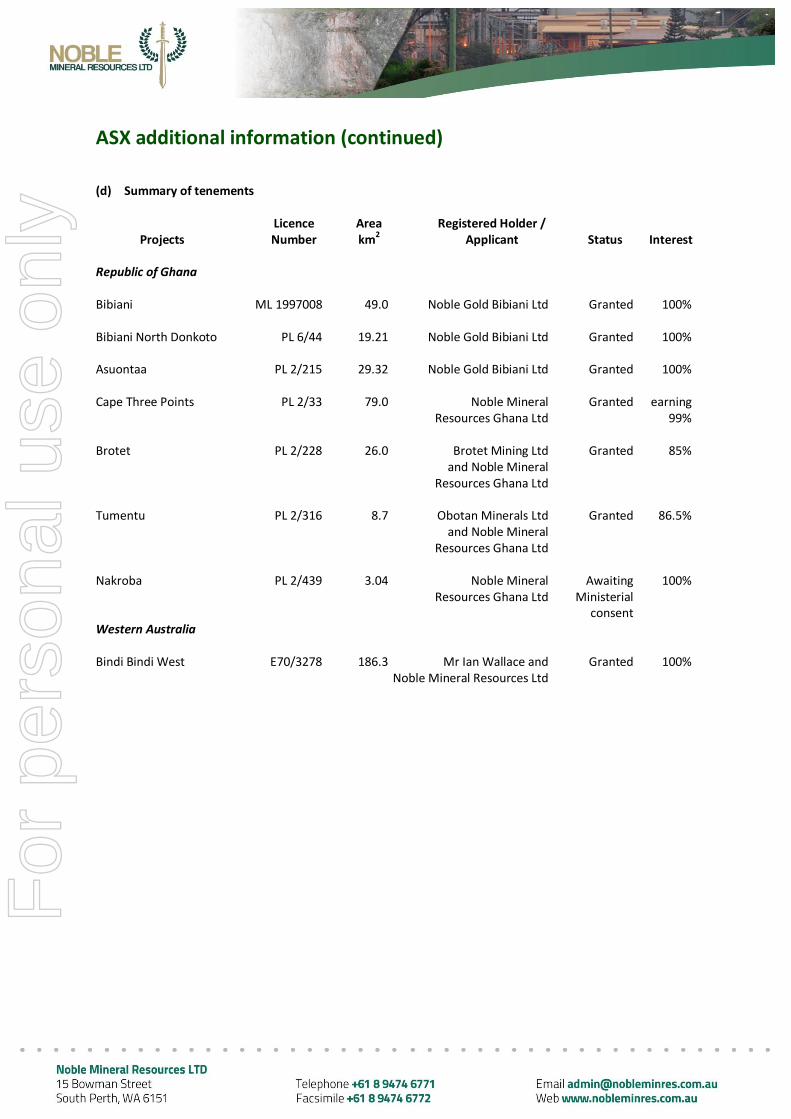
ASX additional information (continued) (d) Summary of tenements Licence Area Registered Holder / Projects Number km2 Applicant Status Interest Republic of Ghana Bibiani ML 1997008 49.0 Noble Gold Bibiani Ltd Granted 100% Bibiani North Donkoto PL 6/44 19.21 Noble Gold Bibiani Ltd Granted 100% Asuontaa PL 2/215 29.32 Noble Gold Bibiani Ltd Granted 100% Cape Three Points PL 2/33 79.0 Noble Mineral Granted earning Resources Ghana Ltd 99% Brotet PL 2/228 26.0 Brotet Mining Ltd Granted 85% and Noble Mineral Resources Ghana Ltd Tumentu PL 2/316 8.7 Obotan Minerals Ltd Granted 86.5% and Noble Mineral Resources Ghana Ltd Nakroba PL 2/439 3.04 Noble Mineral Awaiting 100% Resources Ghana Ltd Ministerial consent Western Australia Bindi Bindi West E70/3278 186.3 Mr Ian Wallace and Granted 100% Noble Mineral Resources Ltd
For
per
sona
l use
onl
y