no. 17 june 21, 2022 contents
TRANSCRIPT

No. 17 June 21, 2022
Contents
EDITORIAL
Intersecting trajectories. Dodman, Affifi, Aillon, Arrobbio, Barbiero, Camino, Colucci-Gray, Ferrara and Folco
3-7
ORIGINAL PAPERS
Sustainable tourism: tourists’ behaviour and their impact on the place visited. Ingaldi and Dziuba
8-38
Community participation in creating sustainable community-based tourism. Kurniawan, Astuti and Syifauddin
39-55
Improving household waste management through a door-to-door collection in Ruaka Town, Kenya. Chisika and Yeom
56-85
Health literacy programme and proper solid waste disposal habits among housewives in Onitsha, Anambra State, Nigeria. Okorie and Ihemegbulem
86-103
The impacts of Covid-19 on household behavior and household waste in Turkey. Yalçınyiğit, Dönmez-Turan, Akbaş and Varank
104-128
The development of a construct in the heritage urban sustainability index. Saleh, Mahat, Hashim, Nayan, Suhaily, Ghazali, Hayati and Utami
129-156
LETTER TO VISIONS
Return to Forests. Therapeutic Potential of Woodland Environments. Piras
157-164
Visions for Sustainability, Vol. 17, Published online, ISSN 2384-8677 http://www.ojs.unito.it/index.php/visions

EDITORS-IN-CHIEF
Martin Dodman, IRIS – Interdisciplinary Research Institute on Sustainability, Italy. [email protected]
Giuseppe Barbiero, University of Valle d'Aosta, Italy. [email protected]
EDITORIAL TEAM Ramsey Affifi, School of Education, University of Edinburgh, United Kingdom Jean-Louis Aillon, Interdisciplinary Research Institute on Sustainability, University of Torino, Italy. Osman Arrobbio, Department of Humanities, Social Sciences and Cultural Industries, University of Parma, Italy.
Interdisciplinary Research Institute on Sustainability. University of Torino, Italy. Elena Camino, Interdisciplinary Research Institute on Sustainability, University of Torino, Italy. Alessandro Cerutti, European Commission Joint Research Centre, Directorate D – Sustainable Resources, Bio-Economy
Unit (D1), Ispra, Italy. Interdisciplinary Research Institute on Sustainability, University of Torino, Italy. Laura Colucci-Gray, School of Education, University of Edinburgh. United Kingdom UK. Interdisciplinary Research Institute
on Sustainability, University of Torino, Italy. Enzo Ferrara, Istituto Nazionale di Ricerca Metrologica, Torino, Italy. Interdisciplinary Research Institute on Sustainability,
University of Torino, Italy. Silvano Folco, Interdisciplinary Research Institute on Sustainability, University of Torino, Italy. Donald Gray, University of Aberdeen, United Kingdom Christine Ji, China Studies Centre, University of Sydney, Australia Helen Kopnina, Institute of Cultural Anthropology and Development Sociology, Leiden University, The Netherlands.
Sustainable Business Programme, The Hague University of Applied Science, The Netherlands. Shé Mackenzie Hawke, Department of Gender and Cultural Studies, School of Philosophical and Historical Inquiry,
University of Sydney, Australia. Mediterranean Institute for Environmental Studies, Science and Research Centre, Koper, Slovenia.
James Miller, Humanities Research Centre, Duke Kunshan University, China. Adriana Pagano, Federal University of Minas Gerais, Belo Horizonte, Brazil. Anna Perazzone, Department of Life Sciences and the Biology of Systems, University of Torino, Italy. Carlos Rojas, Department of Asian and Middle Eastern Studies, Duke University, USA. Humanities Research Centre, Duke
Kunshan University, China. Visions for Sustainability is an indexed scientific journal published in open access by the Interdisciplinary Research Institute on Sustainability (IRIS). The journal promotes a debate on how the concept of sustainability can be addressed and applied in existing and foreseeable societies worldwide. Particular emphasis is placed on facilitating communication between researchers of different disciplines, supporting educational projects and examining the role of contemporary science in dealing with issues related to sustainability. Papers are welcome from researchers and scholars of natural, political, social and other sciences as well as philosophical and humanistic disciplines, and in particular from anyone wishing to make a contribution which combines multiple viewpoints. The aim is to host as wide a range as possible of multidisciplinary, interdisciplinary and transdisciplinary perspectives on sustainability. Discussions or comments on articles which have previously appeared in the journal are also welcome. All submissions will be refereed before publication. Articles can be submitted directly online at the journal website http://www.ojs.unito.it/index.php/visions through the login procedure. Any further questions and/or submission enquiries can be addressed to [email protected] or [email protected]. Direttore Responsabile: Luca Biamonte Proprietario: IRIS – Istituto Ricerche interdisciplinari sulla Sostenibilità Editore: IRIS – Istituto Ricerche interdisciplinari sulla Sostenibilità ISSN: 2384-8677 © IRIS – Istituto Ricerche Interdisciplinari sulla Sostenibilità, Dipartimento di Scienze della Vita e Biologia dei Sistemi, Università degli studi di Torino, Via Accademia Albertina, 13 - 10123 Torino, Italy

www.ojs.unito.it/index.php/visions
Intersecting trajectories
Martin Dodman Ramsey Affifi, Jean-Louis Aillon, Osman Arrobbio, Giuseppe Barbiero, Elena Camino, Laura Colucci-Gray, Enzo Ferrara, Silvano Folco
Correspondence: [email protected]
When we launched Visions for Sustainability, we wanted to provide a space for as
wide a range as possible of ways of looking at the concept of sustainability and
at the same time of considering the multiple perspectives from which that con-
cept can shed light on the ecological trajectories of all the biotic and abiotic com-
ponents of the planet we inhabit.
Since we are human beings, we are particularly concerned with the trajectories of
our own species, how they are driven by evolutionary feedbacks between char-
acteristics and adaptations, how they intersect with and impact on all other tra-
jectories, and how our understanding of this can lead to developing ways of
changing them and rendering them more sustainable. The papers in this issue
provide specific perspectives on various aspects of these concerns, emphasizing
the importance of promoting public and institutional awareness as an essential
prerequisite for action, while focusing on a wide range of diverse geographical
locations. We are particularly pleased to host studies from different parts of the
Global South.
One of the principal characteristics of Homo sapiens has been an early and ever-
increasing propensity to travel. Recent studies link movement out of Africa to
climate change which made travelling necessary and at the same time rendered it
possible. Such initial migration was determined by the quest for space, food, and
security. Dynamic population growth then led to groups splitting and travelling
ever further apart. New technologies and in particular means of transport, such
Editorial

4 Dodman et al.
Vis Sustain, 17, 6823, 3-7 http://dx.doi.org/10.13135/2384-8677/6823
as boats, enabled ever greater distances to be covered. Other important aspects
included human traits such as imagination, adaptability, curiosity, adventure, and
risk-taking. Each one of these factors is clearly involved both in the migratory
flows that characterize all human history as well as a very recent predilection for
a particular kind of movement, known as tourism, which has seen a rapid expo-
nential growth in the last few decades.
In “Sustainable tourism: tourists’ behaviour and their impact on the visited
place”, Ingaldi and Dziuba address the question of overtourism and the need for
tourist destinations that suffer from overcrowding and its various consequences
to develop ways to render the influx of tourists sustainable. They argue that a
prerequisite for this is greater awareness of the problem on the part of tourists
themselves. As part of a larger project on sustainable tourism and people's per-
ceptions of this in different parts of Europe, they investigate the understanding
and attitudes of people towards the concept of sustainable tourism in the coun-
tries of the Visegrád Group. The results of their survey show that, while respond-
ents demonstrate understanding of what sustainable tourism means, this fre-
quently does not translate into a consequent and coherent behavior. They argue
that further research can become a stimulus to investigating ways of rethinking
and changing behaviors.
In “Community participation in creating sustainable community-based tourism”,
Kurniawan, Astuti and Syifauddin consider the question of the welfare of the
local community of tourist destinations, together with that of environmental and
cultural preservation. Their research investigates community participation in re-
alizing sustainable community-based tourism in Karimunjawa, Indonesia. The
results show that community participation in realizing sustainable community-
based tourism is a combination of Spontaneous Participation and Induced Par-
ticipation, involving elements of participation that are active and bottom-up
while others that are passive and top-down still remain.
Another striking characteristic of Homo sapiens has been to go beyond satisfying
our basic needs for survival and develop increasingly high rates of consumption.
This has led to the consolidation of embedded over-consumption patterns, the
frenetic generation of techno-scientific innovations for resource gathering and
accumulation, the establishment of forms of organization based on the principle
of growth as an accelerating tendency towards increase in every sphere of human
activity, population dynamics, and urban settlements. At whatever scale, increas-
ing consumption, population size and density inevitably lead to waste production
and concomitant problems related to waste management, sanitation, and the
spread of disease.

Intersecting trajectories 5
Vis Sustain, 17, 6823, 3-7 http://dx.doi.org/10.13135/2384-8677/6823
In “Improving household waste management through a door-to-door collection
in Ruaka Town, Kenya” Chisika and Yeom explore ways of improving household
waste collection in urban areas by comparing households served by door-to-door
waste collection and those without it. Their results show that door-to-door solid
waste collection can induce positive behavioural changes and enhance sustaina-
bility at waste generation points. They argue that the resulting waste separation
and recycling can help improve revenue from waste management and help re-
solve the waste financing gap facing many governments. At the same time, cur-
rent practices are unsustainable and can reinforce inequality. More studies are
necessary to investigate the correlation between individual household demo-
graphic attributes and the effectiveness of door-to-door waste collection More-
over, priority must be given to regulating door-to-door service, increasing citizen
participation in waste management, and improving waste separation at the source
to measure the system’s maximum impact.
In “Health Literacy Programme and Proper Solid Waste Disposal Habits Among
Housewives in Onitsha, Anambra State, Nigeria”, Okorie and Ihemegbulem in-
vestigate different aspects of the efficacy of a health literacy programme related
to understanding the dangers of improper disposal of waste, building the neces-
sary knowledge for proper disposal, and developing a positive attitudinal change
towards personal habits. Their findings show that the community health literacy
programme has achieved good results in each of these areas. They illustrate fur-
ther recommendations for developing the programme to increase its efficacy in
terms of behaviors.
In “The Impacts of Covid-19 on Household Behavior and Household Waste”
Yalçınyiğit, Dönmez-Turan, Akbaş and Varank examine the impacts of Covid-
19 pandemic on household behavior and waste in Istanbul. Their research shows
that mask, glove, disposable bag usage, cooking at home, online shopping, cargo
arrival, dishwasher and washing machine usage all increased, while ordering food
from outside decreased. Consequently, medical, food, disposable bag and plastic
waste also increased. The authors also investigate the correlation between the
changes in household behavior and waste disposal and income and household
size. Their findings show the importance of developing specific management
strategies for medical, food and plastic wastes and for households with different
socio-economic backgrounds.
Human trajectories leading to the increasing pervasiveness and dimension of ur-
ban settlements as complex systems based on intricate and dynamic relationships
can be analysed from many other perspectives. One is the way in which they have
given rise to a multidimensional heritage, involving both tangible and intangible

6 Dodman et al.
Vis Sustain, 17, 6823, 3-7 http://dx.doi.org/10.13135/2384-8677/6823
components, that can be variously analysed through the lens of sustainability in
terms of urban heritage management.
In “The development of a construct in the heritage urban sustainability index”
Saleh, Mahat, Hashim, Nayan, Suhaily, Ghazali, Hayati and Utami consider the
question of identifying sustainability indicators for the creation of sustainable cit-
ies for communities, with reference to the development of a heritage urban sus-
tainability index construct in Malaysia using exploratory factor analysis. Their
study is based on five main constructs of urban heritage sustainability: economic
prosperity, social well-being, environmental well-being, cultural heritage, and the
role of government and community. The results demonstrate the relationship
between the items that constitute each of the constructs. The authors believe that
their findings can help research on the sustainability of heritage cities in other
areas.
The intersecting trajectories of Homo sapiens and forest ecosystems have given rise
to a vast literature in recent decades. The focus has been principally on the rea-
sons for and the consequences of the massive human destruction of ever-increas-
ing areas of tropical rainforest. Forest ecosystems have been analyzed as a key
provider of many ecological services related to climate, water, air, energy, biodi-
versity, and innumerable others.
Only very recently has there been a development of a literature related to the
benefits that can derive for human beings, as for all living organisms, from a
relationship with forests as a therapeutic environment. In “Return to forests.
Therapeutic potential of woodland environments.”, Piras argues that, while for-
ests can undeniably be beneficial for human beings, there are still open questions
that need further research concerning what is beneficial for whom and for what
aspects of human psychophysical health. At present there is neither a clear un-
derstanding of the characteristics to look for in the forests nor of the activities to
be carried out there. She illustrates two lines of research. The first aims at inves-
tigating forest ecosystems with a high degree of biodiversity and their relationship
to individual human characteristics and needs and types of activities. The second
refers to the possibility of benefiting from forests in terms of a pathway by which
the patient develops, rather than acquires, an ability to relate to forests them-
selves. The pathway consists of five stages – biophilic, sensory, haptic/proprio-
ceptive, adaptive, integrative – and becomes a circular path in which each phase
is gradually retraced employing the new skills and competencies developed pre-
viously.

Intersecting trajectories 7
Vis Sustain, 17, 6823, 3-7 http://dx.doi.org/10.13135/2384-8677/6823
Citation
Dodman, M., Affifi, R., Aillon, J.-L., Arrobbio, O., Barbiero, G., Camino, E., Colucci-Gray, L., Ferrara, E., Folco, S. (2022) Intersecting trajectories. Visions for Sustainability, 17, 6823, 3-7 http://dx.doi.org/10.13135/2384-8677/6823
© 2022 Dodman, M., Affifi, R., Aillon, J.-L., Arrobbio, O., Barbiero, G., Camino, E., Colucci-Gray, L., Ferrara, E., Folco, S.
This is an open access publication under the terms and conditions of the Creative Commons Attribution (CC BY) license (http://creativecommons.org/licenses/by/4.0/).

www.ojs.unito.it/index.php/visions
Sustainable tourism: tourists’ behaviour and their impact on the place visited
Manuela Ingaldi, Szymon T. Dziuba
Received: 11 May 2021 | Accepted: 17 August 2021 | Published: 9 September 2021
Citation: Ingaldi, M., Dziuba, S.T. (2021) Sustainable tourism: tourists’ behaviour and their im-pact on the place visited. Visions for Sustainability, 17, 5828, 8-38. http://dx.doi.org/10.13135/2384-8677/5828
Correspondence: [email protected] Extended authors informations available on the last page of the article
1. Introduction
2. Literature review
3. Materials and Methods
4. Results
5. Discussion
6. Conclusions
Keywords: overtourism, survey, sustainable tourism, tourists’ behaviour, tour-ism impacts.
________________________________________________________
Abstract. With more members of society increasingly becoming more afflu-
ent, greater ease of movement around the world, cheaper airline tickets, and
intense competition on websites that offer accommodation, tourism has be-
come more and more popular. Many places have become a destination for tour-
ists, not only because of their tourist value but more often because of fashion-
able trends. This is consequently associated with increasing overcrowding in
such places, and thus with the occurrence of the phenomenon termed over-
tourism. Potential salvation for such places lies in attempts to incorporate the
Original Paper
Sustainable tourism 9
Vis Sustain, 17, 8-38 http://dx.doi.org/10.13135/2384-8677/5828
concepts of sustainable tourism into their way of operating. However, for this
to be successful, tourists must also understand the need to change attitudes
and behaviors. Otherwise, it will be hard to do anything that achieves a true
impact. The aim of this paper was to assess the attitudes of people from the
countries of the Visegrád Group (i.e., the Czech Republic, Poland, Slovakia,
and Hungary) towards sustainable tourism, with the emphasis on their un-
derstanding of the concept and incorporating it into their travel habits. The
survey was conducted in the form of an online questionnaire administered to
residents of these countries. The survey is part of a larger project on sustain-
able tourism and people's perceptions of this tourism in Europe. The results
of the survey showed that the respondents understand what the concept of
sustainable tourism means and what its assumptions are. However, this often
does not translate into changing their behavior and applying these assump-
tions within their lives as tourists. Conducting similar research, however, can
be a way to encourage respondents to rethink and change their behavior. At
the same time, it is also necessary to help build scientific knowledge in the
context of sustainable development and sustainable tourism in order to inform
policies and decisions.
_____________________________________________________________
1. Introduction
Tourism is an important sector of service industries that has been constantly
growing at an ever-increasing pace in recent years. There is a continuous growth
in the number of tourists around the world, especially in the most popular tourist
destinations (Heslinga, 2018). Major tourist-related investments and changes can
be seen in areas such as transport, the hotel industry, catering, trade, and the
production and sale of souvenirs. This creates new jobs, which results in the local
community having the opportunity to earn money and live better, which is espe-
cially important in places with high unemployment. Tourists potentially bring
income to the place visited, so that it can be cared for, developed, and new in-
vestments can be made (Gonzalez et al., 2018; Scheyvens, 2009).
However, the positive developmental outlook for the future was abruptly inter-
rupted when the COVID-19 pandemic swept across the world. The years 2020

10 Ingaldi and Dziuba
Vis Sustain, 17, 8-38 http://dx.doi.org/10.13135/2384-8677/5828
and 2021 have witnessed a freeze in many sectors, including the tourism industry.
With restrictions in many countries, movement bans, and mandatory quarantine,
the pandemic has taken its toll on the industry's business (Mroz, 2021). Kuqi et
al. (2021) argue that tourism is the sector most affected by the pandemic, expe-
riencing a rapid and steep decline in demand and an increase in job layoffs. This
not only leads to lower revenues for the tourist destination but also for its resi-
dents. Consequently, adequate synergy is needed between tourists and tourist
destinations. It remains to be seen to what extent tourists, businesses, and people
who profit from tourism will be able to initiate a new cycle of sustainable tourist
growth.
Almost everyone likes traveling, especially to relax and change habitual environ-
ments. Every year people look for new and interesting places to visit (UNWTO,
2018). The choice of destination is determined by various factors, such as the
cost of the trip, its duration, and the interests of the traveler. Due to the increas-
ing affluence of parts of society, wider access to modern means of transport,
lower costs of travel, and simplified procedures for obtaining the necessary doc-
uments, traveling is becoming easier and more frequent (Pan et al., 2021; Japutra,
Hossain, 2020; Baryshnikova et al., 2020).
People want to spend their time actively while exploring new places that they
may have seen on television or read about online (Beeton, 2016). Information
about interesting places that are worth visiting or various events can often be
found on the Internet. People are naturally curious about the world, about other
cultures, about other lifestyles, and the best way to get to know them is to travel.
This makes tourism a significant element of globalization. Tourism has become
one of the principal industries in the world, characterized by the largest and fast-
est growth (Gorica, 2007). According to Eurostat (Eurostat, 2021) the number
of employees (full and part-time) in the tourism sector in European Union coun-
tries rose from 216 214.6 thousand in 2011, to 220 915.0 in 2015 and 232 612.9
in 2019. The overall growth rate in the sector has been in line with a 2011 forecast
of 3% per annum (Hills, 2011). Although the COVID-19 pandemic has severely
impacted on the industry, it would seem likely that sooner or later rapid growth
rates will be resumed.
Unfortunately, with the increase in the number of travelers, especially for tourist
purposes, the phenomenon of overtourism has emerged. Well-known European
examples of where the negative effects of overtourism are felt are cities such as
Barcelona, Berlin, Lisbon, and Prague (Koens et al., 2018; Milano, 2017; Novy
and Colomb, 2016; Ingaldi, 2020). With the growth of tourism, local stakeholders
have started to loudly voice the need to counteract the problem of overtourism.

Sustainable tourism 11
Vis Sustain, 17, 8-38 http://dx.doi.org/10.13135/2384-8677/5828
Overtourism should be considered from two perspectives: the right of tourists
to travel and the right of residents to live in peace and dignity (Perkumiene and
Pranskuniene, 2019). Without tourists, many tourist destinations would not sur-
vive since tourists are the main source of income. However, residents, tired of
the influx of too many tourists, and often their strange or inappropriate behavior,
may attempt to find other sources of income. Several studies have been exploring
the relationships between the rights of tourists and residents from different per-
spectives (e.g., Juss, 2004; Dauvergne, 2004; Gilbert, 2014).
The solution that is proposed for many tourist destinations burdened with over-
tourism is developing ways of implementing sustainable tourism. The main idea be-
hind this concept is to minimize the negative effect of tourism on the environ-
ment and local culture while helping generate employment opportunities and in-
come for residents. The goal of sustainable tourism is to ensure that development
brings a positive experience for local communities, tourism businesses, and tour-
ists themselves (Peeters, Dubois, 2010; Larsen, Guiver, 2013; Canavan, 2014).
For sustainable tourism to be properly implemented, it needs to be understood
both by tourists and the local population. Only in this case is it possible to im-
plement its underlying assumptions.
It should be remembered that this will not only improve the condition of the
natural environment or have a positive impact on local communities, although
these are the most important premises for the implementation of sustainable
tourism. There should also be an improvement in the quality of the various ser-
vices offered to tourists (Ulewicz, Blaskova, 2018; Anttila, Jussila, 2018;
Staniszewska et al. 2020; Kardas, 2016). High quality of services should translate
into tourist satisfaction, and at the same time into an appropriate level of prices.
Therefore, the income of the members of local community and of the specific
place visited as a whole can increase (Zelga-Szmidla, Kapustka, 2019; Teplická,
Hurná, 2020).
The following study aimed to explore the attitudes of people from the countries
of the Visegrád Group towards sustainable tourism. The survey was conducted
using the authors’ questionnaire distributed through Internet forums and social
networking sites among residents of these countries. The questionnaire included
15 statements concerning the organization of holiday trips and tourist behavior
during such trips, rated on a five-point Likert scale, and 6 questions designed to
test respondents' understanding of the basic problems of sustainable tourism.
This survey was developed based on a previously conducted literature study. The
findings themselves were also compared to other studies on similar problems
that have been published in recent years.

12 Ingaldi and Dziuba
Vis Sustain, 17, 8-38 http://dx.doi.org/10.13135/2384-8677/5828
2. Literature review
Year by year, the issues of tourism in the context of sustainable development are
becoming an increasingly important aspect of research on both the tourism sec-
tor and the problems of sustainable economy related to the environment. Nu-
merous in-depth studies in this field have been published over a period of several
years. An exhaustive review of publications from the previous few decades is
included in a paper published in 2013 (Nunkoo et al., 2012), which highlights an
increase in both methodological sophistication and awareness of the theory be-
hind the research. In the extensive literature on green tourism, publications deal-
ing with the negative effects of excessive (and therefore harmful from the point
of view of sustainable development) activity of tourists are worthy of note.
Among the most important papers in scientific journals dealing with this issue
there are many examples whose authors adopted overtourism as the specific fo-
cus of their investigation. Some of these studies were conducted using a method
like that presented in our paper, i.e., a questionnaire designed on the basis a lit-
erature review and previous experiences in studying the problems discussed
(Muler Gonzalez et al., 2018). However, this is often the only similarity. Publica-
tions tend to focus on residents of tourist destinations rather than on tourists
themselves, which represents an important difference in examining attitudes and
behaviors that negatively impact on the environment. At the same time, the pub-
lished research is not only useful for investigating solutions, but also helps for-
mulate questions properly. The term overtourism itself is sometimes misused, or
at least used in very different contexts (Koens et al., 2018). This should not be
surprising, although there are often doubts as to whether it is related to a new
line of research or simply used as another term for a long-known phenomenon
(Capocchi et al., 2019).
Undoubtedly, the problem of overtourism has become of increasing importance
in recent years, as it leads to discontent and conflict in terms of social relations,
and, at the same time, resistance from activists aware of the potential threat and
demanding action to reduce harmful effects of tourism (Milano et al., 2019). This
is often linked to the notion of degrowth, understood to mean demands to limit
the unfettered growth of the capitalist economy, which can be considered com-
plementary to objections to overtourism (Fletcher et al., 2019). Therefore, re-
gardless of the theoretical investigations, the problem is important from an eco-
nomic, social, and environmental point of view. Moreover, by its very nature, it
is also interdisciplinary. For this reason, it is important to clearly define precisely
what the research involves at the stage of method description. Questions are
usually asked based on the assessment of the effects of overtourism (or otherwise
Sustainable tourism 13
Vis Sustain, 17, 8-38 http://dx.doi.org/10.13135/2384-8677/5828
harmful tourism), whether from the standpoint of tourists or residents. Analyses
targeting local residents may have some specific assumptions, including those
related to sustainability, for example, in the context of tourism area life cycle
theory (Lee, Jan, 2018).
While from a social point of view the attitude of residents seems to be particularly
important (it is also the one most often studied, even when the axis of tourist-
resident relations is analyzed (Cheung, Li, 2019)), from the point of view of atti-
tude formation and concern for sustainable development, observations of the
attitudes of tourists seem to be underrepresented. Among the important research
studies focusing on this topic (especially using a survey based on a large research
sample), should be mentioned the analysis of tourists of one of the most popular
destinations in Norway (Oklevik et al., 2019). An important conclusion drawn
here is that tourist areas should cater for people who visit them in terms of length
of stay, expenses, and intentions. This helps build a sustainable tourism economy,
without severe restrictions, by creating one that is better adapted to economic,
social, and environmental conditions. It offers a path for possible exploration
that represents a more rational point of view, different from that of the often-
critical residents or community activists who might see a problem but are unable
to propose a constructive solution. Only the search for a kind of activity that
considers both the needs of the environment and the attitudes and expectations
of visitors, can result in the development of an effective strategy for sustainable
tourism.
As can be seen from this review, research on tourist behavior and attitudes is
among the most important issues concerning the tourism industry. Frequently
cited publications in this area, directly concerning current problems, already ap-
peared at the beginning of the second decade of the 21st century. Obviously, this
is related to the then growing interest of researchers in tracking the impact of the
economy on the environment in the context of the idea of sustainable develop-
ment. Even then, it was noted that while humans are inclined to adopt pro-envi-
ronmental attitudes in their places of residence, when assuming the role of tour-
ists, they tend to show much less awareness of and commitment to such prob-
lems (Barr et al., 2010). Subsequent analyses were devoted to this observation,
including those leading to the conclusion that motivating visitors to behave pro-
environmentally during holidays is not a simple task (Ballantyne et al., 2011a).
This finding is significant because the growing environmental awareness within
society may obscure the fact that a correct attitude suffers reduction during trips.
Similar premises were used when investigating the attitudes of tourists seeking
wilderness experience, calling for actions that foster personal engagement to

14 Ingaldi and Dziuba
Vis Sustain, 17, 8-38 http://dx.doi.org/10.13135/2384-8677/5828
encourage sustainable activities and practices. It was also noted that, depending
on the impressions of visitors, these attitudes may persist for shorter or longer
periods of time (Ballantyne et al., 2011b). Equally important for this type of tour-
ist destination is to consider the potential for sustainable tourism in specially pro-
tected areas such as national parks (Cetin et al., 2018). Nevertheless, the problem
of visitor attitudes affects virtually every type of destination, as they are all ex-
posed to the effects of climate change. It is worth noting that the real attitudes
and actions of tourists related to the needs of the environment are also important,
although these are not easy to explore and interpret (Gossling et al., 2012). There-
fore, analyses aimed directly at the identification of attitudes declared by tourists
and their less frequently formulated expectations and motivations are extremely
important for the future of effective actions aimed at reducing the harmful effects
of tourism. In this respect, it seems reasonable to search for a balance between
environmental and social concerns.
Years ago, the impact on society caused by the constant flow of tourists was
already noted, and more in-depth qualitative research on their interrelationship
was called for (Deery et al., 2012). This should not be underestimated, especially
since it cannot be ruled out that the two dimensions are closely linked, especially
in recent times. This, of course, does not exclude the use of quantitative methods,
based, for example, on techniques related to big data, as is already being done
both for tourist behavior (Miah et al., 2017) and by analyzing the effects of their
presence, for example in the form of a carbon footprint (Henar Salas-Olmedo et
al., 2018). Emphasizing the importance of qualitative methods should serve as a
reminder of the need for in-depth analyses that are ultimately intended to lead to
a better understanding of tourists' decisions and attitudes. This can be attempted
through various means, including a systematic literature review (in scientometric
terms (Fang et al., 2018)), but due to the evolving nature of this sector of the
economy, empirical research seems to be the most effective approach. In this
group, the survey or interview techniques are most popular. Furthermore, it is
common among researchers dealing with these problems to focus on a geo-
graphic region, not necessarily a specific location, as there may also be similar
locations in a larger area (Ali et al., 2018). There is no doubt that a survey or
interview targeted on an essentially homogeneous group of tourists can lead to
more consistent results, which in turn can later be used by local industries to
improve both services and marketing and increase care for the environment. The
transformation of tourist areas towards improving the comfort of young people,
who are constantly using ICTs and the Internet, and therefore expect adequate
facilities regardless of the type of tourist destination, is an important and devel-
oping issue (Femenia-Serra, 2019). One of the interesting directions of

Sustainable tourism 15
Vis Sustain, 17, 8-38 http://dx.doi.org/10.13135/2384-8677/5828
contemporary trends is also the tourism networks organized according to Islamic
rules (Al-Ansi, Han, 2019). The all-encompassing view of the tourism industry is
indicative of the ever-increasing internationalization and globalization. Neverthe-
less, in order not to be harmful, any development must be accompanied by ade-
quate environmental attitudes, something which is unanimously indicated by all
significant contemporary published research.
In conclusion of this analysis of previous publications, it is worth noting that
both the validity of the research and the empirical approach play an important
role in them. The rapid evolution of the tourism sector, society in general, and,
above all, questions related to the environment, makes it necessary to constantly
supplement previous knowledge with conclusions concerning previously un-
known or neglected aspects and conditions. Only by learning about the expecta-
tions and behavior, and thus the attitudes and choices, of tourists, is it possible
to reliably draw conclusions about the current state and the near future of tour-
ism. The available empirical studies are dominated by those concerning a specific
aspect of tourism services or a given geographical area. However, analyses con-
ducted on consumers in this sector can show greater cognitive usefulness than
those conducted on providers of these services. At the same time, certain unique-
ness of offers and attractiveness of given destinations, and diverse needs and
expectations of tourists from a specific area, suggest the need for developing
research based on a certain unification of populations. Therefore, the conclu-
sions drawn will be more legible and possible to implement by eventual practical
recipients of the research results. Efforts to learn more about tourists' attitudes
should also continue so that measures can be developed to ensure that sustaina-
ble tourism increasingly reflects the realities of both the industry and consumer
behavior, and that overtourism becomes less of a problem.
3. Materials and Methods
The overall study was designed to analyze the attitudes of people in different
regions of Europe towards sustainable tourism. The research was part of a larger
research project the authors were involved in. The authors started their research
with the Visegrád Group countries, as they come from one of these countries
and collaborate with several universities from other countries in the same region.
Another aim was also to ascertain the difference between these countries and
Western European countries. A great socio-cultural transformation has taken
place in Central and Eastern Europe over the last 30 years. With the free-market
economy and no restrictions on movement, more and more people are spending

16 Ingaldi and Dziuba
Vis Sustain, 17, 8-38 http://dx.doi.org/10.13135/2384-8677/5828
their holidays in different parts of the world, although there are still many people
who consider price as a determining factor. Therefore, further research in West-
ern European countries and a comparison of the results of both phases of the
research are planned to examine whether these differences are still observed be-
tween the various parts of Europe, also as regards sustainable tourism in general.
The study was divided into two parts. The first part was conducted in the form
of an online survey. It was made available through various Internet forums and
social networking sites. Over 2,500 respondents from the Visegrád Group coun-
tries participated. The survey was made available in English, which may have had
an impact on its results, as it could only involve people with the necessary level
of communicative competence in that language. However, this solution allowed
the survey to be targeted to a wider range of respondents and to include the
international community. The research using this tool was conducted in the pe-
riod from January to November 2019. This part is presented in this paper.
Before conducting the survey, in November 2018 pilot studies were carried out
on 30 respondents from Poland to check the correctness of the survey (the con-
tent of the questionnaire in electronic form), the correctness of response collect-
ing process (form operation) and the manner of answering by the respondents
(understanding the questions, especially in the second part of the survey). To
avoid bias, these responses were not included in the final analysis.
The survey was divided into three sections. The first part included questions
about the respondents' tourist preferences. Respondents were asked to rate the
statements concerning tourism on a Likert scale of 1 to 5 (1 meaning “I totally
disagree”, 5 meaning “I totally agree”). The numbers of the statements were used
in the subsequent analysis of the results to identify them more easily.
1. I choose places that are popular with tourists.
2. I go on vacation from July to August.
3. I look for the most comfortable accommodation possible.
4. I look for accommodation close to tourist attractions.
5. I use the services of travel agencies.
6. I like to spend time during my vacation in luxury.
7. I prefer to travel by plane.
8. I don't like trains/buses.
9. I choose the best restaurants.
10. I choose franchised restaurants (e.g., McDonald's, KFC).
11. I like visiting trendy tourist destinations.

Sustainable tourism 17
Vis Sustain, 17, 8-38 http://dx.doi.org/10.13135/2384-8677/5828
12. I like visiting places that are promoted on social media by famous peo-
ple.
13. I like looking into every nook and cranny, even the forbidden places.
14. I like crowds.
15. Residents of tourist destinations should welcome tourists with open
arms because they bring in money.
16. The visited place should pay for cleaning and removal of garbage left by
tourists.
17. Tourists have priority.
18. Tourists during vacation time are entitled to have a good time, even at
night.
19. I will pay almost any price for the opportunity to visit a unique place.
20. I will pay almost any price for the opportunity to purchase unique mem-
orabilia.
The statements were structured in such a way that responses of 5 in most cases
mean that respondents do not consider sustainable tourism when choosing their
holiday destination and when traveling. Respondents were not informed of this
fact so as not to influence their responses.
The second part of the questionnaire was to check the extent to which the re-
spondents understand sustainable tourism. The structure of the questions and
possible answers was quite different from the previous part of the survey. They
were asked 6 closed questions to which they were requested to answer: ‘Yes’,
‘Neither yes nor no’, ‘No’, ‘I don't know’. A symbol was added next to the ques-
tions, which was used in the subsequent analysis of the results. The letter P was
added to ensure that these symbols do not interfere with those used in Part 1 of
the survey.
1. Do you identify agritourism as an element of sustainable development in the
context of human impact on the natural environment, while meeting the so-
cial, economic, and environmental needs of both present and future genera-
tions? (P1)
2. Do you think that agritourism is not only a chance for the economic revival
of rural areas but also a form of promoting ecological thinking and greater
respect for the environment? (P2)
3. Do you think that sustainable tourism also includes the development of the
production of foods with higher ecological parameters and traditional food?
(P3)

18 Ingaldi and Dziuba
Vis Sustain, 17, 8-38 http://dx.doi.org/10.13135/2384-8677/5828
4. Do you believe that sustainable tourism consists in maintaining the integrity
of the landscape, cultural values, and attractiveness of the village and sur-
rounding area? (P4)
5. Do you think that sustainable tourism also means promoting the protection
of the natural environment while taking into account economic and social
aspects? (P5)
6. Do you think that development of sustainable tourism is a determinant of
the development of infrastructure supporting green solutions in transporta-
tion, energy production, waste, sewage and water management, and services
for tourists? (P6).
The third part of the questionnaire was respondent data (gender, age, education,
place of residence, and status). It allowed for statistical analysis of the structure
of the sample of respondents.
The use of a five-point Likert scale in the first part of the questionnaire allowed
for analysis of the survey results for the reliability of the responses. The
Cronbach’s alpha test and the standardized Cronbach’s alpha were used, and the
results of the analysis were interpreted according to the assumptions presented
in Hair et al. (2003). It is assumed that a Cronbach’s alpha index over 0.7 means
that the collected data is suitable for further analysis. This analysis was the first
part of the questionnaire. A scale analysis was conducted to see which ratings
were most frequently given by respondents. The results of the assessments were
then analyzed, i.e., basic statistics and percentages of each assessment were cal-
culated.
The second part of the questionnaire was also analyzed. Due to the specificity of
the possible responses, it was not possible to compile the results in a similar way
as in the first part. The percentages of each assessment were calculated and pre-
sented in the form of a cumulative bar graph, which clearly highlighted the dif-
ferences in responses.
In the questionnaire, respondents were also asked to indicate whether they
wished to take part in further research in the form of a face-to-face interview.
About 8% of the respondents declared their willingness to do so, and eventually
26 people from the Czech Republic, Poland and Slovakia took part in the inter-
view. This part was intended to find how the respondents define the concept of
sustainability and sustainable tourism in particular, but also whether they apply
their principles in their lives during holidays. This was the second part of the

Sustainable tourism 19
Vis Sustain, 17, 8-38 http://dx.doi.org/10.13135/2384-8677/5828
overall project. The results of the face-to-face interview were also analyzed, but
they represent a separate study and are not presented in this paper.
4. Results
There were 2569 respondents to the survey. For formal reasons, 62 question-
naires were rejected as they were incomplete. Subsequently, 2507 questionnaires
were further analyzed (Table 1).
Number Percentage
Observations, including: 2569 100.00
valid 2507 97.59
excluded 62 2.41
Table 1. Data analyzed (own study).
First, the structure of the sample of respondents was analyzed to see what the
statistical profile of the respondent was. The results of the analysis are presented
in Table 2. The majority of the respondents was male (58.3%). Most respondents
came from Poland (45.6%), followed by Slovakia (24.7%). Perhaps this is due to
the authors' country of origin and thus better (direct) dissemination of the survey.
The most frequent respondents were aged 21-30 years (32.4%), followed by
those aged 31-40 years (21.9%), and 41-50 years (19.4%). Perhaps these are the
groups of people who travel the most and organize their vacation time on their
own. The lowest percentage was recorded for those over 70, which may be due
to two reasons. The first reason is digital exclusion. People of this age often do
not use computers or the Internet, although this situation is slowly changing in
the countries of the European Union. The second reason, especially in the Vise-
grád countries, is that people over 70, living on a pension, can rarely afford the
luxury of a distant holiday.
Analysis of the social status and education reveals that the respondents were
mainly people who were employed (59.6%) and self-employed (21.8%), mostly
with higher (42.3%) or secondary (31.3%) education levels. These are groups of
people who are more likely to be able to afford to travel.

20 Ingaldi and Dziuba
Vis Sustain, 17, 8-38 http://dx.doi.org/10.13135/2384-8677/5828
The last characteristic was the place of residence. The majority of respondents
came from cities with a population of over 300 thousand (34.1%) and from cities
with a population between 201 and 300 thousand (26.7%). Therefore, it can be
stated that the most typical statistical respondent is a young male Pole aged 21-
30, employed with higher education, living in a city of over 300 thousand inhab-
itants.
Characteristic Option Percentage
Gender female 41.7
male 58.3
Nationality Czech Republic 17.3
Poland 45.6
Slovakia 24.7
Hungary 12.4
Age Up to 20 7.6
21-30 32.4
31-40 21.9
41-50 19.4
51-60 14.8
61-70 3.7
Over 70 0.2
Social/profes-
sional status
pupil/university student 11.2
employed 59.6
unemployed 4.2
self-employed 21.8
pensioner 3.2
Education primary education 1.2
lower secondary education 6.5

Sustainable tourism 21
Vis Sustain, 17, 8-38 http://dx.doi.org/10.13135/2384-8677/5828
vocational education 18.7
secondary education 31.3
higher education 42.3
Place of resi-
dence
rural areas 8.1
city with up to 50 thousand inhabitants 9.4
city with 51 to 100 thousand inhabitants 11.3
city with 101 to 200 thousand inhabitants 10.4
city with 201 to 300 thousand inhabitants 26.7
city with over 300 thousand inhabitants 34.1
Table 2. Respondents’ characteristics (own study).
In further analysis of the results, Cronbach's alpha and standardized Cronbach’s
Alpha coefficients were used to assess the reliability of the questionnaire (Table
3). The Cronbach’s alpha test resulted in a score just below 0.8, and the stand-
ardized Cronbach’s alpha was well above this value. According to Table 2, these
scores mean good (Cronbach’s alpha) and very good strength of association
(standardized Cronbach’s alpha). According to Table 1 and previous assump-
tions, such results indicate the reliability of the study, so the results were further
analyzed.
Cronbach
Alpha
Standardized Cronbach
Alpha
No of
items
Questionnaire
Part 1 0.793 0.831 20
Table 3. Cronbach’s alpha coefficients: questionnaire Part 1 (own study).
In analyzing the responses given by the respondents, the scale statistics were first
evaluated. Table 4 illustrates what the mean, variance, and standard deviation
would be on a scale composed of all five items analyzed (a Likert scale of 1-5 was

22 Ingaldi and Dziuba
Vis Sustain, 17, 8-38 http://dx.doi.org/10.13135/2384-8677/5828
used). It can be observed that the adopted scale can take values from 20 (if the
respondent chooses the lowest possible value for all items, i.e., 1) to 100 (if the
respondent chooses the value of 5 for all values). The mean was 51.14 on this
scale, which is about the middle of the scale and indicates a rather indifferent
attitude of respondents towards sustainable tourism.
Mean Variance Standard deviation No of items
51.14 133.306 11.546 5
Table 4. Scale statistics: questionnaire Part 1 (own study).
Next, the mean and standard deviations were calculated for the scores of each
item and each group of items (Table 5). The mean for all responses was 2.56,
indicating that respondents either disagree or are indifferent to the statements.
Therefore, it can be concluded that, in general, respondents only partially con-
sider sustainable tourism assumptions when deciding where to travel and during
the trip itself. The standard deviation for all responses was 1.21, which, for the
variable studied, implies considerable variation in responses.
The highest mean was recorded for statement 4: I look for accommodation close
to tourist attractions. In this case, the mean was 3.86, i.e., almost 4, which means
that the respondents agree with the statement. It seems likely that the cost of
accommodation or crowds of tourists are not important for them. The important
thing is that the location should be close. It can be concluded that, when choos-
ing accommodation, tourists consider their convenience more than sustainable
tourism objectives.
In many cases, the mean was close to 3, indicating respondents' general indiffer-
ence to the statement and to sustainable tourism itself. This means that in the
case of these statements, the respondents are not guided by their convenience,
nor do they pay attention to making a choice during their holidays considering
only their own interests, but at the same time they do not behave coherently with
the assumptions of a sustainable development and sustainable tourism. On the
one hand, this situation can be positively assessed, because the respondents are
not guided only by their own good or their comfort, and do not behave too self-
ishly. This does not mean, however, that they base their choices and the course
of holidays solely on the good of the visited place, its inhabitants, or also other
tourists. It should be emphasized that sustainable tourism is not only a given

Sustainable tourism 23
Vis Sustain, 17, 8-38 http://dx.doi.org/10.13135/2384-8677/5828
place and its inhabitants, which should be considered in various respects, but also
the rights of other tourists.
The lowest value was recorded for statement 17: Tourists have priority. Its mean
was 1.32. It can be concluded that the respondents are aware of the right of the
local community to live peacefully and that tourists should respect the rules of
the place. A few statements were rated below 2 on average, which is very positive
because also in these cases respondents on average disagree with the statements.
This means understanding the need to consider sustainable tourism when travel-
ing.
In the case of statements for which the average score was below 2, it can be said
that the respondents consider the rights of visitors and inhabitants during their
vacations, they understand that this is the home of ordinary people who deserve
peace and respect, and the place itself should not be destroyed.
Statement 5: I use the services of travel agencies and its low rating (i.e., not agree-
ing with a given statement) is not entirely consistent with the assumptions of
sustainable development. The operation of tourist agencies allows the employ-
ment of a community living not only in the visited places (e.g., residents), but
also where tourists come from. Partly, the use of travel agencies leads to groups
of tourists who travel together using one common mode of transport, which may
have an impact on the environment.
Statement 10: I choose franchised restaurants (e.g., McDonald's, KFC) and its
low assessment means that the respondents either use their own food (e.g., pre-
paring meals on their own), but also can use local restaurants, getting to know
the cuisine of a given town, which results not only in supporting local companies,
but also willingness to learn about the culture of a given place.
Many respondents disagreed with statement 14: I like crowds. This means that
many respondents prefer to visit less popular places with fewer tourists and
therefore easier access to local attractions. From the point of view of sustainable
tourism, this is good for such places as it permits earning money from tourism,
but without a heavy tourist burden.
Statement 19: I will pay almost any price for the opportunity to visit a unique
place, and statement 20: I will pay almost any price for the opportunity to pur-
chase unique memorabilia, and their low assessment also deserve special atten-
tion. The respondents disagreed with these two statements. Even though in many
cases the respondents are educated people in employment from larger cities, they
do not want to spend a fortune on the chance to choose a place or souvenirs.

24 Ingaldi and Dziuba
Vis Sustain, 17, 8-38 http://dx.doi.org/10.13135/2384-8677/5828
They want to have a good time, visit a new place, but not at all costs. Perhaps
from the tourism enterprise's point of view, this is not good, as it means custom-
ers are reluctant to spend large sums of money. However, from the point of view
of tourists themselves, and as a society, it is a financial saving that can be used in
other ways.
Statement Mean Standard deviation
1 3.16 1.103
2 3.14 1.455
3 3.05 1.541
4 3.86 1.070
5 1.92 1.343
6 2.30 1.540
7 3.19 1.449
8 2.27 1.388
9 2.62 1.260
10 1.97 1.262
11 3.19 1.352
12 2.46 1.348
13 3.32 1.253
14 1.68 1.116
15 2.35 1.299
16 3.35 1.144
17 1.32 0.773
18 2.32 1.275
19 1.89 1.157
20 1.76 1.282
Table 5. Item statistics: questionnaire Part 1 (own study).

Sustainable tourism 25
Vis Sustain, 17, 8-38 http://dx.doi.org/10.13135/2384-8677/5828
Next, the percentages of ratings given to each statement were calculated, which
allowed for the analysis of the structure of the responses (Table 6). It can be
noted here how substantially the respondents differed in their answers. What
should be emphasized is that for several statements no rating of 5 (completely
agree) was recorded. This was the case with statement 1: I choose places that are
popular with tourists, statement 9: I choose the best restaurants, statement 17:
Tourists have priority, and statement 19: I will pay almost any price for the op-
portunity to visit a unique place. However, it is difficult to assess the extent to
which respondents are driven by the idea of sustainable tourism. The fact that
the survey was conducted among people from the countries of the Visegrád
Group should be considered here. These are countries with a lower economic
status than countries in Western Europe. In a number of cases, social status and
travel cost may determine to some extent where and how people travel.
Percentage fraction of answers
Statement 1 2 3 4 5
1 16.22 5.39 24.32 54.07 0.00
2 24.93 5.43 23.41 22.14 24.09
3 29.73 5.44 16.28 26.93 21.62
4 5.93 5.62 16.39 42.31 29.75
5 62.16 10.81 5.41 16.22 5.41
6 54.05 2.70 16.22 13.51 13.51
7 24.38 5.43 16.11 35.17 18.91
8 48.65 5.48 24.32 13.48 8.07
9 32.43 8.11 25.38 34.08 0.00
10 59.21 2.78 21.62 13.48 2.91
11 18.92 2.70 32.43 29.73 16.22
12 40.54 8.17 18.92 29.73 2.64
13 16.22 5.42 21.59 43.24 13.53
14 70.19 2.82 18.92 5.41 2.67

26 Ingaldi and Dziuba
Vis Sustain, 17, 8-38 http://dx.doi.org/10.13135/2384-8677/5828
15 43.24 2.73 35.14 13.51 5.38
16 10.81 8.17 29.74 37.74 13.54
17 83.78 2.70 10.81 2.70 0.00
18 43.24 5.68 29.72 18.64 2.72
19 59.46 5.46 21.62 13.46 0.00
20 70.23 2.73 16.23 2.67 8.14
Table 6. Percentages of answers to individual questions: questionnaire
part 1 (own study).
Part two of the questionnaire was further analyzed, although the specificity of
the possible responses in this section made it impossible to conduct as thorough
an analysis as in the first part. Only the percentages of each response were calcu-
lated and presented as a cumulative bar graph (Figure 1).
The analysis of Figure 1 and the first part of the questionnaire reveals several
interesting elements to note. For all questions, ‘Yes’ was the predominant answer,
meaning that most respondents agreed with the statements. Most ‘Yes’ responses
were recorded for items P4 and P5. In these two cases, no negative responses
were observed.
The smallest number of ‘Yes’ responses (over 43%) was recorded for item P6.
However, many respondents were not sure of their opinion in this case and an-
swered, ‘Neither yes nor no’ (over 35%). This item had the highest number of
negative responses (over 21%). However, such a situation may have been influ-
enced by the question itself, which is long and may seem difficult to understand,
and only slightly more than 42% of the respondents declared a higher education
level.
It can be concluded from the answers given in this part that the respondents
understand the idea of sustainable tourism, although the first part of the survey
revealed that they do not fully follow its principles in everyday life. It should be
remembered that the research involved mainly educated and employed people
from larger cities, who by now realize that to survive, to be able to continue living
on our planet, it is necessary to take care of the natural, social and economic
environment, and thus act in accordance with the principles of sustainable devel-
opment. In the case of tourists, these are the assumptions of sustainable tourism,

Sustainable tourism 27
Vis Sustain, 17, 8-38 http://dx.doi.org/10.13135/2384-8677/5828
which will not only allow them to enjoy the visited place, but at the same time
allow for the proper development of this place, the well-being of its inhabitants,
without unnecessarily interfering with their lives and destroying the natural envi-
ronment.
Figure 1. Percentages of answers to individual questions: question-naire part 2 (own study).
5. Discussion
The findings presented should be related to other studies in this field recently
published in journals. Indeed, some of the studies on sustainable tourism and
overtourism show different perspectives, both of tourists and the local commu-
nity and its representatives. In their research, Aall and Koens (2019) demon-
strated that, in terms of social sustainability, there is a conflict between the quality
of various aspects of the life of residents and urban development in favor of the
tourism industry. Furthermore, there is also a conflict between local people, with
their desire for good local environmental standards, and visiting tourists, leading
to several local environmental problems related to overtourism. Researching
these problems is of great importance for the development of solutions. It is also
0% 20% 40% 60% 80% 100%
P1
P2
P3
P4
P5
P6
Percentage fraction
Qu
esti
on
Yes Neither yes nor no No I don't know

28 Ingaldi and Dziuba
Vis Sustain, 17, 8-38 http://dx.doi.org/10.13135/2384-8677/5828
important that the tourists themselves understand that, in addition to their right
to leisure and sightseeing, they must also respect the right of the local communi-
ties to a peaceful and normal life. In this respect, it can be said that both the Aall
and Koens’ study and the research presented in this paper show that tourists'
understanding of what sustainable tourism means can have a positive impact on
the place visited and its residents, as well as on tourists’ enjoyment of their vaca-
tion.
In their study, Neuts and Vannestew (2020) referred principally to the point of
view of the local community. They state that there is a concern in many places
that tourism has become unsustainable. To promote a dynamic blend of visitors
and residents, development strategies must consider the preferences of residents,
particularly their right to live normal lives. Residents place high value on green
space and improved commercial facilities and the prevention of overcrowding.
The research identified the need to accommodate individual differences in pref-
erences and to reconcile the potentially conflicting goals of cities both enhancing
local livability and creating an attractive environment for visitors. At the same
time, it should be remembered that tourists, by choosing to visit a place, spend
money, helping create new jobs. This makes the question highly complex to an-
alyze. Additionally, it should be remembered that both the residents and the tour-
ists are responsible for the conditions of the place visited, and the comfort of
living in and visiting it. Tourists need to understand their impact and that they
must learn to live with the local community, a fact that also receives some con-
firmation from the results of the research presented in this paper.
A study by Liao and Chuang (2020) addressed tourists and their expectations of
tourism, with an emphasis on package tours. The most important characteristics
that tourists consider when choosing package tours were ‘attractiveness’, fol-
lowed by ‘accommodation’, ‘length of stay’, ‘price’, ‘cuisine’, ‘transport’, and ‘sea-
son’. Therefore, they were not really interested in whether this way of spending
holidays can be called sustainable tourism, which is also in line with what emerges
from our research. Only by keeping in mind the principles of sustainable tourism
when choosing a destination for traveling, can tourists enjoy their vacation with-
out causing harm to others and their environment. As with the results presented
in this paper, the opinions expressed on selected factors related to sustainable
tourism, which were included in the analyzed survey, showed that tourists ap-
proach them in different ways, but are slowly beginning to understand the prob-
lems related to overtourism and excessive impact on the lives of residents, be-
cause it also affects their comfort while travelling. A similar approach was pre-
sented by Katahenggam (2019). This author conducted research on tourists’

Sustainable tourism 29
Vis Sustain, 17, 8-38 http://dx.doi.org/10.13135/2384-8677/5828
perceptions and preferences in Singapore's cultural heritage districts. The study
found that demographic and geographical factors influence tourist preferences
and that many tourists, also from other countries, are guided by these factors.
Ciocan et al. (2020) referred to rural tourism (agritourism), an area that has great
growth potential. Currently, agritourism constitutes only a small part of tourism
in general, but in recent years, its share has been growing regularly. Rural areas
attract many tourists who appreciate this way of spending leisure time due to the
picturesque landscapes and cultural habits nurtured for generations. They allow
tourists to immerse themselves in the local environment, in nature, and help them
understand what kind of life the local community has. It can be said that this way
of spending a vacation has some elements of sustainable tourism. This perspec-
tive has been extended by the results presented in this paper, especially in the
second part of the survey, where the respondents were asked about their
knowledge concerning sustainable tourism, with particular emphasis on the ques-
tions marked P2, P3 and P4.
Leonte et al. (2016) also reported on tourists choosing agritourism destinations.
They argued that rural tourism and agritourism, with high rates in rural areas, is
a major factor with direct implications for local development and for meeting the
consumption needs of tourists. According to the authors, the advantages of
agritourism include better use of rural areas and natural conditions, excellent pro-
tection and development of cultural heritage and rural traditions, creation of new
jobs, meeting the requirements of recreational tourism and traditional cuisine,
offering specific products and menus based on local recipes, and contributing to
the development of infrastructure. There are also several economic reasons that
justify the implementation of socio-cultural initiatives in rural areas that can con-
tribute to increasing the income of rural residents and thus the sustainable devel-
opment and efficiency of the local economy.
Other interesting research results concerning sustainable tourism and agritourism
were published by Ungureanu (2008). In this research, this author referred to
tourism in Romania, with a strong emphasis on rural areas, which are particularly
attractive in this country, especially from the point of view of folklore and preser-
vation of the purity of the ancient culture. The author’s concern was more about
maintaining this culture for future generations than about the needs, attitudes,
and behaviors of tourists themselves.
Wu et al. (2019) presented an approach to building a hierarchical framework for
sustainable tourism. They included socio-economic, socio-environmental, and
eco-efficiency aspects in their study. They also showed that tourism businesses
30 Ingaldi and Dziuba
Vis Sustain, 17, 8-38 http://dx.doi.org/10.13135/2384-8677/5828
face conflicts in balancing economic growth with environmental impact. Their
study proposed rewarding employees for promoting green processes, creating
new green trade linkages with society, and establishing green organizations to
increase competitiveness and profitability. These kinds of initiatives should affect
the satisfaction of both tourists and the local community.
Tekalign et al. (2018) investigated tourists' preferences for tourism activities de-
signed by local stakeholders in one of the oldest protected parks in Ethiopia.
Despite many attractions, the local community benefits little from tourism, often
coming into conflict with park managers. The study was designed to increase
stakeholder involvement in sustainable tourism planning and revealed a mis-
match between the preferences of tourists and the activities planned by the host
community to engage them in tourism. To be implemented efficiently, planning
and development of sustainable tourism must consider the differences in percep-
tions between host communities and tourists. Only then can tourism be consid-
ered sustainable.
Furthermore, a study by Cheung and Li (2019) was designed to show the tourist-
resident relationships in terms of sustainable tourism. The researchers argued
that all tourist destinations seek to increase the number of tourists, while less
attention is paid to balancing the increase in the number of tourists with the
resulting irritants for the local community. They mentioned overtourism, which
poses a potential threat to many popular tourist destinations around the world.
The authors suggest that decision-makers in such places should keep in mind
that the deterioration of the visitor-resident relationships due to excessive tour-
ism may lead to a significant hysteresis effect that will persist far beyond the
original stimulus.
The research presented in this paper complements that of the previous literature
cited, showing at the same time the topicality and validity of the investigations
into sustainable tourism. It focuses on a highly significant interested party, the
tourists, who decide where to go, what to visit and what to spend their money
on, but often forget that a given tourist place belongs primarily to the inhabitants
who live there. It must be said that many tourists are indifferent to these prob-
lems of unsustainable tourism and that they rarely take them into account when
choosing their vacation destinations and during the vacation itself. They do not
consider how their behavior affects the place they visit and the local community.
And if they do, they are involved to an insignificant degree. This is one of the
reasons why sustainable tourism is a difficult problem to address. At the same
time, what emerges is that there is at least an increasing understanding of what
sustainable tourism and overtourism mean.
Sustainable tourism 31
Vis Sustain, 17, 8-38 http://dx.doi.org/10.13135/2384-8677/5828
6. Conclusions
With the ever-increasing number of tourists, many popular tourist destinations
become crowded while sightseeing becomes more and more difficult and bur-
densome. Large numbers of tourists also cause difficulties for the local commu-
nity and disturb their everyday life. Through their failure to respect specific rules
and conform to certain standards of behavior, tourists damage the places they
visit, drop litter, and negatively affect the environment. The excessive number of
tourists leads to the phenomenon termed overtourism, which negatively affects
tourist destinations.
However, it is important to remember that tourists increasingly create new jobs
for the local community. The large amount of money they spend becomes in-
come for the place visited and its residents. On the one hand, it should be re-
membered that a given tourist destination is a home for its residents and a part
of the natural environment or cultural heritage, but on the other, it often has no
chance for development without tourists. Therefore, the concept of sustainable
tourism is of vital importance. The research presented in this paper showed that
many people understand this concept and know what impact tourism has on the
local community and the environment. However, too many tourists still do not
consider sustainability principles in their behavior during their trips, concentrat-
ing their attention on their own expectations and rights without thinking about
the place visited and the consequences of this behavior.
The present study is certainly not without limitations. Although the design of the
questionnaire was based on a literature review, it was developed specifically for
this study and may have been influenced by the subjectivity of the authors. Only
selected papers were used for both the literature review and the discussion of the
results and comparison to other studies. It was impossible to include all the pa-
pers available on the subject, and the authors were guided solely by their experi-
ence in selecting references. Although the survey topic was popular, the ques-
tionnaire was not completed as frequently as the authors had hoped, hence the
smaller research sample size. To make it easier to reach respondents, the ques-
tionnaire was made available through various social media platforms and using
the authors' closest professional contacts, which can be reflected in the structure
of the sample of respondents. This may have led to the exclusion of people with-
out or with limited access to the Internet. Moreover, the structure of the sample
could have influenced the understanding of the questions and the answers given
by the respondents, which were sometimes surprising for the authors. The last
element may be due to the features of the research area (countries of the Visegrád
Group). Perhaps respondents from other countries, especially those with

32 Ingaldi and Dziuba
Vis Sustain, 17, 8-38 http://dx.doi.org/10.13135/2384-8677/5828
different approaches to environmental protection and sustainable tourism, would
answer differently. However, this last limitation opens opportunities for future
research in other European countries aand comparative study.
Nevertheless, it is important to continue this type of research, not only to see if
tourists incorporate the assumptions of sustainable tourism in their behavior and
habits and if they know what the phenomenon of overtourism is. Such research,
principally based on as wide as possible respondent participation in the survey,
can stimulate reflection and raise awareness, helping at least some people to
change their attitudes. Even small steps can gradually contribute to improve-
ments. Moreover, research conducted thus far can be the basis for further studies
in the context of sustainable development and sustainable tourism, help build
scientific knowledge on this subject and constitute a means of understanding
more fully this complex question and making more informed decisions in the
field of proper tourism management.
The authors intend to continue their research, making use of their cooperation
network and extending the research to other European countries, thereby allow-
ing for a broader and more detailed analysis of the problems studied. This will
also allow the results to be used for a comparative study between different re-
gions of Europe to see to what extent the behavior of tourists from different
European countries differs. Conducting an in-depth statistical analysis will allow
examination of the relationship between the answers to the survey questions and
the individual characteristics of the respondents in terms of individual respond-
ent groups.
References
Aall, C., and Koens, K. (2019). The Discourse on Sustainable Urban Tourism: The
Need for Discussing More Than Overtourism. Sustainability, 11(15), 4228.
https://doi.org/10.3390/su11154228
Al-Ansi, A., and Han, H. (2019). Role of halal-friendly destination performances, value,
satisfaction, and trust in generating destination image and loyalty. Journal of Destina-
tion Marketing and Management, 13, 51-60
Ali, F., Kim, W.G., and Li, J. (2018). Make it delightful: Customers' experience, satisfac-
tion, and loyalty in Malaysian theme parks. Journal of Destination Marketing and Manage-
ment, 7, 1-11

Sustainable tourism 33
Vis Sustain, 17, 8-38 http://dx.doi.org/10.13135/2384-8677/5828
Anttila, J., and Jussila, K. (2018). Organizational learning in developing the integrated
quality management. Production Engineering Archives, 18, 3-13.
https://doi.org/10.30657/pea.2018.18.01
Ballantyne, R., Packer, J., and Falk, J. (2011). Visitors' learning for environmental sus-
tainability: Testing short- and long-term impacts of wildlife tourism experiences us-
ing structural equation modelling. Tourism Management, 32, 1243-1252
Ballantyne, R., Packer, J., and Sutherland, L.A. (2011). Visitors' memories of wildlife
tourism: Implications for the design of powerful interpretive experiences. Tourism
Management, 32, 770-779
Barr, S., Shaw, G., and Coles, T. (2010). A holiday is a holiday': practicing sustainability,
home and away. Journal of Transport Geography, 18, 474-481
Baryshnikova, N., Kiriliuk, O,. and Klimecka-Tatar, D. (2020). Management approach
on food export expansion in the conditions of limited internal demand. Polish Journal
of Management Studies, 21(2), 101-114. https://doi.org/10.17512/pjms.2020.21.2.08
Beeton, S. (2016). Film-Induced Tourism. Channel View Publications, Clevedon
Canavan, B. (2014). Sustainable tourism: development, decline and de-growth. Manage-
ment issues from the Isle of Man. Journal of Sustainable Tourism, 22(1), 127-147,
https://doi.org/10.1080/09669582.2013.819876
Capocchi, A., Vallone, C., and Amaduzzi, A. (2019). Is 'overtourism' a new issue in
tourism development or just a new term for an already known phenomenon? Cur-
rent Issues in Tourism, 23, 2235-2239
Cetin, M., Zeren, I., and Sevik, H. (2018). A study on the determination of the natural
park's sustainable tourism potential. Environmental Monitoring and Assessment, 190(3),
167
Cheung, K.S., and Li, L.H. (2019). Understanding visitor-resident relations in overtour-
ism: developing resilience for sustainable tourism. Journal of Sustainable Tourism, 27,
1197-1216. https://doi.org/10.1080/09669582.2019.1606815
Ciocan, H.N., Alecu, I.N., Condei, R., and Dona, I. (2020). Analysis of consumer pref-
erences regarding tourism and rural tourism activity in Hunedoara County. Scientific
Papers-Series Management Economic Engineering in Agriculture And Rural Development,
20(1), 137-144
Dauvergne, C. (2004). Sovereignty, Migration and the Rule of Law in Global Times. The
Modern Law Review, 67(4), 125-138. https://doi.org/10.1111/j.1468-
2230.2004.00501.x
Deery, M., Jago, L., and Fredline, L. (2012). Rethinking social impacts of tourism re-
search: A new research agenda. Tourism Management, 33(1), 64-73.
https://doi.org/10.1016/j.tourman.2011.01.026
Eurostat. (2021).
https://ec.europa.eu/eurostat/databrowser/view/tour_lfs1r2/default/table?lang=en

34 Ingaldi and Dziuba
Vis Sustain, 17, 8-38 http://dx.doi.org/10.13135/2384-8677/5828
Fang, Y., Yin, J., and Wu, B. (2018). Climate change and tourism: a scientometric analy-
sis using CiteSpace. Journal of Sustainable Tourism, 26(1), 108-126.
https://doi.org/10.1080/09669582.2017.1329310
Femenia-Serra, F., Perles-Ribes, J.F., and Ivars-Baidal, J.A. (2019). Smart destinations
and tech-savvy millennial tourists: hype versus reality. Tourism Review, 74(1), 63-81.
https://doi.org/10.1108/TR-02-2018-0018
Fletcher, R., Murray Mas, I., and Blanco-Romero, A. (2019). Tourism and degrowth: an
emerging agenda for research and praxis. Journal of Sustainable Tourism, 27(12), 1745-
1763
Gilbert, J. (2014). Nomadic Peoples and Human Rights. University of East London, Lon-
don, UK
Gonzalez, V.M., Coromina, L., and Galí, N. (2018). Overtourism: Residents’ percep-
tions of tourism impact as an indicator of resident social carrying capacity - Case
study of a Spanish heritage town. Tourism Review, 73(3), 277-296.
https://doi.org/10.1108/TR-08-2017-0138
Gorica, K. (2007). Sustainable tourism in the small and medium tourism businesses in
Albania. Tourism Today, 7, 139-149
Gossling, S., Scott, D., and Hall, C.M. (2012). Consumer behaviour and demand re-
sponse of tourists to climate change. Annals of Tourism Research, 39(1), 36-58.
https://doi.org/10.1016/j.annals.2011.11.002
Hair, J.F. Jr, Babin, B., Money, A.H., and Samouel, P. (2003). Essential of business research
methods. John Wiley and Sons, United States of America
Henar Salas-Olmedo, M., Moya-Gomez, B., and Carlos Garcia-Palomares, J. (2018).
Tourists' digital footprint in cities: Comparing Big Data sources. Tourism Management
66, 13-25. https://doi.org/10.1016/j.tourman.2017.11.001
Heslinga, J.H. (2018). Synergetic Tourism-Landscape Interactions: Policy, Public Discourse and
Partnerships. University of Groningen, Groningen, The Netherlands
Hess, J. (2019). Thailand: shutting down a destination. In: Dodds, R., Butler, R. (eds.) Over-
tourism: Issues, Realities and Solutions, Degruyter, Berlin/Boston, MA, pp 111-240
Hills, A. (March 14, 2011) Tourism: one of the world’s fastest growing industries. Tour-
ist News. https://www.tourism-review.com/tourism-industry-is-growing-fast-
news2649
Ingaldi, M. (2020). Tourist Service Quality vs. Overtourism - Polish Example. In: International
Business Information Management (IBIMA), Seville, Spain, 1-2 April 2020, Soliman
Khalid, S. (eds.) Education Excellence and Innovation Management: a 2025 Vision
to Sustain Economic Development during Global Challenges. International Busi-
ness Information Management Association (IBIMA): Norristown, USA, pp 1703-
1714

Sustainable tourism 35
Vis Sustain, 17, 8-38 http://dx.doi.org/10.13135/2384-8677/5828
Japutra, A., and Hossain, M.I. (2020), Tourists' mindsets and choice of adventurous
holiday activities. Current Issues in Tourism.
https://doi.org/10.1080/13683500.2020.1814705
Juss, S.S. (2004). Free Movement and the World Order. International Journal of Refugee
Law, 16(3), 289-335. https://doi.org/10.1093/ijrl/16.3.289
Kardas, E. (2016). The Analysis Of The Environmental Management System In One Of Munici-
pal Plants In Poland. In: 16th International Miltidisciplinary Conference SGEM 2016,
Conference Proceedings, 30 June - 6 July 2016, Albena, Bulgaria, STEF92 Technol-
ogy Ltd.: Sofia, Bulgaria, Book 5. Ecology, Economics, Education and Legislation.
Vol.3. Environmental Economics, pp 619 – 626
Katahenggam, N. (2019). Tourist perceptions and preferences of authenticity in herit-
age tourism: visual comparative study of George Town and Singapore. Journal Of
Tourism And Cultural Change, 18(4) 371-385.
https://doi.org/10.1080/14766825.2019.1659282
Koens, K., Postma, A., and Papp, B. (2018). Is Overtourism Overused? Understanding
the Impact of Tourism in a City Context. Sustainability, 10(12), 4384.
https://doi.org/10.3390/su10124384
Kuqi, B., Elezaj, E., Millaku, B., Dreshaj, A., and Hung, N.T. (2021). The impact of
COVID-19 (SARS-CoV-2) in tourism industry: evidence of Kosovo during Q1, Q2
and Q3 period of 2020. Journal Of Sustainable Finance and Investment,
https://doi.org/10.1080/20430795.2021.1883986
Larsen, G.R., and Guiver, J.W. (2013). Understanding tourists' perceptions of distance:
a key to reducing the environmental impacts of tourism mobility. Journal of Sustaina-
ble Tourism, 21(7), 968-981. https://doi.org/10.1080/09669582.2013.81987
Lee, T.H., and Jan, F.-H. (2018). Can community-based tourism contribute to sustaina-
ble development? Evidence from residents' perceptions of the sustainability. Tourism
Management, 70, 368-380. https://doi.org/10.1016/j.tourman.2018.09.003
Leonte, E., Chiran, A., and Miron, P. (2016). Implementing agritourism marketing strat-
egy as tools for the efficiency and sustainable development of rural tourism. Environ-
mental Engineering And Management Journal, 15(12), 2663-2669.
https://doi.org/10.30638/eemj.2016.292
Liao, C.S., and Chuang, H.K. (2020). Tourist preferences for package tour attributes in
tourism destination design and development. Journal Of Vacation Marketing, 26(2),
230-246. DOI: 10.1177/1356766719880250
Miah, S.J., Vu, H.Q., and Gammack, J. (2017). A Big Data Analytics Method for Tour-
ist Behaviour Analysis. Information and Management, 54(6), 771-785.
https://doi.org/10.1016/j.im.2016.11.011
Milano, C. (2017). Overtourism and Tourismphobia: Global Trends and Local Contexts, Ostelea
School of Tourism and Hospitality, Barcelona.

36 Ingaldi and Dziuba
Vis Sustain, 17, 8-38 http://dx.doi.org/10.13135/2384-8677/5828
www.researchgate.net/publication/323174488_Overtourism_and_Tour-
ismphobia_Global_trends_and_local_contexts (accessed January 31, 2019)
Milano, C., Cheer, J.M., and Novelli, M. (2019). Overtourism: an evolving phenomenon. In:
Milano, C., Cheer, J.M., Novelli, M. (eds.) Overtourism: excesses, discontents and
measures in travel and tourism, Abingdon: CABI, pp 1-17
Mroz, F. (2021). The Impact of COVID-19 on Pilgrimages and Religious Tourism in
Europe During the First Six Months of the Pandemic. Journal Of Religion and Healt.
https://doi.org/10.1007/s10943-021-01201-0
Muler Gonzalez, V., Coromina, L., and Gali, N. (2018). Overtourism: residents' percep-
tions of tourism impact as an indicator of resident social carrying capacity - case
study of a Spanish heritage town. Tourism Review, 73(3), 277-296.
https://doi.org/10.1108/TR-08-2017-0138
Neuts, B., and Vanneste, D. (2020). Analysing Residential Preferences for Urban Rede-
velopment in Tourism Destinations: An Application of Choice Experiments. Tour-
ism Planning and Development, 17(2), 147-165.
https://doi.org/10.1080/21568316.2019.1580211
Novy, J., and Colomb, C. (2016) Urban tourism and its discontents. An introduction. In: Co-
lomb, C., Novy, J. (eds.) Protest and Resistance in the Tourist City, Routledge, Ab-
ingdon and New York, NY, pp. 1-30
Nunkoo, R., Smith, S.L.J., and Ramkissoon, H. (2012). Residents' attitudes to tourism: a
longitudinal study of 140 articles from 1984 to 2010. Journal of Sustainable Tourism,
21(1), 5-25. https://doi.org/10.1080/09669582.2012.673621
Oklevik, O., Gossling, S., Hall, C.M., Jacobsen, J.K.S., Grotte, I.P., and McCabe, S.
(2019). Overtourism, optimisation, and destination performance indicators: a case
study of activities in Fjord Norway. Journal of Sustainable Tourism, 27(12), 1804-1824.
https://doi.org/10.1080/09669582.2018.1533020
Pan, X.F., Rasouli, S., and Timmermans, H. (2021). Investigating tourist destination
choice: Effect of destination image from social network members. Tourism Manage-
ment, 83, 104217. https://doi.org/10.1016/j.tourman.2020.104217
Peeters, P., and Dubois, G. (2010). Tourism travel under climate change mitigation
constraints. Journal of Transport Geography, 18(3), 447-457.
https://doi.org/10.1016/j.jtrangeo.2009.09.003
Perkumiene, D., and Pranskuniene, R. (2019). Overtourism: Between the Right to
Travel and Residents’ Rights. Sustainability, 11(7), 2138.
https://doi.org/10.3390/su11072138
Scheyvens, R. (2009). Pro-Poor Tourism: Is There Value Beyond the Rhetoric? Tourism
Recreation Research, 34(2), 191-196.
https://doi.org/10.1080/02508281.2009.11081590

Sustainable tourism 37
Vis Sustain, 17, 8-38 http://dx.doi.org/10.13135/2384-8677/5828
Staniszewska, E., Klimecka-Tatar, D., and Obrecht, M. (2020). Eco-design processes in
the automotive industry. Production Engineering Archives, 26(4), 131-137.
https://doi.org/10.30657/pea.2020.26.25
Tekalign, M., Zevert, N.G., Weldegebriel, A., Poesen, J., Nyssen, J., Van Rompaey, A.,
Norgrove, L., Muys, B., and Vranken, L. (2018). Do Tourists' Preferences Match
the Host Community's Initiatives? A Study of Sustainable Tourism in One of Afri-
ca's Oldest Conservation Areas. Sustainability, 10(11), 4167.
https://doi.org/10.3390/su10114167
Teplická, K., and Hurná, S. (2020). New approach of costs of quality according their
trend of during long period in industrial enterprises in SMEs. Management Systems in
Production Engineering, 29(1), 20-26. https://doi.org/10.2478/mspe-2021-0003
Ulewicz, R. and Blaskova, M (2018). Sustainable development and knowledge manage-
ment from the stakeholders' point of view. Polish Journal Of Management Studies, 18(2),
363-374. https://doi.org/10.17512/pjms.2018.18.2.29
Ungureanu, D. (2008). Sustainable development alternatives by rural tourism and
agritourism in the Romanian mountain rural area. Amfiteatru Economic, 10, 207-212.
UNWTO (2018) ‘Overtourism’? – Understanding and Managing Urban Tourism Growth beyond
Perceptions. World Tourism Organization (UNWTO), Centre of Expertise Leisure,
Tourism and Hospitality, NHTV Breda University of Applied Sciences, and NHL
Stenden University of Applied Sciences. Madrid: UNWTO.
https://doi.org/10.18111/9789284419999
Wu, K.J., Zhu, Y.F., Chen, Q., and Tseng, M.L. (2019). Building sustainable tourism hi-
erarchical framework: Coordinated triple bottom line approach in linguistic prefer-
ences. Journal Of Cleaner Production, 229, 157-168. https://doi.org/10.1016/j.jcle-
pro.2019.04.212
Zelga-Szmidla, A., and Kapustka, K. (2019). Eco-Innovation in Municipalities as an El-
ement of Smaller Agglomerations Sustainable Development - Case Study. Conference
Quality Production Improvement – CQPI, 1(1), 110-116. https://doi.org/10.2478/cqpi-
2019-0015
Authors
Manuela Ingaldi, PhD Eng., Czestochowa University of Technology, Faculty of Man-
agement, ul. Dabrowskiego 69, 42-201 Czestochowa, Poland,
[email protected]; [email protected], orcid id: 0000-0002-9793-6299
Szymon T. Dziuba, PhD Eng., Wroclaw University of Economics and Business, Fac-
ulty of Business and Management, Wroclaw, Poland, [email protected], or-
cid id: 0000-0002-6509-5843

38 Ingaldi and Dziuba
Vis Sustain, 17, 8-38 http://dx.doi.org/10.13135/2384-8677/5828
Authors' contributions
Both authors contributed to the conception and design of the study; material prepa-
ration, data collection and analysis; writing of the first draft of the manuscript; com-
menting on previous versions of the manuscript; reading and approval of the final
manuscript.
Funds
Publication financed from statutory research of the Czestochowa University of Tech-
nology SPB-600-3016/2021.
Competing Interests
The author has declared that no competing interests exist.
© 2021 Ingaldi, M., Dziuba, S.T.
This is an open access publication under the terms and conditions of the Creative Commons Attribution (CC BY) license (http://creativecommons.org/licenses/by/4.0/).

www.ojs.unito.it/index.php/visions
Community participation in creating sustainable community-based tourism
Edi Kurniawan, Tri Marhaeni Pudji Astuti, Mohammad Syifauddin
Received: 12 August 2021 | Accepted: 7 November 2021 | Published: 19 November 2021
Citation: Kurniawan, E., Astuti, T.M.P., Syifauddin, M. (2021). Community participation in cre-ating sustainable community-based tourism. Visions for Sustainability, 17, 5997, 39-55 http://dx.doi.org/10.13135/2384-8677/5997
Correspondence: [email protected] Extended authors information available at the end of the article
1. Introduction
2. Literature review
2.1. Sustainable Tourism and Community Based Tourism
2.2. Community Participation in Tourism
2.3. Previous Studies
3. Research Methodology
4. Results and Discussion
4.1. Community Participation in Creating Sustainable Tourism in Karimunjawa
4.1.1. Community Participation in the Planning Phase
4.1.2. Community Participation in the Implementation Phase
4.1.3. Community Participation in the Supervision Phase
4.2. Types of Community Participation in Creating a Sustainable Community-
Based Tourism in Karimunjawa
5. Conclusions
Keywords: Community-based tourism; Community participation; Sustainable tourism.
Original Paper

40 Kurniawan, Astuti, Syifauddin
Vis Sustain, 17, 5997, 39-55 http://dx.doi.org/10.13135/2384-8677/5997
Abstract. Tourism is one of the fastest-growing economic sectors in the
world. However, the development of tourism in various regions does not nec-
essarily guarantee the welfare of the local community of the tourist destina-
tions. Moreover, there is an inevitable correlation between the rapid growth of
tourism and large-scale negative impacts. In promoting sustainable tourism
development, national and local government need to pay attention to environ-
mental and cultural preservation. There is also a need to prioritize the inter-
ests of local communities to foster a sustainable community-based tourism
(CBT). This study analyzes the question of community participation in real-
izing sustainable CBT in Karimunjawa, an archipelago of 27 islands in the
Java Sea. Primary and secondary data were collected with snowball sampling
selection techniques, using participatory observation, interviews, and docu-
mentation. Data analysis was conducted using the interactive analysis
method of data reduction, data presentation, and drawing conclusions. The
results show that the typology of community participation in realizing sus-
tainable CBT in Karimunjawa can be classified as the Spontaneous-Induced
Participation type—seen from the planning, implementation, and supervision
stages. The participation of the Karimunjawa community is the result of the
interaction between spontaneous and induced participation. In some of its di-
mensions, participation is active and bottom-up, while, in others, participa-
tion is still top-down and passive. In this respect, we argue that sustainable
tourism development will succeed only if spontaneous participation is en-
hanced. Since the research is limited to the Karimunjawa area, its results can-
not be generalized to others. Any further studies need to conduct research on
broader or different areas, so that a wider range of similarities and differences
can be revealed and analyzed. In this way, it should be possible to identify the
characteristics of successful community participation for sustainable tourism
development.
_____________________________________________________________

Community Participation in Creating Sustainable Community-Based Tourism 41
Vis Sustain, 17, 5997, 39-55 http://dx.doi.org/10.13135/2384-8677/5997
1. Introduction
Tourism is one of the fastest growing economic sectors in the world and acts as
the main source of income for various developing countries (Sangkakorn and
Suwannarat, 2013). Tourism can be a driving force for the growth of numerous
related sectors, including hotel, communication and transportation, trade, culi-
nary, and others. It is an economic locomotive providing jobs, income from for-
eign exchange, strategic markets for potential local products, and support for
infrastructure development in various regions. It has the potential to promote
equitable development in multiple areas and influence various dimensions of
people’s lives, not least in remote areas (Nagarjuna, 2015). The multiplier effect
of the tourism industry, together with the fact that it has no boundaries in space
nor territorial borders, mean that tourism is a sector that has bright prospects
and a high strategic potential to improve the quality of society in the fields of
economy, education, culture, politics, and the environment (Aref, Gill, and Aref,
2010; Pramusita and Sinirastiti, 2017).
In the past five years, tourism has become one of the leading sectors playing a
role as the backbone for the Indonesian economy (Agfianto, Antara, and Suar-
dana, 2019). However, the development of tourism in various regions does not
necessarily guarantee the welfare of the local community of the tourist destina-
tions. This is because many destinations are still controlled by capitalists largely
comprised of people from outside the tourist area (Siqid and Resnawaty, 2019).
Instead of increasing economic growth for the benefit of the community, tourism
development becomes merely income and profit oriented. It is generally top-
down and does not reflect the interests of the local communities (Phanumat, et
al., 2015). Moreover, the rapid development of tourism is also directly correlated
with large-scale negative impacts caused in the form of environmental degrada-
tion, disappearing culture and local wisdom, and changes in people’s lifestyles
(Agfianto, Antara, and Suardana, 2019; Ertuna and Kirbas, 2012; Yazdi, 2012).
Ideally, the development of tourism should pay attention to the preservation of
the environment and local culture and involve a significant role for government.
The most important thing is to prioritize the interests of local communities
(Palimbunga, 2018). Therefore, a shift in the paradigm of tourism development
from a capitalist-destructive nature and a top-down approach to a bottom-up
approach that guarantees justice and people’s welfare and becomes sustainable is
necessary. To realize this, local community participation in tourism development
is essential (Aref, 2011). Since local people directly or indirectly feel the positive
and negative impacts of tourism, participation on the part of the community is

42 Kurniawan, Astuti, Syifauddin
Vis Sustain, 17, 5997, 39-55 http://dx.doi.org/10.13135/2384-8677/5997
crucial to ensure the sustainability of tourism as a human activity and economic
resources for the areas involved (Adikampana, Sunarta, and Pujani, 2019). More-
over, the local community is also a stakeholder with deep knowledge of the char-
acteristics of their tourism products, their activities, rituals, traditions, culture,
and their natural conditions, so that they are best aware of the optimal policies
to be taken in tourism development (Kim, Park, and Phandanpuvong, 2014; Sal-
leh, et al., 2016).
Concern over the complexity of such problems has given birth to the concepts
of CBT and sustainable tourism. CBT is planned, developed, owned, and man-
aged by the community and for the community, based on decision-making that
is collective, responsible, and provides benefits to the community (Giampiccoli
and Saayman, 2018). The development of sustainable tourism ensures that natu-
ral, social, and cultural resources utilized for tourism in the current generation
could also be preserved for future generations.
One of the CBT destinations most concerned with sustainability in Indonesia is
Karimunjawa. The tourism industry began to be developed since 2005 to 2006
and the area has become a leading tourism destination with abundant natural
potential for marine tourism lovers (Laksono and Massadun, 2014; Qodriyatun,
2018). Karimunjawa is also a National Park area that must be preserved in com-
pliance with the Decree of the Ministry of Forestry and Plantation No. 78/Kpts-
II/1999. Moreover, Karimunjawa is a multicultural community area consisting
of Javanese, Madura, Bugis, Bajau, and other tribes (Central Statistics Bureau of
Jepara Regency, 2018).
This massive tourism potential in Karimunjawa and its unique multicultural com-
munity permit researchers to study and analyze various aspects of community
participation in realizing sustainable CBT there. Community participation analy-
sis can demonstrate its pattern and typology in various aspects and stages of tour-
ism development. So far, we know of no research that has analyzed the charac-
teristics of community participation in multicultural community-based sustaina-
ble tourism in national parks and remote areas such as Karimunjawa. The results
should primarily contribute to the scientific literature about community partici-
pation and the development of sustainable community-based tourist destina-
tions. Moreover, such community participation typology analysis is crucial as a
reference for decision-makers and stakeholders involved in making policies and
taking action.

Community Participation in Creating Sustainable Community-Based Tourism 43
Vis Sustain, 17, 5997, 39-55 http://dx.doi.org/10.13135/2384-8677/5997
2. Literature Review
2.1 Sustainable Tourism and Community Based Tourism
Sustainable tourism can be considered an effort to create tourism that has a low
negative impact on local nature and culture and creates a future-oriented eco-
nomic distribution beneficial for the local community (Joobi and Satheesh, 2017).
In this sense, sustainable tourism refers to tourism that takes full account of cur-
rent economic, social, and environmental impacts, accommodating the interests
of visitors, industry, the environment, and local communities. The sustainability
principles consist of three main domains in tourism development: environment,
economy, and socio-cultural. These domains must be balanced to ensure long-
term sustainability (Aal, 2014). In this way, sustainable tourism is seen as tourism
development that means “building together with the society” so that it can pro-
duce benefits at the economic, social, and cultural levels for the public and
thereby becomes CBT (Munawaroh, 2018). CBT is aimed at addressing disad-
vantages for the community and is related to strategic sustainability issues regard-
ing empowerment, social justice, and self-reliance (Giampiccoli and Sayman,
2018). Three basic principles of CBT are community involvement in decision-
making, the certainty of benefits for the community from tourism activities, and
tourism education for the local people. CBT will have implications for the crea-
tion of sustainable tourism because tourism development is not only related to
how to achieve economic growth but also how to preserve the environment,
freeing the economic, political, cultural, and social environment autonomy of the
region from subordination towards greater political and economic power (Putra,
2014).
2.2 Community Participation in Tourism
The development of CBT requires a participatory approach because it is tourism
organized by the community (Pramusita and Sarinastiti, 2017; Sidiq and Res-
nawaty, 2019). There are various forms of community participation in tourism
(Tosun, 2006). Initially, several authors tried to examine the conditions of com-
munity participation in development activities in general, including Pretty (1995)
and Arnstein (1969), who categorize forms of community participation in terms
of several levels based on the involvement of external parties, local control, and
reflecting power relations between them. Subsequently, Tosun (2006) identified
three forms: spontaneous, induced, and coercive (Figure 1).

44 Kurniawan, Astuti, Syifauddin
Vis Sustain, 17, 5997, 39-55 http://dx.doi.org/10.13135/2384-8677/5997
Figure 1. Typology Partecipation in Tourism. Source: Tosun, 2006.
2.3 Previous Studies
Some previous studies that examined community participation in tourism were
conducted by Aref, Gill, and Aref (2010) and Nagarjuna G (2015). Their research
suggests that community participation in tourism is crucial because the commu-
nity is the main reason tourists visit the place. The unique culture, way of life,
local products, and the community also forms a landscape. If there is community
participation, tourism will also positively impact on society in income generation,
equitable development, and improving the quality of education and life in gen-
eral. Research by Thestane (2019) also suggests that planning, decision making,
implementation, and evaluation in tourism must involve the community. Moyo
and Tichaawa (2017) conducted a study in Zimbabwe as an example in which the
community is less able to develop. Research by Qodriyatun (2018) also shows
that current efforts to achieve sustainable tourism in Karimunjawa have still not
been realized.
Another study by Guiterrez (2019) suggests that community participation in
tourism had different levels in various locations. CBT in the world still suffers
from multiple problems. Research by Karta, Sukarsa, Hardini, and Suarthana
(2016) and Kim, Park, and Phandanouvong (2014) shows that the low level of
competence and awareness of the community and the uneven synchronization
of the vision between the community and the government in various regions are
crucial causes that hamper the growth of CBT. Research by Sidiq and Resnawaty

Community Participation in Creating Sustainable Community-Based Tourism 45
Vis Sustain, 17, 5997, 39-55 http://dx.doi.org/10.13135/2384-8677/5997
(2019) also shows that the asynchronous mission between the government and
the community tend to cause excessive domination by the government. People
need to get education related to tourism to permit their aspirations to be heard
(Moyo and Tichaawa (2017).
3. Research Methodology
Taking account of previous studies, our research was conducted on community
participation in realizing sustainable CBT in Karimunjawa to identifying what the
patterns and typologies of participation are. The research was conducted in the
Karimunjawa National Park Area. It was a case study which applied qualitative
data collection methods to analyze community participation in realizing sustain-
able CBT. The analysis will attempt to identify its pattern and typology in various
aspects and stages of tourism development. The qualitative approach aims to
analyze in-depth images of the complexities of human interactions (Dezin and
Lincoln, 1994), to examine in detail the nature of public participation in realizing
sustainable CBT.
The study used primary and secondary data sources. Primary data was obtained
through direct research in the field which included data on tourism agents in
Karimunjawa, the role of the community and actors involved in tourism activi-
ties, the interaction between communities in Karimunjawa, and the role of gov-
ernment in tourism in the area. The secondary data consisted of written library
sources that could be in the form of books, scientific magazines, archival sources,
personal documents, and official documents, including documents, announce-
ments, letters, banners, photos, statistical data, data from the National Park Of-
fice Karimunjawa, and popular scientific articles that have been published. Sec-
ondary data were also collected through a general literature review, particularly
on previous studies and documents from Statistics Indonesia online. The re-
searchers also obtained various kinds of data from both village and sub-district
governments directly at their offices.
The subjects of this study were the community and tourism actors, district and
village administrations, the management of the Karimunjawa National Park Of-
fice, government offices, NGO stakeholders and tourists themselves visiting Ka-
rimunjawa. The sample selection was done by using the Snowball Sampling
method. Data collection was started by asking the Karimunjawa Sub-district Of-
fice and Village Office for permission. Data collection in this research was carried
out through participatory observation techniques, interviews, and documenta-
tion.

46 Kurniawan, Astuti, Syifauddin
Vis Sustain, 17, 5997, 39-55 http://dx.doi.org/10.13135/2384-8677/5997
Interviews were carried out in both structured and non-structured modes. Struc-
tured interviews were conducted with the government, including the Head of
Karimunjawa Sub-district, the Head of Karimunjawa Village, the Chairman of
the Indonesian Tour Guides Association (HPI), and Karimunjawa National Park
Office employees. At the same time, non-structured interviews were carried out
with the community of tourism actors, including members of HPI, ship person-
nel, traders, homestay owners, tour service providers, and other tourism actors.
The researchers acted as tourists by staying in homes owned by members of the
local community, participating in tourist tour activities, using the services of boats
and tour guides, and buying various products sold by traders. In this way, multi-
ple questions related to community participation were answered spontaneously,
and the interviewees could openly provide detailed and objective information.
The researchers also conducted participatory observations so that the data ob-
tained was more complete.
The data obtained was analyzed using three channels identified by Milles and
Huberman (1992), following the process of data reduction, data presentation,
and drawing conclusions. The objective was to identify and examine the relation-
ship between the various features that emerged from the field research con-
ducted.
4. Results and Discussion
4.1 Community Participation in Creating Sustainable Tourism in Karimunjawa
Community participation in tourism development is crucial if based on the belief
that the community knows best what is needed. Achieving the essence of full
participation is when in the community is involved in every dimension of the
tourist development stage, including planning, decision making, implementation,
and supervision of development programs. In realizing this, careful consideration
of the community’s opportunities, willingness, and ability to act are needed.
4.1.1 Community Participation in the Planning Phase
In tourism development in Karimunjawa, the planning system is carried out with
both a top-down and a bottom-up approach. The top-down approach involves
development planning and program activities related to tourism that derives
purely from government policies, either through the Central Java Provincial
Tourism Office, the Jepara Regency Tourism Office, the Regional Planning and
Development Agency, or from the Karimunjawa National Park Office. The bot-
tom-up approach is development planning that comes from community

Community Participation in Creating Sustainable Community-Based Tourism 47
Vis Sustain, 17, 5997, 39-55 http://dx.doi.org/10.13135/2384-8677/5997
initiatives as a form of community action in achieving goals and finding solutions
for various problems encountered in tourism activities.
The government’s planning with a top-down approach usually relates to physical
development programs that require substantial financial support. Some develop-
ment programs from the government are the construction and provision of fa-
cilities in several tourism destinations, the Karimunjawa Square development
plan, the construction of a sports center, the development plan on Bukit
Jatikerep, and the cross-cultural facility development plan. Through the tourism
office, the government also has a non-physical development program in the form
of a Karimunjawa CD-making project as a tourism promotion media. In this
planning, the community did not participate in the planning process because the
plan had been handled by the government and only sought the community’s ap-
proval.
Top-down planning is also carried out by the private sector, such as external
investors who develop hotel and resort businesses in the Karimunjawa. This con-
dition creates problems in the development of tourism in Karimunjawa in terms
of the economy. It inevitably means that the most significant profits go to the
owners of capital. In this way, the community becomes a slave to the tourist
industry, facing a process of socio-economic marginalization and enjoying mini-
mal profits. This condition is a sign of resurgent neocolonialism that is starting
to penetrate the Karimunjawa region and exploiting local communities, causing
social and economic disparities within the tourism industry in Karimunjawa. The
community does not participate in planning and does not have the power to ob-
struct or reject development by external investors.
In contrast to top-down planning, the community participates fully in bottom-
up planning because its members are driven by the desire to provide the best for
tourism in Karimunjawa and sustainable for themselves and their area. Commu-
nity participation in the planning stage is reflected in forming groups of tourism
actors in Karimunjawa initiated by people who are aware of the tourism potential
and threats to the environment and the sociocultural characteristics. These
groups have goals, ideals, regulations, and policies that each of their members
has agreed on. Rules and policies in each group are arranged based on the vision
and mission of each group, in the economic, environmental, social, and cultural
fields.
The community participates in the process of decision making, which is decided
in a meeting forum organized by each group. The community of the tourism
actors also hold some forums to accommodate the aspirations of all groups of

48 Kurniawan, Astuti, Syifauddin
Vis Sustain, 17, 5997, 39-55 http://dx.doi.org/10.13135/2384-8677/5997
tourism actors. The forum is used to discuss the tourism system in Karimunjawa,
including price agreements and service systems, the direction of tourism devel-
opment, regulations regarding the rules of tourism, policies governing the envi-
ronment and cultural values, and policies towards tourism actors from outside
the area. This forum is also used to discuss planned events related to tourism, for
example, Barikan Kubro (an ancient Javanese ritual) events, Sail Indonesia (an
annual yacht rally), and others.
4.1.2 Community Participation in the Implementation Phase
Communities have a high level of participation in the implementation phase of
tourism, in terms of involvement in the management of tourism businesses and
thereby in realizing sustainable CBT.
The Karimunjawa community is a party that embodies the fulfillment of the 3A
aspects in tourism (Attraction, Amenities, and Accessibility). It also plays a role in
realizing tourist attractions in Karimunjawa, related to something to see, some-
thing to do, and something to buy. This condition is reflected in the number of
Karimunjawa people who are active in the tourism business. Moreover, many
people are engaged in environmental and cultural conservation. This participa-
tion is manifested by the active contribution of the people who are members of
the groups of tourism actors.
These groups include: 1) The homestay owners group, 2) The shipowner group,
3) Tour package sellers or travel agents, 4) Motorcycle rental owners, 5) Car rental
groups and services shuttle (Karimun Trans), 6) The association of souvenir and
culinary sellers 7) The merchants’ association, 8) The airport car pickup group
(Kemojan), 9) The Indonesian Tour Guide Association (HPI) as a tour guide,
10) The Traditional Dance group (Kemojan), 11) The Arts group (Karimunjawa),
12) Karimunjawa typical souvenirs entrepreneurs (Pawon Nyamplungan), 13)
Entrepreneurs for rental of snorkeling equipment, 14) The Pitulikur Karimun-
jawa Foundation, 15) Pokmaswas Karimunjawa Maritime Tourism, 16) MMP
Karimunjawa, 17) The Segoro Karimunjawa Circle of Friends, and 18) The Ka-
rimun Nature Foundation.
In implementing tourism in Karimunjawa community participation is seen as
crucial. This is because the people of Karimunjawa are parties who understand
the conditions and potential that exist there. This is very necessary, especially in
snorkeling tourism activities, the main base of tourist attractions in Karimunjawa.
In snorkeling activities, many local people play the role of tour guides and boat

Community Participation in Creating Sustainable Community-Based Tourism 49
Vis Sustain, 17, 5997, 39-55 http://dx.doi.org/10.13135/2384-8677/5997
drivers because of their intimate knowledge of the conditions of the Karimun-
jawa Sea.
Community participation in tourism activities is also manifested in support for
the achievement of Sapta Pesona Wisata in the Karimunjawa region. Sapta Pesona
Wisata consists of safe, orderly, clean, relaxed, beautiful, friendly, and memorable.
The community actively participates in realizing these conditions, both those di-
rectly related to tourism activities as tourism agents and members of the public
who are not directly involved in the tourism business.
The values of honesty and friendliness are held firmly by the people of Karimun-
jawa and are instrumental in bringing about security and order so that tourists
feel safe during their visit. The existence of environmental organizations such as
the Pitulikur Foundation and other organizations and the presence of routine
community service activities play a notable role in maintaining cleanliness, cool-
ness, and beauty in Karimunjawa. This is realized through cleaning the village,
harbor, sea, island, beach, and mosque. The community also strives to be a good
host always ready to be friendly, help and respect tourists, understand and be
tolerant of their needs and behaviors.
The extent of public involvement in the implementation of tourism in Karimun-
jawa does not guarantee diminishing outside intervention in the tourism business.
The increase in tourist influx adds to the intense competition and intervention
can come from domestic or foreign countries that directly manage the tourism
business in Karimunjawa or capital owners who have workers (confidants) there.
Many of them are engaged in hotel and tour package service provision. Some
also hold positions regarding management rights or private property rights to
beaches or islands which are tourist destinations. This causes profits from the
tourism business in Karimunjawa to be enjoyed less by the local community and
more by outsiders who tend to be capitalist and exploitative.
4.1.3 Community Participation in the Supervision Phase
The supervision phase is designed to ensure that the range of activities planned
and carried out correspond to the targets set despite the changes. Local commu-
nities have a substantial role in developing community-based sustainable tourism
because control of the decision-making process must be given to those who later
bear the consequences of the tourism industry. Supervision of tourism activities
is carried out by the Karimunjawa community, who work hand in hand with the
Karimunjawa National Park and the Tourism Office.

50 Kurniawan, Astuti, Syifauddin
Vis Sustain, 17, 5997, 39-55 http://dx.doi.org/10.13135/2384-8677/5997
Community participation in supervision is clearly foreseen by the regulations that
are stipulated and carefully overseen by the community. These regulations set the
norms that must be maintained and implemented by tourists, such as clothing,
prohibition of consumption of liquor, and related to efforts to protect the envi-
ronment, in line with the fact that most of the community are Muslims. Commu-
nity participation plays an important role in maintaining the purity of local culture
so as it is not by eroded western culture and Karimunjawa remains a sustainable
tourist destination in this respect.
Other regulations to maintain the sustainability of nature in Karimunjawa are
based on the agreement of all tour operators in the area. The ordinance regulates
the obligation to protect the environment, including prohibiting tourists from
touching and stepping on the reef during snorkeling and diving activities, the
obligation to maintain the cleanliness of beaches, islands, and the sea for all tour
operators, tourists, and the public, the obligation to maintain the quality of ships
so minimize fuel leakage, including maintaining the quality of land vehicles for
travel entrepreneurs to minimize air pollution.
Tour operators also set other regulations regarding tour leaders, tour guides, and
sea tour packages. To maintain the sustainability of CBT, there are rules that
prohibit external tour leaders and tour guides from conducting sea tours in Ka-
rimunjawa. Tour guides from outside the Indonesian Guides Association (HPI)
are not allowed to operate. Tour leaders (tour agents) who from outside Kari-
munjawa are still allowed to come there. However, the tour activities must be
managed by the ships and tour guides from Karimunjawa itself. As well as main-
taining the overall sustainability of CBT, this is also motivated by the desire to
always protect the marine environment since guides from Karimunjawa are bet-
ter able to understand and care for the local seabed.
Supervision is also carried out by the Karimunjawa National Park, which focuses
on environmental sustainability and the biodiversity of land and sea in Karimun-
jawa. Its supervision envisages regulations regarding zoning of the park area and
ensuring the zoning regulations are familiar to the public and tourism actors. The
Karimunjawa National Park provides information to the public and tourism ac-
tors on how to work together in maintaining environmental sustainability in Ka-
rimunjawa. It also conducts a patrol to monitor tourist and community activities
in the area.

Community Participation in Creating Sustainable Community-Based Tourism 51
Vis Sustain, 17, 5997, 39-55 http://dx.doi.org/10.13135/2384-8677/5997
4.2 Types of Community Participation in Creating a Sustainable Community-Based Tourism in Karimunjawa
The typology of participation is a picture of community involvement in the par-
ticipation process, with the leading indicator being the power held by the com-
munity to influence decision-making. Knowing the typology of community par-
ticipation will make it easier for stakeholders to help understand the practices
and processes of community involvement, find out the extent of efforts to in-
crease community participation, and evaluate stakeholders’ success in increasing
community participation. In this study, the typology of community participation
in realizing community-based sustainable tourism in Karimunjawa was analyzed
in terms of spontaneous and induced features of participation Tosun (2006).
During the planning stage, community participation in realizing sustainable CBT
in Karimunjawa is both spontaneous and induced. Spontaneous participation is
reflected in community initiatives to form a group of tourism actors, then inde-
pendently determine the objectives, regulations, and policies regarding the direc-
tion and organization of tourism activities in the area. Induced Participation oc-
curs in development planning carried out by the government and private inves-
tors in Karimunjawa.
During the implementation stage, spontaneous participation could be identified
in the active involvement of the members of various groups of tourism actors
whose role is to realize aspects of the 3As (Attraction, Accommodation, and Ac-
cessibility) and to realize Sapta Pesona Wisata. Induced participation is reflected in
the continued intervention of the private sector and the government in imple-
menting tourism in Karimunjawa.
During the supervision stage, community participation still shows spontaneous
and induced features. The community plays an important role in monitoring en-
vironmental sustainability, preserving cultural values, and ensuring the commu-
nity’s independence in tourism activities. On the other hand, in tourism activities
the community is also still under the supervision of the Karimunjawa National
Park.
Thus, we see that the community participation in realizing sustainable CBT in
Karimunjawa is of the Spontaneous-Induced Participation type, with both fea-
tures intersecting. In several dimensions, the community has bottom-up partici-
pation, is active in achieving its own goals, has considerable power in the deci-
sion-making process, has independent planning, and has authentic participation,
which is reflected in the awareness of the community to be fully responsible for
decisions that have been taken to achieve change.

52 Kurniawan, Astuti, Syifauddin
Vis Sustain, 17, 5997, 39-55 http://dx.doi.org/10.13135/2384-8677/5997
However, in some dimensions, the community has passive participation in that
the government starts participatory actions through strategies to encourage co-
operation and support the community. These are largely implemented by the
tourism office and Karimunjawa National Park. Thus, what follows is a top-
down process leading to pseudo participation, where the community is not in-
volved in making decisions but is involved in implementing decisions taken by
other parties. Moreover, the inability of the community to stem the intervention
and the presence of investors from outside Karimunjawa has led to induced par-
ticipation where the community only participated because of the stimulus of pos-
sible sharing of economic benefits.
4. Conclusions
Our research leads us to conclude that the typology of community participation
at the planning, implementation, and supervision stages in realizing sustainable
CBT in Karimunjawa is of the Spontaneous-Induced Participation type. Sponta-
neous authentic participation based on bottom-up processes coexists with more
passive involvement in induced top-down government initiatives and external
investment.
Community participation in promoting sustainable CBT in Karimunjawa must
certainly be continuously improved. Sustainable tourism development will only
succeed if spontaneous participation is fully realized. This allows people to rec-
ognize their needs, solve their problems, acquire direction and goals with their
specific strategies, and fully participate in the tourism agenda so that the profit
will grow over time and feed back into the community. Besides, it will ensure the
sustainability of tourism since the community has overall control of the various
activities. For this to happen, increasing community capabilities and social capital
is an essential process.
Our study has a limitation in that it is a case study that only examines community
participation in tourism activities in the Karimunjawa area. Thus, the results are
specific and cannot necessarily be generalized and or considered comparable to
other sites. Further studies will need to extend research over a broader area, or
over several diverse regions so that a range of similarities and differences can be
identified and analyzed. In this way, it will be increasingly possible to outline key
features for the achievement of community participation and produce a more
detailed framework to describe community participation in all the various aspects
of tourism development.

Community Participation in Creating Sustainable Community-Based Tourism 53
Vis Sustain, 17, 5997, 39-55 http://dx.doi.org/10.13135/2384-8677/5997
References
Aal, C. (2014). Sustainable tourism in practice: Promoting or preventing the quest for a
sustainable development? Journal of Sustainability, 6, 2562-2583.
Adikampana, I. M., Sunarta, I. N., & Pujani, N. L. K. (2019). A model of community-
based rural tourism products development. Journal IPTA, 7(1), 83-88.
Agfianto, T., Antara, M., & Suardana, I. W. (2019). Dampak ekonomi pengembangan
community-based tourism terhadap masyarakat lokal di Kabupaten Malang (Studi
kasus destinasi wisata Cafe Sawah Pujon Kidul). Journal JUMPA, 05(02), 259-282.
Aref, F. (2011). Sense of community and participation for tourism development. Life
Science Journal, 8(1), 20-25.
Aref, F., Gill, S. S., & Aref, F. (2010). Tourism development in local communities: As a
community development approach. Journal of American Science, 6(2), 155-161.
Arnstein, S. R. (1969). A ladder of citizen participation, Journal of the American Institute of
Planners, 35(4), 216-224.
Central Statistics Berau of Jepara Regency. (2018). Kecamatan Karimunjawa dalam angka
2018. Jepara: Central Statistics Berau of Jepara Regency.
Decree of the Minister of Forestry and Plantation No. 78/Kpts-II/1999.
Dezin, N. K. & Lincoln, Y. S. (1994). Handbook of Qualitative Research. California: Sage,
Thousand Oaks, 1994.
Ertuna, B. & Kirbas, G. (2012). Local community involvement in rural tourism devel-
opment: the case of Kastamonu, Turkey. Revista de Turismo y Patrimonio Cultural,
10(1), 17-24.
Giampiccoli, A. & Saayman, M. (2018). Community-based tourism development model
and community participation. African Journal of Hospitality, Tourism and Leisure, 4, 1-
27.
Gutierrez, E. L. (2019). Participation in tourism. Case study on community-based tour-
ism (CBT) in the Philipines. Ritsumeikan Journal of Asia Pacific Studies. 37, 23-36.
Joobi, V. P. & Satheesh, E. K. (2017). Local community participation in responsible
tourism – A case of Kumarakam Panchayath in Kerala. International Journal of Current
Research in Multidisciplinary. 2(11), 05-11.
Karta, N. L. P. A. & Sukarsa, I. M., Hardini, W. & Suarthana, I. K. P. (2016). Local
community participation in community-based tourism in Kintamani and their im-
pact to the economy. In Proc. of Asia Tourism Forum 2016 – The 12th Biennial Conference
of Hospitality and Tourism Industry in Asia.
Kim, S., Park, E., & Phandanpuvong, T. (2014). Barriers to local residents’ participation
in community-based tourism: Lesson from Houay Kaeng Village in Laos. SHS Web
of Conferences 12.

54 Kurniawan, Astuti, Syifauddin
Vis Sustain, 17, 5997, 39-55 http://dx.doi.org/10.13135/2384-8677/5997
Laksono, A. N. & Mussadun. (2014). Dampak aktivitas ekowisata di Pulau Karimun-
jawa berdasarkan persepsi masyarakat. Jurnal Teknik PWK, 3, 262-273.
Miles, M. & Huberman, A. M. (1992). Analisis Data Kualitatif: Buku Sumber Tantang
Metode-Metode Baru. Jakarta: UI Press.
Moyo, S. & Tichaawa, T. M. (2017). Community involvement and participation in tour-
ism development: a Zimbabwe study. African Journal of Hospitality, Tourism and Leisure,
6(4), 1-15.
Munawaroh, R. (2018). Partisipasi masyarakat dalam pengembangan pariwisata berbasis
masyarakat di Taman Nasional Gunung Merbabu Suwanting, Magelang. In Press.
Nagarjuna, G. (2015). Local community involvement in tourism: A content analysis of
websites of wildlife resorts. Atna, Journal of Tour Study, 10(1), 13-21.
Palimbunga, I. P. (2018). Keterlibatan masyarakat dalam pengembangan pariwisata di
desa wisata Tablanusu, Papua. Journal JUMPA, 05(01), 93-210.
Phanumat, W., Sangsnit, N., Mitrochob, C., Kaesang, S., & Noithammaraj, P. (2015). A
multi-stakeholder participatory approach in community-based tourism develop-
ment: a case study from Thailand. Journal of Sustainable Development and Planning, 193,
915-928.
Pramusita, A. & Sarinastiti, E. N. (2017). Aspek sosial ekonomi masyarakat lokal dalam
pengelolaan desa wisata Pantai Trisik, Kulonprogo. Jurnal Pariwisata Terapan, 1(2),
14-25.
Pretty, J. (1995). Participatory learning for sustainable agriculture. World Development,
23(8), 1247-1263.
Putra, I. N. D. (2014). Empat srikandi kuliner Bali: Peran perempuan dalam pem-
bangunan pariwisata berkelanjutan. Journal JUMPA, 01(01), 65-94.
Qodriyatun, S. N. (2018). Implementasi kebijakan pengembangan pariwisata berkelanju-
tan di Karimunjawa. Aspirasi: Jurnal Masalah-Masalah Sosial, 9(2), 240-259.
Salleh, N. H. M., Shukor, M. S., Othman, R., Samsudin, M., & Idris, S. H. M. (2016).
Factors of local community participation in tourism-related business: case of
Langkawi Island. International Journal of Soial Science and Humanity, 6(8), 565-571.
Sangkakorn, K. & Suwannarat, S. (2013). Local people participation in tourism develop-
ment: The case study of Chiang Mai. In Proc. of the 2nd Conference on Asian Economic
Development at Faculty of Economics, Ciang Mai University.
Sidiq, A. J. & Resnawaty, R. (2019). Pengembangan desa wisata berbasis partisipasi
masyarakat lokal di desa wisata Linggarjati Kuningan, Jawa Barat. in Proc KS: Riset
dan PKM, 4(1), 38-44.
Thestane, R. M. (2019). Local community participation in tourism development: The
case of Kaste Villages in Lestoho. Athens Journal of Tourism, 6(2), 123-140.
Tosun, C. (2006) Expected nature of community participation in tourism development.
Journal of Tourism Management, 27, 493-504.

Community Participation in Creating Sustainable Community-Based Tourism 55
Vis Sustain, 17, 5997, 39-55 http://dx.doi.org/10.13135/2384-8677/5997
Yazdi, S. K. (2012) Sustainable tourism. American International Journal of Social Science, 1,
50-56.
Authors
Edi Kurniawan
Universitas Negeri Semarang, Semarang City, Central Java, Indonesia, 50228.
E.mail: [email protected]
Tri Marhaeni Pudji Astuti
Universitas Negeri Semarang, Semarang City, Central Java, Indonesia, 50228.
E.mail: [email protected]
Mohammad Syifauddin
Universitas Negeri Semarang, Semarang City, Central Java, Indonesia, 50229.
E.mail: [email protected]
Competing Interests
The authors declared that no competing interests exist.
© 2021 Kurniawan, E., Astuti, T.M.P., Syifauddin, M.
This is an open access publication under the terms and conditions of the Creative Commons Attribution (CC BY) license (http://creativecommons.org/licenses/by/4.0/).

www.ojs.unito.it/index.php/visions
Improving household waste management through a door-to-door collection in Ruaka Town, Kenya
Sylvester Ngome Chisika, Chunho Yeom
Received: 2 December 2021 | Accepted: 22 February 2022 | Published: 2 March 2022
Citation: Chisika, S.N., Yeom, C. (2022) Improving household waste management through a door-to-door collection in Ruaka Town, Kenya. Visions for Sustainability, 17, 56-85. http://dx.doi.org/10.13135/2384-8677/6294
Correspondence: Chunho Yeom, e-mail: [email protected] Extended author information available on the last page of the article
1. Introduction
2. Materials and methods
2.1. Study area: Ruaka town in the outskirts of Nairobi City
2.2. Study design
2.3. Data collection
2.4. Data Analysis
3. Results
3.1. Respondent characteristics and influence on door-to-door waste collection
3.2. The current status of door-to-door household solid waste collection
3.2.1. Waste generation characteristics
3.2.2. Door-to-door Household Waste collection
3.2.3. Waste transportation to the dumpsite
3.3. Improving door-to-door solid waste collection system
4. Discussion
5. Conclusion and recommendation
Original Paper

Improving household waste management through a door-to-door collection 57
Vis Sustain, 17, 56-85 http://dx.doi.org/10.13135/2384-8677/6294
Keywords: citizen participation; door-to-door waste collection; financial con-straints; sustainable development; technology; willingness to pay.
________________________________________________________
Abstract. This study explores ways of improving household waste collection
in urban areas through a door-to-door waste collection system in Ruaka town,
Kenya, by comparing the collection practices between households served by
door-to-door waste collection and those without it. Literature review, random
sampling technique with semi-structured questionnaires, and direct observa-
tion were used. The case results confirm that door-to-door solid waste collec-
tion at households has the capacity to induce positive behavioural changes to-
wards sustainability at waste generation points. Waste separation and recy-
cling, which accompanies this system, can help improve revenue streams in
the waste management value chain, which may help to plug the waste financ-
ing gap facing many governments. However, the study notes that in Ruaka
town, the current practice of door-to-door waste collection is unsustainable
and could reinforce inequality amongst users seeking to access waste collec-
tion facilities. Apart from more household surveys to document the correlation
between individual household demographic attributes and effectiveness of
door-to-door waste collection, the study calls for developing robust regulations
for door-to-door service, increased citizen participation in waste management
matters, including the need for waste separation at the source to measure the
system’s maximum impact.
_____________________________________________________________
1. Introduction
The dual existence of urban areas as centers for economic growth and innovation
as well as hotspots for waste accumulation and pollution continues to challenge
and bemuse city planners and environmentalists alike. The concept of sustainable
development, which requires a balance between the social, economic, and envi-
ronmental aspects of human development, forces many cities to navigate the
problems and paradoxes facing sustainable urban development. Sustainable

58 Chisika and Yeom
Vis Sustain, 17, 56-85 http://dx.doi.org/10.13135/2384-8677/6294
development aims to integrate environmental conservation and economic objec-
tives following the commencement of large-scale industrialization and urbaniza-
tion experienced in the 21st-century. These aims involve key action points nec-
essary to realize sustainable consumption and production practices that reduce
the accumulation of waste and pollution as envisaged under Sustainable Devel-
opment Goal 12.
All over the world, the challenge of accumulated municipal solid waste (MSW)
deposits is an indication of societal lifestyle and how well solid waste manage-
ment (SWM) practices and production technologies are performing (Roberts,
2010). In some societies, development has led to stagnation due to inadequate
waste management policies, leading to the proliferation of disease, environmental
degradation, and loss of livelihoods (UN, 2020). It is, therefore, considered im-
perative for developing countries to rethink policies and practices that could en-
hance sustainable development. Effective solid waste management policies
should be ‘good,’ sound, and aimed at improving service delivery for people.
Sound policy management involves defining public participation and giving peo-
ple a voice (UN-Habitat, 2016).
In contrast, ineffective or ‘bad’ policy management could impose heavy social
and public administrative burdens on citizens (UN-Habitat, 2014). It has been
established that in many developing countries, these ‘policy failures’ are at-
tributed to the highly segmented nature of some environmental policies, includ-
ing those that govern solid waste. In addition, the complex application context
driven by unclear technical objectives sometimes considered in isolation affects
the effectiveness of policies (UN-Habitat, 2016). Consequently, there are grow-
ing criticisms that sustainable development policies have somehow led to nega-
tive impacts on solid waste management because the threat of waste accumula-
tion appears to be real and threatens to continue, increasing to unsustainable
levels with the growing urban population (Hoornweg and Bhada-Tata, 2012; UN
Habitat, 2014; UN Habitat, 2012). If the status quo remains, many environmental
and biological systems could be disrupted, thus distorting the balance between
the various components of sustainable development (Roberts, 2010).
The door-to-door management of household solid waste is increasingly being
promoted as a feasible method for promoting sustainable development in devel-
oping countries by improving the management of household wastes. This house-
hold-level waste management approach is increasingly being promoted since it
induces behavioural changes at waste generation points in the long term (Laurieri
et al., 2020). A typical door-to-door system of solid waste collection entails vehi-
cles visiting specific waste collection points following a precise schedule as wastes

Improving household waste management through a door-to-door collection 59
Vis Sustain, 17, 56-85 http://dx.doi.org/10.13135/2384-8677/6294
are collected (Laurieri et al., 2020). Remarkable achievements have been realised
with this practice since both the demand and supply sides of waste generation
are targeted during implementation (Hoornweg and Bhada-Tata, 2012; UN-Hab-
itat, 2014). In addition, this approach increases the participation of users in the
sorting and collection of household wastes (Laurieri et al., 2020; Ibanez et al.,
2018; European Commission, 2015).
In general, there is a need to further explore the door-to-door waste collection
system across regions and countries in order to document and share experiences
on how to improve it and hence the need for this study. Existing literature shows
various methods can be used to improve the door-to-door solid waste collection
system. But, with inreasing budgetary constraints on governments, there is a
growing tendency towards improving solid waste management by imploring cit-
izens to contribute a portion of their income towards sustainable solid waste
management. The contingent valuation method has thus gained popularity
amongst policymakers and scientists interested in the sustainable management of
solid waste because of its application in gauging people’s attitudes towards waste.
It has proven particularly useful when implemented alone or jointly with other
valuation techniques for non-market goods, such as the travel cost method or
hedonic approaches. However, it remains the only technique that is capable of
placing a value on commodities that have a large non-use component of value
and when the environmental improvements to be valued are outside the range of
available data. The goal of contingent valuation is to measure the compensating
or equivalent variation for good in question.
Other household demographic features have been found to have different influ-
ences on solid waste management. For instance, household education, age, and
homeownership have a significant influence on the decision to pay and the
amount to be paid by a household targeted by a waste improvement project
(Banga et al., 2011; Coaffey and Coad, 2015). However, in general, individuals in
high-income groups tend to generate more waste at a much higher rate (Zia et
al., 2017). Education and knowledge levels on the health impacts of waste have
positive impacts on waste management, whereas income was a decisive economic
factor of knowledge and attitudes (Seng et al., 2018). Illegal dumping of waste
was higher in communities with low employment rates (Matsumoto and
Takeuchi, 2011). Knowledge, attitudes, and people’s practices of people affect
solid waste management (Kiran et al., 2015). Income level, age, number of chil-
dren, a quantity of waste generated have an influence on solid waste management
by households (Awunyo-Victor et al., 2013).
60 Chisika and Yeom
Vis Sustain, 17, 56-85 http://dx.doi.org/10.13135/2384-8677/6294
Kenya is also experiencing the challenges of unsustainable solid waste accumula-
tion due to rising urbanization, rapid population growth, and limited budgetary
allocation for waste management. However, unlike other parts of the world, ur-
banization in Kenya has attracted a large population both of informal settlement
dwellers and the middle class. Moreover, increasing affluence has increased waste
generation and the complexity of waste streams. In attempts to remedy the waste
situation in the country and embrace the concept of sustainability, Kenya’s envi-
ronmental policy on waste management highlights that the government will de-
velop an integrated national waste management strategy and promote the use of
economic incentives to manage waste (Mutiso, 1994). To this end, following the
Earth Summit on sustainable development, Kenya initiated the National Envi-
ronment Action Plan (NEAP), which was completed in 1994. The NEAP rec-
ommended a national policy on laws pertaining to the environment. The policy-
making process culminated in 1999, with Sessional Paper No. 6 entitled ‘Envi-
ronment and Development.’ In the same year, the legislative process produced
the Environmental Management and Coordination Act (EMCA) No. 8 of 1999,
which was Kenya’s first framework environmental law implemented by a state
corporation under the Ministry of Environment called the National Environ-
ment Management Authority (NEMA). Both the sessional paper and the act
added to a large number of existing sectoral laws and policies on various facets
of the environment, such as water, forest, and minerals. It has created a diffuse
system of environmental laws and policies to achieve sustainable development as
set out in Kenya’s development blueprint, Vision 2030. Other national environ-
mental management reforms included developing a task force report, The Na-
tional Solid Waste Management Strategy, prepared by the National Environmen-
tal Management Authority (NEMA) in February 2015, whose aim was to apply
the ‘zero-waste’ principle and recommend methods for creating wealth and em-
ployment and reducing environmental pollution while satisfying the minimum
conditions for waste generation, collection, transportation, and disposal based on
statistics from five fast-growing urban areas in Kenya, namely Kisumu, Thika,
Eldoret, Nakuru, and Mombasa. Interestingly, even with these policy reforms
and the devolved governance that followed the implementation of the 2010 con-
stitution, many challenges that faced the previous waste management regimes
still persist.
Nonetheless, urban residents appear to be shifting focus towards implementing
variants of the door-to-door waste collection system, including in Ruaka, a rap-
idly urbanizing satellite town in the outskirts of Nairobi City County, the capital
of Kenya. Waste management is carried out by both the County Government of
Kiambu, which has distributed mixed waste collection bins in certain locations

Improving household waste management through a door-to-door collection 61
Vis Sustain, 17, 56-85 http://dx.doi.org/10.13135/2384-8677/6294
of the residential town, and private waste handlers who are currently providing a
form of door-to-door waste collection service. The private waste handlers pro-
vide waste bags to tenants (Kiambu County CIDP 2018-2022). Once the bags
are full, the tenants deposit them in large waste boxes located outside their apart-
ments from where the private waste handlers load them on lorries for transpor-
tation to the dumpsite. Even though door-to-door waste collection appears to be
serving the purpose, there is limited information on how it could be improved
for maximum societal benefits (Kiambu County CIDP 2018-2022). Moreover,
there are limited studies on residents’ perception and participation in a door-to-
door waste collection system. As such, this study seeks to apply qualitative re-
search approaches to explore ways of improving the current door-to-door house-
hold solid waste collection in Ruaka town in order to draw lessons for a wide
array of stakeholders on the future of household solid waste management. In
order to respond to these research needs, this paper will first review the concept
of solid waste management from the theoretical perspective of sustainable devel-
opment. Secondly, using primary data collected by simple random sampling of
households, a comparison will be made for individuals who receive door-to-door
waste collection services and those who do not in order to formulate the practical
implications of the system. Ruaka town is a particularly suitable study site because
it represents one of the rapidly urbanizing areas in the outskirts of Nairobi City
County, which is currently characterised by increased production and consump-
tion and infrastructural development. It will be important to investigate whether
the rapid growth in Ruaka town is accompanied by an attendant growth and de-
velopment in sustainable waste management systems.
2. Materials and methods
2.1 Study area: Ruaka town in the outskirts of Nairobi City
Ruaka is located approximately 12 km from the city center of Nairobi and is
named after the Ruaka River. The name ‘Ruaka’ is derived from the local lan-
guage meaning a place where ‘women used to bathe.’ The land was once owned
communally. During colonial times, the people were regrouped into villages. The
first village was in Ruaka shopping center, where the people worked on the white
settlers’ coffee farms. Some shops were built in the current Ruaka shopping cen-
ter. The land was subdivided into private plots on which most people practiced
agriculture as the main source of livelihood. Urbanization has slowly caused land-
use changes, and thus people have been developing residential and commercial
shelters (Kiambu County Integrated Development Plan 2018-2022).

62 Chisika and Yeom
Vis Sustain, 17, 56-85 http://dx.doi.org/10.13135/2384-8677/6294
According to the KNBS (2009) census, the population of the larger Karuri area
in which Ruaka is located stood at 129,000 in 2009, which is a 41.7% increase
from the figure in the 1999 census (Cytonn Investment Website, 2020). KNBS
(2009) projected that by 2025, the population would be 176,191, an annual pop-
ulation growth of 1.97%. Ruaka’s population comprises both local middle-in-
come earners and foreign residents and is a real estate investment satellite town.
The town is close to Nairobi’s central business district and has two prime com-
mercial retail developments in its vicinity, namely Two Rivers Mall and Rosslyn
Riviera Mall. The area’s high immigration rate results in a high population growth
rate. In turn, this has led to very high demand for housing. Among other reasons,
the two main incentives for people to move to this area are cheaper housing
compared to other major urban areas and the search for employment, (Cytonn
website, 2020). It will thus be interesting to investigate how a door to door waste
management is being practiced given these seemingly rapid socio-economic de-
velopments in Ruaka town.
2.2 Study design
The current household door-to-door solid waste collection practices in Ruaka
town were evaluated in terms of sustainable development by comparing respond-
ents’ answers from two waste generation groups, those served by a door-to-door
waste collection service and those who do not have such a service, identified by
the random sampling technique. Simple random sampling (SRS) is a sample se-
lection method comprising n number of sampling units out of the population
and having N number of sampling units, such that every sampling unit has an
equal chance of being chosen. SRS was chosen as the most appropriate study
design because it is cost-effective, easy to use, and it is normally used to accurately
represent a larger population, such as the one in Ruaka satellite town. It was used
to select a sample of 166 respondents from a population of 129,000 people with
a 92.25% confidence level. Caution was exercised to ensure that all respondents
came from different households in the study area.
𝑛𝑠𝑚𝑎𝑙𝑙𝑒𝑠𝑡 = 𝑛𝑒
1 +𝑛𝑒
𝑁
If N is large, then the required n is n ≥ ne and n smallest = ne.
This was calculated as follows:

Improving household waste management through a door-to-door collection 63
Vis Sustain, 17, 56-85 http://dx.doi.org/10.13135/2384-8677/6294
n = 129,000
1 + 129,000(0.0775)2
2.3 Data collection
In this study, both primary and secondary data were collected in order to respond
to the research questions. Primary qualitative data were collected using a house-
hold survey questionnaire (Appendix 1). The survey questionnaire covered three
thematic areas (i.e., the demographic characteristics of respondents, the current
status of door-to-door household solid waste management, and how the door-
to-door solid waste collection could be improved). The survey questionnaire was
initially pre-tested on ten respondents. The pre-test was important because there
was a need to guarantee the quality of responses from the study given the diver-
sity of the surveyed respondents, especially in terms of differences in education
levels. After verifying the quality of the responses, the survey questionnaire was
revised and administered as the principal tool for collecting primary data. Up to
five research assistants were trained on the objectives of the study as well as how
to administer the data collection tool. Both English and Kiswahili, which are
widely spoken by residents, were used as the medium of communication.
In addition, observation was used to record some of the daily events that the
research assistants witnessed during the course of this study. Observation en-
tailed walking through the town and observing how individuals were disposing
of their wastes. Through observation and note-taking, photographic data was
also collected to show the different practices in waste collection and manage-
ment. The data obtained was then passed on to the principal researchers for fur-
ther processing.
There was no need to develop an ethical checklist for this study because it did
not involve the extraction of samples on humans or animals, nor did it introduce
foreign materials into the country. Moreover, during the data collection process,
the research assistants walked through the town and interviewed respondents in
the place where they met them during the day. Data collection was challenging
due to the current COVID-19 pandemic, which required observing stringent
rules such as social and physical distancing as well as the wearing of face masks
whenever in public space. In addition, some respondents were not willing to par-
ticipate in the study because of a lack of cash incentives, and some were uncom-
fortable with the question relating to weekly income due to the suspicion that
such information could be used against them during the fulfillment of statutory
tax obligations. However, in order to reduce this suspicion and eliminate
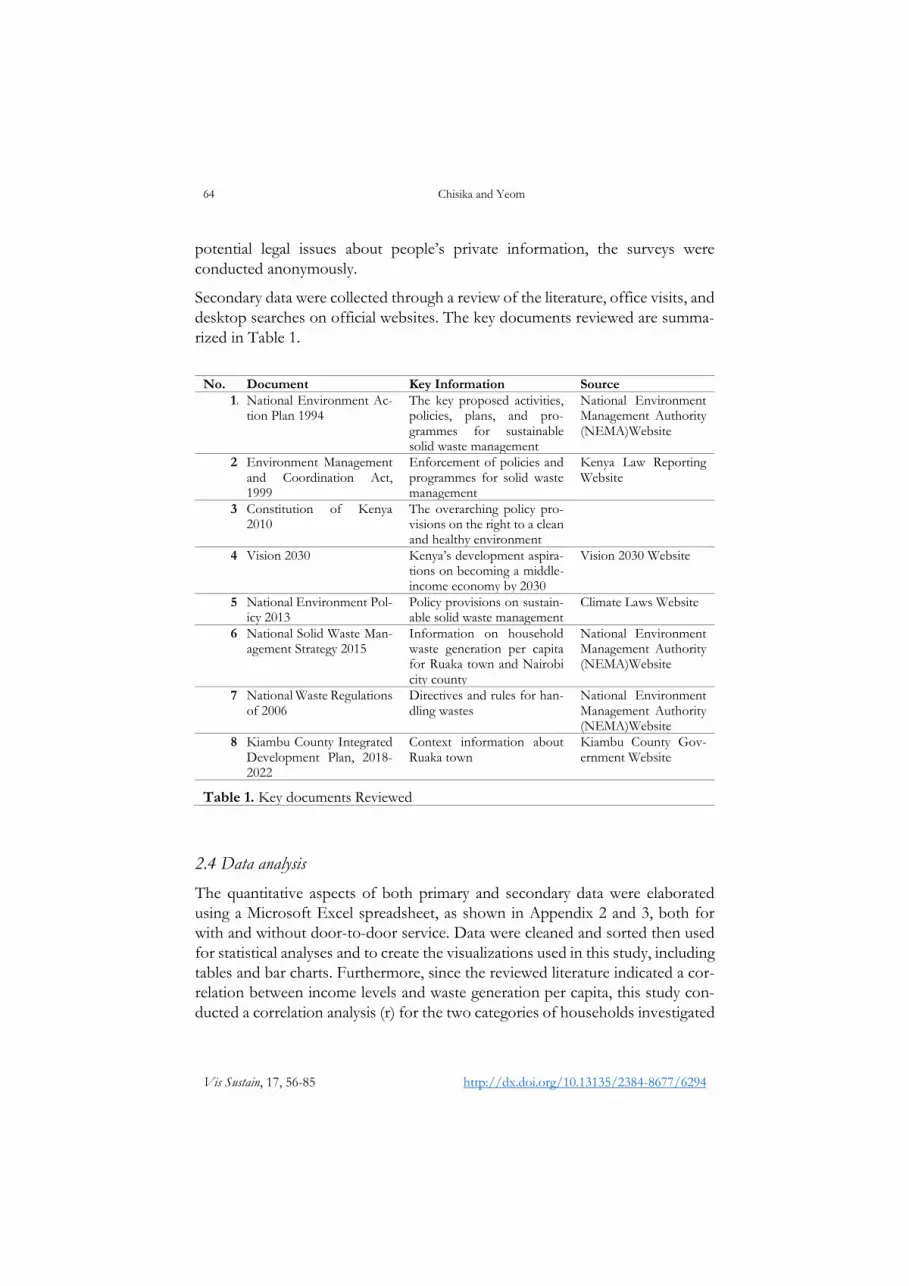
64 Chisika and Yeom
Vis Sustain, 17, 56-85 http://dx.doi.org/10.13135/2384-8677/6294
potential legal issues about people’s private information, the surveys were
conducted anonymously.
Secondary data were collected through a review of the literature, office visits, and
desktop searches on official websites. The key documents reviewed are summa-
rized in Table 1.
No. Document Key Information Source
1. National Environment Ac-tion Plan 1994
The key proposed activities, policies, plans, and pro-grammes for sustainable solid waste management
National Environment Management Authority (NEMA)Website
2. Environment Management and Coordination Act, 1999
Enforcement of policies and programmes for solid waste management
Kenya Law Reporting Website
3. Constitution of Kenya 2010
The overarching policy pro-visions on the right to a clean and healthy environment
4. Vision 2030 Kenya’s development aspira-tions on becoming a middle-income economy by 2030
Vision 2030 Website
5. National Environment Pol-icy 2013
Policy provisions on sustain-able solid waste management
Climate Laws Website
6. National Solid Waste Man-agement Strategy 2015
Information on household waste generation per capita for Ruaka town and Nairobi city county
National Environment Management Authority (NEMA)Website
7. National Waste Regulations of 2006
Directives and rules for han-dling wastes
National Environment Management Authority (NEMA)Website
8. Kiambu County Integrated Development Plan, 2018-2022
Context information about Ruaka town
Kiambu County Gov-ernment Website
Table 1. Key documents Reviewed
2.4 Data analysis
The quantitative aspects of both primary and secondary data were elaborated
using a Microsoft Excel spreadsheet, as shown in Appendix 2 and 3, both for
with and without door-to-door service. Data were cleaned and sorted then used
for statistical analyses and to create the visualizations used in this study, including
tables and bar charts. Furthermore, since the reviewed literature indicated a cor-
relation between income levels and waste generation per capita, this study con-
ducted a correlation analysis (r) for the two categories of households investigated

Improving household waste management through a door-to-door collection 65
Vis Sustain, 17, 56-85 http://dx.doi.org/10.13135/2384-8677/6294
to compare case study results with the literature. Particularly noteworthy was the
considerable difference in the door-to-door waste collection between individuals
with low incomes and high incomes. The income comparison was based on
Kenya’s taxable income threshold of US$ 300, where earners whose monthly
income was less than US$ 300 are exempted from the 30% monthly income tax.
3. Results
3.1 Respondent characteristics and influence on door-to-door waste collection
In total, 166 survey questionnaires were distributed, out of which 102 were re-
ceived back. This represents 61% of the target respondents. The survey indicates
that there is a marked difference in demographic attributes between households
with door-to-door waste collection services and those without them. In terms of
gender, results from Figure 1 indicate there were marginally more male respond-
ents (37) with door-to-door waste collection services than female respondents
(32). This may signify a relatively equal level of awareness or consciousness on
the issue of solid waste management amongst residents of Ruaka town. More
female respondents (19) were without the door-to-door service compared to
male respondents (14). This outcome may be attributed to the existing income
and employment inequalities between men and women in the town.
Figure 1. Gender and waste collection category.
37
14
32
19
0
10
20
30
40
With door-to-door service Without a door to doorservice
Nu
mb
er
of
Re
spo
nd
en
ts
Male Female

66 Chisika and Yeom
Vis Sustain, 17, 56-85 http://dx.doi.org/10.13135/2384-8677/6294
There were more respondents in the age bracket 29-39 years (34) with door-to-
door service compared to 16 without door-to-door service (Figure 2). Ruaka
town is populated by a relatively young population whose members appear to be
more conscious about solid waste issues.
There are more respondents (30) with a secondary level of education currently
receiving door-to-door service compared to 11 with a secondary level of educa-
tion without door-to-door service (Figure 3). This outcome implies a good pro-
portion of households with an education level that is likely to contribute to their
understanding of the impacts of an improper solid waste management system.
Figure 2. Age and waste collection category
16
34
11
35
9
16
6
1 1
0
5
10
15
20
25
30
35
40
18-28 29-39 40-50 51-61 62+
Nu
mb
er
of
Re
spo
nd
en
ts
Age (Years)
With door-to-door service Without a door to door service

Improving household waste management through a door-to-door collection 67
Vis Sustain, 17, 56-85 http://dx.doi.org/10.13135/2384-8677/6294
Figure 3. Education and waste collection category
There were more respondents (50) earning a monthly income of more than US$
300 compared to 13 in the category without a door-to-door service earning the
same amount of income (Figure 4). This outcome indicates there may be a high
likelihood of finding individuals with a good portion of disposable income who
could contribute a portion of their income towards improving the current waste
collection system in Ruaka town.
Figure 4. Income and waste collection category
11
3028
1
11
20
0
5
10
15
20
25
30
35
Primary Secondary Post-secondaryNu
mb
er
of
Re
spo
nd
en
ts
Education Level
With door-to-door service Without a door to door service
19 20
50
13
0
10
20
30
40
50
60
With door-to-door service Without a door to door service
Nu
mb
er
of
Re
spo
nd
en
ts
Waste collection category
Monthly income <30,000 Monthly income > or =30,000

68 Chisika and Yeom
Vis Sustain, 17, 56-85 http://dx.doi.org/10.13135/2384-8677/6294
In terms of family size, there were 65 respondents with family size of 1-4 mem-
bers compared to 29 without a door-to-door service but with similar family size
(Figure 5).
Figure 5. Family size and waste collection category
There were 27 respondents in self-employment in the category with door-to-
door service compared with 9 in the category without. Similarly, there were 27
respondents in private employment with door-to-door service compared to 14
in the category without the service, as shown in Figure 6. Since private and self-
employment are closely related and could be grouped as private employment, it
could be concluded that most Ruaka residents are privately employed.
Figure 6. Employment and waste collection category
65
4 0
29
4 00
20
40
60
80
(1 to 4) (5 to 8) (>9)
Nu
mb
er
of
Re
spo
nd
en
ts
Family Size
With door-to-door service Without a door to door service
27
15
27
9 1014
0
10
20
30
Self Government Private
Nu
mb
er o
f R
esp
on
den
ts
Employment Category
With door-to-door service Without a door to door service

Improving household waste management through a door-to-door collection 69
Vis Sustain, 17, 56-85 http://dx.doi.org/10.13135/2384-8677/6294
3.2 The current status of door-to-door household solid waste collection
3.2.1 Waste generation characteristics
Weekly household waste by residents of Ruaka is composed of four major ingre-
dients: food waste, electronic waste, paper, and plastic. Food waste and paper
dominate waste generation and composition among residents with a door-to-
door waste collection service and those without it, as shown in Figure 7. How-
ever, there is more food waste (76%) among residents with door-to-door collec-
tion than those without it (46%), as shown in Figure 7. For both categories of
study respondents, paper constitutes the second highest waste product by pro-
portion. Paper and food waste together constitute up to 90% of the waste that is
generated by respondents with a door-to-door waste collection service. For those
without the service, paper and food waste constitute about 82%. On average,
those with door-to-door service generate 1.94 kg of waste per day, while those
without it produce approximately 1.86 kg per day.
Figure 7. Waste generation per week
Moreover, the correlation (r) between monthly income and waste generated per
week indicates a weak positive association (0.05665) amongst respondents with
door-to-door service. In contrast, the correlation is relatively strong and positive
(0.328866) amongst residents without a door-to-door service for waste collec-
tion. Nonetheless, 63 out of 102 surveyed respondents have a monthly income
greater than or equal to Kshs. 30,000 (US$ 300).

70 Chisika and Yeom
Vis Sustain, 17, 56-85 http://dx.doi.org/10.13135/2384-8677/6294
3.2.2 Door-to-door Household Waste collection
Waste collection from households in Ruaka town is largely similar for both resi-
dents with door-to-door and those without it. Waste collection from tenants with
door-to-door service is organized so that the landlord contracts a private waste
collection service provider who, in turn, provides waste collection bags to house-
holds. These waste bags are distributed to tenants with door-to-door service
twice per month or at the landlord’s discretion and timing in some cases. The
size of the waste bag is ‘standard’ for all households and measures approximately
60-liters (Figure 8). Waste from those with door-to-door service is collectively
dumped into the waste bag without being sorted or separated into various con-
stituents. Once the waste bag is full, it is tied at the top or sometimes never tied,
and the tenant with door-to-door service deposits it into a concrete waste box in
front of the apartment. However, sometimes, if the landlord or his agent has
locked the waste box, the tenant with door-to-door service usually leaves the
waste on top of or adjacent to the concrete waste box. In some cases, especially
where the waste boxes are left open, both human and animal scavengers (ravens,
wild cats, and stray dogs) often get into the boxes and may dig and spill the con-
tents out of the waste box.
There is no regulation that limits the size of waste bags, the size of concrete waste
boxes, or the number of waste containers. If needed, all tenants can easily buy
the readily available extra containers from mobile merchants who roam and sell
waste containers around residential areas in order to accommodate more waste.
When the extra mixed-waste containers are full, tenants are free to buy more, or
they can decide to take the waste into the concrete waste boxes or leave them
beside the concrete box if it is full. Most apartments are not fitted with electronic
lifts or the opportunities for such technological upgrades, so tenants who live on
higher floors have to walk down the narrow winding stairs to take their waste to
the concrete box outside the apartment building. This becomes challenging for
people living with physical disabilities, the sick, and the elderly who have to con-
tract another person to carry their wastes to the concrete box at an extra cost.
For tenants who receive door-to-door collection service, the cost of waste bags
is included in the monthly rent payment. The waste collection fee varies, but it is
typically Kshs. 250 (US$ 2.5) or below.

Improving household waste management through a door-to-door collection 71
Vis Sustain, 17, 56-85 http://dx.doi.org/10.13135/2384-8677/6294
Figure 8. A standard waste bag from a private waste collection service provider.
For those households that receive door-to-door waste collection service, once
the waste collection bag is ready for disposal, the residents must take it out and
dump it into one of the concrete waste boxes located at the gates of most resi-
dential apartments. There are various waste box designs; some have lids that can
be locked (Figure 9), and others are lidless (Figure 10). Similar facilities are avail-
able for those without door-to-door service in some apartment buildings.
Figure 9. A waste box with a lid mostly found in relatively high-income neighborhoods.

72 Chisika and Yeom
Vis Sustain, 17, 56-85 http://dx.doi.org/10.13135/2384-8677/6294
Figure 10. A waste box without a lid found in relatively low-income neighborhoods.
3.2.3 Waste transportation to the dumpsite
In some cases, garbage collectors walk around the neighbourhood with a drum
or a cart, collecting trash from each household, especially in relatively low-income
neighbourhoods. Still, mostly, the trash that is placed in waste boxes is collected
monthly by private waste collection trucks for a fee, which is normally paid by
the landlord. There are other collectors who simply take the trash away in the
plastic bags that individual households provide for waste disposal.
After collection, all trash is brought to the nearest collection point. In addition
to County government workers, certain CBOs and informal garbage collectors
also provide waste collection services. It costs around US$ 1 per day to rent a
cart, and the availability of this option makes it more convenient for households
to dispose of their waste, especially in low-income areas. However, the garbage
collectors have to deal with poor working conditions, which involve certain
health risks. Most collectors, including those who work for Kiambu County and
private companies, were observed not wearing any protective gear, such as gloves
and masks.

Improving household waste management through a door-to-door collection 73
Vis Sustain, 17, 56-85 http://dx.doi.org/10.13135/2384-8677/6294
There are certain residential areas that are neglected in that they do not receive
any service from Kiambu County. Residents who are excluded in this way are
likely to solicit private services, while others who are not able to afford that al-
ternative must manage their waste personally. Often, illegal dumping sites arise
when such residents accumulate their waste in a particular spot before setting it
all on fire after a few days of storage. In some cases, once a tenant realizes that
their waste composition is paper or plastic, they burn it beside the concrete box.
Sometimes, smoke billowing from burning waste finds its way into the homes of
nearby tenants and other neighbours thus exposing many people to environmen-
tal and health risks.
3.3 Improving door-to-door solid waste collection system
Results appear to indicate that surveyed residents would like to improve the cur-
rent door-to-door system of waste management in Ruaka town, albeit with a few
differences between those with door-to-door service and those without.
Amongst study respondents with door-to-door waste collection, 40 out of 69
expressed their willingness to pay for an improved service. In contrast, 24 out of
33 among those without the service were willing to pay for improved waste col-
lection, as shown in Table 2 below. In total, 64 respondents from both categories
are willing to pay for improved waste collection. It represents approximately 60%
of all study respondents. Moreover, 36 respondents indicate that they are willing
to pay more than US$ 3 for improvements to the current waste collection service
in Ruaka satellite town, as shown in Table 2.
Door to door collection The maximum amount (Kshs.)
<100 200~300 >300 Total
Yes 0 17 23 40
No 0 11 13 24
Table 1. WTP Willingness to pay results
4. Discussion
Many developing countries have recognized that proper management of solid
waste is important for human advancement within the context of sustainable de-
velopment goals. Many countries are implementing policy instruments that target

74 Chisika and Yeom
Vis Sustain, 17, 56-85 http://dx.doi.org/10.13135/2384-8677/6294
behaviour change at the household level in favour of sustainable solid waste man-
agement of waste. In this regard, improving the door-to-door collection of
household wastes has emerged as a feasible approach.
Similarly, the government of Kenya is keen on promoting sustainable solid waste
management in the country. It has purposefully put in place somewhat robust
environmental management reforms to tackle solid waste in its quest for sustain-
able development, as evidenced by the reviewed policy documents. Generally,
there is a convergence of thought that efficient solid waste management is essen-
tial as governments strive to deliver services to their citizens (National Environ-
ment Action Plan, 1994; Environmental Management and Coordination Act,
1999; National Environment Policy, 2013; National Solid Waste Management
Strategy, 2015).
The door-to-door collection of solid waste amongst urban residents is thus fast
emerging as an improved waste collection method. The residents of the satellite
town of Ruaka on the outskirts of Nairobi City exemplify this government com-
mitment. They show a desire to enjoy the benefits of sustainable development
through proper solid waste management. Case results show that out of 102 study
respondents, 69 have signed up for door-to-door waste collection, which in-
volves being provided with a polythene bag for waste collection and storage (Fig-
ures 1-8). The socio-economic characteristics of the residents appear to have an
influence on the sustainability and effectiveness of door-to-door household solid
waste collection. Case results show that the family size and employment status
were important factors in describing the influence of demography on door-to-
door waste management. In particular, private employment appears to be related
to an increased desire for door-to-door waste management, as demonstrated by
those with door-to-door service. At the same time, it would be important to see
if different results might emerge from a study conducted in the post COVID-19
period.
Moreover, a survey of their perceptions on improving the current door-to-door
service shows that many study respondents, including those without the service,
are willing to pay a fraction of their income in order to improve the current door-
to-door waste collection method, as shown in Table 2. These results demonstrate
a positive attitude towards proper solid waste management amongst the residents
who were studied. The favourable attitude could arise from the consciousness of
the effects of accumulated solid waste, especially health risks and environmental
risks. Moreover, the results could also imply favourable conditions and opportu-
nities for creating collaborative social networks for financial partnerships towards
appropriate waste management in Ruaka town, which appears to be a big

Improving household waste management through a door-to-door collection 75
Vis Sustain, 17, 56-85 http://dx.doi.org/10.13135/2384-8677/6294
challenge. The literature reviewed has emphasized the importance of understand-
ing local attitudes and the existing situation, focusing on financial partnerships
with citizens for improved waste management (Coaffey and Coad, 2015; Su-
mukwo and Cheserek, 2012; Banga and Mkenda, 2011; Kounani et al., 2020).
In general, the maximum willingness to pay for improved waste collection varies
between those who have a door-to-door waste collection and those who do not
have the service. Results indicate that no respondent was willing to pay less than
Kshs. 100 (US$ 1) to improve waste management. Furthermore, as shown in
Table 2, a majority of residents are willing to pay more than Kshs. 300 (US$ 3)
for improved waste management, but there are more residents amongst those
with a door-to-door collection service who are willing to pay Kshs. 300 (US$ 3)
than those without one. However, the quest for a higher premium amongst those
with a door-to-door collection service may indicate a certain level of dissatisfac-
tion amongst them since many of them could feel that they are not being served
well. Nevertheless, it will be important to conduct more household surveys to
further investigate these speculations in the future.
The results appear to have indirectly identified some reasons behind this dissat-
isfaction among residents with door-to-door service. First, the waste collection
charge is fixed by an agreement between the landlord and the private waste col-
lector (company) without tenants’ participation. This circumstance is concerning
given that the literature review has confirmed that citizen participation is the key
to successful waste management (Altaf and Deshazo, 1996; National Solid Waste
Management Strategy, 2015; UN-Habitat, 2014; UN-Habitat, 2016; Laurieri et
al., 2020; Ibanez et al., 2018; European Commission, 2015). Secondly, waste bags
are only provided twice per month, which may be upsetting to this group of
residents. Thirdly, the concrete waste boxes outside most apartments are only
emptied occasionally, once per month, and this sometimes encourages littering,
causes bad odours, and encourages illegal dumping.
In addition, the authors observe that even though door-to-door waste collection
may have many advantages, the current form of implementing door-to-door col-
lection practice in Ruaka town is incentivizing increased environmental degrada-
tion risks by encouraging an endless generation of waste amongst residents be-
sides entrenching inequality in access to waste collection facilities. First, provid-
ing tenants with high-capacity (60-litre) waste bags encourages waste generation
at the source (Figure 8). Indeed, on average, residents with the door-to-door col-
lection have a higher daily rate of waste generation (1.94 kg) compared to those
without it, who, on average, only produce approximately 1.86 kg per day in com-
parison with Nairobi City’s projected 0.7 kg/capita/day. Secondly, the landlords’

76 Chisika and Yeom
Vis Sustain, 17, 56-85 http://dx.doi.org/10.13135/2384-8677/6294
or houseowners’ practice of discretionarily allowing apartment tenants to buy
extra waste containers reverses the gains that could have been achieved through
the door-to-door collection and the transition to a zero-waste society as envi-
sioned in the National Solid Waste Management Strategy of 2015 and other key
environmental policy documents already discussed. Thirdly, the current system
does not encourage waste sorting and separation at the source, thus complicating
waste handling, transportation, and eventual disposal. Fourthly, the fixing of the
waste collection fee is non-participatory because tenants are not involved.
Moreover, contracted private collectors’ low waste collection frequency indicates
that Kiambu County could only be minimally enforcing private companies’ waste
collection contracts. This may be attributed to limited budgetary allocations,
amongst other reasons, as indicated in the National Solid Waste Management
Strategy of 2015 and other policy documents. Finally, the apartment building
technology, which excludes important facilities such as lifts, could hinder proper
solid waste collection on the part of physically disadvantaged groups (especially
the sick, people living with disabilities, and the elderly) and is likely to dispropor-
tionately escalate their waste collection costs because they may be required to
hire another person to help them take their wastes to the concrete boxes. These
findings may support the UN-Habitat’s (2016) findings, which attribute policy
failures to the highly-segmented nature of some environmental policies, includ-
ing those that govern solid waste, as well as the complex application context,
which is driven by unclear technical objectives that are considered in isolation
from other factors that determine effectiveness. Our study shows ho some envi-
ronmental policies are adopted on a foundation that is entirely comprised of ad-
hoc assumptions rather than collectively investigated realities, which could then
enable policy implementation. Moreover, door-to-door waste management ap-
pears to be affected by factors that can be controlled both by the existing waste
management strategies such as environmental consciousness amongst residents
and factors that are beyond the waste management strategies such as family size,
building technology, and socio-cultural factors. On this account, this paper calls
for more household surveys that would help to address these waste problems.
Notably, Altaf and Deshazo (1996) call for similar actions in the case of Pakistan
in efforts aimed at investigating these waste management realities.
In the case of Ruaka, waste separation at the point of generation has the potential
to reduce waste collection costs and the risk of health and negative environmen-
tal impacts, as Coaffey and Coad (2015) have indicated. Waste separation com-
bined with composting of biodegradable wastes could yield many benefits, in-
cluding boosting soil fertility for local agricultural productivity and promoting

Improving household waste management through a door-to-door collection 77
Vis Sustain, 17, 56-85 http://dx.doi.org/10.13135/2384-8677/6294
urban farming as well as rural-urban integration and development. This study’s
results have expressly confirmed these possibilities, as shown in Figure 7, which
indicates that household waste in Ruaka is dominated by food waste and paper,
both of which are largely biodegradable and could be composted to produce ma-
nure for food production and other functions. Composting and recycling have
been recognized as feasible methods of managing waste in Kenya in reviewed
policy documents and could offer many benefits in the case of Ruaka town. First,
the more waste that is composted or recycled, the less waste there is to be dis-
posed of. It can significantly reduce waste collection costs by reducing disposal
fees, time loss at dumpsites, and distances that must be traveled to access remote
dump sites. Secondly, selling recyclable materials from separated wastes to recy-
cling industries can generate additional revenue in the waste management value
chain and reduce waste collection costs. Thus, the promotion of composting and
recycling can help make waste collection more affordable Afroz and Masud
(2011).
5. Conclusion and recommendation
This study has reviewed and provided insights on how the current door-to-door
system of household solid waste management in Ruaka satellite town in the peri-
urban region of Nairobi could be improved. Case study results have shown that
proper solid waste management is linked to improved human health and sustain-
able development. The door-to-door collection of wastes from households, if
properly implemented, could accelerate sustainable management of solid waste
and even generate new revenue streams for financing waste management pro-
grammes. Case results from Ruaka town have also shown that people desire to
have improved waste management and are willing to devote a portion of their
income to a program that implements these wishes. This offers an opportunity
for the County Government of Kiambu to address the current budgetary con-
straints facing waste management.
At the same time, in the case of Ruaka town, the results of this study lead us to
recommend increasing the involvement of residents in issues of waste collection
through the formation of resident associations, reviewing the current waste man-
agement regulations to clearly define the maximum size of a waste bag, size of
concrete waste boxes, providing incentives for waste separation at source, im-
proving the working conditions of waste collectors, improving equity in access
to waste collection facilities by redesigning buildings, outlawing the hawking of
extra waste containers which is rampant in Ruaka town, and reviewing the tenant-

78 Chisika and Yeom
Vis Sustain, 17, 56-85 http://dx.doi.org/10.13135/2384-8677/6294
landlord contract to include provisions that could encourage the minimal waste
generation and waste separation. These steps are important for supporting the
technical analyses conducted by various waste management stakeholders and
providing opportunities for developing an environmentally sustainable waste col-
lection system. In the future, more household surveys are needed to explore bet-
ter ways of securing a high rate of citizen participation and the application of
smart technologies for home waste management.
References
Afroz, R. and Masud, M. M. (2011). Using a contingent valuation approach for im-
proved solid waste management facility: Evidence from Kuala Lumpur, Malaysia.
Waste management, 31(4), 800-808.
Altaf, M. A., and Deshazo, J. R. (1996). Household demand for improved solid waste
management: A case study of Gujranwala, Pakistan. World Development, 24(5), 857-
868.
Awunyo-Vitor, D., Ishak, S. and Seidu Jasaw, G. (2013). Urban Households’ willingness
to pay for improved solid waste disposal services in Kumasi Metropolis, Ghana. Ur-
ban Studies Research, 2013.
Adger, W. N., and Jordan, A. (2009). Sustainability: exploring the processes and out-
comes of governance. In W. N. Adger, and A. Jordan, (eds.) Governing sustainability.
Cambridge University Press, pp. 3-31.
Banga, M., Lokina, R. B. and Mkenda, A. F. (2011). Households’ willingness to pay for
improved solid waste collection services in Kampala city, Uganda. The Journal of En-
vironment and Development, 20(4), 428-448.
Constitution of Kenya, 2010. Accessed at http://kenyalaw.org/kl/index.php?id=398
Coffey, M. and Coad, A. (2010). Collection of municipal solid waste in developing countries. UN-
Habitat, United Nations Human Settlements Programme.
Cytonn Investment Website (2020). Accessed at https://cytonn.com/topicals/ruaka-
real-estate-investment-opportunity on 20th September 2021.
Environmental Management and Coordination Act No. 8 of 1999. Accessed at
www.kenyalawreports.org on 15th June, 2021.
European Commission, Directorate-General for Environment, Weißenbacher, J.,
Dollhofer, M., Herczeg, M. (2015). Assessment of separate collection schemes in the 28 capi-
tals of the EU: final report, Publications Office of the European Union.
https://data.europa.eu/doi/10.2779/49194
Habitat, U. N. (2016). World cities report 2016. Urbanization and development–emerging fu-
tures. New York: UN Habitat.

Improving household waste management through a door-to-door collection 79
Vis Sustain, 17, 56-85 http://dx.doi.org/10.13135/2384-8677/6294
Hoornweg, D., and Bhada-Tata, P. (2012). What a waste: a global review of solid waste man-
agement. Washington, DC: World Bank.
Habitat, U. N. (2014). A new strategy of sustainable neighbourhood planning: Five principles. Nai-
robi, Kenya: United Nations Human Settlements Programme.
Un-Habitat. (2012). State of the World’s Cities 2008/9: Harmonious Cities. Routledge.
Ibáñez-Forés, V., Bovea, M. D., Coutinho-Nóbrega, C., de Medeiros-García, H. R., and
Barreto-Lins, R. (2018). Temporal evolution of the environmental performance of
implementing selective collection in municipal waste management systems in devel-
oping countries: A Brazilian case study. Waste Management, 72, 65-77.
Kiran, K. G., Kini, S., Ravi, K., Santhosh, N. P., and Kiran, N. U. (2015). KAP study of
solid waste disposal of households in Kuttar and Manjanadi Panchayath covered
under gramaskhema programme of KS Hegde Medical Academy. Nitte University
Journal of Health Science, 5(3), 29.
Kiambu County Integrated Development Plan 2018-2022. Accessed at https://reposi-
tory.kippra.or.ke/handle/123456789/709?show=full on 15th February, 2022.
Kenya, L. O. (2013). The Constitution of Kenya: 2010. Chief Registrar of the Judiciary.
Kounani, A., Skanavis, C., Marini, K., and Plaka, V. (2020). Waste management percep-
tions of Aegean Islands’ residents: a footprint due to refugee inflows. International
Journal of Environment and Waste Management, 25(3), 263-297.
Kenya Population and Housing Census Report 2009. Accessed at
https://www.knbs.or.ke/?p=5621 on 15th June, 2021.
Laurieri, N., Lucchese, A., Marino, A., and Digiesi, S. (2020). A Door-to-Door Waste
Collection System Case Study: A Survey on its Sustainability and Effectiveness. Sus-
tainability, 12(14), 5520.
Mutiso, S. K. (1994). Kenya’s National Environmental Action Plan. Waterlines, 13(2),
11-14.
Matsumoto, S., and Takeuchi, K. (2011). The effect of community characteristics on
the frequency of illegal dumping. Environmental Economics and Policy Studies, 13(3),
177-193.
National Environment Policy of 2013. Accessed at https://climate-laws.org/cclow/ge-
ographies/kenya/policies/national-environment-policy-2013 on 15th June, 2021.
National Solid Waste Management Strategy of 2015. Accessed at www.nema.go.ke on
16th June, 2021.
National Solid Waste Regulations of 2006. Accessed at https://www.nema.go.ke/im-
ages/Docs/Regulations/Waste%20Management%20Regulations-1.pdf on 15th
February, 2022.
Redclift, M. (1997). Graham Woodgate, eds. 1997. International Handbook of Environmental
Sociology. Cheltenham: Edward Elgar Publishing.
Roberts, J. (2010). Environmental policy. Routledge.

80 Chisika and Yeom
Vis Sustain, 17, 56-85 http://dx.doi.org/10.13135/2384-8677/6294
Sumukwo, J., Kiptui, M. and Cheserek, G. J. (2012). Economic valuation of improved
solid waste management in Eldoret Municipality. Journal of Emerging Trends in Econom-
ics and Management Sciences, 3(6), 962-970.
Seng, B., Fujiwara, T., and Spoann, V. (2018). Households’ knowledge, attitudes, and
practices toward solid waste management in suburbs of Phnom Penh, Cambodia.
Waste Management and Research, 36(10), 993-1000.
United Nations (UN) Website (2020). Accessed at https://www.un.org/develop-
ment/desa/disabilities/envision2030.html on 22nd October 2021
Vision 2030. Accessed at https://vision2030.go.ke/publication/kenya-vision-2030-
popular-version/ on 15th February 2022.
Zia, A., Batool, S. A., Chauhdry, M. N., and Munir, S. (2017). Influence of income level
and seasons on quantity and composition of municipal solid waste: A case study of
the capital city of Pakistan. Sustainability, 9(9), 1568.

Improving household waste management through a door-to-door collection 81
Vis Sustain, 17, 56-85 http://dx.doi.org/10.13135/2384-8677/6294
Appendix 1: Survey Questionnaire
Part 1: Demographic characteristics What is your gender? What is your age? What is your highest education level? What is your average weekly income? What is your family size? What is your employment status? Do you have a door-to-door service for collecting your household solid waste? Part 2: Current Status of household solid waste collection in Ruaka Town Is the accumulation of solid waste an issue of concern to you as a resident of Ruaka town? Approximately how much Kg of waste do you generate per day in your house? Approximately, what is the highest percentage per waste component? Would you separate waste into the various components if you were told to do so by the waste collection company? What are the main challenges of the current door-to-door waste collection system in Ruaka? Part 3: Improving household solid waste collection through the door-to-door system Are you satisfied with the current door to door to door system of collecting waste? How much are you charged for waste collection per month? Do you think government policies have been adequate in promoting door-to-door solid waste management in Ruaka town? Your household currently pays ______ Kshs. per month as a tariff for door-to-door solid waste management. However, there is a certain level of dissatisfaction regarding service provision. If you were to receive a proper door-to-door waste collection (five days per week), weekly cleaning of intermediate waste bins, and safe disposal of gener-ated waste, would you be willing to pay Kshs. 100 per month for such a service? NB: this amount would be in addition to your current monthly household expenditure, but you have than nothing extra to pay in this regard. If yes, would you be willing to pay Kshs. 200? If yes, would you be willing to pay Kshs. 400? If no, why? What would be your maximum willingness to pay for improved door-to-door service?

82 Chisika and Yeom
Vis Sustain, 17, 56-85 http://dx.doi.org/10.13135/2384-8677/6294
Appendix 2: Results from those with door-to-door service
Questionnaire
Survey No.
Gender Age Education
level
Monthly
income
Weekly
Income
(Kshs.)
Family
size
Employer Approximate
waste gener-
ated per week
(Kg)
Main Composition
(Food waste, pa-
per, bones, etc.)
Have door to
door collection
or not (Yes/No)
WTP for im-
provement
(Yes/No)
If yes, how
much
(Kshs.)?
95 F 34 Secondary 32,000 8000 1 Government 3 Electronic Waste Yes No 0
11 M 28 Secondary 40,000 10000 1 Government 2.5 Food Waste Yes No 0
23 F 26 Tertiary 4,000 1000 2 Government 1.5 Food Waste Yes No 0
12 F 36 Secondary 20,000 5000 2 Government 1.8 Paper Yes No 0
65 M 38 Tertiary 26,000 6500 2 Government 1 Food Waste Yes No 0
9 M 35 Secondary 104,000 26000 2 Government 2 Food Waste Yes No 0
10 M 26 Tertiary 12,000 3000 3 Government 1.5 Food Waste Yes No 0
43 F 35 Secondary 120,000 30000 3 Government 2 Food Waste Yes No 0
71 M 26 Secondary 400 100 3 Private sector 1.3 Food Waste Yes No 0
83 F 22 Tertiary 320,000 80000 3 Private sector 2 Food Waste Yes No 0
32 F 44 Secondary 2,000 500 4 Private sector 1 Paper Yes No 0
34 M 43 Secondary 40,000 10000 4 Private sector 3 Paper Yes No 0
31 M 42 Secondary 48,000 12000 4 Private sector 1 Food Waste Yes No 0
55 F 26 Tertiary 56,000 14000 4 Private sector 1 Food Waste Yes No 0
33 M 46 Primary 80,000 20000 4 Private sector 2.3 Food Waste Yes No 0
30 F 39 Tertiary 120,000 30000 4 Private sector 1 Food Waste Yes No 0
101 F 49 Tertiary 180,000 45000 4 Private sector 1.3 Food Waste Yes No 0
35 M 42 Tertiary 14,000 3500 5 Private sector 3 Electronic Waste Yes No 0
61 M 38 Primary 60,000 15000 1 self 1.3 Food Waste Yes No 0
22 M 54 Secondary 3,400 850 2 self 1 Paper Yes No 0
44 F 72 Tertiary 40,000 10000 2 self 2 Paper Yes No 0
77 F 30 Tertiary 40,000 10000 2 self 1.3 Food Waste Yes No 0
51 M 22 Tertiary 48,000 12000 2 self 6 Food Waste Yes No 0
89 M 35 Primary 100,000 25000 2 self 2 Food Waste Yes No 0
4 F 45 Secondary 80,000 20000 3 self 0.9 Paper Yes No 0
36 M 35 Secondary 100,000 25000 3 self 4 Plastic Yes No 0
17 F 44 Tertiary 120,000 30000 3 self 2 Food Waste Yes No 0
2 F 22 Secondary 32,000 8000 4 self 1.5 Paper Yes No 0
37 M 55 Tertiary 40,000 10000 6 self 3.5 Food Waste Yes No 0
69 M 33 Tertiary 80,000 20000 1 Private sector 1 Food Waste Yes Yes 200
63 F 56 Tertiary 12,000 3000 3 Private sector 1.2 Food Waste Yes Yes 200
67 M 30 Tertiary 4,000 1000 4 self 1.8 Food Waste Yes Yes 200
81 M 30 Tertiary 76,000 19000 1 Private sector 2 Food Waste Yes Yes 250
57 F 34 Secondary 64,000 16000 2 Private sector 1.3 Food Waste Yes Yes 250
53 M 65 Tertiary 76,000 19000 2 Private sector 3 Food Waste Yes Yes 250
27 F 34 Secondary 80,000 20000 2 Private sector 1.3 Food Waste Yes Yes 250
73 M 23 Secondary 40,000 10000 5 Private sector 1.4 Food Waste Yes Yes 250

Improving household waste management through a door-to-door collection 83
Vis Sustain, 17, 56-85 http://dx.doi.org/10.13135/2384-8677/6294
Questionnaire
Survey No.
Gender Age Education
level
Monthly
income
Weekly
Income
(Kshs.)
Family
size
Employer Approximate
waste gener-
ated per week
(Kg)
Main Composition
(Food waste, pa-
per, bones, etc.)
Have door to
door collection
or not (Yes/No)
WTP for im-
provement
(Yes/No)
If yes, how
much
(Kshs.)?
75 F 35 Primary 20,000 5000 1 self 1.8 Food Waste Yes Yes 250
79 M 30 Tertiary 140,000 35000 2 self 2 Food Waste Yes Yes 250
42 F 39 Tertiary 40,000 10000 1 Government 2 Paper Yes Yes 300
19 F 25 Primary 4,000 1000 2 Private sector 1 Food Waste Yes Yes 300
25 M 31 Secondary 72,000 18000 3 Private sector 1.5 Electronic Waste Yes Yes 300
49 M 35 Tertiary 100,000 25000 3 Private sector 4 Food Waste Yes Yes 300
59 M 36 Secondary 52,000 13000 4 Private sector 0.5 Food Waste Yes Yes 300
45 F 35 Secondary 400 100 1 self 2 Food Waste Yes Yes 300
3 F 33 Primary 40,000 10000 1 self 2 Food Waste Yes Yes 300
1 M 18 Secondary 120,000 30000 2 self 1 Food Waste Yes Yes 300
85 M 45 Secondary 24,000 6000 3 self 2 Food Waste Yes Yes 300
39 F 36 Secondary 60,000 15000 3 self 4 Food Waste Yes Yes 300
15 F 37 Tertiary 52,000 13000 1 Government 3 Food Waste Yes Yes 350
13 F 38 Primary 800 200 4 Government 1.5 Food Waste Yes Yes 350
93 M 36 Tertiary 60,000 15000 6 Government 2 Food Waste Yes Yes 350
20 M 23 Tertiary 14,400 3600 2 self 1 Food Waste Yes Yes 350
38 F 26 Secondary 60,000 15000 2 self 3.6 Food Waste Yes Yes 350
40 F 35 Primary 100,000 25000 4 Government 2.5 Food Waste Yes Yes 400
21 M 65 Secondary 52,000 13000 2 Private sector 1 Food Waste Yes Yes 400
47 M 23 Primary 60,000 15000 4 Private sector 2 Food Waste Yes Yes 400
24 M 32 Secondary 72,000 18000 2 self 1.5 Paper Yes Yes 400
6 M 70 Secondary 4,800 1200 1 Private sector 2.5 Plastic Yes Yes 500
28 F 37 Tertiary 8,000 2000 3 Private sector 1 Food Waste Yes Yes 500
29 F 38 Secondary 40,000 10000 3 Private sector 1 Food Waste Yes Yes 500
16 F 39 Tertiary 40,000 10000 1 self 1.6 Plastic Yes Yes 500
91 M 26 Tertiary 52,000 13000 2 self 2 Food Waste Yes Yes 500
26 F 33 Primary 64,000 16000 3 self 1.9 Plastic Yes Yes 500
41 F 35 Secondary 32,000 8000 2 Government 2 Food Waste Yes Yes 600
99 M 46 Tertiary 40,000 10000 4 Government 4 Food Waste Yes Yes 600
7 M 23 Secondary 60,000 15000 1 Private sector 1 Food Waste Yes Yes 600
97 M 44 Primary 800 200 1 self 3 Food Waste Yes Yes 600
87 M 70 Secondary 56,000 14000 1 self 1.5 Food Waste Yes Yes 600

84 Chisika and Yeom
Vis Sustain, 17, 56-85 http://dx.doi.org/10.13135/2384-8677/6294
Appendix 3: Results from those without door-to-door service
Questionnaire
Survey No.
Gender Age Educa-
tion level
Monthly
Income
Weekly
Income
(Kshs.)
Family
size
Employer Approximate
waste gener-
ated per week
(Kg)
Main Composition
(Food waste, pa-
per, bones, etc.)
Have door to
door collection
or not (Yes/No)
WTP for im-
provement
(Yes/No)
If yes, how
much(Kshs.)?
74 F 35 Secondary 2,800 700 1 Government 1.7 Paper No No 0
84 F 33 Tertiary 4,400 1100 1 Government 2 Paper No Yes 250
5 F 26 Tertiary 3,200 800 2 Government 0.8 Food Waste No Yes 450
14 F 35 Secondary 10,000 2500 2 Government 2 Paper No Yes 400
66 F 31 Tertiary 12,000 3000 2 Government 1.5 Plastic No Yes 250
88 M 23 Secondary 2,000 500 3 Government 1 Food Waste No Yes 500
80 M 30 Tertiary 3,200 800 3 Government 2 Food Waste No No 0
94 F 36 Tertiary 92,000 23000 3 Government 3 Paper No Yes 300
64 F 22 Tertiary 60,000 15000 4 Government 1.5 Paper No Yes 300
100 M 48 Tertiary 18,000 4500 5 Government 3 Food Waste No Yes 500
50 F 26 Tertiary 400 100 1 Private sector 5 Food Waste No No 0
70 F 45 Tertiary 800 200 1 Private sector 1 Food Waste No Yes 250
58 M 36 Tertiary 2,000 500 1 Private sector 1 Food Waste No Yes 250
54 F 32 Tertiary 8,000 2000 1 Private sector 2 Paper No Yes 250
92 M 33 Tertiary 40,000 10000 1 Private sector 2 Paper No No 0
8 M 35 Primary 2,400 600 2 Private sector 1 Food Waste No Yes 500
18 F 45 Primary 2,400 600 2 Private sector 2.3 Food Waste No No 0
72 F 70 Tertiary 40,000 10000 2 Private sector 1.5 Paper No Yes 250
86 M 26 Tertiary 52,000 13000 2 Private sector 1.3 Plastic No No 0
56 F 23 Tertiary 40,000 10000 3 Private sector 1.2 Plastic No No 0
52 M 35 Tertiary 260,000 65000 3 Private sector 5 Paper No Yes 250
62 M 34 Secondary 240,000 60000 4 Private sector 1.2 Paper No Yes 250
46 F 56 Secondary 60,000 15000 5 Private sector 2 Plastic No Yes 400
102 F 50 Tertiary 64,000 16000 5 Private sector 1.5 Paper No Yes 500
68 F 22 Tertiary 800 200 1 self 1.2 Food Waste No No 0
60 M 37 Secondary 2,000 500 2 self 1.2 Food Waste No No 0
48 F 35 Secondary 2,800 700 2 self 1 Food Waste No Yes 300
96 M 45 Secondary 4,000 1000 2 self 3 Plastic No Yes 500
82 F 18 Tertiary 76,000 19000 2 self 2 Paper No Yes 250
76 F 26 Secondary 40,000 10000 3 self 1.5 Plastic No Yes 250
90 M 35 Secondary 4,000 1000 4 self 2 Food Waste No Yes 600
78 M 30 Tertiary 4,000 1000 4 self 2 Food Waste No Yes 250
98 M 41 Secondary 36,000 9000 5 self 1.3 Food Waste No Yes 600

Improving household waste management through a door-to-door collection 85
Vis Sustain, 17, 56-85 http://dx.doi.org/10.13135/2384-8677/6294
Authors
Sylvester Ngome Chisika, International School of Urban Sciences, University of
Seoul, 02504 Seoul, Korea; [email protected]
Chunho Yeom, International School of Urban Sciences, University of Seoul, 02504
Seoul, Korea; [email protected]
Funds
This work was supported by the Ministry of Education of the Republic of Korea and
the National Research Foundation of Korea (NRF-2020S1A5C2A01092978).
Competing Interests
The authors have declared that no competing interests exist.
© 2022 Chisika, S.N., Yeom, C.
This is an open access publication under the terms and conditions of the Creative Commons Attribution (CC BY) license (http://creativecommons.org/licenses/by/4.0/).

www.ojs.unito.it/index.php/visions
Health literacy programme and proper solid waste disposal habits among housewives in Onitsha, Anambra State, Nigeria
Christiana Uzoaru Okorie, Emmanuel Ekene Ihemegbulem
Received: 8 June 2021 | Accepted: 8 February 2022 | Published: 5 March 2022
Citation: Okorie, C.U., Ihemegbulem, E.E. (2022) Health literacy programme and proper solid waste disposal habits among housewives in Onitsha, Anambra State, Nigeria. Visions for Sus-tainability, 17, 86-103. http://dx.doi.org/10.13135/2384-8677/5857
Correspondence: Christiana Uzoaru Okorie, e-mail: [email protected] Extended author information available on the last page of the article
1. Introduction
2. Solid Waste Disposal and Health Literacy
3. The Research Questions and Methodology
4. Results
4.1. Research Question One
4.2. Research Question Two
4.3. Research Question Three
5. Discussion and Conclusions
Keywords: Health literacy programme; Household solid waste disposal.
________________________________________________________
Abstract. This paper presents a study which examines promoting proper
solid waste disposal habits among housewives in Onitsha, Anambra State,
Original Paper

Health Literacy Programme and Proper Solid Waste Disposal Habits 87
Vis Sustain, 17, 86-103 http://dx.doi.org/10.13135/2384-8677/5857
Nigeria, in the context of a health literacy programme. Three research ques-
tions focus on different aspects of the efficacy of the programme related to un-
derstanding the dangers of improper disposal of waste, building the necessary
knowledge for proper disposal, and developing a positive attitudinal change
towards personal habits. The study adopted a descriptive survey design, while
a simple random technique was used to select 1200 women who have been
involved in the health literacy programme. A validated questionnaire with
0.72% reliability index was used to collect data from the respondents. Data
collected was analyzed using a statistical package for social sciences (SPSS
25). The findings show that the community health literacy programme has
achieved a high level of efficacy for each of the research question. The paper
concludes with recommendations for developing the programme.
_____________________________________________________________
1. Introduction
Various empirical studies have shown how waste disposal and management is
very poor in most municipal cities in developing countries. Nguyen Matsui and
Fujiwara (2011) described how many cities face serious environmental degrada-
tion and health risks due their poorly developed municipal solid waste manage-
ment system. Mamady (2015) also illustrated how indiscriminate waste disposal
together with inadequate waste collection is strongly linked with the existence of
unplanned settlements in cities. This study links household and community
groups’ waste disposal practices to residents’ socioeconomic status and geo-
graphical factors such as the distance of residential areas from permitted munic-
ipal dumpsites. Authorities should be encouraged to promote environmental in-
formation and education of the public. According to Khatib, Monou, Abdul,
Hafez & Despo (2010), solid waste generation (SWG) is an issue of concern eve-
rywhere in the world, particularly in urban centers. SWG is considered one of the
most challenging issues faced by most developing countries that suffer from se-
vere environmental pollution problems.
Awuah (2018) observed that waste collection systems such as communal con-
tainer collection methods (waste bins) appear most common in many nations and
that this kind of waste collection system is provided at dedicated points within
neighborhoods for households to drop-off their solid waste. It is then expected

88 Okorie and Ihemegbulem
Vis Sustain, 17, 86-103 http://dx.doi.org/10.13135/2384-8677/5857
that trash collectors will use their trash collection vehicles to empty the waste
bins and transport the waste to a designated dump site, where it is trashed, often
by incineration. Awuah (2018) further explained that this trash collection method
is fraught with difficulties, because most of the time the waste ends up not being
collected by the authorized waste collectors, thereby leading to overflow of waste
and ground dumping at collection sites.
In Nigeria, solid household waste disposal has become one of the fundamental
national problems, despite environmental sanitation programmes and policies
having been adopted by the government at various levels to manage it. Solid
household waste, which comprises kitchen and other home-related waste, is gen-
erated daily in large quantities across urban and rural cities and the mode of dis-
posal is a cause of considerable concern. Most residents throw away their trash
in an improper manner due to their attitude towards waste as something that is
no longer valuable and can be discarded anywhere convenient without paying
heed to its impact on the environment and to human health in general.
Most states in Nigeria set aside either the first or last Saturday of every month as
monthly sanitation days which usually start at 7am and end at 10am. Lagos and
Rivers state government also set aside every Thursday from 7am to 10am as
weekly sanitation for the markets and all shops, stores, and any other category of
business, excluding pharmaceutical stores. However, most urban cities in Nigeria
are every day littered with household generated solid waste. Pedestrian walkways
become like waste dumps in most cities due to improper waste disposal habits
among residents, non-availability of refuse collectors, or irregular collection hab-
its of existing refuse collection workers.
Onitsha metropolis is one of the urban cities in Nigeria that is best known for
improper household solid waste disposal. It is a densely populated commercial
city where people from different parts of the county carry out their business ac-
tivities, mostly as traders in the main market, and the proximity of the residential
areas to the market attracts an influx of residents who in turn generate tons of
solid waste which are littered on the streets daily. According to Orhorhoro &
Oghoghorie (2019), Onitsha generates 84,137 tons of waste monthly, with a den-
sity of 310kg/m3, derived from a daily 0.53 kg per capita waste production. Lawal
(2004) affirms that that roughly two thirds of waste generated by households in
Onitsha are dumped indiscriminately on the streets and in the drains, thus posing
serious environmental health hazards. Places where waste are left to overflow are
usually accompanied by serious air pollution due to stench caused by rotten and
decayed waste, a problem that is aggravated during the rainy season. Streets in
most parts of Onitsha are filled with piles of refuse due to proliferation of illegal

Health Literacy Programme and Proper Solid Waste Disposal Habits 89
Vis Sustain, 17, 86-103 http://dx.doi.org/10.13135/2384-8677/5857
dumping sites despite waste management authorities concerted efforts to clear
the city of refuse (Fig. 1-3).
Figure 1. Dumpsite at residential area

90 Okorie and Ihemegbulem
Vis Sustain, 17, 86-103 http://dx.doi.org/10.13135/2384-8677/5857
Figure 2. Indiscriminate dumping of waste by resident along the street

Health Literacy Programme and Proper Solid Waste Disposal Habits 91
Vis Sustain, 17, 86-103 http://dx.doi.org/10.13135/2384-8677/5857
Figure 3. Dumpsite at a major road in the town

92 Okorie and Ihemegbulem
Vis Sustain, 17, 86-103 http://dx.doi.org/10.13135/2384-8677/5857
2. Solid Waste Disposal and Health Literacy
Household waste can be hazardous or non-hazardous waste which can be recy-
cled. Waste generated at home is mostly composed of solid waste particles such
as garbage, broken bottles or plates, spoiled food items, papers, cartons, different
types of plastic and polythene, tins and metals, damaged home appliances, used
batteries, insecticide containers, and so on. This waste generation varies, depend-
ing on location and time, and its indiscriminate disposal causes a range of envi-
ronmental pollution and health problems. Solid waste discharged inside drainage
systems causes a blockage affecting the flow of water, posing dangers of disease
transmission by creating breeding sites for disease vectors. This is one of the
major causes of ill-health among people, as well as leading to soil erosion, flood-
ing, and other environmental hazards.
A study by Tessema (2010) shows how the proliferation of pathogens in the liv-
ing areas of poor homes and neighbourhoods is an aftermath of inadequacies in
the provision of sanitation facilities, inappropriate anthropogenic practices of
sanitation at household level and current waste management problems. In a study
by Suleman, Darko, & Agyemang-Duah (2015) high incidences of water related
diseases such as diarrhea, dysentery, typhoid, and intestinal parasites are at-
tributed to inadequate infrastructure and poor waste management practices em-
bedded in the “throw-away” culture of citizens. The pathogens that cause these
diseases lead to many debilitating and endemic diseases that mainly afflict the
poorer urban households that are hidden from public view in the backyard slums
of the city. Wang, Lu, Zhao, et al. (2016) also demonstrate how improper disposal
of wastes creates and disseminate pathogens which can quickly spread among
human and animal populations in the city. Mazhindu, Gumbo, Gondo (2012)
described how waste dumped in the streets for many hours awaiting collection
becomes a nuisance, forming foul-smells and leachate from the waste pile, at-
tracting insects and rodents that become vectors of diseases. Their study also
shows how high-concentrated leachate due to improper waste disposal causes
environmental threats, affecting ground water and surrounding environments,
and informal dumping and uncollected household waste in watersheds get carried
into waterways by runoff water, often contaminating the local drinking water.
Okorie and Amadi (2017) showed how residents in most urban cities in Nigeria
have very little appreciation of the value of the environment and how waste dis-
posal habits are characterized by a lack of awareness both of environmental prob-
lems in general and of the health risks generated. The attitude of residents to-
wards waste disposal is a major problem particularly in urban low-cost residential
areas. Most of the residents find it difficult to bag their waste before disposal,

Health Literacy Programme and Proper Solid Waste Disposal Habits 93
Vis Sustain, 17, 86-103 http://dx.doi.org/10.13135/2384-8677/5857
some even empty their waste into gutter as soon as it begins to rain, while others
carry their refuse to designated dump site and empty it on the ground, thereby
littering the whole area. According to Venes (2001), attitude can be seen as be-
havior based on conscious or unconscious mental views developed through cu-
mulative experience. Altmann (2008) studied the correlation between people’s
attitudes and their orientation towards their social and physical environment, in-
cluding themselves. Attitude is seen as having a cognitive, affective, and behav-
ioral component. It is bipolar and is a response to a stimulus. Thus, we argue that
the actions residents exhibit towards solid household waste disposal can be seen
as a result of their mental disposition towards waste and require a change in be-
havior through fundamental educational processes such as community-based
health literacy programme.
Health literacy is the ability of individuals to understand necessary health care
information and being able to use this information in making appropriate health
related decisions. Yılmazel and Çetinkaya (2016) observed that health literacy
promotes both the health and the quality of life. This requires that healthcare
professionals acquire communication and clinical skills and that individuals be-
come involved in decision-making in the health care field. They also asserted that
health literacy is based on social and cultural factors in society and serves as a
mediator between individuals, the health system, the education system, and
health issues. The Institute of Medicine of the National Academies (2004) de-
fined health literacy as the degree to which individuals can obtain, process, and
understand the basic health information and services they need to make appro-
priate health decisions.
Nutbeam (2008) identified three levels of health literacy, which are:
1. Functional Health Literacy Level: The level at which an individual is ex-
pected to possess the ability to apply basic health skills such as reading
and understanding medication labels (cognitive skills)
2. Interactive Health Literacy Level: The level at which an individual is expected
to use cognitive skills and operate in a social environment that supports
social participation in health-related issues in the community.
3. Critical Health Literacy Level: The level at which an individual is able to
evaluate health issues, determine the challenges and advantages of spe-
cific issues, recognize the potential benefit of a particular strategy, and
offer advice at the community level.

94 Okorie and Ihemegbulem
Vis Sustain, 17, 86-103 http://dx.doi.org/10.13135/2384-8677/5857
Nutbeam (2009) further explained that at each level of health literacy, success-
fully completing tasks to maintain or improve health involves specific skills.
These skills require a capacity for understanding health information within a
given perspective or belief system, and an empowered proactive approach to
achieving health related goals, which may be identified as competence. To Jen-
sen, King, Davis & Guntzviller (2010: 807) health literacy:
is an individual’s ability to find and use health information. As such, health
literacy could include basic skills (e.g., reading, writing, mathematics,
speaking), cognitions (e.g., self-efficacy, health motivation), and environ-
mental factors (e.g., access). Put another way, what constitutes health lit-
eracy may be situationally dependent. It is whatever an individual needs to
successfully navigate their health care environment (Jensen et al., 2010:
807).
Hepburn (2012) suggested that health literacy can be improved through the pro-
vision of information, effective communication, and structured education, and
that it can be regarded as a measurable outcome of health education or patient
education. Improvements in health literacy can be assessed through the measure-
ment of changes to the knowledge and skills that enable well-informed and more
autonomous health decision-making. A health literacy programme for proper
waste disposal is thus a health-based programme at the community level that is
meant to provide residents with needed health care information on dangers as-
sociated with improper waste disposal and human health. It is meant to equip
residents with adequate health literacy awareness, knowledge and skills needed to
process and understand health information and services in order to be able to
make appropriate health decisions.
Unfortunately, several the inhabitants of Onitsha lack awareness of what their
action impacts on their immediate environment and their health at large. They
are indeed often blinded by their local belief that “dirty does no kill black man”. This
a local parlance that is generally perpetuated and nurtured by these residents and
contributes to their attitude toward waste disposal. They also have the belief that
anything can be thrown into gutters and canals, that it will be washed away to the
river, that the river does not run dry (orimiri anaghi ata ata) and that their tiny
household waste cannot pollute it. This explains why many drainage and canals
are blocked within Onitsha.
The question of their ‘blind’ belief in “dirty does no kill black man” is of considerable
concern and has contributed laisser-faire attitude towards waste disposal which -
despite government environmental sanitation measures – is damaging to the

Health Literacy Programme and Proper Solid Waste Disposal Habits 95
Vis Sustain, 17, 86-103 http://dx.doi.org/10.13135/2384-8677/5857
sustainability of the environment, human health, and life in general and requires
a re-orientation of the residents’ awareness and action through appropriate edu-
cational programmes. Through the Anambra State Waste Management
(ASWAMA) programme, the government has adopted different measures to im-
prove residents’ attitude toward waste disposal, and among the measures is com-
munity health education programme. This has introduced residents, largely
housewives, to knowledge on waste management and disposal, health risks asso-
ciated with improper waste disposal, and the effects of improper waste disposal
on the environment. This research aims to investigate the extent to which the
community health literacy has influenced waste disposal habits of housewives in
Onitsha.
3. The Research Questions and Methodology
The purpose of this study is to examine the influence of health literacy pro-
gramme on proper household solid waste disposal habits among housewives in
Onitsha. The study focuses on women, since waste disposal is still considered
exclusively one of their roles in society. The specific research questions are de-
signed to ascertain:
1. The extent to which the health literacy programme has introduced
housewives to the health-related dangers associated with improper
household waste disposal habits in Onitsha.
2. The extent to which health literacy programme has equipped housewives
with requisite knowledge of proper household waste disposal in Onitsha.
3. The extent to which health literacy programme has orientated house-
wives in Onitsha towards a positive attitudinal change as regards proper
household waste disposal habits.
The study adopted a descriptive survey design, since it only focused on soliciting
information from women living in different households in the area where the
study was conducted. The population of the study is 4000 women from 20 streets
within Onitsha metropolis where indiscriminate waste disposal is more evident
(see figure 4 for a map of the area of study).

96 Okorie and Ihemegbulem
Vis Sustain, 17, 86-103 http://dx.doi.org/10.13135/2384-8677/5857
Figure 4. Maps showing Onitsha Metropolis.
A simple random technique was adopted to select 60 women each from the 20
streets, which gave a total of 1200 housewives. The women were selected from
those who have been involved in the health literacy programme in the area stud-
ied. The instrument used for data collection was a researcher designed question-
naire called the “Health literacy and Proper Solid Waste Disposal Habits among
Housewives Questionnaire”. The instrument was face validated by two experts
in measurement and evaluation form the department of Adult and Non-Formal
Education, University of Port Harcourt while the content validity was carried out
by psycho-statisticians in Faculty of Education in University of Port Harcourt.
The instrument has a reliability index of 0.72%. The instrument was designed on
a four-point modified Likert scale. Data collection was carried out by the re-
searcher with the help of two trained research assistants. Data collected was an-
alyzed through descriptive statistics using a statistical package for social sciences
(SPSS 25). A decision on each research question was based on a criterion mean
of 2.5. Any mean score that is equal to or greater than 2.5 (the criterion mean
derived from the four-point Likert scale) is accepted as a positive response (high
extent) while any mean score lesser than 2.5 is a negative response (low extent).

Health Literacy Programme and Proper Solid Waste Disposal Habits 97
Vis Sustain, 17, 86-103 http://dx.doi.org/10.13135/2384-8677/5857
4. Results
4.1 Research Question One
To what extent has the health literacy programme introduced housewives to the
health-related dangers associated with improper household waste disposal habits
in Onitsha?
S/N Statements X SD Decision 1 You learnt that throwing waste around can create fa-
vorable conditions that will lead to the survival and growth of microbial pathogen which are responsible for airborne disease such as cholera.
2.80 0.818 High Extent
2 You learnt that uncollected solid waste can also ob-struct storm water runoff, resulting in the forming of stagnant water bodies that become the breeding ground of disease.
2.70 0.705 High Extent
3 You learnt that direct dumping of untreated waste in rivers, seas, and lakes results in the accumulation of toxic substances in the food chain through the plants and animals that feed on it and when we catch these animals and consume them we will be infected with disease such as liver problems.
3.09 1.092 High Extent
4 You learnt that burying or improper disposal of haz-ardous waste components such as empty insecticide containers can result in explosion and injury to pass-ersby.
2.82 0.750 High Extent
5 You learnt that waste plastic water bottles break down to release a harmful component which hurts our re-productive capabilities, causes liver dysfunction and weight loss issues.
2.90 0.920 High Extent
6 You learnt that rainfall easily mixes with toxic liquid substances and seeps into the water streams to end up in nearby water bodies which affects the quality of wa-ter in your area.
2.83 0.872 High Extent
7 You learnt that harmful greenhouse gases are created from decomposing waste and that the gases cause lots of health challenges.
3.08 1.004 High Extent
8 You learnt that heaps of waste that litter the streets are breeding ground for diseases carrying mosquitoes which spread sickness and death among the living population.
2.97 0.942 High Extent
9 You learnt that landfill gases such as smoke (carbon) and methane are cancerous.
2.97 0.947 High Extent
10 You learnt that smoke that is emitted from landfills and refuse dumps creates respiratory viability prob-lems in humans.
2.89 0.923 High Extent

98 Okorie and Ihemegbulem
Vis Sustain, 17, 86-103 http://dx.doi.org/10.13135/2384-8677/5857
11 You learnt that landfill explosion of cans put people nearby at constant risk.
2.74 0.734 High Extent
12 You learnt that when we come in contact with waste, it causes skin irritation and blood infection.
2.91 0.995 High Extent
Table 1. The responses to items 1-12 gave mean scores and corresponding standard de-
viations that demonstrate positive responses. The results thus indicate that the community
health literacy programme has achieved to a high extent the objective of introducing
housewives in Onitsha metropolis to the health-related dangers associated with improper
household waste disposal habits.
4.2 Research Question Two
To what extent has the community health literacy programme equipped house-
wives with necessary knowledge concerning proper household waste disposal in
Onitsha?
S/N Statements X SD Decision 13 Through the community health training programme
on waste management, you have learnt how to sort you household waste to minimize waste you generate daily.
2.65 0.949 High Extent
14 You bag your waste properly now and dispose it to waste trucks at appropriate time due to awareness of dangers associated to improper waste disposal.
2.55 0.605 High Extent
15 You no longer pour your waste into gutters when it is raining due to knowledge of dangers associated with the act you learnt from the health literacy programme.
2.76 1.010 High Extent
16 You no longer throw your waste on the floor of the pedestrian walkway along the street due to awareness on implication of indiscriminate dumping on waste on the environment.
2.55 0.548 Low Extent
17 You now practice local recycling of waste in your home to reduce waste generated.
2.57 0.740 High Extent
18 You practice re-use of bottles, polythene bags, and other items that I usually threw away due to the input you got from the community health education pro-gramme.
2.58 0.751 High Extent
19 Pollution education will improve habit of people of not discharging solid wastes into drainages and other water ways within and outside your area.
2.95 1.035 High Extent

Health Literacy Programme and Proper Solid Waste Disposal Habits 99
Vis Sustain, 17, 86-103 http://dx.doi.org/10.13135/2384-8677/5857
20 You sort out cans from my waste due to awareness of it been an explosive item that is injurious to human life.
2.83 0.964 High Extent
21 You do not bury your broken bottles, plates, and glasses in the ground due to your knowledge of the negative impact of such act on the environmental sus-tainability.
2.69 0.658 High Extent
22 You keep to the time that the government has stated for throwing of refuse, to put your waste in the waiting waste van to avoid dumping it on the ground.
2.60 0.791 High Extent
Table 2. The responses to items 13-22 gave mean scores and corresponding standard
deviations that demonstrate positive responses, with the sole exception of item 16, which
implies that indiscriminate dumping may remain a problem. The results indicate that the
community health literacy programme has achieved to a high extent the objective of
equipping housewives with requisite knowledge of proper household waste disposal in
Onitsha. The mean scores are generally slightly lower than for research question 1.
4.3 Research Question Three
To what extent has the community health literacy programme orientated house-
wives in Onitsha towards a positive attitudinal change as regards proper house-
hold waste disposal habits?
S/N Statements X SD Decision 23 Through the community health education programme,
your attitude toward dumping solid wastes at desig-nated dumpsites has improved
2.80 1.050 High Extent
24 Your attitude to seeing dirt as what cannot kill a black man change due to the input you got from the com-munity health literacy programme
2.81 0.788 High Extent
25 You no longer participate in roadside waste dumping due the input you got from the community health ed-ucation programme
2.91 1.033 High Extent
26 You now regard my immediate environment as a place that requires nurture and care due to the awareness you developed through the community health literacy pro-gramme
2.73 0.806 High Extent
27 Your attitude toward maintenance of clean environ-ment has improved due to experience you got from the community health literacy programme
2.79 0.866 High Extent

100 Okorie and Ihemegbulem
Vis Sustain, 17, 86-103 http://dx.doi.org/10.13135/2384-8677/5857
28 Your attitude to throwing waste into gutter when it rains has been changed due to the input you got from the community health literacy programme
2.79 0.888 High Extent
29 You now participate in programme that contribute to the beautification of the environment
3.13 1.044 High Extent
30 You participate in weekly environmental sanitation ex-ercise due to the input you got from the community health literacy programme
3.12 1.041 High Extent
31 You regularly speak to neighbors about the need to keep our environment clean by not dumping our waste on the floor, walkways and streets
2.88 0.746 High Extent
32 You champion the cause of bagging waste before dis-posal in your neighborhood
2.80 0.884 High Extent
Table 3. The responses to items 23-32 gave mean scores and corresponding standard
deviations that demonstrate positive responses, without exception.
The results indicate that the community health literacy programme has achieved
to a high extent the objective of orientating housewives in Onitsha towards a
positive attitudinal change as regards proper household waste disposal habits.
The mean scores are once again generally slightly lower than for research ques-
tion 1.
Discussion and conclusions
Okorie (2016) and Okorie and Amadi (2017) argued that the provision of envi-
ronmental sanitation, pollution, hygiene, and community health education pro-
grammes would help to create awareness of proper waste disposal habit among
residents and demonstrate good sanitary behavior and practice of responsible
waste disposal, as well as the importance of protecting the environment. The
findings of this study show that the community health literacy programme has to
a largely high extent successfully introduced housewives to the health-related
dangers associated with improper household waste disposal habits.
The study also shows that community health literacy programme has equipped
housewives with basic necessary knowledge concerning proper household waste
disposal such as sorting of household waste to minimize waste generated daily,
bagging of waste, and disposing them at appropriate time, practicing of local re-
cycling at home to reduce waste generated, and other measures. The results also
reveal that community health literacy programme has orientated housewives to-
wards a positive attitudinal change as regards proper household waste disposal
habits, that women are aware that waste should be dumped properly at

Health Literacy Programme and Proper Solid Waste Disposal Habits 101
Vis Sustain, 17, 86-103 http://dx.doi.org/10.13135/2384-8677/5857
designated site at the appropriate time stated by authorities in charge of waste
collection, and that the widespread belief that dirt cannot kill a black man has
changed due to the input they received from the community health literacy pro-
gramme.
Further confirmation that women’s attitudes towards their immediate environ-
ment are gradually changing can be seen in the way that they now speak to neigh-
bors about the need to keep their environment clean by not dumping our waste
on the floor, walkways, and street roads. To consolidate on these results, it will
be necessary to create incentives for housewives to broaden attendance of such
programmes, to provide periodic follow-up training programmes to maintain and
further promote what has already been achieve, and to develop health literacy
programmes concerning appropriate waste disposal habits for all members of
society so that the burden of responsibility does not permanently remain with
women alone.
References
Al-Khatib, L.A, Monou, M., Abdul, S.F. Hafez, Q.S, Despo, K. (2010). Solid, waste
characterization, quantification and management practices in developing countries.
A case study Nablus district – Palestine. Journal of Environmental Management 91,
1131–1138.
Awuah, K.G.B. (2018). The role of urban planning in Sub‐Saharan Africa. Urban Pollu-
tion; Science Management. Urban Pollution: Science and Management, 385-395.
Babayemi, J. O. & Dauda, K. T. (2009). Evaluation of Solid Waste Generation Catego-
ries and Disposal Options in Developing Countries. A case study of Nigeria. Jour-
nal of Applied Sciences and Environmental Management 13, 3
https://doi.org/10.4314/jasem.v13i3.55370
Bolanle, A. Odufuwa, B. O. Odufuwa, O. M. E & Segun, O. (2012). Household Partici-
pation in Waste Disposal and Management in Ijebu-Ode, Nigeria. Journal of Human
Ecology, 40, 3.
Hepburn, M. (2012). Health Literacy, Conceptual Analysis for Disease Prevention. In-
ternational Journal of Collaborative Research on Internal Medicine & Public Health 4(3), 228-
238. https://internalmedicine.imedpub.com/health-literacy-conceptual-analysis-for-
disease-prevention.php?aid=6075
Mamady. K. (2016). Factors influencing attitude, safety behavior, and knowledge re-
garding household waste management in Guinea: A cross-sectional study. Journal of
Environmental and Public Health, 6, 1-9.

102 Okorie and Ihemegbulem
Vis Sustain, 17, 86-103 http://dx.doi.org/10.13135/2384-8677/5857
Mazhindu E, Gumbo T, Gondo T. (2012). Waste management threats to human health
and urban aquatic habitats- a case study of Addis Ababa, Ethiopia. In: Rebellon
LFM, editor. Waste management - an integrated vision. London, UK: InTechOpen
https://doi.org/10.5772/48077
Nguyen, P.T, Matsui, Y, Fujiwara, T (2011). Assessment of plastics waste generation
and its potential recycling of household waste in Can Tho City, Vietnam. Environ-
mental Monitoring and Assessment 175 (1-4), 23-35. https://doi.org/10.1007/s10661-
010-1490-8
Nutbeam D. (2009) Defining and measuring health literacy: What can we learn from lit-
eracy studies? International Journal of Public Health, 54, 303-305.
Nutbeam D. (2008) The evolving concept of health literacy. Social Science & Medicine, 67,
2072-2078.
Okorie, C.U. and Amadi, G.N. (2017). Awareness and attitude towards proper solid
waste disposal among residents of Port Harcourt Metropolis in Rivers State. Interna-
tional Journal of Multidisciplinary Education and Research, 2(5), 40-44.
Okorie, C.U. (2016). Environmental adult education programme for environmental sus-
tainability. In G. Adekola, G. and M.A. Oyebamiji. Adult education and the environment.
eds. Portharcourt: Pearl publishers international.
Orhorhoro, E.K. & Oghoghorie, O. (2019). Review on Solid Waste Generation and
Management in Sub-Saharan Africa: A Case Study of Nigeria. Journal of Applied Sci-
ence and Environmental Management. 23 (9), 1729-1737.
Wang G, Lu G, Zhao J, et al. (2016) Evaluation of toxicity and estrogenicity of the
landfill-concentrated leachate during advanced oxidation treatment: chemical analy-
sis and bioanalytical tools. Environ Sci Pollu Res. https://doi.org/10.1007/s11356-
016-6669-2
Yılmazel. G, Çetinkaya. F. (2016). The importance of health literacy for community
health. TAF Preventive Medicine Bulletin, 15(1), 69-74.

Health Literacy Programme and Proper Solid Waste Disposal Habits 103
Vis Sustain, 17, 86-103 http://dx.doi.org/10.13135/2384-8677/5857
Authors
Christiana Uzoaru Okorie, PhD, Department of Adult and Non-Formal Education,
University of Port Harcourt. [email protected] and
[email protected]. Phone: +234 8037762692
Emmanuel Ekene Ihemegbulem, Department of Adult and Non-Formal Education-
Faculty of Education, University of Port Harcourt. [email protected].
Phone: +234 (0) 7039448474
Funds
This research received no specific grant from any funding agency in the public,
commercial, or non-profit sectors.
Competing Interests
The authors have declared that no competing interests exist.
© 2022 Okorie, C.U., Ihemegbulem, E.E.
This is an open access publication under the terms and conditions of the Creative Commons Attribution (CC BY) license (http://creativecommons.org/licenses/by/4.0/).

www.ojs.unito.it/index.php/visions
The impacts of Covid-19 on household behavior and household waste in Turkey
Serap Yalçınyiğit, Aygül Dönmez-Turan, Halil E. Akbaş, Gamze Varank
Received: 22 November 2021 | Accepted: 27 January 2022 | Published: 7 February 2022
Citation: Yalçınyiğit, S., Dönmez-Turan, A., Akbaş, H.E., Varank, G. (2022) The impacts of Covid-19 on household behavior and household waste in Turkey. Visions for Sustainability, 17, 104-128. http://dx.doi.org/10.13135/2384-8677/6258
Correspondence: Serap Yalçınyiğit, e-mail: [email protected] Extended author information available on the last page of the article
1. Introduction
2. Materials and Methods
2.1. Sample and Measurement Instrument
2.2. Data Analysis
3. Results and Discussion
3.1. Household Behavior Changes During the Pandemic Period
3.2. Household Waste Changes During the Pandemic Period
4. Conclusions
Keywords: Covid-19; Household Behavior; Household Income; Household Size; Household Waste.
________________________________________________________
Abstract. COVID-19 has caused many radical changes in our daily life. The
main purpose of this study is to examine the impact of the pandemic on
Original Paper

The Impacts of Covid-19 on Household Behavior and Household Waste in Turkey 105
Vis Sustain, 17, 104-128 http://dx.doi.org/10.13135/2384-8677/6258
household behavior and waste changes in the largest city of Turkey, Istanbul.
Research data were collected from 946 participants in the period May to De-
cember 2020 through an online survey, and frequency and logistic regression
analyses were conducted. Frequency analysis of the data showed that mask,
glove, disposable bag usage, cooking at home, online shopping, home delivery,
dishwasher and washing machine usage increased, while ordering food from
outside decreased. In line with these behavioral changes, we found that medi-
cal, food, disposable bag and plastic wastes generated by the sampled house-
holds increased as well. We then conducted logistic regression analysis to ex-
amine the correlation between changes in household behavior and waste dis-
posal and the income and size of households during this pandemic period. The
empirical findings highlight the importance of developing special management
strategies for medical, food and plastic wastes and for households with differ-
ent socio-economic backgrounds to reduce the unsustainable environmental
impact of COVID-19.
_____________________________________________________________
1. Introduction
The rapid spread of the COVID-19 pandemic (Clements, 2020; Di Renzo et al.,
2020; Zhong et al., 2020; Somani et al., 2020) has meant that, as of January 21,
2022, 216 countries, areas, or territories have been affected, resulting in
340,543,962 confirmed cases and 5,570,163 total deaths globally (WHO, 2022).
The protection of people’s health and lives has become the most important pri-
ority for governments all over the world, and in many countries, including Tur-
key, drastic measures were taken to slow down or control the spread of the pan-
demic (Evren et al., 2020; Turgut et al. 2020). These measures focused on social
distancing and personal safety measures, in the initial absence of an effective
treatment or preventative vaccine (Nussbaumer‐Streit et al., 2020). Such
measures, together with lockdowns, closing schools and venues where people
can gather (i.e., cinemas, shopping centers, restaurants, and bars), travel re-
strictions, encouraging working from home (Jribi et al., 2020; Somani et al., 2020),
brought about significant changes in citizens’ lifestyles and had substantial social,
economic, and environmental impacts (Buzzi et al., 2020; Pérez-Fuentes et al.,
2020; Shakil et al., 2020; Chakraborty and Maity, 2020).

106 Yalçınyiğit et al.
Vis Sustain, 17, 104-128 http://dx.doi.org/10.13135/2384-8677/6258
A wide range of literature reports that COVID-19 has had both positive and
negative impacts on the environment. The most apparent immediate positive im-
pact was the improved air quality due to the reductions in the concentrations of
air pollutants (Bao and Zhang, 2020; EEA, 2020a; Collivignarelli et al., 2020). It
has also been suggested that there was an improvement in water quality and
cleaner rivers, reduction in noise pollution and recovery in wildlife (Zambrano-
Monserrate et al., 2020; Arora et al., 2020; EEA, 2020b). On the other hand, the
pandemic has also had negative impacts on the environment by causing an in-
crease in waste generation, especially in medical and household waste (Sarkis et
al., 2020; Dente and Hashimoto, 2020; Naughton, 2020; Kulkarni and Anantha-
rama, 2020).
Household waste has for some time been seen as a major environmental problem
(Wang et al., 2020; Massawe et al., 2014; Omran et al., 2009) and it has been
suggested that the effects of different consumption patterns on waste generation
deserve special attention in terms of achieving sustainable development goals
(EEA, 2020b), since the amount and composition of household waste is directly
related to the lifestyles and socio-economic conditions of citizens which have
changed significantly due to the COVID-19 pandemic control measures (Ou-
hsine et al., 2020; Cesaro and Pirozzi, 2020). In this sense, Kulkarni and Anan-
tharama (2020) have suggested that investigating the impacts of the pandemic on
the quantity and composition of household waste represents a prerequisite for
developing effective waste management.
The waste management of both medical facilities and households waste must be
studied. Although this may help to prevent the spread of the virus, the environ-
ment is exposed to various threats due to pollution caused by the unsustainable
use of single-use plastics in this period. In addition, many mandatory provisions,
such as the global use of personal protective equipment like face masks by every
individual, have triggered unsustainable use (Sarkodie and Owusu, 2021). The
consequent extra volume of medical waste in households causes great problems
for waste management sectors (Das et al., 2021). In accordance with the United
Nations Environment Program for sustainable waste management, the directive
to control the spread of COVID-19 through waste management states that the
virus can be destroyed only by processing waste at a temperature close to 1000
degrees in incinerators. For this reason, household waste should be disposed of
and managed in a sustainable manner that does not harm human and environ-
mental health (Elleuch et al., 2018).
This study mainly aims to analyze the impacts of COVID-19 on household be-
havior and waste in the context of Turkey. We also aim to investigate the effects

The Impacts of Covid-19 on Household Behavior and Household Waste in Turkey 107
Vis Sustain, 17, 104-128 http://dx.doi.org/10.13135/2384-8677/6258
of household income (in local currency, Turkish Lira “₺”) and household size on
the behavior of household members and waste changes during COVID-19 pan-
demic. We focus on research data collected from May to December 2020, during
a period while lockdowns continued across the country. Since a gradual “normal-
ization” throughout the country started as of July 2021 (Interior Ministry of
Turkey, 2021), the waste behavior of households was examined during the period
when the effects of the COVID-19 virus could most clearly be detected.
The rest of the paper is structured as follows. The next section describes the
materials and methods employed in the study. The third section reports and dis-
cusses the results of the study, and the last section presents the conclusions we
have reached.
2. Materials and Methods
Our research aims to examine household behavior and waste changes during the
COVID-19 pandemic period focused on, by collecting data to test the following
hypotheses related to the influence of household income and size:
Hypothesis 1: During the pandemic period household income influences house-
hold behaviors (a. cooking at home, b. ordering food from outside, c. online
shopping, d. dishwasher usage, e. washing machine usage, f. disposable bag us-
age, g. home delivery, h. mask usage, i. glove usage).
Hypothesis 2: During the pandemic period household size also influences the
same range of household behaviors during the pandemic period.
Hypothesis 3: During the pandemic period household income influences waste
changes (a. paper, b. food, c. plastic, d. glass, e. electronical equipment, f. garden,
g. textile, h. disposable bag, i. antivirus protection equipment).
Hypothesis 4: During the pandemic period household size influences the same
range of waste changes.
2.1 Sample and Measurement Instrument
Households in Turkey's largest city, Istanbul, were chosen for our research. Ac-
cording to Address Based Population Registration System Results published by
the Turkish Statistical Institute in 2019, the number of people residing in Istanbul
was 15.519.267, a number equivalent to 18,66 % of Turkey's population. While
the total number of households in Istanbul was reported to be 4.521.402 in 2019,
the average household size was reported as 3,33 members (Turkish Statistical
Institute, 2019).

108 Yalçınyiğit et al.
Vis Sustain, 17, 104-128 http://dx.doi.org/10.13135/2384-8677/6258
A survey of such a large population, in a crowded and chaotic metropolis, and
during a very difficult period, poses problems in terms of time and cost. All com-
ponents of the population were eligible to participate the research sample and
research data were collected from the participants who volunteered. The sample
was created using the convenience sampling method and we reached 946 partic-
ipants. Table 1 reports the socio-economic characteristics of the participants, in-
cluding age, gender, marital status, educational level, occupation, household size
(in terms of the number of members within the household) and household in-
come.
Demographics Characteristics of the household Respondent’s number and percentage
Age
18-20 age range 146 (15.4%)
21-30 age range
31-40 age range
362 (38,3%)
208 (22,0%)
51-59 age range 216 (22,8%)
60-75 age range 14 (1.5%)
Gender
Women 719 (76.0%)
Men 223 (23.6%)
Does not want to indicate 4 (0.4%)
Marital
Status
Single 573 (60.6%)
Married 373 (39.4%)
Occupation
Public Sector 187 (19.8%)
Private Sector 249 (26.3%)
Own Business 61 (6.4%)
Student 267 (28.2%)
Retired 18 (1.9%)
Does not work 164 (17.3%)
Educational
Level
High School & Lower Degrees 160 (17.0%)
Vocational School 41 (4.3%)
Bachelor 534 (56.4%)
Master 152 (16.1%)
PhD 59 (6.2%)

The Impacts of Covid-19 on Household Behavior and Household Waste in Turkey 109
Vis Sustain, 17, 104-128 http://dx.doi.org/10.13135/2384-8677/6258
Household
Size
1 member 69 (7.3%)
2-4 members 666 (70.4%)
5-7 members 205 (21.7%)
8-10 members 6 (0.6%)
Household
Income
3000₺ (-) 150 (15.9%)
3001-6000₺ 262 (27.7%)
6001-9000₺ 217 (22.9%)
9001-12000₺ 137 (14.5%)
12001-15000₺ 71 (7.5%)
15001 (+) 109 (11.5%)
Total 946 (100%)
Table 1. Socio-economic characteristics of the participants.
From Table 1 we see that a large number of the respondents represent the
younger age ranges. Like the rest of Turkey, Istanbul is a city whose inhabitants
are mostly young people and also attracts many students. At the same time, the
vast majority of the sample consists of women. This reflects an imbalance in
gender distribution since housework is often attributed to one gender, as is com-
mon in communities that maintain a collectivist culture. An average household
in Turkey consists of 3.3 members (mostly parents and their children) and the
data on household size reflect this.
The questionnaire was created online and with an easy-to-use and simple design
to facilitate compilation. The survey link was announced on various social media
platforms to reach wider audiences. In order to not limit the sample only to social
media users, the link was also disseminated by e-mail and telephone. In addition,
volunteers who contacted the researchers to participate were also included in the
study. The questionnaire form consists of three sections. In the first section, the
demographic characteristics (age, gender, educational level, marital status, occupation,
household size and household income) of the participants were requested (Umunnakwe
et al., 2019). The remaining sections include items on household behavior and
waste change during the pandemic period. Multiple-choice questions were pre-
pared for the participants to compare their attitudes before and during the pan-
demic period considered. In the second and third part, the participants were
asked to mark the appropriate choice (increasing/decreasing/no change) for the
items according to their experience. In the second part, items related to daily

110 Yalçınyiğit et al.
Vis Sustain, 17, 104-128 http://dx.doi.org/10.13135/2384-8677/6258
living habits (i.e., cooking at home) were listed, while in the third part, items
related to waste and recycling behaviors (i.e., paper waste and recycling) were
included.
To test the changes in household behavior and waste the participants were asked
to answer questions in two different sections created after a detailed literature
review. Household behaviors are considered as Cooking at Home, Ordering Food
from Outside, Online Shopping, Usage of Dishwasher, Usage of Washing Machine, Disposa-
ble Bag Consumption, Home Delivery, Usage of Masks and Usage of Gloves. In addition,
waste changes include Paper, Food, Plastic, Glass, Electrical Equipment, Garden Waste,
Textile Products, Disposable Bags, and Items for Antivirus Protection. Data on household
behavior and waste changes are given under separate headings as in the question-
naire form.
2.2 Data Analysis
The research designed involved using a cross-sectional and quantitative method
for descriptive and explanatory purposes. Statistical analysis was performed using
SPSS software (IBM SPSS Statistics for Windows, Version 25.0. Armonk, NY:
IBM Corp.). The questionnaire items were analyzed using descriptive as well as
applied statistics. Data were collected through an online survey, which is thought
to be the fastest and healthiest way during the COVID-19 pandemic period con-
sidered. The data of 946 participants were analyzed by multivariate logistic re-
gression after examining the frequency distribution.
3. Results and Discussion
3.1 Household behavior changes during the pandemic period
Various changes occurred in individuals' lifestyles. Almost all people wore masks
outside their homes, washed their hands frequently, and worked remotely if it
was possible (Rhee, 2020). As the lifestyle changed, household behavior changed
correspondingly. Spending more time at home led to an increase in domestic
activities. While this caused most household behaviors to increase, in some cases
it had the opposite effect. Household behaviors that are reported to have in-
creased the most during the pandemic period are using a mask (99%), cooking at
home (71%), shopping online (70%), home delivery (70%), usage of dishwasher (70%).
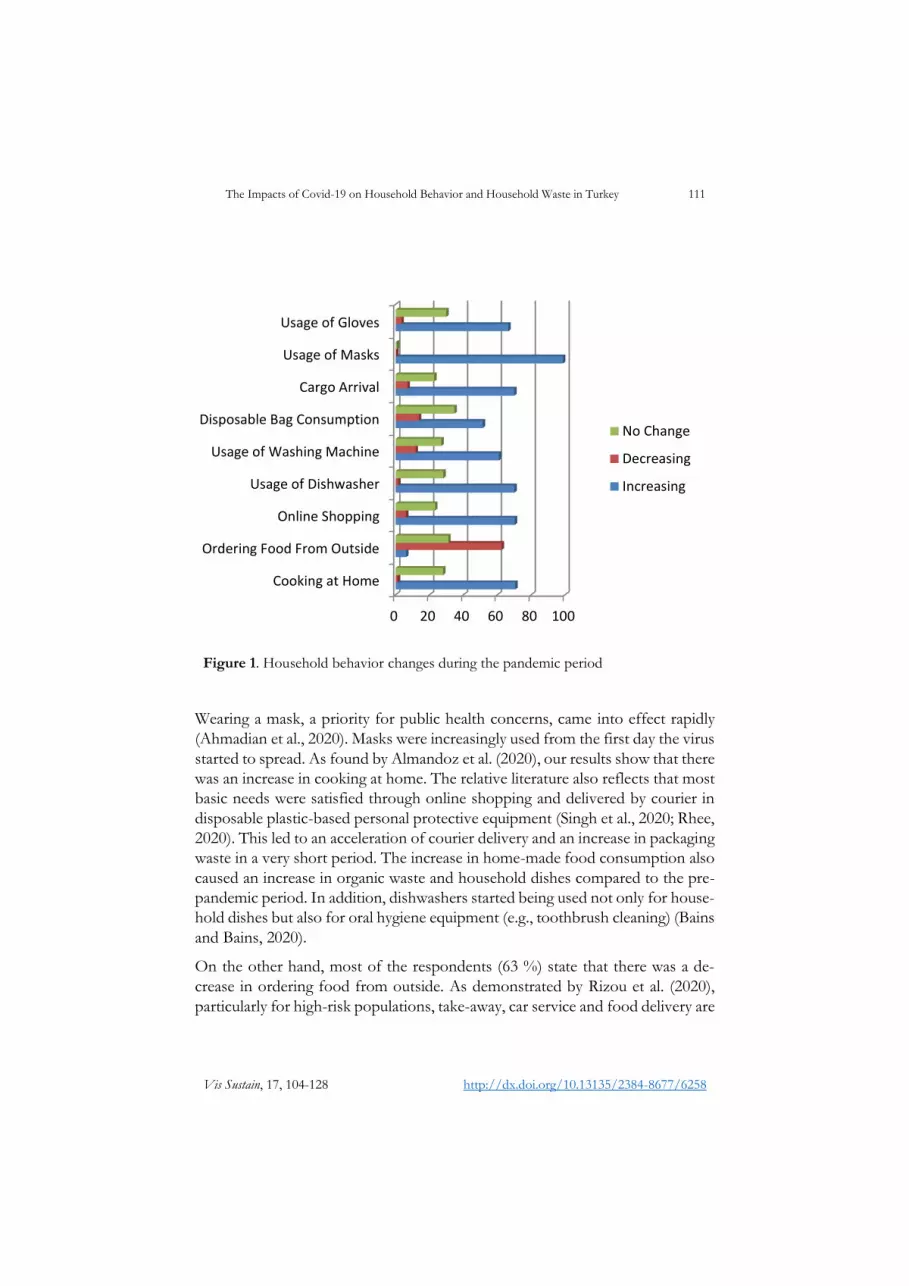
The Impacts of Covid-19 on Household Behavior and Household Waste in Turkey 111
Vis Sustain, 17, 104-128 http://dx.doi.org/10.13135/2384-8677/6258
Figure 1. Household behavior changes during the pandemic period
Wearing a mask, a priority for public health concerns, came into effect rapidly
(Ahmadian et al., 2020). Masks were increasingly used from the first day the virus
started to spread. As found by Almandoz et al. (2020), our results show that there
was an increase in cooking at home. The relative literature also reflects that most
basic needs were satisfied through online shopping and delivered by courier in
disposable plastic-based personal protective equipment (Singh et al., 2020; Rhee,
2020). This led to an acceleration of courier delivery and an increase in packaging
waste in a very short period. The increase in home-made food consumption also
caused an increase in organic waste and household dishes compared to the pre-
pandemic period. In addition, dishwashers started being used not only for house-
hold dishes but also for oral hygiene equipment (e.g., toothbrush cleaning) (Bains
and Bains, 2020).
On the other hand, most of the respondents (63 %) state that there was a de-
crease in ordering food from outside. As demonstrated by Rizou et al. (2020),
particularly for high-risk populations, take-away, car service and food delivery are
0 20 40 60 80 100
Cooking at Home
Ordering Food From Outside
Online Shopping
Usage of Dishwasher
Usage of Washing Machine
Disposable Bag Consumption
Cargo Arrival
Usage of Masks
Usage of Gloves
No Change
Decreasing
Increasing

112 Yalçınyiğit et al.
Vis Sustain, 17, 104-128 http://dx.doi.org/10.13135/2384-8677/6258
among critical risk management practices to prevent the spread of the virus. Con-
sequently, there was a decrease in the behavior of households regarding ordering
from outside.
Based on the percentage changes of household behaviors, we aimed to investi-
gate each change (increasing and decreasing) in detail. Examining the frequencies
of behaviors, we saw that only "ordering food from outside" displayed a decreas-
ing tendency while the others showed an increasing tendency. Therefore, we con-
ducted analysis based on the emerging tendencies, using the “decreasing” and
“no change” data to design a logistic model only for "ordering food from out-
side" behavior, and “increasing” and “no change” data to design logistic models
for the other behaviors.
Household behaviors were studied as related to household income and house-
hold size. Each household behavior was measured with dichotomous variables
either changing or not changing the related behavior. Response categories of only
"ordering food from outside" behavior were determined as “decreasing” and “no
change”, whereas the other household behavior categories were determined as
“increasing” and “no change” for the logistic model analysis. Response catego-
ries of household income were designed as an ordinal variable, as shown in Table
2. As a continuous variable, household size was taken to be the number of people
living in the house. Multivariate logistic regression models were designed for each
household behavior, so that ten distinct models were analyzed in this study, based
on the Equation 1.
In this context, equation 2 represents ten possible different models of household
behaviors described in terms of income and size of households. Each household
behavior, the dependent variable in ten separately designed models, was meas-
ured as a dichotomous variable "changing"/"not changing" of the related behav-
iors. This technique was used to reveal the most "change" regardless of the in-
crease or decrease in household behavior changes. In addition, the category of
"no change" was fixed as a reference category. The ordinal independent variable
household income has six income levels. The minimum level (below 3000₺) was
ln p
1−p = β0 + β1X1 + β2X2+ . . + βkXk Equation 1
ln Changing household behavior
1−household behavior = β0 + β1 h. income + β2 h. size Equation 2
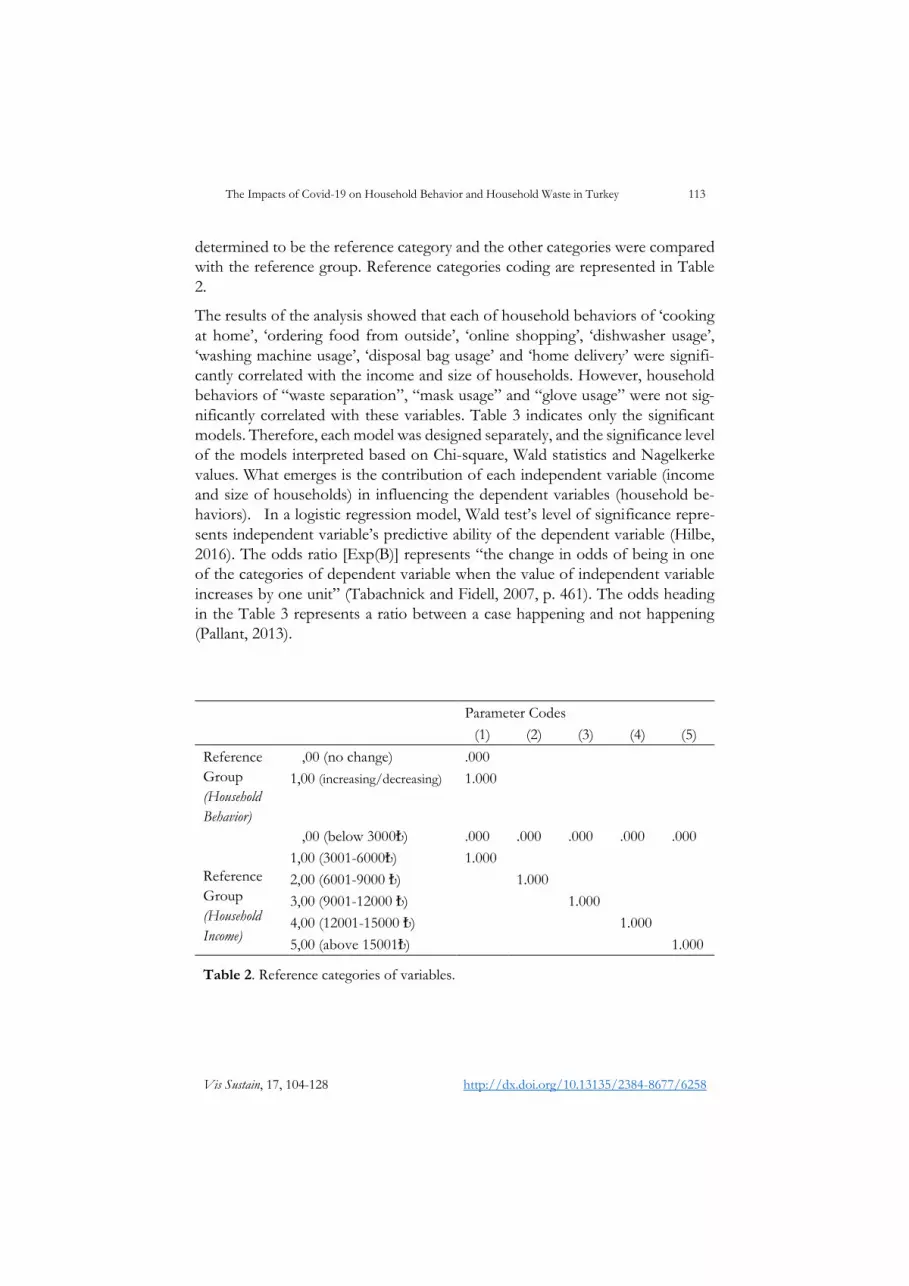
The Impacts of Covid-19 on Household Behavior and Household Waste in Turkey 113
Vis Sustain, 17, 104-128 http://dx.doi.org/10.13135/2384-8677/6258
determined to be the reference category and the other categories were compared
with the reference group. Reference categories coding are represented in Table
2.
The results of the analysis showed that each of household behaviors of ‘cooking
at home’, ‘ordering food from outside’, ‘online shopping’, ‘dishwasher usage’,
‘washing machine usage’, ‘disposal bag usage’ and ‘home delivery’ were signifi-
cantly correlated with the income and size of households. However, household
behaviors of “waste separation”, “mask usage” and “glove usage” were not sig-
nificantly correlated with these variables. Table 3 indicates only the significant
models. Therefore, each model was designed separately, and the significance level
of the models interpreted based on Chi-square, Wald statistics and Nagelkerke
values. What emerges is the contribution of each independent variable (income
and size of households) in influencing the dependent variables (household be-
haviors). In a logistic regression model, Wald test’s level of significance repre-
sents independent variable’s predictive ability of the dependent variable (Hilbe,
2016). The odds ratio [Exp(B)] represents “the change in odds of being in one
of the categories of dependent variable when the value of independent variable
increases by one unit” (Tabachnick and Fidell, 2007, p. 461). The odds heading
in the Table 3 represents a ratio between a case happening and not happening
(Pallant, 2013).
Parameter Codes
(1) (2) (3) (4) (5)
Reference
Group
(Household
Behavior)
,00 (no change) .000
1,00 (increasing/decreasing) 1.000
Reference
Group
(Household
Income)
,00 (below 3000₺) .000 .000 .000 .000 .000
1,00 (3001-6000₺) 1.000
2,00 (6001-9000 ₺) 1.000
3,00 (9001-12000 ₺) 1.000
4,00 (12001-15000 ₺) 1.000
5,00 (above 15001₺) 1.000
Table 2. Reference categories of variables.

114 Yalçınyiğit et al.
Vis Sustain, 17, 104-128 http://dx.doi.org/10.13135/2384-8677/6258
First, direct logistic regression was conducted to ascertain the likelihood that re-
spondents would report increasing in cooking at home based on income and size
of household. The overall model found significant X2(6, N=946) = 28,477; p<
.05; Wald=161,893. Given the significance level of each independent variable in
explaining the dependent variable, it was confirmed that cooking at home was
correlated with income and size of households.
Table 3. Variables in the multivariate logistic regression models for household behaviors.
X2/df Nagelkerke
R2 Beta Wald df Sig.
Exp(B)
(Odds)
Model 1 Income Ref-Below 3000₺ 12,340 5 ,030
Cooking at 28,477/6 .043
Income 4 [12001-15000 ₺] ,936 6,642 1 ,010 2,551
Home p = .000 Income 5 (above 15001₺) ,892 8,675 1 ,003 2,440
Ref: Inc Household size -,183 11,196 1 ,001 ,833
Model 2 Income Ref-Below 3000₺ 14,172 5 ,15
Ordering Food Income 2 [6001-9000 ₺] ,576 6,040 1 ,014 1,779
From Outside 29.875/6 .046
Income 3 [9001-12000₺] ,572 4,886 1 ,027 1,772
p = .000 Income 4 [12001-15000 ₺] 1,009 8,371 1 ,004 2,742
Income 5 [above 15001₺] ,782 7,445 1 ,006 2,185
Ref:Dec Household size -,165 9,235 1 ,002 ,848
Model 3 Income Ref - Below 3000₺ 22,572 5 ,000
Online Income 1 [3001-6000 ₺] ,463 4,044 1 ,044 1,588
Shopping 23.621/6 .039
Income 2 [6001-9000 ₺] ,863 11,495 1 ,001 2,370
p = .000 Income 3 [9001-12000₺] ,536 3,877 1 ,049 1,710
Income 4 [12001-15000 ₺] 1,390 11,895 1 ,001 4,017
Ref:Inc Income 5 [above 15001₺] 1,126 12,629 1 ,000 3,083
Model 4 Income Ref - Below 3000₺ 21,170 5 ,001
Dishwasher 28.532/6 .044
Income 3 [9001-12000₺] ,509 3,693 1 ,055 1,663
Usage p = .000 Income 4 [12001-15000 ₺] 1,379 11,943 1 ,001 3,969
Ref: Inc Income 5 [above 15001₺] 1,087 12,083 1 ,001 2,964
Model 5 Income Ref - Below 3000₺ 10,957 5 ,052
Washing M. 13.695/6 .023
Income 4 [12001-15000 ₺] ,828 5,406 1 ,020 2,290
Usage p = .033 Income 5 [above 15001₺] ,820 6,544 1 ,011 2,270
Ref:Inc
Model 6 Income Ref - Below 3000₺ 10,775 5 ,056
Disposal Bag 26.571/6 .044
Income 4 [12001-15000 ₺] ,741 4,418 1 ,036 2,099
Usage p = .000
Ref:Inc.
Model 7 Income Ref-Below 3000₺ 16,924 5 ,005
Home 18.490/6 .031
Income 2 [6001-9000 ₺] ,588 5,449 1 ,020 1,801
Delivery p = .005 Income 4 [12001-15000 ₺] 1,372 10,577 1 ,001 3,942
Ref: Inc Income 5 [above 15001₺] ,993 9,695 1 ,002 2,699

The Impacts of Covid-19 on Household Behavior and Household Waste in Turkey 115
Vis Sustain, 17, 104-128 http://dx.doi.org/10.13135/2384-8677/6258
Nagelkerke R2 indicated that the income and size of households explained 4.3%
of cooking at home. Based on the multivariate logistic regression model, each
category was compared with the reference category. As regards Model 1, by com-
paring household income with the reference category, it was seen that individuals
who have between 12001₺ and 15000₺ household income were over 2.5 times
more likely to cook at home than those who have 3000₺ and below household
income. In addition, individuals who have more than 15000₺ household income
would probably cook at home 2.4 times more than those who have less than
3000₺ income. The odds ratio of .83 of household size was less than 1, which
indicated that for each additional person in a house it was .83 times less likely to
increase cooking at home, controlling for other factors in the model.
Model 2 indicates the overall model concerning how ordering food from outside
behavior was analyzed as related to income and size of household. Household
income and size explained 4.6% of ordering food from outside. It was seen that
individuals with more than 6000₺ household income were less likely to order
food from outside than those with under 3000₺ household income. We found
that individuals who have between 6001₺ and 9000₺ household income were
over 1.7 times less likely to order food from outside than those who have 3000₺
and below household income. This result was the same for the 9001-12000₺
household income group who order from outside with 1.7 times lower probabil-
ity than those who have 3000₺ and below. In addition, the household income
group of ‘12001-15000’ and ‘15000₺ above’ were approximately 2 times less likely
to order food from outside than those who have 3000₺ and below. The odds
ratio of .84 of household size was less than 1, which indicated that for each ad-
ditional person in a house it was .84 times less likely to decrease ordering food
from outside, controlling for other factors in the model.
The results of the analysis showed a significant correlation between online shop-
ping and household income, as seen in Model 3. However, household size pro-
duced a non-significant coefficient in this model. Household income explained
3.9% of online shopping behavior. All categories of household income (‘3001-
6000₺’, ‘6001-9000₺’, ‘9001–12000₺’, ‘12001-15000₺’, ‘above 15001₺’) would
probably do online shopping more than the reference category (‘under 3000₺’
household income). Results indicate that individuals who have between 3001 and
6000₺ household income were 1.5 times, individuals who have between 6001 and
9000₺ were 2.3 times, individuals who have between 9001 and 12000₺ were 1.7
times, individuals who have between 12001 and 15000₺ were 4 times, and indi-
viduals who have more than 15001₺ were 3 times more likely to do online shop-
ping than those who have 3000₺ and below.

116 Yalçınyiğit et al.
Vis Sustain, 17, 104-128 http://dx.doi.org/10.13135/2384-8677/6258
Model 4 showed a significant correlation between dishwasher machine usage and
household. At the same time, household size produced a non-significant value in
this model. Household income explained 4.4% of dishwasher machine usage. It
was seen that individuals who have between 9001₺ and 12000₺ household in-
come were over 1.6 times more likely to use a dishwasher than those who have
3000₺ and below. In addition, individuals with 12001₺ and 15000₺ household
income were over 3.9 times more likely to use a dishwasher than those with
3000₺ and below. Furthermore, individuals who have more than 15000₺ house-
hold income would probably use a dishwasher 2.9 times more than those who
have 3000₺ and below.
Model 5 showed a significant correlation between washing machine usage on the
basis of household income, while household size is non-significant in this model.
Household income explained 2.3% of washing machine usage. It was seen that
individuals with between 12001₺ and 15000₺ household income were over 2.2
times more likely to use washing machine than those with 3000₺ and below.
Moreover, individuals who have more than 15000₺ household income would
probably use washing machine 2.2 times more than those who have 3000₺ and
below.
The results of the analysis showed that disposable bag usage could be signifi-
cantly explained on the basis of household income, as seen in Model 6. At the
same time, household size is non-significant in this model. Therefore, household
income explained 4.4% of disposal bag usage. Comparing household income
with the reference category, individuals who have more than 15000₺ household
income would probably use disposable bags 2 times more than those who have
3000₺ and below.
Model 7 indicates that home delivery was significantly correlated with household
income. However, household size proved non-significant in this model. House-
hold income explained 3.1% of home delivery. It was seen that individuals with
between 6001₺ and 9000₺ household income were over 1.8 times more likely to
prefer home delivery service than those with 3000₺ and below household in-
come. In addition, individuals who have between 12001₺ and 15000₺ household
income were over 3.9 times more likely to prefer home delivery service than those
who have 3000₺ and below. Moreover, individuals who have more than 15000₺
household income would probably prefer home delivery service 2.6 times more
than those who have 3000₺.
Thus, through our logistic regression model and analysis we confirmed the H1a,
H2a, H1b, H2b, H1c, H1d, H1e, H1f, H1g hypotheses.

The Impacts of Covid-19 on Household Behavior and Household Waste in Turkey 117
Vis Sustain, 17, 104-128 http://dx.doi.org/10.13135/2384-8677/6258
Figure 2. Household waste changes during the pandemic period.
3.2 Household Waste Changes During the Pandemic Period
Factors such as rapid increase in population and urbanization, socio-economic
transformations and improvement of living standards lead to an increase in the
amount of municipal solid waste generation (Wang et al., 2020; Omran et al.,
2009). Istanbul is the most populous city of Turkey and is subject to an ongoing
process of overcrowding in various ways, leading to an increase in the waste col-
lected by the municipalities. According to the Turkish Statistical Institute data, in
2018 the amount of waste collected by municipalities in Istanbul was 7,042,585
tons (Turkish Statistical Institute, 2018). This equates to 1,28 kilograms of waste
per person living in Istanbul. In addition to the overcrowding of the city, a de-
crease in recycling sensitivity has been recorded as one of the negative side effects
of COVID-19 (Zambrano-Monserrate et al., 2020), significantly leading to an
increase in waste in Istanbul. The main reasons for this decrease in recycling sen-
sitivity can be cited as the increase in the use of disposable products, new prod-
ucts that have become a part of daily life, and the closure of the recycling centers
necessary for the reuse of the wastes of these products. Like many sustainability
0 20 40 60 80 100
Paper
Food
Plastic
Glass
Electrical Equipment
Garden Waste
Textile Products
Disposable Bag
Items for Antivirus Protection
No Change
Decreasing
Increasing

118 Yalçınyiğit et al.
Vis Sustain, 17, 104-128 http://dx.doi.org/10.13135/2384-8677/6258
practices disrupted by the pandemic, recycling centers were temporarily closed in
many countries, based on the belief that they could add to the risk of spreading
COVID-19. Waste separation is another important issue concerning the effi-
ciency of recycling centers. For example, since it was not possible for some mu-
nicipalities to recycle masks and gloves that are separated as household waste, the
increased waste volume caused further negative consequences for the environ-
ment, together with decreased recycling sensitivity (Bal and Ozturk, 2020).
Figure 2 represents the data we collected from the households of Istanbul re-
garding waste change. Household waste, which the households stated to be those
that most increased, is listed as items for antivirus protection (95%), food (63%), dispos-
able bag (57%) and plastic (49%).
Waste behavior can clearly be expected to change during a pandemic period. Hy-
giene products and various methods of virus protection, which are more inte-
grated into individuals' lives than ever before, have also changed the solid waste
production of households. Behaviors aimed at increasing individual hygiene
standards have caused a large amount of medical waste in the environment
(Saadat et al., 2020). Uncertainty about a possible stressful event and the fact that
this uncertainty will persist for an indefinite period impairs the necessary self-
control required to balance food consumption (Core et al., 2018). The active
spread of the virus and the continuing uncertainty about the future have caused
individuals to stay home. As a result, household waste has increased due to the
increase in home-made meals and the demand for home delivery (Dente and
Hashimoto, 2020). Additionally, the literature shows that the demand for and use
of plastic packages and disposable plastic bags has increased during the pandemic
period because of safety and hygiene concerns (Sharma et al., 2020; Klemeš et
al., 2020; Singh et al., 2020). All these factors have played an inevitable role in the
increase of household waste.
Concerns surrounding safety and hygiene during the pandemic have led to a sub-
stantial increase in plastic packaging, with likely implications on global sustaina-
bility efforts to curb plastic pollution. The reliance on online shopping for home
delivery of commercial and essential products during lockdown has provoked a
surge in demand for single-use plastic bags.
Based on the frequencies of waste shown in Figure 2, we aimed to investigate
each type of waste change in detail. Investigating the frequency distribution of
the waste changes, we observed an increasing trend in the data, so we conducted
analysis on the basis of the existing increasing tendencies of each type of waste

The Impacts of Covid-19 on Household Behavior and Household Waste in Turkey 119
Vis Sustain, 17, 104-128 http://dx.doi.org/10.13135/2384-8677/6258
change. In addition, we used “increasing” and “no change” data to develop lo-
gistic models for waste changes.
Waste changing was explained on household income and household size
grounds. Multivariate logistic regression models were designed for each waste
change, to analyze nine distinct models, proceeding as in Equation 2 above.
Parameter Codes
(1) (2) (3) (4) (5)
Reference Group
(Waste changing in household)
,00 (no change) .000
1,00
(increasing/decreasing)
1.000
Reference Group
(Household Income)
,00 (below 3000₺) .000 .000 .000 .000 .000
1,00 (3001-6000₺) 1.000
2,00 (6001-9000 ₺) 1.000
3,00 (9001-12000 ₺) 1.000
4,00 (12001-15000 ₺) 1.000
5,00 (above 15001₺) 1.000
Table 4. Reference Categories of Variables.
In this way, nine different models of waste changing in household are examined
on the basis of income and size of households. Each waste change, the depend-
ent variable, was measured as a dichotomous variable "decreasing"/"increasing"
of the relative waste change. The category of "no change" was fixed as a reference
category. One of the ordinal independent variables, household income, has six
income levels. The minimum level (below 3000₺) was determined to be the ref-
erence category and the other categories were compared with the reference
group. Reference categories coding is represented in Table 4.
The results of the analysis showed that ‘paper’, ‘glass’, ‘disposable bag’ and ‘anti-
virus protection equipment’ waste changes were significantly correlated with
ln Changing waste
1−changing waste = β0 + β1 h. income + β2 h. size Equation 3

120 Yalçınyiğit et al.
Vis Sustain, 17, 104-128 http://dx.doi.org/10.13135/2384-8677/6258
income and size of household. On the other hand, ‘food’, ‘plastic’, ‘textile’, ‘elec-
tronic equipment’ and ‘garden’ waste changes were not correlated significantly
with these variables. Table 5 represents only the significant models. Each model
was designed separately, and the significance level of models analyzed based on
Chi-square, Wald statistics and Nagelkerke values. This shows the contribution
of each independent variable (income and size of households) to observe their
influence on the dependent variables (waste change).
Table 5. Variables in the multivariate logistic regression models for waste changes.
Multivariate logistic regression analysis was conducted to ascertain the likelihood
that respondents would report an increase in paper waste based on income and
size of household. The overall model found household income significant, but
household size non-significant. Nagelkerke R2 indicated that household income
explained 3.9% of paper waste change.
On the basis of the multivariate logistic regression model, each variable was com-
pared with the reference category. For Model 1, by comparing household income
with the reference category, it was seen that individuals with than 6001₺ house-
hold income were more likely to produce paper waste than those with under
3000₺. Results indicated that individuals who have between 6001 and 9000₺
household income were 1.8 times, individuals who have between 9001 and
X2/df
Nagelkerke R2
Beta Wald df Sig.
Exp(B)
(Odds)
Model 1 Income Ref-Below 3000₺ 16,973 5 ,005
Paper Waste 22,520/6 .039 Income 2 [6001-9000₺] ,589 5,498 1 ,019 1,802
Change p = .001 Income 3 [9001-12000₺] ,711 6,825 1 ,009 2,036
Income 4 [12001-15000₺] ,950 8,554 1 ,003 2,585
Ref: Inc Income 5 [above 15001₺] ,861 8,868 1 ,003 2,366
Model 2 Income Ref-Below 3000₺ 36,528 5 ,000
Glass waste 55.394/6 .084 Income 3 [9001-12000₺] 1,021 12,503 1 ,000 2,777
change p = .000 Income 4 [12001-15000₺] 1,467 19,361 1 ,000 4,337
Income 5 [above 15001₺] 1,230 16,804 1 ,000 3,422
Ref: Inc Household size -,185 10,343 1 ,001 ,831
Model 3 Income Ref-Below 3000₺ 14,258 5 ,014
Disposal Bag 22.632/6 .036 Income 3 [9001-12000₺] ,773 7,734 1 ,005 2,167
Change p = .001 Household size -,117 4,827 1 ,028 ,889
Ref:Inc
Model 4 Income Ref-Below 3000₺ 10,080 5 ,073
Antivirus 16.689/6 .056 Income 1 [3001-6000₺] 1,161 7,088 1 ,008 3,192
protection p = .010 Income 2 [6001-9000₺] 1,148 6,302 1 ,012 3,152
Ref:Inc

The Impacts of Covid-19 on Household Behavior and Household Waste in Turkey 121
Vis Sustain, 17, 104-128 http://dx.doi.org/10.13135/2384-8677/6258
12000₺ were 2 times, individuals who have between 12001 and 15000₺ were 2.5
times, and individuals who have more than 15001₺ were 2.3 times more likely to
produce paper waste than those who have 3000₺ and below.
Model 2 showed that the overall glass waste was correlated with income and size
of household. Household income and size explained 8.4% of glass usage. Results
showed that individuals with more than 9001₺ household income were more
likely to produce glass waste than those with under 3000₺. We found that indi-
viduals who have between 9001₺ and 12000₺ household income were over 2.7
times, individuals who have between 12001₺ and 15000₺ household income were
over 4.3 times, individuals who have more than 15000₺ household income were
over 3.4 times more likely more likely to produce glass waste. The odds ratio of
.83 of household size was less than 1, which indicated that for each additional
person in a house it .83 times less likely to increase glass waste, controlling for
other factors in the model.
Model 3 indicated that disposable bag waste correlated with household income
and size. Household income and size explained 3.6% of disposable bag waste
change. Individuals who have between 9001₺ and 12000₺ household income
were 2.1 times more likely to produce disposable bag waste than those who have
3000₺ and below. The odds ratio of .88 of household size was less than 1, which
indicated that for each additional person in a house it was .8 times less likely to
increase disposable bag waste, controlling for other factors in the model.
Our results showed that antivirus protection waste change could be significantly
correlated with household income, as seen in Model 4. However, household size
produced a non-significant coefficient in this model. We found that household
income explained 5.6% of antivirus production waste during pandemic period.
The household income group of ‘12001-15000₺’ and ‘15000₺ above’ were ap-
proximately 3.1 times more likely to produce antivirus protection waste than
those who have 3000₺ and below.
Thus, through our logistic regression model and analysis we confirmed the H3a,
H3d, H4d, H3i, H4i, H3h hypotheses.
4. Conclusions
In the light of the impact of the COVID-19 pandemic on the lifestyles of citizens,
this research aimed to empirically analyze how household behavior and waste
changed in the period from May to December 2020 in the largest city of Turkey,
Istanbul, by using an online questionnaire survey. Our results indicate that usage

122 Yalçınyiğit et al.
Vis Sustain, 17, 104-128 http://dx.doi.org/10.13135/2384-8677/6258
of masks, cooking at home, online shopping, home delivery, and usage of dish-
washers increased substantially. On the other hand, results of the study indicate
that most of the respondents reduced ordering food from outside. In line with
these behavioral changes, we have also detected important changes in the house-
hold waste of the respondents. Most of the respondents reported that there are
increases in the quantities of medical waste, food waste, disposal bags and plastic
waste. These results show that individual health precautions to avoid infection
and decreased outdoor mobility led to increase in these types of household
wastes.
We also attempted to analyze the effects of household income and household
size on the behavioral and household waste changes during the pandemic period.
The results of logistic regression analysis show that household income and size
are related to the changes in the respondents’ behaviors such as ‘cooking at
home’, ‘ordering food from outside’, ‘online shopping’, ‘dishwasher usage’,
‘washing machine usage’, ‘disposal bag usage’ and ‘home delivery’. ‘Paper’, ‘glass’,
‘disposable bag’ and ‘antivirus protection equipment’ waste changes during the
pandemic period are also related to household income and size.
Our study highlights the need for developing special management strategies and
action plans, especially for medical, food and plastic household waste to reduce
the negative environmental impacts of such a pandemic. Examples of this could
be sustainable industrialization (to support the huge amounts of unexpected ma-
terial production), reusing (minimizing the unnecessary usage of raw material and
waste generation), efficient food use (meal planning, freezing, and preserving),
and behavioral change in daily life (optimum consumption and raising awareness
towards recycling and reusing) (Babbitt et al., 2021; Rume and Islam, 2020). Fur-
thermore, considering the effects of household income and size on the compo-
sition of household waste, it is possible to say that local and central authorities
should seek ways of developing effective waste management strategies for citi-
zens who have different socio-economic characteristics. In addition, dissemina-
tion of methods such as composting and waste separation by the authorities are
necessary to increase the involvement of individuals in sustainable waste man-
agement (Khan et al., 2019).
Acknowledgements
This research received no specific grant from any funding agency in the public,
commercial, or no-profit sectors.

The Impacts of Covid-19 on Household Behavior and Household Waste in Turkey 123
Vis Sustain, 17, 104-128 http://dx.doi.org/10.13135/2384-8677/6258
References
Ahmadian, R., Uncu, Y., Ercan, I. (2020). Turkey in between European Union coun-
tries in the new coronavirus (COVID-19) outbreak: An examination of the dou-
bling times. Turkiye Klinikleri Turkish Journal of Medical Sciences, 40 (2), 220-227.
https://doi.org/10.5336/medsci.2020-75702.
Almandoz, J.P., Xie, L., Schellinger, J.N., Mathew, M.S., Gazda, C., Ofori, A., et al.
(2020). Impact of COVID‐19 stay‐at‐home orders on weight‐related behaviors
among patients with obesity. Clin Obes, 10 (5), e12386.
https://doi.org/10.1111/cob.12386.
Arora, S., Bhaukhandi, K.D., Mishra, P.K. (2020). Coronavirus lockdown helped the
environment to bounce back. Science of the Total Environment, 742, 140573.
https://doi.org/10.1016/j.scitotenv.2020.140573.
Babbitt, C. W., Babbitt, G. A., & Oehman, J. M. (2021). Behavioral impacts on
residential food provisioning, use, and waste during the COVID-19 pandemic.
Sustainable Production and Consumption, 28, 315-325.
https://doi.org/10.1016/j.spc.2021.04.012.
Bains, V.K., Bains, R. (2020) Is oral hygiene as important as hand hygiene during
COVID-19 pandemic?. The Asian Journal of Oral Health and Allied Sciences, 10, 5.
https://doi.org/10.25259/ajohas_8_2020.
Bal, E., Ozturk, F. (2020). Koronavirüs: Türkiye, maske ve plastik eldiven atıklarıyla
nasıl başa çıkıyor? [Coronavirus: How is Turkey coping with the waste of masks and
plastic gloves?] https://www.bbc.com/turkce/haberler-dunya-52987147 Accessed
on: 19.01.2022.
Bao, R., Zhang, A. (2020). Does lockdown reduce air pollution? Evidence from 44 cit-
ies in northern China. Science of the Total Environment, 731, 139052.
https://doi.org/10.1016/j.scitotenv.2020.139052.
Buzzi, C., Tucci, M., Ciprandi, R., Brambilla, I., Caimmi, S., Ciprandi, G., Marseglia,
G.L. (2020). The psycho-social effects of COVID-19 on Italian adolescents’ atti-
tudes and behaviors. Italian Journal of Pediatrics, 46 (1), 69.
https://doi.org/10.1186/s13052-020-00833-4.
Cesaro, A., Pirozzi, F. (2020). About the effects of Covid-19 on solid waste manage-
ment. TeMA-Journal of Land Use, Mobility and Environment, 59-66.
http://dx.doi.org/10.6092/1970-9870/6904.
Chakraborty, I., Maity, P. (2020). COVID-19 outbreak: Migration, effects on society,
global environment and prevention. Science of the Total Environment, 728,
138882. https://doi.org/10.1016/j.scitotenv.2020.138882.
124 Yalçınyiğit et al.
Vis Sustain, 17, 104-128 http://dx.doi.org/10.13135/2384-8677/6258
Clements, J.M. (2020). Knowledge and behaviors toward COVID-19 among US resi-
dents during the early days of the pandemic: Cross-sectional online questionnaire.
JMIR Public Health Surveill, 6 (2), e19161.
https://doi.org/10.2196/preprints.19161.
Collivignarelli, M.C., Abbà, A., Bertanza, G., Pedrazzani, R., Ricciardi, P., Miino, M.C.
(2020). Lockdown for CoViD-2019 in Milan: What are the effects on air quality?.
Science of the Total Environment, 732, 139280.
https://doi.org/10.1016/j.scitotenv.2020.139280.
Core, T.J., Price, M.M., Alquist, J.L., Baumeister, R.F., Tice, D.M. (2018). Life is uncer-
tain, eat dessert first: Uncertainty causes controlled and unemotional eaters to con-
sume more sweets. Appetite, 131, 68-72.
https://doi.org/10.1016/j.appet.2018.09.006.
Das, A. K., Islam, M. N., Billah, M. M., & Sarker, A. (2021). COVID-19 and municipal
solid waste (MSW) management: a review. Environmental Science and Pollution Research,
1-16. https://doi.org/10.1007/s11356-021-13914-6.
Dente, S.M.R., Hashimoto, S. (2020). COVID-19: A pandemic with positive and nega-
tive outcomes on resource and waste flows and stocks. Resources, Conservation &
Recycling, 161, 104979. https://doi.org/10.1016/j.resconrec.2020.104979.
Di Renzo, L., Gualtieri, P., Pivari, F., Soldati, L., Attinà, A., Cinelli, G., et al. (2020).
Eating habits and lifestyle changes during COVID-19 lockdown: an Italian survey.
Journal of Translational Medicine, 18, 229. https://doi.org/10.21203/rs.3.rs-
30403/v1.
Elleuch, B., Bouhamed, F., Elloussaief, M., & Jaghbir, M. (2018). Environmental
sustainability and pollution prevention. Environmental Science and Pollution
Research, 25(19), 18223-18225. https://doi.org/10.1007/s11356-017-0619-5.
European Environment Agency (EEA), (2020a). Air pollution goes down as Europe
takes hard measures to combat coronavirus.
https://www.eea.europa.eu/downloads/4af3d2f4196345848b1cfe9571df271c/1591
869417/air-pollution-goes-down-as.pdf Accessed on 28.08.2020
European Environment Agency (EEA), (2020b). Explore what we know.
https://www.eea.europa.eu/down-
loads/6e6c9dd80c0f417999338b2701f3598b/1594026359/explore.pdf Accessed on
28.08.2020
Evren, C., Evren, B., Dalbudak, E., Topcu, M., Kutlu, N. (2020). Measuring anxiety re-
lated to COVID-19: A Turkish validation study of the Coronavirus Anxiety Scale.
Death Studies, https://doi.org/10.1080/07481187.2020.1774969.
Hilbe, J.M. (2016). Practical Guide to Logistic Regression. Taylor & Francis, Boca Ra-
ton, FL.

The Impacts of Covid-19 on Household Behavior and Household Waste in Turkey 125
Vis Sustain, 17, 104-128 http://dx.doi.org/10.13135/2384-8677/6258
Jribi, S., Ben Ismail, H., Doggui, D., Debbabi, H. (2020). COVID-19 virus outbreak
lockdown: What impacts on household food wastage?. Environment, Development
and Sustainability, 22 (5), 3939-3955. https://doi.org/10.1007/s10668-020-00740-y.
Khan, F., Ahmed, W., Najmi, A., 2019. Understanding consumers’ behavior intentions
towards dealing with the plastic waste: Perspective of a developing country.
Resources, Conservation & Recycling. 142, 49–58.
https://doi.org/10.1016/j.resconrec.2018.11.020.
Klemeš, J.J., Van Fan, Y., Tan, R.R., Jiang, P. (2020). Minimising the present and future
plastic waste, energy and environmental footprints related to COVID-19.
Renewable & Sustainable Energy Reviews, 127, 109883.
https://doi.org/10.1016/j.rser.2020.109883.
Kulkarni, B.N., Anantharama, V. (2020). Repercussions of COVID-19 pandemic on
municipal solid waste management: Challenges and opportunities. Science of the
Total Environment, 743, 140693. https://doi.org/10.1016/j.scitotenv.2020.140693.
Massawe, E., Legleu, T., Vasut, L., Brandon, K., Shelden, G. (2014). Voluntary ap-
proaches to solid waste management in small towns: A case study of community in-
volvement in household hazardous waste recycling. The Journal of Environmental
Health, 76 (10), 26-33.
Ministry Interior of Turkey, (2021). Circular on Gradual Normalization Measures,
https://en.goc.gov.tr/circular-on-gradual-normalization-measures Accessed on
14.01.2022.
Naughton, C.C. (2020). Will the COVID-19 pandemic change waste generation and
composition?: The need for more real-time waste management data and systems
thinking. Resources, Conservation & Recycling, 162, 105050.
https://doi.org/10.1016/j.resconrec.2020.105050.
Nghiem, L.D., Morgan, B., Donner, E., Short, M.D. (2020). The COVID-19 pandemic:
considerations for the waste and wastewater services sector. Case Studies in
Chemical and Environmental Engineering, 1, 100006.
https://doi.org/10.1016/j.cscee.2020.100006.
Nussbaumer‐Streit, B., Mayr, V., Dobrescu, A. I., Chapman, A., Persad, E., Klerings, I.,
et al. (2020). Quarantine alone or in combination with other public health measures
to control COVID‐19: A rapid review. Cochrane Database of Systematic Reviews,
9, CD013574. https://doi.org/10.1002/14651858.cd013574.
Omran, A., Mahmoud, A., Abdul, A.H., Robinson, G.M. (2009). Investigating house-
holds attitude toward recycling of solid waste in Malaysia: a case study. International
Journal of Environmental Research, 3 (2), 275-288.
Ouhsine, O., Ouigmane, A., Layati, E., Aba, B., Isaifan, R. J., Berkani, M. (2020). Im-
pact of COVID-19 on the qualitative and quantitative aspect of household solid
waste. Global Journal of Environmental Science and Management, 6 (4), 1-12.
https://doi.org/10.22034/gjesm.2020.04.0.

126 Yalçınyiğit et al.
Vis Sustain, 17, 104-128 http://dx.doi.org/10.13135/2384-8677/6258
Pallant, J. (2013). SPSS Survival Manual. McGraw-Hill Education, United Kingdom
Pérez-Fuentes, M.D.C., Molero Jurado, M.D.M., Oropesa Ruiz, N.F., Martos Martínez,
Á., Simón Márquez, M.D.M., Herrera-Peco, I., Gázquez Linares, J.J. (2020). Ques-
tionnaire on perception of threat from COVID-19. Journal of Clinical Medicine, 9
(4), 1196. https://doi.org/10.3390/jcm9041196.
Rhee, S.W. (2020). Management of used personal protective equipment and wastes re-
lated to COVID-19 in South Korea. Waste Management & Research, 38 (8), 820-
824. https://doi.org/10.1177/0734242x20933343.
Rizou, M., Galanakis, I.M., Aldawoud, T.M., Galanakis, C.M. (2020). Safety of foods,
food supply chain and environment within the COVID-19 pan-
demic. Trends in Food Science & Technology, 102, 293-299.
https://doi.org/10.1016/j.tifs.2020.06.008.
Rume, T., & Islam, S. D. U. (2020). Environmental effects of COVID-19 pandemic
and potential strategies of sustainability. Heliyon, e04965.
https://doi.org/10.1016/j.heliyon.2020.e04965.
Saadat, S., Rawtani, D., Hussain, C.M. (2020). Environmental perspective of COVID-
19. Science of the Total Environment, 728, 138870.
https://doi.org/10.1016/j.scitotenv.2020.138870.
Sarkis, J., Cohen, M.J., Dewick, P., Schröder, P. (2020). A brave new world: lessons
from the COVID-19 pandemic for transitioning to sustainable supply and produc-
tion. Resources, Conservation & Recycling, 159, 104894.
https://doi.org/10.1016/j.resconrec.2020.104894.
Sarkodie, S. A., & Owusu, P. A. (2020). Impact of meteorological factors on COVID-
19 pandemic: Evidence from top 20 countries with confirmed cases. Environmental
Research, 191, 110101. https://doi.org/10.1007/s10668-020-00956-y.
Shakil, M.H., Munim, Z.H., Tasnia, M., Sarowar, S. (2020). COVID-19 and the envi-
ronment: A critical review and research agenda. Science of the Total Environment,
745, 141022. https://doi.org/10.1016/j.scitotenv.2020.141022.
Sharma, H.B., Vanapalli, K.R., Cheela, V.S., Ranjan, V.P., Jaglan, A.K., Dubey, B.,et al.
(2020). Challenges, opportunities, and innovations for effective solid waste manage-
ment during and post COVID-19 pandemic. Resources, Conservation & Recycling,
162, 105052. https://doi.org/10.1016/j.resconrec.2020.105052.
Singh, N., Tang, Y., Zhang, Z., Zheng, C. (2020). COVID-19 waste management: Ef-
fective and successful measures in Wuhan, China. Resources, Conservation &
Recycling, 163, 105071. https://doi.org/10.1016/j.resconrec.2020.105071.
Somani, M., Srivastava, A.N., Gummadivalli, S.K., Sharma, A. (2020). Indirect implica-
tions of COVID-19 towards sustainable environment: An investigation in Indian
context. Bioresource Technology Reports, 11, 100491.
https://doi.org/10.1016/j.biteb.2020.100491.
The Impacts of Covid-19 on Household Behavior and Household Waste in Turkey 127
Vis Sustain, 17, 104-128 http://dx.doi.org/10.13135/2384-8677/6258
Tabachnick, B.G., Fidell, L.S. (2007). Experimental Designs Using ANOVA. Thomson
Brooks/Cole , Belmont, CA.
Turgut, A., Arlı, H., Altundağ, Ü., Hancıoğlu, S., Egeli, E., Kalenderer, Ö. (2020). Ef-
fect of COVID-19 pandemic on the fracture demographics: Data from a tertiary
care hospital in Turkey. Acta Orthopaedica et Traumatologica Turcica, 54 (4), 355-
363. https://doi.org/10.5152/j.aott.2020.20209.
Turkish Statistical Institute, (2018). Municipal Waste Statistics,
https://data.tuik.gov.tr/Bulten/Index?p=Belediye-Atik-Istatistikleri-2018-30666
Accessed on 28.08.2020.
Turkish Statistical Institute, (2019). Address Based Population Registration System Re-
sults, https://data.tuik.gov.tr/Kategori/GetKategori?p=nufus-ve-demografi-
109&dil=1 Accessed on 28.08.2020.
Umunnakwe, J.E., Ekweozor, I., Umunnakwe, B.A. (2019). Impact of lifestyle scenarios
on household wastes in Port Harcourt. Management of Environmental Quality An
International Journal, 30 (4), 864-889. https://doi.org/10.1108/meq-04-2018-0079.
Wang, H., Liu, X., Wang, N., Zhang, K., Wang, F., Zhang, S. et al. (2020). Key factors
influencing public awareness of household solid waste recycling in urban areas of
China: A case study. Resources, Conservation & Recycling, 158, 104813.
https://doi.org/10.1016/j.resconrec.2020.104813.
Wang, Y., Yuan, Y., Wang, Q., Liu, C., Zhi, Q., Cao, J. (2020). Changes in air quality re-
lated to the control of coronavirus in China: Implications for traffic and industrial
emissions. Science of the Total Environment, 731, 139133.
https://doi.org/10.1016/j.scitotenv.2020.139133.
World Health Organization, (2022). WHO Coronovirus (COVID-19) Dashboard,
https://covid19.who.int/ Accessed on 21.01.2022.
Zambrano-Monserrate, M.A., Ruano, M. A., Sanchez-Alcalde, L. (2020). Indirect ef-
fects of COVID-19 on the environment. Science of the Total Environment,
728,138813. https://doi.org/10.1016/j.scitotenv.2020.138813.
Zhang, B., Lai, K.H., Wang, B., Wang, Z. (2019). From intention to action: How do
personal attitudes, facilities accessibility, and government stimulus matter for house-
hold waste sorting?. The Journal of Environmental Management, 233, 447-458.
https://doi.org/10.1016/j.jenvman.2018.12.059.
Zhong, B.L., Luo, W., Li, H.M., Zhang, Q.Q., Liu, X.G., Li, W.T., Li, Y. (2020).
Knowledge, attitudes, and practices towards COVID-19 among Chinese residents
during the rapid rise period of the COVID-19 outbreak: a quick online cross-sec-
tional survey. International Journal of Biological Sciences, 16 (10), 1745-1752.
https://doi.org/10.7150/ijbs.45221.

128 Yalçınyiğit et al.
Vis Sustain, 17, 104-128 http://dx.doi.org/10.13135/2384-8677/6258
Authors
Serap Yalçınyiğit, OrcID: 0000-0002-6928-7172 - Scopus ID: 57215861927, Yildiz Tech-
nical University, Faculty of Economics and Administrative Sciences, Istanbul, Tur-
key. [email protected]
Aygül Dönmez-Turan, OrcID: 0000-0003-4137-3228 - Scopus ID: 57208129744, Yildiz
Technical University, Faculty of Economics and Administrative Sciences, Istanbul,
Turkey. [email protected]
Halil E. Akbaş, OrcID: 0000-0001-8923-5700 - Scopus ID: 37005571000, Yildiz Tech-
nical University, Faculty of Economics and Administrative Sciences, Istanbul, Tur-
key. [email protected]
Gamze Varank, OrcID: 0000-0003-3437-4505 - Scopus ID: 26650264100, Yildiz Tech-
nical University, Faculty of Civil Engineering, Istanbul, Turkey.
Authors' contributions
The contribution of each author to the manuscript is as follows:
Serap Yalçınyiğit: Preparing the research design, writing the draft. Aygül Dönmez-Tu-
ran: Analysis of the collected data, gathering the data. Halil E. Akbaş: Gathering the
data, contributing the theoretical background. Gamze Varank: Contributing the theo-
retical background.
Funds
This research received no specific grant from any funding agency in the public,
commercial, or no-profit sectors.
Competing Interests
The authors have declared that no competing interests exist.
© 2022 Yalçınyiğit, S., Dönmez-Turan, A., Akbaş, H.E., Varank, G.
This is an open access publication under the terms and conditions of the Creative Commons Attribution (CC BY) license (http://creativecommons.org/licenses/by/4.0/).

www.ojs.unito.it/index.php/visions
The development of a construct in the heritage urban sustainability index
Yazid Saleh, Hanifah Mahat, Mohmadisa Hashim, Nasir Nayan, Samsudin Suhaily, Mohamad Khairul Anuar Ghazali, Rahma Hayati, Rahma Kurnia Sri Utami.
Received: 5 October 2021 | Accepted: 2 November 2021 | Published: 19 November 2021
Citation: Saleh, Y., Mahat, H., Hashim, M., Nayan, N., Suhaily, S., Ghazali, M.K.A., Hayati, R., Utami, R.K.S. (2021). The development of a construct in the heritage urban sustainability index. Visions for Sustainability, 17, 6082, 129-156. http://dx.doi.org/10.13135/2384-8677/6082
Correspondence: [email protected] Extended authors information available at the end of the article
1. Introduction
2. Literature review
3. Methodology and Study Area
3.1. Study Area
3.2. Population and Sample
3.3. Instruments
3.4. Instruments Reliability
3.5. Data Analysis Method
4. Findings
4.1. Respondents’ Background
4.2. Exploratory Factor Analysis Constructs of Economic Prosperity
4.3. Exploratory Factor Analysis of Social Well-Being Constructs
4.4. Exploratory Factor Analysis of Environmental Well-Being Constructs
4.5. Exploratory Factor Analysis of Cultural Heritage Constructs
4.6. Exploratory Factor Analysis Constructs the Role of Government and Com-
munity
5. Discussion
6. Conclusions
Original Paper

130 Saleh et al.
Vis Sustain, 17, 6082, 129-156 http://dx.doi.org/10.13135/2384-8677/6082
Keywords: Cultural heritage; Exploration factor analysis, Heritage urban sus-tainability.
Abstract. The UN Sustainable Development Goals (SDGs) have outlined
that every country in the world needs to create sustainable cities for commu-
nities by 2030. The first thing to consider is how to identify sustainability
indicators to be used as a guide in measuring the sustainability index. There-
fore, this article aims to explore the formation of the heritage urban sustaina-
bility index construct in Malaysia using exploratory factor analysis (EFA).
The respondents consisted of 100 residents in the heritage city of Kajang, Ma-
laysia, who were selected using a simple random sampling technique. Likert
scale questionnaires 1 to 5 were used to elicit feedback. The results showed
that the items in each study construct achieved acceptable reliability with
Cronbach’s alpha values greater than 0.70 and met the normality test require-
ments. Data was processed using EFA for grouping items according to appro-
priate constructs. The results of the study from 154 items of the questionnaire
have formed five main constructs of urban heritage sustainability in Malaysia,
namely (1) economic prosperity, (2) social well-being, (3) environmental well-
being, (4) cultural heritage, and (5) the role of government and community.
The results of this study also meet the index value requirements set by Kaiser-
Meyer-Olkin (KMO) and Bartlett’s Test of Sphericity. Furthermore, the for-
mation of the five constructs of this study directly demonstrates the relation-
ship between items according to constructs. Indirectly, these findings help re-
search on the sustainability of heritage cities in other areas as well.
_____________________________________________________________
1. Introduction
The UN Sustainable Development Goals (SDGs) target all countries globally
with the aim of building sustainable cities and communities for all by 2030. The
eleventh goal mentions the sustainability of cities and communities. It is detailed
under Target 11.3 that by 2030 all countries need to improve inclusive and
sustainable urbanisation for integrated and sustainable human settlement
planning and management (UNDP, 2019). To achieve the SDGs' recommended

The Heritage Urban Sustainability Index 131
Vis Sustain, 17, 6082, 129-156 http://dx.doi.org/10.13135/2384-8677/6082
level of sustainability, a method or measurement must be applied systematically
and holistically. To achieve this goal, a tool or benchmark must be created to
assess each city's level of sustainability. Therefore, countries have been engaged
in building their own measurement instruments to measure the sustainability of
their respective cities, including Malaysia. The level of urban sustainability in
Malaysia is measured by an instrument developed by the Federal Department of
Town and Country Planning (Jabatan Perancangan Bandar dan Desa, 2019), the
Malaysian Urban-Rural Sustainable Development Indicator Network (Murninet)
2.0, used from 2017 until the present day.
However, the constructs used in Murninet 2.0 do not include all elements,
especially elements involving cultural heritage. Indeed, elements of cultural
heritage are not included in Murninet 2.0 as a measurement construct. However,
the cultural heritage element is element 11.4 in the SDGs, which sets the target
that, by 2030, all countries need to strengthen efforts to preserve and protect the
world’s cultural heritage in urban development. This means that sustainable
urban development should involve cultural heritage elements as one of the
constructs in the measurement, especially for cities classified as heritage cities.
Many people are unaware that cultural heritage is one of the drivers of
sustainable development in the Agenda 2030, especially in the context of urban
development. Cultural heritage supports sustainable economic development, the
formation of prosperous communities and the creation of a conducive
environment. Cultural heritage is able to generate an economy based on heritage
tourism, form a harmonious society by cultivating a sense of belonging as a result
of the identification of origins and save the use of natural resources by reusing
existing heritage elements. The values brought by cultural heritage cross borders
and complement every existing dimension in sustainable urban development.
In Malaysia, there are 162 cities classified as heritage cities that existed
before World War II (1941). Melaka and Georgetown have been listed in the
World Heritage List as World Heritage Sites (UNESCO, 2019). Heritage cities
have distinctive and unique features and elements that not found in ordinary
cities (Keawsomnuk, 2021). For example, tangible and intangible cultural heritage
such as the architectural design of buildings that orient the unique living culture
of the local community, dialects used in daily speech, and lifestyle practices in
certain ethnic and sub-ethnic cities (Baba Nyonya, Jawi Peranakan, Bugis, and
others).
Therefore, the measurement of heritage urban sustainability should be
identified in the context of Malaysia so that it can be used as a guide and indicator

132 Saleh et al.
Vis Sustain, 17, 6082, 129-156 http://dx.doi.org/10.13135/2384-8677/6082
in future studies and as a guide for external researchers. This study is in line with
the view of Ban Ki-Moon that sustainable urban development does not
marginalise elements of cultural heritage (Wiktor-Mach, 2019). Cultural heritage
is already an integral part of the life of local communities. It been raised on a par
with economic, social and environmental elements in measuring the level of
sustainability (Appendino, 2017). Therefore, this article aims to explore and test
cultural heritage constructs along with economic, social, environmental,
governmental, and community roles in heritage cities in Malaysia.
2. Literature Review
In general, sustainable development has been defined as development that meets
the demands of the present without compromising the ability of future
generations to meet their needs. Sustainable development associates economic,
societal, and environmental sustainability with poverty eradication and income
distribution equity as important key goals (Chamhuri et al., 2014). The Limits to
Growth (Meadows et al., 1972) was the catalyst, followed by the Brundtland
Report (Brundtland, 1987), the Rio Summit (1992) (UNESCO, 2017), the
Decade of Education for Sustainable Development (2004-2014) (UNESCO,
2017), and, most recently, the Sustainable Development Goals (SDGs) with 17
key goals that each country must act on (United Nations, 2019). Sustainable
development in urbanisation has resulted in a number of global urbanisation
agendas, including The Healthy Cities Movement, Local Agenda 21, and the most
recent, the New Urban Agenda. A New Urban Agenda has goals for a enhance
and more sustainable future (Satterthwaite, 2016; Habitat III, 2016). The New
Urban Agenda was accepted at the United Nations Conference on Housing and
Sustainable Urban Development in Quito on October 20, 2016 (Caprotti et al.,
2017). One of the goals to be achieved in the New Urban Agenda is to create
sustainable cities.
According to Fatimah et al. (2008) and Abdul Samad et al. (2004),
sustainable urban development is a collaborative decision-making process in-
volving stakeholders in urban planning such as local authorities, local business
associations, non-governmental organisations, and consumers, to ensure that
economic activities, population welfare (including health), and ecosystems are all
given integrated consideration to ensure that current and future generations can
meet their needs on an ongoing basis. An important criterion in the formation
of a sustainable city is the environment, economy, society, and local authorities'
ability to implement efforts to achieve the mission and vision of planned
sustainable development.

The Heritage Urban Sustainability Index 133
Vis Sustain, 17, 6082, 129-156 http://dx.doi.org/10.13135/2384-8677/6082
When the New Urban Agenda is examined more closely, it can be seen that,
in addition to the relationship between good urbanisation and job creation,
livelihood opportunities, and revised quality of life, the natural and cultural
heritage of cities is also a key component in urban planning, including
rehabilitation and adaptation efforts, promotion and dissemination of knowledge
regarding these issues (Habitat III, 2016). This shows that cultural heritage has
been recognised as a key component in creating sustainable cities. This has led
to debate between scholars such as Runnalls (2007), Tweed and Sutherland
(2007), as well as Salvatore (2018), who place cultural heritage as the fourth
dimension in sustainable development. Appendino (2017) has clearly shown a
shift in the paradigm towards the foundation of sustainability when placing the
element of heritage as one of the main pillars for sustainability achievers.
Each city has its own uniqueness. Whether big or small, a city has its
uniqueness related to natural or cultural, tangible or intangible variables
(Salvatore, 2018). According to Guzmán et al. (2014) and Abdul Rani (2018),
cultural heritage not only transcends economic success and achieves policy-
making attention but is also an urban uniqueness. According to Van Oers and
Pereira Roders (2012), who studied the role of cultural heritage in sustainable
urban development in Belfast, Ireland, cultural heritage has contributed to unique
urban features and instilled a sense of belonging in residents of various
generations, resulting in the development of a sustainable city. In most cases,
heritage cities are often analysed in the context of tourism sustainability, as
discussed by Coccossis (2008), Al-Hagla (2010) and Thorosby (2016). At the
same time, the role of cultural heritage in contributing to sustainable cities has
not been neglected (Thorosby, 2016; Kotradyova, 2019).
As Malaysia is committed to implementing the SDG agenda and adopting
the New Urban Agenda, together with being a country rich in relics and
uniqueness of its past, especially in cities, it needs to have an index to measure
the sustainability of its heritage cities. The term sustainable heritage city does not
apply only to UNESCO-recognized heritage cities but includes all cities with
unique cultural characteristics. Some countries and cities have developed their
own sustainability indexes, such as the Sustainable Cities Index (Australia), the
Urban Sustainability Index (China), and the London Sustainable Development
Indicator (United Kingdom), as well as Malaysia, which has developed Murninet
2.0, an instrument to measure urban sustainability (Mohamad et al. 2021). All of
them view the city in general without placing the heritage element as one of the
key domains for forming and calculating the index. This scenario is seen as
marginalising the heritage that is the legacy of a city.

134 Saleh et al.
Vis Sustain, 17, 6082, 129-156 http://dx.doi.org/10.13135/2384-8677/6082
Questions concerning the sustainability of heritage cities in Malaysia can be
addressed through the availability of instruments and indicators covering all
sustainability components. Murninet 2.0 uses only three main constructs:
economic, social, and environmental as introduced by Brundtland (1987). We
propose that, by using the foundations of these three constructs, integrated by
the cultural heritage constructs introduced by Appendino (2017) as well as the
government and community role constructs introduced by Leus and Verhelst
(2018) and Tan et al. (2018), an instrument with five complete constructs can be
built and applied in Malaysia. Next, the details of each construct, sub-construct,
and item can be based on the local environment of heritage cities in Malaysia by
referring to various relevant sources such as UNESCO, New Urban Agenda,
Healthy City Movement, Local Agenda 21, and others.
3. Methodology and Study Area
This study uses exploratory factor analysis (EFA) to identify a limited number of
latent factors or constructs from a large number of observed constructs
consisting of EFA. In this study, only EFA conducted to explore the heritage
city sustainability index components in Malaysia. Pilot study data used to meet
the requirements of EFA by using data and samples that were different from the
actual study still had similar and almost identical characteristics to the actual study
(Worthington and Whittaker, 2006).
3.1 Study Area
The selected study area is the city of Kajang, located in the state of Selangor,
Malaysia. Kajang is a city listed in the Malaysian Architectural Heritage Inventory
report as a heritage city established before the Second World War (1941). Kajang
still retains elements of its cultural heritage despite the expansion of Kuala Lum-
pur’s development. Many elements of tangible cultural heritage buildings and
shops built before the war are still preserved in this city and have an early transi-
tional style and architectural design, with balustrades, domes on columns, attrac-
tive windows, various plaster decorations, patterns, and carvings that depict the
culture of the loaves and fishes (Syed Zainol, 1992). In addition, an element of
intangible cultural heritage is still intensely practised by the locals, including
young people. In the city of Kajang, there are various elements of the intangible
heritage of the cultural life of various ethnic and sub-ethnic groups, such as Ja-
vanese, Bugis, Malay, Chinese, and others who inhabit it. Among the popular
intangible culture practised by Kajang’s community is a Silat Sukmo Rogo per-
formance, which takes place when there is a wedding ceremony (Hafez and

The Heritage Urban Sustainability Index 135
Vis Sustain, 17, 6082, 129-156 http://dx.doi.org/10.13135/2384-8677/6082
Aloysius, 2019). In addition to the preservation of cultural heritage, the city of
Kajang is also competitive in economic growth, social development, and the en-
vironment, which makes it listed as one of the cities most chosen for livelihood
and inhabited by residents (Abdul Samad et al., 2004). The characteristics of Ka-
jang make it appropriate for selection as a pilot study area.
3.2 Population and Sample
This study set the total study sample at 100 residents aged 18 years and above,
living in heritage urban areas. This is the initial sample for the verification process
of instrument construction measurement using EFA. This population consists
of locals and non-locals who migrated and settled in the city to work or study or
for other reasons. The selection of respondents was with a simple random
sampling technique. The number of samples is based on Leohlin (1992) and
Kline (2005) in terms of the minimum number of samples recommended.
3.3 Instruments
The research instrument used was a questionnaire. This consists of six sections:
sections A, B, C, D, E, and F (Table 1). Each section contains information related
to the study constructs: Section A (economic prosperity), Section B (social well-
being), Section C (environmental well-being), Section D (cultural heritage), Sec-
tion E (role of government and community), and Section F (respondents’ pro-
file). Sections A, B, C, D and E are adaptations and modifications from the sus-
tainability theory introduced over a period of time from Brundland Report (1987)
to Appendino (2017). Table 2 shows in detail the constructs, items, and state-
ments of this study.
Table 1: Questionnaire Information
Section Constructs Constructs Explanation Items Source A Economic
Prosperity Economic prosperity refers to human mobility, business/investment activities and economic growth contributing to employment opportunities, income, and human influx.
33 Adapted from Jab-atan Perancangan Bandar dan Desa (2019) and Choon et al. (2011)
B Social Well-Being
Community well-being refers to basic amenities, relationships/communica-tions and utilities, safety and public or-der. Basic facilities lead to the infra-structure provided for all residents. Safety and public order are related to social problems in society and commu-nication/utilities are related to trans-portation networks and domestic ser-vices such as water and electricity sup-ply that lead to social well-being.
31 Adapted from United Nation Sustainable Development (1992) and Choon et al. (2011)

136 Saleh et al.
Vis Sustain, 17, 6082, 129-156 http://dx.doi.org/10.13135/2384-8677/6082
C Environmen-tal Well-Being
Environmental quality refers to physi-cal health, namely air, sound, smell, congenital diseases and clean water supply. In addition, the land use that involves saturated built-up areas con-tributes to the quality of the environ-ment.
20 Adapted from Takano (2003); O’neill and Simard (2006); Lafond and Heritage (2009)
D Cultural Herit-age
Cultural heritage refers to tangible cul-ture that can clearly be seen and touched, such as buildings, monuments and other constructions, while intangi-ble culture is a culture that cannot be seen and touched such as practices, customs, art, and so on, as well as the preservation and conservation of herit-age that involves restoration, repaint-ing, modification, and other activities that leading to the survival of cultural heritage
28 Adapted from Appendino (2017); Abdul Aziz (2011) and Syed Zainol (1992)
E Role of Gov-ernment and Community
The role of government and commu-nity refers to community involvement, environmental management, tourism and heritage management, and risk management, as efforts made to pre-serve cultural heritage
42 Adapted from United Nation Sustainable Development (1992) and Tan et al. (2018)
F Respondent’s Profile
Involves information on gender, race and population status
3 Built according to the needs of the study
Table 2: Constructs, Items, and Statements of Heritage City Sustainability
Constructs Items Statements
Economic Prosperity a1 Many job opportunities are available in this area.
a2 Side job opportunities abound in this area.
a3 The price of essential goods is in accordance with the Ministry of Do-mestic Trade and Consumer Affairs (KPDNHEP) standards in this area.
a4 The annual salary increase is inconsistent in this area.
a5 Many people are unemployed in this area.
a6 Many job opportunities are monopolized by foreign workers (non-citi-zens) in this area.
a7 Many non-locals live in this area due to employment factors.
a8 Many shops are empty and unused in the area.
a9 Rental rates for shops or business premises are high in this area.
a10 Service activities such as hotels/guest houses/motels are plentiful in this area.
a11 Business activities are thriving/growing rapidly in this area.
a12 The opportunity to run your own business is huge in this area.
a13 All types of businesses can be found in this area.
a14 There are certain business clusters (clothing, retail, furniture, restaurants etc) in this area.
a15 Multi-National Companies (MNCs) (e.g. 7Eleven, KFC, McD) operate extensively in this area.
a16 Small and Medium Enterprises (SMEs) (e.g. grocery stores, restaurants etc.) abound in this area.
a17 Many companies or shops practice shifting hours in this area.
a18 Business activities are active until night in the area.

The Heritage Urban Sustainability Index 137
Vis Sustain, 17, 6082, 129-156 http://dx.doi.org/10.13135/2384-8677/6082
a19 Non -locals run businesses around the area.
a20 Traders around this area receive special assistance from the local/central government.
a21 Enough space is provided for locals to do business in the area.
a22 Land tax for business or commercial lots is adequate in this area.
a23 This area is the focus of the public.
a24 This area is the focus of foreign workers.
a25 Every weekend many tourists come to this area.
a26 Residents from this countryside often come to travel to this area.
a27 This city is frequently visited seasonally (school holidays, convocations, etc.)
a28 Every school holiday season many tourists come to this area.
a29 Road congestion occurs during the holiday season due to the influx of many vehicles.
a30 Tourists drive sales in this area.
a31 The presence of tourists contributes to the development of this area.
a32 The presence of tourists contributes to the economy of the area.
a33 The presence of tourists increases the use of technology in this area.
Social Well-Being b1 Wellness facilities are fully available in the area.
b2 Hypermarket facilities are available nearby in the area.
b3 Facilities such as schools, community colleges and institutes of higher education are adequate in this area.
b4 Security facilities (e.g., Police Station, Fire Station) are fully available in this area.
b5 Complex facilities and a cultural centre are fully available in the area.
b6 Facilities for the disabled are fully available in this area.
b7 Playground and field facilities for leisure and sports facilities are fully available in the area.
b8 Pedestrian facilities are available throughout the area.
b9 Safe cycling routes are available in the area.
b10 Hygienic dining facilities are cleanly available in the area.
b11 The assembly square facilities are sufficient to accommodate the resi-dents in this area.
b12 Hygienic public toilet facilities are available in the area.
b13 Access to services and facilities (Hospitals, police stations, fire stations, post offices, government clinics, etc.) of the urban area is within a radius of less than 5 km.
b14 Criminal cases (theft, snatching, robbery) are alarming in this area.
b15 Symptoms of social malaise (“rempit”1, drugs, vice, etc.) among adoles-cents are alarming in this area.
b16 Women are safe to walk in this area.
b17 Children are safe to play in this area.
b18 Public safety assurance is good and controlled in this area.
b19 The police are constantly patrolling and inspecting the area.
b20 The road infrastructure in this area is good and convenient to use.
b21 Cases of premise or shop house fires are frequent in this area.
1 "ramp-(rev)-it" (ramp the throttle)

138 Saleh et al.
Vis Sustain, 17, 6082, 129-156 http://dx.doi.org/10.13135/2384-8677/6082
b22 Public transport such as buses and taxis are always available in the area.
b23 E-hailing transport such as Grab and Mycar are easily available in the area.
b24 Bus terminal facilities are fully available in the area.
b25 A wide selection of bus ticket counters and kiosks are available in the area.
b26 There are many bus stops in the area.
b27 Many parking lots are available in the area.
b28 Public transport services connect all places in the area.
b29 Few water supply disruptions occur in this area.
b30 Electricity supply is often cut off (blackout) in this area.
b31 Telephone networks and maximum internet speed (4G) are available throughout the area.
Environmental Well-Being
c1 Air pollution is frequent in this area.
c2 The temperature is at a comfortable level in this area.
c3 Noise is frequent in this area.
c4 Bad smells are common in this area.
c5 Water-borne diseases (e.g., diarrhea) are common in this area.
c6 Vector-borne diseases (e.g., dengue) are common in this area.
c7 Domestic tap water supply is clean in this area.
c8 Tap water needs to be filtered first before being used for cooking and drinking purposes.
c9 Tap water is often cloudy and silty.
c10 The is a lot of open space here.
c11 Buildings in this area are built close together.
c12 Buildings in this area are a built-in storey.
c13 The local authority oversees well the physical construction of the build-ing.
c14 There is construction of buildings on an ad hoc (private) basis by land-owners.
c15 Property values in this area are very high.
c16 Most of the soil surface has been completely cemented/asphalted in this area.
c17 Flash floods often occur in this area.
c18 This area lacks green vegetation cover.
c19 There is a well-equipped public park in the area.
c20 There is an open area such as a large football field in the area.
Cultural Heritage d1 A heritage shop building still functions in the area.
d2 Another type of heritage building still functions in this area.
d3 Heritage buildings have their design features in the area.
d4 Heritage buildings have their architectural features in the area.
d5 Heritage buildings are the symbol of the community in this area.
d6 Heritage buildings are the source of education in this area.
d7 Heritage buildings can enhance the spirit of patriotism and love for the country.
d8 Heritage buildings are still strong and intact in terms of structure in this area.
d9 Heritage buildings still retain the originally built structures in the area.

The Heritage Urban Sustainability Index 139
Vis Sustain, 17, 6082, 129-156 http://dx.doi.org/10.13135/2384-8677/6082
d10 The walls of heritage buildings are not painted to maintain their origi-nality.
d11 The walls of heritage buildings in this area have cracks.
d12 The walls of heritage buildings in this area have been sloping.
d13 Cultural performing arts are often exhibited in this area.
d14 The community in this area still listens to folk songs and traditional mu-sic.
d15 Traditional games and folk sports are always played in this area.
d16 Customs and rituals still practiced in this area.
d17 Traditional businesses still abound and operate in the area.
d18 Annual festivals and activities are often organised on a large scale in the area.
d19 Festivals/ rituals/ crowds are celebrated every year in this area.
d20 Preservation and conservation of heritage is done by the owner of the premises or local authority in this area.
d21 Heritage buildings still function as originally in the area.
d22 The structure of a heritage building has not altered to maintain its origi-nality in the area.
d23 Heritage tombs are still preserved and preserved in this area.
d24 Preservation and conservation of heritage enhance the image of this area so that it becomes a visitor attraction.
d25 Preservation and conservation of heritage increase the value of proper-ties in the area.
d26 Preservation and conservation of heritage attract many tourists to come to this area.
d27 Preservation and conservation of heritage attract researchers to this area.
d28 Preservation and conservation of heritage retain historical value.
Role of Government and Community
e1 Local authorities (PBT) put up posters and signboards promoting recy-cling practices in the area.
e2 Local authorities hold recycling programs regularly to promote resident awareness in this area.
e3 Local authorities provide recycling bins in every place to dispose of gar-bage in this area for the convenience of residents.
e4 Local authorities always encourage residents to use public transport to reduce traffic congestion in this area.
e5 Local authorities always hold environmental education programs for res-idents in this area.
e6 Local authorities always carry out scheduled waste collection according to the regulations that have been made in this area.
e7 Local authorities always clean the drains, drains, public toilets and road shoulders perfectly in this area.
e8 Local authorities carry out greening (planting flowers) to cool the tem-perature in this area.
e9 Local authorities always ensure that the landscape is maintained so that it looks neat in this area.
e10 Local authorities impose compounds and fines on premises that do not manage solid waste properly in this area.
e11 Local authorities impose compounds and fines on residents who dump garbage in public areas.
e12 Heritage buildings are safe to use by the public in this area.
e13 Road signs provided for the convenience of the public in the area.
e14 Traffic lights work well for traffic convenience in this area.

140 Saleh et al.
Vis Sustain, 17, 6082, 129-156 http://dx.doi.org/10.13135/2384-8677/6082
e15 The disaster victim collection centre equipped with various facilities in the area.
e16 All accident risk areas are put up with signboards to warn the public in this area.
e17 Local authorities often conduct disaster drills for the public in this area.
e18 Authorities conduct regular inspections of heritage buildings to ensure the level of security in this area.
e19 The government recognizes this urban area as a heritage city.
e20 The government gazetted buildings and monuments as a national herit-age to attract tourists to the area.
e21 The government always encourages conservation and preservation ac-tivities to be carried out in this area.
e22 The government has always provided financial assistance for the conser-vation and preservation process in this area.
e23 The government is constantly launching tourism campaigns to attract people to the area.
e24 The government has made the uniqueness of the cultural heritage a key asset for the promotion of tourism in the area.
e25 The government always holds annual festivals or activities in the city to attract tourists to the area.
e26 The government provides assistance and incentives to traditional busi-ness activities to drive the economy in the area.
e27 The government supports the movement of associations/NGOs that campaigns for the survival of heritage in this area.
e28 The government provides a comprehensive cultural centre in the area.
e29 The government provides a comprehensive heritage and tourism infor-mation centre in the area.
e30 The government has prepared a comprehensive cultural heritage preser-vation and conservation plan in the area.
e31 Care of the traditional premises of the heritage city is the responsibility of the local government.
e32 Care of the traditional premises of the heritage city is the responsibility of the owner of the premises.
e33 Many groups/clubs that campaign for cultural heritage for the future have been established in this area.
e34 Many groups/clubs that carry out preservation and conservation for fu-ture survival have been established in this area.
e35 Heritage groups/clubs often hold community activities to cultivate a love of history in this area.
e36 Heritage groups/clubs often conduct community-based programs for the preservation and conservation of heritage in this area.
e37 Heritage groups/clubs often hold cultural programs with the commu-nity to attract young people to this area.
e38 Heritage groups/clubs often run campaigns to attract tourists to this area.
e39 Heritage groups/clubs often hold seminars or cultural classes to teach young people in this area.
e40 Heritage groups/clubs often hold cultural performances to the commu-nity for entertainment in the area.
e41 The local community joins heritage groups/clubs to fight for the cus-toms in the area.
e42 Young people join heritage groups/clubs to avoid the extinction of an-cestral traditions in the area.

The Heritage Urban Sustainability Index 141
Vis Sustain, 17, 6082, 129-156 http://dx.doi.org/10.13135/2384-8677/6082
3.4 Instrument Reliability
Table 3 shows the reliability of heritage urban sustainability constructs with
Cronbach’s alpha values for measuring the internal consistency level of the con-
structs. The Cronbach’s alpha value is based on the reliability index analysis: 0.90-
1.00 (very high), 0.70-0.89 (high), 0.30-0.69 (moderate), and 0.00-0.30 (low)
(Babbie, 1992). Therefore, good reliability values are 0.70 and above (Mohamad
et al., 2015). The analysis results showed that Cronbach’s alpha value is between
0.70-0.95, within a range between high and very high. Therefore, the instrument
used in this investigation demonstrates a high level of dependability (Babbie,
1992).
Table 3: Pilot Study Findings
Constructs Items α Coefficient value
Economic Prosperity 33 .878
Social Well-Being 31 .898
Environmental Well-Being 20 .745
Cultural Heritage 28 .914
Role of Government and Community 42 .974
3.5 Data Analysis Method
The data analysis method used was exploratory factor analysis (EFA). More sspe-
cifically, the EFA procedure proposed by Hair et al. (2010) and Chua (2014) was
used. Among the procedures are:
(i) Correlation matrix values for items less than 0.5 dropped.
(ii) Items that do not belong to any of the factors eliminated.
(iii) Items that include more than one factor not accepted and dropped.
(iv) Items with a loading factor value greater than or equal to 0.50 re-
tained in their respective components.
(v) The Keizer-Meyer-Olkin sample adequacy test must be 0.60 or
more.
(vi) At least three items must be available for each component.

142 Saleh et al.
Vis Sustain, 17, 6082, 129-156 http://dx.doi.org/10.13135/2384-8677/6082
4. Findings
The study's findings will touch on two main outcomes: the profile of respondents
and the analysis of exploratory factors for each construct of the Malaysian
heritage city sustainability index.
4.1 Respondents’ Background
Table 4 shows 100 respondents living in the Kajang area. The analysis results
found that 27 people were male and 73 people were female. 96 people were Ma-
lays and four were Chinese. 87 people were locals, born and raised in the city,
and the remaining 13 were non-locals who came to live in the area for work,
study, and other reasons.
Table 4: Respondents’ Background
Respondent Background Frequency Percentage (%)
Gender Male 27 27.0
Female 73 73.0
Ethnicity Malay 96 96.0
Chinese 4 4.0
Population Status Local Resident 87 87.0
Non-Local Residents 13 13.0
4.2 Exploratory Factor Analysis Constructs of Economic Prosperity
The EFA results on the economic prosperity construct measuring tool explained
the anti-image correlation analysis procedure, showing that the correlation coef-
ficient value was more than 0.5. This meant that the factor analysis could con-
tinue. The Kaiser-Meyer-Olkin sampling adequacy measures and Bartlett’s Test
of Sphericity obtained showed a KMO value of 0.768. In contrast, Bartlett’s Test
of Sphericity was significant with a chi-squared value of 2326.386 at 528 degrees
of freedom (Table 5).

The Heritage Urban Sustainability Index 143
Vis Sustain, 17, 6082, 129-156 http://dx.doi.org/10.13135/2384-8677/6082
Table 5: Suitability Test for the Use of Factor Analysis and Uniformity of KMO Items
and Bartlett’s Test on Economic Prosperity Constructs
Kaiser-Meyer-Olkin Measure of Sampling Adequacy 0.768
Bartlett’s Test of Sphericity Approx. Chi-Square Sphericity 2326.386
df 528
Sig. .000
The number of components to be separated in the factor analysis was set at three
as categorised in the questionnaire. The component matrix with varimax rotation
is shown in Table 6. The varimax rotation method was chosen because it can
decrease complex variables and improve projected results. As a result, it found
that the values of a7, a9, a19, a25, a26, a27, a28, a29, a30, a31, a32, and a33 belong
to component 1, human mobility; a3, a6, a11, a12, a13, a14, a16, a18, a20, a21,
and a22 belong to component 2, business and investment activities; and a1, a4,
a10, a15, a17, and a24 belong to component 3, economic growth. Items that are
not specified were dropped because they did not meet the set standards. The
coefficients or loading factors for each item that tend to each cumulative factor
are shown in Table 6. This number reflects the relationship between the item and
the factors that have been formed. Therefore, it is important to know what type
of factors have been formed.

144 Saleh et al.
Vis Sustain, 17, 6082, 129-156 http://dx.doi.org/10.13135/2384-8677/6082
Table 6: Component Matrix with Varimax Round Constructs Economic Prosperity
Component
Human Mobility Business/Investment Activities Economic Growth
Item Factor loading Item Factor loading Item Factor loading
a7 .647 a3 .567 a1 .576
a9 .544 a6 .555 a4 .514
a19 .560 a11 .623 a10 .585
a25 .780 a12 .699 a15 .593
a26 .649 a13 .705 a17 .573
a27 .605 a14 .681 a24 .547
a28 .791 a16 .687
a29 .668 a18 .503
a30 .684 a20 .657
a31 .683 a21 .693
a32 .709 a22 .516
a33 .702
4.3 Exploratory Factor Analysis of Social Well-Being Constructs
The anti-image correlation analysis technique was described through the EFA
results on the social well-being measure, which showed that the correlation co-
efficient value was greater than 0.5, indicating that the factor analysis can con-
tinue. Furthermore, the Kaiser-Meyer-Olkin sampling adequacy measures and
Bartlett's Test of Sphericity were conducted, with a KMO value of 0.741 and a
chi-squared value of 2359.493 at 465 degrees of freedom, respectively (Table 7).
Table 7: Suitability Test for the Use of Factor Analysis and Uniformity of KMO Items
and Bartlett’s Test on Social Well-Being Constructs

The Heritage Urban Sustainability Index 145
Vis Sustain, 17, 6082, 129-156 http://dx.doi.org/10.13135/2384-8677/6082
Kaiser-Meyer-Olkin Measure of Sampling Adequacy 0.741
Bartlett’s Test of Sphericity Approx. Chi-Square Sphericity 2359.493
df 465
Sig. .000
The number of factors to be separated in the factor analysis was set at three in
accordance with the questionnaire's categorisation. The component matrix with
varimax rotation is shown in Table 8. As a result, it was found that the values of
b1, b2, b3, b7, b11, b13, b20, b21, b26, and b29 belong to component 1, public
facilities; b4, b5, b6, b8, b9, b12, b19, b21, b23, b24, b25, and b27 belong to
component 2, communication and utilities; b10, b14, b16, b17, b18, and b31 be-
long to component 3, public safety and order. Items not specified were dropped
from the questionnaire instrument. The values shown in Table 8 are the coeffi-
cients or loading factors for each item that tends to each accumulated factor.
Table 8: Component Matrix with Varimax Round Constructs of Social Well-Being
Component
Public Facilities Utilities and Communication Public Safety and Order
Item Factor loading Item Factor loading Item Factor loading
b1 .747 b4 .541 b10 .531
b2 .614 b5 .791 b14 .644
b3 .663 b6 .708 b16 .764
b7 .667 b8 .723 b17 .842
b11 .704 b9 .647 b18 .844
b13 .755 b12 .634 b31 .610
b20 .550 b19 .554
b22 .723 b21 .645
b26 .783 b23 .556
b29 .561 b24 .720
b25 .775
b27 .550
4.4 Exploratory Factor Analysis of Environmental Well-Being Constructs

146 Saleh et al.
Vis Sustain, 17, 6082, 129-156 http://dx.doi.org/10.13135/2384-8677/6082
The EFA results on the environmental well-being construct measuring instru-
ment explained the anti-image correlation analysis procedure, showing the cor-
relation coefficient value as more than 0.5, thereby indicating that the factor anal-
ysis could be continued. In addition, the Kaiser-Meyer-Olkin sampling adequacy
measures and Bartlett’s Test of Sphericity obtained showed a KMO value of
0.750, while Bartlett’s Test of Sphericity was significant with a chi-squared value
of 1038.175 at 190 degrees of freedom (Table 9).
Table 9: Suitability Test for the Use of Factor Analysis and Uniformity of KMO Items
and Bartlett’s Test on Environmental Well-Being Constructs
Kaiser-Meyer-Olkin Measure of Sampling Adequacy 0.750
Bartlett’s Test of Sphericity Approx. Chi-Square Sphericity 1038.175
df 190
Sig. .000
The number of components to be separated in the factor analysis was set at two
in accordance with the questionnaire's categorisation. The component matrix
with varimax rotation is shown in Table 10. Because it can decrease complex
variables and improve predicted results, the varimax rotation method is used.
As a result, it was found that the values of c3, c4, c5, c7, c8, c9, c10, c17, c18,
and c20 belong to component 1, which is environmental health; c11, c12, c13,
c15, c16, and c19 belong to component 2, land use. Unnamed items are items
that do not meet the set standards and are dropped. The coefficients or loading
factors that tend to each cumulative factor for each item are provided in Table
10.

The Heritage Urban Sustainability Index 147
Vis Sustain, 17, 6082, 129-156 http://dx.doi.org/10.13135/2384-8677/6082
Table 10: Component Matrix with Round Varimax Environmental Wellness Constructs
Component
Environmental Health Land Use
Item Factor loading Item Factor loading
c3 .692 c11 .749
c4 .510 c12 .803
c5 .856 c13 .732
c7 .560 c15 .643
c8 .600 c16 .510
c9 .691 c19 .719
c10 .569
c17 .725
c18 .847
c20 .662
4.5 Exploratory Factor Analysis of Cultural Heritage Constructs
The EFA results on the cultural heritage construct measuring instrument explain
the anti-image correlation analysis procedure. The correlation coefficient value is
more than 0.5, indicating that the factor analysis can be continued. The Kaiser-
Meyer-Olkin sampling adequacy measures and Bartlett’s Test of Sphericity ob-
tained showed a KMO value of 0.834, while Bartlett’s Test of Sphericity was
significant with a chi-square value of 2576.052 at 378 degrees of freedom (Table
11).

148 Saleh et al.
Vis Sustain, 17, 6082, 129-156 http://dx.doi.org/10.13135/2384-8677/6082
Table 11: Suitability Test for the Use of Factor Analysis and Uniformity of KMO Items
and Bartlett’s Test on Cultural Heritage Constructs
Kaiser-Meyer-Olkin Measure of Sampling Adequacy 0.834
Bartlett’s Test of Sphericity Approx. Chi-Square Sphericity 2576.052
df 378
Sig. .000
Factor analysis was conducted by setting the number of factors to be separated
at two as categorised in the questionnaire. Table 12 shows the component matrix
with varimax rotation. As a result, it found that the values of d2, d3, d4, d5, d6,
d7, d8, d9, d21, d22, d23, d24, d25, d26, d27, and d28 belong to component 1,
tangible culture; d13, d14, d15, d16, d17, d18 and d20 belong to component 2,
intangible cultures; the rest are dropped. The values shown in Table 12 are the
coefficients or loading factors for each item that tends to each of the accumulated
factors.
Table 12: Component Matrix with Varimax Rotation of Cultural Heritage Construct
Component
Tangible Culture Intangible Culture
Item Factor loading Item Factor loading
d2 .733 d13 .652
d3 .754 d14 .666
d4 .749 d15 .618
d5 .588 d16 .624
d6 .542 d17 .671
d7 .713 d18 .706
d8 .789 d20 .546
d9 .757
d21 .685
d22 .675
d23 .784
d24 .717
d25 .605
d26 .653
d27 .749
d28 .784

The Heritage Urban Sustainability Index 149
Vis Sustain, 17, 6082, 129-156 http://dx.doi.org/10.13135/2384-8677/6082
4.6 Exploratory Factor Analysis Constructs the Role of Government and Community
The EFA results on the government and community role construct measure ex-
plained the anti-image correlation analysis procedure, showing that the correla-
tion coefficient value was more than 0.5, indicating that factor analysis could be
continued. In addition, the Kaiser-Meyer-Olkin sampling adequacy measures and
Bartlett’s Test of Sphericity obtained showed a KMO value of 0.860, while Bart-
lett’s Test of Sphericity was significant with a chi-square value of 4330.186 at 861
degrees of freedom (Table 13).
Table 13: Suitability Test for the Use of Factor Analysis and Uniformity of KMO Items
and Bartlett’s Test on Government and Community Role Constructs
Kaiser-Meyer-Olkin Measure of Sampling Adequacy 0.860
Bartlett’s Test of Sphericity Approx. Chi-Square Sphericity 4330.186
df 861
Sig. .000
Factor analysis was done by setting the number of factors to be separated at four
as categorised in the questionnaire. Table 14 shows the component matrix with
varimax rotation. As a result, it was found that the values of e4, e28, e33, e34,
e35, e36, e37, e38, e39, e40, e41, and e42 belong to component 1, namely, com-
munity involvement; e2, e3, e5, e6, e7, e8, e9, e10, and e11 belong to component
2, environmental management; e18, e20, e21, e22, e23, e24, e25, e27, and e29 are
in component 3, tourism and heritage management; e12, e13, e14, e19, e26, e31,
and e32 are in group 4, risk management. The unspecified items are dropped for
not complying with the set conditions. The values shown in Table 14 are the
coefficients or loading factors for each item that tends to each of the accumulated
factors.

150 Saleh et al.
Vis Sustain, 17, 6082, 129-156 http://dx.doi.org/10.13135/2384-8677/6082
Table 14: Component Matrix with Varimax Rotation Government and Community Role
Constructs
Component
Community
Involvement
Environmental
Management
Tourism and Heritage
Management
Risk Management
Item Factor
loading
Item Factor
loading
Item Factor
loading
Item Factor
loading
e4 .556 e2 .575 e18 .698 e12 .725
e28 .578 e3 .601 e20 .707 e13 .754
e33 .641 e5 .625 e21 .763 e14 .750
e34 .788 e6 .748 e22 .672 e19 .629
e35 .818 e7 .693 e23 .704 e26 .667
e36 .763 e8 .667 e24 .663 e31 .768
e37 .817 e9 .681 e25 .600 e32 .769
e38 .825 e10 .645 e27 .574
e39 .722 e11 .631 e29 .564
e40 .597
e41 .771
e42 .809
5. Discussion
There are five main constructs in measuring the sustainability index of heritage
cities in Malaysia that need to be adhered to. The questionnaire constructed and
tested in the Kajang heritage city area consists of five constructs with 154 items.
After the field test and EFA analysis were performed, only 134 items were ac-
cepted, and 20 items were dropped for not meeting the conditions and proce-
dures proposed by Hair et al. (2010) and Chua, (2014). The KMO values obtained
for each construct were above 0.6 and Bartlett’s Test of Sphericity also showed
significant values. This indicates that the findings of this exploratory factor

The Heritage Urban Sustainability Index 151
Vis Sustain, 17, 6082, 129-156 http://dx.doi.org/10.13135/2384-8677/6082
analysis meet the requirements of the set index value. Thus, a total of 134 items
with five constructs can be used as instruments in the study of the construction
of the heritage city sustainability index in Malaysia.
After the EFA analysis was performed, there was a change in the order of
the items and the number of items in the instrument. For the economic prosper-
ity construct, there are three components, or sub-constructs identified: (1) human
mobility, (2) business and investment activities, and (3) economic growth. The
social well-being construct also has three components: (1) public facilities, (2)
communication and utilities, and (3) public safety and order. The environmental
well-being construct has only two components: (1) environmental health and (2)
land use. The cultural heritage construct also has two main components: (1) tan-
gible culture and (2) intangible culture. Finally, for the role of government and
community construct, there are four components: (1) community involvement,
(2) environmental management, (3) tourism and heritage management, and (4)
risk management.
The results of the EFA analysis show that the constructs suggested by Ap-
pendino (2017) and Brundtland (1987) – economic, social, environmental, cul-
tural heritage, government, and community roles are suitable for use in the con-
text of heritage cities in Malaysia. This finding is also a new perspective in Ma-
laysia because the urban sustainability index measurement instrument used by
Murninet 2.0 (Jabatan Perancangan Bandar dan Desa, 2019), does not involve
cultural heritage constructs. However, the results of the EFA analysis indicate
that cultural heritage constructs are appropriate and should be used as key con-
structs in the construction of the heritage urban sustainability index. Thus, it can
be concluded that there are five constructs with 134 items that need to be used
to construct Malaysia's heritage city sustainability index.
6. Conclusion
In conclusion, to identify the main constructs and components of each one of
these in the heritage city sustainability index in Malaysia, EFA analysis was used.
This is one of the essential methods in each initial study in the production of a
research instrument. Results from the EFA indicate that centralised validity and
discriminant validity can be achieved in this study. The findings show that there
are five main constructs: economic prosperity, social well-being, environmental
well-being, cultural heritage, and the role of government and community. The
components of each construct or sub-constructs is 14, with 134 items adopted
from the original 154 items. This means that as many as 20 items have been

152 Saleh et al.
Vis Sustain, 17, 6082, 129-156 http://dx.doi.org/10.13135/2384-8677/6082
discarded for not meeting the set procedures. Therefore, this EFA can be used
as a new questionnaire instrument to be distributed to respondents for the actual
study of heritage urban sustainability index measurement in Malaysia and can be
used as a guide to researchers in the field of heritage urban sustainability devel-
opment. However, in the future these indicators need to be further diversified,
especially in the context of intangible cultural heritage so that its importance can
be highlighted more deeply in the dynamics of heritage cities. For example, the
role of traditional lifestyles, customs, taboos are aspects that shape the economic
and social environment of an important heritage city. The uniqueness of the
economic and social environment in the heritage city is the result of the
composition of such elements that are not found in other areas. Therefore, future
researchers can consider more indicators that are relevant and appropriate to
intangible heritage in particular or cultural heritage in general in contributing to
the development of sustainable heritage cities in line with the Agenda 2030.
Acknowledgement
This research has been carried out under Fundamental Research Grants Scheme
(FRGS/1/2019/SS07/UPSI/02/1) provided by Ministry of Education Malaysia.
The authors would like to extend their gratitude to Universiti Pendidikan Sultan
Idris (UPSI) that helped manage the grants.
References
Abdul Aziz, H. (Ed.). (2011). Pemuliharaan dan pemeliharaan warisan di Malaysia. Pulau
Pinang: Universiti Sains Malaysia. [in Malay]
Abdul Rani, M. F. (2018). The adaptation of Buddhist art motifs as architectural orna-
ments in contemporary building interior design: the case study of 5-star hotel lob-
bies in Chiang Mai. Humanities, Art and Social Sciences Studies, 18(3), 557–586.
Abdul Samad, H., Shaharudin, I., dan Abdul Hadi, H. S. (2004). Persekitaran bandar
lestari untuk kesejahteraan komuniti. Malaysia Journal of Environmental Management, 5,
3–29.[in Malay]
Al-Hagla, K. S. (2010). Sustainable urban development in historical areas using the
tourist trail approach: A case study of the Cultural Heritage and Urban Develop-
ment (CHUD) project in Saida, Lebanon. Cities, 27(4), 234–248.
Appendino, F. (2017). Balancing Heritage Conservation and Sustainable Development–
The Case of Bordeaux. World Multidisciplinary Civil Engineering-Architecture-Urban Plan-
ning Symposium- WMCAUS 2017, Jun 2017. https://doi.org/:10.1088/1757-
899X/245/6/062002

The Heritage Urban Sustainability Index 153
Vis Sustain, 17, 6082, 129-156 http://dx.doi.org/10.13135/2384-8677/6082
Babbie, E. (1992). The practise of social research. Belmont, CA: Wadsworth Publishing
Company.
Brundtland, G. H. (1987). Report of the World Commission on Environment and Development:
Our Common Future. Retrieved from [Online URL: https://sustainabledevelop-
ment.un.org/content/documents/5987our-common-future.pdf] accessed on Dis-
ember 13, 2020.
Caprotti, F., Cowley, R., Datta, A., Broto, V. C., Gao, E., Georgeson, L., & Joss, S.
(2017). The new urban agenda: key opportunities and challenges for policy and
practice. Urban Research & Practice, 10(3), 367–378.
Chamhuri, S., Rospidah, G., dan Sharina, A. H. (Eds.). (2014). Pembangunan lestari di
Malaysia: harapan dan kenyataan. Kuala Lumpur: Dewan Bahasa dan Pustaka.[in
Malay]
Choon, S. W., Chamhuri, S., Pereira, J. J., Jemain, A. A., Hashim, H. S., and Hadi, A. S.
(2011). A sustainable city index for Malaysia. International Journal of Sustainable Develop-
ment & World Ecology, 18(1), 28–35.
Chua, Y. P. (2014). Kaedah dan statistik penyelidikan Buku 5: ujian regresi, analisis faktor dan
analisis SEM (2nd Ed). Kuala Lumpur: McGraw-Hill (Malaysia).[in Malay]
Coccossis, H. (2008). Cultural heritage, local resources and sustainable tourism. Interna-
tional Journal of Services Technology and Management, 10(1), 8–14.
Fatimah, Y., Katiman, R., dan Zikri, M. (2008). Bandar Berdaya Saing vis-a-vis Pem-
bangunan Bandar Lestari: Suatu wacana tentang pembangunan bandar di Malaysia.
Geografia-Malaysian Journal of Society and Space, 4(1), 85–98.[in Malay]
Guzmán, P. C., Pereira Roders, A. R., and Colenbrander, B. J. F. (2014). Bridging the
gap between urban development and cultural heritage protection. In Conference Pro-
ceedings’ Impact Assessment for Social and Economic Development, 34 Th Annual Conference of
the International Association for Impact Assessment, 8–11.
Habitat III. (2016). New urban agenda. Retrieved from [Online URL: //habi-
tat3.org/the-new-urban-agenda/] accessed on January 22, 2021.
Hafez, Z., and Aloysius, Y. (2019). Surviving traditional village heritage in rapid urbani-
sation: The case of Kajang town. International Journal of Heritage, Art and Multimedia,
2(6), 33–40.
Hair, G., Black, B., Babin, B., Anderson, R., and Tatham, R. (2010). Multivariate data
analysis (7th ed). Upper Saddle River, New Jersey: Pearson.
Jabatan Perancangan Bandar dan Desa. (2019). Jaringan Penunjuk Pembangunan Mam-
pan Bandar-Luar Bandar Malaysia (MurniNet 2.0). Retrieved from [Online URL:
http://murninet.townplan.gov.my/murninetsv2/ ] accessed on June 02, 2021. [in
Malay]
Keawsomnuk, P. (2021). A structural equation model of factors relating to smart cities
that affect the management of the world heritage site as well as the quality of life of

154 Saleh et al.
Vis Sustain, 17, 6082, 129-156 http://dx.doi.org/10.13135/2384-8677/6082
tourists and villagers in Ayutthaya, Thailand. Humanities, Art and Social Sciences Studies,
21(1), 35–42.
Kline, R. B. (2005). Methodology in the social sciences.Principles and practice of structural equation
modeling (2nd ed). Guilford Press.
Kotradyova, V. (2019). Local identity in material cultural as part of wellbeing and social
sustainability. Visions for Sustainability, 11, 17–28. http://dx.doi.org/10.13135/2384-
8677/3274
Lafond, L. J., and Heritage, Z. (2009). National networks of healthy cities in Europe.
Health Promotion International, 24(1). [Online URL:
//doi.org/https://doi.org/10.1093/heapro/dap060] accessed on February 15,
2021.
Leohlin, J. C. (1992). Latern Variable Models: an introduction to factor, path and structural anal-
ysis (2 nd). New Jersey: Hillsdale.
Leus, M., and Verhelst, W. (2018). Sustainability assessment of urban heritage sites.
Buildings, 8(8), 107. [Online URL://doi.org/doi:10.3390/buildings8080107] ac-
cessed on February 15, 2021.
Meadows, D. H., Meadows, D. L., Randers, J., and Behrens III, W. W. (1972). The Lim-
its to growth. New York: Universe Books.
Mohamad, K. A. G., Yazid, S., dan Hanifah, M. (2021). Pembinaan kerangka konstruk
kelestarian bandar warisan di Malaysia. Geografia-Malaysian Journal of Society and Space,
17(1), 211–226.[in Malay]
Mohamad, M. M., Sulaiman, N. L., Sern, L. C., and Salleh, K. M. (2015). Measuring the
validity and reliability of research instruments. 4th World Congress on Technical and Vo-
cational Education and Training (WoCTVET), 5th-6th November 2014, Malaysia, 164–
171. Malaysia.
O’neill, M., and Simard, P. (2006). Choosing indicators to evaluate healthy cities pro-
jects: a political task? Health Promotion International, 21(2), 145–152.
Runnalls, C. (2007). Choreographing community sustainability: The importance of cultural planning
to community viability. Canada: Centre of Expertise on Culture and Communities, Si-
mon Fraser University.
Salvatore, C. L. (Ed.). (2018). Cultural Heritage Care and Management: Theory and Practice.
Lanham: Rowman & Littlefield.
Satterthwaite, D. (2016). A new urban agenda? Environment and Urbanisation, 28(1), 3–12.
Syed Zainol, A. I. (1992). Pemuliharaan warisan rupa bandar. Kuala Lumpur: Badan
Warisan Malaysia.
Takano, T. (2003). Development of healthy cities and need for research. In T. Takano
(Ed.), Healthy cities and urban policy research (pp. 1–9). London and New York: Spon
Press.

The Heritage Urban Sustainability Index 155
Vis Sustain, 17, 6082, 129-156 http://dx.doi.org/10.13135/2384-8677/6082
Tan, S. K., Tan, S. H., Kok, Y. S., and Choon, S. W. (2018). Sense of place and sustain-
ability of intangible cultural heritage – The case of George Town and Melaka. Tour-
ism Management, 67, 376–387. [Online URL: //doi.org/10.1016/j.tour-
man.2018.02.012] accessed on February 18, 2021.
Thorosby, D. (2016). Tourism, heritage and cultural sustainability: three “golden rules.”
In L. F. Girard and P. Nijkamp (Eds.), Cultural Tourism and Sustainable Local Develop-
ment (1st ed., pp. 31–48). London: Routledge.
Tweed, C., and Sutherland, M. (2007). Built cultural heritage and sustainable urban de-
velopment. Landscape and Urban Planning, 83(1), 62–69.
UNDP. (2019). Sustainable development gold. Retrieved from [Online URL:
//www.my.undp.org/content/malaysia/en/home/sustainable-development
goals/goal-11-sustainable-cities-and-communities.html] accessed on Mac 01, 2021.
UNESCO. (2017). Sustainable Development Goal. Retrieved from UNESCO website:
[Online URL: //www.un.org/sustainabledevelopment] accessed on Mac 01, 2021.
UNESCO. (2019). World Heritage Convention. Retrieved from UNESCO website:
[Online URL://whc.unesco.org/en/about/] accessed on Mac 12, 2021.
United Nation. (2019). Sustainable Development Goals (SDGs). Retrieved from United
Nation website: [Online URL: //www.un.org/sustainabledevelopment/] accessed
on Mac 12, 2021.
United Nation Sustainable Development. (1992). Agenda 21. United Nations Conference on
Environment & Development Rio de Janerio, Brazil, 3 to 14 June 1992, 1–351. Rio De
Jenerio, Brazil.
Van Oers, R., and Pereira Roders, A. (2012). Historic cities as model of sustainability.
Journal of Cultural Heritage Management and Sustainable Development, 2(1), 4–14.
Wiktor-Mach, D. (2019). Cultural heritage and development: UNESCO’s new paradigm
in a changing geopolitical context. Third World Quarterly, 1593–1612. [Online URL:
//doi.org/https://doi.org/10.1080/01436597.2019.1604131] accessed on February
18, 2021.
Worthington, R., and Whittaker, T. (2006). Scale development research: A content anal-
ysis and recommendations for best practices. Counseling Psychologist, 34, 806–838.

156 Saleh et al.
Vis Sustain, 17, 6082, 129-156 http://dx.doi.org/10.13135/2384-8677/6082
Authors
Yazid Saleh
Department of Geography and Environment, Faculty of Human Sciences, Universiti
Pendidikan Sultan Idris, Perak
Hanifah Mahat
Department of Geography and Environment, Faculty of Human Sciences, Universiti
Pendidikan Sultan Idris, Perak
Mohmadisa Hashim
Department of Geography and Environment, Faculty of Human Sciences, Universiti
Pendidikan Sultan Idris, Perak
Nasir Nayan
Department of Geography and Environment, Faculty of Human Sciences, Universiti
Pendidikan Sultan Idris, Perak
Samsudin Suhaily
Institute of Malay Civilization, Universiti Pendidikan Sultan Idris, Perak, Malaysia
Mohamad Khairul Anuar Ghazali
Department of Geography and Environment, Faculty of Human Sciences, Universiti
Pendidikan Sultan Idris, Perak
Rahma Hayati
Department of Geography, Faculty of Social Science, Universitas Negeri Semarang,
Indonesia
Rahma Kurnia Sri Utami
Department of Geography Education, Faculty of Teacher Training and Education,
Universitas Lampung, Indonesia
Competing Interests
The authors declared that no competing interests exist.
© 2021 Saleh, Y., Mahat, H., Hashim, M., Nayan, N., Su-haily, S., Ghazali, M.K.A., Hayati, R., Utami, R.K.S.
This is an open access publication under the terms and conditions of the Creative Commons Attribution (CC BY) license (http://creativecommons.org/licenses/by/4.0/).

www.ojs.unito.it/index.php/visions
Return to Forests.
Therapeutic potential of woodland environments
Pierangela Fiammetta Piras
Received: 27 July 2021 | Accepted: 2 August 2021 | Published online: 3 August 2021
Citation: Piras, P.F. (2021). Return to Forests. Therapeutic Potential of Woodland Environments. Visions for Sustainability, 17, 5987, 157-164 http://dx.doi.org/10.13135/2384-8677/5987
Correspondence: [email protected]
_____________________________________________________________
Dear Editors,
Your journal Visions of Sustainability has paid considerable attention to biophilia
and biophilic design. Authors often document the benefits of connectedness to
Nature. However, relatively little space has been devoted to one of the most an-
cient environments for our relationship with Nature: the forest. The benefits of
frequenting forests are undeniable (Hansen et al., 2017; Kotte et al., 2019; Stier-
Jarmer et al., 2021). However, fundamental questions remain about what is ben-
eficial for whom and for what aspects of human psychophysical health. Conse-
quently, there is no clear understanding of either the characteristics to look for
in the forests or the activities to be carried out in them in order to benefit from
such an environment.
A correct prescription of forest therapies is essential not only for the patient but
also for the coherent management of the forests themselves. There is a risk of
considering the forest in a partial, reductive, and excessively utilitarian way. For
example, the mere consideration of the beneficial effects of some phytoncides
(Antonelli et al., 2020) cannot explain those obtained in broad-leaved forests in
the winter season, when the production of phytoncides is considered irrelevant
(Peterfalvi et al., 2021). The importance of taking account of the characteristics
of each forest ecosystem is confirmed by the contradictory results in relation to
Letter to Visions

158 Piras
Vis Sustain, 17, 157-164 http://dx.doi.org/10.13135/2384-8677/5987
the activities proposed. Activities whose efficacy is known when carried out in-
doors, such as physical exercise, can generate stress in complex forest environ-
ments (Toda, 2013), while they are preferred in open natural environments
(Zhang et al., 2015). However, more complex forests can offer equal or greater
benefits if appropriate activities are carried out in terms of quality and intensity
(e.g., Lee et al., 2018). Moreover, making generalizations concerning the thera-
peutic indications of the forest becomes even more problematic if we add the
variables related to the individual visitors: their state of health, their attitudes,
their knowledge and predispositions, and, last but not least, the level of their
‘connectedness to Nature’ (Berto et al., 2018).
To evaluate the therapeutic potential of woodland environments, the Forest
Therapies in Italian Forests Network (Rete Terapie Forestali in Foreste Italiane - TeF-
FIt, www.teffit.it) is developing two lines of research. The first aims at identifying
and describing forest ecosystems with a high degree of biodiversity, which ap-
pears to be the most promising both in terms of individual human characteristics
and needs (Haahtela, 2019) and the type of activities proposed (Doimo et al.,
2020).
The second refers to cross-sectional and longitudinal studies that indicate how
the possibility of benefiting from forests is a pathway by which the patient devel-
ops (not ‘acquires’) a growing ability to relate to forests themselves (Sonntag-
Öström, 2015). Patients learn to act in the forests in the ways that are most suited
to their psychophysical needs. They improve their state of health and, at the same
time, develop an awareness of lifestyle habits that are healthier for themselves
and more sustainable for the environment (Oh, 2020; Clarke, 2021). However,
this is not a linear but rather a circular path, which develops according to indi-
vidual times and modes. For this reason, forest therapists must have the ability
and sensitivity to adapt their proposals to the characteristics and needs of the
patient without intrusiveness or forcing.
We can describe this pathway in five stages: (1) biophilic, (2) sensory, (3) hap-
tic/proprioceptive, (4) adaptive, (5) integrative. Each stage corresponds to the
central stimulation activated, remembering that it is a circular path in which each
phase is gradually retraced employing the new skills and competencies developed
previously.
1. BIOPHILIC. It has been observed that people with a poor connection with
Nature are unable to restore themselves in complex forest environments, even
though these are the most restorative ones (Berto et al., 2018). Therefore, in this
first phase, it seems appropriate to give emphasis to accompanying the patient in

Return to Forests 159
Vis Sustain, 17, 157-164 http://dx.doi.org/10.13135/2384-8677/5987
environments with a high biophilic value, but with easy, reassuring pathways,
which make it possible to encounter the life of the forest (which is initially
scarcely or not at all perceived) in a positive way. The patient's attention will be
directed towards the forms of life that induce fascination.
2. SENSORY. In the first approaches to the forest, it is appropriate to choose
environments whose perceptible biodiversity is represented by similar life forms
(mammals, birds) and that are therefore pleasant and reassuring: nesting places
for songbirds, flowery areas, or areas with soft and open plant forms, soft
mosses, tasty berries, pleasant scents. The goal is to favor an exotopic approach1,
to accompany people towards an emerging and growing curiosity, confidence,
and wonder towards forms of life that are increasingly distant and different from
the human.
3. HAPTIC-PROPRIOCEPTIVE. Touch is the only ‘reciprocal’ human sense.
Everything that can be touched in a forest is alive. In turn, every living thing
perceives the human touch. Being aware of this ‘reciprocity’ can improve the
lived experience in a forest. Even simply walking on different natural soils can
represent both a proprioceptive-kinesthetic and a relational experience, to which
every individual reacts in a particular way. There is no such opportunity when
dealing with artificial sensory pathways (Tsunetsugu, 2013; Gross, 2019; Song et
al., 2019). The experience of contact with the life of the soil and subsoil helps to
develop an awareness of the presence of forms of life that are barely perceptible
and less similar to humans (arthropods, fungi, protists). Patients learn to react
correctly together with these living forms, and, over time, the reaction methods
can evolve as they become familiar with the complexity and diversity of the forest
ecosystem.
4. ADAPTIVE. The biophilic, sensory, and haptic-proprioceptive experiences
allow the patient to express their adaptive abilities. Patients explore the environ-
ment (in this case, the forest) and look for stimuli that relieve symptoms and
discomfort and improve their physiological functions (Sonntag-Öström et al.,
1 Exotopia is "a dialogic tension in which empathy plays a transitory and minor role, dominated instead by the continuous reconstituting the other as the bearer of an autonomous perspective, as sensible [I read ‘sensible’ as ‘endowed with sense’ - which concerns sensoriality and sensitivity - and at the same time ‘endowed with meaning’, Author’s note] as ours and not reducible to ours" (Sclavi, 2003). Exotopia could also prove suitable for preventing eco-anxiety phenomena (Capaldi et al., 2014; Panu, 2020; Verplanken et al., 2020) resulting from distorted or simply inexperienced forms of ‘connection with Nature’. Similarly, in the clinical, social, and educational context, the transition from empathy to exotopia has made it possible to have a more constructive dialogue with the ‘different’ human other, be it a sick person, an immigrant, or a disabled person, helping to reduce the burnout of operators (Sclavi, 2003).

160 Piras
Vis Sustain, 17, 157-164 http://dx.doi.org/10.13135/2384-8677/5987
2015), from breathing to movement. The exploration of oneself and the envi-
ronment leads to the development of an awareness of the dynamism of the pro-
cesses. This combined approach enables patients to adapt both to changes in the
forest (circadian, seasonal, climate, microenvironment) and changes in them-
selves, such as perceptive skills, awareness, and connection with the forest de-
velop.
5. INTEGRATIVE. The care paradigm adopted by the TeFFIt Network de-
pends on patients’ abilities to perceive and be aware of their needs and how to
respond to them through the forest. At the same time, patients will have under-
stood (through the exercise of exotopia) the different and often mysterious needs
of the life forms that inhabit the forest. In this way, the patient-forest interaction
will be adaptive and not opportunistic or, on the other hand, unrealistically emo-
tional. For example, patients will be able to enjoy phytoncides without however
voluntarily damaging the plants to perceive some of them better or persistently
search for them while neglecting other beneficial elements, as well as being able
to express their desire to leave a trace of themselves in the forest or to communi-
cate its presence in some way, without becoming intrusive or harmful. In this
way, the feeling of affiliation with Nature can develop into competence. The pa-
tient learns how to integrate into wild environments, always maintaining accepta-
ble behavior.
Although the current trend in forest therapies is to multiply the proposals for
activities, even in terms of single activities (trekking, mindfulness, yoga, physical
exercise, etc.), regardless of environmental analysis and individual needs, a per-
sonalized setting of forest frequentation seems a preferable model of health pro-
motion, as it is simpler and easier to apply. A personalized setting requires only
minimal initial support, favors the advantages of proximity (Korpela, 2007), and
is more suitable for maximizing the reciprocity of benefits for human health and
the forests.
In conclusion, I would like to propose a reflection on awareness, a term that is
central to forest therapy. Traditional mindfulness practices are recognized as try-
ing to make a non-judgmental acknowledgment of the present moment (Kabat-
Zinn, 1994). In forest therapy practices shared by the TeFFIt Network, we prefer
to talk about ‘taking notice’. This practice goes beyond simply taking note of the
present moment. Taking notice involves keeping a memory of it, that is, being
capable of re-evoking it in the mind and body, capable of promoting the devel-
opment of the organism's adaptation and integration with the forest. With ‘taking
notice’ practice, patients are able to maintain delicate divided attention on what
they can perceive of the forest, how the organism reacts to it, and how the forest

Return to Forests 161
Vis Sustain, 17, 157-164 http://dx.doi.org/10.13135/2384-8677/5987
reacts to itself. Almost an observation ‘out of the corner of one’s eye’, whose
sustained maintenance over time is facilitated by the restorative action of the
forest, through fascination (Kaplan, 1995).
As members of the TeFFIt Network we have observed that, contrary to what is
suggested in established mindfulness practices (Kabat-Zinn, 1990; 1994; Segal et
al., 2002), it is counterproductive to focus attention only on a physiological func-
tion, such as breathing, or individual parts of the body. It appears more effective
to observe when the same function or area of the body emerge from our atten-
tion, stimulated by the forest. Likewise, any emerging thoughts and sensations
can be noted, to perhaps understand their meaning later, instead of committing
oneself to letting them go, facilitated by the fact that among the actions of the
forest, there is the interruption of brooding (Chen, 2019) and instead the favoring
of the alternation between mind-wandering, which is internally oriented, and soft
charm, fascination, which is externally oriented (Williams et al., 2018). The desir-
able qualities of curious, non-judgmental attention and attentive, decentralized
listening will be facilitated both by the exercise of exotopia and by the decentral-
izing action of the forest itself (Chen, 2019; Oh et al., 2020). In other words,
wandering freely, mind and body, in the forest, ‘taking note’ of what emerges to
capture the attention, far from hindering awareness, could instead support people
in developing greater flexibility and new associations of ideas (Williams et al.,
2018), as well as to adopt healthier (Oh et al., 2020) and more sustainable (Clarke,
2021) lifestyles. Mindfulness-Based Interventions (MBIs)2, often proposed as ex-
amples of green mindfulness (Danon, 2019), seem to have specific objectives
that are different from those of immersion in the forest. Furthermore, MBIs also
have needs regarding the organization, setting, and privacy that are not easily
compatible and consistent with their practice in wild forests (Ambrose-Oji,
2013). A more informal and open awareness seems better suited for therapeutic
activities in natural settings (Djernis et al., 2019).
Forest therapies are arousing more and more interest. However, many open
questions remain, requiring research efforts to accurately describe the environ-
ments where this is practiced. With a precise catalog of the qualities of each forest
ecosystem, the therapeutic prescription will be more precise, considering the fact
that the observations made so far suggest that it is the forest itself which stimu-
lates a state of awareness and adaptivity that is appropriate to and suitable for
each patient.
2 Such as, for example, Mindfulness Based Stress Reduction (MBSR), Acceptance-Based Stress Therapy (ABST), Acceptance Commitment Therapy (ACT) and Mindfulness Based Cognitive Be-havioral Therapy (MBCBT).

162 Piras
Vis Sustain, 17, 157-164 http://dx.doi.org/10.13135/2384-8677/5987
References
Ambrose-Oji, B., (2013). Mindfulness Practice in Woods and Forests: An Evidence Re-
view. Research Report for The Mersey Forest, Forest Research. Alice Holt Lodge
Farnham, Surrey.
Antonelli, M., Donelli, D., Barbieri, G., Valussi, M., Maggini, V., Firenzuoli, F. (2020).
Forest Volatile Organic Compounds and Their Effects on Human Health: A State-
of-the-Art Review. International Journal of Environmental Research and Public Health, 17,
6506. https://doi.org/10.3390/ijerph17186506
Berto, R., Barbiero, G., Barbiero, P., Senes, G. (2018). An individual’s connection to
nature can affect perceived restorativeness of natural environments. Some observa-
tions about biophilia. Behavioral Sciences, 8 (3), 34.
https://doi.org/10.3390/bs8030034
Capaldi, C.A., Dopko, R.L., Zelenski, J M. (2014). The relationship between nature
connectedness and happiness: A meta-analysis. Frontiers in psychology, 5, 976.
https://doi.org/10.3389/fpsyg.2014.00976
Chen, C. (2019). Nature's pathways on human health. In International Handbook of Forest
Therapy Publisher. Cambridge Scholars Publishing, pp. 12-31.
Clarke, F.J., Kotera, Y., & McEwan, K. (2021). A Qualitative Study Comparing Mind-
fulness and Shinrin-Yoku (Forest Bathing): Practitioners’ Perspectives. Sustainabil-
ity, 13 (12), 6761. https://doi.org/10.3390/su13126761
Danon, M. (2019). “From Ego to Eco": The contribution of Ecopsychology to the cur-
rent environmental crisis management. Visions for Sustainability, 12, 8-17.
https://doi.org/10.13135/2384-8677/3261
Djernis, D., Lerstrup, I., Poulsen, D., Stigsdotter, U., Dahlgaard, J., O’Toole, M. A
(2019) Systematic Review and Meta-Analysis of Nature-Based Mindfulness: Effects
of Moving Mindfulness Training into an Outdoor Natural Setting. International Jour-
nal of Environmental Research and Public Health, 16, 3202.
https://doi.org/10.3390/ijerph16173202
Doimo, I., Masiero, M., Gatto, P. (2020). Forest and wellbeing: Bridging medical and
forest research for effective forest-based initiatives. Forests, 11(8), 791.
https://doi.org/10.3390/f11080791
Gross, M., (2019). Are we losing touch with our world? Current Biology, 29, R265-R268.
https://doi.org/10.1016/j.cub.2019.04.003
Haahtela, T. (2019). A biodiversity hypothesis. Allergy, 74(8), 1445-1456. https://doi.
org/10.1111/all.13763.
Hansen, M.M., Jones, R., Tocchini, K. (2017). Shinrin-Yoku (Forest Bathing) and Na-
ture Therapy: A State-of-the-Art Review. International Journal of Environmental Research
and Public Health. 2017; 14 (8), 851. https://doi.org/10.3390/ijerph14080851

Return to Forests 163
Vis Sustain, 17, 157-164 http://dx.doi.org/10.13135/2384-8677/5987
Kabat-Zinn, J. (1990). Full Catastrophe Living: Using the Wisdom of Your Body and Mind to
Face Stress, Pain, and Illness. New York, Delacorte Press.
Kabat-Zinn, J. (1994). Wherever you go, there you are Mindfulness meditation in everyday life.
New York Hyperion.
Kaplan, S. (1995). The restorative effects of nature: Toward an integrative framework.
Journal of Environmental Psychology, 15, 169-182. https://doi.org/10.1016/0272-
4944(95)90001-2
Korpela, K., & Ylén, M. (2007). Perceived health is associated with visiting natural fa-
vourite places in the vicinity. Health & Place, 13, 138-151.
https://doi.org/10.1016/j.healthplace.2005.11.002
Kotte, D., Li, Q., Shin, W.S., Michalsen, A. (2019), International Handbook of Forest Ther-
apy. Cambridge Scholars Publishing: Newcastle, UK
Lee, K. J., Hur, J., Yang, K. S., Lee, M. K., & Lee, S. J. (2018). Acute biophysical re-
sponses and psychological effects of different types of forests in patients with meta-
bolic syndrome. Environment and Behavior, 50 (3), 298-323.
https://doi.org/10.1177/0013916517700957
Oh, K.H., Shin, W.S., Khil, T.G., Kim, D.J. (2020) Six-Step Model of Nature-Based
Therapy Process. International Journal of Environmental Research and Public Health, 17,
685. https://doi.org/10.3390/ijerph17030685.
Peterfalvi, A., Meggyes, M., Makszin, L., Farkas, N., Miko, E., Miseta, A., Szereday, L.
(2021) Forest Bathing Always Makes Sense: Blood Pressure-Lowering and Immune
System-Balancing Effects in Late Spring and Winter in Central Europe. International
Journal of Environmental Research and Public Health, 18, 2067.
https://doi.org/10.3390/ijerph18042067.
Panu, P. (2020). Anxiety and the Ecological Crisis: An Analysis of Eco-Anxiety and Cli-
mate Anxiety. Sustainability, 12(19), 7836. https://doi.org/10.3390/su12197836
Sclavi, M. (2003). Arte di ascoltare e mondi possibili, Mondadori.
Segal, Z.V., Williams, J.M.G., Teasdale, J.D. (2002). Mindfulness-based cognitive therapy for
depression: a new approach to preventive relapse. New York: Guilford Press
Song, C., Ikei, H., Miyazaki, Y. (2019). Physiological effects of forest-related visual, ol-
factory, and combined stimuli on humans: An additive combined effect. Urban For-
estry & Urban Greening, 44, 126437. https://doi.org/10.1016/j.ufug.2019.126437
Sonntag-Öström, E., Stenlund, T., Nordin, M., Lundell, Y., Ahlgren, C., Fjellman-
Wiklund, A., Järvholm, L., Dolling, A. (2015). “Nature's effect on my mind”–Pa-
tients’ qualitative experiences of a forest-based rehabilitation programme. Urban For-
estry & Urban Greening, 14 (3), 607-614.
http://dx.doi.org/doi:10.1016/j.ufug.2015.06.002.
Stier-Jarmer, M., Throner, V., Kirschneck, M., Immich, G., Frisch, D., & Schuh, A.
(2021). The psychological and physical effects of forests on human health: A

164 Piras
Vis Sustain, 17, 157-164 http://dx.doi.org/10.13135/2384-8677/5987
systematic review of systematic reviews and meta-analyses. International Journal of En-
vironmental Research and Public Health, 18 (4), 1770.
https://doi.org/10.3390/ijerph18041770
Toda, M., Den, R., Hasegawa-Ohira, M., & Morimoto, K. (2013). Effects of woodland
walking on salivary stress markers cortisol and chromogranin A. Complementary thera-
pies in medicine, 21 (1), 29-34. https://doi.org/10.1016/j.ctim.2012.11.004
Tsunetsugu Y, Park BJ, Miyazaki Y (2012) Physiological effects of visual, olfactory, au-
ditory, and tactile factors in the forest environment. In: Li Q (ed) Forest medicine.
Nova Science Publishers Inc, New York, pp 169–181
Verplanken, B., Marks, E., & Dobromir, A. I. (2020). On the nature of eco-anxiety:
How constructive or unconstructive is habitual worry about global warming? Journal
of Environmental Psychology, 72, 101528. https://doi.org/10.1016/j.jenvp.2020.101528
Williams, K., Lee, K.E., Hartig, T., Sargent, L., Williams, N.S., & Johnson, K.A. (2018).
Conceptualising creativity benefits of nature experience: Attention restoration and
mind wandering as complementary processes. Journal of Environmental Psychology, 59,
36-45. https://doi.org/10.1016/j.jenvp.2018.08.005.
Zhang, T., Deng, S., Ma, Q., Sasaki, K., (2015) Evaluations of Landscape Locations
along Trails Based on Walking Experiences and Distances Traveled in the Akasawa
Forest Therapy Base, Central Japan. Forests, 6, 2853-2878.
https://doi.org/10.3390/f6082853.
Author
Pierangela Fiammetta Piras, MD, Head of Forest Therapy, Rete Terapie Forestali in
Foreste Italiane (TeFFIt), Bosco di Puck, Cortona, Italy
Competing Interests
The author has declared that no competing interests exist.
© 2021 Piras, P.F.
This is an open access publication under the terms and conditions of the Creative Commons Attribution (CC BY) license (http://creativecommons.org/licenses/by/4.0/).