n,n-dimethyl-p-toluidine (casrn 99-97-8) in f344/n rats
TRANSCRIPT
NTP TECHNICAL REPORT
ON THE
TOXICOLOGY AND CARCINOGENESIS
STUDIES OF N,N-DIMETHYL-p-TOLUIDINE (CAS NO. 99-97-8)
IN F344/N RATS AND B6C3F1/N MICE (GAVAGE STUDIES)
National Toxicology Program P.O. Box 12233
Research Triangle Park, NC 27709
September 2012
NTP TR 579
NIH Publication No. 12-5921
National Institutes of Health Public Health Service
U.S. DEPARTMENT OF HEALTH AND HUMAN SERVICES

FOREWORD The National Toxicology Program (NTP) is an interagency program within the Public Health Service (PHS) of the Department of Health and Human Services (HHS) and is headquartered at the National Institute of Environmental Health Sciences of the National Institutes of Health (NIEHS/NIH). Three agencies contribute resources to the program: NIEHS/NIH, the National Institute for Occupational Safety and Health of the Centers for Disease Control and Prevention (NIOSH/CDC), and the National Center for Toxicological Research of the Food and Drug Administration (NCTR/FDA). Established in 1978, the NTP is charged with coordinating toxicological testing activities, strengthening the science base in toxicology, developing and validating improved testing methods, and providing information about potentially toxic substances to health regulatory and research agencies, scientific and medical communities, and the public. The Technical Report series began in 1976 with carcinogenesis studies conducted by the National Cancer Institute. In 1981, this bioassay program was transferred to the NTP. The studies described in the Technical Report series are designed and conducted to characterize and evaluate the toxicologic potential, including carcinogenic activity, of selected substances in laboratory animals (usually two species, rats and mice). Substances selected for NTP toxicity and carcinogenicity studies are chosen primarily on the basis of human exposure, level of production, and chemical structure. The interpretive conclusions presented in NTP Technical Reports are based only on the results of these NTP studies. Extrapolation of these results to other species, including characterization of hazards and risks to humans, requires analyses beyond the intent of these reports. Selection per se is not an indicator of a substance’s carcinogenic potential. The NTP conducts its studies in compliance with its laboratory health and safety guidelines and FDA Good Laboratory Practice Regulations and must meet or exceed all applicable federal, state, and local health and safety regulations. Animal care and use are in accordance with the Public Health Service Policy on Humane Care and Use of Animals. Studies are subjected to retrospective quality assurance audits before being presented for public review. NTP Technical Reports are indexed in the NIH/NLM PubMed database and are available free of charge electronically on the NTP website (http://ntp.niehs.nih.gov) or in hardcopy upon request from the NTP Central Data Management group at [email protected] or (919) 541-3419.

NTP TECHNICAL REPORT
ON THE
TOXICOLOGY AND CARCINOGENESIS
STUDIES OF N,N-DIMETHYL-p-TOLUIDINE (CAS NO. 99-97-8)
IN F344/N RATS AND B6C3F1/N MICE (GAVAGE STUDIES)
National Toxicology Program P.O. Box 12233
Research Triangle Park, NC 27709
September 2012
NTP TR 579
NIH Publication No. 12-5921
National Institutes of Health Public Health Service
U.S. DEPARTMENT OF HEALTH AND HUMAN SERVICES

2
CONTRIBUTORS
National Toxicology Program Evaluated and interpreted results and reported findings J.K. Dunnick, Ph.D., Study Scientist A.E. Brix, D.V.M., Ph.D., Study Pathologist
Experimental Pathology Laboratories, Inc. J.B. Bishop, Ph.D. R.S. Chhabra, Ph.D. P.M. Foster, Ph.D. R.A. Herbert, D.V.M., Ph.D. M.J. Hooth, Ph.D. A.P. King-Herbert, D.V.M. G.E. Kissling, Ph.D. D.E. Malarkey, D.V.M., Ph.D. J.H. Roycroft, Ph.D. J.M. Sanders, Ph.D. C.S. Smith, Ph.D. G.S. Travlos, D.V.M. N.J. Walker, Ph.D. K.L. Witt, M.S. Battelle Columbus Operations Conducted studies and evaluated pathology findings M.R. Hejtmancik, Ph.D., Principal Investigator D.M. Sells, D.V.M., Ph.D. J.D. Toft, II, D.V.M., Ph.D. D.Y. Vasconcelos, D.V.M., Ph.D. Experimental Pathology Laboratories, Inc. Provided pathology review M.H. Hamlin, II, D.V.M., Principal Investigator A.E. Brix, D.V.M., Ph.D. H.M. Kolenda-Roberts, D.V.M., Ph.D. R.A. Miller, D.V.M., Ph.D. R.R. Moore, D.V.M., Ph.D. TherImmune Research Corporation Provided SMVCE analysis G.W. Wolfe, Ph.D., Principal Investigator B. Atkinson, M.Sc. Y. Wang, M.S.
Dynamac Corporation Prepared quality assessment audits S. Brecher, Ph.D., Principal Investigator S. Iyer, B.S. V.S. Tharakan, D.V.M. NTP Pathology Working Group Evaluated slides and contributed to pathology report on 2-year rats (July 1, 2010) G.D. Hill, D.V.M., Ph.D., Coordinator
ILS, Inc. A.E. Brix, D.V.M., Ph.D.
Experimental Pathology Laboratories, Inc. J.T. Painter, D.V.M., Ph.D.
ILS, Inc. M.F. Cesta, D.V.M., Ph.D.
National Toxicology Program G.P. Flake, M.D.
National Toxicology Program R.A. Herbert, D.V.M., Ph.D.
National Toxicology Program H.M. Kolenda-Roberts, D.V.M., Ph.D.
Experimental Pathology Laboratories, Inc. D.E. Malarkey, D.V.M., Ph.D.
National Toxicology Program R.A. Miller, D.V.M., Ph.D.
Experimental Pathology Laboratories, Inc. K.T. Morgan, B.V.Sc., Ph.D.
Sanofi-Aventis Evaluated slides and contributed to pathology report on 2-year mice (May 6, 2010) J.T. Painter, D.V.M., Ph.D., Coordinator
ILS, Inc. D.K. Giri, D.V.M., Ph.D., Coordinator
ILS, Inc. A.E. Brix, D.V.M., Ph.D.
Experimental Pathology Laboratories, Inc. M.F. Cesta, D.V.M., Ph.D.
National Toxicology Program S. Chandra, D.V.M., Ph.D.
GlaxoSmithKline S.A. Elmore, D.V.M., M.S.
National Toxicology Program G.P. Flake, M.D.
National Toxicology Program R.A. Herbert, D.V.M., Ph.D.
National Toxicology Program R.R. Moore, D.V.M., Ph.D.
Experimental Pathology Laboratories, Inc.

N,N-Dimethyl-p-toluidine, NTP TR 579 3
SRA International, Inc. Provided statistical analyses R.W. Morris, Ph.D., Principal Investigator L.J. Betz, M.S. S.F. Harris, B.S.
Biotechnical Services, Inc. Prepared Technical Report S.R. Gunnels, M.A., Principal Investigator B.F. Hall, M.S. L.M. Harper, B.S. P.C. Rathman, B.S.E. D.C. Serbus, Ph.D.
4
CONTENTS
ABSTRACT ................................................................................................................................................................. 7
EXPLANATION OF LEVELS OF EVIDENCE OF CARCINOGENIC ACTIVITY ........................................ 14
PEER REVIEW PANEL .......................................................................................................................................... 15
SUMMARY OF PEER REVIEW PANEL COMMENTS ..................................................................................... 16
INTRODUCTION ..................................................................................................................................................... 19
MATERIALS AND METHODS .............................................................................................................................. 25
RESULTS ................................................................................................................................................................... 35
DISCUSSION AND CONCLUSIONS ..................................................................................................................... 85
REFERENCES .......................................................................................................................................................... 91
APPENDIX A Summary of Lesions in Male Rats in the 2-Year Gavage Study of N,N-Dimethyl-p-toluidine ......................................................................................................... 99 APPENDIX B Summary of Lesions in Female Rats in the 2-Year Gavage Study of N,N-Dimethyl-p-toluidine ....................................................................................................... 117 APPENDIX C Summary of Lesions in Male Mice in the 2-Year Gavage Study of N,N-Dimethyl-p-toluidine ....................................................................................................... 133 APPENDIX D Summary of Lesions in Female Mice in the 2-Year Gavage Study of N,N-Dimethyl-p-toluidine ....................................................................................................... 149 APPENDIX E Genetic Toxicology ...................................................................................................................... 165 APPENDIX F Clinical Pathology Results .......................................................................................................... 175 APPENDIX G Organ Weights and Organ-Weight-to-Body-Weight Ratios ................................................... 183 APPENDIX H Reproductive Tissue Evaluations and Estrous Cycle Characterization ................................. 187 APPENDIX I Chemical Characterization and Dose Formulation Studies .................................................... 193

N,N-Dimethyl-p-toluidine, NTP TR 579 5
APPENDIX J Ingredients, Nutrient Composition, and Contaminant Levels in NTP-2000 Rat and Mouse Ration .......................................................................................... 205 APPENDIX K Sentinel Animal Program ........................................................................................................... 209
6 N,N-Dimethyl-p-toluidine, NTP TR 579
SUMMARY
Background N,N-Dimethyl-p-toluidine is used in hardening dental materials and bone cements. We studied the effects of N,N-dimethyl-p-toluidine on male and female rats and mice to identify potential toxic or cancer-related hazards.
Methods We deposited solutions containing N,N-dimethyl-p-toluidine in corn oil through a tube directly into the stomach to groups of 50 male and female rats and mice five days per week for two years. Animals received 6, 20, or 60 milligrams of N,N-dimethyl-p-toluidine per kilogram body weight. Control animals received corn oil with no chemical added by the same method. At the end of the study, tissues from more than 40 sites were examined for every animal.
Results In all four studies, the incidences of liver tumors were greater in animals receiving N,N-dimethyl-p-toluidine than in the control groups. These tumors were hepatocellular carcinomas and adenomas in both rats and mice, plus hepatoblastomas in male and female mice. Male and female rats administered N,N-dimethyl-p-toluidine had cancers of the nose (transitional epithelial adenomas). Male rats also had slightly increased rates of thyroid gland tumors. Female mice exposed to N,N-dimethyl-p-toluidine also had increased incidences of lung tumors (alvelolar/bronchiolar adenomas and carcinomas) and of forestomach tumors.
Conclusions We conclude that N,N-dimethyl-p-toluidine caused cancers of the liver and nose in male and female rats, cancer of the liver in male and female mice, and cancers of the lung and forestomach in female mice. Thyroid gland tumors in male rats may also have been related to exposure to N,N-dimethyl-p-toluidine.

7
ABSTRACT
N,N-DIMETHYL-p-TOLUIDINE
CAS No. 99-97-8
Chemical Formula: C9H13N Molecular Weight: 135.21
Synonyms: N,N-dimethyl-4-methylaniline; dimethyl-4-toluidine; dimethyl-p-toluidine; N,N-dimethyl-p-tolylamine; p-(dimethylamino)toluene; p-methyl-N,N-dimethylaniline; N,N,4-trimethylaniline; p,N,N-trimethylaniline; N,N,4-trimethylbenzenamine
N,N-Dimethyl-p-toluidine was nominated for toxicology and carcinogenesis studies by the National Cancer Institute based on the potential for human exposure through its use in dental materials and bone cements and the lack of toxicity and carcinogenicity data. Male and female F344/N rats and B6C3F1/N mice were administered N,N-dimethyl-p-toluidine (greater than 99% pure) in corn oil by gavage for 3 months or 2 years. Genetic toxicology studies were conducted in Salmonella typhimurium and Escherichia coli, mouse peripheral blood, and mouse and rat liver.
3-MONTH STUDY IN RATS Groups of 10 male and 10 female rats were adminis-tered 0, 62.5, 125, 250, 500, or 1,000 mg N,N-dimethyl-p-toluidine/kg body weight in corn oil by gavage, 5 days per week for 14 weeks. Additional groups of 10 male and 10 female rats (clinical pathology study) were administered the same doses, 5 days per week for 25 days. On day 88, blood was collected from core study rats for hemoglobin and methemoglobin analyses only. All 1,000 mg/kg male and female rats and one
500 mg/kg male rat died by study day 3. Mean body weights of all surviving dosed groups of males and females were significantly less than those of the vehicle controls. Clinical findings associated with exposure to N,N-dimethyl-p-toluidine included cyanosis, abnormal breathing, and lethargy in groups administered 250 mg/kg or greater. Methemoglobinemia appeared to be the primary hema-tologic toxic response, and many other lesions could be explained as secondary to methemoglobin formation including Heinz body formation; a macrocytic, hypo-chromic, responsive anemia; and increased hematopoi-etic cell proliferation in the spleen and bone marrow. In general, hematologic changes were dose-related and occurred at both evaluated timepoints in all dosed groups. Anemia was evidenced by decreases in hemat-ocrit values, hemoglobin concentrations, and erythro-cyte counts; erythrocyte macrocytosis was characterized by increases in mean cell volume and mean cell hemo-globin values; erythrocyte hypochromia was evidenced by decreases in mean cell hemoglobin concentration values; and an erythropoietic response to the anemia
8 N,N-Dimethyl-p-toluidine, NTP TR 579
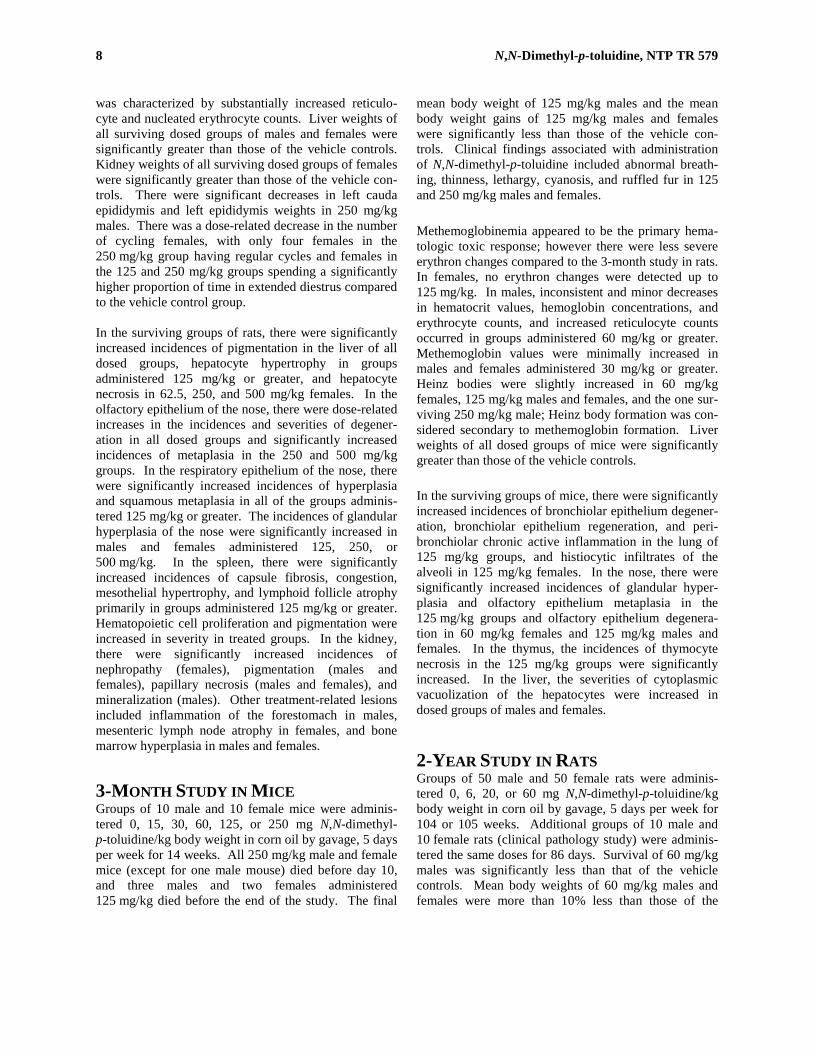
was characterized by substantially increased reticulo-cyte and nucleated erythrocyte counts. Liver weights of all surviving dosed groups of males and females were significantly greater than those of the vehicle controls. Kidney weights of all surviving dosed groups of females were significantly greater than those of the vehicle con-trols. There were significant decreases in left cauda epididymis and left epididymis weights in 250 mg/kg males. There was a dose-related decrease in the number of cycling females, with only four females in the 250 mg/kg group having regular cycles and females in the 125 and 250 mg/kg groups spending a significantly higher proportion of time in extended diestrus compared to the vehicle control group. In the surviving groups of rats, there were significantly increased incidences of pigmentation in the liver of all dosed groups, hepatocyte hypertrophy in groups administered 125 mg/kg or greater, and hepatocyte necrosis in 62.5, 250, and 500 mg/kg females. In the olfactory epithelium of the nose, there were dose-related increases in the incidences and severities of degener-ation in all dosed groups and significantly increased incidences of metaplasia in the 250 and 500 mg/kg groups. In the respiratory epithelium of the nose, there were significantly increased incidences of hyperplasia and squamous metaplasia in all of the groups adminis-tered 125 mg/kg or greater. The incidences of glandular hyperplasia of the nose were significantly increased in males and females administered 125, 250, or 500 mg/kg. In the spleen, there were significantly increased incidences of capsule fibrosis, congestion, mesothelial hypertrophy, and lymphoid follicle atrophy primarily in groups administered 125 mg/kg or greater. Hematopoietic cell proliferation and pigmentation were increased in severity in treated groups. In the kidney, there were significantly increased incidences of nephropathy (females), pigmentation (males and females), papillary necrosis (males and females), and mineralization (males). Other treatment-related lesions included inflammation of the forestomach in males, mesenteric lymph node atrophy in females, and bone marrow hyperplasia in males and females.
3-MONTH STUDY IN MICE Groups of 10 male and 10 female mice were adminis-tered 0, 15, 30, 60, 125, or 250 mg N,N-dimethyl-p-toluidine/kg body weight in corn oil by gavage, 5 days per week for 14 weeks. All 250 mg/kg male and female mice (except for one male mouse) died before day 10, and three males and two females administered 125 mg/kg died before the end of the study. The final
mean body weight of 125 mg/kg males and the mean body weight gains of 125 mg/kg males and females were significantly less than those of the vehicle con-trols. Clinical findings associated with administration of N,N-dimethyl-p-toluidine included abnormal breath-ing, thinness, lethargy, cyanosis, and ruffled fur in 125 and 250 mg/kg males and females. Methemoglobinemia appeared to be the primary hema-tologic toxic response; however there were less severe erythron changes compared to the 3-month study in rats. In females, no erythron changes were detected up to 125 mg/kg. In males, inconsistent and minor decreases in hematocrit values, hemoglobin concentrations, and erythrocyte counts, and increased reticulocyte counts occurred in groups administered 60 mg/kg or greater. Methemoglobin values were minimally increased in males and females administered 30 mg/kg or greater. Heinz bodies were slightly increased in 60 mg/kg females, 125 mg/kg males and females, and the one sur-viving 250 mg/kg male; Heinz body formation was con-sidered secondary to methemoglobin formation. Liver weights of all dosed groups of mice were significantly greater than those of the vehicle controls. In the surviving groups of mice, there were significantly increased incidences of bronchiolar epithelium degener-ation, bronchiolar epithelium regeneration, and peri-bronchiolar chronic active inflammation in the lung of 125 mg/kg groups, and histiocytic infiltrates of the alveoli in 125 mg/kg females. In the nose, there were significantly increased incidences of glandular hyper-plasia and olfactory epithelium metaplasia in the 125 mg/kg groups and olfactory epithelium degenera-tion in 60 mg/kg females and 125 mg/kg males and females. In the thymus, the incidences of thymocyte necrosis in the 125 mg/kg groups were significantly increased. In the liver, the severities of cytoplasmic vacuolization of the hepatocytes were increased in dosed groups of males and females.
2-YEAR STUDY IN RATS Groups of 50 male and 50 female rats were adminis-tered 0, 6, 20, or 60 mg N,N-dimethyl-p-toluidine/kg body weight in corn oil by gavage, 5 days per week for 104 or 105 weeks. Additional groups of 10 male and 10 female rats (clinical pathology study) were adminis-tered the same doses for 86 days. Survival of 60 mg/kg males was significantly less than that of the vehicle controls. Mean body weights of 60 mg/kg males and females were more than 10% less than those of the

N,N-Dimethyl-p-toluidine, NTP TR 579 9
vehicle controls after week 61 and week 33, respec-tively. Clinical findings included signs of pallor in 60 mg/kg females and hyperactivity and boxing behav-ior in 20 mg/kg females and 60 mg/kg males and females. The hematology findings at the 3-month timepoint were consistent with those in the 3-month study in rats which indicated that methemoglobinemia was the primary hematologic toxic response. In the 20 and 60 mg/kg groups, there were dose-related decreases in hematocrit values, hemoglobin concentrations, and erythrocyte counts. There were similar trends toward erythrocyte macrocytosis and hypochromia and increased erythro-poiesis as seen in the 3-month study. While the magni-tudes of the erythron decreases were not sufficient to classify the responses as anemias, the patterns of the erythron changes were identical to those in the 3-month study. In the liver of 60 mg/kg males and females, there were significantly increased incidences of hepatocellular car-cinoma and hepatocellular adenoma or hepatocellular carcinoma (combined). Numerous nonneoplastic liver lesions occurred in dosed males and females primarily in the 20 and 60 mg/kg groups. In the nose, there were significantly increased inci-dences of transitional epithelium adenoma and transi-tional epithelium adenoma or carcinoma (combined) in 60 mg/kg males; transitional epithelium adenoma also occurred in female rats administered 6 or 60 mg/kg. In the nose, there were significantly increased incidences of nonneoplastic lesions in the olfactory, respiratory, and transitional epithelia of dosed rats. These lesions occurred with the greatest incidence and severity in the 60 mg/kg groups. The incidences of inflammation and nerve atrophy were significantly increased in males and females administered 60 mg/kg. There were increased incidences of follicular cell ade-noma or carcinoma (combined) of the thyroid gland in all dosed groups of males, and an increased incidence of follicular cell adenoma in 20 mg/kg females. In the spleen, there were significantly increased inci-dences of hematopoietic cell proliferation in all dosed groups of males and females. The incidences of con-gestion and mesothelial hypertrophy of the capsule were significantly increased in 60 mg/kg males and all dosed groups of females. There were also significantly increased incidences of capsular fibrosis and atrophy of the lymphoid follicle in the 60 mg/kg groups. The inci-dences of pigmentation were significantly increased in all dosed groups of males and in 60 mg/kg females.
In all dosed groups of female rats, there were signifi-cantly increased incidences of nephropathy. Although the incidences of this lesion were not significantly increased in dosed males, the severities increased with increasing dose in both males and females. The inci-dences of pigmentation of the kidney were significantly increased in all dosed groups of males and in 60 mg/kg females. In the forestomach of males, there were significantly increased incidences of hyperplasia and ulcer in the 20 and 60 mg/kg groups and inflammation in the 60 mg/kg group. In the bone marrow of 20 and 60 mg/kg males and 60 mg/kg females, there were significantly increased incidences of hyperplasia. In the mesenteric lymph node of 20 and 60 mg/kg males, there were sig-nificantly increased incidences of histiocytic cellular infiltrates.
2-YEAR STUDY IN MICE Groups of 50 male and 50 female mice were adminis-tered 0, 6, 20, or 60 mg N,N-dimethyl-p-toluidine/kg body weight in corn oil by gavage, 5 days per week for 105 weeks. Survival of 60 mg/kg females was signifi-cantly less than that of the vehicle control group. Mean body weights of 60 mg/kg males and females were more than 10% less than those of the vehicle controls after week 89 and week 65, respectively. In the liver, there were significantly increased inci-dences of hepatocellular adenoma in 20 and 60 mg/kg females and hepatocellular carcinoma in 60 mg/kg males and all dosed female groups. The increased inci-dences of hepatocellular adenoma and carcinoma in the dosed groups were primarily due to increased inci-dences of animals with multiple hepatocellular neo-plasms. The incidences of hepatoblastoma were signifi-cantly increased in 20 mg/kg males and 60 mg/kg males and females. In all dosed groups of males and females, there were significantly increased incidences of hepato-cyte hypertrophy, and the incidences of eosinophilic focus were significantly increased in the 20 and 60 mg/kg males and females. There were significantly increased incidences of fatty change and necrosis in 60 mg/kg females. In the lung of 20 and 60 mg/kg female mice, there were significantly increased incidences of alveolar/ bronchi-olar adenoma and alveolar/bronchiolar adenoma or car-cinoma (combined). There were also significantly increased incidences of alveolar epithelium hyperplasia in 20 mg/kg females; bronchiolar epithelium regenera-tion, bronchus epithelium regeneration, and bronchus

10 N,N-Dimethyl-p-toluidine, NTP TR 579
necrosis in 60 mg/kg females; and alveolar infiltrates of histiocytes in 60 mg/kg males and females. In the forestomach of 20 and 60 mg/kg female mice, there were significantly increased incidences of squa-mous cell papilloma and squamous cell papilloma or carcinoma (combined). There were significantly increased incidences of epithelium hyperplasia in 20 and 60 mg/kg females, and inflammation and ulcer in 60 mg/kg females. In the nose, there were significantly increased inci-dences of nonneoplastic lesions of the olfactory and respiratory epithelia in 60 mg/kg males and 20 and 60 mg/kg females. There were significantly increased incidences of nerve atrophy in 60 mg/kg males and females and of inflammation in 60 mg/kg females. The incidences of atrophy of the olfactory lobe were signifi-cantly increased in 60 mg/kg males and females. In 60 mg/kg females, the incidences of regenerative hyper-plasia of the nasolacrimal duct and necrosis of the vomeronasal organ were significantly increased. In the spleen, there was a significantly increased inci-dence of atrophy in 60 mg/kg females. There were also significantly increased incidences of bone marrow hyperplasia in all dosed groups of females and mesen-teric lymph node atrophy in 60 mg/kg females.
GENETIC TOXICOLOGY N,N-Dimethyl-p-toluidine was tested in two indepen-dent bacterial gene mutation studies; both studies gave negative results in S. typhimurium or E. coli tester strains, with and without exogenous metabolic activa-tion. In vivo, no significant increases in the frequencies of micronucleated erythrocytes were observed in peripheral blood of male or female B6C3F1/N mice treated with N,N-dimethyl-p-toluidine by gavage for 3 months. Furthermore, no increases in micronucleated reticulocytes were observed in male B6C3F1/N mice treated with N,N-dimethyl-p-toluidine for 4 days. Results of DNA damage (comet) studies yielded mixed results. No increases in DNA damage (measured as percent tail DNA) were seen in liver cells or blood leukocytes of male B6C3F1/N mice administered N,N-dimethyl-p-toluidine by gavage once daily for 4 days. However, a small but significant increase in
DNA damage was seen in liver cells of male Sprague-Dawley rats administered 60 mg/kg N,N-dimethyl-p-toluidine once daily for 4 days.
CONCLUSIONS Under the conditions of these 2-year oral gavage studies, there was clear evidence of carcinogenic activity* of N,N-dimethyl-p-toluidine in male F344/N rats based on increased incidences of hepatocellular carcinoma, and hepatocellular adenoma or carcinoma (combined), and increased incidences of nasal cavity neoplasms (primarily nasal cavity transitional epithe-lium adenoma). The increased incidences of thyroid gland follicular cell neoplasms may have been related to treatment. There was clear evidence of carcinogenic activity of N,N-dimethyl-p-toluidine in female F344/N rats based on increased incidences of hepatocellular carcinoma and hepatocellular adenoma or carcinoma (combined). The occurrence of nasal cavity transitional epithelium adenoma was considered to be related to treatment. There was clear evidence of carcinogenic activity of N,N-dimethyl-p-toluidine in male B6C3F1/N mice based on increased incidences of hepatocellular adenoma (multiple), hepatocellular carcinoma, and hepatoblastoma. There was clear evidence of carcino-genic activity of N,N-dimethyl-p-toluidine in female B6C3F1/N mice based on increased incidences of hepatocellular adenoma, hepatocellular carcinoma, and hepatoblastoma and increased incidences of alveolar/ bronchiolar neoplasms (primarily adenoma). The increased incidences of forestomach squamous cell pap-illoma in female mice were considered to be related to treatment. Administration of N,N-dimethyl-p-toluidine resulted in increased incidences of nonneoplastic lesions of the liver and nasal cavity in male and female rats and mice; the kidney in male and female rats; the spleen and bone marrow in male and female rats and female mice; the lung in male and female mice; the forestomach in male rats and female mice; the mesenteric lymph node in male rats and female mice; and the olfactory lobe in male and female mice. N,N-Dimethyl-p-toluidine also caused hematologic tox-icity and increases in methemoglobin levels in male and female rats and mice (as measured at 3 months).
* Explanation of Levels of Evidence of Carcinogenic Activity is on page 14. A summary of the Peer Review Panel comments and the public
discussion on this Technical Report appears on page 16.

N,N-Dimethyl-p-toluidine, NTP TR 579 11
Summary of the 2-Year Carcinogenesis and Genetic Toxicology Studies of N,N-Dimethyl-p-toluidine
Male F344/N Rats
Female
F344/N Rats
Male
B6C3F1/N Mice
Female
B6C3F1/N Mice
Doses in corn oil by gavage
0, 6, 20, or 60 mg/kg 0, 6, 20, or 60 mg/kg 0, 6, 20, or 60 mg/kg 0, 6, 20, or 60 mg/kg
Body weights 60 mg/kg group 10% less
than the vehicle control group after week 61
60 mg/kg group 10% less than the vehicle control group after week 33
60 mg/kg group 10% less than the vehicle control group after week 89
60 mg/kg group 10% less than the vehicle control group after week 65
Survival rates 37/50, 37/50, 31/50, 21/50 33/50, 42/50, 33/50, 23/50 34/50, 36/50, 31/50, 36/50 43/50, 40/50, 39/50, 32/50 Nonneoplastic effects Liver: eosinophilic focus
(11/50, 21/50, 21/50, 29/50); mixed cell focus (18/50, 17/50, 17/50, 35/50); bile duct, fibrosis (21/50, 27/50, 41/50, 42/50); bile duct, hyperplasia (40/50, 42/50, 44/50, 44/50); degeneration, cystic (4/50, 10/50, 9/50, 17/50); hepatocyte, hypertrophy (0/50, 0/50, 6/50, 31/50) Nose: glands, olfactory epithelium, dilatation (0/50, 0/49, 3/50, 49/49); glands, olfactory epithelium, hyperplasia (0/50, 2/49, 0/50, 48/49); glands, olfactory epithelium, metaplasia (0/50, 0/49, 0/50, 38/49); glands, olfactory epithelium, necrosis (0/50, 0/49, 0/50, 22/49); glands, respiratory epithelium, dilatation (13/50, 15/49, 19/50, 48/49); glands, respiratory epithelium, hyperplasia (0/50, 8/49, 8/50, 41/49); glands, respiratory epithelium, metaplasia, respiratory (29/50, 39/49, 39/50, 47/49); glands, transitional epithelium, dilatation (0/50, 0/49, 5/50, 3/49); glands, transitional epithelium, hyperplasia (0/50, 1/49, 24/50, 40/49); inflammation (35/50, 40/49, 38/50, 48/49); nerve, atrophy (0/50, 0/49, 0/50, 15/49); olfactory epithelium, degeneration (0/50, 0/49, 1/50, 47/49); olfactory epithelium, hyperplasia, basal cell (0/50, 1/49, 2/50, 38/49);
Liver: clear cell focus (7/50, 17/50, 24/50, 29/49); eosinophilic focus (18/50, 24/50, 29/50, 32/49); mixed cell focus (14/50, 20/50, 17/50, 26/49); bile duct, fibrosis (6/50, 11/50, 23/50, 27/49); bile duct, hyperplasia (10/50, 21/50, 27/50, 43/49); degeneration, cystic (0/50, 0/50, 2/50, 10/49); hepatocyte, hypertrophy (0/50, 0/50, 6/50, 22/49); hepatocyte, necrosis (0/50, 0/50, 1/50, 5/49) Nose: glands, olfactory epithelium, dilatation (0/50, 0/49, 0/50, 48/49); glands, olfactory epithelium, hyperplasia (0/50, 0/49, 4/50, 47/49); glands, olfactory epithelium, metaplasia (0/50, 0/49, 0/50, 42/49); glands, olfactory epithelium, necrosis (0/50, 0/49, 0/50, 18/49); glands, respiratory epithelium, dilatation (5/50, 12/49, 27/50, 47/49); glands, respiratory epithelium, hyperplasia (6/50, 9/49, 22/50, 45/49); glands, respiratory epithelium, metaplasia, respiratory (17/50, 33/49, 44/50, 47/49); glands, transitional epithelium, dilatation (0/50, 0/49, 0/50, 9/49); glands, transitional epithelium, hyperplasia (0/50, 4/49, 12/50, 24/49); inflammation (23/50, 24/49, 22/50, 45/49); nerve, atrophy (0/50, 0/49, 0/50, 4/49);
Liver: eosinophilic focus (25/50, 30/50, 39/50, 43/50); hepatocyte, hypertrophy (1/50, 9/50, 11/50, 16/50) Nose: glands, olfactory epithelium, dilatation (4/49, 11/50, 7/50, 48/50); glands, olfactory epithelium, hyperplasia (4/49, 9/50, 7/50, 49/50); glands, olfactory epithelium, metaplasia, respiratory (5/49, 5/50, 6/50, 48/50); glands, respiratory epithelium, dilatation (17/49, 19/50, 13/50, 41/50); glands, respiratory epithelium, metaplasia, respiratory (2/49, 2/50, 2/50, 10/50); nerve, atrophy (2/49, 7/50, 4/50, 42/50); olfactory epithelium, metaplasia, respiratory (10/49, 10/50, 5/50, 49/50); olfactory epithelium, necrosis (1/49, 3/50, 3/50, 8/50) Lung: alveolus, infiltration cellular, histiocyte (1/50, 2/50, 2/50, 10/50) Olfactory lobe: atrophy (0/38, 1/43, 0/39, 5/34)
Liver: eosinophilic focus (20/50, 18/50, 45/50, 38/50); fatty change (1/50, 0/50, 0/50, 8/50); hepatocyte, hypertrophy (0/50, 11/50, 10/50, 17/50); necrosis (1/50, 8/50, 4/50, 10/50) Lung: alveolar epithelium, hyperplasia (2/50, 3/50, 8/50, 2/50); alveolus, infiltration cellular, histiocyte (1/50, 0/50, 0/50, 7/50); bronchiole, epithelium, regeneration (0/50, 0/50, 0/50, 5/50); bronchus, epithelium, regeneration (0/50, 0/50, 0/50, 5/50); bronchus, necrosis (0/50, 0/50, 0/50, 5/50) Forestomach: epithelium, hyperplasia (3/50, 5/50, 12/50, 17/50); inflammation (3/50, 4/50, 7/50, 16/50); ulcer (2/50, 2/50, 4/50, 7/50) Nose: glands, olfactory epithelium, dilatation (13/50, 14/49, 20/50, 46/50); glands, olfactory epithelium, hyperplasia (2/50, 14/49, 14/50, 50/50); glands, olfactory epithelium, metaplasia, respiratory (2/50, 5/49, 7/50, 44/50); glands, respiratory epithelium, dilatation (10/50, 17/49, 15/50, 33/50); glands, respiratory epithelium, hyperplasia (0/50, 2/49, 12/50, 13/50); glands, respiratory epithelium, metaplasia, respiratory (0/50, 0/49, 10/50, 10/50); inflammation (3/50, 7/49, 3/50, 32/50);

12 N,N-Dimethyl-p-toluidine, NTP TR 579
Summary of the 2-Year Carcinogenesis and Genetic Toxicology Studies of N,N-Dimethyl-p-toluidine
Male F344/N Rats
Female
F344/N Rats
Male
B6C3F1/N Mice
Female
B6C3F1/N Mice
Nonneoplastic effects (continued)
Nose (continued): olfactory epithelium, metaplasia, respiratory (4/50, 9/49, 9/50, 40/49); respiratory epithelium, hyperplasia (15/50, 29/49, 32/50, 49/49); transitional epithelium, hyperplasia (1/50, 1/49, 11/50, 46/49) Spleen: capsule, fibrosis (1/50, 0/50, 2/50, 46/50); capsule, hypertrophy, mesothelium (0/50, 1/50, 3/50, 39/50); congestion (1/50, 0/50, 0/50, 39/50); hematopoietic cell proliferation (34/50, 44/50, 42/50, 44/50); lymphoid follicle, atrophy (0/50, 5/50, 2/50, 19/50); pigmentation (36/50, 48/50, 47/50, 48/50) Kidney: severity of nephropathy (1.4, 2.0, 2.5, 2.7); pigmentation (24/50, 46/50, 37/50, 44/50) Forestomach: hyperplasia (0/50, 3/50, 5/50, 11/50); inflammation (1/50, 5/50, 5/50, 7/50); ulcer (0/50, 2/50, 5/50, 6/50) Bone marrow: hyperplasia (17/50, 13/50, 28/50, 50/50) Mesenteric lymph node: infiltration cellular, histiocyte (21/50, 23/50, 30/50, 34/50)
Nose (continued): olfactory epithelium, degeneration (0/50, 0/49, 1/50, 46/49); olfactory epithelium, hyperplasia, basal cell (0/50, 0/49, 0/50, 25/49); olfactory epithelium, metaplasia, respiratory (4/50, 6/49, 1/50, 21/49); respiratory epithelium, hyperplasia (10/50, 13/49, 11/50, 41/49); transitional epithelium, hyperplasia (0/50, 1/49, 6/50, 33/49) Spleen: capsule, fibrosis (8/50, 0/50, 8/50, 41/50); capsule, hypertrophy, mesothelium (1/50, 14/50, 10/50, 16/50); congestion (0/50, 9/50, 26/50, 28/50); hematopoietic cell proliferation (32/50, 45/50, 47/50, 42/50); lymphoid follicle, atrophy (1/50, 2/50, 0/50, 28/50); pigmentation (44/50, 47/50, 47/50, 49/50) Kidney: nephropathy (28/50, 38/50, 38/50, 41/50): severity of nephropathy (1.1, 1.2, 1.2, 1.8); pigmentation (41/50, 45/50, 43/50, 49/50) Bone marrow: hyperplasia (18/50, 13/50, 18/50, 49/50)
Nose (continued): nasolacrimal duct, hyperplasia, regenerative (0/50, 0/49, 0/50, 4/50); nerve, atrophy (0/50, 0/49, 0/50, 41/50); olfactory epithelium, accumulation, hyaline droplet (2/50, 5/49, 8/50, 15/50); olfactory epithelium, metaplasia, respiratory (1/50, 6/49, 14/50, 46/50); olfactory epithelium, necrosis (0/50, 0/49, 3/50, 6/50); respiratory epithelium, hyperplasia (11/50, 15/49, 11/50, 30/50); respiratory epithelium, necrosis (0/50, 0/49, 0/50, 5/50); vomeronasal organ, necrosis (0/50, 0/49, 0/50, 4/50) Olfactory lobe: atrophy (0/27, 0/34, 0/24, 8/29) Bone marrow: hyperplasia (5/50, 14/50, 15/50, 14/49) Mesenteric lymph node: atrophy (1/49, 5/49, 5/49, 12/50) Spleen: red pulp atrophy (0/49, 0/49, 0/49, 5/50)
Neoplastic effects Liver: hepatocellular
carcinoma (0/50, 0/50, 1/50, 6/50); hepatocellular adenoma or carcinoma (0/50, 0/50, 2/50, 6/50) Nose: transitional epithelium, adenoma (0/50, 3/49, 2/50, 11/49); transitional epithelium, adenoma or carcinoma (0/50, 3/49, 2/50, 13/49)
Liver: hepatocellular carcinoma (0/50, 0/50, 0/50, 4/49); hepatocellular adenoma or carcinoma (0/50, 1/50, 1/50, 7/49) Nose: transitional epithelium, adenoma (0/50, 1/49, 0/50, 2/49)
Liver: hepatocellular adenoma, multiple (17/50, 19/50, 27/50, 26/50); hepatocellular carcinoma (22/50, 25/50, 30/50, 36/50); hepatoblastoma (1/50, 5/50, 10/50, 8/50)
Liver: hepatocellular adenoma (17/50, 19/50, 37/50, 44/50); hepatocellular carcinoma (6/50, 13/50, 18/50, 31/50); hepatoblastoma (0/50, 1/50, 0/50, 4/50) Lung: alveolar/bronchiolar adenoma (2/50, 4/50, 8/50, 12/50); alveolar/bronchiolar adenoma or carcinoma (2/50, 5/50, 9/50, 13/50)

N,N-Dimethyl-p-toluidine, NTP TR 579 13
Summary of the 2-Year Carcinogenesis and Genetic Toxicology Studies of N,N-Dimethyl-p-toluidine
Male F344/N Rats
Female
F344/N Rats
Male
B6C3F1/N Mice
Female
B6C3F1/N Mice
Neoplastic effects (continued)
Forestomach: squamous cell papilloma (1/50, 5/50, 6/50, 7/50); squamous cell papilloma or carcinoma (1/50, 6/50, 6/50, 7/50)
Equivocal effects Thyroid gland: follicular
cell adenoma or carcinoma (1/50, 2/49, 2/50, 4/49)
None None None
Level of evidence of carcinogenic activity
Clear evidence Clear evidence Clear evidence Clear evidence
Genetic toxicology Bacterial gene mutations: Negative in S. typhimurium strains TA97, TA98, TA100, and TA1535
with and without S9; negative in E. coli WP2 uvrA/pKM101 with and without S9
Micronucleated erythrocytes Mouse peripheral blood in vivo: Negative in males and females (3-month study) and males (4-day
study) DNA damage
Male mouse blood and liver in vivo: Negative Male rat liver in vivo: Positive

14 N,N-Dimethyl-p-toluidine, NTP TR 579
EXPLANATION OF LEVELS OF EVIDENCE OF CARCINOGENIC ACTIVITY
The National Toxicology Program describes the results of individual experiments on a chemical agent and notes the strength of the evidence for conclusions regarding each study. Negative results, in which the study animals do not have a greater incidence of neoplasia than control animals, do not necessarily mean that a chemical is not a carcinogen, inasmuch as the experiments are conducted under a limited set of conditions. Positive results demonstrate that a chemical is carcinogenic for laboratory animals under the conditions of the study and indicate that exposure to the chemical has the potential for hazard to humans. Other organizations, such as the International Agency for Research on Cancer, assign a strength of evidence for conclusions based on an examination of all available evidence, including animal studies such as those conducted by the NTP, epidemiologic studies, and estimates of exposure. Thus, the actual determination of risk to humans from chemicals found to be carcinogenic in laboratory animals requires a wider analysis that extends beyond the purview of these studies. Five categories of evidence of carcinogenic activity are used in the Technical Report series to summarize the strength of evidence observed in each experiment: two categories for positive results (clear evidence and some evidence); one category for uncertain findings (equivocal evidence); one category for no observable effects (no evidence); and one category for experiments that cannot be evaluated because of major flaws (inadequate study). These categories of interpretative conclusions were first adopted in June 1983 and then revised on March 1986 for use in the Technical Report series to incorporate more specifically the concept of actual weight of evidence of carcinogenic activity. For each separate experiment (male rats, female rats, male mice, female mice), one of the following five categories is selected to describe the findings. These categories refer to the strength of the experimental evidence and not to potency or mechanism.
• Clear evidence of carcinogenic activity is demonstrated by studies that are interpreted as showing a dose-related (i) increase of malignant neoplasms, (ii) increase of a combination of malignant and benign neoplasms, or (iii) marked increase of benign neoplasms if there is an indication from this or other studies of the ability of such tumors to progress to malignancy.
• Some evidence of carcinogenic activity is demonstrated by studies that are interpreted as showing a chemical-related increased incidence of neoplasms (malignant, benign, or combined) in which the strength of the response is less than that required for clear evidence.
• Equivocal evidence of carcinogenic activity is demonstrated by studies that are interpreted as showing a marginal increase of neoplasms that may be chemical related.
• No evidence of carcinogenic activity is demonstrated by studies that are interpreted as showing no chemical-related increases in malignant or benign neoplasms
• Inadequate study of carcinogenic activity is demonstrated by studies that, because of major qualitative or quantitative limitations, cannot be interpreted as valid for showing either the presence or absence of carcinogenic activity.
For studies showing multiple chemical-related neoplastic effects that if considered individually would be assigned to different levels of evidence categories, the following convention has been adopted to convey completely the study results. In a study with clear evidence of carcinogenic activity at some tissue sites, other responses that alone might be deemed some evidence are indicated as “were also related” to chemical exposure. In studies with clear or some evidence of carcinogenic activity, other responses that alone might be termed equivocal evidence are indicated as “may have been” related to chemical exposure. When a conclusion statement for a particular experiment is selected, consideration must be given to key factors that would extend the actual boundary of an individual category of evidence. Such consideration should allow for incorporation of scientific experience and current understanding of long-term carcinogenesis studies in laboratory animals, especially for those evaluations that may be on the borderline between two adjacent levels. These considerations should include:
• adequacy of the experimental design and conduct; • occurrence of common versus uncommon neoplasia; • progression (or lack thereof) from benign to malignant neoplasia as well as from preneoplastic to neoplastic lesions; • some benign neoplasms have the capacity to regress but others (of the same morphologic type) progress. At present, it is impossible
to identify the difference. Therefore, where progression is known to be a possibility, the most prudent course is to assume that benign neoplasms of those types have the potential to become malignant;
• combining benign and malignant tumor incidence known or thought to represent stages of progression in the same organ or tissue; • latency in tumor induction; • multiplicity in site-specific neoplasia; • metastases; • supporting information from proliferative lesions (hyperplasia) in the same site of neoplasia or other experiments (same lesion in
another sex or species); • presence or absence of dose relationships; • statistical significance of the observed tumor increase; • concurrent control tumor incidence as well as the historical control rate and variability for a specific neoplasm; • survival-adjusted analyses and false positive or false negative concerns; • structure-activity correlations; and • in some cases, genetic toxicology.

N,N-Dimethyl-p-toluidine, NTP TR 579 15
NATIONAL TOXICOLOGY PROGRAM TECHNICAL REPORTS PEER REVIEW PANEL
The members of the Peer Review Panel who evaluated the draft NTP Technical Report on N,N-dimethyl-p-toluidine on February 8, 2012, are listed below. Panel members serve as independent scientists, not as representatives of any institution, company, or governmental agency. In this capacity, panel members have five major responsibilities in reviewing the NTP studies:
• to ascertain that all relevant literature data have been adequately cited and interpreted, • to determine if the design and conditions of the NTP studies were appropriate, • to ensure that the Technical Report presents the experimental results and conclusions fully and clearly, • to judge the significance of the experimental results by scientific criteria, and • to assess the evaluation of the evidence of carcinogenic activity and other observed toxic responses.
Stephen M. Roberts, Ph.D., Chairperson College of Veterinary Medicine University of Florida Gainesville, FL
Jane Alcorn, D.V.M., Ph.D.
University of Saskatchewan Saskatchewan, Canada
Lucy M. Anderson, Ph.D., Consultant
Catonsville, MD Hillary M. Carpenter, III, Ph.D., Primary Reviewer
Minnesota Department of Health St. Paul, MN
Russell C. Cattley, V.M.D., Ph.D.
College of Veterinary Medicine Auburn University Auburn, AL
Michael R. Elwell, D.V.M., Ph.D. Covance Laboratories, Inc. Chantilly, VA
Jon C. Mirsalis, Ph.D.
SRI International Menlo Park, CA
Ofelia A. Olivero, Ph.D.
National Cancer Institute Bethesda, MD
Lisa A. Peterson, Ph.D., Primary Reviewer
University of Minnesota Minneapolis, MN
Michael V. Pino, D.V.M., Ph.D., Primary Reviewer
Sanofi Bridgewater, NJ
Keith A. Soper, Ph.D.
Merck Research Laboratories West Point, PA

16 N,N-Dimethyl-p-toluidine, NTP TR 579
SUMMARY OF PEER REVIEW PANEL COMMENTS
On February 8, 2011, the draft Technical Report on the toxicology and carcinogenesis studies of N,N-dimethyl-p-toluidine received public review by the National Toxicology Program’s Technical Reports Peer Review Panel. The review meeting was held at the National Institute of Environmental Health Sciences, Research Triangle Park, NC. Dr. J.K. Dunnick, NIEHS, introduced the draft Technical Report on N,N-dimethyl-p-toluidine by describing the chemical’s use in dental materials and bone cements, the negative findings in genetic toxicity tests, the occurrence of hematologic toxicity and non-neoplastic lesions in the liver, nasal cavity, and the hematopoietic system in short-term studies, and neo-plastic and nonneoplastic lesions in the 2-year studies. The proposed conclusions were clear evidence of carci-nogenic activity of N,N-dimethyl-p-toluidine in male and female F344/N rats, and clear evidence of carcino-genic activity of N,N-dimethyl-p-toluidine in male and female B6C3F1/N mice. Dr. Pino, the first primary reviewer, said that the studies were adequately conducted and that the dose selections for the 2-year studies were appropriate. He said that for the liver neoplasms in male rats, clear evidence of carci-nogenicity should be based on carcinomas only, not combined with adenomas. He noted that the incidence of thyroid gland follicular adenoma in female rats was only slightly above the concurrent and historical ranges and asked whether these neoplasms were considered related to N,N-dimethyl-p-toluidine treatment or not. He noted that while the rat uterine stromal polyps and granulosa cell neoplasms and the tongue neoplasms were mentioned in the text, it was unclear if they were considered chemical-related effects. He suggested that the extended diestrus noted in female rats may be a sec-ondary effect. Overall, he agreed with the conclusions, except for suggesting that the clear evidence in male rats was due to hepatocellular carcinomas, and should not be combined with adenomas. Dr. Carpenter, the second primary reviewer, said he concurred with the calls that had been made by the staff, and that it was a very strong study. He noted that there is ample evidence for exposure to the general public, as well as occupational exposure. He felt that the presence of rare neoplasms was quite important and made the call much stronger.
Dr. Peterson, the third primary reviewer, concurred with the proposed conclusions. Dr. Dunnick replied that the call on hepatocellular neo-plasms was mainly related to the hepatocellular car-cinomas, and the hepatocellular adenomas had been included because they are part of the same carcinogenic response. Regarding the thyroid gland neoplasms in the female rats, she said it was not a significant effect and was not considered to be related to the chemical. The few tongue and uterine neoplasms were noted in the results text for completeness but were not included in the overall conclusion. Dr. Dunnick explained that after consulting with experts, the staff felt that the extended diestrus indicated a potential for reproductive toxicity. Dr. Alcorn asked when NTP considers total neoplasm incidence in making a call, when there are sometimes decreases. Dr. Dunnick said the decrease in mononu-clear cell leukemia was a phenomenon seen with other nitro-aromatic compounds, and that it was discussed as a finding typical with this class of chemical. Dr. Cattley agreed that hepatocellular carcinomas were the primary liver neoplasms in male rats, and suggested that the conclusion should reflect that. Dr. Elwell asked about the standard protocol for examining the tongue. Study pathologist, Dr. A.E. Brix, NIEHS, said that occa-sionally wet tissue was examined when warranted by gross examination. Dr. Alcorn suggested corn oil was a potential con-founder in any study of a chemical’s carcinogenic potential and asked if NTP was planning to move away from corn oil as a delivery vehicle for lipophilic com-pounds. Dr. J.R. Bucher, NIEHS, said no such plan was presently in place. Dr. Anderson noted that questions have arisen about the nutritional role of the corn oil compared to the animals’ diets. Dr. A.P. King-Herbert, NIEHS, explained that the NTP-2000 diet does include corn oil, and that there is a nutritional analysis of how much fat is in the diet. Dr. Pino moved to modify the conclusion for the male rat study by striking the reference to “and hepatocellular adenoma or carcinoma (combined).” Dr. Mirsalis sec-onded the motion. Dr. D.E. Malarkey, NIEHS, men-tioned that hepatocellular adenomas were less common in the rat compared to the mouse and they are known to
N,N-Dimethyl-p-toluidine, NTP TR 579 17
progress to carcinomas, which was the rationale for combining the neoplasms types. Dr. Carpenter added that it was his impression that this was a fairly standard way of referring to those neoplasms. Dr. Malarkey said that occasionally the reference is stated as “predomi-nantly carcinomas.” Dr. Carpenter said he would be more comfortable with that terminology. Dr. Roberts called for a vote on Dr. Pino’s motion to strike the line “and hepatocellular adenoma or car-cinoma (combined).” The motion failed with three yes votes and seven no votes. Dr. Carpenter suggested retaining the original language while adding “primarily carcinomas.” Dr. Malarkey suggested “(primarily carcinoma).” Drs. L.S. Birnbaum and R.C. Sills, NIEHS, noted that the original language
was standard NTP language, and suggested it be retained as well. Dr. Soper moved to accept the original language in the conclusion’s first sentence and Drs. Elwell and Peterson seconded. The motion carried with eight yes votes and two no votes. Drs. Pino and Olivero voted no. Dr. Pino cited the reasons he had already stated, that the hepato-cellular carcinomas were primarily responsible for the liver neoplasms in male rats and the conclusion should be reworded to state that. Dr. Olivero felt that the para-graph was not clear enough as it stood. Dr. Carpenter moved to accept the full study conclu-sions as written. Dr. Peterson seconded. The panel voted in favor of the motion with eight yes votes and two no votes. Drs. Pino and Olivero voted no, for the same reasons they had stated for the prior motion.

18 N,N-Dimethyl-p-toluidine, NTP TR 579
19
INTRODUCTION
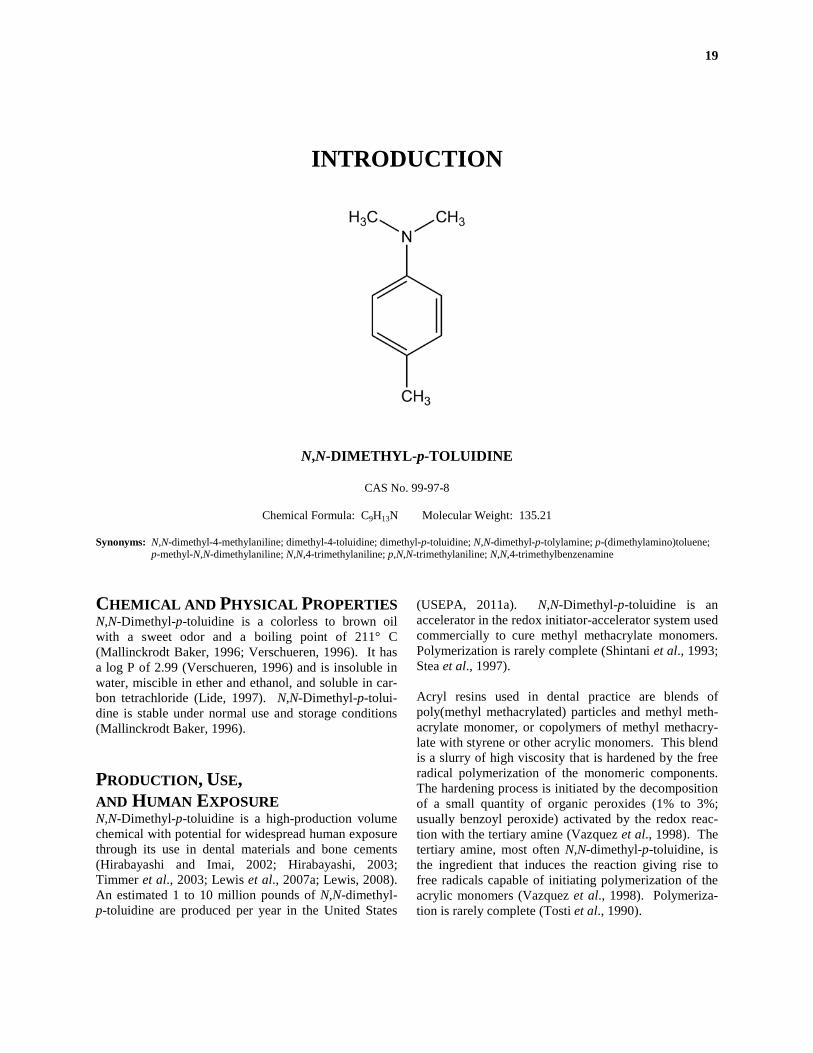
N,N-DIMETHYL-p-TOLUIDINE
CAS No. 99-97-8
Chemical Formula: C9H13N Molecular Weight: 135.21
Synonyms: N,N-dimethyl-4-methylaniline; dimethyl-4-toluidine; dimethyl-p-toluidine; N,N-dimethyl-p-tolylamine; p-(dimethylamino)toluene; p-methyl-N,N-dimethylaniline; N,N,4-trimethylaniline; p,N,N-trimethylaniline; N,N,4-trimethylbenzenamine
CHEMICAL AND PHYSICAL PROPERTIES N,N-Dimethyl-p-toluidine is a colorless to brown oil with a sweet odor and a boiling point of 211° C (Mallinckrodt Baker, 1996; Verschueren, 1996). It has a log P of 2.99 (Verschueren, 1996) and is insoluble in water, miscible in ether and ethanol, and soluble in car-bon tetrachloride (Lide, 1997). N,N-Dimethyl-p-tolui-dine is stable under normal use and storage conditions (Mallinckrodt Baker, 1996).
PRODUCTION, USE, AND HUMAN EXPOSURE N,N-Dimethyl-p-toluidine is a high-production volume chemical with potential for widespread human exposure through its use in dental materials and bone cements (Hirabayashi and Imai, 2002; Hirabayashi, 2003; Timmer et al., 2003; Lewis et al., 2007a; Lewis, 2008). An estimated 1 to 10 million pounds of N,N-dimethyl-p-toluidine are produced per year in the United States
(USEPA, 2011a). N,N-Dimethyl-p-toluidine is an accelerator in the redox initiator-accelerator system used commercially to cure methyl methacrylate monomers. Polymerization is rarely complete (Shintani et al., 1993; Stea et al., 1997). Acryl resins used in dental practice are blends of poly(methyl methacrylated) particles and methyl meth-acrylate monomer, or copolymers of methyl methacry-late with styrene or other acrylic monomers. This blend is a slurry of high viscosity that is hardened by the free radical polymerization of the monomeric components. The hardening process is initiated by the decomposition of a small quantity of organic peroxides (1% to 3%; usually benzoyl peroxide) activated by the redox reac-tion with the tertiary amine (Vazquez et al., 1998). The tertiary amine, most often N,N-dimethyl-p-toluidine, is the ingredient that induces the reaction giving rise to free radicals capable of initiating polymerization of the acrylic monomers (Vazquez et al., 1998). Polymeriza-tion is rarely complete (Tosti et al., 1990).
20 N,N-Dimethyl-p-toluidine, NTP TR 579
N,N-Dimethyl-p-toluidine has been used in the prepara-tion of acrylic denture materials for the past 50 years (Vazquez et al., 1998). It is used as the accelerator for the cement in most of the hip and bone replacements to activate the polymerization reaction (Lewis et al., 2007b) at concentrations ranging from 0.7% to 2.6% (Linder, 1976; Haddad et al., 1996; Stea et al., 1997). N,N-Dimethyl-p-toluidine is found in industrial glues and artificial fingernail preparations and is used as an intermediate in dye and pesticide synthesis (Potter et al., 1988; Taningher et al., 1993; Haddad et al., 1996). It has a shorter setting time (11.5 minutes) than some alternative accelerators (Liso et al., 1997). The residual amounts of N,N-dimethyl-p-toluidine in acrylic resins have been reported to be 0.6% after storage in water for up to 15 months (Brauer et al., 1977). Others have detected up to 0.2% of N,N-dimethyl-p-toluidine in methyl methacrylates after long term implantation (Bösch et al., 1982). The National Occupational Exposure Survey, which was conducted by the National Institute for Occupational Safety and Health (NIOSH) between 1981 and 1983, estimated that 62,720 workers were poten-tially exposed to N,N-dimethyl-p-toluidine in the work-place (NIOSH, 1990). There is potential for widespread human exposure to N,N-dimethyl-p-toluidine in occupa-tional settings where bone cements, dental prostheses, industrial glues, and artificial fingernails are manufac-tured or used. Exposure to N,N-dimethyl-p-toluidine may be a concern because of the possible release of unreacted chemicals from polymeric composites (Kronoveter, 1977; Taningher et al., 1993; Haddad et al., 1996). “Sniffing” glue is one possible means of exposure to N,N-dimethyl-p-toluidine (Neumark et al., 1998; Wu et al., 2008; Marsolek et al., 2010). N,N-Dimethyl-p-toluidine may be present in various glues at concentrations of 1% to 7% (Misiak and Scheffler, 2003; 3M, 2004).
REGULATORY STATUS No standards or guidelines have been set by NIOSH or the Occupational Safety and Health Administration (OSHA) for occupational exposure to N,N-dimethyl-p-toluidine (NIOSH, 2007). Under the Food and Drug Administration guidelines, bone cements are classified as drugs (Brauer et al., 1986). N,N-Dimethyl-p-tolui-dine is on the United States Environmental Protection Agency High Production Challenge Program (USEPA, 2011b).
ABSORPTION, DISTRIBUTION, METABOLISM, AND EXCRETION Experimental Animals In a study conducted for the NTP, 14C uniformly ring-labeled N,N-dimethyl-p-toluidine was rapidly absorbed from the gastrointestinal tract of F344 rats and B6C3F1 mice and excreted primarily in the urine as metabolites (Lovelace, 2006; Dix et al., 2007). Groups of three or four male rats and mice received single doses of 2.5, 25, or 250 mg/kg by gavage (in 10% aqueous Alkamuls®) or 2.5 mg/kg by intravenous (IV) injection. Female rats and mice received an oral dose of 25 mg/kg. The cumulative disposition data were similar between males receiving either 2.5 or 25 mg/kg and for female rats. Rats excreted approximately 90% of the total dose in urine and 4% in feces within 24 hours of dosing. Approximately 4% of the total dose remained in tissues and the gastrointestinal tract at the 24-hour terminal timepoint. Absorption of these doses was estimated to be at or near 100% based on comparison of oral and IV data. The cumulative disposition data for the 2.5 and 25 mg/kg doses in male mice were similar to those observed for rats. However, female mice excreted less 14C (approximately 77% of the total dose) in cumulative (0- to 24-hour) urine than did male mice. The amounts excreted in feces and remaining in tissues and the gastrointestinal tract were similar between male and female mice and the lower amount of 14C detected in female urine corresponded to a lower dose recovery. In male rats, excretion of 14C in the urine over time was affected by dose. A lower rate of excretion of the 25 mg/kg dose was observed over the first 6 hours; however, cumulative excretion was similar to that of the 2.5 mg/kg dose by the 12-hour timepoint. Urinary excretion of the high dose (250 mg/kg) amounted to only 70% of the total dose at 24 hours after dosing. A small amount (approximately 2%) of the high dose was excreted in feces and an average of 18% remained in tissues and the gastrointestinal tract at this timepoint. Approximately 8% of this total was detected in the stomach. At 72 hours after dosing, only residual amounts (approximately 2%) of 14C remained in tissues and the gastrointestinal tract in male rats treated with 250 mg/kg. This result indicated near complete absorp-tion and excretion of the high dose over the extended holding period. N,N-Dimethyl-p-toluidine-derived radioactivity was excreted at similar rates over time in the 2.5 and 25 mg/kg male mouse dosing groups. Dis-position data are not reported here for mice receiving 250 mg/kg by gavage due to acute toxicity, including mortality in the group. Less than 1% of the total
N,N-Dimethyl-p-toluidine, NTP TR 579 21
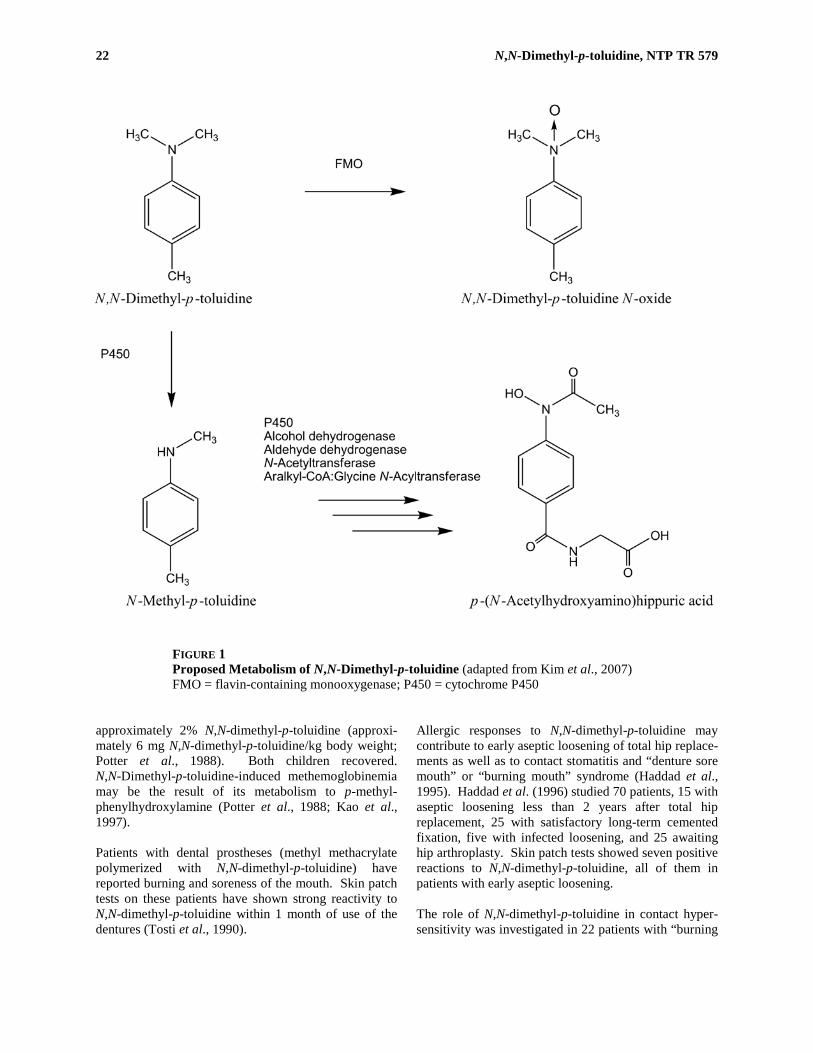
administered 14C was excreted as volatiles by gavaged rats and mice. At the lower doses in rats, kidney and liver contained the highest amounts of residual 14C, and with the urinary bladder, were the only tissues with a tissue:blood ratio greater than one. The amounts in blood, kidney, and liver were generally proportional to dose. In contrast to results observed at the lower doses, adipose tissue of 250 mg/kg rats contained amounts of 14C similar to those observed in liver and kidney. Liver and lung contained the highest amounts of residual 14C in mice. Toxicity may have contributed to the delayed gastric emptying, absorption, and excretion observed in 250 mg/kg male rats. Clinical signs of toxicity (decreased activity, piloerection, excessive blinking, and hunched posture) were observed in the rats; however, the effects were transitory. No significant vehicle effects were observed in a group of male rats receiving 250 mg/kg in corn oil, indicating that the disposition data presented here using the aqueous-based vehicle would be applicable to oral toxicity studies of N,N-dimethyl-p-toluidine using a corn oil vehicle. Samples from these studies were analyzed by high per-formance liquid chromatography (HPLC) for the presence of N,N-dimethyl-p-toluidine and metabolites (Lovelace, 2006; Kim et al., 2007). In male rats, the major metabolite in urine was identified as p-(N-acetyl-hydroxyamino)hippuric acid by mass spectrometry and nuclear magnetic resonance analysis (Figure 1). Two lesser metabolites were identified as N,N-dimethyl-p-toluidine N-oxide and N-methyl-p-toluidine. A small amount (not quantitated) of unmetabolized N,N-dimethyl-p-toluidine was also detected in the urine. Approximately 8% of the radiolabel administered to most of the treatment groups consisted of 14C-N-methyl-p-toluidine and may have contributed to the amount of the metabolite observed in rat urine. N-Methyl-p-toluidine was confirmed as a urinary metabolite of N,N-dimethyl-p-toluidine following intravenous treat-ment of a group of male rats with purified radiolabel. Furthermore, N-demethylation of N,N-dimethylaniline has been shown to occur in rat hepatocyte and guinea pig and rabbit tissue incubations (Gorrod and Gooderham, 1981; Sherratt and Damani, 1989) and is evident for N,N-dimethyl-p-toluidine from the large amount of p-(N-acetylhydroxyamino)hippuric acid present in the urine of rats in the current study. Exposure to N,N-dimethyl-p-toluidine is known to cause methemoglobinemia in humans, putatively via for-mation of p-methylphenylhydroxylamine (Potter et al., 1988). A similar metabolite (phenylhydroxylamine) of aniline is a potent inducer of methemoglobinemia in rats (Harrison and Jollow, 1987). p-Methylphenylhydroxyl-amine was not detected or identified in the current studies; however, it can be postulated to be an inter-mediate in the formation of p-(N-acetylhydroxyamino)-
hippuric acid through N-methyl-p-toluidine. Further, the formation of p-methylphenylhydroxylamine may lead to covalent binding with DNA (Marques et al., 1997) or perhaps give rise to an imine methide or quinone imine similar to that for the hepatotoxicant, 4-hydroxyacetanilide (acetaminophen) (Peter, 1989). Metabolism data for mice were not reported by Kim et al. (2007) and metabolites in mouse urine were not specifically identified in the report submitted to the NTP (Lovelace, 2006). However, the information indicated that N,N-dimethyl-p-toluidine-derived metab-olites were qualitatively, but not quantitatively similar between rats and mice. For instance, the major peak in mouse urine did not appear to be p-(N-acetylhydroxy-amino)hippuric acid. Humans No data describing the in vivo fate of N,N-dimethyl-p-toluidine in humans were identified in the literature.
TOXICITY Experimental Animals LD50 values of N,N-dimethyl-p-toluidine in the rat are 1,650 mg/kg (oral; methemoglobinemia noted) and 1.4 mg/L (4-hour inhalation LC50) (RTECS, 2011). In the New Zealand White rabbit, the dermal LD50 is greater than 2,000 mg/kg (RTECS, 2011). The intra-peritoneal LD50 in the mouse is 212 mg/kg and both the 24- and 96-hour LC50 values in fish are 52 mg/L (Geiger et al., 1986; Verschueren, 1996; RTECS, 2011). The intravenous LD50 of N,N-dimethyl-p-toluidine in mice was 75 mg/kg (Liso et al., 1997). The acute 4-hour inhalation toxicity of N,N-dimethyl-p-toluidine was assessed in male and female Sprague-Dawley rats following doses of 0.30, 0.99, 1.73, or 5.27 mg/L (ChemFirst, 1997). Clinical signs in rats exposed to 1.73 mg/L included hypoactivity, a coma-tose/prostrate condition, dyspnea or rapid respiration, and salivation. Nasal discharge and red material around the nose were observed in the 0.30 and 0.99 mg/L groups. Mottled lungs, red ovaries, and gas-filled gastrointestinal organs were observed in the rats exposed to 1.73 or 5.27 mg/L. No 2-week or 3-month studies of N,N-dimethyl-p-tolui-dine were reported in the literature. Humans A 16-month-old girl (Potter et al., 1988) and a 5-month-old boy (Kao et al., 1997) developed methemo-globinemia following ingestion of 15 and 30 mL, respectively, of artificial fingernail solutions containing
22 N,N-Dimethyl-p-toluidine, NTP TR 579
FIGURE 1 Proposed Metabolism of N,N-Dimethyl-p-toluidine (adapted from Kim et al., 2007) FMO = flavin-containing monooxygenase; P450 = cytochrome P450
approximately 2% N,N-dimethyl-p-toluidine (approxi-mately 6 mg N,N-dimethyl-p-toluidine/kg body weight; Potter et al., 1988). Both children recovered. N,N-Dimethyl-p-toluidine-induced methemoglobinemia may be the result of its metabolism to p-methyl-phenylhydroxylamine (Potter et al., 1988; Kao et al., 1997). Patients with dental prostheses (methyl methacrylate polymerized with N,N-dimethyl-p-toluidine) have reported burning and soreness of the mouth. Skin patch tests on these patients have shown strong reactivity to N,N-dimethyl-p-toluidine within 1 month of use of the dentures (Tosti et al., 1990).
Allergic responses to N,N-dimethyl-p-toluidine may contribute to early aseptic loosening of total hip replace-ments as well as to contact stomatitis and “denture sore mouth” or “burning mouth” syndrome (Haddad et al., 1995). Haddad et al. (1996) studied 70 patients, 15 with aseptic loosening less than 2 years after total hip replacement, 25 with satisfactory long-term cemented fixation, five with infected loosening, and 25 awaiting hip arthroplasty. Skin patch tests showed seven positive reactions to N,N-dimethyl-p-toluidine, all of them in patients with early aseptic loosening. The role of N,N-dimethyl-p-toluidine in contact hyper-sensitivity was investigated in 22 patients with “burning
N,N-Dimethyl-p-toluidine, NTP TR 579 23
mouth” syndrome (Dutrée-Meulenberg et al., 1992). Twenty of the patients wore a complete or partial den-ture. Positive patch test reactions to N,N-dimethyl-p-toluidine were seen in three cases – all denture wearers. Verschueren and Bruynzeel (1991) and Tosti et al. (1990) also cite N,N-dimethyl-p-toluidine allergy in relation to “burning mouth” syndrome. Santosh et al. (1999) reported that a dental student who presented with vesiculobullous lesions on the fingertips following contact with dental materials used in prostheses, showed a positive reaction to a common patch test for N,N-dimethyl-p-toluidine. N,N-Dimethyl-p-toluidine allergic reactions may be due to N,N-dimethyl-p-toluidine exposures from bone cements and dental prostheses (Kaaber et al., 1979; Kaaber, 1990). N,N-Dimethyl-p-toluidine has been identified in bone cements after storage in air or after long-term implantation in patients (Brauer et al., 1986; Tosti et al., 1990).
REPRODUCTIVE AND DEVELOPMENTAL TOXICITY No studies on the reproductive or developmental toxic-ity of N,N-dimethyl-p-toluidine in experimental animals or humans were found in the literature.
CARCINOGENICITY Experimental Animals In a lifetime study in rats, N,N-dimethyl-p-toluidine was administered at approximately 7 mg/day in the diet (approximately 35 mg/kg per day) (Druckrey et al., 1954). No treatment-related tumor response was reported. Humans There were no human epidemiology studies examining the potential carcinogenic effects of N,N-dimethyl-p-toluidine reported in the literature. The IARC evalu-ated surgical implants and other foreign bodies for evi-dence of carcinogenic risks to humans and found that there was inadequate evidence for evaluation of the car-cinogenic potential for most dental and hip replace-ments (IARC, 1999).
GENETIC TOXICITY There is some debate in the literature about the muta-genicity of N,N-dimethyl-p-toluidine in bacterial test
systems. Up to a maximum nontoxic dose of 70 µg/plate, N,N-dimethyl-p-toluidine was reported to be nonmutagenic in Salmonella typhimurium strains TA97, TA98, and TA100, either with or without S9 metabolic activation (Taningher et al., 1993). However, using the spot test to evaluate a 300 mg/mL solution (10 µL added to plate) of N,N-dimethyl-p-toluidine, Miller et al. (1986) were able to induce mutations in TA100 with and without S9, and in TA104 in the pres-ence of S9; no mutation induction was seen in TA98 with or without S9, consistent with the results of the Taningher et al. (1993) study. N,N-Dimethyl-p-toluidine was reported to be genotoxic in two mammalian cell assays. The compound was reported to induce trifluorothymidine resistance in L5178Y mouse lymphoma tk+/– cells when tested up to 0.044 µL/mL with S9, and up to 0.24 µL/mL without S9 (IARC, 1999). In an in vitro micronucleus test (a measure of numerical or structural chromosomal damage), N,N-dimethyl-p-toluidine demonstrated evidence of both aneugenic and clastogenic activity (inducing both CREST+ and CREST-MN) in Chinese hamster V79 cells over a con-centration range of 0.3 to 1.2 mM in the absence of S9, when cells were analyzed 48 hours after compound addition (Taningher et al., 1993). However, this micro-nucleus study exposed cells for approximately 3 to 4 cell cycles, longer than the recommended 1.5 to 2 cell cycles for in vitro micronucleus determination (OECD, 2010), and the level of cytotoxicity induced at higher concentrations could not be accurately assessed. In vivo, Taningher et al. (1993) measured DNA frag-mentation by the alkaline elution test in liver of BALB/c mice and Sprague-Dawley rats treated with N,N-dimethyl-p-toluidine by oral gavage or intra-peritoneal injection. The greatest DNA elution rate, 2.4 times the mean value seen in the control rats, was obtained in rats 6 hours after oral administration of 8 mmol/kg N,N-dimethyl-p-toluidine, but the increase was not significant; 24 hours after treatment, the elution rate returned to control values. Intraperitoneal admin-istration of 8 mmol/kg in the rat showed only a slight increase in elution rate 2 hours after treatment, and the rate returned to control values after 24 hours. DNA fragmentation in mouse liver was not increased 2 hours after intraperitoneal administration of 2 mmol/kg N,N-dimethyl-p-toluidine (highest dose tolerated by mice), but a marginal response was seen 24 hours after intraperitoneal administration of 1 mmol/kg (P<0.05).

24 N,N-Dimethyl-p-toluidine, NTP TR 579
STUDY RATIONALE N,N-Dimethyl-p-toluidine was nominated for toxicology and carcinogenesis studies by the National Cancer
Institute based on the potential for human exposure through its use in dental materials and bone cements, and the lack of toxicity and carcinogenicity data.

25
MATERIALS AND METHODS
PROCUREMENT AND CHARACTERIZATION N,N-Dimethyl-p-toluidine N,N-Dimethyl-p-toluidine was obtained from Alfa Aesar, a Johnson Matthey Company (Ward Hill, MA), in two lots (H3124A and J7601A). Lot H3124A was used in the 3-month studies. The remainder of lot H3124A was combined with lot J7601A to make lot 050404 which was used in the 2-year studies. Identity and purity analyses were conducted by the analytical chemistry laboratory at Battelle’s Chemistry Support Services (Columbus, Ohio) and by the study laboratory at Battelle Columbus Operations (Columbus, OH), and Karl Fischer titration and elemental analyses were performed by Galbraith Laboratories, Inc. (Knoxville, TN), and by Prevalere Life Sciences, Inc. (Whitesboro, NY) (Appendix I). Reports on analyses performed in support of the N,N-dimethyl-p-toluidine studies are on file at the National Institute of Environmental Health Sciences. All lots of the chemical, a pale-yellow liquid, were identified as N,N-dimethyl-p-toluidine by infrared spectroscopy. Identity confirmation of lot H3124A and combined lot 050404 was conducted by proton and carbon-13 nuclear magnetic resonance spectroscopy. For lot H3124A, Karl Fischer titration indicated approx-imately 0.22% water. Boiling point determination and elemental analyses results for carbon, hydrogen, and nitrogen were consistent with theoretical values. Gas chromatography with flame ionization detection (GC/FID) indicated one major peak and two impurities (0.1% and 0.2%) with peak areas greater than or equal to 0.1% of the major peak area. Differential scanning calorimetry indicated a purity of 99.8%. The overall purity of lot H3124A was determined to be greater than 99%. For lot J7601A, GC/FID indicated one major peak and three impurities (0.1%, 0.1%, and 0.2%) with peak areas greater than or equal to 0.1% of the total peak area. The overall purity of lot J7601A was determined to be greater than 99% and was sufficiently similar to lot H3124A to allow the two lots to be combined.
For combined lot 050404, Karl Fischer titration indi-cated approximately 0.2% water; elemental analyses for carbon, hydrogen, and nitrogen were consistent with theoretical values. GC/FID indicated one major peak and four impurities (0.2%, 0.1%, 0.2%, and 0.1%) with peak areas greater than or equal to 0.1% of the total peak area. The overall purity of combined lot 050404 was determined to be greater than 99%. To ensure stability, the bulk chemical was stored in amber glass containers sealed with Teflon®-lined lids at room temperature. Periodic reanalyses of the bulk chemical using GC/FID were performed at the beginning, middle, and end of the 3-month studies and at least every 6 months during the 2-year studies; no degradation of the chemical was observed. Corn Oil USP-grade corn oil was obtained in multiple lots from Spectrum Chemicals and Laboratory Products (Gardena, CA). Periodic analyses of the corn oil vehicle using potentiometric titration demonstrated peroxide concen-trations below the acceptable limit of 3 mEq/kg.
PREPARATION AND ANALYSIS OF DOSE FORMULATIONS Dose formulations were prepared by adding the appro-priate amount of N,N-dimethyl-p-toluidine to corn oil to achieve the desired concentration (Table I1). Dose for-mulations were prepared three times for the 3-month studies and approximately monthly for the 2-year studies. The 400 mg/mL dose formulation was prepared and observed to be a true solution, therefore, no homoge-neity or gavageability studies were performed. Stability studies of a 1.0 mg/mL formulation in corn oil were performed using GC/FID. Stability was confirmed for up to 44 days for formulations stored in amber glass containers sealed with Teflon®-lined lids, protected from light, at up to room temperature and for at least 3 hours under simulated animal room conditions. Periodic analyses of the dose formulations were con-ducted by the study laboratory using GC/FID. During

26 N,N-Dimethyl-p-toluidine, NTP TR 579
the 3-month studies, the dose formulations were ana-lyzed at the beginning, midpoint, and end of the studies; animal room samples of these dose formulations were also analyzed (Table I2). Of the dose formulations ana-lyzed and used, all 13 for rats and all 15 for mice were within 10% of the target concentrations; all 13 animal room samples for rats and all 15 for mice were within 10% of the target concentrations. During the 2-year studies, the dose formulations were analyzed at least every 3 months; animal room samples were also ana-lyzed (Table I3). Of the dose formulations analyzed and used, all 30 for rats and all 30 for mice were within 10% of the target concentrations; all 12 animal room samples for rats and all 12 for mice were within 10% of the target concentrations.
3-MONTH STUDIES The 3-month studies were conducted to evaluate the cumulative toxic effects of repeated exposure to N,N-dimethyl-p-toluidine and to determine the appro-priate doses to be used in the 2-year studies. The N,N-dimethyl-p-toluidine oral LD50 value in rats is 1,650 mg/kg. The oral TDLo value in mice is 250 mg/kg (RTECS, 2011). The doses for the N,N-dimethyl-p-toluidine 3-month studies were selected based on these LD50 values to deliver 0, 62.5, 125, 250, 500, and 1,000 mg/kg in rats, and 0, 15, 30, 60, 125, and 250 mg/kg in mice. The low dose was approximately 10 times the amount ingested in children that was reported to cause methemoglobinemia (Potter et al., 1988; Kao et al., 1997). The chemical was administered by oral gavage because the chemical was not palatable by the feed route (Fomby and Graves, 2001). Male and female F344/N rats and B6C3F1/N mice were obtained from Taconic Farms, Inc. (Germantown, NY). On receipt, the rats and mice were 4 to 5 weeks old. Animals were quarantined for 11 (male rats), 12 (female rats), 14 (male mice), or 13 (female mice) days and were 5 to 7 weeks old on the first day of the studies. Before the studies began, five male and five female rats and mice were randomly selected for parasite evaluation and gross observation for evidence of disease. At 4 weeks and the end of the studies, serologic analyses were performed on five male and five female sentinel rats and mice using the protocols of the NTP Sentinel Animal Program (Appendix K). Groups of 10 male and 10 female rats were adminis-tered N,N-dimethyl-p-toluidine in corn oil by gavage at doses of 62.5, 125, 250, 500, or 1,000 mg/kg body weight, 5 days per week for 14 weeks. Additional clini-cal pathology groups of 10 male and 10 female rats received the same doses for 25 days. Groups of 10 male
and 10 female mice received N,N-dimethyl-p-toluidine in corn oil by gavage at doses of 15, 30, 60, 125, or 250 mg/kg, 5 days per week for 14 weeks. Vehicle control animals received the corn oil vehicle alone. Feed and water were available ad libitum. Rats and female mice were housed five per cage and male mice were housed individually. The animals were weighed and clinical findings were recorded at study start, on the first Friday after dosing started, weekly thereafter, and at study termination. Details of the study design and animal maintenance are summarized in Table 1. Blood was collected for hematology and clinical chem-istry analyses from clinical pathology rats on day 25 and from surviving core study rats at study termination; on day 88, blood was collected from core study rats for hemoglobin and methemoglobin only. Blood was col-lected for hematology analyses from surviving mice at study termination. Blood for methemoglobin analyses was collected within 4 hours of dosing after 5 consecutive days of dosing; otherwise, blood was collected within 24 hours of dosing. At all timepoints, the animals were anesthetized with a CO2/O2 mixture and blood was collected from the retroorbital sinus. Blood for hematology analyses was placed in tubes containing EDTA as the anticoagulant. Erythrocyte, platelet, leukocyte (total and differential), and reticulo-cyte counts; automated hematocrit values; hemoglobin concentration; mean cell volume; mean cell hemoglo-bin; and mean cell hemoglobin concentration were determined using an ADVIA 120 analyzer (Bayer Diagnostics Division, Tarrytown, NY). Blood smears for rats and mice were stained with a Romanowsky-type stain and evaluated microscopically for blood morphol-ogy and enumeration of nucleated erythrocytes/ 100 white cells. Blood smears, prepared from supra-vitally-stained whole blood, were used for the enumer-ation of Heinz bodies (i.e., as a Heinz body:erythrocyte ratio using the Miller disc method) (Brecher and Schneiderman, 1950). Methemoglobin concentration was determined using the method of Evelyn and Malloy (1938) and reagents purchased from Sigma Chemical Company (St. Louis, MO). Blood samples for clinical chemistry analyses were placed in tubes containing sep-arator gel and allowed to clot. After clot retraction occurred, the samples were centrifuged, and the serum was aliquoted for assay of serum chemistry analytes using a Hitachi 911 analyzer (Boehringer Mannheim, Indianapolis, IN). The parameters measured are listed in Table 1. At the end of the 3-month studies, samples were col-lected for sperm motility and vaginal cytology evalua-tions on core study rats administered 0, 62.5, 125, or 250 mg/kg and mice administered 0, 15, 30, or 60 mg/kg. The parameters evaluated are listed in
N,N-Dimethyl-p-toluidine, NTP TR 579 27
Table 1. For 12 consecutive days prior to scheduled terminal kill, the vaginal vaults of the females were moistened with saline, if necessary, and samples of vaginal fluid and cells were stained. Relative numbers of leukocytes, nucleated epithelial cells, and large squa-mous epithelial cells were determined and used to ascer-tain estrous cycle stage (i.e., diestrus, proestrus, estrus, and metestrus). Male animals were evaluated for sperm count and motility. The left testis and left epididymis were isolated and weighed. The tail of the epididymis (cauda epididymis) was then removed from the epi-didymal body (corpus epididymis) and weighed. Test yolk (rats) or modified Tyrode’s buffer (mice) was applied to slides and a small incision was made at the distal border of the cauda epididymis. The sperm effluxing from the incision were dispersed in the buffer on the slides, and the numbers of motile and nonmotile spermatozoa were counted for five fields per slide by two observers. Following completion of sperm motility estimates, each left cauda epididymis was placed in buf-fered saline solution. Caudae were finely minced, and the tissue was incubated in the saline solution and then heat fixed at 65° C. Sperm density was then determined microscopically with the aid of a hemacytometer. To quantify spermatogenesis, the testicular spermatid head count was determined by removing the tunica albuginea and homogenizing the left testis in phosphate-buffered saline containing 10% dimethyl sulfoxide. Homogeni-zation-resistant spermatid nuclei were counted with a hemacytometer. Necropsies were performed on all animals. The heart, right kidney, liver, lung, right testis, and thymus were weighed. Tissues for microscopic examination were fixed and preserved in 10% neutral buffered formalin (except eyes were first fixed in Davidson’s solution), processed and trimmed, embedded in paraffin, sectioned to a thickness of 4 to 6 µm, and stained with hema-toxylin and eosin. Complete histopathologic examina-tions were performed on vehicle control, 500, and 1,000 mg/kg core study rats and vehicle control, 125, and 250 mg/kg mice. The bone marrow, kidney, liver, lung, nose, spleen, and thymus of rats and mice; the forestomach and mesenteric lymph node of rats; the heart and glandular stomach of female rats; and the mandibular and mesenteric lymph nodes and trachea of mice were examined in the remaining dosed groups. Table 1 lists the tissues and organs routinely examined. After a review of the laboratory reports and selected histopathology slides by a quality assessment patholo-gist, the findings and reviewed slides were submitted to a NTP Pathology Working Group (PWG) coordinator for a second independent review. Any inconsistencies in the diagnoses made by the laboratory and quality
assessment pathologists were resolved by the NTP pathology peer review process. Final diagnoses for reviewed lesions represent a consensus between the laboratory pathologist, NTP pathologist, reviewing pathologist(s), and the PWG coordinator. Details of these review procedures have been described, in part, by Maronpot and Boorman (1982) and Boorman et al. (1985).
2-YEAR STUDIES Study Design Groups of 50 male and 50 female rats and mice were administered N,N-dimethyl-p-toluidine in corn oil by gavage at doses of 6, 20, or 60 mg/kg 5 days per week for 104 (male rats) or 105 weeks. Vehicle control ani-mals received the corn oil vehicle alone. Additional clinical pathology groups of 10 male and 10 female rats were administered the same doses for 86 days. Formu-lations were administered at a volume of 2.5 mL/kg (rats) or 5 mL/kg (mice) and were calculated based on each animal’s most recent body weight. Source and Specification of Animals Male and female F344/N rats and B6C3F1/N mice were obtained from Taconic Farms, Inc. (Germantown, NY), for use in the 2-year studies. Animals were quarantined for 13 (male rats), 14 (female rats), 12 (male mice), or 11 (female mice) days before the beginning of the studies. Five male and five female rats and mice were randomly selected for parasite evaluation and gross observation of disease. Rats and mice were 5 to 7 weeks old at the beginning of the studies. The health of the animals was monitored during the studies according to the protocols of the NTP Sentinel Animal Program (Appendix K). Animal Maintenance All animal studies were conducted in an animal facility accredited by the Association for the Assessment and Accreditation of Laboratory Animal Care International. Studies were approved by the Battelle Columbus Operations Animal Care and Use Committee and con-ducted in accordance with all relevant NTP animal care and use policies and applicable federal, state, and local regulations and guidelines. Male rats were housed up to three per cage, female rats were housed five per cage, female mice were housed three to five per cage, and male mice were housed individually. Feed and water were available ad libitum. Further details of animal maintenance are given in Table 1. Information on feed composition and contaminants is provided in Appendix J.

28 N,N-Dimethyl-p-toluidine, NTP TR 579
Clinical Examinations and Pathology All animals were observed twice daily. Clinical find-ings were recorded every 4 weeks beginning with week 5 and at the end of the studies. Body weights were recorded on day 1, weekly for the first 13 weeks, every 4 weeks thereafter, and at terminal kill. After anesthetization with a CO2/O2 mixture, blood was taken from the retroorbital sinus of clinical pathology rats on day 86 for hematology analyses. Blood was placed in tubes containing EDTA as the anticoagulant. Hematology analyses were performed as described for the 3-month studies. The parameters measured are listed in Table 1. Complete necropsies and microscopic examinations were performed on all core study rats and mice. At nec-ropsy, all organs and tissues were examined for grossly visible lesions, and all major tissues were fixed and pre-served in 10% neutral buffered formalin (except eyes were first fixed in Davidson’s solution), processed and trimmed, embedded in paraffin, sectioned to a thickness of 4 to 6 µm, and stained with hematoxylin and eosin for microscopic examination. For all paired organs (e.g., adrenal gland, kidney, ovary), samples from each organ were examined. Tissues examined microscopi-cally are listed in Table 1. Microscopic evaluations were completed by the study laboratory pathologist, and the pathology data were entered into the Toxicology Data Management System. The report, slides, paraffin blocks, residual wet tissues, and pathology data were sent to the NTP Archives for inventory, slide/block match, wet tissue audit, and stor-age. The slides, individual animal data records, and
pathology tables were evaluated by an independent quality assessment laboratory. The individual animal records and tables were compared for accuracy, the slide and tissue counts were verified, and the histo-technique was evaluated. For the 2-year studies, a qual-ity assessment pathologist evaluated slides from all tumors and all potential target organs, which included the liver and nose of rats and mice; the bone marrow, kidney, and spleen of rats; and the lung of mice. The quality assessment report and the reviewed slides were submitted to the NTP PWG coordinator, who reviewed the selected tissues and addressed any incon-sistencies in the diagnoses made by the laboratory and quality assessment pathologists. Representative histo-pathology slides containing examples of lesions related to chemical administration, examples of disagreements in diagnoses between the laboratory and quality assess-ment pathologists, or lesions of general interest were presented by the coordinator to the PWG for review. The PWG consisted of the quality assessment pathol-ogist and other pathologists experienced in rodent toxi-cologic pathology. This group examined the tissues without any knowledge of dose groups. When the PWG consensus differed from the opinion of the laboratory pathologist, the diagnosis was changed. Final diagnoses for reviewed lesions represent a consensus between the laboratory pathologist, reviewing pathologist(s), and the PWG. Details of these review procedures have been described, in part, by Maronpot and Boorman (1982) and Boorman et al. (1985). For subsequent analyses of the pathology data, the decision of whether to evaluate the diagnosed lesions for each tissue type separately or combined was generally based on the guidelines of McConnell et al. (1986).
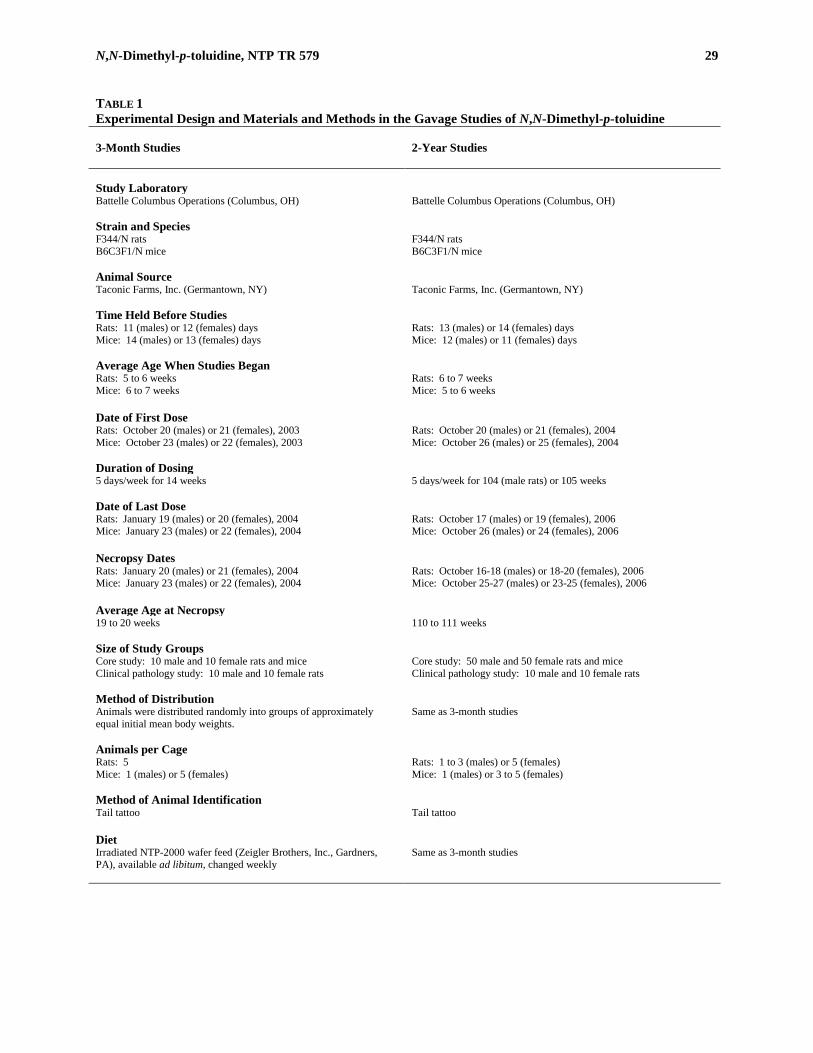
N,N-Dimethyl-p-toluidine, NTP TR 579 29
TABLE 1 Experimental Design and Materials and Methods in the Gavage Studies of N,N-Dimethyl-p-toluidine 3-Month Studies
2-Year Studies
Study Laboratory Battelle Columbus Operations (Columbus, OH) Battelle Columbus Operations (Columbus, OH) Strain and Species F344/N rats B6C3F1/N mice
F344/N rats B6C3F1/N mice
Animal Source Taconic Farms, Inc. (Germantown, NY) Taconic Farms, Inc. (Germantown, NY) Time Held Before Studies Rats: 11 (males) or 12 (females) days Mice: 14 (males) or 13 (females) days
Rats: 13 (males) or 14 (females) days Mice: 12 (males) or 11 (females) days
Average Age When Studies Began Rats: 5 to 6 weeks Rats: 6 to 7 weeks Mice: 6 to 7 weeks Mice: 5 to 6 weeks Date of First Dose Rats: October 20 (males) or 21 (females), 2003 Mice: October 23 (males) or 22 (females), 2003
Rats: October 20 (males) or 21 (females), 2004 Mice: October 26 (males) or 25 (females), 2004
Duration of Dosing 5 days/week for 14 weeks 5 days/week for 104 (male rats) or 105 weeks Date of Last Dose Rats: January 19 (males) or 20 (females), 2004 Mice: January 23 (males) or 22 (females), 2004
Rats: October 17 (males) or 19 (females), 2006 Mice: October 26 (males) or 24 (females), 2006
Necropsy Dates Rats: January 20 (males) or 21 (females), 2004 Mice: January 23 (males) or 22 (females), 2004
Rats: October 16-18 (males) or 18-20 (females), 2006 Mice: October 25-27 (males) or 23-25 (females), 2006
Average Age at Necropsy 19 to 20 weeks 110 to 111 weeks Size of Study Groups Core study: 10 male and 10 female rats and mice Clinical pathology study: 10 male and 10 female rats
Core study: 50 male and 50 female rats and mice Clinical pathology study: 10 male and 10 female rats
Method of Distribution Animals were distributed randomly into groups of approximately equal initial mean body weights.
Same as 3-month studies
Animals per Cage Rats: 5 Mice: 1 (males) or 5 (females)
Rats: 1 to 3 (males) or 5 (females) Mice: 1 (males) or 3 to 5 (females)
Method of Animal Identification Tail tattoo Tail tattoo Diet Irradiated NTP-2000 wafer feed (Zeigler Brothers, Inc., Gardners, PA), available ad libitum, changed weekly
Same as 3-month studies
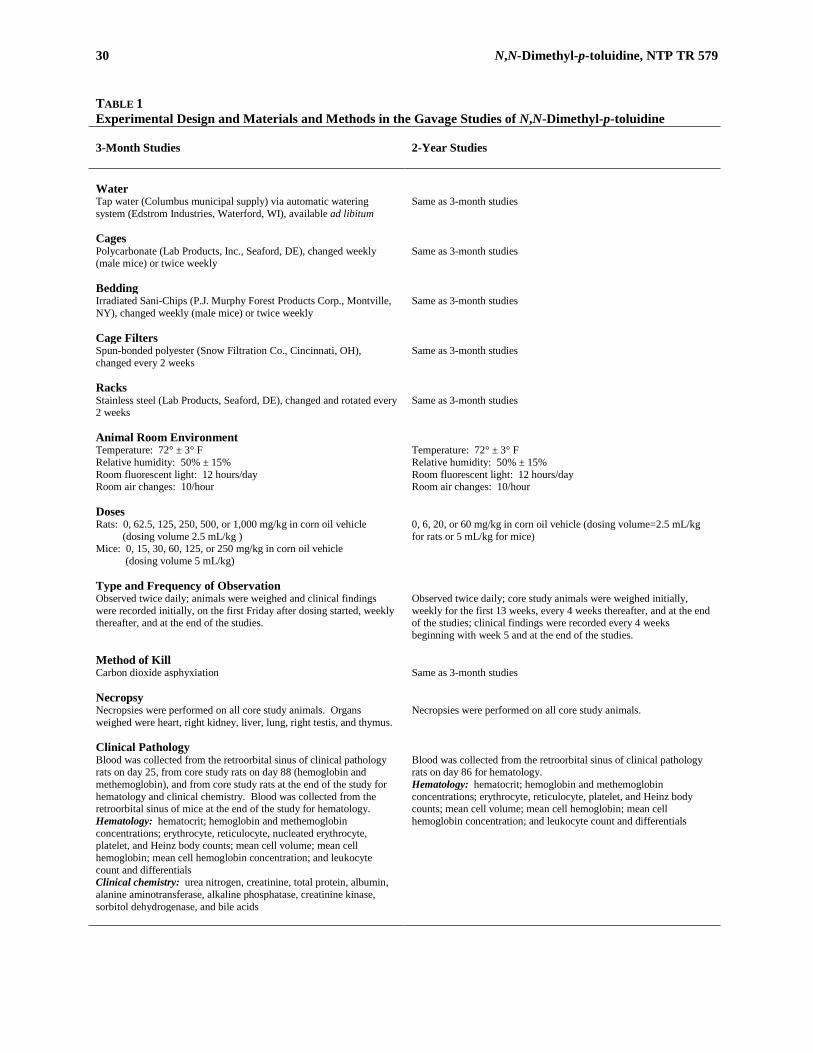
30 N,N-Dimethyl-p-toluidine, NTP TR 579
TABLE 1 Experimental Design and Materials and Methods in the Gavage Studies of N,N-Dimethyl-p-toluidine 3-Month Studies
2-Year Studies
Water Tap water (Columbus municipal supply) via automatic watering system (Edstrom Industries, Waterford, WI), available ad libitum
Same as 3-month studies
Cages Polycarbonate (Lab Products, Inc., Seaford, DE), changed weekly (male mice) or twice weekly
Same as 3-month studies
Bedding Irradiated Sani-Chips (P.J. Murphy Forest Products Corp., Montville, NY), changed weekly (male mice) or twice weekly
Same as 3-month studies
Cage Filters Spun-bonded polyester (Snow Filtration Co., Cincinnati, OH), changed every 2 weeks
Same as 3-month studies
Racks Stainless steel (Lab Products, Seaford, DE), changed and rotated every 2 weeks
Same as 3-month studies
Animal Room Environment Temperature: 72° ± 3° F Relative humidity: 50% ± 15% Room fluorescent light: 12 hours/day Room air changes: 10/hour
Temperature: 72° ± 3° F Relative humidity: 50% ± 15% Room fluorescent light: 12 hours/day Room air changes: 10/hour
Doses Rats: 0, 62.5, 125, 250, 500, or 1,000 mg/kg in corn oil vehicle
(dosing volume 2.5 mL/kg ) Mice: 0, 15, 30, 60, 125, or 250 mg/kg in corn oil vehicle
(dosing volume 5 mL/kg)
0, 6, 20, or 60 mg/kg in corn oil vehicle (dosing volume=2.5 mL/kg for rats or 5 mL/kg for mice)
Type and Frequency of Observation Observed twice daily; animals were weighed and clinical findings were recorded initially, on the first Friday after dosing started, weekly thereafter, and at the end of the studies.
Observed twice daily; core study animals were weighed initially, weekly for the first 13 weeks, every 4 weeks thereafter, and at the end of the studies; clinical findings were recorded every 4 weeks beginning with week 5 and at the end of the studies.
Method of Kill Carbon dioxide asphyxiation Same as 3-month studies Necropsy Necropsies were performed on all core study animals. Organs weighed were heart, right kidney, liver, lung, right testis, and thymus.
Necropsies were performed on all core study animals.
Clinical Pathology Blood was collected from the retroorbital sinus of clinical pathology rats on day 25, from core study rats on day 88 (hemoglobin and methemoglobin), and from core study rats at the end of the study for hematology and clinical chemistry. Blood was collected from the retroorbital sinus of mice at the end of the study for hematology. Hematology: hematocrit; hemoglobin and methemoglobin concentrations; erythrocyte, reticulocyte, nucleated erythrocyte, platelet, and Heinz body counts; mean cell volume; mean cell hemoglobin; mean cell hemoglobin concentration; and leukocyte count and differentials Clinical chemistry: urea nitrogen, creatinine, total protein, albumin, alanine aminotransferase, alkaline phosphatase, creatinine kinase, sorbitol dehydrogenase, and bile acids
Blood was collected from the retroorbital sinus of clinical pathology rats on day 86 for hematology. Hematology: hematocrit; hemoglobin and methemoglobin concentrations; erythrocyte, reticulocyte, platelet, and Heinz body counts; mean cell volume; mean cell hemoglobin; mean cell hemoglobin concentration; and leukocyte count and differentials

N,N-Dimethyl-p-toluidine, NTP TR 579 31
TABLE 1 Experimental Design and Materials and Methods in the Gavage Studies of N,N-Dimethyl-p-toluidine 3-Month Studies
2-Year Studies
Histopathology Histopathology was performed on vehicle control, 500, and 1,000 mg/kg core study rats and vehicle control, 125, and 250 mg/kg mice. In addition to gross lesions and tissue masses, the following tissues were examined to a no-effect level: adrenal gland, bone (including marrow), brain, clitoral gland, esophagus, gallbladder (mice), heart (including aorta), large intestine (cecum, colon, and rectum), small intestine (duodenum, jejunum, and ileum), kidney, liver, lung (and mainstem bronchi), lymph nodes (mandibular and mesenteric), mammary gland, nose, ovary, pancreas, parathyroid gland, pituitary gland, preputial gland, prostate gland, salivary gland, skin, spleen, stomach (forestomach and glandular), testis (with epididymis and seminal vesicle), thymus, thyroid gland, trachea, urinary bladder, and uterus. In addition, the bone marrow, kidney, liver, lung, nose, spleen, and thymus of rats and mice; the forestomach and mesenteric lymph node of rats; the heart and glandular stomach of female rats; and the mandibular and mesenteric lymph nodes and trachea of mice were examined in the remaining groups.
Complete histopathology was performed on all core study animals. In addition to gross lesions and tissue masses, the following tissues were examined: adrenal gland, bone (including marrow), brain, clitoral gland, esophagus, eye, gallbladder (mice), Harderian gland, heart (including aorta), large intestine (cecum, colon, and rectum), small intestine (duodenum, jejunum, and ileum), kidney, liver, lung (and mainstem bronchi), lymph nodes (mandibular and mesenteric), mammary gland, nose, ovary, pancreas, parathyroid gland, pituitary gland, preputial gland, prostate gland, salivary gland, skin, spleen, stomach (forestomach and glandular), testis (with epididymis and seminal vesicle), thymus, thyroid gland, trachea, urinary bladder, uterus, and Zymbal’s gland (male rats).
Sperm Motility and Vaginal Cytology
At the end of the studies, spermatid and sperm samples were collected from male rats in the vehicle control, 62.5, 125, and 250 mg/kg groups and from male mice in the vehicle control, 15, 30, and 60 mg/kg groups. The following parameters were evaluated: spermatid heads per testis and per gram testis, sperm motility, and sperm per cauda epididymis and per gram cauda epididymis. The left cauda, left epididymis, and left testis were weighed. Vaginal samples were collected for up to 12 consecutive days prior to the end of the studies from female rats administered 0, 62.5, 125, or 250 mg/kg and from female mice administered 0, 15, 30, or 60 mg/kg.
32 N,N-Dimethyl-p-toluidine, NTP TR 579
STATISTICAL METHODS Survival Analyses The probability of survival was estimated by the prod-uct-limit procedure of Kaplan and Meier (1958) and is presented in the form of graphs. Animals found dead of other than natural causes were censored; animals dying from natural causes were not censored. Statistical anal-yses for possible dose-related effects on survival used Cox’s (1972) method for testing two groups for equality and Tarone’s (1975) life table test to identify dose-related trends. All reported P values for the survival analyses are two sided. Calculation of Incidence The incidences of neoplasms or nonneoplastic lesions are presented in Tables A1, A4, B1, B4, C1, C4, D1, and D4 as the numbers of animals bearing such lesions at a specific anatomic site and the numbers of animals with that site examined microscopically. For calcula-tion of statistical significance, the incidences of most neoplasms (Tables A2, B2, C2, and D2) and all non-neoplastic lesions are given as the numbers of animals affected at each site examined microscopically. How-ever, when macroscopic examination was required to detect neoplasms in certain tissues (e.g., mesentery, pleura, peripheral nerve, skeletal muscle, tongue, tooth, and Zymbal’s gland) before microscopic evaluation, the denominators consist of the number of animals that had a gross abnormality. When neoplasms had multiple potential sites of occurrence (e.g., leukemia or lym-phoma), the denominators consist of the number of ani-mals on which a necropsy was performed. Tables A2, B2, C2, and D2 also give the survival-adjusted neo-plasm rate for each group and each site-specific neo-plasm. This survival-adjusted rate (based on the Poly-3 method described below) accounts for differential mor-tality by assigning a reduced risk of neoplasm, pro-portional to the third power of the fraction of time on study, only to site-specific, lesion-free animals that do not reach terminal kill. Analysis of Neoplasm and Nonneoplastic Lesion Incidences The Poly-k test (Bailer and Portier, 1988; Portier and Bailer, 1989; Piegorsch and Bailer, 1997) was used to assess neoplasm and nonneoplastic lesion prevalence. This test is a survival-adjusted quantal-response proce-dure that modifies the Cochran-Armitage linear trend test to take survival differences into account. More spe-cifically, this method modifies the denominator in the quantal estimate of lesion incidence to approximate more closely the total number of animal years at risk. For analysis of a given site, each animal is assigned a risk weight. This value is one if the animal had a lesion at that site or if it survived until terminal kill; if the ani-
mal died prior to terminal kill and did not have a lesion at that site, its risk weight is the fraction of the entire study time that it survived, raised to the kth power. This method yields a lesion prevalence rate that depends only upon the choice of a shape parameter for a Weibull hazard function describing cumulative lesion incidence over time (Bailer and Portier, 1988). Unless otherwise specified, a value of k=3 was used in the analysis of site-specific lesions. This value was recommended by Bailer and Portier (1988) following an evaluation of neoplasm onset time distributions for a variety of site-specific neoplasms in control F344 rats and B6C3F1 mice (Portier et al., 1986). Bailer and Portier (1988) showed that the Poly-3 test gave valid results if the true value of k was anywhere in the range from 1 to 5. A further advantage of the Poly-3 method is that it does not require lesion lethality assumptions. Variation introduced by the use of risk weights, which reflect dif-ferential mortality, was accommodated by adjusting the variance of the Poly-3 statistic as recommended by Bieler and Williams (1993). Tests of significance included pairwise comparisons of each dosed group with controls and a test for an overall dose-related trend. Continuity-corrected Poly-3 tests were used in the analysis of lesion incidence, and reported P values are one sided. The significance of lower incidences or decreasing trends in lesions is rep-resented as 1–P with the letter N added (e.g., P=0.99 is presented as P=0.01N). Analysis of Continuous Variables Two approaches were employed to assess the signifi-cance of pairwise comparisons between dosed and con-trol groups in the analysis of continuous variables. Organ and body weight data, which historically have approximately normal distributions, were analyzed with the parametric multiple comparison procedures of Dunnett (1955) and Williams (1971, 1972). Hematol-ogy, clinical chemistry, spermatid, and epididymal sper-matozoal data, which have typically skewed distribu-tions, were analyzed using the nonparametric multiple comparison methods of Shirley (1977) (as modified by Williams, 1986) and Dunn (1964). Jonckheere’s test (Jonckheere, 1954) was used to assess the significance of the dose-related trends and to determine whether a trend-sensitive test (Williams’ or Shirley’s test) was more appropriate for pairwise comparisons than a test that does not assume a monotonic dose-related trend (Dunnett’s or Dunn’s test). Prior to statistical analysis, extreme values identified by the outlier test of Dixon and Massey (1957) were examined by NTP personnel, and implausible values were eliminated from the anal-ysis. Proportions of regular cycling females in each dosed group were compared to the control group using
N,N-Dimethyl-p-toluidine, NTP TR 579 33
the Fisher exact test (Gart et al., 1979). Tests for extended periods of estrus, diestrus, metestrus, and pro-estrus, as well as skipped estrus and skipped diestrus, were constructed based on a Markov chain model pro-posed by Girard and Sager (1987). For each dose group, a transition probability matrix was estimated for transitions among the proestrus, estrus, metestrus, and diestrus stages, with provision for extended stays within each stage as well as for skipping estrus or diestrus within a cycle. Equality of transition matrices among dose groups and between the control group and each dosed group was tested using chi-square statistics. Historical Control Data The concurrent control group represents the most valid comparison to the treated groups and is the only control group analyzed statistically in NTP bioassays. How-ever, historical control data are often helpful in inter-preting potential treatment-related effects, particularly for uncommon or rare neoplasm types. For meaningful comparisons, the conditions for studies in the historical database must be generally similar. One significant fac-tor affecting the background incidence of neoplasms at a variety of sites is diet. In 1995, the NTP incorporated a new diet (NTP-2000) that contains less protein and more fiber and fat than the NIH-07 diet previously used in toxicity and carcinogenicity studies (Rao, 1996, 1997). The NTP historical database contains all studies that use the NTP-2000 diet with histopathology findings completed within the most recent 5-year period. A second potential source of variability is route of admin-istration. In general, the historical database for a given study will include studies using the same route of administration, and the overall incidences of neoplasms for all routes of administration are included for com-parison, including the present study.
QUALITY ASSURANCE METHODS The 3-month and 2-year studies were conducted in compliance with Food and Drug Administration Good Laboratory Practice Regulations (21 CFR, Part 58). In addition, as records from the 2-year studies were sub-mitted to the NTP Archives, these studies were audited retrospectively by an independent quality assurance contractor. Separate audits covered completeness and accuracy of the pathology data, pathology specimens, final pathology tables, and a draft of this NTP Technical Report. Audit procedures and findings are presented in the reports and are on file at NIEHS. The audit findings were reviewed and assessed by NTP staff, and all com-ments were resolved or otherwise addressed during the preparation of this Technical Report.
GENETIC TOXICOLOGY The genetic toxicity of N,N-dimethyl-p-toluidine was assessed by testing the ability of the chemical to induce mutations in various strains of Salmonella typhimurium and Escherichia coli, increases in the frequency of micronucleated erythrocytes in mouse peripheral blood, and DNA damage in mice and Sprague-Dawley rats. Micronuclei (literally “small nuclei” or Howell-Jolly bodies) are biomarkers of induced structural or numer-ical chromosomal alterations and are formed when acentric fragments or whole chromosomes fail to incor-porate into either of two daughter nuclei during cell division (Schmid, 1975; Heddle et al., 1983). The pro-tocols for these studies and the results are given in Appendix E. The genetic toxicity studies have evolved from an ear-lier effort by the NTP to develop a comprehensive data-base permitting a critical anticipation of a chemical’s carcinogenicity in experimental animals based on numerous considerations, including the molecular struc-ture of the chemical and its observed effects in short-term in vitro and in vivo genetic toxicity tests (structure-activity relationships). The short-term tests were origin-ally developed to clarify proposed mechanisms of chemical-induced DNA damage based on the relation-ship between electrophilicity and mutagenicity (Miller and Miller, 1977) and the somatic mutation theory of cancer (Straus, 1981; Crawford, 1985). However, it should be noted that not all cancers arise through geno-toxic mechanisms. DNA reactivity combined with Salmonella mutagenicity is highly correlated with induction of carcinogenicity in multiple species/sexes of rodents and at multiple tissue sites (Ashby and Tennant, 1991). A positive response in the Salmonella test was shown to be the most predic-tive in vitro indicator for rodent carcinogenicity (89% of the Salmonella mutagens are rodent carcinogens) (Tennant et al., 1987; Zeiger et al., 1990). Additionally, no battery of tests that included the Salmonella test improved the predictivity of the Salmonella test alone. However, these other tests can provide useful infor-mation on the types of DNA and chromosomal damage induced by the chemical under investigation. The predictivity for carcinogenicity of a positive response in acute in vivo bone marrow chromosome aberration or micronucleus tests appears to be less than that in the Salmonella test (Shelby et al., 1993; Shelby and Witt, 1995). However, clearly positive results in long-term peripheral blood micronucleus tests have high predictivity for rodent carcinogenicity; a weak response in one sex only or negative results in both sexes in this

34 N,N-Dimethyl-p-toluidine, NTP TR 579
assay do not correlate well with either negative or posi-tive results in rodent carcinogenicity studies (Witt et al., 2000). The comet assay detects a variety of DNA dam-age including single and double strand breaks, DNA-DNA and DNA-protein crosslinks, and alkali labile sites in individual cells (Collins et al., 2008). A comprehen-sive study that assessed the correlation between positive comet assay data in a variety of target tissues of rats and mice and rodent carcinogenicity concluded that a posi-tive comet assay response in at least one organ of one
species is well correlated with rodent carcinogenicity (Sasaki et al., 2000). An in-depth examination of the relationship between comet assay results and rodent carcinogenicity is currently underway by the NTP. Because of the theoretical and observed associations between induced genetic damage and adverse effects in somatic and germ cells, the determination of in vivo genetic effects is important to the overall understanding of the risks associated with exposure to a particular chemical.

35
RESULTS
RATS 3-MONTH STUDY All 1,000 mg/kg male and female rats and one 500 mg/kg male rat died by study day 3 (Table 2). The final mean body weights and mean body weight gains of all surviving dosed groups of males and females were
significantly less than those of the vehicle controls (Table 2 and Figure 2). Clinical findings associated with exposure to N,N-dimethyl-p-toluidine included cyanosis, abnormal breathing, and lethargy in groups administered 250 mg/kg or greater.
TABLE 2 Survival and Body Weights of Rats in the 3-Month Gavage Study of N,N-Dimethyl-p-toluidinea
Dose (mg/kg)
Survivalb
Initial Body Weight (g)
Final Body Weight (g)
Change in Body Weight (g)
Final Weight
Relative to Controls
(%)
Male
0 10/10 99 ± 3 327 ± 2 228 ± 4 62.5 10/10 99 ± 3 296 ± 5** 197 ± 5** 90
125 10/10 98 ± 3 289 ± 8** 191 ± 8** 88 250 10/10 97 ± 2 252 ± 5** 155 ± 4** 77 500 9/10c 99 ± 3 234 ± 9** 135 ± 8** 72
1,000 0/10c 99 ± 3 — — — Female
0 10/10 93 ± 3 193 ± 3 100 ± 2 62.5 10/10 92 ± 3 183 ± 3* 91 ± 2* 95
125 10/10 92 ± 3 172 ± 4** 80 ± 2** 89 250 10/10 93 ± 3 174 ± 3** 80 ± 3** 90 500 10/10 92 ± 2 175 ± 3** 82 ± 2** 91
1,000 0/10c 92 ± 2 — — — * Significantly different (P≤0.05) from the vehicle control group by Williams’ test ** P≤0.01 a Weights and weight changes are given as mean ± standard error. Subsequent calculations are based on animals surviving to the end of the
study. b Number of animals surviving at 14 weeks/number initially in group c Week of deaths: 1
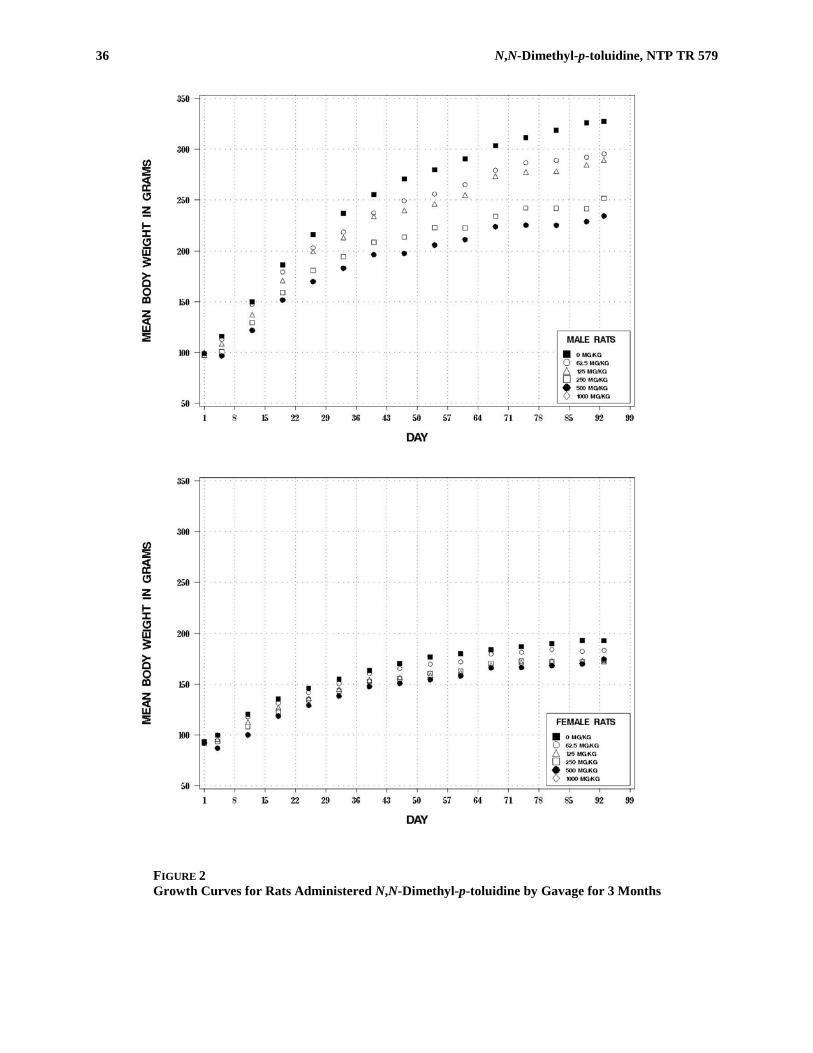
36 N,N-Dimethyl-p-toluidine, NTP TR 579
FIGURE 2 Growth Curves for Rats Administered N,N-Dimethyl-p-toluidine by Gavage for 3 Months
N,N-Dimethyl-p-toluidine, NTP TR 579 37
The hematology data for rats are presented in Tables 3 and F1. The hematology findings were consistent with methemoglobinemia and Heinz body formation (Plates 1 and 2) resulting in a macrocytic, hypochromic, responsive anemia. In general, these changes were dose-related, occurred at both timepoints evaluated, and involved all dosed groups of both sexes. The methemo-globinemia was described by a considerable treatment-related increase in methemoglobin values. The anemia was characterized by dose-related decreases in the erythron including decreases in hematocrit values, hemoglobin concentrations, and erythrocyte counts. The greatest magnitudes of decrease occurred in the 500 mg/kg groups on day 25; the decrease was greater than 20% for hematocrit and hemoglobin values and close to 40% for erythrocyte counts. By week 14, there was some amelioration in the severities of the anemia. Erythrocyte macrocytosis was characterized by increases in mean cell volume and mean cell hemoglo-bin values indicating that the circulating erythrocytes were larger than those of the concurrent vehicle controls. Erythrocyte hypochromia was evidenced by decreases in mean cell hemoglobin concentration val-ues, indicating that the circulating erythrocytes did not have the normal intracellular hemoglobin content. An erythropoietic response to the anemia was characterized by substantially increased reticulocyte and nucleated erythrocyte counts. Decreases in leukocyte counts occurred in 250 and 500 mg/kg male and female rats on day 25. Decreases in lymphocyte counts mimicked the leukocyte count decreases; these changes were con-sistent with physiologic responses to stress. On day 25, markers of hepatocellular injury, serum activities of alanine aminotransferase and sorbitol dehy-drogenase, demonstrated dose-related increases in essentially all dosed groups of males and females; the 500 mg/kg animals had increases of greater than threefold (Table F1). By week 14, the increases in alan-ine aminotransferase and sorbitol dehydrogenase activ-ities had ameliorated or resolved in all dosed groups. Serum concentrations of total bile acids, a marker of hepatic function/injury and cholestasis, were increased in higher-dose animals; the 500 mg/kg groups were the most consistently affected demonstrating a greater than threefold increase at both timepoints. Another marker of cholestasis (alkaline phosphatase activity), however, demonstrated decreases (day 25) or no change (week 14). Thus, it would appear that the increases in bile acid concentrations were not related to a cholestatic event. Serum albumin concentrations (and by exten-sion, serum total protein) were increased in essentially all dosed male and female groups at both timepoints. The increases in albumin and total protein were proportional, suggesting that the increases were related to a physiologic hemoconcentration-type response (i.e.,
dehydration). This supposition was supported by the substantially lower body weights suggesting that the treated animals did not eat and, therefore, drink as expected. The absolute and relative liver weights of all surviving dosed groups of males and females were significantly greater than those of the vehicle controls (Table G1). The absolute right kidney weights of 125 and 500 mg/kg males and all surviving dosed groups of females and the relative right kidney weights of all sur-viving dosed groups of males and females were signifi-cantly greater than those of the vehicle controls. The absolute right testis weight of 500 mg/kg males was significantly less than that of the vehicle controls, but the relative right testis weights of all surviving groups were significantly greater than that of the vehicle controls. There was a dose-related decrease in the proportion of cycling females, with only four females in the 250 mg/kg group having regular cycles (Table H2), despite a loss of cells due to technical errors that com-promised the evaluation of estrous cyclicity. Females in the 125 and 250 mg/kg groups spent a significantly higher proportion of time in extended diestrus compared to the vehicle control group (P=0.0022 and P=0.0002, respectively). There were no significant differences in spermatid or epididymal spermatozoal measurements of male rats administered 62.5, 125, or 250 mg/kg N,N-dimethyl-p-toluidine when compared to the vehicle control group; however, there were significant decreases in left cauda epididymis and left epididymis weights in the 250 mg/kg group (Table H1). Based on these results, N,N-dimethyl-p-toluidine has the potential to be a reproductive toxicant in female rats but not in male rats. Many of the histological findings in 1,000 mg/kg males and females were not observed in the lower dose groups and were considered to be related to stress and/or non-specific toxicity. These lesions included centrilobular hepatocellular necrosis and fatty change of the liver, ulceration of the forestomach, renal tubule dilatation, red pulp atrophy of the spleen, and necrosis and hemor-rhage of the thymus. Centrilobular hepatocyte necrosis was characterized by necrosis of individual hepatocytes in the centrilobular regions. The individual necrotic hepatocytes presented with finely granular chromatin fragments outlining the nuclear region and with a loss of cytoplasmic detail without condensation. Centrilobular fatty change resulted in clear, sharply defined, intracyto-plasmic vacuoles primarily within centrilobular hepato-cytes. Ulceration of the forestomach was diagnosed when there was full-thickness necrosis of the squamous epithelium, and included lesions in which a focus of

38 N,N-Dimethyl-p-toluidine, NTP TR 579
TABLE 3 Selected Hematology Data for Rats in the 3-Month Gavage Study of N,N-Dimethyl-p-toluidinea
Vehicle Control
62.5 mg/kg
125 mg/kg
250 mg/kg
500 mg/kg
Male n
Day 25 10 10 9 10 8 Day 88 10 10 10 10 9 Week 14 10 10 10 10 9
Hematocrit (%)
Day 25 49.7 ± 0.3 45.0 ± 0.5** 42.8 ± 0.4** 40.2 ± 0.5** 39.2 ± 0.5** Week 14 46.1 ± 0.4 42.1 ± 0.5** 42.3 ± 0.4** 42.1 ± 0.4** 42.4 ± 0.7**
Hemoglobin (g/dL) Day 25 15.3 ± 0.1 13.3 ± 0.1** 12.5 ± 0.1** 11.8 ± 0.1** 11.0 ± 0.1** Week 14 14.8 ± 0.1 13.0 ± 0.2** 13.0 ± 0.1** 12.9 ± 0.1** 12.7 ± 0.2**
Erythrocytes (106/μL) Day 25 8.26 ± 0.05 7.44 ± 0.07** 6.79 ± 0.07** 5.97 ± 0.09** 5.06 ± 0.05** Week 14 8.62 ± 0.07 7.43 ± 0.08** 6.94 ± 0.05** 6.40 ± 0.07** 6.19 ± 0.07**
Reticulocytes (106/μL) Day 25 0.26 ± 0.01 0.50 ± 0.01** 0.64 ± 0.01** 0.94 ± 0.03** 1.08 ± 0.03** Week 14 0.25 ± 0.01 0.50 ± 0.01** 0.60 ± 0.02** 0.76 ± 0.01** 0.89 ± 0.04**
Nucleated erythrocytes/100 leukocytes Day 25 0.2 ± 0.1 1.3 ± 0.4* 1.3 ± 0.5* 4.7 ± 0.7** 21.6 ± 2.1** Week 14 0.2 ± 0.1 0.9 ± 0.2* 2.0 ± 0.4** 1.7 ± 0.3** 3.6 ± 0.6**
Mean cell volume (fL) Day 25 60.2 ± 0.2 60.5 ± 0.2 63.1 ± 0.2** 67.5 ± 0.6** 77.5 ± 0.5** Week 14 53.5 ± 0.3 56.6 ± 0.3** 61.1 ± 0.3** 65.8 ± 0.3** 68.5 ± 0.6**
Mean cell hemoglobin (pg) Day 25 18.5 ± 0.1 17.9 ± 0.1 18.4 ± 0.1 19.7 ± 0.1** 21.8 ± 0.1** Week 14 17.2 ± 0.1 17.5 ± 0.1* 18.7 ± 0.1** 20.1 ± 0.1** 20.6 ± 0.2**
Mean cell hemoglobin concentration (g/dL) Day 25 30.8 ± 0.1 29.7 ± 0.1** 29.2 ± 0.2** 29.2 ± 0.1** 28.2 ± 0.1** Week 14 32.1 ± 0.1 31.0 ± 0.2** 30.7 ± 0.1** 30.5 ± 0.1** 30.0 ± 0.1**
Methemoglobin (g/dL) Day 25 0.35 ± 0.03 0.90 ± 0.04** 1.56 ± 0.04**b 1.95 ± 0.05** 1.63 ± 0.06** Day 88 0.38 ± 0.02 1.37 ± 0.08** 1.95 ± 0.07** 2.29 ± 0.08** 2.03 ± 0.08**
Methemoglobin (% hemoglobin) Day 25 2.40 ± 0.22 6.70 ± 0.30** 12.44 ± 0.41** 16.60 ± 0.31** 14.75 ± 0.56** Day 88 2.44 ± 0.18c 10.10 ± 0.55** 15.50 ± 0.48** 18.20 ± 0.53** 17.67 ± 0.71**
Heinz bodies (% erythrocytes) Day 25 0.0 ± 0.0 0.0 ± 0.0 2.0 ± 0.6** 14.5 ± 1.9** 23.5 ± 2.6** Week 14 0.0 ± 0.0 0.5 ± 0.2** 2.8 ± 0.3** 4.1 ± 0.4** 2.9 ± 0.8**
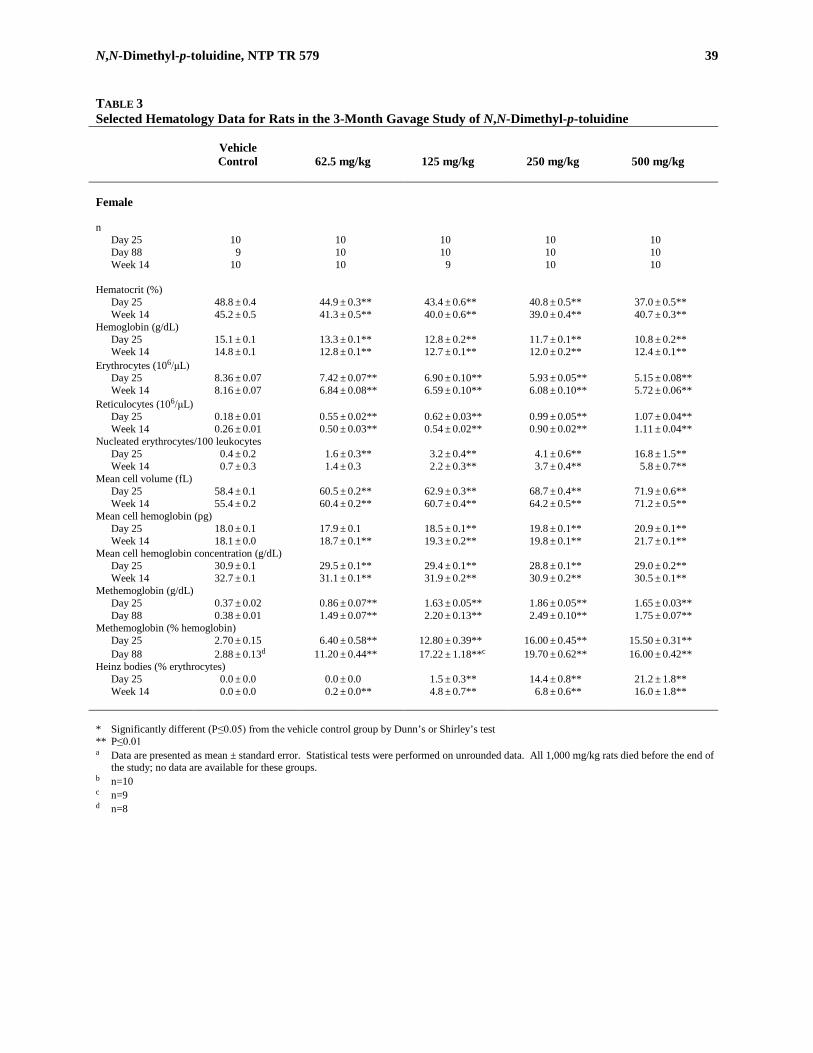
N,N-Dimethyl-p-toluidine, NTP TR 579 39
TABLE 3 Selected Hematology Data for Rats in the 3-Month Gavage Study of N,N-Dimethyl-p-toluidine
Vehicle Control
62.5 mg/kg
125 mg/kg
250 mg/kg
500 mg/kg
Female n
Day 25 10 10 10 10 10 Day 88 9 10 10 10 10 Week 14 10 10 9 10 10
Hematocrit (%)
Day 25 48.8 ± 0.4 44.9 ± 0.3** 43.4 ± 0.6** 40.8 ± 0.5** 37.0 ± 0.5** Week 14 45.2 ± 0.5 41.3 ± 0.5** 40.0 ± 0.6** 39.0 ± 0.4** 40.7 ± 0.3**
Hemoglobin (g/dL) Day 25 15.1 ± 0.1 13.3 ± 0.1** 12.8 ± 0.2** 11.7 ± 0.1** 10.8 ± 0.2** Week 14 14.8 ± 0.1 12.8 ± 0.1** 12.7 ± 0.1** 12.0 ± 0.2** 12.4 ± 0.1**
Erythrocytes (106/μL) Day 25 8.36 ± 0.07 7.42 ± 0.07** 6.90 ± 0.10** 5.93 ± 0.05** 5.15 ± 0.08** Week 14 8.16 ± 0.07 6.84 ± 0.08** 6.59 ± 0.10** 6.08 ± 0.10** 5.72 ± 0.06**
Reticulocytes (106/μL) Day 25 0.18 ± 0.01 0.55 ± 0.02** 0.62 ± 0.03** 0.99 ± 0.05** 1.07 ± 0.04** Week 14 0.26 ± 0.01 0.50 ± 0.03** 0.54 ± 0.02** 0.90 ± 0.02** 1.11 ± 0.04**
Nucleated erythrocytes/100 leukocytes Day 25 0.4 ± 0.2 1.6 ± 0.3** 3.2 ± 0.4** 4.1 ± 0.6** 16.8 ± 1.5** Week 14 0.7 ± 0.3 1.4 ± 0.3 2.2 ± 0.3** 3.7 ± 0.4** 5.8 ± 0.7**
Mean cell volume (fL) Day 25 58.4 ± 0.1 60.5 ± 0.2** 62.9 ± 0.3** 68.7 ± 0.4** 71.9 ± 0.6** Week 14 55.4 ± 0.2 60.4 ± 0.2** 60.7 ± 0.4** 64.2 ± 0.5** 71.2 ± 0.5**
Mean cell hemoglobin (pg) Day 25 18.0 ± 0.1 17.9 ± 0.1 18.5 ± 0.1** 19.8 ± 0.1** 20.9 ± 0.1** Week 14 18.1 ± 0.0 18.7 ± 0.1** 19.3 ± 0.2** 19.8 ± 0.1** 21.7 ± 0.1**
Mean cell hemoglobin concentration (g/dL) Day 25 30.9 ± 0.1 29.5 ± 0.1** 29.4 ± 0.1** 28.8 ± 0.1** 29.0 ± 0.2** Week 14 32.7 ± 0.1 31.1 ± 0.1** 31.9 ± 0.2** 30.9 ± 0.2** 30.5 ± 0.1**
Methemoglobin (g/dL) Day 25 0.37 ± 0.02 0.86 ± 0.07** 1.63 ± 0.05** 1.86 ± 0.05** 1.65 ± 0.03** Day 88 0.38 ± 0.01 1.49 ± 0.07** 2.20 ± 0.13** 2.49 ± 0.10** 1.75 ± 0.07**
Methemoglobin (% hemoglobin) Day 25 2.70 ± 0.15 6.40 ± 0.58** 12.80 ± 0.39** 16.00 ± 0.45** 15.50 ± 0.31** Day 88 2.88 ± 0.13d 11.20 ± 0.44** 17.22 ± 1.18**c 19.70 ± 0.62** 16.00 ± 0.42**
Heinz bodies (% erythrocytes) Day 25 0.0 ± 0.0 0.0 ± 0.0 1.5 ± 0.3** 14.4 ± 0.8** 21.2 ± 1.8** Week 14 0.0 ± 0.0 0.2 ± 0.0** 4.8 ± 0.7** 6.8 ± 0.6** 16.0 ± 1.8**
* Significantly different (P≤0.05) from the vehicle control group by Dunn’s or Shirley’s test ** P≤0.01 a Data are presented as mean ± standard error. Statistical tests were performed on unrounded data. All 1,000 mg/kg rats died before the end of
the study; no data are available for these groups. b n=10 c n=9 d n=8
40 N,N-Dimethyl-p-toluidine, NTP TR 579
necrotic cells remained in the affected areas. Renal tubule dilatation was associated with variable dilatation of the renal cortical tubules. Atrophy of the splenic red pulp was characterized by decreased hematopoietic activity within the red pulp. Necrosis of the thymus was characterized by thymocytes with shrunken, pyknotic nuclei and karyorrhectic nuclear debris. In the nose, degeneration of the olfactory epithelium, and hyper-plasia (males) or metaplasia (females) of the respiratory epithelium were observed in the 1,000 mg/kg groups as well as most of the other dosed groups. Treatment-related histologic lesions occurred in the liver, nose, kidney, spleen, bone marrow, mesenteric lymph node, and forestomach of surviving groups of rats. These lesions are described below. In the liver, there were significantly increased inci-dences of hepatocellular hypertrophy in males and females administered 125 mg/kg or greater (Table 4); the severity of this lesion was also generally increased. In males and females, there were significantly increased incidences of pigmentation in the 62.5, 125, 250, and 500 mg/kg groups. The incidences of hepatocyte necro-sis in 62.5, 250, and 500 mg/kg females were sig-nificantly increased compared to the vehicle control incidences. Hepatocellular hypertrophy consisted of large hepato-cytes with abundant eosinophilic granular cytoplasm and some degree of nuclear enlargement (Plates 3 and 4). A coinciding increase in mitotic figures was not recorded separately. Hepatocellular necrosis (not des-ignated as centrilobular) was characterized by liver lobules having randomly scattered hepatocytes with condensed eosinophilic cytoplasm and nuclear frag-mentation. Pigmentation was diagnosed when there was an accumulation of golden-brown pigment, presumed to be hemosiderin, within Kupffer cells and was attributed to increased erythrocyte destruction. Hematopoietic cell proliferation was characterized by erythropoiesis – scattered small clusters of immature hematopoietic cells. In the nose, dose-related increases in the incidences and severities of olfactory epithelium degeneration occurred in all dosed groups of males and females (Table 4). In the 250 and 500 mg/kg males and females, there were significantly increased incidences of olfactory epithe-lium metaplasia. The incidences of respiratory epithe-lium hyperplasia were significantly increased in males and females administered 125, 250, and 500 mg/kg. There were significantly increased incidences of respi-ratory epithelium squamous metaplasia in 62.5, 125, 250, and 500 mg/kg males and in females administered
125, 250, and 500 mg/kg. In males and females admin-istered 125, 250, and 500 mg/kg, there were signifi-cantly increased incidences of hyperplasia of the glands underlying the olfactory epithelium (Bowman’s glands). Olfactory epithelial degeneration was characterized by disorganization, disruption or loss of epithelial cells, by various vacuoles within the epithelium, by degeneration and/or atrophy of the olfactory nerves, and by variable acute to chronic active inflammatory infiltrates (Plates 5 and 6). Olfactory epithelial metaplasia occurred when the normal olfactory epithelium was replaced by a cili-ated respiratory epithelium. Hyperplasia of the respira-tory epithelium was characterized by increased numbers of respiratory epithelial cells that formed a pseudostrati-fied columnar epithelium. Metaplasia of the respiratory epithelium was recorded when a squamous epithelium replaced the normal respiratory epithelium. Hyperplasia of glands consisted of proliferations of the cells lining the glands, variable luminal/ductular dilatation, and occasional inflammatory infiltrates. In the kidney, there were significantly increased inci-dences of pigmentation in males and females adminis-tered 62.5, 125, 250, and 500 mg/kg (Table 4). The incidences of papillary necrosis in 125, 250, and 500 mg/kg males and 250 mg/kg females were signifi-cantly greater than those in the vehicle controls. In males, there were significantly increased incidences of mineralization in the 125, 250, and 500 mg/kg groups. In females, there were significantly increased incidences of nephropathy in the 125, 250, and 500 mg/kg groups. Pigmentation was characterized by accumulation of orange-brown pigment consistent with hemosiderin. Papillary necrosis was characterized by patchy to dif-fuse acute necrosis of the renal papilla (Plates 7 and 8). Nephropathy was characterized by flattened basophilic renal tubular epithelial cells, luminal dilation, and a minimal thickening of the tubular basement membranes. Mineralization occurred within tubules of the deep cor-tex or medulla, often in association with papillary necrosis. In the spleen, there were significantly increased inci-dences of congestion in all dosed groups of males and 125, 250, and 500 mg/kg females; lymphoid follicle atrophy in males administered 250 and 500 mg/kg and females administered 500 mg/kg; and capsular fibrosis in 125, 250, and 500 mg/kg males and females; the severities of these lesions also increased with dose (Table 4). There were also significantly increased inci-dences of mesothelial hypertrophy in 125 mg/kg males and 250 and 500 mg/kg males and females. The severi-ties of hematopoietic cell proliferation and pigmentation in all dosed groups were increased compared to those of

N,N-Dimethyl-p-toluidine, NTP TR 579 41
TABLE 4 Incidences of Selected Nonneoplastic Lesions in Rats in the 3-Month Gavage Study of N,N-Dimethyl-p-toluidinea
Vehicle Control
62.5 mg/kg
125 mg/kg
250 mg/kg
500 mg/kg
Male Liverb 10 10 10 10 10
Hepatocyte, Hypertrophyc 0 2 (1.0)d 9** (1.0) 10** (1.2) 10** (1.8) Pigmentation 0 4* (1.0) 7** (1.0) 9** (1.0) 9** (1.0)
Nose 10 10 10 10 10
Glands, Hyperplasia 0 0 10** (1.8) 10** (2.1) 9** (2.1) Olfactory Epithelium, Degeneration 0 5* (1.0) 10** (2.5) 10** (3.0) 10** (3.1) Olfactory Epithelium, Metaplasia 0 0 0 9** (1.9) 9** (2.9) Respiratory Epithelium, Hyperplasia 1 (1.0) 2 (1.0) 7** (1.4) 10** (1.5) 9** (1.8) Respiratory Epithelium, Metaplasia,
Squamous 0 8** (1.5) 10** (2.5) 10** (2.8) 9** (3.0) Kidney 10 10 10 10 10
Mineralization 1 (1.0) 4 (1.0) 10** (1.3) 10** (1.8) 8** (2.1) Pigmentation 0 10** (1.0) 10** (1.0) 10** (1.6) 9** (1.9) Papilla, Necrosis 0 0 7** (1.3) 7** (1.7) 9** (2.4)
Spleen 10 10 10 10 10 Capsule, Fibrosis 1 (1.0) 5 (1.0) 10** (1.4) 10** (2.7) 9** (2.8) Congestion 0 10** (1.2) 10** (1.8) 10** (2.4) 9** (3.0) Hematopoietic Cell Proliferation 9 (1.0) 10 (2.0) 10 (2.0) 10 (1.9) 9 (1.8) Lymphoid Follicle, Atrophy 0 0 0 8** (1.5) 10** (2.7) Mesothelium, Hypertrophy 3 (1.3) 5 (1.2) 8* (1.5) 10** (1.5) 9** (1.8) Pigmentation 10 (1.0) 10 (2.1) 10 (2.2) 10 (2.0) 9 (2.0)
Bone Marrow 10 10 10 10 10
Hyperplasia 0 10** (2.0) 10** (2.9) 10** (3.0) 10** (2.9)
Forestomach 10 10 10 10 10 Inflammation 0 0 1 (1.0) 0 5* (1.4)

42 N,N-Dimethyl-p-toluidine, NTP TR 579
TABLE 4 Incidences of Selected Nonneoplastic Lesions in Rats in the 3-Month Gavage Study of N,N-Dimethyl-p-toluidine
Vehicle Control
62.5 mg/kg
125 mg/kg
250 mg/kg
500 mg/kg
Female Liver 10 10 10 10 10
Hepatocyte, Hypertrophy 0 1 (1.0) 7** (1.0) 9** (1.1) 10** (2.7) Hepatocyte, Necrosis 1 (1.0) 6* (1.5) 5 (1.4) 7** (1.3) 6* (1.2) Pigmentation 0 10** (1.0) 10** (1.0) 10** (1.8) 10** (1.9)
Nose 10 10 10 10 10
Glands, Hyperplasia 0 3 (1.0) 9** (1.7) 10** (1.9) 10** (2.0) Olfactory Epithelium, Degeneration 0 7** (1.3) 10** (2.1) 10** (3.0) 10** (3.0) Olfactory Epithelium, Metaplasia 0 0 0 7** (1.6) 10** (2.9) Respiratory Epithelium, Hyperplasia 0 1 (1.0) 7** (1.1) 10** (1.7) 10** (1.7) Respiratory Epithelium, Metaplasia,
Squamous 0 0 6** (1.5) 10** (2.2) 10** (2.6) Kidney 10 10 10 10 10
Nephropathy 2 (1.0) 2 (1.0) 9** (1.0) 10** (1.0) 10** (1.3) Pigmentation 0 10** (1.0) 10** (1.0) 10** (1.0) 10** (1.6) Papilla, Necrosis 0 0 0 6** (1.5) 2 (2.5)
Spleen 10 10 10 10 10 Capsule, Fibrosis 0 3 (1.0) 7** (1.3) 10** (2.2) 10** (2.7) Congestion 0 2 (1.0) 10** (1.4) 10** (2.4) 10** (3.0) Hematopoietic Cell Proliferation 10 (1.0) 10 (1.9) 10 (1.9) 10 (2.3) 10 (2.0) Lymphoid Follicle, Atrophy 0 0 0 0 10** (1.3) Mesothelium, Hypertrophy 0 1 (1.0) 2 (1.5) 9** (1.1) 9** (1.1) Pigmentation 10 (1.0) 10 (2.0) 10 (2.0) 10 (1.9) 10 (2.0)
Bone Marrow 10 10 10 10 10 Hyperplasia 0 10** (1.9) 10** (2.7) 10** (3.0) 10** (3.0)
Lymph Node, Mesenteric 10 10 10 10 10 Atrophy 0 0 0 1 (2.0) 6** (2.2)
* Significantly different (P≤0.05) from the vehicle control group by the Fisher exact test ** P≤0.01 a Data not shown for 1,000 mg/kg groups because all animals died during week 1. b Number of animals with tissue examined microscopically c Number of animals with lesion d Average severity grade of lesions in affected animals: 1=minimal, 2=mild, 3=moderate, 4=marked the vehicle control groups. The spleen of many dosed animals was noted to be enlarged macroscopically, and this finding correlated microscopically with congestion, which was characterized by increased numbers of red blood cells in the red pulp. Pigmentation in the spleen resulted from an accumulation of brown pigment con-sistent with hemosiderin deposition after erythrocyte destruction. Islands of proliferating hematopoietic cells within the red pulp characterized hematopoietic cell proliferation. Atrophy of lymphoid follicles was char-
acterized by depletion of lymphocytes within lymphoid follicles. Capsular fibrosis was characterized by a vari-able thickening of the capsule due to an accumulation of fibrous connective tissue. Fibrotic areas often contained mononuclear cells; hypertrophy of the mesothelium often accompanied the finding. In bone marrow, the incidences of hyperplasia in all dosed groups of male and female rats were significantly greater than those in the vehicle controls (Table 4).
N,N-Dimethyl-p-toluidine, NTP TR 579 43
Bone marrow hyperplasia was characterized by an expansion of marrow hematopoietic tissue with a con-comitant decrease in marrow adipose tissue. In the mesenteric lymph node, there were significantly increased incidences of atrophy in 500 mg/kg females (Table 4). Atrophy was characterized by a general depletion of lymphocytes and loss of follicles. In the forestomach, the incidence of inflammation was significantly increased in 500 mg/kg males (Table 4); inflammation was characterized by mixed inflammatory infiltrates in the mucosa and submucosa.
Dose Selection Rationale: Based on mortality in the 1,000 mg/kg groups, decreased (more than 10%) final mean body weights in the 125, 250, and 500 mg/kg male groups, and treatment-related nonneoplastic lesions in the liver, nose, spleen, kidney, and bone mar-row with increased severity at 125 mg/kg or greater, a high dose of 60 mg/kg N,N-dimethyl-p-toluidine was selected for the 2-year gavage study in rats. The low dose of 6 mg/kg was selected because this dose was reported to cause toxicity in humans (Potter et al., 1988). The doses selected for the 2-year gavage study in rats were 0, 6, 20, and 60 mg/kg, with a threefold dose spacing.
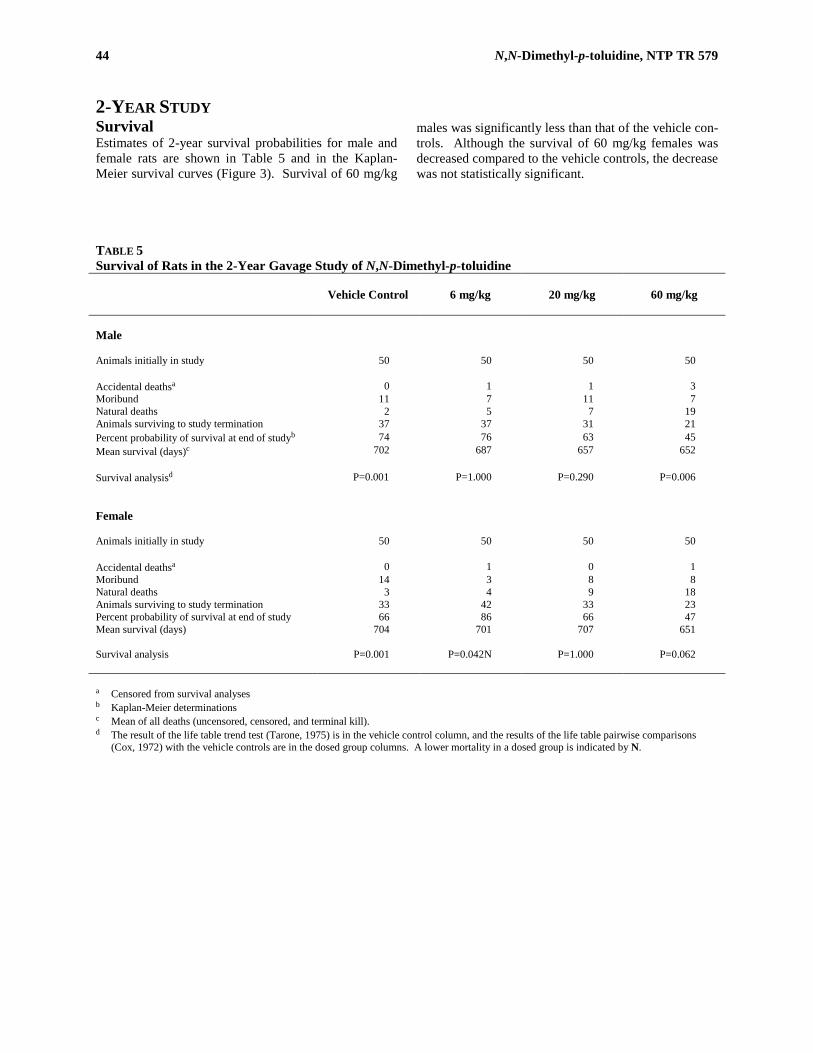
44 N,N-Dimethyl-p-toluidine, NTP TR 579
2-YEAR STUDY Survival Estimates of 2-year survival probabilities for male and female rats are shown in Table 5 and in the Kaplan-Meier survival curves (Figure 3). Survival of 60 mg/kg
males was significantly less than that of the vehicle con-trols. Although the survival of 60 mg/kg females was decreased compared to the vehicle controls, the decrease was not statistically significant.
TABLE 5 Survival of Rats in the 2-Year Gavage Study of N,N-Dimethyl-p-toluidine
Vehicle Control
6 mg/kg
20 mg/kg
60 mg/kg
Male Animals initially in study 50 50 50 50 Accidental deathsa 0 1 1 3 Moribund 11 7 11 7 Natural deaths 2 5 7 19 Animals surviving to study termination 37 37 31 21 Percent probability of survival at end of studyb 74 76 63 45 Mean survival (days)c 702 687 657 652 Survival analysisd P=0.001 P=1.000 P=0.290 P=0.006 Female Animals initially in study 50 50 50 50 Accidental deathsa 0 1 0 1 Moribund 14 3 8 8 Natural deaths 3 4 9 18 Animals surviving to study termination 33 42 33 23 Percent probability of survival at end of study 66 86 66 47 Mean survival (days) 704 701 707 651 Survival analysis P=0.001 P=0.042N P=1.000 P=0.062 a Censored from survival analyses b Kaplan-Meier determinations c Mean of all deaths (uncensored, censored, and terminal kill). d The result of the life table trend test (Tarone, 1975) is in the vehicle control column, and the results of the life table pairwise comparisons
(Cox, 1972) with the vehicle controls are in the dosed group columns. A lower mortality in a dosed group is indicated by N.

N,N-Dimethyl-p-toluidine, NTP TR 579 45
FIGURE 3 Kaplan-Meier Survival Curves for Rats Administered N,N-Dimethyl-p-toluidine by Gavage for 2 Years

46 N,N-Dimethyl-p-toluidine, NTP TR 579
Body Weights and Clinical Findings The mean body weights of 60 mg/kg males were over 10% less than those of the vehicle controls after week 61 (day 421) and those of 60 mg/kg females were less than those of the vehicle controls after week 33 (day 225) (Figure 4; Tables 6 and 7). Clinical findings included signs of pallor in 60 mg/kg females and hyper-activity and boxing behavior in 20 mg/kg females and 60 mg/kg males and females. Hyperactivity and boxing behavior were first noticed during study month 8. All
animals exhibited normal behavior prior to dosing. Boxing behavior, characterized by “kangaroo boxing” between cage mate pairs, was seen after dosing in 20 mg/kg females and 60 mg/kg males and females. In most months where this behavior was observed, the per-centage of animals displaying this behavior was greater following the first dose of the week compared to the percentage following the last dose of the week. The percentage of 60 mg/kg females displaying boxing behavior decreased over the course of the study.
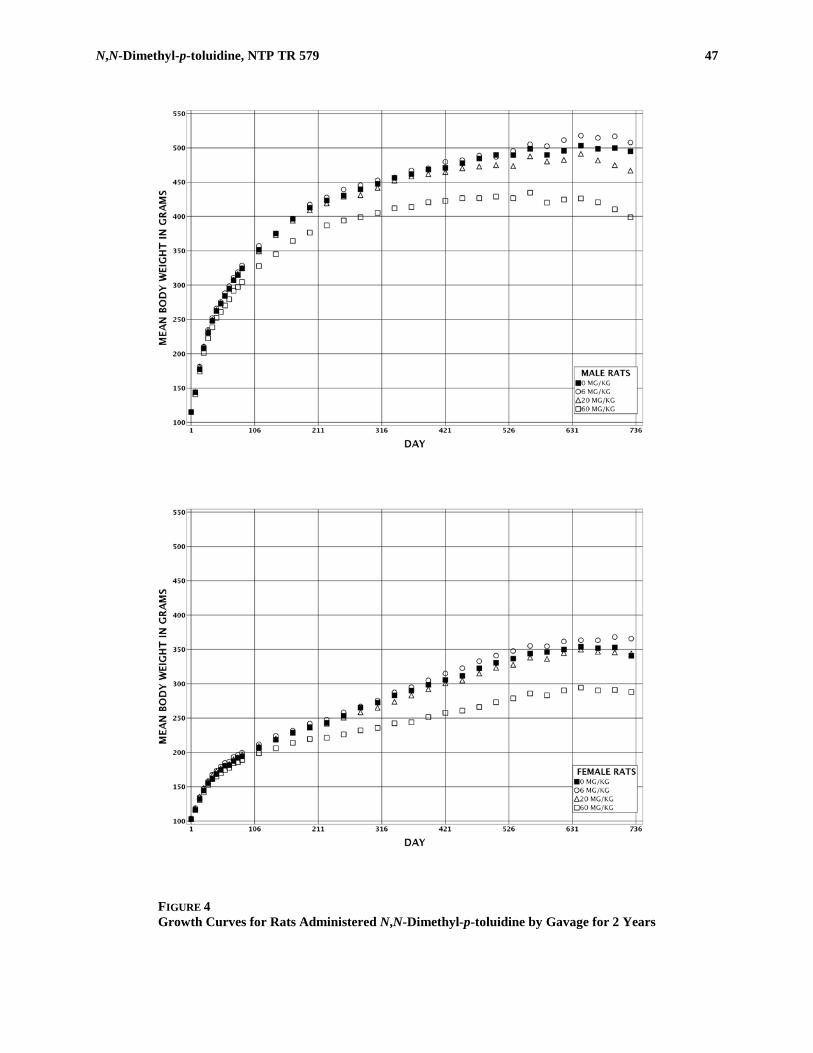
N,N-Dimethyl-p-toluidine, NTP TR 579 47
FIGURE 4 Growth Curves for Rats Administered N,N-Dimethyl-p-toluidine by Gavage for 2 Years

48 N,N-Dimethyl-p-toluidine, NTP TR 579
TABLE 6 Mean Body Weights and Survival of Male Rats in the 2-Year Gavage Study of N,N-Dimethyl-p-toluidine
Vehicle Control
6 mg/kg
20 mg/kg
60 mg/kg
Day Av. Wt.
(g) No. of
Survivors Av. Wt
(g) Wt. (% of Controls)
No. of Survivors
Av. Wt. (g)
Wt. (% of Controls)
No. of Survivors
Av. Wt (g)
Wt. (% of Controls)
No. of Survivors
1 115 50 115 100 50 115 100 50 115 100 50 8 144 50 144 100 50 145 100 50 141 98 50
15 177 50 181 102 50 181 102 50 174 98 50 22 208 50 210 101 50 211 101 50 202 97 50 29 231 50 235 102 50 234 101 50 223 97 50 36 248 50 252 102 50 250 101 50 239 96 50 43 263 50 266 101 50 264 101 50 253 96 50 50 273 50 276 101 50 274 100 50 261 96 50 57 285 50 288 101 50 284 100 50 271 95 50 64 295 50 299 101 49 295 100 50 280 95 50 71 307 50 311 101 49 308 100 50 292 95 50 78 315 50 319 101 49 317 101 50 298 95 50 85 324 50 329 101 49 325 100 50 305 94 50
113 352 50 357 102 49 350 99 50 328 93 50 141 376 50 375 100 49 373 99 49 345 92 50 169 397 50 397 100 49 394 99 48 365 92 50 197 413 50 417 101 49 409 99 48 377 91 49 225 424 50 428 101 49 419 99 48 387 91 49 253 431 50 440 102 49 429 100 46 394 92 49 281 440 50 446 101 49 431 98 46 399 91 49 309 448 50 453 101 49 442 99 46 405 91 49 337 456 49 457 100 48 452 99 46 412 90 49 365 462 49 467 101 48 458 99 46 414 90 48 393 469 49 470 100 48 462 99 46 421 90 47 421 471 49 480 102 48 465 99 46 423 90 46 449 478 49 482 101 48 470 98 46 427 89 45 477 485 49 489 101 48 473 98 46 427 88 45 505 490 49 487 99 48 475 97 46 429 88 44 533 490 49 495 101 46 473 97 45 427 87 44 561 499 49 505 101 46 488 98 44 435 87 44 589 490 49 503 103 45 480 98 43 420 86 42 617 496 45 511 103 44 483 97 41 425 86 38 645 504 44 518 103 43 491 98 38 427 85 34 673 499 42 514 103 43 482 97 36 421 84 27 701 500 38 517 103 40 475 95 33 411 82 25
Mean for Weeks
1-13 245 248 101 246 100 235 96 14-52 415 419 101 411 99 379 91
53-101 487 495 102 475 98 424 87

N,N-Dimethyl-p-toluidine, NTP TR 579 49
TABLE 7 Mean Body Weights and Survival of Female Rats in the 2-Year Gavage Study of N,N-Dimethyl-p-toluidine
Vehicle Control
6 mg/kg
20 mg/kg
60 mg/kg
Day Av. Wt.
(g) No. of
Survivors Av. Wt
(g) Wt. (% of Controls)
No. of Survivors
Av. Wt. (g)
Wt. (% of Controls)
No. of Survivors
Av. Wt (g)
Wt. (% of Controls)
No. of Survivors
1 103 50 104 101 50 103 100 50 103 101 50 8 117 50 119 102 50 119 102 50 116 100 50
15 132 50 135 102 50 135 102 50 131 99 49 22 145 50 148 102 50 148 102 50 142 98 49 29 156 50 158 102 50 159 102 50 153 98 49 36 162 50 168 103 50 167 103 50 162 100 49 43 169 50 173 103 49 173 102 50 165 98 49 50 175 50 179 103 49 177 101 50 170 97 49 57 181 50 185 102 49 181 100 50 175 97 49 64 182 50 187 103 49 183 101 50 178 98 49 71 188 50 193 103 49 190 101 50 185 98 49 78 192 50 196 102 49 193 101 50 186 97 49 85 195 50 200 103 49 197 101 50 189 97 49
113 207 50 212 102 49 210 101 50 199 96 49 141 219 50 224 103 49 220 101 50 206 94 49 169 229 50 232 101 49 229 100 50 214 94 49 197 237 50 242 102 49 236 100 50 220 93 49 225 243 50 248 102 49 242 99 50 222 91 49 253 254 50 259 102 49 251 99 50 226 89 49 281 266 50 267 101 49 258 97 50 232 88 49 309 273 50 276 101 49 265 97 50 236 87 49 337 283 50 288 102 49 274 97 50 243 86 49 365 290 50 295 102 49 283 98 50 244 84 49 393 299 50 305 102 49 292 98 50 252 84 47 421 306 50 315 103 49 301 99 50 258 84 47 449 312 50 323 104 49 305 98 50 261 84 47 477 323 50 333 103 49 315 98 50 266 83 44 505 331 50 341 103 49 323 98 50 273 83 44 533 337 50 348 103 48 328 97 50 279 83 43 561 344 49 355 103 48 338 98 50 286 83 40 589 347 48 355 102 47 336 97 50 283 82 39 617 350 47 362 103 45 345 99 46 290 83 36 645 354 44 364 103 45 350 99 45 295 83 35 673 352 41 364 103 45 347 99 41 290 83 34 701 353 34 368 104 43 346 98 38 291 82 29
Mean for Weeks
1-13 161 165 102 163 101 158 98 14-52 246 250 102 243 99 222 90
53-101 331 341 103 324 98 275 83
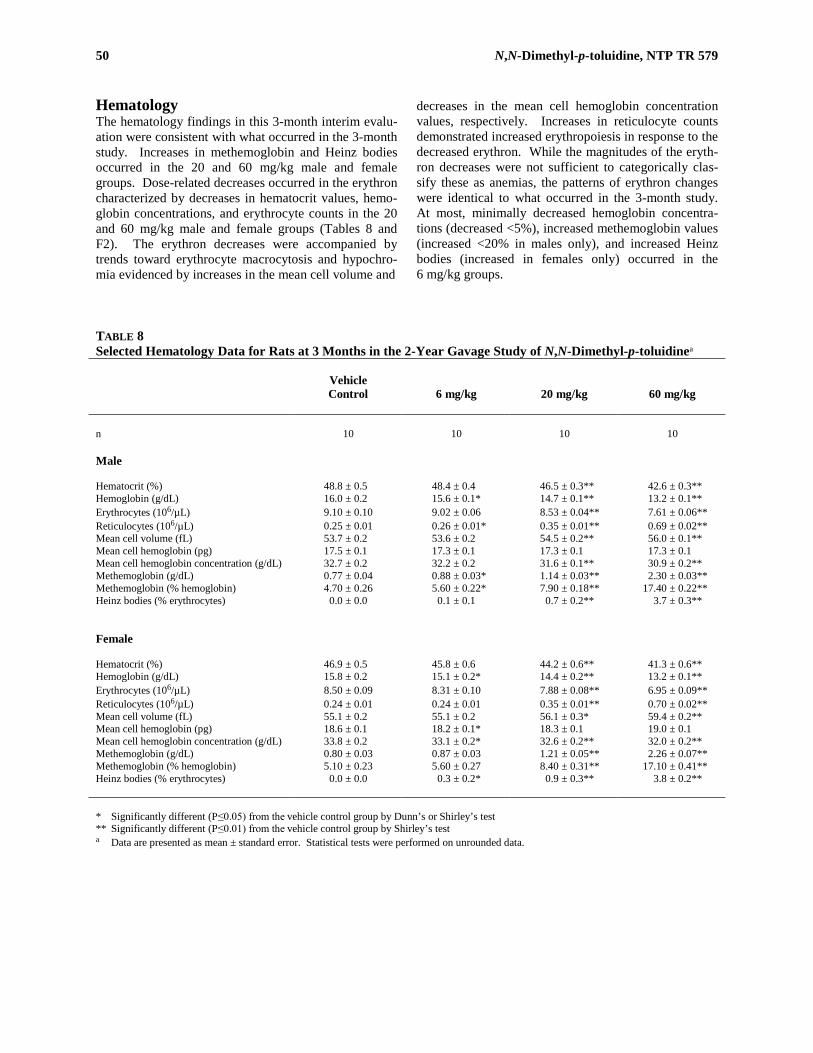
50 N,N-Dimethyl-p-toluidine, NTP TR 579
Hematology The hematology findings in this 3-month interim evalu-ation were consistent with what occurred in the 3-month study. Increases in methemoglobin and Heinz bodies occurred in the 20 and 60 mg/kg male and female groups. Dose-related decreases occurred in the erythron characterized by decreases in hematocrit values, hemo-globin concentrations, and erythrocyte counts in the 20 and 60 mg/kg male and female groups (Tables 8 and F2). The erythron decreases were accompanied by trends toward erythrocyte macrocytosis and hypochro-mia evidenced by increases in the mean cell volume and
decreases in the mean cell hemoglobin concentration values, respectively. Increases in reticulocyte counts demonstrated increased erythropoiesis in response to the decreased erythron. While the magnitudes of the eryth-ron decreases were not sufficient to categorically clas-sify these as anemias, the patterns of erythron changes were identical to what occurred in the 3-month study. At most, minimally decreased hemoglobin concentra-tions (decreased <5%), increased methemoglobin values (increased <20% in males only), and increased Heinz bodies (increased in females only) occurred in the 6 mg/kg groups.
TABLE 8 Selected Hematology Data for Rats at 3 Months in the 2-Year Gavage Study of N,N-Dimethyl-p-toluidinea
Vehicle Control
6 mg/kg
20 mg/kg
60 mg/kg
n 10 10 10 10 Male Hematocrit (%) 48.8 ± 0.5 48.4 ± 0.4 46.5 ± 0.3** 42.6 ± 0.3** Hemoglobin (g/dL) 16.0 ± 0.2 15.6 ± 0.1* 14.7 ± 0.1** 13.2 ± 0.1** Erythrocytes (106/µL) 9.10 ± 0.10 9.02 ± 0.06 8.53 ± 0.04** 7.61 ± 0.06** Reticulocytes (106/µL) 0.25 ± 0.01 0.26 ± 0.01* 0.35 ± 0.01** 0.69 ± 0.02** Mean cell volume (fL) 53.7 ± 0.2 53.6 ± 0.2 54.5 ± 0.2** 56.0 ± 0.1** Mean cell hemoglobin (pg) 17.5 ± 0.1 17.3 ± 0.1 17.3 ± 0.1 17.3 ± 0.1 Mean cell hemoglobin concentration (g/dL) 32.7 ± 0.2 32.2 ± 0.2 31.6 ± 0.1** 30.9 ± 0.2** Methemoglobin (g/dL) 0.77 ± 0.04 0.88 ± 0.03* 1.14 ± 0.03** 2.30 ± 0.03** Methemoglobin (% hemoglobin) 4.70 ± 0.26 5.60 ± 0.22* 7.90 ± 0.18** 17.40 ± 0.22** Heinz bodies (% erythrocytes) 0.0 ± 0.0 0.1 ± 0.1 0.7 ± 0.2** 3.7 ± 0.3** Female Hematocrit (%) 46.9 ± 0.5 45.8 ± 0.6 44.2 ± 0.6** 41.3 ± 0.6** Hemoglobin (g/dL) 15.8 ± 0.2 15.1 ± 0.2* 14.4 ± 0.2** 13.2 ± 0.1** Erythrocytes (106/µL) 8.50 ± 0.09 8.31 ± 0.10 7.88 ± 0.08** 6.95 ± 0.09** Reticulocytes (106/µL) 0.24 ± 0.01 0.24 ± 0.01 0.35 ± 0.01** 0.70 ± 0.02** Mean cell volume (fL) 55.1 ± 0.2 55.1 ± 0.2 56.1 ± 0.3* 59.4 ± 0.2** Mean cell hemoglobin (pg) 18.6 ± 0.1 18.2 ± 0.1* 18.3 ± 0.1 19.0 ± 0.1 Mean cell hemoglobin concentration (g/dL) 33.8 ± 0.2 33.1 ± 0.2* 32.6 ± 0.2** 32.0 ± 0.2** Methemoglobin (g/dL) 0.80 ± 0.03 0.87 ± 0.03 1.21 ± 0.05** 2.26 ± 0.07** Methemoglobin (% hemoglobin) 5.10 ± 0.23 5.60 ± 0.27 8.40 ± 0.31** 17.10 ± 0.41** Heinz bodies (% erythrocytes) 0.0 ± 0.0 0.3 ± 0.2* 0.9 ± 0.3** 3.8 ± 0.2** * Significantly different (P≤0.05) from the vehicle control group by Dunn’s or Shirley’s test ** Significantly different (P≤0.01) from the vehicle control group by Shirley’s test a Data are presented as mean ± standard error. Statistical tests were performed on unrounded data.

N,N-Dimethyl-p-toluidine, NTP TR 579 51
Pathology and Statistical Analyses This section describes the statistically significant or bio-logically noteworthy changes in the incidences of mononuclear cell leukemia and neoplasms and nonneo-plastic lesions of the liver, nose, and thyroid gland; nonneoplastic lesions of the spleen, bone marrow, mesenteric lymph node, kidney, and forestomach; and neoplasms of the uterus, vagina, ovary, tongue, and mammary gland. Summaries of the incidences of neo-plasms and nonneoplastic lesions, statistical analyses of primary neoplasms that occurred with an incidence of at least 5% in at least one animal group, and historical incidences for the neoplasms mentioned in this section are presented in Appendix A for male rats and Appendix B for female rats. Liver: There were significant increases in the inciden-ces of hepatocellular carcinoma and hepatocellular ade-noma or carcinoma (combined) in 60 mg/kg males and females (Tables 9, A2, and B2). Hepatocellular car-
cinomas were characterized by enlarged hepatocytes arranged in a trabecular pattern with trabeculae at least three cells in width (Plates 9 and 10). Cells were vari-ably sized and nuclei contained prominent nucleoli. Mitotic figures were occasionally observed. In contrast, hepatocellular adenomas tended to be smaller, more dis-crete masses that lacked a trabecular pattern. Hepato-cellular adenomas caused compression of surrounding parenchyma and were composed of hepatocytes contain-ing eosinophilic, basophilic or vacuolated cytoplasm. Hepatocellular adenomas and hepatocellular carcinomas are considered part of the same neoplastic process, and therefore were combined. There were significantly increased incidences of eosin-ophilic focus in all dosed male groups and 20 and 60 mg/kg females, clear cell focus in all dosed female groups, and mixed cell focus in 60 mg/kg males and females (Tables 9, A4, and B4). Incidences of baso-philic focus in all dosed groups of males and 20 and
TABLE 9 Incidences of Neoplasms and Nonneoplastic Lesions of the Liver in Rats in the 2-Year Gavage Study of N,N-Dimethyl-p-toluidine
Vehicle Control
6 mg/kg
20 mg/kg
60 mg/kg
Male Number Examined Microscopically 50 50 50 50
Basophilic Focusa 28 6** 0** 3** Eosinophilic Focus 11 21* 21* 29** Mixed Cell Focus 18 17 17 35** Bile Duct, Fibrosis 21 (1.0)b 27 (1.0) 41** (1.1) 42** (1.5) Bile Duct, Hyperplasia 40 (1.2) 42 (1.5) 44* (1.6) 44 (1.8) Degeneration, Cystic 4 (1.3) 10 (1.4) 9 (1.3) 17** (1.3) Hepatocyte, Hypertrophy 0 0 6* (1.5) 31** (1.5) Hepatocellular Adenomac 0 0 1 1
Hepatocellular Carcinomad
Overall ratee 0/50 (0%) 0/50 (0%) 1/50 (2%) 6/50 (12%) Adjusted ratef 0.0% 0.0% 2.4% 14.9% Terminal rateg 0/37 (0%) 0/37 (0%) 1/31 (3%) 2/21 (10%) First incidence (days) —i — 727 (T) 612 Poly-3 testh P<0.001 —j P=0.479 P=0.009
Hepatocellular Adenoma or Carcinomak Overall rate 0/50 (0%) 0/50 (0%) 2/50 (4%) 6/50 (12%) Adjusted rate 0.0% 0.0% 4.8% 14.9% Terminal rate 0/37 (0%) 0/37 (0%) 1/31 (3%) 2/21 (10%) First incidence (days) — — 688 612 Poly-3 test P<0.001 — P=0.215 P=0.009

52 N,N-Dimethyl-p-toluidine, NTP TR 579
TABLE 9 Incidences of Neoplasms and Nonneoplastic Lesions of the Liver in Rats in the 2-Year Gavage Study of N,N-Dimethyl-p-toluidine
Vehicle Control
6 mg/kg
20 mg/kg
60 mg/kg
Female
Number Examined Microscopically 50 50 50 49
Basophilic Focus 46 45 5** 6** Clear Cell Focus 7 17* 24** 29** Eosinophilic Focus 18 24 29* 32** Mixed Cell Focus 14 20 17 26** Bile Duct, Fibrosis 6 (1.2) 11 (1.0) 23** (1.0) 27** (1.1) Bile Duct, Hyperplasia 10 (1.6) 21* (1.0) 27** (1.0) 43** (1.5) Degeneration, Cystic 0 0 2 (1.0) 10** (1.2) Hepatocyte, Hypertrophy 0 0 6* (1.3) 22** (1.3) Hepatocyte, Necrosis 0 0 1 (2.0) 5* (1.8) Hepatocellular Adenomal
Overall rate 0/50 (0%) 1/50 (2%) 1/50 (2%) 3/49 (6%) Adjusted rate 0.0% 2.1% 2.2% 7.8% Terminal rate 0/33 (0%) 1/42 (2%) 1/33 (3%) 2/23 (9%) First incidence (days) — 728 (T) 728 (T) 720 Poly-3 test P=0.044 P=0.504 P=0.502 P=0.091
Hepatocellular Carcinoma, Multiple 0 0 0 1 Hepatocellular Carcinoma (includes multiple)m
Overall rate 0/50 (0%) 0/50 (0%) 0/50 (0%) 4/49 (8%) Adjusted rate 0.0% 0.0% 0.0% 10.4% Terminal rate 0/33 (0%) 0/42 (0%) 0/33 (0%) 4/23 (17%) First incidence (days) — — — 728 (T) Poly-3 test P<0.001 — — P=0.041
Hepatocellular Adenoma or Carcinoman Overall rate 0/50 (0%) 1/50 (2%) 1/50 (2%) 7/49 (14%) Adjusted rate 0.0% 2.1% 2.2% 18.1% Terminal rate 0/33 (0%) 1/42 (2%) 1/33 (3%) 6/23 (26%) First incidence (days) — 728 (T) 728 (T) 720 Poly-3 test P<0.001 P=0.504 P=0.502 P=0.003
* Significantly different (P≤0.05) from the vehicle control group by the Poly-3 test ** P≤0.01 (T) Terminal kill a Number of animals with lesion b Average severity grade of lesions in affected animals: 1=minimal, 2=mild, 3=moderate, 4=marked c Historical incidence for 2-year gavage studies with corn oil vehicle controls (mean ± standard deviation): 3/299 (1.0% ± 1.1%),
range 0%-2%; all routes: 18/1,249 (1.4% ± 1.9%), range 0%-6% d Historical incidence for corn oil gavage studies: 0/299; all routes: 5/1,249 (0.4% ± 1.0%), range 0%-4% e Number of animals with neoplasm per number of animals with liver examined microscopically f Poly-3 estimated neoplasm incidence after adjustment for intercurrent mortality g Observed incidence at terminal kill h Beneath the vehicle control incidence is the P value associated with the trend test. Beneath the dosed group incidence are the P values
corresponding to pairwise comparisons between the vehicle controls and that dosed group. The Poly-3 test accounts for differential mortality in animals that do not reach terminal kill.
i Not applicable; no neoplasm in animal group j Value of statistic cannot be computed. k Historical incidence for corn oil gavage studies: 3/299 (1.0% ± 1.1%), range 0%-2%; all routes: 23/1,249 (1.8% ± 1.9%), range 0%-6% l Historical incidence for corn oil gavage studies: 1/300 (0.3% ± 0.8%), range 0%-2%; all routes: 11/1,200 (0.9% ± 1.6%), range 0%-4% m Historical incidence for corn oil gavage studies: 0/300; all routes: 1/1,200 (0.1% ± 0.4%), range 0%-2% n Historical incidence for corn oil gavage studies: 1/300 (0.3% ± 0.8%), range 0%-2%; all routes: 12/1,200 (1.0% ± 1.6%), range 0%-4%

N,N-Dimethyl-p-toluidine, NTP TR 579 53
60 mg/kg females were significantly less than those of the vehicle controls. Incidences of cystic degeneration were significantly increased in 60 mg/kg males and females. In the bile ducts of the liver, fibrosis in 20 and 60 mg/kg males and females and hyperplasia in 20 mg/kg males and all dosed groups of females were significantly increased. In 20 and 60 mg/kg males and females, there were significantly increased incidences of hepatocellular hypertrophy. In 60 mg/kg females, there was a significantly increased incidence of hepatocellular necrosis. Eosinophilic foci were typically composed of enlarged, eosinophilic hepatocytes that caused no or minimal compression of the surrounding parenchyma. In gen-eral, they tended to be smaller than hepatocellular ade-nomas. Mixed cell focus was diagnosed when a focus of altered hepatocytes was composed of two types of hepatocytes, and neither type made up more than 80% of the hepatocytes within the focus. Clear cell foci were characterized by hepatocytes with clear vacuoles, con-sistent with glycogen accumulation, within eosinophilic cytoplasm. Hepatocytes within a clear cell focus may have been enlarged, but were not necessarily so. Baso-philic foci, a common background lesion in rats, were composed of hepatocytes that stained more basophilic than the surrounding or typical hepatocytes, and affected hepatocytes were often smaller in size. Cystic degeneration was characterized by multilocular cystic structures that often contained flocculent eosinophilic material. Foci of cystic degeneration were randomly located in the liver, and were occasionally observed within a focus of altered hepatocytes. Bile duct hyperplasia was characterized by the presence of increased bile duct profiles in portal areas. Although bile duct hyperplasia is often associated with some fibrosis, bile duct fibrosis was recorded as a separate diagnosis during this study because the amount of fibrous connective tissue surrounding bile ducts was more than is typically associated with bile duct hyper-plasia. In some occurrences, there was a focus of solid fibrous connective tissue that contained only one or two bile duct profiles. Hypertrophied hepatocytes were up to three times larger than normal hepatocytes and the hypertrophy lacked a specific zonality, rather it was randomly distributed throughout the liver lobules. Hepatocellular necrosis ranged from scattered individual cell necrosis to large, coalescing areas of coagulative necrosis. Necrosis within a neoplasm was not recorded separately. Nose: There were significantly increased incidences of transitional epithelium adenoma and transitional epithe-lium adenoma or carcinoma (combined) in 60 mg/kg
males; transitional epithelium adenoma also occurred in the other dosed male groups and in 6 and 60 mg/kg females (Tables 10, A2, and B2). Transitional epithe-lium carcinoma occurred in two 60 mg/kg males. While the incidences of transitional epithelium adenoma in female rats were not statistically significant, these are very uncommon neoplasms. Transitional epithelial ade-nomas were typically small exophytic masses that arose from the transitional epithelium lining the nasotur-binates or the lateral wall between the maxilloturbinate and the nasoturbinate of the Level I nasal section (Plates 11 and 12). Neoplastic cells were moderately sized and polygonal with moderate amounts of lightly granular eosinophilic cytoplasm. Nuclei were also mod-erately sized and round to oval, with lightly stippled chromatin and one or two prominent basophilic to amphophilic nucleoli. Carcinomas were expansile mas-ses that extended from the dorsolateral to ventral region of Level I, and resulted in obliteration of the maxillo-turbinate (Plates 13 and 14). Like the cells in the tran-sitional epithelial adenomas, cells in the carcinomas were polygonal with eosinophilic cytoplasm and promi-nent nucleoli, and appeared to arise from the transitional epithelium. The cells were arranged in sheets, or gland-like structures, and had a moderately vascular stroma. Mitotic figures were present but uncommon in the carci-nomas (Plate 15), with none to one per five high power fields. An adenoma of the glands underlying the olfactory epi-thelium (Bowman’s glands) occurred in a 60 mg/kg male (Tables 10 and A1). While not statistically sig-nificant, this neoplasm is very unusual. It consisted of a mixed pattern of cells, with some cells containing baso-philic cytoplasm with peripherally displaced nuclei and other cells containing single or a few large, colorless vacuoles (Plates 16 and 17). Still other cells contained brightly eosinophilic cytoplasm and appeared to be forming glands. Nests of cells were surrounded and separated by a delicate fibrovascular stroma. In the transitional epithelium of the nose, the incidences of hyperplasia in 20 and 60 mg/kg males and females were significantly greater than those in the vehicle con-trols (Tables 10, A4, and B4). One 60 mg/kg female had degeneration of the transitional epithelium (Table B4). In the glands underlying the transitional epithelium, there were increased incidences of hyper-plasia in 20 and 60 mg/kg males and females and dila-tation in 20 mg/kg males and 60 mg/kg females. In addition, the severities of these lesions tended to increase with dose. Transitional epithelium hyperplasia was characterized by increased numbers of transitional epithelium cells lining the lateral wall, and less fre-quently the nasoturbinate, when compared to the same location in the vehicle controls. Degeneration of the
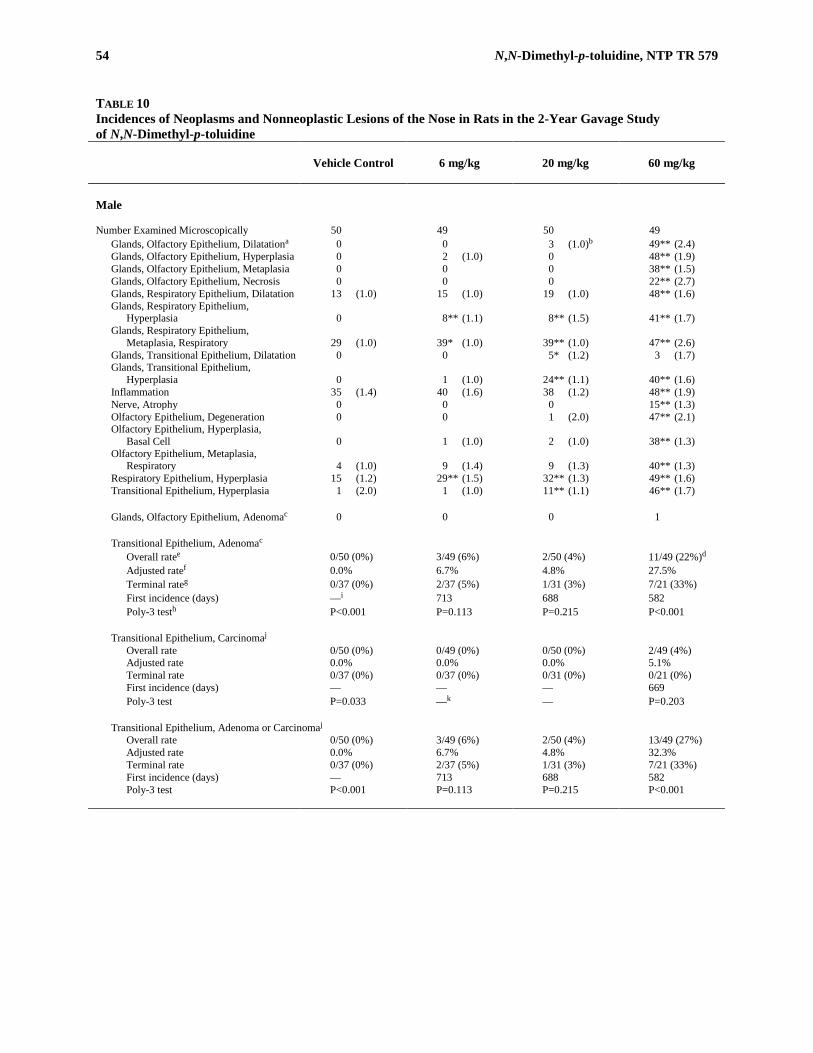
54 N,N-Dimethyl-p-toluidine, NTP TR 579
TABLE 10 Incidences of Neoplasms and Nonneoplastic Lesions of the Nose in Rats in the 2-Year Gavage Study of N,N-Dimethyl-p-toluidine
Vehicle Control
6 mg/kg
20 mg/kg
60 mg/kg
Male Number Examined Microscopically 50 49 50 49
Glands, Olfactory Epithelium, Dilatationa 0 0 3 (1.0)b 49** (2.4) Glands, Olfactory Epithelium, Hyperplasia 0 2 (1.0) 0 48** (1.9) Glands, Olfactory Epithelium, Metaplasia 0 0 0 38** (1.5) Glands, Olfactory Epithelium, Necrosis 0 0 0 22** (2.7) Glands, Respiratory Epithelium, Dilatation 13 (1.0) 15 (1.0) 19 (1.0) 48** (1.6) Glands, Respiratory Epithelium,
Hyperplasia 0 8** (1.1) 8** (1.5) 41** (1.7) Glands, Respiratory Epithelium,
Metaplasia, Respiratory 29 (1.0) 39* (1.0) 39** (1.0) 47** (2.6) Glands, Transitional Epithelium, Dilatation 0 0 5* (1.2) 3 (1.7) Glands, Transitional Epithelium,
Hyperplasia 0 1 (1.0) 24** (1.1) 40** (1.6) Inflammation 35 (1.4) 40 (1.6) 38 (1.2) 48** (1.9) Nerve, Atrophy 0 0 0 15** (1.3) Olfactory Epithelium, Degeneration 0 0 1 (2.0) 47** (2.1) Olfactory Epithelium, Hyperplasia,
Basal Cell 0 1 (1.0) 2 (1.0) 38** (1.3) Olfactory Epithelium, Metaplasia,
Respiratory 4 (1.0) 9 (1.4) 9 (1.3) 40** (1.3) Respiratory Epithelium, Hyperplasia 15 (1.2) 29** (1.5) 32** (1.3) 49** (1.6) Transitional Epithelium, Hyperplasia 1 (2.0) 1 (1.0) 11** (1.1) 46** (1.7) Glands, Olfactory Epithelium, Adenomac 0 0 0 1 Transitional Epithelium, Adenomac
Overall ratee 0/50 (0%) 3/49 (6%) 2/50 (4%) 11/49 (22%)d Adjusted ratef 0.0% 6.7% 4.8% 27.5% Terminal rateg 0/37 (0%) 2/37 (5%) 1/31 (3%) 7/21 (33%) First incidence (days) —i 713 688 582 Poly-3 testh P<0.001 P=0.113 P=0.215 P<0.001
Transitional Epithelium, Carcinomaj Overall rate 0/50 (0%) 0/49 (0%) 0/50 (0%) 2/49 (4%) Adjusted rate 0.0% 0.0% 0.0% 5.1% Terminal rate 0/37 (0%) 0/37 (0%) 0/31 (0%) 0/21 (0%) First incidence (days) — — — 669 Poly-3 test P=0.033 —k — P=0.203
Transitional Epithelium, Adenoma or Carcinomaj Overall rate 0/50 (0%) 3/49 (6%) 2/50 (4%) 13/49 (27%) Adjusted rate 0.0% 6.7% 4.8% 32.3% Terminal rate 0/37 (0%) 2/37 (5%) 1/31 (3%) 7/21 (33%) First incidence (days) — 713 688 582 Poly-3 test P<0.001 P=0.113 P=0.215 P<0.001

N,N-Dimethyl-p-toluidine, NTP TR 579 55
TABLE 10 Incidences of Neoplasms and Nonneoplastic Lesions of the Nose in Rats in the 2-Year Gavage Study of N,N-Dimethyl-p-toluidine
Vehicle Control
6 mg/kg
20 mg/kg
60 mg/kg
Female
Number Examined Microscopically 50 49 50 49
Glands, Olfactory Epithelium, Dilatation 0 0 0 48** (2.4) Glands, Olfactory Epithelium, Hyperplasia 0 0 4 (1.0) 47** (1.9) Glands, Olfactory Epithelium, Metaplasia 0 0 0 42** (1.3) Glands, Olfactory Epithelium, Necrosis 0 0 0 18** (2.8) Glands, Respiratory Epithelium, Dilatation 5 (1.0) 12 (1.0) 27** (1.1) 47** (1.2) Glands, Respiratory Epithelium,
Hyperplasia 6 (1.2) 9 (1.0) 22** (1.3) 45** (1.6) Glands, Respiratory Epithelium,
Metaplasia, Respiratory 17 (1.1) 33** (1.1) 44** (1.8) 47** (2.0) Glands, Transitional Epithelium, Dilatation 0 0 0 9** (1.4) Glands, Transitional Epithelium,
Hyperplasia 0 4 (1.0) 12** (1.2) 24** (1.4) Inflammation 23 (1.3) 24 (1.4) 22 (1.1) 45** (1.5) Nerve, Atrophy 0 0 0 4* (1.8) Olfactory Epithelium, Degeneration 0 0 1 (1.0) 46** (2.0) Olfactory Epithelium, Hyperplasia,
Basal Cell 0 0 0 25** (1.2) Olfactory Epithelium, Metaplasia,
Respiratory 4 (1.5) 6 (1.5) 1 (2.0) 21** (1.2) Respiratory Epithelium, Hyperplasia 10 (1.0) 13 (1.4) 11 (1.1) 41** (1.3) Transitional Epithelium, Hyperplasia 0 1 (1.0) 6* (1.0) 33** (1.1) Transitional Epithelium, Adenomal
Overall rate 0/50 (0%) 1/49 (2%) 0/50 (0%) 2/49 (4%) Adjusted rate 0.0% 2.2% 0.0% 5.1% Terminal rate 0/33 (0%) 1/42 (2%) 0/33 (0%) 0/23 (0%) First incidence (days) — 728 (T) — 625 Poly-3 test P=0.127 P=0.503 — P=0.203
* Significantly different (P≤0.05) from the vehicle control group by the Poly-3 test ** P≤0.01 (T) Terminal kill a Number of animals with lesion b Average severity grade of lesions in affected animals: 1=minimal, 2=mild, 3=moderate, 4=marked c Historical incidence of nose adenoma (epithelium unspecified) for 2-year gavage studies with corn oil vehicle controls (mean ± standard
deviation): 0/299; all routes: 0/1,248 d A single incidence of adenoma in the glands underlying the olfactory epithelium occurred in an animal that also had an adenoma in the
transitional epithelium. e Number of animals with neoplasm per number of animals with nose examined microscopically f Poly-3 estimated neoplasm incidence after adjustment for intercurrent mortality g Observed incidence at terminal kill h Beneath the vehicle control incidence is the P value associated with the trend test. Beneath the dosed group incidence are the P values
corresponding to pairwise comparisons between the vehicle controls and that dosed group. The Poly-3 test accounts for differential mortality in animals that do not reach terminal kill.
i Not applicable; no neoplasm in animal group j No historical control data available k Value of statistic cannot be computed. l Historical incidence of nose adenoma (epithelium unspecified) for corn oil gavage studies: 0/299; all routes: 1/1,196 (0.1% ± 0.4%),
range 0%-2%

56 N,N-Dimethyl-p-toluidine, NTP TR 579
transitional epithelium was characterized by decreased cellularity and disorganization of the transitional epi-thelium. Hyperplasia of the glands underlying the tran-sitional epithelium was characterized by increased num-bers of submucosal glands in the lateral wall region when compared to the number of glands in the same region in the vehicle controls. In the olfactory epithelium of the nose, there were sig-nificantly increased incidences of degeneration, basal cell hyperplasia, and respiratory metaplasia in 60 mg/kg males and females (Tables 10, A4, and B4). In the glands underlying the olfactory epithelium, the inci-dences of hyperplasia, dilatation, metaplasia, and necro-sis in 60 mg/kg males and females were significantly greater than those in the vehicle controls. Degeneration of the olfactory epithelium was characterized by disor-ganization of the olfactory epithelium, with increased intercellular spaces and vacuolization or apoptosis of individual cells (Plates 18 and 19) and was observed most commonly in Level II and/or III of affected rats. Basal cell hyperplasia of the olfactory epithelium con-sisted of minimal to mild increased numbers of basal epithelial cells along the basal lamina; this lesion was observed most frequently in Level III, and less com-monly in Level II, of affected rats (Plates 20 and 21). Replacement of olfactory epithelium by respiratory epithelium was recorded as respiratory metaplasia of the olfactory epithelium and occurred in Levels II and III of affected rats. Two 60 mg/kg females had squamous metaplasia of the olfactory epithelium (Table B4); this lesion consisted of replacement of the olfactory epithe-lium by attenuated epithelium. Hyperplasia of the glands underlying the olfactory epithelium was charac-terized by the presence of increased numbers of glands, while dilatation consisted of minimal to moderately dilated glands that often contained eosinophilic mate-rial, inflammatory cells and sloughed epithelial cells (Plates 22, 23, and 24). These glands were usually lined by nonciliated cuboidal to attenuated epithelial cells. Metaplasia of the glands was characterized by glands in the olfactory region that were lined by ciliated cuboidal to columnar epithelium (Plate 24). Necrosis of the glands consisted of glands that were lined by variably sized, eosinophilic to vacuolated, epithelial cells with pyknotic nuclei (Plate 25). Affected glands often con-tained cell debris or sloughed epithelial cells. In the respiratory epithelium of the nose, the incidences of hyperplasia were significantly increased in all dosed male groups and 60 mg/kg females (Tables 10, A4, and B4). In the glands underlying the respiratory epithe-lium, there were significantly increased incidences of hyperplasia in all dosed male groups and 20 and 60 mg/kg females, dilatation in 20 mg/kg females and 60 mg/kg males and females, and respiratory metaplasia
in all dosed groups of males and females. Hyperplasia of the respiratory epithelium was characterized by increased numbers of respiratory epithelial cells, which often formed invaginations into the underlying sub-mucosa, making it difficult to distinguish hyperplasia of the respiratory epithelium from hyperplasia of the glands underlying the respiratory epithelium. In some instances, the glands underlying the respiratory epithe-lium were dilated, and in others, were characterized by metaplasia. Respiratory metaplasia of the glands was diagnosed when the glands, most commonly at the olfactory/respiratory junction of Level II, were lined by ciliated columnar epithelium. There were significantly increased incidences of inflam-mation of the nose and atrophy of the nerves underlying the olfactory epithelium in 60 mg/kg males and females (Tables 10, A4, and B4). Inflammation of the nose con-sisted predominantly of neutrophils with fewer macro-phages, and occasional plasma cells and eosinophils in the lamina propria of the olfactory, respiratory, and/or transitional epithelial regions, and within the nasal cavity. Atrophy of the nerves underlying the olfactory epithelium was often associated with degeneration of the olfactory epithelium and was characterized by the loss of nerve bundles in the olfactory regions, primarily in Level III, and less often in Level II. There were negative trends in the incidences of hyaline droplet accumulation in the respiratory and olfactory epithelium in dosed groups of males and females (Tables A4 and B4). Hyaline droplet accumulation con-sisted of brightly eosinophilic droplets or globules within the cytoplasm of the epithelial cells. Thyroid Gland: There were increased incidences of fol-licular cell adenoma or carcinoma (combined) in all dosed groups of males (Tables 11, A1, and A2). Follic-ular cell carcinomas occurred only in treated males, not control males. While the increased incidences were not statistically significant, the incidence in 60 mg/kg males exceeded the historical control ranges for corn oil gavage studies and for all routes of exposure (Tables 11 and A3c). In 20 mg/kg females, there was an increased incidence of follicular cell adenoma (Tables 11 and B1). Although not statistically significant, the incidence of follicular cell adenoma in 20 mg/kg females exceeded the historical control ranges for corn oil gavage studies and for all routes. However, unlike in males, no follic-ular cell neoplasms occurred in 60 mg/kg females, but follicular cell adenoma occurred in one control female. The highest incidence of follicular cell neoplasms in females occurred in the 20 mg/kg group, but was only one more than that of the control group. Follicular cell adenomas were usually a single, well-circumscribed expansile mass that caused compression of the adjacent

N,N-Dimethyl-p-toluidine, NTP TR 579 57
TABLE 11 Incidences of Neoplasms of the Thyroid Gland in Rats in the 2-Year Gavage Study of N,N-Dimethyl-p-toluidine
Vehicle Control
6 mg/kg
20 mg/kg
60 mg/kg
Male Follicular Cell Adenomaa
Overall rateb 1/50 (2%) 0/49 (0%) 1/50 (2%) 3/49 (6%) Adjusted ratec 2.2% 0.0% 2.4% 7.7% Terminal rated 1/37 (3%) 0/37 (0%) 0/31 (0%) 3/21 (14%) First incidence (days) 727 (T) —f 680 727 (T) Poly-3 teste P=0.060 P=0.506N P=0.738 P=0.248
Follicular Cell Carcinomag Overall rate 0/50 (0%) 2/49 (4%) 1/50 (2%) 2/49 (4%) Adjusted rate 0.0% 4.5% 2.4% 5.1% Terminal rate 0/37 (0%) 2/37 (5%) 1/31 (3%) 2/21 (10%) First incidence (days) — 727 (T) 727 (T) 727 (T) Poly-3 test P=0.261 P=0.230 P=0.479 P=0.202
Follicular Cell Adenoma or Carcinomah Overall rate 1/50 (2%) 2/49 (4%) 2/50 (4%) 4/49 (8%) Adjusted rate 2.2% 4.5% 4.8% 10.3% Terminal rate 1/37 (3%) 2/37 (5%) 1/31 (3%) 4/21 (19%) First incidence (days) 727 (T) 727 (T) 680 727 (T) Poly-3 test P=0.088 P=0.489 P=0.465 P=0.132
Female
Follicular Cell Adenomai Overall rate 1/49 (2%) 1/47 (2%) 2/47 (4%) 0/45 (0%) Adjusted rate 2.2% 2.2% 4.6% 0.0% Terminal rate 0/33 (0%) 1/42 (2%) 2/33 (6%) 0/23 (0%) First incidence (days) 701 728 (T) 728 (T) — Poly-3 test P=0.397N P=0.760 P=0.491 P=0.539N
(T) Terminal kill a Historical incidence for 2-year gavage studies with corn oil vehicle controls (mean ± standard deviation): 6/299 (2.0% ± 1.3%),
range 0%-4%; all routes: 13/1,239 (1.0% ± 1.7%), range 0%-6% b Number of animals with neoplasm per number of animals with thyroid gland examined microscopically c Poly-3 estimated neoplasm incidence after adjustment for intercurrent mortality d Observed incidence at terminal kill e Beneath the vehicle control incidence is the P value associated with the trend test. Beneath the dosed group incidence are the P values
corresponding to pairwise comparisons between the vehicle controls and that dosed group. The Poly-3 test accounts for differential mortality in animals that do not reach terminal kill. A negative trend or a lower incidence in a dose group is indicated by N.
f Not applicable; no neoplasm in animal group g Historical incidence for corn oil gavage studies: 3/299 (1.0% ± 1.7%), range 0%-4%; all routes: 10/1,239 (0.8% ± 1.5%), range 0%-4% h Historical incidence for corn oil gavage studies: 9/299 (3.0% ± 2.1%), range 0%-6%; all routes: 23/1,239 (1.9% ± 2.2%), range 0%-6% i Historical incidence for corn oil gavage studies: 3/298 (1.0% ± 1.1%), range 0%-2%; all routes: 8/1,186 (0.7% ± 1.0%), range 0%-2%
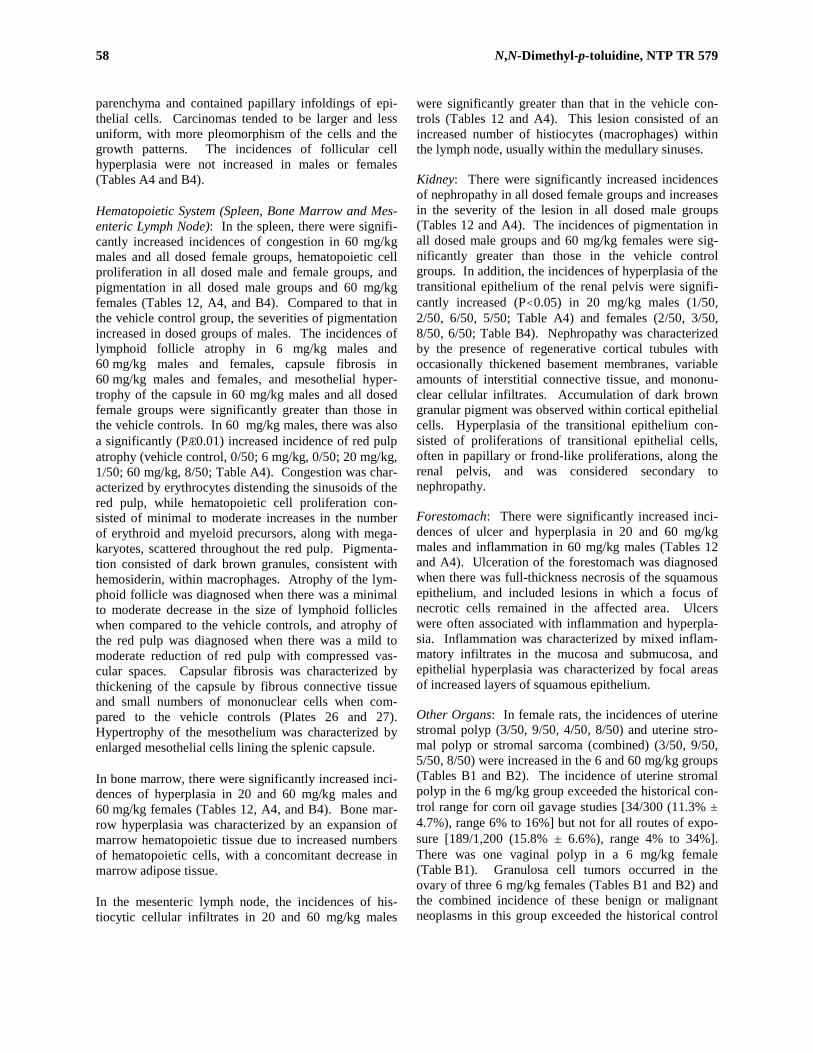
58 N,N-Dimethyl-p-toluidine, NTP TR 579
parenchyma and contained papillary infoldings of epi-thelial cells. Carcinomas tended to be larger and less uniform, with more pleomorphism of the cells and the growth patterns. The incidences of follicular cell hyperplasia were not increased in males or females (Tables A4 and B4). Hematopoietic System (Spleen, Bone Marrow and Mes-enteric Lymph Node): In the spleen, there were signifi-cantly increased incidences of congestion in 60 mg/kg males and all dosed female groups, hematopoietic cell proliferation in all dosed male and female groups, and pigmentation in all dosed male groups and 60 mg/kg females (Tables 12, A4, and B4). Compared to that in the vehicle control group, the severities of pigmentation increased in dosed groups of males. The incidences of lymphoid follicle atrophy in 6 mg/kg males and 60 mg/kg males and females, capsule fibrosis in 60 mg/kg males and females, and mesothelial hyper-trophy of the capsule in 60 mg/kg males and all dosed female groups were significantly greater than those in the vehicle controls. In 60 mg/kg males, there was also a significantly (PÆ0.01) increased incidence of red pulp atrophy (vehicle control, 0/50; 6 mg/kg, 0/50; 20 mg/kg, 1/50; 60 mg/kg, 8/50; Table A4). Congestion was char-acterized by erythrocytes distending the sinusoids of the red pulp, while hematopoietic cell proliferation con-sisted of minimal to moderate increases in the number of erythroid and myeloid precursors, along with mega-karyotes, scattered throughout the red pulp. Pigmenta-tion consisted of dark brown granules, consistent with hemosiderin, within macrophages. Atrophy of the lym-phoid follicle was diagnosed when there was a minimal to moderate decrease in the size of lymphoid follicles when compared to the vehicle controls, and atrophy of the red pulp was diagnosed when there was a mild to moderate reduction of red pulp with compressed vas-cular spaces. Capsular fibrosis was characterized by thickening of the capsule by fibrous connective tissue and small numbers of mononuclear cells when com-pared to the vehicle controls (Plates 26 and 27). Hypertrophy of the mesothelium was characterized by enlarged mesothelial cells lining the splenic capsule. In bone marrow, there were significantly increased inci-dences of hyperplasia in 20 and 60 mg/kg males and 60 mg/kg females (Tables 12, A4, and B4). Bone mar-row hyperplasia was characterized by an expansion of marrow hematopoietic tissue due to increased numbers of hematopoietic cells, with a concomitant decrease in marrow adipose tissue. In the mesenteric lymph node, the incidences of his-tiocytic cellular infiltrates in 20 and 60 mg/kg males
were significantly greater than that in the vehicle con-trols (Tables 12 and A4). This lesion consisted of an increased number of histiocytes (macrophages) within the lymph node, usually within the medullary sinuses. Kidney: There were significantly increased incidences of nephropathy in all dosed female groups and increases in the severity of the lesion in all dosed male groups (Tables 12 and A4). The incidences of pigmentation in all dosed male groups and 60 mg/kg females were sig-nificantly greater than those in the vehicle control groups. In addition, the incidences of hyperplasia of the transitional epithelium of the renal pelvis were signifi-cantly increased (P<0.05) in 20 mg/kg males (1/50, 2/50, 6/50, 5/50; Table A4) and females (2/50, 3/50, 8/50, 6/50; Table B4). Nephropathy was characterized by the presence of regenerative cortical tubules with occasionally thickened basement membranes, variable amounts of interstitial connective tissue, and mononu-clear cellular infiltrates. Accumulation of dark brown granular pigment was observed within cortical epithelial cells. Hyperplasia of the transitional epithelium con-sisted of proliferations of transitional epithelial cells, often in papillary or frond-like proliferations, along the renal pelvis, and was considered secondary to nephropathy. Forestomach: There were significantly increased inci-dences of ulcer and hyperplasia in 20 and 60 mg/kg males and inflammation in 60 mg/kg males (Tables 12 and A4). Ulceration of the forestomach was diagnosed when there was full-thickness necrosis of the squamous epithelium, and included lesions in which a focus of necrotic cells remained in the affected area. Ulcers were often associated with inflammation and hyperpla-sia. Inflammation was characterized by mixed inflam-matory infiltrates in the mucosa and submucosa, and epithelial hyperplasia was characterized by focal areas of increased layers of squamous epithelium. Other Organs: In female rats, the incidences of uterine stromal polyp (3/50, 9/50, 4/50, 8/50) and uterine stro-mal polyp or stromal sarcoma (combined) (3/50, 9/50, 5/50, 8/50) were increased in the 6 and 60 mg/kg groups (Tables B1 and B2). The incidence of uterine stromal polyp in the 6 mg/kg group exceeded the historical con-trol range for corn oil gavage studies [34/300 (11.3% ± 4.7%), range 6% to 16%] but not for all routes of expo-sure [189/1,200 (15.8% ± 6.6%), range 4% to 34%]. There was one vaginal polyp in a 6 mg/kg female (Table B1). Granulosa cell tumors occurred in the ovary of three 6 mg/kg females (Tables B1 and B2) and the combined incidence of these benign or malignant neoplasms in this group exceeded the historical control
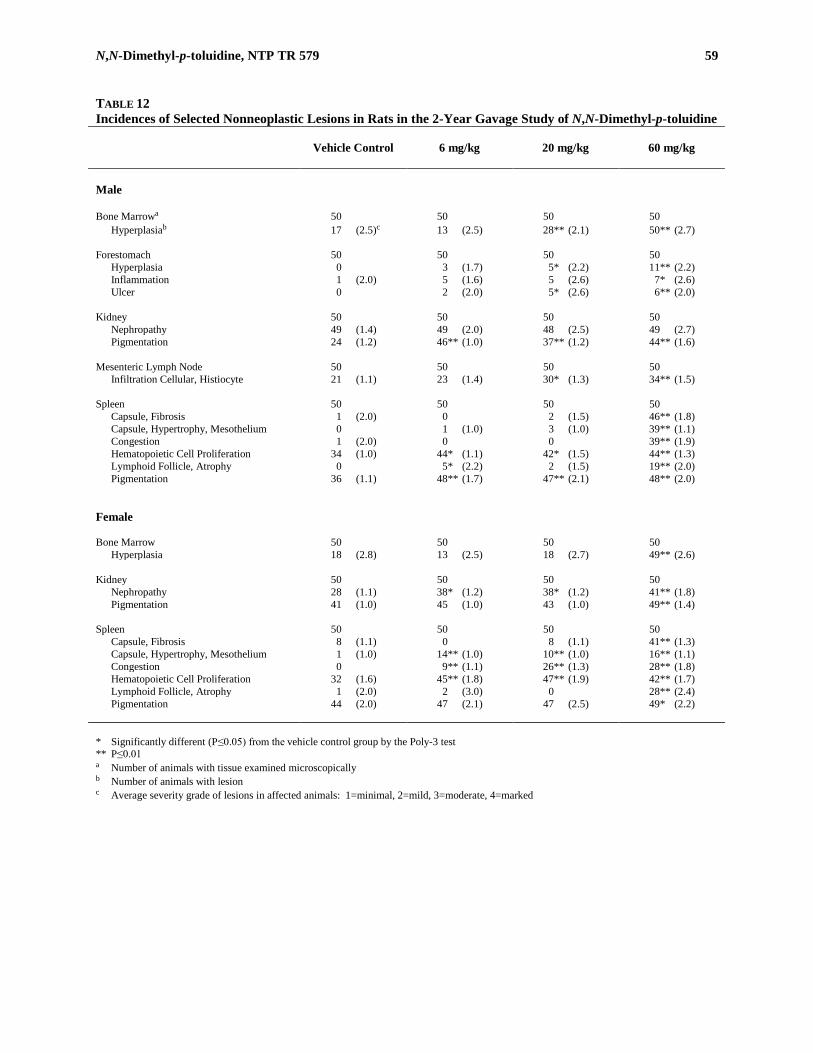
N,N-Dimethyl-p-toluidine, NTP TR 579 59
TABLE 12 Incidences of Selected Nonneoplastic Lesions in Rats in the 2-Year Gavage Study of N,N-Dimethyl-p-toluidine
Vehicle Control
6 mg/kg
20 mg/kg
60 mg/kg
Male Bone Marrowa 50 50 50 50
Hyperplasiab 17 (2.5)c 13 (2.5) 28** (2.1) 50** (2.7)
Forestomach 50 50 50 50 Hyperplasia 0 3 (1.7) 5* (2.2) 11** (2.2) Inflammation 1 (2.0) 5 (1.6) 5 (2.6) 7* (2.6) Ulcer 0 2 (2.0) 5* (2.6) 6** (2.0)
Kidney 50 50 50 50 Nephropathy 49 (1.4) 49 (2.0) 48 (2.5) 49 (2.7) Pigmentation 24 (1.2) 46** (1.0) 37** (1.2) 44** (1.6)
Mesenteric Lymph Node 50 50 50 50
Infiltration Cellular, Histiocyte 21 (1.1) 23 (1.4) 30* (1.3) 34** (1.5)
Spleen 50 50 50 50 Capsule, Fibrosis 1 (2.0) 0 2 (1.5) 46** (1.8) Capsule, Hypertrophy, Mesothelium 0 1 (1.0) 3 (1.0) 39** (1.1) Congestion 1 (2.0) 0 0 39** (1.9) Hematopoietic Cell Proliferation 34 (1.0) 44* (1.1) 42* (1.5) 44** (1.3) Lymphoid Follicle, Atrophy 0 5* (2.2) 2 (1.5) 19** (2.0) Pigmentation 36 (1.1) 48** (1.7) 47** (2.1) 48** (2.0)
Female Bone Marrow 50 50 50 50
Hyperplasia 18 (2.8) 13 (2.5) 18 (2.7) 49** (2.6)
Kidney 50 50 50 50 Nephropathy 28 (1.1) 38* (1.2) 38* (1.2) 41** (1.8) Pigmentation 41 (1.0) 45 (1.0) 43 (1.0) 49** (1.4)
Spleen 50 50 50 50
Capsule, Fibrosis 8 (1.1) 0 8 (1.1) 41** (1.3) Capsule, Hypertrophy, Mesothelium 1 (1.0) 14** (1.0) 10** (1.0) 16** (1.1) Congestion 0 9** (1.1) 26** (1.3) 28** (1.8) Hematopoietic Cell Proliferation 32 (1.6) 45** (1.8) 47** (1.9) 42** (1.7) Lymphoid Follicle, Atrophy 1 (2.0) 2 (3.0) 0 28** (2.4) Pigmentation 44 (2.0) 47 (2.1) 47 (2.5) 49* (2.2)
* Significantly different (P≤0.05) from the vehicle control group by the Poly-3 test ** P≤0.01 a Number of animals with tissue examined microscopically b Number of animals with lesion c Average severity grade of lesions in affected animals: 1=minimal, 2=mild, 3=moderate, 4=marked
60 N,N-Dimethyl-p-toluidine, NTP TR 579
ranges for corn oil gavage studies [1/300 (0.3% ± 0.8%), range 0% to 2%] and for all routes of exposure [8/1,198 (0.7% ± 1.1%), range 0% to 4%]. There was no dose response for any of the above neoplasms, and no pairwise statistical significance, therefore, they were not considered to be treatment related. In the tongue, the incidences of squamous cell pap-illoma or squamous cell carcinoma (combined) were increased in 6 and 60 mg/kg males and 60 mg/kg females (males: vehicle control, 0/50; 6 mg/kg, 1/50; 20 mg/kg, 0/50; 60 mg/kg, 1/50; females: 1/50, 0/50, 0/50, 2/50; Tables A1 and B1). While the incidences of these neoplasms were not significantly increased, the incidence in 60 mg/kg females exceeded the historical control ranges for corn oil gavage studies [2/300 (0.7% ± 1.0%), range 0% to 2%] and all routes of exposure [5/1,200 (0.4% ± 0.8%), range 0% to 2%] and the inci-dences in 6 and 60 mg/kg males exceeded the historical control range for corn oil gavage studies (0/299). How-ever, the lack of a dose response or statistical signifi-
cance led to the conclusion that these neoplasms were not associated with exposure to N,N-dimethyl-p-tolui-dine. The tongue is not examined microscopically unless a gross lesion is observed; therefore, the histori-cal control values may not be as robust for tongue neo-plasms as for other tissues. There were negative trends in the incidences of mono-nuclear cell leukemia in males and females and the inci-dences in all dosed groups were significantly less than those in the vehicle control groups (males: 14/50, 1/50, 2/50, 0/50; females: 15/50, 2/50, 1/50, 1/50; Tables A2 and B2). In the mammary gland of 60 mg/kg females, there was a significantly decreased incidence of fibroadenoma (29/50, 26/50, 26/50, 11/50; Tables A1 and A3) that was considered to be due to decreased body weights in this dose group (Haseman et al., 1997; Stout et al., 2008).

N,N-Dimethyl-p-toluidine, NTP TR 579 61
MICE 3-MONTH STUDY All 250 mg/kg male and female mice died before day 10 except for one male mouse that survived until terminal kill (Table 13). Three males and two females adminis-tered 125 mg/kg died before the end of the study. The final mean body weight of 125 mg/kg males and the
mean body weight gains of 125 mg/kg males and females were significantly less than those of the vehicle controls (Table 13 and Figure 5). Clinical findings associated with administration of N,N-dimethyl-p-tolui-dine included abnormal breathing, thinness, lethargy, cyanosis, and ruffled fur in 125 and 250 mg/kg males and females.
TABLE 13 Survival and Body Weights of Mice in the 3-Month Gavage Study of N,N-Dimethyl-p-toluidinea
Dose (mg/kg)
Survivalb
Initial Body Weight (g)
Final Body Weight (g)
Change in Body Weight (g)
Final Weight
Relative to Controls
(%)
Male
0 10/10 23.1 ± 0.3 33.6 ± 1.4 10.5 ± 1.2 15 10/10 22.6 ± 0.2 35.2 ± 0.5 12.6 ± 0.4 105 30 10/10 22.8 ± 0.3 33.0 ± 1.0 10.2 ± 0.9 98 60 10/10 22.8 ± 0.4 33.1 ± 1.0 10.3 ± 0.8 99
125 7/10c 22.6 ± 0.2 29.5 ± 0.4* 7.0 ± 0.2* 88 250 1/10d 22.7 ± 0.3 26.5 5.2 79
Female
0 10/10 18.4 ± 0.2 27.7 ± 0.7 9.4 ± 0.6 15 10/10 18.9 ± 0.2 29.4 ± 0.5 10.5 ± 0.4 106 30 10/10 18.2 ± 0.3 28.2 ± 0.9 9.9 ± 0.7 102 60 10/10 18.5 ± 0.2 27.8 ± 0.6 9.4 ± 0.5 100
125 8/10e 19.0 ± 0.3 26.2 ± 0.3 6.9 ± 0.3** 95 250 0/10e 18.3 ± 0.3 — — —
* Significantly different (P≤0.05) from the vehicle control group by Williams’ test ** P≤0.01 a Weights and weight changes are given as mean ± standard error. Subsequent calculations are based on animals surviving to the end of the
study. b Number of animals surviving at 14 weeks/number initially in group c Weeks of deaths: 2, 2, 11 d Weeks of deaths: 1, 1, 1, 1, 1, 1, 1, 1, 2 e Week of deaths: 1

62 N,N-Dimethyl-p-toluidine, NTP TR 579
FIGURE 5 Growth Curves for Mice Administered N,N-Dimethyl-p-toluidine by Gavage for 3 Months

N,N-Dimethyl-p-toluidine, NTP TR 579 63
The hematology data for mice are presented in Tables 14 and F3. At equivalent doses, mice demon-strated similar, but less severe erythron changes com-pared to rats. Methemoglobin values were minimally increased in 30 mg/kg or greater males and females. Heinz bodies demonstrated small increases in 60 mg/kg females, 125 mg/kg males and females, and the lone surviving 250 mg/kg male. In fact, for female mice no erythron changes were detected up to the highest remaining dose (125 mg/kg) and for males, inconsistent and minor decreases in hematocrit values, hemoglobin concentrations, and erythrocyte counts and increased reticulocyte counts occurred in the 60 mg/kg and greater groups (including the lone surviving 250 mg/kg male).
The absolute and relative liver weights of all dosed male and female groups and the absolute and relative lung weights of 125 mg/kg males and females were signifi-cantly greater than those of the vehicle controls (Table G2). The absolute and relative thymus weights of 125 mg/kg females were significantly less than those of the vehicle controls. There were no significant differences in any of the reproductive organ weights or sperm parameters of male mice at any dose (Table H3). There were no changes in the proportion of regularly cycling females, estrous cycle length, or percentage of time spent in the individ-ual stages of the estrous cycle of female mice at any
TABLE 14 Selected Hematology Data for Mice in the 3-Month Gavage Study of N,N-Dimethyl-p-toluidinea
Vehicle Control
15 mg/kg
30 mg/kg
60 mg/kg
125 mg/kg
Male n 10 10 10 10 7 Hematocrit (%) 46.6 ± 0.6 43.7 ± 0.5* 45.4 ± 0.6 43.5 ± 0.5** 44.7 ± 0.5 Hemoglobin (g/dL) 16.4 ± 0.3 15.5 ± 0.2 16.0 ± 0.3 15.0 ± 0.1** 15.3 ± 0.1** Erythrocytes (106/µL) 10.82 ± 0.18 10.18 ± 0.14* 10.63 ± 0.15 10.14 ± 0.12* 10.27 ± 0.10 Reticulocytes (106/µL) 0.25 ± 0.01 0.24 ± 0.01 0.26 ± 0.01 0.27 ± 0.01 0.28 ± 0.01* Mean cell volume (fL) 43.1 ± 0.2 42.9 ± 0.2 42.8 ± 0.1 42.9 ± 0.2 43.5 ± 0.4 Mean cell hemoglobin (pg) 15.2 ± 0.1 15.2 ± 0.1 15.0 ± 0.2 14.8 ± 0.1* 15.0 ± 0.1 Mean cell hemoglobin concentration (g/dL) 35.3 ± 0.3 35.4 ± 0.3 35.1 ± 0.4 34.5 ± 0.2 34.4 ± 0.3 Methemoglobin (g/dL) 0.35 ± 0.02 0.36 ± 0.02 0.42 ± 0.02* 0.47 ± 0.02** 0.61 ± 0.03** Methemoglobin (% hemoglobin) 2.10 ± 0.10 2.50 ± 0.17 2.80 ± 0.13** 3.10 ± 0.10** 4.00 ± 0.22** Heinz bodies (% erythrocytes) 0.0 ± 0.0 0.0 ± 0.0 0.0 ± 0.0 0.0 ± 0.0 0.5 ± 0.1** Female n 10 9 10 10 8 Hematocrit (%) 44.9 ± 0.4 43.8 ± 0.6 45.5 ± 0.6 44.9 ± 0.4 46.4 ± 0.7 Hemoglobin (g/dL) 15.8 ± 0.3 15.5 ± 0.2 16.1 ± 0.2 15.7 ± 0.1 16.1 ± 0.2 Erythrocytes (106/µL) 10.42 ± 0.11 10.13 ± 0.15 10.57 ± 0.14 10.41 ± 0.07 10.64 ± 0.12 Reticulocytes (106/µL) 0.26 ± 0.02 0.26 ± 0.02 0.24 ± 0.02 0.24 ± 0.02 0.31 ± 0.02 Mean cell volume (fL) 43.1 ± 0.1 43.2 ± 0.1 43.0 ± 0.1 43.1 ± 0.1 43.6 ± 0.2 Mean cell hemoglobin (pg) 15.1 ± 0.2 15.3 ± 0.1 15.2 ± 0.1 15.1 ± 0.0 15.2 ± 0.0 Mean cell hemoglobin concentration (g/dL) 35.1 ± 0.4 35.4 ± 0.2 35.3 ± 0.2 35.1 ± 0.1 34.8 ± 0.2* Methemoglobin (g/dL) 0.32 ± 0.01 0.34 ± 0.02 0.43 ± 0.02** 0.53 ± 0.02** 0.58 ± 0.03** Methemoglobin (% hemoglobin) 2.10 ± 0.10 2.22 ± 0.15 2.60 ± 0.16* 3.40 ± 0.16** 3.88 ± 0.13** Heinz bodies (% erythrocytes) 0.0 ± 0.0 0.0 ± 0.0 0.1 ± 0.1 0.2 ± 0.1** 0.5 ± 0.1** * Significantly different (P≤0.05) from the vehicle control group by Dunn’s or Shirley’s test ** P≤0.01 a Data are presented as mean ± standard error. Statistical tests were performed on unrounded data. No data are presented for the 250 mg/kg
groups due to high mortality.
64 N,N-Dimethyl-p-toluidine, NTP TR 579
dose (Table H4). Therefore, N,N-dimethyl-p-toluidine was not considered to have the potential to be a repro-ductive toxicant in male or female mice. Many of the histological findings in 250 mg/kg male and female mice were not observed in lower dose groups and were considered to be associated with stress and/or nonspecific toxicity. These lesions included hepatocellular fatty change and necrosis of the liver; chronic active inflammation of the nose; and necrosis and/or atrophy of the lymph nodes, spleen, and thymus. In mild cases, fatty change of the liver consisted of small, colorless, discrete vacuoles within the cytoplasm of hepatocytes. Although this change was diffuse, it was more pronounced in the centrilobular zone. Centri-lobular hepatocytes enlarged by coalescing colorless vacuoles characterized more severe occurrences of fatty change. Cells in these animals often looked degenera-tive, including having nuclear changes such as periph-eralized chromatin and shrunken nuclei. Necrosis of the liver typically occurred in random, irregular patches of either brightly eosinophilic individualized hepatocytes lacking nuclei or containing pyknotic nuclei or areas devoid of cellular detail. Hemorrhage was present in some of the necrotic areas. Hepatocellular necrosis also occurred as individual cell necrosis associated with fatty change. Chronic active inflammation of the nose consisted of a mixture of inflammatory cells, predom-inantly within the nasal cavity itself, but to a lesser extent, in the epithelium and lamina propria. Occa-sionally, sloughed cells or cell debris were present in the lumen. Atrophy was characterized by a general deple-tion of lymphocytes and a loss of follicles in the lymph nodes, a decreased cortical cellularity due to decreased numbers of thymocytes in the thymus, and an overall decrease in organ size due to white and red pulp deple-tion in the spleen. Necrosis of the spleen and lymph nodes was characterized by necrotic lymphocytes in follicles, which were evidenced by scattered remnants of pyknotic and karyorrhectic nuclei. In the lung, incidences of degeneration of the bron-chiolar epithelium and peribronchiolar chronic active inflammation were observed in the 250 mg/kg groups and were increased in the 125 mg/kg groups. Necrosis of the tracheal epithelium was observed in most of the males and all of the females exposed to 250 mg/kg and two males and females exposed to 125 mg/kg. Treatment-related histological lesions occurred in the liver, lung, trachea, nose, and thymus of mice adminis-tered 125 mg/kg or less. These lesions are described below.
In the liver, the severities of cytoplasmic vacuolization of the hepatocytes were increased in dosed groups of male and female mice (Table 15). Cytoplasmic vacuoli-zation was characterized by irregular, colorless to lightly eosinophilic areas in the cytoplasm consistent with glycogen accumulation that frequently resulted in hepatocyte enlargement. In the lung, there were significantly increased inci-dences of bronchiolar epithelium degeneration and peri-bronchiolar chronic active inflammation and bronchio-lar epithelium regeneration in 125 mg/kg males and females, and histocytic infiltrates of the alveoli in 125 mg/kg females (Table 15). Degeneration of the bronchiole epithelium was characterized in some mice by loss of apical cytoplasm or apical cytoplasmic bleb-bing, variations in cell size, and architectural disorgan-ization. In other mice, there was an absence of epithe-lial cells lining the bronchioles or the presence of necrotic epithelial cells with shrunken pyknotic or kary-orrhectic nuclei and eosinophilic cytoplasm. Sloughed cells could occasionally be seen in bronchiolar lumens. Attempts at regeneration ranged from epithelial cells with attenuated cytoplasm extending to cover denuded areas to multiple layers of proliferating epithelial cells lining the bronchioles (Plates 28 and 29). Peribron-chiolar chronic active inflammation was composed of a mixture of inflammatory cells, including neutrophils, lymphocytes and plasma cells, with fewer macrophages, although alveolar histiocytes were prominent in a few animals. Typically, the inflammatory reaction was cen-tered on the bronchioles. In tracheas in which necrosis occurred, there were denuded areas due to the loss of epithelial cells or the presence of shrunken epithelial cells with pyknotic nuclei. In the nose, there were significantly increased inci-dences of glandular hyperplasia in 125 mg/kg males and females (Table 15). In the olfactory epithelium of the nose, there were significantly increased incidences of degeneration in 125 mg/kg males and 60 and 125 mg/kg females and metaplasia in 125 mg/kg males and females. Glandular hyperplasia was characterized by increased profiles of glands in affected areas; these glands were often dilated and sometimes contained cell debris. Degeneration of the olfactory epithelium was characterized by a loss of nuclei and a thinning of the layer, a disorganization of the layer, or cytoplasmic vacuoles within the olfactory epithelial cells. Metapla-sia of the olfactory epithelium was of the respiratory
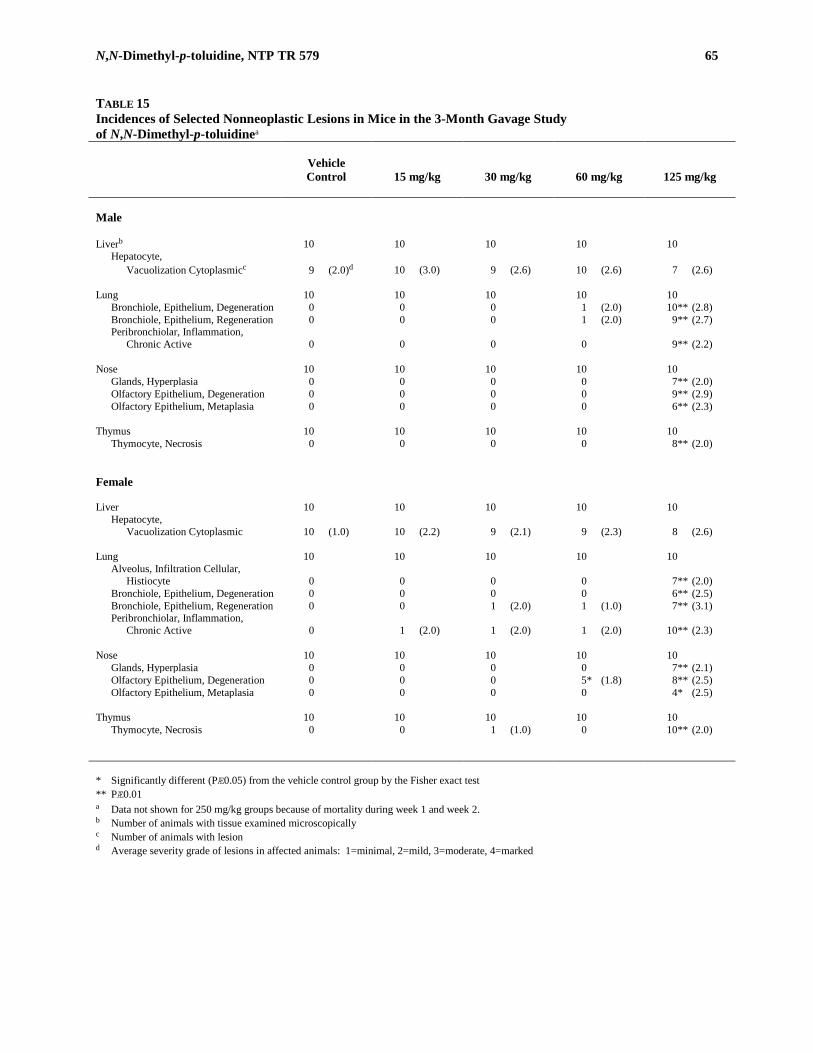
N,N-Dimethyl-p-toluidine, NTP TR 579 65
TABLE 15 Incidences of Selected Nonneoplastic Lesions in Mice in the 3-Month Gavage Study of N,N-Dimethyl-p-toluidinea
Vehicle Control
15 mg/kg
30 mg/kg
60 mg/kg
125 mg/kg
Male Liverb 10 10 10 10 10
Hepatocyte, Vacuolization Cytoplasmicc 9 (2.0)d 10 (3.0) 9 (2.6) 10 (2.6) 7 (2.6)
Lung 10 10 10 10 10
Bronchiole, Epithelium, Degeneration 0 0 0 1 (2.0) 10** (2.8) Bronchiole, Epithelium, Regeneration 0 0 0 1 (2.0) 9** (2.7) Peribronchiolar, Inflammation,
Chronic Active 0 0 0 0 9** (2.2) Nose 10 10 10 10 10
Glands, Hyperplasia 0 0 0 0 7** (2.0) Olfactory Epithelium, Degeneration 0 0 0 0 9** (2.9) Olfactory Epithelium, Metaplasia 0 0 0 0 6** (2.3)
Thymus 10 10 10 10 10 Thymocyte, Necrosis 0 0 0 0 8** (2.0)
Female Liver 10 10 10 10 10
Hepatocyte, Vacuolization Cytoplasmic 10 (1.0) 10 (2.2) 9 (2.1) 9 (2.3) 8 (2.6)
Lung 10 10 10 10 10
Alveolus, Infiltration Cellular, Histiocyte 0 0 0 0 7** (2.0)
Bronchiole, Epithelium, Degeneration 0 0 0 0 6** (2.5) Bronchiole, Epithelium, Regeneration 0 0 1 (2.0) 1 (1.0) 7** (3.1) Peribronchiolar, Inflammation,
Chronic Active 0 1 (2.0) 1 (2.0) 1 (2.0) 10** (2.3)
Nose 10 10 10 10 10 Glands, Hyperplasia 0 0 0 0 7** (2.1) Olfactory Epithelium, Degeneration 0 0 0 5* (1.8) 8** (2.5) Olfactory Epithelium, Metaplasia 0 0 0 0 4* (2.5)
Thymus 10 10 10 10 10 Thymocyte, Necrosis 0 0 1 (1.0) 0 10** (2.0)
* Significantly different (PÆ0.05) from the vehicle control group by the Fisher exact test ** PÆ0.01 a Data not shown for 250 mg/kg groups because of mortality during week 1 and week 2. b Number of animals with tissue examined microscopically c Number of animals with lesion d Average severity grade of lesions in affected animals: 1=minimal, 2=mild, 3=moderate, 4=marked

66 N,N-Dimethyl-p-toluidine, NTP TR 579
type, and consisted of ciliated cuboidal to columnar epithelium replacing the normal olfactory epithelium. Nerve bundles in these areas were atrophic. In the thymus, the incidences of thymocyte necrosis in 125 mg/kg males and females were significantly increased compared to those in the vehicle controls (Table 15). Necrosis was evidenced by scattered rem-nants of pyknotic and karyorrhectic nuclei found primarily in the cortical region.
Dose Selection Rationale: Based on treatment-related mortality in the 250 mg/kg group and toxicity in the liver, lung, trachea, nose, and thymus in the 125 mg/kg group, the highest N,N-dimethyl-p-toluidine dose selected for the 2-year gavage study in mice was 60 mg/kg. As in rats, 6 mg/kg was selected as the low dose because this dose was reported to cause toxicity in humans (Potter et al., 1988). The doses selected for the 2-year gavage study in mice were 0, 6, 20, and 60 mg/kg with a threefold dose spacing.

N,N-Dimethyl-p-toluidine, NTP TR 579 67
2-YEAR STUDY Survival Estimates of 2-year survival probabilities for male and female mice are shown in Table 16 and in the Kaplan-Meier survival curves (Figure 6). Survival of the
60 mg/kg female group was significantly less than that of the vehicle control group; survival of dosed groups of males was similar to that of the vehicle control group.
TABLE 16 Survival of Mice in the 2-Year Gavage Study of N,N-Dimethyl-p-toluidine
Vehicle Control
6 mg/kg
20 mg/kg
60 mg/kg
Male Animals initially in study 50 50 50 50 Accidental deathsa 2 0 0 0 Moribund 5 4 11 14 Natural deaths 9 10 8 0 Animals surviving to study termination 34e 36 31 36 Percent probability of survival at end of studyb 71 72 62 72 Mean survival (days)c 665 702 683 694 Survival analysisd P=1.000 P=1.000 P=0.448 P=1.000 Female Animals initially in study 50 50 50 50 Accidental deathsa 0 1 1 2 Moribund 3 1 7 10 Natural deaths 4 8 3 6 Animals surviving to study termination 43 40 39 32 Percent probability of survival at end of study 86 82 80 67 Mean survival (days) 715 696 690 656 Survival analysis P=0.014 P=0.763 P=0.553 P=0.034 a Censored from survival analyses b Kaplan-Meier determinations c Mean of all deaths (uncensored, censored, and terminal kill). d The result of the life table trend test (Tarone, 1975) is in the vehicle control column, and the results of the life table pairwise comparisons
(Cox, 1972) with the vehicle controls are in the dosed group columns. e Includes one animal that died during the last week of the study

68 N,N-Dimethyl-p-toluidine, NTP TR 579
FIGURE 6 Kaplan-Meier Survival Curves for Mice Administered N,N-Dimethyl-p-toluidine by Gavage for 2 Years

N,N-Dimethyl-p-toluidine, NTP TR 579 69
Body Weights and Clinical Findings The mean body weights of 60 mg/kg males were over 10% less than those of the vehicle controls after week 89 (day 617), and those of 60 mg/kg females were
less than those of the vehicle controls after week 65 (day 449) (Tables 17 and 18; Figure 7). No clinical findings related to chemical administration were observed.

70 N,N-Dimethyl-p-toluidine, NTP TR 579
TABLE 17 Mean Body Weights and Survival of Male Mice in the 2-Year Gavage Study of N,N-Dimethyl-p-toluidine
Vehicle Control
6 mg/kg
20 mg/kg
60 mg/kg
Day Av. Wt.
(g) No. of
Survivors Av. Wt
(g) Wt. (% of Controls)
No. of Survivors
Av. Wt. (g)
Wt. (% of Controls)
No. of Survivors
Av. Wt (g)
Wt. (% of Controls)
No. of Survivors
1 23.0 50 23.0 100 50 23.0 100 50 23.0 100 50 8 23.2 48 23.1 100 50 23.2 100 50 22.0 95 50
15 24.3 48 24.4 100 50 24.6 101 50 24.4 100 50 22 26.1 48 26.2 100 50 26.4 101 50 26.1 100 50 29 26.6 48 26.7 100 50 26.9 101 50 27.1 102 50 36 27.4 48 27.5 101 50 27.6 101 50 27.9 102 50 43 28.6 48 28.3 99 50 28.5 100 50 28.6 100 50 50 30.7 48 30.3 99 50 30.8 100 50 30.3 99 50 57 31.7 48 31.3 99 50 31.5 100 50 31.4 99 50 64 32.4 48 32.0 99 50 32.5 100 50 32.4 100 50 71 33.7 48 33.4 99 50 34.2 102 50 33.6 100 50 78 34.7 48 34.7 100 50 35.6 103 50 34.9 101 50 85 35.9 48 35.8 100 50 36.7 102 50 35.8 100 50
113 40.8 48 40.2 99 50 40.6 100 50 39.1 96 50 141 44.0 48 44.0 100 50 44.2 101 50 41.3 94 50 169 45.7 47 45.6 100 50 46.0 101 50 42.6 93 50 197 48.2 47 48.0 100 50 49.2 102 50 44.0 91 50 225 49.5 47 49.1 99 50 50.6 102 50 45.7 93 50 253 50.9 47 50.6 99 50 52.0 102 50 47.9 94 50 281 51.9 47 51.6 99 50 53.0 102 50 49.7 96 49 309 51.7 47 51.2 99 50 53.4 103 50 51.0 99 49 337 52.4 47 52.7 101 50 53.2 102 50 51.2 98 49 365 53.2 47 53.6 101 50 54.9 103 50 52.0 98 49 393 54.5 47 54.4 100 50 56.1 103 50 53.9 99 49 421 54.9 47 54.8 100 50 56.6 103 49 54.0 99 49 449 54.3 47 54.2 100 50 56.3 104 47 54.2 100 48 477 55.1 47 54.8 100 50 57.2 104 47 55.4 101 48 505 55.2 47 55.2 100 50 57.2 104 47 55.7 101 48 533 55.1 47 54.7 99 50 57.5 104 46 54.0 98 48 561 55.2 45 55.4 101 47 57.0 103 44 52.9 96 48 589 55.1 42 55.7 101 44 53.5 97 44 52.0 94 46 617 55.7 41 55.3 99 43 54.6 98 41 51.1 92 45 645 55.6 40 54.7 98 43 52.6 95 41 49.3 89 43 673 55.5 39 54.4 98 41 51.3 92 37 47.9 86 38 701 55.3 36 53.3 97 39 50.4 91 33 46.5 84 36
Mean for Weeks
1-13 29.1 29.0 100 29.3 101 29.0 100 14-52 48.3 48.1 100 49.1 102 45.8 95
53-101 55.0 54.7 99 55.0 100 52.2 95
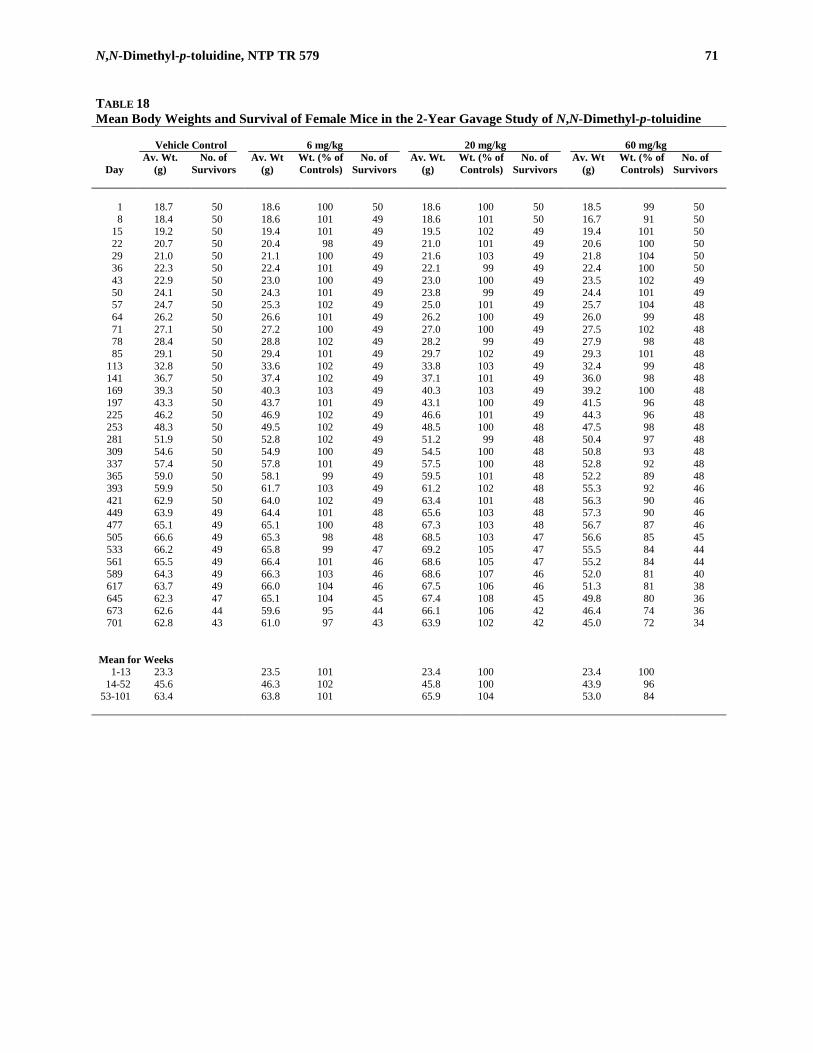
N,N-Dimethyl-p-toluidine, NTP TR 579 71
TABLE 18 Mean Body Weights and Survival of Female Mice in the 2-Year Gavage Study of N,N-Dimethyl-p-toluidine
Vehicle Control
6 mg/kg
20 mg/kg
60 mg/kg
Day Av. Wt.
(g) No. of
Survivors Av. Wt
(g) Wt. (% of Controls)
No. of Survivors
Av. Wt. (g)
Wt. (% of Controls)
No. of Survivors
Av. Wt (g)
Wt. (% of Controls)
No. of Survivors
1 18.7 50 18.6 100 50 18.6 100 50 18.5 99 50 8 18.4 50 18.6 101 49 18.6 101 50 16.7 91 50
15 19.2 50 19.4 101 49 19.5 102 49 19.4 101 50 22 20.7 50 20.4 98 49 21.0 101 49 20.6 100 50 29 21.0 50 21.1 100 49 21.6 103 49 21.8 104 50 36 22.3 50 22.4 101 49 22.1 99 49 22.4 100 50 43 22.9 50 23.0 100 49 23.0 100 49 23.5 102 49 50 24.1 50 24.3 101 49 23.8 99 49 24.4 101 49 57 24.7 50 25.3 102 49 25.0 101 49 25.7 104 48 64 26.2 50 26.6 101 49 26.2 100 49 26.0 99 48 71 27.1 50 27.2 100 49 27.0 100 49 27.5 102 48 78 28.4 50 28.8 102 49 28.2 99 49 27.9 98 48 85 29.1 50 29.4 101 49 29.7 102 49 29.3 101 48
113 32.8 50 33.6 102 49 33.8 103 49 32.4 99 48 141 36.7 50 37.4 102 49 37.1 101 49 36.0 98 48 169 39.3 50 40.3 103 49 40.3 103 49 39.2 100 48 197 43.3 50 43.7 101 49 43.1 100 49 41.5 96 48 225 46.2 50 46.9 102 49 46.6 101 49 44.3 96 48 253 48.3 50 49.5 102 49 48.5 100 48 47.5 98 48 281 51.9 50 52.8 102 49 51.2 99 48 50.4 97 48 309 54.6 50 54.9 100 49 54.5 100 48 50.8 93 48 337 57.4 50 57.8 101 49 57.5 100 48 52.8 92 48 365 59.0 50 58.1 99 49 59.5 101 48 52.2 89 48 393 59.9 50 61.7 103 49 61.2 102 48 55.3 92 46 421 62.9 50 64.0 102 49 63.4 101 48 56.3 90 46 449 63.9 49 64.4 101 48 65.6 103 48 57.3 90 46 477 65.1 49 65.1 100 48 67.3 103 48 56.7 87 46 505 66.6 49 65.3 98 48 68.5 103 47 56.6 85 45 533 66.2 49 65.8 99 47 69.2 105 47 55.5 84 44 561 65.5 49 66.4 101 46 68.6 105 47 55.2 84 44 589 64.3 49 66.3 103 46 68.6 107 46 52.0 81 40 617 63.7 49 66.0 104 46 67.5 106 46 51.3 81 38 645 62.3 47 65.1 104 45 67.4 108 45 49.8 80 36 673 62.6 44 59.6 95 44 66.1 106 42 46.4 74 36 701 62.8 43 61.0 97 43 63.9 102 42 45.0 72 34
Mean for Weeks
1-13 23.3 23.5 101 23.4 100 23.4 100 14-52 45.6 46.3 102 45.8 100 43.9 96
53-101 63.4 63.8 101 65.9 104 53.0 84

72 N,N-Dimethyl-p-toluidine, NTP TR 579
FIGURE 7 Growth Curves for Mice Administered N,N-Dimethyl-p-toluidine by Gavage for 2 Years
N,N-Dimethyl-p-toluidine, NTP TR 579 73
Pathology and Statistical Analyses This section describes the statistically significant or bio-logically noteworthy changes in the incidences of neo-plasms and nonneoplastic lesions of the liver, lung, and forestomach; nonneoplastic lesions of the nose, olfac-tory lobe, spleen, bone marrow, mandibular and mesen-teric lymph nodes; and neoplasms of the Harderian gland. Summaries of the incidences of neoplasms and nonneoplastic lesions, statistical analyses of primary neoplasms that occurred with an incidence of at least 5% in at least one animal group, and historical inci-dences for the neoplasms mentioned in this section are presented in Appendix C for male mice and Appendix D for female mice. Liver: There were significantly increased incidences of hepatocellular adenoma in 20 and 60 mg/kg females and hepatocellular carcinoma in 60 mg/kg males and all dosed female groups (Tables 19, C2, and D2). The incidences of multiple hepatocellular adenoma were increased in 20 and 60 mg/kg males and females, and the incidences of multiple hepatocellular carcinoma were increased in 20 and 60 mg/kg males and 60 mg/kg females. There were also significantly increased inci-dences of hepatoblastoma in males receiving 20 and 60 mg/kg and females receiving 60 mg/kg. The inci-dences of hepatocellular adenoma or carcinoma (com-bined) and hepatocellular adenoma, hepatocellular car-cinoma, or hepatoblastoma (combined) were signifi-cantly increased in males and females receiving 20 and 60 mg/kg. Hepatocellular adenomas typically consisted of a well-circumscribed mass, which caused compres-sion of the surrounding hepatic parenchyma, and was composed of a monotonous population of hepatocytes. Most commonly, hepatocellular carcinomas were large lesions that contained trabeculae at least three cells thick. Areas of necrosis and hemorrhage were common. Hepatoblastomas, unlike the previously described pro-liferative lesions, were composed of cells with scant
amounts of basophilic cytoplasm, and oval, vesicular to open-faced nuclei. These cells were often arranged in nests and whorls. The incidences of eosinophilic focus in 20 and 60 mg/kg males and females were significantly greater than those in the vehicle controls (Tables 19, C4, and D4). Dosed mice had multiple eosinophilic foci more frequently than the vehicle controls. There were signif-icantly decreased incidences of mixed cell focus and clear cell focus in 60 mg/kg males. In contrast to hepa-tocellular adenomas, eosinophilic foci did not cause compression circumferentially and tended to be smaller, although this was not always the case. Mixed cell foci were diagnosed when a focus of altered hepatocytes was composed of two types of hepatocytes, and neither type made up more than 80% of the hepatocytes within the focus. Clear cell foci were characterized by hepatocytes with clear vacuoles, consistent with glycogen accumula-tion, within eosinophilic cytoplasm. Hepatocytes within a clear cell focus may have been enlarged, but were not necessarily so. In all dosed groups of males and females, there were significantly increased incidences of hepatocellular hypertrophy (Tables 19, C4, and D4). There were also significantly increased incidences of diffuse fatty change in 60 mg/kg females and necrosis in 6 and 60 mg/kg females. In males, the severity of necrosis was increased in dosed groups although the incidences were not. In hepatocellular hypertrophy, the affected hepatocytes were large, with homogenous eosinophilic cytoplasm. Diffuse fatty change was characterized by microvesicles within hepatocytes. In some animals, the fatty change appeared to be centrilobular in distribution, but the change typically lacked a specific zonality. Necrosis typically consisted of focal areas of coagu-lative necrosis surrounded by mixed inflammatory cells; but occasionally, necrosis was more widespread and

74 N,N-Dimethyl-p-toluidine, NTP TR 579
TABLE 19 Incidences of Neoplasms and Nonneoplastic Lesions of the Liver in Mice in the 2-Year Gavage Study of N,N-Dimethyl-p-toluidine
Vehicle Control
6 mg/kg
20 mg/kg
60 mg/kg
Male Number Examined Microscopically 50 50 50 50
Clear Cell Focusa 15 22 15 7* Eosinophilic Focus 25 30 39** 43** Mixed Cell Focus 21 25 17 12* Hepatocyte, Hypertrophy 1 (1.0)b 9** (1.2) 11** (1.9) 16** (2.1) Necrosis 9 (1.6) 8 (2.5) 7 (1.9) 10 (2.0) Hepatocellular Adenoma, Multiple 17 19 27* 26* Hepatocellular Adenoma
(includes multiple)c 29 34 37 36 Hepatocellular Carcinoma, Multiple 7 7 16* 22** Hepatocellular Carcinoma (includes multiple)d
Overall ratee 22/50 (44%) 25/50 (50%) 30/50 (60%) 36/50 (72%) Adjusted ratef 48.9% 52.2% 65.1% 75.7% Terminal rateg 16/34 (47%) 17/36 (47%) 19/31 (61%) 27/36 (75%) First incidence (days) 548 539 442 562 Poly-3 testh P=0.002 P=0.458 P=0.084 P=0.005
Hepatocellular Adenoma or Carcinomai Overall rate 38/50 (76%) 44/50 (88%) 47/50 (94%) 48/50 (96%) Adjusted rate 83.1% 90.6% 98.0% 98.6% Terminal rate 28/34 (82%) 34/36 (94%) 31/31 (100%) 36/36 (100%) First incidence (days) 548 539 442 449 Poly-3 test P=0.005 P=0.206 P=0.010 P=0.006
Hepatoblastoma, Multiple 0 0 2 0 Hepatoblastoma (includes multiple)j
Overall rate 1/50 (2%) 5/50 (10%) 10/50 (20%) 8/50 (16%) Adjusted rate 2.3% 10.8% 22.3% 17.3% Terminal rate 1/34 (3%) 3/36 (8%) 4/31 (13%) 3/36 (8%) First incidence (days) 730 (T) 539 512 580 Poly-3 test P=0.064 P=0.121 P=0.005 P=0.021
Hepatocellular Adenoma, Hepatocellular Carcinoma, or Hepatoblastomak Overall rate 38/50 (76%) 45/50 (90%) 48/50 (96%) 48/50 (96%) Adjusted rate 83.1% 91.7% 99.2% 98.6% Terminal rate 28/34 (82%) 34/36 (94%) 31/31 (100%) 36/36 (100%) First incidence (days) 548 539 442 449 Poly-3 test P=0.006 P=0.157 P=0.004 P=0.006

N,N-Dimethyl-p-toluidine, NTP TR 579 75
TABLE 19 Incidences of Neoplasms and Nonneoplastic Lesions of the Liver in Mice in the 2-Year Gavage Study of N,N-Dimethyl-p-toluidine
Vehicle Control
6 mg/kg
20 mg/kg
60 mg/kg
Female Number Examined Microscopically 50 50 50 50
Clear Cell Focus 0 2 2 3 Eosinophilic Focus 20 18 45** 38** Mixed Cell Focus 3 9 7 7 Fatty Change 1 (4.0) 0 0 8** (2.5) Hepatocyte, Hypertrophy 0 11** (1.6) 10** (1.6) 17** (1.9) Necrosis 1 (2.0) 8* (1.5) 4 (2.0) 10** (1.8)
Hepatocellular Adenoma, Multiple 2 6 29** 35** Hepatocellular Adenoma (includes multiple)l
Overall rate 17/50 (34%) 19/50 (38%) 37/50 (74%) 44/50 (88%) Adjusted rate 35.5% 41.1% 80.0% 96.1% Terminal rate 16/43 (37%) 17/40 (43%) 34/39 (87%) 31/32 (97%) First incidence (days) 698 720 649 481 Poly-3 test P<0.001 P=0.364 P<0.001 P<0.001
Hepatocellular Carcinoma, Multiple 1 3 5 19** Hepatocellular Carcinoma (includes multiple)m
Overall rate 6/50 (12%) 13/50 (26%) 18/50 (36%) 31/50 (62%) Adjusted rate 12.5% 28.2% 39.3% 71.9% Terminal rate 4/43 (9%) 12/40 (30%) 16/39 (41%) 24/32 (75%) First incidence (days) 666 720 669 512 Poly-3 test P<0.001 P=0.049 P=0.002 P<0.001
Hepatocellular Adenoma or Carcinoman Overall rate 20/50 (40%) 25/50 (50%) 42/50 (84%) 45/50 (90%) Adjusted rate 41.6% 54.1% 90.6% 98.3% Terminal rate 18/43 (42%) 23/40 (58%) 38/39 (97%) 32/32 (100%) First incidence (days) 666 720 649 481 Poly-3 test P<0.001 P=0.154 P<0.001 P<0.001
Hepatoblastomao Overall rate 0/50 (0%) 1/50 (2%) 0/50 (0%) 4/50 (8%) Adjusted rate 0.0% 2.2% 0.0% 9.7% Terminal rate 0/43 (0%) 1/40 (3%) 0/39 (0%) 3/32 (9%) First incidence (days) —p 729 (T) — 699 Poly-3 test P=0.007 P=0.493 —q P=0.044
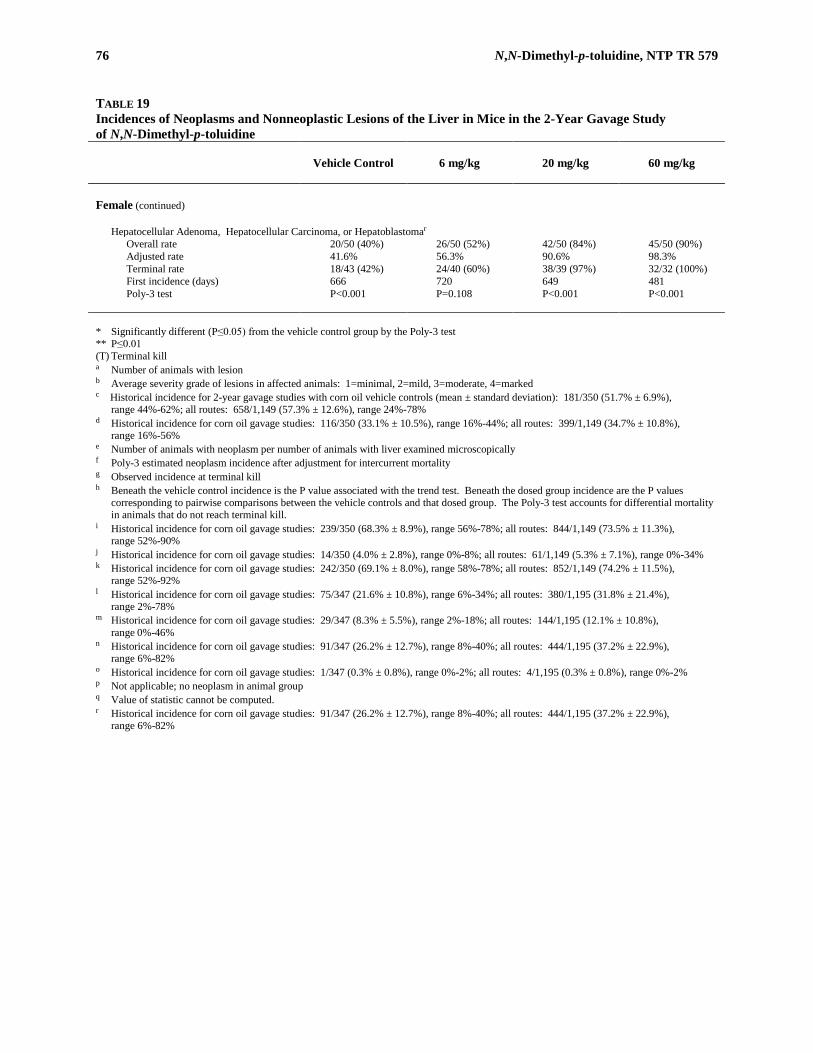
76 N,N-Dimethyl-p-toluidine, NTP TR 579
TABLE 19 Incidences of Neoplasms and Nonneoplastic Lesions of the Liver in Mice in the 2-Year Gavage Study of N,N-Dimethyl-p-toluidine
Vehicle Control
6 mg/kg
20 mg/kg
60 mg/kg
Female (continued)
Hepatocellular Adenoma, Hepatocellular Carcinoma, or Hepatoblastomar Overall rate 20/50 (40%) 26/50 (52%) 42/50 (84%) 45/50 (90%) Adjusted rate 41.6% 56.3% 90.6% 98.3% Terminal rate 18/43 (42%) 24/40 (60%) 38/39 (97%) 32/32 (100%) First incidence (days) 666 720 649 481 Poly-3 test P<0.001 P=0.108 P<0.001 P<0.001
* Significantly different (P≤0.05) from the vehicle control group by the Poly-3 test ** P≤0.01 (T) Terminal kill a Number of animals with lesion b Average severity grade of lesions in affected animals: 1=minimal, 2=mild, 3=moderate, 4=marked c Historical incidence for 2-year gavage studies with corn oil vehicle controls (mean ± standard deviation): 181/350 (51.7% ± 6.9%),
range 44%-62%; all routes: 658/1,149 (57.3% ± 12.6%), range 24%-78% d Historical incidence for corn oil gavage studies: 116/350 (33.1% ± 10.5%), range 16%-44%; all routes: 399/1,149 (34.7% ± 10.8%),
range 16%-56% e Number of animals with neoplasm per number of animals with liver examined microscopically f Poly-3 estimated neoplasm incidence after adjustment for intercurrent mortality g Observed incidence at terminal kill h Beneath the vehicle control incidence is the P value associated with the trend test. Beneath the dosed group incidence are the P values
corresponding to pairwise comparisons between the vehicle controls and that dosed group. The Poly-3 test accounts for differential mortality in animals that do not reach terminal kill.
i Historical incidence for corn oil gavage studies: 239/350 (68.3% ± 8.9%), range 56%-78%; all routes: 844/1,149 (73.5% ± 11.3%), range 52%-90%
j Historical incidence for corn oil gavage studies: 14/350 (4.0% ± 2.8%), range 0%-8%; all routes: 61/1,149 (5.3% ± 7.1%), range 0%-34% k Historical incidence for corn oil gavage studies: 242/350 (69.1% ± 8.0%), range 58%-78%; all routes: 852/1,149 (74.2% ± 11.5%),
range 52%-92% l Historical incidence for corn oil gavage studies: 75/347 (21.6% ± 10.8%), range 6%-34%; all routes: 380/1,195 (31.8% ± 21.4%),
range 2%-78% m Historical incidence for corn oil gavage studies: 29/347 (8.3% ± 5.5%), range 2%-18%; all routes: 144/1,195 (12.1% ± 10.8%),
range 0%-46% n Historical incidence for corn oil gavage studies: 91/347 (26.2% ± 12.7%), range 8%-40%; all routes: 444/1,195 (37.2% ± 22.9%),
range 6%-82% o Historical incidence for corn oil gavage studies: 1/347 (0.3% ± 0.8%), range 0%-2%; all routes: 4/1,195 (0.3% ± 0.8%), range 0%-2% p Not applicable; no neoplasm in animal group q Value of statistic cannot be computed. r Historical incidence for corn oil gavage studies: 91/347 (26.2% ± 12.7%), range 8%-40%; all routes: 444/1,195 (37.2% ± 22.9%),
range 6%-82%

N,N-Dimethyl-p-toluidine, NTP TR 579 77
involved larger areas of hepatic parenchyma. Necrosis was not recorded as a separate lesion if it occurred within a neoplasm. Lung: There were significantly increased incidences of alveolar/bronchiolar adenoma and adenoma or carci-noma (combined) in 20 and 60 mg/kg females (Tables 20, D1, and D2). In females, the incidences of alveolar/bronchiolar adenoma in the 20 and 60 mg/kg groups exceeded the historical control ranges for corn oil gavage studies and for all routes of exposure (Tables 20 and D3b). In male mice, the incidences of alveolar/bronchiolar adenoma, carcinoma, and adenoma
or carcinoma (combined) were not significantly increased (Tables 20 and C2), but the incidences of alveolar/bronchiolar adenoma in the 6 and 20 mg/kg groups exceeded the historical control ranges for corn oil gavage studies and for all routes of exposure (Tables 20 and C3b). However, in male mice, the lack of statistical significance or a dose response, as well as the incidences of adenoma or carcinoma (combined) falling within the historical control range, led to the conclusion that alveolar/bronchiolar neoplasms in male mice were not related to N,N-dimethyl-p-toluidine exposure. Alveolar/bronchiolar adenomas were discrete lesions that caused compression of the surrounding lung
TABLE 20 Incidences of Neoplasms and Nonneoplastic Lesions of the Lung in Mice in the 2-Year Gavage Study of N,N-Dimethyl-p-toluidine
Vehicle Control
6 mg/kg
20 mg/kg
60 mg/kg
Male Number Examined Microscopically 50 50 50 50
Alveolus, Infiltration Cellular, Histiocytea 1 (2.0)b 2 (1.5) 2 (2.5) 10** (1.2) Alveolar/bronchiolar Adenoma, Multiple 0 5 1 0 Alveolar/bronchiolar Adenoma
(includes multiple)c 11 16 18 10 Alveolar/bronchiolar Carcinoma, Multiple 0 1 0 0 Alveolar/bronchiolar Carcinoma
(includes multiple)d 2 3 0 4
Alveolar/bronchiolar Adenoma or Carcinomae Overall ratef 13/50 (26%) 19/50 (38%) 18/50 (36%) 12/50 (24%) Adjusted rateg 30.0% 41.2% 41.1% 26.2% Terminal rateh 11/34 (32%) 16/36 (44%) 13/31 (42%) 8/36 (22%) First incidence (days) 643 568 609 562 Poly-3 testi P=0.167N P=0.187 P=0.194 P=0.433N
Female Number Examined Microscopically 50 50 50 50
Alveolar Epithelium, Hyperplasia 2 (3.0) 3 (2.3) 8* (1.5) 2 (1.0) Alveolus, Infiltration Cellular, Histiocyte 1 (1.0) 0 0 7* (1.4) Bronchiole, Epithelium, Regeneration 0 0 0 5* (1.8) Bronchus, Epithelium, Regeneration 0 0 0 5* (2.0) Bronchus, Necrosis 0 0 0 5* (1.6) Alveolar/bronchiolar Adenoma, Multiple 2 1 1 0 Alveolar/bronchiolar Adenoma (includes multiple)j
Overall rate 2/50 (4%) 4/50 (8%) 8/50 (16%) 12/50 (24%) Adjusted rate 4.2% 8.7% 17.5% 28.2% Terminal rate 2/43 (5%) 4/40 (10%) 7/39 (18%) 8/32 (25%) First incidence (days) 729 (T) 729 (T) 649 570 Poly-3 test P<0.001 P=0.322 P=0.039 P<0.001
Alveolar/bronchiolar Carcinomak 0 1 2 1
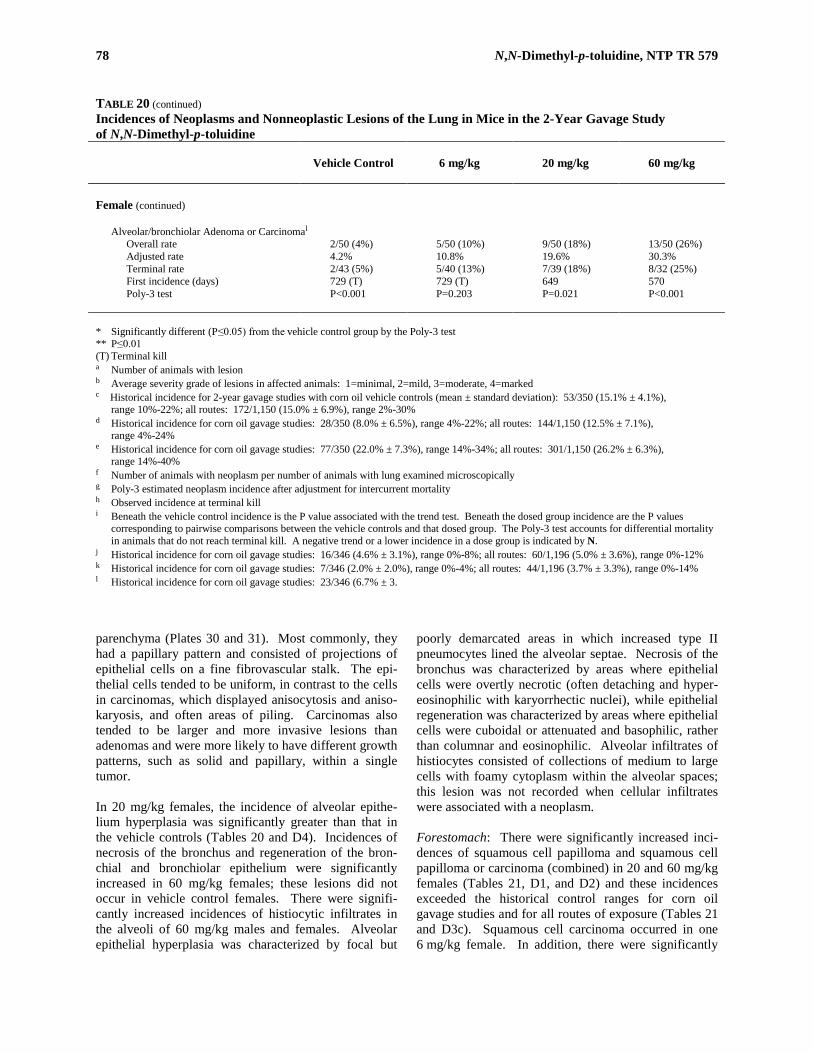
78 N,N-Dimethyl-p-toluidine, NTP TR 579
TABLE 20 (continued) Incidences of Neoplasms and Nonneoplastic Lesions of the Lung in Mice in the 2-Year Gavage Study of N,N-Dimethyl-p-toluidine
Vehicle Control
6 mg/kg
20 mg/kg
60 mg/kg
Female (continued)
Alveolar/bronchiolar Adenoma or Carcinomal Overall rate 2/50 (4%) 5/50 (10%) 9/50 (18%) 13/50 (26%) Adjusted rate 4.2% 10.8% 19.6% 30.3% Terminal rate 2/43 (5%) 5/40 (13%) 7/39 (18%) 8/32 (25%) First incidence (days) 729 (T) 729 (T) 649 570 Poly-3 test P<0.001 P=0.203 P=0.021 P<0.001
* Significantly different (P≤0.05) from the vehicle control group by the Poly-3 test ** P≤0.01 (T) Terminal kill a Number of animals with lesion b Average severity grade of lesions in affected animals: 1=minimal, 2=mild, 3=moderate, 4=marked c Historical incidence for 2-year gavage studies with corn oil vehicle controls (mean ± standard deviation): 53/350 (15.1% ± 4.1%),
range 10%-22%; all routes: 172/1,150 (15.0% ± 6.9%), range 2%-30% d Historical incidence for corn oil gavage studies: 28/350 (8.0% ± 6.5%), range 4%-22%; all routes: 144/1,150 (12.5% ± 7.1%),
range 4%-24% e Historical incidence for corn oil gavage studies: 77/350 (22.0% ± 7.3%), range 14%-34%; all routes: 301/1,150 (26.2% ± 6.3%),
range 14%-40% f Number of animals with neoplasm per number of animals with lung examined microscopically g Poly-3 estimated neoplasm incidence after adjustment for intercurrent mortality h Observed incidence at terminal kill i Beneath the vehicle control incidence is the P value associated with the trend test. Beneath the dosed group incidence are the P values
corresponding to pairwise comparisons between the vehicle controls and that dosed group. The Poly-3 test accounts for differential mortality in animals that do not reach terminal kill. A negative trend or a lower incidence in a dose group is indicated by N.
j Historical incidence for corn oil gavage studies: 16/346 (4.6% ± 3.1%), range 0%-8%; all routes: 60/1,196 (5.0% ± 3.6%), range 0%-12% k Historical incidence for corn oil gavage studies: 7/346 (2.0% ± 2.0%), range 0%-4%; all routes: 44/1,196 (3.7% ± 3.3%), range 0%-14% l Historical incidence for corn oil gavage studies: 23/346 (6.7% ± 3.
parenchyma (Plates 30 and 31). Most commonly, they had a papillary pattern and consisted of projections of epithelial cells on a fine fibrovascular stalk. The epi-thelial cells tended to be uniform, in contrast to the cells in carcinomas, which displayed anisocytosis and aniso-karyosis, and often areas of piling. Carcinomas also tended to be larger and more invasive lesions than adenomas and were more likely to have different growth patterns, such as solid and papillary, within a single tumor. In 20 mg/kg females, the incidence of alveolar epithe-lium hyperplasia was significantly greater than that in the vehicle controls (Tables 20 and D4). Incidences of necrosis of the bronchus and regeneration of the bron-chial and bronchiolar epithelium were significantly increased in 60 mg/kg females; these lesions did not occur in vehicle control females. There were signifi-cantly increased incidences of histiocytic infiltrates in the alveoli of 60 mg/kg males and females. Alveolar epithelial hyperplasia was characterized by focal but
poorly demarcated areas in which increased type II pneumocytes lined the alveolar septae. Necrosis of the bronchus was characterized by areas where epithelial cells were overtly necrotic (often detaching and hyper-eosinophilic with karyorrhectic nuclei), while epithelial regeneration was characterized by areas where epithelial cells were cuboidal or attenuated and basophilic, rather than columnar and eosinophilic. Alveolar infiltrates of histiocytes consisted of collections of medium to large cells with foamy cytoplasm within the alveolar spaces; this lesion was not recorded when cellular infiltrates were associated with a neoplasm. Forestomach: There were significantly increased inci-dences of squamous cell papilloma and squamous cell papilloma or carcinoma (combined) in 20 and 60 mg/kg females (Tables 21, D1, and D2) and these incidences exceeded the historical control ranges for corn oil gavage studies and for all routes of exposure (Tables 21 and D3c). Squamous cell carcinoma occurred in one 6 mg/kg female. In addition, there were significantly
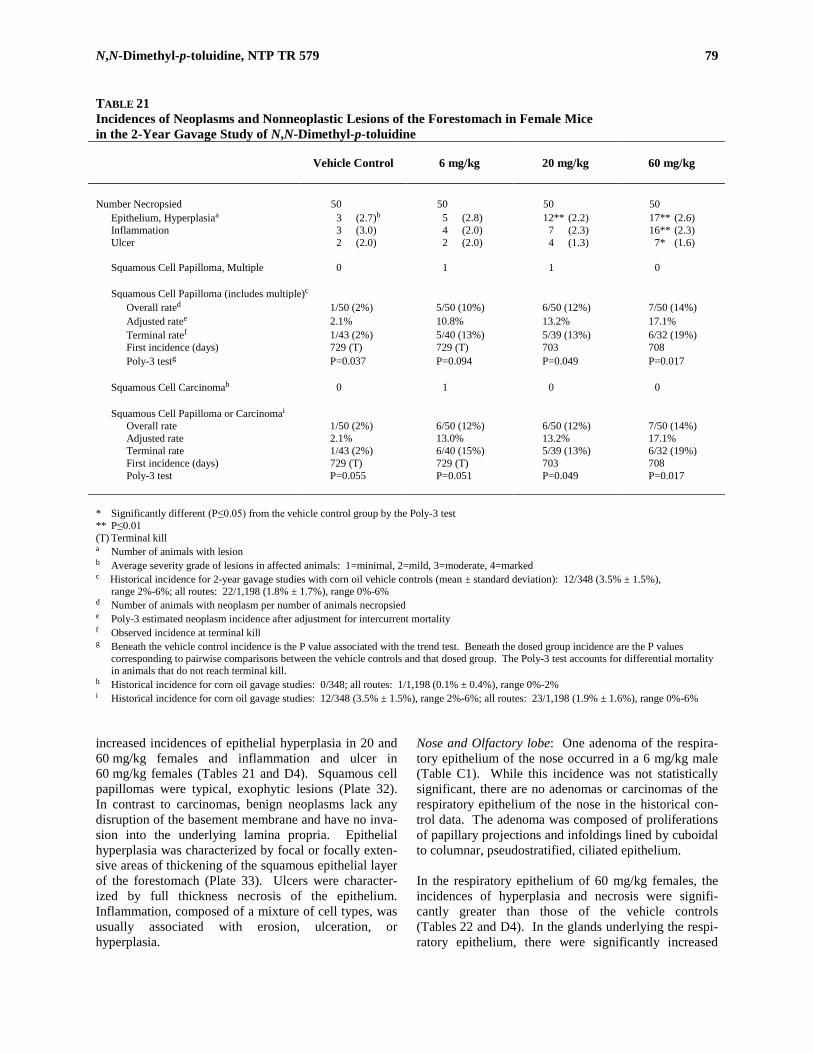
N,N-Dimethyl-p-toluidine, NTP TR 579 79
TABLE 21 Incidences of Neoplasms and Nonneoplastic Lesions of the Forestomach in Female Mice in the 2-Year Gavage Study of N,N-Dimethyl-p-toluidine
Vehicle Control
6 mg/kg
20 mg/kg
60 mg/kg
Number Necropsied 50 50 50 50
Epithelium, Hyperplasiaa 3 (2.7)b 5 (2.8) 12** (2.2) 17** (2.6) Inflammation 3 (3.0) 4 (2.0) 7 (2.3) 16** (2.3) Ulcer 2 (2.0) 2 (2.0) 4 (1.3) 7* (1.6) Squamous Cell Papilloma, Multiple 0 1 1 0 Squamous Cell Papilloma (includes multiple)c
Overall rated 1/50 (2%) 5/50 (10%) 6/50 (12%) 7/50 (14%) Adjusted ratee 2.1% 10.8% 13.2% 17.1% Terminal ratef 1/43 (2%) 5/40 (13%) 5/39 (13%) 6/32 (19%) First incidence (days) 729 (T) 729 (T) 703 708 Poly-3 testg P=0.037 P=0.094 P=0.049 P=0.017
Squamous Cell Carcinomah 0 1 0 0
Squamous Cell Papilloma or Carcinomai Overall rate 1/50 (2%) 6/50 (12%) 6/50 (12%) 7/50 (14%) Adjusted rate 2.1% 13.0% 13.2% 17.1% Terminal rate 1/43 (2%) 6/40 (15%) 5/39 (13%) 6/32 (19%) First incidence (days) 729 (T) 729 (T) 703 708 Poly-3 test P=0.055 P=0.051 P=0.049 P=0.017
* Significantly different (P≤0.05) from the vehicle control group by the Poly-3 test ** P≤0.01 (T) Terminal kill a Number of animals with lesion b Average severity grade of lesions in affected animals: 1=minimal, 2=mild, 3=moderate, 4=marked c Historical incidence for 2-year gavage studies with corn oil vehicle controls (mean ± standard deviation): 12/348 (3.5% ± 1.5%),
range 2%-6%; all routes: 22/1,198 (1.8% ± 1.7%), range 0%-6% d Number of animals with neoplasm per number of animals necropsied e Poly-3 estimated neoplasm incidence after adjustment for intercurrent mortality f Observed incidence at terminal kill g Beneath the vehicle control incidence is the P value associated with the trend test. Beneath the dosed group incidence are the P values
corresponding to pairwise comparisons between the vehicle controls and that dosed group. The Poly-3 test accounts for differential mortality in animals that do not reach terminal kill.
h Historical incidence for corn oil gavage studies: 0/348; all routes: 1/1,198 (0.1% ± 0.4%), range 0%-2% i Historical incidence for corn oil gavage studies: 12/348 (3.5% ± 1.5%), range 2%-6%; all routes: 23/1,198 (1.9% ± 1.6%), range 0%-6%
increased incidences of epithelial hyperplasia in 20 and 60 mg/kg females and inflammation and ulcer in 60 mg/kg females (Tables 21 and D4). Squamous cell papillomas were typical, exophytic lesions (Plate 32). In contrast to carcinomas, benign neoplasms lack any disruption of the basement membrane and have no inva-sion into the underlying lamina propria. Epithelial hyperplasia was characterized by focal or focally exten-sive areas of thickening of the squamous epithelial layer of the forestomach (Plate 33). Ulcers were character-ized by full thickness necrosis of the epithelium. Inflammation, composed of a mixture of cell types, was usually associated with erosion, ulceration, or hyperplasia.
Nose and Olfactory lobe: One adenoma of the respira-tory epithelium of the nose occurred in a 6 mg/kg male (Table C1). While this incidence was not statistically significant, there are no adenomas or carcinomas of the respiratory epithelium of the nose in the historical con-trol data. The adenoma was composed of proliferations of papillary projections and infoldings lined by cuboidal to columnar, pseudostratified, ciliated epithelium. In the respiratory epithelium of 60 mg/kg females, the incidences of hyperplasia and necrosis were signifi-cantly greater than those of the vehicle controls (Tables 22 and D4). In the glands underlying the respi-ratory epithelium, there were significantly increased
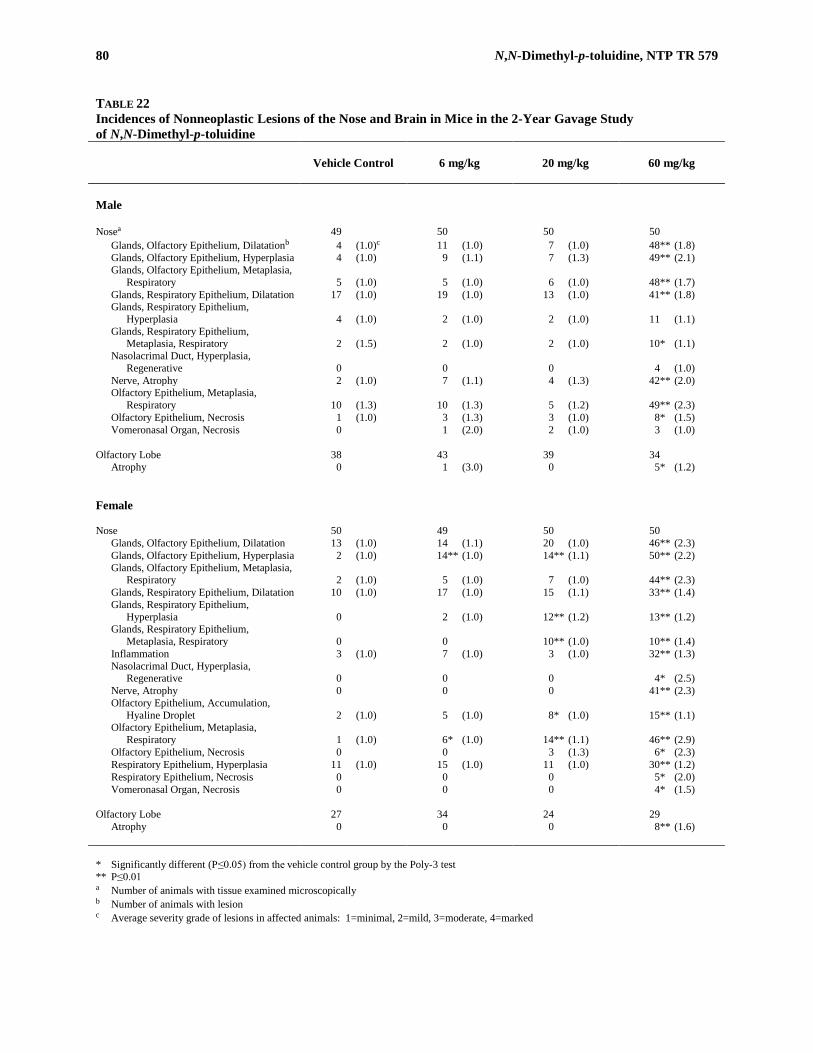
80 N,N-Dimethyl-p-toluidine, NTP TR 579
TABLE 22 Incidences of Nonneoplastic Lesions of the Nose and Brain in Mice in the 2-Year Gavage Study of N,N-Dimethyl-p-toluidine
Vehicle Control
6 mg/kg
20 mg/kg
60 mg/kg
Male Nosea 49 50 50 50
Glands, Olfactory Epithelium, Dilatationb 4 (1.0)c 11 (1.0) 7 (1.0) 48** (1.8) Glands, Olfactory Epithelium, Hyperplasia 4 (1.0) 9 (1.1) 7 (1.3) 49** (2.1) Glands, Olfactory Epithelium, Metaplasia,
Respiratory 5 (1.0) 5 (1.0) 6 (1.0) 48** (1.7) Glands, Respiratory Epithelium, Dilatation 17 (1.0) 19 (1.0) 13 (1.0) 41** (1.8) Glands, Respiratory Epithelium,
Hyperplasia 4 (1.0) 2 (1.0) 2 (1.0) 11 (1.1) Glands, Respiratory Epithelium,
Metaplasia, Respiratory 2 (1.5) 2 (1.0) 2 (1.0) 10* (1.1) Nasolacrimal Duct, Hyperplasia,
Regenerative 0 0 0 4 (1.0) Nerve, Atrophy 2 (1.0) 7 (1.1) 4 (1.3) 42** (2.0) Olfactory Epithelium, Metaplasia,
Respiratory 10 (1.3) 10 (1.3) 5 (1.2) 49** (2.3) Olfactory Epithelium, Necrosis 1 (1.0) 3 (1.3) 3 (1.0) 8* (1.5) Vomeronasal Organ, Necrosis 0 1 (2.0) 2 (1.0) 3 (1.0)
Olfactory Lobe 38 43 39 34 Atrophy 0 1 (3.0) 0 5* (1.2)
Female Nose 50 49 50 50
Glands, Olfactory Epithelium, Dilatation 13 (1.0) 14 (1.1) 20 (1.0) 46** (2.3) Glands, Olfactory Epithelium, Hyperplasia 2 (1.0) 14** (1.0) 14** (1.1) 50** (2.2) Glands, Olfactory Epithelium, Metaplasia,
Respiratory 2 (1.0) 5 (1.0) 7 (1.0) 44** (2.3) Glands, Respiratory Epithelium, Dilatation 10 (1.0) 17 (1.0) 15 (1.1) 33** (1.4) Glands, Respiratory Epithelium,
Hyperplasia 0 2 (1.0) 12** (1.2) 13** (1.2) Glands, Respiratory Epithelium,
Metaplasia, Respiratory 0 0 10** (1.0) 10** (1.4) Inflammation 3 (1.0) 7 (1.0) 3 (1.0) 32** (1.3) Nasolacrimal Duct, Hyperplasia,
Regenerative 0 0 0 4* (2.5) Nerve, Atrophy 0 0 0 41** (2.3) Olfactory Epithelium, Accumulation,
Hyaline Droplet 2 (1.0) 5 (1.0) 8* (1.0) 15** (1.1) Olfactory Epithelium, Metaplasia,
Respiratory 1 (1.0) 6* (1.0) 14** (1.1) 46** (2.9) Olfactory Epithelium, Necrosis 0 0 3 (1.3) 6* (2.3) Respiratory Epithelium, Hyperplasia 11 (1.0) 15 (1.0) 11 (1.0) 30** (1.2) Respiratory Epithelium, Necrosis 0 0 0 5* (2.0) Vomeronasal Organ, Necrosis 0 0 0 4* (1.5)
Olfactory Lobe 27 34 24 29 Atrophy 0 0 0 8** (1.6)
* Significantly different (P≤0.05) from the vehicle control group by the Poly-3 test ** P≤0.01 a Number of animals with tissue examined microscopically b Number of animals with lesion c Average severity grade of lesions in affected animals: 1=minimal, 2=mild, 3=moderate, 4=marked
N,N-Dimethyl-p-toluidine, NTP TR 579 81
incidences of dilatation in 60 mg/kg males and females, hyperplasia in 20 and 60 mg/kg females, and respiratory metaplasia in 20 mg/kg females and 60 mg/kg males and females (Tables 22, C4, and D4). Hyperplasia was also increased in 60 mg/kg males, but the increase was not significant. Hyperplasia of the respiratory epithe-lium consisted of increased numbers of cells in the respiratory epithelium, with resultant nuclear crowding and infoldings of epithelium. Necrosis of the respira-tory epithelium was characterized by widespread necro-sis of the epithelium throughout the nasal section; it was usually seen in conjunction with necrosis of the tran-sitional and olfactory epithelium. In the glands under-lying the respiratory epithelium it was often difficult to tell hyperplastic glands that had undergone respiratory metaplasia from hyperplasia of the respiratory epithe-lium that produced infoldings into the underlying lamina propria (pseudogland formation). Hyperplasia of the glands was characterized by increased profiles of glands in the lamina propria underlying the respiratory epithelium; these glands were often lined by increased numbers of cells, which were crowded together and often metaplastic. Dilated glands had enlarged luminal areas, and often contained amorphous, eosinophilic material, inflammatory cells, or cell debris. Respiratory metaplasia of the glands was characterized by glands lined by cuboidal to columnar ciliated epithelial cells. In the olfactory epithelium of the nose, there were sig-nificantly increased incidences of respiratory metaplasia in 60 mg/kg males and all dosed female groups (Tables 22, C4, and D4). There were also significantly increased incidences of necrosis in 60 mg/kg males and females and hyaline droplet accumulation in 20 and 60 mg/kg females. In males, there was a negative trend in the incidence of hyaline droplet accumulation (Table C4). In the glands underlying the olfactory epi-thelium, there were significantly increased incidences of dilatation and respiratory metaplasia in 60 mg/kg males and females and hyperplasia in 60 mg/kg males and all dosed female groups. Respiratory metaplasia of the olfactory epithelium was diagnosed when the normal olfactory epithelium was replaced with cuboidal to columnar pseudostratified cili-ated epithelium. Necrosis of the olfactory epithelium was characterized by individual cell necrosis within the layer of olfactory epithelium in some animals. Typi-cally, there were decreased numbers of cells in the olfactory epithelium of affected animals. In other ani-mals, there was denudement of the olfactory epithelium as part of widespread necrosis of the epithelial layers in the nose. Hyaline droplet accumulation consisted of
brightly eosinophilic droplets or globules within the cytoplasm of epithelial cells. Hyperplasia of the glands underlying the olfactory epithelium was diagnosed when there were increased profiles of glands and/or the glands were composed of increased numbers of cells (Plates 34 and 35). Respiratory metaplasia of these glands was diagnosed when the epithelium of the glands consisted of pseudostratified, ciliated, cuboidal to columnar epithelium (Plate 36). Dilated glands had enlarged luminal areas, and often contained amorphous, eosinophilic material, inflammatory cells, or cell debris. In 60 mg/kg females, there were significantly increased incidences of regenerative hyperplasia of the nasolacri-mal duct, necrosis of the vomeronasal organ, and inflammation of the nose; these lesions were also increased in 60 mg/kg males, but not significantly (Tables 22, C4, and D4). In 60 mg/kg males and females, there were significantly increased incidences of nerve atrophy in the nose and olfactory lobe atrophy in the brain. A review of the nasal sections of the brain indicated that a portion of the olfactory lobe was visible on the most caudal section of the nasal cavity in many, but not all, mice (males: vehicle control, 38/50; 6 mg/kg, 43/50; 20 mg/kg, 39/50; 60 mg/kg, 34/50; females: 27/50, 34/50, 24/50, 29/49). Because the olfactory lobe is part of the brain, these diagnoses were recorded in the Tables C4 and D4 under the category of brain. While sections of the brain were examined for all animals, the denominators for olfactory lobes examined presented in Table 22 are the number observed on the nasal sections of the brain. Regenerative hyperplasia of the nasolacrimal duct was characterized by attenuated epithelial cells containing large vesicular nuclei and displaying cellular pleomorphism. Necrosis of the vomeronasal organ was characterized by loss of cellular detail, nuclear pyknosis, and replacement of columnar epithelium by cell debris. Inflammation of the nose consisted predominantly of neutrophils with fewer mac-rophages, and occasional plasma cells and eosinophils in the lamina propria of the olfactory, respiratory, and/or transitional epithelial regions, and within the nasal cav-ity. Nerve atrophy was characterized by a decrease in the numbers of nerves, with remaining nerves being vacuolated and/or irregular in outline. Atrophy of the olfactory lobe of the brain was characterized by the shrinkage and vacuolation of the neuropil. Hematopoietic System (Spleen, Bone Marrow, and Man-dibular and Mesenteric Lymph Nodes): In the spleen, there were increased incidences of atrophy in 20 and 60 mg/kg males, but only the incidence in the 20 mg/kg group was statistically significant (Tables 23 and C4).

82 N,N-Dimethyl-p-toluidine, NTP TR 579
TABLE 23 Incidences of Nonneoplastic Lesions of the Hematopoietic System in Mice in the 2-Year Gavage Study of N,N-Dimethyl-p-toluidine
Vehicle Control
6 mg/kg
20 mg/kg
60 mg/kg
Male Spleena 48 50 49 50
Atrophyb 4 (2.5)c 11 (2.2) 11* (2.4) 6 (1.8) Female Bone Marrow 50 50 50 49
Hyperplasia 5 (2.2) 14* (1.9) 15** (2.1) 14** (2.1)
Lymph Node, Mesenteric 49 49 49 50 Atrophy 1 (2.0) 5 (2.0) 5 (2.2) 12** (2.9) Hyperplasia, Lymphoid 7 (2.3) 3 (3.7) 1* (2.0) 0*
Spleen 49 49 49 50 Red Pulp, Atrophy 0 0 0 5* (3.2)
* Significantly different (P≤0.05) from the vehicle control group by the Poly-3 test ** P≤0.01 a Number of animals with tissue examined microscopically b Number of animals with lesion c Average severity grade of lesions in affected animals: 1=minimal, 2=mild, 3=moderate, 4=marked
The incidence of red pulp atrophy in 60 mg/kg females was significantly increased compared to the vehicle controls (Tables 23 and D4). Atrophy of the spleen was diagnosed when there was a decrease in the size of lym-phoid follicles when compared to the vehicle controls, and atrophy of the red pulp was diagnosed when there was a reduction in the amount of red pulp, with compressed vascular spaces. In bone marrow, the incidences of hyperplasia were significantly increased in all dosed female groups (Tables 23 and D4). Bone marrow hyperplasia was diagnosed when there was an increase in cellularity of any myeloid, erythroid, or megakaryocytic lineages, though generally the erythroid and myeloid series were the predominant cell types present. In the mesenteric lymph node, the incidences of atrophy were significantly increased in 60 mg/kg females (Tables 23 and D4). There was also a negative trend in the incidences of lymphoid hyperplasia of the mesen-teric lymph node in females. Atrophy of the lymph node was based upon reduction in lymphocyte density in the cortex and paracortex and in reduction in overall lymph node size. Lymphoid hyperplasia was charac-terized by an increased number of follicles, and/or an
increase in cellularity, due to increased numbers of lym-phocytes, in the section of lymph node. Harderian Gland: There were significantly decreased incidences of adenoma or carcinoma (combined) in 20 and 60 mg/kg males (11/50, 8/50, 5/50, 2/50; Tables C1 and C2). The incidence of Harderian gland adenoma or carcinoma (combined) in 60 mg/kg males is below the historical control ranges for corn oil gavage studies [57/350 (16% ± 5%), range 10% to 24%] and all routes of exposure [184/1,150 (16% ± 5%), range 6% to 24%]. It is uncertain if these decreased incidences were related to treatment.
GENETIC TOXICOLOGY N,N-Dimethyl-p-toluidine was tested in two indepen-dent bacterial gene mutation studies, and negative results were obtained in both studies (Tables E1 and E2). In the first study (concentration range, 0.33 to 1,000 µg/plate), no increases in the numbers of mutant colonies were seen in Salmonella typhimurium strains TA97, TA98, TA100, or TA1535, with or without 10% or 30% S9 derived from induced hamster or rat liver. In the second study, which tested the same chemical lot
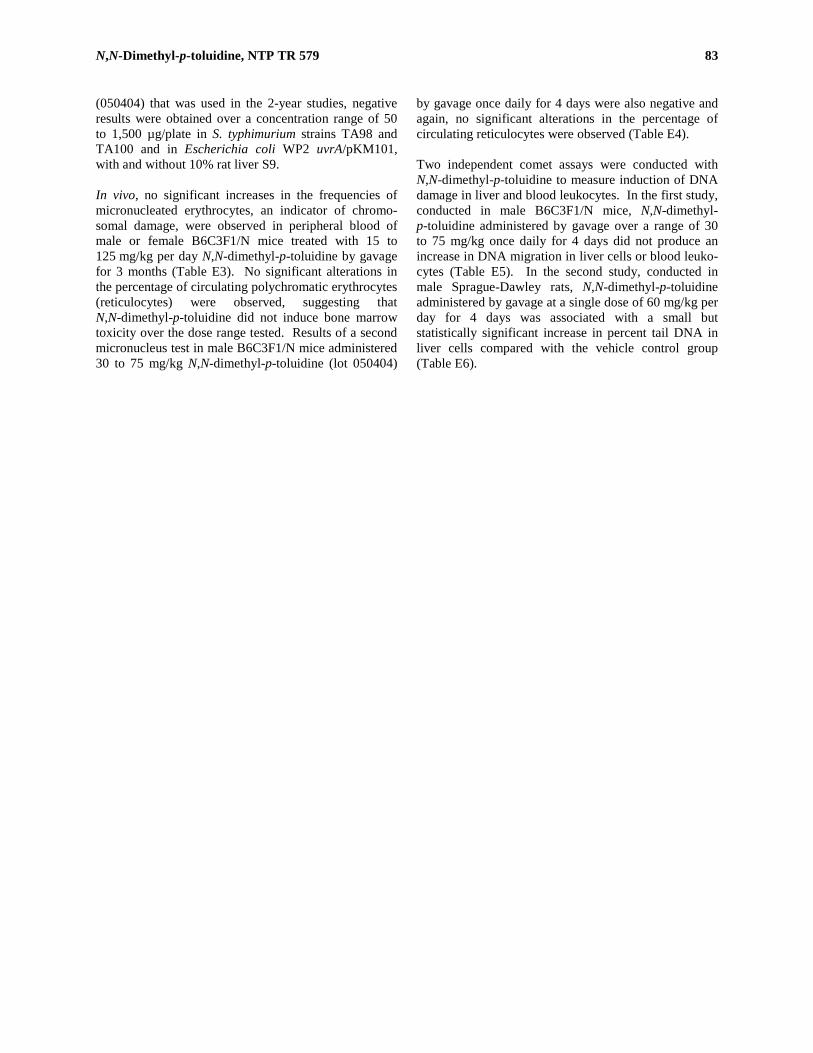
N,N-Dimethyl-p-toluidine, NTP TR 579 83
(050404) that was used in the 2-year studies, negative results were obtained over a concentration range of 50 to 1,500 µg/plate in S. typhimurium strains TA98 and TA100 and in Escherichia coli WP2 uvrA/pKM101, with and without 10% rat liver S9. In vivo, no significant increases in the frequencies of micronucleated erythrocytes, an indicator of chromo-somal damage, were observed in peripheral blood of male or female B6C3F1/N mice treated with 15 to 125 mg/kg per day N,N-dimethyl-p-toluidine by gavage for 3 months (Table E3). No significant alterations in the percentage of circulating polychromatic erythrocytes (reticulocytes) were observed, suggesting that N,N-dimethyl-p-toluidine did not induce bone marrow toxicity over the dose range tested. Results of a second micronucleus test in male B6C3F1/N mice administered 30 to 75 mg/kg N,N-dimethyl-p-toluidine (lot 050404)
by gavage once daily for 4 days were also negative and again, no significant alterations in the percentage of circulating reticulocytes were observed (Table E4). Two independent comet assays were conducted with N,N-dimethyl-p-toluidine to measure induction of DNA damage in liver and blood leukocytes. In the first study, conducted in male B6C3F1/N mice, N,N-dimethyl-p-toluidine administered by gavage over a range of 30 to 75 mg/kg once daily for 4 days did not produce an increase in DNA migration in liver cells or blood leuko-cytes (Table E5). In the second study, conducted in male Sprague-Dawley rats, N,N-dimethyl-p-toluidine administered by gavage at a single dose of 60 mg/kg per day for 4 days was associated with a small but statistically significant increase in percent tail DNA in liver cells compared with the vehicle control group (Table E6).

84 N,N-Dimethyl-p-toluidine, NTP TR 579
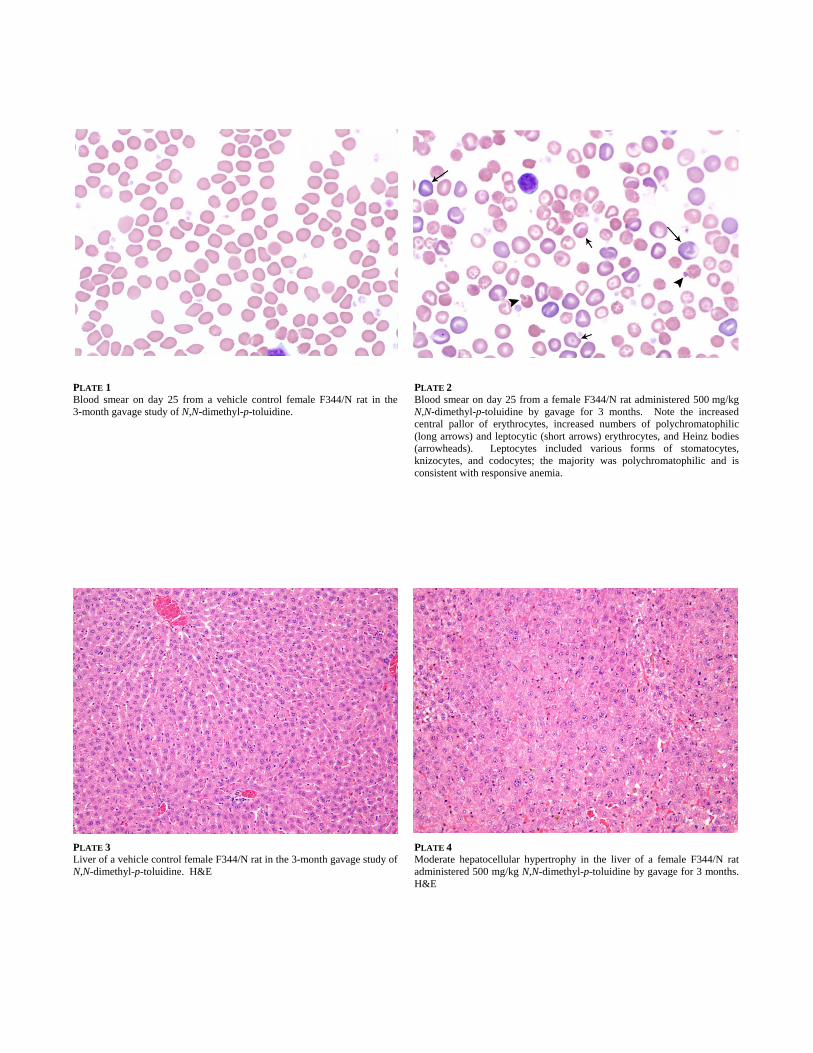
PLATE 1 Blood smear on day 25 from a vehicle control female F344/N rat in the3-month gavage study of N,N-dimethyl-p-toluidine.
PLATE 2
Blood smear on day 25 from a female F344/N rat administered 500 mg/kgN,N-dimethyl-p-toluidine by gavage for 3 months. Note the increased central pallor of erythrocytes, increased numbers of polychromatophilic (long arrows) and leptocytic (short arrows) erythrocytes, and Heinz bodies(arrowheads). Leptocytes included various forms of stomatocytes, knizocytes, and codocytes; the majority was polychromatophilic and isconsistent with responsive anemia.
PLATE 3 Liver of a vehicle control female F344/N rat in the 3-month gavage study of N,N-dimethyl-p-toluidine. H&E
PLATE 4 Moderate hepatocellular hypertrophy in the liver of a female F344/N rat administered 500 mg/kg N,N-dimethyl-p-toluidine by gavage for 3 months. H&E

PLATE 5 Level III nasal section of a vehicle control female F344/N rat in the 3-month gavage study of N,N-dimethyl-p-toluidine. H&E
PLATE Level III nasal section showing degeneration of the olfactory epithelium and dilatation (arrows) and hyperplasia of the underlying glands in a male F344/N rat administered 500 mg/kg N,N-dimethyl-p-toluidine by gavage for 3 months. H&E
6
PLATE 7 Section of the renal papilla of a vehicle control male F344/N rat in the 3-month gavage study of N,N-dimethyl-p-toluidine. H&E
PLATE 8 Widespread necrosis in the renal papilla of a male F344/N rat administered 500 mg/kg N,N-dimethyl-p-toluidine by gavage for 3 months. H&E
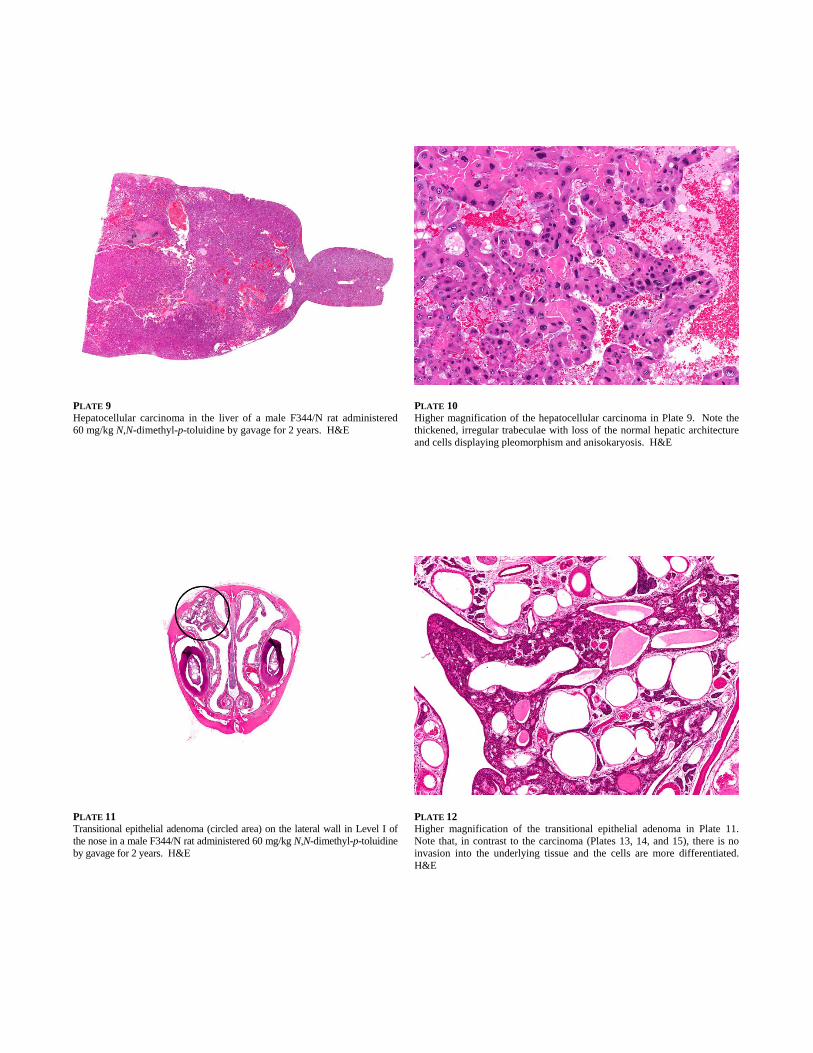
PLATE 9 Hepatocellular carcinoma in the liver of a male F344/N rat administered 60 mg/kg N,N-dimethyl-p-toluidine by gavage for 2 years. H&E
PLATE 10 Higher magnification of the hepatocellular carcinoma in Plate 9. Note the thickened, irregular trabeculae with loss of the normal hepatic architecture and cells displaying pleomorphism and anisokaryosis. H&E
PLATE 11 Transitional epithelial adenoma (circled area) on the lateral wall in Level I of the nose in a male F344/N rat administered 60 mg/kg N,N-dimethyl-p-toluidineby gavage for 2 years. H&E
PLATE 12 Higher magnification of the transitional epithelial adenoma in Plate 11. Note that, in contrast to the carcinoma (Plates 13, 14, and 15), there is no invasion into the underlying tissue and the cells are more differentiated. H&E

PLATE 13 Transitional epithelial carcinoma (circled area) arising in the dorsolateralaspect of the nasal cavity in nasal Level I in a male F344/N rat administered 60 mg/kg N,N-dimethyl-p-toluidine by gavage for 2 years. H&E
PLATE 14
Higher magnification of the transitional epithelial carcinoma in Plate 13. Note invasion through the bone of the turbinate (arrows). H&E
PLATE 15 Higher magnification of the transitional epithelial carcinoma in Plate 14.Note cells in division (mitotic figures) (arrowheads). H&E
PLATE 16
Nasal adenoma arising from the glands underlying the olfactory epithelium (circled area) in nasal Level II in a male F344/N rat administered 60 mg/kg N,N-dimethyl-p-toluidine by gavage for 2 years. H&E

PLATE 17 Higher magnification of the adenoma in Plate 16. Note the mixed pattern of cells. H&E
PLATE 18 Normal olfactory epithelium (arrows) in a vehicle control male F344/N rat in the 2-year gavage study of N,N-dimethyl-p-toluidine. Note the orderly arrangement. The lamina propria contains numerous nerve bundles(asterisks) and glands (arrowheads). H&E
PLATE 19 Olfactory epithelium in a male F344/N rat administered 60 mg/kgN,N-dimethyl-p-toluidine by gavage for 2 years. Note the milddegeneration of the olfactory epithelium (arrow) as evidenced by decreased cellularity and vacuolization of the epithelial layer. There are few nerves present in the lamina propria. H&E
PLATE 20 Normal olfactory epithelium in a vehicle control male F344/N rat in the2-year gavage study of N,N-dimethyl-p-toluidine. Note a row of flattened cells (arrows) at the basal layer of the epithelium. H&E
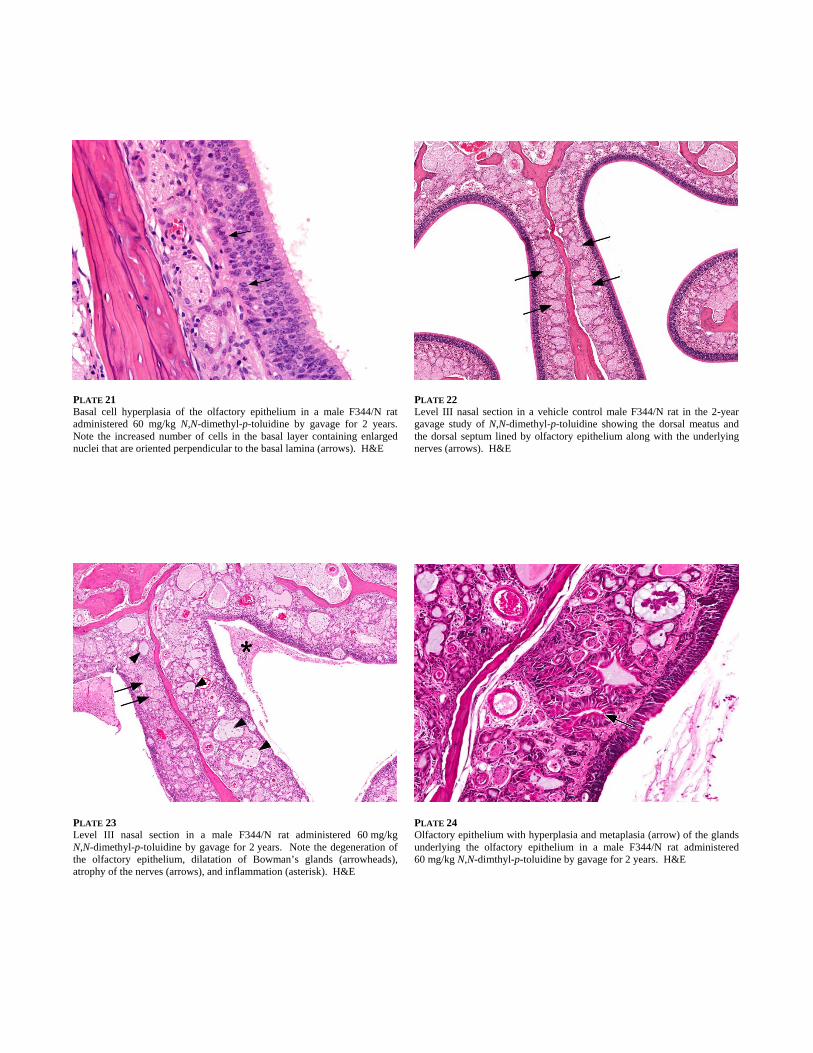
PLATE 21 Basal cell hyperplasia of the olfactory epithelium in a male F344/N rat administered 60 mg/kg N,N-dimethyl-p-toluidine by gavage for 2 years. Note the increased number of cells in the basal layer containing enlarged nuclei that are oriented perpendicular to the basal lamina (arrows). H&E
PLATE 22 Level III nasal section in a vehicle control male F344/N rat in the 2-year gavage study of N,N-dimethyl-p-toluidine showing the dorsal meatus and the dorsal septum lined by olfactory epithelium along with the underlying nerves (arrows). H&E
PLATE 23 Level III nasal section in a male F344/N rat administered 60 mg/kg N,N-dimethyl-p-toluidine by gavage for 2 years. Note the degeneration of the olfactory epithelium, dilatation of Bowman’s glands (arrowheads), atrophy of the nerves (arrows), and inflammation (asterisk). H&E
PLATE 24 Olfactory epithelium with hyperplasia and metaplasia (arrow) of the glands underlying the olfactory epithelium in a male F344/N rat administered 60 mg/kg N,N-dimthyl-p-toluidine by gavage for 2 years. H&E
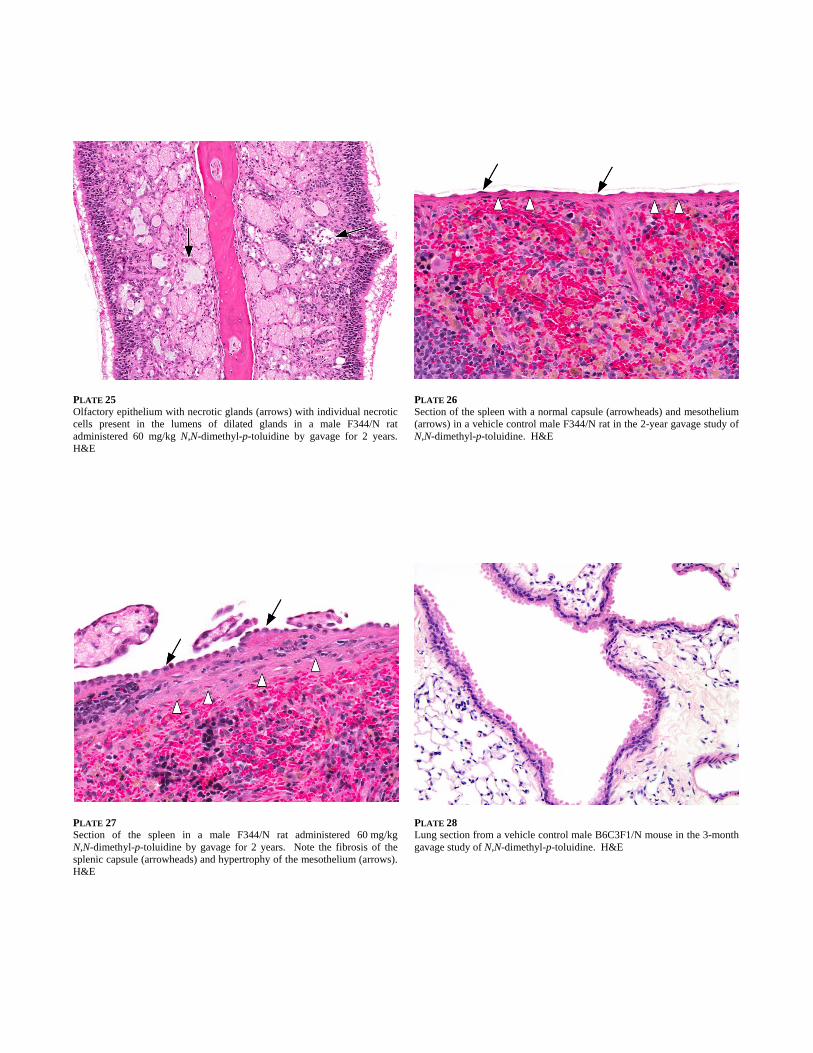
PLATE 25 Olfactory epithelium with necrotic glands (arrows) with individual necrotic cells present in the lumens of dilated glands in a male F344/N ratadministered 60 mg/kg N,N-dimethyl-p-toluidine by gavage for 2 years. H&E
PLATE 26 Section of the spleen with a normal capsule (arrowheads) and mesothelium (arrows) in a vehicle control male F344/N rat in the 2-year gavage study of N,N-dimethyl-p-toluidine. H&E
PLATE 27 Section of the spleen in a male F344/N rat administered 60 mg/kg N,N-dimethyl-p-toluidine by gavage for 2 years. Note the fibrosis of the splenic capsule (arrowheads) and hypertrophy of the mesothelium (arrows). H&E
PLATE 28 Lung section from a vehicle control male B6C3F1/N mouse in the 3-month gavage study of N,N-dimethyl-p-toluidine. H&E

PLATE 29 Lung section from an early death male B6C3F1/N mouse administered 125 mg/kg N,N-dimethyl-p-toluidine in the 3-month gavage study. Note the sloughed epithelium (arrowheads) and regeneration of the bronchiolar epithelium (arrows). H&E
PLATE 30 An alveolar/bronchiolar adenoma in the lung of a female B6C3F1/N mouse administered 60 mg/kg N,N-dimethyl-p-toluidine by gavage for 2 years. The neoplasm is a discrete lesion causing compression of surrounding lung parenchyma, and composed of papillary projections lined by uniform populations of epithelial cells. H&E
PLATE 31 Higher magnification of the alveolar/bronchiolar adenoma in Plate 28.H&E
PLATE 32
A squamous cell papilloma of the forestomach in a female B6C3F1/N mouse administered 60 mg/kg N,N-dimethyl-p-toluidine by gavage for 2 years. H&E

PLATE 33 Ulceration, inflammation, and epithelial hyperplasia of the forestomach in a female B6C3F1/N mouse administered 60 mg/kg N,N-dimethyl-p-toluidine by gavage for 2 years. H&E
PLATE 34 Level III section of the nose showing the dorsal meatus and the dorsal septum lined by olfactory epithelium in a vehicle control B6C3F1/N mouse in the 2-year gavage study of N,N-dimethyl-p-toluidine. H&E
PLATE 35 Level III section of the nose in a female B6C3F1/N mouse administered 60 mg/kg N,N-dimethyl-p-toluidine by gavage for 2 years. Note the dilatation (arrows) and hyperplasia of the glands underlying the olfactory epithelium. H&E
PLATE 36 Higher magnification of the Level III section of the nose in Plate 33. Note the respiratory metaplasia of the glands (arrows). H&E
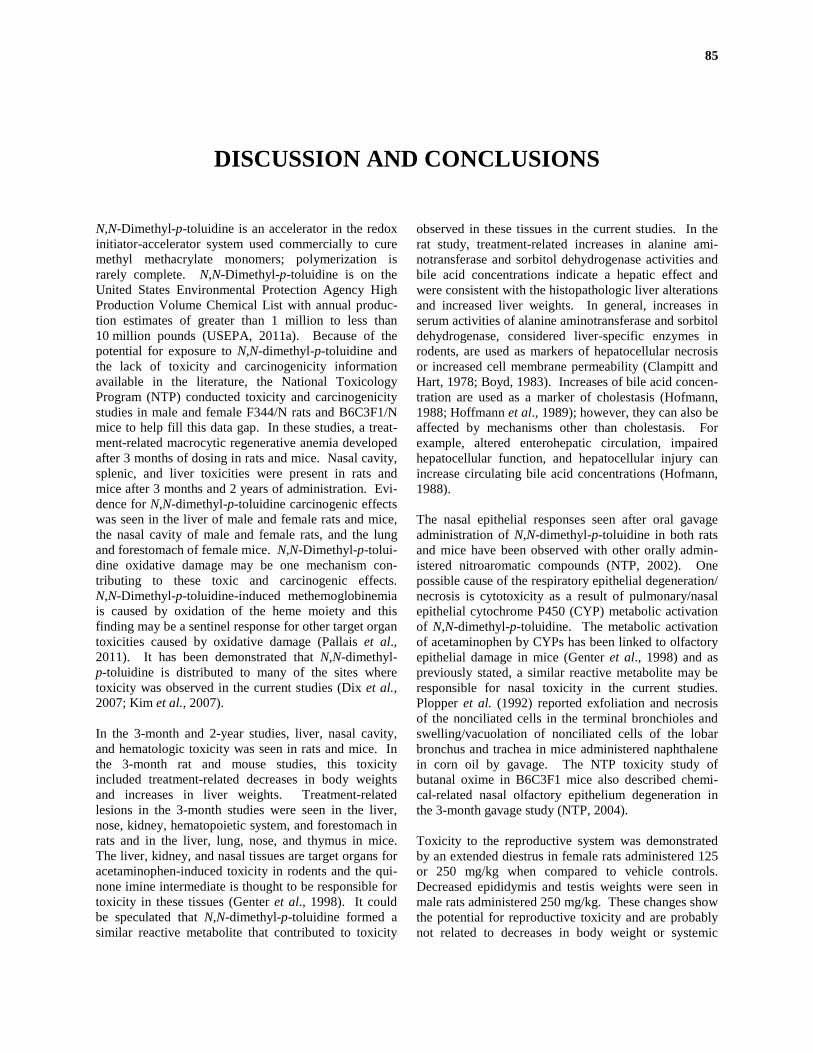
85
DISCUSSION AND CONCLUSIONS
N,N-Dimethyl-p-toluidine is an accelerator in the redox initiator-accelerator system used commercially to cure methyl methacrylate monomers; polymerization is rarely complete. N,N-Dimethyl-p-toluidine is on the United States Environmental Protection Agency High Production Volume Chemical List with annual produc-tion estimates of greater than 1 million to less than 10 million pounds (USEPA, 2011a). Because of the potential for exposure to N,N-dimethyl-p-toluidine and the lack of toxicity and carcinogenicity information available in the literature, the National Toxicology Program (NTP) conducted toxicity and carcinogenicity studies in male and female F344/N rats and B6C3F1/N mice to help fill this data gap. In these studies, a treat-ment-related macrocytic regenerative anemia developed after 3 months of dosing in rats and mice. Nasal cavity, splenic, and liver toxicities were present in rats and mice after 3 months and 2 years of administration. Evi-dence for N,N-dimethyl-p-toluidine carcinogenic effects was seen in the liver of male and female rats and mice, the nasal cavity of male and female rats, and the lung and forestomach of female mice. N,N-Dimethyl-p-tolui-dine oxidative damage may be one mechanism con-tributing to these toxic and carcinogenic effects. N,N-Dimethyl-p-toluidine-induced methemoglobinemia is caused by oxidation of the heme moiety and this finding may be a sentinel response for other target organ toxicities caused by oxidative damage (Pallais et al., 2011). It has been demonstrated that N,N-dimethyl-p-toluidine is distributed to many of the sites where toxicity was observed in the current studies (Dix et al., 2007; Kim et al., 2007). In the 3-month and 2-year studies, liver, nasal cavity, and hematologic toxicity was seen in rats and mice. In the 3-month rat and mouse studies, this toxicity included treatment-related decreases in body weights and increases in liver weights. Treatment-related lesions in the 3-month studies were seen in the liver, nose, kidney, hematopoietic system, and forestomach in rats and in the liver, lung, nose, and thymus in mice. The liver, kidney, and nasal tissues are target organs for acetaminophen-induced toxicity in rodents and the qui-none imine intermediate is thought to be responsible for toxicity in these tissues (Genter et al., 1998). It could be speculated that N,N-dimethyl-p-toluidine formed a similar reactive metabolite that contributed to toxicity
observed in these tissues in the current studies. In the rat study, treatment-related increases in alanine ami-notransferase and sorbitol dehydrogenase activities and bile acid concentrations indicate a hepatic effect and were consistent with the histopathologic liver alterations and increased liver weights. In general, increases in serum activities of alanine aminotransferase and sorbitol dehydrogenase, considered liver-specific enzymes in rodents, are used as markers of hepatocellular necrosis or increased cell membrane permeability (Clampitt and Hart, 1978; Boyd, 1983). Increases of bile acid concen-tration are used as a marker of cholestasis (Hofmann, 1988; Hoffmann et al., 1989); however, they can also be affected by mechanisms other than cholestasis. For example, altered enterohepatic circulation, impaired hepatocellular function, and hepatocellular injury can increase circulating bile acid concentrations (Hofmann, 1988). The nasal epithelial responses seen after oral gavage administration of N,N-dimethyl-p-toluidine in both rats and mice have been observed with other orally admin-istered nitroaromatic compounds (NTP, 2002). One possible cause of the respiratory epithelial degeneration/ necrosis is cytotoxicity as a result of pulmonary/nasal epithelial cytochrome P450 (CYP) metabolic activation of N,N-dimethyl-p-toluidine. The metabolic activation of acetaminophen by CYPs has been linked to olfactory epithelial damage in mice (Genter et al., 1998) and as previously stated, a similar reactive metabolite may be responsible for nasal toxicity in the current studies. Plopper et al. (1992) reported exfoliation and necrosis of the nonciliated cells in the terminal bronchioles and swelling/vacuolation of nonciliated cells of the lobar bronchus and trachea in mice administered naphthalene in corn oil by gavage. The NTP toxicity study of butanal oxime in B6C3F1 mice also described chemi-cal-related nasal olfactory epithelium degeneration in the 3-month gavage study (NTP, 2004). Toxicity to the reproductive system was demonstrated by an extended diestrus in female rats administered 125 or 250 mg/kg when compared to vehicle controls. Decreased epididymis and testis weights were seen in male rats administered 250 mg/kg. These changes show the potential for reproductive toxicity and are probably not related to decreases in body weight or systemic
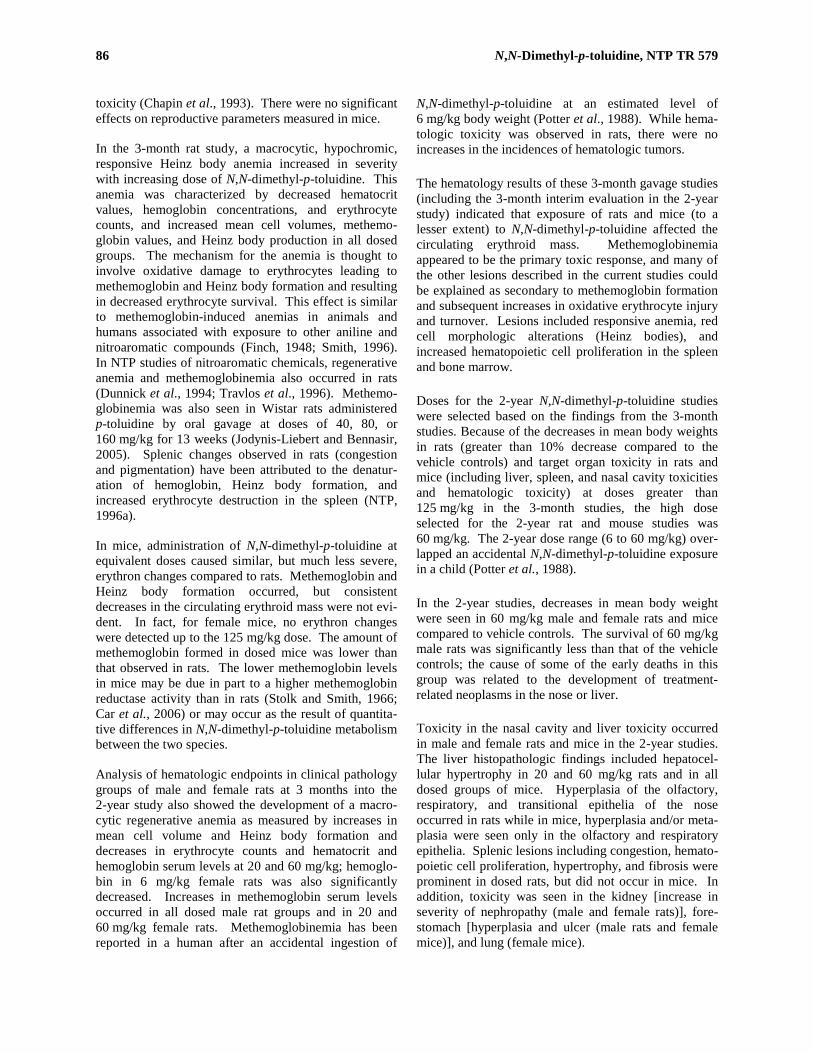
86 N,N-Dimethyl-p-toluidine, NTP TR 579
toxicity (Chapin et al., 1993). There were no significant effects on reproductive parameters measured in mice. In the 3-month rat study, a macrocytic, hypochromic, responsive Heinz body anemia increased in severity with increasing dose of N,N-dimethyl-p-toluidine. This anemia was characterized by decreased hematocrit values, hemoglobin concentrations, and erythrocyte counts, and increased mean cell volumes, methemo-globin values, and Heinz body production in all dosed groups. The mechanism for the anemia is thought to involve oxidative damage to erythrocytes leading to methemoglobin and Heinz body formation and resulting in decreased erythrocyte survival. This effect is similar to methemoglobin-induced anemias in animals and humans associated with exposure to other aniline and nitroaromatic compounds (Finch, 1948; Smith, 1996). In NTP studies of nitroaromatic chemicals, regenerative anemia and methemoglobinemia also occurred in rats (Dunnick et al., 1994; Travlos et al., 1996). Methemo-globinemia was also seen in Wistar rats administered p-toluidine by oral gavage at doses of 40, 80, or 160 mg/kg for 13 weeks (Jodynis-Liebert and Bennasir, 2005). Splenic changes observed in rats (congestion and pigmentation) have been attributed to the denatur-ation of hemoglobin, Heinz body formation, and increased erythrocyte destruction in the spleen (NTP, 1996a). In mice, administration of N,N-dimethyl-p-toluidine at equivalent doses caused similar, but much less severe, erythron changes compared to rats. Methemoglobin and Heinz body formation occurred, but consistent decreases in the circulating erythroid mass were not evi-dent. In fact, for female mice, no erythron changes were detected up to the 125 mg/kg dose. The amount of methemoglobin formed in dosed mice was lower than that observed in rats. The lower methemoglobin levels in mice may be due in part to a higher methemoglobin reductase activity than in rats (Stolk and Smith, 1966; Car et al., 2006) or may occur as the result of quantita-tive differences in N,N-dimethyl-p-toluidine metabolism between the two species. Analysis of hematologic endpoints in clinical pathology groups of male and female rats at 3 months into the 2-year study also showed the development of a macro-cytic regenerative anemia as measured by increases in mean cell volume and Heinz body formation and decreases in erythrocyte counts and hematocrit and hemoglobin serum levels at 20 and 60 mg/kg; hemoglo-bin in 6 mg/kg female rats was also significantly decreased. Increases in methemoglobin serum levels occurred in all dosed male rat groups and in 20 and 60 mg/kg female rats. Methemoglobinemia has been reported in a human after an accidental ingestion of
N,N-dimethyl-p-toluidine at an estimated level of 6 mg/kg body weight (Potter et al., 1988). While hema-tologic toxicity was observed in rats, there were no increases in the incidences of hematologic tumors. The hematology results of these 3-month gavage studies (including the 3-month interim evaluation in the 2-year study) indicated that exposure of rats and mice (to a lesser extent) to N,N-dimethyl-p-toluidine affected the circulating erythroid mass. Methemoglobinemia appeared to be the primary toxic response, and many of the other lesions described in the current studies could be explained as secondary to methemoglobin formation and subsequent increases in oxidative erythrocyte injury and turnover. Lesions included responsive anemia, red cell morphologic alterations (Heinz bodies), and increased hematopoietic cell proliferation in the spleen and bone marrow. Doses for the 2-year N,N-dimethyl-p-toluidine studies were selected based on the findings from the 3-month studies. Because of the decreases in mean body weights in rats (greater than 10% decrease compared to the vehicle controls) and target organ toxicity in rats and mice (including liver, spleen, and nasal cavity toxicities and hematologic toxicity) at doses greater than 125 mg/kg in the 3-month studies, the high dose selected for the 2-year rat and mouse studies was 60 mg/kg. The 2-year dose range (6 to 60 mg/kg) over-lapped an accidental N,N-dimethyl-p-toluidine exposure in a child (Potter et al., 1988). In the 2-year studies, decreases in mean body weight were seen in 60 mg/kg male and female rats and mice compared to vehicle controls. The survival of 60 mg/kg male rats was significantly less than that of the vehicle controls; the cause of some of the early deaths in this group was related to the development of treatment-related neoplasms in the nose or liver. Toxicity in the nasal cavity and liver toxicity occurred in male and female rats and mice in the 2-year studies. The liver histopathologic findings included hepatocel-lular hypertrophy in 20 and 60 mg/kg rats and in all dosed groups of mice. Hyperplasia of the olfactory, respiratory, and transitional epithelia of the nose occurred in rats while in mice, hyperplasia and/or meta-plasia were seen only in the olfactory and respiratory epithelia. Splenic lesions including congestion, hemato-poietic cell proliferation, hypertrophy, and fibrosis were prominent in dosed rats, but did not occur in mice. In addition, toxicity was seen in the kidney [increase in severity of nephropathy (male and female rats)], fore-stomach [hyperplasia and ulcer (male rats and female mice)], and lung (female mice).
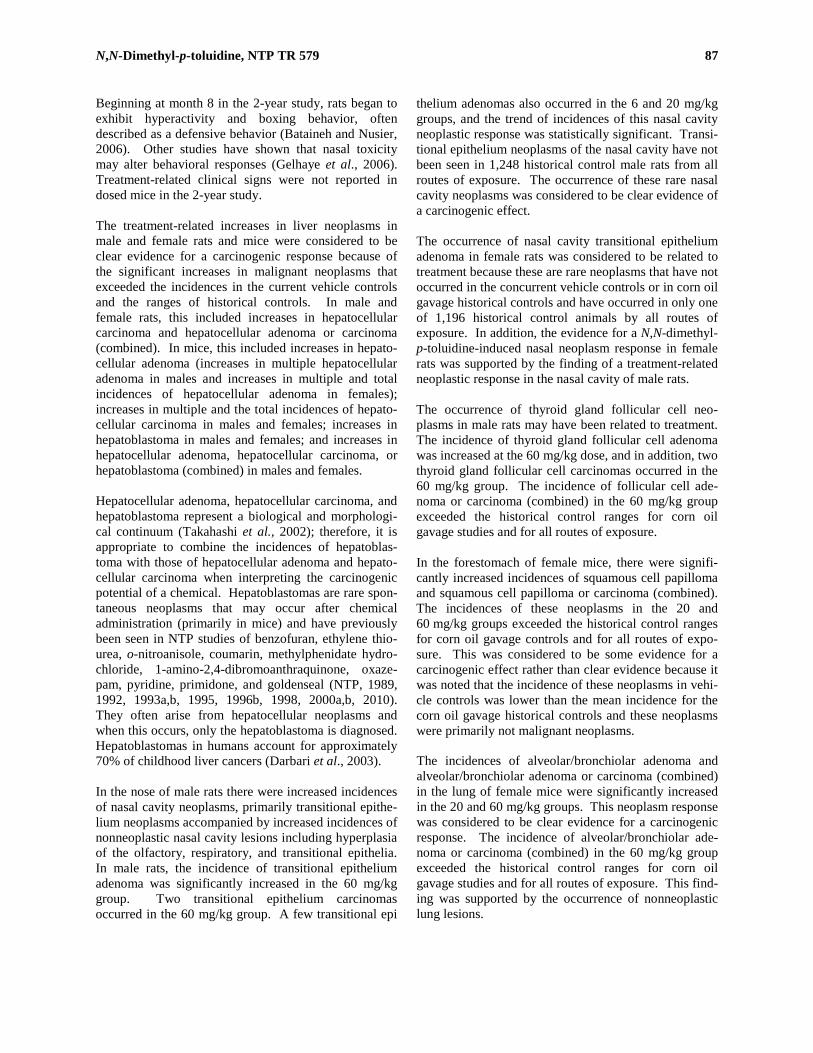
N,N-Dimethyl-p-toluidine, NTP TR 579 87
Beginning at month 8 in the 2-year study, rats began to exhibit hyperactivity and boxing behavior, often described as a defensive behavior (Bataineh and Nusier, 2006). Other studies have shown that nasal toxicity may alter behavioral responses (Gelhaye et al., 2006). Treatment-related clinical signs were not reported in dosed mice in the 2-year study. The treatment-related increases in liver neoplasms in male and female rats and mice were considered to be clear evidence for a carcinogenic response because of the significant increases in malignant neoplasms that exceeded the incidences in the current vehicle controls and the ranges of historical controls. In male and female rats, this included increases in hepatocellular carcinoma and hepatocellular adenoma or carcinoma (combined). In mice, this included increases in hepato-cellular adenoma (increases in multiple hepatocellular adenoma in males and increases in multiple and total incidences of hepatocellular adenoma in females); increases in multiple and the total incidences of hepato-cellular carcinoma in males and females; increases in hepatoblastoma in males and females; and increases in hepatocellular adenoma, hepatocellular carcinoma, or hepatoblastoma (combined) in males and females. Hepatocellular adenoma, hepatocellular carcinoma, and hepatoblastoma represent a biological and morphologi-cal continuum (Takahashi et al., 2002); therefore, it is appropriate to combine the incidences of hepatoblas-toma with those of hepatocellular adenoma and hepato-cellular carcinoma when interpreting the carcinogenic potential of a chemical. Hepatoblastomas are rare spon-taneous neoplasms that may occur after chemical administration (primarily in mice) and have previously been seen in NTP studies of benzofuran, ethylene thio-urea, o-nitroanisole, coumarin, methylphenidate hydro-chloride, 1-amino-2,4-dibromoanthraquinone, oxaze-pam, pyridine, primidone, and goldenseal (NTP, 1989, 1992, 1993a,b, 1995, 1996b, 1998, 2000a,b, 2010). They often arise from hepatocellular neoplasms and when this occurs, only the hepatoblastoma is diagnosed. Hepatoblastomas in humans account for approximately 70% of childhood liver cancers (Darbari et al., 2003). In the nose of male rats there were increased incidences of nasal cavity neoplasms, primarily transitional epithe-lium neoplasms accompanied by increased incidences of nonneoplastic nasal cavity lesions including hyperplasia of the olfactory, respiratory, and transitional epithelia. In male rats, the incidence of transitional epithelium adenoma was significantly increased in the 60 mg/kg group. Two transitional epithelium carcinomas occurred in the 60 mg/kg group. A few transitional epi
thelium adenomas also occurred in the 6 and 20 mg/kg groups, and the trend of incidences of this nasal cavity neoplastic response was statistically significant. Transi-tional epithelium neoplasms of the nasal cavity have not been seen in 1,248 historical control male rats from all routes of exposure. The occurrence of these rare nasal cavity neoplasms was considered to be clear evidence of a carcinogenic effect. The occurrence of nasal cavity transitional epithelium adenoma in female rats was considered to be related to treatment because these are rare neoplasms that have not occurred in the concurrent vehicle controls or in corn oil gavage historical controls and have occurred in only one of 1,196 historical control animals by all routes of exposure. In addition, the evidence for a N,N-dimethyl-p-toluidine-induced nasal neoplasm response in female rats was supported by the finding of a treatment-related neoplastic response in the nasal cavity of male rats. The occurrence of thyroid gland follicular cell neo-plasms in male rats may have been related to treatment. The incidence of thyroid gland follicular cell adenoma was increased at the 60 mg/kg dose, and in addition, two thyroid gland follicular cell carcinomas occurred in the 60 mg/kg group. The incidence of follicular cell ade-noma or carcinoma (combined) in the 60 mg/kg group exceeded the historical control ranges for corn oil gavage studies and for all routes of exposure. In the forestomach of female mice, there were signifi-cantly increased incidences of squamous cell papilloma and squamous cell papilloma or carcinoma (combined). The incidences of these neoplasms in the 20 and 60 mg/kg groups exceeded the historical control ranges for corn oil gavage controls and for all routes of expo-sure. This was considered to be some evidence for a carcinogenic effect rather than clear evidence because it was noted that the incidence of these neoplasms in vehi-cle controls was lower than the mean incidence for the corn oil gavage historical controls and these neoplasms were primarily not malignant neoplasms. The incidences of alveolar/bronchiolar adenoma and alveolar/bronchiolar adenoma or carcinoma (combined) in the lung of female mice were significantly increased in the 20 and 60 mg/kg groups. This neoplasm response was considered to be clear evidence for a carcinogenic response. The incidence of alveolar/bronchiolar ade-noma or carcinoma (combined) in the 60 mg/kg group exceeded the historical control ranges for corn oil gavage studies and for all routes of exposure. This find-ing was supported by the occurrence of nonneoplastic lung lesions.

88 N,N-Dimethyl-p-toluidine, NTP TR 579
N,N-Dimethyl-p-toluidine and other nitroaromatic chemicals (NTP, 2002) cause hematopoiesis and hemo-siderin pigment accumulation in the spleen and decreased incidences of mononuclear cell leukemia in male rats (Elwell et al., 1996). The spleen plays a criti-cal role in the pathogenesis of mononuclear cell leuke-mia. Although the stem cell for mononuclear cell leuke-mia in Fischer rats is considered to be a lymphocyte of bone marrow origin, the initial histological evidence for proliferation and expansion of these neoplastic cells occurs in the spleen, where the leukemia cells fill the sinusoids. Alteration of the spleen microenvironment can affect the development of mononuclear cell leuke-mia (Elwell et al., 1996). The findings of increased splenic toxicity and decreased incidences of mononu-clear cell leukemia in male and female rats in the cur-rent study are consistent with similar response patterns seen with other nitroaromatic compounds, including p-nitrotoluene (Elwell et al., 1996). When the National Cancer Institute (NCI) nominated N,N-dimethyl-p-toluidine for study they noted that the NTP/NCI had conducted cancer bioassays with structur-ally related chemicals and these chemicals were car-cinogenic in rats and/or mice, particularly ortho-substi-tuted aromatic compounds. o-Toluidine hydrochloride induced a high incidence of mesothelioma in male rats, while no mesotheliomas were observed after treatment with m- or p-toluidine (Weisburger et al., 1978). In studies of o- and p-anisidine hydrochloride, only the ortho isomer induced a carcinogenic response (urinary bladder neoplasms in rats and mice and kidney and thy-roid gland neoplasms in male rats) (NCI, 1978a,b). o-Toluidine hydrochloride, o-anisidine hydrochloride, and o-nitrotoluene [also inducing a wide range of car-cinogenic effects including mesotheliomas in rats (NTP, 2002)] all contain a benzene ring with a methyl- or methoxy- and nitrogen-containing group on adjacent carbons. This structural similarity suggests that a simi-lar intermediate may be responsible for the carcinogenic effects. N,N-Dimethyl-p-toluidine did not have the same spectrum of carcinogenic activity as these other aminoaromatic chemicals, suggesting different mecha-nisms may have been involved with the carcinogenic activity. Like N,N-dimethyl-p-toluidine, p-toluidine induced liver neoplasms in mice fed diets containing the chemical at concentrations of 1,000 or 2,000 ppm for 6 months, and then diets containing the chemical at 500 or 1,000 ppm (respectively) for an additional 12 months (Weisberger et al., 1978). Details on the types of liver neoplasms were not reported. p-Toluidine was not reported to induce neoplasms in Sprague-Dawley rats although the animals were only exposed to the chemical (1,000 or 2,000 ppm) for 18 months (Weisburger et al., 1978).
N,N-Dimethyl-p-toluidine was not mutagenic in any of several bacterial tester strains, with or without exoge-nous metabolic activation, but positive results were reported in an in vitro micronucleus assay conducted in Chinese hamster ovary cells (Taningher et al., 1993), and an in vitro gene mutation assay in L5178Y mouse lymphoma tk+/– cells (IARC, 1999). In both cases, pos-itive results were seen in the absence of metabolic acti-vation, suggesting that N,N-dimethyl-p-toluidine was a direct-acting mutagenic agent. In the current study, however, no increases in the frequencies of micronucle-ated reticulocytes or erythrocytes were seen in male and/or female mice following 4 days or 3 months of exposure to N,N-dimethyl-p-toluidine by gavage (Appendix E). Furthermore, no increases in DNA damage were observed in liver preparations from the male mice treated with N,N-dimethyl-p-toluidine for 4 days. However, a small but statistically significant (P=0.024) increase in DNA damage was observed by the comet assay in liver cells of male Sprague-Dawley rats administered 60 mg/kg N,N-dimethyl-p-toluidine by gavage once daily for 4 days. An analysis of results of a comprehensive study of chemical-induced DNA damage measured by the comet assay in mice and rats showed that a significant increase in DNA damage in at least one organ of one species is well correlated with rodent carcinogenicity (Sasaki et al., 2000). The authors further concluded that the species or tissue in which chemical-induced DNA damage was detected did not always predict the species or tissue in which tumors were seen. The carcinogenic effects of N,N-dimethyl-p-toluidine in the nasal cavity (male rats), liver (male and female rats and mice), and lung and forestomach (female mice) may be due in part to toxicity and increased cell turnover in target organs. In a human submandibular gland adeno-carcinoma cell line with visible light irradiation, the photosensitizer camphorquinone in the presence of N,N-dimethyl-p-toluidine demonstrated both dose- and time-dependent production of reactive oxygen species (Atsumi et al., 2001). Free radical formation with subsequent DNA damage in target organs may also have contributed to the carcinogenic effects (Winter et al., 2005; Masuki et al., 2007; Li et al., 2008; Pereira et al., 2008). N,N-Dimethyl-p-toluidine has been reported to have an estrogen antagonist activity in vitro (yeast reporter gene assay) (Nomura et al., 2003). Whether this reported endocrine effect contributed to N,N-dimethyl-p-toluidine biologic effects is not known. Members of the alkylaniline class of compounds, including p-toluidine (4-methylaniline), have the potential for DNA adduct formation (Marques et al., 1997), although the DNA binding capacity of N,N-dimethyl-p-toluidine was not measured in this series of studies.
N,N-Dimethyl-p-toluidine, NTP TR 579 89
CONCLUSIONS Under the conditions of these 2-year oral gavage studies, there was clear evidence of carcinogenic activity* of N,N-dimethyl-p-toluidine in male F344/N rats based on increased incidences of hepatocellular carcinoma, and hepatocellular adenoma or carcinoma (combined), and increased incidences of nasal cavity neoplasms (primarily nasal cavity transitional epithe-lium adenoma). The increased incidences of thyroid gland follicular cell neoplasms may have been related to treatment. There was clear evidence of carcinogenic activity of N,N-dimethyl-p-toluidine in female F344/N rats based on increased incidences of hepatocellular carcinoma and hepatocellular adenoma or carcinoma (combined). The occurrence of nasal cavity transitional epithelium adenoma was considered to be related to treatment. There was clear evidence of carcinogenic activity of N,N-dimethyl-p-toluidine in male B6C3F1/N mice based on increased incidences of hepatocellular adenoma (multiple), hepatocellular carcinoma, and hepatoblastoma. There was clear evidence of carcino-genic activity of N,N-dimethyl-p-toluidine in female
B6C3F1/N mice based on increased incidences of hepatocellular adenoma, hepatocellular carcinoma, and hepatoblastoma and increased incidences of alveolar/ bronchiolar neoplasms (primarily adenoma). The increased incidences of forestomach squamous cell papilloma in female mice were considered to be related to treatment. Administration of N,N-dimethyl-p-toluidine resulted in increased incidences of nonneoplastic lesions of the liver and nasal cavity in male and female rats and mice; the kidney in male and female rats; the spleen and bone marrow in male and female rats and female mice; the lung in male and female mice; the forestomach in male rats and female mice; the mesenteric lymph node in male rats and female mice; and the olfactory lobe in male and female mice. N,N-Dimethyl-p-toluidine also caused hematologic tox-icity and increases in methemoglobin levels in male and female rats and mice (as measured at 3 months).
* Explanation of Levels of Evidence of Carcinogenic Activity is on page 14. A summary of the Peer Review Panel comments and the public
discussion on this Technical Report appears on page 16.

90 N,N-Dimethyl-p-toluidine, NTP TR 579
91
REFERENCES
3M (2004). 3M™ Scotch-Weld™ Instant Adhesive Surface Activator: Material Safety Data Sheet. 3M, St. Paul, MN. The Aldrich Library of FT-IR Spectra (1997). 2nd ed. (C.J. Pouchert, Ed.). Spectrum II:2042D. Aldrich Chemical Company, Inc., Milwaukee, WI. Ashby, J., and Tennant, R.W. (1991). Definitive rela-tionships among chemical structure, carcinogenicity and mutagenicity for 301 chemicals tested by the U.S. NTP. Mutat. Res. 257, 229-306. Atsumi, T., Iwakura, I., Fujisawa, S., and Ueha, T. (2001). The production of reactive oxygen species by irradiated camphorquinone-related photosensitizers and their effect on cytotoxicity. Arch. Oral Biol. 46, 391-401. Bailer, A.J., and Portier, C.J. (1988). Effects of treat-ment-induced mortality and tumor-induced mortality on tests for carcinogenicity in small samples. Biometrics 44, 417-431. Bataineh, H.N., and Nusier, M.K. (2006). Impact of 12-week ingestion of sodium fluoride on aggression, sexual behavior, and fertility in adult male rats. Fluoride 39, 293-301. Bieler, G.S., and Williams, R.L. (1993). Ratio esti-mates, the delta method, and quantal response tests for increased carcinogenicity. Biometrics 49, 793-801. Boorman, G.A., Montgomery, C.A., Jr., Eustis, S.L., Wolfe, M.J., McConnell, E.E., and Hardisty, J.F. (1985). Quality assurance in pathology for rodent car-cinogenicity studies. In Handbook of Carcinogen Testing (H.A. Milman and E.K. Weisburger, Eds.), pp. 345-357. Noyes Publications, Park Ridge, NJ. Bösch, P., Harms, H., and Lintner, F. (1982). The proof of dimethylparatoluidine in bone cement even after long-time implantation [in German, English summary]. Arch. Toxicol. 51, 157-166. Boyd, J.W. (1983). The mechanisms relating to increases in plasma enzymes and isoenzymes in dis-eases of animals. Vet. Clin. Pathol. 12, 9-24.
Brauer, G.M., Termini, D.J., and Dickson, G. (1977). Analysis of the ingredients and determination of the residual components of acrylic bone cements. J. Biomed. Mater. Res. 11, 577-607. Brauer, G.M., Steinberger, D.R., and Stansbury, J.W. (1986). Dependence of curing time, peak temperature, and mechanical properties on the composition of bone cement. J. Biomed. Mater. Res. 20, 839-852. Brecher, G., and Schneiderman, M. (1950). A time-saving device for the counting of reticulocytes. Am. J. Clin. Pathol. 20, 1079-1083. Burlinson, B., Tice, R.R., Speit, G., Agurell, E., Brendler-Schwaab, S.Y., Collins, A.R., Escobar, P., Honma, M., Kumaravel, T.S., Nakajima, M., Sasaki, Y.F., Thybaud, V., Uno, Y., Vasquez, M., and Hartmann, A. (2007). Fourth International Workingroup on Genotoxicity Testing: Results of the in vivo Comet assay workgroup. Mutat. Res. 627, 31-35. Car, B.D., Eng, V.M., Everds, N.E., and Bounous, D.I. (2006). Clinical pathology of the rat. In The Laboratory Rat, 2nd ed. (M.A. Suckow, S.H. Weisbrouth, and C.L. Franklin, Eds.), pp. 128-149. Elsevier, Inc., Burlington, MA. Chapin, R.E., Gulati, D.K., Barnes, L.H., and Teague, J.L. (1993). The effects of feed restriction on reproductive function in Sprague-Dawley rats. Fundam. Appl. Toxicol. 20, 23-29. ChemFirst, Inc. (1997). Initial submission: Acute inhalation toxicity study of N,N-dimethyl-p-toluidine in rats with MSDS attachment. EPA/OTS: Doc-88970000118S. Clampitt, R.B., and Hart, R.J., (1978). The tissue activ-ities of some diagnostic enzymes in ten mammalian species. J. Comp. Pathol. 88, 607-621. Code of Federal Regulations (CFR) 21, Part 58. Collins, A.R., Oscoz, A.A., Brunborg, G., Gaivão, I., Giovannelli, L., Kruszewski, M., Smith, C.C., and Štětina, R. (2008). The comet assay: Topical issues. Mutagenesis 23, 143-151.
92 N,N-Dimethyl-p-toluidine, NTP TR 579
Cox, D.R. (1972). Regression models and life-tables. J. R. Stat. Soc. B34, 187-220. Crawford, B.D. (1985). Perspectives on the somatic mutation model of carcinogenesis. In Advances in Modern Environmental Toxicology. Mechanisms and Toxicity of Chemical Carcinogens and Mutagens (M.A. Mehlman, W.G. Flamm, and R.J. Lorentzen, Eds.), pp. 13-59. Princeton Scientific Publishing Co., Inc., Princeton, NJ. Darbari, A., Sabin, K.M., Shapiro, C.N., and Schwarz, K.B. (2003). Epidemiology of primary hepatic malignancies in U.S. children. Hepatology 38, 560-566. Dix, K.J., Ghanbari, K., and Hedtke-Weber, B.M. (2007). Disposition of [14C]N,N-dimethyl-p-toluidine in F344 rats and B6C3F1 mice. J. Toxicol. Environ. Health A 70, 789-798. Dixon, W.J., and Massey, F.J., Jr. (1957). Introduction to Statistical Analysis, 2nd ed., pp. 276-278, 412. McGraw-Hill Book Company, Inc., New York. Druckrey, H., Schmähl, D., and Reiter, A. (1954). Fehlen einer carcerogenen Wirking bei den drei Isomeren N-dimethyl-toluidinen an Ratten. Arzneimittelforschung 4, 365-366. Dunn, O.J. (1964). Multiple comparisons using rank sums. Technometrics 6, 241-252. Dunnett, C.W. (1955). A multiple comparison proce-dure for comparing several treatments with a control. J. Am. Stat. Assoc. 50, 1096-1121. Dunnick, J.K., Elwell, M.R., and Bucher, J.R. (1994). Comparative toxicities of o-, m-, and p-nitrotoluene in 13-week feed studies in F344 rats and B6C3F1 mice. Fundam. Appl. Toxicol. 22, 411-421. Dutrée-Meulenberg, R.O.G.M., Kozel, M.M.A., and van Joost, Th. (1992). Burning mouth syndrome: A possible etiologic role for local contact hypersensitivity. J. Am. Acad. Dermatol. 26, 935-940. Elwell, M.R., Dunnick, J.K., Hailey, J.R., and Haseman, J.K. (1996). Chemicals associated with decreases in the incidence of mononuclear cell leukemia in the Fischer rat. Toxicol. Pathol. 24, 238-245. Evelyn, K.A., and Malloy, H.T. (1938). Microdeter-mination of oxyhemoglobin, methemoglobin and sulf-hemoglobin in a single sample of blood. J. Biol. Chem. 126, 655-662.
Finch, C.A. (1948). Methemoglobinemia and sulfhemo-globinemia. N. Engl. J. Med. 239, 470-478. Fomby, L., and Graves, S. (2001). Regarding NTP ChemTask No. CHEM06191, Battelle Study No. G004110-AYJ, CAS No., 99-97-8, Preliminary Chemical Studies Task: Palatability study for N,N-dimethyl-p-toluidine (DMPT) formulated in feed and administered to Fischer 344 rats and B6C3F1 mice for up to 14 days. Letter dated June 18, 2001, to Dr. Cynthia Smith, NIEHS. Battelle Memorial Institute, Columbus, OH. Gart, J.J., Chu, K.C., and Tarone, R.E. (1979). Statisti-cal issues in interpretation of chronic bioassay tests for carcinogenicity. JNCI 62, 957-974. Geiger, D.L., Poirier, S.H., Brooke, L.T., and Call, D.J., Eds. (1986). Acute Toxicities of Organic Chemicals to Fathead Minnows (Pimephales promelas), Volume III, pp. 221-224. Center for Lake Superior Environmental Studies, University of Wisconsin-Superior, Superior, WI. Gelhaye, M., Trabalon, M., Martrette, J.M., and Legrand-Frossi, C. (2006). Effects of early olfactory deprivation on novelty-seeking behavior and primary and secondary lymphoid organs in young rats. Psychoneuroendocrinology 31, 997-1008. Genter, M.B., Liang, H.C., Gu, J., Ding, X., Negishi, M., McKinnon, R.A., and Nebert, D.W. (1998). Role of CYP2A5 and 2G1 in acetaminophen metabolism and toxicity in the olfactory mucosa of the Cyp1a2(-/-) mouse. Biochem. Pharmacol. 55, 1819-1826. Ghanayem, B.I., Witt, K.L., Kissling, G.E., Tice, R.R., and Recio, L. (2005). Absence of acrylamide-induced genotoxicity in CYP2E1-null mice: Evidence consistent with a glycidamide-mediated effect. Mutat. Res. 578, 284-297. Girard, D.M., and Sager, D.B. (1987). The use of Markov chains to detect subtle variation in reproductive cycling. Biometrics 43, 225-234. Gorrod, J.W., and Gooderham, N.J. (1981). The in vitro metabolism of N,N-dimethylaniline by guinea pig and rabbit tissue preparations. Eur. J. Drug Metab. Pharmacokinet. 6, 195-206. Haddad, F.S., Levell, N.J., Dowd, P.M., Cobb, A.G., and Bentley, G. (1995). Cement hypersensitivity: A cause of aseptic loosening? J. Bone Joint Surg. [Br] 77, 329-330.
N,N-Dimethyl-p-toluidine, NTP TR 579 93
Haddad, F.S., Cobb, A.G., Bentley, G., Levell, N.J., and Dowd, P.M. (1996). Hypersensitivity in aseptic loos-ening of total hip replacements. J. Bone Joint Surg. [Br] 78, 546-549. Harrison, J.H., Jr., and Jollow, D.J. (1987). Contribu-tion of aniline metabolites to aniline-induced methemo-globinemia. Mol. Pharmacol. 32, 423-431. Haseman, J.K., Young, E., Eustis, S.L., and Hailey, J.R. (1997). Body weight-tumor incidence correlations in long-term rodent carcinogenicity studies. Toxicol. Pathol. 25, 256-263. Heddle, J.A., Hite, M., Kirkhart, B., Mavournin, K., MacGregor, J.T., Newell, G.W., and Salamone, M.F. (1983). The induction of micronuclei as a measure of genotoxicity. A report of the U.S. Environmental Protection Agency Gene-Tox Program. Mutat. Res. 123, 61-118. Hirabayashi, C. (2003). Studies on MMA-TBB resin II. The effect of dual use of TBB and other initiators on polymerization of PMMA/MMA resin. Dent. Mater. J. 22, 48-55. Hirabayashi, C., and Imai, Y. (2002). Studies on MMA-TBB resin I. Comparison of TBB and other ini-tiators in the polymerization of PMMA/MMA resin. Dent. Mater. J. 21, 314-321. Hoffmann, W.E., Kramer, J., Main, A.R., and Torres, J.L. (1989). Clinical enzymology. In The Clin-ical Chemistry of Laboratory Animals (W.F. Loeb and F.W. Quimby, Eds.), pp. 237-278. Pergamon Press, Inc., New York. Hofmann, A.F. (1988). Bile acids. In The Liver: Biol-ogy and Pathobiology, 2nd ed. (I.M. Arias, W.B. Jakoby, H. Popper, D. Schachter, and D.A. Shafritz, Eds.), pp. 553-572. Raven Press, Ltd., New York. International Agency for Research on Cancer (IARC) (1999). IARC Monographs on the Evaluation of Carci-nogenic Risks to Humans. Surgical Implants and Other Foreign Bodies, Vol. 74. IARC, Lyon, France. Jodynis-Liebert, J., and Bennasir, H.A.H. (2005). Effect of dietary fat on selected parameters of toxicity following 1- or 3-month exposure of rats to toluidine isomers. Int. J. Toxicol. 24, 365-376.
Jonckheere, A.R. (1954). A distribution-free k-sample test against ordered alternatives. Biometrika 41, 133-145. Kaaber, S. (1990). Allergy to dental materials with spe-cial reference to the use of amalgam and polymethyl-methacrylate. Int. Dent. J. 40, 359-365. Kaaber, S., Thulin, H., and Nielsen, E. (1979). Skin sensitivity to denture base materials in the burning mouth syndrome. Contact Dermatitis 5, 90-96. Kao, L., Leikin, J.B., Crockett, M., and Burda, A. (1997). Methemoglobinemia from artificial fingernail solution. JAMA 278, 549-550. Kaplan, E.L., and Meier, P. (1958). Nonparametric estimation from incomplete observations. J. Am. Stat. Assoc. 53, 457-481. Kendall, M.G. (1938). A new measure of rank correla-tion. Biometrika 30, 81-93. Kim, N.-C., Ghanbari, K., Kracko, D.A., Weber, W.M., McDonald, J.D., and Dix, K.J. (2007). Identification of urinary metabolites of orally administered N,N-dimethyl-p-toluidine in male F344 rats. J. Toxicol. Environ. Health A 70, 781-788. Kissling, G.E., Dertinger, S., Hayashi, M., and MacGregor, J.T. (2007). Sensitivity of the erythrocyte micronucleus assay: Dependence on number of cells scored and inter-animal variability. Mutat. Res. 634, 235-240. Kronoveter, K.J. (1977). Health Hazard Evaluation Determination Report No. HHE-76-82-361. Hair Zoo, Penfield, NY. Division of Surveillance, Hazard Evaluation, and Field Studies, National Institute of Occupational Safety and Health, Cincinnati, OH. Lewis, G. (2008). Alternative acrylic bone cement for-mulations for cemented arthroplasties: Present status, key issues, and future prospects. J. Biomed. Mater. Res. B Appl. Biomater. 84B, 301-319. Lewis, G., Xu, J., Madigan, S., and Towler, M.R. (2007a). Influence of strontia on various properties of Surgical Simplex® P acrylic bone cement and experi-mental variants. Acta Biomat. 3, 970-979.
94 N,N-Dimethyl-p-toluidine, NTP TR 579
Lewis, G., Xu, J., Madigan, S., and Towler, M.R. (2007b). Influence of two changes in the composition of an acrylic bone cement on its handling, thermal, physical, and mechanical properties. J. Mater. Sci. Mater. Med. 18, 1649-1658. Li, Y.C., Huang, F.M., Lee, S.S., Lin, R.H., Chou, M.Y., and Chang, Y.C. (2008). Protective effects of antioxi-dants on micronuclei induced by irradiated 9-fluorenone/ N,N-dimethyl-p-toluidine in CHO cells. J. Biomed. Mater. Res. B. Appl. Biomater. 84, 58-63. Lide, D.R., Ed. (1997). CRC Handbook of Chemistry and Physics, 78th ed., p. 3-26. CRC Press, Boca Raton, FL. Linder, L. (1976). Tissue reaction to methyl methacry-late monomer. A comparative study in the rabbit’s ear on the toxicity of methyl methacrylate monomer of varying composition. Acta Orthop. Scand. 47, 3-10. Liso, P.A., Vázquez, B., Rebuelta, M., Hernáez, M.L., Rotger, R., and San Román, J. (1997). Analysis of the leaching and toxicity of new amine activators for the curing of acrylic bone cements and composites. Biomaterials 18, 15-20. Lovelace Biomedical and Environmental Research Institute (2006). Metabolism and disposition of N,N-dimethyl-p-toluidine (DMPT) in rats and mice after oral and intravenous administration. Project Report No. 3, Contract No. N01-ES-25483. Submitted to the National Institute of Environmental Health Sciences, Research Triangle Park, NC. McConnell, E.E., Solleveld, H.A., Swenberg, J.A., and Boorman, G.A. (1986). Guidelines for combining neo-plasms for evaluation of rodent carcinogenesis studies. JNCI 76, 283-289. MacGregor, J.T., Wehr, C.M., Henika, P.R., and Shelby, M.D. (1990). The in vivo erythrocyte micronu-cleus test: Measurement at steady state increases assay efficiency and permits integration with toxicity studies. Fundam. Appl. Toxicol. 14, 513-522. Mallinckrodt Baker, Inc. (1996). Material Safety Data Sheet: N,N-Dimethyl-p-toluidine. <http://www.jybaker.com/msds/ d7176.htm> Accessed July 9, 1999. Mann, H.S., and Whitney, D.R. (1947). On a test of whether one of two random variables is stochastically larger than the other. Ann. Math. Statist. 18, 50-60.
Maronpot, R.R., and Boorman, G.A. (1982). Interpre-tation of rodent hepatocellular proliferative alterations and hepatocellular tumors in chemical safety assess-ment. Toxicol. Pathol. 10, 71-80. Marques, M.M., Mourato, L.L., Amorim, M.T., Santos, M.A., Melchior, W.B., Jr., and Beland, F.A. (1997). Effect of substitution site upon the oxidation potentials of alkylanilines, the mutagencities of N-hydroxyalkylanilines, and the conformations of alkylanaline-DNA adducts. Chem. Res. Toxicol. 10, 1266-1274. Marsolek, M.R., White, N.C., and Litovitz, T.L. (2010). Inhalant abuse: Monitoring trends by using poison con-trol data, 1993-2008. Pediatrics 125, 906-913. Masuki, K., Nomura, Y., Bhawal, U.K., Sawajiri, M., Hirata, I., Nahara, Y., and Okazaki, M. (2007). Apop-totic and necrotic influence of dental resin polymeriza-tion initiators in human gingival fibroblast cultures. Dent. Mater. J. 26, 861-869. Miller, E.G., Washington, V.H., Bowles, W.H., and Zimmermann, E.R. (1986). Mutagenic potential of some chemical components of dental materials. Dent. Mater. 2, 163-165. Miller, J.A., and Miller, E.C. (1977). Ultimate chemical carcinogens as reactive mutagenic electrophiles. In Origins of Human Cancer (H.H. Hiatt, J.D. Watson, and J.A. Winsten, Eds.), pp. 605-627. Cold Spring Harbor Laboratory, Cold Spring Harbor, NY. Misiak, H., and Scheffler, I. (2003). Activator for cyanoacrylate adhesives. United States Patent No. US 6,547,917 B1. National Cancer Institute (NCI) (1978a). Bioassay of o-Anisidine Hydrochloride for Possible Carcinogenicity (CAS No. 134-29-2). Technical Report Series No. 89. NIH Publication No. 78-1339. U.S. Department of Health, Education, and Welfare, Public Health Service, National Institutes of Health, Bethesda, MD. National Cancer Institute (NCI) (1978b). Bioassay of p-Anisidine Hydrochloride for Possible Carcinogenicity (CAS No. 20265-97-8). Technical Report Series No. 116. NIH Publication No. 78-1371. U.S. Depart-ment of Health, Education, and Welfare, Public Health Service, National Institutes of Health, Bethesda, MD. National Institute for Occupational Safety and Health (NIOSH) (1990). National Occupational Exposure Sur-vey (1981-1983), unpublished provisional data as of July 1, 1990. NIOSH, Cincinnati, OH.

N,N-Dimethyl-p-toluidine, NTP TR 579 95
National Institute for Occupational Safety and Health (NIOSH) (2007). NIOSH Pocket Guide to Chemical Hazards. U.S. Department of Health and Human Ser-vices, Centers for Disease Control and Prevention, Washington, D.C.
National Toxicology Program (NTP) (1989). Toxicol-ogy and Carcinogenesis Studies of Benzofuran (CAS No. 271-89-6) in F344/N Rats and B6C3F1 Mice (Gavage Studies). Technical Report Series No. 370. NIH Publication No. 90-2825. U.S. Department of Health and Human Services, Public Health Service, National Institutes of Health, Research Triangle Park, NC.
National Toxicology Program (NTP) (1992). Toxicol-ogy and Carcinogenesis Studies of Ethylene Thiourea (CAS No. 96-45-7) in F344/N Rats and B6C3F1 Mice (Feed Studies). Technical Report Series No. 388. NIH Publication No. 92-2843. U.S. Department of Health and Human Services, Public Health Service, National Institutes of Health, Research Triangle Park, NC.
National Toxicology Program (NTP) (1993a). Toxicol-ogy and Carcinogenesis Studies of o-Nitroanisole (CAS No. 91-23-6) in F344 Rats and B6C3F1 Mice (Feed Studies). Technical Report Series No. 416. NIH Publi-cation No. 93-3147. U.S. Department of Health and Human Services, Public Health Service, National Insti-tutes of Health, Research Triangle Park, NC.
National Toxicology Program (NTP) (1993b). Toxicol-ogy and Carcinogenesis Studies of Coumarin (CAS No. 91-64-5) in F344/N Rats and B6C3F1 Mice (Gavage Studies). Technical Report Series No. 422. NIH Pub-lication No. 93-3153. U.S. Department of Health and Human Services, Public Health Service, National Insti-tutes of Health, Research Triangle Park, NC.
National Toxicology Program (NTP) (1995). Toxicol-ogy and Carcinogenesis Studies of Methylphenidate Hydrochloride (CAS No. 298-59-9) in F344/N Rats and B6C3F1 Mice (Feed Studies). Technical Report Series No. 439. NIH Publication No. 95-3355. U.S. Depart-ment of Health and Human Services, Public Health Ser-vice, National Institutes of Health, Research Triangle Park, NC.
National Toxicology Program (NTP) (1996a). Toxicity and Carcinogenicity Studies of o-Nitrotoluene and o-Toluidine Hydrochloride (CAS Nos. 88-72-2 and 636-21-5) Administered in Feed to Male F344/N Rats. Toxicity Report Series No. 44. NIH Publication No. 96-3936. U.S. Department of Health and Human Services, Public Health Service, National Institutes of Health, Research Triangle Park, NC. National Toxicology Program (NTP) (1996b). Toxicol-ogy and Carcinogenesis Studies of 1-Amino-2,4-Dibro-moanthraquinone (CAS No. 81-49-2) in F344/N Rats and B6C3F1 Mice (Feed Studies). Technical Report Series No. 383. NIH Publication No. 96-2838. U.S. Department of Health and Human Services, Public Health Service, National Institutes of Health, Research Triangle Park, NC. National Toxicology Program (NTP) (1998). Toxicol-ogy and Carcinogenesis Studies of Oxazepam (CAS No. 604-75-1) in F344/N Rats (Feed Studies). Technical Report Series No. 468. NIH Publication No. 99-3958. U.S. Department of Health and Human Services, Public Health Service, National Institutes of Health, Research Triangle Park, NC. National Toxicology Program (NTP) (2000a). Toxicol-ogy and Carcinogenesis Studies of Pyridine (CAS No. 110-86-1) in F344/N Rats, Wistar Rats, and B6C3F1 Mice (Drinking Water Studies). Technical Report Series No. 470. NIH Publication No. 00-3960. U.S. Department of Health and Human Services, Public Health Service, National Institutes of Health, Research Triangle Park, NC. National Toxicology Program (NTP) (2000b). Toxicol-ogy and Carcinogenesis Studies of Primidone (CAS No. 125-33-7) in F344/N Rats and B6C3F1 Mice (Feed Studies). Technical Report Series No. 476. NIH Publi-cation No. 00-3966. U.S. Department of Health and Human Services, Public Health Service, National Insti-tutes of Health, Research Triangle Park, NC. National Toxicology Program (NTP) (2002). Toxicol-ogy and Carcinogenesis Studies of o-Nitrotoluene (CAS No. 88-72-2) in F344/N Rats and B6C3F1 Mice (Feed Studies). Technical Report Series No. 504. NIH Publication No. 02-4438. U.S. Department of Health and Human Services, Public Health Service, National Institutes of Health, Research Triangle Park, NC.
96 N,N-Dimethyl-p-toluidine, NTP TR 579
National Toxicology Program (NTP) (2004). Toxicity Studies of Butanal Oxime (CAS No. 110-69-0) Admin-istered in Drinking Water and by Gavage to F344/N Rats and B6C3F1 Mice. Toxicity Report Series No. 69. NIH Publication No. 04-4417. U.S. Department of Health and Human Services, Public Health Service, National Institutes of Health, Research Triangle Park, NC. National Toxicology Program (NTP) (2010). Toxicol-ogy and Carcinogenesis Studies of Goldenseal Root Powder (Hydrastis canadensis) in F344/N Rats and B6C3F1 Mice (Feed Studies). Technical Report Series No. 562. NIH Publication No. 10-5903. National Insti-tutes of Health, Public Health Service, U.S. Department of Health and Human Services, Research Triangle Park, NC. Neumark, Y.D., Delva, J., and Anthony, J.C. (1998). The epidemiology of adolescent inhalant drug involve-ment. Arch. Pediatr. Adolesc. Med. 152, 781-786. Nomura, Y., Ishibashi, H., Miyahara, M., Shinohara, R., Shiraishi, F., and Arizono, K. (2003). Effects of dental resin metabolites on estrogenic activity in vitro. J. Mater. Sci. Mater. Med. 14, 307-310. Organisation for Economic Co-operation and Develop-ment (OECD) (2010). Test No. 487: In Vitro Mamma-lian Cell Micronucleus Test. In OECD Guidelines for Testing of Chemicals Section 4: Health Effects. Paris, France. Pallais, J.C., Mackool, B.T., and Pitman, M.B. (2011). Case records of the Massachusetts General Hospital: Case 7-2011: A 52-year old man with upper respiratory symptoms and low oxygen saturation levels. N. Engl. J. Med. 364, 957-966. Pereira, S.G., Telo, J.P., and Nunes, T.G. (2008). Towards a controlled photopolymerization of dental dimethacrylate monomers: EPR studies on effects of dilution, filler loading, storage and aging. J. Mater. Sci. Mater. Med. 19, 3135-3144. Peter, M.G. (1989). Chemical modifications of biopoly-mers by quinones and quinone methides. Angew. Chem. Int. Ed. Engl. 28, 555-570. Piegorsch, W.W., and Bailer, A.J. (1997). Statistics for Environmental Biology and Toxicology, Section 6.3.2. Chapman and Hall, London.
Plopper, C.G., Suverkropp, C., Morin, D., Nishio, S., and Buckpitt, A. (1992). Relationship of cytochrome P-450 activity to Clara cell cytotoxicity. I. Histo-pathologic comparison of the respiratory tract of mice, rats and hamsters after parenteral administration of naphthalene. J. Pharmacol. Exp. Ther. 261, 353-363. Portier, C.J., and Bailer, A.J. (1989). Testing for increased carcinogenicity using a survival-adjusted quantal response test. Fundam. Appl. Toxicol. 12, 731-737. Portier, C.J., Hedges, J.C., and Hoel, D.G. (1986). Age-specific models of mortality and tumor onset for historical control animals in the National Toxicology Program’s carcinogenicity experiments. Cancer Res. 46, 4372-4378. Potter, J.L., Krill, C.E., Jr., Neal, D., and Kofron, W.G. (1988). Methemoglobinemia due to ingestion of N,N-dimethyl-p-toluidine, a component used in the fab-rication of artificial fingernails. Ann. Emerg. Med. 17, 1098-1100. Rao, G.N. (1996). New diet (NTP-2000) for rats in the National Toxicology Program toxicity and carcinoge-nicity studies. Fundam. Appl. Toxicol. 32, 102-108. Rao, G.N. (1997). New nonpurified diet (NTP-2000) for rodents in the National Toxicology Program’s toxicology and carcinogenesis studies. J. Nutr. 127, 842s-846s. Recio, L., Hobbs, C., Caspary, W., and Witt, K.L. (2010). Dose-response assessment of four genotoxic chemicals in a combined mouse and rat micronucleus (MN) and Comet assay protocol. J. Toxicol. Sci. 35, 149-162. Registry of Toxic Effects of Chemical Substances (RTECS) (2011). N,N-Dimethyl-p-toluidine. National Library of Medicine, Bethesda, MD. Sadtler Condensed Phase IR Standards Library (March 2, 2004). Spectrum No. SA8303. KnowItAll Informatics Systems, Version 3.005. Sadtler-Aldrich Library of Condensed Phase IR Standards (2004). Spectrum SA 8303. Sadtler Research Libraries, Philadelphia. Santosh, V., Ranjith, K., Shenoi, S.D., Sachin, V., and Balachandran, C. (1999). Results of patch testing with dental materials. Contact Dermatitis 40, 50-51.

N,N-Dimethyl-p-toluidine, NTP TR 579 97
Sasaki, Y.F., Sekihashi, K., Izumiyama, F., Nishidate, E., Saga, A., Ishida, K., and Tsuda, S. (2000). The comet assay with multiple mouse organs: Com-parison of comet assay results and carcinogenicity with 208 chemicals selected from the IARC monographs and U.S. NTP Carcinogenicity Database. Crit. Rev. Toxicol. 30, 629-799. Schmid, W. (1975). The micronucleus test. Mutat. Res. 31, 9-15. Shelby, M.D., and Witt, K.L. (1995). Comparison of results from mouse bone marrow chromosome aberra-tion and micronucleus tests. Environ. Mol. Mutagen. 25, 302-313. Shelby, M.D., Erexson, G.L., Hook, G.J., and Tice, R.R. (1993). Evaluation of a three-exposure mouse bone marrow micronucleus protocol: Results with 49 chem-icals. Environ. Mol. Mutagen. 21, 160-179. Sherratt, A.J., and Damani, L.A. (1989). The metabo-lism of N,N-dimethylaniline by isolated rat hepatocytes: Identification of a novel N-conjugate. Xenobiotica 19, 379-388. Shintani, H., Tsuchiya, T., Hata, Y., and Nakamura, A. (1993). Solid phase extraction and HPLC analysis of toxic components eluted from methyl methacrylate den-tal materials. J. Anal. Toxicol. 17, 73-78. Shirley, E. (1977). A non-parametric equivalent of Williams’ test for contrasting increasing dose levels of a treatment. Biometrics 33, 386-389. Sigma-Aldrich Internet Catalog (2004). Number D18900-6, July 2, 2004. Smith, R.P. (1996). Toxic responses of the blood. In Casarett and Doull’s Toxicology: The Basic Science of Poisons, 5th ed. (M.O. Amdur, J. Doull, and C.D. Klaassen, Eds.), pp. 335-354. McGraw-Hill, New York. Statistical Data Base System (SDBS) (June 7, 2004). Proton NMR No. 3077HSP-06-320; Carbon-13 NMR No. 3077CDS-03-164. http://www.aist.go.jp/RIODB/ SDBS. National Institute of Advanced Industrial Science and Technology (AIST), Japan. Stea, S., Granchi, D., Zolezzi, C., Ciapetti, G., Visentin, M., Cavedagna, D., and Pizzoferrato, A. (1997). High-performance liquid chromatography assay of N,N-dimethyl-p-toluidine released from bone cements: Evidence for toxicity. Biomaterials 18, 243-246.
Stolk, J.M., and Smith, R.P. (1966). Species differences in methemoglobin reductase activity. Biochem. Pharmacol. 15, 343-351. Stout, M.D., Kissling, G.E., Suárez, F.A., Malarkey, D.E., Herbert, R.A., and Bucher, J.R. (2008). Influence of Helicobacter hepaticus infection on the chronic toxicity and carcinogenicity of triethanolamine in B6C3F1 mice. Toxicol. Pathol. 36, 783-794. Straus, D.S. (1981). Somatic mutation, cellular differ-entiation, and cancer causation. JNCI 67, 233-241. Takahashi, K., Dinse, G.E., Foley, J.F., Hardisty, J.F., and Maronpot, R.R. (2002). Comparative prevalence, multiplicity, and progression of spontaneous and vinyl carbamate-induced liver lesions in five strains of male mice. Toxicol. Pathol. 30, 599-605. Taningher, M., Pasquini, R., and Bonatti, S. (1993). Genotoxicity analysis of N,N-dimethylaniline and N,N-dimethyl-p-toluidine. Environ. Mol. Mutagen. 21, 349-356. Tarone, R.E. (1975). Tests for trend in life table analy-sis. Biometrika 62, 679-682. Tennant, R.W., Margolin, B.H., Shelby, M.D., Zeiger, E., Haseman, J.K., Spalding, J., Caspary, W., Resnick, M., Stasiewicz, S., Anderson, B., and Minor, R. (1987). Prediction of chemical carcinogenic-ity in rodents from in vitro genetic toxicity assays. Science 236, 933-941. Tice, R.R., Agurell, E., Anderson, D., Burlinson, B., Hartmann, A., Kobayashi, H., Miyamae, Y., Rojas, E., Ryu, J.-C., and Sasaki, Y.F. (2000). Single cell gel/Comet assay: Guidelines for in vitro and in vivo genetic toxicology testing. Environ. Mol. Mutagen. 35, 206-221. Timmer, M.D., Ambrose, C.G., and Mikos, A.G. (2003). Evaluation of thermal- and photo-crosslinked bio-degradable poly(propylene fumarate)-based networks. J. Biomed. Mater. Res. 66A, 811-818. Tosti, A., Bardazzi, E., Piancastelli, E., and Brasile, G.P. (1990). Contact stomatitis due to N,N-dimethyl-para-toluidine. Contact Dermatitis 22, 113. Travlos, G.S., Mahler, J., Ragan, H.A., Chou, B.J., and Bucher, J.R. (1996). Thirteen-week inhalation toxicity of 2- and 4-chloronitrobenzene in F344/N rats and B6C3F1 mice. Fundam. Appl. Toxicol. 30, 75-92.
98 N,N-Dimethyl-p-toluidine, NTP TR 579
United States Environmental Protection Agency (USEPA) (2011a). Non-confidential 2006 IUR Records by Chemical, including Manufacturing, Processing and Use Information. CAS No. 99-97-8, Benzenamine, N,N,4-trimethyl. < http://cfpub.epa.gov/iursearch/2006 _iur_companyinfo.cfm?chemid=6749&outchem=both > Accessed May 18, 2011. United States Environmental Protection Agency (USEPA) (2011b). High Production Volume Information System. Benzenamine, N,N,4-trimethyl, CAS No. 99-97-8. <http://iaspub.epa.gov/oppthpv/ quicksearch.display?pChem=100729> Accessed May 18, 2011. Vazquez, B., Levenfeld, B., and San Roman, J. (1998). Role of amine activators on the curing parameters, pro-perties and toxicity of acrylic bone cements. Polym. Int. 46, 241-250. Verschueren, G.L.A., and Bruynzeel, D.P. (1991). Allergy to N,N-dimethyl-p-toluidine in dental materials. Contact Dermatitis 24, 149. Verschueren, K., Ed. (1996). Handbook of Environmen-tal Data on Organic Chemicals, 3rd ed., pp. 842-843. Van Nostrand Reinhold, New York. Weisburger, E.K., Russfield, A.B., Homburger, F., Weisburger, J.H., Boger, E., van Dongen, C.G., and Chu, K.C. (1978). Testing of twenty-one environmental aromatic amines or derivatives for long-term toxicity or carcinogenicity. J. Environ. Pathol. Toxicol. 2, 325-356. Williams, D.A. (1971). A test for differences between treatment means when several dose levels are compared with a zero dose control. Biometrics 27, 103-117. Williams, D.A. (1972). The comparison of several dose levels with a zero dose control. Biometrics 28, 519-531.
Williams, D.A. (1986). A note on Shirley’s nonpara-metric test for comparing several dose levels with a zero-dose control. Biometrics 42, 183-186. Winter, K., Pagoria, D., and Geurtsen, W. (2005). The effect of antioxidants on oxidative DNA damage induced by visible-light-irradiated camphorquinone/ N,N-dimethyl-p-toluidine. Biomaterials 26, 5321-5329. Witt, K.L., Knapton, A., Wehr, C.M., Hook, G.J., Mirsalis, J., Shelby, M.D., and MacGregor, J.T. (2000). Micronucleated erythrocyte frequency in peripheral blood of B6C3F1 mice from short-term, prechronic, and chronic studies of the NTP Carcinogenesis Bioassay Program. Environ. Mol. Mutagen. 36, 163-194. Witt, K.L., Livanos, E., Kissling, G.E., Torous, D.K., Caspary, W., Tice, R.R., and Recio, L. (2008). Com-parison of flow cytometry and microscopy-based methods for measuring micronucleated reticulocyte fre-quencies in rodents treated with nongenotoxic and geno-toxic chemicals. Mutat. Res. 649, 101-113. Wu, L.-T., Howard, M.O., and Pilowsky, D.J. (2008). Substance abuse disorders among inhalant users: Results from the National Epidemiologic Survey on Alcohol and Related Conditions. Addict. Behav. 33, 968-973. Zeiger, E., Haseman, J.K., Shelby, M.D., Margolin, B.H., and Tennant, R.W. (1990). Evaluation of four in vitro genetic toxicity tests for predicting rodent carcinogenicity: Confirmation of earlier results with 41 additional chemicals. Environ. Mol. Mutagen. 16 (Suppl. 18), 1-14. Zeiger, E., Anderson, B., Haworth, S., Lawlor, T., and Mortelmans, K. (1992). Salmonella mutagenicity tests: V. Results from the testing of 311 chemicals. Environ. Mol. Mutagen. 19 (Suppl. 21), 2-141.

99
APPENDIX A SUMMARY OF LESIONS IN MALE RATS
IN THE 2-YEAR GAVAGE STUDY OF N,N-DIMETHYL-p-TOLUIDINE
TABLE A1 Summary of the Incidence of Neoplasms in Male Rats in the 2-Year Gavage Study of N,N-Dimethyl-p-toluidine .............................................................. 100 TABLE A2 Statistical Analysis of Primary Neoplasms in Male Rats in the 2-Year Gavage Study of N,N-Dimethyl-p-toluidine .............................................................. 104 TABLE A3a Historical Incidence of Hepatocellular Neoplasms in Control Male F344/N Rats ........................ 108 TABLE A3b Historical Incidence of Adenoma of the Nose in Control Male F344/N Rats ................................ 108 TABLE A3c Historical Incidence of Follicular Cell Neoplasms of the Thyroid Gland in Control Male F344/N Rats ............................................................................................................ 109 TABLE A4 Summary of the Incidence of Nonneoplastic Lesons in Male Rats in the 2-Year Gavage Study of N,N-Dimethyl-p-toluidine .............................................................. 110

100 N,N-Dimethyl-p-toluidine, NTP TR 579
TABLE A1 Summary of the Incidence of Neoplasms in Male Rats in the 2-Year Gavage Study of N,N-Dimethyl-p-toluidinea
Vehicle Control
6 mg/kg
20 mg/kg
60 mg/kg
Disposition Summary Animals initially in study 50 50 50 50 Early deaths
Accidental deaths 1 1 3 Moribund 11 7 11 7 Natural deaths 2 5 7 19
Survivors Terminal kill 37 37 31 21
Animals examined microscopically 50 50 50 50 Alimentary System Esophagus (50) (50) (50) (50) Intestine large, cecum (50) (50) (50) (50) Intestine large, colon (50) (50) (50) (50) Intestine large, rectum (50) (50) (50) (50)
Carcinoma 1 (2%) Intestine small, duodenum (50) (50) (50) (50) Intestine small, ileum (50) (50) (50) (50) Intestine small, jejunum (50) (50) (50) (50) Liver (50) (50) (50) (50)
Hepatocellular adenoma 1 (2%) 1 (2%) Hepatocellular carcinoma 1 (2%) 6 (12%)
Mesentery (7) (5) (2) (1) Pancreas (50) (50) (50) (50) Salivary glands (50) (50) (50) (50)
Sarcoma 1 (2%) Stomach, forestomach (50) (50) (50) (50) Stomach, glandular (50) (50) (50) (50) Tongue (0) (1) (0) (1)
Squamous cell carcinoma 1 (100%) Squamous cell papilloma 1 (100%)
Tooth (1) (2) (2) (0) Cardiovascular System Blood vessel (50) (50) (50) (50) Heart (50) (50) (50) (50)
Carcinoma, metastatic, uncertain primary site 1 (2%)
Endocrine System Adrenal cortex (50) (50) (50) (50)
Adenoma 1 (2%) 1 (2%) Osteosarcoma, metastatic, bone 1 (2%)
Adrenal medulla (50) (50) (50) (50) Pheochromocytoma benign 6 (12%) 2 (4%) 8 (16%) 4 (8%) Pheochromocytoma complex 1 (2%) 1 (2%) Pheochromocytoma malignant 1 (2%) 3 (6%) 1 (2%)
Islets, pancreatic (50) (50) (50) (50) Adenoma 2 (4%) 6 (12%) 4 (8%) 1 (2%) Carcinoma 1 (2%)
Parathyroid gland (49) (49) (45) (48)

N,N-Dimethyl-p-toluidine, NTP TR 579 101
TABLE A1 Summary of the Incidence of Neoplasms in Male Rats in the 2-Year Gavage Study of N,N-Dimethyl-p-toluidine
Vehicle Control
6 mg/kg
20 mg/kg
60 mg/kg
Endocrine System (continued) Pituitary gland (50) (50) (50) (50)
Pars distalis, adenoma 23 (46%) 27 (54%) 18 (36%) 15 (30%) Pars distalis, carcinoma 1 (2%) 1 (2%) Pars intermedia, carcinoma 1 (2%)
Thyroid gland (50) (49) (50) (49) Sarcoma, metastatic, salivary glands 1 (2%) Bilateral, C-cell, adenoma 1 (2%) 1 (2%) 1 (2%) C-cell, adenoma 10 (20%) 7 (14%) 7 (14%) 2 (4%) C-cell, carcinoma 1 (2%) Follicular cell, adenoma 1 (2%) 1 (2%) 3 (6%) Follicular cell, carcinoma 2 (4%) 1 (2%) 2 (4%)
General Body System Tissues NOS (0) (0) (2) (0)
Carcinoma, metastatic, Zymbal’s gland 1 (50%)
Genital System Coagulating gland (1) (2) (1) (0) Epididymis (50) (50) (50) (50) Preputial gland (50) (50) (50) (50)
Adenoma 1 (2%) 1 (2%) Prostate (50) (50) (50) (50)
Adenoma 1 (2%) Seminal vesicle (50) (50) (50) (50) Testes (50) (50) (50) (50)
Hemangioma 1 (2%) Bilateral, interstitial cell, adenoma 29 (58%) 23 (46%) 33 (66%) 25 (50%) Interstitial cell, adenoma 11 (22%) 13 (26%) 10 (20%) 12 (24%)
Hematopoietic System Bone marrow (50) (50) (50) (50) Lymph node (4) (3) (3) (7) Lymph node, mesenteric (50) (50) (50) (50) Spleen (50) (50) (50) (50)
Hemangiosarcoma 1 (2%) Thymus (50) (48) (48) (47) Integumentary System Mammary gland (50) (50) (49) (50)
Carcinoma 1 (2%) Skin (50) (50) (50) (50)
Basal cell adenoma 1 (2%) 1 (2%) 1 (2%) Basal cell carcinoma 1 (2%) 3 (6%) Fibroma 5 (10%) 3 (6%) 5 (10%) 3 (6%) Fibroma, multiple 1 (2%) 1 (2%) Keratoacanthoma 3 (6%) 3 (6%) 1 (2%) 2 (4%) Keratoacanthoma, multiple 1 (2%) Lipoma 1 (2%) 1 (2%) Liposarcoma 1 (2%) Sarcoma 1 (2%) 1 (2%) Squamous cell papilloma 1 (2%) Trichoepithelioma 1 (2%) Sebaceous gland, adenoma 1 (2%) 2 (4%) 1 (2%)

102 N,N-Dimethyl-p-toluidine, NTP TR 579
TABLE A1 Summary of the Incidence of Neoplasms in Male Rats in the 2-Year Gavage Study of N,N-Dimethyl-p-toluidine
Vehicle Control
6 mg/kg
20 mg/kg
60 mg/kg
Musculoskeletal System Bone (50) (50) (50) (50)
Chondroma 1 (2%) Osteosarcoma 1 (2%) 1 (2%)
Nervous System Brain (50) (50) (50) (50)
Astrocytoma malignant 1 (2%) Carcinoma, metastatic, pituitary gland 1 (2%) 1 (2%) 1 (2%) Granular cell tumor malignant 1 (2%)
Spinal cord (0) (1) (0) (0) Osteosarcoma, metastatic, bone 1 (100%)
Respiratory System Lung (50) (50) (50) (50)
Alveolar/bronchiolar adenoma 1 (2%) 1 (2%) 1 (2%) Carcinoma, metastatic, tissues NOS 1 (2%) Hepatocellular carcinoma, metastatic,
liver 2 (4%) Osteosarcoma, metastatic, bone 1 (2%) Pheochromocytoma malignant, metastatic,
adrenal medulla 1 (2%) 1 (2%) 1 (2%) Nose (50) (49) (50) (49)
Glands, olfactory epithelium, adenoma 1 (2%) Transitional epithelium, adenoma 3 (6%) 2 (4%) 11 (22%) Transitional epithelium, carcinoma 2 (4%)
Trachea (50) (50) (50) (50)
Special Senses System Eye (50) (50) (50) (50) Harderian gland (50) (50) (50) (50) Zymbal’s gland (49) (50) (50) (50)
Adenoma 1 (2%) Carcinoma 2 (4%) 1 (2%)
Urinary System Kidney (50) (50) (50) (50)
Oncocytoma benign 1 (2%) Renal tubule, adenoma 1 (2%)
Ureter (0) (0) (0) (1) Urinary bladder (50) (50) (50) (50)
Transitional epithelium, papilloma 1 (2%)
Systemic Lesions Multiple organsb (50) (50) (50) (50)
Leukemia mononuclear 14 (28%) 1 (2%) 2 (4%) Mesothelioma malignant 1 (2%) 2 (4%) 3 (6%) 1 (2%)

N,N-Dimethyl-p-toluidine, NTP TR 579 103
TABLE A1 Summary of the Incidence of Neoplasms in Male Rats in the 2-Year Gavage Study of N,N-Dimethyl-p-toluidine
Vehicle Control
6 mg/kg
20 mg/kg
60 mg/kg
Neoplasm Summary Total animals with primary neoplasmsc 49 48 46 44
Total primary neoplasms 118 107 119 104 Total animals with benign neoplasms 48 46 46 43
Total benign neoplasms 97 93 100 89 Total animals with malignant neoplasms 19 13 16 15
Total malignant neoplasms 21 14 19 15 Total animals with metastatic neoplasms 4 2 2 4
Total metastatic neoplasms 4 4 3 4 Total animals with malignant neoplasms
of uncertain primary site 1 a Number of animals examined microscopically at the site and the number of animals with neoplasm b Number of animals with any tissue examined microscopically c Primary neoplasms: all neoplasms except metastatic neoplasms
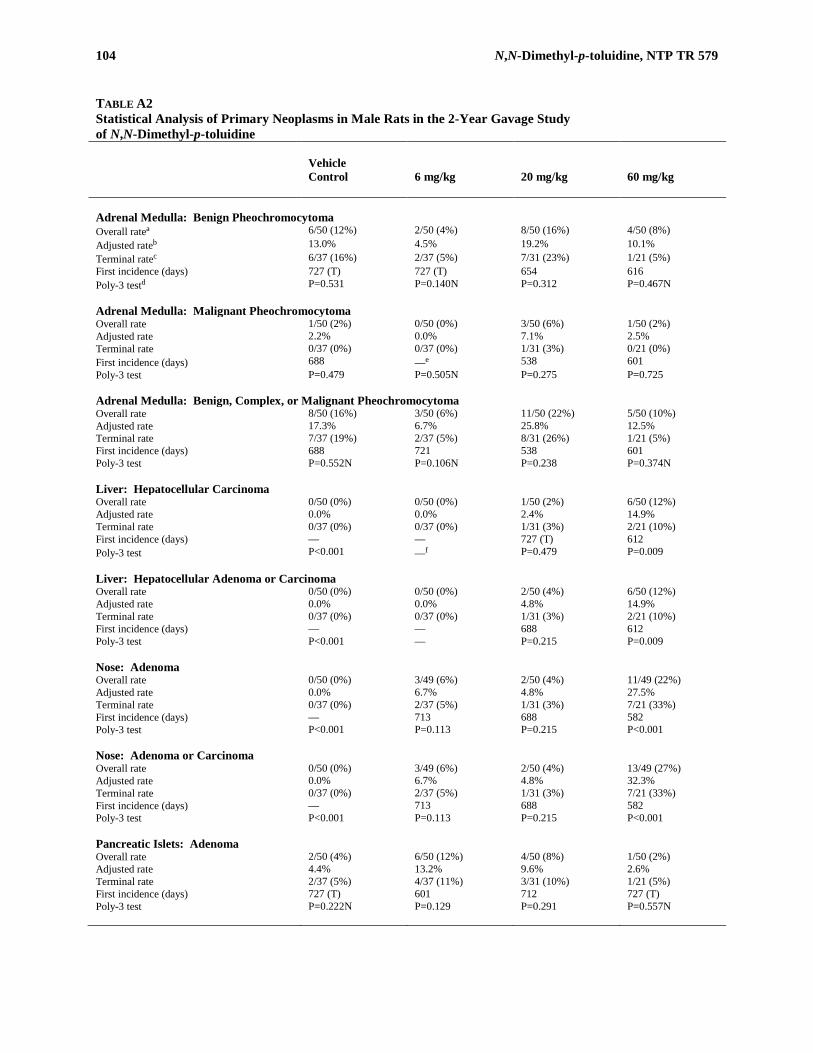
104 N,N-Dimethyl-p-toluidine, NTP TR 579
TABLE A2 Statistical Analysis of Primary Neoplasms in Male Rats in the 2-Year Gavage Study of N,N-Dimethyl-p-toluidine
Vehicle Control
6 mg/kg
20 mg/kg
60 mg/kg
Adrenal Medulla: Benign Pheochromocytoma Overall ratea 6/50 (12%) 2/50 (4%) 8/50 (16%) 4/50 (8%) Adjusted rateb 13.0% 4.5% 19.2% 10.1% Terminal ratec 6/37 (16%) 2/37 (5%) 7/31 (23%) 1/21 (5%) First incidence (days) 727 (T) 727 (T) 654 616 Poly-3 testd P=0.531 P=0.140N P=0.312 P=0.467N Adrenal Medulla: Malignant Pheochromocytoma Overall rate 1/50 (2%) 0/50 (0%) 3/50 (6%) 1/50 (2%) Adjusted rate 2.2% 0.0% 7.1% 2.5% Terminal rate 0/37 (0%) 0/37 (0%) 1/31 (3%) 0/21 (0%) First incidence (days) 688 —e 538 601 Poly-3 test P=0.479 P=0.505N P=0.275 P=0.725 Adrenal Medulla: Benign, Complex, or Malignant Pheochromocytoma Overall rate 8/50 (16%) 3/50 (6%) 11/50 (22%) 5/50 (10%) Adjusted rate 17.3% 6.7% 25.8% 12.5% Terminal rate 7/37 (19%) 2/37 (5%) 8/31 (26%) 1/21 (5%) First incidence (days) 688 721 538 601 Poly-3 test P=0.552N P=0.106N P=0.238 P=0.374N Liver: Hepatocellular Carcinoma Overall rate 0/50 (0%) 0/50 (0%) 1/50 (2%) 6/50 (12%) Adjusted rate 0.0% 0.0% 2.4% 14.9% Terminal rate 0/37 (0%) 0/37 (0%) 1/31 (3%) 2/21 (10%) First incidence (days) — — 727 (T) 612 Poly-3 test P<0.001 —f P=0.479 P=0.009 Liver: Hepatocellular Adenoma or Carcinoma Overall rate 0/50 (0%) 0/50 (0%) 2/50 (4%) 6/50 (12%) Adjusted rate 0.0% 0.0% 4.8% 14.9% Terminal rate 0/37 (0%) 0/37 (0%) 1/31 (3%) 2/21 (10%) First incidence (days) — — 688 612 Poly-3 test P<0.001 — P=0.215 P=0.009 Nose: Adenoma Overall rate 0/50 (0%) 3/49 (6%) 2/50 (4%) 11/49 (22%) Adjusted rate 0.0% 6.7% 4.8% 27.5% Terminal rate 0/37 (0%) 2/37 (5%) 1/31 (3%) 7/21 (33%) First incidence (days) — 713 688 582 Poly-3 test P<0.001 P=0.113 P=0.215 P<0.001 Nose: Adenoma or Carcinoma Overall rate 0/50 (0%) 3/49 (6%) 2/50 (4%) 13/49 (27%) Adjusted rate 0.0% 6.7% 4.8% 32.3% Terminal rate 0/37 (0%) 2/37 (5%) 1/31 (3%) 7/21 (33%) First incidence (days) — 713 688 582 Poly-3 test P<0.001 P=0.113 P=0.215 P<0.001 Pancreatic Islets: Adenoma Overall rate 2/50 (4%) 6/50 (12%) 4/50 (8%) 1/50 (2%) Adjusted rate 4.4% 13.2% 9.6% 2.6% Terminal rate 2/37 (5%) 4/37 (11%) 3/31 (10%) 1/21 (5%) First incidence (days) 727 (T) 601 712 727 (T) Poly-3 test P=0.222N P=0.129 P=0.291 P=0.557N
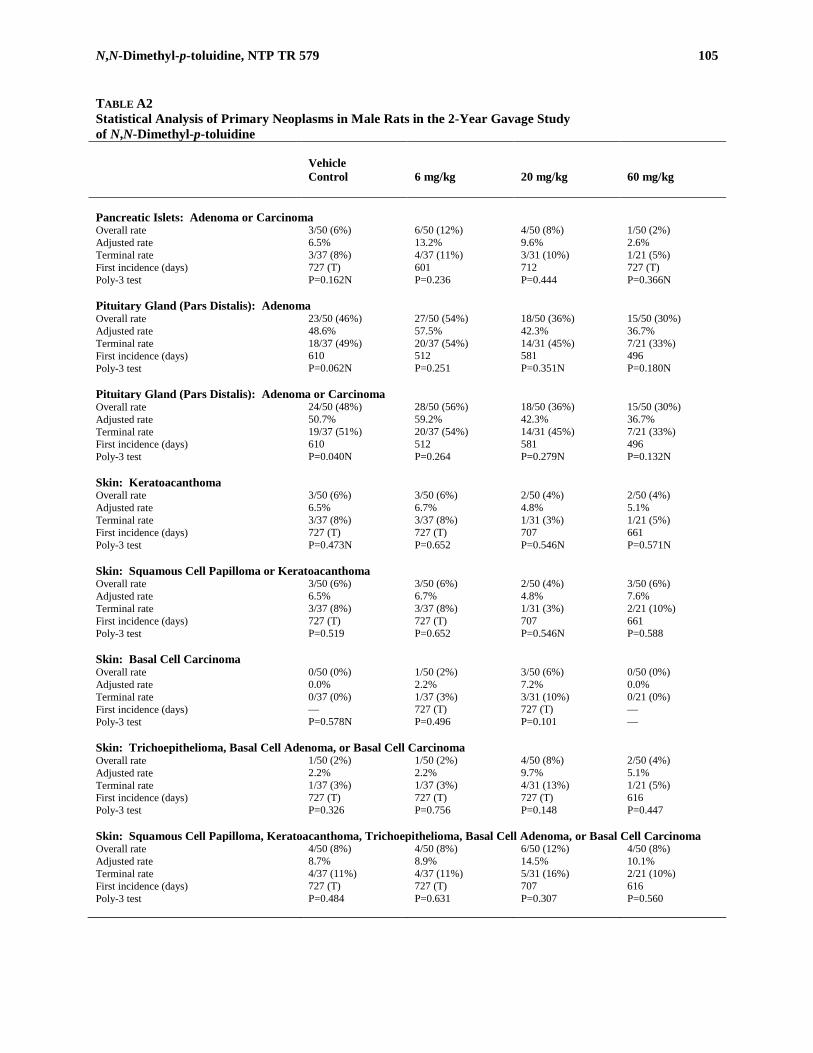
N,N-Dimethyl-p-toluidine, NTP TR 579 105
TABLE A2 Statistical Analysis of Primary Neoplasms in Male Rats in the 2-Year Gavage Study of N,N-Dimethyl-p-toluidine
Vehicle Control
6 mg/kg
20 mg/kg
60 mg/kg
Pancreatic Islets: Adenoma or Carcinoma Overall rate 3/50 (6%) 6/50 (12%) 4/50 (8%) 1/50 (2%) Adjusted rate 6.5% 13.2% 9.6% 2.6% Terminal rate 3/37 (8%) 4/37 (11%) 3/31 (10%) 1/21 (5%) First incidence (days) 727 (T) 601 712 727 (T) Poly-3 test P=0.162N P=0.236 P=0.444 P=0.366N Pituitary Gland (Pars Distalis): Adenoma Overall rate 23/50 (46%) 27/50 (54%) 18/50 (36%) 15/50 (30%) Adjusted rate 48.6% 57.5% 42.3% 36.7% Terminal rate 18/37 (49%) 20/37 (54%) 14/31 (45%) 7/21 (33%) First incidence (days) 610 512 581 496 Poly-3 test P=0.062N P=0.251 P=0.351N P=0.180N Pituitary Gland (Pars Distalis): Adenoma or Carcinoma Overall rate 24/50 (48%) 28/50 (56%) 18/50 (36%) 15/50 (30%) Adjusted rate 50.7% 59.2% 42.3% 36.7% Terminal rate 19/37 (51%) 20/37 (54%) 14/31 (45%) 7/21 (33%) First incidence (days) 610 512 581 496 Poly-3 test P=0.040N P=0.264 P=0.279N P=0.132N Skin: Keratoacanthoma Overall rate 3/50 (6%) 3/50 (6%) 2/50 (4%) 2/50 (4%) Adjusted rate 6.5% 6.7% 4.8% 5.1% Terminal rate 3/37 (8%) 3/37 (8%) 1/31 (3%) 1/21 (5%) First incidence (days) 727 (T) 727 (T) 707 661 Poly-3 test P=0.473N P=0.652 P=0.546N P=0.571N Skin: Squamous Cell Papilloma or Keratoacanthoma Overall rate 3/50 (6%) 3/50 (6%) 2/50 (4%) 3/50 (6%) Adjusted rate 6.5% 6.7% 4.8% 7.6% Terminal rate 3/37 (8%) 3/37 (8%) 1/31 (3%) 2/21 (10%) First incidence (days) 727 (T) 727 (T) 707 661 Poly-3 test P=0.519 P=0.652 P=0.546N P=0.588 Skin: Basal Cell Carcinoma Overall rate 0/50 (0%) 1/50 (2%) 3/50 (6%) 0/50 (0%) Adjusted rate 0.0% 2.2% 7.2% 0.0% Terminal rate 0/37 (0%) 1/37 (3%) 3/31 (10%) 0/21 (0%) First incidence (days) — 727 (T) 727 (T) — Poly-3 test P=0.578N P=0.496 P=0.101 — Skin: Trichoepithelioma, Basal Cell Adenoma, or Basal Cell Carcinoma Overall rate 1/50 (2%) 1/50 (2%) 4/50 (8%) 2/50 (4%) Adjusted rate 2.2% 2.2% 9.7% 5.1% Terminal rate 1/37 (3%) 1/37 (3%) 4/31 (13%) 1/21 (5%) First incidence (days) 727 (T) 727 (T) 727 (T) 616 Poly-3 test P=0.326 P=0.756 P=0.148 P=0.447 Skin: Squamous Cell Papilloma, Keratoacanthoma, Trichoepithelioma, Basal Cell Adenoma, or Basal Cell Carcinoma Overall rate 4/50 (8%) 4/50 (8%) 6/50 (12%) 4/50 (8%) Adjusted rate 8.7% 8.9% 14.5% 10.1% Terminal rate 4/37 (11%) 4/37 (11%) 5/31 (16%) 2/21 (10%) First incidence (days) 727 (T) 727 (T) 707 616 Poly-3 test P=0.484 P=0.631 P=0.307 P=0.560
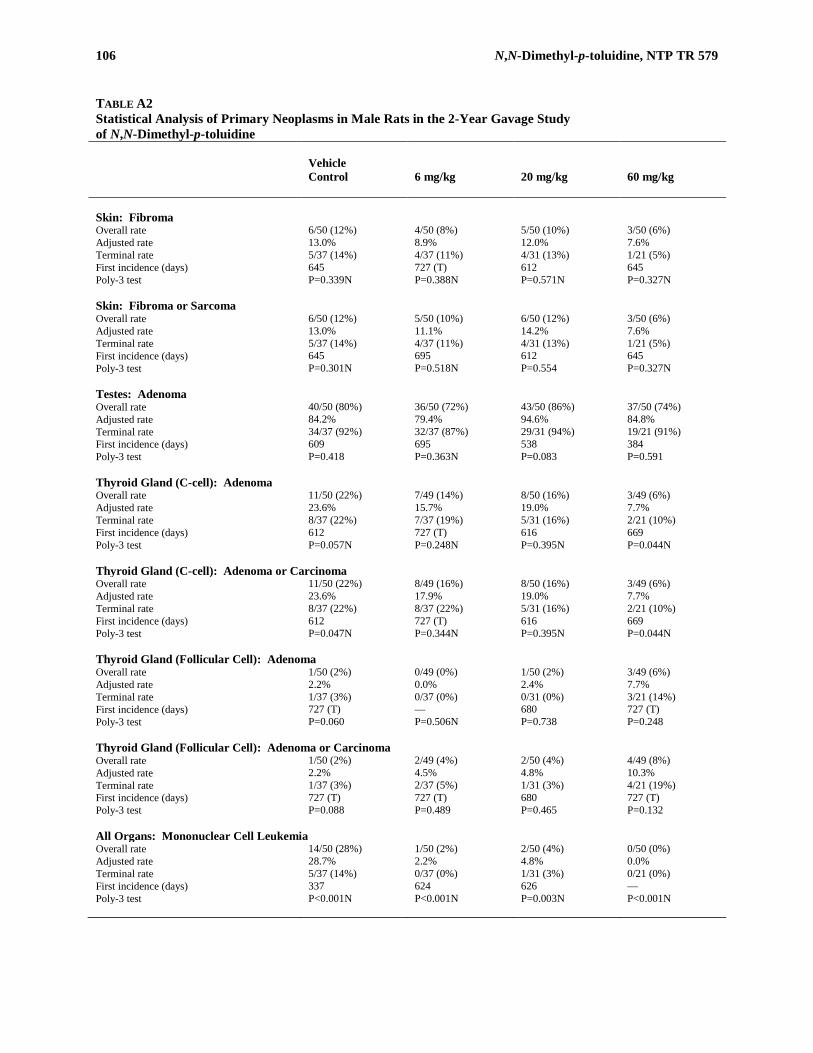
106 N,N-Dimethyl-p-toluidine, NTP TR 579
TABLE A2 Statistical Analysis of Primary Neoplasms in Male Rats in the 2-Year Gavage Study of N,N-Dimethyl-p-toluidine
Vehicle Control
6 mg/kg
20 mg/kg
60 mg/kg
Skin: Fibroma Overall rate 6/50 (12%) 4/50 (8%) 5/50 (10%) 3/50 (6%) Adjusted rate 13.0% 8.9% 12.0% 7.6% Terminal rate 5/37 (14%) 4/37 (11%) 4/31 (13%) 1/21 (5%) First incidence (days) 645 727 (T) 612 645 Poly-3 test P=0.339N P=0.388N P=0.571N P=0.327N Skin: Fibroma or Sarcoma Overall rate 6/50 (12%) 5/50 (10%) 6/50 (12%) 3/50 (6%) Adjusted rate 13.0% 11.1% 14.2% 7.6% Terminal rate 5/37 (14%) 4/37 (11%) 4/31 (13%) 1/21 (5%) First incidence (days) 645 695 612 645 Poly-3 test P=0.301N P=0.518N P=0.554 P=0.327N Testes: Adenoma Overall rate 40/50 (80%) 36/50 (72%) 43/50 (86%) 37/50 (74%) Adjusted rate 84.2% 79.4% 94.6% 84.8% Terminal rate 34/37 (92%) 32/37 (87%) 29/31 (94%) 19/21 (91%) First incidence (days) 609 695 538 384 Poly-3 test P=0.418 P=0.363N P=0.083 P=0.591 Thyroid Gland (C-cell): Adenoma Overall rate 11/50 (22%) 7/49 (14%) 8/50 (16%) 3/49 (6%) Adjusted rate 23.6% 15.7% 19.0% 7.7% Terminal rate 8/37 (22%) 7/37 (19%) 5/31 (16%) 2/21 (10%) First incidence (days) 612 727 (T) 616 669 Poly-3 test P=0.057N P=0.248N P=0.395N P=0.044N Thyroid Gland (C-cell): Adenoma or Carcinoma Overall rate 11/50 (22%) 8/49 (16%) 8/50 (16%) 3/49 (6%) Adjusted rate 23.6% 17.9% 19.0% 7.7% Terminal rate 8/37 (22%) 8/37 (22%) 5/31 (16%) 2/21 (10%) First incidence (days) 612 727 (T) 616 669 Poly-3 test P=0.047N P=0.344N P=0.395N P=0.044N Thyroid Gland (Follicular Cell): Adenoma Overall rate 1/50 (2%) 0/49 (0%) 1/50 (2%) 3/49 (6%) Adjusted rate 2.2% 0.0% 2.4% 7.7% Terminal rate 1/37 (3%) 0/37 (0%) 0/31 (0%) 3/21 (14%) First incidence (days) 727 (T) — 680 727 (T) Poly-3 test P=0.060 P=0.506N P=0.738 P=0.248 Thyroid Gland (Follicular Cell): Adenoma or Carcinoma Overall rate 1/50 (2%) 2/49 (4%) 2/50 (4%) 4/49 (8%) Adjusted rate 2.2% 4.5% 4.8% 10.3% Terminal rate 1/37 (3%) 2/37 (5%) 1/31 (3%) 4/21 (19%) First incidence (days) 727 (T) 727 (T) 680 727 (T) Poly-3 test P=0.088 P=0.489 P=0.465 P=0.132 All Organs: Mononuclear Cell Leukemia Overall rate 14/50 (28%) 1/50 (2%) 2/50 (4%) 0/50 (0%) Adjusted rate 28.7% 2.2% 4.8% 0.0% Terminal rate 5/37 (14%) 0/37 (0%) 1/31 (3%) 0/21 (0%) First incidence (days) 337 624 626 — Poly-3 test P<0.001N P<0.001N P=0.003N P<0.001N

N,N-Dimethyl-p-toluidine, NTP TR 579 107
TABLE A2 Statistical Analysis of Primary Neoplasms in Male Rats in the 2-Year Gavage Study of N,N-Dimethyl-p-toluidine
Vehicle Control
6 mg/kg
20 mg/kg
60 mg/kg
All Organs: Malignant Mesothelioma Overall rate 1/50 (2%) 2/50 (4%) 3/50 (6%) 1/50 (2%) Adjusted rate 2.2% 4.5% 7.1% 2.6% Terminal rate 1/37 (3%) 2/37 (5%) 1/31 (3%) 1/21 (5%) First incidence (days) 727 (T) 727 (T) 626 727 (T) Poly-3 test P=0.588N P=0.492 P=0.274 P=0.723 All Organs: Benign Neoplasms Overall rate 48/50 (96%) 46/50 (92%) 46/50 (92%) 43/50 (86%) Adjusted rate 98.2% 97.7% 99.8% 95.0% Terminal rate 37/37 (100%) 37/37 (100%) 31/31 (100%) 21/21 (100%) First incidence (days) 609 512 519 384 Poly-3 test P=0.173N P=0.747N P=0.626 P=0.348N All Organs: Malignant Neoplasms Overall rate 20/50 (40%) 13/50 (26%) 16/50 (32%) 15/50 (30%) Adjusted rate 40.9% 28.0% 36.3% 36.3% Terminal rate 10/37 (27%) 8/37 (22%) 8/31 (26%) 7/21 (33%) First incidence (days) 337 324 538 601 Poly-3 test P=0.535 P=0.134N P=0.407N P=0.412N All Organs: Benign or Malignant Neoplasms Overall rate 49/50 (98%) 48/50 (96%) 46/50 (92%) 44/50 (88%) Adjusted rate 98.5% 99.2% 99.8% 96.4% Terminal rate 37/37 (100%) 37/37 (100%) 31/31 (100%) 21/21 (100%) First incidence (days) 337 324 519 384 Poly-3 test P=0.210N P=0.772 P=0.677 P=0.501N (T) Terminal kill a Number of neoplasm-bearing animals/number of animals examined. Denominator is number of animals examined microscopically for
adrenal medulla, liver, nose, pancreatic islets, pituitary gland, testes, and thyroid gland; for other tissues, denominator is number of animals necropsied.
b Poly-3 estimated neoplasm incidence after adjustment for intercurrent mortality c Observed incidence at terminal kill d Beneath the vehicle control incidence is the P value associated with the trend test. Beneath the dosed group incidence are the P values
corresponding to pairwise comparisons between the vehicle controls and that dosed group. The Poly-3 test accounts for the differential mortality in animals that do not reach terminal kill. A negative trend or a lower incidence in a dose group is indicated by N.
e Not applicable; no neoplasms in animal group f Value of statistic cannot be computed.
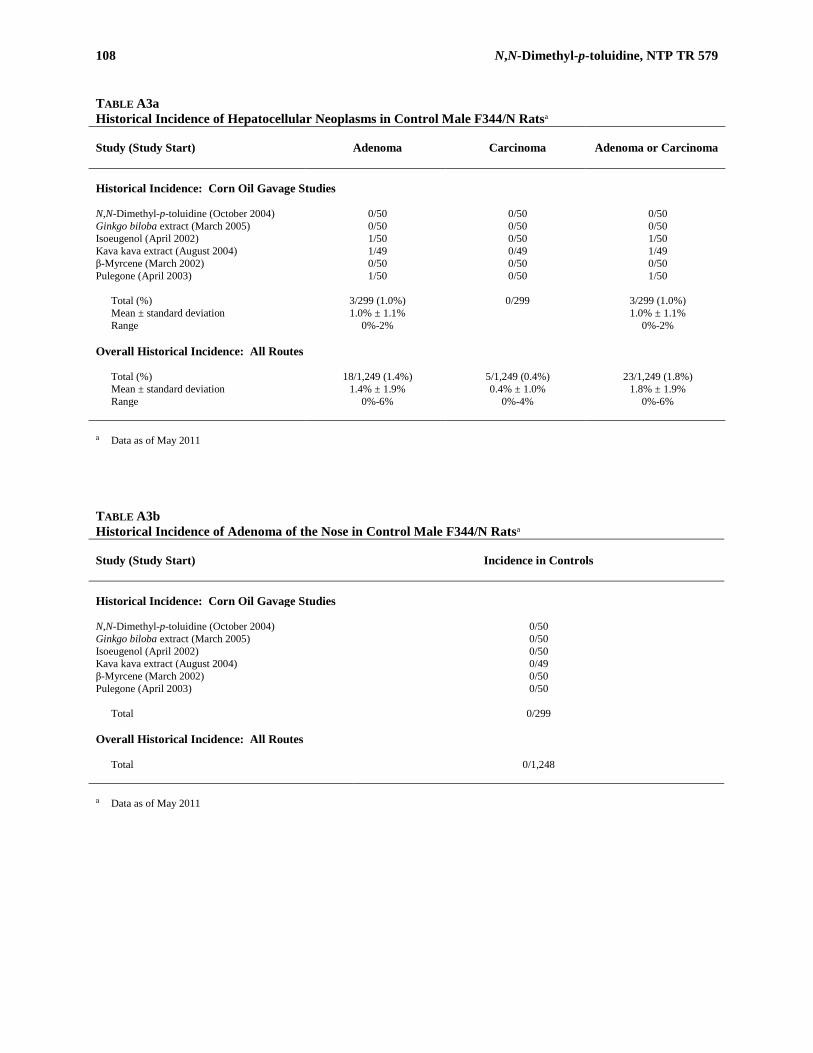
108 N,N-Dimethyl-p-toluidine, NTP TR 579
TABLE A3a Historical Incidence of Hepatocellular Neoplasms in Control Male F344/N Ratsa Study (Study Start)
Adenoma
Carcinoma
Adenoma or Carcinoma
Historical Incidence: Corn Oil Gavage Studies N,N-Dimethyl-p-toluidine (October 2004) 0/50 0/50 0/50 Ginkgo biloba extract (March 2005) 0/50 0/50 0/50 Isoeugenol (April 2002) 1/50 0/50 1/50 Kava kava extract (August 2004) 1/49 0/49 1/49 β-Myrcene (March 2002) 0/50 0/50 0/50 Pulegone (April 2003) 1/50 0/50 1/50
Total (%) 3/299 (1.0%) 0/299 3/299 (1.0%) Mean ± standard deviation 1.0% ± 1.1% 1.0% ± 1.1% Range 0%-2% 0%-2%
Overall Historical Incidence: All Routes
Total (%) 18/1,249 (1.4%) 5/1,249 (0.4%) 23/1,249 (1.8%) Mean ± standard deviation 1.4% ± 1.9% 0.4% ± 1.0% 1.8% ± 1.9% Range 0%-6% 0%-4% 0%-6%
a Data as of May 2011
TABLE A3b Historical Incidence of Adenoma of the Nose in Control Male F344/N Ratsa Study (Study Start)
Incidence in Controls
Historical Incidence: Corn Oil Gavage Studies N,N-Dimethyl-p-toluidine (October 2004) 0/50 Ginkgo biloba extract (March 2005) 0/50 Isoeugenol (April 2002) 0/50 Kava kava extract (August 2004) 0/49 β-Myrcene (March 2002) 0/50 Pulegone (April 2003) 0/50
Total 0/299 Overall Historical Incidence: All Routes
Total 0/1,248 a Data as of May 2011

N,N-Dimethyl-p-toluidine, NTP TR 579 109
TABLE A3c Historical Incidence of Follicular Cell Neoplasms of the Thyroid Gland in Control Male F344/N Ratsa Study (Study Start)
Adenoma
Carcinoma
Adenoma or Carcinoma
Historical Incidence: Corn Oil Gavage Studies N,N-Dimethyl-p-toluidine (October 2004) 1/50 0/50 1/50 Ginkgo biloba extract (March 2005) 2/50 0/50 2/50 Isoeugenol (April 2002) 1/50 1/50 2/50 Kava kava extract (August 2004) 1/49 0/49 1/49 β-Myrcene (March 2002) 1/50 2/50 3/50 Pulegone (April 2003) 0/50 0/50 0/50
Total (%) 6/299 (2.0%) 3/299 (1.0%) 9/299 (3.0%) Mean ± standard deviation 2.0% ± 1.3% 1.0% ± 1.7% 3.0% ± 2.1% Range 0%-4% 0%-4% 0%-6%
Overall Historical Incidence: All Routes
Total (%) 13/1,239 (1.1%) 10/1,239 (0.8%) 23/1,239 (1.9%) Mean ± standard deviation 1.0% ± 1.7% 0.8% ± 1.5% 1.9% ± 2.2% Range 0%-6% 0%-4% 0%-6%
a Data as of May 2011
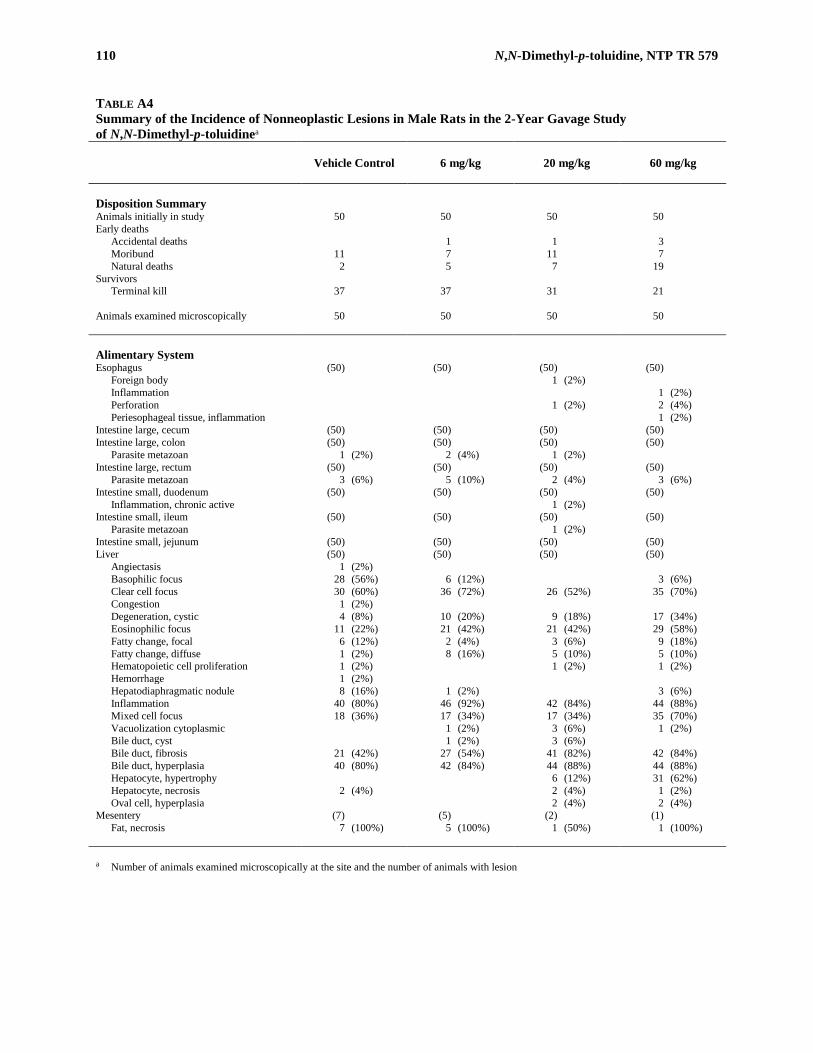
110 N,N-Dimethyl-p-toluidine, NTP TR 579
TABLE A4 Summary of the Incidence of Nonneoplastic Lesions in Male Rats in the 2-Year Gavage Study of N,N-Dimethyl-p-toluidinea
Vehicle Control
6 mg/kg
20 mg/kg
60 mg/kg
Disposition Summary Animals initially in study 50 50 50 50 Early deaths
Accidental deaths 1 1 3 Moribund 11 7 11 7 Natural deaths 2 5 7 19
Survivors Terminal kill 37 37 31 21
Animals examined microscopically 50 50 50 50 Alimentary System Esophagus (50) (50) (50) (50)
Foreign body 1 (2%) Inflammation 1 (2%) Perforation 1 (2%) 2 (4%) Periesophageal tissue, inflammation 1 (2%)
Intestine large, cecum (50) (50) (50) (50) Intestine large, colon (50) (50) (50) (50)
Parasite metazoan 1 (2%) 2 (4%) 1 (2%) Intestine large, rectum (50) (50) (50) (50)
Parasite metazoan 3 (6%) 5 (10%) 2 (4%) 3 (6%) Intestine small, duodenum (50) (50) (50) (50)
Inflammation, chronic active 1 (2%) Intestine small, ileum (50) (50) (50) (50)
Parasite metazoan 1 (2%) Intestine small, jejunum (50) (50) (50) (50) Liver (50) (50) (50) (50)
Angiectasis 1 (2%) Basophilic focus 28 (56%) 6 (12%) 3 (6%) Clear cell focus 30 (60%) 36 (72%) 26 (52%) 35 (70%) Congestion 1 (2%) Degeneration, cystic 4 (8%) 10 (20%) 9 (18%) 17 (34%) Eosinophilic focus 11 (22%) 21 (42%) 21 (42%) 29 (58%) Fatty change, focal 6 (12%) 2 (4%) 3 (6%) 9 (18%) Fatty change, diffuse 1 (2%) 8 (16%) 5 (10%) 5 (10%) Hematopoietic cell proliferation 1 (2%) 1 (2%) 1 (2%) Hemorrhage 1 (2%) Hepatodiaphragmatic nodule 8 (16%) 1 (2%) 3 (6%) Inflammation 40 (80%) 46 (92%) 42 (84%) 44 (88%) Mixed cell focus 18 (36%) 17 (34%) 17 (34%) 35 (70%) Vacuolization cytoplasmic 1 (2%) 3 (6%) 1 (2%) Bile duct, cyst 1 (2%) 3 (6%) Bile duct, fibrosis 21 (42%) 27 (54%) 41 (82%) 42 (84%) Bile duct, hyperplasia 40 (80%) 42 (84%) 44 (88%) 44 (88%) Hepatocyte, hypertrophy 6 (12%) 31 (62%) Hepatocyte, necrosis 2 (4%) 2 (4%) 1 (2%) Oval cell, hyperplasia 2 (4%) 2 (4%)
Mesentery (7) (5) (2) (1) Fat, necrosis 7 (100%) 5 (100%) 1 (50%) 1 (100%)
a Number of animals examined microscopically at the site and the number of animals with lesion
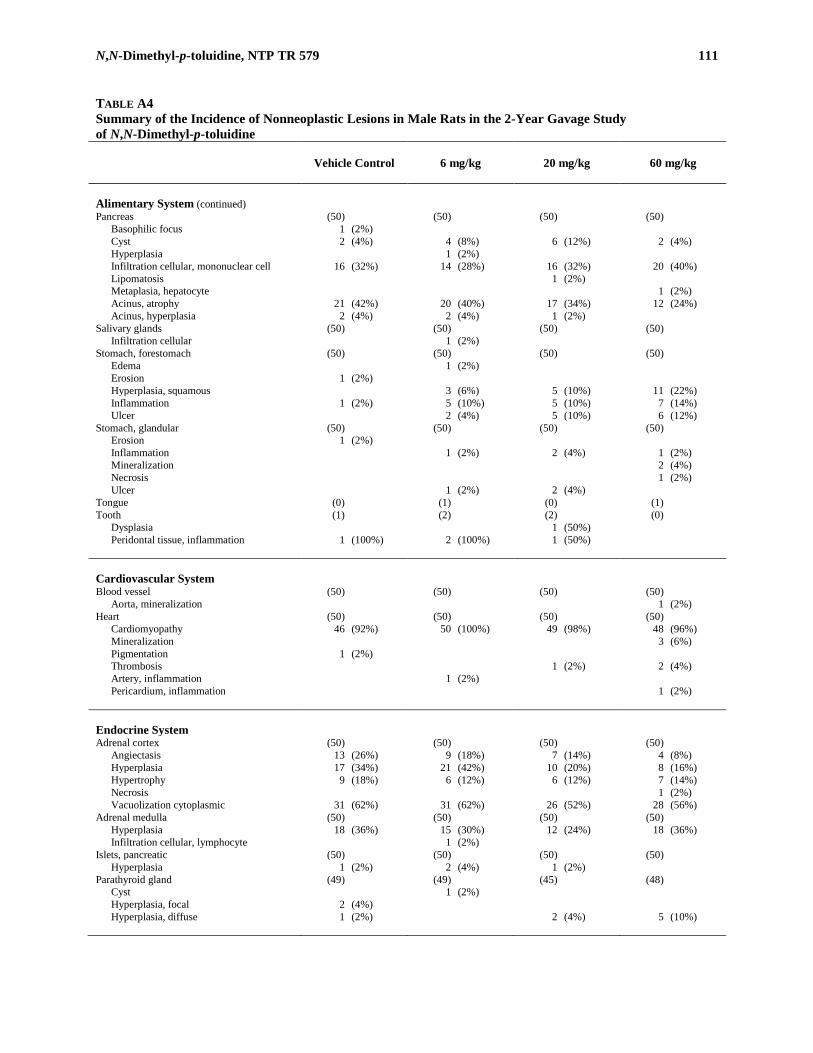
N,N-Dimethyl-p-toluidine, NTP TR 579 111
TABLE A4 Summary of the Incidence of Nonneoplastic Lesions in Male Rats in the 2-Year Gavage Study of N,N-Dimethyl-p-toluidine
Vehicle Control
6 mg/kg
20 mg/kg
60 mg/kg
Alimentary System (continued) Pancreas (50) (50) (50) (50)
Basophilic focus 1 (2%) Cyst 2 (4%) 4 (8%) 6 (12%) 2 (4%) Hyperplasia 1 (2%) Infiltration cellular, mononuclear cell 16 (32%) 14 (28%) 16 (32%) 20 (40%) Lipomatosis 1 (2%) Metaplasia, hepatocyte 1 (2%) Acinus, atrophy 21 (42%) 20 (40%) 17 (34%) 12 (24%) Acinus, hyperplasia 2 (4%) 2 (4%) 1 (2%)
Salivary glands (50) (50) (50) (50) Infiltration cellular 1 (2%)
Stomach, forestomach (50) (50) (50) (50) Edema 1 (2%) Erosion 1 (2%) Hyperplasia, squamous 3 (6%) 5 (10%) 11 (22%) Inflammation 1 (2%) 5 (10%) 5 (10%) 7 (14%) Ulcer 2 (4%) 5 (10%) 6 (12%)
Stomach, glandular (50) (50) (50) (50) Erosion 1 (2%) Inflammation 1 (2%) 2 (4%) 1 (2%) Mineralization 2 (4%) Necrosis 1 (2%) Ulcer 1 (2%) 2 (4%)
Tongue (0) (1) (0) (1) Tooth (1) (2) (2) (0)
Dysplasia 1 (50%) Peridontal tissue, inflammation 1 (100%) 2 (100%) 1 (50%)
Cardiovascular System Blood vessel (50) (50) (50) (50)
Aorta, mineralization 1 (2%) Heart (50) (50) (50) (50)
Cardiomyopathy 46 (92%) 50 (100%) 49 (98%) 48 (96%) Mineralization 3 (6%) Pigmentation 1 (2%) Thrombosis 1 (2%) 2 (4%) Artery, inflammation 1 (2%) Pericardium, inflammation 1 (2%)
Endocrine System Adrenal cortex (50) (50) (50) (50)
Angiectasis 13 (26%) 9 (18%) 7 (14%) 4 (8%) Hyperplasia 17 (34%) 21 (42%) 10 (20%) 8 (16%) Hypertrophy 9 (18%) 6 (12%) 6 (12%) 7 (14%) Necrosis 1 (2%) Vacuolization cytoplasmic 31 (62%) 31 (62%) 26 (52%) 28 (56%)
Adrenal medulla (50) (50) (50) (50) Hyperplasia 18 (36%) 15 (30%) 12 (24%) 18 (36%) Infiltration cellular, lymphocyte 1 (2%)
Islets, pancreatic (50) (50) (50) (50) Hyperplasia 1 (2%) 2 (4%) 1 (2%)
Parathyroid gland (49) (49) (45) (48) Cyst 1 (2%) Hyperplasia, focal 2 (4%) Hyperplasia, diffuse 1 (2%) 2 (4%) 5 (10%)

112 N,N-Dimethyl-p-toluidine, NTP TR 579
TABLE A4 Summary of the Incidence of Nonneoplastic Lesions in Male Rats in the 2-Year Gavage Study of N,N-Dimethyl-p-toluidine
Vehicle Control
6 mg/kg
20 mg/kg
60 mg/kg
Endocrine System (continued) Pituitary gland (50) (50) (50) (50)
Angiectasis 1 (2%) Cyst 1 (2%) 2 (4%) 2 (4%) 1 (2%) Pars distalis, cyst 1 (2%) Pars distalis, hemorrhage 1 (2%) Pars distalis, hyperplasia 15 (30%) 18 (36%) 15 (30%) 18 (36%)
Thyroid gland (50) (49) (50) (49) C-cell, hyperplasia 14 (28%) 20 (41%) 14 (28%) 5 (10%) Follicle, cyst 1 (2%) Follicular cell, hyperplasia 1 (2%)
General Body System Tissue NOS (0) (0) (2) (0) Genital System Coagulating gland (1) (2) (1) (0)
Inflammation 1 (100%) 2 (100%) Epithelium, hyperplasia 1 (100%) 1 (50%)
Epididymis (50) (50) (50) (50) Atypia cellular 1 (2%) Inflammation 1 (2%) 2 (4%) 2 (4%)
Preputial gland (50) (50) (50) (50) Cyst 1 (2%) Hyperplasia 1 (2%) 1 (2%) Inflammation 49 (98%) 49 (98%) 43 (86%) 45 (90%)
Prostate (50) (50) (50) (50) Inflammation 23 (46%) 28 (56%) 18 (36%) 16 (32%) Pigmentation 1 (2%) Epithelium, hyperplasia 2 (4%) 6 (12%) 2 (4%) 3 (6%)
Seminal vesicle (50) (50) (50) (50) Inflammation 1 (2%) 1 (2%) 1 (2%) Epithelium, hyperplasia 1 (2%) 1 (2%)
Testes (50) (50) (50) (50) Cyst 1 (2%) Mineralization 1 (2%) 1 (2%) 1 (2%) Interstitial cell, hyperplasia 16 (32%) 16 (32%) 6 (12%) 12 (24%)
Hematopoietic System Bone marrow (50) (50) (50) (50)
Hemorrhage 1 (2%) 4 (8%) Hyperplasia 17 (34%) 13 (26%) 28 (56%) 50 (100%) Myelofibrosis 1 (2%) Necrosis 1 (2%)
Lymph node (4) (3) (3) (7) Deep cervical, hyperplasia, plasma cell 1 (25%) Mediastinal, ectasia 2 (67%) 2 (67%) 3 (43%) Mediastinal, hemorrhage 1 (33%) Mediastinal, hyperplasia, lymphoid 1 (33%) 3 (43%) Mediastinal, hyperplasia, plasma cell 1 (33%) 1 (14%)

N,N-Dimethyl-p-toluidine, NTP TR 579 113
TABLE A4 Summary of the Incidence of Nonneoplastic Lesions in Male Rats in the 2-Year Gavage Study of N,N-Dimethyl-p-toluidine
Vehicle Control
6 mg/kg
20 mg/kg
60 mg/kg
Hematopoietic System (continued) Lymph node, mesenteric (50) (50) (50) (50)
Atrophy 1 (2%) Ectasia 2 (4%) Hyperplasia, lymphoid 2 (4%) 1 (2%) 1 (2%) Hyperplasia, plasma cell 1 (2%) Infiltration cellular, histiocyte 21 (42%) 23 (46%) 30 (60%) 34 (68%)
Spleen (50) (50) (50) (50) Congestion 1 (2%) 39 (78%) Hematopoietic cell proliferation 34 (68%) 44 (88%) 42 (84%) 44 (88%) Inflammation, suppurative 2 (4%) Pigmentation 36 (72%) 48 (96%) 47 (94%) 48 (96%) Capsule, fibrosis 1 (2%) 2 (4%) 46 (92%) Capsule, hemorrhage 1 (2%) Capsule, hypertrophy, mesothelium 1 (2%) 3 (6%) 39 (78%) Lymphoid follicle, atrophy 5 (10%) 2 (4%) 19 (38%) Red pulp, atrophy 1 (2%) 8 (16%)
Thymus (50) (48) (48) (47) Atrophy 44 (88%) 46 (96%) 44 (92%) 44 (94%) Hyperplasia, lymphoid 1 (2%)
Integumentary System Mammary gland (50) (50) (49) (50)
Cyst 1 (2%) Hyperplasia 2 (4%)
Skin (50) (50) (50) (50) Cyst epithelial inclusion 1 (2%) Inflammation 1 (2%)
Musculoskeletal System Bone (50) (50) (50) (50) Nervous System Brain (50) (50) (50) (50)
Demyelination 1 (2%) Hemorrhage 1 (2%)
Spinal cord (0) (1) (0) (0) Respiratory System Lung (50) (50) (50) (50)
Congestion 1 (2%) 3 (6%) Foreign body 1 (2%) Inflammation 2 (4%) 5 (10%) 6 (12%) 1 (2%) Mineralization 1 (2%) Alveolar epithelium, hyperplasia 8 (16%) 9 (18%) 6 (12%) 6 (12%) Alveolus, foreign body 1 (2%) Alveolus, infiltration cellular, histiocyte 14 (28%) 2 (4%) 5 (10%) 11 (22%) Alveolus, inflammation, suppurative 1 (2%)

114 N,N-Dimethyl-p-toluidine, NTP TR 579
TABLE A4 Summary of the Incidence of Nonneoplastic Lesions in Male Rats in the 2-Year Gavage Study of N,N-Dimethyl-p-toluidine
Vehicle Control
6 mg/kg
20 mg/kg
60 mg/kg
Respiratory System (continued) Nose (50) (49) (50) (49)
Foreign body 13 (26%) 17 (35%) 11 (22%) 9 (18%) Inflammation 35 (70%) 40 (82%) 38 (76%) 48 (98%) Glands, olfactory epithelium, dilatation 3 (6%) 49 (100%) Glands, olfactory epithelium, hyperplasia 2 (4%) 48 (98%) Glands, olfactory epithelium, metaplasia 38 (78%) Glands, olfactory epithelium, necrosis 22 (45%) Glands, respiratory epithelium, dilatation 13 (26%) 15 (31%) 19 (38%) 48 (98%) Glands, respiratory epithelium,
hyperplasia 8 (16%) 8 (16%) 41 (84%) Glands, respiratory epithelium,
metaplasia, respiratory 29 (58%) 39 (80%) 39 (78%) 47 (96%) Glands, transitional epithelium, dilatation 5 (10%) 3 (6%) Glands, transitional epithelium,
hyperplasia 1 (2%) 24 (48%) 40 (82%) Nerve, atrophy 15 (31%) Olfactory epithelium, accumulation,
hyaline droplet 49 (98%) 44 (90%) 40 (80%) Olfactory epithelium, degeneration 1 (2%) 47 (96%) Olfactory epithelium, hyperplasia,
basal cell 1 (2%) 2 (4%) 38 (78%) Olfactory epithelium, metaplasia,
respiratory 4 (8%) 9 (18%) 9 (18%) 40 (82%) Respiratory epithelium, accumulation,
hyaline droplet 42 (84%) 35 (71%) 30 (60%) 8 (16%) Respiratory epithelium, hyperplasia 15 (30%) 29 (59%) 32 (64%) 49 (100%) Respiratory epithelium, ulcer 1 (2%) Squamous epithelium, cyst 1 (2%) Transitional epithelium, hyperplasia 1 (2%) 1 (2%) 11 (22%) 46 (94%)
Trachea (50) (50) (50) (50) Inflammation 3 (6%) 1 (2%) 1 (2%) 3 (6%) Perforation 1 (2%) Peritracheal tissue, inflammation 2 (4%)
Special Senses System Eye (50) (50) (50) (50)
Dysplasia 1 (2%) Inflammation 1 (2%) Cornea, hyperplasia 1 (2%) Cornea, inflammation 1 (2%) 1 (2%) Lens, degeneration 1 (2%) 1 (2%) Retina, atrophy 1 (2%) 1 (2%) 3 (6%)
Harderian gland (50) (50) (50) (50) Infiltration cellular, lymphoid 1 (2%) Inflammation 3 (6%) 6 (12%) 10 (20%)
Zymbal’s gland (49) (50) (50) (50) Hyperplasia 1 (2%) 1 (2%)

N,N-Dimethyl-p-toluidine, NTP TR 579 115
TABLE A4 Summary of the Incidence of Nonneoplastic Lesions in Male Rats in the 2-Year Gavage Study of N,N-Dimethyl-p-toluidine
Vehicle Control
6 mg/kg
20 mg/kg
60 mg/kg
Urinary System Kidney (50) (50) (50) (50)
Accumulation, hyaline droplet 2 (4%) 1 (2%) Cyst 1 (2%) 1 (2%) Mineralization 44 (88%) 37 (74%) 38 (76%) 49 (98%) Nephropathy 49 (98%) 49 (98%) 48 (96%) 49 (98%) Pigmentation 24 (48%) 46 (92%) 37 (74%) 44 (88%) Papilla, necrosis 2 (4%) Pelvis, dilatation 3 (6%) Pelvis, inflammation 3 (6%) 1 (2%) Pelvis, transitional epithelium, hyperplasia 1 (2%) 2 (4%) 6 (12%) 5 (10%)
Ureter (0) (0) (0) (1) Inflammation 1 (100%)
Urinary bladder (50) (50) (50) (50) Hemorrhage 1 (2%) 2 (4%) Inflammation 2 (4%) 2 (4%) 2 (4%) Ulcer 1 (2%) Transitional epithelium, necrosis 1 (2%)

116 N,N-Dimethyl-p-toluidine, NTP TR 579

117
APPENDIX B SUMMARY OF LESIONS IN FEMALE RATS
IN THE 2-YEAR GAVAGE STUDY OF N,N-DIMETHYL-p-TOLUIDINE
TABLE B1 Summary of the Incidence of Neoplasms in Female Rats in the 2-Year Gavage Study of N,N-Dimethyl-p-toluidine .............................................................. 118 TABLE B2 Statistical Analysis of Primary Neoplasms in Female Rats in the 2-Year Gavage Study of N,N-Dimethyl-p-toluidine .............................................................. 122 TABLE B3a Historical Incidence of Hepatocellular Neoplasms in Control Female F344/N Rats .................... 126 TABLE B3b Historical Incidence of Adenoma of the Nose in Control Female F344/N Rats ............................ 126 TABLE B4 Summary of the Incidence of Nonneoplastic Lesons in Female Rats in the 2-Year Gavage Study of N,N-Dimethyl-p-toluidine .............................................................. 127

118 N,N-Dimethyl-p-toluidine, NTP TR 579
TABLE B1 Summary of the Incidence of Neoplasms in Female Rats in the 2-Year Gavage Study of N,N-Dimethyl-p-toluidinea
Vehicle Control
6 mg/kg
20 mg/kg
60 mg/kg
Disposition Summary Animals initially in study 50 50 50 50 Early deaths
Accidental death 1 1 Moribund 14 3 8 8 Natural deaths 3 4 9 18
Survivors Terminal kill 33 42 33 23
Animals examined microscopically 50 50 50 50 Alimentary System Esophagus (50) (50) (50) (50) Intestine large, cecum (50) (50) (50) (50) Intestine large, colon (50) (50) (50) (50) Intestine large, rectum (50) (50) (50) (50) Intestine small, duodenum (50) (50) (50) (50) Intestine small, ileum (50) (50) (50) (50) Intestine small, jejunum (50) (50) (50) (50)
Leiomyosarcoma 1 (2%) Liver (50) (50) (50) (49)
Hepatocellular adenoma 1 (2%) 1 (2%) 3 (6%) Hepatocellular carcinoma 3 (6%) Hepatocellular carcinoma, multiple 1 (2%)
Mesentery (8) (9) (9) (3) Pancreas (50) (50) (50) (50) Salivary glands (50) (50) (50) (48) Stomach, forestomach (50) (50) (50) (50) Stomach, glandular (50) (50) (50) (50)
Neural crest tumor, metastatic, ear 1 (2%) Tongue (1) (0) (0) (2)
Squamous cell carcinoma 1 (50%) Squamous cell papilloma 1 (100)%) 1 (50%)
Tooth (0) (1) (0) (0) Cardiovascular System Blood vessel (50) (50) (50) (50) Heart (50) (50) (50) (50)
Endocrine System Adrenal cortex (50) (50) (50) (49)
Adenoma 3 (6%) 3 (6%) 1 (2%) 2 (4%) Adrenal medulla (50) (50) (50) (49)
Pheochromocytoma benign 2 (4%) 2 (4%) 1 (2%) 1 (2%) Pheochromocytoma malignant 1 (2%)
Islets, pancreatic (50) (50) (50) (50) Adenoma 1 (2%) Carcinoma 1 (2%)
Parathyroid gland (50) (50) (50) (46) Pituitary gland (50) (50) (50) (50)
Pars distalis, adenoma 31 (62%) 29 (58%) 30 (60%) 20 (40%) Thyroid gland (49) (47) (47) (45)
C-cell, adenoma 9 (18%) 3 (6%) 5 (11%) 2 (4%) C-cell, carcinoma 1 (2%) Follicular cell, adenoma 1 (2%) 1 (2%) 2 (4%)

N,N-Dimethyl-p-toluidine, NTP TR 579 119
TABLE B1 Summary of the Incidence of Neoplasms in Female Rats in the 2-Year Gavage Study of N,N-Dimethyl-p-toluidine
Vehicle Control
6 mg/kg
20 mg/kg
60 mg/kg
General Body System None
Genital System Clitoral gland (50) (49) (50) (50)
Adenoma 5 (10%) 3 (6%) 7 (14%) 2 (4%) Adenoma, multiple 1 (2%) Carcinoma 2 (4%) 2 (4%)
Ovary (50) (50) (50) (50) Granulosa cell tumor benign 1 (2%) Granulosa cell tumor malignant 2 (4%) 1 (2%) Bilateral, fibrosarcoma 1 (2%)
Uterus (50) (50) (50) (50) Adenocarcinoma 1 (2%) Adenoma 1 (2%) Polyp stromal 3 (6%) 9 (18%) 3 (6%) 8 (16%) Polyp stromal, multiple 1 (2%) Sarcoma stromal 1 (2%)
Vagina (1) (1) (0) (0) Polyp 1 (100%) Schwannoma malignant 1 (100%)
Hematopoietic System Bone marrow (50) (50) (50) (50) Lymph node (2) (1) (2) (1)
Deep cervical, sarcoma, metastatic, skin 1 (50%) Mediastinal, neural crest tumor,
metastatic, ear 1 (100%) Lymph node, mesenteric (50) (49) (50) (49) Spleen (50) (50) (50) (50) Thymus (47) (50) (50) (48)
Thymoma benign 1 (2%) Integumentary System Mammary gland (50) (50) (50) (50)
Carcinoma 1 (2%) 2 (4%) Carcinoma, multiple 1 (2%) Fibroadenoma 17 (34%) 11 (22%) 19 (38%) 11 (22%) Fibroadenoma, multiple 12 (24%) 15 (30%) 7 (14%)
Skin (50) (50) (50) (50) Basal cell adenoma 1 (2%) Basal cell carcinoma 1 (2%) 1 (2%) 1 (2%) Fibroma 1 (2%) 4 (8%) 1 (2%) Fibrosarcoma 2 (4%) Fibrosarcoma, multiple 1 (2%) Keratoacanthoma 1 (2%) 1 (2%) 1 (2%) Lipoma 1 (2%) Liposarcoma 1 (2%) 1 (2%) Sarcoma 1 (2%) 1 (2%) Schwannoma malignant 1 (2%) 1 (2%) Squamous cell papilloma 1 (2%) Trichoepithelioma 1 (2%)

120 N,N-Dimethyl-p-toluidine, NTP TR 579
TABLE B1 Summary of the Incidence of Neoplasms in Female Rats in the 2-Year Gavage Study of N,N-Dimethyl-p-toluidine
Vehicle Control
6 mg/kg
20 mg/kg
60 mg/kg
Musculoskeletal System Bone (50) (50) (50) (50)
Chordoma 1 (2%) Osteosarcoma 2 (4%)
Nervous System Brain (50) (50) (50) (50)
Oligodendroglioma malignant 1 (2%) Peripheral nerve (0) (0) (1) (0) Spinal cord (0) (0) (1) (0)
Respiratory System Lung (50) (50) (50) (50)
Alveolar/bronchiolar adenoma 1 (2%) 1 (2%) Fibrosarcoma, metastatic, skin 1 (2%) Neural creast tumor, metastatic, ear 1 (2%) Osteosarcoma, metastatic, bone 1 (2%) Sarcoma, metastatic, skin 1 (2%)
Nose (50) (49) (50) (49) Transitional epithelium, adenoma 1 (2%) 2 (4%)
Trachea (50) (50) (50) (50)
Special Senses System Ear (1) (0) (0) (1)
Neural crest tumor 1 (100%) 1 (100%) Eye (50) (50) (50) (50)
Melanoma benign 1 (2%) Harderian gland (50) (50) (50) (50) Lacrimal gland (0) (0) (0) (1) Urinary System Kidney (50) (50) (50) (50)
Carcinoma 1 (2%) Lipoma 1 (2%)
Urinary bladder (50) (50) (50) (50) Transitional epithelium, papilloma 1 (2%)
Systemic Lesions Multiple organsb (50) (50) (50) (50)
Leukemia mononuclear 15 (30%) 2 (4%) 1 (2%) 1 (2%)

N,N-Dimethyl-p-toluidine, NTP TR 579 121
TABLE B1 Summary of the Incidence of Neoplasms in Female Rats in the 2-Year Gavage Study of N,N-Dimethyl-p-toluidine
Vehicle Control
6 mg/kg
20 mg/kg
60 mg/kg
Neoplasm Summary Total animals with primary neoplasmsc 49 46 43 36
Total primary neoplasms 114 96 98 69 Total animals with benign neoplasms 46 44 42 33
Total benign neoplasms 89 87 84 55 Total animals with malignant neoplasms 23 9 12 11
Total malignant neoplasms 24 9 14 13 Total animals with metastatic neoplasms 1 1 2
Total metastatic neoplasms 1 2 4 Total animals with uncertain neoplasms-
benign or malignant 1 1 Total uncertain neoplasms 1 1
a Number of animals examined microscopically at the site and the number of animals with neoplasm b Number of animals with any tissue examined microscopically c Primary neoplasms: all neoplasms except metastatic neoplasms

122 N,N-Dimethyl-p-toluidine, NTP TR 579
TABLE B2 Statistical Analysis of Primary Neoplasms in Female Rats in the 2-Year Gavage Study of N,N-Dimethyl-p-toluidine
Vehicle Control
6 mg/kg
20 mg/kg
60 mg/kg
Adrenal Cortex: Adenoma Overall ratea 3/50 (6%) 3/50 (6%) 1/50 (2%) 2/49 (4%) Adjusted rateb 6.6% 6.4% 2.2% 5.2% Terminal ratec 3/33 (9%) 3/42 (7%) 0/33 (0%) 1/23 (4%) First incidence (days) 728 (T) 728 (T) 613 682 Poly-3 testd P=0.473N P=0.652N P=0.299N P=0.575N Clitoral Gland: Adenoma Overall rate 5/50 (10%) 3/49 (6%) 8/50 (16%) 2/50 (4%) Adjusted rate 10.8% 6.6% 17.2% 5.1% Terminal rate 3/33 (9%) 3/41 (7%) 5/33 (15%) 1/23 (4%) First incidence (days) 646 728 (T) 659 714 Poly-3 test P=0.344N P=0.362N P=0.280 P=0.286N Clitoral Gland: Adenoma or Carcinoma Overall rate 5/50 (10%) 5/49 (10%) 10/50 (20%) 2/50 (4%) Adjusted rate 10.8% 10.9% 21.3% 5.1% Terminal rate 3/33 (9%) 5/41 (12%) 6/33 (18%) 1/23 (4%) First incidence (days) 646 728 (T) 611 714 Poly-3 test P=0.267N P=0.624 P=0.136 P=0.286N Liver: Hepatocellular Adenoma Overall rate 0/50 (0%) 1/50 (2%) 1/50 (2%) 3/49 (6%) Adjusted rate 0.0% 2.1% 2.2% 7.8% Terminal rate 0/33 (0%) 1/42 (2%) 1/33 (3%) 2/23 (9%) First incidence (days) —e 728 (T) 728 (T) 720 Poly-3 test P=0.044 P=0.504 P=0.502 P=0.091 Liver: Hepatocellular Carcinoma Overall rate 0/50 (0%) 0/50 (0%) 0/50 (0%) 4/49 (8%) Adjusted rate 0.0% 0.0% 0.0% 10.4% Terminal rate 0/33 (0%) 0/42 (0%) 0/33 (0%) 4/23 (17%) First incidence (days) — — — 728 (T) Poly-3 test P<0.001 —f — P=0.041 Liver: Hepatocellular Adenoma or Carcinoma Overall rate 0/50 (0%) 1/50 (2%) 1/50 (2%) 7/49 (14%) Adjusted rate 0.0% 2.1% 2.2% 18.1% Terminal rate 0/33 (0%) 1/42 (2%) 1/33 (3%) 6/23 (26%) First incidence (days) — 728 (T) 728 (T) 720 Poly-3 test P<0.001 P=0.504 P=0.502 P=0.003 Mammary Gland: Fibroadenoma Overall rate 29/50 (58%) 26/50 (52%) 26/50 (52%) 11/50 (22%) Adjusted rate 60.4% 55.4% 54.5% 27.6% Terminal rate 18/33 (55%) 24/42 (57%) 17/33 (52%) 9/23 (39%) First incidence (days) 625 688 646 612 Poly-3 test P<0.001N P=0.385N P=0.349N P<0.001N Mammary Gland: Fibroadenoma or Carcinoma Overall rate 30/50 (60%) 27/50 (54%) 26/50 (52%) 11/50 (22%) Adjusted rate 61.9% 57.0% 54.5% 27.6% Terminal rate 18/33 (55%) 24/42 (57%) 17/33 (52%) 9/23 (39%) First incidence (days) 574 611 646 612 Poly-3 test P<0.001N P=0.392N P=0.297N P<0.001N
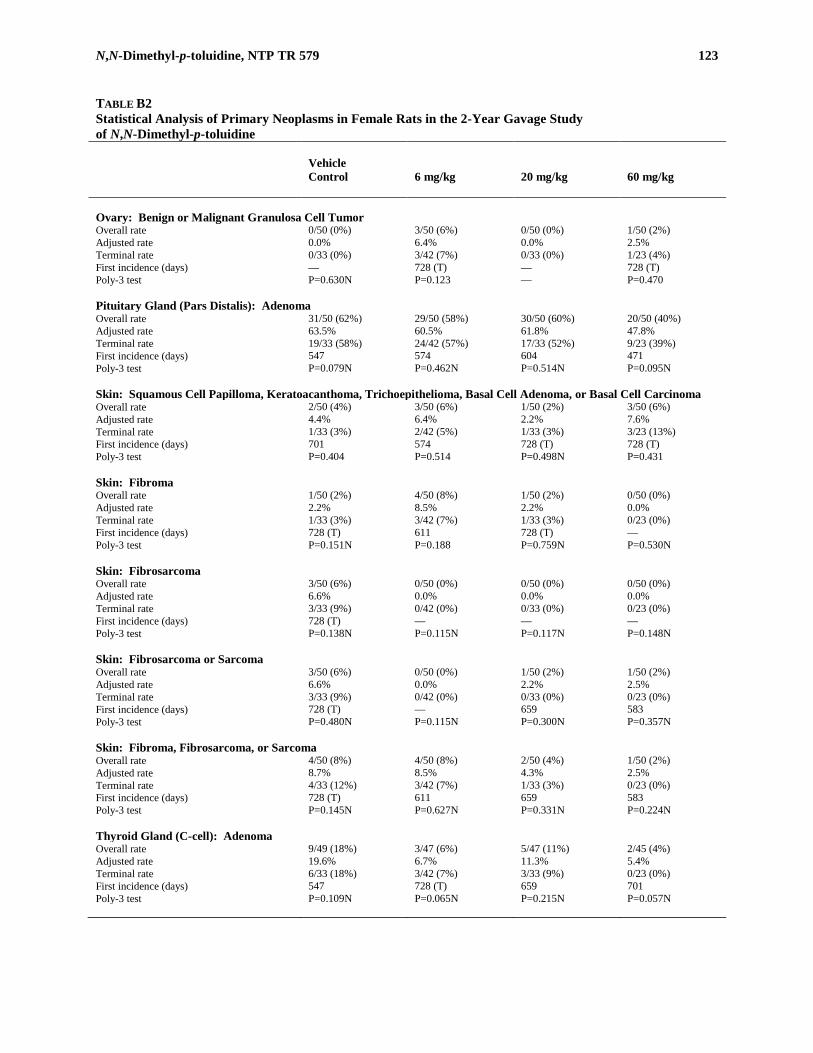
N,N-Dimethyl-p-toluidine, NTP TR 579 123
TABLE B2 Statistical Analysis of Primary Neoplasms in Female Rats in the 2-Year Gavage Study of N,N-Dimethyl-p-toluidine
Vehicle Control
6 mg/kg
20 mg/kg
60 mg/kg
Ovary: Benign or Malignant Granulosa Cell Tumor Overall rate 0/50 (0%) 3/50 (6%) 0/50 (0%) 1/50 (2%) Adjusted rate 0.0% 6.4% 0.0% 2.5% Terminal rate 0/33 (0%) 3/42 (7%) 0/33 (0%) 1/23 (4%) First incidence (days) — 728 (T) — 728 (T) Poly-3 test P=0.630N P=0.123 — P=0.470 Pituitary Gland (Pars Distalis): Adenoma Overall rate 31/50 (62%) 29/50 (58%) 30/50 (60%) 20/50 (40%) Adjusted rate 63.5% 60.5% 61.8% 47.8% Terminal rate 19/33 (58%) 24/42 (57%) 17/33 (52%) 9/23 (39%) First incidence (days) 547 574 604 471 Poly-3 test P=0.079N P=0.462N P=0.514N P=0.095N Skin: Squamous Cell Papilloma, Keratoacanthoma, Trichoepithelioma, Basal Cell Adenoma, or Basal Cell Carcinoma Overall rate 2/50 (4%) 3/50 (6%) 1/50 (2%) 3/50 (6%) Adjusted rate 4.4% 6.4% 2.2% 7.6% Terminal rate 1/33 (3%) 2/42 (5%) 1/33 (3%) 3/23 (13%) First incidence (days) 701 574 728 (T) 728 (T) Poly-3 test P=0.404 P=0.514 P=0.498N P=0.431 Skin: Fibroma Overall rate 1/50 (2%) 4/50 (8%) 1/50 (2%) 0/50 (0%) Adjusted rate 2.2% 8.5% 2.2% 0.0% Terminal rate 1/33 (3%) 3/42 (7%) 1/33 (3%) 0/23 (0%) First incidence (days) 728 (T) 611 728 (T) — Poly-3 test P=0.151N P=0.188 P=0.759N P=0.530N Skin: Fibrosarcoma Overall rate 3/50 (6%) 0/50 (0%) 0/50 (0%) 0/50 (0%) Adjusted rate 6.6% 0.0% 0.0% 0.0% Terminal rate 3/33 (9%) 0/42 (0%) 0/33 (0%) 0/23 (0%) First incidence (days) 728 (T) — — — Poly-3 test P=0.138N P=0.115N P=0.117N P=0.148N Skin: Fibrosarcoma or Sarcoma Overall rate 3/50 (6%) 0/50 (0%) 1/50 (2%) 1/50 (2%) Adjusted rate 6.6% 0.0% 2.2% 2.5% Terminal rate 3/33 (9%) 0/42 (0%) 0/33 (0%) 0/23 (0%) First incidence (days) 728 (T) — 659 583 Poly-3 test P=0.480N P=0.115N P=0.300N P=0.357N Skin: Fibroma, Fibrosarcoma, or Sarcoma Overall rate 4/50 (8%) 4/50 (8%) 2/50 (4%) 1/50 (2%) Adjusted rate 8.7% 8.5% 4.3% 2.5% Terminal rate 4/33 (12%) 3/42 (7%) 1/33 (3%) 0/23 (0%) First incidence (days) 728 (T) 611 659 583 Poly-3 test P=0.145N P=0.627N P=0.331N P=0.224N Thyroid Gland (C-cell): Adenoma Overall rate 9/49 (18%) 3/47 (6%) 5/47 (11%) 2/45 (4%) Adjusted rate 19.6% 6.7% 11.3% 5.4% Terminal rate 6/33 (18%) 3/42 (7%) 3/33 (9%) 0/23 (0%) First incidence (days) 547 728 (T) 659 701 Poly-3 test P=0.109N P=0.065N P=0.215N P=0.057N
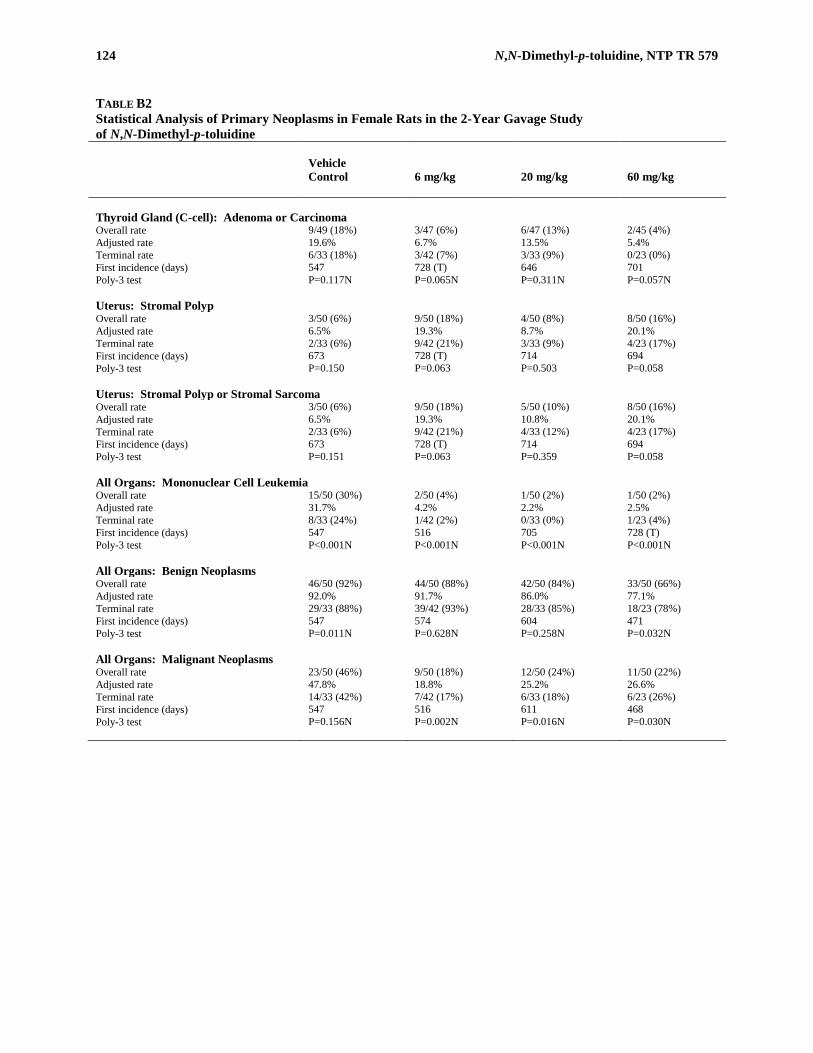
124 N,N-Dimethyl-p-toluidine, NTP TR 579
TABLE B2 Statistical Analysis of Primary Neoplasms in Female Rats in the 2-Year Gavage Study of N,N-Dimethyl-p-toluidine
Vehicle Control
6 mg/kg
20 mg/kg
60 mg/kg
Thyroid Gland (C-cell): Adenoma or Carcinoma Overall rate 9/49 (18%) 3/47 (6%) 6/47 (13%) 2/45 (4%) Adjusted rate 19.6% 6.7% 13.5% 5.4% Terminal rate 6/33 (18%) 3/42 (7%) 3/33 (9%) 0/23 (0%) First incidence (days) 547 728 (T) 646 701 Poly-3 test P=0.117N P=0.065N P=0.311N P=0.057N Uterus: Stromal Polyp Overall rate 3/50 (6%) 9/50 (18%) 4/50 (8%) 8/50 (16%) Adjusted rate 6.5% 19.3% 8.7% 20.1% Terminal rate 2/33 (6%) 9/42 (21%) 3/33 (9%) 4/23 (17%) First incidence (days) 673 728 (T) 714 694 Poly-3 test P=0.150 P=0.063 P=0.503 P=0.058 Uterus: Stromal Polyp or Stromal Sarcoma Overall rate 3/50 (6%) 9/50 (18%) 5/50 (10%) 8/50 (16%) Adjusted rate 6.5% 19.3% 10.8% 20.1% Terminal rate 2/33 (6%) 9/42 (21%) 4/33 (12%) 4/23 (17%) First incidence (days) 673 728 (T) 714 694 Poly-3 test P=0.151 P=0.063 P=0.359 P=0.058 All Organs: Mononuclear Cell Leukemia Overall rate 15/50 (30%) 2/50 (4%) 1/50 (2%) 1/50 (2%) Adjusted rate 31.7% 4.2% 2.2% 2.5% Terminal rate 8/33 (24%) 1/42 (2%) 0/33 (0%) 1/23 (4%) First incidence (days) 547 516 705 728 (T) Poly-3 test P<0.001N P<0.001N P<0.001N P<0.001N All Organs: Benign Neoplasms Overall rate 46/50 (92%) 44/50 (88%) 42/50 (84%) 33/50 (66%) Adjusted rate 92.0% 91.7% 86.0% 77.1% Terminal rate 29/33 (88%) 39/42 (93%) 28/33 (85%) 18/23 (78%) First incidence (days) 547 574 604 471 Poly-3 test P=0.011N P=0.628N P=0.258N P=0.032N All Organs: Malignant Neoplasms Overall rate 23/50 (46%) 9/50 (18%) 12/50 (24%) 11/50 (22%) Adjusted rate 47.8% 18.8% 25.2% 26.6% Terminal rate 14/33 (42%) 7/42 (17%) 6/33 (18%) 6/23 (26%) First incidence (days) 547 516 611 468 Poly-3 test P=0.156N P=0.002N P=0.016N P=0.030N
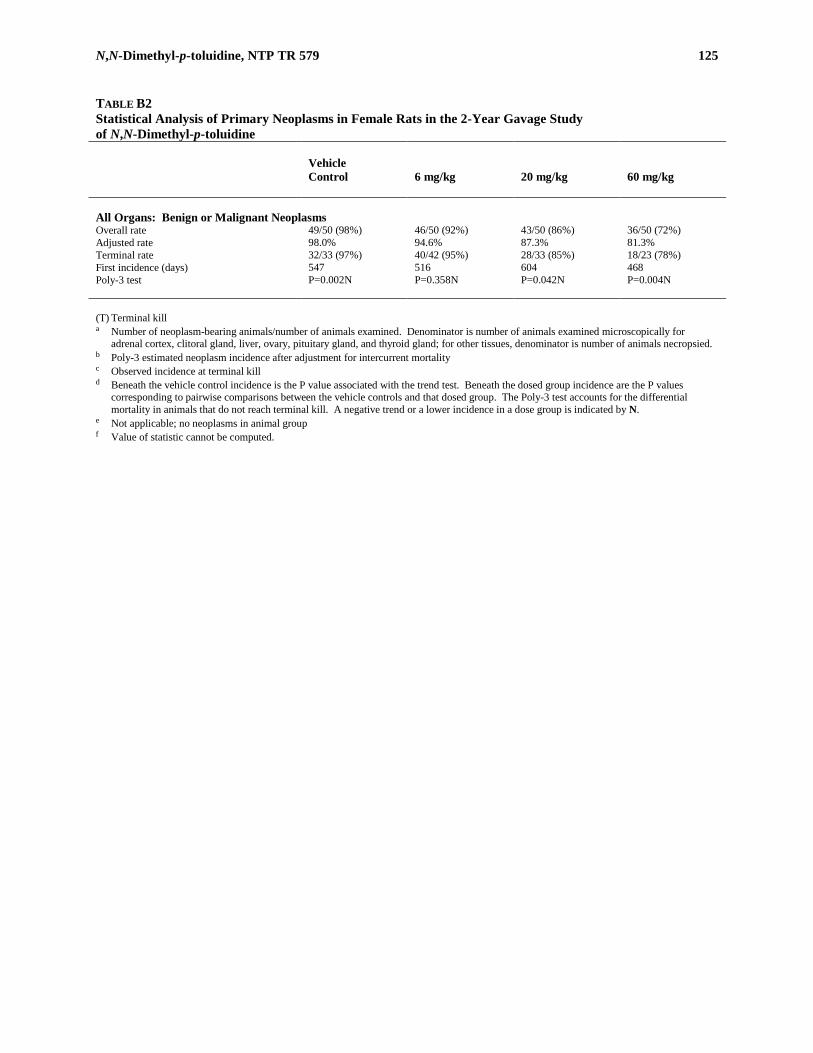
N,N-Dimethyl-p-toluidine, NTP TR 579 125
TABLE B2 Statistical Analysis of Primary Neoplasms in Female Rats in the 2-Year Gavage Study of N,N-Dimethyl-p-toluidine
Vehicle Control
6 mg/kg
20 mg/kg
60 mg/kg
All Organs: Benign or Malignant Neoplasms Overall rate 49/50 (98%) 46/50 (92%) 43/50 (86%) 36/50 (72%) Adjusted rate 98.0% 94.6% 87.3% 81.3% Terminal rate 32/33 (97%) 40/42 (95%) 28/33 (85%) 18/23 (78%) First incidence (days) 547 516 604 468 Poly-3 test P=0.002N P=0.358N P=0.042N P=0.004N (T) Terminal kill a Number of neoplasm-bearing animals/number of animals examined. Denominator is number of animals examined microscopically for
adrenal cortex, clitoral gland, liver, ovary, pituitary gland, and thyroid gland; for other tissues, denominator is number of animals necropsied. b Poly-3 estimated neoplasm incidence after adjustment for intercurrent mortality c Observed incidence at terminal kill d Beneath the vehicle control incidence is the P value associated with the trend test. Beneath the dosed group incidence are the P values
corresponding to pairwise comparisons between the vehicle controls and that dosed group. The Poly-3 test accounts for the differential mortality in animals that do not reach terminal kill. A negative trend or a lower incidence in a dose group is indicated by N.
e Not applicable; no neoplasms in animal group f Value of statistic cannot be computed.

126 N,N-Dimethyl-p-toluidine, NTP TR 579
TABLE B3a Historical Incidence of Hepatocellular Neoplasms in Control Female F344/N Ratsa Study (Study Start)
Adenoma
Carcinoma
Adenoma or Carcinoma
Historical Incidence: Corn Oil Gavage Studies N,N-Dimethyl-p-toluidine (October 2004) 0/50 0/50 0/50 Ginkgo biloba extract (March 2005) 0/50 0/50 0/50 Isoeugenol (April 2002) 0/50 0/50 0/50 Kava kava extract (August 2004) 0/50 0/50 0/50 β-Myrcene (March 2002) 0/50 0/50 0/50 Pulegone (April 2003) 1/50 0/50 1/50
Total (%) 1/300 (0.3%) 0/300 1/300 (0.3%) Mean ± standard deviation 0.3% ± 0.8% 0.3% ± 0.8% Range 0%-2% 0%-2%
Overall Historical Incidence: All Routes
Total (%) 11/1,200 (0.9%) 1/1,200 (0.1%) 12/1,200 (1.0%) Mean ± standard deviation 0.9% ± 1.6% 0.1% ± 0.4% 1.0% ± 1.6% Range 0%-4% 0%-2% 0%-4%
a Data as of May 2011
TABLE B3b Historical Incidence of Adenoma of the Nose in Control Female F344/N Ratsa Study (Study Start)
Incidence in Controls
Historical Incidence: Corn Oil Gavage Studies N,N-Dimethyl-p-toluidine (October 2004) 0/50 Ginkgo biloba extract (March 2005) 0/49 Isoeugenol (April 2002) 0/50 Kava kava extract (August 2004) 0/50 β-Myrcene (March 2002) 0/50 Pulegone (April 2003) 0/50
Total 0/299 Overall Historical Incidence: All Routes
Total (%) 1/1,196 (0.1%) Mean ± standard deviation 0.1% ± 0.4% Range 0%-2%
a Data as of May 2011
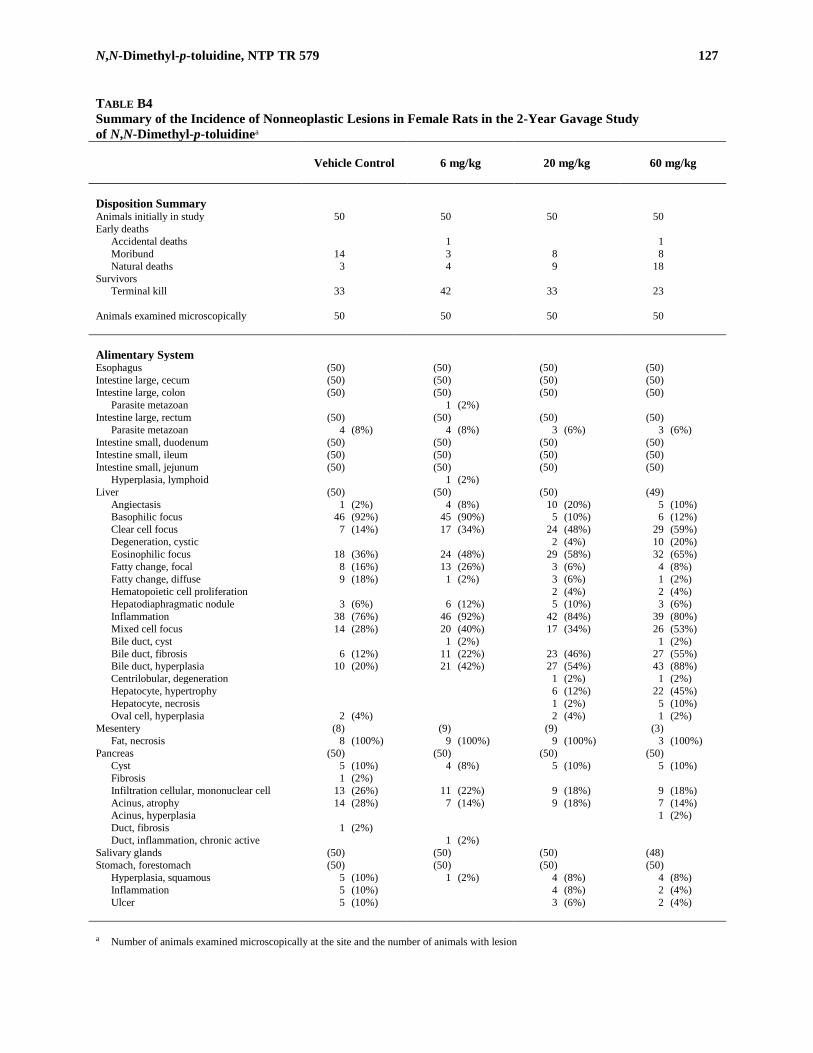
N,N-Dimethyl-p-toluidine, NTP TR 579 127
TABLE B4 Summary of the Incidence of Nonneoplastic Lesions in Female Rats in the 2-Year Gavage Study of N,N-Dimethyl-p-toluidinea
Vehicle Control
6 mg/kg
20 mg/kg
60 mg/kg
Disposition Summary Animals initially in study 50 50 50 50 Early deaths
Accidental deaths 1 1 Moribund 14 3 8 8 Natural deaths 3 4 9 18
Survivors Terminal kill 33 42 33 23
Animals examined microscopically 50 50 50 50 Alimentary System Esophagus (50) (50) (50) (50) Intestine large, cecum (50) (50) (50) (50) Intestine large, colon (50) (50) (50) (50)
Parasite metazoan 1 (2%) Intestine large, rectum (50) (50) (50) (50)
Parasite metazoan 4 (8%) 4 (8%) 3 (6%) 3 (6%) Intestine small, duodenum (50) (50) (50) (50) Intestine small, ileum (50) (50) (50) (50) Intestine small, jejunum (50) (50) (50) (50)
Hyperplasia, lymphoid 1 (2%) Liver (50) (50) (50) (49)
Angiectasis 1 (2%) 4 (8%) 10 (20%) 5 (10%) Basophilic focus 46 (92%) 45 (90%) 5 (10%) 6 (12%) Clear cell focus 7 (14%) 17 (34%) 24 (48%) 29 (59%) Degeneration, cystic 2 (4%) 10 (20%) Eosinophilic focus 18 (36%) 24 (48%) 29 (58%) 32 (65%) Fatty change, focal 8 (16%) 13 (26%) 3 (6%) 4 (8%) Fatty change, diffuse 9 (18%) 1 (2%) 3 (6%) 1 (2%) Hematopoietic cell proliferation 2 (4%) 2 (4%) Hepatodiaphragmatic nodule 3 (6%) 6 (12%) 5 (10%) 3 (6%) Inflammation 38 (76%) 46 (92%) 42 (84%) 39 (80%) Mixed cell focus 14 (28%) 20 (40%) 17 (34%) 26 (53%) Bile duct, cyst 1 (2%) 1 (2%) Bile duct, fibrosis 6 (12%) 11 (22%) 23 (46%) 27 (55%) Bile duct, hyperplasia 10 (20%) 21 (42%) 27 (54%) 43 (88%) Centrilobular, degeneration 1 (2%) 1 (2%) Hepatocyte, hypertrophy 6 (12%) 22 (45%) Hepatocyte, necrosis 1 (2%) 5 (10%) Oval cell, hyperplasia 2 (4%) 2 (4%) 1 (2%)
Mesentery (8) (9) (9) (3) Fat, necrosis 8 (100%) 9 (100%) 9 (100%) 3 (100%)
Pancreas (50) (50) (50) (50) Cyst 5 (10%) 4 (8%) 5 (10%) 5 (10%) Fibrosis 1 (2%) Infiltration cellular, mononuclear cell 13 (26%) 11 (22%) 9 (18%) 9 (18%) Acinus, atrophy 14 (28%) 7 (14%) 9 (18%) 7 (14%) Acinus, hyperplasia 1 (2%) Duct, fibrosis 1 (2%) Duct, inflammation, chronic active 1 (2%)
Salivary glands (50) (50) (50) (48) Stomach, forestomach (50) (50) (50) (50)
Hyperplasia, squamous 5 (10%) 1 (2%) 4 (8%) 4 (8%) Inflammation 5 (10%) 4 (8%) 2 (4%) Ulcer 5 (10%) 3 (6%) 2 (4%)
a Number of animals examined microscopically at the site and the number of animals with lesion

128 N,N-Dimethyl-p-toluidine, NTP TR 579
TABLE B4 Summary of the Incidence of Nonneoplastic Lesions in Female Rats in the 2-Year Gavage Study of N,N-Dimethyl-p-toluidine
Vehicle Control
6 mg/kg
20 mg/kg
60 mg/kg
Alimentary System (continued) Stomach, glandular (50) (50) (50) (50)
Inflammation 1 (2%) Mineralization 1 (2%) Ulcer 1 (2%)
Tongue (1) (0) (0) (2) Tooth (0) (1) (0) (0)
Peridontal tissue, inflammation 1 (100%) Cardiovascular System Blood vessel (50) (50) (50) (50) Heart (50) (50) (50) (50)
Cardiomyopathy 36 (72%) 42 (84%) 40 (80%) 42 (84%) Pigmentation 1 (2%) Thrombosis 1 (2%) Endocardium, hyperplasia 1 (2%)
Endocrine System Adrenal cortex (50) (50) (50) (49)
Angiectasis 39 (78%) 42 (84%) 43 (86%) 34 (69%) Degeneration, cystic 8 (16%) 5 (10%) 5 (10%) 3 (6%) Hyperplasia 26 (52%) 24 (48%) 28 (56%) 12 (24%) Hypertrophy 11 (22%) 10 (20%) 12 (24%) 8 (16%) Necrosis 1 (2%) 1 (2%) Pigmentation 1 (2%) Vacuolization cytoplasmic 26 (52%) 26 (52%) 26 (52%) 18 (37%)
Adrenal medulla (50) (50) (50) (49) Atrophy 1 (2%) Hyperplasia 4 (8%) 3 (6%) 1 (2%) 5 (10%)
Islets, pancreatic (50) (50) (50) (50) Parathyroid gland (50) (50) (50) (46)
Hyperplasia, focal 1 (2%) Hyperplasia, diffuse 1 (2%) 2 (4%) 2 (4%) 5 (11%)
Pituitary gland (50) (50) (50) (50) Cyst 11 (22%) 20 (40%) 15 (30%) 4 (8%) Fibrosis 1 (2%) Pigmentation 1 (2%) Pars distalis, angiectasis 1 (2%) 1 (2%) Pars distalis, cyst 4 (8%) 2 (4%) 1 (2%) Pars distalis, hyperplasia 14 (28%) 17 (34%) 15 (30%) 17 (34%)
Thyroid gland (49) (47) (47) (45) C-cell, hyperplasia 29 (59%) 33 (70%) 15 (32%) 4 (9%) Follicle, cyst 1 (2%) Follicular cell, hyperplasia 1 (2%) 1 (2%)
General Body System None
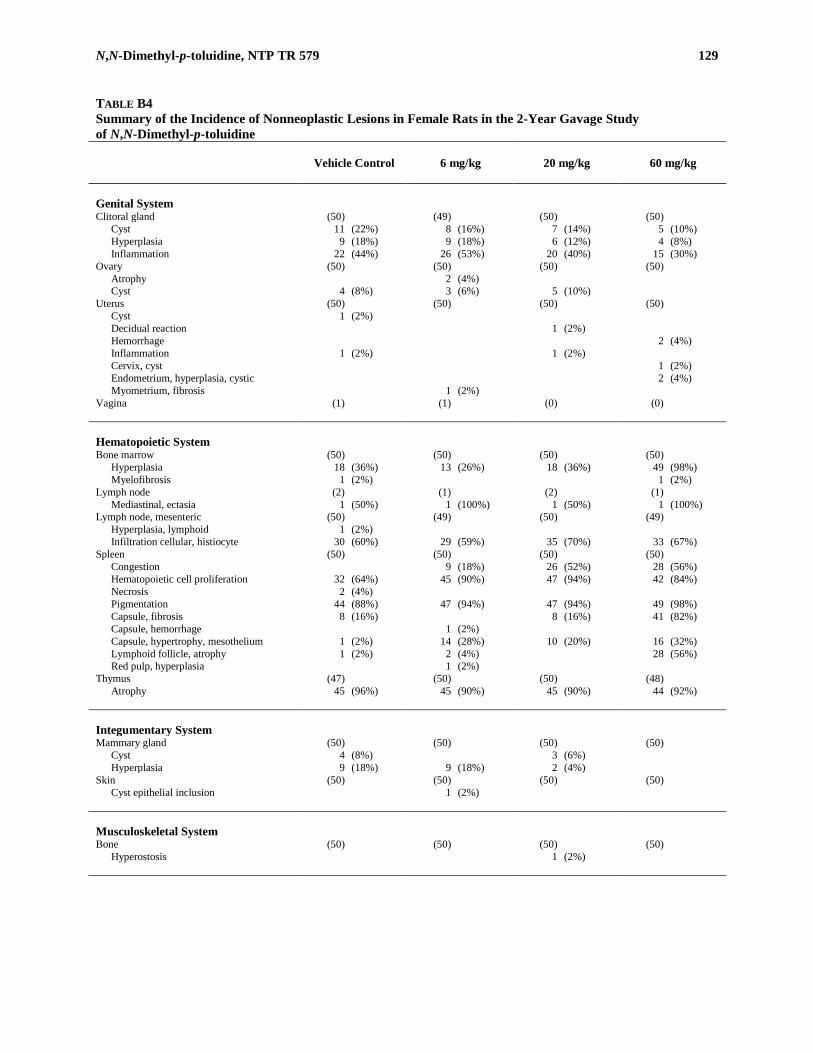
N,N-Dimethyl-p-toluidine, NTP TR 579 129
TABLE B4 Summary of the Incidence of Nonneoplastic Lesions in Female Rats in the 2-Year Gavage Study of N,N-Dimethyl-p-toluidine
Vehicle Control
6 mg/kg
20 mg/kg
60 mg/kg
Genital System Clitoral gland (50) (49) (50) (50)
Cyst 11 (22%) 8 (16%) 7 (14%) 5 (10%) Hyperplasia 9 (18%) 9 (18%) 6 (12%) 4 (8%) Inflammation 22 (44%) 26 (53%) 20 (40%) 15 (30%)
Ovary (50) (50) (50) (50) Atrophy 2 (4%) Cyst 4 (8%) 3 (6%) 5 (10%)
Uterus (50) (50) (50) (50) Cyst 1 (2%) Decidual reaction 1 (2%) Hemorrhage 2 (4%) Inflammation 1 (2%) 1 (2%) Cervix, cyst 1 (2%) Endometrium, hyperplasia, cystic 2 (4%) Myometrium, fibrosis 1 (2%)
Vagina (1) (1) (0) (0) Hematopoietic System Bone marrow (50) (50) (50) (50)
Hyperplasia 18 (36%) 13 (26%) 18 (36%) 49 (98%) Myelofibrosis 1 (2%) 1 (2%)
Lymph node (2) (1) (2) (1) Mediastinal, ectasia 1 (50%) 1 (100%) 1 (50%) 1 (100%)
Lymph node, mesenteric (50) (49) (50) (49) Hyperplasia, lymphoid 1 (2%) Infiltration cellular, histiocyte 30 (60%) 29 (59%) 35 (70%) 33 (67%)
Spleen (50) (50) (50) (50) Congestion 9 (18%) 26 (52%) 28 (56%) Hematopoietic cell proliferation 32 (64%) 45 (90%) 47 (94%) 42 (84%) Necrosis 2 (4%) Pigmentation 44 (88%) 47 (94%) 47 (94%) 49 (98%) Capsule, fibrosis 8 (16%) 8 (16%) 41 (82%) Capsule, hemorrhage 1 (2%) Capsule, hypertrophy, mesothelium 1 (2%) 14 (28%) 10 (20%) 16 (32%) Lymphoid follicle, atrophy 1 (2%) 2 (4%) 28 (56%) Red pulp, hyperplasia 1 (2%)
Thymus (47) (50) (50) (48) Atrophy 45 (96%) 45 (90%) 45 (90%) 44 (92%)
Integumentary System Mammary gland (50) (50) (50) (50)
Cyst 4 (8%) 3 (6%) Hyperplasia 9 (18%) 9 (18%) 2 (4%)
Skin (50) (50) (50) (50) Cyst epithelial inclusion 1 (2%)
Musculoskeletal System Bone (50) (50) (50) (50)
Hyperostosis 1 (2%)

130 N,N-Dimethyl-p-toluidine, NTP TR 579
TABLE B4 Summary of the Incidence of Nonneoplastic Lesions in Female Rats in the 2-Year Gavage Study of N,N-Dimethyl-p-toluidine
Vehicle Control
6 mg/kg
20 mg/kg
60 mg/kg
Nervous System Brain (50) (50) (50) (50)
Hemorrhage 1 (2%) 1 (2%) Hydrocephalus 1 (2%)
Peripheral nerve (0) (0) (1) (0) Spinal cord (0) (0) (1) (0) Respiratory System Lung (50) (50) (50) (50)
Congestion 2 (4%) Fibrosis 1 (2%) Inflammation 3 (6%) 1 (2%) Metaplasia, squamous 2 (4%) Alveolar epithelium, hyperplasia 5 (10%) 2 (4%) 2 (4%) 2 (4%) Alveolus, infiltration cellular, histiocyte 11 (22%) 10 (20%) 11 (22%) 17 (34%)
Nose (50) (49) (50) (49) Foreign body 3 (6%) 8 (16%) 1 (2%) 4 (8%) Inflammation 23 (46%) 24 (49%) 22 (44%) 45 (92%) Glands, hyperplasia 1 (2%) Glands, olfactory epithelium, dilatation 48 (98%) Glands, olfactory epithelium, hyperplasia 4 (8%) 47 (96%) Glands, olfactory epithelium, metaplasia 42 (86%) Glands, olfactory epithelium, necrosis 18 (37%) Glands, respiratory epithelium, dilatation 5 (10%) 12 (24%) 27 (54%) 47 (96%) Glands, respiratory epithelium,
hyperplasia 6 (12%) 9 (18%) 22 (44%) 45 (92%) Glands, respiratory epithelium,
metaplasia, respiratory 17 (34%) 33 (67%) 44 (88%) 47 (96%) Glands, transitional epithelium, dilatation 9 (18%) Glands, transitional epithelium,
hyperplasia 4 (8%) 12 (24%) 24 (49%) Nasolacrimal duct, inflammation 1 (2%) Nerve, atrophy 4 (8%) Olfactory epithelium, accumulation,
hyaline droplet 43 (86%) 42 (86%) 38 (76%) Olfactory epithelium, degeneration 1 (2%) 46 (94%) Olfactory epithelium, hyperplasia,
basal cell 25 (51%) Olfactory epithelium, metaplasia,
respiratory 4 (8%) 6 (12%) 1 (2%) 21 (43%) Olfactory epithelium, metaplasia,
squamous 2 (4%) Respiratory epithelium, accumulation,
hyaline droplet 35 (70%) 30 (61%) 23 (46%) 2 (4%) Respiratory epithelium, hyperplasia 10 (20%) 13 (27%) 11 (22%) 41 (84%) Transitional epithelium, degeneration 1 (2%) Transitional epithelium, hyperplasia 1 (2%) 6 (12%) 33 (67%)
Trachea (50) (50) (50) (50) Inflammation 1 (2%) Inflammation, suppurative 1 (2%) Perforation 1 (2%)

N,N-Dimethyl-p-toluidine, NTP TR 579 131
TABLE B4 Summary of the Incidence of Nonneoplastic Lesions in Female Rats in the 2-Year Gavage Study of N,N-Dimethyl-p-toluidine
Vehicle Control
6 mg/kg
20 mg/kg
60 mg/kg
Special Senses System Ear (1) (0) (0) (1) Eye (50) (50) (50) (50)
Cataract 3 (6%) 2 (4%) 3 (6%) Ciliary body, cornea, inflammation 1 (2%) Cornea, degeneration 1 (2%) Retina, atrophy 2 (4%) 3 (6%) 3 (6%) 1 (2%)
Harderian gland (50) (50) (50) (50) Inflammation 6 (12%) 4 (8%) 2 (4%) 1 (2%)
Lacrimal gland (0) (0) (0) (1) Urinary System Kidney (50) (50) (50) (50)
Accumulation, hyaline droplet 25 (50%) 23 (46%) 5 (10%) 1 (2%) Calculus microscopic observation only 1 (2%) Cyst 1 (2%) 1 (2%) Infarct 4 (8%) 5 (10%) 2 (4%) Mineralization 33 (66%) 35 (70%) 35 (70%) 37 (74%) Nephropathy 28 (56%) 38 (76%) 38 (76%) 41 (82%) Pigmentation 41 (82%) 45 (90%) 43 (86%) 49 (98%) Papilla, fibrosis 1 (2%) 1 (2%) Papilla, inflammation 1 (2%) Papilla, necrosis 1 (2%) Pelvis, dilatation 1 (2%) Pelvis, inflammation 3 (6%) 3 (6%) 9 (18%) 5 (10%) Pelvis, transitional epithelium, hyperplasia 2 (4%) 3 (6%) 8 (16%) 6 (12%) Renal tubule, dilatation 1 (2%) Renal tubule, hyperplasia 1 (2%)
Urinary bladder (50) (50) (50) (50) Inflammation 1 (2%)

132 N,N-Dimethyl-p-toluidine, NTP TR 579
133
APPENDIX C SUMMARY OF LESIONS IN MALE MICE
IN THE 2-YEAR GAVAGE STUDY OF N,N-DIMETHYL-p-TOLUIDINE
TABLE C1 Summary of the Incidence of Neoplasms in Male Mice in the 2-Year Gavage Study of N,N-Dimethyl-p-toluidine .............................................................. 134 TABLE C2 Statistical Analysis of Primary Neoplasms in Male Mice in the 2-Year Gavage Study of N,N-Dimethyl-p-toluidine .............................................................. 138 TABLE C3a Historical Incidence of Liver Neoplasms in Control Male B6C3F1/N Mice ................................. 141 TABLE C3b Historical Incidence of Alveolar/bronchiolar Neoplasms in Control Male B6C3F1/N Mice ....... 142 TABLE C4 Summary of the Incidence of Nonneoplastic Lesons in Male Mice in the 2-Year Gavage Study of N,N-Dimethyl-p-toluidine .............................................................. 143
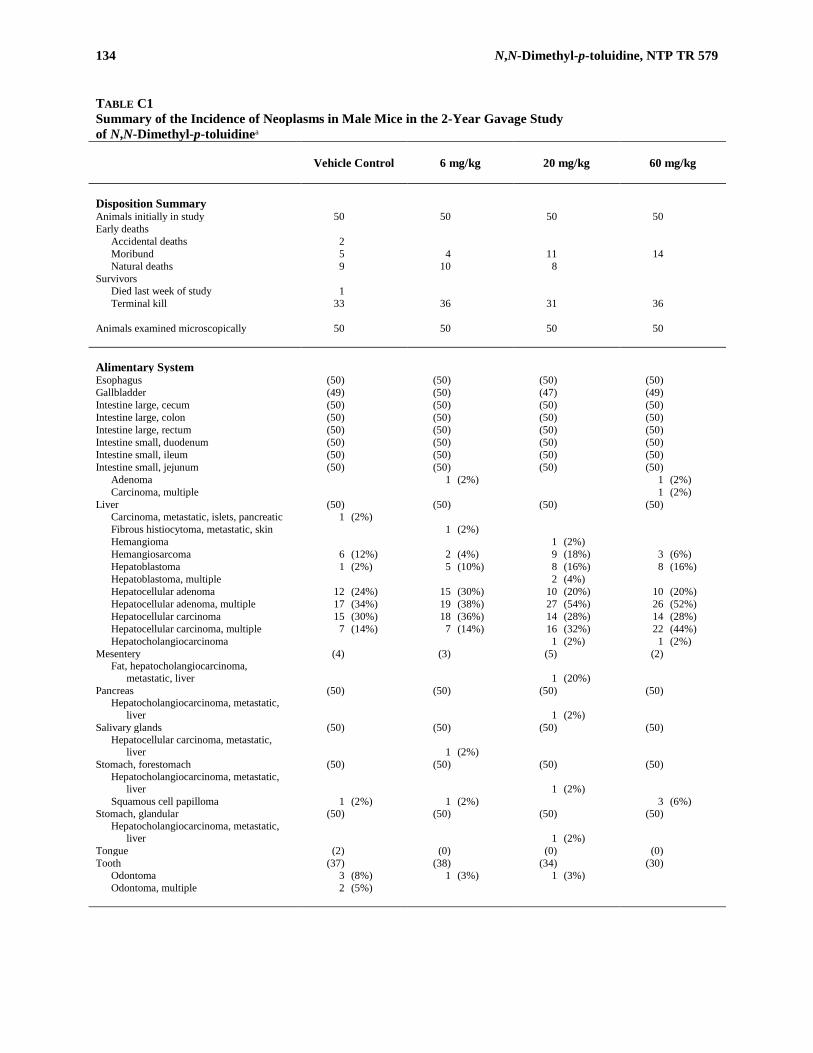
134 N,N-Dimethyl-p-toluidine, NTP TR 579
TABLE C1 Summary of the Incidence of Neoplasms in Male Mice in the 2-Year Gavage Study of N,N-Dimethyl-p-toluidinea
Vehicle Control
6 mg/kg
20 mg/kg
60 mg/kg
Disposition Summary Animals initially in study 50 50 50 50 Early deaths
Accidental deaths 2 Moribund 5 4 11 14 Natural deaths 9 10 8
Survivors Died last week of study 1 Terminal kill 33 36 31 36
Animals examined microscopically 50 50 50 50 Alimentary System Esophagus (50) (50) (50) (50) Gallbladder (49) (50) (47) (49) Intestine large, cecum (50) (50) (50) (50) Intestine large, colon (50) (50) (50) (50) Intestine large, rectum (50) (50) (50) (50) Intestine small, duodenum (50) (50) (50) (50) Intestine small, ileum (50) (50) (50) (50) Intestine small, jejunum (50) (50) (50) (50)
Adenoma 1 (2%) 1 (2%) Carcinoma, multiple 1 (2%)
Liver (50) (50) (50) (50) Carcinoma, metastatic, islets, pancreatic 1 (2%) Fibrous histiocytoma, metastatic, skin 1 (2%) Hemangioma 1 (2%) Hemangiosarcoma 6 (12%) 2 (4%) 9 (18%) 3 (6%) Hepatoblastoma 1 (2%) 5 (10%) 8 (16%) 8 (16%) Hepatoblastoma, multiple 2 (4%) Hepatocellular adenoma 12 (24%) 15 (30%) 10 (20%) 10 (20%) Hepatocellular adenoma, multiple 17 (34%) 19 (38%) 27 (54%) 26 (52%) Hepatocellular carcinoma 15 (30%) 18 (36%) 14 (28%) 14 (28%) Hepatocellular carcinoma, multiple 7 (14%) 7 (14%) 16 (32%) 22 (44%) Hepatocholangiocarcinoma 1 (2%) 1 (2%)
Mesentery (4) (3) (5) (2) Fat, hepatocholangiocarcinoma,
metastatic, liver 1 (20%) Pancreas (50) (50) (50) (50)
Hepatocholangiocarcinoma, metastatic, liver 1 (2%)
Salivary glands (50) (50) (50) (50) Hepatocellular carcinoma, metastatic,
liver 1 (2%) Stomach, forestomach (50) (50) (50) (50)
Hepatocholangiocarcinoma, metastatic, liver 1 (2%)
Squamous cell papilloma 1 (2%) 1 (2%) 3 (6%) Stomach, glandular (50) (50) (50) (50)
Hepatocholangiocarcinoma, metastatic, liver 1 (2%)
Tongue (2) (0) (0) (0) Tooth (37) (38) (34) (30)
Odontoma 3 (8%) 1 (3%) 1 (3%) Odontoma, multiple 2 (5%)

N,N-Dimethyl-p-toluidine, NTP TR 579 135
TABLE C1 Summary of the Incidence of Neoplasms in Male Mice in the 2-Year Gavage Study of N,N-Dimethyl-p-toluidine
Vehicle Control
6 mg/kg
20 mg/kg
60 mg/kg
Cardiovascular System Blood vessel (50) (50) (50) (50) Heart (50) (50) (50) (50)
Carcinoma, metastatic, Zymbal’s gland 1 (2%) Hemangiosarcoma 1 (2%)
Endocrine System Adrenal cortex (50) (50) (50) (50)
Adenoma 1 (2%) Bilateral, subscapular, adenoma 1 (2%) Subscapular, adenoma 3 (6%) 4 (8%) 1 (2%) 1 (2%)
Adrenal medulla (50) (50) (50) (50) Pheochromocytoma benign 1 (2%)
Islets, pancreatic (50) (50) (50) (50) Adenoma 1 (2%) 1 (2%) Adenoma, multiple 1 (2%) Carcinoma 1 (2%)
Parathyroid gland (40) (43) (45) (42) Pituitary gland (50) (50) (49) (50) Thyroid gland (50) (50) (50) (50)
Follicular cell, adenoma 1 (2%)
General Body System None
Genital System Coagulating gland (0) (1) (0) (0) Epididymis (50) (50) (50) (50)
Hemangiosarcoma 1 (2%) Preputial gland (50) (50) (50) (50) Prostate (50) (50) (50) (50)
Hepatocholangiocarcinoma, metastatic, liver 1 (2%)
Seminal vesicle (50) (50) (50) (50) Testes (50) (50) (50) (50) Hematopoietic System Bone marrow (50) (50) (50) (50)
Hemangiosarcoma 1 (2%) Lymph node (2) (3) (4) (0)
Mediastinal, hepatocholangiocarcinoma, metastatic, liver 1 (25%)
Pancreatic, hemangiosarcoma 1 (25%) Lymph node, mandibular (50) (50) (49) (50) Lymph node, mesenteric (50) (50) (49) (50)
Hemangiosarcoma 1 (2%) Hepatocholangiocarcinoma, metastatic,
liver 1 (2%) Spleen (48) (50) (49) (50)
Hemangiosarcoma 3 (6%) 1 (2%) 3 (6%) 1 (2%) Hemangiosarcoma, multiple 1 (2%)
Thymus (48) (48) (48) (49) Carcinoma, metastatic, Zymbal’s gland 1 (2%)

136 N,N-Dimethyl-p-toluidine, NTP TR 579
TABLE C1 Summary of the Incidence of Neoplasms in Male Mice in the 2-Year Gavage Study of N,N-Dimethyl-p-toluidine
Vehicle Control
6 mg/kg
20 mg/kg
60 mg/kg
Integumentary System Skin (50) (50) (50) (50)
Subcutaneous tissue, fibrosarcoma 1 (2%) Subcutaneous tissue, fibrous histiocytoma 1 (2%) Subcutaneous tissue, lipoma 1 (2%) 1 (2%) Subcutaneous tissue, melanoma malignant 1 (2%)
Musculoskeletal System Bone (50) (50) (50) (50) Skeletal muscle (0) (1) (2) (2)
Hemangiosarcoma 1 (50%) Hepatocholangiocarcinoma, metastatic,
liver 1 (50%) Sarcoma 1 (50%)
Nervous System Brain (50) (50) (50) (50)
Respiratory System Lung (50) (50) (50) (50)
Alveolar/bronchiolar adenoma 11 (22%) 11 (22%) 17 (34%) 10 (20%) Alveolar/bronchiolar adenoma, multiple 5 (10%) 1 (2%) Alveolar/bronchiolar carcinoma 2 (4%) 2 (4%) 4 (8%) Alveolar/bronchiolar carcinoma, multiple 1 (2%) Carcinoma, metastatic, harderian gland 1 (2%) Carcinoma, metastatic, Zymbal’s gland 1 (2%) Hemangiosarcoma 1 (2%) Hepatoblastoma, metastatic, liver 2 (4%) 4 (8%) 5 (10%) Hepatocellular carcinoma, metastatic,
liver 6 (12%) 5 (10%) 7 (14%) 3 (6%) Hepatocholangiocarcinoma, metastatic,
liver 1 (2%) Osteosarcoma, metastatic,
uncertain primary site 1 (2%) Bronchus, adenoma 1 (2%)
Nose (49) (50) (50) (50) Respiratory epithelium, adenoma 1 (2%)
Trachea (50) (50) (50) (50)
Special Senses System Ear (1) (0) (0) (0) Eye (50) (50) (50) (50) Harderian gland (50) (50) (50) (50)
Adenoma 10 (20%) 7 (14%) 4 (8%) 2 (4%) Carcinoma 1 (2%) 1 (2%) Bilateral, adenoma 1 (2%)
Zymbal’s gland (1) (0) (0) (0) Carcinoma 1 (100%)
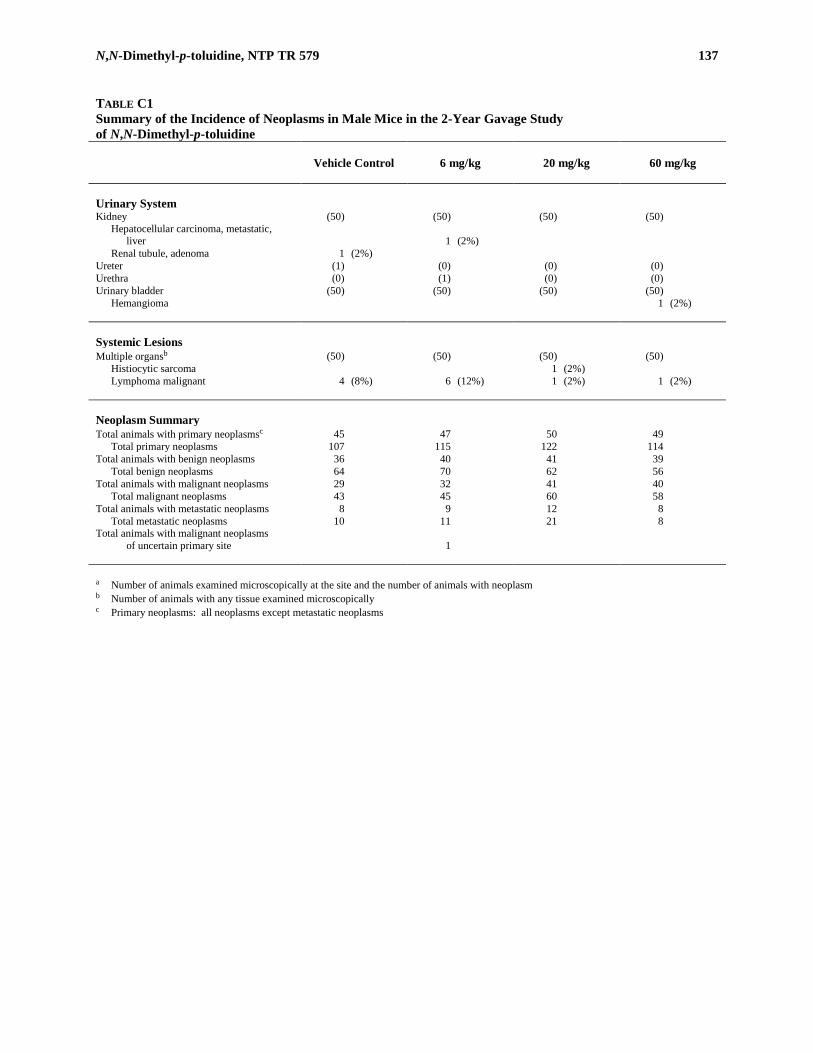
N,N-Dimethyl-p-toluidine, NTP TR 579 137
TABLE C1 Summary of the Incidence of Neoplasms in Male Mice in the 2-Year Gavage Study of N,N-Dimethyl-p-toluidine
Vehicle Control
6 mg/kg
20 mg/kg
60 mg/kg
Urinary System Kidney (50) (50) (50) (50)
Hepatocellular carcinoma, metastatic, liver 1 (2%)
Renal tubule, adenoma 1 (2%) Ureter (1) (0) (0) (0) Urethra (0) (1) (0) (0) Urinary bladder (50) (50) (50) (50)
Hemangioma 1 (2%)
Systemic Lesions Multiple organsb (50) (50) (50) (50)
Histiocytic sarcoma 1 (2%) Lymphoma malignant 4 (8%) 6 (12%) 1 (2%) 1 (2%)
Neoplasm Summary Total animals with primary neoplasmsc 45 47 50 49
Total primary neoplasms 107 115 122 114 Total animals with benign neoplasms 36 40 41 39
Total benign neoplasms 64 70 62 56 Total animals with malignant neoplasms 29 32 41 40
Total malignant neoplasms 43 45 60 58 Total animals with metastatic neoplasms 8 9 12 8
Total metastatic neoplasms 10 11 21 8 Total animals with malignant neoplasms
of uncertain primary site 1 a Number of animals examined microscopically at the site and the number of animals with neoplasm b Number of animals with any tissue examined microscopically c Primary neoplasms: all neoplasms except metastatic neoplasms
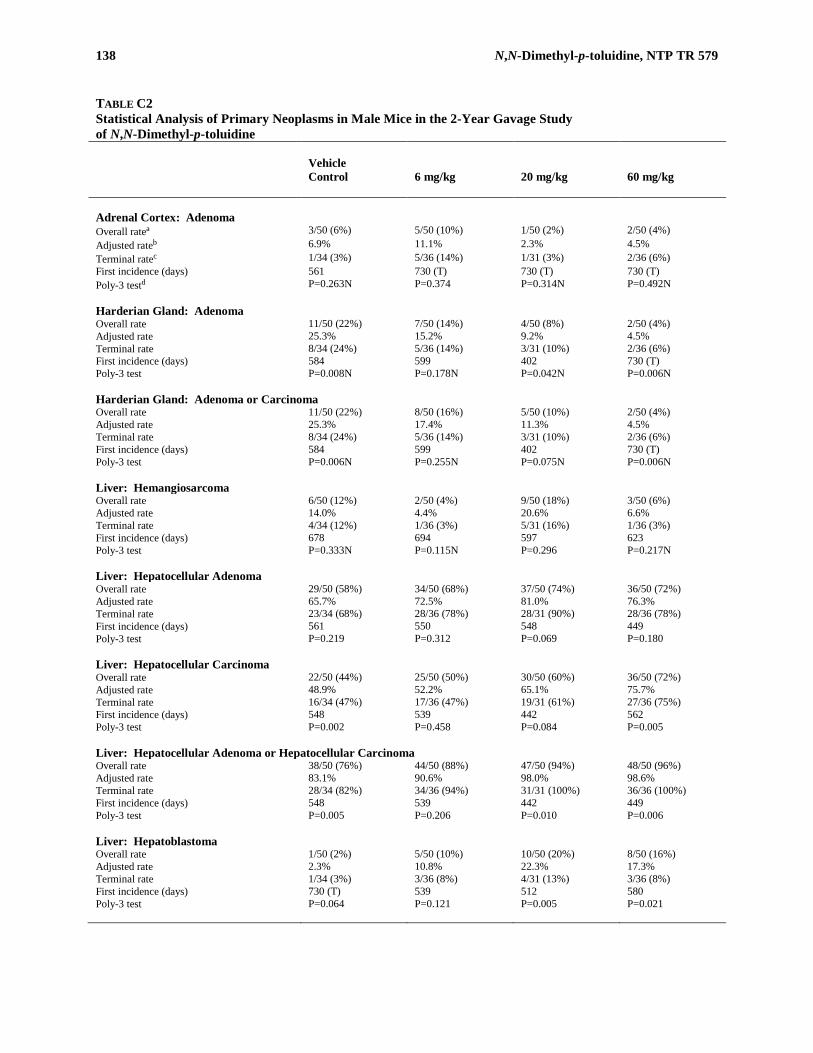
138 N,N-Dimethyl-p-toluidine, NTP TR 579
TABLE C2 Statistical Analysis of Primary Neoplasms in Male Mice in the 2-Year Gavage Study of N,N-Dimethyl-p-toluidine
Vehicle Control
6 mg/kg
20 mg/kg
60 mg/kg
Adrenal Cortex: Adenoma Overall ratea 3/50 (6%) 5/50 (10%) 1/50 (2%) 2/50 (4%) Adjusted rateb 6.9% 11.1% 2.3% 4.5% Terminal ratec 1/34 (3%) 5/36 (14%) 1/31 (3%) 2/36 (6%) First incidence (days) 561 730 (T) 730 (T) 730 (T) Poly-3 testd P=0.263N P=0.374 P=0.314N P=0.492N Harderian Gland: Adenoma Overall rate 11/50 (22%) 7/50 (14%) 4/50 (8%) 2/50 (4%) Adjusted rate 25.3% 15.2% 9.2% 4.5% Terminal rate 8/34 (24%) 5/36 (14%) 3/31 (10%) 2/36 (6%) First incidence (days) 584 599 402 730 (T) Poly-3 test P=0.008N P=0.178N P=0.042N P=0.006N Harderian Gland: Adenoma or Carcinoma Overall rate 11/50 (22%) 8/50 (16%) 5/50 (10%) 2/50 (4%) Adjusted rate 25.3% 17.4% 11.3% 4.5% Terminal rate 8/34 (24%) 5/36 (14%) 3/31 (10%) 2/36 (6%) First incidence (days) 584 599 402 730 (T) Poly-3 test P=0.006N P=0.255N P=0.075N P=0.006N Liver: Hemangiosarcoma Overall rate 6/50 (12%) 2/50 (4%) 9/50 (18%) 3/50 (6%) Adjusted rate 14.0% 4.4% 20.6% 6.6% Terminal rate 4/34 (12%) 1/36 (3%) 5/31 (16%) 1/36 (3%) First incidence (days) 678 694 597 623 Poly-3 test P=0.333N P=0.115N P=0.296 P=0.217N Liver: Hepatocellular Adenoma Overall rate 29/50 (58%) 34/50 (68%) 37/50 (74%) 36/50 (72%) Adjusted rate 65.7% 72.5% 81.0% 76.3% Terminal rate 23/34 (68%) 28/36 (78%) 28/31 (90%) 28/36 (78%) First incidence (days) 561 550 548 449 Poly-3 test P=0.219 P=0.312 P=0.069 P=0.180 Liver: Hepatocellular Carcinoma Overall rate 22/50 (44%) 25/50 (50%) 30/50 (60%) 36/50 (72%) Adjusted rate 48.9% 52.2% 65.1% 75.7% Terminal rate 16/34 (47%) 17/36 (47%) 19/31 (61%) 27/36 (75%) First incidence (days) 548 539 442 562 Poly-3 test P=0.002 P=0.458 P=0.084 P=0.005 Liver: Hepatocellular Adenoma or Hepatocellular Carcinoma Overall rate 38/50 (76%) 44/50 (88%) 47/50 (94%) 48/50 (96%) Adjusted rate 83.1% 90.6% 98.0% 98.6% Terminal rate 28/34 (82%) 34/36 (94%) 31/31 (100%) 36/36 (100%) First incidence (days) 548 539 442 449 Poly-3 test P=0.005 P=0.206 P=0.010 P=0.006 Liver: Hepatoblastoma Overall rate 1/50 (2%) 5/50 (10%) 10/50 (20%) 8/50 (16%) Adjusted rate 2.3% 10.8% 22.3% 17.3% Terminal rate 1/34 (3%) 3/36 (8%) 4/31 (13%) 3/36 (8%) First incidence (days) 730 (T) 539 512 580 Poly-3 test P=0.064 P=0.121 P=0.005 P=0.021

N,N-Dimethyl-p-toluidine, NTP TR 579 139
TABLE C2 Statistical Analysis of Primary Neoplasms in Male Mice in the 2-Year Gavage Study of N,N-Dimethyl-p-toluidine
Vehicle Control
6 mg/kg
20 mg/kg
60 mg/kg
Liver: Hepatocellular Carcinoma or Hepatoblastoma Overall rate 22/50 (44%) 28/50 (56%) 34/50 (68%) 37/50 (74%) Adjusted rate 48.9% 57.8% 72.2% 77.6% Terminal rate 16/34 (47%) 19/36 (53%) 21/31 (68%) 27/36 (75%) First incidence (days) 548 539 442 562 Poly-3 test P=0.003 P=0.256 P=0.016 P=0.003 Liver: Hepatocellular Adenoma, Hepatocellular Carcinoma, or Hepatoblastoma Overall rate 38/50 (76%) 45/50 (90%) 48/50 (96%) 48/50 (96%) Adjusted rate 83.1% 91.7% 99.2% 98.6% Terminal rate 28/34 (82%) 34/36 (94%) 31/31 (100%) 36/36 (100%) First incidence (days) 548 539 442 449 Poly-3 test P=0.006 P=0.157 P=0.004 P=0.006 Lung: Alveolar/bronchiolar Adenoma Overall rate 11/50 (22%) 16/50 (32%) 18/50 (36%) 10/50 (20%) Adjusted rate 25.4% 34.7% 41.1% 22.2% Terminal rate 9/34 (27%) 13/36 (36%) 13/31 (42%) 8/36 (22%) First incidence (days) 643 568 609 609 Poly-3 test P=0.204N P=0.233 P=0.089 P=0.457N Lung: Alveolar/bronchiolar Carcinoma Overall rate 2/50 (4%) 3/50 (6%) 0/50 (0%) 4/50 (8%) Adjusted rate 4.7% 6.6% 0.0% 8.8% Terminal rate 2/34 (6%) 3/36 (8%) 0/31 (0%) 2/36 (6%) First incidence (days) 730 (T) 730 (T) —e 562 Poly-3 test P=0.271 P=0.526 P=0.237N P=0.364 Lung: Alveolar/bronchiolar Adenoma or Carcinoma Overall rate 13/50 (26%) 19/50 (38%) 18/50 (36%) 12/50 (24%) Adjusted rate 30.0% 41.2% 41.1% 26.2% Terminal rate 11/34 (32%) 16/36 (44%) 13/31 (42%) 8/36 (22%) First incidence (days) 643 568 609 562 Poly-3 test P=0.167N P=0.187 P=0.194 P=0.433N Spleen: Hemangiosarcoma Overall rate 3/48 (6%) 1/50 (2%) 4/49 (8%) 1/50 (2%) Adjusted rate 7.3% 2.2% 9.2% 2.2% Terminal rate 3/34 (9%) 0/36 (0%) 2/31 (7%) 1/36 (3%) First incidence (days) 730 (T) 697 548 730 (T) Poly-3 test P=0.332N P=0.272N P=0.526 P=0.278N Stomach (Forestomach): Squamous Cell Papilloma Overall rate 1/50 (2%) 1/50 (2%) 0/50 (0%) 3/50 (6%) Adjusted rate 2.3% 2.2% 0.0% 6.7% Terminal rate 1/34 (3%) 1/36 (3%) 0/31 (0%) 2/36 (6%) First incidence (days) 730 (T) 730 (T) — 665 Poly-3 test P=0.132 P=0.748N P=0.500N P=0.322 Tooth: Odontoma Overall rate 5/50 (10%) 1/50 (2%) 1/50 (2%) 0/50 (0%) Adjusted rate 11.5% 2.2% 2.3% 0.0% Terminal rate 4/34 (12%) 1/36 (3%) 0/31 (0%) 0/36 (0%) First incidence (days) 561 730 (T) 710 — Poly-3 test P=0.042N P=0.091N P=0.104N P=0.028N
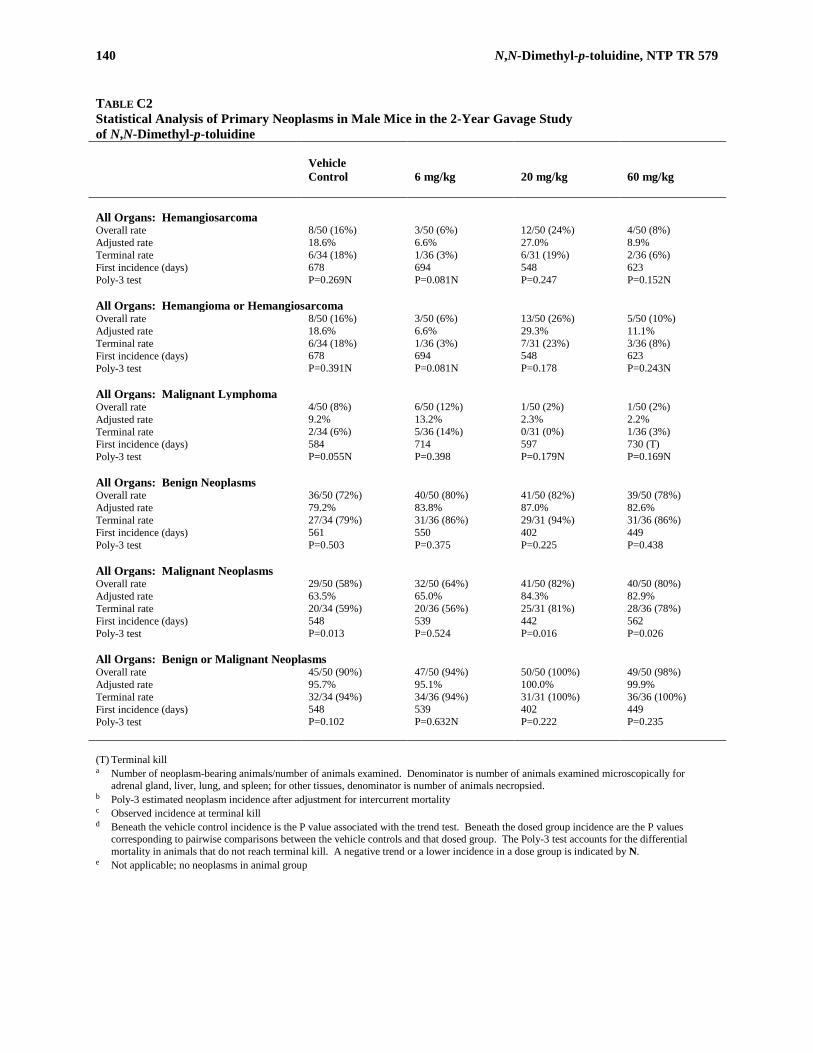
140 N,N-Dimethyl-p-toluidine, NTP TR 579
TABLE C2 Statistical Analysis of Primary Neoplasms in Male Mice in the 2-Year Gavage Study of N,N-Dimethyl-p-toluidine
Vehicle Control
6 mg/kg
20 mg/kg
60 mg/kg
All Organs: Hemangiosarcoma Overall rate 8/50 (16%) 3/50 (6%) 12/50 (24%) 4/50 (8%) Adjusted rate 18.6% 6.6% 27.0% 8.9% Terminal rate 6/34 (18%) 1/36 (3%) 6/31 (19%) 2/36 (6%) First incidence (days) 678 694 548 623 Poly-3 test P=0.269N P=0.081N P=0.247 P=0.152N All Organs: Hemangioma or Hemangiosarcoma Overall rate 8/50 (16%) 3/50 (6%) 13/50 (26%) 5/50 (10%) Adjusted rate 18.6% 6.6% 29.3% 11.1% Terminal rate 6/34 (18%) 1/36 (3%) 7/31 (23%) 3/36 (8%) First incidence (days) 678 694 548 623 Poly-3 test P=0.391N P=0.081N P=0.178 P=0.243N All Organs: Malignant Lymphoma Overall rate 4/50 (8%) 6/50 (12%) 1/50 (2%) 1/50 (2%) Adjusted rate 9.2% 13.2% 2.3% 2.2% Terminal rate 2/34 (6%) 5/36 (14%) 0/31 (0%) 1/36 (3%) First incidence (days) 584 714 597 730 (T) Poly-3 test P=0.055N P=0.398 P=0.179N P=0.169N All Organs: Benign Neoplasms Overall rate 36/50 (72%) 40/50 (80%) 41/50 (82%) 39/50 (78%) Adjusted rate 79.2% 83.8% 87.0% 82.6% Terminal rate 27/34 (79%) 31/36 (86%) 29/31 (94%) 31/36 (86%) First incidence (days) 561 550 402 449 Poly-3 test P=0.503 P=0.375 P=0.225 P=0.438 All Organs: Malignant Neoplasms Overall rate 29/50 (58%) 32/50 (64%) 41/50 (82%) 40/50 (80%) Adjusted rate 63.5% 65.0% 84.3% 82.9% Terminal rate 20/34 (59%) 20/36 (56%) 25/31 (81%) 28/36 (78%) First incidence (days) 548 539 442 562 Poly-3 test P=0.013 P=0.524 P=0.016 P=0.026 All Organs: Benign or Malignant Neoplasms Overall rate 45/50 (90%) 47/50 (94%) 50/50 (100%) 49/50 (98%) Adjusted rate 95.7% 95.1% 100.0% 99.9% Terminal rate 32/34 (94%) 34/36 (94%) 31/31 (100%) 36/36 (100%) First incidence (days) 548 539 402 449 Poly-3 test P=0.102 P=0.632N P=0.222 P=0.235 (T) Terminal kill a Number of neoplasm-bearing animals/number of animals examined. Denominator is number of animals examined microscopically for
adrenal gland, liver, lung, and spleen; for other tissues, denominator is number of animals necropsied. b Poly-3 estimated neoplasm incidence after adjustment for intercurrent mortality c Observed incidence at terminal kill d Beneath the vehicle control incidence is the P value associated with the trend test. Beneath the dosed group incidence are the P values
corresponding to pairwise comparisons between the vehicle controls and that dosed group. The Poly-3 test accounts for the differential mortality in animals that do not reach terminal kill. A negative trend or a lower incidence in a dose group is indicated by N.
e Not applicable; no neoplasms in animal group

N,N-Dimethyl-p-toluidine, NTP TR 579 141
TABLE C3a Historical Incidence of Liver Neoplasms in Control Male B6C3F1/N Micea Study (Study Start)
Hepatocellular Adenoma
Hepatocellular Carcinoma
Hepatocellular Adenoma or Hepatocellular Carcinoma
Historical Incidence: Corn Oil Gavage Studies N,N-Dimethyl-p-toluidine (October 2004) 29/50 22/50 38/50 Ginkgo biloba extract (March 2005) 31/50 22/50 39/50 Isoeugenol (May 2002) 24/50 8/50 28/50 Kava kava extract (August 2004) 27/50 20/50 38/50 β-Myrcene (April 2002) 26/50 14/50 33/50 Pulegone (April 2003) 22/50 13/50 29/50 3,3′,4,4′-Tetrachloroazobenzene (February 2003) 22/50 17/50 34/50
Total (%) 181/350 (51.7%) 116/350 (33.1%) 239/350 (68.3%) Mean ± standard deviation 51.7% ± 6.9% 33.1% ± 10.5% 68.3% ± 8.9% Range 44%-62% 16%-44% 56%-78%
Overall Historical Incidence: All Routes
Total (%) 658/1,149 (57.3%) 399/1,149 (34.7%) 844/1,149 (73.5%) Mean ± standard deviation 57.3% ± 12.6% 34.7% ± 10.8% 73.5% ± 11.3% Range 24%-78% 16%-56% 52%-90%
Hepatoblastoma
Hepatocellular Adenoma, Hepatocellular Carcinoma,
or Hepatoblastoma
Historical Incidence: Corn Oil Gavage Studies N,N-Dimethyl-p-toluidine (October 2004) 1/50 38/50 Ginkgo biloba extract (March 2005) 3/50 39/50 Isoeugenol (May 2002) 3/50 30/50 Kava kava extract (August 2004) 0/50 38/50 β-Myrcene (April 2002) 4/50 34/50 Pulegone (April 2003) 1/50 29/50 3,3′,4,4′-Tetrachloroazobenzene (February 2003) 2/50 34/50
Total (%) 14/350 (4.0%) 242/350 (69.1%) Mean ± standard deviation 4.0% ± 2.8% 69.1% ± 8.0% Range 0%-8% 58%-78%
Overall Historical Incidence: All Routes
Total (%) 61/1,149 (5.3%) 852/1,149 (74.2%) Mean ± standard deviation 5.3% ± 7.1% 74.2% ± 11.5% Range 0%-34% 52%-92%
a Data as of May 2011

142 N,N-Dimethyl-p-toluidine, NTP TR 579
TABLE C3b Historical Incidence of Alveolar/bronchiolar Neoplasms in Control Male B6C3F1/N Micea Study (Study Start)
Adenoma
Carcinoma
Adenoma or Carcinoma
Historical Incidence: Corn Oil Gavage Studies N,N-Dimethyl-p-toluidine (October 2004) 11/50 2/50 13/50 Ginkgo biloba extract (March 2005) 8/50 11/50 17/50 Isoeugenol (May 2002) 6/50 2/50 7/50 Kava kava extract (August 2004) 9/50 2/50 11/50 β-Myrcene (April 2002) 8/50 5/50 13/50 Pulegone (April 2003) 6/50 3/50 9/50 3,3′,4,4′-Tetrachloroazobenzene (February 2003) 5/50 3/50 7/50
Total (%) 53/350 (15.1%) 28/350 (8.0%) 77/350 (22.0%) Mean ± standard deviation 15.1% ± 4.1% 8.0% ± 6.5% 22.0% ± 7.3% Range 10%-22% 4%-22% 14%-34%
Overall Historical Incidence: All Routes
Total (%) 172/1,150 (15.0%) 144/1,150 (12.5%) 301/1,150 (26.2%) Mean ± standard deviation 15.0% ± 6.9% 12.5% ± 7.1% 26.2% ± 6.3% Range 2%-30% 4%-24% 14%-40%
a Data as of May 2011

N,N-Dimethyl-p-toluidine, NTP TR 579 143
TABLE C4 Summary of the Incidence of Nonneoplastic Lesions in Male Mice in the 2-Year Gavage Study of N,N-Dimethyl-p-toluidinea
Vehicle Control
6 mg/kg
20 mg/kg
60 mg/kg
Disposition Summary Animals initially in study 50 50 50 50 Early deaths
Accidental deaths 2 Moribund 5 4 11 14 Natural deaths 9 10 8
Survivors Died last week of study 1 Terminal kill 33 36 31 36
Animals examined microscopically 50 50 50 50 Alimentary System Esophagus (50) (50) (50) (50)
Necrosis 1 (2%) Perforation 1 (2%) Periesophageal tissue, inflammation 2 (4%)
Gallbladder (49) (50) (47) (49) Intestine large, cecum (50) (50) (50) (50) Intestine large, colon (50) (50) (50) (50) Intestine large, rectum (50) (50) (50) (50) Intestine small, duodenum (50) (50) (50) (50) Intestine small, ileum (50) (50) (50) (50) Intestine small, jejunum (50) (50) (50) (50)
Peyer’s patch, hyperplasia 1 (2%) Liver (50) (50) (50) (50)
Angiectasis 3 (6%) 1 (2%) Basophilic focus 5 (10%) 11 (22%) 8 (16%) 2 (4%) Clear cell focus 15 (30%) 22 (44%) 15 (30%) 7 (14%) Eosinophilic focus 25 (50%) 30 (60%) 39 (78%) 43 (86%) Fatty change 3 (6%) 1 (2%) 2 (4%) Hematopoietic cell proliferation 4 (8%) 1 (2%) 4 (8%) 1 (2%) Inflammation, chronic active 23 (46%) 22 (44%) 18 (36%) 19 (38%) Mineralization 1 (2%) 1 (2%) 1 (2%) Mitotic alteration 1 (2%) 1 (2%) 2 (4%) 1 (2%) Mixed cell focus 21 (42%) 25 (50%) 17 (34%) 12 (24%) Necrosis 9 (18%) 8 (16%) 7 (14%) 10 (20%) Pigmentation 3 (6%) 2 (4%) 2 (4%) Bile duct, cyst 1 (2%) 1 (2%) Bile duct, hyperplasia 1 (2%) 1 (2%) 2 (4%) Centrilobular, degeneration 1 (2%) 1 (2%) Hepatocyte, hypertrophy 1 (2%) 9 (18%) 11 (22%) 16 (32%) Hepatocyte, karyomegaly 1 (2%) Kupffer cell, hyperplasia 1 (2%) Oval cell, hyperplasia 1 (2%) 1 (2%) 2 (4%)
Mesentery (4) (3) (5) (2) Inflammation, suppurative 1 (25%) Fat, necrosis 2 (50%) 3 (100%) 5 (100%) 2 (100%) Vein, thrombosis 1 (25%)
Pancreas (50) (50) (50) (50) Atrophy 1 (2%) 1 (2%) 1 (2%) Basophilic focus 1 (2%) Inflammation 1 (2%) Acinus, hyperplasia 1 (2%) Duct, cyst 1 (2%) 2 (4%)
a Number of animals examined microscopically at the site and the number of animals with lesion

144 N,N-Dimethyl-p-toluidine, NTP TR 579
TABLE C4 Summary of the Incidence of Nonneoplastic Lesions in Male Mice in the 2-Year Gavage Study of N,N-Dimethyl-p-toluidine
Vehicle Control
6 mg/kg
20 mg/kg
60 mg/kg
Alimentary System (continued) Salivary glands (50) (50) (50) (50)
Fibrosis 1 (2%) Stomach, forestomach (50) (50) (50) (50)
Erosion 2 (4%) 1 (2%) Hemorrhage 1 (2%) Inflammation 13 (26%) 12 (24%) 13 (26%) 8 (16%) Necrosis 1 (2%) Ulcer 5 (10%) 4 (8%) 5 (10%) 5 (10%) Epithelium, hyperplasia 14 (28%) 14 (28%) 17 (34%) 11 (22%)
Stomach, glandular (50) (50) (50) (50) Inflammation 1 (2%) 1 (2%) Mineralization 1 (2%) Epithelium, necrosis 1 (2%) 1 (2%) 1 (2%)
Tongue (2) (0) (0) (0) Angiectasis 1 (50%) Cyst 1 (50%)
Tooth (37) (38) (34) (30) Dysplasia 34 (92%) 36 (95%) 34 (100%) 26 (87%)
Cardiovascular System Blood vessel (50) (50) (50) (50)
Inflammation 1 (2%) Mineralization 1 (2%)
Heart (50) (50) (50) (50) Cardiomyopathy 8 (16%) 7 (14%) 10 (20%) 13 (26%) Inflammation 2 (4%) 1 (2%) Mineralization 1 (2%) 2 (4%) 5 (10%) Atrium, thrombosis 1 (2%) Valve, thrombosis 1 (2%)
Endocrine System Adrenal cortex (50) (50) (50) (50)
Hypertrophy 3 (6%) 3 (6%) 1 (2%) 1 (2%) Adrenal medulla (50) (50) (50) (50)
Hyperplasia 1 (2%) 1 (2%) Islets, pancreatic (50) (50) (50) (50)
Hyperplasia 12 (24%) 5 (10%) 2 (4%) 1 (2%) Parathyroid gland (40) (43) (45) (42)
Amyloid deposition 1 (2%) Pituitary gland (50) (50) (49) (50)
Pars distalis, hyperplasia 1 (2%) 1 (2%) Thyroid gland (50) (50) (50) (50) General Body System None
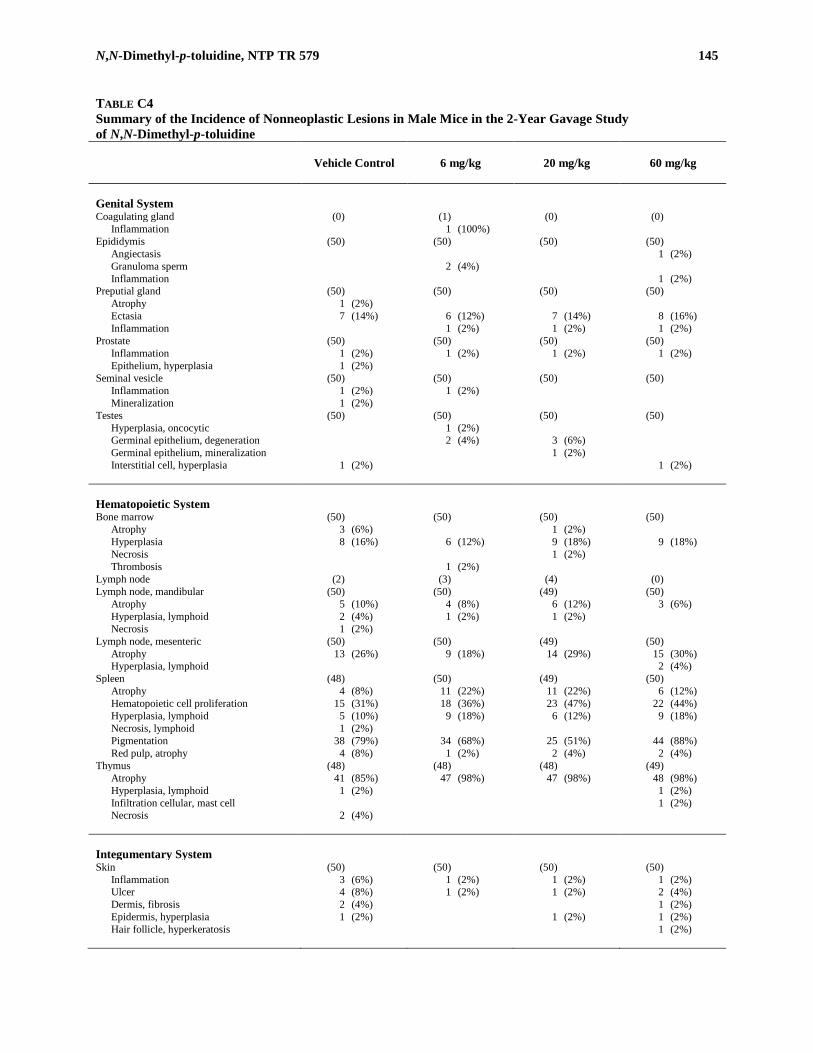
N,N-Dimethyl-p-toluidine, NTP TR 579 145
TABLE C4 Summary of the Incidence of Nonneoplastic Lesions in Male Mice in the 2-Year Gavage Study of N,N-Dimethyl-p-toluidine
Vehicle Control
6 mg/kg
20 mg/kg
60 mg/kg
Genital System Coagulating gland (0) (1) (0) (0)
Inflammation 1 (100%) Epididymis (50) (50) (50) (50)
Angiectasis 1 (2%) Granuloma sperm 2 (4%) Inflammation 1 (2%)
Preputial gland (50) (50) (50) (50) Atrophy 1 (2%) Ectasia 7 (14%) 6 (12%) 7 (14%) 8 (16%) Inflammation 1 (2%) 1 (2%) 1 (2%)
Prostate (50) (50) (50) (50) Inflammation 1 (2%) 1 (2%) 1 (2%) 1 (2%) Epithelium, hyperplasia 1 (2%)
Seminal vesicle (50) (50) (50) (50) Inflammation 1 (2%) 1 (2%) Mineralization 1 (2%)
Testes (50) (50) (50) (50) Hyperplasia, oncocytic 1 (2%) Germinal epithelium, degeneration 2 (4%) 3 (6%) Germinal epithelium, mineralization 1 (2%) Interstitial cell, hyperplasia 1 (2%) 1 (2%)
Hematopoietic System Bone marrow (50) (50) (50) (50)
Atrophy 3 (6%) 1 (2%) Hyperplasia 8 (16%) 6 (12%) 9 (18%) 9 (18%) Necrosis 1 (2%) Thrombosis 1 (2%)
Lymph node (2) (3) (4) (0) Lymph node, mandibular (50) (50) (49) (50)
Atrophy 5 (10%) 4 (8%) 6 (12%) 3 (6%) Hyperplasia, lymphoid 2 (4%) 1 (2%) 1 (2%) Necrosis 1 (2%)
Lymph node, mesenteric (50) (50) (49) (50) Atrophy 13 (26%) 9 (18%) 14 (29%) 15 (30%) Hyperplasia, lymphoid 2 (4%)
Spleen (48) (50) (49) (50) Atrophy 4 (8%) 11 (22%) 11 (22%) 6 (12%) Hematopoietic cell proliferation 15 (31%) 18 (36%) 23 (47%) 22 (44%) Hyperplasia, lymphoid 5 (10%) 9 (18%) 6 (12%) 9 (18%) Necrosis, lymphoid 1 (2%) Pigmentation 38 (79%) 34 (68%) 25 (51%) 44 (88%) Red pulp, atrophy 4 (8%) 1 (2%) 2 (4%) 2 (4%)
Thymus (48) (48) (48) (49) Atrophy 41 (85%) 47 (98%) 47 (98%) 48 (98%) Hyperplasia, lymphoid 1 (2%) 1 (2%) Infiltration cellular, mast cell 1 (2%) Necrosis 2 (4%)
Integumentary System Skin (50) (50) (50) (50)
Inflammation 3 (6%) 1 (2%) 1 (2%) 1 (2%) Ulcer 4 (8%) 1 (2%) 1 (2%) 2 (4%) Dermis, fibrosis 2 (4%) 1 (2%) Epidermis, hyperplasia 1 (2%) 1 (2%) 1 (2%) Hair follicle, hyperkeratosis 1 (2%)
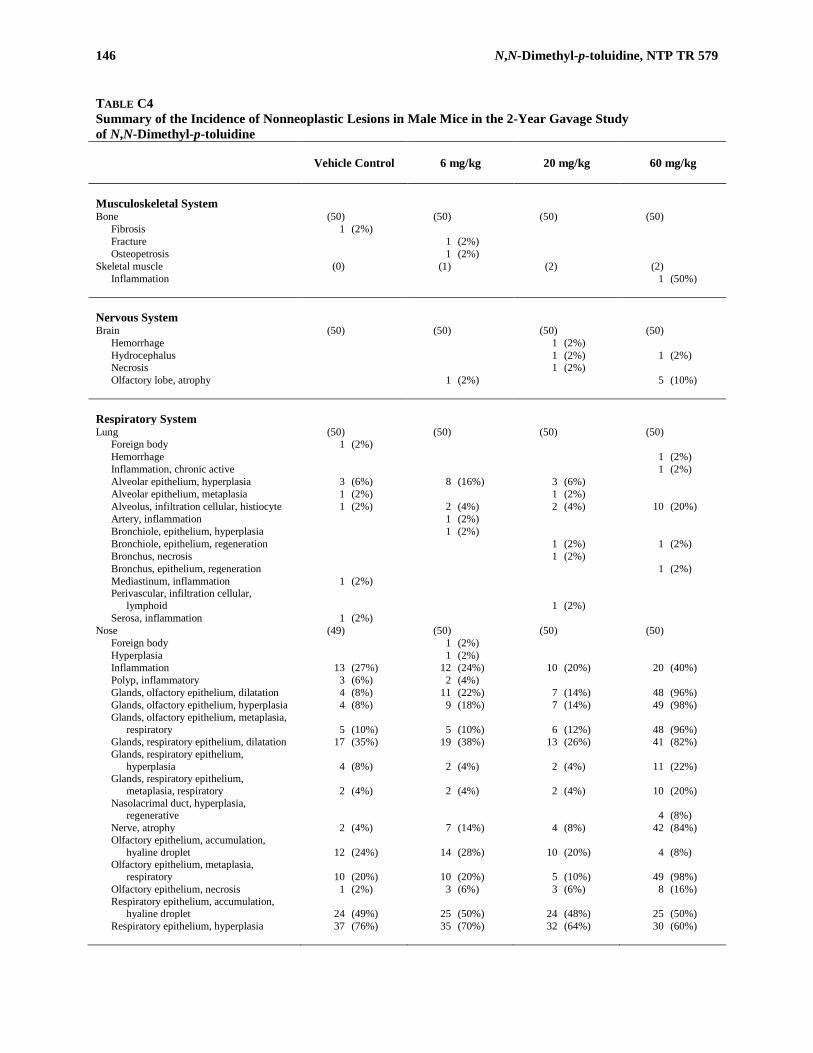
146 N,N-Dimethyl-p-toluidine, NTP TR 579
TABLE C4 Summary of the Incidence of Nonneoplastic Lesions in Male Mice in the 2-Year Gavage Study of N,N-Dimethyl-p-toluidine
Vehicle Control
6 mg/kg
20 mg/kg
60 mg/kg
Musculoskeletal System Bone (50) (50) (50) (50)
Fibrosis 1 (2%) Fracture 1 (2%) Osteopetrosis 1 (2%)
Skeletal muscle (0) (1) (2) (2) Inflammation 1 (50%)
Nervous System Brain (50) (50) (50) (50)
Hemorrhage 1 (2%) Hydrocephalus 1 (2%) 1 (2%) Necrosis 1 (2%) Olfactory lobe, atrophy 1 (2%) 5 (10%)
Respiratory System Lung (50) (50) (50) (50)
Foreign body 1 (2%) Hemorrhage 1 (2%) Inflammation, chronic active 1 (2%) Alveolar epithelium, hyperplasia 3 (6%) 8 (16%) 3 (6%) Alveolar epithelium, metaplasia 1 (2%) 1 (2%) Alveolus, infiltration cellular, histiocyte 1 (2%) 2 (4%) 2 (4%) 10 (20%) Artery, inflammation 1 (2%) Bronchiole, epithelium, hyperplasia 1 (2%) Bronchiole, epithelium, regeneration 1 (2%) 1 (2%) Bronchus, necrosis 1 (2%) Bronchus, epithelium, regeneration 1 (2%) Mediastinum, inflammation 1 (2%) Perivascular, infiltration cellular,
lymphoid 1 (2%) Serosa, inflammation 1 (2%)
Nose (49) (50) (50) (50) Foreign body 1 (2%) Hyperplasia 1 (2%) Inflammation 13 (27%) 12 (24%) 10 (20%) 20 (40%) Polyp, inflammatory 3 (6%) 2 (4%) Glands, olfactory epithelium, dilatation 4 (8%) 11 (22%) 7 (14%) 48 (96%) Glands, olfactory epithelium, hyperplasia 4 (8%) 9 (18%) 7 (14%) 49 (98%) Glands, olfactory epithelium, metaplasia,
respiratory 5 (10%) 5 (10%) 6 (12%) 48 (96%) Glands, respiratory epithelium, dilatation 17 (35%) 19 (38%) 13 (26%) 41 (82%) Glands, respiratory epithelium,
hyperplasia 4 (8%) 2 (4%) 2 (4%) 11 (22%) Glands, respiratory epithelium,
metaplasia, respiratory 2 (4%) 2 (4%) 2 (4%) 10 (20%) Nasolacrimal duct, hyperplasia,
regenerative 4 (8%) Nerve, atrophy 2 (4%) 7 (14%) 4 (8%) 42 (84%) Olfactory epithelium, accumulation,
hyaline droplet 12 (24%) 14 (28%) 10 (20%) 4 (8%) Olfactory epithelium, metaplasia,
respiratory 10 (20%) 10 (20%) 5 (10%) 49 (98%) Olfactory epithelium, necrosis 1 (2%) 3 (6%) 3 (6%) 8 (16%) Respiratory epithelium, accumulation,
hyaline droplet 24 (49%) 25 (50%) 24 (48%) 25 (50%) Respiratory epithelium, hyperplasia 37 (76%) 35 (70%) 32 (64%) 30 (60%)

N,N-Dimethyl-p-toluidine, NTP TR 579 147
TABLE C4 Summary of the Incidence of Nonneoplastic Lesions in Male Mice in the 2-Year Gavage Study of N,N-Dimethyl-p-toluidine
Vehicle Control
6 mg/kg
20 mg/kg
60 mg/kg
Respiratory System (continued) Nose (continued) (49) (50) (50) (50)
Respiratory epithelium, necrosis 1 (2%) 1 (2%) 1 (2%) Transitional epithelium, hyperplasia 1 (2%) Transitional epithelium, necrosis 1 (2%) Vomeronasal organ, necrosis 1 (2%) 2 (4%) 3 (6%)
Trachea (50) (50) (50) (50) Necrosis 1 (2%)
Special Senses System Ear (1) (0) (0) (0)
External ear, inflammation 1 (100%) External ear, necrosis 1 (100%)
Eye (50) (50) (50) (50) Cornea, inflammation 3 (6%) 1 (2%) 4 (8%) Lens, cataract 1 (2%) Optic nerve, atrophy 1 (2%)
Harderian gland (50) (50) (50) (50) Atrophy 1 (2%) Hyperplasia 1 (2%) 4 (8%) 1 (2%) 1 (2%)
Zymbal’s gland (1) (0) (0) (0) Urinary System Kidney (50) (50) (50) (50)
Accumulation, hyaline droplet 1 (2%) Infarct 3 (6%) 2 (4%) 2 (4%) Inflammation 2 (4%) 1 (2%) Mineralization 5 (10%) 7 (14%) 9 (18%) 6 (12%) Nephropathy 39 (78%) 41 (82%) 43 (86%) 37 (74%) Pigmentation 2 (4%) Cortex, cyst 3 (6%) 2 (4%) 1 (2%) 2 (4%) Papilla, necrosis 1 (2%) 1 (2%) Pelvis, dilatation 2 (4%) 1 (2%) 1 (2%) Renal tubule, dilatation 1 (2%) Renal tubule, hyperplasia 1 (2%) Renal tubule, necrosis 2 (4%) 1 (2%)
Ureter (1) (0) (0) (0) Inflammation 1 (100%) Necrosis 1 (100%)
Urethra (0) (1) (0) (0) Inflammation 1 (100%) Necrosis 1 (100%)
Urinary bladder (50) (50) (50) (50) Calculus gross observation 2 (4%) Inflammation 1 (2%) Transitional epithelium, hyperplasia 1 (2%)

148 N,N-Dimethyl-p-toluidine, NTP TR 579
149
APPENDIX D SUMMARY OF LESIONS IN FEMALE MICE
IN THE 2-YEAR GAVAGE STUDY OF N,N-DIMETHYL-p-TOLUIDINE
TABLE D1 Summary of the Incidence of Neoplasms in Female Mice in the 2-Year Gavage Study of N,N-Dimethyl-p-toluidine .............................................................. 150 TABLE D2 Statistical Analysis of Primary Neoplasms in Female Mice in the 2-Year Gavage Study of N,N-Dimethyl-p-toluidine .............................................................. 154 TABLE D3a Historical Incidence of Liver Neoplasms in Control Female B6C3F1/N Mice.............................. 157 TABLE D3b Historical Incidence of Alveolar/bronchiolar Neoplasms in Control Female B6C3F1/N Mice .................................................................................................. 158 TABLE D3c Historical Incidence of Squamous Cell Neoplasms of the Forestomach in Control Female B6C3F1/N Mice .................................................................................................. 158 TABLE D4 Summary of the Incidence of Nonneoplastic Lesons in Female Mice in the 2-Year Gavage Study of N,N-Dimethyl-p-toluidine .............................................................. 159
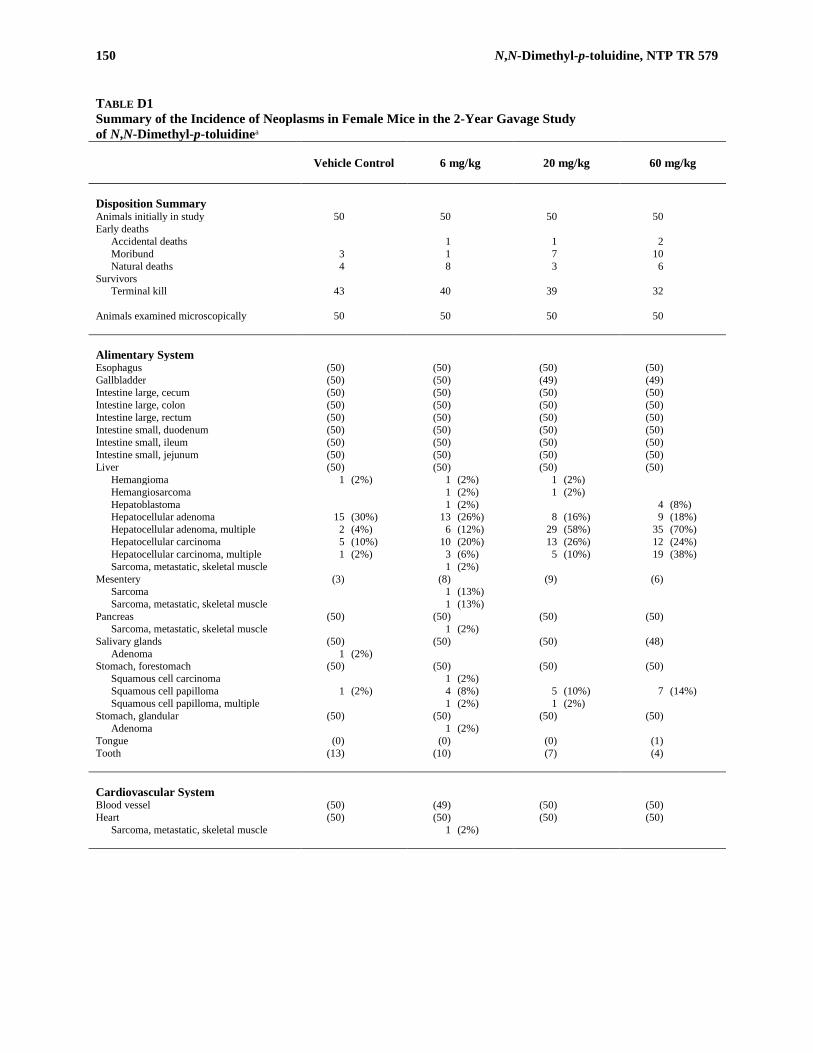
150 N,N-Dimethyl-p-toluidine, NTP TR 579
TABLE D1 Summary of the Incidence of Neoplasms in Female Mice in the 2-Year Gavage Study of N,N-Dimethyl-p-toluidinea
Vehicle Control
6 mg/kg
20 mg/kg
60 mg/kg
Disposition Summary Animals initially in study 50 50 50 50 Early deaths
Accidental deaths 1 1 2 Moribund 3 1 7 10 Natural deaths 4 8 3 6
Survivors Terminal kill 43 40 39 32
Animals examined microscopically 50 50 50 50 Alimentary System Esophagus (50) (50) (50) (50) Gallbladder (50) (50) (49) (49) Intestine large, cecum (50) (50) (50) (50) Intestine large, colon (50) (50) (50) (50) Intestine large, rectum (50) (50) (50) (50) Intestine small, duodenum (50) (50) (50) (50) Intestine small, ileum (50) (50) (50) (50) Intestine small, jejunum (50) (50) (50) (50) Liver (50) (50) (50) (50)
Hemangioma 1 (2%) 1 (2%) 1 (2%) Hemangiosarcoma 1 (2%) 1 (2%) Hepatoblastoma 1 (2%) 4 (8%) Hepatocellular adenoma 15 (30%) 13 (26%) 8 (16%) 9 (18%) Hepatocellular adenoma, multiple 2 (4%) 6 (12%) 29 (58%) 35 (70%) Hepatocellular carcinoma 5 (10%) 10 (20%) 13 (26%) 12 (24%) Hepatocellular carcinoma, multiple 1 (2%) 3 (6%) 5 (10%) 19 (38%) Sarcoma, metastatic, skeletal muscle 1 (2%)
Mesentery (3) (8) (9) (6) Sarcoma 1 (13%) Sarcoma, metastatic, skeletal muscle 1 (13%)
Pancreas (50) (50) (50) (50) Sarcoma, metastatic, skeletal muscle 1 (2%)
Salivary glands (50) (50) (50) (48) Adenoma 1 (2%)
Stomach, forestomach (50) (50) (50) (50) Squamous cell carcinoma 1 (2%) Squamous cell papilloma 1 (2%) 4 (8%) 5 (10%) 7 (14%) Squamous cell papilloma, multiple 1 (2%) 1 (2%)
Stomach, glandular (50) (50) (50) (50) Adenoma 1 (2%)
Tongue (0) (0) (0) (1) Tooth (13) (10) (7) (4) Cardiovascular System Blood vessel (50) (49) (50) (50) Heart (50) (50) (50) (50)
Sarcoma, metastatic, skeletal muscle 1 (2%)

N,N-Dimethyl-p-toluidine, NTP TR 579 151
TABLE D1 Summary of the Incidence of Neoplasms in Female Mice in the 2-Year Gavage Study of N,N-Dimethyl-p-toluidine
Vehicle Control
6 mg/kg
20 mg/kg
60 mg/kg
Endocrine System Adrenal cortex (50) (50) (50) (50) Adrenal medulla (50) (50) (50) (50)
Pheochromocytoma benign 2 (4%) 2 (4%) Islets, pancreatic (50) (50) (50) (50) Parathyroid gland (48) (38) (38) (34) Pituitary gland (48) (50) (50) (49)
Pars distalis, adenoma 2 (4%) 1 (2%) Pars intermedia, adenoma 3 (6%)
Thyroid gland (50) (50) (50) (50) Follicular cell, adenoma 1 (2%)
General Body System None
Genital System Clitoral gland (50) (50) (50) (49) Ovary (50) (49) (50) (50)
Cystadenoma 1 (2%) 2 (4%) 1 (2%) 1 (2%) Luteoma 1 (2%) Thecoma benign 1 (2%) Tubulostromal adenoma 1 (2%)
Oviduct (0) (1) (0) (0) Sarcoma, metastatic, skeletal muscle 1 (100%)
Uterus (50) (50) (50) (50) Carcinoma 1 (2%) Fibrous histiocytoma 1 (2%) Polyp stromal 2 (4%) 2 (4%) Sarcoma stromal 1 (2%) Squamous cell carcinoma 1 (2%)
Hematopoietic System Bone marrow (50) (50) (50) (49) Lymph node (7) (3) (5) (4)
Mediastinal, osteosarcoma, metastatic, bone 1 (25%)
Lymph node, mandibular (50) (50) (50) (48) Hemangioma 1 (2%)
Lymph node, mesenteric (49) (49) (49) (50) Sarcoma, metastatic, skeletal muscle 1 (2%)
Spleen (49) (49) (49) (50) Hemangiosarcoma 1 (2%) Sarcoma, metastatic, skeletal muscle 1 (2%)
Thymus (50) (50) (48) (48) Sarcoma, metastatic, skeletal muscle 1 (2%)

152 N,N-Dimethyl-p-toluidine, NTP TR 579
TABLE D1 Summary of the Incidence of Neoplasms in Female Mice in the 2-Year Gavage Study of N,N-Dimethyl-p-toluidine
Vehicle Control
6 mg/kg
20 mg/kg
60 mg/kg
Integumentary System Mammary gland (50) (50) (50) (50)
Carcinoma 1 (2%) 1 (2%) Skin (50) (50) (50) (50)
Keratoacanthoma 1 (2%) Dermis, fibrous histiocytoma 1 (2%) Subcutaneous tissue, fibrosarcoma 1 (2%) 1 (2%) Subcutaneous tissue, fibrosarcoma,
multiple 1 (2%) Subcutaneous tissue, liposarcoma 1 (2%) Subcutaneous tissue, melanoma malignant 1 (2%) Subcutaneous tissue, neurofibrosarcoma 1 (2%) Subcutaneous tissue, sarcoma 1 (2%) Subcutaneous tissue,
schwannoma malignant 1 (2%)
Musculoskeletal System Bone (50) (50) (50) (50)
Osteosarcoma 1 (2%) Skeletal muscle (0) (2) (1) (2)
Rhabdomyosarcoma 2 (100%) Rhabdomyosarcoma, multiple 1 (100%) Sarcoma 1 (50%)
Nervous System Brain (50) (50) (50) (49)
Meningioma benign 1 (2%) Peripheral nerve (0) (0) (1) (0) Spinal cord (0) (0) (1) (0)
Respiratory System Lung (50) (50) (50) (50)
Alveolar/bronchiolar adenoma 3 (6%) 7 (14%) 12 (24%) Alveolar/bronchiolar adenoma, multiple 2 (4%) 1 (2%) 1 (2%) Alveolar/bronchiolar carcinoma 1 (2%) 2 (4%) 1 (2%) Carcinoma, metastatic, harderian gland 1 (2%) 2 (4%) Fibrous histiocytoma 1 (2%) Hepatoblastoma, metastatic, liver 1 (2%) Hepatocellular carcinoma, metastatic,
liver 2 (4%) 3 (6%) 2 (4%) Osteosarcoma, metastatic, bone 1 (2%) Sarcoma, metastatic, skeletal muscle 1 (2%)
Nose (50) (49) (50) (50) Trachea (50) (50) (50) (50)
Special Senses System Eye (50) (50) (50) (49) Harderian gland (50) (50) (50) (49)
Adenoma 1 (2%) 6 (12%) 1 (2%) 3 (6%) Carcinoma 1 (2%) 2 (4%)

N,N-Dimethyl-p-toluidine, NTP TR 579 153
TABLE D1 Summary of the Incidence of Neoplasms in Female Mice in the 2-Year Gavage Study of N,N-Dimethyl-p-toluidine
Vehicle Control
6 mg/kg
20 mg/kg
60 mg/kg
Urinary System Kidney (50) (50) (50) (50)
Sarcoma 1 (2%) Urinary bladder (50) (50) (50) (50)
Fibrous histiocytoma 1 (2%)
Systemic Lesions Multiple organsb (50) (50) (50) (50)
Histiocytic sarcoma 2 (4%) 3 (6%) 1 (2%) Lymphoma malignant 15 (30%) 9 (18%) 11 (22%) 8 (16%)
Neoplasm Summary Total animals with primary neoplasmsc 35 41 47 46
Total primary neoplasms 52 82 107 120 Total animals with benign neoplasms 24 31 40 44
Total benign neoplasms 28 47 57 72 Total animals with malignant neoplasms 21 25 34 36
Total malignant neoplasms 24 35 50 48 Total animals with metastatic neoplasms 2 4 2 4
Total metastatic neoplasms 2 13 2 5 a Number of animals examined microscopically at the site and the number of animals with neoplasm b Number of animals with any tissue examined microscopically c Primary neoplasms: all neoplasms except metastatic neoplasms

154 N,N-Dimethyl-p-toluidine, NTP TR 579
TABLE D2 Statistical Analysis of Primary Neoplasms in Female Mice in the 2-Year Gavage Study of N,N-Dimethyl-p-toluidine
Vehicle Control
6 mg/kg
20 mg/kg
60 mg/kg
Harderian Gland: Adenoma Overall ratea 1/50 (2%) 6/50 (12%) 1/50 (2%) 3/50 (6%) Adjusted rateb 2.1% 13.0% 2.2% 7.2% Terminal ratec 1/43 (2%) 6/40 (15%) 1/39 (3%) 1/32 (3%) First incidence (days) 729 (T) 729 (T) 729 (T) 578 Poly-3 testd P=0.539 P=0.051 P=0.750 P=0.259 Harderian Gland: Adenoma or Carcinoma Overall rate 1/50 (2%) 6/50 (12%) 3/50 (6%) 3/50 (6%) Adjusted rate 2.1% 13.0% 6.6% 7.2% Terminal rate 1/43 (2%) 6/40 (15%) 1/39 (3%) 1/32 (3%) First incidence (days) 729 (T) 729 (T) 669 578 Poly-3 test P=0.529 P=0.051 P=0.290 P=0.259 Liver: Hepatocellular Adenoma Overall rate 17/50 (34%) 19/50 (38%) 37/50 (74%) 44/50 (88%) Adjusted rate 35.5% 41.1% 80.0% 96.1% Terminal rate 16/43 (37%) 17/40 (43%) 34/39 (87%) 31/32 (97%) First incidence (days) 698 720 649 481 Poly-3 test P<0.001 P=0.364 P<0.001 P<0.001 Liver: Hepatocellular Carcinoma Overall rate 6/50 (12%) 13/50 (26%) 18/50 (36%) 31/50 (62%) Adjusted rate 12.5% 28.2% 39.3% 71.9% Terminal rate 4/43 (9%) 12/40 (30%) 16/39 (41%) 24/32 (75%) First incidence (days) 666 720 669 512 Poly-3 test P<0.001 P=0.049 P=0.002 P<0.001 Liver: Hepatocellular Adenoma or Hepatocellular Carcinoma Overall rate 20/50 (40%) 25/50 (50%) 42/50 (84%) 45/50 (90%) Adjusted rate 41.6% 54.1% 90.6% 98.3% Terminal rate 18/43 (42%) 23/40 (58%) 38/39 (97%) 32/32 (100%) First incidence (days) 666 720 649 481 Poly-3 test P<0.001 P=0.154 P<0.001 P<0.001 Liver: Hepatoblastoma Overall rate 0/50 (0%) 1/50 (2%) 0/50 (0%) 4/50 (8%) Adjusted rate 0.0% 2.2% 0.0% 9.7% Terminal rate 0/43 (0%) 1/40 (3%) 0/39 (0%) 3/32 (9%) First incidence (days) —e 729 (T) — 699 Poly-3 test P=0.007 P=0.493 —f P=0.044 Liver: Hepatocellular Carcinoma or Hepatoblastoma Overall rate 6/50 (12%) 14/50 (28%) 18/50 (36%) 32/50 (64%) Adjusted rate 12.5% 30.3% 39.3% 74.2% Terminal rate 4/43 (9%) 13/40 (33%) 16/39 (41%) 25/32 (78%) First incidence (days) 666 720 669 512 Poly-3 test P<0.001 P=0.029 P=0.002 P<0.001 Liver: Hepatocellular Adenoma, Hepatocellular Carcinoma, or Hepatoblastoma Overall rate 20/50 (40%) 26/50 (52%) 42/50 (84%) 45/50 (90%) Adjusted rate 41.6% 56.3% 90.6% 98.3% Terminal rate 18/43 (42%) 24/40 (60%) 38/39 (97%) 32/32 (100%) First incidence (days) 666 720 649 481 Poly-3 test P<0.001 P=0.108 P<0.001 P<0.001

N,N-Dimethyl-p-toluidine, NTP TR 579 155
TABLE D2 Statistical Analysis of Primary Neoplasms in Female Mice in the 2-Year Gavage Study of N,N-Dimethyl-p-toluidine
Vehicle Control
6 mg/kg
20 mg/kg
60 mg/kg
Lung: Alveolar/bronchiolar Adenoma Overall rate 2/50 (4%) 4/50 (8%) 8/50 (16%) 12/50 (24%) Adjusted rate 4.2% 8.7% 17.5% 28.2% Terminal rate 2/43 (5%) 4/40 (10%) 7/39 (18%) 8/32 (25%) First incidence (days) 729 (T) 729 (T) 649 570 Poly-3 test P<0.001 P=0.322 P=0.039 P<0.001 Lung: Alveolar/bronchiolar Adenoma or Carcinoma Overall rate 2/50 (4%) 5/50 (10%) 9/50 (18%) 13/50 (26%) Adjusted rate 4.2% 10.8% 19.6% 30.3% Terminal rate 2/43 (5%) 5/40 (13%) 7/39 (18%) 8/32 (25%) First incidence (days) 729 (T) 729 (T) 649 570 Poly-3 test P<0.001 P=0.203 P=0.021 P<0.001 Pituitary Gland (Pars Intermedia): Adenoma Overall rate 0/48 (0%) 3/50 (6%) 0/50 (0%) 0/49 (0%) Adjusted rate 0.0% 6.5% 0.0% 0.0% Terminal rate 0/41 (0%) 3/40 (8%) 0/39 (0%) 0/32 (0%) First incidence (days) — 729 (T) — — Poly-3 test P=0.279N P=0.120 — — Stomach (Forestomach): Squamous Cell Papilloma Overall rate 1/50 (2%) 5/50 (10%) 6/50 (12%) 7/50 (14%) Adjusted rate 2.1% 10.8% 13.2% 17.1% Terminal rate 1/43 (2%) 5/40 (13%) 5/39 (13%) 6/32 (19%) First incidence (days) 729 (T) 729 (T) 703 708 Poly-3 test P=0.037 P=0.094 P=0.049 P=0.017 Stomach (Forestomach): Squamous Cell Papilloma or Squamous Cell Carcinoma Overall rate 1/50 (2%) 6/50 (12%) 6/50 (12%) 7/50 (14%) Adjusted rate 2.1% 13.0% 13.2% 17.1% Terminal rate 1/43 (2%) 6/40 (15%) 5/39 (13%) 6/32 (19%) First incidence (days) 729 (T) 729 (T) 703 708 Poly-3 test P=0.055 P=0.051 P=0.049 P=0.017 Uterus: Stromal Polyp or Stromal Sarcoma Overall rate 0/50 (0%) 2/50 (4%) 3/50 (6%) 0/50 (0%) Adjusted rate 0.0% 4.3% 6.6% 0.0% Terminal rate 0/43 (0%) 2/40 (5%) 3/39 (8%) 0/32 (0%) First incidence (days) — 729 (T) 729 (T) — Poly-3 test P=0.456N P=0.230 P=0.110 — All Organs: Hemangioma or Hemangiosarcoma Overall rate 1/50 (2%) 3/50 (6%) 2/50 (4%) 1/50 (2%) Adjusted rate 2.1% 6.5% 4.4% 2.4% Terminal rate 0/43 (0%) 3/40 (8%) 2/39 (5%) 1/32 (3%) First incidence (days) 698 729 (T) 729 (T) 729 (T) Poly-3 test P=0.483N P=0.292 P=0.482 P=0.725 All Organs: Histiocytic Sarcoma Overall rate 0/50 (0%) 2/50 (4%) 3/50 (6%) 1/50 (2%) Adjusted rate 0.0% 4.3% 6.5% 2.4% Terminal rate 0/43 (0%) 0/40 (0%) 0/39 (0%) 1/32 (3%) First incidence (days) — 449 585 729 (T) Poly-3 test P=0.530 P=0.234 P=0.114 P=0.470

156 N,N-Dimethyl-p-toluidine, NTP TR 579
TABLE D2 Statistical Analysis of Primary Neoplasms in Female Mice in the 2-Year Gavage Study of N,N-Dimethyl-p-toluidine
Vehicle Control
6 mg/kg
20 mg/kg
60 mg/kg
All Organs: Malignant Lymphoma Overall rate 15/50 (30%) 9/50 (18%) 11/50 (22%) 8/50 (16%) Adjusted rate 30.7% 19.4% 23.7% 18.9% Terminal rate 13/43 (30%) 8/40 (20%) 8/39 (21%) 4/32 (13%) First incidence (days) 444 671 627 570 Poly-3 test P=0.216N P=0.151N P=0.297N P=0.147N All Organs: Benign Neoplasms Overall rate 24/50 (48%) 31/50 (62%) 40/50 (80%) 44/50 (88%) Adjusted rate 50.1% 67.1% 85.4% 96.1% Terminal rate 23/43 (54%) 29/40 (73%) 35/39 (90%) 31/32 (97%) First incidence (days) 698 720 585 481 Poly-3 test P<0.001 P=0.068 P<0.001 P<0.001 All Organs: Malignant Neoplasms Overall rate 21/50 (42%) 25/50 (50%) 34/50 (68%) 36/50 (72%) Adjusted rate 42.4% 51.7% 71.8% 80.9% Terminal rate 16/43 (37%) 19/40 (48%) 26/39 (67%) 26/32 (81%) First incidence (days) 444 449 585 386 Poly-3 test P<0.001 P=0.236 P=0.002 P<0.001 All Organs: Benign or Malignant Neoplasms Overall rate 35/50 (70%) 41/50 (82%) 47/50 (94%) 46/50 (92%) Adjusted rate 70.7% 84.8% 99.2% 98.6% Terminal rate 30/43 (70%) 34/40 (85%) 39/39 (100%) 32/32 (100%) First incidence (days) 444 449 585 386 Poly-3 test P<0.001 P=0.072 P<0.001 P<0.001 (T) Terminal kill a Number of neoplasm-bearing animals/number of animals examined. Denominator is number of animals examined microscopically for liver,
lung, and pituitary gland; for other tissues, denominator is number of animals necropsied. b Poly-3 estimated neoplasm incidence after adjustment for intercurrent mortality c Observed incidence at terminal kill d Beneath the vehicle control incidence is the P value associated with the trend test. Beneath the dosed group incidence are the P values
corresponding to pairwise comparisons between the vehicle controls and that dosed group. The Poly-3 test accounts for the differential mortality in animals that do not reach terminal kill. A negative trend or a lower incidence in a dose group is indicated by N.
e Not applicable; no neoplasms in animal group f Value of statistic cannot be computed.
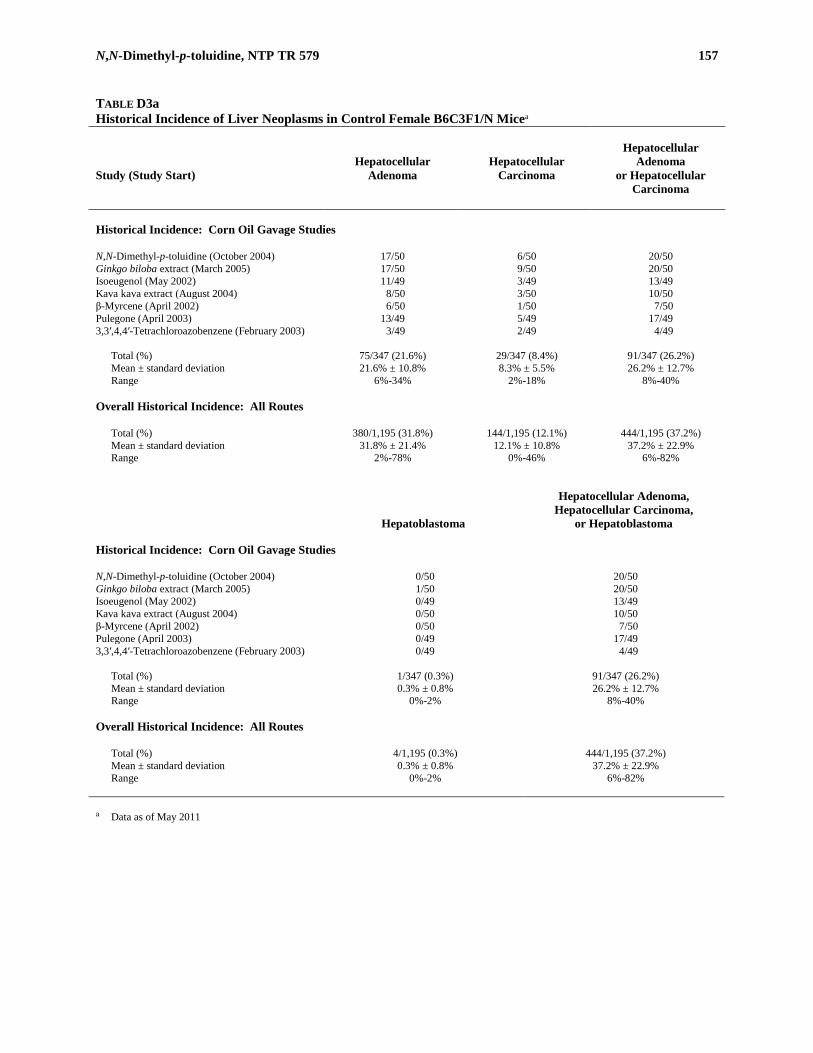
N,N-Dimethyl-p-toluidine, NTP TR 579 157
TABLE D3a Historical Incidence of Liver Neoplasms in Control Female B6C3F1/N Micea Study (Study Start)
Hepatocellular Adenoma
Hepatocellular Carcinoma
Hepatocellular Adenoma or Hepatocellular Carcinoma
Historical Incidence: Corn Oil Gavage Studies N,N-Dimethyl-p-toluidine (October 2004) 17/50 6/50 20/50 Ginkgo biloba extract (March 2005) 17/50 9/50 20/50 Isoeugenol (May 2002) 11/49 3/49 13/49 Kava kava extract (August 2004) 8/50 3/50 10/50 β-Myrcene (April 2002) 6/50 1/50 7/50 Pulegone (April 2003) 13/49 5/49 17/49 3,3′,4,4′-Tetrachloroazobenzene (February 2003) 3/49 2/49 4/49
Total (%) 75/347 (21.6%) 29/347 (8.4%) 91/347 (26.2%) Mean ± standard deviation 21.6% ± 10.8% 8.3% ± 5.5% 26.2% ± 12.7% Range 6%-34% 2%-18% 8%-40%
Overall Historical Incidence: All Routes
Total (%) 380/1,195 (31.8%) 144/1,195 (12.1%) 444/1,195 (37.2%) Mean ± standard deviation 31.8% ± 21.4% 12.1% ± 10.8% 37.2% ± 22.9% Range 2%-78% 0%-46% 6%-82%
Hepatoblastoma
Hepatocellular Adenoma, Hepatocellular Carcinoma,
or Hepatoblastoma
Historical Incidence: Corn Oil Gavage Studies N,N-Dimethyl-p-toluidine (October 2004) 0/50 20/50 Ginkgo biloba extract (March 2005) 1/50 20/50 Isoeugenol (May 2002) 0/49 13/49 Kava kava extract (August 2004) 0/50 10/50 β-Myrcene (April 2002) 0/50 7/50 Pulegone (April 2003) 0/49 17/49 3,3′,4,4′-Tetrachloroazobenzene (February 2003) 0/49 4/49
Total (%) 1/347 (0.3%) 91/347 (26.2%) Mean ± standard deviation 0.3% ± 0.8% 26.2% ± 12.7% Range 0%-2% 8%-40%
Overall Historical Incidence: All Routes
Total (%) 4/1,195 (0.3%) 444/1,195 (37.2%) Mean ± standard deviation 0.3% ± 0.8% 37.2% ± 22.9% Range 0%-2% 6%-82%
a Data as of May 2011
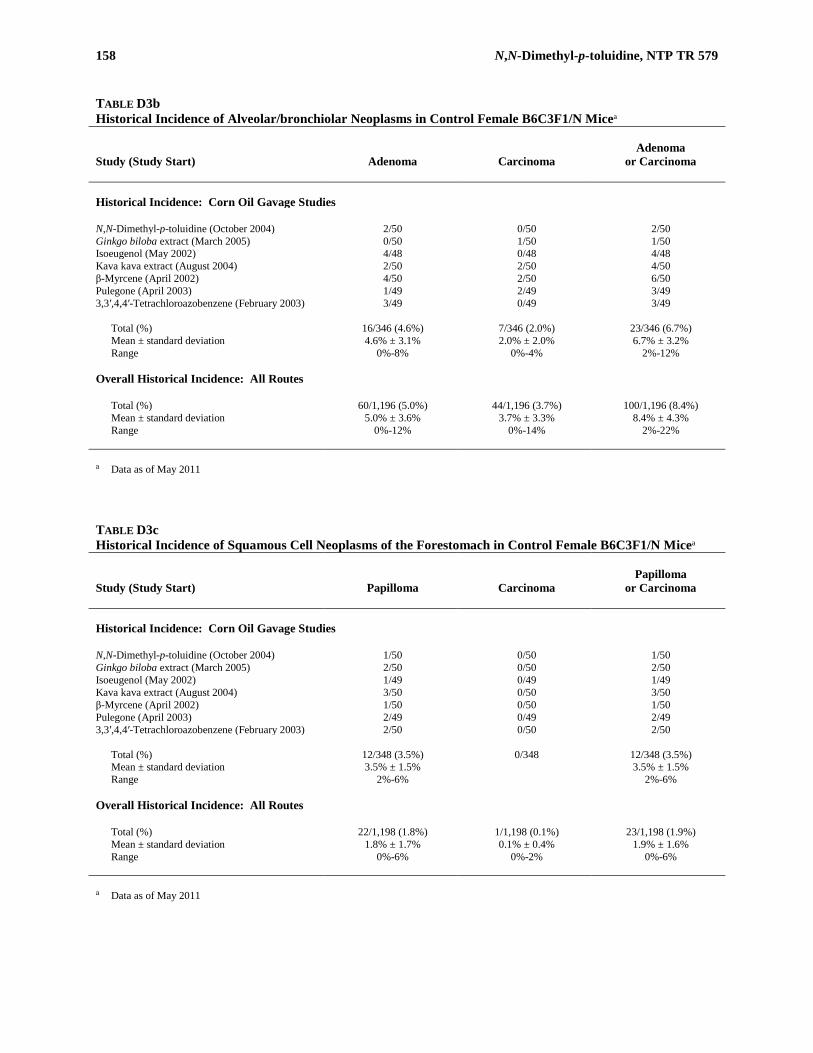
158 N,N-Dimethyl-p-toluidine, NTP TR 579
TABLE D3b Historical Incidence of Alveolar/bronchiolar Neoplasms in Control Female B6C3F1/N Micea Study (Study Start)
Adenoma
Carcinoma
Adenoma or Carcinoma
Historical Incidence: Corn Oil Gavage Studies N,N-Dimethyl-p-toluidine (October 2004) 2/50 0/50 2/50 Ginkgo biloba extract (March 2005) 0/50 1/50 1/50 Isoeugenol (May 2002) 4/48 0/48 4/48 Kava kava extract (August 2004) 2/50 2/50 4/50 β-Myrcene (April 2002) 4/50 2/50 6/50 Pulegone (April 2003) 1/49 2/49 3/49 3,3′,4,4′-Tetrachloroazobenzene (February 2003) 3/49 0/49 3/49
Total (%) 16/346 (4.6%) 7/346 (2.0%) 23/346 (6.7%) Mean ± standard deviation 4.6% ± 3.1% 2.0% ± 2.0% 6.7% ± 3.2% Range 0%-8% 0%-4% 2%-12%
Overall Historical Incidence: All Routes
Total (%) 60/1,196 (5.0%) 44/1,196 (3.7%) 100/1,196 (8.4%) Mean ± standard deviation 5.0% ± 3.6% 3.7% ± 3.3% 8.4% ± 4.3% Range 0%-12% 0%-14% 2%-22%
a Data as of May 2011
TABLE D3c Historical Incidence of Squamous Cell Neoplasms of the Forestomach in Control Female B6C3F1/N Micea Study (Study Start)
Papilloma
Carcinoma
Papilloma or Carcinoma
Historical Incidence: Corn Oil Gavage Studies N,N-Dimethyl-p-toluidine (October 2004) 1/50 0/50 1/50 Ginkgo biloba extract (March 2005) 2/50 0/50 2/50 Isoeugenol (May 2002) 1/49 0/49 1/49 Kava kava extract (August 2004) 3/50 0/50 3/50 β-Myrcene (April 2002) 1/50 0/50 1/50 Pulegone (April 2003) 2/49 0/49 2/49 3,3′,4,4′-Tetrachloroazobenzene (February 2003) 2/50 0/50 2/50
Total (%) 12/348 (3.5%) 0/348 12/348 (3.5%) Mean ± standard deviation 3.5% ± 1.5% 3.5% ± 1.5% Range 2%-6% 2%-6%
Overall Historical Incidence: All Routes
Total (%) 22/1,198 (1.8%) 1/1,198 (0.1%) 23/1,198 (1.9%) Mean ± standard deviation 1.8% ± 1.7% 0.1% ± 0.4% 1.9% ± 1.6% Range 0%-6% 0%-2% 0%-6%
a Data as of May 2011

N,N-Dimethyl-p-toluidine, NTP TR 579 159
TABLE D4 Summary of the Incidence of Nonneoplastic Lesions in Female Mice in the 2-Year Gavage Study of N,N-Dimethyl-p-toluidinea
Vehicle Control
6 mg/kg
20 mg/kg
60 mg/kg
Disposition Summary Animals initially in study 50 50 50 50 Early deaths
Accidental deaths 1 1 2 Moribund 3 1 7 10 Natural deaths 4 8 3 6
Survivors Terminal kill 43 40 39 32
Animals examined microscopically 50 50 50 50 Alimentary System Esophagus (50) (50) (50) (50)
Foreign body 1 (2%) Perforation 1 (2%) 1 (2%) Epithelium, inflammation 1 (2%) Muscularis, degeneration 1 (2%) 1 (2%) Muscularis, inflammation 1 (2%) Periesophageal tissue, hemorrhage 1 (2%)
Gallbladder (50) (50) (49) (49) Intestine large, cecum (50) (50) (50) (50)
Fibrosis 1 (2%) Lymphoid tissue, hyperplasia, lymphoid 1 (2%)
Intestine large, colon (50) (50) (50) (50) Fibrosis 1 (2%)
Intestine large, rectum (50) (50) (50) (50) Intestine small, duodenum (50) (50) (50) (50) Intestine small, ileum (50) (50) (50) (50)
Fibrosis 1 (2%) Intestine small, jejunum (50) (50) (50) (50)
Fibrosis 1 (2%) Peyer’s patch, hyperplasia, lymphoid 1 (2%)
Liver (50) (50) (50) (50) Angiectasis 1 (2%) Basophilic focus 7 (14%) 5 (10%) 9 (18%) 11 (22%) Clear cell focus 2 (4%) 2 (4%) 3 (6%) Eosinophilic focus 20 (40%) 18 (36%) 45 (90%) 38 (76%) Fatty change 1 (2%) 8 (16%) Hematopoietic cell proliferation 2 (4%) 4 (8%) 2 (4%) 3 (6%) Inflammation, chronic active 39 (78%) 27 (54%) 33 (66%) 35 (70%) Mineralization 1 (2%) Mixed cell focus 3 (6%) 9 (18%) 7 (14%) 7 (14%) Necrosis 1 (2%) 8 (16%) 4 (8%) 10 (20%) Pigmentation 1 (2%) 1 (2%) 1 (2%) 4 (8%) Bile duct, cyst 2 (4%) 1 (2%) 1 (2%) 3 (6%) Hepatocyte, hypertrophy 11 (22%) 10 (20%) 17 (34%) Kupffer cell, hyperplasia 1 (2%) 1 (2%) Oval cell, hyperplasia 2 (4%) Serosa, fibrosis 1 (2%) Serosa, inflammation, chronic active 1 (2%)
Mesentery (3) (8) (9) (6) Inflammation, chronic 1 (13%) Fat, necrosis 3 (100%) 5 (63%) 9 (100%) 6 (100%)
a Number of animals examined microscopically at the site and the number of animals with lesion

160 N,N-Dimethyl-p-toluidine, NTP TR 579
TABLE D4 Summary of the Incidence of Nonneoplastic Lesions in Female Mice in the 2-Year Gavage Study of N,N-Dimethyl-p-toluidine
Vehicle Control
6 mg/kg
20 mg/kg
60 mg/kg
Alimentary System (continued) Pancreas (50) (50) (50) (50)
Atrophy 1 (2%) 2 (4%) Acinus, hyperplasia 1 (2%) Acinus, necrosis 1 (2%) Duct, cyst 2 (4%)
Salivary glands (50) (50) (50) (48) Atrophy 1 (2%) Fibrosis 1 (2%)
Stomach, forestomach (50) (50) (50) (50) Erosion 1 (2%) 2 (4%) Fibrosis 1 (2%) Inflammation 3 (6%) 4 (8%) 7 (14%) 16 (32%) Necrosis 1 (2%) Ulcer 2 (4%) 2 (4%) 4 (8%) 7 (14%) Epithelium, cyst 1 (2%) 1 (2%) Epithelium, hyperplasia 3 (6%) 5 (10%) 12 (24%) 17 (34%)
Stomach, glandular (50) (50) (50) (50) Mineralization 1 (2%) Epithelium, necrosis 1 (2%) Glands, dysplasia 1 (2%)
Tongue (0) (0) (0) (1) Cyst 1 (100%)
Tooth (13) (10) (7) (4) Dysplasia 13 (100%) 10 (100%) 4 (57%) 4 (100%) Peridontal tissue, pulp, inflammation 1 (8%)
Cardiovascular System Blood vessel (50) (49) (50) (50)
Embolus bacterial 1 (2%) Inflammation 3 (6%) Media, pulmonary artery, hyperplasia 1 (2%)
Heart (50) (50) (50) (50) Cardiomyopathy 5 (10%) 2 (4%) 4 (8%) 2 (4%) Inflammation 1 (2%) Mineralization 1 (2%) 2 (4%) 1 (2%) 5 (10%) Necrosis 2 (4%) Epicardium, fibrosis 1 (2%) Valve, thrombosis 1 (2%) 1 (2%) Ventricle, thrombosis 1 (2%)
Endocrine System Adrenal cortex (50) (50) (50) (50)
Angiectasis 1 (2%) Necrosis 2 (4%) Vacuolization cytoplasmic 1 (2%)
Adrenal medulla (50) (50) (50) (50) Hyperplasia 3 (6%) Necrosis 1 (2%)
Islets, pancreatic (50) (50) (50) (50) Hyperplasia 1 (2%) 2 (4%)
Parathyroid gland (48) (38) (38) (34) Pituitary gland (48) (50) (50) (49)
Pars distalis, angiectasis 1 (2%) Pars distalis, hyperplasia 5 (10%) 3 (6%) 3 (6%) 3 (6%) Pars intermedia, hyperplasia 1 (2%) 1 (2%) 1 (2%) 2 (4%)
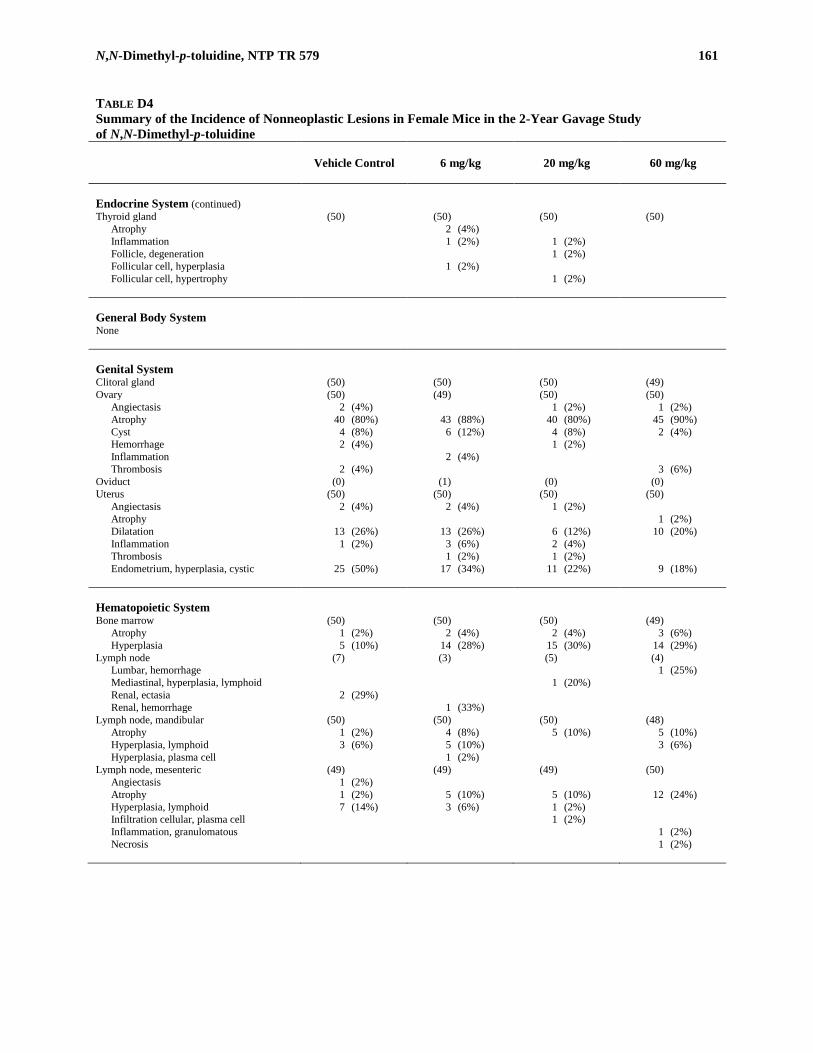
N,N-Dimethyl-p-toluidine, NTP TR 579 161
TABLE D4 Summary of the Incidence of Nonneoplastic Lesions in Female Mice in the 2-Year Gavage Study of N,N-Dimethyl-p-toluidine
Vehicle Control
6 mg/kg
20 mg/kg
60 mg/kg
Endocrine System (continued) Thyroid gland (50) (50) (50) (50)
Atrophy 2 (4%) Inflammation 1 (2%) 1 (2%) Follicle, degeneration 1 (2%) Follicular cell, hyperplasia 1 (2%) Follicular cell, hypertrophy 1 (2%)
General Body System None Genital System Clitoral gland (50) (50) (50) (49) Ovary (50) (49) (50) (50)
Angiectasis 2 (4%) 1 (2%) 1 (2%) Atrophy 40 (80%) 43 (88%) 40 (80%) 45 (90%) Cyst 4 (8%) 6 (12%) 4 (8%) 2 (4%) Hemorrhage 2 (4%) 1 (2%) Inflammation 2 (4%) Thrombosis 2 (4%) 3 (6%)
Oviduct (0) (1) (0) (0) Uterus (50) (50) (50) (50)
Angiectasis 2 (4%) 2 (4%) 1 (2%) Atrophy 1 (2%) Dilatation 13 (26%) 13 (26%) 6 (12%) 10 (20%) Inflammation 1 (2%) 3 (6%) 2 (4%) Thrombosis 1 (2%) 1 (2%) Endometrium, hyperplasia, cystic 25 (50%) 17 (34%) 11 (22%) 9 (18%)
Hematopoietic System Bone marrow (50) (50) (50) (49)
Atrophy 1 (2%) 2 (4%) 2 (4%) 3 (6%) Hyperplasia 5 (10%) 14 (28%) 15 (30%) 14 (29%)
Lymph node (7) (3) (5) (4) Lumbar, hemorrhage 1 (25%) Mediastinal, hyperplasia, lymphoid 1 (20%) Renal, ectasia 2 (29%) Renal, hemorrhage 1 (33%)
Lymph node, mandibular (50) (50) (50) (48) Atrophy 1 (2%) 4 (8%) 5 (10%) 5 (10%) Hyperplasia, lymphoid 3 (6%) 5 (10%) 3 (6%) Hyperplasia, plasma cell 1 (2%)
Lymph node, mesenteric (49) (49) (49) (50) Angiectasis 1 (2%) Atrophy 1 (2%) 5 (10%) 5 (10%) 12 (24%) Hyperplasia, lymphoid 7 (14%) 3 (6%) 1 (2%) Infiltration cellular, plasma cell 1 (2%) Inflammation, granulomatous 1 (2%) Necrosis 1 (2%)

162 N,N-Dimethyl-p-toluidine, NTP TR 579
TABLE D4 Summary of the Incidence of Nonneoplastic Lesions in Female Mice in the 2-Year Gavage Study of N,N-Dimethyl-p-toluidine
Vehicle Control
6 mg/kg
20 mg/kg
60 mg/kg
Hematopoietic System (continued) Spleen (49) (49) (49) (50)
Atrophy 3 (6%) 8 (16%) 1 (2%) 6 (12%) Hematopoietic cell proliferation 18 (37%) 23 (47%) 24 (49%) 21 (42%) Hyperplasia, lymphoid 14 (29%) 15 (31%) 12 (24%) 15 (30%) Infarct 1 (2%) Infiltration cellular, plasma cell 1 (2%) Pigmentation 37 (76%) 39 (80%) 33 (67%) 43 (86%) Capsule, fibrosis 1 (2%) Red pulp, atrophy 5 (10%)
Thymus (50) (50) (48) (48) Atrophy 46 (92%) 46 (92%) 39 (81%) 43 (90%) Hyperplasia, histiocytic 1 (2%) Hyperplasia, lymphoid 3 (6%)
Integumentary System Mammary gland (50) (50) (50) (50) Skin (50) (50) (50) (50)
Hemorrhage 1 (2%) Inflammation 1 (2%) 2 (4%) 1 (2%) Ulcer 2 (4%) 2 (4%) 1 (2%) Dermis, fibrosis 1 (2%) 1 (2%) Epidermis, hyperplasia 1 (2%) 2 (4%) Sebaceous gland, hyperplasia 1 (2%)
Musculoskeletal System Bone (50) (50) (50) (50)
Fibro-osseous lesion 3 (6%) 5 (10%) 6 (12%) 11 (22%) Fracture 1 (2%) Osteopetrosis 1 (2%) 1 (2%) 1 (2%)
Skeletal muscle (0) (2) (1) (2) Inflammation 1 (50%)
Nervous System Brain (50) (50) (50) (49)
Necrosis 1 (2%) 1 (2%) Olfactory lobe, atrophy 8 (16%)
Peripheral nerve (0) (0) (1) (0) Spinal cord (0) (0) (1) (0) Respiratory System Lung (50) (50) (50) (50)
Foreign body 1 (2%) 2 (4%) Hemorrhage 1 (2%) Inflammation 2 (4%) 2 (4%) Alveolar epithelium, hyperplasia 2 (4%) 3 (6%) 8 (16%) 2 (4%) Alveolus, infiltration cellular, histiocyte 1 (2%) 7 (14%) Bronchiole, epithelium, necrosis 1 (2%) Bronchiole, epithelium, regeneration 5 (10%) Bronchus, necrosis 5 (10%) Bronchus, epithelium, regeneration 5 (10%)

N,N-Dimethyl-p-toluidine, NTP TR 579 163
TABLE D4 Summary of the Incidence of Nonneoplastic Lesions in Female Mice in the 2-Year Gavage Study of N,N-Dimethyl-p-toluidine
Vehicle Control
6 mg/kg
20 mg/kg
60 mg/kg
Respiratory System (continued) Nose (50) (49) (50) (50)
Inflammation 3 (6%) 7 (14%) 3 (6%) 32 (64%) Glands, lateral wall, dilatation 2 (4%) Glands, olfactory epithelium, dilatation 13 (26%) 14 (29%) 20 (40%) 46 (92%) Glands, olfactory epithelium, hyperplasia 2 (4%) 14 (29%) 14 (28%) 50 (100%) Glands, olfactory epithelium, metaplasia,
respiratory 2 (4%) 5 (10%) 7 (14%) 44 (88%) Glands, respiratory epithelium, dilatation 10 (20%) 17 (35%) 15 (30%) 33 (66%) Glands, respiratory epithelium,
hyperplasia 2 (4%) 12 (24%) 13 (26%) Glands, respiratory epithelium,
metaplasia, respiratory 10 (20%) 10 (20%) Nasolacrimal duct, hyperplasia,
regenerative 4 (8%) Nerve, atrophy 41 (82%) Olfactory epithelium, accumulation,
hyaline droplet 2 (4%) 5 (10%) 8 (16%) 15 (30%) Olfactory epithelium, degeneration 1 (2%) Olfactory epithelium, metaplasia,
respiratory 1 (2%) 6 (12%) 14 (28%) 46 (92%) Olfactory epithelium, necrosis 3 (6%) 6 (12%) Respiratory epithelium, accumulation,
hyaline droplet 33 (66%) 34 (69%) 39 (78%) 36 (72%) Respiratory epithelium, hyperplasia 11 (22%) 15 (31%) 11 (22%) 30 (60%) Respiratory epithelium, hyperplasia,
regenerative 3 (6%) Respiratory epithelium, necrosis 5 (10%) Transitional epithelium, hyperplasia,
regenerative 1 (2%) Transitional epithelium, necrosis 2 (4%) Vomeronasal organ, necrosis 4 (8%)
Trachea (50) (50) (50) (50) Inflammation 1 (2%) Glands, hyperplasia 1 (2%)
Special Senses System Eye (50) (50) (50) (49)
Fibrosis 1 (2%) Cornea, inflammation 1 (2%) 1 (2%) 3 (6%) Lens, cataract 1 (2%) Optic nerve, atrophy 1 (2%)
Harderian gland (50) (50) (50) (49) Fibrosis 1 (2%) Hyperplasia 4 (8%) 2 (4%) 2 (4%) Inflammation 1 (2%)

164 N,N-Dimethyl-p-toluidine, NTP TR 579
TABLE D4 Summary of the Incidence of Nonneoplastic Lesions in Female Mice in the 2-Year Gavage Study of N,N-Dimethyl-p-toluidine
Vehicle Control
6 mg/kg
20 mg/kg
60 mg/kg
Urinary System Kidney (50) (50) (50) (50)
Accumulation, hyaline droplet 2 (4%) 1 (2%) Infarct 4 (8%) 3 (6%) 4 (8%) Inflammation 1 (2%) 2 (4%) Mineralization 1 (2%) 3 (6%) Nephropathy 13 (26%) 15 (30%) 15 (30%) 17 (34%) Cortex, cyst 1 (2%) Papilla, necrosis 1 (2%) Renal tubule, necrosis 1 (2%) 2 (4%) 2 (4%)
Urinary bladder (50) (50) (50) (50)

165
APPENDIX E GENETIC TOXICOLOGY
BACTERIAL MUTAGENICITY TEST PROTOCOL ....................................................................................................... 166 MOUSE PERIPHERAL BLOOD MICRONUCLEUS TEST PROTOCOLS ......................................................................... 166 DNA DAMAGE TEST PROTOCOL .............................................................................................................................. 167 EVALUATION PROTOCOL ......................................................................................................................................... 168 RESULTS .................................................................................................................................................................... 168 TABLE E1 Mutagenicity of N,N-Dimethyl-p-toluidine in Salmonella typhimurium ........................................ 169 TABLE E2 Mutagenicity of N,N-Dimethyl-p-toluidine in Bacterial Tester Strains ......................................... 171 TABLE E3 Frequency of Micronuclei in Peripheral Blood Erythrocytes of Mice Following Administration of N,N-Dimethyl-p-toluidine by Gavage for 3 Months ....................... 172 TABLE E4 Frequency of Micronuclei in Peripheral Blood Erythrocytes of Male Mice Following Administration of N,N-Dimethyl-p-toluidine by Gavage for 4 Days ............................ 173 TABLE E5 DNA Damage in the Blood and Liver of Male B6C3F1/N Mice Following Administration of N,N-Dimethyl-p-toluidine by Gavage for 4 Days ............................ 174 TABLE E6 DNA Damage in the Liver of Male Sprague-Dawley Rats Following Administration of N,N-Dimethyl-p-toluidine by Gavage for 4 Days ............................ 174

166 N,N-Dimethyl-p-toluidine, NTP TR 579
GENETIC TOXICOLOGY
BACTERIAL MUTAGENICITY TEST PROTOCOL Testing procedures used at BioReliance Corporation followed protocols reported by Zeiger et al. (1992); in the tests conducted at SITEK Research Laboratories, using the same chemical lot that was tested in the 2-year studies (050404), a slightly modified procedure was used, and that is described in more detail below. N,N-Dimethyl-p-toluidine was tested as a coded sample. In the tests conducted at BioReliance Corporation, it was incubated with the Salmonella typhimurium tester strains TA97, TA98, TA100, and TA1535 either in buffer or 10% or 30% S9 mix (metabolic activation enzymes and cofactors from Aroclor 1254-induced male Sprague-Dawley rat or Syrian hamster liver) for 20 minutes at 37° C. Top agar supplemented with L-histidine and d-biotin was added, and the contents of the tubes were mixed and poured onto the surfaces of minimal glucose agar plates. Histidine-independent mutant colonies arising on these plates were counted following incubation for 2 days at 37° C. The protocol used at SITEK Research Laboratories used only 10% rat liver S9 for exogenous metabolic activation, and employed Escherichia coli strain WP2 uvrA/pKM101 as a bacterial tester strain in addition to S. typhimurium strains TA98 and TA100. Incubation of bacterial strains with N,N-dimethyl-p-toluidine and subsequent plating were carried out as described above. In both studies, each trial consisted of triplicate plates of concurrent positive and negative controls and five doses of N,N-dimethyl-p-toluidine. The high dose was limited by toxicity. All trials were repeated using the same or higher S9 concentration. In this assay, a positive response is defined as a reproducible, dose-related increase in histidine-independent (revertant) colonies in any one strain/activation combination. An equivocal response is defined as an increase in revertants that is not dose related, is not reproducible, or is not of sufficient magnitude to support a determination of mutagenicity. A negative response is obtained when no increase in revertant colonies is observed following chemical treatment. There is no minimum percentage or fold increase required for a chemical to be judged positive or weakly positive, although positive calls are typically reserved for increases in mutant colonies that are at least twofold over background.
MOUSE PERIPHERAL BLOOD MICRONUCLEUS TEST PROTOCOLS Slide-Based Assay A detailed discussion of this assay is presented by MacGregor et al. (1990). At the end of the 3-month gavage study (lot H3124A), peripheral blood samples were obtained from male and female mice. Smears were immediately prepared and fixed in absolute methanol. The methanol-fixed slides were shipped to the genetic toxicity testing laboratory where they were stained with acridine orange and coded. Slides were scanned to determine the frequency of micronuclei in 2,000 normochromatic erythrocytes (NCEs, mature erythrocytes) per animal. In addition, the percentage of polychromatic erythrocytes (PCEs, reticulocytes) among a population of 1,000 erythrocytes in the peripheral blood was scored for each dose group as a measure of bone marrow toxicity. The results were tabulated as the mean of the pooled results from all animals within a treatment group plus or minus the standard error of the mean. The frequency of micronucleated cells among NCEs was analyzed by a statistical software package that tested for increasing trend over dose groups with a one-tailed Cochran-Armitage trend test, followed by pairwise comparisons between each dosed group and the control group. In the presence of excess binomial variation, as detected by a binomial dispersion test, the binomial variance of the Cochran-Armitage test was adjusted upward in proportion to the excess variation. In the slide-based micronucleus test, an individual trial is considered positive if the trend test P value is less than or equal to 0.025 or if the P value for any single dosed group is less than or equal to 0.025 divided by the number of dosed groups. A final call of positive for micronucleus induction is preferably based on reproducibly positive trials (as noted above). Results of the 3-month studies were accepted without repeat tests, because additional test data could not be obtained. Ultimately, the final call is

N,N-Dimethyl-p-toluidine, NTP TR 579 167
determined by the scientific staff after considering the results of statistical analyses, the reproducibility of any effects observed, and the magnitudes of those effects. Flow Cytometric Assay The treatment protocol and blood sample preparation procedures for this assay have been described in detail by Recio et al. (2010). Male mice were administered 30, 60, or 75 mg N,N-dimethyl-p-toluidine (lot 050404)/kg body weight in corn oil by gavage once daily for 4 days. The highest dose was based on the toxicity information obtained in the 3-month mouse study. Ethyl methanesulfonate in 0.9% saline was used as the positive control. Four hours after the fourth dose, peripheral blood samples were collected and processed for flow cytometric evaluation of micronucleated erythrocytes as described by Witt et al. (2008). For each sample, 20,000 immature CD71+ reticulocytes were analyzed to determine the frequency of micronucleated reticulocytes. More than 106 mature erythrocytes were enumerated during the reticulocyte analysis, and the percentage of reticulocytes among total erythrocytes was calculated as a measure of bone marrow toxicity. Because measurements of micronucleus frequency using flow cytometry are obtained from a large number of cells, it is reasonable to assume that the proportion of micronucleated cells is approximately normally distributed within each sample (Kissling et al., 2007). The NTP uses Levene’s test at α=0.05 to test for equal variances among the treatment groups. In the case of equal variances, linear regression was used to test for a dose-related trend, and Williams’ test (Williams, 1971, 1972) was used to test for pairwise differences between each treatment group and the vehicle control group. In the case of unequal variances, Jonckheere’s test (Jonckheere, 1954) was used to test for a linear trend, and pairwise differences with the control group were tested using Dunn’s test (Dunn, 1964). To correct for multiple pairwise comparisons, the P value for each comparison was multiplied by the number of comparisons made. Trend tests and pairwise comparisons with the controls were considered statistically significant at P≤0.025. A one-tailed independent t-test was used to verify a positive response (P≤0.05) to the control compound, ethyl methanesulfonate.
DNA DAMAGE TEST PROTOCOL The treatment protocol and tissue sample preparation procedures followed in this study have been described in detail (Recio et al., 2010). Male mice used in this assay are the same as those used in the flow cytometric micronucleus assay. In addition, male Sprague-Dawley rats were administered 60 mg/kg N,N-dimethyl-p-toluidine (lot 050404) in a 1% acetone/corn oil vehicle by gavage once daily for 4 days; this dose is the same as the highest dose used in the 2-year study in F344/N rats. Four hours after the fourth dose, blood samples were collected from mice and samples of the left liver lobe were collected from mice and rats for assessment of DNA damage using the comet assay (Tice et al., 2000; Ghanayem et al., 2005; Burlinson et al., 2007). Cell preparations were diluted with phosphate buffered saline, mixed with 0.5% low melting point agarose at 37° C, layered onto slides, and placed in cold lysing solution overnight. After rinsing, slides were treated with cold alkali (200 mM NaOH, 1 mM Na2EDTA, pH>13) for 20 minutes, then electrophoresed at 4° to 10° C for 20 minutes at 1.0 V/cm, 300 mA. Slides were then neutralized for 5 minutes, incubated for 5 minutes in ice-cold 100% ethanol, and allowed to air dry. Slides were stained with SYBR® Gold and 100 cells were scored per tissue per animal using Comet Assay IV Imaging Software Version 4.11 (Perceptive Instruments, Ltd., Suffolk, UK). For each cell, the extent of DNA migration was characterized using the percent tail DNA endpoint measurement (intensity of all tail pixels divided by the total intensity of all pixels in the comet, expressed as a percentage). For the study conducted in rats, a one-tailed pairwise comparison using Student’s t-test was used to assess significance (P≤0.05) of the percent tail DNA in N,N-dimethyl-p-toluidine-treated rats compared with the vehicle control group. For the study conducted in mice using multiple dose levels, the Shapiro-Wilk test was first used to assess normality of the vehicle control group. Data that were normally distributed were analyzed using an independent Student’s t-test to compare each dose level to the concurrent control and linear regression to determine the presence of a dose response. Normally distributed data were also tested for homogeneity of variances using the F test; for data of unequal variances, the Welch’s approximation for unequal variances t-test value was used for determination of a one-tailed significant (P<0.05) increase in DNA migration. Data that were not normally distributed were analyzed by the Mann-Whitney test (Mann and Whitney, 1947) comparing each dose level to the vehicle control, followed by the Kendall rank correlation test (Kendall, 1938) to determine the presence of a dose response. Trend tests were considered statistically significant at P≤0.025 and pairwise comparisons were significant

168 N,N-Dimethyl-p-toluidine, NTP TR 579
at P≤0.008 (0.025 divided by the number of dosed groups) to correct for multiple comparisons. A one-tailed independent t-test was used to verify a significant (P≤0.05) induction of DNA damage by the positive control compound, ethyl methanesulfonate.
EVALUATION PROTOCOL These are the basic guidelines for arriving at an overall assay result for assays performed by the National Toxicology Program. Statistical as well as biological factors are considered. For an individual assay, the statistical procedures for data analysis have been described in the preceding protocols. There have been instances, however, in which multiple aliquots of a chemical were tested in the same assay, and different results were obtained among aliquots and/or among laboratories. Results from more than one aliquot or from more than one laboratory are not simply combined into an overall result. Rather, all the data are critically evaluated, particularly with regard to pertinent protocol variations, in determining the weight of evidence for an overall conclusion of chemical activity in an assay. In addition to multiple aliquots, the in vitro assays have another variable that must be considered in arriving at an overall test result. In vitro assays are conducted with and without exogenous metabolic activation. Results obtained in the absence of activation are not combined with results obtained in the presence of activation; each testing condition is evaluated separately. The summary table in the Abstract of this Technical Report presents a result that represents a scientific judgement of the overall evidence for activity of the chemical in an assay.
RESULTS N,N-Dimethyl-p-toluidine was tested in two independent bacterial gene mutation studies, and negative results were obtained in both studies (Tables E1 and E2). In the first study (concentration range, 0.33 to 1,000 µg/plate), no increases in the numbers of mutant colonies were seen in S. typhimurium strains TA97, TA98, TA100, or TA1535, with or without 10% or 30% S9 derived from induced hamster or rat liver. In the second study, which tested the same chemical lot (050404) that was used in the 2-year studies, negative results were obtained over a concentration range of 50 to 1,500 µg/plate in S. typhimurium strains TA98 and TA100 and in E. coli WP2 uvrA/pKM101, with and without 10% rat liver S9. In vivo, no significant increases in the frequencies of micronucleated erythrocytes, an indicator of chromosomal damage, were observed in peripheral blood of male or female B6C3F1/N mice treated with 15 to 125 mg/kg per day N,N-dimethyl-p-toluidine by gavage for 3 months (Table E3). No significant alterations in the percentage of circulating reticulocytes were observed, suggesting that N,N-dimethyl-p-toluidine did not induce bone marrow toxicity over the dose range tested. Results of a second micronucleus test in male B6C3F1/N mice administered 30 to 75 mg/kg N,N-dimethyl-p-toluidine (lot 050404) by gavage once daily for 4 days were also negative and again, no significant alterations in the percentage of circulating reticulocytes were observed (Table E4). Two independent comet assays were conducted with N,N-dimethyl-p-toluidine to measure induction of DNA damage in liver and blood leukocytes. In the first study, conducted in male B6C3F1/N mice, N,N-dimethyl-p-toluidine administered by gavage over a range of 30 to 75 mg/kg once daily for 4 days did not produce an increase in DNA migration in liver cells or blood leukocytes (Table E5). In the second study, conducted in male Sprague-Dawley rats, N,N-dimethyl-p-toluidine administered by gavage at a single dose of 60 mg/kg per day for 4 days was associated with a small but statistically significant increase in percent tail DNA in liver cells compared with the vehicle control group (Table E6).

N,N-Dimethyl-p-toluidine, NTP TR 579 169
TABLE E1 Mutagenicity of N,N-Dimethyl-p-toluidine in Salmonella typhimuriuma Strain
Dose
(μg/plate)
Without S9
Without S9
With 10% hamster S9
With 30% hamster S9
With 10% rat S9
With 30% rat S9
TA100 0 169 ± 7 198 ± 13 180 ± 6 179 ± 10 178 ± 12 183 ± 4 10 184 ± 12 204 ± 4 176 ± 3 166 ± 21 180 ± 3 136 ± 7 33 182 ± 14 198 ± 4 188 ± 2 170 ± 13 173 ± 10 170 ± 11 100 163 ± 16 200 ± 8 187 ± 10 165 ± 18 195 ± 10 177 ± 2 333 92 ± 10b 166 ± 7 154 ± 5 75 ± 3b 166 ± 5 79 ± 11b 500 67 ± 9b 6 ± 1b 52 ± 6b 1,000 Toxic Toxic 2 ± 2b Trial summary Negative Negative Negative Negative Negative Negative Positive controlc 669 ± 22 665 ± 14 2,198 ± 23 736 ± 22 855 ± 85 735 ± 46
Without S9
Without S9
Without S9
TA97 0 114 ± 9 137 ± 12 146 ± 11 0.33 161 ± 2 1 147 ± 7 3.3 153 ± 5 10 140 ± 8 134 ± 8 143 ± 9 33 123 ± 12 148 ± 7 146 ± 11 100 130 ± 9 146 ± 8 333 110 ± 13 114 ± 14b 500 57 ± 20b 1,000 Toxic Trial summary Equivocal Equivocal Negative Positive control 517 ± 92 699 ± 7 500 ± 54
With 10% hamster S9
With 30% hamster S9
With 30% hamster S9
With 10% rat S9
With 30% rat S9
With 30% rat S9
TA97 (continued) 0 171 ± 9 158 ± 2 146 ± 5 171 ± 8 181 ± 16 219 ± 6 10 170 ± 11 140 ± 17 163 ± 6 186 ± 15 33 157 ± 3 162 ± 3 188 ± 17 163 ± 5 168 ± 9 223 ± 12 100 149 ± 8 143 ± 13 178 ± 7 157 ± 4 194 ± 15 201 ± 7 333 146 ± 18b 183 ± 8 158 ± 2 133 ± 5b 193 ± 3 194 ± 24 500 188 ± 6 150 ± 2b 199 ± 5 164 ± 4 1,000 Toxic 0 ± 0b 23 ± 17b 2 ± 0b Trial summary Negative Equivocal Equivocal Negative Negative Negative Positive control 1,131 ± 7 1,048 ± 77 1,553 ± 54 2,072 ± 50 669 ± 12 664 ± 19

170 N,N-Dimethyl-p-toluidine, NTP TR 579
TABLE E1 Mutagenicity of N,N-Dimethyl-p-toluidine in Salmonella typhimurium Strain
Dose
(μg/plate)
Without S9
Without S9
With 10% hamster S9
With 30% hamster S9
With 10% rat S9
With 30% rat S9
TA98 0 17 ± 1 13 ± 1 24 ± 3 20 ± 3 16 ± 2 23 ± 1 10 14 ± 3 15 ± 3 22 ± 4 19 ± 3 22 ± 1 22 ± 0 33 15 ± 2 15 ± 1 27 ± 3 23 ± 2 15 ± 2 23 ± 3 100 16 ± 2 13 ± 2 25 ± 5 16 ± 1 22 ± 2 24 ± 5 333 8 ± 0b 13 ± 1b 13 ± 3b 6 ± 1b 10 ± 3b 11 ± 1b 500 8 ± 1b 5 ± 2b 8 ± 1b 1,000 Toxic 0 ± 0b Toxic Trial summary Negative Negative Negative Negative Negative Negative Positive control 168 ± 25 167 ± 16 925 ± 23 1,038 ± 42 688 ± 42 251 ± 34
Without S9
Without S9
With 10% hamster S9
With 30% hamster S9
With 30% hamster S9
TA1535 0 22 ± 3 20 ± 1 16 ± 2 18 ± 6 14 ± 1 10 23 ± 1 17 ± 4 15 ± 2 16 ± 2 33 18 ± 2 18 ± 2 13 ± 1 16 ± 1 16 ± 3 100 20 ± 4 19 ± 1 16 ± 1 16 ± 3 18 ± 2d 333 20 ± 2 13 ± 1b 9 ± 1b 18 ± 2 17 ± 3 500 5 ± 1b 14 ± 2 11 ± 3 1,000 Toxic Toxic 0 ± 0b Trial summary Negative Negative Negative Negative Negative Positive control 273 ± 8 267 ± 40 192 ± 14 241 ± 16 295 ± 12
With 10% rat S9
With 30% rat S9
With 30% rat S9
TA1535 (continued) 0 15 ± 2 14 ± 2 16 ± 2 10 12 ± 1 15 ± 2 33 12 ± 1 15 ± 2 18 ± 3 100 13 ± 2 18 ± 2 17 ± 5 333 12 ± 2b 12 ± 2 14 ± 4 500 15 ± 2 14 ± 1 1,000 Toxic 1 ± 1b Trial summary Negative Negative Negative Positive control 339 ± 55 109 ± 17 135 ± 11 a Study was performed at BioReliance Corporation. Data are presented as revertants/plate (mean ± standard error) from three plates. The
detailed protocol is presented by Zeiger et al. (1992). 0 μg/plate was the solvent control. b Slight toxicity c The positive controls in the absence of metabolic activation were sodium azide (TA100 and TA1535), 9-aminoacridine (TA97), and
4-nitro-o-phenylenediamine (TA98). The positive control for metabolic activation with all strains was 2-aminoanthracene. d Contamination
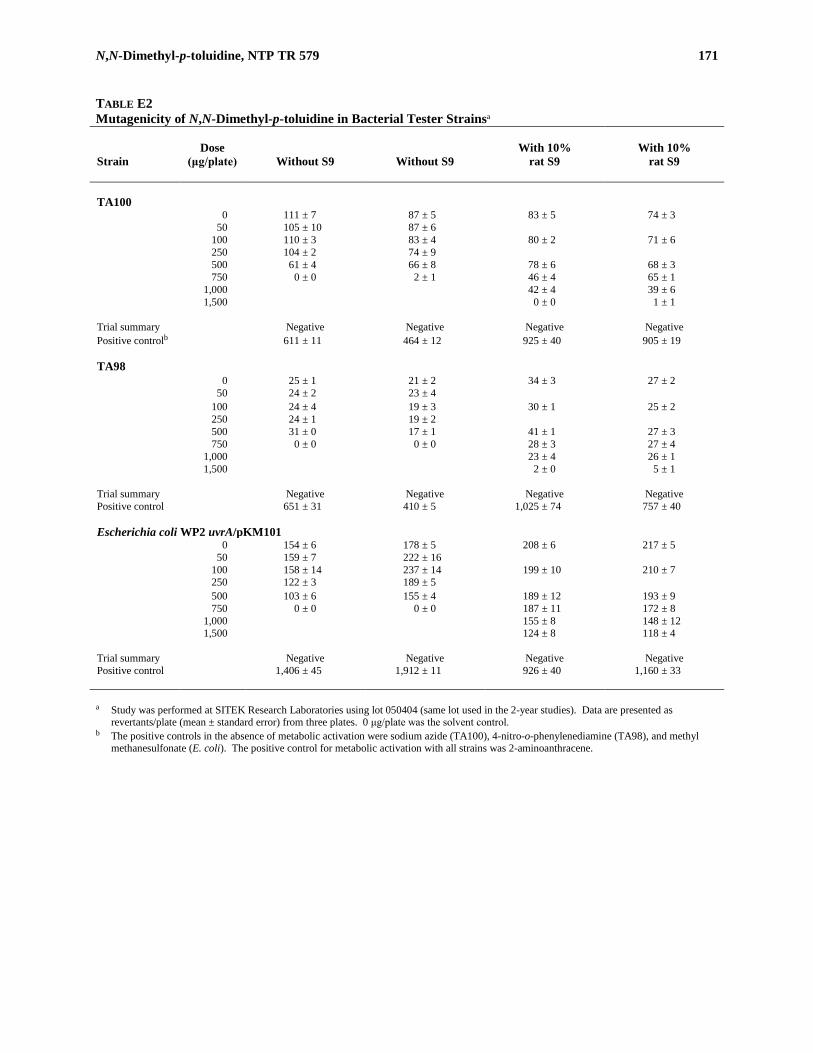
N,N-Dimethyl-p-toluidine, NTP TR 579 171
TABLE E2 Mutagenicity of N,N-Dimethyl-p-toluidine in Bacterial Tester Strainsa Strain
Dose
(μg/plate)
Without S9
Without S9
With 10% rat S9
With 10% rat S9
TA100 0 111 ± 7 87 ± 5 83 ± 5 74 ± 3 50 105 ± 10 87 ± 6 100 110 ± 3 83 ± 4 80 ± 2 71 ± 6 250 104 ± 2 74 ± 9 500 61 ± 4 66 ± 8 78 ± 6 68 ± 3 750 0 ± 0 2 ± 1 46 ± 4 65 ± 1 1,000 42 ± 4 39 ± 6 1,500 0 ± 0 1 ± 1 Trial summary Negative Negative Negative Negative Positive controlb 611 ± 11 464 ± 12 925 ± 40 905 ± 19 TA98 0 25 ± 1 21 ± 2 34 ± 3 27 ± 2 50 24 ± 2 23 ± 4 100 24 ± 4 19 ± 3 30 ± 1 25 ± 2 250 24 ± 1 19 ± 2 500 31 ± 0 17 ± 1 41 ± 1 27 ± 3 750 0 ± 0 0 ± 0 28 ± 3 27 ± 4 1,000 23 ± 4 26 ± 1 1,500 2 ± 0 5 ± 1 Trial summary Negative Negative Negative Negative Positive control 651 ± 31 410 ± 5 1,025 ± 74 757 ± 40 Escherichia coli WP2 uvrA/pKM101 0 154 ± 6 178 ± 5 208 ± 6 217 ± 5 50 159 ± 7 222 ± 16 100 158 ± 14 237 ± 14 199 ± 10 210 ± 7 250 122 ± 3 189 ± 5 500 103 ± 6 155 ± 4 189 ± 12 193 ± 9 750 0 ± 0 0 ± 0 187 ± 11 172 ± 8 1,000 155 ± 8 148 ± 12 1,500 124 ± 8 118 ± 4 Trial summary Negative Negative Negative Negative Positive control 1,406 ± 45 1,912 ± 11 926 ± 40 1,160 ± 33 a Study was performed at SITEK Research Laboratories using lot 050404 (same lot used in the 2-year studies). Data are presented as
revertants/plate (mean ± standard error) from three plates. 0 μg/plate was the solvent control. b The positive controls in the absence of metabolic activation were sodium azide (TA100), 4-nitro-o-phenylenediamine (TA98), and methyl
methanesulfonate (E. coli). The positive control for metabolic activation with all strains was 2-aminoanthracene.

172 N,N-Dimethyl-p-toluidine, NTP TR 579
TABLE E3 Frequency of Micronuclei in Peripheral Blood Erythrocytes of Mice Following Administration of N,N-Dimethyl-p-toluidine by Gavage for 3 Monthsa
Dose (mg/kg)
Number of Mice with Erythrocytes Scored
Micronucleated NCEs/1,000 NCEsb
P Valuec
PCEsb (%)
Male Corn oild 0 5 2.00 ± 0.32 3.34 ± 0.24 N,N-Dimethyl-p-toluidine 15 5 2.10 ± 0.29 0.4379 2.62 ± 0.05 30 5 2.40 ± 0.19 0.2730 3.20 ± 0.25 60 5 2.80 ± 0.90 0.1238 4.16 ± 0.29 125 5 3.00 ± 0.52 0.0784 3.94 ± 0.11 P=0.050e Female Corn oil 0 5 1.50 ± 0.16 4.24 ± 0.36 N,N-Dimethyl-p-toluidine 15 5 1.90 ± 0.40 0.2462 3.32 ± 0.29 30 5 1.70 ± 0.12 0.3617 3.24 ± 0.45 60 5 1.30 ± 0.41 0.6474 3.58 ± 0.25 125 5 2.10 ± 0.40 0.1584 5.36 ± 0.60 P=0.238 a Study was performed at ILS, Inc. The detailed protocol is presented by MacGregor et al. (1990). NCE=normochromatic erythrocyte;
PCE=polychromatic erythrocyte b Mean ± standard error c Pairwise comparison with the vehicle control group; dosed group values are significant at P ≤0.006 d Vehicle control e Significance of micronucleated NCEs/1,000 NCEs tested by the one-tailed trend test; significant at P≤0.025

N,N-Dimethyl-p-toluidine, NTP TR 579 173
TABLE E4 Frequency of Micronuclei in Peripheral Blood Erythrocytes of Male Mice Following Administration of N,N-Dimethyl-p-toluidine by Gavage for 4 Daysa
Dose (mg/kg)
Number of Mice
with Erythrocytes
Scored
Micronucleated
PCEs/ 1,000 PCEsb
P Valuec
Micronucleated
NCEs/ 1,000 NCEsb
P Valuec
PCEsb (%)
P Valuec
Corn oild 0 5 2.59 ± 0.20 1.46 ± 0.02 1.270 ± 0.11 N,N-Dimethyl-p-toluidine 30 5 2.57 ± 0.19 0.5114 1.49 ± 0.03 0.3095 1.201 ± 0.07 0.748 60 5 2.66 ± 0.22 0.5200 1.47 ± 0.02 0.3706 1.140 ± 0.15 0.465 75 5 2.78 ± 0.54 0.4341 1.54 ± 0.04 0.0588 1.103 ± 0.12 0.430 P=0.327e P=0.089 P=0.243 Ethyl methanesulfonatef 150 5 12.18 ± 0.34 0.0000 1.69 ± 0.04 0.0004 0.942 ± 0.04 0.015 a Study was performed at ILS, Inc. The detailed protocol is presented by Witt et al. (2008). NCE=normochromatic erythrocyte;
PCE=polychromatic erythrocyte b Mean ± standard error c Pairwise comparison with the vehicle control group; values are significant at P ≤0.025 by Williams’ test d Vehicle control e Significance tested by a linear regression trend test; significant at P≤0.025 f Positive control; pairwise comparison with the vehicle control group; values are significant at P≤0.05 by a one-tailed independent t-test
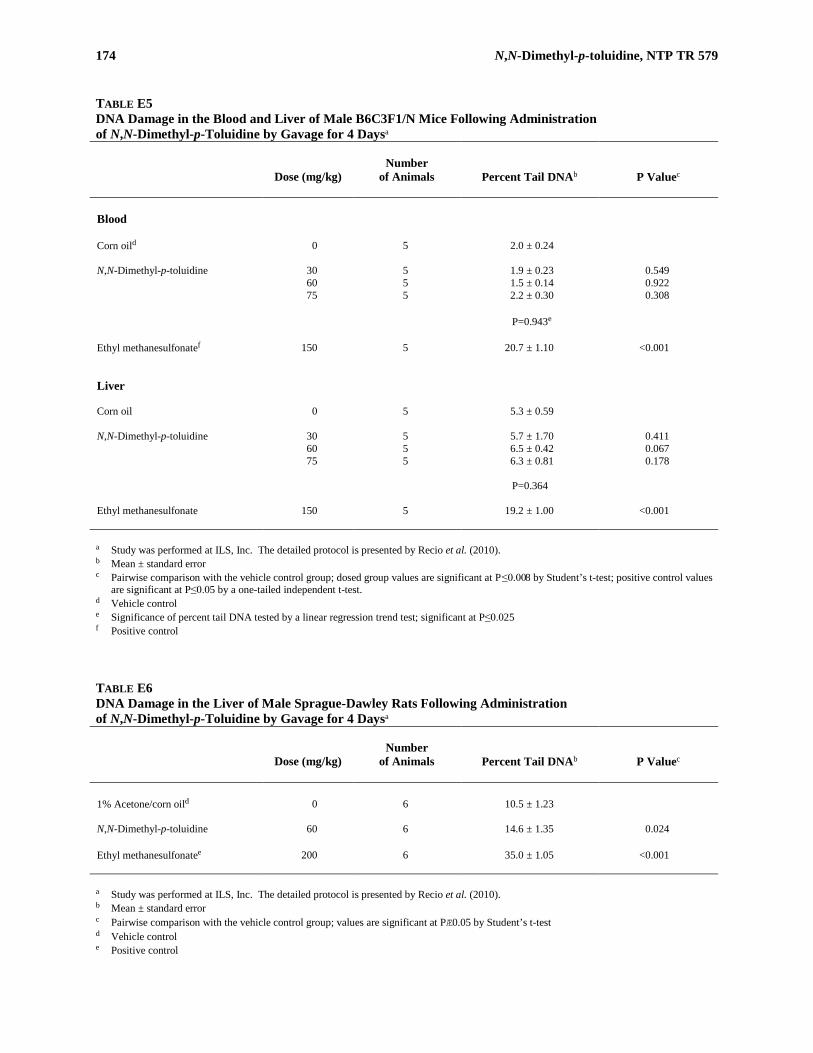
174 N,N-Dimethyl-p-toluidine, NTP TR 579
TABLE E5 DNA Damage in the Blood and Liver of Male B6C3F1/N Mice Following Administration of N,N-Dimethyl-p-Toluidine by Gavage for 4 Daysa
Dose (mg/kg)
Number
of Animals
Percent Tail DNAb
P Valuec
Blood Corn oild 0 5 2.0 ± 0.24 N,N-Dimethyl-p-toluidine 30 5 1.9 ± 0.23 0.549 60 5 1.5 ± 0.14 0.922 75 5 2.2 ± 0.30 0.308 P=0.943e Ethyl methanesulfonatef 150 5 20.7 ± 1.10 <0.001 Liver Corn oil 0 5 5.3 ± 0.59 N,N-Dimethyl-p-toluidine 30 5 5.7 ± 1.70 0.411 60 5 6.5 ± 0.42 0.067 75 5 6.3 ± 0.81 0.178 P=0.364 Ethyl methanesulfonate 150 5 19.2 ± 1.00 <0.001 a Study was performed at ILS, Inc. The detailed protocol is presented by Recio et al. (2010). b Mean ± standard error c Pairwise comparison with the vehicle control group; dosed group values are significant at P≤0.008 by Student’s t-test; positive control values
are significant at P≤0.05 by a one-tailed independent t-test. d Vehicle control e Significance of percent tail DNA tested by a linear regression trend test; significant at P≤0.025 f Positive control
TABLE E6 DNA Damage in the Liver of Male Sprague-Dawley Rats Following Administration of N,N-Dimethyl-p-Toluidine by Gavage for 4 Daysa
Dose (mg/kg)
Number
of Animals
Percent Tail DNAb
P Valuec
1% Acetone/corn oild 0 6 10.5 ± 1.23 N,N-Dimethyl-p-toluidine 60 6 14.6 ± 1.35 0.024 Ethyl methanesulfonatee 200 6 35.0 ± 1.05 <0.001 a Study was performed at ILS, Inc. The detailed protocol is presented by Recio et al. (2010). b Mean ± standard error c Pairwise comparison with the vehicle control group; values are significant at PÆ0.05 by Student’s t-test d Vehicle control e Positive control
175
APPENDIX F CLINICAL PATHOLOGY RESULTS
TABLE F1 Hematology and Clinical Chemistry Data for Rats in the 3-Month Gavage Study of N,N-Dimethyl-p-toluidine .............................................................................................................. 176 TABLE F2 Hematology Data for Rats at 3 Months in the 2-Year Gavage Study of N,N-Dimethyl-p-toluidine .............................................................................................................. 180 TABLE F3 Hematology Data for Mice in the 3-Month Gavage Study of N,N-Dimethyl-p-toluidine ............. 181

176 N,N-Dimethyl-p-toluidine, NTP TR 579
TABLE F1 Hematology and Clinical Chemistry Data for Rats in the 3-Month Gavage Study of N,N-Dimethyl-p-toluidinea
Vehicle Control
62.5 mg/kg
125 mg/kg
250 mg/kg
500 mg/kg
1,000 mg/kg
Male Hematology n Day 25 10 10 9 10 8 0b Day 88 10 10 10 10 9 0 Week 14 10 10 10 10 9 0 Hematocrit (%)
Day 25 49.7 ± 0.3 45.0 ± 0.5** 42.8 ± 0.4** 40.2 ± 0.5** 39.2 ± 0.5** Week 14 46.1 ± 0.4 42.1 ± 0.5** 42.3 ± 0.4** 42.1 ± 0.4** 42.4 ± 0.7**
Hemoglobin (g/dL) Day 25 15.3 ± 0.1 13.3 ± 0.1** 12.5 ± 0.1** 11.8 ± 0.1** 11.0 ± 0.1** Week 14 14.8 ± 0.1 13.0 ± 0.2** 13.0 ± 0.1** 12.9 ± 0.1** 12.7 ± 0.2**
Erythrocytes (106/μL) Day 25 8.26 ± 0.05 7.44 ± 0.07** 6.79 ± 0.07** 5.97 ± 0.09** 5.06 ± 0.05** Week 14 8.62 ± 0.07 7.43 ± 0.08** 6.94 ± 0.05** 6.40 ± 0.07** 6.19 ± 0.07**
Reticulocytes (106/μL) Day 25 0.26 ± 0.01 0.50 ± 0.01** 0.64 ± 0.01** 0.94 ± 0.03** 1.08 ± 0.03** Week 14 0.25 ± 0.01 0.50 ± 0.01** 0.60 ± 0.02** 0.76 ± 0.01** 0.89 ± 0.04**
Nucleated erythrocytes/100 leukocytes Day 25 0.2 ± 0.1 1.3 ± 0.4* 1.3 ± 0.5* 4.7 ± 0.7** 21.6 ± 2.1** Week 14 0.2 ± 0.1 0.9 ± 0.2* 2.0 ± 0.4** 1.7 ± 0.3** 3.6 ± 0.6**
Mean cell volume (fL) Day 25 60.2 ± 0.2 60.5 ± 0.2 63.1 ± 0.2** 67.5 ± 0.6** 77.5 ± 0.5** Week 14 53.5 ± 0.3 56.6 ± 0.3** 61.1 ± 0.3** 65.8 ± 0.3** 68.5 ± 0.6**
Mean cell hemoglobin (pg) Day 25 18.5 ± 0.1 17.9 ± 0.1 18.4 ± 0.1 19.7 ± 0.1** 21.8 ± 0.1** Week 14 17.2 ± 0.1 17.5 ± 0.1* 18.7 ± 0.1** 20.1 ± 0.1** 20.6 ± 0.2**
Mean cell hemoglobin concentration (g/dL) Day 25 30.8 ± 0.1 29.7 ± 0.1** 29.2 ± 0.2** 29.2 ± 0.1** 28.2 ± 0.1** Week 14 32.1 ± 0.1 31.0 ± 0.2** 30.7 ± 0.1** 30.5 ± 0.1** 30.0 ± 0.1**
Platelets (103/μL) Day 25 930.9 ± 35.0 1,067.8 ± 37.9* 1,077.6 ± 28.2* 1,051.3 ± 21.8 1,097.9 ± 50.0* Week 14 666.5 ± 20.3 738.3 ± 28.4 848.6 ± 25.7** 694.9 ± 23.0 735.8 ± 20.0
Leukocytes (103/μL) Day 25 12.41 ± 0.37 11.16 ± 0.35 12.09 ± 0.51 10.53 ± 0.41** 8.01 ± 0.18** Week 14 8.11 ± 0.37 8.77 ± 0.41 8.53 ± 0.78 7.30 ± 0.37 6.28 ± 0.20**
Segmented neutrophils (103/μL) Day 25 1.12 ± 0.08 1.05 ± 0.03 1.67 ± 0.24 1.10 ± 0.05 1.31 ± 0.11 Week 14 1.28 ± 0.11 1.06 ± 0.09 1.10 ± 0.13 1.00 ± 0.07 1.22 ± 0.06
Lymphocytes (103/μL) Day 25 10.90 ± 0.34 9.74 ± 0.34 9.99 ± 0.38 8.96 ± 0.36** 6.32 ± 0.16** Week 14 6.53 ± 0.38 7.43 ± 0.36 7.17 ± 0.67 6.11 ± 0.31 4.88 ± 0.15**
Monocytes (103/μL) Day 25 0.27 ± 0.02 0.27 ± 0.02 0.35 ± 0.03* 0.40 ± 0.03** 0.33 ± 0.02* Week 14 0.16 ± 0.03 0.16 ± 0.02 0.16 ± 0.03 0.13 ± 0.01 0.12 ± 0.01
Basophils (103/μL) Day 25 0.076 ± 0.009 0.066 ± 0.005 0.064 ± 0.008 0.047 ± 0.004** 0.036 ± 0.006** Week 14 0.030 ± 0.004 0.037 ± 0.007 0.033 ± 0.004 0.024 ± 0.003 0.027 ± 0.002
Eosinophils (103/μL) Day 25 0.04 ± 0.01 0.04 ± 0.00 0.03 ± 0.00* 0.03 ± 0.00** 0.01 ± 0.00** Week 14 0.10 ± 0.02 0.07 ± 0.01 0.07 ± 0.01* 0.04 ± 0.01** 0.03 ± 0.00**
Methemoglobin (g/dL) Day 25 0.35 ± 0.03 0.90 ± 0.04** 1.56 ± 0.04**c 1.95 ± 0.05** 1.63 ± 0.06** Day 88 0.38 ± 0.02 1.37 ± 0.08** 1.95 ± 0.07** 2.29 ± 0.08** 2.03 ± 0.08**

N,N-Dimethyl-p-toluidine, NTP TR 579 177
TABLE F1 Hematology and Clinical Chemistry Data for Rats in the 3-Month Gavage Study of N,N-Dimethyl-p-toluidine
Vehicle Control
62.5 mg/kg
125 mg/kg
250 mg/kg
500 mg/kg
1,000 mg/kg
Male (continued) Hematology (continued) n Day 25 10 10 9 10 8 0 Day 88 10 10 10 10 9 0 Week 14 10 10 10 10 9 0 Methemoglobin (% hemoglobin)
Day 25 2.40 ± 0.22 6.70 ± 0.30** 12.44 ± 0.41** 16.60 ± 0.31** 14.75 ± 0.56** Day 88 2.44 ± 0.18d 10.10 ± 0.55** 15.50 ± 0.48** 18.20 ± 0.53** 17.67 ± 0.71**
Heinz bodies (% erythrocytes) Day 25 0.0 ± 0.0 0.0 ± 0.0 2.0 ± 0.6** 14.5 ± 1.9** 23.5 ± 2.6** Week 14 0.0 ± 0.0 0.5 ± 0.2** 2.8 ± 0.3** 4.1 ± 0.4** 2.9 ± 0.8**
Clinical Chemistry n Day 25 10 10 10 10 8 0 Week 14 10 10 10 10 9 0 Urea nitrogen (mg/dL)
Day 25 13.0 ± 0.3 11.1 ± 0.2* 9.3 ± 0.3** 11.3 ± 0.3 12.0 ± 0.7 Week 14 14.2 ± 0.3 12.4 ± 0.5 13.8 ± 0.5 13.9 ± 0.4 17.1 ± 0.7*
Creatinine (mg/dL) Day 25 0.47 ± 0.02 0.45 ± 0.02 0.44 ± 0.02 0.40 ± 0.00** 0.34 ± 0.02** Week 14 0.60 ± 0.00 0.54 ± 0.02** 0.54 ± 0.02** 0.51 ± 0.02** 0.52 ± 0.01**
Total protein (g/dL) Day 25 6.6 ± 0.1 7.4 ± 0.1** 7.3 ± 0.1** 7.2 ± 0.1** 6.7 ± 0.1 Week 14 6.8 ± 0.0 7.4 ± 0.1** 7.4 ± 0.1** 7.3 ± 0.1** 7.4 ± 0.1**
Albumin (g/dL) Day 25 4.4 ± 0.0 4.9 ± 0.0** 4.8 ± 0.0** 4.8 ± 0.1** 4.6 ± 0.0 Week 14 4.6 ± 0.0 5.1 ± 0.0** 5.1 ± 0.1** 5.2 ± 0.0** 5.3 ± 0.0**
Alanine aminotransferase (IU/L) Day 25 45 ± 1 56 ± 2** 88 ± 6** 163 ± 17** 172 ± 19** Week 14 72 ± 5 52 ± 4* 62 ± 6 51 ± 4** 58 ± 7
Alkaline phosphatase (IU/L) Day 25 449 ± 9 348 ± 11** 368 ± 9** 353 ± 10** 336 ± 6** Week 14 195 ± 5 177 ± 3* 176 ± 3* 188 ± 4 187 ± 4
Creatine kinase (IU/L) Day 25 179 ± 19 120 ± 12 172 ± 21 185 ± 21 409 ± 125 Week 14 285 ± 55 220 ± 48 168 ± 30 228 ± 53 201 ± 27
Sorbitol dehydrogenase (IU/L) Day 25 18 ± 1 25 ± 1** 40 ± 2** 51 ± 5** 45 ± 6** Week 14 22 ± 2 23 ± 2 24 ± 3 18 ± 2 20 ± 2
Bile acids (µmol/L) Day 25 12.1 ± 1.9 13.5 ± 2.5 22.0 ± 4.0 14.6 ± 2.4 21.1 ± 3.1 Week 14 6.3 ± 1.1 9.1 ± 1.8 11.8 ± 2.3* 13.5 ± 1.6** 18.9 ± 2.5**
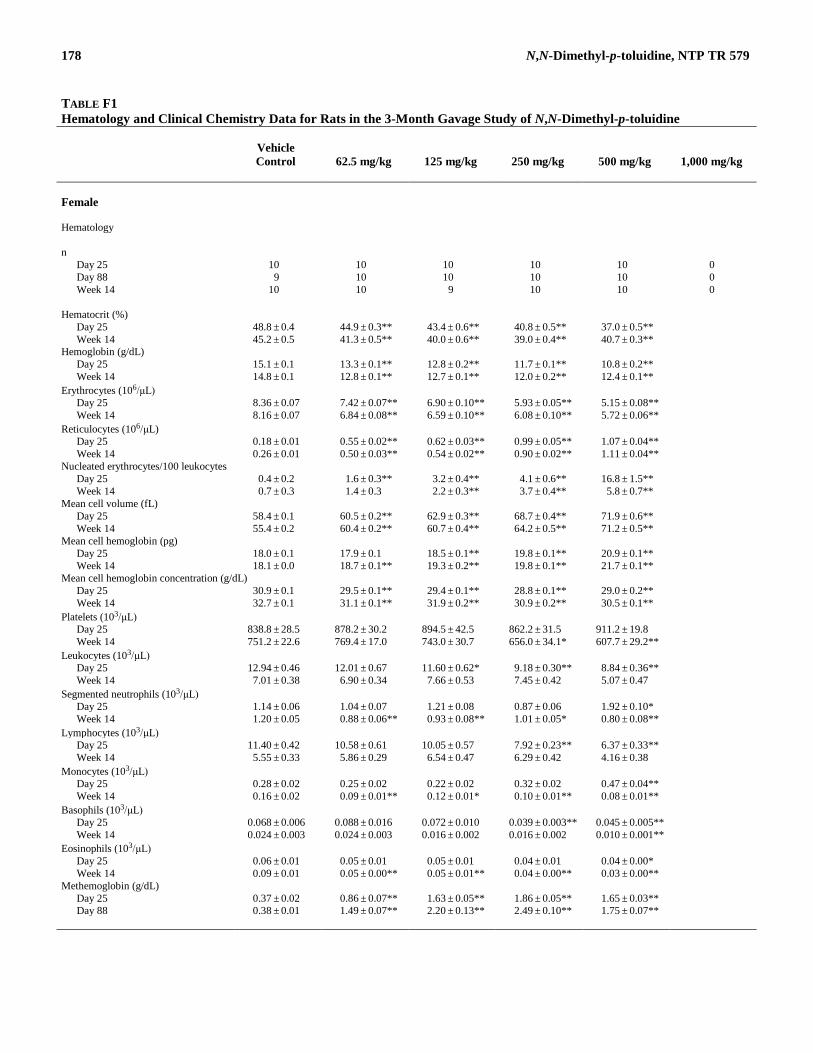
178 N,N-Dimethyl-p-toluidine, NTP TR 579
TABLE F1 Hematology and Clinical Chemistry Data for Rats in the 3-Month Gavage Study of N,N-Dimethyl-p-toluidine
Vehicle Control
62.5 mg/kg
125 mg/kg
250 mg/kg
500 mg/kg
1,000 mg/kg
Female Hematology n
Day 25 10 10 10 10 10 0 Day 88 9 10 10 10 10 0 Week 14 10 10 9 10 10 0
Hematocrit (%)
Day 25 48.8 ± 0.4 44.9 ± 0.3** 43.4 ± 0.6** 40.8 ± 0.5** 37.0 ± 0.5** Week 14 45.2 ± 0.5 41.3 ± 0.5** 40.0 ± 0.6** 39.0 ± 0.4** 40.7 ± 0.3**
Hemoglobin (g/dL) Day 25 15.1 ± 0.1 13.3 ± 0.1** 12.8 ± 0.2** 11.7 ± 0.1** 10.8 ± 0.2** Week 14 14.8 ± 0.1 12.8 ± 0.1** 12.7 ± 0.1** 12.0 ± 0.2** 12.4 ± 0.1**
Erythrocytes (106/μL) Day 25 8.36 ± 0.07 7.42 ± 0.07** 6.90 ± 0.10** 5.93 ± 0.05** 5.15 ± 0.08** Week 14 8.16 ± 0.07 6.84 ± 0.08** 6.59 ± 0.10** 6.08 ± 0.10** 5.72 ± 0.06**
Reticulocytes (106/μL) Day 25 0.18 ± 0.01 0.55 ± 0.02** 0.62 ± 0.03** 0.99 ± 0.05** 1.07 ± 0.04** Week 14 0.26 ± 0.01 0.50 ± 0.03** 0.54 ± 0.02** 0.90 ± 0.02** 1.11 ± 0.04**
Nucleated erythrocytes/100 leukocytes Day 25 0.4 ± 0.2 1.6 ± 0.3** 3.2 ± 0.4** 4.1 ± 0.6** 16.8 ± 1.5** Week 14 0.7 ± 0.3 1.4 ± 0.3 2.2 ± 0.3** 3.7 ± 0.4** 5.8 ± 0.7**
Mean cell volume (fL) Day 25 58.4 ± 0.1 60.5 ± 0.2** 62.9 ± 0.3** 68.7 ± 0.4** 71.9 ± 0.6** Week 14 55.4 ± 0.2 60.4 ± 0.2** 60.7 ± 0.4** 64.2 ± 0.5** 71.2 ± 0.5**
Mean cell hemoglobin (pg) Day 25 18.0 ± 0.1 17.9 ± 0.1 18.5 ± 0.1** 19.8 ± 0.1** 20.9 ± 0.1** Week 14 18.1 ± 0.0 18.7 ± 0.1** 19.3 ± 0.2** 19.8 ± 0.1** 21.7 ± 0.1**
Mean cell hemoglobin concentration (g/dL) Day 25 30.9 ± 0.1 29.5 ± 0.1** 29.4 ± 0.1** 28.8 ± 0.1** 29.0 ± 0.2** Week 14 32.7 ± 0.1 31.1 ± 0.1** 31.9 ± 0.2** 30.9 ± 0.2** 30.5 ± 0.1**
Platelets (103/μL) Day 25 838.8 ± 28.5 878.2 ± 30.2 894.5 ± 42.5 862.2 ± 31.5 911.2 ± 19.8 Week 14 751.2 ± 22.6 769.4 ± 17.0 743.0 ± 30.7 656.0 ± 34.1* 607.7 ± 29.2**
Leukocytes (103/μL) Day 25 12.94 ± 0.46 12.01 ± 0.67 11.60 ± 0.62* 9.18 ± 0.30** 8.84 ± 0.36** Week 14 7.01 ± 0.38 6.90 ± 0.34 7.66 ± 0.53 7.45 ± 0.42 5.07 ± 0.47
Segmented neutrophils (103/μL) Day 25 1.14 ± 0.06 1.04 ± 0.07 1.21 ± 0.08 0.87 ± 0.06 1.92 ± 0.10* Week 14 1.20 ± 0.05 0.88 ± 0.06** 0.93 ± 0.08** 1.01 ± 0.05* 0.80 ± 0.08**
Lymphocytes (103/μL) Day 25 11.40 ± 0.42 10.58 ± 0.61 10.05 ± 0.57 7.92 ± 0.23** 6.37 ± 0.33** Week 14 5.55 ± 0.33 5.86 ± 0.29 6.54 ± 0.47 6.29 ± 0.42 4.16 ± 0.38
Monocytes (103/μL) Day 25 0.28 ± 0.02 0.25 ± 0.02 0.22 ± 0.02 0.32 ± 0.02 0.47 ± 0.04** Week 14 0.16 ± 0.02 0.09 ± 0.01** 0.12 ± 0.01* 0.10 ± 0.01** 0.08 ± 0.01**
Basophils (103/μL) Day 25 0.068 ± 0.006 0.088 ± 0.016 0.072 ± 0.010 0.039 ± 0.003** 0.045 ± 0.005** Week 14 0.024 ± 0.003 0.024 ± 0.003 0.016 ± 0.002 0.016 ± 0.002 0.010 ± 0.001**
Eosinophils (103/μL) Day 25 0.06 ± 0.01 0.05 ± 0.01 0.05 ± 0.01 0.04 ± 0.01 0.04 ± 0.00* Week 14 0.09 ± 0.01 0.05 ± 0.00** 0.05 ± 0.01** 0.04 ± 0.00** 0.03 ± 0.00**
Methemoglobin (g/dL) Day 25 0.37 ± 0.02 0.86 ± 0.07** 1.63 ± 0.05** 1.86 ± 0.05** 1.65 ± 0.03** Day 88 0.38 ± 0.01 1.49 ± 0.07** 2.20 ± 0.13** 2.49 ± 0.10** 1.75 ± 0.07**

N,N-Dimethyl-p-toluidine, NTP TR 579 179
TABLE F1 Hematology and Clinical Chemistry Data for Rats in the 3-Month Gavage Study of N,N-Dimethyl-p-toluidine
Vehicle Control
62.5 mg/kg
125 mg/kg
250 mg/kg
500 mg/kg
1,000 mg/kg
Female (continued) Hematology (continued) n Day 25 10 10 10 10 10 0 Day 88 9 10 10 10 10 0 Week 14 10 10 9 10 10 0 Methemoglobin (% hemoglobin)
Day 25 2.70 ± 0.15 6.40 ± 0.58** 12.80 ± 0.39** 16.00 ± 0.45** 15.50 ± 0.31** Day 88 2.88 ± 0.13e 11.20 ± 0.44** 17.22 ± 1.18**d 19.70 ± 0.62** 16.00 ± 0.42**
Heinz bodies (% erythrocytes) Day 25 0.0 ± 0.0 0.0 ± 0.0 1.5 ± 0.3** 14.4 ± 0.8** 21.2 ± 1.8** Week 14 0.0 ± 0.0 0.2 ± 0.0** 4.8 ± 0.7** 6.8 ± 0.6** 16.0 ± 1.8**
Clinical Chemistry n
Day 25 10 10 10 10 10 0 Week 14 10 10 10 10 10 0
Urea nitrogen (mg/dL)
Day 25 12.5 ± 0.4 10.5 ± 0.5 9.1 ± 0.5** 10.3 ± 0.5* 11.9 ± 0.3 Week 14 14.4 ± 0.3 14.4 ± 0.4 15.4 ± 0.5 16.9 ± 0.5** 21.3 ± 1.8**
Creatinine (mg/dL) Day 25 0.46 ± 0.02 0.40 ± 0.00** 0.40 ± 0.00** 0.40 ± 0.00** 0.36 ± 0.02** Week 14 0.52 ± 0.01 0.50 ± 0.00 0.50 ± 0.00 0.50 ± 0.00 0.49 ± 0.02
Total protein (g/dL) Day 25 6.1 ± 0.1 6.9 ± 0.1** 7.0 ± 0.1** 6.7 ± 0.1* 6.6 ± 0.1 Week 14 6.5 ± 0.1 7.0 ± 0.1** 6.9 ± 0.1** 6.9 ± 0.1** 7.0 ± 0.0**
Albumin (g/dL) Day 25 4.3 ± 0.1 4.9 ± 0.0** 5.0 ± 0.1** 4.8 ± 0.0** 4.7 ± 0.1 Week 14 4.6 ± 0.1 5.1 ± 0.0** 5.1 ± 0.1** 5.2 ± 0.0** 5.3 ± 0.0**
Alanine aminotransferase (IU/L) Day 25 34 ± 1 32 ± 1 43 ± 1** 88 ± 8** 149 ± 9** Week 14 53 ± 4 35 ± 1 42 ± 4 61 ± 7 83 ± 18
Alkaline phosphatase (IU/L) Day 25 324 ± 5 245 ± 9** 258 ± 6** 269 ± 10** 276 ± 10* Week 14 172 ± 4 151 ± 3 154 ± 3 171 ± 3 215 ± 6*
Creatine kinase (IU/L) Day 25 177 ± 29 170 ± 11 153 ± 14 161 ± 35 185 ± 29 Week 14 272 ± 39 221 ± 46 234 ± 38 179 ± 22 195 ± 37
Sorbitol dehydrogenase (IU/L) Day 25 13 ± 1 17 ± 1* 27 ± 1** 47 ± 5** 60 ± 4** Week 14 16 ± 1 21 ± 1* 25 ± 4* 27 ± 5* 24 ± 5
Bile acids (µmol/L) Day 25 7.2 ± 0.7 11.1 ± 1.6 12.8 ± 1.5** 11.5 ± 1.6** 20.7 ± 3.1** Week 14 8.9 ± 1.6 14.1 ± 2.4 13.2 ± 1.0 11.9 ± 1.2 32.2 ± 3.5**
* Significantly different (P≤0.05) from the vehicle control group by Dunn’s or Shirley’s test ** P≤0.01 a Data are presented as mean ± standard error. Statistical tests were performed on unrounded data. b All 1,000 mg/kg rats died before the end of the study; no data are available for these groups. c n=10 d n=9 e n=8

180 N,N-Dimethyl-p-toluidine, NTP TR 579
TABLE F2 Hematology Data for Rats at 3 Months in the 2-Year Gavage Study of N,N-Dimethyl-p-toluidinea
Vehicle Control
6 mg/kg
20 mg/kg
60 mg/kg
n 10 10 10 10 Male Hematocrit (%) 48.8 ± 0.5 48.4 ± 0.4 46.5 ± 0.3** 42.6 ± 0.3** Hemoglobin (g/dL) 16.0 ± 0.2 15.6 ± 0.1* 14.7 ± 0.1** 13.2 ± 0.1** Erythrocytes (106/µL) 9.10 ± 0.10 9.02 ± 0.06 8.53 ± 0.04** 7.61 ± 0.06** Reticulocytes (106/µL) 0.25 ± 0.01 0.26 ± 0.01* 0.35 ± 0.01** 0.69 ± 0.02** Mean cell volume (fL) 53.7 ± 0.2 53.6 ± 0.2 54.5 ± 0.2** 56.0 ± 0.1** Mean cell hemoglobin (pg) 17.5 ± 0.1 17.3 ± 0.1 17.3 ± 0.1 17.3 ± 0.1 Mean cell hemoglobin concentration (g/dL) 32.7 ± 0.2 32.2 ± 0.2 31.6 ± 0.1** 30.9 ± 0.2** Platelets (103/µL) 645.4 ± 27.5 682.6 ± 7.8 721.4 ± 18.4** 722.0 ± 26.0* Leukocytes (103/µL) 9.44 ± 0.49 9.91 ± 0.45 9.99 ± 0.51 9.31 ± 0.58 Segmented neutrophils (103/µL) 1.38 ± 0.09 1.42 ± 0.04 1.42 ± 0.09 1.50 ± 0.05 Lymphocytes (103/µL) 7.70 ± 0.42 8.10 ± 0.41 8.18 ± 0.41 7.46 ± 0.52 Monocytes (103/µL) 0.23 ± 0.02 0.26 ± 0.02 0.24 ± 0.02 0.20 ± 0.02 Basophils (103/µL) 0.062 ± 0.007 0.071 ± 0.006 0.079 ± 0.012 0.075 ± 0.009 Eosinophils (103/µL) 0.08 ± 0.02 0.07 ± 0.01 0.08 ± 0.01 0.06 ± 0.02 Methemoglobin (g/dL) 0.77 ± 0.04 0.88 ± 0.03* 1.14 ± 0.03** 2.30 ± 0.03** Methemoglobin (% hemoglobin) 4.70 ± 0.26 5.60 ± 0.22* 7.90 ± 0.18** 17.40 ± 0.22** Heinz bodies (% erythrocytes) 0.0 ± 0.0 0.1 ± 0.1 0.7 ± 0.2** 3.7 ± 0.3** Female Hematocrit (%) 46.9 ± 0.5 45.8 ± 0.6 44.2 ± 0.6** 41.3 ± 0.6** Hemoglobin (g/dL) 15.8 ± 0.2 15.1 ± 0.2* 14.4 ± 0.2** 13.2 ± 0.1** Erythrocytes (106/µL) 8.50 ± 0.09 8.31 ± 0.10 7.88 ± 0.08** 6.95 ± 0.09** Reticulocytes (106/µL) 0.24 ± 0.01 0.24 ± 0.01 0.35 ± 0.01** 0.70 ± 0.02** Mean cell volume (fL) 55.1 ± 0.2 55.1 ± 0.2 56.1 ± 0.3* 59.4 ± 0.2** Mean cell hemoglobin (pg) 18.6 ± 0.1 18.2 ± 0.1* 18.3 ± 0.1 19.0 ± 0.1 Mean cell hemoglobin concentration (g/dL) 33.8 ± 0.2 33.1 ± 0.2* 32.6 ± 0.2** 32.0 ± 0.2** Platelets (103/µL) 597.4 ± 46.6 583.1 ± 46.9 578.8 ± 49.0 719.3 ± 31.9 Leukocytes (103/µL) 8.04 ± 0.35 8.65 ± 0.22 8.59 ± 0.56 7.46 ± 0.38 Segmented neutrophils (103/µL) 1.40 ± 0.10 1.51 ± 0.11 1.52 ± 0.15 0.95 ± 0.11 Lymphocytes (103/µL) 6.29 ± 0.30 6.76 ± 0.26 6.74 ± 0.44 6.24 ± 0.33 Monocytes (103/µL) 0.21 ± 0.01 0.24 ± 0.02 0.18 ± 0.02 0.15 ± 0.01* Basophils (103/µL) 0.060 ± 0.007 0.054 ± 0.003 0.065 ± 0.009 0.052 ± 0.006 Eosinophils (103/µL) 0.07 ± 0.01 0.09 ± 0.01 0.09 ± 0.02 0.07 ± 0.03 Methemoglobin (g/dL) 0.80 ± 0.03 0.87 ± 0.03 1.21 ± 0.05** 2.26 ± 0.07** Methemoglobin (% hemoglobin) 5.10 ± 0.23 5.60 ± 0.27 8.40 ± 0.31** 17.10 ± 0.41** Heinz bodies (% erythrocytes) 0.0 ± 0.0 0.3 ± 0.2* 0.9 ± 0.3** 3.8 ± 0.2** * Significantly different (P≤0.05) from the vehicle control group by Dunn’s or Shirley’s test ** Significantly different (P≤0.01) from the vehicle control group by Shirley’s test a Data are presented as mean ± standard error. Statistical tests were performed on unrounded data.
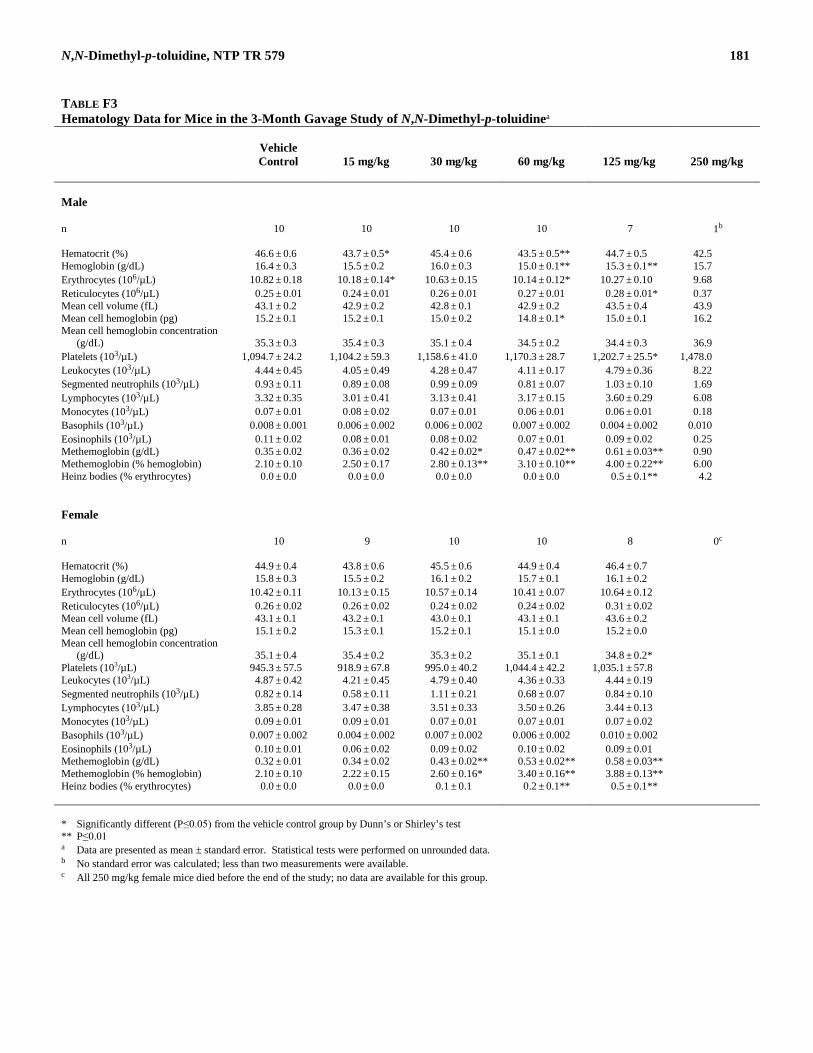
N,N-Dimethyl-p-toluidine, NTP TR 579 181
TABLE F3 Hematology Data for Mice in the 3-Month Gavage Study of N,N-Dimethyl-p-toluidinea
Vehicle Control
15 mg/kg
30 mg/kg
60 mg/kg
125 mg/kg
250 mg/kg
Male n 10 10 10 10 7 1b Hematocrit (%) 46.6 ± 0.6 43.7 ± 0.5* 45.4 ± 0.6 43.5 ± 0.5** 44.7 ± 0.5 42.5 Hemoglobin (g/dL) 16.4 ± 0.3 15.5 ± 0.2 16.0 ± 0.3 15.0 ± 0.1** 15.3 ± 0.1** 15.7 Erythrocytes (106/µL) 10.82 ± 0.18 10.18 ± 0.14* 10.63 ± 0.15 10.14 ± 0.12* 10.27 ± 0.10 9.68 Reticulocytes (106/µL) 0.25 ± 0.01 0.24 ± 0.01 0.26 ± 0.01 0.27 ± 0.01 0.28 ± 0.01* 0.37 Mean cell volume (fL) 43.1 ± 0.2 42.9 ± 0.2 42.8 ± 0.1 42.9 ± 0.2 43.5 ± 0.4 43.9 Mean cell hemoglobin (pg) 15.2 ± 0.1 15.2 ± 0.1 15.0 ± 0.2 14.8 ± 0.1* 15.0 ± 0.1 16.2 Mean cell hemoglobin concentration
(g/dL) 35.3 ± 0.3 35.4 ± 0.3 35.1 ± 0.4 34.5 ± 0.2 34.4 ± 0.3 36.9 Platelets (103/µL) 1,094.7 ± 24.2 1,104.2 ± 59.3 1,158.6 ± 41.0 1,170.3 ± 28.7 1,202.7 ± 25.5* 1,478.0 Leukocytes (103/µL) 4.44 ± 0.45 4.05 ± 0.49 4.28 ± 0.47 4.11 ± 0.17 4.79 ± 0.36 8.22 Segmented neutrophils (103/µL) 0.93 ± 0.11 0.89 ± 0.08 0.99 ± 0.09 0.81 ± 0.07 1.03 ± 0.10 1.69 Lymphocytes (103/µL) 3.32 ± 0.35 3.01 ± 0.41 3.13 ± 0.41 3.17 ± 0.15 3.60 ± 0.29 6.08 Monocytes (103/µL) 0.07 ± 0.01 0.08 ± 0.02 0.07 ± 0.01 0.06 ± 0.01 0.06 ± 0.01 0.18 Basophils (103/µL) 0.008 ± 0.001 0.006 ± 0.002 0.006 ± 0.002 0.007 ± 0.002 0.004 ± 0.002 0.010 Eosinophils (103/µL) 0.11 ± 0.02 0.08 ± 0.01 0.08 ± 0.02 0.07 ± 0.01 0.09 ± 0.02 0.25 Methemoglobin (g/dL) 0.35 ± 0.02 0.36 ± 0.02 0.42 ± 0.02* 0.47 ± 0.02** 0.61 ± 0.03** 0.90 Methemoglobin (% hemoglobin) 2.10 ± 0.10 2.50 ± 0.17 2.80 ± 0.13** 3.10 ± 0.10** 4.00 ± 0.22** 6.00 Heinz bodies (% erythrocytes) 0.0 ± 0.0 0.0 ± 0.0 0.0 ± 0.0 0.0 ± 0.0 0.5 ± 0.1** 4.2 Female n 10 9 10 10 8 0c Hematocrit (%) 44.9 ± 0.4 43.8 ± 0.6 45.5 ± 0.6 44.9 ± 0.4 46.4 ± 0.7 Hemoglobin (g/dL) 15.8 ± 0.3 15.5 ± 0.2 16.1 ± 0.2 15.7 ± 0.1 16.1 ± 0.2 Erythrocytes (106/µL) 10.42 ± 0.11 10.13 ± 0.15 10.57 ± 0.14 10.41 ± 0.07 10.64 ± 0.12 Reticulocytes (106/µL) 0.26 ± 0.02 0.26 ± 0.02 0.24 ± 0.02 0.24 ± 0.02 0.31 ± 0.02 Mean cell volume (fL) 43.1 ± 0.1 43.2 ± 0.1 43.0 ± 0.1 43.1 ± 0.1 43.6 ± 0.2 Mean cell hemoglobin (pg) 15.1 ± 0.2 15.3 ± 0.1 15.2 ± 0.1 15.1 ± 0.0 15.2 ± 0.0 Mean cell hemoglobin concentration
(g/dL) 35.1 ± 0.4 35.4 ± 0.2 35.3 ± 0.2 35.1 ± 0.1 34.8 ± 0.2* Platelets (103/µL) 945.3 ± 57.5 918.9 ± 67.8 995.0 ± 40.2 1,044.4 ± 42.2 1,035.1 ± 57.8 Leukocytes (103/µL) 4.87 ± 0.42 4.21 ± 0.45 4.79 ± 0.40 4.36 ± 0.33 4.44 ± 0.19 Segmented neutrophils (103/µL) 0.82 ± 0.14 0.58 ± 0.11 1.11 ± 0.21 0.68 ± 0.07 0.84 ± 0.10 Lymphocytes (103/µL) 3.85 ± 0.28 3.47 ± 0.38 3.51 ± 0.33 3.50 ± 0.26 3.44 ± 0.13 Monocytes (103/µL) 0.09 ± 0.01 0.09 ± 0.01 0.07 ± 0.01 0.07 ± 0.01 0.07 ± 0.02 Basophils (103/µL) 0.007 ± 0.002 0.004 ± 0.002 0.007 ± 0.002 0.006 ± 0.002 0.010 ± 0.002 Eosinophils (103/µL) 0.10 ± 0.01 0.06 ± 0.02 0.09 ± 0.02 0.10 ± 0.02 0.09 ± 0.01 Methemoglobin (g/dL) 0.32 ± 0.01 0.34 ± 0.02 0.43 ± 0.02** 0.53 ± 0.02** 0.58 ± 0.03** Methemoglobin (% hemoglobin) 2.10 ± 0.10 2.22 ± 0.15 2.60 ± 0.16* 3.40 ± 0.16** 3.88 ± 0.13** Heinz bodies (% erythrocytes) 0.0 ± 0.0 0.0 ± 0.0 0.1 ± 0.1 0.2 ± 0.1** 0.5 ± 0.1** * Significantly different (P≤0.05) from the vehicle control group by Dunn’s or Shirley’s test ** P≤0.01 a Data are presented as mean ± standard error. Statistical tests were performed on unrounded data. b No standard error was calculated; less than two measurements were available. c All 250 mg/kg female mice died before the end of the study; no data are available for this group.

182 N,N-Dimethyl-p-toluidine, NTP TR 579

183
APPENDIX G ORGAN WEIGHTS
AND ORGAN-WEIGHT-TO-BODY-WEIGHT RATIOS
TABLE G1 Organ Weights and Organ-Weight-to-Body-Weight Ratios for Rats in the 3-Month Gavage Study of N,N-Dimethyl-p-toluidine ........................................................... 184 TABLE G2 Organ Weights and Organ-Weight-to-Body-Weight Ratios for Mice in the 3-Month Gavage Study of N,N-Dimethyl-p-toluidine ........................................................... 185

184 N,N-Dimethyl-p-toluidine, NTP TR 579
TABLE G1 Organ Weights and Organ-Weight-to-Body-Weight Ratios for Rats in the 3-Month Gavage Study of N,N-Dimethyl-p-toluidinea
Vehicle Control
62.5 mg/kg
125 mg/kg
250 mg/kg
500 mg/kg
1,000 mg/kg
Male n 10 10 10 10 9 0b Necropsy body wt 327 ± 2 296 ± 5** 289 ± 8** 252 ± 5** 234 ± 9** Heart
Absolute 0.91 ± 0.01 0.90 ± 0.01 0.92 ± 0.02 0.88 ± 0.02 0.85 ± 0.04 Relative 2.766 ± 0.028 3.038 ± 0.040** 3.192 ± 0.050** 3.482 ± 0.044** 3.634 ± 0.072**
R. Kidney Absolute 1.04 ± 0.02 1.10 ± 0.02 1.17 ± 0.03* 1.08 ± 0.02 1.18 ± 0.06* Relative 3.188 ± 0.054 3.721 ± 0.069** 4.042 ± 0.065** 4.298 ± 0.050** 5.021 ± 0.158**
Liver Absolute 11.65 ± 0.15 13.62 ± 0.37* 14.90 ± 0.70** 14.11 ± 0.39** 14.36 ± 0.94** Relative 35.606 ± 0.408 46.030 ± 0.754** 51.269 ± 1.082** 56.017 ± 1.057** 60.768 ± 1.748**
Lung Absolute 1.56 ± 0.07 1.49 ± 0.04 1.43 ± 0.05 1.36 ± 0.06* 1.28 ± 0.06** Relative 4.769 ± 0.193 5.063 ± 0.144 4.939 ± 0.159 5.396 ± 0.188* 5.519 ± 0.277*
R. Testis Absolute 1.390 ± 0.015 1.416 ± 0.020 1.387 ± 0.030 1.317 ± 0.020 1.247 ± 0.038** Relative 4.248 ± 0.047 4.795 ± 0.067** 4.802 ± 0.048** 5.239 ± 0.071** 5.367 ± 0.203**
Thymus Absolute 0.314 ± 0.020 0.263 ± 0.013* 0.261 ± 0.016* 0.233 ± 0.007** 0.200 ± 0.013** Relative 0.958 ± 0.062 0.888 ± 0.034 0.896 ± 0.032 0.929 ± 0.038 0.858 ± 0.045
Female n 10 10 10 10 10 0 Necropsy body wt 193 ± 3 183 ± 3* 172 ± 4** 174 ± 3** 175 ± 3** Heart
Absolute 0.63 ± 0.01 0.69 ± 0.02** 0.67 ± 0.01** 0.68 ± 0.01** 0.73 ± 0.01** Relative 3.242 ± 0.054 3.753 ± 0.090** 3.878 ± 0.086** 3.907 ± 0.053** 4.198 ± 0.062**
R. Kidney Absolute 0.69 ± 0.01 0.77 ± 0.01** 0.80 ± 0.02** 0.82 ± 0.01** 0.99 ± 0.04** Relative 3.560 ± 0.052 4.194 ± 0.042** 4.617 ± 0.066** 4.738 ± 0.066** 5.673 ± 0.157**
Liver Absolute 6.22 ± 0.11 8.61 ± 0.20** 9.11 ± 0.28** 10.61 ± 0.25** 12.61 ± 0.37** Relative 32.286 ± 0.427 46.986 ± 0.525** 52.859 ± 0.894** 61.141 ± 0.935** 72.141 ± 1.144**
Lung Absolute 1.21 ± 0.08 1.14 ± 0.05 1.02 ± 0.03* 1.01 ± 0.03** 0.96 ± 0.03** Relative 6.268 ± 0.421 6.182 ± 0.234 5.960 ± 0.173 5.813 ± 0.167 5.469 ± 0.130
Thymus Absolute 0.247 ± 0.011 0.219 ± 0.007* 0.210 ± 0.006* 0.226 ± 0.008* 0.190 ± 0.008** Relative 1.278 ± 0.048 1.195 ± 0.036 1.224 ± 0.037 1.306 ± 0.048 1.090 ± 0.046*
* Significantly different (P≤0.05) from the vehicle control group by Williams’ or Dunnett’s test ** Significantly different (P≤0.01) from the vehicle control group by Williams’ test a Organ weights (absolute weights) and body weights are given in grams; organ-weight-to-body-weight ratios (relative weights) are given as
mg organ weight/g body weight (mean ± standard error). b All 1,000 mg/kg rats died before the end of the study; no data are available for this group.

N,N-Dimethyl-p-toluidine, NTP TR 579 185
TABLE G2 Organ Weights and Organ-Weight-to-Body-Weight Ratios for Mice in the 3-Month Gavage Study of N,N-Dimethyl-p-toluidinea
Vehicle Control
15 mg/kg
30 mg/kg
60 mg/kg
125 mg/kg
250 mg/kg
Male n 10 10 10 10 7 1b Necropsy body wt 33.6 ± 1.4 35.2 ± 0.5 33.0 ± 1.0 33.1 ± 1.0 29.5 ± 0.4* 26.5 Heart
Absolute 0.17 ± 0.01 0.18 ± 0.00 0.18 ± 0.01 0.18 ± 0.01 0.16 ± 0.00 0.14 Relative 5.092 ± 0.135 5.016 ± 0.140 5.316 ± 0.157 5.302 ± 0.141 5.333 ± 0.053 5.358
R. Kidney Absolute 0.27 ± 0.01 0.30 ± 0.01** 0.28 ± 0.01 0.27 ± 0.01 0.25 ± 0.01 0.23 Relative 7.975 ± 0.244 8.447 ± 0.159 8.474 ± 0.224 8.252 ± 0.138 8.514 ± 0.178 8.717
Liver Absolute 1.43 ± 0.07 1.88 ± 0.03** 1.72 ± 0.09** 1.91 ± 0.07** 2.01 ± 0.04** 2.25 Relative 42.520 ± 0.810 53.390 ± 0.817** 51.805 ± 1.324** 57.853 ± 1.401** 68.107 ± 0.984** 84.792
Lung Absolute 0.22 ± 0.01 0.25 ± 0.02 0.22 ± 0.01 0.23 ± 0.01 0.28 ± 0.01* 0.25 Relative 6.500 ± 0.301 7.151 ± 0.617 6.692 ± 0.290 6.895 ± 0.343 9.316 ± 0.396** 9.358
R. Testis Absolute 0.116 ± 0.002 0.115 ± 0.002 0.116 ± 0.002 0.117 ± 0.002 0.114 ± 0.002 0.105 Relative 3.470 ± 0.079 3.277 ± 0.058 3.540 ± 0.114 3.545 ± 0.092 3.854 ± 0.052** 3.962
Thymus Absolute 0.042 ± 0.003 0.044 ± 0.002 0.041 ± 0.002 0.041 ± 0.002 0.038 ± 0.002 0.035 Relative 1.245 ± 0.050 1.247 ± 0.062 1.228 ± 0.051 1.250 ± 0.039 1.297 ± 0.066 1.321
Female n 10 10 10 10 8 0c Necropsy body wt 27.7 ± 0.7 29.4 ± 0.5 28.2 ± 0.9 27.8 ± 0.6 26.2 ± 0.3 Heart
Absolute 0.13 ± 0.01 0.14 ± 0.00 0.14 ± 0.01 0.14 ± 0.00 0.14 ± 0.00 Relative 4.799 ± 0.221 4.859 ± 0.161 4.992 ± 0.124 4.928 ± 0.130 5.228 ± 0.062
R. Kidney Absolute 0.16 ± 0.00 0.18 ± 0.01 0.17 ± 0.01 0.18 ± 0.00 0.17 ± 0.00 Relative 5.930 ± 0.108 5.986 ± 0.170 6.142 ± 0.207 6.311 ± 0.098 6.557 ± 0.138**
Liver Absolute 1.20 ± 0.03 1.47 ± 0.04** 1.51 ± 0.06** 1.60 ± 0.05** 1.71 ± 0.04** Relative 43.230 ± 0.576 49.900 ± 1.100** 53.618 ± 1.521** 57.589 ± 1.092** 65.419 ± 1.276**
Lung Absolute 0.23 ± 0.01 0.23 ± 0.01 0.24 ± 0.01 0.25 ± 0.01 0.27 ± 0.01** Relative 8.166 ± 0.464 7.755 ± 0.428 8.467 ± 0.561 8.832 ± 0.325 10.484 ± 0.314**
Thymus Absolute 0.053 ± 0.002 0.053 ± 0.002 0.049 ± 0.002 0.047 ± 0.003 0.039 ± 0.002** Relative 1.918 ± 0.068 1.782 ± 0.073 1.744 ± 0.078 1.698 ± 0.106 1.501 ± 0.070**
* Significantly different (P≤0.05) from the vehicle control group by Williams’ or Dunnett’s test ** P≤0.01 a Organ weights (absolute weights) and body weights are given in grams; organ-weight-to-body-weight ratios (relative weights) are given as
mg organ weight/g body weight (mean ± standard error). b No standard error was calculated and statistical analysis was not performed; less than two measurements were available. c All 250 mg/kg female mice died before the end of the study; no data are available for this group.

186 N,N-Dimethyl-p-toluidine, NTP TR 579
187
APPENDIX H REPRODUCTIVE TISSUE EVALUATIONS
AND ESTROUS CYCLE CHARACTERIZATION
TABLE H1 Summary of Reproductive Tissue Evaluations for Male Rats in the 3-Month Gavage Study of N,N-Dimethyl-p-toluidine ........................................................... 188 TABLE H2 Estrous Cycle Characterization for Female Rats in the 3-Month Gavage Study of N,N-Dimethyl-p-toluidine ........................................................... 188 FIGURE H1 Vaginal Cytology Plots for Female Rats in the 3-Month Gavage Study of N,N-Dimethyl-p-toluidine ........................................................... 189 TABLE H3 Results of Vaginal Cytology Study Using the Transition Matrix Approach in Female Rats Administered N,N-Dimethyl-p-toluidine by Gavage for 3 Months ..................... 190 TABLE H4 Summary of Reproductive Tissue Evaluations for Male Mice in the 3-Month Gavage Study of N,N-Dimethyl-p-toluidine ........................................................... 191 TABLE H5 Estrous Cycle Characterization for Female Mice in the 3-Month Gavage Study of N,N-Dimethyl-p-toluidine ........................................................... 191

188 N,N-Dimethyl-p-toluidine, NTP TR 579
TABLE H1 Summary of Reproductive Tissue Evaluations for Male Rats in the 3-Month Gavage Study of N,N-Dimethyl-p-toluidinea
Vehicle Control
62.5 mg/kg
125 mg/kg
250 mg/kg
n 10 10 10 10 Weights (g)
Necropsy body wt 327 ± 2 296 ± 5** 289 ± 8** 252 ± 5** L. Cauda epididymis 0.1440 ± 0.0033 0.1259 ± 0.0046* 0.1392 ± 0.0050 0.1178 ± 0.0049** L. Epididymis 0.4241 ± 0.0049 0.3955 ± 0.0116 0.4170 ± 0.0102 0.3740 ± 0.0101** L. Testis 1.4584 ± 0.0189 1.5586 ± 0.0776 1.4644 ± 0.0305 1.4121 ± 0.0487
Spermatid measurements
Spermatid heads (106/testis) 172.00 ± 4.11 172.00 ± 5.31 180.00 ± 5.53 167.13 ± 6.96 Spermatid heads (106/g testis) 129.6 ± 3.0 124.4 ± 6.7 135.0 ± 4.6 131.5 ± 4.2
Epididymal spermatozoal measurements
Sperm motility (%) 82.2 ± 1.2 81.2 ± 1.2 82.8 ± 0.9 81.3 ± 0.8 Sperm (106/cauda epididymis) 98.63 ± 9.33 81.88 ± 4.89 82.13 ± 3.57 73.13 ± 5.81 Sperm (106/g cauda epididymis) 682 ± 58 659 ± 47 598 ± 33 617 ± 32
* Significantly different (P≤0.05) from the vehicle control group by Dunnett’s test ** Significantly different (P≤0.01) from the vehicle control group by Dunnett’s test (cauda epididymis weight) or Williams’ test (body and
epididymis weights) a Data are presented as mean ± standard error. Differences from the vehicle control group are not significant by Dunnett’s test (testis weight) or
Dunn’s test (spermatid and epididymal spermatozoal measurements). TABLE H2 Estrous Cycle Characterization for Female Rats in the 3-Month Gavage Study of N,N-Dimethyl-p-toluidinea
Vehicle Control
62.5 mg/kg
125 mg/kg
250 mg/kg
Number weighed at necropsy 10 10 10 10
Necropsy body wt (g) 193 ± 3 183 ± 3* 172 ± 4** 174 ± 3**
Proportion of regular cycling femalesb 9/10 10/10 8/9 4/4
Estrous cycle length (days) 4.95 ± 0.17 5.10 ± 0.15 5.56 ± 0.32c 5.38 ± 0.47d Estrous stagese (% of cycle)
Diestrus 51.7 55.8 59.2 60.0 Proestrus 12.5 13.3 12.5 7.5 Estrus 25.0 23.3 17.5 13.3 Metestrus 4.2 6.7 8.3 7.5 Not clear or no cells observed 6.7 0.8 2.5 11.7
* Significantly different (P≤0.05) from the vehicle control group by Williams’ test ** P≤0.01 a Necropsy body weights and estrous cycle length data are presented as mean ± standard error. Differences from the vehicle control group are
not significant by Dunn’s test (estrous cycle length). b Number of females with a regular cycle/number of females cycling c Estrous cycle was longer than 12 days or unclear in 2 of 10 animals. d Estrous cycle was longer than 12 days or unclear in 6 of 10 animals. e Evidence shows that females exposed to 125 mg/kg differ significantly (Wilkes’ Criterion, P≤0.05) from the vehicle control females in the
relative length of time spent in the estrous stages. Tests for equality of transition probability matrices among all groups and between the vehicle control group and each dosed group indicated that females in the 250 mg/kg dose group spent significantly (P<0.001) more time in extended diestrus than females in the vehicle control group.

N,N-Dimethyl-p-toluidine, NTP TR 579 189
Dose (mg/kg)
0 E D D D P E E M D D P E 0 E D D D P E D D D P E D 0 E D D D P E D D D P E P 0 D P E D D D IC E D D D D 0 E E D D D D E D D D D IC 0 E D D D P E E D D P IC E 0 P E D D D D E D D D P E 0 D D D P E M D D IC E M IC 0 D IC P E D D D E E M D IC 0 D P E D D D E E M D D IC
62.5 E M D D E E M D D D E E 62.5 E M D D P E D D D D P E 62.5 M D D D E M D D P E E D 62.5 D P E D D D P E D D D E 62.5 D D P E D D D D E D D D 62.5 E M D D D D P E D D D P 62.5 P E M D D P E D D D P E 62.5 E M D D P E D D D P E D 62.5 D P E D D D E D D D D E 62.5 D D P E D D D P IC D D D
125 E M D D D D E E D D D P 125 D P E M D D D P IC M D D 125 D D E D D D P E D D D P 125 D E M D D E D D D E D D 125 D P E M D D P E M D D P 125 IC D D D D D D D D P E D 125 E M D D P E D D D D P E 125 D D D D E M D D IC P E D 125 D D P E M D D D P E D D 125 P E M D D D D D D D D E
250 D D D P E M D D IC D E D 250 D D P E M D D D IC E E M 250 D D D D D D D IC D D IC D 250 D D D D P E E D D D E M 250 E D D D P E D D D D P IC 250 D D D D D D D D IC D D IC 250 D P E M D D D IC D P IC D 250 M D D D P M D IC IC D D IC 250 E M D D D E E M D D IC E 250 D D IC D E D D D D D D P
FIGURE H1 Vaginal Cytology Plots for Female Rats in the 3-Month Gavage Study of N,N-Dimethyl-p-toluidine (D = diestrus, P = proestrus, E = estrus, M = metestrus, IC = insufficient number of cells to determine stage)
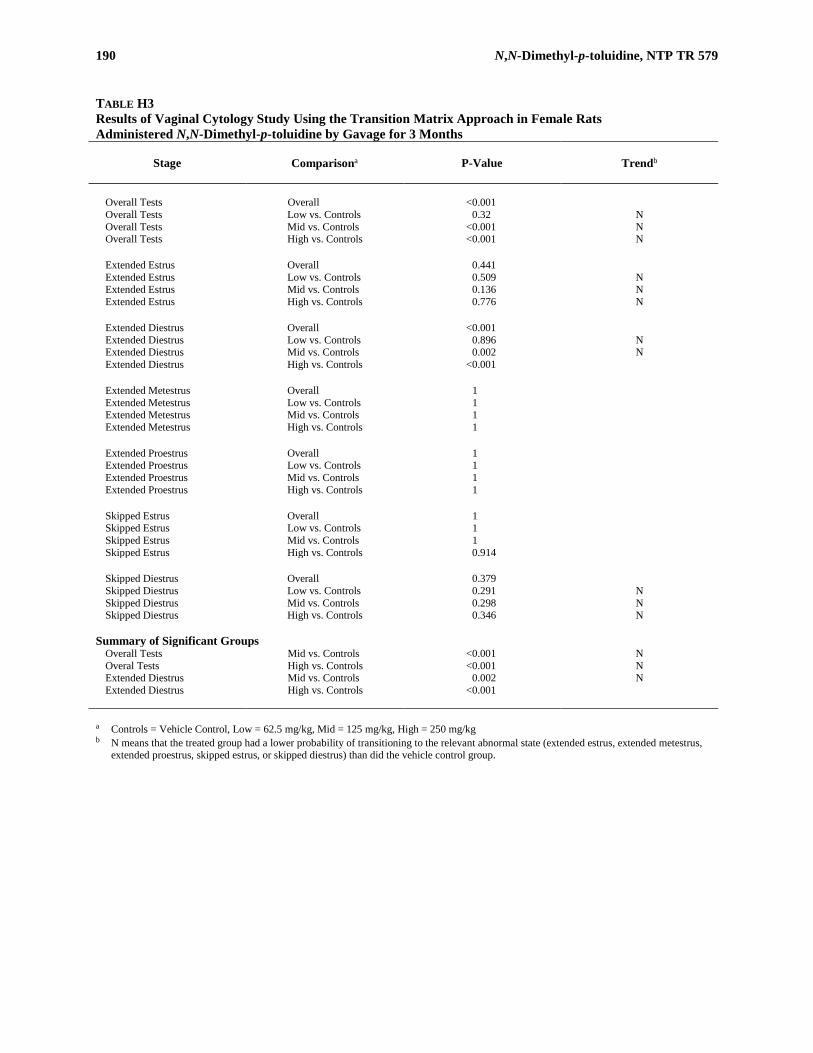
190 N,N-Dimethyl-p-toluidine, NTP TR 579
TABLE H3 Results of Vaginal Cytology Study Using the Transition Matrix Approach in Female Rats Administered N,N-Dimethyl-p-toluidine by Gavage for 3 Months
Stage
Comparisona
P-Value
Trendb
Overall Tests Overall <0.001 Overall Tests Low vs. Controls 0.32 N Overall Tests Mid vs. Controls <0.001 N Overall Tests High vs. Controls <0.001 N Extended Estrus Overall 0.441 Extended Estrus Low vs. Controls 0.509 N Extended Estrus Mid vs. Controls 0.136 N Extended Estrus High vs. Controls 0.776 N Extended Diestrus Overall <0.001 Extended Diestrus Low vs. Controls 0.896 N Extended Diestrus Mid vs. Controls 0.002 N Extended Diestrus High vs. Controls <0.001 Extended Metestrus Overall 1 Extended Metestrus Low vs. Controls 1 Extended Metestrus Mid vs. Controls 1 Extended Metestrus High vs. Controls 1 Extended Proestrus Overall 1 Extended Proestrus Low vs. Controls 1 Extended Proestrus Mid vs. Controls 1 Extended Proestrus High vs. Controls 1 Skipped Estrus Overall 1 Skipped Estrus Low vs. Controls 1 Skipped Estrus Mid vs. Controls 1 Skipped Estrus High vs. Controls 0.914 Skipped Diestrus Overall 0.379 Skipped Diestrus Low vs. Controls 0.291 N Skipped Diestrus Mid vs. Controls 0.298 N Skipped Diestrus High vs. Controls 0.346 N
Summary of Significant Groups Overall Tests Mid vs. Controls <0.001 N Overal Tests High vs. Controls <0.001 N Extended Diestrus Mid vs. Controls 0.002 N Extended Diestrus High vs. Controls <0.001
a Controls = Vehicle Control, Low = 62.5 mg/kg, Mid = 125 mg/kg, High = 250 mg/kg b N means that the treated group had a lower probability of transitioning to the relevant abnormal state (extended estrus, extended metestrus,
extended proestrus, skipped estrus, or skipped diestrus) than did the vehicle control group.
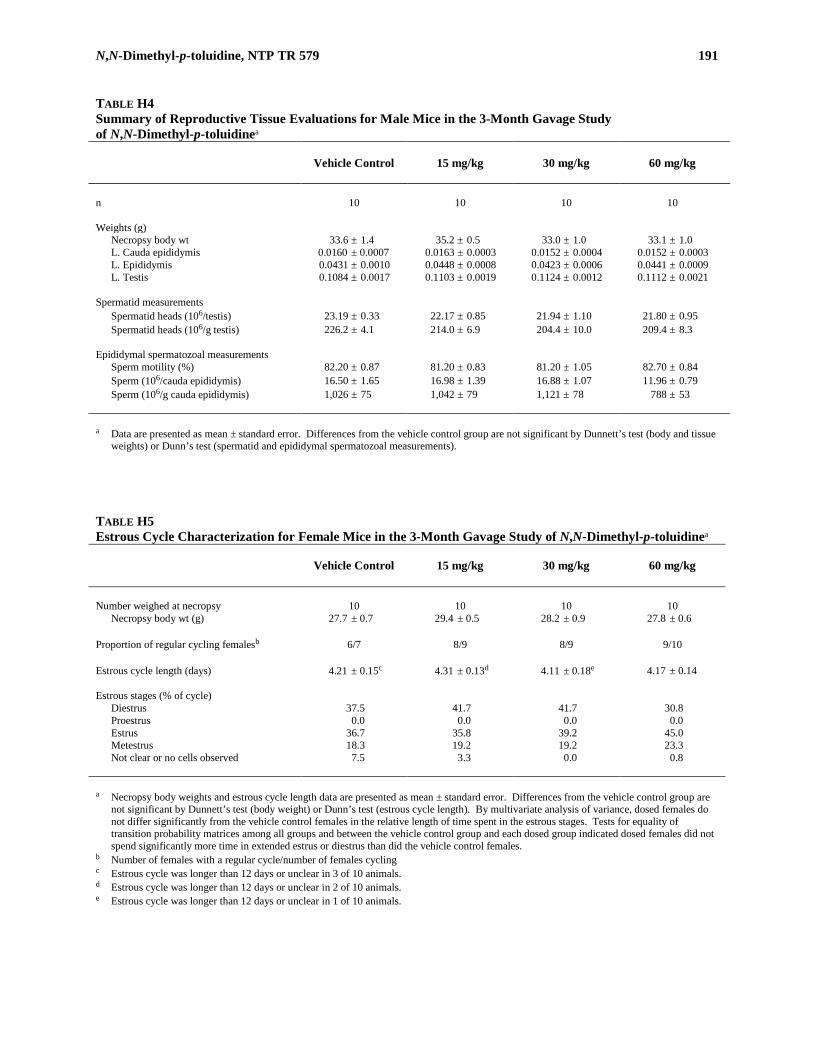
N,N-Dimethyl-p-toluidine, NTP TR 579 191
TABLE H4 Summary of Reproductive Tissue Evaluations for Male Mice in the 3-Month Gavage Study of N,N-Dimethyl-p-toluidinea
Vehicle Control
15 mg/kg
30 mg/kg
60 mg/kg
n 10 10 10 10 Weights (g)
Necropsy body wt 33.6 ± 1.4 35.2 ± 0.5 33.0 ± 1.0 33.1 ± 1.0 L. Cauda epididymis 0.0160 ± 0.0007 0.0163 ± 0.0003 0.0152 ± 0.0004 0.0152 ± 0.0003 L. Epididymis 0.0431 ± 0.0010 0.0448 ± 0.0008 0.0423 ± 0.0006 0.0441 ± 0.0009 L. Testis 0.1084 ± 0.0017 0.1103 ± 0.0019 0.1124 ± 0.0012 0.1112 ± 0.0021
Spermatid measurements
Spermatid heads (106/testis) 23.19 ± 0.33 22.17 ± 0.85 21.94 ± 1.10 21.80 ± 0.95 Spermatid heads (106/g testis) 226.2 ± 4.1 214.0 ± 6.9 204.4 ± 10.0 209.4 ± 8.3
Epididymal spermatozoal measurements
Sperm motility (%) 82.20 ± 0.87 81.20 ± 0.83 81.20 ± 1.05 82.70 ± 0.84 Sperm (106/cauda epididymis) 16.50 ± 1.65 16.98 ± 1.39 16.88 ± 1.07 11.96 ± 0.79 Sperm (106/g cauda epididymis) 1,026 ± 75 1,042 ± 79 1,121 ± 78 788 ± 53
a Data are presented as mean ± standard error. Differences from the vehicle control group are not significant by Dunnett’s test (body and tissue
weights) or Dunn’s test (spermatid and epididymal spermatozoal measurements).
TABLE H5 Estrous Cycle Characterization for Female Mice in the 3-Month Gavage Study of N,N-Dimethyl-p-toluidinea
Vehicle Control
15 mg/kg
30 mg/kg
60 mg/kg
Number weighed at necropsy 10 10 10 10
Necropsy body wt (g) 27.7 ± 0.7 29.4 ± 0.5 28.2 ± 0.9 27.8 ± 0.6
Proportion of regular cycling femalesb 6/7 8/9 8/9 9/10
Estrous cycle length (days) 4.21 ± 0.15c 4.31 ± 0.13d 4.11 ± 0.18e 4.17 ± 0.14 Estrous stages (% of cycle)
Diestrus 37.5 41.7 41.7 30.8 Proestrus 0.0 0.0 0.0 0.0 Estrus 36.7 35.8 39.2 45.0 Metestrus 18.3 19.2 19.2 23.3 Not clear or no cells observed 7.5 3.3 0.0 0.8
a Necropsy body weights and estrous cycle length data are presented as mean ± standard error. Differences from the vehicle control group are not significant by Dunnett’s test (body weight) or Dunn’s test (estrous cycle length). By multivariate analysis of variance, dosed females do not differ significantly from the vehicle control females in the relative length of time spent in the estrous stages. Tests for equality of transition probability matrices among all groups and between the vehicle control group and each dosed group indicated dosed females did not spend significantly more time in extended estrus or diestrus than did the vehicle control females.
b Number of females with a regular cycle/number of females cycling c Estrous cycle was longer than 12 days or unclear in 3 of 10 animals. d Estrous cycle was longer than 12 days or unclear in 2 of 10 animals. e Estrous cycle was longer than 12 days or unclear in 1 of 10 animals.

192 N,N-Dimethyl-p-toluidine, NTP TR 579

193
APPENDIX I CHEMICAL CHARACTERIZATION AND
DOSE FORMULATION STUDIES
PROCUREMENT AND CHARACTERIZATION ............................................................................................................. 194 PREPARATION AND ANALYSIS OF DOSE FORMULATIONS ....................................................................................... 195 FIGURE I1 Infrared Absorption Spectrum of N,N-Dimethyl-p-toluidine ......................................................... 196 FIGURE I2 Proton Nuclear Magnetic Resonance Spectrum of N,N-Dimethyl-p-toluidine ............................. 197 TABLE I1 Preparation and Storage of Dose Formulations in the Gavage Studies of N,N-Dimethyl-p-toluidine ........................................................................ 198 TABLE I2 Results of Analyses of Dose Formulations Administered to Rats and Mice in the 3-Month Gavage Studies of N,N-Dimethyl-p-toluidine ........................................................ 199 TABLE I3 Results of Analyses of Dose Formulations Administered to Rats and Mice in the 2-Year Gavage Studies of N,N-Dimethyl-p-toluidine............................................................ 201
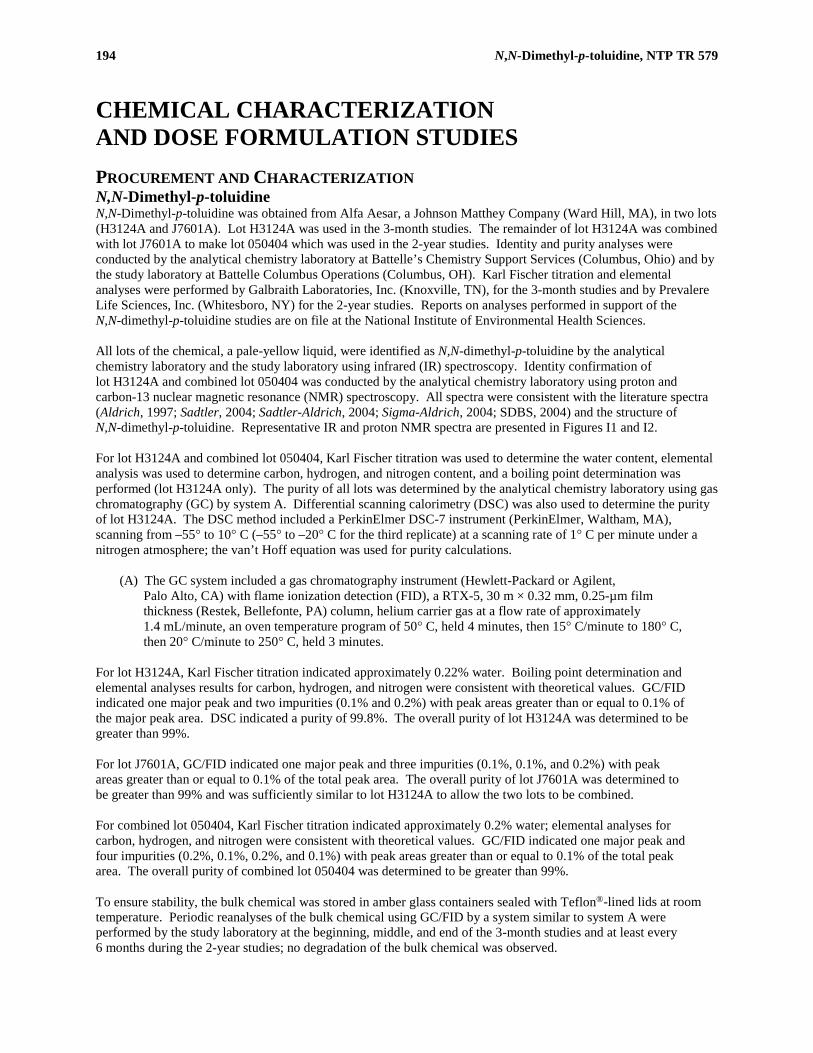
194 N,N-Dimethyl-p-toluidine, NTP TR 579
CHEMICAL CHARACTERIZATION AND DOSE FORMULATION STUDIES PROCUREMENT AND CHARACTERIZATION N,N-Dimethyl-p-toluidine N,N-Dimethyl-p-toluidine was obtained from Alfa Aesar, a Johnson Matthey Company (Ward Hill, MA), in two lots (H3124A and J7601A). Lot H3124A was used in the 3-month studies. The remainder of lot H3124A was combined with lot J7601A to make lot 050404 which was used in the 2-year studies. Identity and purity analyses were conducted by the analytical chemistry laboratory at Battelle’s Chemistry Support Services (Columbus, Ohio) and by the study laboratory at Battelle Columbus Operations (Columbus, OH). Karl Fischer titration and elemental analyses were performed by Galbraith Laboratories, Inc. (Knoxville, TN), for the 3-month studies and by Prevalere Life Sciences, Inc. (Whitesboro, NY) for the 2-year studies. Reports on analyses performed in support of the N,N-dimethyl-p-toluidine studies are on file at the National Institute of Environmental Health Sciences. All lots of the chemical, a pale-yellow liquid, were identified as N,N-dimethyl-p-toluidine by the analytical chemistry laboratory and the study laboratory using infrared (IR) spectroscopy. Identity confirmation of lot H3124A and combined lot 050404 was conducted by the analytical chemistry laboratory using proton and carbon-13 nuclear magnetic resonance (NMR) spectroscopy. All spectra were consistent with the literature spectra (Aldrich, 1997; Sadtler, 2004; Sadtler-Aldrich, 2004; Sigma-Aldrich, 2004; SDBS, 2004) and the structure of N,N-dimethyl-p-toluidine. Representative IR and proton NMR spectra are presented in Figures I1 and I2. For lot H3124A and combined lot 050404, Karl Fischer titration was used to determine the water content, elemental analysis was used to determine carbon, hydrogen, and nitrogen content, and a boiling point determination was performed (lot H3124A only). The purity of all lots was determined by the analytical chemistry laboratory using gas chromatography (GC) by system A. Differential scanning calorimetry (DSC) was also used to determine the purity of lot H3124A. The DSC method included a PerkinElmer DSC-7 instrument (PerkinElmer, Waltham, MA), scanning from –55° to 10° C (–55° to –20° C for the third replicate) at a scanning rate of 1° C per minute under a nitrogen atmosphere; the van’t Hoff equation was used for purity calculations.
(A) The GC system included a gas chromatography instrument (Hewlett-Packard or Agilent, Palo Alto, CA) with flame ionization detection (FID), a RTX-5, 30 m × 0.32 mm, 0.25-µm film thickness (Restek, Bellefonte, PA) column, helium carrier gas at a flow rate of approximately 1.4 mL/minute, an oven temperature program of 50° C, held 4 minutes, then 15° C/minute to 180° C, then 20° C/minute to 250° C, held 3 minutes.
For lot H3124A, Karl Fischer titration indicated approximately 0.22% water. Boiling point determination and elemental analyses results for carbon, hydrogen, and nitrogen were consistent with theoretical values. GC/FID indicated one major peak and two impurities (0.1% and 0.2%) with peak areas greater than or equal to 0.1% of the major peak area. DSC indicated a purity of 99.8%. The overall purity of lot H3124A was determined to be greater than 99%. For lot J7601A, GC/FID indicated one major peak and three impurities (0.1%, 0.1%, and 0.2%) with peak areas greater than or equal to 0.1% of the total peak area. The overall purity of lot J7601A was determined to be greater than 99% and was sufficiently similar to lot H3124A to allow the two lots to be combined. For combined lot 050404, Karl Fischer titration indicated approximately 0.2% water; elemental analyses for carbon, hydrogen, and nitrogen were consistent with theoretical values. GC/FID indicated one major peak and four impurities (0.2%, 0.1%, 0.2%, and 0.1%) with peak areas greater than or equal to 0.1% of the total peak area. The overall purity of combined lot 050404 was determined to be greater than 99%. To ensure stability, the bulk chemical was stored in amber glass containers sealed with Teflon®-lined lids at room temperature. Periodic reanalyses of the bulk chemical using GC/FID by a system similar to system A were performed by the study laboratory at the beginning, middle, and end of the 3-month studies and at least every 6 months during the 2-year studies; no degradation of the bulk chemical was observed.
N,N-Dimethyl-p-toluidine, NTP TR 579 195
Corn Oil USP-grade corn oil was obtained in multiple lots from Spectrum Chemicals and Laboratory Products (Gardena, CA) and was used as the vehicle in the 3-month and 2-year studies. Periodic analyses of the corn oil vehicle performed by the study laboratory using potentiometric titration demonstrated peroxide concentrations below the acceptable limit of 3 mEq/kg. PREPARATION AND ANALYSIS OF DOSE FORMULATIONS Dose formulations were prepared by adding the appropriate amount of N,N-dimethyl-p-toluidine to corn oil to achieve the desired concentration (Table I1). After October 21, 2003, during the 3-month studies, the 400 mg/mL dose formulation was discontinued due to the termination of all animals in the 1,000 mg/kg group. Dose formulations were prepared three times for the 3-month studies and approximately monthly for the 2-year studies. The 400 mg/mL dose formulation was prepared and observed to be a true solution, therefore, no homogeneity or gavageability studies were performed. Stability studies of a 1.0 mg/mL formulation in corn oil were performed by the analytical chemistry laboratory using GC/FID by system A. Stability was confirmed for up to 44 days for formulations stored in amber glass containers sealed with Teflon®-lined lids, protected from light, at up to room temperature and for at least 3 hours under simulated animal room conditions. Periodic analyses of the dose formulations were conducted by the study laboratory using GC/FID by a system similar to system A, with the exception of the following oven temperature program, which provided greater separation (50° C, held 4 minutes, then 15° C/minute to 180° C, then 20° C/minute to 260° C, held 5 minutes). During the 3-month studies, the dose formulations were analyzed at the beginning, midpoint, and end of the studies; animal room samples of these dose formulations were also analyzed (Table I2). Of the dose formulations analyzed and used, all 13 for rats and all 15 for mice were within 10% of the target concentrations; all 13 of the animal room samples for rats and all 15 for mice were within 10% of the target concentrations. During the 2-year studies, the dose formulations were analyzed at least every 3 months; animal room samples were also analyzed (Table I3). Of the dose formulations analyzed and used, all 30 for rats and all 30 for mice were within 10% of the target concentrations; all 12 of the animal room samples for rats and all 12 for mice were within 10% of the target concentrations.
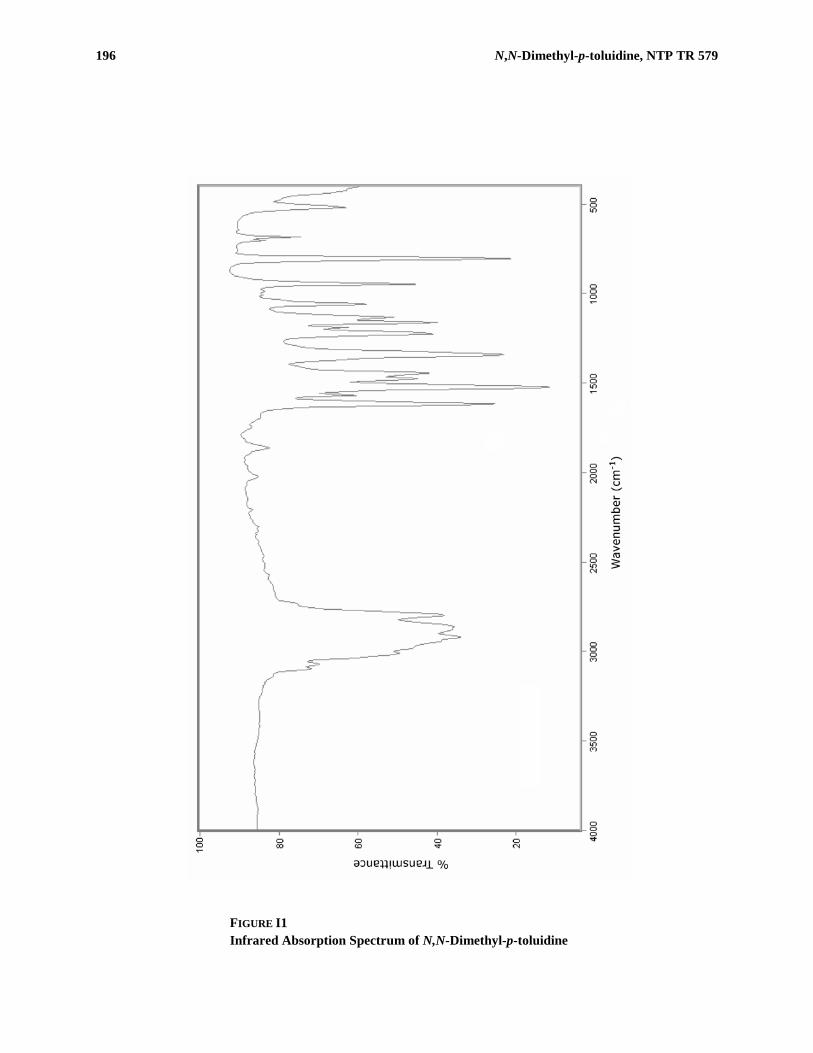
196 N,N-Dimethyl-p-toluidine, NTP TR 579
FIGURE I1 Infrared Absorption Spectrum of N,N-Dimethyl-p-toluidine
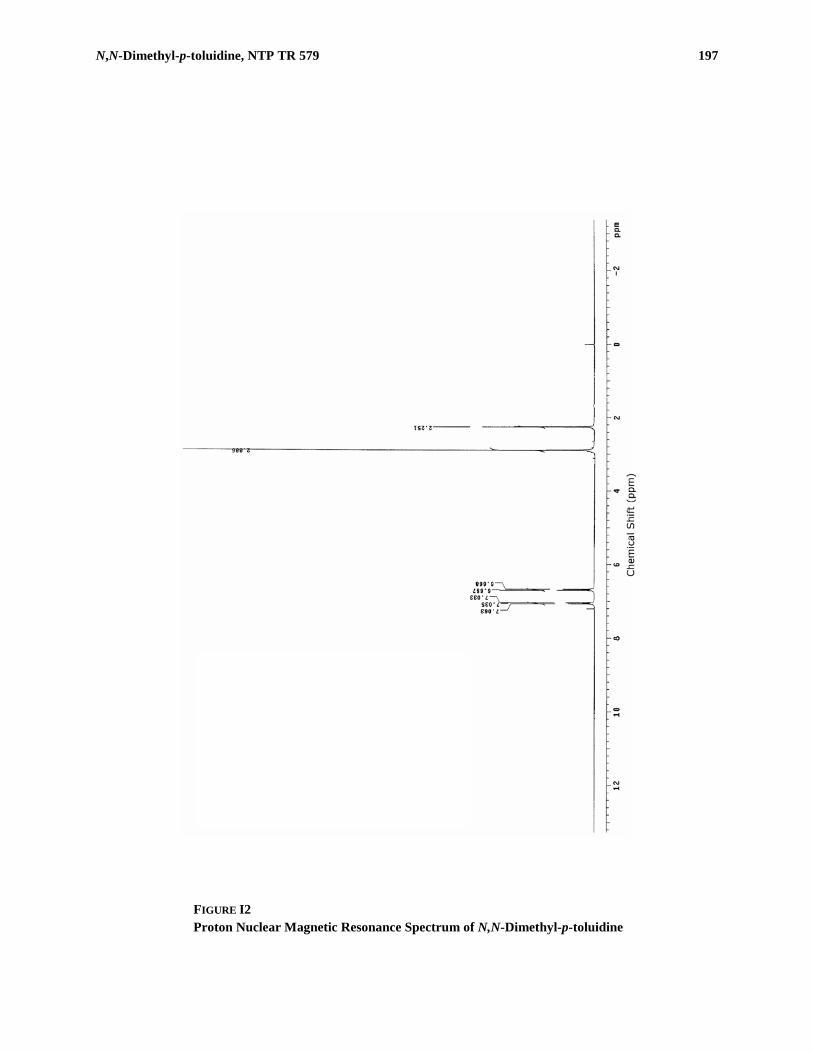
N,N-Dimethyl-p-toluidine, NTP TR 579 197
FIGURE I2 Proton Nuclear Magnetic Resonance Spectrum of N,N-Dimethyl-p-toluidine
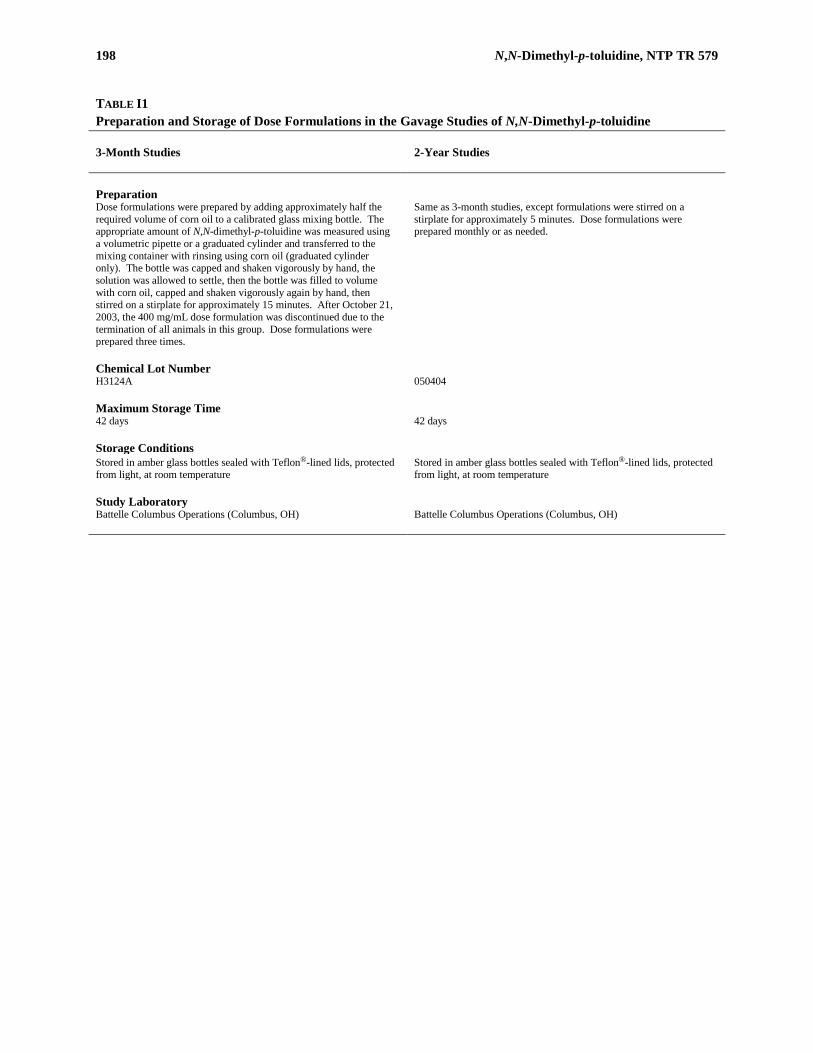
198 N,N-Dimethyl-p-toluidine, NTP TR 579
TABLE I1 Preparation and Storage of Dose Formulations in the Gavage Studies of N,N-Dimethyl-p-toluidine 3-Month Studies
2-Year Studies
Preparation Dose formulations were prepared by adding approximately half the required volume of corn oil to a calibrated glass mixing bottle. The appropriate amount of N,N-dimethyl-p-toluidine was measured using a volumetric pipette or a graduated cylinder and transferred to the mixing container with rinsing using corn oil (graduated cylinder only). The bottle was capped and shaken vigorously by hand, the solution was allowed to settle, then the bottle was filled to volume with corn oil, capped and shaken vigorously again by hand, then stirred on a stirplate for approximately 15 minutes. After October 21, 2003, the 400 mg/mL dose formulation was discontinued due to the termination of all animals in this group. Dose formulations were prepared three times.
Same as 3-month studies, except formulations were stirred on a stirplate for approximately 5 minutes. Dose formulations were prepared monthly or as needed.
Chemical Lot Number H3124A 050404 Maximum Storage Time 42 days 42 days Storage Conditions Stored in amber glass bottles sealed with Teflon®-lined lids, protected from light, at room temperature
Stored in amber glass bottles sealed with Teflon®-lined lids, protected from light, at room temperature
Study Laboratory Battelle Columbus Operations (Columbus, OH) Battelle Columbus Operations (Columbus, OH)

N,N-Dimethyl-p-toluidine, NTP TR 579 199
TABLE I2 Results of Analyses of Dose Formulations Administered to Rats and Mice in the 3-Month Gavage Studies of N,N-Dimethyl-p-toluidine Date Prepared
Date Analyzed
Target
Concentration (mg/mL)
Determined
Concentrationa (mg/mL)
Difference
from Target (%)
Rats October 7, 2003 October 13-14, 2003 25 23.82 –5 50 49.21 –2 100 99.24 –1 200 200.4 0 400 397.5 –1 November 21-22, 2003b 25 23.12 –8 50 47.78 –4 100 96.31 –4 200 190.1 –5 400 388.6 –3 November 4, 2003 November 6-7, 2003 25 23.93 –4 50 48.59 –3 100 96.28 –4 200 189.9 –5 December 23-24, 2003b 25 23.55 –6 50 48.61 –3 100 93.77 –6 200 182.0 –9 December 30, 2003 January 5-6, 2004 25 24.79 –1 50 50.18 0 100 96.66 –3 200 198.3 –1 February 6-7, 2004b 25 23.60 –6 50 48.71 –3 100 95.24 –5 200 191.9 –4 Mice October 7, 2003 October 13-14, 2003 3 3.023 +1 6 5.975 0 12 11.75 –2 25 23.82 –5 50 49.21 –2 November 21-22, 2003b 3 2.831 –6 6 5.657 –6 12 11.41 –5 25 23.93 –4 50 47.70 –5

200 N,N-Dimethyl-p-toluidine, NTP TR 579
TABLE I2 Results of Analyses of Dose Formulations Administered to Rats and Mice in the 3-Month Gavage Studies of N,N-Dimethyl-p-toluidine Date Prepared
Date Analyzed
Target
Concentration (mg/mL)
Determined
Concentration (mg/mL)
Difference
from Target (%)
Mice (continued) November 4, 2003 November 6-7, 2003 3 2.900 –3 6 5.768 –4 12 11.78 –2 25 23.93 –4 50 48.59 –3 December 23-24, 2003b 3 2.833 –6 6 5.564 –7 12 11.50 –4 25 23.83 –5 50 47.97 –4 December 30, 2003 January 5-6, 2004 3 2.951 –2 6 6.044 +1 12 12.22 +2 25 24.79 –1 50 50.18 0 February 6-9, 2004b 3 2.961 –1 6 5.925 ± 0.031c –1 12 11.91 –1 25 23.99 –4 50 48.82 ± 0.20c –2 a Results of duplicate analyses. Dosing volume for rats=2.5 mL/kg: 25 mg/mL=62.5 mg/kg; 50 mg/mL=125 mg/kg; 100 mg/mL=250 mg/kg;
200 mg/mL=500 mg/kg; 400 mg/mL=1,000 mg/kg. Dosing for mice=5 mL/kg: 3 mg/mL=15 mg/kg; 6 mg/mL=30 mg/kg; 12 mg/mL=60 mg/kg; 25 mg/mL=125 mg/kg; 50 mg/mL=250 mg/kg
b Animal room samples c Mean ± standard deviation; results presented are an average of three runs. The initial duplicate set did not pass the acceptance criterion, and
another duplicate set was analyzed. One of the original set was eliminated as an outlier based on the Q-test.
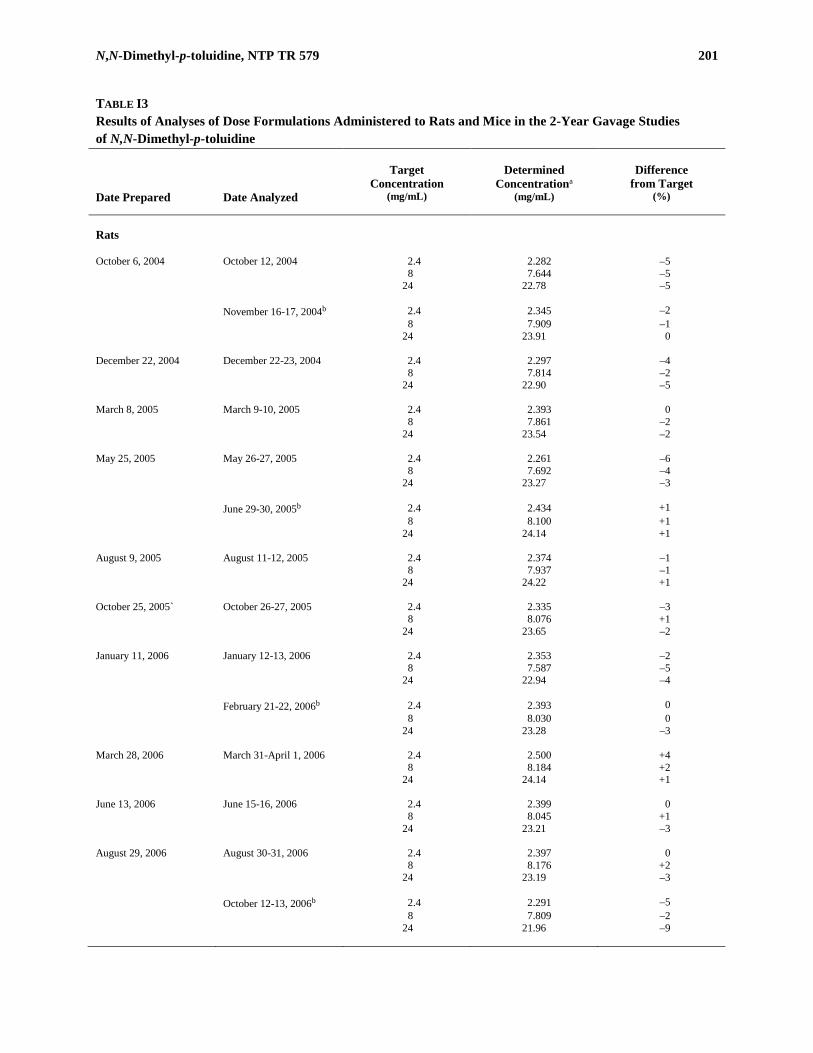
N,N-Dimethyl-p-toluidine, NTP TR 579 201
TABLE I3 Results of Analyses of Dose Formulations Administered to Rats and Mice in the 2-Year Gavage Studies of N,N-Dimethyl-p-toluidine Date Prepared
Date Analyzed
Target
Concentration (mg/mL)
Determined
Concentrationa (mg/mL)
Difference
from Target (%)
Rats October 6, 2004 October 12, 2004 2.4 2.282 –5 8 7.644 –5 24 22.78 –5 November 16-17, 2004b 2.4 2.345 –2 8 7.909 –1 24 23.91 0 December 22, 2004 December 22-23, 2004 2.4 2.297 –4 8 7.814 –2 24 22.90 –5 March 8, 2005 March 9-10, 2005 2.4 2.393 0 8 7.861 –2 24 23.54 –2 May 25, 2005 May 26-27, 2005 2.4 2.261 –6 8 7.692 –4 24 23.27 –3 June 29-30, 2005b 2.4 2.434 +1 8 8.100 +1 24 24.14 +1 August 9, 2005 August 11-12, 2005 2.4 2.374 –1 8 7.937 –1 24 24.22 +1 October 25, 2005` October 26-27, 2005 2.4 2.335 –3 8 8.076 +1 24 23.65 –2 January 11, 2006 January 12-13, 2006 2.4 2.353 –2 8 7.587 –5 24 22.94 –4 February 21-22, 2006b 2.4 2.393 0 8 8.030 0 24 23.28 –3 March 28, 2006 March 31-April 1, 2006 2.4 2.500 +4 8 8.184 +2 24 24.14 +1 June 13, 2006 June 15-16, 2006 2.4 2.399 0 8 8.045 +1 24 23.21 –3 August 29, 2006 August 30-31, 2006 2.4 2.397 0 8 8.176 +2 24 23.19 –3 October 12-13, 2006b 2.4 2.291 –5 8 7.809 –2 24 21.96 –9

202 N,N-Dimethyl-p-toluidine, NTP TR 579
TABLE I3 Results of Analyses of Dose Formulations Administered to Rats and Mice in the 2-Year Gavage Studies of N,N-Dimethyl-p-toluidine Date Prepared
Date Analyzed
Target
Concentration (mg/mL)
Determined
Concentration (mg/mL)
Difference
from Target (%)
Mice October 6, 2004 October 12, 2004 1.2 1.131 –6 4 3.715 –7 12 11.28 –6 November 16-17, 2004b 1.2 1.161 –3 4 3.759 –6 12 11.34 –6 December 22, 2004 December 22-23, 2004 1.2 1.139 –5 4 3.713 –7 12 11.43 –5 March 8, 2005 March 9-10, 2005 1.2 1.185 –1 4 3.710 –7 12 11.48 –4 May 25, 2005 May 26-27, 2005 1.2 1.159 –3 4 3.773 –6 12 11.64 –3 June 29-30, 2005b 1.2 1.173 –2 4 3.902 –2 12 11.52 –4 August 9, 2005 August 11-12, 2005 1.2 1.189 –1 4 3.859 –4 12 11.64 –3 October 25, 2005 October 26-27, 2005 1.2 1.177 –2 4 3.795 –5 12 11.68 –3 January 11, 2006 January 12-13, 2006 1.2 1.164 –3 4 3.837 –4 12 11.50 –4 February 21-22, 2006b 1.2 1.170 –3 4 3.879 –3 12 11.78 –2 March 28, 2006 March 31-April 1, 2006 1.2 1.211 +1 4 3.997 0 12 12.27 +2 June 13, 2006 June 15-16, 2006 1.2 1.176 –2 4 3.796 –5 12 11.76 –2

N,N-Dimethyl-p-toluidine, NTP TR 579 203
TABLE I3 Results of Analyses of Dose Formulations Administered to Rats and Mice in the 2-Year Gavage Studies of N,N-Dimethyl-p-toluidine Date Prepared
Date Analyzed
Target
Concentration (mg/mL)
Determined
Concentration (mg/mL)
Difference
from Target (%)
Mice (continued) August 29, 2006 August 30-31, 2006 1.2 1.184 –1 4 3.833 –4 12 11.81 –2 October 12-13, 2006b 1.2 1.177 –2 4 3.689 –8 12 11.29 –6 a Results of duplicate analyses. Dosing volume for rats=2.5 mL/kg: 2.4 mg/mL=6 mg/kg; 8 mg/mL=20 mg/kg; 24 mg/mL=60 mg/kg. Dosing volume for mice=5 mL/kg: 1.2 mg/mL=6 mg/kg; 4 mg/mL=20 mg/kg; 12 mg/mL=60 mg/kg. b Animal room samples

204 N,N-Dimethyl-p-toluidine, NTP TR 579

205
APPENDIX J INGREDIENTS, NUTRIENT COMPOSITION,
AND CONTAMINANT LEVELS IN NTP-2000 RAT AND MOUSE RATION
TABLE J1 Ingredients of NTP-2000 Rat and Mouse Ration ............................................................................ 206 TABLE J2 Vitamins and Minerals in NTP-2000 Rat and Mouse Ration ......................................................... 206 TABLE J3 Nutrient Composition of NTP-2000 Rat and Mouse Ration ........................................................... 207 TABLE J4 Contaminant Levels in NTP-2000 Rat and Mouse Ration ............................................................. 208
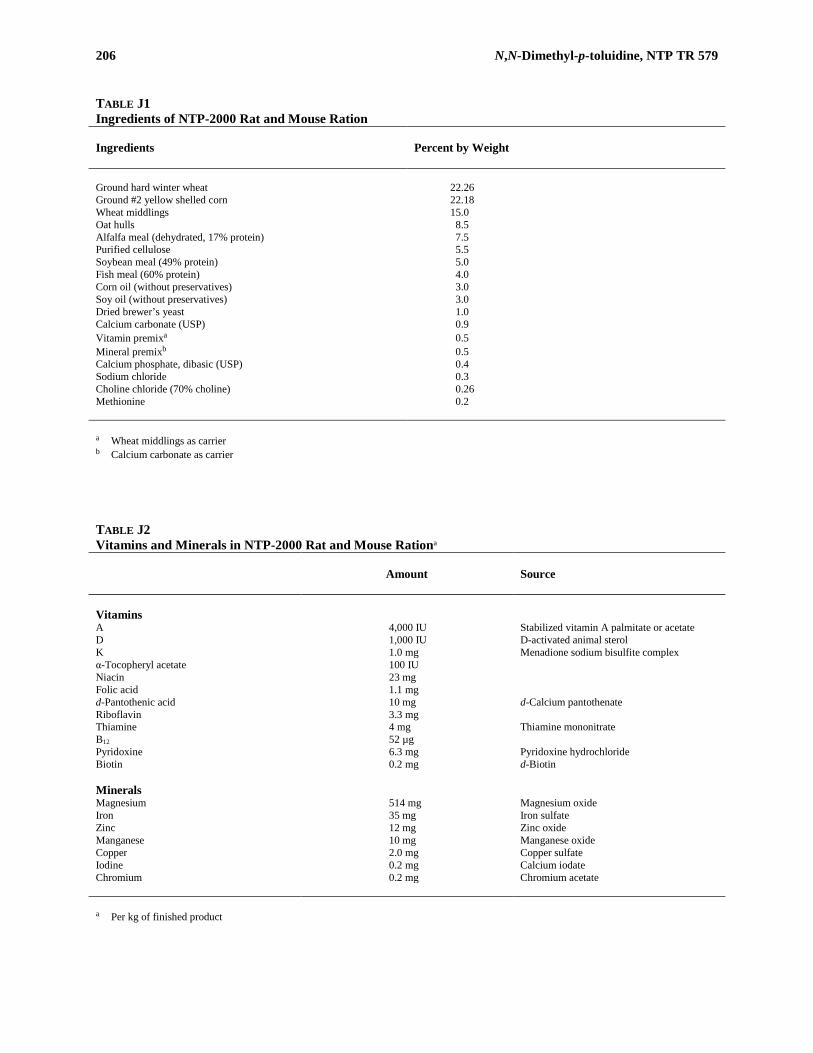
206 N,N-Dimethyl-p-toluidine, NTP TR 579
TABLE J1 Ingredients of NTP-2000 Rat and Mouse Ration Ingredients
Percent by Weight
Ground hard winter wheat 22.26 Ground #2 yellow shelled corn 22.18 Wheat middlings 15.0 Oat hulls 8.5 Alfalfa meal (dehydrated, 17% protein) 7.5 Purified cellulose 5.5 Soybean meal (49% protein) 5.0 Fish meal (60% protein) 4.0 Corn oil (without preservatives) 3.0 Soy oil (without preservatives) 3.0 Dried brewer’s yeast 1.0 Calcium carbonate (USP) 0.9 Vitamin premixa 0.5 Mineral premixb 0.5 Calcium phosphate, dibasic (USP) 0.4 Sodium chloride 0.3 Choline chloride (70% choline) 0.26 Methionine 0.2 a Wheat middlings as carrier b Calcium carbonate as carrier
TABLE J2 Vitamins and Minerals in NTP-2000 Rat and Mouse Rationa
Amount
Source
Vitamins A 4,000 IU Stabilized vitamin A palmitate or acetate D 1,000 IU D-activated animal sterol K 1.0 mg Menadione sodium bisulfite complex α-Tocopheryl acetate 100 IU Niacin 23 mg Folic acid 1.1 mg d-Pantothenic acid 10 mg d-Calcium pantothenate Riboflavin 3.3 mg Thiamine 4 mg Thiamine mononitrate B12 52 µg Pyridoxine 6.3 mg Pyridoxine hydrochloride Biotin 0.2 mg d-Biotin Minerals Magnesium 514 mg Magnesium oxide Iron 35 mg Iron sulfate Zinc 12 mg Zinc oxide Manganese 10 mg Manganese oxide Copper 2.0 mg Copper sulfate Iodine 0.2 mg Calcium iodate Chromium 0.2 mg Chromium acetate a Per kg of finished product

N,N-Dimethyl-p-toluidine, NTP TR 579 207
TABLE J3 Nutrient Composition of NTP-2000 Rat and Mouse Ration Nutrient
Mean ± Standard Deviation
Range
Number of Samples
Protein (% by weight) 14.6 ± 0.67 13.5 – 16.3 25 Crude fat (% by weight) 8.3 ± 0.37 7.6 – 9.3 25 Crude fiber (% by weight) 9.2 ± 0.45 8.4 – 10.0 25 Ash (% by weight) 5.0 ± 0.24 4.6 – 5.4 25 Amino Acids (% of total diet) Arginine 0.778 ± 0.068 0.670 – 0.970 21 Cystine 0.220 ± 0.025 0.150 – 0.250 21 Glycine 0.701 ± 0.042 0.620 – 0.800 21 Histidine 0.354 ± 0.079 0.270 – 0.680 21 Isoleucine 0.544 ± 0.045 0.430 – 0.660 21 Leucine 1.092 ± 0.068 0.960 – 1.240 21 Lysine 0.704 ± 0.112 0.310 – 0.840 21 Methionine 0.409 ± 0.047 0.260 – 0.490 21 Phenylalanine 0.626 ± 0.040 0.540 – 0.720 21 Threonine 0.503 ± 0.043 0.430 – 0.610 21 Tryptophan 0.148 ± 0.027 0.110 – 0.200 21 Tyrosine 0.397 ± 0.058 0.280 – 0.540 21 Valine 0.666 ± 0.044 0.550 – 0.730 21 Essential Fatty Acids (% of total diet) Linoleic 3.92 ± 0.227 3.49 – 4.54 21 Linolenic 0.30 ± 0.030 0.21 – 0.35 21 Vitamins Vitamin A (IU/kg) 3,927 ± 772 2,340 – 5,590 25 Vitamin D (IU/kg) 1,000a α-Tocopherol (ppm) 80.1 ± 22.48 27.0 – 124.0 21 Thiamine (ppm)b 7.8 ± 1.17 6.3 – 10.5 25 Riboflavin (ppm) 7.1 ± 1.91 4.20 – 11.20 21 Niacin (ppm) 78.6 ± 9.16 66.4 – 98.2 21 Pantothenic acid (ppm) 27.1 ± 12.89 17.4 – 81.0 21 Pyridoxine (ppm)b 9.47 ± 2.01 6.4 – 13.7 21 Folic acid (ppm) 1.63 ± 0.49 1.15 – 3.27 21 Biotin (ppm) 0.319 ± 0.10 0.200 – 0.704 21 Vitamin B12 (ppb) 53.8 ± 40.6 18.3 – 174.0 21 Choline (ppm)b 2,885 ± 459 1,820 – 3,790 21 Minerals Calcium (%) 0.979 ± 0.049 0.895 – 1.080 25 Phosphorus (%) 0.570 ± 0.030 0.515 – 0.623 25 Potassium (%) 0.663 ± 0.027 0.626 – 0.732 21 Chloride (%) 0.387 ± 0.039 0.300 – 0.474 21 Sodium (%) 0.190 ± 0.016 0.160 – 0.222 21 Magnesium (%) 0.216 ± 0.063 0.185 – 0.490 21 Sulfur (%) 0.170 ± 0.029 0.116 – 0.209 14 Iron (ppm) 185 ± 40.1 135 – 311 21 Manganese (ppm) 51.6 ± 10.49 21.0 – 73.1 21 Zinc (ppm) 53.6 ± 8.62 43.3 – 78.5 21 Copper (ppm) 7.07 ± 2.611 3.21 – 16.30 21 Iodine (ppm) 0.497 ± 0.209 0.158 – 0.972 21 Chromium (ppm) 0.684 ± 0.279 0.330 – 1.380 20 Cobalt (ppm) 0.26 ± 0.164 0.11 – 0.86 19 a From formulation b As hydrochloride (thiamine and pyridoxine) or chloride (choline)

208 N,N-Dimethyl-p-toluidine, NTP TR 579
TABLE J4 Contaminant Levels in NTP-2000 Rat and Mouse Rationa
Mean ± Standard Deviationb
Range
Number of Samples
Contaminants Arsenic (ppm) 0.23 ± 0.060 0.16 – 0.39 25 Cadmium (ppm) 0.05 ± 0.010 0.04 – 0.09 25 Lead (ppm) 0.09 ± 0.016 0.07 – 0.13 25 Mercury (ppm) <0.02 25 Selenium (ppm) 0.29 ± 0.100 0.18 – 0.49 25 Aflatoxins (ppb) <5.00 25 Nitrate nitrogen (ppm)c 13.91 ± 7.35 4.76 – 36.8 25 Nitrite nitrogen (ppm)c <0.61 25 BHA (ppm)d <1.0 25 BHT (ppm)d <1.0 25 Aerobic plate count (CFU/g) 10 ± 0.0 10.0 25 Coliform (MPN/g) 3.0 ± 0.0 3.0 25 Escherichia coli (MPN/g) <10 25 Salmonella (MPN/g) Negative 25 Total nitrosoamines (ppb)e 4.81 ± 1.63 2.2 – 9.9 25 N-Nitrosodimethylamine (ppb)e 2.7 ± 1.22 1.0 – 6.3 25 N-Nitrosopyrrolidine (ppb)e 2.1 ± 0.71 1.1 – 3.6 25 Pesticides (ppm) α-BHC <0.01 25 β-BHC <0.02 25 γ-BHC <0.01 25 δ-BHC <0.01 25 Heptachlor <0.01 25 Aldrin <0.01 25 Heptachlor epoxide <0.01 25 DDE <0.01 25 DDD <0.01 25 DDT <0.01 25 HCB <0.01 25 Mirex <0.01 25 Methoxychlor <0.05 25 Dieldrin <0.01 25 Endrin <0.01 25 Telodrin <0.01 25 Chlordane <0.05 25 Toxaphene <0.10 25 Estimated PCBs <0.20 25 Ronnel <0.01 25 Ethion <0.02 25 Trithion <0.05 25 Diazinon <0.10 25 Methyl chlorpyrifos 0.139 ± 0.127 0.020 – 0.416 25 Methyl parathion <0.02 25 Ethyl parathion <0.02 25 Malathion 0.245 ± 0.243 0.020 – 0.994 25 Endosulfan I <0.01 25 Endosulfan II <0.01 25 Endosulfan sulfate <0.03 25 a All samples were irradiated. CFU=colony-forming units; MPN=most probable number; BHC=hexachlorocyclohexane or benzene
hexachloride b For values less than the limit of detection, the detection limit is given as the mean. c Sources of contamination: alfalfa, grains, and fish meal d Sources of contamination: soy oil and fish meal e All values were corrected for percent recovery.
209
APPENDIX K SENTINEL ANIMAL PROGRAM
METHODS .................................................................................................................................................................. 210 RESULTS .................................................................................................................................................................... 211
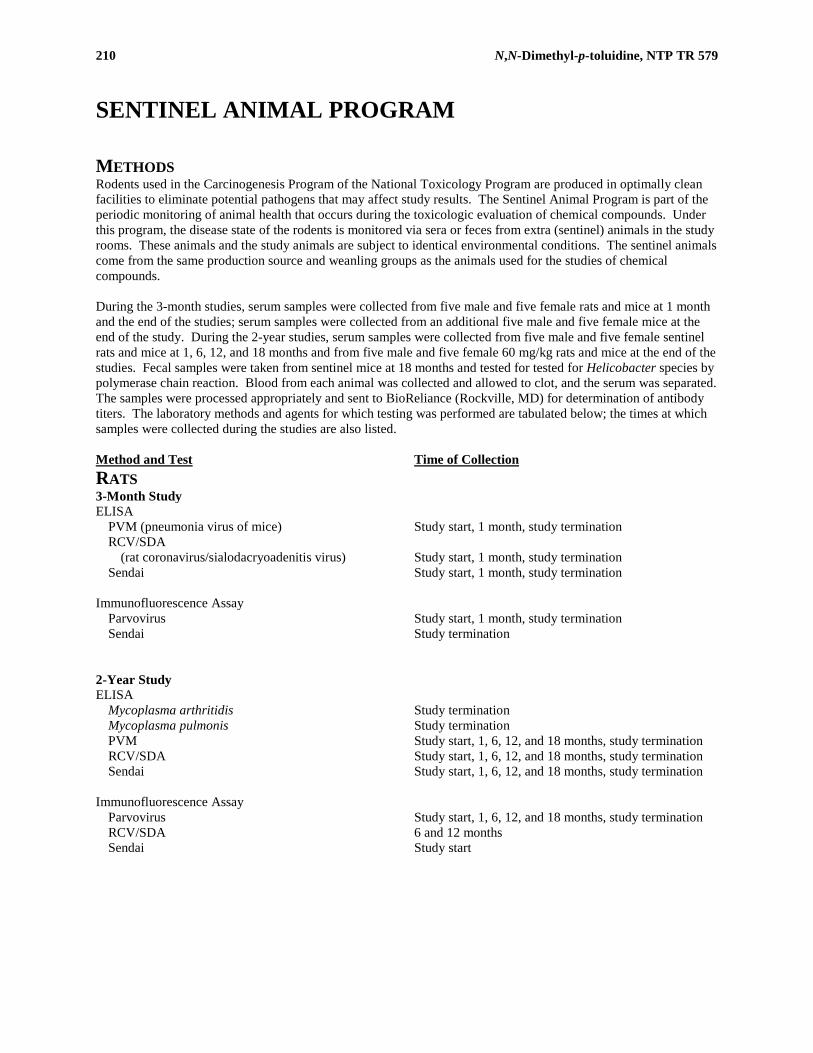
210 N,N-Dimethyl-p-toluidine, NTP TR 579
SENTINEL ANIMAL PROGRAM
METHODS Rodents used in the Carcinogenesis Program of the National Toxicology Program are produced in optimally clean facilities to eliminate potential pathogens that may affect study results. The Sentinel Animal Program is part of the periodic monitoring of animal health that occurs during the toxicologic evaluation of chemical compounds. Under this program, the disease state of the rodents is monitored via sera or feces from extra (sentinel) animals in the study rooms. These animals and the study animals are subject to identical environmental conditions. The sentinel animals come from the same production source and weanling groups as the animals used for the studies of chemical compounds. During the 3-month studies, serum samples were collected from five male and five female rats and mice at 1 month and the end of the studies; serum samples were collected from an additional five male and five female mice at the end of the study. During the 2-year studies, serum samples were collected from five male and five female sentinel rats and mice at 1, 6, 12, and 18 months and from five male and five female 60 mg/kg rats and mice at the end of the studies. Fecal samples were taken from sentinel mice at 18 months and tested for tested for Helicobacter species by polymerase chain reaction. Blood from each animal was collected and allowed to clot, and the serum was separated. The samples were processed appropriately and sent to BioReliance (Rockville, MD) for determination of antibody titers. The laboratory methods and agents for which testing was performed are tabulated below; the times at which samples were collected during the studies are also listed. Method and Test Time of Collection RATS 3-Month Study ELISA
PVM (pneumonia virus of mice) Study start, 1 month, study termination RCV/SDA
(rat coronavirus/sialodacryoadenitis virus) Study start, 1 month, study termination Sendai Study start, 1 month, study termination
Immunofluorescence Assay
Parvovirus Study start, 1 month, study termination Sendai Study termination
2-Year Study ELISA
Mycoplasma arthritidis Study termination Mycoplasma pulmonis Study termination PVM Study start, 1, 6, 12, and 18 months, study termination RCV/SDA Study start, 1, 6, 12, and 18 months, study termination Sendai Study start, 1, 6, 12, and 18 months, study termination
Immunofluorescence Assay Parvovirus Study start, 1, 6, 12, and 18 months, study termination RCV/SDA 6 and 12 months Sendai Study start
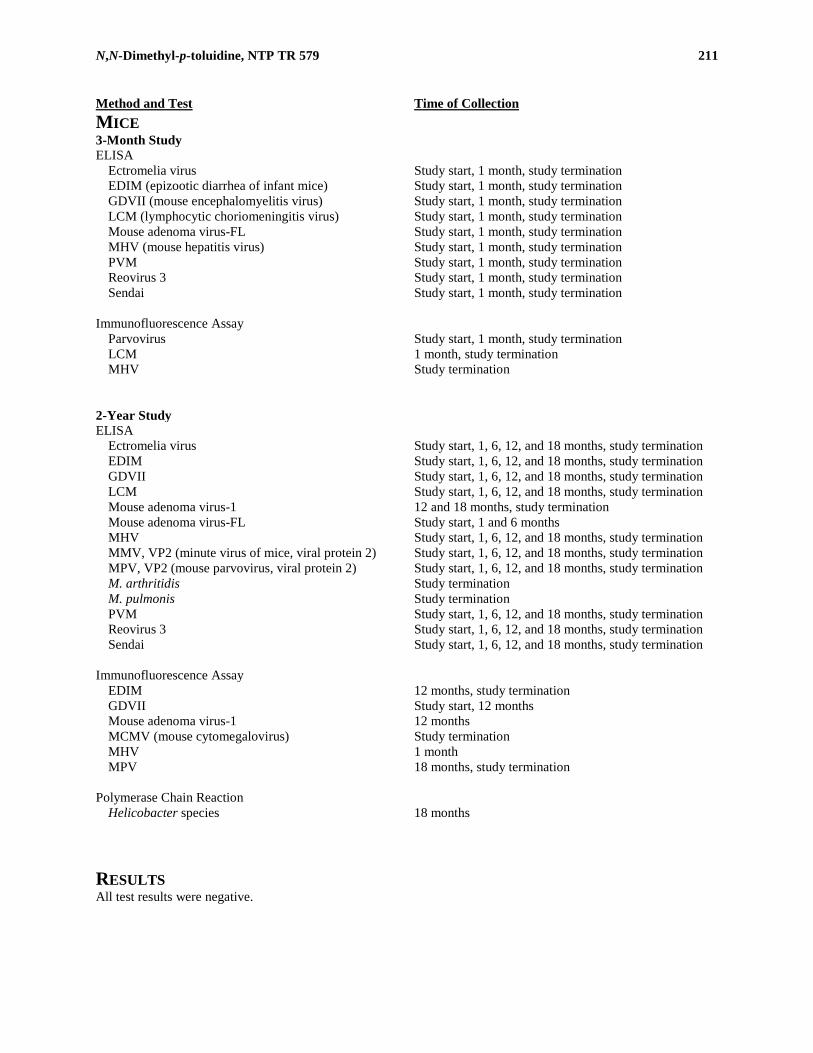
N,N-Dimethyl-p-toluidine, NTP TR 579 211
Method and Test Time of Collection MICE 3-Month Study ELISA
Ectromelia virus Study start, 1 month, study termination EDIM (epizootic diarrhea of infant mice) Study start, 1 month, study termination GDVII (mouse encephalomyelitis virus) Study start, 1 month, study termination LCM (lymphocytic choriomeningitis virus) Study start, 1 month, study termination Mouse adenoma virus-FL Study start, 1 month, study termination MHV (mouse hepatitis virus) Study start, 1 month, study termination PVM Study start, 1 month, study termination Reovirus 3 Study start, 1 month, study termination Sendai Study start, 1 month, study termination
Immunofluorescence Assay
Parvovirus Study start, 1 month, study termination LCM 1 month, study termination MHV Study termination
2-Year Study ELISA
Ectromelia virus Study start, 1, 6, 12, and 18 months, study termination EDIM Study start, 1, 6, 12, and 18 months, study termination GDVII Study start, 1, 6, 12, and 18 months, study termination LCM Study start, 1, 6, 12, and 18 months, study termination Mouse adenoma virus-1 12 and 18 months, study termination Mouse adenoma virus-FL Study start, 1 and 6 months MHV Study start, 1, 6, 12, and 18 months, study termination MMV, VP2 (minute virus of mice, viral protein 2) Study start, 1, 6, 12, and 18 months, study termination MPV, VP2 (mouse parvovirus, viral protein 2) Study start, 1, 6, 12, and 18 months, study termination M. arthritidis Study termination M. pulmonis Study termination PVM Study start, 1, 6, 12, and 18 months, study termination Reovirus 3 Study start, 1, 6, 12, and 18 months, study termination Sendai Study start, 1, 6, 12, and 18 months, study termination
Immunofluorescence Assay EDIM 12 months, study termination GDVII Study start, 12 months Mouse adenoma virus-1 12 months MCMV (mouse cytomegalovirus) Study termination MHV 1 month MPV 18 months, study termination
Polymerase Chain Reaction Helicobacter species 18 months
RESULTS All test results were negative.

212 N,N-Dimethyl-p-toluidine, NTP TR 579