nitrogenous preference of toxigenic pseudo-nitzschia australis (bacillariophyceae) from field and...
TRANSCRIPT

Nitrogenous preference of toxigenic Pseudo-nitzschia australis
(Bacillariophyceae) from field and laboratory experiments
Meredith D. Armstrong Howard a,*, William P. Cochlan b,Nicolas Ladizinsky 1, Raphael M. Kudela a
a Ocean Science Department, University of California, Santa Cruz, 1156 High Street, Santa Cruz, CA 95064, USAb Romberg Tiburon Center for Environmental Studies, San Francisco State University,
3152 Paradise Drive, Tiburon, CA 94920-1250, USA
Received 12 July 2005; received in revised form 19 June 2006; accepted 29 June 2006
www.elsevier.com/locate/hal
Harmful Algae 6 (2007) 206–217
Abstract
Field and laboratory experiments were designed to determine the differential growth and toxin response to inorganic and organic
nitrogen additions in Pseudo-nitzschia spp. Nitrogen enrichments of 50 mM nitrate (KNO3), 10 mM ammonium (NH4Cl), 20 mM urea
and a control (no addition) were carried out in separate carboys with seawater collected from the mouth of the San Francisco Bay
(Bolinas Bay), an area characterized by high concentrations of macronutrients and iron. All treatments showed significant increases in
biomass, with chlorophyll a peaking on days 4–5 for all treatments except urea, which maintained exponential growth through the
termination of the experiment. Pseudo-nitzschia australis Frenguelli abundance was 103 cells l�1 at the start of the experiment and
increased by an order of magnitude by day 2. Particulate domoic acid (pDA) was initially low but detectable (0.15 mg l�1), and
increased throughout exponential and stationary phases across all treatments. At the termination of the experiment, the urea treatment
produced more than double the amount of pDA (9.39 mg l�1) than that produced by the nitrate treatment (4.26 mg l�1) and triple that of
the control and ammonium treatments (1.36 mg l�1 and 2.64 mg l�1, respectively). The mean specific growth rates, calculated from
increases in chlorophyll a and from cellular abundance of P. australis, were statistically similar across all treatments.
These field results confirmed laboratory experiments conducted with a P. australis strain isolated from Monterey Bay, CA
(isolate AU221-a) grown in artificial seawater enriched with 50 mM nitrate, 50 mM ammonium or 25 mM of urea as the sole
nitrogen source. The exponential growth rate of P. australis was significantly slower for cells grown on urea (ca. 0.5 day�1)
compared to the cells grown on either nitrate or ammonium (ca. 0.9 day�1). However the urea-grown cells produced more
particulate and dissolved domoic acid (DA) than the ammonium- or nitrate-grown cells. The field and laboratory experiments
demonstrate that P. australis is able to grow effectively on urea as the primary source of nitrogen and produced more pDA when
grown on urea in both natural assemblages and unialgal cultures. These results suggest that the influence of urea from coastal runoff
may prove to be more important in the development or maintenance of toxic blooms than previously thought, and that the source of
nitrogen may be a determining factor in the relative toxicity of west coast blooms of P. australis.
# 2006 Elsevier B.V. All rights reserved.
Keywords: Domoic acid; Harmful algae; Nitrogen; Pseudo-nitzschia australis; Urea
* Corresponding author. Tel.: +1 831 247 7206;
fax: +1 831 459 4882.
E-mail address: [email protected] (M.D.A. Howard).1 Current address: U.S. Geological Survey, Menlo Park Campus,
Bldg. 3, 345 Middlefield Rd., Menlo Park, CA 94025, USA.
1568-9883/$ – see front matter # 2006 Elsevier B.V. All rights reserved.
doi:10.1016/j.hal.2006.06.003
1. Introduction
The occurrence of harmful algal blooms (HABs)
appears to be increasing in both frequency and intensity
in recent years (e.g., see reviews by Hallegraeff, 1993;
M.D.A. Howard et al. / Harmful Algae 6 (2007) 206–217 207
Anderson et al., 2002; Glibert et al., 2005a). This is
especially evident along the central California coast
where amnesic shellfish poisoning (ASP) events caused
by toxic blooms of the diatom Pseudo-nitzschia spp.
have increased dramatically over the last decade (Buck
et al., 1992; Scholin et al., 2000; Trainer et al., 2000).
The first major ASP event identified in North America
occurred in 1987 in eastern Prince Edward Island,
Canada, where a toxic bloom of Pseudo-nitzschia
multiseries Hasle (Bates et al., 1989) resulted in 107
illnesses and the deaths of three people after ingesting
contaminated blue mussels (Mytilus edulis) (Perl et al.,
1990). Blooms of Pseudo-nitzschia australis in Mon-
terey Bay, California were first recorded during the fall
months of 1989, 1990 and 1991 as well as the spring of
1990 and summer of 1991 (Buck et al., 1992). In
September 1991, the first confirmed report of domoic
acid poisoning on the U.S. west coast resulted in the
mortality of more than 100 brown pelicans (Pelecanus
occidentalis) and Brandt’s cormorants (Phalacrocorax
penicillatus) (Fritz et al., 1992; Work et al., 1993). In
1998 another bloom, which spanned the central
California coast, resulted in the deaths of over 400
sea lions (Zalophus californianus) due to consumption
of contaminated northern anchovies (Engraulis mor-
dax) (Scholin et al., 2000; Trainer et al., 2000).
As a result of these events, a number of laboratory
studies on Pseudo-nitzschia were initiated, which
identified macronutrient limitation as an important factor
affecting cellular toxicity (Pan et al., 1996a,b,c; Bates,
1998). Although initial studies focused on macronu-
trients, iron and copper limitation, as well as elevated
copper conditions, have been shown in laboratory studies
to induce toxin production in both P. multiseries and P.
australis (Maldonado et al., 2002; Ladizinsky and Smith,
2003; Wells et al., 2005). Domoic acid (DA) has been
shown to form chelates with both of these trace metals,
potentially increasing the biological availability of iron
and/or decreasing the toxicity of copper (Ladizinsky and
Smith, 2000; Rue and Bruland, 2001). However, Bates
et al. (2000) reported DA levels were 10 times lower in
iron-stressed cultures relative to iron-replete cultures of
P. multiseries.
Substantial variability in growth and toxicity has been
shown among different Pseudo-nitzschia species as well
as isolates of the same species in culture from the same
geographical area (Bates, 1998; Kudela et al., 2003a).
Macronutrient limitation (silicate and phosphate, but not
nitrogen) is known to induce toxin production in P.
multiseries (Pan et al., 1996a,b; Bates, 1998). Pan et al.
(1996a,b) proposed two different stages in the production
of DA under silicate limitation. The first occurs during
the late exponential phase, characterized by slower
growth rates and moderate DA production. The second
stage occurs during stationary phase and is distinguished
by the depletion of silicate and a significant increase in
toxin production per cell (an order of magnitude higher in
batch culture). Similar results were found under
phosphate limitation. Pan et al. (1996c) showed an
increase in the production of domoic acid in P.
multiseries, in both steady-state continuous culture and
batch cultures, when phosphate concentrations were
limiting and alkaline phosphatase activity was high.
There have been fewer laboratory studies using strains of
P. australis. Garrison et al. (1992) isolated P. australis
from the Monterey Bay bloom in 1991, and conducted
batch culture experiments with two strains that confirmed
DA production by this species with maximum particulate
DA concentrations of 37 pg cell�1 and 12 pg cell�1.
Despite the many studies on toxin production and
nutrient limitation, very few studies have evaluated the
nutritional preference of Pseudo-nitzschia spp., parti-
cularly in terms of nitrogen sources. In laboratory
experiments, Bates et al. (1993) grew cultures of P.
multiseries with varying concentrations of ammonium
and nitrogen, ranging from 55 mM to 880 mM, and
found that at less than 110 mM N the growth of the cells
and the production of DA were the same for nitrate- and
ammonium-grown cultures. Hillebrand and Sommer
(1996) also evaluated the nitrogenous preference of P.
multiseries by using nitrate, ammonium and urea in
batch cultures. In a batch culture with initial concentra-
tions of 40 mM ammonium, the growth rate increased
with increasing concentration of nitrate added to the
culture, which the authors interpreted as an alleviation
of ammonium inhibition of nitrate uptake, whereas at
growth-saturating nitrate concentrations, ammonium
additions decreased the growth rate of P. multiseries.
While there have been numerous laboratory studies
using isolates of P. multiseries, this is the first study to
examine the nitrogenous nutrition (including urea) of P.
australis, the predominant DA producer in California
waters. In contrast to previous nitrogen-based studies,
the field and laboratory experiments reported here were
designed to identify differential responses to ammo-
nium, nitrate and urea enrichment using ecologically
relevant nitrogen concentrations.
2. Materials and methods
2.1. Field experiment
Nutrient addition experiments were conducted aboard
the R/V Point Sur during February 2003. Seawater was

M.D.A. Howard et al. / Harmful Algae 6 (2007) 206–217208
collected in the vicinity of the San Francisco Bay
(Bolinas Bay, 37851.300N, 122839.130W). At the time of
collection, there was a broad chlorophyll maximum that
ranged from 4 m to 14 m depth, a surface mixed layer
temperature of 12.5 8C and a practical salinity of 31.5.
Ten-liter PVC Niskin bottles (refitted with silicone
rubber band springs) mounted on an instrumented rosette
were used to collect seawater from 4 m depth. Although
water was not collected using strict trace metal clean
protocols, reasonable care was taken to reduce the risk of
metal contamination. On the same cruise, water collected
in the same fashion, but from a high nutrient low
chlorophyll (HNLC) coastal region was apparently not
contaminated by iron, as evidenced by the lack of
enhanced phytoplankton growth under multi-day, deck
incubation conditions (data not shown).
Four 9-liter acid-cleaned polycarbonate (Nalgene)
carboys were rinsed three times and filled with seawater
using multiple Niskin bottles. Carboys were then either
unenriched (control) or enriched with nitrogen and
placed in a deckboard incubator maintained at the
ambient surface temperature (with running seawater) and
ca. 50% surface irradiance (using neutral density
screening). The ambient nitrogen concentration of the
seawater collected for the experiment was 6.6 mM
nitrate, 1.76 mM ammonium, and 0.9 mM urea. Three
separate nutrient treatments were conducted where
42.4 mM nitrate (as KNO3) was added to the first carboy
(total nitrate 49 mM), 10 mM ammonium (as NH4Cl) was
added to the second carboy (total ammonium 11.76 mM)
and 20 mM urea was added to the third carboy (total urea
20.9 mM). There was also a control (no addition).
Reagent grade stocks and Milli-Q1 water were used to
prepare all nutrient enrichments. Incubations were
maintained for 3 days at sea in a deckboard incubator
(mean daily irradiance ca. 350 mmol photons m�2 s�1),
and subsequently transferred to a walk-in environmental
chamber (15 8C and ca. 100 mmol photons m�2 s�1
irradiance using ‘‘cool-white’’ fluorescent lamps and a
12:12 light:dark cycle) at the University of California
Santa Cruz (due to termination of the cruise) for the
remainder of the experiment.
2.1.1. Analytical methods
Samples for chlorophyll a were collected daily in
triplicate and filtered onto uncombusted glass-fiber filters
(Whatman GF/F; nominal pore size 0.7 mm); separate
samples for size fractionated chlorophyll a were
determined using 1-mm and 5-mm polycarbonate filters
(Poretics), frozen in liquid nitrogen and processed using
the non-acidification method (Welschmeyer, 1994).
Macronutrients (nitrate plus nitrite [hereafter referred
to as nitrate], silicate and ortho-phosphate) were sampled
daily, stored frozen, and later analyzed with a Lachat
Quick Chem 8000 Flow Injection Analysis system using
standard colorimetric techniques (Knepel and Bogren,
2001; Smith and Bogren, 2001a,b). Ammonium and urea
samples were collected using 60 ml low-density poly-
ethylene (LDPE) centrifuge tubes (Corning1). Ammo-
nium samples were stored refrigerated after the addition
of the phenolic reagent; the addition of the phenolic
reagent binds ammonium and eliminates the need to
freeze samples (Degobbis, 1973). The remaining
reagents were added within 120 h, and the samples were
manually analyzed using a spectrophotometer equipped
with a 10-cm cell (Solorzano, 1969). Urea samples were
frozen at �20 8C, and subsequently thawed ashore at
room temperature before manual analysis using the
diacetyl monoxime thiosemicarbizide technique (Price
and Harrison, 1987), modified to account for a longer
time period (72 h) and lower digestion temperature
(22 8C). Particulate domoic acid (pDA) samples were
filtered onto uncombusted Whatman GF/F filters and
processed according to the method of Pocklington et al.
(1990), using high performance liquid chromatography
with fluorescence detection. At two time points, P.
australis was identified using large subunit rRNA-
targeted fluorescent probes (whole cell) as described by
Miller and Scholin (1998). The samples were also probed
for P. multiseries but this species was not present.
Samples (10 ml) from each treatment were collected in
triplicate, on days 0 and 2, filtered and immediately
preserved in saline ethanol for later microscopic analysis
in the laboratory. Because rRNA probes were not
available for the remaining sample points, whole-water
samples were collected on all days, to be preserved with
acidified Lugol’s solution; however, after inspecting the
samples, it was apparent that 1% non-acidic Lugol’s
solution was erroneously used. Therefore, it was not
possible to use these samples for phytoplankton floristic
analysis. Visual examination of the positive whole-cell
probe samples (which probes all phytoplankton) pro-
vided a record of dominant groups.
2.2. Laboratory experiments
P. australis was isolated from Monterey Bay,
California (isolate AU221-a), and grown as batch
cultures in filter-sterilized (0.2 mm), nutrient-enriched
artificial seawater (modified ESAW; Harrison et al.,
1980) at the Romberg Tiburon Center; modifications to
this artificial seawater included reducing the nitrogen
enrichment to 50 mM nitrate, 50 mM ammonium and
25 mM urea, respectively, for each treatment. Other
M.D.A. Howard et al. / Harmful Algae 6 (2007) 206–217 209
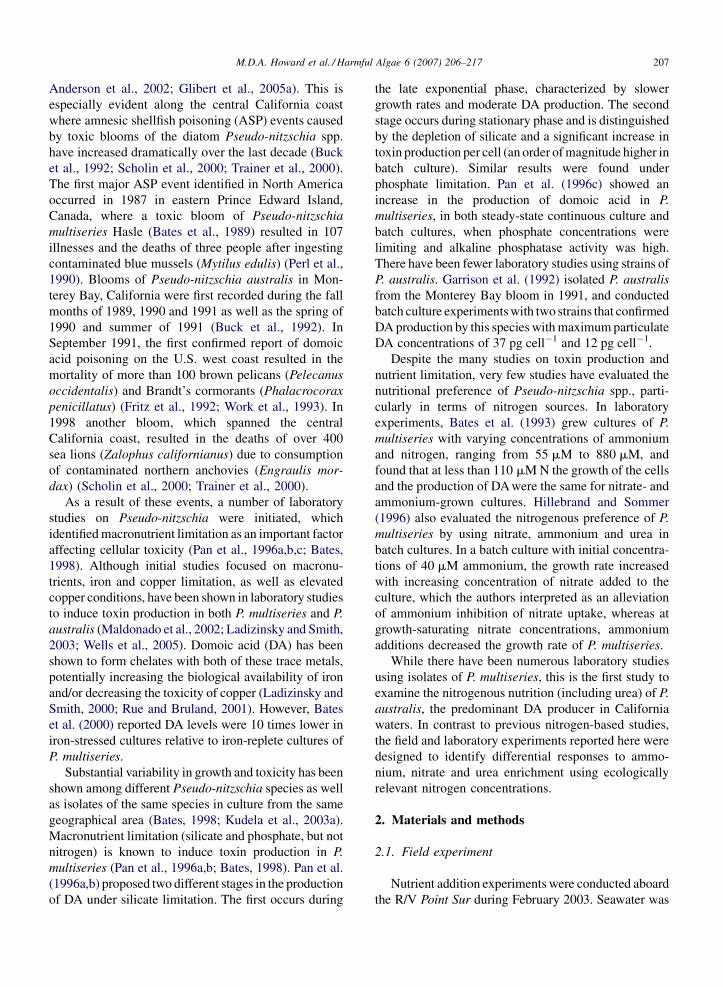
Fig. 1. (A) Total phytoplankton community chlorophyll a measured
daily from the field experiment and (B) semi-log plot of growth of the
same samples for each nitrogen treatment: control (*), ammonium
(*), nitrate (!) and urea (5). Samples were not taken on day 6 of the
experiment. Values are the mean of triplicate samples.
modifications are described in detail by Berges et al.
(2003). Cultures were maintained at 15 (�0.3) 8C with
irradiance levels at 100 mmol photons m�2 s�1 for a
12:12 light:dark cycle. Cell samples were fixed in 1%
acidic Lugol’s solution and counted using a Palmer-
Maloney nanoplankton counter at 100� using a phase
contrast microscope (Eclipse E4000, Nikon1). Chlor-
ophyll a samples were collected during the late
exponential phase; 20 ml of each treatment was filtered
onto uncombusted Whatman GF/F filters, extracted in
90% acetone and analyzed as described for the field
experiment. Particulate and dissolved DA samples
were also taken towards the end (late exponential
phase) of the experiment and analyzed using the
ELISA method (Garthwaite et al., 2001). For
particulate determinations, cells were filtered onto
0.2-mm pore-sized polycarbonate filters (Nuclepore)
that were placed in 4-ml vials containing 2-ml
deionized water (Millipore). They were cycled through
four freeze–thaw sequences using liquid nitrogen and
boiling water to liberate the water-soluble DA
molecule from the cellular matrix. After the samples
were refiltered through a 0.2-mm acrodisc syringe
filter, aliquots of the supernatant were analyzed with
appropriate dilutions. The 0.2-mm filtrate was col-
lected for measurement of dissolved DA and analyzed
directly without dilution. In vivo chlorophyll a and
the ratio of variable (Fv) to maximum (Fm) fluores-
cence measured during the dark cycle using DCMU
(Cullen and Renger, 1979) were determined daily
on a Turner Designs 10-AU fluorometer. All experi-
ments were conducted in triplicate for each nitrogen
source.
3. Results
3.1. Field experiment
Seawater was collected during a period of minimal
prior rainfall, low ambient nutrient levels, and a
relatively homogenous water column to 50 m depth.
Total biomass (as chlorophyll a) in the carboys was
initially moderate (4.03 mg l�1 on day 0) and increased
significantly with the addition of each nitrogen substrate
as well as in the control (Fig. 1A). The maximum
chlorophyll values were recorded on day 4 for the
nitrate addition and the control (29.33 mg l�1 and
19.9 mg l�1, respectively) and on day 5 for the
ammonium addition (28.48 mg l�1). The urea addition
was still in exponential growth on day 7 (30.40 mg l�1)
(Fig. 1B). Size fractionated chlorophyll indicated that
most of the biomass was greater than 1.0 mm.
3.1.1. Domoic acid
Initially, particulate domoic acid (pDA) was low but
easily detectable, 0.15 mg l�1 on day 0 (Fig. 2). However,
by day 4 during exponential growth, the pDA of the
community increased to the following: nitrate addition,
0.41 mg l�1; ammonium addition (the highest on day 4),
1.50 mg l�1; urea addition, 1.04 mg l�1; the control,
0.46 mg l�1. By the end of the experiment (day 7), the
urea treatment produced significantly more pDA
(9.39 mg l�1) and was still in exponential growth, while
the control was still the lowest at 1.36 mg l�1 and it had
entered stationary phase. Both the nitrate and ammonium
additions were in stationary phase on day 7, when pDA
increased to 4.26 mg l�1 and 2.64 mg l�1, respectively.
Using the days 0 and 2 P. australis specific cell counts,
per-cell toxicity was 43 pg cell�1 on day 0. We do not
have simultaneous whole-cell probe data and toxin
data for other days; however, using chlorophyll as a
proxy, pDA chl�1 was 38.7 ng pDA chl�1 on day 0. By
day 4, the control and nitrate addition decreased to

M.D.A. Howard et al. / Harmful Algae 6 (2007) 206–217210
Fig. 2. Particulate domoic acid (mg l�1) sampled on days 0, 4, and 7
of the field experiment for each nitrogen treatment: control (lined
bar), ammonium (white bar), nitrate (solid black bar), and urea
(hatch bar).
Fig. 3. Nitrate, ammonium and urea concentrations (in mM) measured
daily in the field experiment for each nitrogen treatment: (A) ammo-
nium; (B) nitrate; (C) control; (D) urea. Nitrate concentration (solid
black bar) on the far left axis, ammonium concentration (white bar) on
the left axis and urea concentration (crosshatch bar) on the right axis.
Samples were not taken on day 6 of the experiment.
23.5 ng pDA chl�1 and 14.0 ng pDA chl�1, respectively,
while the ammonium and urea treatments increased
to 64.0 ng pDA chl�1 and 54.7 ng pDA chl�1. Concen-
trations increased for all carboys by day 7 to 162.0
ng pDA chl�1 in the nitrate addition, 99.3 ng pDA chl�1
in the ammonium addition, 309.1 ng pDA chl�1 in the
urea addition and 94.3 ng pDA chl�1 in the control
carboy.
3.1.2. Inorganic and organic nitrogen
The ambient nitrogen concentration of the seawater
used in the incubation experiments was 6.6 mM nitrate,
1.7 mM ammonium and 0.9 mM urea. An additional
42.4 mM N was added for the nitrate addition treatment,
10 mM N for the ammonium treatment, and 20 mM urea
for the urea addition. For the ammonium treatment, the
ammonium concentration was half of its initial value by
day 2 and was depleted by day 5 (Fig. 3A).
The initial urea concentration did not change
significantly in the nitrate (Fig. 3B) ammonium and
control treatments (Fig. 3C), but decreased �50% by
day 5 in the urea treatment (Fig. 3D) which also
corresponded to the time point at which nitrate was
depleted. At the termination of the experiment there was
still 6.6 mM urea in the urea treatment.
Macronutrient depletion rates were calculated from a
least-squares linear regression analysis of the exponen-
tial growth phase and an analysis of variance (ANOVA)
determined from semi-log plots of nutrient concentra-
tion versus time (Guillard, 1973). The depletion of total
nitrogen in each treatment was highest in the control
treatment (Table 1) and lowest in the nitrate treatment.
Because of the large amount of nitrate added (relative to
the depletion rate) and due to issues associated with the
analysis of these high values on the autoanalyzer, the
analytical error associated with the estimate of nitrate
drawdown precludes accurate estimation of nitrate
depletion rates to compare with the drawdown of
ammonium and urea. As a result, the depletion rates
M.D.A. Howard et al. / Harmful Algae 6 (2007) 206–217 211
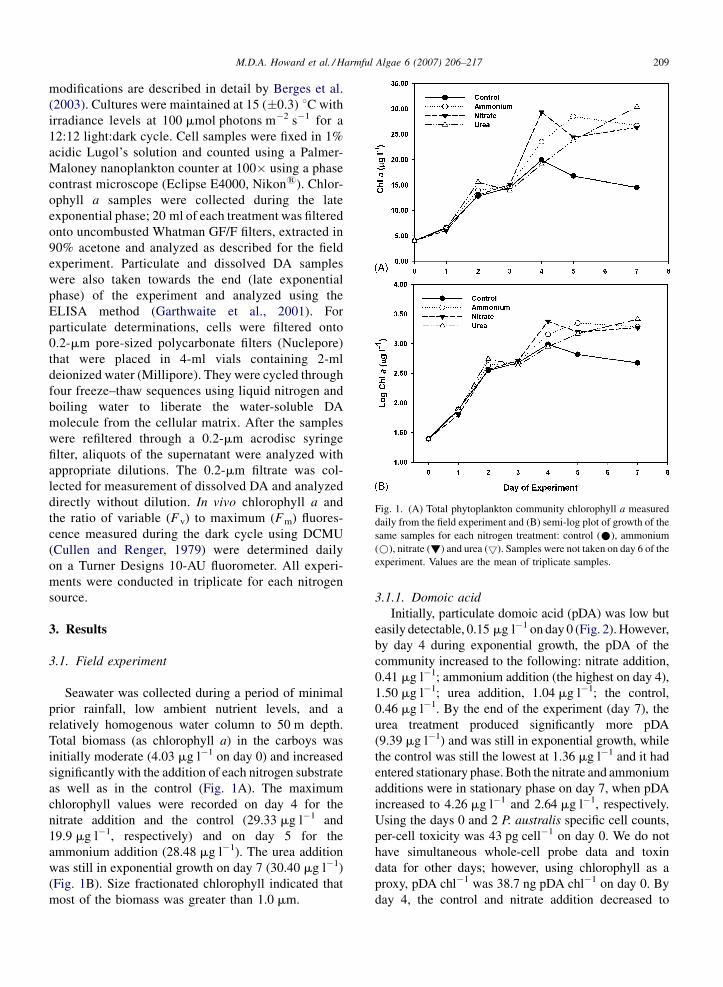
Table 1
Net nitrogen depletion rates for all treatments during the field experiment
Treatment Depletion rates (day�1) from days 0 to 3 (S.E.; n; r2)
Nitrate Ammonium Urea Total nitrogen
Nitrate 0.13 0.35 �0.47 0.13
0.06 4 0.95 0.38 4 0.82 0.31 4 0.92 0.06 4 0.95
Ammonium 0.30 1.47 0.13 0.58
0.30 4 0.83 0.88 4 0.88 0.61 4 0.34 0.45 4 0.89
Urea 0.77 0.38 0.06 0.15
0.35 4 0.96 0.28 4 0.90 0.05 4 0.89 0.07 4 0.96
Control 0.87 0.36 �0.48 0.62
0.36 4 0.96 0.31 4 0.88 0.39 4 0.88 0.16 4 0.98
Standard error (S.E.), number of days included in the rate calculation (n) and r-squared values (r2) are included in the table.
Table 2
Calculated growth rates based on the increase in phytoplankton
community chlorophyll a (during exponential growth) and Pseudo-
nitzschia australis cell abundance (days 0–2) during the field experi-
ment off San Francisco Bay
Treatment Chlorophyll
growth rates
(day�1)
(S.D.; n; r2)
Growth rate of
P. australis (day�1)
Nitrate 0.48 0.95
0.14 5 0.97
Ammonium 0.39 1.19
0.19 6 0.94
Urea 0.34 1.16
0.26 6 0.88
Control 0.40 1.08
0.16 5 0.94
Standard deviation (S.D.), number of days included in the rate
calculation (n) and r-squared values (r2) are included in the table
for chlorophyll-based rates.
calculated for the nitrate treatment (total nitrogen and
nitrate) do not accurately reflect the utilization of total
nitrogen, as evidenced by the growth rates which are
statistically indistinguishable across treatments. The
highest net nitrate depletion rate (excluding the nitrate
treatment) was in the control treatment and the lowest
was in the ammonium treatment. For ammonium-based
depletion rates, the ammonium treatment had the
highest rate of depletion and the nitrate treatment was
lowest. The ammonium-based depletion rates for the
nitrate, urea and control treatments were not statistically
indistinguishable ( p < 0.05). For urea depletion rates,
the highest rates were observed in the ammonium
treatment and lowest in the urea treatment, while the
nitrate treatment and the control had positive depletion
rates for urea, meaning there was an increase in urea
with time, probably due to grazers.
3.1.3. Other nutrients
The silicate concentration was initially 23 mM and
decreased to 2.7–3.5 mM in the nitrogen additions and
to 8.7 mM in the control by the end of the 7-day
experiment. Silicate decreased to half of the initial
concentration in the nitrate and ammonium treatments
by day 3, and in the urea and control treatments, by day
4. The concentration of phosphate was initially 0.8 mM
and by day 3 was half of this concentration across all
treatments. Phosphate was depleted by day 4 in the
nitrogen additions but not until day 7 in the control
treatment.
3.1.4. Growth rate
Growth rates for the whole phytoplankton commu-
nity were calculated from a linear regression analysis of
the exponential growth phase and ANOVA determined
from semi-log plots of chlorophyll a versus time
(Guillard, 1973). Growth rates were statistically
indistinguishable across all treatments ( p > 0.05):
nitrate 0.48 day�1 (calculated over 5 days, days 0–4);
ammonium, 0.39 day�1 (days 0–5); urea, 0.34 day�1
(days 0–5); control, 0.40 day�1 (days 0–4). Qualitative
indicators of growth of P. australis were calculated over
2 days from enumeration of the whole cell probes taken
on days 0 and 2. The ammonium treatment was the
highest (1.19 day�1), followed by urea (1.16 day�1),
then the control (1.08 day�1), and the lowest was the
nitrate treatment (0.95 day�1) (Table 2). The growth
rates of for P. australis were substantially higher than
those calculated from the entire assemblage.
3.1.5. Community composition
The phytoplankton assemblage was initially diatom-
dominated, with ca. 76% centric and 24% pennate

M.D.A. Howard et al. / Harmful Algae 6 (2007) 206–217212
Fig. 4. (A) Growth rates derived from cell count measurements during
exponential growth phase; (B) semi-log plot of cell counts measured
daily from the laboratory experiment for each nitrogen treatment:
(*), nitrate (*), ammonium (!) and urea. Values are the mean of
triplicate samples and error bars on the growth rate plot denote range
of replicates.
forms (by number). Dominant genera included Aster-
ionellopsis, Chaetoceros, and Thalassiosira spp.; other
genera included Skeletonema and Stephanopyxis and, to
a lesser extent, Coscinodiscus and Eucampia; dino-
flagellates were negligible.
Despite the elevated growth rate for P. australis
calculated from direct cell counts, there was a reduction
from days 0 to 2 in pennate abundance (ca. 5–6.5% by
number versus ca. 91–94% centrics and 0.5–2.1%
dinoflagellates).
Although only two time points were available for P.
australis enumeration (whole cell probe), P. australis
was present in all samples. P. australis cell concentra-
tion was initially 3.60 � 103 cells l�1 and by day 2 had
increased by an order of magnitude in all treatments to
the following: nitrate addition, 2.77 � 104 cells l�1;
ammonium addition, 4.62 � 104 cell l�1; urea addition,
4.32 � 104 cells l�1; the control, 3.64 � 104 cells l�1.
At the start of the experiment, P. australis comprised
72% of all pennates and 17% of the whole phyto-
plankton community. By day 2, P. australis accounted
for 41% of the pennates in the nitrate treatment, 86% in
the ammonium treatment, 55% in the urea treatment and
69% in the control, but only 2.3–5.5% of the entire
assemblage.
3.2. Laboratory experiment
3.2.1. Growth rate
Specific growth rates during the exponential growth
phase were determined from linear regressions of the
natural log of cell abundance versus time (Fig. 4A and
B). Comparisons of the mean (�1S.D.) growth rates,
using ANOVA (using post-hoc Tukey’s test), indicate
that the cells maintained on urea grew slower
(0.52 � 0.09 day�1) than the cells grown on either
nitrate (0.89 � 0.08 day�1) or ammonium (0.93 �0.001 day�1), which both maintained significantly
greater growth rates ( p < 0.01), but were indistinguish-
able from each other ( p > 0.05).
3.2.2. Chlorophyll a and cellular fluorescence
capacity
Chlorophyll a samples were collected during late
exponential phase and the chlorophyll a per cell was
statistically indistinguishable ( p > 0.05) for the nitrate
and ammonium treatments (2.44 � 0.55 pg cell�1 and
2.37 � 0.48 pg cell�1, respectively). However, the urea
treatment exhibited a significantly lower ( p < 0.05)
mean cellular chlorophyll a concentration of
0.99 � 0.43 pg cell�1. The cellular fluorescence capa-
city for all nitrogen-substrate treatments, determined
using DCMU, was indistinguishable from one another
during exponential growth; Fv/Fm averaged
0.62 � 0.05 (n = 16). The Fv/Fm values did not
decrease during the late exponential phase when
samples were collected for chlorophyll a and DA.
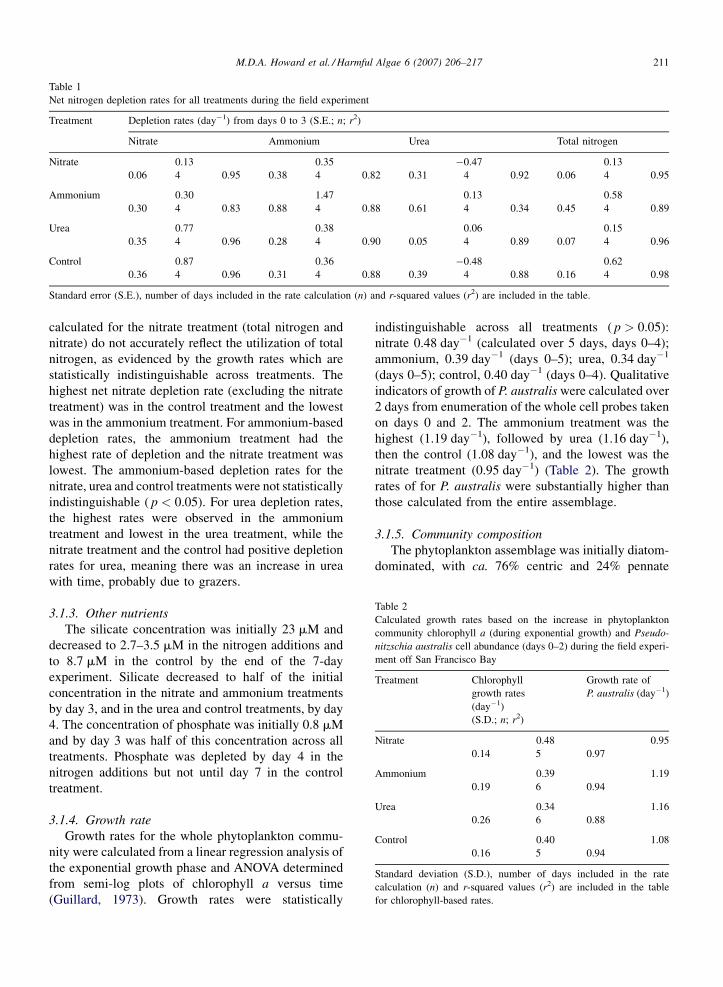
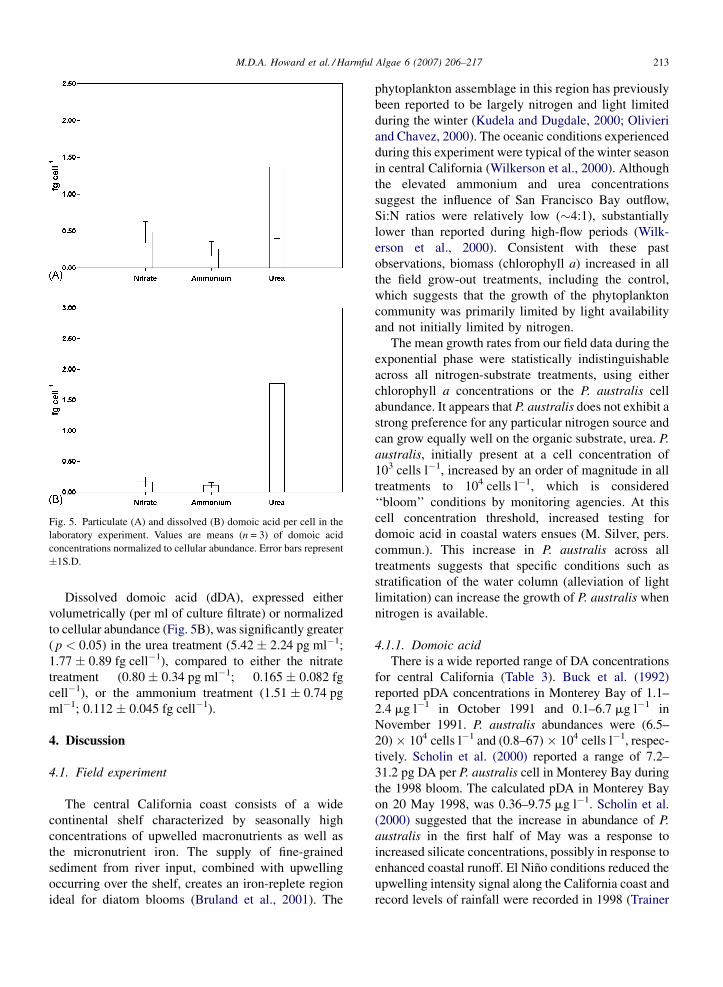
3.2.3. Domoic acid
Particulate DA was collected during late exponential
growth for each culture andnormalized tocell abundance;
the mean (�1S.D.) pDA per cell for each nitrogen
treatment is presented here and graphically (Fig. 5A). The
urea treatment had substantially greater pDA per cell,
1.37 � 0.97 fg cell�1, whereas the nitrate and ammo-
nium treatments were lower, 0.48 � 0.14 fg cell�1 and
0.26 � 0.098 fg cell�1, respectively. Overall, strain
Au221-a was generally less toxic than the natural
assemblages,which isconsistentwithprevious laboratory
experiments that demonstrate substantial strain-specific
variability as well as a gradual loss of toxicity with time
(e.g. Villac et al., 1993; Kudela et al., 2003b).
M.D.A. Howard et al. / Harmful Algae 6 (2007) 206–217 213
Fig. 5. Particulate (A) and dissolved (B) domoic acid per cell in the
laboratory experiment. Values are means (n = 3) of domoic acid
concentrations normalized to cellular abundance. Error bars represent
�1S.D.
Dissolved domoic acid (dDA), expressed either
volumetrically (per ml of culture filtrate) or normalized
to cellular abundance (Fig. 5B), was significantly greater
( p < 0.05) in the urea treatment (5.42 � 2.24 pg ml�1;
1.77 � 0.89 fg cell�1), compared to either the nitrate
treatment (0.80� 0.34 pg ml�1; 0.165 � 0.082 fg
cell�1), or the ammonium treatment (1.51 � 0.74 pg
ml�1; 0.112 � 0.045 fg cell�1).
4. Discussion
4.1. Field experiment
The central California coast consists of a wide
continental shelf characterized by seasonally high
concentrations of upwelled macronutrients as well as
the micronutrient iron. The supply of fine-grained
sediment from river input, combined with upwelling
occurring over the shelf, creates an iron-replete region
ideal for diatom blooms (Bruland et al., 2001). The
phytoplankton assemblage in this region has previously
been reported to be largely nitrogen and light limited
during the winter (Kudela and Dugdale, 2000; Olivieri
and Chavez, 2000). The oceanic conditions experienced
during this experiment were typical of the winter season
in central California (Wilkerson et al., 2000). Although
the elevated ammonium and urea concentrations
suggest the influence of San Francisco Bay outflow,
Si:N ratios were relatively low (�4:1), substantially
lower than reported during high-flow periods (Wilk-
erson et al., 2000). Consistent with these past
observations, biomass (chlorophyll a) increased in all
the field grow-out treatments, including the control,
which suggests that the growth of the phytoplankton
community was primarily limited by light availability
and not initially limited by nitrogen.
The mean growth rates from our field data during the
exponential phase were statistically indistinguishable
across all nitrogen-substrate treatments, using either
chlorophyll a concentrations or the P. australis cell
abundance. It appears that P. australis does not exhibit a
strong preference for any particular nitrogen source and
can grow equally well on the organic substrate, urea. P.
australis, initially present at a cell concentration of
103 cells l�1, increased by an order of magnitude in all
treatments to 104 cells l�1, which is considered
‘‘bloom’’ conditions by monitoring agencies. At this
cell concentration threshold, increased testing for
domoic acid in coastal waters ensues (M. Silver, pers.
commun.). This increase in P. australis across all
treatments suggests that specific conditions such as
stratification of the water column (alleviation of light
limitation) can increase the growth of P. australis when
nitrogen is available.
4.1.1. Domoic acid
There is a wide reported range of DA concentrations
for central California (Table 3). Buck et al. (1992)
reported pDA concentrations in Monterey Bay of 1.1–
2.4 mg l�1 in October 1991 and 0.1–6.7 mg l�1 in
November 1991. P. australis abundances were (6.5–
20) � 104 cells l�1 and (0.8–67) � 104 cells l�1, respec-
tively. Scholin et al. (2000) reported a range of 7.2–
31.2 pg DA per P. australis cell in Monterey Bay during
the 1998 bloom. The calculated pDA in Monterey Bay
on 20 May 1998, was 0.36–9.75 mg l�1. Scholin et al.
(2000) suggested that the increase in abundance of P.
australis in the first half of May was a response to
increased silicate concentrations, possibly in response to
enhanced coastal runoff. El Nino conditions reduced the
upwelling intensity signal along the California coast and
record levels of rainfall were recorded in 1998 (Trainer

M.D.A. Howard et al. / Harmful Algae 6 (2007) 206–217214
Table 3
Highest concentrations of particulate domoic acid reported in field observations for central California from 1991 to 2003 where P. australis was the
dominant recorded organism
Location DA (mg l�1) Date Reference
Monterey Bay 1.1–2.4 October 1991 Buck et al. (1992)
Monterey Bay 0.1–6.7 November 1991 Buck et al. (1992)
Monterey Bay 9.75 May 1998 Scholin et al. (2000)
Santa Cruz Wharf 2.5 May 1998 Scholin et al. (2000)
Monterey Bay 0.36 May 1998 Scholin et al. (2000)
Point Lobos 0.18–0.27 June 1998 Trainer et al. (2000)
Morro Bay 1.3–3.8 June 1998 Trainer et al. (2000)
Point Arguello and Point Conception 2.2–7.3 June 1998 Trainer et al. (2000)
Santa Barbara 0.5–1.2 June 1998 Trainer et al. (2000)
Mouth of San Francisco Bay 0.13 June 1998 Trainer et al. (2000)
Above Point Ano Nuevo 0.44 June 1998 Trainer et al. (2000)
Monterey Bay and Point Lobos 0.38 June 1998 Trainer et al. (2000)
Bolinas Bay 0.15–9.39 February 2003 This study
Note that the values from Trainer et al. (2000) are whole water samples (particulate and dissolved domoic acid).
et al., 2000). However, even in May and June during the
1998 bloom, temperature and salinity measurements
indicated oceanic conditions. Trainer et al. (2000)
suggested upwelling, not enhanced river flow, as the
source of nutrients that sustained the bloom. Concentra-
tions of whole water DA on 3–5 June ranged from 1.3 to
3.8 mg l�1 in Morro Bay and 2.2 to 6.3 mg l�1 in Point
Conception where P. australis was the dominant species,
at abundances of 4.9� 104 cells l�1 and 2.3 � 105
cells l�1, respectively. The highest whole water DA
concentrations (7.3 mg l�1) were recorded in southern
California, at Point Arguello (Trainer et al., 2000).
Results from this experiment (0.15–9.39 mg
pDA l�1) fall within the reported range for pDA values,
with initial concentrations on the low end, increased
concentrations across all treatments by day 4 and the
highest levels achieved near the maximum pDA
concentrations of 9.75 mg l�1 reported by others
(Scholin et al., 2000). All but the urea treatment
entered stationary growth phase by the end of the
experiment (day 7). The results of the urea treatment
are especially significant since it produced the highest
pDA on day 7, which was double the amount produced
by the nitrate treatment and three times more than that
of the control and ammonium treatments. The initial
(days 0–2) quantitative indicators of growth of P.
australis were similar in all of the treatments, and the
mean specific growth rates calculated from community
chlorophyll concentrations were also statistically
indistinguishable from each other. Therefore, the large
increase in pDA production cannot be explained
simply by higher biomass or lower growth rates in
the urea treatment. This suggests that the per-cell
production of pDA was substantially greater when
grown on urea. Since the cells in the urea treatment
were still growing exponentially when pDA was
measured, and previous laboratory experiments have
shown that the major increase in production of pDA is
in stationary phase (at least for P. multiseries; Pan et al.,
1996a,b; Bates, 1998), one might expect pDA values to
be conservative. The implications of these results are
that elevated concentrations of urea from anthropo-
genic sources such as agricultural and urban runoff, or
sewage discharge, could be a significant source of
nitrogen for toxic bloom development or sustenance of
P. australis.
4.1.2. Utilization of more than one nitrogen source
The depletion of half of the initial concentration of
ammonium and approximately 10% of the concentra-
tion of nitrate in the ammonium treatment by day 2, as
well as the depletion of both nitrogen sources by day 5,
demonstrates simultaneous utilization of more than one
nitrogen source. In addition, there was no indication of
any inhibitory effects of ammonium on nitrate uptake.
Bates et al. (1993) showed that cultures grown at less
than 110 mM of nitrate and ammonium had equivalent
growth rates and that there was no inhibition of nitrate
uptake due to ammonium. As might be expected,
ammonium addition stimulated ammonium depletion
rates, whereas ammonium depletion rates were similar
in the other treatments. Since these experiments utilized
mixed phytoplankton assemblages, it is not possible to
attribute these nitrogen uptake characteristics to
Pseudo-nitzschia specifically, but P. australis remained
the dominant pennate diatom (86%) in the ammonium
treatment and accounted for 41% in the nitrate
treatment.
M.D.A. Howard et al. / Harmful Algae 6 (2007) 206–217 215
In the urea treatment, the depletion of 6 mM of the
initial nitrate but only 2 mM of the initial urea by day 2
indicates a slight preference for nitrate over urea.
However, the depletion of nitrate by day 5 and the
subsequent drawdown of urea indicate the sustained
growth capabilities of the assemblage, including P.
australis, when urea is the sole nitrogen source,
particularly since this treatment was still growing
exponentially on day 7. The lower depletion rates for
urea across all treatments were expected since elevated
ammonium concentrations (>1 mM) have been shown
to suppress the uptake mechanism for urea in unialgal
cultures (e.g. Molloy and Syrett, 1988; Cochlan and
Harrison, 1991). In addition, an increase in urea in the
carboys can be attributed to grazers. Growth rates were
not statistically different across treatments, but based on
the growth and nitrogen depletion rates (Tables 1 and 2),
there appears to be a slight preference for nitrate and
ammonium relative to urea.
Although limitation by other macro- or micronu-
trients was not directly assessed, ambient silicate and
phosphate conditions during the experiment suggest
that these nutrients were not limiting (they were not
completely depleted for most treatments). Iron limita-
tion and copper toxicity were also not directly
addressed; however, initial iron concentrations were
elevated, as expected over this shallow shelf region
(Bruland, pers. commun.). Copper concentrations can
be expected to be similar across nutrient additions, so
any changes in growth rate or toxin production are not
directly attributable to changes in copper toxicity.
4.2. Laboratory experiment
4.2.1. Growth rates and chlorophyll a
Laboratory experiments indicated that the concen-
tration of chlorophyll a per cell was two- to three-fold
less in the urea treatment compared to the nitrate and
ammonium treatments. The low chlorophyll a per cell
in the urea treatment could indicate possible nutrient
stress, but the cellular fluorescence capacity for each
nitrogen treatment did not differ (mean Fv/Fm = 0.62,
and did not decline with time), suggesting that the
physiological status was unaffected by the nitrogen
source supporting growth. However, the exponential
growth rate (determined using cell abundance) of P.
australis was significantly slower for cells grown on
urea compared to those grown on nitrate and
ammonium, which both maintained similar growth
rates. These laboratory results demonstrate the cap-
ability of this diatom to grow equally well on oxidized
and reduced forms of nitrogen, and that P. australis is
capable of using urea as the sole nitrogen source for
growth, albeit at a somewhat slower rate than cultures
grown on either nitrate or ammonium.
4.2.2. Domoic acid
The highest level of particulate domoic acid (pDA)
per cell occurred in the urea treatment. As with the urea-
amended field experiment, cells from the laboratory
cultures were harvested in late logarithmic phase for
particulate and dissolved domoic acid (dDA) analysis,
and it is possible that urea-grown cells could potentially
produce higher pDA cell�1 once the cells enter
stationary phase. In addition, the dDA (normalized to
cell abundance) was �140% of the pDA in the urea
treatment whereas in the ammonium and nitrate
treatments dDA/pDA only averaged 40–50%. This
ratio of dDA/pDA is unusually high for cells harvested
in late logarithmic phase. However, there are no other
published results at this concentration of ammonium.
The results for the laboratory experiment were similar
to those of the field experiment in that DA production as
a function of nitrogen source was greatest when
nitrogen was derived solely from urea, followed by
nitrate and ammonium, which were statistically indis-
tinguishable. Assuming that DA production would
continue to increase as cells entered stationary phase,
and that a considerable fraction of DA is dissolved, our
estimates of enhanced toxicity when grown on urea are
likely conservative.
5. Conclusions
In California coastal waters, Pseudo-nitzschia spp.
represent only a minor constituent of the total
phytoplankton assemblage during most of the year.
Previous authors have suggested a number of potential
environmental factors such as coastal runoff (Scholin
et al., 2000), metal stress (Rue and Bruland, 2001;
Maldonado et al., 2002; Ladizinsky and Smith, 2003;
Wells et al., 2005) or macronutrient limitation (Pan
et al., 1996a,b,c) that may trigger toxin production in
Pseudo-nitzschia blooms. In the San Francisco Bay
experiment, no conspicuous ‘‘triggers’’ of DA produc-
tion, such as silicate or phosphate limitation, were
observed. The phytoplankton assemblage, which
included a large proportion of P. australis, did not
exhibit a preference for any particular nitrogen
substrate, and both inorganic and organic nitrogen
sources could support the growth of this assemblage,
while the unialgal cultures definitively show that P.
australis can grow on all nitrogen substrates tested.
Both the field and laboratory experiments demonstrate
M.D.A. Howard et al. / Harmful Algae 6 (2007) 206–217216
that urea-grown cells were more toxic than cells
utilizing either nitrate or ammonium. Given that this
diatom blooms during both upwelling and non-
upwelling conditions off the west coast of the U.S.
(Buck et al., 1992; Fryxell et al., 1997; Trainer et al.,
2000), substantial differences in the nitrogenous
nutrition of P. australis can be expected, and anthro-
pogenic inputs of reduced nitrogen substrates, such as
urea, may be more important in harmful algal bloom
development than previously thought, as suggested in a
recent analysis by Glibert et al. (2005b). We conclude
that P. australis is capable of using both inorganic and
organic nitrogen sources and that nitrogenous source
can influence toxin production in this species in central
California.
Acknowledgements
This work was supported by the NOAA-ECOHAB
grant NA96OP0475 awarded to RMK and WPC, and
additional grants awarded to RMK and MDA, including
C7-94085 (NOAA), OCE-138544 (NSF), and those
from Dr. Earl H. and Ethyl M. Meyers Trust, Ida Benson
Lynn Fellowship, the University of California, Santa
Cruz Women’s Club, and the Ocean Science Depart-
ment. Ship time for the field component was made
available by Dr. Kenneth W. Bruland, funded by NSF
grant OCE-0238347. The authors thank Dr. Peter E.
Miller, Dr. Chris Scholin, Mr. Rob Franks, Dr. Mary
Silver, Mr. Julian Herndon and the captain and crew of
the R/V Point Sur. In particular, we acknowledge the
time and effort of Ms. Margaret P. Hughes and Dr. Mark
L. Wells for their culturing assistance, domoic acid
analyses, and for supplying the initial cultures. We also
thank two anonymous reviewers and Dr. Ted Smayda
who provided useful commentary on an earlier version
of the manuscript.[TS]
References
Anderson, D.M., Glibert, P.M., Burkholder, J.M., 2002. Harmful algal
blooms and eutrophication: nutrient sources, composition and
consequences. Estuaries 25, 562–584.
Bates, S.S., Bird, C.J., de Freitas, A.S.W., Foxall, R., Gilgan, M.,
Hanic, L.A., Johnson, G.R., McCulloch, A.W., Odense, P., Pock-
lington, R., Quilliam, M.A., Sim, P.G., Smith, J.C., Subba Rao,
D.V., Todd, E.C.D., Walter, J.A., Wright, J.L.C., 1989. Pennate
diatom Nitzschia pungens as the primary source of domoic acid, a
toxin in shellfish from eastern Prince Edward Island, Canada. Can.
J. Fish. Aquat. Sci. 46, 1203–1215.
Bates, S.S., Worms, J., Smith, J.C., 1993. Effects of ammonium and
nitrate on growth and domoic acid production by Nitzschia pun-
gens in batch culture. Can. J. Fish. Aquat. Sci. 50, 1248–1254.
Bates, S.S., 1998. Ecophysiology and metabolism of ASP toxin
production. In: Anderson, D.M., Cembella, A.D., Hallegraeff,
G.M. (Eds.), The Physiological Ecology of Harmful Algal
Blooms. Springer-Verlag, Heidelberg, pp. 405–426.
Bates, S.S., Leger, C., Satchwell, M., Boyer, G.L., 2000. The effects of
iron on domoic acid production by Pseudo-nitzschia multiseries.
In: Hallegraeff, G.A., Blackburn, S.I., Bolch, C.J., Lewis, R.J.
(Eds.), Harmful Algal Blooms 2000. Intergov. Oceanogr. Comm.,
Paris, pp. 320–323.
Berges, J.A., Franklin, D.J., Harrison, P.J., 2003. Evolution of an
artificial seawater medium: Improvements in enriched seawater,
artificial water over the last two decades. J. Phycol. 37, 1138–1145
[Correction addition 40 (2004) 619].
Bruland, K.W., Rue, E.L., Smith, G.J., 2001. Iron and macronutrients
in California coastal upwelling regimes: implications for diatom
blooms. Limnol. Oceanogr. 46, 1661–1674.
Buck, K.R., Uttal-Cooke, L., Pilskaln, C.H., Roelke, D.L., Villac,
M.C., Fryxell, G.A., Cifuentes, L., Chavez, F.P., 1992. Autecology
of the diatom Pseudonitzschia australis Frenguelli, a domoic acid
producer, from Monterey Bay, California. Mar. Ecol. Prog. Ser. 84,
293–302.
Cochlan, W.P., Harrison, P.J., 1991. Uptake of nitrate ammonium and
urea by nitrogen-starved cultures of Micomonas-pusilla (Prasino-
phyeae): transient responses. J. Phycol. 27, 673–679.
Cullen, J.J., Renger, E.H., 1979. Continuous measurement of the
DMCU-induced fluorescence response of natural phytoplankton
populations. Mar. Biol. 53, 13–20.
Degobbis, D., 1973. On the storage of sea water samples for ammonia
determination. Limnol. Oceanogr. 18, 146–150.
Fritz, L., Quilliam, M.A., Wright, J.L.C., Beale, A., Work, T.M., 1992.
An outbreak of domoic acid poisoning attributed to the pennate
diatom Pseudo-nitzschia australis. J. Phycol. 28, 439–442.
Fryxell, G.A., Villac, M.C., Shapiro, L.P., 1997. The occurrence of the
toxic diatom genus Pseudonitzschia (Bacillariophyceae) on the
West Coast of the USA, 1920–1996: a review. Phycologia 36, 419–
437.
Garrison, D.L., Conrad, S.M., Eilers, P.P., Waldron, E.M., 1992.
Confirmation of domoic acid production by Pseudonitzschia
australis (Bacillariophyceae) cultures. J. Phycol. 28, 604–
607.
Garthwaite, I., Ross, K.M., Mile, C.O., Briggs, L.R., Towers, N.R.,
2001. Integrated enzyme-linked immunosorbent assay screening
system for amnesic, neurotoxic, diarrhetic, and paralytic shellfish
poisoning toxins found in New Zealand. J. AOAC Int. 84, 1643–
1648.
Glibert, P.M., Anderson, D.M., Gentien, P., Graneli, E., Sellner, K.G.,
2005a. The global, complex phenomena of harmful algal blooms.
Oceanography 18, 136–147.
Glibert, P.M., Harrison, J., Heil, C., Seitzinger, S., 2005b. Escalating
worldwide use of urea—a global change contributing to coastal
eutrophication. Biogeochemistry 77, 441–463.
Guillard, R.R.L., 1973. Division rates. In: Stein (Eds.), Handbook of
Phycological Methods, vol. VI. Cambridge University Press,
Cambridge, pp. 289–312.
Hallegraeff, G.M., 1993. A review of harmful algal blooms and their
apparent global increase. Phycologia 32, 79–99.
Harrison, P.J., Waters, R.E., Taylor, F.J.R., 1980. A broad spectrum
artificial sea water medium for coastal and open ocean phyto-
plankton. J. Phycol. 16, 28–35.
Hillebrand, H., Sommer, U., 1996. Nitrogenous nutrition of the
potentially toxic diatom Pseudonitzschia pungens f. multiseries
Hasle. J. Plank. Res. 18, 295–301.
M.D.A. Howard et al. / Harmful Algae 6 (2007) 206–217 217
Knepel, K., Bogren, K., 2001. Determination of orthophosphorous by
flow injection analysis in seawaters: QuickChem Method 31-115-
01-1-H. In: Saline Methods of Analysis, Lachat Instruments,
Milwaukee, WI, 14 pp.
Kudela, R., Dugdale, R., 2000. Nutrient regulation of phytoplankton
productivity in Monterey Bay, California. Deep-Sea Res. II 47,
1023–1053.
Kudela, R., Cochlan, W., Roberts, A., 2003a. Spatial and temporal
patterns of Pseudo-nitzschia spp. in central California related
regional oceanography. In: Steidinger, K.A., Landsberg, J.H.,
Tomas, C.R., Vargo, G.A. (Eds.), Harmful Algae 2002. Florida
and Wildlife Conservation Commission, Florida Institute of Ocea-
nography, and Intergovernmental Oceanographic Commission of
UNESCO, pp. 347–349.
Kudela, R., Roberts, A., Armstrong, M., 2003b. Laboratory analyses
of nutrient stress and toxin production in Pseudo-nitzschia spp.
from Monterey Bay, California. In: Steidinger, K.A., Landsberg,
J.H., Tomas, C.R., Vargo, G.A. (Eds.), Harmful Algae 2002.
Florida and Wildlife Conservation Commission, Florida Institute
of Oceanography, and Intergovernmental Oceanographic Com-
mission of UNESCO, pp. 136–138.
Ladizinsky, N., Smith, G.J., 2000. Accumulation of domoic acid by
the coastal diatom Pseudo-nitzschia multiseries: a possible copper
complexation strategy. J. Phycol. 36, 41.
Ladizinsky, N., Smith, G.J., 2003. Copper influence on the production
of domoic acid in toxic Pseudo-nitzschia spp. in Monterey Bay,
CA: a field study. Poster. In: Proceedings of the Second Sympo-
sium on Harmful Marine Algae in the US, Woods Hole, MA.
Maldonado, M.T., Hughes, M.P., Rue, E.L., 2002. The effect of Fe and
Cu on growth and domoic acid production by Pseudo-nitzschia
multiseries and Pseudo-nitzschia australis. Limnol. Oceanogr. 47,
515–526.
Miller, P.E., Scholin, C.A., 1998. Identification and enumeration of
cultured and wild Pseudo-nitzschia (Bacillariophyceae) using
species-specific LSU rRNA-targeted fluorescent probes and fil-
ter-based whole cell hybridization. J. Phycol. 34, 371–382.
Molloy, C.J., Syrett, P.J., 1988. Interrelationships between uptake of
urea and uptake of ammonium by microalgae. J. Exp. Mar. Biol.
Ecol. 118, 85–95.
Olivieri, R.A., Chavez, F.P., 2000. A model of plankton dynamics for
the coastal upwelling system of Monterey Bay, California. Deep-
Sea Res. II 47, 1077–1106.
Pan, Y., Subba Rao, D.V., Mann, K.H., Brown, R.G., Pocklington, R.,
1996a. Effects of silicate limitation on production of domoic acid,
a neurotoxin, by the diatom Pseudo-nitzschia multiseries. I. Batch
culture studies. Mar. Ecol. Prog. Ser. 131, 225–233.
Pan, Y., Subba Rao, D.V., Mann, K.H., Li, W.K.W., Harrison, W.G.,
1996b. Effects of silicate limitation on production of domoic
acid, a neurotoxin, by the diatom Pseudo-nitzschia multiseries.
II. Continuous culture studies. Mar. Ecol. Prog. Ser. 131, 235–
243.
Pan, Y., Subba Rao, D.V., Mann, K.H., 1996c. Changes in domoic acid
production and cellular chemical composition of the toxigenic
diatom Pseudo-nitzschia multiseries under phosphate limitation. J.
Phycol. 32, 371–381.
Perl, T.M., Bedard, L., Kosatsky, T., Hockin, J.C., Todd, E.C.D.,
Remis, R.S., 1990. An outbreak of toxic encephalopathy by eating
mussels contaminated with domoic acid. New. Engl. J. Med. 322,
1775–1780.
Pocklington, R., Milley, J.E., Bates, S.S., Bird, C.J., de Freitas,
A.S.W., Quilliam, M.A., 1990. Trace determination of domoic
acid in seawater and phytoplankton by high-performance liquid
chromatography of the fluorenylmethoxycarbonyl (FMOC) deri-
vative. Int. J. Environ. Anal. Chem. 38, 351–368.
Price, N.M., Harrison, P.J., 1987. A comparison of methods for the
measurement of dissolved urea concentration in seawater. Mar.
Biol. 92, 307–319.
Rue, E.L., Bruland, K.W., 2001. Domoic acid binds iron and copper: a
possible role for the toxin produced by the marine diatom Pseudo-
nitzschia. Mar. Chem. 76, 127–134.
Scholin, C.A., Gulland, F., Doucette, G.J., Benson, S., Busman, M.,
Chavez, F.P., Cordaro, J., DeLong, R., DeVogelaere, A., Harvey, J.,
Haulena, M., Lefebvre, K., Lipsomb, T., Loscutoff, S., Lowens-
tine, L.J., Marin III, R., Miller, P.E., McLellan, W.A., Moeller,
P.D.R., Powell, C.L., Rowles, T., Silvagni, P., Silver, M., Spraker,
T., Trainer, V., Van Dolah, F.M., 2000. Mortality of sea lions along
the central California coast linked to a toxic diatom bloom. Nature
403, 80–84.
Smith, P., Bogren, K., 2001a. Determination of nitrate and/or nitrite in
brackish or seawater by flow injection analysis colorimeter:
QuickChem Method 31-107-04-1-E. In: Saline Methods of Ana-
lysis, Lachat Instruments, Milwaukee, WI, 12 pp.
Smith, P., Bogren, K., 2001b. Determination of silicate in brackish or
seawater by flow injection analysis colorimeter: QuickChem
Method 31-114-27-1-C. In: Saline Methods of Analysis, Lachat
Instruments, Milwaukee, WI, 12 pp.
Solorzano, L., 1969. Determination of ammonium in natural waters by
the phenolhypochlorite method. Limnol. Oceanogr. 14, 799–801.
Trainer, V.L., Adams, N.G., Bill, B.D., Stehr, C.M., Wekell, J.C.,
Moeller, P., Busman, M., Woodruff, D., 2000. Domoic acid
production near California coastal upwelling zones, June 1998.
Limnol. Oceanogr. 45, 1818–1833.
Villac, M.C., Roelke, D.L., Chavez, F.P., Cifuentes, L.A., Fryxell,
G.A., 1993. Pseudonitzschia australis Frenguelli and related
species from the west coast of the U.S.A.: occurrence and domoic
acid production. J. Shellfish Res. 12, 457–465.
Wells, M.L., Trick, C.G., Cochlan, W.P., Hughes, M.P., Trainer, V.L.,
2005. Domoic acid: the synergy of iron, copper, and the toxicity of
diatoms. Limnol. Oceanogr. 50, 1908–1917.
Welschmeyer, N.A., 1994. Fluorometric analysis of chlorophyll a in
the presence of chlorophyll b and pheopigments. Limnol. Ocea-
nogr. 39, 1985–1992.
Wilkerson, F.P., Dugdale, R.C., Chavez, F.P., Kudela, R.M., 2000.
Biomass and productivity in Monterey Bay, CA: contribution of
the larger autotrophs. Deep-Sea Res. II 47, 1003–1022.
Work, T.M., Beale, A.M., Fritz, L., Quilliam, M.A., Silver, M., Buck,
K., Wright, J.L.C., 1993. Domoic acid intoxication of brown
pelicans and cormorants in Santa Cruz, California. In: Smayda,
T.J., Shimizu, Y. (Eds.), Toxic Phytoplankton Blooms in the Sea.
Elsevier, Amsterdam, pp. 643–650.