nitrogen transformations and diversity of ammonia-oxidizing bacteria in a desert ephemeral streama...
TRANSCRIPT

ENVIRONMENTAL MICROBIOLOGY
Nitrogen Transformations and Diversity of Ammonia-OxidizingBacteria in a Desert Ephemeral Stream Receiving UntreatedWastewater
Roey Angel & Lior Asaf & Zeev Ronen & Ali Nejidat
Received: 18 January 2009 /Accepted: 16 June 2009 /Published online: 11 July 2009# Springer Science + Business Media, LLC 2009
Abstract Levels of inorganic nitrogen species (ammonia,nitrite, and nitrate), ammonia oxidation potential (AOP),and diversity of ammonia-oxidizing bacteria (AOB) werestudied in the sediments of a 50-km-long segment of anephemeral stream in the Negev desert, receiving untreatedwastewater. Water analysis in downstream sampling pointsshowed reductions of 91.7% in biological oxygen demand,87.7% in chemical oxygen demand, 73.9% in totalnitrogen, and 72.8% in total ammonia nitrogen. SignificantAOP levels in the sediment were detected mainly in the falland spring seasons. Denaturing gradient gel electrophoresisof AOB 16S rRNA gene fragments showed that in mostsampling points, the streambed was dominated by Nitro-sospira cluster 3 strains similar to those dominating thestream bank’s soils and sediments in nearby springs.Nitrosomonas strains introduced by discharged wastewaterand others dominated some sections of the stream character-ized by high organic carbon levels. The results suggest that
climatic conditions in the Negev desert select for AOBbelonging to Nitrosospira cluster 3, and these conditionsdominate the aquatic environment effect along most of thestream sections. In addition, the nitrification–denitrificationprocesses were not sufficient to reduce nitrogen levels in thesediment and prevent the eutrophication of some sections ofthe stream ecosystem. Thus, the discharge of high nitrogenwastewater into desert streams should be done carefully as itmay endanger the already fragile ecosystem.
Introduction
Excess influx of nutrients from anthropogenic sources, suchas wastewater and runoff from fertilized fields into aquaticecosystems, causes eutrophication and brings to ecosystemdeterioration [2, 8]. Nitrogen has the most pronouncedeffect on the extent of eutrophication. Coupled nitrificationand denitrification eliminates excess nitrogen and attenuatesthe eutrophication process [39]. Aerobic nitrification iscarried out jointly by the ammonia-oxidizing and nitrite-oxidizing bacteria. Recent molecular studies have alsodemonstrated the prevalence of ammonia-oxidizing Ar-chaea in natural systems, including soils and marineenvironments. However, the extent of their activity andecological importance has yet to be established [33].
The activity and community structure of ammonia-oxidizing bacteria (AOB), which catalyze the rate-limitingstep of nitrification, have been studied in the water, sedi-ments, and estuaries of several rivers [31, 42] demonstratingthe effect of wastewater discharge on the composition anddiversity of the AOB [9, 10]. However, the activity anddiversity of nitrifiers and nitrogen transformations in desertstreams suffering from discharge of domestic wastewaterwere not studied before.
R. AngelMax-Planck-Institute for Terrestrial Microbiology,Karl-von-Frisch-Str,35043 Marburg, Germany
L. AsafTHAL Group,54 Ibn Gvirol St,Tel Aviv 64364, Israel
Z. Ronen :A. Nejidat (*)Department of Environmental Hydrology and Microbiology,Zukerberg Institute for Water Research,The Jacob Blaustein Institutes for Desert Research,Ben-Gurion University of the Negev,Sede Boqer Campus,84990 Midreshet Ben-Gurion, Israele-mail: [email protected]
Microb Ecol (2010) 59:46–58DOI 10.1007/s00248-009-9555-3

The Be’er Sheva/Hebron stream, running through theNegev desert, Israel, drains the untreated domestic waste-water of the city of Hebron and Qiryat Arba [15], and in2003, it had the highest load of organic carbon (OC) amongall major streams in Israel [37]. The stream used to be anephemeral stream with an average of three flood events peryear and sections exposed to wetting and drying cycles.However, the continuous discharge of untreated wastewatercompletely altered its morphology and ecology [15],turning it into a perennial stream with water running alonga ca.100-km stretch from the wastewater source and sharpseasonal fluctuations in water level. In order to minimizeeutrophication processes, the stream’s ecosystem must becolonized by active nitrifiers that survive the extreme desertconditions. AOB were shown to survive through periods ofstress [13, 14, 47] and undergo changes in communitycomposition in response to various environmental factors[5, 9, 19, 24, 35]. However, the high organic loadoriginating from the discharge of untreated wastewater incombination with the extreme desert climatic conditionsmay hamper the growth and activity of AOB, thushindering self purification processes in the stream. Theaim of this study therefore was to examine the changes inthe levels of organic matter and the inorganic nitrogenspecies (ammonia, nitrite, and nitrate) in respect to theabundance and diversity of AOB in the sediment along a50-km section of the Be’er Sheva/Hebron stream. It is partof a larger research scheme aimed at monitoring thestream’s changing ecosystem and its potential for “self-purification” under the extreme desert conditions.
Materials and Methods
Environmental Samples
Water and sediment samples were collected from sixsampling points covering about 50 km of the Be’er Sheva/Hebron stream (Fig. 1, points 1–6). The first sampling pointwas adjacent to the border line between the Palestinianterritory and Israel and the last was located 100 km fromthe Hebron wastewater output. The studied section of thestream is located in the northern Negev desert with anaverage annual precipitation of 150 mm, cold winters, hotsummers (air temperatures exceeding 40°C in July andAugust), and high levels of radiation [32]. The daily rate ofwastewater discharge from the city of Hebron is estimatedat 15,000 m3 [44]. Flow width of the sampled section of thestream was 2–9 m and water depth was 0.2–1.0 m.Sediment samples from each of the six sampling pointsand the stream bank’s soil were taken once a season, fromfall 2005 to the following summer 2006. Data for the wintersampling (water and sediment) at sampling point number 6(100 km) was not obtained because this location was dry atthe time of sampling. In addition, the input wastewater andtwo presumably clean reference springs (points 7 and 8 inFig. 1) were also included in the fall sampling.
On-site measurements of pH, dissolved oxygen (DO)content, temperature, and electric conductivity (EC) weretaken in parallel to the water sampling using a Multi 350iSET (WTW, Germany). Water samples were collected inhigh-density polyethylene bottles rinsed in stream water.
Figure 1 A map depicting theBesor/El Khalil watershed. Thesegment of perennial flowstretches from the city ofHebron to Ze’elim Reservoir.Sampling points 1–6 (51.2, 74.8,80.1, 86.2, 92.6 km, respective-ly) are located along thestream’s channel; points 7 and8 mark two reference springs
Diversity of Ammonia-Oxidizing Bacteria in an Ephemeral Stream 47

Sediment samples of the upper 1 cm of the wet sedimentwere collected using a Petri dish and a small square piece ofhigh-density polyethylene and stored in low-density poly-ethylene ziplock bags. A composite sample of approxi-mately 500 g was formed by collecting three subsamplesfrom each sampling point. Each subsample was taken fromthe center of the stream at approximately 10-m increments.Samples were stored on ice in the dark until reaching thelaboratory. Upon arrival at the laboratory, a 50-mL aliquotof each water sample was filtered through 45-µm GF-3filter papers (MN GmbH& Co. KG, Germany) forspectrophotometric analysis of nitrogen species. All otheranalyses were performed using unfiltered water. Sedimentsamples were centrifuged at 3,000 rpm for 5 min toremove the pore water and then partitioned. Approximate-ly 10 g of the wet sediments from each sample werestored at −80°C for DNA extraction and the rest wasweighed and incubated in Petri dishes at 65°C (withoutaffecting nitrogen species content) until complete dryness.The dried sediments were ground using a D3V-10 soil-cutting mill (MRC, Israel) and used for nitrogen speciesand organic carbon analyses.
Chemical Analyses
Biological oxygen demand (BOD) and chemical oxygendemand (COD) in water samples were determined usingstandard methods for water analysis [3]. In order todetermine the nitrogen species content in the sedimentsamples, 10 g portion of the dried ground sediments fromeach sample was transferred to a 50-mL tube containing25 mL of 1 M KCl [40] and was mixed for 1 h on a modelG2 Gyrotory shaker (New Brunswick Scientific, Edison,NJ, USA). After extraction, the tubes were centrifuged for5 min at 10,000 rpm and the supernatant was filteredthrough 0.45-µm GF-3 filter papers. Total nitrogen, totalammonia nitrogen (TAN), and nitrite in the water samplesas well as sediment filtrates were analyzed by standardmethods [4]. Nitrate was analyzed using the second-derivative spectroscopy method [11]. Chlorophyll a analy-sis was performed after extraction of dried ground sedimentsamples with dimethyl sulfoxide according to Shoaf andLium [38], and measurements of organic matter content inthe sediments were performed according to the Walkley–Black method [7].
Ammonia Oxidation Potential
Ammonia oxidation potential (AOP) was determined byincubating 10 g of wet centrifuged sediment in 40 mL AOBmedium containing 10 mM potassium chlorate in order toinhibit the activity of the nitrite-oxidizing bacteria. Experi-ments were run in triplicate on a shaker at 25°C in a dark
room for 5 h. Nitrite accumulation was determined asabove. The following incubation medium was used [1]:0.3 g (NH4)2SO4, 0.5 g K2HPO4, 0.05 g MgSO4, 0.004 gCaCl2, 0.1 mL Fe ethylenediaminetetraacetic acid (EDTA)solution (0.14 g EDTA disodium salt, 0.5 g FeSO4∙7H2O,0.05 mL H2SO4, diluted with double-distilled water to100 mL), 4.77 g 4-(2-hydroxyethyl)-1-piperazineethanesul-fonic acid buffer, and 1.5 mL microelement solution (0.1 gNaMoO4∙2H2O, 0.2 g MnCl2∙2H2O, 0.002 g CoCl2∙6H2O,0.1 g ZnSO4∙7H2O, 0.02 g CuSO4∙7H2O, diluted withdouble-distilled water to 1 L).
DNA Isolation, PCR Amplification, and DenaturingGradient Gel Electrophoresis Analysis
Whole genomic DNA extraction was performed usingPowerSoil™ DNA Isolation Kit (MO BIO Lab. Inc.,Solana Beach, CA, USA) and quantified using NanoDrop(ND-1000, NanoDrop Inc., Wilmington, DE, USA). A 465-bp DNA fragment from the 16S rRNA gene of thebetaproteobacterial ammonia oxidizers was amplified bynested polymerase chain reaction (PCR) strategy. First, alarger DNA fragment was amplified by primers β-AMO1315r and β-AMO143f [28], followed by a secondPCR using primers CTO189f-GC and CTO654r [21].Mahmood et al. [29] found this approach to yield morebands on denaturing gradient gel electrophoresis (DGGE)for AOB than direct PCR amplification.
PCR was performed in 50 µl volumes using 5 µl of 10×reaction buffer, 2.5 mM MgCl2, 250 μM of each of the fourdeoxyribonucleotide triphosphates, 25 pmol of each of theprimers, 50 µg bovine serum albumin, 1.5 U of REDTaqDNA polymerase (Sigma, St. Louis, MO, USA), andapproximately 20 ng of DNA template. Amplification wascarried out in a TGradient thermocycler (Biometra, Gottin-gen, Germany) using the following program: 5 min at 95°C,followed by 30 cycles of 45 s at 94°C, 45 s at 58°C, and1 min at 72°C, and a final elongation step for 10 min at72°C. A single band of the expected size was obtainedwhen PCR products were visualized on ethidium bromide-stained agarose gels. DGGE analysis was performed with aDcode™ Universal Mutation Detection System (Bio-Rad,Hercules, CA, USA) under the following conditions:1-mm-thick 8% polyacrylamide gel and a denaturinggradient of 38–50% urea–formamide at 60°C, 70 V for14 h. Polyacrylamide gels and all DGGE solutions wereprepared according to the manufacturer’s instructions (Bio-Rad). Ethidium bromide-stained gels were visualized on aGel Doc XR gel imaging system (Bio-Rad) and DNA bandswere excised on a UV transilluminator table using a scalpel.DNA was eluted as previously described [34] and used as atemplate for reamplification by CTO primers without GC-clamp under the conditions described above.
48 R. Angel et al.

Sequencing, Cloning, and Phylogenetic Analysis
Reamplified DGGE bands were cloned using an InsTA-clone™ PCR cloning kit (MBI Fermentas, Hanover, MD,USA) and sequenced commercially by Danyel Biotech Ltd.(Rehovot, Israel) using a MegaBACE 1000 sequencer.Sequences (after trimming of primer) were analyzed usingthe Ribosomal Database Project II classifier tool [46](http://rdp.cme.msu.edu/). Some of the closely relatedsequences were downloaded to be used as referencesequences for the phylogenetic analysis. All sequenceswere aligned using ClustalX multiple alignment algorithm(http://www.clustal.org) [25] for the construction of amaximum likelihood phylogenetic tree with bootstrap usingRAxML 7.03with rapid hill climbing algorithm andGTRMIXevolutionary model (http://icwww.epfl.ch/~stamatak/index-Dateien/Page443.htm) [41]. Sequences obtained in this studywere submitted to GenBank using Sequin tool (http://www.ncbi.nlm.nih.gov/Sequin/) and were assigned accessionnumbers EF042976–EF043008.
Statistical Analysis
A semiquantitative statistical analysis was performed toexamine the similarity between the DGGE banding patternsof the different samples and the correlation between thesepatterns and the different environmental factors. First, theDGGE gels were digitized using a MATLAB codespecifically designed for this purpose available at http//www.staff.uni-marburg.de/~angel/DGGE-Analyzer-1.2.zip.The positions of each band and its relative (normalized)intensity were used as a relative abundance index [12].These results were used to generate a sample by species
matrix. Because the sample by species matrix containsmany null values, the species scores were transformedfollowing Legendre and Gallagher [26], to give the Chorddistance between samples when Euclidean distances arecomputed for use in further statistical analysis. A paralleltable containing the chemical parameters of the water andsediment corresponding to each sample was also generatedto account for environmental variables [45]. Except for pH,the environmental variables were log-transformed {ln(x+1)} prior to statistical analysis. The construction of a linearmodel was found adequate by preliminary detrendedcorrespondence analysis, which showed a short gradientlength (SD<4) [45]. As a result, the transformed speciesscores were ordinated using a correlation-based principalcomponent analysis (PCA). The effects of the variousenvironmental factors on AOB community structure weretested using a constrained canonical redundancy analysis(RDA) model. The significance of the measured environ-mental gradient was explicitly tested using the Monte Carlopermutation test [18, 27, 45]. Both multivariate analyseswere performed using the Canoco 4.53 software package(http://www.canoco.com).
Results
Chemical Analysis of the Stream Water and Sediment
On-site measurements of the DO levels in the stream watershowed a suboxic state mostly upstream (i.e., the first andsecond sampling points) and a supersaturated state in themiddle section of the stream, in particular at sampling pointnumber 4 (86.2 km; Fig. 2). In most cases, the DO pattern
BO
D/C
OD
(m
g/L
)
a. Fall
0.22
0.190.21
0.11 0.1
0.14
0
200
400
600
800
1000
1200
DO
(m
g/L
)
0
5
10
15
20
0
200
400
600
800
1000
1200
b. Winter
0.35
0.37
0.08
0.07 0.10
0
5
10
15
20BODCOD DO
c. Spring
0.88
0.42
0.42 0.37
0.28
51.2 74.8 80.1 86.2 92.6 100.0
0
200
400
600
800
1000
1200
0
5
10
15
20
51.2 74.8 80.1 86.2 92.6 100.0
0
200
400
600
800
1000
1200
DO
(m
g/L
)
0
5
10
15
20
0.41
0.34
0.28
0.240.12
0.05
d. Summer
BO
D/C
OD
(m
g/L
)
Distance from source (km) Distance from source (km)
Figure 2 Levels of biologicaloxygen demand (BOD),chemical oxygen demand(COD), and dissolved oxygen(DO) in the stream water asmeasured in four samplingseasons. The numbers above theCOD plot represent BOD/CODratios. a Fall, b winter, c spring,d summer
Diversity of Ammonia-Oxidizing Bacteria in an Ephemeral Stream 49

correlated with the amount of chlorophyll a in the water (datanot shown), which is indicative of algal biomass. Levels of ECalong the stream were measured in the range of 1.9–3.8 mS cm−1 and pH levels were in the range of 7.03–8.42,with no apparent spatial or temporal trends. Chemicalanalyses of the stream water showed a general decreasingtrend along the flow direction in the levels of both organicmatter as expressed by BOD and COD (Fig. 2). Levels ofBOD and COD were high at the first sampling point, rangingfrom 224 to 990 and 685 to 1,262 mg O2L
−1, respectively, butdecreased significantly to levels as low as 6 and 15 mg O2L
−1,respectively, at the last sampling points (Fig. 2). A seasonalvariation in BOD and COD levels at the first sampling pointindicated great variability in the quality of the effluentsdischarged into the stream. The ratios of BOD to COD alsodeclined with the distance indicating that the decrease inorganic matter is mainly the result of biological activity. BOD
of 6.9 and 2.6 mg O2L−1 and COD of 69 and 26.7 mg O2L
−1
were measured at the two reference springs. These valueswere much lower than those in most parts of the stream andare representing the natural background levels.
In the water samples, levels of TAN, the major form ofnitrogen, were very high at the first upstream samplingpoint with seasonal variations (Fig. 3) and were decreasingwith increasing distance from the wastewater source.Nitrate levels reached 11.2 mg NL−1 only at samplingpoint number 4 (86.2 km) in the fall and being barelydetectable in all other samples (Fig. 3). Nitrite, up to1.1 μg mL−1, was detected only at the fourth samplingpoint during the fall sampling (data not shown). In thesediment (Fig. 3), TAN levels ranged from about50 mg Nkg−1 dry weight (wt) sediment to 800 mg N kg−1
dry wt sediment with no apparent spatial or seasonalpatterns. Significant levels of nitrate were detected in the
51.2 74.8 80.1 86.2 92.6 100.051.2 74.8 80.1 86.2 92.6 100.0
Water (mg-N/L) Sediment (mg-N/kg)
TAN
NO3--N
Total N
NO3--N
020406080
100120140160
020406080
100120140160
TAN
020406080
100120140160
0
100
200
300
400
500
600
700
0
100
200
300
400
500
600
700
0
100
200
300
400
500
600
700
0
100
200
300
400
500
600
700
020406080
100120140160
a.
c.
b.
d.
Distance from source (km) Distance from source (km)
Figure 3 Levels of nitrogenspecies in the stream water andin the stream sediment asmeasured in four samplingseasons (a fall, b winter,c spring, d summer). TAN totalammonia nitrogen
50 R. Angel et al.

sediments from the fourth sampling point with 97 mgNO3
−-N kg−1 dry wt sediment in the fall, whereasconcentrations were lower in the subsequent seasons(Fig. 3). Nitrite was hardly detectable in the sediments,and only trace levels (up to 0.7 mg N kg−1 dry wt sediment)were found at the fourth sampling point in the fall. TANand nitrate levels in the sediments of the reference springswere in the range of 80–100 and 7–18 mg-N kg−1 dry wtsediment, respectively.
OCwas analyzed in the sediments as an indicator of organicload (Fig. 4). The OC levels of the fourth sampling point(86.2 km) were four- to fivefold higher than those at the othersampling points, the latter one ranging at around 1% with noapparent seasonal or temporal gradient. Levels at thereference springs of Ein Besor and Ein Sarohan were similarto the other sampling points, 1.1% and 1.4%, respectively.
Potential Nitrification Activity and Community Structureof AOB
The presence of oxidized nitrogen forms in the streamwater and sediments indicated the occurrence of nitrifica-tion (Fig. 3). AOP was determined in sediment samples, asammonia oxidation generally considered being the rate-limiting step of nitrification (Fig. 5). The results indicatedhigh nitrification activity in the fall and spring samples andat sampling point (100 km) during the summer sampling,compared to the other samples (winter and summersamples).
A representative DGGE analysis of amplified AOB 16SrRNA gene fragments from DNA extracted from sedimentsamples in the fall of 2005 is shown in Fig. 6. Seventeendominant DNA bands were identified during the fourseasons and 16 of them are marked in Fig. 6 (band 110-8,which was detected in the winter, is not marked). However,bands identity was determined based on their DNA
sequences and not only by their position on the gel. Table 1summarizes the bands obtained during the different seasonsat the different sampling points, and their sequences wereused to construct a phylogenetic tree (Fig. 7). All sequenceswere clustered into two of the eight recognized AOBclusters [36]: (1) cluster 7 (Nitrosomonas europaea/Nitro-
0
10
20
30
40
50
60
70
51.27 74.8 80.1 86.2 92.6 100
FallWinterSpringSummer
AO
P-µg
N (
g dr
y w
t)-1
h-1
Figure 5 Ammonia oxidation potential (AOP) in the stream sedimentsampled during four seasons
51.2 74.8 80.1 86.2 92.6 1000
2
4
6
8 Fall Winter Spring Summer
Org
anic
Car
bon
(% o
f dry
mas
s)
Distance from source (km)EIB EIS
EIBEIS
Figure 4 Organic carbon in the stream sediment, measured duringfour sampling seasons in six sampling points along the stream and intwo reference springs. EIS Ein Sarohan, EIB Ein Besor
H-4
H-5
W.W
H-4
H-5
88-3
74-174-
79-174-374-474-5
74-7
74-6
-
-2
----
-
-
100 92.6 86.2 80.1 74.8 51.2Distance (km)
EIS
H--
74-
61-1-
74 2
Soil
74-374-474-5
-3--
74-6--1
74-5
79-
-74-6-
3
88 1-
a. b. c. d.
35 3-48-1-1
74-1-
Figure 6 DGGE analysis of PCR-amplified 16S rRNA gene frag-ments from a the stream sediment in fall 2005, b the input wastewater(W.W), c a reference spring (EIS), and d a bank soil sample. DNAfragments were amplified by nested PCR strategy using the βAMOand CTO primers. PCR bands that were sequenced are marked on thegels. The figure is composed from several gels that were run under thesame conditions
Diversity of Ammonia-Oxidizing Bacteria in an Ephemeral Stream 51

Tab
le1
Recov
ered
DGGEband
sandtheirappearance
inthestream
with
theircloset
relativ
es(see
tree
inFig.7)
Band
#Closestrelativ
eSim
ilarity
(%)
Falla
Winter
Spring
Sum
mer
51.2
74.8
80.1
86.2
92.6
100
51.2
74.8
80.1
86.2
92.6
51.2
74.8
80.1
86.2
92.6
100
51.2
74.8
80.1
86.2
92.6
100
Soils
Springs
W.W
35-3
Nitrosospira
briensis,
AY12
3800
98.9
++
++
+
48-1
Nitrosospira
briensis,
AY12
3800
99.8
+
61-1
Nitrosom
onas
europa
ea,
AF3531
60
99.1
+
74-1
Nitrosospira
sp.
R5c20,AF38
6755
99.8
++
++
++
++
++
++
++
++
++
++
74-2
Nitrosospira
sp.
R5c20,AF38
6755
99.8
++
++
++
++
++
++
++
++
++
++
74-3
Nitrosospira
sp.
R5c20,AF38
6755
99.3
++
++
++
++
++
++
++
++
++
+
74-4
Nitrosospira
sp.
R5c20,AF38
6755
99.5
++
++
++
++
++
++
++
++
++
74-5
Nitrosospira
sp.
R5c20,AF38
6755
99.5
++
++
++
++
++
++
++
++
++
74-6
Nitrosospira
sp.
R5c20,AF38
6755
99.5
++
++
++
++
++
+
74-7
Nitrosospira
sp.
FJI82
,AY63
1269
99.3
++
++
++
+
79-1
Nitrosospira
sp.
R5c20,AF38
6755
98.3
++
++
++
++
++
++
88-1
Nitrosom
onas
europa
ea,
AF3531
60
98.3
++
++
++
++
++
++
++
++
++
+
88-3
Nitrosom
onas
europa
ea,
AF3531
60
98.6
++
++
++
++
++
++
++
++
++
+
110-8
Nitrosospira
sp.
Nsp2,
AY12
3802
98.8
++
++
+
H3
Nitrosom
onas
sp.K1,
AF3632
8996
.4+
H4
Nitrosospira
multiformis,
CP00
0103
100
+
H5
Uncultured
bacterium,
DQ00
1636
97.2
+
W.W
wastewater
aDistancefrom
thewastewater’sou
tletin
kilometers
52 R. Angel et al.
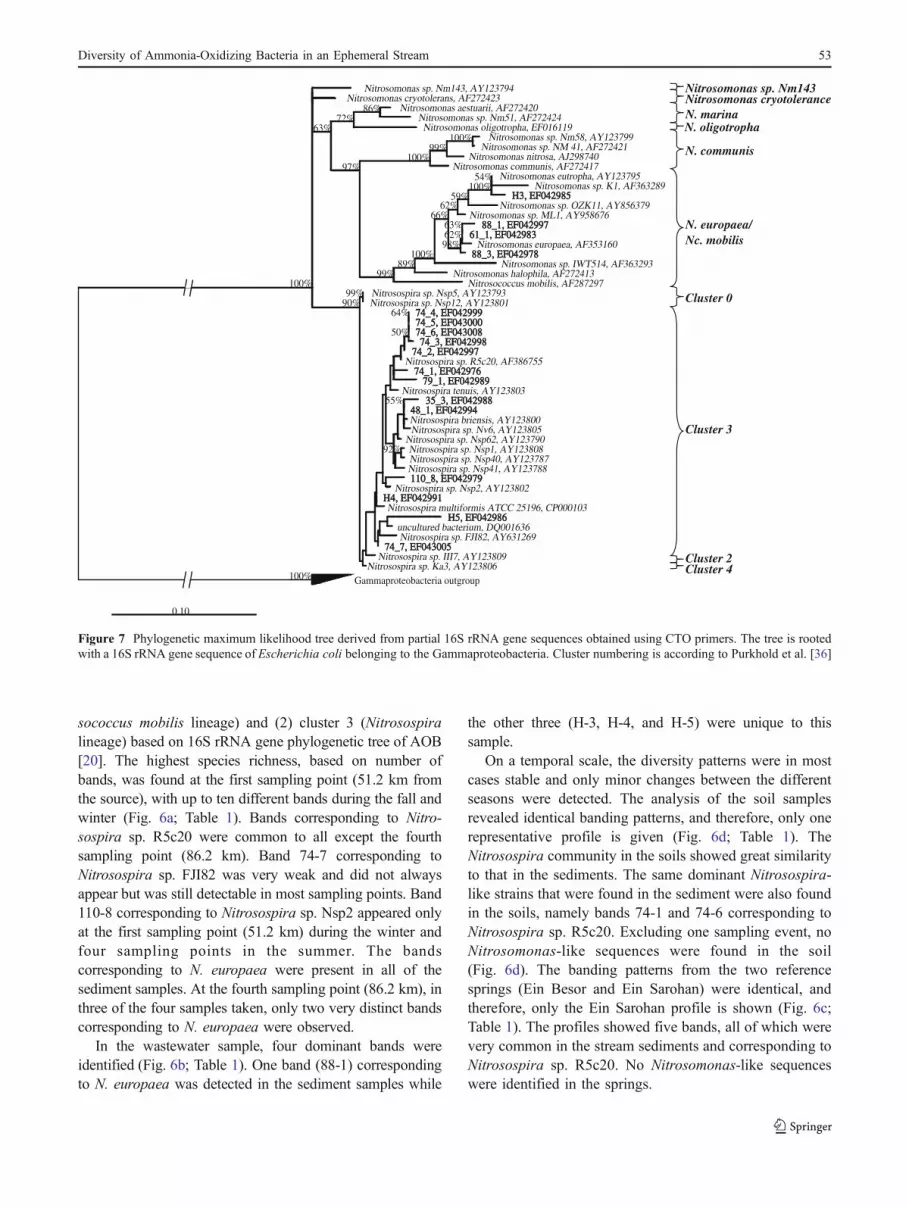
sococcus mobilis lineage) and (2) cluster 3 (Nitrosospiralineage) based on 16S rRNA gene phylogenetic tree of AOB[20]. The highest species richness, based on number ofbands, was found at the first sampling point (51.2 km fromthe source), with up to ten different bands during the fall andwinter (Fig. 6a; Table 1). Bands corresponding to Nitro-sospira sp. R5c20 were common to all except the fourthsampling point (86.2 km). Band 74-7 corresponding toNitrosospira sp. FJI82 was very weak and did not alwaysappear but was still detectable in most sampling points. Band110-8 corresponding to Nitrosospira sp. Nsp2 appeared onlyat the first sampling point (51.2 km) during the winter andfour sampling points in the summer. The bandscorresponding to N. europaea were present in all of thesediment samples. At the fourth sampling point (86.2 km), inthree of the four samples taken, only two very distinct bandscorresponding to N. europaea were observed.
In the wastewater sample, four dominant bands wereidentified (Fig. 6b; Table 1). One band (88-1) correspondingto N. europaea was detected in the sediment samples while
the other three (H-3, H-4, and H-5) were unique to thissample.
On a temporal scale, the diversity patterns were in mostcases stable and only minor changes between the differentseasons were detected. The analysis of the soil samplesrevealed identical banding patterns, and therefore, only onerepresentative profile is given (Fig. 6d; Table 1). TheNitrosospira community in the soils showed great similarityto that in the sediments. The same dominant Nitrosospira-like strains that were found in the sediment were also foundin the soils, namely bands 74-1 and 74-6 corresponding toNitrosospira sp. R5c20. Excluding one sampling event, noNitrosomonas-like sequences were found in the soil(Fig. 6d). The banding patterns from the two referencesprings (Ein Besor and Ein Sarohan) were identical, andtherefore, only the Ein Sarohan profile is shown (Fig. 6c;Table 1). The profiles showed five bands, all of which werevery common in the stream sediments and corresponding toNitrosospira sp. R5c20. No Nitrosomonas-like sequenceswere identified in the springs.
Nitrosomonas sp. Nm143, AY123794Nitrosomonas cryotolerans, AF272423
Nitrosomonas aestuarii, AF272420Nitrosomonas sp. Nm51, AF272424Nitrosomonas oligotropha, EF016119
86%
Nitrosomonas sp. Nm58, AY123799Nitrosomonas sp. NM 41, AF272421
Nitrosomonas nitrosa, AJ298740
100%
Nitrosomonas communis, AF272417
99%
Nitrosomonas eutropha, AY123795Nitrosomonas sp. K1, AF363289
H3, EF042985 H3, EF042985
54%
Nitrosomonas sp. OZK11, AY856379
100%
Nitrosomonas sp. ML1, AY958676
59%
88_1, EF04299788_1, EF04299761_1, EF04298361_1, EF042983
Nitrosomonas europaea, AF353160
63%
88_3, EF04297888_3, EF042978
62%
62%
98%
Nitrosomonas sp. IWT514, AF363293
66%
Nitrosomonas halophila, AF272413
100%
Nitrosococcus mobilis, AF287297
89%
100%
99%
72%
97%
63%
Nitrosospira sp. Nsp5, AY123793Nitrosospira sp. Nsp12, AY123801
74_4, EF04299974_4, EF04299974_5, EF04300074_5, EF04300074_6, EF04300874_6, EF043008
64%
74_3, EF04299874_3, EF04299874_2, EF04299774_2, EF042997
50%
Nitrosospira sp. R5c20, AF38675574_1, EF04297674_1, EF042976
79_1, EF04298979_1, EF042989Nitrosospira tenuis, AY123803
35_3, EF04298835_3, EF04298848_1, EF04299448_1, EF042994Nitrosospira briensis, AY123800Nitrosospira sp. Nv6, AY123805
55%
Nitrosospira sp. Nsp62, AY123790Nitrosospira sp. Nsp1, AY123808Nitrosospira sp. Nsp40, AY123787Nitrosospira sp. Nsp41, AY123788
92%
110_8, EF042979110_8, EF042979Nitrosospira sp. Nsp2, AY123802
H4, EF042991H4, EF042991Nitrosospira multiformis ATCC 25196, CP000103
H5, EF042986H5, EF042986uncultured bacterium, DQ001636Nitrosospira sp. FJI82, AY631269
74_7, EF04300574_7, EF043005Nitrosospira sp. III7, AY123809
Nitrosospira sp. Ka3, AY123806
99%90%
Gammaproteobacteria outgroup5
100%
100%
0.10
Nitrosomonas sp. Nm143Nitrosomonas cryotolerance
N. oligotropha
N. communis
N. marina
N. europaea/Nc. mobilis
Cluster 0
Cluster 3
Cluster 2Cluster 4
Figure 7 Phylogenetic maximum likelihood tree derived from partial 16S rRNA gene sequences obtained using CTO primers. The tree is rootedwith a 16S rRNA gene sequence of Escherichia coli belonging to the Gammaproteobacteria. Cluster numbering is according to Purkhold et al. [36]
Diversity of Ammonia-Oxidizing Bacteria in an Ephemeral Stream 53

Statistical Analysis
The PCA (Fig. 8a) analysis demonstrates distinguishingbetween two major clusters: a small cluster comprisingthe samples from the fourth sampling point (86.2 km)and the wastewater and a larger cluster comprising therest of the samples. Within the larger cluster, the soiland spring samples were seen to cluster together.
Results of the RDA analysis and the Monte Carlo testshowed that the fourth sampling point (86.2 km) and thewastewater sample are significantly different (p=0.002 and0.042, respectively, F=11.08 and 3.82, respectively) fromthe other sampling points, but not from the soils or springs(data not shown). The environmental factors found to be
significantly correlated to the community composition ofAOB (when tested individually) were OC (p<0.002; F=15.59), sediment nitrate (p<0.002; F=7.91), and DO (p=0.008; F=3.98). However, when the OC (or any other ofthese variables) was taken into account, none of the otherfactors remained significant, indicating that these factorsare all interdependent. Organic matter itself was found toexplain 36% of the variability in AOB community structurein the sediment samples. Other variables tested, such asTAN (in water and sediment) and BOD level were notfound to be significantly correlated to the AOB communitystructure in the sediments despite expressing a cleargradient themselves. We also examined the relations ofdifferent species to the samples and the environmentalvariables. Figure 8b shows a PCA plot with the OC levelsmeasured in each sample. The connection between N.europaea to the sample contained high OC, i.e., thesamples from the fourth sampling point (86.2 km) observedfrom their close location in Fig. 8b.
Discussion
Water Quality and Nitrification in the Stream
The improvement in water quality along the stream (Fig. 3)can be attributed to physical and biological processes. Thedecreased organic matter levels are likely due to sedimen-tation and microbial biodegradation while the reduction oftotal nitrogen levels (TAN accounting for most of it) can beexplained by sorption to the sediment, ammonia volatiliza-tion, and nitrification–denitrification processes. However,nitrogen concentrations (mainly TAN) were still signifi-cantly high in the water and the sediment even at the endsampling point. This was best displayed at the eutrophiedsampling point (86.2 km) characterized by algal bloomreaching 210 μg L−1 of chlorophyll a in the summer andhigh levels of organic carbon and DO. In this location, thestream widens significantly (about 10 m) and is devoid ofvegetation; thus, it is completely exposed to direct sunlight.The low nitrate concentrations might be due to efficientdenitrification, low rates of ammonia oxidation, or both.However, the high levels of ammonia in the water and thesediment indicate nonefficient ammonia oxidation capacityto cope with the ammonia at the stream ecosystem. Thenonsufficient nitrification rates, as indicated by ammoniaaccumulation, might be due to chemical pollutants dis-charged at different locations along the stream or due to thedesert environmental conditions. These results are in linewith the low AOP measured in the winter and the summersamples (Fig. 5). The higher AOP measured in the fall andspring is possibly due to the relatively moderate climaticconditions during those seasons [17, 48]. The relatively
-1.0 2.0
-1.0
1.0
35-3
74-1
74-2
74-374-4
74-5
74-6
74-7
79-188-1
88-3110-8
PC1: 53.4%
PC2:
14.
7%
Nitrosospira type strains
Nitrosomonas type strains
-1.0 2.0
-1.0
1.0
F_1F_2
F_3
F_4F_5F_6
W_1
W_2
W_3W_4
W_5
SP_1
SP_2SP_3
SP_4
SP_5
SP_6
S_6
EIS EIB
B_1 B_2
B_3
B_4
B_5
B_6
W.W
S_3
S_1
S_2
S_5S_4
TANT-NBOD
Sediment TAN
Sediment NO3-
DO OC
COD
PC1: 53.4%
PC2:
14.
7%
W.WSoilSummerFallWinterSpringSprings
b.
a.
NO3-
Figure 8 a Principal components analysis representing AOB diver-sity patterns obtained from DGGE of the samples from the streamsediments, the bank soils, the reference springs (EIS, EIB), and thewastewater (W.W.). The arrows represent different environmentalvariables. B bank soil, F fall, W winter, S summer, SP spring. Thenumbers following indicate the sampling point (see Fig. 1). b PCA ofAOB pattern diversity in all of the samples, with species gradients andlevels of OC. Each sample is represented here by a gray circle. Thesize of the full circles represents the OC levels measured and thetrajectories of each of the arrows represent the gradient of the specificstrain. The arrows represent the gradient size and direction of each ofthe strains
54 R. Angel et al.

high nitrification activity in the summer sampling of thesixth sampling point (100 km) may stem from the fact thatthis sampling point is the closest to the sea where temper-atures are less extreme than the other sampling points.However, all measured AOP values in the stream sedimentare much higher than those measured in soil samples thatwere randomly collected from the Negev desert [32]indicating the advantageous aquatic environment in sup-porting nitrification activity in this ecosystem.
Diversity of AOB in the Stream Sediment
Based on phylogenetic tree of the AOB 16S rRNA genesequences, all obtained sequences corresponded to only twoclusters. Nitrosomonas-like sequences corresponded tocluster 7 while Nitrosospira ones corresponded to cluster3. Cluster 7 is the N. europaea/N. mobilis lineage andstrains of this cluster normally dominate wastewater andactivated sludge and are also often found in eutrophiedfreshwater environments [21]. This was most evident insampling point number 4 (86.2) where the eutrophiedenvironment selected for Nitrosomonas species only(Fig. 6). Cluster 3 is the largest of the Nitrosospira clusters,and its strains are known to dominate soils [16, 17] and areubiquitous and dominant in natural environments [6].Furthermore, a general pattern was suggested in whichNitrosospira cluster 2 was dominant in acidic soils whilecluster 3 dominated neutral soils [43].
The small number of studies that analyzed the commu-nity composition of AOB in freshwater sediments makes itdifficult to determine whether the community found in thiscase fits general ecophysiological patterns. However, Nitro-somonas-like sequences, mostly of clusters 6a and 7(Nitrosomonas oligotropha and N. europaea/Nitrosomonaseutropha, respectively) were found in sediment enrichmentsalong the nonsaline parts of the Elbe estuary [42], while N.mobilis and N. oligotropha were found to dominate sedi-ments close to wastewater treatment plant effluents [30].The prevalence of Nitrosospira-like sequences in thesediments of the Hebron/Be’er Sheva, at least in terms ofspecies richness, contrasts somewhat with the findingsdescribed above possibly due to the extreme desertconditions or as reminiscence of the period when thestream was exposed to wetting and dryness cycles.
Changes in diversity patterns, although very prominentand stable, do not seem to correspond to the chemicalgradient of organic material and nitrogen load found in thewater. The most notable shift was seen at the fourthsampling point (86.2 km), which expresses a strongdominance of N. europaea-like strains (Fig. 6) that isconfirmed by the PCA plot and RDA analysis (Fig. 8).Temporarily, the community composition of AOB wasfound to be generally stable with minor changes, mostly
within the Nitrosospira group (Table 1). This is inaccordance with the findings of Cébron et al. [9] who alsoreported temporal stability of the AOB community in thewater of the Seine river, even though the temperaturedifferences between seasons were large. Many of theNitrosospira strains that were found in the stream sedimentwere also detected in the bank soil (Table 1). Moreover,these are the same strains that were found to dominate 11soil samples that were randomly collected from varioushabitats in the Negev desert [32] supporting the fact thatthese strains are adapted to the conditions of the NegevDesert and are not a result of local microhabitat conditions.The sediment samples from the two reference springsshowed identical banding patterns which, in turn, weresimilar to the soil patterns. The sediments in the springswere dominated by the same Nitrosospira sp. R5c20-likesequences that dominate the soils in the region. Althoughthe springs clustered somewhat far from the sediment andsoil samples on the PCA plot, they were not statisticallydifferent (Fig. 8). Similarly, no Nitrosomonas-like sequen-ces were found in the springs, despite the fact that N.oligotropha is common in freshwater environments [20].The absence of Nitrosomonas strains in the soils andsprings indicates that they are not part of the natural AOBcommunity in this region and that the prevalence of N.europaea in the stream is a result of inoculation from thewastewater [20]. Based on these findings, it is hypothesizedthat the aquatic environment itself has practically no effecton the composition of the AOB in the soil/sedimentenvironment and it further supports the dominant effect ofthe desert climatic conditions on AOB diversity.
Persistence of AOB Strains from the Wastewaterin the Stream Sediment
Persistence of wastewater AOB strains in river streamswas previously reported [10, 11]. However, the results ofthis study showed that only one band (88-1) of thosedetected in the wastewater sample was found in thestream sediment (Figs. 6 and 8). The sequences retrievedfrom the wastewater sample corresponded to N. europaeaand Nitrosospira multiformis. The Nitrosomonas-likesstrains are typical to wastewater and are normally isolatedfrom activated sludge [21], with N. eutropha usuallybeing the dominant strain [20]. Nitrosospira are normallynot found in wastewater, although N. multiformis inparticular has been reported in samples from activatedsludge [20]. Those findings further imply for a dominanceof the desert climatic conditions in selecting for certainAOB strains.
Interestingly, Nitrosomonas strain (88-3) detected in thestream sediment was not present in analyses of either thewastewater or the streambank soil (Fig. 6). It is unclear
Diversity of Ammonia-Oxidizing Bacteria in an Ephemeral Stream 55

whether this strain existed in small undetectable numbers inthe wastewater or the soil and flourished due to theenvironmental conditions in the stream or whether it wasnative to the stream sediment. Similar findings have beendescribed by Oved et al. [34], where irrigation ofagricultural soil with treated effluent resulted in theappearance of a novel Nitrosomonas-like strain in the soilwhich was not apparent prior to the treatment and wasclearly different from the strain found in the wastewater.Furthermore, Nejidat [32] reported upon the appearance ofN. eutropha in high salt enrichments of desert soil samplesdominated by Nitrosospira strains.
Factors Affecting Community Composition of AOB in theStream
Several parameters (pH, ammonia, OC, temperature, salin-ity, etc.) are thought to induce changes in AOB communi-ties [19]. Due to their long generation time, communityshifts in AOB take place long after conditions havechanged—sometimes taking up to 16 weeks of incubation[5]. However, the sampling intervals in this research andthe highly dynamic nature of the system suggest that theobserved stability is not a result of a lag in the community’sresponse or due to background DNA of nonactive cells asAOP can survive for relative long periods under stressconditions [13].
Of all the chemical parameters examined in the RDAanalysis, only sediment nitrate, sediment OC, and DO werefound to be statistically significant in explaining variationsin the community composition of AOB. Of these, only OCis thought to be a direct cause of community changes. OCcan explain 36% of the variability in the communitycomposition of AOB in the sediments. Other chemical orenvironmental factors did not show significant variabilityacross the studied section of the stream and unlikely to havecontributed to the observed diversity. Measured watersalinity along the stream (about 1,900 mg chloride L−1,data not shown) was still far below the salinity limits ofeven the most sensitive strain, Nitrosospira tenuis, whichcan tolerate up to 3.5 g L−1 [19]. The same holds for pH,which has been found to affect selection for differentNitrosospira clusters but in this setting remained between 7and 8 along the stream studied section and indeed led todominance of cluster 3 Nitrosospira. Effects of temperatureon community composition were observed [5]. However,since there was no significant gradient in the streamtemperature along the studied section, the temperatureeffect on AOB diversity might be not relevant. Theresponse of AOB to different oxygen levels is generallyminor and oxygen levels, from 1% to 21%, were shown notto produce any community changes [22, 35]. Shifts in AOBcommunity structure were previously associated with
ammonia concentrations. Such shifts in municipal waste-water reactor were observed only when amended withammonium concentrations of 3,000 mg L−1 [35] that isabout tenfold higher than TAN concentrations measured inthe stream water or sediment during the study. Avrahami etal. [4] observed no changes in AOB community structure insoil samples supplemented with up to 395 mg NH4
+-N g−1
after 4 weeks of incubation while significant shifts weredemonstrated in soils treated with a nitrogen fertilizer andin soil slurries amended with 4 mM urea after 16 weeks ofincubation. Shifts were within the Nitrosospira genus andcluster 3 was found at most ammonia concentrationsexamined [5]. In the fourth sampling point, the shift inAOB community structure was between genera resulting ina total exclusion of Nitrosospira strains and the dominanceof Nitrosomonas ones (Fig. 6). These results support thepossibility of OC being an AOB selection factor (Fig. 8).Interestingly, correlations between cell numbers as well asAOP to levels of OC and nitrogen in the sediments of apolluted stream were previously reported [30]. However,since organic matter can be a source for ammonia, throughmineralization, the contribution of ammonia concentrationsto AOB shift in the fourth sampling point cannot bediscounted. Shifts within the genus Nitrosospira that wereassociated to nitrogen mineralization rates (ammoniaavailability) were demonstrated in secondary succession ofcalcareous grasslands [23]. Nitrosospira cluster 3 dominat-ed in early successional fields with high nitrogen mineral-ization rates while Nitrosospira cluster 4 dominated latersuccessional fields with low nitrogen mineralization rates.This may explain the dominance of Nitrosospira cluster 3in the sediment (except sampling point 4). However, thedominance of cluster 3 in the reference springs and thebank soil is in support of the desert conditions, such as hightemperatures [5], to be the dominant AOB selecting factorin this system, without excluding the possible contributionof the high ammonia levels (Fig. 3).
In conclusion, the conditions in the Negev desert appearto support self-purification processes in polluted streamssubjected to discharge of untreated wastewater in respect toorganic load. However, although decreasing levels of totalnitrogen were recorded downstream, significant levels(mainly ammonia) were measured both in the water andthe sediment that can cause eutrophication of the streamecosystem. Thus, nitrification–denitrification processeswere not sufficient to cope efficiently with nitrogen load.Environmental conditions in the Negev desert favor thegroup of AOB belonging to Nitrosospira cluster 3.However, Nitrosomonas strains (88-1) introduced by dis-charged wastewater can become dominant under high OC.Moreover, under certain conditions, autochthonous Nitro-somonas strains can be the dominant AOB strains. Thus,AOB community structure is primarily affected by the
56 R. Angel et al.

desert climatic conditions with secondary influence fromthe discharged untreated wastewater.
Acknowledgments This research was supported by the Middle EastResearch and Cooperation (MERC) Program of the U.S. Agency forInternational Development: Buraeu for Economic Growth, Agricultureand Trade. Project number M23-019.
References
1. Aakra A, Utaker JB, Nes IF, Bakken LR (1999) An evaluatedimprovement of the extinction dilution method for isolation ofammonia-oxidizing bacteria. J Microbiol Methods 39:23–31
2. Anderson NJ, Rippey B (1994) Monitoring lake recovery frompoint-source eutrophication: the use of diatom-inferred epilimnetictotal phosphorus and sediment chemistry. Freshwater Biol32:625–639
3. APHA (1985) Standard methods for the examination of water andwastewater. APHA AWWA WPCF, Washington
4. Avrahami S, Conrad R, Braker G (2002) Effect of soil ammoniumconcentration on N2O release and on the community structure ofammonia oxidizers and denitrifiers. Appl Environ Microbiol68:5685–5692
5. Avrahami S, Liesack W, Conrad R (2003) Effects of temperatureand fertilizer on activity and community structure of soil ammoniaoxidizers. Environ Microbiol 5:691–705
6. Bothe H, Jost G, Schloter M, Ward BB, Witzel K-P (2000)Molecular analysis of ammonia oxidation and denitrification innatural environments. FEMS Microbiol Rev 24:673–690
7. Boyd CE (1995) Bottom soils, sediment and pond aquaculture.Chapman & Hall, New York
8. Carpenter SR, Caraco NF, Correll DL, Howarth RW, SharpleyAN, Smith VH (1998) Nonpoint pollution of surface waters withphosphorus and nitrogen. Ecol Appl 8:559–568
9. Cébron A, Coci M, Garnier J, Laanbroek HJ (2004) Denaturinggradient gel electrophoretic analysis of ammonia-oxidizing bacte-rial community structure in the lower Seine River: impact of Pariswastewater effluents. Appl Environ Microbiol 70:6726–6737
10. De Bie M, Speksnijder AGCL, Kowalchuk GA, Schurman T,Zwart G, Stephen JR, Diekmann OE, Laanbroek HJ (2001) Shiftsin the dominant populations of ammonia-oxidizing beta -subclassProteobacteria along the eutrophic Schelde Estuary. AquaticMicrob Ecol 23:225–236
11. Ferree MA, Shannon RD (2001) Evaluation of a second derivativeUV/visible spectroscopy technique for nitrate and total nitrogenanalysis of wastewater samples. Water Res 35:327–332
12. Fromin N, Hamelin J, Tarnawski S, Roesti D, Jourdain-MiserezK, Forestier N, Teyssier-Cuvelle S, Gillet M, Aragno F, Rossi P(2002) Statistical analysis of denaturing gel electrophoresis (DGE)fingerprinting patterns. Environ Microbiol 4:634–643
13. Geets J, Boon N, Verstraete W (2006) Strategies of aerobicammonia-oxidizing bacteria for coping with nutrient and oxygenfluctuations. FEMS Microbiol Ecol 58:1–13
14. Gerards S, Duyts H, Laanbroek HJ (1998) Ammonium-inducedinhibition of ammonium-starved Nitrosomonas europaea cells insoil and sand slurries. FEMS Microbiol Ecol 26:269–280
15. Hassan MA, Egozi R (2001) Impact of wastewater discharge onthe channel morphology of ephemeral streams. Earth SurfProcesses Landf 26:1285–1302
16. Hastings RC, Ceccherini MT, Miclaus N, Saunders JR, BazzicalupoM, McCarthy AJ (1997) Direct molecular biological analysis ofammonia oxidising bacteria populations in cultivated soil plotstreated with swine manure. FEMS Microbiol Ecol 23:45–54
17. Horz H-P, Barbrook A, Field CB, Bohannan BJM (2004)Ammonia-oxidizing bacteria respond to multifactorial globalchange. Proc Natl Acad Sci U S A 101:15136–15141
18. Jongman RHG, Ter Braak CJF, Van Tongeren OFR (1995) Dataanalysis in community and landscape ecology. CambridgeUniversity Press, Cambridge
19. Koops H-P, Pommerening-Roser A (2001) Distribution andecophysiology of the nitrifying bacteria emphasizing culturedspecies. FEMS Microbiol Ecol 37:1–9
20. Koops H-P, Purkhold U, Pommerening-Roser A, Timmermann G,Wagner M (2003) The lithoautotrophic ammonia-oxidizing bacte-ria. In: Dworkin M et al. (eds) The prokaryotes: an evolvingelectronic resource for the microbiological community, 3rd edn,release 3, 13. Springer, New-York. http://link.springer-ny.com/link/service/books/10125/
21. Kowalchuk G, Stephen J, De Boer W, Prosser J, Embley T,Woldendorp JW (1997) Analysis of ammonia-oxidizing bacteriaof the beta subdivision of the class Proteobacteria in coastal sanddunes by denaturing gradient gel electrophoresis and sequencingof PCR-amplified 16S ribosomal DNA fragments. Appl EnvironMicrobiol 63:1489–1497
22. Kowalchuk GA, Bodelier PLE, Heilig GHJ, Stephen JR,Laanbroek HJ (1998) Community analysis of ammonia-oxidizing bacteria, in relation to oxygen availability in soils androot-oxygenated sediments, using PCR, DGGE and oligonucleo-tide probe hybridization. FEMS Microbiol Ecol 27:339–350
23. Kowalchuk GA, Stienstra AW, Heilig GHJ, Stephen JR, Wolden-dorp JW (2000) Changes in the community structure of ammoniaoxidizing bacteria during secondary succession of calcareousgrasslands. Environ Microbiol 2:99–110
24. Kowalchuk GA, Stephen JR (2001) Ammonia-oxidizing bacteria:a model for molecular microbial ecology. Annu Rev of Microbiol55:485–529
25. Larkin MA, Blackshields G, Brown NP, Chenna R, McGettiganPA, McWilliam H, Valentin F, Wallace IM, Wilm A, Lopez R,Thompson JD, Gibson TJ, Higgins DG (2007) Clustal W andClustal X version 2.0. Bioinformatics 23:2947–2948
26. Legendre P, Gallagher E (2001) Ecologically meaningful trans-formations for ordination of species data. Oecologia 129:271–280
27. Leps J, Smilauer P (1999) Multivariate analysis of ecological data.Faculty of Biological Sciences, University of South Bohemia,Ceske Budejovice
28. Mahmood S, Freitag TE, Prosser JI (2006) Comparison of PCRprimer-based strategies for characterization of ammonia oxidizercommunities in environmental samples. FEMS Microbiol Ecol56:482–493
29. McCaig AE, Embley TM, Prosser JI (1994) Molecular analysis ofenrichment cultures of marine ammonia oxidisers. FEMS Micro-biol Lett 120:363–367
30. Montuelle B, Balandras B, Volat B, Feray C (2003) Effect ofwastewater treatment plant discharges on the functional nitrifyingcommunities in river sediments. Aquat Ecosyst Health Manag6:381–390
31. Nakamura Y, Satoh H, Kindaichi T, Okabe S (2006) Communitystructure, abundance, and in situ activity of nitrifying bacteria inriver sediments as determined by the combined use of moleculartechniques and microelectrodes. Environ Sci Technol 40:1532–1539
32. Nejidat A (2005) Nitrification and occurrence of salt-tolerantnitrifying bacteria in the Negev desert soils. FEMS Microbiol Ecol52:21–29
33. Nicol GW, Schleper C (2006) Ammonia-oxidizing Crenarchaeota:important players in the nitrogen cycle? Trends Microbiol 14:207–212
34. Oved T, Shaviv A, Goldrath T, Mandelbaum RT Minz D (2001)Influence of effluent irrigation on community composition and
Diversity of Ammonia-Oxidizing Bacteria in an Ephemeral Stream 57

function of ammonia-oxidizing bacteria in soil. Appl EnvironMicrobiol 67:3426–3433
35. Princic A, Mahne I, Megusar F, Paul EA, Tiedje JM (1998)Effects of pH and oxygen and ammonium concentrations on thecommunity structure of nitrifying bacteria from wastewater. ApplEnviron Microbiol 64:3584–3590
36. Purkhold U, Pommerening-Roser A, Juretschko S, Schmid MC,Koops H-P, Wagner M (2000) Phylogeny of all recognized speciesof ammonia oxidizers based on comparative 16S rRNA and amoAsequence analysis: implications for molecular diversity surveys.Appl Environ Microbiol 66:5368–5382
37. Shapira DA, Mazor G (2004) Pollutants loadings in streams: acomparison between the years 1994, 2000, 2001 and 2003. TheIsraeli Ministry of the Environment, Jerusalem in Hebrew
38. Shoaf W, Lium B (1976) Improved extraction of chlorophyll a andb from algae using dimethyl sulfoxide. Limnol Oceanogr 21:926–928
39. Smith VH, Tilman GD, Nekola JC (1999) Eutrophication: impactsof excess nutrient inputs on freshwater, marine, and terrestrialecosystems. Environ Pollut 100:179–196
40. Soil and Plant Analysis Council (2000) Soil analysis handbook ofreference methods. CRC, Boca Raton
41. Stamatakis A, Ludwig T, Meier H (2005) RAxML-III: a fastprogram for maximum likelihood-based inference of largephylogenetic trees. Bioinformatics 21(4):456–463
42. Stehr G, Bottcher B, Dittberner P, Rath G, Koops H-P (1995) Theammonia-oxidizing nitrifying population of the River Elbeestuary. FEMS Microbiol Ecol 17:177–186
43. Stephen JR, Kowalchuk GA, Brun M-AV, McCaig AE, PhillipsCJ, Embley TM, Prosser JI (1998) Analysis of beta -subgroupproteobacterial ammonia oxidizer populations in soil by denatur-ing gradient gel electrophoresis analysis and hierarchical phylo-genetic probing. Appl Environ Microbiol 64:2958–2965
44. Tal A, Al Khatib N, Asaf L, Assi A, Nassar A, Abu SadahM, GazithA, Laronne JB, Zeev R, Hirshkovitz Y, Halawani D, Nagouker N,Angel R, Akerman H, Diabat M (2006) Watershed modeling:biomonitoring and economic analysis to determine optimal restora-tion strategies for transboundary streams. AIES, Eilot
45. Ter Braak CJF, Smilauer P (1998) Canoco 4. Centre for BiometryWageningen, Wageningen
46. Wang Q, Garrity GM, Tiedje JM, Cole JR (2007) Naïve Bayesianclassifier for rapid assignment of rRNA sequences into the newbacterial taxonomy. Appl Environ Microbiol 73:5261–5267
47. Wilhelm R, Abeliovich A, Nejidat A (1998) Effect of long-termammonia starvation on the oxidation of ammonia and hydroxylamineby Nitrosomonas europaea. J Biochem (Tokyo) 124:811–815
48. Yuan F, Ran W, Shen Q, Wang D (2005) Characterization ofnitrifying bacteria communities of soils from different ecologicalregions of China by molecular and conventional methods. BiolFertil Soils 41:22–27
58 R. Angel et al.