new maths frameworking - umm assad home school
TRANSCRIPT

NEW MATHSFRAMEWORKING
Kevin Evans, Keith Gordon, Trevor Senior, Brian Speed
Matches the revised KS3 Framework
Year 9, Pupil Book 3
Maths Frameworking PB 9.3 Chs 1–9 29/5/08 18:33 Page i

Introduction vi
Sequences 1
Quadratic sequences 4
Functions 6
Graphs 8
Limits of sequences 11
National Test questions 12
Functional Maths – Mobile phone tariffs 14
The four rules governing fractions 16
Percentages and compound interest 19
Reverse percentages and percentage change 22
Direct and inverse proportion 25
Ratio in area and volume 28
Numbers between 0 and 1 32
Reciprocal of a number 34
Rounding and estimation 35
National Test questions 37
Functional Maths – The London Olympics 2012 40
Equations, formulae and identities 42
Simultaneous equations 45
Solving by substitution 47
Equations involving fractions 48
Inequalities 50
Graphs showing direct proportion 52
Solving simultaneous equations by graphs 55
National Test questions 57
CHAPTER 3 Algebra 3
CHAPTER 2 Number 1
CHAPTER 1 Algebra 1 & 2
Contents
ii
Maths Frameworking PB 9.3 Chs 1–9 29/5/08 18:33 Page ii

iii
Pythagoras’ theorem 58
Solving problems using Pythagoras’ theorem 62
Loci 64
Congruent triangles 68
Circle theorems 70
Tessellations and regular polygons 73
Practical Pythagoras 75
National Test questions 77
Functional Maths – Garden design 80
Scatter graphs and correlation 82
Scatter graphs and lines of best fit 85
Time series graphs 88
Two-way tables 91
Cumulative frequency diagrams 93
Estimation of a mean from grouped data 95
Statistical investigations 98
National Test questions 101
Functional Maths – Rainforest deforestation 106
Similar triangles 108
Metric units for area and volume 112
Length of an arc and area of a sector 114
Volume of a cylinder 116
Rate of change 118
National Test questions 122
Functional Maths – Athletics stadium 124
Standard form 126
Multiplying with numbers in standard form 128
Dividing with numbers in standard form 130
Upper and lower bounds 1 132
Upper and lower bounds 2 134
Recurring decimals 136
Efficient use of calculators 139
National Test questions 141
Functional Maths – Paper 144
CHAPTER 7 Number 2
CHAPTER 6 Geometry and Measures 2
CHAPTER 5 Statistics 1
CHAPTER 4 Geometry and Measures 1
Maths Frameworking PB 9.3 Chs 1–9 29/5/08 18:33 Page iii

Index notation with algebra – negative powers 146
Square roots, cube roots and other fractional powers 148
Quadratic graphs 151
Cubic graphs 153
National Test questions 155
Functional Maths – Packages 156
Probability statements 158
Mutually exclusive events and exhaustive events 160
Combining probabilities and tree diagrams 163
Estimates of probability 165
National Test questions 169
Functional Maths – Class test 172
Fractional enlargements 174
Trigonometry – The tangent of an angle 178
Trigonometry – The sine and cosine of an angle 183
Solving problems using trigonometry 187
National Test questions 189
Functional Maths – Map reading 192
Expansion 194
Factorisation 197
Quadratic expansion 199
Quadratic factorisation 201
Change of subject 202
Graphs from equations in the form Ay ± Bx = C 205
National Test questions 206
Functional Maths – Trip to Rome 208
Number 1 – Fractions, percentages and decimals 210
Number 2 – The first four rules, ratios and standard
form 213
Algebra 1 – Rules of algebra and solving equations 215
Algebra 2 – Graphs 216
Geometry and measures 219
Statistics 222
CHAPTER 12 Solving Problems and Revision
CHAPTER 11 Algebra 5
CHAPTER 10 Geometry and Measures 3
CHAPTER 9 Statistics 2
CHAPTER 8 Algebra 4
iv
Maths Frameworking PB 9.3 Chs 1–9 29/5/08 18:33 Page iv

v
Statistical techniques 225
A handling data project 231
Geometry and measures revision 234
Geometry and measures investigations 236
Symmetry revision 237
Symmetry investigations 239
Revision of probability 241
A probability investigation 246
Solving quadratic equations 249
Quadratic equations of the form ax2 + bx + c 250
Quadratic equations 251
The quadratic formula 252
Completing the square 253
The difference of two squares 255
GCSE past-paper questions 256
The Eden Project 260
Road safety 262
Squirrels 264
Mobile shop 266
Index 268
Garden design activity worksheet 271
CHAPTER 17 Functional Maths Practice
CHAPTER 16 GCSE Preparation
CHAPTER 15 Statistics 4 and Revision
CHAPTER 14 Geometry and Measures 4 and Revision
CHAPTER 13 Statistics 3 and Revision
Maths Frameworking PB 9.3 Chs 1–9 29/5/08 18:33 Page v

Learning objectives
See what you are going to cover and whatyou should already know at the start ofeach chapter. The purple and blue boxesset the topic in context and provide ahandy checklist.
National Curriculum levels
Know what level you are working at soyou can easily track your progress with thecolour-coded levels at the side of the page.
Worked examples
Understand the topic before you start theexercises by reading the examples in blueboxes. These take you through how toanswer a question step-by-step.
Functional Maths
Practise your Functional Maths skills to seehow people use Maths in everyday life.
Look out for the Functional Mathsicon on the page.
Extension activities
Stretch your thinking and investigativeskills by working through the extensionactivities. By tackling these you areworking at a higher level.
Introduction
vi
Maths Frameworking PB 9.3 Chs 1–9 29/5/08 18:33 Page vi

vii
Level booster
Progress to the next level by checking theLevel boosters at the end of each chapter.These clearly show you what you need toknow at each level and how to improve.
National Test questions
Practise the past paper Test questions tofeel confident and prepared for your KS3National Curriculum Tests. The questionsare levelled so you can check what levelyou are working at.
Extra interactive National
Test practice
Watch and listen to the audio/visualNational Test questions on the separateInteractive Book CD-ROM to help yourevise as a class on a whiteboard.
Look out for the computer mouseicon on the page and on the screen.
Functional Maths
activities
Put Maths into context with these colourfulpages showing real-world situationsinvolving Maths. You are practising yourFunctional Maths skills by analysing datato solve problems.
Extra interactive
Functional Maths
questions and video clips
Extend your Functional Maths skills bytaking part in the interactive questions onthe separate Interactive Book CD-ROM.Your teacher can put these on thewhiteboard so the class can answer thequestions on the board.
See Maths in action by watching the videoclips and doing the related Worksheets onthe Interactive Book CD-ROM. The videosbring the Functional Maths activities to lifeand help you see how Maths is used in thereal world.
Look out for the computer mouseicon on the page and on the screen.
Hone your Functional Maths skills further by doing the four exciting
tasks given in the new chapter – Functional Maths Practice.
NEW
Maths Frameworking PB 9.3 Chs 1–9 29/5/08 18:33 Page vii

Maths Frameworking PB 9.3 Chs 1–9 29/5/08 18:33 Page viii

Sequences
Arsenal had a sequence of 43 games inwhich they scored in every game. Is itpossible to predict how many goals theywould score in their next game?
A sequence is an ordered set of numbersor terms, such as the positive integers, 1,2, 3… . Every number or term in asequence is given by applying the samerule throughout the sequence. Look atExamples 1.1 and 1.2.
Example 1.1
Example 1.2
The position of a term in a sequence can sometimes be used to find its value. The idea isto try to find a general term which represents the pattern. This is usually written as the nth term, or as T(n).
What is the next number in this sequence?
1, 2, 4, 7, 11, 16, …
It is 22.
Show the differences between consecutive terms. They are: 1, 2, 3, 4, 5,… .
What is the next number in the following sequence?
10, 100, 1000, 10 000, ...
It is 100 000.
What is the term-to-term rule for the sequence? Multiply by 10.
1
CHAPTER 1 Algebra 1 & 2
This chapter is going to show you
How to find the nth term of a
linear sequence
How to describe a sequence
derived from a geometrical
pattern
How to find a second difference
How to find inverse functions
The limits of some series
What you should already know
How to continue a given pattern
How to graph a simple
relationship
Maths Frameworking PB 9.3 Chs 1–9 29/5/08 18:33 Page 1

nth term of a A sequence is usually defined by its nth term. Look at Examples 1.3 to 1.5 to see how thissequence works.
Example 1.3
Example 1.4
When a sequence has the same difference between consecutive terms, it is called a linearsequence. A linear sequence can be defined by a general term that will be in thefollowing form:
T(n) = An + B
where A is the common difference between consecutive terms, B is the value which isadded to A to give the first term, and n is the number of the term (that is, first, second, …).
Example 1.5
Find the next three terms in each of the following sequences.
a 1, 5, 9, 13, … b 3, 8, 13, 18, … c 2, 9, 16, 23, …
d 4, 10, 17, 25, … e 6, 14, 24, 36, … f 5, 8, 13, 20, …
Write down the first four terms of each of the following sequences whose nth term isgiven below.
a 2n + 3 b 3n – 2 c 4n + 5 d 5n – 3
e 3n – 1 f 4n – 5 g 2n – 4
Exercise 1A
Write down the nth term of the sequence 5, 9, 13, 17, 21, … .
The difference between consecutive terms is 4.
To get the first term of 5, 1 must be added to 4.
Hence, the nth term is T(n) = 4n + 1
Check this as follows: T(1) = 4 × 1 + 1 = 5
T(2) = 4 × 2 + 1 = 9
T(3) = 4 × 3 + 1 = 13
So, T(n) = 4n +1 is correct.
Write down the nth term of the sequence 2, 5, 8, 11, … .
First, find the differences between consecutive terms. The sequence has the samedifference, 3, between consecutive terms. This shows that the sequence is in theform An + B.
Since the common difference is 3, then A = 3.
So, in order to get the first term of 2, –1 must be added to 3. Hence B = –1.
That is, the nth term is given by T(n) = 3n – 1.
Write down the first four terms of the sequence whose nth term is given by T(n) = 4n + 2.
The first term, T(1), is given by n = 1. Hence, 4 × 1 + 2 = 6.
The second term, T(2), is given by n = 2. Hence, 4 × 2 + 2 = 10.
The third term, T(3), is given by n = 3. Hence, 4 × 3 + 2 = 14.
The fourth term, T(4), is given by n = 4. Hence, 4 × 4 + 2 = 18.
So, the first four terms are 6, 10, 14, 18.
2
Maths Frameworking PB 9.3 Chs 1–9 29/5/08 18:33 Page 2

Find the nth term of each of the following sequences.
a 6, 10, 14, 18, 22, … b 8, 15, 22, 29, 36, …
c 21, 19, 17, 15, 13, … d 32, 28, 24, 20, 16, …
Find the nth term of each of the following sequences.
a 43, 51, 59, 67, 75, … b 57, 50, 43, 36, 29, …
c 35, 48, 61, 74, 87, … d 67, 76, 85, 94, 103, …
Find the nth term of each of the following sequences.
a 9, 4, –1, –6, –11, … b –11, –9, –7, –5, –3, …
c –1, –5, –9, –13, –17, … d –15, –12, –9, –6, –3, …
Find the nth term of each of the following sequences.
a 2.4, 2.6, 2.8, 3.0, 3.2, … b 1.7, 2.0, 2.3, 2.6, 2.9, …
c 6.8, 6.3, 5.8, 5.3, 4.8, … d 5.3, 4.9, 4.5, 4.1, 3.7, …
Find the nth term of each of the following sequences of fractions.
a , , , , , … b , , , , , …
Look at each of the following sequences of squares.
a Find the number of squares in the nth shape.
b Find the number of squares in the 50th shape in the pattern.
Look at each of the following sequences of lines (blue) and crosses (green).
a Find the number of lines in the nth shape.
b Find the number of crosses in the 50th shape in the pattern.
c Find the number of crosses in the nth shape in the pattern.
The nth term of a sequence is given by 1–2n(n + 1).
1 Work out the first five terms of the sequence.
2 Write down the term-to-term rule for the sequence.
3 Continue the sequence for 10 terms.
4 What special name is given to this sequence of numbers?
Diagram 1 Diagram 2 Diagram 3 Diagram 4
Shape 1 Shape 2 Shape 3 Shape 4
1124
919
714
59
34
514
411
38
25
12
3
6
Maths Frameworking PB 9.3 Chs 1–9 29/5/08 18:33 Page 3

Quadratic sequences
You have already met the sequence of square numbers:
1, 4, 9, 16, 25, 36, …
The nth term of this sequence is n2.
Many sequences have nth terms that include n2.
These are called quadratic sequences.
Example 1.6
Example 1.7
Write down the first four terms of each of the following sequences whose nth term isgiven below.
a n2 b n2 + 1 c n2 + n d n2 + 3n + 4
For each of the following nth terms:
i work out the first five terms of the sequence.
ii write down the term-to-term rule for this sequence.
iii continue the sequence for ten terms.
a n(n + 3) b 3n2 c n2 + 5
d (n + 1)2 e (n + 3)(n – 2) f 2n2 + n + 1
Exercise 1B
Write down the nth term of the following sequences.
a 1, 4, 9, 16, 25, … b 3, 6, 11, 18, 27, …
c 2, 8, 18, 32, 50, … d 1–2, 2, 41–
2, 8, 121–2, …
a This is the square number sequence, nth term = n2
b This is 2 more than the square number sequence, nth term = n2 + 2
c This is twice the square number sequence, nth term = 2n2
d This is half the square number sequence, nth term = 1–2n2
The nth term of a quadratic sequence is given by n2 + 3n + 2.
a Work out the first five terms of the sequence.
b Write down the term-to-term rule for this sequence.
c Continue the sequence for ten terms.
d What is the 100th term in the sequence?
a Substituting n = 1, 2, 3, 4 and 5 into the expression for the nth term gives thefirst five terms of the sequence: 6, 12, 20, 30, 42
b The sequence increases by 6, 8, 10 and 12 so the term-to-term rule is ‘goes upin even numbers starting with 6’.
c Carry on adding 14, 16, … to give:
6, 12, 20, 30, 42, 56, 72, 90, 110, 132, …
d The 100th term is 1002 + 3 × 100 + 2 = 10 302
4
7
Maths Frameworking PB 9.3 Chs 1–9 29/5/08 18:33 Page 4

Write down the nth term of the following sequences.
a 1, 4, 9, 16, 25, … b 2, 5, 10, 17, 26, …
c 5, 20, 45, 80, 125, … d , 1, 2 , 4, 6 , …
Look at the way straight lines can intersect one another.
The maximum number of intersections for each set of lines is shown in the table below.
Number of lines 1 2 3 4
Maximum number of intersections 0 1 3 6
a Before drawing a diagram, can you predict, from the table, the maximumnumber of intersections you will have for five lines?
b Draw the five lines so that they all intersect one another. Count the number ofintersections. Were you right?
c Now predict the maximum number of intersections for six and seven lines.
d Draw the diagram for six lines to confirm your result.
e Which of the following is the nth term of the sequence?
n(n + 1) (n – 1)(n + 1) n(n – 1)
Look at the following polygons. Each vertex is joined to every other vertex with astraight line, called a diagonal.
The table below shows the number of diagonals drawn inside each polygon.
Number of sides 3 4 5 6 7
Number of diagonals 0 2 5 9 14
a Before drawing a diagram, can you predict, from the table, the number ofdiagonals you will have for a polygon with eight sides?
b Draw an eight-sided polygon and put in all the diagonals. Count the number ofdiagonals. Were you right?
c Now predict the number of diagonals for polygons with nine and ten sides.
d Check your results for part c by drawing the polygons with their diagonals andseeing how many diagonals there are in each case.
3 sides0 diagonals
4 sides2 diagonals
5 sides5 diagonals
6 sides9 diagonals
7 sides14 diagonals
12
12
1 line0 intersections
2 lines1 intersection
3 lines3 intersections
4 lines6 intersections
14
14
14
5
7
Maths Frameworking PB 9.3 Chs 1–9 29/5/08 18:33 Page 5

e Which of the following is the nth term of the sequence?
(n + 2)(n – 1) n2 + n – 1 (n2 + n – 2)
Write down the first five terms of each of the following sequences.
a T(n) = (n + 1)(n + 2) b T(n) = (n – 1)(n – 2)
c T(n) = n + (n – 1)(n – 2) d T(n) = 2n + (n – 1)(n – 2) (n – 3)
e T(n) = 3n + (n – 1)(n – 2)(n – 3)(n – 4)
Functions
A function is a rule which changes one number, called the input, to another number,called the output. For example, y = 2x + 1 is a function. So, when x = 2, a new number y = 5 is produced. Another way of writing this function is:
x → 2x + 1
Identity function x → x is called the identity function because it maps any number onto itself. In otherwords, it leaves the inputs unaltered.
0 → 01 → 12 → 23 → 34 → 4
What is the pattern of second differences in T(n) = n2?
The first six terms of the sequence T(n) = n2, where T(1) = 1, are:
1, 4, 9, 16, 25, 36
The first differences are those between consecutive terms. These are:
1 4 9 16 25 363 5 7 9 11
The second differences are those between consecutive first differences, asshown below:
3 5 7 9 112 2 2 2
Every quadratic sequence has second differences which are the samethroughout the sequence, as shown above.
1 a Find the second differences for each of the following sequences bywriting down the first six terms.
i T(n) = n2 + 3n + 4 ii T(n) = n2 + 4n + 3
b What do you notice about each second difference?
2 a Find the second differences for each of the following sequences bywriting down the first six terms.
i T(n) = 2n2 + 3n + 4 ii T(n) = 2n2 + 4n + 3
b What do you notice about each second difference?
c What do you expect the second difference to be for T(n) = 3n2 + 3n + 4?
12
12
12
12
6
7
Maths Frameworking PB 9.3 Chs 1–9 29/5/08 18:33 Page 6

Inverse function Every linear function has an inverse function which reverses the direction of theoperation. In other words, the output is brought back to the input.
Example 1.8
Example 1.9
When a function is built up from two or more operations, you will need to consider theoriginal operations and work backwards through these to find the inverse.
Example 1.10
Self-inverse function The inverse functions of some functions are the functions themselves. These are calledself-inverse functions.
Example 1.11 The inverse function of x → 8 – x can be seen to be itself, as y → 8 – y.
x → 8 – x0 → 8 → 01 → 7 → 12 → 6 → 23 → 5 → 34 → 4 → 45 → 3 → 5
y → 8 – y
Find the inverse function of x → 4x + 3.
The sequence of operations for this function is:
Reversing this sequence gives:
Then give the output the value y:
y – 3–– ← y – 3 ← y4
So, the inverse function is:
y – 3y → ––
4
Input × 4 + 3 Output
Input ÷ 4 – 3 Output
The inverse function of x → x + 3 is seen to be y → y – 3.
x → x + 30 → 3 → 01 → 4 → 12 → 5 → 23 → 6 → 3
y → y – 3
yThe inverse function of x → 4x is seen to be y → –.4
x → 4x
0 → 0 → 01 → 4 → 12 → 8 → 23 → 12 → 3
y →y–4
Note that the inverse function is sometimes written as x →x–4, but we will use the
letter y for inverse functions to avoid confusion.
7
Maths Frameworking PB 9.3 Chs 1–9 29/5/08 18:33 Page 7

Write down the inverse function of each of the following functions.
a x → 2x b x → 5x c x → x + 6xd x → x + 1 e x → x – 3 f x → –5
For each of the following functions:
i draw the flow diagram for the function.ii draw the flow diagram for the inverse function.iii write down the inverse function in the form y → …
a x → 2x + 3 b x → 3x + 1 c x → 4x – 3
d x → 5x – 2 e x → 4x + 7 f x → 6x – 5
Show that the following are self-inverse functions.
a x → 6 – x b x →
Write down the inverse function of each of the following functions.
(x + 3)a x → 2(x + 3) b x → 3(x – 4) c x → ––4
(x – 2)d x → –– e x →1–2x + 3 f x →
1–2 x – 7
5
Graphs
The distance–time graph on the right illustrates threepeople in a race.
The graph shows how quicklyeach person ran, who was aheadat various times, who won andby how many seconds.
1000
900
800
700
600
500
400
300
200
100
00
Time (min)
Dis
tance
(m
)
1 2 3 4 5
Ron
Paul
Jeff
1 The function x → 2x can also be expressed as y = 2x. Show this to be trueby considering the input set {1, 2, 3, 4, 5}.
a What is the output set from {1, 2, 3, 4, 5} with the function x → 2x?
b Find the values of y when x has values {1, 2, 3, 4, 5}, where y = 2x.
c Are the two sets of values found in parts a and b the same? If so, then you haveshown that y = 2x is just another way of showing the function x → 2x.
2 Draw a graph of the function x → 2x by using y = 2x. On the same pair ofaxes, draw the graph of the inverse function of x → 2x.
3 On the same pair of axes, draw the graphs representing the function x → 4x and its inverse function.
4 On the same pair of axes, draw the graphs representing the function x → 5x and its inverse function.
5 Look at the two lines on each graph you have drawn for Questions 2, 3and 4. Do you notice anything special about each pair of lines?
2x
Exercise 1C
8
7
Maths Frameworking PB 9.3 Chs 1–9 29/5/08 18:33 Page 8

PaulNotice that Paul’s graph is a straight line. This means that he ran at the same speedthroughout the race. Paul won the race, finishing about 20 seconds in front of Ron.
RonThe shape of Ron’s graph indicates that he started quickly and then slowed down. He wasin the lead for the first 850 m, before Paul overtook him.
JeffJeff started slowly, but then picked up speed to overtake Paul for a minute before runningout of steam and slowing down to come in last, about 30 seconds behind Ron.
Note: The steeper the graph, the faster the person is running.
Look at the distance–timegraph, which illustrates howtwo rockets flew during atest flight. Rocket D flewhigher than Rocket E.
Estimate the heightreached by Rocket D.
Estimate how muchhigher than Rocket ERocket D went.
How long after thelaunch were bothrockets at the same height?
For how long was each rocket higher than 150 m?
Can you tell which rocket travelled further? Explain your answer.
Look at the graph below, which illustrates the amount of water in a bath after it hasstarted to be filled.
Explain what might have happened 1 minute after the start.
When was the plug pulled out for the bath to start emptying?
Why do you think the graph shows a curved line while the bath was emptying?
How long did the bath take to empty?d
c
b
a
80
70
60
50
40
30
20
10
00
Time (min)
Am
ount of w
ater
in b
ath (litr
es)
2 4 73 651
e
d
c
b
a
350
300
250
200
150
100
50
00
Time (s)
Hei
ght (m
)
10 20 60 70 110
D
E
30 40 50 80 10090
Exercise 1D
9
7
Maths Frameworking PB 9.3 Chs 1–9 29/5/08 18:33 Page 9

Water drips steadily into the container shown on the right. The graph shows how the depthof water varies with time.
Sketch similar graphs for bottles with thefollowing shapes.
Suggest which graph below best fits each situation given.
a b c
A The distance travelled by a train moving at a constant speed.
B The distance travelled by a motorbike accelerating to overtake.
C The distance travelled by an old car, which starts well, but gradually slows down.
Suggest which graph below best fits each situation given.
a b c
A The amount of fuel left in the tank of my car as I travel from Sheffield to Cornwall.
B The amount of infection in a body as it responds to medicine will first reducegradually and then more quickly until it has all gone.
C The rate of cooling of a hot drink starts quickly and then slows down.
Sketch graphs to illustrate each of the following situations.
The number of euros that can be purchased with £x
The temperature during the 24 hours of 21st July
The temperature during the 24 hours of 12th February
The number of empty car-park spaces in a supermarket on a Saturday between 8 am and 8 pm
The amount of daylight each day of the year from 21st June to next 20th Junee
d
c
b
a
O O O
TimeO
Dis
tan
ce
TimeO
Dis
tan
ce
TimeO
Dis
tan
ce
a b c dTime
O
Dep
th
10
7
Maths Frameworking PB 9.3 Chs 1–9 29/5/08 18:33 Page 10

Limits of sequences
Some sequences go on forever, as you have seen. These are called infinite sequences.Other sequences finish after so many numbers or terms. These are called finite sequences.Follow through Example 1.12, which shows an infinite sequence.
Example 1.12
Notice that the sequence gets closer and closer to 5, which is called the limit of thesequence.
a Using the term-to-term rule ‘Divide by 2 and add 3’ to build a sequence and startingat 1, find the first 12 terms generated by this sequence. Use a calculator or aspreadsheet.
b To what value does this sequence get closer and closer?
c Use the same term-to-term rule with different starting numbers. What do you notice?
Repeat Question 1, but change the ‘add 3’ in the term-to-term rule to ‘add 4’.
Repeat Question 1, but change the ‘add 3’ in the term-to-term rule to ‘add 5’.
a Look at your answers to Questions 1 to 3. See whether you can estimate to whatvalue the sequence will get closer and closer when you change the ‘add 3’ inQuestion 1 to ‘add 6’.
b Work out the sequence to see whether you were correct in part a.
Repeat Question 1, but change the ‘divide by 2’ to ‘divide by 3’.
Repeat Question 5, but change the ‘add 3’ to ‘add 4’.
Repeat Question 5, but change the ‘add 3’ to ‘add 5’.
Exercise 1E
Using the term-to-term rule ‘Divide by 5 and add 4’, find the first 10 terms of thissequence, which starts at 1.
This rule generates the following sequence:
1, 4.2, 4.84, 4.968, 4.9936, 4.998 72, 4.999 744, 4.999 948 8, 4.999 989 76,4.999 997 952
The UK population has been increasing overthe last 200 years. The following table showsthe population every 20 years.
a Draw a graph to show how thepopulation has increased since 1801.
b From the graph, estimate what thepopulation was in 2001.
c Try to find out what the actual population was in 2001.
Year Population (millions) Year Population (millions)
1801 12 1901 38
1821 15.5 1921 44
1841 20 1941 47
1861 24.5 1961 53
1881 31 1981 56
11
7
7
Maths Frameworking PB 9.3 Chs 1–9 29/5/08 18:33 Page 11

a Look at your answers to Questions 5 to 7. See whether you can estimate to whatvalue the sequence will get closer and closer when you change the ‘add 3’ inQuestion 5 to ‘add 6’.
b Work out the sequence to see whether you were correct in part a.
1 2005 Paper 2
a The nth term of a sequence is 3n + 4
What is the 8th term of this sequence?
b The nth term of a different sequence is
Write the first three terms of this sequence.
2 1999 Paper 1
Each term of a number sequence is made by adding 1 to the numerator and 2 to the denominator of the
previous term. Here is the beginning of the number sequence:
, , , , , …5–11
4–9
3–7
2–5
1–3
n – 2–––––n2
Continue the above investigation to see whether you can predict the limiting numberthat each sequence reaches from the term-to-term rule ‘Divide by A and add B’.
12
7
8
5I can predict the next terms in a linear sequence of numbers.
I can write down and recognise the sequence of square numbers.
I know the squares of all numbers up to 152 and the corresponding square roots.
I can find any term in a sequence given the first term and the term-to-term rule.
I can find any term in a sequence given the algebraic rule for the nth term.
6I can find the nth term of a sequence in the form an + b.
7I can find any term in a sequence given the algebraic rule for the nth term, where the nth term
contains the term n2.
I can recognise and give the nth term of a sequence based on the square number sequence.
I can work out the second difference of a quadratic sequence and use this to continue the sequence.
I can work out the inverse function of a function of the form x → ax + b.
I can recognise and sketch graphs of real-life situations.
7
Maths Frameworking PB 9.3 Chs 1–9 29/5/08 18:33 Page 12

a Write an expression for the nth term of the sequence.
b The first five terms of the sequence
are shown on the graph.
The sequence goes on and on for ever.
Which of the four graphs below shows
how the sequence continues?
nc The nth term of a different sequence is ––.
n2 + 1
The first term is .
Write down the next three terms.
d This new sequence also goes on and on for ever. Which of these four graphs shows how the sequence
continues?
Term number
0.5
0Valu
e o
f te
rm
Term number
0.5
0Valu
e o
f te
rm
Term number
0.5
0Valu
e o
f te
rm
Term number
0.5
0Valu
e o
f te
rm
i ii
iii iv
12
Term number
0.45
0.3Valu
e o
f te
rm
i
Term number
0.5
0.3Valu
e o
f te
rm
ii
Term number
1
0.3Valu
e o
f te
rm
iii
Term number
100
0.3Valu
e o
f te
rmiv
Term number
0.6
0.5
0.4
0.3Valu
e o
f te
rm
0 1 2 3 4 5
13
7
Maths Frameworking PB 9.3 Chs 1–9 29/5/08 18:33 Page 13

14
Mobile phone tariffs
Functional Maths
Ed has the ‘Mix and match 700’ tariff and paysby voucher each month.a How much does this cost a month before
VAT is added?b How much does this cost a month when
VAT is added at 17 %?
Sean has the ‘Mix and match 900’ tariff andpays by debit card each month.a How much does this cost a month before
VAT is added?b How much does this cost a month when
VAT is added at 17 %?
Sandra has the ‘Mix and match 500’ tariff. Sheuses all of her any network minutes and all ofher free ‘3 to 3’ minutes. How many minutesdid she talk in total? Give your answer inhours and minutes.
3
12
2
12
1Gordon has the ‘£12 promotional’ tariff. So
far he has used 24 minutes on voice calls
and sent 19 texts. How many more minutes
or texts can he send before he gets
charged extra?
Dave has the ‘£15 texter’ tariff. He pays by
direct debit. In one month he uses 750 texts
and 100 minutes of voice calls. What is his
bill for that month?
Andy has the ‘£20 texter’ tariff. He pays by
direct debit. In one month he uses all of his
100 anytime, any network voice calls and
makes x texts. His bill for the month before
discount and VAT is £23. What is the value
of x?
6
5
4
Use the information on Mobile phone tariffs to help you answer these questions.
Pick your plan
Mix & match plans Inclusive UK minutes and texts Free 3 to 3minutes Free voicemail Free Instant
Messaging Free Skype
£12
a month
£12PromotionalTariff
100Anytime any network minutes ortexts or any mix of the two
3003 to 3 minutes
✔ ✔ ✔
£15
a month
Mix & match300
300Anytime any network minutes ortexts or any mix of the two
3003 to 3 minutes
✔ ✔ ✔
£18
a month
Mix & match500
500Anytime any network minutes ortexts or any mix of the two
3003 to 3 minutes
✔ ✔ ✔
£21
a month
Mix & match700
700Anytime any network minutes ortexts or any mix of the two
3003 to 3 minutes
✔ ✔ ✔
£24
a month
Mix & match900
900Anytime any network minutes ortexts or any mix of the two
3003 to 3 minutes
✔ ✔ ✔
£27
a month
Mix & match1100
1100Anytime any network minutes ortexts or any mix of the two
3003 to 3 minutes
✔ ✔ ✔
Texter plans Texts Minutes Free voicemail One-Off Cost UnlimitedSkype
£15
a month
£15 Texter 600 75Anytime, any network
£20
a month
£20 Texter 1000 100Anytime, any network
■ Pay by voucher ordirect debit
■ If you pay by voucher,service is suspendedonce the monthlyallowance is reached
■ If you pay by directdebit, any minutes ortexts over theallowance arecharged at 15p perminute or 15p pertext
■ 10% discount if youpay by direct debit
■ All tariffs do notinclude VAT which ischarged at 17 1–
2%
FM Ch 1 Mobile Phone PB 9.3 29/5/08 18:49 Page 14

15
Lucy has the ‘£15 texter’ tariff. She pays by
direct debit. In one month she makes y minutes
of voice calls and 540 texts. Her bill for the
month before discount and VAT is £24.90. What
is the value of y?
Ann has the ‘Mix and match 300’ tariff and the
Sony Ericsson K850i phone. She pays by
voucher.
a How much does this cost a month before
VAT is added?
b How much does this cost a month when
VAT is added at 17 %?
Steve has the ‘Mix and match 500’ tariff and
the LG U990 Viewty phone. He pays by direct
debit.
a How much does this cost a month before
VAT is added?
b How much does this cost a month when
VAT is added at 17 %?
Ben has the ‘Mix and match 500’ tariff and an
LG U990 Viewty phone. He pays by direct
debit. In one month he makes 400 minutes of
voice calls, sends 150 texts and sends 100
minutes of videos. How much is his bill for
the month?
10
12
9
12
8
7
Once a tariff has been chosen there are offers on phones.
This table shows the monthly costs of phones and their extra features.
£5
a month
Sony Ericsson K850i with 50 video calling minutesThe K850i is a true photographer’s phone. With a 5 megapixelcamera, auto lens cover, autofocus and Xenon flash, it allowsperfect pictures all the time.
5 megapixel 40 MB internal, 512 MB M2 included
£9
a month
LG U990 Viewty with 90 video calling minutesThe complete camera phone. 5 megapixels and large touchsensitive screen.
5 megapixel 100 MB internal, MicroSD expandable
FREE Sony Ericsson K800iCyber-Shot camera and phone.
3.2 megapixel Expandable with M2card
■ Extra video minutes charged at20p per minute
■ 10% discount if you pay by directdebit
■ All tariffs do not include VAT whichis charged at 17 1–
2%
Coryn has a ‘Mix and match 300’ tariff and a
Sony Ericsson K800i phone. He pays by
voucher. Coryn knows that his average voice
calls per month are 220 minutes and he sends
an average of 40 texts. He sees this
advertisement.
If Coryn changes to the ‘Mix and match 250’
tariff, will he save money in an average month?
You must show your working to justify your
answer.
Robin has a ‘Mix and match 100’ tariff and a
Sony Ericsson K850i phone. He pays by direct
debit. In one month he makes 80 minutes of
voice calls, sends x texts and sends y minutes
of video. He notices that he sends 10 more
minutes of videos than the number of texts.
His bill for the month before discount and VAT
is £27.
What are the values of x and y?
12
11
Special offer for existing customers
‘Mix and match 250’
250 anytime any network minutes or texts
or any mix of the two.
Only £13.00 per month including VAT.
Extra minutes or texts 15p.
FM Ch 1 Mobile Phone PB 9.3 29/5/08 18:49 Page 15

The four rules governing fractions
You met the addition and subtraction of fractions in Year 8. This section will show youhow to solve all types of problem involving the addition, subtraction, multiplication anddivision of fractions.
Example 2.1 Work out the answer to each of these.
a 31–3 + 12–
5 b 43–8 – 12–
3
a When adding mixed numbers, you can convert them to improper (top-heavy)fractions and add them using a common denominator. If appropriate, canceland/or convert the answer to a mixed number.
So, you have:
31–3 + 12–
5 = 10–3 + 7–5
= 50–15 + 21–
15 = 71–15 = 411–
15
As this method involves large numbers, it is easy to make a mistake. A bettermethod is to split up the problem:
31–3 + 12–
5 = 3 + 1 + 1–3 + 2–5
The whole-number part gives 3 + 1 = 4, and the fraction part gives:1–3 + 2–5 = 5–
15 + 6–15 = 11–
15
Hence, the total is:
4 + 11–15 = 4 11–
15
b Using the method of splitting up the calculation, you have:
4 3–8 – 12–
3 = 4 + 3–8 – 1 – 2–3
= 4 – 1 + 3–8 – 2–3= 3 + 9–
24 – 16–24
= 3 – 7–24 = 217–
24
16
CHAPTER 2 Number 1
This chapter is going to show you
How to multiply and divide
fractions
How to calculate with percentages
in more complicated problems,
such as compound interest
How to solve problems using
ratios
What reciprocals are
Connection between enlargement
of length, area and volume
What you should already know
How to add and subtract simple
fractions
How to cancel simple fractions
and ratios
How to work out simple
percentages of quantities
Maths Frameworking PB 9.3 Chs 1–9 29/5/08 18:34 Page 16

So far, you have seen how to add and to subtract fractions. Now you will multiply anddivide fractions.
Example 2.2
Example 2.3 Work out each of these.
a 3–4 ×
2–9 b 23–
7 × 24–5
a Following Example 2.2, you can calculate mentally that the answer is 6–36 , which
can be cancelled to 1–6 . However, this is an example of where it is easier to
cancel before you complete the multiplication.
When numerators and denominators have factors in common, you can cancelthem. In this example, 3 and 9 will cancel, as do 2 and 4. The calculation istherefore given like this:
The remaining numbers are multiplied together to give the new numerator andthe new denominator. When the fractions are cancelled properly, the finalanswer will not cancel.
b Convert the mixed numbers to improper (top-heavy) fractions and cancel whenpossible. Change the answer to a mixed number if appropriate.
Hence, you have:
1 13 2 1– × – = –4 9 6
2 3
217 1423–
7 × 24–5 = –– × ––
7 51
34= –– = 64–55
Jan’s watering can is 3–5 full. She waters her roses and uses half of this water. How full
is her watering can now?
As you can see from the diagram, Jan’s watering can is 3–10 full after she has watered
the roses. How can you calculate this result?
One half of 3–5 is written as:
1 3 1 × 3 3– × – = –– = –2 5 2 × 5 10
This shows that when a fraction is multiplied by another fraction, the new numeratoris found by multiplying together the two original numerators, and the newdenominator by multiplying together the two original denominators.
17
Maths Frameworking PB 9.3 Chs 1–9 29/5/08 18:34 Page 17

Example 2.4
Convert each of the following pairs of fractions to a pair of equivalent fractions witha common denominator. Then work out the answer, cancelling down or writing as amixed number if appropriate.
a 1 + 1 b 2 + 2 c 2 + 1 d 2 + 1
e 4 + 1 f 5 + 1 g 6 + 2 h 7 + 3
a 3 – 1 b 4 – 1 c 2 – 1 d 3 – 1
e 3 – 1 f 5 – 1 g 7 – 2 h 6 – 3
Work out each of the following.
a + b + c +
d – e – f –
Work out each of the following. Cancel before multiplying when possible.
a × b × c × d ×
e × f × g × h ×
i × j × ×
Work out each of the following. Write as improper (top-heavy) fractions and cancelbefore multiplying when possible.
a 1 × 2 b 2 × 3 c 2 × 1 d 1 × 1
e 2 × f 3 × g × 3 h 2 × 2
i 1 × 2 j 4 × 2 35
12
25
56
45
27
35
12
835
12
1021
15
45
14
35
12
15
34
18
35
1118
1522
35
89
34
815
14
611
12
35
56
1225
58
49
38
58
27
34
34
25
13
715
1925
1532
3148
221
512
935
1128
421
29
914
34
78
56
89
56
56
12
34
25
13
12
13
25
16
25
14
13
78
16
19
56
56
12
34
15
12
13
25
13
16
25
14
23
Exercise 2A
Work out each of these.
a 3–5 ÷ 1–
4 b 15–24 ÷ 9–
16 c 22–7 ÷ 111–
21
a When you are dividing by a fraction, always use the following rule:
Turn the dividing fraction upside down and multiply by it.
So, you have:
3 1 3 4 3 × 4 12– ÷ – = – × – = –– = – = 22–55 4 5 1 5 × 1 5
b When possible, cancel during the multiplication.
c Convert the mixed numbers to improper (top-heavy) fractions. Turn the dividingfraction upside down, put in a multiplication sign and cancel if possible. Thenchange the result to a mixed number if appropriate.
5 2
15 9 15 16 5 × 2 10–– ÷ –– = –– × –– = ––– = –– = 11–924 16 24 9 3 × 3 9
3 3
16 3222–7 ÷ 111–
21 = –– ÷ ––7 21
1 3
16 21 3= –– × –– = – = 11–27 32 2
1 2
18
6
Maths Frameworking PB 9.3 Chs 1–9 29/5/08 18:34 Page 18

Work out each of the following. Cancel at the multiplication stage when possible.
a ÷ b ÷ c ÷ d ÷
e ÷ f ÷ g ÷ h ÷
i ÷ j ÷
Work out each of the following. Write as improper (top-heavy) fractions and cancelat the multiplication stage when possible.
a 1 ÷ b 3 ÷ 1 c 2 ÷ 1 d 1 ÷ 1
e 2 ÷ 1 f 1 ÷ 2 g 4 ÷ h 4 ÷
i ÷ 2 j 3 ÷
A rectangle has sides of cm and cm. Calculate its area.
A rectangle has sides of 5 cm and 4 cm. Calculate its area.
How many -metre lengths of cloth can be cut from a roll that is 3 metres long?
A rectangle has an area of 7 m2. Its length is 3 m.
What is its width?
Percentages and compound interest
If you put £100 in a bank and it earns 5% interest each year, which graph do you thinkrepresents the way the amount of money in the bank changes as time passes – assumingyou don’t spend any of it!
Money
Time (years)
Money
Time (years)
Money
Time (years)
Money
Time (years)
74–5 m
2
31–4 m
14
45
29
23
58
14
1427
37
34
12
34
78
89
12
35
12
38
12
712
56
35
23
14
12
35
12
58
14
38
14
35
12
913
34
78
27
1516
58
310
45
67
13
23
56
35
23
18
12
19
6
This is a fractional magic square.
What is the magic number?
Find the missing values in the cells.15
13
715
215
Maths Frameworking PB 9.3 Chs 1–9 29/5/08 18:34 Page 19

Example 2.5
Example 2.6 A petri dish containing 200 000 bacteria is treated with a new drug. This reduces thenumber of bacteria by 16% each day.
a How many bacteria remain after 7 days?
b How long does it take to reduce the bacteria to below a safe level of 20 000?
a The method of calculating the decrease and subtracting it day by day will take toolong. It is quicker to use a multiplier. For a 16% decrease, the multiplier is 0.84.
Key into your calculator:
You may not need the brackets and your power key may be different.
This gives an answer of 59 018.069 31, which can be rounded to 59 000 bacteria.
x( ) =2 0 0 0 0 0 0 . 8 4 7
Jenny puts £100 in a bank and it earns 5% interest per annum (Latin for ‘each year’).How much will she have after 3 years?
Making calculations such as this are sometimes called compound interest problems.There are two ways to solve such problems.
Method 1 Increase and add on
Calculate the amount of interest earned after each year and add it to the previousyear’s total, as shown below.
After first year: 5% of £100 = £5, which gives Jenny £100 + £5 = £105
After second year: 5% of £105 = £5.25, which gives Jenny £105 + £5.25 = £110.25
After third year: 5% of £110.25 = £5.51, which gives Jenny £110.25 + £5.51= £115.76
The last amount of interest has been rounded to the nearest penny. As you can see,the increase gets bigger year by year.
Method 2 Use a multiplier
When dealing with percentage increase, the multiplier is found by adding thepercentage increase expressed as a decimal to 1, which represents the originalvalue. So, in this case, the multiplier is given by 1 + 0.05 = 1.05
(When dealing with a percentage decrease, the multiplier is found by subtracting thedecrease from 1, which gives a value for the multiplier of less than 1.)
So, you have:
After first year: £100 × 1.05 = £105
After second year: £105 × 1.05 = £110.25
After third year: £110.25 × 1.05 = £115.76
This can also be done using the power key on the calculator as: £100 × (1.05)3 = £115.7625 ≈ £115.76
The second method is good if you use a calculator as you get the final answer veryquickly. Make sure you write down your calculation in case you make a mistake.
20
Maths Frameworking PB 9.3 Chs 1–9 29/5/08 18:34 Page 20

Compound interest does not only concern money. It can be applied to, for example, growthin population and increases in the body weight of animals. It can also involve reduction bya fixed percentage, such as decrease in the value of a car, pollution losses and water losses.
Write down the multiplier which is equivalent to each of these.
a 12% increase b 5% decrease c 8% decrease
d 7% increase e 4% decrease f 2% increase
g 3.2% increase h 2 % increase i 15% decrease
j 6% increase k 2.6% decrease l % increase
m 24% decrease n 7% decrease o 17 % increase
You may want to check your answers, as they will help you with the rest of thequestions.
How much would you have in the bank if you invest:
a £200 at 2% interest per annum for 4 years?
b £3000 at 3.2% interest per annum for 7 years?
c £120 at 6% interest per annum for 10 years?
d £5000 at 7% interest per annum for 20 years?
e £75 at 2 % interest per annum for 3 years?
Investments (including stocks and shares) can decrease in value as well as increase.How much would your investments be worth in each of the following cases?
a You invested £3000 which lost 4% each year for 6 years.
b You invested £250 which lost 2.6% each year for 5 years.
c You invested £4000 which lost 24% each year for 4 years.
To decrease the rabbit population in Australia, the disease mixomatosis wasintroduced into rabbit colonies. In one colony, there were 45 000 rabbits. Thedisease decreased the population by 7% each month. How many rabbits were left inthat colony after: a 4 months? b a year?
Some Internet sales sites will decrease the price of a product by a certain percentageeach day until someone buys it.
Freda is interested in buying a computer. She has £1500 to spend. An Internet sitehas the computer Freda wants but it is £2000. The price is to be decreased by 5% perday. How many days will Freda have to wait until she can afford the computer?
During a hot spell, a pond loses 8% of its water each day due to evaporation. It has120 gallons in it at the start of the hot spell. How many days will it take before thepond’s volume of water falls to 45 gallons?
12
12
12
12
Exercise 2B
b Using trial and improvement to make this calculation, gives these rounded values:
168 000, 141 120, 118 541, 99 574, 83 642, 70 260, 59 018,
49 575, 41 643, 34 980, 29 383, 24 682, 20 733, 17 416
So, it takes 14 days to get below 20 000.
Check by calculating 200 000 × 0.8413 and 200 000 × 0.8414.
21
7
8
Maths Frameworking PB 9.3 Chs 1–9 29/5/08 18:34 Page 21

Reverse percentages and percentagechange
In Britain, most prices inshops include VAT. Inthe USA, a sales tax(similar to VAT) has tobe added to thedisplayed price.
Which camera ischeaper if the exchangerate is $1.96 to onepound?
Example 2.7 After a 10% pay rise, John now gets £5.50 an hour. How much per hour did he getbefore the pay rise?
Making calculations such as this are sometimes called reverse percentage problems.There are two ways to solve such problems.
Method 1 Unitary method
A 10% pay rise means that he now gets 100% + 10% = 110%
£5.50 represents 110%
£0.05 represents 1% (dividing both sides by 110)
£5.00 represents 100% (multiplying both sides by 100)
So, before his pay rise, John was paid £5.00 an hour.
��������
��������
��������
��������
Cost £175.25
(including 171–2 % VAT)
Cost $350.00( not including 6%
sales tax )
22
8 Jane started drinking a bottle of cola a day, which cost her £1.50.
Her brother Jack put £1.50 into a jar each day and took the money (£45) tothe bank each month.
The bank paid Jack 1–2% compound interest each month.
How much does Jane spend on cola in a year (365 days)?
The first £45 that Jack pays in earns 11 months of interest. How muchdoes the first £45 increase to over the 11 months?
The second £45 that Jack pays in earns 10 months of interest. How muchdoes the second £45 increase to over the 10 months?
Now work out the value of each £45 that Jack pays in. For example, thethird £45 is in the bank for 9 months and the final £45 is paid in on thelast day of the year, so gets no interest.
Add up the answers to parts 2, 3 and 4 to find out how much Jack has inthe bank at the end of the year.
A computer spreadsheet is useful for this activity.
5
4
3
2
1
Maths Frameworking PB 9.3 Chs 1–9 29/5/08 18:34 Page 22

Example 2.8
Example 2.9
ChangePercentage change = –––––––––––––– × 100
Original amount
Example 2.10
Example 2.11 A shop’s offer is shown on the right.
Explain why this is misleading.
A 171–2% increase on £510 is £599.25
but an £89 reduction on £599 is:
Reduction 89 –––– × 100 = – × 100 = 14.9%Original amount 599
So, the reduction is only about 15%.
We will pay your VAT of 17 1–2%.
Typical exampleA sofa costing £599 including VAT
will cost you £510.
This is a 17 1—2 % reduction on
the normal price!
The price of a hi-fi system increases from £189 to £199. What percentage of theoriginal price is the increase?
The increase is £10 and the original price was £189. So, the percentage increase is:
Increase 10 –––– × 100 = – × 100 = 5.3%Original amount 189
The number of fish in a pond increased to 3750 in one year. This was a 25%increase. How many fish were in the pond originally?
Multiplier method
A 25% increase is represented by the multiplier 1 + 0.25 = 1.25
To work backwards to find the number of fish in the pond originally, divide 3750 bythe multiplier.
This gives: 3750 ÷ 1.25 = 3000
In a sale the price of a coat is reduced by 20%. It now costs £40. How much did itcost before the sale?
Unitary method
In the sale, the price of the coat is 80% (100% – 20%) of the original cost.
So £40 represents 80%
0.50 represents 1% (dividing both sides by 80)
£50 represents 100% (multiplying both sides by 100)
So the price of the coat before the sale was £50.
Method 2 Use a multiplier
10% = 0.1
A 10% increase is represented by the multiplier 1 + 0.1 = 1.1
To work backwards to find John’s hourly rate of pay before his pay rise, divide £5.50by the multiplier.
This gives: £5.50 ÷ 1.1 = £5.00
23
Maths Frameworking PB 9.3 Chs 1–9 29/5/08 18:34 Page 23
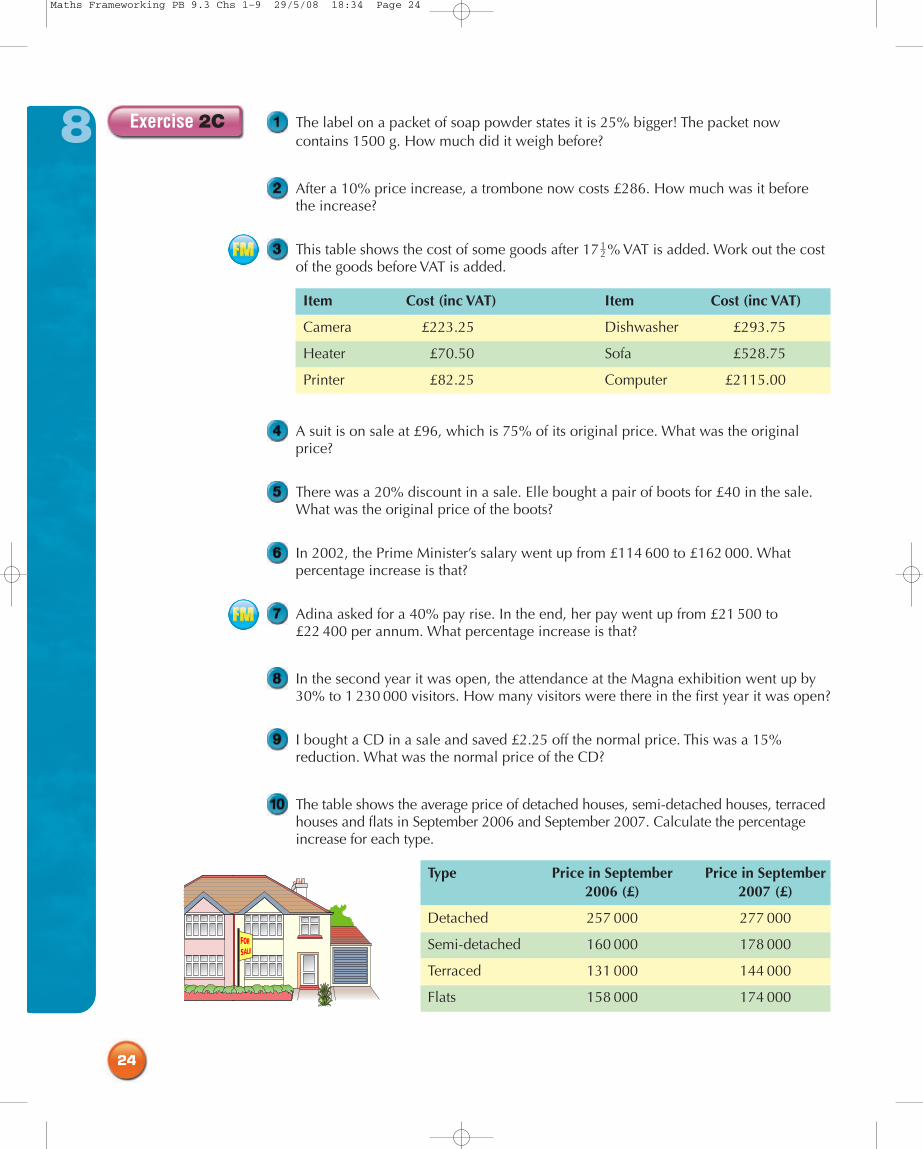
The label on a packet of soap powder states it is 25% bigger! The packet nowcontains 1500 g. How much did it weigh before?
After a 10% price increase, a trombone now costs £286. How much was it beforethe increase?
This table shows the cost of some goods after 17 % VAT is added. Work out the costof the goods before VAT is added.
Item Cost (inc VAT) Item Cost (inc VAT)
Camera £223.25 Dishwasher £293.75
Heater £70.50 Sofa £528.75
Printer £82.25 Computer £2115.00
A suit is on sale at £96, which is 75% of its original price. What was the originalprice?
There was a 20% discount in a sale. Elle bought a pair of boots for £40 in the sale.What was the original price of the boots?
In 2002, the Prime Minister’s salary went up from £114 600 to £162 000. Whatpercentage increase is that?
Adina asked for a 40% pay rise. In the end, her pay went up from £21 500 to £22 400 per annum. What percentage increase is that?
In the second year it was open, the attendance at the Magna exhibition went up by30% to 1 230 000 visitors. How many visitors were there in the first year it was open?
I bought a CD in a sale and saved £2.25 off the normal price. This was a 15%reduction. What was the normal price of the CD?
The table shows the average price of detached houses, semi-detached houses, terracedhouses and flats in September 2006 and September 2007. Calculate the percentageincrease for each type.
Type Price in September Price in September2006 (£) 2007 (£)
Detached 257 000 277 000
Semi-detached 160 000 178 000
Terraced 131 000 144 000
Flats 158 000 174 000
12
Exercise 2C
24
8
Maths Frameworking PB 9.3 Chs 1–9 29/5/08 18:34 Page 24

Direct and inverse proportion
Example 2.12
Example 2.13
Example 2.14
Example 2.15 Four men take 5 days to lay a pipeline that is 300 m long. What length of pipe couldbe laid by six men working for 8 days?
It takes 4 × 5 = 20 man-days to lay 300 m of pipe.
Hence, 1 man-day would lay 300 ÷ 20 = 15 m of pipe.
So, 6 × 8 = 48 man-days would lay 48 × 15 = 720 m of pipe.
Six girls take 4 days to paint a fence. How longwill it take eight girls?
If it takes six girls 4 days to paint the fence, it wouldtake one girl 6 × 4 = 24 days to paint the fence.
Hence, eight girls will take 24 ÷ 8 = 3 days topaint the fence.
A guitarist plays for 40 minutes with 400 people in the audience. How long would ittake him to play the same set if there were only 300 people in the audience?
It takes exactly the same time of 40 minutes! The number of people in the audiencedoes not affect the length of the performance.
Six tubes of toothpaste have a total mass of 972 g. What is the mass of 11 tubes?
If six tubes have a mass of 972 g, one tube has a mass of: 972 ÷ 6 = 162 g
Hence, 11 tubes have a mass of 11 × 162 = 1782 g = 1.782 kg
25
8Credit card companies and loan companies quote the Annual PercentageRate or APR. This is the equivalent over a year to the interest which theycharge monthly.
For example, if 2% is charged each month on a loan of £1000, the amountowed after 12 months will be £1000 × (1.02)12 = £1268, which is equivalentto 26.8% APR (because £1000 increased by 26.8% gives £1268).
1 Work out the APR for companies which charge an interest rate of:
1.5% per month 0.9% per month
1% per month 5% per month
2 Work out the monthly interest rate for an APR of 30%. [Hint: Try trial andimprovement.]
A computer spreadsheet is useful for this activity.
dc
ba
Maths Frameworking PB 9.3 Chs 1–9 29/5/08 18:34 Page 25

Example 2.16
Be careful! Some of these questions may trip you up.
You may use a calculator for this exercise.
In 5 hours a man earns £28. How much does he earn in 7 hours?
A girl walks 3 miles in 1 hour. How long would it take her to walk 5 miles?
Four men lay a pipeline in 5 days. How long would 10 men take?
Travelling at 8 miles an hour, a boy takes 5 hours for a cycling trip. How long wouldhe take at a speed of 12 miles per hour?
Seven chocolate bars cost £1.82. How much would 11 chocolate bars cost?
In two days my watch loses 4 minutes. How much does it lose in one week (7 days)?
It takes 6 minutes to hard-boil three eggs in a pan. How long would it take to hard-boil two eggs in the same pan?
I have three cats who eat a large bag of cat food every 4 days. If I get another cathow long will the bag of food last now?
In 20 minutes an aircraft travels 192 miles. How far would it travel in 25 minutes atthe same speed?
Four buckets standing in a rain shower take 40 minutes to fill. How long would threebuckets standing in the same rain shower take to fill?
Nine men build a wall in 20 days. How long will the job take 15 men?
A distance of 8 km is represented by a distance of 12.8 cm on a map.
a How many centimetres would represent a distance of 14 km?
b What distance is represented by 7 cm on the map?
My motorbike travels 120 miles on 10 litres of petrol.
a How many miles will it travel on 12 litres?
b How many litres will I need to travel 55 miles?
Four taps fill a bath in 36 minutes. How long would it take three taps to fill the samebath?
An electric light uses 5 units of electricity in 120 minutes. If 9 units of electricityhave been used, how long has it been switched on?
Exercise 2D
Six shirts hanging on a washing line take 2 hoursto dry. How long would it take three shirts to dry?
It would take the same time! The number of shirtson the line does not make any difference.
26
6
Maths Frameworking PB 9.3 Chs 1–9 29/5/08 18:34 Page 26

It takes 12 seconds to dial the 12-digit number of a friend who lives 100 miles away.
a How long will it take to dial the 12-digit number of a friend who lives 50 milesaway?
b How long will it take to dial the 6-digit number of a friend who lives 10 milesaway?
At peak times, a phone card gives 120 minutes of calls. At off-peak times, the cost isone-third of the cost at peak times. How many minutes of calls will the phone cardgive at off-peak times?
A box of emergency rations can feed 12 men for six days. For how long would thebox of rations feed eight men?
A man takes 10 minutes to hang out a load of washing. How long would it take twomen?
One woman went to mow a meadow. It took her 15 minutes to walk there. If twowomen went to mow a meadow how long would it take them to walk there?
Some tins of beans are packed into seven boxes each of which holds 12 tins. If I pack them into four boxes instead, how many tins will be in each box?
Two men can paint a room in 6 hours. How long would five men take?
A shelf is filled with 20 books each 3.5 cm thick. If the books are replaced by28 books of equal thickness, how thick would they have to be to fill the shelf?
From the top of a hill, two girls can see 20 miles. How far would three girls be ableto see from the top of the same hill?
A 2.5 gallon cylinder of gas will keep a patio heater burning at full power for 30 hours. How many hours will a 1.5 gallon cylinder of gas keep the heaterburning at half power?
Three women building a patio lay 30 m2 in 4 days. How many days would it taketwo women to lay a patio that is 45 m2?
A family use four tubes of toothpaste in nine weeks, brushing their teeth twice a day.They decide to give a four-week trial to brushing their teeth three times a day. Howmany tubes of toothpaste will they use in that time?
A haulage company charges £240 to transport four pallets a distance of 300 miles.How far would they transport five pallets for a cost of £180?
Seven men can pack 2352 boxes of chocolate bars in a 4-hour shift. How longwould it take five men to pack 3150 boxes of chocolate bars?
In 1 hour, eight teachers can mark 90 exam papers. How many exam papers can15 teachers mark in one and a half hours?
27
6
Maths Frameworking PB 9.3 Chs 1–9 29/5/08 18:34 Page 27

Ratio in area and volume
Investigation
These three blocks are similar. This means that the ratio height : length : width is the samefor all three blocks.
a Work out the area of the front face of each block.
b Work out the volume of each block.
Work out each of the following ratios and write it in the form 1 : n.
c i Length of block A to length of block Bii Area of the front face of block A to area of the front face of block Biii Volume of block A to volume of block B
d i Length of block A to length of block Cii Area of the front face of block A to area of the front face of block Ciii Volume of block A to volume of block C
e i Length of block B to length of block Cii Area of the front face of block B to area of the front face of block Ciii Volume of block B to volume of block C
Look at your answers to parts c, d and e. What do you notice?
Explain the connection between the ratio of the lengths, areas and volumes of similar shapes.
12 cm
12 cm
18 cm
C
4 cm
4 cm
6 cm
B
A3 cm
2 cm
2 cm
You are told that:
a × b × c = d
1 What would the answer be if a were doubled?
2 What would the answer be if b were trebled?
3 What would the answer be if c were halved?
4 What would the answer be if, at the same time, a were doubled, b trebled and c halved?
5 What would the answer be if, at the same time, a were doubled, b doubled and c doubled?
6 What would the answer be if, at the same time, a were halved, b halvedand c halved?
28
6
Maths Frameworking PB 9.3 Chs 1–9 29/5/08 18:34 Page 28

You will have found out that two similar shapes with their lengths in the ratio 1 : ahave areas in the ratio 1 : a2.
The following shapes are similar. The drawings are not to scale. For each shape, youare given the width. You are also given the area of shape P.
Copy and complete the following. (The first has been done for you.)
a i The ratio of lengths of shapes P and Q is 1 : 2.
ii The ratio of areas of shapes P and Q is 1 : 4.
iii The area of shape Q is 4 × area of shape P. So, area of Q = 4 × 5 = 20 cm2
b i The ratio of lengths of shapes P and R is 1 : ….
ii The ratio of areas of shapes P and R is 1 : ….
iii The area of shape R is … × area of shape P. So, area of R = … × 5 = … cm2
c i The ratio of lengths of shapes P and S is 1 : ….
ii The ratio of areas of shapes P and S is 1 : ….
iii The area of shape S is … × area of shape P. So, area of S = … × 5 = … cm2
You will have found out that two similar shapes with their lengths in the ratio 1 : ahave volumes in the ratio 1 : a3.
The following shapes are similar. The drawings are not to scale. For each shape youare given the width. You are also given the volume of shape J.
Copy and complete the following. (The first has been done for you.)
a i The ratio of lengths of shapes J and K is 1 : 2.
ii The ratio of volumes of shapes J and K is 1 : 8.
iii The volume of shape K is 8 x volume of shape J. So, volume of K = 8 × 6 = 48 cm3
b i The ratio of lengths of shapes J and L is 1 : ….
ii The ratio of volumes of shapes J and L is 1 : ….
iii The volume of shape L is … × volume of shape J. So, volume of L = … × 6 = … cm3
J K L M
2 cm
4 cm
10 cm8 cm
V = 6 cm3
A = 5 cm2
2 cm4 cm
10 cm
6 cm
P Q R S
Exercise 2E
29
8
Maths Frameworking PB 9.3 Chs 1–9 29/5/08 18:34 Page 29

c i The ratio of lengths of shapes J and M is 1 : ….
ii The ratio of volumes of shapes J and M is 1 : ….
iii The volume of shape M is … × volume of shape J. So, volume of M = … × 6 = … cm3
The following pair of shapes, A and B, are similar. The drawings are not to scale.Work out the area of shape B.
Two similar shapes, P and Q, are shown below. The drawings are not to scale. Workout the area of shape P.
The following pair of solids, C and D, are similar. The drawings are not to scale.Work out the volume of solid D.
Two similar solids, R and S, are shown below. The drawings are not to scale. Workout the volume of solid R.
9 cm
27 cm
R S
V = 54 cm3
C
4 cm
D
8 cm
V = 8 cm3
P
11 cm
A = 64 cm2
44 cm
Q
A B
A = 10 cm2 3 cm1 cm
30
8
Maths Frameworking PB 9.3 Chs 1–9 29/5/08 18:34 Page 30

The sides of a cube are reduced by a half.
a By what fraction is the area of a face reduced?
b By what fraction is the volume of the cube reduced?
A one-centimetre cube is placed alongside a metre cube.
a What is the ratio of the lengths of the two cubes?
b What is the ratio of the areas of a face of the two cubes?
c What is the ratio of the volumes of the two cubes?
Three cylinders have the dimensions shown.
1 Explain how you know that the cylinders are similar.
2 For cylinders A, B and C work out each of the following.
a The area of the circular end
b The volume of the cylinder (Formula for the volume is πr2h.)
3 Work out each of the following ratios.
a End area of A : End area of B
b End area of A : End area of C
c Volume of A : Volume of B
d Volume of A : Volume of C
4 Another similar cylinder, D, has a radius of 15 cm. Write down each ofthe following ratios.
a End area of C : End area of D
b Volume of C : Volume of D
2 cm
4 cmA
3 cm
6 cmB
5 cm
10 cmC
1–2
31
8
Maths Frameworking PB 9.3 Chs 1–9 29/5/08 18:34 Page 31

Numbers between 0 and 1
The special numbers –1, 0 and 1 divide the number line shown above into four sets ofnumbers: A, B, C and D.
A contains all the numbers less than –1. B contains all the numbers between –1 and 0. C contains all the numbers between 0 and 1 and D contains all the numbers greater than 1.
Example 2.17
Copy and complete this table, which shows the result of multiplying the first numberby the second number. The result from Example 2.17, part a, has been filled in alongwith some other results.
× Set A –1 Set B 0 Set C 1 Set D
Set A C or D Set A Set A
–1 –1
Set B
0 0
Set C A or B
1 1
Set D
Second number
Firstnumber
Exercise 2F
a What happens when a number from set A is multiplied by a number from set D?
b What happens when a number from set B is divided by 1?
a Choose any number from set A, say –2. Choose any number from set D, say +3.Multiply them together:
–2 × +3 = –6
The answer belongs to set A.
Try other combinations of numbers from set A and set D. For example:
–4 × +4 = –16 –1.5 × 5 = –7.5 –5 × 1.5 = –7.5
They all belong to set A. So, a number from set A multiplied by a number fromset D always gives a number in set A.
b Pick numbers from set B and divide each one by 1. For example:
–0.4 ÷ 1 = –0.4 – 2–3 ÷ 1 = – 2–
3 –0.03 ÷ 1 = –0.03
The answers are the same as the values from set B. So, they all give numbers inset B.
–3 –2 –1 0 1 2 3
A B C D
–1 0 1
32
7
Maths Frameworking PB 9.3 Chs 1–9 29/5/08 18:34 Page 32

Copy and complete this table, which shows the result of dividing the first number bythe second number. The result from Example 2.17, part b, has been filled in alongwith some other results. One thing you cannot do in maths is to divide by zero. So, this column has been deleted.
Use your tables to answer each of the following. Choose one answer.
a When any positive number is divided by a number between 0 and 1, the answer is:i the same. ii always bigger.iii always smaller. iv sometimes bigger, sometimes smaller.
b When any positive number is divided by a number bigger than 1, the answer is:i the same. ii always bigger.iii always smaller. iv sometimes bigger, sometimes smaller.
c When any positive number is multiplied by a number between 0 and 1, theanswer is:i the same. ii always bigger.iii always smaller. iv sometimes bigger, sometimes smaller.
d When any positive number is multiplied by a number bigger than 1, the answer is:i the same. ii always bigger.iii always smaller. iv sometimes bigger, sometimes smaller.
In each case, give an example to show that the statement is not true. (Such anexample is called a counter-example.)
a When you divide any number by –1, the answer is always negative.
b When you multiply any number by a number less than –1, the answer is alwaysbigger.
c Dividing any number by a number between –1 and 1 (except 0) always gives abigger number.
d Multiplying any number by a number between –1 and 1 (except 0) always givesa smaller number.
Repeat Example 2.17 but this time add and subtract the numbers from each set.Can you reach any definite conclusions?
÷ Set A –1 Set B 0 Set C 1 Set D
Set A C or D
–1 –1
Set B C or D A or B Set B
0 0
Set C
1
Set D
Second number
Firstnumber
33
7
Maths Frameworking PB 9.3 Chs 1–9 29/5/08 18:34 Page 33

Reciprocal of a number
The reciprocal of a number is the number divided into 1. For example, the reciprocal of 2 is 1 ÷ 2 = 0.5.
On a calculator, the reciprocal key is usually marked in one of the ways shown below.
Example 2.18
a Find, as a decimal, the reciprocal of each and every integer from 1 to 20.
b Which of the reciprocals are terminating decimals?
Find the reciprocal of each of the following numbers. Round your answers if necessary.
a 30 b 0.005 c 80 d 0.001 25
e 2000 f 0.002 g 100 h 106
Investigation
Using a calculator and its fraction key, find the reciprocals of some fractions.
For example, has a reciprocal of 1 ÷ = 1 =
You will need to convert any mixed numbers to improper fractions.
Repeat this until you can write down a rule for quickly finding the reciprocal of afraction.
Investigation
The grid shows five pairs of lines.
a What is the geometrical relationshipbetween each pair of lines?
b Copy and fill in the following table.Some values have been filled in.
Pair Gradient line 1 Gradient line 2
A 1–2
B
C – 2–3
D
E 3
Line 1
Line 2
Pair A Pair B
Line 1
Line 2
Pair C
Pair E
Pair D
Line 2
Line 1
Line 2
Line 2
Line 1
Line 1
32
12
23
23
Exercise 2G
Find the reciprocals of: a 25 b 0.625
Using the reciprocal key on your calculator, or dividing the number into 1, you will get:
a 1 ÷ 25 = 0.04
b 1 ÷ 0.625 = 1.6
x–1
1/x 11/x
34
8
Maths Frameworking PB 9.3 Chs 1–9 29/5/08 18:34 Page 34

c Look at the values of the gradients of each pair of lines. What is therelationship between them?
Copy and complete the following statement.
When a pair of lines is…… their gradients are the …… …… of each other.
Calculate the sum of each of the following numbers with its reciprocal.
a 1 b –1
Is it always true that the sum of a number and its reciprocal is the positive value ofthe sum of the negative number and its reciprocal? Investigate.
Is there a reciprocal of zero ?
Rounding and estimation
Example 2.19
Example 2.20 By rounding the numbers to one significant figure, estimate the value of each of thefollowing.
a (3124 × 0.476) ÷ 0.283 b 0.067 × (0.82 – 0.57)
a Round each number to one significant figure. Then proceed with the calculationusing the rules which you have already learnt.
(3124 x 0.476) ÷ 0.283 ≈ (3000 x 0.5) ÷ 0.3
= 1500 ÷ 0.3
= 15 000 ÷ 3 = 5000
b Proceed as in part a.
0.067 × (0.82 – 0.57) ≈ 0.07 × (0.8 – 0.6)
= 0.07 × 0.2 = 0.014
Round each of the following numbers to one significant figure.
a 582 b 0.0893 c 0.732 d 0.291
When rounding to one significant figure, you need to find the nearest number whichhas just one digit followed or preceded by zeros. This gives:
a 582 ≈ 600 (1 sf) b 0.0893 ≈ 0.09 (1 sf)
c 0.732 ≈ 0.7 (1 sf) d 0.291 ≈ 0.3 (1 sf)
The powers of two are 2, 22, 23, 24, …, which are equal to 2, 4, 8, 16, ….
1 Use a calculator to find the negative powers of two, namely: 2–1, 2–2, 2–3, ….
2 Use your calculator to investigate the relationship between the reciprocalsof positive powers of two and those of negative powers of two.
35
8
Maths Frameworking PB 9.3 Chs 1–9 29/5/08 18:34 Page 35

Round each of the following numbers to one significant figure.
a 598 b 0.312 c 0.06734 d 109
e 0.327 f 0.092 g 345 h 0.378
i 0.65 j 0.609 k 888 l 0.98
Work out each of the following.
a 200 × 400 b 300 × 5000 c 60 × 70 d 80 × 2000
e 90 × 90 f 0.6 × 0.3 g 0.09 × 0.7 h 0.05 × 0.8
i 2000 × 0.05 j 200 × 0.7 k 0.08 × 3000 l 0.6 × 700
Work out each of the following.
a 300 ÷ 50 b 600 ÷ 0.2 c 2000 ÷ 400 d 24000 ÷ 60
e 800 ÷ 20 f 1500 ÷ 30 g 200 ÷ 0.4 h 300 ÷ 0.5
i 20 ÷ 0.05 j 4 ÷ 0.08 k 60 ÷ 0.15 l 0.09 ÷ 0.3
By rounding values to one significant figure, estimate the answer to each of thefollowing. Show your working.
a 0.73 × 621 b 278 ÷ 0.47
c 3127 ÷ 0.58 d 0.062 × 0.21
e (19 × 0.049) ÷ 0.38 f (0.037 + 0.058) × (0.067 + 0.083)
g (211 × 0.112) × (775 ÷ 0.018) h 0.475 × (33.66 ÷ 0.41)
i 4.82× 7.8 ÷ 0.192 j (19.7 × 0.38) ÷ (1.98 + 0.46)
Estimate the answer to each of the following.
231 × 0.615 298 + 376 1852a –––––– b –––––– c –––
0.032 0.072 0.382
0.831 × 0.478 715 × 0.723 632 219d –––––– e –––––– f ––– + –––387 341 × 0.058 0.41 0.46
You can round to any number of significant figures. For example, rounding tothree significant figures is very common in trigonometry problems, whichyou will meet later.
Take, for example, 253.78, which has five significant figures.
253.78 ≈ 253.8 (4 sf) ≈ 254 (3 sf) ≈ 250 (2 sf) ≈ 300 (1 sf)
Now, take as an example 0.098 54, which has four significant figures.
0.098 54 ≈ 0.0985 (3 sf) ≈ 0.099 (2 sf) ≈ 0.1 (1 sf)
Round each of the following to the accuracy shown.
a 347 (2 sf) b 4217 (3 sf) c 4217 (2 sf)
d 0.6187 (3 sf) e 0.6187 (2 sf) f 302 (1 sf)
g 4698 (2 sf) h 4698 (3 sf) i 0.0785 (2 sf)
j 978.32 (4 sf) k 978.32 (3 sf) l 978.32 (2 sf)
Exercise 2H
36
7
8
Maths Frameworking PB 9.3 Chs 1–9 29/5/08 18:34 Page 36

1 2007 Paper 1
a In this design, the ratio of grey to black is 3 : 1
What percentage of the design is black?
b In this design, 60% is grey and the rest is black.
What is the ratio of grey to black?
Write your ratio in its simplest form.
2 2005 Paper 1
a Look at this information.
One of the statements below is true.
Write it down.
Both numbers must be zero.
At least one number must be zero.
Exactly one number must be zero.
Neither number can be zero.
Two numbers multiply to make zero.
37
6
6I can change fractions to decimals.
I can add and subtract fractions with different denominators.
I can solve problems involving ratio.
I can use percentages to solve real-life problems.
I can use brackets correctly.
I can solve questions involving proportions.
7I can multiply and divide by numbers between 0 and 1.
I can solve problems by multiplying and dividing with numbers of any size.
I can understand and use percentage change using multiplier methods.
I can follow a method to calculate reverse percentages.
I can round numbers to one significant figure.
8I can solve compound interest problems.
I can solve reverse percentage problems.
I understand and can use ratios to solve problems involving areas and volumes.
I can work out the reciprocal of a number.
Maths Frameworking PB 9.3 Chs 1–9 29/5/08 18:34 Page 37

b Now look at this information.
If one number is zero, what is the other number?
If neither number is zero, give an example of what the numbers could be.
3 2002 Paper 2
a One calculation below gives the answer to the question:
What is 70 increased by 9%?
Choose the correct one.
Choose one of the other calculations. Write a question about percentages that this calculation
represents.
Calculation chosen: ……
Question it represents: ……
Now do the same for one of the remaining two calculations:
Calculation chosen: ……
Question it represents: ……
b Fill in the missing decimal number.
To decrease by 14%, multiply by ……
4 2006 Paper 1
a Give an example to show the statement below is not correct.
b Now give an example to show the statement below is not correct.
c Is the statement below correct for all numbers?
Explain how you know.
5 2004 Paper 1
a Calculate ×
Show your working.
Write your answer as a fraction in its simplest form.
b Four-fifths of the members of a club are female.
Three-quarters of these females are over 20 years old.
What fraction of the members of the club are females over 20 years old?
Show your working.
35
56
The square of a number is greater than the number itself.
When you subtract a number from 2, the answer is always less than 2.
When you multiply a number by 2, the answer is always greater than 2.
70 × 1.0970 × 0.0970 × 1.970 × 0.9
Two numbers add to make zero.
38
6
7
Maths Frameworking PB 9.3 Chs 1–9 29/5/08 18:34 Page 38

6 2007 Paper 2
Here is part of a newspaper report about wildlife in a country in Africa.
About how many gorillas were there in this country ten years earlier?
7 2006 Paper 2
Since 1952 the total number of people living in Wales has increased by about one-eighth.
The total number of people living in Wales now is about 3 million.
About how many people lived in Wales in 1952?
8 2005 Paper 2
a Each side of a square is increased by 10%.
By what percentage is the area increased?
b The length of a rectangle is increased by 20%.
The width is decreased by 20%.
By what percentage is the area changed?
9 2001 Paper 2
A shop had a sale. All prices were reduced by 15%.
A pair of shoes cost £38.25 in the sale. What price were
the shoes before the sale? Show your working.
10 2003 Paper 2
Find the values of t and r.
2 t– = –3 6 t = ……
2 5– = –3 r r = ……
11 2002 Paper 1
I fill a glass with orange juice and lemonade in the ratio 1 : 4.
I drink of the contents of the glass, then I fill the glass using orange juice. Now what is the ratio of orange
juice to lemonade in the glass?
Show your working, and write the ratio in its simplest form.
12 2002 Paper 2
A 10% increase followed by another 10% increase is not the same as a total increase of 20%.
What is the total percentage increase? Show your working.
14
SALE15% off
The number of gorillas has fallen
by 70% in the last ten years.
Only about 5000 gorillas are left.
39
8
Maths Frameworking PB 9.3 Chs 1–9 29/5/08 18:34 Page 39

40
The London Olympics 2012
Functional Maths
Olympic village
Beds provided for 17320 athletes and officials during Olympics.
Beds provided for 8756 athletes and officials during Paralympics.
The dining hall will cater for 5500 athletes at a time.
After the Games, the village will provide 4000 homes.
Tickets
Number of tickets for sale
8 million for the Olympics
1.6 million for the Paralympics
Tickets include free travel on London Transport.
Cost
75% of tickets will cost less than £50.
Organisers expect to sell 82% of all Olympic tickets and 63%
of all Paralympics tickets.
Athletics
Ticket prices start from £15.
20 000 big screen tickets available for £10.
Travel
90% of venues will have three or more forms of public transport
including:
Docklands light railway
‘Javelin’ rail link from St Pancras to Olympic park
London Underground
New rail links
Buses – The iBus: an automatic vehicle location system
Cycle lanes and footpaths
Two major park and ride sites off the M25 with a combined
capacity of 12 000 cars
During the Games, up to 120 000 passengers will arrive and
depart through Stratford station each day.
FM Ch 2 Olympics PB 9.3 29/5/08 18:50 Page 40

41
How many beds are there for athletes and officials during the Olympics?
Give your answer to two significant figure.1
The Olympic stadium will have 80 000 seats.
If for an event the stadium is 85% full, how many seats will be empty?2
a How many passengers will arrive and depart through Stratford
station over the 17 days?
b 45% of all spectators visiting the games each day will arrive and
depart through Stratford station.
Work out the number of spectators that are expected at the games
each day. Give your answer to the nearest 10 000.
3
Boccia is a Paralympic sport.
The aim of the game is to throw red or blue leather balls as close as
possible to a white target ball.
At the end of every round, the competitor whose ball is closest to the
target ball scores one point for every one of his balls that is closer than
his opponent’s.
a At the end of a game, the blue team has 8 points and the red team has
4 points. Write the number of points as a ratio in its simplest form.
b At the end of another game 15 points have been scored altogether.
The points are divided between the blue team and the red team in
the ratio 3 : 2.
How many points does each team have?
4
Here are some men’s long jump world record distances and the years
in which they occurred.
8.90 metres 8.95 metres 7.98 metres 8.13 metres 8.21 metres
1991 1968 1931 1960 1935
a Copy and complete
the table by putting
the distances and
years in the correct
order. Two of the
answers have already
been filled in.
b Ralph Boston broke Jesse Owens’ world record.
For how long did Jesse Owens’ world record stand before it
was broken?
Name Year World record
Mike Powell 1991
Bob Beamon
Ralph Boston
Jesse Owens
Chuhei Nambu 7.98 metres
5
Use the information on
the left to answer these
questions.
a How many tickets for the Olympics will cost less than £50?
b How many tickets for the Olympics that cost less than £50 do the
organisers expect to sell?
6
FM Ch 2 Olympics PB 9.3 29/5/08 18:50 Page 41

Equations, formulae and identities
Equations An equation is formed when an expression is made equal to a number or anotherexpression.
As a general rule, an equation can be solved.
You will be expected to deal with equations which have only one variable or letter inthem. For example:
3x + 2 = 7 x2 = 24 y + 3 = 4y – 2
The solution to an equation is that value of the variable which makes the equation true.For example:
2x + 6 = 18
for which the solution is x = 6.
Always check that the answer makes the equation true. In this case:
2 × 6 + 6 = 18
which is correct.
Example 3.1 Solve 4(2x – 3) = 3(x + 11)
Expand both brackets to obtain:
8x – 12 = 3x + 33
Subtract 3x from both sides, which gives:
5x – 12 = 33
Add 12 to both sides to obtain:
5x = 45
Dividing both sides by 5 gives the solution:
x = 9
42
CHAPTER 3 Algebra 3
This chapter is going to show you
How to construct and solve
different types of linear equation
How to use trial and
improvement
How to solve problems
involving direct proportion
What you should already know
How to solve simple linear
equations
How to find the square root of a
number
Maths Frameworking PB 9.3 Chs 1–9 29/5/08 18:35 Page 42

Formulae Although it may look like an equation, a formula states the connection between two ormore quantities. Each quantity is represented by a different letter.
Every formula has a subject, which is the variable (letter) which stands on its own, usuallyon the left-hand side of the ‘equals’ sign. For example:
P = 2l + 2w A = lw
where P and A are the subjects.
Example 3.2
Identities An identity is an algebraic equation or formula which is true for all values whethernumerical or algebraic. It has a special sign –––.
Example 3.3
Solve each of the following equations.
a 5(x – 1) = 4(x + 1) b 3(x – 2) = 2(x + 2)
c 5(x + 3) = 3(x + 5) d 3(2x + 1) = 2(4x + 3)
e 4(3x – 2) = 5(2x + 3) f 6(2x – 1) = 4(2x + 5)
Solve each of the following equations.
a 3(m – 1) – 2(m + 4) = 0 b 4(k + 3) – 3(k – 7) = 0
c 5(y + 2) – 4(y + 3) = 0 d 2(5x – 4) – 3(2x + 5) = 1
e 4(3p – 2) – 2(5p + 3) = 0 f 7(2w – 3) – 5(3w – 1) = 0
Exercise 3A
Show that (a + b)2 ––– a2 + 2ab + b2 is an identity by substituting the following values.
a a = 3 and b = 5 b a = x and b = 2x
a Substitute into the left-hand side:
(a + b)2 = (3 + 5)2 = 82 = 64
Substitute into the right-hand side:
a2 + 2ab + b2 = 32 + 2 × 3 × 5 + 52 = 9 + 30 + 25 = 64
Both sides give the same value of 64.
b Substitute into the left-hand side:
(a + b)2 = (x + 2x)2 = (3x)2 = 9x2
Substitute into the right hand side:
a2 + 2ab + b2 = x2 + 2 × x × 2x + (2x)2 = x2 + 4x2 + 4x2 = 9x2
Both sides give the same value of 9x2.
The formula for the volume of a cylinder is V = πr2h.
Giving your answers in terms of π, calculate the volume when:
a r = 5 and h = 8 b r = r and h = 2r
a V = π × 52 × 8 = 200π
b V = π × r2 × 2r = 2πr3
43
6
Maths Frameworking PB 9.3 Chs 1–9 29/5/08 18:35 Page 43

a Look at each of the following statements.
A an equation
B a formula
C an identity
Note: None of the identities below carry a ––––– sign.
Match either A or B or C to each of the following.
i 3x + 5 = x – 9 ii y = 4x + 3 iii t = u + st
iv p = 3d v √–x × √
–y = √
–xy vi m + 3 = 5m – 4
vii y = mx + c viii ax + ay = a(x + y) ix t = 3w + 5
b Write a brief explanation about the difference between an equation, a formulaand an identity.
The formula A = 180(n – 2) is used to calculate the sum of the angles inside apolygon with n sides.
a Use the formula to calculate the sum of the angles for:
i an octagon. ii a dodecagon.
b A polygon has an angle sum of 1440°. How many sides does it have?
DJ Dave uses the following formula to work out how much to charge for his gigs:
C = £55 + £3N + £5T + £10E
where:
N is the number of people attending the gig
T is the number of hours worked before midnight
E is the number of hours worked after midnight
Calculate the cost of each of the following gigs.
A teenager’s party with 25 people from 7 pm to 11 pm
A wedding reception with 60 people from 9 pm to 2 am
Show that 2(a + b) ––– 2a + 2b is an identity by substituting the values below intoboth sides.
a a = 5 and b = 4 b a = 5x and b = 2x
Show that (a + b)(a – b) ––– a2 – b2 is an identity by substituting the values below intoboth sides.
a a = 7 and b = 4 b a = 3x and b = x
The area of this rectangle is 6.4 cm2.
Find its perimeter.
3x + 1
8x
b
a
44
6
7
Maths Frameworking PB 9.3 Chs 1–9 29/5/08 18:35 Page 44

Simultaneous equations
Simultaneous equations are equations for which we want the same solution. Therefore,we solve them together.
The simultaneous equations you will meet are always in pairs and are always linear.
For example, x + y = 8 has many solutions:
x = 2, y = 6 x = 3, y = 5 x = 4, y = 4 x = 5, y = 3 …
Also, 2x + y = 13 has many solutions:
x = 2, y = 9 x = 3, y = 7 x = 4, y = 5 x = 5, y = 3 …
But only one solution, x = 5 and y = 3, satisfies both equations at the same time.
One way to solve pairs of simultaneous equations is by the elimination method.
Elimination method Follow through the Examples 3.4 and 3.5 to see how this method works.
Example 3.4 Solve 5x + y = 23
2x + y = 11
First, number the equations:
5x + y = 23 (i)
2x + y = 11 (ii)
Since both equations have the same y-term, subtract equation (ii) from equation (i).This eliminates y to give:
3x = 12
x = 4 (Divide both sides by 3)
Now substitute x = 4 into one of the original equations (usually that with thesmallest numbers).
So, substitute x = 4 into (ii): 2x + y = 11
which gives: 8 + y = 11
y = 11 – 8
y = 3
Next, test the solution in equation (i). So, substitute x = 4 and y = 3 into 5x + y,which gives:
20 + 3 = 23
This is correct, so we can confidently say that the solution is x = 4 and y = 3.
45
Maths Frameworking PB 9.3 Chs 1–9 29/5/08 18:35 Page 45

Example 3.5
In both Example 3.4 and Example 3.5, the y-term was eliminated. But with other pairs ofequations, it could be easier to eliminate the x-term. See, for example, Questions 7, 8and 10 in Exercise 3B.
Solve each pair of simultaneous equations.
5x + y = 21 6x + 2y = 14
2x + y = 9 2x + 2y = 10
3x + y = 10 4x + 2y = 24
5x – y = 14 2x – 2y = 6
5x – 4y = 31 4x + 2y = 26
x – 4y = 3 7x – 2y = 29
x + 4y = 12 2x + 4y = 20
x + 3y = 10 2x + 3y = 16
5x – y = 10 2x + 5y = 19
3x + y = 14 2x + 3y = 13
5x – 3y = 11 6x – y = 26
2x + 3y = 17 3x – y = 11
Exercise 3B
Solve 4x + 3y = 34
2x – 3y = 8
First number the equations:
4x + 3y = 34 (i)
2x – 3y = 8 (ii)
Since both equations have the same y-term but different signs, add equations (i) and(ii). This eliminates y to give:
6x = 42
x = 7 (Divide both sides by 6.)
Now substitute into equation (i).
So, put x = 7 into (i): 4x + 3y = 34
This gives: 28 + 3y = 34
3y = 6
y = 2 (Divide both sides by 3)
Test the solution by putting x = 7 and y = 2 into the equation (ii), 2x – 3y. This gives:
14 – 6 = 8
This is correct. So, the solution is x = 7 and y = 2.
46
7
Maths Frameworking PB 9.3 Chs 1–9 29/5/08 18:35 Page 46

Solving by substitution
Simultaneous equations can be solved another way. When one or other of the twovariables can be easily made the subject of either of the two equations, it can be easier tosubstitute that variable in the other equation.
Example 3.6 Solve 3x + 2y = 18
2x – y = 5
First number the equations:
3x + 2y = 18 (i)
2x – y = 5 (ii)
Take equation (ii) and add y to both sides, which gives:
2x – y = 5
2x = 5 + y
Subtracting 5 from both sides gives:
2x – 5 = y
By convention, this is written as:
y = 2x – 5
Substitute y = 2x – 5 into equation (i), which gives:
3x + 2(2x – 5) = 18
Expand the bracket to obtain:
3x + 4x – 10 = 18
7x – 10 = 18
Add 10 to both sides, which gives:
7x = 28
x = 4 (Divide both sides by 7.)
Now substitute x = 4 into the equation with y as the subject, y = 2x – 5, giving:
y = 2 × 4 – 5 = 3
Hence, the solution is x = 4 and y = 3.
Solve each of the following problems by expressing it as a pair ofsimultaneous equations, for which you find the solution.
1 The two people in front of me in the post office bought stamps. One bought10 second-class and five first-class stamps at a total cost of £3.35. The otherbought 10 second-class and 10 first-class stamps at a total cost of £4.80.
How much would I pay for:
a one first-class stamp? b one second-class stamp?
2 In a fruit shop, one customer bought five bananas and eight oranges at atotal cost of £2.85. Another customer bought five bananas and 12oranges at a total cost of £3.65.
If I bought two bananas and three oranges, how much would it cost me?
47
8
Maths Frameworking PB 9.3 Chs 1–9 29/5/08 18:35 Page 47

Solve each of the following pairs of simultaneous equations by first changing the subjectof one of the equations to give an equal term. Then, by addition or subtraction, eliminatethe equal term.
5x + 3y = 23 3x + y = 9
2x – y = 7 4x + 5y = 23
5x – 2y = 14 4x + 3y = 37
x – y = 1 2x + y = 17
2x + y = 9 10x – 3y = 19
6x + 2y = 22 x + 2y = 18
4x + 5y = 13 3x + y = 14
x + 3y = 5 4x – 2y = 2
5x – 2y = 24 5x – 2y = 36
3x + y = 21 x + 6y = 20
x + 3y = 16 3x – y = 7
4x + 7y = 39 5x + 6y = 50
Equations involving fractions
When you have to solve an equation which involves a fraction, you have to use the rulesfor working out ordinary fractions.
For example, to solve = 5, you first multiply both sides by 3 in order to remove thedenominator:
× 3 = 5 × 3
which gives: x = 15
x–3
x–3
Work out each of the following problems by expressing it as a pair ofsimultaneous equations, which are then solved.
1 At a local tea room, I couldn’t help noticing that at one table, where thepeople had eaten six buns and had three teas, the total cost was £1.65.
At another table, the people had eaten 11 buns and had seven teas at atotal cost of £3.40.
My guests and I had five buns and had six teas. What would it cost me?
2 A chef uses this formula to cook a roast: T = a + bW
where T is the time it takes (minutes), W is the weight of the roast (kg),and both a and b are constants.
The chef says it takes 2 hours 51 minutes to cook a 12 kg roast, and 1 hour 59 minutes to cook an 8 kg roast.
How long will it take to cook a 5 kg roast?
Exercise 3C
48
8
Maths Frameworking PB 9.3 Chs 1–9 29/5/08 18:35 Page 48

Follow through Examples 3.7 to 3.9, which show you how to remove the fractional part ofequations.
Example 3.7
Example 3.8
Example 3.9 Solve 4–5 (2x + 1) = 2–
3(x – 3)
Multiply both sides by the product of the denominators of the fractions, which is 5 × 3 = 15. This gives:
15 × 4–5 (2x + 1) = 15 × 2–
3(x – 3)
Cancelling the fractions leaves:
3 × 4(2x + 1) = 5 × 2(x – 3)
12(2x + 1) = 10(x – 3)
Multiply out both brackets to obtain:
24x + 12 = 10x – 30
which simplifies to:
14x = –42
Dividing both sides by 14 gives the solution:
x = –3
x – 1 2x + 8Solve –– = ––2 6
The product of the two denominators is 12. So, multiply both sides by 12 which,after cancelling, gives:
6(x – 1) = 2(2x + 8)
Expand both sides to obtain:
6x – 6 = 4x + 16
which simplifies to:
2x = 22
x = 11
So, x = 11 is the solution.
4x + 5Solve ––– = 73
First, multiply both sides by 3 to obtain:
4x + 5 = 21
Subtract 5 from both sides, which gives:
4x = 16
Dividing both sides by 4 gives the solution:
x = 4
49
Maths Frameworking PB 9.3 Chs 1–9 29/5/08 18:35 Page 49

Solve each of these equations.
a = 12 b = 6 c = 9 d = 8 e = 6
Solve each of the following equations.
a = b = c =
Solve each of the following equations.
a (x + 2) = (4x + 1) b (2x + 5) = (3x – 2)
c (2x + 3) = (3x – 6) d (4x – 1) = (2x – 4)
Solve each of the following equations.
a = b = c =
d = e = f =
Inequalities
5x + 6 ≥ 10 is a linear inequality. It looks and behaves similarly to linear equations whichyou have already met, but instead of an equals sign, it contains one of the four inequalitysigns. It is important that you are familiar with them:
> is greater than
≥ is greater than or equal to
< is less than
≤ is less than or equal to
The same rules are used to solve linear inequalities as linear equations. However, thesolutions to linear inequalities can be expressed graphically on a number line as wellas using standard inequality notation, as examples 3.10 and 3.11 show.
1 Solve each of the following equations.
a 4(2t + 3) = 3(4t + 1) – 5(3t – 2) b 2(5h + 4) = 6(2h + 3) – 3(5h + 1)
c 5(3m + 1) = 4(5m – 2) – 4(2m – 3) d 7(8g – 5) = 5(6g + 4) – 2(3g + 4)
e 3(4k – 2) = 5(3k + 1) – 2(4k – 3) f 4(3x – 1) = 3(5x – 2) – 4(2x – 7)
2 Solve each of the following equations.
a 5(t + 0.3) = 2(t + 1.6) – 4(t – 0.2) b 2(h + 1.4) = 5(h + 3.1) + 3(h + 1.1)
c 6(m + 1.3) = 3(m – 0.2) – 3(m – 3.2) d 5(g – 0.5) = 4(g + 1.4) – 2(3g + 0.4)
e 4(4k – 0.2) = 4(k + 1.1) – 2(4k – 3.1) f 3(2x – 1.3) = 2(3x – 2.1) – 3(x – 0.7)
3––(5x – 1)
2––(4x + 3)
2––(2x – 1)
6––(5x + 1)
5––(x + 4)
7––(x – 3)
2––(x – 5)
3––(x + 2)
4––(x – 1)
5––(x + 3)
7––(x + 4)
4––(x + 1)
34
23
12
35
34
12
12
34
(3x – 2)––5
(2x – 3)––2
(2x + 3)––4
(3x – 1)––3
(x – 4)––2
(2x + 1)––5
3w–4
2x–3
3m–8
2t–5
4x–5
Exercise 3D
50
7
Maths Frameworking PB 9.3 Chs 1–9 29/5/08 18:35 Page 50

Example 3.10
Example 3.11
Solve the following inequalities and illustrate their solutions on number lines.
a x + 3 < 5 b x – 2 ≥ 7 c t – 4 < 2
d 2t + 3 > 7 e 3t – 1 ≤ 8 f 5x + 3 < 8
g 3x + 5 > 2 h 4t + 7 ≤ –1 i 2x – 4 ≥ 4
j 7t + 3 ≥ 3 k 3(x + 4) ≥ 6 l 2(x – 2) ≤ 8
m > 3 n x + 1 < 3 o 4(2x – 3) ≥ 12
Write down the values of x that satisfy the conditions given.
a x + 11 < 20, where x is a positive integer
b x + 15 ≤ 20, where x is a positive, odd number
c 2x – 3 < 14, where x is a positive, even number
d 5(3x + 4) < 100, where x is a positive, prime number
e 2x + 1 ≤ 50, where x is a positive, square number
f 4x – 1 ≤ 50, where x is a positive, prime number
g 5x + 3 < 60, where x is a positive, multiple of three
Solve the following linear inequalities.
a ≤ 4 b > 7
c < 2 d ≥ 52x – 5––3
3x + 1––5
x – 4––3
x + 3––2
12
x4
Exercise 3E
Solve 1–2 t – 1 < 4
Add 1 to both sides to give: 1–2 t < 5
Multiply both sides by 2 to obtain: t < 10
The solution expressed on a number line is shown below. An empty circle is used toshow that the 10 is not included in the solution.
So:
–10 –5 0 5 10 15
x≤
x<
x≥
x>
Solve 5x + 6 ≥ 10
Subtract 6 from both sides to give: 5x ≥ 4
Divide both sides by 5 to obtain: x ≥ 0.8
The solution expressed on a number line is shown below. To show that 0.8 isincluded in the solution, a filled in circle is used.
–1 0 1 2
51
7
Maths Frameworking PB 9.3 Chs 1–9 29/5/08 18:35 Page 51

Solve the following linear inequalities, illustrating their solutions on number lines.
a 2x + 4 < 17 and x > 3 b 4(x – 3) ≤ 0 and x > –2
c 5x – 4 > 18 and x ≤ 8 d 2(5x + 7) ≥ 15 and x < 1
e 1 ≤ 3x + 2 ≤ 17 f 1 ≤ 4x – 3 < 13
Graphs showing direct proportion
When Mr Shah uses his car for business he gets paid 80p per mile by his company.
The table below shows the amounts he claims for different lengths of journeys.
Length of journey (miles, M) 5 10 15 20 25 30
Claim (£, C) 4.00 8.00 12.00 16.00 20.00 24.00
The information can be graphed, as shown on the right. Because the amount claimed is in directproportion to the length of journey, the graph is astraight line.
Note that the equation of the graph is C = 0.8M,where C is the amount claimed in pounds and Mis the number of miles travelled. The gradient ofthe line, 0.8, is the amount paid per mile.
Straight-line graphs that pass through the origin show the relationship between twovariables that are in direct proportion. This means that for every unit that one variableincreases the other variable increases by a fixed amount.
24
20
16
12
8
4
0
Cla
im (£,
C)
0 5 10 15 20 25 30
Length of journey (miles, M)
THIS SALE
LITRES
20.00
25.00
£
Much like linear equations, linear inequalities can also beplotted on a graph. The result is a region that lies on one side of a straight line or the other, which is usually shaded.
1 Show each of the following inequalities as a graph.
a y ≥ 6 b x ≤ 4 c y ≤ 3x + 2
2 The shaded area shown on the graph on the right shows a region that satisfies more than one inequality.
Write down the three inequalities which describe the shaded area.
y
x
y ≤ 2
4
3
2
1
O 1 2 3 4
x
y
52
7
8
Maths Frameworking PB 9.3 Chs 1–9 29/5/08 18:35 Page 52

Not all graphs that show the relationship between two variables are in direct proportion.
For example, taxi fares have a fixed charge to start then the rest of the cost of the journeyis in direct proportion to the mileage travelled.
Example 3.12
One morning in Scotland, Jenny recorded the temperature every hour from 8 amuntil noon. Her results are shown below.
Time 8 am 9 am 10 am 11 am 12 noon
Temperature (ºC) 4 5.5 7 8.5 10
a Plot the points on a graph and join them up with a suitable line.
b On this morning, are the temperature rises above 4° directly proportional to thenumber of hours after 8 am?
c Write down the equation of the line showing the relationship between thenumber of hours after 8 am, t, and temperature, C.
d If the relationship held all day, what would be the temperature at 4 pm, when t = 8?
Thousands of fans pour into a stadium ready to watch Joe King. A count is kept of thenumber of fans in the stadium after various time intervals.
Time (pm) 1.30 1.45 2.00 2.15
Number of fans 14 000 26 000 38 000 50 000
a Plot the points on a graph and join them up with a suitable line.
b For this hour, is the increase in the number of fans above the initial 14 000directly proportional to the time after 1.30 pm?
Exercise 3F
Mr Evans wants to convert the scores on a written French test to a standard percentage. All of his class already have 20 percent on an oral test.
The table above shows data he wants to use.
a Create a graph which Mr Evans could use as a conversion graph from his Frenchscores to percentage scores.
b What is the equation of this graph?
a Use the three points given above to draw a straight-line graph. Then use that graph to make a conversion graph.
b The gradient of the line is approximately 1.33, so the equation is P = 20 + 1.33F.
100
80
60
40
20
0
Final
per
cen
tage
(P
)
0 10 20 30 40 50 60
Written test score (F)
Written test score (F) 0 30 60
Final Percentage (P) 20 60 100
53
6
Maths Frameworking PB 9.3 Chs 1–9 29/5/08 18:35 Page 53

c Write down the equation of the line showing the relationship between thenumber of minutes added after 1.30 pm, t, and the number of fans, f.
d If the relationship held all afternoon, when did the first fan enter the stadium?
Given in the table below is the length of a stretched spring with each of a series ofdifferent weights hanging from it.
Weight (g) 0 200 400 600 800 1000
Length (cm) 10 12 14 16 18 20
a Plot the points on a graph and join them up with a suitable line.
b Is the extension directly proportional to the weight?
c Write down the equation of the line showing the relationship between hangingweight, w, and length, L.
d If the relationship continued to hold, what would be the hanging weight whenthe length of the spring is 27 cm?
Tea is served at a garden party between 3.00 pm and 5.30 pm. The number of cupsof tea sold during the afternoon is shown in the table below.
Time (pm) 3.00 3.15 4.00 4.45 5.00 5.30
Cups of tea 0 13 52 91 104 130
a Plot the points on a graph and join them up with a suitable line.
b On this afternoon, is the number of cups of tea sold during a time intervaldirectly proportional to the length of time?
c Write down the equation of the line showing the relationship between the lengthof time, t, and the number of cups of tea sold, S.
d If the relationship held all day and the garden party continued, how many cupsof tea would have been sold by 9.30 pm, when t = 6.5?
An experiment was done with a bouncing tennis ball. A tennis ball was droppedfrom different heights and the height of the first bounce was measured. The resultsare given in the table below.
Height of drop (cm) 25 50 75 100 125 150 175 200
Bounce (cm) 15 31 48 66 82 98 113 130
a Plot the points on a graph and join them up with a suitable line.
b Is the bounce directly proportional to the height of drop?
c Write down the equation of the line showing the relationship between height ofdrop, h, and bounce, b.
d If the relationship held, from what height would you need to drop the ball inorder to have a bounce of 5 m?
54
6
Maths Frameworking PB 9.3 Chs 1–9 29/5/08 18:35 Page 54

Solving simultaneous equations by graphs
Every equation can be graphed. Every pair of coordinates on the graph represent a possiblesolution for the equation. Hence, when the graphs of two equations are drawn betweenthe same axes, where they intercept gives a solution which satisfies both equations.
Example 3.13 By drawing their graphs on the same grid, find the solution of these simultaneousequations:
3x + 5y = 25
5x – 3y = 2
First, number the equations:
3x + 5y = 25 (i)
5x – 3y = 2 (ii)
Equation (i) is drawnby plotting thepoints where thegraph crosses bothaxes:
When x = 0, y = 5, giving the coordinates (0, 5).
When y = 0, x = 8.3, giving the coordinates (8.3, 0).
Equation (ii) is drawn by plotting three points for y and substituting:
When y = 0, x = 0.4, giving the coordinates (0.4, 0).
When y = 1, x = 1, giving the coordinates (1, 1).
When y = 6, x = 4, giving the coordinates (4, 6).
The point where the graphs intercept is (2.5, 3.5). So, the solution to thesimultaneous equations is x = 2.5 and y = 3.5.
6
5
4
3
2
1
0 1 2
x
y
3 4 5 6 7 8 9
Solve this problem by drawing a graph.
Two women are walking on the same long, straight road towards each other. Onesets off at 9.00 am at a speed of 4 km/h. The other also sets off at 9.00 am, 15 kmaway, at a speed of 5 km/h. At 9.10 am, a butterfly leaves the shoulder of thequicker woman and flies to the other woman at 20 km/h. It continues to fly fromone woman to the other until they both meet, and take a photograph of it.
a At what time will the butterfly be photographed?
b How many times will the butterfly have landed on the woman walking at 4 km/h?
55
7
Maths Frameworking PB 9.3 Chs 1–9 29/5/08 18:35 Page 55

Solve each pair of simultaneous equations by drawing their graphs. Give your solutions toone decimal place.
x + y = 5
y = 5x – 4
x + y = 4
2y = 4x – 7
y = x – 1
y = 8 – x
x + y = 5
x = 8 – 3y
y = 6x – 5
x + y = 4
y = 3x – 5
2x + y = 6
4y = 12 + x
3x = 2y – 3
x + y = 4
5y – 3x = 3
Solve each pair of simultaneous equations by drawing their graphs.
1 y = x2 – 1 and 5x + 4y = 20
2 y = x2 + x and 8x + 3y = 12
Exercise 3G
56
7
8
6I can expand and simplify expressions involving brackets.
I can solve linear equations with brackets where the solution may be fractional or negative.
I can solve equations involving a fraction where the solution may be negative.
I can draw and interpret graphs that show direct proportion.
7I can solve equations with more than one fraction where the solution may be negative.
I can solve linear inequalities and represent their solution on a number line.
I can solve a pair of linear simultaneous equations by elimination of one variable.
I can solve a pair of linear simultaneous equations by drawing graphs.
8I can solve a pair of linear simultaneous equations by substitution of one equation into the other.
Maths Frameworking PB 9.3 Chs 1–9 29/5/08 18:35 Page 56

1 2007 Paper 2
Look at the equation in the box.
Use it to help you write the missing expressions in terms of y.
The first one is done for you.
5 + x + (x + 1) + (x + 2) = y + 5
(x + 5) + (x + 6) + (x + 7) =
2x + 2(x + 1) + 2(x + 2) =
(x + a) + (x + 1 + a) + (x + 2 + a) =
2 2006 Paper 1
Solve these simultaneous equations using an algebraic method.
3x + 7y = 18
x + 2y = 5
You must show your working.
3 2007 Paper 1
Look at the simultaneous equations.
a Write an expression for y in terms of a and b.
b Now write an expression for x in terms of a and b.
Write your expression as simply as possible.
x + 2y = ax + y = b
x + (x + 1) + (x + 2) = y
57
7
8
Maths Frameworking PB 9.3 Chs 1–9 29/5/08 18:35 Page 57

Pythagoras’ theorem
Thousands of years ago, the builders of the pyramids in Egypt used a rope with 12 equally spaced knots, which, whenstretched out as shown on the right, formed a right-angledtriangle.
This helped the builders make sure that any right anglesrequired in the construction of the Pyramids were accurate.
In a right-angled triangle, the longest side opposite the right angle is called the hypotenuse. Hypotenuse
58
CHAPTER 4 Geometry and Measures 1
This chapter is going to show you
How to use Pythagoras’ theorem
How to find the locus of a point
using more complex rules
How to recognise congruent
triangles
Some important circle theorems
How regular polygons tessellate
The difference between a
practical demonstration and a
proof
What you should already know
How to find the square and the
square root of a number
How to find the locus of a point
How to construct the
perpendicular bisector of a line
segment and the bisector of an
angle
How to recognise congruent
shapes
The definition of a circle and the
names of its parts
How to calculate the interior
and exterior angles of a polygon
Maths Frameworking PB 9.3 Chs 1–9 29/5/08 18:35 Page 58

Activity Make accurate copies of the three right-angled triangles below.
Next, measure the length of the hypotenuse of each one. Then copy and complete thetable below.
Can you see a pattern in the last three columns? If you can, you have just rediscoveredPythagoras’ theorem.
Pythagoras was a Greek philosopher and mathematician, who was born in about 581 BCon the island of Samos, just off the coast of Turkey. The following famous theorem aboutright-angled triangles is attributed to him.
In any right-angled triangle, the square of the hypotenuse is equal to the sum of the squares of the other two sides.
Pythagoras’ theorem is usually written as:
c2 = a2 + b2
The following two examples will show you how to use Pythagoras’ theorem.
Example 4.1 Finding the length of the hypotenuse
Calculate the length x in the triangle shown on the right.
Using Pythagoras’ theorem:
x2 = 62 + 52
= 36 + 25
= 61
So, x = √–61 = 7.8 cm (1 dp)
You should be able to work this out on a scientific calculator. Try the followingsequence of keystrokes:
This may not work on some makes of calculator, and you may need to ask yourteacher to help you.
5 cm
6 cmx
+x2 =6 5 x
2 =
ca
b
a b c a2 b2 c2
3 4
5 12
6 8
ca
b
4 cm
3 cm
12 cm
5 cm
8 cm
6 cm
59
Maths Frameworking PB 9.3 Chs 1–9 29/5/08 18:35 Page 59

Example 4.2
Calculate the length of the hypotenuse in each of the following right-angledtriangles. Give your answers to one decimal place.
Calculate the length of the unknown side in each of the following right-angledtriangles. Give your answers to one decimal place.
8 cm5 cm
18 cm
20 cmd
4 m
6 me
a b c d
e f g h
a 11 cm
15 cmb 10 cm
12 cm
c
3.9 m5.6 m
f
7.6 mg
6.2 m
4.5 m
h
1 m
5 cm
3 cma
b8 cm
9 cm
c
12 cm
6 cmd
4 cm
4 cme
4 m
1 m
g
3 m
2 mf
6.5 mh
8.7 m
a b c d
e f g h
7 cm
6 cm
Exercise 4A
Finding the length of a shorter side
Calculate the length x in the triangle shown on the right.
Using Pythagoras’ theorem:
x2 + 72 = 92
x2 = 92 – 72
= 81 – 49
= 32
So, x = √–32 = 5.7 cm (1 dp)
Try the following sequence of keystrokes:
x
7 cm9 cm
79 –x2 =x
2 =
60
7
Maths Frameworking PB 9.3 Chs 1–9 29/5/08 18:35 Page 60

Calculate the lengths of x, y and z in the diagram on the right.Give your answers to one decimal place.
Calculate the length of the diagonal AC in the rectangle ABCD. Give your answer toone decimal place.
Calculate the length of the diagonal of a square with side length 5 cm. Give youranswer to one decimal place.
The table below shows the lengths, in centimetres, of the three sides of six triangles.
Construct each one accurately, using a ruler and a pair of compasses. Label it as in the triangle on the right.
Copy and complete the table. Then, write down a rule using the results in thelast two columns.
Test your rule by drawing triangles with different lengths for a, b and c.
c
C
B A
a b
a b c a2 b2 c2 a2+ b2 Is a2 + b2 = c2? Is ∠CIs a2 + b2 > c2? right-angled,Is a2 + b2 < c2? acuteWrite =, > or < or obtuse?
3 4 5
4 5 7
5 6 7
5 12 13
4 8 10
7 8 9
10 cm
4 cm
A B
D C
1 cm
1 cm
1 cm
1 cm
x
y z
61
7
Maths Frameworking PB 9.3 Chs 1–9 29/5/08 18:35 Page 61

Solving problems using Pythagoras’theorem
Pythagoras’ theorem can be used to solve various practical problems.
When solving such a problem:
● Draw a diagram for the problem, clearly showing the right angle.
● Decide whether the hypotenuse or one of the shorter sides needs to be found.
● Label the unknown side x.
● Use Pythagoras’ theorem to calculate x.
● Round your answer to a suitable degree of accuracy.
Example 4.3
In this exercise, give your answers to a suitable degree of accuracy.
An aircraft flies 80 km due north. It then flies 72 km due west. Calculate how far theaircraft would have travelled had it taken the direct route.
A flagpole is 10 m high. It is held in position by two ropes which are fixed to the ground, 4 m away from the foot of the flagpole.Calculate the length of each rope.
An 8 m ladder is placed against a wall so that the foot of the ladder is 2 m away from the bottom of the wall. Calculate how farthe ladder reaches up the wall.
2 m
8 m
10 m
4 m4 m
Exercise 4B
A ship sails 4 km due east. It then sails for a further 5 km due south. Calculate thedistance the ship would have travelled had it sailed a direct route.
First, draw a diagram to show the distances sailed by the ship. Then label the direct distance, x.
Now use Pythagoras’ theorem:
x2 = 42 + 52
= 16 + 25
= 41
So, x = √––41 = 6.4 km (1 dp)
5
4
x
62
7
Maths Frameworking PB 9.3 Chs 1–9 29/5/08 18:35 Page 62

The diagram shows the side wall of a shed. Calculate the length of the sloping roof.
The diagram shows a walkway leading from the dock on to a ferry. Calculate thevertical height of the walkway above thedock.
Two sides of a right-angled triangle are 20 cm and 30 cm. Calculate the length of thethird side in each of the following cases.
a It is the hypotenuse.
b It is not the hypotenuse.
ABC is an isosceles triangle.
a Calculate the perpendicular height, h.
b Hence calculate the area of the triangle.
The diagram shows three towns X, Y and Z connected by straight roads. Calculate the shortest distance fromX to the road connecting Y and Z.
The triangle PQR is drawn on a coordinategrid, as shown on the right.
a The length of PQ is 3 units. Write down the length of QR.
b Calculate the length of PR.
6
5
4
3
2
1
00 1 2 3 4 5 6
y
x
R
P
Q
X
Y Z
6 km 6 km
8 km
h8 cm 8 cm
6 cm
A
B C
8 m
7.8 m
2.6 m3.5 m
2.4 m
63
7
Maths Frameworking PB 9.3 Chs 1–9 29/5/08 18:35 Page 63

Calculate the length between each of the following pairs of coordinate points.
a A(2, 3) and B(4, 7) b C(1, 5) and D(4, 3)
c E(–1, 0) and F(2, –3) d G(–5, 1) and H(4, –3)
Loci
A locus (plural ‘loci’) is the movement of a point according to a given set of conditionsor a rule.
In Year 8, you met two important constructions, which can now be stated to be loci.
Example 4.4
A locus can sometimes be a region.
B
A
C
A B
● The locus of a point which isalways equidistant from each oftwo fixed points, A and B, is theperpendicular bisector of the linejoining the two points.
● The locus of a point which isequidistant from two fixed lines ABand BC, which meet at B, is thebisector of the angle ABC.
Pythagorean triples
Each set of the three numbers in the table on the right obey Pythagoras’ theorem, c2 = a2 + b2, where a, b and c are whole numbers. Each set of numbers is called a Pythagorean triple, named after Pythagoras, who first discovered a formula for finding them.
a Continue the table to find other Pythagorean triples. You may wish to use a spreadsheet to help you.
b Can you find the formula which Pythagoras discovered, giving b and cwhen the value of a is known?
c Do multiples of any Pythagorean triple still give another Pythagoreantriple?
a b c
3 4 5
5 12 13
7 24 25
64
7
Maths Frameworking PB 9.3 Chs 1–9 29/5/08 18:35 Page 64

Example 4.5
Using a ruler and compasses, construct the perpendicular bisector of each of thefollowing lines.
a b
Using a ruler and compasses, construct the bisector of each of the following angles.
a b c
X is a fixed point. Draw diagrams to show the following.
a The locus of a point which is always 3 cm from X.
b The locus of a point which is always 3 cm or less from X.
c The locus of a point which is always less than 3 cm from X.
A and B are two points, 6 cm apart. Draw a diagram to show the region which is 4 cm or less from A and 3 cm or less from B.
Q R
P
40°
X Y
Z
75°
A B
C
120°
A B6 cm
C
D4.5 cm
Exercise 4C
● A point which moves so that it is always 5 cm from a fixedpoint X has a locus which is a circle of radius 5 cm, with itscentre at X.
● The locus of a set of points which are 5 cm or less from a fixedpoint X is a region inside a circle of radius 5 cm, with its centreat X.
Note that the region is usually shaded.
● The locus of a set of points which are less than 5 cm from afixed point X is a region inside a circle of radius 5 cm, with itscentre at X.
Note that the boundary usually is drawn as a dashed line toshow that the points which are exactly 5 cm from X are not tobe included.
X
X
X
65
6
Maths Frameworking PB 9.3 Chs 1–9 29/5/08 18:35 Page 65

Make a copy of Treasure Island,as shown on the right. Thetreasure is buried at a point Xon the island.
X is equidistant from A and Dand is also equidistant from Band C. Mark the position of the treasure on your map.
The diagram shows two perpendicular fences, PQ and QR. Bob wants to plant a tree so that it isequidistant from both fences and equidistant from Pand R.
On a copy of the diagram, mark, with a cross, theposition where Bob plants the tree.
A radar station at X has a range of 100 km, and a radar station at Y has a range of 80 km. The direct distance from X to Y is 140 km.
Using a scale of 1 cm to 20 km, make a scale drawing to show the region where anaircraft can be picked up by both radar stations.
A and B are two barns which are 120 m apart. A farmer wants to fence off an area ofland that is nearer to barn A than barn B and is within 80 m of barn B. Using a scaleof 1 cm to 20 m, make a scale drawing to show the area of land enclosed by thefence.
P is a fixed point and a point Q moves in space so that the length of PQ is always 10 cm. Describe the locus of Q.
A fly moves around a strip light such that it is always 5 cm from the light. Describethe locus of the fly.
A B
120 m
P
Q R
AB
DC
66
7
Maths Frameworking PB 9.3 Chs 1–9 29/5/08 18:35 Page 66

1 X is a point on the circumference of a circle. Draw the locus of X as thecircle rolls along the line AB.
To help you draw the locus, use a coin and a ruler. Put a mark on thecoin and as it rolls along the edge of the ruler, make marks on your paperfor different positions of the coin, as on the diagram below. Join themarks with a curve to show the locus of X.
2 The diagram on the right shows a 6 m ladder leaning against the wall of a house. The ground is slippery and the ladder slides down the wall until it lies flat on the ground.
Make a scale drawing to show the locus of the middle point of the ladder as the ladder slides down the wall. Use a scale of 1 cm to 1m.
3 If you have access to ICT facilities, find how to draw the locus for morecomplex rules.
4 A builder wants to make a straight path from House A to the road, andanother straight path from House B to the same point on the road.
Draw a sketch to show where the paths should go in order to make thelengths of the paths as short as possible.
6 m
A
B
A B
X
67
7
Maths Frameworking PB 9.3 Chs 1–9 29/5/08 18:35 Page 67

Congruent triangles
You already know how to construct triangles from given dimensions, as summarised below.
Three sides (SSS) Two sides and the Two angles and the Right angle, hypotenuseincluded angle (SAS) included side (ASA) and side (RHS)
You can use these conditions to show that two triangles are congruent, as Example 4.6shows.
Example 4.6
Show that each of the following pairs of triangles are congruent. Give reasons foreach answer and state which condition of congruency you are using: SSS, SAS, ASAor RHS.
a b
c d
N O
M
8 cm
50° 70°
8 cm
5 cm
W X
V
5 cm
8 cm
S
T U
P
QR
50°
70° 8 cm
H I
G
10 cm 11 cm
12 cm
11 cm
10 cm12 cm
J
L
K
5 cm
3 cm
E
D
F
110°
5 cm
3 cmB C
A
110°
Exercise 4D
Side
Hypotenuse
Angle
Side
Angle
Side
Angle
Side
Side Side
Side
68
7
Show that ABC is congruent to XYZ.
The diagram shows the following:
∠B = ∠X
∠C = ∠Y
BC = XY
So, ABC is congruent to XYZ (ASA).
This can be written as:
ABC ≡ XYZ
A
B
C5 cm
70°
56°
Z X
Y
5 cm56°
70°
Maths Frameworking PB 9.3 Chs 1–9 29/5/08 18:35 Page 68

Explain why ABC is congruent to XYZ.
a Explain why PQR is not necessarily congruent to XYZ.
b Check your answer by trying to draw one of the triangles.
ABC is an isosceles triangle with AB = AC.The perpendicular from A meets BC at D.
Show that ABD is congruent to ACD.
Draw a rectangle ABCD. Draw in the diagonals AC and BD to intersect at X. State thedifferent sets of congruent triangles in your diagram.
A
B D C
32°
79°
69°
Q R
P X Y
Z
69°
79°
32°
40° 60°
4 cmB C
A 4 cmX Y
Z
60°
80°
69
7
1 Show that the opposite angles in a parallelogram are equal by usingcongruent triangles.
2 Draw a kite and label its vertices ABCD with AB = AD. Now draw thediagonals and label their intersection E.
a Show that ABC is congruent to ADC.
b State all other pairs of congruent triangles.
3 Construct as many different triangles as possible by choosing any threemeasurements from the following: 4 cm, 5 cm, 40° and 30°.
4 Show what happens when you try to construct a triangle for which thegiven angle is not included between the two given sides (SSA). There arethree cases to consider.
Maths Frameworking PB 9.3 Chs 1–9 29/5/08 18:35 Page 69

Circle theorems
The following terms for parts of a circle were met in Year 8.
A circle is a set of points equidistant from a centre, O.
Circumference The distance around a circle.
Radius The distance from the centre of a circle to its circumference.
Diameter The distance from one side of a circle to the other, passing through the centre.
Chord A line which cuts a circle into two parts.
Tangent A line which touches a circle at a single point on its circumference.
Exercise 4E introduces two important circle theorems.
The angle between a tangent and a radius
● Draw a circle, centre O, with a radius of 3 cm.
● Draw a tangent to the circle with the point of contact at A.
● Draw the radius OA.
● Measure the angle between the tangent and the radius.
● Write down what you notice.
● Repeat for circles with different radii.
You have just completed a practical demonstration to show an important circletheorem:
A radius is perpendicular to a tangent at the point of contact.
Draw a diagram in your book to explain this theorem.
The perpendicular bisector of a chord
● Draw a circle, centre O, with a radius of 3 cm.
● Draw a chord anywhere inside the circle.
● Construct the perpendicular bisector of the chord.
● Write down what you notice.
● Repeat for circles with different radii.
You have just completed a practical demonstration to show another important circletheorem:
The perpendicular bisector of a chord passes through the centre of a circle.
Draw a diagram in your book to explain this theorem.
Exercise 4E
Circumference C
O
Radius rr
Chord
Tangent
Od
Diameter d
70
8
Maths Frameworking PB 9.3 Chs 1–9 29/5/08 18:35 Page 70

Calculate the size of the lettered angle in each of the following diagrams.
Use Pythagoras’ theorem to calculate the length x in each of the following diagrams.Give your answers to one decimal place.
O
c d
O5 cm
4 cm 4 cm
x
x
12 cm5 cm
5 cm
O
x3 cm
a
8 cm
b
O
x25 cm
10 cm
62°
a
OOb
25°
O
c
40°
a b c
d e f
60°
dO O
e 102°
O
32°
f
g h i57°
g
O
O
h42°
O
i
50°
71
8
Maths Frameworking PB 9.3 Chs 1–9 29/5/08 18:35 Page 71

The lines AB and CD below are tangents to a circle. The circle touches the tangentsat the points E and F. On a copy of the diagram, construct the circle, using a rulerand compasses.
Hint: Construct two lines to find the centre of the circle.
XY and XZ are two chords of the same circle. On a copy of the diagram, constructthe circle, using a ruler and compasses.
1 The angle in a semicircle
● Draw a circle, centre O, with a radius of 3 cm.
● Draw a diameter and label it AB.
● Mark a point P anywhere on the circumference.
● Complete the triangle APB in the semicircle.
● Measure ∠APB.
● Write down what you notice.
● Repeat for different points on the circumference.
You have just completed a practical demonstration to show yet anotherimportant circle theorem:
The angle formed in a semicircle equals 90°.
Draw a diagram in your book to explain this theorem.
Use this theorem to calculate the size of the lettered angles in each of thefollowing diagrams.
52°
d
O
d
O
f
23°
e
e
57° a
O
a
Ob
48°
b
O
c
35°
c
Y
X
Z
A
B
E
C
F
D
72
8
Maths Frameworking PB 9.3 Chs 1–9 29/5/08 18:35 Page 72

Tessellations and regular polygons
A tessellation is a repeating pattern made on a plane (flat) surface with identical shapeswhich fit together exactly, leaving no gaps.
This section will show you how some of the regular polygons tessellate.
Remember: To show how a shape tessellates, draw up to about ten repeating shapes.
Example 4.7
On an isometric grid, show how a regular hexagon tessellates.
Trace this regular pentagon onto card and cut it out to make a template.
a Use your template to show that a regular pentagondoes not tessellate.
b Explain why a regular pentagon does not tessellate.
Exercise 4F
The diagrams below show how equilateral triangles and squares tessellate.
2 The diagram on the right shows two circles intersecting at B. O is the centre of the small circle and AO is the diameter of the large circle with its centre at P.
Prove that AB is a tangent to the small circle.
3 AP and BP are tangents to a circle with centre O. By using congruent triangles, prove that AP = BP.
P OA
B
O
A
P
B
73
8
Maths Frameworking PB 9.3 Chs 1–9 29/5/08 18:35 Page 73

Trace this regular octagon onto card and cut it outto make a template.
a Use your template to show that a regularoctagon does not tessellate.
b Explain why a regular octagon does nottessellate.
a Copy and complete the table below for regular polygons.
b Use the table to explain why only some of the regular polygons tessellate.
c Do you think that a regular nonagon tessellates? Explain your reasoning.
Polygons can be combined together to form a semi-tessellation. Twoexamples are shown below.
Rectangles and isosceles triangles Squares and hexagons
Invent your own semi-tessellations and make a poster to display in your classroom.
Regular polygon Size of each Does this polygon interior angle tessellate?
Equilateral triangle
Square
Regular pentagon
Regular hexagon
Regular octagon
74
6
Maths Frameworking PB 9.3 Chs 1–9 29/5/08 18:36 Page 74

Practical Pythagoras
This activity is a practical demonstration to show Pythagoras’ theorem. You will need asheet of thin card and a pair of scissors.
● In your book, draw the right-angled triangle X, as on the right.
● On the card, draw eight more triangles identical to X. Cutthem out and place them to one side.
● On your original triangle, X, draw squares on each of thethree sides of the triangle. Label them A, B and C, as below.
● On the card, draw another diagram identical to this. Cut out the squares A, B and C.
● Arrange the cut-outs of the eight triangles and three squares as in the two diagramsbelow.
● What can you say about the total area of Diagram 1 and of Diagram 2?
● Now remove the four triangles from each diagram.
● What can you say about the areas of squares A, B and C?
● Show how this demonstrates Pythagoras’ theorem.
B
A
X
X
X
X
C
X X
X X
Diagram 1 Diagram 2
5 cm
4 cm
3 cm
C
A
X
B
5 cm3 cm
4 cm
X
75
7
Maths Frameworking PB 9.3 Chs 1–9 29/5/08 18:36 Page 75

The activity on page 75 showed a practical demonstration of Pythagoras’theorem. You can also prove Pythagoras’ theorem by using algebra.
Copy the proof below into your book and make sure you can follow each step.
To prove Pythagoras’ theorem
A right-angled triangle has sides a, b and c.
Draw the following diagram using four of these triangles.
The area of each triangle = 1–2ab
So, the area of the four triangles = 2ab
The area of the large square = (a + b)2
The area of the large square can also be given as c2 + 2ab
Therefore: (a + b)2 = c2 + 2ab
a2 + 2ab + b2 = c2 + 2ab
which gives a2 + b2 = c2
This is Pythagoras’ theorem.
cb
a
a
a
a
a
b
b
b
b
cc
cc
76
8
5I know how to tessellate shapes.
6I can find and use interior and exterior angles of polygons.
7I can use and apply Pythagoras’ theorem.
I know how to find the locus of a set of points.
I can recognise congruent triangles.
8I know the difference between a practical demonstration and a proof.
I can solve problems using circle theorems.
Maths Frameworking PB 9.3 Chs 1–9 29/5/08 18:36 Page 76

1 2000 Paper 2
a Any quadrilateral can be split into two triangles.
Explain how you know that the angles inside a quadrilateral add up to 360°.
b What do the angles inside a pentagon add up to?
c What do the angles inside a heptagon (seven-sided shape) add up to?
Show your working.
2 2001 Paper 2
a Calculate the length of the unknown side of this right-angled triangle.
Show your working.
b Calculate the length of the unknown side of this right-angled triangle.
Show your working.
Not drawn
accurately5 cm
11cm
Not drawn
accurately12 cm
17cm
77
6
7
Maths Frameworking PB 9.3 Chs 1–9 29/5/08 18:36 Page 77

3 2001 Paper 2
The diagram shows five triangles. All lengths are in centimetres.
Write the letters of two triangles that are congruent to each other.
Explain how you know they are congruent.
4 2006 Paper 2
In a wildlife park in Africa, wardens wantto know the position of an elephant in acertain area.
They place one microphone at eachcorner of a 4 km by 4 km square.
Each microphone has a range of 3 km.
The elephant is out of range ofmicrophones A and B.
Where in the square could theelephant be?
Show the region accurately on a copyof the diagram, and label the region R.
5 2003 Paper 2
Two right-angled triangles are joined together to make a larger triangle ACD.
a Show that the perimeter of triangleACD is 78 cm.
b Show that triangle ACD is also aright-angled triangle. 28.8cm 5cm
12cm
A DB
C
Not drawn
accurately
12
A B
Scale:
2 cm to 1 km
6
6
7 7 7
8
6 7
8
7
6
8
9
9
10.5
B
AC
D
E
78
7
8
Maths Frameworking PB 9.3 Chs 1–9 29/5/08 18:36 Page 78

6 2003 Paper 1
The diagram shows three points, A, B and C, on a circle, centre O. AC is the diameter of the circle.
a Angle BAO is x° and angle BCO is y°. Explain why angle ABO must be x° and CBO must be y°.
b Use algebra to show that angle ABC must be 90°.
C A
B
O
y°x°
79
8
Maths Frameworking PB 9.3 Chs 1–9 29/5/08 18:36 Page 79

80
Functional Maths
At the end of the garden there is going to be a chicken run.
A piece of netting will be fixed from the long south fence to the
east fence, as shown on the activity worksheet.
Calculate the length of netting that is needed.
Round your answer up to the nearest 0.1 m.
1
The hexagonal seat that goes around the tree is to be made
from planks of wood. Each of the
six sections are identical.
Work out the angles,
(shown in the
diagram), that each
section needs to be
cut at.
3
Garden design
A large semi-circular table
will be placed in front of the
BBQ area, as shown here.
Draw the table accurately on
the activity worksheet.
4
2 m
5 m
1 m 1 m1.5 m
BBQ area
3 m
Instead of 7 m wide, Greg considers making the run 2.5 m wide.
If the same length of netting from Question 1 is used to make
the triangular chicken run, how far along the east fence would
the netting reach?
Round your answer down to the nearest 0.1 m.
2
Greg has just moved house and is designing his new garden.
To work out the questions related to Greg’s garden, you will need a
copy of the Activity Worksheet on page 271.
FM Ch 4 Garden PB 9.3 29/5/08 18:51 Page 80

81
There is going to be a circular pond of radius 1 m at the end of the
garden. The centre of the pond will be 4 m from the corner where the
short south fence meets the northwest fence. The pond will be
equidistant from the two fences.
Draw the pond accurately on the activity worksheet.
Leave in your construction lines.
5
A rotary washing line is to be placed 3 m from the corner where the
long south fence meets the west fence. The washing line will be
equidistant from the two fences.
Show the position of the rotary washing line on the activity worksheet
with a cross (X).
Leave in your construction lines.
6
Paving slabs are going to be put underneath the rotary washing line.
a Which of the following slabs tessellate? Explain how you know.
Draw a sketch if it will help you explain more fully.
A B C
D E F
b Which of the slabs would you choose? Why?
40°
45 cm45 cm
45 cm
30 cm40 cm
50°
130°
50°
40°
30 cm
30 cm
30 cm
30 cm 30 cm
7
A footpath will be laid, starting 8 m from the house. It will go all the
way to the chicken run and will be equidistant from the two trees.
The footpath is going to be 1 m wide.
Draw the footpath accurately onto activity worksheet.
Leave in your construction lines.
8
There is a circular flowerbed near the house. A shrub will be planted in
the centre of the flowerbed.
Show the position of the centre of the flowerbed on the activity
worksheet with a cross (X).
Leave in your construction lines.
9
FM Ch 4 Garden PB 9.3 29/5/08 18:51 Page 81

Scatter graphs and correlation
The maximum temperature, rainfall and hours of sunshine were recorded each day in atown on the south coast of England.
Look at the two scatter graphs below, which were plotted from this data. Is it possible towork out the relationship between rainfall and hours of sunshine?
The graph on the left shows negative correlation. In this case, it means that the higher thetemperature, the less rainfall there is.
The graph on the right shows positive correlation. In this case, it means that the higherthe temperature, the more hours of sunshine there are.
Rai
nfa
ll
Temperature (°C)
Hours
of
sunsh
ine
Temperature (°C)
82
CHAPTER 5 Statistics 1
This chapter is going to show you
How to plan a statistical
investigation
How to interpret correlation
from two scatter graphs
How to draw and use lines of
best fit on a scatter graph
How to interpret time series
graphs
How to draw a cumulative
frequency graph and use it to
estimate median and
interquartile range
How to estimate a mean from a
large set of data
What you should already know
How to calculate statistics
How to collect data using a
suitable method
How to draw and interpret
graphs for discrete data
How to compare two sets of
data using mode, median, mean
or range
Maths Frameworking PB 9.3 Chs 1–9 29/5/08 19:06 Page 82

Looking at both graphs together, what dothey tell you about the effects of changes intemperature?
From the graph on the left, high rainfall means lowtemperature. From the graph on the right, lowtemperature means little sunshine. So, you candeduce that high rainfall means little sunshine. Thatis, rainfall and sunshine are negatively correlated.The graph opposite illustrates this.
The graph on the right shows no correlationbetween the temperature and the number of fishcaught daily off Rhyl – as you might expect.
Here is a table which gives you the rules for combining two scatter graphs, which have acommon axis, to obtain the resulting correlation.
Positive No correlation Negative correlation correlation
Positive correlation Positive No correlation Negative
No correlation No correlation Cannot tell No correlation
Negative correlation Negative No correlation Positive
As you may see from the table, the new graph can have its axes in either order, as thisdoes not affect the correlation.
To remember these rules, think of the rules for multiplying together positive and negativenumbers. See below.
Multiply (×) + 0 –
+ + 0 –
0 0 The exception 0
– – 0 +
Nu
mb
er o
f fi
sh c
augh
td
aily
off
Rhyl
Temperature (°C)
Ho
urs
of
sun
shin
e
Rainfall
83
Maths Frameworking PB 9.3 Chs 1–9 29/5/08 19:06 Page 83

A competition has three different games.
a Ryan plays two games.
To win, Ryan needs a mean score of 60.
How many points does he need to score in Game C? Show your working.
b Ian and Nina play the three games.
Their scores have the same mean.
The range of Ian’s scores is twice the range of Nina’s scores. Copy the tableabove and fill in the missing scores.
The scatter diagrams show the scores of everyone who plays all three games.
c Look at the scatter diagrams and read the statements below:● Positive relationship● No relationship
Which statement most closely describes the relationship between these games?
i Game A and Game B
ii Game A and Game C
iii Game B and Game C
A post office compares the cost of postage with the weight of each parcel and alsothe cost of postage with the size of each parcel. The results are shown on the scattergraphs below.
a Describe the type of correlation between the weight of parcels and the cost ofpostage.
b Describe the type of correlation between the size of parcels and the cost of postage.
c Describe the relationship between the weight of parcels and the size of parcels.
d Draw a scatter graph to show the correlation between the weight of parcels andthe size of parcels. (Plot about 10 points for your graph.)
Wei
ght of par
cel
Cost of postage
Size
of par
cel
Cost of postage
0 20 40 60 80 100
100
80
60
40
20
0
Gam
e B
Game A
0 20 40 60 80 100
100
80
60
40
20
0
Gam
e C
Game A
Ian’s scores 40
Nina’s scores 35 40 45
Game A Game B Game C
Score 62 53Exercise 5A
84
6
Maths Frameworking PB 9.3 Chs 1–9 29/5/08 19:06 Page 84

A pupil compared the ages of a group of men with the length of their hair and alsowith their weights. His results are shown on the two scatter graphs.
a Describe the type of correlation between the length of hair and age.
b Describe the type of correlation between the length of hair and weight.
c Describe the relationship between age and weight.
d Draw a scatter graph to show the correlation between age and weight. (Plotabout 10 points for your graph.)
Scatter graphs and lines of best fit
Look at the two scatter graphs below. One shows a positive correlation and one shows anegative correlation, which you met in the previous lesson.
A line of best fit shows a trend on a scatter graph. Predictions, or estimates, can then bemade using the line of best fit to show what might happen in certain circumstances.
Engi
ne
size
(litr
es)
0–60 time (seconds)0 5 10 15 20
6
5
4
3
2
1
0
0–60 time against engine size
Wei
ght (k
g)
Engine size (litres)0 5 10 15 20
3000
2500
2000
1500
1000
500
0
Weight against engine size
Collect test marks for ten pupils in three different subjects: for example, mathematics,science and art. Draw the scatter graphs for mathematics/science, mathematics/art andscience/art. Comment on your results. You may wish to use a table to show the testmarks.
Maths
Science
Art
Pupil 1 Pupil 2 Pupil 3 Pupil 4 Pupil 5 Pupil 6 Pupil 7 Pupil 8 Pupil 9 Pupil 10
Lem
gth
of
hai
r (c
m)
Age (years)
Len
gth
of
hai
r (c
m)
Weight (kg)
85
6
7
Maths Frameworking PB 9.3 Chs 1–9 29/5/08 19:06 Page 85

To draw a line of best fit, first look at the correlation to decide which direction to drawthe line. Then, using a ruler, draw a straight line between all the plotted points, passing asclose as possible to all of them. Each line should have approximately equal numbers ofpoints on each side.
All the lines of best fit which you will meet will be straight, ruled lines to show positive ornegative correlation.
Example 5.1 The table shows the marks obtained by 10 pupils in their maths and science tests.
a Draw a scatter graph to show the results. b Draw a line of best fit.
c Sarah scored 70 in her maths test but was absent for the science test. Use theline of best fit to estimate the result she would have obtained in science.
Pupil 1 2 3 4 5 6 7 8 9 10
Maths 32 75 53 76 25 62 85 48 39 50
Science 41 80 44 60 30 57 63 48 47 56
a
b
c The estimate of Sarah’s science mark is 62.
Scie
nce
Maths0 20 40 80 100
90
80
70
60
50
40
30
20
10
060
Maths and science test results for 10 pupils
Scie
nce
Maths0 20 40 80 100
90
80
70
60
50
40
30
20
10
060
Maths and science test results for 10 pupils
Engi
ne
size
(li
tres
)
0–60 time (seconds)0 5 10 15 20
6
5
4
3
2
1
0
0–60 time against engine size
Wei
ght
(kg)
Engine size (litres)0 5 10 15 20
3000
2500
2000
1500
1000
500
0
Weight against engine size
86
Maths Frameworking PB 9.3 Chs 1–9 29/5/08 19:06 Page 86

The table shows the scores of some pupils in a mental test and in a written test.
Pupil Andy Betty Chris Darren Eve Frank Gina Harry Ingrid Jack
Mental 12 16 21 25 20 11 17 14 13 19
Written 24 29 33 12 35 18 45 25 28 36
a Plot the data on a scatter graph. Use the x-axis for the mental test from 0 to 30,and the y-axis for the written test from 0 to 50.
b Draw a line of best fit.
c One person did not do as well as expected on the written test. Who do you thinkit was? Give a reason.
The table shows the age of a group of home-owners and the distance that they livefrom their local shops.
Name Kylie Liam Mick Norris Ollie Philip Qaysar Richard Steven Trevor
Age (years) 18 22 28 34 40 42 50 56 65 72
Distancefrom shops 2.5 2 3 1.8 2.4 1.9 2.5 0.5 0.3 0.2(miles)
a Plot the data on a scatter graph. Use the x-axis for the age (years) from 0 to 80,and the y-axis for the distance from the shops from 0 to 5 miles.
b Draw a line of best fit.
c State what you think your line of best fit tells you about this group of people.
A survey is carried out to compare pupils’ ages with the amount of money that theyspend each week.
Age (years) 10 10 11 11 12 12 12 14 14 15
Amount spent 5 8 7 9.50 10 12 6 14 15 13each week (£)
a Plot the data on a scatter graph. Use the x-axis for age from 8 years to 20 years,and the y-axis for amount spent from £0 to £15.
b Draw a line of best fit.
c Use your line of best fit to estimate how much a 13-year-old would spend eachweek.
Look again at Questions 2 and 3.
1 For Question 2, explain why it might not be sensible to use your line ofbest fit to estimate the distance from the shops for a young child.
2 For Question 3, explain why it would not be sensible to use your line ofbest fit to estimate the amount spent each week for a 20-year-old.
Exercise 5B
87
7
Maths Frameworking PB 9.3 Chs 1–9 29/5/08 19:06 Page 87

Time series graphs
A time series graph is any graph which has a time scale.
Look at the graphs below to see whether you can match each graph to one of thestatements listed after graph 5.
Graph 1: Mean temperature difference from normal for UK in 2002
Graph 2: Average annual temperatures of Central England 1659–2001
11
10.5
10
9.5
9
8.5
8
7.5
7
6.5
1659
Tem
per
ature
(°C
)
1668
1677
1686
1695
1704
1713
1722
1731
1740
1749
1758
1767
1776
1785
1794
1803
1812
1821
1830
1839
1848
1857
1866
1875
1884
1893
1902
1911
1920
1929
1938
1947
1956
1965
1974
1983
1992
2001
Year
4.0
3.0
2.0
1.0
0.0
–1.0
–2.0
–3.0Jan Feb Mar Apr May Jun Jul Aug Sep Oct Nov Dec
Diffe
rence
fro
m n
orm
al (
°C
)
Months
88
Maths Frameworking PB 9.3 Chs 1–9 29/5/08 19:06 Page 88

Graph 3: Monthly rainfall data for Perth, Australia
Graph 4: Monthly rainfall data for Brisbane, Australia
Graph 5: Monthly temperature data for Perth, Australia
Statement A: February is the hottest month here.
Statement B: October was colder than normal.
Statement C: September is a fairly dry month in Australia.
Statement D: This country is gradually getting warmer.
Statement E: The difference between the lowest and highest temperatures is least in July.
Jan
50
40
30
20
10
0
–10
–20
Tem
per
ature
(°C
)
Feb Mar Apr May Jun Jul Aug Sep Oct Nov Dec
Highest maximum
Average maximum
Average minimum
Lowest minimum
Months
Jan
200
150
100
50
0
Rai
nfa
ll (m
m)
30
25
20
15
10
5
0Feb Mar Apr May Jun Jul Aug Sep Oct Nov Dec
Average monthly rainfall
Number of raindays
Num
ber
of ra
ind
ays
Months
Jan
200
150
100
50
0
Rai
nfa
ll (
mm
)
30
25
20
15
10
5
0Feb Mar Apr May Jun Jul Aug Sep Oct Nov Dec
Average monthly rainfall
Number of raindays
Num
ber
of
rain
day
s
Months
89
Maths Frameworking PB 9.3 Chs 1–9 29/5/08 19:06 Page 89

The time series graph shows the height to which a ball bounces against the timetaken to reach that height.
Write a comment stating what happens to the length of time for which the ball isin the air after each bounce.
This ball always bounces to a fixed fraction of its previous height. What fractionis this?
After how many bounces does this ball bounce to less than half of the greatestheight?
In theory, how many bounces does the ball make before it comes to rest?
Look again at the graph showing the mean temperature changes in the UK for 2002.
Use the graph to support an argument that global warming is taking place.
Tammy says: ‘The graph shows that global warming is taking place’. Give areason why Tammy could be wrong.
Look again at the graphs showing the rainfall for Perth and Brisbane.
Which month has the greatest rainfall in Perth?
Which month has the least rainfall in Brisbane?
Explain how you can tell that Perth and Brisbane are not in the same region.
Which place, Perth or Brisbane, has more days of rainfall over the year? Showhow you work it out.
Use an atlas, encyclopaedia or the Internet to find a graph on whosecoordinates, shape and trend you would be able to comment.
d
c
b
a
b
a
d
c
b
a
25
20
15
10
5
00 5 10 15 20
Time (seconds)
Hei
ght
(cm
)
Exercise 5C
90
7
Maths Frameworking PB 9.3 Chs 1–9 29/5/08 19:06 Page 90

Two-way tables
An Internet company charges delivery for goods based on the type of delivery – normaldelivery (taking 3 to 5 days) or next-day delivery – and also on the cost of the order. Thetable shows how it is calculated.
This is called a two-way table.
Example 5.2
The table shows the percentage of boys and girlsby age group who have a mobile phone.
Comment on any differences between boys and girls.
Comment on any other trends that you notice.b
a
Age Boys Girls
10 18% 14%
11 21% 18%
12 42% 39%
13 53% 56%
14 56% 59%
15 62% 64%
Exercise 5D
Use the two-way table above to answer the questions about delivery costs.
a Comment on the difference in delivery charges for normal and next-day delivery.
b Two items cost £5 and £29. How much would you save by ordering themtogether: i using normal delivery? ii using next-day delivery?
a It always costs more using next-day delivery but for goods costing between£10.01 and £30, or between £50.01 and £75, it is only £2 more. It is £3 morefor all other orders.
b Using normal delivery and ordering the items separately, it would cost £1.95 +£2.95 = £4.90, but ordering them together would cost £3.95. The saving wouldbe £4.90 – £3.95 = 95p
Using next-day delivery and ordering the items separately, it would cost £4.95 +£4.95 = £9.90, but ordering them together would cost £6.95. The saving wouldbe £9.90 – £6.95 = £2.95
Cost of order Normal delivery Next-day delivery(3 to 5 days)
0–£10 £1.95 £4.95
£10.01–£30 £2.95 £4.95
£30.01–£50 £3.95 £6.95
£50.01–£75 £2.95 £4.95
Over £75 Free £3.00
91
6
Maths Frameworking PB 9.3 Chs 1–9 29/5/08 19:06 Page 91

The cost of a set of old toys depends on whether the toys are still in theoriginal boxes and also on thecondition of the toys. The table showsthe percentage value of a toycompared with its value if it is inperfect condition and boxed.
a Copy and complete the table.
Explain the effect of the set being boxed compared with the condition of the toys.
A school analyses the information on the month of birth for 1000 pupils. The resultsare shown in the table.
Month Jan Feb Mar Apr May Jun Jul Aug Sep Oct Nov Dec
Boys 34 36 43 39 47 50 44 39 55 53 42 35
Girls 37 31 36 35 44 43 36 40 52 49 43 37
a On the same grid, plot both sets of values to give a time series graph for the boysand another for the girls.
Use the graphs to examine the claim that more children are born in the summerthan in the winter.
The heights of 70 Year 9 pupils are recorded. Here are the results given to the nearestcentimetre.
Height (cm) Boys Girls
130–139 3 3
140–149 2 4
150–159 10 12
160–169 14 11
170–179 6 5
Use the results to examine the claim that boys are taller than girls in Year 9. You mayuse a frequency diagram to help you.
b
b
Condition Difference between boxed and not boxed
Excellent 100% – 60% = 40%
Very good
Good
Average
Poor
Condition Boxed Not boxed
Excellent 100% 60%
Very good 80% 50%
Good 60% 40%
Average 40% 25%
Poor 20% 10%
92
7
Maths Frameworking PB 9.3 Chs 1–9 29/5/08 19:06 Page 92

Cumulative frequency diagrams
In this section, you will learn how to draw cumulative frequency diagrams for large sets ofgrouped data. You will also find out how to use these to obtain estimates of the medianand the interquartile range.
‘Cumulative’ means to build up or to accumulate.
Example 5.3 The table shows the waiting times of 100 people in a bus station.
Time waiting, T (min) Number of passengers
0 < T ≤ 5 14
5 < T ≤ 10 35
10 < T ≤ 15 26
15 < T ≤ 20 18
20 < T ≤ 25 7
a Draw a cumulative frequency diagram.
b Estimate the median and the interquartile range.
Look at the two-way table showing the number of different colours of the80 cars in the school car park. If a car is chosen at random, what is theprobability that it is one of the following?
a Peugeot
b Red
c Red Peugeot
d Not blue
e Not a Ford
Peugeot 8 1 4 1 4
Ford 11 2 4 2 6 Make
Vauxhall 5 4 0 0 2 of cars
Citroen 1 2 2 0 3
Other 6 3 3 4 2
Colour of cars
Red White Blue Black Other
93
8
Maths Frameworking PB 9.3 Chs 1–9 29/5/08 19:06 Page 93

Example 5.3
continued
a First, you need to change the table from a frequency table into a cumulativefrequency table. This is sometimes called a less than or less than or equal tocumulative frequency table.
There are 14 passengers with a waiting time of less than or equal to 5 minutes.
There are 14 + 35 = 49 passengers with a waiting time of less than or equal to10 minutes.
Continue to build up until the table is complete for 100 passengers:
Time waiting, T (min) Cumulative frequency
T ≤ 5 14
T ≤ 10 14 + 35 = 49
T ≤ 15 49 + 26 = 75
T ≤ 20 75 + 18 = 93
T ≤ 25 93 + 7 = 100
Now plot this information onto a cumulative frequency graph, starting with (0, 0), (5, 14), (10, 49) and so on.
The points can be joined up withstraight lines or a curve.
To estimate the median, read off fromthe graph at the mid-value of thecumulative frequency. In this case,read off at 50.
This gives the median as 10.2 minutes.
To estimate the interquartile range,first obtain the values of the lowerquartile and the upper quartile.
To estimate the lower quartile, readoff from the graph at the one-quartervalue of the cumulative frequency,which is 25. This gives the lowerquartile as 6.6 minutes.
To estimate the upper quartile, readoff from the graph at the three-quartervalue of the cumulative frequency,which is 75. This gives the upperquartile as 15 minutes.
To work out the interquartile range:
Interquartile range = Upper quartile – Lower quartile= 15 – 6.6= 8.4 minutes
Cum
ula
tive
fre
quen
cy
Time waiting (minutes)0 5 10 15
100
90
80
70
60
50
40
30
20
10
020 25
94
Maths Frameworking PB 9.3 Chs 1–9 29/5/08 19:06 Page 94

For each table of data, do the following.
a Copy and complete the cumulative frequency table.
b Draw the cumulative frequency graph.
c Use your graph to estimate the median and interquartile range.
The temperature over 100 days
The time taken to walk to school by 40 pupils
The mass of 80 sacks of potatoes
Estimation of a mean from grouped data
You are now going to learn how to estimate a mean from a table of grouped data.
When data is grouped, it is not possible to calculate an exact value for the mean, as youdo not have the exact value of each piece of data.
Mass, M (kg) Cumulative frequency
M ≤ 24
M ≤ 25
M ≤ 26
M ≤ 27
M ≤ 28
Mass, M (kg) Number of sacks
23 < M ≤ 24 0
24 < M ≤ 25 15
25 < M ≤ 26 31
26 < M ≤ 27 22
27 < M ≤ 28 12
Time, t (min) Cumulative frequency
t ≤ 5
t ≤ 10
t ≤ 15
t ≤ 20
t ≤ 25
t ≤ 30
Time, t (min) Number of pupils
0 < t ≤ 5 5
5 < t ≤ 10 12
10 < t ≤ 15 9
15 < t ≤ 20 7
20 < t ≤ 25 4
25 < t ≤ 30 3
Temperature, T Cumulative (°C) frequency
T ≤ 5
T ≤ 10
T ≤ 15
T ≤ 20
T ≤ 25
Temperature, T Number of days(°C)
0 < T ≤ 5 8
5 < T ≤ 10 15
10 < T ≤ 15 42
15 < T ≤ 20 25
20 < T ≤ 25 10
Exercise 5E
95
8
Maths Frameworking PB 9.3 Chs 1–9 29/5/08 19:06 Page 95

Example 5.4 The times for 100 cyclists to completea 200 m time trial are grouped in thetable.
Obtain an estimate for the mean time.
Because the data is grouped, you have to assume that in each class the data iscentred on the mid-class value.
This means, for example, that in the first class 13 < T ≤ 14, you assume that thereare 12 cyclists with times around 13.5 seconds (the mid-value of the class).
Add an extra column to the table to give:
Time, t (seconds) Frequency, f Mid-value, x, of time (seconds)
13 < T ≤ 14 12 13.5
14 < T ≤ 15 21 14.5
15 < T ≤ 16 39 15.5
16 < T ≤ 17 20 16.5
17 < T ≤ 18 8 17.5
To calculate the mean time, you need to estimate the total time taken for each class.
For example, in the first class, you have 12 cyclists taking approximately 13.5 seconds. That is: 12 × 13.5 = 162 seconds
Add a fourth column to show the total times for each class. Then add up these timesto obtain:
Time, t (seconds) Frequency, f Mid-value, x, f × x
of time (seconds) (seconds)
13 < T ≤ 14 12 13.5 162
14 < T ≤ 15 21 14.5 304.5
15 < T ≤ 16 39 15.5 604.5
16 < T ≤ 17 20 16.5 330
17 < T ≤ 18 8 17.5 140
Total = 100 Total = 1541
Estimate of the total time taken by the 100 cyclists = 1541 seconds
1541Estimate of the mean time = –– = 15.41 seconds100
Time, t (seconds) Frequency, f
13 < T ≤ 14 12
14 < T ≤ 15 21
15 < T ≤ 16 39
16 < T ≤ 17 20
17 < T ≤ 18 8
96
Maths Frameworking PB 9.3 Chs 1–9 29/5/08 19:06 Page 96

For each table of values given, do the following.
a Rewrite the table with four columns, as shown in Example 5.4.
b Complete the table including the totals, as shown in Example 5.4.
c Obtain an estimate of the mean.
i ii
The temperature of a school swimming pool was recorded every day over a period of100 days. The results are summarised in the table below.
Obtain an estimate of the mean temperature.
The times taken by 40 pupils to complete an obstacle course are below.
Hint: Be careful, these classes are different widths.
For each of the questions above, find the class which contains the median.
Time, t (min) Frequency, f
5 < t ≤ 6 8
6 < t ≤ 7 10
7 < t ≤ 9 11
9 < t ≤ 13 5
13 < t ≤ 15 6
Temperature, T (°C) Frequency, f
0 < T ≤ 10 17
10 < T ≤ 20 23
20 < T ≤ 30 56
30 < T ≤ 40 3
40 < T ≤ 50 1
Length, L (cm) Frequency, f
20 < L ≤ 24 13
24 < L ≤ 28 35
28 < L ≤ 32 24
32 < L ≤ 36 8
Mass, M (kg) Frequency, f
0 < M ≤ 2 8
2 < M ≤ 4 11
4 < M ≤ 6 10
6 < M ≤ 8 5
8 < M ≤ 10 6
Exercise 5F
97
7
8
Maths Frameworking PB 9.3 Chs 1–9 29/5/08 19:06 Page 97

Statistical investigations
Investigating a problem will involve several steps. Three examples will be studied fromdifferent subjects alongside an overall plan.
Step Example 1 PE Example 2 Science Example 3 Geography
1 Decide which generaltopic to study
2 Specify in more detail
3 Consider questionswhich you couldinvestigate
4 State your hypotheses(your guesses at whatcould happen)
5 Sources of informationrequired
How to improve pupilperformance in sport
A throwing event
How much further dopupils throw using a runup?Is a Year 9 pupil able tothrow as far as a Year 11pupil of the same height?
Distance thrown willimprove using a run up
Year 11 pupils of the sameheight may be physicallystronger and wouldtherefore throw further
Survey of distance thrownwith different lengths ofrun-up
Effect of engine size on acar’s acceleration
A particular make of car
Does a bigger enginealways mean that a carcan accelerate faster?
In general, more powerfulengines produce thegreater acceleration
More powerful enginestend to be in heavier carsand therefore theacceleration will not beaffected
Larger engines in thesame model of car willimprove acceleration
Magazines and/or bookswith information on enginesizes and accelerationtimes for 0–60 mph
Life expectancy versuscost of housing
Compare house prices inYorkshire with those inSouth-east England
Do people who live inexpensive housing tend tolive longer?
People in expensivehousing have greaterincomes and also mayhave a longer lifeexpectancy
Library or the Internet forcensus data for each area
Village Green
98
Maths Frameworking PB 9.3 Chs 1–9 29/5/08 19:06 Page 98

Step Example 1 PE Example 2 Science Example 3 Geography
6 Relevant data
7 Possible problems
8 Data collection
9 Decide on the level ofaccuracy required
10 Determine sample size
11 Construct tables forlarge sets of raw datain order to make workmanageable
12 Decide which statisticsare most suitable
Choose pupils fromdifferent age groups witha range of heights
Make sure that there is anequal number of boys andgirls
Choose pupils from thefull range of ability
Avoid bias when choosingyour sample or carryingout your survey
Make sure that you canrecord all the factorswhich may affect thedistance thrown: forexample, age or height
Decide how accurateyour data needs to be: forexample, nearest 10 cm
Remember that collectingtoo much informationmay slow down theexperiment
Group distances throwninto intervals of 5 metres
Use two-way tables tohighlight differencesbetween boys’ and girls’data
When the distancesthrown are close together,use the mean. When thereare a few extreme values,use the median
Make of car, engine sizeand acceleration
Note: The governmentrequires car manufacturersto publish the time takento accelerate from 0–60 mph
Petrol engines must becompared with otherpetrol engines not withdiesel engines
Make sure that you canrecord all the informationwhich you need, such asengine size and weight ofcar. Remember to quotesources of data
Round any publishedengine sizes to the nearest100 cm3 (usually given as‘cc’ in the car trade),which is 0.1 litre
For example, a 1905 ccengine has a capacity ofapproximately 1.9 litres
Average cost of housingfor each area
Data about lifeexpectancy for each area
Extract relevant data fromsources. Remember toquote sources of data
Group population data inage groups of, forexample, 10 year intervals
Sample should besufficiently large to beable to use the mean
99
Maths Frameworking PB 9.3 Chs 1–9 29/5/08 19:06 Page 99

Look at the three examples presented in the preceding table and investigate eitherone of the problems given or a problem of your own choice. You should follow thesteps given there, including your own ideas.
Think of a problem related to a piece of work, such as a foreign languageessay or a history project. See whether you can use the step-by-step plan tocarry out a statistical investigation.
For example, you may wish to compare the word length of an English and aFrench piece of writing, or you may wish to compare data about two wars.
Exercise 5G
100
7
6I can draw conclusions from scatter graphs.
I have a basic understanding of correlation.
7I can draw a line of best fit on a scatter diagram by inspection.
I can estimate the mean from a grouped frequency.
8I can interpret and construct cumulative frequency diagrams using the upper boundary of a class interval.
I can estimate the median and the interquartile range, and use these to compare distributions and
make inferences.
Maths Frameworking PB 9.3 Chs 1–9 29/5/08 19:06 Page 100

1 2002 Paper 2
A newspaper wrote an article about public libraries in England and Wales. It published this diagram.
Use the diagram to decide whether each statement below is true or false, or whether you cannot be certain.
a The number of libraries open for more than 45 hours per week fell by more than half from 1988 to 1998.
True False Cannot be certain
Explain your answer.
b In 2004 there will be about 450 libraries open in England and Wales for more than 45 hours a week.
True False Cannot be certain
Explain your answer.
2 2006 Paper 1
The scatter graph shows 15 pupils’ coursework and test marks.
To find a pupil’s total mark, you add the coursework mark to
the test mark.
a Which pupil had the highest total mark?
b Look at the statement below. State whether it is True or
False.
Explain your answer.
The range of coursework marks was
greater than the range of test marks.
Test
mark
Coursework mark
50
40
30
20
10
00 10 20 30 40 50
A D G
L P
JFC
KN
R
B HE
1988 1990 1992 1994 1996 1998
Year
Nu
mb
er
of
libra
ries o
pen
fo
r
mo
re t
han
45
ho
urs
a w
eek
750
700
650
600
550
500
450
Reduction in opening hours
101
6
Maths Frameworking PB 9.3 Chs 1–9 29/5/08 19:06 Page 101

c Pupils with total marks in the shaded region on the graph
win a prize.
What is the smallest total mark needed to win a prize?
d Another school has a different rule for pupils to win a prize.
Rule: The coursework mark must be 25 or more, and
the test mark must be 25 or more, and
the total mark must be 65 or more.
On a copy of the graph to the right, shade the region of
total marks for which pupils would win a prize.
3 2003 Paper 1
The scatter graph shows information about trees called
poplars.
a What does the scatter graph show about the
relationship between the diameter of the tree trunk and
the height of the tree?
b The height of a different tree is 3 m. The diameter of its
trunk is 5 cm. Use the graph to explain why this tree is
not likely to be a poplar.
c Another tree is a poplar. The diameter of its trunk is 3.2
cm. Estimate the height of this tree.
d Below are some statements about drawing lines of best
fit on scatter graphs. Copy each statement, and then
tick it to show whether the statement is True or False.
Lines of best fit must always …
go throught the origin. True False
have a positive gradient. True False
join the smallest and the largest values. True False
pass through every point on the graph. True False
0 1 2 3 4 5
Diameter of tree trunk (cm)
Heig
ht
of
tree (m
)
6
5
4
3
2
1
0
Test
mark
Coursework mark
50
40
30
20
10
00 10 20 30 40 50
Test
mark
Coursework mark
50
40
30
20
10
00 10 20 30 40 50
102
6
7
Maths Frameworking PB 9.3 Chs 1–9 29/5/08 19:06 Page 102

4 2001 Paper 2
The goldcrest is Britain’s smallest species of bird.
On winter days, a goldcrest must eat enough food to keep it warm at night.
During the day, the mass of the bird increases.
The scatter diagram shows the mass of goldcrests at different times during winter days.
It also shows the line of best fit.
a Estimate the mass of a goldcrest at 11:30 am.
b Estimate how many grams, on average, the mass of a goldcrest increases during one hour.
c Which goldcrest represented on the scatter diagram is least likely to survive the night if it is cold?
Give your coordinates of the correct point on the scatter diagram.
Then explain why you chose that point.
5 2006 Paper 1
A pupil investigated whether pupils who study more watch less
television.
The scatter graph shows his results. The line of best fit is
also shown.
a What type of correlation does the graph show?
b The pupil says the equation of the line of best fit is
y = x + 40
Explain how you can tell that this equation is wrong.
Num
ber
of
ho
urs
watc
hin
gte
levis
ion in o
ne w
eek
Number of hoursstudying in one week
40
30
20
10
00 10 20 30 40
x
y
7 am 8 am 9 am 10 am 11 am 12 pm
Time (GMT)
1 pm 2 pm 3 pm
Mass (g
)
6.0
5.5
5.0
4.5
4.0
3.5
0
103
7
Maths Frameworking PB 9.3 Chs 1–9 29/5/08 19:06 Page 103

6 2001 Paper 1
The first ‘Thomas the Tank Engine’ stories
were written in 1945. In the 1980s, the
stories were rewritten.
The cumulative frequency graph shows the
number of words per sentence for one of the
stories.
There are 58 sentences in the old version.
There are 68 sentences in the new version.
a Estimate the median number of words per
sentence in the old version and in the new
version.
Show your method on a copy of the graph.
b What can you tell from the data about the
number of words per sentence in the old
version and in the new version?
c Estimate the percentage of sentences in the
old version that had more than 12 words per
sentence. Show your working.
7 2007 Paper 1
5000 pupils took part in a test. Pupils took two
papers, paper 1 and paper 2.
The graph shows the cumulative frequencies of
their marks for each paper.
Use the graph to answer these questions.
For each question state True, or False, or Not
enough information.
a The median mark for paper 1 was about 38.
True False Not enough information
Explain your answer.
b The interquartile range of the marks for
paper 1 was about 23.
True False Not enough information
Explain your answer.
c Paper 1 was easier than paper 2.
True False Not enough information
Explain your answer.
5000
4500
4000
3500
3000
2500
2000
1500
1000
500
0
Marks
0 10 20 30 40 50 60 70
Cum
ula
tive f
req
uency
Key
Paper 1
Paper 2
0 10 20 30
Number of words per sentence
Cu
mu
lative f
req
uen
cy
70
60
50
40
30
20
10
0
Key
Old version
New version
104
8
Maths Frameworking PB 9.3 Chs 1–9 29/5/08 19:06 Page 104

8 2003 Paper 1
Tom did a survey of the age distribution of
people at a theme park. He asked 160 people.
The cumulative frequency graph shows his
results.
a Use the graph to estimate the median age
of people at the theme park.
b Use the graph to estimate the interquartile
range of the age of people at the theme
park. Show your method on the graph.
c Tom did a similar survey at a flower show.
Results:
The median age was 47 years.
The interquartile range was 29 years.
Compare the age distribution of the
people at the flower show with that of the
people at the theme park.0
Age (years)
10 20 30 40 50 60 70 80C
um
ula
tive f
req
uen
cy
160
140
120
100
80
60
40
20
0
105
8
Maths Frameworking PB 9.3 Chs 1–9 29/5/08 19:06 Page 105

106
Functional Maths
Rainforest deforestation
Since 1970, over 600 000 km2 of
Amazon rainforest have been
destroyed. This is an area larger
than Spain.
Between the years 2000 and
2005, Brazil lost over 132 000 km2
of forest – an area about the
same size as Greece.
The table below shows how much
of the rainforests in Brazil have
been lost each year since 1988.
Deforestation figure
YearDeforestation
(sq km)
1988 21 000
1989 18 000
1990 14 000
1991 11 000
1992 14 000
1993 15 000
1994 15 000
1995 29 000
1996 18 000
1997 13 000
1998 17 000
1999 17 000
2000 18 000
2001 18 000
2002 21 000
2003 25 000
2004 27 000
2005 19 000
2006 14 000
2007 10 000
FM Ch 5 Rainforest PB 9.3 29/5/08 18:52 Page 106

107
From 1988 to 1991, Brazil had an economic slowdown. From 1992 to
1995, Brazil had economic growth.
a What does the chart and the information above suggest about a
link between deforestation and the economy in Brazil.
b What do think was happening to Brazil’s economy:
i from 1998 to 2004?
ii from 2005-7?
Draw a cumulative graph, showing the total deforestation since 1988,
year by year.
If the rate of deforestation from 2005–7 continued at the same rate,
estimate when the deforestation would be 4000 km2.
The pie chart below shows the three main reasons for deforestation in
the Amazon from 2000–5.
What percentage of the deforestation was caused by each reason?
It was suggested that over the next two years:
the same amount of deforestation would take place.
the amount of construction work would actually double.
the number of small farms would halve.
the number of cattle ranches would increase.
Draw a new pie chart reflecting the reasons for deforestation
suggested for 2007.
5
4
Construction – roads,dams, towns
Small farms
Cattle ranches
42°
95°
223°
3
2
1
Use the information on the left to answer these questions.
FM Ch 5 Rainforest PB 9.3 29/5/08 18:52 Page 107

Similar triangles
Triangle ABC has been mapped onto triangle A'B'C' by an enlargement of scale factor 2.
Under an enlargement, all of the angles are the same size, and the corresponding sidesare in the same ratio.
So in this example, AB : A’B’ = AC : A’C’ = BC : B’C’ = 1 : 2
A’B’ A’C’ B’C’This can also be written as ––– = ––– = ––– = 2AB AC BC
The two triangles are said to be similar.
Two triangles are similar if their angles are the same size, or if their corresponding sidesare in the same ratio. If one of these conditions is true, then so is the other.
B C
A
2 cm 3 cm
4 cm
B’ C’
A’
4 cm 6 cm
8 cm
108
CHAPTER 6 Geometry and Measures 2
This chapter is going to show you
How to solve problems using
similar triangles
How to convert from one metric
unit to another for area and
volume
How to calculate the length of
arcs and the area of sectors
How to calculate the volume of
a cylinder
How to solve problems
involving speed
What you should already know
How to use ratio
How to find alternate and
corresponding angles in parallel
lines
The metric units for area and
volume
The formulae for the
circumference and the area
of a circle
How to calculate the volume of
a prism
Maths Frameworking PB 9.3 Chs 1–9 29/5/08 18:38 Page 108

Example 6.1
Example 6.2
Example 6.3 In the triangle below, EB is parallel to DC. Calculate the length of DC.
∠AEB = ∠ADC (corresponding angles in parallel lines)∠ABE = ∠ACD (corresponding angles in parallel lines)
So, triangle AEB is similar to triangle ADC since theangles are the same size (∠A is common to bothtriangles).
Let the side DC = x
Since triangle AEB is similar to triangle ADC, corresponding sides are in the same ratio.
DC ACSo, ––– = –––EB AB
x 8Therefore, – = – = 23 4
So, x = 2 × 3 = 6 cm
D C
A
3 cm
4 cm
B
4 cm
E
Triangle ABC is similar to triangle DEF. Calculate the length of the side DF.
Let the side DF = x
Since the triangles are similar, corresponding sides are in the same ratio.
DE EF DFSo, ––– = ––– = ––– = 3AB BC AC
DF xTherefore, since ––– = 3, – = 3AC 6
So, x = 18 cm
B C
A
4 cm 6 cm
5 cm
E
D
12 cm
15 cm F
Show that the two triangles below are similar.
In triangle ABC, ∠C = 80°
In triangle XYZ, ∠X = 48°
(The sum of the angles in atriangle = 180°)
Since the angles in both triangles are the same, triangle ABC is similar to triangle XYZ.
X
Y Z
80° 52°52°
48°
B C
A
109
Maths Frameworking PB 9.3 Chs 1–9 29/5/08 18:38 Page 109

State whether each of the pairs of triangles below are similar.
a Explain why triangle ABCis similar to triangle XYZ.
b Find the length of XY.
a Explain why triangleABC is similar totriangle PQR.
b Find the length of theside QR.
In the diagram on the right, ST is parallel to QR.
a Explain why triangle PST is similar totriangle PQR.
b Find the length of the side ST.
In the diagram on the right, AB is parallel to DE.
a Explain why triangle ABC is similar to triangleCDE.
b Find the length of the side DE.
24 cm
16 cm
4 cm
A B
C
D E
Q R
P
3 cm
12 cm
T
6 cm
S
58°
51°
C
B
A P
QR
71°
58°
6 cm
4 cm
8 cm
39°
54°
B C
A
4 cm
3 cm Y Z
X
6 cm
39°
54°
a b
c d
32° 32°
58°
56°
45°
45°
89°
64°
43°
73°43° 43°
39°
39°
42°
Exercise 6A
110
8
Maths Frameworking PB 9.3 Chs 1–9 29/5/08 18:38 Page 110

In the diagram on the right, LM is parallel to PQ. Given that OL = 15 cm, OQ = 10 cm and PQ = 8 cm, find the length of LM.
Use similar triangles to find the height of the tower in the diagram below.
The rope on the pair of stepladders, shown on the right,stops the steps from opening too far. Use similar trianglesto find the length of the rope.
1 In each of the following, write down the pair of similar triangles and findthe length marked x.
9 cm
10 cm
3 cm
J
K
M N
x
L
16 cm
12 cm
15 cm W Z
V
X
Y x
10 cm15 cm
12 cmTR
S
P
Q x
5 cm
10 cm3 cm
A
B
D E
C
x
a b
c d
150 cm
50 cm
120 cm
2 m
6 m
120 m
M
L
O
P
Q
111
8
Maths Frameworking PB 9.3 Chs 1–9 29/5/08 18:38 Page 111

Metric units for area and volume
The following are the metric units for area, volume and capacity which you need toknow. Also given are the conversions between these units.
The unit symbol for litres is the letter l. To avoid confusion with the digit 1 (one), the fullunit name may be used instead of the symbol.
Remember:
To change large units to smaller units, always multiply by the conversion factor.
To change small units to larger units, always divide by the conversion factor.
Example 6.4 Convert each of the following as indicated.
a 72 000 cm2 to m2 b 0.3 cm3 to mm3 c 4500 cm3 to litres
a 72 000 cm2 = 72 000 ÷ 10 000 = 7.2 m2
b 0.3 cm3 = 0.3 × 1000 = 300 mm3
c 4500 cm3 = 4500 ÷ 1000 = 4.5 litres
Capacity
1 m3 = 1000 litres (l)1000 cm3 = 1 litre
1 cm3 = 1 millilitre (ml)10 millilitres = 1 centilitre (cl)
1000 millilitres = 100 centilitres = 1 litre
Volume
1 000 000 cm3 = 1 m3
1000 mm3 = 1 cm3
Area
10 000 m2 = 1 hectare (ha)10 000 cm2 = 1 m2
1m2 = 1000 000 mm2
100 mm2 = 1 cm2
2 This question will show you how to divide a line in a given ratio.
Divide the line AB in the ratio 1 : 4
● Firstly, draw a line XB 5 cm in length in the ratio XY : YB = 1 cm : 4 cm
● Next, draw a line joining X and A.
● Now, draw a line parallel to XA from the point Y to meet AB at C.
● Point C divides the line AB in the ratio 1 : 4
Use this method to divide four lines of any length in the following ratios.
a 1 : 3 b 1 : 5 c 2 : 3 d 3 : 5
A
B
1 cm
A
X Y B
C
4 cm
112
8
Maths Frameworking PB 9.3 Chs 1–9 29/5/08 18:38 Page 112

Express each of the following in cm2.
a 4 m2 b 7 m2 c 20 m2 d 3.5 m2 e 0.8 m2
Express each of the following in mm2.
a 2 cm2 b 5 cm2 c 8.5 cm2 d 36 cm2 e 0.4 cm2
Express each of the following in cm2.
a 800 mm2 b 2500 mm2 c 7830 mm2 d 540 mm2 e 60 mm2
Express each of the following in m2.
a 20 000 cm2 b 85 000 cm2 c 270 000 cm2
d 18 600 cm2 e 3480 cm2
Express each of the following in mm3.
a 3 cm3 b 10 cm3 c 6.8 cm3 d 0.3 cm3 e 0.48 cm3
Express each of the following in m3.
a 5 000 000 cm3 b 7 500 000 cm3 c 12 000 000 cm3
d 650 000 cm3 e 2000 cm3
Express each of the following in litres.
a 8000 cm3 b 17 000 cm3 c 500 cm3 d 3 m3 e 7.2 m3
Express each of the following as indicated.
a 85 ml in cl b 1.2 litres in cl c 8.4 cl in ml
d 4500 ml in litres e 2.4 litres in ml
How many square paving slabs, each of side 50 cm, are needed to cover arectangular yard measuring 8 m by 5 m?
A football pitch measures 120 m by 90 m. Find the area of the pitch in thefollowing units.
a m2 b Hectares
A fish tank is 1.5 m long, 40 cm wide and 25 cm high. How many litres of water willit hold if it is filled to the top?
The volume of the cough medicine bottle is 240 cm3. How many days will the coughmedicine last?
How many lead cubes of side 2 cm can be cast from 4 litres of molten lead?
COUGH
MEDICINE
Two 5 ml spoonfuls to betaken four times a day
Exercise 6B
113
6
Maths Frameworking PB 9.3 Chs 1–9 29/5/08 18:38 Page 113

Length of an arc and area of a sector
In Year 8, you found how to calculate the circumference and the area of a circle using theformulae:
C = πd = 2πr
A = πr2
where π = 3.142, or use the key on your calculator.
The arc, AB, is part of the circumference. The sector AOB is a slice of the circle enclosedby the arc AB, and the radii OA and OB.
∠AOB is the angle of the sector, and is usually denoted by the Greek letter θ (pronouncedtheta).
θThe length of the arc AB, as a fraction of the circumference, is ––360
θSo, the length of the arc AB = –– × πd360
θSimilarly, the area of the sector AOB = –– × πr 2
360
Example 6.5 Calculate:
a The length of the arc AB.
b The area of the sector AOB.
Give your answers correct to three significant figures (sf).
60a Length of the arc AB = –– × π × 10 = 5.24 cm (3 sf)360
60b Area of the sector AOB = –– × π × 52 = 13.1 cm2 (3 sf)360
A B
60°
O
5 cm
AArc
θ
B
Sector
O
π
O
r
d
1 A farmer has 100 m of fencing to enclose his sheep. He uses the wall for one side of the rectangular sheep-pen. If each sheep requires 5 m2 of grass inside the pen, what is the greatest number of sheep that the pen can hold?
2 Use this information to find:
a the number of square inches in one square yard.
b the number of cubic inches in one cubic yard.
3 What is an acre? Use reference books or the Internet to find out.
Wall
12 inches = 1 foot
3 feet = 1 yard
114
6
Maths Frameworking PB 9.3 Chs 1–9 29/5/08 18:38 Page 114

In this exercise, let π = 3.142 or use the key on your calculator.
For each of the circles below, calculate:
i the length of the arc.
ii the area of the sector.
Give your answers correct to three significant figures.
A flowerbed in a park is in the shape of a sector of a circle.
a Calculate the total perimeter of the flowerbed.
b Calculate the area of the flowerbed.
Give your answers correct to three significant figures.
Calculate the total perimeter of the ‘Pacman’ shape on the right. Give your answer to the nearest millimetre.
Calculate the area of the shaded segment on the right. Give your answer to the nearest square centimetre.
For the following circles, calculate: i the length of the arc. ii the area of the sector.
Give your answers in terms of π.
240°
3 cm
120°
9 cm30°
12 cm45°16 cm
60°
6 cm
a b c d e
10 cm
10 cm
60°
15 mm
135°
5.4 m
a b c60°
10 cm
45°7 cm
20°
12 cm
d e f
75°
4 m120°
2.5 m
150°
7.2 m
πExercise 6C
115
8
Maths Frameworking PB 9.3 Chs 1–9 29/5/08 18:38 Page 115

Volume of a cylinder
In Year 8 you found how to calculate the volume of a prism.
The volume V of a prism is found by multiplying the area A of its cross-section by its length l:
V = Al
The cross-section of a cylinder is a circle with radius r.
The area of the cross-section is A = πr2
If the height of the cylinder is h, then the volume V for thecylinder is given by the formula:
V = πr2 × h = πr2h
Example 6.6
In this exercise take π = 3.142 or use the key on your calculator.
Calculate the volume of each of the following cylinders. Give your answers correctto three significant figures.
The diameter of a 2p coin is 2.6 cm and its thickness is 2 mm.Calculate the volume of the coin, giving your answer to thenearest cubic millimetre.
a b c
10 cm
6 cm3 cm
8 cm
4 m
1.5 m
12 m
2 m 0.5 cm
5 cmd e
πExercise 6D
Calculate the volume of the cylinder, giving the answer correct to three significant figures.
V = π × 52 × 8 = 628 cm3 (3 sf) 8 cm
5 cm
h
r
Length l
Area A
116
7
Maths Frameworking PB 9.3 Chs 1–9 29/5/08 18:38 Page 116

Three different shaped cake tins are shown below.
a b c
Which cake tin has the greatest volume?
The diagram on the right shows a tea urn.
a Calculate the volume of the urn, giving your answer inlitres, correct to one decimal place.
b A mug holds 25 cl of tea. How many mugs of tea can beserved from the urn?
The diagram on the right shows a cylindrical paddling pool.
a Calculate the volume of the pool, giving your answer incubic metres, correct to three significant figures.
b How many litres of water are in the pool when it isthree quarters full? Give your answer to the nearest litre.
The canister on the right has a capacity of 10 litres.
a Write down the volume of the canister in cubiccentimetres.
b Calculate the area of the base of the canister.
c Calculate the radius of the base of the canister, givingyour answer correct to one decimal place.
In this exercise, take π = 3.142 or use the key on your calculator.
1 Surface area of a cylinder
When an open cylinder is cut and opened out, a rectangle is formed withthe same length as the circumference of the base of the cylinder.
The curved surface area of the cylinder is the same as the area of the rectangle.
The area of the rectangle is 2πrh.
The total surface area of the cylinder is the curved surface area plus thearea of the circles at each end.
The formula for the total surface area of a cylinder is A = 2πrh + 2πr2
h
r
h
C = πd = 2πr
π
40 cmCapacity
10 l
2 m
48 cm
50 cm
30 cm
7.5 cm
20 cm
7 cm
24 cm14 cm
25 cm
13 cm
10 cm
8 cm
117
7
8
Maths Frameworking PB 9.3 Chs 1–9 29/5/08 18:38 Page 117

Rate of change
A rate of change is a way of comparing how one quantity changes with another.Examples of rates of change are:
Speed with units in miles per hour (mph), kilometres per hour (km/h) or metres persecond (m/s).
Density with units in grams per cubic centimetre (g/cm3).
Fuel consumption with units in miles per gallon (mpg) or kilometres per litre (km/l).
Speed, distance Speed is the distance travelled per unit of time. The relationships between speed, distance and time and time can be expressed by the following three formulae.
Distance DistanceSpeed = ––––– Distance = Speed × Time Time = –––––Time Speed
When we refer to speed, we usually mean average speed, as it is unusual to maintain thesame exact speed in one journey.
The relationships between distance, D, time, T, and speed, S, can be remembered by using the triangle:
Covering up the quantity you want to find gives the three formulaeyou need:
D DS = – D = ST T = –
T S
Example 6.7 A plane travels at an average speed of 500 mph. Find the distance travelled by theplane in 31–
2 hours.
Using the formula D = ST, the distance travelled = 500 × 31–2 = 1750 miles
D
S T
Use this formula to calculate the total surface area of the followingcylinders. Give your answers correct to three significant figures.
a b
2 The volume of a can is to be 1000 cm3. The area of the metal used tomake the can is to be kept to a minimum. What should the height andthe radius of the can be?
A spreadsheet could be used to complete this question.
3 cm
8 cm
5 m
2 m
118
8
Maths Frameworking PB 9.3 Chs 1–9 29/5/08 18:38 Page 118

Example 6.8
Density Density is the mass of a substance per unit of volume.
1 cm3 of gold has a mass of 19.3 g. We say that the density of gold is 19.3 g per cm3,written briefly as 19.3 g/cm3.
MassDensity = ––––Volume
The relationships between density, D, mass, M, and volume, V, can be remembered by using this triangle:
Covering up the quantity you want to find gives the three formulae youneed:
M MD = –– M = DV V = ––
V D
Example 6.9
Example 6.10
An Intercity train has an average speed of 120 mph. Find the distance the train travelsduring the following times.
a 2 hours b 1 hours c 15 minutes d 20 minutes
The road distance between Leeds and London is 210 miles. Find the average speedof a car for each of the following journey times between the two cities.
a 4 hours b 5 hours
c 3 hours d 3 hours 20 minutes
John’s average cycling speed is 12 mph. Find the time it takes him to cycle thefollowing distances.
a 36 miles b 30 miles c 40 miles d 21 miles
12
12
Exercise 6E
Find the mass of a stone, which has a volume of 40 cm3 and a density of 2.25 g/cm3.
Using the formula M = DV, the mass of the stone = 2.25 × 40 = 90 g
The volume of a metal rod is 4 cm3 and its mass is 32 g. Find the density of themetal.
M 32Using the formula D = –– , the density of the metal is –– = 8 g/cm3
V 4
M
D V
A coach travels 180 km on a motorway at an average speed of 80 km/h. Find thetime taken for the journey.
D 180Using the formula T = –– , the time taken = ––– = 2.25 hours = 21–4 hours
S 80or 2 hours 15 minutes
119
6
Maths Frameworking PB 9.3 Chs 1–9 29/5/08 18:38 Page 119

Copy and complete the following table.
Distance travelled Time taken Average speed
a 150 miles 2 hours
b 540 kilometres 4 hours
c 5 hours 25 mph
d 2 hours 15 minutes 100 km/h
e 250 metres 20 m/s
f 200 miles 60 mph
A gamekeeper fires his gun and the bullet travels at 120 m/s. Find the distancecovered by the bullet in 1.8 seconds.
The distance between New York and San Francisco is 2550 miles. A plane takes offfrom New York at 7 am and lands at San Francisco at 11.15 am. Find the averagespeed of the plane.
Change each of the following speeds, given in kilometres per hour, to metres persecond.
a 36 km/h b 90 km/h c 120 km/h
If the density of a marble is 2.8 g/cm3, find the mass of a marble that has a volume of56 cm3.
Find the volume of a liquid that has a mass of 6 kg and a density of 1.2 g/cm3. Giveyour answer in litres.
A 1 kg bag of sugar has a volume of 625 cm3. Find the density of the sugar in g/cm3.
1 Frank travels 105 miles on a motorway. The first 30 miles of his journeyare completed at an average speed of 60 mph. He then stops for 30 minutes at a service station before completing the final stage of hisjourney at an average speed of 50 mph.
Find the average speed for the whole of his journey.
2 A train travels at an average speed of 50 mph for 2 hours. It then slowsdown to complete the final 30 minutes of the journey at an averagespeed of 40 mph.
Find the average speed of the train for the whole journey.
3 Sue cycles to visit a friend who lives 30 km from her home. She cycles toher friend’s house travelling at an average speed of 20 km/h and returnshome travelling at an average speed of 15 km/h.
Find her average speed over the whole journey.
SUGAR1 kg
12
120
6
7
Maths Frameworking PB 9.3 Chs 1–9 29/5/08 18:38 Page 120

4 The density of kitchen foil is 2.5 g/cm3. A roll of kitchen foil is 10 m long, 30 cm wide and is 0.06 mm thick. Calculate the mass of the roll of foil.
5 A car uses petrol at a rate of 30 mpg.
a How far can the car travel on 3 gallons of petrol?
b How many gallons of petrol are required for a journey of 600 miles?
6 In Science, other measures for rates of change are used. Use referencebooks or the Internet to find the formulae and the units used foracceleration, pressure and power.
Kitchen Foil 10 m
121
7
5I know the metric units for area, volume and capacity.
6I can use the formulae to calculate the circumference and the area of a circle.
I can use metric units for area, volume and capacity when solving problems.
7I can calculate the volume of a cylinder.
I can solve problems involving speed.
8I know how to use similar triangles.
I can calculate the length of an arc and the area of a sector.
Maths Frameworking PB 9.3 Chs 1–9 29/5/08 18:38 Page 121

1 2001 Paper 2
a A coach travels 300 miles at an average speed of 40 mph. For how many hours does the coach travel?
b An aeroplane flies 1860 miles in 4 hours. What is its average speed?
c A bus travels for 2 hours at an average speed of 24 mph. How far does the bus travel?
2 2003 Paper 1
The diagram shows the distance between my home, H, and the towns, A and B. It also shows information
about journey times.
a What is the average speed of the journey from my home to town A?
b What is the average speed of the journey from my home to town B?
c I drive from town A to my home and then to town B. The journey time is 30 minutes. What is my average
speed?
Show your working.
3 2005 5–7 Paper 2
The diagram shows two circles and a square, ABCD.
A and B are the centres of the circles.
The radius of each circle is 5 cm.
Calculate the area of the shaded part of the square.
4 2000 Paper 1
a The triangles below are similar.
What is the value of p? Show your working.10 cm
8 cm
a
b p cm
12 cm
a
b Not drawn
accurately
5 cm
5 cmA
BD
C
Not drawn
accurately
10 miles
Journey time
10 minutes
10 miles
Journey time
20 minutes
A H B
12
122
6
7
8
Maths Frameworking PB 9.3 Chs 1–9 29/5/08 18:38 Page 122

b Triangles ABC and BDC are similar.
What is the length of CD?
c Look at the triangles on the right.
Are they similar? Show working to explain
how you know.
5 2001 Paper 2
The diagram shows parts of two circles,
sector A and sector B.
a Which sector has the bigger area?
Show working to explain your answer.
b The perimeter of a sector is made from
two straight lines and an arc. Which sector has the bigger perimeter?
Show working to explain your answer.
c A semi-circle of radius 4 cm, has the same area as a complete circle of radius r cm.
What is the radius of the complete circle? Show your working.
6 2003 Paper 2
A cylinder has a radius of 2.5 cm. The volume of the cylinder,
in cm3, is 4.5π.
What is the height of the cylinder? Show your working.
2.5 cm
height
radius 4 cm
r cmNot drawn
accurately
AB
radius 5 cm radius 4 cm
1–8 of a circle 1
–5 of a circle
60°
80°
60°
40°
Not drawn
accurately
x
x
6 cm
A C D
B
3 cm
Not drawn
accurately
123
8
Maths Frameworking PB 9.3 Chs 1–9 29/5/08 18:38 Page 123

124
Functional Maths
The shot-put circle is going to be resurfaced.
a What is the area of the circle?
b The circle is resurfaced with a sand and cement mix which is
25 mm thick.
What is the volume of the sand and cement mix that is needed
to resurface the shot-put circle?
2.135 m
1
The high jump zone is also going to be resurfaced.
a What is the area of the high jump zone?
b Resurfacing costs £57.50 per square metre.
What is the cost to resurface the high jump zone?30 m
2
A new winners’ podium is
going to be built.
This sketch shows
the dimensions.
What is the total volume
of the podium?
4
Athletics stadium
An athletics stadium is having a ‘face-lift’.
The running track is going to be repainted.
The diagram shows the dimensions
of the inside line of the track.
a What is the total distance of the
inside line?
b The track has eight lanes.
Each lane is 1 m wide.
What is the total distance of all
the lines?
c One litre of paint is needed for 4 m of line.
How many litres of paint are needed for all eight lanes?
d A large tin of paint holds 20 litres. How many tins are needed?
e One tin of paint costs £52.70. What is the total cost of the paint?
3
73 m
85 m
90 cm
20 cm 3rd
90 cm
1st
90 cm
2nd
40 cm60 cm
FM Ch 6 Athletics PB 9.3 29/5/08 18:53 Page 124

125
This sketch shows the dimensions of the sandpit for the
long jump.
0.6 m3 of sand weighs 1 tonne.
How many tonnes of sand are needed to fill the sandpit?
40 cm
8 m
3 m
5
A ramp for wheelchair access into the stadium is going to
be built.
a What volume of concrete will be needed to make the ramp?
b Concrete costs £48 per cubic metre.
How much does it cost to make the ramp?
30 cm
3 m
2 m
6
FM Ch 6 Athletics PB 9.3 29/5/08 18:53 Page 125

Standard form
Standard form is a way of writing concisely very large and very small numbers such asthose that occur in physics and astronomy. For example, 53 000 000 000 000 can bewritten as 5.3 × 10¹³.
There are three things to remember about a number expressed in standard form. These areexplained on the typical example given below.
5.3 × 10¹³
In general, the standard form of a number is defined as:
A × 10n
where 1 ≤ A < 10 and n is a positive or negative integer.
Examples of standard form are: radius of an electron, 2.82 × 10⁻¹⁵ m; mean radius of theearth, 6.4 × 10⁶ m; speed of light, 2.998 × 10⁸ m/s.
You have already met the way that calculators display numbers in standard form. Forexample, the number above may be displayed as:
5.3 × 10¹³
126
CHAPTER 7 Number 2
This chapter is going to show you
How to write numbers in
standard form and how to
calculate with them
How to calculate with numbers
given to different degrees of
accuracy
How to write recurring decimals
as fractions
What you should already know
How to multiply and divide by
10, 100, 0.1 and 0.01
How to round numbers to
various degrees of accuracy
Rule 1
The first part is anumber between1 and 10
Rule 2
The first part isalways multipliedby a power of 10
Rule 3
The power of 10 iseither a positive ornegative integer(whole number)
Maths Frameworking PB 9.3 Chs 1–9 29/5/08 19:11 Page 126

Example 7.1
Example 7.2
Write each of the following numbers in standard form. (All have positive powers of 10.)
a 5 690 b 1 200 000 c 938 000 d 77 800
e 396 500 000 f 561 g 73 h 4 300 000 000
Write each of the following numbers in standard form. (All have negative powers of 10.)
a 0.0034 b 0.056 c 0.000 0371 d 0.000 0092
e 0.76 f 0.0005 g 0.000 0072 h 0.0004
Write each of the following numbers in standard form. (These have a mixture ofpositive and negative powers of 10.)
a 8 900 000 b 0.0053 c 18 000 d 33 300 000
e 0.000 0067 f 8923 g 0.735 h 0.000 09
Write each of the following standard form numbers as an ordinary number.
a 2.3 × 10⁶ b 4.56 × 10² c 6.7 × 10⁵ d 3.59 × 10³
e 9 × 10⁶ f 2.01 × 10⁶ g 3.478 × 10⁴ h 8.73 × 10⁷
Exercise 7A
Write each of the following standard form numbers as an ordinary number.
a 3.45 × 10⁶ b 8.9 × 10⁻² c 7.632 × 10⁴
a Move the digits to the left the same number of places as the power of 10:
3.45 × 106 = 3.45 × 1 000 000 = 3 450 000
b A negative power of 10 means move the digits to the right:
8.9 × 10–2 = 8.9 × 0.01 = 0.089
c Proceed as in part a:
7.632 × 104 = 7.632 × 10 000 = 76 320
Express each of the following numbers in standard form.
a 760 000 b 0.000 005 42 c 36 × 107 d 0.24 × 10⁻²
a Count how many places the digits have to be moved to the right to get thenumber between 1 and 10:
760 000 = 7.6 × 10⁵
b Moving the digits to the left makes the power negative.
0.000 005 42 = 5.42 × 10⁻⁶
c 36 × 107 is not in standard form, as the first part is not a number between 1 and 10. So proceed as follows:
36 × 107 = 3.6 × 10 × 107 = 3.6 × 10⁸
d Proceed as in part b:
0.24 × 10–2 = 2.4 × 10–1× 10–2 = 2.4 × 10⁻³
127
8
Maths Frameworking PB 9.3 Chs 1–9 29/5/08 19:11 Page 127

Write each of the following standard form numbers as an ordinary number.
a 6.7 × 10⁻⁵ b 3.85 × 10⁻² c 7.8 × 10⁻⁴ d 5.39 × 10⁻³
e 8 × 10⁻⁶ f 1.67 × 10⁻¹ g 3.21 × 10⁻³ h 6.6 × 10⁻⁷
Write each of the following standard form numbers as an ordinary number.
a 4.6 × 10³ b 5.766 × 10⁻² c 9.3 × 10² d 1.22 × 10⁻³
e 5 × 10⁴ f 3.05 × 10⁻¹ g 4.82 × 10⁶ h 5.43 × 10⁻²
Write each of the following numbers in standard form.
a 43 × 105 b 56.8 × 10² c 0.78 × 10⁴ d 0.58 × 10³
e 94 × 10–5 f 20.1 × 10⁻⁵ g 0.8 × 10⁻³ h 80 × 10–3
i 25 × 10–4 j 0.56 × 10⁻² k 0.67 × 10⁵ l 35.9 × 10³
Multiplying with numbers in standard form
Example 7.3 Calculate each of the following. Give your answer in standard form. Do not use acalculator.
a (3 × 103) × (2 × 104) b (4 × 102) × (5 × 103) c (2.5 × 10–3) × (6 × 105)
a Rewrite the problem as 3 × 2 × 103× 104. Then multiply the numbers and add
the powers of 10:
3 × 2 × 103× 104 = 6 × 10⁷
b After multiplying 4 by 5, this is not in standard form, so it needs to beconverted:
4 × 5 × 102× 103 = 20 × 105
20 × 105 = 2 × 10 × 105 = 2 × 10⁶
c After multiplying 2.5 by 6, this is also not in standard form, so proceed as in part b:
2.5 × 6 × 10–3× 105 = 15 × 102
= 1.5 × 10 × 102
= 1.5 × 10³
Calculate, or use the Internet, to find out the following and write the answersin standard form.
1 Average distance of the Sun from the Earth in kilometres
2 Width of a red blood cell
3 Number of seconds that are in 70 years
4 The mass of an electron
5 The mass of a cubic metre of uranium in grams at 4°C
128
8
Maths Frameworking PB 9.3 Chs 1–9 29/5/08 19:11 Page 128

Example 7.4
Example 7.5
Do not use a calculator for this question. Work out each of the following and giveyour answers in standard form.
a (2 × 103) × (4 × 102) b (3 × 102) × (4 × 105) c (4 × 103) × (2 × 104)
d (3 × 10–2) × (3 × 10–3) e (4 × 10–5) × (8 × 10–3) f (6 × 103) × (7 × 10–6)
g (4.2 × 10–4) × (5 × 102) h (6.5 × 104) × (4 × 10–2) i (7 × 106) × (8 × 10–4)
j (2.5 × 106) × (9 × 10–2) k (2.8 × 105) × (4 × 10–3) l (6 × 10³)2
You may use a calculator for this question. Work out each of the following and giveyour answers in standard form. Do not round off your answers.
a (4.3 × 104) × (2.2 × 105) b (6.4 × 102) × (1.8 × 105)
c (2.8 × 102) × (4.6 × 107) d (1.9 × 10–3) × (2.9 × 10–2)
e (7.3 × 10-2) × (6.4 × 106) f (9.3 × 104) × (1.8 × 10–6)
g (3.25 × 104) × (9.2 × 10–1) h (2.85 × 104) × (4.6 × 10–2)
i (3.6 × 10²)3
Exercise 7B
6
7
Use a calculator to work out each of the following. Give your answer in standardform to 3 sf.
a (3.74 × 104) × (2.49 × 103) b (1.255 × 10–3) × (5.875 × 10–2)
The key on a calculator with which to enter standard form is usually .
Remember that a negative power will need the negative key .
So, to enter 3.74 × 10⁴ press these keys:
Note the × sign is not pressed. If this key is pressed the wrong value is entered.
a Enter the following:
The display will be 93126000 or 9.3126 × 10⁷.
When rounded to 3 sf, the answer is 9.31 × 10⁷.
b Enter the following:
The display will be:
0.000073731 or 7.3731 × 10⁻⁵
When rounded to 3 sf, the answer is 7.37 × 10⁻⁵.
10x
(–)
3 . 47 410x
43 . 3. 2 97 4 4 =10x
10x
. 282 71 355 5 . 5 =10x
10x(–) (–)
Light from the sun takes about 8 minutes to reach the earth. Light travels at299 792 kilometres per second. How far is the sun from the earth? Give your answer in standard form.
First, convert 8 minutes to seconds:
8 minutes = 8 × 60 = 480 seconds
Then multiply speed of light by number of seconds to get distance of the sun fromthe earth:
480 × 299 792 = 144 000 000 = 1.44 × 10⁸ km (rounded to 3 sf)
129
8
Maths Frameworking PB 9.3 Chs 1–9 29/5/08 19:11 Page 129

You may use a calculator for this question. Work out each of the following and giveyour answers in standard form. Round your answers to three significant figures.
a (2.35 × 105) × (4.18 × 105) b (1.78 × 105) × (4.09 × 102)
c (9.821 × 102) × (7.402 × 106) d (2.64 × 10–2) × (8.905 × 10–5)
e (4.922 × 104) × (8.23 × 10–8) f (7.92 × 103) × (7.38 × 10–6)
g (4.27 × 10–3) × (6.92 × 108) h (2.65 × 10–5) × (5.87 × 10–2)
i (7.83 × 10⁶)2 j (2.534 × 10⁻²)3
Zip discs are used to store large amounts of information. One megabyte (Mb) is 1 million bytes.
How many bytes are there in a pack of five 250 Mb zip discs? Answer in standard form.
There are approximately 120 000 hairs on a human head. Each hair is about 1 × 10⁻⁵ metres in diameter.
If all the hairs on a head were laid side by side, what would the total width be?
Dividing with numbers in standard form
Example 7.6 Calculate each of the following. Give your answer in standard form. Do not use acalculator.
a (3 × 10⁶) ÷ (2 × 10²) b (4 × 10⁻⁶) ÷ (5 × 10⁻³) c (1.2 × 10⁵) ÷ (4 × 10⁻²)
a Rewrite the problem as (3 ÷ 2) × (106 ÷ 102). Note that the numbers and thepowers have been separated but there is still a multiplication sign betweenthem. This is because standard form numbers are always expressed in this way.
Divide the numbers and subtract the powers of 10, which gives:
(3 ÷ 2) × (106 ÷ 102) = 1.5 × 10⁴
b (4 ÷ 5) × (10–6 ÷ 10–3) = 0.8 × 10⁻³. After dividing 4 by 5, this is not in standardform, so it needs to be converted:
0.8 × 10–3 = 8 × 10–1× 10–3 = 8 × 10⁻⁴
c After dividing 1.2 by 4, this is also not in standard form, so proceed as in part b:
(1.2 ÷ 4) × (105 ÷ 10–2) = 0.3 × 107
= 3 × 10–1× 107
= 3 × 10⁶
1 Use the Internet to find out about very large numbers. Look up ‘googol’on a search engine.
Note: The name of the well-known search engine is google, which ispronounced in the same way.
2 Can you find the meaning of ‘googolplex’?
3 What is the largest number of any practical use?
130
8
Maths Frameworking PB 9.3 Chs 1–9 29/5/08 19:11 Page 130

Example 7.7
Do not use a calculator for this question. Work out each of the following and giveyour answers in standard form.
a (6 × 10⁶) ÷ (2 × 10²) b (3 × 10⁶) ÷ (4 × 10³) c (4 × 10³) ÷ (2 × 10⁴)
d (9 × 10⁻²) ÷ (3 × 10⁻⁷) e (4 × 10⁸) ÷ (8 × 10²) f (6 × 10³) ÷ (5 × 10⁻⁶)
g (4.5 × 10⁻⁴) ÷ (5 × 10²) h (1.6 × 10⁶) ÷ (4 × 10⁻³) i (8 × 10⁹) ÷ (5 × 10⁴)
j (2.5 × 10⁻³) ÷ (5 × 10⁻⁶) k (2.8 × 10⁵) ÷ (4 × 10⁻³) l √––––(9 ×
––––106)
You may use a calculator for this question. Work out each of the following and giveyour answers in standard form. Do not round off your answers.
a (8.1 × 10⁹) ÷ (1.8 × 10⁵) b (6.48 × 10⁵) ÷ (1.6 × 10³)
c (3.78 × 10²) ÷ (1.35 × 10⁷) d (9.86 × 10⁻³) ÷ (2.9 × 10⁻⁵)
e (5.12 × 10⁻²) ÷ (6.4 × 10⁶) f (2.88 × 10⁴) ÷ (4.8 × 10⁻⁶)
g (6.44 × 10⁴) ÷ (9.2 × 10⁻¹) h (3.68 × 10⁴) ÷ (4.6 × 10⁻²)
i 3√––––(8 × 10⁶)
–––
You may use a calculator for this question. Work out the following and give youranswers in standard form. Round your answers to three significant figures.
a (2.3 × 10⁸) ÷ (4.1 × 10³) b (6.7 × 10⁵) ÷ (4.9 × 10²)
c (9.8 × 10²) ÷ (7.4 × 10⁶) d (2.6 × 10⁻²) ÷ (8.9 × 10⁻⁵)
e (4.9 × 10⁴) ÷ (8.2 × 10⁻⁸) f (6.9 × 10³) ÷ (2.4 × 10⁻⁶)
g (4.3 × 10⁻³) ÷ (6.9 × 10⁸) h (2.6 × 10⁻⁵) ÷ (5.8 × 10⁻²)
i √–––––(6.25 × 10⁶)
–––––j 3√
––––(1.728
––––––× 109)
–
The circumference of the earth at the equator is 4 × 10⁴ km. Calculate the radius ofthe earth. Give your answer in standard form.
A virus is 3 × 10⁻⁵ m wide. How many would fit across the head of a pin which is 1 mm wide?
Use the Internet to find out about very small numbers. Look up ‘centi’ on asearch engine.
Can you find out the meaning of these prefixes: milli, micro, nano, pico,femto, atto, zepto and yocto?
Exercise 7C
A nanometre is a billionth of a metre, or about 1––––25
––––400
––––000 inch. Write 1 ÷ 25 400 000
as a number in standard form to three significant figures.
Doing the calculation on a calculator, the display may say:
3.937 × 10⁻⁸ or 0.00000003937
When rounded and put into standard form, the answer is 3.94 × 10⁻⁸.
131
8
Maths Frameworking PB 9.3 Chs 1–9 29/5/08 19:11 Page 131

Upper and lower bounds 1
Form 7Q are making invitations to their Christmas party. They cut pieces of card 10 cmwide on which to write the invitations. They make envelopes 10.5 cm wide in which toput them.
The invitations are accurate to the nearest centimetre and the envelopes are accurate tothe nearest half centimetre. Will all of the invitations fit into all of the envelopes?
Example 7.8
Example 7.9
Find the upper and lower bounds between which each of the following quantities lie.
a The number of toffees in a tin which is 30 to the nearest 10
b The amount of rice in a bag which is 20 g to the nearest 10 g
c The speed of a car which is 70 mph to the nearest 10 mph
d The speed of a car which is 70 mph to the nearest unit
e The length of a piece of string which is 20 cm to one significant figure
f The length of a piece of string which is 20 cm to two significant figures
Exercise 7D
A rectangle is measured as 15 cm by 10 cm. Both measurements are given to thenearest centimetre. What are the greatest and least possible values of the perimeter?
The length is 14.5 ≤ Length < 15.5 and the width is 9.5 ≤ Width < 10.5
Least perimeter is given by:
14.5 + 9.5 + 14.5 + 9.5 = 48 cm
Greatest perimeter is given by:
15.5 + 10.5 + 15.5 + 10.5 = 52 cm
So, 48 ≤ Perimeter < 52
Note: It is easier to calculate with upper bounds if recurring decimals are not used.
Give the possible range of values for each of the following.
a A football crowd which is 3400 to the nearest hundred
b A piece of wood which is 32 cm long to the nearest centimetre
c The mass of a marble which is 12 g to two significant figures
a The smallest value is 3350 and the greatest is 3449.
b The smallest value is 31.5 cm and the greatest is 32.49.. But to make the range
easier, the upper bound is given as 32.5 cm. Strictly speaking, the ranges shouldbe expressed as:
31.5 ≤ Actual length < 32.5
(Note the ‘strict’ inequality for the upper bound.)
c The actual values must be within three significant figure limits:
11.5 ≤ Mass < 12.5
10 cm 10.5 cm
I NV I TAT ION
132
7
Maths Frameworking PB 9.3 Chs 1–9 29/5/08 19:11 Page 132

g The mass of a cake which is 500 g to the nearest 10 g
h The mass of a donut which is 50 g to the nearest gram
i The capacity of a jug which holds 1 litre to the nearest cubic centimetre
j The storage capacity of a hard drive which is 40 Gb to two significant figures
A lawn is 4 m by 3 m, each measurement accurate to the nearest 10 cm.
a What are the upper and lower bounds for the length of the lawn?
b What are the upper and lower bounds for the width of the lawn?
c What are the upper and lower bounds for the perimeter of the lawn?
A tile is 10 cm by 10 cm, measured to the nearest centimetre.
a What are the smallest possible dimensions of the tile?
b What are the largest possible dimensions of the tile?
c If ten of the tiles are placed side by side will they be guaranteed to cover alength of 98 cm?
d John wants to tile a wall which is 3 m long by 2 m high. Will he have enoughtiles if he has 700 tiles?
Woodville United had crowds of 1200, 1300, 1600, 1000 and 1400 for the first fivematches of the season. Each of these values was recorded to the nearest 100.
a What was the least possible total for the five matches?
b What was the greatest possible total for the five matches?
There are 200 sweets in a jar, measured to the nearest 10. They weigh 200 g to thenearest 10 g.
a Between what bounds does the number of sweets lie?
b Between what bounds does the mass of the sweets lie?
c Why are the answers to parts a and b different?
A petri dish contains 24 000 bacteria, measured to the nearest thousand.
a What is the least number of bacteria in the dish?
b What is the most number of bacteria in 10 similar dishes?
A bat colony has 230 bats, measured to the nearest 10.
a What is the least number of bats there could be?
b What is the greatest number of bats there could be?
Mr Ahmed wants to lay a path of slabs 20 m long. He buys 50 slabs which are 40 cmsquare to the nearest centimetre. Can he be sure he has enough slabs to cover 20 m?
A mug holds 200 ml of a drink to the nearest 10 ml. A jug holds 1900 ml to thenearest 100 ml. Can you be sure that nine mugfuls can be poured into a jug withoutspilling?
An exam has five modules. The mark for each module is given to the nearest 5%.Melanie scores 45, 50, 65, 40 and 55 on the five modules. The final grade is basedon the actual total of the marks. To get a pass a pupil needs a total of 250 marks(50%). Can Melanie be sure of passing?
133
7
Maths Frameworking PB 9.3 Chs 1–9 29/5/08 19:11 Page 133

Upper and lower bounds 2
Form 7Q are making biscuits for their Christmas party. They take lumps of mixture, which weigh 25 g to thenearest 5 g, from a bowl of mixture containing 3 kg tothe nearest 100 g. Can they be sure to make enoughbiscuits to give each member of the form of 30, fourbiscuits?
Example 7.10
Example 7.11 A briefcase containing a laptop has a mass of 3.5 kg, measured to the nearest 100 g. The laptop is taken out and the briefcase now has a mass of 0.5 kg, measuredto the nearest 100 g. What are the upper and lower bounds of the mass of thelaptop?
The upper and lower bounds of the briefcase plus laptop are 3450 ≤ Mass < 3550
The upper and lower bounds of the briefcase without laptop are 450 ≤ Mass < 550
The greatest difference is:
3550 – 450 = 3100 = 3.1 kg
The least difference is:
3450 – 550 = 2900 = 2.9 kg
The upper and lower bounds of the laptop are 2.9 ≤ Mass < 3.1 kg
A rectangle has a length of 20 cm and a width of 12 cm, both measured to the nearestcentimetre. What are the upper and lower bounds of the area of the rectangle?
The upper and lower bounds of the length are 19.5 ≤ Length < 20.5
The upper and lower bounds of the width are 11.5 ≤ Width < 12.5
The upper bound of the area is:
20.5 × 12.5 = 256.25 cm2
The lower bound of the area is:
19.5 × 11.5 = 224.25 cm2
The upper and lower bounds of the area are 224.25 ≤ Area < 256.25 cm2
1 A piece of wood is 1.2 m long to the nearest centimetre. A piece is cutoff, which is 85 cm to the nearest cm. Assuming that there is no loss oflength due to the cutting, explain why the largest possible length left is36 cm and the smallest possible length left is 34 cm.
2 A rectangle has an area of 45 cm2, measured to the nearest 5 cm2. Thewidth is 2 cm measured to the nearest cm. Explain why the largestpossible length is 31.67 cm and the smallest possible length is 17 cm.
134
7
Maths Frameworking PB 9.3 Chs 1–9 29/5/08 19:11 Page 134

Example 7.12
Find the limits (upper and lower bounds) of the area of each of the followingrectangles. All measurements are to the nearest centimetre.
a b c
a = 12, b = 18 and c = 24. All the values are to the nearest whole number.
a Write down the upper and lower bounds of a, b and c.
b Work out the upper and lower bounds of each of these.
i a × b ii b ÷ a iii (a + b) × c iv c2
Speed = Distance ÷ Time
A car travels for 40 miles, measured to the nearest mile, in a time of 30 minutes,measured to the nearest minute.
a What is the greatest possible speed of the car?
b What is the least possible speed of the car?
Distance = Speed × Time
A plane travels at 550 mph, to the nearest 10 mph, for 2 hours, measured to the nearest tenth of an hour.
a What is the greatest possible distance travelled?
b What is the least possible distance travelled?
There are 200 sweets in a jar, measured to the nearest 10. They weigh 600 g to thenearest 10 g.
a What is the least possible mass of each sweet?
b What is the greatest possible mass of each sweet?
A square has an area of 100 cm2 measured to the nearest 10 cm2. What are theupper and lower bounds of the side of the square?
6 cm
3 cm
8 cm
2 cm
12 cm
9 cm
Exercise 7E
a = 7.2 to one decimal place; b = 4.52 to two decimal places. What are the upperand lower bounds of a ÷ b?
The upper and lower bounds of a are 7.15 ≤ a < 7.25
The upper and lower bounds of b are 4.515 ≤ b < 4.525
The greatest value from the division is:
7.25 ÷ 4.515 = 1.606 (3 dp)
The least value from the division is:
7.15 ÷ 4.525 = 1.580 (3 dp)
a aThe upper and lower bounds for – are 1.580 ≤ – < 1.606b b
135
8
Maths Frameworking PB 9.3 Chs 1–9 29/5/08 19:11 Page 135

a = 3.2, b = 4.5 and c = 6.8, all values being accurate to one decimal place. Workout the greatest and least possible values of the following.
(a + b)a a × b × c b ––– c a + b – c d (b – a)2c
A rectangle has an area of 250 cm2, measured to the nearest 10 cm2. The length is 25 cm, measured to the nearest centimetre. What are the upper and lower bounds ofthe width of the rectangle?
On his bathroom scales, which measure to the nearest kilogram, Mr Wilson’s casehad a mass of 22 kg. On the way to the airport, he took out a coat. On the airportscales, which measure to the nearest tenth of a kilogram, the case weighed 19.8 kg.What are the upper and lower bounds for the weight of the coat?
Holes are drilled which have a radius of 4 cm measured to one significant figure.Cylindrical rods are made with a radius of 4.0 cm, measured to two significantfigures. Will every rod fit in every hole?
Recurring decimals
= 0.375 = 0.666 666… π = 3.141 59…
The decimals shown above are, from left to right, a terminating decimal, a recurringdecimal and a decimal which never terminates nor recurs. This is called an irrationalnumber.
Every recurring decimal can be written as a fraction.
To show a recurring decimal, a small dot is placed over the first and last of the recurringdigits. For example:
= 0.27.
= 0.3.6.
= 0.2.85 714
.
Example 7.13 Write each of the following fractions as a recurring decimal.
a 5–9 b 4–
7 c 7–11
Use a calculator to divide each numerator by its denominator.
a 5–9 = 5 ÷ 9 = 0.555 555… = 0.5
.
b 4–7 = 4 ÷ 7 = 0.571 428 5714… = 0.5
.71 428
.
c 7–11 = 7 ÷ 11 = 0.636 363… = 0.63
..
27
411
518
23
38
1 A cube has a volume of 500 cm3, measured to the nearest 100 cm3. Whatare the upper and lower bounds for the surface area of the cube? Write youranswer to 4 sf.
2 A sphere has a volume of 300 cm3, measured to the nearest 10 cm3. Whatare the upper and lower bounds for the surface area of the sphere? Writeyour answer to 4 sf. (Volume of a sphere = 4–3 πr
3; surface area = 4πr2)
136
8
Maths Frameworking PB 9.3 Chs 1–9 29/5/08 19:11 Page 136

Example 7.14
Example 7.15 Write each of the following recurring decimals as a fraction in its simplest form.
a 0.6.3.
b 0.23.8.
c 2.04.12.
In these examples (apart from a), the method used in Example 7.14 cannot be usedbecause the recurring decimals do not occur immediately after the decimal point.
a Because there are two recurring digits, multiply the original number, x, by 100.This gives:
x = 0.63636363… (1)
100x = 63.636363… (2)
Subtract equation 1 from equation 2, to obtain:
99x = 63
63 7x = –– = ––
99 11
b Because there are two recurring digits, multiply the original number, x, by 100.This gives:
x = 0.23838383… (1)
100x = 23.8383838… (2)
Subtract equation 1 from equation 2, to obtain:
99x = 23.623.6 236 118
x = ––– = ––– = –––99 990 495
Write each of the following recurring decimals as a fraction in its simplest form.
a 0.4.8.
b 0.3.42.
c 3.4.
a Because there are two recurring digits, the denominator is 99 (see table below).
Fraction 1–9
1–99
1–999
Decimal 0.111 111 0.010 101 0.001 001
Dot form 0.1.
0.0.1.
0..001
.
So, you have:
48 160.4.8.
= –– = –– (Cancel by 3)99 33
b Because there are three recurring digits, the denominator is 999. So you have:
342 380.3.42.
= –– = –– (Cancel by 9)999 111
c Ignore the whole number. Hence, you have:
40.4.
= ––9
This does not cancel, so 3.4.
= 34–9
137
Maths Frameworking PB 9.3 Chs 1–9 29/5/08 19:11 Page 137

Example 7.15
continued
Write each of the following fractions as a recurring decimal.
a b c d e
Write down the ninths as recurring decimals: for example, = 0.1.. Describe any
patterns you see.
Write down the elevenths as recurring decimals: for example, = 0.0.9.,
= 0.1.8.… . Describe any patterns you see.
Write down the sevenths as recurring decimals: for example, = 0.1.42 857
.,
= 0.2.85 714
.… . Describe any patterns you see.
Write each of the following recurring decimals as a fraction in its simplest form.
a 0.4.5.
b 0.3.21.
c 0.8.
d 0.7.29.
e 0.1.2.
f 0.8.1.
g 0.1.107
.h 0.7
.8.
i 0.8.01.
j 0.9.
Write each of the following recurring decimals as a fraction. Write each fraction inits simplest form.
a 0.04.
b 0.05.6.
c 0.5.78.
d 0.07.04.
e 0.034.5.
Write each of the following recurring decimals as a mixed number.
a 2.39.
2.
b 1.05.
c 5.21.08.
d 2.408.2.
The thirteenths are recurring decimals. They always have six recurring digits which fit into one of two cycles. These are shown right.
For example: 1–13 = 0.0
.76 923
.and 2–13 = 0.1
.53 846
.
Without using a calculator, and by working out the first one or two digits,write down all the thirteenths as recurring decimals.
For example:
1 0.07…— = —————13 13/1.000000
So, the recurring decimal must be 0.0.76923
..
0
9
3 7
2 6
1
8
6 5
4 3
27
17
211
111
19
29
13
2333
76101
47
Exercise 7F
c Because there are three recurring digits, multiply the original fraction, x, by1000 (ignoring the whole number, 2). This gives:
x = 0.0412412412 (1)
1000x = 41.2412412… (2)
999x = 41.2
41.2 412 206x = ––– = –––– = –––
999 9990 4995
206Replace the 2, which gives 2 ––––4995
138
8
Maths Frameworking PB 9.3 Chs 1–9 29/5/08 19:11 Page 138

Efficient use of a calculator
You have previously used the keys which control brackets, memory, sign change andfractions. This section will remind you how to use these keys and a few others which canbe found on most scientific calculators.
Example 7.16
Example 7.17
Using the π key on your calculator, work out each of the following. Round eachanswer to a suitable degree of accuracy.
a π x 72 b √––––π ÷ 8 c 2 × π × 10 × 9 + π × 92
Using the power key on your calculator, work out each of the following. Round youranswers to a suitable degree of accuracy if necessary.
a 3.72 b 85 c 1.253 d 0.0745
Exercise 7G
Use the power key to evaluate: a 5.94 and b 813–4
The power key may be marked x ■, or be an inverse or shift function.
a Key in the following:
The answer is 1211.7361.
b Key in the following:
The answer is 27.
5 . 9 4 =x
8 1 3 4 =x
Use a calculator to evaluate each of the following.
36.7 × 18.32 13 11a [3.52 + (5.2 – 2.34)]2 b –––– c – – –3.7(5.6 – 2.91) 15 18
a Key in as follows:
The answer is 228.3121.
b Key in as follows:
The answer is 67.551 8939…, which can be rounded to 67.6.
c Key in as follows:
The answer is 23–90.
( 3 . 5 x2 + ( 5 . 2 – 2 . 3 4 ) ) x
2 =
( 3 . 76 1 8 . 3 2 ) ÷ 3 . 7
( 5 . 6 – 2 . 9 1 ) =)
(
1 3 1 5 – 1 1 1 8 =
139
8
Maths Frameworking PB 9.3 Chs 1–9 29/5/08 19:11 Page 139

Using the power key and the fraction key, calculate each of the following.
a 9 b 64 c 121 d 2.25
Using the power key and the fraction key, calculate each of the following.
a 8 b 64 c 125 d 0.216
Use your calculator to work out each of the following. Round your answers to asuitable degree of accuracy.
5.65 × 56.8a √––––16.52
––– 4.72
–––b ––––– c [4.62 + (3.2 – 1.73)]2
3.04(3.4 – 1.9)
6√5.2––––––
2 +––––
42–––
d 3.8 – [2.9 – (12.3 × 8.4)] e –––5
Use the fraction key to work out each of these.
a + b ( – ) × ( – ) c ( + ) ÷ ( – )
Choose a number between 1 and 2, say 1.5. Key it into the calculator display.
Perform the following sequence of key presses:
Note: The key is called the reciprocal key.
After the sequence has been performed, the display should show 2–5 or 0.4.
Repeat the above sequence of key presses. The display should now show 0.714 … .
Keep repeating the above sequence of key presses until the first three decimalplaces of the number in the display start to repeat.
+ 1 = =x–1
x–1
16
49
58
23
35
57
56
78
1722
1118
13
13
13
13
12
12
12
12
140
8
6I can round numbers to two or more decimal places.
I can use the power and root buttons on my calculator.
7I can use my calculator efficiently to solve more complex calculations.
I can round numbers to one significant figure.
I can write down upper and lower bounds for a quantity.
8I can convert from ordinary numbers to standard form and vice versa.
I can multiply and divide using numbers in standard form.
I can calculate limits using upper and lower bounds.
I can convert recurring decimals to fractions.
Maths Frameworking PB 9.3 Chs 1–9 29/5/08 19:11 Page 140

1 2002 Paper 2
A company sells and processes films of two different sizes. The tablesshow how much the company charges.
I want to take 360 photos. I need to buy the film, pay for the film to beprinted and pay for the postage.
a Is it cheaper to use all films of 24 photos or all films of 36 photos?
b How much cheaper is it?
2 2007 Paper 2
The value of π correct to 7 decimal places is:
a Write the value of π correct to 4 decimal places.
b Which value below is closest to the value of π?
3 ( )2
3 2006 Paper 1
a Put these values in order of size with the smallest first.
52 32 33 24
b Look at this information.
What is 57?
4 2007 Paper 1
Here is the rule to find the geometric mean of two numbers.
Example: geometric mean of 4 and 9 = √4 × 9––––––
= √36–––
= 6
a For the two numbers 10 and x, the geometric mean is 30.
What is the value of x?
Multiply the two numbers together, then find the square root of the result.
55 is 3125
355113
169
17
17957
3.1415927
Film size: 24 photos
Cost of each film £2.15
Postage Free
Cost to print film £0.99
Postage of each film 60p
Film size: 36 photos
Cost of each film £2.65
Postage Free
Cost to print film £2.89
Postage of each film 60p
141
6
7
Maths Frameworking PB 9.3 Chs 1–9 29/5/08 19:11 Page 141

b Reena says:
‘For the two numbers –2 and 8, it is impossible to find the geometric mean.’
Is Reena correct?
Explain your answer.
5 2006 Paper 1
Copy these multiplication grids and write in the missingnumbers.
6 2001 Paper 1
1––– is equal to 0.0004.2500
a Write 0.0004 in standard form.
1b Write ––– in standard form.
2500
c Work out
1 1––– + –––2500 2500
Show your working, and write your answer in standard form.
7 2002 Paper 2
The star nearest the Earth (other than the Sun) is Proxima Centauri. Proxima Centauri is 4.22 light-yearsaway. (One light-year is 9.46 × 10¹² kilometres.)
Suppose a spaceship could travel at 40 000 km per hour.
a Copy the following calculations. Then state what each one represents. The first one is done for you.
i 4.22 × 9.46 × 1012 Number of km from Earth to Proxima Centauri
4.22 × 9.46 × 1012ii –––––– ……
40 000
4.22 × 9.46 × 1012iii –––––– ……
40 000 × 24 × 365.25
b Work out
4.22 × 9.46 × 1012––––––40 000 × 24 × 365.25
Give your answer to the nearest thousand.
8 2007 Paper 2
a One light year is approximately 9 430 000 000 000 kilometres.
Write this distance in standard form.
b A star called Wolf 359 is approximately 7.8 light years from Earth.
About how many kilometres is this?
Write your answer in standard form.
3 1.2
6
0.2×
9 72
–6 30
8×
142
7
8
Maths Frameworking PB 9.3 Chs 1–9 29/5/08 19:11 Page 142

9 2006 Paper 1
a Look at the number.
Round it to the nearest thousand.
Give your answer in standard form.
b Now look at this number.
Round it to the nearest thousandth.
Give your answer in standard form.
10 2005 Paper 1
a Show that (4 x 108) x (8 x 104) = 3.2 × 10¹³
b What is (4 x 10⁸) ÷ (8 x 10⁴)?
Write your answer in standard form.
8.679 × 10⁻⁴
8.679 × 10⁴
143
8
Maths Frameworking PB 9.3 Chs 1–9 29/5/08 19:11 Page 143

144
Paper
Functional Maths
Paper sizes
Standard paper sizes are called A0, A1, A2 and so on.
A0 is approximately 1188 mm by 840 mm.
The next size A1 is found by cutting A0 in half.
Here is a diagram of a piece of paper of size A0.
Paper for sale
1 ream = 500 sheets
A1
A2
A3
A4
A5
A6
A0
1188 mm
840 mm
Reams of Paper – Special offer
Example for Standard paper:
1 ream costs £2.10
5 reams at full price = 5 × £2.10 = £10.50
Saving = 1–3
of £10.50 = £3.50
Cost of 5 reams = £7.00
10 reams with 1–3
off = 2 × £7.00 = £14.00
Extra 10% discount = £1.40
Cost of 10 reams = £12.60
Grade of
paper
Prices
1 ream 5–9 reams 10+ reams
Standard £2.10
SAVE 1–3
per
ream
EXTRA 10%
discount
Special £1.80
Quality £3.00
Photo £3.60
Buy 5 reamsYou save
£3.50
Buy 10 reams
You save
£8.40
FM Ch 7 Paper PB 9.3 29/5/08 18:54 Page 144

145
How many sheets of paper are there in 400 reams of paper?1
The thickness of a piece of paper is 1.2 × 10⁻¹ mm.
How high would 4 reams (2000 sheets) of this paper be?
Give your answer as an ordinary number in centimetres.
2
Here is a table of paper sizes.
Copy and complete the table.
Check your result for A4 paper by measuring.
Paper size A0 A1 A2 A3 A4 A5
Length (mm) 1188 840 594
Width (mm) 840 594
3
How many pieces of A5 paper would be needed to make
a piece of A1 paper?4
Look at the special offers.
a Work out the cost of 3 reams of Special grade paper.
b Work out the cost of 5 reams of Quality grade paper.
c Work out the difference between the cost of 9 reams of
Photo grade pagper and 10 reams of Photo grade
paper.
5
Use the information on the left to answer these questions.
Work out the saving if you buy 20 reams of Quality paper
using the offers.6
FM Ch 7 Paper PB 9.3 29/5/08 18:54 Page 145

Index notation with algebra – negative
powers
You met two rules of algebra regarding indices in Year 8.
When multiplying powers of the same variable, add the indices:
x A× x B = x A + B
Example 8.1
When dividing powers of the same variable, subtract the indices:
x A ÷ x B = x A – B
Example 8.2
As you have already seen, powers of numbers and variables can be negative, as in 4–1, x–3
and 10–5. This section will show you that negative powers obey the same rules as positivepowers stated above. Follow through Example 8.3 to see how the rules work for negativepowers.
Simplify each of these.
a m6 ÷ m3 b 6w5 ÷ 2w
a m6 ÷ m3 = m6 – 3 = m3
b 6w5 ÷ 2w = (6 ÷ 2)w5 – 1 = 3w4
Simplify each of these.
a g4× g b 3t2 × 5t4
a g4× g = g4 + 1 = g5
b 3t2× 5t4 = (3 × 5)t2 + 4 = 15t6
146
CHAPTER 8 Algebra 4
This chapter is going to show you
How to interpret negative
powers
How to interpret powers given
as fractions, including square
roots and cube roots
How to construct quadratic and
cubic graphs
What you should already know
How to find square roots and
cube roots
What a factor is
Maths Frameworking PB 9.3 Chs 1–9 29/5/08 19:16 Page 146

Example 8.3
Investigation
Simplify each of the following.
a 4x2× x3 b m3
× 7m c n5 ÷ n3 d x6 ÷ x
e 8m5 ÷ 2m f 3x × 2x3 g 5t3 × 3t h 10m6 ÷ 2m3
i g5× g4 j 5m6 ÷ 5m2 k 8t5 ÷ 2t3 l 5m3
× 3m5
m 12q4× 4q2 n am2
× bm3 o cy × dy3
Simplify each of the following. Your answers should not contain fractions.
a 4x ÷ x3 b 7m3 ÷ m5 c n2 ÷ n5
d 8x6 ÷ 2x9 e 8m2 ÷ 2m7 f 3x ÷ 2x3
g 5t3× 3t –5 h 10m ÷ 2m3 i g–5
× g4
Simplify each of the following.
a x3 ÷ x–4 b m4 ÷ m–3 c n–2 ÷ n–4
d 4x5 ÷ 2x–3 e 9m–4 ÷ 3m–1 f 6x ÷ 2x–2
g 4t –2× 3t –5 h 12m ÷ 2m–4 i 3g–4
× 2g–1
Write each of the following in fraction form.
a m–1 b k–2 c x–3 d n–4
e 5m–2 f 4y–1 g 8x–3 h ab–1
Write each of the following using a negative power.
1 1 3 1a – b – c – d –5 4 x x2
1 1 5 Ae – f – g – h –m6 9 x4 m3
Exercise 8A
Work through each of the following. Write your answer:
i using a negative power. ii in fraction form.
The answers to the first two questions have been completed for you.
1 1a i 4 ÷ 42 = 41 – 2 = 4–1 ii 4 ÷ 42 = 4 ÷ 16 = – That is: 4–1 = –4 4 1
1 1 1b i 4 ÷ 43 = 41 – 3 = 4–2 ii 4 ÷ 43 = 4 ÷ 64 = – = – That is: 4–2 = –16 42 4 2
c i 4 ÷ 44 = ii That is:
d i 4 ÷ 45 = ii That is:
Write down a generalisation from the investigation of x–n.
Simplify each of the following.
a 6x4 ÷ 2x–1 b 2m–1× 4m–2
a 6x4 ÷ 2x–1 = (6 ÷ 2)x4 – –1 = 3x5
b 2m–1× 4m–2 = (2 × 4)m–1 + –2 = 8m–3
147
7
8
Maths Frameworking PB 9.3 Chs 1–9 29/5/08 19:16 Page 147

Simplify each of the following.
a 3x4× x–3
× x b 2m3× 5m–4
× 3m2 c 4n3 ÷ 2n3× 3n
d 8x5 ÷ 2x–2× 3x3 e 10m3 ÷ 5m × 3m–4 f 4x2
× 3x–3× 2x–1
g 4t5× 5t –1
× 3t –1 h 12m5 ÷ 3m2× 2m–4 i 3g6
× g–4× 3g–1
j 7m7 ÷ 7m5× 4m–3 k 18t6 ÷ 3t –4
× 5t–3 l 6m2× 4m3 ÷ m–2
m 3q5× 2q3 ÷ q–4 n km2
× pm3 ÷ m–1 o dy3× ey ÷ y–4
Square roots, cube roots and otherfractional powers
The square root of a given number is that number which, when multiplied by itself,produces the given number.
For example, the square root of 36 is 6, since 6 × 6 = 36. A square root is represented bythe symbol √
–. For example, √
–36 = 6
Example 8.4
The cube root of a given number is that number which, when multiplied by itself twice,produces the given number.
For example, the cube root of 64 is 4, since 4 × 4 × 4 = 64. A cube root is represented bythe symbol 3√
–. For example, 3√
–64 = 4
Example 8.5 Solve y3 = 216
Taking the cube root of both sides gives y = 6
Note that the sign (+ or –) of the value is the same as the sign of the original number,because here + × + × + = +. If the original number had been –216, the solutionwould have been –6 (because – × – × – = –).
Solve: a x2 = 49 b (x + 3)2 = 25
a Taking the square root of both sides gives x = 7 and –7
The negative value of x is also a solution, because –7 × –7 = 49
Note that all square roots have two solutions: a positive value and its negative.
b Taking square roots of both sides gives x + 3 = ±5
If x + 3 = +5 ⇒ x = 2 and if x + 3 = –5 ⇒ x = –8
1 Find some values of x which meet each of the following conditions.
a x2 is always larger than x.
b x2 is always smaller than x.
c x2 = x
2 Find some values of x which meet each of the following conditions.
a x2 is always larger than 5x.
b x2 is always smaller than 5x.
c x2 = 5x
148
7
8
Maths Frameworking PB 9.3 Chs 1–9 29/5/08 19:16 Page 148

You should be familiar with the following square roots and cube roots.
√1 √4 √9 √16 √25 √36 √49 √64 √81 √100 √121 √144 √169 √196 √225
±1 ±2 ±3 ±4 ±5 ±6 ±7 ±8 ±9 ±10 ±11 ±12 ±13 ±14 ±15
3√1 3√8 3√27 3√64 3√125 3√216 3√343 3√512 3√729 3√1000
1 2 3 4 5 6 7 8 9 10
Often a calculator will be needed to find a square root or a cube root. So, do make sureyou know how to use the power key and root key on your calculator.
When decimal numbers are involved, solutions are usually rounded to one decimalplace. For example: 3√
–––250 = 6.3, √
–––153 = 12.4
Expressions of the The investigation below demonstrates how to interpret powers given as fractions.form x
1–n
Investigation
Example 8.6
Jack has done his homework incorrectly. Find out on which line he has gone wrongand correct the homework from there.
a Solve the equation 2x2 = 50 b Solve the equation 4x2 = 36
x2 = 2 × 50 = 100 4x = √36 = 6 and –6
x = 10 and –10 x = and –
x = 1 and –1
Use a calculator to find the positive root of each of the following to one decimal place.
a √–26 b √
–55 c √
–94 d √
–––109 e √
–––275
12
12
64
64
Exercise 8B
Find 31–4 using a calculator.
Press the following keys:
which gives the answer 1.316, correct to three decimal places.
On some makes of calculator the root key is or
3 4xSHIFT
x 1–
y
y
x
This investigation looks at the values of expressions which are given in the form x1–n.
The index 1–n shows that the nth root of x is to be taken, as shown below.
You know that √–3 × √
–3 = 3
31–2 × 3
1–2 can be simplified to 3
1–2 + 1–2
So, 31–2 × 3
1–2 = 3
1–2 + 1–2 = 31 = 3
This means that 31–2 is the same as √
–3.
a Simplify 51–3 × 5
1–3 × 5
1–3
b What does 51–3 mean?
c What meaning can be given to these expressions? i x1–4 ii x
1–5
d Write down what you can say about the expression x1–n.
149
Maths Frameworking PB 9.3 Chs 1–9 29/5/08 19:16 Page 149

Without using a calculator, state the cube root of each of the following numbers.
a 8 b 1 c 125 d 27 e 1000
f –64 g –1 h –1000 i 0.001 j 0.008
Use a calculator to find the cube root of each of the following to one decimal place.
a 86 b 100 c 45 d 267 e 2000
State which of each pair of numbers is larger.
a √–10, 3√
–50 b √
–30, 3√
–––150 c √
–20, 3√
–60
d √–35, 3√
–––200 e √
–15, 3√
–55 f √
–40, 3√
–––220
Write down two solutions to each of the following equations.
a x2 = 9 b x2 = 36 c x2 = 49 d x2 = 121
Solve each of these equations. Each has two solutions.
a x2 + 4 = 40 b x2 + 8 = 33 c m2 + 13 = 62
d t2 + 23 = 104 e t2 – 6 = 10 f x2 – 12 = 52
g 8 + k2 = 152 h 12 + g2 = 133 i 21 + h2 = 70
j 150 – t2 = 101 k 210 – n2 = 146 l 175 – y2 = 94
Solve each of these equations. Each has two solutions.
a (x + 3)2 = 16 b (x + 5)2 = 64 c (m + 1)2 = 49
d (t + 7)2 = 900 e (t + 5)2 = 400 f (k + 8)2 = 144
g (x – 2)2 = 9 h (h – 4)2 = 36 i (n – 7)2 = 121
I square a number, add 18 to the outcome and get 67. What are the two possiblenumbers I have squared?
I think of a number, subtract 5, square it and get the answer 169. What are the twopossible numbers I am thinking of?
Write down the value of each of the following without using a power. Use acalculator to help you.
a 161–2 b 25
1–2 c 81
1–2 d 100
1–2
e 81–3 f 1000
1–3 g (–64)
1–3 h (–125)
1–3
i 6251–4 j 81
1–4 k 1296
1–4 l 32
1–5
m 7291–6 n 3125
1–5 o 1024
1–10 p 729
1–3
Investigate each of the following statements to see which are:
i always true. ii sometimes true.
For those which are sometimes true, state when they are true.
a √–A + √
–B = √
–––(A + B)
––b 3√
–A × 3√
–B = 3√
–––(A × B)
––
c √–A – √
–B = √
–––(A – B)
––d √
–A ÷ √
–B = √
–––(A ÷ B)
––
150
6
7
8
7
Maths Frameworking PB 9.3 Chs 1–9 29/5/08 19:16 Page 150

Quadratic graphs
A quadratic equation has the form y = ax2 + bx + c. That is, it is an equation which has asquare as its highest power.
Follow through Example 8.7 in which a graph is drawn from a quadratic equation. Thisexample demonstrates that the graph of a quadratic equation is a curved line.
Example 8.7
Notice that the graph has a smooth U-shape. All quadratic graphs have a similar shape,although some will be upside down.
When drawing quadratic graphs, remember the following important points.
● They have curved bottoms (or tops).
● There are no straight sections in the graph.
● There are no kinks, bulges or sharp points.
Copy and complete each table and use the suggested scale to draw a smooth graphof each equation.
a y = x2
x –3 –2 –1 0 1 2 3
x2 9 9
y = x2 9 9
● x on the horizontal axis, scale 2 cm to 1 unit, from –3 to 3
● y on the vertical axis, scale 2 cm to 1 unit, from 0 to 9
Exercise 8C
Draw a graph of the equation y = x2 – 4x + 3 between x = –1 and x = 4.
Start by constructing a table of coordinates for values of x from –1 to 4. To do this,calculate each part of the quadratic equation, then add the parts together.
x –1 0 1 2 3 4
x2 1 0 1 4 9 16
–4x 4 0 –4 –8 –12 –16
3 3 3 3 3 3 3
y = x2 – 4x + 3 8 3 0 –1 0 3
Plot these points and join them with asmooth curve. The outcome is shownon the right.
8
6
4
2
O 1 3 4–1 2x
y
y = x2 – 4x +3
151
7
Maths Frameworking PB 9.3 Chs 1–9 29/5/08 19:16 Page 151

b y = x2 + 4
x –3 –2 –1 0 1 2 3
x2 9 9
4 4 4 4 4 4
y = x2 + 4 13 13
● x on the horizontal axis, scale 2 cm to 1 unit, from –3 to 3
● y on the vertical axis, scale 2 cm to 1 unit, from 0 to 13
c y = x2 + x
x –4 –3 –2 –1 0 1 2
x2 16
x –4 –3 2
y = x2 + x 12
● x on the horizontal axis, scale 2 cm to 1 unit, from –4 to 2
● y on the vertical axis, scale 2 cm to 1 unit, from –1 to 12
d y = x2 + 3x – 1
x –4 –3 –2 –1 0 1 2
x2 16
3x –12
–1 –1
y = x2 + 3x –1 3
● x on the horizontal axis, scale 2 cm to 1 unit, from –4 to 2
● y on the vertical axis, scale 2 cm to 1 unit, from –3 to 9
Construct a table of values for each of the following equations. Then, using a suitablescale, draw its graph.
a y = 2x2 from x = –3 to 3 b y = x2 + 2x from x = –4 to 2
c y = x2 + 2x – 3 from x = –4 to 2 d y = x2 + x – 2 from x = –3 to 3
Investigation
a Construct a table of values for each equation below. Then plot the graph of eachequation on the same pair of axes, x = –2 to 2. Use a scale of 4 cm to 1 unit onthe horizontal axis and 1 cm to 1 unit on the vertical axis.
i y = x2 ii y = 2x2 iii y = 3x2 iv y = 4x2
b Comment on your graphs.
c Sketch on your diagram the graphs with these equations.
i y = x2 ii y = 2 x2 iii y = 5x2
Investigation
a Construct a table of values for each equation below. Then plot the graphs of eachequation on the same pair of axes, x = –3 to 3. Use a scale of 2 cm to 1 unit onboth the horizontal and vertical axes.
i y = x2 ii y = x2 + 1 iii y = x2 – 1
iv y = x2 + 2 v y = x2 – 2
12
12
152
7
Maths Frameworking PB 9.3 Chs 1–9 29/5/08 19:16 Page 152

b Comment on your graphs.
c Sketch on your diagram the graphs with these equations.
i y = x2 + 3 ii y = x2 – iii y = x2 + 3
Cubic graphs
A cubic equation is one which has a cube as its highest power. For example: y = x3, y = 4x3 + 5 and y = 3x3 + x2.
Example 8.8 Draw a graph of the equation y = x3 + 4x2 between x = –5 and x = 2.
Start by constructing a table of coordinates for values of x from –5 to 2. To do this,calculate each part of the cubic equation, then add the parts together.
x –5 –4 –3 –2 –1 0 1 2
x3 –125 –64 –27 –8 –1 0 1 8
4x2 100 64 36 16 4 0 4 16
y = x3 + 4x
2 –25 0 9 8 3 0 5 24
Plot these points and join them with a smooth curve. The outcome is shown on the right.
–5 –4 –3 –2 O 1 2
25
20
15
10
5
–5
–10
–15
–20
–25
–1
y
x
y = x3 + 4x2
y
x
87654321
–1–2–3–4–5–6–7–8
–3 –2 –1 1 2O
y = x3 + 3x2 + 3x + 1
1 a Construct a suitable table of values and draw the graph of theequation y = 1 – x2.
b Comment on the shape of the graph.
2 a Draw the graph of y = x2.
b Draw the reflection on the x-axis of the graph of y = x2 on the same grid.
c What is the equation of this reflection?
12
12
153
7
8
Maths Frameworking PB 9.3 Chs 1–9 29/5/08 19:16 Page 153

Notice that the graph is a smooth curve with two bends or turning points. All cubicgraphs have a similar shape. Sometimes the two bends coincide, giving the graph a singletwist instead. (One example of such a graph is given above by y = x3 + 3x2 + 3x + 1.)
Also notice that this graph starts in the third quadrant (bottom left-hand corner) andfinishes in the first quadrant (top right-hand corner). Others start in the second quadrant(top left-hand corner) and finish in the fourth (bottom right-hand corner).
Plot the graph of the equation y = x3 for values of x from –2 to 2.
Plot the graph of the equation y = x3 – 9x for values of x from –3 to 3.
Plot the graph of the equation y = x3 – x + 3 for values of x from –2 to 2. You willneed to include x = –0.5 and x = 0.5 in your table.
Plot the graph of the equation y = x3 – 5x2 – 4 for values of x from –2 to 3.
By drawing suitable graphs, solve the following pair of simultaneous equations.
x + y = 4
y = x3 + 1
There is only one solution.
The velocity, v metres per second, of a particle moving along a straight line is givenby v = 1 + t3, where t is the time in seconds.
Draw the velocity–time graph for the first 3 seconds.
Investigate the shapes of each of the following graphs.
a y = x–1 b y = x–2 c y = x–3
Exercise 8D
154
78
5I know the squares of the first 15 integers and the corresponding square roots.
I know the cubes of 1, 2, 3, 4, 5 and 10 and the corresponding cube roots.
I can calculate powers and simplify algebraic expressions using index form.
6I can solve quadratic equations by taking square roots, giving two possible solutions.
7I can use the index laws of addition and subtraction to simplify expressions.
I can draw and interpret graphs of quadratic functions.
8I know that a negative power is the reciprocal of the positive power.
I know that fractional powers represent roots.
I can draw and interpret graphs of cubic functions.
Maths Frameworking PB 9.3 Chs 1–9 29/5/08 19:16 Page 154

1 2007 Paper 2
Write the missing numbers.
6x + 2 = 10 1 – 2y = 10
so 6x + 1 = … so (1 – 2y)2 = …
2 2007 Paper 1
Look at this information.
Copy and complete the following equations, using the information to find the missing numbers.
y4 =
y = 1000
3 2007 Paper 1
a Is 3100 even or odd?
Explain your answer.
b Write down the number below that is the same as 3100× 3100
3200 6100 9200 310 000 910 000
4 2006 Paper 1
Look at this equation.
y =
a Find y when x = 19.
There are two answers. Write them both down.
b You cannot find a value for y when x = 10.
Explain why not.
c There are other values of x for which you cannot find a value for y.
Give one such value of x.
60––––––––––––±√x – 10
––––––
y2 = 10
155
6
7
8
Maths Frameworking PB 9.3 Chs 1–9 29/5/08 19:16 Page 155

156
Packages
Functional Maths
For each of the cuboidal packages
in the following table say whether it
is acceptable to the Post Office.
If it is not, give a reason why.
Package Weight Length Width Height
A 15 kg 1.2 m 70 cm 20 cm
B 22 kg 160 cm 30 cm 20 cm
C 10 kg 110 cm 80 cm 10 cm
D 40 kg 90 cm 50 cm 20 cm
E 16 kg 80 cm 60 cm 30 cm
F 20 kg 90 cm 70 cm 40 cm
G 32 kg 1 m 60 cm 60 cm
H 3000 g 1.8 m 20 cm 20 cm
I 4 kg 50 cm 50 cm 50 cm
J 18 kg 140 cm 50 cm 30 cm
1
Maximum package dimensions
The Post Office will only accept packages that follow the following rules.
Regular cuboidal packages
The length (greatest dimension) cannot be
longer than 1.5 m.
The girth is the distance around the
package (2 × width + 2 × height).
The girth and the length put together must
not exceed 3 m in total.
Irregular packages
Greatest dimension
cannot exceed 1.5 m.
Girth is measured
around the thickest
part of package.
The girth plus the
length must not
exceed 3 m in total.
Prices
Up to and including 10 kg: £14.99
Every kg or part thereof: Add 80p
Maximum weight: 30 kg
Length measured asgreatest dimension
Girth measuredaround thickestpart
LengthWidth
Height
Use the information above to answer these questions.
For each of the acceptable packages in Question 1, work out the cost of postage.2
FM Ch 8 Packages PB 9.3 29/5/08 18:55 Page 156

157
Each of the following cuboidal packages is at the limit of acceptability.
Work out the missing dimension.
a b c
d e f
? cm 40 cm
20 cm
80 cm ? cm
50 cm
100 cm x cm
x cm
100 cm 40 cm
? cm
150 cm ? cm
50 cm
120 cm 60 cm
? cm
3
The following irregular packages are just acceptable.
Work out the missing dimension.
a b
c d
150 cm? cm
? cm? cm
? cm 60 cm
60 cm
30 cm
50 cm
20 cm
120 cm? cm
70 cm70 cm
? cm45 cm
75 cm
60 cm
4
What is the largest possible
acceptable dimension, in
centimetres, of a cubical
package?
Give your answers to the
nearest centimetre.
7Calculate the maximum possible
length, l, for tubes with the following
diameters, d.
Give your answers to the nearest
centimetre.
a 10 cm b 60 cm c 70 cm
6
Tubes are often used to send things through the post.
Calculate the maximum diameter, d, for tubes with
the following lengths, l.
Give your answers to the nearest centimetre.
a 150 cm b 100 cm c 80 cm
5 l
d
? ?
?
FM Ch 8 Packages PB 9.3 29/5/08 18:55 Page 157

Probability statements
You have already studied many probability situations. Check, using the tables below, thatyou remember how each of the probabilities is worked out.
Also, make sure that you know and understand all the probability terms which are usedin this chapter.
Single event Outcome Probability
Roll a dice 5
Toss a coin Head
Two blue counters and three green counters in a bag Blue
Two events Outcome Probability
Roll two dice Double 6
Toss two coins Two heads
Toss a coin and roll a dice Head and 5
Most of the combined events you have dealt with so far have been independent events.Two events are said to be independent when the outcome of one of them does not affectthe outcome of the other event. Example 9.1 illustrates this situation.
112
14
136
25
12
16
158
CHAPTER 9 Statistics 2
This chapter is going to show you
How to interpret statements
about probability
How to identify mutually
exclusive outcomes
How to solve probability
problems involving mutually
exclusive outcomes
How to use tree diagrams to
solve probability problems
involving more than one event
How to use relative frequency to
compare the outcomes of
experiments
What you should already know
How to use a probability scale
How to calculate probabilities
for single events
How to use a two-way table or
sample space diagram to
calculate probabilities
How to compare fractions
Maths Frameworking PB 9.3 Chs 1–9 29/5/08 18:41 Page 158

Example 9.1
Now look closely at the statements in Examples 9.2 and 9.3, and the comments on them.In Exercise 9A, you will have to decide which given statements are sensible.
Example 9.2
Example 9.3
Write a comment on each of the following statements, explaining why the statementis incorrect.
a A game for two players is started by rolling a six on a dice. Ashad says: ‘I neverstart first because I’m unlucky.’
b It will rain tomorrow because it rained today.
c There is a 50% chance of snow tomorrow because it will either snow or it won’t.
d There are mint, chocolate and plain sweets in the packet, so the probability ofpicking out a chocolate sweet is .
Decide whether each of the following statements is correct or incorrect.
a I fell down yesterday. I don’t fall down very often, so it could not possiblyhappen again today.
b I have just tossed a coin to get a Head three times in succession. The next time Ithrow the coin, the probability that I will get a Head is still .
c My bus is always on time. It will be on time tomorrow.
d There is an equal number of red and blue counters in a bag. My friend picked acounter out and it was blue. She then put it back. It is more likely that I will getred when I pick one out.
Here are three coloured grids. The squares have either a winning symbol or a losingsymbol hidden.
a If you pick a square from each grid, isit possible to know on which you havethe greatest chance of winning?
Grid 1 Grid 2 Grid 3
12
13
Exercise 9A
Clare says: ‘If I buy a lottery ticket every week, I am bound to win sometime.’
Each week, the chance of winning is very small (1 chance in 13 983 816), so it ishighly unlikely that Clare would win in any week. Losing one week does notincrease your chances of winning the following week.
Daniel says: ‘There is a 50–50 chance that the next person to walk through the doorof a supermarket will be someone I know because I will either know them or I won’t.’
The next person that walks through the door may be someone whom he knows, butthere are far more people whom he does not know. So, there is more chance ofshe/he being someone whom he does not know. Hence, the statement is incorrect.
A Glaswegian girl was late for school on Friday, the day before the world record forthrowing the javelin was broken in Sydney by a Korean athlete. Were these eventsconnected in any way?
The pupil’s late arrival at school clearly could have no effect on the Korean’sperformance on the Saturday. So, the two events are independent.
159
6
Maths Frameworking PB 9.3 Chs 1–9 29/5/08 18:41 Page 159

b You are now told that on Grid 1there are three winning squares, onGrid 2 there are five winning squaresand on Grid 3 there are four winningsquares. Which grid gives you theleast chance of winning?
c Helen says that there are more winning squares on Grid 2, which means thatthere is more chance of winning using Grid 2. Explain why she is wrong.
Here are three events, A, B, and C.
A Jonathan writes computer programs on Monday evenings.
B Jonathan watches television on Monday evenings.
C Jonathan wears a blue shirt on Mondays.
Which of these events are independent?
a A and B b A and C c B and C
Mutually exclusive events and exhaustive events
In Year 8, you looked at mutually exclusive events. Remember that these are events whichdo not overlap.
Example 9.4
Example 9.5 There are red, green and blue counters in a bag.● Event A: Pick a red counter.● Event B: Pick a blue counter.● Event C: Pick a counter that is not green.
Which pairs of events are mutually exclusive?
Events A and B are mutually exclusive because there is no overlap. A red counterand a blue counter are different.
Events A and C are not mutually exclusive because they overlap. A red counter anda counter which is not green could be the same colour.
Events B and C are not mutually exclusive because they overlap. A blue counter anda counter which is not green could be the same colour.
Which of these three types of number are mutually exclusive: odd, even and prime?
Odd and even numbers are mutually exclusive. Odd and prime numbers, and evenand prime numbers are not: for example, 11 and 2.
Draw each of the following different-sized grids.
● 5 by 5 grid with seven winning squares
● 6 by 6 grid with ten winning squares
● 10 by 10 grid with 27 winning squares
Work out which grid gives you the best chance of finding a winning square.Explain your reasoning.
160
6
7
Maths Frameworking PB 9.3 Chs 1–9 29/5/08 18:41 Page 160

Example 9.6
Discs lettered A, B, C, D and E, and the probability of choosing each, are shown.
P(A) = 0.3 P(B) = 0.1 P(C) = ? P(D) = 0.25 P(E) = 0.05
a What is the probability of choosing a disc with either A or B on it?
b What is the probability of choosing a disc with C on it?
c What is the probability of choosing a disc which does not have E on it?
EDCBA
Exercise 9B
The eight counters shown are contained in a bag. A counter is chosen at random.
a What is the probability of picking a red counter?
b What is the probability of not picking a red counter?
c What is the probability of picking a green counter?
d What is the probability of picking a blue counter?
e What is the sum of the three probabilities in a, c and d?
a There are three red counters out of a total of eight. This gives:
P(red) = 3–8
b Since there are five outcomes which are not red counters, this means:
P(not red) = 5–8
Notice that
P(red) + P(not red) = 3–8 + 5–8 = 1
So, if you know P(Event happening), then
P(Event not happening) = 1 – P(Event happening)
c There is one green counter, which means:
P(green) = 1–8
d There are four blue counters, which means:
P(blue) = 4–8 = 1–2
e The sum of the probabilities is
P(red) + P(green) + P(blue)
= 3–8 + 1–8 + 4–8 = 1
All these events are mutually exclusive because only one counter is taken out at a time.
Also, because they cover all possibilities, they are called exhaustive events.
Note that the probabilities of exhaustive events which are also mutually exclusiveadd up to 1.
161
6
Maths Frameworking PB 9.3 Chs 1–9 29/5/08 18:41 Page 161

A set of 25 cards is shown.
a What is the probability of choosing acard with a fish on it?
b What is the probability of choosing acard with a fish or a cow on it?
c What is the probability of choosing acard with a sheep or a pig on it?
d What is the probability of choosing acard without a fish on it?
A spinner is shown with the probabilities of its landing on red, green or blue.
What is the probability of the spinner landing on one ofthe following?
a Red or green b Blue or green
c Blue, green or red d Yellow
The discs shown right are placed in a bag. One of them is chosen at random. Here are four events.
A A red disc is chosen.
B A blue disc is chosen.
C A green disc is chosen.
D A green or blue disc is chosen.
State which events are mutually exclusive, exhaustive, both or neither.
a A and B b A and C c A and D d B and D
You can work out how many times that you expect something to happen overa number of trials using this formula:
Expected number of successes = Probability of success in each trial × Number of trials
For example, the probability of the spinner in Question 3 landing on green is 0.25.If the spinner is spun 20 times, you have:
Expected number of times it lands on green = 0.25 × 20 = 5 times
Copy and complete the table of the expected number of successes in each case.
Probability of Number of trials Expected number of success successes
1–2 10
1–4 80
2–3 60
0.24 100
0.4 150
0.75 120
0.3
0.250.2
?
Fish
Fish
Fish
Fish
Fish
Fish
Fish
Fish
Fish
Fish
Fish
Fish
Fish
Fish
Fish
Fish
Fish
Fish
Fish
Fish
sheep
cow
cow
cow
cow
162
6
Maths Frameworking PB 9.3 Chs 1–9 29/5/08 18:41 Page 162

Combining probabilities and tree diagrams
There are four pets in a vet’s waiting room, a white dog, a white cat, a black dog and ablack cat. Two of these pets are owned by David. He has a dog and a cat. How manydifferent possibilities are there?
Sometimes tree diagrams are used to help to calculate probabilities when there are two ormore events.
Example 9.7 Dawn makes candles. The probability that a candle is damaged is 0.1. Each candleis made independently.
Dawn makes two candles. Calculate the probability that:
a both candles are damaged.
b only one candle is damaged.
The probabilities can be written on a tree diagram as shown.
To work out the probability of one event happening and then another eventhappening independently, the probabilities must be multiplied together.
a The probability that the first candle is damaged and the second candle isdamaged = 0.1 × 0.1 = 0.01
b There are two ways that only one candle could be damaged.
The first candle could be damaged and the second candle not damaged. Or thefirst candle could be not damaged and the second candle damaged.
The probability that the first candle is damaged and the second candle is notdamaged = 0.1 × 0.9 = 0.09
The probability that the first candle is not damaged and the second candle isdamaged = 0.9 × 0.1 = 0.09
This gives a total probability of 0.09 + 0.09 = 0.18
Often, probability questions use fractions which need to be simplified.
Damaged
Not damaged
0.1
0.9
First candle
Damaged
Not damaged
0.1
0.9
Damaged
Not damaged
0.1
0.9
Second candle
163
Maths Frameworking PB 9.3 Chs 1–9 29/5/08 18:41 Page 163

Example 9.8
Two fair, six-sided dice are rolled. Copy andcomplete the tree diagramand use it to calculate theprobability that the first dicelands on 5 or 6, and thesecond dice lands on aneven number.
A woman goes to a health club. The probability that she goes on a Saturday is 1–4. Theprobability that she goes swimming is 2–3. Each event is independent. Calculate theprobability for each of the following situations.
a She does not go on a Saturday.
b She does not go swimming.
c She goes on a Saturday and she goes swimming.
A cube is chosen from each bag.
a Copy and complete the two-way table.
b What is the probability of choosing two red cubes?
c What is the probability of choosing one red cube and one blue cube?(Remember that it could be red and then blue or blue and then red.)
5 or 6
Not 5 or 6
……
……
First dice
Even
Not even
……
……
Even
Not even
……
……
Second diceExercise 9C
A cube is chosen from each bag. What is the probability of choosing two red cubes?
The probability of choosing a red cube from the first bag is 4–5.
The probability of choosing a red cube from the second bag is 3–4.
The probability of choosing red and red = 4–5 ×3–4 = 3–5
Here is a two-way table showing all the different combinations.
Red 4–5
4–5 ×
3–4 = 3–5
4–5 ×
1–4 = 1–5First bag
Blue 1–5
1–5 ×
3–4 = 3–
201–5 ×
1–4 = 1–
20
Second bag
Red 3–4 Blue 1–
4
164
8
RedFirst bag
Blue 12
12
Second bag
Red Blue 45
15
Maths Frameworking PB 9.3 Chs 1–9 29/5/08 18:41 Page 164

Estimates of probability
In an experiment to test whether a dice is biased, the dice was rolled 120 times. These arethe results.
Number on dice 1 2 3 4 5 6
Frequency 18 25 20 22 14 21
Do you think that the dice is biased?
A player plays three games. The probability of winning each time is 2–3.
a Copy and complete the tree diagram.
b Write down the different ways of winning at least two games.
c Work out the probability of winning at least two games.
or 6
Not even
……
……
Win
Lose
……
……
Second game
Win
Lose
……
……
Win
Lose
……
……
Third game
Win
Lose
……
……
Win
Lose
……
……
Win
Lose
……
……
Win
Lose
……
……
First game
165
8
Maths Frameworking PB 9.3 Chs 1–9 29/5/08 18:41 Page 165

Number 2 was rolled 25 times out of 120. So, an estimate of the probability of rollingnumber 2 is given by:
25–– = 0.208120
The fraction is called the relative frequency.
Relative frequency is an estimate of probability based on experimental data. The relative frequency may be the only way of estimating probability when events are notequally likely.
Number of successful trialsRelative frequency = ––––––––––Total number of trials
Number 2 was rolled 25 times out of 120. So, for example, you would expect it to berolled 50 times out of 240. The expected number of successes can be calculated from theformula:
Expected number of successes = Relative frequency × Number of trials
Hence, in this case, the expected number of times number 2 is rolled is given by:
25–– × 240 = 50120
Example 9.9
Example 9.10 The relative frequencies of the number of times a spinner lands on red is shown in the table below.
Number of spins 10 20 50 75 100
Relative frequency of 0.3 0.25 0.28 0.24 0.26landing on red
a Plot the relative frequencies on a graph.
b Write down the best estimate of the number of times the spinner would land onred in 1000 spins.
c Do you think the spinner is fair? Explain your answer.
Look again at the example above.
A dice is rolled 120 times. Here are the results.
Number on dice 1 2 3 4 5 6
Frequency 18 25 20 22 14 21
a How could you obtain a more accurate estimate than the relative frequency?
b If the dice were rolled 1000 times, how many times would you expect to get ascore of 2?
a A more accurate estimate could be obtained by carrying out more trials.
b The expected number of times a score of 2 is rolled in 1000 trials is given by:
0.208 × 1000 = 208
25120
166
Maths Frameworking PB 9.3 Chs 1–9 29/5/08 18:41 Page 166

Example 9.10
continued
A four-sided spinner was spun 100 times. Here are the results.
Number on spinner 1 2 3 4
Frequency 20 25 23 32
a What is the estimated probability of a score of 4?
b Do you think from these results that the spinner is biased? Give a reason for youranswer.
c If the spinner were spun 500 times, how many times would you expect to get ascore of 4?
A drawing pin is thrown and the number of times that it lands point up is recorded atregular intervals and the results shown in the table.
a Copy and complete the table for the relative frequencies.
Number of throws 10 20 30 40 50
Number of times pin lands point up 6 13 20 24 32
Relative frequency of landing point up 0.6
b What is the best estimate of the probability of the pin landing point up?
c How many times would you expect the pin to land point up in 200 throws?
Exercise 9D
a
b The best estimate of the theoretical probability is 0.26 as this was the result ofthe most spins in the experiment. So the best estimate of the number of timesthe spinner would land on red is 0.26 × 1000 = 260.
c There are two out of six sections of the spinner which are red, so if the spinnerwere fair, the theoretical probability of landing on red would be 1–3. Also, in 1000spins the spinner would be expected to land on red 333 times ( 1–
3 of 1000). It islikely that this spinner is biased.
Rel
ativ
e fr
equ
ency
Number of spins
0 10 20 30
0.6
0.5
0.4
0.3
0.2
0.1
040 50 60 70 80 90 100
167
6
7
Maths Frameworking PB 9.3 Chs 1–9 29/5/08 18:41 Page 167

A bag contains yellow and blue cubes. Cubes are picked from the bag, the colourrecorded and the cubes replaced.
a Copy and complete the table for the relative frequencies for the number of timesa blue cube was chosen.
Number of trials 10 25 50 100
Number of times blue cube chosen 3 8 15 28
Relative frequency 0.3
b What is the best estimate of the probability of picking a blue cube from the bag?
c You are now told that there are 75 cubes in the bag altogether. What is the bestestimate of the number of blue cubes in the bag?
The number of times a coin lands on Heads is shown in the table below.
Number of throws 10 20 30 40 50
Number of Heads 7 12 18 22 28
Relative frequency of Heads = 0.7
a Copy and complete the table to show the relative frequency of Heads.
b Plot the relative frequencies on a graph.
c Write down the best estimate of the probability of a Head.
d Use your estimate to predict the number of Heads in 200 throws.
e Do you think the coin is biased towards Heads? Explain your answer.
The relative frequencies of the number of times a player wins a game of bowling is shown below.
Number of games 2 4 6 8 10
Relative frequency 0.5 0.75 0.67 0.75 0.70 of winning
Number of wins
a Plot the relative frequencies on a graph.
b Explain why it is not possible to tell from the graph whether the first game wasa win.
c Write down the best estimate of the probability of winning a game
d Copy and complete the table to show the number of wins for 2, 4, 6, 8 and10 games.
710
ELIZA
BE
TH
IID·G
·R
EG
·F·D·1996
168
7
Maths Frameworking PB 9.3 Chs 1–9 29/5/08 18:41 Page 168

1 2005 Paper 2
Here is some information about all the pupils in class 9A:A teacher is
going to choose a pupil from 9A at random.
a What is the probability that the pupil chosen will be a girl?
b What is the probability that the pupil chosen will be left-handed?
c The teacher chooses the pupil at random. She tells the class that the pupil is left-handed.
What is the probability that this left-handed pupil is a boy?
Right-handed 13 14
Left-handed 1 2
Number Number
of boys of girls
Here is a graph showing therelative frequency of the numberof times a darts player hits thetarget.
a How many times did the dartsplayer hit the target in the first10 throws?
b What is the best estimate ofthe probability of a hit?
c How many times would youexpect the darts player to hitthe target in 100 throws? Stateany assumptions that youmake.
d Why is it not appropriate touse the graph to find out howmany hits there were in thefirst 15 throws?
1
0.9
0.8
0.7
0.6
0.5
0.4
0.3
0.2
0.1
00
Number of throwsR
elat
ive
freq
uen
cy o
f num
ber
of hits
5 10 15 20 25 30 35 40 45 50
169
7
6I can identify outcomes from two events.
I can use tables and diagrams to show outcomes.
I can solve problems involving mutually exclusive events.
I can use the fact that the total probability of all mutually exclusive events of an experiment is 1.
7I know how to take account of bias.
I can compare outcomes of experiments.
I understand relative frequency as an estimate of probability.
8I understand how to calculate the probability of a compound event and use this in solving problems.
6
Maths Frameworking PB 9.3 Chs 1–9 29/5/08 18:41 Page 169

2 2002 Paper 1
I have a bag that contains blue, red, green and yellow counters. I am going to take out one counter at
random.
The table shows the probability of each
colour being taken out.
a Explain why the number of yellow
counters in the bag cannot be 10.
b What is the smallest possible number of each
colour of counter in the bag? Copy and
complete the table.
3 2006 Paper 2
A pupil wants to investigate a report that Belgian one euro coins are biased in favour of heads.
Here is her plan for the investigation.
I will spin 20 Belgian one euro coins to give one set of results.
I will do this 10 times to give a total of 200 results to work out an estimated probability of spinning
a head.
If this probability is greater than 56% my conclusion will be that Belgian one euro coins are biased in
favour of heads.
The table shows the 10 sets of results.
Using the pupil’s plan, what should her conclusion be?
You must show your working.
4 2006 Paper 1
Meg and Ravi buy sweet pea seeds and grow them in identical conditions.
Meg’s results:
Ravi’s results:
a Using Meg’s results and Ravi’s results, calculate two different estimates of the probability that a
sweet pea seed will germinate.
Copy and complete the following.
Using Meg’s results: …
Using Ravi’s results: …
Number of packetsNumber of seeds in each
packet
Total number of seeds that
germinate
10 20 170
Number of packetsNumber of seeds in each
packet
Number of seeds that
germinate from each packet
5 20 18, 17, 17, 18, 19
Number of each set of 20 coins that showed heads
10 13 11 11 12 12 11 9 10 11
Blue Red Green Yellow
Probability 0.05 0.3 0.45 0.2
Blue Red Green Yellow
170
7
Maths Frameworking PB 9.3 Chs 1–9 29/5/08 18:41 Page 170

b Whose results are likely to give the better estimate of the probability?
State whether it is Meg’s or Ravi’s.
Explain why.
5 2003 Paper 1
a A fair coin is thrown. When it lands it shows Heads or Tails.
Game: Throw the coin three times.
Player A wins one point each time the coin shows a Head.
Player B wins one point each time the coin shows a Tail.
Show that the probability that player A scores three points is .
b What is the probability that player B scores exactly two points? Show your working.
6 2003 Paper 1
A girl plays the same computer game lots of
times. The computer scores each game using
1 for win, 0 for lose.
After each game, the computer calculates her
overall mean score. The graph shows the
results for the first 20 games.
a For each of the first three games, write W
if she won or L if she lost.
First game ……
Second game ……
Third game ……
b What percentage of the 20 games did the girl win?
The graph shown right shows the girl’s results for
the first 100 games.
c She is going to play the game again.
Estimate the probability that she will win.
d Suppose for the 101st to 120th games, the girl
were to lose each game. What would the graph
look like up to the 120th game?
Show your answer on a copy of the graph below.
0 20 60 80 100Number of games played40 120
Overa
ll m
ean s
co
re
1
0.8
0.6
0.4
0.2
0
0 20 60 80 100Number of games played
40
Overa
ll m
ean s
co
re
1
0.8
0.6
0.4
0.2
0
0 5 10 15 20Number of games played
Overa
ll m
ean s
co
re
1
0.9
0.8
0.7
0.6
0.5
0.4
0.3
0.2
0.1
0
18
171
7
8
Maths Frameworking PB 9.3 Chs 1–9 29/5/08 18:41 Page 171

172
Functional Maths
Class test
A Year 9 class sat some practice tests before their SATs. The following are
their test results.
Name Gender English Maths Science
John Addy M 17 45 32
Sean Allsop M 43 37 41
Sally Emerson F 65 54 48
Gerry Evans M 28 65 55
Kay Gilbert F 76 84 78
Zoe Ginn F 49 46 57
Zahir Greer M 87 24 43
Isabell Harding F 93 75 68
Muhanad Hatamleh M 72 56 51
Liah Huxter F 69 74 78
Sahid Jallya M 25 62 65
Molly Kenward F 51 37 42
Brian Keys M 48 53 49
Daniel Mann M 55 85 73
John O’Dubhchair M 62 39 35
Godwin Osakwe M 38 41 27
Krishna Pallin M 78 56 67
Joy Peacock F 69 76 65
William Qui M 87 92 89
Alan Runciman M 92 34 45
Billie Speed M 64 74 76
Robert Spooner M 44 67 61
Joyce Tapman F 53 43 39
Vi Thomas F 37 57 64
Cliff Tompkins M 48 43 51
Lesley Wallace F 68 58 52
Madge Webb F 74 42 44
John Wilkins M 35 41 47
Jenny Wong F 69 58 43
Jo Zunde F 94 98 96
FM Ch 9 Class test PB 9.3 29/5/08 18:56 Page 172

173
Draw a scatter diagram for the results in the following
subjects.
a English and maths
b English and science
c Maths and science
1
Draw in the lines of best fit, if there are any, and comment
on the correlation shown in the three scatter diagrams you
have drawn.
2
On your scatter diagrams, use colours to highlight the
males and the females and comment on any gender
differences now apparent from these results.
3
Draw a stem and leaf diagram for each set of results.5
a Create a grouped frequency table for each set of
results using the boundaries 1–20, 21–40, 41–60,
61–80 and 81–100.
b Use the table to estimate the means for each subject.
7
Extend each grouped frequency table to create a
cumulative frequency column for each set of results and
draw a cumulative frequency graph for each table.
8
Use the given information and the diagrams you have
produced to comment on which test appears to be the
easiest and which the hardest.
9
Use the given information
to answer these questions.
Two pupils were absent during the test week and only
managed to do one test each.
Isaac Fawcett sat the maths test and scored 74.
Julie Holberry sat the English test and scored 54.
Use the scatter diagrams to estimate what they might have
scored in the other two sets.
4
From your stem and leaf diagrams, state the median score
of each and comment on your results.6
FM Ch 9 Class test PB 9.3 29/5/08 18:56 Page 173

174
Fractional enlargements
Positive The diagram will remind you how to enlarge triangle ABC by a scale factor of 3 about theenlargement centre of enlargement O to give triangle A’B’C’.
Lines called rays or guidelines are drawn from O through A, B, C to A’, B’, C’. Here, thescale factor is given as 3. So, OA’ = 3 × OA, OB’ = 3 × OB, OC’ = 3 × OC. The length ofeach side of A’B’C’ is three times the length of the corresponding side of triangle ABC.
That is, the object triangle ABC is enlarged by a scale factor of 3 about the centre ofenlargement, O, to give the image triangle A’B’C’.
The object and image are on the same side of O. The scale factor is positive. So, this iscalled positive enlargement.
Notice that the object and image are similar shapes, since the corresponding angles areequal and the corresponding sides are all in the ratio 1 : 3.
O
A
B
C
A’
B’
C’
ObjectImage
CHAPTER 10 Geometry and Measures 3
This chapter is going to show you
How to enlarge a shape by a
fractional scale factor
How to use trigonometry to find
lengths and angles in right-
angled triangles
How to solve problems using
trigonometry
What you should already know
How to enlarge a shape by a
positive scale factor
How to recognise similar
shapes
How to use Pythagoras’
theorem
Maths Frameworking PB 9.3 Chs 10–17 29/5/08 18:45 Page 174

Fractional In the diagram below, triangle ABC is enlarged by a scale factor of to give triangle enlargement A’B’C’.
Each side of A’B’C’ is half the length of the corresponding side of ABC. Notice also
that OA’ = of OA, OB’ = of OB and OC’ = of OC.
That is, the object ABC has been enlarged by a scale factor of about the centre ofenlargement, O, to give the image A’B’C’.
The object and the image are on the same side of O, with the image smaller than theobject. The scale factor is a fraction. This is called fractional enlargement.
Fractional When fractional enlargement is on a grid, the principles are the same. The grid may or enlargement may not have coordinate axes, and the centre of enlargement may be anywhere on the grid. on a grid
The grid means that it is not always necessary to draw rays to find the image points.
Example 10.1
12
12
12
12
O
A’
B’
C’
A
B
C
ImageObject
12
175
Enlarge ABC on the coordinate grid by a scale factor of about the origin (0, 0).
● Draw rays, or count grid units in the x- and y-directions, from points A, B, C to theorigin.
● Multiply the ray lengths or the numbers of x, yunits by .
● Plot these new lengths or numbers of units toobtain points A’, B’, C’.
● Join these points to give A’B’C’.
The object ABC has been enlarged by a scale factor
of about the origin (0, 0) to give the image A’B’C’.
Notice that we still use the term enlargement, even
though the image is smaller than the object.
For a fractional enlargement about the origin of a grid, the coordinates of the objectare multiplied by the scale factor to give the image coordinates. So here:
Object coordinates: A(6, 6) B(6, 4) C(2, 4)
Multiply each coordinate by to give: Image coordinates: A’(3, 3) B’(3, 2) C’(1, 2)12
12
12
12
6
5
4
3
2
1
00 1 2 3 4 5 6
y
x
C
A
B
A’
B’C’
Maths Frameworking PB 9.3 Chs 10–17 29/5/08 18:45 Page 175

Draw copies of (or trace) the shapes below and enlarge each one by the given scalefactor about the given centre of enlargement, O.
a Scale factor b Scale factor c Scale factor
Draw copies of (or trace) the shapes below and enlarge each one by the given scalefactor about the given centre of enlargement, O.
a Scale factor 1 b Scale factor 2 c Scale factor –
Copy the diagrams below onto a coordinate grid and enlarge each one about theorigin (0, 0) by multiplying the coordinates by the given scale factor. Plot your imagecoordinates and check them using rays.
a Scale factor b Scale factor
10
9
8
7
6
5
4
3
2
1
00 1 2 3 4 5 6
y
10x
6 7 8 9
10
9
8
7
6
5
4
3
2
1
00 1 2 3 4 5 6
y
10x
6 7 8 9
13
12
O
O
O
12
12
12
O
O
O
13
14
12
Exercise 10A
176
7
Maths Frameworking PB 9.3 Chs 10–17 29/5/08 18:45 Page 176

c Scale factor
Copy the diagram shown onto centimetre squared paper.
a Trapezium A is mapped onto Trapezium B by an enlargement. What is the scalefactor of the enlargement?
b Find the coordinates of the centre of enlargement by adding suitable rays to yourdiagram.
c i Write down the areas of Trapezium A and Trapezium B.
ii Use your answer to c i to find the ratio of the two areas in its simplest form.
d If a shape is enlarged by a scale factor of , what is the area scale factor for theenlargement?
12
12
11
10
9
8
7
6
5
4
3
2
1
00 1 2 3 4 5 6
y
12x
6 7 8 9 10 11
A
B
12
11
10
9
8
7
6
5
4
3
2
1
00 1 2 3 4 5 6
y
12x
6 7 8 9 10 11
14
177
7
Maths Frameworking PB 9.3 Chs 10–17 29/5/08 18:45 Page 177

Trigonometry – The tangent of an angle
Trigonometry is a branch of Mathematics that is concerned with calculating the lengths ofsides and the sizes of angles in right-angled triangles. Its main use is in areas ofengineering, navigation and surveying.
Right-angled In a right-angled triangle, such as those shown triangles on the right:
● The side opposite the right angle (AC) isalways the longest side and is known asthe hypotenuse.
● The side opposite the angle in question(labelled θ here) is called the opposite side(BC in the top triangle and AB in thebottom triangle).
● The side next to the angle in question iscalled the adjacent side (AB in the toptriangle and BC in the bottom triangle).
C B
A
Hypotenuse (H)
Opposite (O)
Adjacent (A)θ
C B
A
Hypotenuse (H)
Adjacent (A)
Opposite (O)
θ
1 Working in pairs or groups, design a poster to show how thesymbol on the right can be enlarged by different fractional scale factors about any convenient centre of enlargement.
2 a i Find the total surface area of the cuboid shown.
ii Find the volume of the cuboid.
b The cuboid is enlarged by a scale factor of 2.
i Find the total surface area of the enlarged cuboid and writedown the area scale factor.
ii Find the volume of the enlarged cuboid and write down thevolume scale factor.
c The original cuboid is now enlarged by a scale factor of 3.
i Find the total surface area of the enlarged cuboid and writedown the area scale factor.
ii Find the volume of the enlarged cuboid and write down thevolume scale factor.
d The cuboid is now enlarged by a scale factor of k.
i Write down the area scale factor.
ii Write down the volume scale factor.
3 Use ICT software, such as Logo, to enlarge shapes by different fractionalscale factors and with different centres of enlargement.
178
7
2 cm
1 cm
3 cm
Maths Frameworking PB 9.3 Chs 10–17 29/5/08 18:45 Page 178

The tangent of an angle
Investigation
Using your Before you start any calculations in trigonometry, you need to make sure that your calculator calculator is in degree mode. You can check this by looking for D or DEG in the display.
To find the value of the tangent of an angle using your calculator, you first need to find
the key. On some calculators you have to key in the size of the angle before you
press the tan button:
On others you have to press the tan key before you key in the size of the angle:
Find out how to use your calculator to find the tangent of an angle. The number on thedisplay should be 0.839099631. Work through Example 10.2 carefully to make sure youare using the keys in the correct order.
4tan 0
4 0 tan
tan
Draw the diagram below accurately on 2 mm graph paper, with AB = 3 cm, AC = 5 cm, AD = 8 cm and AE = 10 cm.
Measure the lengths of BF, CG, DH and EIto the nearest millimetre. Copy the tablebelow and use these measurements tocomplete the table, giving your answersto two decimal places.
Using ∠A as 40°, you have found the values of the ratio of
the opposite side O –––––– ( – ) in triangles ABF, ACG, ADH and AEI.the adjacent side A
If you have measured accurately, you should have found that the four ratios have thesame value – approximately 0.84. The investigation has shown that thecorresponding sides are in the same ratio. This means that the triangles are similar.
The value of the ratio you have just found is called the tangent of angle A, and isshortened to tanA. The value of the tangent of every angle is stored in yourcalculator.
Ratio of sides Answer to 2 dp
A
40°
B C D E
F
G
H
I
BF––AB
CG––AC
DH––AD
EI––AE
179
Maths Frameworking PB 9.3 Chs 10–17 29/5/08 18:45 Page 179

Example 10.2
Example 10.3
Finding an angle When you know the opposite and adjacent sides in a right-angled triangle, you can usetangents to calculate an angle. Example 10.4 shows you how.
Example 10.4
Finding the You can use the same formula to calculate the length of the opposite side when you knowopposite side the size of an angle and the length of the adjacent side in a right-angled triangle, as the
following example shows.
Calculate the angle marked θ in the diagram below. Give your answer to 1 decimal place.
OppositeUsing the formula tanθθ = ––––
Adjacent
5= – = 0.6258
So, θ = 32.0° (1dp)
This can be done on a calculator in one sequence. This will depend on how yourcalculator works.
Or, on some calculators you may have to key in:
8 cm
5 cm
θ
( 5 =8 )÷tanSHIFT
5 2ndFINV÷ 8 = or tan
Find the value of θ if: a tanθ = 0.3 b tanθ = 0.724 c tanθ = 3.764Give your answers to 1 decimal place.
a 16.7° b 35.9° c 75.1°
Find the value of: a tan20° b tan32° c tan72.3°
Give your answers to 3 decimal places.
a 0.364 b 0.625 c 3.133
The key can be used to find the lengths of sides and the size of angles in right-angled triangles.
OppositeFor right-angled triangles, we can use the formula tanθθ = ––––
Adjacent
Once you have found the value of tan θ, you will need to be able to find the valueof the angle θ itself. You can use the inverse tan button function on your calculatorto do this. This is usually marked above the tan key as tan–1 or arctan. Depending onyour calculator, you will need to press one of the following keys to access thisfunction:
You will then need to press the tan key and the number keys in the same order asbefore. Work through Example 10.3 carefully to make sure you are using the correctkeys on your calculator.
tan
SHIFT 2ndFINV
180
Maths Frameworking PB 9.3 Chs 10–17 29/5/08 18:45 Page 180

Example 10.5
Find the value of each of the following. Give your answers to 3 decimal places.
a tan28° b tan60° c tan45°
d tan9° e tan37.2° f tan85.1°
Find the value of θ for each of the following. Give your answers to 1 decimal place.
a tanθ = 0.5 b tanθ = 0.23 c tanθ = 0.846
d tanθ = 1.5 e tanθ = 2.33 f tanθ = 10
Find the value of each of the following. Give your answers to 3 significant figures.
a 2tan37° b 8tan25° c 10tan45°
d 24tan59° e 3.5tan60.1° f 14.8tan80.3°
Calculate the angle marked θ in each of the following triangles. Give your answers to1 decimal place.
10 cm
3 cmθ
8 cm
4 cm
θ
11 cm
5 cm
θ
12 cm
12 cm
θ
7 cm
2 cm
θ
a b c
d e f
19.8 cm
8.5 cm θ
Exercise 10B
Calculate the length of the side marked x on the diagram below. Give your answerto 3 significant figures.
OppositeUsing the formula tanθθ = ––––
Adjacent
xtan42° = –5
Multiplying both sides by 5, gives: 5tan42° = x
So, x = 4.50 cm (3sf)
Depending on your calculator, this can be done in one sequence:
5 cm
42°
x
5 42 = =tan or5 42tanor 5 42 tan =
181
8
Maths Frameworking PB 9.3 Chs 10–17 29/5/08 18:45 Page 181

Calculate the length of the side marked x in each of the following triangles. Giveyour answers to 3 significant figures.
In the PQR, ∠P = 90°, PQ = 6 cm and PR = 10 cm. Find ∠R. Give your answer to 1 decimal place. Hint: Draw a sketch to help you.
In the XYZ, ∠Z = 90°, ∠Y = 56° and YZ = 7.2 cm. Find the length of XZ. Giveyour answer to 3 significant figures. Hint: Draw a sketch to help you.
1 Finding the adjacent side
You can use the same trigonometric ratio to calculatethe length of the adjacent side when you know the size of an angle and the length of the opposite side in a right-angled triangle, as the following example shows.
Calculate the length marked x on the diagram to the right. Give your answer to 3 significant figures.
OppositeUsing the formula tanθθ = ––––
Adjacent
7tan36° = –x
Multiplying both sides by x, gives: xtan36° = 7
7Dividing both sides by tan36°, gives x = ––tan36°
So, x = 9.63 cm (3sf)
Depending on your calculator, this can be done in one sequence:
7 cm
x
36°
7 36 = =tan 7 36 tanor÷ ÷
x
18.9 cm65°
a b c
d e f
14 cm
45°
x
10 cm18°
x
8 cm
x
28°
52°
25 cm
x
x
5.7 cm30°
182
8
Maths Frameworking PB 9.3 Chs 10–17 29/5/08 18:45 Page 182

Trigonometry – The sine and cosine ofan angle
As you saw on page 179, for a right-angled triangle such as the
one on the right, the tangent of the angle θ (tanθ) = .
This is the ratio of two sides of a right-angled triangle – theopposite and the adjacent. We could just as easily have taken theratio of any two sides such as the opposite and the hypotenuse orthe adjacent and the hypotenuse.
O––A
A
O
θ
H
Calculate the length of the side marked x in each of the followingtriangles. Give your answers to 3 significant figures.
2 Angle of elevation and angle of depression
An angle of elevation is the angle measured from the horizontal when you look up to something.
An angle of depression is the angle measured from the horizontal when you look down at something.
a The angle of elevation of the top of a tower from a point on the ground 400 m away from its base is 8°. Draw a sketch to show this and calculate the height of the tower. Give your answer to 3 significant figures.
b A boat is 250 m from the foot of vertical cliffs which are 50 m high.Draw a sketch to show this and calculate the angle of depression of theboat from the top of the cliffs. Give your answer to 1 decimal place.
a b c
4 cm
x
30°
d
25.6 cm
x
42°
7.6 cm
70° x
32 cm
62°x
angle of elevation
angle of depression
183
8
Maths Frameworking PB 9.3 Chs 10–17 29/5/08 18:45 Page 183

In a right-angled triangle (such as the one on the previous page):
Oppositethe value of the ratio –––– is called the sine of the angle θθ, written as sinθθ
Hypotenuse
Adjacentthe value of the ratio –––– is called the cosine of the angle θθ, written as cosθθ.
Hypotenuse
The sine and cosine are used in the same way as tangent to find the lengths of sides andthe sizes of angles in right-angled triangles when the length of the hypotenuse is eitherknown or required.
The and keys on your calculator are used in exactly the same way as the key. Check that you know how to use them correctly by working through examples10.6–10.8.
Example 10.6
Example 10.7
Example 10.8
Find the value of each of the following. Give your answers to 3 decimal places.
a sin18° b sin30° c sin65.8°
d cos29° e cos60° f cos85.4°
Exercise 10C
Calculate the length of the side marked x on the diagram below. Give your answer to 3 significant figures.
The angle and the hypotenuse are given, and the opposite side is required, so use sine:
Osinθ = –H
xsin20°= –7
Multiply both sides by 7 to give: 7sin20°= x
So, x = 7sin20° = 2.39 cm (3sf)
20°
7 cmx
Calculate the angle marked θ in the diagram below. Give your answer to 1 decimal place.
The adjacent side and the hypotenuse are given, so use cosine:
A 5cosθ = – = –– = 0.416H 12
So, θ = 65.4° (1dp)
5 cm
θ
12 cm
1 Find the value of: a sin25° b sin38.6° c cos45° iv cos65.3°Give your answers to 3 decimal places.
a 0.423 b 0.624 c 0.707 d 0.418
2 Find the value of θ if a sinθ = 0.2 b sinθ = 0.724 c cosθ = 0.36d cosθ = 0. 895. Give your answers to 1 decimal place.
a 11.5° b 46.4° c 68.9° d 26.5°
tancossin
184
8
Maths Frameworking PB 9.3 Chs 10–17 29/5/08 18:45 Page 184

Find the value of θ for each of the following. Give your answers to 1 decimal place.
a sinθ = 0.1 b sinθ = 0.53 c sinθ = 0.855
d cosθ = 0.4 e cosθ = 0.68 f cosθ = 0.958
Find the value of each of the following. Give your answers to 3 significant figures.
a 3sin32° b 5sin45° c 12.2sin86°
d 2cos9° e 3.8cos20.1° f 25cos68.9°
Calculate the angle marked θ in each of the following triangles. Give your answers to1 decimal place.
Calculate the length of the side marked x in each of the following. Give your answersto 3 significant figures.
In the ∆ABC, ∠B = 90°, ∠C = 72° and AC = 20 cm. Find the length AB. Give youranswer to 3 significant figures.
In the ∆XYZ, ∠X = 90°, XZ = 8.6 cm and YZ = 13.2 cm. Find ∠Z. Give your answerto 1 decimal place.
a b c
d e f
45°
21 cm13.5 cm
20°
x
9 cmx
25°
58.4°
23.4 cm
x
9.5 cm 30°
x3 cm
49°
x
x
10 cm3 cm
θ
7 cm4 cm
θ
15 cm
θ
12.7 cm9.6 cm
θ
2 cm
θ
a b c
d e f
32 cm
8 cm52 cm
18 cmθ
185
8
Maths Frameworking PB 9.3 Chs 10–17 29/5/08 18:45 Page 185

1 Finding the hypotenuse
You can use the same trigonometric ratio to calculate the length of thehypotenuse when you know the size of an angle and the length of theopposite side or adjacent side in a right-angled triangle, as the followingexample shows.
Calculate the length of the side marked x on the diagram on the left.Give your answer to 3 significant figures.
OppositeUsing the formula sinθθ° = ––––
Hypotenuse
4sin40° = –x
Multiplying both sides by x, gives: xsin40°= 4
4Dividing both sides by sin40°, gives x = –– = 6.22 cm (3s.f.)sin40°
So, x = 6.22 cm (3sf)
Calculate the length of the side marked x in each of the following.Give your answers to 3 significant figures.
2 The graphs of y = sinθ and y = cosθ
a Copy and complete the table below, giving your answers to twodecimal places.
b Write down anything you notice about the values of sinθ and cosθ.
c On 2 mm graph paper and using the same axes, draw the graphs of y = sinθ and y = cosθ, for 0°≤ θ ≤ 90° and 0 ≤ y ≤ 1.
a b c
6 cmx
28°
d 36.4 cm
x
42°
2.7 cm73°x
14 cm
62° x
θθ 0° 10° 20° 30° 40° 50° 60° 70° 80° 90°
sinθθ
cosθθ
40°
x4 cm
186
8
Maths Frameworking PB 9.3 Chs 10–17 29/5/08 18:45 Page 186

Solving problems using trigonometry
When solving a problem using trigonometry, the following steps should be followed.
1 Draw a sketch of the right-angled triangle in the problem. Even when an illustrationor diagram accompanies the problem, it is a good idea to redraw the triangle.
2 Mark on the sketch all the known sides and angles, including the units.
3 Identify the unknown side or angle by labelling it x or θ.
4 Decide and write down which ratio you need to solve the problem.
5 Solve the problem and give your answer to a suitable degree of accuracy. This isusually three significant figures for lengths and one decimal place for angles.
Example 10.9
Simon places a ladder against a wall so that it makes an angle of 76° with theground. When the foot of the ladder is 1.8 m from the foot of the wall, calculate howhigh up the wall the ladder reaches.
Veena walks for 800 m up a road that has a uniform slope of 5° to the horizontal.Calculate the vertical height she has risen.
Richard’s slide is 7 m long and the top of the slide is 4.5 m above the ground.Calculate the angle the slide makes with the ground.
Exercise 10D
A window cleaner has a ladder that is 8 m long. He leans it against a wall so thatthe foot of the ladder is 3 m from the wall. Calculate the angle the ladder makeswith the wall.
1 Draw a sketch for the problem and write on all the known sides and angles:
2 Identify the angle required by labelling it θ:
3 Decide and write down which ratio you need to useto solve the problem:
The opposite and hypotenuse are known, so sineshould be used to solve the problem.
OThe ratio required is sinθ = –H
4 Solve the problem:
3sinθ = – = 0.3758
So, θ = 22.0° (1 dp)
3 m
8 m
3 m (O)
8 m (H)θ
187
8
Maths Frameworking PB 9.3 Chs 10–17 29/5/08 18:45 Page 187

A ship is 8 km east and 5 km north of a lighthouse.
Calculate the bearing of the ship from thelighthouse.
Pat is flying a kite on a string that is 35 m long. She holds the string at 1 m above the ground at anangle of 42° with the horizontal. Calculate theheight of the kite above the ground.
Calculate the acute angle between the diagonals of a rectangle which has length 18 cm and width 10 cm.
In the isosceles triangle ABC, AB = AC = 8 cm and ∠ABC = 64°. Calculate:
a the perpendicular height, h, of the triangle.
b the length of BC.
c the area of the triangle.
1 A plane flies for 200 km on a bearing of 135°. It then alters course and flies for 150 km on a bearing of 040°.
a Calculate how far east the plane is from its starting point.
b Calculate how far south the plane is from its starting point.
c Calculate how far the plane is from its starting point.
2 ABCDE is a regular pentagon of side 5 cm.
a Calculate the perpendicular height of ∆OCD.
b Calculate the area of ∆OCD.
c Hence calculate the area of the pentagon.
40°
135°
200 km150 km
N
N
A
B
CD
E
O
B C
A
h
42°
35 m
1 m
N
Sea
Land
188
8
Maths Frameworking PB 9.3 Chs 10–17 29/5/08 18:45 Page 188

1 2002 Paper 2
The sketch shows two arrows.
The bigger arrow is an enlargement by scale factor 1.5 of the smaller arrow.
Write down the three missing values a, b and c.
Don’t forget to include units.
40°
8 cm
a6 cm
Not drawn
accurately
b
c
189
7
7I can enlarge a 2-D shape by a fractional scale factor.
I can recognise similar shapes.
8I can use sine, cosine and tangent in right-angled triangles.
I can solve problems using trigonometry.
Maths Frameworking PB 9.3 Chs 10–17 29/5/08 18:45 Page 189

2 2002 Paper 1
A picture has a board behind it. The drawings show the dimensions
of the rectangular picture and of the rectangular board.
a Show that the two rectangles are not mathematically similar.
b Suppose you wanted to cut the board to make it mathematically similar to the picture.
Keep the width of the board as 14 cm. What should the new height of the board be?
Show your working.
3 2005 Paper 2
a Calculate the length w.
b Calculate the size of angle x.
4 2007 Paper 1
a Use tan35° as 0.7 to work out length k.
b Now use tan35° as 0.7 to work out the
area of this isosceles triangle.
You must show your working.
20 cm
35°
Not drawn
accurately
10 cm
35°
k
Not drawn
accurately
x
60 cm 42 cm Not drawn
accurately
28 cm
52°
w
Not drawn
accurately
10 cm
8 cm
14 cm
12 cmBoard
190
8
Maths Frameworking PB 9.3 Chs 10–17 29/5/08 18:45 Page 190

5 2000 Paper 2
ABC and ACD are both right-angled triangles.
a Explain why the length of AC is 10 cm.
b Calculate the length of AD. Show your working.
c By how many degrees is angle x bigger than angle y? Show your working.
8 cm
6 cm
6 cm
D
C
B A
Not drawn
accurately
191
8
8 cm
6 cm
6 cm
D
C
B A
Not drawn
accurately
x
y
Maths Frameworking PB 9.3 Chs 10–17 29/5/08 18:45 Page 191

192
Map reading
Functional Maths
G
E
D
C
B
A
I
F
H
J
K
FM Ch 10 Map reading PB 9.3 29/5/08 18:56 Page 192

193
Copy and complete this table showing the
distances that they walk.
What is the total distance that they walk on
roads?
They walk at an average speed of 4 km/h on
the roads, and 3 km/h on the footpaths.
How long does the walk take them?
3
2
From ToRoad orfootpath
Distanceon map
Distanceon ground
A B Road 9.6 cm 2.4 km
B C
C D
D E
E F
F G
G H
H I
I J
J K
K A
1
They leave their car at 10.00 am. They stop
for a 1-hour lunch and a 30-minute rest.
At what time do they get back to their car?
At point D, Katie suggests they walk in a
straight line to the Cairn.
a How far east of D is the Cairn?
b How far north of D is the Cairn?
c What is the bearing they must walk on to
get from D to the Cairn?
d What is the bearing they must walk on to
get back from the Cairn to D?
On a map, symbols are used to represent
different things.
Represents a campsite Represents a picnic site
a Draw an enlargement of the campsite
symbol using a scale factor of 11–2.
b Draw an enlargement of the picnic site
symbol using a scale factor of 21–2.
6
5
4
Katie and Richard go for a walk. The route they take is shown on the map.
The map has a scale of 1 : 25000. They park their car at the point marked A.
They walk from A to B, then B to C and so on until they arrive back at A.
Use the map to answer the questions below.
FM Ch 10 Map reading PB 9.3 29/5/08 18:56 Page 193

Expansion
What is the area of this rectangle?
Split the rectangle into two smaller rectanglesand find the area of each. Then the area of theoriginal rectangle is the sum of the areas of thetwo smaller rectangles, as shown below:
Area = 6x2 + 8x
This helps to illustrate the expansion of 2x(3x + 4), where the term outside the bracketmultiplies every term of the expression inside the bracket. This is the principle ofexpanding brackets, which you met first in Year 8.
Take, for example, the next two expressions:
3(2x + 5) =
= 3 × 2x + 3 × 5 = 6x + 15
t(8 – 3t) =
= t × 8 – t × 3t = 8t – 3t2
8 – 3t
=
8
t t8tt – 3t2
3t
2x
+
5
3 36x 15
3x
+
4
2x 2x6x2 8x
3x + 4
2x
194
CHAPTER 11 Algebra 5
This chapter is going to show you
How to expand algebraic
expressions
How to factorise algebraic
expressions
How to factorise quadratic
expressions
How to change the subject of a
formula
What you should already know
How to multiply one expression
by another
How to apply the simple rules of
powers
Maths Frameworking PB 9.3 Chs 10–17 29/5/08 18:46 Page 194

Manipulation
Example 11.1
Expand each of the following.
a 3(x + 2) b 5(t + 4) c 4(m + 3) d 2(y + 7)
e 4(3 + m) f 3(2 + k) g 5(1 + t) h 7(2 + x)
Expand each of the following.
a 2(x – 3) b 4(t – 3) c 3(m – 4) d 6(y – 5)
e 5(4 – m) f 2(3 – k) g 4(2 – t) h 3(5 – x)
Expand each of the following.
a 4(2x + 2) b 6(3t – 4) c 5(2m – 3) d 3(3y + 7)
e 3(3 – 3m) f 4(2 + 4k) g 6(1 – 2t) h 2(2 + 3x)
Write down an expression for the area of each of the following rectangles. Simplifyyour expression as far as possible.
a b c d e
Expand each of the following.
a x(x + 3) b t(t + 5) c m(m + 4) d y(y + 8)
e m(2 + m) f k(3 + k) g t(2 + t) h x(5 + x)
Expand each of the following.
a x(x – 2) b t(t – 4) c m(m – 3) d y(y – 6)
e m(5 – m) f k(2 – k) g t(3 – t) h x(6 – x)
Expand each of the following.
a x(4x + 3) b t(2t – 3) c m(3m – 2) d y(4y + 5)
e m(4 – 5m) f k(3 + 2k) g t(4 – 3t) h x(1 + 4x)
4t + 1
3 3x + 2
5
5x – 1
2
6x – 2
4
7
4t – 2
Exercise 11A
Find the two missing lengths, AB and CD, of this rectangle.
From the diagram, the length of AB is given by:
(2p + 7) – 3 = 2p + 7 – 3
= 2p + 4
Hence, the length of AB is 2p + 4.
The length of CD is given by:
(5m + 6) – m = 5m + 6 – m
= 4m + 6
Hence, the length of CD is 4m + 6.
5m + 6 ?
?
mD
CBA
2p + 7
3
195
Maths Frameworking PB 9.3 Chs 10–17 29/5/08 18:46 Page 195

Write down an expression for the area of each of the following rectangles. Simplifyyour expression as far as possible.
a b c d
Expand and simplify each of the following.
a 3(x + 2) + 2(4 + 3x) b 4(t + 3) + 3(5 + 2t) c 4(m + 3) + 3(2 – 4m)
d 5(2k + 4) + 2(3 – 4k) e 6(2x – 3) + 2(3 – 4x) f 5(3x – 2) + 3(1 – 2x)
g 3(x + 4) – 2(3 + 2x) h 4(x + 5) – 3(4 + 2x) i 4(m + 2) – 3(2 – 3m)
j 5(2m + 1) – 2(4 – 3m) k 5(2x – 1) – 2(1 + 3x) l 6(3x – 5) – 3(2 + 4x)
m 3(x – 2) – 2(4 – 3x) n 4(2x – 1) – 3(5 – 2x)
Write down the missing lengths in each of the following rectangles.
y
?
x
5
B
A
CD ?
3x – 1
2
?
B
A
CD ?
5x + 3
4x
3y + 2
2y
?B
CD ?
5x
2y + 3
?B
A
CD ?
4x + 1
x
6y + 4A
y – 1
2x + 3
a b
c d
k
7k – 2
4 + 5m
m
5 – 3t
t
2x + 3
x
196
6
7
1 a Show that + = is true for all values of a and b.
b Show that + = is true for all values of a and b.
2 a Think of a number. Multiply it by 3 and add 15. Then divide theresult by 3 and take away 5.
b What is the number you end up with? What do you notice? Try thiswith a few more numbers.
c Show by algebra that this result will always be the answer.
d Find another similar routine which gives a constant answer.
(ad + bc)––bd
c– d
a– b
(a + b)––ab
1– b
1–a
Maths Frameworking PB 9.3 Chs 10–17 29/5/08 18:46 Page 196

Factorisation
Factorisation is the opposite (inverse) process to expanding a bracket. For example,expanding 3(2x + 5) gives:
3(2x + 5) = 3 × 2x + 3 × 5
= 6x + 15
Factorisation starts with an expression, such as 6x + 15, and works back to find the factorswhich, when multiplied together give that expression when simplified.
Example 11.2
Example 11.3
Always check your factorised expressions by expanding them. So, in the case of Example 11.2:
3(2x + 5) = 3 × 2x + 3 × 5
= 6x + 15
In the case of Example 11.3:
t(8 – 3t) = t × 8 – t × 3t
= 8t – 3t2
Factorise each of the following.
a 3x + 6 b 4t + 6 c 4m + 8 d 5y + 10
e 8 + 2m f 3 + 6k g 5 + 15t h 12 + 3x
Factorise each of the following.
a 2x – 4 b 4t – 12 c 3m – 9 d 6y – 9
e 14 – 7m f 21 – 3k g 12 – 8t h 15 – 3x
Exercise 11B
Factorise 8t – 3t2.
Look for a factor which will divide into each term in the expression. Here, that is t.
Now rewrite the expression using the common factor, which gives:
t × 8 – t × 3t
Insert brackets and place the common factor outside them, to obtain:
t(8 – 3t)
Factorise 6x + 15.
Look for a factor which will divide into each term in the expression. Here, thatcommon factor is 3.
Now rewrite the expression using the common factor, which gives:
3 × 2x + 3 × 5
Insert brackets and place the common factor outside them, to obtain:
3(2x + 5)
197
7
Maths Frameworking PB 9.3 Chs 10–17 29/5/08 18:46 Page 197

Factorise each of the following.
a 12x + 3 b 6t – 4 c 9m – 3 d 3y + 6
e 15 – 3m f 12 + 4k g 6 – 2t h 27 + 3x
Write down an expression for the missing lengths of each of the following rectangles.Simplify each expression as far as possible.
Factorise each of the following.
a x2 + 3x b t2 + 4t c m2 + 5m d y2 + 7y
e 3m + m2 f 4k + k2 g 3t + t2 h x + x2
Factorise each of the following.
a x2 – 3x b 3t2 – 5t c m2 – 2m d 4y2 – 5y
e 2m – m2 f 4k – 3k2 g 5t – t2 h 7x – 4x2
Factorise each of the following.
a 3x2 + 4x b 5t2 – 3t c 3m2 – 2m d 4y2 + 5y
e 4m –3m2 f 2k + 5k2 g 4t – 3t2 h 2x + 7x2
Write down an expression for the missing lengths of each of the following rectangles.
a Write down expressions for three consecutive integers, where the smallest ofthem is n.
b Write down an expression for the sum of these three consecutive integers.Simplify your expression as far as possible.
c Factorise this expression.
d Use your result to explain why the sum of any three consecutive integers is amultiple of 3.
1 The area of a rectangle is 2x2 + 4x. Write down three different pairs ofexpressions for the possible lengths of two adjacent sides of the rectangle.
2 Show, by substitution of x = 1, x = 2 and x = 3, that each pair of valuesgenerates the same values of areas.
3 The area of another rectangle is 12x2 + 18x. Write down seven differentpairs of expressions for the possible lengths of two adjacent sides of therectangle.
?
Area = 6x + 8 2
?
Area = 6 + 9m 3
?
Area = 12 – 8t 4
?
Area = 8x – 2 2
a b c d
?
Area = 3x2 + 4x x
?
Area = 5t + 3t2 t
?
Area = 2m2 – 3m m
?
Area = 4t – 2t2 t
a b c d
198
7
Maths Frameworking PB 9.3 Chs 10–17 29/5/08 18:46 Page 198

Quadratic expansion
What is the area of this rectangle?
It is (x + 3)(x + 2).
Its area can also be found by splitting each side into two sections, as shown below. Theoriginal rectangle is thus divided into four smaller rectangles.
The area of each smaller rectangle is then found, giving the area of the original rectangleas the sum of the areas of the four smaller rectangles.
The area of the four rectangles = x2 + 3x + 2x + 6 = x2 + 5x + 6
The area of the original rectangle = (x + 3)(x +2)
Hence:
(x + 3)(x + 2) = x2 + 5x + 6
This illustrates the expansion of (x + 2)(x + 3), where every term in the first bracket ismultiplied by every term in the second bracket, as shown below.
= x2 + 3x + 2x + 6
= x2 + 5x + 6
Using this method of curved arrows makes dealing with negative signs inside the bracketsmuch easier, as Example 11.4 shows.
Example 11.4
Example 11.5
Expand each of the following expressions.
(x + 3)(x + 4) (x + 5)(x + 1)
(x + 2)(x + 7) (x + 2)(x – 4)
(x + 4)(x – 3) (x + 1)(x – 5)
(x – 3)(x + 2) (x – 1)(x + 6)
Exercise 11C
Expand (x + 3)2.
(x + 3)2 = (x + 3)(x + 3) = x2 + 3x + 3x + 9 = x2 + 6x + 9
Expand (x – 3)(x – 4).
= x2 – 4x – 3x + 12
= x2 – 7x + 12(x – 3)(x – 4)
(x + 3)(x + 2)
x2 3x
2x 6
x
x
3
2
x + 3
x + 2
199
7
Maths Frameworking PB 9.3 Chs 10–17 29/5/08 18:46 Page 199

(x – 4)(x + 3) (x – 1)(x – 2)
(x – 3)(x – 6) (x – 4)(x – 5)
(4 + x)(1 – x) (5 + x)(2 – x)
(3 + x)(6 – x) (x + 5)2
(x – 3)2 (2 – x)2
Investigation
a Take a square piece of card or paper andlabel the two adjacent sides, x.
The area of the square is x2.
b In the unlabelled corner, draw a smaller squareand label each side.
The area of the smaller square is y2.
c Cut out this square of side y, and then label theremaining parts of the two sides x – y.
The area of this remaining shape must be (x2 – y2).
d Now cut this remaining shape diagonally, asindicated by the dashed line. Fit the two partstogether, as shown.
The area remains, as before, (x2 – y2).
e This makes a rectangle of side (x + y) and (x – y).
Hence:
(x + y)(x – y) = x2 – y2
f It has been shown that the above identity is true geometrically. Now show it isalso true algebraically.
The result x2 – y2 = (x + y)(x – y) from Question 19 is called the difference of twosquares, and can be used to solve certain arithmetic problems. For example, find thevalue of 322 – 282 without squaring any numbers.
322 – 282 = (32 + 28)(32 – 28)
= 60 × 4 = 240
Use this method to calculate each of the following.
a 542 – 462 b 252 – 152 c 172 – 32
d 382 – 372 e 292 – 212 f 182 – 172
g 8.12 – 1.92 h 7.92 – 2.12 i 9992 – 9982
x
x
x
xy
y
x
xy
y
x – y
x – y
y
y
x
x
x – y
200
7
Maths Frameworking PB 9.3 Chs 10–17 29/5/08 18:46 Page 200

Quadratic factorisation
Expansion removes brackets, so (x + 2)(x + 4) gives x2 + 6x + 8. Factorisation is theopposite of expansion and involves putting an expression back into the brackets fromwhich it was derived.
This generally requires the application of what is called ‘intelligent trial andimprovement’.
Let’s look at a few examples of factorising expressions in the form of x2 + Bx + C.
Example 11.6
Example 11.7 Factorise x2 – 9x + 20.
Look at the signs. The second sign is a plus which means that the two signs in thebrackets will be the same. The first sign is a minus which means that both signs areminuses.
From the x2 and the signs, the arrangement of the brackets must be of the form (x – a)(x – b). The question is what are the values of a and b?
The product ab is equal to 20. So, a and b must be a factor pair of 20. The choicesare 20, 1; 10, 2; 5, 4.
The sum of a and b is –9. So, the pair required is –5 and –4. Hence:
x2 – 9x + 20 = (x – 5)(x – 4)
Factorise x2 + 6x + 8.
Given the x2 and both signs being +, the arrangement of brackets must be of theform (x + a)(x + b). So, the question is what are the values of a and b?
The product ab is equal to 8. So, a and b must be a factor pair of 8. The choices are8, 1 and 4, 2.
The sum of a and b is 6. So the pair required is 2 and 4. Hence:
x2 + 6x + 8 = (x + 2)(x + 4)
Expand each of the following quadratic expressions.
1 (2x + 3)(4x + 1)
2 (3x + 2)(4x + 5)
3 (4x + 3)(2x – 1)
4 (5x – 2)(2x + 6)
5 (4x – 3)(2x – 4)
6 (5x – 3)2
201
8
Maths Frameworking PB 9.3 Chs 10–17 29/5/08 18:46 Page 201

Example 11.8
Factorise each of the following.
x2 + 10x + 24 x2 + 14x + 24 x2 + 9x + 18
x2 – 11x + 18 x2 – 7x + 12 x2 – 8x + 12
x2 + 2x – 24 x2 + 7x – 44 x2 + 4x – 12
x2 – 7x – 44 x2 – 2x – 63 x2 – x – 90
x2 + 10x + 25 x2 – 12x + 36 x2 – 2x + 1
x2 – 4 x2 – 25 x2 – 100
Change of subject
The cost, in pounds sterling, of advertising in a local paper is given by the formula:
C = 10 + 4A
where A is the area (in cm2) of the advertisement.
To find the cost of a 7 cm2 advertisement, substitute A = 7 into the formula to give:
C = 10 + 4 × 7 = £38
To find the size of the advertisement you would get for, say, £60, you would take thesetwo steps.
● Rearrange the formula to make it read A =
● Substitute C = 60 into this formula
C – 10––4
Factorise each of the following. Take note of the coefficient of x2.
1 3x2 + 4x + 1 2 3x2 – 5x – 2 3 9x2 + 12x + 4
4 2x2 – 11x + 5 5 4x2 – 15x – 25 6 6x2 – 7x – 20
Exercise 11D
Factorise x2 – 5x – 24.
Look at the signs. The second sign is a minus which means that the signs in thebrackets will be different. The first sign is also a negative, which means that thelarger number will need to be negative.
From the x2 and the signs, the arrangement of the brackets must be of the form (x + a)(x – b). The question is what are the values of a and b?
The product ab is equal to 24. So a and b must be a factor pair of 24. The choicesare 24, 1; 12, 2; 8, 3; 6, 4.
The sum of a and b is –5. As the signs are different, this means that the difference of a and b is –5, with the larger number being negative. So, the pair required is 3 and–8. Hence:
x2 – 5x – 24 = (x + 3)(x – 8)
202
8
Maths Frameworking PB 9.3 Chs 10–17 29/5/08 18:46 Page 202

When a formula is rearranged like this, it is called changing the subject of the formula.The subject of a formula is the variable (letter) in the formula which stands on its own,usually on the left-hand side of the equals sign. So, in this case, C is the subject in theoriginal formula. In the rearranged formula, A becomes the subject.
To change the subject of a formula, use the same method as in solving equations. That is,do the same thing to both sides of the equals sign in order to isolate the variable which isto be the new subject. So, in this example:
C = 10 + 4A
● First, subtract 10 from both sides: C – 10 = 4A
● Then divide both sides by 4: = A
● Now switch the formula so that the subject is on the left-hand side:
A =
Hence, to find the size of an advertisement costing £60, substitute C = 60 to give:
A = = 12.5 cm2
Change the subject of each of the following formulae as indicated.
a i Make I the subject of V = IR.
ii Make R the subject of V = IR.
b i Make U the subject of S = U + FT.
ii Make F the subject of S = U + FT.
iii Make T the subject of S = U + FT.
c i Make b the subject of P = 2b + 2w.
ii Make w the subject of P = 2b + 2w.
d i Make b the subject of A = .
ii Make h the subject of A = .
The formula F = + 32 is used to convert temperatures in degrees Celsius, C, to
degrees Fahrenheit, F.
a Make C the subject of the formula.
b Use this formula to find the Celsius value of each of the following Fahrenheittemperatures. Give your answers to 1 decimal place.
i Temperature on the planet Corus, –65 °F
ii Body temperature of a reptile, 66.5 °F
iii Recommended temperature for a tropical fish tank, 56.5 °F
The Greek mathematician Hero showed that the area Aof a triangle with sides a, b and c is given by the formula:
–––––––––––––––––––––––––––A = √S(S – a)(S – b)(S – c)
a + b + cwhere S = ––2
a b
c
9C–5
bh–2
bh–2
Exercise 11E
60 – 10––4
C – 10––4
C – 10––4
203
7
Maths Frameworking PB 9.3 Chs 10–17 29/5/08 18:46 Page 203

Use Hero’s formula to find the area of the following triangles to 1 decimal place.
a b
The estimated cost, £C, of making a pizza of radius r cm and depth d cm is given by:
C =
a What is the estimated cost of making a pizza of radius 8 cm with a depth of 0.5 cm?
b i Rearrange the formula to make d the subject.
ii What is the depth of a 10 cm radius pizza whose estimated cost to make is£3.75?
The area, A cm2, of an ellipse is given by A = πab. Calculate to one decimal place each of these.
a Find the area of an ellipse with a = 8 cm and b = 5 cm.
b i Rearrange the formula to make a the subject.
ii Find the length of a when A = 150 cm2 and b = 5 cm.
c i Rearrange the formula to make b the subject.
ii Find the length of b when A = 45 cm2 and a = 9.5 cm.
Euler’s theorem, which connects the number of nodes (N), the number of regions (R)and the number of arcs (A) of a figure, is stated as:
N + R – A = 2
Take, for example, the figure on the right. This shows 5 nodes, 3 regions (two inside and one outside the figure)and 6 arcs.
a Show that Euler’s theorem is correct for the shapeshown.
b Show that Euler’s theorem is correct by drawing a shape with 6 nodes and 5 regions.
c i Rearrange the formula to make A the subject.
ii How many arcs will there be in a shape which has 10 nodes and 9 regions?
1 a Make r the subject of A = πr2, where A is the area of a circle.
b Make r the subject of V = πr2h, where V is the volume of a cylinder.
4πr3c Make r the subject of V = ––––, where V is the volume of a sphere.
3
2 What is the radius of a circle with an area of 100 cm2?
3 What is the radius of a cylinder with a volume of 200 cm3 and a height of 9 cm?
b
a
r2d–20
8 m
3 m
8 m
5 cm 10 cm
12 cm
204
7
8
Maths Frameworking PB 9.3 Chs 10–17 29/5/08 18:46 Page 204

Graphs from equations in the form Ay ± Bx = C
You have already met the linear equation y = mx + c which generates a straight-line graph.It is this equation which is seen here as Ay ± Bx = C. When the graph is plotted, it will, ofcourse, still produce a straight line.
To construct the graph of Ay + Bx = C, follow these steps.
● Substitute x = 0 into the equation so that it becomes Ay = C
● Solve for y, i.e. y = so that one point on the graph is
● Substitute y = 0 into the equation so that it becomes Bx = C
● Solve for x, i.e. x = so that one point on the graph is
● Plot the two points on the axes and join them up.
Example 11.9
Note that this method is sometimes called the ‘cover-up’ method as all you have to do tosolve for x or y is cover up the other term:
i.e. 4y = 20 ⇒ y = 5
– 5x = 20 ⇒ x = –4
Draw graphs of these straight lines. Use a grid that goes from 0 to +10 on both the x- and y-axis.
a 2y + 3x = 6 b 4y + 3x = 12 c y + 2x = 8
d y + x = 6 e 5y + 2x = 10 f 2y + 5x = 20
Exercise 11F
Draw the graph of 4y – 5x = 20.
Substitute x = 0 ⇒ 4y = 20 y = 5
So the graph passes through (0, 5).
Substitute y = 0 ⇒ –5x = 20 x = –4
So the graph passes through (–4, 0).
Plot the points and join them up.
6
4
2
–2
–4
–1O
2 3
x
y
–2–3–4–5 1
C –, 0B
C–B
C0, – A
C–A
205
7
Maths Frameworking PB 9.3 Chs 10–17 29/5/08 18:46 Page 205

Draw graphs of these straight lines. Use a grid that goes from –10 to +10 on both thex- and y-axis.
a y – 5x = 10 b 2y – 3x = 12 c x – 3y = 9
d 2y + 3x = –6 e 2y – 5x = 10 f 2x – 3y = 6
g y + 3x = –9 h 3x – 4y = 12 i y – 2x = 8
j y + x = –8 k 5y – 2x = 10 l x – 4y = 10
1 2000 Paper 1
a Two of the expressions below are equivalent. Write them down.
5(2y + 4) 5(2y + 20) 7(y + 9) 10(y + 9) 2(5y + 10)
b One of the expressions below is not a correct factorisation of 12y + 24. Which one is it? Write downyour answer.
12(y + 2) 3(4y + 8) 2(6y + 12) 12(y + 24) 6(2y + 4)
1 Show clearly that when 4x + 5y = 20 is rearranged to make y the subject,the answer is y = – 4–
5 x + 4.
2 Describe how you would plot the graph 4x + 5y = 20 using the ‘cover-up’ method.
3 Describe how you would plot the graph y = – 4–5 x + 4 using the
gradient–intercept method.
4 Compare the advantages or disadvantages of rearranging into the form y = mx +c to draw the graph over using the cover-up method.
206
7
5I can expand simple brackets.
6I can expand and simplify expressions with two or more brackets.
7I can factorise expressions by taking out a common factor.
I can rearrange formulae to change the subject.
I can multiply a pair of linear brackets to get a quadratic expression.
I can draw linear graphs using the cover-up method.
8I can factorise a quadratic expression into two linear brackets.
7
Maths Frameworking PB 9.3 Chs 10–17 29/5/08 18:46 Page 206

c Factorise this expression: 7y + 14.
d Factorise this expression as fully as possible: 6y3 – 2y2.
2 2005 Paper 2
Multiply out the brackets in these expressions.
y(y – 6)
(k + 2)(k + 3)
3 2006 Paper 2
Multiply out these expressions.
Write your answers as simply as possible.
5(x + 2) + 3(7 + x)
(x + 2)(x + 5)
4 2006 Paper 1
a Copy and complete these factorisations.
x2 + 7x + 12 = (x + 3)(… + …)
x2 – 7x – 30 = (x + 3)(… – …)
b Factorise these expressions.
x2 + 7x – 18
x2 – 49
5 2005 Paper 1
To change temperatures measured in °C to °F you can use an exact formula or an approximate formula.
F is the temperature in °F
C is the temperature in °C
At what temperature in °C do these formulae give an equal value of F?
You must show an algebraic method.
6 2007 Paper 2
I am thinking of a number.
What is my number?
You must show an algebraic method.
When I subtract 25 from my number, then squarethe answer, I get the same result as when I square
my number, then subtract 25 from the answer.
Approximate formula
F = 2C + 30
Exact formula
F = 9C––5 + 32
207
7
8
Maths Frameworking PB 9.3 Chs 10–17 29/5/08 18:46 Page 207

208
Trip to Rome
Functional Maths
Tom and his wife Geri live in Silkstone. Their friends Stan and his wife Olive live in
Barlborough. They both want to take a 7-day holiday in Rome. There are two airports
in Rome, Ciampino (CIA) and Fiumicino (FCO).
The diagram shows the local airports, the costs of flights on the days they want to fly
and the cost of parking a car for 7 days. Prices for flights are per person and include
all taxes and fees.
The diagram also shows the main roads from their homes to the airports.
Motorways and dual carriageways are shown solid and minor roads are shown dotted.
Junctions are marked with arrows and the distances between arrows are shown in miles.
149
107
9
15
10
5
9
10
36
28
62
5
34
22
12
30
5
86
39
Silkstone
BarlboroughLiverpool (LPL) to
Rome (CIA)
Out £52.79Return £15.79Parking £36.50
Birmingham (BHX)
to Rome (FCO)
Out £62.34Return £20.34Parking £19.92
East Midlands (EMA)
to Rome CIA)
Out £64.99Return £64.99Parking £29.00
Manchester (MAN
to Rome (FCO)
Out £85.99Return £43.76Parking £23.92
Leeds/Bradford (LBA)
to Rome (FCO)
Out £48.99Return £73.76Parking £39.60
Transfers from Rome airports to City Centre
Fiumicino – Train to Termini station €10 each way
Ciampino – Bus to Termini station €9 each way, €14 return
FM Ch 11 Rome PB 9.3 29/5/08 18:57 Page 208

209
The exchange rate is £1 = €1.40.
a How much would it cost to get a return
transfer from each airport to Rome city
centre in pounds?
b Which is the cheapest of the five airports
for two people to fly to Rome and back
and park their car for seven days? Include
the cost of return transfers from the airport
to the centre of Rome.
a How far is it from Silkstone to
Leeds/Bradford airport?
b How much of this distance is on minor
roads?
To calculate the driving time to the airports the
following rules are used.
On motorways assume an average speed of
60 miles per hour.
On minor roads assume an average speed of
30 miles per hour.
Allow 15 minutes to park the car and get to the
terminal.
How long will it take Stan to drive to each of
the airports by the shortest routes?
A flight from Manchester is scheduled to leave
at 08.30. The airline asks passengers to check
in 2 hours before the flight. What is the latest
time Stan should leave home to be sure of
being at the terminal for 06.30?
Another flight from Birmingham is scheduled
to leave at 06.45.
What time would Stan need to leave home to
be sure of being at the terminal in time?
5
4
3
2
1
Tom knows that the running cost of his car is
80p per mile.
Stan knows that the running cost of his car is
90p per mile.
The friends decide to travel together. They work
out two possible arrangements.
Plan 1: Stan and Olive will pick up Tom and Geri
and the four will fly from Leeds/Bradford.
Plan 2: Tom and Geri will pick up Stan and Olive
and the four will fly from East Midlands.
a Work out the cost of each plan taking into
account all possible costs.
b The flight from Leeds/Bradford leaves at
09.00. The flight from East Midlands leaves
at 06.30. Allow 10 minutes to pick up
friends at their house.
i What time would Stan need to leave
home for Plan 1?
ii What time would Tom need to leave
home for Plan 2?
c Which plan would you advise the friends to
go for? Give reasons for your choice.
Devise a Plan 3 which would be much
cheaper than either Plan 1 or Plan 2.
A local taxi company called ‘Jane’s taxis’ operates
from Silkstone. The table shows their charges.
Stan and Olive intend to drive to Silkstone,
park their car and the 4 friends will then take
Jane’s taxi’s to Manchester airport to fly to
Rome and back, then get Jane’s taxis to pick
them up.
How much will this cost in total?
Include the cost of Stan’s drive from
Barlborough to Silkstone and the transfers
from the airport in Rome.
Using all the available data, find the cheapest
possible way for the four friends to fly to
Rome and back.
9
8
Airport LBA MAN LPL EMA BHX
Drop off £28 £28 £35 £28 £42
Pick up £28 £28 £35 £28 £42
7
6
Use the information to answer these questions.
FM Ch 11 Rome PB 9.3 29/5/08 18:57 Page 209

Number 1 – Fractions, percentages anddecimals
Do not use a calculator for the first two questions.
Calculate the following, giving your answers as fractions.
a + b – c 2 + 1
The following method can be used to work out 11.5% of 320:
10% of 320 = 32
1% of 320 = 3.21–2% of 320 = 1.6
––––––––––––––––11.5% of 320 = 36.8
Use a similar method or a method of your own to work out 281–2% of 480.
You may use a calculator for the rest of the exercise unless told otherwise.
Jack’s Jackets is having a sale.
Calculate the original price of a jacket with a sale price of £36.21.
SALE SALE
SALESALE SALE
2–5
3–4
1–6
5–9
1–3
3–5
Exercise 12A
210
CHAPTER 12 Solving Problems and Revision
This chapter is going to give you practice in National Test questions about
Number – fractions, percentages and decimals
Number – the four rules, ratios and standard form
Algebra – the basic rules and solving linear equations
Algebra – graphs
Geometry and measures
Statistics
6
Maths Frameworking PB 9.3 Chs 10–17 29/5/08 18:47 Page 210

This table shows the populations (in thousands) of the eight largest towns in the UKin 1991 and in 2001. It also shows the percentage change in the populations of thetowns over that 10-year period.
London Birmingham Leeds Glasgow Sheffield Liverpool Manchester Bristol
1991 6 800 1007 717 660 529 481 439 407
2001 7 200 1 017 731 692 531 456 423
% change 5.9% 1% 2.0% 4.8% 0.3% –5.2% –3.2%
a How many more people lived in Leeds than Sheffield in 2001?
b Calculate the population of Manchester in 2001.
c Calculate the percentage change in the population of Bristol over the 10 years.
A garage records the sales of fuel in one morning.
Fuel Number of litres sold Takings
Premium 345 £334.72
Ultimate 102 180 £189.56
Diesel 422 £417.48
LP Gas 25 £14.60
Total 972 £956.36
a What percentage of the total litres sold was Ultimate 102?
b What percentage of the total money taken was for Diesel?
c Which is cheaper per litre, Diesel or Premium?
Do not use a calculator for this question.
a Calculate: i 0.2 × 0.4 ii 600 ÷ 0.3
479 × 0.48b Estimate the answer to ––––0.59
Some bathroom scales measure in stones and pounds, whilst others measure inkilograms. One way to change from stones and pounds to kilograms is shown below.
Use the flowchart to help you convert 70 kg to stones.
The train fare for a child on a journey to London is £13. This child’s fare is 35% lessthan an adult fare. How much is an adult’s fare?
Answer is weightin kilograms
Divide by2.2
Add numberof pounds
Multiply by 14
Number of stones
211
6
7
Maths Frameworking PB 9.3 Chs 10–17 29/5/08 18:47 Page 211

The table shows the number of mobile phones perthousand of the population in the USA and the UK.
Between 2003 and 2007 the use of mobile phones inthe UK increased by 48.5%. How many people per1000 had mobile phones in the UK in 2007?
What was the percentage increase in mobile phone use in the USA between2003 and 2007?
On Sunday, an Internet auction siteposted some computers for sale.Each day the price of the computersis reduced by 12% of the price theday before.
A computer was priced at £950on Sunday. Derek bought it onMonday. How much did he payfor it?
Another computer sold for £439.12 on Monday. What was its price on Sunday?
A computer was priced at £560 on Sunday. It was eventually sold on Friday.How much did it sell for?
John decides to take a chance on a computer that is priced at £1500 on Sunday,and wait until it is less than half the original price. How many days will he haveto wait?
Do not use a calculator for this question.
a Which calculation below gives the answer to this question?
In a sale, Tomb Taker III, which is priced at £45, is reduced by 15%. The saleprice is then reduced by a further 10%. How much is Tomb Taker III now?
b What value do you multiply by to increase a quantity by 13%?
For each part of the question, where n is always an integer, write down the answerthat is true and explain your choice. Do not use a calculator.
n(n + 1)(n + 2)a When n is even, ––– is:
4
Always odd Always even Sometimes odd, sometimes even
n(n + 1)(n + 2)b When n is even, ––– is:
6
Always an integer Always a fraction Sometimes an integer,sometimes a fraction
The following formula can be used to calculate the area of a triangle with sides a, band c.
A = √––––s(s – a)(s – b)
–––(s – c) where s = (a + b + c)
a If a triangle has sides of length a = 4.5 cm, b = 7.5 cm and c = 9.5 cm, calculatethe area of the triangle. Write down all the digits shown on your calculator.
b Round off your answer to three significant figures.
12
45 × (0.85 + 0.9)45 × 0.85 × 0.945 × 1.15 × 1.145 × 0.15 × 0.10
d
c
b
a
http//:www.computers.com
PENTUIM 4 · 2.8GHZ · 120HD · DVD · CD
PENTUIM 4 · 2.4GHZ · 80HD
Hard Drives
CD-rewriters
Printers
Scanners
Software
b
a
2003 2007
USA 830 980
UK 800
212
7
8
Maths Frameworking PB 9.3 Chs 10–17 29/5/08 18:47 Page 212

Number 2 – The four rules, ratios andstandard form
Do not use a calculator for the first three questions.
Litter bins cost £29 each. A school has a budget of £500 to spend on bins. Howmany bins can the school afford?
Alf and Bert are paid £48 for doing a job. They decide to share the money in the ratio 3 : 5. How much does Alf get?
Work out: a 24 × 0.6 b 54 ÷ 0.6 c 0.2 × 0.3
You may use a calculator for the rest of the exercise unless told otherwise.
A car company wants to move 700 cars by rail. Each train can carry 48 cars.
How many trains will be needed to move the 700 cars?
Each train costs £3745. What is the total cost of the trains?
What is the cost per car of transporting them by train?
A bus travels 234 miles in 4 hours and 30 minutes. What is the average speed ofthe bus?
A car travels 280 miles at an average speed of 60 miles per hour. How long wasthe car travelling for? Give your answer in hours and minutes.
Concrete is made by mixing cement and sand in the ratio 1 : 4.
What weight of sand is needed to mix with four bags of concrete, eachweighing 25 kg?
Frank needs one tonne of concrete. How many 25 kg bags of cement will heneed?
Parking tickets cost £1.25 each. In one daya ticket machine takes the coins listed inthe table.
How many tickets were sold that day?
Without using a calculator, find the values of a, b and c.
a 81 = 3a b 256 = 2b c 64 = (22)c
Coin Number of coins
£1 126
50p 468
20p 231
10p 185
5p 181
b
a CEMENTPORTLAND
50 kg
SAND25 kg
SAND25 kgSAN
D25 kg
SAN
D25 kg
b
a
c
b
a
���������������
��
��
��� ��
5 5 6 8 9 0 2 1 4 5 4
����
��� ��
5 5
6 8
9 0
2 1
4 5
4� �����
5 5
6 8
9 0
2 1
4 5
4
���������������
���������������
������������������������������
������������
������������
ON E P O U N DP
LI
ED I O L · W
YF
ON E P O U N D
ON E P O U N DP
LI
ED I O L · W
YF
PL I E D I O L
·W
Exercise 12B
213
6
7
Maths Frameworking PB 9.3 Chs 10–17 29/5/08 18:47 Page 213

Look at the six cards with numbers on below. Do not use a calculator.
a Which card has the largest value?
b Which two cards have the same value?
c Which card is equal to 28?
d Which cards have values that are cube numbers?
A litre jug contains orange squash and water in the ratio 1 : 4. A 900 ml jug contains orange squash and water in the ratio 2 : 7. Both jugs are poured into a two-litre jug. This is thentopped up with water. What is the ratio of orange squash towater in the two-litre jug now?
Do not use a calculator for this question.
a Which of these statements is true?
i 32 × 103 is smaller than 33 × 102
ii 32 × 103 is equal to 33 × 102
iii 32 × 103 is larger than 33 × 102
b Which two numbers below are equal?
360 × 102 3.6 × 10³ 36 × 102 0.36 × 10⁵ (3.6 × 10)2
c Two of these numbers have the same value as 5.4 × 10⁻². Which two?
0.54 × 10⁻³ 54 × 10-3 0.54 × 10⁻¹ 54 × 10-1 540 × 10-5
The diameter of a virus is 0.000 001 cm.
a Write this number in standard form.
b How many viruses would fit across a full stop which has a diameter of 0.05 cm?Give your answer in standard form.
The table below shows the population of some areas of the world in 2000 togetherwith their yearly population growth.
Continent Population (2000) Growth per year
Asia 8.25 × 10⁸ 2.5%
Australia 1.92 × 10⁷ 0.7%
Pacific Islands and New Zealand 1.4 ×10⁷ 1.1%
Australia, the Pacific Islands and New Zealand form the continent of Oceania.Work out the population of Oceania.
If the growth rate of Asia continues at the same rate, work out the population ofAsia in 2005. Give your answer in standard form to three significant figures.
If the growth rate of Australia continues at the same rate, work out thepopulation of Australia in 2010. Give your answer in standard form to threesignificant figures.
c
b
a
(–3)45982(–2)644(–1)2
214
7
8
Maths Frameworking PB 9.3 Chs 10–17 29/5/08 18:47 Page 214

Algebra 1 – Rules of algebra and solvingequations
Do not use a calculator for this exercise.
The diagram shows a square with sides of length (n + 4) cm.
The square has been split into four smaller rectangles. The area of one rectangle is shown.
a On a copy of the diagram, fill in the three missing areas with a number or an algebraic expression.
b Write down an expression for the total area of the square.
Expand each of the following brackets and simplify each expression if possible.
a 4(x – 5) b 3(2x + 1) + 5x c 3(x – 2) + 2(x + 4)
d 5(3x + 4) + 2(x – 2) e 4(2x + 1) – 3(x – 6)
a When x = 4 and y = 6, work out the value of each of the three expressions below.
i 3x + 9 ii 4x – y iii 2(3x + 2y + 1)
b Solve the equations below to find the value of z in each case.
z – 8i 5z + 9 = 24 ii –– = 7 iii 5z + 9 = 3z + 72
Two friends, Selma and Khalid are revising algebra.
Selma says: ‘I am thinking of a number. If you multiply it by 6 and add 3, you get ananswer of 12.’
Khalid says: ‘I am thinking of a number. If you multiply it by 3 and subtract 6, youget the same answer as adding the number to 7.’
a Call Selma’s number x and form an equation. Then solve the equation.
b Call Khalid’s number y and form an equation. Then solve the equation.
Solve each of the following equations.
a 3x + 7 = x + 10 b 5x – 6 = 10 – 3x c 3(x + 3) = x + 8
a You are told that 2a + 4b = 15 and that 2b – c = 13.
Write down the values of the following.
i 6a + 12b = … ii 4b – 2c = … iii 2a + 2c = …
b Factorise each of the following.
i 3x + 6y ii x2 + x iii 4ab + 6a
For each equation below, write down the missing expression to make the equationtrue.
a + = b – =
c + = d – = 5n + 3………8n + 25n + 3………6n + 1
5n + 3………6n + 95n + 3………3n – 1
…… 4n
…… ……
n
4
n 4
Exercise 12C
215
6
7
Maths Frameworking PB 9.3 Chs 10–17 29/5/08 18:47 Page 215

a Two of the expressions below are equivalent. Which ones are they?
3(4x – 6) 2(6x – 4) 12(x – 3) 6(2x – 3) 8(4x – 1)
b Factorise this expression: 6y – 12
c Factorise this expression as fully as possible.
9y2 – 6y
a Find the value of these expressions when x = 2.
3x3 2x2(x + 3)i –– ii ––8 5x
4x2y3
b Simplify this expression: ––6xy
c Simplify these expressions.
i 4(x – 3) – 3(x + 4) ii 2(3y + 4x) + 3(y – 2x)
Look at this sequence of fractions:
…
a What is the nth term of this sequence ?n2
b Another sequence has an nth term of ––. The first term is .n2 + 1
Write down the next three terms.
c The sequence in part b goes on forever and reaches a limit. What is the limit?
Solve the following equations.
7y 4a 5 – 3y = 12 – 4y b –– = 5 c –– = y – 2y – 1 y – 2
Simplify these expressions.
a (x – 4)(x – 4) b (x – 4)(x + 5) c (3x – 2)(4x + 1)
The triangle and the rectangle havethe same area.
Find the value of z.
Algebra 2 – Graphs
Do not use a calculator for this exercise.
You will need graph paper or centimetre-squared paper.
For all the graphs you are asked to draw, axes the size of those in Question 4 will belarge enough.
Exercise 12D
2z
2z + 2
4z – 2
z
1– 2
10–13
8–11
6– 9
4– 7
2– 5
216
7
8
Maths Frameworking PB 9.3 Chs 10–17 29/5/08 18:47 Page 216

In a house, the hot-water tank automatically refills with cold water whenever hotwater is taken out. The heating system then heats the water to a pre-set temperature.
Dad always has a shower in the morning. Mum always has a bath and the twochildren get up so late that all they do is wash their hands and faces.
The graph shows the temperature of the water in the hot-water tank between 7 am and 9 am one morning.
a At what time did Dad have his shower?
b At what time did Mum have her bath?
c At what time did the first child wash?
Gran likes to have as hot a bath aspossible, once everyone else has left thehouse at 9 am. Estimate at what time thewater will be back to its maximum temperature.
For every point on the graph of x + y = 6, the x- and y-coordinates add up to 6.Which of the following points lie on the line?
a i (3, –3) ii (6, 0)
iii (–7, –1) iv (–1, 7)
b On a grid draw the graph of x + y = 6.
The prison population of a country was increasing rapidly, as is the use of illegaldrugs. These graphs show the changes in prison population and drug use between2003 and 2006.
Use the graphs to decide for each of the following statements, a, b and c, if:
● the statement is true.
● the statement is false.
● you cannot be sure if it is true or false from the information given.
Use only the information given in the graphs. Do not use any facts that you mightalready know about the subject. Explain your answers.
There is a positive correlation between prison population and illegal drug use.
The prison population will reach 70 000 before 2013.
Reducing illegal drug use will decrease the prison population.c
b
a
Ille
gal dru
g use
(1000s)
Year
’03 ’04 ’05 ’06
120
80
40
Pri
son p
opula
tion
(1000s)
Year
’03 ’04 ’05 ’06
80
70
60
50
40
d
Tem
per
ature
°C
Time7 am 8 am 9 am
217
6
Maths Frameworking PB 9.3 Chs 10–17 29/5/08 18:47 Page 217

The graph shows the line y = 2x + 2.
a Copy the graph and draw and label the liney = 2x – 1 on the same axes.
b Draw and label the line y = x + 2 on thesame axes.
c Write down the coordinates of the pointwhere the graphs y = 2x – 1 and y = x + 2 intersect.
The diagram shows a rectangle ABCD.
a The equation of the line AB is x = 1.
What is the equation of the line CB?
b The equation of the diagonal AC is y = 2x + 2.
What is the equation of the diagonal BD?
c Write down the equations of the two lines ofsymmetry of the rectangle.
a On the same axes, draw and label the graphs of y = –3, x = 2 and y = 3x.
b The three lines you have drawn enclose a triangle. Work out the area of thistriangle in square units.
Here are the equations of six graphs.
A y = 2x – 1 B y = x C y = 2 D x = 2
E y = 2x + 3 F y = x – 1
a Which two graphs are parallel?
b Which two graphs are perpendicular?
c Which pair of graphs cross the y-axis at the same point?
d Which pair of graphs cross the x-axis at the same point?
The graph on the right shows the journey ofa train from Leeds to London, stopping atDoncaster.
a What time did the train arrive atDoncaster?
b What was the average speed of the trainfor the whole journey?
Dis
tance
fro
m L
ondon
(km
)
Time9.00 9.30 10.00 10.30 11.00
300
250
200
150
100
50
12
–3 –1 2 3
1
2
–1
–3
0
y
x
3
–2 1
–2
4A
B
D
C
–6 –4 –2 2 4 6
2
4
6
–2
–4
–6
0
y
x
y = 2x + 2
218
7
Maths Frameworking PB 9.3 Chs 10–17 29/5/08 18:47 Page 218

The diagram shows two graphs, A and B.
a Show that the equation of line A is x + 2y = 8.
b Write down the equation of line B.
The graph on the right shows the equation y = x2 – 4. Use the graph to solve the equation x2 = 6.
Copy the diagram exactly and number both axes from 0 to 4.
a Write down three inequalities that describethe shaded region shown on the right.
b Mark the region described by the followinginequalities with the letter R.
y ≥ x
y ≤ 43 ≤ x ≤ 4
Geometry and measures
Do not use a calculator for Questions 1, 2, 6, 7 and 8.
You will find squared paper useful for Question 5.
Find the values of angles a, b and c in this diagram. The lines marked with arrows are parallel.
b
c
a98°
126°
Exercise 12E
0 1 2 3 4
4
3
2
1
0
y
x
–5 5
–5
5
0 2 4 6 8
8
6
4
2
0
B
A
y
x
219
6
8
Maths Frameworking PB 9.3 Chs 10–17 29/5/08 18:47 Page 219

Calculate the area of the trapezium shown on the right.
You may use a calculator for the rest of this exercise unless told otherwise.
This car speedometer shows speed in both miles perhour (mph) and kilometres per hour (kph). Use thespeedometer to answer the following questions.
How many kilometres are equivalent to 50 miles?
Is someone travelling at 100 kph breaking thespeed limit of 70 mph? Justify your answer.
About how many miles is 150 km? Explain youranswer.
ABCD is an isosceles trapezium.
a Work out the size of angles a, b and c in the diagram.
b Explain how you know that BE isparallel to AD.
Copy the diagram onto squared paper and enlarge the shape by a scale factorof 3, using the point O as the centre ofenlargement.
Do not use a calculator for this question.
a What is the volume of the prism shown on the right?
b The prism below has the same volume as the prismin part a. What is the cross-sectional area?
Crosssection
12 cm
13 cm
5 cm10 cm
O
A B
CED
43°
a
b
c
16°
82°
c
b
a
10
20
30
40
5060
80
70
0
0
20
40
60
10080
120
MPH
KPH
6.2 cm
5 cm
4.8 cm
220
6
7
Maths Frameworking PB 9.3 Chs 10–17 29/5/08 18:47 Page 220

Do not use a calculator for this question.
The two triangles shown are similar. Calculate the values of x and y.
Do not use a calculator for this question.
a A rectangle measures 24 cm by 12 cm. What is its area?
b The rectangle is folded in half several times until itmeasures 6 cm by 3 cm. How many times was it folded?
c What is the ratio of the areas of the original rectangleand the smaller rectangle? Give your answer in its simplest form.
a Make an accurate construction of this triangle.
b Measure the angle at A.
The diagram shows a cuboid and a triangular prism. Both solids have the samevolume. Use this information to calculate the length of the prism.
a Calculate the length of the side marked x in this right-angled triangle.
b Calculate the length of the side marked y in this right-angled triangle.
2 cm
6 cm
y
6 cm
2 cmx
5 cm
12 cm
4 cm4 cm
3 cml
A
BC 8 cm
5 cm
60°
12 cm
24 cm
3 cm
6 cm
12 cm
8 cm y cm12 cm 15 cm
x cm
221
7
Maths Frameworking PB 9.3 Chs 10–17 29/5/08 18:47 Page 221

a What is the area and perimeter of this sector of a circle?
b A semicircle of radius 5 cm has the same perimeter as a circle ofradius, r. Calculate the value of r. Give your answer to 3 sf.
In the two triangles shown below, the lengths AB and PQ are equal. Calculate thevalue of the length x and the angle y.
Statistics
Do not use a calculator for Questions 1 to 5, 9 and 10.
A bag contains only red and blue marbles. A marble is to be taken from the bag atrandom.
It is twice as likely that the marble will be red as blue. Give a possible number of redand blue marbles in the bag.
Paul’s marks for his last nine maths homeworks are:
9 3 5 4 4 7 5 8 6
a What is the range of his marks?
b What is the median mark?
c After checking his final homework, Paul realised that his teacher did not markone of the questions. Once this had been marked, Paul’s mark increased from6 to 8.
Say whether each of the statements, i, ii and iii are true, false or if it is notpossible to say. Explain your answers.i The mode of the marks has increased.ii The median mark has increased.iii The mean mark has increased.
The probability that a ball taken at random from a bag is black is 0.7. What is the probability that a ball taken atrandom from the same bag is not black?
Exercise 12F
x cm
20 cm
A
BC34° y°
15 cm
P
Q R
60°
8 cm
222
6
8
Maths Frameworking PB 9.3 Chs 10–17 29/5/08 18:47 Page 222

Lee and Alex are planning a survey of what pupils at their school prefer to do at thelocal entertainment complex, where there is a cinema, a bowling alley, a gamesarcade and a disco.
a Alex decides to give out a questionnaire to all the pupils in a Year 7 tutor group.Explain why this may not give reliable results for the survey.
b Lee decides to include this question in his questionnaire:
How many times in a week do you go to the entertainment complex?
Never 1–2 times 2–5 times Every day
Explain why this is not a good question.
x is a whole number bigger than 1. For the five values on the cards below:
a what is the median value?
b what is the mean value?
You may use a calculator for the rest of the exercise unless told otherwise.
The scatter diagram shows the value andthe mileage for anumber of cars. Themileage is the totaldistance a car hastravelled since new.The value of a car isgiven as a percentageof its value when itwas new.
A line of best fit has been drawn on the scatter diagram.
a What does the scatter diagram show about the relationship between the value ofa car and its mileage?
b A car has a mileage of 45 000. Estimate its value as a percentage of its valuewhen new.
c A car cost £12 000 when it was new. It is now worth £7800. Use thisinformation to estimate how many miles it has travelled.
The table shows the National Test Levels awarded to a class in Mathematics.
Level 3 4 5 6
Number of pupils 2 7 13 8
a How many pupils were there altogether in the class?
b Work out the mean National Test score for the class.
Val
ue
Miles (1000s)
10
100%
80%
60%
40%
20%
20 30 40 50 60 70
6x + 13x + 2x + 12x + 13x
223
7
Maths Frameworking PB 9.3 Chs 10–17 29/5/08 18:47 Page 223

A teacher records how long it takes her classto do a test. The table shows the results.
Work out the mean time taken to do the test.
Do not use a calculator for this question.
Look at the two spinners on the right.
Use a tree diagram to help you calculatethe probability of spinning the samecolour on both spinners.
Do not use a calculator for this question.
The diagram shows the cumulativefrequency graph for the marksthat 1000 pupils received on aGCSE maths paper.
a Find the median mark.
b Find the interquartile range.
c Pupils who score 65 or overget a grade A. Approximatelywhat percentage of pupils isthis?
A bag contains 4 red and 6 blue marbles. A marble is taken from the bag at random and replaced. Another marble is then takenfrom the bag.
A tree diagram may help to answer these questions.
a What is the probability that both marbles are blue?
b What is the probability that there is one marble of each colour?
c A marble is taken from the bag. The colour is recorded and themarble is then replaced. This is done 200 times. How many redmarbles would you expect to get?
More National Test practice provided in the Interactive Book.
Cum
ula
tive
fre
quen
cy
Mark
0
1000
900
800
700
600
500
400
300
200
100
010 20 30 40 50 60 70 80 90 100
Time, t minutes Frequency
0 < t ≤ 2 9
2 < t ≤ 4 12
4 < t ≤ 6 15
6 < t ≤ 8 3
8 < t ≤ 10 1
224
7
8
Maths Frameworking PB 9.3 Chs 10–17 29/5/08 18:47 Page 224

225
Statistical techniques
This lesson will remind you of the statistical techniques that you have met before. You willbe using these to carry out a handling data project.
The following tables show the vocabulary you should know before you start aninvestigation.
Handling data vocabulary
Collecting data
CHAPTER 13 Statistics 3 and Revision
This chapter is going to show you
Some of the statistical
techniques you have met before
How to make a hypothesis
How to carry out a handling
data investigation
What you should already know
How to carry out a survey
How to write a questionnaire
How to collect data
How to construct and interpret
two-way tables
How to construct and interpret
frequency diagrams
How to construct and interpret
scatter graphs
How to compare data
How to draw and interpret
cumulative frequency graphs
How to calculate statistics for
large sets of data
Definition Example
Questionnaire
Population
Sample
Survey
A set of questions used tocollect information frompeople
The set of people or objectsbeing investigated
Part of the whole populationbeing used for analysis
The collection of data from asample of the population
Here is an example of a poor question:
How old are you?
0–10 10–20
20–30 over 30
It is poor because the categories overlap, so that both 10and 20 are in two response sections.
A school with 1000 pupils
50 pupils picked from the 1000 in a school
Investigating the favourite colour of pupils in a school byasking 50 pupils
Maths Frameworking PB 9.3 Chs 10–17 29/5/08 18:47 Page 225

226
Definition Example
Census
Data collectionsheet orObservation sheet
Tally
Raw data
Primary data
Secondary data
Two-way table
Frequency table
Frequencydiagram
The collection of data from anentire population
A form for recording results
A means of recording dataquickly
Data which has not beensorted or analysed
Data that you have collected,usually by observation,surveys or experiments
Data collected by someoneelse and then used by you
A table for combining twosets of data
A table showing the quantitiesof different items or values
A diagram showing thequantities of different items orvalues
Investigating the favourite colour of pupils in a school byasking every pupil in the school
Favourite colours of 50 pupils:
Blue I I I I I I I I
Red I I I I I I I I I I I I I I I
Green I I I I I I I I I I I I
Other I I I I I I I
Ages of 10 pupils:12, 14, 13, 11, 12, 12, 15, 13, 11, 12
Colours of cars on your street
Acceleration times of different cars
Ford Vauxhall Peugeot
Red 3 5 2
Blue 1 0 4
Green 2 0 1
Weight of parcels Number of parcelsW (kg) (frequency)
0 < W ≤ 1 5
1 < W ≤ 2 7
W > 2 3
Reasons for absence
Sick
Dentist
Holiday
Unauthorised
1614121086420
Nu
mb
er o
f p
up
ils
Red Blue Green Yellow
Pupils’ favourite colours
BAR CHARTPIE CHART
12
10
8
6
4
2
0
Freq
uen
cy
0 15 30 45 60Time (minutes)
Journey times
HISTOGRAM
Maths Frameworking PB 9.3 Chs 10–17 29/5/08 18:47 Page 226

227
Definition Example
Frequencydiagram(continued)
Stem-and-leafdiagram
Populationpyramid
Scatter graph orscatter diagramincluding line ofbest fit
Cumulativefrequencydiagram
A way of grouping data, inorder
A statistical diagram oftenused for comparing large setsof data
A graph to compare two setsof data
A graph used to estimatemedian and interquartilerange for large sets of data
Recorded speeds of 16 cars
2 | 3 7 7 8 9 93 | 1 2 3 5 5 5 74 | 2 2 5
Key: 2 | 3 means 23 miles per hour
100+95–9990–9485–8980–8475–7970–7465–6960–6455–5950–5445–4940–4435–3930–3425–2920–2415–1910–145–90–4
Male Female
Age distribution in France (2000)
2.5 2.0 1.5 1.0 0.5 0.0 0.0 0.5 1.0 1.5 2.0 2.5
Population (millions)
Hours ofsunshine
Temperature
30
25
20
15
10
5
0
Ave
rage
tem
per
atu
re (
°C
)
Janu
ary
MonthFe
brua
ry
Mar
chApr
ilM
ayJu
ne July
Augus
t
Sept
embe
r
Octob
er
Nov
embe
r
Dec
embe
r
Mean temperature for two cities
City A
City B
LINE GRAPH
0 5
Amount of money earned (£)
10 15 20 25 30 35 40 45 50
Cu
mu
lative
fre
qu
ency
40
30
20
10
0
Maths Frameworking PB 9.3 Chs 10–17 29/5/08 18:47 Page 227

Criticise each of the following questions that were used in a questionnaire abouttravelling to school.
a How do you travel to school?
Walk Bus Car
b How long does your journey take?
0–5 minutes 5–10 minutes
10–15 minutes 15–20 minutes
c At what time do you usually set off to school?
Before 8.00 am 8.00–8.15 am
8.15–8.30 am Other
Exercise 13A
228
6
Definition Example
Mode
Median
Mean
Range
Lower quartile
Upper quartile
Interquartilerange
The value that occurs mostoften
The middle value when thedata is written in order (or theaverage of the middle twovalues)
The sum of all the valuesdivided by the number ofitems of data
The difference between thelargest and smallest values
One quarter of the values liebelow the lower quartile
Three quarters of the valueslie below the upper quartile
The difference between theupper quartile and the lowerquartile
Find the mode, median, mean and range of this set of data
23, 17, 25, 19, 17, 23, 21, 23
Sorting the data into order, smallest first, gives:
17, 17, 19, 21, 23, 23, 23, 25
Mode = 23
21+ 23Median = –– = 222
17 + 17 + 19 + 21 + 23 + 23 + 23 + 25Mean = –––––––––= 218
Range = 25 – 17 = 8
From the stem-and-leaf diagram find the median and theinterquartile range
Ages of a team of 11 footballers
1 | 7 7 7 8 9 92 | 0 5 63 | 1 5
Key: 1 | 7 means 17 years old
There are 11 footballers(11 + 1)Median = –– = 6th value = 19 years
2
Lower quartile = 3rd value= 17 years
Upper quartile = 9th value= 26 years
Interquartile range = 26 – 17 = 9 years
Processing data
Maths Frameworking PB 9.3 Chs 10–17 29/5/08 18:47 Page 228

A school quiz team is made up of pupilsfrom four different classes. The table shows the number of pupils in the team from each class.
a Represent this information in a pie chart.
b Holly says: ‘The percentage of pupilschosen from class C is double thepercentage chosen from class A.’ Explainwhy this might not be true.
19 pupils take a test. The total marks available were 20. Here are the results.
17, 16, 12, 14, 19, 15, 9, 16, 18, 10, 6, 11, 11, 14, 20, 8, 12, 19, 5
a Use the data to copy and complete this stem-and-leaf diagram:
0 |1 |2 |Key: | means
b Work out the median mark.
c State the range of the marks.
d How many pupils scored 75% or more in the test?
Look at the population pyramid for France in the year 2000 on page 227.
a Compare the number of females and males alive in the year 2000 who wereborn during or before World War II, which lasted from 1939 to 1945.
b Suggest some possible reasons for the difference in the number of males andfemales in this age range.
In a spelling test for a class of 30:
● six scored between 0 and 2
● fifteen scored between 3 and 7
● nine scored between 8 and 10
Estimate the mean score.
Below are the times taken (T seconds) by 20 pupils to run 100 m.
Boys 13.1 14.0 17.9 15.2 15.9 17.5 13.9 21.3 15.5 17.6
Girls 15.3 17.8 16.3 18.0 19.2 21.4 13.5 18.2 18.4 13.6
a Copy and complete the two-way table to show the frequencies.
b What percentage completed the 100 m in less than 16 seconds?
c Which is the modal class for the girls?
d In which class is the median time for the boys?
Boys Girls
12 ≤ T < 14
14 ≤ T < 16
16 ≤ T < 18
18 ≤ T < 20
20 ≤ T < 22
Class Number of pupils
A 4
B 3
C 8
D 5
229
6
7
Maths Frameworking PB 9.3 Chs 10–17 29/5/08 18:47 Page 229

Use the table of data in Question 8 below to estimate the mean height of the groupof Year 9 pupils.
The table below shows the heights of 100 pupils in Year 9.
a Copy and complete the cumulative frequency table.
b Draw the cumulative frequency graph.
c Use your graph to estimate the median and interquartile range.
Height, h (cm) Number of pupils Height, h (cm) Cumulative frequency
0 < h ≤ 100 0 h ≤ 100
100 < h ≤ 120 7 h ≤ 120
120 < h ≤ 130 32 h ≤ 130
130 < h ≤ 140 41 h ≤ 140
140 < h ≤ 150 17 h ≤ 150
150 < h ≤ 160 3 h ≤ 160
It was estimated that there were 58 836 700 people living in the UK in mid-2001. This was an increase of 1.4 million people (2.4 per cent) since 1991.
The graph shows the population (in thousands) of the UK between 1991 and2001. Explain why it may be misleading.
59000
58500
58000
57500
57000
56500
Popula
tion (
thousa
nds)
1991
Year
UK Population
1992 1993 1994 1995 1996 1997 1998 1999 2000 2001
230
7
8
7
Maths Frameworking PB 9.3 Chs 10–17 29/5/08 18:47 Page 230

A handling data project
In this section you are going to plan and write a handling data investigation. Look at thehandling data cycle below. This shows the basic steps in an investigation.
More detail is given about each step below. Follow this checklist when doing yourinvestigation and writing your report.
● Specify the problem and plan
● Statement of problem or topic to investigate
● Hypothesis stating what you think the investigation will show
● How you will choose your sample and sample size
● Any practical problems you foresee
● Identify any sources of bias and plan how to minimise them
● How you will obtain your data
● Identify what extra information may be required to extend the project
● Collect data from a variety of sources
● Follow initial plan and use a suitable data collection sheet
● Process and represent data
● Analysis of your results using appropriate statistical calculations and diagrams
● Interpret and discuss data
● Comparison of results with your original hypothesis
● List of any factors which might have affected your results and how you couldovercome these in future
● Consider the limitations of any assumptions made
● A final conclusion
Specify the problemand plan
Collect data froma variety of sources
Interpret anddiscuss data
Process andrepresent data
Eval
uateresults
0.5
0.0
–0.5
Tem
pera
ture
°C
Global temperature °C
1860 1880 1900 1920 1940 1960 1980 2000
Year
Pre
dic
tio
ns
red
white
lightblue
yellowblue
231
Maths Frameworking PB 9.3 Chs 10–17 29/5/08 18:47 Page 231

232
7
In small groups investigate one of the following topics.
Compare people’s hand-span with their shoe size.
Compare the reaction times of two different groups of people: for example, girls andboys.
Investigate the ability of people to estimate the lengths of lines (straight or curved)and to estimate the size of angles.
Compare the word lengths in a newspaper with those in a magazine, or compare theword lengths in two different newspapers.
“How fair do the people of the UK feel that Society is? Does their opinion changewith age?”
Ask about 40 people of various ages, trying to ask about 20 female and 20 male.
Use the simple recording sheet below:
● Enter the gender, F, female or M, male
● Enter Age, years (Be sensitive to the older generation!)
● Ask the question “How fair do you think the UK society is as a whole, pleasegive a score between 1 and 20, where:
1 = Not fair at all
10 = Sometimes fair and sometimes not fair
20 = Very fair
Sex F/M Age How fair is our society?
Not all fair Sometimes fair Very Sometimes not fair fair
● Once you have all results, create scatter graphs using:
● Age on a vertical scale
● Fairness score on the horizontal axis
● You should create three different scatter diagrams for the following.
i Both sexes
ii Just male
iii Just female
● Look at the scatter graphs and see if there are any relationships to be seenbetween age and how fair they feel society is.
1 2 3 4 5 6 7 8 9 10 11 12 13 14 15 16 17 18 19 20
Exercise 13B
Maths Frameworking PB 9.3 Chs 10–17 29/5/08 18:47 Page 232

More National Test practice provided in the Interactive Book.
Choose one of the following tasks.
1 Working individually, write a report of your investigation using the checklist.Look again at the limitations of your investigation. Think how you couldovercome these: for example, by increasing your sample size or choosingyour sample using a different method.
2 In your small group, create a display which can be used as part of apresentation to show the other groups in your class how you carried outyour investigation and what results you obtained. Look again at thelimitations of your investigation. Think how you could overcome these: forexample, by increasing your sample size or choosing your sample using adifferent method.
3 If you have completed your report, then consider a different problem fromthe list in Exercise 13B. Write a plan of how you would investigate it,including how to overcome any problems encountered in your first project.
233
7
Maths Frameworking PB 9.3 Chs 10–17 29/5/08 18:47 Page 233

Geometry and measures revision
Before starting an investigation into geometry and measures, you must be familiar with allthe formulae and terms which you have met so far.
This section provides a checklist before you start your investigation.
Perimeter and area
Square Rectangle Parallelogram Triangle Trapezium Circle
P = 4l P = 2l + 2w A = bh A = bh A = (a + b)h C = πd = 2πr
A = l2 A = lw A = πr 2
Volume and surface area
Cube Cuboid Prism Cylinder
V = l3 V = lwh V = Al V = πr2h
A = 6l2 A = 2lw + 2lh + 2hw
l
A
h
l
w
l
l
h
r
12
12
l
l
w
l
h
b b
h h
b
a
r
234
CHAPTER 14Geometry and Measures 4and Revision
This chapter is going to show you
Some of the methods already
met to determine shapes and
their properties
How to carry out a shape and
space investigation
How to carry out a symmetry
investigation
What you should already know
How to find the surface area of
2-D shapes
How to find the volume of 3-D
shapes
How to use reflective and
rotational symmetry
Maths Frameworking PB 9.3 Chs 10–17 29/5/08 18:47 Page 234

For each of the following shapes, find: i the perimeter. ii the area.
For each of the following circles, calculate: i the circumference. ii the area.
Take π = 3.14 or use the key on your calculator. Give your answers to onedecimal place.
a b c d
A circle has a circumference of 20 cm.
a Calculate the diameter of the circle.
b Calculate the area of the circle.
Take π = 3.14 or use the key on your calculator. Give each answer to onedecimal place.
For each of the following 3-D shapes, calculate: i the surface. ii the volume.
a b
c d
12 cm
10 cm
20 cm8 cm
10 cm
3 cm
4 cm
8 cm
5 cm
2 cm
10 cm5 cm
5 cm
5 cm5 cm
π
12.6 cm10 cm
4.5 cm3 cm
π
5 cm
9 cm
3 cm
3 cm
5 cm 5 cm
6 cm
4 cm 3 cm5 cm 5 cm
6 cm
14 cm
a b
cd e
16 cm
16 cm
10 cm10 cm8 cm
Exercise 14A
235
6
Maths Frameworking PB 9.3 Chs 10–17 29/5/08 18:47 Page 235

Calculate the volume of each of the following cylinders. Give each answer to three
significant figures. (Take π = 3.142 or use the key on your calculator.)
a b c
A cylinder has a volume of 200 cm3 and a height of 5 cm. Calculate the diameter ofthe cylinder. Give your answer to one decimal place.
Geometry and measures investigations
When undertaking an investigation, you should carry out the following.
● Draw some easy examples first, making all diagrams clear with all measurements shown.● Put your results in a table with suitable headings.● Look for any patterns among the entries in the table.● Describe and explain any patterns you spot.● Try to find a rule or formula to explain each pattern.● Try another example to see whether your rule or formula does work.● Summarise your results with a conclusion.● If possible, extend the investigation by introducing different questions.
Working in pairs or small groups, investigate one of the following.
Investigate whether the perimeter and the area of a square can have the same value.Extend the problem by looking at rectangles.
For the growing squares on thegrid opposite,investigate theratio of thelength of a sideto the perimeterand the ratio ofthe length of aside to the area.
Exercise 14B
Calculate the perimeter and the area of the shape on the right.
Take π = 3.14 or use the key on your calculator. Give your answers to three significant figures.
π40 m
120 m
8 cm
3 cm
15 cm
5 cm 1.2 m
2.8 m
π
236
6
7
6
Maths Frameworking PB 9.3 Chs 10–17 29/5/08 18:47 Page 236

A coin is stamped from a square sheet of metal. Investigatethe percentage waste for coins of different sizes.
The diagram below represents a 6 × 2 snooker table with a pocket ateach corner, A, B, C and D.
A snooker ball is hit from the cornerat A at an angle of 45° and carries onbouncing off the sides of the tableuntil it goes down one of the pockets.
a How many times does the ball bounce off the sides before it goes down a pocket?
b Down which pocket does the ball go?
c Investigate for different sizes of snooker tables.
Symmetry revision
Before starting an investigation into symmetry, you must be familiar with terms which youhave met so far.
This section provides a checklist before you start your investigation.
There are two types of symmetry: reflection symmetry and rotational symmetry.
Some 2-D shapes have both types of symmetry, while some have only one type.
All 2-D shapes have rotational symmetry of order 1 or more.
Reflection symmetry
A square has 4 lines of symmetry A parallelogram has no lines of symmetry
Remember that tracing paper or a mirror can be used to find the lines of symmetry of a shape.
Rotational symmetry
A 2-D shape has rotational symmetry when it can be rotated about a point to look exactlythe same in its new position.
The order of rotational symmetry is the number of different positions in which the shapelooks the same when rotated about the point.
A square has rotational symmetry This trapezium has rotational symmetry of order 4 of order 1
Remember that tracing paper can be used to find the order of rotational symmetry of a shape.
A B
D C
237
7
Maths Frameworking PB 9.3 Chs 10–17 29/5/08 18:47 Page 237

Planes of symmetry
A plane of symmetry divides a 3-D shape into two identical parts. Each part is a reflectionof the other in the plane of symmetry.
A cuboid has three planes of symmetry, as shown below.
Each plane of symmetry is a rectangle.
Copy each of these shapes and draw its lines of symmetry. Write below each shapethe number of lines of symmetry it has.
a b c d e
Write down the number of lines of symmetry for each of the following shapes.
a b c d
Copy each of the following diagrams and write the order of rotational symmetrybelow each one.
a b c d e
Write down the order of rotational symmetry for each of the following shapes.
a b c d
Exercise 14C
238
Maths Frameworking PB 9.3 Chs 10–17 29/5/08 18:47 Page 238

Write down the number of planes of symmetry for each of the following 3-D letters.
a b c d
Draw a 3-D shape that has five planes of symmetry.
Symmetry investigations
When undertaking a symmetry investigation, you should carry out the following.
● Draw some easy examples first, showing any lines of symmetry and/or stating theorder of rotational symmetry on the diagrams.
● Explain anything you notice from the diagrams.
● Describe and explain any patterns which you spot.
● Summarise your results with a conclusion.
● If possible, extend the investigation by introducing different questions.
Working in pairs or small groups, investigate one of the following.
Three squares are shaded on the 3 × 3 tile shown so that the tile has one line of symmetry.
a Investigate the line symmetry of the tile when threesquares are shaded.
b Investigate the line symmetry when different numbers ofsquares are shaded.
Extend the problem by looking at different sizes of tiles.
Pentominoes are shapes made from five squares which touch edge to edge. Here aretwo examples.
Investigate line symmetry and rotational symmetry for different pentominoes.
Extend the problem by looking at hexominoes. These are shapes made from sixsquares which touch edge to edge.
Exercise 14D
Find pictures in magazines which have reflection or rotational symmetry.
Make a poster of your pictures to display in your classroom.
239
6
7
Maths Frameworking PB 9.3 Chs 10–17 29/5/08 18:47 Page 239

In how many ways will the T-shape fit inside the 3 × 3 grid?
Investigate the number of ways theT-shape will fit inside a 10 mmsquare grid of any size.
The symmetry number for a 3-D solid is the number of ways the solid can be placedthrough a 2-D outline of the solid.
For example, the outline of a cuboid is a rectangle and the cuboid can be ‘posted’(so that it fits exactly) through the rectangle in four different ways. These are:
● Side 3 first, with side 2 facing up (shown above)● Side 3 first, with 2 facing down● Side 1 first, with 2 facing up● Side 1 first, with 2 facing down
So, the symmetry number for a cuboid is 4.
Investigate the symmetry number for other 3-D solids.
More National Test practice provided in the Interactive Book.
1
32
240
6
7
Maths Frameworking PB 9.3 Chs 10–17 29/5/08 18:47 Page 240

241
Revision of probability
Make sure that you are familiar with the vocabulary of probability, which is listed in thetable below.
Probability vocabulary
CHAPTER 15 Statistics 4 and Revision
This chapter is going to show you
Different topics within
probability
How to use probability to make
a hypothesis
How to carry out a handling
data investigation using
experimental and theoretical
probabilities
What you should already know
Probabilities are numbers
between 0 and 1
How to work out simple
probabilities
How to calculate probabilities
for two or more outcomes using
sample spaces
How to calculate probabilities
for two or more outcomes using
tree diagrams
The difference between
experimental and theoretical
probability
The vocabulary of probability
Example
Probability scale
Chance/likelihoodEqually likelyCertainUncertainVery likelyUnlikelyFifty–fiftychance/evens
Impossible Very unlikely Unlikely 50-50 Chance Likely Very likely Certain
0 0.5 1
Maths Frameworking PB 9.3 Chs 10–17 29/5/08 18:47 Page 241

242
Example
Probability
EventOutcomeRandomExperimentalprobabilityTheoreticalprobabilityRelative frequencyExpectationBiasFair
Probability diagram
SampleSample space
Tree diagram
Example 1
A fair spinner is numbered 1, 2, 3.
a The spinner is spun twice.List all the outcomes.
b How many possible outcomes are there if the spinner is spun 3 times?
a 1, 1 1, 2 1, 3 2, 1 2, 2 2, 3 3, 1 3, 2 3, 3
b 3 × 3 × 3 = 27
Example 2
A six-sided dice is rolled 60 times.It lands on six 15 times.
a What is the experimental probability of landing on a 6?
b If the dice were rolled 300 times, how many times would you expect it to landon 6?
c If the dice were fair, what would be the theoretical probability of landing on 6?
a =
b × 300 = 75 times
c
Example 3
A coin is thrown and a dice is rolled.
a Draw a sample space diagram.
b Write down the probability of getting a Head and a 6.
a
b
Example 4
The probability that it rains on one day = 0.6.
a Draw a tree diagram to show the probabilities of rain on two consecutive days.
b Use the tree diagram to calculate the probability that it rains on only one of thetwo days.
1–12
1–6
1–4
1–4
15–60
3
2
1
CoinHead H,1 H,2 H,3 H,4 H,5 H,6
Tail T,1 T,2 T,3 T,4 T,5 T,6
Dice
1 2 3 4 5 6
Maths Frameworking PB 9.3 Chs 10–17 29/5/08 18:47 Page 242

243
Example
Estimate of probability(relative frequency)
a
b Probability of rain on only one day is given by:
P(Rain on 1st day and does not rain on 2nd day) OR P(Does not rain on 1st day and rains on 2nd day)
= 0.6 × 0.4 + 0.4 × 0.6
= 0.24 + 0.24
= 0.48
Example 5
The number of times a javelin successfully sticks in the ground is shown.
a Complete the table to show the relative frequency of success.
b Plot the relative frequencies on a graph.
c Write down the best estimate of the probability of success.
d Use your estimate to predict the number of times a javelin successfully sticks inthe ground in 500 throws.
a
Rain
Does not rain
0.6
0.4
1st day
Rain
Does not rain
0.6
0.4
Rain
Does not rain
0.6
0.4
2nd day
Number of throws 10 20 30 40 50
Number of successes 8 19 27 36 45
Relative frequency of success
= 0.8
8–10
Number of throws 10 20 30 40 50
Number of successes 8 19 27 35 45
Relative frequency of success
= 0.8 = 0.95 = 0.9 = 0.875 = 0.9
45–50
35–40
27–30
19–20
8–10
Maths Frameworking PB 9.3 Chs 10–17 29/5/08 18:47 Page 243

Three coins are thrown.
a How many different outcomes are there? Make a list to show all the possibilities.
b Work out the probability of getting no Heads.
c Work out the probability of getting exactly one Head.
d Work out the probability of getting at least one Head.
Matthew is either late, on time or early for school. The probability that he is late is 0.1 and the probability that he is on time is 0.3.
a What is the probability that he is late or on time?
b What is the probability that he is early?
Exercise 15A
244
6
Example
Estimate of probability(relative frequency)(continued)
Event
ExhaustiveIndependentMutually exclusive
Probability notation
P(Event)
b
c Best estimate of probability = 0.9 (50 throws)
d 0.9 × 500 = 450 successes
Example 6
In a raffle there are blue, green and yellowtickets.The table shows the probability of eachcolour being chosen.
a What is the probability of picking a blueor a yellow ticket?
b What is the probability of picking agreen ticket?
a + =
b 1 – =
P(Green) = 3–8
3–8
5–8
5–8
1–8
1–2
1
0.8
0.6
0.4
0.2
00 10 20 30 40 50 60
Number of throwsR
elat
ive
freq
uen
cy
Ticket colour Probability
Blue
Green ?
Yellow 1–8
1–2
Maths Frameworking PB 9.3 Chs 10–17 29/5/08 18:47 Page 244

A group of 50 pupils are told to draw two straight lines on a piece of paper. Sevenpupils draw parallel lines, twelve draw perpendicular lines and the rest draw lineswhich are neither parallel nor perpendicular.
Use these results to estimate the probability that a pupil chosen at random has:
a drawn parallel lines.
b drawn perpendicular lines.
c drawn lines that are neither parallel nor perpendicular.
A five-sided spinner is spun 50 times. Here are the results.
Number on spinner 1 2 3 4 5
Frequency 8 11 10 6 15
a Write down the experimental probability of the spinner landing on the number 4.
b Write down the theoretical probability of a fair, five-sided spinner landing on thenumber 4.
c Compare the experimental and theoretical probabilities and say whether youthink the spinner is fair.
d How many fours would you expect if the spinner were spun 250 times?
The relative frequencies of the number of wins of a
football team are shown in the table below.
a Plot the relative frequencies on a graph.
b Explain why it is not possible to tell from the graphwhether the first game was a win.
c Write down the best estimate of the probability of winning the next game.
d Copy and complete the table to show the number of wins for 10, 15, 20 and 25games.
Geoff is building a wall. The probability that Geoff completes the wall by Saturday
is .
Andy is building a patio. The probability that Andy completes the patio by Saturday
is . Calculate the probability that by Saturday:
a both the wall and the patio are completed.
b the wall is completed but the patio is not completed.
c neither the wall nor the patio are completed.
1–3
4–5
Number of games 5 10 15 20 25
Relative frequency of wins 0.8 0.7 0.67 0.75 0.76
Number of wins 4
Goal!
245
6
7
8
Maths Frameworking PB 9.3 Chs 10–17 29/5/08 18:47 Page 245

A probability investigation
Look again at the handling data cycle.
Specify the problemand plan
Collect data froma variety of sources
Interpret anddiscuss data
Process andrepresent data
Eval
uateresults
0.5
0.0
–0.5
Tem
pera
ture
°C
Global temperature °C
1860 1880 1900 1920 1940 1960 1980 2000
Year
Pre
dic
tio
ns
red
white
lightblue
yellowblue
1 State whether each of the following pairs of events are independent ornot independent. Explain your answers.
a Rolling a dice and getting 6Rolling the dice a second time and getting 6
b Picking out a winning raffle ticketPicking out a second winning raffle ticket
c It raining in London on MondayIt raining in London on Tuesday
2 State whether each of the following pairs of outcomes are mutuallyexclusive or not mutually exclusive. Explain your answers.
a An ordinary, six-sided dice landing on an even numberThe dice landing on a prime number
b Two coins being thrown and getting at least one HeadThe two coins being thrown and getting two Tails
c Two coins being thrown and getting at least one TailThe two coins being thrown and getting two Tails
3 State whether each of the following outcomes are exhaustive or notexhaustive. Explain your answers.
a A dice landing on an odd numberThe dice landing on a multiple of 2
b A spinner numbered 1, 2, 3, 4, 5 landing on a number greater than 3The spinner landing on a number less than 3
c A spinner numbered 1, 2, 3, 4, 5 landing on a number greater than 3The spinner landing on a number less than 4
246
7
Maths Frameworking PB 9.3 Chs 10–17 29/5/08 18:47 Page 246

Use the handling data cycle to help you when completing your probability investigation.More detail is given about each step below.
● Specify the problem and plan
● Statement of problem or topic to investigate
● Hypothesis stating what you think the investigation will show
● How you will choose your sample and sample size
● Any practical problems you foresee
● Identify any sources of bias and plan how to minimise them
● How you will obtain your experimental data
● Identify what extra information may be required to extend the project
● Collect data from a variety of sources
● Follow initial plan and use a suitable data collection sheet
● Process and represent data
● Analysis of your results using appropriate statistical calculations and diagrams
● Interpret and discuss data
● Comparison of results with your original hypothesis
● List of any factors which might have affected your results and how you couldovercome these in future
● Consider the limitations of any assumptions made
● A final conclusion
In small groups carry out an experiment to investigate one of the following.
Organise a class lottery. Get each person to choose ten numbers, from 1 to 20. Have10 separate draws and record who has a winning number each time (there may bemore than one winner for each draw). Compare the theoretical and experimentalprobabilities of each player winning.
Investigate whether a drawing pin will land point up more often than point down.Use different-sized drawing pins to test whether the results are always the same.
Ask a member of your group to put 10 coloured cubes in a bag, so that the rest of thegroup do not know what the colours are. Investigate how many times you need topick a cube out and replace it in order to be able to predict accurately the contentsof the bag.
Some people are luckier than others when rolling a dice.
A playing card usually lands face-up when dropped.
Exercise 15B
247
6
Maths Frameworking PB 9.3 Chs 10–17 29/5/08 18:47 Page 247

More National Test practice provided in the Interactive Book.
Choose one of the following tasks.
1 Working individually, write a report of your experiment using thechecklist. Look again at the limitations of your experiment and think howyou could overcome these: for example, by increasing your sample sizeor choosing your sample using a different method.
2 In your small group, create a display which can be used as part of apresentation to show the other groups in your class how you carried outyour experiment and what results you obtained. Look again at thelimitations of your experiment and think how you could overcome these:for example, by increasing your sample size or choosing your sampleusing a different method.
3 If you have completed your report, then consider a different problemfrom the list in Exercise 15B. Write a plan of how you would investigateit, including how to overcome any problems encountered in your firstproject.
248
7
Maths Frameworking PB 9.3 Chs 10–17 29/5/08 18:47 Page 248

249
Solving quadratic equations
Example 16.1
Example 16.2
To solve a quadratic equation, firstly factorise the left hand side.
For example, solve x2 – 5x + 6 = 0.
Factorising the left hand side gives (x – 2)(x – 3) = 0.
The values of the brackets multiplied together can only give 0 if one or the other bracketsequals 0. So either x – 2 = 0 or x – 3 = 0.
Therefore the roots of x2 – 5x + 6 = 0 are x = 2 or x = 3.
Example 16.3 Solve these quadratic equations using the above rule.
a (x – 5)(x + 2) = 0 b x2 + 5x – 14 = 0 c x2 – 4x + 4 = 0
a Either x – 5 = 0, so x = 5; or x + 2 = 0, so x = –2.
The roots are x = 5 or x = –2.
b x2 + 5x – 14 = 0 factorises into (x + 7)(x – 2) = 0.
Either x + 7 = 0, so x = –7; or x – 2 = 0, so x = 2.
The roots are x = –7 or x = 2.
Sometimes the roots of a quadratic equation are the same.
c x2 – 4x + 4 = 0 factorises into (x – 2)(x – 2) = 0.
As both brackets are the same, x – 2 = 0, so x = 2.
Hence the quadratic equation has just one root, x = 2.
a p × q = 0
What are the possible values of p and q?
b (x – 2)(x – 3) = 0
What are the possible values of x?
a Either p = 0, so 0 × q = 0, or q = 0, so p × 0 = 0.
b Either x – 2 = 0, so 0 × (x – 3) = 0, in which case x = 2; or x – 3 = 0, so (x – 2) × 0 = 0, in which case x = 3.
Substitute into the quadratic expression x2 – 5x + 6.
a x = 2 b x = 3
a (2)2 – 5(2) + 6 = 4 – 10 + 6 = 0
b (3)2 – 5(3) + 6 = 9 – 15 + 6 = 0
The values 2 and 3 are known as the roots of the quadratic equation x2 – 5x + 6 = 0since they solve the equation exactly.
CHAPTER 16 GCSE Preparation
This chapter is going to
Get you started on your GCSE course
Maths Frameworking PB 9.3 Chs 10–17 29/5/08 18:47 Page 249

Solve these equations.
a (x + 1)(x – 1) = 0 b (x – 2)(x + 5) = 0 c (x – 3)(x + 6) = 0
d (x + 4)(x + 3) = 0 e (x + 2)(x + 7) = 0 f (x – 3)(x – 8) = 0
g (x – 8)(x + 1) = 0 h (x + 3)(x + 3) = 0 i (x – 4)(x – 4) = 0
First factorise then solve these equations.
a x2 + 3x + 2 = 0 b x2 + 11x + 30 = 0 c x2 + 6x + 8 = 0
d x2 – 5x + 6 = 0 e x2 – 7x + 10 = 0 f x2 – 5x + 4 = 0
g x2 + 10x + 25 = 0 h x2 – 8x + 16 = 0 i x2 – 2x – 15 = 0
j x2 + 2x – 15 = 0 k x2 – 2x – 24 = 0 l x2 – x – 6 = 0
m x2 – 10x + 9 = 0 n x2 – 3x – 18 = 0 o x2 + 2x + 1 = 0
Quadratic expressions of the form ax2 + bx + c
Example 16.4
Example 16.5 Factorise:
a 3x2 + 7x + 2 b 6x2 – 17x + 12
a We know that there will be two brackets. The factors of 3 are 3 and 1, so thebrackets must start (3x )(x ). The factors of 2 are 2 and 1. Now it is a matter offinding a combination of both sets of factors to give 7x. By trial we can find that(3x + 1)(x + 2) works.
b Factors of 6 are 1 and 6 or 3 and 2. Factors of 12 are 1 and 12, 2 and 6 or 3 and4.
We now have to find a pair of factors of 6 that combine with a pair of factors of12 to give –17.
Factors of 6 Factors of 12
1 2 | 1 2 36 3 | 12 6 4
We can see that combining the following factors gives (2 × –4) + (3 × –3) = –17.
So, the factorisation is (2x – 3)(3x – 4).
2 3
3 4
Expand these brackets.
a (2x + 3)(x – 1) b (3x – 4)(2x + 3) c (3x – 2)2
a (2x + 3)(x – 1) = 2x(x – 1) + 3(x – 1) = 2x2 – 2x + 3x – 3 = 2x2 + x – 3
b (3x – 4)(2x + 3) = 3x(2x + 3) – 4(2x + 3) = 6x2 + 9x – 8x – 12 = 6x2 + x – 12
c (3x – 2)2 = (3x – 2)(3x – 2) = 9x2 – 6x – 6x + 4 = 9x2 – 12x + 4
Exercise 16A
250
B
Maths Frameworking PB 9.3 Chs 10–17 29/5/08 18:47 Page 250

Expand the brackets into quadratic expressions.
a (2x + 1)(x + 5) b (3x – 3)(x + 4) c (2x – 5)(2x – 4)
d (3x + 3)(2x – 7) e (2x + 6)2 f (3x – 4)2
g (2x – 8)(3x + 1) h (4x – 1)(2x + 3) i (2x – 1)(2x + 1)
Factorise these quadratic expressions.
a 2x2 + 7x + 3 b 2x2 + 9x + 10 c 3x2 + 13x + 4
d 2x2 – x – 1 e 6x2 + 7x + 2 f 2x2 – x – 6
g 2x2 + 3x – 9 h 4x2 + 4x + 1 i 4x2 + 7x – 2
j 5x2 + 11x + 2 k 3x2 + 2x – 1 l 8x2 + 6x + 1
m 3x2 – 5x – 2 n 6x2 + x – 1 o 4x2 – 11x – 3
p 4x2 + 4x – 15 q 2x2 – 9x – 35 r 2x2 – 5x – 25
s 3x2 + 14x – 5 t 9x2 + 6x + 1 u 10x2 + 13x – 3
Quadratic equations
Example 16.6
Example 16.7 Solve the following equations.
a x2 + 6x = 7 b 2x(x + 2) = 3(x + 1)
a This equation is not in the correct form to factorise and solve. It needs to berearranged.
x2 + 6x = 7
So, x2 + 6x – 7 = 0
Factorising gives (x + 7)(x – 1) = 0
So, x = –7 or x = 1
b Expanding and rearranging the brackets gives 2x2 + 4x = 3x + 3
So, 2x2 + x – 3 = 0
Factorising gives (2x + 3)(x – 1) = 0
So, x = –11–2 or x = 1
Solve these equations.
a 2x2 + 7x + 3 = 0 b 4x2 + 4x – 15 = 0
a 2x2 + 7x + 3 = 0 factorises to (2x + 1)(x + 3) = 0
Either 2x + 1 = 0 so, x = –1–2 or x + 3 = 0 so, x = –3
The solutions are x = –1–2 or x = –3
b 4x2 + 4x – 15 = 0 factorises to (2x – 3)(2x + 5) = 0
Either 2x – 3 = 0 so, x = 11–2, or 2x + 5 = 0 so, x = –21–
2
The solutions are x = 11–2 or x = –21–
2
Exercise 16B
251
B
A
Maths Frameworking PB 9.3 Chs 10–17 29/5/08 18:47 Page 251

First factorise then solve these equations.
a 2x2 – 7x + 3 = 0 b 3x2 – 5x – 2 = 0 c 2x2 + 7x – 4 = 0
d 4x2 + 4x – 3 = 0 e 2x2 + 11x – 6 = 0 f 4x2 + 7x – 2 = 0
g 6x2 + 17x + 5 = 0 h 6x2 + x – 1 = 0 i 4x2 + 12x + 9 = 0
j 20x2 – 9x + 1 = 0 k 6x2 – 19x + 10 = 0 l 9x2 + 6x + 1 = 0
m 4x2 – 4x + 1 = 0 n 6x2 – x – 5 = 0 o 3x2 – x – 10 = 0
Solve these equations.
a x2 + x = 2 b x(x – 1) = 1 – x c 2x(x – 1) = 1 – x
d 3x2 = x + 2 e 4x(x – 1) = 5x – 2 f 4x(4x – 3) = 4(x – 1)
g x(x + 5) = 5x + 25 h 6x(x + 1) = x + 4 i 1 – x = 20x2
The quadratic formula
Another way to solve quadratic equations in the form ax2 + bx + c = 0 is by using thefollowing formula:
– b ± √–b2 – 4ac––
x = –––––––2a
This formula is used when quadratic equations do not factorise, although it will work withany quadratic equation. The symbol ‘±’ means that you firstly add the values to find oneroot to the equation, and then subtract the values to find the other root.
Example 16.8 Solve these equations.
a 2x2 + 7x + 3 = 0 b x2 – 16 = 0
a First, identify a, b and c.
For this equation, a = 2, b = 7 and c = 3.
–(7) ± √–(7)2–– 4(2)–
(3)–
Substitute these values into the formula x = ––––––2(2)
–(7) ± √–25 –(7) ± 5Now evaluate the square root x = –––– = ––
4 4
–7 + 5 –2 1 –7 – 5 –12So the solutions are x = ––– = –– = – –– or –– = –– = –34 4 2 4 4
b For this equation, a = 1, b = 0 and c = –16.
–(0) ± √–(0)2–– 4(1)–
(–16)–
Substitute into the formula x = ––––––2(1)
0 ± √–64 ± 8Now evaluate the square root x = –––– = ––
2 2
So the solutions are x = 4 or –4
Exercise 16C
252
A
Maths Frameworking PB 9.3 Chs 10–17 29/5/08 18:47 Page 252

Example 16.9
Solve these equations using the quadratic formula. All of the answers are wholenumbers or fractions.
a x2 + 2x – 24 = 0 b x2 + 6x – 7 = 0 c 2x2 + 3x – 2 = 0
d 2x2 + 3x – 20 = 0 e x2 + 5x = 0 f x2 – 36 = 0
Solve these equations, giving your answers to 2 decimal places.
a 2x2 + 3x – 6 = 0 b 3x2 – x – 6 = 0 c x2 + 4x – 7 = 0
d 2x2 – 4x – 1 = 0 e x2 + 6x – 1 = 0 f 2x2 + 5x – 1 = 0
g 3x2 – 6x + 1 = 0 h 2x2 – 3x – 3 = 0 i x2 – 5x + 2 = 0
Solve these equations, giving your answer in surd form.
a x2 – 3x + 1 = 0 b x2 + 4x – 1 = 0 c x2 + 4x + 1 = 0
d x2 + 6x + 1 = 0 e x2 + 10x + 2 = 0 f x2 + 2x – 1 = 0
Completing the square
Another way of factorising quadratic expressions is called completing the square. This isbased on the expansion (x + a)2 = x2 + 2ax + a2, which can be rearranged to:
x2 + 2ax = (x + a)2 – a2
Exercise 16D
Solve these equations.
a 2x2 + 3x – 4 = 0, giving your answer to 2 decimal places
b 3x2 – 4x –1 = 0, giving your answer in surd form. Surd form means leavingsquare roots in your answer.
These equations will not factorise. The ‘clue’ is that you are asked for youranswers to 2 decimal places or in surd form.
a In this equation, a = 2, b = 3 and c = –4
–(3) ± √––(3)2–– 4–(2)(–4)–
Substituting into the formula gives x = ––––––2(2)
–(3) ± √––41 –3 ± 6.4031
Therefore x = ––– = –––––4 4
So the answers are x = 0.85 and –2.35
b In this equation, a = 3, b = –4 and c = –1
–(–4) ± √––(–4)2–
– 4–
(3)(–1)–
Substituting into the formula gives x = ––––––––––2(3)
4 + √––28 4 – √
––28Therefore x = –––– or ––––
6 6
253
A
A★
Maths Frameworking PB 9.3 Chs 10–17 29/5/08 18:47 Page 253

Example 16.10
Example 16.11
Example 16.12
Complete the square for these quadratic expressions.
a x2 + 8x b x2 – 2x c x2 – 12x
d x2 – 14x e x2 + 4x f x2 + 2x
Exercise 16E
Solve these quadratic equations by completing the square.
a x2 + 6x – 1 = 0 b x2 – 2x – 15 = 0
a x2 + 6x – 1 = 0
Complete the square (x + 3)2 – 9 – 1 = 0Tidy up (x + 3)2 – 10 = 0Take constant term to right hand side (x + 3)2 = 10Square root both sides x + 3 = ± √10Make x the subject x = –3 ± √10
So, the answer is x = –3 + √10 or x = –3 – √10
The answer should be left in surd form.
b x2 – 2x – 15 = 0
Complete the square (x – 1)2 – 1 – 15 = 0Tidy up (x – 1)2 – 16 = 0Take constant term to right hand side (x – 1)2 = 16Square root both sides x – 1 = ± 4Make x the subject x = +1 ± 4
So, the answer is x = 5 or x = –3
By completing the square, rewrite these quadratic expressions.
a x2 + 6x – 4 b x2 – 4x + 1
Firstly, complete the square for the x2 and x term. Then ‘tidy up’ the rest of theexpression.
a x2 + 6x – 4 = (x + 3)2 – 9 – 4 = (x + 3)2 – 13
b x2 – 4x + 1 = (x – 2)2 – 4 + 1 = (x – 2)2 – 3
Complete the square for these quadratic expressions.
a x2 + 4x b x2 – 10x
To find the value that goes with x inside the bracket, halve the x coefficient (thecoefficient is the number in front of a letter), and then subtract the square of this.
a In this expression, half of 4 is 2.
So, x2 + 4x = (x + 2)2 – 22 = (x + 2)2 – 4
b x2 – 10x = (x – 5)2 – 52 = (x – 5)2 – 25
254
A
Maths Frameworking PB 9.3 Chs 10–17 29/5/08 18:47 Page 254

By completing the square, rewrite these quadratic expressions.
a x2 + 8x – 1 b x2 – 2x + 3 c x2 – 12x + 5
d x2 – 14x + 7 e x2 + 4x – 3 f x2 + 2x – 5
g x2 + 6x – 2 h x2 + 10x – 9 i x2 – 6x + 3
Solve these quadratic equations by completing the square method.
a x2 + 8x – 1 = 0 b x2 – 2x – 3 = 0 c x2 – 12x + 5 = 0
d x2 – 14x + 7 = 0 e x2 + 4x – 5 = 0 f x2 – 6x – 2 = 0
g x2 – 10x + 1 = 0 h x2 – 6x + 4 = 0 i x2 – 8x + 5 = 0
j x2 – 2x – 1 = 0 k x2 + 2x – 5 = 0 l x2 + 12x – 7 = 0
The difference of two squares
Example 16.13
Example 16.13 demonstrates the rule known as the difference of two squares. Reversingthe result in part b gives:
a2 – b2 = (a – b)(a + b)
Example 16.14
Expand and simplify these brackets into quadratic expressions.
a (x + 1)(x – 1) b (x – 5)(x + 5) c (x – y)(x + y)
d (2x + 1)(2x – 1) e (x + 2y)(x – 2y) f (2x – 3y)(2x + 3y)
Factorise these quadratic expressions.
a x2 – 100 b x2 – 4 c x2 – 36
d x2 – 81 e x2 – 64 f x2 – 121
g x2 – z2 h 4x2 – 25 i x2 – 9y2
j 16x2 – 9 k 4x2 – 25y2 l 25x2 – 64
m 9 – x2 n 4x2 – 36 o 36x2 – 1
Exercise 16F
Factorise these expressions.
a x2 – 16 b x2 – 4y2 c 9x2 – 4
Once you know the above rule, you can use it to factorise expressions like these.
a x2 – 16 = x2 – 42 = (x – 4)(x + 4)
b x2 – 4y2 = x2 – (2y)2 = (x – 2y)(x + 2y)
c 9x2 – 4 = (3x)2 – 22 = (3x – 2)(3x + 2)
Expand these brackets.
a (x + 3)(x – 3) b (a – b)(a + b)
a (x + 3)(x – 3) = x(x – 3) + 3(x – 3) = x2 – 3x + 3x – 9 = x2 – 9
b (a – b)(a + b) = a(a + b) – b(a + b) = a2 + ba – ba – b2 = a2 – b2
255
B
A
A★
A
Maths Frameworking PB 9.3 Chs 10–17 29/5/08 18:47 Page 255

Edexcel, Question 4, Paper 13, March 2005
1 Expand and simplify (x – 9)(x + 4)
AQA, Question 13, Paper 1, November 2005
2 Solve x2 + 7x + 12 = 0
EDEXCEL, Question 8, Paper 19, June 2005
3 The diagram shows a 6-sided shape.All the corners are right angles.All measurements are given in centimetres.The area of the shape is 25 cm2.
Show that 6x2 + 17x – 39 = 0
OCR, Question 4c, Paper 3, January 2004
4 Solve x2 + 7x + 5 = 0 giving the roots correct to two decimal places.
AQA, Question 13, Paper 1, November 2005
5 Solve the equation x2 – 6x – 3 = 0
Give your answer in the form p ± q√3 where p and q are integers.
AQA, Question 12, Paper 2, November 2006
6 a Show clearly that (p + q)2 ––– p2 + 2pq + q2
b Hence, or otherwise, write the expression below in the form ax2 + bx + c
(2x + 3)2 + 2(2x + 3)(x – 1) + (x – 1)2
AQA, Question 19, Paper 2, June 2007
7 Solve the equation
2x2 – 6x – 1 = 0
Give your answers to two decimal places.
You must show your working.
EDEXCEL, Question 7, Paper 13 March 2005
8 For all values of x
x2 + 6x + 4 = (x + p)2 + q
a Find the value of p and the value of q.
b Hence, or otherwise, solve the equation x2 + 6x + 4 = 0
Give your solutions in the form a ± √b, where a and b are integers.
(3x – 2)
(2x + 5)
(3x – 2)
2
256
C
B
A
A★
Maths Frameworking PB 9.3 Chs 10–17 29/5/08 18:47 Page 256

EXEXCEL, Question 7, Paper 13, January 2005
9 Solve x2 + 6x = 4
Give your answers in the form p ± √q, where p and q are integers.
EDEXCEL, Question 25, Paper 3, June 2005
10 Simplify fully
a (2x3y)5
x2 – 4xb ––––––––––
x2 – 6x + 8
OCR, Question 25, Paper 3, January 2004
11 a By completing the square find the integers p and q such that
x2 + 6x – 1 = (x + p)2 + q
b Hence solve x2 + 6x – 1 = 0, leaving the roots in surd form.
OCR, Question 20c, d, Paper 3, January 2004
12 Simplify
a 2x(x – 5y) – y(2x + 5y)
x – x2b ––––––––––
x2 + 5x – 6
AQA, Question 16, Paper 1, November 2006
13 The diagram shows a graph of the form y = x2 + qx + r
a The graph crosses the x-axis at A (–2, 0) and B (8, 0).
Show that this is the graph of y = x2 – 6x – 16
b Point P is the lowest point of the graph.
What are the coordinates of P?
c Solve the equation (x + 3)2 – 6(x + 3) – 16 = 0
AQA, Question 21, Paper 1, June 2007
14 a Find the value of a and b such that
x2 + 6x – 11 ––– (x + a)2 + b
b Hence, or otherwise, solve the equation x2 + 6x – 11 = 0
Give your answer in surd form.
x
y
–2 8
A B
O
P
Not drawn
accurately
257
A★
Maths Frameworking PB 9.3 Chs 10–17 29/5/08 18:47 Page 257

258
Maths Frameworking PB 9.3 Chs 10–17 29/5/08 18:47 Page 258

CHAPTER 17 Functional Maths Practice
259
Maths Frameworking PB 9.3 Chs 10–17 29/5/08 18:47 Page 259

260
The Eden Project business plan expected 700 000
visitors in the first year, followed by a 9% increase
in visitor numbers each year for each of the next
8 years.
How many visitors did they expect to get in the
fifth year?
Round your answer to a sensible number.
The Schools Visit Manager at the Eden Project
estimates that the ratio of men : women : children
visiting the project is 1 : 2 : 4.
On the first Wednesday in March, there were 7700
visitors to the project.
a How many of the 7700 visitors were children?
b Every person visiting that day was given a
ticket with a number on, and one was chosen
at random for a prize.
What is the probability that a child won the prize?
The extract below is part of a UK website.
This information needs to be placed in an American
web page.
The standard unit used in the USA for this type of
measurement is feet (not metres).
Rewrite the website information for the American
web page using the information below.
1 acres = 0.405 hecatres, 1 meter = 39.37 inches,
1 foot = 12 inches
The thermometer on a wall in the Humid Tropics
Biome shows 24°C.
Lorna remembers the formula she used in her
science lesson last week to change a temperature
in degrees Celsius to degrees Fahrenheit:
°F = 1.8 × °C + 32
Change 75.2°F into °C.
‘The People’s £50 million National Lottery Grant’
was held on ITV in December. The Eden Project’s
‘The Edge’ got 34 560 votes. This equated to
approximately 12% of all the votes cast. How
many people voted altogether in this programme?
Rio asked 100 people
he met in the Warm
Temperature Biome how
long it took them to get
to the Eden Project that
morning. He put his results
in the grouped frequency
table as on the right:
a Draw a cumulative frequency diagram
illustrating this data.
b Use your cumulative frequency diagram to
estimate the median time taken.
c Use your cumulative frequency diagram to
estimate the interquartile range of the time taken.
In one of the restaurants, two friends bought
some food.
Zafira bought 3 packs of sandwiches and 4 small
fruit juices for £11.55.
Cordoba bought 1 pack of sandwiches and 3 small
fruit juices for £5.10.
Use simultaneous equations to find the cost of:
a a pack of sandwiches.
b a small fruit juice.
Time taken, T (hrs)
Number ofpeople
0 < T ≤ 1 8
1 < T ≤ 2 20
2 < T ≤ 3 42
3 < T ≤ 4 17
4 < T ≤ 5 8
5 < T ≤ 6 5
The largest greenhouse in the worldis the ‘Humid Tropics Biome’ (HTB) atthe Eden Project, Cornwall, England.
The HTB covers 1,559 hectares, is 55m high, 100 m wide and 200 m long.
The Eden Project
Maths Frameworking PB 9.3 Chs 10–17 29/5/08 18:47 Page 260

261
The graph below shows the change in temperature
for part of one day last June in the Humid Tropics
Biome (HTB).
a What time did the Sun rise?
b The Sun went behind a cloud in the morning.
For how long?
c The automatic vents start working when the
temperature rises too high. At what time did
they start working?
d What was the minimum temperature in the HTB?
e What was the maximum temperature in
the HTB?
f What do you think happens to the temperature
in the HTB after 7 pm?
A node is a large piece of cast iron which can weigh
up to 80 kg. Three beams are attached to each
node to make a structure.
The nodes are similar. Find the volume of the
smaller node below.
Diameter = 90 cm Diameter = 45 cm
Volume = 9500 cm3 Volume = _____ cm3
Bambusa Gigantica, a type
of bamboo, can grow up to
45 cm a day.
A display shows one week’s
growth from one of the large
bamboo plants. This piece has a diameter of 11 cm.
Calculate the volume, in cm3, of bamboo that grew
in one week from this bamboo plant.
The percentage humidity is the amount of water
vapour in the air.
The ‘apparent’ temperature is people’s average
guess of the temperature.
A biology pupil compared the percentage humidity
in different parts of the different biomes with the
‘apparent’ temperature, and also with the number
of plants per square metre (m2).
Her results are shown on the two scatter diagrams
given.
a Describe the type of correlation between
humidity and apparent temperature.
b Describe the type of correlation between humidity
and the number of plants per square metre (m2).
c Describe the relationship between the apparent
temperature and the number of plants per
square metre (m2).
d Draw a scatter diagram to show the correlation
between the apparent temperature and the
number of plants per square metre (m2). Plot
about 10 points on your graph.
All regular hexagons
are similar to each other.
Calculate the length of
the diagonal shown in
the smaller hexagon.
One of the longest cylindrical beams used in the
biomes is 18.6 m long and has a diameter of 40 cm.
The steel it is made from has a density of 7.9 g/cm3.
Find, correct to 3 significant figures, the weight of
the beam in tonnes.
Fabia is watching an exit door from a biome. She
notices that the probability of a man leaving through
this door is 0.4 and the probability of a woman
leaving through it is 0.6.
a Draw a tree diagram to show the probabilities
of the next two people leaving through the exit.
b Use your tree diagram to calculate the
probability that the next two people leaving
through the exit are both men.
One type of automated vent is an
equilateral triangle within a regular
hexagon.
Find the area of the triangular vent.
Using a ruler and protractor, draw a regular
hexagon of perimeter 42 cm.
The total site of the Eden Project covers
502022 m2, of which 97843 m2 is landscaped
and 1231 m2 is a man-made lake.
a What percentage of the total site has been
landscaped? Give your answer correct to
2 significant figures.
b What percentage of the total site is the man
made lake? Give your answer correct to
2 decimal places.
6 m
6 m
8 m
13.86 m
8 m
7 m
? m
7 m
‘Ap
pare
nt’
tem
pera
ture
(°C
)
Pla
nts
per
sq
uare
metr
e
Humidity (%) Humidity (%)
Diameter of
bamboo = 11 cm
36
34
32
30
28
26
24
22
20
186 am 7 am 8 am 9 am 10 am 11 am 12 1 pm 2 pm 3 pm 4 pm 5 pm 6 pm 7 pm
Time
Tem
pera
ture
(°C
)
Maths Frameworking PB 9.3 Chs 10–17 29/5/08 18:47 Page 261

262
Road safety
Here are some road signs.
For each part, copy the sign and draw in all the
lines of symmetry.
a b c
Minimum 30 mph Road narrows Clearway
Here are some road signs.
For each part, state the order of rational symmetry.
a b c
Roundabout Clearway No entry
Here are three advertisements for driving schools.
a Work out the cost of 40 hours of lessons using
Fast Pass.
b Work out the cost of 40 hours of lessons using
Easy Drive. Remember to save money by using
the block booking prices.
c Work out the cost of 40 hours of lessons using
Safe Motoring. Remember to save money by
using the block booking prices.
d Which driving school is the cheapest for
40 hours of lessons?
The table shows the percentage of casualties in
road accidents for different age groups.
a Draw a pie chart to show this information.
b Give a reason why there are more casualties in
the 17–25 years age group.
Age Percentage
17–25 years 33%
26–39 years 28%
40–59 years 24%
60 years and over 15%
30
Fast Pass
First four lessons £8 each
Then £20 per lesson
All lessons 1 hour
Easy DriveStandard hourly rate £20
First five hours £60
Block bookings10 hours £15015 hours £225
Safe MotoringFirst lesson free
Normal price £20 per hour£2 off per hour for block booking
of 10 or more lessons
Maths Frameworking PB 9.3 Chs 10–17 2/6/08 13:13 Page 262

263
Research shows that it is safer for pedestrians to
walk facing traffic than walking with their back to
traffic on rural roads.
10% of those involved in an accident when walking
with their back to traffic are killed or seriously injured.
6% of those involved in an accident when facing
traffic are killed or seriously injured.
a If 2000 pedestrians are involved in accidents
when walking with their back to traffic, how
many of these are likely to be killed or seriously
injured?
b If 2000 pedestrians are involved in accidents
when facing traffic, how many of these are
likely to be killed or seriously injured?
The driving test is made up of two parts: the theory
test and the practical test.
A learner has to pass the theory test before taking a
practical test.
In April 2008, the theory test cost £30 and the
practical test cost £56.50 for weekdays and £67 for
weekday evenings or weekends.
a The probability that a driver passes the theory
test is 0.9. What is the probability that the
driver fails the theory test?
b A driver passes her theory test first time and
the practical test on the third attempt. How
much more does it cost if the practical tests
are taken at the weekend than if they are taken
on a weekday?
A practical test lasts for 40 minutes and covers
12 miles. Work out the average speed in miles
per hour.
The table shows the number of attempts that some
drivers take to pass their driving test.
a What fraction of the drivers pass at the first
attempt?
b Work out the median number of attempts to
pass.
c Work out the mean number of attempts to pass
for these drivers.
The scatter diagram shows the relationship
between the age and the number of driving lessons
taken by students at a driving school.
a Describe the correlation.
b Estimate the number of lessons taken by a
36-year-old person at this driving school.
c Explain why it would not be sensible to use the
scatter diagram to estimate the number of
lessons needed by a 50-year-old person.
Here is a formula for working out stopping distance,
d (feet), when travelling at speed, v (mph).
d = v + v2
–20
a Work out the stopping distance in feet when
v = 20 mph.
b By working out the stopping distance in feet
when v = 30 mph, show that a car would travel
almost twice as far when stopping from 30 mph
than 20 mph.
20 25 30 35 40 45 500
Age (years)
Num
ber
of
lesso
ns
80
70
60
50
40
30
20
10
0
Number of attempts to pass Number of drivers
1 16
2 9
3 7
4 4
5 3
6 1
Total = 40
Maths Frameworking PB 9.3 Chs 10–17 2/6/08 13:13 Page 263

264
Squirrels
Today it is estimated that there are 180000 red
squirrels and 2.7 million grey squirrels in Britain.
a Write 2.7 million in figures.
b Write the ratio number of red squirrels : number
of grey squirrels in its simplest form.
The population of red squirrels in England, Wales
and Scotland is estimated as:
Draw a fully-labelled pie chart to show this information.
A study on the body weights of squirrels gave the
following data for red squirrels over a 12-month
period.
This graph shows the same data for grey squirrels.
a On a copy of the graph, draw a line graph to
show the average body weight of the red
squirrels.
b Why do you think the weights of the squirrels
increase in the autumn?
c Comment on the differences in the weights of
the red and grey squirrels over the year.
One reason that grey squirrels do better than red
squirrels is that they are more aggressive feeders.
This table shows how many of each type can be
supported in different types of habitats.
Grizedale forest in Cumbria has an area of 2445
hectares. The table also shows the percentage of
Grizedale forest given over to different habitats.
a How many hectares of Grizedale forest are
broad-leaved woodland?
Give your answer to an appropriate degree of
accuracy.
b Assuming no red squirrels live in the forest,
estimate how many grey squirrels the forest
could support.
c In fact the ratio of grey to red squirrels in the
forest in n : 1.
Show that the value of n is approximately 8.
Type of habitatNumber of
grey squirrelsper hectare
Number of redsquirrels per
hectare
Land use (%)of forest
Broad-leaved woodland 8 1 65
Coniferous woodland 2 0.1 12
Agricultural 0 0 10
Wildlife management 10 2 2
Open areas 0 0 11
Weig
ht
(g)
600
550
500
450
400
FJ M A M J J A S O N D
Months
Month Jan Feb Mar Apr May Jun Jul Aug Sep Oct Nov Dec
Averageweight (g)
273 265 274 280 285 290 310 325 345 376 330 290
Country Number of red squirrels
England 35 000
Scotland 120 000
Wales 25 000
Red squirrels are native to Britain. In 1870 some North American grey squirrels were released
in the North of England. The grey squirrel thrived in the conditions in Britain and slowly took
over the habitats of the red squirrel, reducing their numbers dramatically.
Maths Frameworking PB 9.3 Chs 10–17 29/5/08 18:47 Page 264

265
10 adult male red and 10 adult male grey squirrels are
trapped and studied.
This is the data obtained
Red squirrels
Grey squirrels
a Work out the mean and range of the weights of
the red squirrels.
b Work out the mean and range of the weights of
the grey squirrels.
c Comment on the differences in the weights of
each species.
For red squirrel A the tail length is 92% (to the
nearest percentage) of the body length and for grey
squirrel A the tail length is 82% of the body length.
a Work out the same data for red and grey
squirrels D, G and J.
b The data for another squirrel is:
Body length: 240 mm Tail length: 215 mm
Unfortunately the species was not recorded.
Is the squirrel a red or grey squirrel? Give a
reason for your answer.
The scatter diagram below shows the relationship
between the body length and tail length of red
squirrels.
a Estimate the tail length of a red squirrel with a
body length of 210 mm.
b Describe the correlation between the body
length and tail length of red squirrels.
c i Using the data for grey squirrels, draw a
scatter diagram to show the relationship
between body length and tail length.
Use a horizontal axis for body length from
240 mm to 290 mm and a vertical axis for
tail length from 190 mm to 230 mm.
ii Draw a line of best fit on the diagram.
iii Use your line of best fit to estimate the
body length of a grey squirrel with a tail
length of 205 mm.
iv Explain why the diagram could not be used
to estimate the tail length of a young grey
squirrel with a body length of 180 mm.
The normal diet of red squirrels is mainly seeds and
pine cones with some fungi and plant shoots.
This table shows the percentage of each type of
food in the diet of some red squirrels.
Copy and complete a percentage bar chart to show
the information.
This is an extract from a newspaper article.
a What is the expected percentage increase in
the red squirrel population between 2007
and 2010?
b What was the population of red squirrels on
Anglesey in 1998?
Red squirrels are affected by the Parapoxvirus. A
colony of red squirrels numbering 1250 was
infected by the virus and lost 15% of its numbers
each month for 5 months. How many squirrels were
left in the colony after 5 months?
0% 50% 100%
Key
Seeds Pine cones Fungi Shoots
Food Seeds Pine cones Fungi Shoots
Percentage 42% 34% 14% 10%
180 190 200 210 220 230 240
Body length (mm)
Tail
leng
th (m
m)
210
200
190
180
170
160
A B C D E F G H I J
Body length(mm)
272 243 278 266 269 280 251 272 278 281
Tail length(mm)
223 196 220 218 218 222 198 220 226 225
Weight (g) 530 512 561 512 542 551 520 530 558 564
A B C D E F G H I J
Body length(mm)
202 185 215 192 205 186 186 199 235 222
Tail length(mm)
185 164 198 175 182 173 162 184 210 203
Weight (g) 320 292 340 305 335 341 295 325 360 357
By 1998 on the Welsh island of Anglesey greysquirrels had almost totally wiped out the native redsquirrels. Since then due to a policy of removing greysquirrels from the island the red squirrel populationhas recovered and in 2007 was 180. This is a 720%increase on the population in 1998. By 2010 it isexpected that the grey squirrel will be completelyremoved from the island and the population of redsquirrels to be over 300.
Maths Frameworking PB 9.3 Chs 10–17 29/5/08 18:47 Page 265

266
This is a map of the villages they decide they will
serve with the distances between villages shown.
The distances are in kilometres.
They plan this route: Ashmansworthy – Dinworthy –
Bradworthy – Colscott – Bulkworthy – East Putford
– Ashmansworthy.
a How many kilometres is this route?
b They plan a timetable.
They intend to be open for 30 minutes in each
village.
It takes 5 minutes to pack all the groceries
safely after they close before they can drive off.
It takes 5 minutes to unpack the groceries after
they arrive and before they can open.
They know they need to allow 2 minutes per
kilometre on the rural roads.
They intend to open the shop at 9 am in
Ashmansworthy.
This is the
timetable for the
first two villages.
Copy and
complete the
timetable for the
opening times
at each village.
c What time do
they arrive back in Ashmansworthy?
Most mobile shops
are often converted
single-decker buses.
Jeff and Donna see
this advert and
decide to buy this
bus.
They know that fitting out the bus will cost £5000.
Insuring and taxing the bus will cost £1500.
Buying the initial stock for the bus will be £2000.
They have savings of £7500.
a What is the minimum amount they need to
borrow from the bank to get started?
b The bank agrees to lend them up to £10000 at
an interest rate of 7.5% per annum.
i How much will the interest be on £10 000
for one year?
ii If they only borrow the minimum amount
they need and decide to pay the loan back
over one year, what will be the
approximate monthly payment?
1983 Leyland Tiger – Mid engine,Plaxton Paramount 3200, Semi-automatic,53 seats with belts, Air Door, Very cleaninside and out. Drives well, MOT Jan 2008.Length: 12 metres, height 3.2 metres,width 2.5 metres. Price: £2500.For more photos please visit our websitewww.usedcoachsales.co.uk
Event Time
Open Ashmansworthy 9.00
Close Ashmansworthy 9.30
Leave Ashmansworthy 9.35
Arrive Dinworthy 9.51
Open Dinworthy 9.56
Close Dinworthy 10.26
Leave Dinworthy 10.31
Ashmansworthy
East Putford
BulkworthyColscott
Bradworthy
Dinworthy
4
6
54
6
5
3
3
5
Mobile shop
Mobile shops were very common in the 1960s but as supermarkets started to open and people had
access to cars, they fell out of favour. Nowadays, with people wanting fresher produce and concerned
about driving long distances to shop, they are returning to some remote rural areas.
Jeff and Donna decide to start a Mobile shop in a rural area of North Devon.
Maths Frameworking PB 9.3 Chs 10–17 29/5/08 18:47 Page 266

267
Health and Safety rules state that they must have
adequate lighting, hot water for washing hands, a
fridge for storing chilled foods and heating for the
winter. They consult an electrician
who estimates the power for
each item to be:
Lighting 500 W
Water heater 2 kW
Fridge 1 kW
Heating kW
a W stands for Watts.
What does k stand for?
b What is the total maximum
power needed? Answer in Watts.
Before they go ahead with the plan, Jeff and Donna
decide to do a survey of the villages to see if there will
be enough business to make the venture worthwhile.
a Jeff says, ‘We need to find out the population
of each village and survey about 20% of the
residents in each of them’.
Donna says, ‘We need to find out how many
households there are in each village and survey
about 20% of them’.
Who is correct and why?
b The number
of households in
each village is
given in the table.
How many
households in
each village
should be
surveyed?
c This is one of the questions that Jeff prepares
for the survey.
Give two criticisms of this question.
d This is a question that Donna prepares for the
survey.
Give two reasons why this is a good question.
The bus is 12 m long and 2.5 m wide.
This is a scale drawing of the bus with 1 cm
representing 1 m.
a What is the total area of the bus?
b What is the actual width of the counter?
c The area behind the counter is the ‘shop area’.
What percentage of the total area is the ‘shop
area’?
Give your answer to the nearest percentage.
d The fridge is 11–2 m high. What is the volume of
the fridge?
Donna uses the following formula to work out the
profit the shop will make each week.
P is the profit. T is the total amount taken over the
counter in pounds in a week.
P = – 150
a What does 150 represent?
b What is the profit if the weekly takings are £1600?
c Jeff says that they need to make a weekly
profit of £400.
How much do they need to take each week to do
this?
d They apply for a grant to the European Union
community fund who agree to subsidise them
by 10% of their takings each week.
i How much profit do they make when their
weekly takings are £1000 and they receive
a subsidy?
ii Show that they need to take between £1800
and £1850 each week to make a profit of
£400 taking the subsidy into account.
A council survey shows that in a month the bus will
drive about 1200 km with a CO2 emission of
390 g/km.
At the same time, the number of miles driven by
people living in the village to travel to supermarkets
will reduce by about 6000 km with an average CO2
emission of 170 g/km.
Estimate the saving in CO2 emissions in a year if the
mobile shop starts to operate. Answer in kilograms.
T–5
How much do you spend each week?
Up to £20 1 £20 – £30 1 More than £30 1
Village Households
Ashmansworthy 322
Dinworthy 178
Bradworthy 476
Colscott 150
Bulkworthy 483
East Putford 189
Please tick the appropriate box.
How much do you spend each week on:
Item£0 to£9.99
£10 to£19.99
£20 to£29.99
£30 ormore
Meat
Fruit
Vegetables
Cleaning products
Other household items
Door
Front Back
FridgeSink
Shelves
Co
unte
r
Steps
Driver and passenger seat
Maths Frameworking PB 9.3 Chs 10–17 29/5/08 18:47 Page 267

268
adjacent side 179–82algebra 1–12, 42–56, 146–54,
194–206basic rules revision 215–16angle bisectors 64APR (Annual Percentage Rate)
25arcs 114–15areas 19, 28–9
circle 114, 234–5
bearings 188best fit, lines of 85–7bounds, upper and lower
132–6
calculatorsdegree mode 179–81,
184–6efficient use 139–40fraction key 139π (pie) key 114–17power key 20, 139reciprocal key 34, 140root key 149
changing subjects 202–4chord 70circle
area 114, 234–5theorems 70–3
circumference 70, 114, 235common factors 197completing the square 253–5compound interest 19–22congruent triangles 68–9correlations 82–7cosine of an angle 184–6cover up method 205cube roots 148–50cubic graphs 153–4cumulative frequency diagrams
93–5, 224
cylinderssurface areas 117–18, 236volumes 31, 43, 116–17,
236
datacollecting 225–7grouped 95–7handling project 225–8,
231–3processing 228
decimalsrecurring 136–8revision 210–12terminating 136
density 119–21diagonals 5diameter 70difference of two squares 200,
255direct proportion 25–8
graphs 52–5distance–time graphs 8–9
elimination method 45–7ellipse, area of 204enlargements
fractional 175–8positive 174
equations 42–4completing the square 253–5with fractions 48–50quadratic 251–2quadratic formula 252–3simultaneous 45–8
estimates, of probability 165–9,243–4
estimation 35–6Euler’s theorem 204events
exhaustive 161–2, 244, 246independent 158–9, 244, 246mutually exclusive 160–2,
244, 246
expansion 194–6quadratic 199–201
factorisation 197–8quadratic 201–2, 249–51
finite sequences 11–12formulae 43–4four rules revision 213–14fractions
in equations 48–50the four rules 16–19revision 210–12
frequency diagrams 226–7cumulative 93–5, 224
Functional Mathsassessing data 230average speed 120compound interest 21–2
revision 214data collecting 232four rules and ratio revision
213graphs revision 217loci 66–7, 78percentages 24–5, 39percentages and decimals
revision 211–12real-life graphs 9–11, 217speed conversion 220standard form revision 214statistical investigations 100time series graphs 90two-way tables 91–2Mobile phone tariffs 14–15The London Olympics 2012
40–1Garden design 80–1, 271Rainforest deforestation
106–7Athletics stadium 124–5Paper 144–5Packages 156–7Class test 172–3Map reading 192–3
F
E
D
C
B
A
Index
Maths Frameworking PB 9.3 Chs 10–17 30/5/08 16:16 Page 268

269
Trip to Rome 208–9The Eden Project 260–1Road safety 262–3Squirrels 264–5Mobile shop 266–7
functions 6–8
geometrical sequences 3, 5geometry and measures
58–76, 108–21, 174–88revision 219–22, 234–7
googol 130graphs
cubic 153–4direct proportion 52–5distance–time 8–9of functions 8inequalities 52linear equations 205–6quadratic 151–3real-life 9–11revision 216–19scatter 82–7, 224of simultaneous equations
55–6time series 88–90
Hero’s formula 203–4hypotenuse 58–9, 178, 186
identities 43–5identity functions 6independent events 158–9index notation, negative powers
146–8inequalities 50–2infinite sequences 11inverse functions 7–8inverse proportion 25–8investigations
cubic graphs 154geometry and measures
236–7probability 246–8quadratic expansion 200quadratic graphs 152–3statistical 98–100symmetry 239–40
irrational numbers 136
limits, of sequences 11–12linear equations
graphs 205–6revision 215–16
linear sequences 2loci 64–7Logo 178lower bounds 132–6
magic squares, fractional 19mass 119means
estimation from grouped data95–7
revision 222–3, 228medians 97
revision 222–3, 228megabytes 130metric units
area, volume and capacity112–14
prefixes 131modes 228multiplier method 22–3mutually exclusive events
160–2
nth terms 1–6number 16–36, 126–40number lines 51–2numbers
between zero and one 32–3 irrational 136reciprocal 34–5
opposite side 179–82
Pacman shapes 115pentagons 188percentages 19–25
revision 210–12perimeter and area revision
234–6perpendicular bisectors 64, 70planes of symmetry 238–9polygons
diagonals 5regular 73–4
probability 161–2estimates 165–9relative frequency 166–9revision 222, 224, 241–6theoretical 167tree diagrams 163–5vocabulary 241–4
proportion 25–8Pythagoras’ theorem 58–61
algebraic proof 76practical proof 75problem solving 62–4, 71
Pythagorean triples 64
quadraticexpansion 199–201factorisation 201–2, 249–51formula 252–3graphs 151–3sequences 4–6
quartiles 228
radius 70range 228rate of change 118–21ratio
areas and volumes 28–31dividing lines 112revision 213–14
real-life graphs 9–11, 217reciprocal numbers 34–5recurring decimals 136–8reflection symmetry 237–8regular polygons 73–4relative frequency 166–9reverse percentages 22–5right-angled triangles 58–64,
178–86rotational symmetry 237–8rounding 35–6, 129
scale factors 174–8scatter graphs 82–7, 223sectors 114–15self-inverse functions 7, 8semicircles 72sequences 1–3
finite 11–12infinite 11linear 2quadratic 4–6
S
R
Q
P
O
N
M
L
I
H
G
Maths Frameworking PB 9.3 Chs 10–17 30/5/08 16:16 Page 269

significant figures 35–6, 129similar triangles 108–11simultaneous equations 45–8
solving by graphs 55–6sine of an angle 184–6solving problems 210–24speed 118–19spheres, volume and surface area
136square roots 148–50standard form 126–8
dividing 130–1multiplying 128–30revision 213–14
statisticalinvestigations 98–100techniques 225–30
statistics 82–100, 158–69revision 222–4
subjects of formulae 43, 202–4substitution method 47–8
surface areascylinders 117–18spheres 136
symmetrynumber 240planes of 238–9reflection 237–8rotational 237–8
tangent of an angle 178–83tangent to a circle 70temperature conversion 203term-to-term rules 1–2, 11tessellations 73–4theoretical probability 167time series graphs 88–90trapeziums 177tree diagrams 163–5, 224, 242–3trial and improvement 201–2triangles
congruent 68–9right-angled 178–86similar 108–11
trigonometrysines and cosines 184–6solving problems 187–8tangents 178–83
two-way tables 91–3
unitary method 22–3upper bounds 132–6
variables 42–3volume and surface area revision
234–6volumes
cylinders 31, 43, 116–18spheres 136
V
UT
270
Maths Frameworking PB 9.3 Chs 10–17 30/5/08 16:16 Page 270

Long South fence
Chickenrun
?
Short South fence
TREE
HOUSE
7 m
5 m
TREE
SEAT
BBQ
AREA
North
West fe
nce
West fe
nce
East fe
nce
Scale
1 cm = 1 m
Garden design activity worksheet
271
Maths Frameworking PB 9.3 Chs 10–17 30/5/08 16:16 Page 271

William Collins’ dream of knowledge for all began with the publication of his first book in 1819. A self-educated mill worker, he not only
enriched millions of lives, but also founded a flourishing publishing house. Today, staying true to this spirit, Collins books are packed with
inspiration, innovation and practical expertise. They place you at the centre of a world of possibility and give you exactly what you need to
explore it.
Collins. Freedom to teach.
Published by Collins
An imprint of HarperCollinsPublishers
77–85 Fulham Palace Road
Hammersmith
London
W6 8JB
© HarperCollinsPublishers Limited 2008
10 9 8 7 6 5 4 3 2 1
ISBN 978-0-00-726626-5
Keith Gordon, Kevin Evans, Brian Speed and Trevor Senior assert
their moral rights to be identified as the authors of this work.
All rights reserved. No part of this publication may be
reproduced, stored in a retrieval system, or transmitted in any
form or by any means, electronic, mechanical, photocopying,
recording or otherwise, without the prior written permission of
the Publisher or a licence permitting restricted copying in the
United Kingdom issued by the Copyright Licensing Agency Ltd.,
90 Tottenham Court Road, London W1T 4LP.
Any educational institution that has purchased one copy of this
publication may make unlimited duplicate copies for use
exclusively within that institution. Permission does not extend to
reproduction, storage within a retrieval system, or transmittal in
any form or by any means, electronic, mechanical,
photocopying, recording or otherwise, of duplicate copies for
loaning, renting or selling to any other institution without the
permission of the Publisher.
British Library Cataloguing in Publication Data
A Catalogue record for this publication is available from the
British Library.
Extra Functional Maths material written by Greg and Lynn Byrd
Commissioned by Melanie Hoffman and Katie Sergeant
Project managed by Priya Govindan
Edited by Karen Westall
Index by Michael Forder
Proofread by Amanda Dickson
Design and typesetting by Jordan Publishing Design
Covers by Oculus Design and Communications
Covers managed by Laura Deacon
Illustrations by Nigel Jordan, Tony Wilkins and Barking Dog Art
Printed and bound by Martins the Printers, Berwick-upon-Tweed
Production by Simon Moore
Acknowledgments
The publishers thank the Qualifications and Curriculum Authority
for granting permission to reproduce questions from past
National Curriculum Test papers for Key Stage 3 Maths.
The publishers have sought permission from AQA, OCR and
EDEXCEL to reproduce past GCSE exam papers.
The map on page 192 is reproduced by permission of Ordnance
Survey on behalf of HMSO. © Crown copyright 2008. All rights
reserved. Ordnance Survey Licence number 100048274.
The publishers wish to thank the following for permission to
reproduce photographs:
p.14–15 (main image) © VisualHongKong / Alamy, p.40–41 (main
image) © Gilbert Iundt / TempSport / Corbis and (inset image of
flag) © Andrew Paterson / Alamy, p.80–81 (main image)
© V. J. Matthew / istockphoto.com, p.106–107 (main image)
© Brandon Alms / istockphoto.com, p.124–125 (main image)
© Josef Philipp / istockphoto.com, p.144–145 (main image)
© Elena Schweitzer / istockphoto.com, p.156–157 (main image)
© Comstock / Corbis and (inset image of violin case)
© Nancy Louie / istockphoto.com, p.172–173 (main image)
© Laurence Gough / istockphoto.com, p.192–193 (main image)
© Guy Nicholls / istockphoto.com, p.208–209 (main image)
© Cornel Stefan Achirei / istockphoto.com, p.260 (main image)
© Brian Kelly / istockphoto.com and (inset image) © Kevin Jarratt /
istockphoto.com, p.262 (main image) © Chris Elwell /
istockphoto.com, p.264 (main images) © Sharon Day /
istockphoto.com, p.266 (main image) © David Lyons / Alamy
Every effort has been made to trace copyright holders and to
obtain their permission for the use of copyright material. The
authors and publishers will gladly receive any information
enabling them to rectify any error or omission at the first
opportunity.
Browse the complete Collins catalogue at
www.collinseducation.com
Maths Frameworking PB 9.3 Chs 10–17 30/5/08 16:16 Page 272