neuromuscular factors determining 5 km running performance and running economy in well-trained...
TRANSCRIPT

ORIGINAL ARTICLE
Ari T. Nummela Æ Leena M. Paavolainen
Karen A. Sharwood Æ Mike I. Lambert
Timothy D. Noakes Æ Heikki K. Rusko
Neuromuscular factors determining 5 km running performanceand running economy in well-trained athletes
Accepted: 10 January 2006 / Published online: 3 February 2006� Springer-Verlag 2006
Abstract This study investigated the effects of the neu-romuscular and force–velocity characteristics in distancerunning performance and running economy. Eighteenwell-trained male distance runners performed five dif-ferent tests: 20 m maximal sprint, running economy atthe velocity of 4.28 m s�1, 5 km time trial, maximalanaerobic running test (MART), and a treadmill test todetermine VO2max. The AEMG ratio was calculated bythe sum average EMG (AEMG) of the five lowerextremity muscles during the 5 km divided by the sumAEMG of the same muscles during the maximal 20 msprinting. The runners’ capacity to produce power aboveVO2max (MART VO2gain) was calculated by subtractingVO2max from the oxygen demand of the maximalvelocity in the MART (VMART). Velocity of 5 km (V5K)correlated with VMART (r=0.77, p<0.001) and VO2max
(r=0.49, p<0.05). Multiple linear regression analysisshowed that MART VO2gain and VO2max explained 73%of the variation in V5K. A significant relationship alsoexisted between running economy and MART VO2gain
(r=0.73, p<0.01). A significant correlation existed be-tween V5K and AEMG ratio during the ground contactphase at the 3 km (r=0.60, p<0.05) suggesting thatneural input may affect distance running performance.The results of the present study support the idea thatdistance running performance and running economy arerelated to neuromuscular capacity to produce force and
that the VMART can be used as a determinant of dis-tance-running performance.
Keywords Distance running performance Æ EMG ÆGround contact time Æ Running economy Æ Stride length
Introduction
Since the classical studies of Hill and Lupton (1923),exercise physiologists have associated the limits of hu-man endurance performance with the ability to trans-port and consume oxygen during exhaustive exercise. Ithas been suggested that hypoxia developed in the activemuscles during exercise causes fatigue and thereby limitsmaximal exercise performance. According to manyprevious studies (e.g. Costill et al. 1973; Davies andThompson 1979; Foster et al. 1978; Joyner 1991),maximal oxygen uptake (VO2max) sets the upper limit forthe endurance performance. In those studies in whichthe subjects had similar VO2max values, sub-maximalendurance (e.g. Costill et al. 1973; Farrell et al. 1978)and running economy (e.g. Conley and Krahenbuhl1980; Morgan et al. 1989) have been shown to be relatedto endurance performance. Di Prampero (1986, 2003)and Bassett and Howley (1997, 2000) summarized thatVO2max, fractional utilization of VO2max, and runningeconomy are the major variables determining thevelocity that can be maintained in distance races.
Although success in endurance sports requires highVO2max, it cannot fully explain all the measured differ-ences in endurance performance. Simultaneous strengthand endurance training has been shown to improvemuscle strength, running economy, and distance runningperformance without any changes in VO2max (Johnstonet al. 1997; Paavolainen et al. 1999a) suggesting thatneuromuscular factors may also be important determi-nants of endurance running performance. This is sup-ported by the study of Paavolainen et al. (1999c)indicating that better performance in the 10 km timetrial is related to higher pre-activation of the working
A. T. Nummela (&) Æ L. M. Paavolainen Æ H. K. RuskoKIHU—Research Institute for Olympic Sports, Rautpohjankatu 6,40700 Jyvaskyla, FinlandE-mail: [email protected].: +358-14-2603140Fax: +358-14-2603171
K. A. Sharwood Æ M. I. Lambert Æ T. D. NoakesMRC/UCT Research Unit for Exercise Science and Sports Medi-cine, Department of Human Biology, Faculty of Health Sciences,University of Cape Town and Sports Science Institute of SouthAfrica, Cape Town, South Africa
H. K. RuskoDepartment of Biology of Physical Activity, University ofJyvaskyla, Jyvaskyla, Finland
Eur J Appl Physiol (2006) 97: 1–8DOI 10.1007/s00421-006-0147-3

muscles accompanied with shorter contact times (CT)throughout the run. They presented a hypotheticalmodel of the variables related to distance running per-formance. In the new model, the traditional model ofendurance performance (Di Prampero 1986; Bassett andHowley 1997) was supplemented with the inclusion offactors relating to the neuromuscular capacity to pro-duce power. Paavolainen et al. (1999a) also observed asignificant relationship between the improvements inforce and velocity tests, maximal anaerobic running test(MART, Rusko et al. 1993), and running economysuggesting that that the maximal velocity of the MART(VMART) can be used as an indicator of neuromuscularpower in endurance athletes. The VMART positivelycorrelates with the times for running distances from 400to 5,000 m and with cross-country skiing performance(Paavolainen et al. 1999a; Rusko and Nummela 1996;Rusko et al. 1993).
An alternative explanation for the limitation ofendurance performance postulates that a central nervoussystem integrates input from various sources duringphysical activity and prevents the recruitment of skeletalmuscles beyond levels of intensity and duration wherepotential damage could occur to the heart and othervital organs (Kayser 2003; Lambert et al. 2005; Noakes2000; Noakes et al. 2001). In accordance with thisexplanation, the changes in the number of skeletalmuscle motor units recruited during exercise provide amore complete explanation for the impaired perfor-mance that develops during exercise and for differencesin athletic performance (Noakes and St Clair Gibson2004; St Clair Gibson and Noakes 2004).
The purpose of the present study is to investigate theimportance of force and velocity characteristics deter-mining distance running performance. A more preciseaim of the study is to investigate whether the maximalvelocity of the MART (VMART), EMG, and stridecharacteristics during the 5 km are related to runningeconomy and distance running performance.
Materials and methods
Subjects
Eighteen well-trained male distance runners participatedin this study. Subjects were included if they were able tocomplete 10 km in under 38 min. Each subject signed aninformed consent form at the beginning of the study. Thestudy was approved by both the Ethics Committee of theUniversity of Jyvaskyla, Jyvaskyla, Finland and theEthics and Research Committee of the Faculty of HealthSciences, University of Cape Town, South Africa.
Experimental design
The runners were required to visit the laboratory onthree separate occasions over a 10-day period. On their
first visit to the laboratory, the runners were given theopportunity to become familiar with the equipment andtesting protocols that would be used during the trial.This familiarization was performed in an attempt toreduce error associated with subjects performing unac-customed exercise. A personal training and racing his-tory was also obtained from each runner. The runnerswere asked to maintain their regular physical activitypattern for the duration of the study and were requestednot to exercise on the morning prior to their testing.
In order to measure maximal sprinting speed, run-ning economy, distance running performance, VMART
and VO2max, the runners ran four different running testson a 144 m indoor track and a running test on atreadmill. The running tests were: 20 m maximal sprintwith a running start of 15 m; eight laps on the track atthe velocity of 4.28 m s�1; 5 km time trial on the indoortrack; MART on the track; and continuous and incre-mental exhaustive running test on the treadmill.
Day 1
Anthropometry
When the runners came to the laboratory for the secondtime, mass, stature, and an anthropometric assessmentwas conducted on each subject. Body fat content wascalculated using the equation of Durnin and Womersley(1974).
Electromyographic activity measurements
Before the start of testing, each runner had bipolarEMG electrodes (Beckman miniature skin electrodes,IL, USA) placed onto the vastus lateralis (VL), vastusmedialis (VM), rectus femoris (RF), biceps femoris (BF),and gastrocnemius (GA) muscles of the right leg. Theskin was shaved, rubbed with sandpaper, and cleanedwith alcohol. The electrodes were positioned longitudi-nally on the belly of each muscle and carefully taped. AllEMG data were recorded telemetrically (Biomes 2000,Glonner, Germany) during each running test on thetrack with a laptop computer using Labview 5.1 (Na-tional Instruments, TX, USA).
Measurements of stride parameters
In order to measure stride parameters, a photocellcontact mat (Viitasalo et al. 1997) and two photocellgates connected to an electronic timer (Newtest Ltd,Oulu, Finland) were placed on the final straight of thetrack. During the 5 km time trial, average velocity,ground CT, and flight times (FT) were measured from a20 m section at every other lap simultaneously withEMG from VL, VM, RF, BF, and GA. Stride frequency(strides per second) was calculated by using CT and FTas (CT + FT)�1. Stride length was calculated by
2
dividing the average velocity by the stride frequency.Both EMG and stride parameter data collected duringeach stride were averaged for the number of strides ta-ken along the 20 m straight during each running test.The non-smoothed EMG signals were rectified, inte-grated, and time normalised (Average EMG, AEMG)for the two phases of running: pre-activation (100 msbefore ground contact) and total ground contact time.
Maximal 20 m sprint test
The runners performed three to five maximal 20 msprints on the indoor track. They were able to accelerate15 m to ensure a normal and maximal running gaitthroughout the 20 m. Each 20 m sprint was separated bya brief recovery period during which the runners re-turned to the start of the sprint course. The 20 m run-ning time was measured using two photocell gatesconnected to an electronic timer (Newtest Ltd). Thefastest 20 m sprint was chosen for all subsequent dataanalysis.
Running economy test
Before the running economy test, the runners put on theportable telemetric oxygen analyser (Cosmed K4 RQ,Rome, Italy) and the analyser was calibrated. Runningeconomy was measured as steady-state sub-maximaloxygen uptake during eight laps (1,150 m) of sub-max-imal running at the velocity of 4.28 m s�1. The runningvelocity was regulated by small lights embedded on theinside of the track at intervals of 2.5 m. The runnerswere instructed to adjust their velocity to coincide withthe lights which were turned on and off sequentiallyaround the track. VO2 was measured for every 15 sduring the whole run using the Cosmed K4, and runningeconomy was calculated as the average VO2
(ml kg�0.75 min�1) and (ml kg�1 min�1) of the lastminute of running.
Five-km time trial
After 20 min recovery, the runners performed the 5 kmtime trial on the indoor track. They were instructed torun at their maximum effort and were provided verbalencouragement during the entire time trial. Times wererecorded for each lap and the split times at each kilo-metre were given to the athletes during the time trial.The runners were asked to run the final lap as fast aspossible. The signals from the EMG, photocell gates,and photocell contact mat were recorded from the 7th(948–968 m), 21st (2,964–2,984 m), 33rd (4,692–4,712 m), and last (4,980–5,000 m) lap when the runnersentered the appropriate 20 m section of track. TheAEMG values were calculated for all the muscles duringthe ground contact and 100 ms pre-activity phase. TheAEMG ratios were calculated at 1 km (seventh lap),
3 km (21st lap), and 5 km (33rd and last lap) by dividingthe AEMG during the 5 km time trial by the AEMGrepresenting the best 20 m sprint.
Day 2
Incremental exhaustive treadmill test
On the next visit to the laboratory, not more than 7 dayslater, peak treadmill running speed (PTRS) and VO2max
were measured using a continuous, incremental runningprotocol on a horizontal, motor driven treadmill. After abrief warm up, the runners began running at 12 km h�1
(3.33 m s�1). The speed was increased by 0.5 km h�1
(0.14 m s�1) every 30 s thereafter (Scrimgeour et al.1986). Oxygen consumption (Cosmed K4 RQ) and heartrate (Vantage XL Polar Electro, Finland) were measuredcontinuously during the test. The test continued until therunner was unable to maintain the pace of the treadmill.VO2max was defined as the highest oxygen consumptionduring the test over a 60 s period.
Maximal anaerobic running test
In the present study, the MART was done on the indoortrack. The MART consisted of 10·150 m runs with a100 s recovery period between the runs. A 5 m runningstart was allowed for the runners. The velocity of thefirst run was 4.75 m s�1, and thereafter the velocity wasincreased by 0.41 m s�1 for each consecutive run. Thelast 150-metre run was performed at the runners’maximal effort. Each runner was guided during the firstnine 150-metre runs to the desired running velocity bythe pacing lights. The maximal velocity of theMART (VMART) was determined as the average velocityof the fastest 150-metre run. Oxygen demand of theVMART was calculated using the formula of Londeree(1986): MART VO2demand (ml kg�1 min�1) = 0.205·v(m min�1) + 0.109· [v (m min�1)/60]2-6.1. Thenthe capability of the runner to produce powerabove VO2max was calculated by: MART VO2gain
(ml kg�1 min�1)=MART VO2demand(ml kg�1 min�1)-VO2max (ml kg�1 min�1).
Data analysis
The energetic model of distance running performancewas tested by calculating the 5 km running speed by theformula of Di Prampero (1986): V5K=F·VO2max·C�1,where F=0.977 for 5 km, as reported by Lacour et al.(1990), and C=[VO2 at 4.28 m s�1–3.5 (ml kg�1
min�1)] [256.8 (m min�1)�1]. Pearson’s product momentcorrelation coefficient was used to determine relation-ships between V5K, running economy, VO2max, VMART,MART VO2gain, and other neuromuscular variables. Astepwise multiple linear regression analysis was used to
3

predict 5 km running speed. The independent variableswere entered into the stepwise procedure to select thevariables that best predicted the V5K. ANOVA was usedwhen relative EMG, running velocity, and stride char-acteristics were compared during the 5 km time trial. Allthe statistical analyses were done using SPSSWIN 13.0(SPSS Inc., Chicago, IL, USA). Values are expressed asmean ± standard deviation or standard error. Statisti-cal significance was accepted as p<0.05.
Results
The descriptive data of the runners are shown inTable 1. The oxygen demand of the VMART was 40%higher than the VO2max resulting in the MART VO2gain
of 25.9±5.6 ml kg�1 min�1. The velocity during the5 km time trial had a positive relationship with stridelength (r=0.76, p<0.01) but not with stride frequency.The V5K also correlated significantly with VMART
(r=0.77, p<0.001), VO2max (r=0.55, p<0.05), andPTRS (r=0.61, p<0.05) but not with maximal 20 mvelocity (r=0.42). The V5K correlated significantly withrunning economy only when VO2 was expressed inml kg�0.75 min�1 (r=�0.47, p<0.05) but not when itwas expressed in ml kg�1 min�1 (r=�0.28). Runningeconomy at 4.28 m s�1 (ml kg�0.75 min�1) correlatedsignificantly with VMART (r=0.52, p<0.05) and MARTVO2gain (r=0.72, p<0.01). Furthermore, a significantcorrelation was observed between MART VO2gain andmaximal 20 m velocity (r=0.88, p<0.001) and betweenVMART and the velocity of the last lap in the 5 km timetrial (r=0.54, p<0.05).
The energetic model of distance running performancewas tested by calculating the V5K by the formula of DiPrampero (1986), which included VO2max and runningeconomy per kg body mass, with the assumption thatVO2rest was 3.5 ml kg�1 min�1 and fractional utilization
of VO2max during the 5 km was 0.977 as reported byLacour et al. (1990). The Pearson correlation coefficientbetween the calculated (4.96±0.38 m s�1) and measuredV5K (4.93±0.33 m s�1) was r=0.75 (p<0.01), and theplotted data are shown in Fig. 1.
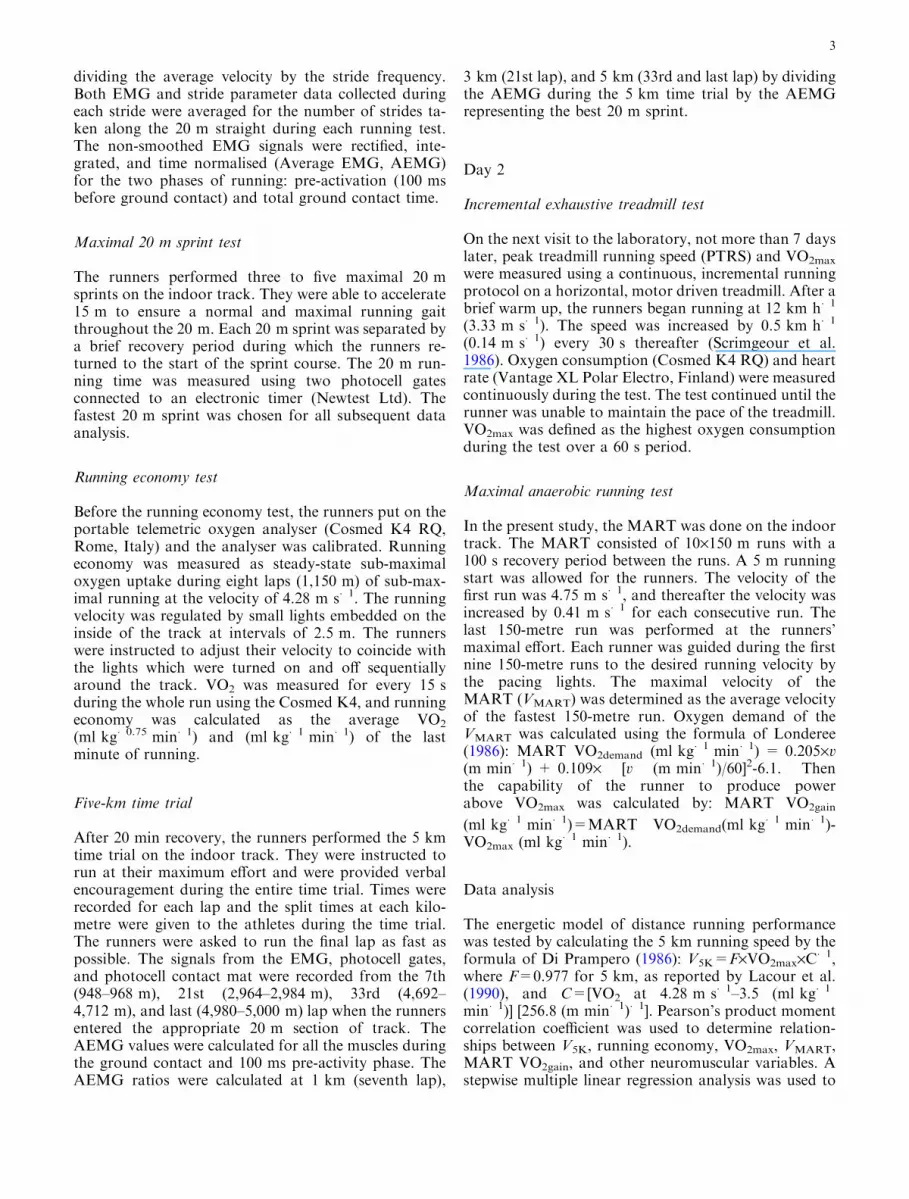
The stepwise multiple regression analysis using V5K
as the dependent variable showed that the combinationof VO2max and MART VO2gain were the best predictorsof V5K (R2=0.728; p<0.001). The linear regressionformula was: V5K=0.066 VO2max + 0.048 MARTVO2gain–0.549. The predicted and measured V5K valuesare plotted in Fig. 2.
The running velocity curve during the 5 km is shownin Fig. 3. The velocity was highest during the last lapand lowest during the 32nd lap (4,424–4,568 m). The
Table 1 Descriptive and performance characteristics of the runners(n=18)
Variable Mean ± SD Min–Max
Age (years) 23.4±6.6 16–34Stature (m) 1.69±0.05 1.61–1.80Body mass (kg) 59.6±4.7 50.3–67.1Body fat (%) 10.7±3.0 6.6–17.7Training (km week�1) 95±27 70–160a
V5K (m s�1) 4.93±0.33 4.30–5.30PTRS (m s�1) 5.76±0.33 5.28–6.53VMART (m s�1) 7.33±0.40a 6.72–8.07V20m (m s�1) 7.72±0.40b 7.00–8.65MART VO2demand (ml kg�1 min�1) 90.0±5.5a 81.5–100.3VO2max (ml kg�1 min�1) 64.0±4.0 56.3–70.7RE (ml kg�1 min�1) 54.3±3.2a 49.1–60.6
Training average training volume from the last three months,VO2max maximal oxygen uptake in an incremental treadmill test,PTRS peak treadmill running speed, VMART the highest 150 mvelocity in the MART, V5K average velocity in a 5 km time trial,V20m average velocity in a 20 m maximal speed test, RE oxygenuptake at the velocity of 4.28 m s�1, MART VO2demand the oxygendemand of the VMART (Londeree 1986)an=17bn=14
4.0
4.2
4.4
4.6
4.8
5.0
5.2
5.4
5.6
5.8
6.0
4.0 4.2 4.4 4.6 4.8 5.0 5.2 5.4 5.6 5.8 6.0
V5K (m · s-1)
Cal
cula
ted
V5K
(m·s
-1)
R2 = 0.563
Fig. 1 Calculated (DiPrampero 1986) and measuredV5K. Straight line representsidentity line
4
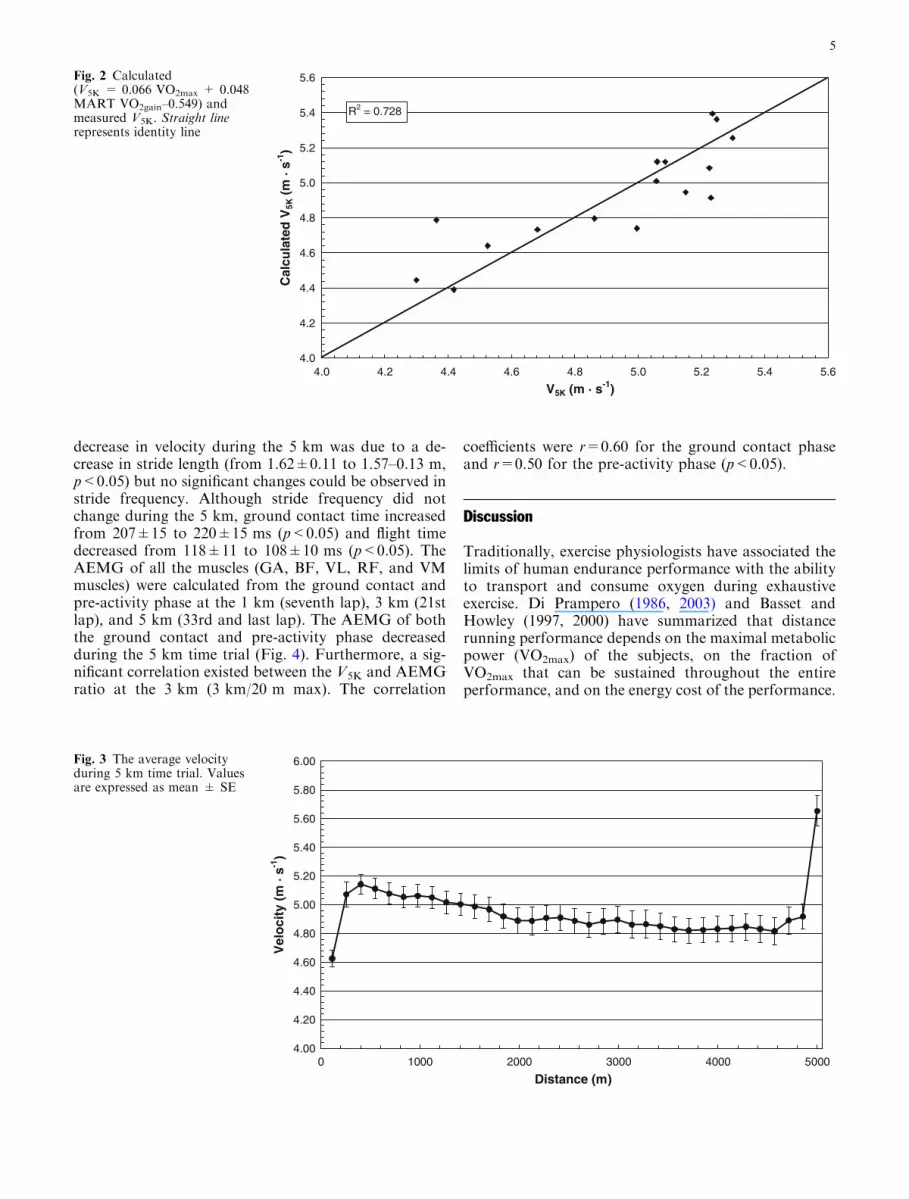
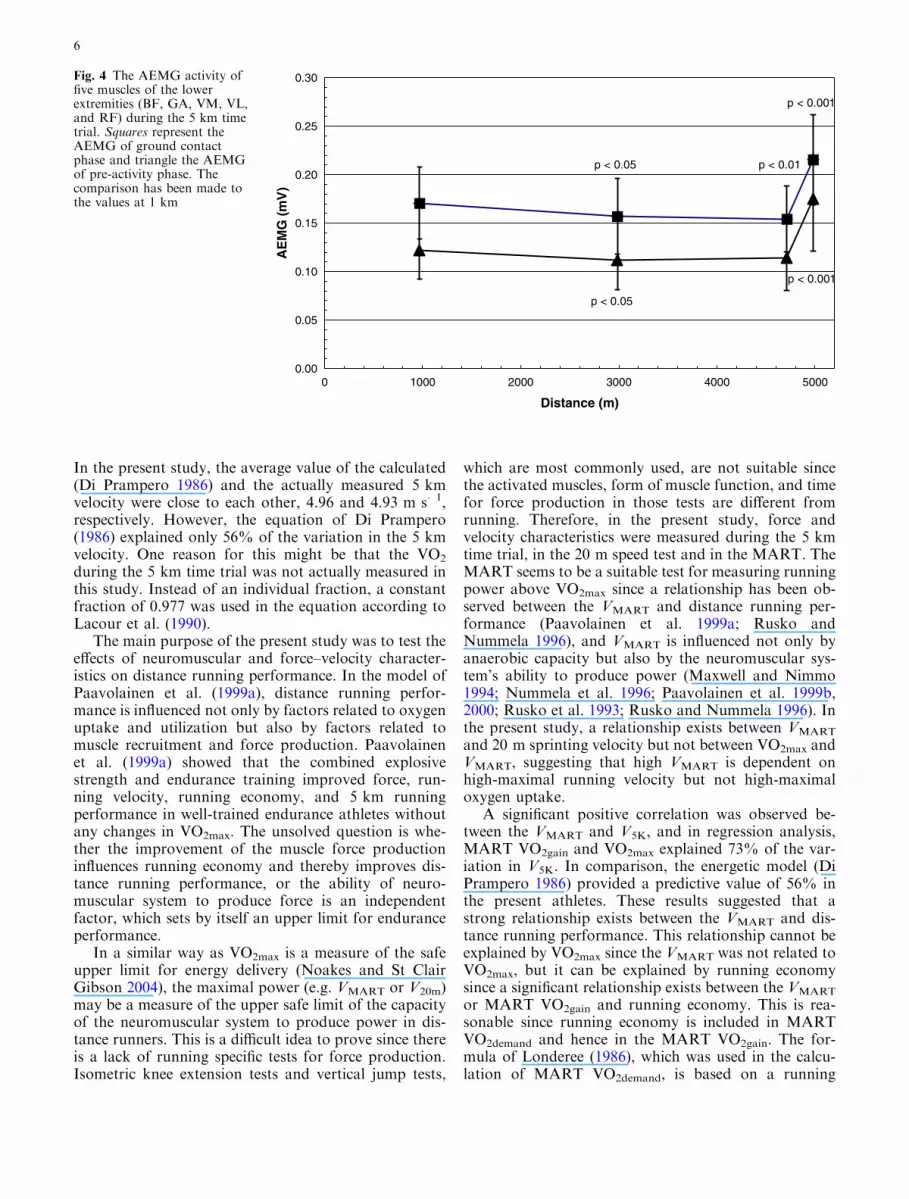
decrease in velocity during the 5 km was due to a de-crease in stride length (from 1.62±0.11 to 1.57–0.13 m,p<0.05) but no significant changes could be observed instride frequency. Although stride frequency did notchange during the 5 km, ground contact time increasedfrom 207±15 to 220±15 ms (p<0.05) and flight timedecreased from 118±11 to 108±10 ms (p<0.05). TheAEMG of all the muscles (GA, BF, VL, RF, and VMmuscles) were calculated from the ground contact andpre-activity phase at the 1 km (seventh lap), 3 km (21stlap), and 5 km (33rd and last lap). The AEMG of boththe ground contact and pre-activity phase decreasedduring the 5 km time trial (Fig. 4). Furthermore, a sig-nificant correlation existed between the V5K and AEMGratio at the 3 km (3 km/20 m max). The correlation
coefficients were r=0.60 for the ground contact phaseand r=0.50 for the pre-activity phase (p<0.05).
Discussion
Traditionally, exercise physiologists have associated thelimits of human endurance performance with the abilityto transport and consume oxygen during exhaustiveexercise. Di Prampero (1986, 2003) and Basset andHowley (1997, 2000) have summarized that distancerunning performance depends on the maximal metabolicpower (VO2max) of the subjects, on the fraction ofVO2max that can be sustained throughout the entireperformance, and on the energy cost of the performance.
4.0
4.2
4.4
4.6
4.8
5.0
5.2
5.4
5.6
4.0 4.2 4.4 4.6 4.8 5.0 5.2 5.4 5.6
V5K (m · s-1)
Cal
cula
ted
V5K
(m·s
-1)
R2 = 0.728
Fig. 2 Calculated(V5K = 0.066 VO2max + 0.048MART VO2gain–0.549) andmeasured V5K. Straight linerepresents identity line
4.00
4.20
4.40
4.60
4.80
5.00
5.20
5.40
5.60
5.80
6.00
0 1000 2000 3000 4000 5000
Distance (m)
Vel
oci
ty (
m·s
-1)
Fig. 3 The average velocityduring 5 km time trial. Valuesare expressed as mean ± SE
5
In the present study, the average value of the calculated(Di Prampero 1986) and the actually measured 5 kmvelocity were close to each other, 4.96 and 4.93 m s�1,respectively. However, the equation of Di Prampero(1986) explained only 56% of the variation in the 5 kmvelocity. One reason for this might be that the VO2
during the 5 km time trial was not actually measured inthis study. Instead of an individual fraction, a constantfraction of 0.977 was used in the equation according toLacour et al. (1990).
The main purpose of the present study was to test theeffects of neuromuscular and force–velocity character-istics on distance running performance. In the model ofPaavolainen et al. (1999a), distance running perfor-mance is influenced not only by factors related to oxygenuptake and utilization but also by factors related tomuscle recruitment and force production. Paavolainenet al. (1999a) showed that the combined explosivestrength and endurance training improved force, run-ning velocity, running economy, and 5 km runningperformance in well-trained endurance athletes withoutany changes in VO2max. The unsolved question is whe-ther the improvement of the muscle force productioninfluences running economy and thereby improves dis-tance running performance, or the ability of neuro-muscular system to produce force is an independentfactor, which sets by itself an upper limit for enduranceperformance.
In a similar way as VO2max is a measure of the safeupper limit for energy delivery (Noakes and St ClairGibson 2004), the maximal power (e.g. VMART or V20m)may be a measure of the upper safe limit of the capacityof the neuromuscular system to produce power in dis-tance runners. This is a difficult idea to prove since thereis a lack of running specific tests for force production.Isometric knee extension tests and vertical jump tests,
which are most commonly used, are not suitable sincethe activated muscles, form of muscle function, and timefor force production in those tests are different fromrunning. Therefore, in the present study, force andvelocity characteristics were measured during the 5 kmtime trial, in the 20 m speed test and in the MART. TheMART seems to be a suitable test for measuring runningpower above VO2max since a relationship has been ob-served between the VMART and distance running per-formance (Paavolainen et al. 1999a; Rusko andNummela 1996), and VMART is influenced not only byanaerobic capacity but also by the neuromuscular sys-tem’s ability to produce power (Maxwell and Nimmo1994; Nummela et al. 1996; Paavolainen et al. 1999b,2000; Rusko et al. 1993; Rusko and Nummela 1996). Inthe present study, a relationship exists between VMART
and 20 m sprinting velocity but not between VO2max andVMART, suggesting that high VMART is dependent onhigh-maximal running velocity but not high-maximaloxygen uptake.
A significant positive correlation was observed be-tween the VMART and V5K, and in regression analysis,MART VO2gain and VO2max explained 73% of the var-iation in V5K. In comparison, the energetic model (DiPrampero 1986) provided a predictive value of 56% inthe present athletes. These results suggested that astrong relationship exists between the VMART and dis-tance running performance. This relationship cannot beexplained by VO2max since the VMART was not related toVO2max, but it can be explained by running economysince a significant relationship exists between the VMART
or MART VO2gain and running economy. This is rea-sonable since running economy is included in MARTVO2demand and hence in the MART VO2gain. The for-mula of Londeree (1986), which was used in the calcu-lation of MART VO2demand, is based on a running
0.00
0.05
0.10
0.15
0.20
0.25
0.30
0 1000 2000 3000 4000 5000
Distance (m)
AE
MG
(mV
)
p < 0.05
p < 0.05
p < 0.01
p < 0.001
p < 0.001
Fig. 4 The AEMG activity offive muscles of the lowerextremities (BF, GA, VM, VL,and RF) during the 5 km timetrial. Squares represent theAEMG of ground contactphase and triangle the AEMGof pre-activity phase. Thecomparison has been made tothe values at 1 km
6

economy of 0.205 ml kg�1 m�1. The results of thepresent study suggest that the ability of neuromuscularsystem to produce power above VO2max affects runningeconomy. This is supported by the previous studies ofPaavolainen et al. (1999a, b) in which they also observeda positive correlation between ground contact time andvelocity in 5 km. This suggests that rapid force pro-duction is beneficial not only for sprint runners but alsofor distance runners. In the present study, 5 km runningvelocity was not related to ground contact times buthigh V5K was more dependent on long strides than high-stride frequency.
Any voluntary high-intensity exercise such as a5 km time trial is not possible without a consciousdecision first to begin the exercise and second to stopthe effort (Kayser 2003). Running at higher velocityalways needs an increase in spatial and temporalrecruitment of motor units (St Clair Gibson andNoakes 2004). This was also shown in the results ofthe present study since both running velocity andEMG activity of lower extremities decreased duringthe 5 km time trial (Fig. 4). The running velocity curveof the 5 km (Fig. 3) represents typical pace judgementin the time trial. In the beginning of the run(approximately 0.5 km), the runners overestimatedtheir running abilities and the pace was gradually de-creased during the first 2 km and thereafter thevelocity remained fairly constant until the final lap, atwhich point the velocity increased significantly.
An interesting finding of the present study was therelationship between relative EMG-activity at the 3 kmand V5K. This suggests that the runners who could keeptheir level of muscle recruitment at high level at thecritical phase of the time trial perform better than therunners whose level of muscle recruitment decreasedremarkably during the 5 km. As reviewed by Kayser(2003), central command in the motor cortex is per-ceived as a sense of effort, and exercise is volitionallyterminated when the sense of effort and other sensationssuch as muscle pain become more intense than is toler-able (St Clair Gibson and Noakes 2004). Indeed it isthese sensations, which appear to cause the terminationof, or ‘‘limit’’ the exercise performance (Lambert et al.2005; St Clair Gibson and Noakes 2004). This suggeststhat based on the sense of effort and the past experienceof running, each runner has developed the capacity toanticipate the proper velocity for the 5 km time trialalready during the first steps of the run as also in otherall-out efforts (Ansley et al. 2004a, b). It might also ex-plain why the last lap was run faster than the previousones for each runner, although one might expect thepresence of some peripheral muscle ‘‘fatigue’’ that wouldhave been more severe at the end of the 5 km than at thebeginning of the run. The AEMG and running velocityof all the runners increased during the final lap sug-gesting that, in spite of accumulated muscle fatigue, therunners were able to increase their muscle recruitmentand running velocity remarkably. The velocity of thefinal lap was related to the VMART but not to the VO2max
or running economy suggesting that neuromuscularcapacity to produce power is more decisive than oxygenutilization in distance running race during the final lap.Even though the decisive role of the central nervoussystem in distance running performance is obvious andlogical and supported by these findings, the notion thatit limits exercise to prevent jeopardizing the integrity ofthe organism remains unproven as yet (Lambert et al.2005; Noakes and St Clair Gibson 2004).
Collectively, these findings add further support forthe interpretation of the results of the training study(Paavolainen et al. 1999a) in which combined enduranceand explosive type strength training improved skeletalmuscle force–velocity characteristics and running econ-omy. It is likely that sprint type training improves motorunit recruitment and synchronization, illustrated byforce production and efficiency of running. In a recentstudy, trained cyclists performed sprint training bi-weekly for 4 weeks (Creer et al. 2004). The EMG datashowed that sprint stimulus was sufficient to improvemotor unit recruitment and synchronization. The au-thors suggested that the synchronization of motor unitsresults in force potentiation, which improves efficiencyand coordination. These authors also suggested that theimproved efficiency, due to neural alterations, may havedelayed the onset of fatigue.
In addition, the results of the present study supportfurther the idea that distance running performance andrunning economy are related to neuromuscular capacityto produce force and that the VMART can be used as adeterminant of distance running performance. Theseresults further support the hypothesis that the neuralcontrol and the ability of the neuromuscular system toproduce force and power provide additional informationto the energetic model of distance running performanceas presented by Di Prampero (1986, 2003) and Bassettand Howley (1997, 2000).
Acknowledgements The authors wish to thank Mr Matti Salonenfor his assistance in data collection and technical support. Thisresearch was supported by the grant from the Finnish Ministry ofEducation. The research of the MRC/UCT Research Unit forExercise Science and Sports Medicine is funded by the HarryCrossley and Nellie Atkinson Staff Research Funds of the Uni-versity of Cape Town, the Medical Research Council, the NationalResearch Foundation through the THRIP initiative and DiscoveryHealth.
References
Ansley L, Robson P, St Clair Gibson A, Noakes TD (2004a)Anticipatory pacing strategies during supramaximal exerciselasting longer than 30 s. Med Sci Sports Exerc 36:309–314
Ansley L, Schabort E, St Clair Gibson A, Lambert MI, Noakes TD(2004b) Regulation of pacing strategies during successive 4-kmtime trials. Med Sci Sports Exerc 36:1819–1825
Bassett DR, Howley ET (1997) Maximal oxygen uptake: classicalversus contemporary viewpoints. Med Sci Sports Exerc 29:591–603
Bassett DR, Howley ET (2000) Limiting factors for maximumoxygen uptake and determinants of endurance performance.Med Sci Sports Exerc 32:70–84
7

Conley DL, Krahenbuhl GS (1980) Running economy and distancerunning performance of highly trained athletes. Med Sci SportsExerc 12:357–360
Costill DL, Thomason H, Roberts E (1973) Fractional utilizationof the aerobic capacity during distance running. Med Sci SportsExerc 5:248–252
Creer AR, Ricard MD, Conlee RK, Hoyt GL, Parcell AC (2004)Neural, metabolic and performance adaptations to four weeksof high intensity sprint-interval training in trained cyclists. Int JSports Med 25:92–98
Davies CTM, Thompson MW (1979) Aerobic performance of fe-male marathon and male ultramarathon athletes. Eur J ApplPhysiol 41:233–245
Di Prampero PE (1986) The energy cost of human locomotion onland and water. Int J Sports Med 7:55–72
Di Prampero PE (2003) Factors limiting maximal performance inhumans. Eur J Appl Physiol 90:420–429
Durnin JV, Womersley J (1974) Body fat assessed from total bodydensity and its estimation from skinfold thickness: measure-ments on 481 men and women aged from 16 to 72 years. Br JNutr 32:77–97
Farrell PA, Wilmore JH, Coyle EF, Billing JE, Costill DL (1978)Plasma lactate accumulation and distance running perfor-mance. Med Sci Sports 11:338–344
Foster C, Costill DL, Daniels JT, Fink WJ (1978) Skeletal muscleenzyme activity, fibre composition and VO2max in relation todistance running performance. Eur J Appl Physiol 39:73–80
Hill AV, Lupton H (1923) Muscular exercise, lactic acid and thesupply and utilization of oxygen. Q J Med 16:135–171
Johnston RE, Quinn TJ, Kertzer R, Vroman NB (1997) Strengthtraining in female distance runners: impact on running econ-omy. J Strength Cond Res 11:224–229
Joyner MJ (1991) Modeling: optimal marathon performance on thebasis of physiological factors. J Appl Physiol 70:683–687
Kayser B (2003) Exercise starts and ends in the brain. Eur J ApplPhysiol 90:411–419
Lacour JR, Padilla-Magunacelaya S, Barthelemy JC, Dormois D(1990) The energetics of middle-distance running. Eur J ApplPhysiol 60:38–43
Lambert EV, St Clair Gibson A, Noakes TD (2005) Complexsystems model of fatigue: integrative homeostatic control ofperipheral physiological systems during exercise in humans. BrJ Sports Med 39:52–62
Londeree BR (1986) The use of laboratory test results with longdistance runners. Sports Med 3:201–213
Maxwell NS, Nimmo MA (1994) Anaerobic capacity in humans:validation of a maximal anaerobic running test against themaximal accumulated oxygen deficit. Clin Sci (Suppl BiochemExerc) 87:15–16
Morgan DW, Martin PE, Krahenbuhl GS (1989) Factors affectingrunning economy. Sports Med 7:310–330
Noakes TD (2000) Physiological models to understand exercisefatigue and the adaptations that predict or enhance athleticperformance. Scan J Med Sci Sports 10:123–145
Noakes TD, Peltonen JE, Rusko HK (2001) Evidence that a centralgovernor regulates exercise performance during acute hypoxiaand hyperoxia. J Exp Biol 204:3225–3234
Noakes TD, St Clair Gibson A (2004) Logical limitations to thecatastrophe models of fatigue during exercise in humans. Br JSports Med 38:648–649
Nummela A, Mero A, Stray-Gundersen J, Rusko H (1996)Important determinants of anaerobic running performance inmale athletes and non-athletes. Int J Sports Med 17(Suppl2):S91–S96
Paavolainen L, Hakkinen K, Hamalainen I, Nummela A, Rusko H(1999a) Explosive strength-training improves 5-km runningtime by improving running economy and muscle power. J ApplPhysiol 86:1527–1533
Paavolainen LM, Nummela AT, Rusko HK (1999b) Neuromus-cular characteristics and muscle power as determinants of 5-kmrunning performance. Med Sci Sports Exerc 31:124–130
Paavolainen L, Nummela A, Rusko K, Hakkinen K (1999c)Neuromuscular characteristics and fatigue during 10-km run-ning. Int J Sports Med 20:1–6
Paavolainen LM, Nummela AT, Rusko HK (2000) Muscle powerfactors and VO2max as determinants of horizontal and uphillrunning performance. Scand J Sci Sports 10:286–291
Rusko H, Nummela A (1996) Measurement of maximal and sub-maximal anaerobic power. Int J Sports Med 17(Suppl 2):S89–S130
Rusko H, Nummela A, Mero A (1993) A new method for theevaluation of anaerobic running power in athletes. Eur J ApplPhysiol 66:97–101
Scrimgeour AG, Noakes TD, Adams B, Myburgh KH (1986) Theinfluence of weekly training distance on fractional utilization ofmaximum aerobic capacity in marathon and ultramarathonrunners. Eur J Appl Physiol 55:202–209
St Clair Gibson A, Noakes TD (2004) Evidence for complex systemintegration and dynamic neural regulation of skeletal musclerecruitment during exercise in humans. Br J Sports Med38:797–806
Viitasalo JT, Luhtanen P, Mononen HV, Norvapalo K, Paavo-lainen L, Salonen M (1997) Photocell contact mat: a newinstrument to measure contact and flight times in running. JAppl Biomech 13:254–266
8