neonatal outcome associated with singleton birth at 34-41 weeks of gestation
TRANSCRIPT

For Review O
nly
Neonatal outcome associated with singleton birth at 34 to 41 weeks of gestation.
Journal: International Journal of Epidemiology
Manuscript ID: IJE-2009-06-0485.R1
Manuscript Type: Original Article
Date Submitted by the Author:
19-Jan-2010
Complete List of Authors: GOUYON, Jean Bernard; CHU du Bocage, Service de Pédiatrie; Université de Bourgogne, Centre d'Epidémiologie des Populations, EA 4184 VINTEJOUX, Amelie; CHU du Bocage, Service de Pédiatrie SAGOT, Paul; CHU du Bocage, Service d'Obstétrique BURGUET, Antoine; CHU du Bocage, Service de Pédiatrie; Université de Bourgogne, Inserm, CIE1, Centre d’Investigation Clinique - Epidémiologie Clinique/Essais Cliniques QUANTIN, Catherine; CHU du Bocage, Service de Biostatistiques et d'Informatique Médicale FERDYNUS, Cyril; Université de Bourgogne, Centre d'Epidémiologie des Populations, EA 4184
Key Words: Late-preterm, respiratory disorders, poor prognosis, early-term, late-term, mortality
peer
-005
7796
0, v
ersi
on 1
- 18
Mar
201
1Author manuscript, published in "International Journal of Epidemiology (2010)"
DOI : 10.1093/ije/DYQ037

For Review O
nly
1
Neonatal outcome associated with singleton birth at 34 to 41 weeks of
gestation.
*†Gouyon JB MD, PHD, *Vintejoux A MD, **†Sagot P MD, PHD, *§Burguet A MD, PHD,
***Quantin C MD, PHD, †***Ferdynus C MS, and the Burgundy Perinatal Network.
From the:
*Pediatrics Department, **Obstetrics Department; ***Department of Biostatistics, CHU de
Dijon, 10 boulevard Maréchal de Lattre de Tassigny, 21079 Dijon cedex, France.
† Centre d'Epidémiologie des Populations, EA 4184, Université de Bourgogne, Dijon, F-
21000, France.
§ Inserm, CIE1, Dijon, F-21000, France ; CHRU Dijon, Centre d’Investigation Clinique -
Epidémiologie Clinique/Essais Cliniques, Dijon, F-21000, France ; Université de Bourgogne,
Dijon, F-21000, France.
Address for correspondence: Jean-Bernard Gouyon, MD, Service de Pédiatrie 2, CHU de
Dijon, 10 boulevard Maréchal de Lattre de Tassigny, 21079 Dijon cedex, France.
E-mail: [email protected]
Short running head: outcome of late-preterm and early-term neonates.
Page 1 of 22
123456789101112131415161718192021222324252627282930313233343536373839404142434445464748495051525354555657585960
peer
-005
7796
0, v
ersi
on 1
- 18
Mar
201
1
For Review O
nly
2
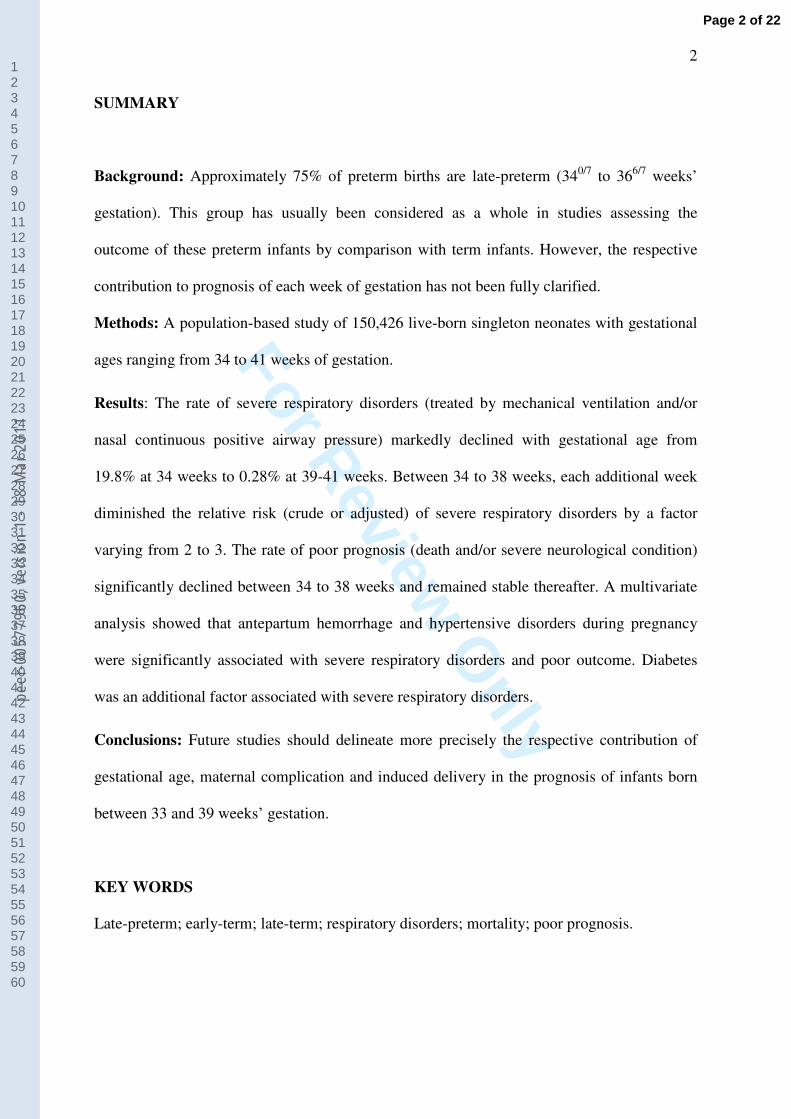
SUMMARY
Background: Approximately 75% of preterm births are late-preterm (340/7
to 366/7
weeks’
gestation). This group has usually been considered as a whole in studies assessing the
outcome of these preterm infants by comparison with term infants. However, the respective
contribution to prognosis of each week of gestation has not been fully clarified.
Methods: A population-based study of 150,426 live-born singleton neonates with gestational
ages ranging from 34 to 41 weeks of gestation.
Results: The rate of severe respiratory disorders (treated by mechanical ventilation and/or
nasal continuous positive airway pressure) markedly declined with gestational age from
19.8% at 34 weeks to 0.28% at 39-41 weeks. Between 34 to 38 weeks, each additional week
diminished the relative risk (crude or adjusted) of severe respiratory disorders by a factor
varying from 2 to 3. The rate of poor prognosis (death and/or severe neurological condition)
significantly declined between 34 to 38 weeks and remained stable thereafter. A multivariate
analysis showed that antepartum hemorrhage and hypertensive disorders during pregnancy
were significantly associated with severe respiratory disorders and poor outcome. Diabetes
was an additional factor associated with severe respiratory disorders.
Conclusions: Future studies should delineate more precisely the respective contribution of
gestational age, maternal complication and induced delivery in the prognosis of infants born
between 33 and 39 weeks’ gestation.
KEY WORDS
Late-preterm; early-term; late-term; respiratory disorders; mortality; poor prognosis.
Page 2 of 22
123456789101112131415161718192021222324252627282930313233343536373839404142434445464748495051525354555657585960
peer
-005
7796
0, v
ersi
on 1
- 18
Mar
201
1
For Review O
nly
3
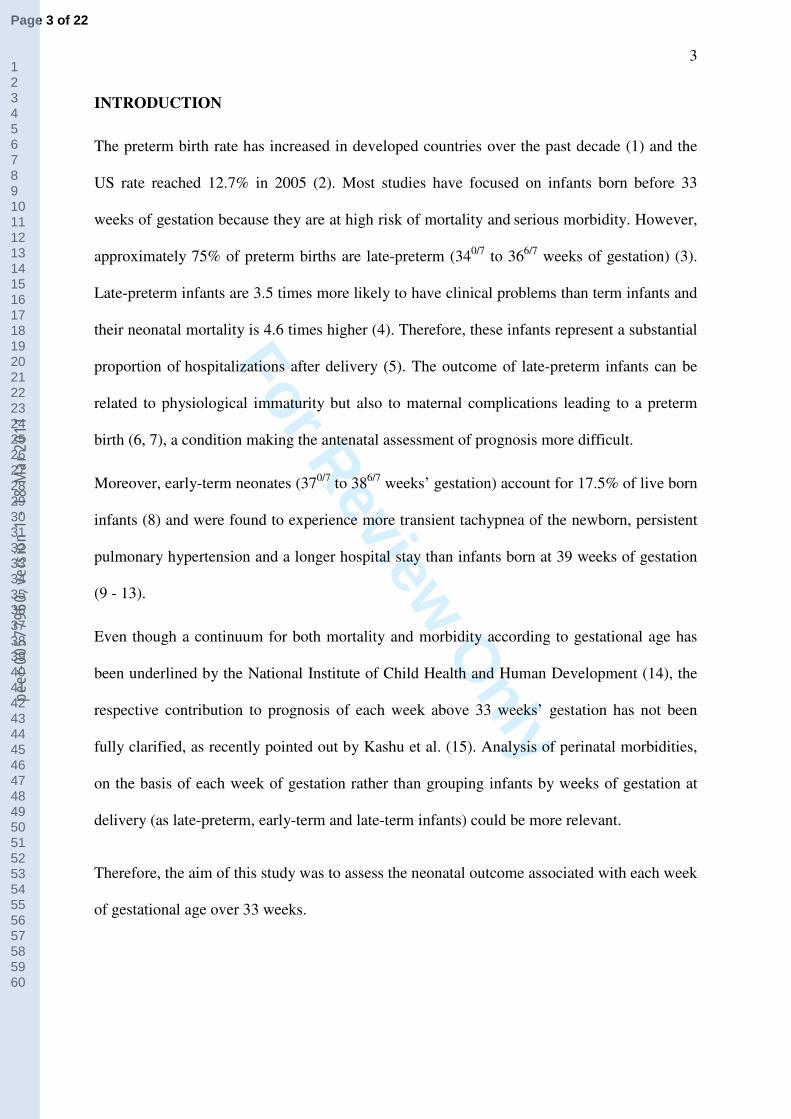
INTRODUCTION
The preterm birth rate has increased in developed countries over the past decade (1) and the
US rate reached 12.7% in 2005 (2). Most studies have focused on infants born before 33
weeks of gestation because they are at high risk of mortality and serious morbidity. However,
approximately 75% of preterm births are late-preterm (340/7
to 366/7
weeks of gestation) (3).
Late-preterm infants are 3.5 times more likely to have clinical problems than term infants and
their neonatal mortality is 4.6 times higher (4). Therefore, these infants represent a substantial
proportion of hospitalizations after delivery (5). The outcome of late-preterm infants can be
related to physiological immaturity but also to maternal complications leading to a preterm
birth (6, 7), a condition making the antenatal assessment of prognosis more difficult.
Moreover, early-term neonates (370/7
to 386/7
weeks’ gestation) account for 17.5% of live born
infants (8) and were found to experience more transient tachypnea of the newborn, persistent
pulmonary hypertension and a longer hospital stay than infants born at 39 weeks of gestation
(9 - 13).
Even though a continuum for both mortality and morbidity according to gestational age has
been underlined by the National Institute of Child Health and Human Development (14), the
respective contribution to prognosis of each week above 33 weeks’ gestation has not been
fully clarified, as recently pointed out by Kashu et al. (15). Analysis of perinatal morbidities,
on the basis of each week of gestation rather than grouping infants by weeks of gestation at
delivery (as late-preterm, early-term and late-term infants) could be more relevant.
Therefore, the aim of this study was to assess the neonatal outcome associated with each week
of gestational age over 33 weeks.
Page 3 of 22
123456789101112131415161718192021222324252627282930313233343536373839404142434445464748495051525354555657585960
peer
-005
7796
0, v
ersi
on 1
- 18
Mar
201
1
For Review O
nly
4
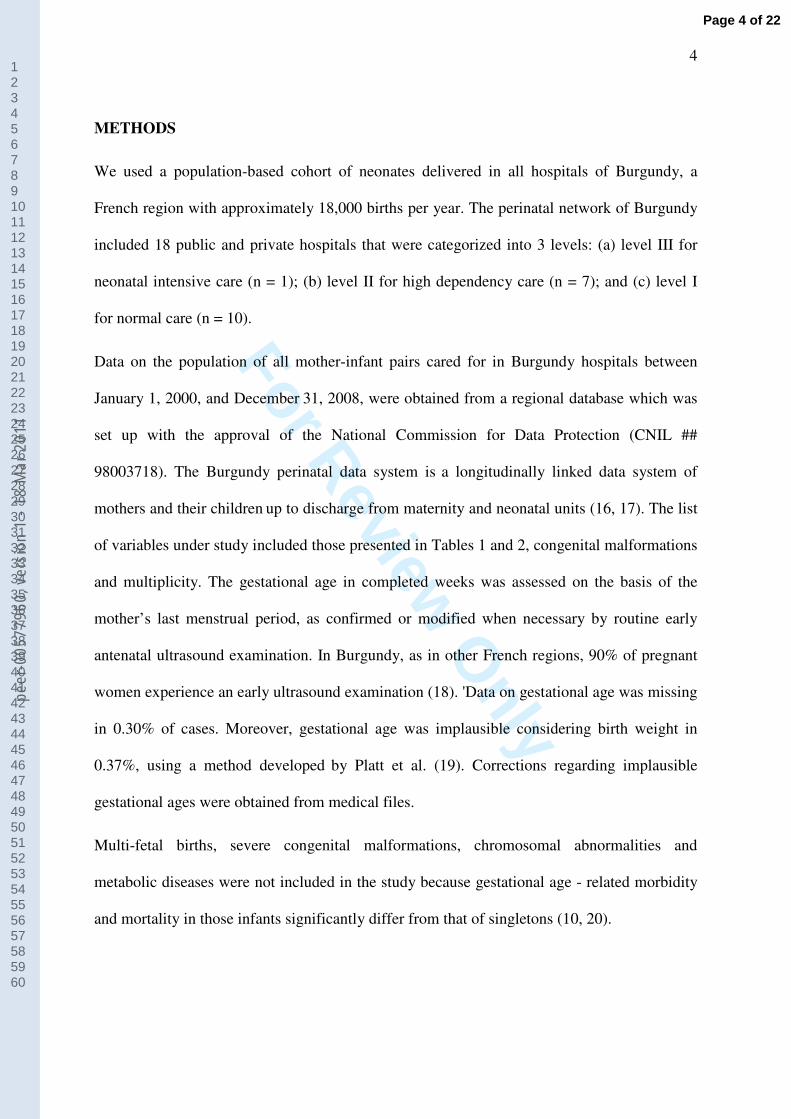
METHODS
We used a population-based cohort of neonates delivered in all hospitals of Burgundy, a
French region with approximately 18,000 births per year. The perinatal network of Burgundy
included 18 public and private hospitals that were categorized into 3 levels: (a) level III for
neonatal intensive care (n = 1); (b) level II for high dependency care (n = 7); and (c) level I
for normal care (n = 10).
Data on the population of all mother-infant pairs cared for in Burgundy hospitals between
January 1, 2000, and December 31, 2008, were obtained from a regional database which was
set up with the approval of the National Commission for Data Protection (CNIL ##
98003718). The Burgundy perinatal data system is a longitudinally linked data system of
mothers and their children up to discharge from maternity and neonatal units (16, 17). The list
of variables under study included those presented in Tables 1 and 2, congenital malformations
and multiplicity. The gestational age in completed weeks was assessed on the basis of the
mother’s last menstrual period, as confirmed or modified when necessary by routine early
antenatal ultrasound examination. In Burgundy, as in other French regions, 90% of pregnant
women experience an early ultrasound examination (18). 'Data on gestational age was missing
in 0.30% of cases. Moreover, gestational age was implausible considering birth weight in
0.37%, using a method developed by Platt et al. (19). Corrections regarding implausible
gestational ages were obtained from medical files.
Multi-fetal births, severe congenital malformations, chromosomal abnormalities and
metabolic diseases were not included in the study because gestational age - related morbidity
and mortality in those infants significantly differ from that of singletons (10, 20).
Page 4 of 22
123456789101112131415161718192021222324252627282930313233343536373839404142434445464748495051525354555657585960
peer
-005
7796
0, v
ersi
on 1
- 18
Mar
201
1
For Review O
nly
5
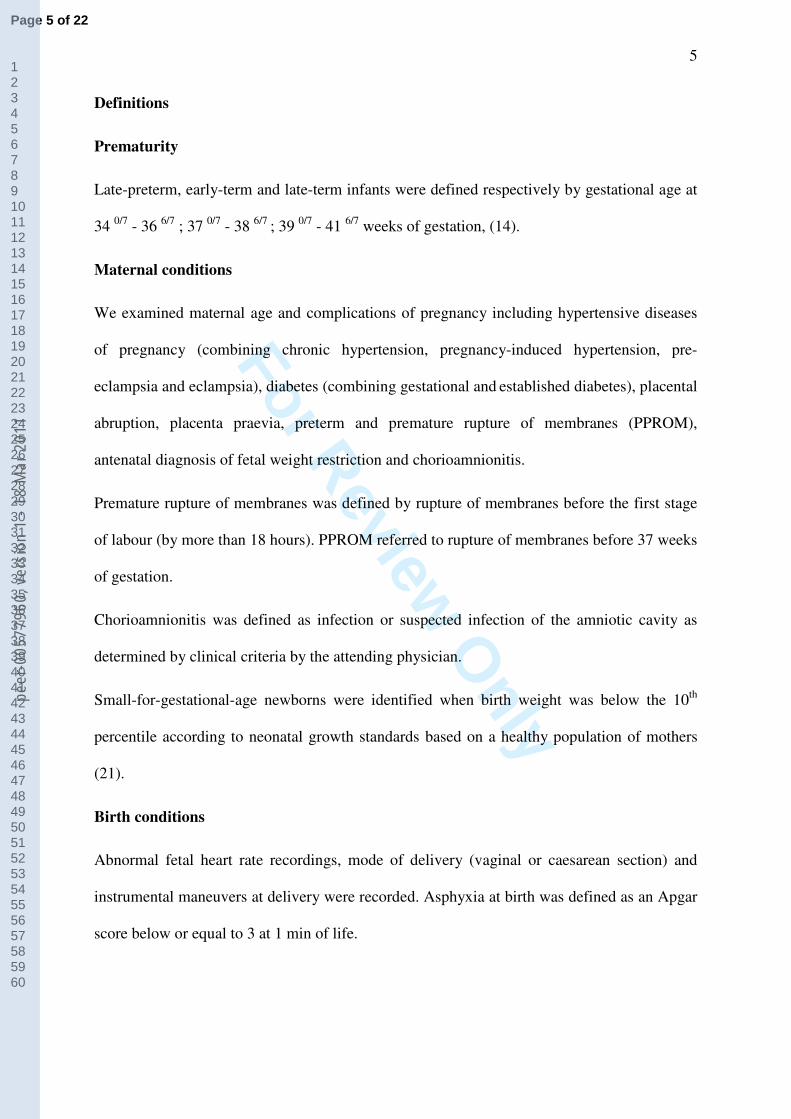
Definitions
Prematurity
Late-preterm, early-term and late-term infants were defined respectively by gestational age at
34 0/7
- 36 6/7
; 37 0/7
- 38 6/7
; 39 0/7
- 41 6/7
weeks of gestation, (14).
Maternal conditions
We examined maternal age and complications of pregnancy including hypertensive diseases
of pregnancy (combining chronic hypertension, pregnancy-induced hypertension, pre-
eclampsia and eclampsia), diabetes (combining gestational and established diabetes), placental
abruption, placenta praevia, preterm and premature rupture of membranes (PPROM),
antenatal diagnosis of fetal weight restriction and chorioamnionitis.
Premature rupture of membranes was defined by rupture of membranes before the first stage
of labour (by more than 18 hours). PPROM referred to rupture of membranes before 37 weeks
of gestation.
Chorioamnionitis was defined as infection or suspected infection of the amniotic cavity as
determined by clinical criteria by the attending physician.
Small-for-gestational-age newborns were identified when birth weight was below the 10th
percentile according to neonatal growth standards based on a healthy population of mothers
(21).
Birth conditions
Abnormal fetal heart rate recordings, mode of delivery (vaginal or caesarean section) and
instrumental maneuvers at delivery were recorded. Asphyxia at birth was defined as an Apgar
score below or equal to 3 at 1 min of life.
Page 5 of 22
123456789101112131415161718192021222324252627282930313233343536373839404142434445464748495051525354555657585960
peer
-005
7796
0, v
ersi
on 1
- 18
Mar
201
1
For Review O
nly
6
Outcomes
Poor prognosis was defined at the end of neonatal hospitalization by death and/or severe
neurological condition (ischemic encephalopathy; intraventricular hemorrhage grades 3-4
according to Papile et al. (22) and/or cystic periventricular leukomalacia in preterm infants
and/or seizures). Transfontanelar echography was systematically performed in newborns with
neurological symptoms.
Severe respiratory disorder was defined as a respiratory distress treated by mechanical
ventilation and/or nasal continuous positive airway pressure.
Statistical Analyses
Qualitative variables were presented as percentages and continuous variables as mean and
standard deviations. Bivariate analyses were conducted using chi-square test or Fisher’s exact
test for comparisons of percentages, and Student’s t-test or Mann-Whitney’s test for
comparisons of means.
Multivariate analyses were conducted using modified Poisson regression models (23) with
correction for overdispersion, separately for each outcome. The final multivariate models
were obtained using backward selection procedure. The covariates with a p-value ≤ 0.20 in
bivariate analyses, and covariates considered as risk factors in the literature, were included in
the initial model, and removed if they did not reach a p-value below 0.05. First order
interactions between each covariate were systematically tested in the final models and
excluded if they did not reach statistical significance at alpha level of 0.05. Crude and
adjusted relative risks (cRR and aRR, respectively) and their 95% Confidence Intervals (CI)
were estimated.
Statistical analyses were performed using SAS 8.2 (SAS Institute Inc).
Page 6 of 22
123456789101112131415161718192021222324252627282930313233343536373839404142434445464748495051525354555657585960
peer
-005
7796
0, v
ersi
on 1
- 18
Mar
201
1
For Review O
nly
7
RESULTS
Among 161,748 neonates born during the study period, 6,083 (3.76%) were excluded
for gestational age at delivery of less than 340/7
weeks or more than 416/7
weeks, 384 (0.24%)
for stillbirth, 298 (0.18%) for major fetal anomaly, 4,166 (2.58%) for multiple births and 391
(0.24%) for lack of information on neonatal outcome. Overall, 150,426 newborns were
included in this study.
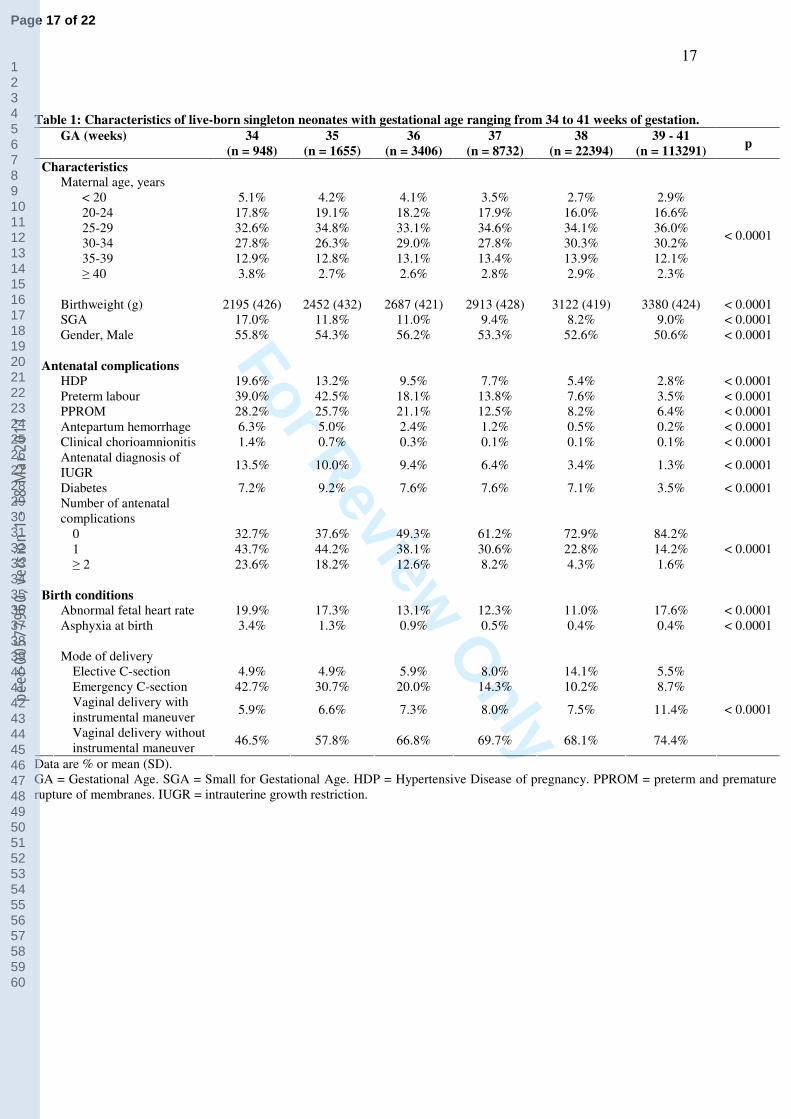
Table 1 shows the characteristics of the study population. Late-preterm, early-term and
late-term infants represented respectively 4.0%, 20.7% and 75.3% of the study population,.
The incidence of all antenatal complications declined linearly from 34 to 39-41 weeks of
gestation. The incidence of mothers without gestational complication was significantly
different among the late-preterm, early-term and late-term groups (43.4% vs 69.6% vs 84.2%,
p < 0.0001). Gestational age was positively correlated with vaginal delivery with or without
instrumental maneuver and negatively correlated with emergency caesarean section (p <
0.0001).
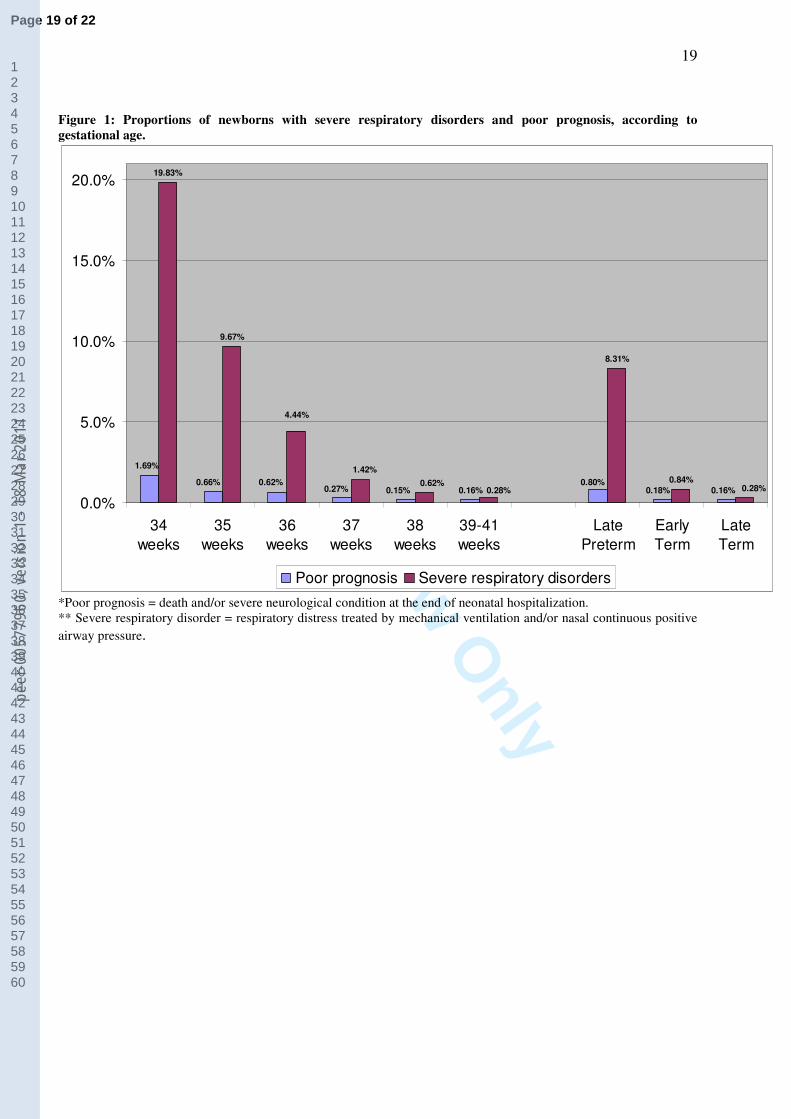
Figure 1 shows the rates of severe respiratory disorders and poor prognosis for each
week of gestational age. A poor prognosis was recorded in 0.80% of late-preterm infants,
0.18% of early-term infants and 0.16% of late-term infants (p < 0.0001). When examining
each week of gestation, the rate of poor prognosis significantly declined from 1.69% at 34
weeks to 0.27% at 37 weeks and remained stable thereafter. The rate of severe respiratory
disorders was 8.3% of late-preterm, 0.84% of early-term and 0.28% of late-term infants (p <
0.0001) . Furthermore, the rate of severe respiratory disorders continuously declined with
gestational age from 19.8% at 34 weeks to 0.28% at 39-41 weeks.
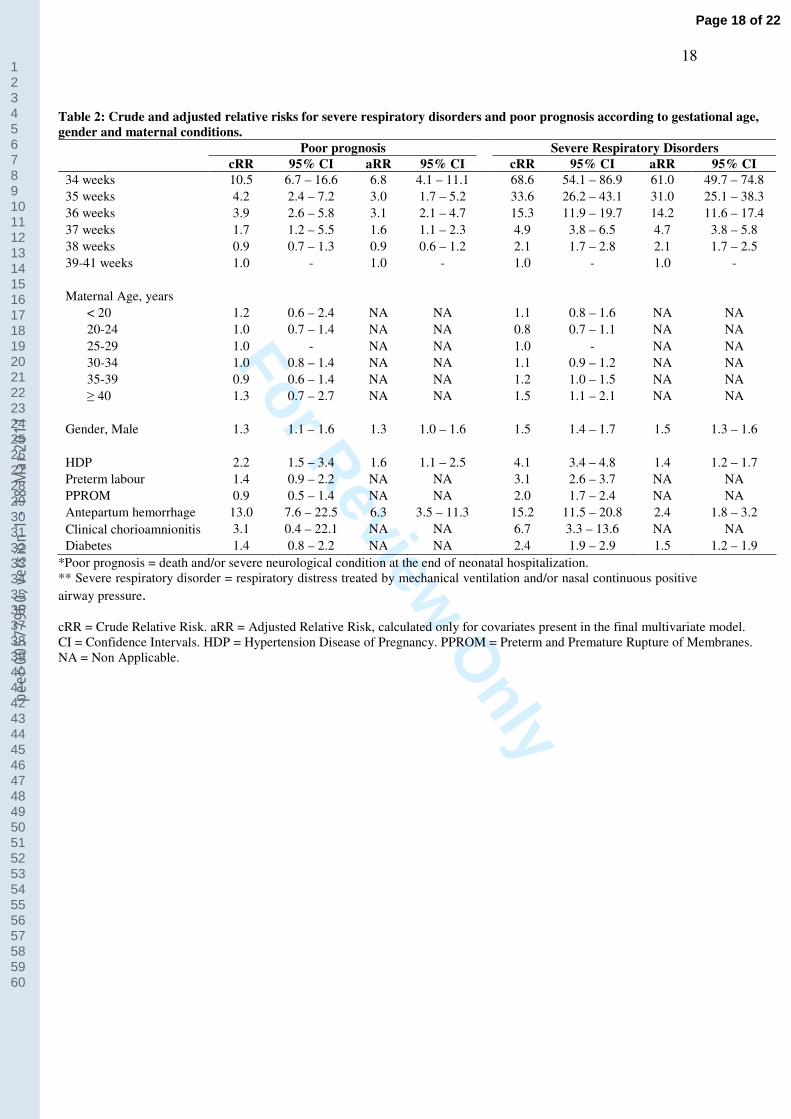
Table 2 shows crude and adjusted relative risks for the two outcomes. Between 34 and
37 weeks of gestation, the risk of poor prognosis gradually diminished, but nevertheless
remained higher than for infants born at 39-41 weeks of gestational age. Even after
Page 7 of 22
123456789101112131415161718192021222324252627282930313233343536373839404142434445464748495051525354555657585960
peer
-005
7796
0, v
ersi
on 1
- 18
Mar
201
1
For Review O
nly
8
adjustment for antenatal diseases, the risk of poor prognosis was higher (aRR= 1.6; 95% CI =
1.1 – 2.3) at 37 weeks of gestation compared with infants born at 39-41 weeks. The adjusted
relative risk for poor prognosis was 3.6 (95 % CI: 2.5 – 5.3) in late-preterm infants and 1.1
(95% CI: 0.8 – 1.4) in early-term infants, compared with the late-term infants.
Between 34 and 38 weeks, each additional week decreased the relative risk (crude or
adjusted) of severe respiratory disorders by a factor varying from 2 to 3 (Table 2). The
adjusted relative risk for severe respiratory disorders was 23.9 (95% CI: 20.5 – 27.8) in late-
preterm infants and 2.7 (95% CI: 2.3 – 3.2) in early-term, compared with late-term infants.
Poor prognosis was associated with severe respiratory disorders in 37.5% for late-
preterm, 37.5% for early-term and 19.7% for late-term infants. The rate of poor prognosis
among the neonates with severe respiratory disorders was 6.8% versus 0.1% in infants
without respiratory disorders (p < 0.0001).
The rate of hospitalization at birth was: 96.9% at 34 weeks of gestational age; 80.1% at
35 weeks; 43.2% at 36 weeks; 17.8% at 37 weeks; 8.8% at 38 weeks and 5.8% at 39-41
weeks (p < 0.0001).
DISCUSSION
This study confirmed that late-preterm infants (340/7
to 366/7
WG) were more likely to
have severe respiratory disorders (i.e. treated with ventilator and/or nasal continuous positive
airway pressure) and poor prognosis than late-term infants born at 39-41 weeks of gestation.
Furthermore, this study provided important additional information showing that: birth at 37
weeks of gestation was associated with an increased incidence of poor prognosis; infants born
at 37 and 38 weeks of gestation were at increased risk of severe respiratory disorders; up until
Page 8 of 22
123456789101112131415161718192021222324252627282930313233343536373839404142434445464748495051525354555657585960
peer
-005
7796
0, v
ersi
on 1
- 18
Mar
201
1
For Review O
nly
9
39 weeks of gestation, each additional week contributed to improve the clinical condition of
the newborns.
The strengths of this study lie in the large population-based cohort of infants and an analysis
by week of gestation. However, its limitation was the retrospective analysis of maternal and
neonatal data, collected prospectively. That condition was previously associated with a lack of
sufficient information on antenatal corticosteroids (1). The 9 year-period of this study might
have been associated with slight changes in clinical practice. However, the study period has
not been associated with overt changes in clinical practice or changes in the distribution of
gestational age in this regional population.
In this study, the incidence of severe respiratory conditions steadily decreased from the late-
preterm group (8.3%), to the early-term group (0.84%) and to the late-term group (0.28%).
This data matches the gestational age-related decline in incidence of respiratory disorders
(respiratory distress syndrome, transient tachypnea of the newborn, persistent pulmonary
hypertension) and need for mechanical ventilation reported in previous epidemiological
studies (11; 24 - 27). This trend may be illustrated by comparison to incidences recorded in
the United States (26) and Italy (27): respectively 20.6% and 22.1% among babies born at 33-
34 weeks; 7.3 and 8.3% at 35-36 weeks; 0.6 and 2.9% at 37-42 weeks.
Compared to at term infants (37-40 weeks), the occurrence of respiratory distress has been
previously evaluated at 4.5-fold higher in the 33-36 week infants (15) and even at 9.1-fold
higher in the 35-36 week infants (25). Compared with late-term infants (39-41 weeks), the
adjusted relative risk for severe respiratory disorders in this study was 2.7 in early-term and
23.9 in late-preterm infants. These results suggest that the risk for respiratory morbidity in
late-preterm infants has been previously underestimated because early-term infants were
included in the control group.
Page 9 of 22
123456789101112131415161718192021222324252627282930313233343536373839404142434445464748495051525354555657585960
peer
-005
7796
0, v
ersi
on 1
- 18
Mar
201
1
For Review O
nly
10
This study also showed that the rate of severe respiratory diseases approximately doubled for
each reduced week of gestation from 39 to 34 weeks. Similarly, Shapiro-Mendoza et al. (7)
also observed that the rate of life-threatening conditions doubled for each reduced week of
gestation before 38 weeks’ gestation. The Kaiser Permanente Cohort showed that an increased
risk of respiratory disease was associated with decreasing gestational age before 37 weeks (9),
while our cohort disclosed that an increased risk of severe respiratory disease was still
apparent at 38 weeks. These overall data strongly support that birth before 39 weeks of
gestation cannot be considered as low-risk, and emphasize the need to consider each week of
gestation separately.
This study found that the incidence of poor prognosis (severe neurological disease and/or
death) was not higher at 38 weeks, while it increased steadily below 38. Furthermore, a 3.5-
fold higher poor prognosis was observed in the late-preterm group compared to the late-term
group. Sources from Canada (29), the Unites States and Europe (15, 30 - 32) disclosed
comparable profiles for gestation-specific neonatal mortality rates. For instance, a Canadian
study (15) found that the neonatal mortality rate was 5.5 times higher in a 33-36 week group
compared with a 37-40 week group. Another study (30) highlighted that mortality in the late-
preterm group contributed to 10 % of overall neonatal mortality, a finding close to the 12.2%
observed in the Burgundy population (personal data).
Recently, Shapiro-Mendoza et al. (7) contributed important information by showing that both
late-preterm birth and, to a lesser extent, maternal medical conditions are each independent
risk factors for severe newborn morbidity, especially when late-preterm infants have been
exposed to antepartum hemorrhage and hypertensive disorders of pregnancy. Using a more
precise classification of clinical neonatal conditions, our study confirmed that antepartum
hemorrhage and hypertensive disorders of pregnancy were associated with severe respiratory
Page 10 of 22
123456789101112131415161718192021222324252627282930313233343536373839404142434445464748495051525354555657585960
peer
-005
7796
0, v
ersi
on 1
- 18
Mar
201
1
For Review O
nly
11
disorders and poor prognosis. Diabetes was an additional factor associated with severe
respiratory distress.
The need for admission in a neonatal unit linearly increased from 39-41 weeks of gestational
age (5.8%) to 37 weeks (17.8%) and to 34 weeks (96.9%). Similarly, a large epidemiological
study conducted in the United States previously found an increase in the neonatal unit
admission rate from 2.6% in infants born at 38-40 weeks to 12% at 37 weeks of gestation and
88% at 34 weeks (5). It can be assumed that the differences in absolute rates of admission
between the studies may result from different care systems at national or regional levels.
Page 11 of 22
123456789101112131415161718192021222324252627282930313233343536373839404142434445464748495051525354555657585960
peer
-005
7796
0, v
ersi
on 1
- 18
Mar
201
1
For Review O
nly
12
CONCLUSIONS
This study confirmed that late-preterm infants are a population at risk of increased respiratory
morbidity and poor prognosis, while an intermediate risk of respiratory morbidity was
observed in the early-term infants. Therefore birth at 37 and 38 weeks of gestation is not low-
risk for the newborn, and this information should lead to avoidance of caesarean section or
labor induction without medical indication in early-term infants as well as in late-preterm
infants.
The continuous pattern of improvement from one week to the following is a limitation of the
current terminology which delineates late-preterm, early-term and late-term infants. Future
studies should identify more precisely the respective contribution of each week of gestation,
of maternal complications and of induced delivery in the prognosis of infants born between 34
and 39 weeks of gestation.
Page 12 of 22
123456789101112131415161718192021222324252627282930313233343536373839404142434445464748495051525354555657585960
peer
-005
7796
0, v
ersi
on 1
- 18
Mar
201
1

For Review O
nly
13
REFERENCES
1. Engle WA, Kominiarek MA. Late preterm infants, early term infants, and timing of elective
deliveries. Clin Perinatol 2008; 35: 325-41.
2. Martin JA, Hamilton BE, Sutton PD et al. Births: final data for 2005. Natl Vital Stat Rep
2007; 56: 1-104.
3. Davidoff MJ, Dias T, Damus K, et al. Changes in the gestational age distribution among
U.S. singleton births: impact on rates of late-preterm birth, 1992 to 2002. Semin Perinatol
2006; 30: 8-15.
4. Engle WA, Tomashek KM, Wallman C; Committee on Fetus and Newborn, American
Academy of Pediatrics. “Late-preterm” infants: a population at risk. Pediatrics 2007; 120:
1390-1401.
5. Escobar GJ, Greene JD, Hulac P et al. Rehospitalisation after birth hospitalisation: patterns among
infants of all gestations. Arch Dis Child 2005; 90: 125-31.
6. Raju TNK. Late-preterm births: challenges and opportunities. Pediatrics 2008; 121:402-3.
7. Shapiro-Mendoza CK, Tomashek KM, Kotelchuck M, et al. Effect of late-preterm birth and
maternal medical conditions on newborn morbidity risk. Pediatrics 2008; 121: e223-32
8. Hankins GDV, Clark S, Munn MB. Cesarean section on request at 39 weeks: impact on
shoulder dystocia, fetal trauma, neonatal encephalopathy, and intrauterine fetal demise. Semin
Perinatol 2006; 30: 276-87.
Page 13 of 22
123456789101112131415161718192021222324252627282930313233343536373839404142434445464748495051525354555657585960
peer
-005
7796
0, v
ersi
on 1
- 18
Mar
201
1
For Review O
nly
14
9. Shapiro-Mendoza CK, Tomashek KM, Kotelchuck M, Barfield W, Weiss J, Evans S. Risk
factors for neonatal morbidity and mortality among "healthy," late-preterm newborns. Semin
Perinatol 2006; 30: 54-60.
10. McIntire DD, Leveno KJ. Neonatal mortality and morbidity rates in late-preterm births
compared with births at term. Obstet Gynecol 2008; 111: 35-41.
11. Madar J, Richmond S, Hey E. Surfactant-deficient respiratory distress after elective
delivery at 'term'. Acta Paediatr 1999; 88: 1244-48
12. Jain L. Morbidity and mortality in late-preterm infants: more than just transient
tachypnea! J Pediatr 2007; 151: 445-6.
13. Sutton L, Sayer GP, Bajuk B, Richardson V, Berry G, Henderson-Smart DJ. Do very sick
neonates born at term have antenatal risks ? 2. Infants ventilated primarily for lung disease.
Acta Obstet Gynecol Scand 2001; 80: 917-25.
14. Raju TN, Higgins RD, Stark AR, Leveno KJ. Optimizing care and outcome for late-
preterm (near-term) infants: a summary of the workshop sponsored by the National Institute
of Child Health and Human Development. Pediatrics 2008; 118: 1207-14.
15. Khashu M, Narayanan M, Bhargava S, Osiovich O. Perinatal outcomes associated with
preterm birth at 33 to 36 weeks’gestation: a population-based cohort study. Pediatrics 2009;
123: 109-13.
16. Cornet B, Gouyon JB, Binquet C, et al. Using discharge abstracts as a tool to assess a
regional perinatal network. Rev Epidemiol Sante Publique 2001; 49: 583-93.
Page 14 of 22
123456789101112131415161718192021222324252627282930313233343536373839404142434445464748495051525354555657585960
peer
-005
7796
0, v
ersi
on 1
- 18
Mar
201
1
For Review O
nly
15
17. Quantin C, Gouyon B, Avillach P, Ferdynus C, Sagot P, Gouyon JB. Using discharge
abstracts to evaluate a regional perinatal network: assessment of the linkage procedure of
anonymous data. Int J Telemed Appl. 2009 ; 2009: 181842.
18. Blondel B SK, Du Mazaubrun C. Résultats des enquêtes périnatales. J Gynecol Obstet
Biol Reprod 2006 ; 35 : 373-87
19. Platt R., Abrahamowicz M., Kramer M. et al. Detecting and eliminating erroneous
gestational ages: a normal mixture model. Stat Med 2001; 20: 3491-503.
20. Young PC, Glasgow TS, Li X, Guest-Warnick G, Stoddard G. Mortality of late-preterm
(near-term) newborns in Utah. Pediatrics 2007; 119: e659-65.
21 Ferdynus C, Quantin C, Abrahamowicz M, et al. Can birth weight standards based on
healthy populations improve the identification of small-for-gestational-age newborns at risk
of adverse neonatal outcomes? Pediatrics. 2009; 123:723-30.
22. Papile LA, Burstein J, Burstein R, Koffler H. Incidence and evolution of subependymal
and intraventricular hemorrhage: a study of infants with birthweight less than 1500 gm. J
Pediatr 1978;92:529-34.
23. Zou G. A modified poisson regression approach to prospective studies with binary data.
Am J Epidemiol 2004; 159: 702-6.
24. Gouyon JB, Ribakovsky C, Ferdynus C et al. Severe respiratory disorders in term
neonates. Paediatr Perinat Epidemiol 2008; 22 :22-30.
25. Wang ML, Dorer DJ, Fleming MP, Catlin EA. Clinical outcomes of near-term infants.
Pediatrics 2004; 114: 372-6.
Page 15 of 22
123456789101112131415161718192021222324252627282930313233343536373839404142434445464748495051525354555657585960
peer
-005
7796
0, v
ersi
on 1
- 18
Mar
201
1
For Review O
nly
16
26. Escobar GJ, Clark RH, Greene JD. Short-term outcomes of infants born at 35 and 36
weeks gestation: we need to ask more questions. Semin Perinatol 2006; 30: 28-33.
27. Rubaltelli FF, Bonafe L, Tangucci M, Spagnolo A, Dani C. Epidemiology of neonatal
acute respiratory disorders. A multicenter study on incidence and fatality rates of neonatal
acute respiratory disorders according to gestational age, maternal age, pregnancy
complications and type of delivery. Italian Group of Neonatal Pneumology. Biol Neonate
1998; 74: 7-15
28. Darcy AE. Complications of the late preterm infant. J Perinat Neonat Nurs 2009; 23: 78-
86.
29. Kramer MS, Demissie K, Yang H, Platt RW, Sauve R, Liston R. The contribution of mild
and moderate preterm birth to infant mortality. Fetal and Infant Health Study Group of the
Canadian Perinatal Surveillance System. JAMA 2000; 284: 843-9.
30. Joseph K, Liu S, Demissie K et al. A parsimonious explanation for intersecting perinatal
mortality curves: understanding the effect of plurality and of parity. BMC Pregnancy
Childbirth. 2003; 3: 3.
31. Hilder L, Costeloe K, Thilaganathan B. Prolonged pregnancy: evaluating gestation-
specific risks of fetal and infant mortality. Br J Obstet Gynaecol 1998; 105: 169-73.
32. Alexander GR, Kogan M, Bader D, Carlo W, Allen M, Mor J. US birth weight/gestational
age-specific neonatal mortality: 1995-1997 rates for whites, hispanics, and blacks. Pediatrics
2003; 111 (1): e61-6.
Page 16 of 22
123456789101112131415161718192021222324252627282930313233343536373839404142434445464748495051525354555657585960
peer
-005
7796
0, v
ersi
on 1
- 18
Mar
201
1
For Review O
nly
17
Table 1: Characteristics of live-born singleton neonates with gestational age ranging from 34 to 41 weeks of gestation.
GA (weeks) 34
(n = 948)
35
(n = 1655)
36
(n = 3406)
37
(n = 8732)
38
(n = 22394)
39 - 41
(n = 113291) p
Characteristics
Maternal age, years
< 20 5.1% 4.2% 4.1% 3.5% 2.7% 2.9%
20-24 17.8% 19.1% 18.2% 17.9% 16.0% 16.6%
25-29 32.6% 34.8% 33.1% 34.6% 34.1% 36.0%
30-34 27.8% 26.3% 29.0% 27.8% 30.3% 30.2%
35-39 12.9% 12.8% 13.1% 13.4% 13.9% 12.1%
≥ 40 3.8% 2.7% 2.6% 2.8% 2.9% 2.3%
< 0.0001
Birthweight (g) 2195 (426) 2452 (432) 2687 (421) 2913 (428) 3122 (419) 3380 (424) < 0.0001
SGA 17.0% 11.8% 11.0% 9.4% 8.2% 9.0% < 0.0001
Gender, Male 55.8% 54.3% 56.2% 53.3% 52.6% 50.6% < 0.0001
Antenatal complications
HDP 19.6% 13.2% 9.5% 7.7% 5.4% 2.8% < 0.0001
Preterm labour 39.0% 42.5% 18.1% 13.8% 7.6% 3.5% < 0.0001
PPROM 28.2% 25.7% 21.1% 12.5% 8.2% 6.4% < 0.0001
Antepartum hemorrhage 6.3% 5.0% 2.4% 1.2% 0.5% 0.2% < 0.0001
Clinical chorioamnionitis 1.4% 0.7% 0.3% 0.1% 0.1% 0.1% < 0.0001
Antenatal diagnosis of
IUGR 13.5% 10.0% 9.4% 6.4% 3.4% 1.3% < 0.0001
Diabetes 7.2% 9.2% 7.6% 7.6% 7.1% 3.5% < 0.0001
Number of antenatal
complications
0 32.7% 37.6% 49.3% 61.2% 72.9% 84.2%
1 43.7% 44.2% 38.1% 30.6% 22.8% 14.2%
≥ 2 23.6% 18.2% 12.6% 8.2% 4.3% 1.6%
< 0.0001
Birth conditions
Abnormal fetal heart rate 19.9% 17.3% 13.1% 12.3% 11.0% 17.6% < 0.0001
Asphyxia at birth 3.4% 1.3% 0.9% 0.5% 0.4% 0.4% < 0.0001
Mode of delivery
Elective C-section 4.9% 4.9% 5.9% 8.0% 14.1% 5.5%
Emergency C-section 42.7% 30.7% 20.0% 14.3% 10.2% 8.7%
Vaginal delivery with
instrumental maneuver 5.9% 6.6% 7.3% 8.0% 7.5% 11.4%
Vaginal delivery without
instrumental maneuver 46.5% 57.8% 66.8% 69.7% 68.1% 74.4%
< 0.0001
Data are % or mean (SD).
GA = Gestational Age. SGA = Small for Gestational Age. HDP = Hypertensive Disease of pregnancy. PPROM = preterm and premature
rupture of membranes. IUGR = intrauterine growth restriction.
Page 17 of 22
123456789101112131415161718192021222324252627282930313233343536373839404142434445464748495051525354555657585960
peer
-005
7796
0, v
ersi
on 1
- 18
Mar
201
1
For Review O
nly
18
Table 2: Crude and adjusted relative risks for severe respiratory disorders and poor prognosis according to gestational age,
gender and maternal conditions.
Poor prognosis Severe Respiratory Disorders
cRR 95% CI aRR 95% CI cRR 95% CI aRR 95% CI
34 weeks 10.5 6.7 – 16.6 6.8 4.1 – 11.1 68.6 54.1 – 86.9 61.0 49.7 – 74.8
35 weeks 4.2 2.4 – 7.2 3.0 1.7 – 5.2 33.6 26.2 – 43.1 31.0 25.1 – 38.3
36 weeks 3.9 2.6 – 5.8 3.1 2.1 – 4.7 15.3 11.9 – 19.7 14.2 11.6 – 17.4
37 weeks 1.7 1.2 – 5.5 1.6 1.1 – 2.3 4.9 3.8 – 6.5 4.7 3.8 – 5.8
38 weeks 0.9 0.7 – 1.3 0.9 0.6 – 1.2 2.1 1.7 – 2.8 2.1 1.7 – 2.5
39-41 weeks 1.0 - 1.0 - 1.0 - 1.0 -
Maternal Age, years
< 20 1.2 0.6 – 2.4 NA NA 1.1 0.8 – 1.6 NA NA
20-24 1.0 0.7 – 1.4 NA NA 0.8 0.7 – 1.1 NA NA
25-29 1.0 - NA NA 1.0 - NA NA
30-34 1.0 0.8 – 1.4 NA NA 1.1 0.9 – 1.2 NA NA
35-39 0.9 0.6 – 1.4 NA NA 1.2 1.0 – 1.5 NA NA
≥ 40 1.3 0.7 – 2.7 NA NA 1.5 1.1 – 2.1 NA NA
Gender, Male 1.3 1.1 – 1.6 1.3 1.0 – 1.6 1.5 1.4 – 1.7 1.5 1.3 – 1.6
HDP 2.2 1.5 – 3.4 1.6 1.1 – 2.5 4.1 3.4 – 4.8 1.4 1.2 – 1.7
Preterm labour 1.4 0.9 – 2.2 NA NA 3.1 2.6 – 3.7 NA NA
PPROM 0.9 0.5 – 1.4 NA NA 2.0 1.7 – 2.4 NA NA
Antepartum hemorrhage 13.0 7.6 – 22.5 6.3 3.5 – 11.3 15.2 11.5 – 20.8 2.4 1.8 – 3.2
Clinical chorioamnionitis 3.1 0.4 – 22.1 NA NA 6.7 3.3 – 13.6 NA NA
Diabetes 1.4 0.8 – 2.2 NA NA 2.4 1.9 – 2.9 1.5 1.2 – 1.9
*Poor prognosis = death and/or severe neurological condition at the end of neonatal hospitalization.
** Severe respiratory disorder = respiratory distress treated by mechanical ventilation and/or nasal continuous positive
airway pressure.
cRR = Crude Relative Risk. aRR = Adjusted Relative Risk, calculated only for covariates present in the final multivariate model.
CI = Confidence Intervals. HDP = Hypertension Disease of Pregnancy. PPROM = Preterm and Premature Rupture of Membranes.
NA = Non Applicable.
Page 18 of 22
123456789101112131415161718192021222324252627282930313233343536373839404142434445464748495051525354555657585960
peer
-005
7796
0, v
ersi
on 1
- 18
Mar
201
1
For Review O
nly
19
Figure 1: Proportions of newborns with severe respiratory disorders and poor prognosis, according to
gestational age.
0.16%
19.83%
9.67%
8.31%
0.84%
0.16%0.15%0.27%0.62%0.66%
1.69%
0.80%
0.18%0.62%
4.44%
0.28%0.28%
1.42%
0.0%
5.0%
10.0%
15.0%
20.0%
34
weeks
35
weeks
36
weeks
37
weeks
38
weeks
39-41
weeks
Late
Preterm
Early
Term
Late
Term
Poor prognosis Severe respiratory disorders
*Poor prognosis = death and/or severe neurological condition at the end of neonatal hospitalization.
** Severe respiratory disorder = respiratory distress treated by mechanical ventilation and/or nasal continuous positive
airway pressure.
Page 19 of 22
123456789101112131415161718192021222324252627282930313233343536373839404142434445464748495051525354555657585960
peer
-005
7796
0, v
ersi
on 1
- 18
Mar
201
1

For Review O
nly
20
FUNDING
This work was supported by “Union Régionale des Caisses d’Assurance Maladie” and
l’Agence Régionale d’Hospitalisation” of Burgundy (grant : FIQCSV 11-04-08).
Page 20 of 22
123456789101112131415161718192021222324252627282930313233343536373839404142434445464748495051525354555657585960
peer
-005
7796
0, v
ersi
on 1
- 18
Mar
201
1

For Review O
nly
21
ACKNOWLEDGEMENTS
The authors wish to thank the members of the Burgundy perinatal network and all physicians
in hospitals of the Burgundy region (CH de Sens, Auxerre, Nevers, Dijon, Beaune, Chalon-
sur-Saône, Mâcon, Montceau-les-Mines, Paray-le-Monial, Le Creusot, Semur-en-Auxois,
Chatillon-sur-Seine, Autun, Decize ; clinique Sainte-Marthe, clinique de Chenôve, clinique
d’Auxerre et clinique du Nohain).
Page 21 of 22
123456789101112131415161718192021222324252627282930313233343536373839404142434445464748495051525354555657585960
peer
-005
7796
0, v
ersi
on 1
- 18
Mar
201
1

For Review O
nly
22
KEY MESSAGES
Birth at 37 weeks of gestation was associated with an increased incidence of poor prognosis;
Infants born at 37 and 38 weeks of gestation were at increased risk of severe respiratory
disorders;
Before 39 weeks of gestation, each additional week contributed to improve the clinical
condition of the newborns.
Page 22 of 22
123456789101112131415161718192021222324252627282930313233343536373839404142434445464748495051525354555657585960
peer
-005
7796
0, v
ersi
on 1
- 18
Mar
201
1