negro and danube are mirror rivers
TRANSCRIPT
arX
iv:0
807.
2988
v1 [
phys
ics.
data
-an]
18
Jul 2
008
Negro and Danube are mirror rivers
R. Goncalves a,∗ A. A. Pinto b
aFaculdade de Engenharia da Universidade do Porto
R. Dr. Roberto Frias, 4200 - 465, Porto, Portugal
bUniversidade do Minho
4710 - 057, Campus de Gualtar, Braga, Portugal
Abstract
We study the European river Danube and the South American river Negro daily
water levels. We present a fit for the Negro daily water level period and standard
deviation. Unexpectedly, we discover that the river Negro and Danube are mirror
rivers in the sense that the daily water levels fluctuations histograms are close to
the BHP and reversed BHP, respectively.
Key words: River Systems, Hydrological Statistics, Data Analysis
PACS: 92.40.qh, 07.05.Kf
∗ Universidade do Porto, R. Dr. Roberto Frias, 4200-465, Porto Portugal, tel/Fax:
+351 225081707/1921
Email address: [email protected] (R. Goncalves).
1 Introduction
Janosi and Gallas [7] analyzed statistics of the Alpine river Danube daily water
level collected, over the period 1901-97, at Nagymaros, Hungary. The authors
found, in the one day logarithmic rate of change of the river water level, sim-
ilar characteristics to those of company growth (see Stanley et al. [8]) which
shows that the properties seen in company data are present in a wider class of
complex systems. Bramwell et al. [3] defined a daily water level mean and vari-
ance and computed the daily river water level fluctuations. They have shown
a data collapse of the Danube daily water level fluctuations histogram to the
(reversed) Bramwell-Holdsworth-Pinton (BHP) probability density function
(pdf). Dahlstedt and Jensen [6] described the statistical properties of several
river systems. They did a careful study of the size of basin areas influence in
the data collapse of the rivers water level and runoff, in particular of river
Negro at Manaus, to the reversed BHP and to the Gaussian pdf showing that
not all rivers have the same statistical behavior. In this paper, we study, again,
the South American river Negro daily water level at Manaus (104 years). We
compute and present a cyclic fit for the Negro daily water level period and the
Negro daily water level standard deviation. We show that the histogram of
the Danube water level fluctuations is on top of the reversed BHP pdf, which
does not happen for the Negro daily water level.
2 BHP and the Danube and Negro data
We define the Danube daily water level period lµ(t) by
2
lµ(t) =1
T
T−1∑
j=0
X(t + 365j), (1)
where T = 87 is the number of observed years and Xt is the Danube daily
water level time series. 1
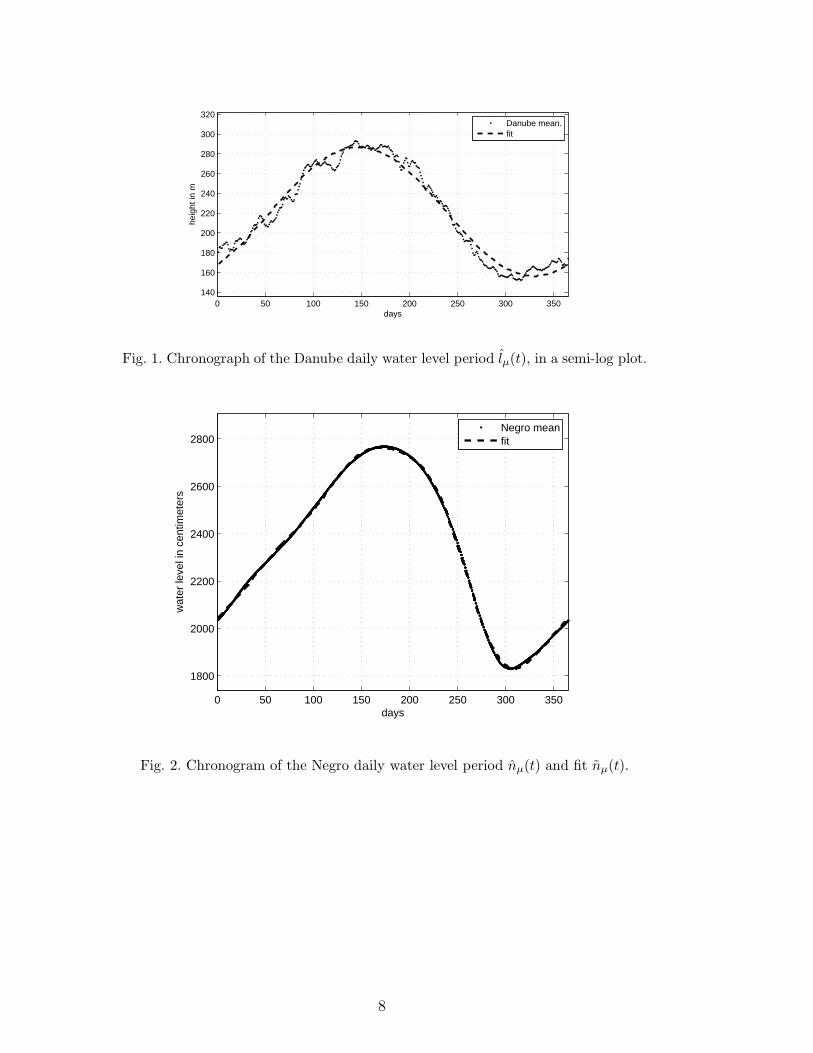
In Figure 1, we show a fit to the Danube daily water level period lµ(t). The
mean period fit, using the first harmonic of the Fourier series, is given by
lµ(t) = 443.06 − 53.3409 sin(
2tπ
365
)
+ 37.4623 cos(
2tπ
365
)
. (2)
The percentage of variance explained by the fit is R2 = 99.8%.
We define the Negro daily water level period nµ(t) by
nµ(t) =1
T
T−1∑
j=0
Y (t + 365j), (3)
where T = 104 is the number of observed years and Yt is the Negro daily water
level time series. 2
In Figure 2, we show a fit nµ(t) of the Negro daily water level period nµ(t).
The mean period fit, using the first four sub-harmonics of the Fourier series,
is given by
nµ(t) =a0
2+
4∑
n=1
an cos(
2tnπ
365
)
+ bn sin(
2tnπ
365
)
. (4)
where an and bn are given in table 1. The percentage of variance explained by
the fit is R2 = 99.9%.
1 All the observations of the days 29th of February were eliminated.
2 All the observations of the days 29th of February were eliminated.
3
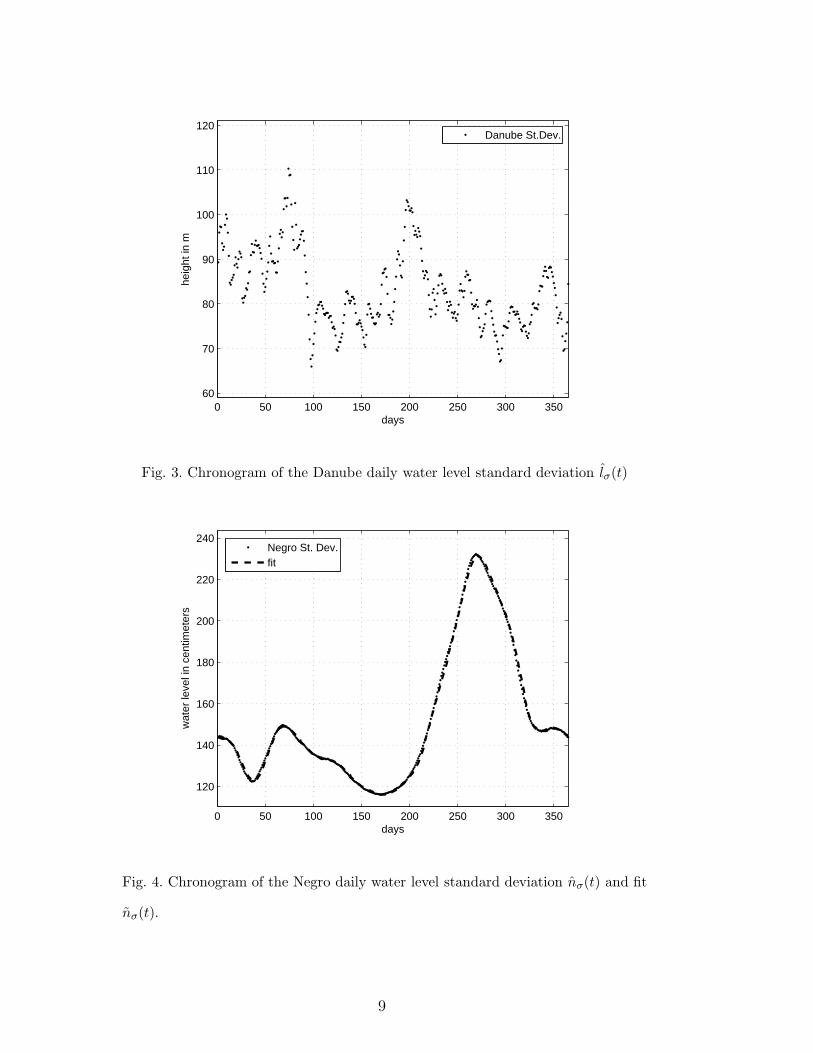
We define the Danube daily water level standard deviation lµ(t) by
lσ(t) =
√
∑T−1
j=0X(t + 365j)2
T− lµ(t)
2
. (5)
In Figure 3, we show the chronogram of the Danube daily water level standard
deviation.
We define the Negro daily water level standard deviation nσ(t) given by
nσ(t) =
√
∑T−1
j=0Y (t + 365j)2
T− nµ(t)2
. (6)
In Figure 4, we show a fit of the Negro daily water level standard deviation.
The fit nσ, using the first ten sub-harmonics of the Fourier series, is given by
nσ(t) =a0
2+
10∑
n=1
an cos(
2tnπ
365
)
+ bn sin(
2tnπ
365
)
(7)
where an and bn are given in table 2. The percentage of variance explained by
the fit is R2 = 88.6%.
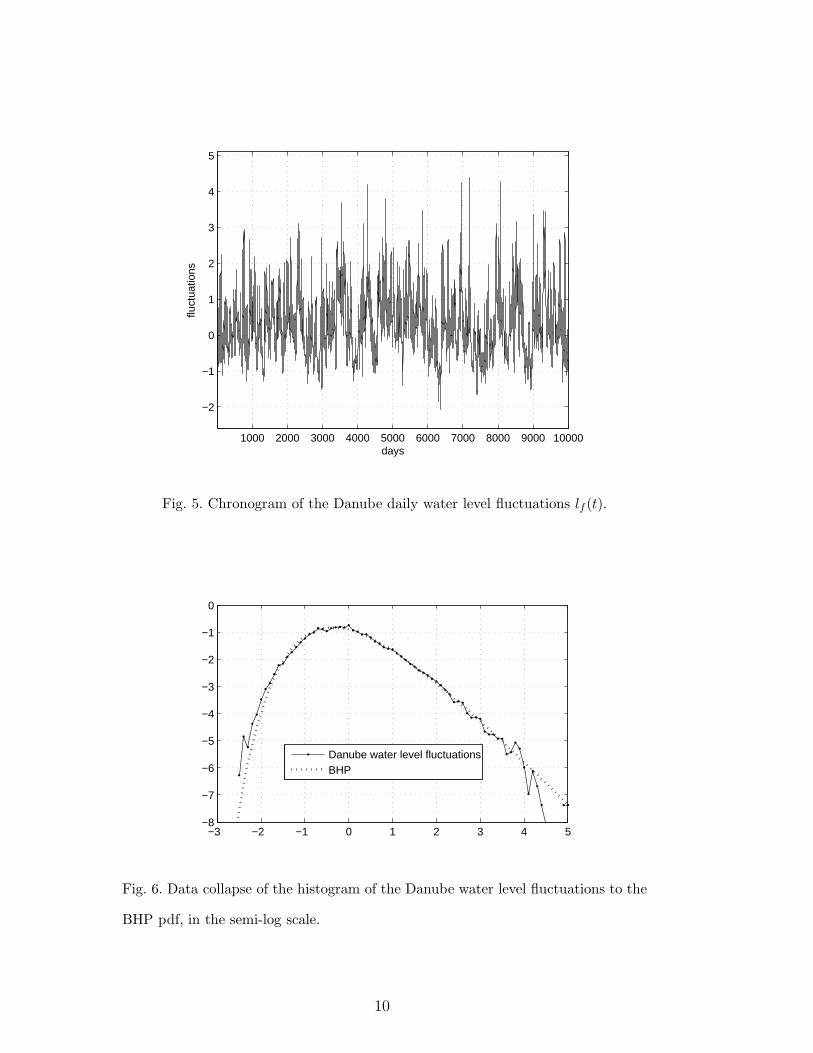
Following Bramwell et. al [3], we define the Danube daily water level fluctua-
tions lf(t) by
lf(t) =l(t) − lµ(t)
lσ(t). (8)
In Figure 5, we show the Danube daily water level fluctuations lf(t). As shown
by Bramwell et al. [3], the (reversed) BHP pdf falls on top of the histogram
of the Danube daily water level fluctuations, in the semi-log scale (see Figure
6).
4
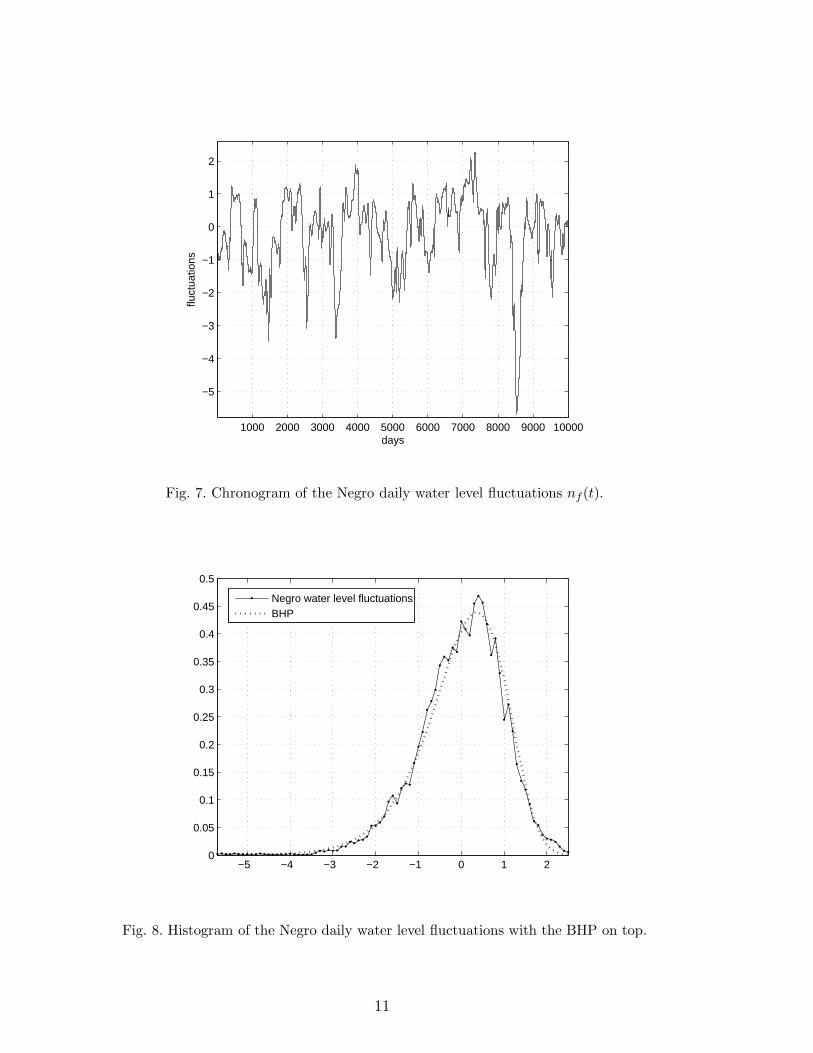
We define the Negro daily water level fluctuations nf(t) by
nf (t) =n(t) − nµ(t)
nσ(t). (9)
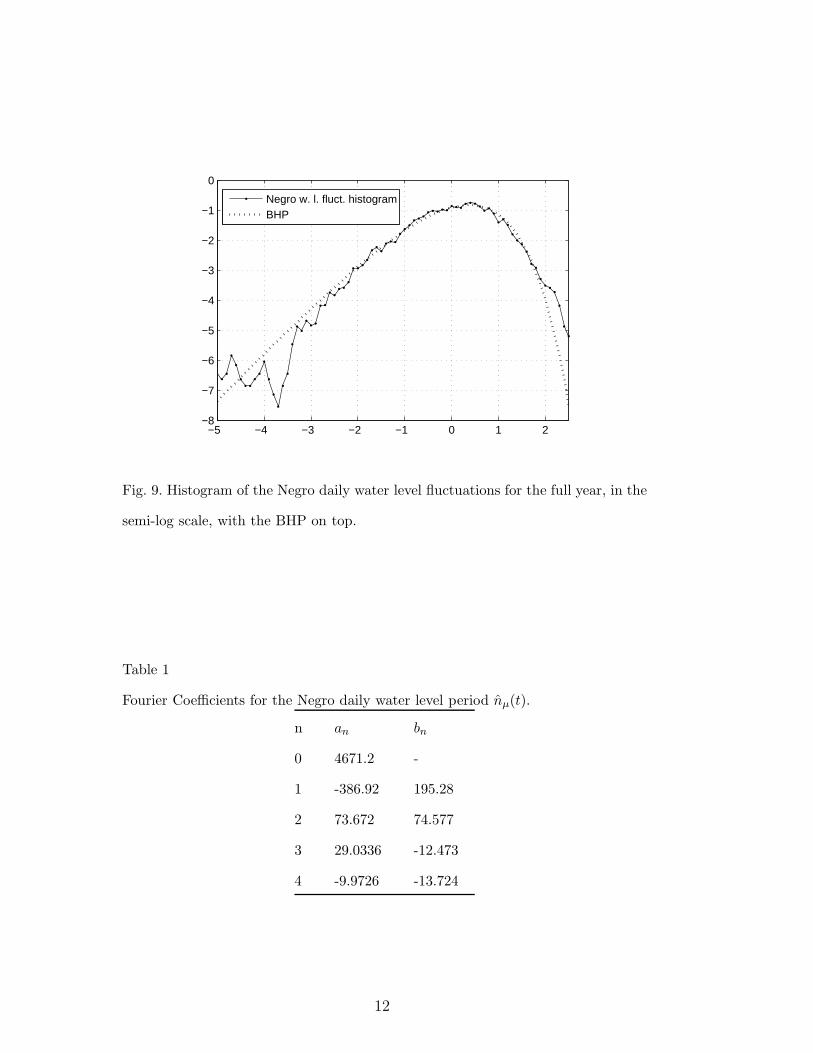
In Figure 7, we show the Negro daily water level fluctuations nf (t). In Figure
8, we show the histogram of the Negro daily water level fluctuations. In Figure
9, we show the data collapse of the histogram in the semi-log scale to the BHP
pdf.
5
3 Conclusions
We computed and presented a cyclic fit for the Negro daily water level period
and for the Negro daily water level standard deviation using the first four and
ten sub-harmonics, respectively. We computed the histogram of the Negro
daily water level fluctuations at Manaus, and we compared it with the BHP
pdf. The histogram of the Negro daily water level fluctuations is close to
the BHP pdf. We have shown that the histogram of the Danube water level
fluctuations is on top of the reversed BHP pdf, which does not happen for the
river Negro daily water level fluctuations.
Acknowledgements
We thank Imre Janosi for providing the river Danube data and Mrs. Andrelina
Santos of the Agencia Nacional de Aguas of Brazil for providing the river Negro
data.
References
[1] Bramwell, S.T., Christensen, K., Fortin, J.Y., Holdsworth, P.C.W., Jensen, H.J.,
Lise, S., Lopez, J.M., Nicodemi, M. & Sellitto,M. (2000) Universal Fluctuations
in Correlated Systems, Phys. Rev. Lett. 84, 3744–3747.
[2] Bramwell, S.T., Fortin, J.Y., Holdsworth, P.C.W., Peysson, S., Pinton, J.F.,
Portelli, B. & Sellitto,M. (2001) Magnetic Fluctuations in the classical XY
model: the origin of an exponential tail in a complex system, Phys. Rev E 63,
041106.
6
[3] Bramwell, S.T., Fennell, T., Holdsworth, P.C.W., & Portelli, B. (2002) Universal
Fluctuations of the Danube Water Level: a Link with Turbulence, Criticality
and Company Growth, Europhysics Letters 57, 310.
[4] Bramwell, S.T., Holdsworth, P.C.W., & Pinton, J.F. (1998) Universality of rare
fluctuations in turbulence and critical phenomena, Nature 396, 552–554.
[5] Dahlstedt, K., & Jensen, H.J. (2001) Universal fluctuations and extreme-value
statistics, J. Phys. A: Math. Gen. 34, 11193–11200.
[6] Dahlstedt, K., & Jensen, H.J. (2005) Fluctuation spectrum and size scaling of
river flow and level, Physica A 348, 596–610.
[7] Janosi, I.M., & Gallas, J.A.C. (1999) Growth of companies and water-level
fluctuations of the River Danube, Physica A 271, 448–457.
[8] Stanley, M.H.R., Amaral, L. A. N., Buildrev, S. V., Havlin, S., Leschhorn, H.
Maass, P., Salinger, M.A. & Stanley, E. (1996) Scaling behaviour in the growth
of companies. Letters to Nature 379, 29, 804-806.
7
0 50 100 150 200 250 300 350140
160
180
200
220
240
260
280
300
320
days
heig
ht in
m
Danube mean.fit
Fig. 1. Chronograph of the Danube daily water level period lµ(t), in a semi-log plot.
0 50 100 150 200 250 300 350
1800
2000
2200
2400
2600
2800
days
wat
er le
vel i
n ce
ntim
eter
s
Negro meanfit
Fig. 2. Chronogram of the Negro daily water level period nµ(t) and fit nµ(t).
8
0 50 100 150 200 250 300 35060
70
80
90
100
110
120
days
heig
ht in
m
Danube St.Dev.
Fig. 3. Chronogram of the Danube daily water level standard deviation lσ(t)
0 50 100 150 200 250 300 350
120
140
160
180
200
220
240
days
wat
er le
vel i
n ce
ntim
eter
s
Negro St. Dev.fit
Fig. 4. Chronogram of the Negro daily water level standard deviation nσ(t) and fit
nσ(t).
9
1000 2000 3000 4000 5000 6000 7000 8000 9000 10000
−2
−1
0
1
2
3
4
5
days
fluct
uatio
ns
Fig. 5. Chronogram of the Danube daily water level fluctuations lf (t).
−3 −2 −1 0 1 2 3 4 5−8
−7
−6
−5
−4
−3
−2
−1
0
Danube water level fluctuationsBHP
Fig. 6. Data collapse of the histogram of the Danube water level fluctuations to the
BHP pdf, in the semi-log scale.
10
1000 2000 3000 4000 5000 6000 7000 8000 9000 10000
−5
−4
−3
−2
−1
0
1
2
days
fluct
uatio
ns
Fig. 7. Chronogram of the Negro daily water level fluctuations nf (t).
−5 −4 −3 −2 −1 0 1 20
0.05
0.1
0.15
0.2
0.25
0.3
0.35
0.4
0.45
0.5
Negro water level fluctuationsBHP
Fig. 8. Histogram of the Negro daily water level fluctuations with the BHP on top.
11
−5 −4 −3 −2 −1 0 1 2−8
−7
−6
−5
−4
−3
−2
−1
0
Negro w. l. fluct. histogramBHP
Fig. 9. Histogram of the Negro daily water level fluctuations for the full year, in the
semi-log scale, with the BHP on top.
Table 1
Fourier Coefficients for the Negro daily water level period nµ(t).
n an bn
0 4671.2 -
1 -386.92 195.28
2 73.672 74.577
3 29.0336 -12.473
4 -9.9726 -13.724
12
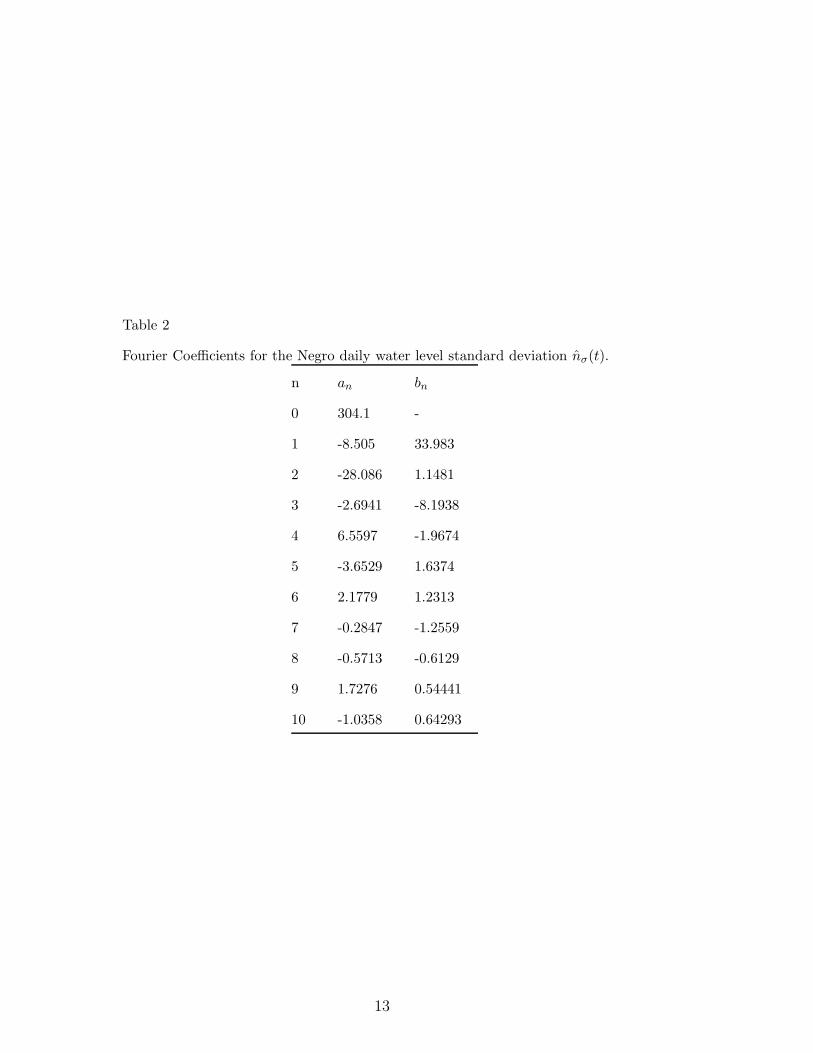
Table 2
Fourier Coefficients for the Negro daily water level standard deviation nσ(t).
n an bn
0 304.1 -
1 -8.505 33.983
2 -28.086 1.1481
3 -2.6941 -8.1938
4 6.5597 -1.9674
5 -3.6529 1.6374
6 2.1779 1.2313
7 -0.2847 -1.2559
8 -0.5713 -0.6129
9 1.7276 0.54441
10 -1.0358 0.64293
13