negotiation under the curse of knowledge
TRANSCRIPT
WZB Berlin Social Science Center Research Area Markets and Choice Research Unit Market Behavior
Put your Research Area and Unit
Thibaud Pierrot Negotiation under the Curse of Knowledge
Discussion Paper
SP II 2019–211r September 2019 (revised November 2019)
Wissenschaftszentrum Berlin für Sozialforschung gGmbH Reichpietschufer 50 10785 Berlin Germany www.wzb.eu
Thibaud Pierrot Negotiation under the Curse of Knowledge
Affiliation of the author:
Thibaud Pierrot WZB Berlin Social Science Center and Technical University of Berlin
Copyright remains with the author.
Discussion papers of the WZB serve to disseminate the research results of work in progress prior to publication to encourage the exchange of ideas and academic debate. Inclusion of a paper in the discussion paper series does not constitute publication and should not limit publication in any other venue. The discussion papers published by the WZB represent the views of the respective author(s) and not of the institute as a whole.
Wissenschaftszentrum Berlin für Sozialforschung gGmbH Reichpietschufer 50 10785 Berlin Germany www.wzb.eu
Abstract
Negotiation under the Curse of Knowledge
by Thibaud Pierrot*
An individual is affected by the curse of knowledge when he fails to appreciate the viewpoint of a lesser-informed agent. In contrast to a rational person, the cursed individual behaves as if part of his private information were common knowledge. This systematic cognitive bias alters many predictions derived from game theory which involve an asymmetry of information between the players. We investigate in this article how the curse of knowledge modifies individual behaviours in negotiation situations. We report the results of a laboratory experiment that was designed to isolate the effect of the curse of knowledge by varying the information available to the players ceteris paribus. Our analysis of the expectations and choices of subjects playing the ultimatum game in different information settings indicates that the curse of knowledge can lead to an increase of impasses in the negotiation and partially explains empirically observed phenomenons such as abnormally high rates of bargaining failures. Unlike previous behavioural research, that is mostly based on motivated beliefs and actions, this work provides a purely nonstrategic explanation for negotiation impasses observed in many real life situations.
Keywords: curse of knowledge, hindsight bias, negotiation, experiments
JEL classification: C91, D80, D82, D83, D84
*E-mail: [email protected].
1 Introduction
Reaching a mutually beneficial agreement is not as trivial in practice as it appears in
theory. This observation, deeply rooted in real life experience seems paradoxical in
light of classic microeconomic theory. Farber and Katz’s (1979) model, for instance,
predicts that an agreement must be reached when the costs and risk associated with
third-party involvement exceed the potential benefits of litigation. Even though this
seems obvious from a rational point of view, the reality of negotiation situations
often differs from this prediction. One emblematic example of recent history is the
Apple Inc. vs. Samsung Electronics Co. patent litigation regarding the design of
smartphones. It lasted over four years, involved more than 50 lawsuits worldwide
and multiple trials in the U.S. including the intervention of the supreme court. The
costs and risks associated with third-party involvement clearly exceeded the poten-
tial benefits of a litigation. This discrepancy between theoretical predictions and
empirical observations has led many behavioural scientists to investigate the psycho-
logical biases that can impair people’s ability to negotiate (see Caputo, 2013, for a
complete review of the articles on negotiation in behavioural sciences1 and Babcock
et al., 1995, for a prime example of this literature).
In this paper, we contribute to this research agenda by investigating a cognitive
bias which may prevent bargainers from reaching an agreement in a negotiation
situation: the curse of knowledge. This work documents for the first time the effect
of this bias in a negotiation situation. Indeed, as many bargaining problems involve
an asymmetry of information between the players in multiple dimensions, e.g. the
valuation of the good at stake or the outside options of the other party, the curse
of knowledge is likely to have substantial consequences on the settlement reached.
Does it distort the players’ strategies? Can it be held responsible for part of the high
rate of impasse observed empirically? How does it affect the negotiation outcomes
when it interacts with the fairness preferences of the bargaining parties? Who is
1“Negotiation” (Bazerman et al., 2000) also provides an interesting review of the articles onbiases in negotiation.
3
most affected by this curse during a negotiation? Our goal is to investigate these
questions and provide some answers based on experimental data.
To fix ideas, let us consider the following hypothetical situation: two individuals are
working on a common project yielding an uncertain profit that they have to share
once their task is completed. The production process generating this profit is a black
box and each bargainer has access to some information regarding it. We explore the
role played by information asymmetry in this context by comparing a framework
where all information available is common knowledge to a condition where one (or
both) bargainer(s) possess a different private information regarding the production
process. In the last scenario the curse of knowledge is likely to occur between the
two bargainers and to have an impact on their strategy. Therefore, it may modify
the outcome of the negotiation.
We conduct a laboratory experiment designed to isolate the causal effect of the curse
of knowledge on the outcome of a negotiation. We use the ultimatum game as
a stylised negotiation situation and a real effort task (a change-detection task) to
determine the proposer’s endowment. It is via this task that we induce the curse of
knowledge in one of our treatments. By providing the respondents of our ultimatum
game with extra information regarding the task we can observe the causal effect of
the curse on both players’ strategy.
Introduced into the economic literature by Camerer et al. (1989), the curse of knowl-
edge designates the inability of a better informed agent to appreciate the viewpoint
of a lesser-informed person. An individual affected by the curse thinks and behaves
as if part of his private information were common knowledge.2
2The curse of knowledge is an interpersonal version of the hindsight bias Fischhoff (1975) - i.e.the concept, well documented in the psychology literature(Guilbault et al., 2004), that labels thetendency to believe that “an event is more predictable after it becomes known than it was before itbecame known” (Roese & Vohs, 2012). Both the curse of knowledge and the hindsight bias sharea common mathematical definition (Camerer et al., 1989). They are formalised as a failure of thelaw of iterated expectations. A person suffering from the hindsight bias exhibits a tendency toforget how ignorant he was before the event occurred and thinks that he“knew it would happen”(Fischhoff & Beyth, 1973). Correspondingly, an agent under the curse of knowledge fails to take
4
Many behavioural economists have investigated this cognitive bias. Camerer et al.
(1989) have shown in an experiment that the curse of knowledge hurts privately
informed agents who are trading with lesser informed partners but that the market
experience in a double oral auction reduces the impact of the bias. Loewenstein and
Moore (2006) found that people are willing to purchase information that, due to the
curse of knowledge, negatively impacts their ability to form accurate expectations
regarding the performance of others and, ultimately, decreases their own pay-off.
Danz (2013) showed that the curse of knowledge induces overconfidence, leading to a
detrimental increase of self-selection into competition.3 These examples demonstrate
the impact of the curse of knowledge in many economic contexts.
Our experimental design also constitutes a relevant contribution to the literature on
the role of information asymmetries in the ultimatum game, see Huck (1999) for a
comprehensive summary of the main findings regarding this topic. It is related to
many studies documenting the effect of information asymmetry in ultimatum games
such as Kagel et al. (1996) who conduct an experiment where the subjects play
an ultimatum game over the split of chips that have a different monetary value
for the players. Their treatments vary with respect to the information available to
the players concerning the chip values of their partner. They find that different
negotiation outcomes are triggered by the information conditions.
The novelty of our approach compared to Kagel et al. (1996) and most earlier work
on information asymmetries in the ultimatum game (Mitzkewitz & Nagel, 1993;
Rapoport & Sundali, 1996; Roth & Murnighan, 1982) is that our experiment is
tailored to shift the players’ beliefs via the curse of knowledge without altering the
game itself. The features of the ultimatum game that is played remain identical in
the two treatments that we conduct, including the players’ information regarding the
into account the ignorance of others.3As for results relative to the hindsight bias, here are a couple of examples: Bias and Weber
(2008) who show theoretically and experimentally that the hindsight bias leads to investors under-estimating the volatility in financial markets, which impairs their investments performance; andDanz et al. (2014) who find that principals suffering from hindsight bias are less likely to delegateoptimally to agents in a delegation game.
5
game. However, when Kagel et al.(1996) reveal information about the chip values to
their subjects in some of their treatments, they change an important aspect of the
game. If the chips have a different value for the two bargainers, knowing these values
implies a trade-off between efficiency and equality that do not exist in the treatment
where this information is hidden. In this context, the subjects can follow different
motives (maximising efficiency or equality) in the different treatments. Indeed, Kagel
et al.(1996) find that the subjects cherry-pick their most preferred motive, mostly
to their advantage, and that the treatment effect is at least partly due to motivated
actions. In our experiment the players’ motives remain unchanged between the
treatments and the subjects have no motivation to believe that the endowment is
higher or lower. Their best strategy is to be as accurate as possible.
Our data show that the curse of knowledge has a causal impact on the negotiation
outcome in the ultimatum game. We find that when the respondents receive private
information regarding the real effort task that was used to determine the proposers’
endowments, they expect this endowment to be larger, due to the curse of knowledge,
and are more likely to reject offers that they would have accepted otherwise. In our
experiment, the bias increases the expected endowment and the lowest acceptable
offer stated by the respondents by respectively 47% and 42% on average. As they
do not anticipate the effect of the curse on the respondents, the proposers report
similar expectations and do not adapt their strategies. They choose the same offers
across treatments. This leads to a higher rate of rejection and a lower profit in the
treatment where respondents are cursed by knowledge.
This paper proceeds as follows. We present the experimental design in the next
section. In section 3 we derive our hypothesis from a simple behavioural model. We
report the results in section 4 and conclude in section 5.
6
2 Experimental design
Our experiment is designed to observe the effect of the curse of knowledge on the
outcome of a negotiation between two parties. We use the ultimatum game as a
stylised negotiation situation and the change-detection task as a medium to trigger
the curse of knowledge. This task, explained in the following section, is used to
determine the proposer’s endowment in the ultimatum game.
2.1 Change-detection task
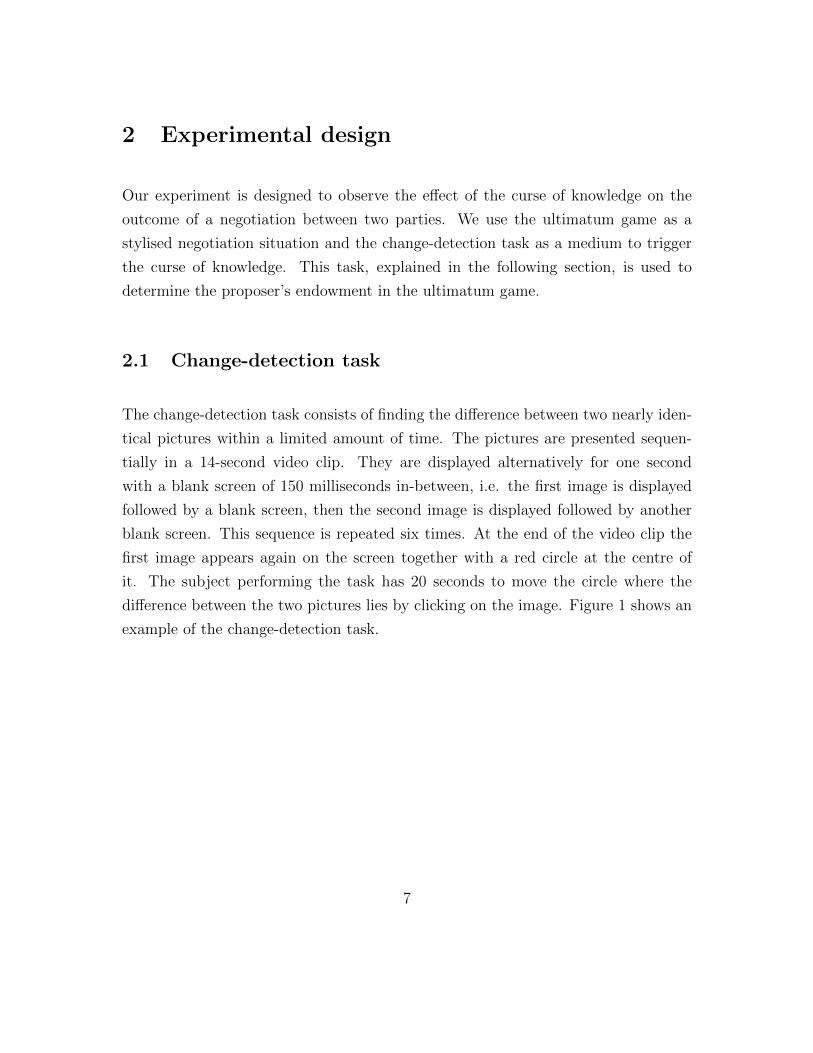
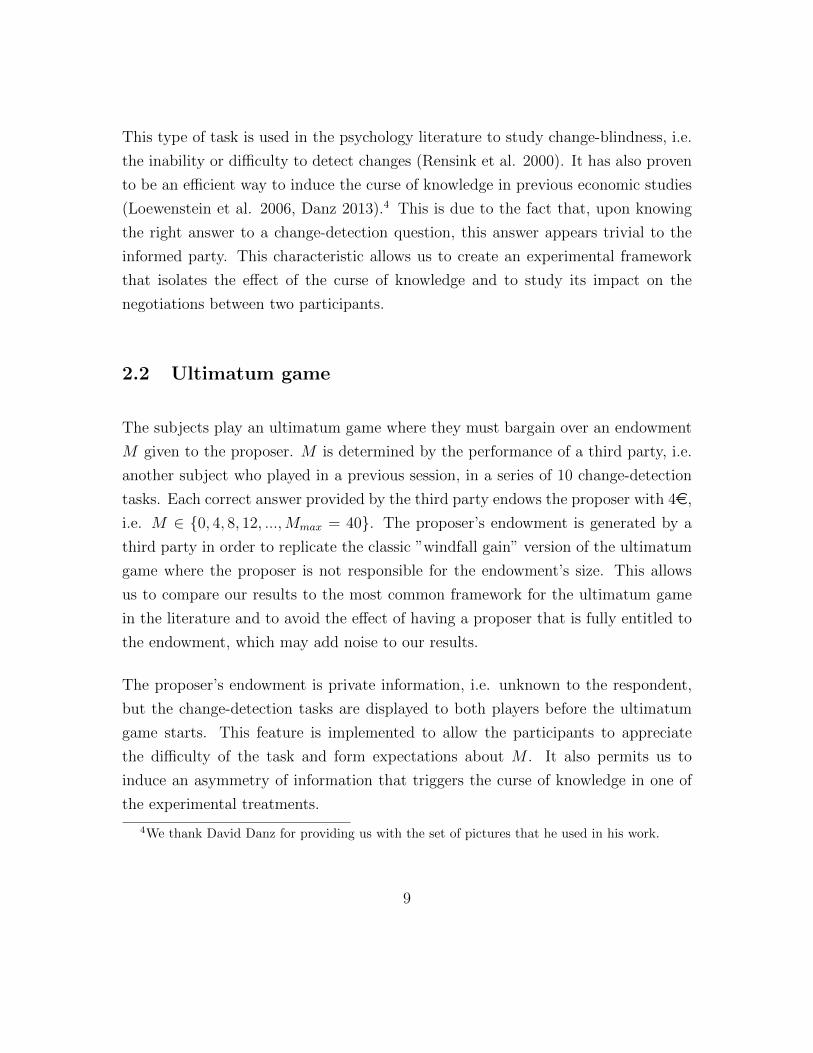
The change-detection task consists of finding the difference between two nearly iden-
tical pictures within a limited amount of time. The pictures are presented sequen-
tially in a 14-second video clip. They are displayed alternatively for one second
with a blank screen of 150 milliseconds in-between, i.e. the first image is displayed
followed by a blank screen, then the second image is displayed followed by another
blank screen. This sequence is repeated six times. At the end of the video clip the
first image appears again on the screen together with a red circle at the centre of
it. The subject performing the task has 20 seconds to move the circle where the
difference between the two pictures lies by clicking on the image. Figure 1 shows an
example of the change-detection task.
7

Figure 1: Example of the change-detection task.
8
This type of task is used in the psychology literature to study change-blindness, i.e.
the inability or difficulty to detect changes (Rensink et al. 2000). It has also proven
to be an efficient way to induce the curse of knowledge in previous economic studies
(Loewenstein et al. 2006, Danz 2013).4 This is due to the fact that, upon knowing
the right answer to a change-detection question, this answer appears trivial to the
informed party. This characteristic allows us to create an experimental framework
that isolates the effect of the curse of knowledge and to study its impact on the
negotiations between two participants.
2.2 Ultimatum game
The subjects play an ultimatum game where they must bargain over an endowment
M given to the proposer. M is determined by the performance of a third party, i.e.
another subject who played in a previous session, in a series of 10 change-detection
tasks. Each correct answer provided by the third party endows the proposer with 4e,
i.e. M ∈ {0, 4, 8, 12, ...,Mmax = 40}. The proposer’s endowment is generated by a
third party in order to replicate the classic ”windfall gain” version of the ultimatum
game where the proposer is not responsible for the endowment’s size. This allows
us to compare our results to the most common framework for the ultimatum game
in the literature and to avoid the effect of having a proposer that is fully entitled to
the endowment, which may add noise to our results.
The proposer’s endowment is private information, i.e. unknown to the respondent,
but the change-detection tasks are displayed to both players before the ultimatum
game starts. This feature is implemented to allow the participants to appreciate
the difficulty of the task and form expectations about M . It also permits us to
induce an asymmetry of information that triggers the curse of knowledge in one of
the experimental treatments.
4We thank David Danz for providing us with the set of pictures that he used in his work.
9
The ultimatum game starts after the display of the change-detection task. An offer
of s ∈ [0,M ]e is chosen by the proposer and a lowest acceptable offer l ∈ [0,Mmax]
is chosen by the respondent. If s ≥ l the offer is accepted and the proposer obtains
M − s e and the respondent s e. Otherwise, the offer is rejected and both players
gain 0e.
The respondents are randomly assigned to two treatments in a between-subjects
design: the ctrl treatment where the change-detection task is displayed on every
player’s screen in the same fashion and the CoK treatment where the difference
between the pictures is highlighted to the respondents only.5 The curse of knowledge
is triggered in this treatment since the respondents know the answer to the change-
detection task while the proposers and the third party performing the task do not
have access to this information.
In the two treatments, the game structure is common knowledge. It is explained
in the instructions to both the respondents and the proposers. This feature was
implemented to guarantee that the instructions did not deceive the players in any
treatment. Consequently, the CoK treatment also differs with respect to the pro-
posers. Indeed, they know that the respondents have access to extra information
regarding the change-detection task during the experiment. This information may
have an effect on their strategy which renders non-trivial the impact of the bias on
the negotiation outcome. The proposers may foresee the effect of the CoK and adapt
their strategy or be blind to it and select the same offers in both treatments.
2.3 Experimental procedure
We conduct six sessions of the experiment using the software z-Tree (Fischbacher
2007). At the beginning of a session, every participant reads the complete set of
5This feature does not allow the respondent to infer the endowment since the third party’sanswers are not observed in any of the treatments.
10
instructions that explains in detail the change-detection task, the way expectations
are recorded, the ultimatum game and the information structure. The instructions,
available in Appendix 1, are common to all the participants within a treatment.
They contain the information relative to both roles, i.e. proposers and respondents,
and the subjects learn their role only at the end.
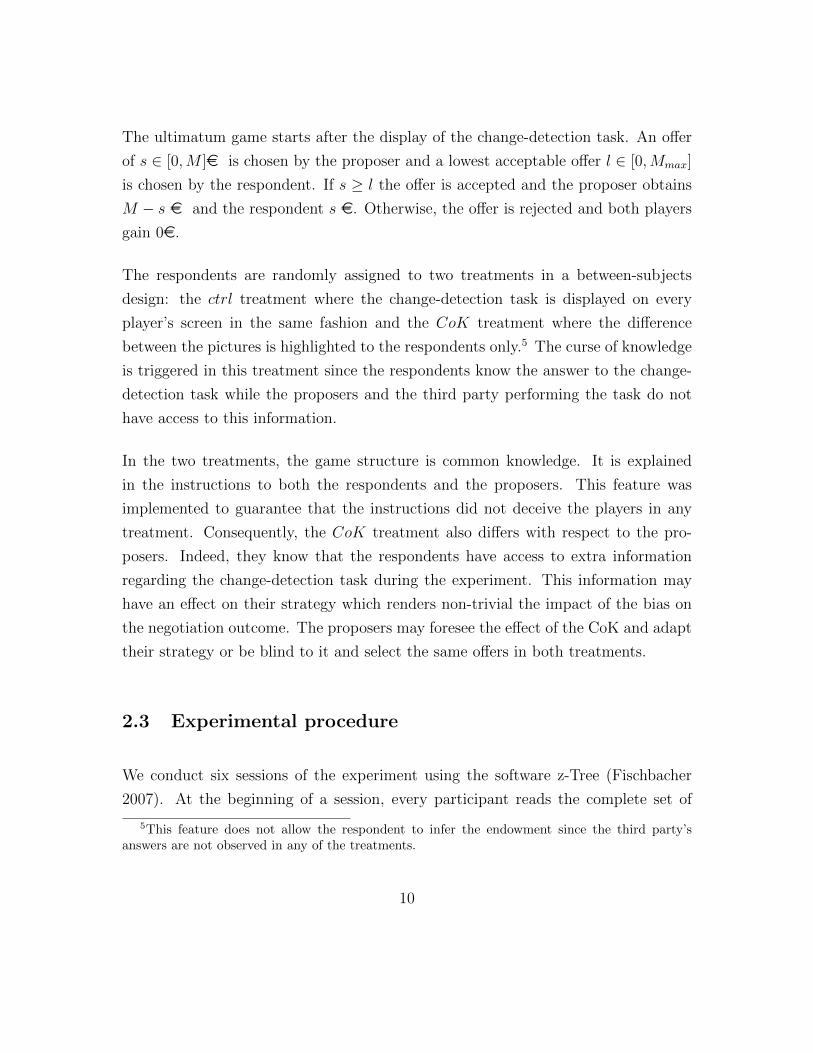
Afterwards, an experimental session proceeds as shown in Figure 3. In step (1), each
subject is randomly matched with another participant in the room and with a third
party who performed the change-detection task in a former session. Meanwhile, in
each group, one of the two subjects is randomly assigned the role of proposer and
the other the role of respondent.
(1) (2) (3) (4) (5)
Role As-signment &Matching
Task ReviewEndowmentExpectations
StrategyExpectations
UltimatumGame
Figure 2: Time-line of the Experiment
During step (2), Task Review, the participants see the 10 change-detection questions
that were formerly answered by the third party. The timing of the tasks and the
breaks between questions are reproduced in the exact same way that the third party
experienced them when performing the task. The aim of this feature is to allow the
subjects to form beliefs about the size of the endowment.
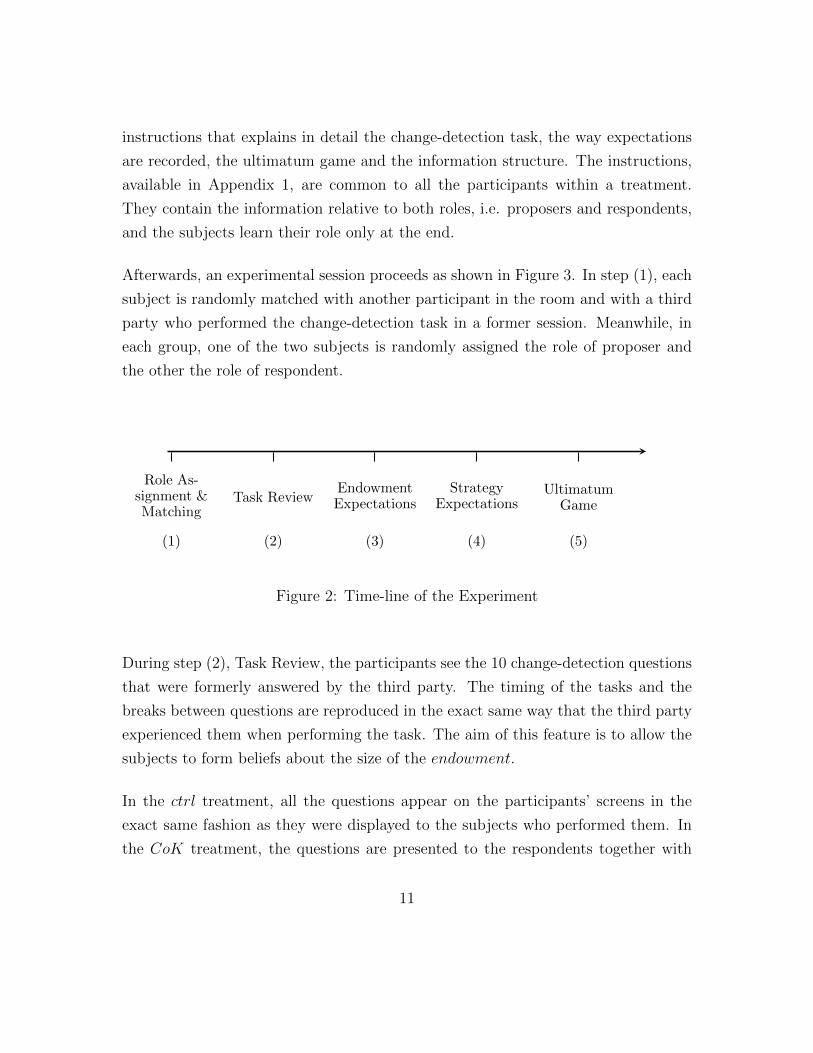
In the ctrl treatment, all the questions appear on the participants’ screens in the
exact same fashion as they were displayed to the subjects who performed them. In
the CoK treatment, the questions are presented to the respondents together with
11
their answers. The areas containing the difference between the two pictures are
highlighted by a blue rectangle that appear on the respondents’ screens as shown
in Figure 3. This blue rectangle constitutes the only difference between the two
treatments.
Figure 3: Example of the change-detection task in z-Tree
Respondents’ Screen in the CoK Treatment
Once the players have seen the change-detection task, the experiment proceeds with
steps three to five. The participants (3) report their predictions regarding the size
of the endowment, (4) report their expectations regarding the choice of their group
member in the ultimatum game, and (5) choose their strategy for the ultimatum
game. When answering the expectations questions, the players receive no further
12
information. The proposers are informed of their endowment only during step (5).
The two expectations are recorded in the form of a probability distribution. The
subjects are given bins that are labelled with a range of possible outcomes and have
to fill these bins with probabilities that must add up to 100%. For example, to report
their expectations regarding the endowment M the subject assigns a probability that
it is: 0, [1, 4], [5, 8], [9, 12] and so on. The strategies in the ultimatum game consist
of typing a single number: for the proposer, his offer to the respondent in his group;
for the respondent, her lowest acceptable offer.
The players are informed of the outcomes in their group at the end of the experiment.
They are shown the proposer’s endowments and offer as well as the respondent’s
lowest acceptable offer. They are paid according to their choices in the ultimatum
game and earn 3e for the completion of the expectations tasks and a 5e show-up
fee.
13
3 Theory
This section is dedicated to the formalisation of our experimental framework as well
as the behavioural concepts that we use to formulate the hypotheses that are tested
in our data analysis. We characterise (1) the game’s framework, (2) the concept of
curse of knowledge and, (3) the model of social preferences on which we base our
pre-experimental conjectures.
3.1 Ultimatum game framework
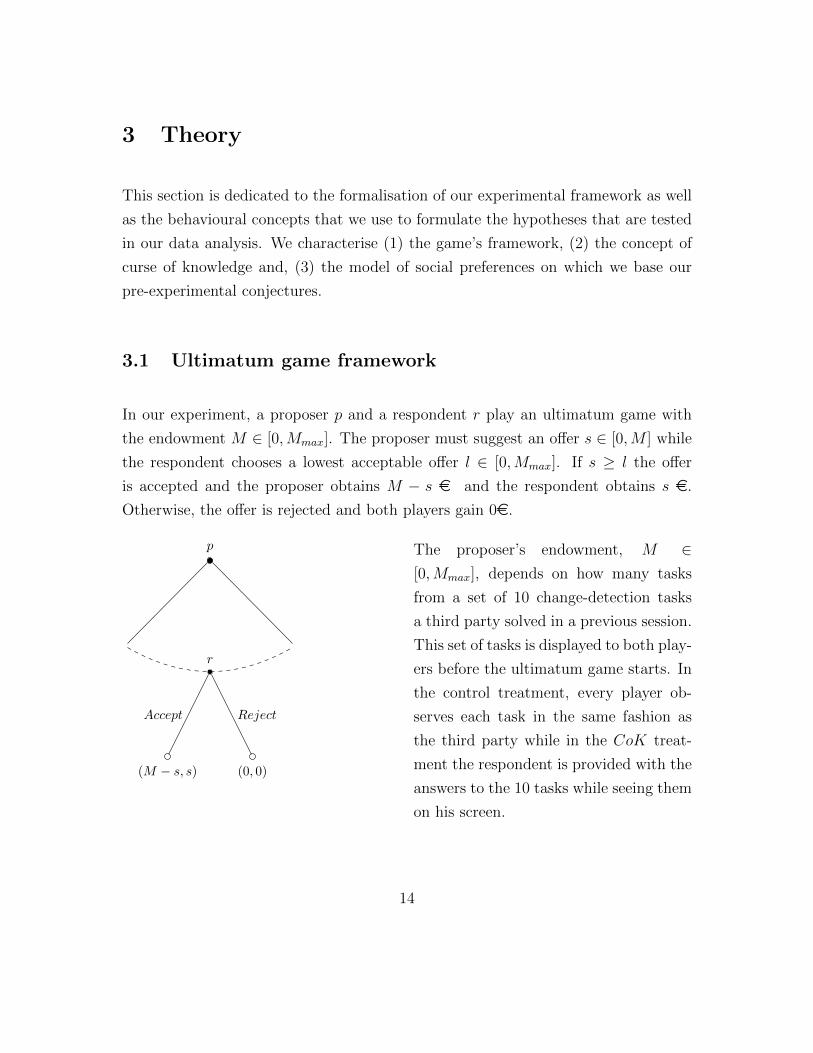
In our experiment, a proposer p and a respondent r play an ultimatum game with
the endowment M ∈ [0,Mmax]. The proposer must suggest an offer s ∈ [0,M ] while
the respondent chooses a lowest acceptable offer l ∈ [0,Mmax]. If s ≥ l the offer
is accepted and the proposer obtains M − s e and the respondent obtains s e.
Otherwise, the offer is rejected and both players gain 0e.
p
(M − s, s)
Accept
(0, 0)
Reject
r
The proposer’s endowment, M ∈[0,Mmax], depends on how many tasks
from a set of 10 change-detection tasks
a third party solved in a previous session.
This set of tasks is displayed to both play-
ers before the ultimatum game starts. In
the control treatment, every player ob-
serves each task in the same fashion as
the third party while in the CoK treat-
ment the respondent is provided with the
answers to the 10 tasks while seeing them
on his screen.
14
All the game’s features are common knowledge including the information displayed
to the respondent.6 Only the endowment M is the proposer’s private information as
it is not observed by the respondent.
3.2 Curse of knowledge
The curse of knowledge designates the inability of a better-informed agent to appre-
ciate the viewpoint of a lesser-informed person. It can be formalised as a failure of
the law of iterated expectations (Camerer et al., 1989). Let us consider an event A
with expectation E[A] and two information sets I0 and I1 with I0 ⊆ I1, i.e. I1 is
strictly more informative than I0.
The law of iterated expectation implies that E[E[A|I0]|I1] = E[A|I0]. This means
that a rational agent must be able to compute the expectation E[A|I0] even though
he has access to the more informative set, I1, as long as I1 contains I0. In other
words, a rational person can ignore part of the information that he possesses in
order to construct the expectation E[A|I0] as if he only knew I0.
For an individual who suffers from the curse of knowledge, we write E[E[A|I0]|I1] =
ωE[A|I1] + (1− ω)E[A|I0]. Where I1 is the information available to the individual,
I0 is the information set of the lesser-informed agent and ω is the degree of the curse
of knowledge exhibited by the individual. This notation implies that a cursed agent
is unable to construct E[A|I0] when they have access to the information set I1.
In our experimental framework, the respondent has to form expectations regarding
the third party’s performance in the change-detection task in order to estimate the
proposer’s endowment M . This requires him to apprehend the tasks’ difficulty in
the perspective of the third party. In this setting, we can formalise the expectation
6The proposer knows whether he is playing against a respondent who knows the answers of thechange-detection task.
15
of a cursed respondent in the following way:
E[E[M |Ip]|Ir]r = ωE[M |Ir] + (1− ω)E[M |Ip]
Where E[E[M |Ip]|Ir]r is the expectation of the respondent regarding the endowment
M when having access to the information Ir while the other players only have access
to Ip.
In the ctrl treatment, where all the players have access to the same information
set, i.e. Ir = Ip, there is no room for the curse of knowledge to have any effect
on the respondent’s beliefs regarding the endowment. For any ω it holds true that
E[E[M |Ip]|Ir]ctrlr = E[M |Ip] = E[M |Ir].
In contrast, the CoK treatment introduces an information asymmetry between the
respondent and the other players by displaying the answers to the change-detection
task on the respondent’s screen. Assuming that if the third party was given all the
answers during the task he would obtain the highest endowment, i.e. E[M |Ir] =
Mmax, the respondent’s expectation can be written as: E[E[M |Ip]|Ir]cokr = ωMmax +
(1− ω)E[M |Ip], leading us to formulate our first hypothesis:
Hypothesis 1a: The curse of knowledge results in upward biased expectations of the
respondents regarding the proposers’ endowments in the CoK treatment: E[M ]cokr =
ωMmax + (1− ω)E[M ]ctrlr > E[M ]ctrlr .
As the treatment only modifies the respondents’ information set, it must have no
effect on the proposers’ expectations regarding their endowment.7
Hypothesis 1b: The proposers’ expectations regarding their endowment is not af-
fected by the treatment: E[M ]cokp = E[M ]ctrlp .
With Hypothesis 1a we anticipate an effect of the curse of knowledge on the re-
7As specified in the experimental design section, we record this expectation before the endowmentis revealed to the proposers.
16
spondents’ expectations. Nevertheless this change in expectation does not necessarily
need to impact a respondent’s strategy in the ultimatum game. Under the assump-
tion of rational agents who only care about their own pay-off, the endowment M
plays no role in defining the best strategy for both players. The subgame perfect
Nash equilibrium is to accept any offer higher than 0 for the respondent and to pro-
pose the smallest possible amount for the proposer. Nevertheless, as we will see in the
following section, introducing preferences for fairness in the players’ utility functions
implies that the strategies of both players are affected by the curse of knowledge,
which leads to different predictions than for the purely rational and selfish players.
3.3 Model of social preferences
We assume that the players’ preferences can be represented by a utility function
taking into account both their own pay-off and the other player’s pay-off. As in
Fehr & Schmidt (2000) the utility of individual i matched with individual j for an
allocation π = (πi, πj) is expressed in the following way:
Ui(π) = πi − αimax[πj − πi, 0]− βimax[πi − πj, 0]
where it is assumed that i 6= j βi ≤ αi and 0 ≤ βi ≤ 1. αi and βi are the coefficients
of the inequality aversion of the individual. αi (βi) prevails when πj ≥ πi (πj < πi) as
it is assumed that individuals may have a different tolerance for inequality depending
on whether their own pay-off is the highest or lowest.
Applying these preferences to our game yields:
Up(s,M) = M − s− αpmax[2s−M, 0]− βpmax[M − 2s, 0] (1)
Ur(s,M) = s− αrmax[M − 2s, 0]− βrmax[2s−M, 0] (2)
To choose the optimal lowest acceptable offer l, the respondent must form an expec-
17
tation regarding the realisation of M that we denote by E[M ]. We assume that the
respondent maximises his expected utility EUr(s, E[M ]).
In case of rejection by the respondent, the utility of both players is U(0, 0) = 0.
Thus, it is a dominated strategy for the respondent to accept any offer s that yields
EUr(s, E[M ]) < 0. For any offer s that yields EUr(s, E[M ]) > 0, the respondent’s
best response is to accept that offer. Hence, a rational respondent maximises his
expected utility by choosing l such that8:
EUr(l, E[M ]) = EU(0, 0) = 0
⇒ 0 = l − αrmax[E[M ]− 2l, 0]
⇒ l =αr
1 + 2αrE[M ]
As Hypothesis 1a states that E[M ]cokr > E[M ]ctrlr for the respondents, we now
derive the following hypothesis regarding the respondents’ strategy:
Hypothesis 2a: The respondents’ lowest acceptable offers are higher in the CoK
treatment than in the ctrl treatment: lcok > lctrl.
The proposers maximise their utility as described in equation (1) by best responding
to the respondents choice of l. To do so, their strategy must be to choose a proposal
8Theoretically, the respondent also wants to choose a maximal acceptable offer m above whichall proposals are rejected. This would yield the following decision criteria:
l =αr
1 + 2αrE[M ] if E[M ] > 2s
m =−βr
1− 2βrE[M ] if E[M ] < 2s
But since we do not allow our respondent to choose such a maximal acceptable offer in our experi-ment, we discuss only the choice rule for the minimal acceptable offer l.
18
s such that:
s =
1+αp
1+2αpM if l < 1+αp
1+2αpM
[0, 1−βp1−2βpM ] if l > 1−βp
1−2βpM
l otherwise
With this strategy, a proposer ensures a minimum utility of 0 from the game when
the lowest acceptable offer of the respondent is too high to find a mutually beneficial
split and extracts the maximum utility from the game when the respondent selects
a lowest acceptable that leaves room for a compromise. Assuming that a relevant
number of proposers choose s = l, we obtain :
Hypothesis 2b: The proposers’ offers are higher in the CoK treatment than in the
ctrl treatment: scok > sctrl.
Yet an increase in l also means that a lower ratio of settlements may be reached.
Indeed, the number of respondents reporting a lowest acceptable offer too high to be
met by a reasonable proposal, i.e. l > 1−βp1−2βpM , may increase in the CoK treatment as
the lowest acceptable offers become larger. Defining settle as the ratio of settlements
reached, we conjecture that
Hypothesis 3: The ratio of settlements is lower in the CoK treatment than in the
ctrl treatment: settlecok < settlectrl.
Finally, to close our theoretical framework, we assume that the players hold correct
beliefs regarding their group member’s strategy, i.e. they use the model to form
their beliefs about the strategy chosen by the other person in their group and these
beliefs correspond to the strategies that are played. This assumption, coupled with
the hypotheses 2a and 2b, leads us to the two following hypotheses:
Hypothesis 4a: The respondents’ expectations regarding the proposers’ offers are
higher in the CoK treatment than in the ctrl treatment: E[s]cok > E[s]ctrl.
19
Hypothesis 4b: The proposers’ expectations regarding the respondents’ lowest ac-
ceptable offer are higher in the CoK treatment than in the ctrl treatment: E[l]cok >
E[l]ctrl.
Note that the assumption of correct beliefs which allows us to close the model and
derive Hypothesis 4a and Hypothesis 4b is not necessary for Hypothesis 3 to
hold. Assuming that the proposers are myopic to the effect of the curse of knowledge
on the respondents’ strategies would also result in lower chances of settlement in
the CoK treatment. The respondents would increase their lowest acceptable offer
while the proposers would not change their offer, which would result in a higher
likelihood of rejection as well.
To sum up, our theoretical model predicts a shift in the expectations and the strate-
gies of both players between the two treatments. This shift, due to the curse of
knowledge, would result in a different allocation of the endowment in favour of the
respondent and in a lower rate of settlements. This scenario and all our hypotheses
are tested in the following section.
20
4 Results
In this section, we analyse the results collected during our experiment. First, we
briefly expose our sample’s descriptive statistics. We then specify which variables of
interest are examined and how they are computed. We present our findings, starting
with the respondents’ decisions before turning to the proposers’ decisions. For each
role we present the average treatment effects on the expectations and strategies
of our subjects and explore the treatment effect on the complete distributions of
behaviours in our sample. Note that we consider a result to be significant when the
p-value associated with its test statistic is lower than 5% (unless otherwise specified).
4.1 Descriptive statistics
The descriptive statistics of our experiment are summarised in Table 1. Overall, 136
subjects participated in six sessions that were conducted in September 2018.9 The
participants were randomly assigned to the ctrl or to the CoK treatment and to the
role of proposer or respondent. Hence, 34 independent observations were collected
per treatment for each role.
9Another 24 subjects participated in a pilot session conducted in August. They were used asthe third-party for our main experiment. They performed the change-detection task under thesame incentive scheme (4e per right answer) and their performance in this task determined theproposers’ endowments in the main experiment.
21
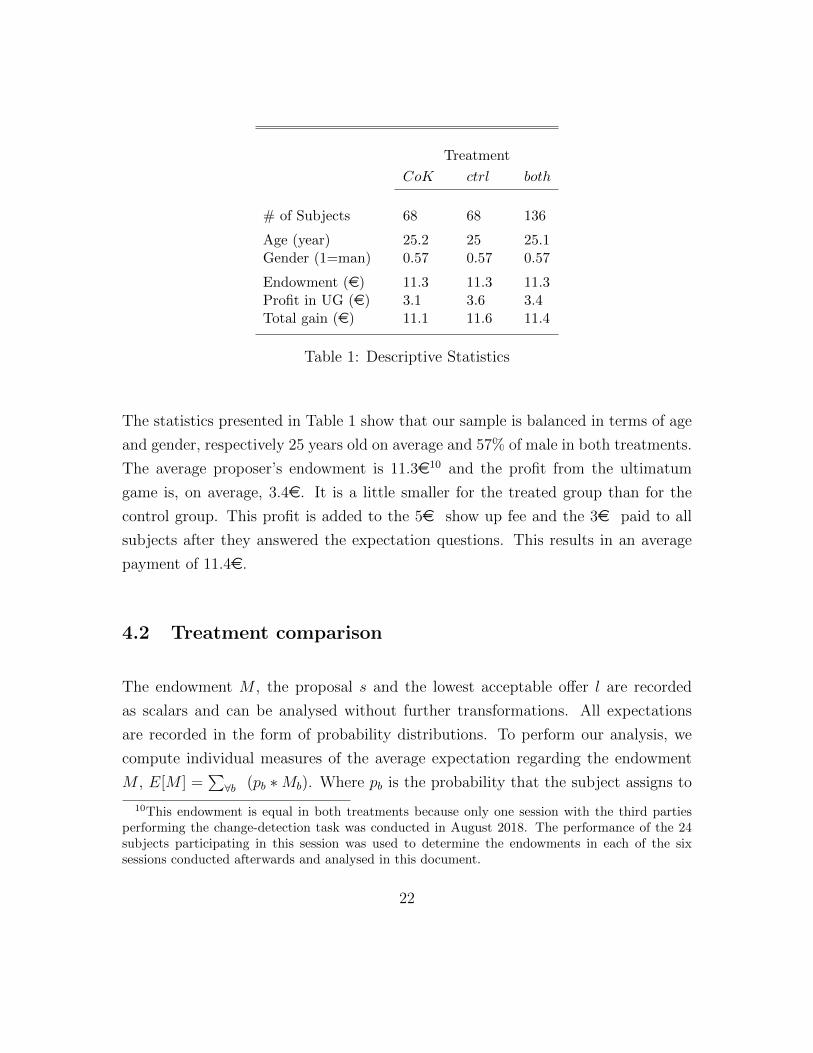
Treatment
CoK ctrl both
# of Subjects 68 68 136
Age (year) 25.2 25 25.1Gender (1=man) 0.57 0.57 0.57
Endowment (e) 11.3 11.3 11.3Profit in UG (e) 3.1 3.6 3.4Total gain (e) 11.1 11.6 11.4
Table 1: Descriptive Statistics
The statistics presented in Table 1 show that our sample is balanced in terms of age
and gender, respectively 25 years old on average and 57% of male in both treatments.
The average proposer’s endowment is 11.3e10 and the profit from the ultimatum
game is, on average, 3.4e. It is a little smaller for the treated group than for the
control group. This profit is added to the 5e show up fee and the 3e paid to all
subjects after they answered the expectation questions. This results in an average
payment of 11.4e.
4.2 Treatment comparison
The endowment M , the proposal s and the lowest acceptable offer l are recorded
as scalars and can be analysed without further transformations. All expectations
are recorded in the form of probability distributions. To perform our analysis, we
compute individual measures of the average expectation regarding the endowment
M , E[M ] =∑∀b (pb ∗Mb). Where pb is the probability that the subject assigns to
10This endowment is equal in both treatments because only one session with the third partiesperforming the change-detection task was conducted in August 2018. The performance of the 24subjects participating in this session was used to determine the endowments in each of the sixsessions conducted afterwards and analysed in this document.
22
the event described in bin b and Mb is the average endowment labelled in bin b. For
example, if a subject reports 20% in the second bin, labelled [1, 4], it means that he
believes that there is a 20% chance that the endowment will be between 1 and 4.
Therefore, p2 = 0.20 and M2 = 2.5.
Similarly, E[s] =∑∀b (pb ∗ sb) is computed for the expectations regarding the
proposal s and E[l] =∑∀b (pb ∗ lb) for the expectations of the lowest acceptable
offer l. We also introduce three variables that help us to analyse the treatment
effect. The variable settle is a dummy that takes the value 1 when a settlement is
reached and 0 otherwise. The variable share is the proportion of the endowment
that a proposer is offering, i.e. share = sM
. Finally, we denote min share the
minimum share of the endowment that a respondent is willing to accept according
to his expectations for the endowment, i.e. min share = lE[M ]
.
For the rest of our analysis, three observations have been removed from our sample
corresponding to three respondents who exhibited irrational behaviour. They re-
ported a lowest acceptable offer that was larger than their average expectation of the
proposer’s endowment. In other words, they were only willing to accept more than
100% of the average endowment that they thought the proposer would get. This
strategy cannot be reconciled with our theoretical framework and we suspect that it
is due to a misunderstanding regarding the game. Nevertheless, as a robustness test,
we provide in Appendix 2 the results of our data analysis without these exclusions.
4.2.1 Respondents’ expectations and strategy
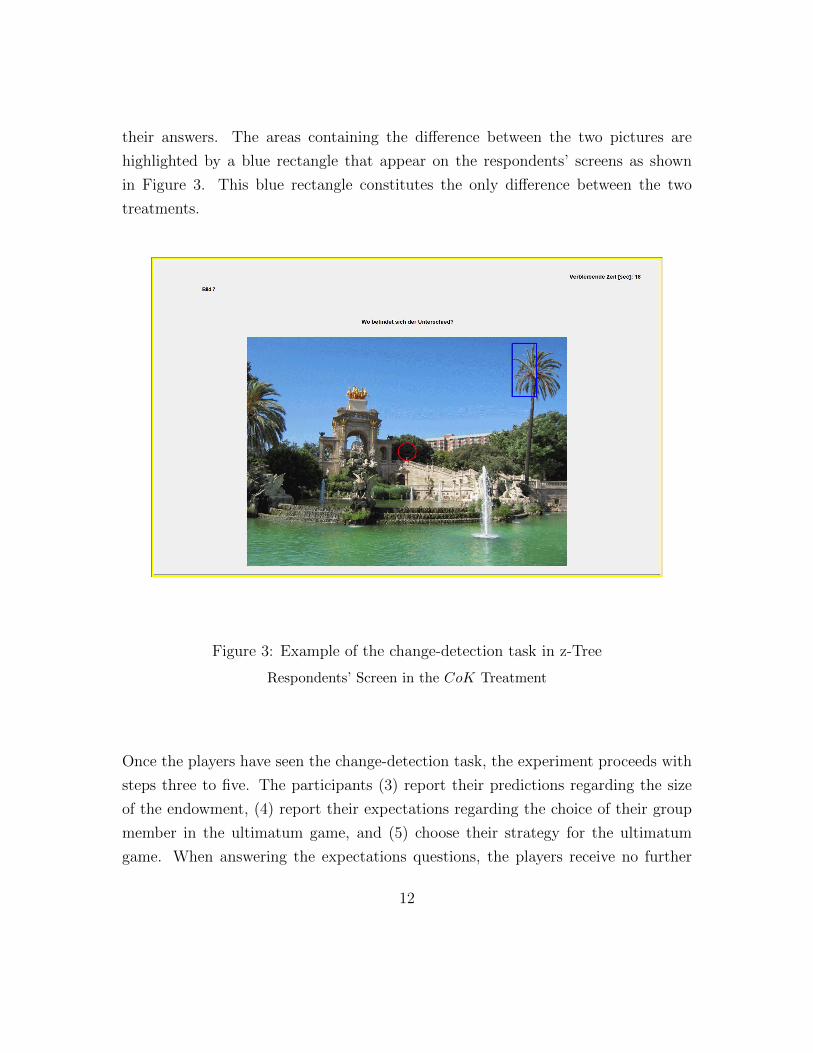
Our main results are presented in Table 2 and Figure 5. We find that the expectations
and strategies of the respondents are significantly impacted by the curse of knowledge
in the direction that our theory predicts.
23
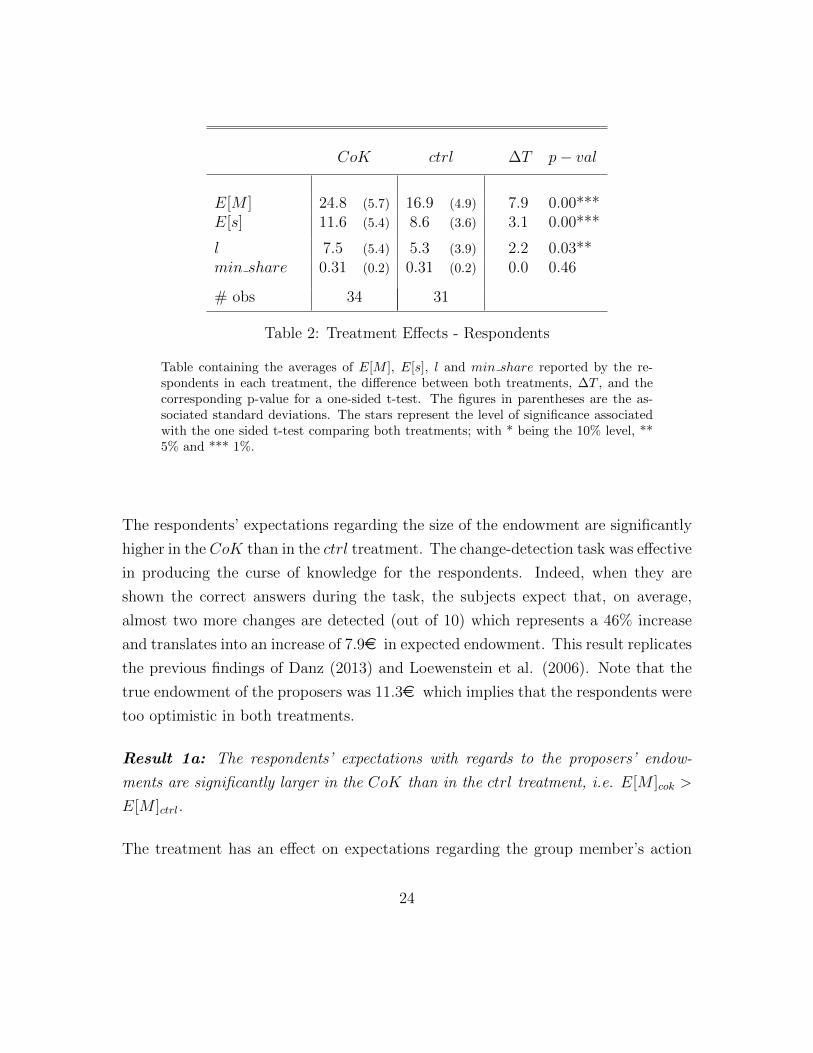
CoK ctrl ∆T p− val
E[M ] 24.8 (5.7) 16.9 (4.9) 7.9 0.00***E[s] 11.6 (5.4) 8.6 (3.6) 3.1 0.00***
l 7.5 (5.4) 5.3 (3.9) 2.2 0.03**min share 0.31 (0.2) 0.31 (0.2) 0.0 0.46
# obs 34 31
Table 2: Treatment Effects - Respondents
Table containing the averages of E[M ], E[s], l and min share reported by the re-spondents in each treatment, the difference between both treatments, ∆T , and thecorresponding p-value for a one-sided t-test. The figures in parentheses are the as-sociated standard deviations. The stars represent the level of significance associatedwith the one sided t-test comparing both treatments; with * being the 10% level, **5% and *** 1%.
The respondents’ expectations regarding the size of the endowment are significantly
higher in the CoK than in the ctrl treatment. The change-detection task was effective
in producing the curse of knowledge for the respondents. Indeed, when they are
shown the correct answers during the task, the subjects expect that, on average,
almost two more changes are detected (out of 10) which represents a 46% increase
and translates into an increase of 7.9e in expected endowment. This result replicates
the previous findings of Danz (2013) and Loewenstein et al. (2006). Note that the
true endowment of the proposers was 11.3e which implies that the respondents were
too optimistic in both treatments.
Result 1a: The respondents’ expectations with regards to the proposers’ endow-
ments are significantly larger in the CoK than in the ctrl treatment, i.e. E[M ]cok >
E[M ]ctrl.
The treatment has an effect on expectations regarding the group member’s action
24
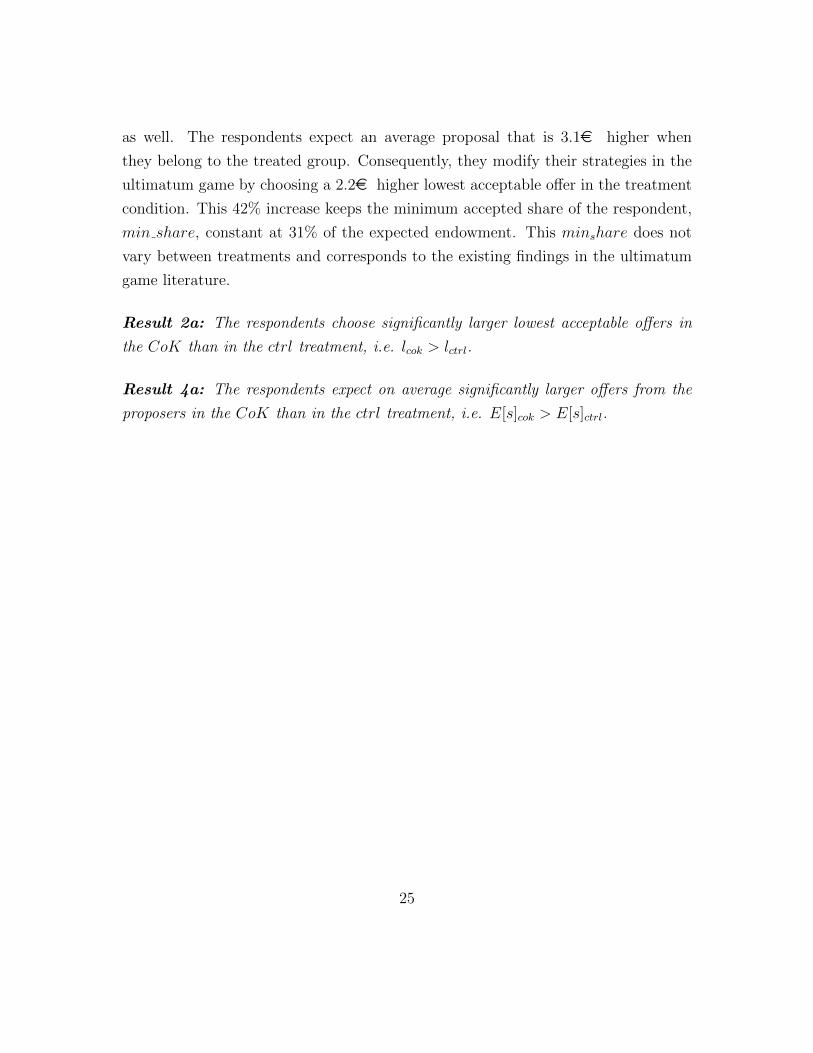
as well. The respondents expect an average proposal that is 3.1e higher when
they belong to the treated group. Consequently, they modify their strategies in the
ultimatum game by choosing a 2.2e higher lowest acceptable offer in the treatment
condition. This 42% increase keeps the minimum accepted share of the respondent,
min share, constant at 31% of the expected endowment. This minshare does not
vary between treatments and corresponds to the existing findings in the ultimatum
game literature.
Result 2a: The respondents choose significantly larger lowest acceptable offers in
the CoK than in the ctrl treatment, i.e. lcok > lctrl.
Result 4a: The respondents expect on average significantly larger offers from the
proposers in the CoK than in the ctrl treatment, i.e. E[s]cok > E[s]ctrl.
25
05
1015
2025
E[M] E[s] l
Control CoK
Figure 5: Treatment Comparison - Respondents
Figure showing the averages of E[M ], E[s] and l reported by the respondents in eachtreatment and their associated 95% confidence intervals.
According to our results, the respondents overestimate the third parties’ success in
the change-detection task in both treatments. The true average success rate is a little
lower than 3 out of 10 for an average endowment of 11.3e. In the ctrl treatment the
respondents expect an average endowment of 16.9e which is slightly overoptimistic.
In the CoK treatment, the overestimation is more dramatic. The subjects who are
given the true answers to the change-detection questions are expecting the endow-
ments’ size to be 24.8e,on average, i.e. 120% more than the true average. Their
expectations are significantly higher than the expectations of the participants who
had no access to the answers. As a result, they ask for a larger amount of money
26
as a lowest acceptable offer l which corresponds to an identical expected minimum
share min share of the total expected endowment. These findings are in line with
the hypotheses 1a, 2a and 4a.
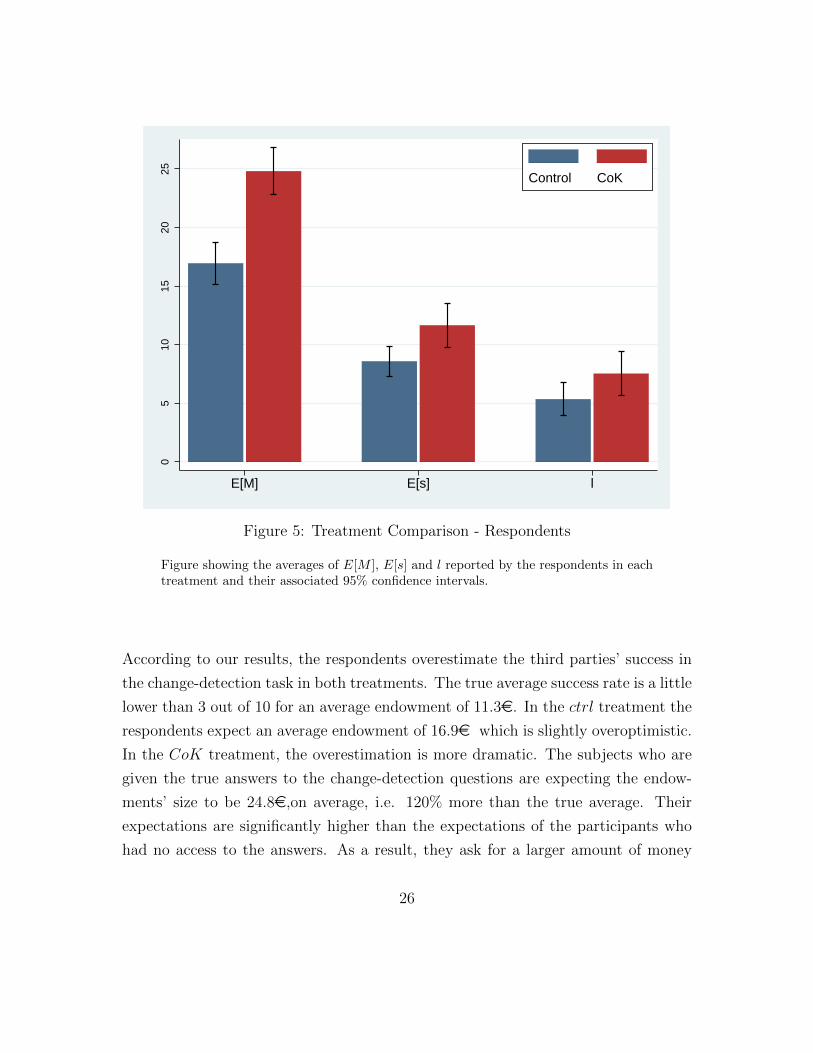
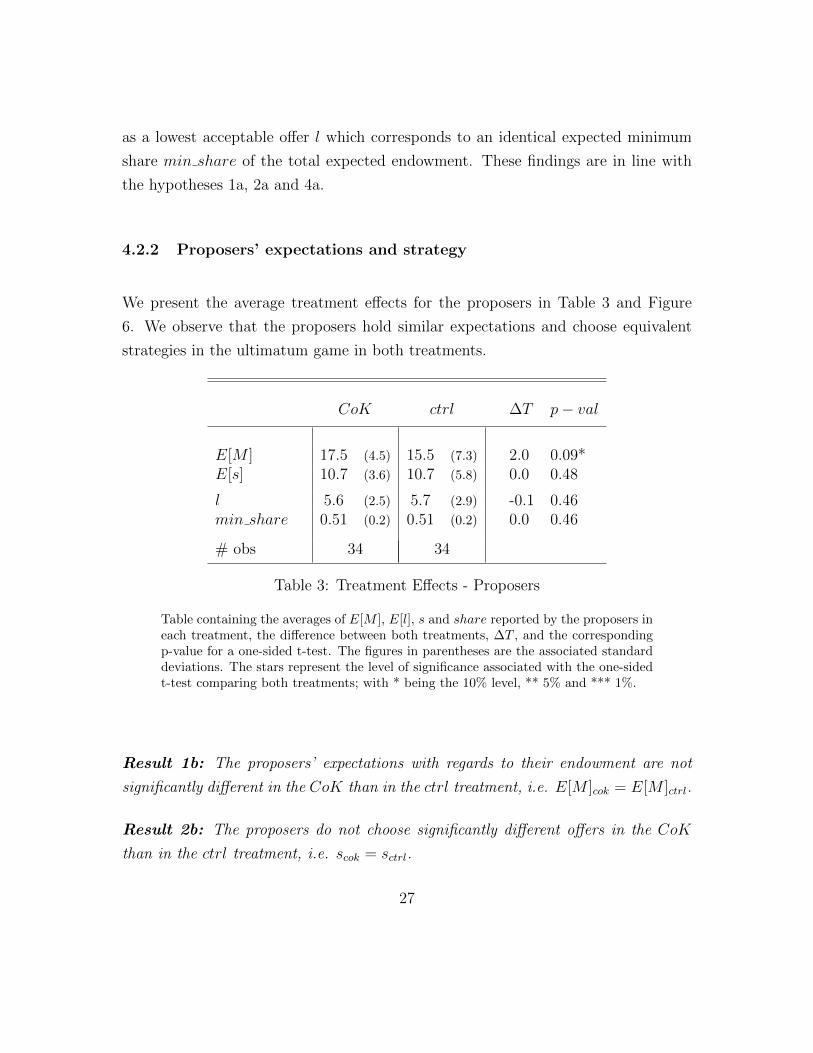
4.2.2 Proposers’ expectations and strategy
We present the average treatment effects for the proposers in Table 3 and Figure
6. We observe that the proposers hold similar expectations and choose equivalent
strategies in the ultimatum game in both treatments.
CoK ctrl ∆T p− val
E[M ] 17.5 (4.5) 15.5 (7.3) 2.0 0.09*E[s] 10.7 (3.6) 10.7 (5.8) 0.0 0.48
l 5.6 (2.5) 5.7 (2.9) -0.1 0.46min share 0.51 (0.2) 0.51 (0.2) 0.0 0.46
# obs 34 34
Table 3: Treatment Effects - Proposers
Table containing the averages of E[M ], E[l], s and share reported by the proposers ineach treatment, the difference between both treatments, ∆T , and the correspondingp-value for a one-sided t-test. The figures in parentheses are the associated standarddeviations. The stars represent the level of significance associated with the one-sidedt-test comparing both treatments; with * being the 10% level, ** 5% and *** 1%.
Result 1b: The proposers’ expectations with regards to their endowment are not
significantly different in the CoK than in the ctrl treatment, i.e. E[M ]cok = E[M ]ctrl.
Result 2b: The proposers do not choose significantly different offers in the CoK
than in the ctrl treatment, i.e. scok = sctrl.
27
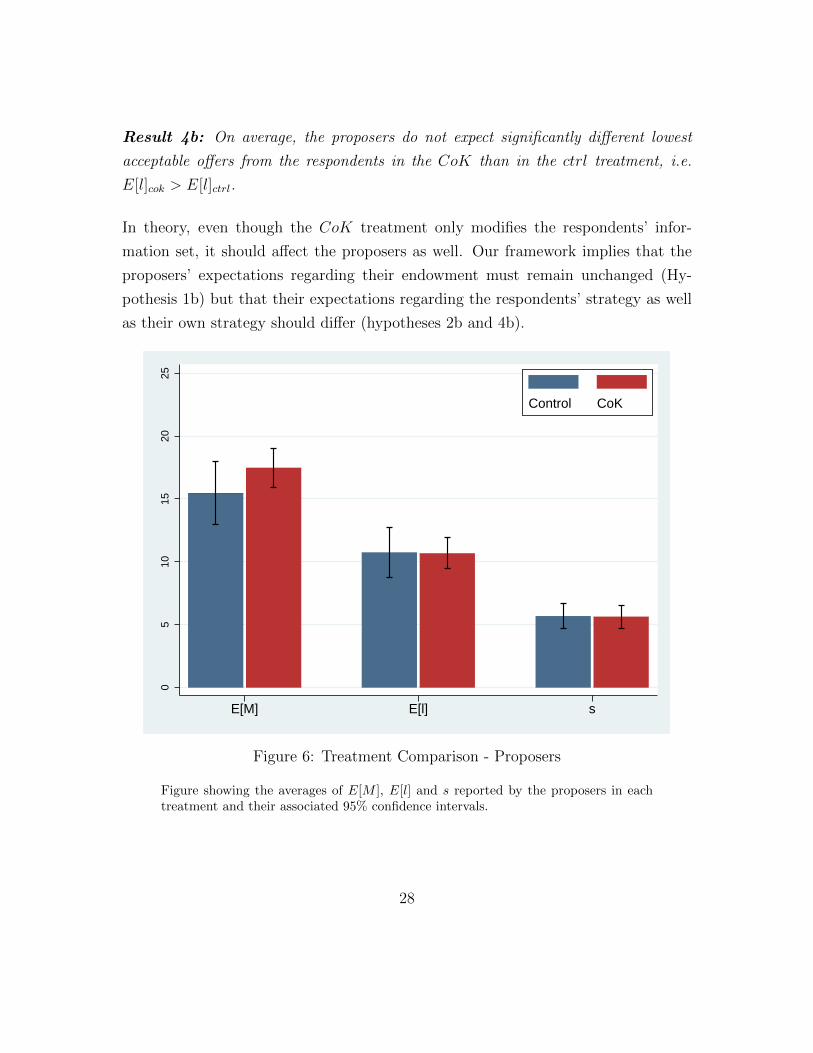
Result 4b: On average, the proposers do not expect significantly different lowest
acceptable offers from the respondents in the CoK than in the ctrl treatment, i.e.
E[l]cok > E[l]ctrl.
In theory, even though the CoK treatment only modifies the respondents’ infor-
mation set, it should affect the proposers as well. Our framework implies that the
proposers’ expectations regarding their endowment must remain unchanged (Hy-
pothesis 1b) but that their expectations regarding the respondents’ strategy as well
as their own strategy should differ (hypotheses 2b and 4b).
05
1015
2025
E[M] E[l] s
Control CoK
Figure 6: Treatment Comparison - Proposers
Figure showing the averages of E[M ], E[l] and s reported by the proposers in eachtreatment and their associated 95% confidence intervals.
28
Only Hypothesis 1b (E[M ]cokp = E[M ]ctrlp ) is in line with our findings. Our data do
not indicate that the proposers’ strategy in the ultimatum game or their expecta-
tions regarding the respondents’ strategy were affected by the CoK treatment. We
cannot reject the null hypotheses that E[l]cokp = E[l]ctrlp and that scok = sctrl. These
observations tend to indicate that the proposers are naive with respect to the effect
of the curse of knowledge on the respondents’ strategies.
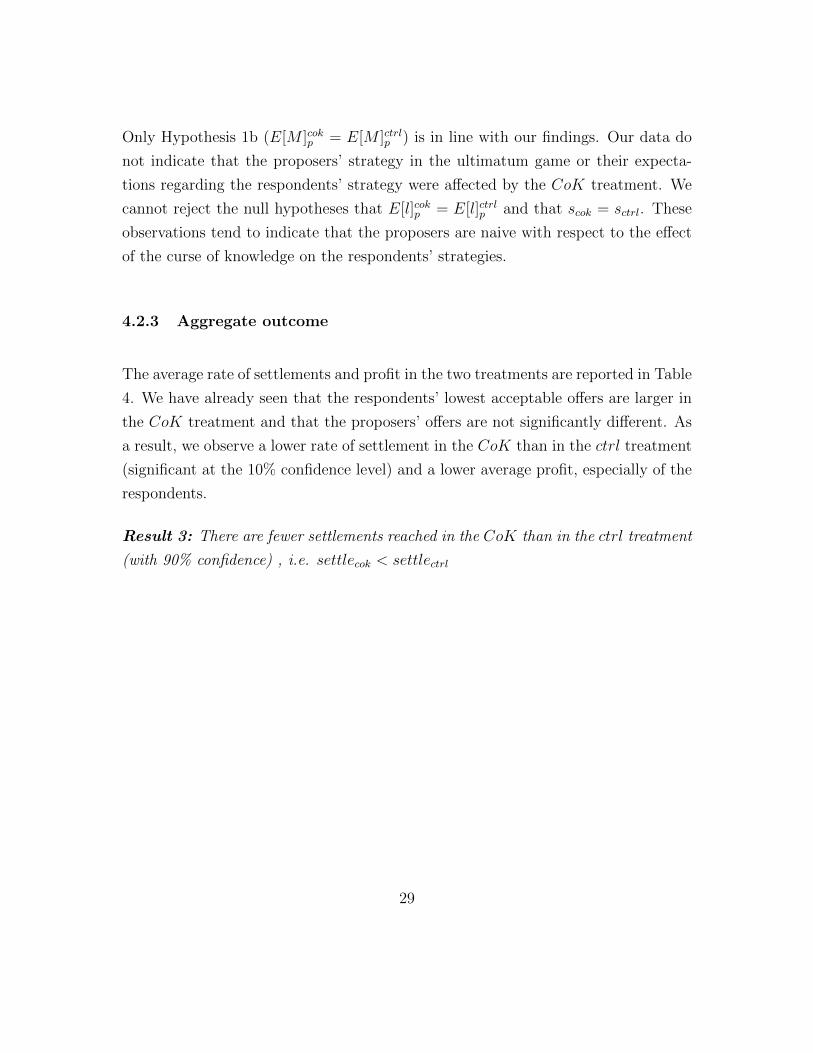
4.2.3 Aggregate outcome
The average rate of settlements and profit in the two treatments are reported in Table
4. We have already seen that the respondents’ lowest acceptable offers are larger in
the CoK treatment and that the proposers’ offers are not significantly different. As
a result, we observe a lower rate of settlement in the CoK than in the ctrl treatment
(significant at the 10% confidence level) and a lower average profit, especially of the
respondents.
Result 3: There are fewer settlements reached in the CoK than in the ctrl treatment
(with 90% confidence) , i.e. settlecok < settlectrl
29
CoK ctrl ∆T p− val
settle 0.47 (0.5) 0.65 (0.5) 0.18 0.08*
profitr 2.9 (3.5) 4.2 (3.9) -1.2 0.09*profitp 3.2 (4.2) 3.5 (3.9) -0.3 0.38
profit 3.1 (3.9) 3.8 (3.9) -0.7 0.13
# obs 68 65
Table 4: Outcome of the game
Table containing the average rate of settlement and profits in each treatment, thedifference between both treatments and the corresponding p-value for a one-sided t-test. The figures in parentheses are the associated standard deviations. The starsrepresent the level of significance associated with the one-sided t-test with * being the10% level, ** 5% and *** 1%.
Due to the curse of knowledge, the respondents are more likely to reject the offers
in the CoK treatment and their profit is lower on average. The rate of settlement
is 18 percentage points lower in the CoK than in the ctrl treatment. This differ-
ence, significant at the 10% level, seems to be the outcome of both the respondents’
changes in behaviours and the proposers’ naivete regarding the effect of the curse of
knowledge. To foresee the effect of the curse on the respondents would have required
a high degree of sophistication among the proposers in the CoK treatment. Our
results indicate that this is not the case as we do not observe any difference in their
strategies between treatments. Therefore, only the number of settlements changes
across treatments.
30
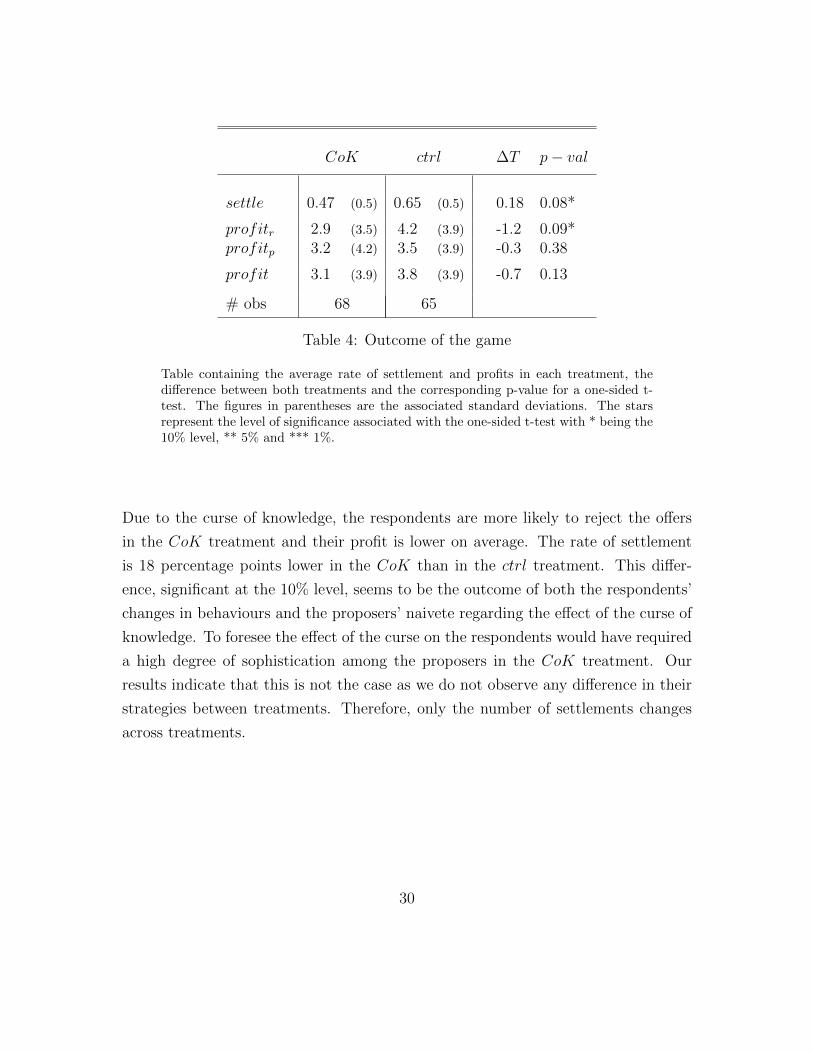
4.3 Quantile analysis
We now go a step further and investigate how the CoK treatment affected the entire
distributions of average expectations and strategies in the ultimatum game. Our goal
in this section is to extend our analysis to see if the results we have gathered can
indicate whether all the respondents are equally affected by the curse of knowledge.
We also aim to see if the curse always leads to a change in strategies and if some of
the proposers are adapting their strategies as well.
Since our experimental treatments are assigned between subjects we cannot isolate
the treatment effect individually. Therefore, we estimate the treatment effect on the
different quantiles of the distributions of E[M ], E[s] and l for the respondents and
E[M ], E[l] and s for the proposers. We report the treatment effects on four different
quantiles of the distributions in Table 5. Additionally, Figures 7 and 8 illustrate our
results by showing for each variable its cumulative distribution function (CDF) as
well as the estimated treatment effects on the different quantiles.
Respondents Proposers
Quantile E[M ] E[s] l E[M ] E[l] s
20 1.9*** 1.13 1 0.47 1.35 040 1.75*** 1.52 1 0.41 1.4 0
60 1.69*** 3.1* 2 0.35 0.76 0
80 2.5*** 5.6* 7*** 0.26 -2.2 0
Table 5: Treatment Effects Per Quantile
Table containing the treatment effects on four different quantiles of the distributions(the 20th, 40th, 60th and 80th) for the variables E[M ], E[s], l, E[l] and s. The effectsare presented for each role, proposer and respondent, separately. The stars representthe level of significance associated with a one-sided t-test against the null hypothesisthat no effect is found; with * being the 10% level, ** 5% and *** 1%.
31
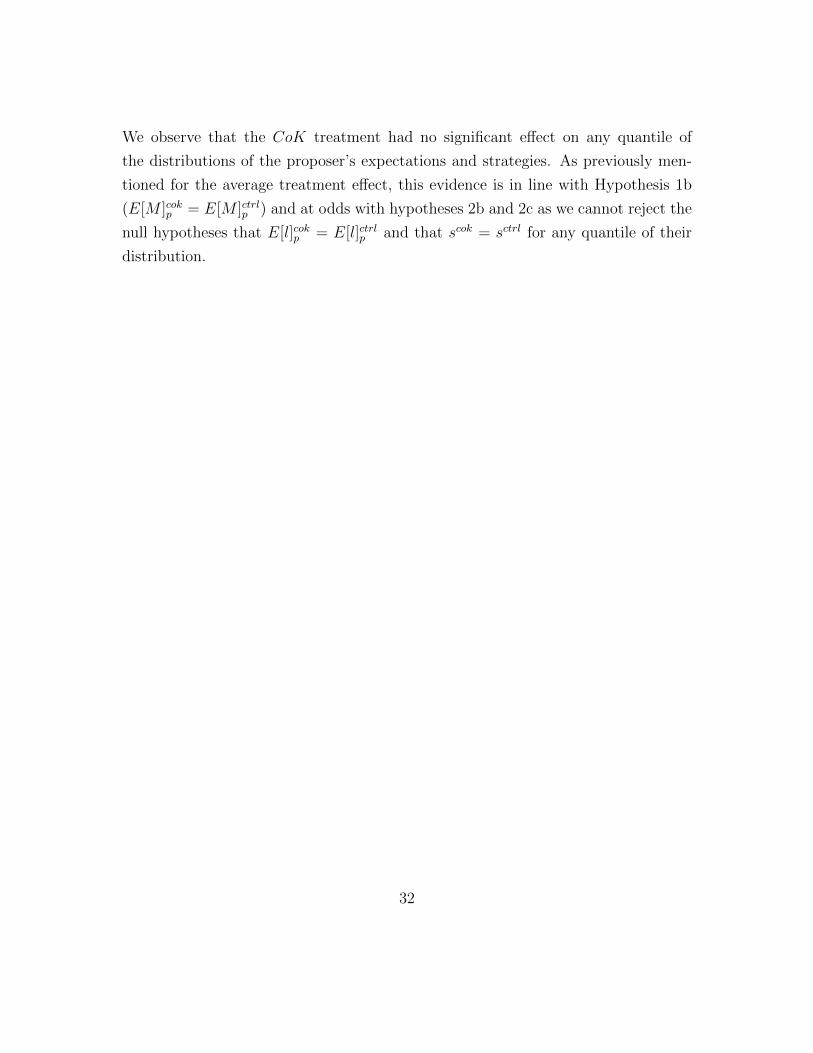
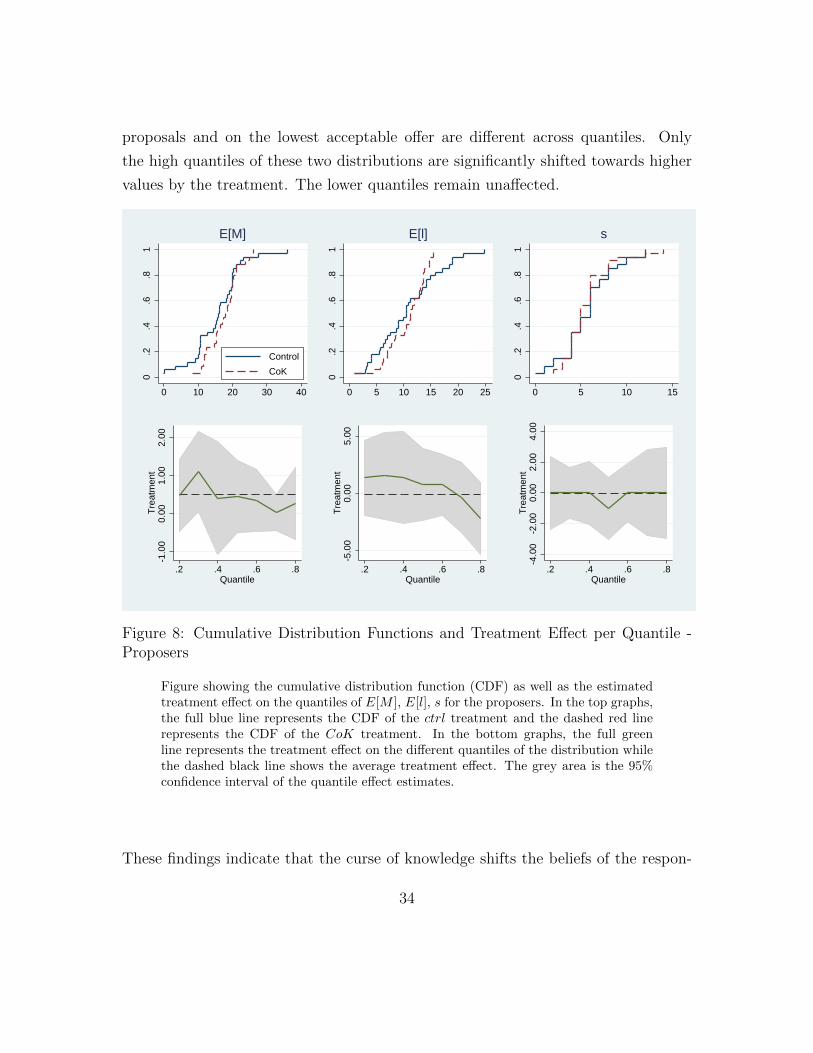
We observe that the CoK treatment had no significant effect on any quantile of
the distributions of the proposer’s expectations and strategies. As previously men-
tioned for the average treatment effect, this evidence is in line with Hypothesis 1b
(E[M ]cokp = E[M ]ctrlp ) and at odds with hypotheses 2b and 2c as we cannot reject the
null hypotheses that E[l]cokp = E[l]ctrlp and that scok = sctrl for any quantile of their
distribution.
32
0.2
.4.6
.81
0 10 20 30 40
ctrl
CoK
E[M]
0.2
.4.6
.81
0 5 10 15 20 25
E[s]
0.2
.4.6
.81
0 5 10 15 20
l0.
001.
002.
003.
004.
00tr
eatm
ent_
effe
ct
.2 .4 .6 .8Quantile
-5.0
00.
005.
0010
.00
trea
tmen
t_ef
fect
.2 .4 .6 .8Quantile
-5.0
00.
005.
0010
.00
15.0
0tr
eatm
ent_
effe
ct
.2 .4 .6 .8Quantile
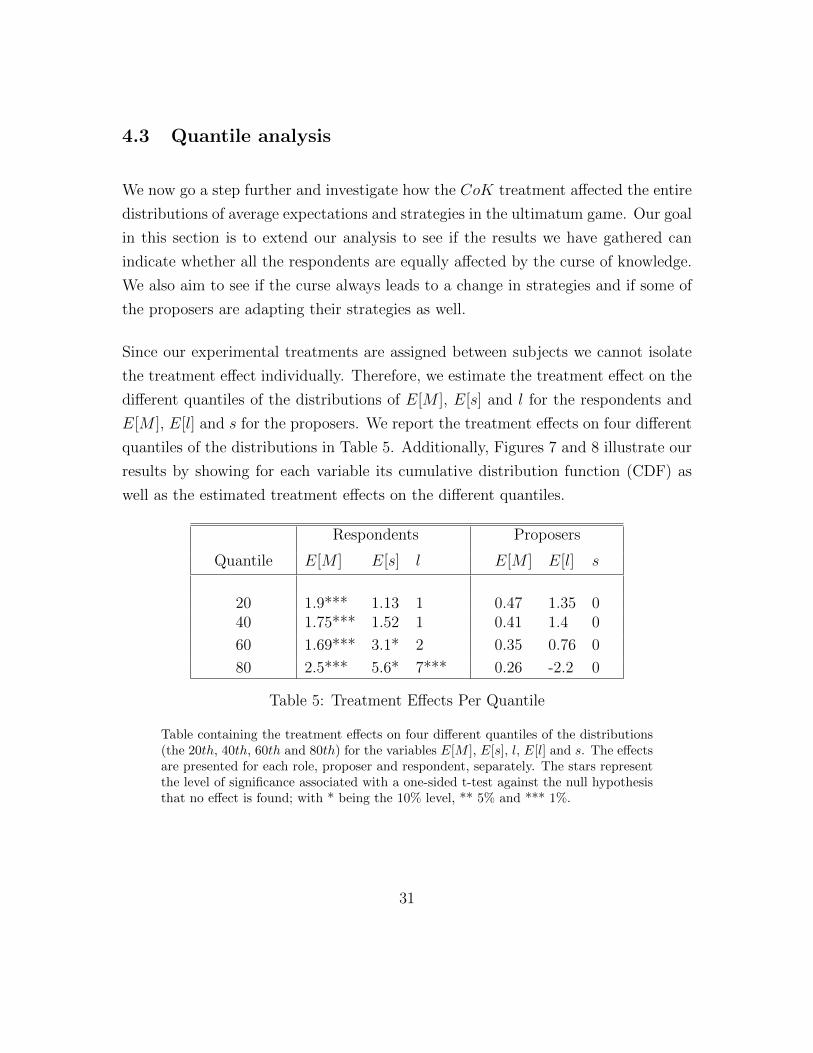
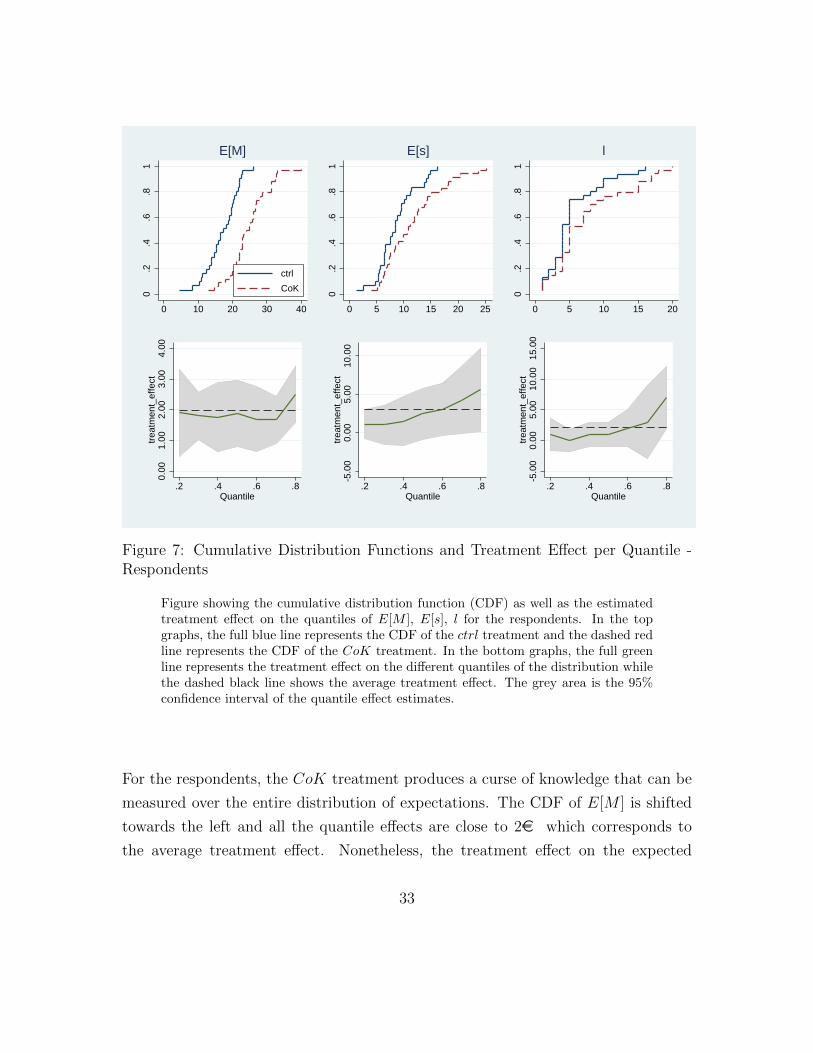
Figure 7: Cumulative Distribution Functions and Treatment Effect per Quantile -Respondents
Figure showing the cumulative distribution function (CDF) as well as the estimatedtreatment effect on the quantiles of E[M ], E[s], l for the respondents. In the topgraphs, the full blue line represents the CDF of the ctrl treatment and the dashed redline represents the CDF of the CoK treatment. In the bottom graphs, the full greenline represents the treatment effect on the different quantiles of the distribution whilethe dashed black line shows the average treatment effect. The grey area is the 95%confidence interval of the quantile effect estimates.
For the respondents, the CoK treatment produces a curse of knowledge that can be
measured over the entire distribution of expectations. The CDF of E[M ] is shifted
towards the left and all the quantile effects are close to 2e which corresponds to
the average treatment effect. Nonetheless, the treatment effect on the expected
33
proposals and on the lowest acceptable offer are different across quantiles. Only
the high quantiles of these two distributions are significantly shifted towards higher
values by the treatment. The lower quantiles remain unaffected.
0.2
.4.6
.81
0 10 20 30 40
Control
CoK
E[M]
0.2
.4.6
.81
0 5 10 15 20 25
E[l]
0.2
.4.6
.81
0 5 10 15
s
-1.0
00.
001.
002.
00T
reat
men
t
.2 .4 .6 .8Quantile
-5.0
00.
005.
00T
reat
men
t
.2 .4 .6 .8Quantile
-4.0
0-2
.00
0.00
2.00
4.00
Tre
atm
ent
.2 .4 .6 .8Quantile
Figure 8: Cumulative Distribution Functions and Treatment Effect per Quantile -Proposers
Figure showing the cumulative distribution function (CDF) as well as the estimatedtreatment effect on the quantiles of E[M ], E[l], s for the proposers. In the top graphs,the full blue line represents the CDF of the ctrl treatment and the dashed red linerepresents the CDF of the CoK treatment. In the bottom graphs, the full greenline represents the treatment effect on the different quantiles of the distribution whilethe dashed black line shows the average treatment effect. The grey area is the 95%confidence interval of the quantile effect estimates.
These findings indicate that the curse of knowledge shifts the beliefs of the respon-
34
dents independently of their preferences for fairness but that only the respondents
who are averse to inequality react to this change. This interpretation is in line with
our theory. Indeed, if we derive from the functional form describing the choice of the
lowest acceptable offer, l = αr
1+2αrE[M ], the following expression:
∆l =αr
1 + 2αr(E[M ]cokr − E[M ]ctrlr )
where ∆l is the difference in the lowest acceptable offer stated by the respondents
between the control and the treatment condition. We can observe that the impact of
the curse of knowledge on the expectations and the fairness preference parameter α
influence the optimal strategy of the respondents in a multiplicative way. This means
that the respondents with a high α, i.e. who are more averse to inequality, both
choose a high lowest acceptable offer and are more affected by the CoK treatment
than those with a low α.
This scenario fits both our data and our theoretical conjectures but is not formally
tested by our design. Further research involving a within-subjects design that let us
observe individual effects would be needed to draw final conclusions regarding the
combined effect of preferences for fairness and the curse of knowledge.
35
5 Summary and conclusions
In this article we present experimental evidence demonstrating the causal effect of the
curse of knowledge on negotiation strategies in a bargaining situation. We conduct
a laboratory experiment in which the ultimatum game is used to create a stylised
negotiation setting. A change-detection task determines the proposer’s endowment in
the game. In one of the two treatments, we provide the respondents of the ultimatum
game with private information about the solution of the change-detection task and
thus induce the curse of knowledge. This manipulation shifts the respondents’ beliefs
regarding the endowment’s size without modifying any feature of the game. Hence,
the treatments allow us to observe the causal effect of the curse of knowledge on our
subjects’ expectations and behaviour.
We find that providing additional information to the respondents impairs their ability
to judge the task’s difficulty. As a result they expect a larger endowment for the
proposers and choose a higher lowest acceptable offer in the ultimatum game. In our
experiment, the effect of the curse of knowledge on the respondents is substantial. It
increases their expected endowment and their lowest acceptable offer by respectively
47% and 42% on average. The respondents maintain a minimum accepted share of
31% of the expected endowment across treatments which corresponds to the existing
findings in the ultimatum game literature. The proposers do not foresee the effect
of the curse on the respondents’ strategies. They report similar expectations and
choose the same offers across treatments. This absence of effect on the proposers’
strategy combined with the difference in respondents’ choices leads to a higher rate
of rejection and a smaller profit for subjects in the CoK than in the ctrl treatment.
We observe a higher rate of bargaining impasse when the respondents receive private
information regarding the solution of the change-detection task.
This treatment variation was designed to show that the curse of knowledge can partly
explain observed bargaining impasses. We selected a setting in which different esti-
mations of the endowment create a mismatch between the respondents’ expectations
36
and the proposers’ offers. Of course, the impact of information asymmetry through
the curse of knowledge may be different depending on the information structure as
well as context-specific features of the negotiation. For example, in a scenario where
the information regarding the task is provided to the proposers instead of the respon-
dents, it could lead to higher offers from the proposers to be matched with relatively
low exigence from the respondents, which would increase the rate of settlement.
Even though our experimental framework is specific, our results demonstrate that
cognitive biases such as the curse of knowledge may generally impact the strategies
of players in bargaining contexts where fairness preferences play a role. We even
provide suggestive evidence of a larger treatment effect on the subjects who have
strong preferences for equality. These findings are important for the interpretations
of scientific evidence related to bargaining with information asymmetry and are also
relevant for policy issues. Indeed, we see that better information does not necessarily
lead to more desirable outcomes.
In contrast to previous research where individuals may consciously change their be-
haviours under different information settings for personal motives, in our environ-
ment it is their cognitive limitations that prevent them from choosing what would
likely have been their favourite strategy with less information. Therefore, the set-
tlement, or the impasse, reached due to the curse of knowledge can be considered
suboptimal and results in a net utility loss for the bargainers. This would mean, for
example, that certain transparency policies that are generally considered beneficial
when individuals behave rationally may in fact have certain costs that must be taken
into account. Especially when these policies target only part of the population.
37
References
[1] Linda Babcock, George Loewenstein, Samuel Issacharoff, and Colin Camerer.
Biased judgments of fairness in bargaining. The American Economic Review,
85(5):1337–1343, 1995.
[2] Max H Bazerman, Jared R Curhan, Don A Moore, and Kathleen L Valley.
Negotiation. Annual review of psychology, 51(1):279–314, 2000.
[3] Bruno Biais and Martin Weber. Hindsight bias, risk perception, and investment
performance. Management Science, 55(6):1018–1029, 2009.
[4] Colin Camerer, George Loewenstein, and Martin Weber. The curse of knowledge
in economic settings: An experimental analysis. Journal of political Economy,
97(5):1232–1254, 1989.
[5] David Danz. The curse of knowledge increases self-selection into competition:
Experimental evidence. Technical report, WZB Discussion Paper, 2014.
[6] David Danz, Frank Huber, Dorothea Kubler, Lydia Mechtenberg, and Julia
Schmid. ’i’ll do it by myself as i knew it all along’: On the failure of hindsight-
biased principals to delegate optimally. Technical report, SFB 649 Discussion
Paper, 2013.
[7] Tarek El-Sehity, Hans Haumer, Christian Helmenstein, Erich Kirchler, and Boris
Maciejovsky. Hindsight bias and individual risk attitude within the context of
experimental asset markets. The Journal of Psychology and Financial Markets,
3(4):227–235, 2002.
[8] Henry S Farber and Harry C Katz. Interest arbitration, outcomes, and the
incentive to bargain. ILR Review, 33(1):55–63, 1979.
[9] Ernst Fehr and Klaus M Schmidt. A theory of fairness, competition, and coop-
eration. The quarterly journal of economics, 114(3):817–868, 1999.
38
[10] Urs Fischbacher. z-tree: Zurich toolbox for ready-made economic experiments.
Experimental Economics, 10(2):171–178, June 2007.
[11] Baruch Fischhoff. Hindsight 6= foresight: the effect of outcome knowledge on
judgment under uncertainty. BMJ Quality & Safety, 12(4):304–311, 2003.
[12] Baruch Fischhoff and Ruth Beyth. I knew it would happen: Remembered proba-
bilities of oncefuture things. Organizational Behavior and Human Performance,
13(1):1–16, 1975.
[13] Rebecca L Guilbault, Fred B Bryant, Jennifer Howard Brockway, and Emil J
Posavac. A meta-analysis of research on hindsight bias. Basic and Applied Social
Psychology, 26(2-3):103–117, 2004.
[14] Steffen Huck. Responder behavior in ultimatum offer games with incomplete
information. Journal of Economic Psychology, 20(2):183–206, 1999.
[15] John H Kagel, Chung Kim, and Donald Moser. Fairness in ultimatum games
with asymmetric information and asymmetric payoffs. Games and Economic
Behavior, 13(1):100–110, 1996.
[16] George Loewenstein, Don A Moore, and Roberto A Weber. Misperceiving the
value of information in predicting the performance of others. Experimental
Economics, 9(3):281–295, 2006.
[17] Michael Mitzkewitz and Rosemarie Nagel. Experimental results on ultimatum
games with incomplete information. International Journal of Game Theory,
22(2):171–198, 1993.
[18] Amnon Rapoport and James A Sundali. Ultimatums in two-person bargaining
with one-sided uncertainty: Offer games. International Journal of Game Theory,
25(4):475–494, 1996.
[19] Amnon Rapoport, James A Sundali, and Darryl A Seale. Ultimatums in two-
person bargaining with one-sided uncertainty: Demand games. Journal of Eco-
nomic Behavior & Organization, 30(2):173–196, 1996.
39
[20] Ronald A Rensink, J Kevin O’Regan, and James J Clark. On the failure to
detect changes in scenes across brief interruptions. Visual cognition, 7(1-3):127–
145, 2000.
[21] Neal J Roese and Kathleen D Vohs. Hindsight bias. Perspectives on psychological
science, 7(5):411–426, 2012.
[22] Alvin E Roth and J Keith Murnighan. The role of information in bargaining: An
experimental study. Econometrica: Journal of the Econometric Society, pages
1123–1142, 1982.
40
Appendices
Appendix 1 : Instructions
Page 1
Welcome to our experiment!
During the experiment you are not allowed to use electronic devices or to communi-
cate with other participants.
Please use only the programmes and functions provided for the experiment. Please
do not talk to other participants.
If you have a question please raise your hand. We will come over and answer your
question in private. Please do not ask questions loudly in front of all the other
participants. If the question is relevant for all participants, we will repeat it and
answer it in front of everyone.
If you do not comply with the rules, you will be excluded from the experiment and
from the remuneration.
This experiment will last 30-40 minutes (instructions included). All of your decisions
are completely anonymous, neither the experimenter nor the other participants will
know about them.
Your remuneration for the experiment depends on your decisions and on chance. You
will at least earn 8e.
41
Page 2
In the experiment, there are three roles: participant A, participant B and
participant C.
All participants are divided into groups of three. In each group there is one partici-
pant A, one participant B and one participant C.
The participants C have participated in an earlier sessions. In this session
of the experiment, only participants A and participants B are taking part. The roles,
either participant A or participant B, will be randomly assigned. You will be told
what your role is at the end of the instructions.
In a prior session of the experiment, participant C worked on the following task:
Participant C had to find the difference between two images which were
shown alternately on their screen 6 times during approximately one sec-
ond each.
After 15 seconds the first image remains on the screen together with a red circle.
Participant C was given 30 seconds to move the circle to the place where the difference
between the two pictures was located. The red circle could be moved by clicking on
the picture.
Every time when participant C found the difference, he/she earned 4e. Participant
C had to find the difference in 10 pairs of pictures. Thus, he/she could earn between
0 and 40e.
On the following page, you will see an example of participant Cs task. In this example
the difference between the two pictures is marked in a blue rectangle to demonstrate
the task.
42
Beware! The blue mark only appears in the example. During the ex-
periment, participant C was not shown the difference marked in a blue
rectangle.
Please click on “Next to see an example.
Page 3
Contained an example of the change detection task.
Page 4
In today’s experiment, participant A and participant B have to accomplish three
tasks.
First, participant A and participant B will see the task that participant C had to
accomplish. Participant A and participant B will be shown the exact same pair of
images for the same amount of time as participant C. 11
The task of Participant A and participant B will be to estimate how many
correct answers participant C has given.
In other words, for each possible number of correct answers, participant
A and B will have to determine, how probable it is (between 0 and
100%) that participant C has answered exactly this number of difference-
detection tasks correctly.
11In the instructions of the treated group, the following sentences are added to this paragraph:Moreover, participant B will be shown the difference between the two pictures in a blue rectangle.This difference is never shown to participant A or C. These two sentences are the only differencesbetween the instructions for the two groups.
43
Example: If participant A or B name 15% as a probability for “2 correct answers”,
it means that in his/her opinion 15 out of 100 people in the role of participant C
have given this number of correct answers.
On the left, an example of the table that you will have to fill in later is displayed.
The probabilities have to add up to 100%.
Your remuneration for this task is 1,50e.
Page 5
Afterwards participant A receives the same sum of money as participant
C in the previous session. Then participant A can make an offer to par-
ticipant B, which the latter can accept or refuse.
Participant A proposes a sum between 0 and 40e to participant B. Participant A
can propose 0, 2e, 3e etc. up to 40e, but no more than he/she has received (the
same sum that participant C has earned in the difference-detection task).
At the same time, participant B decides on the minimal offer that he/she is willing
to accept.
After participant A has made his/her offer and after his/her attributed participant
B has named his lowest acceptable offer, the experiment is over. The remuneration is
calculated from the offer of participant A and the corresponding answer of participant
B for this offer (acceptance or rejection).
If the offer made by participant A is greater or equal to participant B’s
lowest acceptable offer, it means that the offer has been accepted by
participant B. In this case, the sum attributed to participant A will be
split between participant A and participant B, according to participant
44
As offer.
Example: Participant C has answered 5 questions correctly and thus, participant
A has 20e (5 x 4e) at his disposal. If participant A makes an offer of 5e and
participant Bs lowest acceptable offer is 3e, then the final split will be:
Participant B receives 5e and participant A receives 15e.
If participant As offer is lower than the lowest acceptable offer named by
participant B, this means that the offer has been rejected by participant
B. In this case, both participants earn 0e for this task.
Page 6
During the experiment a third task must be completed: participant A and participant
B must give their expectations regarding the how the other participant in their group
will behave during the experiment.
In every round Participant A has to estimate for each interval (0e, 1-
4e; 5-8e; 9-12e; 13-16e; 17-20e; 21-24e; 25- 28e; more than 28e) how
probable it is that participant B’s lowest acceptable offer falls into this
interval.
Example: If participant A gives an estimate of 20% for the interval of “1-4e”, this
means that he/she thinks, that there is a 20 percent chance that participant B will
determine either 1e, 2eor 3e as his/her lowest acceptable offer.
In every round participant B has to estimate for each interval (0e, 1-
4e; 5-8e; 9-12e; 13-16e; 17-20 e; 21-24e; 25- 28e; more than 28e) how
probable it is that participant A makes such an offer.
45
Example: If participant B gives an estimate of 100% for the interval of “13-16e”,
this means that he/she thinks, that there is a 100 percent chance that participant A
will offer propose him/her either 13e, 14e, 15eor 16e.
On the right, an example of the table that you will have to fill in later is displayed.
The probabilities have to add up to 100%.
Your remuneration for this task is 1,5e.
Page 7
The experiment will be conducted as follows: First you will see participant C’s task.
Then you have to give your estimation for every possible number of correct answers,
how probable it is (between 0% and 100%) that participant C has answered exactly
this number of questions correctly.
Then participant A and participant B will give their expectations about the other
participant’s behaviour during the experiment: Participant A has to estimate for
each interval how probable it is that participant B’s lowest acceptable offer falls into
this interval. Participant B has to estimate for each interval how probable it is that
participant A makes such an offer.
Then participant A offers a sum between 0 and 40 euros to participant B. Simulta-
neously, participant B decides what the lowest offer is, that he is willing to accept.
After participant A has made his/her offer and his/her assigned participant B has
named his/her lowest acceptable offer the experiment is over. At the end of the ex-
periment your remuneration is determined by your own decisions and the decisions
of the other participant assigned to you. Additionally, you will receive 5e for your
participation and 1,50e for the two other tasks.
46
Page 8
You have been assigned the role of participant A (B).
You can consult the instructions throughout the whole experiment by clicking on
“Instructions”. If you have questions, please raise your hands. We will come and
answer them.
If you do not have any questions, you can click on “Start”. The experiment will start
when all participants are ready.
47
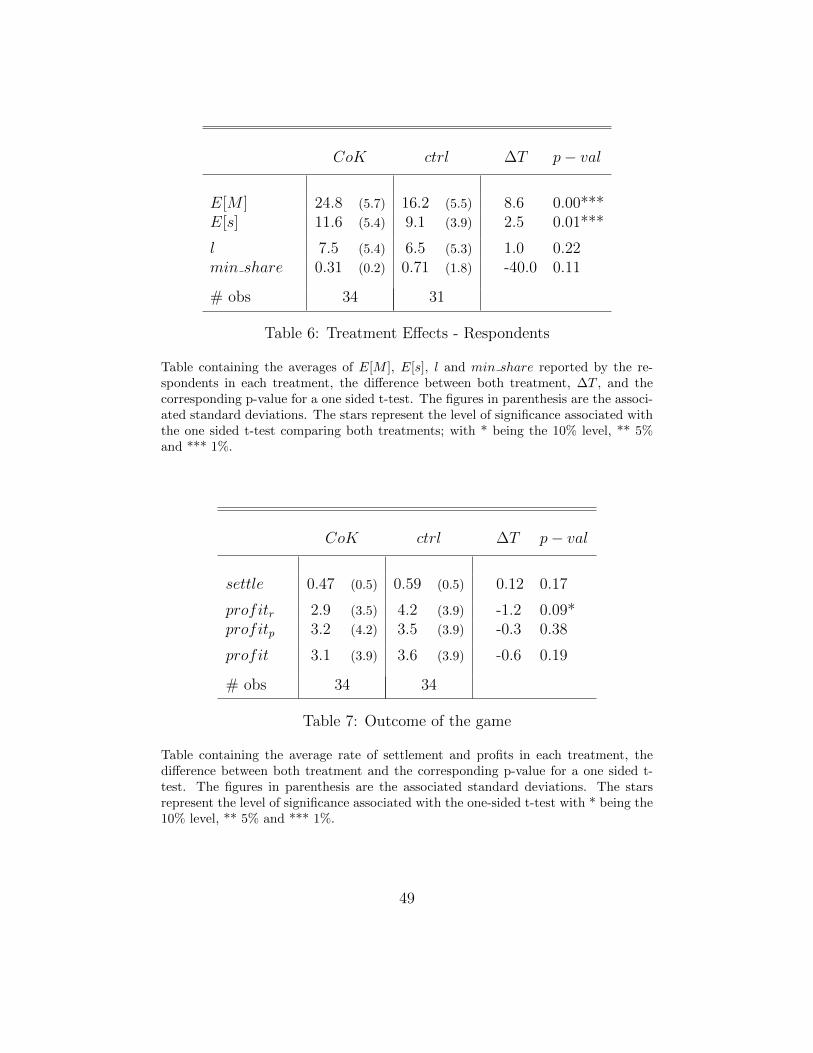
Appendix 2 : Results including outliers
This appendix contains the treatment effects measured on the beliefs and the strate-
gies of the respondents as well as the effects on the outcome of the ultimatum game,
i.e. the rate of settlement and the profit made by the players. We do not report
any new results regarding the proposers’ behaviour since no outliers were detected
among them. Table 6 is the equivalent of Table 2 and Table 7 is the equivalent of
Table 4.
The three outliers where all participating in the control treatment. We can see
that adding them to the sample increases substantially the lowest acceptable offers
in this treatment and renders the minimal share accepted very high (70%) with a
large standard deviation (180%). These observations indicate that the three subjects
behaved in a strange manner that was very different from all the others. Nevertheless,
the impact of the outliers on our analysis is not substantial. Taking them into account
does not change the direction of the main results. It only dampens the treatment
effect on the lowest acceptable offers.
48
CoK ctrl ∆T p− val
E[M ] 24.8 (5.7) 16.2 (5.5) 8.6 0.00***E[s] 11.6 (5.4) 9.1 (3.9) 2.5 0.01***
l 7.5 (5.4) 6.5 (5.3) 1.0 0.22min share 0.31 (0.2) 0.71 (1.8) -40.0 0.11
# obs 34 31
Table 6: Treatment Effects - Respondents
Table containing the averages of E[M ], E[s], l and min share reported by the re-spondents in each treatment, the difference between both treatment, ∆T , and thecorresponding p-value for a one sided t-test. The figures in parenthesis are the associ-ated standard deviations. The stars represent the level of significance associated withthe one sided t-test comparing both treatments; with * being the 10% level, ** 5%and *** 1%.
CoK ctrl ∆T p− val
settle 0.47 (0.5) 0.59 (0.5) 0.12 0.17
profitr 2.9 (3.5) 4.2 (3.9) -1.2 0.09*profitp 3.2 (4.2) 3.5 (3.9) -0.3 0.38
profit 3.1 (3.9) 3.6 (3.9) -0.6 0.19
# obs 34 34
Table 7: Outcome of the game
Table containing the average rate of settlement and profits in each treatment, thedifference between both treatment and the corresponding p-value for a one sided t-test. The figures in parenthesis are the associated standard deviations. The starsrepresent the level of significance associated with the one-sided t-test with * being the10% level, ** 5% and *** 1%.
49
All discussion papers are downloadable: http://www.wzb.eu/en/publications/discussion-papers/markets-and-choice
Discussion Papers of the Research Area Markets and Choice 2019
Research Unit: Market Behavior
Azar Abizada, Inácio Bó SP II 2019-201 Hiring from a pool of workers
Philipp Albert, Dorothea Kübler, Juliana Silva-Goncalves SP II 2019-202 Peer effects of ambition
Yves Breitmoser, Sebastian Schweighofer-Kodritsch SP II 2019-203 Obviousness around the clock
Tobias König, Sebastian Schweighofer-Kodritsch, Georg Weizsäcker SP II 2019-204 Beliefs as a means of self-control? Evidence from a dynamic student survey
Rustamdjan Hakimov, Dorothea Kübler SP II 2019-205 Experiments on matching markets: A survey
Puja Bhattacharya , Jeevant Rampal SP II 2019-206 Contests within and between groups
Kirby Nielsen, Puja Bhattacharya, John H. Kagel, Arjun Sengupta SP II 2019-207 Teams promise but do not deliver
Julien Grenet, Yinghua He, Dorothea Kübler SP II 2019-208 Decentralizing centralized matching markets: Implications from early offers in university admissions
Joerg Oechssler, Andreas Reischmann, Andis Sofianos SP II 2019-209 The conditional contribution mechanism for repeated public goods – the general case
Rustamdjan Hakimov, C.-Philipp Heller, Dorothea Kübler, Morimitsu Kurino
SP II 2019-210
How to avoid black markets for appointments with online booking systems
Thibaud Pierrot SP II 2019-211 Negotiation under the curse of knowledge
Research Unit: Economics of Change
Kai Barron, Steffen Huck, Philippe Jehiel SP II 2019-301 Everyday econometricians: Selection neglect and overoptimism when learning from others
Marta Serra-Garcia, Nora Szech SP II 2019-302 The (in)elasticity of moral ignorance
All discussion papers are downloadable: http://www.wzb.eu/en/publications/discussion-papers/markets-and-choice
Kai Barron, Robert Stüber, Roel van Veldhuizen SP II 2019-303 Motivated motive selection in the lying-dictator game
Maja Adena, Steffen Huck SP II 2019-304 Can mass fundraising harm your core business? A field experiment on how fundraising affects ticket sales
Maja Adena, Rustamdjan Hakimov, Steffen Huck SP II 2019-305 Charitable giving by the poor: A field experiment on matching and distance to charitable output in Kyrgyzstan
Research Unit: Ethics and Behavioral Economics
Daniel Parra, Manuel Muñoz-Herrera, Luis Palacio SP II 2019-401 The limits of transparency as a means of reducing corruption