nd-isotope evidence for the distal provenance of the historical (c. \u003c3000 bp) lateritic surface...
TRANSCRIPT

Aeolian Research 15 (2014) 177–192
Contents lists available at ScienceDirect
Aeolian Research
journal homepage: www.elsevier .com/locate /aeol ia
Nd-isotope evidence for the distal provenance of the historical(c. <3000 BP) lateritic surface cover underlying the Equatorial forestin Gabon (Western Africa)
http://dx.doi.org/10.1016/j.aeolia.2014.06.0021875-9637/� 2014 Elsevier B.V. All rights reserved.
⇑ Corresponding author. Tel.: +33 2 38 64 35 08.E-mail address: [email protected] (D. Thiéblemont).
D. Thiéblemont a,⇑, C. Guerrot a, Ph. Négrel a, R. Braucher b, D.L. Bourlès b, R. Thiéblemont c
a BRGM, B.P. 6009, 45060 Orléans Cedex, Franceb Aix-Marseille Université, CNRS-IRD-Collège de France, UM 34 CEREGE, Technopôle de l’Environnement Arbois-Méditerranée, BP80, 13545 Aix-en-Provence, Francec GEOMAR, Helmholtz Centre for Ocean Research, Kiel Düsternbrooker Weg, 24105 Kiel, Germany
a r t i c l e i n f o
Article history:Received 25 March 2014Revised 4 June 2014Accepted 4 June 2014Available online 4 July 2014
Keywords:GabonNamib desertNd-isotopesUpper HoloceneAeolian sedimentationClimatic crisis
a b s t r a c t
Surficial formations in Gabon, as well as in other places of western Central Africa include a ubiquitous,homogeneous and 1–3 m-thick clayey to sandy lateritic surface cover known as the ‘Cover Horizon’. From14C radiometric dating it has been concluded that the emplacement of this unit was correlative with amajor environmental crisis which affected Central Africa c. 3000–2000 years ago. 10Be and Nd-isotopicanalyses have been performed to provide new constraints on the age and origin of this layer. Six samplesfrom two depth profiles investigated for 10Be exhibit an almost constant concentration consistent with avery recent deposition age. Nd-isotopic analyses performed on the silt to clay fraction of eleven samplesfrom widely spaced locations over Gabon attest for mildly radiogenic signatures (eNd = �23 to �17) inten of them, and a slightly radiogenic signature (eNd = �9) in one sample. TDM model ages range from1.6 to 2.6 Ga, and a perfect discrimination is observed between the Nd-isotopic signature of the CoverHorizon and that of the underlying Congo Craton. This makes an aeolian origin as the most probablefor the Cover Horizon. The average eNd (c. �20) is however rather unusual for aeolian sediments or aero-sols. A possible source of particles is therefore tested by considering the present-day atmospheric fluxover Gabon and adjacent regions. Combined atmospheric modeling and Nd-isotopes leads to the conclu-sion that the fine fraction of the Cover Horizon could have originated from the northern part of the Namibdesert.
� 2014 Elsevier B.V. All rights reserved.
1. Introduction
In contrast to West Africa where lateritic profiles result fromthe in situ weathering of basement rocks (Tardy, 1997; Roquinet al., 1990), the surface formations of Central Africa exhibit abun-dant evidences of reworking precluding such interpretation. Theseformations are classically described as a superposition of three lay-ers (Marchesseau, 1965; Vincent, 1966a,b; Collinet, 1969; Lecomte,1988; Chevallier et al., 2002; Edou-Minko et al., 1992) (Fig. 1): (i) abasal saprolite derived from the weathering of the basement, (ii) anintermediate blocky horizon known as the Stone Line, (iii) an uppersandy to clayey surface cover usually designated as a ‘ferralsol’, theCover Horizon.
Each of the above three layers is generally 1–2 m thick, but inGabon thicknesses up-to 7–8 m have been reported for the Cover
Horizon (Arnould, 1966; Thiéblemont et al., 2009). Along theseprofiles, evidences of reworking are mainly observed within theStone Line, which hosts an abundant lithic industry of Old to Mid-dle Stone-Age (Locko, 1991; Lanfranchi, 1991; Schwartz, 1996;Mercader et al., 2002). The typical lateritic nature of the upper partof the profile (Cover Horizon) is well established and many authors(Lecomte, 1988; Edou-Minko et al., 1992) have pointed out theresemblance between that horizon and the saprolitic materialforming the weathered basement. Therefore, despite their particu-lar organization, the surface formations of Central Africa are gener-ally considered as having a lateritic origin (Lecomte, 1988;Schwartz, 1996; Chevallier et al., 2002).
In Gabon as well as in Congo (DRC and Congo), the Cover Horizonis usually interpreted as a colluvial (hillwash) deposit (Vincent1966a,b; Rünge, 2001; Peyrot et al., 2003), which implies that thesandy to clayey materials of which it is composed should originatefrom the upper parts of the relief and be further spread along theslopes by water stream. Abundant field, granulometric, geochemical

Fig. 1. View of a typical profile of surficial formations in Central Gabon showing the superposition of: (i) the weathered basement (weathered paragneisses); (ii) the StoneLine (polygenic breccia); (iii) the Cover Horizon (�1.5 m thick layer of homogeneous yellow fine-grained material). The four plastic bags correspond to the four superposedsamples collected in this profile. (For interpretation of the references to color in this figure legend, the reader is referred to the web version of this article.)
178 D. Thiéblemont et al. / Aeolian Research 15 (2014) 177–192
and geochronological data obtained during the course of a geologi-cal mapping program of the Gabonese Republic sponsored by theE.U. (SYSMIN funds) led Thiéblemont et al. (2009, 2013) andThiéblemont (2013) to refute this ‘parautochthonous’ model andto invoke an allochthonous origin for the Cover Horizon. From pre-cise 14C dating obtained on coal fragments, they also concluded thatthis unit was emplaced as recently as to 3000–2000 BP ago, a timeperiod during which Central Africa was affected by a major environ-mental crisis responsible for a drastic regression of the Equatorialforest (Elenga et al., 1994; Maley and Brenac, 1998; Vincens et al.,1998). Thus, the landscape of Central Africa during this period mustbe seen as very different from today, resulting in strongly differentgeomorphological processes (water flows, erosion, lateral move-ments etc.). Thiéblemont et al. (2009, 2013) and Thiéblemont(2013) concluded that an aeolian origin was the most probable forthe Cover Horizon. They envisaged that its constituting lateriticmaterial was derived from the remobilization of the fine-grainedmaterial (alteration clays and silts) located at the surface of adenuded region, but did not attempt to precise the location of thissource region because of the lack of suitable data (Thiéblemontet al., 2009).
The Sm–Nd isotopic system has proved to be a pertinent and effi-cient tool for constraining the origin of aeolian sediments (e.g.Grousset and Biscaye, 2005). Because alteration has little effect onthe Sm/Nd ratio and therefore virtually no effect on the 143Nd/144Ndisotopic ratio (Négrel, 2006; Négrel and Pételet-Giraud, 2010), the143Nd/144Nd isotopic ratio may be considered equal in a basementrock and in its alteration products, especially if the time elapsedsince the weathering event is limited (c. <50 Ma).
In this paper, we present the first Nd-isotopic analyses obtainedon samples of the Cover Horizon collected in widely spaced loca-tions spread over the Gabonese territory. Available geochronologi-cal data (e.g. 14C dates) indicate that the deposition of the CoverHorizon is a quasi-historical event (<3000 BP) implying that itsNd-isotopic signature could be considered as identical to that ofits source. 10Be measured along two depth profiles are also pre-sented to put additional geochronological constraints on the depo-sition of the Cover Horizon.
Only the silt to clay fraction (Ø < 63 lm) has been analyzed forNd-isotopes because this fraction is the most likely to have been
transported by wind over long distances. The Nd-isotopic signatureof this regolith material is compared to that of its basement, thislatter being well known owing to systematic regional studies(Caen-Vachette et al., 1988; Mayaga-Mikolo, 1997; Thiéblemontet al., 2009). This approach corroborates the allochthonous charac-ter of the Cover Horizon and led us to test possible sources in aregional context, i.e. find out large areas of Africa with isotopiccharacteristics similar to those of the Cover Horizon. Finally, atmo-spheric data are used together with the isotopic constraints inorder to localize the possible source region of the fine-grainedmaterial.
2. Stratigraphy of the Cover Horizon
All geologists involved in geological mapping or regional explo-ration projects in Gabon or western Congo have mentioned theoccurrence of a ubiquitous yellow layer which constitutes theupper part of the regolith in western Equatorial Africa (Fig. 1). Thislayer may be traced from place to place all over Gabon (Lecomte,1988), forming a unique soil horizon of homogeneous verticaland lateral aspect. Because of its constant stratigraphic positionthis layer is considered as a ‘formation’ (Lecomte, 1988;Thiéblemont et al., 2009) in a geological sense (Bates andJackson, 1987).
Toward its base, the contact with the Stone Line polygenic brec-cia may be sharp or gradational and, below the Stone Line, the topof the basement may be intensely weathered (saprolite) (Fig. 1). Onthe other hand, the Cover Horizon is locally observed as restingdirectly on fresh and massive rocks (Fig. 2) and to the east and westof Gabon, it overlies aeolian sands of Plio-Quaternary age, respec-tively the Batéké Sands (Séranne et al., 2008) and Cirques Series(Fig. 3).
The thickness of the Cover Horizon is remarkably constant, fromc. 1 to 3 meters according to most authors (e.g. Lecomte, 1988 andReferences. therein). Outcrops in the canyons (‘Cirques’) excavatedin the Plio-Quaternary sands (Cirques Series) of the coastal basinsof Gabon and Congo show that the Cover Horizon may locally reachmore than ten meters close to the shore line (Fig. 3) but such athickness has never been reported inland on the cratonic regions(Congo Craton). In Gabon, consistent field observations and remote

Fig. 2. View of the Cover Horizon overlying unweathered Mesoarchean gneiss in North-Central Gabon (Mitzic region).
Fig. 3. View of the Cover Horizon overlying red-colored Plio-Quaternary sands in the Congo Coastal Basin (Pointe Noire region). (For interpretation of the references to colorin this figure legend, the reader is referred to the web version of this article.)
D. Thiéblemont et al. / Aeolian Research 15 (2014) 177–192 179
sensing maps (SRTM data) let us to define large outcrops where theCover Horizon constitute c. 30 m-high plateau overlying theCoastal basin paleosurface (Thiéblemont, 2009). Maps drawn fromthe SRTM radar survey reveal NW-trending ridges on the northernpart of the plateaus. These ridges could be original structures asso-ciated with the deposition of the Cover Horizon that are entirelycovered by forest today. A drill in the lower part of the slope ofone of these plateaus has recovered 10 m of a yellow loamy mate-rial (‘Limon’) overlying a lateritic breccia (Stone Line) (Arnould,1966).
Beyond its rather homogeneous yellow color, the Cover Horizonshows a strongly variable granulometric composition (Vincent,1966a,b; Thiéblemont, 2013). As indicated in Table 1, the sand frac-tion (0.063 mm < Ø < 2 mm) reaches 65–70% in samples depositedover the aeolian sands of the Cirques Series but less than 6% insamples collected on the Mesoarchean greenstone belts of the inte-rior of Gabon. Conversely, the clay fraction (Ø < 2 lm) reaches 80–90% in the latter and 15–18% in the former. The aeolian origin of
the Cover Horizon in the coastal basin of Congo has been demon-strated by Giresse and le Ribault (1981) from a morphologicalstudy of quartz grains. These quartz were derived from the rework-ing of the underlying Plio-Quaternary sands and mixed with a finefraction which gave them the characteristic yellow color of theCover Horizon. At the scale of the Gabonese country,Thiéblemont (2013) has interpreted the granulometric and geo-chemical variability of the Cover Horizon as the consequence of amixing between two main components: quartz and clays (mainlykaolinite). Quartz is the main component of the sand fraction andclays form the finest fraction. As indicated by the work of Giresseand le Ribault (1981) the quartz may result from the redepositionof local materials blown by wind. Thus, the high thickness andcoarse granulometry of the Cover Horizon in the Coastal basinsprobably reflects the abundance of sands in the local context,whereas the fine-grained granulometry of the Cover Horizon inthe regions of ancient basement reflects the predominance of a dis-tal component.
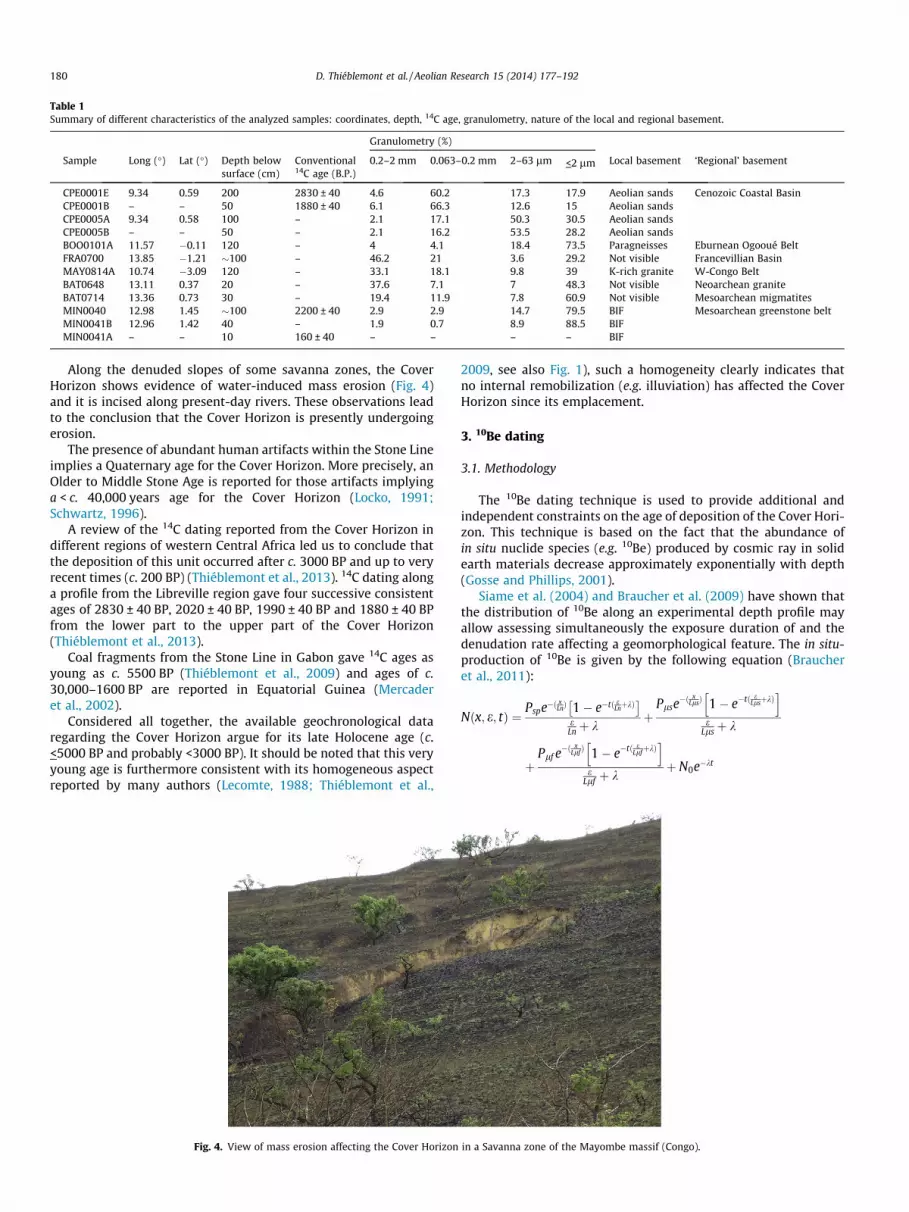
Table 1Summary of different characteristics of the analyzed samples: coordinates, depth, 14C age, granulometry, nature of the local and regional basement.
Granulometry (%)
Sample Long (�) Lat (�) Depth belowsurface (cm)
Conventional14C age (B.P.)
0.2–2 mm 0.063–0.2 mm 2–63 lm <2 lm Local basement ‘Regional’ basement
CPE0001E 9.34 0.59 200 2830 ± 40 4.6 60.2 17.3 17.9 Aeolian sands Cenozoic Coastal BasinCPE0001B – – 50 1880 ± 40 6.1 66.3 12.6 15 Aeolian sandsCPE0005A 9.34 0.58 100 – 2.1 17.1 50.3 30.5 Aeolian sandsCPE0005B – – 50 – 2.1 16.2 53.5 28.2 Aeolian sandsBOO0101A 11.57 �0.11 120 – 4 4.1 18.4 73.5 Paragneisses Eburnean Ogooué BeltFRA0700 13.85 �1.21 �100 – 46.2 21 3.6 29.2 Not visible Francevillian BasinMAY0814A 10.74 �3.09 120 – 33.1 18.1 9.8 39 K-rich granite W-Congo BeltBAT0648 13.11 0.37 20 – 37.6 7.1 7 48.3 Not visible Neoarchean graniteBAT0714 13.36 0.73 30 – 19.4 11.9 7.8 60.9 Not visible Mesoarchean migmatitesMIN0040 12.98 1.45 �100 2200 ± 40 2.9 2.9 14.7 79.5 BIF Mesoarchean greenstone beltMIN0041B 12.96 1.42 40 – 1.9 0.7 8.9 88.5 BIFMIN0041A – – 10 160 ± 40 – – – – BIF
180 D. Thiéblemont et al. / Aeolian Research 15 (2014) 177–192
Along the denuded slopes of some savanna zones, the CoverHorizon shows evidence of water-induced mass erosion (Fig. 4)and it is incised along present-day rivers. These observations leadto the conclusion that the Cover Horizon is presently undergoingerosion.
The presence of abundant human artifacts within the Stone Lineimplies a Quaternary age for the Cover Horizon. More precisely, anOlder to Middle Stone Age is reported for those artifacts implyinga < c. 40,000 years age for the Cover Horizon (Locko, 1991;Schwartz, 1996).
A review of the 14C dating reported from the Cover Horizon indifferent regions of western Central Africa led us to conclude thatthe deposition of this unit occurred after c. 3000 BP and up to veryrecent times (c. 200 BP) (Thiéblemont et al., 2013). 14C dating alonga profile from the Libreville region gave four successive consistentages of 2830 ± 40 BP, 2020 ± 40 BP, 1990 ± 40 BP and 1880 ± 40 BPfrom the lower part to the upper part of the Cover Horizon(Thiéblemont et al., 2013).
Coal fragments from the Stone Line in Gabon gave 14C ages asyoung as c. 5500 BP (Thiéblemont et al., 2009) and ages of c.30,000–1600 BP are reported in Equatorial Guinea (Mercaderet al., 2002).
Considered all together, the available geochronological dataregarding the Cover Horizon argue for its late Holocene age (c.<5000 BP and probably <3000 BP). It should be noted that this veryyoung age is furthermore consistent with its homogeneous aspectreported by many authors (Lecomte, 1988; Thiéblemont et al.,
Fig. 4. View of mass erosion affecting the Cover Horizon
2009, see also Fig. 1), such a homogeneity clearly indicates thatno internal remobilization (e.g. illuviation) has affected the CoverHorizon since its emplacement.
3. 10Be dating
3.1. Methodology
The 10Be dating technique is used to provide additional andindependent constraints on the age of deposition of the Cover Hori-zon. This technique is based on the fact that the abundance ofin situ nuclide species (e.g. 10Be) produced by cosmic ray in solidearth materials decrease approximately exponentially with depth(Gosse and Phillips, 2001).
Siame et al. (2004) and Braucher et al. (2009) have shown thatthe distribution of 10Be along an experimental depth profile mayallow assessing simultaneously the exposure duration of and thedenudation rate affecting a geomorphological feature. The in situ-production of 10Be is given by the following equation (Braucheret al., 2011):
Nðx; e; tÞ ¼Pspe�ð
xLnÞ 1� e�tð eLnþkÞ� �
eLnþ k
þPlse
�ð xLlsÞ 1� e�tð e
LlsþkÞh i
eLlsþ k
þPlf e
�ð xLlfÞ 1� e�tð e
LlfþkÞh i
eLlf þ k
þ N0e�kt
in a Savanna zone of the Mayombe massif (Congo).

D. Thiéblemont et al. / Aeolian Research 15 (2014) 177–192 181
where N(x, e, t) is the 10Be concentration as a function of depth x (g/cm2), erosion rate e (g/cm2/year) and exposure time t (year), k is theradioactive decay constant (year�1), and Pn, Pls and Plf are the rel-ative production rates due to neutrons, slow muons and fast muons.Ln, Lls, and Llf are the effective apparent attenuation lengths (g/cm2), for neutrons, slow muons, and fast muons, respectively.Finally, N0 is the number of atoms present at the initiation of theexposure scenario (i.e. inheritance).
The exponential decrease of cosmogenic 10Be concentrationswith depth insures that all samples within the studied profile havebeen exposed in the same relative position during their exposurehistory and that this exposure history has been long enough toallow concentration differentiation from top to bottom.
3.2. Sampling and analytical method
The 10Be results obtained on six selected bulk samples,together with the mandatory parameters in cosmogenic nuclidedating: latitude, longitude, altitude, scaling factor, density, . . .,are reported in Table 2. The samples were collected from twosites very close to each other in the coastal region of Gabon(CPE location on Fig. 6) where the Cover Horizon overlies sandsof probable Plio-Quaternary age. Conventional 14C ages deter-mined on coal fragments recovered from two samples selectedfrom a single profile are 2830 ± 40 BP for the one collected atthe base of the profile (CPE0001E, 200 cm depth) and1880 ± 40 BP for the other (CPE0001B) collected 50 cm belowthe surface (Table 2).
The chemical treatment of the samples and the AcceleratorMass Spectrometry (AMS) measurements of their 10Be concentra-tions were performed at the French Cosmogenic Nuclides NationalLaboratory (LN2C; CEREGE, Aix-en-Provence). The chemical proce-dures relative to the preparation of 10Be concentration measure-ments were adapted from Brown et al. (1991) and Merchel andHerpers (1999). After addition of �100 ll of an in-house 3.06510�3 g/g 9Be carrier solution prepared from deep-mined phenakitecrystals (Merchel et al., 2008) to each sample, all 10Be concentra-tions were normalized to 10Be/9Be SRM 4325 NIST standard withan assigned value of (2.79 ± 0.03) � 10�11. Analytical uncertainties(reported as 1r) include uncertainties associated with AMS count-ing statistics, AMS external error (0.5%) and chemical blank mea-surement (Blank 10Be/9Be was 3.2397 � 10�16 corresponding�3% of the sample concentration). Cosmocalc add-in for excel(Vermeesch, 2007) has been used to calculate sample thickness(�2 cm) scaling (with an attenuation coefficient of 150 g cm�2)and atmospheric pressures. The 10Be production rate was scaledfollowing Stone (2000) with a sea level high latitude productionrate of (4.5 ± 0.3) at/g/year. There was no topographic shieldingto deal with at our sampling place (shielding factor of 1). Finally,latest published value for 10Be half-life, that is(1.387 ± 0.012) � 106 years, was used for this nuclide (Chmeleffet al., 2010; Korschinek et al., 2010).
Table 210Be results obtained on six selected samples. The Stone Scal/Topo Shield column gives the srespective contribution of spallation, slow muon and fast muon to the 10Be production (se
Samples Lat. N Lon. E Alt. Pressure Stone Scal./Topo Shield.dd dd m mbar
CPE0001A 9.3353 0.5883 18 1011.089 0.605/0.985CPE0001BCPE0001DCPE0001ECPE0002ACPE0002B
Blank concentration: 6557 ± 2934 at.
3.3. Results
The 10Be concentrations of the six samples range from 201.5 to220.5 kat/g. They are statistically indistinguishable according tothe Chi2 test as defined and developed in Ward and Wilson(1978). From a geomorphological point of view, this either evi-dences a recent deposit event of material with a mean inherited10Be concentration in the order of 208 kat/g or a fast denudationprocess.
A minimum exposure duration was calculated by considering(Fig. 7A): (i) the lower limit of the 10Be concentration measuredin the uppermost sample (CPE0001A, 10 cm depth), (ii) an inher-ited concentration of �210 kat/g, which is in the range measuredfor subsurface samples collected from a profile studied byBraucher et al. (1998) in Congo (�160–280 kat/g) and (iii) no denu-dation (a value of 12 m/Ma is calculated in the above site byBraucher et al., 1998). This yields a minimum exposure durationof c. 1.5 ka (Fig. 7A).
Because of the peculiar concentration distribution with depththat evidences almost no decrease, it was impossible to calculatea unique triplet (denudation, exposure age, inheritance) which fitthe absolute minimum Chi2 value of 0.76. Exposure ages andinheritance values were determined for different denudation ratesassuming this minimum Chi2 (Fig. 7B). A low (i.e. <20 ka) andalmost constant exposure duration is obtained until a denudationrate of 75 m/Ma. Beyond this value a sharp increase is observedfor both the exposure age and inheritance. Emplacement ages ofmore than c. 100 Ka would imply an abnormally high denudationrate (e.g. >80 m/Ma) when compared with the site in Congo men-tioned above (<15 m/Ma) and considering the very flat relief ofthe Cap Esterias region. On the contrary, a recent age is perfectlyconsistent with the 14C dates of 2830–1880 BP mentioned above.
4. Sm–Nd isotopic data
4.1. Analytical method and accuracy
The Nd isotopic analyses have been performed on eleven sam-ples (Table 3). The <63 lm fraction of each sample has been sepa-rated by sieving, and crushed in an agate mortar. After completedissolution of this powder, the separation of Nd was operated fol-lowing the method described in Richard et al. (1976). It firstly usesan ion exchange column filled with cationic resin (AG50WX8, 200–400 mesh) for the REEs separation, followed by reverse chromatog-raphy with PTFE powder impregnated with (HDEHP) for Nd purifi-cation. Total blank for the whole chemistry is less than 50 pg. Ndisotopic ratios were measured in static mode using a FinniganMAT 262 multi-collector mass spectrometer with samples loadedon double Re filaments. The 143Nd/144Nd ratios were normalizedto 146Nd/144Nd = 0.7219. Repeated measurements of the La Jollainternational standard during the period of analysis yielded a mean143Nd/144Nd of 0.511875 ± 0.000015 (2r, n = 10). The sample
caling factor used for the calculation. The Pspall, Pl Slow and Pl Fast columns give thee Braucher et al., 2011 for details).
Pspall Pl Slow Pl Fast Depth Density 10Beat/g/a at/g/a at/g/a cm at/g (blank corr.)
2.682 0.012 0.040 10 2.35 220447 ± 737450 207339 ± 10604
120 202967 ± 8124200 205699 ± 9332100 210261 ± 6499180 201472 ± 6384

Table 3Sm and Nd analytical results for the eleven selected samples of Cover Horizon. The present day normalized eNd is calculated using the 143Nd/144Nd of 0.51264 reported by DePaolo and Wasserburg (1976) for the Chondritic Uniform Reservoir (CHUR). The Sm–Nd model age (TDM) (Goldstein et al., 1984) is calculated assuming a 147Sm/144Nd of 0.2137and a 143Nd/144Nd of 0.51315 for the depleted mantle (DM).
Sample Sm (ppm) Nd (ppm) (Sm/Nd)N147Sm/144Nd 143Nd/144Nd 2r(m) eNd TDM (Ga)
CPE0001E 1.1 6.2 0.57 0.10727 0.511499 0.000009 �22.26 2.35CPE0001B 1.1 6.3 0.56 0.10556 0.511566 0.000006 �20.95 2.22CPE0005A 1 5.3 0.61 0.11407 0.511683 0.000005 �18.67 2.24CPE0005B 0.8 4.7 0.55 0.10291 0.511707 0.000003 �18.20 1.98BOO0101A 2.5 13 0.62 0.11627 0.511476 0.000004 �22.71 2.60FRA0700 4.1 25.4 0.52 0.09759 0.511620 0.000005 �19.90 2.00MAY0814A 1.02 5.6 0.59 0.11012 0.511722 0.000004 �17.91 2.09BAT0648 1.9 12 0.51 0.09573 0.511448 0.000005 �23.25 2.19BAT0714 2 11.9 0.54 0.10161 0.511801 0.000006 �16.37 1.83MIN0040 2 11 0.58 0.10993 0.511521 0.000004 �21.83 2.38MIN0041B 1.9 9.4 0.65 0.12220 0.512174 0.000007 �9.09 1.62
Fig. 5. Contour map of Africa showing the position of Gabon and perimeter of thegeological maps of Figs. 6 and 11.
182 D. Thiéblemont et al. / Aeolian Research 15 (2014) 177–192
values were then adjusted to the value of 0.511860 of the La Jollastandard. The 143Nd/144Nd ratios are expressed as eNd which rep-resents the deviation in parts per 104 (e units) from 143Nd/144Ndin a chondritic reservoir with a present day CHUR value of0.512636 (De Paolo and Wasserburg, 1976). Error propagation onthe eNd value is estimated to be ±2. Nd and Sm abundances weredetermined by ICP–MS (BRGM).
4.2. Sample collection
About half of the Gabonese territory on both sides of the Equa-tor (Figs. 5 and 6) was investigated during the geological mappingprogram; all along this program, the Cover Horizon was observedeverywhere. Seven widely spaced sites were selected (Fig. 6) fromwhich 21 samples were collected for granulometric, geochemicaland 14C geochronological analyses (for samples carrying charcoalfragments) (Thiéblemont, 2013; Thiéblemont et al., 2013). Samplesfrom all sites were then selected for the isotopic study (Table 3),and amongst the 11 analyzed samples, four (2 � 2) were collectedat different levels along two profiles (samples CPE0001E [bottom]and B [top], and CPE0005B [bottom] and A [top]). A typical sam-pling site is presented in Fig. 1 that shows the location of four sam-ples collected along a single profile in the central part of Gabon(BOO site, Booué – Lopé region). The relevant information regard-ing the sampling sites: coordinates, altitude, depth below surfacelevel, 14C ages, granulometry, are listed in Table 2.
The geology of the basement rocks at each sampling site may bededuced from the simplified geological map displayed on Fig. 6.Although this basement was not actually observed at each sitebecause of the presence of the Stone Line in the lower part of someof them:
– The four CPE samples (Table 3) were collected from two sites inthe Libreville region, close to the Atlantic shoreline. As notedearlier 10Be analyses were also performed on six samples col-lected at this site (Table 2). The Cover Horizon in this regionrests on the Cenozoic terrains of the Gabonese Coastal Basin.The basement consisting of cross-bedded yellow to red sandswas actually visible at one outcrop. These sands more probablybelong to the Plio-Quaternary Cirques Series (Chevallier et al.,2002) than to the Cretaceous series of the Coastal Basin. A viewof such a superposition of the Cover Horizon over weatheredsands is presented in Fig. 3;
– Strongly contrasting with the CPE samples, four samples werecollected from regions of Archean basement (Congo Craton).Two are from the NE part of Gabon where they overlay a Neo-archean plutonic massif (BAT0648) and Mesoarchean migma-tites (BAT0714), and two (MIN0040, MIN0041B) have beencollected on the Mesoarchean greenstone terrains forming wellmarked linear chains in Northern Gabon (Bélinga Group);
– The three last samples were collected from regions of Paleopro-terozoic basement. At the BOO site, the Cover Horizon rests onparagneisses belonging to the Eburnean Ogooué Belt. In theFranceville region, the FRA site lies in the perimeter of thePaleoproterozoic Francevillian Basin but the basement rockwas not visible at the outcrop. In the Mayumba region (SW-Gabon), only the Stone Line was visible in the lower part ofthe profile (MAY site), but outcrops around indicate that thebasement consists of Eburnean (Paleoproterozoic) K-richgranites.
4.3. Results
The analyses are reported in binary diagrams showing the pres-ent-day eNd as a function of the Chondrite-normalized (Anders andGrévesse, 1989) (Sm/Nd)N ratio. 11 out of the 12 analyzed samplesdisplay (Sm/Nd)N ratios ranging from �0.5 to 0.65 and eNd from�16 to �23 (Fig. 8) but sample MIN0041B shows a eNd value of�9. This sample has been collected at a depth of about 50 cm onthe ridge of the Minkébé Mts. (Fig. 6), an abrupt chain built onthe Mesoarchean greenstone belts of NE-Gabon. At the same
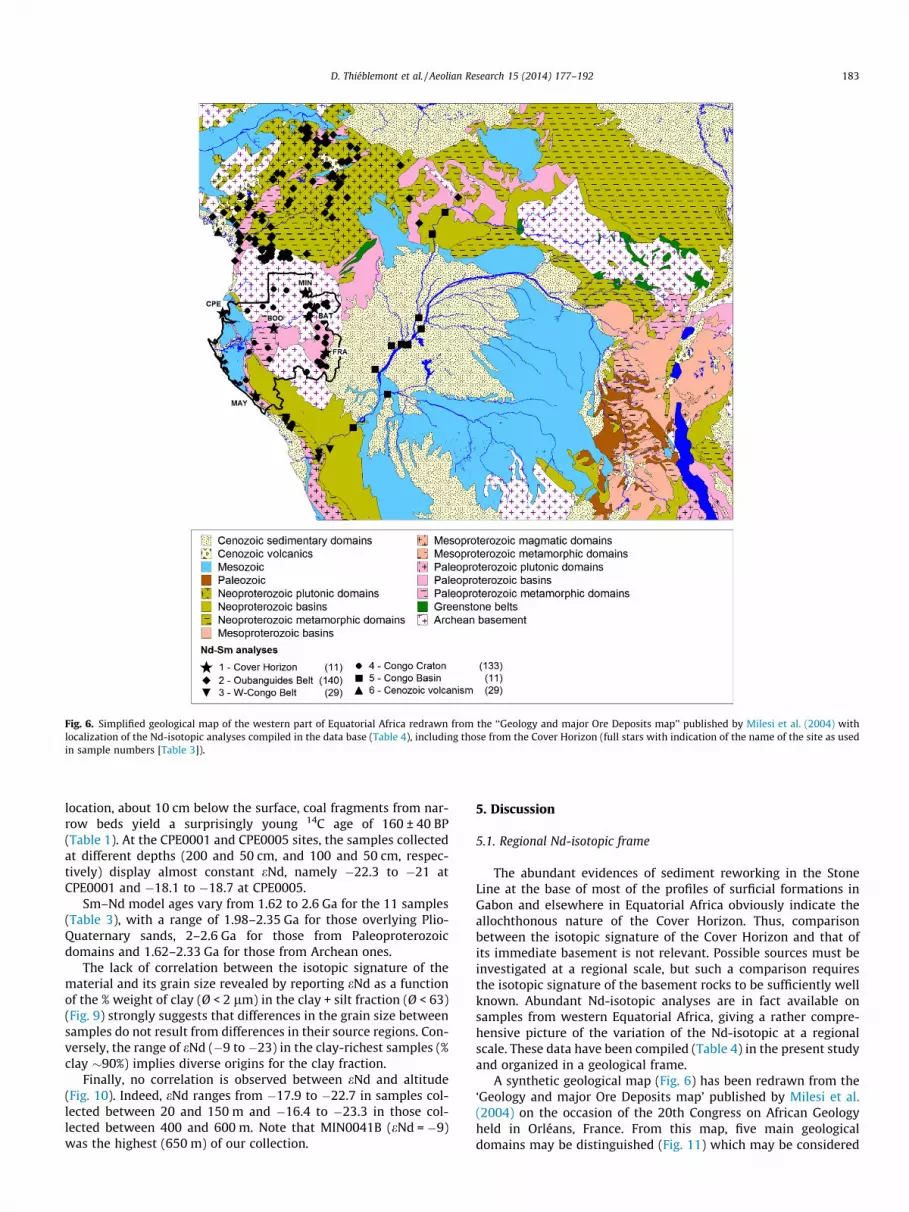
Fig. 6. Simplified geological map of the western part of Equatorial Africa redrawn from the ‘‘Geology and major Ore Deposits map’’ published by Milesi et al. (2004) withlocalization of the Nd-isotopic analyses compiled in the data base (Table 4), including those from the Cover Horizon (full stars with indication of the name of the site as usedin sample numbers [Table 3]).
D. Thiéblemont et al. / Aeolian Research 15 (2014) 177–192 183
location, about 10 cm below the surface, coal fragments from nar-row beds yield a surprisingly young 14C age of 160 ± 40 BP(Table 1). At the CPE0001 and CPE0005 sites, the samples collectedat different depths (200 and 50 cm, and 100 and 50 cm, respec-tively) display almost constant eNd, namely �22.3 to �21 atCPE0001 and �18.1 to �18.7 at CPE0005.
Sm–Nd model ages vary from 1.62 to 2.6 Ga for the 11 samples(Table 3), with a range of 1.98–2.35 Ga for those overlying Plio-Quaternary sands, 2–2.6 Ga for those from Paleoproterozoicdomains and 1.62–2.33 Ga for those from Archean ones.
The lack of correlation between the isotopic signature of thematerial and its grain size revealed by reporting eNd as a functionof the % weight of clay (Ø < 2 lm) in the clay + silt fraction (Ø < 63)(Fig. 9) strongly suggests that differences in the grain size betweensamples do not result from differences in their source regions. Con-versely, the range of eNd (�9 to �23) in the clay-richest samples (%clay �90%) implies diverse origins for the clay fraction.
Finally, no correlation is observed between eNd and altitude(Fig. 10). Indeed, eNd ranges from �17.9 to �22.7 in samples col-lected between 20 and 150 m and �16.4 to �23.3 in those col-lected between 400 and 600 m. Note that MIN0041B (eNd = �9)was the highest (650 m) of our collection.
5. Discussion
5.1. Regional Nd-isotopic frame
The abundant evidences of sediment reworking in the StoneLine at the base of most of the profiles of surficial formations inGabon and elsewhere in Equatorial Africa obviously indicate theallochthonous nature of the Cover Horizon. Thus, comparisonbetween the isotopic signature of the Cover Horizon and that ofits immediate basement is not relevant. Possible sources must beinvestigated at a regional scale, but such a comparison requiresthe isotopic signature of the basement rocks to be sufficiently wellknown. Abundant Nd-isotopic analyses are in fact available onsamples from western Equatorial Africa, giving a rather compre-hensive picture of the variation of the Nd-isotopic at a regionalscale. These data have been compiled (Table 4) in the present studyand organized in a geological frame.
A synthetic geological map (Fig. 6) has been redrawn from the‘Geology and major Ore Deposits map’ published by Milesi et al.(2004) on the occasion of the 20th Congress on African Geologyheld in Orléans, France. From this map, five main geologicaldomains may be distinguished (Fig. 11) which may be considered

Fig. 7. (A) 10Be concentration evolution as a function of depth (dot); The black linerepresents the fit obtained for the minimum exposure age of �1.5 ka considering nodenudation, the lower limit of the upper 10Be measured concentration of sampleCPE0001A and an inheritance concentration (�210 kat/g) corresponding to theupper limit of the measured concentration of sample CPE0001D. (B) Exposure ages(dot) and inheritance (cross) as a function of denudation that yield to an absoluteminimum Chi2 of 0.76 when fitting all sample concentrations following Braucheret al. (2009). Due to the peculiar concentration distribution with depth (almost nodecrease), a unique solution cannot be found as demonstrated in Braucher et al.(2009) when considering a real exponential decrease.
Fig. 8. eNd vs. (Sm/Nd)N diagram for the Cover Horizon samples.
Fig. 9. eNd vs. % Clay in the <63 lm fraction diagram for the Cover Horizon samples.
Fig. 10. eNd vs. Altitude diagram for the Cover Horizon samples.
184 D. Thiéblemont et al. / Aeolian Research 15 (2014) 177–192
as possible source areas for the Cover Horizon in the Gabonesecountry. References of available Nd-isotopic analyses for the fivedomains are listed in Table 4:
1. Congo Craton. The Congo Craton forms the western part of theregion. It is composed of Archean and Paleoproterozoic rocks(Fig. 6) which form well separated geological domains in theGabon country (Thomas et al., 2001; Chevallier et al., 2002;Thiéblemont, 2009; Thiéblemont et al., 2009). The Archeanincludes: (i) a Mesoarchean basement mainly composed ofmore or less deformed granitoids of tonalitic to granitic compo-sition (‘TTG’ type basement); (ii) a charnockitic suite geochem-ically not very different from the TTG; (iii) greenstone beltsforming elongated belts within the granitic basement; (iv) a
Neoarchean granitic suite. The Paleoproterozoic includes: (i) agroup of intracratonic basins (Francevillian basins) filled withsedimentary and volcanic formations; (ii) a group of meta-igne-ous and meta-sedimentary rocks affected by the Eburnean (c.2 Ga) orogeny (Ogooué Belt); (iii) a western plutonic domainmainly composed of K-rich granitoids, also of Eburnean age.Nd-isotopes analyses (Table 4) for most of these differentlithostratigraphic groups were obtained in the frame of a geo-chronological survey of Gabon (Caen-Vachette et al., 1988;Mayaga-Mikolo, 1997). The dataset was improved during the
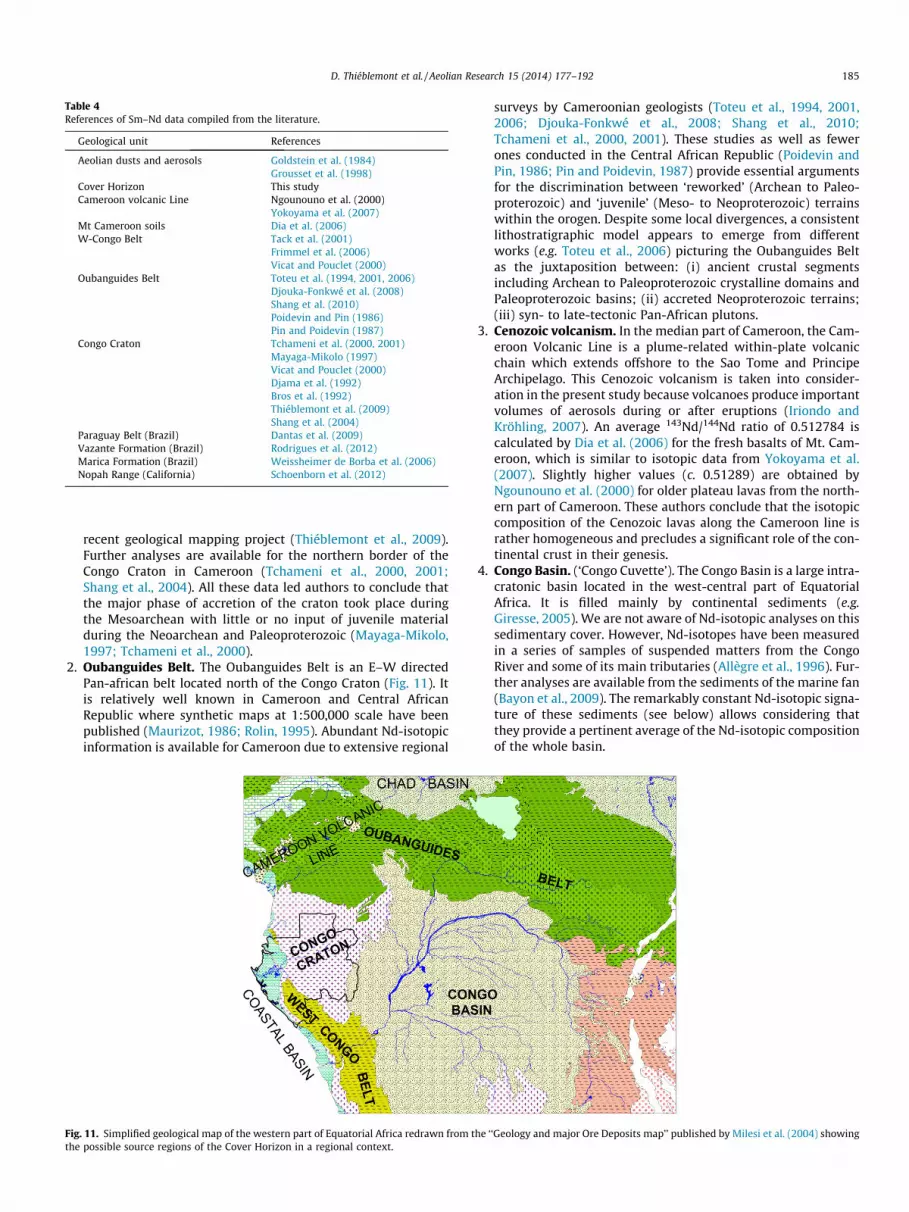
Table 4References of Sm–Nd data compiled from the literature.
Geological unit References
Aeolian dusts and aerosols Goldstein et al. (1984)Grousset et al. (1998)
Cover Horizon This studyCameroon volcanic Line Ngounouno et al. (2000)
Yokoyama et al. (2007)Mt Cameroon soils Dia et al. (2006)W-Congo Belt Tack et al. (2001)
Frimmel et al. (2006)Vicat and Pouclet (2000)
Oubanguides Belt Toteu et al. (1994, 2001, 2006)Djouka-Fonkwé et al. (2008)Shang et al. (2010)Poidevin and Pin (1986)Pin and Poidevin (1987)
Congo Craton Tchameni et al. (2000, 2001)Mayaga-Mikolo (1997)Vicat and Pouclet (2000)Djama et al. (1992)Bros et al. (1992)Thiéblemont et al. (2009)Shang et al. (2004)
Paraguay Belt (Brazil) Dantas et al. (2009)Vazante Formation (Brazil) Rodrigues et al. (2012)Marica Formation (Brazil) Weissheimer de Borba et al. (2006)Nopah Range (California) Schoenborn et al. (2012)
D. Thiéblemont et al. / Aeolian Research 15 (2014) 177–192 185
recent geological mapping project (Thiéblemont et al., 2009).Further analyses are available for the northern border of theCongo Craton in Cameroon (Tchameni et al., 2000, 2001;Shang et al., 2004). All these data led authors to conclude thatthe major phase of accretion of the craton took place duringthe Mesoarchean with little or no input of juvenile materialduring the Neoarchean and Paleoproterozoic (Mayaga-Mikolo,1997; Tchameni et al., 2000).
2. Oubanguides Belt. The Oubanguides Belt is an E–W directedPan-african belt located north of the Congo Craton (Fig. 11). Itis relatively well known in Cameroon and Central AfricanRepublic where synthetic maps at 1:500,000 scale have beenpublished (Maurizot, 1986; Rolin, 1995). Abundant Nd-isotopicinformation is available for Cameroon due to extensive regional
Fig. 11. Simplified geological map of the western part of Equatorial Africa redrawn from tthe possible source regions of the Cover Horizon in a regional context.
surveys by Cameroonian geologists (Toteu et al., 1994, 2001,2006; Djouka-Fonkwé et al., 2008; Shang et al., 2010;Tchameni et al., 2000, 2001). These studies as well as fewerones conducted in the Central African Republic (Poidevin andPin, 1986; Pin and Poidevin, 1987) provide essential argumentsfor the discrimination between ‘reworked’ (Archean to Paleo-proterozoic) and ‘juvenile’ (Meso- to Neoproterozoic) terrainswithin the orogen. Despite some local divergences, a consistentlithostratigraphic model appears to emerge from differentworks (e.g. Toteu et al., 2006) picturing the Oubanguides Beltas the juxtaposition between: (i) ancient crustal segmentsincluding Archean to Paleoproterozoic crystalline domains andPaleoproterozoic basins; (ii) accreted Neoproterozoic terrains;(iii) syn- to late-tectonic Pan-African plutons.
3. Cenozoic volcanism. In the median part of Cameroon, the Cam-eroon Volcanic Line is a plume-related within-plate volcanicchain which extends offshore to the Sao Tome and PrincipeArchipelago. This Cenozoic volcanism is taken into consider-ation in the present study because volcanoes produce importantvolumes of aerosols during or after eruptions (Iriondo andKröhling, 2007). An average 143Nd/144Nd ratio of 0.512784 iscalculated by Dia et al. (2006) for the fresh basalts of Mt. Cam-eroon, which is similar to isotopic data from Yokoyama et al.(2007). Slightly higher values (c. 0.51289) are obtained byNgounouno et al. (2000) for older plateau lavas from the north-ern part of Cameroon. These authors conclude that the isotopiccomposition of the Cenozoic lavas along the Cameroon line israther homogeneous and precludes a significant role of the con-tinental crust in their genesis.
4. Congo Basin. (‘Congo Cuvette’). The Congo Basin is a large intra-cratonic basin located in the west-central part of EquatorialAfrica. It is filled mainly by continental sediments (e.g.Giresse, 2005). We are not aware of Nd-isotopic analyses on thissedimentary cover. However, Nd-isotopes have been measuredin a series of samples of suspended matters from the CongoRiver and some of its main tributaries (Allègre et al., 1996). Fur-ther analyses are available from the sediments of the marine fan(Bayon et al., 2009). The remarkably constant Nd-isotopic signa-ture of these sediments (see below) allows considering thatthey provide a pertinent average of the Nd-isotopic compositionof the whole basin.
he ‘‘Geology and major Ore Deposits map’’ published by Milesi et al. (2004) showing
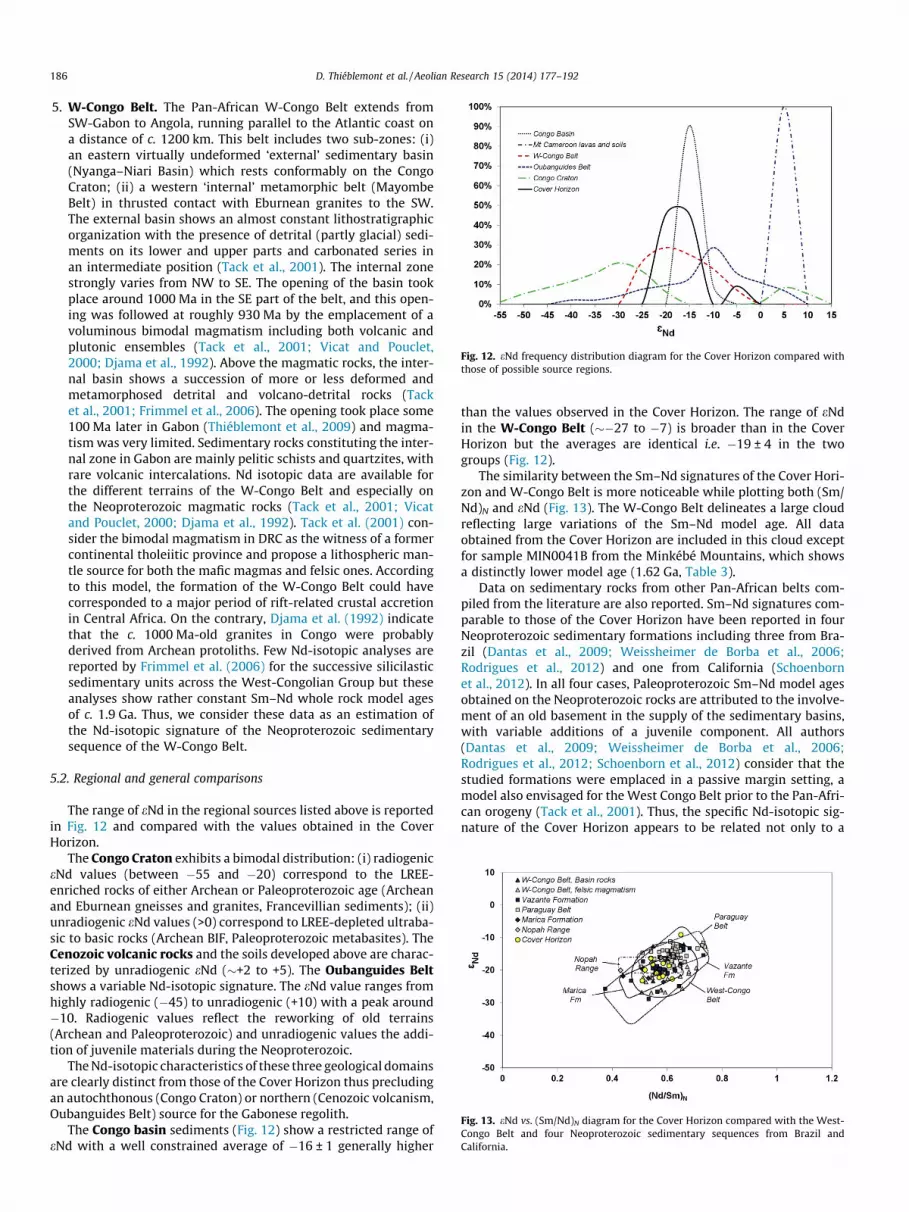
Fig. 12. eNd frequency distribution diagram for the Cover Horizon compared withthose of possible source regions.
Fig. 13. eNd vs. (Sm/Nd)N diagram for the Cover Horizon compared with the West-Congo Belt and four Neoproterozoic sedimentary sequences from Brazil andCalifornia.
186 D. Thiéblemont et al. / Aeolian Research 15 (2014) 177–192
5. W-Congo Belt. The Pan-African W-Congo Belt extends fromSW-Gabon to Angola, running parallel to the Atlantic coast ona distance of c. 1200 km. This belt includes two sub-zones: (i)an eastern virtually undeformed ‘external’ sedimentary basin(Nyanga–Niari Basin) which rests conformably on the CongoCraton; (ii) a western ‘internal’ metamorphic belt (MayombeBelt) in thrusted contact with Eburnean granites to the SW.The external basin shows an almost constant lithostratigraphicorganization with the presence of detrital (partly glacial) sedi-ments on its lower and upper parts and carbonated series inan intermediate position (Tack et al., 2001). The internal zonestrongly varies from NW to SE. The opening of the basin tookplace around 1000 Ma in the SE part of the belt, and this open-ing was followed at roughly 930 Ma by the emplacement of avoluminous bimodal magmatism including both volcanic andplutonic ensembles (Tack et al., 2001; Vicat and Pouclet,2000; Djama et al., 1992). Above the magmatic rocks, the inter-nal basin shows a succession of more or less deformed andmetamorphosed detrital and volcano-detrital rocks (Tacket al., 2001; Frimmel et al., 2006). The opening took place some100 Ma later in Gabon (Thiéblemont et al., 2009) and magma-tism was very limited. Sedimentary rocks constituting the inter-nal zone in Gabon are mainly pelitic schists and quartzites, withrare volcanic intercalations. Nd isotopic data are available forthe different terrains of the W-Congo Belt and especially onthe Neoproterozoic magmatic rocks (Tack et al., 2001; Vicatand Pouclet, 2000; Djama et al., 1992). Tack et al. (2001) con-sider the bimodal magmatism in DRC as the witness of a formercontinental tholeiitic province and propose a lithospheric man-tle source for both the mafic magmas and felsic ones. Accordingto this model, the formation of the W-Congo Belt could havecorresponded to a major period of rift-related crustal accretionin Central Africa. On the contrary, Djama et al. (1992) indicatethat the c. 1000 Ma-old granites in Congo were probablyderived from Archean protoliths. Few Nd-isotopic analyses arereported by Frimmel et al. (2006) for the successive silicilasticsedimentary units across the West-Congolian Group but theseanalyses show rather constant Sm–Nd whole rock model agesof c. 1.9 Ga. Thus, we consider these data as an estimation ofthe Nd-isotopic signature of the Neoproterozoic sedimentarysequence of the W-Congo Belt.
5.2. Regional and general comparisons
The range of eNd in the regional sources listed above is reportedin Fig. 12 and compared with the values obtained in the CoverHorizon.
The Congo Craton exhibits a bimodal distribution: (i) radiogeniceNd values (between �55 and �20) correspond to the LREE-enriched rocks of either Archean or Paleoproterozoic age (Archeanand Eburnean gneisses and granites, Francevillian sediments); (ii)unradiogenic eNd values (>0) correspond to LREE-depleted ultraba-sic to basic rocks (Archean BIF, Paleoproterozoic metabasites). TheCenozoic volcanic rocks and the soils developed above are charac-terized by unradiogenic eNd (�+2 to +5). The Oubanguides Beltshows a variable Nd-isotopic signature. The eNd value ranges fromhighly radiogenic (�45) to unradiogenic (+10) with a peak around�10. Radiogenic values reflect the reworking of old terrains(Archean and Paleoproterozoic) and unradiogenic values the addi-tion of juvenile materials during the Neoproterozoic.
The Nd-isotopic characteristics of these three geological domainsare clearly distinct from those of the Cover Horizon thus precludingan autochthonous (Congo Craton) or northern (Cenozoic volcanism,Oubanguides Belt) source for the Gabonese regolith.
The Congo basin sediments (Fig. 12) show a restricted range ofeNd with a well constrained average of �16 ± 1 generally higher
than the values observed in the Cover Horizon. The range of eNdin the W-Congo Belt (��27 to �7) is broader than in the CoverHorizon but the averages are identical i.e. �19 ± 4 in the twogroups (Fig. 12).
The similarity between the Sm–Nd signatures of the Cover Hori-zon and W-Congo Belt is more noticeable while plotting both (Sm/Nd)N and eNd (Fig. 13). The W-Congo Belt delineates a large cloudreflecting large variations of the Sm–Nd model age. All dataobtained from the Cover Horizon are included in this cloud exceptfor sample MIN0041B from the Minkébé Mountains, which showsa distinctly lower model age (1.62 Ga, Table 3).
Data on sedimentary rocks from other Pan-African belts com-piled from the literature are also reported. Sm–Nd signatures com-parable to those of the Cover Horizon have been reported in fourNeoproterozoic sedimentary formations including three from Bra-zil (Dantas et al., 2009; Weissheimer de Borba et al., 2006;Rodrigues et al., 2012) and one from California (Schoenbornet al., 2012). In all four cases, Paleoproterozoic Sm–Nd model agesobtained on the Neoproterozoic rocks are attributed to the involve-ment of an old basement in the supply of the sedimentary basins,with variable additions of a juvenile component. All authors(Dantas et al., 2009; Weissheimer de Borba et al., 2006;Rodrigues et al., 2012; Schoenborn et al., 2012) consider that thestudied formations were emplaced in a passive margin setting, amodel also envisaged for the West Congo Belt prior to the Pan-Afri-can orogeny (Tack et al., 2001). Thus, the specific Nd-isotopic sig-nature of the Cover Horizon appears to be related not only to a
D. Thiéblemont et al. / Aeolian Research 15 (2014) 177–192 187
particular source region, but also to a particular age and tectonicsetting of that source region. By comparison, it is worth noting thatthe model ages obtained for juvenile Pan-African belts in otherplaces of the world are typically Neoproterozoic and thereforemore than 1 Ga younger than those obtained in the W-Congo Belt.This is the case, for example, with the accreted island-arcs and vol-cano-sedimentary basins forming the Pan-African Belt of theArabian–Nubian Shield (Hargrove et al., 2006).
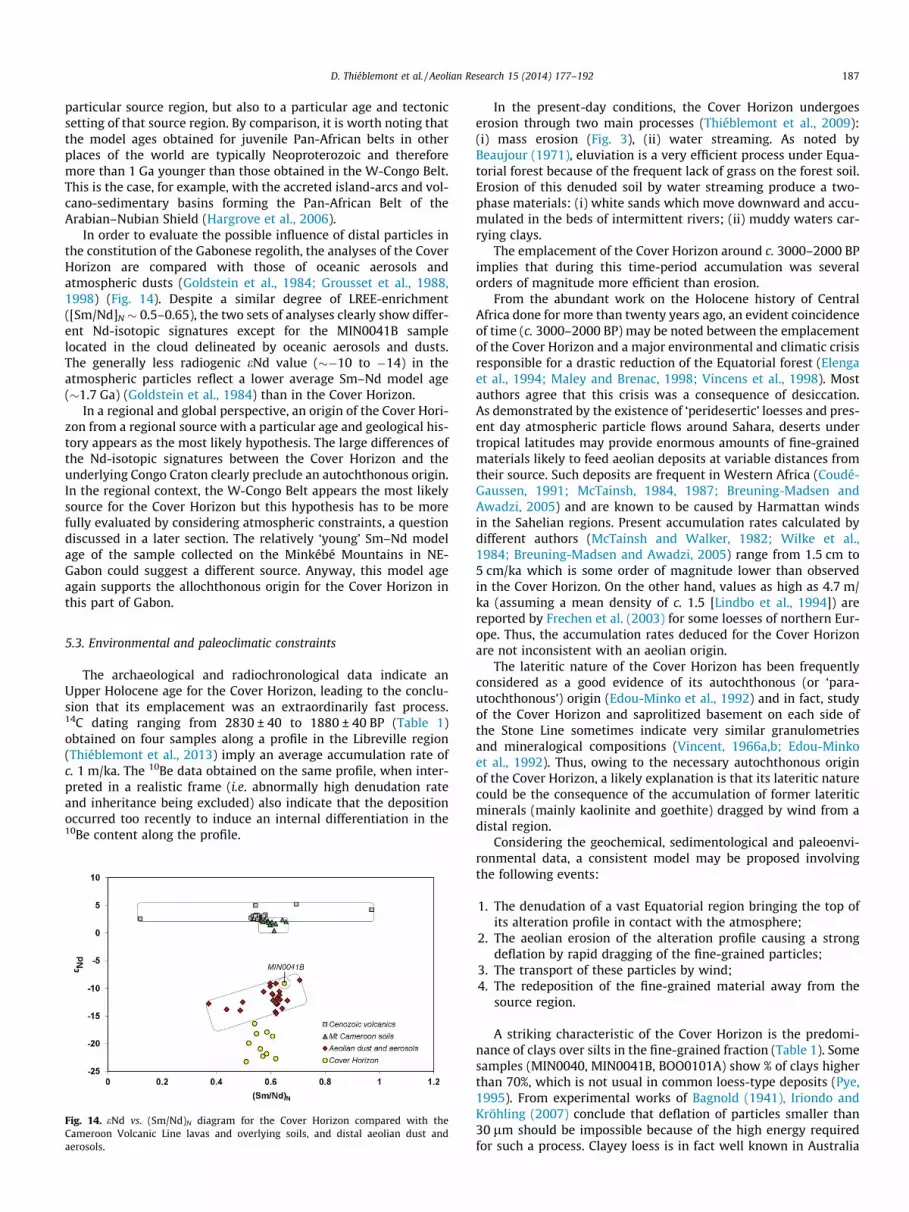
In order to evaluate the possible influence of distal particles inthe constitution of the Gabonese regolith, the analyses of the CoverHorizon are compared with those of oceanic aerosols andatmospheric dusts (Goldstein et al., 1984; Grousset et al., 1988,1998) (Fig. 14). Despite a similar degree of LREE-enrichment([Sm/Nd]N � 0.5–0.65), the two sets of analyses clearly show differ-ent Nd-isotopic signatures except for the MIN0041B samplelocated in the cloud delineated by oceanic aerosols and dusts.The generally less radiogenic eNd value (��10 to �14) in theatmospheric particles reflect a lower average Sm–Nd model age(�1.7 Ga) (Goldstein et al., 1984) than in the Cover Horizon.
In a regional and global perspective, an origin of the Cover Hori-zon from a regional source with a particular age and geological his-tory appears as the most likely hypothesis. The large differences ofthe Nd-isotopic signatures between the Cover Horizon and theunderlying Congo Craton clearly preclude an autochthonous origin.In the regional context, the W-Congo Belt appears the most likelysource for the Cover Horizon but this hypothesis has to be morefully evaluated by considering atmospheric constraints, a questiondiscussed in a later section. The relatively ‘young’ Sm–Nd modelage of the sample collected on the Minkébé Mountains in NE-Gabon could suggest a different source. Anyway, this model ageagain supports the allochthonous origin for the Cover Horizon inthis part of Gabon.
5.3. Environmental and paleoclimatic constraints
The archaeological and radiochronological data indicate anUpper Holocene age for the Cover Horizon, leading to the conclu-sion that its emplacement was an extraordinarily fast process.14C dating ranging from 2830 ± 40 to 1880 ± 40 BP (Table 1)obtained on four samples along a profile in the Libreville region(Thiéblemont et al., 2013) imply an average accumulation rate ofc. 1 m/ka. The 10Be data obtained on the same profile, when inter-preted in a realistic frame (i.e. abnormally high denudation rateand inheritance being excluded) also indicate that the depositionoccurred too recently to induce an internal differentiation in the10Be content along the profile.
Fig. 14. eNd vs. (Sm/Nd)N diagram for the Cover Horizon compared with theCameroon Volcanic Line lavas and overlying soils, and distal aeolian dust andaerosols.
In the present-day conditions, the Cover Horizon undergoeserosion through two main processes (Thiéblemont et al., 2009):(i) mass erosion (Fig. 3), (ii) water streaming. As noted byBeaujour (1971), eluviation is a very efficient process under Equa-torial forest because of the frequent lack of grass on the forest soil.Erosion of this denuded soil by water streaming produce a two-phase materials: (i) white sands which move downward and accu-mulated in the beds of intermittent rivers; (ii) muddy waters car-rying clays.
The emplacement of the Cover Horizon around c. 3000–2000 BPimplies that during this time-period accumulation was severalorders of magnitude more efficient than erosion.
From the abundant work on the Holocene history of CentralAfrica done for more than twenty years ago, an evident coincidenceof time (c. 3000–2000 BP) may be noted between the emplacementof the Cover Horizon and a major environmental and climatic crisisresponsible for a drastic reduction of the Equatorial forest (Elengaet al., 1994; Maley and Brenac, 1998; Vincens et al., 1998). Mostauthors agree that this crisis was a consequence of desiccation.As demonstrated by the existence of ‘peridesertic’ loesses and pres-ent day atmospheric particle flows around Sahara, deserts undertropical latitudes may provide enormous amounts of fine-grainedmaterials likely to feed aeolian deposits at variable distances fromtheir source. Such deposits are frequent in Western Africa (Coudé-Gaussen, 1991; McTainsh, 1984, 1987; Breuning-Madsen andAwadzi, 2005) and are known to be caused by Harmattan windsin the Sahelian regions. Present accumulation rates calculated bydifferent authors (McTainsh and Walker, 1982; Wilke et al.,1984; Breuning-Madsen and Awadzi, 2005) range from 1.5 cm to5 cm/ka which is some order of magnitude lower than observedin the Cover Horizon. On the other hand, values as high as 4.7 m/ka (assuming a mean density of c. 1.5 [Lindbo et al., 1994]) arereported by Frechen et al. (2003) for some loesses of northern Eur-ope. Thus, the accumulation rates deduced for the Cover Horizonare not inconsistent with an aeolian origin.
The lateritic nature of the Cover Horizon has been frequentlyconsidered as a good evidence of its autochthonous (or ‘para-utochthonous’) origin (Edou-Minko et al., 1992) and in fact, studyof the Cover Horizon and saprolitized basement on each side ofthe Stone Line sometimes indicate very similar granulometriesand mineralogical compositions (Vincent, 1966a,b; Edou-Minkoet al., 1992). Thus, owing to the necessary autochthonous originof the Cover Horizon, a likely explanation is that its lateritic naturecould be the consequence of the accumulation of former lateriticminerals (mainly kaolinite and goethite) dragged by wind from adistal region.
Considering the geochemical, sedimentological and paleoenvi-ronmental data, a consistent model may be proposed involvingthe following events:
1. The denudation of a vast Equatorial region bringing the top ofits alteration profile in contact with the atmosphere;
2. The aeolian erosion of the alteration profile causing a strongdeflation by rapid dragging of the fine-grained particles;
3. The transport of these particles by wind;4. The redeposition of the fine-grained material away from the
source region.
A striking characteristic of the Cover Horizon is the predomi-nance of clays over silts in the fine-grained fraction (Table 1). Somesamples (MIN0040, MIN0041B, BOO0101A) show % of clays higherthan 70%, which is not usual in common loess-type deposits (Pye,1995). From experimental works of Bagnold (1941), Iriondo andKröhling (2007) conclude that deflation of particles smaller than30 lm should be impossible because of the high energy requiredfor such a process. Clayey loess is in fact well known in Australia

188 D. Thiéblemont et al. / Aeolian Research 15 (2014) 177–192
(Butler, 1956) and dust plume with mean particle size as low as3 lm has been observed in Mali (Gillies et al., 1996). The lack ofclayey horizons at the surface of Sahara makes obvious the factthat no clay has survived the aeolian deflation subsequent todesertification. On the other hand, clays cannot be produced in aridconditions because chemical weathering is very limited; thisimplies that desert will not be able to provide clays once the defla-tion of the former alteration profiles will be completed.
Thus the abundance of clays (Table 1) in the Cover Horizon inGabon could be indicative of two aspects of its genesis: (i) thedeflation was affecting the upper clayey section of the regolith justfollowing the vanishing of the vegetal cover; (ii) because of theability of clays to be carried out over long distances, the CoverHorizon could have originated from a region very distant fromGabon.
5.4. Atmospheric constraints
The model developed above requires a sustained flux of parti-cles to have blown over Western Central Africa since c. 2800 BP.
The present day flux along the western part of southern Africahas been calculated using the ERA-Interim meteorological reanaly-sis (Dee et al., 2011) from the ECMWF (European Center for Med-ium-Range Weather Forecasts) model (Fig. 15). ERA-Interim arebased on version Cy31r2 of the model with a spectral truncationof T255L corresponding to a horizontal resolution of 0.7� in latitudeand longitude (or 80 km at the equator). ERA-Interim fields weused are provided at a time step of 12 h and a horizontal resolutionof 2� in latitude and longitude. More details on ERA-Interim reanal-ysis are available in Dee et al. (2011). To examine the prevailing
Fig. 15. Climatological winds speed and direction at 925 hPa (�600 m height) averaged ofor details on data and calculations). Vector scaling is shown on each panel (red) and corrfigure legend, the reader is referred to the web version of this article.)
wind regime in the studied region, we performed 54 years averageof the horizontal wind speed and direction at 925 hPa (600 m)from 1958 to 2012. The averages are shown for four periods/sea-sons, namely DJF (dry season), MAM (wet season), JJA (dry season)and SON (wet season) (Fig. 15). Note that averages calculated ateach grid point take into account about 1800 data.
Whatever the season, Fig. 15 indicates a constant wind parallelto the Benguela current along the coast of Namibia, moving NNWtoward the Gulf of Guinea, then turning NE to E over Congo andGabon. From this map, it may be envisaged that the wind blowingover Gabon previously passes along the coast of Namibia, a regionwhich constitutes the hyper-arid Namib desert.
More precisely, the area overlapping northern Namibia andsouthern Angola appears as a possible source for particles likelyto be transported to Gabon and Congo (Fig. 15). Climatic zonationin this region (Fig. 16) shows a dominant hot arid steppe inland,passing to the SW to the northern edge of the Namib desert.
The geological basement in this region (Fig. 17) is mainly com-posed of Archean to Paleoproterozoic crystalline terrains (thesouth-western edge of the Congo Craton here designated as theAngola shield) which constitutes the basement of two Neoprotero-zoic belts: (i) the W-Congolian belt to the NE and (ii) Kaoko belt tothe SW. To the SE, the Kaoko belt passes to the Damara belt,another Neoproterozoic belt which forms the most extensive base-ment in the Namib desert.
Abundant isotopic data have been published in recent timesfrom the Kaoko belt and its basement in Namibia (southern partof the Angola shield). Table 5 gives a statistical view of the varia-tion of the Nd isotopic signature of the different regional litho-stratigraphic units.
ver the period 1958–2012 and seasons DJF (a), MAM (b), JJA (c) and SON (d) (see textesponds to 2.5 ms�1 wind speed. (For interpretation of the references to color in this
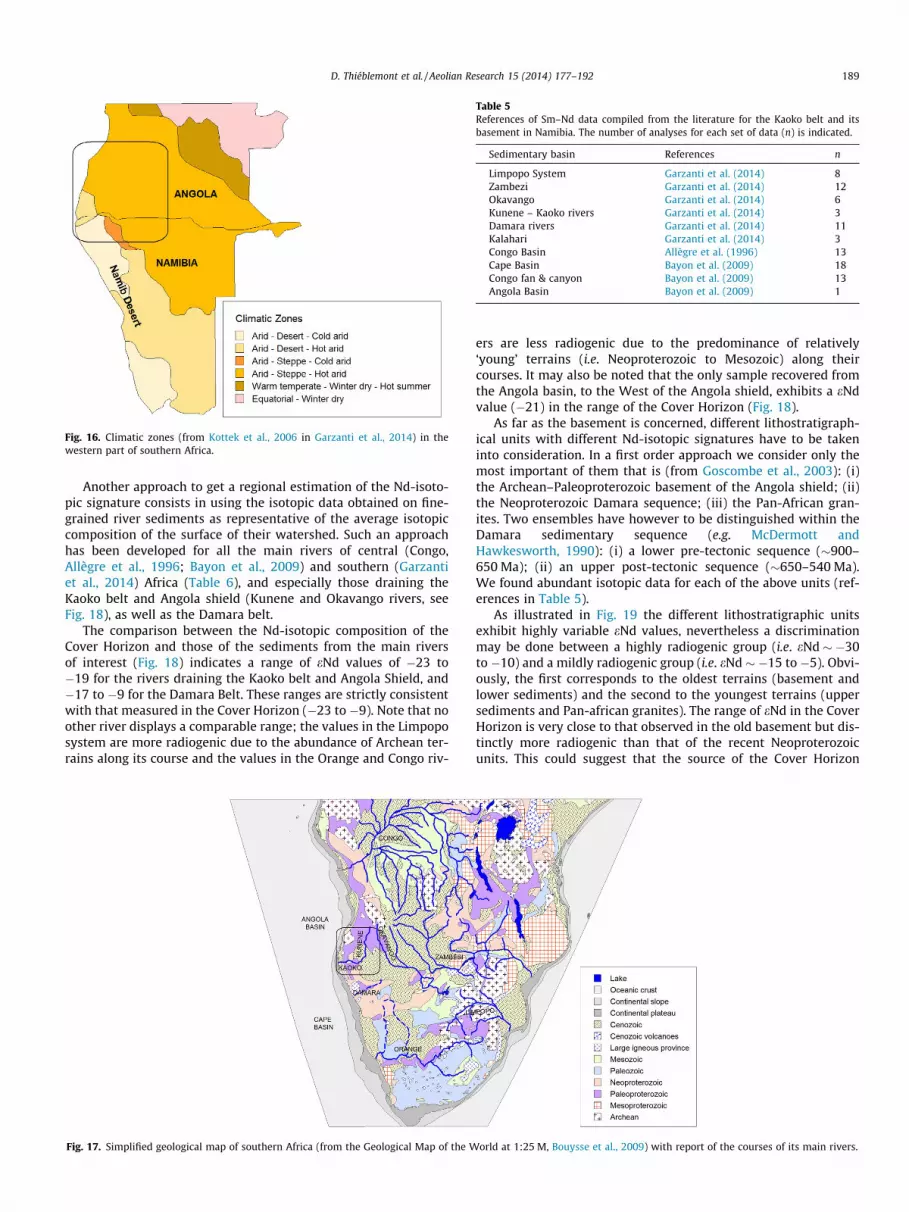
Fig. 16. Climatic zones (from Kottek et al., 2006 in Garzanti et al., 2014) in thewestern part of southern Africa.
Table 5References of Sm–Nd data compiled from the literature for the Kaoko belt and itsbasement in Namibia. The number of analyses for each set of data (n) is indicated.
Sedimentary basin References n
Limpopo System Garzanti et al. (2014) 8Zambezi Garzanti et al. (2014) 12Okavango Garzanti et al. (2014) 6Kunene – Kaoko rivers Garzanti et al. (2014) 3Damara rivers Garzanti et al. (2014) 11Kalahari Garzanti et al. (2014) 3Congo Basin Allègre et al. (1996) 13Cape Basin Bayon et al. (2009) 18Congo fan & canyon Bayon et al. (2009) 13Angola Basin Bayon et al. (2009) 1
D. Thiéblemont et al. / Aeolian Research 15 (2014) 177–192 189
Another approach to get a regional estimation of the Nd-isoto-pic signature consists in using the isotopic data obtained on fine-grained river sediments as representative of the average isotopiccomposition of the surface of their watershed. Such an approachhas been developed for all the main rivers of central (Congo,Allègre et al., 1996; Bayon et al., 2009) and southern (Garzantiet al., 2014) Africa (Table 6), and especially those draining theKaoko belt and Angola shield (Kunene and Okavango rivers, seeFig. 18), as well as the Damara belt.
The comparison between the Nd-isotopic composition of theCover Horizon and those of the sediments from the main riversof interest (Fig. 18) indicates a range of eNd values of �23 to�19 for the rivers draining the Kaoko belt and Angola Shield, and�17 to �9 for the Damara Belt. These ranges are strictly consistentwith that measured in the Cover Horizon (�23 to �9). Note that noother river displays a comparable range; the values in the Limpoposystem are more radiogenic due to the abundance of Archean ter-rains along its course and the values in the Orange and Congo riv-
Fig. 17. Simplified geological map of southern Africa (from the Geological Map of the W
ers are less radiogenic due to the predominance of relatively‘young’ terrains (i.e. Neoproterozoic to Mesozoic) along theircourses. It may also be noted that the only sample recovered fromthe Angola basin, to the West of the Angola shield, exhibits a eNdvalue (�21) in the range of the Cover Horizon (Fig. 18).
As far as the basement is concerned, different lithostratigraph-ical units with different Nd-isotopic signatures have to be takeninto consideration. In a first order approach we consider only themost important of them that is (from Goscombe et al., 2003): (i)the Archean–Paleoproterozoic basement of the Angola shield; (ii)the Neoproterozoic Damara sequence; (iii) the Pan-African gran-ites. Two ensembles have however to be distinguished within theDamara sedimentary sequence (e.g. McDermott andHawkesworth, 1990): (i) a lower pre-tectonic sequence (�900–650 Ma); (ii) an upper post-tectonic sequence (�650–540 Ma).We found abundant isotopic data for each of the above units (ref-erences in Table 5).
As illustrated in Fig. 19 the different lithostratigraphic unitsexhibit highly variable eNd values, nevertheless a discriminationmay be done between a highly radiogenic group (i.e. eNd � �30to �10) and a mildly radiogenic group (i.e. eNd � �15 to �5). Obvi-ously, the first corresponds to the oldest terrains (basement andlower sediments) and the second to the youngest terrains (uppersediments and Pan-african granites). The range of eNd in the CoverHorizon is very close to that observed in the old basement but dis-tinctly more radiogenic than that of the recent Neoproterozoicunits. This could suggest that the source of the Cover Horizon
orld at 1:25 M, Bouysse et al., 2009) with report of the courses of its main rivers.

Table 6References of Sm–Nd data compiled from the literature for the present-day sedimentstransported by the major rivers of southern Africa (see Fig. 16 for location) andsediments cored in some oceanic basins of SW Africa.
Basement formation References n
Kaoko BeltPan-African granites Van de Fierdt et al. (2003) 15
Masberg et al. (2005) 19Jung et al. (2009) 23Janoušek et al. (2010) 8Seth et al. (1998) 1
Lower Damara sequence Masberg et al. (2005) 3Janoušek et al., 2010 2McDermott and Hawkesworth (1990) 18
Upper Damara sequence McDermott and Hawkesworth (1990) 16
Archean to Paleoproterozoic basementCongo Craton Janoušek et al. (2010) 3Archean basement Seth et al. (1998) 3Paleoproterozoic gneisses Seth et al. (1998) 1High-grade rock Seth et al. (2008) 1Epupa Complex Kröner et al. (2010) 11
Gleißner et al., 2011 11Granulitic gneiss Jung et al. (2007) 1
Fig. 18. Comparison between the Nd-isotopic composition of the Cover Horizonand that of fine-grained sediments from the major rivers of central and southernAfrica, and oceanic basins along the western coast of southern Africa (references inTable 5). Three sizes of symbol have been used according to the number of analysescompiled in a considered eNd range: 1 analyse (narrow symbol), 2–4 analyses(medium symbol), > 4 analyses (large symbol).
Fig. 19. Comparison between the Nd-isotopic composition of the Cover Horizonand that of the major lithostratigraphical units covering the Kaoko belt and itsbasement (references in Table 6). Symbols size as in Fig. 18.
190 D. Thiéblemont et al. / Aeolian Research 15 (2014) 177–192
was localized in the Angola shield rather than in the Kaoko belt. Itis worth noting that despite he belongs to the Congo Craton theAngola shield displays a generally less radiogenic isotopic signa-ture (maxima around �20) than the Gabon basement (maximaaround�30, see Fig. 12), which suggests different geological evolu-tions for those two regions.
6. Conclusions
From the Nd-isotopic data on the Cover Horizon presented inthis paper we confirm the distal – and therefore aeolian, origin ofthis historical geological unit. In the context of Equatorial Africa,the W-Congo belt is the only geological domain isotopically com-parable to the Cover horizon. A far as the wind regime is con-cerned, a possible source could lie in the arid to hyper-aridregion located on the Atlantic side of NW-Namibian and SW-Angola. A suitable Isotopic signature in this region is actuallyobserved in the basement terrains of the Angola shield. Thus a con-sistent model may be drawn relating the Cover Horizon to a largescale aeolian process affecting the SE-Atlantic Ocean and adjacentW-Africa. At this stage of the researches, this model may be onlyconsidered as the most probable frame to explain how the CoverHorizon could have formed. However many questions remainwhich offer fruitful perspectives for future researches.
Acknowledgments
Geological mapping in Gabon was sponsored by E.U. (Sysminfunds) and the Gabonese Ministry of Mines. The BRGM ScientificDirection provided financial support for geochronological and iso-topic analyses. The team of the ‘Sysmin’ project is greatly acknowl-edged for the invaluable years we spent together in the Gaboneseforest. Thanks to A. Préat for his careful review of the manuscriptand M. Arnold, G. Aumaître, and K. Keddadouche for their invalu-able assistance during the 10Be measurements at the ASTER AMSnational facility (CEREGE, Aix-en-Provence), which is supportedby the INSU/CNRS, the French Ministry of Research and HigherEducation, the IRD and the CEA. Jan-Berend Stuut and Inka Meyerhave provided detailed and helpful reviews of the manuscript.
References
Allègre, C.J., Dupré, B., Négrel, Ph., Gaillardet, J., 1996. Sr–Nd–Pb isotopes in Amazonand Congo River systems: constraints about erosion processes. Chem. Geol. 131,93–112.
Anders, E., Grévesse, N., 1989. Abundances of the elements: meteoritic and solar.Geochim. Cosmochim. Acta 53, 197–214.
Arnould, A., 1966. Synthèse Pb socle-crétacé Gabon. BRGM Technical Report, LIB 66A2.
Bagnold, R.A., 1941. The Physics of Blown Sands and Desert Dunes. Methuen,London, p. 241.
Bates, R.L., Jackson, J.A., 1987. Glossary of Geology, third ed. American GeologicalInstitute, Falls Church, Virginia, p. 788.
Bayon, G., Burton, K.W., Soulet, G., Vigier, N., Dennielou, B., Etoubleau, J., Ponzevera,E., German, C.R., Nesbitt, R.W., 2009. Hf and Nd isotopes in marine sediments:constraints on global silicate weathering. Earth Planet. Sci. Lett. 277, 318–326.
Beaujour, A., 1971. Notice explicative Makokou-Ouest et carte géologique dereconnaissance au 1/500,000. Ministère des Mines, des Ressources hydrauliqueset de l’Energie, Gabon, Paris, p. 49.
Bouysse, Ph., et al., 2009. Geological map of the World at 1:25 M, third ed., twosheets, CGMW.
Braucher, R., Colin, F., Brown, E.T., Bourlès, D.L., Bamba, O., Raisbeck, G.M., Yiou, F.,Koud, J.M., 1998. African laterite dynamics using in situ-produced 10Be.Geochim. Cosmochim. Acta 62 (9), 1501–1507.
Braucher, R., Del Castillo, P., Siame, L., Hidy, A.J., Bourlès, D.L., 2009. Determinationof both exposure time and denudation rate from an in situ-produced 10Be depthprofile: a mathematical proof of uniqueness. Model sensitivity and applicationsto natural cases. Quat. Geochron. 4, 56–67.
Braucher, R., Merchel, S., Borgomano, J., Bourlès, D.L., 2011. Production ofcosmogenic radionuclides at great depth: a multi element approach. EarthPlanet. Sci. Lett. 309, 1–9.
Breuning-Madsen, H., Awadzi, T.W., 2005. Harmattan dust deposition and particlesize in Ghana. Catena 63, 23–38.

D. Thiéblemont et al. / Aeolian Research 15 (2014) 177–192 191
Bros, R., Stille, P., Gauthier-Lafaye, F., Wéber, F., Clauer, N., 1992. Sm–Nd isotopicdating of proterozoic clay materials: an example from the Francevilliansedimentary series, Gabon. Earth Planet. Sci. Lett. 113 (1–2), 207–218.
Brown, E.T., Edmond, J.M., Raisbeck, G.M., Yiou, F., Kurz, M.D., Brook, E.J., 1991.Examination of surface exposure ages of Antarctic moraines using in situ-produced 10Be and 26Al. Geochim. Cosmochim. Acta 55, 2269–2283.
Butler, B.E., 1956. Parna-an aeolian clay. Aust. J. Sci. 18, 145–151.Caen-Vachette, M., Vialette, Y., Bassot, J.P., Vidal, Ph., 1988. Apport de la
géochronologie isotopique à la connaissance de la géologie gabonaise. Chr.Rech. Min. 491, 35–54.
Chevallier, L., Makanga, J.F., Thomas, R.J., 2002. Notice explicative de la Cartegéologique de la République Gabonaise à 1/1,000,000. DGMG Editions, Gabon, p.195.
Chmeleff, J., Von Blanckenburg, F., Kossert, K., Jakob, D., 2010. Determination of the10Be half-life by multicollector ICP-MS and liquid scintillation counting. Nucl.Instrum. Methods Phys. Res. B 268, 192–199.
Collinet, J., 1969. Contribution à l’étude des ‘‘stone lines’’ dans la région du MoyenOgooué (Gabon). Cahiers ORSTOM, sér. Pédol. VII (1), 1–42.
Coudé-Gaussen, G., 1991. Les poussières sahariennes. John Libbey Eurotext, Paris, p.485.
Dantas, E.L., Souza de Alvarenga, J., Ventura Santos, R., Pimentel, M.M., 2009. UsingNd isotopes to understand the provenance of sedimentary rocks from acontinental margin to a foreland basin in the Neoproterozoic Paraguay Belt,Central Brazil. Precambrian Res. 170, 1–12.
De Paolo, D.J., Wasserburg, G.J., 1976. Interferences about magma sources andmantle structure from variations of 143Nd/144Nd. Geophys. Res. Lett. 3, 743–746.
Dee, D.P., Uppala, S.M., Simmons, A.J., Berrisford, P., Poli, P., Kobayashi, S., Andrae, U.,Balmaseda, M.A., Balsamo, G., Bauer, P., Bechtold, P., Beljaars, A.C.M., van deBerg, L., Bidlot, J., Bormann, N., Delsol, C., Dragani, R., Fuentes, M., Geer, A.J.,Haimberger, L., Healy, S.B., Hersbach, H., Hólm, E.V., Isaksen, K., Kållberg, P.,Köhler, M., Matricardi, McNally, A.P., Monge-Sanz, B.M., Morcrette, J-.J., Park,B.K., Peubey, C., de Rosnay, P., Tavolato, C., Thépaut, J-.N., Vitart, F., 2011. TheERA-Interim reanalysis: configuration and performance of the data assimilationsystem. Q. J. R. Meteorolog. Soc. 137, 553–597.
Dia, A., Chauvel, C., Bulourde, M., Gérard, M., 2006. Eolian contribution to soils onMount Cameroon: isotopic and trace element records. Chem. Geol. 226, 232–252.
Djama, L.M., Leterrier, J., Michard, A., 1992. Pb, Sr and Nd isotope study of thebasement of the Mayumbian belt (Guena gneisses and Mfoubou granite,Congo): implications for crustal evolution in Central Africa. J. Afr. Earth Sci. 14,227–237.
Djouka-Fonkwé, M.L., Schulz, B., Schüssler, U., Tchouankoué, J.P., Nzolang, C., 2008.Geochemistry of the Bafoussam Pan-African I- and S-type granitoids in westernCameroon. J. Afr. Earth Sci. 50, 148–167.
Edou-Minko, A., Colin, F., Trescases, J.J., Lecomte, P., 1992. Altération latéritique dugîte aurifère d’Ovala (Gabon), et formation d’une anomalie superficielle dedispersion. Miner. Deposita 27, 90–100.
Elenga, H., Schwartz, D., Vincens, A., 1994. Pollen evidence of late quaternaryvegetation and inferred climate changes in Congo. Palaeogeo. Palaeoclim.Palaeoeco. 109, 345–356.
Frechen, M., Oches, E.A., Kohfeld, K.E., 2003. Loess in Europe – mass accumulationrates during the Last Glacial Period. Quat. Sci. Rev. 22, 1835–1857.
Frimmel, H.E., Tack, L., Basei, M.S., Nutman, A., Boven, A., 2006. Provenance andchemostratigraphy of the Neoproterozoic West Congolian Group in theDemocratic Republic of Congo. J. Afr. Earth Sci. 46, 221–239.
Garzanti, E., Padoan, M., Setti, M., Lòpez-Galindo, A., Villa, I.M., 2014. Provenanceversus weathering control on the composition of tropical river mud (southernAfrica). Chem. Geol. 366, 61–74.
Gillies, J.A., Nickling, W.G., McTainsh, G.H., 1996. Dust concentrations and particle-size characteristics of an intense dust haze event: Inland delta region, Mali,West Africa. Atmos. Environ. 30 (7), 1081–1090.
Giresse, P., 2005. Mesozoic–Cenozoic history of the Congo Basin. J. Afr. Earth Sci. 43,301–315.
Giresse, P., Le Ribault, L., 1981. Contribution de l’étude exoscopique des quartz à lareconstitution paléogéographique des derniers épisodes du Quaternaire littoraldu Congo. Quat. Res. 15, 86–100.
Gleißner, P., Drüppel, K., Romer, R.L., 2011. The role of crustal contamination inmassif-type anorthosites, new evidence from Sr–Nd–Pb isotopic composition ofthe Kunene Intrusive complex, NW Namibia. Precambrian Res. 185, 18–36.
Goldstein, S.L., O’Nions, R.K., Hamilton, P.J., 1984. A Sm–Nd isotopic study ofatmospheric dusts and particulates from major river systems. Earth Planet. Sci.Lett. 70, 221–236.
Goscombe, B., Hand, M., Gray, D., 2003. Structure of the Kaoko Belt, Namibia:progressive evolution of a classic transpressional orogeny. J. Struct. Geol. 25,1049–1081.
Gosse, J.C., Phillips, F.M., 2001. Terrestrial in situ cosmogenic nuclides: theory andapplication. Quat. Sci. Rev. 20, 1475–1560.
Grousset, F.E., Biscaye, P.E., 2005. Tracing dust sources and transport patterns usingSr, Nd and Pb isotopes. Chem. Geol. 222, 149–167.
Grousset, F.E., Biscaye, P.E., Zindler, A., Prospero, J., Chester, R., 1988. Neodyniumisotopes as tracers in marine sediments and aerosols: North Atlantic. EarthPlanet. Sci. Lett. 87, 367–378.
Grousset, F.E., Parra, M., Bory, A., Martinez, P., Bertrand, P., Simmield, G., Ellam, R.M.,1998. Saharan wind regimes traced by the Sr–Nd isotopic composition ofsubtropical Atlantic sediments: last glacial maximum vs today. Quat. Sci. Rev.17, 395–409.
Hargrove, U.S., Stern, R.J., Kimura, J.I., Manton, W.I., Johnson, P.R., 2006. Howjuvenile is the Arabian – Nubian Shield? Evidence from Nd isotopes and pre-Neoproterozoic inherited zircon in the Bi’rUmq suture zone, Saudi Arabia. EarthPlanet. Sci. Lett. 252, 308–326.
Iriondo, M., Kröhling, D., 2007. Non classical types of loess. Sediment. Geol. 202 (3),352–368.
Janoušek, V., Konopásek, J., Ulrich, S., Erban, V., Tajcmanová, L., Jerábek, P., 2010.Geochemical character and petrogenesis of Pan-African Amspoort suite of theBoundary Igneous Complex in the Kaoko Belt (NW Namibia). Gondawana Res.18, 688–707.
Jung, S., Kröner, A., Kröner, S., 2007. A �700 Ma Sm–Nd garnet-whole rock age fromthe granulite facies Central Kaoko Zone (Namibia): Evidence for a cryptic high-grade metamorphic history? Lithos 97, 247–270.
Jung, S., Masberg, P., Mihm, D., Hoernes, S., 2009. Partial melting of diverse crustalsources – constraints from Sr–Nd–O isotope compositions of quartz diorite–granodiorite–leucogranite associations (Kaoko Belt, Namibia). Lithos 111, 236–251.
Korschinek, G., Bergmaier, A., Faestermann, T., Gerstmann, U.C., Knie, K., Rugel, G.,Wallner, A., Dillmann, I., Dollinger, G., Lierse Von Gostomski, C., Kossert, K.,Maiti, M., Poutivtsev, M., Remmert, A., 2010. A new value for the half-life of 10Beby Heavy-Ion Elastic Recoil Detection and liquid scintillation counting. Nucl.Instrum. Methods Phys. Res. B 268, 187–191.
Kottek, M., Grieser, J., Beck, C., Rudolf, B., Rubel, F., 2006. World map of the Köppen–Geiger climate classification updated. Meteorol. Z. 15, 259–263.
Kröner, A., Rojas-Agramonte, Y., Hegner, E., Hoffmann, K.H., Windgate, M.T.D., 2010.SHRIMP zircon dating and Nd isotopic systematics of Paleoproterozoicmagmatic orthogneisses in the Epupa Metamorphic Complexe ofnorthwestern Namibia. Precambrian Res. 183, 50–69.
Lanfranchi, R., 1991. Synthèse régionale des Ages de la Pierre Ancien et Moyen. In:Lanfranchi, R., Clist, B. (Eds.), Aux origines de l’Afrique centrale, Ages de la pierreAncien et Moyen – Old Stone Age (O.S.A.) et Middle Stone Age (M.S.A.). CentresCulturels Français d’Afrique centrale, Centre International de CivilisationsBantu, Libreville, Sepia, pp. 89–95.
Lecomte, P., 1988. Stone line profiles: importance in geochemical exploration. J.Geochem. Explor. 30, 35–61.
Lindbo, D.L., Rhoton, F.E., Bigham, J.M., Hudnall, W.H., Jones, F.S., Smeck, N.E., Tyler,D.D., 1994. Bulk density and fragipan identification in loess soils of the lowerMississippi river valley. Soil Sci. Soc. Am. J. 58, 884–891.
Locko, M., 1991. Gabon. In: Lanfranchi, R., Clist, B. (Eds.), Aux origines de l’Afriquecentrale, Ages de la pierre Ancien et Moyen – Old Stone Age (O.S.A.) et MiddleStone Age (M.S.A.). Centres Culturels Français d’Afrique centrale, CentreInternational de Civilisations Bantu, Libreville, Sepia, pp. 67–70.
Maley, J., Brenac, P., 1998. Vegetation dynamics, paleoenvironments and climaticchanges in the forests of western Cameroon during the last 28,000 years B.P.Rev. Palaeobot. Palynol. 99, 157–187.
Marchesseau, J., 1965. Etude minéralogique et morphologique de la stone-line auGabon. Bull.’Inst. Fondam. Afr. Noire 29 A (2), 862–865.
Masberg, P., Mihm, D., Jung, S., 2005. Major and trace element and isotopic (Sr, Nd,O) constraints for Pan-African crustally contaminated grey granite gneissesfrom the southern Kaoko belt, Namibia. Lithos 84, 25–50.
Maurizot, P., 1986. Carte géologique du sud-ouest Cameroun. République duCameroun, Ministère des Mines et l’Eau et de l’Energie, Direction des Mines etde la Géologie, BRGM Ed.
Mayaga-Mikolo, F., 1997. Chronologie des évènements sédimentaires, magmatiqueset tectono-métamorphiques du Précambrien d’Afrique Centrale Occidentale(Gabon): tectogenèse Ogooué et héritage archéen. Documents du BRGM, BRGMEd., p. 185.
McDermott, F., Hawkesworth, C.J., 1990. Intracrustal recycling and upper-crustalevolution: a case study from the Pan-African Damara mobile belt, centralNamibia. Chem. Geol. 83, 263–280.
McTainsh, G., 1984. The nature and origin of the aeolian mantles of the centralnorthern Nigeria. Geoderma 33, 13–37.
McTainsh, G., 1987. Desert loess in northern Nigeria. Z. Geomorphologie N.F. 31 (2),145–165.
McTainsh, G., Walker, P.H., 1982. Nature and distribution of Harmattan dust. Z.Geomorphologie N.F. 26, 417–435.
Mercader, J., Martí, R., Martínez, J.L., Brooks, A., 2002. The nature of ‘stone lines’ inthe African Quaternary record: archaeological resolution at the rainforest site ofMosumu, Equatorial Guinea. Quat. Int. 89, 71–96.
Merchel, S., Herpers, U., 1999. An update on radiochemical separation techniquesfor the determination of long-lived radionuclides via accelerator massspectrometry. Radiochim. Acta 84, 215–219.
Merchel, S., Arnold, M., Aumaître, G., Benedetti, L., Bourlès, D.L., Braucher, R.,Alfimov, V., Freeman, S.P.H.T., Steier, P., Wallner, A., 2008. Towards more precise10Be and 36Cl data from measurements at the 10–14 level: influence of samplepreparation. Nucl. Instrum. Methods Phys. Res. B 266, 4921–4926.
Milesi, J.P., Feybesse, J.L., Pinna, P., Deschamps, Y., Kampunzu, H.A.B., Muhonogo, S.,Lescuyer, J.L., Toteu, S.F., 2004. Géologie et principaux gisements de l’Afrique,échelle 1/1,000,000. In: 20th Congress on African Geology, Orléans, BRGM Ed.
Négrel, Ph., 2006. Water-granite interaction: clues from strontium, neodymium andrare earth elements in saprolite, sediments, soils, surface and mineralizedwaters. Appl. Geochem. 21, 1432–1454.
Négrel, Ph., Pételet-Giraud, E., 2010. Geochemistry and isotopic composition (O, D,Sr, Nd) in the groundwater of French Guiana as indicators of their origin andinterrelation. C.R. Geosci. 342, 786–795.

192 D. Thiéblemont et al. / Aeolian Research 15 (2014) 177–192
Ngounouno, I., Déruelle, B., Demaiffe, D., 2000. Petrology of the bimodal Cenozoicvolcanism of the Kapsiki plateau (northernmost Cameroon, Central Africa). J.Volcanol. Geotherm. Res. 102, 21–44.
Peyrot, B., Oslisly, R., Abdessadok, S., Fontugne, M., Hatte, C., White, L., 2003. Lespaléoenrivonnements de la fin du Pléistocène et de l’Holocène dans la reservede la Lopé (Gabon): approche par les indicateurs géomorphologiques,sédimentologiques, phytologiques, géochimiques et anthropogènes desmilieux enregistreurs de la dépression de la Lopé. L’anthropologie 107, 291–307.
Pin, C., Poidevin, J.L., 1987. U–Pb zircon evidence for a Pan-African granulite faciesmetamorphism in the Central African Republic. A new interpretation of thehigh-grade series of the northern border of the Congo Craton. Precambrian Res.36, 303–312.
Poidevin, J.L., Pin, C., 1986. 2 Ga U–Pb zircon dating of Mbigranodiorite (CentralAfrican Republic) and its bearing on the chronology of the Proterozoic of CentralAfrica. J. Afr. Earth Sci. 5 (6), 581–587.
Pye, K., 1995. The nature, origin and accumulation of loess. Quat. Sci. Rev. 14, 653–667.
Richard, P., Shimizu, N., Allègre, C.J., 1976. 143Nd/144Nd, a natural tracer: anapplication to oceanic basalts. Earth Planet. Sci. Lett. 31, 269–278.
Rodrigues, J.B., Pimentel, M.M., Buhn, B., Matteini, M., Dardenne, M.A., Alvarenga,C.J.S., Armstrong, R.A., 2012. Provenance of the Vazante group: new U–Pb, Sm–Nd, Lu–Hf isotopic data and implications for the tectonic evolution of theNeoproterozoic Brasília Belt. Gondwana Res. 21, 439–450.
Rolin, P., 1995. Carte tectonique de la République Centrafricaine. RépubliqueCentrafricaine, Ministère des Mines et de l’Energie.
Roquin, C., Freyssinet, Ph., Zeegers, H., Tardy, Y., 1990. Element distribution patternsin laterites of southern Mali: consequence for geochemical prospecting andmineral exploration. Appl. Geochem. 5, 303–315.
Rünge, J., 2001. On the age of stone-lines and hillwash sediments in the easternCongo basin – palaeoenvironmental implications. In: Heine, K. (Ed.),Palaeocology of Africa and the Surroundings Islands. Proc. XVth INQUAConference, pp. 19–36.
Schoenborn, W.A., Fedo, M.F., Lang Farmer, G., 2012. Provenance of theNeoproterozoic Johnnie Formation and Stirling Quartzite, southeasternCalifornia, determined by zircon geochronology and Nd isotope geochemistry.Precambrian Res. 206–207, 182–199.
Schwartz, D., 1996. Archéologie préhistorique et processus de formation des stone-lines en Afrique centrale (Congo-Brazzaville et zones périphériques). Seminaron Geo-archaeology in Tropical and Mediterraean Regions, Brussels, April1996.Royal Academy of Overseas Sciences. Geo Eco Trop 20 (1–4), 15–38(April).
Séranne, M., Bruguier, O., Moussavou, M., 2008. U-Pb single grain dating of Presentfluvial and Cenozoic aeolian sediments from Gabon: consequences onsediments provenance, reworking, and erosion processes on the equatorialWest Africa margin. Bull. Soc. Géol. France 179 (1), 29–40.
Seth, B., Kröner, A., Mezger, K., Nemchin, A.A., Pidgeon, R.T., Okrusch, M., 1998.Archaean to Neoproterozoic magmatic events in the Kaoko belt of NW Namibiaand their geodynamic significance. Precambrian Res. 92, 341–363.
Seth, B., Jung, S., Gruner, B., 2008. Deciphering polymetamorphic episodes in high-grade metamorphic orogens: constraints from PbSL, Sm/Nd and Lu/Hf garnetdating of low- to high-grade metasedimentary rocks from the Kaoko belt(Namibia). Lithos 104, 131–146.
Shang, C.K., Satir, M., Siebel, W., Nsifa, E.N., Taubald, H., Liégeois, J.P., Tchoua, F.M.,2004. TTG magmatism in the Congo craton; a view from major and traceelement geochemistry, Rb–Sr and Sm–Nd systematics: case of the Sangmelimeregion, Ntem complex, southern Cameroon. J. Afr. Earth Sci. 40, 61–79.
Shang, C.K., Satir, M., Morteani, G., Taubald, H., 2010. Zircon and titanite ageevidence for coeval granitization and migmatization of the early Middle andearly Late Proterozoic Saharan Metacraton; example from the central NorthSudan basement. J. Afr. Earth Sci. 57, 492–524.
Siame, L., Bellier, O., Braucher, R., Sébrier, M., Cushing, M., Bourlès, D., Hamelin, B.,Baroux, E., De Voogd, B., Raisbeck, G., Yiou, F., 2004. Local erosion rates versusactive tectonics: cosmic ray exposure modeling in Provence (south-east France).Earth Planet. Sci. Lett. 220 (3–4), 345–364.
Stone, J.O., 2000. Air pressure and cosmogenic isotope production. J. Geophys. Res.105, 23753–23759.
Tack, L., Wingate, M.T.D., Liégeois, J.-P., Fernandez-Alonso, M., Deblond, A., 2001.Early Neoproterozoic magmatism (1000–910 Ma) of the Zadinian andMayumbian Groups (Bas-Congo): onset of Rodinia rifting at the western edgeof the Congo craton. Precambrian Res. 110, 277–306.
Tardy, Y., 1997. Petrology of Laterites and Tropical Soils. Balkema, p. 408.Tchameni, R., Mezger, K., Nsifa, N.E., Pouclet, A., 2000. Neoarchean crustal evolution
in the Congo Craton: evidence from K rich granitoids of the Ntem Complex,southern Cameroon. J. Afr. Earth Sci. 30 (1), 133–147.
Tchameni, R., Mezger, K., Nsifa, N.E., Pouclet, A., 2001. Crustal origin of EarlyProterozoic syenites in the Congo Craton (Ntem Complex), South Cameroon.Lithos 57, 23–42.
Thiéblemont, D., 2009. Carte géologique et des Ressources minérales de laRépublique gabonaise à 1/1,000,000, third ed. DGMG Editions, Ministère desMines, du Pétrole, des Hydrocarbures, Libreville.
Thiéblemont, D., 2013. Evidence for an aeolian origin of the Holocene lateriticsurface cover of Gabon (Central Africa). Quat. Int. 296, 176–197.
Thiéblemont, D., Castaing, C., Billa, M., Bouton, P., Préat, A., 2009. Notice explicativede la Carte géologique et des Ressources minérales de la République gabonaise à1/1,000,000. DGMG Editions, Ministère des Mines, du Pétrole, desHydrocarbures, Libreville, p. 384.
Thiéblemont, D., Flehoc, C., Ebang-Obiang, M., Rigollet, C., Prian, Prognon, F., 2013.Geochronological arguments for a close relationship between surficialformation profiles and environmental crisis (c. 3000–2000 BP) in Gabon(Central Africa). C.R. Geosci. 345, 272–283.
Thomas, R.J., Makanga, J.F., Chevallier, L., 2001. Carte géologique de la RépubliqueGabonaise à 1/1,000,000, Second ed. DGMG Editions, Gabon.
Toteu, S.F., Van Schmus, W.R., Penaye, J., Nyobé, J.B., 1994. U–Pb and Sm–Ndevidence for Eburnian and Pan-African high-grade metamorphism in cratonicrocks of southern Cameroon. Precambrian Res. 67, 321–347.
Toteu, S.F., Van Schmus, W.R., Penaye, J., Michard, A., 2001. New U–Pb and Sm–Nddata from north-central Cameroon and its bearing on the pre-Pan Africanhistory of central Africa. Precambrian Res. 108, 45–73.
Toteu, S.F., Penaye, J., Deloule, E., Van Schmus, W.R., Tchameni, R., 2006.Diachronous evolution of volcano-sedimentary basins north of the Congocraton: insights from U-Pb ion microprobe dating of zircons from the Poli, Lomand Yaoundé Groups (Cameroon). J. Afr. Earth Sci. 44, 428–442.
Van de Fierdt, T., Hoernes, S., Jung, S., Masberg, P., Hoffer, E., Schaltegger, U.,Friedrichsen, H., 2003. Lower crustal melting and the role of open-systemprocesses in the genesis of syn-orogenic quartz–diorite–granite–leucograniteassociations: constraints from Sr–Nd–O isotopes from the BandombaaiComplex, Namibia. Lithos 67, 205–226.
Vermeesch, P., 2007. CosmoCalc: an Excel add-in for cosmogenic nuclidecalculations. Geochem. Geophys. Geosyst. 8. http://dx.doi.org/10.1029/2006GC001530 Q08003.
Vicat, J.P., Pouclet, A., 2000. Palaeo- and neoproterozoicgranitoids and rhyolitesfrom the West Congolian Belt (Gabon, Congo, Cabinda, north Angola): chemicalcomposition and geotectonic implication. J. Afr. Earth Sci. 31, 597–617.
Vincens, A., Schwartz, D., Bertaux, J., Elenga, H., de Namur, C., 1998. Late Holoceneclimatic changes in Western Equatorial Africa inferred from pollen from LakeSinnda, Southern Congo. Quat. Res. 50, 34–45.
Vincent, P.L., 1966a. Les formations meubles superficielles au Sud du Congo et duGabon. Mission 1964–1965. Rapport BRGM 65 BRA 009.
Vincent, P.L., 1966b. Les formations meubles superficielles au Sud du Congo et duGabon. Mission 1964–1965. Bull. BRGM 4, 53–111.
Ward, G.K., Wilson, S.R., 1978. Procedures for comparing and combiningradiocarbon age determinations: a critique. Archaeometry 20, 19–31.
Weissheimer de Borba, A., Pimentel Mizusaki, A.M., Andrade da Silva, D.R., Koester,E., de Lima Noronha, F., Casagrande, J., 2006. Provenance of theNEOPROTEROZOICMARICÁ formation (Sul-rio-grandense Shield, SouthernBrazil): petrographic and Sm–Nd isotopic constraints. Gondwana Res. 9, 464–474.
Wilke, B.M., Dukz, B.J., Jimoh, W.L.O., 1984. Mineralogy and chemistry of Harmattandust in Northern Nigeria. Catena 11, 91–96.
Yokoyama, T., Aka, F.T., Kusakabe, M., Nakamura, E., 2007. Plume-lithosphereinteraction beneath Mt. Cameroon volcano, West Africa: constraints from238U–230Th–226Ra and Sr–Nd–Pb isotope systematics. Geochim. Cosmochim.Acta 71, 1835–1854.