natural resources inventory - city of columbia, mo
TRANSCRIPT

Natural Resources Inventory
Columbia Metropolitan Planning AreaReview Draft (10-1-10)
NATURAL RESOURCES INVENTORY
Review Draft (10-1-10)
City of Columbia, Missouri
October 1, 2010

- Blank -
Preface for Review Document
The NRI area covers the Metropolitan Planning Area defined by the Columbia Area Transportation Study Organization (CATSO), which is the local metropolitan planning organization.
The information contained in the Natural Resources Inventory document has been compiled from a host of public sources. The primary data focus of the NRI has been on land cover and tree canopy, which are the product of the classification work completed by the University of Missouri Geographic Resource Center using 2007 imagery acquired for this project by the City of Columbia.
The NRI uses the area’s watersheds as the geographic basis for the data inventory. Landscape features cataloged include slopes, streams, soils, and vegetation. The impacts of regulations that manage the landscape and natural resources have been cataloged; including the characteristics of the built environment and the relationship to undeveloped property.
Planning Level of Detail
NRI data is designed to support planning and policy level analysis. Not all the geographic data created for the Natural Resources Inventory can be used for accurate parcel level mapping. The goal is to produce seamless datasets with a spatial quality to support parcel level mapping to apply NRI data to identify the individual property impacts. There are limitations to the data that need to be made clear to avoid misinterpretations.
Stormwater Buffers: The buffer data used in the NRI are estimates based upon the stream centerlines, not the high water mark specified in City and County stormwater regulations. The final GIS product for release will be a stormwater buffer which will be derived from the high water mark, once the high mark can be identified from the leaf-off infrared digital aerial imagery.
Sewer Service Areas: The estimated service areas were derived from a digital elevation model and based on spatial interpretations of the subarea drainages with a watershed.
Slopes: Ten slope categories were used for the slope distribution presentation to provide a sufficient range of data to accommodate future slope-based analysis. For the inventory, a slope of ten percent or greater, which accounts for approximately 10% of the NRI area, has been identified the initial threshold for the analysis steep slopes. The ten percent slope serves as a bench mark to provide a basis for identifying areas of interest for the NRI.
A companion document will be released as a Technical Appendix in 2011 will provide a detailed inventory of the land cover, land use, and tree canopy for each portion of the 29 watersheds within the NRI area. This will include an analysis of the environmental services provided by the tree canopy.

- Blank -
TABLE OF CONTENTS
i
CHAPTER ONE: PROJECT OVERVIEW
1.1 What Is A Natural Resources Inventory………………………………..……….. 11.2 Project Overview………………………………………………………………… 11.3 Land Cover and Vegetation Mapping…………….……………..…………….. 31.4 NRI Data Stakeholders………………………………………………………..... 3
CHAPTER TWO: DATA COLLECTION AND ANALYSIS
2.1 Data Collection and Analysis……………………………………………..…… 5 2.2 Digital Imagery and Database Mapping……..……………………………….. 5 2.3 Field Reconnaissance……….…………………………………………………. 9 2.4 Land Cover and Vegetation Mapping………………………………………… 9 2.5 Additional Data Resource……………………………………………………... 10
CHAPTER THREE: NATURAL RESOURCES OVERVIEW
3.1 Location and General Information …………………………………………… 11 3.2 Regional Context ……………………………..……………………………….. 11 3.3 Climate……….…………………………………………………………………. 12 3.4 Geology – Overview and Context……...……………………………………… 13 Aggregate Resources…………………………………………………………... 13 Mineral Resources……………………………………………………………… 14 3.5 Soils and Soil Types…………………………………………………………….. 15 3.6 Local Energy Sources…………………………………………………………… 18 Fossil Fuels……………………………………………………………………… 18 Wind Energy……………………………………………………………………. 19 Solar Energy…………………………………………………………………….. 21 Biomass Energy…………………………………………………………………. 21 Geothermal Energy…………………………………………………………….. 22
CHAPTER FOUR: LANDSCAPE
4.1 Introduction…………………….……………………………………………..…… 25 4.2 Landform and Terrain……………………..……..……………………………….. 25 4.3 Slope…………………………….…………………………………………………. 25 4.4 Vulnerable Landscape…………………..………………………………………… 28 Karst Topography…………..……………………………………………………... 29 Highly Erodible Soils………………………………………………………………. 29 Steep Slopes……………………………………………………………………….. 30
TABLE OF CONTENTS
ii
CHAPTER FIVE: WATERSHEDS AND STREAMS
5.1 Watersheds………………………….…………………………………………… 31 5.2 Physical Characteristics of Streams…………...……………………………….. 33 5.3 Stream Types………….…………………………………………………………. 34 5.4 Stream Order…………………….……...……………………………………… 35 5.5 Characteristics of Streams……………………….……………………………... 37 5.6 Water Quality Issues…………………………………………………………… 38 Water Temperature …………………………………………………………….. 38 Suspended Solids and Turbidity in Streams…………………………………… 39 Dissolved Oxygen in Streams…………………………………………………… 40 Stream pH….……………………………………………………………………. 40 Nutrients in Streams…………………………………………………………….. 41 Fecal Coliform Bacteria in Streams….…………………………………………. 41 5.7 Land Use/Land Cover & Water Quality……………………………………….. 42 5.8 Locally Impaired Streams……………………………………………………….. 43
CHAPTER SIX: LAND COVER
6.1 Land Cover…………………………………..………………………………….. 45 6.2 Land Cover Types……………………………………………………………….. 45
CHAPTER SEVEN: LAND USE
7.1 Land Use………………………………………………………………………… 49 7.2 Land Development Status – Vacant/Developed …………………………….… 49 7.3 Land Development Status – Platted/Unplatted ……………………………..… 50 7.4 Development Characteristics ………………………………………………...… 52 7.5 Development Density ….………………………………………………….……. 53 CHAPTER EIGHT: FEDERAL, STATE, COUNTY, & CITY ENVIRONMENTAL REGULATIONS, PLANS & PROGRAMS
8.1 Environmental Regulations ………..…………………………………………… 55 8.2 Federal Regulations……………….…………...……………………………….. 55 Clean Water Act: 303d Water Quality Standards…………………………….. 56 Clean Water Act: Section 401…….……...….………………………………… 59 Clean Water Act: Section 404……………………….…….…………………... 59 Flood Control Act of 1936…………………………………………...…………… 60 National Flood Insurance Act of 1968.……………………..…………………….. 60 The Endangered Species Act ………………...………………………………… 61 Soil Conservation and Domestic Allotment Act ……………………………..… 61 Emergency Watershed Protection Programs ….………………..……………... 62 8.3 State of Missouri…..…………………………………………………………….. 62 Missouri Revised Statutes Chapter 644….……………………………..……… 62
TABLE OF CONTENTS
iii
Missouri Revised Statutes (MSR) Chapter 278 Soil Conservation …………..... 64 Endangered Species…………………………………………………………….. 64 8.4 Boone County…………..……………………………………………………….. 64 Zoning Regulations – Section 22 Floodplain Management…………………… 64 Zoning Regulations – Section 26 Stream Buffer Regulations………………….. 64 Stormwater Ordinance……..…………………………………………………… 65 Hinkson Creek Watershed Study………………………………..………….…... 65 Bonne Femme Watershed Plan………………………………………………… 66 8.5 City of Columbia………………………………………………………………... 66 Chapter 12A - Land Preservation…………………………………………….… 66 Floodplain Management…………………………………………………..…… 67 Stormwater Management Plan…..……….……………………..……………… 67 1935 Plan…………………………………..…………………………………… 67 Metro 2020…………………………………..…………………………………. 68 Greenbelt Plan…………………………………………………..……………… 68 Household Hazardous Waste Program……………………….….……………. 70 8.6 Non-Government Organizations (NGO)………………………………………. 70 Audubon Society………………………………………………………………… 70 Nature Conservancy…………………………………………………………….. 70 Greenbelt Land Trust……………………………………………………………. 70
CHAPTER NINE: REGULATED LANDSCAPE AREAS
9.1 Introduction……………………………………..……..…………………………... 73 9.2 Zoning…………………………………………………………………………………… 73 9.3 Floodplain……………..………………………………………….………..…………… 76 9.4 Stormwater…………………..…….……………………………………..……………… 77 9.5 Tree Preservation…………………………………………………………………...…… 78
CHAPTER TEN: LIMITATIONS TO DEVELOPMENT
10.1 Types of Limitations…..………………….………………………………………. 81 10.2 Centralized Sewer……….……………….…………………………………….… 81 10.3 Floodplain……………….…………………………………………………..…… 84 10.4 Stormwater…………………….…..……….……………………..……………… 84 10.5 Vulnerable Landscape……………………....…………………………………… 84 10.6 Limitations to Development …………...……..…………………………………. 85
CHAPTER ELEVEN: TREE CANOPY AND VEGETATION
11.1 Vegetation Types…..……………..…….………………………………………. 87 11.2 Tree Canopy…...…...….……………….…………………………………….… 88 Tree Associations……………………………………………………………….. 89 NRI Tree Canopy……………………………………………………………….. 92
TABLE OF CONTENTS
iv
11.3 Estimating Changes In the Forest Cover ………….………….…………..…… 93
CHAPTER TWELVE: PLANT AND WILDLIFE HABITAT
12.1 Introduction……..…..……………..…….………………………………………. 97 12.2 Habitat Identification..….……………….…………………………………….… 97 12.3 Habitat Loss………………………………………….………….…………..…… 97 12.4 Habitat Preservation Strategies……………….…..……………..……………… 98
CHAPTER THIRTEEN: ENVIRONMENTAL SERVICES
13.1 Environmental Services.…...…………….…………………………………….… 101 13.2 Local Application of Regulating Services ………….………….…………..…… 101
CHAPTER FOURTEEN: NRI PHASE TWO
14.1 Introduction……………..………………………………………………………. 103 14.2 Citizen Reporting…………………………………………………………...…... 103 14.3 Data Products………………………………………………….……………….. 103 14.4 Web-based Mapping..……..………………………………………………..… 103 14.5 Suggested Actions and Related Concepts……………………...………….….. 104 Action One…...……………….………………………………………………… 104 Action Two……………...……………..………………………………………... 104 Related Concepts……………….…………………………………………….… 105 14.6 Staff Recommendations..…………………………………………………..…… 107
TABLE OF CONTENTS
v
CHARTS Chart 1: Slope Distribution for NRI Area……………………………………………… 27 Chart 2: Distribution of Stream Order In the NRI Area…………….………………… 36 Chart 3: Land Cover by Type………………………………………………………..… 46 Chart 4: Development Status for NRI Area………………………………………….... 50 Chart 5: Platting and Development Status for NRI Area……………………………… 51 Chart 6: Land Use Development Distribution…………………………………………. 52 Chart 7: City of Columbia Zoning Distribution by Area……………………………… 73 Chart 8: Boone County Zoning Distribution by Area…………………………………. 75 Chart 9: Centralized Sewer Service Status for the NRI Area………………………….. 82 Chart 10: Vegetation by Type and Percent of Total………………………………...… 87 Chart 11: Distribution of City Tree Associations by Slope Classification Areas…………….. 91 Chart 12: Percent Slope Area Covered by Tree Canopy……………………………... 92 Chart 13: Forest Age Composition 2005…………………………………………….. 95 FIGURES Figure 1: Multispectral Image Analysis………………………………………………… 7 Figure 2: Typical Soil Configuration Associated with River Bluff Areas………………. 17 Figure 3: Typical Soil Configuration Associated with Glacial Till…………………..… 17 Figure 4: Dendritic Network and Stream Order………………………………………. 36 Figure 5: Measuring Stream Sinuosity…………………………………………………. 38 Figure 6: Preservation Area Configuration Impacts on Undisturbed Habitat………... 99 Figure 7: Spatial Organization of Habitat Preservation Areas ………………………. 100 MAPS Map 1: NRI area showing City Limits, County, and MPO Boundary………...………. 2 Map 2: Areas Identified for Public Access…………………………………………………….. 9 Map 3: Ozark Highland Ecoregion……………………………………………………………. 12 Map 4: Generalized Geologic Map of Missouri………………………………………………. 13 Map 5: NRI Area Mineral Resources & Past Mineral Extraction Sites………………………… 14 Map 6: NRI Area Soils By Hydrologic Group………………………………………………….. 16 Map 7: Geothermal Resources………………………………………………………………… 22 Map 8: Slopes by Category……………………………………………………………. 26 Map 9: Vulnerable Landscape Areas.…………………………………………………. 28 Map 10: Major Watersheds and Creeks in the NRI…………………..………………. 31 Map 11: NRI Streams by Type……………………………………………………….… 35 Map 12: Land Cover of the NRI Area…………………………………………………. 47
TABLE OF CONTENTS
vi
Map 13: NPDES Permits for Land Disturbance in the NRI Area……………………… 58 Map 14: Metro 2020 Greenbelt/Open Space District……………………………….. 69 Map 15: FEMA “100 Year” Flood Hazard Areas in the NRI………………….……… 76 Map 16: Applicability of City of Columbia Stormwater Regulations…………………. 78 Map 17: Climax Forest Regulatory Status…………………….………………………. 79 Map 18: Existing and Future Sewer Service Areas……………………………………. 83 Map 19: Limitation To Development………………………………………………….. 85 Map 20: Tree Canopy…...…………………………………………………………….. 89 Map 21: Changes In Forest Cover – 1976 to 2005…………………………………. 94 TABLES Table 1: Average Monthly Wind Speeds and Direction for Columbia, MO………….
19
Table 2: Columbia, MO Energy Values for a Tracker 2-Axis Solar Collection System 20 Table 3: Slope Distribution for NRI Area………………………………………………. 27 Table 4: Vulnerable Landscape Areas……….………………………………………… 30 Table 5: Primary, Secondary, and Immediate Watershed Acreages…………….…… 32 Table 6: Summary of Streams by Type………………………………………………… 34 Table 7: Stream Order Distribution in the NRI Area………………………………….. 37 Table 8: Land Uses and Associated Pollutant Types………………………………….. 42 Table 9: Land Cover by Type, Area, and Percent of NRI Area………………………. 46 Table 10: Development Status for NRI Area by Type and Area……………..……….. 50 Table 11: Platting and Development Status of NRI Area……………….…………….. 51 Table 12: Developed Land Use by Type and Area 2009…………………………….. 53 Table 13: Developed Land Area and Development Densities..……………..……….. 53 Table 14: Land Disturbance and Permit Requirements……………………………….. 57 Table 15: City of Columbia Zoning Summary Table…………………………………. 74 Table 16: County Zoning Summary Table for NRI Area……………………………… 75 Table 17: Centralized Sewer Service Status for NRI Area…………………………….. 82 Table 18: Limitations To Development by Type and Acreage…………………….….. 86 Table 19: Vegetation Type by Acreage………………………………………………... 88 Table 20: City Tree Associations by Acreage and Percent of Total Tree Canopy…………... 91 Table 21: Percent of Tree Canopy by Slope Area and Total Percent of Tree Canopy. 93 Table 22: Loss/Gain in Forest Areas 1976 – 2005………………………………………… 91 Table 23: Percent of Forest Cover by Slope Area and Total Percent of Forest……………… 93 Table 24: Changes In Established Forest by Slope Area 1976 to 2005……………………. 95
TABLE OF CONTENTS
vii
APPENDICES
APPENDIX A: State of Missouri Endangered and Threatened Species
APPENDIX B: Visioning Final Report – NRI
APPENDIX C: Sample CityGreen Analysis
DRAFT NATURAL RESOURCES INVENTORY OCTOBER 1, 2010
___________________________________________________________________________ 1 Natural Resources Inventory Columbia, MO
CHAPTER ONE: PROJECT OVERVIEW 1.1 What is the Natural Resource Inventory The Natural Resources Inventory (NRI) is a compilation of data, descriptions, and maps to document the natural resources of a given geographic area. An information baseline is established and built upon by continued observation and research. Natural resources are the basic components of the environment that sustain the life and health of all creatures and provide the resources to sustain human economies and quality of life. Key outcomes of the NRI are:
• documentation of the geographical location of resources • display and summaries of existing data • assessment of natural resource functions and condition • analysis of the inter-relationships between natural resources • identification of the threats to the existing health and integrity • provision of benchmarks against which future change can be measured • identification of additional areas for further study • incorporation of new or revised information from interested citizens
The NRI provides information on the types of resources that are likely to exist on a particular site, how sensitive they are, and whether or not closer examination is needed. The NRI can also guide landowners to a fuller understanding of the resources over which they have stewardship.
The central data source for the NRI is the digital photography. The University of Missouri Geographic Resource Center performed the analysis of the imagery to produce the land cover, vegetation, and tree cover databases.
The NRI is organized based on watersheds to catalog the analysis and inventory process. Key data elements were designed to support stormwater planning, tree preservation, and land disturbance impacts. 1.2 Project Overview
The Natural Resources Inventory project was initiated by the Columbia City Council in December, 2006. A budget was established to acquire high resolution digital color imagery to produce land cover and vegetation maps for use in the City’s geographic information system (GIS).
The NRI study area covers approximately 198 square miles in and around Columbia. The NRI boundary includes the 180 square mile Metropolitan Planning Area defined by the
DRAFT NATURAL RESOURCES INVENTORY OCTOBER 1, 2010
___________________________________________________________________________ 2 Natural Resources Inventory Columbia, MO
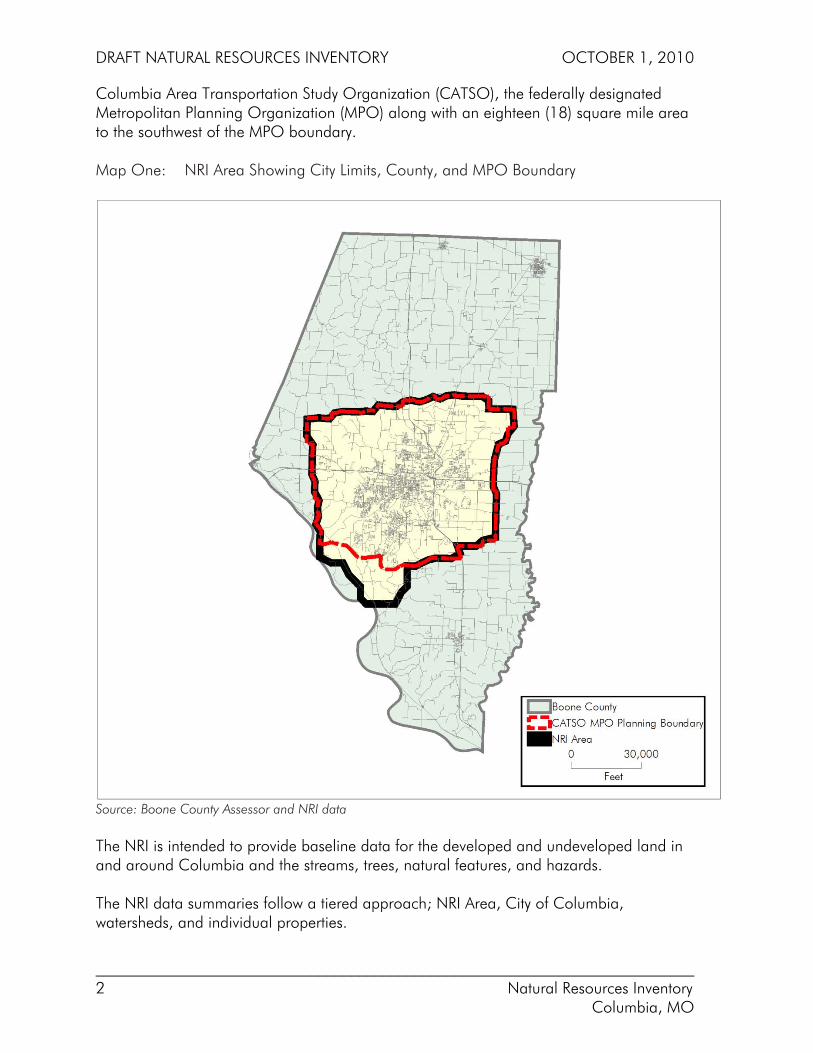
Columbia Area Transportation Study Organization (CATSO), the federally designated Metropolitan Planning Organization (MPO) along with an eighteen (18) square mile area to the southwest of the MPO boundary. Map One: NRI Area Showing City Limits, County, and MPO Boundary
Source: Boone County Assessor and NRI data The NRI is intended to provide baseline data for the developed and undeveloped land in and around Columbia and the streams, trees, natural features, and hazards.
The NRI data summaries follow a tiered approach; NRI Area, City of Columbia, watersheds, and individual properties.
DRAFT NATURAL RESOURCES INVENTORY OCTOBER 1, 2010
___________________________________________________________________________ 3 Natural Resources Inventory Columbia, MO
The GIS databases are designed to provide planning level detail. Detail at the smaller scales, will be approximate; not at a scale of accuracy sufficient for site specific survey or engineering applications. 1.3 Land Cover and Vegetation Mapping
The central data source for the NRI is the digital photography. The University of Missouri Geographic Resource Center performed the analysis of the digital imagery to produce the land cover, vegetation, and tree cover databases.
Land cover is the natural landscape recorded as surface components: forest, water, wetlands, urban, etc. Land cover can be documented by analyzing spectral signatures of satellite and aerial imagery.
Potential uses of land cover data are many and varied, and include assessing ecosystem status and health, modeling nutrient and pesticide runoff, understanding spatial patterns of biodiversity, land use planning, deriving landscape pattern metrics, and developing land management/land preservation policies.
• Land cover by type • Wetlands, lakes, ponds, and waterways • Public land • Forest cover, by type, age and condition • Steep slopes • Important plant and animal habitats • Tree canopy and roof tops • Plant species and associations found in Columbia • Impervious surface • Threatened natural resources
The land use/land cover (LULC) classification of the NRI imagery is compatible with the land cover standards used by the United States Geological Survey (USGS). The use of compatible LULC standards provides the opportunity to compare changes in 2007 NRI forest cover with previous LANDSAT image products dating back to 1975. 1.4 NRI Data Stakeholders The data stakeholders, or interested parties for the NRI data were identified through meetings with City of Columbia departments; Boone County, University of Missouri representatives, and through public meetings and requests from a variety of organizations with environmental and/or related interests. Two stakeholders groups were established based on data development requirements. City departments providing financing for the NRI and other agencies sharing data formed the Data Stakeholders group. Business organizations, environmental groups and other interested parties were identified as Community Stakeholders.

DRAFT NATURAL RESOURCES INVENTORY OCTOBER 1, 2010
___________________________________________________________________________ 4 Natural Resources Inventory Columbia, MO
Data Stakeholders: The role of the data stakeholders group was to: 1) Identify the deliverable map and data products for inclusion in the contract document for the UM/C Geographic Resource Center (GRC), 2) review the methodologies and products to insure that the NRI data products selected will provide the basis to answer departmental questions, community issues, and provide a basis for sound decision making; and 3) define the data requirements. The following organizations and City departments participated as data stakeholders:
• Columbia Water & Light • Columbia Planning & Development • Columbia Public Works • Boone County • Columbia Area Transportation Study Organization • University of Missouri
Community Stakeholders: An important goal of the NRI was to insure that the mapping and data products developed for the NRI would address community issues and interests. On June 28, 2007, an open house and presentation was held at the City’s Activities and Recreation Center (ARC) to solicit comments from the public. Appendix A: Comment Sheet Responses, contains the summary of all the issue areas identified by the participants at the June 28, 2007 Open House. The following citizen and business interest groups will have the opportunity to participate and comment on the inventory data
• Columbia Visioning Committees • City Commissions • Audubon Society • Columbia Board of Realtors • Columbia Chamber of Commerce • Friends of Rock Bridge State Park • Greenbelt Land Trust • Home Builders Association of Columbia • Interested citizens • Mid-Missouri Development Council • Missouri Department of Conservation • Native Plant Society • Show-Me Clean Streams • Smart Growth • Sierra Club • Wild Ones
Data collection from the aforementioned groups and other sources will be ongoing. As new data is acquired, the NRI GIS databases will capture the data.
DRAFT NATURAL RESOURCES INVENTORY OCTOBER 1, 2010
___________________________________________________________________________ 5 Natural Resources Inventory Columbia, MO
CHAPTER TWO: DATA COLLECTION AND ANALYSIS 2.1 Data Collection and Analysis The data collection and analysis methods used for the NRI are based on a standard protocol suitable for the scale and purpose of the project. The NRI methodology incorporates these basic standards:
• The delineation of vegetation land cover will be derived from high resolution multispectral aerial photography and field checking and/or uses other geo-reference data layers;
• The aerial photography is acquired digitally and incorporated into a geographic
information system (GIS) using State Plane coordinates; • The vegetation and land cover mapping will be done by the personnel at the
University of Missouri’s Geographic Resource Center and trained natural resource professionals familiar with the particular Central Missouri plant species to be inventoried;
• The inventory incorporates methods being used by other agencies within the region
or state such as the Missouri Resource Assessment Partnership (MoRAP) to facilitate sharing data; and
• The NRI inventory will provide data to implement the strategies identified in the
City’s Final Vision Report visioning project and reflect the direction and priorities residents identified as part of the NRI process.
2.2 Digital Imagery and Database Mapping Most analysis of remotely sensed data is performed on a computer with digital images. The images can be acquired by digitizing photographs from film cameras or directly with digital cameras and other specialized electronic instruments. A digital photograph is represented by hundreds of thousands or millions of dots called pixels (picture elements) and is stored electronically. Digital cameras record reflectance with arrays of tiny sensors and store images directly, without the use of photographic film. A pixel is a term derived from the phrase "picture element" and represents the smallest unit of information in an image. Different sensors have different pixels sizes. In geographic terms, a pixel represents an area of ground. The pixel size is governed by the characteristics of the camera sensor, or instantaneous field of view (IFOV).
The spatial resolution, or pixel size, of an image is the smallest object or feature detectable by a camera or sensor. On-line mapping services such as Google Earth use imagery that typical utilizes a pixel size of 2 feet x 2 feet. This means that anything on the
DRAFT NATURAL RESOURCES INVENTORY OCTOBER 1, 2010
___________________________________________________________________________ 6 Natural Resources Inventory Columbia, MO
landscape that is smaller than 2 feet in diameter, or 4 square feet, will be generalized and be indiscernible from other small features in the same area.
The spatial resolution used for the NRI (6 inch pixels) will represent the spectral response for a stand of vegetation consisting of a combination of spectra of all vegetation types, soil, ground litter, etc. within that 6”x 6” area. This level of spatial resolution is 16 times greater that the typical 2’x 2’ pixel size collected for the NAIP and 38,553 times greater than the 30 meter pixel size previous collected by the LANDSAT program. This high spatial resolution for the imagery used for the NRI analysis will produce more specific and accurate mapping products than were possible previously. The spectral signature, or the light intensity and colors (red, blue, green, infrared) within a pixel of an image represent the average of the reflectances of all materials within that pixel. Multispectral imagery techniques can be used to categorize image data based on its spectral values or signature. In land cover classification, the unique spectral signatures of various types of land features, such as open land, forests, agriculture, water bodies, and structures, are used to identify these areas. Categorization of resulting land cover themes can be refined to provide information on the types of trees or other vegetation growing in a forest using pattern recognition.
The LANDSAT Program is the longest running enterprise for acquisition of imagery of the earth from space and uses 30 meter x 30 meter pixels. The first LANDSAT satellite was launched in 1972; the most recent, LANDSAT 7, was launched on April 15, 1999. The instruments on the LANDSAT satellites have acquired millions of images. Over the years, theses images have been used for applications in agriculture, geology, forestry, regional planning, education and national security and all the previous land cover information for Columbia.
To develop the NRI, the City of Columbia contracted with the Surdex Corporation of St. Louis, Missouri for digital aerial photography for the 198 square mile area covered by the NRI. The NRI area was flown in June 2007 with the tree cover completed leafed out. The digital imagery was multispectral, which was essential for the University of Missouri Geographic Resource Center to perform the image analysis to produce land cover and vegetation maps. Older 30m LANDSAT images, USDA Farm Service Agency - National Agriculture Imagery Program (NAIP) photography was also available for additional analysis of historic trends. Multispectral refers to the digital camera's spectral resolution. The camera sensors collecting between 2 and 16 portions (bands) along the electromagnetic spectrum (EMS) are typically considered multispectral. LANDSAT and SPOT satellites are examples of multispectral sensors. Both Landsat and SPOT contain discrete observations over ranges of reflected light, or bands. Landsat collects one observation in each of the blue, green,
DRAFT NATURAL RESOURCES INVENTORY OCTOBER 1, 2010
___________________________________________________________________________ 7 Natural Resources Inventory Columbia, MO
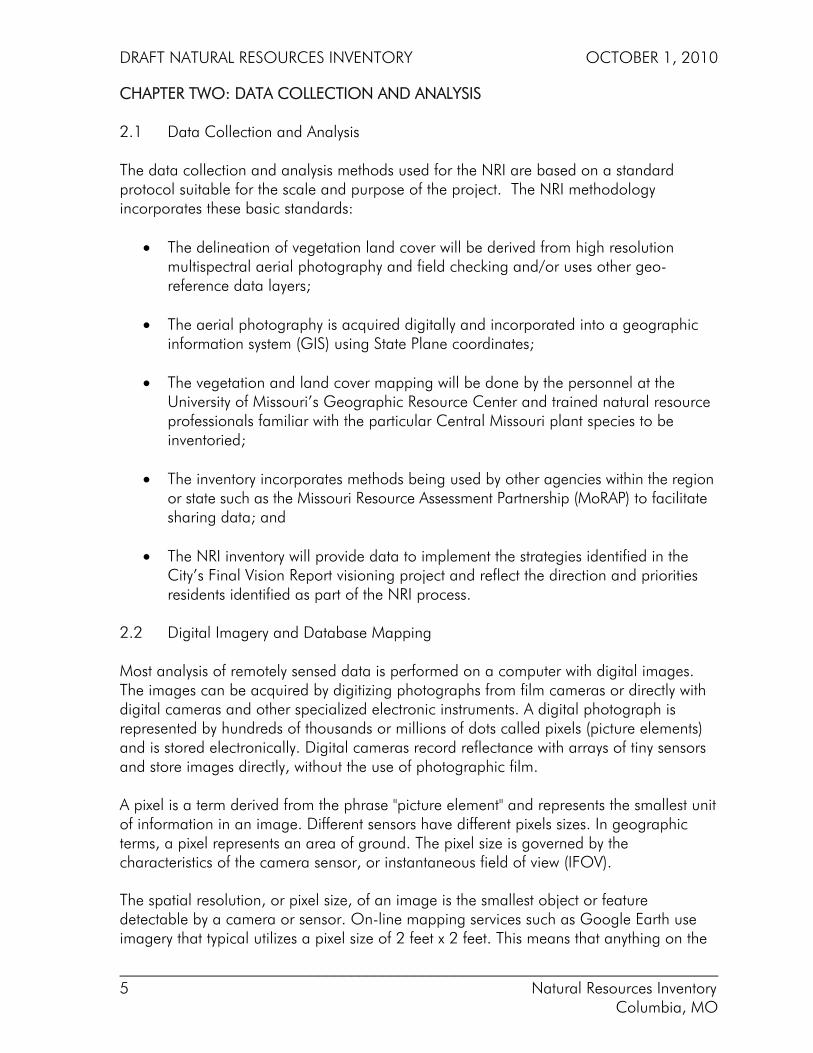
red, near infrared, two shortwave infrared, and thermal wavelengths. Four bands were collected for the NRI; blue, green, red, and infrared. The following figure provides an illustrated overview of how the various spectral values are acquired and then analyzed: Figure One: Multispectral Image Analysis
Source: Natural Resources Inventory The image type used for the NRI is 4-band (RGBN) natural color (Red, Green, Blue) and near infrared in 8 bits (values ranging 0-255) per band format. The digital aerial imagery produces a rectangular grid of pixels, or points of color with corresponding values Classification of land use and vegetation from imagery is based on pixel values and spatial positioning derived from ground observations (ground truthing). When the values for the specific elements of vegetation and land cover are identified, specialized imaging software locates and merges the selected pixels by value to produce a vector-based polygon for use in a Geographic Information System (GIS). Change detection analysis is another important and growing use of image data. Images captured on different dates can be analyzed to determine differences in spectral response. The changes in land cover can be mapped to show land disturbance and timbering activities by comparing images acquired at different point in time and identifying the areas where the spectral values have changed.
DRAFT NATURAL RESOURCES INVENTORY OCTOBER 1, 2010
___________________________________________________________________________ 8 Natural Resources Inventory Columbia, MO
2.3 Field Reconnaissance
In order to more accurately classify the land cover from the digital aerial photography, field reconnaissance was conducted on sample areas within the Metro Area. Referred to as “ground truthing”, information on the existing land cover is collected "on location". This data is used to relate image data to real features and materials on the ground. The collection of ground-truth data enables calibration of remote-sensing data, and aids in the interpretation and analysis of the digital imagery.
Ground truthing is the act of physically going to a field to determine the cause of variability detected in an image. The specific application of the information collected during the ground truthing process produces the data relationships between the pixel values on the digital imagery and actual ground cover. It is this relationship that permits the imaging software to classify the contents of the pixel on the image and produce a land cover or vegetation map,.
Ground truthing is done on site by collecting surface observations and measurements of various properties of the features of the ground resolution cells that are being studied on the remotely sensed digital image. It also involves matching the geographic coordinates of the site ground cover and comparing those with the coordinates of the image pixels being studied by the remote sensing software.
Ground truthing is important in the initial supervised classification of an image. The field data for selected sites is collected for land cover types for use are as “training” sites. The spectral characteristics of the selected sites is then used to “train” the remote sensing software to establish the parameters for classifying the remaining imagery. This allows for a supervised classification to help determine the accuracy of the initial classification performed by the remote sensing software; minimizing errors of misclassification and errors of unclassified data.
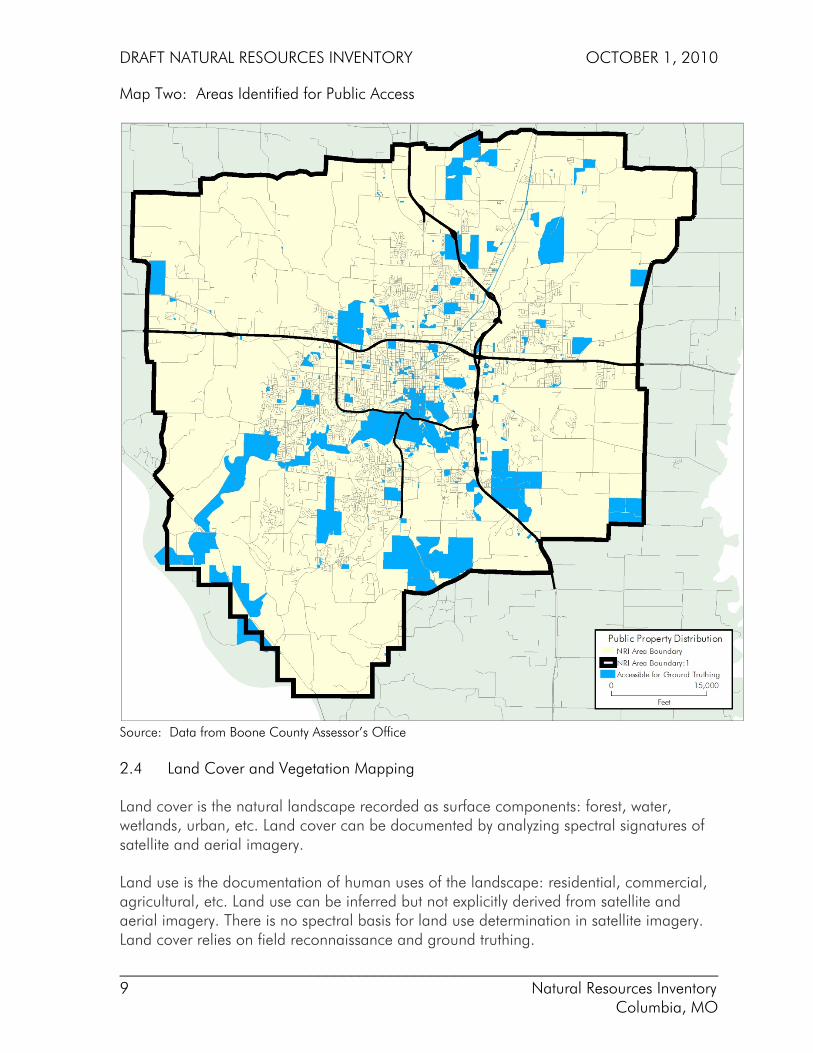
City staffing for the ground truthing process was provided by the City of Columbia Parks and Recreation Department, which assisted by extensively surveying the City park properties. Public properties which would allow for volunteer access, typically parks and city property, were identified and mapped. In some instances, individual volunteers surveyed their own property.
The City of Columbia Volunteer Coordinator solicited volunteers from the Tree Keeper program. The ability to identify tree species was an important factor for successful data collection. As part of the instruction for the Tree Keepers, plant and tree identification was completed. For others, field guides provided by the Missouri Department of Conservation were provided to assist with the task. In total, 21 volunteers participated in the survey.
DRAFT NATURAL RESOURCES INVENTORY OCTOBER 1, 2010
___________________________________________________________________________ 9 Natural Resources Inventory Columbia, MO
Map Two: Areas Identified for Public Access
Source: Data from Boone County Assessor’s Office
2.4 Land Cover and Vegetation Mapping
Land cover is the natural landscape recorded as surface components: forest, water, wetlands, urban, etc. Land cover can be documented by analyzing spectral signatures of satellite and aerial imagery.
Land use is the documentation of human uses of the landscape: residential, commercial, agricultural, etc. Land use can be inferred but not explicitly derived from satellite and aerial imagery. There is no spectral basis for land use determination in satellite imagery. Land cover relies on field reconnaissance and ground truthing.
DRAFT NATURAL RESOURCES INVENTORY OCTOBER 1, 2010
___________________________________________________________________________ 10 Natural Resources Inventory Columbia, MO
Potential uses of land cover data are many and varied, and include assessing ecosystem status and health, modeling nutrient and pesticide runoff, understanding spatial patterns of biodiversity, land use planning, deriving landscape pattern metrics, and developing land management/land preservation policies. The following are examples of analysis and mapping projects that would utilize NRI land cover data:
• Land cover by type • Wetlands, lakes, ponds, and waterways • Public land • Forest cover, by type, age and condition • Steep slopes (e.g., greater than 15 percent) • Important plant and animal habitats • Tree canopy and roof tops • Plant species and associations found in Columbia • Impervious surface • Threatened natural resources
By applying USGS land cover standards, the NRI imagery can be classified to provide the opportunity to analyze change with previous LANDSAT image products dating back to 1975. 2.5 Additional Data Resources The Boone County Assessor’s Office was the source for the property information and GIS tax maps, “leaf off” high resolution color imagery for the NRI area, and the digital elevation model which was critical to complete the orthorectification of the NRI digital photography. The City of Columbia Department of Public Works made available a number of GIS databases, including the topography. The Missouri Department of Natural Resources, the Missouri Stream Team, and United States Geological Survey (USGS) contributed GIS databases that support the NRI analysis. The report Atlas of Missouri Ecoregions published by the Missouri Department of Conservation in 2002 and authored by Timothy A. Nigh and Walter A. Schroeder served as an important resource for the organization of the NRI project and for providing the regional context for the NRI area.
DRAFT NATURAL RESOURCES INVENTORY OCTOBER 1, 2010
___________________________________________________________________________ 11 Natural Resources Inventory Columbia, MO
CHAPTER THREE: NATURAL RESOURCES OVERVIEW
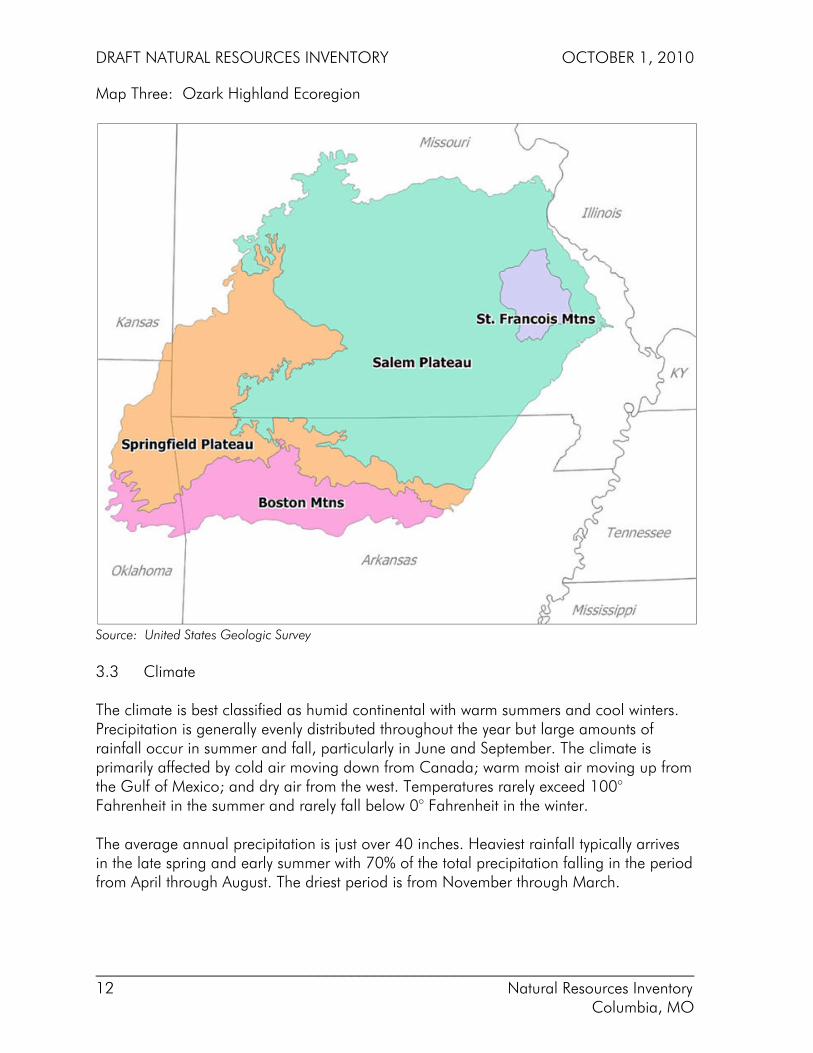
3.1 Location and General Information The NRI study area covers approximately 198 square miles in and around Columbia. in the central portion of the state. The NRI boundary includes the 180 square mile Metropolitan Planning Area defined by the Columbia Area Transportation Study Organization (CATSO), the federally designated Metropolitan Planning Organization (MPO) along with an eighteen (18) square mile area to the southwest of the MPO boundary where the City had recently annexed property. All or portions, in some cases very small portions, of 46 waterways are within the NRI area. 3.2 Regional Context The NRI area is located in an transition area between the Glaciated Plains ecoregion to the north and the Ozark Highlands ecoregion to the south, within the outer Ozark border subsection. The Ozarks consist of four primary physiographic sections—the Springfield Plateau, the Salem Plateau, the Saint Francois Mountains, and the Boston Mountains. Topography is mostly gently rolling, except in the Boston Mountains, along the escarpments separating the Springfield and Salem Plateaus, and the Saint Francois Range where it is rugged. Karst features such as springs, losing streams, sinkholes, and caves are common in the limestones of the Springfield Plateau and abundant in the dolostone bedrock of the Salem Plateau and Boston Mountains. Missouri is known as "The Cave State" with over 6000 recorded caves; the majority of these caves are found in the Ozark counties, including The Devil’s Icebox cave in Boone County. The Ozark Plateaus aquifer system affects groundwater movement in all areas except the igneous core of the St. Francois Mountains. Geographic features unique to the Ozarks, particularly in Missouri, include limestone and dolomite glades—grasses and forbs in shallow soil on exposed bedrock in sloping, otherwise heavily forested areas. The Outer Ozark Border Subsection consists of a belt of deeply dissected hills and bluff lands bordering the Missouri and Mississippi Rivers and several relatively smooth karst plains. Relief in the river hills is mostly 200–350 feet. Slopes are steep and bedrock exposures are common. Loess soils, occasionally very thick, mantles the uplands of the entire subsection. Geologic strata are variable but consist mainly of Mississippian limestone high in the landscape and a variety of Ordovician dolomite formations in the valleys. The ecoregion subsection was historically timbered in oak savanna and woodland, oak and mixed-hardwood forests, and occasional prairie and glade openings. Today, land use is extremely varied, including row crops, improved pasture, and densely wooded valleys.
DRAFT NATURAL RESOURCES INVENTORY OCTOBER 1, 2010
___________________________________________________________________________ 12 Natural Resources Inventory Columbia, MO
Map Three: Ozark Highland Ecoregion
Source: United States Geologic Survey 3.3 Climate The climate is best classified as humid continental with warm summers and cool winters. Precipitation is generally evenly distributed throughout the year but large amounts of rainfall occur in summer and fall, particularly in June and September. The climate is primarily affected by cold air moving down from Canada; warm moist air moving up from the Gulf of Mexico; and dry air from the west. Temperatures rarely exceed 100° Fahrenheit in the summer and rarely fall below 0° Fahrenheit in the winter. The average annual precipitation is just over 40 inches. Heaviest rainfall typically arrives in the late spring and early summer with 70% of the total precipitation falling in the period from April through August. The driest period is from November through March.
DRAFT NATURAL RESOURCES INVENTORY OCTOBER 1, 2010
___________________________________________________________________________ 13 Natural Resources Inventory Columbia, MO
3.4 Geology – Overview and Context
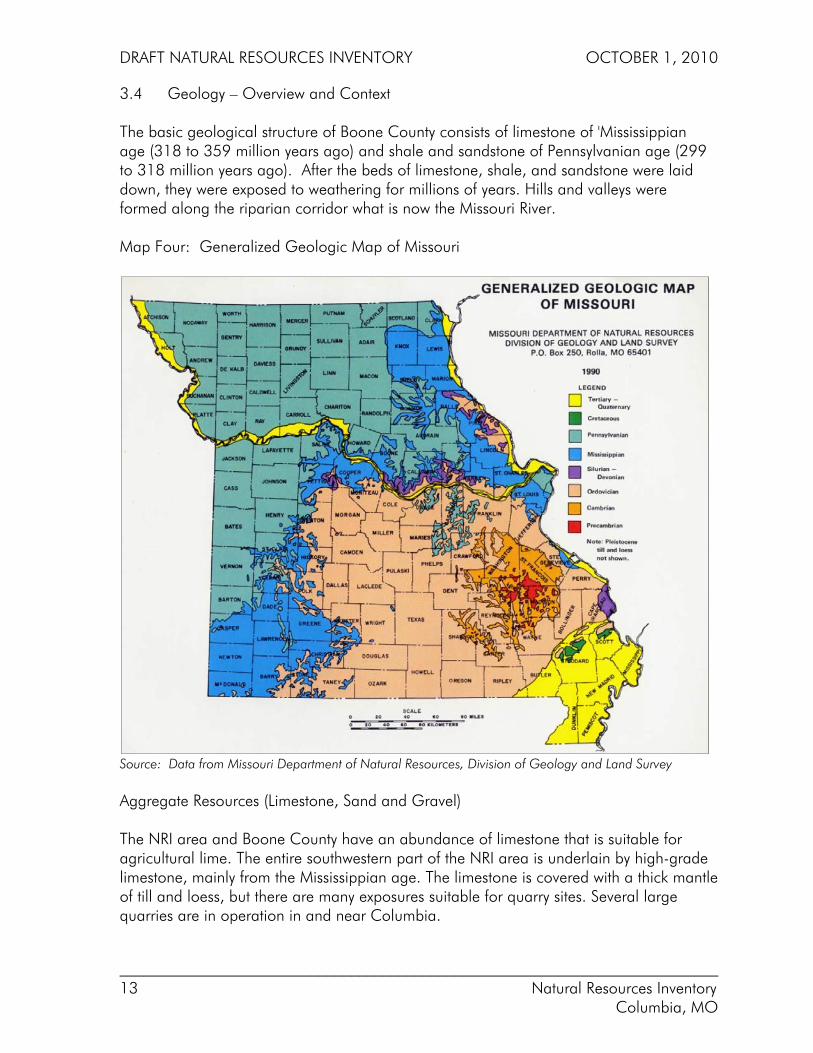
The basic geological structure of Boone County consists of limestone of 'Mississippian age (318 to 359 million years ago) and shale and sandstone of Pennsylvanian age (299 to 318 million years ago). After the beds of limestone, shale, and sandstone were laid down, they were exposed to weathering for millions of years. Hills and valleys were formed along the riparian corridor what is now the Missouri River. Map Four: Generalized Geologic Map of Missouri
Source: Data from Missouri Department of Natural Resources, Division of Geology and Land Survey Aggregate Resources (Limestone, Sand and Gravel) The NRI area and Boone County have an abundance of limestone that is suitable for agricultural lime. The entire southwestern part of the NRI area is underlain by high-grade limestone, mainly from the Mississippian age. The limestone is covered with a thick mantle of till and loess, but there are many exposures suitable for quarry sites. Several large quarries are in operation in and near Columbia.
DRAFT NATURAL RESOURCES INVENTORY OCTOBER 1, 2010
___________________________________________________________________________ 14 Natural Resources Inventory Columbia, MO
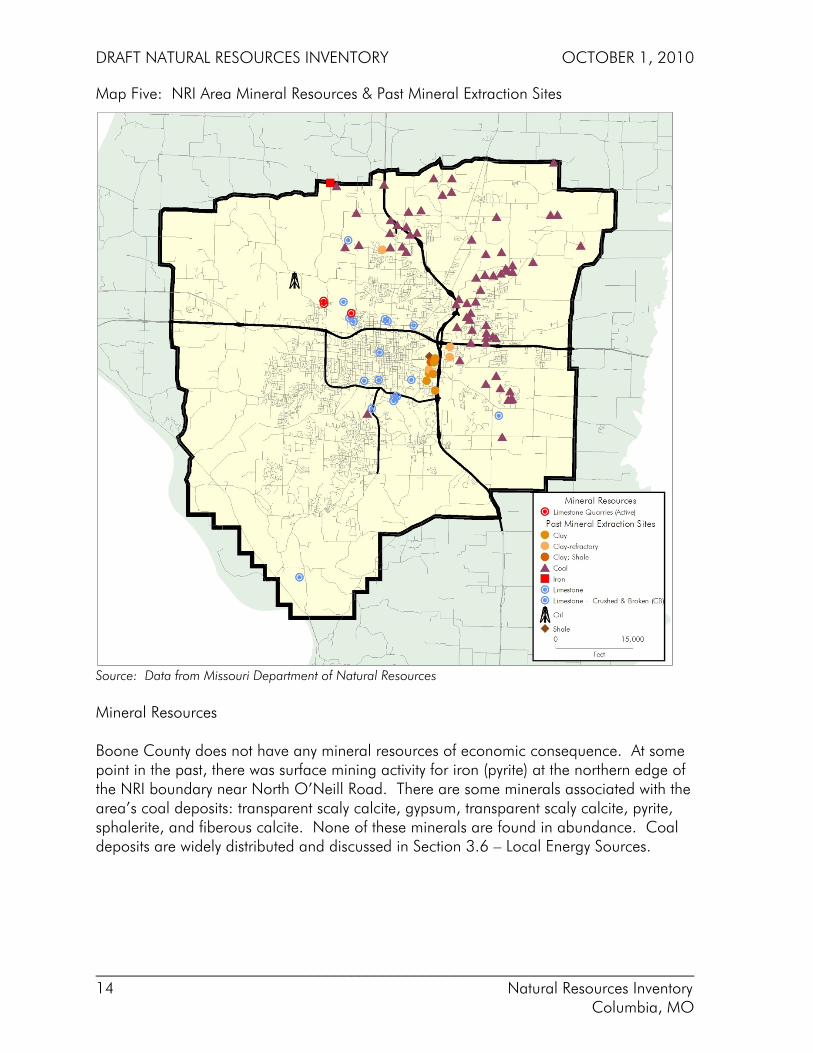
Map Five: NRI Area Mineral Resources & Past Mineral Extraction Sites
Source: Data from Missouri Department of Natural Resources Mineral Resources Boone County does not have any mineral resources of economic consequence. At some point in the past, there was surface mining activity for iron (pyrite) at the northern edge of the NRI boundary near North O’Neill Road. There are some minerals associated with the area’s coal deposits: transparent scaly calcite, gypsum, transparent scaly calcite, pyrite, sphalerite, and fiberous calcite. None of these minerals are found in abundance. Coal deposits are widely distributed and discussed in Section 3.6 – Local Energy Sources.
DRAFT NATURAL RESOURCES INVENTORY OCTOBER 1, 2010
___________________________________________________________________________ 15 Natural Resources Inventory Columbia, MO
3.5 Soils and Soil Types (excerpted from the Soil Survey of Boone County, Missouri) Soil is formed by weathering and other processes that act on parent material. The characteristics of the soil at any given point depend upon (1) the climate, (2) the plant and animal life, (3) the physical and mineralogical composition of the parent materials, (4) the relief, or lay of the land, and (5) the passage of time. The effect of climate on soil and plants is modified by the characteristics of the soil and by relief. Relief, in turn, strongly influences drainage, aeration, runoff, erosion, and exposure to sun and wind. Soils are classified by series, types, and phases. A soil series is given a place name; for example, the Mexico soil series are so named because they were first mapped near Mexico, Mo. The soils of a series resemble each other in any ways but may differ somewhat in texture of the surface, soil. A soil type is named by adding texture of surface soil to the series name; for example, Mexico silt loam. Most of the soil-mapping units are phases of soil types. These soil phases are named by adding information about slope, degree of erosion, or other details to the name of the soil type. Within the NRI area, there are 51different soil series, types, and phases identified. Soils in the NRI area are generally fine-grained with moderately pervious surface soils and less pervious subsoils. They are classified according to the unified classification system primarily as silt loams and silty clay loams. Soils are generally classified as hydrological Groups C and D with small areas of Group B according to the Soil Conservation.
• Group A: Low runoff potential when thoroughly wet. Water is transmitted freely through the soil.
• Group B: Soils in this group have moderately low when thoroughly wet. Water transmission through the soil is unimpeded.
• Group C: Soils in this group have moderately high runoff potential when thoroughly wet. Water transmission through the soil is somewhat restricted.
• Group D—Soils in this group have high runoff potential when thoroughly wet. Water movement through the soil is restricted or very restricted.
During the melting of the last ice sheet of the Wisconsin glacial age (35,500 to 11,500), large amounts of water flowed down the Missouri River which deposited finely ground rock material on the flood plains. During the colder spells in winter, when the melting of the ice sheet was checked, the flood plains became dry mudflats. Windstorms picked up the rock dust from the flood plains and deposited the larger particles close by, and the finer particles farther away on the uplands. These silty deposits are called loess, which is the material from which most of the upland soils in Boone County developed.
DRAFT NATURAL RESOURCES INVENTORY OCTOBER 1, 2010
___________________________________________________________________________ 16 Natural Resources Inventory Columbia, MO
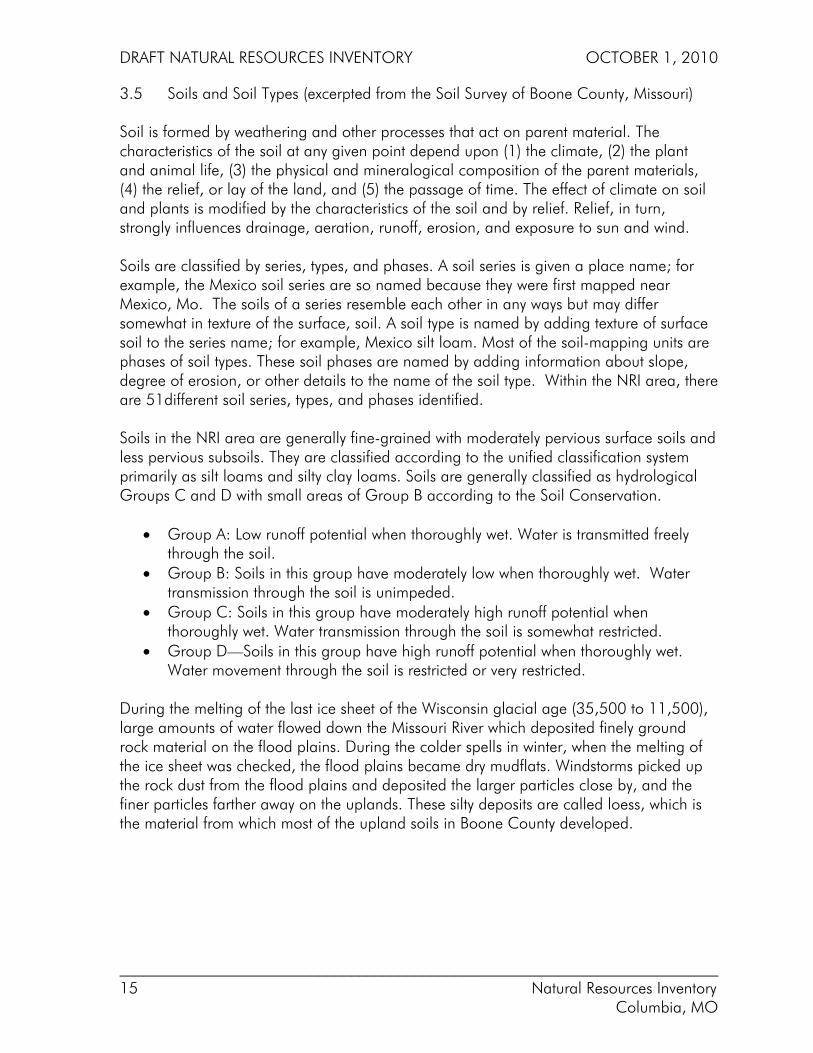
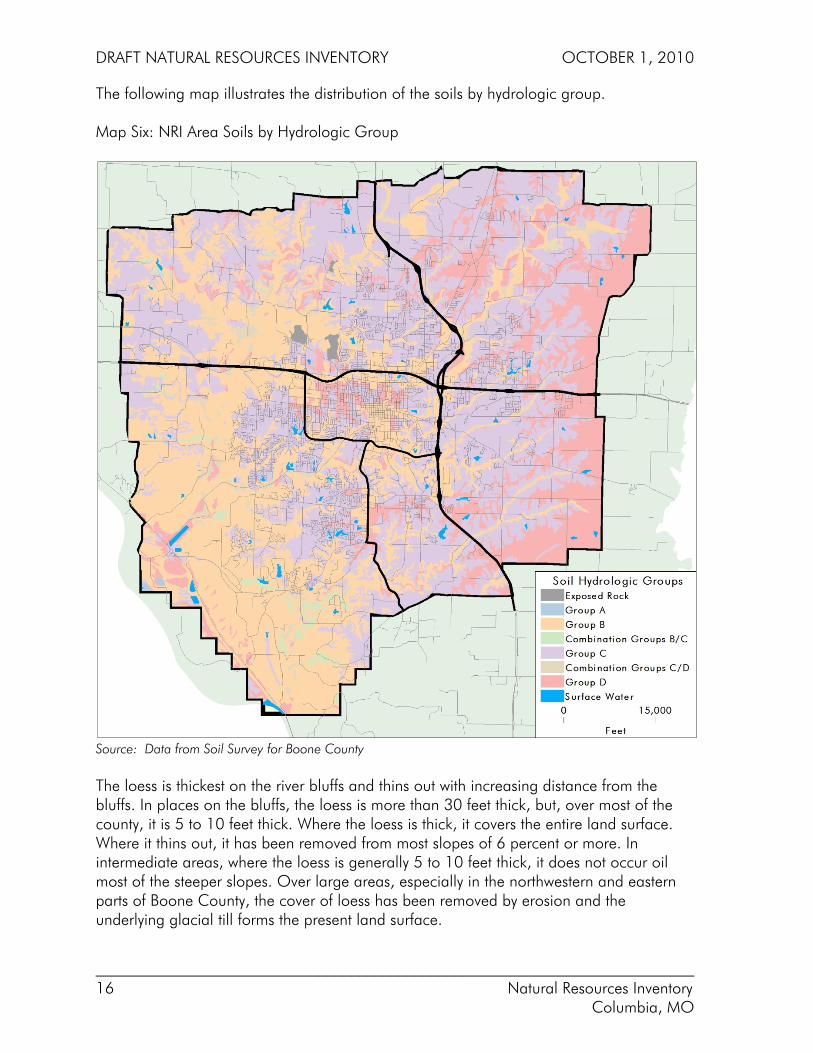
The following map illustrates the distribution of the soils by hydrologic group. Map Six: NRI Area Soils by Hydrologic Group
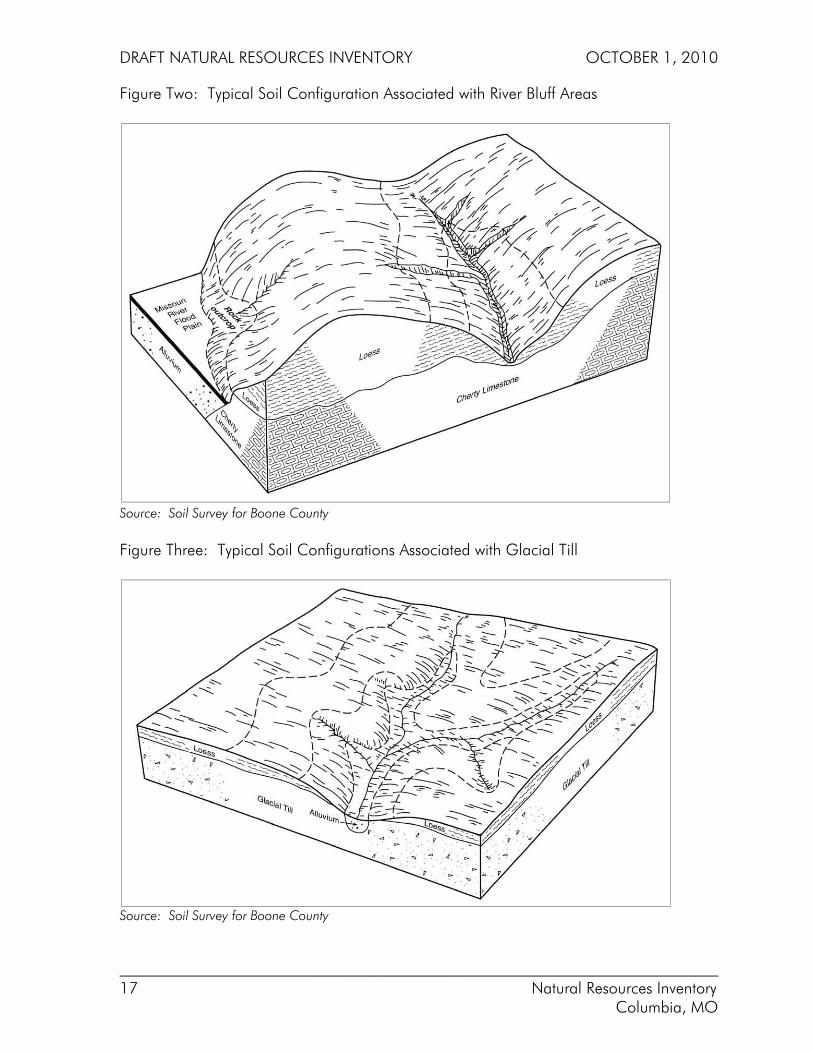
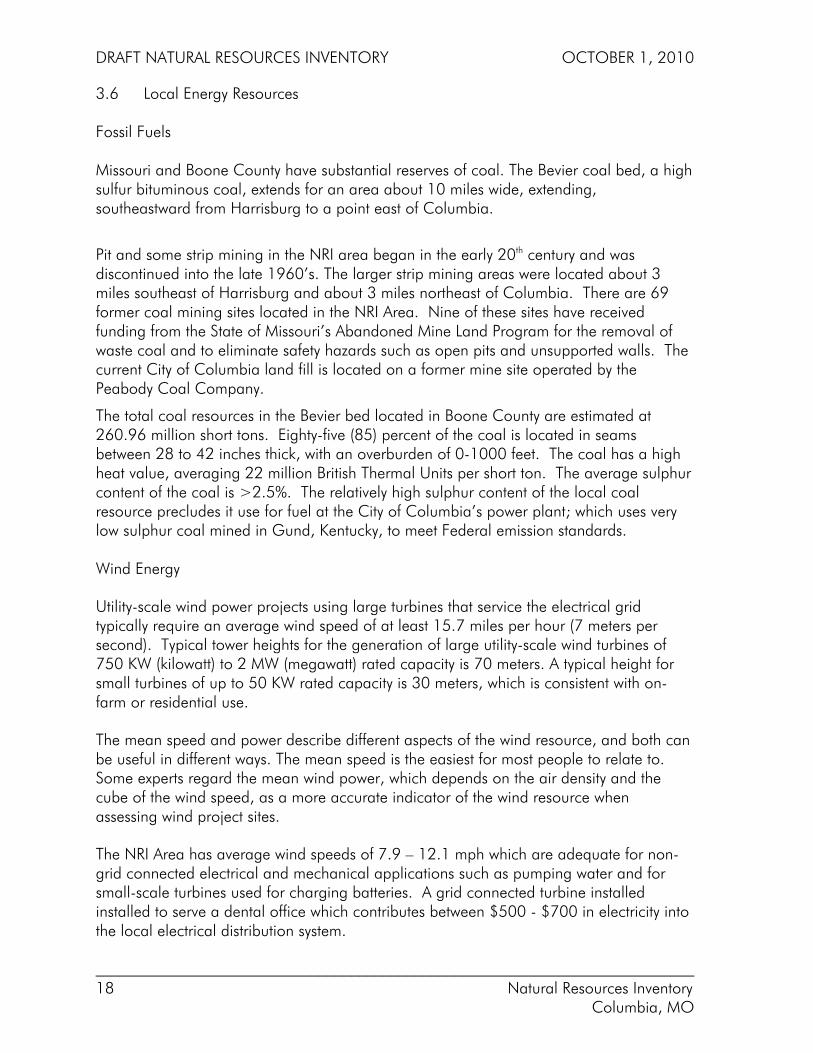
Source: Data from Soil Survey for Boone County The loess is thickest on the river bluffs and thins out with increasing distance from the bluffs. In places on the bluffs, the loess is more than 30 feet thick, but, over most of the county, it is 5 to 10 feet thick. Where the loess is thick, it covers the entire land surface. Where it thins out, it has been removed from most slopes of 6 percent or more. In intermediate areas, where the loess is generally 5 to 10 feet thick, it does not occur oil most of the steeper slopes. Over large areas, especially in the northwestern and eastern parts of Boone County, the cover of loess has been removed by erosion and the underlying glacial till forms the present land surface.
DRAFT NATURAL RESOURCES INVENTORY OCTOBER 1, 2010
___________________________________________________________________________ 17 Natural Resources Inventory Columbia, MO
Figure Two: Typical Soil Configuration Associated with River Bluff Areas
Source: Soil Survey for Boone County Figure Three: Typical Soil Configurations Associated with Glacial Till
Source: Soil Survey for Boone County
DRAFT NATURAL RESOURCES INVENTORY OCTOBER 1, 2010
___________________________________________________________________________ 18 Natural Resources Inventory Columbia, MO
3.6 Local Energy Resources
Fossil Fuels Missouri and Boone County have substantial reserves of coal. The Bevier coal bed, a high sulfur bituminous coal, extends for an area about 10 miles wide, extending, southeastward from Harrisburg to a point east of Columbia.
Pit and some strip mining in the NRI area began in the early 20th century and was discontinued into the late 1960’s. The larger strip mining areas were located about 3 miles southeast of Harrisburg and about 3 miles northeast of Columbia. There are 69 former coal mining sites located in the NRI Area. Nine of these sites have received funding from the State of Missouri’s Abandoned Mine Land Program for the removal of waste coal and to eliminate safety hazards such as open pits and unsupported walls. The current City of Columbia land fill is located on a former mine site operated by the Peabody Coal Company.
The total coal resources in the Bevier bed located in Boone County are estimated at 260.96 million short tons. Eighty-five (85) percent of the coal is located in seams between 28 to 42 inches thick, with an overburden of 0-1000 feet. The coal has a high heat value, averaging 22 million British Thermal Units per short ton. The average sulphur content of the coal is >2.5%. The relatively high sulphur content of the local coal resource precludes it use for fuel at the City of Columbia’s power plant; which uses very low sulphur coal mined in Gund, Kentucky, to meet Federal emission standards. Wind Energy
Utility-scale wind power projects using large turbines that service the electrical grid typically require an average wind speed of at least 15.7 miles per hour (7 meters per second). Typical tower heights for the generation of large utility-scale wind turbines of 750 KW (kilowatt) to 2 MW (megawatt) rated capacity is 70 meters. A typical height for small turbines of up to 50 KW rated capacity is 30 meters, which is consistent with on-farm or residential use.
The mean speed and power describe different aspects of the wind resource, and both can be useful in different ways. The mean speed is the easiest for most people to relate to. Some experts regard the mean wind power, which depends on the air density and the cube of the wind speed, as a more accurate indicator of the wind resource when assessing wind project sites.
The NRI Area has average wind speeds of 7.9 – 12.1 mph which are adequate for non-grid connected electrical and mechanical applications such as pumping water and for small-scale turbines used for charging batteries. A grid connected turbine installed installed to serve a dental office which contributes between $500 - $700 in electricity into the local electrical distribution system.
DRAFT NATURAL RESOURCES INVENTORY OCTOBER 1, 2010
___________________________________________________________________________ 19 Natural Resources Inventory Columbia, MO
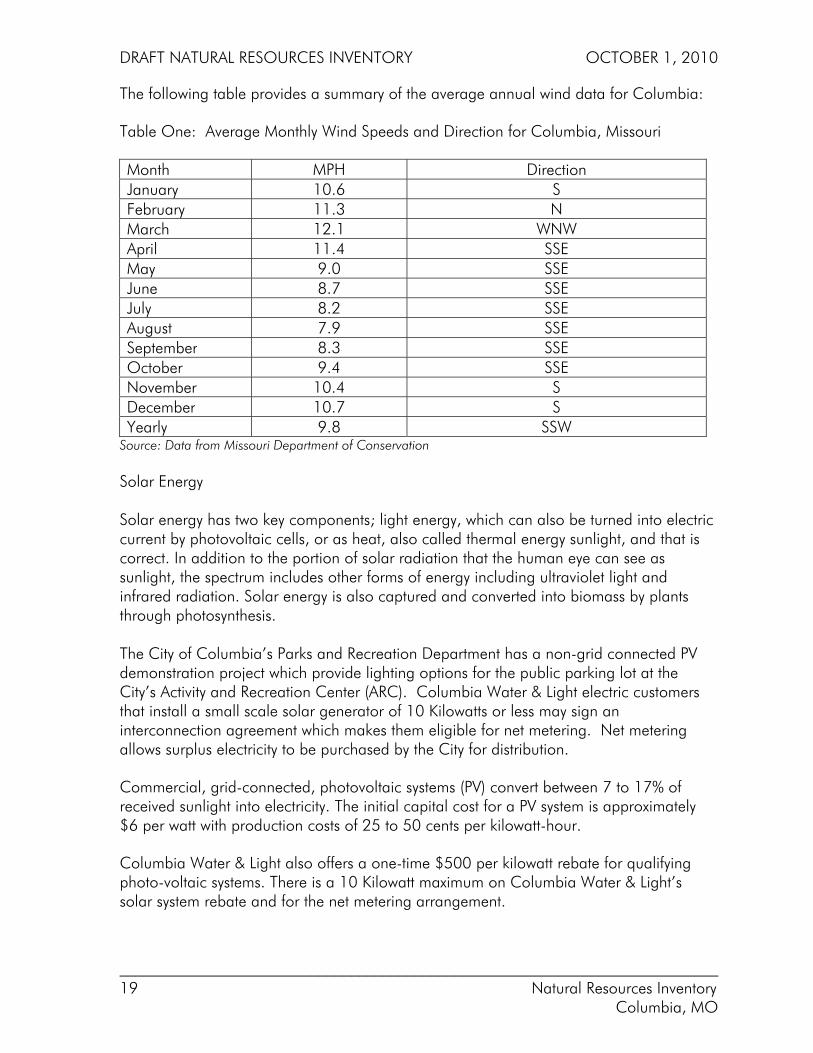
The following table provides a summary of the average annual wind data for Columbia:
Table One: Average Monthly Wind Speeds and Direction for Columbia, Missouri
Month MPH Direction January 10.6 S February 11.3 N March 12.1 WNW April 11.4 SSE May 9.0 SSE June 8.7 SSE July 8.2 SSE August 7.9 SSE September 8.3 SSE October 9.4 SSE November 10.4 S December 10.7 S Yearly 9.8 SSW
Source: Data from Missouri Department of Conservation
Solar Energy Solar energy has two key components; light energy, which can also be turned into electric current by photovoltaic cells, or as heat, also called thermal energy sunlight, and that is correct. In addition to the portion of solar radiation that the human eye can see as sunlight, the spectrum includes other forms of energy including ultraviolet light and infrared radiation. Solar energy is also captured and converted into biomass by plants through photosynthesis. The City of Columbia’s Parks and Recreation Department has a non-grid connected PV demonstration project which provide lighting options for the public parking lot at the City’s Activity and Recreation Center (ARC). Columbia Water & Light electric customers that install a small scale solar generator of 10 Kilowatts or less may sign an interconnection agreement which makes them eligible for net metering. Net metering allows surplus electricity to be purchased by the City for distribution.
Commercial, grid-connected, photovoltaic systems (PV) convert between 7 to 17% of received sunlight into electricity. The initial capital cost for a PV system is approximately $6 per watt with production costs of 25 to 50 cents per kilowatt-hour.
Columbia Water & Light also offers a one-time $500 per kilowatt rebate for qualifying photo-voltaic systems. There is a 10 Kilowatt maximum on Columbia Water & Light’s solar system rebate and for the net metering arrangement.
DRAFT NATURAL RESOURCES INVENTORY OCTOBER 1, 2010
___________________________________________________________________________ 20 Natural Resources Inventory Columbia, MO
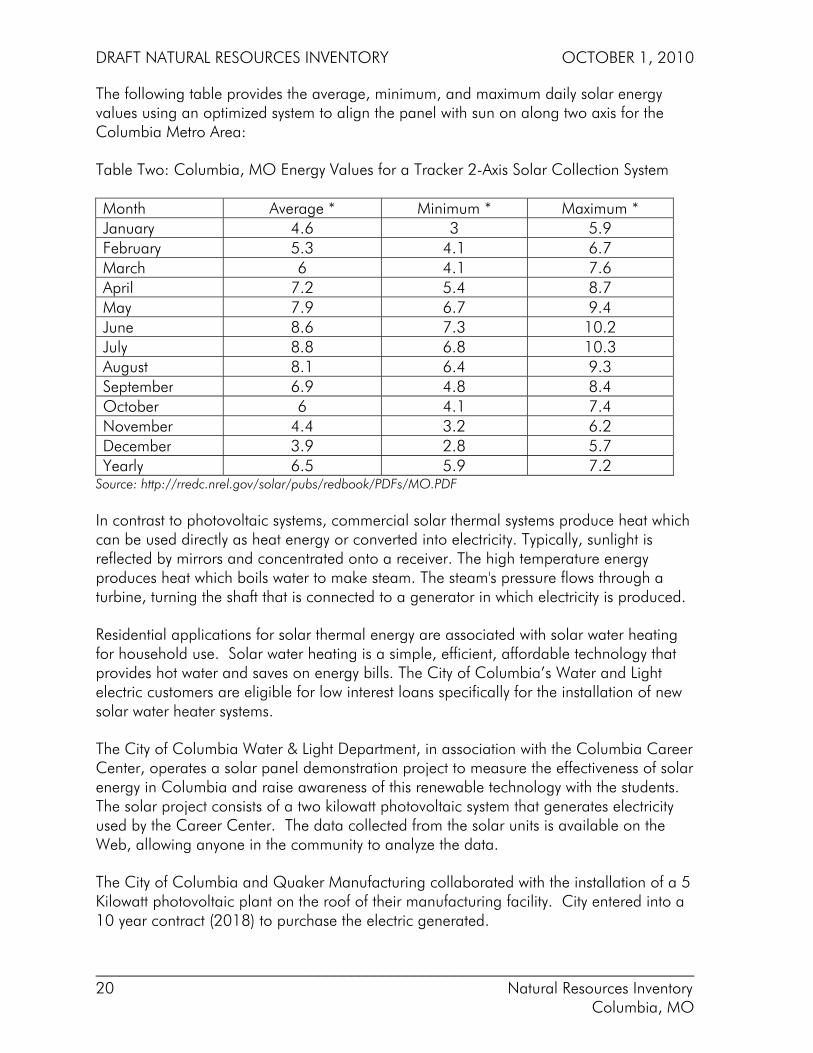
The following table provides the average, minimum, and maximum daily solar energy values using an optimized system to align the panel with sun on along two axis for the Columbia Metro Area:
Table Two: Columbia, MO Energy Values for a Tracker 2-Axis Solar Collection System
Month Average * Minimum * Maximum * January 4.6 3 5.9 February 5.3 4.1 6.7 March 6 4.1 7.6 April 7.2 5.4 8.7 May 7.9 6.7 9.4 June 8.6 7.3 10.2 July 8.8 6.8 10.3 August 8.1 6.4 9.3 September 6.9 4.8 8.4 October 6 4.1 7.4 November 4.4 3.2 6.2 December 3.9 2.8 5.7 Yearly 6.5 5.9 7.2
Source: http://rredc.nrel.gov/solar/pubs/redbook/PDFs/MO.PDF
In contrast to photovoltaic systems, commercial solar thermal systems produce heat which can be used directly as heat energy or converted into electricity. Typically, sunlight is reflected by mirrors and concentrated onto a receiver. The high temperature energy produces heat which boils water to make steam. The steam's pressure flows through a turbine, turning the shaft that is connected to a generator in which electricity is produced.
Residential applications for solar thermal energy are associated with solar water heating for household use. Solar water heating is a simple, efficient, affordable technology that provides hot water and saves on energy bills. The City of Columbia’s Water and Light electric customers are eligible for low interest loans specifically for the installation of new solar water heater systems.
The City of Columbia Water & Light Department, in association with the Columbia Career Center, operates a solar panel demonstration project to measure the effectiveness of solar energy in Columbia and raise awareness of this renewable technology with the students. The solar project consists of a two kilowatt photovoltaic system that generates electricity used by the Career Center. The data collected from the solar units is available on the Web, allowing anyone in the community to analyze the data.
The City of Columbia and Quaker Manufacturing collaborated with the installation of a 5 Kilowatt photovoltaic plant on the roof of their manufacturing facility. City entered into a 10 year contract (2018) to purchase the electric generated.

DRAFT NATURAL RESOURCES INVENTORY OCTOBER 1, 2010
___________________________________________________________________________ 21 Natural Resources Inventory Columbia, MO
The project, called Solar One, has a proposed goal of installing enough solar panels to produce 1% of Columbia's electricity by the year 2023. The project consists of private entities, such as Quaker Oats, installing solar panels on their roofs and selling that power to Water and Light at an agreed price for a period of ten years. Water and Light will, in turn, sell the solar energy to interested customers who want to help encourage the development of local solar power and are willing to pay a premium for it. Cost estimates are that it will cost no more than $.45 per KWH to purchase the solar power and that the utility can resell it to voluntary subscribing customers in 100 KWH blocks per year. One block of 100 KWH represents approximately 1% of the average consumer’s yearly use. The additional fee of $40 would be collected over the course of year by adding $3.50 to each monthly bill. Biomass Energy Biomass resources are available from a variety of sources: crop residues, methane emissions from manure management, methane emissions from landfills and wastewater treatment facilities, forest residues, primary and secondary mill residues, urban wood waste, and dedicated energy crops.
The principal biomass resource for the Columbia Metro Area comes in the form of tree trimmings and grass clippings from the urban environment and all types of organic post-consumer residues, and the City of Columbia’s landfill and wastewater treatment facilities. Urban wood residues from construction and demolition debris and unusable pallets are additional sources of potential energy.
Composting enterprises around the country are increasing and utilizing biomass materials such as tree trimmings, grass clippings, and agriculturally derived post-consumer residues such as food wastes from restaurants or schools. Landfill gas derived from City of Columbia’s municipal landfill is also a biomass resource that would be included under the category of municipal urban residues.
Landfill gas is extracted from landfills using a series of wells and a blower/flare (or vacuum) system. This system directs the collected gas to a central point where it can be processed and treated depending upon the ultimate use for the gas. Landfill gas (LFG) is created as solid waste decomposes in a landfill. This gas consists of about 50 percent methane (CH4), the primary component of natural gas, about 50 percent carbon dioxide (CO2), and a small amount of non-methane organic compounds. The City of Columbia dedicated the area’s first landfill gas-to-energy project in December 2007. This project will use the gas created when the waste decomposes to generate 2.1 megawatts of renewable energy. This would supply approximately 1.5 percent of Columbia’s energy use per year, which is the amount of energy needed to power approximately 1,500 homes in Columbia. The cost of the energy is estimated to be approximately $0.05 per to $0.055 per Kilowatt Hour.
DRAFT NATURAL RESOURCES INVENTORY OCTOBER 1, 2010
___________________________________________________________________________ 22 Natural Resources Inventory Columbia, MO
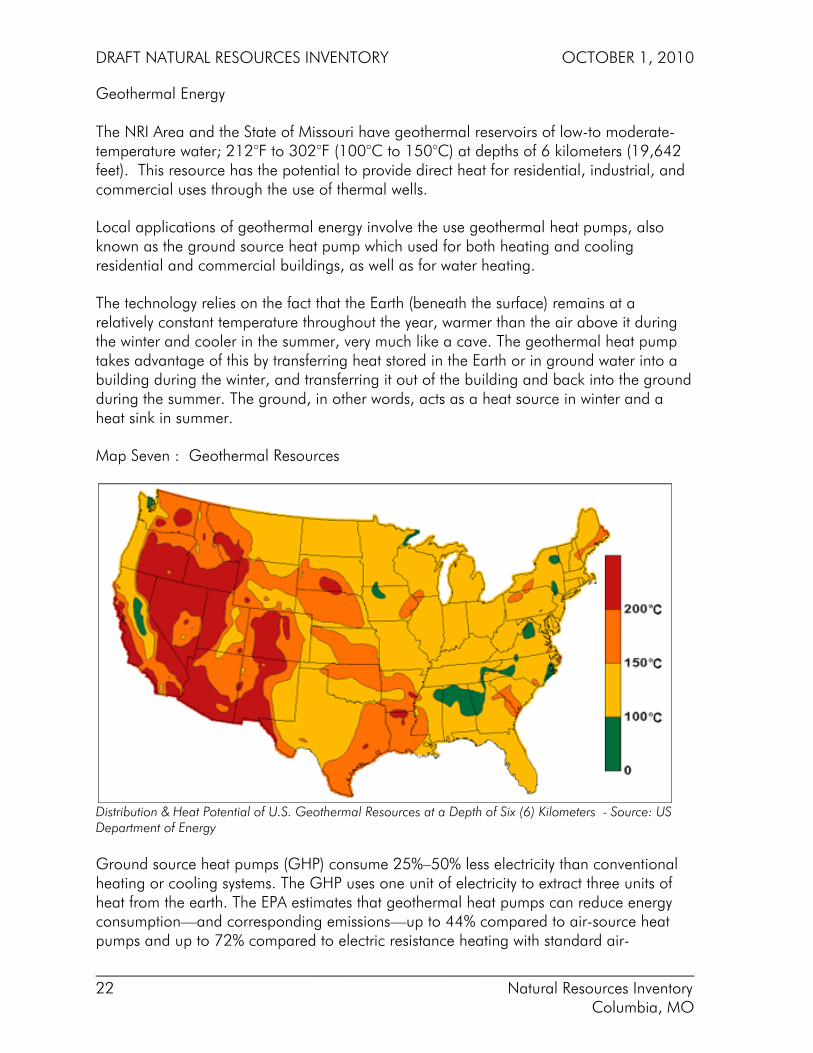
Geothermal Energy The NRI Area and the State of Missouri have geothermal reservoirs of low-to moderate-temperature water; 212°F to 302°F (100°C to 150°C) at depths of 6 kilometers (19,642 feet). This resource has the potential to provide direct heat for residential, industrial, and commercial uses through the use of thermal wells.
Local applications of geothermal energy involve the use geothermal heat pumps, also known as the ground source heat pump which used for both heating and cooling residential and commercial buildings, as well as for water heating.
The technology relies on the fact that the Earth (beneath the surface) remains at a relatively constant temperature throughout the year, warmer than the air above it during the winter and cooler in the summer, very much like a cave. The geothermal heat pump takes advantage of this by transferring heat stored in the Earth or in ground water into a building during the winter, and transferring it out of the building and back into the ground during the summer. The ground, in other words, acts as a heat source in winter and a heat sink in summer.
Map Seven : Geothermal Resources
Distribution & Heat Potential of U.S. Geothermal Resources at a Depth of Six (6) Kilometers - Source: US Department of Energy
Ground source heat pumps (GHP) consume 25%–50% less electricity than conventional heating or cooling systems. The GHP uses one unit of electricity to extract three units of heat from the earth. The EPA estimates that geothermal heat pumps can reduce energy consumption—and corresponding emissions—up to 44% compared to air-source heat pumps and up to 72% compared to electric resistance heating with standard air-

DRAFT NATURAL RESOURCES INVENTORY OCTOBER 1, 2010
___________________________________________________________________________ 23 Natural Resources Inventory Columbia, MO
conditioning equipment. Columbia Water and Light offers rebates for the installation of ground source heat pump equipment.
DRAFT NATURAL RESOURCES INVENTORY OCTOBER 1, 2010
___________________________________________________________________________ 24 Natural Resources Inventory Columbia, MO
- Blank -
DRAFT NATURAL RESOURCES INVENTORY OCTOBER 1, 2010
___________________________________________________________________________ 25 Natural Resources Inventory Columbia, MO
CHAPTER FOUR: LANDSCAPE 4.1 Introduction The term “landscape” refers to the visible features of an area of land, including physical elements such as landforms, flora and fauna, and human elements like human activity and the built environment. For the NRI, landscape elements such as hill slopes, sinkholes, karst topography, rock, drainage patterns, loess hills, and other components of the overall landscape differentiated by vegetative, geologic, hydrologic, and structural distinctions are documented and quantified. 4.2 Landform and Terrain Topographic relief, or topography, is of primary importance because of its influence on soil formation, stormwater runoff, and other related factors including soil erosion. Topographic maps with elevation contours have made "topography" synonymous with relief. In addition, topography has a direct influence on the distribution of vegetation and local infrastructure and development patterns. The majority of the NRI area is rolling hill with steep slopes along Hinkson and Perche Creeks. The City of Columbia has an elevation of approximately 750 feet above sea level. The drainage basins and watersheds in the NRI area generally drain from a northeast to a southwest direction. The highest point within the NRI area of approximately 940 feet is located in the far northeastern edge. The lowest point is in the NRI is approximately 500 feet above mean sea level and is located in the flood plain of Perche Creek near its confluence with the Missouri River. Approximately 440 feet of relief occurs from the high point to the low point. The surface water in the NRI area drains into the Missouri River through a number of tributaries, including Bonne Femme, Hinkson, and Perche Creeks. 4.3 Slope
Slope, in combination with geologic factors, influences the suitability of land for constructing such facilities as buildings, roads, and utility lines. Foundation stability, construction costs, accessibility, and immediate and long term environmental impacts are also related to slope. Slope influences surface drainage, favoring either percolation into the soil or runoff depending upon the slope percentage and the vegetation and tree cover on the surface. On sloping ground there is a tendency for water to run down the hill rather than percolate into the soil which has impacts on stormwater runoff.
Map Eight: Slopes by Category illustrates that the steepest slopes in the NRI area are associated with the Missouri River, Perche Creek and its secondary tributaries, Hinkson Creek, Grindstone Creek, and Little Bonne Femme Creek. Steep slopes for the purposes

DRAFT NATURAL RESOURCES INVENTORY OCTOBER 1, 2010
___________________________________________________________________________ 26 Natural Resources Inventory Columbia, MO
Map Eight: Slopes by Category
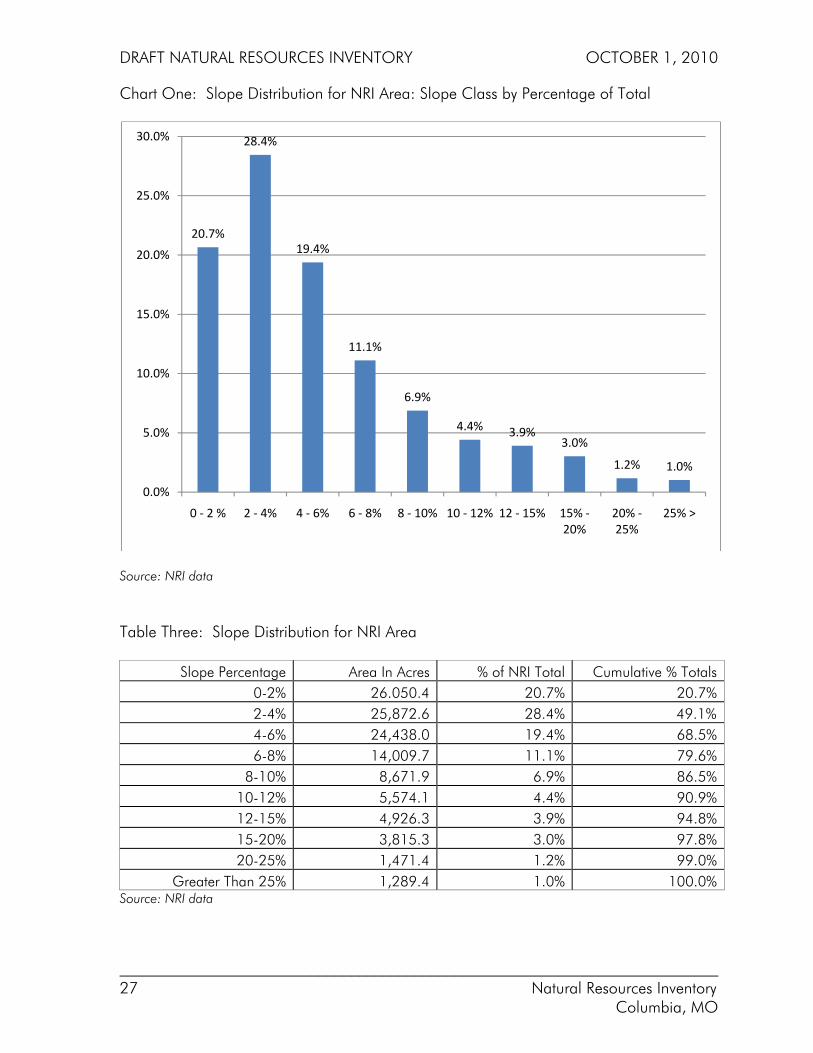
Source: Boone County Assessor DEM and NRI data of the NRI have been defined as slope areas greater than 15%. Approximately 2.2% of the NRI area is covered by steep slopes. The average slope for the NRI area is approximately 5.5% which is considered a gentle slope with 86.5% of the NRI area falling in the 0 – 10% slope category. Chart 1: Slope Distribution for NRI Area and Table One: Slope Distribution for NRI Area provides the percentage distribution for the slope area and the total acreage with each class.
DRAFT NATURAL RESOURCES INVENTORY OCTOBER 1, 2010
___________________________________________________________________________ 27 Natural Resources Inventory Columbia, MO
Chart One: Slope Distribution for NRI Area: Slope Class by Percentage of Total
Source: NRI data Table Three: Slope Distribution for NRI Area
Slope Percentage Area In Acres % of NRI Total Cumulative % Totals 0-2% 26.050.4 20.7% 20.7% 2-4% 25,872.6 28.4% 49.1% 4-6% 24,438.0 19.4% 68.5% 6-8% 14,009.7 11.1% 79.6%
8-10% 8,671.9 6.9% 86.5% 10-12% 5,574.1 4.4% 90.9% 12-15% 4,926.3 3.9% 94.8% 15-20% 3,815.3 3.0% 97.8% 20-25% 1,471.4 1.2% 99.0%
Greater Than 25% 1,289.4 1.0% 100.0% Source: NRI data
20.7%
28.4%
19.4%
11.1%
6.9%
4.4% 3.9%3.0%
1.2% 1.0%
0.0%
5.0%
10.0%
15.0%
20.0%
25.0%
30.0%
0 ‐ 2 % 2 ‐ 4% 4 ‐ 6% 6 ‐ 8% 8 ‐ 10% 10 ‐ 12% 12 ‐ 15% 15% ‐20%
20% ‐25%
25% >
DRAFT NATURAL RESOURCES INVENTORY OCTOBER 1, 2010
___________________________________________________________________________ 28 Natural Resources Inventory Columbia, MO
4.4 Vulnerable Landscape
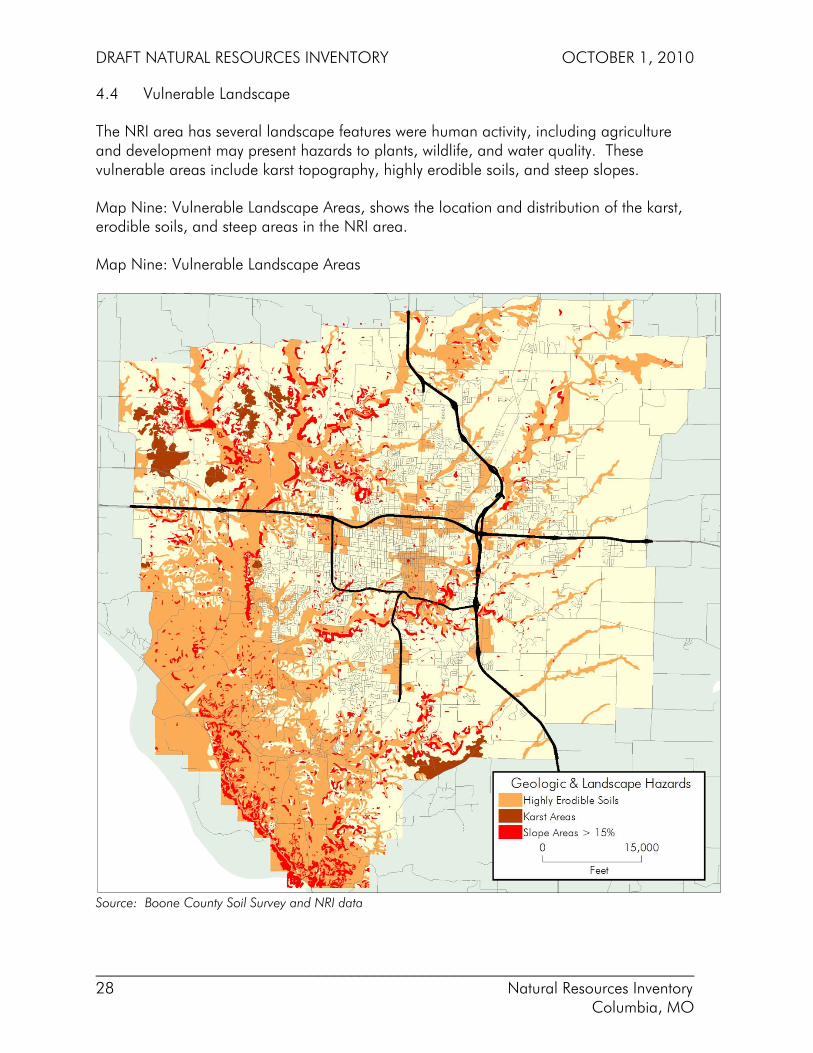
The NRI area has several landscape features were human activity, including agriculture and development may present hazards to plants, wildlife, and water quality. These vulnerable areas include karst topography, highly erodible soils, and steep slopes.
Map Nine: Vulnerable Landscape Areas, shows the location and distribution of the karst, erodible soils, and steep areas in the NRI area.
Map Nine: Vulnerable Landscape Areas
Source: Boone County Soil Survey and NRI data
DRAFT NATURAL RESOURCES INVENTORY OCTOBER 1, 2010
___________________________________________________________________________ 29 Natural Resources Inventory Columbia, MO
In the NRI area, the erodible soils are primarily concentrated along the Missouri river bottoms and bluffs and major riparian corridors, as are the steep slope areas. Two major karst areas are located in Rock Bridge State Park and northwest of the Midway area. A minor karst feature is found west of Scott Boulevard in parkland owned by the City of Columbia.
Karst geological formations, highly erodible soils, and steep slopes are the most significant vulnerable landscape features in the NRI area. Karst areas offer a pathway for pollutants from the surface to penetrate into local groundwater sources. The highly erodible soil areas are associated with urbanized areas, loess soils, and flood plains. These soils when disturbed are vulnerable to erosion from the transport actions of rainwater and wind. Steep slopes, especially those slope areas of 15% or greater, may amplify the erosion of topsoil when disturbed, allowing sediment to be transported into adjacent streams. Slope effects the potential velocity of surface runoff as does the slope length and groundcover.
Karst Topography
Areas of karst topography present both environmental and physical hazards. Karst topography is formed when rainwater is acidified through organic material in the topsoil, penetrates the soil and infiltrates the cracks and fissure in the limestone bedrock. The acidified water slowly dissolves the limestone, creating large voids, or karst features. These voids become caves or a sinkhole, if the underlying limestone collapses to form a depression on the surface. In the NRI area, the Devils Icebox Cave in Rockbridge State Park is a major karst feature as is the Pierpont Sinkhole Plain.
The nature of the groundwater flow system causes karst areas to be extremely vulnerable to groundwater contamination from surface contaminants transported by rainwater. Sinkholes present an additional hazard from sinkhole flooding and sinkhole collapse. Boone County has established buffer areas around sinkholes to reduce the potential for groundwater contamination.
Highly Erodible Soils Soil erosion is a major cause of stream water quality degradation throughout the United States. Soil erosion is a result of several factors, including rainfall intensity, the steepness of slopes in the drainage area, length of slopes, vegetative cover, and management practices. The physical and chemical properties of a soil type play a major role in the ability of water to detach and transport its soil particles. These properties determine a soil’s erodibility. The City of Columbia and Boone County both regulate land disturbance and require sediment fencing and other containment practice to contain any eroded soil on the permitted site.
DRAFT NATURAL RESOURCES INVENTORY OCTOBER 1, 2010
___________________________________________________________________________ 30 Natural Resources Inventory Columbia, MO
Steep Slopes Areas with slopes greater than 15% present issues for site development and providing infrastructure such as streets, sewers, and electric service. The extensive alteration of hillside or steep slope can lead to increased erosion, landslides, and sedimentation. The removal of trees and vegetation on the areas of steep slopes expose the underlying soil to the erosion effects of wind and water.
Table Four provides the acreages and percentage breakdowns for each landscape hazard type.
Table Four: Vulnerable Landscape Areas
Vulnerable Landscape Areas
Acreage % of NRI Area Highly Erodible Soil 4,563.9 3.6% Karst Areas 1,993.5 1.6% Exposed Rock Outcroppings 118.7 0.1% Steep Slope Areas > 15% 3,120.8 2.6% Total 9,796.9 7.9%
Source: Boone County Soil Survey and NRI data
DRAFT NATURAL RESOURCES INVENTORY OCTOBER 1, 2010
___________________________________________________________________________ 31 Natural Resources Inventory Columbia, MO
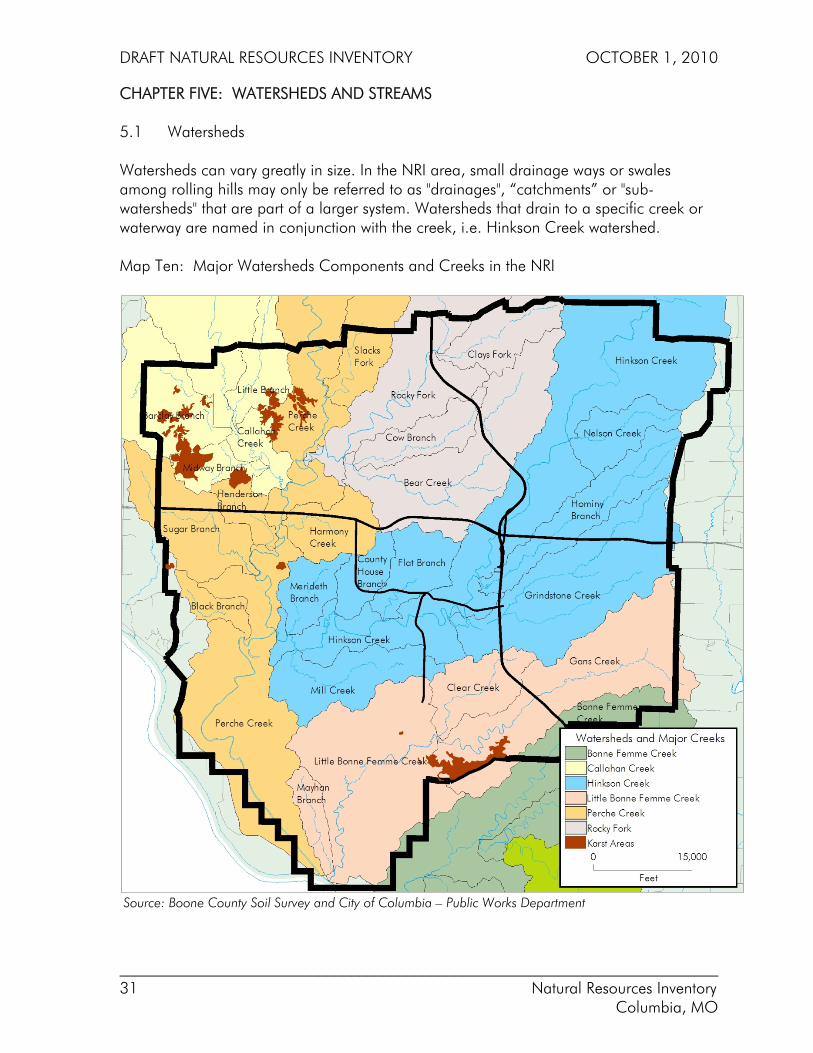
CHAPTER FIVE: WATERSHEDS AND STREAMS 5.1 Watersheds Watersheds can vary greatly in size. In the NRI area, small drainage ways or swales among rolling hills may only be referred to as "drainages", “catchments” or "sub-watersheds" that are part of a larger system. Watersheds that drain to a specific creek or waterway are named in conjunction with the creek, i.e. Hinkson Creek watershed. Map Ten: Major Watersheds Components and Creeks in the NRI
Source: Boone County Soil Survey and City of Columbia – Public Works Department

DRAFT NATURAL RESOURCES INVENTORY OCTOBER 1, 2010
___________________________________________________________________________ 32 Natural Resources Inventory Columbia, MO
Map Ten: Major Watersheds and Creeks in the NRI shows the boundaries of three major watersheds and their relationship to the NRI area. The general movement of surface water is from the northeast to the southwest to join the Missouri River. The boundaries of a watershed are formed from the high points and ridges which serve as the dividing lines between areas drained to a common destination point. Gravity moves water from higher to lower points collecting surface runoff from rain into collected water flows. When a collection of high points or ridges direct water flow towards a common creek or river, it creates a defined drainage area or watershed. The surface water in the NRI area drains into the Missouri River through three major watersheds;
o Perche Creek (254,829 acres) o Little Boone Femme Creek (25,081 acres) o Boone Femme Creek (2,508 acres)
The Perche Creek watershed covers approximately 93% of the NRI area and is drained by 33 named streams, the largest of which are Rocky Fork Creek, Callahan Creek, and Hinkson Creek. The Little Bonne Femme watershed, which is significantly smaller, is drained by four named streams the largest of which is Little Bonne Femme Creek. Only a small fraction of the Bonne Femme watershed is captured in the NRI area and that portion contains a section of Bonne Femme Creek that is approximately 5,000 feet in length. Table 5: Primary, Secondary, and Immediate Watershed Acreages Primary Watershed Areas Watershed Acreage Acres in NRI Area NRI % of Total Watershed
Bonne Femme Creek 34,576.6 2,460.4 7.1%
Little Bonne Femme Creek 25,081.1 23,381.4 93.2%
Perche Creek 254,829.3 94,547.3 37.1%
Secondary Watershed Areas Watershed Acreage Acres in NRI Area NRI % of Total Watershed
Bonne Femme Creek 14,181.3 2,460.4 17.3%
Callahan Creek 22,494.7 9,003.0 40.0%
Hinkson Creek 55,078.7 43,502.0 79.0%
Little Bonne Femme Creek 25,081.1 23,381.4 93.2%
Perche Creek 94,106.0 25,366.3 27.0%
Rocky Fork 31,438.6 16,675.9 53.0%
Immediate Watershed Areas Watershed Acreage Acres in NRI Area NRI % of Total Watershed
Barclay Branch 5,318.6 2,848.8 53.6%
Bear Creek 8,927.6 8,927.6 100.0%
Black Branch 1,055.6 1,055.6 100.0%
Bonne Femme Creek 14,181.3 2,460.4 17.3%
Callahan Creek 13,278.8 2,973.0 22.4%
Clays Fork 3,281.7 2,696.4 82.2%

DRAFT NATURAL RESOURCES INVENTORY OCTOBER 1, 2010
___________________________________________________________________________ 33 Natural Resources Inventory Columbia, MO
Clear Creek 2,895.3 2,895.3 100.0%
County House Branch 1,583.4 1,583.4 100.0%
Cow Branch 2,355.6 2,355.6 100.0%
Flat Branch 2,448.6 2,448.6 100.0%
Gans Creek 10,114.7 8,929.3 88.3%
Grindstone Creek 9,533.7 9,379.1 98.4%
Harmony Creek 2,505.4 2,505.4 100.0%
Henderson Branch 1,304.3 1,304.3 100.0%
Hinkson Creek 29,113.2 17,691.1 60.8%
Hominy Branch 4,235.8 4,235.8 100.0%
Little Bonne Femme Creek 10,829.0 10,314.7 95.3%
Little Branch 2,480.8 1,764.8 71.1%
Mayhan Branch 1,242.1 1,242.1 100.0%
Merideth Branch 1,794.4 1,794.4 100.0%
Midway Branch 1,416.5 1,416.5 100.0%
Mill Creek 3,980.1 3,980.1 100.0%
Nelson Creek 2,389.5 2,389.5 100.0%
Perche Creek 41,047.7 15,154.5 36.9%
Rocky Fork 4,002.6 2,696.4 67.4%
Slacks Fork 1,722.6 1,722.6 100.0%
Sugar Branch 4,710.1 3,624.0 76.9% Source: City of Columbia – Public Works Department and NRI data 5.2 Physical Characteristics of Streams
To qualify as a stream it must be either recurring or perennial. Recurring streams have water in the channel for at least part of the year. Streams are created when excess water from rain, snowmelt, or near-surface groundwater accumulates on the ground surface and begins to run downhill. This excess water from rain or snowmelt generally occurs when the water accumulates at a faster rate than the soil and organic matter can absorb the water, plants can use it, or the water can be evaporated into the air.
Groundwater also may create a stream, or may add to its flow. For example, water may emerge from the ground as a spring, forming the headwaters of a stream. Farther downslope, shallow groundwater adjacent to a stream or beneath the streambed also may contribute water to the stream.
Regardless of its water source, a stream flows to the lowest elevation present in the landscape, joining other rivulets from other low spots on the landscape. These small first-order and second-order streams may in turn join larger third-order streams, and so on, creating a dendritic drainage network within the watershed.
DRAFT NATURAL RESOURCES INVENTORY OCTOBER 1, 2010
___________________________________________________________________________ 34 Natural Resources Inventory Columbia, MO
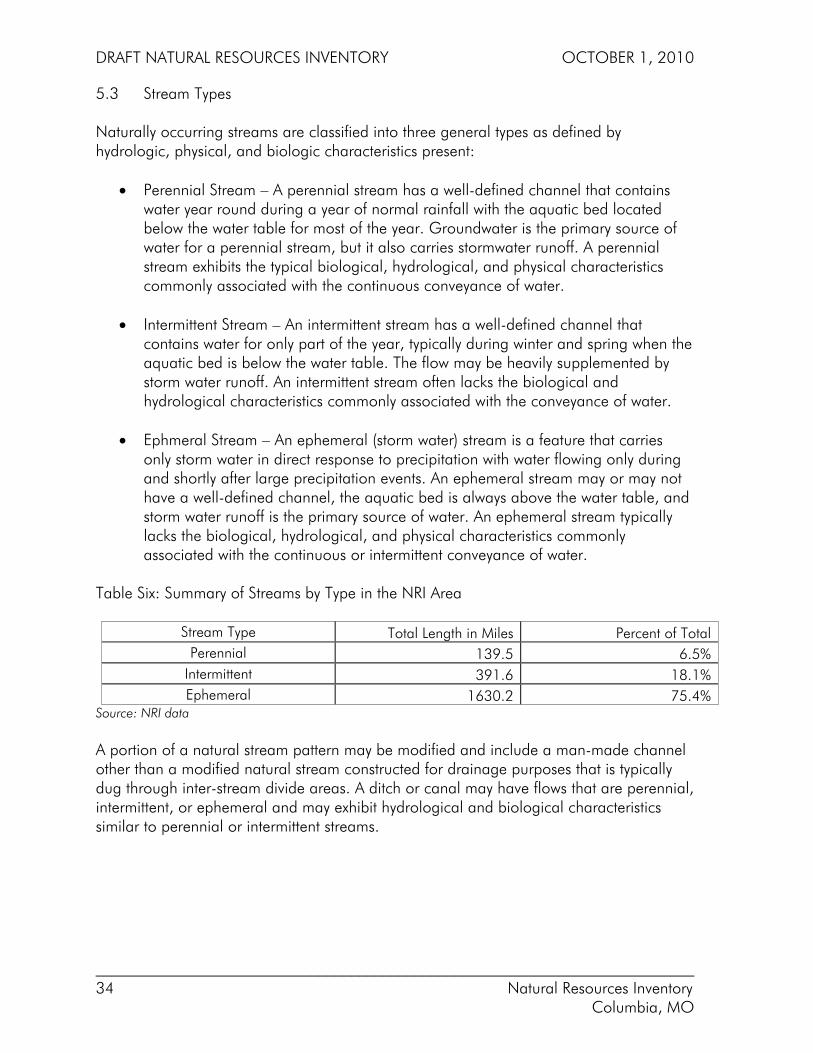
5.3 Stream Types Naturally occurring streams are classified into three general types as defined by hydrologic, physical, and biologic characteristics present:
• Perennial Stream – A perennial stream has a well-defined channel that contains water year round during a year of normal rainfall with the aquatic bed located below the water table for most of the year. Groundwater is the primary source of water for a perennial stream, but it also carries stormwater runoff. A perennial stream exhibits the typical biological, hydrological, and physical characteristics commonly associated with the continuous conveyance of water.
• Intermittent Stream – An intermittent stream has a well-defined channel that
contains water for only part of the year, typically during winter and spring when the aquatic bed is below the water table. The flow may be heavily supplemented by storm water runoff. An intermittent stream often lacks the biological and hydrological characteristics commonly associated with the conveyance of water.
• Ephmeral Stream – An ephemeral (storm water) stream is a feature that carries
only storm water in direct response to precipitation with water flowing only during and shortly after large precipitation events. An ephemeral stream may or may not have a well-defined channel, the aquatic bed is always above the water table, and storm water runoff is the primary source of water. An ephemeral stream typically lacks the biological, hydrological, and physical characteristics commonly associated with the continuous or intermittent conveyance of water.
Table Six: Summary of Streams by Type in the NRI Area
Stream Type Total Length in Miles Percent of Total Perennial 139.5 6.5%
Intermittent 391.6 18.1% Ephemeral 1630.2 75.4%
Source: NRI data A portion of a natural stream pattern may be modified and include a man-made channel other than a modified natural stream constructed for drainage purposes that is typically dug through inter-stream divide areas. A ditch or canal may have flows that are perennial, intermittent, or ephemeral and may exhibit hydrological and biological characteristics similar to perennial or intermittent streams.
DRAFT NATURAL RESOURCES INVENTORY OCTOBER 1, 2010
___________________________________________________________________________ 35 Natural Resources Inventory Columbia, MO
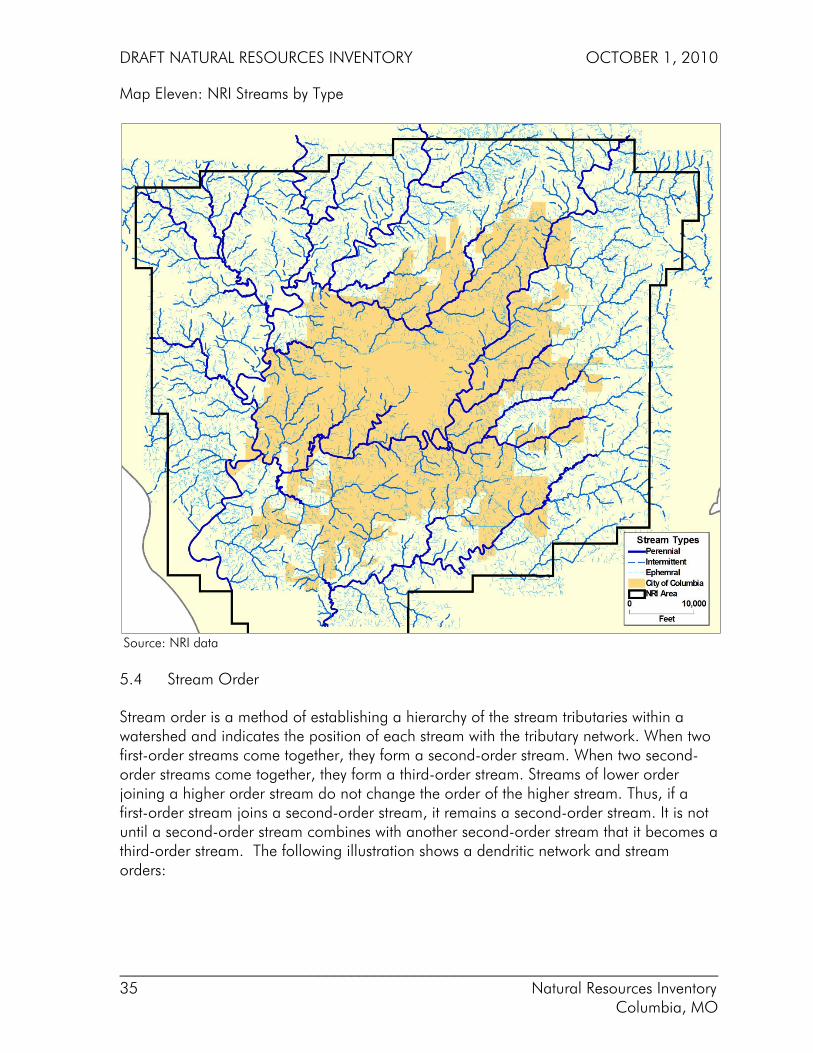
Map Eleven: NRI Streams by Type
Source: NRI data
5.4 Stream Order
Stream order is a method of establishing a hierarchy of the stream tributaries within a watershed and indicates the position of each stream with the tributary network. When two first-order streams come together, they form a second-order stream. When two second-order streams come together, they form a third-order stream. Streams of lower order joining a higher order stream do not change the order of the higher stream. Thus, if a first-order stream joins a second-order stream, it remains a second-order stream. It is not until a second-order stream combines with another second-order stream that it becomes a third-order stream. The following illustration shows a dendritic network and stream orders:

DRAFT NATURAL RESOURCES INVENTORY OCTOBER 1, 2010
___________________________________________________________________________ 36 Natural Resources Inventory Columbia, MO
Figure Four: Dendritic Network and Stream Order
Source: USGS
Stream order classification is correlated with the drainage area. The higher order streams drain larger areas than lower order streams. Chart Two: illustrates this relationship. Chart Two: Distribution of Stream Order In The NRI Area
Source: NRI data
DRAFT NATURAL RESOURCES INVENTORY OCTOBER 1, 2010
___________________________________________________________________________ 37 Natural Resources Inventory Columbia, MO
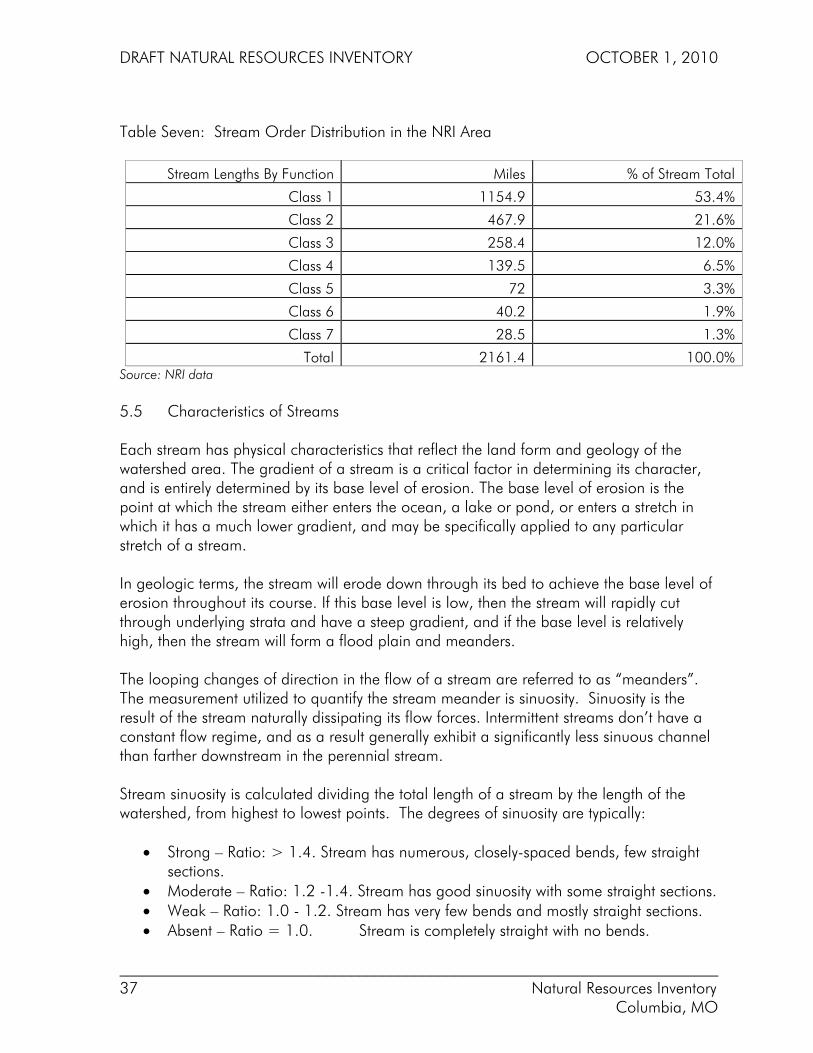
Table Seven: Stream Order Distribution in the NRI Area
Stream Lengths By Function Miles % of Stream Total Class 1 1154.9 53.4% Class 2 467.9 21.6% Class 3 258.4 12.0% Class 4 139.5 6.5% Class 5 72 3.3% Class 6 40.2 1.9% Class 7 28.5 1.3%
Total 2161.4 100.0% Source: NRI data 5.5 Characteristics of Streams
Each stream has physical characteristics that reflect the land form and geology of the watershed area. The gradient of a stream is a critical factor in determining its character, and is entirely determined by its base level of erosion. The base level of erosion is the point at which the stream either enters the ocean, a lake or pond, or enters a stretch in which it has a much lower gradient, and may be specifically applied to any particular stretch of a stream. In geologic terms, the stream will erode down through its bed to achieve the base level of erosion throughout its course. If this base level is low, then the stream will rapidly cut through underlying strata and have a steep gradient, and if the base level is relatively high, then the stream will form a flood plain and meanders. The looping changes of direction in the flow of a stream are referred to as “meanders”. The measurement utilized to quantify the stream meander is sinuosity. Sinuosity is the result of the stream naturally dissipating its flow forces. Intermittent streams don’t have a constant flow regime, and as a result generally exhibit a significantly less sinuous channel than farther downstream in the perennial stream. Stream sinuosity is calculated dividing the total length of a stream by the length of the watershed, from highest to lowest points. The degrees of sinuosity are typically:
• Strong – Ratio: > 1.4. Stream has numerous, closely-spaced bends, few straight sections.
• Moderate – Ratio: 1.2 -1.4. Stream has good sinuosity with some straight sections. • Weak – Ratio: 1.0 - 1.2. Stream has very few bends and mostly straight sections. • Absent – Ratio = 1.0. Stream is completely straight with no bends.

DRAFT NATURAL RESOURCES INVENTORY OCTOBER 1, 2010
___________________________________________________________________________ 38 Natural Resources Inventory Columbia, MO
The sinuosity of a stream is a way the stream maintains a constant slope. The more sinuous a stream, the more gentle the slope. Sinuosity is also important when evaluating the potential for creek bank erosion and water quality. Figure Five: Measuring Stream Sinuosity
Sinuosity=Total Stream length/Valley length Source: University of Georgia
5.6 Water Quality Issues
Water quality is a measure of both the physical condition and the chemical composition of the water. The chemical condition of the water looks at sediments, dissolved oxygen, nutrients, metals, oils, and pesticides. The physical conditions such as temperature, flow, total suspended solids, and the erosion potential of the stream banks are another measure of the stream’s water quality and ability to support a variety of aquatic plant and animal life.
Water Temperature
Water temperature impacts the diversity of aquatic life that can live in a stream. Fish, insects, zooplankton, phytoplankton, and other aquatic species all have a preferred temperature range. If temperatures get too far above or below this preferred range, the number of individuals of the species decreases until finally there are none.
DRAFT NATURAL RESOURCES INVENTORY OCTOBER 1, 2010
___________________________________________________________________________ 39 Natural Resources Inventory Columbia, MO
Temperature also is important because it influences water chemistry. The rate of chemical reactions generally increases at higher temperatures, which in turn affects biological activity. An important example of the effects of temperature on water chemistry is its impact on oxygen. Warm water holds less oxygen than cool water, so it may be "saturated" with oxygen but still not contain enough for survival of aquatic life. Some compounds are also more toxic to aquatic life at higher temperatures.
The land use and physical characteristics in a watershed has an effect on water temperature of a stream. If the watershed is forested and steep or hilly, runoff water will move quickly and the sun won’t have much time to warm the runoff before it reaches the stream. Conversely, in a flat and sparsely vegetated watershed, the water moves more slowly, with more time to absorb heat from the ground surface and the sunlight.
Suspended Solids and Turbidity in Streams
Total suspended solids (TSS) concentrations and turbidity both indicate the amount of solids suspended in the water, whether mineral (e.g., soil particles) or organic (e.g., algae). However, the TSS test measures an actual weight of material per volume of water, while turbidity measures the amount of light scattered from a sample (more suspended particles cause greater scattering). This difference becomes important when trying to calculate total quantities of material within or entering a stream. Such calculations are possible with TSS values but not with turbidity readings.
High concentrations of particulate matter can cause increased sedimentation and siltation in a stream, which in turn can ruin important habitat areas for fish and other aquatic life. Suspended particles also provide attachment places for other pollutants, such as metals and bacteria. High suspended solids or turbidity readings thus can be used as "indicators" of other potential pollutants.
TSS and turbidity values vary naturally for two main reasons – one physical, the other biological. Heavy rains and fast-moving water are erosive. They can pick up and carry enough dirt and debris to make any stream look dirty. So, heavy rainfall may cause higher TSS concentrations or turbidity, unless the additional particles are dispersed throughout large volumes of flood water. The native soils and geology of the watershed of course determine how easily erosion occurs.
A small part of the natural increase may be explained by seasonal changes in algae populations. It is the suspended forms of algae that are measured by TSS and turbidity.
Land use is probably the greatest factor influencing changes in TSS or turbidity in streams. As watersheds develop, there is an increase in disturbed areas (e.g., cropland or construction sites), a decrease in vegetation, and increases in the rate of runoff. These all cause increases in erosion, particulate matter, and nutrients, which turn promote increased algal growth. For example, loss of vegetation due to urbanization exposes more

DRAFT NATURAL RESOURCES INVENTORY OCTOBER 1, 2010
___________________________________________________________________________ 40 Natural Resources Inventory Columbia, MO
soil to erosion, allows more runoff to form, and simultaneously reduces the watershed’s ability to filter runoff before in reaches the stream.
Dissolved Oxygen in Streams
Like terrestrial animals, fish and other aquatic organisms need oxygen to live. As water moves past their gills (or other breathing apparatus), microscopic bubbles of oxygen gas in the water, called dissolved oxygen (DO), are transferred from the water to their blood. Like any other gas diffusion process, the transfer is efficient only above certain concentrations. So, a certain minimum amount of oxygen must be present in water for aquatic life to survive. In other words, oxygen can be present in the water, but at too low a concentration to sustain aquatic life. In addition to being required by aquatic organisms for respiration, oxygen also is used for decomposition of organic matter and other biological and chemical processes.
Pollution tends to cause a decrease in stream oxygen concentrations. This change can be caused by addition of effluent or runoff water with a low concentration of DO or chemical or biological constituents that have a high oxygen demand – that is they require large amounts of oxygen before they can be thoroughly decomposed. The latter is often the more typical and more serious case.
Stormwater runoff also delivers oxygen-demanding substances to streams. When a watershed becomes developed, greater quantities of pollutants are released and the total volume of runoff increases. Most conventional pollutants (sediments, nutrients, organic matter) require oxygen for decomposition or for chemical reactions. Consequently, DO concentrations often decrease in streams located in a developed or developing watershed.
Stream pH
The pH of a sample of water is a measure of the concentration of hydrogen ions. The term pH was derived from the manner in which the hydrogen ion concentration is calculated – it is the negative logarithm of the hydrogen ion (H+) concentration. The pH scale ranges from 0 to 14. A pH of 7 is considered to be neutral. Substances with pH less than 7 are acidic, while substances with pH greater than 7 are basic. The pH of most natural waters ranges between 6.5 and 8.5.
The pH of water determines the solubility (amount that can be dissolved in the water) and biological availability (amount that can be utilized by aquatic life) of chemical constituents such as nutrients (e.g., phosphorus, nitrogen, and carbon) and heavy metals (e.g., lead, cadmium, copper). For example, in addition to determining how much and what form of phosphorus is most abundant in the water, pH also determines whether aquatic life can use it. Heavy metals tend to be more toxic at lower pH because they are more soluble and bioactive.
DRAFT NATURAL RESOURCES INVENTORY OCTOBER 1, 2010
___________________________________________________________________________ 41 Natural Resources Inventory Columbia, MO
Because polluted conditions typically correspond with increased photosynthesis in a stream, pollution may cause a long-term increase in pH. The more common concern is changes in pH caused by discharge of municipal or industrial effluents.
Nutrients in Streams
Nutrients in streams serve the same basic function as nutrients in a garden. They are essential for growth. In a garden, growth and productivity are considered beneficial, but this is not necessarily so in a stream. The additional algae and other plant growth allowed by the nutrients may be beneficial up to a point, but may easily become a nuisance.
The main nutrients of concern are phosphorus and nitrogen. Both elements are measured in several forms. Phosphorus can be measured as total phosphorus (TP), or soluble reactive phosphate (SRP) (also sometimes called phosphate (PO4) or orthophosphate (ortho-P). The last three chemical compounds represent different terms used to describe the fraction of TP that is soluble or available to organisms for growth.
Increased nutrient concentrations are almost always an impact of pollution. Municipal and industrial discharges usually contain nutrients, and overland flow from developed watersheds contains nutrients from lawn and garden fertilizers as well as the additional organic debris so easily washed from urban surfaces. Agricultural areas also contribute to nutrient increases through poor manure and fertilizing practices and increased erosion from plowed surfaces.
Nutrient loading can result in increased algae growth. In stream segments where conditions are right, algae take the form of an attached growth – called periphyton – on rocks, logs, and other substrate. You may have noticed long green filaments or masses of algae in streams or even stepped on rocks made slippery by these growths. Excessive growths of attached algae can cause low DO, unsightly conditions, odors, and poor habitat conditions for aquatic organisms.
Fecal Coliform Bacteria in Streams
Fecal coliform bacteria are microscopic organisms that live in the intestines of warm-blooded animals. They also live in the waste material, or feces, excreted from the intestinal tract. When fecal coliform bacteria are present in high numbers in a water sample, it means that the water has received fecal matter from one source or another. Although not necessarily agents of disease, fecal coliform bacteria may indicate the presence of disease-carrying organisms, which live in the same environment as the fecal coliform bacteria.
The primary sources of fecal coliform bacteria to fresh water are wastewater treatment plant discharges, failing septic systems, and animal waste. Bacteria levels do not necessarily decrease as a watershed develops from rural to urban. Instead, urbanization usually generates new sources of bacteria. Farm animal manure and septic systems are replaced by domestic pets and leaking sanitary sewers. In fact, stormwater runoff in
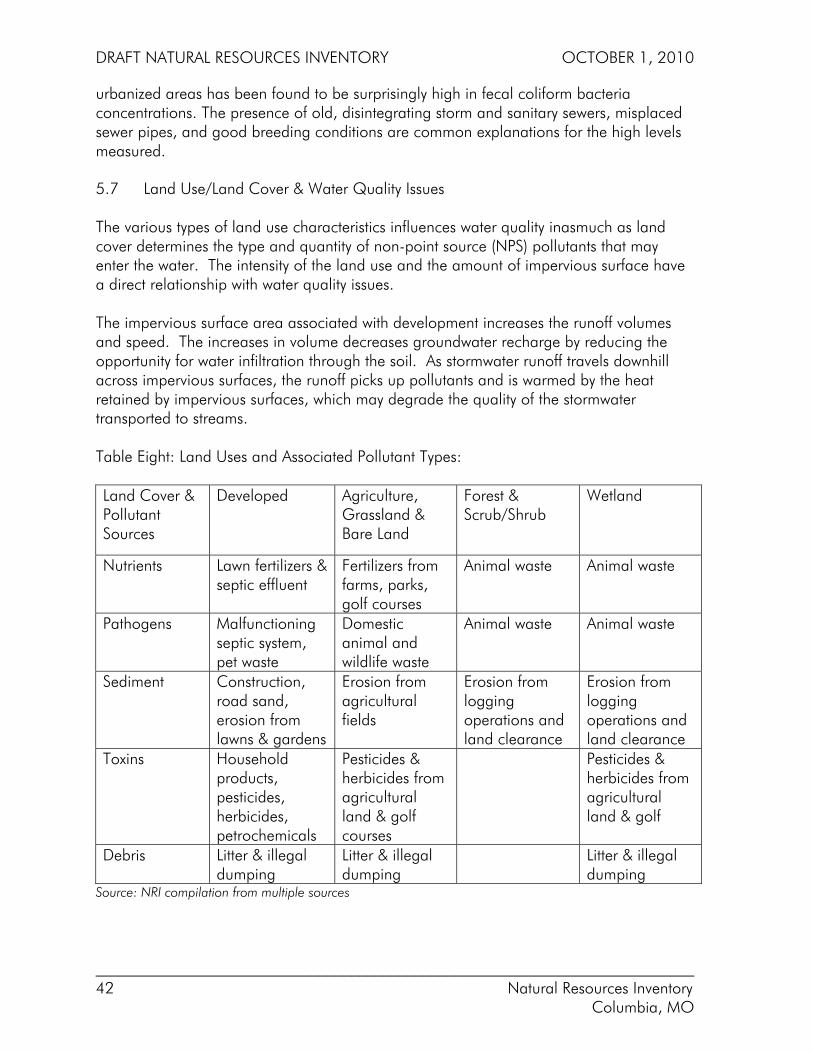
DRAFT NATURAL RESOURCES INVENTORY OCTOBER 1, 2010
___________________________________________________________________________ 42 Natural Resources Inventory Columbia, MO
urbanized areas has been found to be surprisingly high in fecal coliform bacteria concentrations. The presence of old, disintegrating storm and sanitary sewers, misplaced sewer pipes, and good breeding conditions are common explanations for the high levels measured.
5.7 Land Use/Land Cover & Water Quality Issues The various types of land use characteristics influences water quality inasmuch as land cover determines the type and quantity of non-point source (NPS) pollutants that may enter the water. The intensity of the land use and the amount of impervious surface have a direct relationship with water quality issues. The impervious surface area associated with development increases the runoff volumes and speed. The increases in volume decreases groundwater recharge by reducing the opportunity for water infiltration through the soil. As stormwater runoff travels downhill across impervious surfaces, the runoff picks up pollutants and is warmed by the heat retained by impervious surfaces, which may degrade the quality of the stormwater transported to streams. Table Eight: Land Uses and Associated Pollutant Types: Land Cover & Pollutant Sources
Developed Agriculture, Grassland & Bare Land
Forest & Scrub/Shrub
Wetland
Nutrients Lawn fertilizers & septic effluent
Fertilizers from farms, parks, golf courses
Animal waste Animal waste
Pathogens Malfunctioning septic system, pet waste
Domestic animal and wildlife waste
Animal waste Animal waste
Sediment Construction, road sand, erosion from lawns & gardens
Erosion from agricultural fields
Erosion from logging operations and land clearance
Erosion from logging operations and land clearance
Toxins Household products, pesticides, herbicides, petrochemicals
Pesticides & herbicides from agricultural land & golf courses
Pesticides & herbicides from agricultural land & golf
Debris Litter & illegal dumping
Litter & illegal dumping
Litter & illegal dumping
Source: NRI compilation from multiple sources
DRAFT NATURAL RESOURCES INVENTORY OCTOBER 1, 2010
___________________________________________________________________________ 43 Natural Resources Inventory Columbia, MO
Pollutants Typical Found In Stormwater Runoff: Sediment: associated with cropland, lawns and gardens, forestry activities, roadways, construction sites, and stream-bank erosion Nutrients: Associated with cropland, lawns and gardens, livestock operations, wildlife, septic systems, and land receiving waste application Pathogens: Livestock, wildlife, septic systems, land receiving waste application, and urban runoff. Toxic contaminants: Roadways, parking lots, mining operations, cropland, lawns and gardens, and forestry. 5.8 Local Impaired Streams Locally, the Missouri Department of Natural Resources (MoDNR) has identified Hinkson Creek from Interstate 70 south to its confluence with Perche Creek as an “impaired stream”. A MoDNR report regarding the status of Hinkson Creek states:
“Although pollutants and sources are listed as unknown, Hinkson Creek exhibits water quality problems typically associated with streams in urban areas that include: 1. Larger and more frequent floods, as well as lower base flows, due to the increase in impervious surfaces (e.g. rooftops, paved roads and parking lots) in the watershed; 2. Increased soil erosion in construction and development areas with subsequent deposition of the soil in streams; 3. Water contamination from urban storm water flows; 4. Degradation of habitat for aquatic organisms due to the concerns listed above; 5. Degradation of aquatic habitat due to the physical alteration of stream channels and adjacent streamside (riparian) corridors. Such practices include:
• Enclosing the stream in a large pipe. • Straightening (channelizing) the stream. • Paving the stream bottom and/or banks with concrete or rip rap. • Removing trees and other permanent vegetation near streams.
At times and in different locations, various pollutants were found in amounts harmful to the aquatic communities in Hinkson Creek. However, no one pollutant or condition could be identified as the source(s) of the impairment. Therefore, for the TMDL, the Department chose to use storm water runoff volume as a surrogate in place of a traditional “pollutant of concern” approach. The Department believes that reducing storm water runoff volume
DRAFT NATURAL RESOURCES INVENTORY OCTOBER 1, 2010
___________________________________________________________________________ 44 Natural Resources Inventory Columbia, MO
can achieve the following conditions that should restore the aquatic life designated use in Hinkson Creek:
• reduce physical impacts of storm water on the stream channel and stream habitat (e.g. erosion, scour and deposition);
• raise the water table and restore the in-stream habitat provided by increased base flow;
• reduce pollutant loads associated with storm water.” Boone County is currently studying the Hinkson Creek watershed to better understand the source(s) and solutions to the water quality issues identified by the Missouri Department of Natural Resources.

DRAFT NATURAL RESOURCES INVENTORY OCTOBER 1, 2010
___________________________________________________________________________ 45 Natural Resources Inventory Columbia, MO
CHAPTER SIX: LAND COVER
6.1 Land Cover
Land cover refers to the type of feature present on the surface of the earth. For example, agricultural fields, lakes, rivers, pine forests, roads, and parking lots are all land cover types. Land cover may refer to a biological categorization of the surface, such as grassland or forest, or to a physical or chemical categorization such as concrete. Land cover is distinct from land use even though the two terms are often used interchangeably. Land use is a description of how people utilize the land and the associated socio-economic activity. Urban and agricultural uses are two of the most commonly recognized classes of land use. Depending on the type of analysis and available data, the land use classification may cover hundreds of individual uses.
Land cover is denoted by the physical state of the land, including the type and quantity of vegetation, water and earth materials. A single land cover may support multiple land uses. A residential land use may contain tree cover, grass cover, and impervious surface.
6.2 Land Cover Types The NRI land cover starts with six basis land cover types. The following outlines the natural and manmade features that fall within the each type. The following land cover categories where defined using the following definitions for classification:
• Tree canopy: All tree cover, deciduous and evergreen. The tree canopy may be naturally occurring such as forest, semi-natural where the natural tree canopy has been modified, and cultivated/amenity tree canopy platted to enhance residential, commercial, and park areas;
• Cropland: Tilled land areas that are typically planted with cereal grain row crops;
• Urban/Impervious: All manmade elements such as rooftops, driveways, parking
areas, sidewalks, trails, and other features that do not permit rain water to penetrate into the soil;
• Water: Surface water present in lakes, ponds, and perennial streams;
• Disturbed/Barren: Natural sparsely vegetated areas and areas of land disturbance
with exposed soil; and
• Grass: Warm and cool season grass; cultivated and naturally occurring in pastures, parks, residential lawns, golf courses, parking strips, etc.

DRAFT NATURAL RESOURCES INVENTORY OCTOBER 1, 2010
___________________________________________________________________________ 46 Natural Resources Inventory Columbia, MO
Chart 3: Land Cover by Type - June 2007
Source: NRI imagery classification Table 9: Land Cover by Type, Area, and Percent of NRI Area – June 2007
Land Cover Acres % of NRI Total Tree Canopy 54,638 43.1% Cropland 11,486 9.1% Urban/Impervious 11,045 8.7% Water 2,350 1.9% Disturbed/Barren 2,849 2.2% Grass 44,302 35.0%
Source: NRI imagery classification Potential uses of land cover data are many and varied, and include assessing ecosystem status and health, modeling nutrient and pesticide runoff, understanding spatial patterns
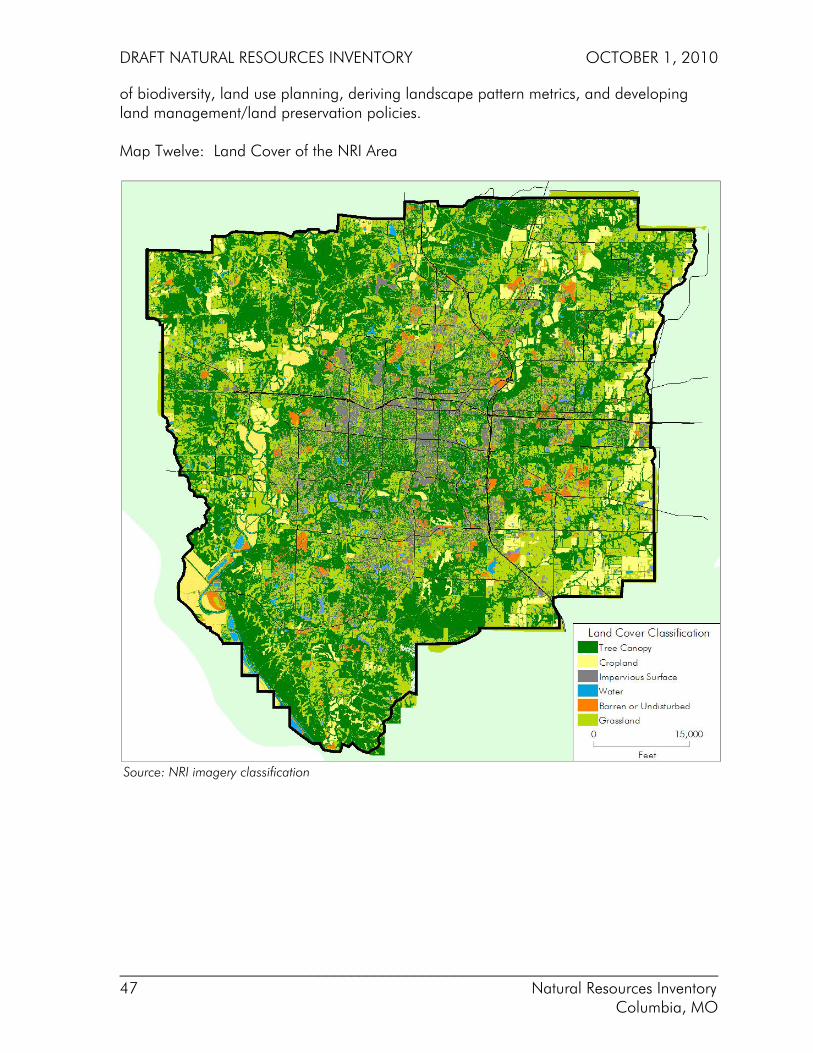
DRAFT NATURAL RESOURCES INVENTORY OCTOBER 1, 2010
___________________________________________________________________________ 47 Natural Resources Inventory Columbia, MO
of biodiversity, land use planning, deriving landscape pattern metrics, and developing land management/land preservation policies. Map Twelve: Land Cover of the NRI Area
Source: NRI imagery classification

DRAFT NATURAL RESOURCES INVENTORY OCTOBER 1, 2010
___________________________________________________________________________ 48 Natural Resources Inventory Columbia, MO
- Blank -
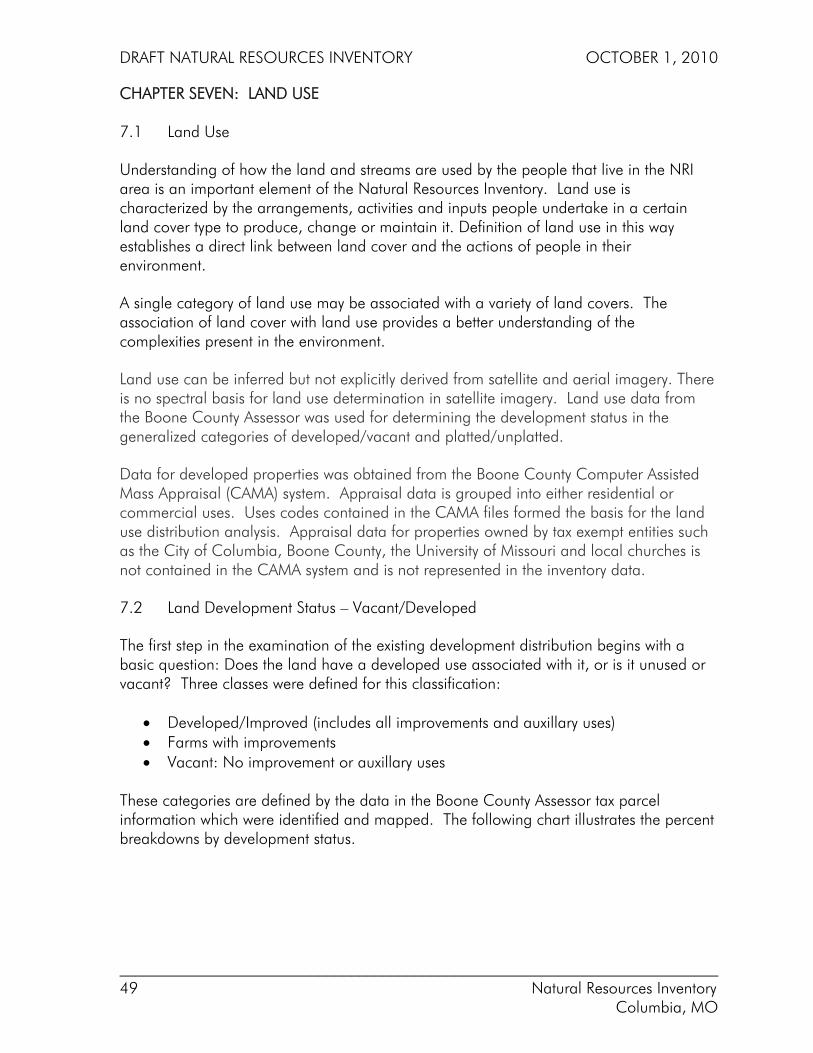
DRAFT NATURAL RESOURCES INVENTORY OCTOBER 1, 2010
___________________________________________________________________________ 49 Natural Resources Inventory Columbia, MO
CHAPTER SEVEN: LAND USE 7.1 Land Use
Understanding of how the land and streams are used by the people that live in the NRI area is an important element of the Natural Resources Inventory. Land use is characterized by the arrangements, activities and inputs people undertake in a certain land cover type to produce, change or maintain it. Definition of land use in this way establishes a direct link between land cover and the actions of people in their environment.
A single category of land use may be associated with a variety of land covers. The association of land cover with land use provides a better understanding of the complexities present in the environment.
Land use can be inferred but not explicitly derived from satellite and aerial imagery. There is no spectral basis for land use determination in satellite imagery. Land use data from the Boone County Assessor was used for determining the development status in the generalized categories of developed/vacant and platted/unplatted.
Data for developed properties was obtained from the Boone County Computer Assisted Mass Appraisal (CAMA) system. Appraisal data is grouped into either residential or commercial uses. Uses codes contained in the CAMA files formed the basis for the land use distribution analysis. Appraisal data for properties owned by tax exempt entities such as the City of Columbia, Boone County, the University of Missouri and local churches is not contained in the CAMA system and is not represented in the inventory data.
7.2 Land Development Status – Vacant/Developed
The first step in the examination of the existing development distribution begins with a basic question: Does the land have a developed use associated with it, or is it unused or vacant? Three classes were defined for this classification:
• Developed/Improved (includes all improvements and auxillary uses) • Farms with improvements • Vacant: No improvement or auxillary uses
These categories are defined by the data in the Boone County Assessor tax parcel information which were identified and mapped. The following chart illustrates the percent breakdowns by development status.
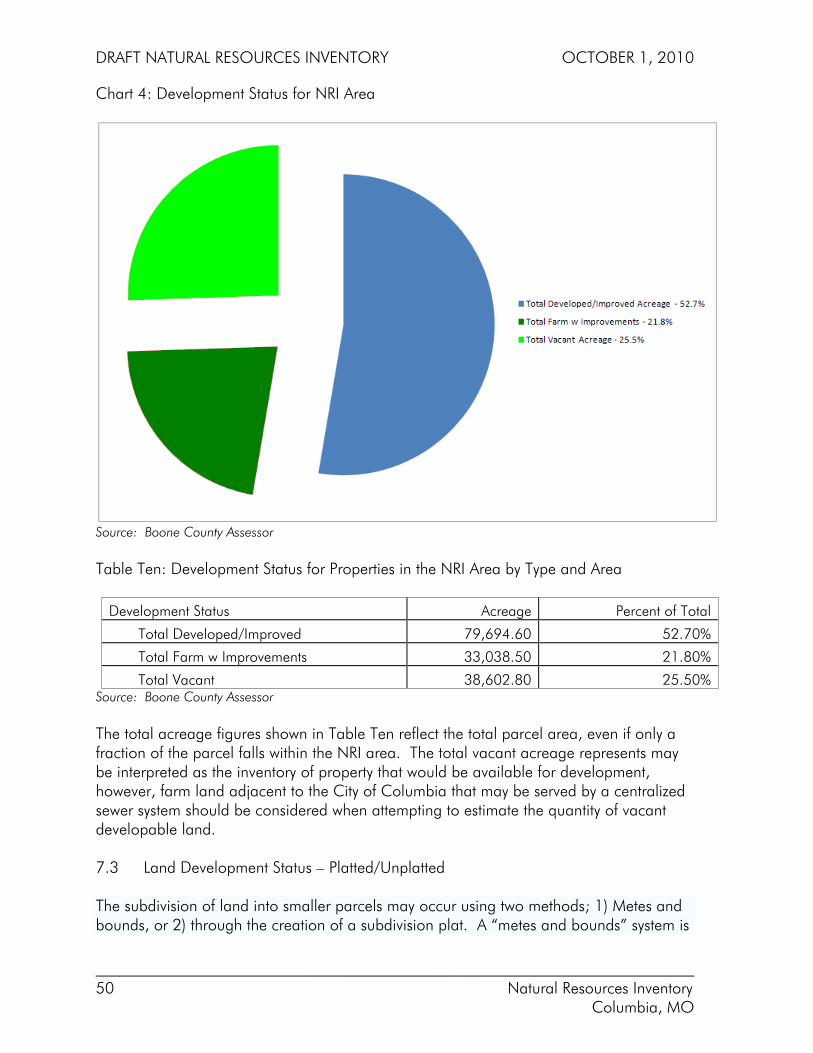
DRAFT NATURAL RESOURCES INVENTORY OCTOBER 1, 2010
___________________________________________________________________________ 50 Natural Resources Inventory Columbia, MO
Chart 4: Development Status for NRI Area
Source: Boone County Assessor Table Ten: Development Status for Properties in the NRI Area by Type and Area
Development Status Acreage Percent of Total Total Developed/Improved 79,694.60 52.70% Total Farm w Improvements 33,038.50 21.80% Total Vacant 38,602.80 25.50%
Source: Boone County Assessor The total acreage figures shown in Table Ten reflect the total parcel area, even if only a fraction of the parcel falls within the NRI area. The total vacant acreage represents may be interpreted as the inventory of property that would be available for development, however, farm land adjacent to the City of Columbia that may be served by a centralized sewer system should be considered when attempting to estimate the quantity of vacant developable land. 7.3 Land Development Status – Platted/Unplatted The subdivision of land into smaller parcels may occur using two methods; 1) Metes and bounds, or 2) through the creation of a subdivision plat. A “metes and bounds” system is
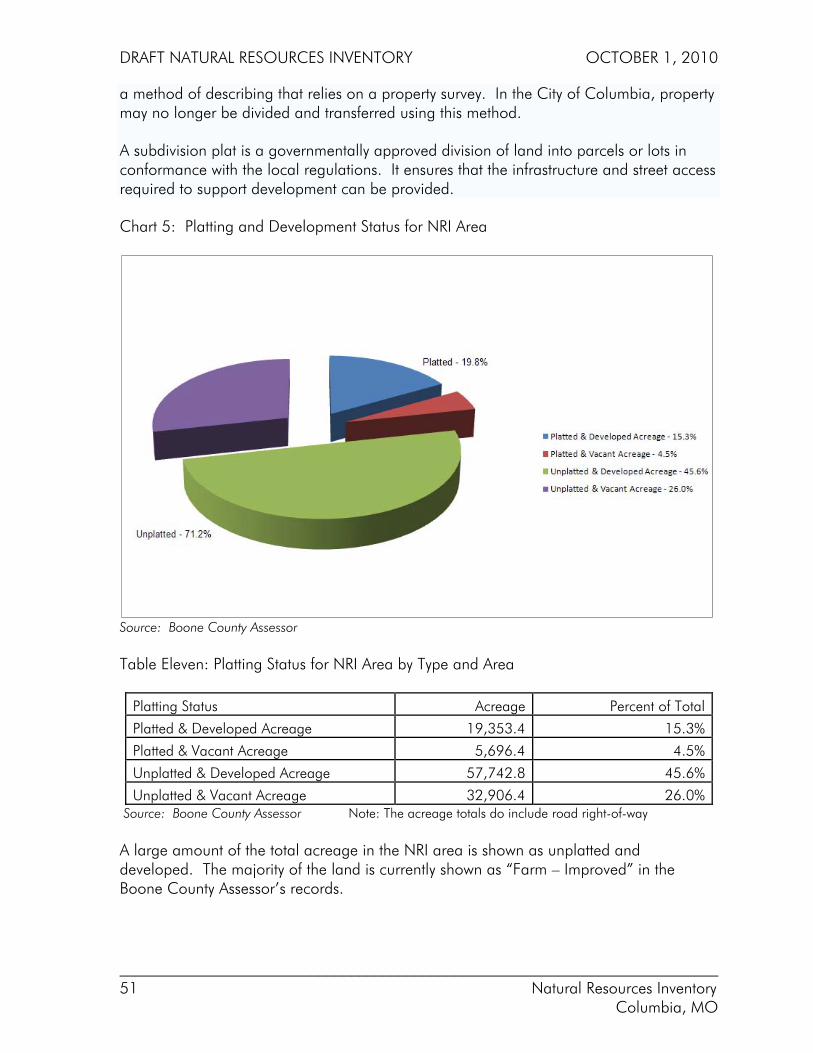
DRAFT NATURAL RESOURCES INVENTORY OCTOBER 1, 2010
___________________________________________________________________________ 51 Natural Resources Inventory Columbia, MO
a method of describing that relies on a property survey. In the City of Columbia, property may no longer be divided and transferred using this method.
A subdivision plat is a governmentally approved division of land into parcels or lots in conformance with the local regulations. It ensures that the infrastructure and street access required to support development can be provided.
Chart 5: Platting and Development Status for NRI Area
Source: Boone County Assessor Table Eleven: Platting Status for NRI Area by Type and Area
Platting Status Acreage Percent of Total Platted & Developed Acreage 19,353.4 15.3% Platted & Vacant Acreage 5,696.4 4.5% Unplatted & Developed Acreage 57,742.8 45.6% Unplatted & Vacant Acreage 32,906.4 26.0%
Source: Boone County Assessor Note: The acreage totals do include road right-of-way A large amount of the total acreage in the NRI area is shown as unplatted and developed. The majority of the land is currently shown as “Farm – Improved” in the Boone County Assessor’s records.

DRAFT NATURAL RESOURCES INVENTORY OCTOBER 1, 2010
___________________________________________________________________________ 52 Natural Resources Inventory Columbia, MO
7.4 Development Characteristics The data for developed properties was obtained from the Boone County Computer Assisted Mass Appraisal (CAMA) system. Appraisal data is grouped into either residential or commercial uses. Uses codes contained in the CAMA files formed the basis for the land use distribution analysis. Land uses were aggregated into self-explanatory groupings for this analysis. Chart 6: Land Use Development Distribution
Source: Boone County Assessor CAMAC and CAMAR data The primary developed land use in the NRI area is single family residence, followed by farms. Chart 4 illustrates the percentage distribution of land uses. Missing from this data are large institutional uses such as the University of Missouri, City of Columbia, and Boone County that are exempt from local property taxes. Data for tax exempt uses is not maintained in the Boone County Assessor’s CAMA data. Data for parks and public lands were provided by the City of Columbia.
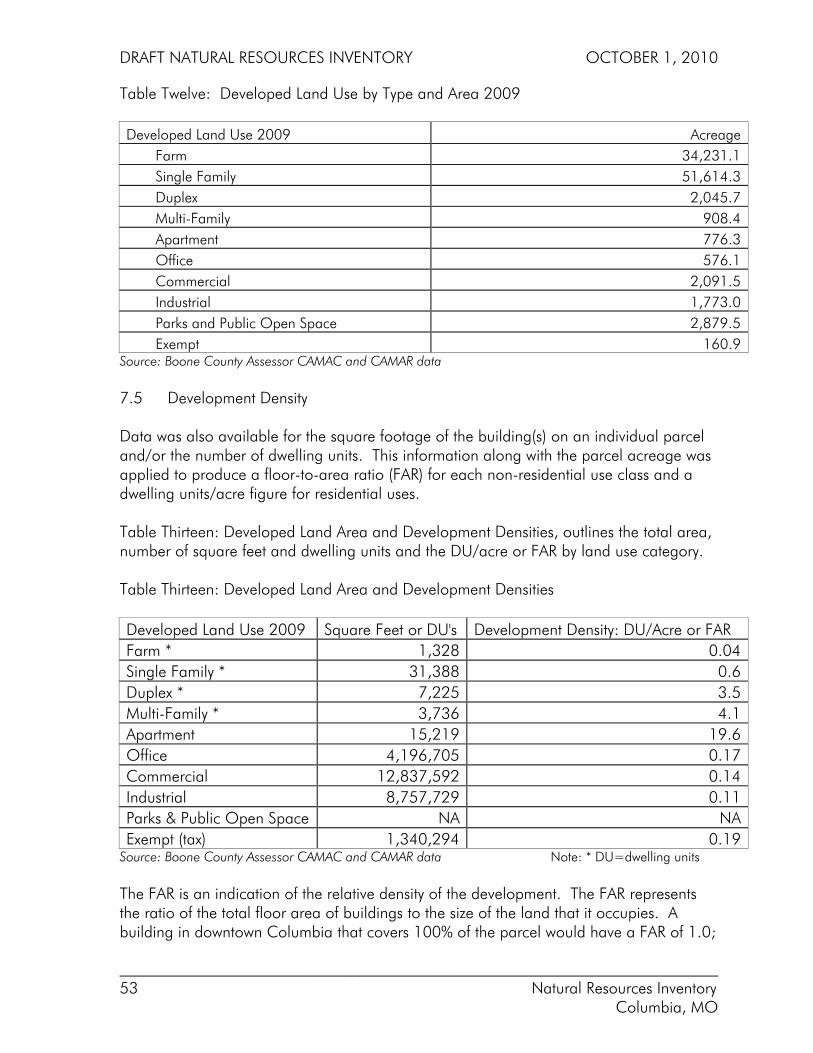
DRAFT NATURAL RESOURCES INVENTORY OCTOBER 1, 2010
___________________________________________________________________________ 53 Natural Resources Inventory Columbia, MO
Table Twelve: Developed Land Use by Type and Area 2009 Developed Land Use 2009 Acreage
Farm 34,231.1 Single Family 51,614.3 Duplex 2,045.7 Multi-Family 908.4 Apartment 776.3 Office 576.1 Commercial 2,091.5 Industrial 1,773.0 Parks and Public Open Space 2,879.5 Exempt 160.9
Source: Boone County Assessor CAMAC and CAMAR data 7.5 Development Density Data was also available for the square footage of the building(s) on an individual parcel and/or the number of dwelling units. This information along with the parcel acreage was applied to produce a floor-to-area ratio (FAR) for each non-residential use class and a dwelling units/acre figure for residential uses. Table Thirteen: Developed Land Area and Development Densities, outlines the total area, number of square feet and dwelling units and the DU/acre or FAR by land use category. Table Thirteen: Developed Land Area and Development Densities Developed Land Use 2009 Square Feet or DU's Development Density: DU/Acre or FAR Farm * 1,328 0.04 Single Family * 31,388 0.6 Duplex * 7,225 3.5 Multi-Family * 3,736 4.1 Apartment 15,219 19.6 Office 4,196,705 0.17 Commercial 12,837,592 0.14 Industrial 8,757,729 0.11 Parks & Public Open Space NA NA Exempt (tax) 1,340,294 0.19
Source: Boone County Assessor CAMAC and CAMAR data Note: * DU=dwelling units The FAR is an indication of the relative density of the development. The FAR represents the ratio of the total floor area of buildings to the size of the land that it occupies. A building in downtown Columbia that covers 100% of the parcel would have a FAR of 1.0;
DRAFT NATURAL RESOURCES INVENTORY OCTOBER 1, 2010
___________________________________________________________________________ 54 Natural Resources Inventory Columbia, MO
a multi-story building in the same location may have a FAR of 3.0. More typically, surface parking for non-residential uses covers many times the square footage of the building producing a FAR of less than 0.2. For residential uses, the number of dwelling units (DU) per acre is a standard indicator of the relative density of the development. The City of Columbia uses the DU/acre concept to establish the maximum permissible density for residential uses such as apartments and in planned unit developments directly in the regulations or through the establishment of minimum lot square footage requirements. The DU/acre for the single family category (0.6 DU/acre) is not indicative of most single family development in the urbanized area. A typical subdivision with centralized sewer will range from 2-5 DU’s/acre. This figure for the NRI area includes many large acreage residences primarily in the unincorporated area that suppresses the “typical” representation.

DRAFT NATURAL RESOURCES INVENTORY OCTOBER 1, 2010
___________________________________________________________________________ 55 Natural Resources Inventory Columbia, MO
CHAPTER EIGHT: FEDERAL, STATE, COUNTY, & CITY ENVIRONMENTAL REGULATIONS & PROGRAMS
8.1 Environmental Regulations The majority of regulations and statutory requirements related to natural resources issues have their origins at the Federal level. Prior to 1972, environmental legislation focused on soil conservation, erosion control, flood control and flood insurance with the Department of Agriculture serving as the administrative agency. Since the passage of the 1972 Clean Water Act, most water pollution control efforts have focused on point-source pollution. Point-source pollution generally comes from the millions of gallons of wastewater discharged from the pipes of industrial facilities and municipal sewage treatment plants into rivers, streams, lakes, and the ocean. Sources of wastewater may include commercial operations such as food processing facilities, agricultural operations, and industrial facilities. The Federal programs to address nonpoint source pollution have focused on the development of incentive programs to promote management practices that prevent or reduce pollution. Nonpoint source water pollution refers to contaminants that do not come from pipes or other permitted sources. It includes contaminants carried in runoff from fields, roads, parking lots, etc., as well as more specific sources such as improperly functioning septic systems. Agriculture is considered the primary source of this type of pollution, although urban areas represent a very significant source as do abandoned mine lands. Federal agencies authorized to administer environmental programs typically rely on State and local governments to serve as the permitting and enforcement agency for the implementation and enforcement of federal regulations. States are required to develop their own programs based on the federal regulations. Local government entities enact regulations intended to comply with the requisite federal mandates. In Missouri, the Department of Natural Resources is the principal agency that oversees the planning and permitting activities of local government and coordinates the review and approval processes with the appropriate federal agency. Boone County and the City of Columbia, under State auspices, are responsible for developing stormwater and flood plain regulations, as well as floodplain management and flood hazard mapping efforts to insure compliance with federal regulatory mandates within their jurisdictions. 8.2 Federal Government
The principal federal regulations related to water pollution are contained in the Clean Water Act. The principal body of law currently in effect is based on the Federal Water Pollution Control Amendments of 1972, which significantly expanded and strengthened

DRAFT NATURAL RESOURCES INVENTORY OCTOBER 1, 2010
___________________________________________________________________________ 56 Natural Resources Inventory Columbia, MO
earlier legislation. Major amendments were enacted in the Clean Water Act of 1977 and the Water Quality Act of 1987.
As amended, the Clean Water Act (CWA) is the cornerstone of surface water quality protection in the United States. The statute employs a variety of regulatory and nonregulatory tools to reduce direct pollutant discharges into waterways, finance municipal wastewater treatment facilities, and manage polluted runoff. These tools are employed to achieve the broader goal of restoring and maintaining the chemical, physical, and biological integrity of the nation's waters so that they can support "the protection and propagation of fish, shellfish, and wildlife and recreation in and on the water."
The basic goals of the CWA were intended to eliminate the use of lakes, rivers, and streams as waste transport/treatment systems and establish permissible level chemical contaminants in the nation’s water sources. To accomplish this goal, the CWA prohibits the discharge of any pollutant to waters of the United States unless the discharge is authorized by a National Pollutant Discharge Elimination System (NPDES) permit. The principal Federal agencies with regulatory oversight are the Environmental Protection Agency and the Army Corp of Engineers. Clean Water Act: 303d Water Quality Standards Section 303(d) of the federal Clean Water Act requires that each state identify rivers, streams and lakes that are not meeting water quality standards and for which adequate water pollution controls have not been required. Water quality standards protect such beneficial uses of water as whole body contact (such as swimming), maintaining fish and other aquatic life, and providing drinking water for people, livestock and wildlife. The 303(d) List helps state and federal agencies keep track of waters that are impaired but not addressed by normal water pollution control programs. As authorized by the Clean Water Act, the National Pollutant Discharge Elimination System (NPDES) permit program controls water pollution by regulating point sources that discharge pollutants into waters of the United States. Point sources are discrete conveyances such as pipes or man-made ditches. Individual homes that are connected to a municipal system, use a septic system, or do not have a surface discharge do not need an NPDES permit; however, industrial, municipal, and other facilities must obtain permits if their discharges go directly to surface waters. In most cases, the NPDES permit program is administered by authorized states. The State of Missouri is an authorized state and is responsible for NPDES permitting. For many years following the passage of CWA in 1972, the regulatory emphasis was on chemical water pollution. Efforts focused on regulating discharges from traditional "point source" facilities, such as municipal sewage plants and industrial facilities, with little attention paid to runoff from streets, construction sites, farms, and other "wet-weather"

DRAFT NATURAL RESOURCES INVENTORY OCTOBER 1, 2010
___________________________________________________________________________ 57 Natural Resources Inventory Columbia, MO
sources. Recent changes have expanded the scope of the CWA to include physical and biological integrity of the nation’s water resources Amendments to the CWA in 1987 added stormwater discharge to the NPDES permitting program. In response, the EPA developed Phase I of the NPDES Stormwater Program in 1990. The Phase I program addressed sources of stormwater runoff that had the greatest potential to negatively impact water quality and required NPDES permit coverage for stormwater discharges from:
• Medium and large municipal separate storm sewer systems located in incorporated places or counties with populations of 100,000 or more;
• Eleven categories of industrial activity which includes construction activity that disturbs five or more acres of land
Operators of the systems, facilities, and construction sites regulated under the Phase I were required to obtain a permit to cover the stormwater discharge leaving their sites.
The Phase II Final Rule, published in the Federal Register on December 8, 1999, requires NPDES permit coverage for stormwater discharges from:
• Certain regulated small municipal separate storm sewer systems; and • Construction activity disturbing between 1 and 5 acres of land
The Phase II regulations call for a local assessment of the storm water drainage system, including the mapping of major storm water pipes, outfalls, topography and areas of concentrated activities likely to be sources of storm water pollution.
The Missouri Department of Natural Resources (DNR) is responsible for the review and NPDES permitting, in conjunction with local municipal and county governments. In Columbia, the City of Columbia reviews all NPDES permits applying locally adopted regulations pertaining to stormwater and land disturbance and recommends either approval or disapproval. The City of Columbia is issued a NPDES permit by MoDNR to cover all City projects. DNR requires a land disturbance permit on disturbances greater than 1 acre. The City of Columbia requires a land disturbance permit on disturbances greater than 3,000 square feet.
Table Fourteen: Land Disturbance and Permit Requirements
Area To Be Disturbed Columbia City Land Disturbance Permit
MO DNR NPDES Permit Fee
< 3,000 square feet No No None
> 3,000 square feet < 1 acre Yes No $200 (City)
> than 1 acre Yes Yes City ($200) MO DNR ($300)
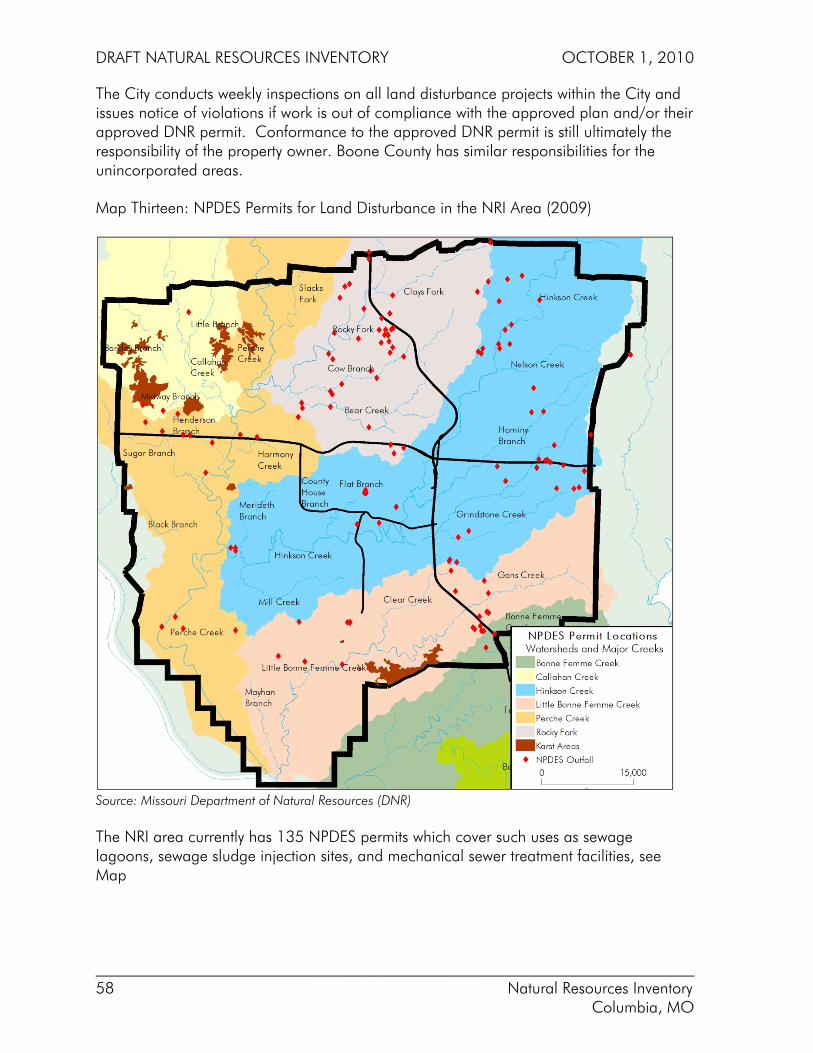
DRAFT NATURAL RESOURCES INVENTORY OCTOBER 1, 2010
___________________________________________________________________________ 58 Natural Resources Inventory Columbia, MO
The City conducts weekly inspections on all land disturbance projects within the City and issues notice of violations if work is out of compliance with the approved plan and/or their approved DNR permit. Conformance to the approved DNR permit is still ultimately the responsibility of the property owner. Boone County has similar responsibilities for the unincorporated areas.
Map Thirteen: NPDES Permits for Land Disturbance in the NRI Area (2009)
Source: Missouri Department of Natural Resources (DNR)
The NRI area currently has 135 NPDES permits which cover such uses as sewage lagoons, sewage sludge injection sites, and mechanical sewer treatment facilities, see Map
DRAFT NATURAL RESOURCES INVENTORY OCTOBER 1, 2010
___________________________________________________________________________ 59 Natural Resources Inventory Columbia, MO
Clean Water Act: Section 401
Section 401 of The Clean Water Act gives the authority to each state to issue a 401 Water Quality Certification (401 Certification) for any project that requires s a Federal 404 Permit (see 4.1.2). The 401 Certification is a formal verification by the state that the project will not violate water quality standards. In Missouri, the Department of Natural Resources (DNR) is charged with the review and verification responsibilities. As part of the 401 Certification, the DNR may require conditions for project certification in order to protect water quality.
The 401 certification is concerned with EPA regulations of discharges into waters regulated by the CWA. The 401 certification may occur prior to or as part of the Section 404 permit process which is deals with the actual construction activities planned to occur within those waters.
Clean Water Act: Section 404
Section 404 of the CWA contains the primary regulatory mechanism for the protection and management of the nation's waters and wetlands. Section 404 regulates the discharge of dredged material, placement of fill material, or excavation within waters of the United States and authorizes the Secretary of the Army, through the Chief of Engineers, to issue permits for such actions.
The fundamental rationale of the program is that no discharge of dredged or fill material should be permitted if there is a practical alternative that would be less damaging to aquatic resources or if significant degradation would occur to the nation’s waters. Permit review and issuance follows a sequence process that encourages avoidance of impacts, followed by minimizing impacts and, finally, requiring mitigation for unavoidable impacts to the aquatic environment.
The provisions of Section 404 apply to streams, rivers, lakes, lakes, tidal areas, and seas defined as “waters of the United States” and adjacent wetlands. Activities that require a 404 permit include:
• Depositing fill or dredged material in regulated waters • Construction of abutments and piers in regulated waters • Placement of riprap in regulated waters • Placement of culverts in regulated waters • Anything that requires that material be placed in regulated waters
Other federal agencies are involved with the Section 404 permit process. The EPA provides program oversight, and the U.S. Fish and Wildlife Service (FWS) serves an advisory role. Wetlands provide important feeding, breeding, and migration habitat for 50 percent of the migratory bird species in the U.S. and over 30 percent of plants and animals listed under the Endangered Species Act. The FWS is authorized to act under the Fish and Wildlife Coordination Act, Fish and Wildlife Act of 1956, Food Security Act,
DRAFT NATURAL RESOURCES INVENTORY OCTOBER 1, 2010
___________________________________________________________________________ 60 Natural Resources Inventory Columbia, MO
Anadromous Fish Conservation Act, Migratory Bird Treaty Act, and Endangered Species Act.
Flood Control Act of 1936 The Flood Control Act of 1936 initiated federal involvement along the navigable waters, their tributaries, and watersheds for the purposes of flood control. The Act focused on the preservation of life and property and commercial activity associated with the nation’s transportation system. The Army Corp of Engineers was authorized to construct levees, flood walls, improve or create river channels for ship and barge traffic, and a reservoir system to contain and manage river flows for flood control purposes.
National Flood Insurance Act of 1968
The National Flood Insurance Program (NFIP) was created by the Congress of the United States in 1968 through the National Flood Insurance Act of 1968. The intent was to reduce future flood damage through community floodplain management ordinances and provide protection for property owners against potential losses through an insurance mechanism that requires a premium to be paid for the protection. Participation in the NFIP is based on an agreement between local communities and the federal government which states that if a community will adopt and enforce a floodplain management ordinance to reduce future flood risks to new construction in Special Flood Hazard Areas (SFHA), the federal government will make flood insurance available within the community as a financial protection against flood losses.
Federal Emergency Management Agency (FEMA) manages the National Flood Insurance Program (NFIP). The three components of the NFIP are:
• Flood Insurance • Floodplain Management • Flood Hazard Mapping
In addition to providing flood insurance and reducing flood damages through floodplain management regulations, the NFIP identifies and maps the Nation's floodplains. Mapping flood hazards creates broad-based awareness of the flood hazards and provides the data needed for floodplain management programs and to actuarially rate new construction for flood insurance.
Floodplain management is the operation of a community program of corrective and preventative measures for reducing flood damage. These measures take a variety of forms and generally include requirements for zoning, subdivision or building, and special-purpose floodplain ordinances.
A community's agreement to adopt and enforce floodplain management ordinances, particularly with respect to new construction, is an important element in making flood insurance available to home and business owners. The City of Columbia and Boone
DRAFT NATURAL RESOURCES INVENTORY OCTOBER 1, 2010
___________________________________________________________________________ 61 Natural Resources Inventory Columbia, MO
County both have floodplain management ordinances in force that mandate building standards for new and existing development in designated floodplain areas.
The Endangered Species Act
The Endangered Species Act of 1973 (ESA) provides for the conservation of species that are endangered or threatened throughout all or a significant portion of their range, and the conservation of the ecosystems on which they depend. The ESA replaced the Endangered Species Conservation Act of 1969 and it been amended several times since enactment.
A "species" is considered endangered if it is in danger of extinction throughout all or a significant portion of its range. A species is considered threatened if it is likely to become an endangered species within the foreseeable future.
The list of federal species is developed by the U.S. Fish and Wildlife Service, Department of the Interior. Federal listing is a rigorous process that includes peer review, a published notice in the Federal Register, and a period of public comment.
The ESA provides for different programs to conserve endangered and threatened species:
Listing of Endangered and Threatened Species Identifying Critical Habitat Species Recovery Plans Habitat Conservation Plans & Permits Enforcement and Penalties
The Department of Interior’s U.S. Fish and Wildlife Service and the Department of Commerce’s National Oceanic and Atmospheric Administration (NOAA) National Marine Fisheries Service share responsibility for implementing the program activities under the Endangered Species Act.
Soil Conservation and Domestic Allotment Act
The Soil Conservation and Domestic Allotment Act of 1935 authorized the federal government to pay farmers to reduce production in order to conserve soil and prevent erosion. The act established the Soil Conservation Services and empowered it to conduct a national program of soil erosion prevention through technical and financial aid to farmers who agreed to implement soil conservation practices.
Starting in 1937, the SCS initiated the soil conservation district concept whereby the federal government would work through state-created conservation districts to meet federal goals. The Secretary of Agriculture was to provide financial assistance to agricultural producers for carrying out conservation and environmental enhancement measures.
DRAFT NATURAL RESOURCES INVENTORY OCTOBER 1, 2010
___________________________________________________________________________ 62 Natural Resources Inventory Columbia, MO
In 1994, the Soil Conservation Service was reorganized and renamed the Natural Resource Conservation Service.
The 1996 Farm Bill repealed certain of these incentive programs and amended the Act to provide financial and technical assistance through the new environmental quality incentives program described in the Food Security Act of 1985 for the preservation of wetland areas through the Wetlands Reserve Program.
The Wetlands Reserve Program is a voluntary program offering landowners the opportunity to protect, restore, and enhance wetlands on their property. The USDA Natural Resources Conservation Service (NRCS) provides technical and financial support to help landowners with their wetland restoration efforts. The NRCS goal is to achieve the greatest wetland functions and values, along with optimum wildlife habitat, on every acre enrolled in the program. This program offers landowners an opportunity to establish long-term conservation and wildlife practices and protection.
Emergency Watershed Protection Programs
The Natural Resource Conservation Service Soil and Water Conservation Section 382 of the Federal Agriculture Improvement and Reform Act provide a program for the purchase of floodplain easements as an emergency measure. The National Resource Conservation Service identifies and purchases floodplain easements on properties that qualify for Emergency Watershed Protection (EWP) program assistance. The floodplain easements are intended to restore, protect, maintain, and enhance the functions of the floodplain; conserve natural values including fish and wildlife habitat, water quality, flood water retention, ground water recharge, and open space; reduce long-term federal disaster assistance; and safeguard lives and property from floods, drought, and the products of erosion. soil survey, watershed projects, water quality, outreach, resource conservation and development and plant materials.
8.3 State of Missouri Statutes The State of Missouri through the Department of Natural Resources is the agency responsible for implementing programs and enforcement of State and Federal regulations related to land, air and water resources. Missouri Revised Statutes Chapter 644 Missouri Revised Statutes Chapter 644, known as the Missouri Clean Water Law, creates Clean Water Commission to develop and administer the regulatory processes required by federal law. Chapter 644 provides for State oversight of water pollution control, the safety of public drinking water sources, and storm water control. The State program does not preclude additional permitting requirements at the county and municipal level.
DRAFT NATURAL RESOURCES INVENTORY OCTOBER 1, 2010
___________________________________________________________________________ 63 Natural Resources Inventory Columbia, MO
The State of Missouri Department of Natural Resources is responsible for administrating the CWA Section 303d National Pollutant Discharge Elimination System (NPDES) permitting, Section 401 Water Quality Standards, and CWA Section 404 water quality permits. MRS 644 creates the Clean Water Commission which is a seven-member citizen's board that is appointed by the Governor and confirmed by the Senate. The commission is responsible for:
• Developing Missouri's Water Quality Standards; • Listing Missouri's impaired waters; • Developing the CWA 303(d) list; • Issuance of permits limiting the discharge of pollutants into the state's waters; • Directing enforcement actions for violation of the Missouri Clean Water Law and
implementing regulations; • Certification of operators of municipal wastewater facilities and the largest
Concentrated Animal Feeding Operation (CAFO) waste management systems; • Financial assistance to protect and preserve water quality; • Develop the Nonpoint Source Management Plan outlining Missouri's approach to
addressing nonpoint problems; and • Maintaining the 303(e) Continuing Planning Process to coordinate all water
pollution control efforts to assure the state maintains progress toward protecting and preserving water quality.
The Department of Natural Resources (DNR) is responsible for the 401 Certification review. DNR must verify that a project will not violate water quality standards. A 401 Certification is needed when placing material, or fill, into the waters or wetlands regulated under the Clean Water Act. As part of the 401 Certification permit, DNR may place conditions on a project to ensure that water quality is protected. The 404 permitting is the responsibility of the U.S. Army Corps of Engineers. The Missouri Department of Natural Resources (DNR) is responsible for day-to-day administration of the State’s storm water management program. Missouri’s stormwater program is closely modeled after the federal NPDES program, which requires stormwater be treated to the maximum extent practicable (MEP). Numeric treatment requirements specific to stormwater have not been established at the state level, but water quality parameters can be established on a site-by-site basis when the risk of contamination is present.
For the NPDES, the DNR establishes permitting requirements for construction sites disturbing more than one acre, industrial sites, and Municipal Separate Storm Sewer Systems (MS4). All MS4’s are responsible for establishing a Stormwater Management Program.
DRAFT NATURAL RESOURCES INVENTORY OCTOBER 1, 2010
___________________________________________________________________________ 64 Natural Resources Inventory Columbia, MO
Missouri Revised Statutes (MSR) Chapter 278 Soil Conservation MRS Chapter 278 designates the Curators of the University of Missouri the State agency responsible for the administration of plans authorized by the federal Soil Conservation and Domestic Allocation Act. The Agricultural Extension Service in connection with the University of Missouri - College of Agriculture is responsible for program activities and planning under the Act. Endangered Species The Missouri Department of Conservation (MDC) is responsible for the listing of endangered species in Missouri. The listing process is lead by the MDC Endangered Species Coordinator with the participation of many Department biologists and managers as well as professionals from colleges, universities, and participation organizations. In the past, committees of three to five people who are knowledgeable of the respective animal or plant group met to review and recommend a protection status. State status is determined by the Wildlife Code of Missouri, where only endangered species are listed. Missouri does not have a ‘threatened’ status. There are currently 306 species of plant and animals listed as endangered in Missouri, of which 30 species are also listed by U.S. Fish and Wildlife Service, Department of the Interior. Appendix A: Missouri Endangered and Threatened Species, list the animals and plants covered. 8.4 Boone County Boone County is responsible for regulation flood prone areas and the management of land disturbance permits within the unincorporated areas. The County zoning ordinance is the source for the regulatory authority. Boone County Zoning Regulations - Section 22 Floodplain Management The Planning Division maintains the County Flood Insurance Rate Maps and enforces the Flood Plain Regulations. All building permit applications are checked against the flood maps to determine the location of a proposed structure relative to the regulatory floodplain. Structures proposed for the floodplain fringe area can be built provided that they are either elevated or flood proofed. There are very strict prohibitions against building in the floodway itself, however, agricultural structures are allowed provided that they can be designed and built such that flood waters are allowed to pass through the structure. Boone County Zoning Regulations - Section 26 Stream Buffer Regulations Adopted in April 2010, the Stream Buffer Regulations establish the minimum acceptable standards for the design of stream buffers to protect the streams, wetlands, floodplains
DRAFT NATURAL RESOURCES INVENTORY OCTOBER 1, 2010
___________________________________________________________________________ 65 Natural Resources Inventory Columbia, MO
and riparian and aquatic ecosystems of the County of Boone, and the implementation of specifications for the establishment, protection and maintenance of vegetation along all stream systems and other regulated waters within the unincorporated areas of Boone County. The key regulatory features included:
• Design standards for stream buffers based on stream type • Extended buffers based on slopes over 15% requires additional width • Exemptions for certain uses
Exempted projects include agricultural and silvicultural use, utilities and pipelines, maintain and repair of stormwater BMP’s and any part of a land development approved by the Boone County Planning Department prior to April 15, 2010. The Boone County regulations have identical stream buffers standards for buffer widths for each of the three types of streams with the exception of the requirements in Section 26.5.4; which states that steep slopes greater than 15% for areas adjacent to and within 200 feet of Type I, II or III streams. An additional 25 feet of buffer area is required for slope areas of 15%-25%, and 50 feet of additional buffer area for slope areas greater than 25%. Boone County Stormwater Ordinance This ordinance establishes the minimum stormwater management requirements for development and redevelopment in the watershed within Boone County. This covers land development of sites greater than one acre, redevelopment that adds or creates 3,000 square feet of impervious surface, and land development in or near ecologically and/or environmentally sensitive areas. The Boone County Planning and Building Department is responsible for issuing land disturbance permits. Hinkson Creek Watershed Management Plan
In 2009, the Boone County Commission began a three-year project funded by a Department of Natural Resources grant to study the Hinkson Creek watershed and determine best-management practices (BMP) for landowners in the environmentally sensitive area.
The goal is to study, manage and make the public aware of excessive runoff, which DNR officials anticipate will be identified as a main polluter of Hinkson Creek. The University of Missouri is engaged with the study to evaluate the effectiveness of the BMP’s in place in the Hinkson Creek watershed.
DRAFT NATURAL RESOURCES INVENTORY OCTOBER 1, 2010
___________________________________________________________________________ 66 Natural Resources Inventory Columbia, MO
Boone Femme Watershed Plan
In June of 2003, Boone County received an EPA grant through the Missouri Department of Natural Resources to address various stream-related issues in the Bonne Femme and Little Bonne Femme Watersheds. The area covered by the plan includes parts of the City of Columbia and the City of Ashland, including Rock Bridge Memorial State Park and Three Creeks Conservation Area. The plan identifies procedures and policies that will help protect the streams in the watersheds, including construction and post-construction BMPs, plat design, and expand areas officially designated as karst. Technical assistance to developers, builders and land owners to promote the use of best management practices (BMPs) for stormwater that will help protect the water quality within the Bonne Femme and Little Bonne Femme watersheds. The Bonne Femme Watershed Plan was completed in February 2007. 8.5 City of Columbia The City of Columbia regulates land disturbance, manages the flood plain and stormwater and has provisions for tree preservation outlined in the City Code of Ordinances. In addition, several plans have been adopted over the course of 75 years that focus attention on the riparian or “greenbelt” corridors in and around the City. The City operates programs that contribute to water quality and educate the public about the responsible disposal of household chemicals. For flood control, land disturbance, and stream buffers, the City of Columbia shares regulatory responsibilities similar to Boone County. The City’s stream buffer requirements are identical to Boone County, with the exception of specifying additional buffer distances for steep slopes. Chapter 12A: Land Preservation Chapter 12A of the City Code provides the regulations for:
• Land Disturbance: permits for areas between 3,000 sq ft and 1 acre; not covered by the State of Missouri NPDES permitting,
• Tree Preservation: Article III outlines the requirements for clearing trees
• Erosion Control: Article IV
• Stormwater Management: Article V
• Best management practices (BMP) Article IX
• Stream Buffer Requirements Article X
When this chapter was first included in to the City Code in 1991, it covered land disturbance, erosion, and tree preservation. To comply with the provisions of the federal
DRAFT NATURAL RESOURCES INVENTORY OCTOBER 1, 2010
___________________________________________________________________________ 67 Natural Resources Inventory Columbia, MO
Clean Water Act -Section 303(d)-NPDES Phase II, the City of Columbia, Missouri developed and adopted a set of new stormwater regulations in 2007. Stream buffer requirements were added to Chapter 12A of the City Code of Ordinances and additional modifications to the stormwater requirements were made effective on September 4, 2007.
Floodplain Management Chapter 29: Zoning – Section 22 District F-1 Floodplain Overlay District. The City of Columbia, Missouri enacts floodplain management regulations under its authority to adopt zoning regulations designed to protect the health, safety and general welfare which authority was granted to the City of Columbia as a home rule charter city by the people of the State of Missouri in Article VI, Section 19(a) of the Missouri Constitution and by the General Assembly of the State of Missouri in Chapter 89 of the Missouri Revised Statutes. The flood plain overlay applies to all lands within the jurisdiction of the City of Columbia identified on the flood insurance rate map (FIRM). In all areas covered by this section, no development shall be permitted except upon the issuance of a floodplain permit to develop granted by the Director of Public Works. under such safeguards and restriction as the Director of Public Works may reasonably impose for the promotion and maintenance of the general welfare and health of the inhabitants of the community and where specifically noted in this section. City of Columbia Stormwater Management Plan In 2010, the City of Columbia anticipates the completion of stream assessments for all perennial streams and the development of procedures for providing this information to the development community. The Stormwater Manual should be amended to allow andencourage developers to obtain stream assessment information from the City where it is available. Assessment results should be used to develop stream restoration projects. These projects could be incorporated into the capital improvement program at the same time as the recommended stormwater master plan. 1935 Columbia Land Use Plan The 1935 Columbia Land Use Plan showed a greenbelt in portions of the City, using the term "parkway" to identify them. The plan describes parkways as "usually elongated park areas, often preserving a natural stream valley, and usually providing, either through the area, or on the borders, roadways for pleasure driving". It also states that other purposes include "preserving natural water channels, thus often avoiding the cost of storm sewers; and also providing local recreation areas for adjacent property". Even then, consideration was being given to stream corridor preservation for a variety of reasons. These parkways

DRAFT NATURAL RESOURCES INVENTORY OCTOBER 1, 2010
___________________________________________________________________________ 68 Natural Resources Inventory Columbia, MO
were thought to be part of a scenic highway system, as well as providing recreation opportunities. The 1935 Plan envisioned a greenbelt corridor that would in effect constitute scenic roadways, the current vision does not include such streets as part of the greenbelt concept. Rather, recreational, environmental, scenic, and a variety of other community values are justification for having a greenbelt. Columbia Metro 2020 The City of Columbia Metro 2020 planning document provides guidance for land use and development decisions in the City. Metro 2020 outlines five land use districts; central city, commercial, employment, neighborhood and open space. As defined in the 2020 Plan, this district is to provide for the aesthetic and recreational needs of the community’s residents. It also is intended to protect sensitive environmental areas from development and to preserve natural areas. The Metro 2020 open space district is comprised of the 100 year flood plain, park land, and recreational facilities such as golf courses and trails. Map Fourteen: Metro 2020 Greenbelt/Open Space District shows the coverage within the NRI area. The City of Columbia is responsible for the implementation of the Metro 2020 Plan. Greenbelt Plan Public interest was responsible for the implementation of the first specific greenbelt plans in Columbia. Citizens expressed concern that the City’s natural areas, especially the undeveloped lands adjoining the City’s creeks, were threatened by development. A grassroots public effort was undertaken to preserve these undeveloped lands. The development of a greenbelt plan and the establishment of policies on local creeks and their adjacent lands was seen as an initial step to address this issue and to raise local awareness. This led to the Columbia City Council taking action in response to this public sentiment.
The City of Columbia passed policy resolutions on greenbelts in 1993 and 1995. The most specific of these, PR 42-95A, adopted the Hinkson Creek and Bear Creek Greenbelt Plans and established policy goals for the greenbelt plans. The resolution states "The primary goal of the greenbelt plans is to maintain and preserve open space along major stream corridors. This goal should be accomplished preferably by private ownership or action, or by public acquisition of land or flood plain regulations." Another stated goal was the construction of trails within specific portions of the greenbelt corridor where "appropriate and feasible". Subdividers and developers of land, in addition to other property owners adjacent to and within the designated greenbelt, are encouraged to provide easements or donations of land to the City in order to provide greenbelt protection and access. Map Fourteen: Metro 2020 Greenbelt/Open Space District
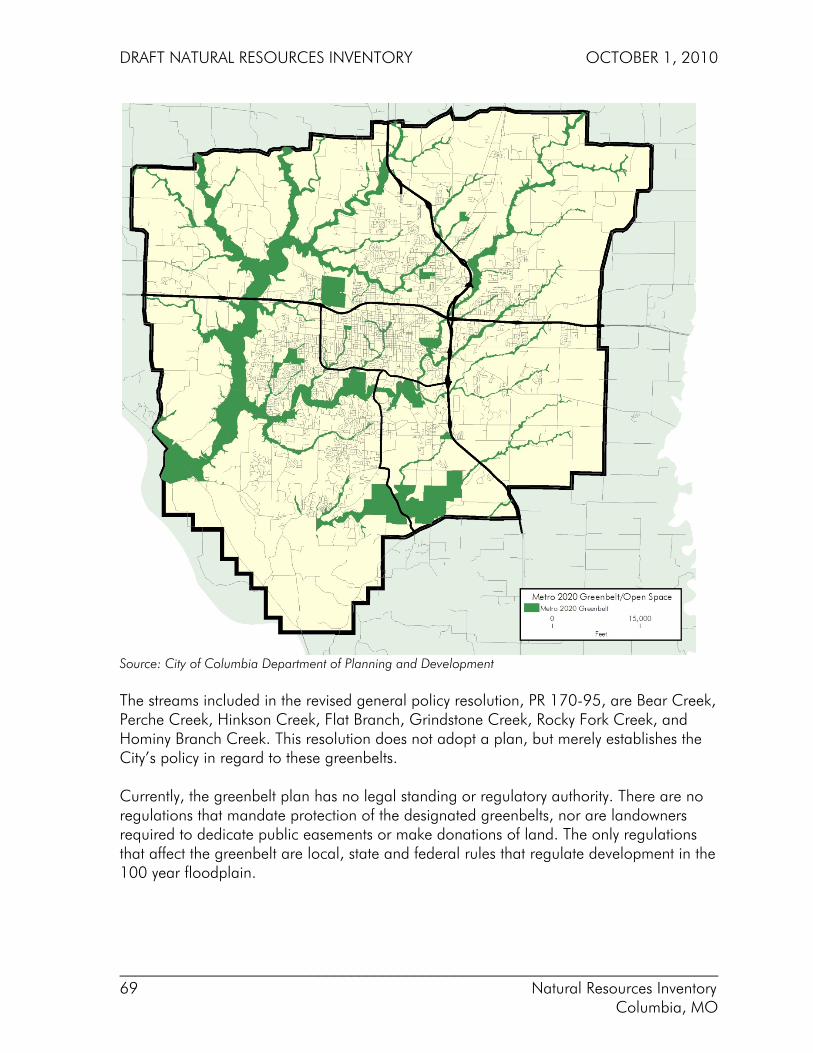
DRAFT NATURAL RESOURCES INVENTORY OCTOBER 1, 2010
___________________________________________________________________________ 69 Natural Resources Inventory Columbia, MO
Source: City of Columbia Department of Planning and Development The streams included in the revised general policy resolution, PR 170-95, are Bear Creek, Perche Creek, Hinkson Creek, Flat Branch, Grindstone Creek, Rocky Fork Creek, and Hominy Branch Creek. This resolution does not adopt a plan, but merely establishes the City’s policy in regard to these greenbelts. Currently, the greenbelt plan has no legal standing or regulatory authority. There are no regulations that mandate protection of the designated greenbelts, nor are landowners required to dedicate public easements or make donations of land. The only regulations that affect the greenbelt are local, state and federal rules that regulate development in the 100 year floodplain.
DRAFT NATURAL RESOURCES INVENTORY OCTOBER 1, 2010
___________________________________________________________________________ 70 Natural Resources Inventory Columbia, MO
Household Hazardous Wastes Program
The City of Columbia offers a voluntary household hazardous waste collection and disposal program. The collection and proper disposal of unwanted toxic products such as used motor oil, paint and gardening chemicals reduces the potential pollutants that might otherwise enter the municipal sewer and storm sewer systems.
8.6 Non-Government Organizations (NGO) Non-government organizations (NGO’s) provide programs to promote conservation and the preservation of natural resources. Many NGO’s partner with Federal, State and local government as well as private companies and landowners to provide:
• Education on environmental and conservation issues; • Advocate environmental preservation and conservation issues; and • Purchasing properties and conservation easements to implement environmental
preservation and conservation.
Audubon Society
The Audubon Society’s stated mission is to conserve and restore natural ecosystems, focusing on birds, other wildlife, and their habitats for the benefit of humanity and the earth's biological diversity.
The Aubudon Society operates a national network of community-based nature centers and local chapters, supporting scientific and educational programs, and advocacy on behalf of areas sustaining important bird populations. The goal is to engage people of all ages and backgrounds in positive conservation experiences.
Locally, the Aududon Society owns several properties adjacent to City of Columbia parks.
Nature Conservancy
The Nature Conservancy is a national organization with a mission to preserve the plants, animals and natural communities that represent the diversity of life on Earth by protecting the lands and waters they need to survive.
Through a strategy of purchasing properties and partnerships with communities, businesses, governments, and other organizations, the Nature Conservancy promotes the preservation of lands and waters for future generations to use and enjoy.
Greenbelt Land Trust The Greenbelt Land Trust is a local organization dedicated to the conservation of non-developed areas that will contribute to the protection of water quality and preservation of a network of green space in mid-Missouri. The organization started in 1993 as the
DRAFT NATURAL RESOURCES INVENTORY OCTOBER 1, 2010
___________________________________________________________________________ 71 Natural Resources Inventory Columbia, MO
Greenbelt Coalition of Mid-Missouri, an advocacy partnership for a network of "greenbelt" lands in and around the City of Columbia. The Greenbelt Land Trust works with conservation-minded private landowners who voluntarily choose to preserve the natural or agricultural character of their property permanently through donations of land, and by donations of conservation easements on privately held land to the Greenbelt Land Trust. Locally, the Greenbelt Land Trust manages several properties, most notably, a tract adjacent to the City of Columbia’s Capen Park and the Hinkson Creek Trail.

DRAFT NATURAL RESOURCES INVENTORY OCTOBER 1, 2010
___________________________________________________________________________ 72 Natural Resources Inventory Columbia, MO
- Blank -
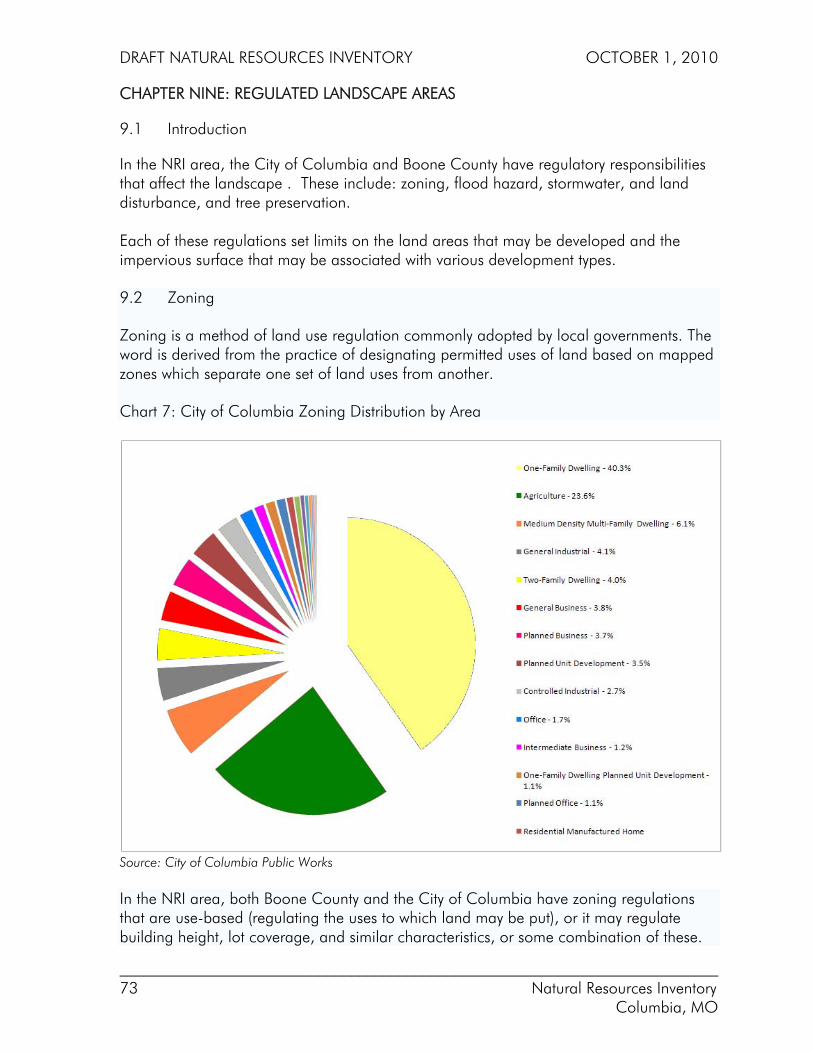
DRAFT NATURAL RESOURCES INVENTORY OCTOBER 1, 2010
___________________________________________________________________________ 73 Natural Resources Inventory Columbia, MO
CHAPTER NINE: REGULATED LANDSCAPE AREAS
9.1 Introduction
In the NRI area, the City of Columbia and Boone County have regulatory responsibilities that affect the landscape . These include: zoning, flood hazard, stormwater, and land disturbance, and tree preservation. Each of these regulations set limits on the land areas that may be developed and the impervious surface that may be associated with various development types.
9.2 Zoning
Zoning is a method of land use regulation commonly adopted by local governments. The word is derived from the practice of designating permitted uses of land based on mapped zones which separate one set of land uses from another.
Chart 7: City of Columbia Zoning Distribution by Area
Source: City of Columbia Public Works
In the NRI area, both Boone County and the City of Columbia have zoning regulations that are use-based (regulating the uses to which land may be put), or it may regulate building height, lot coverage, and similar characteristics, or some combination of these.
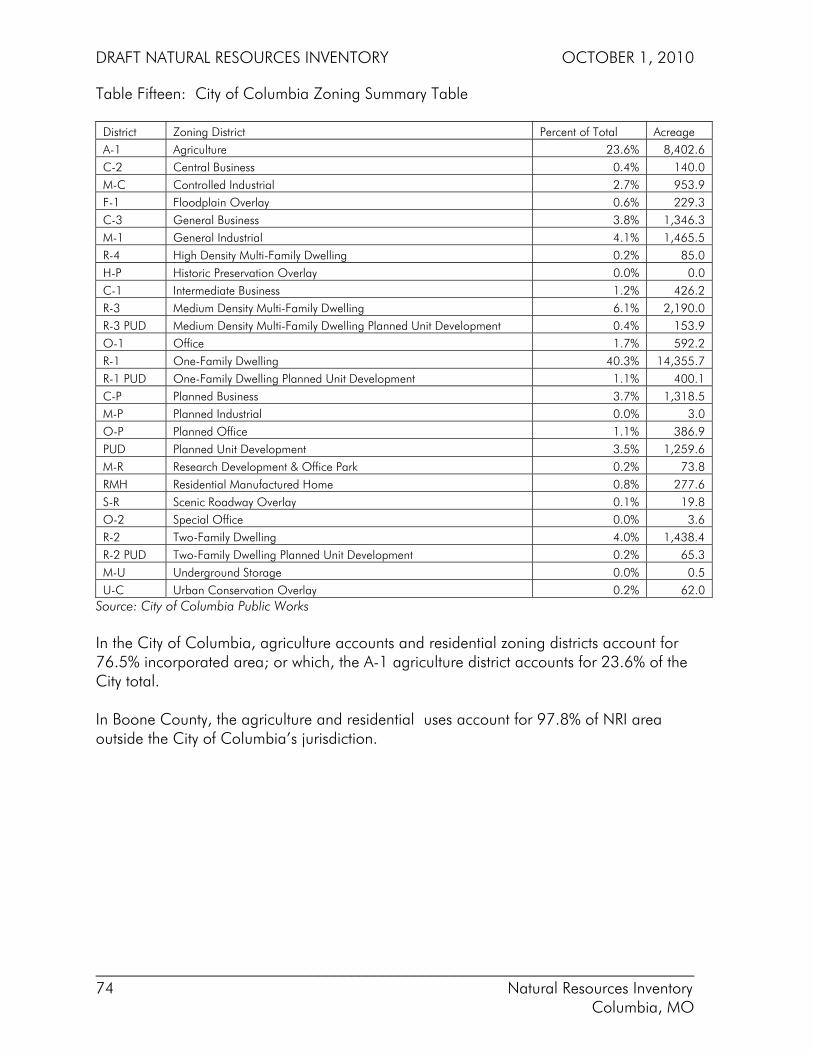
DRAFT NATURAL RESOURCES INVENTORY OCTOBER 1, 2010
___________________________________________________________________________ 74 Natural Resources Inventory Columbia, MO
Table Fifteen: City of Columbia Zoning Summary Table
District Zoning District Percent of Total Acreage A-1 Agriculture 23.6% 8,402.6 C-2 Central Business 0.4% 140.0 M-C Controlled Industrial 2.7% 953.9 F-1 Floodplain Overlay 0.6% 229.3 C-3 General Business 3.8% 1,346.3 M-1 General Industrial 4.1% 1,465.5 R-4 High Density Multi-Family Dwelling 0.2% 85.0 H-P Historic Preservation Overlay 0.0% 0.0 C-1 Intermediate Business 1.2% 426.2 R-3 Medium Density Multi-Family Dwelling 6.1% 2,190.0 R-3 PUD Medium Density Multi-Family Dwelling Planned Unit Development 0.4% 153.9 O-1 Office 1.7% 592.2 R-1 One-Family Dwelling 40.3% 14,355.7 R-1 PUD One-Family Dwelling Planned Unit Development 1.1% 400.1 C-P Planned Business 3.7% 1,318.5 M-P Planned Industrial 0.0% 3.0 O-P Planned Office 1.1% 386.9 PUD Planned Unit Development 3.5% 1,259.6 M-R Research Development & Office Park 0.2% 73.8 RMH Residential Manufactured Home 0.8% 277.6 S-R Scenic Roadway Overlay 0.1% 19.8 O-2 Special Office 0.0% 3.6 R-2 Two-Family Dwelling 4.0% 1,438.4 R-2 PUD Two-Family Dwelling Planned Unit Development 0.2% 65.3 M-U Underground Storage 0.0% 0.5 U-C Urban Conservation Overlay 0.2% 62.0
Source: City of Columbia Public Works In the City of Columbia, agriculture accounts and residential zoning districts account for 76.5% incorporated area; or which, the A-1 agriculture district accounts for 23.6% of the City total. In Boone County, the agriculture and residential uses account for 97.8% of NRI area outside the City of Columbia’s jurisdiction.
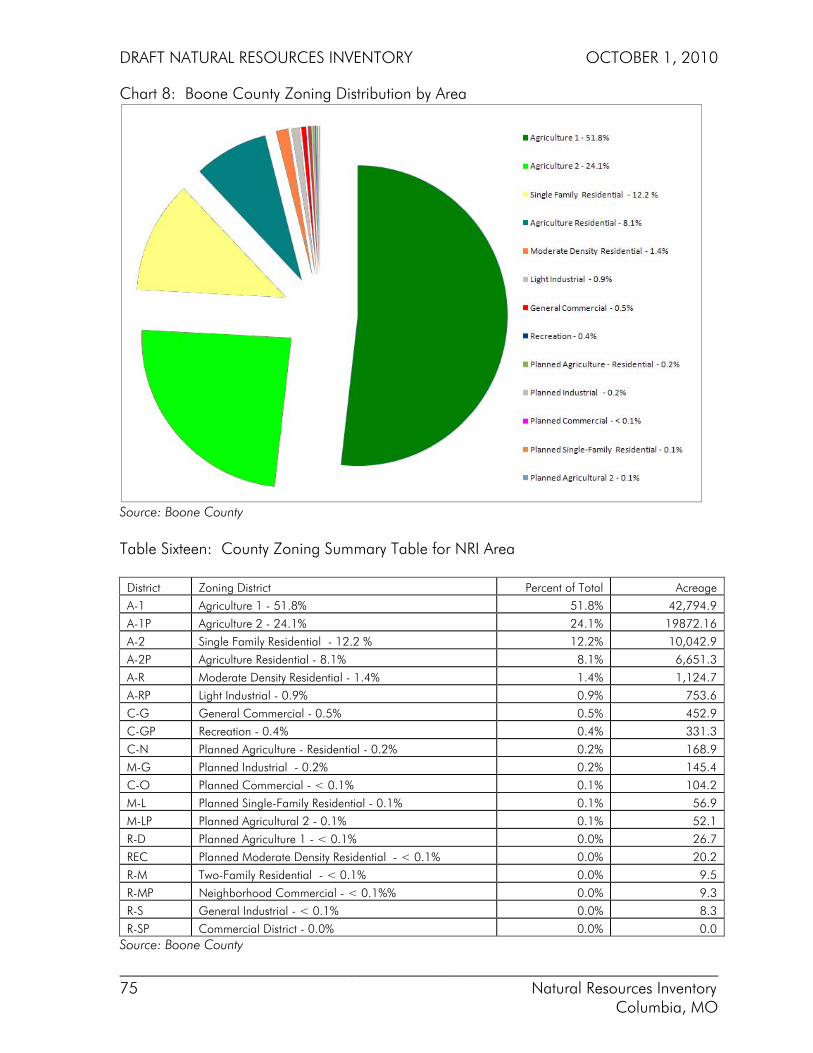
DRAFT NATURAL RESOURCES INVENTORY OCTOBER 1, 2010
___________________________________________________________________________ 75 Natural Resources Inventory Columbia, MO
Chart 8: Boone County Zoning Distribution by Area
Source: Boone County Table Sixteen: County Zoning Summary Table for NRI Area
District Zoning District Percent of Total Acreage
A-1 Agriculture 1 - 51.8% 51.8% 42,794.9
A-1P Agriculture 2 - 24.1% 24.1% 19872.16
A-2 Single Family Residential - 12.2 % 12.2% 10,042.9
A-2P Agriculture Residential - 8.1% 8.1% 6,651.3
A-R Moderate Density Residential - 1.4% 1.4% 1,124.7
A-RP Light Industrial - 0.9% 0.9% 753.6
C-G General Commercial - 0.5% 0.5% 452.9
C-GP Recreation - 0.4% 0.4% 331.3
C-N Planned Agriculture - Residential - 0.2% 0.2% 168.9
M-G Planned Industrial - 0.2% 0.2% 145.4
C-O Planned Commercial - < 0.1% 0.1% 104.2
M-L Planned Single-Family Residential - 0.1% 0.1% 56.9
M-LP Planned Agricultural 2 - 0.1% 0.1% 52.1
R-D Planned Agriculture 1 - < 0.1% 0.0% 26.7
REC Planned Moderate Density Residential - < 0.1% 0.0% 20.2
R-M Two-Family Residential - < 0.1% 0.0% 9.5
R-MP Neighborhood Commercial - < 0.1%% 0.0% 9.3
R-S General Industrial - < 0.1% 0.0% 8.3
R-SP Commercial District - 0.0% 0.0% 0.0 Source: Boone County

DRAFT NATURAL RESOURCES INVENTORY OCTOBER 1, 2010
___________________________________________________________________________ 76 Natural Resources Inventory Columbia, MO
9.3 Floodplain
The local regulation of floodplains is the product of the National Flood Insurance Program administered by the Federal Emergency Management Agency (FEMA). A community must agree to adopt and enforce floodplain management ordinances. FEMA’s decision to make flood insurance available to local home and business owners, especially for new construction, is dependent upon local regulations intended to avoid flood losses.
Map Fifteen: FEMA “100 Year” Flood Hazard Areas in the NRI
Source: City of Columbia Public Works
The City of Columbia and Boone County have adopted and enforce local floodplain management ordinances that provide flood loss reduction building standards for new and existing development. A key element is the flood hazard map which identifies the “100 Year” flood plain for regulatory purposes.

DRAFT NATURAL RESOURCES INVENTORY OCTOBER 1, 2010
___________________________________________________________________________ 77 Natural Resources Inventory Columbia, MO
Floodplain management is the operation of a community program of corrective and preventative measures for reducing flood damage. These measures take a variety of forms and generally include requirements for zoning, subdivision or building, and special-purpose floodplain ordinances.
9.4 Stormwater Under the provision of the Clean Water Act, the Environmental Protection Agency (EPA) has issued two final rules to implement the act. Phase 1 created the National Pollutant Discharge Elimination System (NPDES) permit requirement to address runoff issues from large scale municipal sewer systems and industrial uses. The Phase II final rule required local governments to develop ordinances/regulations to control the unregulated stormwater runoff to preserve water quality. Boone County and the City of Columbia both have stormwater regulations in place which establish buffer areas around certain classes of streams and karst features to reduce the amount of soil and surface containments entering local creeks and streams. Map 16: Applicability of City of Columbia Stormwater Regulations shows the exempt and non-exempt areas in Columbia. Stream buffer areas serve as natural boundaries between local waterways and existing development. They help protect water quality by filtering pollutants, sediment, and nutrients from runoff. Other benefits of buffers include flood control, stream bank stabilization, stream temperature control, and room for lateral movement of the stream channel. Good aquatic buffer ordinances specify the size and management of the stream buffer and are a specific planning tool to protect stream quality and aquatic habitat. The storm water buffer requirements are based on the type of stream. Type I and Type II streams are those shown on USGS maps as solid or dashed blue lines (see Map 16). These are the “blue line” streams that are often frequently mentioned. Type III are the non-blue line, are ephemeral streams draining an area of 50 acres or larger. The buffer area begins at the ordinary high water mark and includes two distinct buffer areas; a streamside buffer to protect the physical, biological and ecological integrity of the stream and an outer buffer to prevent encroachment into the streamside zone and to maintain vegetation to filter runoff from residential and commercial development. The buffer requirements for by stream type are:
• Type I – Perennial: 50 feet • Type II - Intermittent: 25 feet • Type III – Minimum drainage catchment 50 acres: 15 feet
Boone County stormwater regulations have an additional 200 foot buffer requirement for sinkholes and karst features. The application of the stormwater buffer requirement is not universal. Within the City of Columbia, properties that were subdivided or had an approved preliminary plat prior to
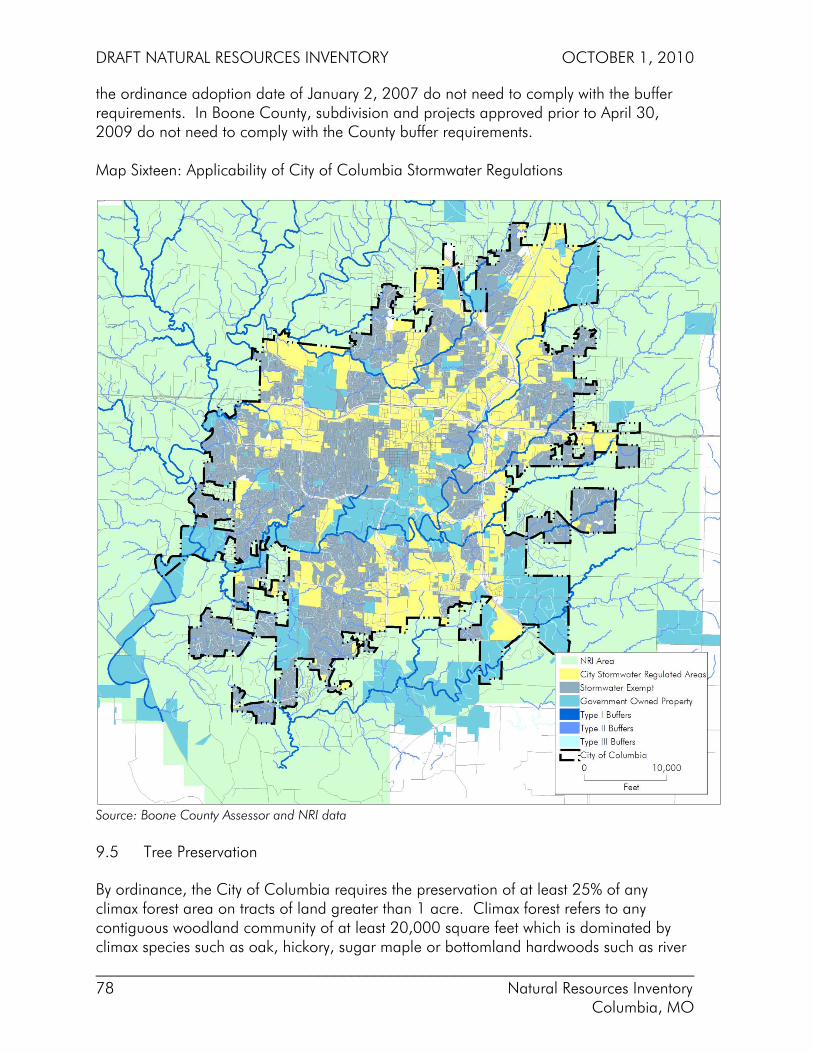
DRAFT NATURAL RESOURCES INVENTORY OCTOBER 1, 2010
___________________________________________________________________________ 78 Natural Resources Inventory Columbia, MO
the ordinance adoption date of January 2, 2007 do not need to comply with the buffer requirements. In Boone County, subdivision and projects approved prior to April 30, 2009 do not need to comply with the County buffer requirements. Map Sixteen: Applicability of City of Columbia Stormwater Regulations
Source: Boone County Assessor and NRI data 9.5 Tree Preservation By ordinance, the City of Columbia requires the preservation of at least 25% of any climax forest area on tracts of land greater than 1 acre. Climax forest refers to any contiguous woodland community of at least 20,000 square feet which is dominated by climax species such as oak, hickory, sugar maple or bottomland hardwoods such as river
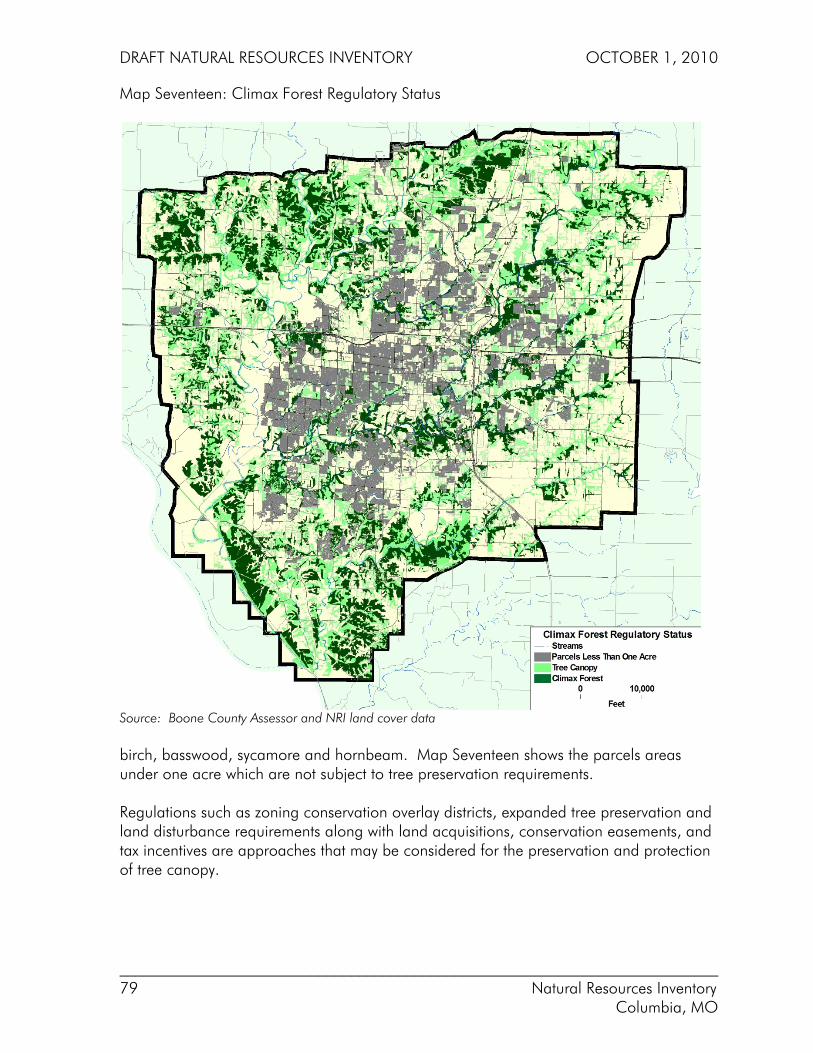
DRAFT NATURAL RESOURCES INVENTORY OCTOBER 1, 2010
___________________________________________________________________________ 79 Natural Resources Inventory Columbia, MO
Map Seventeen: Climax Forest Regulatory Status
Source: Boone County Assessor and NRI land cover data birch, basswood, sycamore and hornbeam. Map Seventeen shows the parcels areas under one acre which are not subject to tree preservation requirements. Regulations such as zoning conservation overlay districts, expanded tree preservation and land disturbance requirements along with land acquisitions, conservation easements, and tax incentives are approaches that may be considered for the preservation and protection of tree canopy.
DRAFT NATURAL RESOURCES INVENTORY OCTOBER 1, 2010
___________________________________________________________________________ 80 Natural Resources Inventory Columbia, MO
- blank -
DRAFT NATURAL RESOURCES INVENTORY OCTOBER 1, 2010
___________________________________________________________________________ 81 Natural Resources Inventory Columbia, MO
CHAPTER TEN: LIMITATIONS TO DEVELOPMENT
10.1 Types of Limitations The ability to develop property may be limited due to physical characteristics of the landscape, lack of utility services, or based on regulatory restrictions adopted by Federal, State or local governments. Common limitations include:
• Physical - Steep slopes, karst topology, sinkholes, soil conditions, etc.,
• Regulatory - City or County zoning regulations on approved land uses, subdivision regulations setting minimum lot sizes and setbacks; Federal floodplain regulations, local stormwater regulations, land disturbance, tree preservation, etc.; and
• Utilities - Availability of centralized sewer service, public water available at sufficient rates of flow, electric service, etc.
10.2 Centralized Sewer The availability of centralized sewer service is a prerequisite for urban density development in the City of Columbia or Boone County. The City of Columbia is the principal sewer service provider in the NRI area. The first sanitary sewer system began construction in the early 1900's in the Flat Branch watershed to serve the commercial downtown district. Prior to 1950, the sewer system was expanded to serve the County House Branch watershed. In the 1960’s, sewers were extended north along Hinkson Creek and sewer systems were constructed in the drainage areas of Bear Creek and tributaries of Perche Creek. During the 1970's and 80's numerous trunk sewers were constructed, including major lines that parallel the Hinkson, Bear and Perche Creeks which serve as influent sewers to the Columbia Regional Wastewater Treatment Plant, constructed from 1980 to 1982. During the past ten years, the extension of City sewer and trunk sewers construction has continued, creating a system with approximately 635 miles of sewer main lines and 16,000 manholes. The City of Columbia has an adopted plan for sewer service extensions that will ultimately provide sewer to approximately 88% of the NRI area. BCRSD has assumed operation and maintenance responsibilities for existing older package treatment plants and outfalls that were privately owned and constructed prior to 1980. The district has a policy to modernize older wastewater and requires that privately owned and operated wastewater collection and treatment systems connect to BCSRD system when it is available. The Boone County Public Works provides technical support services to the Boone County Regional Sewer District on a contract basis.
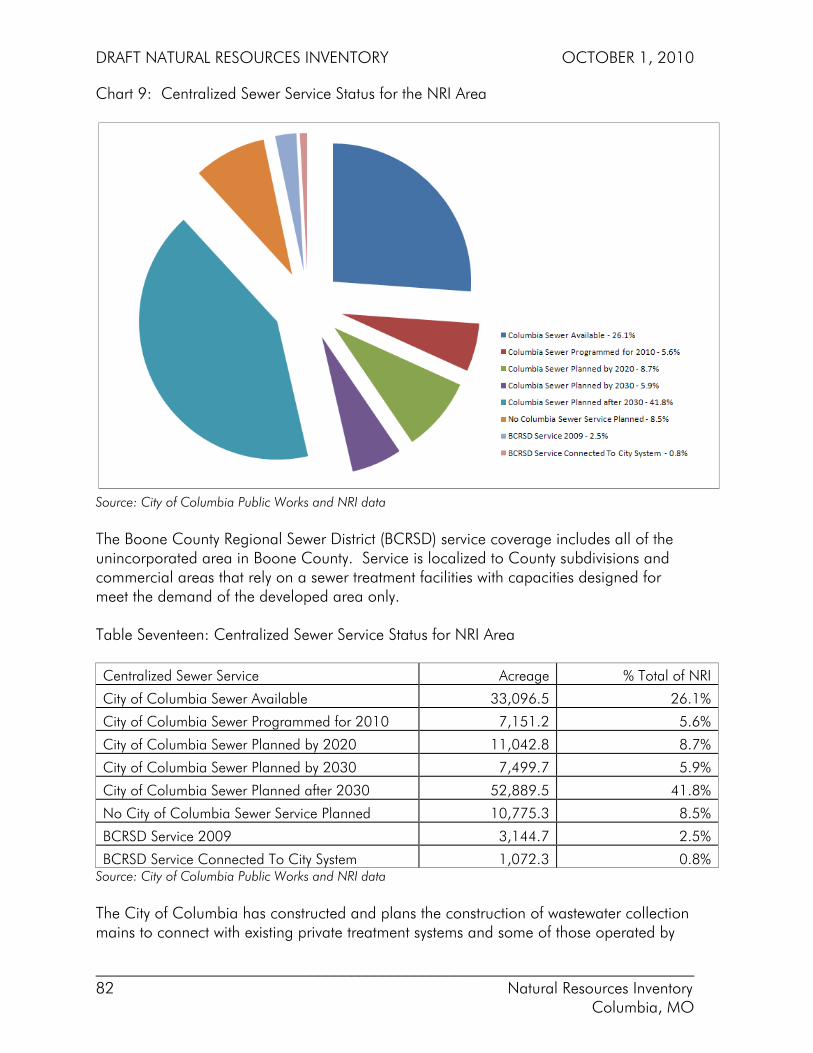
DRAFT NATURAL RESOURCES INVENTORY OCTOBER 1, 2010
___________________________________________________________________________ 82 Natural Resources Inventory Columbia, MO
Chart 9: Centralized Sewer Service Status for the NRI Area
Source: City of Columbia Public Works and NRI data The Boone County Regional Sewer District (BCRSD) service coverage includes all of the unincorporated area in Boone County. Service is localized to County subdivisions and commercial areas that rely on a sewer treatment facilities with capacities designed for meet the demand of the developed area only. Table Seventeen: Centralized Sewer Service Status for NRI Area Centralized Sewer Service Acreage % Total of NRI City of Columbia Sewer Available 33,096.5 26.1% City of Columbia Sewer Programmed for 2010 7,151.2 5.6% City of Columbia Sewer Planned by 2020 11,042.8 8.7% City of Columbia Sewer Planned by 2030 7,499.7 5.9% City of Columbia Sewer Planned after 2030 52,889.5 41.8% No City of Columbia Sewer Service Planned 10,775.3 8.5% BCRSD Service 2009 3,144.7 2.5% BCRSD Service Connected To City System 1,072.3 0.8%
Source: City of Columbia Public Works and NRI data The City of Columbia has constructed and plans the construction of wastewater collection mains to connect with existing private treatment systems and some of those operated by
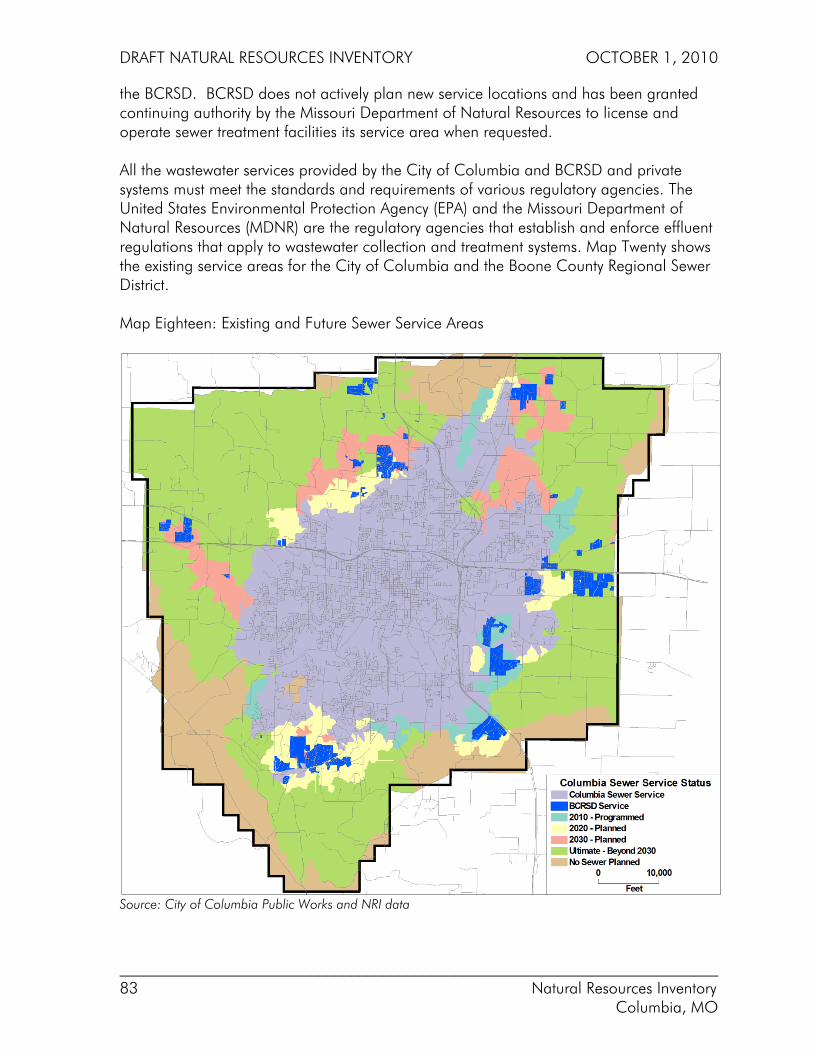
DRAFT NATURAL RESOURCES INVENTORY OCTOBER 1, 2010
___________________________________________________________________________ 83 Natural Resources Inventory Columbia, MO
the BCRSD. BCRSD does not actively plan new service locations and has been granted continuing authority by the Missouri Department of Natural Resources to license and operate sewer treatment facilities its service area when requested. All the wastewater services provided by the City of Columbia and BCRSD and private systems must meet the standards and requirements of various regulatory agencies. The United States Environmental Protection Agency (EPA) and the Missouri Department of Natural Resources (MDNR) are the regulatory agencies that establish and enforce effluent regulations that apply to wastewater collection and treatment systems. Map Twenty shows the existing service areas for the City of Columbia and the Boone County Regional Sewer District. Map Eighteen: Existing and Future Sewer Service Areas
Source: City of Columbia Public Works and NRI data
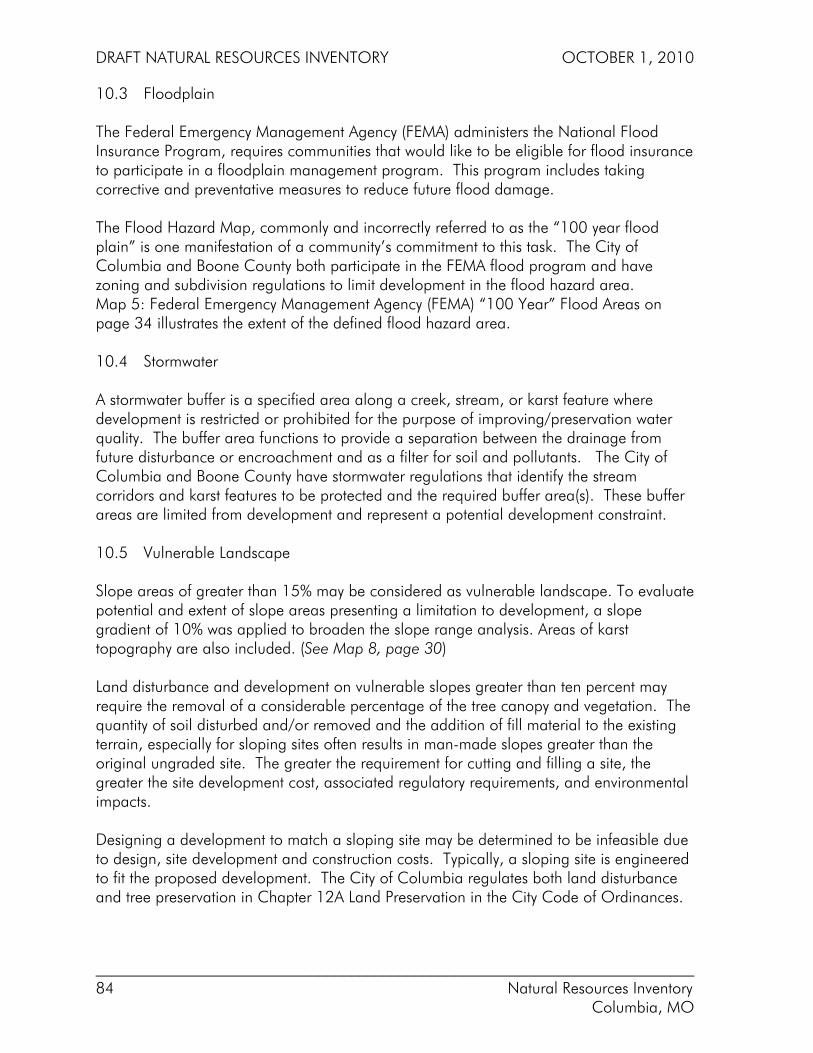
DRAFT NATURAL RESOURCES INVENTORY OCTOBER 1, 2010
___________________________________________________________________________ 84 Natural Resources Inventory Columbia, MO
10.3 Floodplain The Federal Emergency Management Agency (FEMA) administers the National Flood Insurance Program, requires communities that would like to be eligible for flood insurance to participate in a floodplain management program. This program includes taking corrective and preventative measures to reduce future flood damage. The Flood Hazard Map, commonly and incorrectly referred to as the “100 year flood plain” is one manifestation of a community’s commitment to this task. The City of Columbia and Boone County both participate in the FEMA flood program and have zoning and subdivision regulations to limit development in the flood hazard area. Map 5: Federal Emergency Management Agency (FEMA) “100 Year” Flood Areas on page 34 illustrates the extent of the defined flood hazard area. 10.4 Stormwater A stormwater buffer is a specified area along a creek, stream, or karst feature where development is restricted or prohibited for the purpose of improving/preservation water quality. The buffer area functions to provide a separation between the drainage from future disturbance or encroachment and as a filter for soil and pollutants. The City of Columbia and Boone County have stormwater regulations that identify the stream corridors and karst features to be protected and the required buffer area(s). These buffer areas are limited from development and represent a potential development constraint. 10.5 Vulnerable Landscape Slope areas of greater than 15% may be considered as vulnerable landscape. To evaluate potential and extent of slope areas presenting a limitation to development, a slope gradient of 10% was applied to broaden the slope range analysis. Areas of karst topography are also included. (See Map 8, page 30) Land disturbance and development on vulnerable slopes greater than ten percent may require the removal of a considerable percentage of the tree canopy and vegetation. The quantity of soil disturbed and/or removed and the addition of fill material to the existing terrain, especially for sloping sites often results in man-made slopes greater than the original ungraded site. The greater the requirement for cutting and filling a site, the greater the site development cost, associated regulatory requirements, and environmental impacts. Designing a development to match a sloping site may be determined to be infeasible due to design, site development and construction costs. Typically, a sloping site is engineered to fit the proposed development. The City of Columbia regulates both land disturbance and tree preservation in Chapter 12A Land Preservation in the City Code of Ordinances.
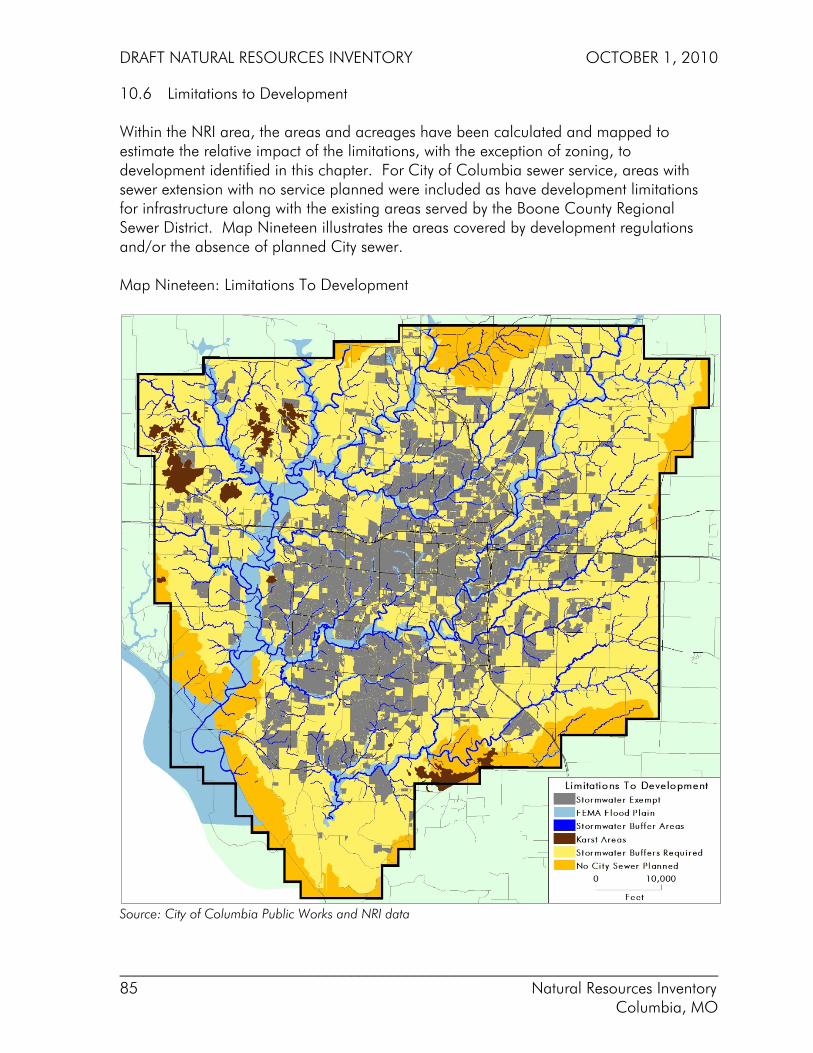
DRAFT NATURAL RESOURCES INVENTORY OCTOBER 1, 2010
___________________________________________________________________________ 85 Natural Resources Inventory Columbia, MO
10.6 Limitations to Development Within the NRI area, the areas and acreages have been calculated and mapped to estimate the relative impact of the limitations, with the exception of zoning, to development identified in this chapter. For City of Columbia sewer service, areas with sewer extension with no service planned were included as have development limitations for infrastructure along with the existing areas served by the Boone County Regional Sewer District. Map Nineteen illustrates the areas covered by development regulations and/or the absence of planned City sewer. Map Nineteen: Limitations To Development
Source: City of Columbia Public Works and NRI data

DRAFT NATURAL RESOURCES INVENTORY OCTOBER 1, 2010
___________________________________________________________________________ 86 Natural Resources Inventory Columbia, MO
Table Eighteen: Limitations to Development by Type and Acreage, provides the acreage totals, the total percent of the NRI area affected, and the percentage of type of development limitation relative to the total area. Table Eighteen: Limitations to Development by Type and Acreage Developmental Constraint Acreage by Type Acreage % by Type % of NRI Area No City of Columbia Sewer Service 20,260.3 42.5% 16.0% 100 Year Flood Plain 14,737.0 30.9% 11.6% Landscape: Slope greater than 10 percent 11,309.8 23.7% 8.9% Stormwater Buffers 1419.7 3.0% 1.1%
Source: City of Columbia Public Works and NRI data The lack of centralized sewer provided by the City of Columbia is the single largest limitation to development in the NRI area. New treatment facilities approved by the BCRSD are designed to support new urban density subdivisions and commercial development. Typically, these facilities are unlikely to be constructed with sufficient excess treatment capacity to support additional development a watershed.
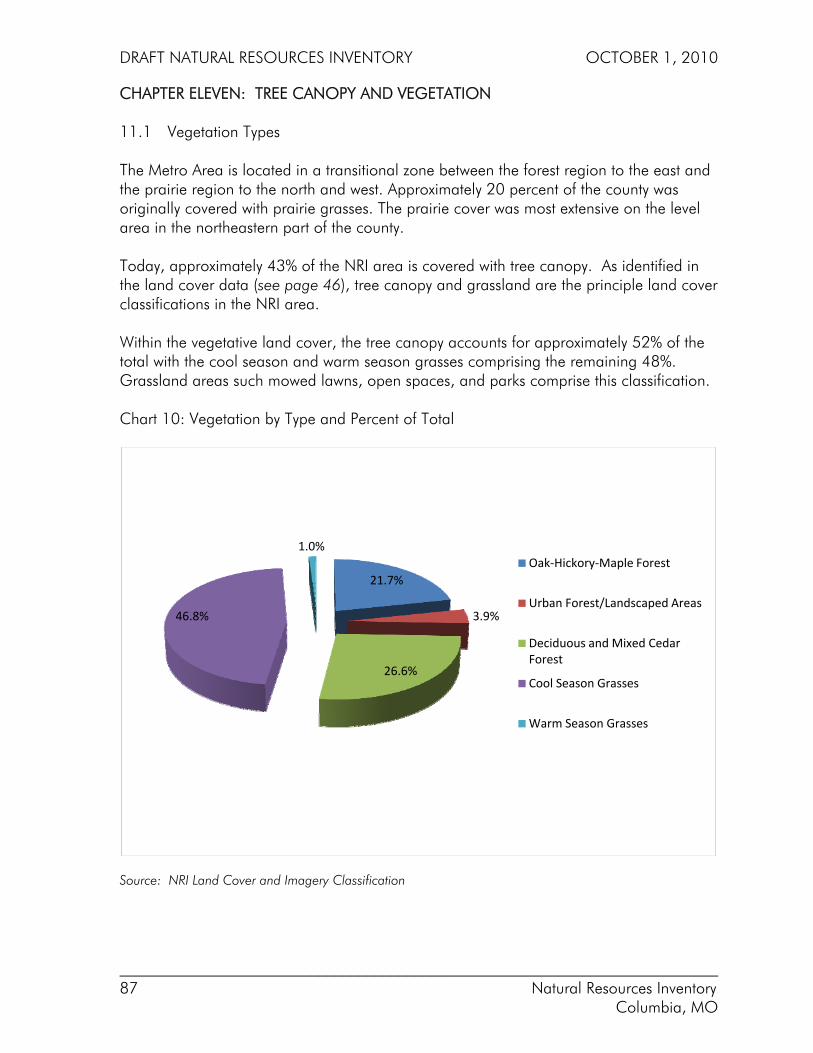
DRAFT NATURAL RESOURCES INVENTORY OCTOBER 1, 2010
___________________________________________________________________________ 87 Natural Resources Inventory Columbia, MO
CHAPTER ELEVEN: TREE CANOPY AND VEGETATION 11.1 Vegetation Types The Metro Area is located in a transitional zone between the forest region to the east and the prairie region to the north and west. Approximately 20 percent of the county was originally covered with prairie grasses. The prairie cover was most extensive on the level area in the northeastern part of the county. Today, approximately 43% of the NRI area is covered with tree canopy. As identified in the land cover data (see page 46), tree canopy and grassland are the principle land cover classifications in the NRI area. Within the vegetative land cover, the tree canopy accounts for approximately 52% of the total with the cool season and warm season grasses comprising the remaining 48%. Grassland areas such mowed lawns, open spaces, and parks comprise this classification. Chart 10: Vegetation by Type and Percent of Total
Source: NRI Land Cover and Imagery Classification
21.7%
3.9%
26.6%
46.8%
1.0%Oak‐Hickory‐Maple Forest
Urban Forest/Landscaped Areas
Deciduous and Mixed Cedar Forest
Cool Season Grasses
Warm Season Grasses
DRAFT NATURAL RESOURCES INVENTORY OCTOBER 1, 2010
___________________________________________________________________________ 88 Natural Resources Inventory Columbia, MO
Table Nineteen: NRI Vegetation Types by Acreage and Percent of Total Vegetation Type Acres % of Total Vegetation Oak-Hickory-Maple Forest 20,115 21.7% Urban Forest/Landscaped Areas 3,600 3.9% Deciduous and Mixed Cedar Forest 24,717 26.6% Cool Season Grasses 43,382 46.8% Warm Season Grasses 920 1.0%
Source: NRI Land Cover and Imagery Classification 11.2 Tree Canopy A detailed classification of the tree canopy within 1/4 mile of the corporate limit of the City of Columbia was conducted to map the various tree species associations. The City analysis area covers 46,471 acres and comprises 36.7 % of the NRI area. Nine classification groups were produced:
• Urban Forest/Landscape Plantings • Mixed Invasive Forest • Oak-Hickory-Maple (young) • Oak-Hickory-Maple (old) • Riverfront/Bottomland Forest (young) • Riverfront/Bottomland Forest (old) • Old Field Forest Mix • Red Cedar Forest • Red Cedar Mixed Forest
The oak-hickory-maple and riverfront bottomland forest classes contain the tree species identified as “climax” forest in the City of Columbia’s Land Preservation ordinance. These two classes are further differentiated based on the maturity of the forest canopy. The tree canopy in the area outside the detailed analysis area was classified as either oak-hickory or tree canopy. This area covers 80,000+ acres. Map Twenty shows the boundary for the City tree association analysis area, the nine tree associations within the area, and the tree canopy and oak-hickory forest the urban fringe area.
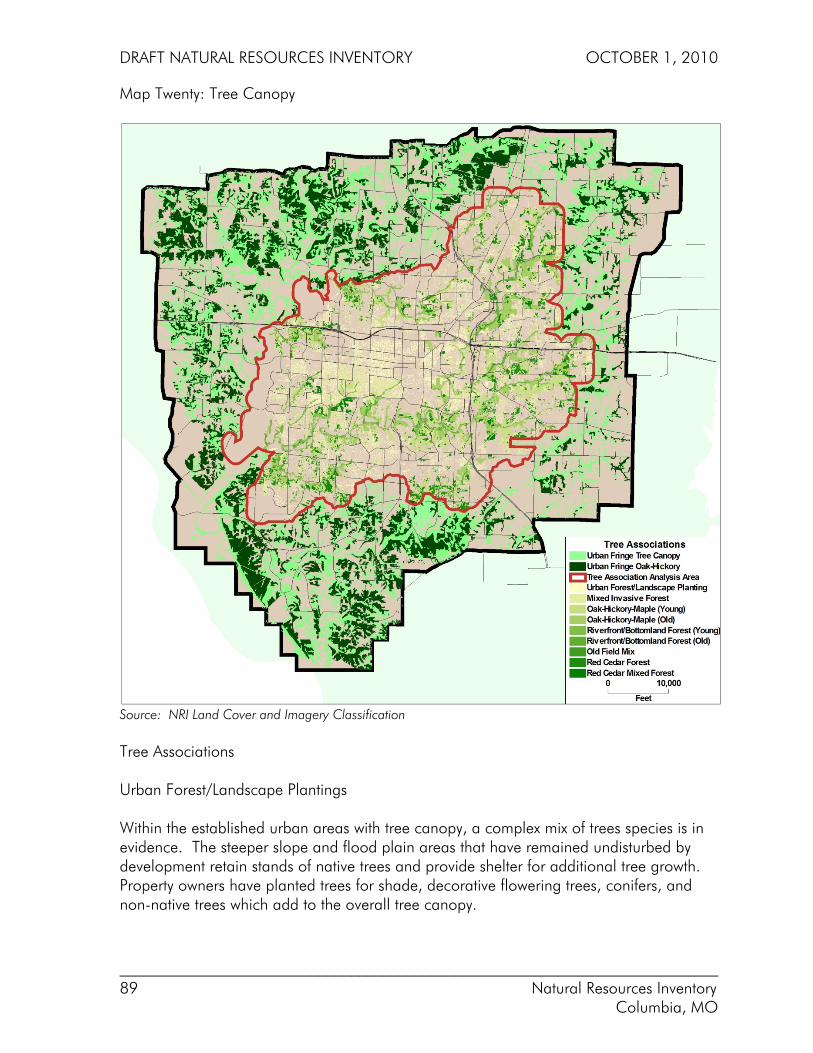
DRAFT NATURAL RESOURCES INVENTORY OCTOBER 1, 2010
___________________________________________________________________________ 89 Natural Resources Inventory Columbia, MO
Map Twenty: Tree Canopy
Source: NRI Land Cover and Imagery Classification Tree Associations Urban Forest/Landscape Plantings Within the established urban areas with tree canopy, a complex mix of trees species is in evidence. The steeper slope and flood plain areas that have remained undisturbed by development retain stands of native trees and provide shelter for additional tree growth. Property owners have planted trees for shade, decorative flowering trees, conifers, and non-native trees which add to the overall tree canopy.
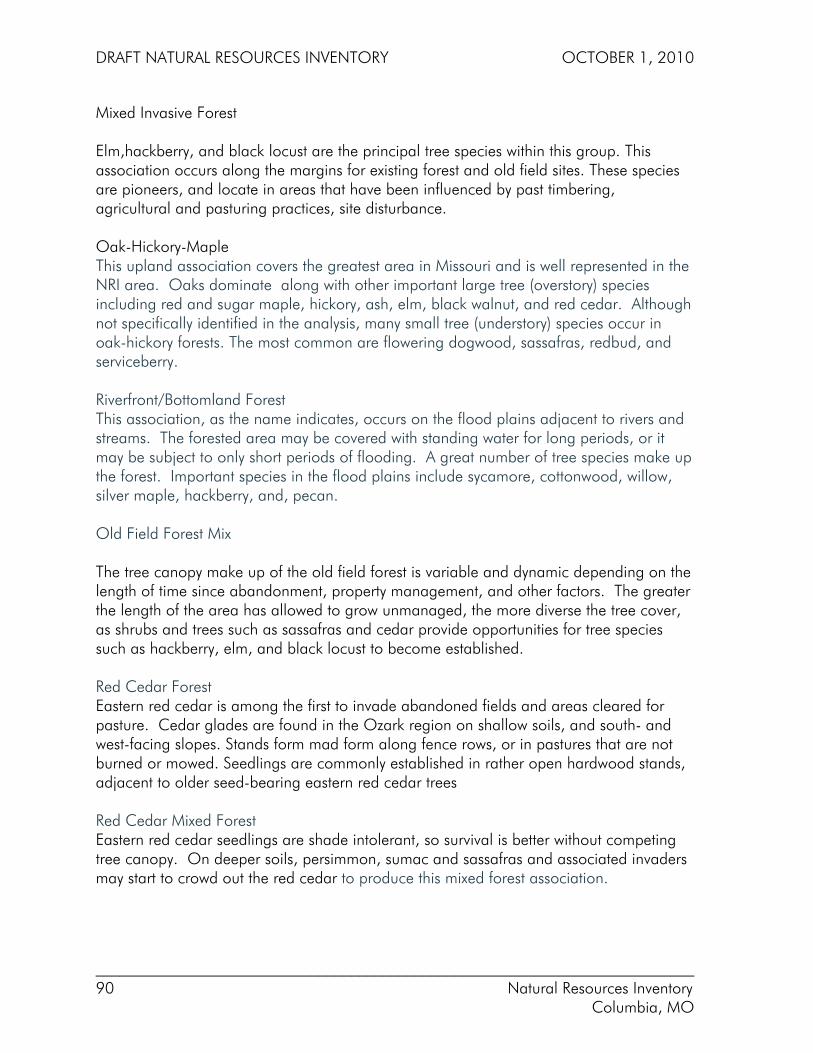
DRAFT NATURAL RESOURCES INVENTORY OCTOBER 1, 2010
___________________________________________________________________________ 90 Natural Resources Inventory Columbia, MO
Mixed Invasive Forest Elm,hackberry, and black locust are the principal tree species within this group. This association occurs along the margins for existing forest and old field sites. These species are pioneers, and locate in areas that have been influenced by past timbering, agricultural and pasturing practices, site disturbance. Oak-Hickory-Maple This upland association covers the greatest area in Missouri and is well represented in the NRI area. Oaks dominate along with other important large tree (overstory) species including red and sugar maple, hickory, ash, elm, black walnut, and red cedar. Although not specifically identified in the analysis, many small tree (understory) species occur in oak-hickory forests. The most common are flowering dogwood, sassafras, redbud, and serviceberry. Riverfront/Bottomland Forest This association, as the name indicates, occurs on the flood plains adjacent to rivers and streams. The forested area may be covered with standing water for long periods, or it may be subject to only short periods of flooding. A great number of tree species make up the forest. Important species in the flood plains include sycamore, cottonwood, willow, silver maple, hackberry, and, pecan. Old Field Forest Mix The tree canopy make up of the old field forest is variable and dynamic depending on the length of time since abandonment, property management, and other factors. The greater the length of the area has allowed to grow unmanaged, the more diverse the tree cover, as shrubs and trees such as sassafras and cedar provide opportunities for tree species such as hackberry, elm, and black locust to become established. Red Cedar Forest Eastern red cedar is among the first to invade abandoned fields and areas cleared for pasture. Cedar glades are found in the Ozark region on shallow soils, and south- and west-facing slopes. Stands form mad form along fence rows, or in pastures that are not burned or mowed. Seedlings are commonly established in rather open hardwood stands, adjacent to older seed-bearing eastern red cedar trees Red Cedar Mixed Forest Eastern red cedar seedlings are shade intolerant, so survival is better without competing tree canopy. On deeper soils, persimmon, sumac and sassafras and associated invaders may start to crowd out the red cedar to produce this mixed forest association.

DRAFT NATURAL RESOURCES INVENTORY OCTOBER 1, 2010
___________________________________________________________________________ 91 Natural Resources Inventory Columbia, MO
Within the City area, the tree canopy is predominated represented by a mix of urban forest/landscape plantings, mixed invasive forest of elm, hackberry, and locust, and climax forest comprised of oak, hickory, and maple. Table Twenty: City Tree Associations by Acreage and Percent of Total Tree Canopy
Tree Associations Acreage % of Total Tree Canopy
Urban Forest/Landscape Planting 3,659.0 22.4% Mixed Invasive Forest (Elm-Hackberry-Locust) 3,218.3 19.7% Mixed Hardwood Forest Young (Oak-Hickory-Maple) 2,480.0 15.1% Mixed Hardwood Forest Old (Oak-Hickory-Maple) 2,277.2 13.9% Riverfront/Bottomland Forest Young (Sycamore-Cottonwood-Willow) 1,504.0 9.2% Riverfront/Bottomland Forest Old (Sycamore-Cottonwood-Willow) 632.2 3.9% Old Field Mix 233.1 1.4% Red Cedar Forest 1,174.0 7.2% Red Cedar Mixed Forest 1,193.2 7.3%
Source: NRI Land Cover and Imagery Classification The distribution of the tree species associations shows that the urban forest/landscape planting and mixed invasive forest are strongly represented in the slope classification areas between the 0 to 6 percent slope areas. Chart Eleven: Distribution of City Tree Associations by Slope Classification Areas
Source: NRI Land Cover and Imagery Classification
0.0
200.0
400.0
600.0
800.0
1,000.0
1,200.0
1,400.0
0 ‐ 2 %
2 ‐4%
4 ‐6%
6 ‐8%
8 ‐10%
10 ‐12%
12 ‐15%
15% ‐20%
20% ‐25%
25% >
Urban Forest/Landscape Planting
Mixed Invasive Forest (Elm‐Hackberry‐Locust)
Mixed Hardwood Forest Young (Oak‐Hickory‐Maple)
Mixed Hardwood Forest Old (Oak‐Hickory‐Maple)
Riverfront/Bottomland Forest Young (Sycamore‐Cottonwood‐Willow)
Riverfront/Bottomland Forest Old (Sycamore‐Cottonwood‐Willow)
Old Field Mix
Red Cedar Forest
Red Cedar Mixed Forest

DRAFT NATURAL RESOURCES INVENTORY OCTOBER 1, 2010
___________________________________________________________________________ 92 Natural Resources Inventory Columbia, MO
NRI Tree Canopy The distribution of forest cover by slope area demonstrates a strong association; as slopes increases, the percentage of the slope area covered by forest increases within the City. The relative higher percentage of forest in the slope areas in all slope classification areas, especially those greater than 10% may indicate the presence of undisturbed natural forest. Chart Twelve: Percent Slope Area Covered by Tree Canopy
Source: NRI image classification and NRI data The distribution of the tree canopy within the City area does not follow the patterns exhibited by the urban fringe area. The urban fringe is predominated by agricultural uses such as row crops and pasture areas which require the removal of tree canopy. Within the City area, urban develop typically is concentrated in the areas with slopes of less than 10 percent. The remaining areas with slopes greater than 10 percent are typically left undisturbed by development or occur with drainage areas for stormwater. The following table presents the relative percentage of tree canopy by slope area in 2005.
0.0%
10.0%
20.0%
30.0%
40.0%
50.0%
60.0%
70.0%
0 ‐ 2 % 2 ‐ 4% 4 ‐ 6% 6 ‐ 8% 8 ‐ 10% 10 ‐12%
12 ‐15%
15% ‐20%
20% ‐25%
25% >
Percent
Tree
Canopy
Slope Area
City
Urban Fringe
Total NRI Area

DRAFT NATURAL RESOURCES INVENTORY OCTOBER 1, 2010
___________________________________________________________________________ 93 Natural Resources Inventory Columbia, MO
Table Twenty-one: Percent of Tree Canopy by Slope Area and Total Percent of Tree Canopy
Slope Class City Acreage
% of Slope Class
Urban Fringe Acreage
% of Slope Class
NRI Total Acreage
% of Slope Class
0 - 2 % 2,597.05 31.7% 2091.8 11.7% 4,689.19 18.0%
2 - 4% 4,048.32 28.1% 4143.3 19.3% 8,191.91 22.8%
4 - 6% 3,125.52 30.8% 3405.4 23.8% 6,531.18 26.7%
6 - 8% 2,109.85 39.6% 2254.6 26.0% 4,364.89 31.2%
8 - 10% 1,424.99 45.2% 1531.0 27.7% 2,956.43 34.1%
10 - 12% 950.01 50.6% 1004.0 27.2% 1,954.53 35.1%
12 - 15% 832.01 53.9% 881.9 26.1% 1,714.44 34.8%
15% - 20% 677.80 58.7% 676.4 25.4% 1,354.75 35.5%
20% - 25% 217.23 57.1% 216.8 19.9% 434.57 29.5%
25% > 165.92 50.3% 165.7 17.3% 332.17 25.8%
Source: NRI image classification and NRI data 11.3 Estimating Changes In the Forest Cover
The changes in the forest cover in the NRI area that is associated with urban development and agricultural has been estimated using data available from the United States Geographic Survey (USGS) and imagery captured by the LANDSAT satellites. The NRI land cover data (tree canopy) could not be used as part of this analysis due to classification differences with historic land cover data available from the USGS. The two major impediments to comparing NRI land cover with USGS land cover are; 1) USGS defines forest as a contiguous area of tree canopy the covers a minimum of 40 acres, the NRI has no minimum, and 2) the pixel resolution of the imagery (30 meter for USGS vs .5 foot for the NRI) does not allow for detailed comparisons.
The deciduous forest tree canopy from the 1976, 1984 USGS land use/land cover data was compared to the MoRAP 2005 Land Use Land Cover to map and evaluate the patterns of climax forest loss and areas of forest growth and to analysis the distribution of forest by slope. Table Twenty-two: Estimated Loss/Gain in Forest Areas 1976 - 2005
Forest Areas Acres Total % Change
Average Annual % Rate of
Change Annual Acreage
Change Forest 1976 26,960.3 --- --- --- 1976 Forest Remaining in 2005 17,941.3 -33.5% -1.1% -311.0 New Forest Since 1976 20,896.5 --- --- --- Forest 2005 38,837.8 44.1% 1.5% 409.6
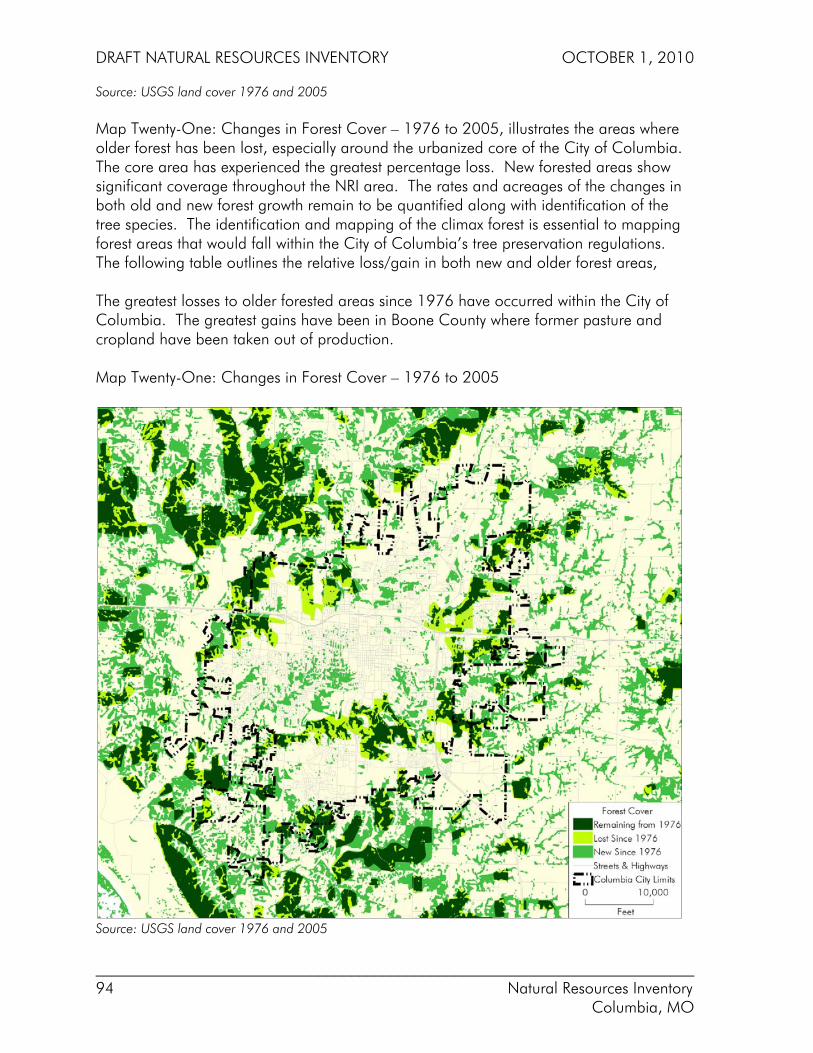
DRAFT NATURAL RESOURCES INVENTORY OCTOBER 1, 2010
___________________________________________________________________________ 94 Natural Resources Inventory Columbia, MO
Source: USGS land cover 1976 and 2005 Map Twenty-One: Changes in Forest Cover – 1976 to 2005, illustrates the areas where older forest has been lost, especially around the urbanized core of the City of Columbia. The core area has experienced the greatest percentage loss. New forested areas show significant coverage throughout the NRI area. The rates and acreages of the changes in both old and new forest growth remain to be quantified along with identification of the tree species. The identification and mapping of the climax forest is essential to mapping forest areas that would fall within the City of Columbia’s tree preservation regulations. The following table outlines the relative loss/gain in both new and older forest areas, The greatest losses to older forested areas since 1976 have occurred within the City of Columbia. The greatest gains have been in Boone County where former pasture and cropland have been taken out of production. Map Twenty-One: Changes in Forest Cover – 1976 to 2005
Source: USGS land cover 1976 and 2005
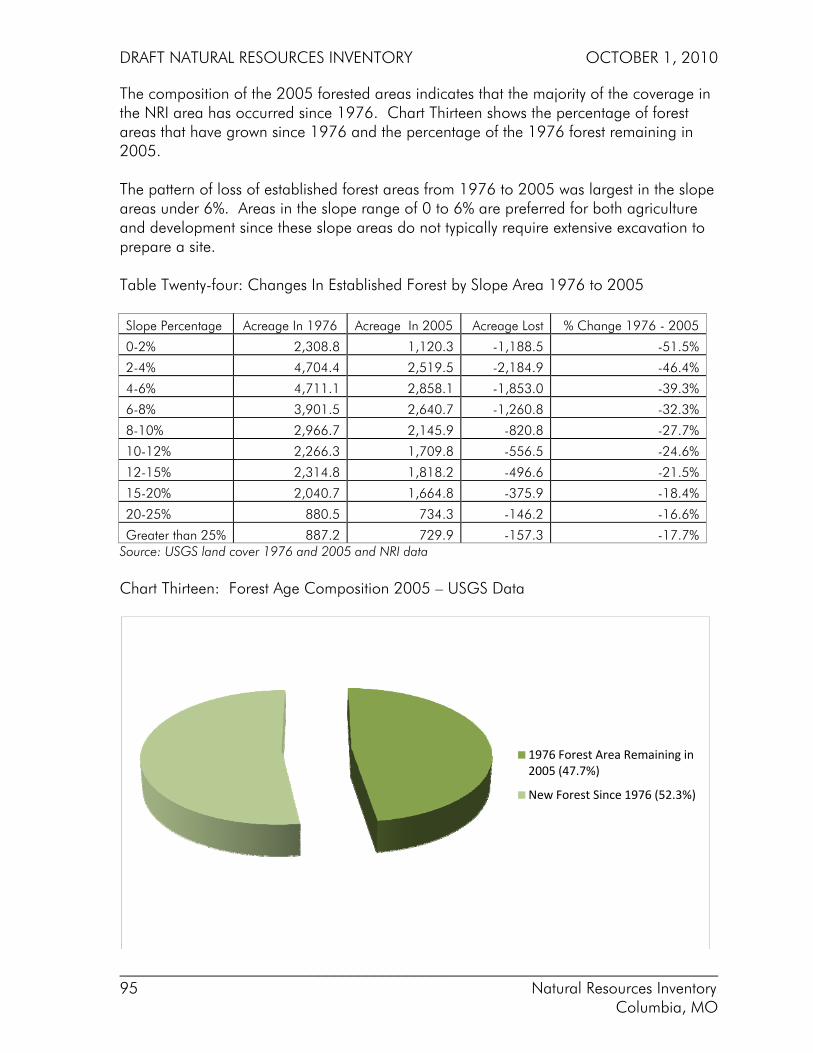
DRAFT NATURAL RESOURCES INVENTORY OCTOBER 1, 2010
___________________________________________________________________________ 95 Natural Resources Inventory Columbia, MO
The composition of the 2005 forested areas indicates that the majority of the coverage in the NRI area has occurred since 1976. Chart Thirteen shows the percentage of forest areas that have grown since 1976 and the percentage of the 1976 forest remaining in 2005. The pattern of loss of established forest areas from 1976 to 2005 was largest in the slope areas under 6%. Areas in the slope range of 0 to 6% are preferred for both agriculture and development since these slope areas do not typically require extensive excavation to prepare a site. Table Twenty-four: Changes In Established Forest by Slope Area 1976 to 2005 Slope Percentage Acreage In 1976 Acreage In 2005 Acreage Lost % Change 1976 - 2005
0-2% 2,308.8 1,120.3 -1,188.5 -51.5%
2-4% 4,704.4 2,519.5 -2,184.9 -46.4%
4-6% 4,711.1 2,858.1 -1,853.0 -39.3%
6-8% 3,901.5 2,640.7 -1,260.8 -32.3%
8-10% 2,966.7 2,145.9 -820.8 -27.7%
10-12% 2,266.3 1,709.8 -556.5 -24.6%
12-15% 2,314.8 1,818.2 -496.6 -21.5%
15-20% 2,040.7 1,664.8 -375.9 -18.4%
20-25% 880.5 734.3 -146.2 -16.6%
Greater than 25% 887.2 729.9 -157.3 -17.7% Source: USGS land cover 1976 and 2005 and NRI data Chart Thirteen: Forest Age Composition 2005 – USGS Data
1976 Forest Area Remaining in 2005 (47.7%)
New Forest Since 1976 (52.3%)

DRAFT NATURAL RESOURCES INVENTORY OCTOBER 1, 2010
___________________________________________________________________________ 96 Natural Resources Inventory Columbia, MO
Source: USGS land cover 1976 and 2005 and NRI data The changes in forested area from 1976 to 2005 are more pronounced in the areas with slopes between 0 and 6%. These slopes areas are suitable for agricultural and urban development which typically involves the removal of unneeded trees and forest. The overall age of the forested areas shows an equal portion of old 1976 forest retained as compared to the newly forested areas since 1976.

DRAFT NATURAL RESOURCES INVENTORY OCTOBER 1, 2010
___________________________________________________________________________ 97 Natural Resources Inventory Columbia, MO
CHAPTER TWELVE: PLANT & WILDLIFE HABITAT 12.1 Introduction: A habitat is the location that provides the conditions necessary to support a plant or animal species. The location and size of the habitat requirements will vary; however, large undisturbed areas generally support the greatest species diversity. The NRI analysis does not include an inventory of the plant and animal species represented in the area. Habitat issues have been identified to guide future policy discussions related to habitat loss and habitat conservation and preservation. To enrich the available datasets, the Columbia Natural Resources Observation System has been created to provide a way for people to report their observations of wildlife, plants, natural features or other items that should be included in the NRI databases. The site is available at: http://www.gocolumbiamo.com/Maps/NRI/form.php 12.2 Habitat Identification Geographic Approach to Planning (GAP) analysis is a method for identifying where animals and plant communities occur in relation to existing preserved land. Species and communities not represented in these protected lands constitute 'gaps' or species at risk. It is designed to be a proactive approach to conservation. The NRI land cover data may be used along with data for wildlife distribution, range limits and habitat preferences for species of interest to produce a predicted distribution map. 12.3 Habitat Loss As urban development occurs, the land disturbance, roadways, utility corridors, buildings, and parking lots, fragments the natural landscape into much smaller pieces. The roads, clearings, and corridors may act as barriers, preventing wildlife from using habitat that is nearby for breeding or feeding. If the former habitat area fragments become too small, they may no longer support some species. The street, utility corridors, buildings, parking lots, and land clearing create breaks or new “edges” in the natural landscape. ‘Edge’ is the area where two habitat types meet. An edge is formed where a grassland area and forest meet, or where a road corridor ends and a forest begins. Habitat fragmentation favors wildlife generalists at the expense of specialists. Habitat specialists are most vulnerable to habitat loss. Specialists are species that are tied to one or more type of plant community to complete their life cycle. In general:
• Fragmentation results in a dramatic increase in 'edge' habitat, which provides increased access to the more protected interior habitats by predators, including domestic animals;
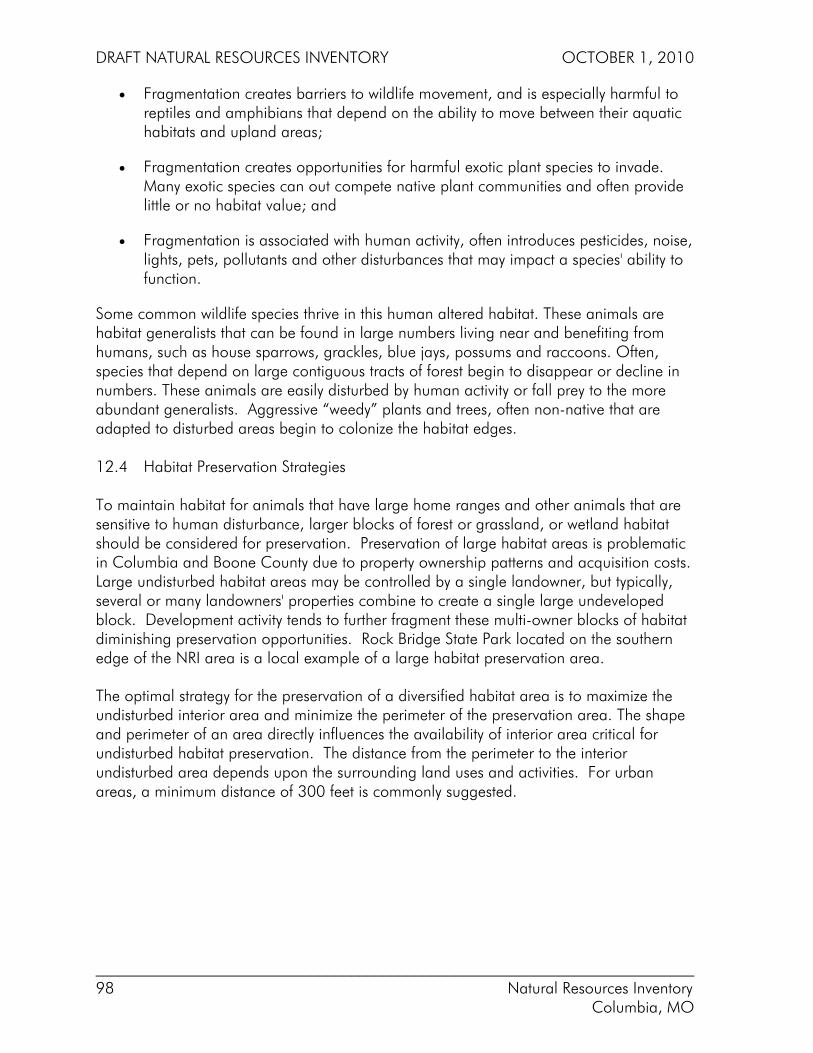
DRAFT NATURAL RESOURCES INVENTORY OCTOBER 1, 2010
___________________________________________________________________________ 98 Natural Resources Inventory Columbia, MO
• Fragmentation creates barriers to wildlife movement, and is especially harmful to reptiles and amphibians that depend on the ability to move between their aquatic habitats and upland areas;
• Fragmentation creates opportunities for harmful exotic plant species to invade. Many exotic species can out compete native plant communities and often provide little or no habitat value; and
• Fragmentation is associated with human activity, often introduces pesticides, noise, lights, pets, pollutants and other disturbances that may impact a species' ability to function.
Some common wildlife species thrive in this human altered habitat. These animals are habitat generalists that can be found in large numbers living near and benefiting from humans, such as house sparrows, grackles, blue jays, possums and raccoons. Often, species that depend on large contiguous tracts of forest begin to disappear or decline in numbers. These animals are easily disturbed by human activity or fall prey to the more abundant generalists. Aggressive “weedy” plants and trees, often non-native that are adapted to disturbed areas begin to colonize the habitat edges. 12.4 Habitat Preservation Strategies To maintain habitat for animals that have large home ranges and other animals that are sensitive to human disturbance, larger blocks of forest or grassland, or wetland habitat should be considered for preservation. Preservation of large habitat areas is problematic in Columbia and Boone County due to property ownership patterns and acquisition costs. Large undisturbed habitat areas may be controlled by a single landowner, but typically, several or many landowners' properties combine to create a single large undeveloped block. Development activity tends to further fragment these multi-owner blocks of habitat diminishing preservation opportunities. Rock Bridge State Park located on the southern edge of the NRI area is a local example of a large habitat preservation area.
The optimal strategy for the preservation of a diversified habitat area is to maximize the undisturbed interior area and minimize the perimeter of the preservation area. The shape and perimeter of an area directly influences the availability of interior area critical for undisturbed habitat preservation. The distance from the perimeter to the interior undisturbed area depends upon the surrounding land uses and activities. For urban areas, a minimum distance of 300 feet is commonly suggested.
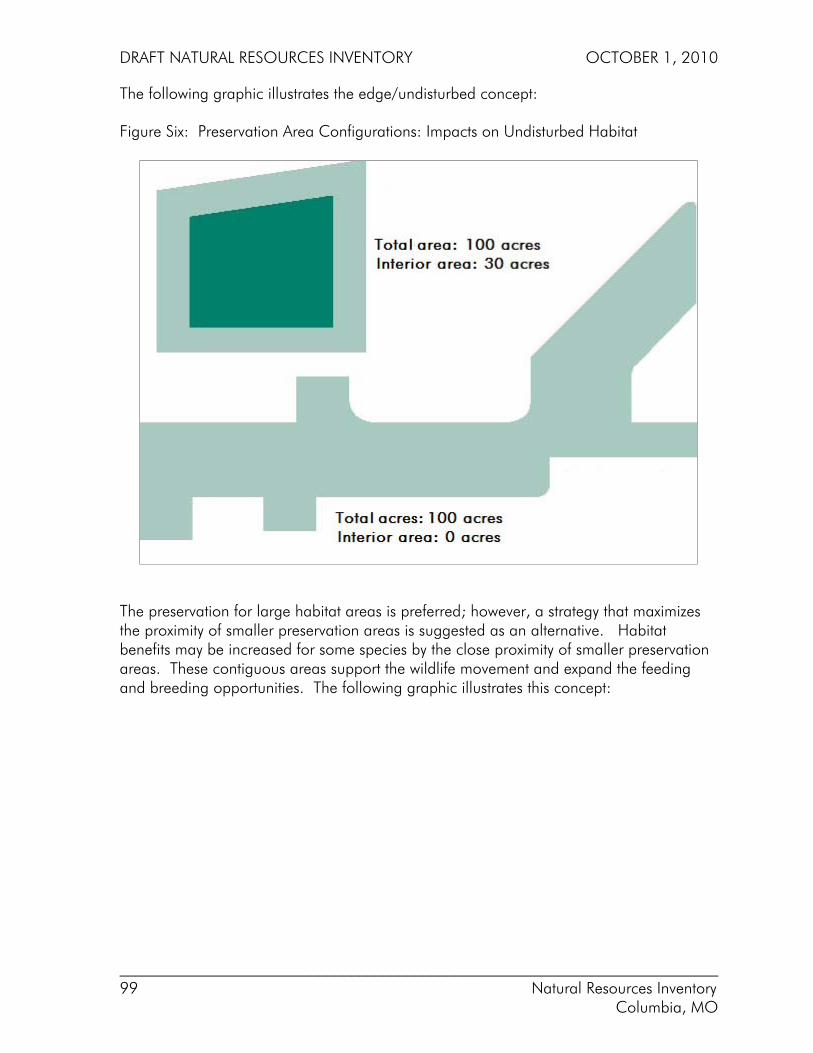
DRAFT NATURAL RESOURCES INVENTORY OCTOBER 1, 2010
___________________________________________________________________________ 99 Natural Resources Inventory Columbia, MO
The following graphic illustrates the edge/undisturbed concept:
Figure Six: Preservation Area Configurations: Impacts on Undisturbed Habitat
The preservation for large habitat areas is preferred; however, a strategy that maximizes the proximity of smaller preservation areas is suggested as an alternative. Habitat benefits may be increased for some species by the close proximity of smaller preservation areas. These contiguous areas support the wildlife movement and expand the feeding and breeding opportunities. The following graphic illustrates this concept:
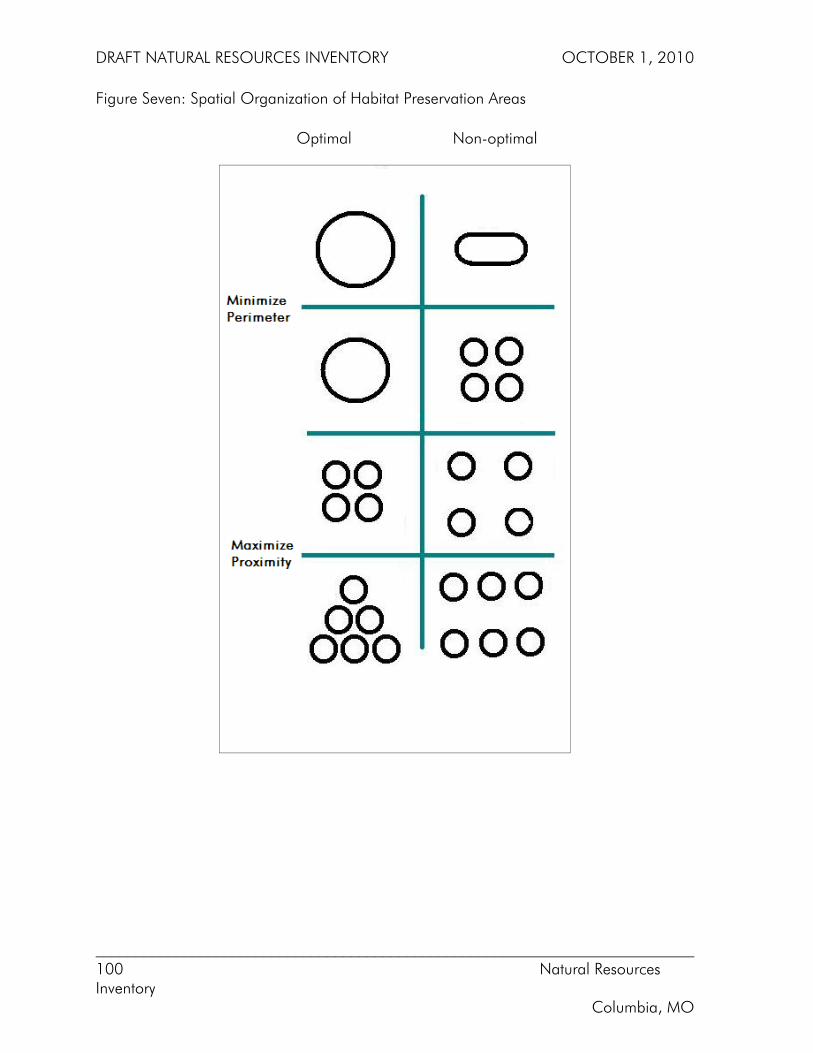
DRAFT NATURAL RESOURCES INVENTORY OCTOBER 1, 2010
___________________________________________________________________________ 100 Natural Resources Inventory Columbia, MO
Figure Seven: Spatial Organization of Habitat Preservation Areas
Optimal Non-optimal
DRAFT NATURAL RESOURCES INVENTORY OCTOBER 1, 2010
___________________________________________________________________________ 101 Natural Resources Inventory Columbia, MO
CHAPTER THIRTEEN: ENVIRONMENTAL SERVICES 13.1 Environmental Services
Environmental services are commonly defined as the benefits people derive from ecosystem activity within the environment. Many of these goods and services are traditionally viewed as free benefits to society, or "public goods" - wildlife habitat and diversity, watershed services, carbon storage, and scenic landscapes, for example. Lacking a formal market, these natural assets are traditionally absent from society’s balance sheet; their critical contributions are often overlooked in public, corporate, and individual decision-making.
The Millennium Ecosystem Assessment – a four-year United Nations assessment of the condition and trends of the world’s ecosystems - categorizes ecosystem services as:
• Provisioning Services - the provision of food, fresh water, fuel, fiber, and other goods;
• Regulating Services - climate, water, pollination reduction and disease control;
• Supporting Services - soil formation and nutrient cycling; and
• Cultural Services - recreational, educational, aesthetic, and cultural heritage values.
13.2 Local Application of Regulating Services
The NRI analysis focuses on the regulating services of the existing tree canopy associated with air pollution removal, carbon storage and sequestration, and stormwater benefits.
As part of the NRI watershed analysis, an analysis of ecosystem services provided by the tree canopy will be provided for each watershed in the NRI Technical Report in 2011. The benefits for the services provided by the trees and other green space in the watershed will be calculated.
Forest and tree canopy provide several key environmental services;
• Stormwater • Carbon Sequestration • Air Quality
Locally, the direct benefit of tree canopy is its function in the system of handling stormwater runoff. Tree canopy also regulates the surface flow of runoff, provides erosion control, and stream bank stabilization. The dollar value of tree canopy becomes evident when compared to the cost of new or improved infrastructure required to replace the stormwater runoff reductions provided by the tree canopy.

DRAFT NATURAL RESOURCES INVENTORY OCTOBER 1, 2010
___________________________________________________________________________ 102 Natural Resources Inventory Columbia, MO
Carbon sequestration is the process by which atmospheric carbon dioxide is taken up by trees, grasses, and other plants through photosynthesis and stored as carbon in biomass (trunks, branches, foliage, and roots) and soils. The process of sequestration reduces levels of carbon dioxide in the air. The sink of carbon sequestration in forests and wood products helps to offset sources of carbon dioxide to the atmosphere, such as deforestation, forest fires, and fossil fuel emissions.
The air quality benefits of tree canopy include:
• Trapping and holding particle pollutants (dust, ash, pollen and smoke) that can damage human lungs;
• Absorbing CO2 and other dangerous gases; and • Producing enough oxygen per acre for 18 people every day.
Trees remove gaseous pollutants by absorbing them through the pores in the leaf surface. Particulates are trapped and filtered by leaves, stems and twigs, and washed to the ground by rainfall.
Landscape trees growing near buildings provide shade and lower air temperatures, reducing the amount of energy that buildings use heating and cooling. The City of Columbia’s Tree Power program promotes energy conservation through energy-efficient landscaping.
Appendix B: Sample CityGreen Analysis contains the quantitative output of the stormwater, carbon sequestration, and air quality benefits of the tree canopy in the sample watershed. The analysis was produced using CITYgreen software developed by the American Forests organization.
DRAFT NATURAL RESOURCES INVENTORY OCTOBER 1, 2010
___________________________________________________________________________ 103 Natural Resources Inventory Columbia, MO
CHAPTER FOURTEEN: NRI PHASE II
14.1 Introduction
The City of Columbia’s Community Visioning document provides the foundation for future actions using the data resources of the Natural Resources Inventory. The City of Columbia’s Comprehensive Plan process offers additional opportunities to define policies based on the NRI land cover, slope distributions, and landscape metrics.
Recent actions by the Missouri Department of Natural Resources (MoDNR) regarding the management of water quality in Hinkson Creek offer the immediate opportunity to begin consideration of natural resource and development issues related to water quality and stormwater management.
The City of Columbia relies on the natural system of drainage ways and creeks for the vast majority of its stormwater system. The preservation of tree canopy provides demonstrable community benefit by reducing the volume of stormwater runoff and reducing the levels of waterborne contaminants.
14.2 Citizen Reporting The Columbia Natural Resources Observation System will be made available on-line for citizens to report on trees, vegetation, birds, animals, or other natural features that may be of interest. The observations include latitude/longitude information which allows each report to be added to the NRI GIS databases. 14.3 Data Products All of the NRI GIS database will be available for public use. A City FTP site may also be used to support the on-line distribution of the GIS data for public use. Data that lends itself to use by Google Earth and Google Maps will be posted on the City’s Map Source webpage for download. NRI geographic data will continue to be refined to improve the cartographic qualities to produce maps with good graphic and visual qualities. New data and geography will be made available as it is developed by the City and collected from State and or Federal agencies.

DRAFT NATURAL RESOURCES INVENTORY OCTOBER 1, 2010
___________________________________________________________________________ 104 Natural Resources Inventory Columbia, MO
14.4 Web-base Mapping Staff is currently working on developing web-based GIS mapping using the high resolution digital imagery and NRI data. System performance is a key issue for a public web mapping site. April 2012 launch date is planned. 14.5 Suggested Actions and Related Concepts
The NRI was designed and developed to provide a mapping and data resources for policy analysis and environmental planning. The Community Visioning document contains specific recommendations that rely on the data from the NRI. Appendix C: Visioning Final Report – NRI contains the portions of the Visioning Final Report that outline the following actions: Action One
From the Community Visioning Document: Implementation of Land Preservation Strategy 2:
“Strategy 2 calls for the appoint a City/County land preservation task force charged with the task of identifying and prioritizing areas that would benefit from protection by the City of Columbia and/or Boone County. This task force would work with natural resource specialists from the U.S. Natural Resources Conservation Service (NRCS), MoDNR and researchers at the University of Missouri such as the Missouri Resource Assessment Partnership (MoRAP). The primary mission of this group is the identify areas needing preservation and find methods to fund the acquisition of properties for preservation under the auspices of a local Land Preservation Authority.”
Starting point for a land preservation authority would be to use an established board to oversee the management of donations and/or properties acquired for preservation.
The Office of Neighborhood Services Trust Specialist oversees the fund of money and property donated to the City of Columbia. An independent trust board administers the fund. Expanding the scope of services for this fund could provide a starting point for land acquisition for preservation.
Action Two
From the Community Visioning Document: Implementation of Environmental Quality Strategy 3:
Strategy 3 calls for the creation of a Natural Resources Committee. The City of Columbia Department of Public Works would assemble a committee of Federal, State, and University resources personnel to select the committee members and identify agency roles. The primary mission of this
DRAFT NATURAL RESOURCES INVENTORY OCTOBER 1, 2010
___________________________________________________________________________ 105 Natural Resources Inventory Columbia, MO
committee was not specifically defined in the Community Visioning document.
In addition to the Federal, State, and University personnel specified in Strategy 3, representatives from City Commissions such as Energy and Environment, Historic Preservation, Planning and Zoning, and Park and Recreation could be included to provide city representation with different perspectives.
Related Concepts There has been some local interest expressed in examining SmartCode as a replacement for the City’s current zoning system. SmartCode is a “form based” land use regulation scheme that may offer an option for addressing land preservation and environmental concerns related to development. The following is an excerpt from Chapter Two of SmartCode which outlines type of development areas to address environmental issues:
Preserved Open Sector
The Preserved Open Sector shall consist of Open Space that is protected from development in perpetuity. The Preserved Open Sector includes areas under envi-ronmental protection by law or regulation, as well as land acquired for conservation through purchase, by easement, or by past Transfer of Development Rights.
The Preserved Open Sector shall consist of the aggregate of the following categories:
a. Surface waterbodies b. Protected wetlands c. Protected habitat d. Riparian Corridors e. Purchased Open Space f. Conservation easements g. Transportation Corridors
Development and construction within the Preserved Open Sector and the specifica-tions required to do so shall be determined on an individual project basis by public hearing of the Legislative Body.
Reserved Open Sector
The Reserved Open Sector shall consist of Open Space that should be, but is not yet, protected from development.
DRAFT NATURAL RESOURCES INVENTORY OCTOBER 1, 2010
___________________________________________________________________________ 106 Natural Resources Inventory Columbia, MO
The Reserved Open Sector shall consist of the aggregate of the following categories:
a. flood plain, including Special Flood Hazard Areas b. steep slopes c. Open Space to be acquired d. Corridors to be acquired e. buffers to be acquired f. legacy woodland g. legacy farmland h. legacy viewsheds
Restricted Growth Sector
The Restricted Growth Sector shall be assigned to areas that have value as Open Space but nevertheless are subject to development, either because the zoning has already been granted or because there is no legally defensible reason, in the long term, to deny it.
Controlled Growth Sector
The Controlled Growth Sector shall be assigned to those locations that can support Mixed Use by virtue of proximity to an existing or planned Thoroughfare.
Intended Growth Sector
The Intended Growth Sector shall be assigned to those locations that can support substantial Mixed Use by virtue of proximity to an existing or planned regional Thoroughfare and/or transit.
Infill Growth Sector
The Infill Growth Sector shall be assigned to areas already developed, having the potential to be modified, confirmed or completed in the pattern of Infill TNDs (traditional neighborhood development) or Infill RCDs (regional center development).
Green Infrastructure The City of Columbia relies on the natural system of drainage ways and creeks for the vast majority of its stormwater system. Many of the City’s parks and trails are located in and along these drainage corridors.
DRAFT NATURAL RESOURCES INVENTORY OCTOBER 1, 2010
___________________________________________________________________________ 107 Natural Resources Inventory Columbia, MO
On the regional scale, Green Infrastructure means the interconnected network of open spaces and natural areas, such as greenways, wetlands, parks, and forest preserves, that naturally recharge aquifers, improve water quality and provide recreational opportunities and wildlife habitat. Green infrastructure may be used as a stormwater management approach to reduce stormwater utility costs, supports sustainability, and integrate the natural systems present in the community to manage municipal stormwater and in the process improve the environment. Tree Compensation A mitigation strategy to address the loss of tree canopy would be to consider the principle of “no net loss of trees or forest cover” when reviewing the footprint of individual projects. Where vegetation removal cannot be avoided, efforts should be made to provide compensation in the form of new plantings. These new plantings shall be incorporated into the design to offset what was lost, and where possible enhance the natural environment. 14.6 Staff Recommendations
A. To implement the aforementioned recommendations, Council should consider the use of existing commissions such as the Energy & Environment Commission, Parks & Recreation Commission, Vision Commission and others, to assist in outlining the role, responsibilities, and composition of a Land Preservation Group.
B. The Energy and Environment Commission should assume the responsibilities and
perform the functions intended for a Natural Resources Committee and work with the Land Preservation Group on a broad spectrum of natural resource issues.
C. The City should explore the opportunities and advantages of implementing a
“green infrastructure” approach to managing municipal stormwater, park, and open space resources. Integrating and coordinating the functions of these natural assets promotes sustainability and offers an efficient method of realizing environmental and cultural benefits from these resources.
DRAFT NATURAL RESOURCES INVENTORY OCTOBER 1, 2010
___________________________________________________________________________ 108 Natural Resources Inventory Columbia, MO
- Blank -
DRAFT NATURAL RESOURCES INVENTORY OCTOBER 1, 2010
___________________________________________________________________________ 109 Natural Resources Inventory Columbia, MO
APPENDICES

DRAFT NATURAL RESOURCES INVENTORY OCTOBER 1, 2010
___________________________________________________________________________ 110 Natural Resources Inventory Columbia, MO
- Blank-
DRAFT NATURAL RESOURCES INVENTORY OCTOBER 1, 2010
___________________________________________________________________________ 111 Natural Resources Inventory Columbia, MO
APPENDIX A: ENDANGERED AND THREATENED SPECIES IN MISSOURI
DRAFT NATURAL RESOURCES INVENTORY OCTOBER 1, 2010
___________________________________________________________________________ 112 Natural Resources Inventory Columbia, MO
- Blank -
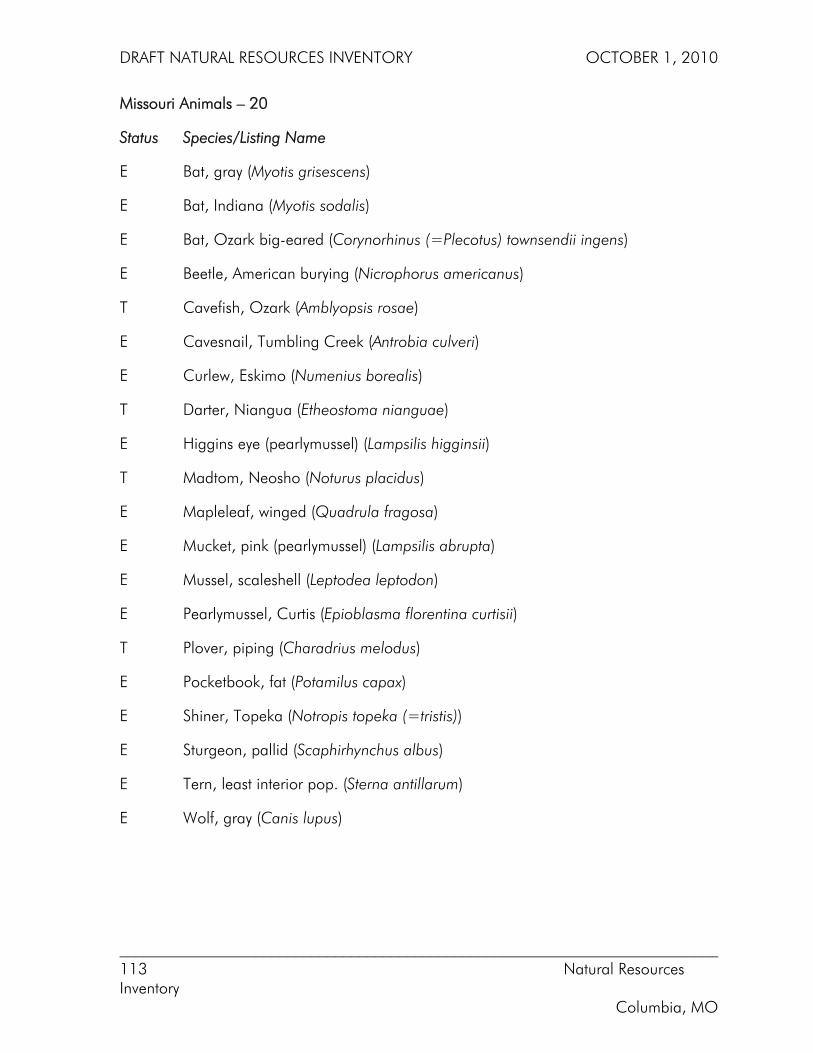
DRAFT NATURAL RESOURCES INVENTORY OCTOBER 1, 2010
___________________________________________________________________________ 113 Natural Resources Inventory Columbia, MO
Missouri Animals – 20
Status Species/Listing Name
E Bat, gray (Myotis grisescens)
E Bat, Indiana (Myotis sodalis)
E Bat, Ozark big-eared (Corynorhinus (=Plecotus) townsendii ingens)
E Beetle, American burying (Nicrophorus americanus)
T Cavefish, Ozark (Amblyopsis rosae)
E Cavesnail, Tumbling Creek (Antrobia culveri)
E Curlew, Eskimo (Numenius borealis)
T Darter, Niangua (Etheostoma nianguae)
E Higgins eye (pearlymussel) (Lampsilis higginsii)
T Madtom, Neosho (Noturus placidus)
E Mapleleaf, winged (Quadrula fragosa)
E Mucket, pink (pearlymussel) (Lampsilis abrupta)
E Mussel, scaleshell (Leptodea leptodon)
E Pearlymussel, Curtis (Epioblasma florentina curtisii)
T Plover, piping (Charadrius melodus)
E Pocketbook, fat (Potamilus capax)
E Shiner, Topeka (Notropis topeka (=tristis))
E Sturgeon, pallid (Scaphirhynchus albus)
E Tern, least interior pop. (Sterna antillarum)
E Wolf, gray (Canis lupus)
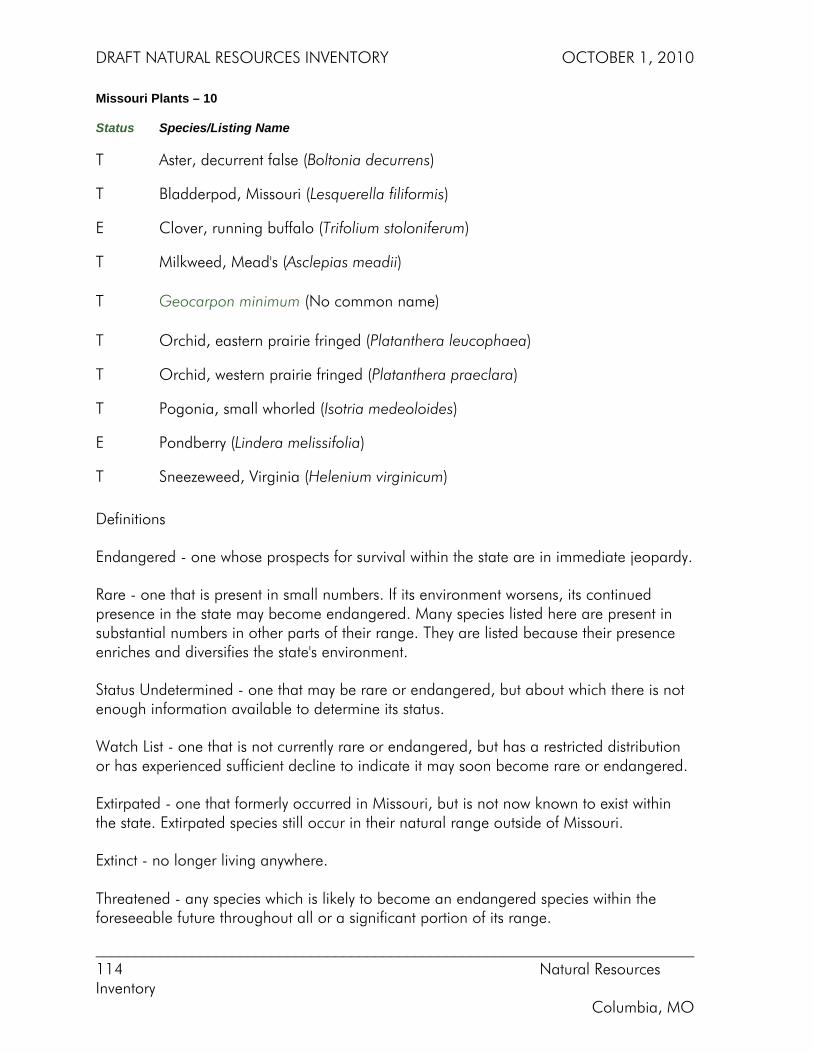
DRAFT NATURAL RESOURCES INVENTORY OCTOBER 1, 2010
___________________________________________________________________________ 114 Natural Resources Inventory Columbia, MO
Missouri Plants – 10
Status Species/Listing Name
T Aster, decurrent false (Boltonia decurrens)
T Bladderpod, Missouri (Lesquerella filiformis)
E Clover, running buffalo (Trifolium stoloniferum)
T Milkweed, Mead's (Asclepias meadii)
T Geocarpon minimum (No common name)
T Orchid, eastern prairie fringed (Platanthera leucophaea)
T Orchid, western prairie fringed (Platanthera praeclara)
T Pogonia, small whorled (Isotria medeoloides)
E Pondberry (Lindera melissifolia)
T Sneezeweed, Virginia (Helenium virginicum)
Definitions
Endangered - one whose prospects for survival within the state are in immediate jeopardy.
Rare - one that is present in small numbers. If its environment worsens, its continued presence in the state may become endangered. Many species listed here are present in substantial numbers in other parts of their range. They are listed because their presence enriches and diversifies the state's environment.
Status Undetermined - one that may be rare or endangered, but about which there is not enough information available to determine its status.
Watch List - one that is not currently rare or endangered, but has a restricted distribution or has experienced sufficient decline to indicate it may soon become rare or endangered.
Extirpated - one that formerly occurred in Missouri, but is not now known to exist within the state. Extirpated species still occur in their natural range outside of Missouri.
Extinct - no longer living anywhere. Threatened - any species which is likely to become an endangered species within the foreseeable future throughout all or a significant portion of its range.
DRAFT NATURAL RESOURCES INVENTORY OCTOBER 1, 2010
___________________________________________________________________________ 115 Natural Resources Inventory Columbia, MO
APPENDIX C: VISIONING FINAL REPORT - NRI