natural killer cell signal integration balances synapse symmetry and migration
TRANSCRIPT
Natural Killer Cell Signal Integration Balances SynapseSymmetry and MigrationFiona J. Culley1¤a, Matthew Johnson1, J. Henry Evans1, Sunil Kumar1, Rupert Crilly1, Juan Casasbuenas1,
Tim Schnyder1, Maryam Mehrabi1, Mahendra P. Deonarain1, Dmitry S. Ushakov2, Veronique Braud3,
Gunter Roth4, Roland Brock5¤b, Karsten Kohler1, Daniel M. Davis1*
1 Division of Cell and Molecular Biology, Imperial College London, London, United Kingdom, 2 National Heart and Lung Institute, Imperial College London, London, United
Kingdom, 3 Institut de Pharmacologie Moleculaire et Cellulaire, Centre National de la Recherche Scientifique/Universite de Nice-Sophia Antipolis, UMR6097, Valbonne,
France, 4 Department of Molecular Biology, Interfacultary Institute for Cell Biology, University of Tubingen, Tubingen, Germany, 5 Department of Biochemistry, Nijmegen
Centre for Molecular Life Sciences, Radboud University Nijmegen Medical Centre, Nijmegen, The Netherlands
Abstract
Natural killer (NK) cells discern the health of other cells by recognising the balance of activating and inhibitory ligandsexpressed by each target cell. However, how the integration of activating and inhibitory signals relates to formation of theNK cell immune synapse remains a central question in our understanding of NK cell recognition. Here we report that ligationof LFA-1 on NK cells induced asymmetrical cell spreading and migration. In contrast, ligation of the activating receptorNKG2D induced symmetrical spreading of ruffled lamellipodia encompassing a dynamic ring of f-actin, concurrent withpolarization towards a target cell and a ‘‘stop’’ signal. Ligation of both LFA-1 and NKG2D together resulted in symmetricalspreading but co-ligation of inhibitory receptors reverted NK cells to an asymmetrical migratory configuration leading toinhibitory synapses being smaller and more rapidly disassembled. Using micropatterned activating and inhibitory ligands,signals were found to be continuously and locally integrated during spreading. Together, these data demonstrate that NKcells spread to form large, stable, symmetrical synapses if activating signals dominate, whereas asymmetrical migratory‘‘kinapses’’ are favoured if inhibitory signals dominate. This clarifies how the integration of activating and inhibitory receptorsignals is translated to an appropriate NK cell response.
Citation: Culley FJ, Johnson M, Evans JH, Kumar S, Crilly R, et al. (2009) Natural Killer Cell Signal Integration Balances Synapse Symmetry and Migration. PLoSBiol 7(7): e1000159. doi:10.1371/journal.pbio.1000159
Academic Editor: Philippa Marrack, National Jewish Medical and Research Center/Howard Hughes Medical Institute, United States of America
Received March 5, 2009; Accepted June 12, 2009; Published July 28, 2009
Copyright: � 2009 Culley et al. This is an open-access article distributed under the terms of the Creative Commons Attribution License, which permitsunrestricted use, distribution, and reproduction in any medium, provided the original author and source are credited.
Funding: This work was funded by a Lister Institute Research Prize for Preventive Medicine (www.lister-institute.org.uk), The Royal Society (royalsociety.org), theMedical Research Council (www.mrc.ac.uk; G0500563), the Biotechnology and Biological Sciences Research Council (www.bbsrc.ac.uk; BB/D011663/1), and aWolfson Royal Society Research Merit Award (royalsociety.org) to DMD. RB acknowledges support from the Volkswagen-Foundation (www.volkswagenstiftung.de; ‘‘Nachwuchsgruppen an Universitaten’’ I/77 472) and the German Ministry for Education and Research (www.bmbf.de; Technical applications of selforganization, 13N9127). The funders had no role in study design, data collection and analysis, decision to publish, or preparation of the manuscript.
Competing Interests: The authors have declared that no competing interests exist.
Abbreviations: IFNc, interferon gamma; IRM, interference reflection microscopy; KIR, killer-cell immunoglobulin-like receptor; LILR, leukocyte Ig-like receptor;MTOC, microtubule organizing centre; NK cell, natural killer cell; PDMS, polydimethylsiloxane; SD, standard deviation; TIRF, total internal reflection fluorescence;YFP, yellow fluorescent protein.
* E-mail: [email protected]
¤a Current address: Department of Respiratory Medicine, National Heart and Lung Institute, Faculty of Medicine, Imperial College London, Norfolk Place, London,United Kingdom¤b Current address: Department of Microsystems Engineering (IMTEK), University of Freiburg, Freiburg, Germany
Introduction
Natural killer (NK) cells are lymphocytes that play an important
role in defence against infections and cancer [1]. They directly kill
tumor-transformed or virally infected cells via the formation of a
cytolytic synapse that facilitates polarisation and subsequent
secretion of cytotoxic granules directed towards the target cell
[2–4] and also contribute to immunity through, for example,
cytokine release [5]. NK cell activation is regulated by a balance of
activating and inhibitory signals through a multitude of germ-line
encoded receptors that recognise ligands expressed on the surface
of other cells [6,7]. One way that cells become susceptible to NK
cell lysis is through an upregulation of activating ligands at their
surface. One of the best characterised activating receptors on NK
cells, NKG2D, recognises ‘‘stress-inducible’’ ligands, such as
MICA, which are upregulated following, for example, heat shock
or UV-induced DNA damage [8,9]. Alternatively, loss of
inhibitory ligands from the surface can also render cells susceptible
to NK lysis. Inhibitory receptors include the killer-cell immuno-
globulin-like receptors (KIRs), members of the leukocyte Ig-like
receptor (LILR) family, and the CD94:NKG2A heterodimer that
recognise class I MHC molecules [10,11]. Broadly, activating
receptors trigger signalling cascades via phosphorylation of ITAM
or ITAM-like motifs encoded within activating receptors or, more
commonly, within associated adaptor proteins, whereas inhibitory
receptors contain ITIM motifs that recruit SH2 domain protein
tyrosine phosphatases upon receptor engagement (recently re-
viewed in [6]).
Understanding how the balance of activating and inhibitory
signals in NK cells leads to appropriate effector responses is an
PLoS Biology | www.plosbiology.org 1 July 2009 | Volume 7 | Issue 7 | e1000159
important challenge in NK cell biology [12]. NK cells form
synapses with target cells in which cell surface molecules
accumulate and organise into micrometer-scale domains
[2,3,13]. At lytic synapses, f-actin accumulates at the synapse,
the microtubule organizing centre (MTOC) polarises, and lytic
granules are directed towards the target cell [2,14–16]. However,
it remains a central gap in our knowledge as to how the balance of
activating and inhibitory signals relates to these dynamic cell
behaviours and controls the eventual outcome of the interaction
[17].
A special characteristic of our immune system compared with,
for example, the nervous system is the high motility of immune
cells and their propensity to form dynamic intercellular conjugates,
or so-called ‘‘make and break’’ synapses [18,19]. Moreover, recent
imaging of immune cell interactions in vivo found that a complex
orchestration of cell–cell contact times is a key correlate to
establishing appropriate immune responses. Integration of com-
peting receptor signals for migration or adhesion likely determine
the duration of cell–cell contacts, and thus understanding the
regulation of immune cell motility is important for how signal
integration leads to appropriate effector functions in these cells. In
homeostasis, T cells scan for specific peptides presented by
dendritic cells by moving rapidly in lymph nodes [20,21]. When a
cognate antigen is encountered, T cells stop and form a prolonged
interaction with the antigen presenting cells [22–25]. Migrating
cells are polarised and asymmetrical, consisting of a leading
lamellipodium, a lamella, and trailing uropod [26], whereas on
activation T cells spread symmetrically to form a stable synapse
[27,28] to which peptide/MHC proteins are recruited and
signalling is sustained within microclusters of proteins that
assemble at the synapse periphery [29,30]. A migratory configu-
ration of T cells, which allows moving contacts with antigen
presenting cells, has recently been termed a ‘‘kinapse’’ [27,31].
Here, we demonstrate that ligation of the cell surface integrin
LFA-1 alone on NK cells can trigger asymmetrical spreading to
aid cell migration. In contrast, ligation of activating receptor
NKG2D imposes symmetrical cell spreading via extension of
sheets of lamellipodia containing a ring of f-actin. NKG2D ligation
also delivers a stop signal to halt NK cell migration. Importantly,
inhibitory signalling is integrated continuously with activating
signals during spreading and serves to block symmetrical spreading
and provides a reverse-stop signal. The size of inhibitory synapses
and the dwell time of NK cells on inhibitory targets are
consequently reduced. Thus, our data suggest that in NK cells, a
dominance of activating signals results in symmetrical spreading to
form a large stable synapse, whereas a dominance of inhibitory
signals results in a smaller less stable migratory ‘‘kinapse’’ thereby
preventing cytotoxicity.
Results
NK Cells Undergo a Spreading and Contraction Responseat Activating but Not Inhibitory Synapses
Broadly, NK cells may form at least two types or categories of
synapse; an activating synapse that triggers target cell killing (and
other effector functions), or an inhibitory synapse, in which signals
from inhibitory ligands dominate and the target cell is spared (and
other effector functions are blocked). Here, we first set out to
compare the sizes of inhibitory and activating synapses. Confocal
images of NK cell–target cell conjugates were acquired and the
maximum length of the cell contact in a single x-y plane was
measured (Figure 1A). To readily compare activating and
inhibitory NK cell synapses, we initially used the well-established
model cell system of the NK cell line YTS transfected to express an
inhibitory receptor KIR2DL1 (YTS/KIR2DL1) mixed with either
untransfected 721.221 (221), which does not express endogenous
HLA-A, -B, or -C, or transfectants of 221 (221/Cw6) expressing
an inhibitory MHC ligand for KIR2DL1, HLA-Cw6. This system
is well-established as functionally leading to NK cell activation or
inhibition [13]. The synaptic contact was 30.864.2 mm between
YTS/KIR2DL1 and 221, i.e., at an activating synapse, compared
to 15.164.4 mm between YTS/KIR2DL1 and 221/Cw6, i.e., an
inhibitory synapse. Thus there is a 4-fold increase in contact area
at activating synapses relative to inhibitory contacts in this system
(Figure 1B).
To determine the kinetics of these morphological changes at
activating and inhibitory synapses, the diameter of the contact
between cells was measured every 30 s. For YTS cells interacting
with 221 cells, i.e., at activating synapses, NK cells rapidly spread
over the surface of the target cell, reaching their maximum area on
average 2 min after contact, which was followed by a contraction
(Figure 1C). In contrast, when HLA-Cw6 was expressed by target
cells, the inhibitory synapse expanded less rapidly and remained
small (Figure 1C).
To test the generality of these observations, another NK cell
line, NKL, was mixed with transfectants of 221 expressing MICA-
yellow fluorescent protein (YFP), a ligand for the activating
receptor NKG2D expressed by NKL. As for YTS, NKL exhibited
a spreading and contraction response at activating contacts that
followed a similar time course (specific example shown in
Figure 1D and 1E). Accumulation of MICA-YFP occurred during
the spreading process, implying that contraction was not necessary
to accumulate ligand at the synapse. Images of the en face synapse,
in transfectants of NKL expressing YFP-actin, revealed that a ring
of actin rapidly accumulated at the periphery of the activating
synapse (Figure 1F). This ring persisted throughout the spreading
phase and dissipated after the contraction phase.
HLA-E delivers an inhibitory signal to NKL cells via the
CD94:NKG2A heterodimeric receptor. We confirmed that HLA-
E expressed on 221 cells was able to inhibit NKL function, as
Author Summary
Immune cells survey their local environment and animmunological response can be activated when anappropriate target cell or antigen-presenting cell isrecognised by key cell surface molecules. Just how themultitude of protein–protein interactions work to regu-late this decision is an ongoing question. Imagingtechnology has provided key insights, demonstratingthat immune cell activation is often accompanied by thesegregation of proteins at immune synapses. Natural killer(NK) cells are lymphocytes that can recognise and killvirally infected or tumour-transformed cells via theformation of a synapse that facilitates secretion ofcytotoxic granules directed at the target cells. Key tounderstanding target cell recognition by NK cells is toestablish how the balance of activating and inhibitorysignals at the synapse leads to an appropriate response,e.g., to kill or spare a target cell. We found that whenactivating ligands are dominant on a target cell, NK cellsstop migrating and spread lamellipodia across the targetcell to form a large symmetrical synapse. If inhibitorysignals dominate, the symmetry of the NK cell spreadingresponse is broken and the stop signal is reversed, whichreduces the time spent in contact with the target cell.Thus, NK cell activating and inhibitory signals regulate NKcell synapse symmetry and migration to determinewhether an NK cell will kill or move on.
NK Cell Spreading and Migration
PLoS Biology | www.plosbiology.org 2 July 2009 | Volume 7 | Issue 7 | e1000159
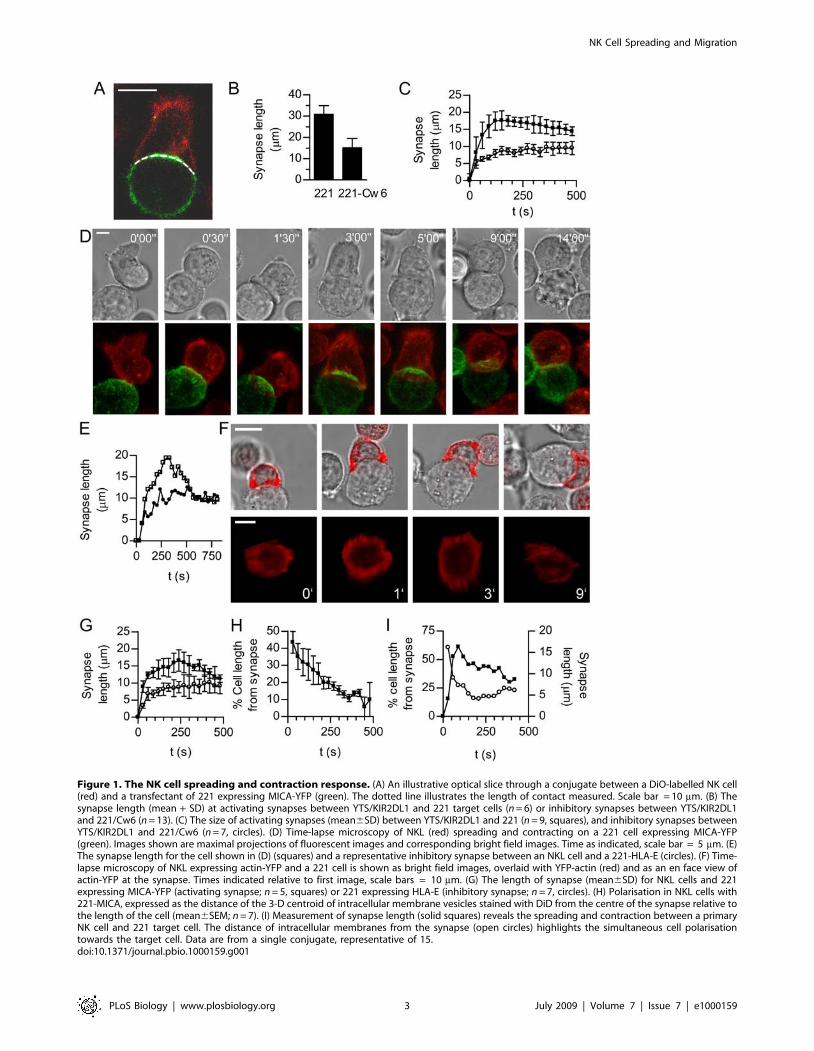
Figure 1. The NK cell spreading and contraction response. (A) An illustrative optical slice through a conjugate between a DiO-labelled NK cell(red) and a transfectant of 221 expressing MICA-YFP (green). The dotted line illustrates the length of contact measured. Scale bar = 10 mm. (B) Thesynapse length (mean + SD) at activating synapses between YTS/KIR2DL1 and 221 target cells (n = 6) or inhibitory synapses between YTS/KIR2DL1and 221/Cw6 (n = 13). (C) The size of activating synapses (mean6SD) between YTS/KIR2DL1 and 221 (n = 9, squares), and inhibitory synapses betweenYTS/KIR2DL1 and 221/Cw6 (n = 7, circles). (D) Time-lapse microscopy of NKL (red) spreading and contracting on a 221 cell expressing MICA-YFP(green). Images shown are maximal projections of fluorescent images and corresponding bright field images. Time as indicated, scale bar = 5 mm. (E)The synapse length for the cell shown in (D) (squares) and a representative inhibitory synapse between an NKL cell and a 221-HLA-E (circles). (F) Time-lapse microscopy of NKL expressing actin-YFP and a 221 cell is shown as bright field images, overlaid with YFP-actin (red) and as an en face view ofactin-YFP at the synapse. Times indicated relative to first image, scale bars = 10 mm. (G) The length of synapse (mean6SD) for NKL cells and 221expressing MICA-YFP (activating synapse; n = 5, squares) or 221 expressing HLA-E (inhibitory synapse; n = 7, circles). (H) Polarisation in NKL cells with221-MICA, expressed as the distance of the 3-D centroid of intracellular membrane vesicles stained with DiD from the centre of the synapse relative tothe length of the cell (mean6SEM; n = 7). (I) Measurement of synapse length (solid squares) reveals the spreading and contraction between a primaryNK cell and 221 target cell. The distance of intracellular membranes from the synapse (open circles) highlights the simultaneous cell polarisationtowards the target cell. Data are from a single conjugate, representative of 15.doi:10.1371/journal.pbio.1000159.g001
NK Cell Spreading and Migration
PLoS Biology | www.plosbiology.org 3 July 2009 | Volume 7 | Issue 7 | e1000159
interferon gamma (IFNc) production by NKL was inhibited for
target cells expressing HLA-E (Figure S1), consistent with previous
studies [32]. More importantly here, recognition of the inhibitory
ligand HLA-E, expressed in transfectants of 221, also prevented
the spreading and contraction response in NKL (Figure 1E and
1G). To determine how spreading at the activating synapse is
temporally related to the polarisation of intracellular granules and
vesicles, trafficking of intracellular membranes was monitored in
cells labelled with the membrane dye DiD. Polarisation, i.e., the
distance of the centroid of the intracellular membranes to the
synapse centre as a proportion of the cell length, began
immediately after cell contact and continued concurrently with
spreading (Figure 1H). Similarly, primary peripheral blood NK
cells underwent a spreading and contraction response on target
221 cells, and this also coincided with the polarisation of granules
towards the target cell (Figure 1I). Taken together, these data
extend observations of NK cell flattening induced by activating
ligands made by others [33] and establish temporal differences in
the morphology of the inhibitory and activating NK synapse;
interaction with an activating target cell triggers NK cells to spread
to form a large synapse concurrent with formation of an actin ring
and polarisation of intracellular granules, which is followed by a
contraction phase and dissipation of the actin ring. In contrast,
during inhibitory interactions the size of the contact between the
NK cell and the target cell remains small.
NKG2D and LFA-1 Ligation Trigger MorphologicallyDifferent Spreading Responses in NK Cells
To identity the minimal requirements for a spreading response
in NK cells, glass slides were coated with mAb against NKG2D, a
major activating receptor on NKL. NKL transfected to express
membrane-bound (palmitoylated) YFP (YFP-mem), or stained
with the membrane dye DiO, were observed to be activated by the
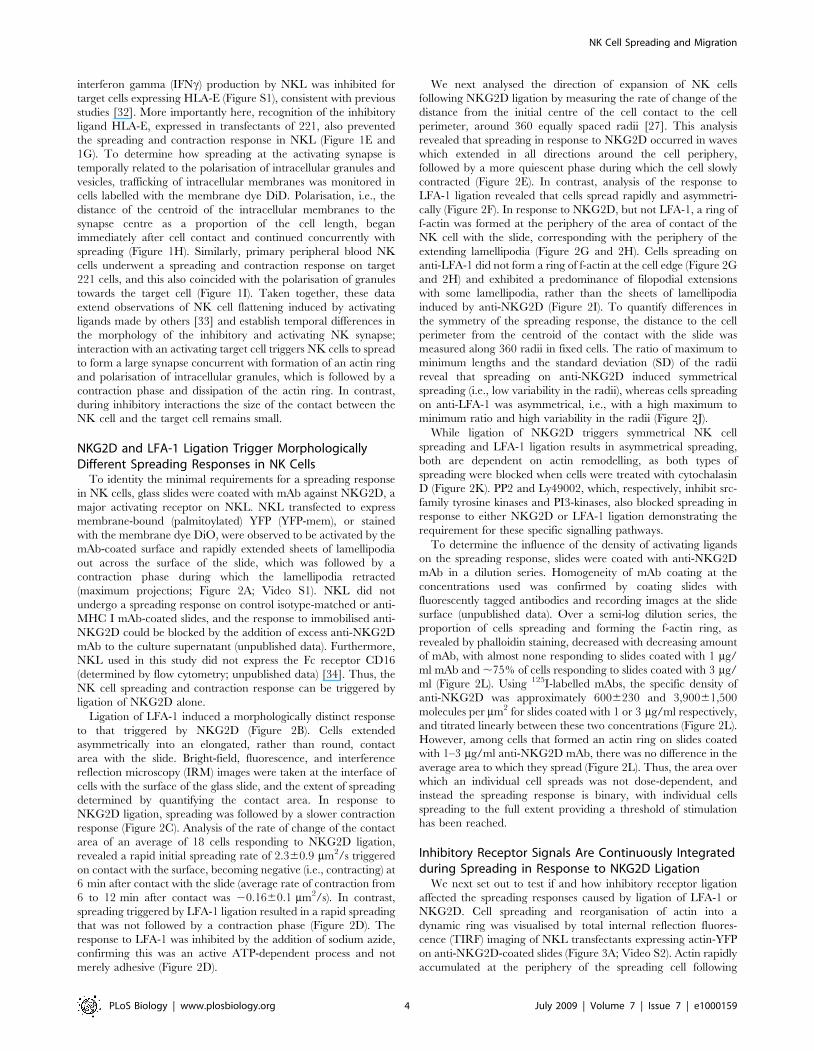
mAb-coated surface and rapidly extended sheets of lamellipodia
out across the surface of the slide, which was followed by a
contraction phase during which the lamellipodia retracted
(maximum projections; Figure 2A; Video S1). NKL did not
undergo a spreading response on control isotype-matched or anti-
MHC I mAb-coated slides, and the response to immobilised anti-
NKG2D could be blocked by the addition of excess anti-NKG2D
mAb to the culture supernatant (unpublished data). Furthermore,
NKL used in this study did not express the Fc receptor CD16
(determined by flow cytometry; unpublished data) [34]. Thus, the
NK cell spreading and contraction response can be triggered by
ligation of NKG2D alone.
Ligation of LFA-1 induced a morphologically distinct response
to that triggered by NKG2D (Figure 2B). Cells extended
asymmetrically into an elongated, rather than round, contact
area with the slide. Bright-field, fluorescence, and interference
reflection microscopy (IRM) images were taken at the interface of
cells with the surface of the glass slide, and the extent of spreading
determined by quantifying the contact area. In response to
NKG2D ligation, spreading was followed by a slower contraction
response (Figure 2C). Analysis of the rate of change of the contact
area of an average of 18 cells responding to NKG2D ligation,
revealed a rapid initial spreading rate of 2.360.9 mm2/s triggered
on contact with the surface, becoming negative (i.e., contracting) at
6 min after contact with the slide (average rate of contraction from
6 to 12 min after contact was 20.1660.1 mm2/s). In contrast,
spreading triggered by LFA-1 ligation resulted in a rapid spreading
that was not followed by a contraction phase (Figure 2D). The
response to LFA-1 was inhibited by the addition of sodium azide,
confirming this was an active ATP-dependent process and not
merely adhesive (Figure 2D).
We next analysed the direction of expansion of NK cells
following NKG2D ligation by measuring the rate of change of the
distance from the initial centre of the cell contact to the cell
perimeter, around 360 equally spaced radii [27]. This analysis
revealed that spreading in response to NKG2D occurred in waves
which extended in all directions around the cell periphery,
followed by a more quiescent phase during which the cell slowly
contracted (Figure 2E). In contrast, analysis of the response to
LFA-1 ligation revealed that cells spread rapidly and asymmetri-
cally (Figure 2F). In response to NKG2D, but not LFA-1, a ring of
f-actin was formed at the periphery of the area of contact of the
NK cell with the slide, corresponding with the periphery of the
extending lamellipodia (Figure 2G and 2H). Cells spreading on
anti-LFA-1 did not form a ring of f-actin at the cell edge (Figure 2G
and 2H) and exhibited a predominance of filopodial extensions
with some lamellipodia, rather than the sheets of lamellipodia
induced by anti-NKG2D (Figure 2I). To quantify differences in
the symmetry of the spreading response, the distance to the cell
perimeter from the centroid of the contact with the slide was
measured along 360 radii in fixed cells. The ratio of maximum to
minimum lengths and the standard deviation (SD) of the radii
reveal that spreading on anti-NKG2D induced symmetrical
spreading (i.e., low variability in the radii), whereas cells spreading
on anti-LFA-1 was asymmetrical, i.e., with a high maximum to
minimum ratio and high variability in the radii (Figure 2J).
While ligation of NKG2D triggers symmetrical NK cell
spreading and LFA-1 ligation results in asymmetrical spreading,
both are dependent on actin remodelling, as both types of
spreading were blocked when cells were treated with cytochalasin
D (Figure 2K). PP2 and Ly49002, which, respectively, inhibit src-
family tyrosine kinases and PI3-kinases, also blocked spreading in
response to either NKG2D or LFA-1 ligation demonstrating the
requirement for these specific signalling pathways.
To determine the influence of the density of activating ligands
on the spreading response, slides were coated with anti-NKG2D
mAb in a dilution series. Homogeneity of mAb coating at the
concentrations used was confirmed by coating slides with
fluorescently tagged antibodies and recording images at the slide
surface (unpublished data). Over a semi-log dilution series, the
proportion of cells spreading and forming the f-actin ring, as
revealed by phalloidin staining, decreased with decreasing amount
of mAb, with almost none responding to slides coated with 1 mg/
ml mAb and ,75% of cells responding to slides coated with 3 mg/
ml (Figure 2L). Using 125I-labelled mAbs, the specific density of
anti-NKG2D was approximately 6006230 and 3,90061,500
molecules per mm2 for slides coated with 1 or 3 mg/ml respectively,
and titrated linearly between these two concentrations (Figure 2L).
However, among cells that formed an actin ring on slides coated
with 1–3 mg/ml anti-NKG2D mAb, there was no difference in the
average area to which they spread (Figure 2L). Thus, the area over
which an individual cell spreads was not dose-dependent, and
instead the spreading response is binary, with individual cells
spreading to the full extent providing a threshold of stimulation
has been reached.
Inhibitory Receptor Signals Are Continuously Integratedduring Spreading in Response to NKG2D Ligation
We next set out to test if and how inhibitory receptor ligation
affected the spreading responses caused by ligation of LFA-1 or
NKG2D. Cell spreading and reorganisation of actin into a
dynamic ring was visualised by total internal reflection fluores-
cence (TIRF) imaging of NKL transfectants expressing actin-YFP
on anti-NKG2D-coated slides (Figure 3A; Video S2). Actin rapidly
accumulated at the periphery of the spreading cell following
NK Cell Spreading and Migration
PLoS Biology | www.plosbiology.org 4 July 2009 | Volume 7 | Issue 7 | e1000159
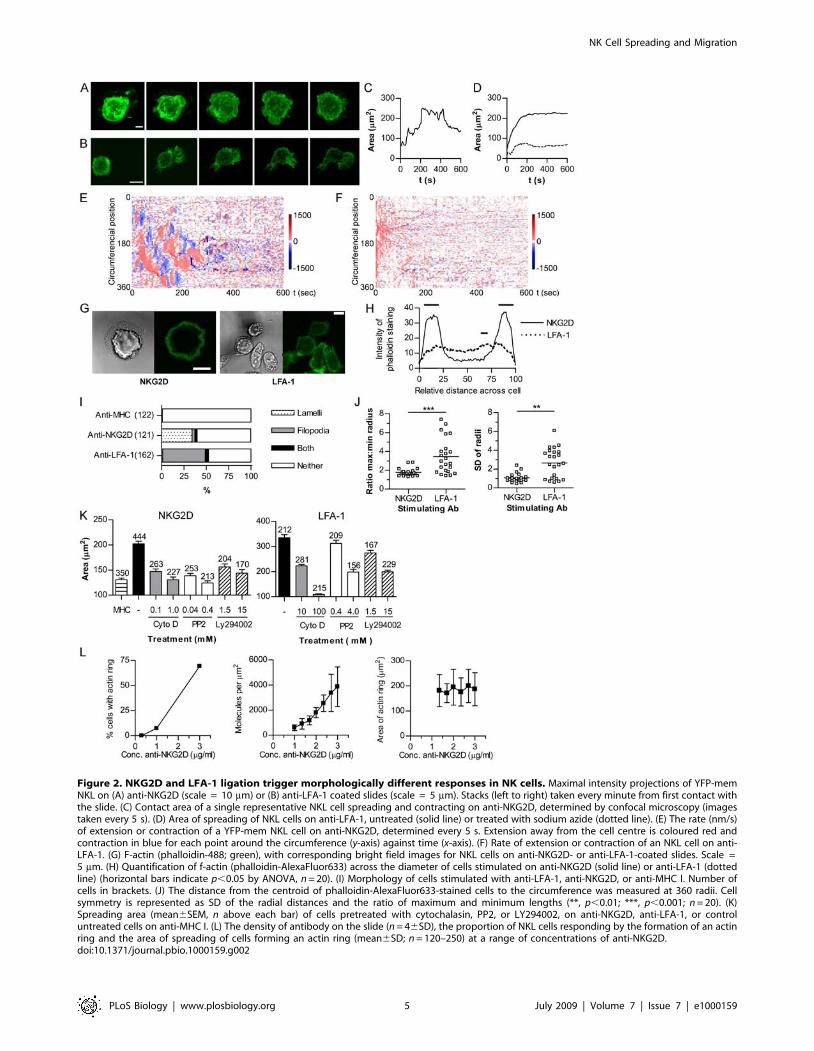
Figure 2. NKG2D and LFA-1 ligation trigger morphologically different responses in NK cells. Maximal intensity projections of YFP-memNKL on (A) anti-NKG2D (scale = 10 mm) or (B) anti-LFA-1 coated slides (scale = 5 mm). Stacks (left to right) taken every minute from first contact withthe slide. (C) Contact area of a single representative NKL cell spreading and contracting on anti-NKG2D, determined by confocal microscopy (imagestaken every 5 s). (D) Area of spreading of NKL cells on anti-LFA-1, untreated (solid line) or treated with sodium azide (dotted line). (E) The rate (nm/s)of extension or contraction of a YFP-mem NKL cell on anti-NKG2D, determined every 5 s. Extension away from the cell centre is coloured red andcontraction in blue for each point around the circumference (y-axis) against time (x-axis). (F) Rate of extension or contraction of an NKL cell on anti-LFA-1. (G) F-actin (phalloidin-488; green), with corresponding bright field images for NKL cells on anti-NKG2D- or anti-LFA-1-coated slides. Scale =5 mm. (H) Quantification of f-actin (phalloidin-AlexaFluor633) across the diameter of cells stimulated on anti-NKG2D (solid line) or anti-LFA-1 (dottedline) (horizontal bars indicate p,0.05 by ANOVA, n = 20). (I) Morphology of cells stimulated with anti-LFA-1, anti-NKG2D, or anti-MHC I. Number ofcells in brackets. (J) The distance from the centroid of phalloidin-AlexaFluor633-stained cells to the circumference was measured at 360 radii. Cellsymmetry is represented as SD of the radial distances and the ratio of maximum and minimum lengths (**, p,0.01; ***, p,0.001; n = 20). (K)Spreading area (mean6SEM, n above each bar) of cells pretreated with cytochalasin, PP2, or LY294002, on anti-NKG2D, anti-LFA-1, or controluntreated cells on anti-MHC I. (L) The density of antibody on the slide (n = 46SD), the proportion of NKL cells responding by the formation of an actinring and the area of spreading of cells forming an actin ring (mean6SD; n = 120–250) at a range of concentrations of anti-NKG2D.doi:10.1371/journal.pbio.1000159.g002
NK Cell Spreading and Migration
PLoS Biology | www.plosbiology.org 5 July 2009 | Volume 7 | Issue 7 | e1000159
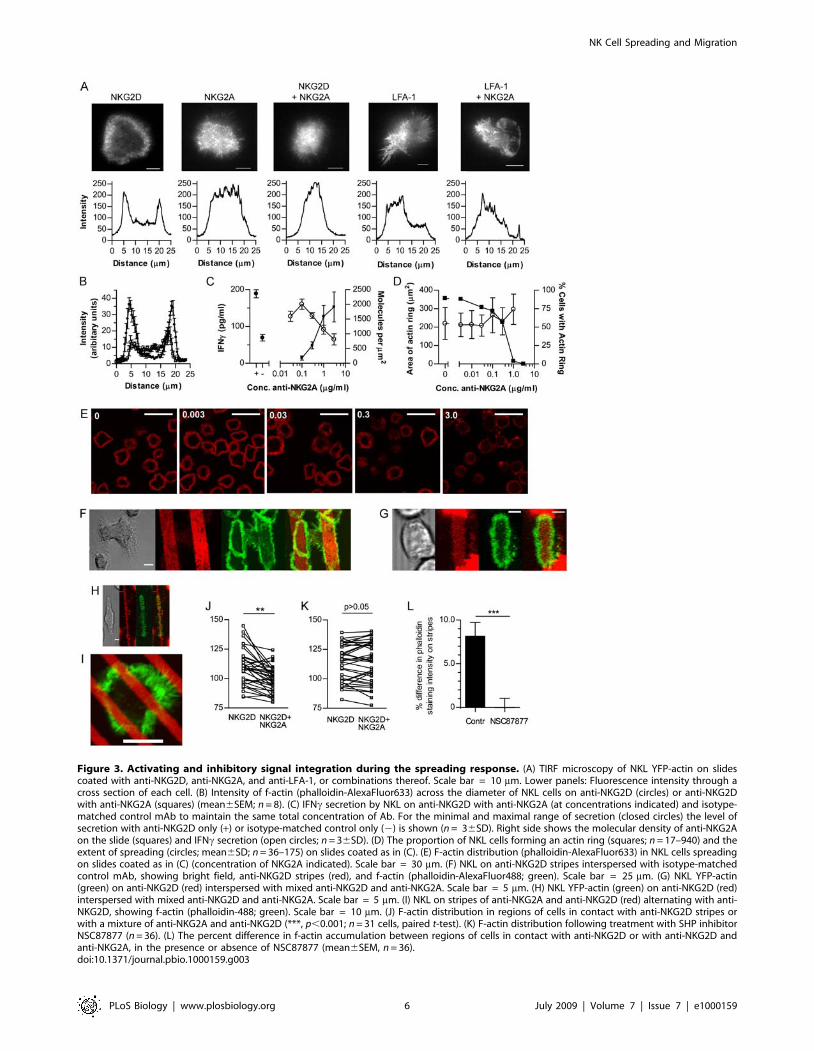
Figure 3. Activating and inhibitory signal integration during the spreading response. (A) TIRF microscopy of NKL YFP-actin on slidescoated with anti-NKG2D, anti-NKG2A, and anti-LFA-1, or combinations thereof. Scale bar = 10 mm. Lower panels: Fluorescence intensity through across section of each cell. (B) Intensity of f-actin (phalloidin-AlexaFluor633) across the diameter of NKL cells on anti-NKG2D (circles) or anti-NKG2Dwith anti-NKG2A (squares) (mean6SEM; n = 8). (C) IFNc secretion by NKL on anti-NKG2D with anti-NKG2A (at concentrations indicated) and isotype-matched control mAb to maintain the same total concentration of Ab. For the minimal and maximal range of secretion (closed circles) the level ofsecretion with anti-NKG2D only (+) or isotype-matched control only (2) is shown (n = 36SD). Right side shows the molecular density of anti-NKG2Aon the slide (squares) and IFNc secretion (open circles; n = 36SD). (D) The proportion of NKL cells forming an actin ring (squares; n = 17–940) and theextent of spreading (circles; mean6SD; n = 36–175) on slides coated as in (C). (E) F-actin distribution (phalloidin-AlexaFluor633) in NKL cells spreadingon slides coated as in (C) (concentration of NKG2A indicated). Scale bar = 30 mm. (F) NKL on anti-NKG2D stripes interspersed with isotype-matchedcontrol mAb, showing bright field, anti-NKG2D stripes (red), and f-actin (phalloidin-AlexaFluor488; green). Scale bar = 25 mm. (G) NKL YFP-actin(green) on anti-NKG2D (red) interspersed with mixed anti-NKG2D and anti-NKG2A. Scale bar = 5 mm. (H) NKL YFP-actin (green) on anti-NKG2D (red)interspersed with mixed anti-NKG2D and anti-NKG2A. Scale bar = 5 mm. (I) NKL on stripes of anti-NKG2A and anti-NKG2D (red) alternating with anti-NKG2D, showing f-actin (phalloidin-488; green). Scale bar = 10 mm. (J) F-actin distribution in regions of cells in contact with anti-NKG2D stripes orwith a mixture of anti-NKG2A and anti-NKG2D (***, p,0.001; n = 31 cells, paired t-test). (K) F-actin distribution following treatment with SHP inhibitorNSC87877 (n = 36). (L) The percent difference in f-actin accumulation between regions of cells in contact with anti-NKG2D or with anti-NKG2D andanti-NKG2A, in the presence or absence of NSC87877 (mean6SEM, n = 36).doi:10.1371/journal.pbio.1000159.g003
NK Cell Spreading and Migration
PLoS Biology | www.plosbiology.org 6 July 2009 | Volume 7 | Issue 7 | e1000159
contact with the slide, and this annular distribution was
maintained throughout the spreading response and during
contraction, after which it dissipates, as was also seen in cell–cell
conjugates (Figure 1H). The actin ring was a highly dynamic
structure within which waves of actin propagated, consistent with
waves of membrane activity driving the symmetrical spreading
process (Figure 2E). Actin ring formation did not occur on slides
coated with mAb against the inhibitory receptor NKG2A
(Figure 3A; Video S3). Most importantly, actin ring formation
was blocked in cells exposed to a combination of anti-NKG2A and
anti-NKG2D mAbs (Figure 3A and 3B; Video S4). This is
consistent with previous studies showing that inhibitory receptor
ligation in NK cells prevents accumulation of f-actin at NK cell
synapses [14,35,36] and is reminiscent of how ligation of the
inhibitory receptor LILRB1 inhibits TCR-mediated actin poly-
merization [37]. In contrast, asymmetrical spreading induced by
LFA-1 ligation was unaffected by co-ligation of inhibitory
receptors (Figure 3A; Videos S5 and S6).
We next titrated the coating concentration of the NKG2A mAb.
Using 125I-labelled NKG2A mAb, in the presence of 3 mg/ml
unlabelled anti-NKG2D and isotype control antibodies (to
maintain the same total antibody concentration), the specific
density of anti-NKG2A on the slides could be estimated, and
reduced in a dose-dependent manner over the range of coating
concentrations used (Figure 3C). The biological consequences of
NKG2A ligation also titrated out over this range of densities, as
shown by the inhibition of IFNc production (Figure 3C).
Importantly however, at increasing concentrations of anti-
NKG2A mAb, the percent of cells forming an f-actin ring
decreased (Figure 3D and 3E). Interestingly, the area of spreading
in cells that did assemble a ring of f-actin did not alter (Figure 3D).
This further demonstrates that the formation of the actin ring is a
binary decision rather than occurring to an extent that is
proportional to the balance of inhibitory and activating signals
received.
Having shown that the integration of activating and inhibitory
signals controls whether or not a cell spreads, we set out to
determine whether the ‘‘decision’’ to spread is irreversible once
spreading has been initiated. To test this, cell spreading was
assessed on spatially segregated arrangements of activating and
inhibitory antibodies. If NK cell spreading is determined only by
the signals received at initiation of the response, cells would be
expected to spread according to the ligands first encountered on
contact with the slide, regardless of further mAb encountered as
they spread. If signals are integrated during spreading, spreading
would be expected to continue only when a cell continued to
encounter activating mAb and to be stopped if the spreading cell
encountered inhibitory mAb.
Microcontact printing with patterned polydimethylsiloxane
(PDMS) stamps was used to coat the surface of slides with mAb
patterned on a micrometer-scale. Specifically, mAb were stamped
in stripes and a second mAb was applied to fill the uncoated spaces
between the stamped mAb regions. The stamping method was
validated by imaging the distribution of stamped and overlaid
antibodies (Figure S2). When slides were stamped to display
alternate stripes of anti-NKG2D and an isotype-matched control
mAb, NKL cells spread in elongated shapes along the stripes of
activating antibodies and the actin ring was restricted to the cell
periphery along the edge of the stripe (Figure 3F). When NKL cells
were stimulated by stripes of activating NKG2D antibodies
interspersed with stripes containing a mixture of activating anti-
NKG2D and inhibitory anti-NKG2A antibodies, spreading was
again restricted to the regions of anti-NKG2D and stopped where
inhibitory receptors were also ligated (Figure 3G and 3H). These
data demonstrate that in regions with only activating ligands,
spreading continues, but as inhibitory signals are encountered or
where activating signals are absent, spreading is halted, which
implies that local activating signals are needed to maintain
spreading.
To test whether the actin cytoskeleton and spreading could be
tightly spatially regulated in NK cells, narrower stripes (of ,4 mm
width) were used such that cells would make contact with several
stripes at the same time (Figure 3I). Quantification of the
abundance of f-actin in different regions of NK cells on these
narrower stripes revealed that that within individual cells, the
intensity of f-actin staining was significantly higher in regions
interacting with activating mAb compared to regions in contact
with mixed activating and inhibitory antibodies (Figure 3J). Thus,
actin polymerisation is regulated according to the local balance of
activating and inhibitory ligands. Blocking activity of SH2-domain
containing tyrosine phosphatases SHP1 (and SHP2) involved in
NKG2A-mediated inhibition, using the inhibitor NSC87877 [38],
abolished the difference in f-actin intensity between regions of
NKG2D and NKG2D and NKG2A engagement (Figure 3K and
3L).
Taken together with the observation of smaller synapses during
inhibitory contacts, this demonstrates that if inhibitory signals are
dominant, spreading and the formation of the f-actin ring are
blocked. If the threshold for activation is exceeded, cell spreading
continues. Rather than an irreversible commitment to spread
occurring according to the signals received by the NK cell on first
contact, signal integration continues during spreading and there is
a constant local requirement for dominance of activating signals to
continue actin polymerisation and spreading.
LFA-1 Triggers NK Cell Migration, NKG2D Imposes a StopSignal, and NKG2A:CD94 Delivers a Reverse-Stop Signal
As NKG2D ligation and LFA-1 ligation resulted in very
different NK cell morphologies we sought to understand how the
signals from these receptors would combine and how they relate to
cell motility. Cells stimulated on slides coated with both NKG2D
and LFA-1 antibodies spread to the same extent as cells stimulated
by either receptor alone, formed a ring of f-actin (Figure 4A) and
spread symmetrically (Figure 4B), demonstrating that NKG2D
imposes symmetrical spreading in the presence of LFA-1 ligation.
Crucially, inhibitory receptor ligation broke the symmetry
imposed by NKG2D in the presence of LFA-1 stimulation
(Figures 4B). Thus, NKG2D imposes symmetry on NK cell
spreading and this is reversed by inhibitory receptor ligation.
To study NK cell motility, slides were coated with ligands to NK
cell receptors, rather than high affinity antibodies. A spreading
response and formation of an f-actin ring were observed in NKL
on slides coated with MICA, a natural ligand of NKG2D
(unpublished data). NKL cells moved across slides coated with
ICAM-1 during which cells extended leading lamellipodia in the
direction of movement (Figure 4C and 4D; Video S7). T cells must
receive a ‘‘stop’’ signal from the TCR, preventing T cell migration,
in order to form a symmetrical stable synapse and become fully
activated [22,27]. Thus, to determine if NKG2D could impose a
stop signal on NK cells, slides were coated with MICA in
combination with ICAM-1. Coating slides with 2.5 mg/ml ICAM-
1 in the presence of MICA generated an ICAM-1 density on the
slide surface of 2,4006440 molecules per mm2 (mean of four
wells6SD), as determined using 125I-labelled protein. MICA was
used at 2.0 mg/ml (leading to densities of protein on the slide of
4,50061,500 molecules per mm2), 1.5 mg/ml (210061,100),
1.0 mg/ml (1,6006120) and 0.5 mg/ml (545685). MICA imposed
symmetrical spreading and delivered a stop signal (Video S8). At
NK Cell Spreading and Migration
PLoS Biology | www.plosbiology.org 7 July 2009 | Volume 7 | Issue 7 | e1000159
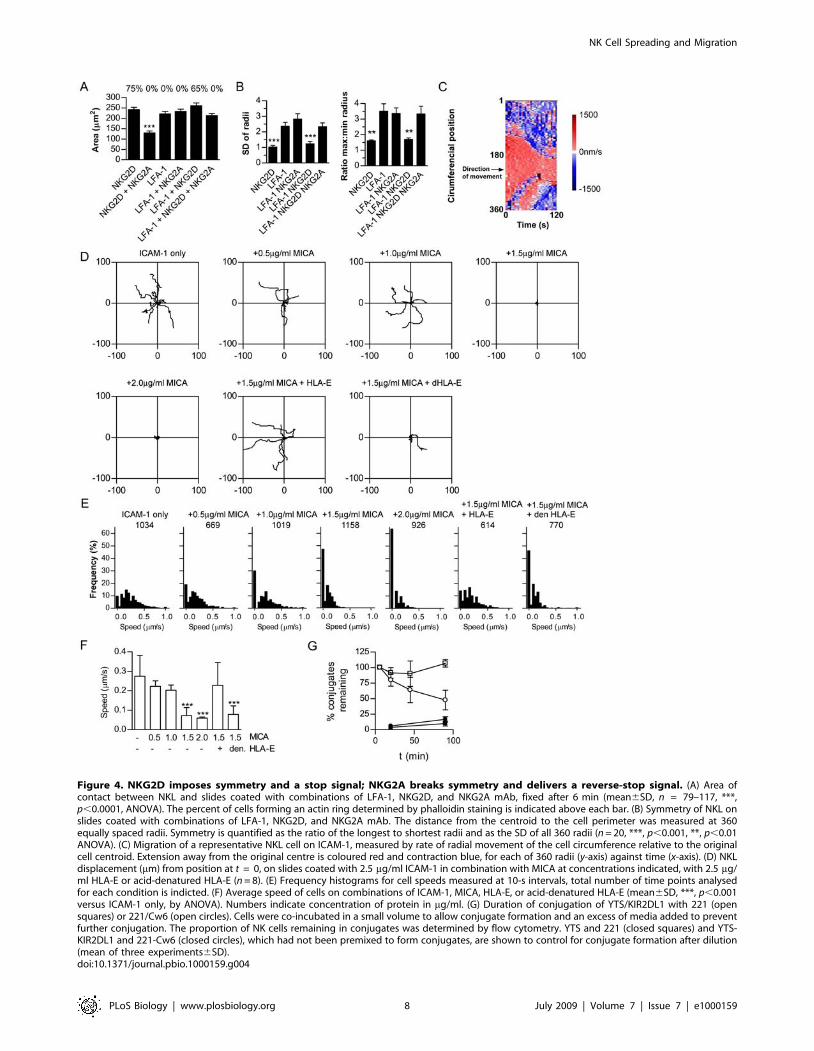
Figure 4. NKG2D imposes symmetry and a stop signal; NKG2A breaks symmetry and delivers a reverse-stop signal. (A) Area ofcontact between NKL and slides coated with combinations of LFA-1, NKG2D, and NKG2A mAb, fixed after 6 min (mean6SD, n = 79–117, ***,p,0.0001, ANOVA). The percent of cells forming an actin ring determined by phalloidin staining is indicated above each bar. (B) Symmetry of NKL onslides coated with combinations of LFA-1, NKG2D, and NKG2A mAb. The distance from the centroid to the cell perimeter was measured at 360equally spaced radii. Symmetry is quantified as the ratio of the longest to shortest radii and as the SD of all 360 radii (n = 20, ***, p,0.001, **, p,0.01ANOVA). (C) Migration of a representative NKL cell on ICAM-1, measured by rate of radial movement of the cell circumference relative to the originalcell centroid. Extension away from the original centre is coloured red and contraction blue, for each of 360 radii (y-axis) against time (x-axis). (D) NKLdisplacement (mm) from position at t = 0, on slides coated with 2.5 mg/ml ICAM-1 in combination with MICA at concentrations indicated, with 2.5 mg/ml HLA-E or acid-denatured HLA-E (n = 8). (E) Frequency histograms for cell speeds measured at 10-s intervals, total number of time points analysedfor each condition is indicted. (F) Average speed of cells on combinations of ICAM-1, MICA, HLA-E, or acid-denatured HLA-E (mean6SD, ***, p,0.001versus ICAM-1 only, by ANOVA). Numbers indicate concentration of protein in mg/ml. (G) Duration of conjugation of YTS/KIR2DL1 with 221 (opensquares) or 221/Cw6 (open circles). Cells were co-incubated in a small volume to allow conjugate formation and an excess of media added to preventfurther conjugation. The proportion of NK cells remaining in conjugates was determined by flow cytometry. YTS and 221 (closed squares) and YTS-KIR2DL1 and 221-Cw6 (closed circles), which had not been premixed to form conjugates, are shown to control for conjugate formation after dilution(mean of three experiments6SD).doi:10.1371/journal.pbio.1000159.g004
NK Cell Spreading and Migration
PLoS Biology | www.plosbiology.org 8 July 2009 | Volume 7 | Issue 7 | e1000159
increasing densities of MICA the average speed of cell migration
was reduced (Figure 4F). Analysis of cell speeds in each 10-s time
frame, revealed that increasing concentrations of MICA increased
the proportion of time cells spend stopped (Figure 4E).
Previously, studies with a rat NK cell line showed that cell
motility was preserved during inhibitory interactions with target
cells [39]. Also, there is evidence that a reduction in conjugate
formation occurs at inhibitory synapses, but an earlier study
showed that blocking inhibitory class I MHC proteins did not
change the extent of NK cell conjugation [40,41]. Thus we next
set out to clarify whether inhibitory receptors act to deliver a
‘‘reverse-stop’’ signal that restores cell motility and decreases the
duration of the synapse. HLA-E was coated onto slides at 2.5 mg/
ml, which produced a density of 11,70062,700 molecules/mm2.
Crucially, the stop signal delivered by MICA was reversed when
slides were coated with ICAM-1, MICA, and the NKG2A:CD94
ligand, HLA-E, and not when HLA-E had been denatured by acid
(Figure 4D–4F).
To next test whether inhibitory receptor ligation causes a
reduction in the duration of conjugation, fluorescently labelled
YTS/KIR2DL1 were co-incubated with target 221 or 221/Cw6
in a small volume to allow conjugate formation and an excess of
media added to dilute the cells and thus prevent further cell–cell
conjugation. The proportion of NK cells in conjugates after
different times was determined by flow cytometry. This revealed
that the presence of inhibitory receptor ligands dramatically
reduced the time of engagement between NK cells and target cells
(Figure 4G). Thus, inhibitory receptor ligation can prevent
cytotoxicity by blocking formation of a large stable symmetrical
synapse and instead favouring a migratory configuration, which
reduces the duration of intercellular conjugation.
Discussion
In summary, we have demonstrated that the balance of
activating and inhibitory ligands is continually locally assessed by
NK cells following contact with a target cell. Under physiological
conditions, NK cell activation results from integration of many
activating and inhibitory signals from surface receptors interacting
within immune synapses. Here we have studied the outcome of
cross-talk between the integrin LFA-1, the activating receptor
NKG2D, and the inhibitory receptor NKG2A. If activating signals
dominate, the NK cell stops and spreads lamellipodia across the
target to form a large stable synapse, simultaneously forming an
actin ring and polarising towards the target cell. Importantly,
inhibitory receptor signalling can break synapse symmetry and
reverse the stop signal, allowing cells to migrate and resulting in a
reduced dwell time on target cells. This establishes a specific
framework by which the balance of activating and inhibitory
signals is translated into an inhibitory or cytolytic response.
In cytotoxic T lymphocytes, the formation of a peripheral actin
ring polarises the MTOC and directs cytotoxic granules to the
target [42]. Using photoactivatable peptides, it has been shown
that MTOC polarisation is induced within 2 min of TCR
engagement, and therefore occurs concurrently with T cell
spreading [43]. Similarly, spreading and actin ring formation in
NK cells also occurred concurrently with granule polarisation. T
cell spreading is mediated by recruitment of adaptor proteins such
as nck and Wiscott-Aldrich Syndrome protein (WASp), which
direct formation of the f-actin-rich ring at the edge of the synapse
[44,45]. WAS patients are impaired in both T cell- and NK cell-
mediated cytotoxicity [46,47] consistent with cytolytic T cells and
NK cells using similar processes in spreading and the delivery of
cytolytic granules.
For B cells the extent of spreading is proportional to the affinity
of the B cell receptor for antigen and the density of antigen [48].
As the B cell spreads it captures further antigen, which is processed
and presented to T cells. Thus, spreading provides a structural
basis for B cell affinity discrimination. In contrast, NK cell
receptors are germ line encoded and thus do not exhibit the log
scale variation in affinity exhibited by B cell and T cell receptors.
Instead, NK cells must determine the relative density of activating
and inhibitory ligands [10,49]. Here, we found that the density of
activating and inhibitory ligands determines whether or not an
NK cell undergoes a spreading response, and that the extent of
spreading is not proportional to the balance of signalling but
rather occurs if a threshold of activation is surpassed. Thus the
spreading response in the NK cell is binary and this reflects a
necessity for the outcome of the interaction of an NK cell with a
target cell to be all-or-nothing, at least in the case of a cytolytic
response, i.e., either killing or sparing the target cell. In T cells,
competing positive and negative feedback pathways involving
ERK and SHP-1 lead to an all-or-none biological response to
TCR ligation [50,51], and analogous pathways may lead to binary
spreading responses in NK cells.
Microcontact printing of spatially segregated activating and
inhibitory mAb was employed to demonstrate that spreading and
actin polymerisation stop when a spreading cell does not
encounter a dominance of activating ligands. Thus signal
integration continues during the spreading response and the
continued dominance of local activating signals is necessary for
spreading to continue. Functionally, this continuous signal
integration during spreading is likely to be crucial in preventing
misdirection of a cytolytic response towards normal healthy
neighbouring cells within crowded tissue, ensuring that the
activating synapse forms only towards an appropriate target cell.
The T cell synapse has recently been described as an adhesive
junction between cells exhibiting radial symmetry, whereas a
moving adhesive junction, with a leading lamellipodium, has been
termed a ‘‘kinapse’’ [27,31]. It remains to be established whether
analogous moving adhesive contacts made by NK cells are capable
of triggering a response such as secretion of particular cytokines, as
found for T cells. There is clearly a great deal of similarity between
NK cells and cytotoxic T lymphocytes, the latter also found to
migrate on ICAM-1 monolayers where co-ligation of NKG2D
favoured formation of an actin ring [52]. Ligation of the inhibitory
receptor CTLA-4 provides a ‘‘reverse-stop’’ signal to T cells and
thus reduces the duration of T cell contact with an APC, which
may be a key mechanism by which it inhibits T cell activation
[53,54]. Taken together with our data, it emerges that inhibitory
receptor signals can act, for both T cells and NK cells, as
regulators of conjugation, by breaking the symmetrical spreading
imposed by activating receptors and reducing the time of contact
between cells.
Materials and Methods
Cell LinesNKL were maintained in 10% FCS, 100 mg/ml streptomycin,
100 U/ml penicillin, L-glutamine, b-mercaptoethanol, nonessen-
tial amino acids in RPMI-1640 (all Invitrogen; complete medium)
with 100 U/ml IL-2. NKL cells were transfected with pEYFP-
actin or pEYFP-mem vectors (Clontech) by electroporation
(Amaxa Biosystems) and stable transfectants selected using
1 mg/ml G418. YTS and YTS/KIR2DL1 and the EBV
transformed B cell line 721.221 (221) and 221 transfected to
express HLA-Cw6 (221-Cw6) or MICA-YFP were obtained and
cultured as described [55–57]. Primary human NK cells were
NK Cell Spreading and Migration
PLoS Biology | www.plosbiology.org 9 July 2009 | Volume 7 | Issue 7 | e1000159
isolated from healthy donor buffy coats under negative magnetic
selection (Miltenyi) and cultured as described [58].
Imaging and Analysis of NK: Target Cell ConjugatesNK and target cells were mixed in chamber slides and live cell–
cell conjugates were imaged at 5% CO2, 37uC by confocal
microscopy (Leica SP5 RS) using a 636water immersion lens (NA
1.2). To measure NK cell polarisation, intracellular membranes,
stained with DiD (Invitrogen), were mapped as a 3D object using
software (Volocity, Improvision). Polarisation was expressed as the
distance of the centroid of this object to the centre of the synapse
as a proportion of the cell length, measured from the centre of the
synapse to the other cell pole.
Preparation of Coated SlidesProtocols for preparing chamber slides (Nunc) were adapted
from published protocols [59]. Briefly, slides were cleaned using
acidified 70% ethanol, coated with 0.01% poly L-lysine, then mAb
or recombinant protein (at 10 mg/ml PBS unless indicated
otherwise), then blocked with complete medium. Antibodies to
NKG2D (Clone 149810, R&D systems), NKG2A (clone 131411,
R&D systems), LFA-1 (Clone G43-25B, Pharmingen), pan-MHC
class I (Clone W6/32), or murine IgG isotype controls (Pharmin-
gen), recombinant ICAM-1, or ICAM-1-Fc and MICA-Fc
chimeras (R&D systems) were used. HLA-E monomers were
produced and refolded with the HLA-G peptide VMAPRTLFL,
as described [11]. HLA-E was denatured by mixing with an equal
volume of citrate/phosphate buffer (0.131 M citric acid, 0.066 M
Na2HPO4 [pH 3.3]) for 1 min [60].
To determine the density of molecules coated on slides, proteins
were radiolabelled with 125I (ICN Chemicals) using iodogen
coated tubes according to manufacturer’s instructions (Pierce
Chemicals) and dialysed overnight against PBS. Slides were coated
with ligands or antibodies under the conditions described above, in
combination with unlabelled proteins as appropriate, in quadru-
plicate wells. Slides were dismantled and the amount of protein
bound per well was counted using a gamma counter (Hewlett
Packard). The coating density was calculated (molecules per mm2)
using reference radiolabelled samples of known concentrations and
molecular weight of each protein as 150, 79, 100, and 48 kDa for
antibodies, ICAM-Fc, MICA-Fc, and HLA-E, respectively.
Microcontact printing was performed using PDMS stamps in an
adaptation of published procedures (Sylgard 184 Silicone
Elastomere kit, Dow Corning) [61]. Stamps were coated for 1 h
with 100 mg/ml PBS mAb mixed with 15 mg/ml AlexaFluor 635
anti-rat IgG (Invitrogen) to allow visualization of antibodies, then
washed with ddH20, air dried, and pressed onto poly L-lysine
coated slides [62]. Stripes were overlaid with of 5 mg/ml mAb in
PBS for 1 h then blocked with 1% bovine serum albumin in PBS.
Imaging NK Cell Spreading and Migration on CoatedSlides
Cells were added to coated chamber slides in 25 mM HEPES in
complete medium. In some cases cells were preincubated for
30 min with PP2, LY294002, cytochalasin D, or the SHP1/2
inhibitor NSC87877 [38] at the concentrations indicated. Bright
field, fluorescence, and IRM images were captured at the slide
surface every 5 or 10 s for up to 30 min using an inverted confocal
microscope (described above) with either 636 or 206 lens (NA
0.7). Cell speeds and spreading were quantified (Volocity,
Improvision). For TIRF microscopy, NKL-YFP actin cells were
added to coated chamber slides. Single colour fluorescent images
were obtained on an inverted microscope (Axiovert 200, Carl
Zeiss) modified for objective-type TIRF (Till Photonics), using a
1006objective (NA 1.45, Carl Zeiss) and recorded using a charge-
coupled device camera (PCO SensiCam) and software (Image J).
To visualise f-actin, cells were fixed (Cytofix/cytoperm, BD
Pharmingen) 6 min after addition to coated chamber slides,
washed with 0.05% Tween/PBS and stained with 2 U/ml
phalloidin-AlexaFluor 635 or phalloidin-AlexaFluor 488 (Invitro-
gen) in 5% horse serum/3% BSA in buffer containing detergent
(Permwash, Pharmingen). The presence of an actin ring was
defined as a broad ring of intense f-actin staining (revealed by
phalloidin) surrounding an unstained cell centre. Filopodia were
defined morphologically as long thin actin-rich extensions,
whereas lamellipodia were defined as broad membranous sheets
extending from the cell body. Each cell was then scored for the
presence of filopodia, lamellipodia, both, or neither, in a single
confocal image taken at the slide surface. To measure the area of
spreading, the edge of the cell was defined by fluorescence
intensity (using Volocity software), and it was confirmed that this
correlated with the edge of the cell identified in the reflected (IRM)
image. To quantify the intensity of phalloidin staining on
micropatterned mAb, binary masks were produced, of the
fluorescent stripes and the overlay, which were multiplied by the
channel containing phalloidin staining, enabling quantification of
f-actin on each surface (using Image J software).
Cell symmetry and the directional rate of extension or
contraction, was determined similarly to published analysis [27],
using a custom programme written in G (Labview software). The
perimeter of the cell was defined according to fluorescence
intensity thresholding and the centroid located. The distance was
measured from the centroid to the perimeter along 360 evenly
spaced radii. The SD of these distances and ratio of maximum to
minimum distance were used to determine cell symmetry. To
measure radial speed of spreading and contraction, this pro-
gramme determined the rate of change of the radius at each angle,
between frames.
Conjugation AssayYTS/KIR2DL1 stained with DiD and 221 cells, with or
without expression of HLA-Cw6 stained with DiO, were
incubated together at 106/ml in 100 ml, for 20 min to allow
conjugate formation, then diluted to stop conjugate formation, in
10 ml complete medium in petri dishes. Conjugates were fixed
with 4% paraformaldehyde at 6, 20, 45, and 90 min after dilution,
and the proportion of single and double positive fluorescent events
(conjugates) analysed by flow cytometry (FACSCalibur, BD
Biosciences) and FlowJo software.
IFNc Secretion AssayChamber slides were prepared as above and coated with 3 mg/
ml NKG2D, mixed with NKG2A mAb, at a range of
concentrations, and isotype control antibody, to a final total
concentration of 6 mg/ml Ab in PBS at 4uC overnight. After
blocking with complete medium, 1.5 6105 NKL were added per
well in 250 ml complete medium. Alternatively, 1.5 6 105 NKL
were mixed with 1.5 6 105 target cells (221, 221-MICA, or 221
HLA-E) in a total volume of 250 ml complete medium. Cells were
incubated for 24 h at 37uC, 5% CO2, after which the supernatant
was assayed for IFNc by ELISA according to manufacturer’s
instructions (matched anti-human IFNc antibody pair; R&D
systems).
Statistical AnalysisData were analysed by t-test or one-way ANOVA as indicated.
NK Cell Spreading and Migration
PLoS Biology | www.plosbiology.org 10 July 2009 | Volume 7 | Issue 7 | e1000159
Supporting Information
Figure S1 Inhibition of IFNc production by target cellexpression of HLA-E. To confirm that 221 transfected to
express HLA-E were inhibitory in our hands, we incubated 1.5 6105 NKL cells with 1.56105 target cells (221, 221-MICA, or 221-
HLA-E) in total volume of 250 ml in triplicate, for 24 h.
Supernatants were then assayed by ELISA for IFNc production
(shown as mean +SD).
Found at: doi:10.1371/journal.pbio.1000159.s001 (0.64 MB TIF)
Figure S2 The homogeneity and density of stripesachieved by microcontact printing. To confirm the efficacy
of our microcontact printing procedure, 100 mg/ml NKG2D mAb
was mixed with 15 mg/ml anti-rat IgG-AlexaFluor 635 to identify
regions of the stamped mAb, and applied to a lysine coated glass slide
using a PDMS stamp. The slide was overlaid with anti-NKG2D mAb
at 5 mg/ml and total mAb detected with anti-mouse AlexaFluor-488.
Image shows the distribution of the stamped mAb (red) overlaid with
total mAb (green); scale = 10 mm. The graph shows the intensity
profile (indicated by a line on the image) for stamped (red) and total
(green) mAb and indicates that the distribution of the stamped mAb is
restricted to the stripes and that the overall density of mAb in the
stripes and regions of overlay are the same.
Found at: doi:10.1371/journal.pbio.1000159.s002 (2.93 MB TIF)
Video S1 NKG2D ligation causes spreading in NKLcells. NKL cells were labelled with the membrane dye DiD and
were stimulated by glass surfaces coated in NKG2D mAb and
imaged every 5 s at the slide surface by confocal microscopy.
Found at: doi:10.1371/journal.pbio.1000159.s003 (8.11 MB
MOV)
Video S2 NKL cell transfected with YFP-actin stimulat-ed on a glass slide coated in NKG2D mAb only. Images
were recorded using TIRF microscopy. Scale = 5 mm. Speed =
156.
Found at: doi:10.1371/journal.pbio.1000159.s004 (1.07 MB
MOV)
Video S3 NKL cell transfected with YFP-actin stimulat-ed on a glass slide coated in NKG2A mAb. Images were
recorded using TIRF microscopy. Scale = 5 mm. Speed = 156.
Found at: doi:10.1371/journal.pbio.1000159.s005 (9.48 MB
MOV)
Video S4 NKL cell transfected with YFP-actin stimulat-ed on a glass slide coated in an equal mixture of NKG2D
and NKG2A mAb. Images were recorded using TIRF
microscopy. Scale = 5 mm. Speed = 156.
Found at: doi:10.1371/journal.pbio.1000159.s006 (2.36 MB
MOV)
Video S5 NKL cell transfected with YFP-actin stimulat-ed on a glass slide coated in LFA-1 mAb. Images were
recorded using TIRF microscopy. Scale = 5 mm. Speed = 156.
Found at: doi:10.1371/journal.pbio.1000159.s007 (5.58 MB
MOV)
Video S6 NKL cell transfected with YFP-actin stimulat-ed on a glass slide coated in and equal mixture of LFA-1and NKG2A mAbs. Images were recorded using TIRF
microscopy. Scale = 5 mm. Speed = 156.
Found at: doi:10.1371/journal.pbio.1000159.s008 (7.63 MB
MOV)
Video S7 NK cells migrate on ICAM-1. NKL cells were
transfected to express YFP-mem and were stimulated by glass
slides coated with ICAM-1. Bright field, fluorescent, and IRM
images were recorded every 10 s. Field of view = 246 6246 mm.
Found at: doi:10.1371/journal.pbio.1000159.s009 (4.25 MB
MOV)
Video S8 NK cells are stopped by MICA. NKL cells were
transfected to express YFP-mem and were stimulated by glass
slides coated with ICAM-1 and MICA. Bright field, fluorescent
and IRM images were recorded every 10 s. Field of view = 2466246 mm.
Found at: doi:10.1371/journal.pbio.1000159.s010 (4.47 MB
MOV)
Acknowledgments
We thank Martin Spitaler in the Facility for Imaging by Light Microscopy
for his assistance. Some of the PDMS stamps were kind gifts from Alexander
Ganser and Heike Glauner, University of Nijmegen, the Netherlands.
Author Contributions
The author(s) have made the following declarations about their
contributions: Conceived and designed the experiments: FJC MJ JHE
SK RC JC TS MPD DSU KK DMD. Performed the experiments: FJC MJ
JHE RC JC TS MM MPD DSU KK. Analyzed the data: FJC MJ JHE SK
RC JC TS MM MPD KK. Contributed reagents/materials/analysis tools:
MPD VB GR RB. Wrote the paper: FJC DMD.
References
1. Caligiuri MA (2008) Human natural killer cells. Blood 112: 461–469.
2. Orange JS (2008) Formation and function of the lytic NK-cell immunological
synapse. Nat Rev Immunol 8: 713–725.
3. Krzewski K, Strominger JL (2008) The killer’s kiss: the many functions of NKcell immunological synapses. Curr Opin Cell Biol 20: 597–605.
4. Roda-Navarro P (2009) Assembly and function of the natural killer cell immune
synapse. Front Biosci 14: 621–633.
5. Biron CA, Nguyen KB, Pien GC, Cousens LP, Salazar-Mather TP (1999)
Natural killer cells in antiviral defense: function and regulation by innatecytokines. Annu Rev Immunol 17: 189–220.
6. Lanier LL (2008) Up on the tightrope: natural killer cell activation and
inhibition. Nat Immunol 9: 495–502.
7. Long EO (2008) Negative signaling by inhibitory receptors: the NK cellparadigm. Immunol Rev 224: 70–84.
8. Bauer S, Groh V, Wu J, Steinle A, Phillips JH, et al. (1999) Activation of NK cells andT cells by NKG2D, a receptor for stress-inducible MICA. Science 285: 727–729.
9. Gasser S, Orsulic S, Brown EJ, Raulet DH (2005) The DNA damage pathway
regulates innate immune system ligands of the NKG2D receptor. Nature 436:1186–1190.
10. Karre K, Ljunggren HG, Piontek G, Kiessling R (1986) Selective rejection of H-
2-deficient lymphoma variants suggests alternative immune defence strategy.
Nature 319: 675–678.
11. Braud VM, Allan DS, O’Callaghan CA, Soderstrom K, D’Andrea A, et al.
(1998) HLA-E binds to natural killer cell receptors CD94/NKG2A, B and C.Nature 391: 795–799.
12. Bryceson YT, Long EO (2008) Line of attack: NK cell specificity and integration
of signals. Curr Opin Immunol 20: 344–352.
13. Davis DM, Chiu I, Fassett M, Cohen GB, Mandelboim O, et al. (1999) The
human natural killer cell immune synapse. Proc Natl Acad Sci U S A 96:15062–15067.
14. Vyas YM, Maniar H, Dupont B (2002) Visualization of signaling pathways andcortical cytoskeleton in cytolytic and noncytolytic natural killer cell immune
synapses. Immunol Rev 189: 161–178.
15. Carpen O, Virtanen I, Saksela E (1982) Ultrastructure of human natural killer
cells: nature of the cytolytic contacts in relation to cellular secretion. J Immunol128: 2691–2697.
16. Carpen O, Virtanen I, Lehto VP, Saksela E (1983) Polarization of NK cell
cytoskeleton upon conjugation with sensitive target cells. J Immunol 131: 2695–2698.
17. Davis DM, Dustin ML (2004) What is the importance of the immunological
synapse? Trends Immunol 25: 323–327.
18. Paul WE, Seder RA (1994) Lymphocyte responses and cytokines. Cell 76:
241–251.
19. Davis DM (2009) Mechanisms and functions for the duration of intercellular
contacts made by lymphocytes. Nat Rev Immunol 9: In press.
NK Cell Spreading and Migration
PLoS Biology | www.plosbiology.org 11 July 2009 | Volume 7 | Issue 7 | e1000159
20. Bajenoff M, Germain RN (2007) Seeing is believing: a focus on the contribution
of microscopic imaging to our understanding of immune system function.
Eur J Immunol 37 Suppl 1: S18–S33.
21. Bousso P (2008) T-cell activation by dendritic cells in the lymph node: lessons
from the movies. Nat Rev Immunol 8: 675–684.
22. Dustin ML, Bromley SK, Kan Z, Peterson DA, Unanue ER (1997) Antigen
receptor engagement delivers a stop signal to migrating T lymphocytes. Proc
Natl Acad Sci U S A 94: 3909–3913.
23. Dustin ML, Springer TA (1989) T-cell receptor cross-linking transiently
stimulates adhesiveness through LFA-1. Nature 341: 619–624.
24. Miller MJ, Wei SH, Parker I, Cahalan MD (2002) Two-photon imaging of
lymphocyte motility and antigen response in intact lymph node. Science 296:
1869–1873.
25. Miller MJ, Wei SH, Cahalan MD, Parker I (2003) Autonomous T cell trafficking
examined in vivo with intravital two-photon microscopy. Proc Natl Acad
Sci U S A 100: 2604–2609.
26. Dustin ML (2008) Hunter to gatherer and back: immunological synapses and
kinapses as variations on the theme of amoeboid locomotion. Annu Rev Cell
Dev Biol 24: 577–596.
27. Sims TN, Soos TJ, Xenias HS, Dubin-Thaler B, Hofman JM, et al. (2007)
Opposing effects of PKCtheta and WASp on symmetry breaking and relocation
of the immunological synapse. Cell 129: 773–785.
28. Grakoui A, Bromley SK, Sumen C, Davis MM, Shaw AS, et al. (1999) The
immunological synapse: a molecular machine controlling T cell activation.
Science 285: 221–227.
29. Monks CR, Freiberg BA, Kupfer H, Sciaky N, Kupfer A (1998) Three-
dimensional segregation of supramolecular activation clusters in T cells. Nature
395: 82–86.
30. Varma R, Campi G, Yokosuka T, Saito T, Dustin ML (2006) T cell receptor-
proximal signals are sustained in peripheral microclusters and terminated in the
central supramolecular activation cluster. Immunity 25: 117–127.
31. Dustin ML (2007) Cell adhesion molecules and actin cytoskeleton at immune
synapses and kinapses. Curr Opin Cell Biol 19: 529–533.
32. Lee N, Llano M, Carretero M, Ishitani A, Navarro F, et al. (1998) HLA-E is a
major ligand for the natural killer inhibitory receptor CD94/NKG2A. Proc Natl
Acad Sci U S A 95: 5199–5204.
33. Graham DB, Cella M, Giurisato E, Fujikawa K, Miletic AV, et al. (2006) Vav1
controls DAP10-mediated natural cytotoxicity by regulating actin and
microtubule dynamics. J Immunol 177: 2349–2355.
34. Robertson MJ, Cochran KJ, Cameron C, Le JM, Tantravahi R, et al. (1996)
Characterization of a cell line, NKL, derived from an aggressive human natural
killer cell leukemia. Exp Hematol 24: 406–415.
35. Masilamani M, Nguyen C, Kabat J, Borrego F, Coligan JE (2006) CD94/
NKG2A inhibits NK cell activation by disrupting the actin network at the
immunological synapse. J Immunol 177: 3590–3596.
36. McCann FE, Vanherberghen B, Eleme K, Carlin LM, Newsam RJ, et al. (2003)
The size of the synaptic cleft and distinct distributions of filamentous actin, ezrin,
CD43, and CD45 at activating and inhibitory human NK cell immune synapses.
J Immunol 170: 2862–2870.
37. Dietrich J, Cella M, Colonna M (2001) Ig-like transcript 2 (ILT2)/leukocyte Ig-
like receptor 1 (LIR1) inhibits TCR signaling and actin cytoskeleton
reorganization. J Immunol 166: 2514–2521.
38. Chen L, Sung SS, Yip ML, Lawrence HR, Ren Y, et al. (2006) Discovery of a
novel shp2 protein tyrosine phosphatase inhibitor. Mol Pharmacol 70: 562–570.
39. Eriksson M, Leitz G, Fallman E, Axner O, Ryan JC, et al. (1999) Inhibitory
receptors alter natural killer cell interactions with target cells yet allow
simultaneous killing of susceptible targets. J Exp Med 190: 1005–1012.
40. Kaufman DS, Schoon RA, Robertson MJ, Leibson PJ (1995) Inhibition of
selective signaling events in natural killer cells recognizing major histocompat-
ibility complex class I. Proc Natl Acad Sci U S A 92: 6484–6488.
41. Burshtyn DN, Shin J, Stebbins C, Long EO (2000) Adhesion to target cells is
disrupted by the killer cell inhibitory receptor. Curr Biol 10: 777–780.
42. Stinchcombe JC, Majorovits E, Bossi G, Fuller S, Griffiths GM (2006)
Centrosome polarization delivers secretory granules to the immunologicalsynapse. Nature 443: 462–465.
43. Huse M, Klein LO, Girvin AT, Faraj JM, Li QJ, et al. (2007) Spatial and
temporal dynamics of T cell receptor signaling with a photoactivatable agonist.Immunity 27: 76–88.
44. Bunnell SC, Kapoor V, Trible RP, Zhang W, Samelson LE (2001) Dynamicactin polymerization drives T cell receptor-induced spreading: a role for the
signal transduction adaptor LAT. Immunity 14: 315–329.
45. Barda-Saad M, Braiman A, Titerence R, Bunnell SC, Barr VA, et al. (2005)Dynamic molecular interactions linking the T cell antigen receptor to the actin
cytoskeleton. Nat Immunol 6: 80–89.46. Orange JS, Ramesh N, Remold-O’Donnell E, Sasahara Y, Koopman L, et al.
(2002) Wiskott-Aldrich syndrome protein is required for NK cell cytotoxicity andcolocalizes with actin to NK cell-activating immunologic synapses. Proc Natl
Acad Sci U S A 99: 11351–11356.
47. Krzewski K, Chen X, Orange JS, Strominger JL (2006) Formation of a WIP-,WASp-, actin-, and myosin IIA-containing multiprotein complex in activated
NK cells and its alteration by KIR inhibitory signaling. J Cell Biol 173: 121–132.48. Fleire SJ, Goldman JP, Carrasco YR, Weber M, Bray D, et al. (2006) B cell
ligand discrimination through a spreading and contraction response. Science
312: 738–741.49. Almeida CR, Davis DM (2006) Segregation of HLA-C from ICAM-1 at NK cell
immune synapses is controlled by its cell surface density. J Immunol 177:6904–6910.
50. Stefanova I, Hemmer B, Vergelli M, Martin R, Biddison WE, et al. (2003) TCRligand discrimination is enforced by competing ERK positive and SHP-1
negative feedback pathways. Nat Immunol 4: 248–254.
51. Altan-Bonnet G, Germain RN (2005) Modeling T cell antigen discriminationbased on feedback control of digital ERK responses. PLoS Biol 3: e356.
doi:10.1371/journal.pbio.0030356.52. Somersalo K, Anikeeva N, Sims TN, Thomas VK, Strong RK, et al. (2004)
Cytotoxic T lymphocytes form an antigen-independent ring junction. J Clin
Invest 113: 49–57.53. Schneider H, Downey J, Smith A, Zinselmeyer BH, Rush C, et al. (2006)
Reversal of the TCR stop signal by CTLA-4. Science 313: 1972–1975.54. Rudd CE (2008) The reverse stop-signal model for CTLA4 function. Nat Rev
Immunol 8: 153–160.55. Cohen GB, Gandhi RT, Davis DM, Mandelboim O, Chen BK, et al. (1999)
The selective downregulation of class I major histocompatibility complex
proteins by HIV-1 protects HIV-infected cells from NK cells. Immunity 10: 661.56. Mandelboim O, Reyburn HT, Vales-Gomez M, Pazmany L, Colonna M, et al.
(1996) Protection from lysis by natural killer cells of group 1 and 2 specificity ismediated by residue 80 in human histocompatibility leukocyte antigen C alleles
and also occurs with empty major histocompatibility complex molecules. J Exp
Med 184: 913–922.57. McCann FE, Eissmann P, Onfelt B, Leung R, Davis DM (2007) The activating
NKG2D ligand MHC class I-related chain A transfers from target cells to NKcells in a manner that allows functional consequences. J Immunol 178:
3418–3426.58. Carlin LM, Eleme K, McCann FE, Davis DM (2001) Intercellular transfer and
supramolecular organization of human leukocyte antigen C at inhibitory natural
killer cell immune synapses. J Exp Med 194: 1507–1517.59. Bunnell SC, Barr VA, Fuller CL, Samelson LE (2003) High-resolution
multicolor imaging of dynamic signaling complexes in T cells stimulated byplanar substrates. Science STKE 2003: L8.
60. Storkus WJ, Zeh HJd, Maeurer MJ, Salter RD, Lotze MT (1993) Identification
of human melanoma peptides recognized by class I restricted tumor infiltratingT lymphocytes. J Immunol 151: 3719–3727.
61. Delamarche E, Bernard A, Schmid H, Michel B, Biebuyck H (1997) Patterneddelivery of immunoglobulins to surfaces using microfluidic networks. Science
276: 779–781.
62. Bernard A, Renault JP, Michel B, Bosshard HR, Delamarche E (2000)Microcontact printing of proteins. Advanced Materials 12: 1067–1070.
NK Cell Spreading and Migration
PLoS Biology | www.plosbiology.org 12 July 2009 | Volume 7 | Issue 7 | e1000159