national risk and vulnerability assessment 2011 - 2012 - ilo
TRANSCRIPT

NATIONAL RISK ANDVULNERABILITY ASSESSMENT
2011 - 2012
(Afghanistan Living Conditions Survey)

NATIONAL RISK ANDVULNERABILITY ASSESSMENT
2011 - 2012
(Afghanistan Living Conditions Survey)

The National Risk and Vulnerability Assessment 2011-12 was implemented by the Central Statistics Organization (CSO) of the Government of the Islamic Republic of Afghanistan with technical assistance from ICON-Institute Public Sector Gmbh.
This publication has been produced with the assistance of the European Union. The contents of this publication is the sole responsibility of CSO and ICON-Institute, and can in no way be taken as to reflect the views of the European Union.
For further information, please contactCSOwww.nrva.cso.gov.afE-mail: [email protected]
ICON-Institutewww.icon-institute.deE-mail: [email protected] (Project Manager) or [email protected] (Chief Analyst/Editor)
Delegation of the European Union to Afghanistanhttp://eeas.europa.eu/delegations/afghanistan/index_en.htm E-mail: [email protected]
Recommended citation:Central Statistics Organization (2014), National Risk and Vulnerability Assessment 2011-12. Afghanistan Living Condition Survey. Kabul, CSO.
Designed by: Mohammad Ashraf AbdullahCOPHEN [email protected]
Printed by: Jehoon Printing Press, Kabul, Afghanistan


FOREWORDi
FOREWORDThe National Risk and Vulnerability Assessment (NRVA), which is called Afghanistan Living Condition Survey (ALCS) by then is providing data about the country for almost 10 years. This publication is now the fourth release after the surveys of 2003, 2005 and 2007-08 by financial supporting of European Commission.
This new round of the survey has brought some more innovations and more details compared to the previous surveys. The questionnaire is now designed in modules that will be ‘rotating’ from round to round to cover all the needs for data to capture the living conditions of the nation.
This survey is still the only nation-wide survey available in Afghanistan and is therefore of utmost importance for the country, its policy makers and all the Organization investing in the future of the country. It is also capturing seasonal variations to make it more accurate to the various realities that the population face throughout the year, especially in terms of labour, poverty and food security.
As the principal agency responsible for the production of national statistics, the Central Statistics Organization is proud to deliver key indicators and statistics at national and provincial level for a broad array of development sectors, including population, poverty, food security, labour market, agriculture, health, education and housing.
The life of the survey is still on-going as a new round has just been launched as we published this report and I hope to be able to address you again in about 18 months to present you with the latest changes in the living conditions of the people of Afghanistan.
I sincerely hope you will enjoy reading this publication, find all the information you expect and use it fruitfully.
Associate Prof. Hasibullah Mowahed,Acting President GeneralCentral Statistics Organization of AfghanistanGovernment of the Islamic Republic of Afghanistan

ii
KEY INDICATORSINDICATOR ANDS no. MDG no. Sub-groupsa National
DemographyPercentage of population under 15 U 42.0; R 50.1; K 53.0 48.4
Percentage of population 65 and over U 3.3; R 2.2; K 2.3 2.5
Sex ratio U 105; R 106; K 110 106
Dependency ratio U 83; R 110; K 124 104
Child dependency ratio U 77; R 105; K 119 99
Aged dependency ratio U 6; R 5; K 5 5
Average household size U 7.5; R 7.4; K 7.3 7.4
Percentage of women in polygamous marriage 7.6
Percentage of married women aged 15-19 whose husband is 10 or more years older 7.9
Percentage of married women aged 20-24 whose husband is 10 or more years older 10.6
Under-five Mortality Rate 8.a 4.1 U 72; R 96M 89; F 92 91
Infant Mortality Rate 8.b 4.2 U (34); R (54)M (49); F (46) (48)
Labour force (national definition)
Labour force participation rate M 80.0; F 18.5U 43.1; R 51.3; K 64.4 49.8
Employment-to-population ratio 1.5 M 74.5; F 15.5U 39.2; R 47.1; K 61.0 45.7
Percentage not-gainfully employed population M 21.8; F 39.3U 17.6; R 26.9; K 28.7 25.0
Under-employment rate M 15.4; F 22.8U 8.6; R 18.7; K 23.3 16.8
Unemployment rate M 6.4; F 16.5U 9.0; R 8.2; K 5.4 8.2
Youth unemployment rate 17.a M 8.1; F 18.8U 13.6; R 9.9; K 4.4 10.4
Youth unemployment as percentage of total unemployment M 38.1; F 40.8U 46.3; R 37.4; K 24.9 39.1
Proportion of own-account and contributing family workers in total employment 1.7 M 79.3; F 87.0
U 59.3; R 85.6; K 95.7 80.5
Agriculture and livestockPercentage of households owning irrigated land 37.9
Percentage of households owning rain-fed land 16.8
Percentage of households owning a garden plot 12.6
Mean size of owned irrigated land (in jeribsb) 6.0
Mean size of owned rain-fed land (in jeribsb) 16.4
Mean size of owned garden plot (in jeribsb) 2.0
Median size of owned irrigated land (in jeribsb) 3.0
Median size of owned rain-fed land (in jeribsb) 7.0
Median size of owned garden plot (in jeribsb) 1.0
Number of cattle (in thousands) 3,715
Number of goats (in thousands) 7,281
Number of sheep (in thousands) 8,772
Number of chickens (in thousands) 12,156
aUurban, R: rural, K: Kuchi, M: male, F: femalebOne jerib is 0.2 hectare (2,000 m2)( ) Indicators between brackets are considered less reliable and are indicative only.
KEY INDICATORS

INDICATOR ANDS no. MDG no. Sub-groupsa National
PovertyPoverty headcount 1.a (alt) U 28.9; R 37.7; 53.8 36.5
Poverty gap 1.b 1.2 U 5.8; R 9.2; K 13.3 8.6
Squared poverty gap U 1.8; R 3.2; K 4.7 3.0
Gini Index U 29.2; R 28.1; K 22.3 31.6
Share of poorest quintile in national consumption 1.c 1.3 8.5
Food securityPercentage of population with calorie deficiency 2.b 1.9 U 34.4; R 29.1; K 25.6 30.1
Percentage of population with protein deficiency U 21.3; R 19.1; K 15.3 19.4
Percentage of population with calorie and protein deficiency U 20.3; R 18.2; K 14.5 18.5
Education
Adult literacy rate (15 years of age and over) M 45.4; F 17.0U 53.5; R 25.0; K 7.2 31.4
Youth literacy rate (15-24 years of age) 3.c 2.3 M 61.9; F 32.1U 71.4; R 39.1; K 9.7 47.0
Net attendance ratio in primary education 3.a 2.1 M 64.4; F 48.3U 77.9; R 53.8; K 19.4 56.8
Net attendance ratio in secondary education M 42.0; F 23.2U 54.3; R 26.3; K ... 32.7
Net attendance ratio in tertiary education M 8.1; F 2.7U 13.1; R 2.4 5.4
Gross attendance ratio in primary education 3.a (alt) M 82.8; F 60.9U 99.1; R 68.7; K 24.9 72.4
Gross attendance ratio in secondary education M 55.3; F 29.0U 69.5; R 34.3; K 6.0 42.3
Gross attendance ratio in tertiary education M 9.1; F 3.8U 15.3; R 3.1 6.5
Percentage of households within two kilometres distance from boys’ primary education facilities U 95.1; R 43.8; K 29.3 53.9
Percentage of households within two kilometres distance from girls’ primary education facilities U 96.5; R 36.4; K 26.8 48.1
Gender equalityShare of women in wage employment in the non-agricultural sector 3.2 11.1
Literacy gender parity index, age 15 and over U 0.55; R 0.27 0.37
Literacy gender parity index, age 15-24 4.d (10) U 0.73; R 0.40; K 0.09 0.52
Ratio of girls to boys in primary education 4.a 3.1 U 0.90; R 0.68; K 0.54 0.74
Ratio of girls to boys in secondary education 4.b 3.1 U 0.74; R 0.38 0.53
Ratio of girls to boys in tertiary education 4.c 3.1 U 0.65; R 0.17 0.42
HealthPercentage under-fives with vitamin-A supplementation U 75.8; R 56.4; K 50.5 59.8
Percentage under-fives with birth certificate U 63.8; R 29.5; K 16.3 35.2
Women with at least two TT injections U 42.8; R 34.6; K 13.1 34.9
Antenatal care coverage (at least one visit) 9.d 5.5 U 78.4; R 46.3; K 23.2 51.2
Antenatal care coverage (at least four visits) 5.5 U 20.8; R 7.7; K 3.5 9.9
Percentage of births attended by skilled health personnel 9.b 5.2 U 75.5; R 32.6; K 13.4 39.9
Percentage of deliveries in institutional facilities U 69.5; R 28.8; K 13.2 35.8
iii KEY INDICATORS

ivKEY INDICATORS
INDICATOR ANDS no. MDG no. Sub-groupsa National
HousingPercentage of households living in communities with distance to nearest drivable road of 2 or less kilometres
U 100.0; R 75.2; K 60.4 80.0
Mean number of persons per room U 3.0; R 3.1; K 4.8 3.2
Percentage of households living in overcrowded dwellings U 33.6; R 35.5; K 69.9 37.0
Percentage of urban population living in slums 14.a (alt) 7.10 86.6
Percentage of population using improved drinking water sources 13.a 7.8 U 70.9; R 39.4; K 21.0 45.5
Percentage of population using an improved sanitation facility 13.b 7.9 U 29.1; R 2.4; K 0.0 8.3
Percentage of households with access to any source of electricity in the last month U 95.0; R 63.8; K 30.3 69.1
Percentage of population using solid fuels 12.e (29) U 32.5; R 93.4; K 99.8 79.9
Mobile cellular subscriptions per 100 inhabitants 19.a 8.15 U 27.1; R 10.6; K 6.3 14.1
Internet users per 100 population 19.b 8.16 U 1.6; R 0.2; K 0.0M 0.8; F 0.2 0.5

v TABLE OF CONTENTS
Foreword i
Key indicators ii
Table of contents v
List of tables viii
List of figures xi
List of text boxes xiii
Abbreviations xiv
Map of Afghanistan xv
Acknowledgements xvi
Executive summary xvii
1 Introduction 1
2 Survey methodology and operations 2
2.1 Introduction 2
2.2 Stakeholder involvement 2
2.3 Questionnaire design 2
2.4 Pilot training and pilot survey 3
2.5 Training and selection of field staff 3
2.6 Sampling design and implementation 4
2.7 Field operations 5
2.8 Data processing 5
2.9 Comparability of results 6
2.10 Data limitations 7
2.11 Reporting 7
3 Population structure and change 8
3.1 Introduction 8
3.2 Population structure and distribution 9
3.3 Household composition and marriage patterns 11
3.3.1 Household structure 11
3.3.2 Marriage patterns 12
3.4 Childhood mortality 15
3.5 Migration 16
3.5.1 General migration 16
3.5.2 International migration 18
3.5.3 Internal migration 22
3.5.4 Seasonal migration 25
3.5.5 Displacement 26
4 Labour force characteristics 29
4.1 Introduction 29
4.2 Labour force participation 29
4.3 Labour force characteristics 31
4.3.1 Conceptualization of employment and unemployment 31
4.3.2 Employment, underemployment and unemployment 32
4.4 Characteristics of the employed population 34
4.4.1 Status in employment 34
4.4.2 Economic sector and occupation 35
TABLE OF CONTENTS

viTABLE OF CONTENTS
4.4.3 Working hours 36
5 Agriculture and livestock 38
5.1 Introduction 38
5.2 Farming and horticulture 39
5.2.1 Irrigated land 39
5.2.2 Rain-fed land 43
5.2.3 Horticulture 45
5.2.4 Farming input costs 46
5.4 Livestock 46
5.4.1 Livestock numbers 46
5.4.2 Sale of animals and animal products 48
5.4.3 Livestock production factors 48
6 Poverty incidence, trend and profiling 50
6.1 Introduction 50
6.2 Measuring trends in poverty 2007-2011 51
6.3 Growth and distribution 52
6.4 Poverty profile 53
6.4.1 Demographic profile 54
6.4.2 Household head characteristics 55
6.5 Conclusions 56
7 Food security 57
7.1 Introduction 57
7.2 Current food security 58
7.3 Distribution by region 59
7.4 Comparison of food security between NRVA 2011-12 and NRVA 2007-08 59
7.5 Characteristics of the food-insecure population 60
7.5.1 Characterization by main income source 60
7.5.2 Characterization by asset ownership 61
7.5.3 Characterization by demographics 61
7.6 Seasonality and food insecurity 62
7.6.1 Afghan calendar seasonal differences 62
7.6.2 Harvest and lean season’s differences 63
7.7 Food access and supply 64
7.6.1 Availability of different food items by food security status 64
7.7.2 Availability of different food items by residence 65
7.7.3 Sources of food items by population group and food security status 65
7.7.4 Sources of food items by main income source 66
7.7.5 Sources of food items by season 66
7.8 Food consumption 66
7.8.1 Dietary diversity 66
7.8.2 Food Consumption Score 67
7.8.3 Contribution of different food groups to caloric intake 68
7.9 Coping with shocks 68
8 Education 70
8.1 Introduction 70
8.2 Educational attendance 71

vii TABLE OF CONTENTS
8.2.1 Educational attendance in residential and gender perspective 71
8.2.2 Change in educational attendance 73
8.2.3 Reasons for not attending 74
8.3 Educational attainment 76
8.4 Literacy 78
8.4.1 Literacy in residential and gender perspective 78
8.4.2 Change in literacy levels 81
9 Health 83
9.1 Introduction 83
9.2 Access to health services 83
9.2.1 Distance to nearest health facility and costs to reach it 83
9.2.2 Household expenditure on health 85
9.2.3 Visits to health care facilities 87
9.2.4 Use of health care providers 89
9.3 Child health 89
9.3.1 Birth registration 89
9.3.2 Child health indicators 90
9.4 Maternal health 91
9.4.1 Ante-natal care 91
9.4.2 Skilled attendance at birth and place of delivery 92
10 Housing and household amenities 95
10.1 Introduction 95
10.2 Tenancy and dwelling characteristics 95
10.2.1 Tenancy 95
10.2.2 Dwelling characteristics 96
10.3 Household amenities 98
10.3.1 Water and sanitation 98
10.3.2 Other household amenities 101
11 Challenges and strategies 105
11.1 Introduction 105
11.2 Indebted households 105
11.3 Household shocks and coping strategies 107
11.3.1 Household shocks 107
11.3.2 Coping strategies 109
11.4 Community development priorities 111
References 113
Annexes 115
I Persons involved in NRVA 2011-12 115
II Subjects covered in NRVA 2007-08 to 2015-16 116
III NRVA 2011-12 questionnaires 117
IV Sample design and implementation 165
V Population by age and sex 169
VI Mortality estimation 170
VII Updating the poverty line using NRVA 2011-12 173
VIII Food security analysis methodology 178
IX Quality assurance and quality assessment 182
X Tables at province level 190
XI Concepts and definitions 210

viiiLIST OF TABLES
LIST OF TABLESTable 2.1 NRVA 2011-12 household questionnaire modules 3
Table 2.2 NRVA 2011-12 Shura questionnaire modules 3
Table 3.1 Population, by residence, sex, and by age 10
Table 3.2 Households, by residence, and by selected household structure indicators 11
Table 3.3 Households and population, by household characteristics (in percentages) 12
Table 3.4 Population, by marital status, and by sex, age (in percentages) 13
Table 3.5 Childhood mortality indicators, by (a) residence and (b) sex 16
Table 3.6 Percentage of population living outside the district of current residence (a) at birth and (b) in October 2004, by previous place of residence, sex, and by current residence
17
Table 3.7 Immigrants (a) born abroad and (b) living abroad in October 2004, by current residence, and by country of origin (in percentages)
18
Table 3.8 Emigrants 14 years and over who emigrated in the year before the survey, by previous residence, and by country of destination (a) at birth and (b) in October 2004 (in percentages)
19
Table 3.9 In-migrants (a) born elsewhere in Afghanistan and (b) living elsewhere in Afghanistan in October 2004, by current residence, and by area of origin (in percentages)
23
Table 3.10 In-migrants (a) born elsewhere in Afghanistan and (b) living elsewhere in Afghanistan in October 2004, by current residence, and by residence of origin (in thousands)
23
Table 3.11 Percentage of population 14 years and over migrating for seasonal work in the year before the survey, by sex and by usual residence
26
Table 3.12 Households returned from displacement since 2002, by country of displacement, and by mode of return (in percentages)
28
Table 4.1 Labour force, by activity status, and by residence, sex (in thousands) 32
Table 4.2 Selected labour force indicators, by residence, sex (in percentages) 32
Table 4.3 Employed population, by residence, sex, and by status in employment (in percentages) 35
Table 5.1 Households, by ownership of irrigated land, irrigated land size (in percentages); also stating mean and median irrigated land size (in jeribs)
39
Table 5.2 Crop production from irrigated land in spring cultivation season prior to the survey 42
Table 5.3 Households, by ownership of rain-fed land, rain-fed land size (in percentages); also stating mean and median rain-fed land size (in jeribs)
44
Table 5.4 Crop production from rain-fed land in spring cultivation season prior to the survey 44
Table 5.5 Households, by access to garden plots, garden plot size (in percentages); also stating mean and median garden plot size (in jeribs)
45
Table 5.6 Crop production from garden plots in spring cultivation season prior to the survey 45
Table 5.7 Livestock numbers in Livestock Census 2002-02a and NRVA 2011-12, by animal type (in thousands); also stating households with specified animal type in NRVA 2011-12 (in thousands)
47
Table 5.8 Number of livestock and animal products sold in the year prior to the NRVA 2011-12 survey, by animal type (in thousands) and type of product (in thousands)
48
Table 5.9 Livestock owners that had vaccinated at least part of their livestock, by type of livestock owned (in percentages) 48
Table 6.1 Trends of poverty measures, by survey year 51
Table 6.2 Mean real per capita consumption (at 2011-12 prices), by poverty quintile 53
Table 6.3 Poverty headcount, by child dependency ratio (household level) 54
Table 6.4 Poverty headcount, poor- and total population shares, by selected characteristics of household head (in percentages)
55
Table 6.5 Poverty headcount, poor- and total population shares, by labor market characteristics of household head (in percentages)
56
Table 7.1 Levels of food security 57
Table 7.2 Population with types of food deficiency, by residence 58
Table 7.3 Food-insecure population, by food-security status, and by region 59
Table 7.4 Households, by livelihood group, asset holding and food insecurity (in percentages) 61
Table 7.5 Percentage of food-insecure households, by residence, and by selected household characteristics 62
Table 7.6 Percentage of food-insecure households, by year, harvest season, and by region 64

ix LIST OF TABLES
Table 7.7 Average quantity of foods available for consumption, by food security status, for selected food commodities (in grams per person per day)
65
Table 7.8 Average number of days of food consumption per week, by residence, and by selected food 67
Table 7.9 Households applying coping strategies, by residence, and by use of selected coping strategies (in percentages) 69
Table 8.1 Net and gross attendance ratio, by residence, and by education level, sex; Gender parity index, by residence, and by educational level; GAR/NAR ratio, by educational level
72
Table 8.2 Population 6-24 years not attending school, by school age, sex, and by residence, reason for not attending (in percentages)
75
Table 8.3 Population 25 years over, by sex, and by educational attainment 77
Table 8.4 Adult literacy rate, by residence, and by sex; Gender equity indicators, by residence 78
Table 8.5 Youth literacy rate, by residence, and by sex; Gender equity indicators, by residence 79
Table 9.1 Access characteristics of the nearest health facility for different health facilities, by residence 84
Table 9.2 Availability of health care staff in nearest health facility, by sex of staff, residence, and by health care provider, staff type (in percentages)
85
Table 9.3 Mean and median household health-related expenditure for A. Households with specified expenditure and B. all households, by expenditure type, residence (in Afghanis)
86
Table 9.4 In-patients (A) and out-patients (B) in the year before the survey, by sex, and by age 87
Table 9.5 Health care seekers in the year before the survey, by residence, and by health care provider 89
Table 9.6 Children under five years of age, by residence, and by different indicators (in percentages) 90
Table 10.1 Households, by residence, and by construction material for (a) walls, (b) roofs and (c) floors (in percentages) 97
Table 10.2 Households, by residence, and by number of rooms in the dwelling (in percentages); also stating occupancy density indicators
98
Table 10.3 Households, by location of cooking facility, and by residence (in percentages) 98
Table 10.4 Percentage of households with access to improved sources of drinking water, by residence; Time to reach drinking water source (all water sources), by residence
99
Table 10.5 Population, by use of improved sanitation, access privacy, and by residence (in percentages) 101
Table 10.6 Population using solid fuels for (a) cooking and (b) heating in winter, by residence (in percentages) 103
Table 11.1 Households, by debt status, debt amount (in percentages); also stating debt means (in Afs.) 106
Table 11.2 Households, by experience of household shocks, and by survey year, residence (in percentages) 108

xANNEX TABLES
ANNEX TABLESTable IV.1 Districts excluded from sample frame for the reserve sample 166
Table IV.2 Interviewed households, by year, and by season (Shamsi calendar) 167
Table V.1 Population, by residence, sex, and by five-year age groups (in thousands) 169
Table VI.1 Sex ratio of children ever born and children dead, by age group of the mother 171
Table VI.2 Estimation of probability of dying and associated reference date, by sex 172
Table VII.1 Median of reported and predicted housing value, by residential dwelling type (in Afghanis) 175
Table VII.2 Consumption aggregate, by consumption-aggregate component, survey year, and by wealth quintile (in percentages) 176
Table VII.3 NRVA 2007-08 basic needs basket, by main food category (in kg. per person per day) 176
Table VII.4 NRVA 2011-12 poverty indicators 177
Table VIII.1 Seasonal crop calendar, by region, province 180
Table IX.1 Quality assurance dimensions and measures in NRVA 2011-12 183
Table IX.2 Sampling errors and confidence intervals for selected indicators 186
Table IX.3 Percentage missing values for selected variables 189
Table X.1 Population, by sex, and by province, age groups (in thousands) 190
Table X.2 Population, by sex, marital status, and by province (in thousands) 196
Table X.3 Population, by immigrant status, and by province (in thousands) 197
Table X.4 Working-age population, by labour force indicators 198
Table X.5 Employed population, by status in employment, and by province (in thousands) 199
Table X.6 Households, by ownership of different types of agricultural land (in thousands) 200
Table X.7 Mean and median size of owned land, for different types of land, by province (in jeribs) 201
Table X.8 Households, by distance to nearest primary education facility for boys and girls, and by province (in thousands) 202
Table X.9 Households, by distance to nearest lower secondary education facility for boys and girls, and by province (in thousands) 203
Table X.10 Literacy rate of population aged 15 years older, by sex, and by province 204
Table X.11 Net and Gross Primary Attendance Ratios, by sex, and by province 205
Table X.12 Net and Gross Secondary Attendance Ratios, by sex, and by province 206
Table X.13 Children under five years of age, by birth registration and Vitamin A supplementation, and by province 207
Table X.14 Women with a birth in the last five years, by maternal health services provided,and by province (in percentages)
208
Table X.15 Population, by access to housing amenities, and by province (in percentages) 209

xi LIST OF FIGURES
LIST OF FIGURES Figure 2.1 Implementation of NRVA 2011-12 sampling clusters, by district 6
Figure 3.1 Population, by age and sex (in percentages) 9
Figure 3.2 Households and population, by household size (in percentages) 12
Figure 3.3 Male and female population, by age, and by marital status (in percentages) 14
Figure 3.4 Females age 15 to 49, by current age group, and by age at first marriage (in percentages) 14
Figure 3.5 Ever-married females, by current age, and by relative age of husband (in percentages) 15
Figure 3.6 Childhood mortality indicators, by survey 16
Figure 3.7 International migrants, by migrant type, and by age (in percentages) 20
Figure 3.8 Immigrants living abroad in October 2004, by main reason for immigration, and by country of residence in 2004 (in percentages)
21
Figure 3.9 Emigrants 14 years of age and older leaving in the past year, by main reason for emigration, and by country of destination (in percentages)
21
Figure 3.10 Annual immigration ratio since October 2004, by province 22
Figure 3.11 Life-time and recent in-migrants, by age (in percentages) 24
Figure 3.12 Recent in-migrants, by age, and by reason for in-migration (in percentages) 25
Figure 3.13 Percentage of population 14 years and over migrating for seasonal work in the year before the survey, usual residence, and by (a) provincial destination and (b) urban-rural destination
26
Figure 3.14 Households returned from displacement since 2002, by year of return, and by country of refuge (in percentages) 27
Figure 4.1 Labour force participation rate, by residence, and by sex 30
Figure 4.2 Labour force participation rate, by sex, and by age 31
Figure 4.3 Labour force not gainfully employed, by (a) residence and (b) sex, and by underemployment and unemployment (in percentages)
33
Figure 4.4 Percentage of the labour force not gainfully employed, by season, and by residence 34
Figure 4.5 Employed population 14 years and over, by sector of employment, and by sex (in percentages) 36
Figure 4.6 Working population, by sex, and by weekly working hours (in percentages) 37
Figure 5.1 Percentage of households owning irrigated farm land, by province 40
Figure 5.2 Percentage of irrigated land not cultivated, by district 41
Figure 5.3 Main source of water for irrigated land (in percentages) 42
Figure 5.4 Percentage of households owning rain-fed farm land, by province 43
Figure 5.5 National annual farming input costs, by type of production input (in million Afs.) 46
Figure 5.6 Percentage of households owning any cattle, by province 47
Figure 5.7 Main type of veterinary service provider and main reason not to use veterinary services 49
Figure 6.1 Trend of poverty headcount, by residence and region (in percentages) 52
Figure 6.2 Trend of Gini coefficient, by residence and region 53
Figure 6.3 Total population and poor population, by age (in percentages) 54
Figure 7.1 Population, by level of food security, and by residence, survey year (in percentages) 60
Figure 7.2 Population, by level of food security, and by residence, season (in percentages) 63
Figure 7.3 Households, by source of wheat flour, and by residence, food security status (in percentages) 66
Figure 7.4 Households, by Kcal intake, and by residence, Food Consumption Score (in percentages) 68
Figure 8.1 Education attendance rate, by sex, and by age 72
Figure 8.2 Net attendance ratio, by sex, and by survey for (a) primary education and (b) secondary education 73
Figure 8.3 Net attendance ratio, by educational level, and by season 74
Figure 8.4 Households within two kilometres distance from primary education facilities, by sex ofstudent population, and by residence (in percentages)
76
Figure 8.5 Population 15 years and over, by educational attainment, and by age, for (a) males and (b) females 78
Figure 8.6 Adult literacy rate, by province, for (a) males and (b) females 80
Figure 8.7 Youth literacy rate, by sex, and by survey year 81

xiiLIST OF FIGURES
Figure 8.8 Literacy rate, by sex, and by age; Gender equity, by age 82
Figure 9.1 In-patients (A) and out-patients (B) in the year before the survey, by sex, and by age as percentage of the total population in the same age-sex group
88
Figure 9.2 Women age 15-49 with a live birth in the five years preceding the survey, by residence, and by the number of TT injections received during the last pregnancy (in percentages)
91
Figure 9.3 Women with a live birth in the five years preceding the survey who received maternal health care during their last pregnancy, by selected characteristics (in percentages)
92
Figure 9.4 Percentage of women with a live birth in the five years preceding the survey who were assisted by skilled birth attendants at last delivery, by provincelast pregnancy, by selected characteristics (in percentages)
93
Figure 9.5 Percentage of women with a live birth in the five years preceding the survey who received maternal health care during their last pregnancy and who delivered in institutional facilities, by survey (in percentages)
94
Figure 10.1 Households, by tenancy status, and by residence (in percentages) 96
Figure 10.2 Percentage of households with access to safe drinking water, by province 100
Figure 10.3 Households, by distance to the nearest drivable road to the community, and by residence (in percentages) 101
Figure 10.4 Households, by change in condition of the access road to the community, and by residence (in percentages) 102
Figure 10.5 Households, by source of electricity, and by survey year (in percentages) 103
Figure 11.1 Households, by assessment of their economic situation compared to one year before, and by residence 106
Figure 11.2 Percentage of households experiencing a drinking water shock in the year before the survey, by province 109
Figure 11.3 Percentage of households applying coping strategies, by residence 110
Figure 11.4 Households, by first community development priority for (a) male Shuras and (b) female Shuras, and by residence (in percentages)
112
ANNEX FIGURESFigure VII.1 Total food consumption aggregate, by food group, and by survey year (in percentages) 174
Figure VII.2 Change in households that own selected durables between NRVA 2007-08 and NRVA 2011-12 (in percentages) 175

xiii LIST OF TEXT BOXES
LIST OF TEXT BOXES Quality of age reporting 9
Infant- and Under-five Mortality Rate 15
MDG Indicators 4.1 and 4.2 – Under-five Mortality Rate and Infant Mortality Rate 16
Migration concepts 17
Labour force definitions 31
MDG Indicator 1.5 – Employment-to-population ratio 32
Labour indicators based on ILO definitions 34
MDG Indicator 1.7 – Proportion of own-account and contributing family workers in total employment 34
MDG Indicator 3.2 – Share of women in wage employment in the non-agricultural sector 36
MDG Indicator 1.2 – Poverty gap ratio 51
MDG Indicator 1.3 – Share of poorest quintile in national consumption 52
MDG Indicator 1.9 – Percentage of population below minimum level of dietary energy consumption 58
MDG Indicator 2.1 – Net attendance in primary education, both sexes 71
MDG Indicator 3.1 – Ratio of girls to boys in primary, secondary and tertiary education 73
MDG Indicator 2.3 – Literacy rates of 15-24 years old 79
Access to health care 84
Availability of health care staff 85
MDG Indicator 5.5 – Antenatal care coverage 92
MDG Indicator 5.2 – Proportion of births attended by skilled health personnel 92
MDG Indicator 7.10 – Percentage of urban population living in slums 97
MDG Indicator 7.8 – Proportion of the population using improved drinking water sources 99
MDG Indicator 7.9 – Proportion of population using an improved sanitation facility 100
MDG Indicator 8.15 – Mobile cellular subscriptions per 100 inhabitants 104
MDG Indicator 8.16 – Internet users per 100 population 104
Household shocks 107

xivABBREVIATIONS
ABBREVIATIONSADB - Asian Development BankAHS - Afghanistan Health SurveyANC - Ante-Natal CareANDS - Afghanistan National Development Strategy ANSP - Afghanistan National Statistical PlanARI - Acute Respiratory IllnessBPHS - Basic Package of Health ServicesCA - Consumption AggregateCBN - Cost of Basic NeedsCDC - Community Development CouncilCI - Confidence IntervalCSO - Central Statistics OrganizationDfID - UK Department for International DevelopmentDPS - District Price SurveyEA - Enumeration AreaFAO - Food and Agriculture OrganizationFCS - Food Consumption ScoreGAR - Gross Attendance RatioGDP - Gross Domestic ProductGIZ - German Gesellschaft für Internationale ZusammenarbeitGoA - Government of AfghanistanICSE - International Classification of Status in EmploymentILO - International Labour OrganizationIMR - Infant Mortality RateISCED - International Standard Classification of EducationKcal - KilocalorieMAIL - Ministry of Agriculture, Irrigation and LivestockMDG - Millennium Development GoalMICS - Multiple Indicator Cluster SurveyMMR - Maternal Mortality RatioMoE - Ministry of EducationMoEc - Ministry of EconomyMoF - Ministry of FinanceMoEW - Ministry of Energy and WaterMoLSAMD - Ministry of Labour, Social Affairs, Martyrs and DisabledMoUA - Ministry of Urban AffairsMoWA - Ministry of Women AffairsNAR - Net Attendance RateNMAK - National Multi-sectoral Assessment of KuchiMRRD - Ministry of Rural Rehabilitation and DevelopmentMoUD - Ministry of Urban DevelopmentNRVA - National Risk and Vulnerability AssessmentNSP - National Solidarity ProgrammePPS - Probability Proportional to SizePSO - Provincial Statistical OfficerPSU - Primary Sampling UnitREFSA - Rapid Emergency Food Security AssessmentRSO - Regional Statistical OfficerSBA - Skilled Birth AttendanceSC - Steering CommitteeTBA - Traditional Birth AttendantsTFR - Total Fertility RateTAC - Technical Advisory CommitteeU5MR - Under-five Mortality RateUNDP - United Nations Development ProgrammeUNECE - United Nations Economic Commission for EuropeUNFPA - United Nations Fund for Population ActivitiesUNICEF - United Nations Children’s FundUNU - Ultimate Sampling UnitTT - Tetanus ToxoidWB - World BankWFP - World Food Programme

MAP OF AFGHANISTAN
xv MAP OF AFGHANISTAN

xviACKNOWLEDGEMENTS
ACKNOWLEDGEMENTSThe National Risk and Vulnerability Assessment report has been through a long way to be reach the hands of the readers. It has been a very ambitious project in its objective and I am delighted to be able to present the result of this hard work to you dear reader.
As for all the project and publication of this scope, the list of persons who have contributed and made this publication a reality is very long and I will probably forget some persons. I pray that they will forgive me.
First of all, I would like to pay tribute to the memory of H.E. Abdul Rahman Ghafoori, President General of the Central Statistical Organization, who sadly left us before this publication could be released. He has always been a huge supporter to the NRVA and never spared his time and efforts to provide guidance, vision and support to the staff and experts working on the project. He will be dearly missed.
I would then like to thank the European Union Delegation to Afghanistan and in particular Mr. Giacomo Miserocchi, Attaché Rural Development, Mr. Wali Mohammed Farhodi, Programme Manager - Rural Development for their endless support in implementing this project as well as Mr. Kristian Orsini, Acting Head of Operation for his commitment. The EU Delegation is our main donor in this project and this publication would never have been published without their commitment.
I would also like to make a special mention to the United Nations World Food Programme for their on-going support to the NRVA. Their help was greatly appreciated, as well as its input in training and in a wide range of survey issues. In this respect, the role of Mr. Amanullah Assil, Programme Officer VAM, has been invaluable. I would like to thank Mr. Amanullah Assil in particular, as well as Mrs. ThiVan Hoang and Mr. William Affif for their assistance and commitment throughout the survey.
Several other international organization were involved and provided assistance to the survey. I would like to thank Ms. Silvia Redaelli, Economist, and Mr. Dean Joliffe, chair of the Technical Advisory Committee, from the World Bank for their contribution to the TAC and their contribution to the Poverty chapter. I am also grateful to UNICEF and especially Mrs. Siping Wang, ILO, and more specifically Mr. Herve Berger.
A special partner for CSO in the last year has been the Senior Adviser of the UNDP Capacity Development Project, Dr. Mishra.
This also enables me to thank to other major contributors to the Steering Committee, namely Mr. Esmatullah Ramzi, adviser for CSO to the President and Prof. Hasibullah Mowahed, Deputy President General, and now Acting President General of CSO for the valuable technical input during the Steering Committee meetings as well as their knowledge of the country and its people.
This survey has benefited for a large support from the international community but could also count on the continuous commitment of the Technical Assistance experts from ICON INSTITUTE Public Sector and especially from the Team Leader Mr. Jan Bartlema who has showed a great patience in managing the team. Another person whose invaluable commitment must be acknowledged is Mr. Bart de Bruijn, the Chief Editor of this report. His assistance and work throughout the years has been a great asset to the office and he has performed an unbelievable work in assisting CSO in the production of this report. I also would like to thank the project managers from ICON who have never spared their efforts to make this project a success, first of them is Mrs. Inga Korte who has initiated the project and Mr. Christophe Dietrich who has taken over from her in the later stage.
Of course, I would also like to thank the staff of CSO for the work they have done in conducting the survey and in particular Mr. Esmatullah Hakimi, Mr. Ahmad Khalid Amarkhel, Mr. Muneer Jamshid, Mr. Tamim Ahmad Shakeb from the NRVA Team, Mr. Whaheed Ibrahimi from the Database section, Mr. Zubair from the data entry section and Mrs. Shakeeba from the GIS section.
I would like to address a special thank to all the contributors to the report, Silvia Redaelli (WB), Mr. Elliot Vhurumuku and Mr. Amanullah Assil (WFP), Ahmad Khalid Amarkhel (CSO) and Bart de Bruijn (ICON).
Finally, I would like to thank the field staff and the respondents to the survey without whom the survey would not have been possible, and of course, I would like to thank you, the readers for getting interest for the living conditions of the people of Afghanistan and the work of the Statistical organization.
Mohamed Sami NabiDirector of Field Operation DepartmentCentral Statistical Organization

xvii EXECUTIVE SUMMARY
EXECUTIVE SUMMARYThe 2011-12 National Risk and Vulnerability Assessment (NRVA) is a survey, which provides national and international stakeholders with information that is required for monitoring development progress and formulate development policies and programmes. The survey was conducted by the Central Statistics Organization (CSO) of the Islamic Republic of Afghanistan and provides results that are representative at national and provincial level. It covered 20,828 households and 159,224 persons across the country, and is unique in the sense that it also includes the nomadic Kuchi population of Afghanistan. Building on previous survey rounds in 2003, 2005 and 2007-08, it has grown into Afghanistan’s most comprehensive source of statistical information. The survey covers a wide range of development themes and indicators, which were agreed upon by government departments, donors and international Organizations.
The picture that emerges from the NRVA 2011-12 is one of significant improvements in various areas of development, especially in education, health and access to safe drinking water. In other areas – such as food security and poverty – results indicate stagnation or even deterioration. Despite observed improvements in many areas, the living conditions of Afghanistan’s population as measured by any development indicator are among the worst in the world. Moreover, the national figures conceal dramatic differences within the population. With only very few exceptions, the situation in urban areas is much better than that in rural areas and among the Kuchi population. And invariantly, gender-specific indicators show that men and boys are far less disadvantaged than women and girls.
The remainder of this summary recapitulates the main findings of the thematic chapters of this report. An in-depth analysis of the interaction between development indicators – and more specifically the apparent nexus between poverty, food insecurity, poor labour market performance, low levels of education, high fertility and mortality, and limited access to services – is beyond the scope of this report and will require additional efforts.
Population
The population share of children under 15 of 48 percent is among the highest in the world. Afghanistan’s very young age structure produces a situation in which a relatively small number of persons in the economically most productive age group 15-64 has to provide for a very large number of people in the dependent ages below 15. This implies a heavy burden for the working population, especially given the poor labour market opportunities in Afghanistan. The fact that the labour market to a large extent excludes women further aggravates this burden for the working population. The high fertility level underlying the young population composition also implies high risks for maternal and child mortality, especially in view of the poor access to health services in the country. In addition, the ever-increasing numbers of children and young adults exceed the absorption capacity of the education system and the labour market.
The Under-five Mortality Rate (U5MR) of 91 deaths per thousand live births confirms a robust downward trend in the percentage of children dying before reaching age 5. It suggests that in the four years since NRVA 2007-08 (with an U5MR of 161) out of one thousand newborn children 70 more survive to age 5.
Besides fertility and mortality, migration is a very important component in population change in Afghanistan. The migration context of the country is particularly complex and is, among others, related to job opportunities, security, (nomadic) lifestyle, gender roles and policies toward Afghans in neighbouring countries. This results in an intricate interaction of gender, age, distance and reasons for migration. Around 16 percent of the population in Afghanistan is born in a district that is different from the district of current residence; 6 percent is born in another province and 3 percent in another country. The corresponding percentages of the urban population born elsewhere are significantly higher, respectively 36, 18 and 4 percent. Kabul is the biggest magnet of attraction by far, and for both internal and international migrants: out of 4.2 million inhabitants, some 360 thousand people were born abroad and 1.9 million elsewhere in Afghanistan. Immigration is dominated by persons arriving from Pakistan (67 percent) and Iran (32 percent). For emigrants Iran is by far the most important destination (76 percent), with smaller numbers going to Pakistan (13 percent) and the Gulf states (8 percent) alongside other countries.
Marriage remains almost universal in Afghanistan and is characterized by early marriage for women. However, the share of marriages below age 18 is consistently dropping for each successive birth cohort in the last decade: whereas 60 percent of women 30 and over were married at age 18, for women aged 20-25 this decreased to 50 percent. Similarly, the age difference between husband and wife has decreased from a mean difference of 7 years for women aged 40 and over to 4 years for women under 20. Both trends could be interpreted as a strengthening of the position of women within marriage.

Labour force characteristics
Two factors dominate the Organization of Afghanistan’s labour market: the importance of the agricultural sector – farming and livestock – and the underrepresentation of women. Afghanistan’s labour force – all persons in the working age of 14 and over who are currently active by being either employed or unemployed – shows a large gender disparity. Out of the labour force of 7.2 million persons, only 1.3 million are women. These numbers underlie the vastly different labour force participation rates for men and women – 80 and 19 percent respectively – and indicate the difficulty for women to economically add to the position of their households, as well as to the economy at large. The share of women in wage employment in the non-agricultural sector – the labour force MDG indicator for gender equality – is only 11 percent. The finding that high participation rates are found for boys 14 and over, as well as for elderly men 65 and over, indicate the dire need for many to contribute to the household income.
In the context of Afghanistan – characterized by low-paid, low-productivity employment and the absence of pensions and unemployment insurance – international definitions of employment and unemployment are largely irrelevant as indicators of labour market performance. Therefore, the country has adopted national definitions that are better attuned to the Afghanistan reality. In this national conceptualisation, the labour-market indicator that is considered to have most policy relevance is the percentage of the labour force that is not gainfully employed. This not-gainfully employed population includes the category of underemployed – persons who need more or other employment in order to provide for sufficient and sustainable income or livelihood – besides the unemployed.
The share of the labour force that belongs to the not-gainfully employed is 25 percent, indicating that the labour market is short of 1.8 million jobs to provide people with an adequate living. Some 17 percent of these are considered underemployed and the remaining 8 percent are unemployed. The figures for the not-gainfully employed differ sharply by residence: whereas 18 percent of the urban labour force cannot find adequate work, the figure is as high as 29 percent for the rural labour force. The corresponding figures for men and women are, respectively 22 and 39 percent, indicating that almost two in five women who want to work cannot find adequate employment. The share of not-gainfully employed youth aged 15-24 (26 percent) is similar to the share of the total labour force, but the component of youth unemployment is somewhat higher (10 against 8 percent).
The share of the working population that is in vulnerable employment – own-account workers, day labourers and unpaid family workers – is 81 percent, 79 percent for men and 87 for women. The sector that absorbed the largest share of the employed (40 percent) is agriculture. Compared to men, female work is much more concentrated in just a few sectors, particularly in livestock tending and food processing. Also in terms of working hours large gender differences are observed: on average men work 45 hours a week and women 30.
Agriculture and livestock
Farming – and more particularly farming irrigated land – is the economic backbone of Afghan society: some 40 percent of the labour force is engaged in farming. Around 38 percent of all households own any irrigated farm land and the corresponding figures for households owning rain-fed land and garden plots are, respectively, 17 and 13 percent.
Households owning irrigated land on average own 6 jeribs, with more than half (57 percent) owning an area of 3 jeribs or less. Those owning rain-fed land on average own 16 jeribs, with around half (51 percent) owning 7 jeribs or less. Cereals – especially wheat, the principal staple food in Afghanistan – are the main farm produce from both farmland types. Around 80 percent of wheat is produced on irrigated land. NRVA results suggest a spring cultivation production of 2.4 million tonnes of wheat in 2011 and 2.8 million tonnes in 2012, which would indicate a serious shortfall of the wheat requirements of around 5 million tonnes. Garden plots are on average 2.0 jeribs and for 53 percent of plot-owning households one jerib or less. They represent an important supplementation of households’ diet and income, as they provide high-value and nutrition-rich produce, in particular fruits and nuts.
Among the main challenges for a productive agricultural sector are water shortage and infertility of farmland. Some 20 percent of the estimated 17 thousand km2 of irrigated farmland is left fallow, primarily because of lack of water (71 percent) and land infertility (21 percent). For rain-fed land (18 thousand km2) the share that is not cultivated is even 37 percent, mainly because of lack of rain (53 percent) and land infertility (18 percent).
The national stock of cattle seems to have dropped since the Livestock census of 2002-03. The NRVA 2011-12 estimates the number at 2.9 million, compared to 3.7 million at the time of the census. On the other hand, the herds of
xviiiEXECUTIVE SUMMARY

EXECUTIVE SUMMARY
small ruminants show significant increases. The number of sheep and goats are estimated at, respectively, 10 and 18 million, compared to 7 and 9 million in the census. The share of households that own one or more cattle, goats, sheep and chickens is, respectively, 39, 29, 31 and 44 percent. Besides providing households with a range of dairy and animal products, market sales of animals or livestock products are an important income source for these households.
With regard to livestock production factors, NRVA 2011-12 shows a relatively good vaccination coverage (between 72 and 91 percent for different types of livestock), but relatively low access to feed concentrate (53 percent). Livestock owners significantly (67 percent) rely on private service providers for veterinary services.
Poverty incidence, trend and profiling
NRVA 2011-12 indicates that 36.5 percent of the Afghan population has a consumption pattern that is below the poverty line. The indicators that measure the depth and severity of poverty (the poverty gap and the squared poverty gap) have values of 8.6 and 3.0, respectively. These figures imply that at national level no poverty change is observed in Afghanistan since the NRVA 2007-08, although at regional level some changes are evident. The stable poverty figures also imply that, due to rapid population growth, in terms of absolute numbers the volume of poor people has increased.
Survey results also show that inequality over time has grown, with consumption of the richer quintile growing much faster than that of the poorest two quintiles. Consequently, the Gini Index increased from 29.7 to 31.6 between the latest two NRVA surveys and the share of the poorest quintile in national consumption declined from 9.1 to 8.5 percent.
The national poverty figures hide significant differentiation across regions and residence. Thus – and similar to 2007-08 – the urban poverty headcount is 28.9 percent, compared to 37.7 percent for rural residents and 53.8 percent for the Kuchi population. Similarly, a large gap exists between the region with the lowest share of population living under the poverty line (Southwest, 28.0 percent) and that with the highest (Northeast, 50.9 percent).
Correlates of poverty include household size and the dependency ratio, an indication that high fertility is positively associated with poverty. The NRVA also suggests that literacy and education of the household head are inversely related to poverty and that households headed by women are worse off than male-headed households. It furthermore suggests that underemployment is even more important than unemployment to make households vulnerable to poverty, thereby confirming the need to focus in labour market policy on not-gainfully employment instead of only unemployment.
Food security
NRVA 2011-12 analysis indicates that around 30.1 percent of Afghanistan’s population – 7.6 million people – had a calorie intake that is insufficient to sustain a healthy and active life. This figure implies thatfood insecurity has slightly worsened compared to the NRVA 2007-08 when the food-insecure represented 28.2 percent. Out of the total number of the food-insecure, 2.2 million (8.5 percent) are very severely food-insecure and 2.4 million (9.5 percent) severely food-insecure. In addition, 19.4 percent of the population – 4.9 million people – have insufficient protein consumption, a deficiency that particularly affects the nutrition of children under five.
Food-security varies by residence, household characteristics, season and geographical region. Some 34.4 percent of the urban population is food-insecure, compared to 29.1 percent of the rural population and 25.6 percent of the Kuchi population. However, in terms of absolute numbers there are more food-insecure people in rural areas (5.2 million, excluding the 5 percent Kuchi population). Households with larger household size, higher ages of the household head and with a widowed or divorced household head are more likely to be food insecure. Relatively many more food-insecure people live in the North-eastern, Central and Central Highlands regions.
In a largely agricultural society like Afghanistan the annual cultivation cycle produces significant variation in food security across seasons. Although locally harvest and lean seasons vary considerably due to the geographic diversity of the country, a clear pattern is observed in the sense that winter and spring time tend to be dire seasons and food security increases in summer and autumn. The variation across seasons in urban areas is less pronounced because here more households rely on market purchases rather than own production of food.
When coping with household shocks, the majority of households use short-term strategies including decreasing food expenditure and reducing food quality. Around one-third of the households reduces food quantity or purchase food on trader credit.
xix

Education
All education-related indicators for Afghanistan – including gender equality indicators – show improvement since NRVA 2007-08, even though at the same time it is observed that the pace of improvement has slowed down. Despite major achievements in the last decade, education performance in Afghanistan is still among the poorest in the world, and the current rate of improvement will fail to achieve the ANDS targets by 2020.
The share of the Afghan population 25 years and over who have completed any level of formal education is very small – less than 25 percent, and for women as few as 10 percent. However, major improvements in primary and secondary school completion are observed for the younger age group 15-24 years, especially for girls. This is the result of increasing school attendance in the past decade. The net primary attendance ratios for girls and boys are now 48 and 64 percent respectively, up from 29 and 43 percent in 2005, and 42 and 60 percent in 2007-08.The downside of these figures is that still some 1.2 million girls and over 900 thousand boys are missing out on the opportunity to learn basic life skills. Net secondary attendance ratios are 23 and 42 for girls and boys respectively, up from 10 and 22 percent in 2007-08.
Opportunities to attend education are few, especially for girls and women, and rural and Kuchi populations in general, even though the gender gap in education and literacy show continuous improvement, in both absolute and relative terms. Thus, the ratio of girls to boys in primary, secondary and tertiary education are 0.74, 0.53 and 0.42 respectively, compared to 0.69, 0.49 and 0.28 in 2007-08. For girls, cultural barriers are dominant among the reasons for not attending school; for boys the main reason is the need to contribute to family income. The importance of these reasons increases with age. Insecurity and distance to schools are important reasons for non-attendance in rural areas. No more than around two in five rural households live within two kilometres of a primary school. Overall net primary school attendance in rural areas is 54 percent, while in urban areas it is 78 percent.
With regard to literacy, similar patterns and changes are recorded as for school attendance. The adult literacy rate is 45 percent for men and a low 17 percent for women. The improvements in literacy between 2005 and 2011-12 are particularly observed in the youth literacy rate, which increased from 20 to 32 percent for females aged 15-24 and from 40 to 62 percent for male youth. Consequently, the gender parity index for youth literacy has improved from 0.45 in 2007-08 to 0.52 in 2011-12. Again, the population in rural areas is at a severe disadvantage: the youth literacy rate there is only 39 percent, compared to 71 percent in urban areas.
Health
Although Afghanistan’s health indicators are poor in an international perspective and cultural barriers impede progress for many components of maternal and child health, significant improvement is evident from successive surveys in the ten years preceding NRVA 2011-12.
Perhaps the most consistent and impressive improvements are observed for maternal health indicators. The proportion of women served by skilled birth attendants has increased to 40 percent, compared to 24 percent in 2007-08 and only 16 in 2005. Similar improvements are found for provision of skilled ante-natal care – to 52 percent, compared to 36 percent in 2007-08 and 23 percent in 2005 – and deliveries in institutional health facilities – 36 percent, compared to 15 percent in 2007-08.
Improvements in the areas of child health seem more modest as far as indicators were measured by NRVA 2011-12. Full protection against neonatal tetanus through at least two TT injections was received by 35 percent of women during their last pregnancy, which is only a small difference with the figure for 2007-08 (33 percent). Supplementation of Vitamin A even seems to have declined in the past four years. The proportion of children officially registered at birth is still only 35 percent.
One of the main concerns with respect to Afghanistan’s health system performance is the very unequal health care provision between urban and rural populations. Invariably, for the majority of Afghanistan’s rural population service delivery and health outcome indicators are significantly lower than for urban dwellers. And the situation is generally even far worse for the nomadic Kuchi population. Thus, in urban areas the percentage of deliveries assisted by skilled health personnel is 76 percent, while that in rural areas is only 33 percent and for Kuchi women even only 13 percent.
In terms of time required to reach the nearest health facility, access to these facilities has improved significantly with the implementation of outreach programmes of the Ministry of Public Health and the distribution of private health facilities
EXECUTIVE SUMMARY xx

xxi EXECUTIVE SUMMARY
across the country. However, cultural responsiveness of the health sector – for instance in terms of provision of female health care providers – remains an important obstacle for the effective use of health care, especially by women. In addition, costs for health services and treatment are prohibitive for many households, in particular for poor households.
Housing and household amenities
The housing conditions of the Afghan population can be defined as poor, with large differences between urban and rural communities. However, several indicators show marked improvements.
Overall, 46 and 8 percent of the population use improved drinking water sources and improved sanitation facilities respectively. The figure for safe drinking water is a significant improvement compared to NRVA 2007-08, when it was only 27 percent. The situation improved in rural areas in particular, where the percentage using improved sources increased from 20 (2007-08) to 39. The situation with regard to sanitation improved slightly, but continues to be poor, with only 8 percent of the population having access to improved sanitation. The still widespread lack of basic infrastructure for water and sanitation implies high risks of potentially fatal diseases, and is especially detrimental for the health and survival chances of infants and young children.
Health conditions in the household are further impaired by the use of solid fuels for cooking (80 percent) and heating (97 percent). The lack of electricity is becoming less of an impediment for the effective spread of information to the general public through mass media, like radio, TV and the internet, as 69 percent of households had access to some source of electricity in the month preceding the survey, compared to 42 percent in 2007-08, and only 23 percent in 2005. However, use of the internet is still virtually non-existent among the population (only 0.5 percent of Afghans use the internet), while mobile phones are used by only 14 percent of the population (up from 6 percent in 2007-08).
Physical access to rural communities is often problematic, as around 14 percent of households there live in villages located more than 6 kilometres from the nearest drivable road. Only 14 percent of Afghans – 45 percent in urban areas and 5 percent in rural areas – live in a dwelling that can be considered durable. Some 37 percent live in an overcrowded dwelling, and – taking water and sanitation conditions into account – 87 percent of urban dwellers (5.3 million people) live in slum-like conditions of poverty and physical and environmental deprivation.
Challenges and strategies
Afghanistan is a country with a high-risk profile, due to a combination of climatic and natural circumstances and being a historically grown hotbed of social and political conflict and economic vulnerability. Consequently, household and community assessments depict challenging and uncertain living conditions for a large majority of the population in Afghanistan. No less than 84 percent of households reported for the year preceding the survey experiencing one or more household shocks – risk events with negative outcomes that are outside people’s direct control. Many shocks are related to food and farm prices (reported by 61 percent of households), drinking water supply (47 percent), agricultural problems (37 percent) and natural disasters (36 percent), most of which are related to the combination of a largely agricultural society, harsh climatic conditions and underdeveloped farming and veterinary support.
As the main priority both households and Shuras stress the need for further improvement of a safe drinking water supply. In addition, improvement of road, irrigation, electricity, health and education infrastructure are high on the Afghan wish list.
In terms of coping strategies, many households have resorted to food intake reduction (42 percent of households that experienced a household shock) or other detrimental coping strategies like sale of production means or removing children from school and placing them in low-paid jobs. Decreasing household expenditure (52 percent) and taking out loans or buying on credit (39 percent) are other strategies frequently applied by households experiencing such a shock. The NRVA survey indicates that 55 percent of Afghan households are in debt, to an average amount of 77 thousand Afs. The survey also suggests that various food-for-work, cash-for-work or income-generating programmes employed more than 420 thousand people and benefited 320 thousand households.

1 INTRODUCTIONAfter decades of war and political instability, Afghanistan remains one of the poorest countries in the world. In 2011 Afghanistan ranked 172nd out of 187 countries in the UNDP Human Development Index, a summary measure that is based on development dimensions of health, education and living standards (UNDP 2011). This poor ranking represents the challenges faced by large parts of the country’s population, but at the same time hides significant improvements in different sectors in the period since 2001.
In order to address the information needs of the Government of Afghanistan and other parties to inform and prioritise development policies and programmes, the Ministry of Rural Rehabilitation and Development (MRRD) and the Central Statistics Organization (CSO) started to conduct the National Risk and Vulnerability Assessment (NRVA). Building on two survey rounds in 2003 and 2005, the NRVA has developed into a full-blown multi-purpose survey under the sole responsibility of CSO It now captures a wide variety of development indicators in such areas as poverty, food security, labour market performance, demography, education, health, gender equality, housing and agriculture.
As such, the NRVA is the major single source of socio-economic statistics of the country. The survey is unique in the sense that – with inclusion of the nomadic Kuchi – it represents the entire population of Afghanistan, and that – since the NRVA 2007-08 survey – year-round data are collected in order to capture the seasonality of indicators like employment, food security and poverty. In order to underline the comprehensiveness of the NRVA, from the next (2013-14) survey round onwards the survey will be labelled ALCS – Afghanistan Living Conditions Survey.
This report presents the results of the latest NRVA that was conducted in 2011-2012. The primary aim is to provide the latest information about the living conditions of Afghanistan’s population and about the performance of, among others, the agricultural sector, the labour market and the education and health systems. The information presented includes 22 indicators to monitor the implementation of the Afghanistan National Development Strategy (ANDS) and 20 Millennium Development Goals (MDG) indicators. The main focus in this report is on information at national level, frequently disaggregated for residential populations (urban, rural and Kuchi). Provincial-level information is largely outside the scope of the present report, although Annex 10 provides tables for selected indicators and statistics at provincial level. The information provided in this report is also largely descriptive in nature; cross-sectoral and more in-depths analyses – especially those aiming at cause-and-effect relationships – will require additional efforts and reporting.
Chapter 2 describes the main methodological characteristics of the NRVA 2011-12, including brief descriptions of the sampling design, survey questionnaires, data collection and processing, data limitations, and comparison with the previous NRVA surveys. Several annexes provide further elaborations and technical details of the methodology.
Subsequent chapters cover the subject-matter of the survey. Population structure and change are addressed first in chapter 3, as these factors permeate into every development aspect of the remaining report sections. Afghanistan’s population composition by age and sex is analysed, as well as some of the underlying demographic dynamics. In addition, household and marriage patterns are examined.
Chapter 4 provides an analysis of the structure of Afghanistan’s labour market and covers various labour force indicators, including employment, underemployment, unemployment, working hours, vulnerable employment, and differentiation by age and sex.
Agriculture, including farming and livestock production, is the subject of chapter 5. The chapter analyses the agricultural sector with a view on access to land, land area size, farm and garden production, type and number of livestock, and sale of animals and animal products, as well as relevant production factors in this sector.
The key chapters 6 and 7 present the results of, respectively, poverty and food-security analyses. Both chapters engage in a first attempt to profiling the poor and the food insecure population in Afghanistan, and compare the results with those from NRVA 2007-08.
The twin chapters 8 and 9 are dedicated to the social sectors of education and health, and to the changes occurring in these sectors. The former analyses literacy rates, school attendance and educational attainment, whereas the latter’s main focus is on out-of-pocket health expenditure and maternal health, besides some indicators for access to health facilities and child health.
The housing situation is described in Chapter 10, with a view on tenancy arrangements, physical characteristics of the dwelling and housing facilities, like electricity, drinking water and sanitation. Household shocks and coping strategies, as well as community preferences for interventions are outlined and analysed in chapter 11.
The last annex to this report provides a comprehensive list of concepts and definitions that may guide the reader in a deeper understanding of the presented materials.
1INTRODUCTION

2 SURVEY METHODOLOGY AND OPERATIONS2.1 IntroductionThe methodologies applied in the NRVA 2011-12 – in terms of questionnaire and sampling design, analysis, and procedures for data collection, data capture and data processing – have taken into account the specific circumstances of Afghanistan. These refer to issues such as fieldwork challenges, stakeholder information needs, socio-cultural specificities, the statistical infrastructure and implementation capacity at various levels of the survey hierarchy. At the same time, methodologies were designed as to comply with international survey recommendations and best practices. Experience gained from the previous rounds of NRVA and application of international standards resulted in some methodological changes, but as much as possible the rigour of previous achievements has been maintained in order to ensure comparability over time.
This chapter provides an introduction to different methodology dimensions adopted in the present round of NRVA for a better understanding of the survey results that are presented in the subject matter chapters 3 to 11. In this respect the different sections will also highlight methodological changes compared with previous rounds.
2.2 Stakeholder involvement
As the primary aim of NRVA is to serve the information needs of data users, consultation with stakeholders has been carried out in several crucial stages of the survey. The group of stakeholders that participated in the meetings organised by CSO included line ministries 1, UN and other international organizations 2, bilateral donors 3 and academic and research bodies.
At the onset of the present NRVA round (January-March 2010) a series of three meetings with stakeholders was organised to discuss and define the information to be collected in the 2011-12 round of NRVA. These meetings also dealt with the sustainability and long-term perspective of the NRVA as Afghanistan’s most important instrument for producing socio-economic information (see Section 2.3). Further stakeholder meetings were organised to discuss the NRVA tabulation and analysis plan and the outline of this final report (July and September 2012).
In addition to these meetings, a number of key stakeholders were present in the NRVA Steering Committee to supervise the work progress and recommend specific actions. Similarly, relevant stakeholders participated in the Technical Advisory Committee (TAC) to scrutinise methodological and technical matters and provide input if and when required.
2.3 Questionnaire design
Since 2003, the successive NRVA surveys incorporated increasing numbers of questions. This continued even to the extent that interview burden and workloads in data processing and analysis run the risk of overreaching the capacity of fieldworkers, respondents and CSO staff. The need to pack all information needs into one survey that was conducted at irregular intervals was reduced when the Afghanistan National Statistical Plan (ANSP) (CSO, 2010) was formulated. The ANSP presented a medium-term perspective that anticipated the implementation of NRVA as the national multi-purpose survey of Afghanistan on an annual basis. This allowed the introduction of a schedule of rotating questionnaire modules: rather than including all questions and topics every year, for successive years different modules are added or expanded to provide more detailed information on specific subjects in addition to the core questionnaire that annually covers a standard set of key indicators.
In the series of consultations with stakeholders in 2010, agreement was reached to re-design the NRVA data collection and questionnaires according to this rotation principle, which implied that meeting information needs, as well as survey implementation could be achieved in a more sustainable way. Annex II provides a summary of contents of successive survey rounds.
The core of NRVA 2011-12 is a household questionnaire consisting of 15 subject sections, 11 administered by male interviewers and answered by the male household representative (usually the head of household), and four asked by female interviewers from female respondents. In addition, the questionnaire included three modules for identification and monitoring purposes (see Table 2.1). On average the time required to answer the household questionnaire was around one-and-a-half hour.
1 MRRD, MAIL, MoPH, MoE, MoLSAMD, MoWA, MoEW, MoEc, MoF, MoUD2 WFP, WB, UNICEF, UNFPA, UNDP, ILO, UNDP, UNHCR, WHO, ADB3 EC, DfID, GIZ
2 SURVEY METHODOLOGY AND OPERATIONS

Table 2.1 NRVA 2011-12 household questionnaire modules (subject matter modules in bold)
Male modules Female modules
Household identification Labour Household identification
Process monitoring Household income Missing household membersHousehold roster Household expenditure General living conditionsHousing and amenities Migration Food consumptionLivestock Education Maternal and child healthAgriculture Household assets Household shocks and
coping strategies
In addition to household information, data were collected at community level through two community questionnaires – one male and one female Shura questionnaire – addressing the topics presented in Table 2.2. Finally, the NRVA survey instrument included a questionnaire to collect data on market prices for food items and a few other commodities. Annex III provides the set of NRVA 2011-12 questionnaires.
Table 2.2 NRVA 2011-12 Shura questionnaire modules (subject matter modules in bold)
Male Shura questionnaire modules Female Shura questionnaire modules
Community identification Community identification
Process monitoring Process monitoring
Community access and access to facilities Community development prioritiesCommunity projectsCommunity development prioritiesAgricultural calendars
2.4 Pilot training and pilot survey
In order to validate the survey instruments, as well as training and field procedures, these were tested prior to the start of the fieldwork. The questionnaires were translated into Dari and Pashto, and were subjected to a pre-test by CSO staff. After this, a full pilot was conducted in October 2010. To this end four survey teams of seven persons each (three interview couples and one supervisor) were selected to participate in a one-week training and subsequent field test.
The pilot teams were distributed over two provinces (Kabul and Parwan), each with a purposely-selected urban and rural cluster. Following a sampling procedure similar to the one in the main survey, within each of the four clusters 30 households were sampled and the resulting 120 households were effectively interviewed.
Changes in contents and wording were made to the questionnaire and manuals, based on the experience from the training and fieldwork.
2.5 Training and selection of field staff
Following a screening procedure based on a review of around one thousand written applications from all 34 provinces and subsequent written tests and interviews, 272 candidates were invited to participate in the training prior to the start of the full survey. This group consisted of three candidate interviewer couples of one male and one female interviewer, and two candidate supervisors per province.
The training was centrally conducted in Kabul over a period of 24 days in February and March 2011. This approach was preferred over regional trainings as it enhanced the consistency of knowledge transfer and optimised the use of expertise available in CSO4. The curriculum consisted of instructions in interview techniques, field procedures and logistics, a step-by-step review of questionnaire contents, practical exercises and examples, in-class mock interviews and field practice in interviewing and supervision.4 The CSO trainers included the Head of Field Operations and Sampling Department, the Lead Statistician, the Director of Operations and the Database
Manager.
3SURVEY METHODOLOGY AND OPERATIONS

The first phase of the two-stage training consisted of one week class-room training and two days of field practice under supervision of CSO staff, and was concluded with an exam. The exam scores and a review of completed questionnaires were used to select the supervisor and two interviewer couples for each province. These 34 supervisors and 136 interviewers continued class-room training for another 15 days. The trainees not selected for the fieldwork were kept as reserves to accommodate drop out during the survey period.
In addition to the initial central training, at the end of the first three quarters of data collection regional workshops were conducted for supervisors, Provincial Statistical Officers (PSOs) and Regional Statistical Officers (RSOs). The aim of these workshops was to feed back the lessons learned from the field, discuss relevant issues, provide additional training, transfer new field supplies and strengthen working relations and coordination between PSOs, RSOs, field supervisors and Headquarters staff. In March 2012 another round of regional training was conducted for all field staff, including PSOs and RSOs, with a special focus on the food consumption modules.
After completion of the survey, a final series of regional debriefings was organised for field staff in order to obtain their views on improvements in field procedures and questionnaire design and contents. This feedback has been incorporated in the development of the next survey round in 2013.
2.6 Sampling design and implementation
The sampling design of the NRVA 2011-12 was developed to produce results that are representative at national and provincial level, as well as for Shamsi calendar seasons.5 In total 35 strata were identified, 34 for the provinces of Afghanistan and one for the nomadic Kuchi population. Stratification by season was achieved by equally distributing data collection over 12 months within the provinces. For the Kuchi population, the design only provided sampling in winter and summer when communities tend to temporarily settle. Given the total sample size of 21,000 and uniform sample size per stratum, each province and the Kuchi stratum was assigned with 600 households to be interviewed.
The sampling frame used for the resident population in the NRVA 2011-12 was the pre-census household listing conducted by CSO in 2003-05. Households were selected on the basis of a two-stage cluster design within each stratum. In the first stage Enumeration Areas (EAs) were selected as Primary Sampling Units (PSUs) with probability proportional to EA size (PPS). Subsequently, in the second stage ten households were selected as the Ultimate Sampling Unit (USU). The design thus provided for 60 clusters per province, implying data collection of five clusters (50 households) per province per month and in total 170 clusters (1,700) households per month and 2,040 clusters (20,400 households) in the full year of data collection.
The Kuchi sample was designed on basis of the 2003-04 National Multi-sectoral Assessment of Kuchi (NMAK-2004). For this stratum a community selection was implemented with PPS and a second stage selection with again a constant cluster size of ten households. The 60 clusters (600 households) for this stratum were equally divided between the summer and winter periods within the survey period.
The reality of survey taking in Afghanistan imposed a number of deviations from the sampling design. In the first six fieldwork months areas that were inaccessible due to insecurity were replaced by sampled areas that were scheduled for a later month, in the hope that over time security conditions would improve and the original cluster interviews could still be conducted. In view of sustained levels of insecurity, from the sixth month of data collection onward clusters in inaccessible areas were replaced by clusters drawn from a reserve sampling frame that excluded insecure districts. In addition, delays in fieldwork caused an uneven seasonal coverage.
Sample weights were calculated for up-scaling the surveyed households and population to the total number of households and population in Afghanistan. The calculation was based on the official CSO population estimate by province for January 2012 and average provincial household size derived from the survey. In view of the unequal distribution of the sample across seasons, a post-stratification adjustment was imposed to give equal weight to the seasons.
Annex IV gives an account of the background and technical details of the sampling design and implementation.
5 The Shamsi years 1390 and 1391, in which the NRVA 2011-12 was conducted, run from, respectively, 21 March 2011 to 19 March 2012 and from 20 March 2012 to 14 March 2013. Season dates are given in Annex IX.
SURVEY METHODOLOGY AND OPERATIONS4

2.7 Field operations
The NRVA 2011-12 field staff consisted of two mixed interview couples and one field supervisor for each of the 34 provinces of Afghanistan. The field operations were supervised by nine Regional Statistical Officers (RSOs), who were selected from the Provincial Statistical Officers (PSOs). In addition, NRVA staff from CSO Headquarters performed monthly monitoring missions for direct feedback to interviewers and supervisors.
The survey instrument consisted of paper questionnaires for households, male and female community Shuras (councils) and commodity prices in the nearest market place. The male interviewers administered the interviews with the male household representative and the female interviewers those with female household representative and other eligible female household members. In addition, a female interviewer conducted the female Shura interviews, whereas the supervisor usually administered the male Shura interviews. The supervisors were also responsible for collecting the market prices.
Each of the field teams had a monthly interview target of 50 household interviews in 5 selected clusters, resulting in a national monthly total of 1,700 household interviews. Data collection started in April 2011. Progress in the first months was slow due to a variety of reasons, including access problems related to insecurity and physical circumstances, replacement of field staff, Ramazan, and the requirement to revise the sampling procedure. Effectively, this meant that in spring and summer 2011 fewer interviews were conducted than planned. The missing interviews were compensated in corresponding period in 2012. For this reason data collection was extended to August 2012. In addition to surveying the resident population during the entire survey period, the nomadic Kuchi population was accessed in winter and summer when they tend to stay put for some time.
Provinces that faced most security challenges were Kapisa, Paktya, Zabul, Logar, Wardak, Sar-e-Pul, Jawzjan, Helmand and Urozgan. In view of recurrent access problems a security strategy was developed. This strategy included mapping of insecure areas, security assessment in the field, consultation of relevant information sources (PSOs, NSP Regional Management Units, CDCs), and discussions and negotiations with relevant actors, such as governors, community leaders and Jahadi commanders.6 As a last resort insecure areas were replaced by more secure areas. The implementation of this strategy resulted in fewer replacements in the second and third survey quarters. The security situation in Zabul did not allow participation of female interviewers. Figure 2.1 shows in which districts the survey was implemented according to the sample design, and in which districts less or no data collection took place. Out of the 357 sampled districts and provincial centres of Afghanistan, in 342 (96 percent) information was collected, although in 35 (10 percent) fewer interviews were conducted than originally planned.
2.8 Data processing
The tasks of the RSOs included checking a sample of the completed questionnaires, as a second level of quality control in the field after the checking by supervisors. On a monthly basis, they transported batches of completed questionnaires and other survey documents back to CSO Headquarters and took new field supplies to the provinces. The PSOs were responsible for the introduction of the field teams to the provincial and local authorities, for monitoring fieldwork progress and the security situation, and for verification of survey results in the field. In four provinces field staff was replaced due to underperformance.
Data processing in CSO Headquarters was done in parallel to the fieldwork and started upon arrival of the first batch of completed questionnaires in May 2011. The first stage consisted of manual checking by three questionnaire editors. Subsequently, the questionnaire batch was submitted for data entry. The data entry staff received two rounds of training before actual data capture started. In the course of the survey, the team was expanded to 30 operators to keep up to eliminate the backlog that arose due to double data entry.
Data capture was done with a specially designed MS Access programme, which was piloted to ensure a smooth performance. The database was equipped with VB coding to perform basic consistency and range checks. The database programme also included several data-cleaning and data-management procedures for process monitoring and daily back-ups by the Database Director.
6 CSO acknowledges the valuable support of MRRD in the development and implementation of this strategy.
SURVEY METHODOLOGY AND OPERATIONS 5

6 SURVEY METHODOLOGY AND OPERATIONS
Figure 2.1 Implementation of NRVA 2011-12 sampling clusters, by district
The principle of double data entry was introduced to avoid high levels of manual data capture errors. For each of the double-entered batches integrity checks were performed at individual, household and batch level. Emerging issues were resolved by a team of seven data editors. A complementary MS Access programme identified discrepancies between the batches of double-entered data, which were subsequently reconciled and again tested for integrity.
Further data editing was first performed on the MS Access database. This database was then transferred to Stata software for the application of programmes to identify data flaws and either perform automatic imputation or manual screen editing. Data processing was completed in September 2012. During the analysis phase, final edits were done.
2.9 Comparability of results
Comparability between the 2007-08 and 2011-12 surveys was maintained as much as possible by a largely similar questionnaire design and content for reported indicators, training and data collection procedures. Whereas the sampling design differed between surveys, both surveys produced representative results at national and provincial level. Comparability with NRVA 2005 is more limited due to major questionnaire revisions in 2007 and the limitation of data collection to three months in 2005, which prevented seasonal analysis like that in the last two NRVA rounds. Any comparison with 2005 results in this report should, therefore, be treated with caution.7
The NRVA questionnaire design partially built on major international survey practices, such as the DHS and MICS surveys. In addition, for internationally agreed indicators, NRVA usually applies the standard conceptualisation and definitions. Therefore, many indicators produced in this report embody a high level of international comparability. The report text indicates if, for some reason, applied definitions deviate from the internationally recommended ones. The annex with concepts and definitions provides the specifications applied in the present analysis (Annex XI).
7 As sampling design, survey design and questionnaire content of NRVA 2003 were very different from the subsequent rounds, no effort is made here to include its results in any trend analysis.

7SURVEY METHODOLOGY AND OPERATIONS
2.10 Data limitations
The specific constraints in the Afghanistan context in terms of security problems, cultural barriers and local survey capacity induced some data limitations. The following observations should be taken into account when interpreting the results in this report:
• In 150 out of 2,100 cases (7.1 percent), originally sampled clusters could not be visited, in most cases due to security reasons. For 133 of these cases (6.3 percent of the total), clusters were replaced. As the non-visited areas may have profiles different from visited areas, the final sample will have a slight bias in the results. This effect will have been larger at the provincial level for provinces with relatively large numbers of replacement.
• In 18 percent of the cases, sampled areas were temporarily inaccessible due to insecurity (13 percent) or physical access problems (5 percent, concentrated in winter time). Upon improvement of local conditions these areas were covered in a later round of data collection.
• Out of the 21,000 household interviews scheduled, 20,828 (99.2 percent) were actually implemented. This data reduction is limited and has not significantly affected the reliability of data.
• Analysis of the population structure by sex and age shows under-enumeration of women and girls, and young children, especially infants. Coverage of the youngest age group was much better than in 2007-08, but significant numbers are still omitted. Cultural backgrounds related to the seclusion of women and high infant mortality are among likely reasons for these omissions.
• Although an improvement compared to NRVA 2007-08 can be noted, the quality of age reporting in the Afghan population remains very poor, as indicated by large age heaping on ages with digits ending on 5 and 0. 8
• Due to security problems, work by female interviewers in Zabul was very restricted. Consequently, the information on maternal and child health, and fertility and mortality information is largely missing for this province. However, the food consumption module in the female questionnaire was collected by male interviewers interviewing male respondents.
2.11 Reporting
The source of all information presented in this report is the NRVA 2011-12, unless otherwise specified. Presenting information from other sources than NRVA does not imply an endorsement by CSO, but should merely be interpreted as a contextualisation of the present findings.
Titles of tables presented in this report follow a standard convention to exactly define the table contents and structure: first, the title states the universe of elements presented in the table, then it defines the variable(s) presented in the column headings, then the variable(s) presented in the row headings. In the title the universe and the column variable(s) are separated by a comma (‘,’); the column variable(s) and the row variable(s) are separated by ‘, and by’.
8 The Myers' Blended Index is 20.6 and the Whipple's Index is 223.

8 POPULATION STRUCTURE AND CHANGE
3 POPULATION STRUCTURE AND CHANGE
SUMMARY. The average household size in Afghanistan is 7.4 persons, of whom on average 3.6 – 48 percent – are children under fifteen. Some 22 percent of the households accommodate 10 or more persons, accounting for 35 percent of the population. The young age composition contributes to the country’s high dependency ratio of 104 and is an indication of a high fertility level and a large burden on the country’s economy. Demographic estimates support the picture of continuous decline in the under-five mortality rate, from 161per 1,000 live births in the NRVA 2007-08 to 91 in the present survey. The migration context of Afghanistan is particularly complex. With respect to internal migration, women more often move short distances within the same province, often to marry, whereas men are more likely to migrate further afield – often to another province – to find work. The attraction of urban centres is reflected in the 2-3 times higher rates of internal migration from rural to urban areas than vice versa. In addition, mobility within the urban sector is significantly higher than within the rural sector. Immigration from other countries is largely family migration, with the age and sex composition of the immigrants corresponding to that of the resident population of Afghanistan. Recent immigrants come almost exclusively from Pakistan (67 percent) and Iran (32 percent) and settle equally in urban and rural areas. Emigration is dominated by young adult men, most of whom move to Iran (76 percent), with smaller numbers going to Pakistan (13 percent) and the Gulf states (8 percent) alongside other countries. The available data suggest that the average annual immigration ratio in the seven years preceding the survey and the emigration rate in the twelve months preceding the survey are almost in balance at 0.4 percent. However, both indicators underestimate true migration levels to an unknown degree. Marriage is almost universal in Afghanistan and is characterized by early marriage for women. However, significant changes are observed in female age at first marriage. In the age group 30 years and older, 25 percent of women were married at age 15, and at least 80 percent at age 20. For women in the age group 20-24 years the corresponding figures have decreased to, 17 and 65 percent respectively, and for the age group 15-19 years only 6 percent were married at age 15. The observed large spousal age difference is a prime cause of high levels of female widowhood: 57 percent of women aged 65 and older are widowed. However, the age difference is rapidly decreasing: while women aged 40 years and older have a husband who is on average 7 years older, the age gap narrows for each younger age group, to around 4 years for women aged 15-19 years.
3.1 Introduction
The last count of the population of Afghanistan was done in the 1979 Population and Housing census. CSO’s estimation of the settled population is based on a constant population growth rate of 2.03 percent since 1979, which results in an estimate of 25.5 million for January 2012. The nomadic Kuchi population is established at 1.5 million persons.
There can be no doubt that high fertility and mortality, and large-scale international migration – including consecutive massive waves of refugees and, more recently, returnees – made a significant impact on the overall size and structure of the population. In addition, geographic differentiation in fertility and mortality, as well as internal migration and movements of internally displaced persons (IDPs) have had major effects on the internal distribution of the population.
One of the aims of the NRVA is to examine the structure and distribution of the population and households of Afghanistan, and their underlying dynamics. Section 3.2 focuses on population structure and distribution, whereas section 3.3 addresses household characteristics and marriage patterns. Sections 3.4 and 3.5 elaborate the population processes of, respectively, childhood mortality and migration, the latter distinguishing between international, internal and seasonal migration and displacement.

3.2 Population structure and distribution
The most striking feature of the Afghan population is its very young age structure (see Figure 3.1 and Table 3.1). Some 48.4 percent (13 million) is under 15 years of age, whereas elderly of 65 and over represent only 2.5 percent of the total population. The proportion under 15 would figure the second highest in the world in the 2010 UN population estimates (UN Population Division 2011).
The young age composition contributes to a very high dependency ratio: for every 100 persons in the working age 15-64, there are 104 persons in the less productive ages of under-fifteen and 65 and over, who are dependent for income and subsistence. This figure implies a significant burden for the prime working-age population and the economy at large, as large economic and social investments in terms of education and health care are concentrated in the youngest age categories.
Overall, the share of the 0-14 year old population has decreased very little compared to 2007-08 (48.6 percent). However, if the better coverage of household members in the present survey is taken into account, the decrease might well have been around four percentage points.
Generally, the sex ratio across age groups follows a pattern in which boys outnumber girls at birth (with around 105 to 100), by and large maintain this male pre-dominance in early childhood, to gradually converge with the number of women at later ages. Around age 50 the male surplus usually turns into a shortfall, which increases at older ages, resulting in an overall sex ratio generally close to 100. This pattern results from the usually small excess of boys at birth and the commonly higher mortality of males over females. Genuine deviations from this pattern can be caused by variations in the sex ratio at birth and by sex-specific mortality and migration. However, sex-specific age-misreporting and under-counting or over-counting can also lead to unexpected sex ratios.
Figure 3.1 Population, by age and sex (in percentages)
30-3435-3940-4445-4950-5455-5960-6465-6970-7475-7980-84
85+
10 8 6 4 2 0 2 4 6 8 10
0-45-9
10-1415-1920-2425-2930-34
Percentage Female Male
POPULATION STRUCTURE AND CHANGE 9
Quality of age reporting
In countries like Afghanistan, many people are unaware about their exact age or date of birth. This leads to high incidences of age misreporting, for instance by age heaping and age shifting. Conse-quently, reported ages in surveys and censuses should be treated with caution. Different procedures to assess the quality of the NRVA data indicate that age reporting is highly inaccurate.a
Another common characteristic of many developing countries is the omission of very young children from enumeration activities. The relatively small 0-4 age group in Figure 3.1 points in this direction. A breakdown by single years of age suggests an even more pronounced undercount of infants and one-year old children. It is not unlikely that around one million young children are omitted from the present figures.
Both age reporting and coverage of young children in the present NRVA are significantly better than in the NRVA rounds of 2005 and 2007-08.a The Myers' blended index is 20.6 and the Whipple’s index is 223.

POPULATION STRUCTURE AND CHANGE10
Table 3.1: Population, by residence, sex, and by age a. in thousands
Age Urban Rural Kuchi National
Male Female Both sexes
Male Female Both sexes
Male Female Both sexes
Male Female Both sexes
0-14 1,335 1,238 2,574 5,048 4,652 9,701 416 358 774 6,799 6,249 13,048
15-24 733 711 1,444 1,698 1,745 3,443 109 110 219 2,540 2,566 5,106
25-39 536 533 1,069 1,637 1,683 3,320 126 134 260 2,299 2,350 4,649
40-64 409 433 842 1,281 1,195 2,476 91 81 172 1,781 1,709 3,490
65+ 128 74 202 281 145 426 21 13 34 430 231 662
Total 3,141 2,989 6,130 9,945 9,420 19,365 764 696 1,459 13,850 13,105 26,955
b. in thousands
Age Urban Rural Kuchi National
Male Female Both sexes
Male Female Both sexes
Male Female Both sexes
Male Female Both sexes
0-14 42.5 41.4 42.0 50.8 49.4 50.1 54.4 51.4 53.0 49.1 47.7 48.4
15-24 23.3 23.8 23.6 17.1 18.5 17.8 14.3 15.8 15.0 18.3 19.6 18.9
25-39 17.1 17.8 17.4 16.5 17.9 17.1 16.5 19.3 17.8 16.6 17.9 17.2
40-64 13.0 14.5 13.7 12.9 12.7 12.8 11.9 11.7 11.8 12.9 13.0 12.9
65+ 4.1 2.5 3.3 2.8 1.5 2.2 2.8 1.8 2.3 3.1 1.8 2.5
Total 100.0 100.0 100.0 100.0 100.0 100.0 100.0 100.0 100.0 100.0 100.0 100.0
The overall sex distribution in the Afghan population is tilted toward males, as indicated by the sex ratio – the number of males per 100 females in the population. The NRVA 2011-12 found a relatively high overall sex ratio of 106 males per 100 females, corresponding to 48.5 percent females and 51.5 percent males. It is likely that a combination of female under-enumeration – related to cultural norms of female seclusion – and excess female mortality – especially related to maternal mortality – are important factors to the high sex ratio in the Afghan population. The especially large under-representation of teenage and older (55 and over) females in the survey results supports this supposition.
As is shown in panel a of Table 3.1, the population of Afghanistan is overwhelmingly rural: the 19.4 million rural residents represent 71.8 percent of the total population. Only 22.7 percent (6.1 million) live in urban areas, whereas 5.4 percent (1.5 million) of the population is classified as Kuchi. The CSO population projection rates imply that since the NRVA 2007-08, the total population has increased with 2.0 million people, of which 1.2 million in urban areas and 828 thousand in rural areas. Due to the assumed counterbalancing effect of natural growth and settlement of the Kuchi, the size of the nomadic population remains stable at 1.5 million people, which implies a steady decrease in terms of its share in the overall population (down from 5.8 in 2007-08).
The breakdown by residence shows considerable differences in the percentage of population below 15 between the urban, rural and Kuchi populations. Whereas this share is over 50 percent in the latter two populations, in urban areas it is only 42 percent. On the other hand, the age group 15-24 is relatively overrepresented in urban areas (23.6 against 17.8 percent in rural areas). These different age structures are to a considerable extent caused by the combined effects of lower urban fertility and selective in-migration of students and young adults looking for education opportunities and jobs on the urban labour market.
At provincial level, the differences in the age structure of the population are even more pronounced. Whereas Kabul – as expected, being the most urbanised province – records the lowest share of under-15 population (41.1 percent), nine provinces have shares of more than 52 percent (data not shown).

11
3.3 Household composition and marriage patterns
3.3.1 Household structure
The total number of households1 in Afghanistan is estimated at around 3.6 million. This implies an average household size of 7.4 persons, about the same as found in the NRVA 2005 and 2007-08 (respectively 7.4 and 7.3 members per household). Despite having fewer children under 15, urban households are slightly larger than rural households (see Table 3.2). This is consistent with the 2007-08 findings, but contrary to the general finding that urban households are smaller. One explanation could be that the housing market in the urban sector of Afghanistan – strongly dominated by Kabul – is tight and rural-to-urban migrants, as well as immigrants, tend to move in with urban family rather then establish an independent household by themselves. This reasoning is supported by the finding that urban households accommodate relatively more extended and multi-generation families (data not shown here).
Table 3.2: Households, by residence, and by selected household structure indicators
Selected householdstructure indicators
Urban Rural Kuchi National
Thousands Percentage Thousands Percentage Thousands Percentage Thousands Percentage
Household size
1-3 persons 68.3 8.4 240.4 9.2 20.2 10.0 328.9 9.1
4-6 persons 273.8 33.5 867.9 33.3 69.7 34.4 1,211.4 33.4
7-9 persons 296.4 36.2 936.5 35.9 71.3 35.3 1,304.2 35.9
10-13 persons 141.4 17.3 445.7 17.1 33.8 16.7 620.8 17.1
14 persons or more 38.0 4.6 119.0 4.6 7.3 3.6 164.2 4.5
Total 817.8 100.0 2,609.4 100.0 202.3 100.0 3,629.5 100.0
Averages
Household size 7.5 7.4 7.2 7.4
No. of children 0-14 3.1 3.7 3.8 3.6
No. of elderly 65 and over 0.25 0.16 0.17 0.18
Share of
Children 0-14 42.0 50.1 53.0 48.4
Elderly 65 and over 3.3 2.2 2.3 2.5
On average, households have 3.6 children under 15 years of age, with urban households having half a child less. One in four urban households, on average, accommodate an elderly person, with the corresponding rural figure being around one in six households.
The large majority of households (69.3 percent) have 4 to 9 members, whereas 21.6 percent (some 785 thousand households) accommodate 10 or more people, and only 9.1 percent has three or fewer persons. The population distribution is to a much larger degree concentrated in large households: more than one in three (35.3 percent) of all Afghans live in households with 10 or more people and only 3.2 percent do so in households with three or fewer people. One-person households are virtually non-existent. Figure 3.2 shows the distribution of households and population by household size.
1 A household is defined as group of people, either related or unrelated, who live together as a unit single in the sense that they have common housekeeping arrangements, that is, they share or are supported by a common budget. They live together, pool their money, and eat at least one meal together each day.
POPULATION STRUCTURE AND CHANGE

Figure 3.2: Households and population, by household size (in percentages)
56789101112131415
01234
1 2 3 4 5 6 7 8 9 10 11 12 13 14 15 16 17 18 19 20+
Households Population
A very small proportion – less than one percent – of households are female-headed (see Table 3.3). In the Afghan context, the absence of a male head of household can signify a highly vulnerable position of the household members in terms of income security and social protection. In a similar way, households headed by young persons (under 18) or old people (65 and over) without younger adult male household members can find themselves exposed to economic and social threats. The occurrence of any one of these three categories of household heading is in 3.1 percent of the cases. This represents 539 thousand people (2.0 percent of the total population) living in such potentially vulnerable households.
More than one in three households (36 percent) is composed of two or more generations. Of the population, just over one out of four persons (27 percent) live in such multi-generation households.
Table 3.3: Households and population, by household characteristics (in percentages)
Characteristics ofhead of household
Percentage of
households population
Headed by female 0.7 0.4
Headed by child (under 18) 0.4 0.3
Headed by elderly (65+)
without younger male adults 2.0 1.3
Multi-generation householda 36.2 27.2a Multi-generation households are those that include three generations or more.
3.3.2 Marriage patterns
Marital status is a key principle in the social relations in Afghan society. Marriage as a universal phenomenon is indicated by the fact that less than one percent of the population of 35 and over remained unmarried. In the total population, however, 63.2 percent is unmarried due to the large representation of the age cohorts under-15 – of whom virtually no one is married – and 15-24 – of whom 70.3 percent is still unmarried (Table 3.4).
12 POPULATION STRUCTURE AND CHANGE

13
Table 3.4: Population, by marital status, and by sex, age (in percentages)
Sex, age Married Widowed Divorced orseparated
Never Total
Male
0-14 0.0 0.0 0.0 100.0 100.0
15-24 17.8 0.1 0.0 82.2 100.0
25-39 88.3 0.3 0.0 11.3 100.0
40-64 97.2 2.3 0.0 0.5 100.0
65+ 85.8 13.6 0.0 0.6 100.0
Total 33.1 0.8 0.0 66.1 100.0
Female
0-14 0.1 0.0 0.0 99.9 100.0
15-24 41.3 0.2 0.0 58.5 100.0
25-39 93.8 1.6 0.1 4.5 100.0
40-64 81.7 17.3 0.2 0.8 100.0
65+ 41.2 57.2 0.9 0.6 100.0
Total 36.3 3.6 0.1 60.0 100.0
Both sexes
0-14 0.0 0.0 0.0 100.0 100.0
15-24 29.6 0.1 0.0 70.3 100.0
25-39 91.1 1.0 0.0 7.9 100.0
40-64 89.6 9.6 0.1 0.6 100.0
65+ 70.2 28.9 0.3 0.6 100.0
Total 34.7 2.2 0.0 63.2 100.0
While divorce and separation are practically invisible in the marital status distribution, the incidence of widowhood increases with age, especially for women. Whereas around 2 and 14 percent of men aged, respectively, 40-64 and over-65 are widowers, the corresponding figures for women are 17 and no less than 57 percent. In absolute numbers, Afghanistan has around 108 thousand widowers, but no less than 471 thousand widows. The main cause of this large number of widows is large age differences between spouses. Irrespective of the cause, widowed women can be classified as being in a vulnerable position in Afghan society.
The marital gender differentiation is clearly visible in Figure 3.3: women tend to get married earlier than men and become widowed earlier and in significantly larger shares.
POPULATION STRUCTURE AND CHANGE

Figure 3.3 Male and female population, by age, and by marital status (in percentages)a. Male b. Female
0
10
20
30
40
50
60
70
80
90
100
0-4
5-9
10-1
4
15-1
9
20-2
4
25-2
9
30-3
4
35-3
9
40-4
4
45-4
9
50-5
4
55-5
9
60-6
4
65-6
9
70-7
4
75+
Married Widowed Divorced or separated Never married
0
10
20
30
40
50
60
70
80
90
100
0-4
5-9
10-1
4
15-1
9
20-2
4
25-2
9
30-3
4
35-3
9
40-4
4
45-4
9
50-5
4
55-5
9
60-6
4
65-6
9
70-7
4
75+
Married Widowed Divorced or separated Never married
The NRVA data also allows the observation of significant social change in marriage patterns. Figure 3.4 shows that women’s cohorts of 30 and above had an almost similar pattern for age at first marriage. Around 25 percent was already married at age 15, more than 60 percent was married by age 18, and 80 or more percent was married by age 20. Starting with the 25-29 year old cohort, the share that was married by a specific age is dropping consistently for every age at first marriage. For this cohort the effect, although visible, is small; but for each successively younger age group the decrease becomes more pronounced. Of all women who at the survey time were 20 to 25 years old, 65 percent were married by age 20 and around 17 percent by age 15. For the youngest cohort of 15-19 the percentage married by age 15 dropped to 6 percent. The mean age of marriage increased from 16.9 for women aged 35-39 to 18.0 for women aged 20-24.
Figure 3.4 Females aged 15 to 49, by current age group, and by age at first marriage (in percentages)
0
10
20
30
40
50
60
70
80
90
100
15 16 17 18 19 20 21 22 23 24 25
Perc
enta
ge m
arri
ed
Age at first marriage
15-19
20-24
25-29
30-34
35-39
40-44
45-49
14 POPULATION STRUCTURE AND CHANGE

Social change is also observed in terms of change in the age difference between spouses. Whereas on average for women of more than 40 years old the age of the husband is around 7 years higher, this age difference consistently declines with the successive younger age cohorts: around 6 years for women aged 30-39, 4.5 years for those aged 20-29 and around 4 for women under-20. Figure 3.5 shows that the share of couples with relatively small spousal age differences (less than four years) has dramatically increased for each younger ten-year age group of women (from 21 percent among women aged 70 and over to 62 percent of those under 20). At the same time, the shares of couples with large (10-19 years) and very large (20 years or more) age differences has similarly declined from close to 40 percent in the oldest age group to 8 percent in the youngest.
Figure 3.5 Ever-married females, by current age, and by relative age of husband (in percentages)
102030405060708090
100
010
10-19 20-29 30-39 40-49 50-59 60-69 70+
Current age of wife
Younger 0-4 years older 5-9 years older10-19 years older 20 or more year older
Large spousal age differences, early age at marriage for women – and consequently early widowhood – are closely related to the practice of polygyny, as a polygamous marriage market creates an unequal demand for male and female spouses. The NRVA 2011-12 data indicate that 7.6 percent of married women (over 260 thousand) are in union with a husband who has more than one wife. Around two-thirds of these have one co-wife. From the male perspective, 3.1 of all Afghan husbands have more than one wife.
3.4 Childhood mortality
NRVA 2011-12 included an abridged battery of questions that allow the estimation of childhood mortality indicators that is comparable to NRVA 2007-08 and other recent surveys in Afghanistan.2 Table 3.5 shows the Infant Mortality Rate (IMR) and Under-five Mortality Rate (U5MR), estimated with the Trussel variant of the Brass method of indirect mortality estimation. 3
The U5MR is estimated at 91 deaths per thousand live births and the IMR at 48 deaths per thousand live births. Data issues related to age reporting and recording of girls born were encountered in the analysis and consequently these indicators should be treated with caution, in particular the IMR. For both indicators, a considerable gap exists between urban and rural populations (Table 3.5). On the other hand, little gender difference is observed, and surprisingly the U5MR for boys is below that of girls.
2 Social change is the change in the age difference between spouses reflects changes in how people relate to one another.3 The battery also allows fertility estimation, but only using a different technique than in the previous NRVA and other surveys and, consequently, does not pro-
duce comparable results.
15
Infant- and Under-five Mortality Rate
The Infant Mortality Rate (IMR) is defined as number of deaths to children under twelve months of age per 1,000 live births.
The Under-five Mortality Rate (U5MR) relates to the number of deaths to children under five years of age per 1,000 live births.
POPULATION STRUCTURE AND CHANGE

Table 3.5: Childhood mortality indicators, by (a) residence and (b) sex
Indicator a. Residence b. Sex Total
ReferenceperiodUrban Rural Boys Girls
IMRa (34) (54) (49) (46) (48) Jan. 2011
U5MR 72 96 89 92 91 Sep. 2005aFigures between brackets are considered unreliable and are indicative only
The U5MR estimated for the NRVA 2011-12 is well in line with the downward trend that was shown by the MICS 2010 (102) since the 2007-08 NRVA benchmark of 161 deaths per thousand live births and provides mutual support to the indicator in these surveys (Figure 3.6). The IMR of the NRVA 2011-12, on the other hand, seems an outlier. Therefore, the
low figure of 48 should not be taken as anything more than indicative for further decreasing infant mortality.
Figure 3.6: Childhood mortality indicators, by survey
3.5 Migration
3.5.1 General migration
The migration context of Afghanistan is particularly complex. Regular and traditional migrant flows – both internal and cross-border – have become mixed with the effects of one of the world’s largest and most protracted refugee situations, the largest volume of returnees in recent history, large-scale internal displacement and remaining nomadism of a seizable part of the population. Although the NRVA is not designed as a migration survey, the information collected is relevant to add to the limited stock of information on migrants and migration flows.
16 POPULATION STRUCTURE AND CHANGE
MDG Indicators 4.1 and 4.2
914.1 U5MR:
(48)4.2 IMR:

17
Migration conceptsA seasonal migrant is a person who spends at least one month, but less than a year away from the household for seasonal work.In this report, migration analysis distinguishes two different time dimensions. Life-time migration occurs when a person currently lives in an area different from where he/she was born. Recent migration is measured as migration since a specific point in recent time. Here this point is defined as October 2004, since many people will remember where they lived during the presidential elections at that time.
The annual immigration and in-migration ratio are calculated as, respectively the immigrant and in-migrant population as percentage of the resident population. The emigration and out-migration rate are calculated as the number of, respectively, emigrants and out-migrants as percentage of the resident population in the area of departure.
Migration is defined by the act of crossing a border and going to live elsewhere for at least a year. Crossing the border of two countries represents international migration. People who enter a country are immigrants and those who leave a country are emigrants. Crossing (administrative) boundaries within a country represents internal migration. Persons moving into an area from within the country are labeled here as in-migrants, those who move to another area within the country are labeled as out-migrants.
Internal migration can be measured at different levels. In this report two levels are distinguished: internal migration between districts and that between provinces. Inter-provincial migration always involves migration between districts, but the opposite does not necessarily hold true.
Emigration and out-migration are under-estimated to the extent that complete households have moved away.
The mobility of the Afghan population is shown by the finding that some 5.1 million people (18.8 percent) were born outside the district where they now reside, either in another district in Afghanistan or abroad. Half of these movers (2.6 million) were also born outside the province of current residence, and some 827 thousand (3.1 percent) were born abroad (Table 3.6, panel a).
Table 3.6: Percentage of population living outside the district of current residence (a) at birth and (b) in October 2004, by previous place of residence, sex, and by current residence
Place ofcurrentresidence
a. Place of birth:in other
b. Place of residence inOctober 2004: in other
country province districta country province district a
Urban 4.3 17.5 35.9 6.9 7.6 15.7
Rural 2.6 2.0 8.0 2.5 0.8 2.6
National b 3.1 6.4 15.7 3.6 2.7 6.2aFigures for previous residence in other district include those with previous residence in other province, i.e. these are counted twice.bNational includes the Kuchi population.
As expected, the share of persons born elsewhere is higher in urban than in rural areas: more than one-third (35.9 percent) of the urban population has moved to another place of residence within Afghanistan since birth, whereas only 8.0 percent of the rural population did so. Also in absolute terms do urban areas accommodate more life-time in-migrants from within Afghanistan: 2.2 million against 1.9 million for rural areas. Urban areas again house in relative terms more persons born abroad than rural areas (4.3 against 2.6 percent), but in absolute numbers more life-time immigrants have moved to rural areas.
Information about the place of residence in October 2004 shows a similar pattern: the share of the population that lived elsewhere seven years before the survey is much higher in urban areas than in rural areas, and of all internal migrants that took up residence in rural areas (2.6 percent of the total rural population) less than a third (0.8 percentage points) came from outside the province of current residence. In urban areas almost one in six persons (15.7 percent) lived elsewhere in Afghanistan in 2004, half of whom in another province. Urban areas also accommodate a relatively larger share of people who immigrated from abroad since 2004 (6.9 percent, compared to 2.5 percent in rural areas), although in absolute numbers more recent immigrants are living in rural areas.
The figures for life-time and recent in-migrants indicate that settling in a new, rural area is relatively uncommon, but less so for immigrants. To the extent that it concerns internal migration, it is largely short-distance moves from neighbouring districts within the province. Possible explanations for this are the limited economic opportunities in the rural sector and the closed community structure in Afghan society, which impede integration of outsiders.
With regard to out-migrants, NRVA 2011-12 shows that in the year before the survey 303 thousand people of 14 years and over had left the household to live somewhere outside the district of residence. More than two-fifth of these remained within the province and one-fifth (65 thousand) moved to another province within Afghanistan. No less than one in three persons leaving the household (107 thousand) went to live abroad.
POPULATION STRUCTURE AND CHANGE

18
3.5.2 International migration
Immigrants’ country of origin and urban-rural settlement
NRVA 2011-12 indicates that 3.1 percent (827 thousand) of the population was born abroad.4 The most important country of birth is Pakistan, where 77 percent of the life-time immigrants were born (638 thousand persons), followed by Iran with 21 percent (174 thousand) (Table 3.7, panel a). Other countries of birth are insignificant with only just over one percent of persons born abroad.
Of the life-time immigrants 32 percent now reside in urban areas and 60 percent in rural areas (the remaining part being Kuchis). For the non-Kuchi population this implies that in proportion to the overall settled population (24 percent urban and 76 percent rural) a preference for urban settlement is observed. This preference is stronger for immigrants from Iran than for those coming from Pakistan. Of the non-Kuchi life-time immigrants born in Pakistan, 28 percent now live in urban areas and 72 in rural areas. For the settled immigrants born in Iran a majority of 56 percent has settled in urban areas, compared to 44 in rural areas. Another difference in the migratory patterns between Pakistan and Iran is the significance of Kuchi immigration from the former country and its virtual absence from the latter.
The picture for recent immigration is quite similar to that of life-time immigration (Table 3.7, panel b). The total number of persons who lived abroad in October 2004 is of the same order of magnitude (725 thousand) and again Pakistan and Iran – respectively with 67 and 32 percent – dwarf any other country of previous residence. Recent immigrants from Iran again settle at a rate similar to that of life-time migrants, with 54 and 46 percent in respectively urban and rural areas. The corresponding figures for recent immigrants from Pakistan are more balanced than for life-time immigrants: 42 against 50 percent (with 8 percent Kuchi). Overall, this implies an even stronger preference to settle in urban areas than in life-time migration.
The number of immigrants since October 2004 suggest an immigration ratio in the order of 0.4 percent per year. However, this strongly under-estimates immigration, as it does not take into account the effects of return migration, repeated immigration and mortality since 2004.5
Table 3.7: Immigrants (a) born abroad and (b) living abroad in October 2004,by current residence, and by country of origin (percentages)
Country oforigin
a. Population born abroad b. Population living abroad in October 2004
Current residence Current residence
Urban Rural Kuchi National Urban Rural Kuchi National
Current residence as percentage of country of originPakistan 25.5 64.1 10.4 100.0 42.5 49.5 8.0 100.0
Iran 55.6 44.3 0.1 100.0 54.3 45.7 0.0 100.0
Other countries (28.6) (56.6) (14.9) (100.0) (14.8) (74.0) (11.2) (100.0)
Total 31.9 59.8 8.3 100.0 45.9 48.6 5.5 100.0
Country of origin as percentage of current residencePakistan 61.6 82.7 96.7 77.1 61.8 68.2 97.6 66.9
Iran 36.8 15.7 0.2 21.1 37.8 30.0 0.0 32.0
Other countries 1.6 1.7 3.1 1.8 0.4 1.8 2.4 1.2
Total 100.0 100.0 100.0 100.0 100.0 100.0 100.0 100.0( ) Data between brackets are considered unreliable
Emigrants’ country of destination and urban-rural area origin
For the year preceding the survey interview, the respondent households indicated that 107 thousand persons of 14 years and older left the household to live abroad. This would imply an emigration rate of 0.4 percent per year. However, this figure underestimates emigration to the extent that entire households left the country.4 The methodological elaboration and sources of error for the estimations are given in Annex VI.5 Calculated as the average number of annual immigrants per province since October 2004 as a percentage of the mid-period population between October 2004
and January 2012.
POPULATION STRUCTURE AND CHANGE

19
The large majority of emigrants (84 percent) originate from rural areas in Afghanistan (Table 3.8). Also in relative terms persons from rural origin are overrepresented in the emigrant population: the 84 percent is high compared to the rural share of 72 percent in the total population. The urban population (23 percent of the total population) seems less inclined to move abroad, as their share in the emigrant population is only 14 percent. This observation is particularly relevant for emigrants to Pakistan, of whom less than 2 percent are from urban areas.
A notable shift has occurred in the importance of destination countries. Whereas in the past Pakistan was the most important destination, now the large majority of emigrants (76 percent) leaves for Iran. Causes of this shift likely include Pakistan’s recent policy shift that restricts Afghan citizens entering and residing in the country. Another notable result is the significant share of other countries in the destination distribution (11 percent), of which the largest part is emigration to one of the countries on the Arabian peninsula.
Table 3.8: Emigrants 14 years and over who emigrated in the year before the survey,by previous residence, and by country of destination (in percentages)
Country of destination Urban Rural Kuchi National
Previous residence as percentage of country of destinationPakistan 1.8 90.0 8.1 100.0
Iran 14.5 84.9 0.6 100.0
Other countries 26.0 72.9 1.0 100.0
Total 14.4 84.0 1.6 100.0
Country of destination as percentage of current residencePakistan 1.6 13.3 63.4 13.3
Iran 75.7 75.8 28.6 75.8
Other countries 22.7 10.9 8.1 10.9
Total 100.0 100.0 100.0 100.0
Characteristics of international migrants
There are marked differences between immigrants and emigrants. As visualized in Figure 3.7, panel a, the age structure of recent immigrants resemble the resident population in the sense that it shows very small old birth cohorts and increasingly larger ones with younger ages. This indicates that immigration is to a large extent family migration from Afghan communities that fled to neighbouring countries in previous decades. The small number of 0-9 year olds can for the most part be explained by truncated observation of persons who were not yet born in 2004. Life-time immigrants, on the other hand, have a strong concentration in the age group 0-29. This is most likely the result of the fact that most Afghans of 30 years and older who live abroad were born in Afghanistan before they moved out of the country. It is their children who were born abroad only from the early 1980s onward that comprise the stock of life-time immigrants.
The age profile of emigrants is again different and for very different reasons. One reason is the motive to leave for another country. The strong concentration in the young adult age group resembles the profile of persons moving for finding employment, which is confirmed by the reasons reported by the survey respondents (see below). Secondly, households that emigrate together are excluded from observation in normal household surveys. To the extent that there are such households, the age structure of all emigrants will more resemble that of the resident population.
Immigration and emigration are also strongly gender-specific. A large majority of 86 percent of emigrants is male, which is closely linked to the largely economic reasons of emigration. On the other hand, for both life-time and recent immigrants the shares of males and females are very close to half each, although slightly less so for recent immigrants (55 percent males, 45 percent females) than for life-time immigrants (51 against 49 percent, respectively). The higher share of male recent immigrants is largely caused by the sex distribution of those coming from Iran, who may include more men returning from employment there while their families remained in Afghanistan. The gender balance of immigrants from Pakistan is very equal (51 and 49 percent for males and females, respectively).
POPULATION STRUCTURE AND CHANGE

20
Figure 3.7: International migrants, by migrant type, and by age (in percentages)a. Immigrants b. Emigrants
0
10
20
30
40
50
60
0-9 10-19 20-29 30-39 40-49 50-59 60+
Life-time immigrants Recent immigrants
0
10
20
30
40
50
60
14-19 20-29 30-59 60+
Emigrants, 14 years and older
Reasons for international migration
By far the most important reason to immigrate into Afghanistan is return from displacement abroad. For 73 percent of all people who came to live in the country since October 2004 (estimated at around half a million6) this was stated as the main reason (Figure 3.8). Family-related and employment reasons were minor – but still discernible – categories of reasons mentioned (respectively for 15 and 8 percent of the recent immigrants).
For immigrants from Pakistan – with around two-thirds the largest immigrant group – the share of returning refugees was even 79 percent (some 360 thousand persons). For persons previously living in Iran return from displacement was mentioned as the main reason in 63 percent if the cases (140 thousand persons), while family-related reasons was another significant category. For the small number of immigrants from other countries such family reasons figured prominently, more than return from displacement and employment. For women the reason of return from displacement was somewhat more important than for men (for 78 and 69 percent, respectively), whereas family reasons were less important (10 against 19 percent).
If return from displacement is by far the most important reason for immigration, employment reasons dominate emigration. Some 80 percent of all emigrants 14 years of age and older moved abroad in the year before the survey to find a job (Figure 3.9). For persons leaving to Iran – comprising 75 percent of all emigrants – this figure is even 91 percent. Emigration is also strongly gender-related: of all male emigrants, 92 percent leave for employment, while for the small group of women by far the most important emigration reason is marriage (78 percent).
6 This figure includes dependent household members for whom the reason ‘moved with the family’ was mentioned and whose head of household returned from displacement.
POPULATION STRUCTURE AND CHANGE

21
Figure 3.8: Immigrants living abroad in October 2004, by main reason for immigration, and by country of residence in 2004 (in percentages)
0102030405060708090
100
Return from displacement
Family reasons Employment Other reasons
Pakistan Iran Other countries All countries
Figure 3.9: Emigrants 14 years of age and older leaving in the past year, by main reason for emigration, and by country of destination (in percentages)
0102030405060708090
100
Employment Marriage Education and health
Other reasons
Pakistan Iran Other countries All countries
Immigration by province
Immigration to Kabul dwarfs all other provincial immigration, as half of all recorded immigrants since October 2004 reside here (360 thousand people). Not surprisingly, most of the next largest immigrant provinces in absolute numbers are those bordering other countries, such as Nangarhar, Jawzjan and Farah. Figure 3.10 shows the annual immigration ratio to the various provinces. Here the relative importance of location at borders with neighbouring countries is a prime factors in the migration context.
POPULATION STRUCTURE AND CHANGE

22
Figure 3.10: Annual immigration ratioa since October 2004, by province
a Calculated as the average number of annual immigrants per province since October 2004 as a percentage of the mid-period population between October 2004 and January 2012.
3.5.3 Internal migration
Origin and destination of internal migrants
In total, 4.2 million Afghan residents (16 percent) live in a district that is different from their district of birth. Most of these (2.5 million persons) live in the their province of birth and the remaining (1.7 million people) have even moved to another province.
Just over half of the internal life-time migrants (52 percent) live in urban areas and only 36 percent reside in rural areas (Table 3.9, panel a). This is an indication of significant rural-to-urban migration in Afghanistan. The importance of intra-province migration is indicated by the 59 percent of internal life-time migrants who moved between districts within the province of birth, while a – large – minority of 41 percent moved across province borders. For rural residents the intra-province migration is even more important (75 percent against 25 percent who moved to another province), but of the Kuchi migrants more than half (57 percent) were born in another province than where they reside now.
For recent internal migrants – close to 5 percent of the population – the numbers that have moved within a province and to another province are, respectively, around 688 and 544 thousand. In contrast to immigration, the patterns of life-time and recent internal migrants are largely the same. However, the share of recent migrants in urban areas is somewhat larger (62 percent) than that of life-time migrants (52 percent), which could indicate that over recent years rural-to-urban migration has gained importance (Table 3.9, panel b).
POPULATION STRUCTURE AND CHANGE

23
Table 3.9: In-migrants (a) born elsewhere in Afghanistan and (b) living elsewhere in Afghanistan in October 2004, by current residence, and by area of origin (in percentages)
Area of origin a. Population born elsewherein Afghanistan
b. Population living elsewherein Afghanistan in October 2004
Current residence Current residence
Urban Rural Kuchi National Urban Rural Kuchi National
Current residence as percentage of area of originSame province 45.0 46.5 8.6 100.0 57.3 36.7 6.0 100.0
Other province 61.8 21.9 16.3 100.0 67.1 19.9 12.9 100.0
Total 51.9 36.4 11.7 100.0 61.6 29.3 9.1 100.0
Area of origin as percentage of current residenceSame province 51.2 75.3 43.2 59.0 51.9 69.9 37.0 55.9
Other province 48.8 24.7 56.8 41.0 48.1 30.1 63.0 44.1
Total 100.0 100.0 100.0 100.0 100.0 100.0 100.0 100.0
The rural-urban population exchange is further specified in Table 3.10. The absolute number of persons born in rural areas who migrated to urban areas is the same as the number that migrated between rural areas since birth (around 1.2 million each) (panel a). However, this number is much larger than the number of urban-to-rural life-time migrants (379 thousand), implying that 858 more life-time migrant moved from rural to urban areas than vice versa. Also the number of life-time migrants that moved within the urban segment is significant with 957 thousand and comparable to the number that moved within the rural segment. The picture for recent migration since 2004 (panel b) similarly shows that the number of migrants from rural to urban areas is larger than the reverse, but also that net movement between urban areas is more important than that between urban and rural areas.
Table 3.10: In-migrants (a) born elsewhere in Afghanistan and (b) living elsewhere in Afghanistan in October 2004, by current residence, and by residence of origin (in thousands)
Residenceof origin
a. Population born elsewherein Afghanistan
b. Population living elsewherein Afghanistan in October 2004
Current residence Current residence
Urban Rural Kuchi National Urban Rural Kuchi National
Urban 957 379 70 1,405 414 164 10 588
Rural 1,237 1,161 426 2,824 346 197 101 644
Total 2,194 1,540 496 4,230 759 361 112 1,232
Households in the NRVA 2011-12 survey reported that close to 200 thousand household members had left the household in the previous year to live somewhere else in Afghanistan. Two-thirds of these remained within the province, which applies to those leaving from rural as well as urban households. However, if the destination is specified in terms of urban-rural residence, there is a strong divergence between out-migrants. Whereas only 35 percent of the out-migrants from urban households go to live in rural areas, rural out-migrants remain for 62 percent in the rural segment.
Characteristics of internal migrants
The age distribution of in-migrants is concentrated in the young adult ages, revealing the prominent underlying reasons of employment and marriage that lead to change of residence within Afghanistan. Although around half of in-migrants across the country are in the age range 15-39, all other ages are represented to a significant degree as well (Figure 3.11). This indicates that internal migration is also to a large extent family migration.
This is further amplified in Figure 3.12, which shows that the largest part (51 percent) of internal migrants are persons moving with their families as dependents, mostly women, children and elderly. The figure also exposes the intricate dynamics of migration, with the interaction of gender, age, distance and reasons for migration. In young and old ages migration because of moving with the family – usually implying the migration reason of the male head of household and breadwinner – is the most important. For men in middle ages employment is a major reason, whereas for women this is
POPULATION STRUCTURE AND CHANGE

24
an insignificant category in any age group. Instead, for teenage and young adult women marriage is the most important reason to move. It is also notable that the motivation underlying relatively short-distance intra-province migration (Table 3.12, panel a) is different from that of inter-province migration (panel b). Especially for men employment reasons are far more important for moving to another province than for moving within a province (39 against 18 percent). On the other hand for women marriage is more related to short-distance movement than inter-province migration (12 compared to 6 percent).
Figure 3.11: Life-time and recent in-migrants, by age (in percentages)
0
5
10
15
20
25
30
35
40
0-9 10-19 20-29 30-39 40-49 50-59 60+
Life -time in -migrants Recent in -migrants
POPULATION STRUCTURE AND CHANGE

25
Figure 3.12: Recent in-migrants, by age, and by reason for in-migration (percentages)a. Intra-province migration
Male Female
0
20
40
60
80
100
0 -14 15 -24 25 -39 40 -64 65+ Total
Employment Displacement and returnMarriage Moving with familyOther reason
0
20
40
60
80
100
0 -14 15 -24 25 -39 40 -64 65+ Total
Employment Displacement and returnMarriage Moving with familyOther reason
b. Inter-province migrationMale Female
0
20
40
60
80
100
0-14 15-24 25-39 40-64 65+ Total
Employment Displacement and returnMarriage Moving with familyOther reason
0
20
40
60
80
100
0-14 15-24 25-39 40-64 65+ Total
Employment Displacement and returnMarriage Moving with familyOther reason
The age of persons who move out of a household to another area in Afghanistan is strongly concentrated in the young adult age: 52 percent is in the age bracket 20-29. For men out-migration is particularly related to employment (30 percent) and for women the overwhelming reason is marriage (86 percent).
3.5.4 Seasonal migration
Seasonal migration is an important phenomenon in Afghanistan and is closely related to the shift in job opportunities during the year. It is defined as taking up temporary residence elsewhere for work for at least one month, but for less than a year.
Overall, 4 percent of the population of 14 years and over – corresponding to more than 530 thousand persons – were reported to have been involved in migration for seasonal work in the year before the survey.7 The rural working-age population is overrepresented, given that close to 5 percent of the rural population against less than 2 percent of the urban population temporarily migrated for work (Table 3.11). The gender bias is even more pronounced than the residence bias, as around 7 percent of the male working-age population was engaged in seasonal migration for work – 7 This population excludes Kuchis, as these have migratory patterns due to their nomadic lifestyle and would distort the overall picture of seasonal migration.
POPULATION STRUCTURE AND CHANGE

26 POPULATION STRUCTURE AND CHANGE
up to 9 percent for the rural male population) – against less than half a percent of the female working-age population. Consequently, the seasonal migratory workforce almost entirely (94 percent, figure not shown) consisted of men, and is even more male-dominated than the total working population (83 percent, see also section 4.3).
Table 3.11: Percentage of population 14 years and over migrating for seasonal workin the year before the surveya, by sex and by usual residence
Usual Sex BothsexesMale Female
Urban 3.0 0.1 1.6
Rural 8.9 0.4 4.7
National 7.3 0.3 3.9a Excluding the Kuchi population
The destination of seasonal migrants also differentiates across urban and rural residence. Half of the urban seasonal migrants go to work in other provinces and another 20 percent migrate within the province to another district (Figure 3.13, panel a). For rural seasonal migrants, on the other hand intra-provincial migration (37 percent) is more important than inter-provincial migration (34 percent). Looking at migration destination in terms of urban-rural composition (panel b), half of the urban migrants move to another urban area, but 59 percent of rural migrants did so. Rural destinations attract fewer seasonal workers: only 20 percent of the urban migrants and 12 percent of the rural migrants.
Figure 3.13: Population 14 years and over migrating for seasonal work in the year before the survey,by usual residence, and by (a) provincial destination and (b) urban-rural destinationa. Provincial destination b. Urban-rural destination
0102030405060708090
100
Urban Rural National
20.336.7 34.9
49.734.1 35.8
30.0 29.2 29.3
Usual residence
Inside province To other province Abroad
0102030405060708090
100
Urban Rural National
49.958.9 57.9
20.011.9 12.8
30.0 29.2 29.3
Usual residence
Urban Rural Abroad
Seasonal migration to other countries makes up the remaining 29 percent of destinations. The results show no significant difference between migrants originating from urban and rural areas in this respect. Overall, Iran is the most important destination abroad for seasonal migration (representing 77 percent of all international seasonal migrants) followed by Pakistan (12 percent), the Arabian peninsula (8 percent) and other countries (2 percent). However, for urban residents the Arabian peninsula and other countries are relatively much more important, with respectively 19 and 9 percent. This may indicate that access to non-bordering countries is easier to obtain by urban dwellers – probably especially those in Kabul – than by rural dwellers.
3.5.5 Displacement
Over the past decades since the early 1980s, Afghanistan has witnessed one of the largest population displacements in recorded history. Millions of Afghans sought asylum in other countries – particularly in Pakistan and Iran – and in addition, large numbers were internally displaced. Although NRVA is not designed as a migration survey, let alone as a

27POPULATION STRUCTURE AND CHANGE
displacement survey 8, the information presented in this section may be of relevance, if only for comparative reasons and more for population characteristics than for absolute numbers.
Apart from the general – individual-level – migration module, the questionnaire contained a small battery of household-level questions about return from displacement. According to this information, some 13 percent of households in Afghanistan (around 470 thousand) reported that they had returned from displacement since 2002 (1381 in the Shamsi calendar) either from abroad (8.5 percent) or from within Afghanistan (4.5 percent).9 Although these households represent around 13 percent of the population in Afghanistan, the share of household members that actually returned from displacement is considerably lower, given the large proportion of household members that were born after the return.10
Overall, 49 percent of households that reported to have returned from displacement are located in urban areas. Compared to the national distribution of households – 24 percent urban and 76 percent rural – this figure is twice as high. This supports the idea that towns and cities, and mainly Kabul, disproportionally absorb households that have a displacement history. Especially returnee households from Iran are concentrated for 65 percent in urban areas.
Of those households that returned from abroad, Pakistan was the most important country of asylum (70 percent of returns) and Iran the second-most important (30 percent).11 Of those households that returned from internal displacement, 37 had been displaced in the same province as where they were currently live, and 63 percent returned from another province. Similarly, 40 percent of households that returned from internal displacement had found refuge in urban areas in the country, whereas 60 percent had fled to rural areas.
Figure 3.14 shows the distribution of the reported year of return from displacement and place of refuge before return. Half of the returned households returned in the two years following the overthrow of the Taliban regime. Since then returns show a gradual decline, especially those from Pakistan and Iran.
Figure 3.14: Households returned from displacement since 2002, by year of return, and by country of refuge (in percentages)
0
5
10
15
20
25
30
35
2002 2003 2004 2005 2006 2007 2008 2009 2010 2011 2012
Pakistan Iran Afghanistan
According to the respondents, around two-thirds of the returned households returned spontaneously. For internally displaced households, however, this was the vast majority (95 percent), whereas refugees returned from abroad more
8 A main bias relates to the fact that areas with and increased number of households due to recent displacement or recent return from displacement will not be proportionally represented in the sampling frame.
9 It is likely that ‘returning’ does not necessarily mean returning to the place of residence before displacement. Especially in the case of returned refugee households, retuning may refer to returning to Afghanistan.
10 Thus, households that returned early 2002 have on average 35 percent of it’s members born in Afghanistan after return from displacement.11 Returns from other countries of asylum were negligible.

28 POPULATION STRUCTURE AND CHANGE
frequently also mentioned having been assisted by UNHCR or other agencies. This assistance was given more often to returnees from Iran (45 percent) than from Pakistan (36 percent). At the same time a sizable proportion of households mentioned to have been deported from the neighboring countries.
Table 3.12: Households returned from displacement since 2002, by country of displacement,and by mode of return (in percentages)
Mode of return Country of refugeTotal
Pakistan Iran Afghanistan
Assisted by UNHCR or other agency 36.4 44.6 2.2 27.9
Deported 7.1 9.7 2.9 6.4
Spontaneous return 56.5 45.6 94.9 65.6
Total 100.0 100.0 100.0 100.0

29LABOUR FORCE CHARACTERISTICS
4 LABOUR FORCE CHARACTERISTICSSUMMARY. As from 2013, Afghanistan applies national definitions for employment, underemployment
and unemployment that are tailored to the specific conditions in the country and provide policymakers with relevant information to understand and monitor labour market performance.
Two factors dominate the Organization of Afghanistan’s labour market: the importance of the agricultural sector – farming and livestock – and the underrepresentation of women. Whereas male labour force participation is 80 percent, that of women is only 19 percent. The female employment-to-population ratio is even as low as 15 percent, signifying a large untapped economic potential. The share of the labour force who want work or more or better work is 25 percent, which implies that the labour market is short of 1.8 million jobs to provide people with an adequate living. The main problem for this not-gainfully employed group is underemployment (17 percent) – working in irregular, low-paid and low-productivity jobs – rather than unemployment. This problem is particularly relevant in the rural sector (19 percent underemployment against 9 percent in urban areas) and for the relatively small female labour force. Overall, 39 percent of economically active women are not gainfully employed, compared to 22 percent for men. The situation is very different for women with tertiary education: as a result of favourable labour market conditions for this group, 78 percent are economically active, of whom only 3 percent are unemployed.
The most notable characteristic of the employed population in Afghanistan is that most workers by far - 81 percent - work in a vulnerable setting, characterised by informal work arrangements and insecure employment, unstable and inadequate earnings, and low productivity. This is almost universally the case for workers in the farming and livestock sub-sectors (accounting for 25 and 15 percent of the employed respectively), but to a very large extent also for those in other sectors characterised by informal employment. Alongside the agricultural sector, trade and manufacturing/processing are the main single economic sectors.
4.1 Introduction
For the vast majority of households in Afghanistan, the engagement in economic activity is the main livelihood strategy. Although for some households remittances, living from rent and forms of zakat are important, most have household members engaging in productive work to provide for their daily living. In a largely unorganized and informal economy like Afghanistan’s, this frequently implies subsistence activities, family work, involvement in irregular, low-paid and low-productivity jobs, child labour, labour migration and working very long or very few hours. It has been well documented that standard international labour indicators – especially those related to employment and unemployment – are inadequate, if not incorrect, to capture the performance of the labour market in such economies (ILO 2008, ILO 2011).
In view of this, CSO, the Ministry of Economy (MoEc) and the Ministry of Labour, Social Services, Martyrs and Disabled (MoLSAMD) developed national definitions of employment, underemployment and unemployment that are better attuned to the Afghanistan reality (see section 4.3). For reasons of international comparability, besides labour force indicators based on the national definition, this report also provides indicators on the basis of ILO definitions. Due to the change in definitions – as well as questionnaire changes – NRVA 2011-12 labour force indicators cannot be compared to those of earlier NRVA rounds.
4.2 Labour force participationDue to the very large share of children, only just over half (54 percent) of the Afghan population is in the working age of 14 years and over. Within this working-age population of 14 million people, half is inactive and half is currently actively engaged in the labour market, either by working or by looking for work. Afghanistan’s labour force – all persons in the working age of 14 and over who are currently active by being either employed or unemployed – amounts to over 7.2 million people, 5.9 million males and 1.3 million females. The labour force participation rate – the share of the working-age population that is currently employed or unemployed – is a key indicator in the analysis of the human resources available for the production of goods and services, for the projections of labour supply and for understanding the labour market behaviour of different categories of the population.
The overall labour force participation rate of 49.8 percent conceals large differences by sex and age. Although generally labour force participation is lower for females than for males, in the Afghan economy this gender gap is especially large.

30 LABOUR FORCE CHARACTERISTICS
Less than one in five (19 percent) of the working-age females is currently active on the labour market, against 80 percent of males, a gap of 61 percent points (see Figure 4.1), indicating that women are still a significant untapped economic potential. However, women with tertiary education have a labour force participation rate of no less than 78 percent.
Labour force participation shows high rates for males in rural areas and among Kuchi’s (respectively 82 and 91 percent). This is typical for less developed economies, in which educational opportunities are few, where most people are engaged in labour-intensive agricultural activities, and where wage earning opportunities are scarce, so that many household members need to work to provide sufficient income. Compared to the region of South Asia and the world at large, the male labour force participation in Afghanistan is high, but the female participation is extremely low.
Compared to the rural sector, in urban areas the labour force participation is lower (43 against 51 percent for both sexes combined, ), indicating opportunities other than employment, such as school attendance and probably less necessity to work due to lower poverty (see chapter 6). It also confirms previous findings that labour force participation is highest in the Kuchi population.
Figure 4.1: Labour force participation rate, by residence, and by sex
0
10
20
30
40
50
60
70
80
90
100
Urban Rural Kuchi National
72
82
91
80
1319
37
19
4351
64
50
Male Female Both sexes
The age pattern of labour force participation shows high levels of 80 percent and over for males in the productive ages of 20 to 59. However, even of boys of 14 years old almost half (46 percent) already work. Similarly, male elderly in age groups between 65 and 79 years old indicate economic activities for percentages ranging from 22 to 53 percent. These figures indicate the dire need for large parts of the population to contribute to family incomes and livelihoods.
For women, labour force participation varies little with age. Overall, participation rates are very low due to cultural barriers for activities outside the household, as well as to high burdens related to household chores and child care. Working largely as contributing family workers (see section 4.4.1), the percentage engaged in economic activities at young ages is hardly below that of women in the adult productive ages.

Figure 4.2: Labour force participation rate, by sex, and by age
0102030405060708090
100
14 15-19 20-24 25-29 30-34 35-39 40-44 45-49 50-54 55-59 60-64 65-69 70-74 75-79 80-84 85+
Male Female Both sexes
4.3 Labour force characteristics
4.3.1 Conceptualization of employment and unemployment
Afghanistan has adopted a definition1 of employment and unemployment that does justice to these concepts as indictors of labour market performance in a better way than the international ILO-based definition. In the context of Afghanistan – characterized by low-paid, low-productivity employment and the absence of pensions and unemployment insurance – open unemployment – according to international recommendations defined as being completely without work in the reference period, currently available for work and seeking work – is not an option for the poor. Consequently, it is found that only a very small part of the labour force is unemployed according to this definition. For the largest part people have to – and actually do – find any work during a week time, however poorly paid and for however few hours. Unemployment regularly is only an option for those who are themselves financially viable or have access to considerable family resources. The paradox, therefore, is that in countries like Afghanistan low unemployment according to the international definition is often not an indication of good labour-market performance, but, to the contrary, of poor performance.
As a consequence, a labour-market indicator that has far more policy relevance than the unemployment rate is the percentage of the labour force that is not gainfully employed, including the unemployed and the underemployed – persons who need more or other employment in order to provide for sufficient and sustainable income or livelihood. The problem in many developing countries is not so much unemployment, but rather the lack of decent and productive work. In Afghanistan CSO, MoEc and MoLSAMD have acknowledged this and developed national definitions of employment, underemployment and unemployment that bear more policy relevance (see Box Labour force definitions). Consequently, NRVA also focuses more on the not-gainfully employed as a key indicator than on unemployment as such.
1 NRVA played a key role in defining national definitions of employment, underemployment and unemployment, in agreement with key stakeholders, such as MoEc, MoLSAMD, ILO and World Bank
31LABOUR FORCE CHARACTERISTICS
Labour force definitionsInternational definitions
Empl oyed. All persons aged 15 and over who, during the reference period (of one week), were in paid employment or self employed and who worked at least one hour.
Unde remployed. All persons working hours of work that are insufficient in relation to an alternative employment situation in which the person is willing and available to engage (time-related underemployment).
Unem ployed. All persons aged 15 and over who, during the reference period (of one week), were:a. without any work, i.e. were not in paid employment or self-employment,b. currently available for work, andc. seeking work.
National definitionsa
Empl oyed. All persons aged 14 and over who, during the reference period of one week, were in paid employment or self employed and who worked at least eight hours.
Unde remployed. All persons aged 14 and over who, during the reference period of one week, were:a. working less than 40 hours,b. available to work additional hours, andc. willing to work additional hours.
Unem ployed. All persons aged 14 and over who, during the reference period of one week, were:a. without any work or working less than eight hours, andb. seeking work.
Not gainfully employed. All persons aged 14 and over who are unemployed or underemployed.

32 LABOUR FORCE CHARACTERISTICS
4.3.2 Employment, underemployment and unemployment
Employment
In Afghanistan, some 6.6 million people are employed of whom 5.5 million (83 percent) are men and 1.1 are women (Table 4.1). An indicator that provides information on the ability of the economy to create employment – and which is more insightful than unemployment rate – is the employment-to-population ratio, the proportion of the working-age population that is employed. The summary table below presents information about the employment-to-population ratio, besides other labour force indicators (Table 4.2). The relatively low national ratio of 46 percent is strongly tempered by the very low female involvement in market-related activities (15 percent only), because women are either unemployed (see section on unemployment below) or, more importantly, out of the labour force altogether (section 4.2).
Table 4.1: Labour force, by activity status, and by residence, sex (in thousands)
Residence, sex Employed, of whomUnemployed Total
fully employed underemployed
Urban 1,307 137 143 1,587
Male 1,145 104 104 1,353
Female 162 33 39 234
Rural 3,763 962 424 5,150
Male 3,208 733 256 4,198
Female 555 229 168 952
Kuchi 326 107 25 457
Male 246 69 15 330
Female 80 38 9 128
National 5,396 1,206 592 7,194
Male 4,599 906 376 5,880
Female 797 300 216 1,313
Table 4.2: Selected labour force indicators, by residence, sex (in percentages)
Residence, sex Labour forceparticipation rate
Employment-to population ratio
Under- employment rate
Un- employmentrate
Not-gainfully employedpopulation
Urban 43.1 39.2 8.6 9.0 17.6
Male 72.0 66.5 7.7 7.7 15.4
Female 12.9 10.8 14.1 16.7 30.8
Rural 51.3 47.1 18.7 8.2 26.9
Male 82.1 77.1 17.5 6.1 23.6
Female 19.3 15.9 24.0 17.6 41.7
Kuchi 64.4 61.0 23.3 5.4 28.7
Male 91.4 87.2 20.8 4.7 25.5
Female 36.6 33.9 29.8 7.2 37.0
National 49.8 45.7 16.8 8.2 25.0
Male 80.0 74.9 15.4 6.4 21.8
Female 18.5 15.5 22.8 16.5 39.3
As already hinted by the high labour force participation rate of women with tertiary education, the employment opportunities for this group stand in stark contrast to the general picture of women in Afghanistan: the employment-to-population ratio for this group is no less than 75 percent.
MDG Indicator 1.5Employment-to-population ratio
45.7 percent

33LABOUR FORCE CHARACTERISTICS
Underemployment and unemployment
Out of the 6.6 million employed persons around 1.2 million – 17 percent of the entire labour force – are underemployed in the sense that they can be considered in need of more or other work to sustain a living. In addition, close to 600 thousand persons are unemployed. The total of underemployed and unemployed people indicate that 25 percent of the labour force in the country is not gainfully employed and that the labour market is short of 1.8 million jobs that provide persons with a sustainable living. Figure 4.3, panel a presents the percentage of not-gainfully employed labour force by residence. The shortage of adequate employment is concentrated in the rural and Kuchi populations, and is especially due to underemployment. NRVA data suggest large differences in the shares of the labour force not gainfully employed across provinces: these range from below 10 percent in Helmand, Jawzjan, Panshjer, Kunduz and Balkh to over 40 percent in Khost, Badghis, Zabul and the central provinces of Wardak, Bamyan, Urozgan and Daykundi.
A differentiation by sex shows that the share of not-gainfully employed women is significantly higher than that of men (Figure 4.3, panel b). Almost two in five (39 percent) of women who want to work cannot find adequate employment. The female share that is underemployed (23 percent of the female labour force) is higher partly because women relatively much more frequently work fewer hours than men (see section 4.4.3) and therefore drop below the level of adequate employment. But more importantly even is the observation that relatively more women than men cannot find employment at all (16 percent of the female labour force), due to additional restrictions for women on the labour market compared to men.
Figure 4.3: Labour force not gainfully employed, by (a) residence and (b) sex,and by underemployment and unemployment (in percentages)
a. By residence b. By sex
0
5
10
15
20
25
30
35
40
Urban Rural Kuchi National
9
1923
17
9
85
818
27 2925
Underemployed Unemployed
0
5
10
15
20
25
30
35
40
Male Female Both sexes
1523
17
6
16
822
39
25
Underemployed UnemployedUnderemployed
The share of persons not gainfully employed does not strongly fluctuate with age. However, the share of unemployed does, which suggests a principle of communicating vessels in which the activity status changes between unemployment and underemployment without an escape to more gainful employment. Overall unemployment rates decrease from 16 percent among 14-year olds to 5 percent in the age group 25-44, and then increase again to levels around 16 percent at ages 60 and over (data not shown). The youth unemployment rate (unemployed persons aged 15-24 as a percentage of the labour force in the corresponding age group) is 10 percent (8 for males and 19 for females). The youth unemployment as a proportion of total unemployment is 39 percent. The unemployment rate of women with tertiary education – 3 percent – is very low, which indicates very favourable labour market conditions for highly qualified women.
As shown in Figure 4.4, employment also has seasonal fluctuations, with different patterns for urban and rural populations. Employment conditions in rural areas are directly related to the farming season and show higher rates of not-gainfully employed persons in the low seasons of winter (December-March) and (early) spring. For urban populations spring is the period with the lowest job opportunities, whereas the Kuchi labour force has again must difficulty in finding adequate employment in winter time.

34 LABOUR FORCE CHARACTERISTICS
Figure 4.4: Percentage of the labour force not gainfully employed, by season, and by residence
0
5
10
15
20
25
30
35
Urban Rural Kuchi National
21
2826
17
25 24 23
15
2523
17
30
34
28
Spring Summer Autumn Winter
Labour indicators based on ILO definitions
Labour force participation rate : 47.7Employment-to-population ratio : 46.3Time-related unemployment : 18.8Unemployment rate : 2.7
4.4 Characteristics of the employed population
4.4.1 Status in employment
Status in employment is an indicator of the types of economic risk that the employed face in their work, the strength of institutional attachment between the person and the job, and the type of authority over establishments and other workers. NRVA distinguishes several categories of workers, largely in line with the International Classification of Status in Employment (ICSE-93). A breakdown of employment information by status in employment provides a statistical basis for describing workers’ behaviour and working conditions, and for defining an individual’s socio-economic group. Thus, a high proportion of salaried workers in a country generally signifies advanced economic development. On the other hand, if the proportions of day labourers, own-account workers and family workers are sizeable, it may be an indication of a large agricultural sector and low growth in the formal economy. These groups can considered to be in vulnerable employment, since they are likely to be characterised by informal work arrangements and insecure employment, unstable and inadequate earnings, low productivity, and a lack of safety nets that guard against loss of incomes during economic hardship (ILO 2007, ILO 2009).
MDG Indicator 1.7
Proportion of own-account and contributing family workers in total employment
80.5 percent

35LABOUR FORCE CHARACTERISTICS
Table 4.3 shows that overall, the large majority of the employed in Afghanistan (81 percent) fall within the category of vulnerable employment.2 Almost all rural women (94 percent) and Kuchi (96 percent) do so. Since employers are hardly visible in the status-in-employment statistics, salaried workers – with 19 percent of the working population – are the only recognizable group in the labour market that can be considered to have secure jobs. As indicated in table 4.3, the occurrence of salaried work is mainly an urban phenomenon, with 39 percent against only 14 percent among the rural employed. It is notable that of the – relatively small – group of female workers in the urban sector half is in salaried employment, compared to only 6 percent of rural women and only 38 percent of urban men. Similarly notable is that within this female urban group the large majority (80 percent) is working in the public sector, whereas their urban male counterparts are equally distributed across the public and private sector.
Table 4.3: Employed population, by residence, sex, and by status in employment (in percentages)a
Status in employment
Urban Rural Kuchi National
M F BS M F BS M F BS M F BS
Day labourer 14 8 13 26 5 22 26 6 20 23 6 20
Salaried worker, private 18 10 17 6 3 5 5 0 3 9 4 8
Salaried worker, public 19 40 22 9 3 8 1 0 0 11 9 11
Own-account worker 41 28 39 50 44 49 54 54 54 48 42 47
Employer 2 1 2 1 0 1 1 0 0 1 0 1
Unpaid family worker 6 14 7 8 45 14 14 40 21 8 39 13
Total employment 100 100 100 100 100 100 100 100 100 100 100 100
Vulnerable employment 61 49 59 84 94 86 94 100 96 79 87 81aM refers to males, F to females and BS to both sexes
The share of the working population in vulnerable employment varies strongly with educational attainment: the percentage decreases from 80 percent for people without education, via 76 percent for those with only primary education and 60 percent for the secondary educated to 14 percent for employed with tertiary education. A similarly large differentiation exists between persons who are literate and illiterate, with, respectively, 63 and 90 percent in vulnerable employment.
4.4.2 Economic sector and occupation
The economy of Afghanistan is dominated by the agricultural sector. Around 40 percent of the employed population is engaged in work in the farming or livestock sub-sectors (Figure 4.5). Male employment is relatively varied with considerable employment of between 10 and 15 percent in construction, trade and various services, besides agriculture including farming and livestock (37 percent). Female employment is much more concentrated in a few sectors: various services, manufacturing and (food) processing, and, particularly, livestock tending. In the latter two sectors the share of women is also in absolute numbers larger than the male share. In the formal sector, the only sector where women are well represented is education.
For the Kuchi population the employment in agriculture is much higher than the national average, with 69 percent in the livestock sector only (not shown here). On the other hand, in urban areas the share is much lower – 4 percent only. Here the – male dominated – wholesale and retail sector is the largest (23 percent), followed by various private services (15 percent) and public services, construction, transportation/communication and manufacturing/processing, each with around 11 percent of employment.
2 Day labourers are included in this category, since they fully qualify the criteria of vulnerable employment

36 LABOUR FORCE CHARACTERISTICS
Figure 4.5: Employed population 14 years and over, by sector of employment, and by sex (in percentages)
0
10
20
30
40
50
28
8
15 13 12
47 7
3 2 17
47
13
0 0
23
1 0
7
0 1
25
15 1511 10
7 6 6 4 1 1
Male
Female
Both sexes
The geographic variation of employment in different sectors is wide. Whereas in Kabul province the share in agriculture is only 11 percent, in Helmand, Nooristan, Ghor and Zabul it is over 70 percent. On the other hand, sectors that are characterised by more formal employment – health, education, government and UN/NGO services – are relatively well represented in the employment of Paktika, Kapisa, Panshjer and Kabul (over 20 percent combined). Urozgan, Helmand, Ghor and Zabul have less than 5 percent in these sectors.
Employment in the farming and livestock sectors is almost entirely in the category of vulnerable employment (98 percent or more), whereas for manufacturing/processing, construction, trade and the private service sector it is between 84 and 94 percent. Only in the education, UN/NGO and various government sectors the percentage of vulnerable employment is 10 percent or lower. An indicator that shows the extent to which women have access to paid employment and their integration into the monetary economy is the share of women in wage employment in the non-agricultural sector. For Afghanistan this MDG indicator is a low 11 percent.
The distribution of occupations shows a large representation of farming and livestock activities (24 and 11 percent, respectively), the former strongly male-dominated. Other categories of relative importance are sales and trade (particularly in urban areas), construction and mining, drivers, and various service work. For women, shepherding (25 percent) and handicraft (20 percent) are the most important single occupational categories, but in the formal sector to a lesser extent also teaching (7 percent).
4.4.3 Working hours
Figure 4.6 shows the distribution of weekly working hours for the total working population, including those who are classified as under- and unemployed. Whereas the majority of men work 48 hours or more per week, the majority of working women (57 percent) is concentrated in the category of 8 to 31 hours work per week. The mean hours worked per week by men and women is, respectively 45 and 30, with the median values close to the mean (48 and 28 hours, respectively) (data not shown). It is likely that the fewer hours worked by women is due to their additional household chores, like cooking, cleaning, fetching water and firewood, and taking care of children and elderly. The data on working hours also shows that on average urban workers work longer hours than rural and Kuchi workers (48 against 41 hours per week).
MDG Indicator 3.2
Share of women in wage employment in the non-agricultural sector
11.1 percent

37LABOUR FORCE CHARACTERISTICS
Figure 4.6: Working populationa, by sex, and by weekly working hours (in percentages)
0
5
10
15
20
25
Less than 8
8-15 16-23 24-31 32-39 40-47 48-55 56-63 64 or more
1
4 5
14
912
22
18
14
4
1720 20
11
9 8 8
32
68
15
1011
20
16
12
Male Female Both sexes
a Including workers classified as under- and unemployed

38 AGRICULTURE AND LIVESTOCK
5 AGRICULTURE AND LIVESTOCKSUMMARY. The NRVA 2011-12 confirms the overriding importance of the agricultural sector for the livelihood of Afghanistan’s
population. Agriculture is the main source of income of close to one-third of households and 40 percent of the labour force are employed in the sector. Irrigated land in particular provides an important resource for 38 percent of households in the country, while 17 percent own rain-fed land. However, productivity of farmland is often low, as indicated by the large shares of land left uncultivated – 20 percent of irrigated land and as much as 37 percent of rain-fed land – mainly due to lack of water, and secondly – but related – because of soil infertility. Cereals, especially wheat, are the main farm produce in Afghanistan. Estimates based on responses to the NRVA survey suggest a spring cultivation production of 2.4 million tonnes of wheat in 2011 and 2.8 million tonnes in 2012. The difference was mainly due to the drought that hit the northern provinces in 2011 and especially affected rain-fed farmland. Maize, rice and potatoes are other staple food crops produced in significant quantities. Tomatoes and – from garden plots – grapes and other fruits and nuts represent other main agricultural products. On the input side, fertilisers, seeds and machine costs are the main investments in farming. In total it is estimated that farmers spent 16.5 billion Afs. (USD 309 million) on farming input for the last spring cultivation. The national stock of cattle seems to have dropped since the Livestock census of 2002-03. On the other hand, the herds of small ruminants – especially sheep – show significant increases. Livestock products are an important part of the daily consumption of animal-owning households, but market sales of animals or livestock products are also an important income source for these households. With regard to livestock production factors, the NRVA shows a relatively good vaccination coverage, but relatively low access to feed concentrate. Livestock owners significantly (67 percent) rely on private service providers for veterinary services. The main obstacles to using veterinary services are refusal by providers, lack of knowledge of the livestock owner and distance to the service provider.
5.1 Introduction
Agriculture – including livestock-related activities – is the backbone of Afghanistan’s economy. For around half (49 percent) of households agriculture provides any source of income and for 30 percent it is even the most important source. Similarly, with 40 percent of the labour force engaged in agriculture, it is the main sector for employment. CSO estimates that the sector contributes 27 percent to the country’s GDP in the solar year 1390 (2011-12) (CSO 2012).
With a varied geography and topography, out of 652 thousand square kilometres of total land area, only an estimated 12 percent is arable, 3 percent of the land is considered forest-covered, 46 percent is under permanent pasture and 39 percent is mountainous, not usable for agriculture (CSO 2012).
This chapter deals with various aspects of Afghanistan’s agricultural sector and is divided into two main parts: section 5.2 on farming and horticulture, and section 5.3 on livestock-related information.

39AGRICULTURE AND LIVESTOCK
5.2 Farming and horticulture
Land tenure in Afghanistan involves a complex system of ownership and access through renting, sharecropping and mortgaging. Furthermore, significant differences exist between productivity of irrigated and rain-fed land. Thus, the Ministry of Agriculture, Irrigation and Livestock (MAIL) estimates that typically yield of wheat from irrigated fields is 2.7 times higher than that from rain-fed fields (MAIL 2012). Horticulture involves again harvests that have high monetary value even though usually garden plots are small in terms of size. Consequently, this section treats the different types of land – irrigated, rain-fed and garden plot – separately, and distinguishes the different types of land tenure.
5.2.1 Irrigated land
Irrigated land tenure
Some 38 percent of all households in Afghanistan – approximately 1.4 million households – own any irrigated farm land. The majority of these land owners (58 percent) have a farm size of less than 4 jeribs (0.8 ha.)1 , whereas the median and mean irrigated land size is, respectively, 3 and 6 jeribs (1.2 and 0.6 ha.) (Table 5.1). Compared to NRVA 2007-08, the share of land owners with small landholdings – below four jeribs – has increased and the mean size of land owned shows a decrease from 6.7 to 6.0 jeribs, which may be due to increased population pressure.
Table 5.1: Households, by ownership of irrigated land, irrigated land size (in percentages);also stating mean and median irrigated land size (in jeribs)
Ownership 2011
No ownership 62.1
Any ownership 37.9
Less than 2.0 jeribs 11.8
2.0-3.9 jeribs 10.3
4.0-5.9 jeribs 5.3
6.0-9.9 jeribs 3.8
10.0-19.9 jeribs 4.8
20 jeribs or more 1.9
Total 100.0
Mean land size (jeribs) 6.0
Median land size (jeribs) 3.0
Just over 6 percent of households reported having access to land without owning it. The data indicate that a similar percentage of land-owning households rent-out or mortgage-out all their irrigated land, as the total percentage of households with access to land is about the same as that of owning land (37 percent). Especially urban households that own land in rural areas may assign other households to cultivate the land in their absence. The occurrence of this practice is supported by the finding that access to irrigated land by urban households is lower than ownership. The percentage of irrigated land ownership by province is given in Figure 5.1.
1 One jerib is 0.2 hectare (2,000 m2)

40 AGRICULTURE AND LIVESTOCK
Figure 5.1: Percentage of households owning irrigated farm land, by province
Irrigated land cultivated and not-cultivated
Based on information provided by households, the total irrigated land area is around 16.8 thousand km2, with Helmand, Balkh and Farah accounting for almost one-third of this total area. However, much of this area is marginal land, as country-wide almost 20 percent of the irrigated land was left fallow, leaving less than 14 thousand km2 irrigated land cultivated. Very large differences exist with regard to the share of un-cultivated irrigated land. Of the 34 provinces, 18 record more than 10 percent fallow irrigated land, nine record more than 20 percent, and six – Paktika, Zabul, Nimroz, Jawzjan, Ghazni and Farah – more than 30 percent , of which in the latter almost half of the irrigated land is not cultivated. Figure 5.2 shows this information by district. There seems to be a relation between the share of land left fallow and land size, as the six provinces mentioned also belong to the ten provinces with the largest mean and median irrigated land size per household.
The reason for leaving irrigated land fallow is overwhelmingly – for 71 percent of the households with access to land – the lack of water. The second main reason – for 21 percent of the households – relates to infertility of the land. Financial constraints (6 percent) and conflict-related reasons (conflict over water or land, or general insecurity for 2 percent) are relatively minor reasons. However, also the reasons for not cultivating the land strongly differ across the provinces, for some of which land infertility is the predominant concern.

41AGRICULTURE AND LIVESTOCK
Figure 5.2: Percentage of irrigated land not cultivated, by districta
aData at district level are not representative. The figure is only meant to be indicative at a more regional level
Source of irrigation water
Almost two-thirds (64 percent) of households with access to irrigated land receive the water for farming land from an irrigated river, canal or dammed water source (Figure 5.3). However, in specific provinces irrigated land farming relies to a large extent on deep-well pumping (Paktika, Farah, Kandahar and Nimroz all for more than 40 percent) or Kariz or Nawara (Ghazni, Daykundi, Paktya and Zabul for more than 40 percent). Again the association with shares of land remaining fallow is apparent.
Crop production from irrigated land
The data collected by NRVA 2011-12 refer to two different harvesting seasons. Since circumstances differed considerably between 2011 and 2012 due to drought in the northern provinces, results produced for crop production differentiate between the two years. However, differences in yields are more pronounced for rain-fed land (see section 5.2.2) than for irrigated land.
Wheat is the most important crop produced on irrigated land. According to the households reporting in the NRVA 2011-12, 2.1 million metric tonnes of wheat were harvested in the spring cultivation season of both years (Table 5.2). Total cereal production – wheat, maize/sorghum, barley, rice and millet – amounted to 2.5 and 2.4 million tonnes in 2011 and 2012 respectively. Next to other food crops – particularly potatoes – fodder (alfalfa, clover and other varieties) and cotton are main production crops. The report on opium is likely to be an underestimate in view of the official stance of the Government of Afghanistan with regard to opium production.

42 AGRICULTURE AND LIVESTOCK
Figure 5.3: Main source of water for irrigated land (in percentages)
64
12
9 7
5
3
36
Irrigated river, canal, dam KarizDeep well SpringAbsialab, snow-melt, flood Other
Table 5.2: Crop production from irrigated land in spring cultivation season prior to the survey
Crop Tonnes
2011 2012a
Total cereals 2,498,662 2,393,223
Wheat 2,064,376 2,090,587
Rice 187,623 :
Maize/sorghum 178,245 153,204
Barley 66,314 61,295
Millet 2,104 2,935
Potatoes 241,131 156,711
Fodder 235,942 328,719
Cotton 71,020 145,831
Onions 58,310 84,421
Water melon/melon 53,342 55,813
Tomatoes 30,498 52,366
Beans 13,021 13,400
Fruit and nuts 3,895 5,882
Opium 3,093 3,434
Other vegetables 56,626 51,222
Other crop 34,384 27,100: Data not availablea Including estimates for Kabul and Bamyan provinces

43AGRICULTURE AND LIVESTOCK
5.2.2 Rain-fed land
Rain-fed land tenure
Farming households in Afghanistan use less rain-fed land than irrigated land. Around one in six households (around 610 thousand) owns any land of this type (Table 5.3). Figure 9.4 shows the percentage of households owning rain-fed farm land by province. Related to its marginal productivity, the size of rain-fed landholdings is on average larger than that of irrigated land, with a mean area size of 16.4 jeribs (3.3 ha.) and a median size of 7.0 (1.4 ha.). Compared to NRVA 2007-08, the share of households owning rain-fed land, as well as the relative area sizes owned show only marginal changes.
In view of the finding that some 11 percent fewer households have actually access to rain-fed land than owning it (26 percent for urban households and 9 percent for rural ones), it could be deduced that renting-out of this type of land is relatively common, especially for urban households.
Figure 5.4: Percentage of households owning rain-fed farm land, by province

44 AGRICULTURE AND LIVESTOCK
Table 5.3: Households, by ownership of rain-fed land, rain-fed land size (in percentages);also stating mean and median rain-fed land size (in jeribs)
Ownership Percentage
No ownership 83.2
Any ownership 16.8
Less than 2.0 jeribs 1.9
2.0-3.9 jeribs 3.0
4.0-5.9 jeribs 2.5
6.0-9.9 jeribs 2.4
10.0-19.9 jeribs 3.6
20 jeribs or more 3.5
Total 100.0
Mean land size (jeribs) 16.4
Median land size (jeribs) 7.0
Rain-fed land cultivated and not-cultivated
NRVA 2011-12 household information suggests that the total rain-fed land area is slightly larger than irrigated land area: 18.1 thousand km2, with Faryab, Herat, Takhar and Ghazni accounting for half of the rain-fed land. However, well over one-third of this land (37 percent) was left uncultivated. In seven provinces – Parwan, Bamyan, Urozgan, Ghazni, Baghlan, Wardak and Kandahar – the part of the land that is left fallow is even more than half.
Lack of rain is the predominant reason for not cultivating rain-fed land (53 percent), followed by infertility of the land (18 percent) and financial constraints (13 percent). The practice of rotating between cultivating land leaving land fallow is common to deal with marginal rain-fed land in Afghanistan.
Crop production from rain-fed land
Production from rain-fed land is limited compared to that of irrigated land. The survey data indicate large differences in crop production between 2011 and 2012. Based on households reporting to the NRVA, in 2012 752 thousand tonnes of cereals were produced on rain-fed land, compared to only 399 thousand in 2011 (Table 5.4). Analysis at provincial level shows that the main differences occurred in the northern provinces, which were affected by drought in 2011. More than 90 percent of cereal production consists of wheat.
Table 5.4 Crop production from rain-fed land in spring cultivation season prior to the survey
Crop Tonnes
2011 2012a
Total cereals 399,468 751,664
Wheat 371,582 693,918
Barley 26,400 57,623
Maize/sorghum 1,486 122
Water melon/melon 62,261 328,719
Other crop 31,831 1,167aIncluding estimates for 3 or more provinces

45AGRICULTURE AND LIVESTOCK
5.2.3 Horticulture
Tenure and size of garden plots
Produce from garden plots can be important for Afghanistan households, in terms of supplementation of their consumption diet, as well as their household income. Valuable garden products – especially fruits and nuts – are harvested from horticulture production. Overall, 13 percent of households own a garden plot (Table 5.5), but in several provinces – Parwan, Bamyan, Sar-e-Pul, Wardak and Zabul – more substantial shares of households till garden plots.
The mean and median size of garden plots are 2.0 and 1.0 jeribs (0.4 and 0.2 ha.) respectively, with considerably larger plot sizes in the south-east eastern provinces of Paktika, Ghazni, Zabul and Kandahar.
Table 5.5: Households, by access to garden plots, garden plot size (in percentages);also stating mean and median garden plot size (in jeribs)
Ownership Percentage
No ownership 87.4
Any ownership 12.6
0.1 - 0.9 jeribs 3.4
1.0 - 1.9 jeribs 4.2
2.0 - 3.9 jeribs 3.2
4.0 - 5.9 jeribs 1.0
6.0 - 9.9 jeribs 0.6
10 jeribs or more 0.2
Total 100.0
Mean land size (jeribs) 2.0
Median land size (jeribs) 1.0
Horticulture production
Grapes and other fruits and nuts from trees are the main products from garden plots, and are produced in large volumes. The yield in 2012 has been considerably larger than in 2011, especially for grapes and other crops.
Table 5.6: Crop production from garden plots in spring cultivation season prior to the survey
Crop Tonnes
2011 2012a
Grapes 267,706 435,383
Fruit/nuts from trees 156,143 160,888
Other fruits 68,414 70,025
Fodder 35,837 33,413
Other produce 36,350 118,033
Other crop 31,831 1,167aIncluding estimates for one or more provinces

46 AGRICULTURE AND LIVESTOCK
5.2.4 Farming input costs
NRVA 2011-12 included a limited battery of questions on expenditures for farming input costs. The nearly 1.6 million households engaged in farming together spent an estimated total of 16.5 billion Afs. (some 309 million USD) on production inputs. For those farming households that did spent anything, the average expenditure amounted to 22 thousand Afs. (around 415 USD) for the last spring cultivation season. Most was spent on fertilisers (5.2 billion Afs.) and seeds (4.1 billion Afs.) (Figure 5.5).
Figure 5.5: National annual farming input costs, by type of production input (in million Afs.)
0
1,000
2,000
3,000
4,000
5,000
6,000
Fertiliser Seed Machine Labour Other Water
5,218
4,144
3,073
1,455 1,346 1,268
5.4 Livestock
5.4.1 Livestock numbers
The livestock sub-sector is another key component in Afghanistan’s economy, but up-to-date statistics are not available. The 2002-03 Afghanistan Livestock Census is the latest comprehensive source of livestock information (FAO 2008). Table 5.7 presents the results of this census and NRVA-based estimates on different types of livestock in 2011-12. The NRVA data suggest that the number of cattle is reduced in the years since the livestock census. However, the numbers of small ruminants, especially sheep, have increased. This suggest that these herds are recovering from recent losses due to animal diseases and droughts, and even despite structural problem facing overgrazing, encroachment of pastures by rain-fed agriculture, insecurity and loss of grazing rights.
The NRVA 2011-12 data furthermore indicate that 39 percent of the households in Afghanistan own one or more cattle. A distribution by province is presented in Figure 5.6. Goats and sheep are owned by 29 and 31percent of the households, respectively. In rural areas the percentages of ownership of cattle, goats and sheep are, respectively 49, 70 and 77. Chicken-holding households are especially common with 44 percent nationally and 57 and 17 percent for rural and urban households. This is particularly important for women, as these are usually responsible for tending poultry and also may have direct benefits from poultry products. Donkeys, goats and sheep are especially important for Kuchi households, as ownership of these animals in this population is as high as 65, 70 and 77 percent, respectively. Two-thirds of all camels are owned by Kuchis.

47AGRICULTURE AND LIVESTOCK
Table 5.7: Livestock numbers in Livestock Census 2002-03a and NRVA 2011-12, by animal type (in thousands); also stating households with specified animal type in NRVA 2011-12 (in thousands)
Animal type Census2002-03
NRVA 2011-12
Animals Households
Cattle 3,715 2,854 1,418
Oxen, yaks na 474 326
Horses 142 102 83
Donkeys 1,588 1,519 968
Camels 175 481 98
Goats 7,281 10,445 1,049
Sheep 8,772 18,018 1,108
Chickens 12,156 13,176 1,614
Other poultry 1,022 1,367 237a The Livestock Census only covered the resident population, NRVA also covers the Kuchi population
Figure 5.6: Percentage of households owning any cattle, by province

48 AGRICULTURE AND LIVESTOCK
5.4.2 Sale of animals and animal products
Table 5.8, panel a provides the number of animals sold in the year preceding the interview of the NRVA survey. In addition, panel b shows the amount of animal products sold in the same period.
Table 5.8: Number of livestock and animal products sold in the year prior to the NRVA 2011-12 survey, by animal type (in thousands) and type of product (in thousands)
Animal type Animals Animal products Amount Unit
Cattle 441 Milk 123,268 Liters
Oxen, yaks 65 Meat from cattle, goats, sheep, etc. 10,300 Kgs.
Horses 23 Meat from poultry 326 Kgs.
Donkeys 111 Wool, cashmere 12,727 Kgs.
Camels 67 Furs, skin, hides 1,573 Pieces
Goats 2,891 Eggs 64,142 Number
Sheep 4,879
Chickens 1,382
Other poultry 183
5.4.3 Livestock production factors
Various services are offered to livestock owners to improve the condition of their animals. These services include access to feed concentrate, vaccination, veterinary services, credit, marketing and advise on feeding, breeding and management of animals. NRVA 2011-12 included information about some of these components.
Just over half of livestock owners (53 percent) reported that they had access to animal concentrate. For Kuchi livestock owners, this is only 35 percent. Table 5.9 indicates the share of owners of specific livestock types that had vaccinated at least some of their animals in the year preceding the survey interview. Vaccination coverage seems relatively high, especially for poultry owners, but less so for owners of small ruminants.
Table 5.9: Livestock owners that had vaccinated at least part of their livestock,by type of livestock owned (percentages)
Owner ofanimal type
Any animalvaccinated
Cattle 83.0
Sheep 71.6
Goats 72.6
Poultry 90.6
Around one in five livestock owners (21 percent) obtained veterinary help, livestock medicine or information about livestock in the year preceding the survey. This percentage ranged from less than one percent in Nooristan, Helmand and Urozgan to over 40 percent in Bamyan, Faryab, Ghazni and Badghis. Figure 5.7, panel a shows the distribution of the service providers to the 21 percent of livestock owners that obtained any service in the past year. Panel b shows the main reason for not obtaining veterinary services. The private sector dominates veterinary service provision with two-thirds of service consults by livestock owners. With regard to reasons not to obtain services, more than half (52 percent) involve voluntary reasons, whereas service access was impeded mainly because of refusal by the service provider, lack of knowledge how to access a provider or distance. Financial reasons seem to be of minor importance.

49AGRICULTURE AND LIVESTOCK
Figure 5.7: Main type of veterinary service provider and main reason not to use veterinary servicesa. Main type of veterinary service provider (in percentages)
0
10
20
30
40
50
60
70
Private Government NGO VeterinaryField Unit
Other
67
18
6 5 4
b. Main reason not to use veterinary services (in percentages)
0
5
10
15
20
25
30
35
Did not need
service
Had too few
animals
Provider refused
Did not know how to obtain
Too far away
Too expensive
Other reason
29
23
1513 12
62

50 POVERTY INCIDENCE, TREND AND PROFILING
6 POVERTY INCIDENCE, TREND AND PROFILINGSUMMARY. The analysis of NRVA 2011-12 indicates that poverty has not changed over time, with about 36 percent of
the population still consuming below the poverty line. Poverty remains higher in rural areas and amongst the Kuchi population. Poverty has also remained unchanged within most regions, and significant changes in poverty are observed in only two regions: in the North-East, where poverty headcount increased from 36.4 to 50.9 percent, and in the North where it declined from 39.4 to 31.7. While average per capita consumption has increased, one of the explanations for stagnating poverty over time is widening inequality, with consumption of richer parts of the population growing faster. The top consumption quintile has experienced annual growth rates more than three times higher than the bottom one over the four years in between the latest two NRVA survey rounds. At the same time, inequality measured by the Gini index has increased from 29.7 to 31.6. As the labor endowment is one of the most critical assets for households, poverty is strongly correlated with household size and demographic composition, being the highest in households with higher dependency ratios. Similarly, education and employment status of the household head are matched with wide differences in poverty vulnerability. In particular, the analysis reveals that about 70 percent of the poor population belongs to households headed by illiterate or uneducated individuals. Moreover, household head’s underemployment, casual labor and employment in the farm or construction sectors are strongly correlated with higher poverty incidence.
6.1 Introduction
One of the main objectives of the NRVA is to provide information on living standards, on their evolution over time, and their distribution over households. Of particular concerns are living standards amongst the poorest segments of the population, and NRVA survey data provide the principal means for estimating the extent and severity of poverty in Afghanistan.
The measure of welfare adopted to assess population living standards is based on household consumption. In particular, an individual is considered as poor if her/his level of consumption is not sufficient to satisfy basic needs i.e. if her/his consumption falls below the minimum threshold identified by the poverty line. In line with international standards, the official absolute poverty line for Afghanistan is estimated following the Cost of Basic Needs (CBN) approach and it was set using the NRVA 2007-08. The CBN absolute poverty line represents the level of per capita consumption at which the members of a household can be expected to meet their “basic needs” in terms of both food and non-food consumption.1 In order to assess the evolution of wellbeing over time, the 2007-08 poverty line was updated to 2011-12 prices to reflect changes in the cost of living.2
This chapter focuses on the estimation and trend analysis of poverty and inequality, and it presents some basic correlates between household characteristics and poverty.
1 More specifically, the food component of the poverty line captures the cost of consuming 2,100 Kcal per day following the typical food consumption patterns of the relatively poor; the non-food component of the poverty line is estimated as the median non-food expenditure of individuals with food consumption around the food poverty line. See IRoA and WB (2010.
2 For more details, see Annex VII.

6.2 Measuring trends in poverty 2007-2011
There are three major poverty indexes that are calculated on the basis of poverty lines. The first is the headcount index, which represents the percentage of the population whose monthly per capita consumption expenditure are below the poverty line. This index is the most commonly used for poverty measurement mainly because of its simplicity and ease of interpretation. However, the major limitation of the headcount index is its insensitiveness to the “degree” of poverty, i.e. its inability to provide information as to whether the poor consume just or far below the poverty line. In fact, two populations with the same poverty headcount index might have totally different living standards in that in one, the poor are concentrated just below the poverty line, while in the other they have consumption levels well below the line. The second index used for poverty measurement is the poverty gap. This index represents the average distance between the consumption levels of the poor and the poverty line, thus capturing whether the poor have consumption just or far below the poverty line. The squared poverty gap, the third poverty measure, is similar in construction to the poverty gap but it differs in that it applies an increasing weight to greater distances below the poverty line, thus capturing the “severity” of poverty. 3
Table 6.1 reports the evolution of poverty over time. It clearly indicates that poverty has not changed over time, irrespective of the poverty indicator used. In order to further confirm the lack of poverty changes over time, Table 1 also reports the 95% confidence interval for each poverty estimate.4 At the national level and for each of the three poverty indicators, none of the differences over time is statistically significant at a 5-percent level.
Table 6.1: Trends of poverty measures, by survey yeara
Poverty indicators Survey year 95% Confidence Interval
2007-08 2011-12 2007-08 2011-12
Poverty headcount 36.3 36.5 [34.96, 37.62] [34.84, 38.14]
Poverty Gap 7.9 8.6 [7.49, 8.31] [8.11, 9.10]
Squared Poverty Gap 2.6 3.0 [2.39, 2.75] [2.75, 3.19]a Provinces of Helmand and Khost were excluded from the original sample in both survey years.
As evidenced in the 2007-08 NRVA report, Afghanistan is characterized by sharp differences in poverty incidence by residence and by region. The analysis of NRVA 2011-12 confirms previous results (Figure 6.1). The incidence of poverty in rural areas is 9 percentage points higher than in urban ones, being 37.7 and 28.9 percent respectively. The nomadic Kuchi population is the most vulnerable to absolute poverty, with poverty rates of 53.8 percent.
In line with the results observed at the national level, poverty has not changed significantly over time within each of the domains considered; it remains constant by residence and region, with the only exceptions being the North and North East regions where poverty has significantly – respectively – decreased and increased over time (Figure 6.1).
3 Formally, the three measures (poverty headcount, poverty gap and squared poverty gap) belong to the Foster-Greer-Thorbecke (FGT) class of poverty measures.
4 As poverty measures are estimates based on sample surveys, they are subject to sampling errors. The confidence interval indicates the range in which the true (or population) indicator would lie with a probability of 95%.
51POVERTY INCIDENCE, TREND AND PROFILING
MDG Indicator 1.2
Poverty gap ratio
8.6 percent

52
Figure 6.1: Trend of poverty headcount, by residence and region (in percentages) a, b, c
0
10
20
30
40
50
60U
rban
Rur
al
Kuc
hi
Sout
hwes
t
Cen
tral
Wes
t
Nor
th
Sout
h
Eas
t
Wes
t-cen
tral
Nor
thea
st
Residence Region National
29.1
36.9
53.9
29.1
29.3 34
.3 39.4
40.3 45
.2 47.9
36.4
36.3
28.9
37.7
53.8
28.0
28.9 30.8
31.7
38.3
44.7 49
.0 50.9
36.5
2007-08 2011-12
6.3 Growth and distribution
One of the explanations for the lack of poverty reduction over time in spite of an increase in average consumption is increasing consumption inequality. This is seen clearly from Table 6.2, indicating that while mean consumption increased 3.2 percent annually for the richest quintile, the corresponding growth rate in mean consumption for the poorest one was only 0.9 percent. As the same time, the consumption share of the poorest 40 percent of the population decreased from 22 to 21 percent to the benefit of top quintile’s consumption share.
Results in Figure 6.2 confirm that recent economic growth has widened consumption inequality in Afghanistan. The Gini Index measures the extent to which the distribution of consumption among individuals or households differs from a perfectly equal one. A value of 0 represents absolute equality with everybody consuming the same amount, a value of 100 absolute inequality, where all consumption is concentrated in one person. The Gini Index increased nationally from 29.7 to 31.6, and inequality significantly widened in the rural sub-sample. At the regional level, inequality increased in the South West, North, South and West Central regions, while decreased in the North East.
a Central: Kabul, Kapisa, Parwan, Wardak, Logar, Panjsher; South: Ghazni, Paktika, Paktya, Khost; East: Nangarhar, Kunarha, Laghman, Nooristan; Northeast: Badakhshan, Takhar, Baghlan, Kunduz; North: Samangan, Balkh, Jawzjan, Sar-e-Pul, Faryab; West: Badghis, Herat, Farah; Southwest: Nimroz, Helmand, Kandahar, Zabul, Urozgan; West-central: Ghor, Bamyan, Daykundi.
b Poverty estimates for South Region exclude Khost province in both survey years; poverty estimates for Southwest Region excludes Helmand province in both survey years.
c Red bars indicate that the difference over time is statistically significant at a 5 percent level.
MDG Indicator 1.3
Share of poorest quintile in national consumption
8.5 percent
POVERTY INCIDENCE, TREND AND PROFILING

53
Table 6.2: Mean real per capita consumption (at 2011-12 prices), by poverty quintilea
Quintile Survey year Annualgrowth (%)2007-08 2011-12
Poorest 984 1,019 0.9
2 1,414 1,515 1.7
3 1,818 1,971 2.0
4 2,412 2,645 2.3
Richest 4,294 4,863 3.2
Total 2,184 2,403 2.4a The 2007-08 consumption has been inflated to 2011-12 prices using the
inflation implicit in poverty lines by region-strata.
Figure 6.2: Trend of Gini index, by residence and region a, b, c
0
10
20
30
40
Urb
an
Rur
al
Kuc
hi
Eas
t
Sout
hwes
t
Nor
thea
st
Nor
th
Cen
tral
Sout
h
Wes
t-ce
ntra
l
Wes
t
Residence Region National
27.9
25.3
25.9 26.9
22.6
29.3
26.2 29
.6
23.6
24.4 27
.6 29.7
29.2
28.1
22.3 24
.4
25.3 26
.8 28.7
29.0
29.1
29.4 31
.2
31.6
2007 -08 2011 -12
6.4 Poverty profile
Household demographic and socio-economic characteristics are important correlates of poverty. In particular, this section presents results as to how poverty correlates with household size or dependency ratio at the household level as well as the education and employment characteristics of the household head. While unveiling causality is beyond the scope of the current report, these results are important for guiding future analysis of poverty determinants.
a Central: Kabul, Kapisa, Parwan, Wardak, Logar, Panjsher; South: Ghazni, Paktika, Paktya, Khost; East: Nangarhar, Kunarha, Laghman, Nooristan; Northeast: Badakhshan, Takhar, Baghlan, Kunduz; North: Samangan, Balkh, Jawzjan, Sar-e-Pul, Faryab; West: Badghis, Herat, Farah; Southwest: Nimroz, Helmand, Kandahar, Zabul, Urozgan; West-central: Ghor, Bamyan, Daykundi.
b Poverty estimates for South Region exclude Khost province in both survey years; poverty estimates for Southwest Region excludes Helmand province in both survey years.
c Red bars indicate that the difference over time is statistically significant at a 5 percent level.
POVERTY INCIDENCE, TREND AND PROFILING

54
6.4.1 Demographic profile
The youngest segments of the population are over-represented amongst the poor. As shown in Figure 6.3, children below 15 represent a larger share of the poor then of the total population – a result in line with the finding that larger households and with relatively more dependents are more likely to be vulnerable to the risk of poverty. As labor endowment is often the only form of capital available to relatively poorer households, a higher child dependency ratio5 at the household level is normally associated with higher poverty rates (Table 6.3).
Figure 6.3: Total population and poor population, by age (in percentages)
0
5
10
15
20
0-4 5-9 10-14 15-24 25-39 40-64 65+
17.1 17.3
13.7
19.0
17.3
13.0
2.6
18.619.3
15.116.6 16.0
12.1
2.2
Total population Poor population
Table 6.3: Poverty headcount, by child dependency ratio (household level)
Child dependencyratio
Povertyheadcount
Below 100 28.2
100-199 39.4
200-299 45.7
300 and more 53.6
5 The child dependency ratio is here defined as the number of children aged 0-14 over the population in the most productive ages (15-64).
POVERTY INCIDENCE, TREND AND PROFILING

55
6.4.2 Household head characteristics
The head of household is in most instances the breadwinner, i.e. the person mostly responsible for household livelihood. As a result, the attributes of the household head are one of the strongest determinants of poverty.
As shown in Table 6.4, the head’s literacy status and education level are strongly correlated with the risk of poverty. Poverty rates for individuals living in households with an illiterate head are 14 percentage points higher than those of individuals living in households with a literate head (41.6 and 27.6 percent respectively). Similar results emerge when looking at the head’s education attainment: poverty rates are the highest for individuals living in households with an uneducated head (42.1 percent). Interestingly and possibly correlated with the low level of education at the aggregate level in the economy, even partial schooling at the primary level is enough to substantially reduce poverty rates.6 Taking the poor population as a whole, more than 70 percent of poor individuals come from households whose heads have no education or are illiterate.
Table 6.4: Poverty headcount, poor- and total population shares, by selected characteristics of household head (in percentages)
Household head characteristics Povertyheadcount
Share of poorpopulation
Share of totalpopulation
Male 36.4 99.3 99.6
Female 54.7 0.7 0.5
Literate 27.6 27.7 36.6
Illiterate 41.6 72.3 63.5
No education 42.1 73.0 63.0
Incomplete primary school (less than grade 5) 31.9 4.0 4.6
Completed primary school (grade 5 or higher) 30.9 9.0 10.6
Completed lower secondary school 25.9 3.5 4.9
Completed upper secondary school 22.9 6.1 9.8
Completed teacher college or technical college 27.1 1.5 2.0
Completed university or post-graduate 14.7 0.9 2.3
Attended or completed Islamic school 25.9 1.6 2.3
Labor market characteristics of the household head are another important correlate of poverty. Table 6.5 indicates that poverty headcount is the highest amongst individuals in households whose head is underemployed. The highest incidence of poverty associated with underemployment – as opposed to unemployment – is in line with previous findings from NRVA 2007-08 (Islamic Republic of Afghanistan, Ministry of Economy, and the World Bank 2010) showing that individuals in poorer households cannot “afford” being unemployed and are more likely to be engaged in some form of income generating activity, irrespective of its quality, to simply make ends meet. While the direction of causality cannot be determined a priori, results from NRVA 2011-12 confirm the importance of employment quality for poverty reduction.
6 Decades of conflict have had a long lasting impact on the human capital stock of the country. Despite significant improvements in school enrollment rates and education achievement in younger (urban) cohorts, the education gap remains substantial by international standards, also taking into account country’s level of development (see also chapter 8 on education).
POVERTY INCIDENCE, TREND AND PROFILING

56
Table 6.5: Poverty headcount, poor- and total population shares, by labor market characteristics of household head (in percentages)
Household head characteristics Povertyheadcount
Share of poorpopulation
Share of totalpopulation
Employed 35.0 66.6 69.6
Underemployed 41.6 17.3 15.2
Unemployed 39.4 5.0 4.6
Inactive 38.2 11.2 10.7
Day labourer 52.1 30.4 21.1
Salaried worker, private sector 31.4 6.7 7.6
Salaried worker, public sector 29.8 9.9 12.0
Self-employed 32.8 47.9 52.8
Employer 18.2 0.6 1.1
Unpaid family worker 30.8 4.6 5.4
Agriculture 38.7 32.3 30.1
Livestock 44.0 8.1 6.7
Manufacturing/processing 31.9 2.6 2.9
Construction 42.8 12.1 10.2
Wholesale and retail trade 27.0 9.9 13.2
Transportation and communication 23.9 5.4 8.2
Health 20.1 0.6 1.1
Education 32.4 3.4 3.8
Other government services 27.4 5.8 7.6
UN/NGOs 15.6 0.7 1.6
Other services 47.3 19.1 14.6
Looking at categories of employment, daily labor is confirmed to be associated with higher poverty rates. The poverty headcount for individuals in households with a day laborer head are more than 20 percentage points more likely to be poor than those in households with a salaried head in either public or private sector jobs. Among the sector of employment, having the head working in agriculture or in livestock production is strongly correlated with poverty, in line with the relatively higher poverty rates registered in rural areas and especially amongst the Kuchi population. In particular, the emerging poverty profile and the lack of progress in poverty reduction over time could be explained by the significant contraction of agriculture production at the time of NRVA 2011-12 data collection.7 The construction sector also emerges as particularly vulnerable, possibly reflecting the higher incidence of casual and poor quality types of jobs in this sector.
6.5 Conclusions
The analysis of data from NRVA 2011-12 reveals the absence of progress in poverty reduction over the past 4 years. While additional analysis would be required to better understand the causes for stagnating poverty despite the positive performance of the Afghan economy, the preliminary analysis presented in this chapter seems to suggest that the poorest segment of the population have not benefited from the general improvement in economic conditions. In particular, limited human capital endowments (literacy, education attainment) in poorer households might have prevented them from reaping the opportunities of better employment opportunities in the non-farm and (high-skill) service sector, resulting in stagnating poverty rates and widening inequality. As poverty is concentrated amongst households engaged in the agriculture, the sector’s low productivity and the extreme volatility of agriculture production remain one of the biggest challenges to poverty reduction in Afghanistan.
7 In particular, while the agricultural sector grew by more than 15 percent in 2007-08, it contracted by 7.6 percent in 2011-12.
POVERTY INCIDENCE, TREND AND PROFILING

57FOOD SECURITY
7 FOOD SECURITYSUMMARY. A high proportion of Afghanistan’s 27 million people face chronic and transitory food insecurity. Food insecurity
based on calorie consumption1 is estimated at 30.1 percent, comparable to the 28.2 percent measured by NRVA 2007-08. Of the 7.6 million food-insecure people, an estimated 2.2 million (or 8.5 percent) are very severely, 2.4 million (9.5 percent) severely, and 3.1 million (12.2 percent) moderately food insecure. The proportion of food insecurity increased in urban and to lower extent in rural populations, whereas it slightly improved among the Kuchi compared to 2007-08. Food insecurity has increased in urban areas from 28.3 percent in 2007-08 to 34.4 percent (1.7 million people) in 2011-12. In rural areas, an estimated 29.0 percent (5.2 million people) are food insecure. The Kuchi population is slightly but not significantly better off compared to the rural and urban, with 25.6 percent or about 350 thousand being food insecure. Food insecurity is mainly attributed to households’ lack of access to sustainable income. The diet of the Afghan population is not only quantitatively inadequate, but also qualitatively poor and heavily cereal-based. In total, 19.4 percent of the Afghan population or 4.9 million people do not consume adequate protein of at least 50 grams per person per day from the available food basket. Among them, 4.7 million people (or 62 percent of the 7.6 million food-insecure people with calorie deficiency) are deficient in both calories and protein. Inadequate protein and calorie consumption at household level will particularly affect nearly a million under-five children who are likely to be vulnerable to malnutrition.
7.1 Introduction
Food security exists when all people, at all times have physical, social and economic access to sufficient, safe and nutritious food for a healthy and active life. In this report, households that meet a minimum of 2,100 calories per person per day are considered as food secure. In the NRVA 2011-12, data were collected on household expenditure, quantities and type of foods, and number of days certain foods are consumed over a seven-day recall period, throughout the survey period. This information allows a calculation of household food security, based on kilocalorie (Kcals) intake data.2 Furthermore, thresholds of calorie consumption are used to categorize the severity of food insecurity in 5 groups from very severely food insecure to food secure (see Table 7.1).
Table 7.1: Levels of food security
Level of food security Kcal intake per person per day
Very severely food insecure Less than 1,500
Severely food insecure 1,500 to 1,799
Moderately food insecure 1,800 to 2,099
Borderline 2,100 to 2,399
Food secure 2,400 and more
This chapter is divided into eight sections. Following this introduction; section 7.2 describes the overall current food security situation, in terms of the number and percentage of the food-insecure among urban, rural and Kuchi populations; section 7.3 gives an indicative comparison of the food security situation of the NRVA 2011-12 with NRVA 2007-08; section 7.4 presents characteristics of food-insecure households; section 7.5 describes the impact of seasonality on food security; section 7.6 describes access and supply; section 7.7 provides information about dietary diversity and the calculation of the Food Consumption Score; whilst section 7.8 outlines coping mechanisms generally adopted by surveyed households.
1 Excluding Helmand and Khost provinces due to lack of reliable data on food security.2 Adjusted for age, sex and additional caloric requirements during the winter period.

58 FOOD SECURITY
7.2 Current food security
Table 7.2 shows that food-insecure households are distributed across all population groups of Afghanistan. Overall, an estimated 7.6 million people or 30.1 percent of the Afghan population are very severely to moderately food insecure. Of these, 2.2 million people or 8.5 percent are very severely food insecure, as they consume on average less than 1,500 Kcal per person per day. In relative terms, more urban households, including the peri-urban population, are food-insecure than their rural and Kuchi counterparts. A total of 34.4 percent of the urban population are food insecure compared to 29.1 percent of the rural population and 25.6 percent of the Kuchi population. However, in terms of absolute numbers, there are more food-insecure people (5.2 million) living in rural areas, where 72 percent of the country’s population resides, excluding the 5 percent Kuchi population. The Kuchi are slightly but not significantly better off compared to the rural and urban populations. An estimated 350 thousand Kuchi and1.7 million urban residents are defined as food insecure.
Table 7.2: Population with types of food deficiency, by residence
Residence Calorie deficiency(food insecure)
Protein deficiency Calorie and proteindeficiency
Millions Percentage Millions Percentage Millions Percentage
Urban 1.7 34.4 1.3 21.3 1.2 20.3
Rural 5.2 29.1 3.4 19.1 3.3 18.2
Kuchi 0.4 25.6 0.2 15.3 0.2 14.5
National 7.6 30.1 4.9 19.4 4.7 18.5
The majority of people facing caloric deficiency are also affected by inadequate protein consumption3 across all population groups. In total, 4.9 million people or 19 percent of the Afghan population do not meet the daily protein requirement of at least 50 grams per person per day from the available food basket. Among them, 4.7 million are facing both calorie and protein deficiency. Inadequate protein consumption will particularly affect children under five years of age, who account for 21 percent of the surveyed population under the NRVA analysis. This means at least 1.5 million under-five children reside in food insecure households, of which more than 900 thousand children are living in households where the consumption of protein and calories are both inadequate, and hence, they are likely to be vulnerable to malnutrition.
By population group, 1.3 million (or 21 percent) of the urban population are protein deficient. Among the 2.1 million urban food-insecure people, 1.2 million face both protein and caloric deficiency. For rural areas, 3.4 million (or 19 percent) of the rural population are protein deficient. Among the 5.2 million rural food-insecure people, 3.3 million face both protein and caloric deficiency. The Kuchi population has a better protein consumption with some 0.2 million (or 15 percent) facing protein deficiency, and almost all of these show both protein and calorie deficiency.
3 Protein thresholds applied for calculating protein deficiency were: ‘Very severe deficit’ is considered as >50% of protein requirement (consumption <25grams/per person/day); ‘Severe deficit’ is of 25 to 50% of protein requirement (consumption of 25 to <37.5g/person/day; ‘Moderate deficit’ of < 25% of requirement (consumption of 37.5 to <50 g/person/day)' and ‘Acceptable’ consumption ≥ 50 grams per person per day.
MDG Indicator 1.9
Percentage of population below minimum level of dietary energy consumption
30.1

59FOOD SECURITY
7.3 Distribution by region
The highest proportion of food insecure people is reported in the North-eastern region (46 percent), followed by Central Highland region (39 percent). The largest number of food insecure population of 1.7 million people is in the North-eastern, followed by 1.6 million people in the Central and 1.1 million in the Central Highlands region (Table 7.3).
Table 7.3: Food-insecure population, by food-security status, and by region
Residence Food-security status
Very severelyfood insecure
Severelyfood insecure
Moderatelyfood insecure
Totalfood insecure
1,000s Perc. 1,000s Perc. 1,000s Perc. 1,000s Perc.
North 221 6.2 327 9.2 491 13.8 1,039 29.1
North-East 684 18.3 561 15 466 12.5 1,711 45.8
Central Highland 426 15.2 301 10.8 352 12.6 1,080 38.5
Central 305 4.6 529 8.1 752 11.5 1,587 24.2
South 40 4.1 57 5.8 135 13.8 232 23.7
East 155 5.5 209 7.4 308 11 672 23.9
West 185 6.1 213 7 326 10.7 724 23.8
South-West 135 7.2 201 10.8 264 14.1 599 32.1
National 2,152 8.5 2,397 9.5 3,095 12.2 7,645 30.1
7.4 Comparison of food security between NRVA 2011-12 and NRVA 2007-08
Figure 7.1 presents insights into changes in food insecurity severity among population groups when a comparable method for calculating food insecurity of NRVA 2007-08 and NRVA 2011-12 is used.4 Based on this comparable analysis, the total food insecurity prevalence has increased from 28 percent to 30 percent over this period. This can be attributed to the deterioration of food security caused by the 2011 severe drought in 14 northern provinces of the country, most of which are usually surplus producing areas. The Rapid Emergency Food Security Assessment (REFSA) (Islamic Republic of Afghanistan, WFP and Food Security and Agriculture Cluster 2011) that was conducted in November 2011 estimated over 2.8 million drought-affected people across 14 provinces who required food assistance.
The largest deterioration in food security based on caloric consumption occurred in urban areas, where the proportion of the food-insecure population increased from 28 percent in 2007-08 to 34 percent in 2011-12. One among the reasons for the significantly increased food insecurity in urban areas includes the different sample design applied in these two NRVA surveys. In the NRVA 2007-08 urban areas were a separate analytical domain covering 11 provincial main cities, while the NRVA 2011-12 did not have urban as separate analytical domain. Urban areas of all provinces had a proportion sample to size of the urban areas. Food insecurity in rural areas did not change significantly (28 percent in NRVA 2007-08 and 29 percent in the present survey). Food insecurity among the Kuchi populations, however, improved by two percent points to 25.6 percent from 27.5 percent in NRVA 2007-08. The reason for this could be consecutive good pasture conditions in the years 2009, 2010 and 2012.
4 I.e. based on adjusted calorie requirement to sex, age and winter temperature, excluding Helmand and Khost provinces, and applying individual weights.

60 FOOD SECURITY
The proportion of very severely- and severely-food insecure people shows a pronounced increase from 13.7 percent in 2007-08 to 17.9 percent in 2011-12. This increase is reported across all population groups, but is more noticeable in urban and rural areas.
Figure 7.1: Population, by level of food security, and by residence, survey year (in percentages)
0
10
20
30
40
50
60
70
80
90
100
2007 -08 2011 -12 2007 -08 2011 -12 2007 -08 2011 -12 2007 -08 2011 -12
Urban Rural Kuchi National
7.7 8.7 6.0 8.6 5.8 6.2 6.3 8.56.9 10.8
7.5 9.1 7.7 7.7 7.4 9.513.6
14.914.8 11.3 14.1 11.6 14.5 12.2
15.816.1
16.9 13.5 20.015.4 16.9 14.3
55.9 49.5 54.8 57.4 52.5 59.0 54.9 55.6
Very severely food insecure Severely food insecure Moderately food insecure
Borderline Food secure
7.5 Characteristics of the food-insecure population
7.5.1 Characterization by main income source
Income sources are assessed and classified according to the proportion the source contributed to the total household income. In general, income that contributes at least 50 percent of total household income is considered as the main source of income. Some households in urban areas have income sources which include rural activities such as agriculture, because of the inclusion of the Nahias (peri-urban locations) as urban centers. Three main income sources from which the majority of the households earn their income include unspecified wage labour (21 percent of the households), production and sale of field crops (15 percent), and shop keeping/small business and other trade (11 percent). Other activities are engaged in by less than 10 percent of the households. On average, doctors, medical workers and non-government workers have the largest average main income level. Following this group are mechanics, road construction workers and other people engaged in other production work. Among those with the lowest average amount of main income source are those dependent on agricultural wage labour, shepherding, Zakat, other wage labour, borrowing, production and sale of livestock, and field crops.
The main source of household income is related to food security status. Households dependent on borrowing, followed by those relying on food processing, street market sale and other service work, shepherding and Zakat have the highest proportion of the food insecure, at 57 percent and around 30 percent, respectively. After these are households whose main income source is shop-keeping, small business, remittance, rental income, other wage labour, carpet weaving and other handicrafts with around 27-29 percent of the population in each group being food insecure. Households with the lowest proportion of the food insecure (from 12 to 23 percent) are those who depend on production and sale of opium and opium wage labour, production and sale of orchard products, and agricultural wage labours (Table 7.4).

61FOOD SECURITY
Table 7.4: Households, by livelihood group, asset holding and food insecurity (in percentages)
Livelihood activity Percentageengaged in activity
of which
with poorasset holding
foodinsecure
Borrowing 3 55 57
Food processing, street market sales and other service work 5 29 30
Shepherding and Zakat 4 61 30
Shopkeeper/small business and other trade 11 20 29
Remittances and rental income 3 38 29
Other wage labour 21 63 28
Carpet weaving, sewing and other handcraft 3 42 27
Military, police and security 5 33 26
Production and sale of livestock 5 46 26
Production and sale of field crops 15 41 26
Teacher and government office work 6 23 25
Doctor, medical worker, non-Government, NGO, UN work 4 15 25
Taxi/transport 8 17 25
Mechanics, road construction and other production work 2 29 25
Agricultural wage labour 4 71 23
Production and sales of orchard products 2 21 22
Production and sale of opium and opium labour 1 17 12
Total 100 40 28
7.5.2 Characterization by asset ownership
Households dependent on agricultural wage labour, other wage labour, shepherding and borrowing are among those with the highest proportion of asset poverty. However, the ownership of household assets such as refrigerators, bicycles, tractors, etc., does not seem to closely correlate with the level of food insecurity, as some of these livelihood groups have a high percentage of households with poor asset holding, yet the proportion of food-insecure households among them is relatively low. For example, 71 percent of households dependent on agricultural wage labour are asset poor, while the percentage of food-insecure households among them is as low as 23 percent. Meanwhile, households dependent on the production and sale of opium and on opium labour have the second lowest proportion of the asset poor at 17 percent, and also have the lowest food insecurity rate at 12 percent (Table 7.4).
7.5.3 Characterization by demographics
Food insecurity tends to increase with household size. Households with more than eight members are more food-insecure than smaller households with less than three people (Table 7.5). This trend is similar across all population groups. The age of the household head does not seem to be related to food insecurity status, except among the Kuchi where households headed by adults under 19 years of age tend to be more food insecure. This could be related to lower livestock ownership among young household heads. On marital status of the household head, the widowed and divorced in urban and rural areas tend to be more food insecure compared to other groups.

62 FOOD SECURITY
Table 7.5: Percentage of food-insecure households, by residence, and by selected household characteristics
Household characteristic Residence
Urban Rural Kuchi National
Household size
1-2 members 13 11 0 11
3-5 members 25 21 18 21
6-8 members 37 27 26 29
More than 8 members 36 32 29 33
Age of head of household
Less than 20 23 18 62 23
20-44 32 24 21 26
45-64 36 31 26 32
65 and more 30 31 28 30
Marital status of head of household
Married 32 27 23 28
Divorced or widowed 49 33 40 37
Never married 37 19 46 26
7.6 Seasonality and food insecurity
7.6.1 Afghan calendar seasonal differences
There is wide variability in the seasonal agricultural pattern in Afghanistan, particularly in areas where food availability from production relies heavily on access to irrigation. Hence, the agricultural production seasons and harvest periods vary considerably across the country, with some areas cultivating two crops (spring and winter). Wheat production comprises 78 percent of all cereal production, based on an 11-year average (MAIL 2012). With this seasonal diversity, some areas experience an interval of up to five months between winter and spring harvests of wheat and maize, whilst in other areas the interval is less than three months. This wide variation results in differences in the start and length of the pre-harvest (lean season), harvest and post-harvest periods that ultimately have an impact on food availability, markets and food security.
In the Afghanistan calendar, Spring lasts from 21 March to 21 June; Summer from 22 June to 22 September; Autumn from 23 September to 21 December; and Winter from 22 December to 20 March. Food insecurity varies slightly within these periods of the year. Overall food insecurity was estimated at 27 percent in the spring of 2011 and declined to 22 percent in the summer of 2011, before climbing to a peak of 29 percent in the winter of 2011. The high food insecurity in 2011 was likely associated with the below average harvest that year, caused by a severe drought, especially in 14 provinces of the northern belt of the country. The level of food insecurity further deteriorated to 32 percent in the spring of 2012 before improving to 28 percent in summer of 2012.
Seasonal differences also occur across the rural and urban areas, with a higher proportion of the population being food insecure in spring and winter in urban areas (35 percent and 33 percent, respectively) (Figure 7.2). A similar higher proportion of food insecurity (31 percent) is reported in spring in rural areas. Food insecurity significantly declines in spring for the Kuchi population compared to the urban and rural areas over the same period, which is probably due to a better availability of dairy products in spring. In general, the variability of food insecurity across the seasons is not dramatic for rural and urban areas, which could be associated with the inherent high level of food insecurity across Afghanistan.

63FOOD SECURITY
Figure 7.2: Population, by level of food security, and by residence, season (in percentages)
0
5
10
15
20
25
30
35
40Sp
ring
Sum
mer
Autu
mn
Win
ter
Sprin
g
Sum
mer
Sprin
g
Sum
mer
Autu
mn
Win
ter
Sprin
g
Sum
mer
Win
ter
Sprin
g
Sum
mer
Sprin
g
Sum
mer
Autu
mn
Win
ter
Sprin
g
Sum
mer
2011 2012 2011 2012 2011 2012 2011 2012
Urban Rural Kuchi National
38
30 32 33 3532
2118
26 2831 29 28
1619
2722
27 2932
28
7.6.2 Harvest and lean season’s differences
The main harvest period is generally between May and July for main staples including wheat, maize and barley crops. The post-harvest period is usually from August to mid-December, and pre-harvest (the lean season) is generally from mid-December to April. However, there is considerable variation in these seasons across the country (see also Annex VII).
Considering these three distinct periods of the harvest, post-harvest and lean season there is a general decrease in the proportion of food-insecure people between the lean season and the harvest period across all regions, except in Central Highlands where the proportion increased from 22 percent to 36 percent in 2011 (Table 7.6). Based on the 2011 seasonal trend, the percentage of food-insecure people increased between the harvest and post-harvest periods in all regions, except the South-west. This increased food insecurity was likely related to the poorer crops in 2011 and diminished cereal stocks due to the severe 2011 drought. An improved situation is reported for the period between the lean season and harvest, as well as between the harvest and post-harvest periods in 2012, when the proportion of food-insecure people consistently decreased in all regions. The above findings indicate that the critical period of food insecurity usually occurs during the lean season that generally lasts from mid-December to April in most parts of the country, and can extend to July in Badakhshan and the provinces of the Central Highlands.
A comparison across population groups shows a similar trend, with the largest proportion of people facing food insecurity during the lean season, except in rural areas in 2011 when the rate remained the same as for the harvest period that same year, which is probably due to the good 2010 harvest. In urban areas in 2012, the proportion of population facing food insecurity increased from 32 percent during the lean season to 37 percent at harvest time, and then reduced to 21 percent in post-harvest period. Since urban food insecurity is affected not only by the amount of harvested crop available in the urban markets, but also by other market and economic factors, the impact of food insecurity seems to go beyond seasonal factors.

64 FOOD SECURITY
Table 7.6: Percentage of food-insecure households, by year, harvest season, and by region and residence
Region andresidence
2011 2012
Leanseason
Harvestperiod
Post-harvestperiod
Leanseason
Harvestperiod
Post-harvestperiod
RegionNorth 23 16 22 41 32 -
North-East 42 30 43 52 46 -
Central highland 22 36 41 33 25 -
Central 30 18 22 25 16 -
South 22 16 27 20 22 -
East 22 8 18 27 26 13
West 17 13 23 25 21 15
South-West 46 30 27 31 20 -
ResidenceUrban 38 29 32 32 37 21
Rural 21 21 27 30 28 11
Kuchi - - 32 24 20 15
National 28 23 28 30 28 13
For rural areas in 2012, the percentage of the population who were food insecure steadily decreased from 30 percent in the lean season to 28 percent in the harvest period and to 11 percent in the post-harvest season. A similar improving trend of food insecurity is also reported among the Kuchi in 2012, where the proportion of population who were food insecure steadily reduced from 24 percent during the lean season to 20 percent during the harvest season and to 15 percent in the post-harvest season. Improved agricultural production, with a good national harvest in 2012, was likely an important factor for dramatically improved food security in the country during post-harvest period of 2012, as compared with the same period in 2011.
7.7 Food access and supply
7.7.1 Availability of different food items by food security status
The average quantity of food items available and consumed per person per day varies with the food security status of the household. The very severely-, severely- and moderately food insecure households consume on average, respectively, 238 grams, 318 grams and 371 grams of cereals per person per day. The quantity of cereals consumed by these food-insecure groups is significantly lower than the recommended cereal ration of 400 grams per person per day for relief food aid interventions. Households with lower caloric intake from cereals are therefore not meeting the recommended requirement for an active and healthy life. There seems to be a very high consumption of dairy products and fruits among the households with better caloric intake, indicating a better quality diet, richer in micronutrients and vitamins. It should be noted that some dairy products consumed, such as dough and ghee, contain no protein. Obviously, food-insecure households consume a much less diversified diet and in lower quantities, making them more vulnerable to food insecurity (Table 7.7).

65FOOD SECURITY
Table 7.7: Average quantity of foods available for consumption, by food security status, for selected food commodities (in grams per person per day)
Food commodity Deficit Borderline Adequate Total
Verysevere
Severe Moderate Surplus Largesurplus
Cereals 238 318 371 426 483 666 512
Tubers 35 45 51 54 60 74 61
Meat and fish 16 24 31 35 40 59 44
Pulses 9 12 15 18 21 35 25
Dairy 41 60 75 89 100 158 114
Oil and fats 20 27 30 33 37 52 40
Vegetables 15 25 29 34 40 53 40
Fruits 32 48 62 72 86 118 88
Nuts 0 1 1 1 2 4 2
Sugar 16 22 25 29 33 50 37
7.7.2 Availability of different food items by residence
In urban areas, the average food consumption is around 1,000 grams per person per day. However, the consumption peaks above 1,000 grams per person per day from Saratan (June-July) through Mizan (September-October). Fruit consumption is highest from June to September for both urban and rural areas. Consumption of other commodities is spread almost equally throughout the year in urban areas. In rural areas, the average food consumption is 947 grams per person, per day. The peak consumption above the average is between Saratan (June-July) and Aqrab (October-November). Cereal consumption in both urban and rural areas tends to be slightly higher in the winter months from December to March to meet an increased calorie requirement in low temperature conditions.
7.7.3 Sources of food items by population group and food security status
When considering food sources, since the major staple food across most parts of Afghanistan is wheat, sources of wheat flour are used as a measure of where households mainly obtain their food. Across all households, 73 percent depend on wheat flour purchases, 23 percent use their own production as their main source, while 4 percent rely on borrowing and taking food on credit. More urban and Kuchi households (about 90 percent of households), depend on purchases for wheat flour. The proportion of households dependent on food purchases in both rural and urban areas increases relatively with the improvement in food security. Across all population groups, a higher proportion of food-insecure households depends on borrowing and credit as a source of food, compared to food-secure households (Figure 7.3).

66 FOOD SECURITY
Figure 7.3: Households, by source of wheat flour, and by residence, food security status (in percentages)
0
10
20
30
40
50
60
70
80
90
100
Food insecure
Border line
Food secure
Food insecure
Border line
Food secure
Food insecure
Border line
Food secure
Urban Rural Kuchi
87 91 94
59 65 69
91 86 92
3 2 3
3332 30
6 14 69 6 3 8 2 1 3 22 1
Purchase Own production Bartered / payed in kind Borrowed / taken on credit Food aid
7.7.4 Sources of food items by main income source
The sources of food vary with livelihood type. As expected, households dependent on agriculture get a relatively larger proportion of their wheat from their own production. However, these households still depend on the market for the balance of their wheat flour needs. Across all livelihood groups, purchases or own production are the most important sources of food. Borrowing and getting food on credit, though not significant, is the third most important wheat flour source. Those households that borrow wheat flour as one of the major sources of food in addition to purchases are also those whose main income source is borrowing. Food aid is more pronounced in households dependent on Zakat and shepherding as a main income source.
7.7.5 Sources of food items by season
Within the year, sources of wheat flour vary slightly and purchases remain as the main source for the Kuchi and urban households, with borrowing becoming more pronounced for the urban households, especially from September to December, as well as between February and April. In rural areas, about a third of households depend on their own production for their wheat throughout the year, and around two-thirds depend on purchases. The proportion of households dependent on purchases in rural areas increases to 70 percent and above in the January to March winter period. For Kuchi households, about 10 percent depend on their own production from June to August, but otherwise purchases are the main source of wheat flour for most of the year.
7.8 Food consumption
7.8.1 Dietary diversity
The number of days each food commodity is consumed determines the dietary diversity in the household. In general, all urban, rural and Kuchi people consume at least seven days of cereals and almost seven days of oil and fats and sugar per week. Urban households tend to have more days of consumption of meat and fish, pulses and lentils, fruits and vegetables, compared to the rural and Kuchi households. As expected, the Kuchi households consume more dairy products compared to other groups. The number of days of consumption of protein- and micronutrient-rich foods in urban areas is still higher among the households with very severe calorie deficiency, indicating that these households tend to compensate for their lower cereal and tuber intake as described above. The wider diversity of foods available in urban areas is likely because most commodities are purchased from the market, an easier access to commodities, as well as the higher cash income levels – and, therefore, a better purchasing power – compared to rural areas and among the Kuchi (Table 7.8).

67FOOD SECURITY
Table 7.8: Average number of days of food consumption per week, by residence, and by selected food items
Food item Residence
Urban Rural Kuchi National
Cereals 7.0 7.0 7.0 7.0
Tubers 2.9 2.6 2.2 2.6
Meat and fish 3.3 2.3 1.7 2.5
Pulses 2.1 1.6 1.5 1.8
Dairy 3.2 3.4 4.3 3.4
Oil and fats 6.7 6.5 6.7 6.5
Vegetables 2.8 1.7 1.8 2.0
Fruits 3.2 1.8 1.1 2.1
Nuts 0.4 0.3 0.0 0.3
Sugar 6.7 5.9 5.9 6.1
7.8.2 Food Consumption Score
Food consumption can be measured based on the food consumption score (FCS5) which is normally used as a proxy to measure food security when quantitative data on calorie intake is not available. As described earlier, since the NRVA 2011-12 provides sufficient quantitative data on calorie intake, the food security level in this report is determined based on the caloric quantity consumed per person per day against the recommended daily calorie requirement. However, in order to strengthen the calorie intake analysis and confirm the relevance of alternative uses of the FCS in rotating years of the NRVA in the future, the relationship between caloric intake and FCS is explored. As such, calorie intake is cross-tabulated with the FCS. Findings show a clear relationship between FCS and caloric intake. In all urban, rural and Kuchi populations, the proportion of households with acceptable food consumption score consistently increased with better caloric intake. Overall, the percentage of households with adequate caloric intake accounts for 65 percent among households with an acceptable food consumption score, while it is much lower (36 percent) among those with a poor food consumption score. In urban areas, 57 percent of the households with adequate caloric intake are found among those with acceptable food consumption score, while this proportion is only 20 percent among those with poor food consumption score. A similar pattern is found for the rural and the Kuchi populations, where 68 percent of the rural households and 64 percent of the Kuchi households with acceptable food consumption also have adequate caloric intake – much higher than among those with poor food consumption score (Figure 7.4).
5 The Food Consumption Score (FCS) is an acceptable proxy indicator to measure caloric intake and diet quality at household level, giving an indication of food security status of the household if combined with other household access indicators. It is a composite score based on dietary diversity, food frequency, and relative nutritional importance of different food groups. The FCS is calculated based on the past 7-day food consumption recall for the household and classified into three categories: poor consumption (FCS = 1.0 to ≤28); borderline (FCS = 28.1 to ≤42); and acceptable consumption (FCS = >42.0). The FCS is a weighted sum of food groups. The score for each food group is calculated by multiplying the number of days the commodity was consumed and its rela-tive weight.

68 FOOD SECURITY
Figure 7.4: Households, by Kcal intake, and by residence, Food Consumption Score (in percentages)
0102030405060708090
100P
oor
Bor
derli
ne
Acc
epta
ble
Tota
l
Poo
r
Bor
derli
ne
Acc
epta
ble
Tota
l
Poo
r
Bor
derli
ne
Acc
epta
ble
Tota
l
Poo
r
Bor
derli
ne
Acc
epta
ble
Tota
l
Urban Rural Kuchi National
63
3627 33
5034
20 27 34 27 21 23
5136
22 28
18
1316
16
12
13
1212
27
10 15 15
13
13
1313
20
51 57 5238
5368 61
38
63 64 62
3651
65 59
Kca
l int
ake
(in p
erce
ntag
es)
Residence, Food Consumption Score
Very severe to moderate deficit Borderline Adequate
7.8.3 Contribution of different food groups to caloric intake
The mean calorie intake per person per day is calculated at 2,749 Kcal, and a median of 2,582 Kcal, with no significant difference between residential population groups (2,642 Kcal in urban; 2,788 Kcal in rural, and 2,794 Kcal among the Kuchi). However, the average total calorie intake significantly varies among food security groups. The food insecure consume 1,669 Kcal, which is only 79 percent of the recommended daily requirement of 2,100 Kcal, and this low calorie intake is similar among the food insecure of all population groups. Meanwhile, the borderline population consumes 2,284 Kcal on average and the food-secure population 3,382 Kcal.
Of the total calorie intake, cereals and tubers contribute 67 percent; oils and fats 13 percent; meat, fish, pulses and dairy products 11 percent; vegetables and fruits 4 percent; and sugar 5 percent. The contribution of cereals and tubers is slightly higher in rural areas and among the Kuchi households, respectively at 69 percent and 68 percent of total calories, as compared to 61 percent in urban areas. However, within each population group, the proportion of calories contributed by cereals and tubers is relatively similar across all food security groups.
Oil and fats contribute 15 percent of the total calories in urban areas, 12 percent in rural areas and 11 percent among the Kuchi. Dairy and its products are consumed at a slightly higher rate by the Kuchi – at 7 percent of the total calories, as compared to 5 percent and 4 percent in rural and urban areas, respectively. The urban population consumes slightly more sugar products – at 7 percent of total calories as compared to 5 percent in rural areas and among the Kuchi. The contribution of other foods such as pulses, meat and fish, vegetables and fruits is minimal, at only 1 to 4 percent, and it is similar across all areas as well all food security groups.
7.9 Coping with shocks
When coping with household shocks, the majority of households (62 to 80 percent) use short-term strategies including decreasing food expenditure, reducing food quality, and taking loans or credit. Around one-third of the households reduce food quantity or purchase food on trader credit (Table 7.9).
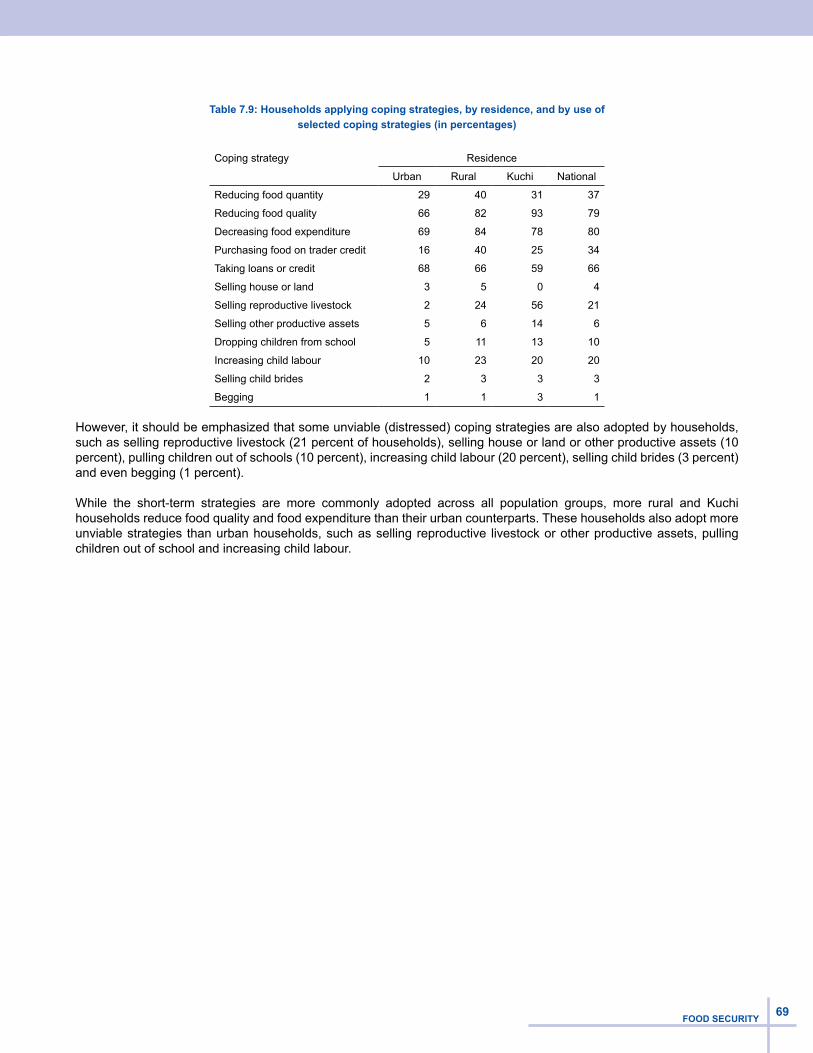
69FOOD SECURITY
Table 7.9: Households applying coping strategies, by residence, and by use of selected coping strategies (in percentages)
Coping strategy Residence
Urban Rural Kuchi National
Reducing food quantity 29 40 31 37
Reducing food quality 66 82 93 79
Decreasing food expenditure 69 84 78 80
Purchasing food on trader credit 16 40 25 34
Taking loans or credit 68 66 59 66
Selling house or land 3 5 0 4
Selling reproductive livestock 2 24 56 21
Selling other productive assets 5 6 14 6
Dropping children from school 5 11 13 10
Increasing child labour 10 23 20 20
Selling child brides 2 3 3 3
Begging 1 1 3 1
However, it should be emphasized that some unviable (distressed) coping strategies are also adopted by households, such as selling reproductive livestock (21 percent of households), selling house or land or other productive assets (10 percent), pulling children out of schools (10 percent), increasing child labour (20 percent), selling child brides (3 percent) and even begging (1 percent).
While the short-term strategies are more commonly adopted across all population groups, more rural and Kuchi households reduce food quality and food expenditure than their urban counterparts. These households also adopt more unviable strategies than urban households, such as selling reproductive livestock or other productive assets, pulling children out of school and increasing child labour.

70 EDUCATION
8 EDUCATIONSUMMARY. The general education picture presented by the NRVA 2011-12 is one of great improvement in the course of
the decade preceding the survey. Indicators like adult and youth literacy rates, attendance ratios and gender equity all show significant improvement. However, there are also indications that the rate of improvement may have declined compared with the observations of NRVA 2007-08: the largest improvements in primary school attendance were recorded prior to that survey and since then progress has been only modest. The present NRVA suggests that the current rate of improvement for education, literacy and related gender-equity indicators will fail to achieve the ANDS targets by 2020. Despite major achievements in the last decade, education performance in Afghanistan is still among the poorest in the world. Opportunities to attend education are few, especially for girls and women, and rural and Kuchi populations in general, even though the gender gap in education and literacy show continuous improvement, in both absolute and relative terms. The share of the adult Afghan population who have completed any level of education is very small – less than 25 percent, and for women as few as 10 percent. However, major improvements in primary and secondary school completion are observed for the younger age group 15-24 years, especially for girls. This is the result of increasing school attendance in the past decade. The net primary attendance ratios for girls and boys are now 48 and 64 percent respectively, up from 29 and 43 percent in 2005, and 42 and 60 percent in 2007-08. This still means that some 1.2 million girls and over 900 thousand boys are missing out on the opportunity to learn basic life skills. Net secondary attendance ratios are 23 and 42 for girls and boys respectively, up from 10 and 22 percent in 2007-08. Reasons for not attending school differ strongly between places of residence, education levels and the sexes. For girls, cultural barriers are dominant, for boys the need to contribute to family income. The importance of these reasons increases with age. Insecurity and distance to schools are largely reasons for non-attendance in rural areas. No more than around two in five rural households live within two kilometres of a primary school. Overall net primary school attendance in rural areas is 54 percent, while in urban areas it is 78 percent. With regard to literacy, similar patterns and changes are recorded as for school attendance. The adult literacy rate is 45 percent for men and 17 percent for women. The improvements in literacy between 2005 and 2011-12 are particularly observed in the youth literacy rate, which increased from 20 to 32 percent for female youth and from 40 to 62 percent for male youth. Again, the population in rural areas is at a severe disadvantage: the youth literacy rate there is only 39 percent, compared to 71 percent in urban areas.
8.1 Introduction
Education is one of the most important aspects of human development. The Convention on the Rights of the Child – the most widely ratified human rights treaty – enshrines the right of all children to a primary education that will give them the skills they need to continue learning throughout life. Yet, a large majority of Afghan people have been denied this right, most of them women and girls. Consequently, they are bereft of many opportunities for personal development and contributions to society.
Afghanistan is faced with a huge challenge to recover from thirty years of conflict and political unrest that resulted in the destruction of the Afghan education system in terms of staffing, premises, curricula and student attendance. During the Taliban rule girls were even prohibited from attending schools. Since 2001, a nationwide reconstruction process is being implemented with large support from the international community. This was reflected in the results of the NRVA 2007-08, which showed significant improvements in the areas of literacy and educational attendance compared to NRVA 2005.
The NRVA 2011-12 covered again several components for a situational analysis on education in the period 2011-12. Section 8.2 addresses the present performance of Afghanistan’s educational system by reviewing attendance and non-attendance, and some of their backgrounds. Section 8.3 is dedicated to the accumulated human capital in terms of highest educational levels attained by Afghanistan’s adult population. Finally, section 8.4 provides an assessment of the situation with regard to literacy, being one of the key effects of education. The chapter also presents most of the education-related MDG indicators.

71EDUCATION
8.2 Educational attendance
8.2.1 Educational attendance in residential and gender perspective
Attendance rates indicate the present functioning of the education system to serve the school-age population. The net attendance rate1 shows the extent of participation in a given level of schooling of children belonging to the official age-group corresponding to that specific level of education.2 The net primary attendance rate is used as the MDG indicator to monitor progress towards the goal of achieving universal
primary education, which provides children with basic reading, writing, and mathematics skills, along with an elementary understanding of such subjects as history, geography, natural science, social science, art and music.
Table 8.1 provides the net attendance rates for primary, secondary and tertiary education. It shows that national net attendance rates obscure large differentials by residence and sex. Thus, for each of the educational levels, urban attendance is much higher than attendance in rural areas. At the same time it can be observed that the higher the educational level, the larger is the relative difference in attendance rates between urban and rural areas. The attendance levels in the Kuchi population are again much lower than in the rest of the population, and their relative deprivation is again larger the higher the educational level. Overall, the attendance rates found for Afghanistan indicate that the country is still among the poorest performers in providing adequate education to its population.
The net primary attendance rates presented here imply that some 2.1 million primary school age children in Afghanistan miss out on primary education. The large majority of these (90 percent or 1.9 million) are from the rural or Kuchi population. The absolute number of persons who are not participating in secondary education (2.5 million) is in the same order of magnitude, due to the combination of a lower attendance rate at this level and a smaller base population. The overrepresentation of the rural and Kuchi population is with 94 percent even larger at this level.
In Afghanistan, many children may enter school late and stay at a specific educational level well past the official school age due to late entry or grade repetition. In addition, children may also enter a specific school level early. This is especially the case in primary education with the recent change in the entry age for primary school from 7 to 6 years. A comparison of the net attendance rate with the gross attendance ratio3 (Table 8.1, middle panel) shows the extent to which early and delayed enrolment and grade repetition occur. At all levels, and for girls and boys alike, this occurs to a significant extent, as indicated by the ratio between gross and net attendance of close to 1.3. This ratio implies that close to 30 percent of pupils at respective education levels do not have the official age for those levels. The breakdown of this ratio by residence shows little variation (not shown here).
1 The net attendance rate is calculated as the number of pupils of the theoretical school-age group for a given level of education, expressed as a percentage of the total population in that age group.
2 In this report, the age range of 7 to 12 is used for primary education, 13-18 for secondary education and 19-24 for tertiary education.3 The gross attendance ratio is the total attendance in a specific level of education, regardless of age, expressed as a percentage of the eligible official
school-age population corresponding to the same level of education.
MDG Indicator 2.1
Net attendance in primary education, both sexes
64.4 percentBoys
48.3 percentGirls
56.8 percentBoth sexes

EDUCATION72
Table 8.1: Net attendance rate and gross attendance ratio, by residence, and by education level, sex;Gender parity index, by residence, and by educational level; GAR/NAR ratio, by educational level
Educational level, sex and gender parity index
Net/gross attendance ratio, residence RatioGAR/NAR
TotalNet attendance ratio Gross attendance ratio
Urban Rural Kuchi National Urban Rural Kuchi National
PrimaryMale 81.8 62.7 24.5 64.4 104.3 80.9 31.4 82.8 1.29
Female 73.6 43.8 13.4 48.3 93.4 55.0 17.1 60.9 1.26
Both sexes 77.9 53.8 19.4 56.8 99.1 68.7 24.9 72.4 1.28
Gender parity index 0.90 0.70 0.55 0.75 0.90 0.68 0.54 0.74
SecondaryMale 62.0 37.0 7.1 42.0 80.0 49.3 10.1 55.3 1.32
Female 47.0 15.1 0.7 23.2 59.4 18.7 1.2 29.0 1.25
Both sexes 54.3 26.3 4.1 32.7 69.5 34.3 6.0 42.3 1.29
Gender parity index 0.76 0.41 0.10 0.55 0.74 0.38 0.12 0.53
TertiaryMale 16.8 4.4 0.2 8.1 18.3 5.3 0.2 9.1 1.13
Female 8.9 0.5 0.0 2.7 11.8 0.9 0.0 3.8 1.39
Both sexes 13.1 2.4 0.1 5.4 15.3 3.1 0.1 6.5 1.20
Gender parity index 0.90 0.68 0.54 0.74 0.65 0.17 0.00 0.42
Age-specific attendance ratios show a pattern of highest attendance in the late primary and early secondary school ages (Figure 8.1). It also indicates that many children enter primary school at ages beyond 7.
Figure 8.1: Education attendance rate, by sex, and by age
0
10
20
30
40
50
60
70
80
6 7 8 9 10 11 12 13 14 15 16 17 18 19 20 21 22 23 24
22
53
6470 70 73 74 74
6864 61
57
48
40
28 28
18 1711
18
4248
5255 54
5148
38 37 3531
2519
9 9 7 6 4
AgeMale Female

73EDUCATION
With regard to gender-specific educational attendance, a standard pattern can be observed that girls and women are disadvantaged compared to boys and men, and that this effect is more pronounced for each higher level of education. This is reflected in MDG indicator 3.1 – the gender parity index for the gross attendance ratio – which evaluates gender disparity in different levels of education. As shown in Table 8.1, this index declines from a relatively high 0.74 (even 0.90 for urban populations) for primary education to 0.42 (and only 0.17 for rural populations) for tertiary education. Education beyond primary school for Kuchis girls is virtually non-existent.
8.2.2 Change in educational attendance
Successive rounds of NRVA demonstrate a pattern of improvement of net attendance ratios (Figure 8.2). The findings of the 2010 Afghanistan MICS are consistent with this pattern. However, panel a of Figure 8.2 suggests a rapid improvement until the period observed by the NRVA 2007-08 and subsequently a relatively small further increase. These observations imply that the intermediate 2010 benchmarks of the Afghanistan Compact (Islamic Republic of Afghanistan 2006) – 60 percent net enrolment in primary school for girls and 75 for boys – have not been met. A likely explanation for the lower pace of improvement in recent years may relate to the disappearance of the catch-up effect of children entering primary school after having missed the opportunity to do so during the years of the Taliban regime. A second possible explanation could be the increasing difficulty of overcoming obstacles to education once the easy-to-reach and education-inclined population segments have been serviced. The NRVA results also indicate that the overall rate of increase since 2007-08 in secondary attendance (Figure 8.2.b) is larger than that of primary attendance (Figure 8.2.a).
Figure 8.2: Net attendance ratio, by sex, and by survey for (a) primary educationand (b) secondary education
a. Primary education b. Secondary education
43
60 63 64
29
4246 48
37
52 55 57
0
10
20
30
40
50
60
70
NRVA 2005
NRVA 2007-08
MICS 2010
NRVA 2011-12
Boys Girls Both sexes
22
4342
10
21 2316
3233
0
10
20
30
40
50
60
70
NRVA 2005
NRVA 2007-08
MICS 2010
NRVA 2011-12
Boys Girls Both sexes
MDG Indicator 3.1
Ratio of girls to boys in primary, secondary and tertiary education
0.74Primary
0.53Secondary
0.42Tertiary

74 EDUCATION
The change in the gender equity in the period between the NRVA 2007-08 and 2011-12 also shows improvement. In roughly four years the gender parity index for primary education increased modestly from 0.69 to 0.74, while the index for secondary education showed a larger increase from 0.42 to 0.53. However, the overall rates of improvement are too low to achieve the ANDS education-related gender-equality targets of full equity by 2020 (Islamic Republic of Afghanistan 2009).
Net school attendance ratios change with a rather steady downward trend within the cycle of a year (Figure 8.3). This suggests that attendance is more affected by cumulative drop-out of pupils and less to possible seasonal influences related to, for instance, farm activities and weather conditions. The trend for net primary school attendance – dropping from 61 percent in spring to 51 percent in winter – is more distinct than that for secondary school attendance.
Figure 8.3: Net attendance ratio, by educational level, and by season
61 59
57 51
35 3430 31
0
10
20
30
40
50
60
70
Spring Summer Autumn Winter
Primary Secondary
8.2.3 Reasons for not attending
The results on educational attendance show that well over half the population of primary-school age, around one-third of secondary-school age and just one-twentieth of tertiary school age are participation in school or advanced education. These figures imply that large numbers – respectively 2.1, 2.5 and 2.4 million persons from the primary-, secondary- and tertiary-school age groups – were not involved in education at the time of the survey. Access to education and actual attendance are multi-facetted issues, which involves – among others – economic, cultural, security, health and distance considerations. As can be seen in Table 8.2, the reasons why potential students do not attend education vary considerably by age, residence and sex.
The most important reason for girls not to attend education is a complex of cultural considerations, including unwillingness of the family to send girls to school, a lack of female teachers and marriage. Whereas this is the main reason for around one-third (34 percent) of primary-school age girls, it is the reason for more than half of those in later ages (52-53 percent), when reluctance to female exposure to the outside world and the pressure to marry become more important. For boys on the other hand, economic considerations – predominantly the need to work for the family and much less the costs of education – are the main reason for non-attendance. Although for one in nine (11 percent) boys in primary school age this is the first reason, at older ages this is the case for 42-46 percent.

75EDUCATION
Table 8.2: Population 6-24 years not attending school, by school age, sex, and by residence, reason for not attending (in percentages)
Residence, reasonfor non-attendance
School-age, sex
Primary Secondary Tertiary
Male Female Bothsexes
Male Female Bothsexes
Male Female Bothsexes
Urban 100 100 100 100 100 100 100 100 100
Distance / access 4 4 4 2 3 3 1 5 3
Economic reasons 12 7 9 53 6 22 52 4 27
Cultural reasons 10 36 25 6 60 43 3 57 31
Insecurity 1 2 1 1 3 2 5 6 5
Problems with school 16 10 13 19 12 14 11 10 10
Child too young 44 26 33 0 0 0 0 0 0
Other reasons 14 15 15 19 15 16 28 19 23
Rural 100 100 100 100 100 100 100 100 100
Distance / access 32 28 30 23 23 23 16 22 20
Economic reasons 11 3 7 43 4 19 46 3 22
Cultural reasons 8 35 24 6 53 35 6 54 32
Insecurity 7 6 7 5 6 6 6 8 7
Problems with school 23 15 19 17 10 12 10 7 8
Child too young 13 8 10 0 0 0 0 0 0
Other reasons 6 4 5 6 4 5 16 6 11
Kuchi 100 100 100 100 100 100 100 100 100
Distance / access 60 60 60 55 55 55 54 56 55
Economic reasons 8 3 6 24 4 14 22 2 11
Cultural reasons 5 23 14 2 27 14 7 25 16
Insecurity 0 0 0 0 0 0 0 1 0
Problems with school 12 7 10 8 6 7 5 7 6
Child too young 3 1 2 0 0 0 0 0 0
Other reasons 12 5 9 12 8 10 12 10 11
National 100 100 100 100 100 100 100 100 100
Distance / access 33 29 31 24 22 23 14 20 17
Economic reasons 11 4 7 42 5 19 46 3 23
Cultural reasons 7 34 23 5 52 35 5 53 31
Insecurity 6 5 6 4 5 5 6 7 6
Problems with school 21 14 17 16 10 12 10 7 8
Child too young 14 9 11 0 0 0 0 0 0
Other reasons 7 5 6 8 6 7 19 9 14
The non-attendance reason of ‘problems with school’ refer to issues like schools being temporarily closed, providing poor quality education or not allowing students access. According the survey, this is a major cause of non-attendance, although more so at the level of primary education (17 percent) than at secondary (12 percent) and tertiary (8 percent) levels, and more for boys than for girls. The motivation that children are too young largely refers to six-year olds. This indicates that the recent decrease in admission age from seven to six for primary schools does not yet enjoy wide support or is not yet widely known.

76 EDUCATION
Insecurity is primarily a rural obstacle for participation in education, and also the distance to or absence of educational facilities is almost entirely restricted to rural populations and is even by far the most important reason for the Kuchi.
Assuming that under normal circumstances two kilometres is an acceptable walking distance for primary-school students, only around half of Afghan households live within easy reach of primary education facilities: 54 percent within two kilometres of boys primary schools and 48 percent within that range for girls primary education (Figure 8.4). This would imply that some 2.5 million children in primary school age (7 to 12 years) do not have access to school within two kilometres distance. The percentage of households that have physical access to primary education within five kilometres distance would be 69 percent for boys education and 60 percent for girls education. This corresponds to around 1.8 million children in primary school age.
Figure 8.4: Households within two kilometres distance from primary education facilities, by sex of student population, and by residence (in percentages)
0
10
20
30
40
50
60
70
80
90
100
Urban Rural Kuchi National
95
44
29
54
97
3627
48
Boys Girls
Disparity of physical accessibility by residence is very large. Whereas almost all urban households live within acceptable walking distance from primary education facilities, in rural areas the corresponding percentages for households that have, respectively, boys and girls primary education within two kilometres are only 44 and 36. The figures for Kuchi households are even far below that. Expanding the distance criterion to 5 kilometres would imply that of all rural primary school age children, some 63 percent boys and 51 percent girls live within this distance from relevant education facilities. For Kuchi children – boys and girls alike – this would only be 42 percent, whereas for urban children virtually all can reach school within five kilometres.
8.3 Educational attainment
Educational attainment can be used as an indicator of the stock and quality of human capital within a country, and as a measure to assess the needs and establish policies for upgrading it. It also reflects the structure and performance of the education system and its accumulated impact on human capital formation. The internationally recommended indicator measures the percentage distribution of the population 25 and over by the number of years or highest level of schooling completed (UNESCO 2009).

77EDUCATION
Table 8.3 shows that less than one quarter of the adult population (25 years and over) in Afghanistan has any formal education. For men this is around one-third and for women only one-tenth. Overall, only 12 percent has more than primary school (excluding Islamic schooling), with the corresponding figures for males and females, respectively 19 and 4 percent.
Table 8.3: Population 25 years over, by sex, and by educational attainment
Educational attainment In thousands In percentages
Male Female Total Male Female Total
No education 2,682 3,572 6,254 64.5 90.3 77.1
Incomplete primary education 173 53 226 4.2 1.3 2.8
Completed primary education 405 109 513 9.7 2.7 6.3
Completed lower secondary education 206 36 242 5.0 0.9 3.0
Completed upper secondary education 399 67 466 9.6 1.7 5.7
Completed teacher/technical college 87 29 115 2.1 0.7 1.4
Completed university / post graduate 110 18 128 2.6 0.5 1.6
Completed Islamic school 98 70 168 2.4 1.8 2.1
Total 4,159 3,955 8,113 100.0 100.0 100.0
Compared to the NRVA 2007-08, the share of persons 25 and over without any education has decreased with 5 percentage points (from 82.5 percent), but the absolute number has remained the same at over 6 million people (data not shown here). On the other hand, the relative and absolute numbers of adults who completed primary, secondary and tertiary education have increased. The adult population with primary school completion increased with 0.6 percentage points (from 5.7 percent) and 82 thousand people; those with completed lower or upper secondary school increased with 1.0 percentage point (from 7.8 percent) and 122 thousand persons, and the corresponding figures for those with completed tertiary education (college or university) are 1.8 percentage points (from 1.2 percent) and 151 thousand persons.
The most salient outcomes of the breakdown of educational attainment by age and sex (Figure 8.5) is the very large difference between males and females. Except for the youngest age group 15-24, 10 percent or less of the female population has completed any level of education. In the male population, on the other hand, up to age 60 a significant minority of at least 30 percent has done so. A second remarkable finding is the rapid expansion of the shares with completed secondary or primary education in the population under 25, especially for women. The percentage with completed secondary education increased more than 50 percent between age groups 25-29 and 20-24 for men, and even tripled for women. And the percentage with completed primary education doubled between age groups 20-24 and 15-19 for men, and almost tripled again for women. These results reflect the large progression that has been made in education system in the decade before NRVA 2011-12.

78 EDUCATION
Figure 8.5: Population 15 years and over, by educational attainment, and by age, for (a) males and (b) females a. Males b. Females
0%10%20%30%40%50%60%70%80%90%
100%
15-1
9
20-2
4
25-2
9
30-3
4
35-3
9
40-4
4
45-4
9
50-5
4
55-5
9
60-6
4
65-6
9
70-7
4
75+
No education completed Completed primary
Completed secondary Completed tertiary
0%10%20%30%40%50%60%70%80%90%
100%
15-1
9
20-2
4
25-2
9
30-3
4
35-3
9
40-4
4
45-4
9
50-5
4
55-5
9
60-6
4
65-6
9
70-7
4
75+
No education completed Completed primary
Completed secondary Completed tertiary
8.4 Literacy
8.4.1 Literacy in residential and gender perspective
Literacy generally denotes the ability to read and write and to use written words in everyday life. Literacy is one of the intended outcomes of education, as well as a measure of a person’s ability to function in society and his or her potential for further intellectual growth and contribution to economic and socio-cultural development of society. The complementary illiteracy indicates the extent of need for policies and efforts in organizing adult literacy programmes and quality primary education.
The adult literacy rate – referring to the population aged 15 and over – indicates the accumulated achievement of primary education and literacy programmes in providing basic literacy skills to the population. Table 8.4 indicates very low adult literacy rates for Afghanistan, with 31 percent overall literacy in the population 15 years and over. It also shows pronounced differences by residence: in the urban population the adult literacy rate is more than twice as high as that in the rural population (54 against 25 percent), whereas among the Kuchi adult literacy is as low as 7 percent.
Table 8.4: Adult literacy rate, by residence, and by sex; Gender equity indicators, by residence
Sex and genderequity indicators
Residence Total
Urban Rural Kuchi
a. SexMale 68.7 39.1 13.2 45.4
Female 37.9 10.4 1.2 17.0
Both sexes 53.5 25.0 7.2 31.4
b. Gender equity indicatorsAbsolute difference 30.8 28.7 12.0 28.4
Gender parity index 0.55 0.27 0.09 0.37

Nationally, only around one in six (17 percent) women 15 years and over is able to read and write, compared to 45 percent for men. The corresponding figure for rural women is one in ten (10 percent). As shown in Table 8.4, these figures imply poor gender equity indicators with large absolute differences between male and female literacy and low female-to-male literacy ratios (gender parity indices). Although the absolute gender differences between urban and rural populations are of similar magnitude (on average 28 percentage points), the performance in terms of the ratio indicator is twice as high in urban areas (0.55) as in rural areas (0.27). The maps of Figures 8.6a and 8.6b below allow a comparison of literacy rates by province and sex. Of the altogether 9.5 million illiterate people 15 years and over in Afghanistan, 5.7 million or 60 percent are women and 3.8 million or 40 percent are men. The absolute gap of 1.8 million could be interpreted as the number of women who should be made literate to achieve at least equality between the sexes.
The youth literacy rate – the rate calculated for the sub-population aged 15-24 – is one of the MDG indicators to measure progress towards universal primary education (MDG goal 2). It reflects the outcomes of primary education over roughly the previous 10 years. As a measure of the effectiveness of the primary education system, it is often seen as a proxy measure of social progress and economic achievement. Table 8.5 again indicates large differences in youth literacy rates by residence and sex, and especially the difficulty to service the Kuchi and the female rural population. The overall youth literacy rate of 47 would imply that Afghanistan takes a sixth-last place in international performance on this indictor (UNICEF 2012).
Table 8.5: Youth literacy rate, by residence, and by sex; Gender equity indicators, by residence
Sex and genderequity indicators
Residence
Urban Rural Kuchi Total
a. SexMale 82.2 55.9 17.9 61.9
Female 60.1 22.5 1.6 32.1
Both sexes 71.4 39.1 9.7 47.0
b. Gender equity indicatorsAbsolute difference 22.1 33.4 16.3 29.8
Gender parity index 0.73 0.40 0.09 0.52
The literacy gender parity index – a former MDG indicator – is the ratio of the female literacy rate to the male literacy rate for the age group 15–24. The indicator measures progress towards gender equity in literacy and learning opportunities for women in relation to those for men and is also a key indicator of empowerment of women in society. At national level, NRVA 2011-12 found a figure of 0.52 for this indicator (from 0.45 in 2007-08) (see Table 8.2). The corresponding figures for urban and rural populations were, respectively, 0.73 (from 0.71 in 2007-08) and 0.40 (from 0.31).
79EDUCATION
MDG Indicator 2.3
Literacy rates of 15-24 years old
61.9 percentMale
32.1 percentFemale
47.0 percentBoth sexes

80 EDUCATION
Figure 8.6: Adult literacy rate, by province, for (a) males and (b) females (in percentages)a: Males
b: Females

81EDUCATION
8.4.2 Change in literacy levels
The pattern of change in literacy rates ratios is consistent with the finding of the change in net attendance rates over time (section 8.2.2). Even though literacy rates in Afghanistan are very low, successive NRVAs showed significant improvement. This improvement is most visible in young cohorts that reached an age where literacy education is completed. Thus, the MDG indicator of the youth literacy rate shows more than 50 percent increase in the rate between NRVA 2005 and NRVA 2011-12 for both males (from 40 to 62 percent) and females (from 20 to 32 percent) (Figure 8.7). This implies a steady continuation of the improvement in literacy that was found in the previous NRVA.
Figure 8.7: Youth literacy rate, by sex, and by survey year (in percentages)
40
53
62
2024
3231
39
47
0
10
20
30
40
50
60
70
NRVA 2005 NRVA 2007 -08 NRVA 2011 -12
Male Female Both sexes
The adult literacy rate – referring to the population 15 years of age and older – has also increased, from 26 percent in 2007-08 to 31 percent in 2011-12 (data not shown). The observed increases for this indicator for the male and female population are, respectively from 39 to 45 and from 12 to 17 percent. These figures imply that the targets defined in the Education Strategic Plan 2010-2014 by the Ministry of Education for 1393 (2014) (MoE 2010) – 48 percent overall literacy, and 54 and 43 percent for males and females respectively – are beyond reach.
Figure 8.8 similarly indicates an improvement in educational performance in the decade before the survey, thereby continuing and confirming the analysis made in the NRVA 2007-08 report (CSO 2009, p. 66). Educational improvement is suggested by the increase of literacy rates in younger age groups at the left of the graph, an effect that is most clear for women. For all women aged 30 and over the literacy rate is below 10 percent, indicating that during the years in which they were in their school age educational opportunities were very poor. The up-turn that can be observed for women in their late twenties, which continues for each successively younger age, reflect the opening-up of the opportunity to enter the formal education system after the remove from power of the Taliban regime in 2001.4 For the youngest age group with age around 12, 45 percent of girls is able to read and write and around 65 percent of boys is able to do so.
4 The age location of the up-turn in the late 20s is due to the combined effect of girls entering education at an advanced age, the application of five-year moving averages in the graph and age misreporting.

82 EDUCATION
Figure 8.8: Literacy rate, by sex, and by age; Gender equity, by agea
05
1015202530354045505560657075
12 14 16 18 20 22 24 26 28 30 32 34 36 38 40 42 44 46 48 50AgeMale Female Male-female difference Female/male literacy ratio
aThe series in this graph present five-year moving averages.
The changes in educational opportunities since 2001 directly affected the gender equity indicators. Although both girls and boys benefitted from improved access to school, the relative impact for the former was much greater. As can be seen in Figure 8.8, the ratio of female-to-male literacy sharply increases from just over 20 percent for persons around 30 years old (who were too old to effectively benefit from the change) to over 70 percent for children around age 12. In absolute terms, the gap between the male and female literacy rates shows a narrow variation band between 30 and 35 percentage points from older ages up to around age 21. Here, also the absolute gap starts to decrease from 35 percentage points to below 20 around age 12.
The basic message of these figures is that in recent years a large improvement must have been achieved in primary education, and that, relatively, girls benefitted more than boys and have begun to catch up with them. In no previous living generation has the gender gap for literacy been so small.

83HEALTH
9 HEALTHSUMMARY. The NRVA 2011-12 confirms the image of a recovering health system in Afghanistan in
the past decade, even to the extent that in some areas it achieves performance levels not previously recorded. Although Afghanistan’s health indicators are poor in an international perspective and cultural barriers impede progress for many components of maternal and child health, significant improvement is evident from successive surveys in the post-Taliban period. In terms of time required to reach the nearest health facility, access to these facilities has improved significantly with the implementation of outreach programmes of the Ministry of Public Health and the distribution of private health facilities across the country. However, cultural responsiveness of the health sector – for instance in terms of provision of female health care providers – remains an important obstacle for the effective use of health care, especially by women. In addition, costs for health services and treatment are prohibitive for many households, in particular for poor households. The 2011-12 round of NRVA collected limited information about child health. The information indicates mixed results with regard to vitamin A supplementation, prevalence of acute respiratory diseases and Tetanus Toxoid Injection (TT) coverage. In addition, the proportion of children officially registered at birth is still small: 35 percent. Perhaps the most consistent and impressive improvements are observed for maternal health indicators. The proportions of women served by skilled ante-natal care providers and skilled birth attendants, and the proportion delivering in institutional health facilities have increased dramatically in the last decade and reached levels of 51, 40 and 36 percent respectively. One of the main concerns with respect to Afghanistan’s health system performance is the very unequal health care provision between urban and rural populations. Invariably, for the majority of Afghanistan’s rural population service delivery and health outcome indicators are significantly lower than for urban dwellers. And the situation is generally even far worse for the nomadic Kuchi population.
9.1 Introduction
The health system of Afghanistan is recovering from a collapse in the recent decades of conflict, especially after the adoption of new health policies and a strategy of delivering a basic package of health services since 2005 (MoPH 2005). Although remaining low in international comparison, many of Afghanistan’s main health indicators are rapidly improving. Whereas the food security situation in the country remains fragile (see chapter 7) and adequate sanitation remains poorly available, significant advance has been achieved with respect to access to safe drinking water (see chapter 10). Other progress has been made with regard to the availability, access and quality of health care services. NRVA 2011-12 provides information about several of these health components, as well as actual health-care use.
9.2 Access to health services
Access to health services is a multi-dimensional concept. It not only relates to the physical distance to health facilities or the travel time involved, but also involves the costs of travel and services, as well as opportunity costs, cultural responsiveness to clients’ needs, mobility of women, and even the ‘value’ attached to the health and survival of specific household members, such as children and women. The NRVA 2011-12 provides information about travel time and travel costs required to reach health facilities, as well as information about gender-specific availability of health care staff, out-of-pocket expenditure on health and actual use of health care providers.
9.2.1 Distance to nearest health facility and costs to reach it
Distance and costs to reach a health facility can be primary reasons for low use of health care, especially in remote areas. Thus, the 2006 Afghanistan Health Survey (AHS) suggested that – after the absence of urgency for seeking health care – the most important reason for not seeking care was distance (27 percent) and the fourth-most important reason mentioned was transport costs (11 percent). In line with this, male and female Shuras responses to the successive rounds of NRVA invariantly mentioned improved access to health facilities among the top priorities (see section 11.4 of this report). It should be expected that given the expansion of Afghanistan’s health care system the importance of these reasons will have been reduced. The text box on access to health care below provides information about travel time to health facilities and costs involved, as well as staff availability in health facilities. However, due to low response rates,

84 HEALTH
this information should not be interpreted as official statistics on health care access.
Access to health care
Table 9.1, panel a gives the present percentage of population that is able to reach different types of health facilities within a specified time by any means of transport. It is evident that the urban population has virtually universal access to health care of any type within two hours. For rural and Kuchi populations access time is less favourable, but around nine in ten of the non-urban population can reach the nearest health facility within two hours. The corresponding overall figure reported in the 2006 Afghanistan Health Survey (AHS) was only 60 percent.
Table 9.1: Access characteristics of the nearest health facility for different health facilities, by residencea a. Population, by minimum travel time b. Mean and median one-way travel cost to nearest health facility (in percentages) per person by private transport (in Afghanis)
Type of health facility, residence Less than 2 hours
2 to 6 hours
More than 6 hours
Type of health facility, residence Mean Median
a. Health post a. Health postUrban n.a. n.a. n.a. Urban n.a. n.a.
Rural 88.4 8.8 2.8 Rural 208 100
Kuchi 89.5 5.1 5.4 Kuchi 470 250
National 91.2 6.4 2.3 National 176 100
b. Public clinic b. Public clinicUrban 99.4 0.0 0.6 Urban 154 100
Rural 82.7 14.2 3.1 Rural 320 140
Kuchi 89.7 10.3 0.0 Kuchi 309 150
National 86.9 10.7 2.4 National 278 120
c. District or provincial hospital c. District or provincial hospitalUrban 99.3 0.7 0.0 Urban 141 100
Rural 76.4 18.3 5.3 Rural 447 200
Kuchi 74.4 10.8 14.8 Kuchi 413 300
National 81.7 13.6 4.6 National 368 150
d. Private doctor or clinic d. Private doctor or clinicUrban 100.0 0.0 0.0 Urban 117 100
Rural 82.9 12.7 4.4 Rural 353 150
Kuchi 76.7 7.5 15.8 Kuchi 366 250
National 86.7 9.3 4.0 National 291 150
a Figures are indicative only due to high levels of missing values, ranging from 13 percent for public clinics to 33 percent for health posts.
The costs involved to reach a health facility by private transport differ by the type of care provider and by residence (Table 9.1, panel b). Half of the population need to pay Afg. 150 or less to reach any type of health facility, but the mean costs are usually twice as high as the median costs, indicating that for the other half of the population the costs are excessively higher. It should be borne in mind that financial constraints to health service access are often larger for women, since they are usually required to be accompanied by a male, doubling any travel costs.

85HEALTH
Availability of health care staff
In the gender-sensitive context of Afghanistan, another impeding factor to seek health care is the absence of same-sex health care staff. Results from the NRVA 2011-12 show that within the public health system only higher up in the referral system and in urban areas any presence of female staff reaches levels close to full coverage (Table 9.2). For example, in rural areas only 52 percent of the population can consult a female doctor in a public clinic and for 14 percent no midwife is available. However, compared to NRVA 2007-08 the availability of female health care staff has increased significantly: the corresponding figures for female doctors and midwives in public clinics at that time were 38 and 60 percent only (CSO 2009). The availability of male health care staff is generally better guaranteed. The figures presented here should be treated with care because of high non-response rates, as well as because of the possible respondents’ inability to distinguish between different health care staff.
Table 9.2: Availability of health care staff in nearest health facility,by sex of staff, residence, and by health care provider, staff type (in percentages)a
Type of health facility, residence Female health care staff Male health care staff
Urban Rural Kuchi National Urban Rural Kuchi National
a. Health postCommunity health worker 91.9 58.3 45.9 67.4 96.8 72.7 93.9 79.6
b. Public clinicDoctor 96.0 52.3 52.3 63.1 98.9 91.4 100.0 93.6
Nurse 96.0 66.3 60.1 73.3 97.2 88.5 96.8 91.0
Midwife 96.7 85.5 80.4 87.9 na na na na
c. District or provincial hospitalDoctor 97.6 87.1 89.0 89.7 100.0 97.9 100.0 98.5
Nurse 99.6 92.0 97.9 94.1 97.7 86.5 96.5 89.8
Midwife 100.0 97.1 98.6 97.9 na na na na
d. Private doctor or hospitalDoctor 95.7 72.3 88.9 79.1 98.3 92.0 100.0 94.0
Nurse 95.9 74.5 92.4 80.8 87.2 63.8 96.1 71.6
Midwife 97.9 86.3 92.4 89.5 na na na na
a Figures are indicative only due to high levels of missing values, ranging from 8 percent for district or provincial hospitals to 43 percent for health posts.
9.2.2 Household expenditure on health
The 2006 AHS found that the third-most important reason – with 24 percent of all reasons – for not seeking medical care was the inability to pay the cost of treatment. For many households health expenditure may be prohibitive, especially if advanced and prolonged treatment or hospitalisation is required. Table 9.3 provides an overview of out-of-pocket expenditure on health in the year preceding the NRVA 2011-12 interviews.

86 HEALTH
Less than one quarter of all households had any costs for in-patient care, but if costs were made it was usually a large amount with a median of 6.6 thousand Afs. and an average expenditure of 34 thousand Afs. On average households in Afghanistan – including those without costs – mentioned an expenditure of 7.5 thousand Afs. for in-patient care. Expenditure on out-patient care was considerably lower (with a median of 300 Afs. and a mean of 1.5 thousand Afs. by all households), but was made twice as often – by 51 percent of all households – as in-patient care costs. Other health-related expenditure was again smaller but more frequent (by 63 percent of households). Overall, households in Afghanistan spent on average more than nine thousand Afs. on health care, with a median expenditure of 1.1 thousand Afs. For those households that did make any costs the corresponding figures are, respectively, 11.2 and 1.6 thousand Afs. It is notable that urban households have a significantly higher level of expenditure than rural households, which is likely related to lower urban poverty levels and better access to health services.
Table 9.3: Mean and median household health-related expenditure for A. Households with specified expenditure and B. all households, by expenditure type, residence (in Afghanis)
A. Households with specified expenditure B. All households
Expenditure type, Households with expenditure All households
Mean Median Mean Median
a. In-patient care expenditureUrban 46,445 8,000 11,376 0
Rural 30,756 6,000 6,586 0
Kuchi 21,082 6,000 3,684 0
Total 34,281 6,600 7,504 0
b. Out-patient care expenditureUrban 3,735 1,100 2,119 450
Rural 2,535 1,200 1,301 200
Kuchi 1,903 1,200 901 0
Total 2,796 1,200 1,463 300
c. Other health-related expenditureUrban 661 250 429 100
Rural 651 300 371 100
Kuchi 518 200 315 90
Total 646 300 381 100
d. Total health-related expenditureUrban 16,021 1,600 13,924 1,200
Rural 10,035 1,600 8,258 1,050
Kuchi 6,103 1,380 4,900 1,000
Total 11,232 1,600 9,348 1,100

87HEALTH
Table 9.4: In-patients (A) and out-patients (B) in the year before the survey, by sex, and by ageA. In-patients
a. In thousands b. In percentages
Age Male Female Total Age Male Female Total
0-9 123 99 221 0-9 32.5 17.7 23.7
10-19 56 63 120 10-19 14.9 11.4 12.8
20-29 35 126 161 20-29 9.2 22.7 17.2
30-39 33 89 122 30-39 8.8 16.0 13.1
40-49 29 67 96 40-49 7.7 12.0 10.3
50-59 31 64 95 50-59 8.1 11.5 10.1
60-69 37 33 70 60-69 9.8 5.9 7.5
70-79 23 13 37 70-79 6.2 2.4 3.9
80-89 9 3 12 80-89 2.4 0.5 1.2
90+ 1 0 1 90+ 0.3 0.0 0.1
Total 378 558 935 Total 100.0 100.0 100.0
B. Out-patients a. In thousands b. In percentages
Age Male Female Total Age Male Female Total
0-9 557 477 1,033 0-9 47.8 30.3 37.8
10-19 149 193 342 10-19 12.8 12.3 12.5
20-29 103 270 372 20-29 8.8 17.1 13.6
30-39 72 214 286 30-39 6.2 13.6 10.5
40-49 70 166 236 40-49 6.0 10.6 8.6
50-59 77 158 235 50-59 6.6 10.1 8.6
60-69 80 67 147 60-69 6.8 4.3 5.4
70-79 35 22 57 70-79 3.0 1.4 2.1
80-89 17 5 22 80-89 1.4 0.3 0.8
90+ 5 1 6 90+ 0.4 0.0 0.2
Total 1,163 1,573 2,736 Total 100.0 100.0 100.0
9.2.3 Visits to health care facilities
NRVA 2011-12 inquired into occurrence of visits to health care facilities in the year preceding the interview. The results show that from more than 800 thousand households one or more members have been admitted to stay overnight in a health facility. In total this referred to 935 thousand different in-patients, 60 percent of whom were women or girls.
As can be seen from Table 9.4, the concentration of female in-patients is in the reproductive ages and is closely related to ante-natal-, delivery- and post-delivery care. Half (51 percent) of all female patients who stayed overnight in a health facility is in the age bracket 15-49, whereas only a quarter (26 percent) of the male in-patients belongs to this age group.In absolute numbers the figures of in-patients decline with age, due to the typical pyramid shape of the population with relatively small numbers of elderly and large numbers of children. However, calculating the number per age group as a percentage of the total population, the incidence of hospitalisation clearly concentrates in the old age groups (Figure 9.1, panel A). This is the expected pattern, as health problems tend to increase with age, with the exception of the immediate years after birth. However, the pattern for women is strongly influenced by visits for maternity reasons as can be seen in the sharp increase of the female prevalence at age group 20-29.

88 HEALTH
Figure 9.1: In-patients (A) and out-patients (B) in the year before the survey, by sex, and by age as percentage of the total population in the same age-sex group.
A. In-patients
0
5
10
15
20
25
30
0-9 10-19 20-29 30-39 40-49 50-59 60-69 70-79 80+ Total
Male Female Total
B. Out-patients
0
5
10
15
20
25
30
0-9 10-19 20-29 30-39 40-49 50-59 60-69 70-79 80+ Total
Male Female Total
With 2.7 million, the volume of out-patients is considerably larger than that of in-patients (Table 9.4, panel B). In terms of the age-sex distribution, the most notable is the over-representation of children under ten and again women in the reproductive age group. This is made visible in Figure 9.1, panel B, where it can be seen that around 11 percent of children under 10 had sought ambulant medical care. Only 5 percent of persons in the age group 10-19 did so, a level that is maintained for men up to the age group 40-49, whereas for women the share that received out-patient care is rising rapidly from age 20 onwards. Overall, 10 percent of the population received ambulant care, 12 percent among women and girls, and 8 percent among men and boys.

89HEALTH
9.2.4 Use of health care providers
There are significant differences in the use of health services between in-patient and out-patient care, as well as between urban and rural populations. For hospitalisation public health facilities are the most important care providers, with 19 percent for national hospitals and 58 percent for provincial and other public health facilities in-patient care (Table 9.5). Private clinics and private doctors and NGOs serve 17 percent of the population for in-patient care, and 5 percent is treated abroad.
For ambulant health services, the first category is private and NGO care, which provides more than half of the services. In urban areas this is even 69 percent, but also in rural areas it is close to half of out-patient service delivery – almost as important as public health care. All together, the private sector served around 1.5 million people for ambulant care.
Table 9.5: Health care seekers in the year before the survey, by residence, and by health care provider A. In thousands B. In percentages
Health care provider Urban Rural Kuchi National Urban Rural Kuchi National
a. In-patient health care providerNational hospital 101.7 72.6 4.8 179.1 43.1 11.2 12.5 19.4
Other public health facility 65.2 446.3 26.2 537.6 27.6 68.7 68.3 58.2
Private health facility 54.4 99.7 4.5 158.5 23.0 15.3 11.7 17.2
Health facility abroad 14.9 31.0 2.9 48.8 6.3 4.8 7.6 5.3
Total 236.2 649.5 38.4 924.0 100.0 100.0 100.0 100.0
b. Out-patient health care provider
National hospital 90.5 41.3 1.9 133.7 14.0 2.1 1.4 4.9
Other public health facility 102.4 941.4 64.9 1,108.7 15.8 48.6 47.7 40.7
Private health facility 448.9 942.6 68.8 1,460.3 69.2 48.7 50.5 53.7
Health facility abroad 6.7 10.9 0.6 18.2 1.0 0.6 0.4 0.7
Total 648.6 1,936.2 136.2 2,721.0 100.0 100.0 100.0 100.0
9.3 Child health
Based on the principle of rotating modules, the NRVA 2011-12 round had a restricted battery of questions on child health compared to the 2007-08 round. Only information about Vitamin A supplementation, fever and diarrhea, and acute respiratory illness (ARI) for children under five was collected. Reduction of vitamin A deficiency, diarrhea and pneumonia are critical to the achievement of MDG 4, the reduction in under-five mortality. In addition to this child health information, the number of under-fives with a birth certificate was recorded.
9.3.1 Birth registration
Although strictly not a health indicator, the percentage of children with a birth certificate may have health implications in the sense of admission difficulty to health facilities, as well as access to various other services and human rights. The International Convention on the Rights of the Child – to which Afghanistan is a party – states that every child has the right to a name and a nationality, and the right to protection from being deprived of his or her identity. Birth registration is a fundamental means of securing these.
NRVA 2011-12 indicated that 35 percent of children under 5 had a birth certificate1 (Table 9.6), slightly below the share reported by the MICS 2010 (37 percent). This would imply that 3 million under-fives are not registered as citizen of Afghanistan. Urban children were more than twice as likely to be registered as rural children (64 compared to 29 percent), and only 16 percent of Kuchi children were registered.
1 Based on verbal report, without having seen the certificate.

90 HEALTH
9.3.2 Child health indicators
Vitamin A supplementation
Vitamin A deficiency is of major public health significance in many parts of the world where poverty is extensive and resources are limited. The association between vitamin A deficiency and an increase in childhood prevalence and severity of infectious diseases, blindness and mortality has been well documented.
As shown in Table 9.6, the share of children under-five that received vitamin A supplementation was found to be 60 percent, which is higher than the MICS 2010 figure of 51 percent. The AHS 2006 reported a 77 percent coverage.2 These results may vary because vitamin A supplementation often coincides with polio or measles campaigns, which occur at specific intervals.
Fever and diarrhea
Fever was the second-most reported health problem in the past month for children under-five in the AHS 2006. In the NRVA 2011-12 a share of 40 percent of under-fives was recorded to have had fever in the last month before the survey. Of these children with fever, 55 percent (22 percent of all under-fives) also had diarrhea.
Table 9.6: Children under five years of age, by residence, and by different indicators (in percentages)
Indicator Urban Rural Kuchi National
With birth certificate 63.8 29.5 16.3 35.2
With vitamin A supplementation 75.8 56.4 50.5 59.8
In last month before the interview:With fever 40.1 40.3 39.6 40.2
With fever and diarrhea 20.7 22.8 20.6 22.2
With symptoms of acute respiratory illness
13.4 13.8 13.0 13.7
a Based on verbal report, without having seen the certificate.
Acute respiratory illness
Pneumonia is the world number one killer of children under-five (UNICEF and WHO 2006). Undernourished children, particularly those not exclusively breastfed, are at higher risk of developing pneumonia. Similarly, children and infants suffering from other illnesses, such as measles, are more likely to develop pneumonia. Environmental factors, such as living in crowded homes or indoor air pollution, may also have a role to play in increasing children’s susceptibility to pneumonia and its severe consequences. All these factors are particularly present in Afghanistan (see sections 10.2.2).
According to NRVA 2011-12 out of all children under-five, 14 percent (corresponding to 611 thousand children) had symptoms of acute respiratory illness, measured as having been ill with a cough accompanied by short, rapid breathing at any time during the month preceding the interview.
Injections against neonatal tetanus
People of all ages can get tetanus, but the disease is particularly common and serious in newborn babies. Neonatal tetanus, which is mostly fatal, is particularly common in rural areas where deliveries are mostly done at home without adequate sterile procedures. Tetanus can be prevented through immunization with tetanus-toxoid (TT) containing vaccines, which is given to women of childbearing age with, either during pregnancy or outside of pregnancy. This protects the mother and – through a transfer of tetanus antibodies to the fetus – also her baby. For full protection, a pregnant woman should receive at least two doses during each pregnancy. If a woman has been vaccinated during a previous pregnancy or during maternal and neonatal tetanus vaccination campaigns, however, she may only require one dose for the current pregnancy. Five doses are considered to provide lifetime protection.
2 MICS and AHS reported for children 6-59 months of age.

91HEALTH
Figure 9.2 presents the percentage of women aged 15-49 with a live birth in the five years preceding the survey by the number of TT injections received during the last pregnancy. Overall and for pregnancies of rural women, full protection was recorded for just over one-third (35 percent) of the women. For urban women the corresponding share was higher, but still close to half (46 percent) did not receive the required two injections. Kuchi women are very much deprived of TT coverage, as 84 percent did not receive any injection at all during their last pregnancy.
Figure 9.2: Women aged 15-49 with a live birth in the five years preceding the survey, by residence,and by the number of TT injections received during the last pregnancy (in percentages)
0
10
20
30
40
50
60
70
80
90
Urban Rural Kuchi National
46
57
84
57
12 83
9
4335
13
35
No 1 2 or more
9.4 Maternal health
Reproductive health implies that women have the right of access to appropriate health care services that will enable them to go safely through pregnancy and childbirth and provide couples with the best chance of having a healthy infant.
A limited and non-representative survey in 2002 suggested a maternal mortality ratio (MMR) of at least 1,600 per 100,000 births, which would imply that the life-time risk of women dying to pregnancy-related causes was at least one in nine (Bartlett et al. 2005). These figures would rank Afghanistan among the very highest in the world in terms of maternal mortality.
9.4.1 Ante-natal care
Skilled antenatal care (ANC) services present opportunities for reaching pregnant women with interventions that may be vital to their health and that of their infants. These interventions include medical check-ups, referrals of pregnancies that could result in complicated deliveries, and information about managing pregnancies and deliveries, immunization, breastfeeding and child spacing.
Overall, 51 percent of women reported at least one visit to or of skilled ANC providers (doctors, nurses or midwives). Use of skilled ANC services during a woman’s last pregnancy in urban and rural areas was, respectively, in 78 and 46 percent of the cases (Figure 9.3, panel a). The proportion of women using skilled ANC services was lowest among the Kuchi women (23 percent). Some 49 percent of the women did not receive any care at all (22 percent in urban areas and 54 percent in rural areas).
Education was significantly associated with skilled antenatal care, and especially the difference between women with no education and primary education is notable: 80 percent of the latter received ante-natal care, whereas only 49 of the former did so. Women with higher education approach universal coverage. Age of mother was also clearly associated with the use of skilled ANC services.

92 HEALTH
For women without pregnancy complications, the WHO recommendation is to have at least four ANC visits as the necessary minimum to provide adequate screening for pregnancy complications. Only 10 percent of the pregnant women in the last five years has realised this minimum, although urban women did so more than two times as much. One-third of the women had two or three visits and about 9 percent had just one visit.
Figure 9.3: Women with a live birth in the five years preceding the survey who received maternal health care during their last pregnancy, by selected characteristics (in percentages)
a. Ante-natal care (at least one visit) b. Skilled birth attendance
0 10 20 30 40 50 60 70 80 90 100
40-4930-3920-29
Under 20Woman's age
TertiarySecondary
PrimaryNone
Woman's educationKuchiRural
UrbanPlace of residence
Total
43.048.6
52.557.6
93.583.5
78.748.2
23.446.3
78.4
51.2
0 10 20 30 40 50 60 70 80 90 100
31.437.4
42.546.2
89.682.8
80.536.6
13.432.6
75.5
39.9
9.4.2 Skilled attendance at birth and place of delivery
Skilled birth attendance (SBA) is considered to be the single most critical intervention for ensuring safe motherhood, because it hastens the timely delivery of emergency obstetric and newborn care when life-threatening complications arise. It also implies access to a more comprehensive level of obstetric care in case of complications requiring surgery or blood transfusions. The proportion of births attended by skilled health personnel is an indicator of a health system’s ability to provide adequate care for pregnant women.
The 2011-12 NRVA reports an overall proportion of women delivering with skilled birth assistance (doctors, nurses and midwives) of 40 percent for the last delivery in the past five years. Overall, traditional birth attendants assisted in 44 percent of the deliveries, and family members or neighbours in 13 percent. All in all, some 1.7 million women were exposed to high risks of largely preventable maternal mortality and morbidity during their last delivery.
As with ANC, there are large differences in the use of professional delivery care by background characteristics. Rural women are less than half as likely to be assisted by a skilled birth attendant as urban women (33 against 75 percent), and for Kuchi women the likelihood is again less than half of that of rural women (13 percent) (Figure 9.3, panel b). Provincial differences are presented in Figure 9.4.
MDG Indicator 5.5Antenatal care coverage
51.2 percentAt least one visit:
9.9 percentAt least four visits:
MDG Indicator 5.2Proportion of births attended by skilled health
personnel
39.9 percent

93HEALTH
Educational attainment of the women has a positive effect on the probability of skilled birth attendance, but the effect is strongest for women who proceed from no education at all to primary education. Also, younger women increasingly rely on skilled birth attendance.
Figure 9.4: Percentage of women with a live birth in the five years preceding the survey who were assisted by skilled birth attendants at last delivery, by province
The level of 36 percent of deliveries taking place in health facilities is close to that of skilled birth attendance. Overall, close to two-thirds of deliveries (63 percent) take place at home. Rural deliveries take place in health institutions in only 29 percent of the cases, while the corresponding urban share is more than three times as high (69 percent). Besides the different proportions of institutional deliveries between rural and urban women, also the use of private facilities differs: 16 percent of urban women have their births in private facilities against 8 percent of rural women.
The present figure of 40 percent skilled delivery assistance indicates a large improvement from the 24 percent recorded in the NRVA 2007-08. This improvement fits in the general trend of rapidly improving maternal health care provision observed in successive surveys in Afghanistan since 2003 (see Figure 9.5). The trends for ante-natal care coverage and institutional delivery follow similar paths of rapid improvement.

94 HEALTH
Figure 9.5: Women with a live birth in the five years preceding the survey whoreceived maternal health care during their last pregnancy and who delivered
in institutional facilities, by surveya (in percentages)
0
10
20
30
40
50
60
MICS 2003
NRVA 2005
AHS 2006
NRVA 2007 -08
MICS 2010
NRVA 2011 -12
Ante -natal careSkilled birth attendanceInstitutional delivery
a NRVA 2011-12 uses births in the last five years, MICS 2010 and 2003, AHS 2006 and NRVA 2007-08 and 2005 use births in the last two years. AHS uses births of only pregnant women, other surveys use those of ever-married women.

95HOUSING AND HOUSEHOLD AMENITIES
10 HOUSING AND HOUSEHOLD AMENITIESSUMMARY. The housing conditions of the Afghan population can be defined as poor, with large differences
between urban and rural communities. However, several indicators show marked improvements. Physical access to rural communities is often problematic, as around 14 percent of households there live in villages located more than 6 kilometres from the nearest drivable road. Only 14 percent of Afghans – 45 percent in urban areas and 5 percent in rural areas – live in a dwelling that can be considered durable. Just over one in three (37 percent) live in an overcrowded dwelling, and – taking water and sanitation conditions into account – 87 percent of urban dwellers (5.3 million people) live in slum-like conditions of poverty and physical and environmental deprivation. Overall, 46 and 8 percent of the population use improved drinking water sources and improved sanitation facilities respectively. The figure for safe drinking water is a significant improvement compared to 2007-08, when it was only 27 percent. The situation improved in rural areas in particular, where the percentage using improved sources increased from 20 (2007-08) to 39. The situation with regard to sanitation improved slightly, but continues to be poor, with only 8 percent of the population having access to improved sanitation. The still widespread lack of basic infrastructure for water and sanitation implies high risks of potentially fatal diseases, and is especially detrimental for the health and survival chances of infants and young children. Health conditions in the household are further impaired by the use of solid fuels for cooking (80 percent) and heating (97 percent). The lack of electricity is becoming less of an impediment for the effective spread of information to the general public through mass media, like radio, TV and the internet, as 69 percent of households had access to some source of electricity in the month preceding the survey, compared to 42 percent in 2007-08, and only 23 percent in 2005. However, use of the internet is still virtually non-existent among the population (only 5 per thousand people use the internet), while mobile phones are used by only 14 percent of the population (up from 6 percent in 2007-08).
10.1 Introduction
The housing situation of a population is often a direct reflection of their living conditions and socio-economic development. This chapter describes different housing characteristics, including the tenancy status (section 10.2), building materials (10.3) and various facilities usually related to the housing situation, such as water supply and sanitation, but also available communication and information means (section 10.4). Consequently, the chapter also covers several related MDG indicators, including the access to safe drinking water and adequate sanitation.
10.2 Tenancy and dwelling characteristics
10.2.1 Tenancy
Tenancy arrangements showed little difference compared with NRVA 2007-08 and even with NRVA 2005. The large majority of urban and rural households (89 percent; 85 percent in 2007-08 and 2005) claim ownership of the house where they live, by either inheritance or in family possession or given freely (59 percent), by purchase (12 percent), or by construction (18 percent) (see Figure 10.1). The concentration in owned dwellings is even stronger in rural areas (95 percent), and here the share of dwellings inherited or in family possession is especially prominent. Renting and other temporary tenancy arrangements hardly occur here. In urban areas, on the other hand, a more even distribution exits between dwellings in own possession (still 72 percent) and those occupied on the basis of more temporary arrangements (27 percent), such as care taking, mortgaging or living in a dwelling of a relative or friend. Due to the mobility and continuous influx of new residents in urban areas, the share of inheritance is lower here (37 percent) than in rural areas (68 percent) and the share of purchased and rented dwellings is higher (both 22 percent). As can be seen in Figure 10.1, renting is an almost exclusively urban phenomenon. The categories of tenancy used are less appropriate to describe the situation in the Kuchi population.

96 HOUSING AND HOUSEHOLD AMENITIES
Figure 10.1: Households, by tenancy status, and by residence (in percentages)
0
10
20
30
40
50
60
70
Urban Rural National
37
6859
22
7 121320 1822
1 65 4 40 0 1
Inherited or given Purchased dwelling
Constructed dwelling Renting
Other temporary arrangement Other arrangement
10.2.2 Dwelling characteristics
A typical Afghan house is made of mud brick walls and a mud roof (64 and 63 percent, respectively) and has an earthen floor (86 percent) (Table 10.1). Urban houses somewhat deviate from this general picture in the sense that concrete is a more common building material. Thereby, these dwellings provide more durable shelter than the traditional Afghan house. Kuchi households – for 70 percent living in tents – have, as expected, a very different pattern of building materials. Dwellings for which the walls, the roof and the floor are all mainly constructed of durable materials – fired brick, stone, concrete or tiles, and wood for the roof – are considered durable dwellings. According to this definitions only in urban areas is a sizable proportion of the households living in a durable dwelling (45 percent).
The distribution of the number of rooms per dwelling is fairly similar for urban and rural households. Around one-third of these dwellings have two rooms and close to another 40 percent has three or four rooms (Table 10.2, panel a). Kuchi dwellings usually consist of one or two tents.

97HOUSING AND HOUSEHOLD AMENITIES
Table 10.1: Households, by residence, and by construction material for(a) walls, (b) roofs and (c) floors (in percentages)
Construction materialand dwelling durability
Residence
Urban Rural Kuchi National
a. Construction material of wallsFired brick/stone 20.8 3.6 1.0 7.3
Concrete 9.9 0.5 0.0 2.6
Mud bricks/mud 60.5 68.4 20.1 63.9
Stone/mud 8.4 26.4 8.1 21.4
Other 0.4 1.0 70.8 4.8
Total 100.0 100.0 100.0 100.0
b. Construction material of roofConcrete 17.0 1.2 0.0 4.7
Wood 28.0 26.8 4.4 25.8
Mud bricks/mud 51.7 69.7 24.3 63.1
Other 3.3 2.4 71.3 6.4
Total 100.0 100.0 100.0 100.0
c. Construction material of floor Mud/earth 53.6 94.5 100.0 85.6
Concrete/tile 44.8 4.6 0.0 13.4
Other 1.5 0.9 0.0 1.0
Total 100.0 100.0 100.0 100.0
d. Durability of dwelling Percentage durable 44.8 4.9 0.0 14.2
Overcrowding is a manifestation of housing inequality and is also a hidden form of homelessness. UN-Habitat defines overcrowding as dwellings with more than three persons per room (UN-Habitat 2007). The effects of overcrowding include an increased risk of disease transmission for a wide range of respiratory diseases, including pneumonia, tuberculosis and many allergies and negative social behaviours, such as domestic violence and child abuse, and negative outcomes of education and child development. NRVA 2011-12 shows that 37 percent of all households in Afghanistan live in such overcrowded dwellings (Table 10.2, panel b). For Kuchi households, the share is even 70 percent.
Overcrowding and durability of dwellings, together with access to safe drinking water and improved sanitation (see section 10.3.1 below), are four criteria1 that determine if an urban household is defined as a slum household. The MDG indicator 7.10 for environmental sustainability that is based on this definition is the percentage of urban population that lives in slum households. In the NRVA 2011-12 a percentage of 87 percent was found for this indicator, which represents 5.3 million people.
1 The fifth criterion – secure tenure – was not considered in NRVA 2011-12.
MDG Indicator 7.10Percentage of urban population living in slums
86.6 percent
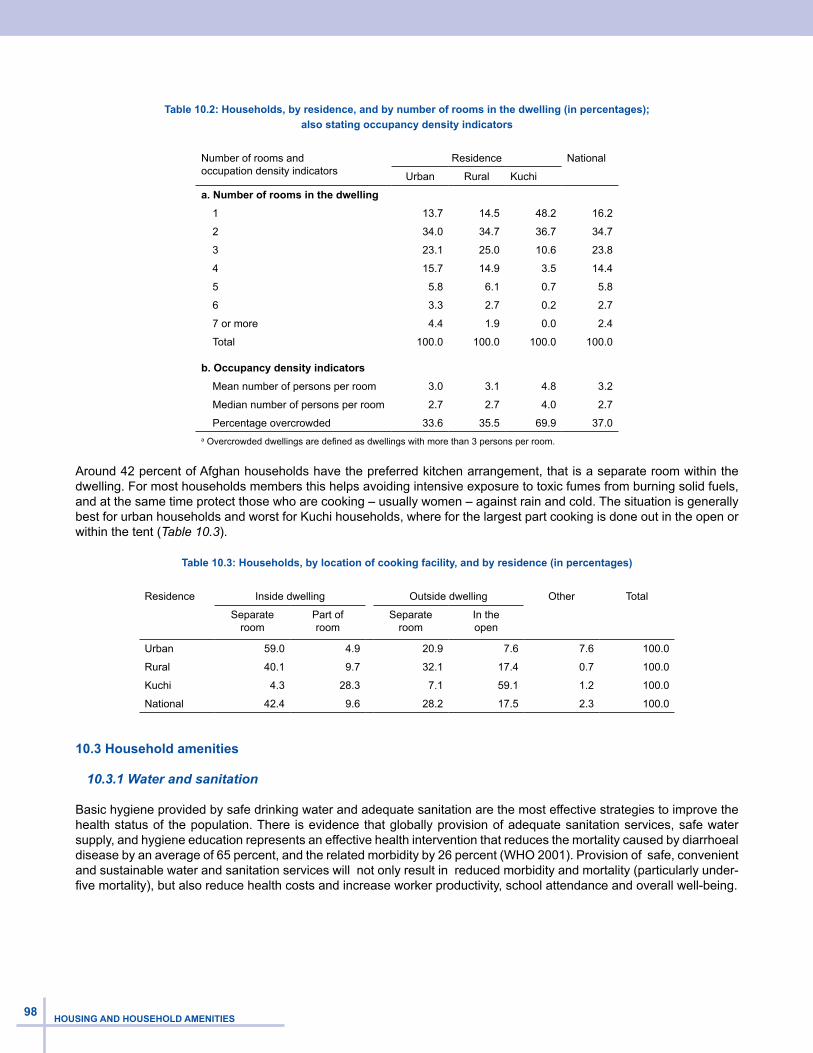
98 HOUSING AND HOUSEHOLD AMENITIES
Table 10.2: Households, by residence, and by number of rooms in the dwelling (in percentages);also stating occupancy density indicators
Number of rooms andoccupation density indicators
Residence National
Urban Rural Kuchi
a. Number of rooms in the dwelling1 13.7 14.5 48.2 16.2
2 34.0 34.7 36.7 34.7
3 23.1 25.0 10.6 23.8
4 15.7 14.9 3.5 14.4
5 5.8 6.1 0.7 5.8
6 3.3 2.7 0.2 2.7
7 or more 4.4 1.9 0.0 2.4
Total 100.0 100.0 100.0 100.0
b. Occupancy density indicatorsMean number of persons per room 3.0 3.1 4.8 3.2
Median number of persons per room 2.7 2.7 4.0 2.7
Percentage overcrowded 33.6 35.5 69.9 37.0a Overcrowded dwellings are defined as dwellings with more than 3 persons per room.
Around 42 percent of Afghan households have the preferred kitchen arrangement, that is a separate room within the dwelling. For most households members this helps avoiding intensive exposure to toxic fumes from burning solid fuels, and at the same time protect those who are cooking – usually women – against rain and cold. The situation is generally best for urban households and worst for Kuchi households, where for the largest part cooking is done out in the open or within the tent (Table 10.3).
Table 10.3: Households, by location of cooking facility, and by residence (in percentages)
Residence Inside dwelling Outside dwelling Other Total
Separate room
Part ofroom
Separate room
In theopen
Urban 59.0 4.9 20.9 7.6 7.6 100.0
Rural 40.1 9.7 32.1 17.4 0.7 100.0
Kuchi 4.3 28.3 7.1 59.1 1.2 100.0
National 42.4 9.6 28.2 17.5 2.3 100.0
10.3 Household amenities
10.3.1 Water and sanitation
Basic hygiene provided by safe drinking water and adequate sanitation are the most effective strategies to improve the health status of the population. There is evidence that globally provision of adequate sanitation services, safe water supply, and hygiene education represents an effective health intervention that reduces the mortality caused by diarrhoeal disease by an average of 65 percent, and the related morbidity by 26 percent (WHO 2001). Provision of safe, convenient and sustainable water and sanitation services will not only result in reduced morbidity and mortality (particularly under-five mortality), but also reduce health costs and increase worker productivity, school attendance and overall well-being.

99HOUSING AND HOUSEHOLD AMENITIES
Drinking water
The NRVA 2011-12 inventory of community preferences for development among male and female Shuras emphasized the importance of water supply, as they assigned it top priority (see section 11.4). The household survey recorded that access to improved drinking water sources 2 is available to 46 percent of the population of Afghanistan. Compared to the results of the NRVA 2007-08 round this indicates a sharp increase of the share of the population with safe drinking water from 27 to 46 percent. The situation especially improved in rural areas, where the share of the population using improved sources almost doubled between 2007-08 and 2011-12 from 20 to 39 percent. If this rate of improvement is continued, the ANDS target of 61.5 percent in 2020 will easily be achieved.
Large differences are observed in the share with access between the urban population on the one hand (71 percent) and the rural and Kuchi populations on the other (39 and 21 percent, respectively) (Table 10.4). Similar differences exist between the provinces, with access ranging from 7 and 9 percent in Urozgan and Zabul to 67 and 78 percent in Balkh and Kabul (Figure 10.2). Close to half the population (49 percent) – equivalent to 14.7 million people – relies on surface water for their main source of water and 28 percent on hand pumps (an improved drinking water source). The reliance on piped water (improved source) is 9 percent overall, but with 26 percent it the most important source in urban areas (data not shown).
Table 10.4: Percentage of households with access to improved sources of drinking watera, by residence; Time to reach drinking water source (all water sources), by residence
Indicator Residence National
Urban Rural Kuchi
Percentage of population with access to improved drinking water source
70.9 39.4 21.0 45.5
Time to reach drinking water source (one way, in minutes)
Mean time 1 7 18 6
Median time 0 3 10 1a Improved sources of drinking water include: hand pump (private or public), bored wells, protected spring, piped water (private or municipal); un-improved sources include: surface water (open well, unprotected spring, kariz, river, lake, channel, pool, drainage), water tanker, bottled water.
The time to reach the main source of drinking water varies significantly by residence, and especially for rural households. Overall, Afghan household members – usually women and children – have to walk on average six minutes to reach the nearest water point and another six minutes to walk back. This average time hides a substantial variation, as 50 percent of the households need only one minute or less and some 11 percent requires half an hour or more for a return trip (data not shown). For urban households, the mean time to reach the water point is only one minute and close to 80 percent has water in or next to the dwelling. The corresponding share of rural households without travel time is half of this (39 percent) and for Kuchi only 15 percent.
2 Improved sources of drinking water in NRVA include: hand pump (private or public), bored wells, protected spring, piped water (private or municipal); un-improved sources include: surface water (open well, unprotected spring, kariz, river, lake, channel, pool, drainage), water tanker, bottled water.
MDG Indicator 7.8Proportion of the population using improved drinking water
sources
45.5 percent

100 HOUSING AND HOUSEHOLD AMENITIES
Figure 10.2: Percentage of households with access to safe drinking water, by province
Sanitation
Safe disposal of human excreta creates the first barrier to excreta-related disease, helping to reduce transmission through direct and indirect – for example, animal and insect – routes. The 2011-12 NRVA found that 8.3 percent of the population used improved sanitation facilities (Table 10.5).3 Compared with NRVA 2007-08, the present survey shows relative improvement up from 5 percent, but in absolute terms the share of the population with improved sanitation remained very low.
The most commonly-used sanitation facilities are a covered latrine and open pit (respectively 57 percent and 19 percent; both considered unimproved) (data not shown). Darean and open field or bush (open defecation) are used by 15 percent of the population. The situation for the urban population is considerably better, as here up to 29 percent of the population has access to improved sanitation.
WHO and UNICEF recently apply a more refined definition of the quality of sanitation, by distinguishing private and shared facilities within the category of improved sanitation (WHO-UNICEF 2013). Using this additional criterion, only 6 percent of the population – 19 percent in urban areas, 2 percent in rural areas and none of the Kuchi – rely on the most adequate method for sanitation.
3 Improved sources of drinking water in NRVA include: hand pump (private or public), bored wells, protected spring, piped water (private or municipal); un-improved sources include: surface water (open well, unprotected spring, kariz, river, lake, channel, pool, drainage), water tanker, bottled water.
MDG Indicator 7.9
Proportion of population using an improvedsanitation facility 3
8.3 percent

101HOUSING AND HOUSEHOLD AMENITIES
Table 10.5: Population, by use of improved sanitationa, access privacy, and by residence (in percentages)
Residence Use of improved sanitation, access privacy
With access Without access Total
Private Shared Total Private Shared Total Private Shared Total
Urban 19.0 10.0 29.1 43.5 27.4 70.9 62.5 37.5 100.0
Rural 1.9 0.5 2.4 68.7 28.9 97.6 70.6 29.4 100.0
Kuchi 0.0 0.0 0.0 24.3 75.7 100.0 24.3 75.7 100.0
National 5.7 2.7 8.3 60.5 31.1 91.7 66.2 33.8 100.0 a Improved sanitation includes flush latrine, improved latrine and covered latrine; un-improved sanitation includes open pit, darean and open defecation.
10.3.2 Other household amenities
Road access
For around 10 percent of households it was reported that access to the dwelling was possible by a paved road, whereas 32 percent could only be reached by a footpath. The remainder – 58 percent had direct access by an unpaved road. The accessibility in urban areas is better, as almost one-third of households had access by paved road and only 18 percent could only be accessed by a footpath.
Overall, 61 percent of Afghan households live in a community that can be reached by drivable road and for 80 percent (Figure 10.3) the distance to the nearest drivable road is two kilometres or less. For 11 percent of the households this distance is more than five kilometres. However, for about 30 percent of the households, the nearest drivable road to the community is not passable throughout the year and only 59 percent of households have all-year access by drivable road in a distance of two kilometres or less from the community. The period in which most roads are impassable are the winter months of Jady, Dalwa and Hoot (around half-December to half-March), and to a lesser extent late autumn (Qaws – November-December) and early spring (Hamal – March-April). In Badakhshan, Bamyan, Daykundi, Ghor, Nooristan, Panshjer and Zabul more than half of the households cannot use the nearest drivable road in winter time.
Figure 10.3: Households, by distance to the nearest drivable road to the community, and by residence (in percentages)
0102030405060708090
100
Urban Rural Kuchi NationalWithin community 1-2 kilometres 3-5 kilometres6-10 kilometres 11-20 kilometres More than 20 kilometres

102 HOUSING AND HOUSEHOLD AMENITIES
Nationally, for 43 percent of the households NRVA 2011-12 reports an improvement in road access to the community in the three years preceding the survey (Figure 10.4). This is more than twice as much as households for which a deterioration was reported (20 percent), implying a significant overall improvement. Although the net balance for rural communities is positive as well, the road improvement in urban areas was relatively much stronger with 65 percent of households enjoying better access against only 6 percent experiencing a deterioration. The community assessment of development needs (see section 11.4) indicates further improvement of the road infrastructure as one of the most frequently mentioned priorities.
Figure 10.4: Households, by change in condition of the access road to the community,and by residence (in percentages)
-30
-20
-10
0
10
20
30
40
50
60
70
Urban Rural National
64.5
38.2 42.6
6.5
22.8 20.0
Improved Deteriorated
Source of electricity
The number of households that have access to electricity has grown very rapidly since 2005. For that year, NRVA reported 23 percent of households having access to any source of electrical power. The corresponding figures reported by NRVA 2007-08 and 2011-12 increased to, respectively, 42 and 69 percent, a three-fold increase in six years time (Figure 10.5).4 Around 64 percent of rural households and 95 percent of urban households have access to any source of electricity.
The main sources for which use have increased are the electric grid (from 15 in 2005 to 26 percent in 2011-12) and renewable solar and wind power (mainly solar; from virtually nothing to 22 percent). The electric grid is primarily an urban source of electrical power (44 percent in 2007-08 and 85 percent in 2011-12, compared to the rural figures of, respectively 5 and 9 percent), while solar power is concentrated in rural areas (3 percent in 2007-08 and 29 percent in 2011-12, compared to the urban figures of, respectively 0 and 4 percent).
4 Access to a source of electricity refers to access at any time in the past month.

103HOUSING AND HOUSEHOLD AMENITIES
Figure 10.5: Households, by source of electricity, and by survey year (in percentages)
0
10
20
30
40
50
60
70
2005 2007-08 2011-12
23
42
69
1517
26
5
15 11
3 56
0 2
22
0 1
10
Any source Electric grid
Government/community generator Private generator
Solar and wind Other
Fuel for cooking and heating
The use of solid fuels for heating and cooking in homes usually results in incomplete combustion and hence in the emission of hundreds of compounds, some of which may induce cancer and other health problems. It also produces greenhouse gases that contribute to global climate change. The nature of the exposure to indoor air pollution and its consequences for health depends on the interactions between the source of pollution (fuel and stove type), its dispersion (housing structure and ventilation) and when household members are in the home. The type of fuel used in cooking has consistently been the most important predictor of this exposure (United Nations 2003). The proportion of population using solid fuels is included as indicator for MDG 7 – ensuring environmental sustainability – has been removed from the international list of MDG indicators. However, it still figures in the Afghanistan National Development Strategy.
Table 10.6 provides the percentage of the population using solid fuel for both cooking and heating the dwelling in winter time. Almost all households use solid fuel for cooking and heating, except urban households who primarily use gas for cooking (detail not shown). For rural households, bushes, firewood and animal dung – in this order – are the most important cooking fuels, whereas firewood is the preferred fuel for heating, followed by bushes and animal dung. For urban households, next to firewood as the primary source for heating, charcoal is a second important fuel. For Kuchi households animal dung is the most important source for both cooking and heating.
Table 10.6: Population using solid fuels for (a) cookingand (b) heating in winter, by residence (in percentages)
Residence (a)Cooking
(b)Heating
Urban 32.5 99.1
Rural 93.4 92.3
Kuchi 99.8 100.0
National 79.9 97.4

104 HOUSING AND HOUSEHOLD AMENITIES
Information and communication means
Modern information and communication technologies are important instruments in the process of development. Telephones, computers and internet allow people to exchange experiences and learn from each other, enabling higher returns on investment and avoiding problems of duplication or missing information. They can also help people in rural areas to find out about market prices and sell their products at a better price, and can overcome traditional barriers to better education by making books and documentation available online. They can also make governments more transparent, thereby reducing corruption and leading to better governance. The use of these technologies is included as MDG indicators.
The use of mobile phones in Afghanistan is still very low in international comparison: there are only 14 mobile phones per 100 population. The figure in urban areas is almost twice as high (27 per 100 population), but lower for rural and Kuchi populations (respectively 11 and 6 per 100 population). However, the present overall number of 14 implies a significant increased from 6 as reported by NRVA 2007-08.
The use of internet is still reserved for extremely small pockets in the population. Only 5 of every thousand people used internet in the month preceding the survey. This share was 8 per thousand for males, 2 per thousand for females, and 16 per thousand in urban areas. For 2007-08, NRVA reported only 3 internet users per thousand population.
MDG Indicator 8.16
Internet users per 100 population
0.5 percent
MDG Indicator 8.15
Mobile cellular subscriptions per 100 inhabitants
14 percent

105CHALLENGES AND STRATEGIES
11 CHALLENGES AND STRATEGIESSUMMARY. Household and community assessments depict challenging and uncertain living conditions for a
large majority of the population in Afghanistan. This situation is based on a wide range of social, economic, natural and other development-related circumstances. Both households and Shuras stress the need for further improvement of a safe drinking water supply. In addition, improvement of road, irrigation, electricity, health and education infrastructure are high on the Afghan wish list. Household shocks – risk events with negative outcomes that are outside people’s direct control – were experienced by 84 percent of households in the year preceding the survey. The combination of a largely agricultural society, harsh climatic conditions and underdeveloped farming and veterinary support leads to dramatic fluctuations in agricultural production and food prices. As a result of the limited availability of productive employment, many households have resorted to food intake reduction (42 percent of households that experienced a household shock) or other detrimental coping strategies like sale of production means or removing children from school and placing them in low-paid jobs. Decreasing household expenditure (52 percent) and taking out loans or buying on credit (39 percent) are other strategies frequently applied by households experiencing such a shock. The NRVA survey indicates that 55 percent of Afghan households are in debt, to an average amount of 77 thousand Afs. The survey also suggests that various food-for-work, cash-for-work or income-generating programmes employed more than 420 thousand people and benefited 320 thousand households.
11.1 Introduction
Afghanistan is a country with a high-risk profile, due to a combination of climatic and natural circumstances and being a historically grown hotbed of social and political conflict and economic vulnerability. The various indicators reported on in this NRVA volume reveal that a large share of the Afghan population live in difficult circumstances, despite marked improvements in several areas. This last chapter brings together the challenges encountered by households and communities, as well as the strategies that are applied to deal with such challenges.
11.2 Indebted households
A large share of 55 percent of Afghan households were currently indebted at the time of the survey (Table 11.1). The mean debt of households with any debt was around 77 thousand Afs. As the median debt was only 40 thousand Afs, this implies quite a large variation of the debt amounts. Although a large share of households had relatively small debts of below 50 thousand Afs, there were still significant numbers of households with large and very large debts.
Table 11.1 also shows considerable differences between urban households on the one hand and rural and Kuchi households on the other. Although the share of indebted households does not differ very much across these groups (from 54 to 59 percent), the amount of debt of urban households is around twice as large as that of rural and Kuchi ones. The former households are much more represented in the categories of high and very high debts.

106 CHALLENGES AND STRATEGIES
Table 11.1: Households, by debt status, debt amount (in percentages); also stating debt means (in Afs.)
Debt status, debtamount; Debt means
Residence National
Urban Rural Kuchi
Without debt 46.2 45.1 40.8 45.1
With debt 53.8 54.9 59.2 54.9
Below 25,000 11.4 19.5 24.4 17.9
25,000 - 49,999 7.4 12.7 13.1 11.5
50,000 - 74,999 8.9 9.8 7.3 9.4
75,000 - 124,999 9.1 6.4 6.6 7.0
125,000 - 299,999 9.9 4.5 5.2 5.8
300,000 and over 7.1 2.0 2.6 3.2
Total 100.0 100.0 100.0 100.0
Debt means of indebted householdsa
Mean debt 124,359 63,444 64,619 76,800
Median debt 70,000 35,000 30,000 40,000a Applying a 1 percent trimmed mean
Compared to the previous NRVA, the debt situation of households seems to have changed. Although in 2007-08 even more of the households reported being indebted (67 percent), the mean and median debt was significantly lower – 45 and 20 thousand, respectively (data not shown).
The survey respondents also reported about their assessment of any change in the economic situation of the household compared to one year before.1 A large proportion of 43 percent experienced no change (Figure 11.1). Of the 57 percent households for which the economic situation did change, more experienced a deterioration (33 percent) than an improvement (24 percent). Whereas the net balance for urban households was about neutral, rural and especially Kuchi households fared worse: respectively 11 and 26 percent more households reported a deterioration than an improvement.
Figure 11.1: Households, by assessmenta of their economic situation compared to one year before,and by residence
05
101520253035404550
Much better Slightly better
Same Slightly worse
Much worse
4
22
47
23
44
20
41
27
8
1
13
47
29
11
4
20
43
26
7
Urban Rural Kuchi National
a The assessment is based on the average of male and female reports
1 The presented figures of the economic assessment are based on the average of male and female reports. Gender-specific reports were very similar.

107CHALLENGES AND STRATEGIES
11.3 Household shocks and coping strategies
11.3.1 Household shocks
Like on previous occasions, the present NRVA investigated into the shocks experienced by households in the 12 months preceding the interview. Shocks are considered those events that have negative outcomes and that are outside the direct control of households. These outcomes can be temporary and relatively mild, but they can also shake the very existence of the household and its members, for which no coping strategy can provide an adequate answer.
A basic distinction is made between generic shocks and idiosyncratic shocks. The first relate to general occurrences that can possibly affect an entire community, like floods, livestock diseases, droughts or general insecurity, whereas the second refer to events affecting specific households or persons, such as the death of a household member, loss of employment or a burnt-down home. The box on household shocks below provides the classification of specific shocks into larger categories.2
A large majority of 84 percent of households reported the experience of any shock during the year before the survey, which is much more than in 2007-08 (65 percent) and 2005 (45 percent) (Table 11.2). The overview of shocks experienced in different years shows large fluctuations, which partly describes the changing situation on the ground and probably partly also a changing perspective or reporting tendency. It can be observed that urban households are less exposed to most shocks than rural and especially Kuchi households.
Household shocksInsecurity: insecurity, violence and theft.
Food and farm gate price: unusually high increases in food prices, unusual decrease in farm gate prices.
Epidemics: unusually high level of human disease.
Idios yncratic: bankruptcy of family business, serious illness or accident for working household member, death of a working household member, death or illness of other household member, involuntary loss of house or land, involuntary loss of livestock, loss of employment by a household member, reduced salary of a household member.
Drinking water: reduced drinking water quantity and quality.
Agri cultural: reduced agricultural water quality and quantity, unusually high level of crop pests and diseases, opium eradication, abandoning opium cultivation, unusually high level of livestock diseases, reduced availability of grazing areas, and reduced availability of Kuchi migration routes.
Natu ral disasters: earthquakes, landslides and avalanches, flooding, late damaging frosts, heavy rains preventing work, severe winter conditions and hailstorms.
2 For reasons of comparability the category of ‘influx of returnee households’ is left aside. In 2011-12, 2.8 percent of households reported this as an event that had negative consequences to them.

108 CHALLENGES AND STRATEGIES
Table 11.2: Households, by experience of household shocks, and by survey year, residence(in percentages)
Survey year,residence
Generic shocks
Idio
sync
ratic
sh
ocks
Any
sho
ck
Drin
king
w
ater
Agr
icul
tura
l
Nat
ural
di
sast
er
Sec
urity
Food
and
farm
pric
es
Epi
dem
ics
NRVA 2011-12
Urban 77 36 8 26 6 64 5 23
Rural 85 48 44 38 17 58 13 20
Kuchi 94 78 62 37 32 76 15 38
National 84 47 37 36 15 61 11 22
NRVA 2007-08
Urban 34 6 5 18 2 4 0 15
Rural 72 21 24 44 13 3 1 31
Kuchi 81 28 48 40 13 1 0 37
National 65 18 22 39 11 3 0 28
NRVA 2005
Urban 18 23 10 36 9 27 9 26
Rural 51 25 48 55 12 19 10 10
Kuchi 52 30 68 40 9 9 8 15
National 45 25 47 53 11 19 9 11
Particular rises were observed for shocks related to drinking water and food and farm gate prices. This may be related to the drought experienced in the northern provinces in 2011. Next to rise in food prices, the single shocks mentioned most frequently by households were drinking water quantity (40 percent), drinking water quality (35 percent) and agricultural water (26 percent) (data not shown). Figure 11.2 shows the percentage of households that were affected by drinking water problems for each province. The belt of northern provinces stand out as a region that suffered drought in 2011. With respect to natural disasters, the most commonly encountered problems were severe winter conditions (26 percent), flooding (18 percent), late damaging frosts and heavy rains (both 17 percent).

109CHALLENGES AND STRATEGIES
Figure 11.2: Percentage of households experiencing a drinking water shock in the year before the survey, by province
Actual experience of violence or insecurity occurred to one in seven households (15 percent), which is a slight increase from earlier NRVAs. This fairly corresponds with the rating by household members of the security situation in their district of residence. The male and female household representatives reported in, respectively, 14 and 12 percent of the cases that the district they were living in was considered – moderately or very – insecure. The corresponding figures for – moderately or very – secure districts were 78 percent for both male and female respondents, the remainder being not secure and not insecure. At province level Nooristan, Urozgan and Logar were rated as the most insecure provinces, and Balkh and Panshjer as the most secure. Urban districts were generally rated as much more secure (for around 94 percent of the households) than rural districts (for only 74 percent of the households). A majority of the respondents (around 78 percent) was satisfied with the performance of the police in the district in serving and protecting the people. However, around 10 percent was moderately or very dissatisfied with the police conduct, around 3 percent in urban areas and around 12 percent in rural areas. There is a strong correspondence between areas that are rated as secure and satisfaction with the police.
11.3.2 Coping strategies
Depending on the severity of shocks experienced, households need to find strategies to adjust their livelihood in response. If so, households may find resort in a variety of such coping strategies, depending on the nature and severity of shocks the households.
Of all households that experienced one or more shocks in the year before the survey, 74 percent mentioned not having fully recovered (data not shown) and 70 percent applied any coping strategy to mitigate the situation (Figure 11.3). The most common strategies were decrease of expenditures (52 percent), food reduction (42 percent, mostly in terms of reduced quality) and taking loans or buying on credit (39 percent). However, for those households that were affected by

110 CHALLENGES AND STRATEGIES
food price increases, food reduction (64 percent) is the most common coping strategy. Households that applied food-reduction strategies at any time represent 9.5 million people.
Figure 11.3: Percentage of households applying coping strategies, by residence
0
10
20
30
40
50
60
70
80
Any strategy Decreasing expenditures
Reduction of food quantity
or quality
Taking loans and credit
Other strategies
Selling or mortgaging production
means
Work strategies
Help from community
69
54
3641
10
26 4
70
51
4339
1511 11 10
66
5047
36
13
24
10 10
70
52
4239
1410 10 9
Urban Rural Kuchi National
Transferring the house or production means (renting, mortgaging or selling the house, land or female reproductive livestock), was another main strategy for Kuchi households (for 24 percent of those that experienced any shock), and to a lesser extent for rural households (11 percent). Despite the short-term mitigating effect of this strategy, it may severely undermine the longer-term capability of the household to recover and improve their economic position. Strategies that directly affected the wellbeing of children included dropping children from school (by 6 percent of households that experienced any shocks), increasing child labour (7 percent) and selling child brides (1 percent) (data not shown).
A small percentage of households that suffered from shocks (2.4 percent) mentioned working in relief programmes as a specific coping strategy, but 9 percent of all households – representing around 320 thousand households – reported that one or more members participated in any such relief programme. The survey results suggest that some 424 thousand persons worked in food-for-work, cash-for-work or income-generating programmes. Compared to NRVA 2007-08 (280 thousand) this suggests a significant increase in the number of households that benefited from such programmes.

111CHALLENGES AND STRATEGIES
11.4 Community development priorities
In most communities in which the survey was conducted, male and female Shuras were interviewed to obtain their views about development priorities to which the government should pay attention. Figure 11.4 gives an insight into the different community priorities by residence and gender. Despite the marked progress made in drinking water supply (see section 10.3.1), this remains the concern that was most often mentioned as the first priority for improvement. This is particularly the case for urban and Kuchi populations, and more so for women than for men (31 against 26 percent). The latter difference might be related to the larger female burden of collecting water and water treatment.
The second development issue that is most frequently mentioned as first priority by women is improvement of health facilities (by 17 percent of the female Shuras) and by men improvement of road infrastructure (by 21 percent of the male Shuras). Whereas the male Shuras did not differentiate between improvement for male and female health facilities, the female Shuras mentioned general health facilities as often as health facilities specifically for women (data not shown). This indicates that particularly for women access to health services is a major concern. It can also be noted that the need for health facility improvement is concentrated in rural areas and is much less an issue in urban areas.
Housing and – particularly – electricity as first development priority is mentioned next often, and about as often by men and women (13-14 percent). Again, this is an issue less important in urban than in rural areas. It should be noted that electricity provision – together with health care – is consistently among the most mentioned second and third priorities (data not shown). The repair of the irrigation system is particularly a rural male issue and hardly figures for women and urban and Kuchi populations. In the NRVA 2007-08 the reconstruction of the irrigation system was still the most frequently mentioned priority, even at national level.
Education – covering basic education, literacy training and vocational training – is a further main development priority, but more for women (12 percent) than for men (8 percent). In addition, whereas the male and female Shuras more or less alike report the need for basic education for both girls and boys, female Shuras also specifically call for attention to literacy and vocational skills training for women (data not shown).
With regard to remaining development priorities, the most notable result is the importance of veterinary services for the Kuchi population, which explains the high value in the ‘Other’ category for the male Shuras. Employment opportunities and justice and security are not mentioned very often as first development priorities. This may either mean that the issue is not of primary importance or that communities do not see a major role for the government in improving the situation in these areas.

112 CHALLENGES AND STRATEGIES
Figure 11.4: Households, by first community development prioritya for(a) male Shuras and (b) female Shuras, and by residence (in percentages)
(a) Male Shuras
0
5
10
15
20
25
30
35
40
45
50
55
Drinking water
Road infrastructure
Housing and electricity
Health facilities
Irrigation system
Education facilities
Other Employment and micro
credit
Justice and security
38
28
95
3
9
4 5
0
21 2016
13 128
4 4 2
43
2
15 16
2
7
15
2 0
26
21
1412
9 85 4
2
Urban Rural Kuchi National
(b) Female Shuras
0
5
10
15
20
25
30
35
40
45
50
55
Drinking water
Health facilities
Road infrastructure
Housing and electricity
Education facilities
Employment and micro
credit
Other Irrigation system
Justice and security
42
4
21
7
128
42 1
2621
1115 13
5 53 2
53
106
19
5
0
7
0 0
31
1713 13 12
6 52 1
Urban Rural Kuchi National
a Drinking water: improved quality and quantity of drinking water; Road infrastructure: repair and construction of local roads and bridge construction/rehabilitation; Housing and electricity: new/improved housing and electricity provision; Health facilities: New/improved local health facilities for women, for men and for women and men; Irrigation system: rehabilitation of the irrigation system; Education facilities: new/improved local education facilities for girls, for boys, for girls and boys, literacy training for women, for men and for women and men, vocational skills training for women, for men and for women and men; Employment and micro credit: increased employment opportunities for women, for men and for women and men, new/improved micro-credit schemes; Justice and security: reformed/improved local justice systems, local land or housing dispute settlement mechanisms and disarmament of local militia/commanders; Other: improved veterinary services, various.

113REFERENCES
REFERENCESBartlett, L.A., S. Mawji, S. Whitehead, C. Crouse, S. Dalil, D. Ionete, P.Salama, Afghan Maternal Mortality Study Team
(2005), Where giving birth is a forecast of death: Maternal mortality in four districts of Afghanistan, 1999-2002. The Lancet, Vol. 365, pp. 864-870.
CSO (2 009), National Risk and Vulnerability Assessment 2007/8. A profile of Afghanistan. Kabul, Central Statistics Organizatio.
CSO (2010), Afghanistan National Statistical Plan. Kabul, Central Statistics Organization. CSO (2012), Afghanistan Statistical Yearbook 2011-12. Kabul, Central Statistics Organization.CSO a nd UNICEF (2003), Multiple Indicator Cluster Survey Afghanistan. Kabul, Central Statistics Organization and
UNICEF.CSO a nd UNICEF (2012), Afghanistan Multiple Indicator Cluster Survey 2010-11: Final report. Kabul, Central Statistics
Organization and UNICEF.Dubuc , S. and D. Coleman (2007), An Increase in the Sex Ratio of Births to India-born Mothers in England and Wales:
Evidence for Sex-Selective Abortion. Population and Development Review, Vol. 33, No. 2, pp. 382-400.ICLS ( 1982), Resolution concerning statistics of the economically active population, employment, unemployment and
underemployment, adopted by the Thirteenth International Conference of Labour Statisticians. Geneva, ILO.ICLS ( 1993), Resolution concerning the International Classification of Status in Employment (ICSE), adopted by the
Fifteenth International Conference of Labour Statisticians. Geneva, ILO.ICLS ( 1998), Resolution concerning the measurement of underemployment and inadequate employment situations,
adopted by the Sixteenth International Conference of Labour Statisticians. Geneva, ILO.ILO (2 008), Decent work indicators for Asia and the Pacific: a guidebook for policy-makers and researchers. Bangkok,
ILO.ILO (2009), Global Employment Trends. January 2009. Geneva, ILO.ILO (2 011), Key Indicators of the Labour Market (KILM) (7th edition).
[http://kilm.ilo.org/manuscript/default.asp]Islami c Republic of Afghanistan (2009), Millennium Development Goals Islamic Republic of Afghanistan. Vision 2020.
Annual progress report 2008.Islamic Republic of Afghanistan (2010), The Afghanistan compact. Islami c Republic of Afghanistan (2011), Drought impact emergency food security assessment in fourteen affected
provinces of Afghanistan. Second phase report. WFP and Food Security and Agriculture Cluster. [http://www.wfp.org/food-security/]
Islami c Republic of Afghanistan (2012), Poverty and Food Security in Afghanistan. Analysis based on the National Risk and Vulnerability Assessment of 2007-08. Ministry of Economics, February 2012.
Islami c Republic of Afghanistan and World Bank (2010), Setting the Official Poverty Line for Afghanistan -Technical Report. [http://cso.gov.af/Content/Media/Documents/CSO-WB_Tech-Report-Pov_v4(2)1162011121045651553325325.pdf]
Islami c Republic of Afghanistan, Ministry of Economy and the World Bank (2010), Poverty Status in Afghanistan: A Profile Based on the National Risk and Vulnerability Assessment (NRVA) 2007/08. Kabul.
Islami c Republic of Afghanistan, WFP and Food Security and Agriculture Cluster (2011), Drought Impact Emergency Food Security Assessment in fourteen provinces of Afghanistan, second report. November 2011
FAO ( 2008), Afghanistan national livestock census 2002-2003. Final report 2006. Rome, Food and Agriculture Organization.

114 REFERENCES
MAIL (2012), Agriculture prospects report. Kabul, Ministry of Agriculture, Irrigation and Livestock.MoE (2010), National Education Strategic Plan for Afghanistan (1389-1393) (Draft). Kabul, Ministry of Education.MoP H (2005), A Basic Package of Health Services for Afghanistan 2005/1384. Kabul, Ministry of Public Health.MoP H ( 2005), Afghanistan Health Survey 2006. Estimates of Priority Health Indicators. Kabul, Ministry of Public
Health.MRRD and CSO (2007), The National Risk and Vulnerability Assessment 2005. Kabul, Ministry of Rural Rehabilitation
and Development and Central Statistics Organization.UNDP (2011), Human Development Report 2013. Sustainability and equity: a better future for all. New York, UNDP.UNDP (2013), Human Development Report 2013. The rise of the South: Human progress in a diverse world. New
York, UNDP.UNEC E (2006), Recommendations for the 2010 censuses of population and housing. New York, United Nations.UNES CO (2009), Education indicators. Technical guidelines. Montreal, UNESCO Institute for Statistics.UNFP A (2011), Report of the International Workshop on Skewed Sex Ratios at Birth: Addressing the Issue and the
Way Forward. New York, UNFPA. UN-H ABITAT (2007), The state of the world's cities 2006-7. London, Earthscan.UNICEF (2012), The State of the World’s Children 2009. Children in an urban World. New York, UNICEFUNICEF and WHO (2006), Pneumonia the forgotten killer of children. New York, UNICEF.United Nations (1983), Manual X: Indirect Techniques for Demographic Estimation. New York, United Nations.United Nations (1989), Convention on the Rights of the Child. New York, United Nations.United Nations (1990), Step-by-step guide to the estimation of child mortality. ST/ESA/SER.A/107 New York, United
Nations, Department of International Economic and Social Affairs [http://www.un.org/esa/population/techcoop/DemEst/stepguide_childmort/stepguide_childmort.html]
United Nations (2003), Indicators for Monitoring the Millennium Development Goals. Definitions, Rationale, Concepts and Sources. New York, United Nations.
United Nations (2008), Principles and Recommendations for Population and Housing Censuses, Rev. 2. No. E.07.XVII.8. New York, United Nations.
United Nations (2011), World population prospects. The 2010 revision. New York, United Nations Population Division [http://esa.un.org/unpd/wpp/Excel-Data/population.htm]
WFP/ VAM and MRRD/VAU (2004), The National Risk and Vulnerability Assessment 2003. Kabul, World Food Programme.
WHO (2001), Water Supply and Sanitation Assessment 2000 Report. Geneva, WHO.WHO-UNICEF (2013), Progress on sanitation and drinking-water. 2013 update. Geneva, WHO.

115ANNEX I PERSONS INVOLVED IN NRVA 2011-12
ANNEX I PERSONS INVOLVED IN NRVA 2011-12I.1 CSO staff
Mohammad Sami Nabi - Project Leader / Head of Field Operation and Sampling DepartmentAhmad Khalid "Amarkhel" - Lead StatisticianTamim Ahmad "Shakeb" - Admin OfficerHafiz Saadat - Database Manager / Field Operations Director (to December 2011)Esmatullah "Hakimi" - Field Operations Director (from December 2011)Mohammad Muneer "Jamshidi" - Data Checking SupervisorAbdul Ahmad "Sherzai" - Support StaffMohammad Sadeq "Sediqi" - Data Quality CheckerAhmad Sameer "Samadi" - Data Quality CheckerMohammad Aman "Rahimi" - Data Quality CheckerMohammad Waheed Ibrahimi - Database DirectorAhmad Zubair “Sarwary” - Data Entry DirectorShakeeba “Rahimi” - GIS DirectorGhulam Hazrat “Faqiri” - Deputy Director Field Operations and SamplingSayed Ali Aqa “Hashimi” - Head of Data ProcessingNargiss "Akbar" - SecretaryMasjedy “Mohammadi” - Driver
I.2 ICON
Inga Korte - Project Manager (to November 2011)Christophe Dietrich - Project Manager (from November 2011)Jan Bartlema - Team LeaderBart de Bruijn - Chief Analyst / EditorAhmad Tariq Wardak - Database ConsultantTarana Feroz - Financial ManagerAhmad Fawad “Barakati” - Driver (to November 2011)Samiullah Zazai - Driver (from November 2011) I.3 Steering Committee
H.E.Abdul Rahman Ghafoori, President General CSOProf. Hasibullah Mowahed, Deputy President General CSOMr. Giacomo Miserocchi, Attaché Rural Development, EU Delegation to AfghanistanMr. Wali Mohammed Farhodi, Programme Manager - Rural Development, EU Delegation to AfghanistanMr. Amanullah Assil, Programme Officer, WFP-VAMMr. Abdul Rehman Shekib, AIRD Executive Director, MRRDMrs. Siping Wang, Chief PME, UNICEFMr. Esmatullah Ramzi, Advisor to the President General, CSOMr. Mohammad Sami Nabi, Head of Field and Sampling Department, CSODr. Prafulla Chandra Mishra, Capacity Development Advisor, CSOMr. Safdar Rajabekof, SRF Project Coordinator, CSO And non-disclosed others
I.4 Technical Advisory Committee
H.E. Abdul Rahman Ghafoori, President General CSOProf. Hasibullah Mowahed, Deputy President General CSOMr. Esmatullah Ramzi, Advisor to the President General, CSOMr. Mohammad Sami Nabi, Head of Field and Sampling Department, CSODr. Prafulla Chandra Mishra, Capacity Development Advisor, CSOMr. Amanullah Assil, Programme Officer, WFP-VAMDr. Dean Joliffe, Senior Economist, Economic Policy and Poverty Team (SASEP), South Asia Region, World BankDr. Silvia Redaelli, Economist, Economic Policy and Poverty Team, World BankDr. Jan Bartlema, Team Leader NRVA 2011-12, ICONDr. Bart de Bruijn, Chief Analyst/Editor NRVA 2011-12, ICONAnd non-disclosed others

116 ANNEX II SUBJECT COVERAGE IN NRVA 2007-08 TO 2015-16
ANNEX II SUBJECT COVERAGE IN NRVA 2007-08 TO 2015-16
SubjectNRVA round
2007-08 2011-12 2013-14 2014-15 2015-16Household structure X X X X XHousing and amenities X X X X XLivestock X X Reduced X ReducedAgriculture X Reduced X Reduced XLabour X Reduced Expanded X ExpandedChild labour X - Expanded - ExpandedPoverty X X Reduced X ReducedFood security X X Reduced X ReducedEducation X X X X XMigration X Reduced Expanded Reduced ReducedDisability X - - X -Child health X Reduced - X ReducedMaternal health X Reduced Reduced X XFertility and mortality X Reduced - X -Gender X - X - -Shocks and coping X X X X X
X – NRVA 2007-08 coverage levelReduced – Reduced coverage Expanded – Expanded coverage N.B. Survey rounds 2007-08 and 2011-12 have been implemented, rounds 2013-14 to 2015-16 are scheduled

ANNEX III NRVA 2011-12 QUESTIONNAIRES 117
ANNEX III NRVA 2011-12 QUESTIONNAIRESIII.a Household questionnaire
Household questionnaire1. Household identification
Supervisor-filled information Interviewer-filled information
Cluster code 1.8 Geo reference waypoint code
Urban ……………1Rural ……………2 1.9 GPS ID codeKuchi ……………3
Province 1.10 Latitudename Range: 29.35 to 38.40 N .
1.11 LongitudeRange: 60.31 to 75.00 E .
1.12 Altitude (m.)Range: 200 to 4500 m.
1.6 Control and Enumeration Area Household number (1-15)
Name of head ofhousehold
If respondent is not the head of household, fill 1.16 and 1.17
1.17 Respondent's line number
1.18 Door number (from tracking sheet)
2. Process monitoring
Date of interview Day Month Year
Interviewers' number Male interviewer Female interviewer
Supervisor's number 2.4 Regional Supervisor's number
Date of office editing Day Month Year
Office editor's code
Date of data entry Day Month Year
Data-entry officer code
District name
1.2 Residentce code
1.3
1.4
1.7 Village name
1.13
National Risk and Vulnerability Survey (NRVA) 1389-90Afghanistan's Multi-Purpose Household Survey
1.1
2.1
2.2
2.3
2.8
2.7
2.5
2.6
1.14
1.15 Head's father's name
1.16 Respondent's name
1.5 Urban Nahia

118 ANNEX III NRVA 2011-12 QUESTIONNAIRES
3. Household rosterINTERVIEWER: We would like to start with some information about the people who usually live and sleep in this
household, starting with the head of the household. Please mention all people who usually stay here, including babies and infants, and people who are not immediate kin.
3.1 3.2 3.3 3.4 3.5 3.6 3.7 3.8 3.9 3.10 3.11Line Write the name What is the Is How old What is Line Does Line Does Lineno. of each household relationship <name> was <name's> number <name's> number <name's> number
member of <name> male or <name>? marital or of (first) father live of mother ofto the head female? on his/her engagement spouse in this this live in this thisof house- last status? house- father house- mother
hold? birthday? For codes, hold? hold?If less see below 1=Yes 1=Yes
than one If not If 'Not in this 2=No 2=NoFor codes, 1=Male year, married, household', If 'No', If 'No', gosee below 2=Female write '00' go to 3.8 write '99' go to 3.10 to next line
01 1 2 1 2 1 2
02 1 2 1 2 1 2
03 1 2 1 2 1 2
04 1 2 1 2 1 2
05 1 2 1 2 1 2
06 1 2 1 2 1 2
07 1 2 1 2 1 2
08 1 2 1 2 1 2
09 1 2 1 2 1 2
10 1 2 1 2 1 2
11 1 2 1 2 1 2
12 1 2 1 2 1 2
13 1 2 1 2 1 2
14 1 2 1 2 1 2
15 1 2 1 2 1 2
16 1 2 1 2 1 2
17 1 2 1 2 1 2
Codes for 3.3 (Relationship to head of household) Codes for 3.6 (Marital status)1 = Household head 5 = Grandchild 9 = Brother-/sister-in-law 1 = Married 4 = Never married,2 = Wife or husband 6 = Father or mother 10 = Other relative 2 = Divorced, separated but engaged3 = Son or daughter 7 = Nephew or niece 11 = Unrelated member 3 = Widowed 5 = Never married,4 = Son-/daughter-in-law 8 = Brother or sister not engaged
1

119ANNEX III NRVA 2011-12 QUESTIONNAIRES
4. Housing and amenities
4.1 What type of dwelling best describes Single family house ……………………1your current dwelling? Part of a shared house ………………2
Separate apartment ……………………3Shared apartment …………………… 4Tent ……………………………………5 Go to 4.6Temporary shelter/shack ……………6Other ………………………………… 7
4.2 What is the major construction material of the exterior walls Fired brick/stone …………………… 1of the dwelling, in the main living area of the family? Concrete ………………………………2
Wood ………………………………… 3Mud bricks/mud …………………… 4Stone/mud ……………………………5Other ………………………………… 6
4.3 What is the major construction material of the roof Concrete ………………………………1of the dwelling that protects the main living area of Wood ………………………………… 2the family from rain? Tin/metal ………………………………3
Mud bricks/mud …………………… 4Other ………………………………… 5
4.4 What is the major construction material of the floor Dirt/earth ………………………………1of this dwelling, in the main living area of the family? Concrete/tile …………………………2
Other ………………………………… 3
4.5 When was this dwelling constructed? Less than 2 years ago ………………12-4 years ago …………………………25-9 years ago …………………………310-19 years ago …………………… 420-29 years ago …………………… 5More than 30 years ago ……………6Don't know ……………………………7
4.6 How did you acquire this dwelling Inheritance or from family …………1or what is the occupancy status? Purchased dwelling ……………………2
Constructed dwelling …………………3Caretaker ………………………………4 Go to 4.8Mortgaging ……………………………5Relative or friend of owner …………6Own - given free, charity ……………7Tenant (renting) ………………………8Other ………………………………… 9
4.7 How much money per month does your household pay to live in this dwelling? Afs. Go to 4.9(If pay in goods or services, estimate the value per month)
4.8 If you were to purchase this dwelling today, how much would it cost? IF 'DON'T KNOW', WRITE '888'
4.9 What kind of kitchen/cooking facilities Kitchen is separate room in dwelling ……………………………1does this dwelling have? Kitchen is part of a room in the dwelling (or part of the tent) 2
Cooking room is in a separate room outside the dwelling ……3Cooking done in the open ………………………………………4Other ………………………………………………………………5
4.10 How many rooms does your household occupy (exclude corridors, balconies)?FOR KUCHI HOUSEHOLDS LIVING IN TENTS, RECORD NUMBER OF TENTS
,,
,

120 ANNEX III NRVA 2011-12 QUESTIONNAIRES
4.11 INTERVIEWER: RECORD ACCESS TO DWELLING Footpath ………………………………1Unpaved road …………………………2Paved road ……………………………3
4.12 Has your household had electrictiy at any time Yes Noin the past month from any of these sources? a Electric grid ………………………1 2
b Government generator …………1 2INTERVIEWER: READ ALL OPTIONS a-i c Private generator (engine) ………1 2
d Private generator (hydro) ……… 1 2e Community generator (engine) …1 2f Community generator (hydro) ……1 2g Solar ………………………………1 2h Wind ………………………………1 2i Battery ……………………………1 2
4.13 In the past month, what has been the household's Animal dung …………………………1main source of cooking fuel? Bushes (ping), twigs/branches ………2
Firewood ………………………………3Crop residue, trash ……………………4Charcoal, coal ………………………5Kerosene or oil ………………………6Gas ……………………………………7Electricity ………………………………8Other ………………………………… 9
4.14 What is the main source of heating for this house in winter? No heating in house …………………1Bushes(ping), twigs/branches, straw 2Firewood ………………………………3Animal dung …………………………4Crop residue, trash ……………………5Charcoal, coal ………………………6Kerosene, diesel, petrol ………………7Gas ……………………………………8Electricity ………………………………9Other ………………………………… 10
4.15 How much did this household spend in the last month a Electricity ………………
for each type of fuel used in the household? (in Afghanis) b Gas ……………………
READ ALL QUESTIONS a-f c Fuel, oil …………………
IF HOUSEHOLD DID NOT SPEND ON A SPECIFIC d Firewood ………………
TYPE OF FUEL, WRITE '0' e Charcoal, coal …………
IF 'DON'T KNOW', WRITE '888' f Ping, straw, manure …
4.16 What main toilet facility does your household use? Open pit …………………………………1Traditional covered latrine …………2Improved latrine ………………………3Flush latrine …………………………4None (open field, bush) or sahrahi …5 Go to 4.18Dearan (not pit) ………………………6Other ………………………………… 7
4.17 Is the toilet facility shared with other households? Yes ……………………………………1No ………………………………………2
,
,
,
,
,
,

121ANNEX III NRVA 2011-12 QUESTIONNAIRES
4.18 What is the main source of drinking water for members Open well - public …………………… 1of your household in the past month? Open well - private ……………………2
Hand pump - public ……………………3Hand pump - private …………………4Bored wells (motorised/hand pump) …5Spring - unprotected …………………6Spring - protected …………………… 7Piped - private ………………………8Piped - municipal …………………… 9Kariz ……………………………………10River, lake, channel, pool, drainage …11Water tanker …………………………12Bottled water, mineral water ……… 13Other, specify …………………………14
4.19 How much did you pay (or will you pay) for water from this drinking water source for the last month? (in Afghanis)
IF NO PAYMENT, WRITE '0' IF 'DON'T KNOW', WRITE '888'
4.20 How many minutes does it take to walk, one way, to this main source of water?
IF DO NOT HAVE TO WALK, WRITE '0' IF 'DON'T KNOW', WRITE '888'
CONTINUE WITH THE NEXT MODULE
,

122 ANNEX III NRVA 2011-12 QUESTIONNAIRES
5. Livestock
5.1 Does any member of your household own any Yes ……………………………………1livestock, including poultry at the present time? No ………………………………………2 Go to 5.10
5.2 5.2: How many of the following animals 5.3: How many of these <animal type>5.3 does your household own today? are productive females?
IF NO ANIMALS OF SPECIFIC TYPE OWNED, WRITE '0' FOR QUESTION 5.2 AND CONTINUE WITH NEXT TYPEIF ANY ANIMALS OF SPECIFIC TYPE OWNED, WRITE NUMBER IN QUESTION 5.2 AND ASK QUESTION 5.3
a Cattle (meat and dairy) …………… Cattle (meat and dairy) ……………
b Oxen, yaks ………………………………
c Horses …………………………………
d Donkeys …………………………………
e Camels …………………………………
f Goats …………………………… Goats ……………………………
g Sheep …………………………… Sheep ……………………………
h Chickens ……………………… Chickens ………………………
i Turkeys, ducks, geese, other birds Turkeys, ducks, geese, other birds
5.4 Do you have access to animal feed concentrate? Yes ……………………………………1No ………………………………………2
5.5 In the past 12 months, have you vaccinated Yes ……………………………………1any of your livestock or poultry? No ………………………………………2 Go to 5.7
5.6 Which type of livestock have you vaccinated Yes Noin the past 12 months? a Cattle ………………………………1 2
b Sheep ………………………………1 2ASK FOR ALL TYPES OF LIVESTOCK a-e MENTIONED c Goats ………………………………1 2
d Poultry ……………………………1 2e Other livestock ……………………1 2
5.7 Did your household obtain information on livestock, medicine Yes ……………………………………1for livestock or veterinary help in the last 12 months? No ………………………………………2 Go to 5.9
5.8 What was the main type of veterinary service provider Goverment veterinary service ……… 1that your household used? VFU (Veterinary Field Unit) …………2 Go to
Other NGO veterinary service ………3 5.10Private veterinary service ……………4Other ………………………………… 5
5.9 What was the main reason you did not use any advice Did not need service …………………1or help from veterinary services in the past 12 months? Had too few animals/poultry ……… 2
Could not afford / too expensive ……3Too far away …………………………4Do not know how to find/obtain ………5Provider would not work with me ……6Other ………………………………… 7
5.10 Did your household sell any live animals Yes ……………………………………1in the past 12 months? No ………………………………………2 Go to 5.12
,
,
, ,
,
,

123ANNEX III NRVA 2011-12 QUESTIONNAIRES
5.11 How many of the following live animals a Cattle …………………………………
did you sell in the last 12 months? b Oxen, yaks ………………………………
ASK FOR EACH OF THE LIVESTOCK a-i MENTIONED c Horses …………………………………
WRITE '0' IF NO ANIMAL SOLD d Donkeys …………………………………
e Camels …………………………………
f Goats ……………………………
g Sheep ……………………………
h Chickens ………………………
i Turkeys, ducks, geese, other birds
5.12 Did your household sell any animal products in the past Yes ……………………………………112 months, like milk, meat, poultry, wool, cashmere, No ………………………………………2 Go to nexthides or eggs? module
5.13 What quantity of <item> did you sell in the last 12 months? a Milk ……………………………………………..Liters
ASK FOR EACH OF THE b Meat from sheep, goats, cattle, horses, etc. ..Kg.
PRODUCE a-f MENTIONED c Meat from poultry (chicken, geese, etc.) …….Kg.
IF ITEM NOT SOLD, WRITE '0' AND d Wool, cashmere ……………………………… Kg.
CONTINUE WITH NEXT ITEM e Furs, skins, hides, leather ………………. Pieces
f Eggs …………………………………….. Number
CONTINUE WITH THE NEXT MODULE
,
,
,
,
,
,
,
,

124 ANNEX III NRVA 2011-12 QUESTIONNAIRES
6. AgricultureINTERVIEWER: Now, I would ask you some questions about land ownership and access to agricultural land
in the most recent spring cultivation season
6.1 Does any of your household members own Yes ……………………………………1agricultural land or a garden plot? No ………………………………………2 Go to 6.5
How many jeribs of each of the following types of land is owned by this household?
IF NO LAND OF A SPECIFIC TYPE OWNED, WRITE '0.0'
6.2 Irrigated land …………………………………………………………………….Jeribs .
6.3 Rain-fed land …………………………………………………………………….Jeribs .
6.4 Garden plot ……………………………………………………………………………Jeribs . Go to 6.6
6.5 Did anyone in your household have access to agricultural Yes ……………………………………1land or a garden plot - without owning it - in the most recent No ………………………………………2 Go to nextspring cultivating season? module
6.6 Did anyone in your household have access to any irrigated Yes ……………………………………1land - owned or not owned - in the most recent spring No ………………………………………2 Go to 6.18cultivation season, excluding a garden plot?
6.7 How many jeribs of irrigated land - without garden plot - Jeribs .did members of your household together cultivate in the IF NONE, WRITE '0.0' most recent spring cultivation season?
6.8 How many jeribs of irrigated land did your household Jeribs . If '0.0',leave fallow in the main spring cultivation season? IF NONE, WRITE '0.0' go to 6.10
6.9 What was the main reason for not cultivating the irrigated Lack of water …………………………1land in the most recent spring cultivation season? Lack of money to provide water ……2
No budget for cultivation ……………3Conflict over water or land …………4Security concerns …………………… 5Land not fertile ………………………6Shifting cultivation …………………… 7Other ………………………………… 8
6.10 What was the most important crop you harvested FOR CODES, SEE AT BOTTOM OF PAGEfrom the last spring cultivation season?
6.11 How much of this <most important crop> did you harvest? Kgs.
6.12 What was the second most important crop you har- FOR CODES, SEE AT BOTTOM OF PAGE If '0.0',vested from the last spring cultivation season? IF NO SECOND CROP, WRITE '00' go to 6.16
6.13 How much of this <second-most important crop> did you harvest? Kgs.
6.14 What was the third most important crop you FOR CODES, SEE AT BOTTOM OF PAGE If '0.0',harvested from the last spring cultivation season? IF NO THIRD CROP, WRITE '00' go to 6.16
6.15 How much of this <third-most important crop> did you harvest? Kgs.
Codes for 6.10 - 6.12 and 6.14 (Harvested crops)1=Wheat 5=Flax 8=Millet 12=Kourgit 16=Tomato 20=Fruit/nut trees2=Maize/sorghum 6=Sugar cane/beet 9=Cotton 13=Potatoes 17=Onions 21=Melon/watermelon3=Barley 7=Alfalfa/clover/ 10=Opium 14=Beans 18=Okra 22=Other fruits4=Rice other fodder 11=Cumin 15=Eggplant 19=Other vegetables 23=Other crop
,
,
,
,
,
,
,
,

125ANNEX III NRVA 2011-12 QUESTIONNAIRES
6.16 What was the main source of irrigation for the majority Irrigated river, canal, dam …………1of the irrigated land you cultivated during the spring Irrigated deep-well pump ……………2cultivation season? Spring ………………………………… 3
Kariz ……………………………………4Nawara …………………………………5Absialab, snow melt, flood …………6Other ………………………………… 7
6.17 In the past spring cultivation season, did you have Yes ……………………………………1sufficient irrigation for your irrigated crops? No ………………………………………2
6.18 Did anyone in your household have access to any rain-fed Yes ……………………………………1land - owned or not owned - in the most recent spring No ………………………………………2 Go to 6.28cultivation season, excluding a garden plot?
6.19 How many jeribs of rain-fed land - without garden plot - Jeribs .did members of your household together cultivate in the IF NONE, WRITE '0.0' most recent spring cultivation season?
6.20 How many jeribs of rain-fed land did your household Jeribs . If '0.0',leave fallow in the main spring cultivation season? IF NONE, WRITE '0.0' go to 6.22
6.21 What was the main reason for not cultivating the rain-fed Lack of rain ……………………………1land in the most recent spring cultivation season? No budget for cultivation ……………2
Conflict over ownership ………………3Security concerns …………………… 4Land not fertile ………………………5No manpower to help …………………6Other ………………………………… 7
6.22 What was the most important crop you harvested Wheat ………………………………… 1in the most recent spring cultivation season from Barley ………………………………… 2rain-fed land? Maize / sorghum …………………… 3
Cotton ………………………………… 4Flax ……………………………………5Cumin …………………………………6Melon / watermelon ……………………7Other crop ……………………………8
6.23 How much of this <most important crop> did you harvest? Kgs.
6.24 What was the second most important crop you harvested Wheat ………………………………… 1in the most recent spring cultivation season from Barley ………………………………… 2rain-fed land? Maize / sorghum …………………… 3
Cotton ………………………………… 4Flax ……………………………………5Cumin …………………………………6Melon / watermelon ……………………7Other crop ……………………………8No second-most important crop ……9 Go to 6.28
6.25 How much of this <second-most important crop> did you harvest? Kgs.
,
,
,
,

126 ANNEX III NRVA 2011-12 QUESTIONNAIRES
6.26 What was the third most important crop you harvested Wheat ………………………………… 1from the most recent spring cultivation season from Barley ………………………………… 2rain-fed land? Maize / sorghum …………………… 3
Cotton ………………………………… 4Flax ……………………………………5Cumin ………………………………6Melon / watermelon ……………………7Other crop ……………………………8No third-most important crop ……9 Go to 6.28
6.27 How much of this <third-most important crop> did you harvest? Kgs.
6.28 Did your household have acces to a garden plot Yes ……………………………………1in the most recent spring cultivation season? No ………………………………………2 Go to 6.34
6.29 How many jeribs of garden plot did your household Jeribs . If '00',cultivate in the most recent spring cultivation season? IF NONE, WRITE '0.0' go to 6.34
6.30 What was the most important crop you harvested in the Fruit / nut trees ………………………1last spring cultivation season from the garden plot? Grapes …………………………………2
Other fruits ……………………………3Maize / sorghum …………………… 4Alfalfa/clover/other fodder …………5Shakarpara ……………………………6Other (specify) ………………………7
6.31 How much of this <most important crop> did you harvest? Kgs.
6.32 What was the second most important crop you harvested Fruit / nut trees ………………………1in the last spring cultivation season from the garden plot? Grapes …………………………………2
Other fruits ……………………………3Maize / sorghum …………………… 4Alfalfa/clover/other fodder …………5Shakarpara ……………………………6Other (specify) ………………………7
No second-most important crop ……8 Go to 6.34
6.33 How much of this <second-most important crop> did you harvest? Kgs.
6.34 What was the total amount of money you spent on agricultural input on the following (a-f):
WRITE '00' IF NO MONEY SPENT ON AN ITEM Afghanis
a Seeds …………………………………………………………………………………
b Water …………………………………………………………………………………
c Fertilisers (UREA/DAP) and pesticides ……………………………………………
d Labour costs (e.g. for weeding) ……………………………………………………
e Machine/tractor rent …………………………………………………………………
f Other input costs ……………………………………………………………………
CONTINUE WITH THE NEXT MODULE
,
,
,
,
,
,
,
,
,

127ANNEX III NRVA 2011-12 QUESTIONNAIRES
7. Household assets
7.1 How many of the following items does your household own?
Item No. of Item No. of Item No. of Item code pieces code pieces Item code pieces
Refrigerator 1 TV 6 Motorcycle 11
Stove / gas balloon 2 VCR/DVD 7 Car 12
Sewing machine 3 Satellite phone 8 Tractor / thresher 13
Iron 4 Electric fan 9
Radio, tape recorder 5 Bicycle 10
Total items A Total items B Total items C
7.2 Grand total of A+B+C …………………………………………………………………………………………………
INTERVIEWER: LIST ALL THE ITEMS IDENTIFIED IN QUESTION 7.1 WITH THE CODE NUMBER BELOW.THE LIST SHOULD HAVE THE SAME NUMBER AS THE GRAND TOTAL OF QUESTION 7.2.THEN ASK QUESTIONS 7.3-7.5 FOR EACH LISTED ITEM.
7.3 Item 7.3 7.57.4 Did you buy this How much did you According to current prices,7.5 No. Description Code <item> in the pay for this what do you think you could
last 12 months? <item>? get if you sold it?1=Yes2=No
If 7.3 is '2', If 'Don't Know', write '888' If 'Don't Know',go to 7.5 Go to next item write '888'
01 1 2
02 1 2
03 1 2
04 1 2
05 1 2
06 1 2
07 1 2
08 1 2
09 1 2
10 1 2
11 1 2
12 1 2
13 1 2
14 1 2 ,, ,,
,
,
,
, ,
,
,
,
,
, ,,
,
,
,
, ,
,
,
,
,,, ,
,
,
,
, ,
,
,
,
, ,,
, ,
,
, ,
, ,
,
, ,
,,
,
,
7.4
,
,
,

128 ANNEX III NRVA 2011-12 QUESTIONNAIRES
7.3 Item 7.3 7.57.4 Did you buy this How much did you According to current prices,7.5 No. Description Code <item> in the pay for this what do you think you could
last 12 months? <item>? get if you sold it?1=Yes2=No
If 7.3 is '2', If 'Don't Know', write '888' If 'Don't Know',go to 7.5 Go to next item write '888'
15 1 2
16 1 2
17 1 2
18 1 2
19 1 2
20 1 2
21 1 2
22 1 2
23 1 2
24 1 2
25 1 2
INTERVIEWER: ASK QUESTIONS 7.6 AND 7.7 FOR FIRST ITEM, THENCONTINUE WITH 7.6 AND 7.7 FOR SECOND ITEM, ETC.IF NO ITEM IN 7.6, WRITE '0' AND CONTINUE WITH 7.6 AND 7.7 FOR NEXT ITEM
7.6 7.77.6 Item How many of the According to current prices,7.7 following items does this how much do you think you
household own? could get if you sold all of them?
Mobile phones
Carpets (khalin) (expensive best quality hand-woven)
Gilim, satrangi, namad, fash (other carpet- products)
Blankets
Kitchen utensils (dishes / pots and pans)
7.8 How many male household members have used the Internet in the past 12 months?
7.9 How many female household members have used the Internet in the past 12 months?
CHECK QUESTION 7.6; IF HOUSEHOLD HAS MOBILE PHONE, ASK 7.10, OTHERWISE GO TO 7.11
7.10 Could we please ask you to give us your phone number?This will only be used to contact you in case we have forgotten something and will be entirely confidential.
7.11 Does your household have any debt at present? Yes ……………………………………1No ………………………………………2 Go to M8
7.12 What is the value of the total outstanding debt for Afs. Go tothis household at present? Module 8
, ,
,
,
,
,
,
,
,
,
, ,
,
,
,
,
, ,,
,
,
,
, ,
,
,
,
,
, ,,
,
,
,
, ,
,
,
,
,
, ,,
,
,
,
, ,
,
,
,
7.4

129ANNEX III NRVA 2011-12 QUESTIONNAIRES
8. L
abou
r
INTE
RVIE
WER
:CO
PY T
HE L
INE
NUM
BER
OF
ALL
HOUS
EHO
LD M
EMBE
RS W
HO A
RE 1
4 YE
ARS
OR
OLD
ER F
ROM
THE
HO
USEH
OLD
RO
STER
TO
8.1
.
8.1
8.2
8.3
8.4
8.5
8.6
8.7
8.8
COPY
In th
e la
st w
eek,
did
<na
me>
do
Alth
ough
<na
me>
did
Wha
t is
the
mai
nW
as <
nam
e>Di
d <n
ame>
try
Wha
t is
the
mai
nIn
the
last
mon
th, d
id <
nam
e> d
oLI
NEan
y wo
rk fo
r pay
, for
profit
, or f
orno
t wor
k la
st w
eek,
doe
sre
ason
that
avai
labl
e fo
rto
find
wor
k or
reas
on <
nam
e>an
y wo
rk fo
r pay
, for
profit
, or f
orNU
MBE
Rfa
mily
gai
n, in
cludi
ng fa
rm w
ork
he/s
he h
ave
work
from
<nam
e> w
aswo
rk in
the
last
star
t a b
usin
ess
did
not l
ook
for
fam
ily g
ain,
inclu
ding
farm
wor
kor
tend
ing
lives
tock
or p
oultr
y, o
rwh
ich h
e/sh
e wa
sab
sent
from
wor
kwe
ek if
it h
adin
the
last
wee
k?wo
rk in
the
last
or te
ndin
g liv
esto
ck o
r pou
ltry,
or
any
occa
siona
l wor
k?te
mpo
raril
y ab
sent
?in
the
last
wee
k?be
en o
ffere
d?we
ek?
any
occa
siona
l wor
k?1=
Yes
1=Ye
sFo
r cod
es,
1=Ye
s1=
Yes
For c
odes
,1=
Yes
2=No
2=No
see
belo
w2=
No2=
Nose
e be
low
2=No
If 'Y
es',
go to
8.9
If 'N
o', g
o to
8.5
All:
go to
8.8
If 'Y
es',
go to
8.8
Go
to n
ext p
erso
n or
nex
t mod
ule
1
2
1
2
1
2
1
21
2
1
2
1
2
1
2
1
21
2
1
2
1
2
1
2
1
21
2
1
2
1
2
1
2
1
21
2
1
2
1
2
1
2
1
21
2
1
2
1
2
1
2
1
21
2
1
2
1
2
1
2
1
21
2
1
2
1
2
1
2
1
21
2
1
2
1
2
1
2
1
21
2
1
2
1
2
1
2
1
21
2
Code
s fo
r 8.4
(Rea
son
for a
bsen
ce fr
om w
ork)
Code
s fo
r 8.7
(Rea
son
not l
ooki
ng fo
r wor
k)1=
Illnes
s / i
njur
y6=
Ente
rpris
e clo
sure
/lay
off
1=St
uden
t / p
upil
6=Be
ing
appr
entic
e10
=Wai
ting
for b
usy
seas
on2=
Holid
ay/ra
mza
n/va
catio
n/le
ave
7=St
rike/
lock
out
2=Ho
usew
ife /
hous
ekee
ping
7=In
milit
ary
serv
ice11
=Do
not w
ant t
o wo
rk3=
Scho
ol/e
duca
tion/
train
ing
8=Se
curit
y sit
uatio
n3=
Retir
ed /
too
old
8=Ha
ve a
lread
y fo
und
a jo
b 12
=No
chan
ces
to g
et a
job
/ no
jobs
ava
ilabl
e4=
Bad
weat
her
9=O
ther
(spe
cify)
4=Illn
ess
/ inj
ury
9=Te
mpo
raril
y la
id o
ff13
=Oth
er (s
pecif
y on
line
in b
ox fo
r Lin
e No
.)5=
Wor
k re
duct
ion/
susp
ensio
n5=
Hand
icapp
edTH
IS IS
PAG
EO
F1

130 ANNEX III NRVA 2011-12 QUESTIONNAIRES
INTE
RVIE
WER
:CO
PY T
HE L
INE
NUM
BER
OF
ALL
HOUS
EHO
LD M
EMBE
RS W
HO A
RE 1
4 YE
ARS
OR
OLD
ER F
ROM
THE
HO
USEH
OLD
RO
STER
TO
8.1
.
8.1
8.9
8.10
8.11
8.12
8.13
8.14
8.15
In w
hat s
ecto
r of
Wha
t typ
e of
act
ivity
didW
as <
nam
e> s
elf-e
mplo
yed
How
man
y day
s did
How
man
y hou
rs p
er d
ay,
Is <
nam
e> w
illing
toIs
<na
me>
ava
ilable
COPY
the
econ
omy
<nam
e> d
o in
the
main
job
or w
orkin
g on
own
acc
ount
,<n
ame>
wor
k in
the
on a
vera
ge, d
id <n
ame>
wo
rk m
ore
hour
s in
to w
ork
mor
e ho
urs
LINE
is th
e m
ain jo
bin
the
mos
t rec
ent w
eek
or a
s un
paid
fam
ily o
rm
ost r
ecen
t wee
kwo
rk in
the
mos
t rec
ent
a we
ek?
in a
week
if o
ffere
d?NU
MBE
Rof
<na
me>
he/s
he w
as w
orkin
g?sa
laried
wor
ker,
or a
s da
yhe
/she
was
wor
king?
week
he/
she
was
work
ing?
1=Ye
s1=
Yes
For c
odes
, see
belo
wFo
r cod
es, s
ee b
elow
labou
rer o
r em
ploye
r?2=
No2=
No
1
2
1
2
1
2
1
2
1
2
1
2
1
2
1
2
1
2
1
2
1
2
1
2
1
2
1
2
1
2
1
2
1
2
1
2
1
2
1
2
Code
s fo
r 8.9
(Sec
tor o
f eco
nom
y)Co
des
for 8
.10
(Typ
e of
act
ivity
)Co
des
for 8
.11
(Em
ploy
men
t sta
tus)
1=Ag
ricult
ure
6=Tr
ansp
orta
tion,
com
mun
icatio
n1=
Farm
ing8=
Plan
t and
mac
hine
oper
ating
1=Da
y lab
oure
r2=
Lives
tock
7=He
alth
2=Sh
ephe
rding
9=Dr
ivers
(car
, tru
ck, b
us, t
axi)
2=Sa
laried
wor
ker,
priva
te s
ecto
r3=
Man
ufac
turin
g / p
roce
ssing
(han
dicra
ft,8=
Educ
ation
3=Sa
les a
nd tr
ade
10=H
ealth
wor
kers
3=Sa
laried
wor
ker,
publi
c se
ctor
food
pro
cess
ing, t
ailor
ing, e
tc.)
9=O
ther
gov
erne
men
t ser
vices
4=Co
nstru
ction
and
mini
ng11
=Tea
ching
4. S
elf-e
mplo
yed
(own
-acc
ount
farm
ers,
4=Co
nstru
ction
(e.g
. roa
ds, b
uildin
gs)
10=U
N/NG
Os
5=Fo
od p
roce
ssing
12=S
ecur
ity w
ork
indep
ende
nt w
orke
rs, e
tc.)
5=W
holes
ale a
nd re
tail t
rade
11=O
ther
ser
vices
6=M
etal
and
wood
wor
k13
=Oth
er s
ervic
e wo
rk5=
Emplo
yer
7=Ha
ndicr
aft w
ork
14=O
ther
wor
k6=
Unpa
id fa
mily
wor
ker

131ANNEX III NRVA 2011-12 QUESTIONNAIRES
9. Household income
9.1 9.1 From what kind of activities did your household 9.2 What was approximately the share of income from9.2 earn the largest share of money in the last year? these activities in the total household income?
FOR CODES, SEE BELOW PercentIF NO MONEY EARNED, WRITE '00' AND GO TO MODULE 10 IF 100 PERCENT, GO TO 9.9
9.3 9.3 Which activities provided the second most important 9.4 What was approximately the share of income from9.4 source of money income for this household? these activities in the total household income?
FOR CODES, SEE BELOW PercentIF NO SECOND SOURCE, WRITE '00' AND GO TO 9.9
9.5 9.5 Which activities provided the third most important 9.6 What was approximately the share of income from9.6 source of money income for this household? these activities in the total household income?
FOR CODES, SEE BELOW PercentIF NO THIRD SOURCE, WRITE '00' AND GO TO 9.9
9.7 9.7 Which activities provided the fourth most important 9.8 What was approximately the share of income from9.8 source of money income for this household? these activities in the total household income?
FOR CODES, SEE BELOW PercentIF NO FOURTH SOURCE, WRITE '00'
9.9 What was approximately the total amount of money income from <NAME MOST IMPORTANT ACTIVITY> in the last year?
Codes for 9.1, 9.3, 9.5, 9.7 (Income-generating activities)
Agriculture and livestock1=Production & sale of field crops (non-opium) 15=Mechanics work Trade2=Production & sale of opium 16=Road/building construction 41=Shopkeeping/small business3=Production & sale of orchard products 17=Other production work 42=Street/market sales4=Agricultural wage labour (non-opium) 43=Other trade5=Opium wage labour Services6=Production & sales of livestock 21=Teacher Other labour
and livestock products 22=Doctor/nurse/medical worker 51=Other work, wage labour7=Sheparding wage labour 23=Military service 52=Other work, day labour
24=PoliceProduction and Manufacturing 25=Office work, government Other income11=Carpet weaving 26=Office work, non-government 61=Borrowing12=Sewing, embroidery, etc 27=Other government/NGO/UN work 62=Rental income13=Other handicraft work 28=Taxi/transport 63=Remittances from migrants14=Food production and processing 29=Security 64=Zakat
(bakers, butchers, etc) 30=Other service work
CONTINUE WITH THE NEXT MODULE
,

132 ANNEX III NRVA 2011-12 QUESTIONNAIRES
10. Household expenditure
I want to ask you a series of questions about expenses made by all household members in the last month.Other questions wil refer to expenses made in the past year. Please carefully consider and include all expensesmade by this household.
INTERVIEWER: ASK ALL QUESTIONS 10.01-10.20IF NO EXPENSES ARE MADE FOR A SPECIFIC ITEM, WRITE '0'
Can you please tell me what the household spent in the last month for the following: Afghanis
10.01 Food consumed at home, including drinks ……………………… 10.01
10.02 Food and drinks consumed outside the home ………………………… 10.02
10.03 Cigarettes …………………………………………………………………… 10.03
10.04 Tobacco/snuff …………………………………………………………… 10.04
10.05 Matches ……………………………………………………………………… 10.05
10.06 Laundry powder/ detergents, cleaning supplies ……………………… 10.06
10.07 Soap (hand, toiletry) ……………………………………………………… 10.07
10.08 Shampoo …………………………………………………………………… 10.08
10.09 Toothpaste ………………………………………………………………… 10.09
10.10 Personal grooming (haircuts, etc) for males …………………………… 10.10
10.11 Fee for public bath ………………………………………………………… 10.11
10.12 Laundry charges ………………………………………………………… 10.12
10.13 Fee for baking bread ……………………………………………………… 10.13
10.14 Fixed phone line and use (including PCO booths) …………………… 10.14
10.15 Mobile phone charges (minutes and prepaid) ………………………… 10.15
10.16 Internet service/ internet café, fax, mail ………………………………… 10.16
10.17 Tranportation fare - bus and taxis ……………………………………… 10.17
10.18 Fuel for car/motor bike (do not include business vehicles) ……… 10.18
10.19 Taxes (formal and informal) ………………………………………… 10.19
10.20 Other miscellaneous expenses in last month …………………… 10.20
Can you please tell me what the household spent in the last year for the following:ASK ALL QUESTIONS 10.21-10.37 Afghanis
10.21 House construction and repair (materials and labour) …… 10.21
10.22 Education fees (tuition for school, college, university) …………… 10.22
10.23 School uniforms ……………………………………………………… 10.23
10.24 Textbooks …………………………………………………………………… 10.24
10.25 Pens, pencils and notebooks (school supplies) ……………………… 10.25
10.26 Other stationery …………………………………………………………… 10.26
10.27 Repair, maintenance and tires for motor vehicles …………… 10.27
10.28 Airfares …………………………………………………………… 10.28
10.29 Men's clothing (excluding shoes) …………………………………… 10.29
,
,
,
,
,
,
,
,
,
,
,
,
,
,
,
,
,
,
,
,
,
,
,
,
,
,
,
,
,
10.30 Women's clothing (excluding shoes) ………………………………… 10.30,

133ANNEX III NRVA 2011-12 QUESTIONNAIRES
10.31 Children's clothing (excluding school uniforms and shoes) ……… 10.31
10.32 Men's shoes …………………………………………………………… 10.32
10.33 Women's shoes ………………………………………………………… 10.33
10.34 Children's shoes ………………………………………………………… 10.34
10.35 Fines or debt payments …………………………………………… 10.35
10.36 Weddings and funerals, haj ………………………………… 10.36
10.37 Annual celebrations and charitable donations (khair-o-khairat) 10.37
Now I would like to ask you about how much your household and all its members spend on health services.Expenditures can be monetary, or non-monetary payments, such as gifts. The value of non-monetary paymentsshould be included in the cost.
10.38 In the last year, how many members of your household If '0' go towere admitted to stay at a health facility overnight? 10.49
Who was/were the household member(s) that stayed INTERVIEWER: LIST NAME(S) AND LINE NUMBERS OFovernight at a health facility? IN-PATIENTS IN 10.40
10.40 Line no. in-patientss [COPY FROM ROSTER]
Name
10.41 How many times was <name> admitted inthe health facility in the last 12 months?
10.42 Where did <name> most recentlystay overnight for health care? CODES ARE BELOW CODES ARE BELOW CODES ARE BELOW
10.43 In total, for this most recent visit, how Afghanis Afghanis Afghanismuch was spent on treatment and servicesreceived during <name's> stay?
We want to know about all costs related tothis visit, including any charges for fees,laboratory tests, medicines, or ambulance
If gifts or non-monetary payments weremade, please estimate cash value and include in total costs
10.44 How much of this total cost, including gifts Afghanis Afghanis Afghanisor non-monetary payments, was paid forjust medicines?
10.45 How much of this total cost, including gifts Afghanis Afghanis Afghanisor non-monetary payments, was paid forjust diagnostic services (excludinglaboratory test, x-ray)?
Codes for 10.42 (Health facility where stayed overnight)Public health facilities in Afghanistan Private health facilities in Afghanistan Other health facility in Afghanistan
1=National hospital 7=Private hospital 11=NGO2=Regional hospital (EPHS) 8=Private clinic 12=Mosque3=Provincial hospital (EPHS) 9=Other private facility 13=Nursing home4=District hospital (BPHS) 14=Pharmacy5=Comprehensive Health Centre 10=Hospital/clinic abroad 15=Other in Afghanistan6=Other public health facility
,
,
,
,
,
,
,
, ,,
, ,
,
,
, ,

134 ANNEX III NRVA 2011-12 QUESTIONNAIRES
Line no. in-patients [COPY FROM 10.40]
10.46 In addition to costs for treatment and Afghanis Afghanis Afghanisservices, how much was paid for transport(non-ambulance), including gifts or non-monetary payments?
10.47 How much additional was paid for food, Afghanis Afghanis Afghanisincluding gifts or non-monetary payments?
10.48 How many nights did <name> stayovernight during this last visit?
10.49 Now I would like to ask some questions about the household members who consulted a health careprovider in the last month, but did not stay overnight
In the last E118, did any member of your household receive care from a Yes …………………1health provider, a pharmacy, or traditional healer without staying overnight? No ……………………2 Go to 10.57
Who was/were the household member(s) that were INTERVIEWER: LIST NAME(S) AND LINE NUMBERS OFadmitted at a health facility without staying overnight? OUT-PATIENTS IN 10.52
10.51 Line no. out-patients [COPY FROM ROSTER]
Name
10.52 From what type of health provider did <name> get care most recently withoutstaying overnight? CODES ARE BELOW CODES ARE BELOW CODES ARE BELOW
10.53 In total, for this visit, how much was spent Afghanis Afghanis Afghanison treatment and services received during<name's> most recent consultation?
We want to know about all costs related tothis consultation, including consultation fees, laboratory tests and medicines
If gifts or non-monetary payments weremade, please estimate cash value and include in total costs
10.54 How much of this total cost, including giftsor non-monetary payments, was paid forjust medicines?
10.55 How much of this total cost, including giftsor non-monetary payments, was paid forjust diagnostic services (excludinglaboratory test, x-ray)?
Codes for 10.53 (Health facility providing care)Public health facilities in Afghanistan Private health facilities in Afghanistan Other health facility in Afghanistan
1=National hospital 7=Private hospital 11=NGO2=Regional hospital (EPHS) 8=Private clinic 12=Mosque3=Provincial hospital (EPHS) 9=Other private facility 13=Nursing home4=District hospital (BPHS) 14=Pharmacy5=Comprehensive Health Centre 10=Hospital/clinic abroad 15=Other in Afghanistan6=Other public health facility
, ,,
, ,,
, ,
,
,
,
,
,,
,

135ANNEX III NRVA 2011-12 QUESTIONNAIRES
Line no. out-patients [COPY FROM 10.51]
10.56 In total, how many times did <name> getcare from a health provider in the last month without staying overnight?
10.57 Apart from any costs for health care consultations (you told me about), Afghanishow much did the household spend for (additional) visits, on health-related items in the last month?
We want to include all health-related items such as drugs, vitamins, herbal IF NO SPENDING, WRITE '0'remedies, family planning methods, etc.
10.58 In the last 12 months, how much was spent on: IF NO SPENDING, WRITE '0' Afghanis
a. Prescription glasses and other vision products? ………………………………………………
b. Hearing aids, canes and prosthetic devices? ……………………………………………………
CONTINUE WITH THE NEXT MODULE
,
,
,

136 ANNEX III NRVA 2011-12 QUESTIONNAIRES
11. Migration11.1 11.2 11.3 11.4 11.5 11.6 11.7 11.8 11.9
Line For all CIRCLE If person is 7 years or older (Line no. in 11.2 circled) CIRCLE If person is 14 years or older (11.7)no. Where LINE Where was How many What was What was LINE Did <name> Where did this
was NO. <name's> usual years did the main the main NO. spend one month person spend<name> IF place of residence <name> reason reason IF or more away most of the timeborn? PERSON at the time Karzai live there? <name> <name> PERSON from the house- during the
IS 7 was elected as If born went to came to IS 14 hold for seasonal absence forYEARS president in 1383? there, live in live in YEARS work in the past seasonal work
OR If not yet born, write '0' go to 11.6 that this OR 12 months? in the pastFor OLDER and go to next person Write '0' if place? place? OLDER 1=Yes 12 months?
codes, If answer is '1' ('In this less than 2=Nosee district'), go to 11.7 1 year If '2', go to For codes, see at
below For codes for 11.3, 11.5 and 11.6, see bottom of page next person bottom of page
01 01 01 1 2
02 02 02 1 2
03 03 03 1 2
04 04 04 1 2
05 05 05 1 2
06 06 06 1 2
07 07 07 1 2
08 08 08 1 2
09 09 09 1 2
10 10 10 1 2
11 11 11 1 2
12 12 12 1 2
13 13 13 1 2
14 14 14 1 2
15 15 15 1 2
16 16 16 1 2
17 17 17 1 2
18 18 18 1 2
Codes for 11.1, 11.3 and 11.9 Codes for 11.5 Codes for 11.61=This same district 1=Parents' place of origin 1=To find work / better workElsewhere, 6=Pakistan 2=Went there for work 2=Security/protection problems
2=Same province, urban 7=Iran 3=Fled there as refugee/IDP 3=Returning refugees/IDPs3=Same province, rural 8=Arabian Penisula 4=To get married 4=To get married4=Other province, urban 9=Other country 5=Moved there with the family 5=Moved with the family5=Other province, rural 88=Don't know 6=Joined the own family there 6=To join the own family
7=To attend education 7=To attend education8=Access to health services 8=Access to health services9=Other reason 9=Other reason

137ANNEX III NRVA 2011-12 QUESTIONNAIRES
11.10 How many persons 14 years of age or older who were members of this household one year If 'None',ago (including daughters), and have moved away and are no longer household members? go to 11.16INTERVIEWER: ASK FOR EACH PERSON THAT MOVED AWAY QUESTIONS 11.11 TO 11.15
IF NO PERSON MOVED AWAY, WRITE '0 AND GO TO 11.16
11.11 11.12 11.13 11.14 11.15What is the relationship Is this person What is this Where does What was the main
of this person to the male or female? person's age this person reason to movehead of household? now? live now? to that place?For codes, see at 1=Male If answer is 'Don't For codes, see at For codes, see atbottom of page 2=Female know', write '98' bottom of page bottom of page
E01 1 2
E02 1 2
E03 1 2
E04 1 2
E05 1 2
E06 1 2
E07 1 2
E08 1 2
E09 1 2
E10 1 2
E11 1 2
11.16 Since 1381 (2002), has this household returned from Yes ……………………………………1displacement from outside or inside Afghanistan? No ………………………………………2 go to M12
11.17 Where did the household return from? Pakistan ……………………………………………1Iran …………………………………………………2Other country ………………………………………3In Afghanistan - this province, urban area ………4In Afghanistan - this province, rural area ………5In Afghanistan - other province, urban area ……6In Afghanistan - other province, rural area ………7
11.18 When did the household return? Shamsi year
11.19 How did the household return? Assisted by UNHCR or other agency ……………1Were you assisted by UNHCR or another agency Deported ……………………………………………2or were you deported or did you return spontaneously? Returned spontaneously …………………………3
Codes for 11.11 Codes for 11.14 Codes for 11.152 = Wife or husband 1=This same district 1=To find work / better work3 = Son or daughter Elsewhere, 6=Pakistan 2=Security/protection problems4 = Son or daughter-in-law 2=Same province, urban 7=Iran 3=Returning refugees/IDPs5 = Grandchild 3=Same province, rural 8=Arabian Penisula 4=To get married6 = Father or mother 4=Other province, urban 9=Other country 5=Moved with the family7 = Nephew or niece 5=Other province, rural 88=Don't know 6=To join the own family8 = Brother or sister 7=To attend education9 = Brother or sister-in-law 8=Access to health services10 = Other relative 9=Other reason11 = Unrelated household member

138 ANNEX III NRVA 2011-12 QUESTIONNAIRES
12. Education12.1 12.2 12.3 12.4 12.5 12.6 12.7 12.8 12.9
Line Name Age For persons 6 years of age and over For persons age 6-24no. Can Did Did <name> What is What is the Is What is
<name> <name> ever attend the highest <name> the mainread have any formal highest grade currently reasonand home school? level of <name> attending that
write? schooling (including formal completed school? <name>or literacy formal Islamic school at this level? is notschool? school) <name> If no grade attending
1=Yes attended? completed, 1=Yes school?2=No write '00' 2=No
COPY THIS INFORMATION 1=Yes 1=Yes If 'No', For codes If Yes, go to For codesFROM HOUSEHOLD ROSTER 2=No 2=No go to 12.9 see below next person see below
01 1 2 1 2 1 2 1 2
02 1 2 1 2 1 2 1 2
03 1 2 1 2 1 2 1 2
04 1 2 1 2 1 2 1 2
05 1 2 1 2 1 2 1 2
06 1 2 1 2 1 2 1 2
07 1 2 1 2 1 2 1 2
08 1 2 1 2 1 2 1 2
09 1 2 1 2 1 2 1 2
10 1 2 1 2 1 2 1 2
11 1 2 1 2 1 2 1 2
12 1 2 1 2 1 2 1 2
13 1 2 1 2 1 2 1 2
14 1 2 1 2 1 2 1 2
15 1 2 1 2 1 2 1 2
16 1 2 1 2 1 2 1 2
17 1 2 1 2 1 2 1 2
Codes for 12.6 and 12.7 (Education level & grade) Codes for 12.9 (Reason for non-attendance)1=Primary (1-6) 6=Post-graduate (17-19) 1=No school/school too far 8=Child needed to work to help family2=Lower secondary (7-9) 7=Technical college (13-14) 2=Studied as far as needed 9=Didn't like school/didn't learn enough3=Upper secondary (10-12) 8=Madrassa (1-12) 3=Poor health / disability 10=Schooling too expensive4=Teacher college (13-14) 9=Dar ul ulum (13-14) 4=Family didn't allow 11=No female teachers5=University (13-16) 10=Dar ul hefaz (1-12) 5=School didn't allow 12=School temporarily not functioning
6=Security concerns 13=Child too young7=Marriage 14=Other reason
THIS IS PAGE OF1
CONTINUE WITH THE NEXT MODULE (UNLESS THERE ARE MORE THAN 17 HOUSEHOLD MEMBERS)

139ANNEX III NRVA 2011-12 QUESTIONNAIRES
13. Household shocks and coping strategies
13.1 In the past year, has the household been negatively affected by any of the following?
READ ALL OPTIONS a-ad
Yes Noa Reduced drinking water quantity ………………………………1 2
b Reduced drinking water quality …………………………………1 2
c Reduced agricultural water quality or quantity ………………1 2
d Unusually high level of crop pests or diseases ………………1 2
e Opium eradication ……………………………………………… 1 2
f Grew opium last season but not this season …………………1 2
g Unusually high level livestock diseases …………………… 1 2
h Insecurity or violence ……………………………………………1 2
i Reduced availability of grazing areas ………………………1 2
j Reduced availability of Kuchi migration routes ………………1 2
k Earthquakes ……………………………………………………1 2
l Landslides and avalanches ……………………………………1 2
m Flooding ………………………………………………………… 1 2
n Late damaging frosts ……………………………………………1 2
o Heavy rains preventing work ………………………………… 1 2
p Severe winter conditions ………………………………………1 2
q Hailstorms …………………………………………………………1 2
r Unusually high level of human disease ………………………1 2
s Large influx of returnee households ………………………1 2
t Unusually high increases in food prices …………………… 1 2
u Unusual decrease in farm gate prices ………………………1 2
v Loss of employment by a household member ………………1 2
w Reduced salary of a household member …………………… 1 2
x Bankruptcy of family business …………………………………1 2
y Serious illness or accident for working household member 1 2
z Death of a working household member …………………… 1 2
aa Death or serious illness of other household member ………1 2
ab Theft or violence ……………………………………………… 1 2
ac Involuntary loss of house or land ………………………………1 2
ad Involuntary loss of livestock ………………………………… 1 2
INTERVIEWER: CHECK QUESTION 13.1 - IF NO SHOCKS MENTIONED (IF ALL ANSWERS ARE '2'), GO TO 13.5
CHECK QUESTION 13.1.s - IF 13.1.s IS '1' (Yes), ASK 13.2, OTHERWISE GO TO 13.3
13.2 Was was the main problem with returnees? Disputes on land …………………………1Disputes on house ………………………2Competition for employment ……………3Competition for water …………………… 4Competition for other natural resources 5Security ……………………………………6Other, specify ………………………………7

140 ANNEX III NRVA 2011-12 QUESTIONNAIRES
13.3 Has the household recovered from the shocks Yes ……………………………………1mentioned for the past year? No ………………………………………2
13.4 What did the household do to cope with any of these shocks?
PROBE FOR ANSWERS Any other strategy that you can think of?
CIRCLE ALL THAT APPLY
a Did not need to do anything to compensate ……… 1
b Reduced quality of diet …………………………………2
c Reduced amount of food or skipped meals ……… 3
d Decreased expenditures ………………………………4
e Purchased food on credit from traders ………………5
f Took loans …………………………………………… 6
g Received help from others in the community ………7
h Sold assets …………………………………………… 8
i Rented out or mortgaged land ………………………9
j Sold house, land or female reproductive livestock 10
k Worked on relief programmes ………………………11
l Joined military …………………………………………12
m Dropped children from school ………………………13
n Increased child labour …………………………………14
o Sold child brides ………………………………………15
p Begging ……………………………………………………16
q Other, specify ……………………………………………17
13.5 Has any member of your household participated in any Yes ……………………………………1cash-for-work, food-for-work or income-generating No ………………………………………2 Go to 13.7programmes or projects during the past year?
13.6 How many people worked in the following a Food-for-work ……………………programmes/projects? b Cash-for-work ……………………IF NO PEOPLE WORKED IN SPECIFIC PROGRAMME, WRITE '0' c Income-generating ……………
13.7 How do you compare the overall economic situation Much better ……………………………1of the household with one year ago? Slightly better …………………………2
Same ………………………………… 3Slightly worse …………………………4Much worse ……………………………5
13.8 To what extent are you satisfied with the police in this district Very satisfied …………………………1doing their job of serving and protecting the people? Moderately satisfied …………………2
Not satisfied, not dissatisfied ……… 3Moderately dissatisfied ………………4Very dissatisfied …………………… 5
13.9 How do you rate the security situation in this district? Very secure ……………………………1Moderately secure ……………………2Not secure, not insecure ……………3Moderately insecure …………………4Very insecure …………………………5
END OF MALE QUESTIONNAIRE; COMPLETE MODULES 1 AND 2THANK THE RESPONDENT

141ANNEX III NRVA 2011-12 QUESTIONNAIRES
20. Household identification (female section)
COPY INFORMATION FROM SECTION 1 (HOUSEHOLD IDENTIFICATION)
Cluster code 20.6 Control and Enumeration Area
Urban ……………1Rural ……………2Kuchi ……………3
Province 20.8 Household number (1-15)name
20.9 Door number (from tracking sheet)
Name of head ofhousehold
20.11 Line number of senior female respondent
SECTIONS 21-23 SHOULD BE ADMINISTERED TO THE SENIOR FEMALE HOUSEHOLD MEMBER, WHO IS EITHERTHE WIFE OF THE HEAD OF HOUSEHOLD, THE MOST ACTIVE AND IMPORTANT FEMALE MEMBER OF THE
HOUSEHOLD, OR IN CASE OF FEMALE-HEADED HOUSEHOLDS, THE HEAD OF HOUSEHOLD
START WITH MODULE 21
National Risk and Vulnerability Survey (NRVA) 1389-90
Afghanistan's Multi-Purpose Household Survey
20.1
20.5
District name
20.2 Residence code
20.4
20.3
Urban Nahia name 20.10
20.7 Village name

142 ANNEX III NRVA 2011-12 QUESTIONNAIRES
21. Missing household membersINTERVIEWER: We listed all the members of this household, but I would like check with you to see whether really
everyone who usually lives here is included. We are especially eager to see that no children, newborns,girls and women - especially older women - are omitted from the list
GO THROUGH THE HOUSEHOLD LISTING WITH THE RESPONDENT AND ADD MISSING PERSONSWITH ADDITIONAL INFORMATION BELOW
21.1 21.2 21.3 21.4 21.5 21.6 21.7 21.8 21.9 21.10 21.11Line Name of additional What is the Is How old What is Line Does Line Does Lineno. household member relationship <name> was <name's> number <name's> number <name's> number
of <name> male or <name>? marital or of (first) father live of mother ofto the head female? on his/her engagement spouse in this this live in this this
CON- of house- last status? house- father house- motherTINUE hold? birthday? hold? hold?FROM For codes,LAST If less see below 1=Yes 1=Yes
than one If not If 'Not in this 2=No 2=NoNUM- For codes, 1=Male year, married, household', If 'No', If 'No', goBER see below 2=Female write '00' go to 21.8 write '99' go to 21.10 to next line
1 2 1 2 1 2
1 2 1 2 1 2
1 2 1 2 1 2
1 2 1 2 1 2
1 2 1 2 1 2
Codes for 21.3 (Relationship to head of household) Codes for 21.6 (Marital status)1 = Household head 5 = Grandchild 9 = Brother-/sister-in-law 1 = Married 4 = Never married,2 = Wife or husband 6 = Father or mother 10 = Other relative 2 = Divorced, separated but engaged3 = Son or daughter 7 = Nephew or niece 11 = Unrelated member 3 = Widowed 5 = Never married,4 = Son-/daughter-in-law 8 = Brother or sister not engaged
CONTINUE WITH NEXT MODULE

143ANNEX III NRVA 2011-12 QUESTIONNAIRES
22. General living conditionsINTERVIEWER:THIS SECTION SHOULD BE ADMINISTERED TO THE SENIOR FEMALE HOUSEHOLD MEMBER, WHO IS EITHERTHE WIFE OF THE HEAD OF HOUSEHOLD, THE MOST ACTIVE AND IMPORTANT FEMALE MEMBER OF THEHOUSEHOLD, OR IN CASE OF FEMALE-HEADED HOUSEHOLDS, THE HEAD OF HOUSEHOLD
22.1 In the past year, was the food supply Yes ……………………………………1 Go to 22.7always sufficient for this household? No ………………………………………2
22.2 How often in the past year did you have problems Rarely (1 to 3 times) …………………1satisfying the food needs of the household? Sometimes (4 to 6 times) ……………2
Often (a few times every month) ……3Mostly (this happens a lot) …………4
22.3 22.3 22.4 22.5 22.6
22.4 IF ANSWER TO 22.3 IS '1' ('Yes'), ASK 22.4 THROUGH 22.6
22.5 Did you apply any of the following strategies Did you do this in How severe do you IF REDUCED AMOUNTto cope with the food shortage? the last week? think this is for your OF FOOD OR SKIPPED
22.6 household? MEALS, ASK 22.6
INTERVIEWER: READ ALL STRATEGIES a-l For whom did you1=High severity reduce the amout
1=Yes 2=Mid severity of food or skipped2=No 3=Low severity meals?
a Reduced amount of food or skipped meals 1 2 1 2 1 2 3 Yes No
b Reduced quality of diet …………………………1 2 1 2 1 2 3 Boys ……… 1 2
c Decreased expenditure on food ………………1 2 1 2 1 2 3 Girls ……… 1 2
d Purchased food on credit from traders ……… 1 2 1 2 1 2 3 Men ……… 1 2
e Took loans or purchased food on credit ………1 2 1 2 1 2 3 Women ……1 2
f Sold house or land ………………………………1 2 1 2 1 2 3
g Sold female reproductive livestock/hens 1 2 1 2 1 2 3
h Sold other productive assets ……………………1 2 1 2 1 2 3
i Dropped children from school …………………1 2 1 2 1 2 3
j Increased child labour …………………………1 2 1 2 1 2 3
k Sold child brides …………………………………1 2 1 2 1 2 3
l Begging ……………………………………………1 2 1 2 1 2 3
22.7 How would you compare the overall economic Much better ……………………………1situation of the household with 1 year ago? Slightly better …………………………2
Same ………………………………… 3Slightly worse …………………………4Much worse ……………………………5
22.8 To what extent are you satisfied with police in this district Very satisfied …………………………1doing their job of serving and protecting the people? Moderately satisfied …………………2
Not satisfied, not dissatisfied ……… 3Moderately dissatisfied ………………4Very dissatisfied …………………… 5
22.9 How do you rate the security situation in this district? Very secure ……………………………1Moderately secure ……………………2Not secure, not insecure ……………3Moderately insecure …………………4Very insecure …………………………5
Yes No
What has the household spent in the last month for: WRITE '0' IF NOTHING SPENT ON ITEM
22.10 Cosmetics and beauty supplies
22.11 Personal grooming (beauty parlours, haircuts, etc) for women and girls (NOT MALES)
22.12 What has the household spent in the last year for tahwiz/shoyest (talisman for health)?
CONTINUE WITH THE NEXT MODULE
,
,
,

144 ANNEX III NRVA 2011-12 QUESTIONNAIRES
23. Food consumption (to senior woman)
23.1 How many household members were resident and ate at least four times dinner in the household during the last 7 days, including yourself? ………………………………………………………
23.2 How many meals from the household cooking pot were eaten by guests in the last 7 days? ……………………………………………………………………………………WRITE '0' IF NO GUESTS ATE IN THE HOUSE IN THE LAST 7 DAYS
23.3 How many meals have been eaten outside of the home (not from household food) by resident household members in the last 7 days? ……………………………………………
INTERVIEWER: I would like to ask you about all the different foods that your household members and any guests have eaten in the last 7 days.Could you please tell me how many days in the past week your household has eaten the following foods, and from what source this food came?
23.4 23.5 23.6Food item How many days did What was the main What was the amount
you eat this item in source of this item? used in the lastthe last 7 days? 7 days?
If not eaten, write '0' For codes, see belowBread and cereals
Rice, high quality …………………………………… . Kgs
Rice, low quality …………………………………… . Kgs
Wheat flour …………………………………………… . Kgs
Purchased nan ……………………………………… Pieces
Barley ………………………………………………… . Kgs
Maize (corn) …………………………………………… . Kgs
Beans ……………………………………………… . Kgs
Mung ………………………………………………… . Kgs
Chick peas …………………………………………… . Kgs
Lentils ………………………………………………… . Kgs
Pasta, macaroni …………………………………… . Kgs
Other bread and cereals …………………………… . Kgs
Meat and fish
Beef …………………………………………………… . Kgs
Veal …………………………………………………… . Kgs
Mutton ………………………………………………… . Kgs
Goat …………………………………………………… . Kgs
Chicken ……………………………………………… . Kgs
Liver …………………………………………………… . Kgs
Dried meat …………………………………………… . Kgs
Fish …………………………………………………… . Kgs
Other meat and fish ………………………………… . Kgs
Codes for 23.5 1 = Purchase 3 = Bartered / payment in kind 5 = Received as gift 7 = Other(Food source) 2 = Own production 4 = Borrowed / taken on credit 6 = Food aid

145ANNEX III NRVA 2011-12 QUESTIONNAIRES
23.4 23.5 23.6Food item How many days did What was the main What was the amount
you eat this item in source of this item? used in the lastthe last 7 days? 7 days?
If not eaten, write '0' For codes, see belowMilk, cheese and eggs
Milk (fresh) …………………………………………… . Kgs
Milk (powdered) ……………………………………… . Kgs
Yogurt ………………………………………………… . Kgs
Curd (chaka) ………………………………………… . Kgs
Krut (dried) …………………………………………… . Kgs
Dogh ………………………………………………… . Kgs
Ghee ………………………………………………… . Kgs
Butter ………………………………………………… . Kgs
Cheese ……………………………………………… . Kgs
Eggs (number) ……………………………………… Number
Other dairy products ………………………………… . Kgs
Oils and fat
Vegetable oil, cotton oil or sesame oil …………… . Kgs
Animal fat …………………………………………… . Kgs
Other oils and fat …………………………………… . Kgs
Vegetables
Potato ………………………………………………… . Kgs
Sweet potato ………………………………………… . Kgs
Onion ………………………………………………… . Kgs
Tomato ……………………………………………… . Kgs
Okra …………………………………………………… . Kgs
Spinach ……………………………………………… . Kgs
Cauliflower …………………………………………… . Pieces
Eggplant …………………………………………… . Kgs
Carrots ……………………………………………… . Kgs
Pumpkin, squash …………………………………… . Kgs
Cucumber …………………………………………… . Kgs
Radish ……………………………………………… . Kgs
Turnip ………………………………………………… . Kgs
Cabbage …………………………………………… . Kgs
Codes for 23.5 1 = Purchase 3 = Bartered / payment in kind 5 = Received as gift 7 = Other(Food source) 2 = Own production 4 = Borrowed / taken on credit 6 = Food aid

146 ANNEX III NRVA 2011-12 QUESTIONNAIRES
23.4 23.5 23.6Food item How many days did What was the main What was the amount
you eat this item in source of this item? used in the lastthe last 7 days? 7 days?
If not eaten, write '0' For codes, see belowVegetables (continued)
Leek ………………………………………………… . Kgs
Hot pepper …………………………………………… . Kgs
Wild leafy vegetables ………………………………… . Kgs
Coriander …………………………………………… . Kgs
Mint …………………………………………………… . Kgs
Dried tomatoes ……………………………………… . Kgs
Dried vegetables …………………………………… . Kgs
Pickled vegetables ………………………………… . Kgs
Green beans ………………………………………… . Kgs
Other vegetables …………………………………… . Kgs
Specify:
Fruit and nuts
Apple ………………………………………………… . Kgs
Grapes ……………………………………………… . Kgs
Melon, watermelon ………………………………… . Kgs
Peach ………………………………………………… . Kgs
Fresh apricots ………………………………………… . Kgs
Dried apricots ………………………………………… . Kgs
Orange, citrus ………………………………………… . Kgs
Plum …………………………………………………… . Kgs
Pomegranate ………………………………………… . Kgs
Pear …………………………………………………… . Kgs
Banana ……………………………………………… . Pieces
Raisins ……………………………………………… . Kgs
Fresh mulberries …………………………………… . Kgs
Dried mulberries …………………………………… . Kgs
Mangoes …………………………………………… . Pieces
Walnuts (without shells) …………………………… . Kgs
Pistachio (without shells) …………………………… . Kgs
Almonds (without shells) …………………………… . Kgs
Other fruit …………………………………………… . Kgs
Codes for 23.5 1 = Purchase 3 = Bartered / payment in kind 5 = Received as gift 7 = Other(Food source) 2 = Own production 4 = Borrowed / taken on credit 6 = Food aid

147ANNEX III NRVA 2011-12 QUESTIONNAIRES
23.4 23.5 23.6Food item How many days did What was the main What was the amount
you eat this item in source of this item? used in the lastthe last 7 days? 7 days?
If not eaten, write '0' For codes, see belowSugar and sweets
White sugar …………………………………………… . Kgs
Brown sugar ………………………………………… . Kgs
Honey ………………………………………………… . Kgs
Chocolates, candy, sherinigack …………………… . Kgs
Beverages
Black tea …………………………………………… Grams
Green tea …………………………………………… Grams
Bottled/canned beverages, mineral water (liters) Liters
Other beverages …………………………………… Liters
Spices
Salt …………………………………………………… . Kgs
Black pepper ………………………………………… Grams
Ginger and garlic …………………………………… . Kgs
Tomato sauce ………………………………………… . Kgs
Mixed spices ………………………………………… . Kgs
Other spices ………………………………………… . Kgs
Codes for 23.5 1 = Purchase 3 = Bartered / payment in kind 5 = Received as gift 7 = Other(Food source) 2 = Own production 4 = Borrowed / taken on credit 6 = Food aid
CONTINUE WITH THE NEXT MODULE
,
,,

148 ANNEX III NRVA 2011-12 QUESTIONNAIRES
24. M
ater
nal a
nd C
hild
Hea
lth
We
are
inte
rest
ed in
eve
ry w
oman
who
is 4
9 ye
ars
or le
ss [R
OST
ER, Q
UES
TIO
N 3
.5] a
nd h
as b
een
ever
mar
ried
[RO
STER
, AN
SWER
ED 1
, 2 o
r 3 to
QU
ESTI
ON
3.6
]; as
k ev
ery
wom
an s
epar
atel
y
24.1
24.3
24.5
24.6
24.8
24.1
324
.14
WH
AT IS
W
hat i
sD
oes
your
How
old
Did
you
eve
r giv
eH
ow m
any
How
man
yH
ow m
any
How
man
yW
hen
was
you
rW
as it
no.
THE
your
cur
rent
husb
and
are
you?
birth
to a
live
-bo
ygi
rlbo
ys a
regi
rls a
rela
st li
vebo
rn c
hild
a bo
ym
arita
lha
ve m
ore
born
chi
ld?
child
ren?
child
ren?
still
aliv
e?st
ill al
ive?
born
(eve
n if
the
or a
OF
THE
stat
us?
wiv
es?
PRO
BE: I
mea
nch
ild h
as d
ied)
?gi
rl?Fo
r cod
es,
even
a c
hild
that
see
belo
wsu
rviv
ed m
inut
es,
WR
ITE
'0'
WR
ITE
'0'
WR
ITE
'0'
WR
ITE
'0'
IND
ICAT
E YE
ARIf
wid
owed
,ho
urs
or d
ays?
IF N
OIF
NO
IF N
OIF
NO
IN S
HAM
SI O
Rdi
vorc
ed o
r1=
Yes
BOYS
GIR
LSBO
YSG
IRLS
CH
RIS
TIAN
se
para
ted
1=Ye
s2=
No
Num
ber
Num
ber
Num
ber
Num
ber
CAL
END
AR1=
Boy
go to
24.
62=
No
If 'N
o', n
ext p
erso
nof
boy
sof
girl
sof
boy
sof
girl
sIF
'DK'
, writ
e '8
888
2=G
irl
1
2
1
2
1
2
1
2
1
2
1
2
1
2
1
2
1
2
1
2
1
2
1
2
1
2
1
2
1
2
1
2
1
2
1
2
1
2
1
2
1
2
1
2
1
2
1
2
1
2
1
2
1
2
1
2
1
2
1
2
Cod
es fo
r 24.
2 (In
terv
iew
resu
lt)C
odes
for 2
4.3
(Mar
ital s
tatu
s)1=
Com
plet
ed1=
Mar
ried
2=N
ot a
t hom
e2=
Wid
owed
3=R
efus
ed3=
Div
orce
d/4=
Partl
y co
mpl
eted
sepa
rate
d
mar
ried
24.1
224
.10
24.1
1At
wha
tag
e w
ere
you
the fir
sttim
e?IF
HU
SBAN
D IS
NO
T H
OU
SE-
HO
LD M
EMBE
R,
WR
ITE
'99'
24.7
24.9
For c
odes
,se
e be
low
49 O
R L
ESS
WIT
H T
HIS
EVER
-MAR
RIE
DW
OM
EN, A
GED
FRO
M R
OST
ER
Line
Nam
e
CO
PY N
AME
AND
LIN
E N
O. O
F AL
LW
OM
AN?
INTE
RVI
EW
RES
ULT
24.2
24.4
Wha
t is
the
CO
PY L
INE
NO
. OF
HU
SBAN
D F
RO
M
nam
e of
you
rhu
sban
d?
RO
STER
5=In
capa
cita
ted
6=O
ther

149 ANNEX III NRVA 2011-12 QUESTIONNAIRES
24. M
ater
nal a
nd C
hild
Hea
lth (c
ontin
ued)
24.1
24.1
524
.16
24.1
724
.18
24.1
924
.20
24.2
124
.22
24.2
324
.24
24.2
5Li
neD
id y
ou s
eeH
ow m
any
Who
m d
id y
ouW
hoW
here
Dur
ing
this
pre
gnan
cy, d
idH
owH
ow m
any
How
man
yH
ow m
any
ofH
ow m
any
no.
anyo
ne fo
r ant
e-tim
es d
idse
e?as
sist
eddi
d th
isyo
u re
ceiv
e an
inje
ctio
n m
any
child
ren
of th
ese
thes
e <n
umbe
r>of
thes
ena
tal c
are
you
rece
ive
with
the
deliv
ery
in th
e ar
m o
r sho
ulde
r to
dose
s /
unde
r age
5<n
umbe
r>
child
ren
<num
ber>
du
ring
your
last
ante
nata
lde
liver
yta
kepr
even
t the
bab
y fro
min
ject
ions
do y
ou h
ave?
child
ren
rece
ived
ach
ildre
npr
egna
ncy?
care
dur
ing
of y
our
plac
e?ge
tting
teta
nus,
that
isdi
d yo
uU
se <
num
ber>
rece
ived
Vita
min
Aha
d fe
ver
1=Ye
syo
ur la
stla
stco
nvul
sion
s af
ter b
irth?
rece
ive
in q
uest
ions
a bi
rthta
blet
or
in th
e la
st2=
No
preg
nanc
y?PR
OBE
AN
D C
IRC
LEch
ild?
1=Ye
sdu
ring
this
24.2
3-24
.25
certific
ate
caps
ule
mon
th?
CO
PY3=
Don
't kn
owAL
L M
ENTI
ON
ED2=
No
preg
nanc
y?an
d 24
.27
at b
irth?
in th
e la
st s
ixLI
NE
If 2
4.15
is '2
' orI
f 'D
on't
know
',Fo
r cod
es,
For c
odes
,3=
Don
't kn
owIf
'0',
go to
If 'N
one'
,m
onth
s?N
Os
3', g
o to
24.
18w
rite
'9'
see
belo
wse
e be
low
If 'N
o' o
r 'D
K', g
o to
24.
22ne
xt p
erso
nw
rite
'0'
1
2
3
1 2
3
4
5 6
7
81
2
3
1
2
3
1 2
3
4
5 6
7
81
2
3
1
2
3
1 2
3
4
5 6
7
81
2
3
1
2
3
1 2
3
4
5 6
7
81
2
3
1
2
3
1 2
3
4
5 6
7
81
2
3
1
2
3
1 2
3
4
5 6
7
81
2
3
1
2
3
1 2
3
4
5 6
7
81
2
3
1
2
3
1 2
3
4
5 6
7
81
2
3
1
2
3
1 2
3
4
5 6
7
81
2
3
1
2
3
1 2
3
4
5 6
7
81
2
3
Cod
es fo
r 24.
17 a
nd 2
4.18
Cod
es fo
r 24.
19 (P
lace
of d
eliv
ery)
(Ant
enat
al c
are
and
deliv
ery
assi
stan
ce)
1=At
hom
e or
rela
tive'
s/ne
ighb
our's
hom
e1=
Doc
tor
5=Tr
aditi
onal
Birt
h At
tend
ant (
TBA)
2=Pu
blic
hos
pita
l2=
Mid
wife
6=O
ther
3=O
ther
pub
lic h
ealth
faci
lity
3=N
urse
7=N
o on
e4=
Priv
ate
heal
th fa
cilit
y4=
Com
mun
ity H
ealth
8-
Don
't kn
ow5=
Oth
erW
orke
r (C
HW
)6=
Don
't kn
ow
If 'N
one'
, writ
e '0
'If
'Non
e', w
rite
'0'

150 ANNEX III NRVA 2011-12 QUESTIONNAIRES
24. Maternal and Child Health (continued) End of interview24.1 24.26 24.27 24.28 Thank theLine How many How many of How many of respondentno. of the these <number> these children and go back
children with children had with a cough in to question 24.2fever had illness with a the last month to fill in the
diarrhoea in cough in the last did breathe faster result of thethe last month? than usual with short, interviewmonth? rapid breaths? Then complete
COPY the remainingLINE question 20.11 NOs If 'None', write '0' If 'None', write '0' If 'None', write '0' in module 20

151ANNEX III NRVA 2011-12 QUESTIONNAIRES
III.b Male Shura questionnaire
Male Shura questionnaire
1. Community identificationSupervisor-filled information Interviewer-filled information
Cluster code 1.8 Geo reference waypoint code
Urban ……………1Rural ……………2 1.9 GPS ID codeKuchi ……………3
Province 1.10 Latitudename Range: 29.35 to 38.40 N .
1.11 LongitudeRange: 60.31 to 75.00 E .
1.12 Altitude (m.)Range: 200 to 4500 m.
1.6 Control and Enumeration Area
2. Process monitoring
Date of interview Day Month Year
Interviewers' number
Supervisor's number 2.4 Regional Supervisor's number
Date of office editing Day Month Year
Office editor's code
Date of data entry Day Month Year
Data-entry officer code
2.5
2.7
2.8
2.6
2.3
2.1
2.2
National Risk and Vulnerability Survey (NRVA) 1389-90
Afghanistan's Multi-Purpose Household Survey
1.1
1.5
1.4
1.3
District name
1.2 Residence code
Urban Nahia
1.7 Village name

152 ANNEX III NRVA 2011-12 QUESTIONNAIRES
3a. Access
3.1 What is the topographical situation of the majority Open plain ………………………………1of cropland used by the community? Valley ……………………………………2
Valley and hills …………………………3Hills (no valley cultivation) ……………4
3.2 How far is the nearest drivable road to this community? km.
IF NEAREST ROAD IS IN COMMUNITY, WRITE ‘0’
3.3 Is the closest road to your community usable by vehicles all year? Yes ………………………………………1 Go to 3.5No …………………………………………2
3.4 During which months is the road impassable in a normal year? INTERVIEWER:CIRCLE ALL MONTHS THAT ARE MENTIONED
Hamal Sawr Jawza Saratan Asad Sunbula Mizan Amrab Maws Jady Dalwa Hoot
1 2 3 4 5 6 7 8 9 10 11 12
3.5 Has there been any program for road repair or/and bridge Own community work ……………………1construction in last 3 years? Government road project ………………2
WFP food-for-work road improvement 3INTERVIEWER: CIRCLE ALL ANSWERS THAT ARE MENTIONED Other food-for-work road project ………4
NSP road constuction programme ……5NGO road consturction project ……… 6Military road construction ………………7Other ……………………………………8None ……………………………………9
3.6 Has there been a change in road access in the last 3 years? No change in road access ……………1Road access improved …………………2Road access has deteriorated ……… 3
3.7 What is the name of the place where this communitybought their foodstuffs in the last month / the last time?
3.8 Where is this place located? In this district ……………………………1 Go to 3.10
In neighbouring district …………………2Provincial food market …………………3 Go to 3.10
3.9 What is the name of that district District name Office
and province? Province name coding
Transport type: Foot/animal Shared public Private vehicle / Bicycletransport / bus taxi
3.10 How long did it take to reach the nearest permanent If '1', If '1', If '1', If '1',food market - one way travel - by <transport type> SKIP 3.11 AND SKIP 3.11 AND SKIP 3.11 AND SKIP 3.11 ANDin the past month? FOR CODES, SEE BELOW 3.12 3.12 3.12 3.12
3.11 What was the cost of return transport to the Afghanis Afghanis Afghanis Afghanispermanent food market, including overnight accommodation if needed, in the past month?
3.12 What is the cost of transporting 50 kg of wheat Afghanis Afghanis Afghanis Afghanisfrom the permanent food market to the community in the past month?
Codes for 3.10 1= No time - market in community 4= 3 to less than 6 hours 7= Not reachable by this (Time to reach 2= Near the community - within 1 hour 5= 6 less than 12 hours means of transportfood market) 3= 1 to less than 3 hours 6= 12 hours or more
, ,
,,
, ,
,,

153ANNEX III NRVA 2011-12 QUESTIONNAIRES
3b. A
cces
s
3.13
3.14
3.15
3.16
3.17
3.18
Type
of h
ealth
How
long
doe
s it
take
toH
ow lo
ng d
oes
it ta
ke to
Wha
t is
the
cost
of o
ne-w
ayH
ow lo
ng d
oes
it ta
keW
hat i
s th
e co
st o
f one
-way
Are
the
follo
wing
type
s fa
cility
reac
h th
e ne
ares
t re
ach
the
near
est <
heal
thtra
nspo
rt fro
m y
our
to re
ach
the
near
est
trans
port
from
you
r of
sta
ff pr
esen
t in
the
<hea
lth fa
cility
> by
faci
lity>
by s
hare
d/pu
blic
com
mun
ity to
this
<he
alth
<hea
lth fa
cility
> by
com
mun
ity to
this
<he
alth
near
est <
heal
th fa
cility
>?fo
ot /
anim
al in
the
trans
port
in th
efa
cility
> by
sha
red/
publ
ic
priv
ate
vehi
cle
/ tax
ifa
cility
> by
priv
ate
vehi
cle
/ la
st m
onth
? (
base
dla
st m
onth
? (
base
dtra
nspo
rt in
the
last
mon
thin
the
last
mon
th?
taxi
in th
e la
st m
onth
1=Ye
son
one
-way
trav
el)
on o
ne-w
ay tr
avel
)(c
ost p
er p
erso
n of
one
way
(bas
ed o
n on
e-(c
ost o
f tra
nspo
rtatio
n 2=
No
t rans
porta
tion
only)
?pe
rson
one
-way
trav
el)
only)
?3=
Don
't kn
owFo
r cod
es, s
ee b
elow
For c
odes
, see
bel
owFo
r cod
es, s
ee b
elow
Hea
lth p
ost (
hous
eof
com
mun
ityFe
mal
e C
HW
……1
23
heal
th w
orke
r)M
ale
CH
W…
……1
23
Fem
ale
doct
or…
12
3Pu
blic
clin
ic
Fem
ale
nurs
e…
…12
3(B
asic
or
Fem
ale
mid
wife
…1
23
Com
preh
ensi
veM
ale
doct
or…
……1
23
heal
th c
entre
)M
ale
nurs
e…
……1
23
Fem
ale
doct
or…
12
3D
istri
ct o
r Fe
mal
e nu
rse
……1
23
Prov
inci
al
Fem
ale
mid
wife
…1
23
hosp
ital
Mal
e do
ctor
……
…12
3M
ale
nurs
e…
……1
23
Fem
ale
doct
or…
12
3Pr
ivat
e do
ctor
's Fe
mal
e nu
rse
……1
23
offic
e or
priv
ate
Fem
ale
mid
wife
…1
23
hosp
ital
Mal
e do
ctor
……
…12
3M
ale
nurs
e…
……1
23
Priv
ate
Fem
ale
CH
W …
…12
3ph
arm
acy
Mal
e C
HW
……
…12
3
Code
s fo
r 3.1
3, 3
.14
and
3.16
1= N
o tim
e - h
ealth
faci
lity in
com
mun
ity4=
6-1
2 ho
urs
(Tim
e to
reac
h he
alth
faci
litie
s)2=
Nea
r com
mun
ity -
2 ho
urs
or le
ss5=
Mor
e th
an 1
2 ho
urs
3= 2
- 6
hour
s6=
Not
reac
habl
e by
this
mea
ns o
f tra
nspo
rt
,,
, ,,
,,,
,,

154 ANNEX III NRVA 2011-12 QUESTIONNAIRES
3b. A
cces
s (c
ontin
ued)
3.19
3.20
3.21
3.22
Type
of
Is a
<sc
hool
type
> pr
esen
tH
ow m
any
publ
ic /
gove
rnm
ent
How
man
y pr
ivat
e / N
GO
Wha
t is
the
one-
way
dist
ance
scho
olin
the
com
mun
ity?
<sch
ool t
ype>
sch
ools
are
ther
e<s
choo
l typ
e> s
choo
ls a
re th
ere
to th
e ne
ares
t <sc
hool
type
> (in
km
.),in
the
com
mun
ity?
in th
e co
mm
unity
?ei
ther
in o
r out
side
the
com
mun
ity?
1=Ye
sIF
NO
T R
EAC
HAB
LE, W
RIT
E '9
9'2=
No
AND
GO
TO
NEX
T SC
HO
OL
TYPE
Prim
ary,
1
2km
.co
-ed/
shift
boy
s-gi
rls
Prim
ary,
girl
s on
ly 1
2km
.
Prim
ary,
boy
s on
ly 1
2km
.
Lowe
r sec
onda
ry 1
2km
.co
-ed/
shift
boy
s-gi
rls
Low e
r sec
onda
ry 1
2km
.sc
hool
, girl
s on
ly
Lowe
r sec
onda
ry 1
2km
.sc
hool
, boy
s on
ly

155ANNEX III NRVA 2011-12 QUESTIONNAIRES
4. Projects
No. 4.1 4.2
Has the following infrastucture or programme (a-n) been Under what programme was thiscreated or completed in this community during projects activity or infrastructure financed?in the last year? What is the main financing source
of this activity?IF ANSWER IS 'No' ('2'), SKIP QUESTION 4.2AND CONTINUE WITH NEXT PROGGRAMME Yes No For codes, see below
a Road / bridge construction or rehabilitation …………………1 2 1 2 3 4 5 6 7 8
b Water supply / construction of wells with hand pumps ………1 2 1 2 3 4 5 6 7 8
c Shelter project - for returnees …………………………………1 2 1 2 3 4 5 6 7 8
d Electricity - micro-hydro, diesel generator ……………………1 2 1 2 3 4 5 6 7 8
e Micro-finance project ……………………………………………1 2 1 2 3 4 5 6 7 8
f Drainage structures (bridges, culverts, washes, retaining walls) …………………………………………………1 2 1 2 3 4 5 6 7 8
g Irrigation infrastructure - improved/construction; dams, washes, intakes, etc. ………………………………1 2 1 2 3 4 5 6 7 8
h Health facility construction or rehabilitation ……………………1 2 1 2 3 4 5 6 7 8
i School construction or rehabilitation …………………………1 2 1 2 3 4 5 6 7 8
j Flood/river protection wall ………………………………………1 2 1 2 3 4 5 6 7 8
k Income generation project - women …………………………1 2 1 2 3 4 5 6 7 8
l Reforestation/tree nurseries / orchard/fruit tree rehabilitation1 2 1 2 3 4 5 6 7 8
m Literacy / vocational training ………………………………… 1 2 1 2 3 4 5 6 7 8
n Other , specify 1 2 1 2 3 4 5 6 7 8
Codes for 4.2 (Financing) 1=Government road project or NERAP2=NSP3=Other cash-for-work project4=Income-generating programme5=Food-for-work programme6=UN7=Other8=Don't know
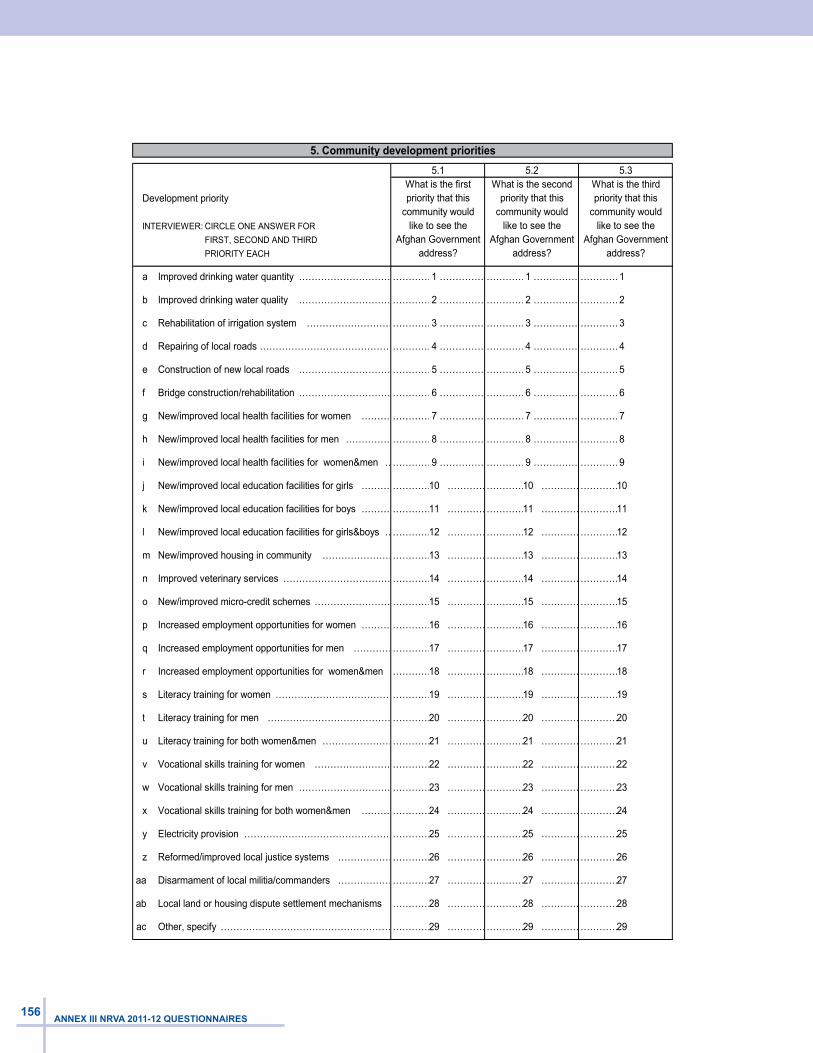
156 ANNEX III NRVA 2011-12 QUESTIONNAIRES
5. Community development priorities5.1 5.2 5.3
What is the first What is the second What is the thirdDevelopment priority priority that this priority that this priority that this
community would community would community wouldINTERVIEWER: CIRCLE ONE ANSWER FOR like to see the like to see the like to see the
FIRST, SECOND AND THIRD Afghan Government Afghan Government Afghan GovernmentPRIORITY EACH address? address? address?
a Improved drinking water quantity ……………………………………1 ………………………1 ………………………1
b Improved drinking water quality ……………………………………2 ………………………2 ………………………2
c Rehabilitation of irrigation system …………………………………3 ………………………3 ………………………3
d Repairing of local roads ………………………………………………4 ………………………4 ………………………4
e Construction of new local roads ……………………………………5 ………………………5 ………………………5
f Bridge construction/rehabilitation ……………………………………6 ………………………6 ………………………6
g New/improved local health facilities for women ……… …………7 ………………………7 ………………………7
h New/improved local health facilities for men ………………………8 ………………………8 ………………………8
i New/improved local health facilities for women&men ……………9 ………………………9 ………………………9
j New/improved local education facilities for girls ……… …………10 ……………………10 ……………………10
k New/improved local education facilities for boys ……… …………11 ……………………11 ……………………11
l New/improved local education facilities for girls&boys ……………12 ……………………12 ……………………12
m New/improved housing in community ………………………………13 ……………………13 ……………………13
n Improved veterinary services …………………………………………14 ……………………14 ……………………14
o New/improved micro-credit schemes …………………… …………15 ……………………15 ……………………15
p Increased employment opportunities for women ……… …………16 ……………………16 ……………………16
q Increased employment opportunities for men ……………………17 ……………………17 ……………………17
r Increased employment opportunities for women&men …………18 ……………………18 ……………………18
s Literacy training for women ……………………………………………19 ……………………19 ……………………19
t Literacy training for men ………………………………… …………20 ……………………20 ……………………20
u Literacy training for both women&men ………………………………21 ……………………21 ……………………21
v Vocational skills training for women …………………… …………22 ……………………22 ……………………22
w Vocational skills training for men ……………………………………23 ……………………23 ……………………23
x Vocational skills training for both women&men ……… …………24 ……………………24 ……………………24
y Electricity provision ……………………………………………………25 ……………………25 ……………………25
z Reformed/improved local justice systems …………………………26 ……………………26 ……………………26
aa Disarmament of local militia/commanders …………………………27 ……………………27 ……………………27
ab Local land or housing dispute settlement mechanisms …………28 ……………………28 ……………………28
ac Other, specify ……………………………………………… …………29 ……………………29 ……………………29

157ANNEX III NRVA 2011-12 QUESTIONNAIRES
6. Calendars
6.1 INTERVIEWER: IS THIS A RURAL COMMUNITY? Yes ………………………………………1No …………………………………………2 END
6.2 Does this community grow winter wheat? Yes ………………………………………1No …………………………………………2 Go to 6.4
6.3 In which months are usually the following activities carried out for winter wheat? CIRCLE ALL MONTHS MENTIONED
Activity Hamal Sawr Jawza Sarat. Asad Sunb. Mizan Amrab Maws Jady Dalwa Hoot
Irrigation system maintenance … 1 2 3 4 5 6 7 8 9 10 11 12
Land preparation ………………… 1 2 3 4 5 6 7 8 9 10 11 12
Planting …………………………… 1 2 3 4 5 6 7 8 9 10 11 12
Weeding ………………………… 1 2 3 4 5 6 7 8 9 10 11 12
Fertilizing ………………………… 1 2 3 4 5 6 7 8 9 10 11 12
Harvesting ………………………… 1 2 3 4 5 6 7 8 9 10 11 12
Post-harvesting process ……… 1 2 3 4 5 6 7 8 9 10 11 12
6.4 Does this community grow spring wheat? Yes ………………………………………1No …………………………………………2 Go to 6.6
6.5 In which months are usually the following activities carried out for spring wheat? CIRCLE ALL MONTHS MENTIONED
Activity Hamal Sawr Jawza Sarat. Asad Sunb. Mizan Amrab Maws Jady Dalwa Hoot
Irrigation system maintenance … 1 2 3 4 5 6 7 8 9 10 11 12
Land preparation ………………… 1 2 3 4 5 6 7 8 9 10 11 12
Planting …………………………… 1 2 3 4 5 6 7 8 9 10 11 12
Weeding ………………………… 1 2 3 4 5 6 7 8 9 10 11 12
Fertilizing ………………………… 1 2 3 4 5 6 7 8 9 10 11 12
Harvesting ………………………… 1 2 3 4 5 6 7 8 9 10 11 12
Post-harvesting process ……… 1 2 3 4 5 6 7 8 9 10 11 12
6.6 Does this community grow rice? Yes ………………………………………1No …………………………………………2 Go to 6.8
6.7 In which months are usually the following activities carried out for rice? CIRCLE ALL MONTHS MENTIONED
Activity Hamal Sawr Jawza Sarat. Asad Sunb. Mizan Amrab Maws Jady Dalwa Hoot
Irrigation system maintenance … 1 2 3 4 5 6 7 8 9 10 11 12
Land preparation ………………… 1 2 3 4 5 6 7 8 9 10 11 12
Planting …………………………… 1 2 3 4 5 6 7 8 9 10 11 12
Weeding ………………………… 1 2 3 4 5 6 7 8 9 10 11 12
Fertilizing ………………………… 1 2 3 4 5 6 7 8 9 10 11 12
Harvesting ………………………… 1 2 3 4 5 6 7 8 9 10 11 12
Post-harvesting process ……… 1 2 3 4 5 6 7 8 9 10 11 12

158 ANNEX III NRVA 2011-12 QUESTIONNAIRES
6.8 Does this community grow barley? Yes ………………………………………1No …………………………………………2 Go to 6.10
6.9 In which months are usually the following activities carried out for barley? CIRCLE ALL MONTHS MENTIONED
Activity Hamal Sawr Jawza Sarat. Asad Sunb. Mizan Amrab Maws Jady Dalwa Hoot
Irrigation system maintenance … 1 2 3 4 5 6 7 8 9 10 11 12
Land preparation ………………… 1 2 3 4 5 6 7 8 9 10 11 12
Planting …………………………… 1 2 3 4 5 6 7 8 9 10 11 12
Weeding ………………………… 1 2 3 4 5 6 7 8 9 10 11 12
Fertilizing ………………………… 1 2 3 4 5 6 7 8 9 10 11 12
Harvesting ………………………… 1 2 3 4 5 6 7 8 9 10 11 12
Post-harvesting process ……… 1 2 3 4 5 6 7 8 9 10 11 12
6.10 Does this community grow maize? Yes ………………………………………1No …………………………………………2 Go to 6.12
6.11 In which months are usually the following activities carried out for maize? CIRCLE ALL MONTHS MENTIONED
Activity Hamal Sawr Jawza Sarat. Asad Sunb. Mizan Amrab Maws Jady Dalwa Hoot
Irrigation system maintenance … 1 2 3 4 5 6 7 8 9 10 11 12
Land preparation ………………… 1 2 3 4 5 6 7 8 9 10 11 12
Planting …………………………… 1 2 3 4 5 6 7 8 9 10 11 12
Weeding ………………………… 1 2 3 4 5 6 7 8 9 10 11 12
Fertilizing ………………………… 1 2 3 4 5 6 7 8 9 10 11 12
Harvesting ………………………… 1 2 3 4 5 6 7 8 9 10 11 12
Post-harvesting process ……… 1 2 3 4 5 6 7 8 9 10 11 12

159ANNEX III NRVA 2011-12 QUESTIONNAIRES
6.12 Can you tell me when for the men in this community there is 1=Strong activity CIRCLE ACTIVITY LEVELstrong activity, low activity or no activity for the following tasks? 2=Low activity FOR EACH MONTH
3=No activity
Task Hamal Sawr Jawza Sarat. Asad Sunb. Mizan Amrab Maws Jady Dalwa Hoot
Agriculture own land ………… 1 2 3 1 2 3 1 2 3 1 2 3 1 2 3 1 2 3 1 2 3 1 2 3 1 2 3 1 2 3 1 2 3 1 2 3
Agriculture working for landlords 1 2 3 1 2 3 1 2 3 1 2 3 1 2 3 1 2 3 1 2 3 1 2 3 1 2 3 1 2 3 1 2 3 1 2 3
Environmental works: land conservation, terracing etc.
Public works (road maintenance etc.) …
Shepherding …………………… 1 2 3 1 2 3 1 2 3 1 2 3 1 2 3 1 2 3 1 2 3 1 2 3 1 2 3 1 2 3 1 2 3 1 2 3
Selling products in market …… 1 2 3 1 2 3 1 2 3 1 2 3 1 2 3 1 2 3 1 2 3 1 2 3 1 2 3 1 2 3 1 2 3 1 2 3
Petty trade …………………… 1 2 3 1 2 3 1 2 3 1 2 3 1 2 3 1 2 3 1 2 3 1 2 3 1 2 3 1 2 3 1 2 3 1 2 3
Laboring in other activities …… 1 2 3 1 2 3 1 2 3 1 2 3 1 2 3 1 2 3 1 2 3 1 2 3 1 2 3 1 2 3 1 2 3 1 2 3
6.13 Can you tell me in which months the following food items 1=Abundantly available CIRCLE ACTIVITY LEVELare abundantly, moderately or not available in this community? 2=Moderately available FOR EACH MONTH
3=Not available
Food item Hamal Sawr Jawza Sarat. Asad Sunb. Mizan Amrab Maws Jady Dalwa Hoot
Bread …………………………… 1 2 3 1 2 3 1 2 3 1 2 3 1 2 3 1 2 3 1 2 3 1 2 3 1 2 3 1 2 3 1 2 3 1 2 3
Fresh fruits …………………… 1 2 3 1 2 3 1 2 3 1 2 3 1 2 3 1 2 3 1 2 3 1 2 3 1 2 3 1 2 3 1 2 3 1 2 3
Dried fruits …………………… 1 2 3 1 2 3 1 2 3 1 2 3 1 2 3 1 2 3 1 2 3 1 2 3 1 2 3 1 2 3 1 2 3 1 2 3
Honey …………………………… 1 2 3 1 2 3 1 2 3 1 2 3 1 2 3 1 2 3 1 2 3 1 2 3 1 2 3 1 2 3 1 2 3 1 2 3
Chicken …………………… …… 1 2 3 1 2 3 1 2 3 1 2 3 1 2 3 1 2 3 1 2 3 1 2 3 1 2 3 1 2 3 1 2 3 1 2 3
Lamb ……… …………………… 1 2 3 1 2 3 1 2 3 1 2 3 1 2 3 1 2 3 1 2 3 1 2 3 1 2 3 1 2 3 1 2 3 1 2 3
Dried meat ……………………… 1 2 3 1 2 3 1 2 3 1 2 3 1 2 3 1 2 3 1 2 3 1 2 3 1 2 3 1 2 3 1 2 3 1 2 3
Milk and dairy products ……… 1 2 3 1 2 3 1 2 3 1 2 3 1 2 3 1 2 3 1 2 3 1 2 3 1 2 3 1 2 3 1 2 3 1 2 3
Fresh vegetables ……………… 1 2 3 1 2 3 1 2 3 1 2 3 1 2 3 1 2 3 1 2 3 1 2 3 1 2 3 1 2 3 1 2 3 1 2 3
Rice ……………………………… 1 2 3 1 2 3 1 2 3 1 2 3 1 2 3 1 2 3 1 2 3 1 2 3 1 2 3 1 2 3 1 2 3 1 2 3
Maize cobs …………………… 1 2 3 1 2 3 1 2 3 1 2 3 1 2 3 1 2 3 1 2 3 1 2 3 1 2 3 1 2 3 1 2 3 1 2 3
1 2 3 1 2 3 1 2 3 1 2 3 1 2 3 1 2 3 1 2 3 1 2 3 1 2 3 1 2 3 1 2 3 1 2 3
1 2 3 1 2 3 1 2 3 1 2 3 1 2 3 1 2 3 1 2 3 1 2 3 1 2 3 1 2 3 1 2 3 1 2 3

160 ANNEX III NRVA 2011-12 QUESTIONNAIRES
Female Shura questionnaire1. Community identificationSupervisor-filled information
Cluster code
Urban ……………1Rural ……………2Kuchi ……………3
Province name
1.6 Control and Enumeration Area
2. Process monitoring
Date of interview Day Month Year
Interviewers' number
Supervisor's number 2.4 Regional Supervisor's number
Date of office editing Day Month Year
Office editor's code
Date of data entry Day Month Year
Data-entry officer code
2.5
2.7
2.2
2.8
2.6
2.3
2.1
National Risk and Vulnerability Survey (NRVA) 1389-90Afghanistan's Multi-Purpose Household Survey
1.1
1.5
1.4
1.3
District name
1.2 Residence code
Urban Nahia
1.7 Village name
III.c Female Shura questionnaire

161ANNEX III NRVA 2011-12 QUESTIONNAIRES
3. Community development priorities3.1 3.2 3.3
What is the first What is the second What is the thirdDevelopment priority priority that this priority that this priority that this
community would community would community wouldINTERVIEWER: CIRCLE ONE ANSWER FOR like to see the like to see the like to see the
FIRST, SECOND AND THIRD Afghan Government Afghan Government Afghan GovernmentPRIORITY EACH address? address? address?
a Improved drinking water quantity ……………………………………1 ………………………1 ………………………1
b Improved drinking water quality ……………………………………2 ………………………2 ………………………2
c Rehabilitation of irrigation system …………………………………3 ………………………3 ………………………3
d Repairing of local roads ………………………………………………4 ………………………4 ………………………4
e Construction of new local roads ……………………………………5 ………………………5 ………………………5
f Bridge construction/rehabilitation ……………………………………6 ………………………6 ………………………6
g New/improved local health facilities for women ……… …………7 ………………………7 ………………………7
h New/improved local health facilities for men ………………………8 ………………………8 ………………………8
i New/improved local health facilities for women&men ……………9 ………………………9 ………………………9
j New/improved local education facilities for girls ……… …………10 ……………………10 ……………………10
k New/improved local education facilities for boys ……… …………11 ……………………11 ……………………11
l New/improved local education facilities for girls&boys ……………12 ……………………12 ……………………12
m New/improved housing in community ………………………………13 ……………………13 ……………………13
n Improved veterinary services …………………………………………14 ……………………14 ……………………14
o New/improved micro-credit schemes …………………… …………15 ……………………15 ……………………15
p Increased employment opportunities for women ……… …………16 ……………………16 ……………………16
q Increased employment opportunities for men ……………………17 ……………………17 ……………………17
r Increased employment opportunities for women&men …………18 ……………………18 ……………………18
s Literacy training for women ……………………………………………19 ……………………19 ……………………19
t Literacy training for men ………………………………… …………20 ……………………20 ……………………20
u Literacy training for both women&men ………………………………21 ……………………21 ……………………21
v Vocational skills training for women …………………… …………22 ……………………22 ……………………22
w Vocational skills training for men ……………………………………23 ……………………23 ……………………23
x Vocational skills training for both women&men ……… …………24 ……………………24 ……………………24
y Electricity provision ……………………………………………………25 ……………………25 ……………………25
z Reformed/improved local justice systems …………………………26 ……………………26 ……………………26
aa Disarmament of local militia/commanders …………………………27 ……………………27 ……………………27
ab Local land or housing dispute settlement mechanisms …………28 ……………………28 ……………………28
ac Other, specify ……………………………………………… …………29 ……………………29 ……………………29

162 ANNEX III NRVA 2011-12 QUESTIONNAIRES
Market price questionnaire1. Identification - market location
Cluster code 1.7 Geo reference waypoint code
Province 1.8 GPS ID codename
1.9 LatitudeRange: 29.35 to 38.40 N .
1.10 LongitudeRange: 60.31 to 75.00 E .
1.5 Control and Enumeration Area
2. Process monitoring
Date of interview Day Month Year
Interviewers' number
Supervisor's number 2.4 Regional Supervisor's number
Date of office editing Day Month Year
Office editor's code
Date of data entry Day Month Year
Data-entry officer code
1.6 Village name
2.6
2.5
2.7
2.8
2.1
2.2
2.3
1.1
1.2
1.3
1.4 Urban Nahia
National Risk and Vulnerability Survey (NRVA) 1389-90
Afghanistan's Multi-Purpose Household Survey
District name
III.d Market price questionnaire

163ANNEX III NRVA 2011-12 QUESTIONNAIRES
3. Prices
Item Unit Cost per unit Item Unit Cost per unit
Bread and cereals Vegetables
3.1 Purchased nan …………………Piece 3.32 Potato ………………………………Kg.
3.2 Barley ……………………………Kg. 3.33 Sweet potato …………………… Kg.
3.3 Maize (corn) ……………………Kg. 3.34 Onion ………………………………Kg.
3.4 Beans ……………………………Kg. 3.35 Tomato ……………………………Kg.
3.5 Mung ……………………………Kg. 3.36 Okra …………………………………Kg.
3.6 Chick peas …………………… Kg. 3.37 Spinach ……………………………Kg.
3.7 Lentils ……………………………Kg. 3.38 Cauliflower ………………………Kg.
3.8 Pasta / macaroni ………………Kg. 3.39 Eggplant …………………………Kg.
Meat and fish 3.40 Carrots ……………………………Kg.
3.9 Beef ………………………………Kg. 3.41 Pumpkin / squash …………………Kg.
3.10 Veal ………………………………Kg. 3.42 Cucumber …………………………Kg.
3.11 Mutton ……………………………Kg. 3.43 Radish ……………………………Kg.
3.12 Goat ………………………………Kg. 3.44 Turnip ………………………………Kg.
3.13 Chicken …………………………Kg. 3.45 Cabbage …………………………Kg.
3.14 Liver ………………………………Kg. 3.46 Leek …………………………………Kg.
3.15 Dried meat …………………… Kg. 3.47 Fresh pepper …………………… Kg.
3.16 Fish ………………………………Kg. 3.48 Wild leaves ………………………Kg.
Milk, cheese and eggs 3.49 Coriander …………………………Kg.
3.17 Milk (fresh) …………………… Kg. 3.50 Mint …………………………………Kg.
3.18 Milk (powdered) ………………Kg. 3.51 Dried tomatoes ……………………Kg.
3.19 Yogurt ……………………………Kg. 3.52 Dried vegetables …………………Kg.
3.20 Curd (chaka) ……………………Kg. 3.53 Pickled vegetables ………………Kg.
3.21 Krut (dried) …………………… Kg. 3.54 Green beans …………………… Kg.
3.22 Dogh ……………………………Kg. Oils and fat
3.23 Ghee ……………………………Kg. 3.55 Animal fat …………………………Kg.
3.24 Butter ……………………………Kg. 3.56 Vegetable/cotton/sesame oil ……Kg.
3.25 Cheese …………………………Kg. 3.57 Other oil and fat …………………Kg.
3.26 Egg ………………………………One Sugar and sweets
Spices 3.58 White sugar …………………… Kg.
3.27 Salt …………………………………Kg. 3.59 Brown sugar …………………… Kg.
3.28 Black pepper …………………… Kg. 3.60 Honey ………………………… Kg.
3.29 Ginger and garlic …………………Kg. 3.61 Candy, chocolates, sherinigack Kg.
3.30 Tomato sauce ……………………Kg.
3.31 Mixed spices …………………… Kg.

164 ANNEX III NRVA 2011-12 QUESTIONNAIRES
3. Prices (continued)
Item Unit Cost per unit Item Unit Cost per unit
Fruit and nuts Beverages
3.62 Apple ……………………………Kg. 3.83 Black tea …………………………Kg.
3.63 Grapes …………………………Kg. 3.84 Green tea …………………………Kg.
3.64 Melon / watermelon ……………Kg. 3.85 Bottled/canned beverages, ………Litermineral water
3.65 Peach ……………………………Kg. Other commodities
3.66 Fresh apricots ……………………Kg. 3.86 Wheat - local (farm-gate) ……… Kg.
3.67 Dried apricots ……………………Kg. 3.87 Wheat - local (market) …………Kg.
3.68 Orange/citrus ……………………Kg. 3.88 Wheat - imported …………………Kg.
3.69 Pomegranate ……………………Kg. 3.89 Wheat flour - local ………………Kg.
3.70 Plum ……………………………Kg. 3.90 Wheat flour - imported …………Kg.
3.71 Pear ………………………………Kg. 3.91 Rice - high quality …………………Kg.
3.72 Banana …………………………Pieces 3.92 Rice - high quality ……………Kg.
3.73 Raisins …………………………Kg. 3.93 Liquid gas …………………………Kg.
3.74 Fresh mulberries ………………Kg. 3.94 Kerosene …………………………Liter
3.75 Dried mulberries ………………Kg. 3.95 Diesel ………………………………Liter
3.76 Mangoes ………………………Kg. 3.96 Gasoline/petrol ……………………Liter
3.77 Walnuts (with shells) …………Kg. 3.97 Dry bread Gram Piece
3.78 Walnuts (without shells) ………Kg.
3.79 Pistachio (with shells) …………Kg.
3.80 Pistachio (without shells) ………Kg.
3.81 Almonds (with shells) …………Kg.
3.82 Almonds (without shells) ………Kg.

165ANNEX IV SAMPLE DESIGN AND IMPLEMENTATION
ANNEX IV SAMPLE DESIGN AND IMPLEMENTATIONIV.1 Introduction
The sampling design of the NRVA 2011-12 was developed to produce results that are statistically reliable for most of the indicators at national and provincial level. In addition, the aim of the sampling design was to have representative estimates by season according to the Shamsi calendar used in Afghanistan,1 in order to capture seasonal fluctuations in a number of key indicators.
The design developed for the 2011-12 survey round was a stratified, two-stage cluster approach. Upon discussion with the Technical Advisory Committee it deviated from the NRVA 2007-08 design in the sense that it did not explicitly stratify for urban and rural areas. However, the sample distribution is sufficiently close to the national urban-rural distribution that separate analysis for these populations is justified. Other differences with 2007-08 were the shift of proportional to equal sub-sample sizes to each of the provinces and the increase of the cluster size from eight to ten households.
IV.2 Sample frame
As in 2007-08, NRVA 2011-12 had to use the pre-census household listing that was conducted by CSO in 2003-05 as the sampling frame. Although more recent listings were carried out since 2005, these were not considered sufficiently complete or reliable at the start of the present survey. The 2003-05 household listing covered 21,194 EAs that were used as PSUs in the first sampling stage. Prior to the fieldwork, the selected EAs – urban and rural – were visited for a mapping update of the households, on the basis of which the second sampling stage was implemented.
The sampling frame that was used for the Kuchi population was the 2003-04 National Multi-sectoral Assessment of Kuchi (NMAK-2004). Although far from perfect given the rate of settlement of Kuchis in recent years and ongoing discussion about the definition of Kuchi, this is the best frame available for this part of Afghanistan’s population.
IV.3 Sample size
Analysis of previous NRVA rounds showed that a sample size of around 21 thousand households with a cluster size of ten households would produce sufficiently reliable estimates for most variables. Consequently, this sample size was set as the standard for future NRVA rounds.
IV.4 Stratification
The sample was stratified into 35 analytical domains: one for each of the 34 provinces of Afghanistan and one for the Kuchi population. Each of these strata were assigned with an equal number of households – 600 – in order to give sufficient weight to provinces with small populations. Since the provincial sub-samples were equally distributed over 12 survey months, the four seasons also become separate analytical domains. The Kuchi stratum was only divided into the 2011 summer and 2011-12 winter season in view of the practical difficulty of locating migrating communities in spring and autumn.
IV.5 Cluster size and number of clusters
The cluster size in the NRVA 2011-12 was established at ten households, compared to eight in NRVA 2007-08, in order to reduce fieldwork costs. There is a pragmatic upper limit to the cluster size, given the time and costs involved in reaching remote villages and the lack of accommodation for fieldworkers in such areas. In addition, the specific conditions in Afghanistan prescribe that in insecure areas the field staff should not be exposed to risks of a stay of more than two days in the interview area. Ten household interviews (plus two Shura interviews) is the maximum that can be achieved in two days time.
The cluster size of ten, in combination with 35 strata, a fixed number of clusters per stratum and a total sample size of 21 thousand, implies 60 clusters per province and five clusters (50 households) per province per month.

166 ANNEX IV SAMPLE DESIGN AND IMPLEMENTATION
1 For conversion of Shamsi season dates, see Annex XI.
IV.6 Sampling stages and selection process
Within each of the 34 provincial strata an equal number of 60 EAs were selected as PSUs in the first sampling stage, based on PPS. In the second stage a cluster of ten households was selected from the updated household listing, based on a fixed-interval and random-start procedure. This two-stage sampling procedure implies an equal sampling probability for all households in a stratum. In rural EAs that contained more than one village, a third sampling stage was introduced to select one of the villages, as it was not feasible to cover different villages during the household update prior to the fieldwork.
In order to accommodate for possible non-response different procedures were devised. Non-response within a cluster was addressed by drawing an additional five households from the household listing in the EA, which could replace households not present or refusing or not able to accommodate an interview.
Replacement of selected EAs that were not accessible due to physical access (mainly in winter time) or insecurity was done by using sampled EAs from later months in the survey period. This principle was based on the assumption that physical access in another time of the year would be feasible and that security is a fluid condition, which may improve over time. However, in a later stage of the fieldwork an alternative strategy was devised to replace clusters insecure areas. A reserve sample of PSUs was drawn from the sampling frame, from which districts that were defined as insecure by the supervisors and PSOs were excluded, as well as EAs that were originally sampled. EAs that were originally selected in these districts and not yet covered were replaced by EAs from this reserve list. Isolated emerging security issues in other districts could also urge the use of replacement from this reserve list. The 27 districts excluded from the sampling frame for the reserve sample list are listed in Table IV.1.
For the Kuchi stratum a first-stage PPS selection of Kuchi communities was carried out on the basis of the NMAK list. The second stage consisted of systematic sampling of clusters of ten households, based on a field compilation of tents and permanent dwellings occupied by Kuchis. This resulted in large communities having more than one cluster, up to a community with nine clusters.
Table IV.1 Districts excluded from sample frame for reserve sample
Province District number and name Province District number and nameKapisa 06 Tagab Paktya 03 Zurmat
07 Alasay 09 Jani KhelParwan 03 Shinwari Takhar 16 Chahab
07 Syahgirdi Ghorband Samangan 06 Dara-e-Soof-e-Payin08 Kohi Safi Sar-e-Pul 01 Prov. capital of Sar-e-Pul
Wardak 02 Nerkh Daykundi 03 Gizab04 Chaki Wardak Zabul 06 Shah Joi05 Sayydabad 11 Kakar (Khak-e-Afghan)
Logar 06 Khar War Kandahar 12 Nesh07 Azra Jawzjan 05 Qush Tepa
Laghman 05 Dawlat Shah 11 DarzabBaghlan 02 Dahana-e-Ghuri Helmand 11 Reg-e-Khan NishinBaghlan 03 Dushi 12 Baghran
Nimroz 05 Khashrod

167ANNEX IV SAMPLE DESIGN AND IMPLEMENTATION
IV.7 Sample design implementation
Two major issues impeded the implementation of the sampling design during the fieldwork period. One was the security situation in parts of the country, which halfway the survey led to the introduction of the reserve sample. In total 133 clusters (6.3 percent of the original 2,100 clusters) were thus replaced with ones from other districts. In addition, 17 clusters, representing 170 households, were not implemented and not replaced. Figure 1.1 in chapter 2 shows in which districts the survey was implemented according to the sample design, and in which districts fewer or no data collection took place.
A second interference with the sampling design concerned delays in the fieldwork due to administrative, logistic and technical issues. This had the following implications:
• The fieldwork was extended from 12 to 16 months in order to capture the full sample.• Information for spring and summer time was collected in two different years (2011 and 2012)• The Kuchi sample was implemented in winter 2011-12 and summer 2012 instead of summer 2011 and winter
2011-12.• There was especially an underrepresentation of coverage during the autumn season.
Table IV.2 presents the number of households interviewed by season and year. In total 20,828 households were covered, 172 (0.8 percent) short of the targeted sample.
Table IV.2 Interviewed households, by year, and by season (Shamsi calendar)
SeasonYear Total
1390 1391
Spring 1,671 4,866 6,537Summer 3,289 4,149 7,438Autumn 2,753 0 2,753Winter 4,100 0 4,100Total 11,813 9,015 20,828
Non-response within clusters was very limited. Only in 797 (3.8 percent) of the scheduled interviews in the 2,099 accessed EAs households were not available or refused or were unable to participate. In 779 of these cases households were replaced by reserve households listed in the cluster reserve list, leaving 18 households unaccounted for (0.09 percent).
IV.8 Calculation of sampling weights and post-stratification
By design, the sample observations in the sample are self-weighted. An implication of this is that the expansion factor for all observations within a specific stratum is simply the ratio of the number of households in a stratum divided by the number of sample observations from each stratum. This applies to the provincial strata as well as to the Kuchi stratum.
For the purpose of calculating the sampling weights, scaling factors were constructed based on the number of households in Afghanistan. The estimated number of households was derived from the CSO population projections by province for January 2012. For the settled population, the provincial population was divided by the average household size in the NRVA 2011 sample of each province to obtain the number of households in the middle of the survey period. This ratio is the scaling factor Whsq that expands the sample of households to the total population of households and reflects the product of the probabilities of selection for the Primary Sampling Unit (PSU) and the Ultimate Sampling Unit (USU):
Whsq = [prob(PSU) * prob(USU)]
where h identifies the household, s identifies the stratum, and q identifies the calendar quarter.

168 ANNEX IV SAMPLE DESIGN AND IMPLEMENTATION
Because the unweighed sample allocation was not uniform across seasons, uncorrected annual estimates would place relatively larger weights on those seasons which had a large sample (spring and summer), thereby distorting the representativeness of national results. Because the sample was stratified by season, and imposing the assumption that the level of seasonal, international migration is negligible, the weighted distribution can be smoothed out to ensure that the estimated population size by quarter is the same. That is to say, the sample-based estimate of the population of Afghanistan is the same in the summer as it is in the winter. This adjustment is implemented as:
Whsq = [prob(PSU) * prob(USU)] * [0.25 * POPs, 2012 ] / ∑hsq HHSIZEhsq
where POP is the CSO estimate for the settled population for January 2012 (25,500,100). This population is divided by four to uniformly allocate the population to each quarter of the year (assuming away seasonal international migration). The denominator term HHSIZEhsq is the size of household h in stratum s sampled in quarter q. The denominator gives the total number of sampled, settled individuals in each stratum by quarter. The adjustment term in the numerator gives the population of individuals for each stratum by quarter as estimated by CSO of the settled population.
In order to obtain an expansion factor for the count of individuals the following calculation was made:
whsq = Whsq * HHSIZEhsq
Whsq and whsq are included in the NRVA 2011-12 dataset as sampling weights to produce survey results for the total populations of households and individuals.

169ANNEX V POPULATION BY AGE AND SEX
ANNEX V POPULATION BY AGE AND SEXTable V.1.a: Population, by residence, sex, and by five-year age groups (in thousands)
Age Urban Rural Kuchi Total
Male Female Both sexes Male Female Both
sexes Male Female Both sexes Male Female Both
sexes
0-4 452 419 871 1,779 1,708 3,486 166 135 301 2,396 2,262 4,658
5-9 459 418 877 1,844 1,670 3,514 138 140 278 2,442 2,228 4,670
10-14 425 402 826 1,425 1,275 2,700 112 83 194 1,962 1,759 3,721
15-19 400 428 828 971 976 1,947 65 57 121 1,436 1,461 2,897
20-24 333 282 616 727 769 1,496 45 53 98 1,105 1,105 2,209
25-29 233 220 453 651 714 1,365 54 61 115 939 995 1,933
30-34 161 161 322 534 521 1,055 38 36 74 733 718 1,451
35-39 141 153 294 452 448 900 34 37 71 628 638 1,265
40-44 120 111 232 356 344 700 25 23 49 501 479 981
45-49 92 89 181 283 254 536 22 18 40 396 361 757
50-54 83 110 193 257 303 559 20 21 41 359 434 793
55-59 60 68 128 198 153 351 13 9 22 271 230 502
60-64 54 53 107 188 142 330 11 9 20 252 205 457
65-69 49 30 79 102 64 166 6 6 12 157 100 257
70-74 40 24 64 92 48 140 7 4 11 140 75 215
75-79 14 10 24 37 15 52 2 3 5 53 28 81
80-84 14 6 20 32 13 45 4 - 4 50 19 69
85+ 11 ... 15 18 5 23 2 - 2 31 9 40
Total 3,141 2,989 6,130 9,945 9,420 19,365 764 696 1,459 13,850 13,105 26,955
Table V.1.b: Population, by residence, sex, and by five-year age groups (in percentages)
Age Urban Rural Kuchi Total
Male Female Both sexes Male Female Both
sexes Male Female Both sexes Male Female Both
sexes
0-4 14.4 14.0 14.2 17.9 18.1 18.0 21.7 19.5 20.6 17.3 17.3 17.3
5-9 14.6 14.0 14.3 18.5 17.7 18.1 18.1 20.1 19.1 17.6 17.0 17.3
10-14 13.5 13.4 13.5 14.3 13.5 13.9 14.6 11.9 13.3 14.2 13.4 13.8
15-19 12.7 14.3 13.5 9.8 10.4 10.1 8.5 8.2 8.3 10.4 11.1 10.7
20-24 10.6 9.4 10.0 7.3 8.2 7.7 5.9 7.6 6.7 8.0 8.4 8.2
25-29 7.4 7.3 7.4 6.5 7.6 7.0 7.1 8.8 7.9 6.8 7.6 7.2
30-34 5.1 5.4 5.3 5.4 5.5 5.4 4.9 5.2 5.1 5.3 5.5 5.4
35-39 4.5 5.1 4.8 4.5 4.8 4.6 4.5 5.3 4.9 4.5 4.9 4.7
40-44 3.8 3.7 3.8 3.6 3.7 3.6 3.3 3.4 3.3 3.6 3.7 3.6
45-49 2.9 3.0 3.0 2.8 2.7 2.8 2.9 2.6 2.7 2.9 2.8 2.8
50-54 2.6 3.7 3.2 2.6 3.2 2.9 2.6 3.0 2.8 2.6 3.3 2.9
55-59 1.9 2.3 2.1 2.0 1.6 1.8 1.7 1.3 1.5 2.0 1.8 1.9
60-64 1.7 1.8 1.7 1.9 1.5 1.7 1.4 1.4 1.4 1.8 1.6 1.7
65-69 1.6 1.0 1.3 1.0 0.7 0.9 0.7 0.9 0.8 1.1 0.8 1.0
70-74 1.3 0.8 1.0 0.9 0.5 0.7 1.0 0.5 0.8 1.0 0.6 0.8
75-79 0.4 0.3 0.4 0.4 0.2 0.3 0.3 0.4 0.3 0.4 0.2 0.3
80-84 0.4 0.2 0.3 0.3 0.1 0.2 0.5 - 0.3 0.4 0.1 0.3
85+ 0.3 0.1 0.2 0.2 0.1 0.1 0.3 - 0.1 0.2 0.1 0.1
Total 100.0 100.0 100.0 100.0 100.0 100.0 100.0 100.0 100.0 100.0 100.0 100.0

170 ANNEX VI MORTALITY ESTIMATION
ANNEX VI MORTALITY ESTIMATIONVI.1 Methodology
The NRVA 2011-12 round did not foresee the production of fertility and mortality estimates. However, at last instance an abridged module was added to collect information about children ever born and children alive. Since no full birth histories were collected, it is not possible to estimate fertility in a way comparable to NRVA 2007-08. However, the data do allow the estimation of mortality indicators similar to the previous round.
For the calculation of the Infant Mortality Rate (IMR) and the Under-five Mortality Rate (U5MR), the Brass method of indirect mortality estimation was applied, using the Trussell variant and the West model life tables of the Coale-Demeny model life tables (United Nations 1983, United Nations 1990). The Brass method uses data on the total number of women by five-year age group, their children ever born and children dead. In combination with coefficients that are estimated by regression analysis of simulated model cases, these data can be used to derive estimates of q(x), the probability of dying between birth and age x, accounting for the duration of exposure to the risk of mortality, which is approximated by the women’s ages and the fertility pattern in the country. The number of women of each age group includes all women, regardless of marital status and parity, while the numbers of children ever born and dead refer to ever-married women between the ages of 15 and 49 in the female section of the NRVA questionnaire. This procedure has also been followed in the NRVA 2007-08 and MICS 2010 (CSO and UNICEF 2012) and was one of the variants applied in the AMS 2010 (APHI/MoPH et al 2010). Women’s weights were calculated to adjust for women’s non-response to module 24 and large absence of information on children-ever-born and children dead from Zabul province.
VI.2 Sources of errors
There are several sources of error that must be considered when calculating child mortality estimates for Afghanistan from a household survey. This section focuses on non-sampling errors and does not examine sampling errors associated with taking a sample as opposed to collecting data on everyone in the population.
One of the problems faced in survey taking in the Afghan population is age misreporting due to illiteracy, lack of birth registration and general ignorance the date of birth. Although the age accuracy has improved compared to NRVA 2007-08, the Whipple index (223) and the Myers index (20.6) indicate highly inaccurate age reporting. The use of five-year age groups helps mitigate age errors to some degree.
A second source of errors relate to the reporting of the population by sex. As mentioned in section 3.2.1, the overall sex ratio in the survey population was 107, which is likely caused by underreporting of female household members. This is supported by the analysis of members that were added to the household listing after checking with the senior female household representative by female interviewers. This showed that detected omissions in the household roster for 79 percent referred to female household members.
As for the sex ratio recorded for the total population, the sex ratio at birth suffers from a male bias. Whereas almost anywhere in the world the biological sex ratio at birth varies only between 105 and 106 boys per 100 girls (UNFPA 2011), with most extreme estimates ranging from 104 to 107 boys per 100 girls (Dubuc and Coleman 2007), the NRVA survey reported on average a sex ratio at birth of 113. Other surveys in Afghanistan collecting information of births experienced the same phenomenon.1 The bias in NRVA 2011-12 is most pronounced in the mothers’ age group 20-24 (Table VI.1). The skewed ratio is most likely resulting from one or both of two phenomena: intentional misclassification of girls as boys (for instance related to shame of having mostly or only girl children) and underreporting of girl children (under the assumption that the total number of boys reported is correct). The former would affect sex-specific mortality ratio’s, but not the overall mortality ratio, while the latter would likely affect female mortality ratio’s as well as the overall mortality ratio.
1 E.g. The AMS 2010 found a sex ratio a t birth of 114, the MICS 2010 115 and NRVA 2007-08 110.

171ANNEX VI MORTALITY ESTIMATION
Table VI.1 Sex ratio of children ever born and children dead, by age group of the mother
Age ofmother
Sex ratio
Childrenever born
Childrendead
15-19 110 110
20-24 127 145
25-29 113 98
30-34 109 108
35-39 109 104
40-44 111 101
45-49 124 106
Total 113 106
There is also some evidence of problems of reporting on deceased children by sex in the mothers’ age categories 20-24 and 25-29. However, the overall sex ratio of deceased children of 106 is plausible, given the biological higher mortality of boys compared to girls.
A simulation was done to compensate for the alleged missing girls born. This simulation assumed a sex ratio at birth of 106 and a conservative estimate of the proportion dead among these missing girls of 25 percent. This procedure would raise the IMR from 48 to 54 and the U5MR from 91 to 92. The results, however, cannot be taken as an improvement as the assumptions are insufficiently substantiated.
VI.3 Mortality estimation
Table VI.2 represents the calculation of probabilities of dying before a specified age x for all reported children born and separately for boys and girls. The estimates for the IMR and U5MR are, respectively 48 and 91 and refer to, respectively early 2011 and late 2005. The value for the IMR is unexpectedly low and given the problems encountered with age reporting, under-registration of girls born and sex ratios of deceased children of mothers in age group 20-29, there are good reasons to mistrust this result.
The U5MR, on the other hand, suffers less from the age-specific problems mentioned above. Moreover, the level of 91 deaths before reaching age 5 per thousand live births is well in line with results found in the MICS 2010 and the AMS 2010 (respectively 102 and 97 2), given time progressed, the 2007-08 NRVA benchmark of 161 death per thousand live births and sampling confidence intervals.
Whereas, as expected, the IMR of boys is higher than that of girls (49 compared to 46 per thousand live births), the U5MR of girls is higher than that of boys: 92 against 89 per thousand live births.
2 Referring to the AMS estimate based on the Brass methodology and excluding the South zone, as this was considered the most reliable result.

172 ANNEX VI MORTALITY ESTIMATION
Tabl
e VI
.2 E
stim
atio
n of
pro
babi
lity
of d
ying
and
ass
ocia
ted
refe
renc
e da
te, b
y se
xa.
Bot
h se
xes
Wom
an's
age
Inde
x
(i)
Num
ber
of w
omen
Chi
ldre
nev
er b
orn
CE
B(i)
Par
ity
(Pi)
Chi
ldre
nde
ceas
edC
D(i)
Pro
porti
onde
ceas
edD
(i)
Mul
tiplie
r
k(i)
Age
of c
hild
ren
(x)
Pro
babi
lity
ofdy
ing
befo
re x
q(x)
Tim
e of
estim
ate
t(i)
Ref
eren
ceda
teT(
i)
15-1
91
1,46
0,99
521
8,97
70.
1499
8,95
90.
0409
1.16
441
0.04
760.
920
11.0
20-2
42
1,10
4,89
21,
487,
378
1.34
6212
4,59
20.
0838
1.08
432
0.09
082.
120
09.9
25-2
93
994,
606
3,15
1,08
53.
1682
243,
129
0.07
721.
0147
30.
0783
3.9
2008
.0
30-3
44
717,
773
3,33
0,19
94.
6396
297,
055
0.08
921.
0165
50.
0907
6.2
2005
.8
35-3
95
638,
012
3,76
7,54
05.
9051
389,
761
0.10
351.
0316
100.
1067
8.7
2003
.2
40-4
46
479,
266
2,99
0,81
46.
2404
342,
509
0.11
451.
0172
150.
1165
11.5
2000
.5
45-4
97
361,
014
2,25
8,66
46.
2564
288,
637
0.12
781.
0110
200.
1292
14.4
1997
.5
Tota
l
5,75
6,55
817
,204
,657
1,
694,
642
b. B
oys
Wom
an's
age
Inde
x
(i)
Num
ber
of w
omen
Boy
sev
er b
orn
CE
B(i)
Par
ity
(Pi)
Boy
sde
ceas
edC
D(i)
Pro
porti
onde
ceas
edD
(i)
Mul
tiplie
r
k(i)
Age
of b
oys
(x)
Pro
babi
lity
ofdy
ing
befo
re x
q(x)
15-1
91
1,46
0,99
511
4,55
00.
0784
4,70
10.
0410
1.20
141
0.04
9320
-24
21,
104,
892
831,
131
0.75
2273
,807
0.08
881.
0821
20.
0961
25-2
93
994,
606
1,66
9,67
61.
6787
120,
492
0.07
221.
0045
30.
0725
30-3
44
717,
773
1,73
6,82
42.
4197
154,
463
0.08
891.
0050
50.
0894
35-3
95
638,
012
1,96
2,84
73.
0765
198,
577
0.10
121.
0191
100.
1031
40-4
46
479,
266
1,57
4,64
33.
2855
171,
955
0.10
921.
0042
150.
1097
45-4
97
361,
014
1,24
9,17
93.
4602
148,
293
0.11
870.
9984
200.
1185
Tota
l
5,75
6,55
89,
138,
850
87
2,28
8
c. G
irls
Wom
an's
age
Inde
x
(i)
Num
ber
of w
omen
Girl
sev
er b
orn
CE
B(i)
Par
ity
(Pi)
Girl
sde
ceas
edC
D(i)
Pro
porti
onde
ceas
edD
(i)
Mul
tiplie
r
k(i)
Age
of g
irls
(x)
Pro
babi
lity
ofdy
ing
befo
re x
q(x)
15-1
91
1,46
0,99
510
4,42
70.
0715
4,25
80.
0408
1.12
011
0.04
5720
-24
21,
104,
892
656,
247
0.59
3950
,785
0.07
741.
0864
20.
0841
25-2
93
994,
606
1,48
1,40
91.
4894
122,
637
0.08
281.
0262
30.
0849
30-3
44
717,
773
1,59
3,37
52.
2199
142,
592
0.08
951.
0298
50.
0922
35-3
95
638,
012
1,80
4,69
32.
8286
191,
184
0.10
591.
0460
100.
1108
40-4
46
479,
266
1,41
6,17
12.
9549
170,
554
0.12
041.
0321
150.
1243
45-4
97
361,
014
1,00
9,48
52.
7962
140,
344
0.13
901.
0254
200.
1426
Tota
l
5,75
6,55
88,
065,
807
82
2,35
4

173ANNEX VII UPDATING THE POVERTY LINE USING NRVA 2011-12
ANNEX VII UPDATING THE POVERTY LINE USING NRVA 2011-12
VII.1 Methodology
The official poverty line for Afghanistan was set in 2007-08, using information available from the National Risk and Vulnerability Assessment (NRVA) survey. In particular, adhering to international best practices, the poverty line was set following the Cost of Basic Needs (CBN) method and it represents the level of per capita consumption at which the members of a household can be expected to meet their “basic needs” in terms of both food a and non-food consumption.1 The measurement of poverty based on the NRVA 2011-12 is obtained by updating the poverty line set using the NRVA 2007-08.
Updating the original poverty line, as opposed to setting a new one, has the advantage of preserving the comparability of poverty estimates over time, thereby allowing an analysis of changes in poverty. In particular, for poverty estimates to be comparable over time between the NRVA 07-08 baseline and the newly released NRVA 11-12, the measure of welfare used to rank households (i.e. consumption aggregate) should be constructed following the same methodology used for the baseline; the “updated” poverty line should be estimated to capture the same level of wellbeing identified by original poverty line, but evaluated at the prices obtained from the current survey. Thus, while in effect updating the poverty line entails the definition of a new poverty line for the 2011-12 survey round, the “poverty line basket” is taken to be pre-determined.2
VII.2 Effective sample size
The effective sample size for the poverty analysis is 19,598 households spread across 32 of the 34 provinces in Afghanistan. Two of the provinces, Helmand and Khost, were dropped from the sample used for poverty estimation due to problems of data quality, which emerged in the measurement of the consumption aggregate and, most notably, in the measurement of food component of the aggregate.3
VII.3 Building the consumption aggregate using NRVA 2011-12
The process of constructing the consumption aggregate matches the one used for setting the poverty line using information from NRVA 2007-08. In particular, the same consumption aggregate subcomponents were defined, namely (i) food component, (ii) non-food component, (iii) consumer durables, and (iv) housing.
In what follows, we provide a brief methodological overview on how each of these subcomponents were constructed, highlighting comparability issues, if any, between 2007-08 and 2011-12. For a more detailed description of the methodology followed in 2007-08, the reader should refer to Islamic Republic of Afghanistan, Ministry of Economy and the World Bank 2010.4
VII.3.1 Food component
Like the previous round, the NRVA 2011-12 includes a very detailed food consumption section in which female respondents are asked about household consumption (quantities/units consumed) of 91 food items, organized into nine food groups, over the past 7 days.5 Food consumption data include food both bought, home produced, as well as food that might have been acquired by means of non-monetary transactions such as gifts and food aid. The nominal expenditure on food consumption was obtained combining food items’ consumption with their price information coming from the District Price Survey (DPS) module which was administered in conjunction with the 2011-12 NRVA.6
1 The official national average poverty line for Afghanistan is Afs 1,253 per person per month. This represents the typical cost of attaining 2,100 calories per person per day and of meeting some basic non-food needs, in terms of fall 2007 prices from urban areas of central Afghanistan. The poverty line reflects regional differences in the cost of living, and also accounts for inflation over the time of the survey. See Islamic Republic of Afghanistan and World Bank 2010.
2 The official national average poverty line for Afghanistan is Afs 1,253 per person per month. This represents the typical cost of attaining 2,100 calories per person per day and of meeting some basic non-food needs, in terms of fall 2007 prices from urban areas of central Afghanistan. The poverty line reflects regional differences in the cost of living, and also accounts for inflation over the time of the survey. See Islamic Republic of Afghanistan and World Bank 2010.
3 The same two provinces were dropped from the analysis of food security (chapter 7).4 Document accessible online at: http://cso.gov.af/Content/Media/Documents/CSO-WB_Tech-Report-Pov_v4(2)1162011121045651553325325.pdf5 Food items are organized into 9 food groups, namely: (i) bread and cereals; (ii) meat and fish; (iii) milk, cheese and eggs; (iv) oil and fat; (v) vegetables; (vi)
fruits and nuts; (vii) sugar and sweets; (viii) beverages, and (ix) spices.6 The District Price Survey module covers the price of all food items in the consumption module and a few other items such as grains and fuels. DPS data
were collected during NRVA survey visits to the PSUs. Team supervisors were responsible to visit the markets of the respective districts (or nahia in urban areas) and to administer the survey. The identification of the relevant market to be surveyed and its location – whether it would be in the district headquarters, provincial capital, or in a neighboring district – were guided by key informant interviews within each community. Price information was matched to household level food consumption by location and month of interview.

174 ANNEX VII UPDATING THE POVERTY LINE USING NRVA 2011-12
For each of the nine food categories, NRVA 2011-12, like NRVA 2007-08, allows for a residual – “other” – food category item. Lacking a price for these residual categories, proxy prices were defined for each “other” category to be the median by month and district of the prices of items in each food group as done for the consumption aggregate in 2007-08.7
A final component of total food consumption is the total value of meals consumed outside the household, e.g. in restaurants, prepared food purchased from the marketplace, etc. The NRVA 2011-12 collects this information in section 10 of the Male Household Questionnaire by asking “What has the household spent in the last 30 days for food and drinks consumed outside the home?”, and, accordingly, the total value of food away from home was used in the imputation of total food consumption.
A comparative analysis of food consumption patterns from the two survey rounds shows a reduction over time in the relative share of staple food (bread and cereals) over total8 , accompanied by an increase in share of relatively more nutritious food items such as meat and fish, diary and vegetables (Figure VII.1).
Figure VII.1: Total food consumption aggregate, by food group, and by survey year (in percentages)
0
10
20
30
40
50
60
70
80
90
100
NRVA 2007 -08 NRVA 2011 -12
Other
Vegetables/fruit
Oils/fat
Meat/fish and dairy products
Bread and cereals
VII.3.2 Non-food component
Total expenditure on non-food items covers a wide and heterogeneous set of items such as expenditure on energy, education, transportation and clothing and was constructed by aggregating expenditures on goods and services from various sections of the NRVA.9 Changes in the measurement of health expenditure in survey instruments made it impossible to build a comparable estimate for health across the two survey rounds. As a result, health expenditure is not included in the non-food component of the consumption aggregate.10
Consumer durables
Following baseline methodology and international best practice, “rental equivalent” of consumer durables are included in the consumption aggregate, to reflect the opportunity cost of money tied up in durable goods and their lifetime and depreciation.11 As done in the previous survey round, asset life is assumed to be 10 years (with a flat-line depreciation of 10 percent per year), and an interest rate 4 percent, implying the effective discount rate of 14 percent.
7 For details on the rationale for the definitions for each category, refer to Islamic Republic of Afghanistan and World Bank 2010.8 The share of breads and cereals in total consumption declined from 43 % to 33% while the shares of all other categories increased.9 Expenditures such as education, transportation and clothing were reported on an annual basis, and converted into monthly values. Energy expenditures
cover all sources: electricity, gas, oil, firewood, charcoal, coal, straw, ping, and manure. Following the 2007-08 approach and standard best practice, the non-food aggregate does not include three categories of expenditure, namely: (1) lumpy expenditures, (2) investment expenditures, and (3) expenditures not related to household well-being.
10 In order to produce comparable estimates of poverty over time, the 2007-08 consumption aggregate had to be recomputed to exclude medical expenditure and the baseline poverty line re-estimated to reflect this change in non-food consumption.
11 Durable items include: refrigerator, stove/ gas balloon, sewing machine, iron, radio/tape recorder, TV, VCR/DVD player, satellite phone, electric fan, bicycle, motorcycle, car, tractor/thresher, mobile phones, carpets (khalin), gilim, blankets, and kitchen utensils.

175
Analysis of asset ownership reveals interesting temporal patterns (Figure VII.2). In particular, an increase in the share of households owning at least one asset is observed, especially in rural areas, where the ownership of assets such as refrigerators, TV, cars and motorbikes has markedly increased since 2007-08.
Figure VII.2: Change in households that own selected durables between NRVA 2007-08and NRVA 2011-12 (in percentages)
-50
0
50
100
150
200
Ref
riger
ator
Stov
e
Sew
ing_
Mac
hine Iro
n
Rad
io TV
VCR
Bic
ycle
Mot
orcy
cle
Car
Trac
tor
At le
ast o
ne a
sset
(exc
l. fa
n)
Urban Rural
Housing
As in the case of consumer durables, the contribution of housing to household welfare is captured in the consumption aggregate by estimating its rental value. Following the same approach adopted for the baseline, the rental value of housing is estimated by fitting a hedonic pricing model, i.e. by regressing self-housing value information on house characteristics. Following baseline methodology, model specifications vary by urban, rural and Kuchi subsamples. Table 1 shows the medians of actual and predicted housing values from the three dwelling groups. The predicted values lie within two percent margin of the actual value and are closest to the actual value among rural households, which account for most of NRVA sample.
Table VII.1: Median of reported and predicted housing value, by residential dwelling type (in Afghanis)a
Dwelling type Housing value
Reported Predicted
Urban dwelling 702,500 619,666
Rural dwelling 165,500 158,318
Tents 7,000 8,590
a Estimates based on the subsample of households reporting actual housing values
Housing values were converted to monthly rent by imposing a relationship based on interest and depreciation rates. In particular, a discount rate (d) of 1.5 percent and interest rate (r) of 4 percent were used.
Analysis of the consumption aggregate
The consumption aggregate based on the NRVA 2011-12 is constructed as the sum of the food-, non-food-, durables- and housing components. The relative share of each component to the total appears to have stayed constant across the two survey rounds, with food consumption having the largest share in the aggregate. Interestingly, differences in consumption composition between the poorest and richest segments of the population seem to have narrowed, overall reflecting an increase in “other than food” expenditure for the first (poorest) quintile.
ANNEX VII UPDATING THE POVERTY LINE USING NRVA 2011-12

176
Table VII.2: Consumption aggregate, by consumption-aggregate component, survey year,and by wealth quintile (in percentages)
Wealth quintile
Consumption-aggregate component, survey year
Food Non-food Durables Rent
2007-08 2011-12 2007-08 2011-12 2007-08 2011-12 2007-08 2011-12
1 (Poorest) 69 63 22 24 2 2 7 11
2 67 64 24 25 2 2 7 10
3 64 64 25 24 3 3 8 9
4 61 63 27 24 3 4 9 10
5 (Richest) 53 58 29 26 5 6 14 10
Total 63 62 25 24 3 3 9 10
VII.4 Updating the poverty line using NRVA 2011-12
The poverty line represents the benchmark for assessing whether an individual can attain the minimum level of wellbeing required to satisfy basic needs in terms of food and non-food consumption. The ultimate objective of poverty measurement using the NRVA 2011-12 is to produce poverty estimates that are comparable with the one based on the absolute poverty line estimated on NRVA 2007-08. More specifically, the NRVA 11-12 poverty line should reflect the same level of wellbeing identified by the 07-08 baseline official poverty line. This section focuses on the methodology adopted for updating the poverty line.
VII.4.1 Food poverty line
According to the Cost of Basic Needs approach, the food poverty line reflects the cost of consuming the reference basic-needs basket, i.e. the food bundle corresponding to a minimum caloric requirement (Table VII.3). In the case of Afghanistan, the food poverty corresponds to the cost of attaining 2,100 Kilocalories based on the typical consumption of the relatively poor. 12
In order to update the food poverty line, the basic-needs basket estimated in 2007-08 was priced using information from the 2011-12 Price District Survey. In particular, each of the items in the basket was priced at its average price by region-quarter to obtain a matrix of 56 region-quarter nominal food poverty lines. As a result, the average national “nominal” poverty line expressed in 2011-12 prices is equal to 1,013 Afs per person per month, and it represents the average cost of purchasing the basic-needs food basket in 2011-12.
Table VII.3: NRVA 2007-08 basic needs basketa, by main food categoryb (in kg. per person per day)
Food category Quantity
Grains and bread 0.4268
Meat 0.0182
Dairy 0.1022
Oil 0.0279
Vegetable 0.1566
Fruits 0.0452
Sweets and sugar 0.0235a The basic need basket is composed of 83 consumption items.
b In this table, items were grouped into main food categories.
12 The relatively poor are defined as those individuals whose consumption level is in the 2-5th deciles of real per-capita consumption in each region (Islamic Republic of Afghanistan, Ministry of Economy and the World Bank 2010).
ANNEX VII UPDATING THE POVERTY LINE USING NRVA 2011-12

177
VII.4.2 Non-food poverty line
In order to fully reflect basic needs, the poverty line also includes an allowance for non-food basic needs. The approach followed for updating the non-food poverty line is identical to the one used in 2007-08. In particular, the non-food allowance is based on the typical non-food expenditure of the subsample of households in each region, whose per capita food expenditure is relatively close to the food poverty line.
Updated 2011-12 poverty line
The overall poverty line is obtained as the sum of the food poverty line and the non-food allowance. The national average poverty line based on NRVA 2011-12 is 1,710 Afs per person per month; it represents the sum of the cost of attaining 2,100 calories per person per day based on the basic need basket set in 2007-08 and the cost of meeting basic non-food needs. A household is defined as poor if the total value of per capita consumption is less than the poverty line.13
Table VII.4: NRVA 2011-12 poverty indicatorsa
Poverty Indicators Estimate Std. Err. [95 percent C. I.]
Poverty Headcount rate 36.5 0.84 34.84 38.14
Poverty Gap 8.6 0. 25 8.11 9.10
Poverty Gap Squared 3.0 0. 11 2.75 3.19a Individual-level weights used, standard errors corrected for complex survey design.
13 The subsample used for estimating the non-food poverty line is selected to reflect equal proportions of households above (10 percent) and below (10 percent) the food poverty line at the regional level.
ANNEX VII UPDATING THE POVERTY LINE USING NRVA 2011-12

178
ANNEX VIII FOOD SECURITY ANALYSIS METHODOLOGYVII.1 Food security analysis methodology
Within NRVA 2011-12, data were collected on household expenditure, quantities and type of foods, and number of days certain foods are consumed over a seven-day recall period. Hence, to determine household food security, kilocalorie (Kcal) intake data based on a seven-day recall is used. The available calories per household and per person are calculated based on the caloric content of all the food commodities reported consumed by the household over a period of seven days. Given that some of the food was consumed by visitors and that some members of the household were away during the survey period, an effective household size is calculated that is then used to determine the calories consumed per household and per person per day.
The household caloric requirement is determined based on household sex and age composition. The calories of food consumed per person per day are calculated to determine whether individuals within the household consumed sufficient calories for a normal and healthy life. The calorie requirement adjusted for sex and age of household members also takes into consideration the additional requirements during the severe winter cold season across the country – 300 Kcal per person per day for adults, 100 Kcal per person per day for children 5 to 9 years old, 150 Kcal per person per day for children 10 to 14 years old, and zero additional calories for children under five years. In considering the winter months, upon consultation with FEWS NET Afghanistan, the calorie requirement in six provinces including Badakhshan, Nuristan, Panjsher, Bamyan, Ghor and Daykundi is adjusted for five winter months (November-March), while in the remaining provinces it is adjusted for three winter months (January-March).
The Kcal thresholds used in food security are then triangulated with other indicators such as demographics, livelihoods, food consumption and expenditure levels to identify variations of food security and key characteristics of food-insecure households. Furthermore, the protein deficit analysis based on the food quantity consumed and the protein requirement by age and sex of the household members is also included in the analysis.
The Food Consumption Score (FCS) is an acceptable proxy indicator to measure caloric intake and dietary quality at the household level, giving an indication of the food security status of the household if combined with other household food access indicators. The FCS is useful when data on caloric intake and protein intake is not available. It is a composite score based on dietary diversity, food frequency (i.e. number of days certain food groups are consumed over a past seven-day recall period), and the relative nutritional importance of different food groups. The FCS is calculated based on the food consumption recall of the previous seven days for the household and classified into three categories: Poor consumption (FCS = 1.0 to 28.0); Borderline (FCS = 28.1 to 42.0); and Acceptable
ANNEX VIII FOOD SECURITY ANALYSIS METHODOLOGY

179
consumption (FCS > 42.0). The FCS is a sum of weighted food groups. The weight for each food group is calculated by multiplying the number of days on which the commodity was consumed by its relative weight. The FCS is normally combined with other indicators such as percentage expenditure on food, coping strategy index or asset ownership. These help to determine household food access and lead to an overall classification of food security.
VII.2 Afghanistan winter and spring wheat, rice and maize harvesting calendar based on NRVA 2011-12 data
The analysis also considers the seasonality factor, based on a region’s pre-harvest (or lean season), harvest and post-harvest season, as food security levels are expected to differ across seasons. The seasonal crop calendar for the different provinces of Afghanistan used in this analysis is based on the crop calendar collected during the 2011-12 NRVA (Table VIII.1).
ANNEX VIII FOOD SECURITY ANALYSIS METHODOLOGY

180
Tabl
e VI
II.1:
Sea
sona
l cro
p ca
lend
ar, b
y re
gion
, pro
vinc
e
Reg
ion
Pro
vinc
eLe
an s
easo
nLo
wes
tpr
ice
onm
arke
t
Win
ter m
onth
sP
lant
ing
seas
onW
inte
r whe
atP
lant
ing
seas
onS
prin
g w
heat
Har
vest
sea
son
Win
ter w
heat
Sta
rtE
ndN
o. o
fm
onth
sP
eak
Sta
rtE
ndS
ever
eco
nditi
ons
Sta
rtE
ndS
tart
End
Sta
rtE
nd
Cen
tral
Kab
ulD
ecFe
b3
Feb
Jun
Jan
Mar
Sep
Oct
Mar
Apr
Aug
Aug
Kap
isa
Dec
Mar
4M
arJu
nJa
nM
arO
ctN
ov_
_Ju
lA
ug
Loga
rD
ecM
ar4
Mar
Jun
Jan
Mar
Sep
Nov
Mar
Apr
Jul
Aug
Par
wan
Dec
Mar
4M
arJu
nJa
nM
arO
ctN
ovM
ayJu
nJu
lS
ep
War
dak
Nov
Mar
5M
arA
prJa
nM
arO
ctN
ovM
arA
prJu
nJu
ly
Pan
jshe
rN
ovA
pr6
Mar
Jun
Nov
Mar
XO
ctN
ovM
arA
prJu
lO
ct
Cen
tral
Hig
hlan
d
Gha
zni
Nov
Mar
5M
arJu
nN
ovM
arX
Sep
Oct
Apr
May
Aug
Nov
Bam
yan
Nov
Apr
6A
prJu
nN
ovM
arX
Sep
Oct
Apr
May
Jun
Sep
Day
kund
iN
ovA
pr6
Apr
Jul
Nov
Mar
XS
epO
ctM
arA
prJu
lO
ct
Gho
rN
ovA
pr6
Apr
Aug
Nov
Mar
XS
epO
ctA
prM
ayA
ugO
ct
Eas
tern
Kun
arJa
nM
ar2
Mar
Jun
Jan
Mar
Nov
Dec
Mar
Mar
May
Jun
Nan
garh
arJa
nFe
b2
Feb
May
Jan
Mar
Oct
Nov
__
May
Jun
Lagh
man
Jan
Mar
3M
arM
ayJa
nM
arO
ctN
ov_
_M
ayJu
n
Noo
rista
nN
ovA
pr5
Apr
Jul
Nov
Mar
Oct
Nov
Apr
May
Aug
Sep
Nor
th
Bal
khJa
nM
ar3
Mar
Jun
Jan
Mar
Nov
Dec
Jan
Mar
Jun
Aug
Jaw
zjan
Jan
Mar
3M
arJu
nJa
nM
arN
ovD
ec_
_Ju
nA
ug
Sam
anga
nJa
nM
ar3
Mar
Jul
Jan
Mar
Oct
Nov
Mar
Apr
Jul
Sep
Sar
-e-P
ulJa
nM
ar3
Mar
Jun
Jan
Mar
Nov
Dec
Mar
Apr
Jul
Oct
Fary
abJa
nM
ar3
Mar
Jul
Jan
Mar
Nov
Dec
Mar
Apr
Jun
Aug
Nor
th-e
ast
(Bad
aksh
an)
Bad
aksh
anN
ovM
ay6
May
Jul
Nov
Apr
XS
epO
ctA
prM
ayJu
lO
ct
ANNEX VIII FOOD SECURITY ANALYSIS METHODOLOGY

181ANNEX VIII FOOD SECURITY ANALYSIS METHODOLOGY
Tabl
e VI
II.1:
Sea
sona
l cro
p ca
lend
ar, b
y re
gion
, pro
vinc
e (c
ontin
ued)
Reg
ion
Pro
vinc
eLe
an s
easo
nLo
wes
tpr
ice
onm
arke
t
Win
ter m
onth
sP
lant
ing
seas
onW
inte
r whe
atP
lant
ing
seas
onS
prin
g w
heat
Har
vest
sea
son
Win
ter w
heat
Sta
rtE
ndN
o. o
fm
onth
sP
eak
Sta
rtE
ndS
ever
eco
nditi
ons
Sta
rtE
ndS
tart
End
Sta
rtE
nd
Nor
th-e
ast
Bag
hlan
Jan
Mar
3M
arJu
lJa
nM
arO
ctN
ovM
arA
prJu
nA
ug
Kun
duz
Jan
Mar
3M
arJu
nJa
nM
arO
ctN
ovM
arA
prJu
nJu
l
Takh
arJa
nM
ar3
Mar
Jul
Jan
Mar
Oct
Dec
Mar
Apr
Jul
Oct
Sou
th-E
ast
Kho
stJa
nM
ar2
Mar
Jun
Jan
Mar
Oct
Nov
Mar
Mar
Jun
Jun
Pak
tika
Dec
Mar
4M
arJu
nJa
nM
arS
epO
ctM
arA
prJu
lA
ug
Pak
tya
Dec
Mar
4M
arJu
nJa
nM
arO
ctN
ovM
arA
prJu
lA
ug
Sou
th-W
est
Hel
man
dJa
nM
ar3
Mar
Jun
Jan
Mar
Dec
Jan
__
May
Jun
Kan
daha
rJa
nM
ar3
Mar
Jun
Jan
Mar
Dec
Jan
Mar
Mar
Jun
Jul
Nim
roz
Jan
Mar
3M
arJu
lJa
nM
arO
ctN
ov_
_Ju
nJu
l
Uro
zgan
Dec
Mar
4M
arJu
lJa
nM
arD
ecJa
nA
prM
ayJu
nA
ug
Zabu
lD
ecM
ar4
Mar
Jun
Jan
Mar
Oct
Nov
Mar
Apr
Jun
Aug
Wes
t
Fara
hJa
nM
ar3
Mar
Jun
Jan
Mar
Oct
Nov
Mar
Apr
Jul
Aug
Her
atJa
nM
ar3
Mar
Jun
Jan
Mar
Dec
Jan
Apr
May
Jun
Aug
Bad
ghis
Nov
Mar
5A
prJu
lD
ecM
arX
Nov
Dec
Mar
Apr
Jun
Jul

182
ANNEX IX QUALITY ASSURANCE AND QUALITY ASSESSMENT
IX.1 Introduction
Quality assurance is relevant for each activity and each operations stage of statistical operations. It should be understood as a multi-dimensional concept, including the following dimensions:1
a. Relevanceb. Completenessc. Accuracyd. Comparabilitye. Coherencef. Timelinessg. Accessibility.
This understanding implies that data accuracy is only one – albeit important – dimension of overall data quality. Section 2 of this annex gives brief overviews of measures to assess the quality of in the NRVA 2011-12 data according to these dimensions, and of actions and procedures implemented to assure data quality.
Subsequent sections IX.3 and IX.4 further elaborate on two main types of data errors that affect sampling surveys: sampling errors and non-sampling errors. Sampling errors relate to the fact that selected households are one of many possible samples that could have been selected from the sampling frame. Each of these would produce results that are somewhat different from one another and likely somewhat different from the total population. Non-sampling errors refer to a wide variety of other data errors that arise during the course of all survey activities other than sampling. Whereas estimates of sampling errors can be quantified by calculating standard errors, non-sampling errors are difficult to evaluate statistically.
IX.2 Quality assurance
No survey is able to achieve a perfect score on each of the dimensions of data quality, as many tend to improve at the expenses of the others. For example, very high quality data require training of census staff at each staff level for such extensive periods, field monitoring and supervision at such intensity, and data editing at such comprehensive detail, that the project will exceed any acceptable time and budget limit. Thus, any survey will have to find an practical and acceptable balance within the bounds of existing resources and constraints. Table IX.1 gives an overview of the measures relevant to NRVA 2011-12 with respect to the specified dimensions of quality assurance. The remainder of this section lists the key activities and procedures implemented in the survey to assure data quality.
a. Management of relevance• Extensive stakeholder consultation was organised to discuss and define the information to be collected in 2011-12
and subsequent rounds of NRVA (January-March 2010).• Additional stakeholder meetings were organised to discuss the NRVA the outline of this final report and the
associated tabulation and analysis plan (July and September 2012).• Survey results and draft chapters and annexes of the NRVA 2011-12 report were shared with relevant stakeholders
for review and comments (January-June 2013).• Household lists of enumeration areas selected for fieldwork were updated immediately prior to data collection.
1 See e.g. UNECE 2006, United Nations 2008.
ANNEX IX QUALITY ASSURANCE AND QUALITY ASSESSMENT

183ANNEX IX QUALITY ASSURANCE AND QUALITY ASSESSMENT
Table IX.1 Quality assurance dimensions and measures in NRVA 2011-12
Dimension Description NRVA quality assurance measuresa.Relevance The degree to which the data
serve to address the purposes for which they are produced and sought by data users. Value is further characterized by the merit of those purposes, in terms of the mandate of the agency.
• CSO is the mandated agency to produce national statistics for Afghanistan; NRVA is CSO’s core instrument for the collection of household data.
• Data users were involved in questionnaire design, the development of the report outline and tabulation and analysis plan, review of produced indicators and other results, and in several occasions in analysis and report writing.
• NRVA is the only survey producing representative information at province level. However, there is a high demand for representative information at district level, which is not met by NRVA.
• The NRVA report includes information at provincial level for 34 indicators and variables. Data users can further explore provincial details in the micro data.
• NRVA is the only national survey capturing information about seasonality.
b. Completeness The degree to which the data serve data users as completely as possible, taking restricted resources into account.
• NRVA is the only survey producing representative information for the entire population of Afghanistan, including the nomadic Kuchi (presently estimated at 5.4 percent of the total population).
• Being a multi-purpose survey, information demands are not covered in as much detail as desired in every survey single round. However, the rotating principle applied in NRVA assures that with a relevant rate of recurrence desired information is provided in successive survey rounds.
• Due to outdated sample frames, it is likely that considerable, but unknown, segments of the population are underrepresented in the survey results.
c. Accuracy The degree to which the data correctly estimate or describe the quantities or characteristics that the survey was designed to measure.
• Quality assurance was sought by estimating standard errors and confidence intervals (see section IX.3), assessing coverage errors and, calculating non-response rates (section IX.4).
• No procedure was in place to assess the rate of data-capture errors.• A wide range of activities was implemented to enhance data accuracy (see
the sub-section on management of data accuracy).
d. Comparability The degree to which statistics are comparable over space and time.
• Questionnaires, definitions and methodologies are increasingly harmonised with international recommendations and national practices. Thus, NRVA applies the national definition of employment, under-employment and unemployment, implements internationally recommended methodologies for poverty and food-security assessments and to a large extent complies with UNICEF-MICS and DHS procedures for indicators for health, child wellbeing and demographic indicators.
• Comparability over time is one of the key criteria in the NRVA. However, this criterion is negotiated by others. Consequently, NRVA is an instrument in continuous development, receptive for changes if improvement is sufficiently important and ensured.
e. Coherence The degree to which data from a single statistical programme, and data brought together across statistical programmes, are logically connected.
• No formalised procedure was in place to harmonise sampling, data collection, methodologies, concepts, definitions, classifications, indicators and other statistics, and dissemination across statistical activities in CSO or between CSO and other data producers and data users.
• Ad-hoc, but continuous efforts were undertaken to embed NRVA in a broader stakeholder agreement on survey taking and production of statistics.
f. Timeliness The delay between the period to which information pertains and the date on which the information becomes available.
• The time between completion of data collection and the release of the NRVA 2011-12 report was just over one year. Given the complexity of the survey and CSO experience in survey taking this is not exceedingly long, but for many data users the survey results have already lost considerable value. This is the case all the more because the start of data collection was two-and-a-half years before the release of the report.
• In order to bridge the gap between data collection and dissemination, quarterly reports with a selected number of key indicators were planned. In the end only one mid-term report was realised.
g. Accessibility The availability of information and the suitability of the form in which the information is available.
• The NRVA 2011-12 report will be available in Dari, Pashtu and English, and in all three languages both on the CSO website and in printed form.
• Selected tables at national and provincial level will be available on the CSO website.
• The NRVA 2011-12 report provides meta data, including information about questionnaires, sampling design, survey procedures, concepts and definitions, methodologies applied for poverty, food-security and mortality estimation, and quality assurance.
• CSO adheres to a micro-data access policy, which applies to NRVA data.• The name of NRVA will change to ALCS – Afghanistan Living Conditions
Survey – to enhance the survey’s appeal and recognition.

184
• The survey was designed to produce information that:▪ is representative at the level of provinces▪ captures the seasonality of development indicators.
• The questionnaire was designed to capture information relevant to the specific context of Afghanistan.• NRVA played a key role in defining national definitions of employment, underemployment and unemployment, in
agreement with key stakeholders, such as MoEc, MoLSAMD, ILO and World Bank.• A strategy was designed and implemented to optimise the probability of implementing fieldwork in remote and high-
risk areas and thus avoiding bias in survey results.• Key stakeholders participated in the NRVA Steering Committee and Technical Advisory Committee to ensure the
soundness the overall project strategy and technical components.
b. Management of completeness
• The NRVA survey cycle is based on a rotation scheme that was agreed upon by the stakeholders (March 2010). This implies that in each survey round a core set of key indicators across development themes is produced, and that at appropriate intervals additional or expanded questionnaire modules are administered to allow more comprehensive information for selected themes in successive survey rounds.
• Special efforts were made to capture information about the nomadic Kuchi population.
c. Management of accuracy
• Questionnaire design included considerations of question justification, wording, sequence of questions and modules, complexity of routing, interview burden, classifications, formatting and layout.
• Questionnaires were tested in a pre-test and in a pilot test (October 2010).• Field staff recruitment was based on review of CV’s, a written test by and an interview with shortlisted applicants,
as well as on a final exam during the field-staff training.• Training activities and procedures included the following:
▪ The field staff training was centrally organised in Kabul to ensure a uniform training by the highest qualified CSO staff.▪ The field staff training was conducted during a full three weeks to allow sufficient time for respective training
elements.▪ In addition to the initial central training, two rounds of regional workshops were conducted to discuss lessons
learned and provide refresher training.• Field monitoring and supervision was implemented at several levels:
▪ Field supervisors supervised day-to-day procedures and checked completed questionnaires.▪ Provincial Statistical Officers checked completed questionnaires on a sample basis.▪ Regional Statistical Officers supervised general field operations.▪ Key NRVA staff from CSO Headquarters performed monthly field monitoring missions.
• Data-processing activities and procedures included the following:▪ Monthly provincial batches of completed questionnaires were manually checked upon receipt at CSO
Headquarters. In case of serious shortcomings, questionnaires were referred back to the field.▪ Data capture in MS Access consisted of double data entry with independent verification. This in principle
eliminated any data typing mistakes. ▪ Checks in MS Access were performed to identify and remedy essential data structure and data integrity problems. ▪ A limited number of consistency and range checks in MS Access were performed before the raw dataset was
delivered.▪ Comprehensive data-editing programmes were designed in Stata to perform consistency and range checks▪ Frequency and cross tabulations were produced in Stata to determine response distributions and identify any
skewed data, missing values, odd results and outliers. Data were corrected as far as circumstantial evidence allowed. If this was not possible, incorrect values were converted to missing values.
▪ NRVA 2011-12 results were triangulated with other data sources where available to assess their plausibility.▪ Indicators of sampling and non-sampling errors were produced to assess specific data quality components (see
sections IX.3 and IX.4).
d. Management of comparability
• Advise was sought with international experts and agencies as to better harmonise NRVA data collection and analysis with international standards and keep it up-to-date with new developments.
ANNEX IX QUALITY ASSURANCE AND QUALITY ASSESSMENT

185ANNEX IX QUALITY ASSURANCE AND QUALITY ASSESSMENT
• Consultations with national stakeholders were organised to explore comparability between NRVA and other data sources, as well as strategies to improve comparability.
• In each phase of survey implementation, comparability with previous rounds of NRVA was a key consideration.
e. Management of coherence
• In the absence of a formalised procedure NRVA explored on an ad-hoc basis the consistency of sampling, data collection, methodologies, concepts, definitions, classifications, indicators and other statistics, and dissemination across statistical activities in CSO, and between CSO and other data producers and data users. Where feasible, these were harmonised.
f. Management of timeliness
• Data collection and data processing were done in parallel to minimise the period between completion of both activities.
• Monitoring procedures were designed and implemented to monitor progress in data collection and data processing.• The release of quarterly reports with selected key indicators one month after completion of quarterly data collection
was planned. Only the release of one mid-term report with selected key indicators was realised (August 2012).
g. Management of accessibility
• The NRVA 2011-12 report will be made available in Dari, Pashtu and English, as to broaden NRVA’s effective audience.
• The NRVA 2011-12 report will be made available both on the CSO website and in printed form.• Selected tables at national and provincial level will be made available on the CSO website.• The NRVA 2011-12 report provides meta data, which supports the understanding of the contents and quality of the
survey results. These meta data include, among other, information about questionnaires, sampling design, survey procedures, concepts and definitions, methodologies applied for poverty and food-security assessment, mortality estimation, and quality assurance.
• NRVA data will be made available to data users in line with CSO’s micro-data access policy.• The name of NRVA will change to ALCS – Afghanistan Living Conditions Survey – to enhance the survey’s appeal
and recognition.
IX.3 Sampling errors
Statistics based on a sample, such as means and percentages, generally differ from the statistics based on the entire population, since the sample does not include all the units of that population. The sampling error refers to the difference between the statistics of the sample and that of the total population. Usually, this error cannot be directly observed or measured, but is estimated probabilistically.
The sampling error is generally measured in terms of the standard error for a particular statistic, which equals the square root of the variance of that statistic in the sample. Subsequently, the standard error can be used to calculate the confidence interval within which the true value of the statistic for the entire population can reasonably be assumed to fall: a value of the statistic produced from the sample will fall within a range of plus or minus two times the standard error of that statistic in 95 percent of all possible samples of identical size and design.
Table IX.2 provides an overview of standard errors and confidence intervals for selected indicators. Since the sample design of NRVA 2011-12 is not simple random sampling, but a multi-stage stratified design, the linearisation method is used for estimation of standard errors.

186 ANNEX IX QUALITY ASSURANCE AND QUALITY ASSESSMENT
Tabl
e IX
.2 S
ampl
ing
erro
rs a
nd c
onfid
ence
inte
rval
s fo
r se
lect
ed in
dica
tors
Sta
tistic
Bas
e po
pula
tion
Valu
eS
tand
ard
erro
rC
onfid
ence
lim
its
Lo
wer
Upp
er
Per
cent
age
unde
r age
15
Tota
l pop
ulat
ion
48.4
0.3
47.9
48.9
Aver
age
hous
ehol
d si
zeA
ll ho
useh
olds
7.4
4.4
7.3
7.5
Em
ploy
men
t-to-
popu
latio
n ra
tioW
orki
ng-a
ge p
opul
atio
n45
.70.
345
.146
.4
Per
cent
age
not-g
ainf
ully
em
ploy
edLa
bour
forc
e25
.00.
524
.125
.9
Per
cent
age
owni
ng ir
rigat
ed la
ndA
ll ho
useh
olds
37.9
0.8
36.5
39.4
Per
cent
age
owni
ng g
arde
n pl
otA
ll ho
useh
olds
12.6
0.6
11.4
13.7
Per
cent
age
belo
w th
e po
verty
line
Tota
l pop
ulat
ion
36.5
0.8
34.8
38.1
Per
cent
age
food
-inse
cure
Tota
l pop
ulat
ion
30.1
0.7
28.7
31.6
Yout
h lit
erac
y ra
teP
opul
atio
n ag
ed 1
5-24
47.0
0.9
45.2
48.8
Net
atte
ndan
ce ra
tio in
prim
ary
educ
atio
nP
rimar
y-sc
hool
-age
pop
ulat
ion
56.8
0.8
55.1
58.4
Net
atte
ndan
ce ra
tio in
sec
onda
ry e
duca
tion
Sec
onda
ry-s
choo
l-age
pop
ulat
ion
32.7
0.9
30.9
34.4
Per
cent
age
rece
ivin
g sk
illed
ant
e-na
tal c
are
(at l
east
1 v
isit)
Mar
ried
wom
en u
nder
age
50
with
a b
irth
in th
e fi
ve y
ears
pre
cedi
ng
the
surv
ey51
.20.
949
.552
.9
Per
cent
age
of b
irths
atte
nded
by
skill
ed h
ealth
per
sonn
el.
Mar
ried
wom
en u
nder
age
50
with
a b
irth
in th
e fi
ve y
ears
pre
cedi
ng
the
surv
ey39
.90.
938
.141
.6
Per
cent
age
usin
g im
prov
ed d
rinki
ng w
ater
sou
rces
Tota
l pop
ulat
ion
45.5
1.1
43.4
47.7
Per
cent
age
usin
g im
prov
ed s
anita
tion
Tota
l pop
ulat
ion
8.3
0.6
7.1
9.7

187ANNEX IX QUALITY ASSURANCE AND QUALITY ASSESSMENT
IX.4 Non-sampling errors
IX.4.1 Overview of possible non-sampling errors
Aside from the sampling error associated with the process of selecting a sample, a survey is subject to a wide variety of non-sampling errors. These errors may – and unavoidably do – occur in all stages of the survey process. Non-sampling errors are usually classified into two groups: random errors and systematic errors. Random errors are unpredictable errors that are generally cancelled out if a large enough sample is used. Since NRVA has a large sample size, random errors are a priori not considered to be an issue of large concern. Systematic errors are those errors that tend to accumulate over the entire sample and may bias the survey results to a considerable extent. Therefore, this category of non-sampling errors is a principal cause for concern. The following overview elaborates the main types of systematic non-sampling errors.
Coverage errors
Coverage errors occur when households are omitted, duplicated or wrongly included in the population or sample. Such errors are caused by defects in the sampling frame, such as inaccuracy, incompleteness, duplications, inadequacy or obsolescence. Coverage errors may also occur in field procedures, for instance when omitting specific households or persons.
The sampling frames used for NRVA 2011-12 included the 2003-05 pre-census household listing and the 2003-04 National Multi-sectoral Assessment of Kuchi (NMAK-2004). Both listings were outdated by the time of fieldwork implementation and it is likely that in the intervening period considerable changes occurred with respect to the number and geographic distribution of households. This will have had particular effect on newly built-up (urban) areas and squatter settlements, including areas with high density of internally displaced persons and returnees. Such areas will have been systematically underrepresented in the sample selection. With regard to the Kuchi coverage, besides the observed, but un-quantified rate of settlement of Kuchi households and natural population growth, changing migration patterns will have caused a population distribution in 2011-12 that is different to the one represented in the NMAK list.
Non-response errors
There are two types of non-response: unit non-response and item non-response. Unit non-response implies that no information is obtained from a given sample unit, while item non-response refers to a situation where some but not all the information is collected for the unit. Item non-response occurs when respondents provide incomplete information, because of respondents’ refusal or incapacity to answer, or omissions by interviewers. Often non-response is not evenly spread across the sample units but is concentrated among sub-groups. As a result, the distribution of the characteristics of subgroups may deviate from that of the selected sample.
Unit non-response in NRVA 2011-12 occurred to the extent that sampled clusters were not visited, or that sampled households in selected clusters were not interviewed. Out of the 2,100 originally scheduled clusters, 150 (7.1 percent) were not visited. For 133 of these non-visited clusters (6.3 percent), replacement clusters were sampled and visited. Although this ensured the approximation of the targeted sample size, it could not avoid the likely introduction of some bias as the omitted clusters probably have a different profile than included clusters.
In the visited clusters – including replacement clusters – 797 households (3.8 percent of the total) could not be interviewed because – mostly – they were not found or because they refused or were unable to participate. For 779 of these non-response households (3.7 percent of the total), replacement households were sampled and interviewed. Since the household non-response is low and it can be expected that the replacement households provide a reasonable representation of the non-response households, this non-response error is considered of minor importance. The overall unit non-response rate – including non-visited clusters and non-interviewed households, without replacement – is 10.9 percent.
With regard to item non-response, the close to 800 variables in the NRVA household and Shura questionnaires each reveal different levels of missing values. During the data-processing stages of manual checking, computerised batch editing and final editing these levels were reduced by edit strategies. For some key variables,2 missing values were
2 All household identification variables – Cluster code (Q1.1), Residence code (Q1.2), Province code (Q1.3), District code (Q1.4), Nahia code (Q1.5), Control and Enumeration area code (Q1.6) and Village code (Q1.7), as well as individual-level variables Relationship to the head of household (Q3.3), Sex (Q3.4), Age (Q3.5) and Marital status (Q3.6).

188
filled in for 100 percent. For other variables, missing values were only filled in when convincing evidence could be found for assigning a specific value. Section X.4.2 gives information about missing values for selected variables. This overview reflects the finding that generally the percentage of missing values is low.3 For household-level variables the level of missing values is typically well below 0.5 percent. The percentage of missing values in individual-level variables is somewhat higher, but generally below 3 percent. Occurrence of higher levels are exceptional and relate to misunderstanding of skipping patterns.
Response errors
Response errors result when questions are incorrectly asked, or information is incorrectly provided, received or recorded. These errors may occur because of inappropriate questionnaire design, inadequate interviewer training, incompetence or irresponsible interviewer behaviour, time pressure, or shortcomings on the side of the respondent, such as misunderstanding, inaccuracy, ignorance, recollection problems or reluctance to provide a correct answer.
The NRVA 2011-12 survey variables showed different rates of response errors, according to consistency and range checks performed. During manual checking and batch- and final editing all key variables (see above) with evidently incorrect values were corrected based on available information, referral back to the field staff or most plausible inference. Other variables were corrected as far as circumstantial evidence allowed. If this was not possible, incorrect values were converted to missing values.
Data-processing errors
In principle, each of the stages of data processing – manual questionnaire checking, data capture, batch editing and final editing – and general data management can add to the number of errors included in the final dataset. However, usually the major source of data-processing errors is data capture. Elaborate data-checking procedures and data-editing programmes can to a significant degree correct data errors, but no dataset is ever completely error-free.
NRVA 2011-12 used double data entry with independent verification for data capture. As this in principle eliminates any data typing mistakes, the only data errors in the data file are response errors. A series of computerised checks provided the information where to remedy essential data structure and data integrity problems. In addition, a limited number of consistency and range checks were performed before the raw dataset was delivered. The main thrust of data editing was done as part of the analysis phase. Although apparent data errors still exist in the final dataset, these are very few and statistically insignificant.
IX.4.2 Missing values
Table IX.3 Provides information about the percentage of missing values for selected variables. Variables were purposely selected from all household-questionnaire modules and cover both key and secondary variables.
3 Missing values also include values that were found to be incorrect, but for which no justifiable valid value could be deduced (see also the section on response errors).
ANNEX IX QUALITY ASSURANCE AND QUALITY ASSESSMENT

189
Table IX.3 Percentage missing values for selected variablesa
Variable Base population Percent missing values
Household-level variablesConstruction material of walls 20,828 1.9
Number of rooms in the dwelling 20,828 0.2
Main source of cooking fuel 20,828 0.4
Type of toilet facility used 20,828 0.0
Main source of drinking water 20,828 0.1
Household owning livestock 20,828 0.0
Number of goats vaccinated 2,969 0.3
Type of veterinary service provider 3,071 0.1
Households owning farm land 20,828 0.0
Jeribs of irrigated land owned 12,604 0.0
Jeribs of irrigated land cultivated 10,145 0.0
Main crop produced on irrigated land 9,993 0.5
Amount of most important crop produced 9,993 0.3
Number of mobile phones owned 20,828 0.4
Value of household debt 10,920 0.1
First household income source 20,828 0.0
Income from most important income source 20,828 0.4
Expenditure on food at home 20,828 0.0
Expenditure on children's clothing 20,828 0.0
Reduced drinking water quantity shock 20,828 0.1
Male assessment of economic situation 20,828 0.5
Sufficiency of food supply in household 20,828 0.0
Assessment of economic situation 20,828 0.8/0.4
Household members consuming dinners 20,828 0.0
Number of days consumed wheat 20,828 0.0
Amount of wheat consumed 19,828 0.2
Individual-level variablesPerson worked last week 84,023 1.1
Person worked last month 42,986 0.4
Economic activity status 84,023 1.1
Occupation 40,144 0.2
Place of birth 159,224 0.2
Place of usual residence in 1983 117,944 0.6
Years lived elsewhere 7,442 18.7
Lived elsewhere for seasonal work 84,023 1.7
Literacy 124,209 0.6
Attended formal school 124,209 2.5
Highest education grade completed 46,181 0.5
Currently attending school 36,595 1.7
Ever had a live birthb 24,774 3.0
Number of girls bornb 21,457 0.0
Birth attendanceb 21,457 0.5
Number of children under fiveb 21,457 2.1
Children under-five with birth certificateb 15,817 1.2a Based on unweighted observationsb Percentages refer to, respectively, all observation units and to all units minus those from Zabul province, where female interviewers could not administer the survey.
ANNEX IX QUALITY ASSURANCE AND QUALITY ASSESSMENT

190
ANNEX X TABLES AT PROVINCE LEVELTable X.1: Population, by sex, and by province, age groups (in thousands)
Province,age group
Sex
Male Female Both sexes
National 13,849 13,106 26,9550-14 6,799 6,249 13,048
15-24 2,540 2,566 5,106
25-39 2,299 2,350 4,649
40-59 1,781 1,709 3,490
60+ 430 231 662
Badakhshan 486 452 9380-14 232 212 444
15-24 84 81 165
25-39 77 83 160
40-59 73 68 141
60+ 21 8 29
Badghis 320 290 6100-14 158 133 291
15-24 52 59 111
25-39 62 60 121
40-59 42 35 77
60+ 7 3 10
Baghlan 459 416 8750-14 225 194 419
15-24 93 95 187
25-39 71 67 138
40-59 59 56 115
60+ 11 5 16
Balkh 611 603 1,2140-14 282 252 534
15-24 129 137 266
25-39 93 110 203
40-59 88 86 174
60+ 19 18 37
Bamyan 218 208 4260-14 100 97 197
15-24 48 42 90
25-39 32 34 67
40-59 28 31 58
60+ 11 4 15
ANNEX X TABLES AT PROVINCE LEVEL

191
Daykundi 194 199 3920-14 95 95 189
15-24 35 41 76
25-39 29 32 61
40-59 26 28 54
60+ 9 4 13
Farah 311 255 5660-14 164 127 291
15-24 57 56 114
25-39 48 41 88
40-59 35 27 62
60+ 7 4 12
Faryab 475 488 9630-14 215 208 423
15-24 66 84 150
25-39 97 113 211
40-59 70 69 139
60+ 26 14 41
Ghazni 662 610 1,2710-14 341 309 649
15-24 99 108 207
25-39 122 107 229
40-59 82 79 161
60+ 19 8 26
Ghor 368 346 7140-14 186 168 354
15-24 59 67 126
25-39 61 62 123
40-59 50 43 93
60+ 12 5 17
Helmand 479 459 9380-14 241 238 479
15-24 85 92 177
25-39 88 84 172
40-59 59 44 103
60+ 5 2 7
Herat 947 924 1,8710-14 474 447 921
15-24 183 200 383
25-39 129 146 274
ANNEX X TABLES AT PROVINCE LEVEL

192
40-59 128 117 245
60+ 33 15 48
Jawzjan 250 250 5000-14 104 106 210
15-24 53 52 105
25-39 42 46 88
40-59 40 38 78
60+ 10 8 18
Kabul 2,219 2,023 4,2430-14 925 818 1,743
15-24 536 490 1,026
25-39 386 355 741
40-59 276 314 590
60+ 97 45 143
Kandahar 536 538 1,0740-14 299 298 597
15-24 45 59 104
25-39 103 115 218
40-59 84 64 148
60+ 5 1 7
Kapisa 214 205 4190-14 93 91 184
15-24 52 45 97
25-39 31 32 63
40-59 30 31 61
60+ 8 6 14
Khost 330 268 5980-14 193 135 328
15-24 49 51 100
25-39 41 41 82
40-59 41 39 80
60+ 5 3 8
Kunarha 232 221 4530-14 133 122 254
15-24 38 43 81
25-39 32 30 62
40-59 26 25 51
60+ 3 1 4
Kunduz 516 475 9900-14 258 238 496
15-24 105 89 194
ANNEX X TABLES AT PROVINCE LEVEL

193
25-39 78 81 159
40-59 60 58 118
60+ 14 9 23
Laghman 251 236 4870-14 137 127 264
15-24 41 39 80
25-39 38 40 78
40-59 30 27 57
60+ 6 3 8
Logar 237 221 4580-14 137 111 247
15-24 18 27 45
25-39 58 60 118
40-59 22 21 43
60+ 2 2 4
Nangarhar 891 847 1,7380-14 487 462 949
15-24 148 139 287
25-39 127 133 260
40-59 104 96 200
60+ 24 17 41
Nimroz 85 78 1640-14 47 41 88
15-24 16 16 32
25-39 12 13 25
40-59 10 7 17
60+ 1 1 2
Nooristan 76 64 1390-14 45 34 79
15-24 5 7 13
25-39 15 16 31
40-59 8 6 14
60+ 1 1 2
Paktika 229 218 4470-14 142 125 267
15-24 18 23 41
25-39 44 49 94
40-59 22 19 41
60+ 3 2 5
Paktya 284 252 536
ANNEX X TABLES AT PROVINCE LEVEL

194
0-14 138 122 260
15-24 59 49 108
25-39 41 42 83
40-59 41 36 77
60+ 6 2 8
Panjsher 72 66 1380-14 33 33 66
15-24 15 10 26
25-39 12 13 25
40-59 10 9 19
60+ 2 2 4
Parwan 356 347 7030-14 168 159 327
15-24 81 76 157
25-39 52 60 112
40-59 41 44 85
60+ 14 9 23
Samangan 197 178 3750-14 94 84 178
15-24 36 30 66
25-39 34 34 69
40-59 25 25 51
60+ 7 5 12
Sar-e-Pul 260 262 522
0-14 125 118 243
15-24 49 51 100
25-39 38 42 80
40-59 37 42 79
60+ 10 9 19
Takhar 476 457 9330-14 230 218 448
15-24 89 96 185
25-39 77 82 159
40-59 61 54 114
60+ 19 7 27
Urozgan 172 180 3520-14 88 95 184
15-24 33 34 67
25-39 23 26 49
40-59 22 22 44
60+ 6 3 9
ANNEX X TABLES AT PROVINCE LEVEL

195
Wardak 309 321 6300-14 159 158 317
15-24 38 53 92
25-39 77 71 148
40-59 30 33 63
60+ 5 5 10
Zabul 129 147 2770-14 54 74 128
15-24 24 25 49
25-39 29 28 57
40-59 20 19 40
60+ 2 1 2
ANNEX X TABLES AT PROVINCE LEVEL

196 ANNEX X TABLES AT PROVINCE LEVEL
Table X.2: Population, by sex, marital statusa, and by province (in thousands)
Province Sex, marital status
Male Female Both sexes
Mar
ried
Wid
owed
Nev
erm
arrie
d
Tota
l
Mar
ried
Wid
owed
Nev
erm
arrie
d
Tota
l
Mar
ried
Wid
owed
Nev
erm
arrie
d
Tota
l
National 4,583 108 9,157 13,849 4,762 471 7,866 13,106 9,345 579 17,023 26,955Badakhshan 166 : 316 486 172 19 261 452 338 24 576 938
Badghis 118 (4) 198 320 121 11 158 290 239 15 355 610
Baghlan 138 : 319 459 144 15 257 416 281 17 577 875
Balkh 196 : 409 611 207 33 362 603 404 38 772 1,214
Bamyan 71 (2) 145 218 73 9 126 208 144 11 271 426
Daykundi 67 : 125 194 71 8 120 199 138 9 245 392
Farah 99 (5) 207 311 102 (5) 148 255 201 (10) 355 566
Faryab 185 : 283 475 199 23 265 488 385 30 548 963
Ghazni 229 : 429 662 234 (8) 368 610 463 (12) 797 1,271
Ghor 129 (4) 235 368 132 12 202 346 261 16 437 714
Helmand 177 : 298 479 181 : 275 459 358 : 573 938
Herat 314 : 626 947 329 42 551 924 643 49 1,178 1,871
Jawzjan 83 (3) 164 250 87 15 147 250 170 19 311 500
Kabul 702 : 1,506 2,219 722 89 1,211 2,023 1,424 101 2,717 4,243
Kandahar 193 : 341 536 195 (10) 333 538 388 (12) 674 1,074
Kapisa 67 : 145 214 69 10 126 205 136 12 271 419
Khost 90 : 238 330 91 : 174 268 181 : 412 598
Kunarha 73 : 159 232 76 (3) 141 221 149 (3) 301 453
Kunduz 155 : 357 516 160 24 292 475 315 27 649 990
Laghman 76 : 173 251 79 5 152 236 155 7 325 487
Logar 82 : 153 237 85 5 130 221 167 8 283 458
Nangarhar 278 : 608 891 293 18 536 847 571 23 1,144 1,738
Nimroz 27 (1) 58 85 27 3 48 78 54 4 106 164
Nooristan 25 (1) 49 76 26 1 36 64 52 2 86 139
Paktika 73 (2) 154 229 81 (3) 134 218 154 (5) 288 447
Paktya 95 (4) 186 284 99 7 146 252 193 11 332 536
Panjsher 23 : 48 72 23 2 41 66 46 2 90 138
Parwan 109 (4) 242 356 114 18 215 347 224 22 457 703
Samangan 64 (3) 130 197 68 10 101 178 132 13 230 375
Sar-e-Pul 88 : 170 260 96 16 150 262 185 17 320 522
Takhar 161 : 313 476 170 15 271 457 332 17 584 933
Urozgan 54 : 117 172 57 5 118 180 111 7 235 352
Wardak 124 : 181 309 125 15 180 321 250 18 361 630
Zabul 52 (2) 76 129 52 5 89 147 104 7 165 277a for divorced/separated are suppressed because of low number of observations.Figures in parentheses are based on 25 to 49 unweighted observations or on data with a percentage of missing values between 20 and 50, or are considered less reliable. A colon (:) denotes figures based on less than 25 unweighted observations or on data with a percentage of missing values over 50, or are considered unreliable.

197ANNEX X TABLES AT PROVINCE LEVEL
Table X.3: Population, by immigrant status, and by province (in thousands)
Province Immigrant status
Non-immigrant Immigrant Total
National 25,620 1,312 26,932Badakhshan 938 : 938
Badghis 607 : 609
Baghlan 864 11 875
Balkh 1,178 35 1,213
Bamyan 416 10 426
Daykundi 385 7 392
Farah 536 30 566
Faryab 955 (8) 963
Ghazni 1,238 33 1,270
Ghor 708 (6) 714
Helmand 933 (5) 938
Herat 1,849 20 1,869
Jawzjan 467 33 500
Kabul 3,674 562 4,236
Kandahar 1,042 29 1,071
Kapisa 418 : 419
Khost 535 62 597
Kunarha 426 27 453
Kunduz 969 19 988
Laghman 473 13 487
Logar 437 20 457
Nangarhar 1,561 177 1,738
Nimroz 138 25 163
Nooristan 136 4 139
Paktika 417 30 447
Paktya 469 67 536
Panjsher 137 (1) 138
Parwan 667 35 702
Samangan 369 7 375
Sar-e-Pul 505 16 521
Takhar 929 : 933
Urozgan 349 (2) 351
Wardak 623 (6) 630
Zabul 270 6 276
Figures in parentheses are based on 25 to 49 unweighted observations or on data with a percentage of missing values between 20 and 50, or are considered less reliable. A colon (:) denotes figures based on less than 25 unweighted observations or on data with a percentage of missing values over 50, or are considered unreliable.

198 ANNEX X TABLES AT PROVINCE LEVEL
Table X.4: Working-age population, by labour force indicators
Province Labour Force Participation
Rate
Employment-to-Population Ratio
Under-employment Rate
Unemployment Rate
Not-Gainfully Employed
Population Rate
National 49.8 45.7 16.8 8.2 25.0Badakhshan 49.5 43.7 22.5 11.7 34.2
Badghis 56.8 52.2 42.4 8.2 50.6
Baghlan 45.6 39.5 (2.6) 13.3 16.0
Balkh 42.2 40.5 (5.0) (4.0) 9.0
Bamyan 49.0 37.4 17.6 23.7 41.3
Daykundi 56.8 40.8 14.4 28.1 42.5
Farah 56.2 51.1 15.9 9.2 25.1
Faryab 60.1 57.2 18.3 4.9 23.2
Ghazni 54.0 48.0 21.2 11.1 32.4
Ghor 46.2 42.0 9.9 9.0 18.9
Helmand 48.4 48.0 : : :
Herat 42.6 40.8 15.5 (4.4) 19.9
Jawzjan 51.7 49.0 (2.5) 5.3 7.8
Kabul 43.0 39.1 9.8 9.0 18.8
Kandahar 47.6 43.2 9.7 9.4 19.1
Kapisa 32.6 28.1 15.9 13.8 29.6
Khost 61.5 45.6 24.4 25.8 50.2
Kunarha 71.2 67.9 31.2 4.6 35.9
Kunduz 41.8 38.6 : 7.7 8.2
Laghman 67.5 61.5 25.7 8.9 34.6
Logar 78.9 73.6 29.2 6.8 36.0
Nangarhar 51.8 50.1 20.2 (3.4) 23.6
Nimroz 52.7 46.6 20.1 11.6 31.7
Nooristan 88.3 83.8 22.4 5.0 27.4
Paktika 51.3 47.2 25.4 7.9 33.3
Paktya 49.6 48.3 30.5 (2.6) 33.1
Panjsher 36.3 35.7 6.4 : 7.9
Parwan 46.5 43.2 16.3 6.9 23.2
Samangan 44.8 42.3 14.2 5.5 19.7
Sar-e-Pul 57.1 52.5 13.5 8.1 21.6
Takhar 46.8 43.7 16.9 6.6 23.5
Urozgan 70.9 68.7 38.4 3.2 41.6
Wardak 71.7 67.3 34.1 6.2 40.3
Zabul 46.6 42.3 44.0 9.3 53.3
Figures in parentheses are based on 25 to 49 unweighted observations or on data with a percentage of missing values between 20 and 50, or are considered less reliable. A colon (:) denotes figures based on less than 25 unweighted observations or on data with a percentage of missing values over 50, or are considered unreliable.

199ANNEX X TABLES AT PROVINCE LEVEL
Table X.5: Employed population, by status in employment, and by province (in thousands)
Province Status in employment
Day labourer Salaried worker
Own account worker Employer Unpaid family
worker Total
National 1,279 1,181 3,013 59 832 6,364Badakhshan 72 42 66 0 31 212
Badghis 13 : 101 0 40 173
Baghlan 25 27 76 3 44 174
Balkh 39 55 162 18 7 281
Bamyan 14 : 42 0 24 88
Daykundi 18 6 34 0 22 80
Farah 14 16 93 0 21 144
Faryab 74 50 141 0 43 307
Ghazni 26 33 237 0 8 304
Ghor 46 10 64 1 35 156
Helmand : : 139 0 86 230
Herat 187 31 168 1 7 394
Jawzjan 60 34 41 0 2 137
Kabul 97 479 284 9 138 1,007
Kandahar 13 12 170 4 4 204
Kapisa 8 24 28 1 4 65
Khost 22 16 66 0 7 111
Kunarha 40 11 14 0 73 139
Kunduz 55 25 113 2 1 196
Laghman 41 17 84 0 2 144
Logar 8 17 112 0 19 156
Nangarhar 129 44 157 6 7 343
Nimroz 10 3 18 0 6 36
Nooristan (1) 7 30 0 12 51
Paktika 10 26 31 0 13 80
Paktya 20 20 71 10 2 123
Panjsher (1) 15 10 0 1 27
Parwan 22 53 73 2 19 168
Samangan 43 10 28 0 4 85
Sar-e-Pul 56 9 81 0 2 148
Takhar 85 27 94 1 4 211
Urozgan 9 (1) 69 0 39 118
Wardak 11 28 71 0 96 206
Zabul 6 3 46 0 8 63
Figures in parentheses are based on 25 to 49 unweighted observations or on data with a percentage of missing values between 20 and 50, or are considered less reliable. A colon (:) denotes figures based on less than 25 unweighted observations or on data with a percentage of missing values over 50, or are considered unreliable.

200 ANNEX X TABLES AT PROVINCE LEVEL
Table X.6: Households, by ownership of different types of agricultural land (in thousands)
Province Total households
Irrigated land Rain-fed land Garden plot
National 3,629 1,377 610 347Badakhshan 135 49 61 26
Badghis 98 15 61 7
Baghlan 114 54 42 11
Balkh 165 55 15 (13)
Bamyan 56 43 14 14
Daykundi 58 49 8 6
Farah 76 53 : 12
Faryab 161 25 55 15
Ghazni 168 60 16 25
Ghor 98 64 63 7
Helmand 115 88 : 11
Herat 279 69 26 10
Jawzjan 66 21 12 :
Kabul 566 112 : 91
Kandahar 146 45 : 21
Kapisa 57 38 : 3
Khost 62 19 (4) :
Kunarha 48 28 17 (3)
Kunduz 128 48 (6) :
Laghman 67 31 : 9
Logar 63 31 (3) 12
Nangarhar 197 58 15 :
Nimroz 23 9 : :
Nooristan 15 12 : 1
Paktika 46 23 6 8
Paktya 57 39 12 10
Panjsher (22) 20 : 3
Parwan 97 44 : 21
Samangan 54 11 30 (4)
Sar-e-Pul 75 19 38 27
Takhar 144 41 46 (13)
Urozgan 33 25 (3) 4
Wardak 105 57 15 38
Zabul 36 24 11 23
Figures in parentheses are based on 25 to 49 unweighted observations or on data with a percentage of missing values between 20 and 50, or are considered less reliable. A colon (:) denotes figures based on less than 25 unweighted observations or on data with a percentage of missing values over 50, or are considered unreliable.

201ANNEX X TABLES AT PROVINCE LEVEL
Table X.7: Mean and median size of owned land, for different types of land, by province (in jeribs)
Province Irrigated land Rain-fed land Garden plot
Mean Median Mean Median Mean Median
National 6.0 3.0 16.4 7.0 2.0 1.0Badakhshan 4.2 2.0 6.4 4.0 1.1 1.0
Badghis 3.3 2.0 11.4 10.0 1.7 1.5
Baghlan 6.5 4.0 13.6 8.0 1.8 2.0
Balkh 16.7 6.0 17.4 10.0 (1.3) (1.0)
Bamyan 4.2 2.5 20.8 10.0 1.4 0.5
Daykundi 2.1 1.5 2.5 2.0 1.9 1.0
Farah 16.6 12.5 : : 1.9 1.0
Faryab 6.3 2.0 27.5 20.0 2.4 2.0
Ghazni 7.3 5.0 84.8 36.0 2.8 2.0
Ghor 2.2 1.5 4.1 3.0 1.4 1.0
Helmand 10.0 9.5 : : 1.2 1.0
Herat 5.0 2.0 56.7 10.0 1.9 1.0
Jawzjan 22.7 6.0 22.9 10.0 : :
Kabul 3.4 1.0 : : 1.8 1.0
Kandahar 10.9 8.0 : : 6.0 6.0
Kapisa 2.2 1.5 : : 1.8 1.0
Khost 1.6 1.0 (2.2) (2.0) : :
Kunarha 1.3 1.0 1.6 1.0 (0.6) (0.3)
Kunduz 7.3 5.0 (39.4) (20.0) : :
Laghman 2.3 1.0 : : 1.2 0.3
Logar 3.6 3.0 (3.9) (3.0) 1.5 1.0
Nangarhar 2.2 1.5 3.0 1.5 : :
Nimroz 27.5 17.0 n.a n.a : :
Nooristan 2.4 2.0 : : 0.6 0.5
Paktika 6.5 5.0 8.1 6.0 2.6 2.0
Paktya 5.9 2.0 6.7 4.0 1.2 0.5
Panjsher 2.5 2.0 : : 0.9 0.6
Parwan 1.9 1.2 : : 1.3 1.0
Samangan 3.5 2.0 14.7 10.0 (2.4) (1.0)
Sar-e-Pul 3.0 2.0 20.6 15.0 1.5 1.0
Takhar 5.8 4.0 19.4 12.0 (1.2) (1.0)
Urozgan 3.2 3.0 (8.7) (7.0) 1.9 1.0
Wardak 2.3 2.0 2.9 3.0 1.8 1.5
Zabul 7.4 7.0 8.8 8.0 3.0 3.0
Figures in parentheses are based on 25 to 49 unweighted observations or on data with a percentage of missing values between 20 and 50, or are considered less reliable. A colon (:) denotes figures based on less than 25 unweighted observations or on data with a percentage of missing values over 50, or are considered unreliable.

202 ANNEX X TABLES AT PROVINCE LEVEL
Table X.8: Households, by distance to nearest primary education facility for boys and girls,and by province (in thousands)
Province Boys' lower secondary education Girls' lower secondary education
0-2 km. 3-5 km. 6 or more km. Total 0-2 km. 3-5 km. 6 or more
km. Total
National 1,746 501 990 3,237 1,489 371 1,236 3,096Badakhshan 75 44 13 132 80 44 10 135
Badghis 35 15 43 92 (17) (8) (52) 77
Baghlan (41) (1) (46) 88 (26) (1) (62) 89
Balkh 132 17 9 158 122 11 20 153
Bamyan (1) (2) (39) 42 3 1 45 50
Daykundi 22 21 12 55 22 20 13 55
Farah 21 18 36 74 17 12 42 71
Faryab 80 49 26 154 78 48 30 156
Ghazni 63 15 65 143 36 14 100 150
Ghor (9) (19) (39) 68 (8) (8) (50) 66
Helmand 14 6 79 99 10 1 84 95
Herat 138 26 88 252 106 26 96 228
Jawzjan (30) (9) (13) 52 (24) (7) (21) 52
Kabul 460 22 41 523 421 10 49 481
Kandahar 59 19 55 133 (32) (4) (78) 114
Kapisa 34 12 9 56 35 14 6 55
Khost 26 5 27 58 21 5 34 60
Kunarha 16 12 18 46 15 9 21 44
Kunduz 11 17 77 105 3 8 92 103
Laghman 32 29 4 66 28 29 9 66
Logar 43 12 5 61 23 7 21 52
Nangarhar 86 29 58 173 86 21 60 167
Nimroz (5) (0) (11) 16 (3) (0) (14) 17
Nooristan (5) (1) (6) 12 5 1 8 14
Paktika 18 21 2 41 11 7 17 36
Paktya 28 24 4 56 (18) (10) (10) 39
Panjsher 14 5 3 22 14 4 3 21
Parwan 80 13 2 95 76 15 2 93
Samangan 31 10 6 47 23 5 16 44
Sar-e-Pul 38 8 24 70 39 10 20 69
Takhar 68 9 40 117 66 2 56 124
Urozgan (4) (0) (19) 23 (2) (0) (19) 22
Wardak (22) (3) (49) 75 (17) (1) (48) 66
Zabul 6 7 22 35 2 5 27 34
Figures in parentheses are based on 25 to 49 unweighted observations or on data with a percentage of missing values between 20 and 50, or are considered less reliable.

203ANNEX X TABLES AT PROVINCE LEVEL
Table X.9: Households, by distance to nearest lower secondary education facility for boys and girls,and by province (in thousands)
Province Boys' lower secondary education Girls' lower secondary education
0-2 km. 3-5 km. 6 or more km. Total 0-2 km. 3-5 km. 6 or more
km. Total
National 1,683 576 846 3,106 1,541 466 1,136 3,143Badakhshan 71 47 17 135 71 36 21 128
Badghis 31 14 43 88 17 10 56 83
Baghlan 83 3 14 100 (49) (1) (28) 78
Balkh 109 19 19 148 118 13 20 151
Bamyan 33 10 10 53 31 11 11 53
Daykundi 19 23 10 51 22 19 13 55
Farah 13 14 41 68 12 10 49 70
Faryab 70 36 47 152 68 39 47 154
Ghazni 57 32 70 159 39 25 93 156
Ghor (12) (19) (45) 75 (14) (21) (39) 73
Helmand (9) (14) (65) 87 (6) (7) (79) 91
Herat (86) (29) (65) 180 83 29 116 228
Jawzjan 28 18 8 55 31 12 16 58
Kabul 449 37 10 496 428 25 32 486
Kandahar 38 17 70 126 34 6 82 122
Kapisa (12) (10) (23) 45 16 7 24 47
Khost 43 6 10 59 17 4 37 58
Kunarha 8 11 25 43 8 10 30 48
Kunduz 46 43 19 109 45 43 30 118
Laghman 22 31 12 65 26 28 14 67
Logar 39 15 5 59 25 9 20 53
Nangarhar (78) (36) (40) 155 83 32 55 169
Nimroz (7) (0) (9.2) 17 7 0 11 19
Nooristan (5) (0) (6.3) 11 4 0 9 13
Paktika 12 7 22 41 3 0 35 38
Paktya 25 22 7 53 (15) (10) (16) 41
Panjsher 13 5 3 21 13 5 3 21
Parwan 75 19 0 94 76 18 0 94
Samangan (25) (3) (15.5) 43 22 3 20 45
Sar-e-Pul 49 10 11 70 52 9 10 71
Takhar 89 11 20 120 89 11 25 124
Urozgan (3) (1) (19.2) 23 (3) (0) (20) 23
Wardak (22) (8) (41.1) 70 (16) (7) (48) 72
Zabul 4 8 22 34 2 5 28 35
Figures in parentheses are based on 25 to 49 unweighted observations or on data with a percentage of missing values between 20 and 50, or are considered less reliable.

204 ANNEX X TABLES AT PROVINCE LEVEL
Table X.10: Literacy rate of population aged 15 years older, by sex, and by province
Province Sex
Male Female Both sexes
National 45.4 17.0 31.4Badakhshan 45.7 25.2 35.7
Badghis 28.3 5.0 16.9
Baghlan 46.0 12.9 29.9
Balkh 49.4 26.8 37.8
Bamyan 52.3 17.5 35.5
Daykundi 48.5 18.0 32.9
Farah 29.6 11.1 21.0
Faryab 42.5 17.6 29.6
Ghazni 59.7 21.4 41.2
Ghor 35.2 5.1 20.3
Helmand 10.2 1.6 6.1
Herat 29.4 19.3 24.3
Jawzjan 34.0 14.6 24.4
Kabul 68.1 34.7 52.0
Kandahar 30.0 3.4 16.8
Kapisa 62.4 21.8 42.8
Khost 27.0 2.4 15.5
Kunarha 39.5 3.8 21.8
Kunduz 25.1 6.9 16.3
Laghman 44.2 6.2 25.6
Logar 53.0 11.4 31.3
Nangarhar 45.0 9.3 27.6
Nimroz 34.5 12.4 23.7
Nooristan 36.7 5.3 21.1
Paktika 63.6 2.6 32.2
Paktya 43.0 5.8 25.6
Panjsher 78.3 18.8 50.8
Parwan 54.6 21.5 38.1
Samangan 32.8 9.5 21.6
Sar-e-Pul 33.9 14.1 23.6
Takhar 32.8 15.5 24.3
Urozgan 14.7 2.4 8.5
Wardak 75.6 10.8 42.4
Zabul 25.5 1.6 13.6

205ANNEX X TABLES AT PROVINCE LEVEL
Table X.11: Net and Gross Primary Attendance Ratios, by sex, and by province
Province Net Primary Attendance Ratio Gross Primary Attendance Ratio
Male Female Both sexes Male Female Both
sexes
National 64 48 57 83 61 72Badakhshan 71 67 69 86 82 84
Badghis 59 46 53 76 57 67
Baghlan 69 55 63 90 67 79
Balkh 72 64 68 90 81 86
Bamyan 73 63 67 98 77 87
Daykundi 80 72 76 107 92 99
Farah 60 38 51 77 49 65
Faryab 78 60 69 101 82 92
Ghazni 74 40 59 87 47 70
Ghor 69 52 61 87 63 75
Helmand 21 10 15 26 12 19
Herat 58 61 59 77 79 78
Jawzjan 74 57 66 101 69 86
Kabul 80 67 74 105 86 96
Kandahar 22 15 19 28 18 23
Kapisa 84 70 78 100 88 94
Khost 57 37 49 68 42 57
Kunarha 53 33 44 70 40 56
Kunduz 46 27 37 61 37 50
Laghman 75 64 70 98 75 87
Logar 73 46 62 83 52 70
Nangarhar 70 45 58 95 59 78
Nimroz 42 42 42 49 52 50
Nooristan 35 29 33 43 34 40
Paktika 79 11 48 93 14 56
Paktya 61 27 46 79 34 59
Panjsher 95 93 94 114 118 116
Parwan 69 51 60 93 64 79
Samangan 80 60 70 107 75 91
Sar-e-Pul 66 55 61 95 75 85
Takhar 66 53 60 83 64 74
Urozgan 9 1 5 15 2 8
Wardak 68 14 45 78 17 51
Zabul 17 4 9 30 6 16

206 ANNEX X TABLES AT PROVINCE LEVEL
Table X.12: Net and Gross Secondary Attendance Ratios, by sex, and by province
Province Net Secondary Attendance Ratio Gross Secondary Attendance Ratio
Male Female Both sexes Male Female Both
sexes
National 42 23 33 55 29 42Badakhshan 52 43 47 62 51 57
Badghis 20 8 15 27 11 20
Baghlan 52 21 37 76 27 52
Balkh 46 32 39 65 42 53
Bamyan 36 30 33 55 38 47
Daykundi 46 33 39 63 44 53
Farah 31 21 26 39 25 32
Faryab 45 34 40 57 43 50
Ghazni 56 32 43 72 39 55
Ghor 22 9 15 33 11 22
Helmand 18 2 10 21 3 12
Herat 22 20 21 30 27 28
Jawzjan 43 26 34 58 34 45
Kabul 60 39 49 77 47 62
Kandahar 29 9 19 38 17 27
Kapisa 75 39 57 96 49 73
Khost 30 4 19 40 5 25
Kunarha 33 5 19 42 6 24
Kunduz 28 11 20 41 13 27
Laghman 45 11 29 54 13 35
Logar 65 23 43 74 26 49
Nangarhar 42 9 27 56 12 36
Nimroz 22 14 18 25 17 21
Nooristan 31 12 22 40 14 28
Paktika 41 1 23 47 1 26
Paktya 31 9 21 45 10 30
Panjsher 78 37 61 89 41 68
Parwan 50 27 39 67 38 53
Samangan 36 15 26 46 22 35
Sar-e-Pul 30 16 23 40 22 31
Takhar 34 28 31 45 33 39
Urozgan 10 3 6 12 3 8
Wardak 70 3 35 94 4 46
Zabul 14 3 8 20 3 11

207ANNEX X TABLES AT PROVINCE LEVEL
Table X.13: Children under five years of age, by birth registration and Vitamin A supplementation,and by province
Province Withoutbirth certificate
Without Vitamin Asupplementation
Thousands Percentage Thousands Percentage
National 3,005 65 1,862 40Badakhshan 139 92 88 58
Badghis (76) (96) 63 79
Baghlan 91 65 32 23
Balkh 49 28 27 16
Bamyan 49 78 6 10
Daykundi 46 79 32 56
Farah 50 41 44 36
Faryab 121 72 44 26
Ghazni 143 64 151 69
Ghor (116) (95) 55 45
Helmand (182) (98) (179) (96)
Herat 166 55 103 35
Jawzjan 49 85 38 67
Kabul 188 30 75 12
Kandahar 196 86 187 83
Kapisa 33 59 31 55
Khost 99 88 88 78
Kunarha 37 41 51 56
Kunduz 151 90 126 76
Laghman (89) (97) 29 32
Logar 77 65 36 30
Nangarhar 163 50 28 9
Nimroz 24 82 9 29
Nooristan (39) (98) (39) (98)
Paktika (127) (98) 51 39
Paktya 78 94 13 15
Panjsher 13 79 12 71
Parwan 70 59 16 13
Samangan 37 66 11 19
Sar-e-Pul 23 28 34 42
Takhar : : 38 23
Urozgan : : : :
Wardak 44 27 48 29
Zabul : : : :
Figures in parentheses are based on 25 to 49 unweighted observations or on data with a percentage of missing values between 20 and 50, or are considered less reliable. A colon (:) denotes figures based on less than 25 unweighted observations or on data with a percentage of missing values over 50, or are considered unreliable.

208 ANNEX X TABLES AT PROVINCE LEVEL
Table X.14: Women with a birth in the last five years, by maternal health services provided,and by province (in percentages)
Province Skilled ante-natal care
Skilled birth attendance
Delivery in health facility
Number of Tetanus-Toxoid injections
None 1 2 or more
National 51 40 36 57 9 35
Badakhshan 50 10 (9) 36 : 63
Badghis 14 : : 91 : (7)
Baghlan 61 33 28 44 : 53
Balkh 87 49 39 38 23 39
Bamyan 63 39 37 36 (7) 56
Daykundi 32 16 16 53 (9) 38
Farah 63 39 32 35 : 61
Faryab 52 26 15 51 (7) 42
Ghazni 41 57 52 44 (5) 51
Ghor (9) : : 93 : :
Helmand 9 8 (6) 91 : 9
Herat 64 34 29 67 (8) 25
Jawzjan 39 43 31 42 (10) 49
Kabul 78 79 74 59 (13) 28
Kandahar 26 47 43 72 11 17
Kapisa 54 34 31 45 : 52
Khost 30 33 30 72 : 27
Kunarha 32 10 10 43 : 54
Kunduz 36 14 13 46 11 43
Laghman 80 50 49 69 (6) 25
Logar 45 53 50 60 11 29
Nangarhar 50 54 46 53 (8) 39
Nimroz 73 51 47 35 15 49
Nooristan : : : 98 : :
Paktika 26 21 17 48 14 37
Paktya 81 57 57 45 22 33
Panjsher 47 27 24 62 : 32
Parwan 65 42 40 56 (7) 37
Samangan 46 37 36 56 24 20
Sar-e-Pul 71 37 36 37 25 38
Takhar 52 22 20 51 (11) 38
Urozgan : : : 98 : :
Wardak 72 74 72 24 : 75
Zabul : : : : : :
Figures in parentheses are based on 25 to 49 unweighted observations or on data with a percentage of missing values between 20 and 50, or are considered less reliable. A colon (:) denotes figures based on less than 25 unweighted observations or on data with a percentage of missing values over 50, or are considered unreliable.

209ANNEX X TABLES AT PROVINCE LEVEL
Table X.15: Population, by access to housing amenities, and by province (in percentages)
Province Safe drinking water
Improved sanitation
Any source of electricity
Drivable road within 2 km.
National 46 8 69 80Badakhshan 37 : 57 93
Badghis 46 : 37 74
Baghlan 28 : 65 80
Balkh 67 17 77 97
Bamyan 21 : 96 79
Daykundi 17 : 96 92
Farah 56 : 75 27
Faryab 33 : 80 79
Ghazni 40 : 75 80
Ghor 20 : 90 67
Helmand 30 : 34 77
Herat 53 16 72 90
Jawzjan 25 : 60 59
Kabul 78 25 88 95
Kandahar 47 (6) 82 50
Kapisa 33 : 80 62
Khost 36 : 47 98
Kunarha 32 10 26 69
Kunduz 27 : 56 62
Laghman 54 : 71 72
Logar 46 : 99 95
Nangarhar 46 10 41 85
Nimroz 11 13 50 80
Nooristan 14 (4) 30 52
Paktika 62 (5) 89 (6)
Paktya 66 : 77 93
Panjsher 63 : 78 61
Parwan 38 14 86 100
Samangan 20 : 59 82
Sar-e-Pul 23 : 85 85
Takhar 61 : 59 90
Urozgan (7) : 7 85
Wardak 13 : 73 53
Zabul 9 : 22 24
Figures in parentheses are based on 25 to 49 unweighted observations or on data with a percentage of missing values between 20 and 50, or are considered less reliable. A colon (:) denotes figures based on less than 25 unweighted observations or on data with a percentage of missing values over 50, or are considered unreliable.

210 ANNEX XI CONCEPTS AND DEFINITIONS
ANNEX XI CONCEPTS AND DEFINITIONSAdult. Person age 18 or over.
Adult literacy rate. The percentage of literate persons aged 15 years and over.
Aged dependency ratio. The ratio of the number of elderly aged 65 and over to the number of persons in the most productive ages of 15-64, expressed as a percentage.
Ante -natal care. Workers/attendants which are accredited health professionals - such as a midwife, doctor or nurse - who have been educated and trained to proficiency in the skills needed to manage normal (uncomplicated) pregnancies, childbirth and the immediate postnatal period, and in the identification, management and referral of complications in women and newborns. Both trained and untrained traditional birth attendants (TBA) are excluded.
Calorie deficiency. A daily caloric intake of less than 2,100 Kcal per person.
Child. Person below age 18.
Child dependency ratio. The ratio of the number of children aged 0-14 to the number of persons in the most productive ages of 15-64, expressed as a percentage.
Cont ributing family workers. Those workers who hold a ‘self-employment’ job in a market-oriented establishment operated by a related person living in the same household, who cannot be regarded as partners, because their degree of commitment to the operation of the establishment, in terms of working time or other factors to be determined by national circumstances, is not at a level comparable to that of the head of the establishment.
Coping strategy. Household strategies to adjust the livelihood situation in response to household shocks.
Depe ndency ratio. The ratio of the number of persons in the unproductive ages of 0-14 and 65 and over to the number of persons in the most productive ages of 15-64, expressed as a percentage.
Dura ble housing. Housing of which the outer walls, roof and floor are made of durable materials that protect its inhabitants from the extremes of climatic conditions, such as rain, heat, cold and humidity. Fired brick, concrete, mud bricks and stone are considered durable materials. For roofs also wood is regarded durable.
Economic sector. A group of establishments engaged on the same, or similar, kinds of production activity
Educational attainment. The highest level of education an individual has successfully completed.
Elderly. Person age 65 or over.
Emigrant. A person who left a country and took up residence abroad for at least one year.
Emigration. The act of crossing an international border and taking up residence abroad for at least one year.
Emigration rate. The number of emigrants as percentage of the resident population.
Empl oyed. All persons age 14 and over who, during the reference period of one week, were in paid employment or self employed and who worked at least eight hours. The employed include military and apprentices, as well as persons who were temporarily absent from work because of holidays or leave, temporary lay-off, or who had a job attachment defined by having access to irrigated farm land.
Empl oyers. Those workers who, working on their own account or with one or a few partners, hold the type of job defined as a self-employed job, and in this capacity, on a continuous basis have engaged one or more persons to work for them in their business as employees.
Empl oyees. Persons who enter an agreement, which may be formal or informal, with an enterprise to work for the enterprise in return for remuneration in cash or in kind.
Employment-to-population ratio. The proportion of the working-age population that is employed.Enum eration Area. Areas into which a country is divided that covers a number of households that can be enumerated in

211ANNEX XI CONCEPTS AND DEFINITIONS
a census by one enumerator.
Food security. Food security exists when all people, at all times have physical, social and economic access to sufficient, safe and nutritious food for a healthy and active life. Here, households that meet a minimum of 2,100 calories per person per day are considered as food secure.
Gend er parity index. The ratio of the number of female students attending primary, secondary and tertiary levels of education to the number of male students in each level (based on the gross attendance ratio).
Gros s attendance ratio. The number of pupils attending a given level of education, regardless of age, expressed as a percentage of the population in the theoretical age group for the same level of education.
Gini Index. An index measuring the extent to which the distribution of consumption expenditure among individuals or households within an economy deviates from a perfectly equal distribution.
Head of household. The person commonly regarded by the household members as their head. Usually it is the main income earner and decision maker for the household.
Head count index. The percentage of the population whose monthly per capita consumption expenditure are below the poverty line.
Healt h post. A community health service provided by community health workers from their home, delivering basic health care services.
Hous ehold. A group of people, either related or unrelated, who live together as a single unit in the sense that they have common housekeeping arrangements, that is, they share or are supported by a common budget. They live together, pool their money, and eat at least one meal together each day.
Hous ehold shocks. Natural, climatic, economic or conflict events with negative outcomes that are outside the direct control of households.
Immigrant. A person who has entered a country and took up residence there for at least one year.
Inact ive population or persons not in the labour force. All persons age 14 and over who were not employed or unemployed during reference period of one week because of (a) attendance at educational institutions, (b) engagement in household duties, (c) retirement or old age, (d) infirmity or disablement or (e) other reasons, which may be specified.
In-mi grant. A person who has entered an administrative area from within a country and took up residence there for at least one year.
In-pa tient. A patient who is formally admitted (or ‘hospitalised’) to an institution for treatment and/or care and stays for a minimum of one night in the hospital or other institution providing in-patient care.
Immi gration. The act of crossing an international border into a country and taking up residence in the country for at least one year.
Immi gration ratio. The number of immigrants as percentage of the resident population.
Impr oved water source. Includes hand pump (private or public), bored wells, protected spring, piped water (private or municipal); does not include surface water (open well, unprotected spring, kariz, river, lake, channel, pool, drainage), water tanker, bottled water.
Impr oved sanitation facility: Includes flush latrine, improved latrine and covered latrine; does not include open pit, darean and open defecation.
In-mi gration. The act of crossing an administrative area border within a country and taking up residence in the area for at least one year.
In-migration ratio. The number of in-migrants as percentage of the resident population.Inter nal migration. The act of crossing a border between two administrative areas within a country and taking up
residence in another area for at least one year.

212 ANNEX XI CONCEPTS AND DEFINITIONS
Inter national migration. The act of crossing a border between two countries and taking up residence abroad for at least one year.
Inter nally displaced person. A persons who has been forced or obliged to flee or to leave his/her home or place of habitual residence, in particular as a result of or in order to avoid the effects of armed conflict, situations of generalized violence, violations of human rights or natural or human-made disasters, and who have not crossed an internationally recognized State border.
Islamic education. Encompasses Madrassa (grades 1-12), Dar-ul-ulum (grades 13-14) and Dar-ul-hefaz (grades 1-12).
Life-t ime migrant. A person who changed residence across an administrative border – either national or international – since birth.
Labo ur force. The economically active population – encompassing the (under)employed and unemployed – in the working-age (14 and over).
Labo ur force participation rate. The ratio of the labour force to the working-age population (14 and over), expressed as a percentage.
Life-time migration. Migration – either internal or international – since birth.
Mate rnal mortality ratio. The number of pregnancy-related deaths during a given time period per 100,000 live births during the same time period.
Migr ation. The act of crossing a border and taking up residence elsewhere for at least a year.
Net a ttendance ratio. The number of pupils of the theoretical school-age group for a given level of education, expressed as a percentage of the total population in that age group.
Occu pation. A set of jobs whose main tasks and duties are characterised by a high degree of similarity. Persons are classified by occupation through their relationship to a past, present or future job.
Out- m igrant. A person who left an administrative area and took up residence elsewhere in the country for at least one year.
Out-m igration. The act of crossing an administrative area border within a country and taking up residence elsewhere in the country for at least one year.
Out-migration rate. The number of out-migrants as percentage of the resident population.
Out-p atient. A patient who receives medical treatment and/or care at health facility, but is not admitted for an overnight stay.
Overc rowded dwelling. Dwelling in which more than three persons live per room.
Own- account workers. Those workers who, working on their own account or with one or more partners, hold the type of job defined as a self-employed job, and have not engaged on a continuous basis any employees to work for them during the reference period.
Poverty gap. The average distance between the consumption levels of the poor and the poverty line.
Primary education. Encompasses education at grades 1-6.
Protein deficiency. A daily protein consumption of less than 50 grams per person.
Quali ty assurance. Any method or procedure for collecting, processing or analysing survey data that is aimed at maintaining or enhancing their reliability or validity.
Rece nt migrant. A person who changed residence across an administrative border – either national or international – a specific point in recent time, here defined as migration since October 2004.
Rece nt migration. Migration – either internal or international – since a specific point in recent time, here defined as migration since October 2004.

213ANNEX XI CONCEPTS AND DEFINITIONS
Retu rnee. A person who has returned from displacement either within the country (former IDP) or to another country (former refugee or asylum seeker). There are subcategories of returnees in terms of the way the return is implemented, e.g. voluntary, forced, assisted and spontaneous returnees.
Season. Seasons are defined according the Shamsi calendar:
Shamsi Year1390 1391
Spring: 21 March to 21 June 2011 Spring: 20 March to 20 June 2012Summer: 22 June to 22 September 2011 Summer: 21 June to 21 September 2012Autumn: 23 September to 21 December 2011 Autumn: 22 September to 20 December 2012Winter: 22 December 2011 to 19 March 2012 Winter: 21 December 2012 to 20 March 2013
Seas onal migrant. A a person who spends at least one month, but less than a year away from the household for seasonal work.
Secondary education. Encompasses lower (grades 7-9) and upper (grades 10-12) education.
Scho ol age. Age ranges used in this report are 7-12 for primary school, 13-18 for secondary school and 19-24 for tertiary education.
Skill ed birth attendant. Health personnel trained in providing life saving obstetric care, including giving the necessary supervision, care and advice to women during pregnancy, labour and the post-partum period, conducting deliveries on their own and caring for newborns. Traditional birth attendants, even if they received a short training course, are not included.
Slum household. A household lacking one or more of the following conditions:• Access to improved water • Access to improved sanitation • Overcrowded dwelling• Durability of housing
Stat us in employment. The status of an economically active person with respect to his or her employment, or the type of explicit or implicit contract of employment with other persons or organisations that the person has in his/her job.
Terti ary education. Encompasses teacher college (grades 13-14), technical college (grades 13-14), university (grades 13-16) and post-graduate education (grades 17-19).
Unde remployed. Persons working hours of work that are insufficient in relation to an alternative employment situation in which the person is willing and available to engage (time-related underemployment). The Afghanistan national time-criterion is working less than 40 hours.
Unemployed. All persons age 14 and over who during the reference period of one week were:a. without any work or working less than eight hours, and b. seeking work.The unemployed include persons not working who are not seeking work because of being discouraged in finding any (the ‘relaxed unemployment’ definition).
Unemployment rate. The number of unemployed as a percentage of the labour force.
Working age. Age 14 and over.
Youth literacy rate. The percentage of literate persons aged 15–24 years.