nasiri-ehsan-phd-civil-june-2019.pdf - dalspace
TRANSCRIPT

EXPERIMENTAL AND NUMERICAL STUDY OF THE IN-PLANE AND OUT-OF-
PLANE BEHAVIOUR OF UNREINFORCED MASONRY INFILLS BOUNDED BY
RC FRAMES
by
Ehsan Nasiri
Submitted in partial fulfilment of the requirements
for the degree of Doctor of Philosophy
at
Dalhousie University
Halifax, Nova Scotia
June 2019
© Copyright by Ehsan Nasiri, 2019

ii
I dedicate this dissertation to my parents
for their endless love, support, and encouragement.

iii
Table of Contents
List of Tables ........................................................................................................................... ix
List of Figures........................................................................................................................... x
Abstract ..................................................................................................................................xvi
List of Abbreviations and Symbols Used .......................................................................... xvii
Acknowledgements ............................................................................................................ xxiii
Chapter 1 Introduction ............................................................................................................. 1
1.1 Masonry Infilled Frames ........................................................................................ 1
1.2 Method of Analysis ................................................................................................ 2
1.3 In-Plane and Out-of-Plane Behaviour of Infills ................................................... 3
1.4 Research Objectives ............................................................................................... 3
1.5 Thesis Layout.......................................................................................................... 5
Chapter 2 Literature Review ................................................................................................... 6
2.1 Introduction ............................................................................................................. 6
2.2 General Behaviour .................................................................................................. 6
2.2.1 In-Plane Behaviour.......................................................................................... 6
2.2.1.1 Aspect Ratio (h/l) ..................................................................................... 8
2.2.1.2 Interfacial Gaps ........................................................................................ 8
2.2.1.3 Openings ................................................................................................... 9
2.2.1.4 Cyclic Loading ......................................................................................... 9
2.2.2 Out-of-Plane Behaviour ................................................................................ 10
2.2.2.1 Interfacial Gaps ...................................................................................... 11
2.2.2.2 Slenderness Ratio ................................................................................... 13
2.2.2.3 Frame Rigidity ........................................................................................ 13
iv
2.2.2.4 Openings ................................................................................................. 14
2.3 Analytical Modelling............................................................................................ 14
2.3.1 Macro-Modelling Methods ........................................................................... 15
2.3.1.1 In-Plane Behaviour ................................................................................. 15
2.3.1.2 Out-of-Plane Behaviour ......................................................................... 19
2.3.2 Micro-Modeling Methods ............................................................................. 24
2.4 Code and Practice ................................................................................................. 30
2.4.1 In-Plane Behaviour........................................................................................ 30
2.4.2 Out-of-Plane Behaviour ................................................................................ 33
2.5 Summary ............................................................................................................... 33
Chapter 3 Experimental Program ......................................................................................... 35
3.1 Introduction ........................................................................................................... 35
3.2 Infilled Frame Specimens .................................................................................... 35
3.3 In-Plane Test Setup and Procedure ..................................................................... 37
3.4 Out-of-Plane Test Setup and Procedure .............................................................. 38
Chapter 4 Development of a Detailed 3D FE Model for Analysis of the In-Plane
Behaviour of Masonry Infilled Concrete Frames ............................................... 41
4.1 Abstract ................................................................................................................. 41
4.2 Introduction ........................................................................................................... 42
4.3 Experimental Program ......................................................................................... 45
4.3.1 Test Setup and Instrumentation .................................................................... 48
4.3.2 Material Properties ........................................................................................ 48
4.4 Finite Element Model ........................................................................................... 49
4.4.1 Nonlinear Behaviour of Concrete and CMUs ............................................. 50
4.4.2 Yield Surface ................................................................................................. 51

v
4.4.3 Flow Rule....................................................................................................... 52
4.4.4 Compressive Stress-strain Relationship....................................................... 53
4.4.5 Tensile Behaviour Model ............................................................................. 55
4.5 Material Model for Reinforcement...................................................................... 57
4.6 Behaviour Model of Interface Elements ............................................................. 59
4.7 Analysis Procedure ............................................................................................... 63
4.8 Verification of the Model ..................................................................................... 64
4.9 Investigation on the Interface Parameters ........................................................... 72
4.9.1 Effect of Failure Surface Parameters ........................................................... 75
4.9.2 Effect of Fracture Energy Parameters .......................................................... 76
4.9.3 Effect of Dilation Angle ............................................................................... 77
4.10 Conclusion ..................................................................................................... 79
4.11 Acknowledgement......................................................................................... 80
Chapter 5 The Out-of-Plane Behaviour of Concrete Masonry Infills Bounded by
Reinforced Concrete Frames ............................................................................... 81
5.1 Abstract ................................................................................................................. 81
5.2 Introduction ........................................................................................................... 82
5.3 Experimental Program ......................................................................................... 84
5.3.1 Test Setup, Instrumentation, and Procedure ................................................ 87
5.3.2 Material Properties ........................................................................................ 89
5.4 Finite Element Model ........................................................................................... 90
5.4.1 Nonlinear Behaviour of Concrete and CMUs ............................................. 91
5.4.1.1 Compressive Behaviour Model ............................................................. 92
5.4.1.2 Tensile Behaviour Model....................................................................... 93

vi
5.4.2 Behaviour Model of Interface Between the CMUs and Between the
CMUs and the Frame .................................................................................... 95
5.4.3 Material Model for Reinforcement .............................................................. 97
5.4.4 Analysis Procedure........................................................................................ 98
5.5 Validation of the Model ....................................................................................... 98
5.6 Parametric Study................................................................................................. 103
5.6.1 Effect of Infill Aspect Ratio ....................................................................... 105
5.6.2 Effect of Frame Stiffness ............................................................................ 106
5.6.3 Effect of Infill Slenderness Ratio ............................................................... 108
5.6.4 Effect of Size and Aspect Ratio of Openings ............................................ 112
5.6.5 Effect of Interfacial Gaps............................................................................ 115
5.6.6 Effect of CMU Web Thickness .................................................................. 119
5.7 Conclusion .......................................................................................................... 121
5.8 Acknowledgement .............................................................................................. 123
Chapter 6 Study of Arching Behaviour and Strength of Concrete Masonry Infills
under Out-of-Plane Loading .............................................................................. 124
6.1 Abstract ............................................................................................................... 124
6.2 Introduction ......................................................................................................... 125
6.3 Finite Element Modelling Method .................................................................... 130
6.3.1 Nonlinear Behaviour of Concrete and CMUs ........................................... 130
6.3.2 Behaviour Model of Interface Elements .................................................... 132
6.4 One-Way Arching with Rigid Supports ............................................................ 133
6.5 Two-Way Arching with Rigid Bounding Frames ............................................ 138
6.6 Experimental Investigation ................................................................................ 139
6.7 Two-Way Arching in Flexible Bounding Frames ............................................ 147
vii
6.7.1 Proposed Modification Based on Dawe and Seah’s Method ................... 153
6.7.2 Performance of the Proposed Equation...................................................... 156
6.8 Conclusion .......................................................................................................... 161
6.9 Acknowledgement .............................................................................................. 162
Chapter 7 Effect of Prior In-Plane Damage on the Out-of-Plane Performance of
Concrete Masonry Infills ................................................................................... 163
7.1 Abstract ............................................................................................................... 163
7.2 Introduction ......................................................................................................... 164
7.3 Finite Element Modelling Method .................................................................... 168
7.4 Experimental Investigation ................................................................................ 170
7.5 Validation of the Model ..................................................................................... 175
7.6 Parametric Study................................................................................................. 178
7.6.1 In-Plane Behaviour...................................................................................... 180
7.6.2 Out-of-Plane Behaviour with In-Plane Damage ....................................... 182
7.6.3 Consideration of Infill Slenderness ............................................................ 187
7.6.4 Consideration of Cyclic Loading ............................................................... 189
7.7 Evaluation of the Existing Analytical Method ................................................. 192
7.8 Suggested Reduction Factor .............................................................................. 195
7.9 Limitations .......................................................................................................... 197
7.10 Conclusion ................................................................................................... 198
7.11 Acknowledgement....................................................................................... 199
Chapter 8 Summary and Conclusions ................................................................................ 200
8.1 In-Plane Behaviour ............................................................................................. 201
8.1.1 Experimental Observations......................................................................... 201
8.1.2 FE Modelling ............................................................................................... 201

viii
8.2 Out-of-Plane Behaviour ..................................................................................... 202
8.2.1 General behaviour ....................................................................................... 202
8.2.2 Effect of Interfacial Gap ............................................................................. 202
8.2.3 Effect of Infill Opening............................................................................... 203
8.2.4 Effect of Infill Aspect Ratio ....................................................................... 203
8.2.5 Effect of Infill Slenderness Ratio ............................................................... 204
8.2.6 Effect of Frame Stiffness ............................................................................ 204
8.2.7 One-Way and Two-Way Arching .............................................................. 204
8.2.8 Effect of In-Plane Damage ......................................................................... 205
8.3 Recommendations for Future Research ............................................................ 206
References............................................................................................................................. 208
Appendix A: Copyright Permissions .................................................................................. 221
ix
List of Tables
Table 2.1. Strut methods in TMS 402/602-16 and CSA S304-14 ...................................... 32
Table 3.1. Summary of frame specimens ............................................................................. 36
Table 4.1. Summary of test specimens ................................................................................. 46
Table 4.2. Summary of material properties for test specimens ........................................... 49
Table 4.3. The CDP model parameters for concrete and CMUs......................................... 53
Table 4.4. Summary of interface parameters........................................................................ 63
Table 4.5. Stiffness and strength comparison of the experimental and FE results ............ 67
Table 4.6. Summary of input parameters used in the sensitivity study .............................. 74
Table 4.7. Material properties used for the sensitivity study .............................................. 75
Table 5.1. Summary of material properties for the specimens ............................................ 89
Table 5.2. The CDP model parameters for concrete and CMUs......................................... 92
Table 5.3. Summary of interface parameters........................................................................ 97
Table 5.4. Material properties used for the parametric study ............................................ 104
Table 6.1. Details of tested RC framed masonry infill specimens .................................... 142
Table 6.2. Summary of FE model results ........................................................................... 149
Table 6.3. Comparison of results from FE analysis and proposed equation .................... 157
Table 6.4. Comparison of results from the proposed equation and experimental
studies ............................................................................................................... 160
Table 7.1. Details of RC framed masonry infill specimens............................................... 170
Table 7.2. Material properties used in the parametric study ............................................. 179
Table 7.3.Comparison of experimental and analytical reduction factor ........................... 197
x
List of Figures
Figure 2.1. Failure modes of infilled RC frames (Asteris et al. 2013) ................................. 7
Figure 2.2. Illustration of arching action .............................................................................. 11
Figure 2.3. Arching action in rigid and gapped conditions (Gabrielsen and Kaplan
1976) ................................................................................................................... 12
Figure 2.4. Masonry infill-frame deformed shape interaction (Asteris et al. 2013) .......... 16
Figure 2.5. Stafford Smith's test setup and equivalent strut replaced for infill (Smith
1966) ................................................................................................................... 16
Figure 2.6. Two-strut with shear spring model proposed by Crisafulli and Carr (2007)
............................................................................................................................ 18
Figure 2.7. Idealized cracking pattern................................................................................... 21
Figure 2.8. Modelling strategies for masonry: (a) detailed micro-modelling; (b)
simplified micro-modelling; (c) continuum element micro-modelling
(Roca et al. 1998)............................................................................................... 25
Figure 3.1. Test setup details, main LVDT locations and side view of the test setup ....... 37
Figure 3.2. Out-of-plane LVDTs and LVDT 1 .................................................................... 38
Figure 3.3. Out-of-plane test setup: (a) Schematic side view; and. (b) setup
components ........................................................................................................ 39
Figure 3.4. LVDTs position for out-of-plane test ................................................................ 40
Figure 4.1. Geometric properties of infilled frame specimens and reinforcement
details in the RC frame ...................................................................................... 47
Figure 4.2. Schematic test set-up .......................................................................................... 48
Figure 4.3. Three dimensional geometric model used in the FE analysis .......................... 51
Figure 4.4. Failure surface of the CDP model in plane stress (D.S.Simulia 2010)............ 52
Figure 4.5. Compression stress-strain curve for: (a) Concrete; and (b) CMUs.................. 55
Figure 4.6. Tension stress-strain curve for concrete ............................................................ 56
Figure 4.7. Tensile behaviour of CMU material: (a) stress-strain curve; and (b) stress-
displacement curve ............................................................................................ 57
xi
Figure 4.8. Modified stess-strain curve for the reinforcement ............................................ 59
Figure 4.9. Hyperbolic Drucker-Prager yield surface (D.S.Simulia 2010) ........................ 61
Figure 4.10. Hardening and flow rule for the hyperbolic Drucker-Prager model
(D.S.Simulia 2010) ............................................................................................ 61
Figure 4.11. Tensile and shear strength softening curves and corresponding fracture
energies............................................................................................................... 62
Figure 4.12. Load-displacement curves for different number of elements......................... 65
Figure 4.13. Comparison of lateral load vs. displacement curves obtained from tests
and FE analysis for all specimens..................................................................... 68
Figure 4.14. Deformed geometry and cracking pattern comparison for: (a) IFNG, (b)
IFW16, (c) IFTG12 and (d) IFSG12 ................................................................ 71
Figure 4.15. Detailed crushing comparison (specimen IFW16) ......................................... 72
Figure 4.16. Yield lines in the p-q plane............................................................................... 74
Figure 4.17. Lateral load vs. displacement curves for interface failure surface
parameters .......................................................................................................... 75
Figure 4.18. Deformed shape (6x magnified) and cracking patterns for interface
failure surfaces ................................................................................................... 76
Figure 4.19. Lateral load vs. displacement curves for interface fracture energy
parameters .......................................................................................................... 77
Figure 4.20. Lateral load vs. displacement curves for different interface dilation
angles .................................................................................................................. 78
Figure 4.21. Deformed shape (10x magnified) and cracking pattern at 25 mm lateral
displacement for dilation angles ....................................................................... 79
Figure 5.1. Geometric properties of specimens and reinforcement details in the RC
frames ................................................................................................................. 86
Figure 5.2. Test set-up for out-of-plane loading of the specimens ..................................... 88
Figure 5.3. Schematic test set-up for in-plane loading of specimens IF-D1 and IF-D2
............................................................................................................................ 88
Figure 5.4. Load vs. lateral displacement curve for the laterally loaded infilled frame
specimens ........................................................................................................... 89
Figure 5.5. Three-dimensional geometric model used in the FE analysis .......................... 91
xii
Figure 5.6. Compressive stress-strain curve for: (a) concrete; and (b) CMUs ................... 93
Figure 5.7. Tensile stress-strain curve for concrete ............................................................. 94
Figure 5.8. Tensile behaviour of CMUs: (a) stress-strain curve; and (b) stress-
displacement curve ............................................................................................ 95
Figure 5.9. Behaviour of the mortar joint interaction .......................................................... 96
Figure 5.10. Finite element stress-strain curves and failure modes for CMUs and
masonry prisms .................................................................................................. 99
Figure 5.11. Comparison of out-of-plane pressure vs. displacement curves obtained
from tests and FE analysis .............................................................................. 100
Figure 5.12. Comparison of FE and experimental results for IFW16: (a) tensile cracks
on the windward face and; (b) compressive crushing in the mid-plane of
the infill ............................................................................................................ 103
Figure 5.13. Development of cracks in the CMU blocks: (a) initiation of cracking;
(b) at the ultimate capacity of the infill; and (c) after collapse of the infill
.......................................................................................................................... 103
Figure 5.14. Infill aspect ratio study: (a) geometric configuration; and (b) failure
mode for varying aspect ratios ........................................................................ 106
Figure 5.15. Effect of infill aspect ratio and frame rigidity on the out-of-plane
strength ............................................................................................................. 107
Figure 5.16. Effect of frame stiffness on the out-of-plane strength .................................. 108
Figure 5.17. Failure mode and deformation contours (unit: m): (a) AR4; and (b) AR4-
W....................................................................................................................... 108
Figure 5.18. Slenderness ratio study: (a) out-of-plane pressure vs. slenderness for
varying aspect ratios; and (b) out-of-plane pressure vs. slenderness for
rigid and model frames .................................................................................... 110
Figure 5.19. Cracking patterns shown at mid-plane of infill at ultimate pressure for
slenderness ratio study: h/l=1 ......................................................................... 111
Figure 5.20. Infill opening size study: (a) geometry of models with different opening
sizes; (b) normalized strength vs. opening area ratios................................... 113
Figure 5.21. Infill opening aspect ratio study (FE results): (a) geometry of models;
and, (b) out-of-plane pressure vs. displacement curves ................................ 114
Figure 5.22. Cracking pattern for different opening aspect ratios at 42 kPa pressure ..... 115

xiii
Figure 5.23. Interfacial gap study: (a) out-of-plane pressure vs. displacement curves;
and (b) normalized strength for different gap sizes/locations....................... 117
Figure 5.24. Effect of beam gap and column gap on the infills with different aspect
ratios ................................................................................................................. 119
Figure 5.25. Maximum compressive stress contours (unit: N/m2) for model AR2 with
gaps at 32 kPa out-of-plane pressure .............................................................. 119
Figure 5.26. CMU web thickness study: normalized strength vs. web thickness ............ 120
Figure 5.27. Cracking development in the webs of different thickness at 30 kPa out-
of-plane pressure .............................................................................................. 121
Figure 6.1. Behaviour of the interface interaction ............................................................. 133
Figure 6.2. Geometric configuration of vertical and horizontal strips and masonry
block dimensions ............................................................................................. 134
Figure 6.3. Out-of-plane strength in vertical and horizontal arching vs. slenderness
ratio ................................................................................................................... 135
Figure 6.4. Failure modes in vertical strips with different h/t ratios (5× magnified
deformations) ................................................................................................... 136
Figure 6.5. Failure modes in horizontal strips with different l/t ratios (5× magnified
deformations) ................................................................................................... 137
Figure 6.6. Two-way and one-way arching comparison for rigid frames ........................ 138
Figure 6.7. Normalized pressure and arching froces in vertical and horizontal
directions .......................................................................................................... 139
Figure 6.8. Geometric properties of specimens and reinforcement details in the RC
frames ............................................................................................................... 141
Figure 6.9. Test set-up for out-of-plane loading of the specimens ................................... 143
Figure 6.10. Comparison of out-of-plane pressure vs. displacement curves obtained
from tests and FE analysis: (a) IFNG; (b) IF-TG; (c) IF-SG; and (d)
Combined results ............................................................................................. 144
Figure 6.11. Comparison of FE and experimental results for cracking patterns: (a)
IFNG; (b) IF-SG; and (c) IF-TG ..................................................................... 146
Figure 6.12. Geometric configuration of the models in parametric study ........................ 148

xiv
Figure 6.13. Comparison of strength value vs aspect ratio for different frame stiffness
.......................................................................................................................... 152
Figure 6.14. Comparison of strength value vs frame stiffness for different infill aspect
ratio ................................................................................................................... 153
Figure 6.15. Two-way and one-way arching comparison for non-rigid frames............... 155
Figure 7.1. Behaviour of the interface interaction ............................................................. 169
Figure 7.2. Geometric properties of specimens and reinforcement details in the RC
frame ................................................................................................................. 171
Figure 7.3. Lateral load vs. drift ratio obtained from in-plane tests.................................. 173
Figure 7.4. Comparison of FE and experimental results for cracking patterns: (a) IF-
D1; (b) IF-D2; and (c) IF-D3 (magnified deformation) ................................ 173
Figure 7.5. Out-of-plane test results: (a) Out-of-plane pressure vs displacement
curves; and (b) normalized out-of-plane strength vs. prior in-plane drift .... 174
Figure 7.6. Comparison of out-of-plane pressure vs. displacement curves obtained
from tests and FE analysis .............................................................................. 177
Figure 7.7. Comparison of FE and experimental cracking pattern in IF-D2 at out-of-
plane loading stage .......................................................................................... 178
Figure 7.8. Geometric configuration of the models and reinforcement details in the
RC frame in the parametric study ................................................................... 179
Figure 7.9. Prior damage pattern at: (a) 0.25%, and (b) 2% in-plane drift (AR=0.8,
f′m = 16 MPa) .................................................................................................. 181
Figure 7.10. Damage patterns for a square panel with: (a) weak, (b) intermediate;
and, (c) strong infill. ........................................................................................ 181
Figure 7.11. In-plane load vs. drift ratio for AR=1.0 model ............................................. 182
Figure 7.12. Pressure vs. displacement curves: (a) Weak; (b) Intermediate; and, (c)
Strong infill ...................................................................................................... 183
Figure 7.13. Normalized out-of-plane strength vs. in-plane drift ratios for different
infill strength and aspect ratios: (a) Weak infill; (b) Intermediate infill;
(c) Strong infill; and, (d) Average of all aspect ratios ................................... 185
Figure 7.14. In-plane cracking pattern for AR=0.8 and AR=1.3 strong infill models
at 1% drift......................................................................................................... 186
xv
Figure 7.15. Normalized out-of-plane strength vs. prior in-plane drift curves for
different slenderness ratios.............................................................................. 188
Figure 7.16. Cracking pattern for: (a) SR=14; and, (b) SR=28 with 0.5% in-plan drift
at the ultimate out-of-plane pressure (magnified deformation) .................... 188
Figure 7.17. Cyclic in-plane loading analysis for out-of-plane strength reduction: (a)
Cyclic loading history; (b) AR=0.8 infill; (c) AR=1.0 infill; and, (d)
AR=1.3 infill .................................................................................................... 191
Figure 7.18. Cyclic and monotonic cracking comparison in different steps
(6×magnified deformations): (a) Monotonic in-plane; (b) Cyclic in-
plane; (c) Monotonic out-of-plane; and, (d) Cyclic out-of-plane ................. 192
Figure 7.19. Out-of-plane strength reduction comparison between Angel et al.’s
method and: (a) test results; and, (b) finite element results .......................... 194
Figure 7.20. Proposed reduction factor equation with FE and test results ....................... 196
xvi
Abstract
A literature review revealed that there is limited technical information available on the
subject of masonry infilled frames, in particular, the interaction between the infill and its
bounding frame and how this interaction affects the infilled system behaviour and strength.
This research was then conducted to further the understanding of the infill-to-frame
interaction considering a range of geometric, material, loading characteristics of the infilled
frame systems. To that end, both experimental and numerical studies were performed with
the focus on the concrete masonry infills bounded by reinforced concrete frames. Both in-
plane and out-of-plane loading situations on the infilled frames were considered. The
experimental testing was designed to provide physical results of failure modes, behaviour
and strength of infilled frames as affected by several key parameters. The numerical study
began with development of a 3D finite element model capable of incorporating properties
of masonry infilled frames using ABAQUS. An extensive validation process on the model
ensued using the physical results. Once verified, the model was used in a finite element
study where several geometric and material parameters with extended range of variations
were systematically studied.
In the experimental study, a total of 17 specimens were tested of which 1) ten were
subjected to in-plane loading; 2) four were subjected to out-of-plane loading; and 3) three
were tested under in-plane loading first and then tested under out-of-plane loading to
failure. Infill openings and infill-to-frame interfacial gaps were designed as two varying
parameters for 1) and 2) test scenarios. The varying in-plane damage was the parameter for
3) testing scenario. While the diagonal cracking followed by corner crushing predominated
the in-plane failure, two-way arching with the shear cracking through the concrete masonry
unit webs was identified as the main load-resisting mechanism in out-of-plane tests. As for
the in-plane damaged specimens, the out-of-plane capacity was reduced as a function of
experienced in-plane drift ratio.
In the numerical study, the finite element model was shown to be capable of predicting the
load-displacement responses as well as the cracking pattern and failure modes accurately
for both in-plane and out-of-plane loading scenarios. The correlations between each studied
parameter and the behaviour and strength of masonry infilled frames were presented and
discussed. Modifications on the out-of-plane design method currently adopted by the
American masonry standard (TMS 402/602-16) were proposed and was shown to improve
the performance of the method. A lower-bound equation for evaluating the out-of-plane
strength of masonry infills with prior in-plane damage was proposed and it showed to
produce better estimate when compared to the existing method.
xvii
List of Abbreviations and Symbols Used
Abbreviations
ASTM American society for testing and materials
BF Bare frame
CC Corner crushing
CDP Concrete damaged plasticity
CMU Concrete masonry unit
COV Coefficient of variation
CSA Canadian standards association
FEMA Federal emergency management agency
IFD Infilled frame with a door opening
IF-D Infilled frame with in-plane damage
IFNG Infilled frame with no gaps
IFSG Infilled frame with side gaps
IFTG Infilled frame with a top gap
IFW Infilled frame with a window opening

xviii
LVDT Linear variable differential transformer
MSJC Masonry society joint committee
NBCC National building code of Canada
RC Reinforced concrete
SS Shear sliding
TMS The masonry society
Symbols
𝐴 Area of diagonal compressive strut
𝐴𝑒 Effective infill area
𝐶𝑑 Wave velocity in the material
𝑑 Length of diagonal compressive strut
𝑑′ Initial shear strength
𝑑𝑣 Effective depth for the shear calculation
𝐸𝐼 Flexural stiffness of the bounding frame
𝐸𝑠∗
Modified elastic modulus
𝐸𝑓 Modulus of elasticity of frame
xix
𝐸𝑚 Modulus of elasticity of masonry
𝑓𝑐𝑟 Cracking stress
𝑓𝑦 Yield stress
𝑓𝑦∗ Modified yield stress
𝑓𝑐′ Compressive strength of concrete
𝑓𝑚′ Compressive strength of masonry
𝑓𝑡 Tensile strength
𝐺 Flow potential function
𝐺𝑓 Mode I fracture energy
𝑔0 Deflection in the direction of arching due to axial shortening or gaps
ℎ Height of the infill
𝐼𝑏 Moment of inertia of the beam
𝐼𝑐 Moment of inertia of the column
𝐽𝑏, 𝐽𝑐 Torsional constant of bounding beam, bounding column
𝐾𝑐 Ratio of the tensile meridian to the compressive meridian
xx
𝐾𝑛𝑛, 𝐾𝑠𝑠 , 𝐾𝑡𝑡 Normal and two shear stiffness of the mortar joint interface
𝑘𝑖 Stiffness of infill at initial cracking load
𝑘𝑐𝑟𝑎 Stiffness of infill at the first major crack load
𝑘𝑢𝑙𝑡 stiffness of infill at ultimate load
𝑙 Length of the infill
𝐿𝑒 Characteristic length of the smallest element
𝑀𝑓 Factored moment
𝑀𝑦ℎ Moment resistance for horizontal arching
𝑀𝑦𝑣 Moment resistance for vertical arching
𝑁𝑢 Compressive force on the shear surface
�̅� hydrostatic pressure stress
𝑝𝑡 Initial tensile strength
𝑞 Von Mises equivalent effective stress
𝑞𝑐𝑟 Out-of-plane load at the occurrence of boundary crushing of infill
𝑞𝑚𝑎𝑥 Out-of-plane load at the occurrence of transverse instability of infill
xxi
𝑞𝑢𝑙𝑡 Ultimate out-of-plane pressure of the infill
𝑅1 Reduction factor to account for the prior in-plane damage
𝑅2 Reduction factor for the bounding frame stiffness
𝑡 Thickness of infill, CMU
�̇� Velocity in equation of motion
�̈� Acceleration in equation of motion
𝑉𝑓 Factored shear force
𝑤 Width of the diagonal strut
𝑤𝑒𝑓𝑓 The effective width of diagonal compressive strut as defined by CSA
S304-14
𝑥𝑦ℎ Displacement of the infill corresponding to horizontal arching at failure
𝑥𝑦𝑣 Displacement of the infill corresponding to vertical arching at failure
β Frictional angle of the material in the p-q plane
𝛾 Factor accounting for the contact area during arching action
∆𝑐𝑟 Lateral deflection required for the cracking of the infill
𝜖 Eccentricity
xxii
휀�̃�𝑝𝑙
Plastic compressive strain
휀�̃�𝑝𝑙
Plastic tensile strain
휀𝑡 , 휀𝑐 Tensile and compressive strain
𝜆 Slenderness effect
𝜇 Coefficient of friction
𝜈 Poisons ratio
𝜌 Reinforcement ratio
�̅̂�𝑚𝑎𝑥 Maximum principal effective stress
𝜎𝑏0 Initial biaxial compressive yield stress
𝜎𝑐0 Initial uniaxial compressive yield stress
𝜎𝑡 , 𝜎𝑐 Tensile and compressive stress
𝜑 Friction angle in the Mohr-Coulomb failure surface
𝜓𝑐, 𝜓𝑖 Dilation angle of concrete and mortar joint

xxiii
Acknowledgements
First and foremost, I would like to thank my supervisor Dr. Yi Liu for her generous support,
guidance and mentorship. This dissertation would not have been possible without her
leadership.
I would also like to thank my supervisory committee members Dr. Gordon Fenton and Dr.
Fadi Oudah, and my external examiner, Dr Tony Yang for taking the time to review this
dissertation, attending my defense, and providing valuable feedback.
Additionally, I would like to thank the civil engineering department staff, Mrs. June
Ferguson and Mrs. Shelley Parker for their help throughout my studies as well as the
laboratory technicians Mr. Blair Nickerson, Mr. Brian Kennedy, Mr. Jesse Keane, and Mr.
Brian Liekens for their assistance with my project.
I would like to thank my fellow colleagues, Chuanjia Hu, Xiaoyan Zeng, Chongyang
Wang, Reza Sepasdar, and Reza Rahimi for their helpful collaboration in completing the
experiments.
I wish to acknowledge the financial contributions from the Canadian Concrete Masonry
Producers Association.
Finally, I would like to thank friends and family for providing their love and support
throughout the past five and a half years. I thank Farzaneh, Parvar, Hosein, Sara, Sahar,
Setareh, Vahid, Ehsan, and all my amazing friends who made this journey unforgettable.
1
Chapter 1 Introduction
1.1 Masonry Infilled Frames
Masonry is the most ancient construction material and its use dates back as early as 10,000
years ago from natural stone and sun-dried brick then developing into the modern
manufactured clay bricks and concrete masonry blocks. In modern construction, masonry
walls are commonly used in steel and concrete frame buildings as infill walls either as
partitions to separate spaces or as cladding to complete the building envelope. Previous
studies have shown that the presence of masonry infill in a framed structure affects the
behaviour of the system significantly. Once the masonry infill participates in the load
sharing of the system, the interaction between the infill and its bounding frame becomes
crucial in determining the strength of the framed system. Most early research has been
focused on understanding the contribution of masonry infills to the frame behaviour when
subjected to in-plane loading. Studies conducted since the 1950s have shown that the infill
results in increasing the stiffness, strength, ductility, and energy dissipation of the frame
system. A design approach based on “diagonal strut” concept has been adopted in the
Canadian and American masonry design standards (CSA S304-14, TMS 402/602-16),
albeit with different design formulations. In comparison, the out-of-plane behaviour of the
infilled frame has been researched much less with only a handful of existing experimental
studies. While a design guideline is provided in the American masonry design standard,
the Canadian standard in this regard is blank and it only directs designers to apply
principles of mechanics for design. It is also worth to point out that the current design
guidelines, if available, need a thorough examination as the work on which the existing
design equations were based was conducted on very limited physical specimens of one type
2
or another. Recent experimental studies have reported large disparities between the
measured strengths when compared with the code values (Pasca et al. 2017, Ricci et al.
2018). It is also recognized that due to the complexity of the system consisting of one brittle
material (infill) and one ductile material (frame) and many variations of material and
geometric properties of each, more in-depth studies are in need to advance the
understanding of the infilled frame behaviour and lead to improvement of the current
design provisions in the standards.
1.2 Method of Analysis
Studies of infilled frames in general dates back to the 1950s. Till 1990s, most studies were
experiment-based, and some led to simplified analytical models with restriction for use
(Mainstone 1971, McDowell et al. 1956a, Monk 1958, Smith and Carter 1969). Although
the parameters studied in the early research were limited, the test set-up, specimen design,
and testing procedure provided foundation on which the later work can be built. With the
advancement in computing technology, finite element modeling techniques have been
increasingly implemented in studies to supplement the experimental results and extend
parameters beyond those that are feasible in laboratory testing. Since 2000s, finite element
(FE) methods encoded in commercial software such as ANSYS, ABAQUS or open source
software OpenSees have achieved various successes in simulation of masonry infilled
frames (Hashemi 2007, Minaie et al. 2014, Mohyeddin et al. 2013, Rahimi and Liu 2017,
Stavridis and Shing 2010). These FE studies also identified challenges and inadequacies in
modeling techniques. Nonetheless, FE methods have been considered to be an effective
tool for analysis of masonry infilled frames. For this study, both experimental and FE
3
studies were conducted where the experimental results were used to validate the FE model
which was in turn used in an extensive parametric study to predict results on a wider range
of parameters.
1.3 In-Plane and Out-of-Plane Behaviour of Infills
As mentioned, most early research was dedicated to the in-plane behaviour of masonry
infilled frames. The focus was to study the performance of the infilled frame as the lateral
load resisting system where the infill in-plane behaviour and strength plays a critical role
in the system lateral load resistance. A large volume of literature is available for the in-
plane studies of masonry infilled frames. A summary of the literature review on the subject
can be found in (Asteris et al. 2013, Chen 2016). In the case of out-of-plane research of
masonry infilled frames, some experimental studies were conducted but with a very limited
number of parameters and limited variations in masonry and frame types. There is a greater
gap in the current standards for design of masonry infills subjected to out-of-plane loading.
This research was focused on the out-of-plane behaviour of masonry infills. If the masonry
infilled frame is considered as a lateral load resisting system, its out-of-plane behaviour
and strength are integral parts of design since the loading is applied in both directions in a
seismic event.
1.4 Research Objectives
This study involved an experimental and numerical investigation of the in-plane and out-
of-plane behaviour and strength of masonry infills with a focus on the latter. Various
parameters deemed influential were considered in the study. The main objectives of the
4
research were to advance the FE modeling technique in simulation of masonry infilled
frames; to provide reliable physical and numerical results of masonry infilled frames
subjected to in-plane/out-of-plane loading; and to propose a rational design method for out-
of-plane strength of masonry infills bounded by frames.
The scope of work includes the following:
• To develop a robust finite element model to simulate the in-plane and out-of-plane
behaviour of the infilled frames and verification of the model using the obtained
experimental data. Focus is given to a three-dimensional model with the least
amount of simplification that is capable of considering the main influencing
materials and geometric parameters.
• To investigate the effect of several key parameters including infill opening,
interfacial gaps, and prior in-plane damage on the out-of-plane behaviour and
strength of infilled RC frames.
• To study the one-way and two-way arching action in concrete masonry infills and
compare the results with the state of the art in analysis of arching.
• To study the effect of various parameters including frame stiffness, aspect ratio,
slenderness ratio, arching direction, and prior in-plane damage on the out-of-plane
behaviour and strength of infills.
• To develop correlations between the studied parameters and the strength of
masonry infills.
• To assess the efficiency of the existing design methods in the literature and current
standards for the infill design and propose new design methods as appropriate.
5
1.5 Thesis Layout
This dissertation is organized in a paper format with eight chapters. The present chapter
presents the subject and objectives of the research. Chapter 2 presents a comprehensive
literature review of the numerical modelling approaches available for masonry infill
analysis. Important experimental studies pertinent to in-plane and out-of-plane behaviour
have also been reported in this chapter. Chapter 3 provides an overview of the experimental
program. Chapters 4 to 7 consist of four papers. Chapter 4 describes the details of the three-
dimensional FE model and validation of the model for in-plane analysis. Chapter 5 focuses
on the application of the proposed FE model for out-of-plane analysis of infills.
Verification of the model using the test results is presented and an investigation on the
effects of various influencing parameters is carried out. Chapter 6 presents a detailed
experimental and numerical analysis on the arching behaviour and out-of-plane resistance
in concrete masonry units. Chapter 7 investigates the effect of in-plane damage on the out-
of-plane behaviour of the infills. Effects of different in-plane damage modes observed in
experiments and other factors investigated numerically are summarized and used to provide
recommendations for estimation of damaged out-of-plane capacity. Finally, a summary of
results, main conclusions and recommendations for future work are presented in Chapter
8.
6
Chapter 2 Literature Review
2.1 Introduction
Research on the behaviour of masonry infilled frames dates back to the 1950s. Studies have
been conducted to investigate the behaviour of masonry infilled frames of various material
and geometric properties subjected to static, quasi-static, or seismic loading. The common
objective of these studies was to quantify the effect of the infill on the strength and stiffness
of the infilled system and to propose guidelines for design of infilled frames. While early
research focused mainly on experimental work, the numerical modeling using finite
element methods has gained popularity in the last two decades with the development of
computing technology. The following chapters deal with a specific subject on the
behaviour of masonry infills furnished with a detailed literature review on that subject.
Rather than repeating the information, this chapter serves as a more general summary of
the important findings that are deemed most relevant to this research. Since this research
is more numerical modelling focused, the following section begins with a description of
general behaviour of infilled frames observed in the experiments and then focuses more on
the review of the state-of-the-art in numerical and analytical studies conducted particularly
on RC frames with infills.
2.2 General Behaviour
2.2.1 In-Plane Behaviour
The in-plane behaviour deals with the behaviour of masonry infilled frames subjected to
in-plane lateral loading. In general, the previous studies showed that the behaviour depends
7
on many factors such as material and geometric properties of both the frame and infill; the
relative stiffness of the frame and infill and loading conditions to just name a few.
Some general behavioural trend and characteristics of infilled frames have been identified
and studied. It was shown that regardless of steel or RC frames, the presence of infills
resulted in significant increases in both stiffness and strength of infilled frame systems
when compared with bare frames. However, the degree of increase was dependent on the
type of frame. Infilled frames can develop a number of possible failure mechanisms. The
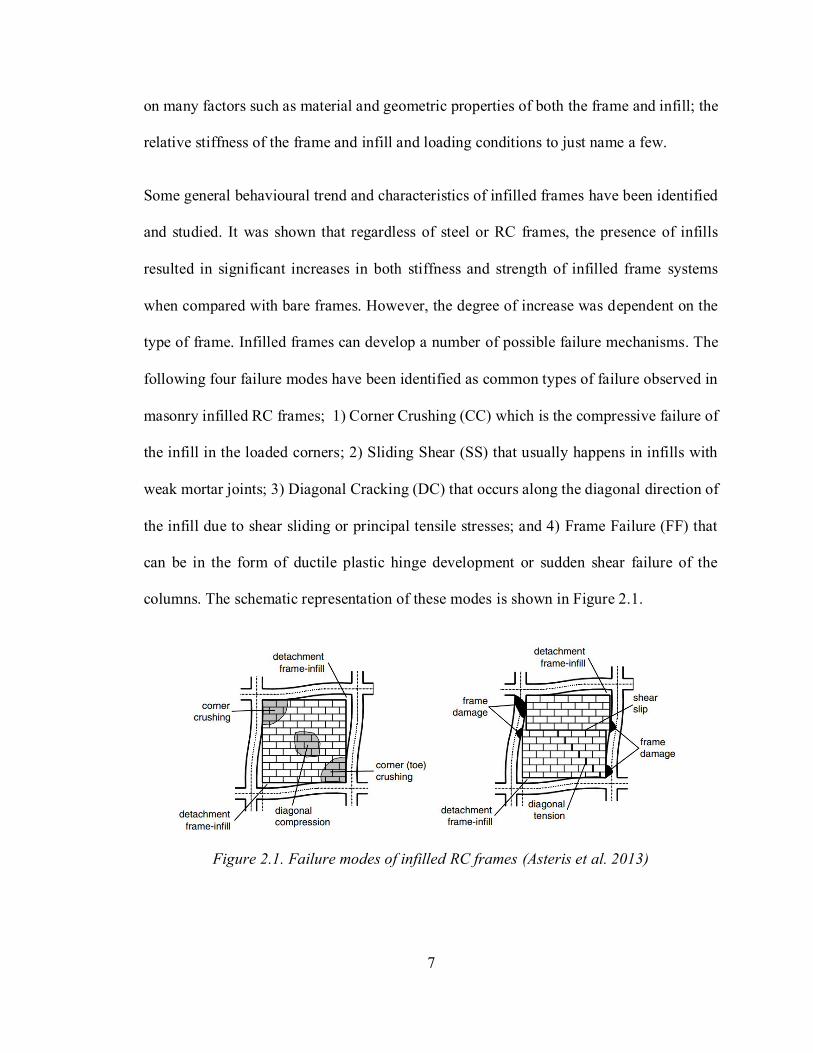
following four failure modes have been identified as common types of failure observed in
masonry infilled RC frames; 1) Corner Crushing (CC) which is the compressive failure of
the infill in the loaded corners; 2) Sliding Shear (SS) that usually happens in infills with
weak mortar joints; 3) Diagonal Cracking (DC) that occurs along the diagonal direction of
the infill due to shear sliding or principal tensile stresses; and 4) Frame Failure (FF) that
can be in the form of ductile plastic hinge development or sudden shear failure of the
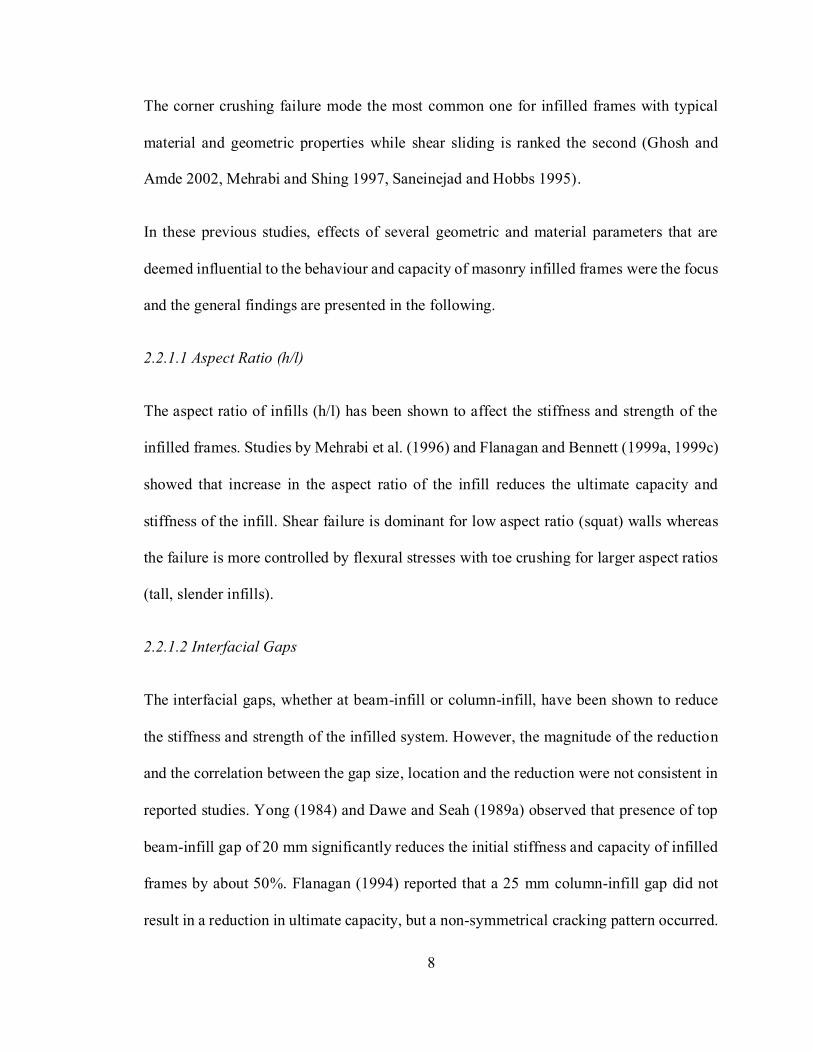
columns. The schematic representation of these modes is shown in Figure 2.1.
Figure 2.1. Failure modes of infilled RC frames (Asteris et al. 2013)
8
The corner crushing failure mode the most common one for infilled frames with typical
material and geometric properties while shear sliding is ranked the second (Ghosh and
Amde 2002, Mehrabi and Shing 1997, Saneinejad and Hobbs 1995).
In these previous studies, effects of several geometric and material parameters that are
deemed influential to the behaviour and capacity of masonry infilled frames were the focus
and the general findings are presented in the following.
2.2.1.1 Aspect Ratio (h/l)
The aspect ratio of infills (h/l) has been shown to affect the stiffness and strength of the
infilled frames. Studies by Mehrabi et al. (1996) and Flanagan and Bennett (1999a, 1999c)
showed that increase in the aspect ratio of the infill reduces the ultimate capacity and
stiffness of the infill. Shear failure is dominant for low aspect ratio (squat) walls whereas
the failure is more controlled by flexural stresses with toe crushing for larger aspect ratios
(tall, slender infills).
2.2.1.2 Interfacial Gaps
The interfacial gaps, whether at beam-infill or column-infill, have been shown to reduce
the stiffness and strength of the infilled system. However, the magnitude of the reduction
and the correlation between the gap size, location and the reduction were not consistent in
reported studies. Yong (1984) and Dawe and Seah (1989a) observed that presence of top
beam-infill gap of 20 mm significantly reduces the initial stiffness and capacity of infilled
frames by about 50%. Flanagan (1994) reported that a 25 mm column-infill gap did not
result in a reduction in ultimate capacity, but a non-symmetrical cracking pattern occurred.
9
All previous research did point to a much softer behaviour of infilled frame at early loading
stage when gap was present. Once the gap was closed at the loaded corner, a sudden
increase in stiffness was observed.
2.2.1.3 Openings
Openings are also proven to reduce the initial stiffness and capacity of the infills. This
reduction is correlated to the size of the infill and to the location of the opening albeit on a
lesser degree. Mallick and Garg (1971) recommended that the best location for opening is
at the center of the infill. However, experiments on RC infilled frames by Kakaletsis and
Karayannis (2007) showed that the best performance of the system was obtained when the
opening is located as close as possible to the edges of the infill panel where a better crack
distribution takes place in the remaining solid sections of the infills. Experiments by
Tasnimi and Mohebkhah (2011) indicated that infills with openings usually develop more
extensive diagonal tension cracking prior to failure than infills without openings. Soon
(2011) suggested that the relationship between the reduction in infill ultimate strength and
the opening size is not linear.
2.2.1.4 Cyclic Loading
Shake table tests on half-scaled single storey infilled frame specimens by Mehrabi et al.
(1996) and Klingner et al. (1996) showed that strength of the infilled system was sustained
through many hysteretic cycles without major damage. Results showed that infills can
significantly increase the stiffness, strength and energy dissipation capacity of the system,
even under simultaneous in- and out-of-plane lateral forces.

10
Pujol and Fick (2010) conducted full-scale experimental testing on three-storey concrete
buildings with and without masonry infills to investigate the effect of infills on the drift
capacity of concrete frames. The presence of infills was found to improve the behaviour of
the frame in terms of controlling the inter-storey drift and increasing the base shear strength
and lateral stiffness up to 100% and 500%, respectively.
2.2.2 Out-of-Plane Behaviour
One critical aspect of analyzing the behaviour of masonry infills bounded by frames
subjected to out-of-plane loading is the confinement provided by the frame. While
behaviour and capacity of a typical flexural wall is controlled by masonry tensile strength,
confinement of the bounding frame has shown to change a tension-controlled failure to a
compression-controlled failure. When the infill is restrained by a relatively rigid frame, the
out-of-plane pressure causes tensile cracks that divide the infill into two or more segments.
These segments then push against the boundary supports which induces in-plane
compressive forces that transfer the out-of-plane pressure through a mechanism called
arching where failure is characterized by compression failure of masonry. The shift from a
tension-controlled mechanism to a compression-controlled mechanism enables the infills
to resist much higher out-of-plane pressures compared to their flexural wall counterparts.
Figure 2.2 illustrates the arching of an infill supported on two boundaries.

11
Figure 2.2. Illustration of arching action
The principles of mechanics can be used to find the capacity of the infill by utilizing
equilibrium between the internal compressive forces and out-of-plane pressure. Different
failure modes have been observed and included compressive crushing in the loaded corners
of the arched segments, compressive/shear failure of the faceshells and buckling of the
infill without major damage (Angel et al. 1994, Dawe and Seah 1989b, Flanagan and
Bennett 1999b, McDowell et al. 1956a). Effects of several geometric parameters influential
to the arching behavior and failure mode have been studied and some main findings are
presented in the following.
2.2.2.1 Interfacial Gaps
Gaps between the masonry infill and its bounding frame are common occurrence due to
the wall shrinkage, workmanship defects or intentional movement joints to separate the
infill from the frame. As development of arching is dependent on the compressive force
induced by the restraints on the boundary frame member, presence of gaps was found to
reduce the out-of-plane resistance of the infill. Gabrielsen et al. (1975) carried out blast
load tests on masonry walls with 2.5 and 5 mm gaps between the wall panel and the top

12
support. Compared to the control specimen, the gapped walls only resisted 1/6 to 1/8 of the
out-of-plane load. However, these walls were still significantly stronger than the cantilever
panels without confinement. Gabrielsen and Kaplan (1976) reported that wall with tight
rigid supports would form a symmetric arching mechanism when subjected to out-of-plane
loads while the presence of a gap at the top of the wall causes larger displacement and
unsymmetrical arching as shown in Figure 2.3.
Figure 2.3. Arching action in rigid and gapped conditions (Gabrielsen and Kaplan 1976)
Drysdale et al. (1994) studied the arching action using mechanics of rigid body movement
and concluded that the maximum gap that could exist for arching to develop is controlled
by the diagonal distance between the compression forces at the hinges and it can be
expressed as:
g ≤4(𝛾𝑡)2
ℎ (2.1)
Where g is the gap size, h is the height of the infill, t is the thickness of masonry, and γ=0.9.
13
2.2.2.2 Slenderness Ratio
Experimental studies conducted by Anderson (1984) showed that the out-of-plane strength
of masonry panels has an inverse relationship with the slenderness ratio (h/t) of the panel.
Further, the failure mode for smaller slenderness ratios was governed by compressive
crushing of the masonry while for larger slenderness ratios (35-40 in their tests) the failure
was governed by instability of the panel.
Angel et al. (1994) tested eight infill specimens with a wide range of slenderness ratios
from 9 to 34 and reported that the out-of-plane strength greatly depended on the slenderness
ratio of the panel. the strength from arching action becomes insignificant for slenderness
ratios greater than 30.
2.2.2.3 Frame Rigidity
Dawe and Seah (1989b) conducted a comprehensive experimental study on the masonry
infilled steel frames that showed the importance of flexural and torsional stiffness of the
bounding frame on the out-of-plane strength of the infill. They included the effect of beam
and column stiffness in their proposed equation for out-plane strength calculation for the
first time.
Angel et al. (1994) also recognized the effect of the frame stiffness in their analytical model
but set an upper limit for the effect of frame’s flexural stiffness (EI) (equal to 2.6×10¹³ N-
mm2) beyond which the increase in out-of-plane strength as a result of frame stiffness is
considered insignificant.
14
Flanagan and Bennett (1999a) evaluated the performance of different analytical models
proposed by Dawe and Seah and Angel at al. and concluded that the flexural stiffness of
the boundary frame has a much greater impact on the out-of-plane strength than its
torsional stiffness.
2.2.2.4 Openings
Experiments by Gabrielsen et al. (1975) showed that the arching action can still develop
on infills with openings.
Dawe and Seah (1989b) tested a 3.6×2.8 m infill specimen with 1.6×1.2 m central opening
under uniform out-of-plane pressure and observed a 19% reduction in the strength and
significantly smaller deflection at failure compared to the control specimen without
opening.
Experiments conducted by Akhoundi et al. (2016) showed that presence of an opening with
13% area of the infill did not change the out-of-plane strength however, it reduced the
deformation at failure to 1/4 of the solid infill.
2.3 Analytical Modelling
In the case of analytical modeling, the following two categories of techniques have been
used by various researchers.
1- Macro-modeling which uses data from experiments and analytical approaches to
develop structural behaviour models (usually simplified methodology, practice-

15
oriented) that can be used in conjunction with other structural frame elements in
design of structural systems.
2- Micro-modeling which uses advanced mathematical and numerical methods to
simulate the behaviour of masonry, as accurate as possible, in order to obtain a wide
range of results (stress, deformation, strength, stiffness, constitutive law and cyclic
behaviour) to be used in detailed analysis and design or to replace expensive
experimental programs.
2.3.1 Macro-Modelling Methods
2.3.1.1 In-Plane Behaviour
The most widely accepted macro-model to simulate the infill contribution to the stiffness
and strength of the infilled system subjected to in-plane loading is the “diagonal strut
method”. This method was originally proposed by Polliakov (1963) and Holmes (1961)
based on experimental tests where strut-like behaviour was observed in infills under lateral
loading conditions (Figure 2.4). The strut width was associated with the contact area
between the infill and the frame beam and column. In this method, the masonry infill is
replaced by one or more pin-jointed equivalent struts connecting loaded corners in the infill
diagonal direction. Once the width of the strut or struts is known, assuming the strut having
the thickness and material property of the infill, a frame analysis can be performed to
determine the system stiffness incorporating the infill contribution. Since its inception,
most research followed has been dedicated in determining the strut width expression that
can provide accurate simulation of frame behaviour.
16
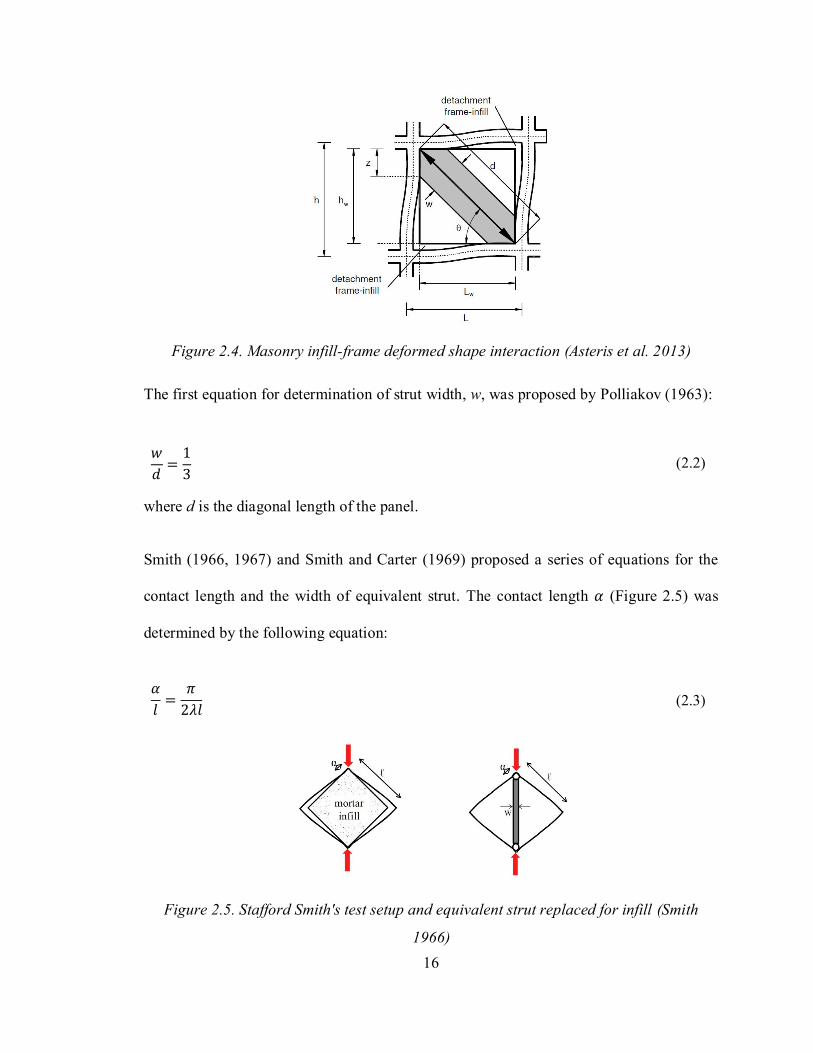
Figure 2.4. Masonry infill-frame deformed shape interaction (Asteris et al. 2013)
The first equation for determination of strut width, w, was proposed by Polliakov (1963):
𝑤
𝑑=1
3 (2.2)
where d is the diagonal length of the panel.
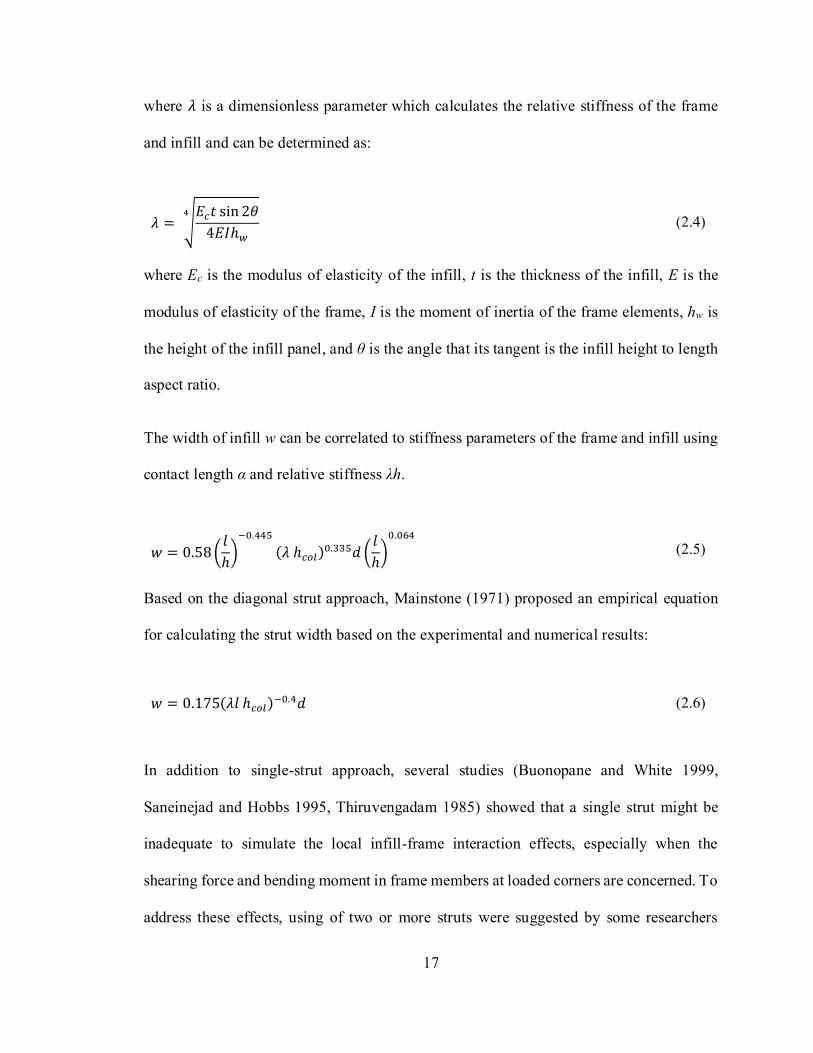
Smith (1966, 1967) and Smith and Carter (1969) proposed a series of equations for the
contact length and the width of equivalent strut. The contact length 𝛼 (Figure 2.5) was
determined by the following equation:
𝛼
𝑙=
𝜋
2𝜆𝑙 (2.3)
Figure 2.5. Stafford Smith's test setup and equivalent strut replaced for infill (Smith
1966)
17
where 𝜆 is a dimensionless parameter which calculates the relative stiffness of the frame
and infill and can be determined as:
𝜆 = √𝐸𝑐𝑡 sin 2𝜃
4𝐸𝐼ℎ𝑤
4
(2.4)
where Ec is the modulus of elasticity of the infill, t is the thickness of the infill, E is the
modulus of elasticity of the frame, I is the moment of inertia of the frame elements, hw is
the height of the infill panel, and θ is the angle that its tangent is the infill height to length
aspect ratio.
The width of infill w can be correlated to stiffness parameters of the frame and infill using
contact length α and relative stiffness λh.
𝑤 = 0.58(𝑙
ℎ)−0.445
(𝜆 ℎ𝑐𝑜𝑙)0.335𝑑 (
𝑙
ℎ)0.064
(2.5)
Based on the diagonal strut approach, Mainstone (1971) proposed an empirical equation
for calculating the strut width based on the experimental and numerical results:
𝑤 = 0.175(𝜆𝑙 ℎ𝑐𝑜𝑙)−0.4𝑑 (2.6)
In addition to single-strut approach, several studies (Buonopane and White 1999,
Saneinejad and Hobbs 1995, Thiruvengadam 1985) showed that a single strut might be
inadequate to simulate the local infill-frame interaction effects, especially when the
shearing force and bending moment in frame members at loaded corners are concerned. To
address these effects, using of two or more struts were suggested by some researchers

18
(Chrysostomou et al. 2002, El-Dakhakhni et al. 2003, Syrmakezis and Vratsanou 1986).
These struts have different width expressions and can be placed diagonally connected to
the beam-column joints or off-diagonally and connected to either beams or columns.
Crisafulli et al. (2000) adopted a multi-strut method to analyze the structural response of
RC infilled frames, focusing on the actions induced in the surrounding frame. Numerical
results on single, two and three strut methods showed that all of the methods can simulate
the infilled frame behaviour with more accurate results for two (Schmidt 1989) and three
strut (Chrysostomou 1991) cases. Finally, it was concluded that the two-strut method is
accurate enough with less complication compared to other methods.
Crisafulli and Carr (2007) proposed a two-strut method, as shown in Figure 2.6, where
struts were connected together with a shear spring to account for shear behaviour of the
infill. This four-node panel element was found capable of capturing both corner crushing
and shear sliding failure mechanisms of the masonry infill when compared with
experimental results obtained by the authors.
Figure 2.6. Two-strut with shear spring model proposed by Crisafulli and Carr (2007)
19
Turgay et al. (2014) summarized results of 51 experiments on masonry infilled RC frames
conducted by 24 researchers. They proposed the following expressions for strut width in
stiffness calculation:
𝑤 = 0.18(𝜆ℎ𝑐𝑜𝑙)−0.25𝑟𝑖𝑛𝑓 (2.7)
𝜆 = √𝐸𝑚𝑒𝑡 sin 2𝜃
4𝐸𝑓𝑒𝐼𝑐𝑜𝑙ℎ𝑖𝑛𝑓⁄
4 (2.8)
Di Trapani et al. (2017) carried out cyclic lateral loading experiments on infilled RC frames
and investigated the use of the strut model to reflect degradation of infill stiffness subjected
to cyclic loading. They proposed a multi-linear plastic behaviour for the strut and showed
that the strength and stiffness of the specimens could be predicted using this behaviour
model.
2.3.1.2 Out-of-Plane Behaviour
The very first methodology for arching action was proposed by McDowell et al. (1956a).
To investigate arching, they conducted lateral loading tests on strips of brick masonry
supported rigidly at the ends and formulated the strength equation in one-way arching
based on compressive strength of masonry (𝑓′𝑚) as shown in Eq. (2.9).
𝑞𝑢 =𝛾𝑓′𝑚
2(ℎ𝑡)2
(2.9)
Where qu is the arching strength, γ is a function of h/t ratio and 𝑓′𝑚 is the compressive
strength of masonry.
20
This theory was further extended to two-way arching in a study by Dawe and Seah (1989b)
where they conducted a series of tests on steel frames infilled with concrete masonry blocks
with different thicknesses. They developed an analytical model by introducing the arching
action in the yield-line theory to calculate the out-of-plane strength of the infills. In this
model, compressive crushing of masonry was assumed as the main failure mode for
ultimate capacity estimation. They proposed an empirical design equation to calculate the
ultimate out-of-plane capacity (Eq. (2.10)-(2.13))
𝑞𝑢𝑙𝑡 = 4.5(𝑓′𝑚)0.75𝑡2𝛼/𝐿2.5 (infill panel bounded on three sides and top
side is free) (2.10)
𝑞𝑢𝑙𝑡 = 4.5(𝑓′𝑚)0.75𝑡2{𝛼/𝐿2.5+ 𝛽/𝐻2.5} (infill panel bounded on four sides) (2.11)
where,
𝛼 = 1𝐻⁄ (𝐸𝐼𝑐𝐻
2 + 𝐺𝐽𝑐𝑡𝐻)0.25 ≤ 50 (≤ 75 for panel bounded on three sides) (2.12)
𝛽 = 1𝐿⁄ (𝐸𝐼𝑏𝐿
2 + 𝐺𝐽𝑏𝑡𝐿)0.25 ≤ 50 (2.13)
and t, L, and H are the thickness, length, and height of the infill panel, respectively.
Parameters 𝛼 and 𝛽 are factors accounting for the stiffness effect of boundary frame where
𝐸 and 𝐺 are the Young’s modulus and shear modulus of the frame members respectively,
and I and J are the moment of inertia and torsional constant of the frame members with
subscript b and c indicating beam and columns respectively.
An upper limit is set for 𝛼 and 𝛽, indicating that the effect of boundary frame stiffness
diminishes as the stiffness becomes greater and at the set limit, the frame can be considered
21
as rigid. The method also provides simple treatment for gaps at frame-to-infill interface,
by setting 𝛼 or 𝛽 equal to zero for frame-column or frame-beam gap, respectively.
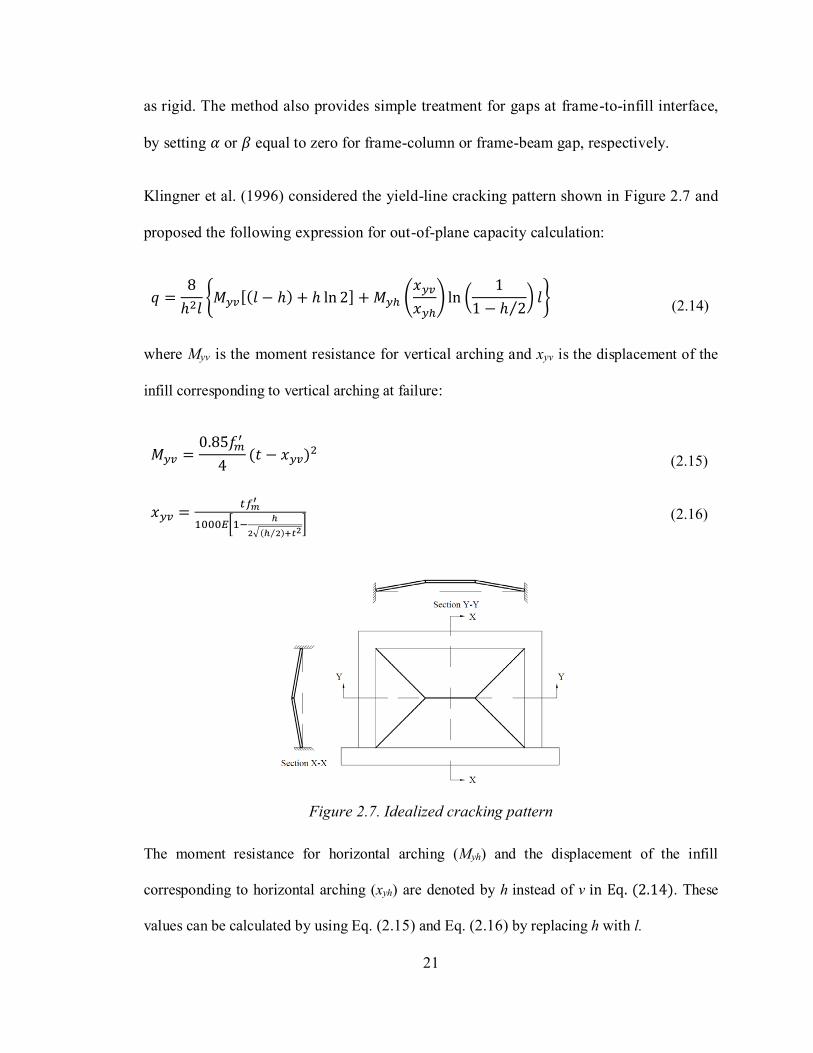
Klingner et al. (1996) considered the yield-line cracking pattern shown in Figure 2.7 and
proposed the following expression for out-of-plane capacity calculation:
𝑞 =8
ℎ2𝑙{𝑀𝑦𝑣[(𝑙 − ℎ) + ℎ ln 2] + 𝑀𝑦ℎ (
𝑥𝑦𝑣
𝑥𝑦ℎ) ln (
1
1 − ℎ 2⁄) 𝑙}
(2.14)
where Myv is the moment resistance for vertical arching and xyv is the displacement of the
infill corresponding to vertical arching at failure:
𝑀𝑦𝑣 =0.85𝑓𝑚
′
4(𝑡 − 𝑥𝑦𝑣)
2 (2.15)
𝑥𝑦𝑣 =𝑡𝑓𝑚
′
1000𝐸[1−ℎ
2√(ℎ 2⁄ )+𝑡2] (2.16)
Figure 2.7. Idealized cracking pattern
The moment resistance for horizontal arching (Myh) and the displacement of the infill
corresponding to horizontal arching (xyh) are denoted by h instead of v in Eq. (2.14). These
values can be calculated by using Eq. (2.15) and Eq. (2.16) by replacing h with l.

22
Angel et al. (1994) proposed an analytical method for arching based on experimental and
numerical results. They conducted in-plane and out-of-plane tests on masonry infilled
concrete frames to investigate the effect of in-plane damage on the out-of-plane behaviour
of infills. The analytical model was developed for one-way arching of masonry strips
cracked at mid-height considering both compressive crushing of masonry at the boundaries
and snap-through of the panel due to buckling as potential failure modes. They proposed
the following for out-of-plane capacity of masonry infills:
𝑞 =2𝑓′𝑚
(ℎ𝑡)𝑅1𝑅2𝜆 (2.17)
𝑅2 = 0.357 + 2.49 × 10⁻¹⁴𝐸𝐼 ≤ 1.0 (2.18)
𝜆 = 0.154exp (−0.0985ℎ
𝑡) (2.19)
where, R1 is a reduction factor for prior in-plane loading as defined in Eq. (2.20); R2 is a
reduction factor accounting for bounding frame flexibility; and λ is a function of h/t and EI
is the flexural stiffness of the smallest member of the bounding frame.
This equation was originally formulated based on a one-way mechanism, however, it was
calibrated using two-way arching tests on infills with 1.5 aspect ratio.
𝑅1 = 1, ∆
∆𝑐𝑟< 1
𝑅1 = [1.08 + (ℎ
𝑡)(−0.015+ (
ℎ
𝑡) (−0.00049+ 0.000013 (
ℎ
𝑡)))]
∆
2∆𝑐𝑟
, ∆
∆𝑐𝑟≥ 1
(2.20)
where Δ is the maximum lateral deflection experienced by the infill and Δcr is the lateral
deflection required for the cracking of the infill.
23
Flanagan and Bennett (1999a) investigated the reliability of the equations suggested by
Dawe and Seah (1989b), Angel et al. (1994) and Klingner et al. (1996) and concluded that
Dawe and Seah (1989b) method provides the best results in prediction of out-of-plane
capacity. They also suggested that for most practical frames, the GJctH and GJbtL terms in
Dawe and Seah (1989b) method are much smaller than the EIcH2 and EIbL2 terms and
eliminated the torsional terms (GJctH and GJbtL). The final modified version of their
method for out-of-plane strength calculation is expressed as follows:
𝑞𝑢𝑙𝑡 = 4.1(𝑓′𝑚)0.75𝑡2𝛼/𝐿2.5 (2.21)
𝛼 = 1𝐻⁄ (𝐸𝐼𝑐𝐻
2)0.25 ≤ 50 (2.22)
𝛽 = 1𝐿⁄ (𝐸𝐼𝑏𝐿
2)0.25 ≤ 50 (2.23)
This formulation was adopted in the current American masonry design standard TMS
402/602-16 for design of masonry infills subjected to out-of-plane loading.
Moghaddam and Goudarzi (2010) proposed two equations based on the masonry crushing
at the boundary (qcr) and transverse instability of the infill (qmax) for out-of-plane strength
calculation. They suggested that the lesser of the two criteria be considered as the strength
of the infill:
𝑞 = 𝑀𝑖𝑛
{
𝑞𝑐𝑟 = [0.85 − (0.12 +
0.045
𝛼)𝑓𝑚′
𝐸𝑚𝜆2]
𝑓𝑚′
𝜆2
𝑞𝑚𝑎𝑥 =0.18𝐸𝑚
(0.12 +0.045𝛼
)𝜆4
(2.24)
24
The qcr is a function of the infill slenderness ratio (λ), masonry compressive strength (f'm)
and elastic modulus (Em), and the ratio of the frame stiffness to the masonry stiffness (α)
that is shown in Eq. (2.27)
𝛼 =𝐾
(𝐸𝑚𝑡𝑙/ℎ)
𝐾 =384𝐸𝑓𝐼𝑏
𝑙3
(2.25)
where K is the frame stiffness for uniformly distributed arching force on the beam.
2.3.2 Micro-Modeling Methods
In micro-model approaches, Finite Element Method (FEM) is commonly adopted as the
analysis tool because of its capability in handling geometrically complex structures and
nonlinear behaviour. Moreover, many interface models have been developed that enables
FEM to be used in simulation of both continuum and discrete media. Other methods such
as Discrete Element Method (DEM) and Boundary Element Method (BEM) have also been
used but with less success.
Most important factors in using micro-models are the types of simplifications and
assumptions used to discretize the system and define material behaviour as well as the
choice of interaction models and interface elements. In general, there are three main
categories in discretization and representation of masonry structures depending on the level
of accuracy and simplicity desired (Lourenco 1996). As shown in Figure 2.8, those are (a)
Detailed micro-modelling, in which blocks and mortars are modeled with continuum
elements and contact behaviour can be used for mortar-block interface; (b) Simplified
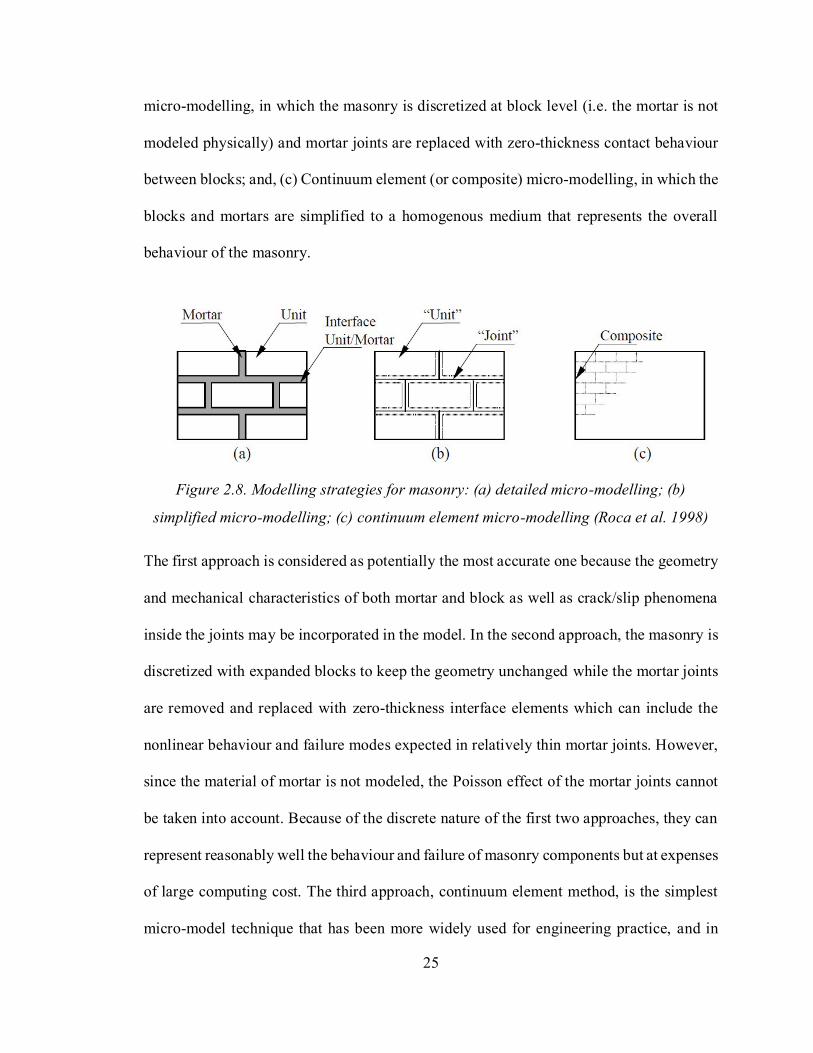
25
micro-modelling, in which the masonry is discretized at block level (i.e. the mortar is not
modeled physically) and mortar joints are replaced with zero-thickness contact behaviour
between blocks; and, (c) Continuum element (or composite) micro-modelling, in which the
blocks and mortars are simplified to a homogenous medium that represents the overall
behaviour of the masonry.
Figure 2.8. Modelling strategies for masonry: (a) detailed micro-modelling; (b)
simplified micro-modelling; (c) continuum element micro-modelling (Roca et al. 1998)
The first approach is considered as potentially the most accurate one because the geometry
and mechanical characteristics of both mortar and block as well as crack/slip phenomena
inside the joints may be incorporated in the model. In the second approach, the masonry is
discretized with expanded blocks to keep the geometry unchanged while the mortar joints
are removed and replaced with zero-thickness interface elements which can include the
nonlinear behaviour and failure modes expected in relatively thin mortar joints. However,
since the material of mortar is not modeled, the Poisson effect of the mortar joints cannot
be taken into account. Because of the discrete nature of the first two approaches, they can
represent reasonably well the behaviour and failure of masonry components but at expenses
of large computing cost. The third approach, continuum element method, is the simplest
micro-model technique that has been more widely used for engineering practice, and in
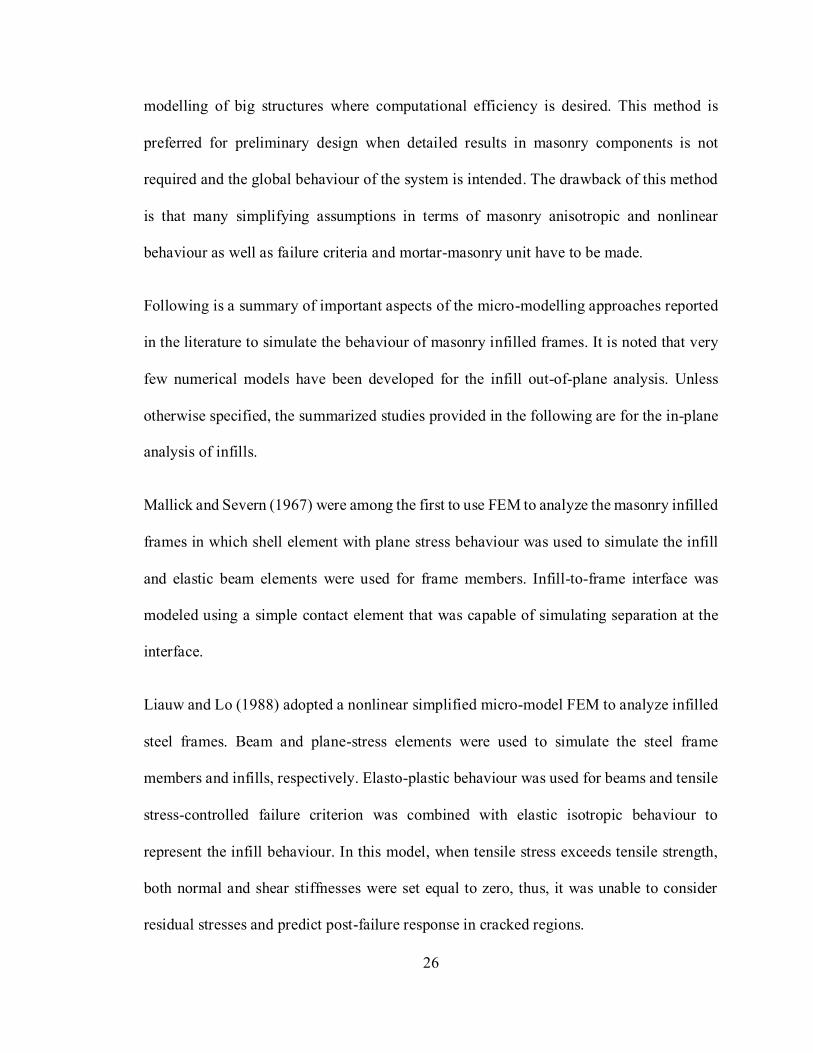
26
modelling of big structures where computational efficiency is desired. This method is
preferred for preliminary design when detailed results in masonry components is not
required and the global behaviour of the system is intended. The drawback of this method
is that many simplifying assumptions in terms of masonry anisotropic and nonlinear
behaviour as well as failure criteria and mortar-masonry unit have to be made.
Following is a summary of important aspects of the micro-modelling approaches reported
in the literature to simulate the behaviour of masonry infilled frames. It is noted that very
few numerical models have been developed for the infill out-of-plane analysis. Unless
otherwise specified, the summarized studies provided in the following are for the in-plane
analysis of infills.
Mallick and Severn (1967) were among the first to use FEM to analyze the masonry infilled
frames in which shell element with plane stress behaviour was used to simulate the infill
and elastic beam elements were used for frame members. Infill-to-frame interface was
modeled using a simple contact element that was capable of simulating separation at the
interface.
Liauw and Lo (1988) adopted a nonlinear simplified micro-model FEM to analyze infilled
steel frames. Beam and plane-stress elements were used to simulate the steel frame
members and infills, respectively. Elasto-plastic behaviour was used for beams and tensile
stress-controlled failure criterion was combined with elastic isotropic behaviour to
represent the infill behaviour. In this model, when tensile stress exceeds tensile strength,
both normal and shear stiffnesses were set equal to zero, thus, it was unable to consider
residual stresses and predict post-failure response in cracked regions.

27
Smeared crack formulation was developed and employed in FE analysis of infilled RC
frames by Lotfi and Shing (1991) to account for nonlinear behaviour of masonry blocks
and concrete. Cracking of the material was determined by a Rankine tension-cut off
criterion. The drawback of this model was its inability in prediction of shear failure.
Mehrabi and Shing (1997) conducted nonlinear finite element analysis for the 14 infilled
RC frames that they tested. They used simplified micro-model method and developed
interface models for shear cracking of concrete and mortar joints as well as bond-slip
behaviour of steel bars in concrete. The model accounted for the compressive hardening
behaviour of cementitious interfaces. It was observed that bond-slip behaviour had an
important influence on the response of bare frame but did not affect the response of the
infilled frame significantly.
Syrmakezis and Asteris (2001) developed an anisotropic failure criterion for masonry
under biaxial stress condition for different level of shear stress. To validate this failure
criterion, they used experimental results conducted by Page (1981) and categorized the
results based on the direction of loading and amount of shear stress. They showed that an
increase in the shear stress can substantially reduce the size of the failure surface of the
masonry.
Al-Chaar et al. (2008) used DIANA commercial finite element program to reproduce test
results by Mehrabi et al. (1996). Smeared crack quadrilateral elements for concrete and
masonry blocks and cohesive interface model for simulation of the mortar behaviour and
shear failure of concrete were assumed. They pointed out that for specimens with column
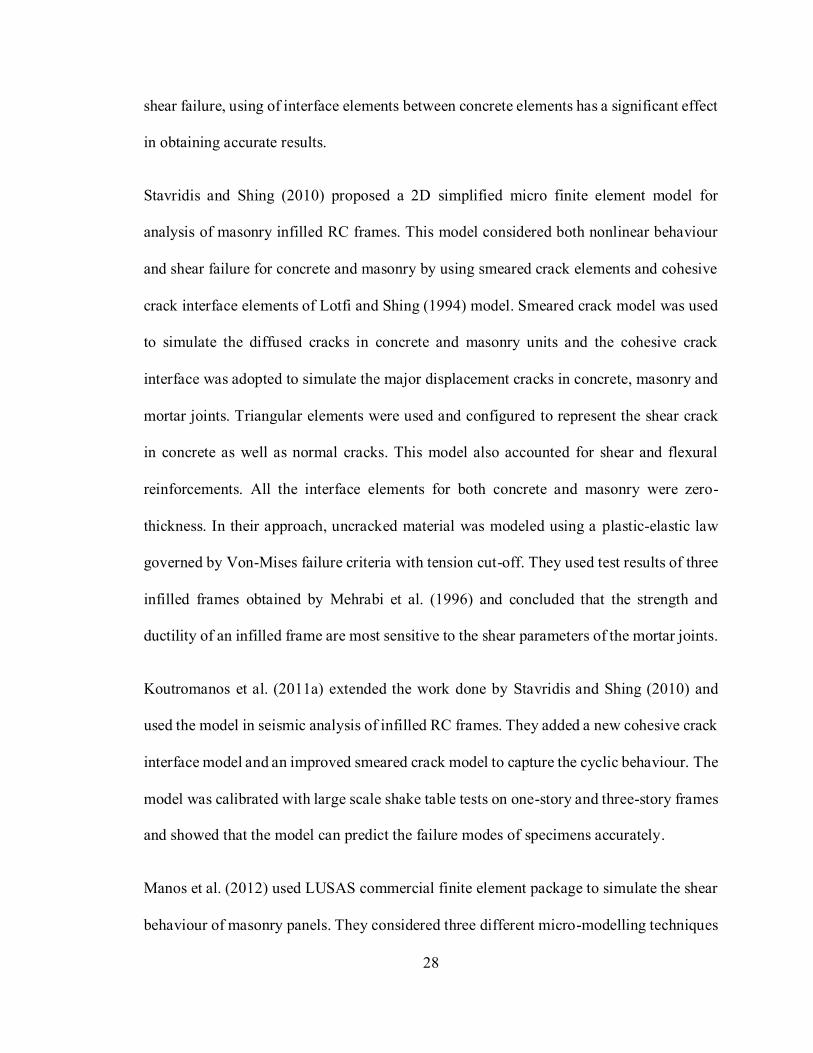
28
shear failure, using of interface elements between concrete elements has a significant effect
in obtaining accurate results.
Stavridis and Shing (2010) proposed a 2D simplified micro finite element model for
analysis of masonry infilled RC frames. This model considered both nonlinear behaviour
and shear failure for concrete and masonry by using smeared crack elements and cohesive
crack interface elements of Lotfi and Shing (1994) model. Smeared crack model was used
to simulate the diffused cracks in concrete and masonry units and the cohesive crack
interface was adopted to simulate the major displacement cracks in concrete, masonry and
mortar joints. Triangular elements were used and configured to represent the shear crack
in concrete as well as normal cracks. This model also accounted for shear and flexural
reinforcements. All the interface elements for both concrete and masonry were zero-
thickness. In their approach, uncracked material was modeled using a plastic-elastic law
governed by Von-Mises failure criteria with tension cut-off. They used test results of three
infilled frames obtained by Mehrabi et al. (1996) and concluded that the strength and
ductility of an infilled frame are most sensitive to the shear parameters of the mortar joints.
Koutromanos et al. (2011a) extended the work done by Stavridis and Shing (2010) and
used the model in seismic analysis of infilled RC frames. They added a new cohesive crack
interface model and an improved smeared crack model to capture the cyclic behaviour. The
model was calibrated with large scale shake table tests on one-story and three-story frames
and showed that the model can predict the failure modes of specimens accurately.
Manos et al. (2012) used LUSAS commercial finite element package to simulate the shear
behaviour of masonry panels. They considered three different micro-modelling techniques
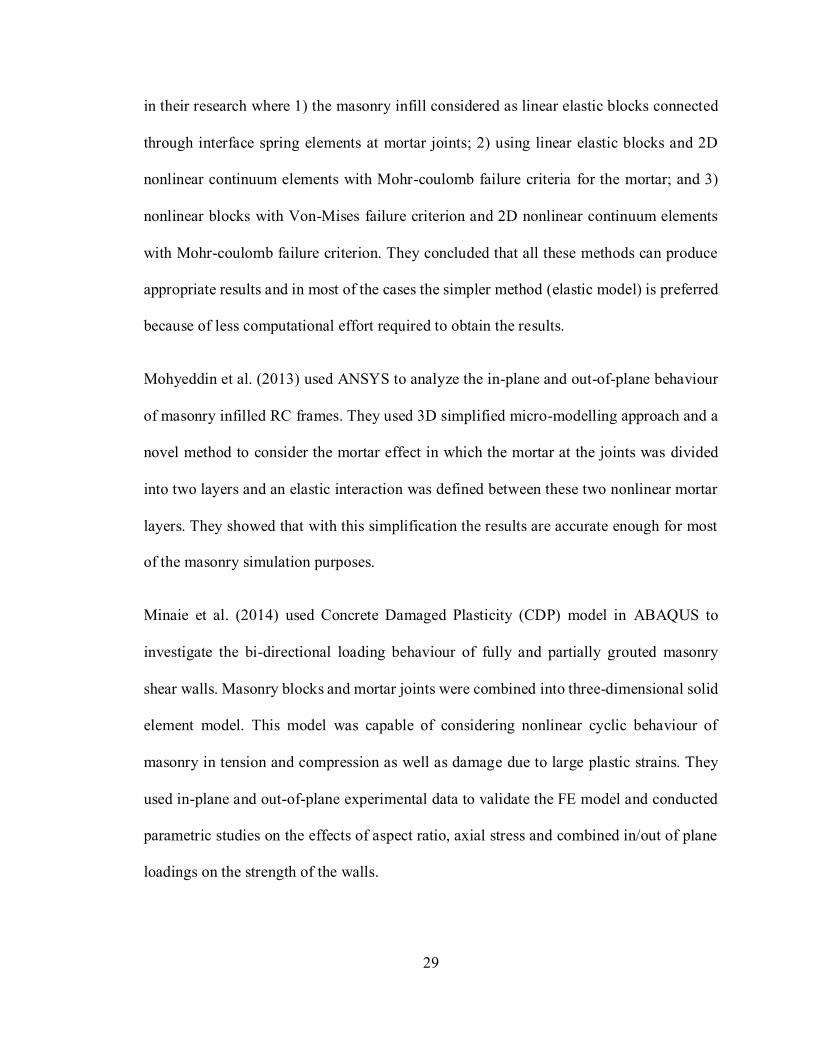
29
in their research where 1) the masonry infill considered as linear elastic blocks connected
through interface spring elements at mortar joints; 2) using linear elastic blocks and 2D
nonlinear continuum elements with Mohr-coulomb failure criteria for the mortar; and 3)
nonlinear blocks with Von-Mises failure criterion and 2D nonlinear continuum elements
with Mohr-coulomb failure criterion. They concluded that all these methods can produce
appropriate results and in most of the cases the simpler method (elastic model) is preferred
because of less computational effort required to obtain the results.
Mohyeddin et al. (2013) used ANSYS to analyze the in-plane and out-of-plane behaviour
of masonry infilled RC frames. They used 3D simplified micro-modelling approach and a
novel method to consider the mortar effect in which the mortar at the joints was divided
into two layers and an elastic interaction was defined between these two nonlinear mortar
layers. They showed that with this simplification the results are accurate enough for most
of the masonry simulation purposes.
Minaie et al. (2014) used Concrete Damaged Plasticity (CDP) model in ABAQUS to
investigate the bi-directional loading behaviour of fully and partially grouted masonry
shear walls. Masonry blocks and mortar joints were combined into three-dimensional solid
element model. This model was capable of considering nonlinear cyclic behaviour of
masonry in tension and compression as well as damage due to large plastic strains. They
used in-plane and out-of-plane experimental data to validate the FE model and conducted
parametric studies on the effects of aspect ratio, axial stress and combined in/out of plane
loadings on the strength of the walls.
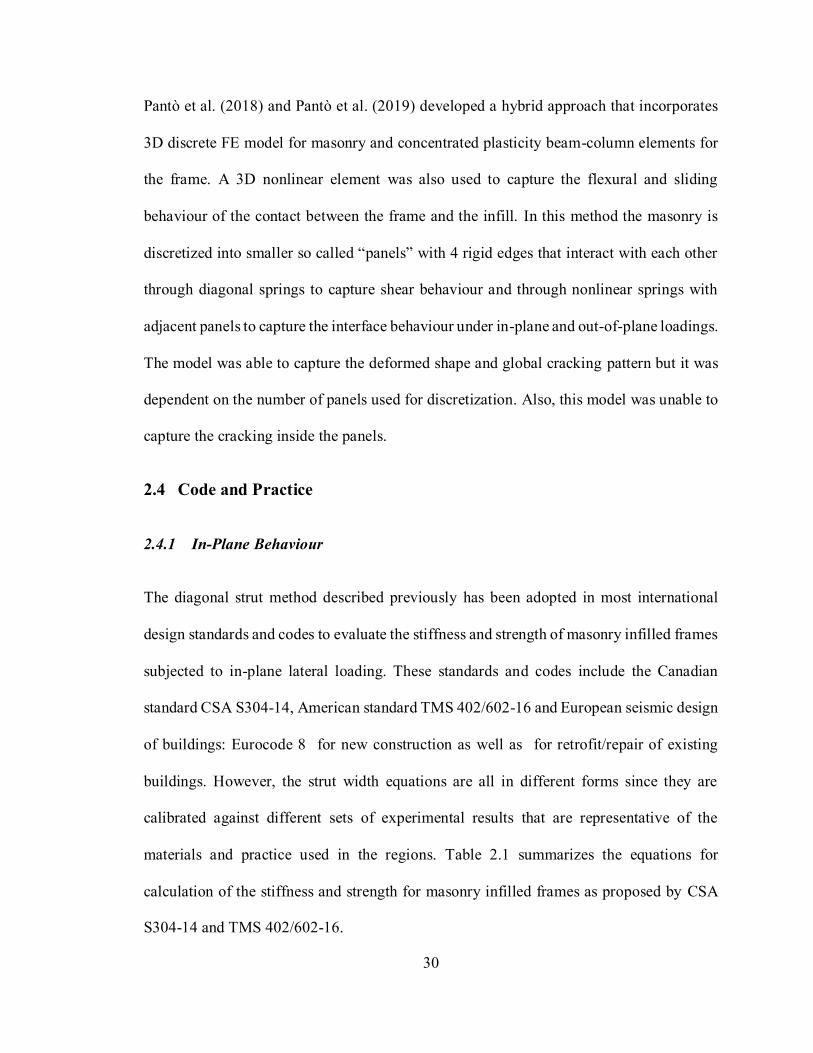
30
Pantò et al. (2018) and Pantò et al. (2019) developed a hybrid approach that incorporates
3D discrete FE model for masonry and concentrated plasticity beam-column elements for
the frame. A 3D nonlinear element was also used to capture the flexural and sliding
behaviour of the contact between the frame and the infill. In this method the masonry is
discretized into smaller so called “panels” with 4 rigid edges that interact with each other
through diagonal springs to capture shear behaviour and through nonlinear springs with
adjacent panels to capture the interface behaviour under in-plane and out-of-plane loadings.
The model was able to capture the deformed shape and global cracking pattern but it was
dependent on the number of panels used for discretization. Also, this model was unable to
capture the cracking inside the panels.
2.4 Code and Practice
2.4.1 In-Plane Behaviour
The diagonal strut method described previously has been adopted in most international
design standards and codes to evaluate the stiffness and strength of masonry infilled frames
subjected to in-plane lateral loading. These standards and codes include the Canadian
standard CSA S304-14, American standard TMS 402/602-16 and European seismic design
of buildings: Eurocode 8 for new construction as well as for retrofit/repair of existing
buildings. However, the strut width equations are all in different forms since they are
calibrated against different sets of experimental results that are representative of the
materials and practice used in the regions. Table 2.1 summarizes the equations for
calculation of the stiffness and strength for masonry infilled frames as proposed by CSA
S304-14 and TMS 402/602-16.
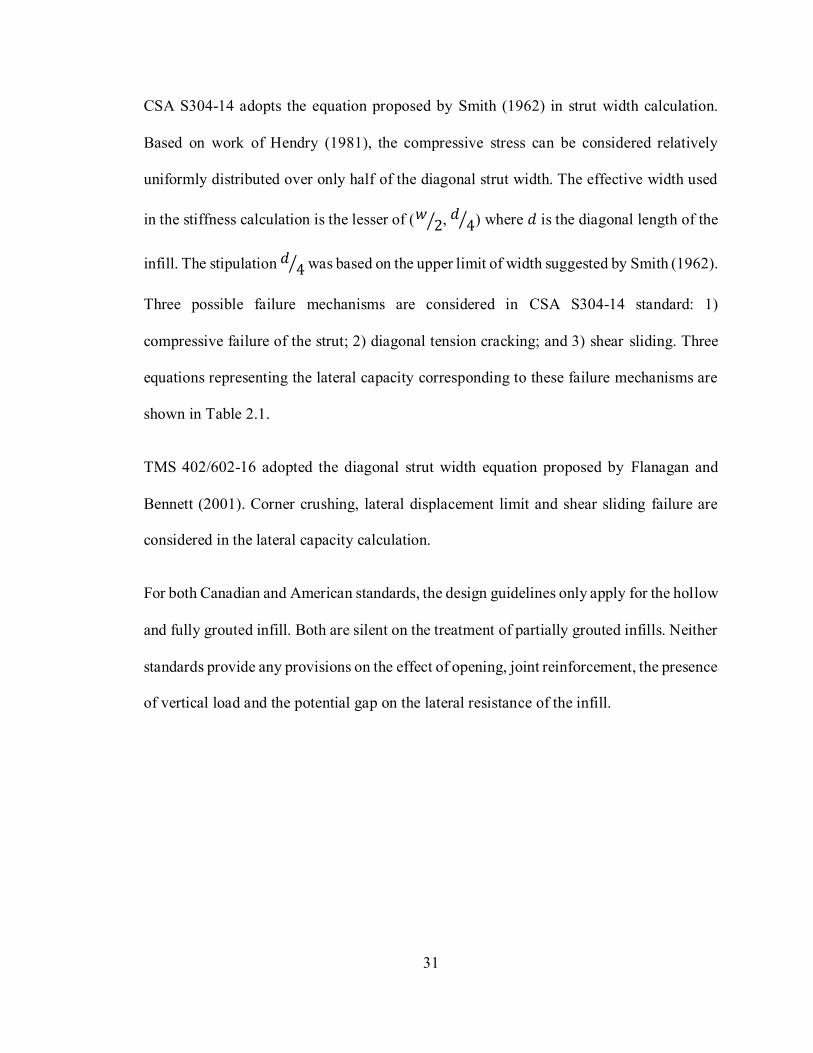
31
CSA S304-14 adopts the equation proposed by Smith (1962) in strut width calculation.
Based on work of Hendry (1981), the compressive stress can be considered relatively
uniformly distributed over only half of the diagonal strut width. The effective width used
in the stiffness calculation is the lesser of (𝑤 2⁄ , 𝑑 4⁄ ) where 𝑑 is the diagonal length of the
infill. The stipulation 𝑑 4⁄ was based on the upper limit of width suggested by Smith (1962).
Three possible failure mechanisms are considered in CSA S304-14 standard: 1)
compressive failure of the strut; 2) diagonal tension cracking; and 3) shear sliding. Three
equations representing the lateral capacity corresponding to these failure mechanisms are
shown in Table 2.1.
TMS 402/602-16 adopted the diagonal strut width equation proposed by Flanagan and
Bennett (2001). Corner crushing, lateral displacement limit and shear sliding failure are
considered in the lateral capacity calculation.
For both Canadian and American standards, the design guidelines only apply for the hollow
and fully grouted infill. Both are silent on the treatment of partially grouted infills. Neither
standards provide any provisions on the effect of opening, joint reinforcement, the presence
of vertical load and the potential gap on the lateral resistance of the infill.
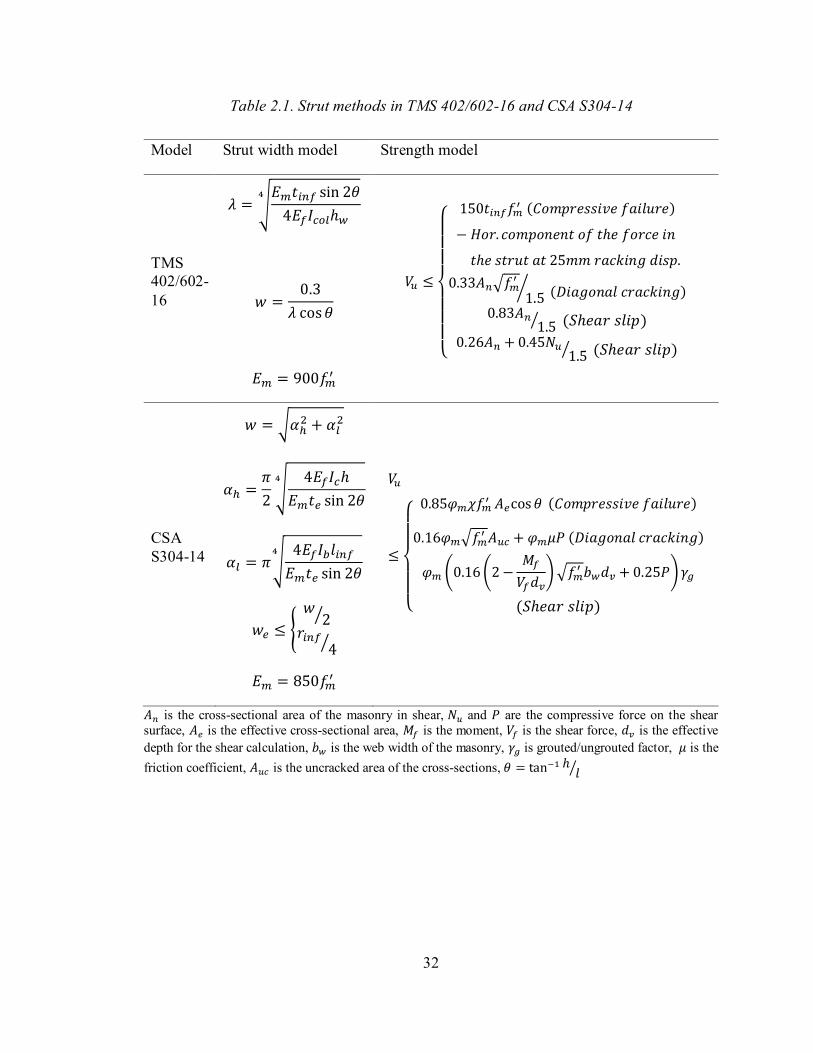
32
Table 2.1. Strut methods in TMS 402/602-16 and CSA S304-14
Model Strut width model Strength model
TMS
402/602-
16
𝜆 = √𝐸𝑚𝑡𝑖𝑛𝑓 sin 2𝜃
4𝐸𝑓𝐼𝑐𝑜𝑙ℎ𝑤
4
𝑤 =0.3
𝜆 cos𝜃
𝐸𝑚 = 900𝑓𝑚′
𝑉𝑢 ≤
{
150𝑡𝑖𝑛𝑓𝑓𝑚′ (𝐶𝑜𝑚𝑝𝑟𝑒𝑠𝑠𝑖𝑣𝑒 𝑓𝑎𝑖𝑙𝑢𝑟𝑒)
− 𝐻𝑜𝑟. 𝑐𝑜𝑚𝑝𝑜𝑛𝑒𝑛𝑡 𝑜𝑓 𝑡ℎ𝑒 𝑓𝑜𝑟𝑐𝑒 𝑖𝑛
𝑡ℎ𝑒 𝑠𝑡𝑟𝑢𝑡 𝑎𝑡 25𝑚𝑚 𝑟𝑎𝑐𝑘𝑖𝑛𝑔 𝑑𝑖𝑠𝑝.
0.33𝐴𝑛√𝑓𝑚′
1.5⁄ (𝐷𝑖𝑎𝑔𝑜𝑛𝑎𝑙 𝑐𝑟𝑎𝑐𝑘𝑖𝑛𝑔)
0.83𝐴𝑛1.5⁄ (𝑆ℎ𝑒𝑎𝑟 𝑠𝑙𝑖𝑝)
0.26𝐴𝑛 +0.45𝑁𝑢1.5⁄ (𝑆ℎ𝑒𝑎𝑟 𝑠𝑙𝑖𝑝)
CSA
S304-14
𝑤 = √𝛼ℎ2 + 𝛼𝑙
2
𝛼ℎ =𝜋
2√
4𝐸𝑓𝐼𝑐ℎ
𝐸𝑚𝑡𝑒 sin 2𝜃
4
𝛼𝑙 = 𝜋√4𝐸𝑓𝐼𝑏𝑙𝑖𝑛𝑓
𝐸𝑚𝑡𝑒 sin 2𝜃
4
𝑤𝑒 ≤ {
𝑤2⁄
𝑟𝑖𝑛𝑓4⁄
𝐸𝑚 = 850𝑓𝑚′
𝑉𝑢
≤
{
0.85𝜑𝑚𝜒𝑓𝑚
′ 𝐴𝑒cos 𝜃 (𝐶𝑜𝑚𝑝𝑟𝑒𝑠𝑠𝑖𝑣𝑒 𝑓𝑎𝑖𝑙𝑢𝑟𝑒)
0.16𝜑𝑚√𝑓𝑚′ 𝐴𝑢𝑐 + 𝜑𝑚𝜇𝑃 (𝐷𝑖𝑎𝑔𝑜𝑛𝑎𝑙 𝑐𝑟𝑎𝑐𝑘𝑖𝑛𝑔)
𝜑𝑚 (0.16(2−𝑀𝑓
𝑉𝑓𝑑𝑣)√𝑓𝑚
′ 𝑏𝑤𝑑𝑣 +0.25𝑃)𝛾𝑔
(𝑆ℎ𝑒𝑎𝑟 𝑠𝑙𝑖𝑝)
𝐴𝑛 is the cross-sectional area of the masonry in shear, 𝑁𝑢 and 𝑃 are the compressive force on the shear
surface, 𝐴𝑒 is the effective cross-sectional area, 𝑀𝑓 is the moment, 𝑉𝑓 is the shear force, 𝑑𝑣 is the effective
depth for the shear calculation, 𝑏𝑤 is the web width of the masonry, 𝛾𝑔 is grouted/ungrouted factor, 𝜇 is the
friction coefficient, 𝐴𝑢𝑐 is the uncracked area of the cross-sections, 𝜃 = tan−1 ℎ 𝑙⁄
33
2.4.2 Out-of-Plane Behaviour
There are no design provisions in the current CSA S304-14 for calculating of the out-of-
plane strength of infill walls. Rather, it specifies that basic principles of mechanics be relied
upon for analysis. In the American masonry design standard TMS 402/602-16, the nominal
capacity to resist out-of-plane forces of the infill is given in the following. These
expressions were based on the work of Dawe and Seah (1989b).
𝑞𝑛 𝑖𝑛𝑓 = 4.1(𝑓𝑚′ )0.75 𝑡𝑖𝑛𝑓
2 (𝛼𝑎𝑟𝑐ℎ
𝑙2.5+𝛽𝑎𝑟𝑐ℎ
ℎ2.5) (2.26)
𝛼𝑎𝑟𝑐ℎ =1
ℎ(𝐸𝑏𝑐𝐼𝑏𝑐ℎ𝑖𝑛𝑓
2)0.25 < 50 (2.27)
𝛽𝑎𝑟𝑐ℎ =1
ℎ(𝐸𝑏𝑏𝐼𝑏𝑏𝑙𝑖𝑛𝑓
2)0.25 < 50 (2.28)
where 𝐸𝑏𝑐 and 𝐸𝑏𝑏 are the modulus of the frame columns and frame beam, respectively
and 𝑡𝑖𝑛𝑓 shall not exceed 1 8⁄ ℎ𝑖𝑛𝑓.
2.5 Summary
A literature review of the state-of-the-art research on masonry infilled frames is provided
in this chapter. Main experimental studies, numerical modeling development, as well as
the current code and practice on the subject are presented. It is shown that the behaviour of
masonry infilled frames is complex as it is affected by many factors of geometric, material,
and loading characteristics of the system. While some advancement in understanding of
the behaviour has been made, inadequacies of the previous studies are summarized in the
following paragraph.
34
In terms of experimental studies, the range of variations in studied parameters was limited
so that there were few developed correlations between the geometric and material
parameters and the in-plane and out-of-plane capacity. A large portion of these studies are
dedicated to steel infilled frames with normal infills and less information is available for
infilled RC frames. In terms of numerical studies, the existing models were generally
developed and validated for specific conditions with certain assumptions and none was
found to be able to provide universally satisfactory estimates for infills with different
material and geometric properties. Also, details of the modeling are commonly not
available in the public domain and thus cannot be easily reproduced for studies of other
parameters. As a result, the design provisions contained in the North American masonry
standards are only applicable to simple infill situations. In view of this, more research is
needed to further the understanding and development of design guidelines for masonry
infills.

35
Chapter 3 Experimental Program
3.1 Introduction
Concurrent to the numerical study, an experimental program was conducted to obtain
physical results on the in-plane and out-of-plane loading response of masonry infilled RC
frames. This experimental investigation aimed to analyze the effect of several influential
parameters on the behaviour of infilled frame that are either not available in the literature
or the reported data are not applicable to concrete masonry units bounded by RC frames.
These results were also used in the validation of the finite element model.
While the experimental work is included and discussed in each following chapter in
different focuses, this chapter is to provide an overall description and summary of the
experimental portion of the research. Along with infilled frame specimens, auxiliary tests
were also conducted to obtain mechanical properties of each component of the infilled
system. These components include concrete masonry units (CMUs), mortar, masonry
prisms, concrete cylinders and reinforcing steel. The obtained results were used in
numerical modeling as input property parameters. Description of the specimens, test setup,
and testing procedure are briefly presented in this chapter.
3.2 Infilled Frame Specimens
A total of seventeen specimens were constructed and tested and they included one bare
frame, two control infilled frames, six infilled frames with side and top interfacial gaps,
five infilled frames with window and door openings, and three regular infilled frames with
prior in-plane damage tested under out-of-plane loading. Table 3.1 presents a summary of
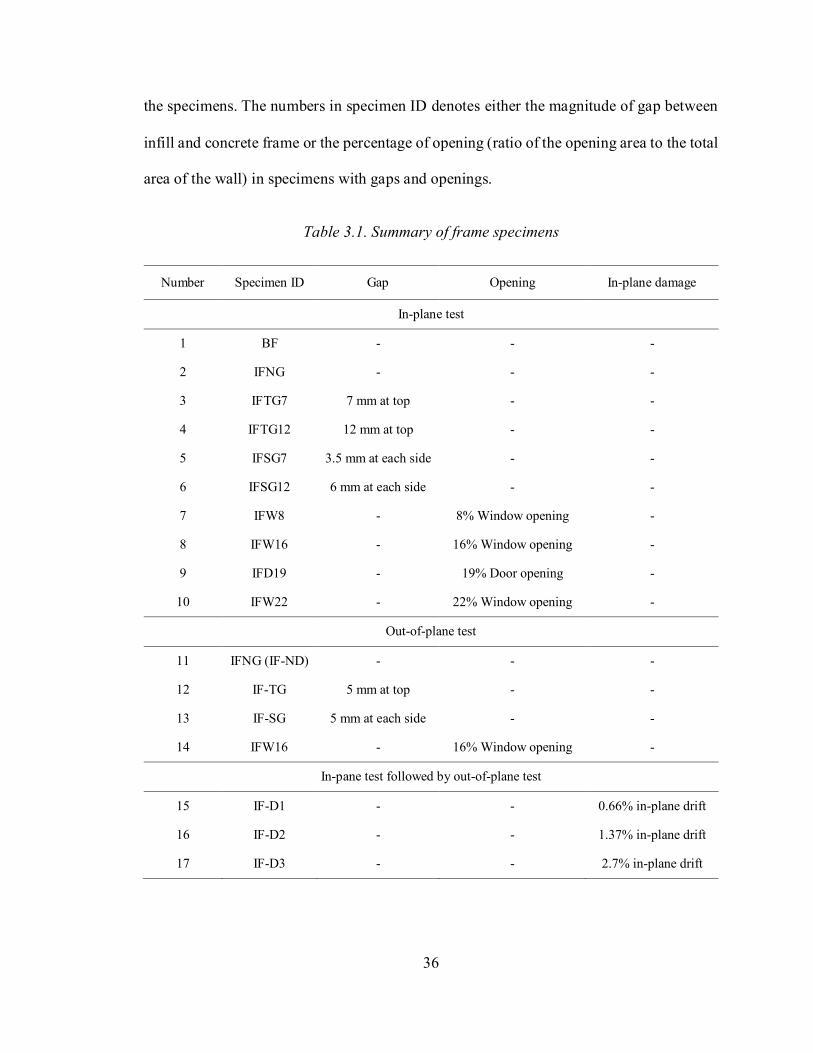
36
the specimens. The numbers in specimen ID denotes either the magnitude of gap between
infill and concrete frame or the percentage of opening (ratio of the opening area to the total
area of the wall) in specimens with gaps and openings.
Table 3.1. Summary of frame specimens
Number Specimen ID Gap Opening In-plane damage
In-plane test
1 BF - - -
2 IFNG - - -
3 IFTG7 7 mm at top - -
4 IFTG12 12 mm at top - -
5 IFSG7 3.5 mm at each side - -
6 IFSG12 6 mm at each side - -
7 IFW8 - 8% Window opening -
8 IFW16 - 16% Window opening -
9 IFD19 - 19% Door opening -
10 IFW22 - 22% Window opening -
Out-of-plane test
11 IFNG (IF-ND) - - -
12 IF-TG 5 mm at top - -
13 IF-SG 5 mm at each side - -
14 IFW16 - 16% Window opening -
In-pane test followed by out-of-plane test
15 IF-D1 - - 0.66% in-plane drift
16 IF-D2 - - 1.37% in-plane drift
17 IF-D3 - - 2.7% in-plane drift
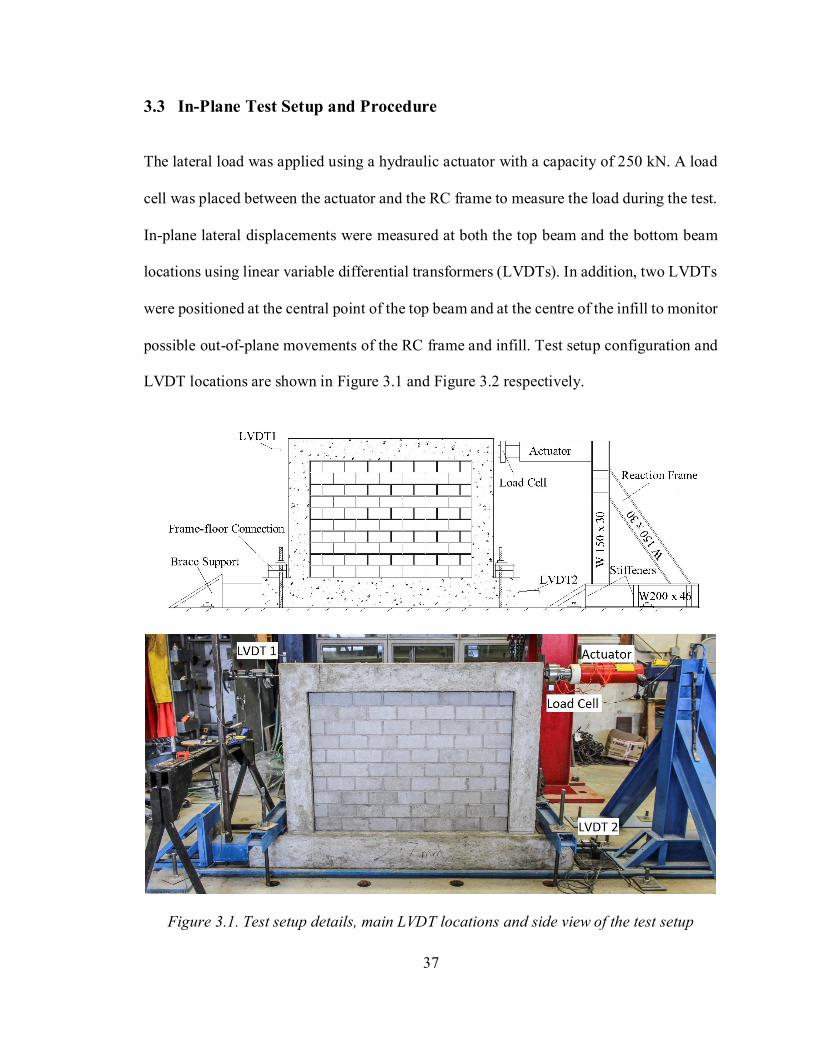
37
3.3 In-Plane Test Setup and Procedure
The lateral load was applied using a hydraulic actuator with a capacity of 250 kN. A load
cell was placed between the actuator and the RC frame to measure the load during the test.
In-plane lateral displacements were measured at both the top beam and the bottom beam
locations using linear variable differential transformers (LVDTs). In addition, two LVDTs
were positioned at the central point of the top beam and at the centre of the infill to monitor
possible out-of-plane movements of the RC frame and infill. Test setup configuration and
LVDT locations are shown in Figure 3.1 and Figure 3.2 respectively.
Figure 3.1. Test setup details, main LVDT locations and side view of the test setup

38
Figure 3.2. Out-of-plane LVDTs and LVDT 1
Prior to each test, the specimens were positioned in place and aligned in both the in-plane
and out-of-plane directions, and the load cell and LVDTs were mounted. The lateral load
was then applied at the centreline of the top beam until the failure of the specimen. The
loading rate was approximately 6 kN per minute which is considered slow enough to
represent quasi-static loading conditions. Load cell and LVDT readings were recorded with
an interval of 0.2 seconds throughout the test using an electronic data acquisition system.
Cracking loads, ultimate loads and cracking patterns were noted for each test.
3.4 Out-of-Plane Test Setup and Procedure
The out-of-plane load was applied to the masonry infills using an airbag through a self-
equilibrating system as shown in Figure 3.3. The airbag was placed in between the masonry
infill and a reaction frame that in turn connected to the corners of the RC frame through
threaded rods. The reaction frame was made of a 15 mm thick plywood board covering the
entire surface area of the infill stiffened with steel HSS sections. Similar to the in-plane
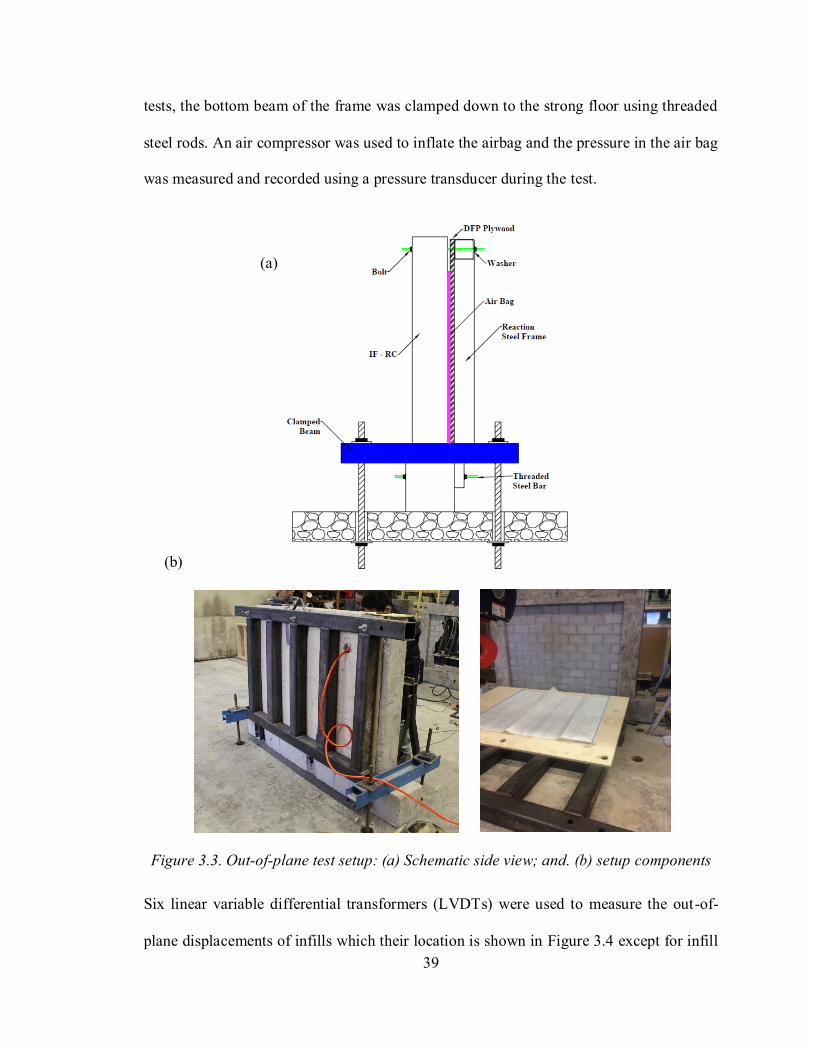
39
tests, the bottom beam of the frame was clamped down to the strong floor using threaded
steel rods. An air compressor was used to inflate the airbag and the pressure in the air bag
was measured and recorded using a pressure transducer during the test.
Figure 3.3. Out-of-plane test setup: (a) Schematic side view; and. (b) setup components
Six linear variable differential transformers (LVDTs) were used to measure the out-of-
plane displacements of infills which their location is shown in Figure 3.4 except for infill
(a)
(b)
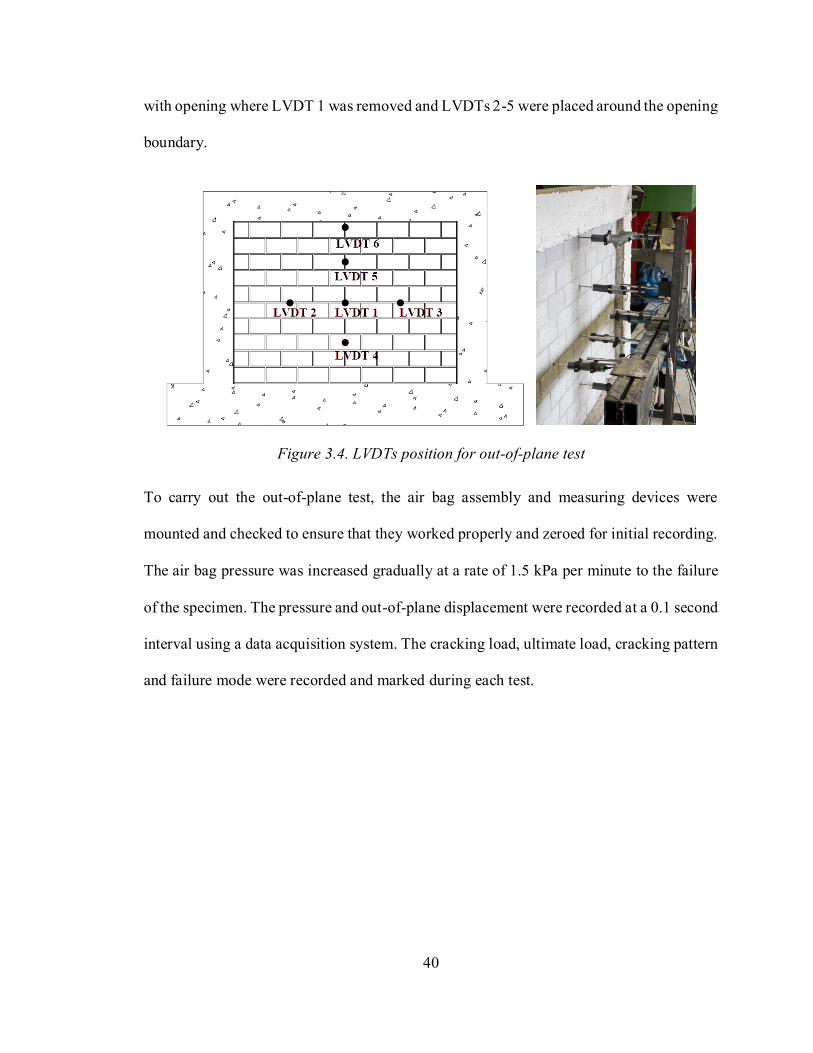
40
with opening where LVDT 1 was removed and LVDTs 2-5 were placed around the opening
boundary.
Figure 3.4. LVDTs position for out-of-plane test
To carry out the out-of-plane test, the air bag assembly and measuring devices were
mounted and checked to ensure that they worked properly and zeroed for initial recording.
The air bag pressure was increased gradually at a rate of 1.5 kPa per minute to the failure
of the specimen. The pressure and out-of-plane displacement were recorded at a 0.1 second
interval using a data acquisition system. The cracking load, ultimate load, cracking pattern
and failure mode were recorded and marked during each test.
41
Chapter 4 Development of a Detailed 3D FE Model for Analysis of the
In-Plane Behaviour of Masonry Infilled Concrete Frames
Ehsan Nasiri, Yi Liu
Published in Engineering Structures, Volume 143, 15 July 2017, Pages 603-616
https://doi.org/10.1016/j.engstruct.2017.04.049
4.1 Abstract
This paper detailed the development of a numerical model for simulating the nonlinear
behaviour of the concrete masonry infilled RC frames subjected to in-plane lateral loading.
The ABAQUS finite element software was used in the modeling. Nonlinear behaviour as
well as cracking and crushing of concrete and masonry blocks were simulated using the
Concrete Damaged Plasticity (CDM) model. The cohesive element method combined with
hyperbolic Drucker-Prager and shear and tensile failure criteria were used to capture the
possible failure mechanisms in mortar joints. Concurrent with the finite element modeling,
an experimental study was also conducted and results of masonry infilled RC frame
specimens incorporating infill openings and interfacial gaps were used to validate the
model. The validation showed that the model can accurately simulate the behaviour and
predict the strength of masonry infilled RC frames. A sensitivity study was subsequently
conducted where the influence of mortar joint failure surface parameters, mortar dilatancy,
and fracture energy on the lateral behaviour of infilled RC frames was investigated. Results
showed that the in-plane behaviour of infilled RC frames was significantly affected by the
input parameters of mortar’s Drucker-Prager yield surface and dilatancy and less affected
by those of mortar fracture energy.
42
Keywords: concrete masonry infills; RC frame; in-plane behavior; finite element; failure
surface; mortar dilation; fracture energy
4.2 Introduction
Masonry walls are often used to infill reinforced concrete (RC) or steel frames in modern
construction to act as either interior partitions or exterior cladding. It is understood that if
an infill is built in tight contact with its surrounding frame, its inherent large in-plane
stiffness will attract large forces and in turn alter the dynamic characteristics of the entire
structure. Thus, an accurate assessment of the infill-frame interaction is crucial for a safe
design. However, the frame, commonly made of steel or reinforced concrete materials,
deforms in a ductile and flexural mode while the masonry infill, made of brittle materials,
tends to deform in a shear mode. This difference in behaviour, coupled with development
of inelasticity of both materials at high load levels, makes it difficult to quantify the exact
extent of the infill-frame interaction for the entire loading history. For the past six decades,
both experimental and numerical studies (Chen and Liu 2015, Dawe and Seah 1989a,
Haach et al. 2009, Koutromanos et al. 2011b, Liu and Manesh 2013, Mehrabi et al. 1996,
Mehrabi and Shing 1997, Mosalam et al. 1997, Smith 1962) have been conducted in an
effort to provide rational methods for considering the infill contribution to the system
stiffness and strength. The diagonal strut method has then emerged as the most adopted
method for evaluating the capacity and stiffness of infilled frames. In this case, the infilled
frame may be considered as a braced frame where the infill is replaced by a diagonal strut
connecting loaded corners. Once the strut width is known, a simple frame analysis can be
performed to determine the stiffness of the system. The strength of the infill can also be
43
related to the strut width. Based on the diagonal strut concept, much research work was
contributed to the development of this method to incorporate effects of material
nonlinearities, various failure mechanisms, geometric properties of the infill and frame,
and boundary conditions (Mosalam et al. 1997, Smith 1962). The effect of infill openings,
infill-to-frame interfacial gaps, and vertical loading on the infill behaviour was investigated
in more recent research (Chen and Liu 2016, Dawe and Seah 1989a, Kakaletsis and
Karayannis 2007, Liu and Manesh 2013, Liu and Soon 2012, Mehrabi et al. 1996, Tasnimi
and Mohebkhah 2011).
With the development of computing technology in the last two decades, numerical
modeling encoded in computer programs has been increasingly used to simulate the
behaviour of masonry infilled frames. Both finite element methods (FEM) (Koutromanos
et al. 2011b, Lourenco 1996, Mehrabi and Shing 1997, Mohyeddin et al. 2013, Stavridis
and Shing 2010) and discrete element methods (DEM) (Mohebkhah et al. 2008, Sarhosis
et al. 2014) have been employed in modeling with the former being the more popular one.
While the DEM is robust in simulating mortar joint effect between blocks, it is quite limited
in providing different geometry and material models for continuums such as the block itself
or frame members. In the case of reinforced concrete frames, interaction between
reinforcing bars and continuum medium of concrete cannot be adequately defined using
DEM. In this study, the FEM was used and thus the following literature review is focused
on studies of FEM in masonry infilled frames. Mehrabi and Shing (1997) developed
interface models for shear cracking of concrete and mortar joints as well as bond-slip
behaviour of steel bars in concrete. Lotfi and Shing (1991) developed a smeared crack
formulation to account for nonlinear behaviour of masonry blocks and concrete in infilled
44
RC frames. Al-Chaar et al. (2008) adopted smeared crack quadrilateral elements for
masonry blocks and cohesive interface model for simulation of mortar behaviour and shear
failure of concrete. Stavridis and Shing (2010) proposed a 2D simplified micro-model for
analysis of masonry infilled RC frames adopting the cohesive crack interface elements
developed by Lotfi and Shing (1994) to consider mortar effect. Mohyeddin et al. (2013)
used a 3D simplified micro-model in which the mortar at joints was halved and an elastic
interaction model was defined between the two mortar layers. Minaie et al. (2014) used
Concrete Damaged Plasticity (CDP) model in ABAQUS to investigate bi-directional
loading behaviour of fully and partially grouted masonry shear walls. Despite that previous
numerical studies have shown capability of FE models in simulation of masonry infills or
masonry shear walls, some limitations of these models are noted as follows. Although
simple to use, the 2D models were not adequate to capture many aspects of infilled frames
such as non-typical geometric properties, stress concentration, local reinforcement effects,
and out-of-plane behaviour. For the existing 3D model studies, there is commonly a lack
of information provided on the input material parameters, which makes it difficult for
others to reproduce the model and associated results. Moreover, these models were
calibrated against test results of a specific type of masonry infill and bounding frame, their
effectiveness for a wide range of material and geometric parameters was not investigated.
In view of the above, this study was then motivated to develop a 3D finite element model
to study the in-plane behaviour of masonry infilled RC frames. Encoded in ABAQUS
software, the model development, analysis procedure, and input parameters were described
in detail in this paper. Concurrent with the finite element modelling, ten masonry infilled
RC frames were tested, and experimental parameters included interfacial gaps and infill
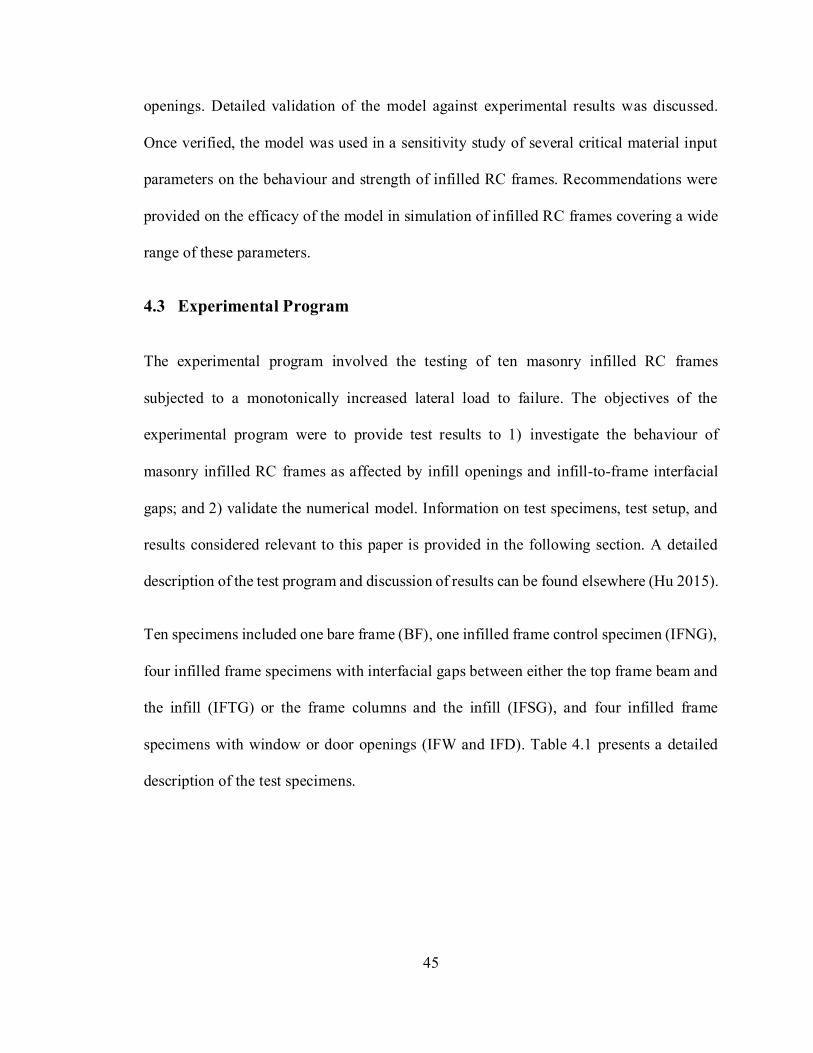
45
openings. Detailed validation of the model against experimental results was discussed.
Once verified, the model was used in a sensitivity study of several critical material input
parameters on the behaviour and strength of infilled RC frames. Recommendations were
provided on the efficacy of the model in simulation of infilled RC frames covering a wide
range of these parameters.
4.3 Experimental Program
The experimental program involved the testing of ten masonry infilled RC frames
subjected to a monotonically increased lateral load to failure. The objectives of the
experimental program were to provide test results to 1) investigate the behaviour of
masonry infilled RC frames as affected by infill openings and infill-to-frame interfacial
gaps; and 2) validate the numerical model. Information on test specimens, test setup, and
results considered relevant to this paper is provided in the following section. A detailed
description of the test program and discussion of results can be found elsewhere (Hu 2015).
Ten specimens included one bare frame (BF), one infilled frame control specimen (IFNG),
four infilled frame specimens with interfacial gaps between either the top frame beam and
the infill (IFTG) or the frame columns and the infill (IFSG), and four infilled frame
specimens with window or door openings (IFW and IFD). Table 4.1 presents a detailed
description of the test specimens.
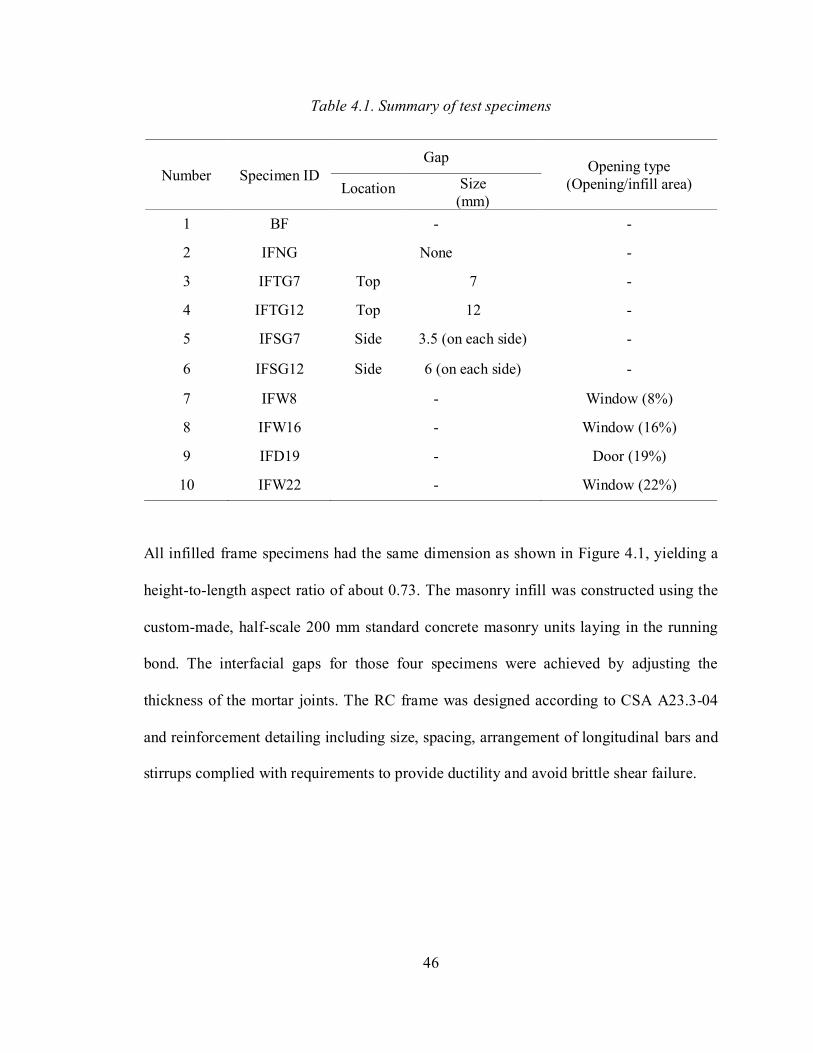
46
Table 4.1. Summary of test specimens
Number Specimen ID
Gap Opening type
(Opening/infill area) Location Size
(mm)
1 BF - -
2 IFNG None -
3 IFTG7 Top 7 -
4 IFTG12 Top 12 -
5 IFSG7 Side 3.5 (on each side) -
6 IFSG12 Side 6 (on each side) -
7 IFW8 - Window (8%)
8 IFW16 - Window (16%)
9 IFD19 - Door (19%)
10 IFW22 - Window (22%)
All infilled frame specimens had the same dimension as shown in Figure 4.1, yielding a
height-to-length aspect ratio of about 0.73. The masonry infill was constructed using the
custom-made, half-scale 200 mm standard concrete masonry units laying in the running
bond. The interfacial gaps for those four specimens were achieved by adjusting the
thickness of the mortar joints. The RC frame was designed according to CSA A23.3-04
and reinforcement detailing including size, spacing, arrangement of longitudinal bars and
stirrups complied with requirements to provide ductility and avoid brittle shear failure.
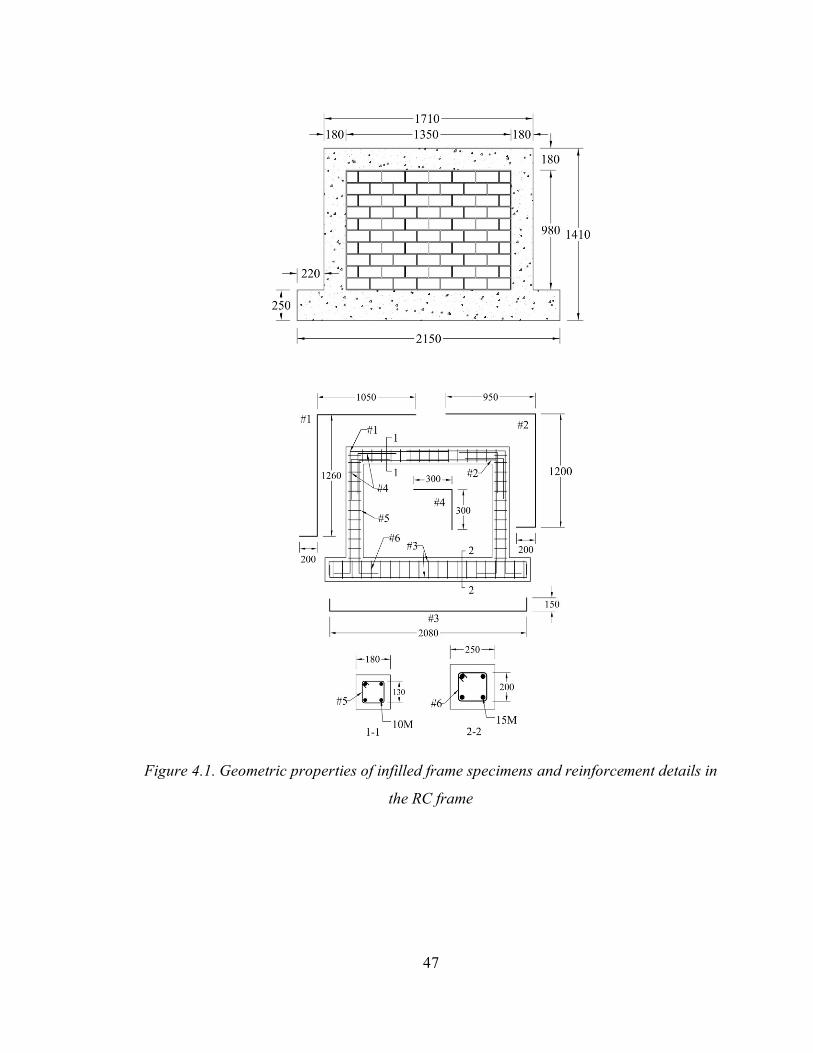
47
Figure 4.1. Geometric properties of infilled frame specimens and reinforcement details in
the RC frame

48
4.3.1 Test Setup and Instrumentation
The experimental set-up is illustrated in Figure 4.2. The specimens were connected to
the strong floor through high strength bolts and the lateral load was applied at the top beam
level using a hydraulic actuator with a capacity of 250 kN. Two linear variable differential
transformers (LVDTs) (LVDT 1 and 2) were mounted at the centerline of the top and
bottom beam respectively to measure the in-plane lateral displacements. Another two
LVDTs (not shown) were positioned at the half height of the masonry infill wall and at the
central point of the top beam respectively, both on the back side, to monitor any possible
out-of-plane movements of the infill wall and the concrete frame, respectively.
Figure 4.2. Schematic test set-up
4.3.2 Material Properties
The mechanical properties of CMUs, mortar, and masonry prisms for the infill and
those of concrete and reinforcement for the frame were obtained experimentally in
accordance with ASTM specifications. A summary of the material properties is presented
in Table 4.2.
49
Table 4.2. Summary of material properties for test specimens
Elastic
modulus E
(MPa)
Compressive
strength
(MPa)
Tensile
strength
(MPa)
Yield
strength
(MPa)
Ultimate (yield)
strain
Concrete 27800 43.8 3.5 - 0.0025
CMUs 3500 25.0 2.5 - 0.008
Mortar 2600 21.3 1.7 - -
Prisms 2980 17.1 - - -
Reinforcement 220000 - 665 446 0.85 (0.003)
4.4 Finite Element Model
In this study, the so-called simplified micro-modelling approach (Lourenco 1996) was
adopted and the key characteristic of this approach is that the mortar joints are not
physically modeled, rather, they are replaced with zero-thickness interface elements. The
geometry and the meshing of the model is shown in Figure 4.3. The ABAQUS software
was used in the model development. The concrete masonry units (CMU) as well as RC
frame members were modeled using 8-node reduced integration solid elements (C3D8R).
The CMU dimensions were increased by the half thickness of the mortar joint in both
horizontal and vertical directions so that the discrete CMUs were connected and interact
with each other through zero-thickness interface elements. The simplified micro-model
was shown to provide desired accuracy (Haach et al. 2009, Lourenco 1996, Mehrabi and
Shing 1997, Stavridis and Shing 2010) and is considered as a more computing efficient
modeling technique than a detailed micro-modelling approach where mortar joints are
50
modelled. The following sections describe modeling details of each component of the
infilled frame. It is noted that while ABAQUS provides the general material constitutive
and interfacial behaviour models for different structural applications, the contribution of
this study lies in the determination of appropriate models and critical material parameters
and conducting computationally efficient and accurate simulation of masonry infilled RC
frames.
4.4.1 Nonlinear Behaviour of Concrete and CMUs
Different from ideal brittle materials such as glass, concrete and CMUs are considered as
quasi-brittle materials with high toughness after subcritical cracking (Anderson and
Anderson 2005). The Concrete Damaged Plasticity (CDP) model for quasi-brittle materials
in ABAQUS (Lubliner et al. 1989) was used to simulate the behaviour of concrete and
CMUs in this study. The CDP model is a continuum, plasticity-based, damage model. Both
isotropic damaged elasticity and tensile and compressive plasticity are considered in this
model and failure mechanisms are defined in terms of tensile cracking and compressive
crushing.

51
Figure 4.3. Three dimensional geometric model used in the FE analysis
4.4.2 Yield Surface
In a general form, the yield function, F, of the CDP model in terms of effective stresses is
defined according to Eq. (4.1):
𝐹 =1
1 − 𝛼(𝑞 − 3𝛼�̅� + 𝛽(휀̃𝑝𝑙)⟨�̅̂�𝑚𝑎𝑥⟩ − 𝛾⟨�̅̂�𝑚𝑎𝑥⟩) − 𝜎𝑐(휀�̃�
𝑝𝑙) = 0
𝛼 =(𝜎𝑏0
𝜎𝑐0⁄ ) − 1
2(𝜎𝑏0
𝜎𝑐0⁄ ) − 1; 0 ≤ 𝛼 ≤ 0.5
𝛽 =�̅�𝑐(휀�̃�
𝑝𝑙)
�̅�𝑡(휀�̃�𝑝𝑙)
⁄ (1 − 𝛼) − (1 + 𝛼) 𝛾 =3(1 − 𝐾𝑐)
2𝐾𝑐 − 1⁄
(4.1)
where �̅� is the hydrostatic pressure stress, 𝑞 is the Von Mises equivalent effective stress,
�̅̂�𝑚𝑎𝑥 is the maximum principal effective stress, 𝜎𝑏0
𝜎𝑐0⁄ is the ratio of initial biaxial
compressive yield stress to initial uniaxial compressive yield stress, 𝐾𝑐 is the ratio of the
tensile meridian to the compressive meridian and defines the shape of the yield surface in
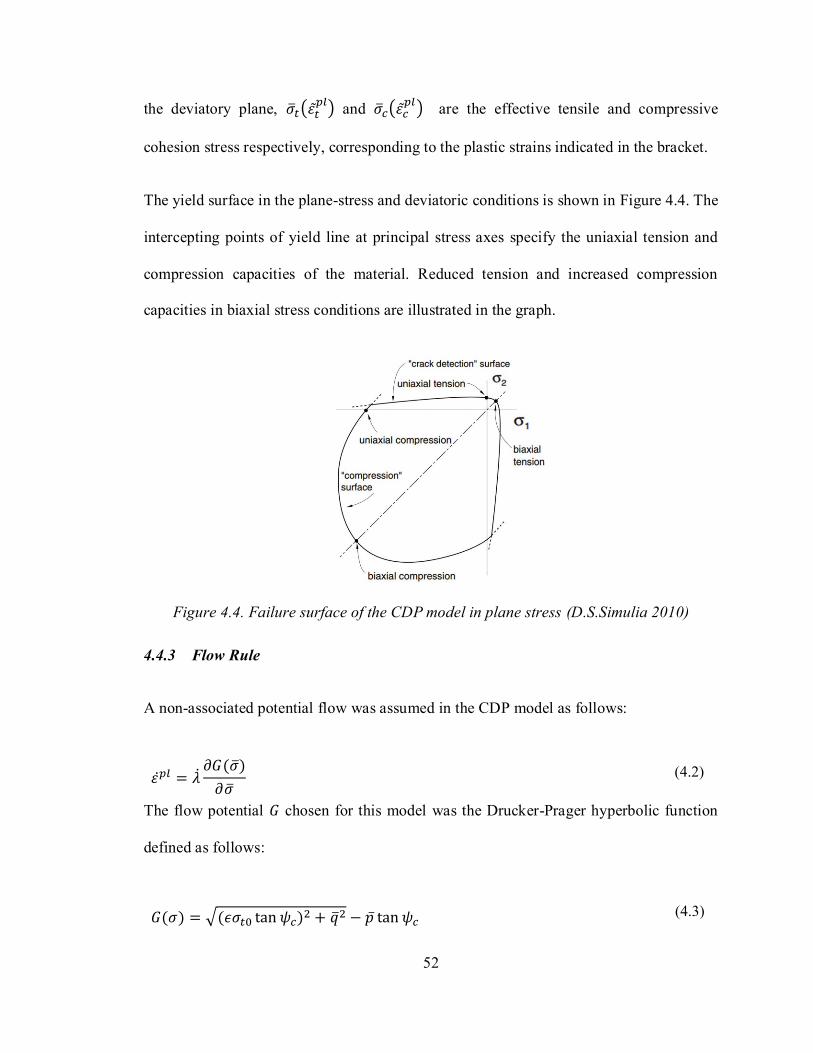
52
the deviatory plane, �̅�𝑡(휀�̃�𝑝𝑙) and �̅�𝑐(휀�̃�
𝑝𝑙) are the effective tensile and compressive
cohesion stress respectively, corresponding to the plastic strains indicated in the bracket.
The yield surface in the plane-stress and deviatoric conditions is shown in Figure 4.4. The
intercepting points of yield line at principal stress axes specify the uniaxial tension and
compression capacities of the material. Reduced tension and increased compression
capacities in biaxial stress conditions are illustrated in the graph.
Figure 4.4. Failure surface of the CDP model in plane stress (D.S.Simulia 2010)
4.4.3 Flow Rule
A non-associated potential flow was assumed in the CDP model as follows:
휀̇𝑝𝑙 = �̇�𝜕𝐺(�̅�)
𝜕�̅� (4.2)
The flow potential 𝐺 chosen for this model was the Drucker-Prager hyperbolic function
defined as follows:
𝐺(𝜎) = √(𝜖𝜎𝑡0 tan 𝜓𝑐)2 + 𝑞2 − �̅� tan 𝜓𝑐
(4.3)
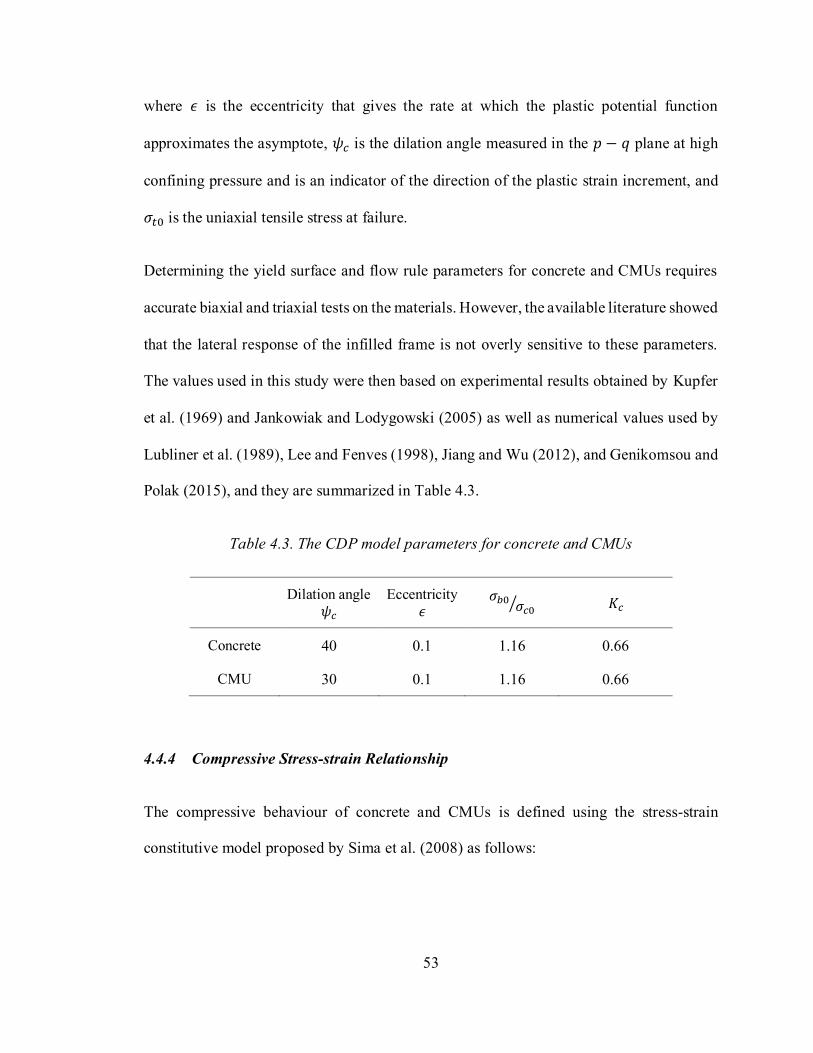
53
where 𝜖 is the eccentricity that gives the rate at which the plastic potential function
approximates the asymptote, 𝜓𝑐 is the dilation angle measured in the 𝑝 − 𝑞 plane at high
confining pressure and is an indicator of the direction of the plastic strain increment, and
𝜎𝑡0 is the uniaxial tensile stress at failure.
Determining the yield surface and flow rule parameters for concrete and CMUs requires
accurate biaxial and triaxial tests on the materials. However, the available literature showed
that the lateral response of the infilled frame is not overly sensitive to these parameters.
The values used in this study were then based on experimental results obtained by Kupfer
et al. (1969) and Jankowiak and Lodygowski (2005) as well as numerical values used by
Lubliner et al. (1989), Lee and Fenves (1998), Jiang and Wu (2012), and Genikomsou and
Polak (2015), and they are summarized in Table 4.3.
Table 4.3. The CDP model parameters for concrete and CMUs
Dilation angle
𝜓𝑐 Eccentricity
𝜖 𝜎𝑏0
𝜎𝑐0⁄ 𝐾𝑐
Concrete 40 0.1 1.16 0.66
CMU 30 0.1 1.16 0.66
4.4.4 Compressive Stress-strain Relationship
The compressive behaviour of concrete and CMUs is defined using the stress-strain
constitutive model proposed by Sima et al. (2008) as follows:
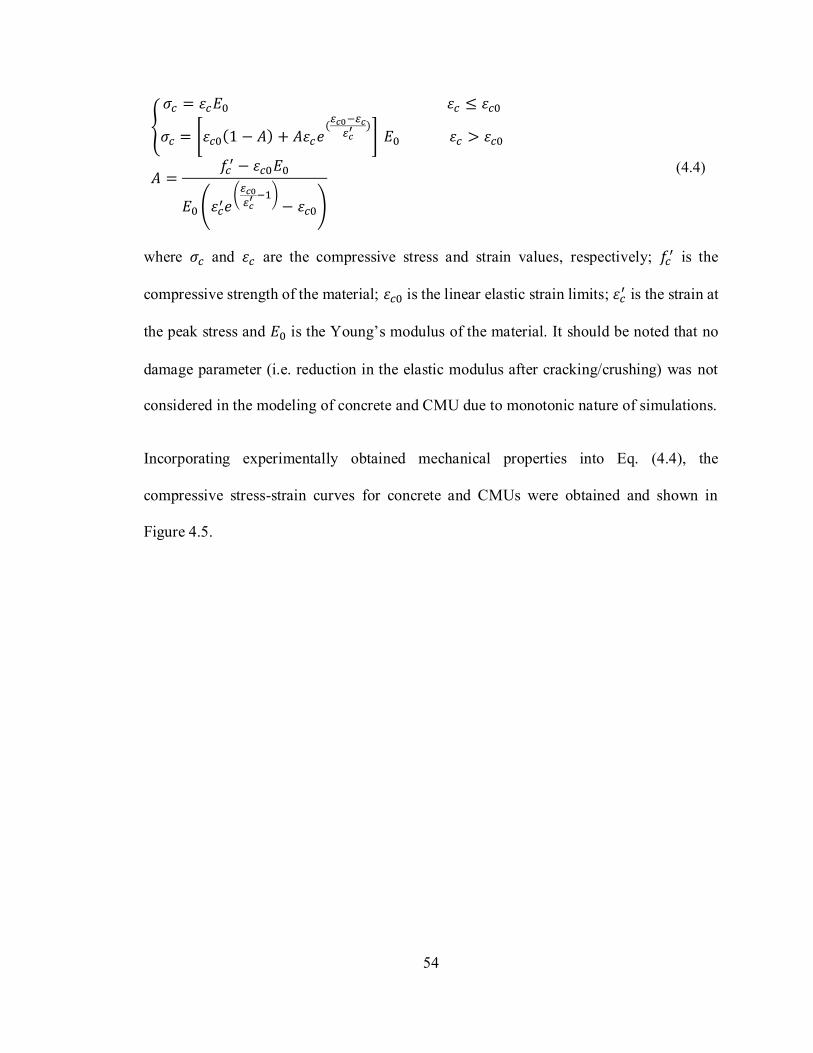
54
{
𝜎𝑐 = 휀𝑐𝐸0 휀𝑐 ≤ 휀𝑐0
𝜎𝑐 = [휀𝑐0(1 − 𝐴) + 𝐴휀𝑐𝑒(𝜀𝑐0−𝜀𝑐𝜀𝑐′ )
] 𝐸0 휀𝑐 > 휀𝑐0
𝐴 =𝑓𝑐′ − 휀𝑐0𝐸0
𝐸0 (휀𝑐′𝑒(𝜀𝑐0𝜀𝑐′ −1)
− 휀𝑐0)
(4.4)
where 𝜎𝑐 and 휀𝑐 are the compressive stress and strain values, respectively; 𝑓𝑐′ is the
compressive strength of the material; 휀𝑐0 is the linear elastic strain limits; 휀𝑐′ is the strain at
the peak stress and 𝐸0 is the Young’s modulus of the material. It should be noted that no
damage parameter (i.e. reduction in the elastic modulus after cracking/crushing) was not
considered in the modeling of concrete and CMU due to monotonic nature of simulations.
Incorporating experimentally obtained mechanical properties into Eq. (4.4), the
compressive stress-strain curves for concrete and CMUs were obtained and shown in
Figure 4.5.
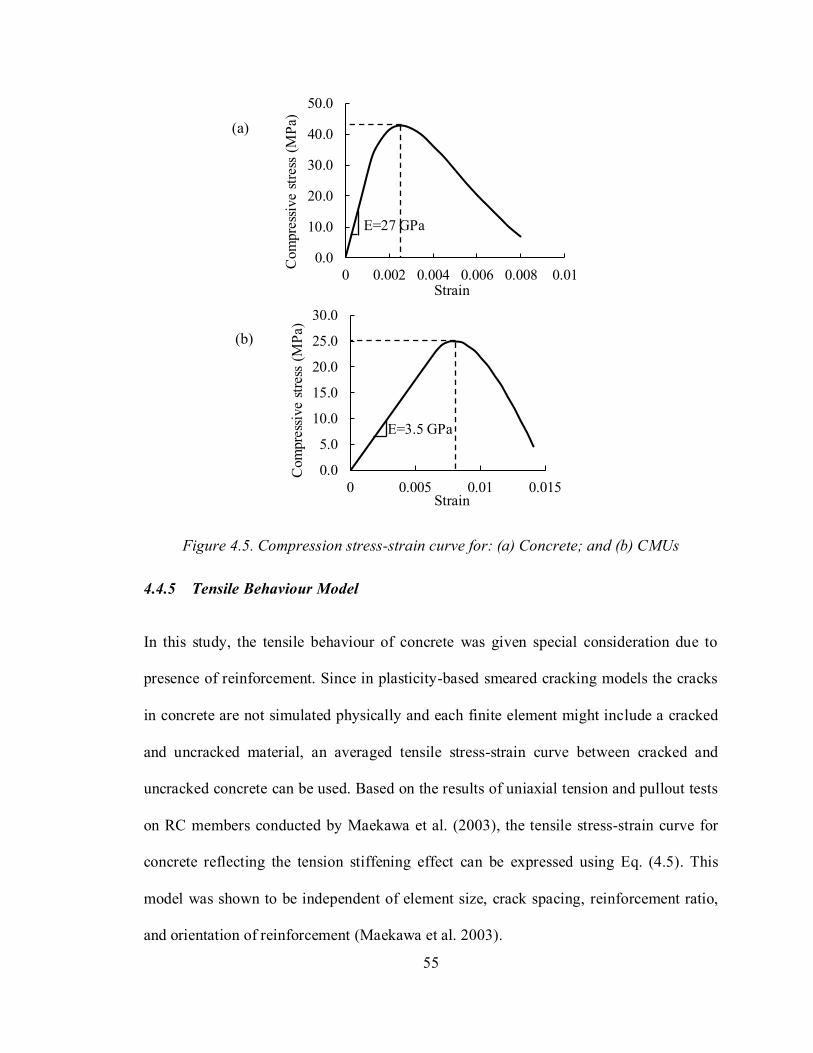
55
Figure 4.5. Compression stress-strain curve for: (a) Concrete; and (b) CMUs
4.4.5 Tensile Behaviour Model
In this study, the tensile behaviour of concrete was given special consideration due to
presence of reinforcement. Since in plasticity-based smeared cracking models the cracks
in concrete are not simulated physically and each finite element might include a cracked
and uncracked material, an averaged tensile stress-strain curve between cracked and
uncracked concrete can be used. Based on the results of uniaxial tension and pullout tests
on RC members conducted by Maekawa et al. (2003), the tensile stress-strain curve for
concrete reflecting the tension stiffening effect can be expressed using Eq. (4.5). This
model was shown to be independent of element size, crack spacing, reinforcement ratio,
and orientation of reinforcement (Maekawa et al. 2003).
E=27 GPa
0.0
10.0
20.0
30.0
40.0
50.0
0 0.002 0.004 0.006 0.008 0.01C
om
pre
ssiv
e st
ress
(M
Pa)
Strain
E=3.5 GPa
0.0
5.0
10.0
15.0
20.0
25.0
30.0
0 0.005 0.01 0.015
Com
pre
ssiv
e st
ress
(M
Pa)
Strain
(a)
(b)

56
{
𝜎𝑡 = 휀𝑡𝐸0 휀𝑡 ≤ 휀𝑡0
𝜎𝑡 = 𝜎𝑡0 (휀𝑡0
휀𝑡)0.4
휀𝑡 > 휀𝑡0 (4.5)
where 𝜎𝑡 and 휀𝑡 are the tensile stress and strain values, respectively; 𝜎𝑡0 and 휀𝑡0 are the
linear elastic stress and strain limit, respectively. Incorporating experimental results of
concrete modulus and elastic stress and strain limit, the tensile stress-strain curve for
concrete was obtained as illustrated in Figure 4.6.
Figure 4.6. Tension stress-strain curve for concrete
In the case of CMUs, due to the absence of steel reinforcement, the tensile behaviour is
more dependent on localized cracks which initiates a sharp stress drop. This type of
behaviour is better described using a stress-crack displacement curve in which the area
under the curve represents the Mode I fracture energy of the material (𝐺𝑓) (Hillerborg et
al. 1976). Thus, the tensile behaviour model for CMUs was defined by a linear elastic
behaviour in the pre-cracking phase and a stress-crack displacement curve in the post-
cracking phase as shown in Figure 4.7. The fracture energy of the CMU material was
estimated using Eq. (4.6) as suggested by Fib: Model Code (2012).
E= 27GPa
0.0
0.5
1.0
1.5
2.0
2.5
3.0
3.5
4.0
0 0.001 0.002 0.003
Ten
sile
str
ess
(MP
a)
Strain
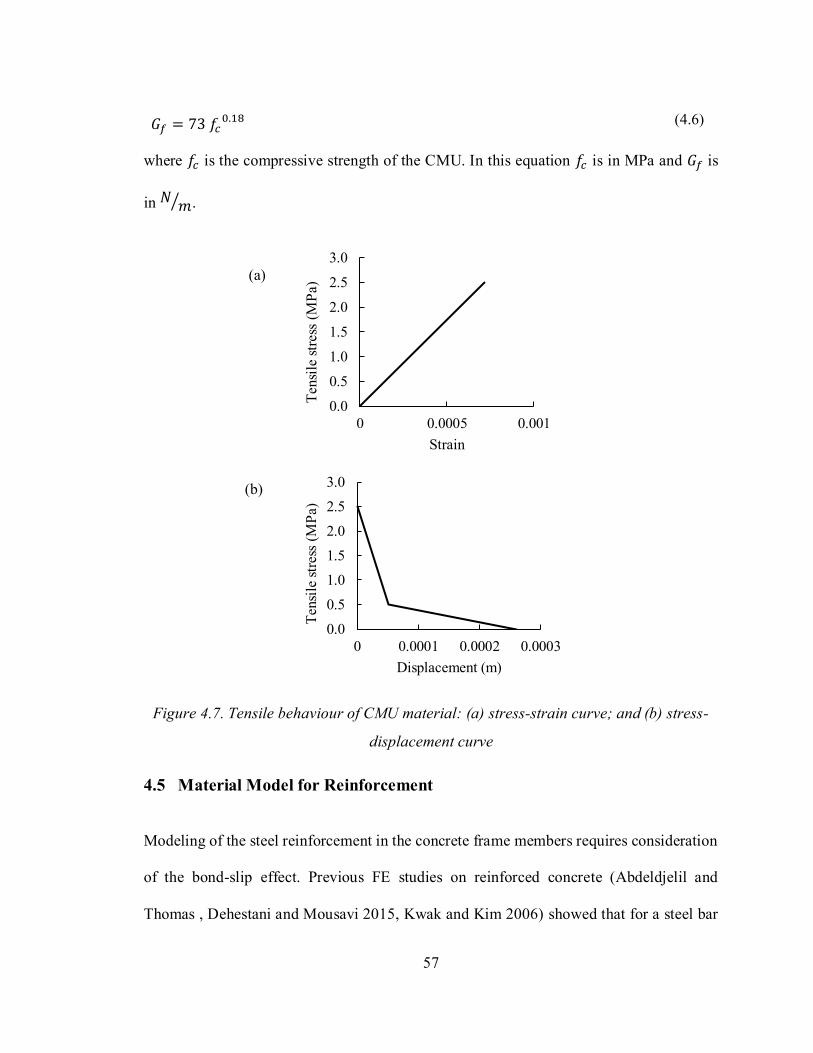
57
𝐺𝑓 = 73 𝑓𝑐0.18
(4.6)
where 𝑓𝑐 is the compressive strength of the CMU. In this equation 𝑓𝑐 is in MPa and 𝐺𝑓 is
in 𝑁 𝑚⁄ .
Figure 4.7. Tensile behaviour of CMU material: (a) stress-strain curve; and (b) stress-
displacement curve
4.5 Material Model for Reinforcement
Modeling of the steel reinforcement in the concrete frame members requires consideration
of the bond-slip effect. Previous FE studies on reinforced concrete (Abdeldjelil and
Thomas , Dehestani and Mousavi 2015, Kwak and Kim 2006) showed that for a steel bar
0.0
0.5
1.0
1.5
2.0
2.5
3.0
0 0.0005 0.001
Ten
sile
str
ess
(MP
a)
Strain
0.0
0.5
1.0
1.5
2.0
2.5
3.0
0 0.0001 0.0002 0.0003
Ten
sile
str
ess
(MP
a)
Displacement (m)
(a)
(b)
58
embedded in concrete, its stress-strain curve averaged at the cracked region and that
adjacent to cracks does not show a pronounced yield plateau and the "apparent yield stress"
is lower than the yield stress of a bare steel bar. This phenomenon, known as bond-slip
effect, is often implemented in models by reducing the elastic modulus or yield stress, or
both of the steel bars. Based on this concept, the method proposed by Dehestani and
Mousavi (2015) was adopted in this study to account for the bond-slip effect in the
modeling of the reinforcement. In this method, the modified elastic modulus, 𝐸𝑠∗, hardening
modulus, 𝐸𝑠𝑝∗ , and yield stress, 𝑓𝑦
∗, can be calculated using Eqs. (4.7) to (4.9). The
experimentally obtained curve on tensile coupons and the corresponding modified curve
are both shown in Figure 4.8.
𝑓𝑦∗
𝑓𝑦= (0.93 − 2𝐵) , 𝐵 =
(𝑓𝑐𝑟𝑓𝑦)1.5
𝜌⁄
(4.7)
𝐸𝑠∗ =
𝑓𝑦∗
휀𝑠 + (𝛿𝑙) (4.8)
𝐸𝑠𝑝∗ = 0.03𝐸𝑠
∗ (4.9)
where 𝑓𝑦 is the yield stress of the reinforcing bars, 𝑓𝑐𝑟 is the cracking stress of the
concrete, 𝜌 is the reinforcement ratio in the RC frame section, 휀𝑠 is the strain of the steel
bar corresponding to the stress 𝑓𝑦∗, 𝑙 is the transmission length of bond strength between
the steel bar and the surrounding concrete and 𝛿 is the slip of the steel bar. More
information on determination of the transmission length l and the maximum slip 𝛿 is
available elsewhere (Dehestani and Mousavi 2015).

59
Figure 4.8. Modified stess-strain curve for the reinforcement
4.6 Behaviour Model of Interface Elements
The interface elements used between CMUs need to account for plastic behaviour and
possible failure modes of the mortar. For this purpose, the cohesive element in ABAQUS
was used in combination with the hyperbolic Drucker-Prager plasticity criterion. The shear
and normal stress damage models were also implemented to allow for degradation and
removal of elements after failure to create the frictional interaction between the CMUs.
Subsequent to the failure of mortar, interaction between the blocks is controlled by Mohr-
Coulomb friction behaviour. The cohesive element is an eight-node three-dimensional
element (COH3D8) with a very small thickness (0.1 mm) to satisfy the zero-thickness
assumption, which also ensures that the separation between masonry blocks can be
obtained with sufficient accuracy after removal of the element at normal or shear stress
failure. In the elastic state, the behaviour of these elements is controlled by an elastic
traction-separation response (D.S.Simulia 2010). Traction stress vector 𝑡 consists of three
Es*=120 GPa
Esp*=3 GPa
0.0
100.0
200.0
300.0
400.0
500.0
600.0
700.0
0 0.05 0.1
Str
ess
(MP
a)
Strain
Tensile test result
Modified curve
60
components, 𝑡𝑛, 𝑡𝑠 and 𝑡𝑡, which represent the normal and two shear tractions. The
corresponding displacements are denoted by 𝛿𝑛, 𝛿𝑠 and 𝛿𝑡. The elastic stress- displacement
behaviour for this case is expressed as:
𝑡 = {𝑡𝑛𝑡𝑠𝑡𝑡
} = [𝐾𝑛𝑛 0 00 𝐾𝑠𝑠 00 0 𝐾𝑡𝑡
] {𝛿𝑛𝛿𝑠𝛿𝑡
} = 𝐾𝛿
(4.10)
This elastic relationship is combined with a hyperbolic Drucker-Prager yield criterion that
controls the tension cracking and shear sliding failure of mortar joints. The advantage of
hyperbolic Drucker-Prager yield criterion over the Mohr-Coulomb or regular Drucker-
Prager criterion is that the tension cut-off can be considered in the failure surface. The
shape of this yield surface in the p-q plane is shown in Figure 4.9 and expressed as:
𝐹 = √𝑙02 + 𝑞2 − 𝑝 tan 𝛽 − 𝑑′ = 0
(4.11)
where 𝑙02 = √𝑑′ − 𝑝𝑡 tan 𝛽 , 𝑑′ is the shear yield stress, 𝑝𝑡 is the hydrostatic tensile strength
and 𝛽 is the frictional angle of the material in the 𝑝 − 𝑞 plane and it can be determined
from the friction angle in the Mohr-Coulomb failure surface (slope of the 𝜎 − 𝜏 failure
surface), 𝜑, as follows:
tan 𝛽 =6 sin 𝜑
3 − sin𝜑 (4.12)

61
Figure 4.9. Hyperbolic Drucker-Prager yield surface (D.S.Simulia 2010)
Experimental and numerical studies have shown that the dilation during shear failure of a
mortar joint has a significant effect on the deformation and strength of the interface (Lotfi
and Shing 1994, Mosalam et al. 1997). In this study, this effect was considered by
implementing the dilation angle (𝜓) in flow potential as defined in Eq. (4.13) and illustrated
in Figure 4.10. The dilation angle controls the amount of plastic volumetric strain
developed during plastic shearing and is assumed constant during plastic yielding. To be
distinguished from the dilation angle 𝜓𝑐 for concrete and CMUs, this dilation angle for the
interface element is labelled as i.
𝐺 = 𝑞 − 𝑝 tan𝑖 (4.13)
Figure 4.10. Hardening and flow rule for the hyperbolic Drucker-Prager model
(D.S.Simulia 2010)
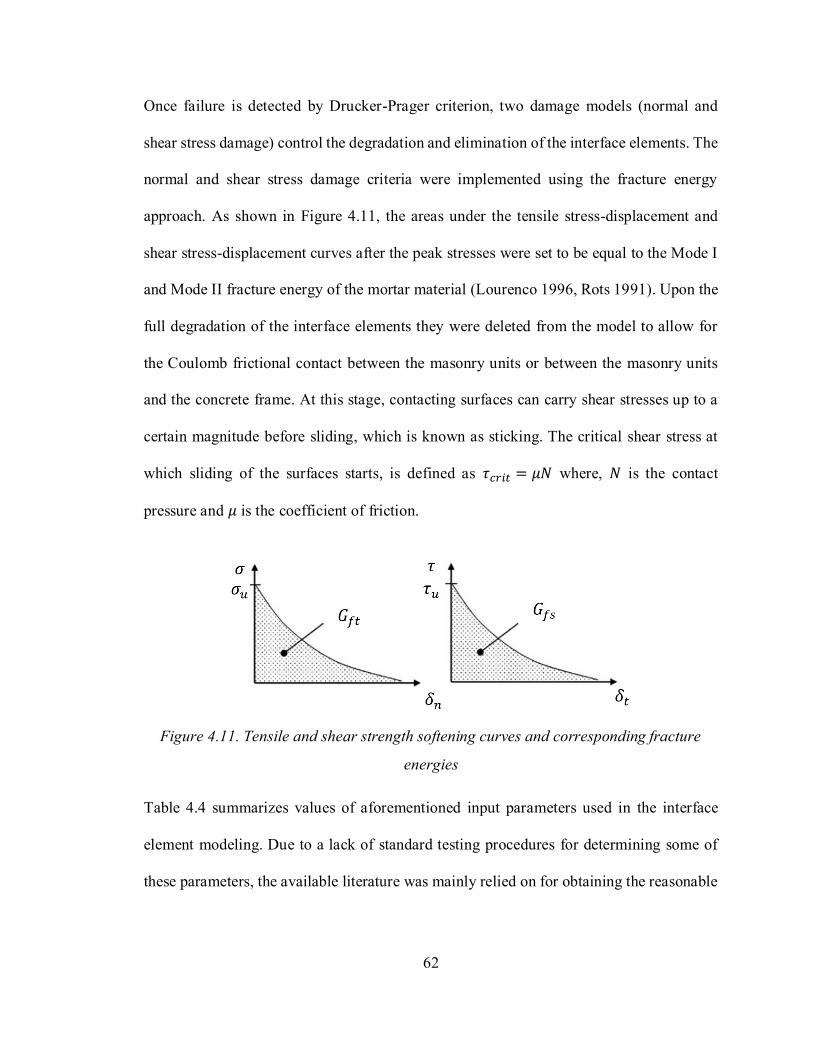
62
Once failure is detected by Drucker-Prager criterion, two damage models (normal and
shear stress damage) control the degradation and elimination of the interface elements. The
normal and shear stress damage criteria were implemented using the fracture energy
approach. As shown in Figure 4.11, the areas under the tensile stress-displacement and
shear stress-displacement curves after the peak stresses were set to be equal to the Mode I
and Mode II fracture energy of the mortar material (Lourenco 1996, Rots 1991). Upon the
full degradation of the interface elements they were deleted from the model to allow for
the Coulomb frictional contact between the masonry units or between the masonry units
and the concrete frame. At this stage, contacting surfaces can carry shear stresses up to a
certain magnitude before sliding, which is known as sticking. The critical shear stress at
which sliding of the surfaces starts, is defined as 𝜏𝑐𝑟𝑖𝑡 = 𝜇𝑁 where, 𝑁 is the contact
pressure and 𝜇 is the coefficient of friction.
Figure 4.11. Tensile and shear strength softening curves and corresponding fracture
energies
Table 4.4 summarizes values of aforementioned input parameters used in the interface
element modeling. Due to a lack of standard testing procedures for determining some of
these parameters, the available literature was mainly relied on for obtaining the reasonable
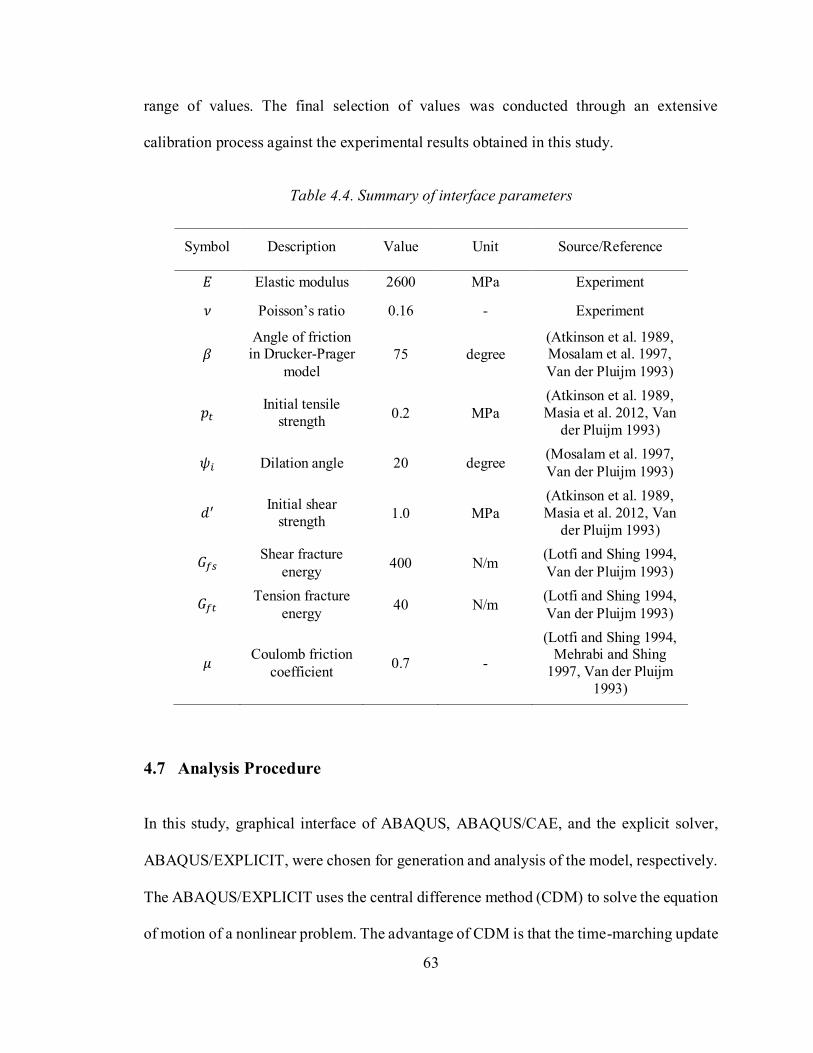
63
range of values. The final selection of values was conducted through an extensive
calibration process against the experimental results obtained in this study.
Table 4.4. Summary of interface parameters
Symbol Description Value Unit Source/Reference
𝐸 Elastic modulus 2600 MPa Experiment
𝜈 Poisson’s ratio 0.16 - Experiment
𝛽
Angle of friction in Drucker-Prager
model
75 degree
(Atkinson et al. 1989, Mosalam et al. 1997,
Van der Pluijm 1993)
𝑝𝑡 Initial tensile
strength 0.2 MPa
(Atkinson et al. 1989,
Masia et al. 2012, Van
der Pluijm 1993)
𝜓𝑖 Dilation angle 20 degree (Mosalam et al. 1997,
Van der Pluijm 1993)
𝑑′ Initial shear
strength 1.0 MPa
(Atkinson et al. 1989,
Masia et al. 2012, Van
der Pluijm 1993)
𝐺𝑓𝑠 Shear fracture
energy 400 N/m
(Lotfi and Shing 1994,
Van der Pluijm 1993)
𝐺𝑓𝑡 Tension fracture
energy 40 N/m
(Lotfi and Shing 1994,
Van der Pluijm 1993)
𝜇 Coulomb friction
coefficient 0.7 -
(Lotfi and Shing 1994, Mehrabi and Shing
1997, Van der Pluijm
1993)
4.7 Analysis Procedure
In this study, graphical interface of ABAQUS, ABAQUS/CAE, and the explicit solver,
ABAQUS/EXPLICIT, were chosen for generation and analysis of the model, respectively.
The ABAQUS/EXPLICIT uses the central difference method (CDM) to solve the equation
of motion of a nonlinear problem. The advantage of CDM is that the time-marching update
64
equations are EXPLICIT, meaning that no iterations are needed to find the new
displacements which satisfy the equation of motion. This method is preferred for
computation problems involving complicated nonlinear constitutive laws and large
deformations and is especially effective for prediction of post-failure behaviour. The
EXPLICIT procedure uses a large number of small time increments to ensure the accuracy
of analysis. The EXPLICIT central difference integration rule is shown as (D.S.Simulia
2010):
�̇�(𝑖+12) = �̇�(𝑖−
12) +
Δ𝑡(𝑖+12) +Δ𝑡(𝑖)
2�̈�(𝑖) (4.14)
𝑢(𝑖+1) = 𝑢(𝑖) + Δ𝑡(𝑖+1)�̇�(𝑖+12) (4.15)
where �̇� is velocity and �̈� is acceleration corresponding to equations of motion. The
superscript (𝑖) refers to the increment number. In order to have a stable solution, the time
increment should be less than the stability limit set as:
∆𝑡𝑚𝑎𝑥 ≤𝐿𝑒
𝐶𝑑 (4.16)
where 𝐿𝑒 is the characteristic length of the smallest element (length of a line across an
element for a first-order element) and 𝐶𝑑 = √𝐸 𝜌⁄ is the wave velocity in the material.
4.8 Verification of the Model
A mesh convergence study was first performed on the model. Using specimen IFNG as an
example, the FE lateral load vs. displacement curves with varying element sizes used to
discretize the masonry infill are compared with the experimental curve in Figure 4.12. It
can be seen that while the results in elastic range and pre-peak region are less affected by
65
the mesh density, the ultimate force and the post-ultimate behaviour is somewhat sensitive
to the mesh size. While the finest mesh (5 mm) produced the ultimate load closest to the
experimental value, the mesh size of 10 mm yielded a response approximately similar to
that produced by mesh size 5 mm. To balance the result accuracy and computational
efficiency, the mesh size of 10 mm was used for the model in the following validation
process.
Figure 4.12. Load-displacement curves for different number of elements
The FE model was then validated using the test results. Table 4.5 summarizes the
comparison results in terms of the initial and crack stiffness, and ultimate strength of
specimens. Table 4.5 shows that the average of 𝑃𝑢,EXP
𝑃𝑢,FE is 1.03 with a COV of 7%, indicating
that the FE model is capable of predicting the ultimate lateral load capacity of the infilled
RC frames with a reasonably good accuracy. In terms of the initial stiffness which is
defined as the slope of initial linear portion of the curve connecting the origin and the 10
0
20
40
60
80
100
120
140
160
0 10 20 30 40
Load
(k
N)
Lateral Displacement (mm)
5 mm elements
10 mm elements
15 mm elements
Experiment
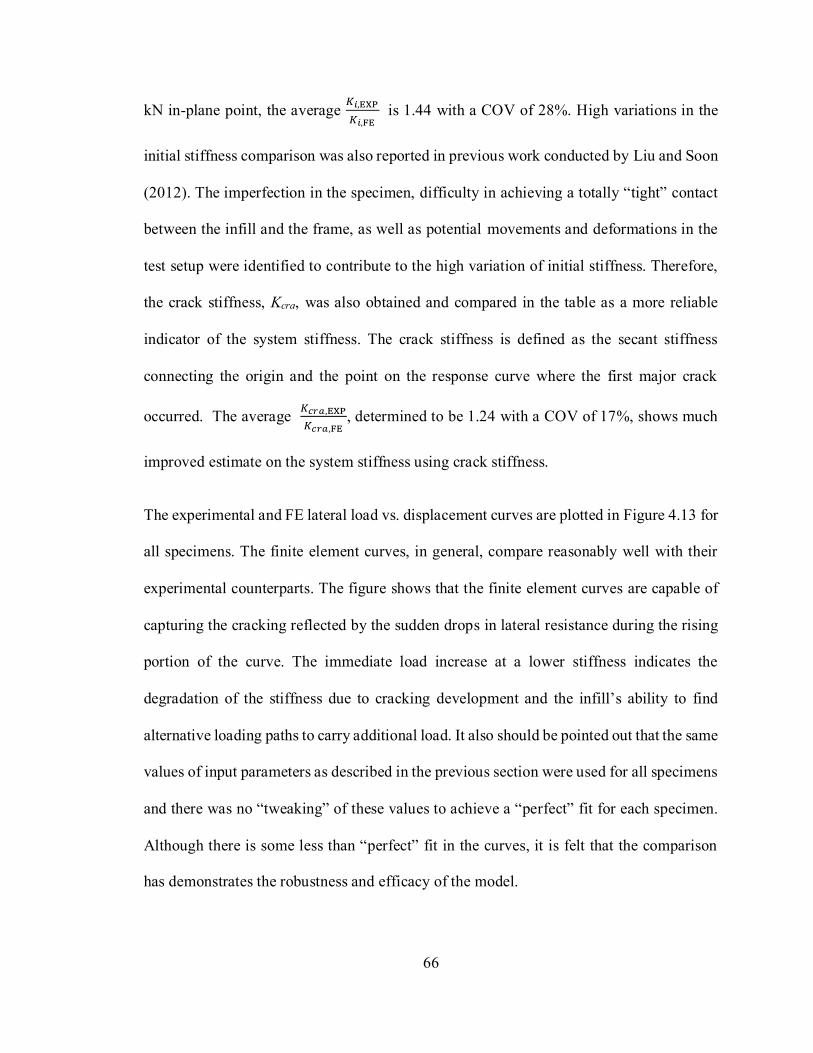
66
kN in-plane point, the average 𝐾𝑖,EXP
𝐾𝑖,FE is 1.44 with a COV of 28%. High variations in the
initial stiffness comparison was also reported in previous work conducted by Liu and Soon
(2012). The imperfection in the specimen, difficulty in achieving a totally “tight” contact
between the infill and the frame, as well as potential movements and deformations in the
test setup were identified to contribute to the high variation of initial stiffness. Therefore,
the crack stiffness, Kcra, was also obtained and compared in the table as a more reliable
indicator of the system stiffness. The crack stiffness is defined as the secant stiffness
connecting the origin and the point on the response curve where the first major crack
occurred. The average 𝐾𝑐𝑟𝑎,EXP
𝐾𝑐𝑟𝑎,FE, determined to be 1.24 with a COV of 17%, shows much
improved estimate on the system stiffness using crack stiffness.
The experimental and FE lateral load vs. displacement curves are plotted in Figure 4.13 for
all specimens. The finite element curves, in general, compare reasonably well with their
experimental counterparts. The figure shows that the finite element curves are capable of
capturing the cracking reflected by the sudden drops in lateral resistance during the rising
portion of the curve. The immediate load increase at a lower stiffness indicates the
degradation of the stiffness due to cracking development and the infill’s ability to find
alternative loading paths to carry additional load. It also should be pointed out that the same
values of input parameters as described in the previous section were used for all specimens
and there was no “tweaking” of these values to achieve a “perfect” fit for each specimen.
Although there is some less than “perfect” fit in the curves, it is felt that the comparison
has demonstrates the robustness and efficacy of the model.
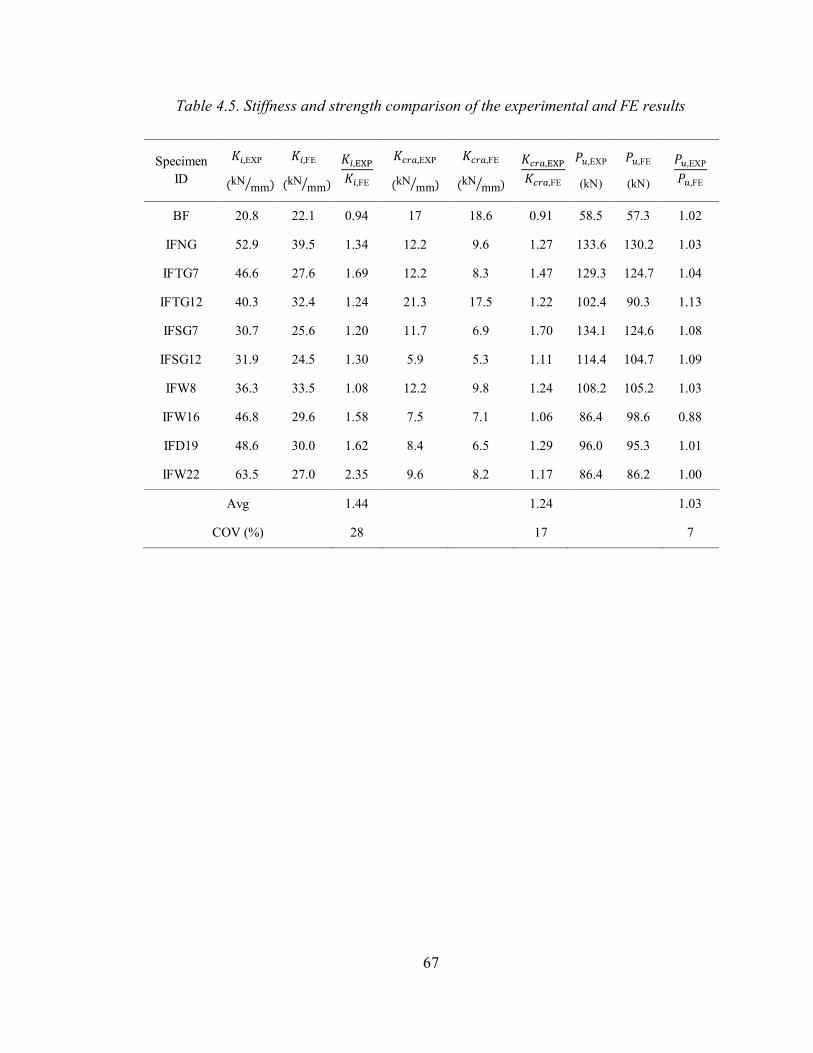
67
Table 4.5. Stiffness and strength comparison of the experimental and FE results
Specimen
ID
𝐾𝑖,EXP
(kNmm⁄ )
𝐾𝑖,FE
(kNmm⁄ )
𝐾𝑖,EXP𝐾𝑖,FE
𝐾𝑐𝑟𝑎,EXP
(kNmm⁄ )
𝐾𝑐𝑟𝑎,FE
(kNmm⁄ )
𝐾𝑐𝑟𝑎,EXP𝐾𝑐𝑟𝑎,FE
𝑃𝑢,EXP
(kN)
𝑃𝑢,FE
(kN)
𝑃𝑢,EXP
𝑃𝑢,FE
BF 20.8 22.1 0.94 17 18.6 0.91 58.5 57.3 1.02
IFNG 52.9 39.5 1.34 12.2 9.6 1.27 133.6 130.2 1.03
IFTG7 46.6 27.6 1.69 12.2 8.3 1.47 129.3 124.7 1.04
IFTG12 40.3 32.4 1.24 21.3 17.5 1.22 102.4 90.3 1.13
IFSG7 30.7 25.6 1.20 11.7 6.9 1.70 134.1 124.6 1.08
IFSG12 31.9 24.5 1.30 5.9 5.3 1.11 114.4 104.7 1.09
IFW8 36.3 33.5 1.08 12.2 9.8 1.24 108.2 105.2 1.03
IFW16 46.8 29.6 1.58 7.5 7.1 1.06 86.4 98.6 0.88
IFD19 48.6 30.0 1.62 8.4 6.5 1.29 96.0 95.3 1.01
IFW22 63.5 27.0 2.35 9.6 8.2 1.17 86.4 86.2 1.00
Avg 1.44 1.24 1.03
COV (%) 28 17 7
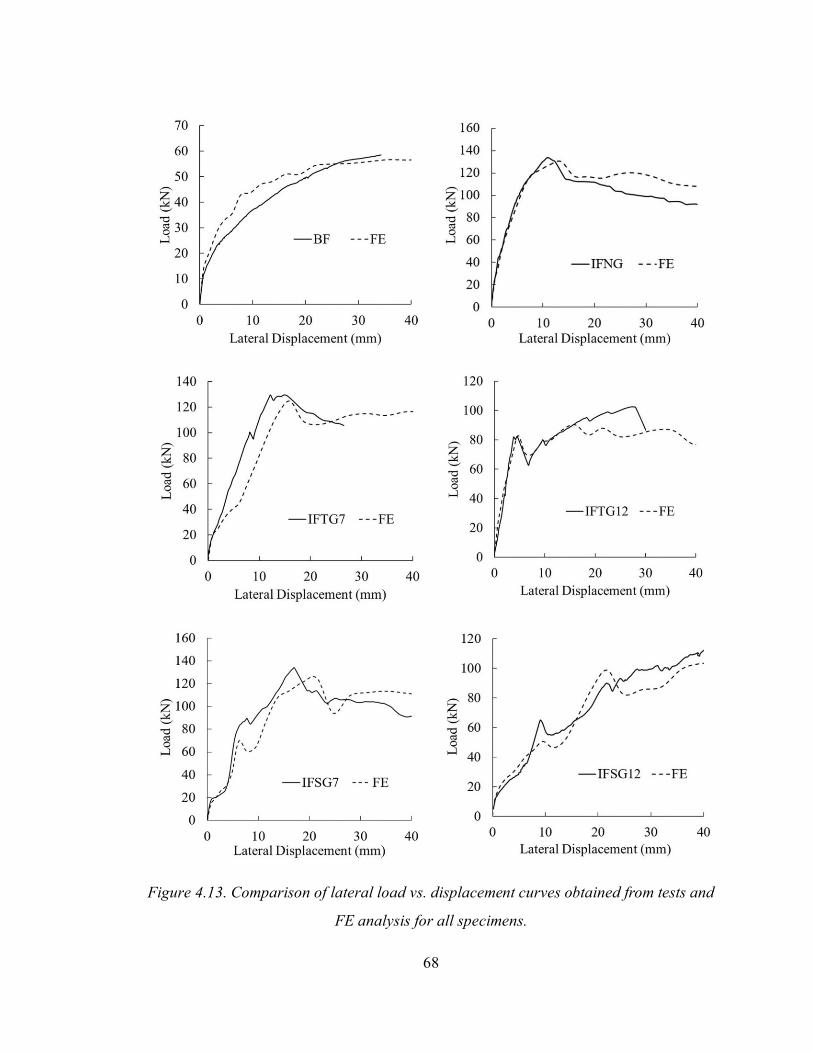
68
Figure 4.13. Comparison of lateral load vs. displacement curves obtained from tests and
FE analysis for all specimens.
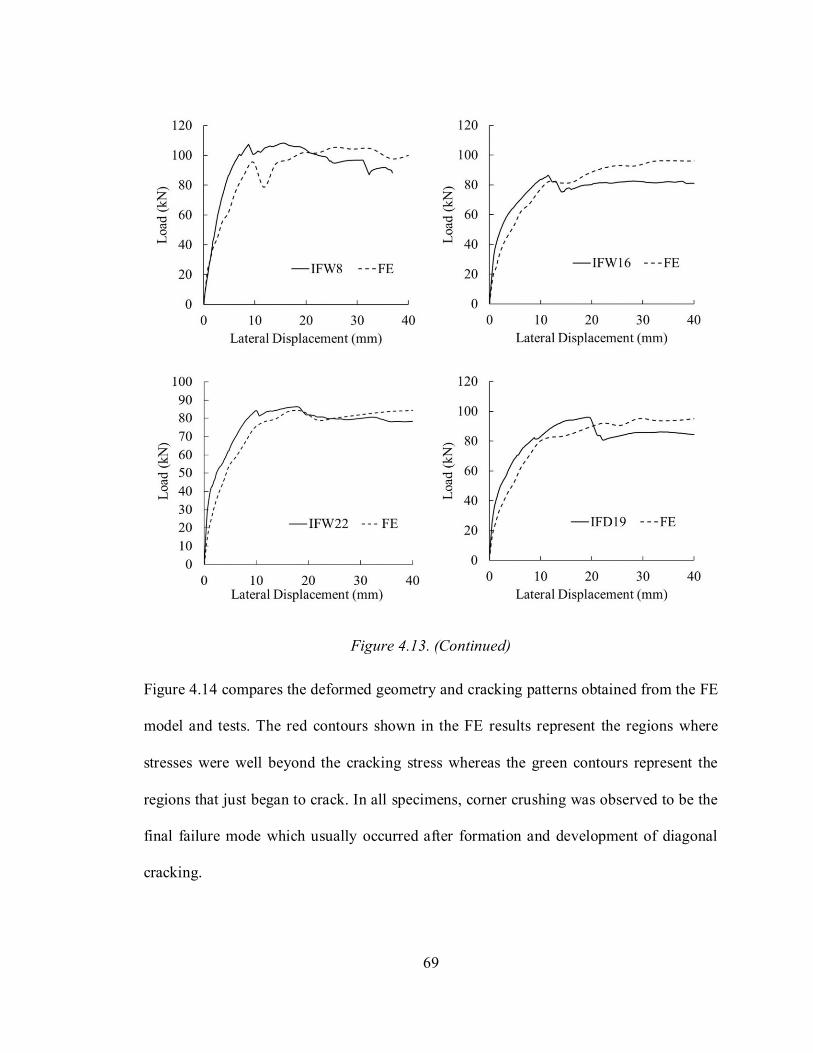
69
Figure 4.13. (Continued)
Figure 4.14 compares the deformed geometry and cracking patterns obtained from the FE
model and tests. The red contours shown in the FE results represent the regions where
stresses were well beyond the cracking stress whereas the green contours represent the
regions that just began to crack. In all specimens, corner crushing was observed to be the
final failure mode which usually occurred after formation and development of diagonal
cracking.

70
For the control specimen, IFNG (Figure 4.14a), the FE model exhibited a similar cracking
pattern and failure mode as the tested specimen where cracking formed and developed in
the general diagonal direction of the infill, and crushing of the infill was observed at the
loaded corners. For the specimen with an opening (Figure 4.14b), the FE model accurately
simulated the diagonal cracks formed and developed around the corners of the opening. As
the load increased, the distortion of the opening (left bottom corner and right top corner)
was also captured. For the specimen with a top gap (Figure 4.14c), the FE model is capable
of predicting a cracking pattern that was different from the control specimen where two
main cracking regions were developed due to the presence of gap. For the specimen with
side gaps (Figure 4.14d), the initiation of failure was shear sliding along the bed joints
which also transformed into the cracking of masonry blocks at some regions. As load
increased, both the model and test showed that the infill was pushed against the lower part
of the frame column at the unloaded side and crushing of the infill was observed at the
loaded corner. Figure 4.15 details the ability of the model in predicting the corner crushing
failure where the crushed element contours are compared with crushed CMUs in the test.
The above comparisons further demonstrate that in addition to the ultimate strength and
stiffness, the FE model is also capable of predicting the complete behaviour including both
loading and unloading stages as well as the cracking pattern and failure mode of the
specimens. Noting that the specimens had either infill openings or varying interfacial
conditions, the comparison indicates the robustness of the model in incorporating infill
frame conditions different from a “regular” infilled frame.
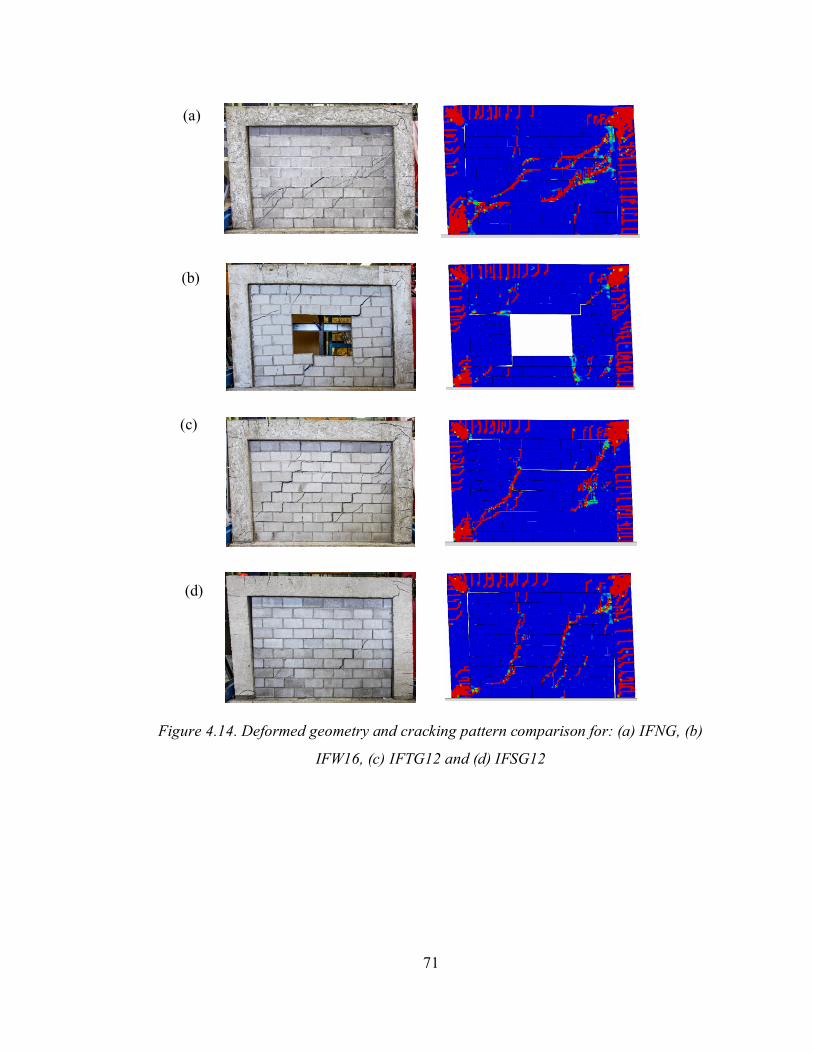
71
Figure 4.14. Deformed geometry and cracking pattern comparison for: (a) IFNG, (b)
IFW16, (c) IFTG12 and (d) IFSG12
(a)
(b)
(c)
(d)
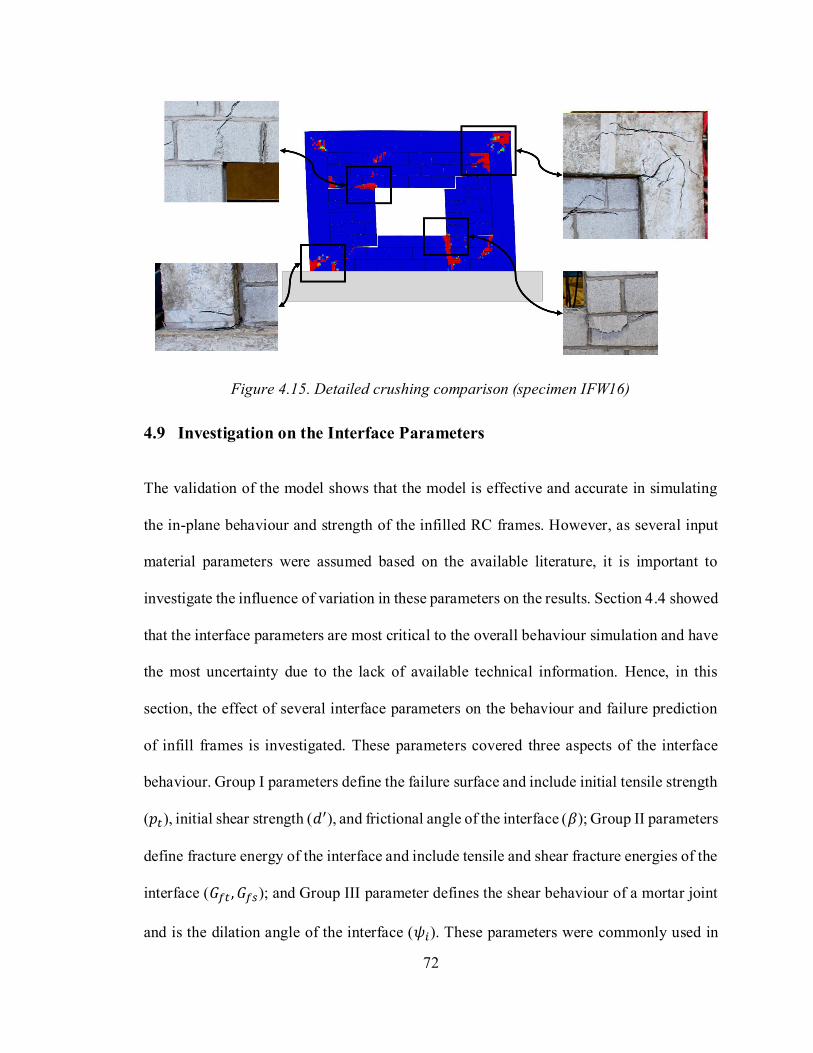
72
Figure 4.15. Detailed crushing comparison (specimen IFW16)
4.9 Investigation on the Interface Parameters
The validation of the model shows that the model is effective and accurate in simulating
the in-plane behaviour and strength of the infilled RC frames. However, as several input
material parameters were assumed based on the available literature, it is important to
investigate the influence of variation in these parameters on the results. Section 4.4 showed
that the interface parameters are most critical to the overall behaviour simulation and have
the most uncertainty due to the lack of available technical information. Hence, in this
section, the effect of several interface parameters on the behaviour and failure prediction
of infill frames is investigated. These parameters covered three aspects of the interface
behaviour. Group I parameters define the failure surface and include initial tensile strength
(𝑝𝑡), initial shear strength (𝑑′), and frictional angle of the interface (𝛽); Group II parameters
define fracture energy of the interface and include tensile and shear fracture energies of the
interface (𝐺𝑓𝑡 , 𝐺𝑓𝑠); and Group III parameter defines the shear behaviour of a mortar joint
and is the dilation angle of the interface (𝜓𝑖). These parameters were commonly used in
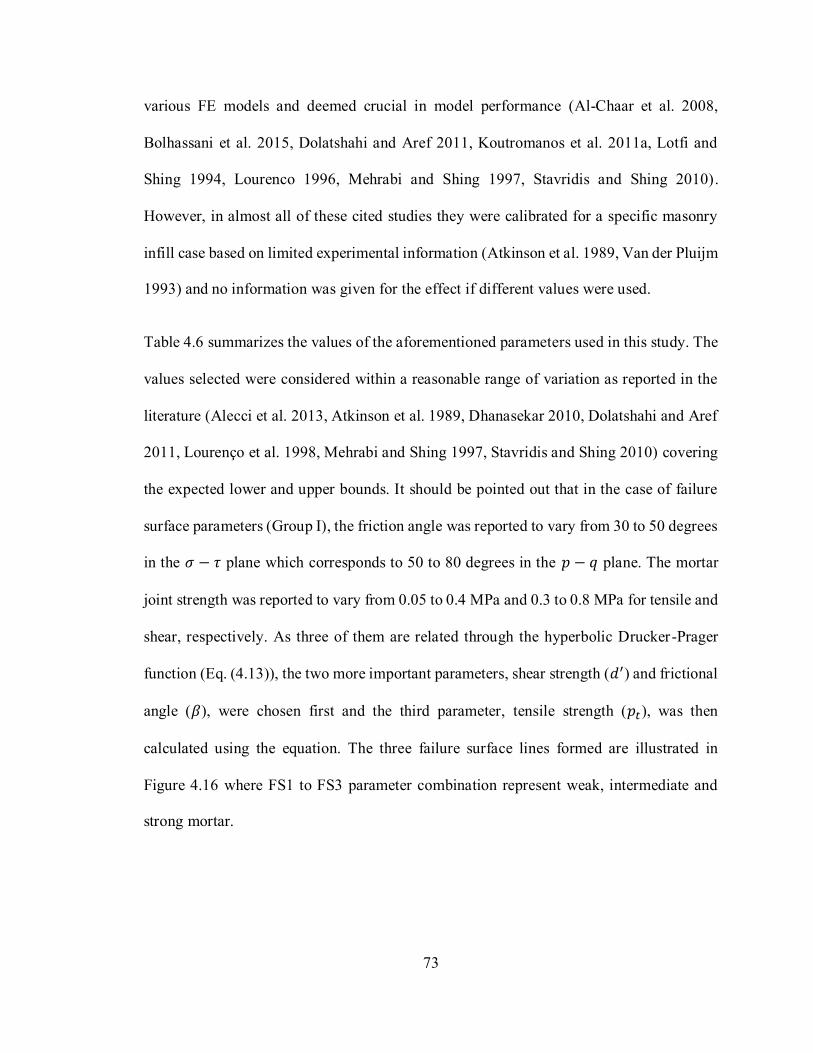
73
various FE models and deemed crucial in model performance (Al-Chaar et al. 2008,
Bolhassani et al. 2015, Dolatshahi and Aref 2011, Koutromanos et al. 2011a, Lotfi and
Shing 1994, Lourenco 1996, Mehrabi and Shing 1997, Stavridis and Shing 2010).
However, in almost all of these cited studies they were calibrated for a specific masonry
infill case based on limited experimental information (Atkinson et al. 1989, Van der Pluijm
1993) and no information was given for the effect if different values were used.
Table 4.6 summarizes the values of the aforementioned parameters used in this study. The
values selected were considered within a reasonable range of variation as reported in the
literature (Alecci et al. 2013, Atkinson et al. 1989, Dhanasekar 2010, Dolatshahi and Aref
2011, Lourenço et al. 1998, Mehrabi and Shing 1997, Stavridis and Shing 2010) covering
the expected lower and upper bounds. It should be pointed out that in the case of failure
surface parameters (Group I), the friction angle was reported to vary from 30 to 50 degrees
in the 𝜎 − 𝜏 plane which corresponds to 50 to 80 degrees in the 𝑝 − 𝑞 plane. The mortar
joint strength was reported to vary from 0.05 to 0.4 MPa and 0.3 to 0.8 MPa for tensile and
shear, respectively. As three of them are related through the hyperbolic Drucker-Prager
function (Eq. (4.13)), the two more important parameters, shear strength (𝑑′) and frictional
angle (𝛽), were chosen first and the third parameter, tensile strength (𝑝𝑡), was then
calculated using the equation. The three failure surface lines formed are illustrated in
Figure 4.16 where FS1 to FS3 parameter combination represent weak, intermediate and
strong mortar.
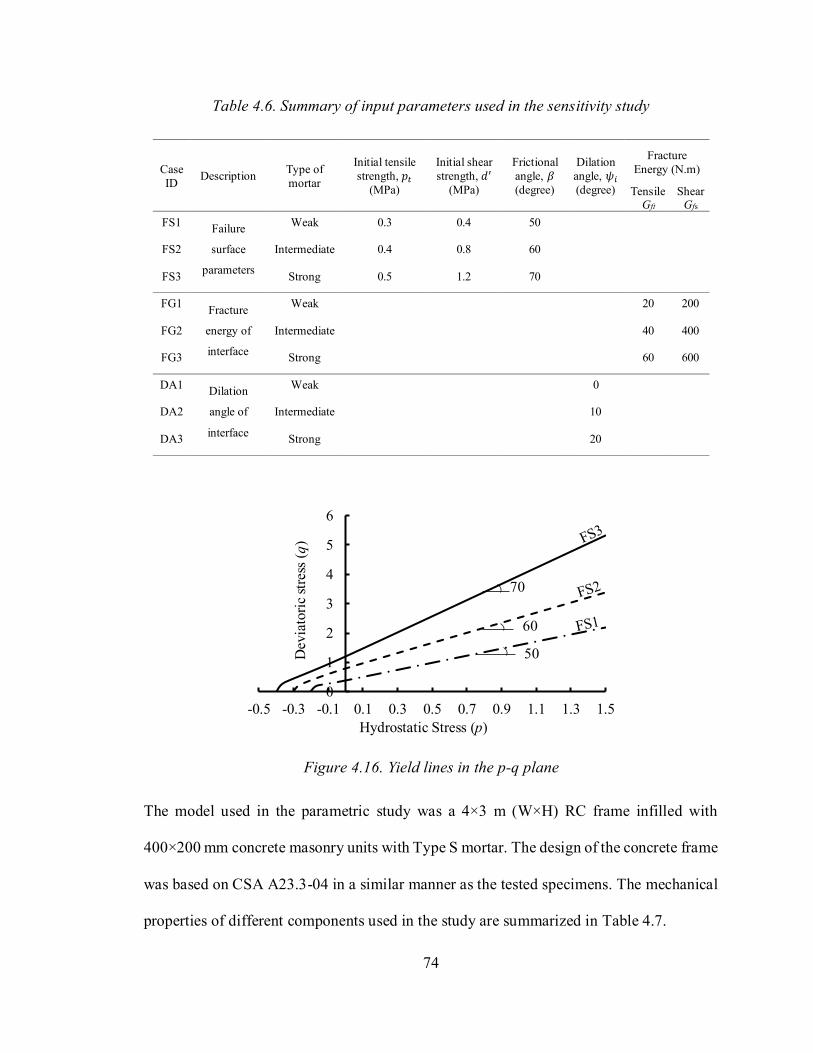
74
Table 4.6. Summary of input parameters used in the sensitivity study
Case
ID Description
Type of
mortar
Initial tensile
strength, 𝑝𝑡 (MPa)
Initial shear
strength, 𝑑′ (MPa)
Frictional
angle, 𝛽
(degree)
Dilation
angle, 𝜓𝑖 (degree)
Fracture
Energy (N.m)
Tensile Gft
Shear Gfs
FS1 Failure
surface
parameters
Weak 0.3 0.4 50
FS2 Intermediate 0.4 0.8 60
FS3 Strong 0.5 1.2 70
FG1 Fracture
energy of
interface
Weak 20 200
FG2 Intermediate 40 400
FG3 Strong 60 600
DA1 Dilation
angle of
interface
Weak 0
DA2 Intermediate 10
DA3 Strong 20
Figure 4.16. Yield lines in the p-q plane
The model used in the parametric study was a 4×3 m (W×H) RC frame infilled with
400×200 mm concrete masonry units with Type S mortar. The design of the concrete frame
was based on CSA A23.3-04 in a similar manner as the tested specimens. The mechanical
properties of different components used in the study are summarized in Table 4.7.
0
1
2
3
4
5
6
-0.5 -0.3 -0.1 0.1 0.3 0.5 0.7 0.9 1.1 1.3 1.5
Dev
iato
ric
stre
ss (
q)
Hydrostatic Stress (p)
70
60
50

75
Table 4.7. Material properties used for the sensitivity study
Property CMUs Mortar Concrete Reinforcement
Compressive Strength (MPa) 20.0 15.0 35.0 -
Elastic Modulus (MPa) 20000 2600 30000 220000
Tensile strength (MPa) 2.0 1.5 3.5 400 (600)*
* Yield and (ultimate) strength
4.9.1 Effect of Failure Surface Parameters
The effect of the interface failure surface parameters on the load vs. displacement response
is shown in Figure 4.17. Results indicate that these parameters have a significant effect on
the cracking stiffness, ultimate capacity and post-ultimate behaviour of the infilled frame
but a minimal effect on the initial stiffness. As expected, strong mortar parameters (FS3)
yielded the greatest ultimate load and post-ultimate strength.
Figure 4.17. Lateral load vs. displacement curves for interface failure surface
parameters
0
100
200
300
400
500
600
700
0 10 20 30 40
Load
(k
N)
Lateral Displacement (mm)
FS1
FS2
FS3
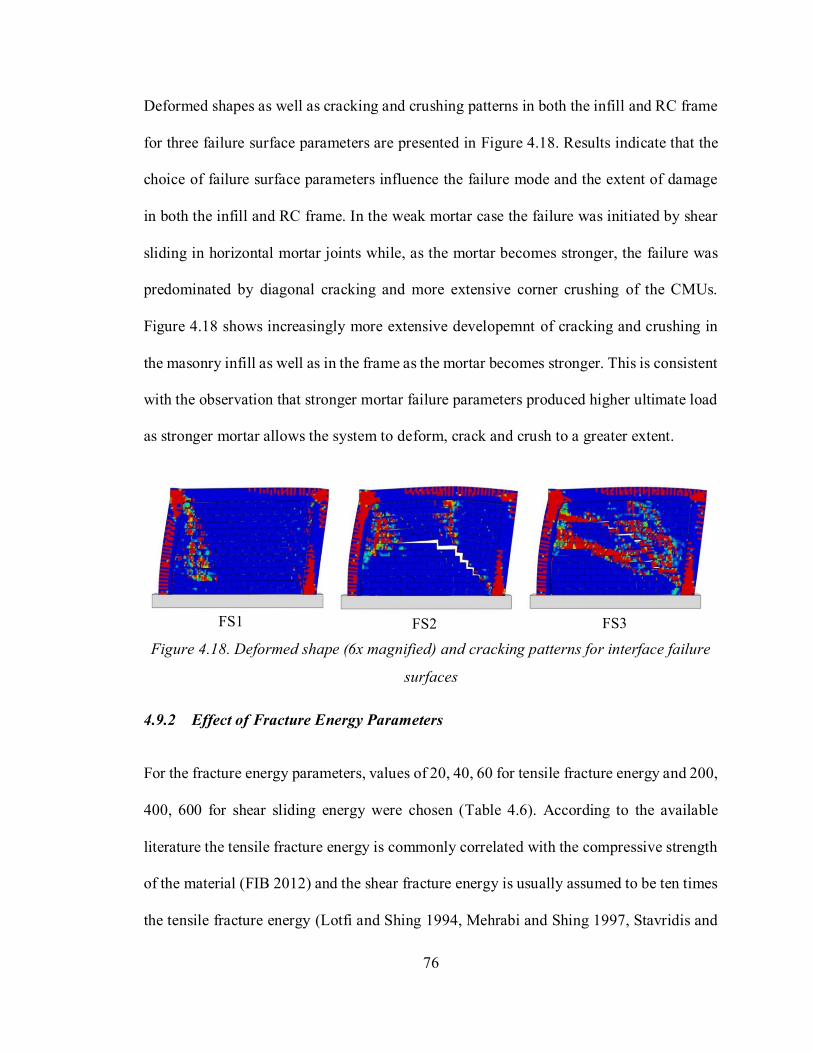
76
Deformed shapes as well as cracking and crushing patterns in both the infill and RC frame
for three failure surface parameters are presented in Figure 4.18. Results indicate that the
choice of failure surface parameters influence the failure mode and the extent of damage
in both the infill and RC frame. In the weak mortar case the failure was initiated by shear
sliding in horizontal mortar joints while, as the mortar becomes stronger, the failure was
predominated by diagonal cracking and more extensive corner crushing of the CMUs.
Figure 4.18 shows increasingly more extensive developemnt of cracking and crushing in
the masonry infill as well as in the frame as the mortar becomes stronger. This is consistent
with the observation that stronger mortar failure parameters produced higher ultimate load
as stronger mortar allows the system to deform, crack and crush to a greater extent.
Figure 4.18. Deformed shape (6x magnified) and cracking patterns for interface failure
surfaces
4.9.2 Effect of Fracture Energy Parameters
For the fracture energy parameters, values of 20, 40, 60 for tensile fracture energy and 200,
400, 600 for shear sliding energy were chosen (Table 4.6). According to the available
literature the tensile fracture energy is commonly correlated with the compressive strength
of the material (FIB 2012) and the shear fracture energy is usually assumed to be ten times
the tensile fracture energy (Lotfi and Shing 1994, Mehrabi and Shing 1997, Stavridis and
FS1 FS2 FS3
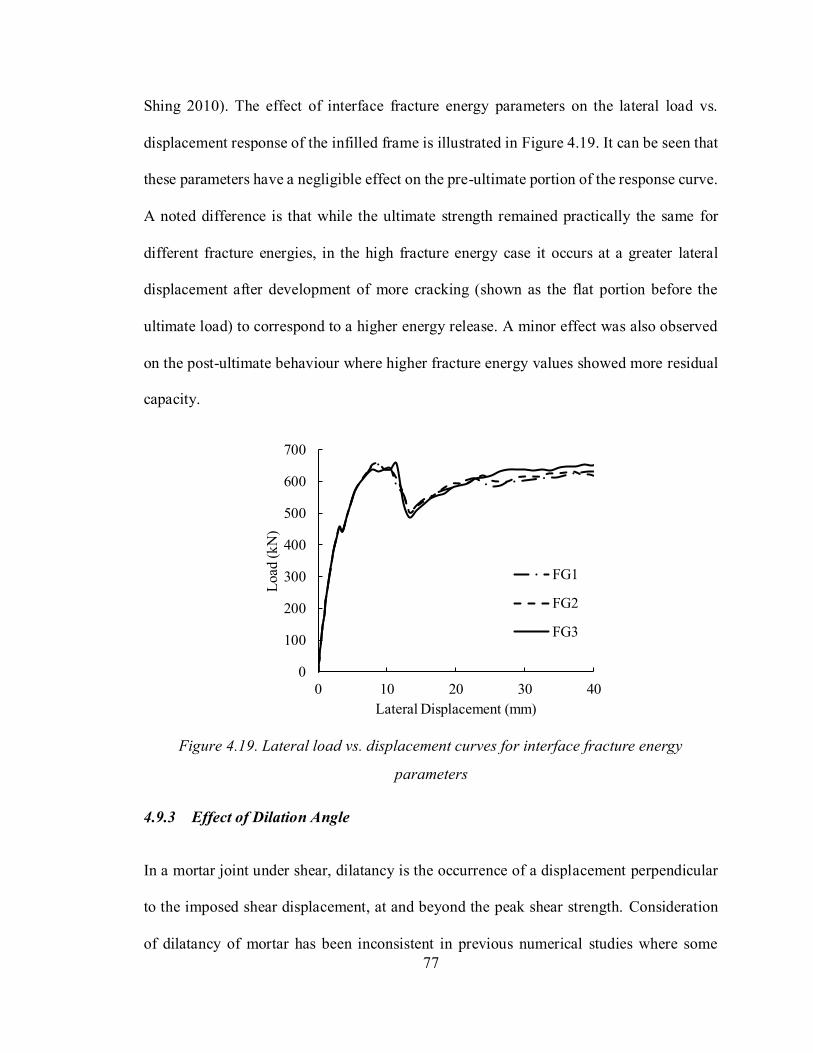
77
Shing 2010). The effect of interface fracture energy parameters on the lateral load vs.
displacement response of the infilled frame is illustrated in Figure 4.19. It can be seen that
these parameters have a negligible effect on the pre-ultimate portion of the response curve.
A noted difference is that while the ultimate strength remained practically the same for
different fracture energies, in the high fracture energy case it occurs at a greater lateral
displacement after development of more cracking (shown as the flat portion before the
ultimate load) to correspond to a higher energy release. A minor effect was also observed
on the post-ultimate behaviour where higher fracture energy values showed more residual
capacity.
Figure 4.19. Lateral load vs. displacement curves for interface fracture energy
parameters
4.9.3 Effect of Dilation Angle
In a mortar joint under shear, dilatancy is the occurrence of a displacement perpendicular
to the imposed shear displacement, at and beyond the peak shear strength. Consideration
of dilatancy of mortar has been inconsistent in previous numerical studies where some
0
100
200
300
400
500
600
700
0 10 20 30 40
Load
(k
N)
Lateral Displacement (mm)
FG1
FG2
FG3
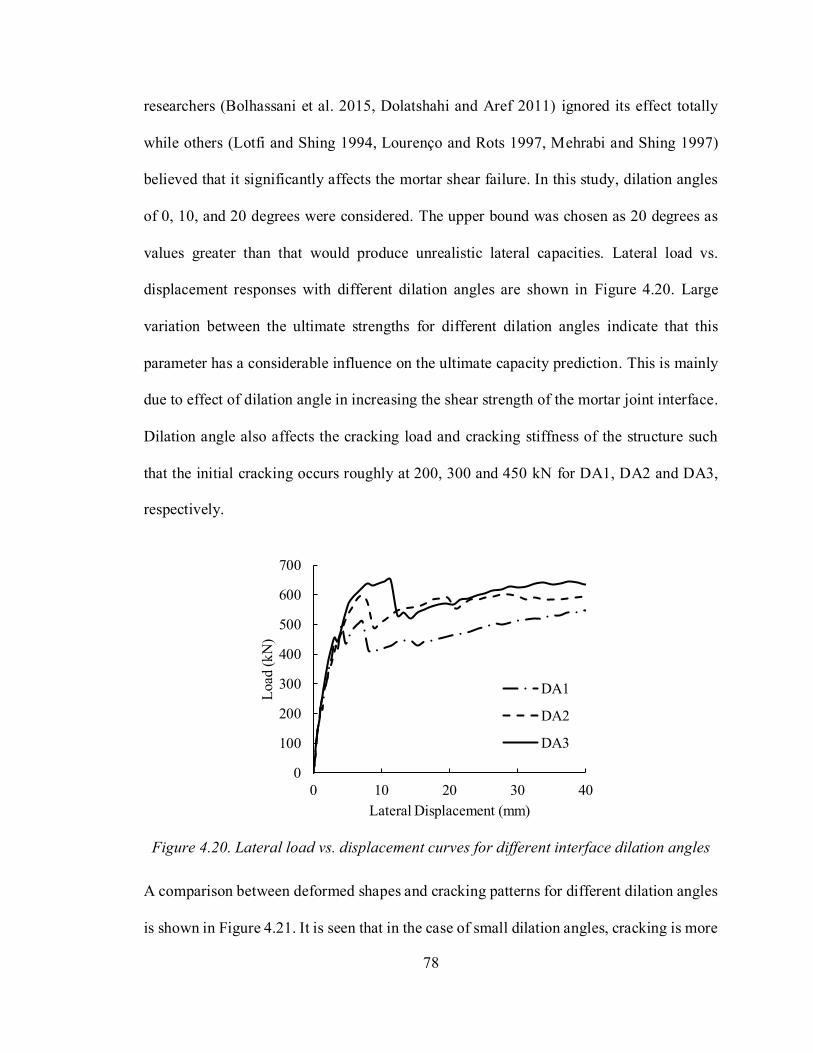
78
researchers (Bolhassani et al. 2015, Dolatshahi and Aref 2011) ignored its effect totally
while others (Lotfi and Shing 1994, Lourenço and Rots 1997, Mehrabi and Shing 1997)
believed that it significantly affects the mortar shear failure. In this study, dilation angles
of 0, 10, and 20 degrees were considered. The upper bound was chosen as 20 degrees as
values greater than that would produce unrealistic lateral capacities. Lateral load vs.
displacement responses with different dilation angles are shown in Figure 4.20. Large
variation between the ultimate strengths for different dilation angles indicate that this
parameter has a considerable influence on the ultimate capacity prediction. This is mainly
due to effect of dilation angle in increasing the shear strength of the mortar joint interface.
Dilation angle also affects the cracking load and cracking stiffness of the structure such
that the initial cracking occurs roughly at 200, 300 and 450 kN for DA1, DA2 and DA3,
respectively.
Figure 4.20. Lateral load vs. displacement curves for different interface dilation angles
A comparison between deformed shapes and cracking patterns for different dilation angles
is shown in Figure 4.21. It is seen that in the case of small dilation angles, cracking is more
0
100
200
300
400
500
600
700
0 10 20 30 40
Load
(k
N)
Lateral Displacement (mm)
DA1
DA2
DA3

79
concentrated in mortar joints and sliding shear with wide cracks in bed joints is observed;
while as the dilation angle becomes larger, sliding shear and cracking in bed joints is
reduced and the mortar joints and CMUs are behaving increasingly more as a unit and
cracking is mainly concentrated in CMUs.
Figure 4.21. Deformed shape (10x magnified) and cracking pattern at 25 mm lateral
displacement for dilation angles
4.10 Conclusion
A nonlinear three-dimensional finite element model was developed to simulate the in-plane
behaviour of masonry infilled RC frames. A concurrent experimental program was
conducted where ten masonry infilled RC frame specimens incorporating either interfacial
gaps or infill openings were tested to failure. The finite element model was extensively
validated using the test results. A sensitivity study of several critical interface input
parameters on the behaviour of the infilled frame was also conducted. Some conclusions
stemming from this study are as follows:
1. The 3D nonlinear model developed is capable of producing accurate results in analysis
of masonry infilled RC frames and its capability in incorporating infill openings and
interfacial gaps is also demonstrated.
DA1 DA2 DA3

80
2. The interface element input parameters for failure surface, fracture energy, and mortar
dilation were analyzed. Of the parameters studied, failure surface parameters and dilation
angle were shown to have a significant effect on the ultimate strength, cracking stiffness,
as well as pre and post-ultimate behaviour of the models while those for fracture energy
were shown to only have a small degree of influence on the ultimate load and post-ultimate
behaviour of the models.
3. Contrary to recommendations from some researchers, FE results of this study showed
that the dilatancy of mortar should be considered in the numerical models. Since there is
little experimental information in the available literature, it is suggested that accurate
methods for experimentally obtaining the dilatancy of mortar need to be developed and
implemented.
4.11 Acknowledgement
The authors wish to recognize the contribution of financial assistance by the Canadian
Concrete Masonry Producers Association and Natural Sciences and Engineering Research
Council of Canada.
81
Chapter 5 The Out-of-Plane Behaviour of Concrete Masonry Infills
Bounded by Reinforced Concrete Frames
Ehsan Nasiri, Yi Liu
Published in Engineering Structures, Volume 184, 1 April 2019, Pages 406-420
https://doi.org/10.1016/j.engstruct.2019.01.098
5.1 Abstract
The paper presents results of a finite element (FE) study of several critical geometric
parameters on the out-of-plane behaviour of concrete masonry infills bounded by
reinforced concrete (RC) frames. The development of FE model adopted a three-
dimensional simplified micro-modeling technique considering detailed geometry and
behaviour characteristics of concrete and masonry units through Concrete Damaged
Plasticity (CDP) method. The surface-based cohesive interaction was incorporated to
capture the behaviour and failure mechanisms of mortar joints. A concurrent experimental
study was also conducted on four infilled RC frames and the results were used to validate
the FE model. The model was shown to be capable of simulating accurately the out-of-
plane behaviour and strength as well as capturing the cracking pattern and failure modes
of infilled RC frames for different geometric and loading situations. The parameters
considered in the FE study included infill aspect ratio, infill slenderness ratio, bounding
frame stiffness, frame-to-infill interfacial gap, infill opening size and aspect ratio, and web
thickness of masonry blocks. The numerical results showed that the out-of-plane behaviour
of infilled RC frames was dependent on these parameters and the correlation between each
parameter and its effect on the infill strength was described as appropriate.
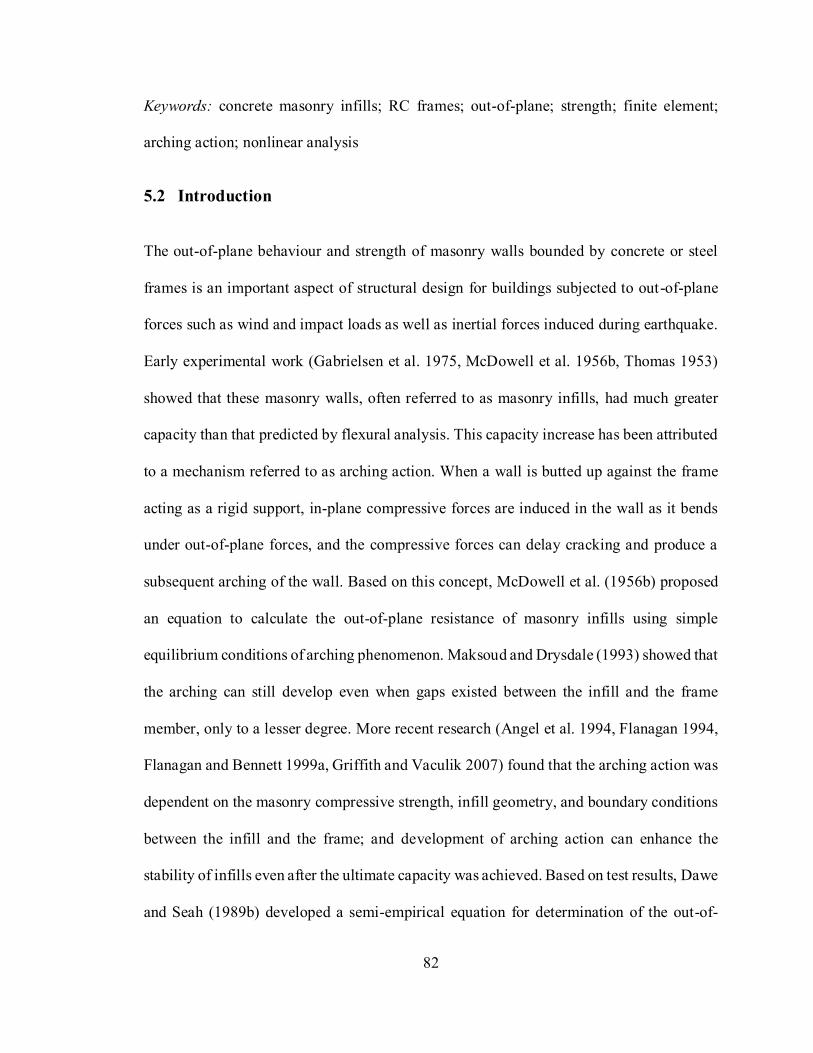
82
Keywords: concrete masonry infills; RC frames; out-of-plane; strength; finite element;
arching action; nonlinear analysis
5.2 Introduction
The out-of-plane behaviour and strength of masonry walls bounded by concrete or steel
frames is an important aspect of structural design for buildings subjected to out-of-plane
forces such as wind and impact loads as well as inertial forces induced during earthquake.
Early experimental work (Gabrielsen et al. 1975, McDowell et al. 1956b, Thomas 1953)
showed that these masonry walls, often referred to as masonry infills, had much greater
capacity than that predicted by flexural analysis. This capacity increase has been attributed
to a mechanism referred to as arching action. When a wall is butted up against the frame
acting as a rigid support, in-plane compressive forces are induced in the wall as it bends
under out-of-plane forces, and the compressive forces can delay cracking and produce a
subsequent arching of the wall. Based on this concept, McDowell et al. (1956b) proposed
an equation to calculate the out-of-plane resistance of masonry infills using simple
equilibrium conditions of arching phenomenon. Maksoud and Drysdale (1993) showed that
the arching can still develop even when gaps existed between the infill and the frame
member, only to a lesser degree. More recent research (Angel et al. 1994, Flanagan 1994,
Flanagan and Bennett 1999a, Griffith and Vaculik 2007) found that the arching action was
dependent on the masonry compressive strength, infill geometry, and boundary conditions
between the infill and the frame; and development of arching action can enhance the
stability of infills even after the ultimate capacity was achieved. Based on test results, Dawe
and Seah (1989b) developed a semi-empirical equation for determination of the out-of-

83
plane strength of infills taking into account of infill geometry and bending and torsional
stiffness of the bounding frame. Flanagan (1994) simplified this equation by removing the
terms for torsional stiffness of the frame member as they argued that the mathematical
value of torsional stiffness is significantly small in comparison to the flexural stiffness.
Their work formed the basis for the out-of-plane strength equation in the current American
masonry design standard TMS 402/602-16. Angel et al. (1994) developed an equation for
accounting for the effect of prior in-plane damage on the out-of-plane strength of infills.
Klingner et al. (1996) proposed an equation considering two-way arching action that may
be developed in an infill. In practice, the Canadian masonry design standard CSA S304-14
suggests using the first principle mechanics based on equilibrium of moments caused by
internal thrust forces and external loading to calculate the out-of-plane strength but does
not provide design equations for the internal thrust force. One such approach is presented
in Drysdale et al. (1994). Comparing with the in-plane behaviour of masonry infilled
frames, research on the out-of-plane behaviour of masonry infills is limited and
experimental results are scarce in the literature. Although several analytical methods were
proposed as described above, they often produce inconsistent, and even conflicting results
due to the fact that these methods were calibrated with different experimental programs
containing a limited number of physical results. More results, from either experimental or
numerical studies on infilled frames with different material and geometric parameters are
needed to provide better understanding of the behaviour as well as to examine the accuracy
of available methods.
With the advancement of computing technology, numerical modeling has been
increasingly used as an effective tool to supplement experimental results. Two-dimensional

84
(2D) finite element models have been commonly used in the simulation of in-plane
behaviour of masonry infilled frames. The simulation of out-of-plane behaviour using 2D
continuum models has also been reported in a few studies (Lourenço 2000, Minaie et al.
2014, Noor-E-Khuda et al. 2016a, Noor-E-Khuda et al. 2016b). While these models were
shown to produce acceptable results for infills with large slenderness (height/thickness)
ratios, for intermediate and low slenderness, the 2D continuum geometry has difficulty to
accurately capture the non-homogeneous characteristics of masonry, and effect of shear
deformations and associated failure modes. For out-of-plane behaviour simulation, it is
believed that a three-dimensional model (3D) would be desirable to fully capture the
behaviour and failure modes unique to infilled frames subjected to out-of-plane loading.
This study was then motivated to develop a 3D finite element model to systematically study
the out-of-plane behaviour of masonry infilled RC frames. Concurrent with the finite
element modelling, four masonry infilled RC frames were tested under out-of-plane
loading and the experimental results were used to validate the model. A subsequent
parametric study focusing on several critical geometric parameters was conducted using
the model. Correlations between each studied parameter and the out-of-plane behaviour
and strength of infills bounded by RC frames were discussed in detail.
5.3 Experimental Program
Four masonry infilled RC frames were tested in the experimental program included one
infilled frame as the control specimen (IFNG), an infilled frame with 16% (opening/infill
area) opening (IFW16), and two infilled frames having in-plane damage sustained prior to
being subjected to out-of-plane loading. The prior damage was diagonal cracking (IF-D1)
85
and corner crushing (IF-D2) respectively. The test results were used to validate the model
and thus information on specimens, test setup, and results deemed relevant to the validation
is provided in the following section. The detailed analysis of the results is available
elsewhere (Sepasdar 2017).
All specimens had the same dimension as shown in Figure 5.1, yielding an infill height-to-
length aspect ratio of about 0.73. The masonry infill was constructed using the custom-
made, half-scale standard 200 mm concrete masonry units (CMUs) laid in the running
bond. Type S mortar was used in construction with an average joint thickness of 7 mm.
The RC frame consisted of two 180 mm square columns, a 180 mm square top beam, and
a 250 mm square bottom beam. The member reinforcement details including size, spacing,
arrangement of longitudinal bars and stirrups was designed according to CSA A23.3-14
and complied with requirements to provide ductility and avoid brittle shear failure.

86
Figure 5.1. Geometric properties of specimens and reinforcement details in the RC
frames
87
5.3.1 Test Setup, Instrumentation, and Procedure
The out-of-plane loading was applied through a self-equilibrating system as shown in
Figure 5.2. The out-of-plane pressure was applied to the infill surface using an airbag that
was housed in a reaction box made from plywood boards and stiffened with steel sections.
The reaction box was in turn connected to the RC frame using high strength bolts. All
specimens were clamped down to the strong floor using steel W-sections on either end of
the frame beam stem to prevent potential lateral or transverse movement. An air
compressor was used to inflate the airbag and the real-time pressure was measured using a
pressure transducer. The air pressure was applied gradually at a rate of approximately 1.5
kPa per minute until failure of the infill.
For the in-plane loading set up for specimens IF-D1 and IF-D2, a lateral in-plane load was
applied at the top beam level using a hydraulic actuator with a capacity of 250 kN. As
shown in Figure 5.3, the hydraulic actuator was attached to the column of an independent
reaction frame. A load cell was mounted at the end of the actuator to measure the applied
load. The bottom beam of the frame was braced against lateral movement. An example
load vs. displacement curve shown in Figure 5.4 indicates the pre-load and deformation
levels of specimens IF-D1 and IF-D2. Specimen IF-D1 was first subjected to in-plane
loading to the onset of first major diagonal cracking on the surface of the infill and then
the in-plane loading was removed. The specimen was subsequently subjected to the out-
of-plane pressure to failure. For specimen IF-D2, the in-plane loading was continued after
the first major diagonal cracking of the specimen till the specimen reached its lateral in-
plane capacity. At this point, the specimen has sustained extensive diagonal cracking as

88
well as exhibiting corner crushing at loaded corners. Then the in-plane loading was
removed, and the specimen was subsequently subjected to the out-of-plane pressure to
failure. Linear variable differential transformers (LVDTs) were used in all cases to measure
either the lateral or out-of-plane displacements of the infill and the frame (Figure 5.3). The
load and LVDT readings were monitored and recorded with an interval of 0.2 seconds
throughout the test using an electronic data acquisition system. For each test, the cracking
load, cracking pattern, ultimate load, and failure mode were noted.
Figure 5.2. Test set-up for out-of-plane loading of the specimens
Figure 5.3. Schematic test set-up for in-plane loading of specimens IF-D1 and IF-D2
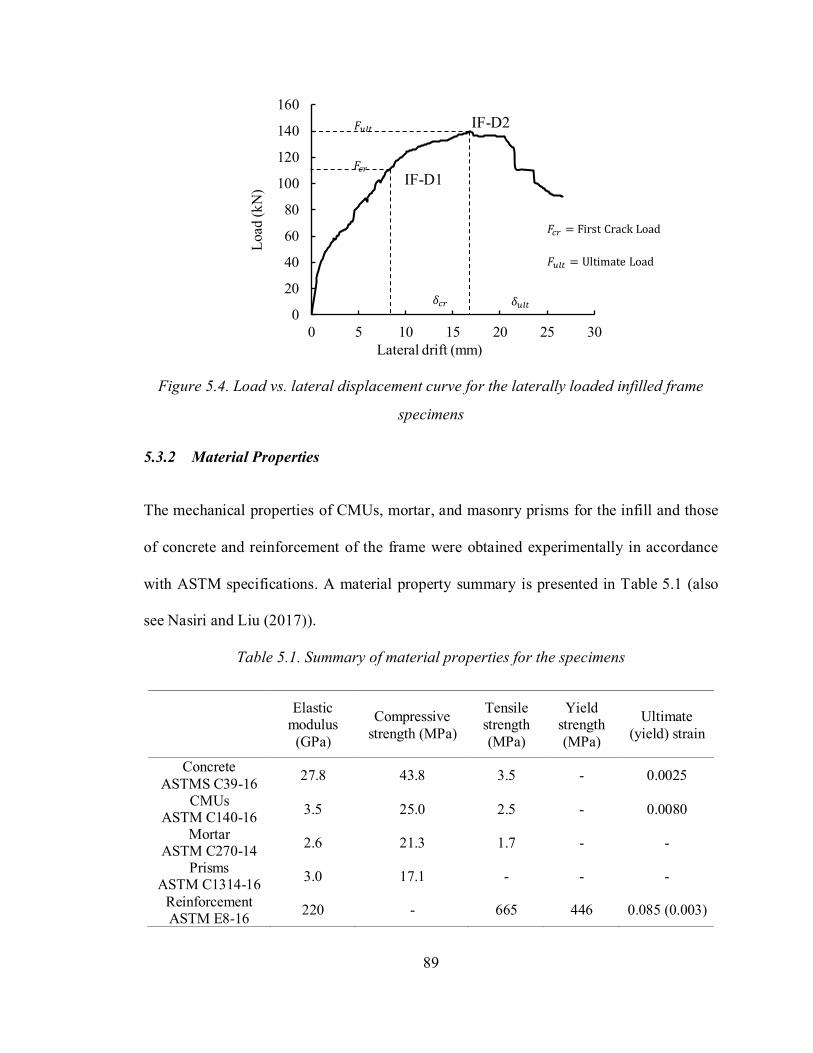
89
Figure 5.4. Load vs. lateral displacement curve for the laterally loaded infilled frame
specimens
5.3.2 Material Properties
The mechanical properties of CMUs, mortar, and masonry prisms for the infill and those
of concrete and reinforcement of the frame were obtained experimentally in accordance
with ASTM specifications. A material property summary is presented in Table 5.1 (also
see Nasiri and Liu (2017)).
Table 5.1. Summary of material properties for the specimens
Elastic
modulus
(GPa)
Compressive
strength (MPa)
Tensile strength
(MPa)
Yield strength
(MPa)
Ultimate
(yield) strain
Concrete
ASTMS C39-16 27.8 43.8 3.5 - 0.0025
CMUs ASTM C140-16
3.5 25.0 2.5 - 0.0080
Mortar ASTM C270-14
2.6 21.3 1.7 - -
Prisms ASTM C1314-16
3.0 17.1 - - -
Reinforcement ASTM E8-16
220 - 665 446 0.085 (0.003)
0
20
40
60
80
100
120
140
160
0 5 10 15 20 25 30
Load
(k
N)
Lateral drift (mm)
IF-D1
IF-D2
𝐹𝑐𝑟 = First Crack Load
𝐹𝑢𝑙𝑡 = Ultimate Load
𝛿𝑐𝑟 = First Crack Displacement
𝛿𝑢𝑙𝑡 = Displacement at Ultimate
𝐹𝑢𝑙𝑡
𝐹𝑐𝑟
𝛿𝑐𝑟
𝛿𝑢𝑙𝑡
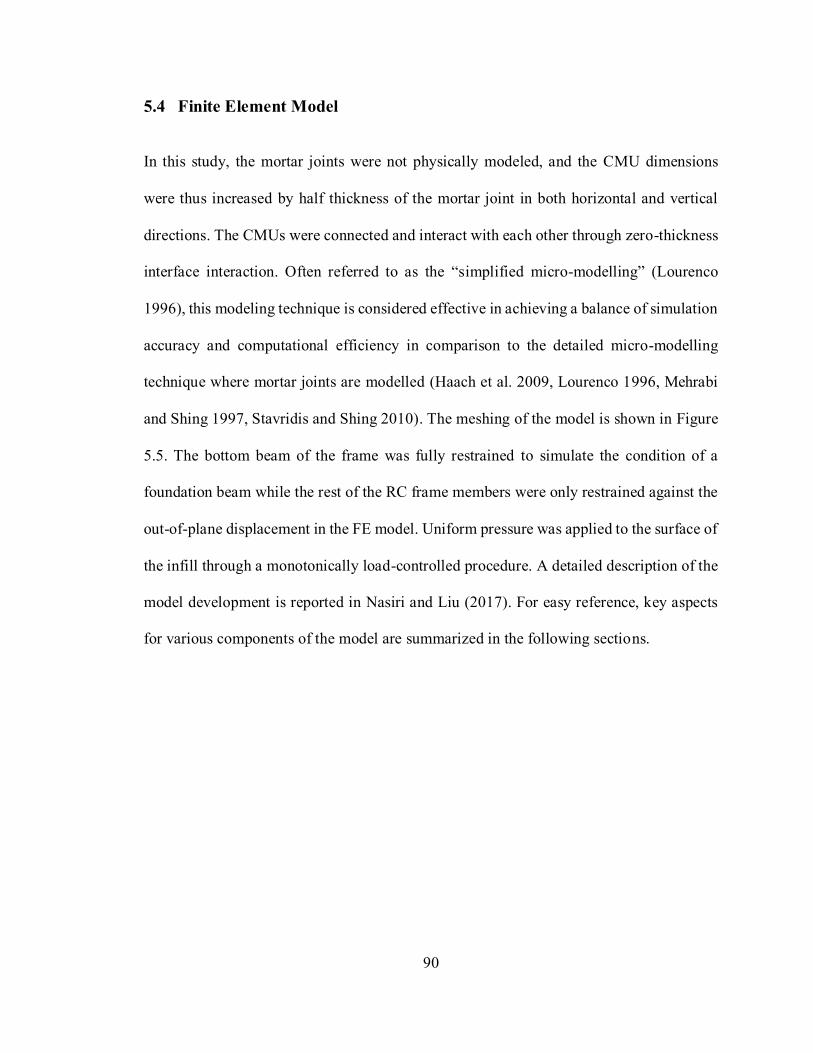
90
5.4 Finite Element Model
In this study, the mortar joints were not physically modeled, and the CMU dimensions
were thus increased by half thickness of the mortar joint in both horizontal and vertical
directions. The CMUs were connected and interact with each other through zero-thickness
interface interaction. Often referred to as the “simplified micro-modelling” (Lourenco
1996), this modeling technique is considered effective in achieving a balance of simulation
accuracy and computational efficiency in comparison to the detailed micro-modelling
technique where mortar joints are modelled (Haach et al. 2009, Lourenco 1996, Mehrabi
and Shing 1997, Stavridis and Shing 2010). The meshing of the model is shown in Figure
5.5. The bottom beam of the frame was fully restrained to simulate the condition of a
foundation beam while the rest of the RC frame members were only restrained against the
out-of-plane displacement in the FE model. Uniform pressure was applied to the surface of
the infill through a monotonically load-controlled procedure. A detailed description of the
model development is reported in Nasiri and Liu (2017). For easy reference, key aspects
for various components of the model are summarized in the following sections.
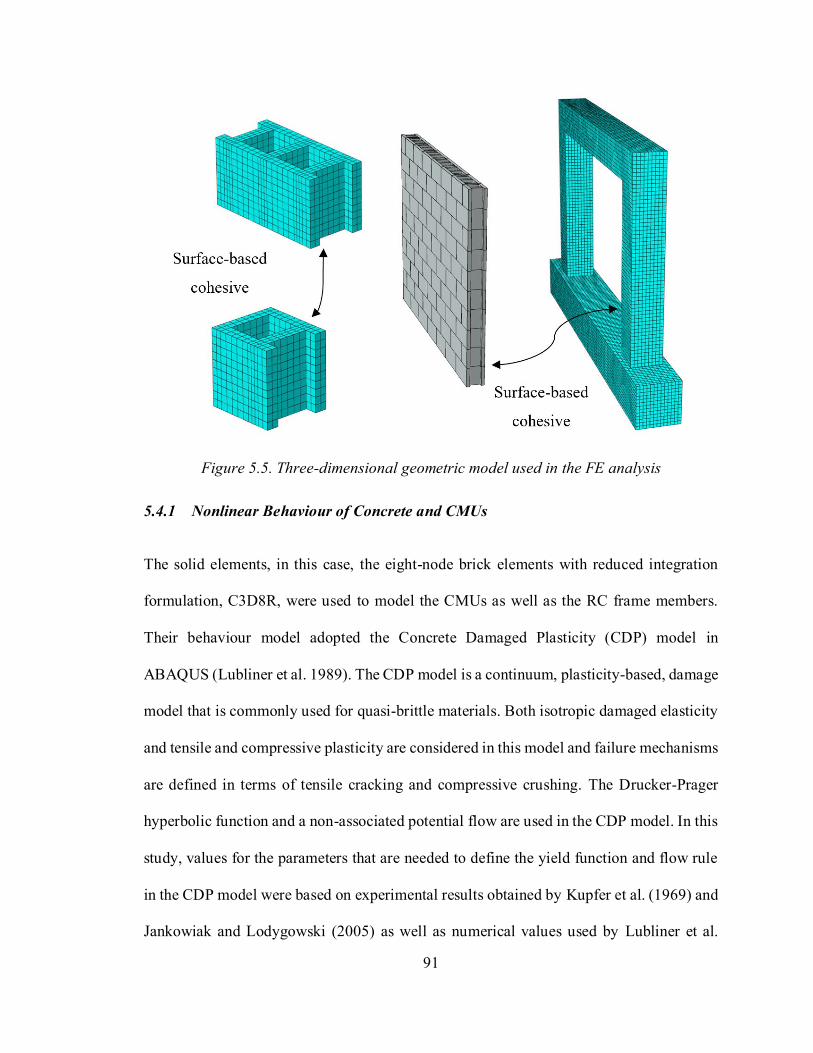
91
Figure 5.5. Three-dimensional geometric model used in the FE analysis
5.4.1 Nonlinear Behaviour of Concrete and CMUs
The solid elements, in this case, the eight-node brick elements with reduced integration
formulation, C3D8R, were used to model the CMUs as well as the RC frame members.
Their behaviour model adopted the Concrete Damaged Plasticity (CDP) model in
ABAQUS (Lubliner et al. 1989). The CDP model is a continuum, plasticity-based, damage
model that is commonly used for quasi-brittle materials. Both isotropic damaged elasticity
and tensile and compressive plasticity are considered in this model and failure mechanisms
are defined in terms of tensile cracking and compressive crushing. The Drucker-Prager
hyperbolic function and a non-associated potential flow are used in the CDP model. In this
study, values for the parameters that are needed to define the yield function and flow rule
in the CDP model were based on experimental results obtained by Kupfer et al. (1969) and
Jankowiak and Lodygowski (2005) as well as numerical values used by Lubliner et al.
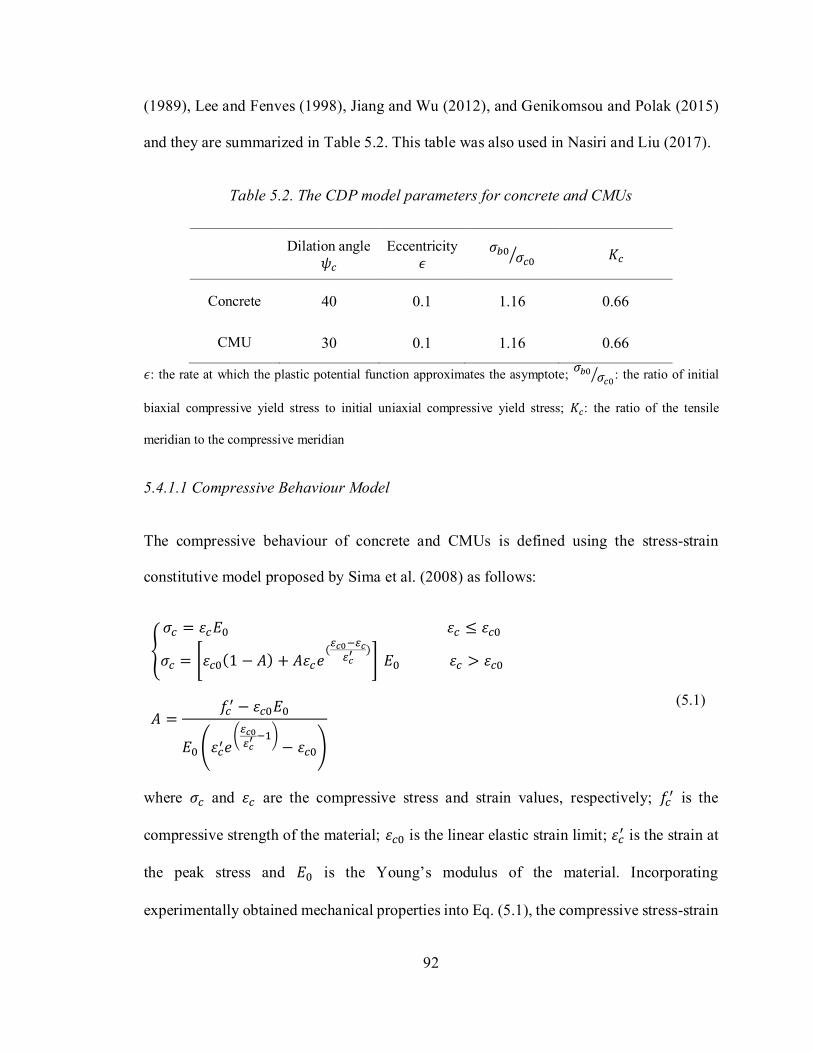
92
(1989), Lee and Fenves (1998), Jiang and Wu (2012), and Genikomsou and Polak (2015)
and they are summarized in Table 5.2. This table was also used in Nasiri and Liu (2017).
Table 5.2. The CDP model parameters for concrete and CMUs
Dilation angle
𝜓𝑐 Eccentricity
𝜖 𝜎𝑏0
𝜎𝑐0⁄ 𝐾𝑐
Concrete 40 0.1 1.16 0.66
CMU 30 0.1 1.16 0.66
𝜖: the rate at which the plastic potential function approximates the asymptote; 𝜎𝑏0
𝜎𝑐0⁄ : the ratio of initial
biaxial compressive yield stress to initial uniaxial compressive yield stress; 𝐾𝑐: the ratio of the tensile
meridian to the compressive meridian
5.4.1.1 Compressive Behaviour Model
The compressive behaviour of concrete and CMUs is defined using the stress-strain
constitutive model proposed by Sima et al. (2008) as follows:
{
𝜎𝑐 = 휀𝑐𝐸0 휀𝑐 ≤ 휀𝑐0
𝜎𝑐 = [휀𝑐0(1 − 𝐴) + 𝐴휀𝑐𝑒(𝜀𝑐0−𝜀𝑐𝜀𝑐′ )
] 𝐸0 휀𝑐 > 휀𝑐0
𝐴 =𝑓𝑐′ − 휀𝑐0𝐸0
𝐸0 (휀𝑐′𝑒(𝜀𝑐0𝜀𝑐′ −1)
− 휀𝑐0)
(5.1)
where 𝜎𝑐 and 휀𝑐 are the compressive stress and strain values, respectively; 𝑓𝑐′ is the
compressive strength of the material; 휀𝑐0 is the linear elastic strain limit; 휀𝑐′ is the strain at
the peak stress and 𝐸0 is the Young’s modulus of the material. Incorporating
experimentally obtained mechanical properties into Eq. (5.1), the compressive stress-strain
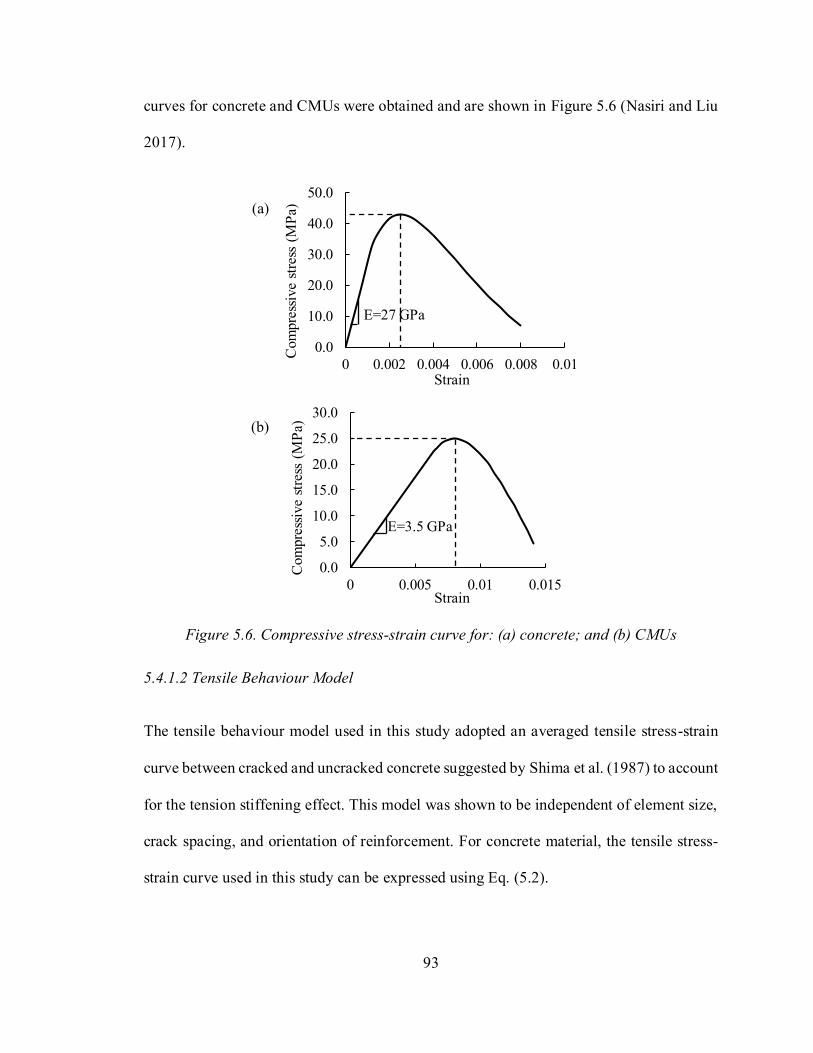
93
curves for concrete and CMUs were obtained and are shown in Figure 5.6 (Nasiri and Liu
2017).
Figure 5.6. Compressive stress-strain curve for: (a) concrete; and (b) CMUs
5.4.1.2 Tensile Behaviour Model
The tensile behaviour model used in this study adopted an averaged tensile stress-strain
curve between cracked and uncracked concrete suggested by Shima et al. (1987) to account
for the tension stiffening effect. This model was shown to be independent of element size,
crack spacing, and orientation of reinforcement. For concrete material, the tensile stress-
strain curve used in this study can be expressed using Eq. (5.2).
E=27 GPa
0.0
10.0
20.0
30.0
40.0
50.0
0 0.002 0.004 0.006 0.008 0.01
Com
pre
ssiv
e st
ress
(M
Pa)
Strain
E=3.5 GPa
0.0
5.0
10.0
15.0
20.0
25.0
30.0
0 0.005 0.01 0.015
Com
pre
ssiv
e st
ress
(M
Pa)
Strain
(a)
(b)

94
{
𝜎𝑡 = 휀𝑡𝐸0 휀𝑡 ≤ 휀𝑡0
𝜎𝑡 = 𝜎𝑡0 (휀𝑡0
휀𝑡)0.4
휀𝑡 > 휀𝑡0 (5.2)
where 𝜎𝑡 and 휀𝑡 are the tensile stress and strain values, respectively; 𝜎𝑡0 and 휀𝑡0 are the
linear elastic stress and strain limits, respectively. Incorporating experimental results of
concrete modulus and elastic stress and strain limit, the tensile stress-strain curve for
concrete was obtained as illustrated in Figure 5.7 (Nasiri and Liu 2017).
Figure 5.7. Tensile stress-strain curve for concrete
For CMUs, the tension stiffening effect described above is non-existent due to the absence
of steel reinforcement. The tensile behaviour is better described using a stress-crack
displacement curve in which the area under the curve represents the Mode I fracture energy
of the material (𝐺𝑓) (Hillerborg et al. 1976). Thus, the tensile behaviour model for CMUs
was defined by a linear elastic behaviour in the pre-cracking phase and a stress-crack
displacement curve in the post-cracking phase as shown in Figure 5.8 (Nasiri and Liu
2017). The fracture energy of the CMU material can be related to the compressive strength
of CMUs using Eq. (5.3) as suggested by Fib: Model Code (2012).
E= 27GPa
0.0
0.5
1.0
1.5
2.0
2.5
3.0
3.5
4.0
0 0.001 0.002 0.003
Ten
sile
str
ess
(MP
a)
Strain
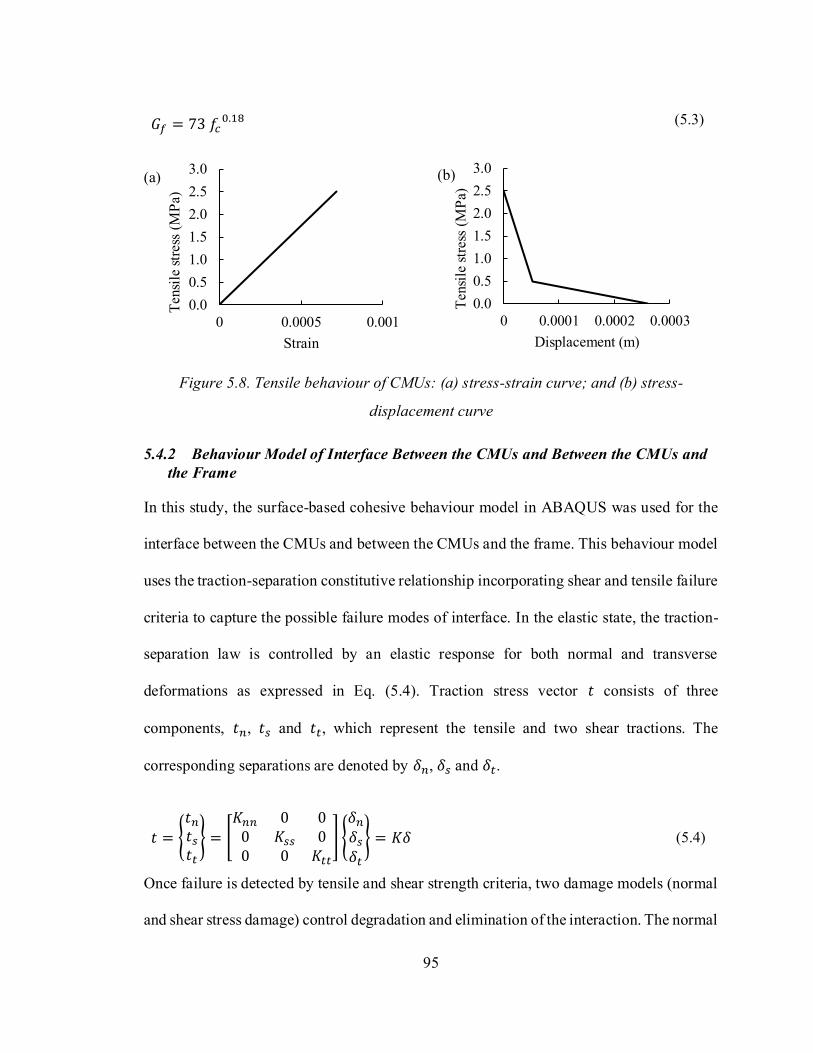
95
𝐺𝑓 = 73 𝑓𝑐0.18
(5.3)
Figure 5.8. Tensile behaviour of CMUs: (a) stress-strain curve; and (b) stress-
displacement curve
5.4.2 Behaviour Model of Interface Between the CMUs and Between the CMUs and
the Frame
In this study, the surface-based cohesive behaviour model in ABAQUS was used for the
interface between the CMUs and between the CMUs and the frame. This behaviour model
uses the traction-separation constitutive relationship incorporating shear and tensile failure
criteria to capture the possible failure modes of interface. In the elastic state, the traction-
separation law is controlled by an elastic response for both normal and transverse
deformations as expressed in Eq. (5.4). Traction stress vector 𝑡 consists of three
components, 𝑡𝑛, 𝑡𝑠 and 𝑡𝑡, which represent the tensile and two shear tractions. The
corresponding separations are denoted by 𝛿𝑛, 𝛿𝑠 and 𝛿𝑡.
𝑡 = {𝑡𝑛𝑡𝑠𝑡𝑡
} = [𝐾𝑛𝑛 0 00 𝐾𝑠𝑠 00 0 𝐾𝑡𝑡
] {𝛿𝑛𝛿𝑠𝛿𝑡
} = 𝐾𝛿 (5.4)
Once failure is detected by tensile and shear strength criteria, two damage models (normal
and shear stress damage) control degradation and elimination of the interaction. The normal
0.0
0.5
1.0
1.5
2.0
2.5
3.0
0 0.0005 0.001
Ten
sile
str
ess
(MP
a)
Strain
0.0
0.5
1.0
1.5
2.0
2.5
3.0
0 0.0001 0.0002 0.0003
Ten
sile
str
ess
(MP
a)
Displacement (m)
(a) (b)
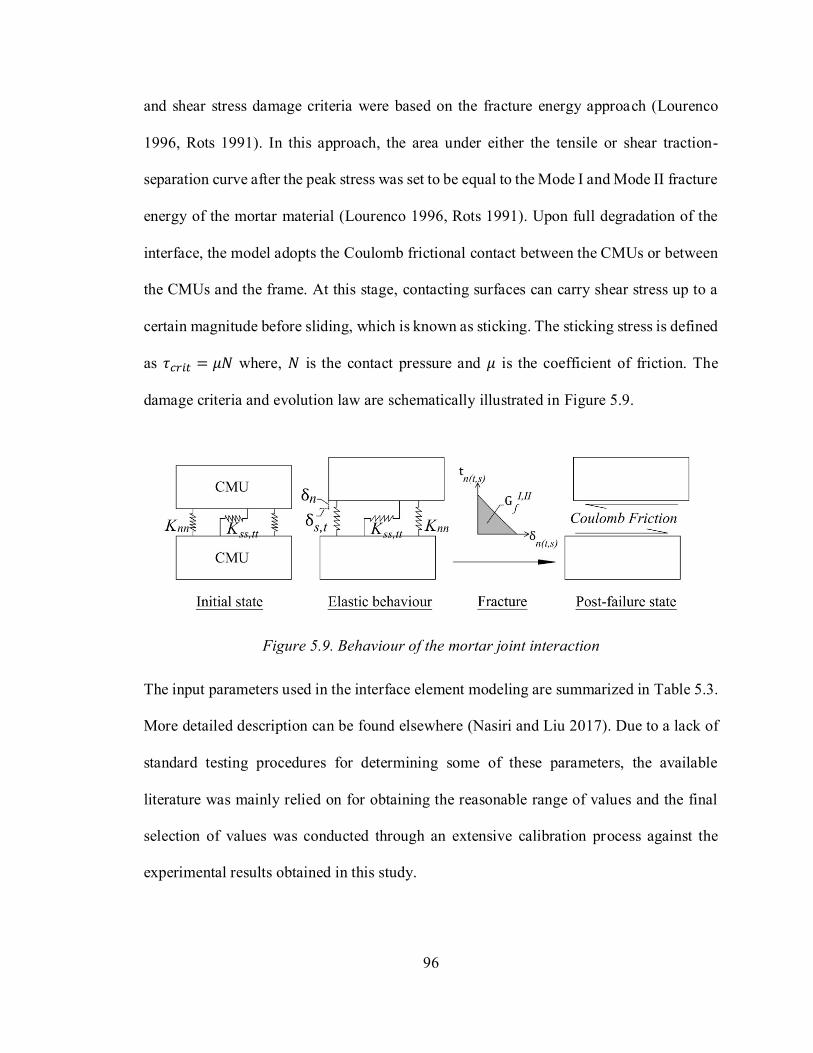
96
and shear stress damage criteria were based on the fracture energy approach (Lourenco
1996, Rots 1991). In this approach, the area under either the tensile or shear traction-
separation curve after the peak stress was set to be equal to the Mode I and Mode II fracture
energy of the mortar material (Lourenco 1996, Rots 1991). Upon full degradation of the
interface, the model adopts the Coulomb frictional contact between the CMUs or between
the CMUs and the frame. At this stage, contacting surfaces can carry shear stress up to a
certain magnitude before sliding, which is known as sticking. The sticking stress is defined
as 𝜏𝑐𝑟𝑖𝑡 = 𝜇𝑁 where, 𝑁 is the contact pressure and 𝜇 is the coefficient of friction. The
damage criteria and evolution law are schematically illustrated in Figure 5.9.
Figure 5.9. Behaviour of the mortar joint interaction
The input parameters used in the interface element modeling are summarized in Table 5.3.
More detailed description can be found elsewhere (Nasiri and Liu 2017). Due to a lack of
standard testing procedures for determining some of these parameters, the available
literature was mainly relied on for obtaining the reasonable range of values and the final
selection of values was conducted through an extensive calibration process against the
experimental results obtained in this study.
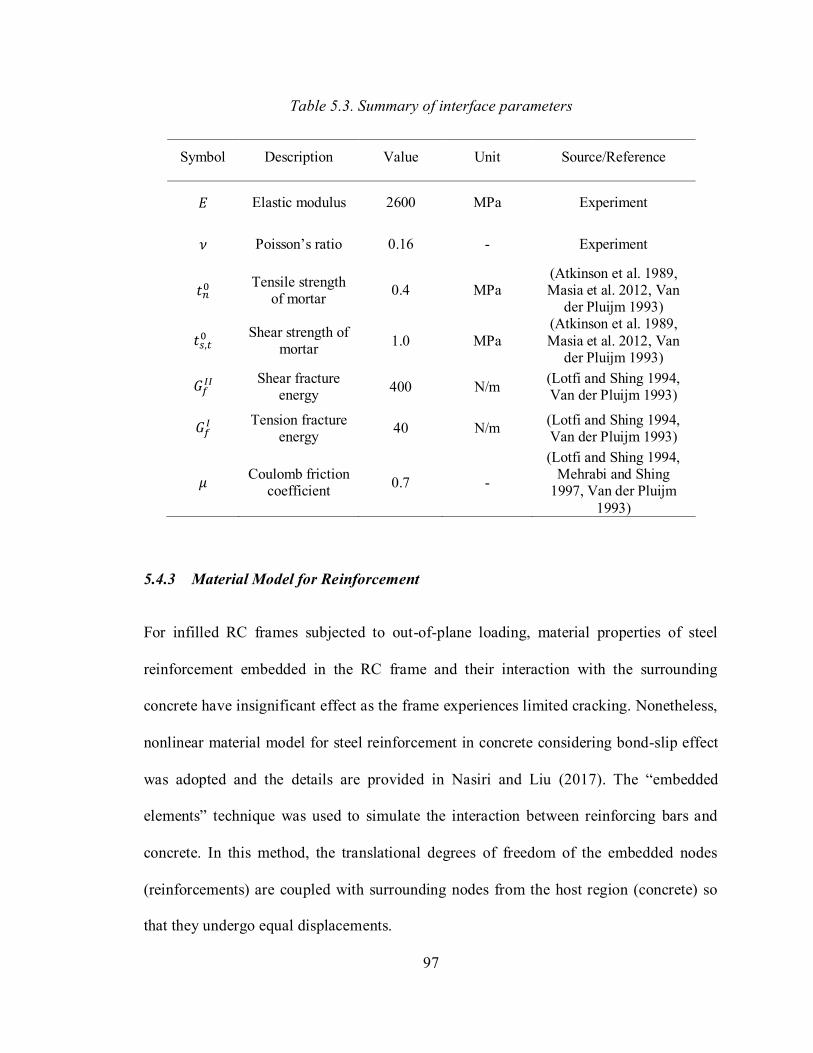
97
Table 5.3. Summary of interface parameters
Symbol Description Value Unit Source/Reference
𝐸 Elastic modulus 2600 MPa Experiment
𝜈 Poisson’s ratio 0.16 - Experiment
𝑡𝑛0
Tensile strength of mortar
0.4 MPa (Atkinson et al. 1989, Masia et al. 2012, Van
der Pluijm 1993)
𝑡𝑠,𝑡0
Shear strength of mortar
1.0 MPa
(Atkinson et al. 1989,
Masia et al. 2012, Van der Pluijm 1993)
𝐺𝑓𝐼𝐼
Shear fracture energy
400 N/m (Lotfi and Shing 1994, Van der Pluijm 1993)
𝐺𝑓𝐼
Tension fracture energy
40 N/m (Lotfi and Shing 1994, Van der Pluijm 1993)
𝜇 Coulomb friction
coefficient 0.7 -
(Lotfi and Shing 1994, Mehrabi and Shing
1997, Van der Pluijm
1993)
5.4.3 Material Model for Reinforcement
For infilled RC frames subjected to out-of-plane loading, material properties of steel
reinforcement embedded in the RC frame and their interaction with the surrounding
concrete have insignificant effect as the frame experiences limited cracking. Nonetheless,
nonlinear material model for steel reinforcement in concrete considering bond-slip effect
was adopted and the details are provided in Nasiri and Liu (2017). The “embedded
elements” technique was used to simulate the interaction between reinforcing bars and
concrete. In this method, the translational degrees of freedom of the embedded nodes
(reinforcements) are coupled with surrounding nodes from the host region (concrete) so
that they undergo equal displacements.
98
5.4.4 Analysis Procedure
A mesh density study was first performed. The FE load vs. displacement curves with
varying element sizes were compared and it was determined that 10 and 20 mm elements
were adequate for discretization of the CMUs and RC frame, respectively. The mesh
density was increased at the webs of the CMUs by using 5 mm elements to capture the
effects of stress concentration and large deformation in the webs of masonry units.
In this study, ABAQUS/CAE and ABAQUS/EXPLICIT were chosen for generation and
analysis of the model, respectively. The ABAQUS/EXPLICIT uses the central difference
method (CDM) to solve the equation of motion of a nonlinear problem. The advantage of
CDM is that the time-marching update equations are EXPLICIT, so that no iterations are
needed to find the new displacements which satisfy the equation of motion. This method
is preferred for computation problems involving complicated nonlinear constitutive laws
and large deformations and is especially effective for prediction of post-failure behaviour.
The EXPLICIT procedure uses a large number of small time increments to ensure the
accuracy of analysis (D.S.Simulia 2010).
5.5 Validation of the Model
As the discretization is carried out at the masonry unit block level, the constitutive
relationship of the CMUs and the interaction model between CMUs are critical to the
accuracy of the final infill model. The validation of the model was then first performed
using the prism test results. The FE obtained stress-strain relationships for CMUs and
three-high prisms are shown in Figure 5.10. Referring to Figure 5.10, the FE results
predicted the strength and modulus of elasticity of both CMUs and prisms with marked
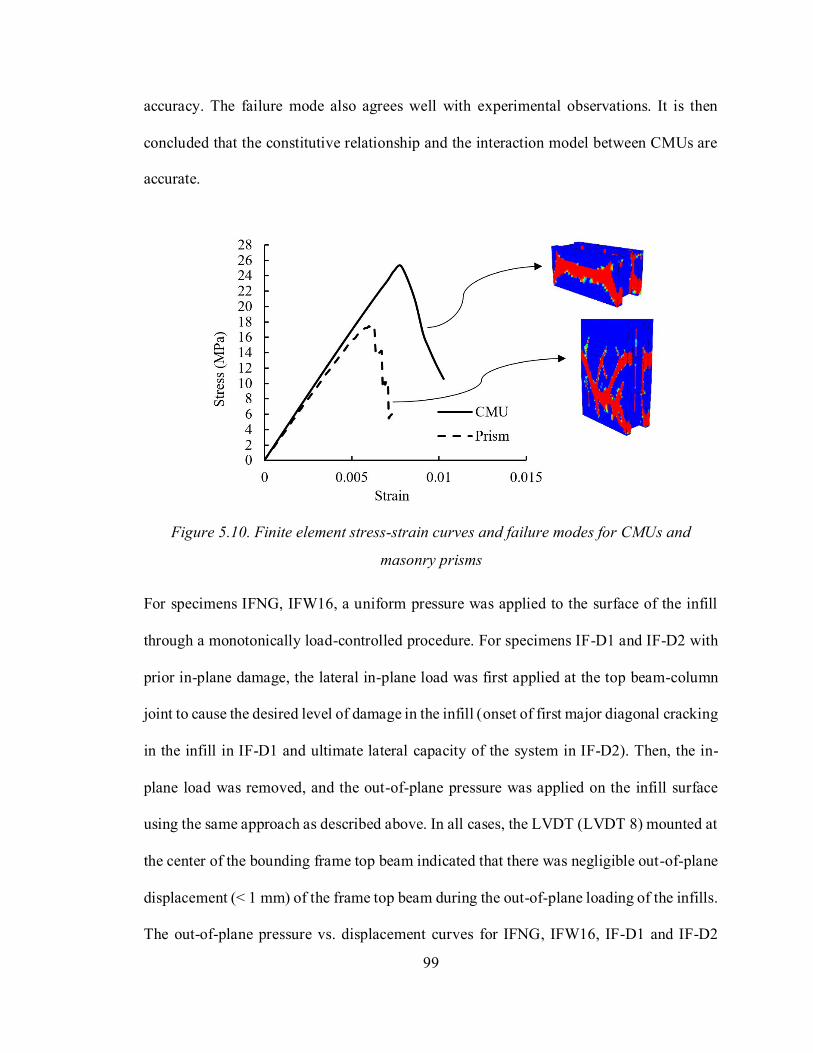
99
accuracy. The failure mode also agrees well with experimental observations. It is then
concluded that the constitutive relationship and the interaction model between CMUs are
accurate.
Figure 5.10. Finite element stress-strain curves and failure modes for CMUs and
masonry prisms
For specimens IFNG, IFW16, a uniform pressure was applied to the surface of the infill
through a monotonically load-controlled procedure. For specimens IF-D1 and IF-D2 with
prior in-plane damage, the lateral in-plane load was first applied at the top beam-column
joint to cause the desired level of damage in the infill (onset of first major diagonal cracking
in the infill in IF-D1 and ultimate lateral capacity of the system in IF-D2). Then, the in-
plane load was removed, and the out-of-plane pressure was applied on the infill surface
using the same approach as described above. In all cases, the LVDT (LVDT 8) mounted at
the center of the bounding frame top beam indicated that there was negligible out-of-plane
displacement (< 1 mm) of the frame top beam during the out-of-plane loading of the infills.
The out-of-plane pressure vs. displacement curves for IFNG, IFW16, IF-D1 and IF-D2
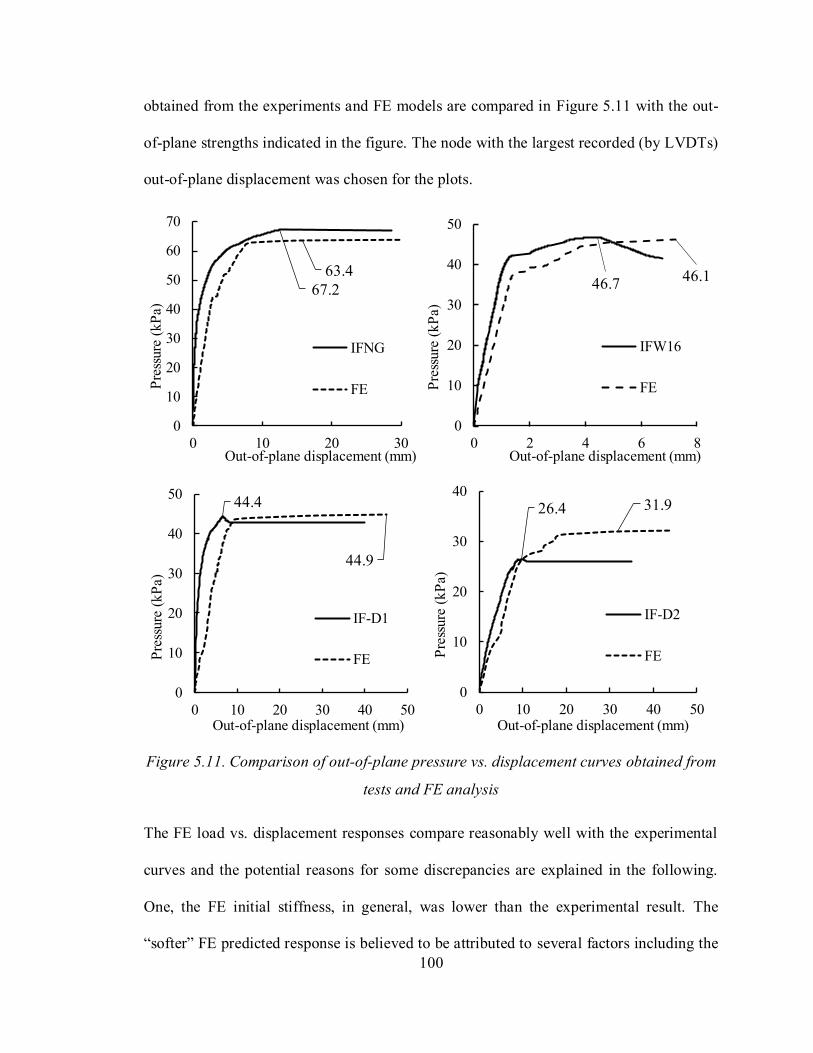
100
obtained from the experiments and FE models are compared in Figure 5.11 with the out-
of-plane strengths indicated in the figure. The node with the largest recorded (by LVDTs)
out-of-plane displacement was chosen for the plots.
Figure 5.11. Comparison of out-of-plane pressure vs. displacement curves obtained from
tests and FE analysis
The FE load vs. displacement responses compare reasonably well with the experimental
curves and the potential reasons for some discrepancies are explained in the following.
One, the FE initial stiffness, in general, was lower than the experimental result. The
“softer” FE predicted response is believed to be attributed to several factors including the
67.2
63.4
0
10
20
30
40
50
60
70
0 10 20 30
Pre
ssure
(k
Pa)
Out-of-plane displacement (mm)
IFNG
FE
46.746.1
0
10
20
30
40
50
0 2 4 6 8P
ress
ure
(k
Pa)
Out-of-plane displacement (mm)
IFW16
FE
44.4
44.9
0
10
20
30
40
50
0 10 20 30 40 50
Pre
ssure
(k
Pa)
Out-of-plane displacement (mm)
IF-D1
FE
26.4 31.9
0
10
20
30
40
0 10 20 30 40 50
Pre
ssure
(k
Pa)
Out-of-plane displacement (mm)
IF-D2
FE

101
use of reduced integration elements, reduced elastic modulus used in steel reinforcements
to account for bond-slip, and the manner that the contact was modelled in the FE method.
In this study, the contact behaviour between CMUs was essentially modelled with
“springs” (Figure 5.9). The stiffness of these springs was adjusted during analysis to limit
the penetration of the two contacting CMU surfaces based on a set penetration tolerance
value, an approach referred to as “penalty method” in ABAQUS. Although this value is set
to be very small, it needs to be simulated in all mortar joints throughout the height and
width of the infill, and the accumulated effect causes the infill to be less stiff than the actual
situation. This discrepancy can be reduced to certain degree by assuming a much higher
spring stiffness or a smaller penetration tolerance value or using a finer mesh but all at the
expense of a significant increase in computing time. Since the overall response trend and
the ultimate load compare well with the experimental results, it is felt that the assumption
used in this study achieved a balance of reasonable accuracy and computing efficiency.
Second, the most significant difference in response was observed in IF-D2. This deviation
is believed to be attributed to inherent weakness of the finite element model in general in
handling excessive deformations. As in this case, large diagonal cracks and crushing of the
infill which have occurred during the in-plane loading stage caused large distortions in the
elements, resulting in lower accuracy in the out-of-plane simulation. It should be pointed
out that same values of the input parameters were used for all specimens and no “tweaking”
of these values was performed to achieve a “perfect” fit for each specimen. Although there
is some less than “perfect” fit in the curves, it is felt that the comparison has demonstrated
the robustness and efficacy of the model.
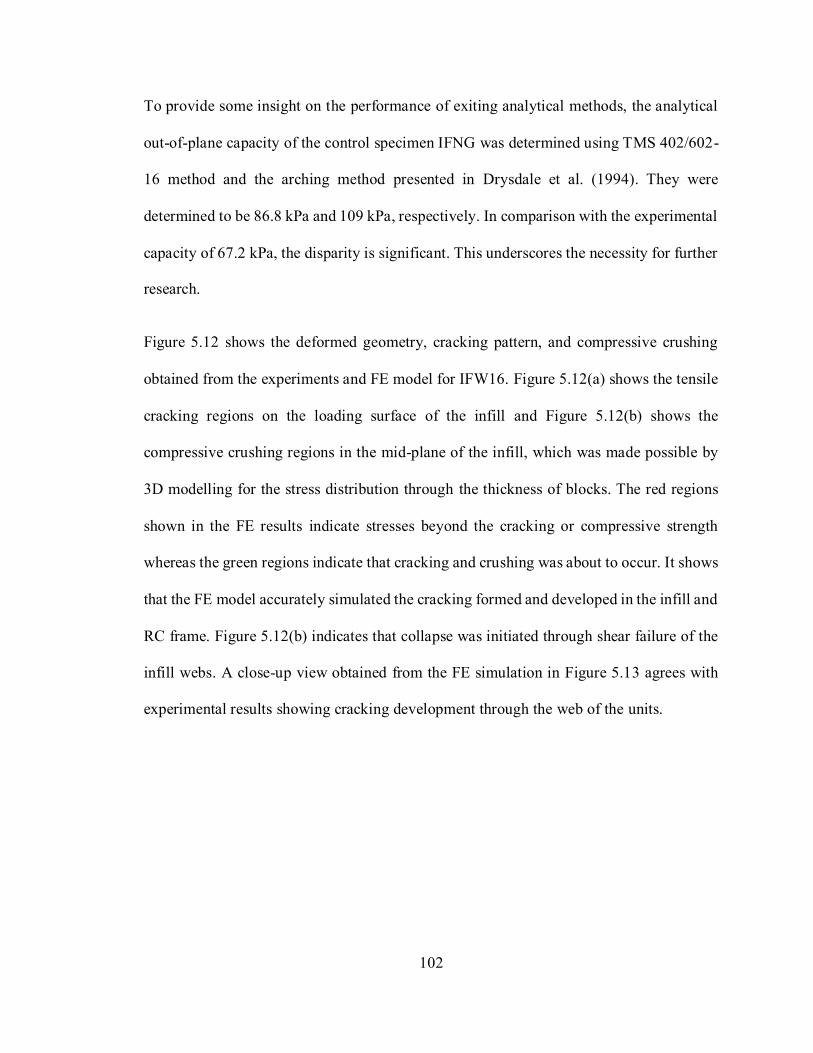
102
To provide some insight on the performance of exiting analytical methods, the analytical
out-of-plane capacity of the control specimen IFNG was determined using TMS 402/602-
16 method and the arching method presented in Drysdale et al. (1994). They were
determined to be 86.8 kPa and 109 kPa, respectively. In comparison with the experimental
capacity of 67.2 kPa, the disparity is significant. This underscores the necessity for further
research.
Figure 5.12 shows the deformed geometry, cracking pattern, and compressive crushing
obtained from the experiments and FE model for IFW16. Figure 5.12(a) shows the tensile
cracking regions on the loading surface of the infill and Figure 5.12(b) shows the
compressive crushing regions in the mid-plane of the infill, which was made possible by
3D modelling for the stress distribution through the thickness of blocks. The red regions
shown in the FE results indicate stresses beyond the cracking or compressive strength
whereas the green regions indicate that cracking and crushing was about to occur. It shows
that the FE model accurately simulated the cracking formed and developed in the infill and
RC frame. Figure 5.12(b) indicates that collapse was initiated through shear failure of the
infill webs. A close-up view obtained from the FE simulation in Figure 5.13 agrees with
experimental results showing cracking development through the web of the units.
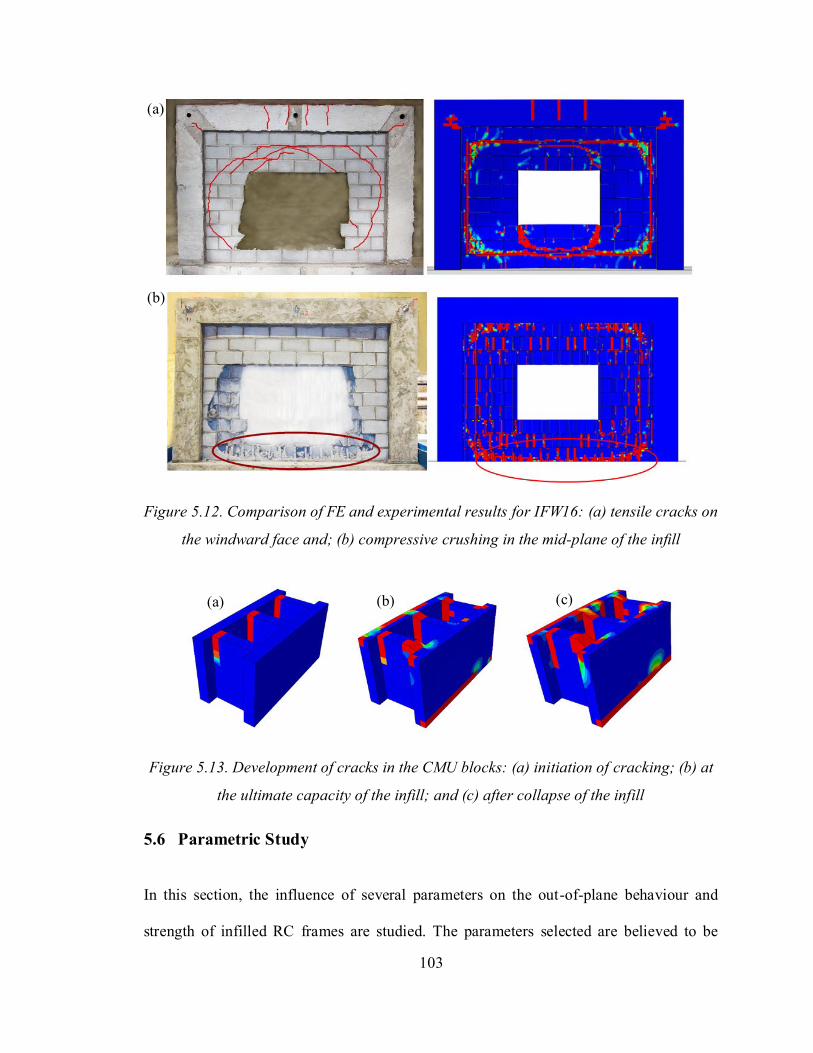
103
Figure 5.12. Comparison of FE and experimental results for IFW16: (a) tensile cracks on
the windward face and; (b) compressive crushing in the mid-plane of the infill
Figure 5.13. Development of cracks in the CMU blocks: (a) initiation of cracking; (b) at
the ultimate capacity of the infill; and (c) after collapse of the infill
5.6 Parametric Study
In this section, the influence of several parameters on the out-of-plane behaviour and
strength of infilled RC frames are studied. The parameters selected are believed to be
(a)
(b)
(c) (a) (b)
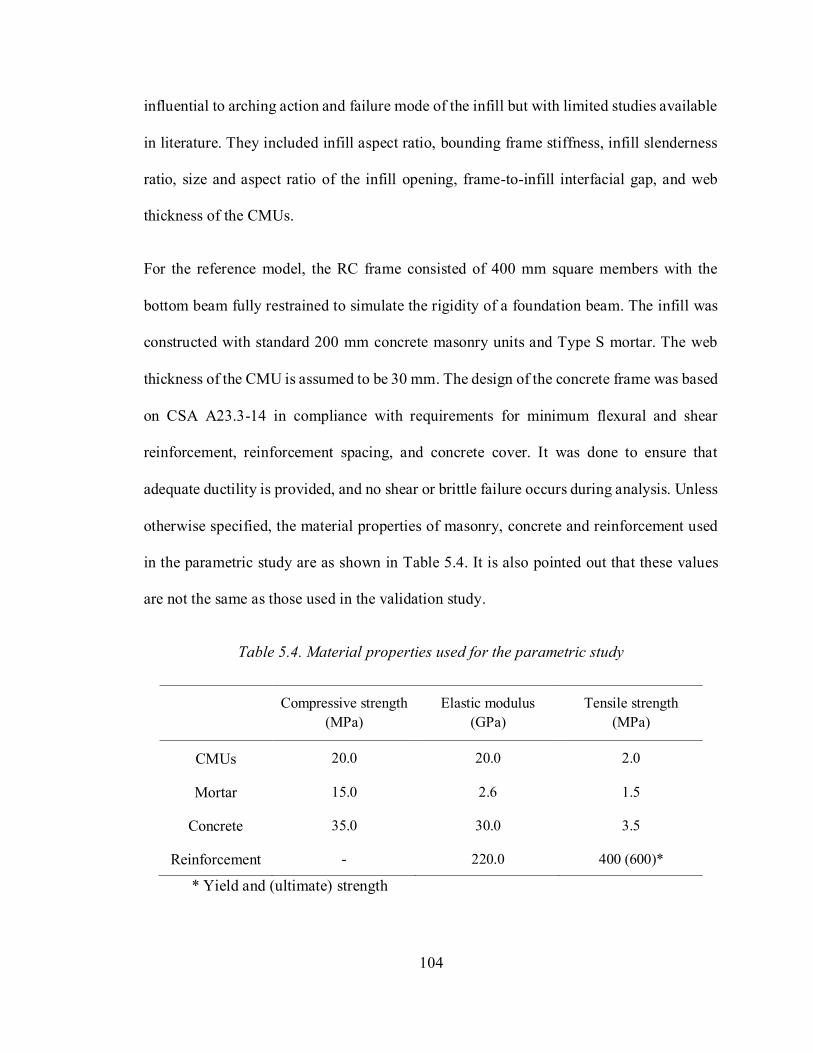
104
influential to arching action and failure mode of the infill but with limited studies available
in literature. They included infill aspect ratio, bounding frame stiffness, infill slenderness
ratio, size and aspect ratio of the infill opening, frame-to-infill interfacial gap, and web
thickness of the CMUs.
For the reference model, the RC frame consisted of 400 mm square members with the
bottom beam fully restrained to simulate the rigidity of a foundation beam. The infill was
constructed with standard 200 mm concrete masonry units and Type S mortar. The web
thickness of the CMU is assumed to be 30 mm. The design of the concrete frame was based
on CSA A23.3-14 in compliance with requirements for minimum flexural and shear
reinforcement, reinforcement spacing, and concrete cover. It was done to ensure that
adequate ductility is provided, and no shear or brittle failure occurs during analysis. Unless
otherwise specified, the material properties of masonry, concrete and reinforcement used
in the parametric study are as shown in Table 5.4. It is also pointed out that these values
are not the same as those used in the validation study.
Table 5.4. Material properties used for the parametric study
Compressive strength
(MPa)
Elastic modulus
(GPa)
Tensile strength
(MPa)
CMUs 20.0 20.0 2.0
Mortar 15.0 2.6 1.5
Concrete 35.0 30.0 3.5
Reinforcement - 220.0 400 (600)*
* Yield and (ultimate) strength
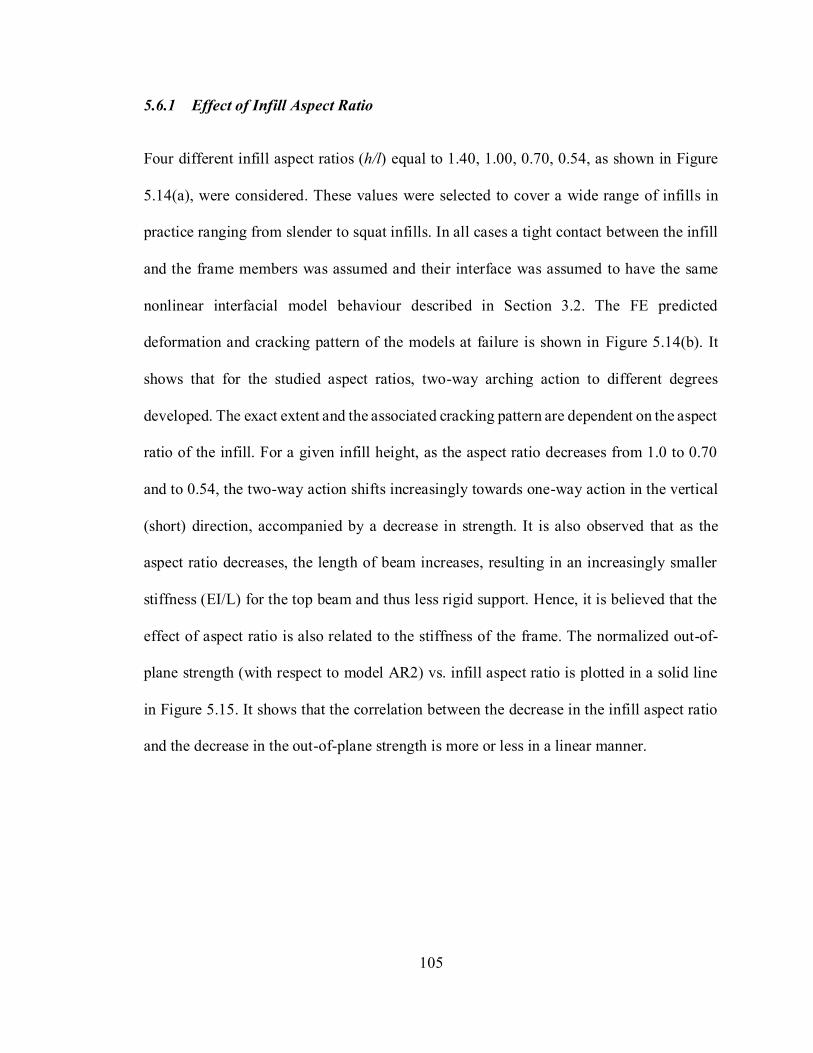
105
5.6.1 Effect of Infill Aspect Ratio
Four different infill aspect ratios (h/l) equal to 1.40, 1.00, 0.70, 0.54, as shown in Figure
5.14(a), were considered. These values were selected to cover a wide range of infills in
practice ranging from slender to squat infills. In all cases a tight contact between the infill
and the frame members was assumed and their interface was assumed to have the same
nonlinear interfacial model behaviour described in Section 3.2. The FE predicted
deformation and cracking pattern of the models at failure is shown in Figure 5.14(b). It
shows that for the studied aspect ratios, two-way arching action to different degrees
developed. The exact extent and the associated cracking pattern are dependent on the aspect
ratio of the infill. For a given infill height, as the aspect ratio decreases from 1.0 to 0.70
and to 0.54, the two-way action shifts increasingly towards one-way action in the vertical
(short) direction, accompanied by a decrease in strength. It is also observed that as the
aspect ratio decreases, the length of beam increases, resulting in an increasingly smaller
stiffness (EI/L) for the top beam and thus less rigid support. Hence, it is believed that the
effect of aspect ratio is also related to the stiffness of the frame. The normalized out-of-
plane strength (with respect to model AR2) vs. infill aspect ratio is plotted in a solid line
in Figure 5.15. It shows that the correlation between the decrease in the infill aspect ratio
and the decrease in the out-of-plane strength is more or less in a linear manner.

106
Figure 5.14. Infill aspect ratio study: (a) geometric configuration; and (b) failure mode
for varying aspect ratios
5.6.2 Effect of Frame Stiffness
In the frame stiffness study, two steps were taken. First, the FE analysis was repeated on
models AR1 to AR4 but with a fully rigid frame (stiffness approaches infinity). The results
are plotted in Figure 5.15 in a dotted line where the normalized out-of-plane strength (with
respect to model AR2) is used. It shows that when a rigid frame is assumed, the decreasing
trend in the infill strength with the decrease in infill aspect ratio is still valid. However, the
correlation is nonlinear. The out-of-plane strength is shown to be greater than that of the
original frame. The degree of increase is the greatest for model AR4 with a 28% increase
which is followed by model AR3 with a 14%, model AR1 with a 6% and model AR2 with
a 3% increase. This confirms that the effect of infill aspect ratio is dependent on the
bounding frame stiffness. As the original model AR4 has the lowest top beam stiffness,
implementation of a rigid beam would result in the maximum strength increase. Secondly,
while maintaining the aspect ratio, the FE analysis was repeated for all models with beam
(b)
(a)
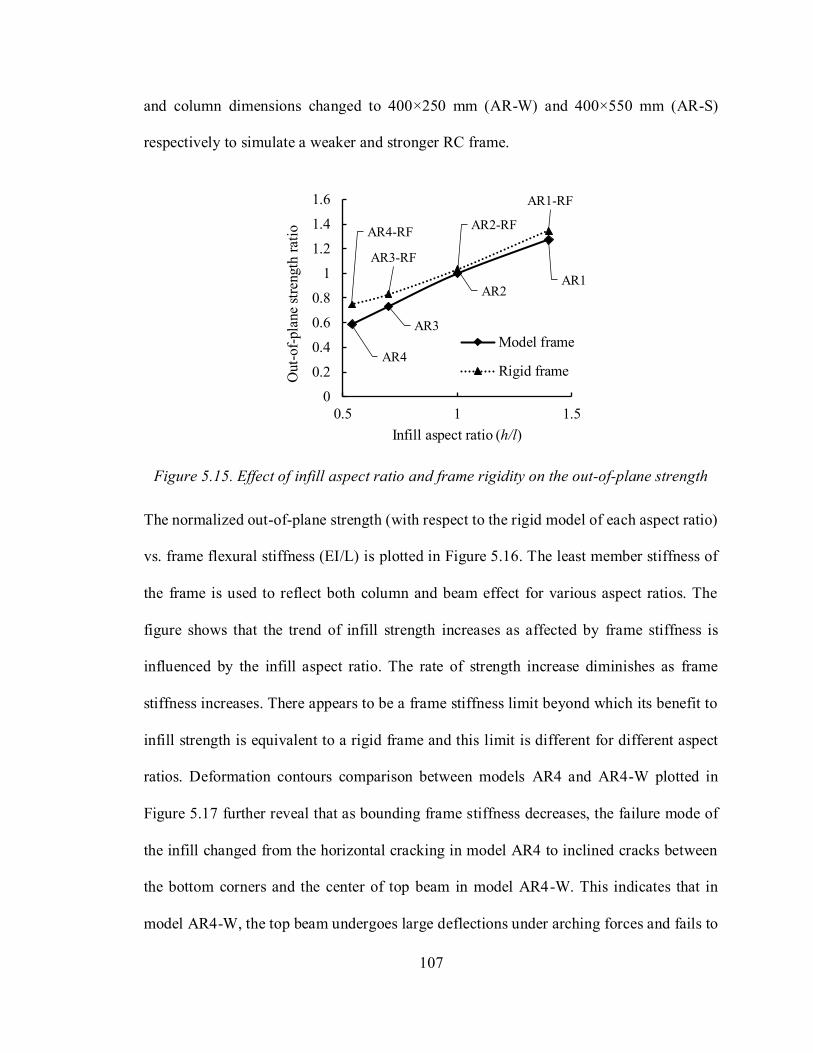
107
and column dimensions changed to 400×250 mm (AR-W) and 400×550 mm (AR-S)
respectively to simulate a weaker and stronger RC frame.
Figure 5.15. Effect of infill aspect ratio and frame rigidity on the out-of-plane strength
The normalized out-of-plane strength (with respect to the rigid model of each aspect ratio)
vs. frame flexural stiffness (EI/L) is plotted in Figure 5.16. The least member stiffness of
the frame is used to reflect both column and beam effect for various aspect ratios. The
figure shows that the trend of infill strength increases as affected by frame stiffness is
influenced by the infill aspect ratio. The rate of strength increase diminishes as frame
stiffness increases. There appears to be a frame stiffness limit beyond which its benefit to
infill strength is equivalent to a rigid frame and this limit is different for different aspect
ratios. Deformation contours comparison between models AR4 and AR4-W plotted in
Figure 5.17 further reveal that as bounding frame stiffness decreases, the failure mode of
the infill changed from the horizontal cracking in model AR4 to inclined cracks between
the bottom corners and the center of top beam in model AR4-W. This indicates that in
model AR4-W, the top beam undergoes large deflections under arching forces and fails to
AR1
AR2-RF
AR3
AR4
AR1-RF
AR2
AR3-RF
AR4-RF
0
0.2
0.4
0.6
0.8
1
1.2
1.4
1.6
0.5 1 1.5
Out-
of-
pla
ne
stre
ngth
rat
io
Infill aspect ratio (h/l)
Model frame
Rigid frame
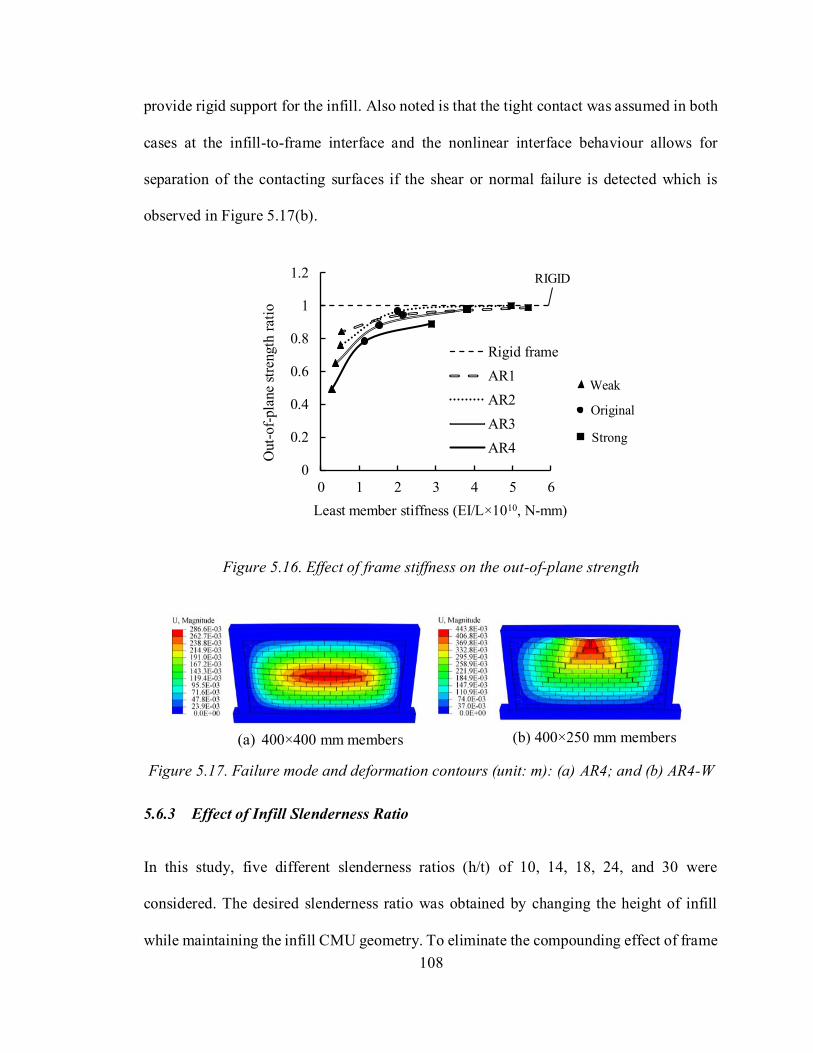
108
provide rigid support for the infill. Also noted is that the tight contact was assumed in both
cases at the infill-to-frame interface and the nonlinear interface behaviour allows for
separation of the contacting surfaces if the shear or normal failure is detected which is
observed in Figure 5.17(b).
Figure 5.16. Effect of frame stiffness on the out-of-plane strength
Figure 5.17. Failure mode and deformation contours (unit: m): (a) AR4; and (b) AR4-W
5.6.3 Effect of Infill Slenderness Ratio
In this study, five different slenderness ratios (h/t) of 10, 14, 18, 24, and 30 were
considered. The desired slenderness ratio was obtained by changing the height of infill
while maintaining the infill CMU geometry. To eliminate the compounding effect of frame
RIGID
0
0.2
0.4
0.6
0.8
1
1.2
0 1 2 3 4 5 6
Out-
of-
pla
ne
stre
ngth
rat
io
Least member stiffness (EI/L×1010, N-mm)
Rigid frame
AR1
AR2
AR3
AR4
(a) 400×400 mm members (b) 400×250 mm members
Original
Weak
Strong

109
stiffness due to changing the infill height, the FE analysis was first carried out assuming
fully rigid frames. The resulted out-of-plane pressure vs. slenderness ratios curves are
plotted in Figure 5.18(a) for four aspect ratios (h/l) of the infill. The figure shows that the
slenderness ratio effect is dependent on the infill aspect ratio. For a given aspect ratio, an
increase in slenderness ratio resulted in an exponential decrease in the out-of-plane
strength. While the reduction trend was similar for all aspect ratios, the difference is noted
that for a given slenderness ratio, infills with a higher aspect ratio (slender infills) attained
a higher strength than squat infills, and this increase in strength is most pronounced in the
low slenderness region. Next, the FE analysis was carried out on the model frame (400 mm
square sections for both beams and columns) as specified in the parametric study and the
results for a square panel (h/l=1) are shown in Figure 5.18(b). It shows that the slenderness
ratio effect is also dependent on the stiffness of the bounding frame. For the model frame,
while the general exponential decreasing trend in strength as slenderness increases remains
valid, when compared with the fully rigid frame, the strength reduction is increasingly
significant for the higher slenderness region (h/t>15). In the lower slenderness region
(h/t<15), the reduction trend between the fully rigid and the model frame is nearly identical,
it is reasonable to deduce that the larger strength deviation observed in the higher
slenderness region is mainly due to the decrease in frame stiffness as a result of infill panel
size increase rather than the reduction in frame member section size.
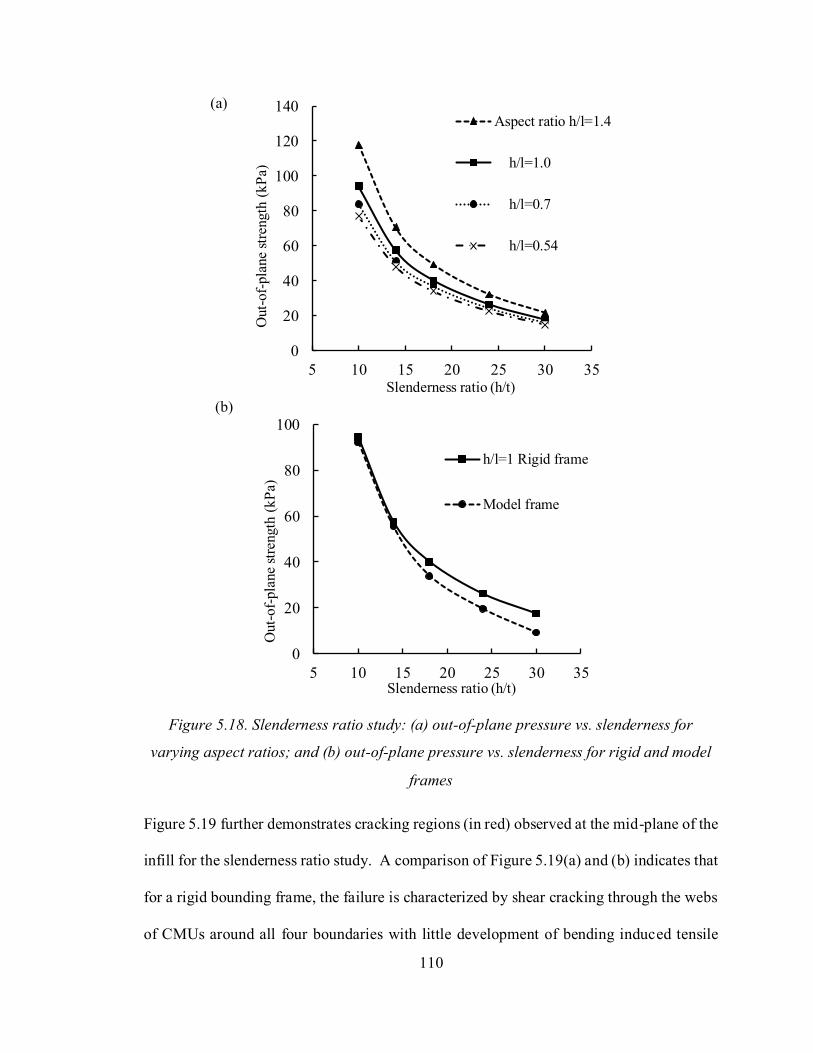
110
Figure 5.18. Slenderness ratio study: (a) out-of-plane pressure vs. slenderness for
varying aspect ratios; and (b) out-of-plane pressure vs. slenderness for rigid and model
frames
Figure 5.19 further demonstrates cracking regions (in red) observed at the mid-plane of the
infill for the slenderness ratio study. A comparison of Figure 5.19(a) and (b) indicates that
for a rigid bounding frame, the failure is characterized by shear cracking through the webs
of CMUs around all four boundaries with little development of bending induced tensile
0
20
40
60
80
100
120
140
5 10 15 20 25 30 35
Out-
of-
pla
ne
stre
ngth
(k
Pa)
Slenderness ratio (h/t)
Aspect ratio h/l=1.4
h/l=1.0
h/l=0.7
h/l=0.54
0
20
40
60
80
100
5 10 15 20 25 30 35
Out-
of-
pla
ne
stre
ngth
(k
Pa)
Slenderness ratio (h/t)
h/l=1 Rigid frame
Model frame
(a)
(b)
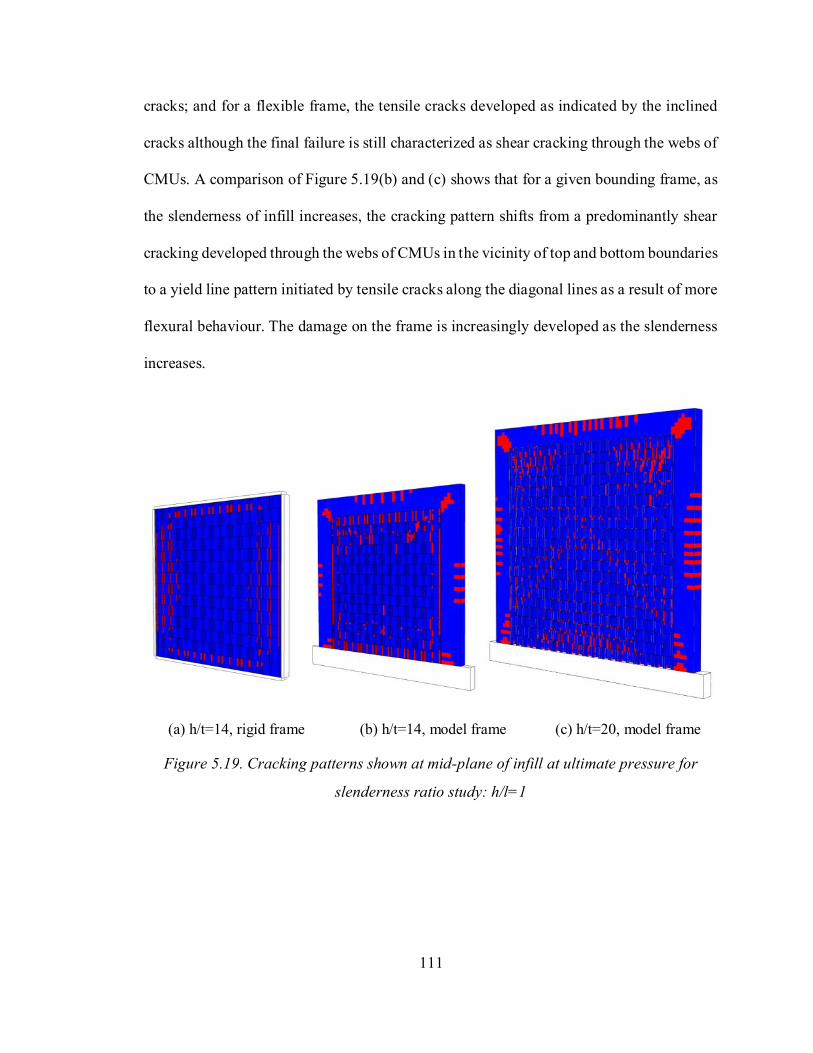
111
cracks; and for a flexible frame, the tensile cracks developed as indicated by the inclined
cracks although the final failure is still characterized as shear cracking through the webs of
CMUs. A comparison of Figure 5.19(b) and (c) shows that for a given bounding frame, as
the slenderness of infill increases, the cracking pattern shifts from a predominantly shear
cracking developed through the webs of CMUs in the vicinity of top and bottom boundaries
to a yield line pattern initiated by tensile cracks along the diagonal lines as a result of more
flexural behaviour. The damage on the frame is increasingly developed as the slenderness
increases.
(a) h/t=14, rigid frame (b) h/t=14, model frame (c) h/t=20, model frame
Figure 5.19. Cracking patterns shown at mid-plane of infill at ultimate pressure for
slenderness ratio study: h/l=1

112
5.6.4 Effect of Size and Aspect Ratio of Openings
Three opening sizes representing 13%, 23%, and 36% of the infill area while having the
same opening aspect ratio (h0/l0=1) were considered on model AR3 as shown in Figure
5.20(a). Figure 5.20(b) plots the normalized strength of infills with openings with respect
to the corresponding solid infill vs. opening area ratio. The figure indicates that the infills
with openings attained higher strengths than the solid infills and the larger the opening, the
higher the strength. The rate of strength increase as a function of opening area ratio appears
to be linear for opening areas investigated. This finding, in line with observation made by
Mays et al. (1998), is believed to apply to non-blast resisting openings where the out-of-
plane pressure was only applied to the solid parts of the infill and no force was applied to
the opening area. This results in a reduction in the total force applied to the infill as well as
the area available for arching. In the case of a blast-resisting opening, the opening study
was repeated for models OS1 to OS3 where the pressure acting on the opening area was
simulated as a line load on the boundary of the opening. The results in terms of normalized
strengths are also plotted in Figure 5.20(b). It shows that for blast resisting opening, the
presence of opening results in a strength reduction around 20%, and this reduction seems
to remain more or less the same for three opening sizes considered.
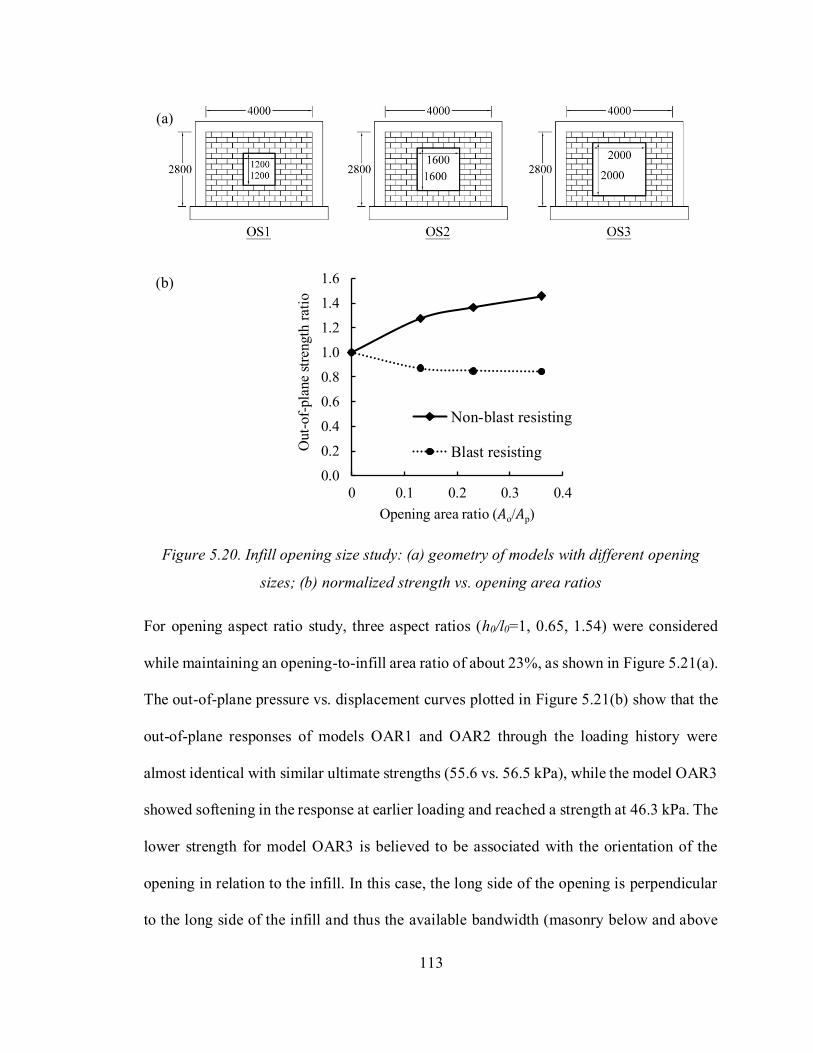
113
Figure 5.20. Infill opening size study: (a) geometry of models with different opening
sizes; (b) normalized strength vs. opening area ratios
For opening aspect ratio study, three aspect ratios (h0/l0=1, 0.65, 1.54) were considered
while maintaining an opening-to-infill area ratio of about 23%, as shown in Figure 5.21(a).
The out-of-plane pressure vs. displacement curves plotted in Figure 5.21(b) show that the
out-of-plane responses of models OAR1 and OAR2 through the loading history were
almost identical with similar ultimate strengths (55.6 vs. 56.5 kPa), while the model OAR3
showed softening in the response at earlier loading and reached a strength at 46.3 kPa. The
lower strength for model OAR3 is believed to be associated with the orientation of the
opening in relation to the infill. In this case, the long side of the opening is perpendicular
to the long side of the infill and thus the available bandwidth (masonry below and above
0.0
0.2
0.4
0.6
0.8
1.0
1.2
1.4
1.6
0 0.1 0.2 0.3 0.4
Out-
of-
pla
ne
stre
ngth
rat
io
Opening area ratio (𝐴o/𝐴p)
Non-blast resisting
Blast resisting
(b)
(a)
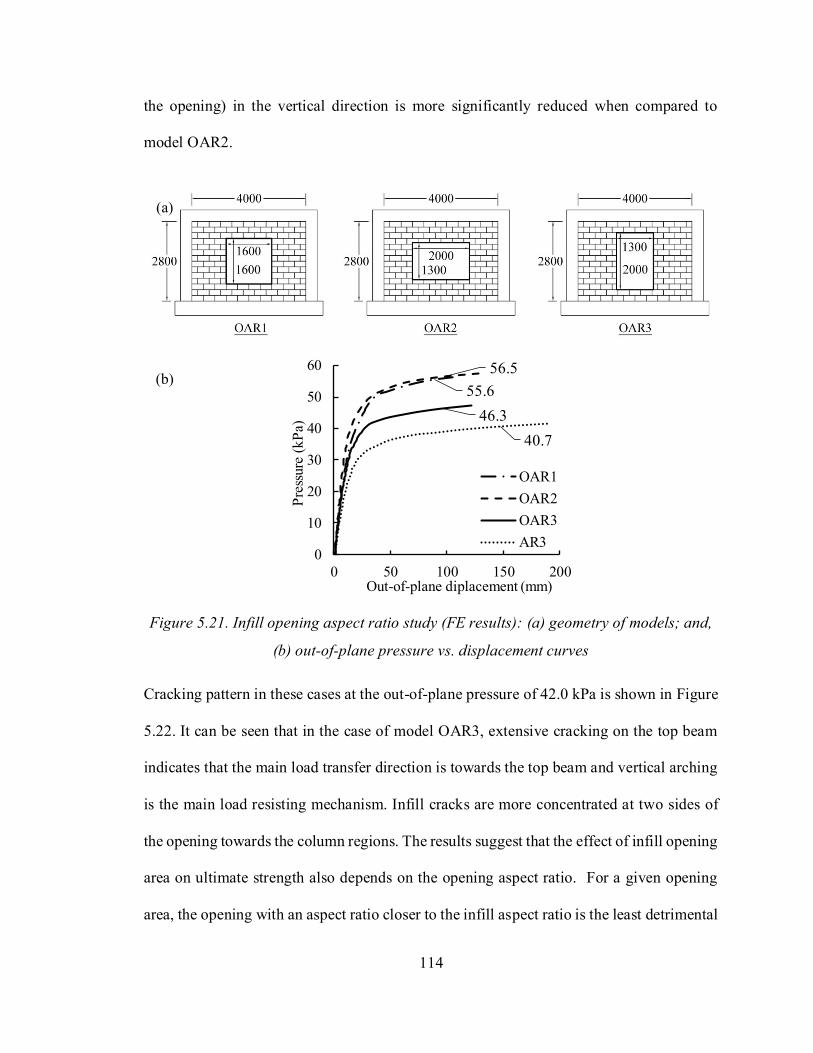
114
the opening) in the vertical direction is more significantly reduced when compared to
model OAR2.
Figure 5.21. Infill opening aspect ratio study (FE results): (a) geometry of models; and,
(b) out-of-plane pressure vs. displacement curves
Cracking pattern in these cases at the out-of-plane pressure of 42.0 kPa is shown in Figure
5.22. It can be seen that in the case of model OAR3, extensive cracking on the top beam
indicates that the main load transfer direction is towards the top beam and vertical arching
is the main load resisting mechanism. Infill cracks are more concentrated at two sides of
the opening towards the column regions. The results suggest that the effect of infill opening
area on ultimate strength also depends on the opening aspect ratio. For a given opening
area, the opening with an aspect ratio closer to the infill aspect ratio is the least detrimental
55.6
56.5
46.3
40.7
0
10
20
30
40
50
60
0 50 100 150 200
Pre
ssure
(k
Pa)
Out-of-plane diplacement (mm)
OAR1
OAR2
OAR3
AR3
(b)
(a)

115
to the out-of-plane strength of the infill. It is noted that the above observations and
discussions are only intended for central window opening cases and are not directly
applicable to the case of door openings and offset openings.
Figure 5.22. Cracking pattern for different opening aspect ratios at 42 kPa pressure
5.6.5 Effect of Interfacial Gaps
Gaps at the frame-to-infill interface are not uncommon due to shrinkage or settlement of
masonry wall or defective workmanship in construction. As infills may rely on arching
action for their out-of-plane resistance, the interfacial gaps could conceivably influence the
arching action and thus change the out-of-plane response of infilled frames. In this study,
three gap scenarios on model AR3 were considered, including: 1) a gap between the infill
and the top beam of the frame (labeled as BG); 2) gaps between the infill and the frame
columns (labelled as CG); and 3) a full separation gap at the frame and the infill interfaces
(labelled as AG). Gaps were introduced into the model by creating actual separation
between the infill and the frame. This was achieved by increasing the length of the columns
or beam and knowing that the maximum gap size is 6 mm, the increase in the frame size
would not have any significant influence on the behaviour of the frame. When these
surfaces become in contact, a Coulomb friction criterion (described in 3.2) controls the
shear behaviour of the contact. The presence of gap at either frame beam-to-infill (BG) or
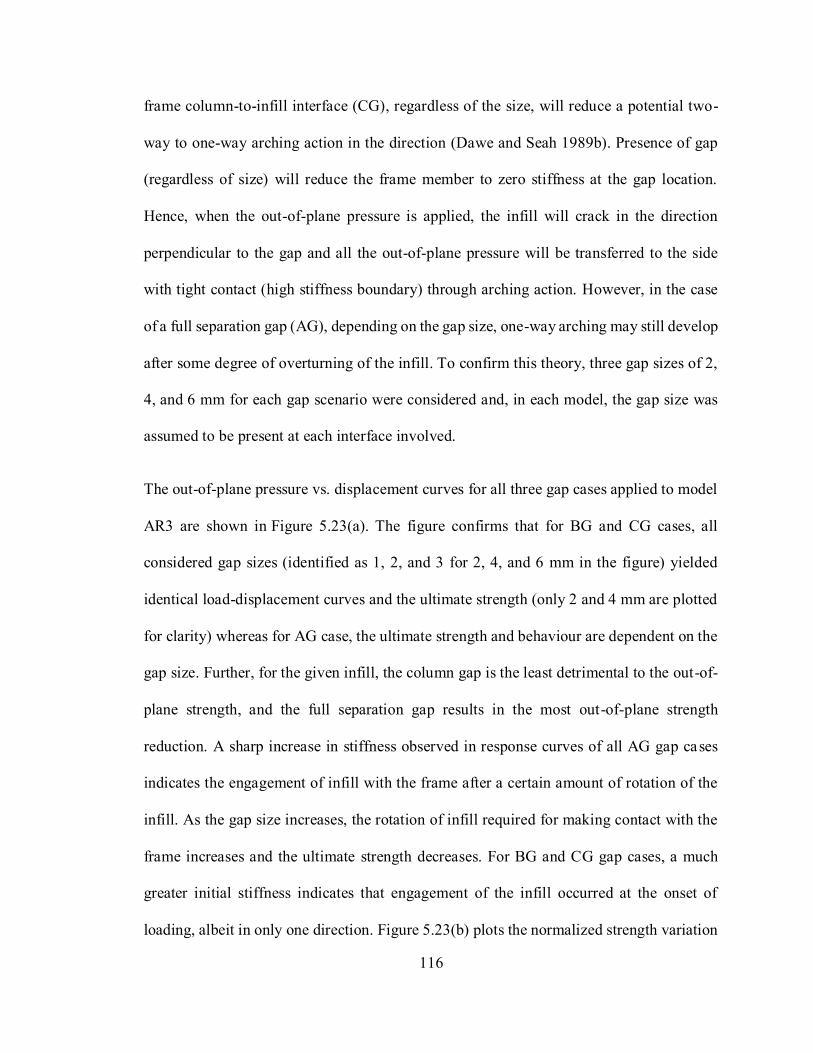
116
frame column-to-infill interface (CG), regardless of the size, will reduce a potential two-
way to one-way arching action in the direction (Dawe and Seah 1989b). Presence of gap
(regardless of size) will reduce the frame member to zero stiffness at the gap location.
Hence, when the out-of-plane pressure is applied, the infill will crack in the direction
perpendicular to the gap and all the out-of-plane pressure will be transferred to the side
with tight contact (high stiffness boundary) through arching action. However, in the case
of a full separation gap (AG), depending on the gap size, one-way arching may still develop
after some degree of overturning of the infill. To confirm this theory, three gap sizes of 2,
4, and 6 mm for each gap scenario were considered and, in each model, the gap size was
assumed to be present at each interface involved.
The out-of-plane pressure vs. displacement curves for all three gap cases applied to model
AR3 are shown in Figure 5.23(a). The figure confirms that for BG and CG cases, all
considered gap sizes (identified as 1, 2, and 3 for 2, 4, and 6 mm in the figure) yielded
identical load-displacement curves and the ultimate strength (only 2 and 4 mm are plotted
for clarity) whereas for AG case, the ultimate strength and behaviour are dependent on the
gap size. Further, for the given infill, the column gap is the least detrimental to the out-of-
plane strength, and the full separation gap results in the most out-of-plane strength
reduction. A sharp increase in stiffness observed in response curves of all AG gap cases
indicates the engagement of infill with the frame after a certain amount of rotation of the
infill. As the gap size increases, the rotation of infill required for making contact with the
frame increases and the ultimate strength decreases. For BG and CG gap cases, a much
greater initial stiffness indicates that engagement of the infill occurred at the onset of
loading, albeit in only one direction. Figure 5.23(b) plots the normalized strength variation

117
vs. gap size for all three gap cases where the strength is normalized with respect to model
AR3 without gaps. The reduction in strength for AG gap case is not linear and rather, the
rate of reduction diminishes with an increase in the gap size. For BG and CG gap cases,
reductions are 54% and 48%, respectively and they are independent of gap sizes.
Figure 5.23. Interfacial gap study: (a) out-of-plane pressure vs. displacement curves; and
(b) normalized strength for different gap sizes/locations
22.0
19.1
18.0
12.8
7.9
0
5
10
15
20
25
0 50 100 150 200 250
Pre
ssure
(k
Pa)
Out-of-plane displacement (mm)
CG1
CG2
BG1
BG2
AG1
AG2
AG3
2 mm
4 mm6 mm
0.0
0.2
0.4
0.6
0.8
1.0
1.2
0 2 4 6 8
Out-
of-
pla
ne
stre
ngth
rat
io
Gap size (mm)
Full separation gap (AG)
Column gap (CG)
Beam gap (BG)
(a)
(b)
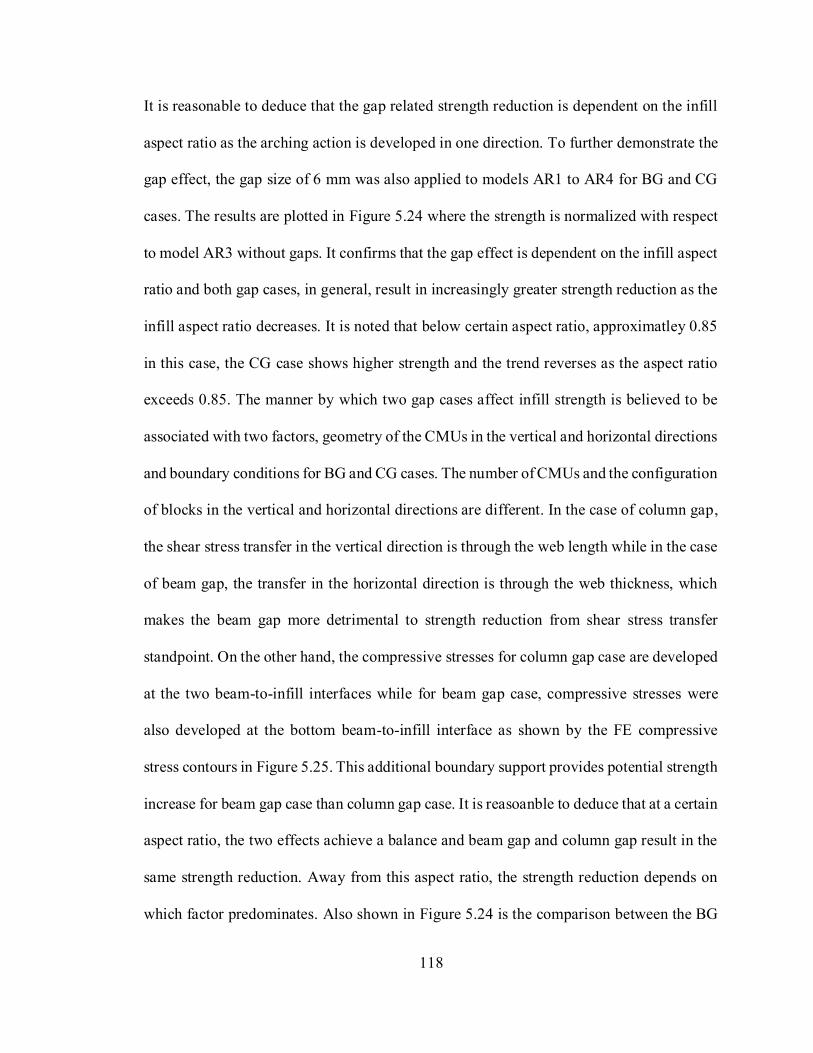
118
It is reasonable to deduce that the gap related strength reduction is dependent on the infill
aspect ratio as the arching action is developed in one direction. To further demonstrate the
gap effect, the gap size of 6 mm was also applied to models AR1 to AR4 for BG and CG
cases. The results are plotted in Figure 5.24 where the strength is normalized with respect
to model AR3 without gaps. It confirms that the gap effect is dependent on the infill aspect
ratio and both gap cases, in general, result in increasingly greater strength reduction as the
infill aspect ratio decreases. It is noted that below certain aspect ratio, approximatley 0.85
in this case, the CG case shows higher strength and the trend reverses as the aspect ratio
exceeds 0.85. The manner by which two gap cases affect infill strength is believed to be
associated with two factors, geometry of the CMUs in the vertical and horizontal directions
and boundary conditions for BG and CG cases. The number of CMUs and the configuration
of blocks in the vertical and horizontal directions are different. In the case of column gap,
the shear stress transfer in the vertical direction is through the web length while in the case
of beam gap, the transfer in the horizontal direction is through the web thickness, which
makes the beam gap more detrimental to strength reduction from shear stress transfer
standpoint. On the other hand, the compressive stresses for column gap case are developed
at the two beam-to-infill interfaces while for beam gap case, compressive stresses were
also developed at the bottom beam-to-infill interface as shown by the FE compressive
stress contours in Figure 5.25. This additional boundary support provides potential strength
increase for beam gap case than column gap case. It is reasoanble to deduce that at a certain
aspect ratio, the two effects achieve a balance and beam gap and column gap result in the
same strength reduction. Away from this aspect ratio, the strength reduction depends on
which factor predominates. Also shown in Figure 5.24 is the comparison between the BG
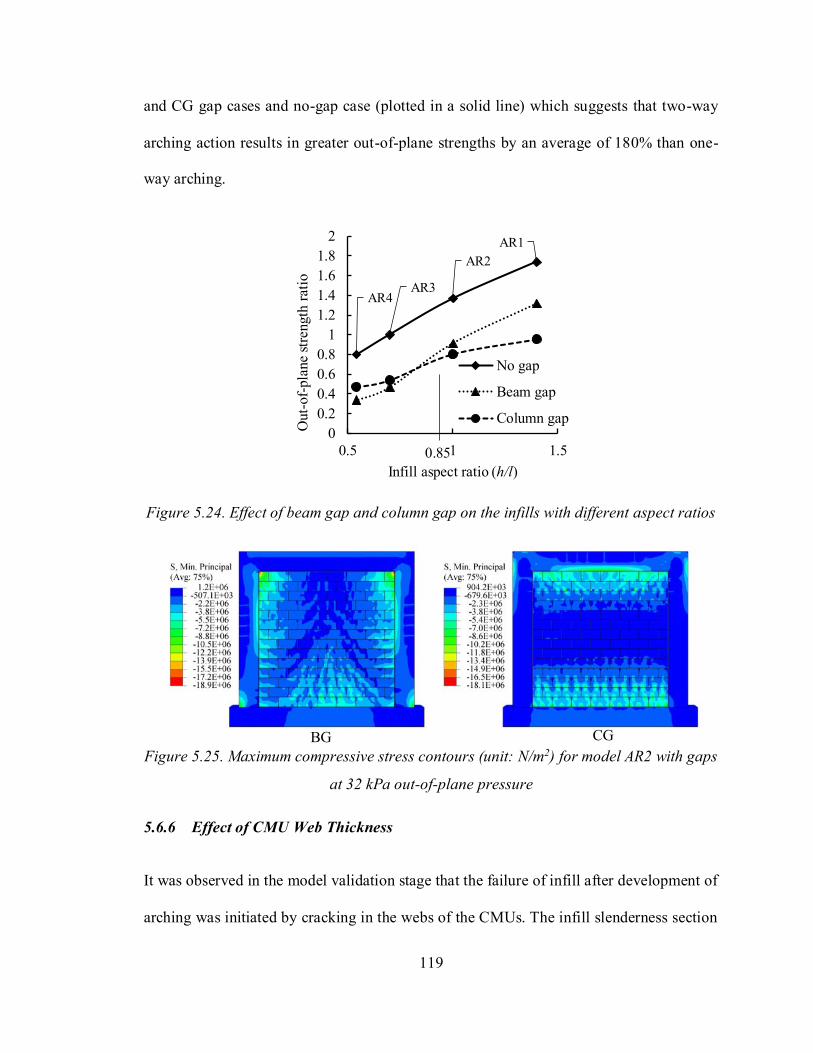
119
and CG gap cases and no-gap case (plotted in a solid line) which suggests that two-way
arching action results in greater out-of-plane strengths by an average of 180% than one-
way arching.
Figure 5.24. Effect of beam gap and column gap on the infills with different aspect ratios
Figure 5.25. Maximum compressive stress contours (unit: N/m2) for model AR2 with gaps
at 32 kPa out-of-plane pressure
5.6.6 Effect of CMU Web Thickness
It was observed in the model validation stage that the failure of infill after development of
arching was initiated by cracking in the webs of the CMUs. The infill slenderness section
AR1
AR2
AR3AR4
0
0.2
0.4
0.6
0.8
1
1.2
1.4
1.6
1.8
2
0.5 1 1.5
Out-
of-
pla
ne
stre
ngth
rat
io
Infill aspect ratio (h/l)
No gap
Beam gap
Column gap
BG CG
0.85
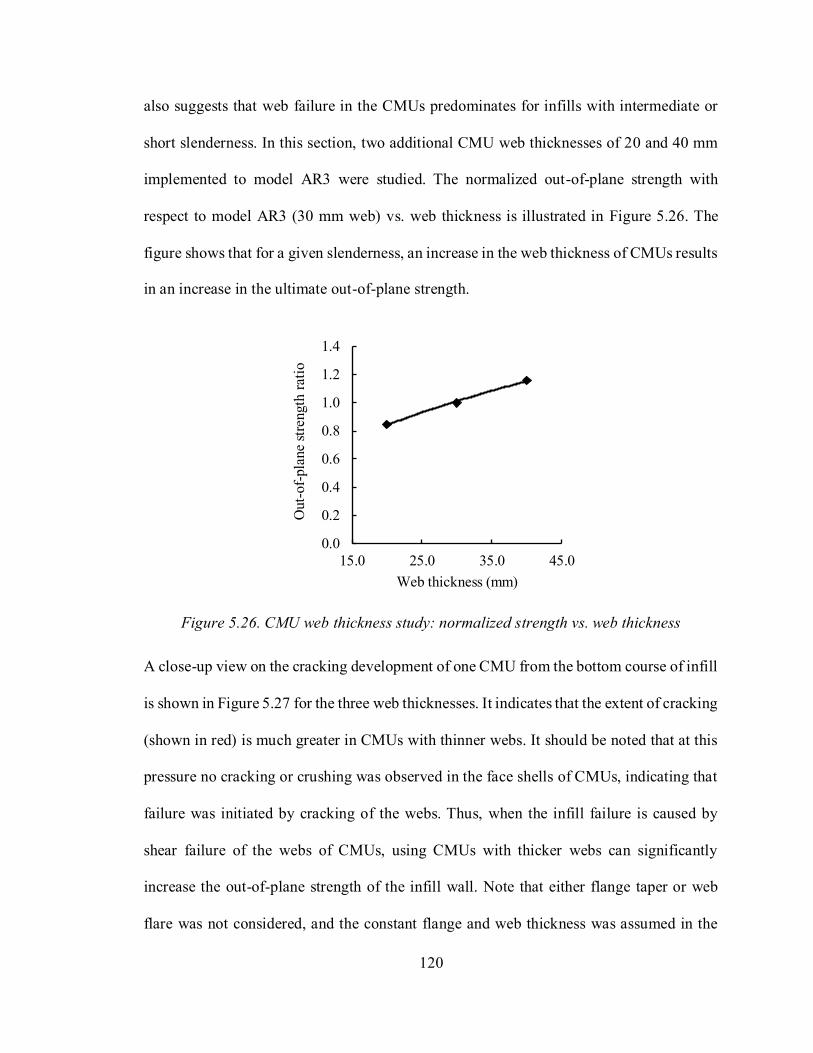
120
also suggests that web failure in the CMUs predominates for infills with intermediate or
short slenderness. In this section, two additional CMU web thicknesses of 20 and 40 mm
implemented to model AR3 were studied. The normalized out-of-plane strength with
respect to model AR3 (30 mm web) vs. web thickness is illustrated in Figure 5.26. The
figure shows that for a given slenderness, an increase in the web thickness of CMUs results
in an increase in the ultimate out-of-plane strength.
Figure 5.26. CMU web thickness study: normalized strength vs. web thickness
A close-up view on the cracking development of one CMU from the bottom course of infill
is shown in Figure 5.27 for the three web thicknesses. It indicates that the extent of cracking
(shown in red) is much greater in CMUs with thinner webs. It should be noted that at this
pressure no cracking or crushing was observed in the face shells of CMUs, indicating that
failure was initiated by cracking of the webs. Thus, when the infill failure is caused by
shear failure of the webs of CMUs, using CMUs with thicker webs can significantly
increase the out-of-plane strength of the infill wall. Note that either flange taper or web
flare was not considered, and the constant flange and web thickness was assumed in the
0.0
0.2
0.4
0.6
0.8
1.0
1.2
1.4
15.0 25.0 35.0 45.0
Out-
of-
pla
ne
stre
ngth
rat
io
Web thickness (mm)
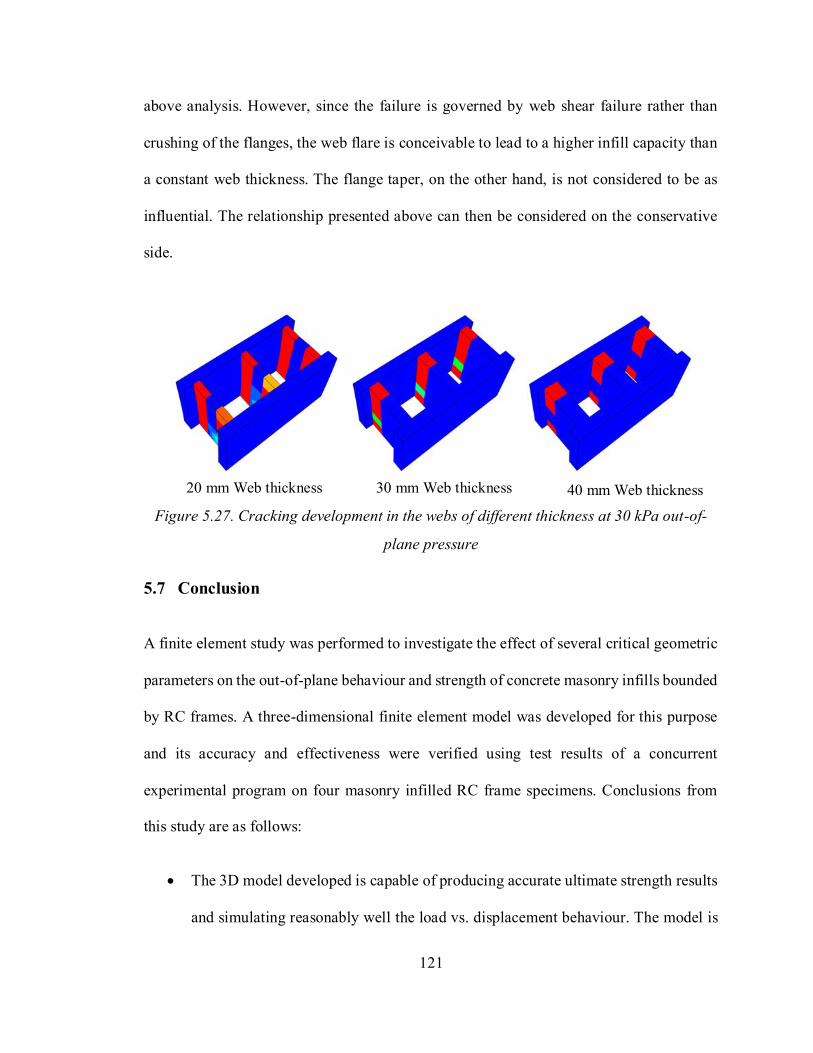
121
above analysis. However, since the failure is governed by web shear failure rather than
crushing of the flanges, the web flare is conceivable to lead to a higher infill capacity than
a constant web thickness. The flange taper, on the other hand, is not considered to be as
influential. The relationship presented above can then be considered on the conservative
side.
Figure 5.27. Cracking development in the webs of different thickness at 30 kPa out-of-
plane pressure
5.7 Conclusion
A finite element study was performed to investigate the effect of several critical geometric
parameters on the out-of-plane behaviour and strength of concrete masonry infills bounded
by RC frames. A three-dimensional finite element model was developed for this purpose
and its accuracy and effectiveness were verified using test results of a concurrent
experimental program on four masonry infilled RC frame specimens. Conclusions from
this study are as follows:
• The 3D model developed is capable of producing accurate ultimate strength results
and simulating reasonably well the load vs. displacement behaviour. The model is
20 mm Web thickness 30 mm Web thickness
40 mm Web thickness
122
also capable of providing detailed stress distribution, crack pattern and failure
modes that may not be fully predicted by a 2D model.
• For a given infill height, a reduction in the aspect ratio (h/l) results in a significant
reduction in the out-of-plane strength. The degree of this reduction is associated
with the bounding frame stiffness. The higher stiffness of the bounding frame, the
lower rate of the reduction.
• For a given infill aspect ratio, the bounding frame flexural stiffness is influential in
the infill strength by ensuring the arching action. A correlation between the frame
flexural stiffness and the infill strength was suggested.
• For a given infill aspect ratio, an increase in the infill slenderness (h/t) results in an
exponential decreasing trend for the infill strength. The failure mode was shown to
shift from a yield line pattern for high slendernesses to a web-shear failure pattern
for low slendernesses.
• When compared with the infills without openings, the infills with non-blast
resisting openings are shown to have higher strengths while infills with blast-
resisting opening are shown to have lower strengths. The strength increase for the
former opening is a function of opening size while the strength decrease for the
latter opening remains almost constant for varying opening sizes.
• For a given gap size, the full separation gap results in the most significant reduction
in infill strength. The reduction as a result of the beam gap or column gap does not
depend on the gap size, rather, it depends on the infill aspect ratio. The aspect ratio
at which the beam or column gap results in the same reduction in infill strength was
identified.
123
• Both experimental and FE results in this study showed that for certain range of infill
slenderness, failure of the infills is initiated by cracking developed in the CMU
webs, rather than compressive crushing of masonry. In this case, increasing the web
thickness of CMUs results in a marked increase in infill strength. A relationship
between the web thickness and infill strength was proposed.
5.8 Acknowledgement
The authors wish to recognize the contribution of financial assistance by the Canadian
Concrete Masonry Producers Association and Natural Sciences and Engineering Research
Council of Canada.

124
Chapter 6 Study of Arching Behaviour and Strength of Concrete
Masonry Infills under Out-of-Plane Loading
Ehsan Nasiri, Yi Liu
Published in Canadian Journal of Civil Engineering
https://doi.org/10.1139/cjce-2018-0662
6.1 Abstract
A numerical study using a three-dimensional finite element model was conducted to
investigate the arching behaviour and strength of concrete masonry infills bounded by RC
frames subjected to out-of-plane loading. Physical specimens were concurrently tested to
provide results for validation of the model as well as evidence of directional characteristics
of arching behaviour of masonry infills. A subsequent parametric study using the model
included a wide range of infilled frame geometric properties. The results showed in detail
the difference in one-way and two-way arching in terms of both strength and failure
mechanism, and the contributing factors to this difference. Evaluation of the two main
design equations for out-of-plane strength of masonry infills led to proposal of
modifications to provide a more rational consideration of directional behaviour of concrete
masonry infills. A comparison study using the available test results showed a marked
improvement of strength prediction based on the proposed modification.
Keywords: concrete masonry infills; RC frames; out-of-plane; strength; finite element;
arching action; nonlinear analysis
125
6.2 Introduction
Masonry walls, when constructed within either a reinforced concrete (RC) or steel frame,
are often referred to as masonry infills. It is well recognized that the behaviour and failure
mode of masonry infills under loading are affected by confinement provided by the
bounding frame and thus are different from those without confinement. In the context of
out-of-plane behaviour, masonry infills were shown to be able to attain much higher
capacity than their flexural wall counterparts (Abrams et al. 1996, Anderson 1984, Dawe
and Seah 1989b, Flanagan 1994, Gabrielsen and Kaplan 1976). While the conventional
flexural walls derive their ultimate capacity through masonry tensile strength, masonry
infills were shown to develop a large portion of their capacity after tensile cracking which
indicates a different failure mechanism. This mechanism, known as “arching”, was first
taken into account by McDowell et al. (1956a) for analysis of out-of-plane strength of
infills. Their model proposed that subsequent to flexural cracking, the rotation of cracked
segments of the infill panel is restrained by the bounding frame, creating in-plane
compressive forces which delay further cracking and thus increase the ultimate capacity.
In their model, the capacity was related to the compressive strength of masonry instead of
tensile stresses as in the case of flexural walls, and slenderness ratio of the infill, as shown
in Eq. (6.1).
𝑞𝑢 =𝛾𝑓′𝑚
2(ℎ𝑡)2
(6.1)
where 𝛾 is a function of h/t ratio and 𝑓′𝑚 is the compressive strength of masonry.
126
Stemming from the basic arching concept, two main approaches have been developed and
become widely referenced analytical methods for calculating the out-of-plane strength of
masonry infills. Both were adopted in different design standards in North America, albeit
with some modifications. One was initially proposed by Dawe and Seah (1989b) where
they expanded McDowell et al.’s method to include two-way arching and also introduced
the boundary frame stiffness as an influential parameter in the strength calculation. The
model combined the arching action with the plate yield-line theory and assumed the
compressive crushing of masonry as the failure mode for ultimate capacity calculation.
They proposed the following equations to calculate the ultimate out-of-plane capacity 𝑞𝑢𝑙𝑡
for two situations of infills.
𝑞𝑢𝑙𝑡 = 4.5(𝑓′𝑚)0.75𝑡2𝛼/𝐿2.5 (infill panel bounded on three sides and top
side is free) (6.2)
𝑞𝑢𝑙𝑡 = 4.5(𝑓′𝑚)0.75𝑡2{𝛼/𝐿2.5+ 𝛽/𝐻2.5} (infill panel bounded on four
sides) (6.3)
and,
𝛼 = 1𝐻⁄ (𝐸𝐼𝑐𝐻
2 + 𝐺𝐽𝑐𝑡𝐻)0.25 ≤ 50 (≤ 75 for panel bounded on three sides) (6.4)
𝛽 = 1𝐿⁄ (𝐸𝐼𝑏𝐿
2 + 𝐺𝐽𝑏𝑡𝐿)0.25 ≤ 50 (6.5)
where t, L, and H are the thickness, length, and height of the infill panel. Parameters 𝛼 and
𝛽 are factors accounting for the stiffness effect of boundary frame where 𝐸 and 𝐺 are the
Young’s modulus and shear modulus of the frame members respectively, and I and J are
the moment of inertia and torsional constant of the frame members with subscript b and c
indicating beam and columns respectively. An upper limit is set for 𝛼 and 𝛽, indicating
127
that the effect of boundary frame stiffness diminishes as the stiffness becomes greater and
at the set limit, the frame can be considered as rigid. The method also provides simple
treatment for gaps at frame-to-infill interface, by setting 𝛼 or 𝛽 equal to zero for frame-
column or frame-beam gap, respectively.
Flanagan and Bennett (1999a) suggested that for most practical frames, the GJctH and
GJbtL terms in Dawe and Seah’s method are much smaller than the EIcH2 and EIbL2 terms.
Thus, they eliminated the torsional terms (GJctH and GJbtL) in their method while
maintaining the remaining of the strength formulation of Dawe and Seah’s method with a
small change of constant (4.5 to 4.1). Flanagan and Bennett’s simplified formulation was
adopted in the current American masonry design standard TMS 402/602-16 for design of
masonry infills subjected to out-of-plane loading.
The second main approach for calculating out-of-plane strength based on arching was
proposed by Angel et al. (1994). Their analytical model was developed considering both
compressive crushing of masonry at the boundaries and snap-through of the panel due to
buckling as potential failure modes for smaller and larger slenderness ratios. The
contribution of the model was to include prior in-plane damage effect in the out-of-plane
capacity calculation. The method is expressed as follows:
𝑞 =2𝑓′𝑚
(ℎ𝑡 )
𝑅1𝑅2𝜆 (6.6)
𝑅2 = 0.357 + 2.49 × 10⁻¹⁴𝐸𝐼 ≤ 1.0 (6.7)
128
𝜆 = 0.154exp(−0.0985ℎ
𝑡) (6.8)
The term R1 is a reduction factor for prior in-plane damage; R2 is a reduction factor
accounting for bounding frame stiffness where 𝐸𝐼 is the least flexural stiffness of the
bounding frame members; and 𝜆 is a function of ℎ/𝑡. Note that this design equation was
originally formulated based on a one-way arching mechanism but was calibrated using
two-way arching tests on infills with 1.5 aspect ratio for the constant terms in the equations.
This method was adopted with some modification by FEMA-356 (2000) and ASCE/SEI41‐
13. (2013) “guideline for the seismic rehabilitation of buildings”.
A close examination of the two methods identified the following issues. In the case of
Dawe and Seah’s method, the two-way arching strength is simply a summation of vertical
and horizontal arching strengths which are calculated in a same manner. Therefore, for
infills with h/l=2 and h/l=0.5, the out-of-plane capacity would be equal for a given infill
material property and frame section. This raises a question since the masonry, in general,
shows a pronounced directional behaviour under compression and shear. Further, the
boundary conditions for infills in the vertical and horizontal directions are not likely to be
the same, which will conceivably result in different strengths in the vertical and horizontal
directions. In the case of Angel et al.’s method, the contribution from horizontal direction
arching is totally ignored as the equation is solely dependent on h/t. Also, the stiffness
factor is expressed only in terms of EI values of frame members and the length effect on
stiffness is not explicitly considered.
The performance of the above presented two main approaches was evaluated in several
studies (Flanagan and Bennett 1999a, Pasca et al. 2017, Ricci et al. 2018) using
129
experimental results available in the literature. It should be pointed out that the results on
out-of-plane tests of masonry infills were, in general, limited and those reported in the
literature were of a great variety in terms of masonry infill type and its mechanical property,
bounding frame type and condition, and out-of-plane load application method. With that
in mind, it is not surprising that the three studies yielded significantly different mean values
of experimental-to-analytical strength ratios with high coefficient of variations for both
methods. However, the general conclusions can be drawn as follows. Overall, Dawe and
Seah’s method provided closer estimates to the test results especially for steel framed
masonry infills. Performance of both methods for RC framed infills was inconclusive as so
few results were available. The level of COVs for both methods (as high as 70%) suggests
a large scatter in estimated capacities vs. experimental results, indicating neither method
can provide estimates for a variety of infill and frame properties with consistent accuracy.
Pasca et al. (2017) recognized that it may not be possible to have one equation that can be
universally applicable to all types of masonry infills and frames and more reliable results,
both numerical and experimental, were needed to provide a more thorough assessment of
analytical models.
In view of the above, the aim of this study was to assess validity of the two main analytical
methods for calculating out-of-plane strength of masonry infills through an extensive finite
element study. Concrete masonry unit (CMU) infills were used as they are a primary infill
material used in Canada. The focus of the assessment was to understand one-way and two-
way arching and the relationship between the two in influencing the out-of-plane strength
of RC framed concrete masonry infills. A 3D finite element (FE) model was used for
simulation of behaviour of masonry infilled RC frames of varying parameters. The model
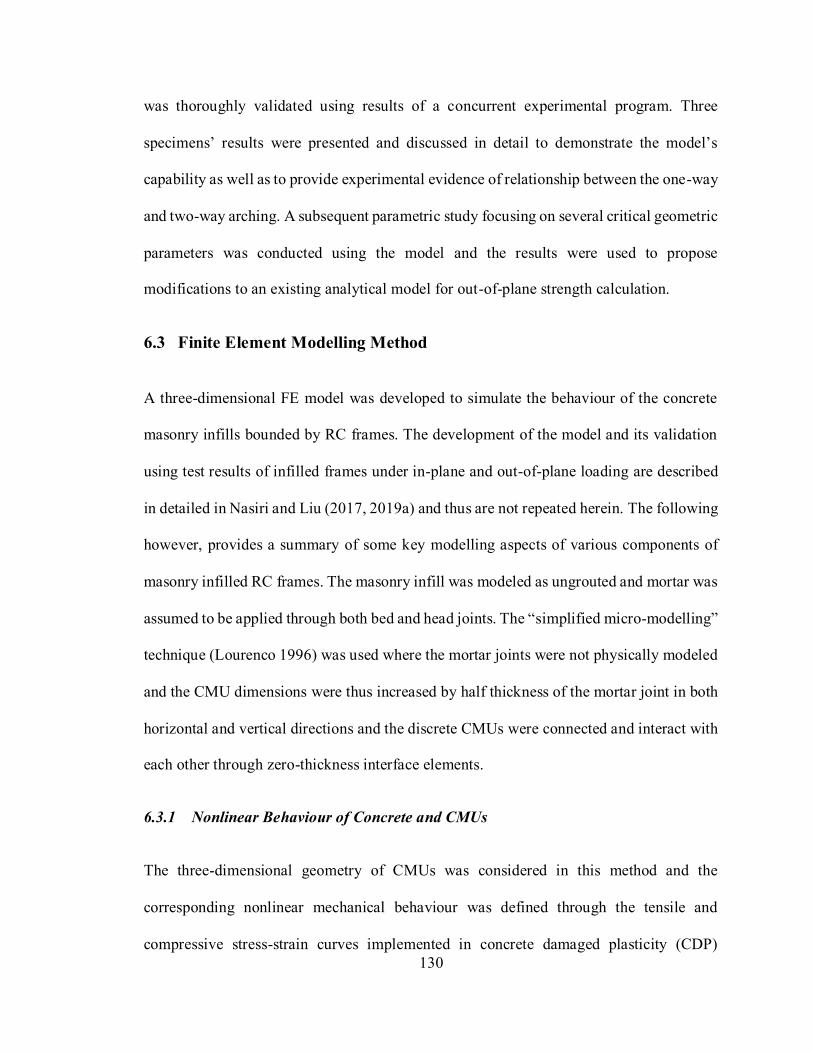
130
was thoroughly validated using results of a concurrent experimental program. Three
specimens’ results were presented and discussed in detail to demonstrate the model’s
capability as well as to provide experimental evidence of relationship between the one-way
and two-way arching. A subsequent parametric study focusing on several critical geometric
parameters was conducted using the model and the results were used to propose
modifications to an existing analytical model for out-of-plane strength calculation.
6.3 Finite Element Modelling Method
A three-dimensional FE model was developed to simulate the behaviour of the concrete
masonry infills bounded by RC frames. The development of the model and its validation
using test results of infilled frames under in-plane and out-of-plane loading are described
in detailed in Nasiri and Liu (2017, 2019a) and thus are not repeated herein. The following
however, provides a summary of some key modelling aspects of various components of
masonry infilled RC frames. The masonry infill was modeled as ungrouted and mortar was
assumed to be applied through both bed and head joints. The “simplified micro-modelling”
technique (Lourenco 1996) was used where the mortar joints were not physically modeled
and the CMU dimensions were thus increased by half thickness of the mortar joint in both
horizontal and vertical directions and the discrete CMUs were connected and interact with
each other through zero-thickness interface elements.
6.3.1 Nonlinear Behaviour of Concrete and CMUs
The three-dimensional geometry of CMUs was considered in this method and the
corresponding nonlinear mechanical behaviour was defined through the tensile and
compressive stress-strain curves implemented in concrete damaged plasticity (CDP)

131
constitutive model in ABAQUS (D.S.Simulia 2010). These curves can be obtained
experimentally or by using existing behaviour models for concrete and masonry. In this
study, the compressive behaviour of concrete and CMUs is defined using the stress-strain
constitutive model proposed by Sima et al. (2008) as follows:
{
𝜎𝑐 = 휀𝑐𝐸0 휀𝑐 ≤ 휀𝑐0
𝜎𝑐 = [휀𝑐0(1 − 𝐴) + 𝐴휀𝑐𝑒(𝜀𝑐0−𝜀𝑐𝜀𝑐′ )
] 𝐸0 휀𝑐 > 휀𝑐0
𝐴 =𝑓𝑐′ − 휀𝑐0𝐸0
𝐸0 (휀𝑐′𝑒(𝜀𝑐0𝜀𝑐′ −1)
− 휀𝑐0)
(6.9)
where 𝜎𝑐 and 휀𝑐 are the compressive stress and strain values, respectively; 𝑓𝑐′ is the
compressive strength of the material; 휀𝑐0 is the linear elastic strain limit; 휀𝑐′ is the strain at
the peak stress and 𝐸0 is the Young’s modulus of the material.
The tensile behaviour model used in this study adopted an averaged tensile stress-strain
curve between cracked and uncracked concrete suggested by Maekawa et al. (2003) to
account for the tension stiffening effect. This model was shown to be independent of
element size, crack spacing, and orientation of reinforcement. For concrete material, the
tensile stress-strain curve used in this study can be expressed using Eq. (6.10).
{
𝜎𝑡 = 휀𝑡𝐸0 휀𝑡 ≤ 휀𝑡0
𝜎𝑡 = 𝜎𝑡0 (휀𝑡0
휀𝑡)0.4
휀𝑡 > 휀𝑡0 (6.10)
where 𝜎𝑡 and 휀𝑡 are the tensile stress and strain values, respectively; 𝜎𝑡0 and 휀𝑡0 are the
linear elastic stress and strain limits, respectively.
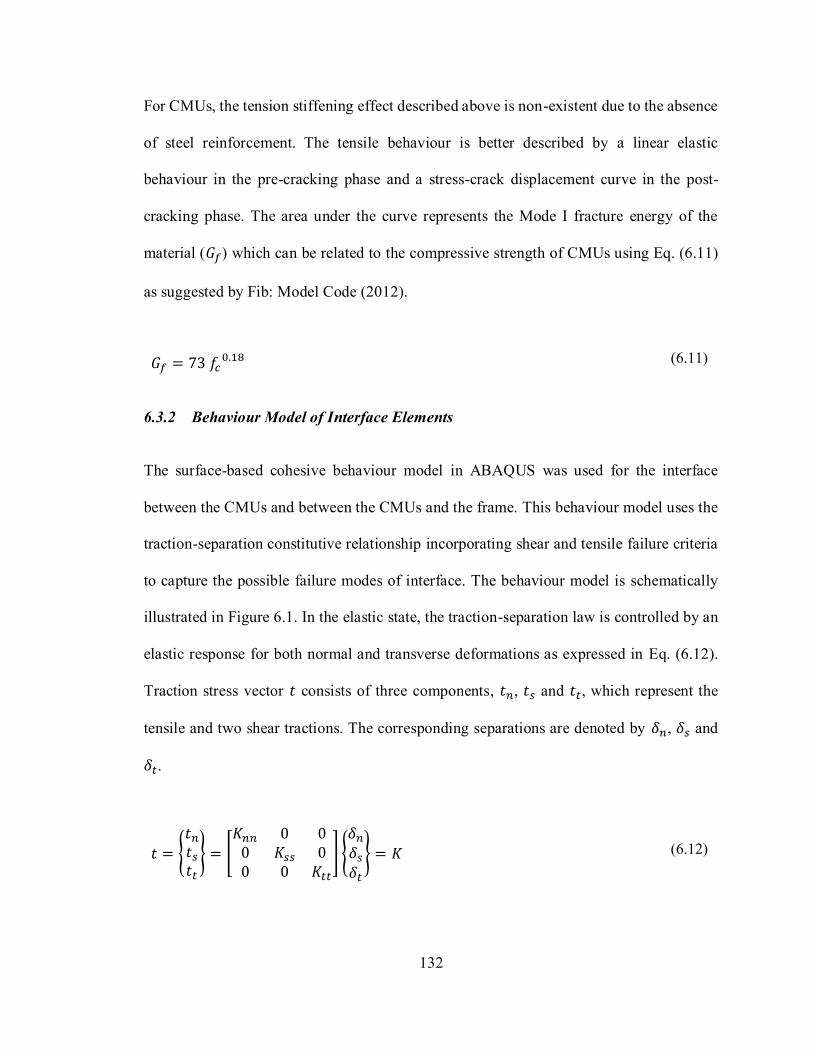
132
For CMUs, the tension stiffening effect described above is non-existent due to the absence
of steel reinforcement. The tensile behaviour is better described by a linear elastic
behaviour in the pre-cracking phase and a stress-crack displacement curve in the post-
cracking phase. The area under the curve represents the Mode I fracture energy of the
material (𝐺𝑓) which can be related to the compressive strength of CMUs using Eq. (6.11)
as suggested by Fib: Model Code (2012).
𝐺𝑓 = 73 𝑓𝑐0.18
(6.11)
6.3.2 Behaviour Model of Interface Elements
The surface-based cohesive behaviour model in ABAQUS was used for the interface
between the CMUs and between the CMUs and the frame. This behaviour model uses the
traction-separation constitutive relationship incorporating shear and tensile failure criteria
to capture the possible failure modes of interface. The behaviour model is schematically
illustrated in Figure 6.1. In the elastic state, the traction-separation law is controlled by an
elastic response for both normal and transverse deformations as expressed in Eq. (6.12).
Traction stress vector 𝑡 consists of three components, 𝑡𝑛, 𝑡𝑠 and 𝑡𝑡, which represent the
tensile and two shear tractions. The corresponding separations are denoted by 𝛿𝑛, 𝛿𝑠 and
𝛿𝑡.
𝑡 = {𝑡𝑛𝑡𝑠𝑡𝑡
} = [𝐾𝑛𝑛 0 00 𝐾𝑠𝑠 00 0 𝐾𝑡𝑡
] {𝛿𝑛𝛿𝑠𝛿𝑡
} = 𝐾 (6.12)
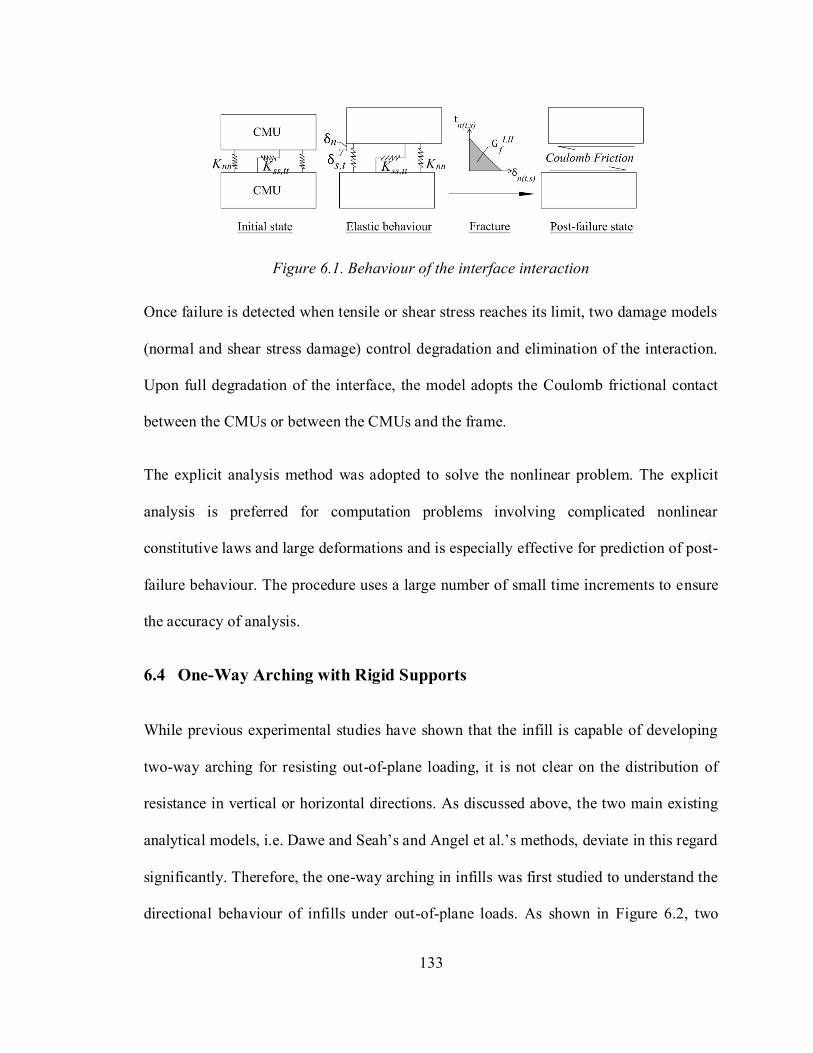
133
Figure 6.1. Behaviour of the interface interaction
Once failure is detected when tensile or shear stress reaches its limit, two damage models
(normal and shear stress damage) control degradation and elimination of the interaction.
Upon full degradation of the interface, the model adopts the Coulomb frictional contact
between the CMUs or between the CMUs and the frame.
The explicit analysis method was adopted to solve the nonlinear problem. The explicit
analysis is preferred for computation problems involving complicated nonlinear
constitutive laws and large deformations and is especially effective for prediction of post-
failure behaviour. The procedure uses a large number of small time increments to ensure
the accuracy of analysis.
6.4 One-Way Arching with Rigid Supports
While previous experimental studies have shown that the infill is capable of developing
two-way arching for resisting out-of-plane loading, it is not clear on the distribution of
resistance in vertical or horizontal directions. As discussed above, the two main existing
analytical models, i.e. Dawe and Seah’s and Angel et al.’s methods, deviate in this regard
significantly. Therefore, the one-way arching in infills was first studied to understand the
directional behaviour of infills under out-of-plane loads. As shown in Figure 6.2, two
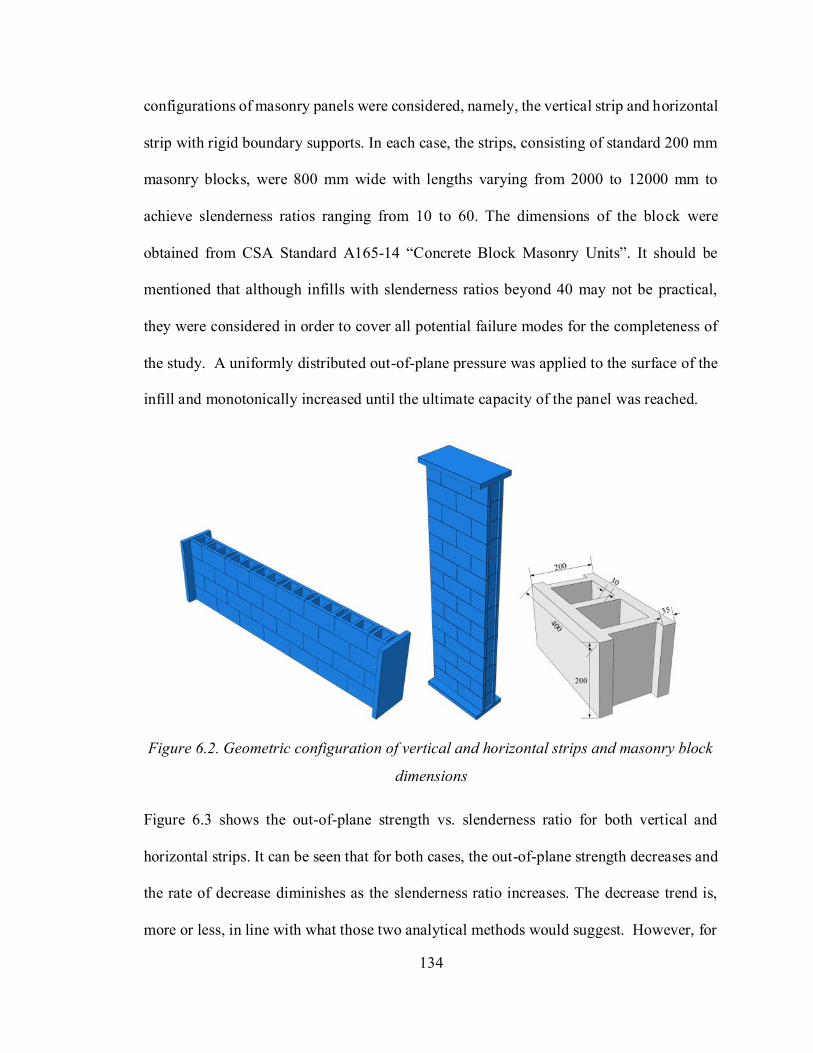
134
configurations of masonry panels were considered, namely, the vertical strip and horizontal
strip with rigid boundary supports. In each case, the strips, consisting of standard 200 mm
masonry blocks, were 800 mm wide with lengths varying from 2000 to 12000 mm to
achieve slenderness ratios ranging from 10 to 60. The dimensions of the block were
obtained from CSA Standard A165-14 “Concrete Block Masonry Units”. It should be
mentioned that although infills with slenderness ratios beyond 40 may not be practical,
they were considered in order to cover all potential failure modes for the completeness of
the study. A uniformly distributed out-of-plane pressure was applied to the surface of the
infill and monotonically increased until the ultimate capacity of the panel was reached.
Figure 6.2. Geometric configuration of vertical and horizontal strips and masonry block
dimensions
Figure 6.3 shows the out-of-plane strength vs. slenderness ratio for both vertical and
horizontal strips. It can be seen that for both cases, the out-of-plane strength decreases and
the rate of decrease diminishes as the slenderness ratio increases. The decrease trend is,
more or less, in line with what those two analytical methods would suggest. However, for
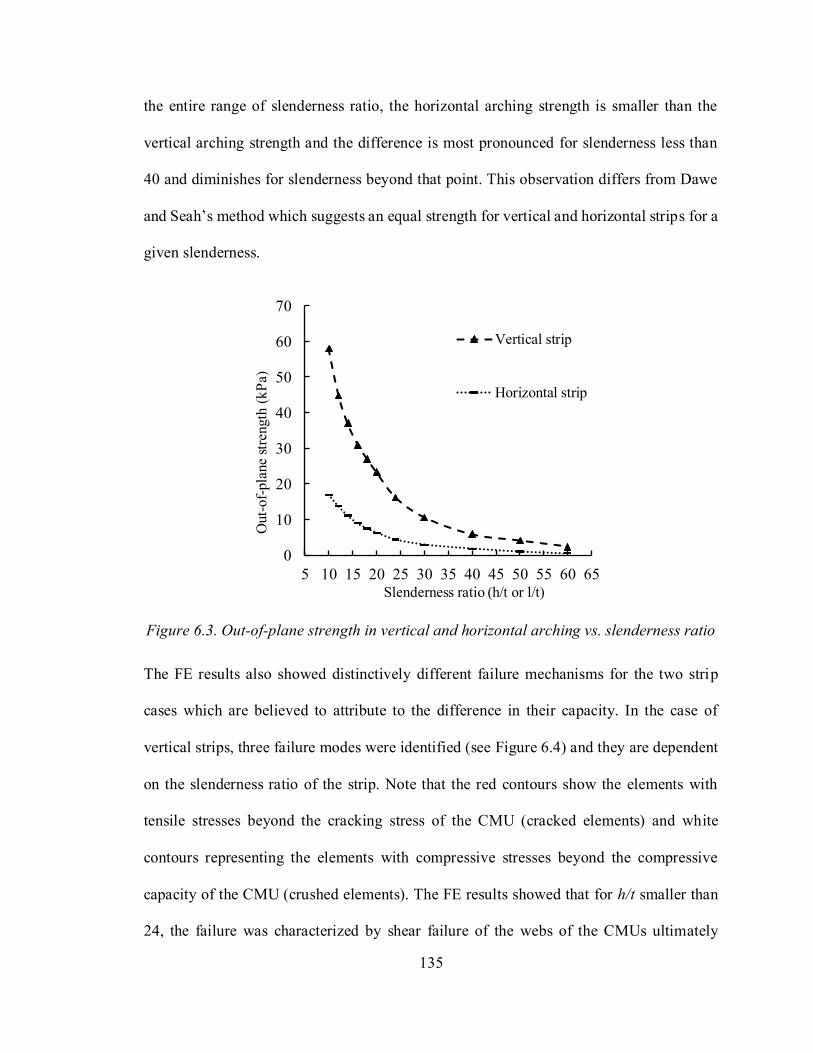
135
the entire range of slenderness ratio, the horizontal arching strength is smaller than the
vertical arching strength and the difference is most pronounced for slenderness less than
40 and diminishes for slenderness beyond that point. This observation differs from Dawe
and Seah’s method which suggests an equal strength for vertical and horizontal strips for a
given slenderness.
Figure 6.3. Out-of-plane strength in vertical and horizontal arching vs. slenderness ratio
The FE results also showed distinctively different failure mechanisms for the two strip
cases which are believed to attribute to the difference in their capacity. In the case of
vertical strips, three failure modes were identified (see Figure 6.4) and they are dependent
on the slenderness ratio of the strip. Note that the red contours show the elements with
tensile stresses beyond the cracking stress of the CMU (cracked elements) and white
contours representing the elements with compressive stresses beyond the compressive
capacity of the CMU (crushed elements). The FE results showed that for h/t smaller than
24, the failure was characterized by shear failure of the webs of the CMUs ultimately
0
10
20
30
40
50
60
70
5 10 15 20 25 30 35 40 45 50 55 60 65
Out-
of-
pla
ne
stre
ngth
(k
Pa)
Slenderness ratio (h/t or l/t)
Vertical strip
Horizontal strip
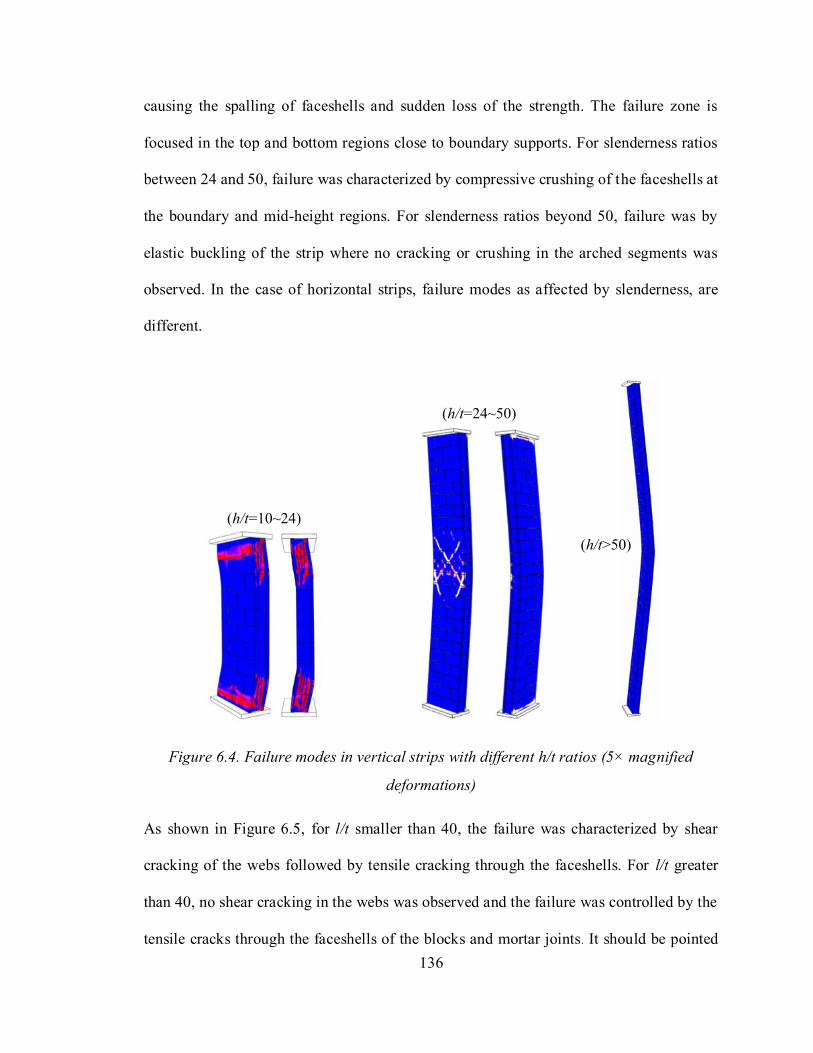
136
causing the spalling of faceshells and sudden loss of the strength. The failure zone is
focused in the top and bottom regions close to boundary supports. For slenderness ratios
between 24 and 50, failure was characterized by compressive crushing of the faceshells at
the boundary and mid-height regions. For slenderness ratios beyond 50, failure was by
elastic buckling of the strip where no cracking or crushing in the arched segments was
observed. In the case of horizontal strips, failure modes as affected by slenderness, are
different.
Figure 6.4. Failure modes in vertical strips with different h/t ratios (5× magnified
deformations)
As shown in Figure 6.5, for l/t smaller than 40, the failure was characterized by shear
cracking of the webs followed by tensile cracking through the faceshells. For l/t greater
than 40, no shear cracking in the webs was observed and the failure was controlled by the
tensile cracks through the faceshells of the blocks and mortar joints. It should be pointed
(h/t=10~24)
(h/t=24~50)
(h/t>50)
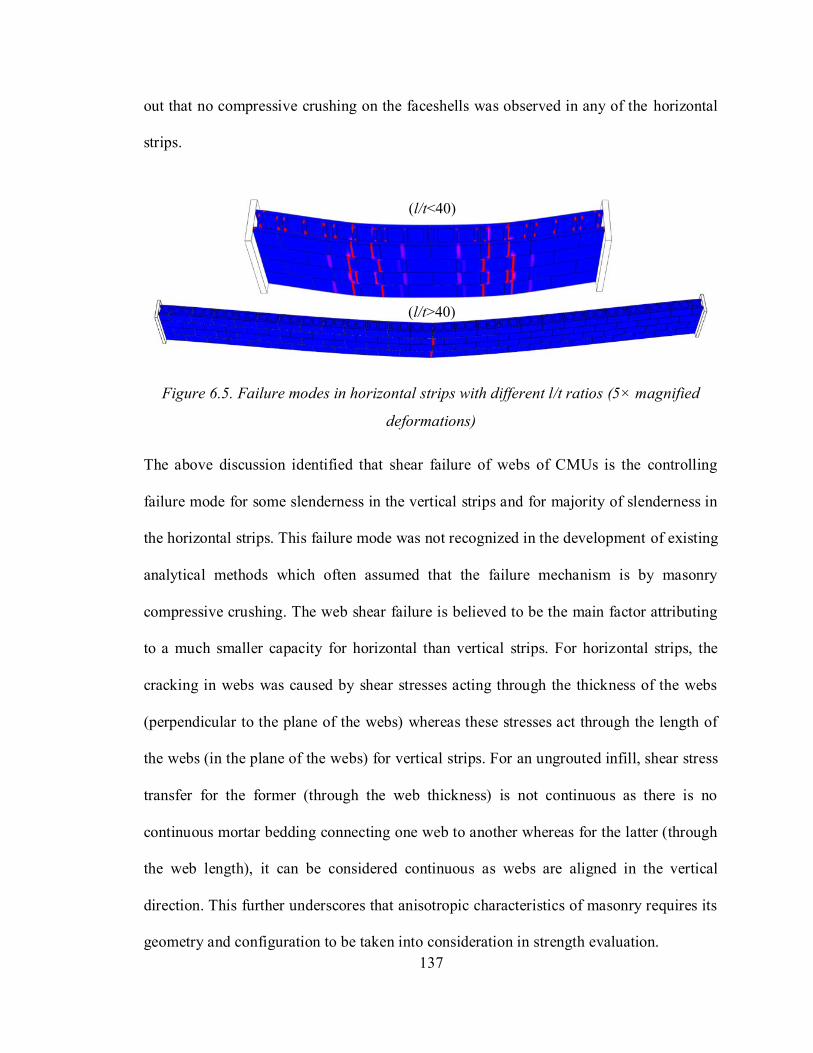
137
out that no compressive crushing on the faceshells was observed in any of the horizontal
strips.
Figure 6.5. Failure modes in horizontal strips with different l/t ratios (5× magnified
deformations)
The above discussion identified that shear failure of webs of CMUs is the controlling
failure mode for some slenderness in the vertical strips and for majority of slenderness in
the horizontal strips. This failure mode was not recognized in the development of existing
analytical methods which often assumed that the failure mechanism is by masonry
compressive crushing. The web shear failure is believed to be the main factor attributing
to a much smaller capacity for horizontal than vertical strips. For horizontal strips, the
cracking in webs was caused by shear stresses acting through the thickness of the webs
(perpendicular to the plane of the webs) whereas these stresses act through the length of
the webs (in the plane of the webs) for vertical strips. For an ungrouted infill, shear stress
transfer for the former (through the web thickness) is not continuous as there is no
continuous mortar bedding connecting one web to another whereas for the latter (through
the web length), it can be considered continuous as webs are aligned in the vertical
direction. This further underscores that anisotropic characteristics of masonry requires its
geometry and configuration to be taken into consideration in strength evaluation.
(l/t>40)
(l/t<40)
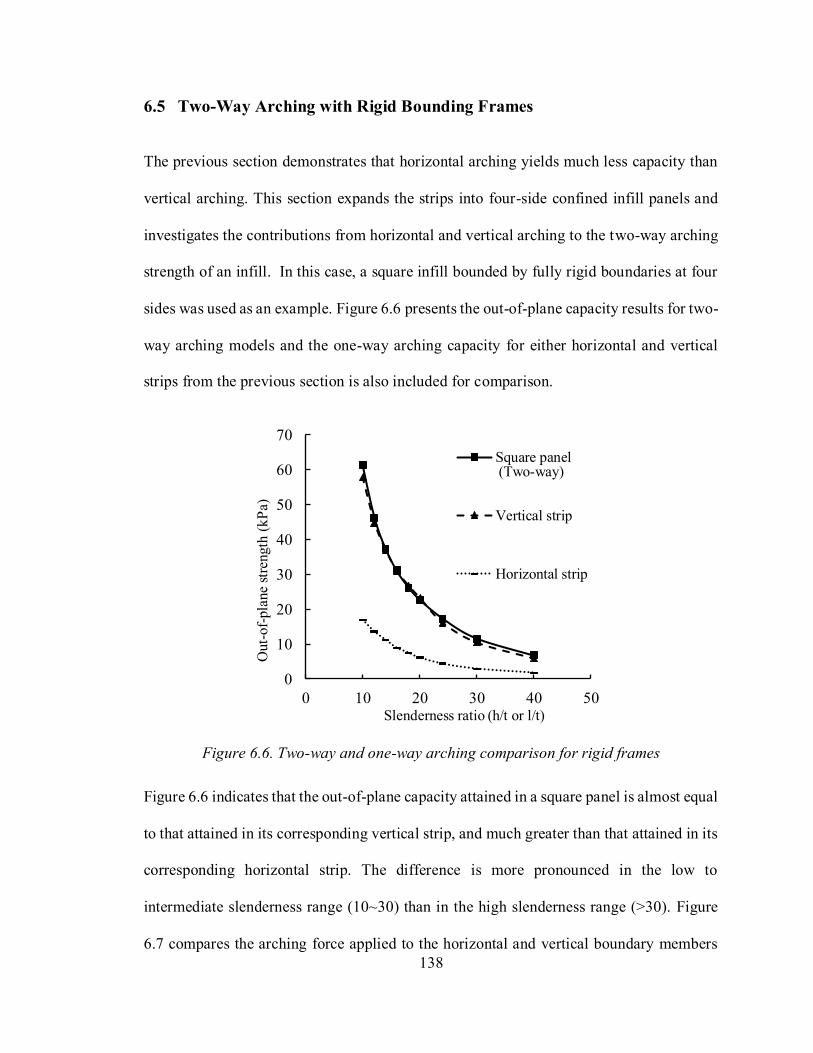
138
6.5 Two-Way Arching with Rigid Bounding Frames
The previous section demonstrates that horizontal arching yields much less capacity than
vertical arching. This section expands the strips into four-side confined infill panels and
investigates the contributions from horizontal and vertical arching to the two-way arching
strength of an infill. In this case, a square infill bounded by fully rigid boundaries at four
sides was used as an example. Figure 6.6 presents the out-of-plane capacity results for two-
way arching models and the one-way arching capacity for either horizontal and vertical
strips from the previous section is also included for comparison.
Figure 6.6. Two-way and one-way arching comparison for rigid frames
Figure 6.6 indicates that the out-of-plane capacity attained in a square panel is almost equal
to that attained in its corresponding vertical strip, and much greater than that attained in its
corresponding horizontal strip. The difference is more pronounced in the low to
intermediate slenderness range (10~30) than in the high slenderness range (>30). Figure
6.7 compares the arching force applied to the horizontal and vertical boundary members
0
10
20
30
40
50
60
70
0 10 20 30 40 50
Out-
of-
pla
ne
stre
ngth
(k
Pa)
Slenderness ratio (h/t or l/t)
Square panel
Vertical strip
Horizontal strip
(Two-way)
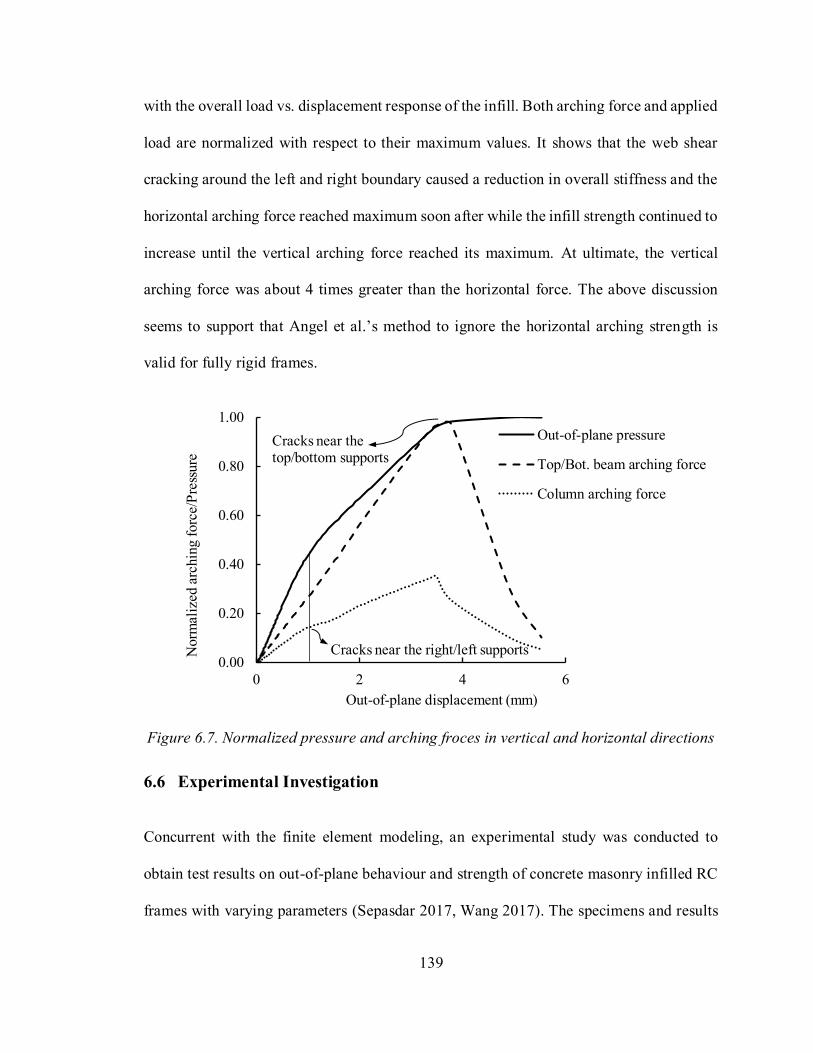
139
with the overall load vs. displacement response of the infill. Both arching force and applied
load are normalized with respect to their maximum values. It shows that the web shear
cracking around the left and right boundary caused a reduction in overall stiffness and the
horizontal arching force reached maximum soon after while the infill strength continued to
increase until the vertical arching force reached its maximum. At ultimate, the vertical
arching force was about 4 times greater than the horizontal force. The above discussion
seems to support that Angel et al.’s method to ignore the horizontal arching strength is
valid for fully rigid frames.
Figure 6.7. Normalized pressure and arching froces in vertical and horizontal directions
6.6 Experimental Investigation
Concurrent with the finite element modeling, an experimental study was conducted to
obtain test results on out-of-plane behaviour and strength of concrete masonry infilled RC
frames with varying parameters (Sepasdar 2017, Wang 2017). The specimens and results
0.00
0.20
0.40
0.60
0.80
1.00
0 2 4 6
Norm
aliz
ed a
rchin
g f
orc
e/P
ress
ure
Out-of-plane displacement (mm)
Out-of-plane pressure
Top/Bot. beam arching force
Column arching force
Cracks near the right/left supports
Cracks near the top/bottom supports
140
discussed in the following were used to validate the capability of the model as well as to
provide physical evidence of one-way and two-way arching correlations for “real”
bounding frames. Three specimens were RC framed concrete masonry infills measuring
1350×980 mm (l×h), constructed with standard half-scaled 200 mm CMUs laid in the
running bond. The RC frame consisted of two 180 mm square columns and a 180 mm
square top beam and a 250 mm square bottom beam. The dimension and reinforcement
details for the specimens are shown in Figure 6.8 and specimen properties and parameters
are summarized in Table 6.1.
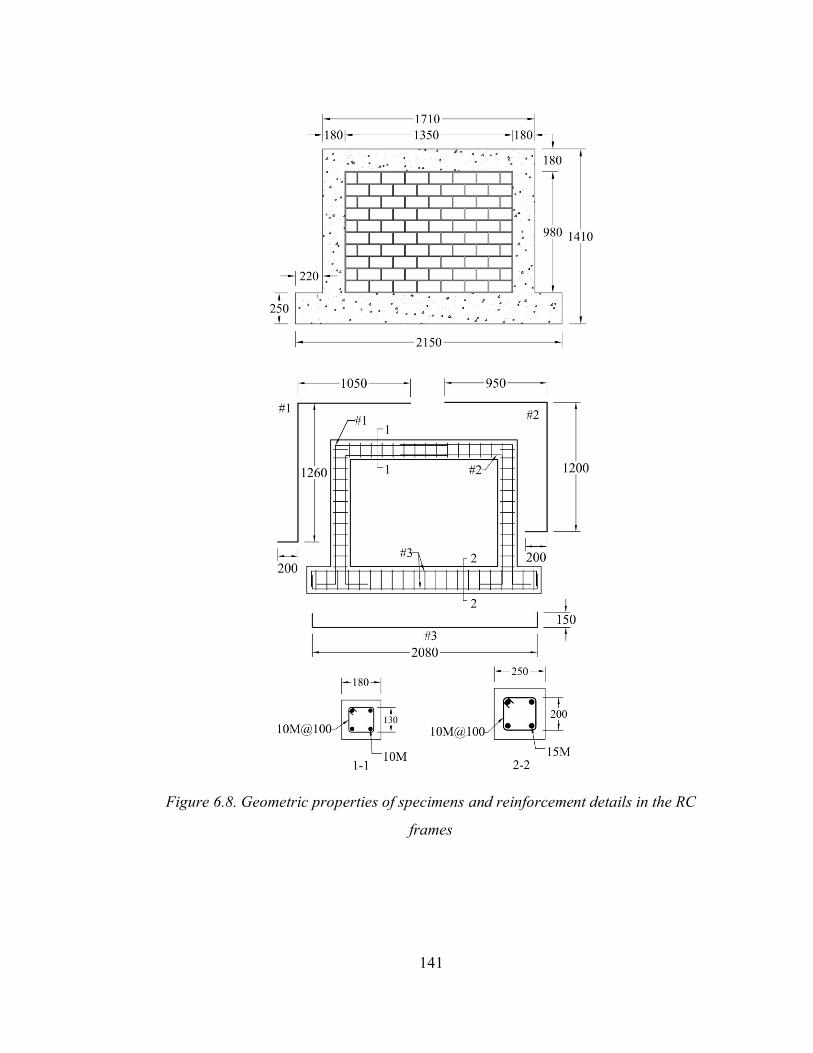
141
Figure 6.8. Geometric properties of specimens and reinforcement details in the RC
frames
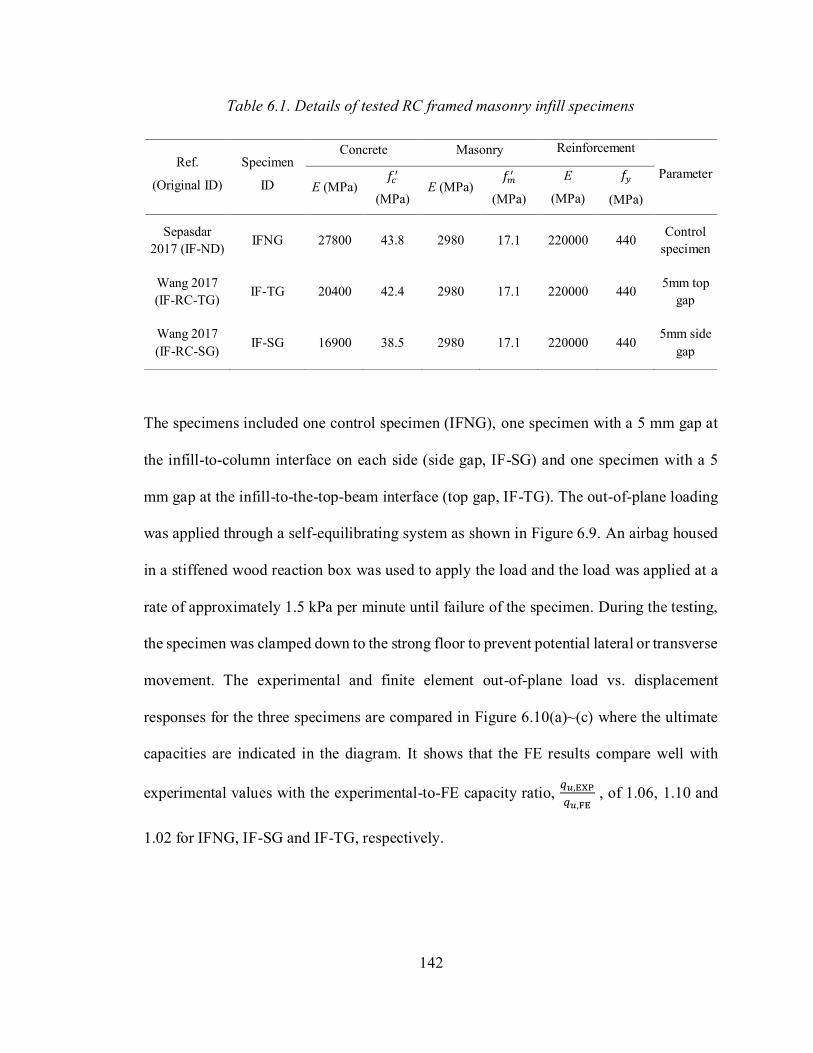
142
Table 6.1. Details of tested RC framed masonry infill specimens
Ref.
(Original ID)
Specimen
ID
Concrete Masonry Reinforcement
Parameter E (MPa)
𝑓𝑐′
(MPa) E (MPa)
𝑓𝑚′
(MPa)
E
(MPa)
𝑓𝑦
(MPa)
Sepasdar
2017 (IF-ND) IFNG 27800 43.8 2980 17.1 220000 440
Control
specimen
Wang 2017
(IF-RC-TG) IF-TG 20400 42.4 2980 17.1 220000 440
5mm top
gap
Wang 2017
(IF-RC-SG) IF-SG 16900 38.5 2980 17.1 220000 440
5mm side
gap
The specimens included one control specimen (IFNG), one specimen with a 5 mm gap at
the infill-to-column interface on each side (side gap, IF-SG) and one specimen with a 5
mm gap at the infill-to-the-top-beam interface (top gap, IF-TG). The out-of-plane loading
was applied through a self-equilibrating system as shown in Figure 6.9. An airbag housed
in a stiffened wood reaction box was used to apply the load and the load was applied at a
rate of approximately 1.5 kPa per minute until failure of the specimen. During the testing,
the specimen was clamped down to the strong floor to prevent potential lateral or transverse
movement. The experimental and finite element out-of-plane load vs. displacement
responses for the three specimens are compared in Figure 6.10(a)~(c) where the ultimate
capacities are indicated in the diagram. It shows that the FE results compare well with
experimental values with the experimental-to-FE capacity ratio, 𝑞𝑢,EXP
𝑞𝑢,FE , of 1.06, 1.10 and
1.02 for IFNG, IF-SG and IF-TG, respectively.
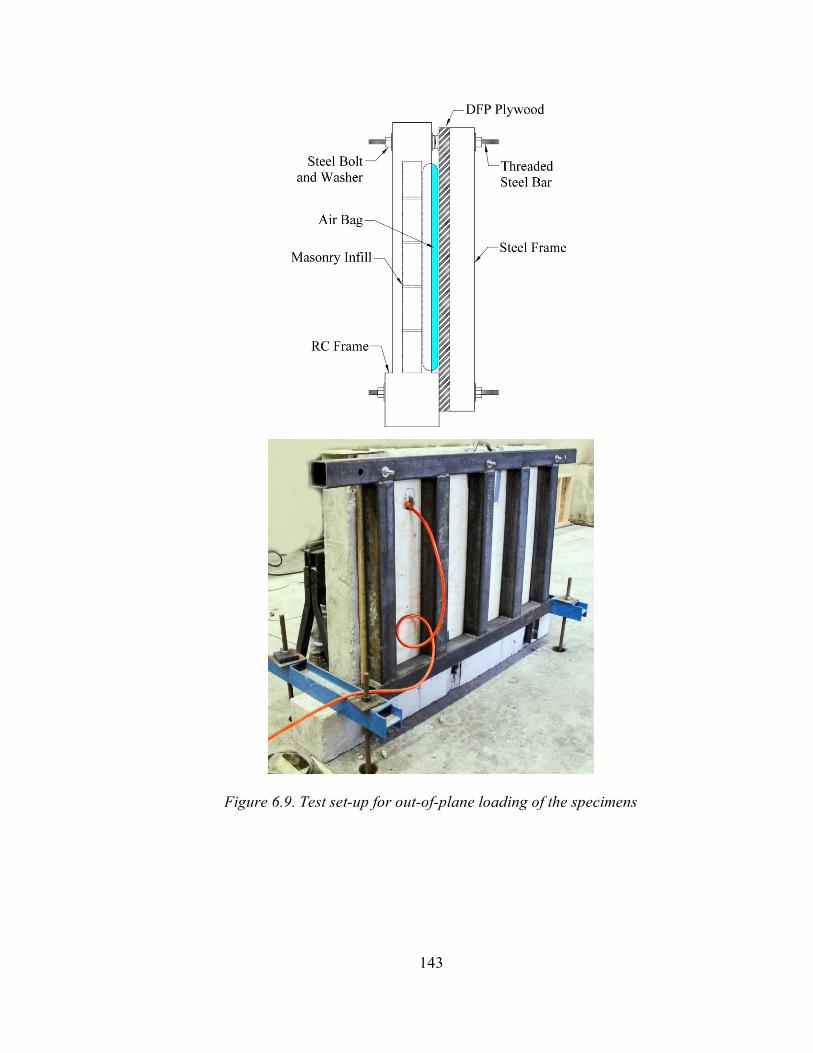
143
Figure 6.9. Test set-up for out-of-plane loading of the specimens
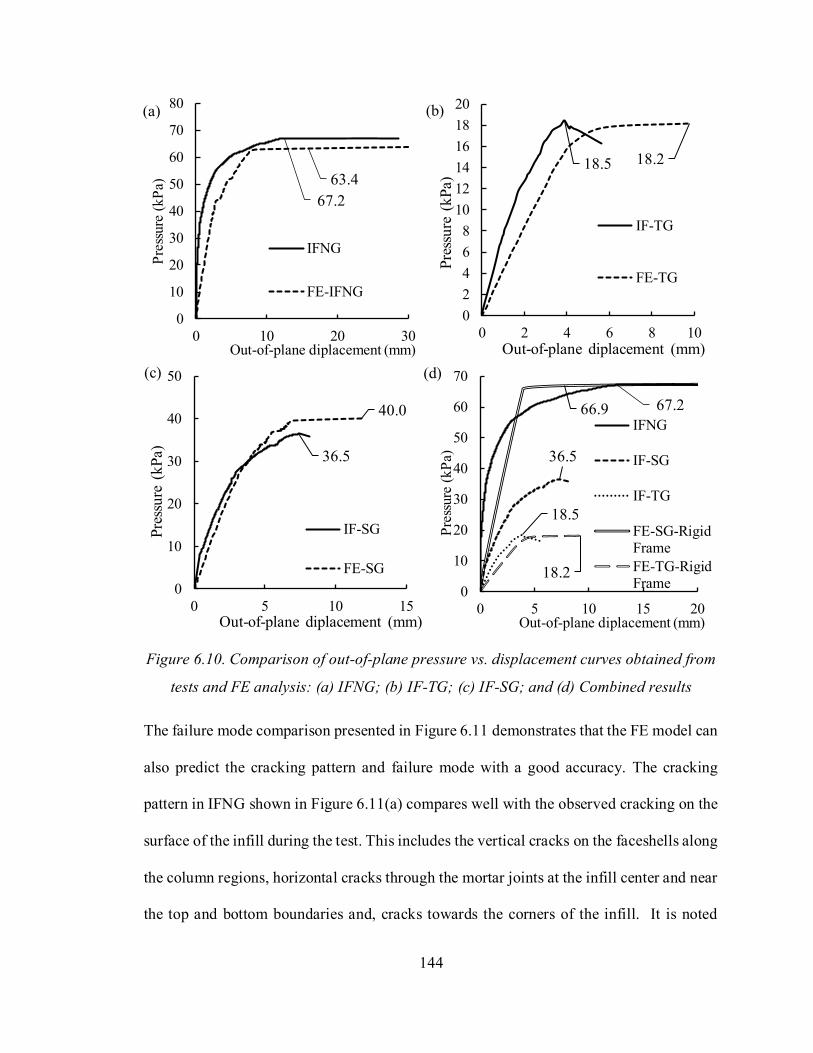
144
Figure 6.10. Comparison of out-of-plane pressure vs. displacement curves obtained from
tests and FE analysis: (a) IFNG; (b) IF-TG; (c) IF-SG; and (d) Combined results
The failure mode comparison presented in Figure 6.11 demonstrates that the FE model can
also predict the cracking pattern and failure mode with a good accuracy. The cracking
pattern in IFNG shown in Figure 6.11(a) compares well with the observed cracking on the
surface of the infill during the test. This includes the vertical cracks on the faceshells along
the column regions, horizontal cracks through the mortar joints at the infill center and near
the top and bottom boundaries and, cracks towards the corners of the infill. It is noted
67.2
63.4
0
10
20
30
40
50
60
70
80
0 10 20 30
Pre
ssure
(k
Pa)
Out-of-plane diplacement (mm)
IFNG
FE-IFNG
18.5 18.2
0
2
4
6
8
10
12
14
16
18
20
0 2 4 6 8 10
Pre
ssu
re (
kP
a)
Out-of-plane diplacement (mm)
IF-TG
FE-TG
36.5
40.0
0
10
20
30
40
50
0 5 10 15
Pre
ssu
re (
kP
a)
Out-of-plane diplacement (mm)
IF-SG
FE-SG
67.2
36.5
18.5
66.9
18.2
0
10
20
30
40
50
60
70
0 5 10 15 20
Pre
ssure
(k
Pa)
Out-of-plane diplacement (mm)
IFNG
IF-SG
IF-TG
FE-SG-RigidFrame
FE-TG-RigidFrame
(a) (b)
(c) (d)
145
though that both FE analysis and experimental observation suggest that the final failure
was governed by cracking through the webs of CMUs. The failure of side gapped specimen
(IF-SG) was initiated with a horizontal crack through the middle of the infill which was
followed by inclined cracks through the CMUs and mortar joints towards the corners of
the infill. This shows that the arching force was mainly transferred towards the corners of
the infill as the top beam deflected. The cracks through concrete frame members were also
accurately predicted in the FE model. On the other hand, the presence of top gap (IF-TG)
resulted in an essentially three-side bounded panel. The largest out-of-plane deformation
was observed at the top of the infill as shown in Figure 6.11(c) and the cracking pattern is
in line with the yield-line pattern for a three-side supported slab but with vertical cracks
developed along two column regions and inside the CMUs through the webs. Again, the
final failure was governed by the web shear failure. Overall, the FE model is shown to
produce capacity results and predict behaviour and failure both accurately.

146
Figure 6.11. Comparison of FE and experimental results for cracking patterns: (a)
IFNG; (b) IF-SG; and (c) IF-TG
Figure 6.10(d) combines the FE and experimental results to illustrate the relationship
between two-way and one-way arching in both a fully rigid frame and a “real” frame
allowing deformations. It can be assumed that specimen IF-SG reflects the vertical arching
behaviour whereas specimen IF-TG reflects the horizontal arching behaviour, albeit with
(b)
(c)
(a)
147
an additional bottom boundary. In previous section, it was shown that for a fully rigid frame
boundary, the vertical arching strength is more or less equal to the two-way arching
strength. This observation is still supported herein by comparing curves of FE-SG-Rigid
Frame and IFNG in the figure. However, when the test results on “real” frames are
considered, the side gap (IF-SG) resulted in a strength reduction of 46% whereas the top
gap (IF-TG) resulted in an even higher strength reduction, at 72%, by comparing curves of
IF-SG, IF-TG and IFNG. Clearly, the hypothesis of vertical arching equal to two-way
arching is not realized in a “real” frame situation. The reduction of strength in IF-SG is
attributed to the deflection of the top beam at the centre enabled by the frame flexibility
creating a less stiff support for the infill and thus less arching strength, indicating the
stiffness of the frame plays an important part in the strength of the infill. For specimen IF-
TG, the strength reduction is at much higher level indicating that horizontal arching is much
weaker. The fact that the fully rigid boundary assumption does not change the predicted
strength (comparing curves of FE-TG-Rigid Frame and FE-TG) suggests that horizontal
arching strength is insensitive to frame stiffness.
6.7 Two-Way Arching in Flexible Bounding Frames
The previous sections discussed the relationship between one-way and two-way arching
using both the FE and experimental results. It can be concluded that for a less than rigid
bounding frame, the vertical arching strength is not equal to the two-way arching strength
of an infill. Also, it was found that the horizontal arching yielded much less capacity than
vertical arching of a panel with the same slenderness and the two-way arching capacity is
not a simple addition of vertical and horizontal arching strengths. In this section, results of
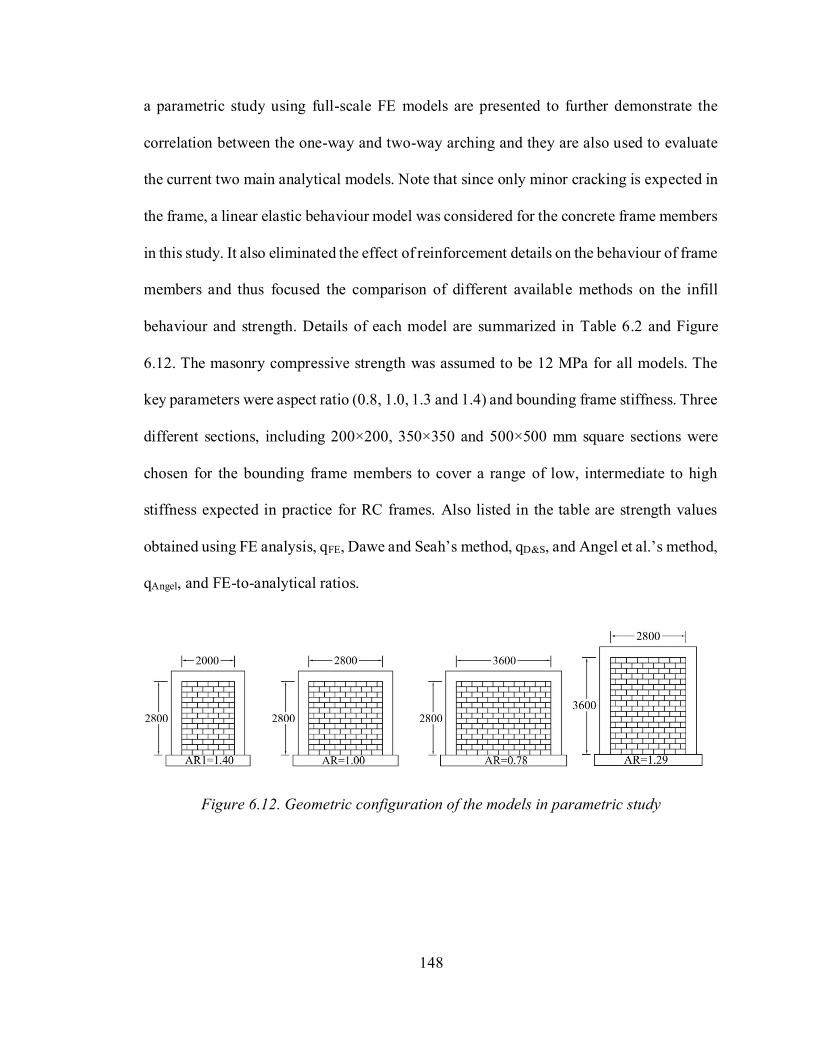
148
a parametric study using full-scale FE models are presented to further demonstrate the
correlation between the one-way and two-way arching and they are also used to evaluate
the current two main analytical models. Note that since only minor cracking is expected in
the frame, a linear elastic behaviour model was considered for the concrete frame members
in this study. It also eliminated the effect of reinforcement details on the behaviour of frame
members and thus focused the comparison of different available methods on the infill
behaviour and strength. Details of each model are summarized in Table 6.2 and Figure
6.12. The masonry compressive strength was assumed to be 12 MPa for all models. The
key parameters were aspect ratio (0.8, 1.0, 1.3 and 1.4) and bounding frame stiffness. Three
different sections, including 200×200, 350×350 and 500×500 mm square sections were
chosen for the bounding frame members to cover a range of low, intermediate to high
stiffness expected in practice for RC frames. Also listed in the table are strength values
obtained using FE analysis, qFE, Dawe and Seah’s method, qD&S, and Angel et al.’s method,
qAngel, and FE-to-analytical ratios.
Figure 6.12. Geometric configuration of the models in parametric study
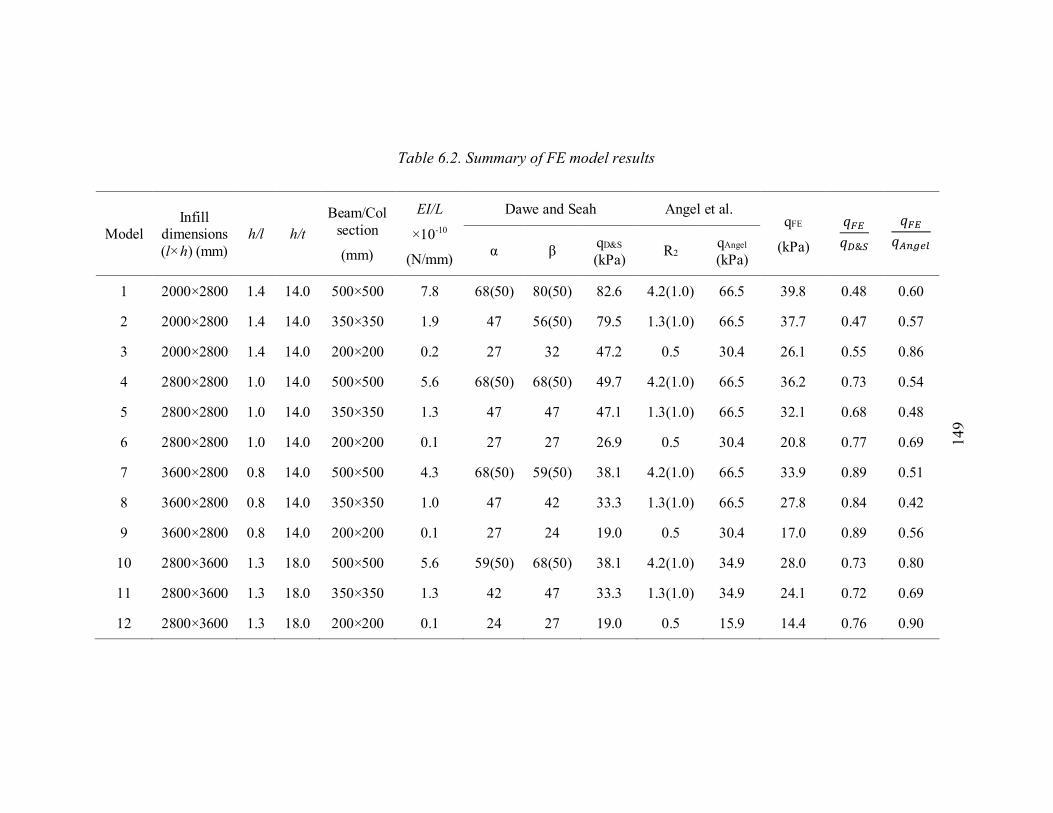
Table 6.2. Summary of FE model results
Model Infill
dimensions
(l×h) (mm)
h/l h/t
Beam/Col
section
(mm)
EI/L
×10-10
(N/mm)
Dawe and Seah Angel et al. qFE
(kPa)
𝑞𝐹𝐸𝑞𝐷&𝑆
𝑞𝐹𝐸𝑞𝐴𝑛𝑔𝑒𝑙
α β qD&S
(kPa) R2
qAngel
(kPa)
1 2000×2800 1.4 14.0 500×500 7.8 68(50) 80(50) 82.6 4.2(1.0) 66.5 39.8 0.48 0.60
2 2000×2800 1.4 14.0 350×350 1.9 47 56(50) 79.5 1.3(1.0) 66.5 37.7 0.47 0.57
3 2000×2800 1.4 14.0 200×200 0.2 27 32 47.2 0.5 30.4 26.1 0.55 0.86
4 2800×2800 1.0 14.0 500×500 5.6 68(50) 68(50) 49.7 4.2(1.0) 66.5 36.2 0.73 0.54
5 2800×2800 1.0 14.0 350×350 1.3 47 47 47.1 1.3(1.0) 66.5 32.1 0.68 0.48
6 2800×2800 1.0 14.0 200×200 0.1 27 27 26.9 0.5 30.4 20.8 0.77 0.69
7 3600×2800 0.8 14.0 500×500 4.3 68(50) 59(50) 38.1 4.2(1.0) 66.5 33.9 0.89 0.51
8 3600×2800 0.8 14.0 350×350 1.0 47 42 33.3 1.3(1.0) 66.5 27.8 0.84 0.42
9 3600×2800 0.8 14.0 200×200 0.1 27 24 19.0 0.5 30.4 17.0 0.89 0.56
10 2800×3600 1.3 18.0 500×500 5.6 59(50) 68(50) 38.1 4.2(1.0) 34.9 28.0 0.73 0.80
11 2800×3600 1.3 18.0 350×350 1.3 42 47 33.3 1.3(1.0) 34.9 24.1 0.72 0.69
12 2800×3600 1.3 18.0 200×200 0.1 24 27 19.0 0.5 15.9 14.4 0.76 0.90
14
9
150
Figure 6.13 compares strength values from the three sources vs. infill aspect ratio for three
frame stiffnesses and Figure 6.14 compares strength values vs. stiffness of the bounding
frame for three infill aspect ratios. The slenderness of infills is kept the same (h/t=14) for
both figures. The frame stiffness was defined using EI/L, rather than EI as in Angel et al.’s
method, to include the effect of member length. The top beam stiffness was used in the plot
as arching in the vertical direction is the primary contributor to the overall strength as
discussed previously. Both figures show that overall, the two analytical methods predict
much higher strengths than the FE results, and this overestimation is more pronounced for
bounding frames of intermediate to high stiffness and infills of large aspect ratio. Further,
as shown in Figure 6.13, qAngel remains constant as aspect ratio varies due to the fact that
Angel et al.’s method does not take the infill aspect ratio into strength consideration. On
the other hand, both FE results and Dawe and Seah’s method suggest an increasing trend
for strength as aspect ratio increases but the difference is noted in the high aspect ratio
region where the latter predicts much higher strengths than the FE analysis. This marked
overestimation by Dawe and Seah’s method in high aspect ratio regions can be explained
as follows. Since Dawe and Seah’s method considers the horizontal and vertical arching
strengths in a same manner and the shorter the span, the higher the strength. An increase
in aspect ratio in this case corresponds to an increasingly shorter horizontal span, and the
method would then yield an increasing horizontal strength. As the FE analysis shows that
the horizontal arching is much weaker than the vertical arching, the difference in treating
the horizontal arching is believed to attribute to the significant disparity in strength
predictions between the FE analysis and Dawe and Seah’s method. This point is further
demonstrated in Table 6.2 by comparing results for models of 3600 × 2800 mm and 2800
151
× 3600 mm. Dawe and Seah’s method results in an equal strength for these two different
aspect ratios but the FE results for the latter are lower than the former and both are lower
than Dawe and Seah’s predicted values.
Figure 6.14 shows that there exists a stiffness limit beyond which the strength increase
levels off and this stiffness limit is dependent on the infill aspect ratio. However, three
methods show different stiffness limits. For the aspect ratios considered, the FE results
suggest that the stiffness EI/L (calculated using the top beam) greater than 210-10 N/mm
has a diminishing effect on increasing the arching strength. Referring to Table 6.2, columns
of and (Dawe and Seah’s method) and R2 (Angel et al.’s method) and noting that the
number in brackets is the limit set by the corresponding method, the FE results seem to
agree more with Dawe and Seah’s method on the stiffness limit. Although calculated
differently, both methods show a cut-off point in a general agreement. For Angel et al.’s
method, it defines a smaller stiffness limit and also does not reflect the dependence of the
stiffness limit on the aspect ratio as R2 factor remains constant for different aspect ratios.
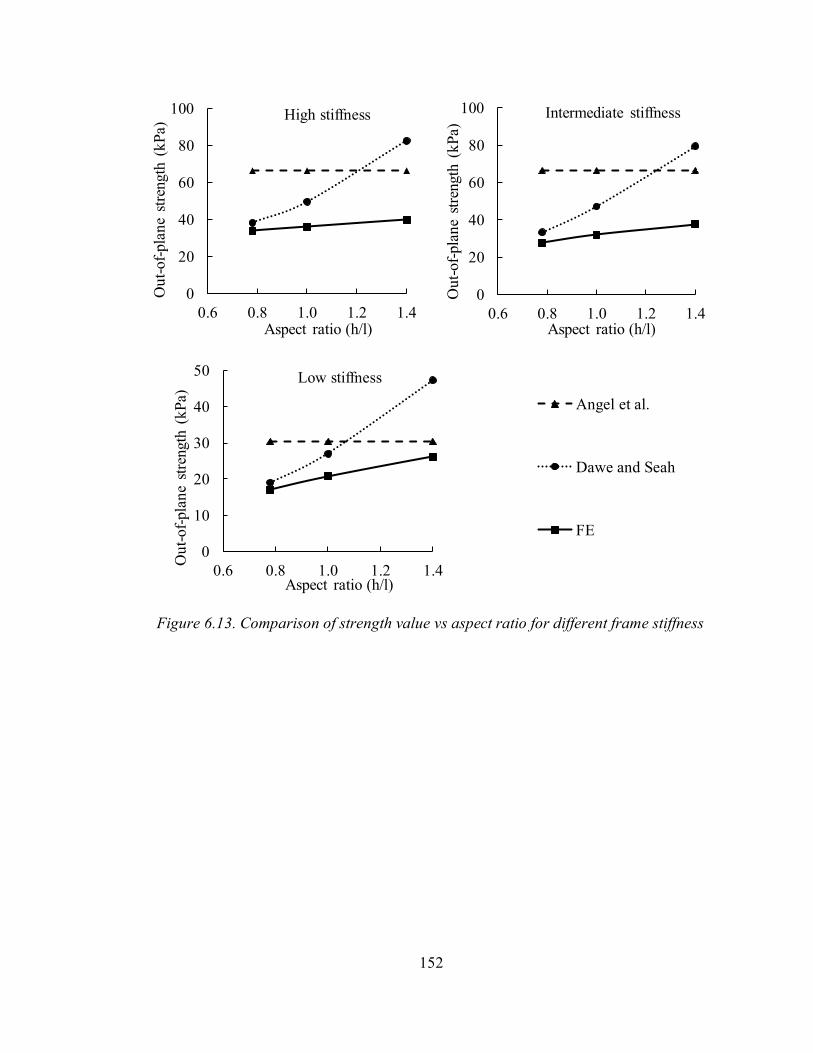
152
Figure 6.13. Comparison of strength value vs aspect ratio for different frame stiffness
0
20
40
60
80
100
0.6 0.8 1.0 1.2 1.4
Ou
t-of-
pla
ne
stre
ngth
(k
Pa)
Aspect ratio (h/l)
High stiffness
0
20
40
60
80
100
0.6 0.8 1.0 1.2 1.4
Ou
t-of-
pla
ne
stre
ngth
(k
Pa)
Aspect ratio (h/l)
Intermediate stiffness
0
10
20
30
40
50
0.6 0.8 1.0 1.2 1.4
Ou
t-of-
pla
ne
stre
ngth
(k
Pa)
Aspect ratio (h/l)
Low stiffness
Angel et al.
Dawe and Seah
FE

153
Figure 6.14. Comparison of strength value vs frame stiffness for different infill aspect
ratio
6.7.1 Proposed Modification Based on Dawe and Seah’s Method
The above discussion shows that the FE results share a more similar overall trend with
Dawe and Seah’s method than Angel et al.’s method with respect to infill aspect ratio and
bounding frame stiffness. It was then decided to use Dawe and Seah’s method as basis to
propose modifications to improve the accuracy of the strength equation. Noting that the
exponential strength decrease trend with respect to slenderness (h/t) of an infill has been
0
20
40
60
80
100
0 1 2 3 4 5 6 7 8
Ou
t-of-
pla
ne
stre
ngth
(k
Pa)
EI/L×10-10 (N.mm)
h/l=1.4
0
20
40
60
80
0 1 2 3 4 5 6
Ou
t-of-
pla
ne
stre
ngth
(k
Pa)
EI/L×10-10 (N.mm)
h/l=1.0
0
20
40
60
80
0 1 2 3 4 5
Ou
t-of-
pla
ne
stre
ngth
(k
Pa)
EI/L×10-10 (N.mm)
h/l=0.78
Angel et al.
Dawe and Seah
FE
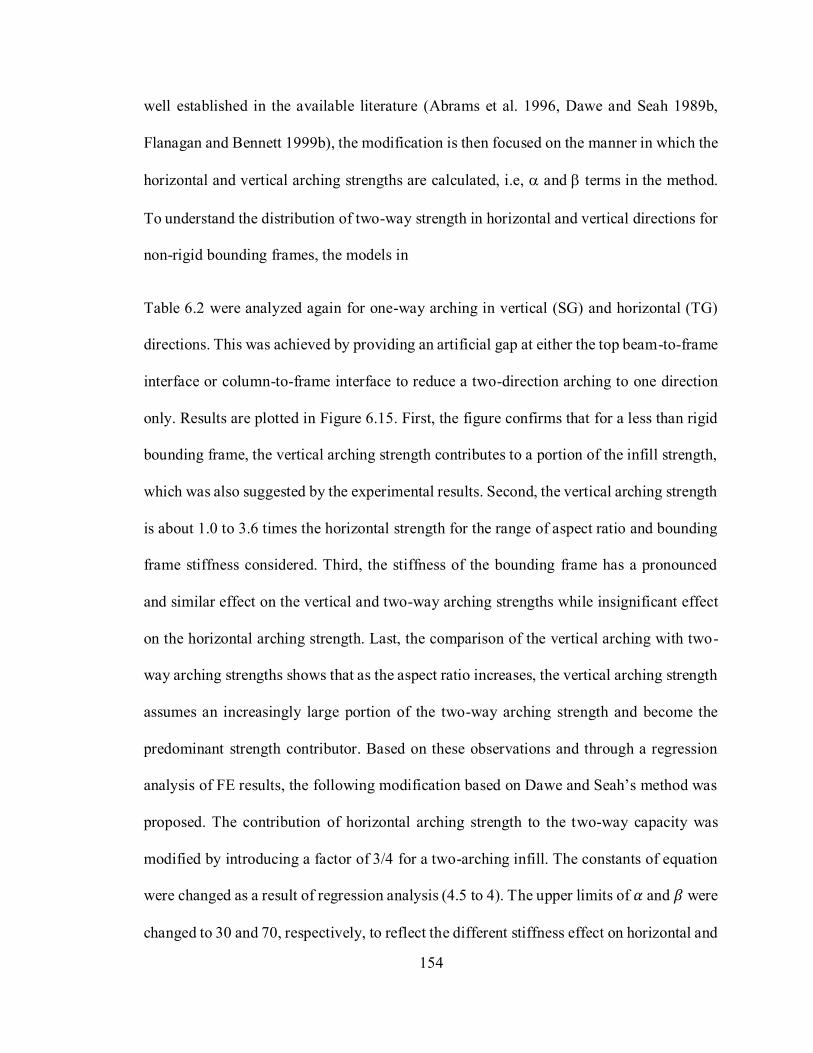
154
well established in the available literature (Abrams et al. 1996, Dawe and Seah 1989b,
Flanagan and Bennett 1999b), the modification is then focused on the manner in which the
horizontal and vertical arching strengths are calculated, i.e, and terms in the method.
To understand the distribution of two-way strength in horizontal and vertical directions for
non-rigid bounding frames, the models in
Table 6.2 were analyzed again for one-way arching in vertical (SG) and horizontal (TG)
directions. This was achieved by providing an artificial gap at either the top beam-to-frame
interface or column-to-frame interface to reduce a two-direction arching to one direction
only. Results are plotted in Figure 6.15. First, the figure confirms that for a less than rigid
bounding frame, the vertical arching strength contributes to a portion of the infill strength,
which was also suggested by the experimental results. Second, the vertical arching strength
is about 1.0 to 3.6 times the horizontal strength for the range of aspect ratio and bounding
frame stiffness considered. Third, the stiffness of the bounding frame has a pronounced
and similar effect on the vertical and two-way arching strengths while insignificant effect
on the horizontal arching strength. Last, the comparison of the vertical arching with two-
way arching strengths shows that as the aspect ratio increases, the vertical arching strength
assumes an increasingly large portion of the two-way arching strength and become the
predominant strength contributor. Based on these observations and through a regression
analysis of FE results, the following modification based on Dawe and Seah’s method was
proposed. The contribution of horizontal arching strength to the two-way capacity was
modified by introducing a factor of 3/4 for a two-arching infill. The constants of equation
were changed as a result of regression analysis (4.5 to 4). The upper limits of 𝛼 and 𝛽 were
changed to 30 and 70, respectively, to reflect the different stiffness effect on horizontal and
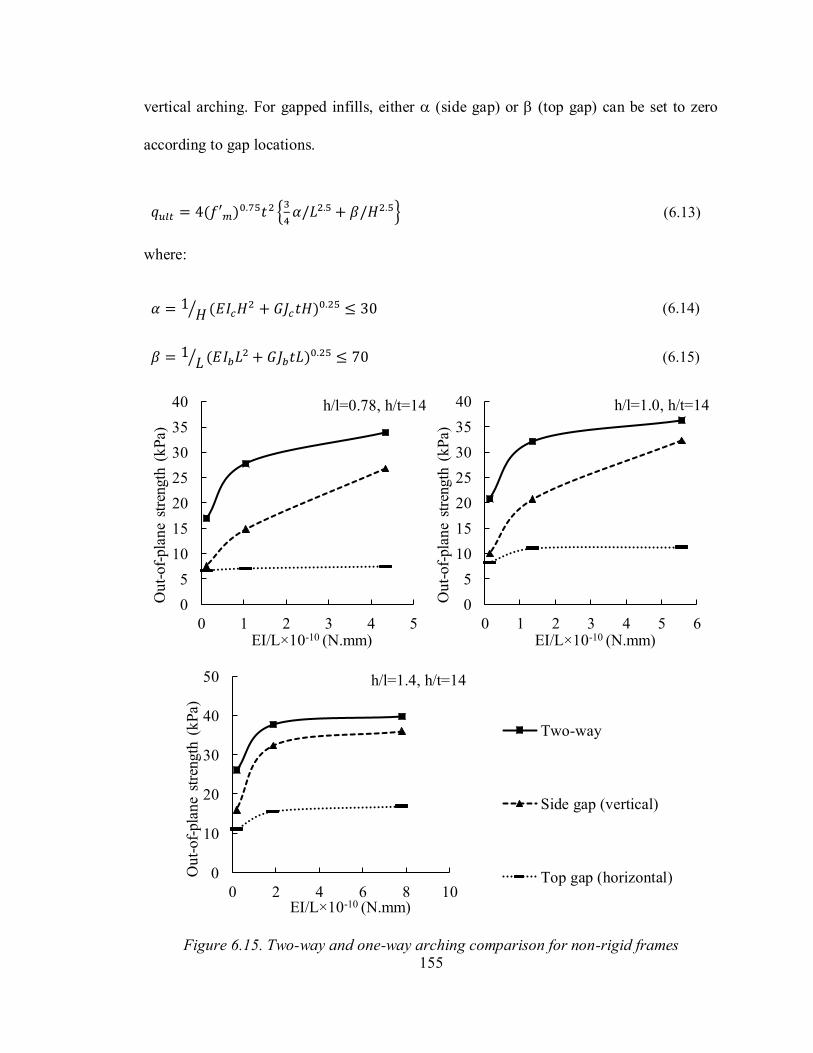
155
vertical arching. For gapped infills, either (side gap) or (top gap) can be set to zero
according to gap locations.
𝑞𝑢𝑙𝑡 = 4(𝑓′𝑚)0.75𝑡2 {
3
4𝛼/𝐿2.5 + 𝛽/𝐻2.5} (6.13)
where:
𝛼 = 1𝐻⁄ (𝐸𝐼𝑐𝐻
2 + 𝐺𝐽𝑐𝑡𝐻)0.25 ≤ 30 (6.14)
𝛽 = 1𝐿⁄ (𝐸𝐼𝑏𝐿
2 + 𝐺𝐽𝑏𝑡𝐿)0.25 ≤ 70 (6.15)
Figure 6.15. Two-way and one-way arching comparison for non-rigid frames
0
5
10
15
20
25
30
35
40
0 1 2 3 4 5
Ou
t-of-
pla
ne
stre
ngth
(k
Pa)
EI/L×10-10 (N.mm)
h/l=0.78, h/t=14
0
5
10
15
20
25
30
35
40
0 1 2 3 4 5 6
Ou
t-of-
pla
ne
stre
ngth
(k
Pa)
EI/L×10-10 (N.mm)
h/l=1.0, h/t=14
0
10
20
30
40
50
0 2 4 6 8 10
Ou
t-of-
pla
ne
stre
ngth
(k
Pa)
EI/L×10-10 (N.mm)
h/l=1.4, h/t=14
Two-way
Side gap (vertical)
Top gap (horizontal)
156
6.7.2 Performance of the Proposed Equation
The performance of the proposed equation was first evaluated against the FE results and a
summary is shown in Table 6.3 together with the two analytical methods. It can be seen
that the overall average of qFE/qeqn is close to unity with a COV of 23%. Both indicators
are improved from Dawe and Seah’s and Angel et al.’s methods, suggesting a better
performance in predicting the strength. When the gapped cases were examined separately,
the average qFE/qeqn are 0.92 for the top gap cases and 1.10 for the side gap cases with
COVs of 28% and 22%, respectively. This, when compared with the average qFE/qD&S of
0.51 and 1.11 with COV of 35% and 30% for results by Dawe and Seah’s method, shows
that the proposed modifications also provide improved predictions for gapped boundary
conditions.
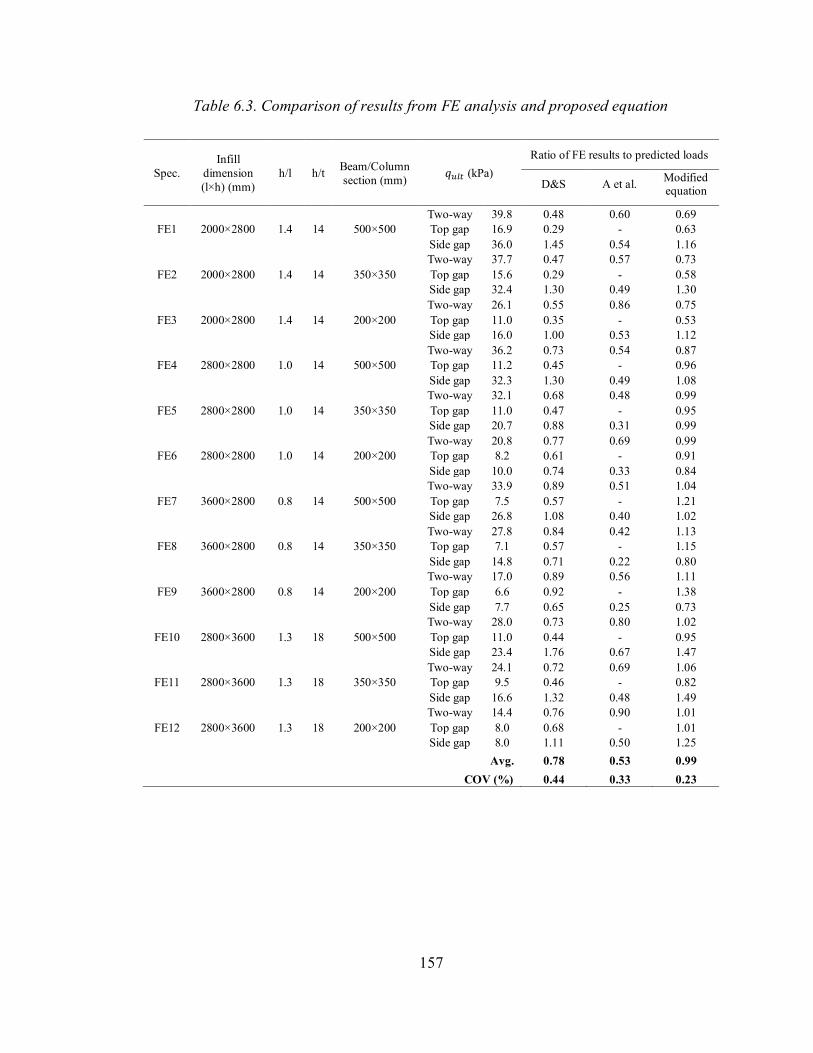
157
Table 6.3. Comparison of results from FE analysis and proposed equation
Spec.
Infill
dimension
(l×h) (mm)
h/l h/t Beam/Column
section (mm) 𝑞𝑢𝑙𝑡 (kPa)
Ratio of FE results to predicted loads
D&S A et al. Modified equation
FE1 2000×2800 1.4 14 500×500
Two-way 39.8 0.48 0.60 0.69
Top gap 16.9 0.29 - 0.63
Side gap 36.0 1.45 0.54 1.16
FE2 2000×2800 1.4 14 350×350
Two-way 37.7 0.47 0.57 0.73
Top gap 15.6 0.29 - 0.58
Side gap 32.4 1.30 0.49 1.30
FE3 2000×2800 1.4 14 200×200
Two-way 26.1 0.55 0.86 0.75
Top gap 11.0 0.35 - 0.53
Side gap 16.0 1.00 0.53 1.12
FE4 2800×2800 1.0 14 500×500
Two-way 36.2 0.73 0.54 0.87
Top gap 11.2 0.45 - 0.96
Side gap 32.3 1.30 0.49 1.08
FE5 2800×2800 1.0 14 350×350
Two-way 32.1 0.68 0.48 0.99
Top gap 11.0 0.47 - 0.95
Side gap 20.7 0.88 0.31 0.99
FE6 2800×2800 1.0 14 200×200
Two-way 20.8 0.77 0.69 0.99
Top gap 8.2 0.61 - 0.91
Side gap 10.0 0.74 0.33 0.84
FE7 3600×2800 0.8 14 500×500
Two-way 33.9 0.89 0.51 1.04
Top gap 7.5 0.57 - 1.21
Side gap 26.8 1.08 0.40 1.02
FE8 3600×2800 0.8 14 350×350
Two-way 27.8 0.84 0.42 1.13
Top gap 7.1 0.57 - 1.15
Side gap 14.8 0.71 0.22 0.80
FE9 3600×2800 0.8 14 200×200
Two-way 17.0 0.89 0.56 1.11
Top gap 6.6 0.92 - 1.38
Side gap 7.7 0.65 0.25 0.73
FE10 2800×3600 1.3 18 500×500
Two-way 28.0 0.73 0.80 1.02
Top gap 11.0 0.44 - 0.95
Side gap 23.4 1.76 0.67 1.47
FE11 2800×3600 1.3 18 350×350
Two-way 24.1 0.72 0.69 1.06
Top gap 9.5 0.46 - 0.82
Side gap 16.6 1.32 0.48 1.49
FE12 2800×3600 1.3 18 200×200
Two-way 14.4 0.76 0.90 1.01
Top gap 8.0 0.68 - 1.01
Side gap 8.0 1.11 0.50 1.25
Avg. 0.78 0.53 0.99
COV (%) 0.44 0.33 0.23

158
Next, the proposed equation was evaluated using the available experimental results
obtained in the literature. A summary of the comparison study is presented in Table 6.4.
The experimental results were divided into two categories. Since the proposed equation
was developed for concrete masonry block infills, the tests involving concrete masonry
infills were considered first. Results of 11 specimens from three studies were collected and
compared with the proposed equation as well as the two analytical methods. It is noted that
this study and Angel et al.’s study used RC frames whereas Dawe and Seah’s study used
steel frames. Specimens IF-TG and WE6, had a gap at the top beam-to-infill interface and
thus were excluded from Angel et al.’s method calculations. Also, the reported strengths
for specimens 4b and 5b (Angel et al.’s study) were not exactly the “ultimate” strengths as
the tests were terminated before the specimens reaching the ultimate load. They were
however included to demonstrate the relative performance between different methods.
Based on the results in Table 6.4, the modified equation provides the best estimate of out-
of-plane strength in each set of tests considered. It should be pointed out that the modified
equation performed better than Dawe and Seah’s method for the tests conducted by Dawe
and Seah. Angel et al.’s method is the least accurate one due to the mean experimental-to-
analytical ratio being far from unity and with the highest COV of all three methods. Next,
the performance of the proposed equation was assessed using experimental results on other
types of masonry infills from three studies (Flanagan and Bennett 1999b, Frederiksen 1992,
Fricke et al. 1992). These results were also used in the studies (Flanagan and Bennett
1999a, Pasca et al. 2017, Ricci et al. 2018) mentioned in the introduction section. All three
studies used steel bounding frames. The results were in line with those of concrete masonry
infills that Dawe and Seah’s and proposed methods provide comparable predictions with
159
the latter showing an improved overall experimental-to-analytical mean value while Angel
et al.’s method performed the worst of the three. Combining the entire data points, the
proposed equation yielded a mean experimental-to-analytical ratio of 1.02 with a COV of
33% in comparison of 0.75% with a COV of 28% obtained using Dawe and Seah’s method.
It should be pointed out that the proposed equation was developed and calibrated based on
results of concrete masonry infills with consideration of their characteristic failure mode
(web shear failure). The comparison above showed that it also provided reasonable
predictions for other types of masonry infills. It is cautioned though, due to the limited data
points, further validation is needed for applicability of the proposed method to a range of
masonry infill and frame types.

160
Table 6.4. Comparison of results from the proposed equation and experimental studies
Ref. Spec.
Infill
dimensions
(l×h)
(mm)
t
(mm) h/l h/t
Beam/Colum
n section
(mm)
𝑓𝑚′
(kPa)
𝑞𝑢𝑙𝑡 (kPa)
Ratio of experimental-to-
predicted load
D&S A et
al.
Modified
equation
Concrete masonry infills
Th
is s
tud
y IFNG 1350×980 90 0.7 10.9 180×180 17100 67.2 0.71 0.97 0.90
IF-TG 1350×980 90 0.7 10.9 180×180 17100 18.5 0.61 - 0.97
IF-SG 1350×980 90 0.7 10.9 180×180 17100 36.5 0.66 0.56 0.75
Avg. 0.66 0.77 0.87
COV (%) 8 38 13
Daw
e an
d S
eah
(1
98
9)
WE1 3600×2800 190 0.8 14.7 B: W200×46
C: W250×58 30500 22.3 0.60 0.33 0.76
WE2 3600×2800 190 0.8 14.7 B: W200×46
C: W250×58 28100 19.2 0.55 0.31 0.70
WE4 3600×2800 140 0.8 20.0 B: W200×46
C: W250×58 22700 11.2 0.70 0.51 0.88
WE8 3600×2800 140 0.8 20.0 B: W200×46
C: W250×58 27400 13.4 0.72 0.50 0.91
WE5 3600×2800 90 0.8 31.1 B: W200×46
C: W250×58 20200 7.8 1.28 1.84 1.61
WE6
(TG) 3600×2800 190 0.8 14.7
B: W200×46
C: W250×58 22300 10.6 0.84 - 1.26
Avg. 0.78 0.70 1.02
COV (%) 34 93 34
An
gel
et
al.
(19
94
)
4b 2400×1600 90 0.7 18.1
B:250×300 +
Slab
C: 300×300
22897 29.8 0.69 0.45 0.77
5b 2400×1600 140 0.7 11.6
B:250×300 +
Slab
C: 300×300
21463 32.2 0.32 0.18 0.36
Avg. 0.50 0.31 0.56
COV (%) 51 62 51
Clay Tile Infill with Steel Frame
Fla
nag
an a
nd
Ben
net
t
(19
99
a)
22 2240×2240 330 1.0 6.8 B: W460×113
C: W410×60 2290 39.5 0.76 1.77 1.23
18 2240×2240 195 1.0 11.5 B: W310×52
C: W250×45 5590 26.6 0.81 1.40 1.30
25 2240×2240 93 1.0 24.1 B: W310×52
C: W250×45 5590 8.1 1.09 3.09 1.74
Fri
cke
et a
l.
(19
92
)
1 8470×3660 195 0.4 18.8 B: W360×216
C: W760×161 4300 6.1 1.00 0.55 1.19
Avg. 0.92 1.70 1.37
COV (%) 17 62 18
Clay Brick Infill with Steel Frame
Fre
deri
kse
n (
19
92
) 86-3 680×970 29.5 1.4 23.3 Rigid 10600 18.0 0.75 4.62 1.08
90-3 680×970 29.5 1.4 23.3 Rigid 15500 31.7 0.66 3.28 0.95
91-3 680×970 29.5 1.4 23.3 Rigid 21200 40.2 0.73 3.22 1.06
Avg. 0.71 3.71 1.03
COV (%) 7 21 7
Overall performance Avg. 0.75 1.47 1.02
COV (%) 28 93 33
161
6.8 Conclusion
A finite element study was conducted to investigate the effect of arching action in both
one-way and two-way on the out-of-plane strength of RC framed concrete masonry infills.
The results were used to assess validity of the two main analytical methods for out-of-plane
strength calculation and further propose a modification based on Dawe and Seah’s method.
Some conclusions drawn from this study are as follows:
• For infills constructed with concrete masonry units, web shear failure was identified
as a predominant failure mode and also a main contributor to difference in strength
in horizontal and vertical arching.
• For a fully rigid bounding frame, the two-way arching strength is practically equal
to the vertical arching strength and horizontal arching is negligible. For a less than
rigid bounding frame, both vertical and horizontal arching contribute to the overall
two-way strength with the former being a more significant contributor. The
distribution between the two depends on geometrical properties of the infill and
stiffness of the frame. The two-way arching capacity is not a simple addition of
vertical and horizontal arching strength.
• The stiffness of the bounding frame has more effect on vertical arching strength
than the horizontal arching strength.
• A strength equation based on Dawe and Seah’s method was proposed showing an
improved performance when compared with the two existing analytical models.

162
• The equation was developed and validated using concrete masonry infills and more
reliable experimental results are needed to evaluate its applicability for other infill
materials.
6.9 Acknowledgement
The authors wish to recognize the contribution of financial assistance by the Canadian
Concrete Masonry Producers Association and Natural Sciences and Engineering Research
Council of Canada.
163
Chapter 7 Effect of Prior In-Plane Damage on the Out-of-Plane
Performance of Concrete Masonry Infills
Ehsan Nasiri, Yi Liu
Submitted to Engineering Structures
7.1 Abstract
This paper presents results of a study on the out-of-plane behaviour and strength of
concrete masonry infills bounded by reinforced concrete (RC) frames with prior in-plane
damage. The experimental portion of the study consisted of testing four physical infilled
frame specimens at varying levels of in-plane damage. A finite element (FE) model was
concurrently developed and validated using the test results. A parametric study using the
model was performed to further study the effect of several influential geometric and
material parameters including infill aspect ratio, masonry strength, and slenderness ratio.
The correlation between the prior in-plane damage sustained by the infill and its out-of-
plane strength as affected by each parameter was discussed in detail. The impact of cyclic
vs. monotonic loading was also studied. The efficacy of the existing analytical method for
calculating the strength reduction was evaluated using both the experimental and FE
results. A new reduction factor equation was proposed and the comparison with the existing
analytical method against the available results showed an improvement in providing an
estimate of residue out-of-plane strength for infills with prior in-plane damage.
Keywords: concrete masonry infills; RC frames; out-of-plane; in-plane damage; finite
element; arching action; nonlinear analysis
164
7.2 Introduction
Masonry walls are often built within concrete and steel frames in modern building
construction to either form the building envelope or act as partition walls. It is well
recognized that accurate prediction of the behaviour and strength of these infilled frames
under various loading conditions must consider the interaction between the frame and the
infill wall. When subjected to in-plane lateral loading, the frame behaviour is shown to be
significantly affected by the infill as the latter increases the stiffness and strength as well
as alters the dynamic characteristics of the frame structure. On the other hand, when
subjected to out-of-plane loading, behaviour of the infill wall is largely impacted by
confinement provided by the bounding frame so that the failure mechanism of the infill is
changed from a flexure-controlled failure to a compression-controlled failure. Both in-
plane and out-of-plane behaviour of the infilled frame has been studied in the past six
decades, albeit with less research contributed to the latter. Some design guidelines for
simple infilled frame situations have been established (CSA S304-14, TMS 402/602-16)
for both in-plane and out-of-plane loading conditions. In the case of in-plane loading, the
formation and development of tensile cracking in the diagonal direction of the infill
followed by masonry crushing at the loaded corners is identified as the most common
failure mode (Asteris et al. 2013, El-Dakhakhni et al. 2003, Flanagan and Bennett 1999c,
Mehrabi et al. 1996). Hence, the diagonal strut concept where the entire infill is simply
replaced by a diagonal strut connecting loaded corners was thus developed to simulate the
infill effect on the stiffness and strength of the frame system. The strut width is dependent
on the contact area between the infill and the bounding frame (El-Dakhakhni et al. 2003,
Flanagan and Bennett 1999c, Smith 1962). In the case of out-of-plane loading, presence of
165
the boundary frame was shown to provide confinement for masonry infills which attain
much higher capacity than their flexural wall counterparts (Abrams et al. 1996, Anderson
1984, Dawe and Seah 1989b, Flanagan 1994, Gabrielsen and Kaplan 1976). This capacity
increase was attributed to a failure mechanism, known as “arching”. It was proposed that
subsequent to flexural cracking, the rotation of cracked segments of the infill wall panel
was restrained by the bounding frame, creating in-plane compressive forces which delayed
further cracking and the failure was caused by masonry compressive stress reaching its
limit. As masonry compressive strength is higher than its tensile strength, the masonry
infills failing by “arching” action attained higher capacity than flexural walls failing by
tension cracking. Previous studies (Angel et al. 1994, Dawe and Seah 1989b, Flanagan and
Bennett 1999b, Varela-Rivera et al. 2012) focused on the effect of several important
parameters on the out-of-plane strength including masonry compressive strength, infill
slenderness and aspect ratio, and bounding frame stiffness. One important work conducted
by Dawe and Seah (1989b) formed the basis of design provisions contained in the
American masonry standard (TMS 402/602-16) for out-of-plane strength of masonry
infills. Nasiri and Liu (2017, 2019a, 2019b) proposed some modifications to Dawe and
Seah’s equation by considering both one-way and two-way arching action as affected by
infill geometry and frame stiffness.
This paper is motivated to investigate the interaction between in-plane and out-of-plane
behaviour, in particular, the effect of prior in-plane damage on the out-of-plane strength of
the masonry infills. As infills are considered to participate in load sharing with the
bounding frame, they often experience both in-plane and out-of-plane loading such as in
an earthquake event. Conceivably, the infill may sustain varying levels of damage caused
166
by in-plane loads and how these damages affect the infill out-of-plane load carrying
capacity is an important design consideration for the stability of the infills. A review of
available literature on the subject showed a general observation among existing studies that
the prior in-plane damage results in reductions in out-of-plane strength of infills (Angel et
al. 1994, Flanagan and Bennett 1999b, Komaraneni et al. 2011). However, due to the
limited results and difference in the type of infills and out-of-plane loading methods used,
the findings in terms of the correlation between the extent of reduction and levels of
damage were not consistent. For example, Flanagan and Bennett (1999b) tested a 2.2×2.2
m square clay tile infill bounded by a steel frame. An in-plane cyclic displacement of 0.85%
drift corresponding to 80% of the in-plane capacity of the specimen was first applied. At
this point, diagonal cracks were developed but no corner crushing was observed. Then the
lateral load was removed, and out-of-plane pressure was applied to the panel surface using
an airbag to the failure of the specimen. This in-plane drift resulted in an 18% reduction in
the infill out-of-plane strength. They concluded that damaged infills can still carry a
significant out-of-plane pressure although with greater deformation. Furtado et al. (2016)
tested one full-scale clay masonry infilled RC frames under cyclic in-plane and out-of-plane
loading. The specimen was subjected to a 0.5% cyclic in-plane drift which was twice the drift
at the ultimate load before being tested under out-of-plane loading. This in-plane damage
resulted in a 75% reduction in out-of-plane strength when compared with the undamaged
control specimen. Calvi and Bolognini (2001) investigated the out-of-plane performance of in-
plane damaged weak clay block masonry infills in RC frames. They used 0.4 and 1.2% drift
levels (serviceability and collapse limit states, respectively) and conducted the out-of-plane
test using the four-point loading scheme. Results indicated 73 and 82% reductions in out-of-
plane strength in specimens with 0.4 and 1.2% prior in-plane drift, respectively. Angel et al.
167
(1994) tested two clay brick masonry infilled RC frames with 0.34 and 0.22% cyclic in-
plane drift ratios and the out-of-plane strength reductions were found to be 51 and 27%
respectively. In the same study, they also proposed an out-of-plane strength reduction
factor equation to account for the effect of prior in-plane damage. The factor is a function
of the ratio of applied in-plane displacement to the in-plane displacement at which the first
crack occurred. This equation is the only analytical method available in the literature to
account for prior in-plane damage. However, it should be pointed out that the equation was
calibrated using one specimen as the reference for all other pre-damaged specimens of
varying slenderness ratios and masonry materials, which raised the question of its efficacy.
Di Trapani et al. (2017) implemented a macroelement model in OpenSees to investigate
the out-of-plane strength of infills with in-plane damage. When compared with the
specimens tested by Angel et al. (1994), it was concluded that the loss of strength predicted
by Angel et al.’s method was significantly higher than that predicted using their model.
This study, consisting of both experimental testing of physical specimens and a finite
element study, was conducted to further investigate the effect of prior in-plane damage on
the out-of-plane strength of masonry infills bounded by RC frames. Concrete masonry unit
(CMU) infills were used as they are a primary infill material used in North America. A 3D
finite element (FE) model was used for simulation of out-of-plane behaviour and strength
of masonry infilled RC frames with in-plane damage. A concurrent experimental program
was conducted on testing of four concrete masonry infilled RC frame specimens with
varying levels of prior in-plane damage. The test results were used to validate the model as
well as to provide experimental evidence of correlation of prior damage and out-of-plane
strength reduction. A subsequent parametric study focusing on several critical parameters

168
was conducted using the model. A bi-linear equation for calculating the out-of-plane
strength reduction factor considering prior in-plane damage was proposed based on both
the FE and experimental results.
7.3 Finite Element Modelling Method
A three-dimensional FE model was developed in ABAQUS to simulate the behaviour of
the concrete masonry infills bounded by RC frames. The detailed development of the
model and its validity in both the in-plane and out-of-plane analysis of the infilled frames
are described in Nasiri and Liu (2017) and thus are not repeated herein. The following
however, provides a summary of some key modelling aspects of various components of
concrete masonry infilled RC frames. The “simplified micro-modelling” technique
(Lourenco 1996) was used where the mortar joints were not physically modeled and the
CMU dimensions were thus increased by half thickness of the mortar joint in both
horizontal and vertical directions. The three-dimensional geometry of CMUs were
considered in this method and the corresponding nonlinear mechanical behaviour was
defined through the tensile and compressive stress-strain curves implemented in concrete
damaged plasticity (CDP) constitutive model in ABAQUS. These curves can be obtained
experimentally or by using existing behaviour models for concrete and masonry.
The surface-based cohesive behaviour model in ABAQUS was used to model the interface
between the CMUs and between the CMUs and the frame. This behaviour model uses the
traction-separation constitutive relationship incorporating shear and tensile failure criteria
to capture the possible failure modes of interface. The behaviour model is schematically
illustrated in Figure 7.1. In the elastic state, the traction-separation law is controlled by an
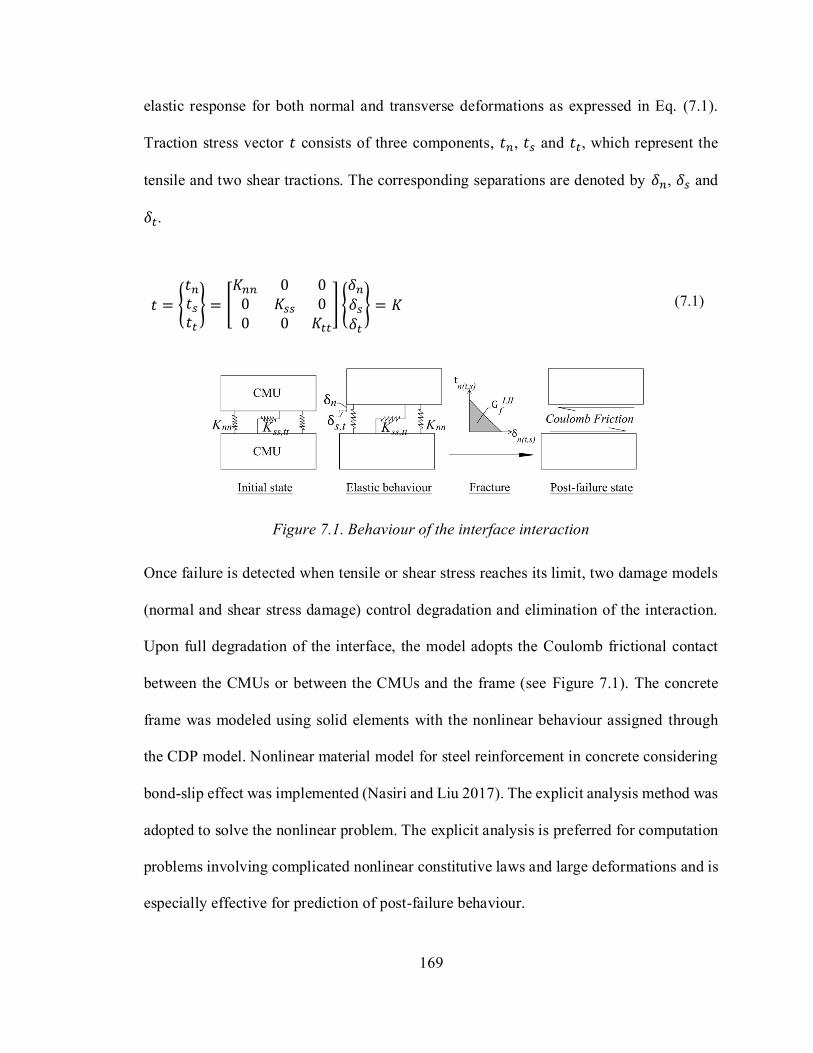
169
elastic response for both normal and transverse deformations as expressed in Eq. (7.1).
Traction stress vector 𝑡 consists of three components, 𝑡𝑛, 𝑡𝑠 and 𝑡𝑡, which represent the
tensile and two shear tractions. The corresponding separations are denoted by 𝛿𝑛, 𝛿𝑠 and
𝛿𝑡.
𝑡 = {𝑡𝑛𝑡𝑠𝑡𝑡
} = [𝐾𝑛𝑛 0 00 𝐾𝑠𝑠 00 0 𝐾𝑡𝑡
] {𝛿𝑛𝛿𝑠𝛿𝑡
} = 𝐾 (7.1)
Figure 7.1. Behaviour of the interface interaction
Once failure is detected when tensile or shear stress reaches its limit, two damage models
(normal and shear stress damage) control degradation and elimination of the interaction.
Upon full degradation of the interface, the model adopts the Coulomb frictional contact
between the CMUs or between the CMUs and the frame (see Figure 7.1). The concrete
frame was modeled using solid elements with the nonlinear behaviour assigned through
the CDP model. Nonlinear material model for steel reinforcement in concrete considering
bond-slip effect was implemented (Nasiri and Liu 2017). The explicit analysis method was
adopted to solve the nonlinear problem. The explicit analysis is preferred for computation
problems involving complicated nonlinear constitutive laws and large deformations and is
especially effective for prediction of post-failure behaviour.

170
7.4 Experimental Investigation
Four concrete masonry infilled RC frame specimens were tested to provide physical results
on the effect of in-plane damage on the infill out-of-plane behaviour. As summarized in
Table 7.1, the four specimens included one control specimen IF-ND, and three with
different extents of prior in-plane damage, IF-D1, IF-D2 and IF-D3. The damage was
defined using the drift ratio measured at the frame top beam level, and in this case, drift
ratios of 0.66, 1.37 and 2.7% were used for IF-D1, IF-D2 and IF-D3, respectively.
Table 7.1. Details of RC framed masonry infill specimens
Specimen
ID
In-plane drift
(/h)
Concrete Masonry 𝑞𝑢,𝐸𝑋𝑃
(kPa)
𝑞𝑢,EXP𝑞𝑢,FE
E
(MPa)
𝑓𝑐′
(MPa)
E
(MPa)
𝑓𝑚′
(MPa)
IF-ND 0 27800 43.8 2980 17.1 67.2 1.06
IF-D1 0.66% 16900 38.5 2980 17.1 44.4 1.01
IF-D2 1.37% 16900 38.5 2980 17.1 37.6 0.96
IF-D3 2.7% 16900 38.5 2980 17.1 26.4 0.83
Avg. 0.97
COV (%) 10
The loading procedure consisted of two steps. First, the in-plane loading was applied at the
top beam level monotonically to the desired drift ratio and corresponding physical damage
was noted. Next, the in-plane load was removed, and the damaged specimens were tested
to failure under out-of-plane load. The in-plane load was applied using a hydraulic actuator
whereas the out-of-plane load was applied as a pressure acting on the surface of the infill
through an airbag. During the test, the specimens were prevented from lateral and
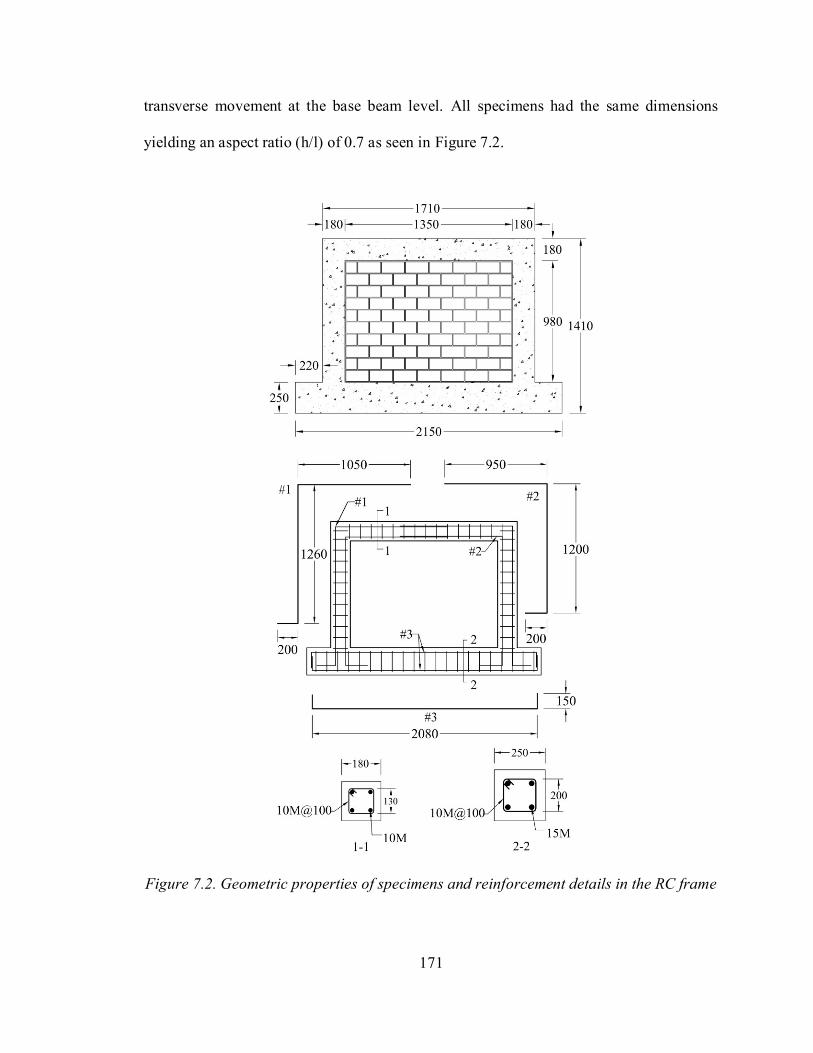
171
transverse movement at the base beam level. All specimens had the same dimensions
yielding an aspect ratio (h/l) of 0.7 as seen in Figure 7.2.
Figure 7.2. Geometric properties of specimens and reinforcement details in the RC frame
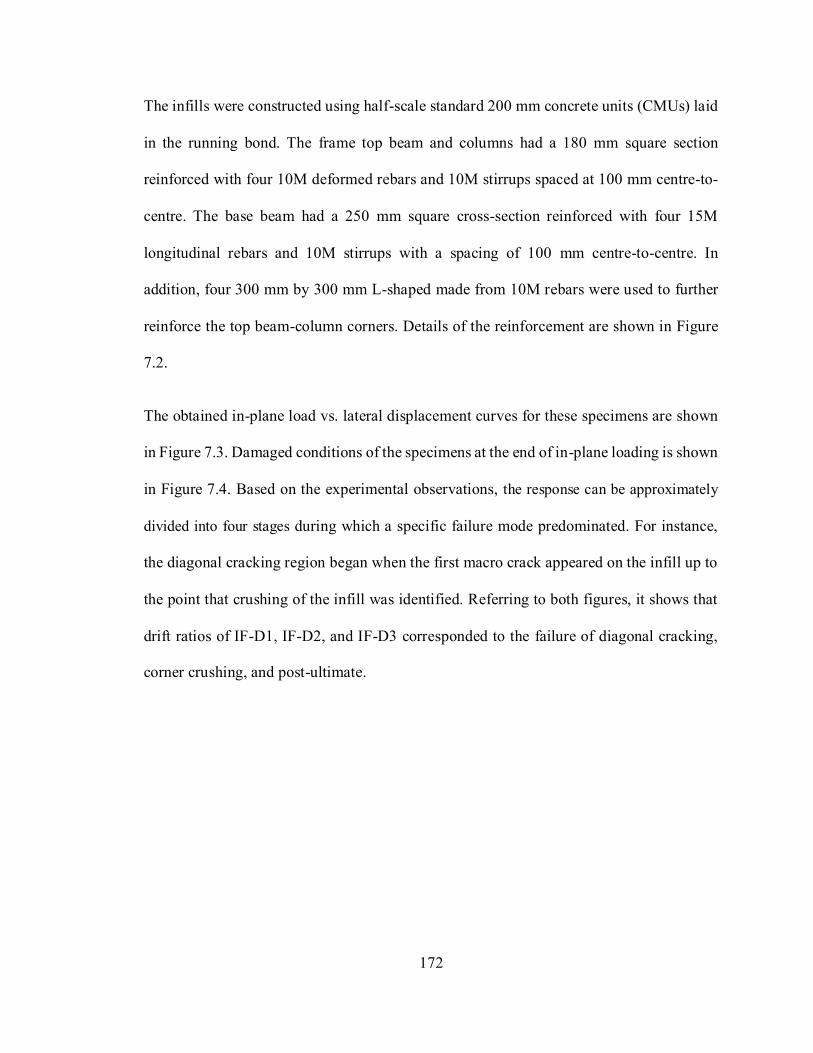
172
The infills were constructed using half-scale standard 200 mm concrete units (CMUs) laid
in the running bond. The frame top beam and columns had a 180 mm square section
reinforced with four 10M deformed rebars and 10M stirrups spaced at 100 mm centre-to-
centre. The base beam had a 250 mm square cross-section reinforced with four 15M
longitudinal rebars and 10M stirrups with a spacing of 100 mm centre-to-centre. In
addition, four 300 mm by 300 mm L-shaped made from 10M rebars were used to further
reinforce the top beam-column corners. Details of the reinforcement are shown in Figure
7.2.
The obtained in-plane load vs. lateral displacement curves for these specimens are shown
in Figure 7.3. Damaged conditions of the specimens at the end of in-plane loading is shown
in Figure 7.4. Based on the experimental observations, the response can be approximately
divided into four stages during which a specific failure mode predominated. For instance,
the diagonal cracking region began when the first macro crack appeared on the infill up to
the point that crushing of the infill was identified. Referring to both figures, it shows that
drift ratios of IF-D1, IF-D2, and IF-D3 corresponded to the failure of diagonal cracking,
corner crushing, and post-ultimate.
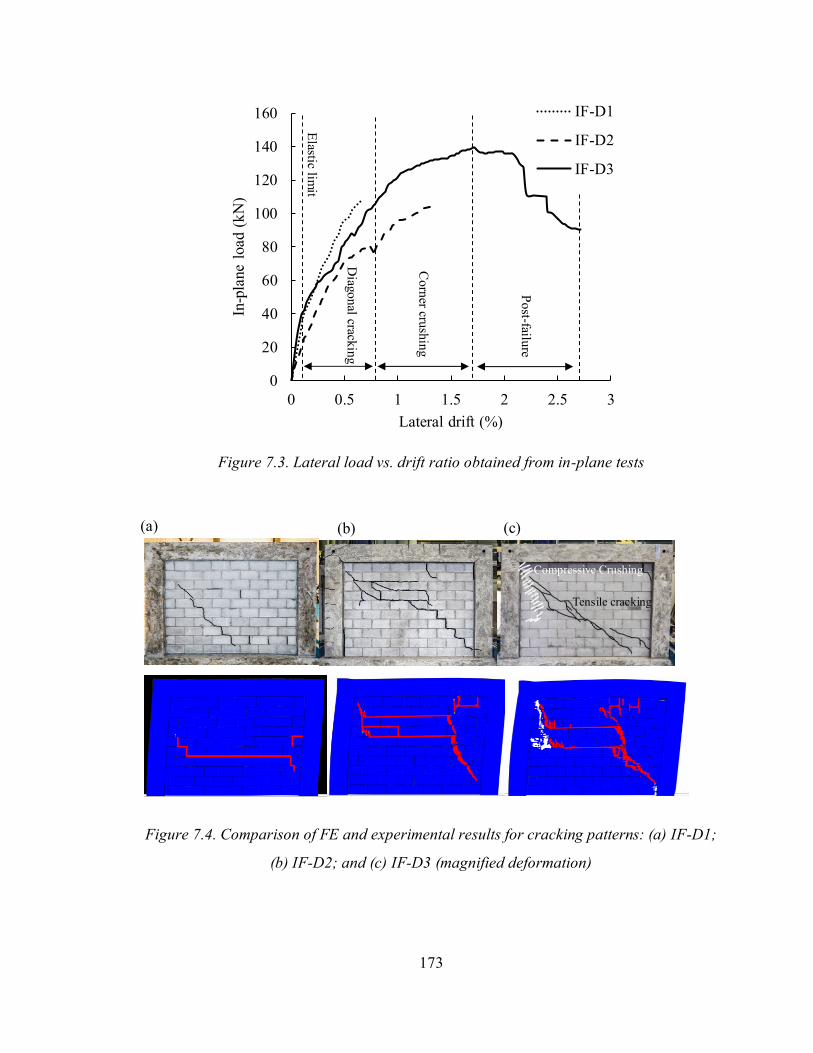
173
Figure 7.3. Lateral load vs. drift ratio obtained from in-plane tests
Figure 7.4. Comparison of FE and experimental results for cracking patterns: (a) IF-D1;
(b) IF-D2; and (c) IF-D3 (magnified deformation)
0
20
40
60
80
100
120
140
160
0 0.5 1 1.5 2 2.5 3
In-p
lane
load
(k
N)
Lateral drift (%)
IF-D1
IF-D2
IF-D3
Corn
er crush
ing
Diag
onal crack
ing
Elastic
limit
Post-failu
re
(a)
Compressive Crushing
Tensile cracking
(b) (c)

174
The out-of-plane strength vs displacement curves of all four specimens are compared in
Figure 7.5 (a) with the ultimate strength attained by each specimen indicated on the curve.
For all specimens, LVDT reading at the center of the infill was used in the plots. It can be seen
that the prior in-plane damage resulted in a reduction in the specimen out-of-plane strength
and increased softness in its behaviour. The greater the damage (higher the drift ratio), the
greater the reduction. The normalized strength with respect to the control specimen vs.
applied in-plane drift is plotted in Figure 7.5 (b). A 34% reduction was observed in the
specimen with 0.66% in-plane drift (IF-D1) which was followed by a 45% reduction in the
specimen with 1.23% in-plane drift (IF-D2). The greatest reduction of strength was about
60% observed in IF-D3 with a 2.7% prior in-plane drift, in which case, the specimen has
reached well into its post-ultimate stage. In other words, the specimen still had about 40%
out-of-plane strength remaining after reaching its in-plane capacity.
Figure 7.5. Out-of-plane test results: (a) Out-of-plane pressure vs displacement curves;
and (b) normalized out-of-plane strength vs. prior in-plane drift
67.2
44.4
37.6
26.4
0
10
20
30
40
50
60
70
0 2 4 6 8 10 12
Pre
ssure
(k
Pa)
Out-of-plane displacement (mm)
IF-ND
IF-D1
IF-D2
IF-D30
0.2
0.4
0.6
0.8
1
0 0.4 0.8 1.2 1.6 2 2.4 2.8
Norm
aliz
ed o
ut-
of-
pla
ne
stre
ngth
Prior in-plane drift (%)
(a) (b)

175
Experimental observations also showed that the cracks from the in-plane loading stage
reduced the stiffness of the system during the out-of-plane testing in the initial loading
phase. At the onset of the out-of-plane loading, the deformation increased through opening
up of existing cracks, however, as the loading increased, new cracks with an X-shaped
pattern similar to the control specimen appeared on the leeward face of the damaged infills.
Similar to the control specimen, the failure of pre-damaged specimens was also sudden and
abrupt, and the failure was initiated by shear cracking of the webs of CMUs near the
bounding frame members. It can be observed that the in-plane damage undermined the out-
of-plane strength through the following mechanisms: a) compromising the integrity of the
infill and reducing the stiffness of the infill panel; b) weakening the infill/frame interface
in the form of mortar joint cracking/crushing and gap formation, and c) reducing the
stiffness of the bounding frame due to tensile cracking and yielding of reinforcement.
7.5 Validation of the Model
The FE model was verified through three aspects of experimental results. First, the FE
predicted damage during the in-plane loading stage is compared with the experimental
results as shown in Figure 7.4. It can be seen that the FE model accurately predicted the in-
plane cracking pattern and its extent as well as ultimate failure mode (masonry crushing)
as drift ratio varied. Secondly, the out-of-plane load vs displacement curves obtained using
the FE model are compared with the experimental curves in Figure 7.6 and the ultimate
capacity comparison is presented in Table 7.1. It can be seen that the FE model is capable
of predicting the out-of-plane behaviour and capacity with reasonable accuracy. As shown
in Table 7.1, the average experimental-to-FE capacity ratio, 𝑞𝑢,EXP
𝑞𝑢,FE , was determined to be
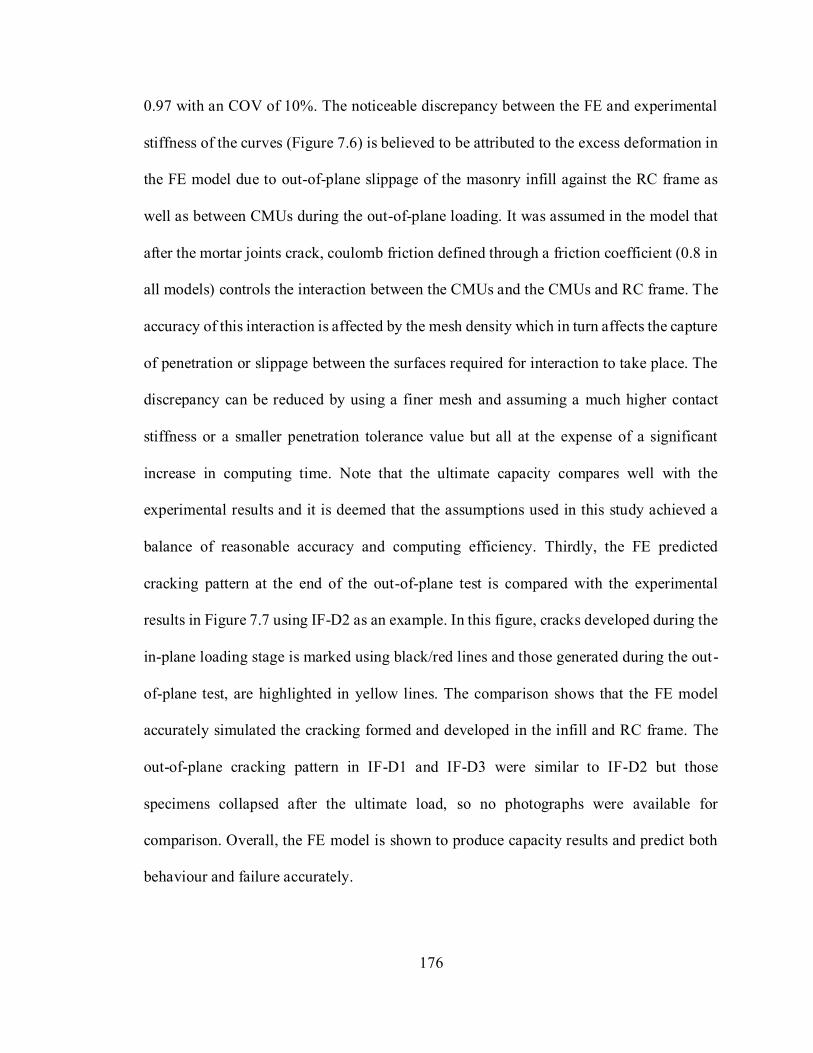
176
0.97 with an COV of 10%. The noticeable discrepancy between the FE and experimental
stiffness of the curves (Figure 7.6) is believed to be attributed to the excess deformation in
the FE model due to out-of-plane slippage of the masonry infill against the RC frame as
well as between CMUs during the out-of-plane loading. It was assumed in the model that
after the mortar joints crack, coulomb friction defined through a friction coefficient (0.8 in
all models) controls the interaction between the CMUs and the CMUs and RC frame. The
accuracy of this interaction is affected by the mesh density which in turn affects the capture
of penetration or slippage between the surfaces required for interaction to take place. The
discrepancy can be reduced by using a finer mesh and assuming a much higher contact
stiffness or a smaller penetration tolerance value but all at the expense of a significant
increase in computing time. Note that the ultimate capacity compares well with the
experimental results and it is deemed that the assumptions used in this study achieved a
balance of reasonable accuracy and computing efficiency. Thirdly, the FE predicted
cracking pattern at the end of the out-of-plane test is compared with the experimental
results in Figure 7.7 using IF-D2 as an example. In this figure, cracks developed during the
in-plane loading stage is marked using black/red lines and those generated during the out-
of-plane test, are highlighted in yellow lines. The comparison shows that the FE model
accurately simulated the cracking formed and developed in the infill and RC frame. The
out-of-plane cracking pattern in IF-D1 and IF-D3 were similar to IF-D2 but those
specimens collapsed after the ultimate load, so no photographs were available for
comparison. Overall, the FE model is shown to produce capacity results and predict both
behaviour and failure accurately.

177
Figure 7.6. Comparison of out-of-plane pressure vs. displacement curves obtained from
tests and FE analysis
67.2
63.4
0
10
20
30
40
50
60
70
0 10 20 30
Pre
ssure
(k
Pa)
Out-of-plane diplacement (mm)
IF-ND
FE
44.4 43.8
0
10
20
30
40
50
0 5 10 15 20
Pre
ssure
(k
Pa)
Out-of-plane displacement (mm)
IF-D1
FE
37.6 39.1
0
10
20
30
40
50
0 5 10 15 20
Pre
ssure
(k
Pa)
Out-of-plane displacement (mm)
IF-D2
FE
26.4
31.9
0
10
20
30
40
0 5 10 15 20 25
Pre
ssure
(k
Pa)
Out-of-plane displacement (mm)
IF-D3
FE
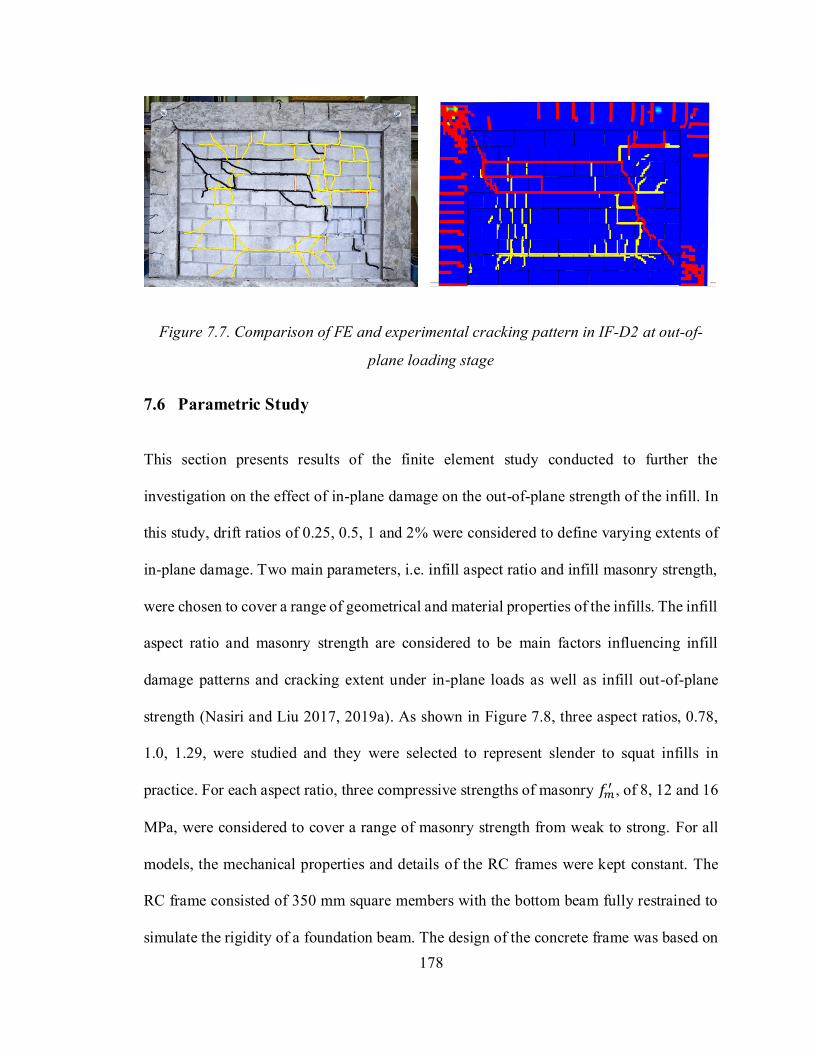
178
Figure 7.7. Comparison of FE and experimental cracking pattern in IF-D2 at out-of-
plane loading stage
7.6 Parametric Study
This section presents results of the finite element study conducted to further the
investigation on the effect of in-plane damage on the out-of-plane strength of the infill. In
this study, drift ratios of 0.25, 0.5, 1 and 2% were considered to define varying extents of
in-plane damage. Two main parameters, i.e. infill aspect ratio and infill masonry strength,
were chosen to cover a range of geometrical and material properties of the infills. The infill
aspect ratio and masonry strength are considered to be main factors influencing infill
damage patterns and cracking extent under in-plane loads as well as infill out-of-plane
strength (Nasiri and Liu 2017, 2019a). As shown in Figure 7.8, three aspect ratios, 0.78,
1.0, 1.29, were studied and they were selected to represent slender to squat infills in
practice. For each aspect ratio, three compressive strengths of masonry 𝑓𝑚′ , of 8, 12 and 16
MPa, were considered to cover a range of masonry strength from weak to strong. For all
models, the mechanical properties and details of the RC frames were kept constant. The
RC frame consisted of 350 mm square members with the bottom beam fully restrained to
simulate the rigidity of a foundation beam. The design of the concrete frame was based on
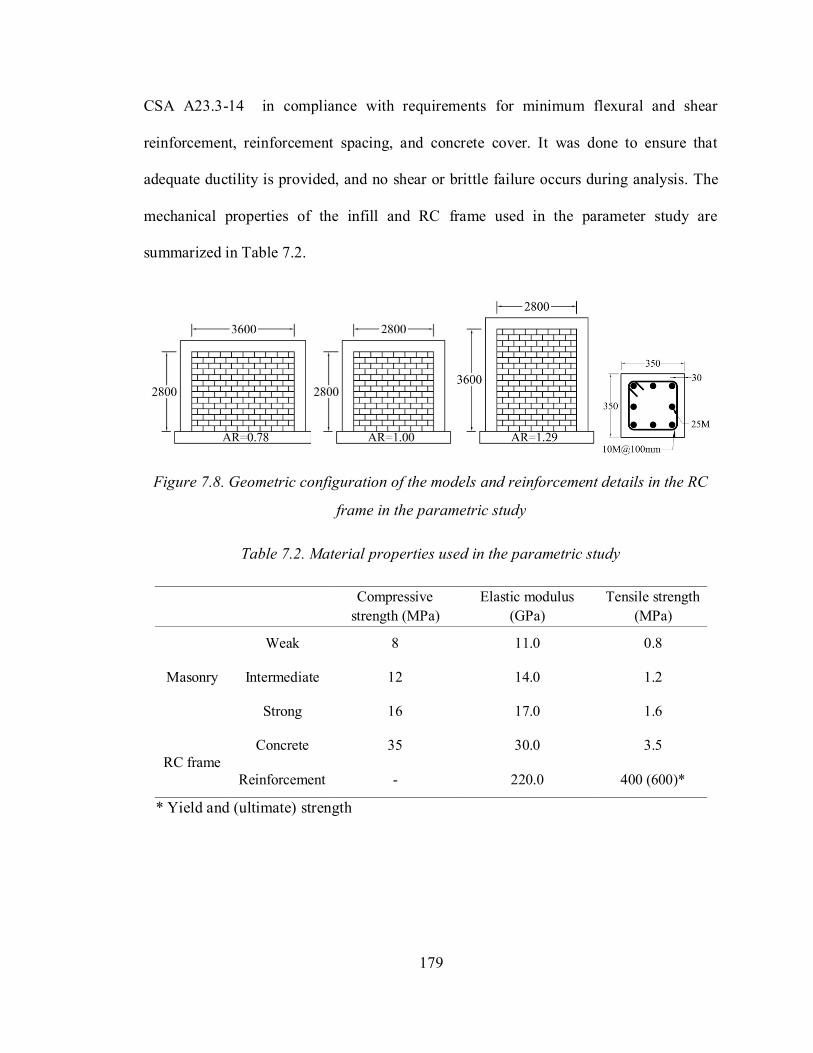
179
CSA A23.3-14 in compliance with requirements for minimum flexural and shear
reinforcement, reinforcement spacing, and concrete cover. It was done to ensure that
adequate ductility is provided, and no shear or brittle failure occurs during analysis. The
mechanical properties of the infill and RC frame used in the parameter study are
summarized in Table 7.2.
Figure 7.8. Geometric configuration of the models and reinforcement details in the RC
frame in the parametric study
Table 7.2. Material properties used in the parametric study
Compressive
strength (MPa)
Elastic modulus
(GPa)
Tensile strength
(MPa)
Masonry
Weak 8 11.0 0.8
Intermediate 12 14.0 1.2
Strong 16 17.0 1.6
RC frame
Concrete 35 30.0 3.5
Reinforcement - 220.0 400 (600)*
* Yield and (ultimate) strength

180
7.6.1 In-Plane Behaviour
When bounded by a relatively strong and ductile RC frame, the in-plane behaviour and
failure mode of the infill is controlled by either the tensile/shear cracking or compressive
crushing of masonry. The former is characterized by the diagonal tensile cracking or
stepped cracks through the mortar joints while the latter is associated with the compressive
stress failure in loaded corners of the diagonal strut (corner crushing). Both failure modes
are often observed in the in-plane testing of infilled frames (Mehrabi et al. 1996, Nasiri and
Liu 2017) but the extent of each mode is different depending on the lateral drift level, infill
aspect ratio, and mechanical properties of the infill. For example, Figure 7.9 plots the FE
simulated damage for the model with f’m = 16 MPa at 0.25 and 2% in-plane drifts. As the
in-plane drift ratio increased, the damage pattern shifted from discrete diagonal cracking
in the infill to extensive cracking throughout the infill, corner crushing and frame cracking.
Figure 7.10 shows the damage patterns for a square panel with (a) weak, (b) intermediate,
and (c) strong infill at a drift ratio of 2%. For the strong infill, there is more cracking and
crushing through CMUs while for the weak infill, the same in-plane drift is accommodated
mainly by shear sliding of mortar joints (indicated by the horizontal lines) and less damage
to the CMUs. The failure pattern of the intermediate infill is somewhere in between. The
in-plane load vs. displacement curves for a square panel with weak, intermediate and strong
masonry infills as well as the bare frame response are shown in Figure 7.11. The strong
infill reached the peak at lower drift ratios; the intermediate and weak infill curves showed
increasingly ductile behaviour. For all models, the first major cracking occurred at drift
ratios between 0.15 and 0.35%. This corresponded to the appearance of tensile cracking
through the mortar joints and marks the end of elastic limit for the infilled frame. Beyond
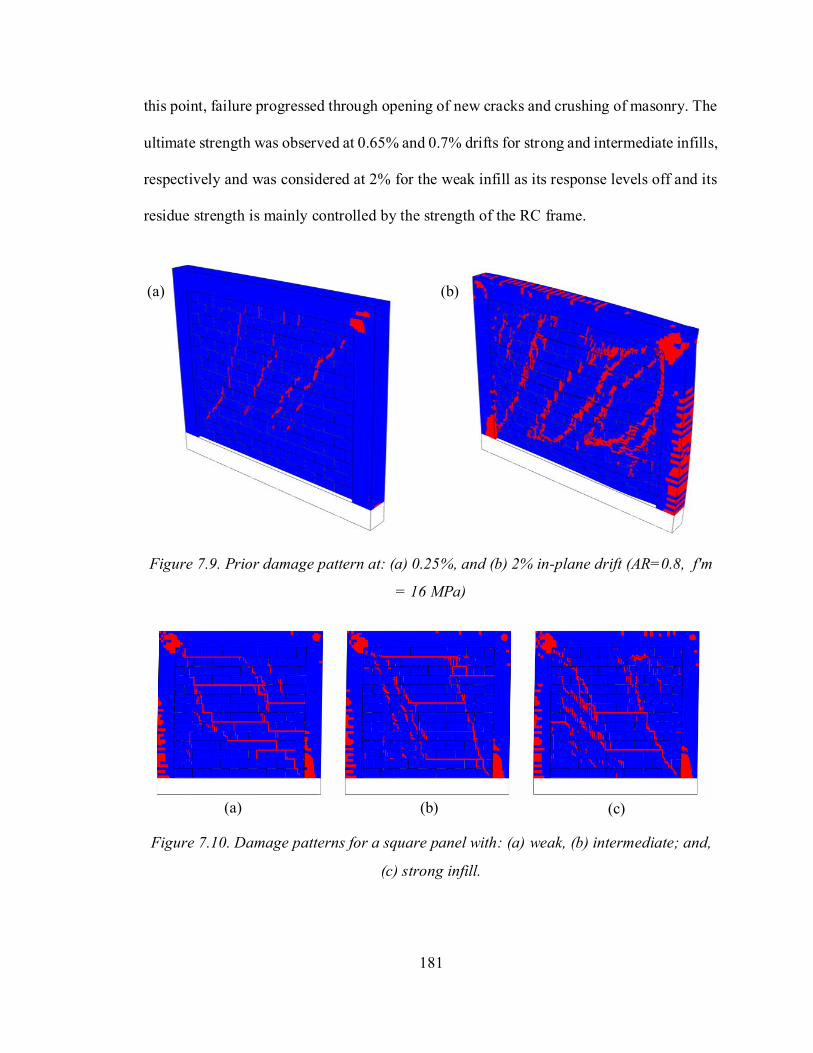
181
this point, failure progressed through opening of new cracks and crushing of masonry. The
ultimate strength was observed at 0.65% and 0.7% drifts for strong and intermediate infills,
respectively and was considered at 2% for the weak infill as its response levels off and its
residue strength is mainly controlled by the strength of the RC frame.
Figure 7.9. Prior damage pattern at: (a) 0.25%, and (b) 2% in-plane drift (AR=0.8, f′m
= 16 MPa)
Figure 7.10. Damage patterns for a square panel with: (a) weak, (b) intermediate; and,
(c) strong infill.
(a) (b)
(a) (b) (c)
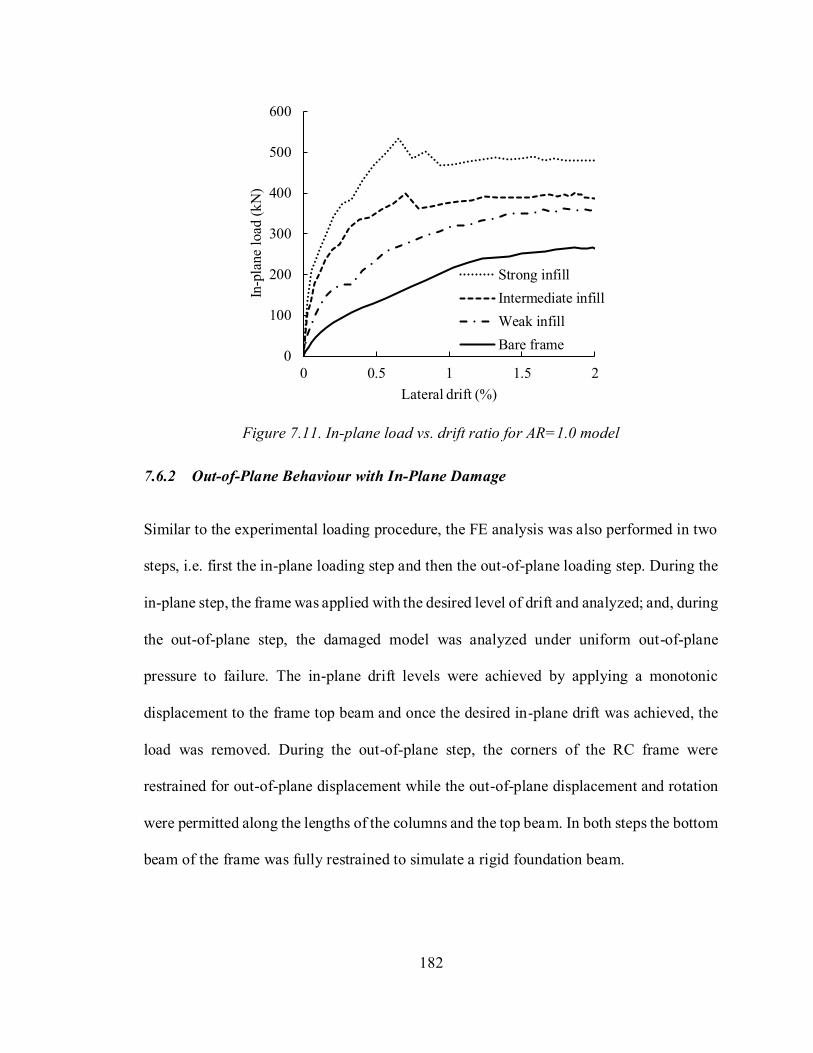
182
Figure 7.11. In-plane load vs. drift ratio for AR=1.0 model
7.6.2 Out-of-Plane Behaviour with In-Plane Damage
Similar to the experimental loading procedure, the FE analysis was also performed in two
steps, i.e. first the in-plane loading step and then the out-of-plane loading step. During the
in-plane step, the frame was applied with the desired level of drift and analyzed; and, during
the out-of-plane step, the damaged model was analyzed under uniform out-of-plane
pressure to failure. The in-plane drift levels were achieved by applying a monotonic
displacement to the frame top beam and once the desired in-plane drift was achieved, the
load was removed. During the out-of-plane step, the corners of the RC frame were
restrained for out-of-plane displacement while the out-of-plane displacement and rotation
were permitted along the lengths of the columns and the top beam. In both steps the bottom
beam of the frame was fully restrained to simulate a rigid foundation beam.
0
100
200
300
400
500
600
0 0.5 1 1.5 2
In-p
lane
load
(k
N)
Lateral drift (%)
Strong infill
Intermediate infill
Weak infill
Bare frame

183
The out-of-plane pressure vs displacement curves for all models are shown in Figure 7.12.
For each case, the model with 0% drift (undamaged) is also included for comparison. It can
be seen that the previous discussed experimental observation is also true for infills with
different aspect ratio and masonry strength. The in-plane damage reduces the out-of-plane
capacity and the amount of reduction is affected by the prior drift experienced by the infill.
The higher the drift, the more the reduction. The out-of-plane stiffness of the infill is also
highly reduced due to in-plane damage causing the infill to experience an increasingly
larger deformation prior to failure as damage level increases.
Figure 7.12. Pressure vs. displacement curves: (a) Weak; (b) Intermediate; and, (c)
Strong infill
(a)
(b)
(c)
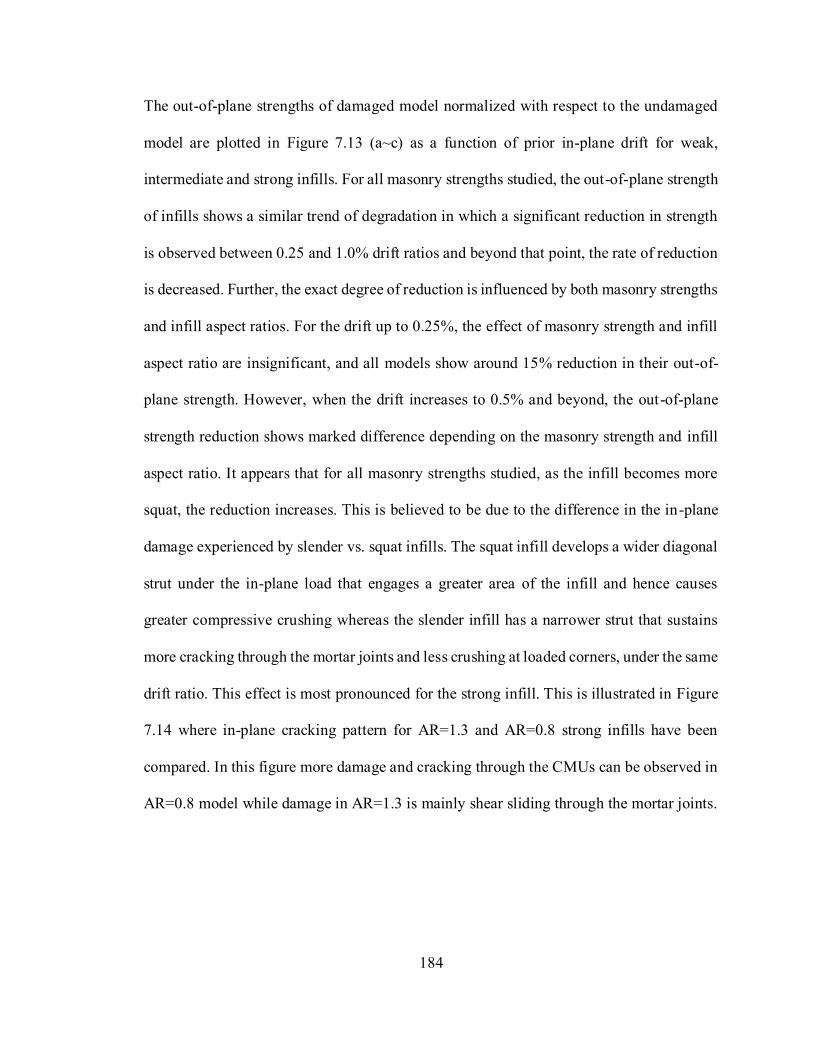
184
The out-of-plane strengths of damaged model normalized with respect to the undamaged
model are plotted in Figure 7.13 (a~c) as a function of prior in-plane drift for weak,
intermediate and strong infills. For all masonry strengths studied, the out-of-plane strength
of infills shows a similar trend of degradation in which a significant reduction in strength
is observed between 0.25 and 1.0% drift ratios and beyond that point, the rate of reduction
is decreased. Further, the exact degree of reduction is influenced by both masonry strengths
and infill aspect ratios. For the drift up to 0.25%, the effect of masonry strength and infill
aspect ratio are insignificant, and all models show around 15% reduction in their out-of-
plane strength. However, when the drift increases to 0.5% and beyond, the out-of-plane
strength reduction shows marked difference depending on the masonry strength and infill
aspect ratio. It appears that for all masonry strengths studied, as the infill becomes more
squat, the reduction increases. This is believed to be due to the difference in the in-plane
damage experienced by slender vs. squat infills. The squat infill develops a wider diagonal
strut under the in-plane load that engages a greater area of the infill and hence causes
greater compressive crushing whereas the slender infill has a narrower strut that sustains
more cracking through the mortar joints and less crushing at loaded corners, under the same
drift ratio. This effect is most pronounced for the strong infill. This is illustrated in Figure
7.14 where in-plane cracking pattern for AR=1.3 and AR=0.8 strong infills have been
compared. In this figure more damage and cracking through the CMUs can be observed in
AR=0.8 model while damage in AR=1.3 is mainly shear sliding through the mortar joints.
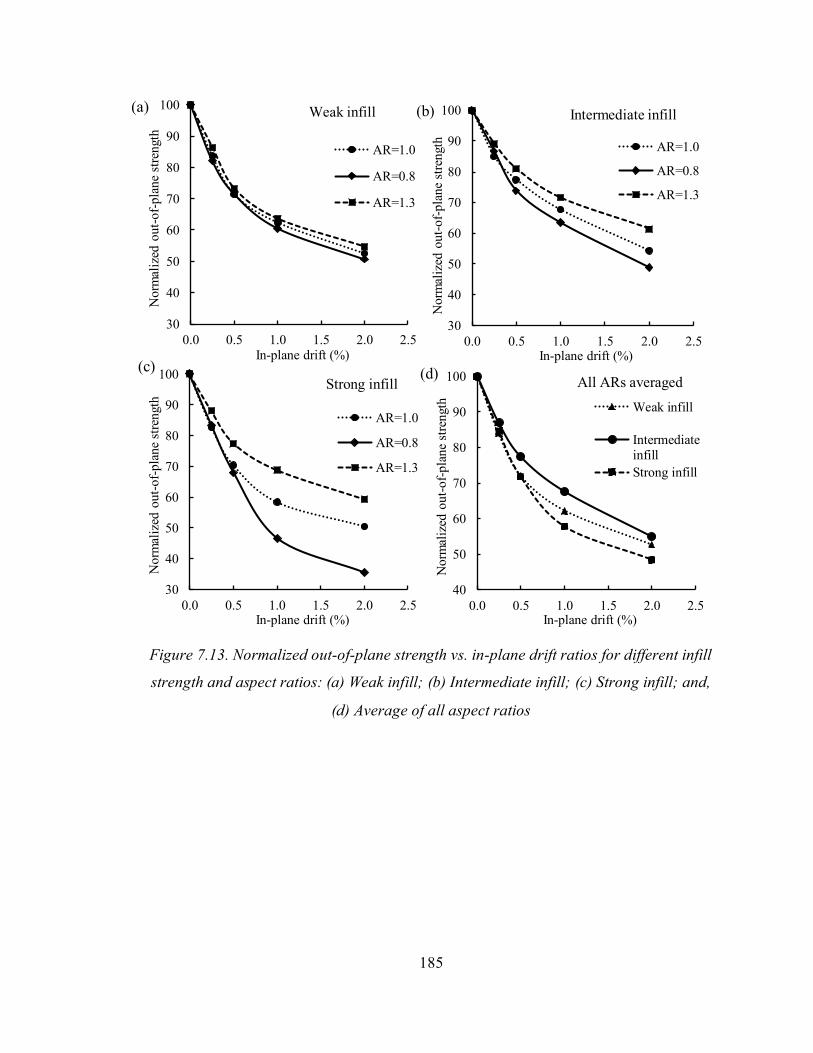
185
Figure 7.13. Normalized out-of-plane strength vs. in-plane drift ratios for different infill
strength and aspect ratios: (a) Weak infill; (b) Intermediate infill; (c) Strong infill; and,
(d) Average of all aspect ratios
30
40
50
60
70
80
90
100
0.0 0.5 1.0 1.5 2.0 2.5
Norm
aliz
ed o
ut-
of-
pla
ne
stre
ngth
In-plane drift (%)
Weak infill
AR=1.0
AR=0.8
AR=1.3
30
40
50
60
70
80
90
100
0.0 0.5 1.0 1.5 2.0 2.5
Norm
aliz
ed o
ut-
of-
pla
ne
stre
ngth
In-plane drift (%)
Intermediate infill
AR=1.0
AR=0.8
AR=1.3
30
40
50
60
70
80
90
100
0.0 0.5 1.0 1.5 2.0 2.5
No
rmal
ized
ou
t-o
f-p
lan
e st
ren
gth
In-plane drift (%)
Strong infill
AR=1.0
AR=0.8
AR=1.3
40
50
60
70
80
90
100
0.0 0.5 1.0 1.5 2.0 2.5
No
rmal
ized
ou
t-o
f-p
lan
e st
ren
gth
In-plane drift (%)
All ARs averaged
Weak infill
Intermediate
infill
Strong infill
(a) (b)
(c) (d)

186
Figure 7.14. In-plane cracking pattern for AR=0.8 and AR=1.3 strong infill models at
1% drift
The effect of masonry strength is shown in Figure 7.13(d) where the normalized strengths
averaged over three aspect ratios vs. drift ratios are plotted. For small in-plane drifts (up to
0.25%), the three infill strengths show a negligible difference on the strength reduction,
but as the drift ratio increases (> 0.5%), the difference increases. Notedly, the intermediate
strength shows an overall better performance when compared to the strong and weak infills.
This is again attributed to the type and extent of damage as affected by different infill
strengths. Referring to Figure 7.10, the strong infill experiences more damage through
CMUs cracking and crushing and damage on the RC frame via the larger diagonal strut
component acting on the RC frame. The weak infills suffer mainly from the cracking
through the mortar joints and shear sliding. The intermediate infills lie somewhere in
between and thus showed the least reduction at a given drift level.
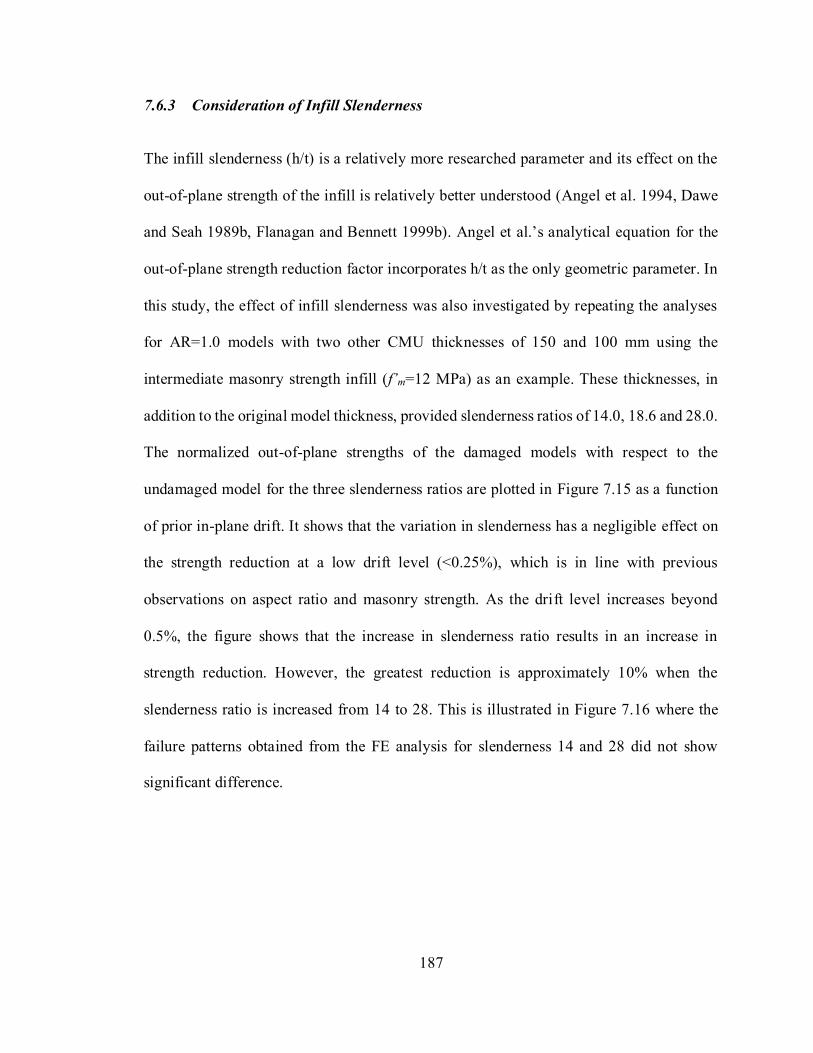
187
7.6.3 Consideration of Infill Slenderness
The infill slenderness (h/t) is a relatively more researched parameter and its effect on the
out-of-plane strength of the infill is relatively better understood (Angel et al. 1994, Dawe
and Seah 1989b, Flanagan and Bennett 1999b). Angel et al.’s analytical equation for the
out-of-plane strength reduction factor incorporates h/t as the only geometric parameter. In
this study, the effect of infill slenderness was also investigated by repeating the analyses
for AR=1.0 models with two other CMU thicknesses of 150 and 100 mm using the
intermediate masonry strength infill (f’m=12 MPa) as an example. These thicknesses, in
addition to the original model thickness, provided slenderness ratios of 14.0, 18.6 and 28.0.
The normalized out-of-plane strengths of the damaged models with respect to the
undamaged model for the three slenderness ratios are plotted in Figure 7.15 as a function
of prior in-plane drift. It shows that the variation in slenderness has a negligible effect on
the strength reduction at a low drift level (<0.25%), which is in line with previous
observations on aspect ratio and masonry strength. As the drift level increases beyond
0.5%, the figure shows that the increase in slenderness ratio results in an increase in
strength reduction. However, the greatest reduction is approximately 10% when the
slenderness ratio is increased from 14 to 28. This is illustrated in Figure 7.16 where the
failure patterns obtained from the FE analysis for slenderness 14 and 28 did not show
significant difference.
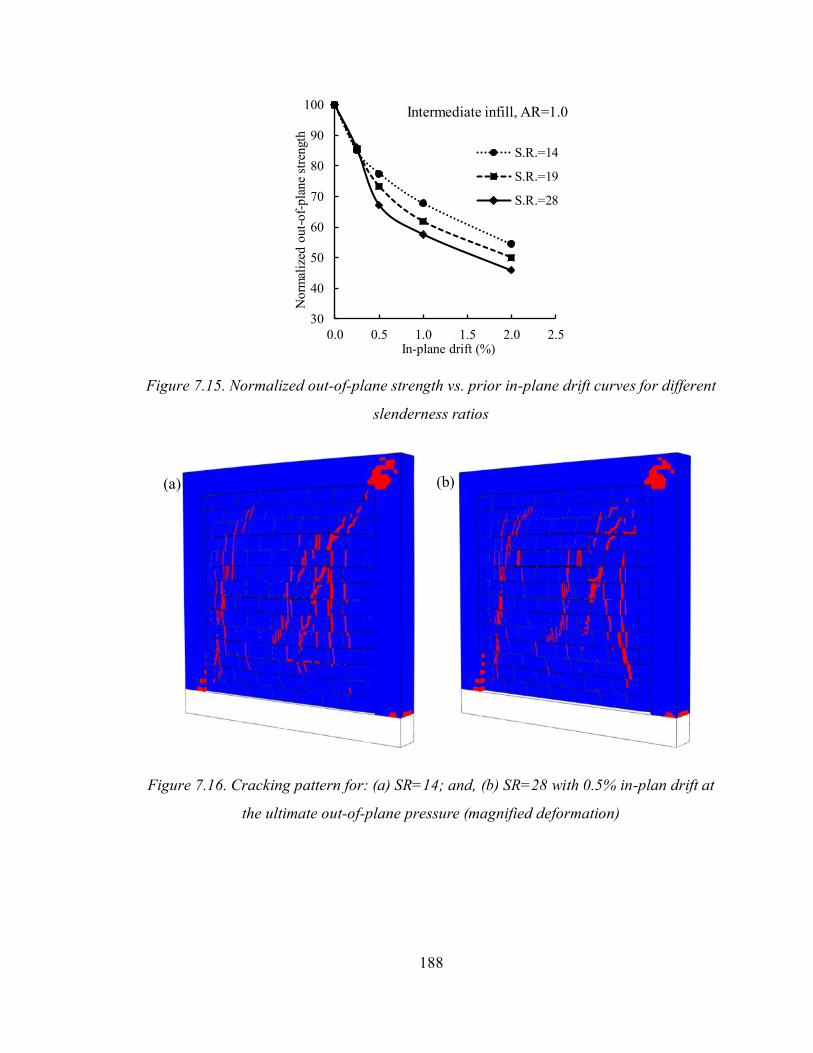
188
Figure 7.15. Normalized out-of-plane strength vs. prior in-plane drift curves for different
slenderness ratios
Figure 7.16. Cracking pattern for: (a) SR=14; and, (b) SR=28 with 0.5% in-plan drift at
the ultimate out-of-plane pressure (magnified deformation)
30
40
50
60
70
80
90
100
0.0 0.5 1.0 1.5 2.0 2.5
Norm
aliz
ed o
ut-
of-
pla
ne
stre
ngth
In-plane drift (%)
Intermediate infill, AR=1.0
S.R.=14
S.R.=19
S.R.=28
(a) (b)
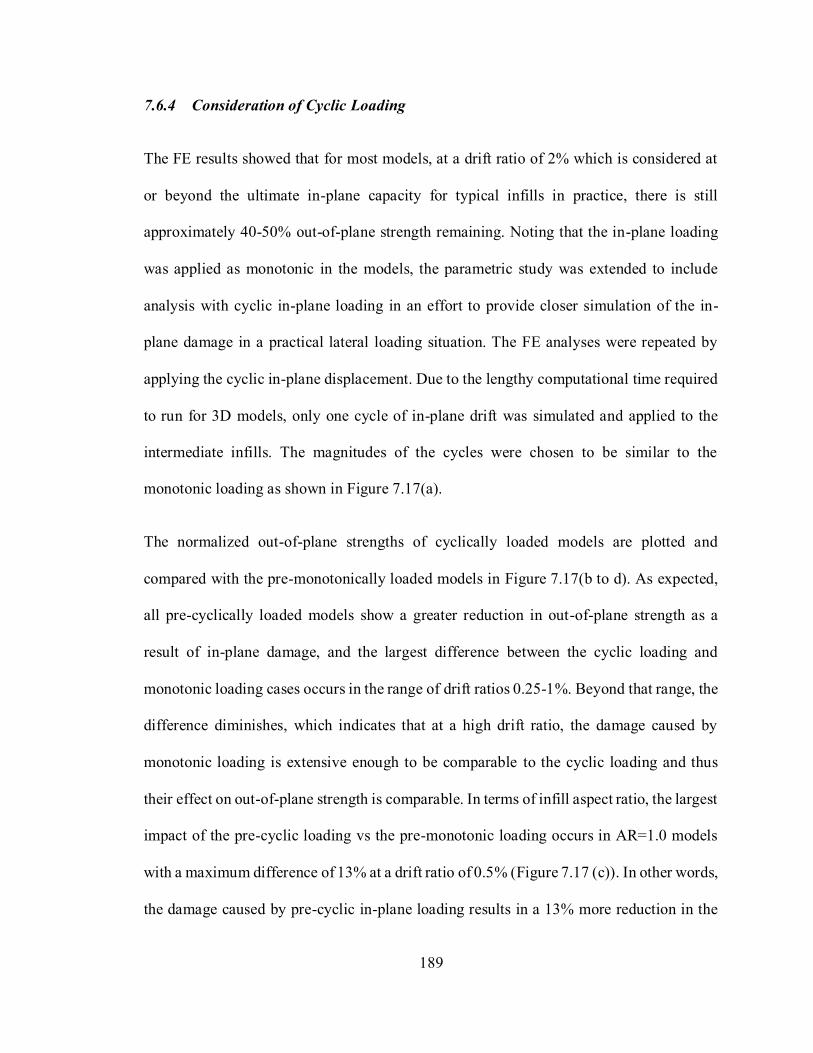
189
7.6.4 Consideration of Cyclic Loading
The FE results showed that for most models, at a drift ratio of 2% which is considered at
or beyond the ultimate in-plane capacity for typical infills in practice, there is still
approximately 40-50% out-of-plane strength remaining. Noting that the in-plane loading
was applied as monotonic in the models, the parametric study was extended to include
analysis with cyclic in-plane loading in an effort to provide closer simulation of the in-
plane damage in a practical lateral loading situation. The FE analyses were repeated by
applying the cyclic in-plane displacement. Due to the lengthy computational time required
to run for 3D models, only one cycle of in-plane drift was simulated and applied to the
intermediate infills. The magnitudes of the cycles were chosen to be similar to the
monotonic loading as shown in Figure 7.17(a).
The normalized out-of-plane strengths of cyclically loaded models are plotted and
compared with the pre-monotonically loaded models in Figure 7.17(b to d). As expected,
all pre-cyclically loaded models show a greater reduction in out-of-plane strength as a
result of in-plane damage, and the largest difference between the cyclic loading and
monotonic loading cases occurs in the range of drift ratios 0.25-1%. Beyond that range, the
difference diminishes, which indicates that at a high drift ratio, the damage caused by
monotonic loading is extensive enough to be comparable to the cyclic loading and thus
their effect on out-of-plane strength is comparable. In terms of infill aspect ratio, the largest
impact of the pre-cyclic loading vs the pre-monotonic loading occurs in AR=1.0 models
with a maximum difference of 13% at a drift ratio of 0.5% (Figure 7.17 (c)). In other words,
the damage caused by pre-cyclic in-plane loading results in a 13% more reduction in the
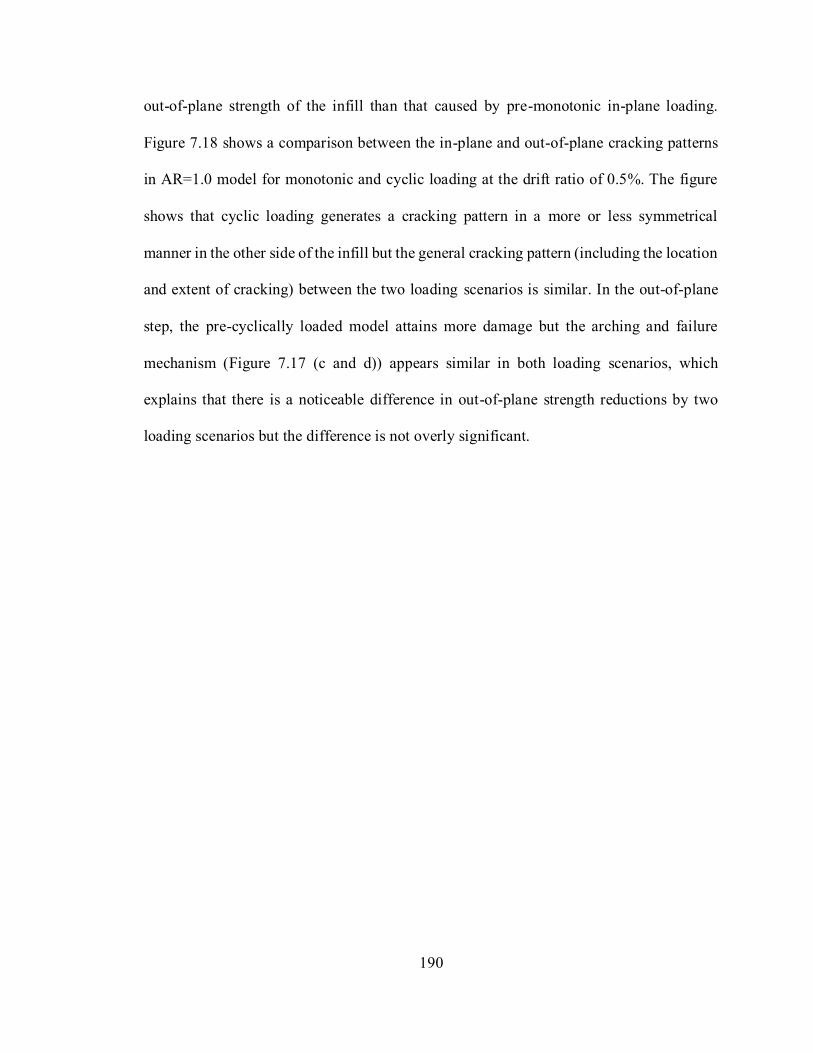
190
out-of-plane strength of the infill than that caused by pre-monotonic in-plane loading.
Figure 7.18 shows a comparison between the in-plane and out-of-plane cracking patterns
in AR=1.0 model for monotonic and cyclic loading at the drift ratio of 0.5%. The figure
shows that cyclic loading generates a cracking pattern in a more or less symmetrical
manner in the other side of the infill but the general cracking pattern (including the location
and extent of cracking) between the two loading scenarios is similar. In the out-of-plane
step, the pre-cyclically loaded model attains more damage but the arching and failure
mechanism (Figure 7.17 (c and d)) appears similar in both loading scenarios, which
explains that there is a noticeable difference in out-of-plane strength reductions by two
loading scenarios but the difference is not overly significant.
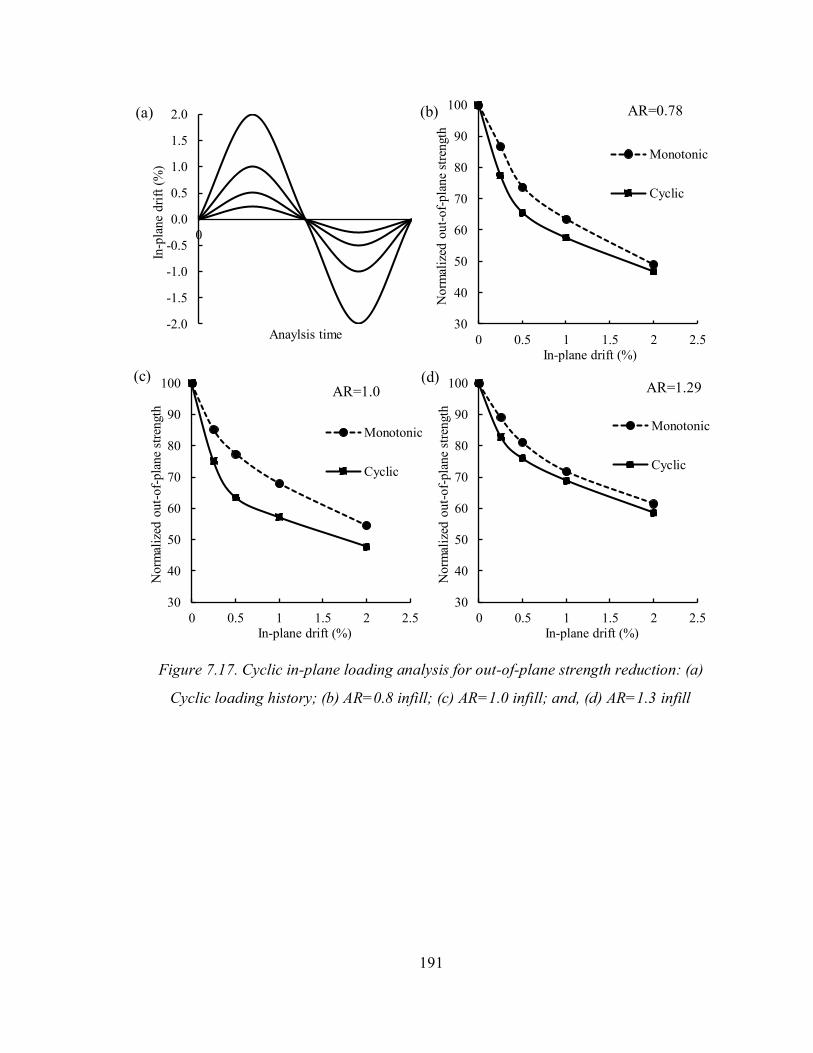
191
Figure 7.17. Cyclic in-plane loading analysis for out-of-plane strength reduction: (a)
Cyclic loading history; (b) AR=0.8 infill; (c) AR=1.0 infill; and, (d) AR=1.3 infill
-2.0
-1.5
-1.0
-0.5
0.0
0.5
1.0
1.5
2.0
0
In-p
lane
dri
ft (
%)
Anaylsis time30
40
50
60
70
80
90
100
0 0.5 1 1.5 2 2.5
Norm
aliz
ed o
ut-
of-
pla
ne
stre
ngth
In-plane drift (%)
AR=0.78
Monotonic
Cyclic
30
40
50
60
70
80
90
100
0 0.5 1 1.5 2 2.5
No
rmal
ized
ou
t-o
f-p
lan
e st
ren
gth
In-plane drift (%)
AR=1.0
Monotonic
Cyclic
30
40
50
60
70
80
90
100
0 0.5 1 1.5 2 2.5
No
rmal
ized
ou
t-o
f-p
lan
e st
ren
gth
In-plane drift (%)
AR=1.29
Monotonic
Cyclic
(a) (b)
(c) (d)
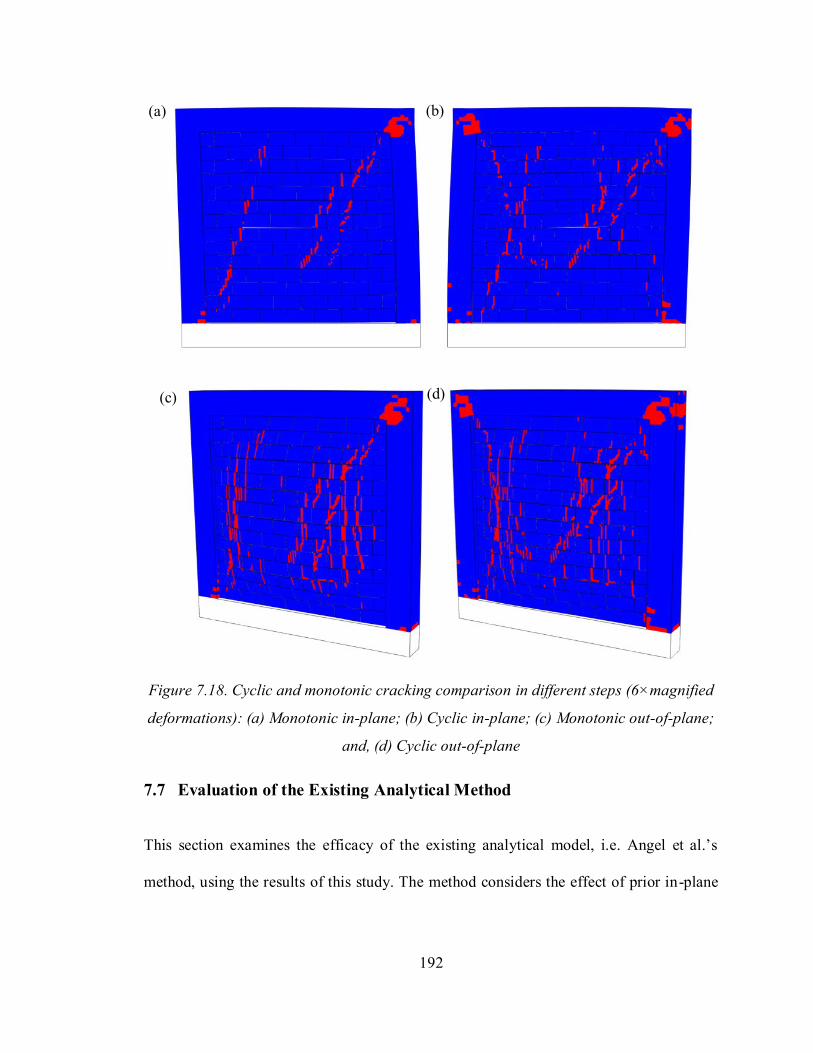
192
Figure 7.18. Cyclic and monotonic cracking comparison in different steps (6×magnified
deformations): (a) Monotonic in-plane; (b) Cyclic in-plane; (c) Monotonic out-of-plane;
and, (d) Cyclic out-of-plane
7.7 Evaluation of the Existing Analytical Method
This section examines the efficacy of the existing analytical model, i.e. Angel et al.’s
method, using the results of this study. The method considers the effect of prior in-plane
(a)
(c)
(b)
(d)
193
damage on the infill out-of-plane strength through a strength reduction factor R1 as
expressed as follows:
𝑅1 = 1, ∆
∆𝑐𝑟< 1
𝑅1 = [1.08 + (ℎ
𝑡)(−0.015+ (
ℎ
𝑡) (−0.00049+ 0.000013 (
ℎ
𝑡)))]
∆
2∆𝑐𝑟
, ∆
∆𝑐𝑟≥ 1
(7.2)
where Δ is the maximum lateral deflection experienced by the infill and Δcr is the lateral
deflection required for the cracking of the infill. This equation suggests that no reduction
in out-of-plane strength is expected when no cracking occurs during the in-plane loading;
and beyond the cracking displacement, there is a power relationship between the reduction
of the strength and the in-plane displacement. The equation also suggests that the rate of
reduction is highly dependent on the infill slenderness ratio. The higher the slenderness
ratio, the higher the strength reduction. Figure 7.19 compares reduction factor vs. in-plane
drift curves obtained using the method as well as the experimental and numerical results
presented in the previous sections.
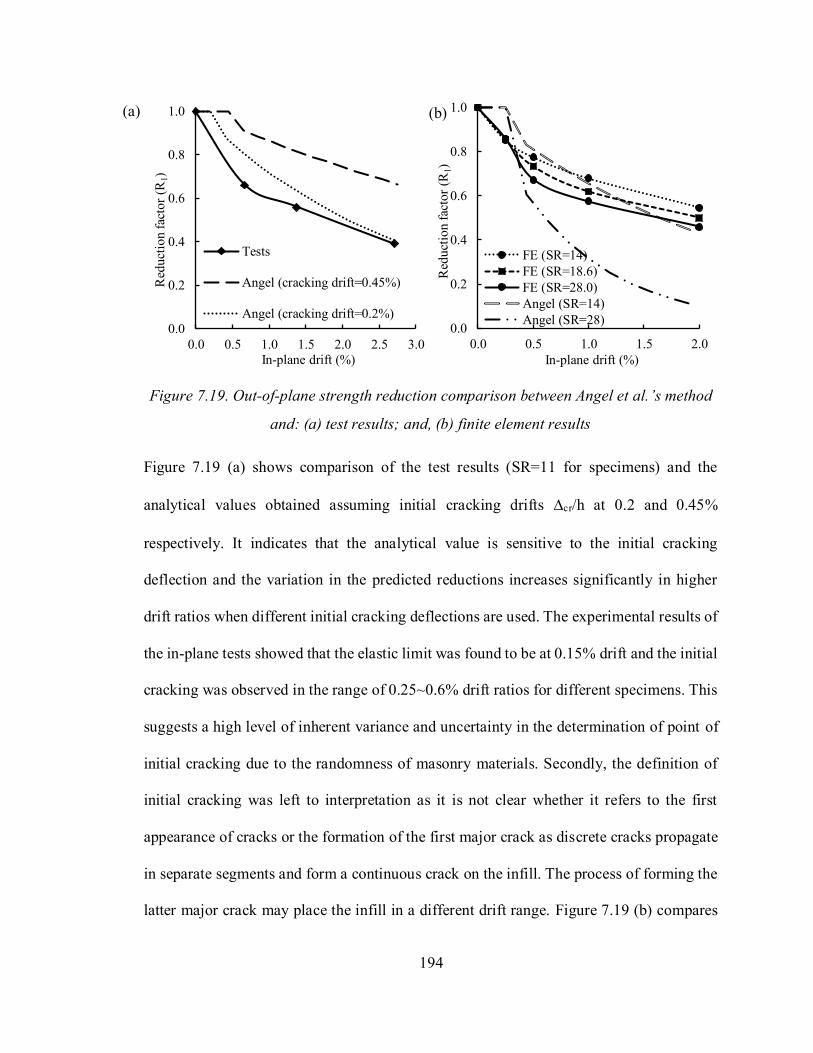
194
Figure 7.19. Out-of-plane strength reduction comparison between Angel et al.’s method
and: (a) test results; and, (b) finite element results
Figure 7.19 (a) shows comparison of the test results (SR=11 for specimens) and the
analytical values obtained assuming initial cracking drifts cr/h at 0.2 and 0.45%
respectively. It indicates that the analytical value is sensitive to the initial cracking
deflection and the variation in the predicted reductions increases significantly in higher
drift ratios when different initial cracking deflections are used. The experimental results of
the in-plane tests showed that the elastic limit was found to be at 0.15% drift and the initial
cracking was observed in the range of 0.25~0.6% drift ratios for different specimens. This
suggests a high level of inherent variance and uncertainty in the determination of point of
initial cracking due to the randomness of masonry materials. Secondly, the definition of
initial cracking was left to interpretation as it is not clear whether it refers to the first
appearance of cracks or the formation of the first major crack as discrete cracks propagate
in separate segments and form a continuous crack on the infill. The process of forming the
latter major crack may place the infill in a different drift range. Figure 7.19 (b) compares
0.0
0.2
0.4
0.6
0.8
1.0
0.0 0.5 1.0 1.5 2.0 2.5 3.0
Red
uct
ion f
acto
r (R
1)
In-plane drift (%)
Tests
Angel (cracking drift=0.45%)
Angel (cracking drift=0.2%)0.0
0.2
0.4
0.6
0.8
1.0
0.0 0.5 1.0 1.5 2.0
Red
uct
ion
fac
tor
(R1)
In-plane drift (%)
FE (SR=14)
FE (SR=18.6)
FE (SR=28.0)
Angel (SR=14)
Angel (SR=28)
(a) (b)
195
the FE results on slenderness ratio effect with the analytical values with the cracking
deflection cr/h assumed at 0.25% drift ratio. It shows that Angel et al.’s method predicts
a much more pronounced effect of slenderness ratio on the degree of reduction than the FE
results. In addition, Angel et al.’s method produces an exponentially increasing reduction
as drift ratio increases while the FE results shows a diminishing reduction rate. An
assessment of Angel et al.’s method by Di Trapani et al. (2017) showed a similar
overestimation of strength reduction by the method as infill slenderness increased.
7.8 Suggested Reduction Factor
A new reduction factor equation based on the afore-presented results is discussed in this
section. In this effort, the upper and lower bound reduction curves as well as the mean
reduction curve obtained from all FE models are plotted in Figure 7.20 together with the
experimental results from this study. It is recognized that the effect of studied parameters
is not independent and rather intertwined which makes the development of an equation
incorporating all individual parameters difficult. Hence, the new reduction factor equation
was based on the lower bound of the FE data as a conservative estimation. As shown, a
bilinear curve was proposed to calculate the out-of-plane strength reduction due to prior
in-plane damage. Expressed in Eq. (7.3), the proposed reduction factor is a function of in-
plane drift /h, instead of /cr. Also note that /h is expressed as a percentage in the
equation.
𝑅 = 1 − 0.83 × ∆ ℎ⁄ ∆ ℎ⁄ ≤ 0.6
𝑅 = 0.5 − 0.1 × (∆ ℎ⁄ − 0.6) ∆ ℎ⁄ > 0.6 (7.3)

196
Figure 7.20. Proposed reduction factor equation with FE and test results
The performance of the proposed reduction factor equation is evaluated against the test
results obtained from this study as well as those available in the literature. Table 7.3 shows
a summary of this evaluation with infills in two categories of concrete masonry unit and
solid maosnry brick respectively. It should be pointed out that the data sample size is small
and also has an inherent large scatter, which makes any conclusive assessment of the
equaiton difficult. However, some useful observations are made as follows. When
compared with Angel et al.’s method, the proposed equation showed an overall improved
and slightly conservative estimate while the former provides marked overestimate in
residue out-of-plane strength. When two types of masonry infills are compared, the
proposed reduction factor seems to perform better in the case of concrete masonry infills,
providing consistently conservative estimate with a low COV. This is expected as the
proposed equation was developed on concrete masonry infills and was intended to capture
the lower bound of reduction. On the other hand, the proposed reduction factor seems to
0.0
0.2
0.4
0.6
0.8
1.0
0 0.5 1 1.5 2 2.5 3
Red
uct
ion f
acto
r (R
)
In-plane drift (%)
Mean FE results
Tests (this study)
Upper bound
Lower bound
Bilinear reduction curve

197
overestimate the residue out-of-plane strength for solid brick infills. It suggests that the
out-of-plane failure mechanism of solid brick infills might be different from concrete
masonry infills which leads to much smaller residue strength. It is thus recommended that
further assessment of the equation needs to be conducted with more data points to cover
different infill types and infill/frame geometric and material properties.
Table 7.3.Comparison of experimental and analytical reduction factor
Ref. Spec.
Infill
dimensions
(l×h)
(mm)
t
(mm) h/l h/t
/h
(%)
cr
(mm) Rexp
R1
(Angel et
al.)
Rexp/R1
R
(this study) Rexp/R
Concrete Masonry Blocks
This study
IF-D1 1350×980 90 0.7 10.9 0.66 6.3 0.66 0.93 0.71 0.45 1.47
IF-D2 1350×980 90 0.7 10.9 1.37 5.5 0.56 0.85 0.66 0.42 1.33
IF-D3 1350×980 90 0.7 10.9 2.7 5.9 0.39 0.74 0.53 0.28 1.40
Flanagan
and Bennett
(1999b)
19 2240×2240 195 1.0 11.5 0.85 4.5 0.82 0.74 1.10 0.48 1.54
Avg. 0.75 1.44
COV (%) 33 6
Solid Masonry Bricks
Angel et al.
(1994)
2b 2400×1600 50 0.7 34.0 0.34 2.8 0.49 0.52 0.94 0.71 0.69
3b 2400×1600 50 0.8 34.0 0.22 1.8 0.73 0.50 1.46 0.82 0.89
Calvi and
Bolognini
(2001)
6 4200×2750 135 0.7 20.0 0.4 5.5 0.27 0.68 0.40 0.67 0.41
2 4200×2750 135 0.7 20.0 1.2 6.5 0.18 0.40 0.45 0.44 0.41
Avg. 0.81 0.6
COV (%) 61 39
Overall performance Avg. 0.78 1.02
COV (%) 47 47
7.9 Limitations
The model developed in this study assumed that the frame is relatively strong and ductile
with shear failure prevented. The in-plane damage is mostly concentrated in the infill and
198
the frame only experiences opening of tensile cracks and yielding of reinforcements. The
results do not apply to the situation where the frame failure controls the system strength.
Secondly, during either the monotonic or cyclic analysis, the damaged infill was assumed
to remain in contact with the bounding frame to allow the arching action to develop. The
results are not applicable to situations where the infill experiences significant separation
from the frame and the infill may slip out of the frame.
7.10 Conclusion
This paper presents results of both an experimental and a numerical study on the effect of
prior in-plane damage on the out-of-plane performance of masonry infills bounded by RC
frames. The experimental results showed the correlation between the reduction in out-of-
plane resistance and prior in-plane drift levels but also revealed that a significant residue
out-of-plane strength can be expected from damaged infills which have reached their in-
plane capacity. The numerical study using a 3D finite element model was performed to
further the study on the correlation as affected by several influential geometric and material
parameters. Some conclusions are summarized as follows:
1. For all models studied, the effect of geometric and material parameters was most
pronounced for drift ratios between 0.25 and 1.5%. The rate of reduction began to
diminish for greater drift ratios.
2. At a given in-plane drift ratio, the squat infills (h/l<1) showed more out-of-plane
strength reduction when compared to slender infills (h/l˃1). When comparing the effect
of infill masonry strength, the intermediate masonry strength, on average, had more
199
residue out-of-plane strength than either the strong or weak infill. The slenderness ratio
was shown to affect the out-of-plane strength reduction, but its effect is not significant.
3. The damage caused by cyclic in-plane loading resulted in more out-of-plane strength
reduction than monotonic in-plane loading and the difference between the two loading
situations was more pronounced in smaller drift ratios (<1%).
4. Evaluation of the existing analytical method suggested that the inherent randomness
and uncertainty in defining the drift causing the first cracking could result in either
under- or over-estimation of reduction factors for infills with different mechanical and
geometric properties.
5. A bi-linear equation was proposed as a lower bound estimate for the out-of-plane
strength reduction considering prior in-plane damage. The equation was shown to
produce improved estimate when compared with the existing analytical method. It is
cautioned that applicability of the proposed equation for solid brick masonry infills
needs to be further investigated.
7.11 Acknowledgement
The authors wish to recognize the contribution of financial assistance by the Canadian
Concrete Masonry Producers Association and Natural Sciences and Engineering Research
Council of Canada.
200
Chapter 8 Summary and Conclusions
A finite element model was developed to simulate the in-plane and out-of-plane behaviour
of masonry infills bounded by reinforced concrete frames. While it is understood that the
frame is also a main contributor of the system behaviour, this research is focused on the
behaviour of infills and thus the frame geometric and material properties were kept constant
in both the experimental and numerical studies. The three-dimensional geometry of
components as well as nonlinear behaviour of masonry block, concrete, steel, and mortar
joint interface was considered in the modelling. Where relevant, information and reference
for determination of each of the model input parameters were provided to make it easy to
be adopted for other masonry infill geometry and configuration. Concurrent with the
numerical modelling, a comprehensive experimental program was conducted to obtain
physical data on the influence of a group of less-studied parameters on the behaviour of
the infilled frames and provide detailed information for calibration of the FE model.
Subsequent to validation of the model, parametric studies on several influential parameters
on both in-plane and out-of-plane behaviour were carried out. Numerical and experimental
findings were also used to evaluate the efficacy of the available methods for determination
of out-of-plane strength and modifications were suggested to provide a more rational
consideration of arching behaviour. Out-of-plane strength of masonry infills which
sustained prior in-plane damage was also studied numerically and experimentally for a
range of infill geometric and mechanical properties, and a simplified solution to count for
the in-plane damage was proposed.
Conclusions drawn from the results of this research are summarized in the following.
201
8.1 In-Plane Behaviour
8.1.1 Experimental Observations
• When compared to the bare frame, presence of the infill resulted in 128% and 154%
increases in the ultimate in-plane capacity and initial stiffness, respectively.
• Presence of gap between the infill and the RC frame reduced the ultimate in-plane
capacity of the infilled frame. It suggests that the gap at the infill to the top beam
of the frame resulted in more reduction than the gap at the infill-to-column interface
whereas the latter gap resulted in a more reduction on the initial stiffness of the
system.
• Presence of openings in the infill reduced the ultimate in-plane capacity of the
infilled frame. The degree of the reduction is in proportion to the opening size. For
a given opening size, the door opening resulted in a more significant reduction than
the window opening.
8.1.2 FE Modelling
• The three-dimensional simplified micro-modelling approach was capable of
capturing the behaviour of the system in terms of its initial stiffness, ultimate
capacity, post-ultimate strength and load-displacement curves with good accuracy.
Using 3D elements and modelled on the basic geometric and material level, this
model was also capable of simulating the out-of-plane behaviour of masonry infills
with a boundary frame.

202
• Failure modes, tensile cracking and compressive crushing patterns in masonry
infills and RC frames were predicted accurately.
• Of all critical mortar interface parameters, the assumption of initial shear and tensile
strength of the mortar joint, friction angle of the failure surface, and dilation angle
were shown to have a significant effect on the simulation of failure mode, ultimate
strength and load-displacement curves while the fracture energy release during
failure was shown to have a negligible effect on the in-plane behaviour.
8.2 Out-of-Plane Behaviour
8.2.1 General behaviour
• In all the out-of-plane tests, the arching of masonry infills was observed to be the
main load-resisting mechanism in specimens.
• All specimens tested under out-of-plane loading had a sudden failure characterized
by out-of-plane collapse of the infill.
• Tensile cracks propagated on the infill surface throughout the out-of-plane loading,
but the final failure mode was identified as web shear cracking in the CMUs
initiated near the frame members.
8.2.2 Effect of Interfacial Gap
• Comparing with the control specimen, the presence of gaps at the infill-to-column
(side gap) or infill-to-beam (top gap) interfaces, resulted in reduction of two-way
arching to one-way arching under uniform out-of-plane loading.
203
• The cracking pattern of the specimen with top gap was similar to yield-line pattern
of a wall supported on three sides, and the specimen with the side gap developed
arching action in the vertical span direction.
• A 10 mm gap at the infill-to-beam interface (top gap) caused a more pronounced
reduction in strength than the same sized gap but positioned at the infill-to-column
interface (side gap). The top gap was found to be more detrimental than the side
gap in the tests.
• Compared with both the top and side gap, a full separation gap (gaps all around the
infill) resulted in a greater reduction in out-of-plane strength and reduced the two-
way arching to one-way vertical arching.
8.2.3 Effect of Infill Opening
• The effect of window opening on the out-of-plane infill strength is dependent on
the type of openings, i.e, blast resisting and non-blast resisting openings.
• Non-blast resisting openings increase the out-of-plane strength and this increase is
a function of opening size.
• Blast-resisting openings reduce the out-of-plane strength; however, this reduction
was almost equal in all infill opening sizes studied.
8.2.4 Effect of Infill Aspect Ratio
• For a given infill height, reduction in the aspect ratio results in a reduction of the
out-of-plane strength of the infill. This reduction varies with the frame stiffness and
204
approaches a constant value for very small aspect ratios (extremely long infills) in
infills with rigid boundary.
• For a given infill area and boundary frame stiffness, the infill with smaller aspect
ratio has higher out-of-plane strength.
8.2.5 Effect of Infill Slenderness Ratio
• Slenderness ratio of the infill (h/t) has a significant effect on the out-of-plane
strength. An increase in slenderness ratio results in an exponential reduction in
strength.
• For small slenderness ratios the failure is characterized by pure shear failure near
the supports while for larger slenderness ratios the failure shifts to flexural failure.
8.2.6 Effect of Frame Stiffness
• Development of arching action and thus out-of-plane resistance of the infills is
highly affected by the flexural stiffness of the bounding frame; the higher the
stiffness, the higher the expected out-of-plane strength.
• For CMU infills, the stiffness of the top beam is more influential on the out-of-
plane strength than the columns due to higher arching forces generated in the
vertical direction.
8.2.7 One-Way and Two-Way Arching
• Shear cracking through the webs of the CMUs was found to be the main failure
mode in concrete masonry infills under arching. Due to the anisotropic
characteristics of CMUs, a significant difference between the out-of-plane strength

205
in horizontal and vertical arching was observed in both the experimental and
numerical studies.
• In a square panel made with standard CMUs laid in running bond and bounded by
a rigid frame, the vertical and two-way arching strengths were found to be equal
and both are significantly greater than the horizontal arching.
• When bounded by a flexible frame, the two-way arching strength is greater than the
vertical and horizontal arching and it is not equal to the sum of the two.
• Modifications to Dawe and Seah (1989b) method was proposed based on the
experimental and numerical findings for arching in concrete masonry infills that
showed improved performance when compared with existing methods.
8.2.8 Effect of In-Plane Damage
• Prior in-plane damage was found to reduce the out-of-plane strength of infilled RC
frames. The greater the damage, the greater the reduction.
• In all damaged specimens, two-way arching was still the main load resisting
mechanism however, cracks from in-plane loading softened the out-of-plane
behaviour and altered the pattern of cracks propagation during the out-of-plane
loading.
• With an equal in-plane drift, the loss of out-of-plane strength in squat (h/l<1) and
stronger infills is higher than the slender (h/l>1) and weak infills.
• Infills subjected to 0.25-1.5% in-plane drift was found to lose the out-of-plane
strength at a higher rate when compared to infills with greater in-plane drifts.

206
• The cyclic in-plane loading resulted in more out-of-plane strength reduction than
monotonic loading and this reduction was more pronounced in smaller drift ratios.
• A bi-linear equation was proposed for calculating reduction factor for the out-of-
plane strength reduction considering prior in-plane damage and was shown to
achieve a good agreement with FE and experimental results on concrete masonry
infills.
8.3 Recommendations for Future Research
The following is recommended for future research:
1- All the tests conducted on the infilled frames were on specimens made with half-
scaled CMUs. Experimental investigation on large-scaled specimens would
provide valuable information on the behaviour in actual conditions.
2- Studies were focused on infills bounded by RC frames. Replacing the RC frame
with steel frame could change the behaviour and lead to different failure mechanism
due to factors such as local deformation in steel section, smaller torsional stiffness
of steel sections, and weaker shear resistance available at the masonry-steel
boundary. The steel bounding frame can be incorporated in the current proposed
numerical model with relative ease.
3- A single frame configuration was used in this study. The validity of conclusions on
multi-bay, multi-storey infilled frames needs further investigation. Moreover,
monotonic loading was used in most analysis cases. Dynamic analysis can be
incorporated in this model to evaluate the seismic behaviour of masonry infills;
207
however, the computational effort is the main barrier that may be overcome by
using high performance computing.
4- More extensive parametric studies on the influential parameters such as gaps,
openings, and CMU geometries should be conducted to draw comprehensive
conclusions leading to design methods for each of these parameters. Furthermore,
effect of axial load, grouting and reinforcing infills, concurrent in-plane and out-
plane loading, and the effect of out-of-plane damage on in-plane behaviour and
strength should be further investigated.
5- Some of the conclusions such as web shear failure are strictly applicable to concrete
masonry units that meet the strength and geometric requirements of Canadian
masonry standards (CSA-S304-14 and CSA-A165-14). The applicability of
conclusions and proposed analytical equations on other masonry types and
properties needs further investigation.
208
References
Abdeldjelil, B., and Thomas, T.C.H. Constitutive Laws of Concrete in Tension and
Reinforcing Bars Stiffened By Concrete. Structural Journal 91(4).
Abrams, D.P., Angel, R., and Uzarski, J. 1996. Out-of-plane strength of unreinforced
masonry infill panels. Earthquake Spectra 12(4): 825-844.
Akhoundi, F., Vasconcelos, G., Lourenço, P.B., and Silva, L. 2016. Out-of-plane response
of masonry infilled RC frames: Effect of workmanship and opening, Taylor & Francis, pp.
1147-1154.
Al-Chaar, G., Mehrabi, A.B., and Manzouri, T. 2008. Finite element interface modeling
and experimental verification of masonry-infilled R/C frames. The Masonry Society
Journal 26(1): 47-65.
Alecci, V., Fagone, M., Rotunno, T., and De Stefano, M. 2013. Shear strength of brick
masonry walls assembled with different types of mortar. Construction and Building
Materials 40: 1038-1045.
Anderson, C. 1984. Arching action in transverse laterally loaded masonry wall panels.
STRUCT. ENG. Struct. Eng. 62(1): 12.
Anderson, T.L., and Anderson, T. 2005. Fracture mechanics: fundamentals and
applications. CRC press.
Angel, R., Abrams, D.P., Shapiro, D., Uzarski, J., and Webster, M. 1994. Behavior of
reinforced concrete frames with masonry infills. University of Illinois Engineering
Experiment Station. College of Engineering. University of Illinois at Urbana-Champaign.
ASCE/SEI41‐13. 2013. Seismic Rehabilitation of Existing Buildings. American Society of
Civil Engineers; Reston, VA.

209
Asteris, P.G., Cotsovos, D.M., Chrysostomou, C.Z., Mohebkhah, A., and Al-Chaar, G.K.
2013. Mathematical micromodeling of infilled frames: State of the art. Engineering
Structures 56: 1905-1921.
ASTM. 2014. ASTM C270-14a Standard Specification for Mortar for Unit Masonry.
ASTM International, West Conshohocken, PA.
ASTM. 2016a. ASTM C39/C39M Standard test method for compressive strength of
cylindrical concrete specimens. In ASTM International, West Conshohocken, PA.
ASTM. 2016b. ASTM C140/C140M Standard Test Methods for Sampling and Testing
Concrete Masonry Units and Related In ASTM International, West Conshohocken, PA.
ASTM. 2016c. ASTM C1314-16 Standard Test Method for Compressive Strength of
Masonry Prisms. ASTM International, West Conshohocken, PA.
ASTM. 2016d. ASTM E8/E8M-16a Standard Test Methods for Tension Testing of
Metallic Materials. ASTM International, West Conshohocken, PA.
Atkinson, R., Amadei, B., Saeb, S., and Sture, S. 1989. Response of masonry bed joints in
direct shear. Journal of Structural Engineering 115(9): 2276-2296.
Bolhassani, M., Hamid, A.A., Lau, A.C.W., and Moon, F. 2015. Simplified micro
modeling of partially grouted masonry assemblages. Construction and Building Materials
83: 159-173.
Buonopane, S., and White, R. 1999. Pseudodynamic testing of masonry infilled reinforced
concrete frame. Journal of structural engineering 125(6): 578-589.
Calvi, G.M., and Bolognini, D. 2001. Seismic response of reinforced concrete frames
infilled with weakly reinforced masonry panels. Journal of Earthquake Engineering 5(02):
153-185.
Chen, X. 2016. Numerical study of the in-plane behaviour of concrete masonry infills
bounded by steel frames.
210
Chen, X., and Liu, Y. 2015. Numerical study of in-plane behaviour and strength of concrete
masonry infills with openings. Engineering Structures 82: 226-235.
Chen, X., and Liu, Y. 2016. A finite element study of the effect of vertical loading on the
in-plane behavior of concrete masonry infills bounded by steel frames. Engineering
Structures 117: 118-129.
Chrysostomou, C.Z. 1991. Effects of degrading infill walls on the nonlinear seismic
response of two-dimensional steel frames, Cornell University Ithaca, NY, USA.
Chrysostomou, C.Z., Gergely, P., and Abel, J.F. 2002. A six-strut model for nonlinear
dynamic analysis of steel infilled frames. International Journal of Structural Stability and
Dynamics 02(03): 335-353.
Crisafulli, F.J., and Carr, A.J. 2007. Proposed macro-model for the analysis of infilled
frame structures. Bulletin of the New Zealand Society for Earthquake Engineering 40(2):
69-77.
Crisafulli, F.J., Carr, A.J., and Park, R. 2000. Analytical modelling of infilled frame
structures-a general review. Bulletin-New Zealand Society for Earthquake Engineering
33(1): 30-47.
CSA. 2004. CAN/CSA-A23.3-04 - Design of Concrete Structures. Canadian Standard
Association.
CSA. 2014a. CAN/CSA-A23.3-14 - Design of Concrete Structures. Canadian Standard
Association.
CSA. 2014b. CAN/CSA-A165 SERIES-04 (R2014) - CSA standards on concrete masonry
units Canadian Standard Association.
CSA. 2014c. CSA S304-14 - Design of masonry structures. Canadian Standard
Association.
D.S.Simulia. 2010. ABAQUS Analysis User’s Manual, Providence, RI, USA.
211
Dawe, J., and Seah, C. 1989a. Behaviour of masonry infilled steel frames. Canadian
Journal of Civil Engineering 16(6): 865-876.
Dawe, J., and Seah, C. 1989b. Out-of-plane resistance of concrete masonry infilled panels.
Canadian Journal of Civil Engineering 16(6): 854-864.
Dehestani, M., and Mousavi, S. 2015. Modified steel bar model incorporating bond-slip
effects for embedded element method. Construction and Building Materials 81: 284-290.
Dhanasekar, M. 2010. Review of modelling of masonry shear. International Journal of
Advances in Engineering Sciences and Applied Mathematics 2(3): 106-118.
Di Trapani, F., Shing, P., and Cavaleri, L. 2017. Macroelement model for in-plane and out-
of-plane responses of masonry infills in frame structures. Journal of Structural Engineering
144(2): 04017198.
Dolatshahi, K.M., and Aref, A.J. 2011. Two-dimensional computational framework of
meso-scale rigid and line interface elements for masonry structures. Engineering Structures
33(12): 3657-3667.
Drysdale, R.G., Hamid, A.A., and Baker, L.R. 1994. Masonry structures: behavior and
design. Prentice Hall.
El-Dakhakhni, W.W., Elgaaly, M., and Hamid, A.A. 2003. Three-strut model for concrete
masonry-infilled steel frames. Journal of Structural Engineering 129(2): 177-185.
Eurocode. 2004. E8: Design of structures for earthquake resistance. CEN, Comité
Européen de Normalisation. pp. 1998-1991.
FEMA-356. 2000. Prestandard and commentary for the seismic rehabilitation of buildings.
Federal Emergency Management Agency, Washington, DC.
FIB. 2012. Fib model code 2010. International Federation for Structural Concrete.
Flanagan, R.D. 1994. Behavior of structural clay tile infilled frames. Oak Ridge National
Lab., TN (United States).
212
Flanagan, R.D., and Bennett, R.M. 1999a. Arching of masonry infilled frames:
Comparison of analytical methods. Practice Periodical on Structural Design and
Construction 4(3): 105-110.
Flanagan, R.D., and Bennett, R.M. 1999b. Bidirectional behavior of structural clay tile
infilled frames. Journal of Structural Engineering 125(3): 236-244.
Flanagan, R.D., and Bennett, R.M. 1999c. In-plane behavior of structural clay tile infilled
frames. Journal of Structural Engineering 125(6): 590-599.
Flanagan, R.D., and Bennett, R.M. 2001. In-plane analysis of masonry infill materials.
Practice Periodical on Structural Design and Construction 6(4): 176-182.
Frederiksen, V. 1992. Membrane effect in laterally loaded masonry walls: a second order
phenomenon, pp. 537-547.
Fricke, K., Jones, W., and Huff, T. 1992. In situ lateral load testing of an unreinforced
masonry hollow clay tile wall, pp. 519-530.
Furtado, A., Rodrigues, H., Arêde, A., and Varum, H. 2016. Experimental evaluation of
out-of-plane capacity of masonry infill walls. Engineering Structures 111: 48-63.
Gabrielsen, B., Wilton, C., and Kaplan, K. 1975. Response of arching walls and debris
from interior walls caused by blast loading. DTIC Document.
Gabrielsen, B.L., and Kaplan, K. 1976. Arching in masonry walls subjected to out-of-plane
forces.
Genikomsou, A.S., and Polak, M.A. 2015. Finite element analysis of punching shear of
concrete slabs using damaged plasticity model in ABAQUS. Engineering Structures 98:
38-48.
Ghosh, A.K., and Amde, A.M. 2002. Finite Element Analysis of Infilled Frames. Journal
of Structural Engineering 128(7): 881-889.

213
Griffith, M., and Vaculik, J. 2007. Out-of-plane flexural strength of unreinforced clay brick
masonry walls. TMS Journal 25(1): 53-68.
Haach, V.G., Vasconcelos, G., and Lourenço, P.B. 2009. Experimental analysis of
reinforced concrete block masonry walls subjected to in-plane cyclic loading. Journal of
structural engineering 136(4): 452-462.
Hashemi, S.A. 2007. Seismic evaluation of reinforced concrete buildings including effects
of masonry infill walls. University of California, Berkeley.
Hendry, A.W. 1981. Structural brickwork. Halsted Press.
Hillerborg, A., Modéer, M., and Petersson, P.-E. 1976. Analysis of crack formation and
crack growth in concrete by means of fracture mechanics and finite elements. Cement and
concrete research 6(6): 773-781.
Holmes, M. 1961. Steel frames with brickwork and concrete infilling. proceedings of the
Institution of civil Engineers 19(4): 473-478.
Hu, C. 2015. Experimental study of the effect of interfacial gaps on the in-plane behaviour
of masonry infilled RC frames, Civil and resource engineering, Dalhousie university,
Halifax.
Jankowiak, T., and Lodygowski, T. 2005. Identification of parameters of concrete damage
plasticity constitutive model. Foundations of civil and environmental engineering 6(1): 53-
69.
Jiang, J.-F., and Wu, Y.-F. 2012. Identification of material parameters for Drucker–Prager
plasticity model for FRP confined circular concrete columns. International Journal of
Solids and Structures 49(3–4): 445-456.
Kakaletsis, D., and Karayannis, C. 2007. Experimental investigation of infilled R/C frames
with eccentric openings. Structural Engineering and Mechanics 26(3): 231-250.

214
Klingner, R., Rubiano, N., Bashandy, T., and Sweeney, S. 1996. Evaluation and analytical
verification of shaking table data from infilled frames. Part 2: Out-of-plane behavior, pp.
521-532.
Komaraneni, S., Rai, D.C., and Singhal, V. 2011. Seismic behavior of framed masonry
panels with prior damage when subjected to out-of-plane loading. Earthquake spectra
27(4): 1077-1103.
Koutromanos, I., Stavridis, A., Shing, B., and Willam, K. 2011a. Numerical modeling of
masonry-infilled RC frames subjected to seismic loads. Computers and Structures 89:
1026-1037.
Koutromanos, I., Stavridis, A., Shing, P.B., and Willam, K. 2011b. Numerical modeling of
masonry-infilled RC frames subjected to seismic loads. Computers & Structures 89(11):
1026-1037.
Kupfer, H., Hilsdorf, H.K., and Rusch, H. 1969. Behavior of concrete under biaxial
stresses, pp. 656-666.
Kwak, H.-G., and Kim, J.-K. 2006. Implementation of bond-slip effect in analyses of RC
frames under cyclic loads using layered section method. Engineering Structures 28(12):
1715-1727.
Lee, J., and Fenves, G.L. 1998. Plastic-damage model for cyclic loading of concrete
structures. Journal of engineering mechanics 124(8): 892-900.
Liauw, T., and Lo, C. 1988. Multibay infilled frames without shear connectors. Structural
Journal 85(4): 423-428.
Liu, Y., and Manesh, P. 2013. Concrete masonry infilled steel frames subjected to
combined in-plane lateral and axial loading – An experimental study. Engineering
Structures 52: 331-339.
Liu, Y., and Soon, S. 2012. Experimental study of concrete masonry infills bounded by
steel frames. Canadian Journal of Civil Engineering 39(2): 180-190.
215
Lotfi, H., and Shing, P. 1991. An appraisal of smeared crack models for masonry shear
wall analysis. Computers & structures 41(3): 413-425.
Lotfi, H.R., and Shing, P.B. 1994. Interface model applied to fracture of masonry
structures. Journal of structural engineering 120(1): 63-80.
Lourenco, P.B. 1996. Computational strategies for masonry structures, TU Delft, Delft
University of Technology.
Lourenço, P.B. 2000. Anisotropic softening model for masonry plates and shells. Journal
of Structural Engineering 126(9): 1008-1016.
Lourenço, P.B., and Rots, J.G. 1997. Multisurface interface model for analysis of masonry
structures. Journal of engineering mechanics 123(7): 660-668.
Lourenço, P.B., Rots, J.G., and Blaauwendraad, J. 1998. Continuum model for masonry:
parameter estimation and validation. Journal of Structural Engineering 124(6): 642-652.
Lubliner, J., Oliver, J., Oller, S., and Onate, E. 1989. A plastic-damage model for concrete.
International Journal of solids and structures 25(3): 299-326.
Maekawa, K., Okamura, H., and Pimanmas, A. 2003. Non-linear mechanics of reinforced
concrete. CRC Press.
Mainstone, R. 1971. On the stiffnesses and strengths ofinfilled frames. Proc. lnxtn cir.
Engrs Suppl.
Maksoud, A., and Drysdale, R. 1993. Rational moment magnification factor for slender
unreinforced masonry walls, pp. 6-9.
Mallick, D., and Garg, R. 1971. Effect of openings on the lateral stiffness of infilled frames.
Proceedings of the Institution of Civil Engineers 49(2): 193-209.
Mallick, D., and Severn, R. 1967. The behaviour of infilled frames under static loading.
Proceedings of the Institution of Civil Engineers 38(4): 639-656.
216
Manos, G., Soulis, V., and Thauampteh, J. 2012. The behavior of masonry assemblages
and masonry-infilled R/C frames subjected to combined vertical and cyclic horizontal
seismic-type loading. Advances in Engineering Software 45(1): 213-231.
Masia, M.J., Simundic, G., and Page, A.W. 2012. Assessment of the AS3700 relationship
between shear bond strength and flexural tensile bond strength in unreinforced masonry.
Mays, G., Hetherington, J., and Rose, T. 1998. Resistance-deflection functions for concrete
wall panels with openings. Journal of Structural Engineering 124(5): 579-587.
McDowell, E., McKee, K., and Sevin, E. 1956a. Arching action theory of masonry walls.
Journal of the Structural Division 82(2): 1-8.
McDowell, E., McKee, K., and Sevin, E. 1956b. Arching action theory of masonry walls.
J. Struct. Div 82(2): 915.
Mehrabi, A.B., Benson Shing, P., Schuller, M.P., and Noland, J.L. 1996. Experimental
evaluation of masonry-infilled RC frames. Journal of Structural Engineering 122(3): 228-
237.
Mehrabi, A.B., and Shing, P.B. 1997. Finite element modeling of masonry-infilled RC
frames. Journal of structural engineering 123(5): 604-613.
Minaie, E., Moon, F.L., and Hamid, A.A. 2014. Nonlinear finite element modeling of
reinforced masonry shear walls for bidirectional loading response. Finite Elements in
Analysis and Design 84: 44-53.
Moghaddam, H., and Goudarzi, N. 2010. Transverse resistance of masonry infills. ACI
Structural Journal 107(4): 461.
Mohebkhah, A., Tasnimi, A.A., and Moghadam, H.A. 2008. Nonlinear analysis of
masonry-infilled steel frames with openings using discrete element method. Journal of
Constructional Steel Research 64(12): 1463-1472.

217
Mohyeddin, A., Goldsworthy, H.M., and Gad, E.F. 2013. FE modelling of RC frames with
masonry infill panels under in-plane and out-of-plane loading. Engineering Structures 51:
73-87.
Monk, C. 1958. Resistance of structural clay masonry to dynamic forces. Structural Clay
Products Research Foundation.
Mosalam, K.M., White, R.N., and Gergely, P. 1997. Static response of infilled frames using
quasi-static experimentation. Journal of Structural Engineering 123(11): 1462-4169.
Nasiri, E., and Liu, Y. 2017. Development of a detailed 3D FE model for analysis of the
in-plane behaviour of masonry infilled concrete frames. Engineering Structures 143: 603-
616.
Nasiri, E., and Liu, Y. 2019a. The out-of-plane behaviour of concrete masonry infills
bounded by reinforced concrete frames. Engineering Structures 184: 406-420.
Nasiri, E., and Liu, Y. 2019b. Study of arching behaviour and strength of concrete masonry
infills under out-of-plane loading. Canadian Journal of Civil Engineering.
Noor-E-Khuda, S., Dhanasekar, M., and Thambiratnam, D.P. 2016a. An explicit finite
element modelling method for masonry walls under out-of-plane loading. Engineering
Structures 113: 103-120.
Noor-E-Khuda, S., Dhanasekar, M., and Thambiratnam, D.P. 2016b. Out-of-plane
deformation and failure of masonry walls with various forms of reinforcement. Composite
Structures 140: 262-277.
Page, A. 1981. The biaxial compressive strength of brick masonry. Proceedings of the
Institution of Civil Engineers 71(3): 893-906.
Pantò, B., Caliò, I., and Lourenço, P. 2018. A 3D discrete macro-element for modelling
the out-of-plane behaviour of infilled frame structures. Engineering Structures 175: 371-
385.
218
Pantò, B., Silva, L., Vasconcelos, G., and Lourenço, P. 2019. Macro-modelling approach
for assessment of out-of-plane behavior of brick masonry infill walls. Engineering
Structures 181: 529-549.
Pasca, M., Liberatore, L., and Masiani, R. 2017. Reliability of analytical models for the
prediction of out-of-plane capacity of masonry infills. Structural Engineering and
Mechanics 64(6): 765-781.
Polliakov, S.V.e. 1963. Masonry in framed buildings: An investigation into the strength
and stiffness of masonry infilling. National Lending Library for Science and Technology,
Boston Spa., Yorkshire.
Pujol, S., and Fick, D. 2010. The test of a full-scale three-story RC structure with masonry
infill walls. Engineering Structures 32(10): 3112-3121.
Rahimi, R., and Liu, Y. 2017. Numerical Investigation on the in-plane behaviour of
concrete masonry infilled RC frames under quasi-static cyclic loading., Halifax, Canada.
Ricci, P., Di Domenico, M., and Verderame, G.M. 2018. Empirical-based out-of-plane
URM infill wall model accounting for the interaction with in-plane demand. Earthquake
Engineering & Structural Dynamics 47(3): 802-827.
Roca, P., González, J., Oñate, E., and Lourenço, P. 1998. Experimental and numerical
issues in the modelling of the mechanical behaviour of masonry. Structural Analysis of
Historical Constructions II. CIMNE, Barcelona: 57-91.
Rots, J. 1991. Numerical simulation of cracking in structural masonry. Heron 36(2): 49-
63.
Saneinejad, A., and Hobbs, B. 1995. Inelastic design of infilled frames. Journal of
Structural Engineering 121(4): 634-650.
Sarhosis, V., Tsavdaridis, K., and Giannopoulos, I. 2014. Discrete element modelling
(DEM) for masonry infilled steel frames with multiple window openings subjected to
lateral load variations. Open Construction and Building Technology Journal 8: 93 - 103.
219
Schmidt, T. 1989. An approach of modelling masonry infilled frames by the FE method
and a modified equivalent strut method. Annual Journal on Concrete and Concrete
Structures.” Darmstadt, Germany: Darmstadt University.
Sepasdar, R. 2017. Experimental investigation on the out-of-plane behaviour of the
concrete masonry infilled RC frames, Civil and resource engineering, Dalhousie
university, Halifax.
Shima, H., Chou, L.-L., and Okamura, H. 1987. Micro and macro models for bond in
reinforced concrete. Journal of the Faculty of Engineering 39(2): 133-194.
Sima, J.F., Roca, P., and Molins, C. 2008. Cyclic constitutive model for concrete.
Engineering structures 30(3): 695-706.
Smith, B.S. 1962. Lateral stiffness of infilled frames. Journal of the Structural Division
88(6): 183-226.
Smith, B.S. 1966. Behavior of square infilled frames. Journal of the Structural Division
92(1): 381-404.
Smith, B.S. 1967. The composite behaviour of infilled frames. In Tall Buildings. Elsevier.
pp. 481-495.
Smith, B.S., and Carter, C. 1969. A method of analysis for infilled frames. Proceedings of
the institution of civil engineers 44(1): 31-48.
Soon, S. 2011. In-plane behaviour and capacity of concrete masonry infills bounded by
steel frames, Civil and resource engineering, Dalhousie university, Halifax.
Stavridis, A., and Shing, P. 2010. Finite Element Modeling of Nonlinear Behavior of
Masonry‐Infilled RC Frames. Journal of Structural Engineering 136(3): 285-296.
Syrmakezis, C., and Asteris, P. 2001. Masonry failure criterion under biaxial stress state.
Journal of Materials in Civil Engineering 13(1): 58-64.

220
Syrmakezis, C., and Vratsanou, V. 1986. Influence of infill walls to RC frames response,
p. 6.5.
Tasnimi, A., and Mohebkhah, A. 2011. Investigation on the behavior of brick-infilled steel
frames with openings, experimental and analytical approaches. Engineering Structures
33(3): 968-980.
Thiruvengadam, V. 1985. On the natural frequencies of infilled frames. Earthquake
engineering & structural dynamics 13(3): 401-419.
Thomas, F. 1953. The strength of brickwork. The Structural Engineer 31(2): 35-46.
TMS. 2016. TMS 402/602 Building Code Requirements and Specifications for Masonry
Structures. The Masonry Society.
Turgay, T., Durmus, M.C., Binici, B., and Ozcebe, G. 2014. Evaluation of the predictive
models for stiffness, strength, and deformation capacity of RC frames with masonry infill
walls. Journal of Structural Engineering 140(10): 06014003.
Van der Pluijm, R. 1993. Shear behaviour of bed joints. In 6th North American Masonry
Conference. Technomic Publ. Co, Philadelphia, Pennsylvania, USA.
Varela-Rivera, J., Moreno-Herrera, J., Lopez-Gutierrez, I., and Fernandez-Baqueiro, L.
2012. Out-of-plane strength of confined masonry walls. Journal of Structural Engineering
138(11): 1331-1341.
Wang, C. 2017. Experimental investigation on the out-of-plane behaviour of concrete
masonry infilled frames, Department of Civil and Resource Engineering, Dalhousie
University, Halifax, NS, Canada.
Yong, T.C. 1984. Shear strength of masonry panels in steel frames, Civil and resource
engineering, University of New Brunswick, Fredericton.

221
Appendix A: Copyright Permissions
Copyright permission for Chapter 4
June 13th, 2019
Engineering Structures,
I am preparing my Ph.D. thesis for submission to the Faculty of Graduate Studies at
Dalhousie University, Halifax, Nova Scotia, Canada. I am seeking your permission to
include a manuscript version of the following paper as a chapter in the thesis:
[Ehsan Nasiri and Yi Liu, “Development of a detailed 3D FE model for analysis of the in-
plane behaviour of masonry infilled concrete frames. Engineering Structures, Volume 143,
2017, pp. 603-616]
Canadian graduate theses are reproduced by the Library and Archives of Canada (formerly
National Library of Canada) through a non-exclusive, world-wide license to reproduce,
loan, distributor or sell these. I am also seeking your permission for the material described
above to be reproduced and distributed by the LAX (NLC). Further details about the LAC
(NLC) thesis program are available on the LAC (NLC) website (www.nlc-bnc.ca) Full
publication details and a copy of this permission letter will be included in the thesis.
Yours Sincerely,
Ehsan Nasiri

222

223
Copyright permission for Chapter 5
June 13th, 2019
Engineering Structures,
I am preparing my Ph.D. thesis for submission to the Faculty of Graduate Studies at
Dalhousie University, Halifax, Nova Scotia, Canada. I am seeking your permission to
include a manuscript version of the following paper as a chapter in the thesis:
[Ehsan Nasiri and Yi Liu, “The Out-of-Plane Behaviour of Concrete Masonry Infills
Bounded by Reinforced Concrete Frames”, Engineering Structures, Volume 184, 2019, pp.
406-420]
Canadian graduate theses are reproduced by the Library and Archives of Canada (formerly
National Library of Canada) through a non-exclusive, world-wide license to reproduce,
loan, distributor or sell these. I am also seeking your permission for the material described
above to be reproduced and distributed by the LAX (NLC). Further details about the LAC
(NLC) thesis program are available on the LAC (NLC) website (www.nlc-bnc.ca) Full
publication details and a copy of this permission letter will be included in the thesis.
Yours Sincerely,
Ehsan Nasiri

224
225
Copyright permission for Chapter 6
June 13th, 2019
Canadian Journal of Civil Engineering,
I am preparing my Ph.D. thesis for submission to the Faculty of Graduate Studies at
Dalhousie University, Halifax, Nova Scotia, Canada. I am seeking your permission to
include a manuscript version of the following paper as a chapter in the thesis:
[Ehsan Nasiri and Yi Liu, “Study of arching behaviour and strength of concrete masonry
infills under out-of-plane loading”, Canadian Journal of Civil Engineering]
Canadian graduate theses are reproduced by the Library and Archives of Canada (formerly
National Library of Canada) through a non-exclusive, world-wide license to reproduce,
loan, distributor or sell these. I am also seeking your permission for the material described
above to be reproduced and distributed by the LAX (NLC). Further details about the LAC
(NLC) thesis program are available on the LAC (NLC) website (www.nlc-bnc.ca) Full
publication details and a copy of this permission letter will be included in the thesis.
Yours Sincerely,
Ehsan Nasiri

226
227