nanopatterning effects on astrocyte reactivity
TRANSCRIPT

Seediscussions,stats,andauthorprofilesforthispublicationat:https://www.researchgate.net/publication/236658261
Nanopatterningeffectsonastrocytereactivity
DATASETinJOURNALOFBIOMEDICALMATERIALSRESEARCHPARTA·MAY2013
ImpactFactor:3.37
CITATIONS
4
READS
23
7AUTHORS,INCLUDING:
HowardWMatthew
WayneStateUniversity
69PUBLICATIONS3,221CITATIONS
SEEPROFILE
GregoryAuner
WayneStateUniversity
341PUBLICATIONS2,758CITATIONS
SEEPROFILE
IldarSalakhutdinov
MiddleEastTechnicalUniversity
47PUBLICATIONS641CITATIONS
SEEPROFILE
PamelaJVandevord
VirginiaPolytechnicInstituteandStateUniv…
71PUBLICATIONS1,338CITATIONS
SEEPROFILE
Availablefrom:IldarSalakhutdinov
Retrievedon:15January2016

Nanopatterning effects on astrocyte reactivity
Evon S. Ereifej,1 Howard W. Matthew,2 Golam Newaz,3 Ashis Mukhopadhyay,4 Gregory Auner,5
Ildar Salakhutdinov,6* Pamela J. VandeVord1,7
1Department of Biomedical Engineering, Wayne State University, Detroit, Michigan2Department of Chemical Engineering and Materials Science, Wayne State University, Detroit, Michigan3Department of Mechanical Engineering, Wayne State University, Detroit, Michigan4Department of Physics, Wayne State University, Detroit, Michigan5Department of Biomedical Engineering, Smart Sensor and Integrated Microsystems, Wayne State University, Detroit, Michigan6Department of Electrical and Computer Engineering, Wayne State University, Detroit, Michigan7Research & Development Service, John D. Dingell VA Medical Center, Detroit, Michigan
Received 8 June 2012; revised 21 September 2012; accepted 26 September 2012
Published online 27 November 2012 in Wiley Online Library (wileyonlinelibrary.com). DOI: 10.1002/jbm.a.34480
Abstract: An array of design strategies have been targeted
toward minimizing failure of implanted microelectrodes by
minimizing the chronic glial scar around the microelectrode
under chronic conditions. Current approaches toward inhibi-
ting the initiation of glial scarring range from altering
the geometry, roughness, size, shape, and materials of the
device. Studies have shown materials which mimic the
nanotopography of the natural environment in vivo will con-
sequently result in an improved biocompatible response.
Nanofabrication of electrode arrays is being pursued in the
field of neuronal electrophysiology to increase sampling
capabilities. Literature shows a gap in research of nanoto-
pography influence in the reduction of astrogliosis. The aim
of this study was to determine optimal feature sizes for
neural electrode fabrication, which was defined as eliciting a
nonreactive astrocytic response. Nanopatterned surfaces
were fabricated with nanoimprint lithography on poly
(methyl methacrylate) surfaces. The rate of protein
adsorption, quantity of protein adsorption, cell alignment,
morphology, adhesion, proliferation, viability, and gene
expression was compared between nanopatterned surfaces
of different dimensions and non-nanopatterned control
surfaces. Results of this study revealed that 3600 nanopat-
terned surfaces elicited less of a response when compared
with the other patterned and non-nanopatterned surfaces.
The surface instigated cell alignment along the nanopattern,
less protein adsorption, less cell adhesion, proliferation and
viability, inhibition of glial fibrillary acidic protein, and mito-
gen-activated protein kinase kinase 1 compared with all
other substrates tested. VC 2012 Wiley Periodicals, Inc. J Biomed
Mater Res Part A: 101A: 1743–1757, 2013.
Key Words: nanopatterning, PMMA, astrogliosis, neural
electrode, astrocytes
How to cite this article: Ereifej ES, Matthew HW, Newaz G, Mukhopadhyay A, Auner G, Salakhutdinov I, VandeVord PJ. 2013.Nanopatterning effects on astrocyte reactivity. J Biomed Mater Res Part A 2013:101A:1743–1757.
INTRODUCTION
The long-term effect of chronically implanted neural electro-des is the formation of a glial scar made up of reactiveastrocytes, microglia and the matrix proteins they gener-ate.1,2 An array of design strategies have been targetedtoward minimizing failure of implanted microelectrodes byminimizing the chronic glial scar around the microelectrodeunder long-term settings. Current approaches toward inhibi-ting the initiation of glial scars range from altering thegeometry, roughness, size, shape, and materials of thedevice.3–6 The speed of implantation, use of bioactive coat-ings, and repositioning of the device postimplantation havealso been studied to improve biocompatibility.7
To properly design a successful neural electrode, theunderstanding of the cellular environment is mandatory.In vivo conditions comprise of cells living in the extracellularmatrix (ECM) meshwork with a three-dimensional (3D) andhigh aspect ratio topographical textures.8,9 The 3D environ-ment allows cells to have topographical cues which will allowthem to differentiate and perform their specific functions.Moreover, the first interaction that a protein has with the bio-material is what influences the cellular response. Propertiessuch as the chemistry, surface charge, and topography of amaterial are the major factors in protein adsorption, of whichconsequently affect the cell reaction as well.10 Studies haveshown that materials which can mimic the nanotopography
*Present address: Department of Applied Physics and Applied Mathematics, Columbia University, New York, New York, USA.
Correspondence to: P. J. VandeVord, School of Biomedical Engineering and Sciences, Virginia Tech University, 447 ICTAS Bldg, 325 Stanger
Blacksburg, VA 24061, USA; e-mail: [email protected]
Contract grant sponsor: NSF MRI program; contract grant number: 1040607
Contract grant sponsor: Wayne State University Dissertation Research Support Award
VC 2012 WILEY PERIODICALS, INC. 1743

of the natural environment in vivo will consequently result inan improved biocompatible response.5,9,11–13
Nanofabrication can improve the understanding ofcell behavior by providing substrates that mimic thenanoenvironment created by the native nanotopographies ofthe ECM.14 Studies have shown that selected proteins (i.e.fibronectin and vitronectin) adsorb more on nanomaterialscompared with smooth materials of the same chemistry.15,16
This protein adsorption is the initiator of better cell adhe-sion, alignment, and outgrowth of neuritis.15 Depending onpattern size, proteins have been shown to adsorb at differ-ent rates, quantities, and even change their conformationdue to the pattern features.15,16 Furthermore, nanotopogra-phy has been shown to affect the cells’ morphology, align-ment, adhesion, proliferation, gene expression profiles, andeven prevent biofouling and contamination on the material’ssurface.10,12,17–19 Topography affects gene expression andprotein production, such as cytokines, growth factors, sig-naling molecules, and cytoskeleton linked molecules.10,20–22
Nanofabrication of electrode arrays is being pursued inthe field of neuronal electrophysiology to increase samplingcapabilities.14 By having a larger electrode surface area,through nanopatterning, the electrode will be more accessibleto ions, therefore, greatly increasing the capacitive compo-nent.5 The proximity of the neuron to the electrode deter-mines the strength of the signal captured, therefore it isimperative to find methods to attract, adhere, and preserveneurons near recording sites. It has been found that regardlessof the surface underneath, neurons will grow on top of astro-cyte monolayers in culture and extend their processes alongthe tracks provided by the astrocytes.2,23,24 Therefore, topotentially block the negative components found in the glialcell response, astrocytes would need to be attracted andadhered onto the electrode surface.2,25 Hence, the goal of neu-ral electrode fabrication is to optimize the biomaterial surfaceto promote neuronal proximity to the recording surface, mini-mize astrogliosis, and eliminate chronic microglial activation.2
This evidence lends support for our proposed work whichexamines that the effect-specific nanopatterning features willhave on protein adsorption and astrocyte response. Literatureshows a gap in research of nanotopography influence in thereduction of astrogliosis. Preliminary data collected in thislaboratory was utilized in determining the material and nano-pattern feature dimensions.26,27 Nanopatterned surfaces werefabricated with nanoimprint lithography (NIL) on poly(methylmethacrylate) (PMMA) surfaces. NIL is inexpensive, fast, andeasily produces patterns <10 nm.28 The rate of proteinadsorption, quantity of protein adsorption, cell alignment, mor-phology, adhesion, proliferation, viability, and gene expressionwere compared between nanopatterned surfaces of differentdimensions and non-nanopatterned control surfaces to gaugechanges in biocompatibility.
METHODOLOGY
Nanopattern fabricationNIL, otherwise known as hot embossing, was utilized to createvarious nanopatterned surface. Specifically, the JenOptik HEX03hot embossing system (Fig. 1) (SSIM laboratory at Wayne StateUniversity, Detroit MI) was used. Goodfellow UV-grade PMMAwas the substrate. The processing temperature was 105–195�C,and the applied controllable force is 300 N to 3 kN (Fig. 2).Reflective holographic-grated molds were purchased fromEdmund Optics (Barrington, NJ) and used to make the patternedsubstrate with a period of 3600 grooves/mm (3600 nanopat-tern) and 1800 grooves/mm (1800 nanopattern). A flat mirrormold was used for a controlled non-nanopatterned surface. Theembossed substrates were cut into 1 cm2 wafers. As a standardsurface, we used polystyrene cover slips. All samples werecleaned with isopropanol, followed by 1� PBS and distilledwater washes, and then sterilized under UV light for 2 h.
Atomic force microscopyThe dimensions of the nanopatterned PMMA substrateswere characterized by Dimension 3100 AFM (VEECO) in the
FIGURE 1. (A) Nanoimprint lithography machine. (B) Area in NIL machine in which the mask is placed. [Color figure can be viewed in the online
issue, which is available at wileyonlinelibrary.com.]
1744 EREIFEJ ET AL. NANOPATTERNING EFFECTS ON ASTROCYTE REACTIVITY

tapping mode in ambient air. The height, amplitude, andphase images were obtained using silicon tapping tips(nanoScience Instruments, VistruaProbes T300) with reso-nance frequency of 300 kHz and tip radius <10 nm. Thescan rate was 1–3 Hz. Height images are plane-fit in the fastscan direction with no additional filtering operation. Thedimensions of the nanopattern structure were determinedusing the sectional height analysis command (Nanoscope5.30r3sr3) by manually measuring the lateral diameters andvertical heights of 3–5 different spots on each sample.
Scanning electron microscopyScanning electron microscopy (SEM) was utilized to imagecells and brain tissue on the substrate surface. In particular,the Environmental SEM Quanta FEG 450 (FEI Company, Hills-boro, OR) was used at an operating high voltage of 10kV andpressure of 5.5 Torr. On day 7, samples were fixed in a 4%paraformaldehyde solution for 30 min at room temperature(RT). After three rinses in 1� PBS, the samples were thenwashed in distilled water to remove salt crystals from the PBS.
EllipsometryTo measure the rate of protein adsorption, a picometerellipsometer (Beaglehole Instruments, NZ) was used. This isa phase-modulated ellipsometer that uses a HeNe laser at633 nm wavelength. The incident angle was set at the Brew-ster angle for PMMA, which is 56� . The samples were placedinside a quartz cuvette and 1 lg/mL of protein (fibronectinor collagen) was pipetted into the cuvette. The experimentswere run for 3 h, and data were collected for every 10 s.The refractive index of the protein film as well as ambientsis required to measure thickness; however, thickness wasnot directly measured in this study. Instead, we measuredthe quantity called ellipticity, which is directly proportional
to the film thickness. The ellipticity was measured as afunction of time. From the rate of change, we can infer therate of protein adsorption on the nanopatterned and non-patterned substrates.
Protein assayThe amount of protein adsorption was measured throughthe Micro-bicinchoninic acid (BCA) Protein Assay (ThermoScientific, Waltham, MA). Wafers were incubated for 2 h atRT with a 200 lL droplet of either 10 lg/mL of fibronectinor collagen. Thereafter, 150 lL of the protein was collectedand pipetted into a 96-well plate. As per manufacturer’sprotocol, 150 lL of the working reaction was mixed withthe protein in the 96-well plate on a shaker for 30 s. Thestandard curve was used to determine the protein concen-trations. The standard curve was created by using serialdilutions of bovine serum albumin. The plate was coveredand incubated at 37�C for 2 h, cooled to RT and then readat 562 nm on a microtiter plate reader.
Contact angle measurementThe water contact angle was determined from the shape ofaxisymmetric menisci of 5 lL distilled water drops using agoniometer.
Cell culturesThis study utilized C6 rat astrocytoma cell line (ATCC, Man-assas, VA). The cells were maintained in a F-12K mediumsupplemented with 10% horse serum, 2.5% fetal bovine se-rum (FBS), and 1% antibiotics–antimycotic. The cells werekept in a humidified incubator with the following settingconditions: 90% humidity, 5% CO2, and 37.8�C. The mediawas changed twice a week. Cells were detached using tryp-sin and then centrifuged at 1000 rpm. The cells were thenresuspended in culture media, stained with Trypan blue,and counted using a hemocytometer. There were 5000 cellsin 100 lL droplet of culture media loaded onto each samplein a 24-well plate. After 3 h of incubation at 37�C, lL of cul-ture media was added to each well.
Proliferation assayThe methylthiazolyldiphenyl tetrazolium bromide (MTT) col-orimetric assay was used to determine the number of cellsand the rate at which they proliferated at days 1, 3, and 7postseeding. At each time point, 0.5 mg/mL MTT reagentwas added to the culture medium and reincubated for 5 h inthe dark at 37�C until the yellow MTT was reduced to purpleformazan crystals. The culture media was removed carefully,so as to not disturb the formazan crystals, and replaced bydimethyl sulfoxide, which solubilized the formazan crystalsand cells. Absorbances were read at 570nm and 650 nm in amicrotiter plate reader. The optical densities were calculatedby subtracting the 650 nm reference wavelength from the570 nm absorbance reading. To measure the approximatenumber of cells on the given test days, a growth curve for C6cells was also generated by performing a MTT assay on agraded series (range from 2000 to 1,500,000 cells) of cellsplated on polystyrene culture dishes.
FIGURE 2. Schematic representation of material fabrication. Shown
is an example using the nanopatterned substrate; the same steps
were used to make the non-nanopatterned samples. [Color figure
can be viewed in the online issue, which is available at
wileyonlinelibrary.com.]
ORIGINAL ARTICLE
JOURNAL OF BIOMEDICAL MATERIALS RESEARCH A | JUN 2013 VOL 101A, ISSUE 6 1745

Real-time polymerase chain reactionReal-time polymerase chain reaction (RT-PCR) was used tomeasure gene expression from different samples relative tothe control surface (polystyrene samples). The total RNAfrom the samples was extracted on days 3 and 7 postseed-ing with Trizol (Invitrogen, Carlsbad, CA) following the man-ufacturer’s protocol. The RNA concentration and purity wasdetermined using a spectrophotometer through UV absorb-ance at 260 nm and 280 nm. Reverse transcriptase usingthe oligo(dT)20 primer converted the messenger RNA to acomplementary DNA (cDNA) template using a thermalcycler (Mastercycler Gradient, Eppendorf, Hauppauge, NY).For PCR analysis, we used cDNA equivalent to 40 ng of totalRNA. Specific primer pairs (Table I) for proliferation,mitogen-activated protein kinase kinase 1 (MAP2k1), andastrocyte activation, glial fibrillary acidic protein (GFAP)were used. As an internal control, the house-keeping geneglyceraldehyde-3-phosphate dehydrogenase (GAPDH) wasused. The PCR master mix included 1� SYBRVR Green(Applied Biosystems, Foster City, CA), and forward andreverse primers (0.4 lM each). cDNA templates and mastermix were read in a 96-well optical plate using a 7500 FastReal-Time PCR System (Applied Biosystems, Foster City, CA).The following profile was used: 50�C for 2 min, 95�C for 10min, and 40 cycles of 95�C for 15s and 60�C for 1 min.Threshold cycle (Ct) values for each sample and primer pairwere obtained and analyzed with the delta–delta (DD)Ctmethod29,30 to calculate the fold change (R) in each targetgene. The following equations were used:
DCt ¼ Ctsample � CtGAPDH
DDCt ¼ DCttest surface � DCtcontrol surface
R ¼ 2�DDCt
Viability testTo visually observe the morphology and viability of the cellson the different surfaces; the Live/DeadV
R
viability/cytotoxic-ity assay (Invitrogen, Carlsbad, CA) was used. Calcein AM [2lm in phenol red-free Dulbecco’s modified Eagle medium(DMEM)] was used to stain the live cells a green fluorescentcolor that can be seen using an emission filter (fluoresceinisothiocyanate) of � 488 nm. Ethidium homodimer (4 lmin phenol red-free DMEM) was used to stain the dead cellsa red fluorescence, which can be seen using an emissionfilter at � 528 nm. The samples were incubated in theLive/Dead stain for 20–30 min inside the incubator (37�C).
Thereafter, the samples were mounted onto slides usingProlong Gold antifade mounting gel (Invitrogen, Carlsbad,CA) and viewed under a Zeiss Axio Observer InvertedMicroscope (Carl Zeiss). Images for each sample were takenin the same location with both the red and green filters.
Cell nuclei and cytoskeleton staining/cell adhesionFluorescence staining was utilized to image the cells’ cyto-skeleton along with the nucleus. The cells were washed inphosphate buffered saline (1� PBS) and fixed in 4% para-formaldehyde for 20 min. The cells were washed in PBS,and then permeabilized by incubation for 25 min in 1� PBScontaining 0.25% Triton X-100. The cells washed, blockedwith 1% FBS for 25 min and washed again with 1� PBS.Cells were stained with Rhodamine Phalloidin in 1� PBS(Invitrogen, Carlsbad, CA) for 20 min at RT in the dark.Double staining of the nucleus was done with 2 lg/mL of40,6-diamidino-2-phenylindole (DAPI; Sigma–Aldrich, St.Louis, MO) for 20 min at RT in the dark. Thereafter, thesamples were mounted onto slides using Prolong Gold anti-fade mounting gel (Invitrogen, Carlsbad, CA) and viewedunder a Zeiss Axio Observer Inverted Microscope (CarlZeiss). Images for each sample were taken in the samelocation with both the red and DAPI filters.
Image analysisImage J software was used to quantify the number of livecells versus the dead cells, and calculate the number ofadhered cells. Each image was first converted to an 8-bitgrayscale from which a threshold binary image was created.An average area of stained live and dead cells was meas-ured and used to set a global scale of a particle size. Theaverage area of stained dead cell was 50 lm2 and a stainedlive cell was 80 lm2. Thereafter, the cells were countedusing the analyze particles function. The following formulawas used to calculate the percentage of live and dead cells:
% of live cells ¼ # of live cells
sum of total cellsðliveþ deadÞ � 100
To calculate the number of adhered cells, total DAPI stainedarea in an image (each image was 217 lm � 162 lm) wasmeasured, then divided by the average measured cellnucleus size (50 lm2).
Statistical analysisAll the data are presented as a mean 6 standard error ofthe mean. Experiments were performed in triplicates and
TABLE I. Primer Sequences for Real-Time PCR Used in Nanopatterned PMMA Studies
Cells Category Gene Primer Sequence
C6 rat astrocytoma cells House-keeping gene GAPDH 50-TGGCCTTCCGTGTTCCTACC-30 (F)50-AGCCCAGGATGCCCTTTAGTG-30 (R)
Proliferation gene MAP2k1 50-TTCAAGGTCTCCCACAAGCCATCT-30 (F)50-TTGATCCAAGGACCCACCATCCAT-30 (R)
Activation gene GFAP 50-GTTGTGTTCAAGCAGCCTGG-30 (F)50-CCAGTGAGTAAAGGTGACAG-30 (R)
1746 EREIFEJ ET AL. NANOPATTERNING EFFECTS ON ASTROCYTE REACTIVITY

repeated three independent times. PASW software (version18.0) was utilized for statistical analysis. A nonparametricstatistical analysis was used to test for statistically signifi-cant differences between the different material groups overall time points for the RT-PCR, MTT assay, BCA assay, viabil-ity, and cell adhesion studies. Parametric statistical methodscould not be completed due to insufficient power from asmall sample size, mean values were either not normallydistributed or the variances of the data were not heteroge-neous. The exact tests were conducted to be able to makereliable inferences by computing exact p values for a verywide class of hypothesis tests, including one-, two-, and Ksample tests, tests for unordered and ordered categoricaldata, and tests for measures of association.
RESULTS
Nanopattern fabricationFigure 3 depicts the successful fabrication of patterns withperiods of either 3600 grooves/mm or 1800 grooves/mm,which translates to a 277 nm width versus a 555 nm width,respectively, and both patterns had a depth of 200 nm.
Protein assayResults from the protein assay demonstrated at least 9 lg/mL of collagen was adsorbed onto all surfaces, whereas 7lg/mL of fibronectin adsorbed onto the surfaces (Fig. 4).There was significantly more (p < 0.01) collagen adsorptionon all surfaces compared with fibronectin adsorption. More-over, there was significantly less (p < 0.05) fibronectinadsorption on the 3600 nanopatterned surface comparedwith the 1800 nanopatterned, non-nanopatterned, andPMMA surfaces. There was significantly elevated levels (p <
0.05) of collagen adsorption on the PMMA surface com-pared with the 1800 nanopatterned surface.
EllipsometryEllipsometry results (Fig. 5) indicated that the rate of colla-gen adsorption was 10-fold faster when compared with thefibronectin adsorption. Results demonstrated that both ofthe nanopatterned substrates had faster rates of collagenand fibronectin adsorption compared with the nonpatternsurfaces. Additionally, the 3600 pattern substrates had thehighest rate of both fibronectin and collagen adsorptioncompared with 1800 pattern and nonpattern substrates.
Contact angleContact angle measurements revealed that the adsorption offibronectin and collagen on the material substrates made
FIGURE 3. Images of the two nanopattern substrates and flat PMMA substrate (before hot embossing). (A) Scanning electron microscopy and
(B) atomic force microscopy. [Color figure can be viewed in the online issue, which is available at wileyonlinelibrary.com.]
FIGURE 4. Micro-BCA protein adsorption assay results. *p < 0.05 fi-
bronectin data compared with 3600, ¤p < 0.05 fibronectin data com-
pared with PMMA, §p < 0.05 collagen data compared with PMMA,
and þp < 0.01 fibronectin data on all surfaces compared with collagen
data on all surfaces.
ORIGINAL ARTICLE
JOURNAL OF BIOMEDICAL MATERIALS RESEARCH A | JUN 2013 VOL 101A, ISSUE 6 1747

the 3600 pattern, PMMA, and control surfaces more hydro-philic (Table II).
Cell alignmentPhase contrast images taken at days 1, 3, and 7, showedthat over time the cells began to orient themselves in onedirection (Fig. 6). Cells appeared to have a unique temporalresponse dependent on the pattern surface. Cells grown onthe 1800 nanopattern began to align in one direction afteronly 1 day in culture. In contrast, cells cultured on the 3600nanopattern did not fully orient in one direction until 3days in culture. As can be seen from Figure 6 cells grownon the non-nanopatterned surface were randomly orientedalong the surface at all time points.
Scanning electron microscopySEM images (Fig. 7) revealed that by day 3, cells on both ofthe patterned surfaces grew along the nanopattern. More-over, the cells growing on the nanopattern surfaces had anelongated shape compared with the typical astrocyte star-like shape seen on the non-nanopattern substrate. Cells fol-lowed the pattern whether in low densities or in completeconfluence.
Viability assayResults of the viability assay revealed that all of the sub-strates tested had at least 89% viability at both time points.
Cells cultured on the 1800 nanopattern substrates had sig-nificantly higher (p < 0.05) viability on day 3 comparedwith cells cultured on 3600 nanopattern, PMMA and controlsubstrates (Fig. 8). Cells grown on the 3600 nanopatternsubstrates had significantly lower (p < 0.05) viability onday 3 compared with cells grown on non-nanopattern andcontrol substrates. Cells grown on the control and non-nanopattern substrates had significantly higher (p < 0.05)viability on day 3 compared with those grown on PMMA.However, by day 7, cells cultured on PMMA had significantlyhigher (p < 0.05) viability compared with 1800 nanopat-tern, 3600 nanopattern, and control substrates. Cells grownon the non-nanopattern substrates had significantly higher(p < 0.05) viability compared with the 3600 nanopatternon day 7.
MTT proliferation assayResults of the MTT proliferation assay demonstrated a sig-nificant increase (p < 0.05) in cell proliferation betweendays 1 and 3 with 1800 nanopattern, 3600 nanopattern,and non-nanopattern substrates (Fig. 9). There was a signifi-cant increase (p < 0.05) in proliferation between days 3and 7 with 1800 nanopattern, 3600 nanopattern, non-nano-pattern and control substrates (Fig. 9). At day 1, all nano-patterned substrates had significantly fewer (p < 0.05) cellscompared with the control, yet significantly more (p <
0.05) cells compared with PMMA (Fig. 10). Results on day 3showed similar findings, all substrates had significantlyfewer (p < 0.05) cells compared with the control and signif-icantly more cells compared with PMMA (Fig. 11). The 3600nanopattern and non-nanopattern substrates had signifi-cantly fewer (p < 0.05) cells on day 3 compared with the1800 pattern substrate (Fig. 11). Day 7 results showed alltest substrates had significantly higher (p < 0.05) numberof cells compared with PMMA (Fig. 12). However, comparedwith the control, only 1800 pattern, non-nanopattern, andPMMA had significantly fewer cells on day 7 (Fig. 12). More-over, compared with the 3600 pattern, the 1800 patternand non-nanopattern had significantly fewer (p < 0.05) cellson day 7 (Fig. 12). Non-nanopattern substrates had signifi-cantly fewer (p < 0.05) cells compared with 1800 pattern(Fig. 12).
Relative gene expressionResults of GFAP relative gene expression on 3600 nanopat-tern were significantly lower (p < 0.05) on day 7 comparedwith 3600 nanopattern on day 3 and control on day 7. It isimportant to note, that GFAP relative gene expression on
FIGURE 5. Ellipsometry results depicting the rate of (A) collagen and
(B) fibronectin adsorption on the two nanopatterns and non-nanopat-
terned surface.
TABLE II. Contact Angle Measurements Show Mean 6
Standard Error
No Protein Collagen Fibronectin
3600 76 6 2 66 6 1 65 6 31800 62 6 1 63 6 1 62 6 3NON 74 6 2 65 6 1 76 6 2PMMA 66 6 3 57 6 2 56 6 1Control 68 6 1 58 6 2 57 6 1
1748 EREIFEJ ET AL. NANOPATTERNING EFFECTS ON ASTROCYTE REACTIVITY

3600 nanopattern was lower on day 7 compared with allsubstrates (Fig. 13). Moreover, GFAP relative gene expressionwas higher on the non-nanopattern substrates comparedwith all other substrates on both days. MAP2k1 relative geneexpression of 3600 pattern on day 7 was significantly lower(p < 0.05) compared with control. Result of MAP2k1 relativegene expression show PMMA had higher levels comparedwith all other substrates on day 3 (Fig. 14).
Cell nuclei and cytoskeleton staining/cell adhesionCell nuclei stained with DAPI were used to measure thenumber of adhered cells after 1 day in culture to quantifycell adhesion characteristics. Cells grown directly on the
substrates, without any protein coating had significantlyfewer (p < 0.05) cells adhered across all substrate typescompared with cells cultured on collagen or fibronectin-coated substrates (Fig. 15). There were significantly more(p < 0.05) cells adhered on PMMA coated with fibronectincompared with PMMA coated with collagen (Fig. 15). To thecontrary, there were significantly fewer (p < 0.05) cellsadhered on 1800 nanopatterned substrate coated withfibronectin compared with 1800 nanopatterned substratecoated with collagen (Fig. 15).
Compared with uncoated 1800 nanopatterned substrate,there were significantly fewer (p < 0.05) cells adhered onthe 3600 nanopatterned, PMMA, and control substrates not
FIGURE 6. Phase contrast images of astrocytes aligned on patterned and nonpatterned PMMA surfaces (20�). [Color figure can be viewed in
the online issue, which is available at wileyonlinelibrary.com.]
FIGURE 7. SEM images of astrocytes growing on the hot embossed PMMA substrates on day 3 in culture (from left to right), 3600 nanopattern,
1800 nanopattern, and non-nanopattern.
ORIGINAL ARTICLE
JOURNAL OF BIOMEDICAL MATERIALS RESEARCH A | JUN 2013 VOL 101A, ISSUE 6 1749

coated with protein (Fig. 16). Similarly, compared with thenon-nanopatterned uncoated substrate, there were signifi-cantly fewer (p < 0.05) cells adhered on the uncoated 3600nanopatterned, uncoated 1800 nanopatterned, PMMA andcontrol substrates (Fig. 16). There were significantly fewer(p < 0.05) cells adhered on the uncoated 3600 nanopat-terned and uncoated control surface compared with PMMA(Fig. 16).
There were significantly fewer (p < 0.05) cells adheredon collagen-coated 3600 nanopattern, 1800 nanopattern,non-nanopattern, and PMMA compared with the control(Fig. 17). Compared with the collagen-coated non-nanopat-
tern substrates, there were significantly fewer (p < 0.05)cells adhered on the 3600 nanopattern and PMMA sub-strates (Fig. 17).
Compared with both fibronectin-coated 3600 patternand 1800 pattern, there were significantly more (p < 0.05)cells adhered on the fibronectin-coated non-nanopattern,PMMA, and control substrates (Fig. 18).
Results from the cell nuclei and cytoskeleton stainingvisually illustrate what Figures 15–18 graphically showed,there were fewer numbers of cells on the uncoated sub-strates compared with the fibronectin and collagen-coatedsubstrates (Fig. 19). Moreover, these images illustrate cells
FIGURE 8. Live/Dead images taken on day 7 (A) 3600 nanopatterned, (B) 1800 nanopatterned, (C) non-nanopatterned, (D) PMMA, (E) control
polystyrene, and (F) viability results of cells on materials surface on days 3 and 7 in vitro. *p < 0.05 data on day 3 compared with 1800, þp <
0.05 data on day 3 compared with 3600, ¤p < 0.05 data on day 7 compared with PMMA, §p < 0.05 data on day 7 compared with PMMA, and Dp
< 0.05 data on day 7 compared with 3600. [Color figure can be viewed in the online issue, which is available at wileyonlinelibrary.com.]
FIGURE 9. MTT proliferation assay. *p < 0.05 day 1 data compared with day 3 data and þp < 0.05 day 3 data compared with day 7 data.
1750 EREIFEJ ET AL. NANOPATTERNING EFFECTS ON ASTROCYTE REACTIVITY
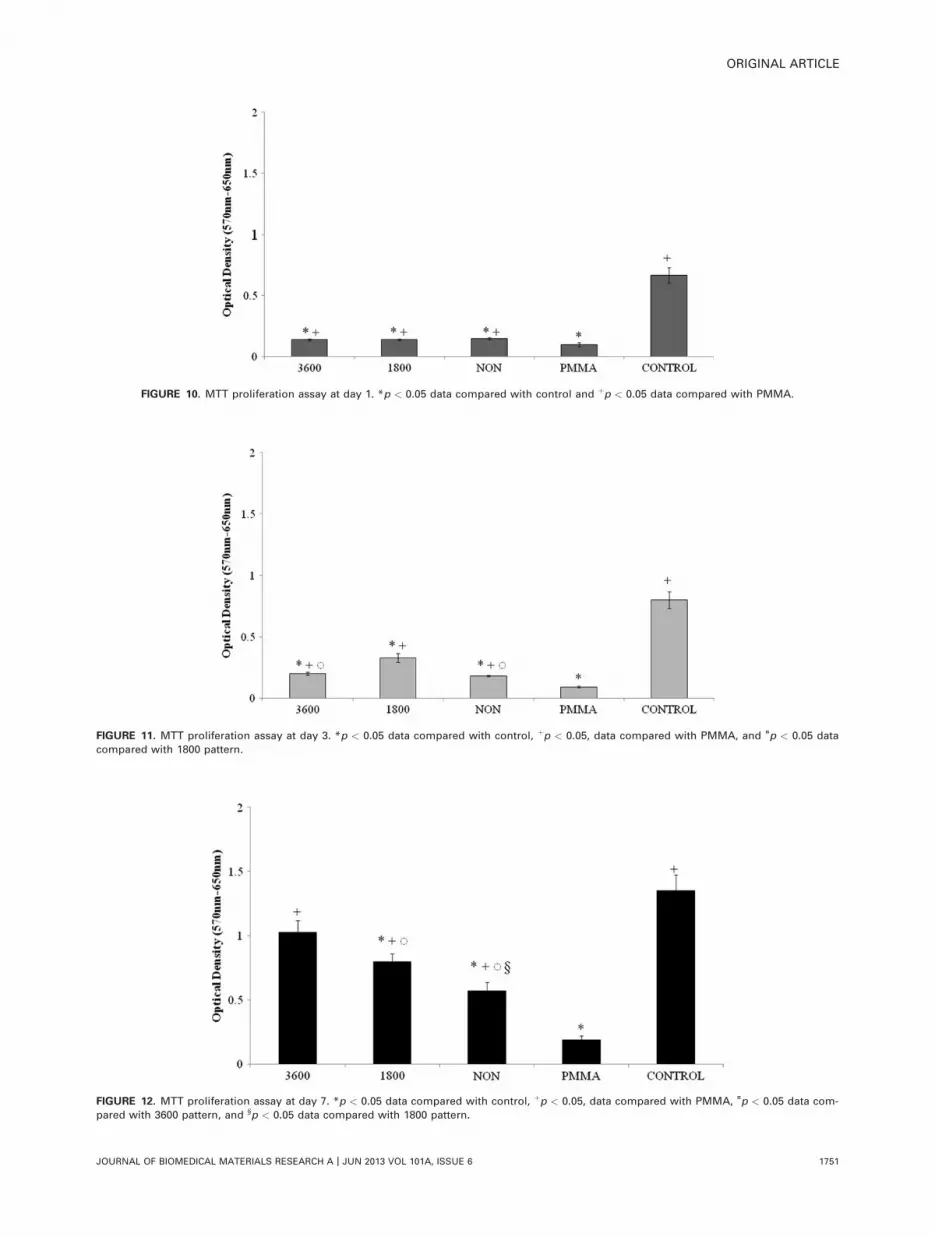
FIGURE 10. MTT proliferation assay at day 1. *p < 0.05 data compared with control and þp < 0.05 data compared with PMMA.
FIGURE 11. MTT proliferation assay at day 3. *p < 0.05 data compared with control, þp < 0.05, data compared with PMMA, and ¤p < 0.05 data
compared with 1800 pattern.
FIGURE 12. MTT proliferation assay at day 7. *p < 0.05 data compared with control, þp < 0.05, data compared with PMMA, ¤p < 0.05 data com-
pared with 3600 pattern, and §p < 0.05 data compared with 1800 pattern.
ORIGINAL ARTICLE
JOURNAL OF BIOMEDICAL MATERIALS RESEARCH A | JUN 2013 VOL 101A, ISSUE 6 1751

grown on the nanopatterned surfaces were growing in a lin-ear fashion, according to the nanopattern direction, whereasthe cells grown on the nonpatterned surfaces wererandomly oriented, growing no particular direction. Further-more, Figure 19 suggests the cell morphology on thenanopatterned substrates to be elongated compared with thestar-like morphology of the cells on the non-nanopatterned,PMMA, and control substrates (Fig. 19).
DISCUSSION
Studies have shown that in a healthy adult brain, commonlyfound ECM proteins, such as fibronectin and collagen, arescarce beneath the blood–brain barrier and choroidplexus.31,32 When brain tissue damage occurs, such as dur-ing neural electrode implantation, the levels of fibronectin isfound to be increased, most likely entering through theinjured blood–brain barrier.32 The binding of fibronectin tothe glial cell receptor (RGD peptide) has been shown to ele-vate their adhesion, migration, proliferation, and productionof cytokines.32–35 This increase in glial cell number is paral-leled with an increase in their reactivity, therefore resulting
in glial scar formation.32,35,36 As such, one of the goals of anoptimal neural electrode biomaterial includes a reducedamount of glial activation which is linked to the increasedfibronectin adsorption. This study showed the rate of fibro-nectin and collagen adsorption was higher on both of thenanopatterned surfaces compared with the non-nanopat-terned surface, although the amount of adsorbed proteinwas not always greater. In fact, there was significantly lessfibronectin adsorption on the 3600 nanopattern comparedwith the 1800 nanopattern, non-nanopattern, and PMMA.These results suggest that although the protein is adsorbingfaster on the nanopattern surfaces, the nanopattern featureson the 3600 nanopattern substrate may inhibit the amountof protein adsorbed.
Protein adsorption facilitates the cellular interactionwith the substrate surface. The number and strength of cellsadhered to a substrate is inherently affected by the level ofprotein adsorption.26,37–39 Surface topography has beenshown to either directly influence the cell response, or indi-rectly affect the cell responses through the affects they haveon the adsorption of proteins.10,40–42 Cell adhesion results
FIGURE 13. RTPCR GFAP relative gene expression. The control is represented in red line. *p < 0.05 data compared with 3600 on day 7 and ¤p <
0.05 data compared with control at day 7. [Color figure can be viewed in the online issue, which is available at wileyonlinelibrary.com.]
FIGURE 14. RTPCR MAP2k1 relative gene expression. The control is represented in red line. ¤p < 0.05 data compared with control at day 7.
[Color figure can be viewed in the online issue, which is available at wileyonlinelibrary.com.]
1752 EREIFEJ ET AL. NANOPATTERNING EFFECTS ON ASTROCYTE REACTIVITY

comparing substrates coated with fibronectin, collagen, orno protein revealed that on all protein-coated substrates,there was significantly more cell adhesion on both of theprotein-coated substrates compared with the substrateswithout any protein coating. The results demonstrate thatthe adsorption of both fibronectin and collagen decreasedthe contact angle of the substrates, therefore making themmore hydrophilic, which is consequently desirable for cellattachment. Furthermore, it was found that there were sig-nificantly fewer number of cells adhered on both of thenanopatterned surfaces coated with fibronectin comparedwith the nonpatterned, the PMMA, and the control. In fact,the fibronectin-coated 3600 nanopattern substrate had theleast number of cells compared with all other substrates.Similarly, Achyuta et al.43 found that a decrease in fibronec-tin adsorption on the material surface resulted in a decreasein microglia attachment to that material because microgliaadhesion on synthetic materials is known to be mediated by
fibronectin. Overall, the amount of collagen adsorption didnot differ significantly between the nanopattern and non-nanopatterned substrates. However, the amount of celladhesion on the collagen-coated 3600 nanopattern was sig-nificantly less than the non-nanopatterned substrate. Thedecrease of cell adhesion on both the fibronectin andcollagen-coated 3600 nanopattern and 1800 nanopattern,compared with the non-nanopattern and control substrates,may be due to conformational changes occurring in the pro-teins as they adhere to the patterned surface. Keller et al.44
observed ultrahigh-molecular-weight polyethylene surfacenanotopography alters the protein orientation and partiallyaligns single human plasma fibrinogen molecules. Tanget al.40–42 have done numerous studies analyzing the cellresponse to various coating of functional groups on materialsurfaces. They found subsequent cellular responses werepartially mediated by the surface chemistries of the materi-als due to the functional group coatings.40–42
FIGURE 16. Number of cells adhered on substrates not coated with proteins at day 1 in culture. *p < 0.05 data compared with 1800, þp < 0.05
compared with NON, and ¤p < 0.05 compared with PMMA.
FIGURE 15. Number of cells adhered on substrates coated with either 10 g/mL fibronectin or 10 g/mL collagen or no protein at day 1 in culture.
*p < 0.05 data compared with no protein and þp < 0.05 data compared with collagen.
ORIGINAL ARTICLE
JOURNAL OF BIOMEDICAL MATERIALS RESEARCH A | JUN 2013 VOL 101A, ISSUE 6 1753

Activated astrocytes are characterized by hypertrophy,hyperplasia, upregulation of GFAP, increased formation of fil-aments, irregularly shaped nuclei.2,45–48 Nanotopographyhas been shown to affect the cells’ adhesion, morphology,alignment, proliferation, gene expression profiles, and evenprevent biofouling and contamination on the material’s sur-face.10 This was evident in this study. Relative gene expres-sion of GFAP was the lowest on both nanopattern substratescompared with the non-nanopatterned, PMMA and controlsubstrates. In fact, the 3600 nanopattern substrate had adecrease in GFAP over time, and had the lowest GFAP geneexpression on day 7 compared with all materials. Theseresults indicate that the nanopatterned PMMA substrates in-hibit GFAP expression, with the 3600 nanopattern havingthe largest effect. The MAP2k1 relative gene expressiondecreased over time with both of the nanopatternsubstrates; again have the lowest levels with the 3600nanopattern by day 7. These results imply that cells grown
on the 3600 nanopattern are less hyperplasic within daysindicating less astrocyte reactivity. O’Keefe et al.20 did astudy on the effects of microgrooves on fibroblast geneexpression. They found there were many initial genechanges and also down-regulation of gene response withtime.20 This was thought to happen due to the deformationin the cell and nucleus morphology.20
Cell alignment generally means the polarization andelongation of the cells in the direction of the nanogrooves.This is thought to be due to the rearrangements of thecytoskeleton induced by the surface. This study demon-strated that nanoscale patterning alters cell attachment andorganization on surface. By day 1 in culture cells on the pat-tern surfaces began to orient and align themselves alongthe nanopattern. Curtis et al.12,17–19 observed that whenfibroblasts were seeded onto a nanostructured surface, thefirst event which took place was the cytoskeleton arrange-ment. Within the first 5 min postseeding, the actin
FIGURE 18. Number of cells adhered on substrates coated with 10 g/mL fibronectin at day 1 in culture. *p < 0.05 data compared with 3600 andþp < 0.05 data compared with 1800.
FIGURE 17. Number of cells adhered on substrates coated with 10 g/mL collagen at day 1 in culture. *p < 0.05 data compared with control andþp < 0.05 data compared with NON.
1754 EREIFEJ ET AL. NANOPATTERNING EFFECTS ON ASTROCYTE REACTIVITY

aggregation occurred then within 20 min the microtubulesaligned.12,17–19 Furthermore, the differences found in geneexpression between the nanopattern and non-nanopatternedsurfaces may be due to the rearrangements of the cytoskele-ton occurring from adhering and aligning along the nano-pattern surface. The transductions of mechanical forcescause the changes in gene expression. Studies have shownmechanical forces directly correlate with gene expressionand protein production.49–51 The mechanical forcesoccurring in vivo are thought to cause shifting in the ECM,
therefore stimulating the cells to establish new contact withthe ECM.49,50,52 The physical stretching of the cell is thenthought to expose previously hidden sites thereby resultingin altered responses.49,50,52
Distinctive results were found comparing the proteinand cell response to the 3600 pattern versus the 1800nanopattern. The 3600 nanopattern had less fibronectin andcollagen adsorption, but at a higher rate of adsorption com-pared with the 1800 nanopattern. There were fewer cellsattached, proliferating and viable on the 3600 nanopattern
FIGURE 19. Rhodamine phalloidin cytoskeleton stain double stained with DAPI for cell nucleus on day 1 (40�) of cells on 3600 nanopatterned,
1800 nanopatterned, non-nanopatterned, PMMA, and control surfaces coated with either 10 g/mL collagen, 10 g/mL fibronectin, or no protein.
[Color figure can be viewed in the online issue, which is available at wileyonlinelibrary.com.]
ORIGINAL ARTICLE
JOURNAL OF BIOMEDICAL MATERIALS RESEARCH A | JUN 2013 VOL 101A, ISSUE 6 1755

compared with the 1800 nanopattern. Finally, the relativeGFAP and MAP2k1 gene expression was lower on the 3600nanopattern compared with the 1800 nanopattern. Theseresults indicate that the addition of surface topographymust be explicit. In fact, studies have shown there arespecific features sizes that induce special protein and cellreactions to the surface topography. Petrossians et al.15,53
showed that there was less adhesion and proliferation ofastrocytes and fibroblasts on carbon nanofibers comparedwith microcarbon fibers. Studies done by Shain et al.3,10
found that astrocytes prefer to grow and adhere onto nano-pattern surfaces of varying dimensions over smooth siliconsurfaces in vitro. Seil et al. studied the astrocyte adhesionand proliferation on zinc oxide nanoparticle polyurethanecomposites. They found that there was a significantdecrease in astrocyte adhesion and proliferation when therewere more zinc oxide nanoparticles on the surface.15 Collec-tively, it has been shown that cells are very particular to thesurface they grow on; their response varies with minute fea-ture alterations on the nanoscale. Our study confirmed thismarvel, exhibiting that an increase of 278 nm in nanogroovewidth elicits varied protein and cell response.
The mechanism involved with the cellular response to ananopatterned surface is not well understood. As previouslymentioned, it is thought that the effects of the surfacetopography either directly influence the cell response, orindirectly affect the cell responses through the affects theyhave on the adsorption of proteins.10 This study showedthat both of these thoughts are accurate. The cells’ prolifera-tion, viability, adhesion, alignment and gene expressionwithout protein adsorption and determined the nanopatternaffected all of these cell responses was studied. Further-more, the protein adsorption, rate of adsorption, the cells’adhesion and alignment on surfaces coated with proteinswas examined. It was determined that the protein and cellresponse was affected. Indeed, it was demonstrated thatprotein coating on the surface increased cell adhesion andalignment, however, this occurrence was found regardless ofprotein coating. Nanoscale surface features better imitatethe nanoscale protein rich environment of the ECM foundin vivo.15 The surface area of the nanoscale roughnesssamples is much larger, therefore allowing for moreinteraction between the cells and proteins on the surface.15
Moreover, nanomaterials have more of a surface energythan flat surface due to their increase in grain boundaries.This increase of surface energy is thought to not onlyincrease the amount of protein adsorption, but the confor-mation of the proteins adsorbed as well.15
CONCLUSIONS
Results of this study agreed with the current literatureshowing that topography affects protein and cell behavior. Itwas found that both proteins and cells were affected by thenanopatterning of PMMA. The aim of this study was todetermine optimal feature sizes for neural electrode fabrica-tion, which was defined as eliciting a nonreactive astrocyticresponse. The 3600 nanopattern surface was determined toelicit less of a response when compared with the other
nanopattern and non-nanopatterned surfaces. The surfaceinstigated cell alignment along the nanopattern, less proteinadsorption, less cell adhesion, proliferation, and viability,inhibition of GFAP and MAP2k1 was compared with allother substrates tested. Further investigation applying thesefeature sizes in an in vivo setting is required to fully toappreciate the beneficial effects of this specific nanopat-terned surface.
ACKNOWLEDGMENTS
The authors acknowledge usage of the environmentalscanning electron microscope at the Lawrence TechnologicalUniversity (Southfield, MI). We express gratitude to Dr. NisrineZakaria for assistance with statistical analysis.
REFERENCES1. Seil JT, Webster TJ. Decreased astroglial cell adhesion and prolif-
eration on zinc oxide nanoparticle polyurethane composites. Int J
Nanomed 2008;3:523–531.
2. Polikov VS, Tresco PA, Reichert WM. Response of brain tissue to
chronically implanted neural electrodes. J Neurosci Methods
2005;148:1–18.
3. Szarowski DH, Andersen MD, Retterer S, Spence AJ, Isaacson M,
Craighead HG, Turner JN, Shain W. Brain responses to micro-
machined silicon devices. Brain Res 2003;983:23–35.
4. Kotzar G, Freas M, Abel P, Fleischman A, Roy S, Zorman C, Moran
JM, Melzak J. Evaluation of MEMS materials of construction for
implantable medical devices. Biomaterials 2002;23:2737–2750.
5. Kotov NA, Winter JO, Clements IP, Jan E, Timko BP, Campidelli
S, Pathak S, Mazzatenta A, Lieber CM, Prato M, Bellamkonda RV,
Silva GA, Kam NWS, Patolsky F, Ballerini L. Nanomaterials for
Neural Interfaces. Adv Mater 2009;21:3970–4004.
6. Grill WM, Norman SE, Bellamkonda RV. Implanted neural interfa-
ces: Biochallenges and engineered solutions. Annu Rev Biomed
Eng 2009;11:1–24.
7. Stice P, Muthuswamy J. Assessment of gliosis around moveable
implants in the brain. J Neural Eng 2009;6.
8. Wu ZZ, Zhao Y, Kisaalita WS. Interfacing SH-SY5Y human neuro-
blastoma cells with SU-8 microstructures. Colloids Surf B Bioin-
terfaces 2006;52:14–21.
9. Millet LJ, Bora A, Sweedler JV, Gillette MU. Direct cellular pepti-
domics of supraoptic magnocellular and hippocampal neurons in
low-density co-cultures. ACS Chem Neurosci 2010;1:36–48.
10. Kriparamanan R, Aswath P, Zhou A, Tang L, Nguyen KT. Nanoto-
pography: Cellular responses to nanostructured materials. J
Nanosci Nanotechnol 2006;6:1905–1919.
11. Ding H, Millet LJ, Gillette MU, Popescu G. Actin-driven cell dy-
namics probed by Fourier transform light scattering. Biomed Opt
Express 2010;1:260–267.
12. Curtis AS, Gadegaard N, Dalby MJ, Riehle MO, Wilkinson CD,
Aitchison G. Cells react to nanoscale order and symmetry in their
surroundings. IEEE Trans Nanobiosci 2004;3:61–65.
13. Zervantonakis IK, Kothapalli CR, Chung S, Sudo R, Kamm RD.
Microfluidic devices for studying heterotypic cell–cell interactions
and tissue specimen cultures under controlled microenviron-
ments. Biomicrofluidics 2011;5:13406.
14. Blattler T, Huwiler C, Ochsner M, Stadler B, Solak H, Voros J,
Grandin HM. Nanopatterns with biological functions. J Nanosci
Nanotechnol 2006;6:2237–2264.
15. Rose TL, Kelliher EM, Robblee LS. Assessment of capacitor elec-
trodes for intracortical neural stimulation. J Neurosci Methods
1985;12:181–193.
16. John GR, Scemes E, Suadicani SO, Liu JS, Charles PC, Lee SC,
Spray DC, Brosnan CF. IL-1beta differentially regulates calcium
wave propagation between primary human fetal astrocytes via
pathways involving P2 receptors and gap junction channels. Proc
Natl Acad Sci U S A 1999;96:11613–11618.
17. Curtis A. The potential for the use of nanofeaturing in medical
devices. Expert Rev Med Devices 2005;2:293–301.
1756 EREIFEJ ET AL. NANOPATTERNING EFFECTS ON ASTROCYTE REACTIVITY

18. Fok-Seang J, DiProspero NA, Meiners S, Muir E, Fawcett JW.
Cytokine-induced changes in the ability of astrocytes to support
migration of oligodendrocyte precursors and axon growth. Eur J
Neurosci 1998;10:2400–2415.
19. Das SK, Chung S, Zervantonakis I, Atnafu J, Kamm RD. A micro-
fluidic platform for studying the effects of small temperature gra-
dients in an incubator environment. Biomicrofluidics2008;2:34106.
20. O’Keefe GM, Nguyen VT, Ping Tang LL, Benveniste EN. IFN-
gamma regulation of class II transactivator promoter IV in macro-
phages and microglia: Involvement of the suppressors of cytokine
signaling-1 protein. J Immunol 2001;166:2260–2269.
21. Yim EK, Pang SW, Leong KW. Synthetic nanostructures inducing
differentiation of human mesenchymal stem cells into neuronal
lineage. Exp Cell Res 2007;313:1820–1829.
22. McKenzie JL, Waid MC, Shi R, Webster TJ. Decreased functions
of astrocytes on carbon nanofiber materials. Biomaterials 2004;25:
1309–1317.
23. Liberto CM, Albrecht PJ, Herx LM, Yong VW, Levison SW. Pro-
regenerative properties of cytokine-activated astrocytes. J Neuro-
chem 2004;89:1092–1100.
24. Theil D, Farina C, Meinl E. Differential expression of CD150
(SLAM) on monocytes and macrophages in chronic inflammatory
contexts: Abundant in Crohn’s disease, but not in multiple sclero-
sis. J Clin Pathol 2005;58:110–111.
25. Duffy HS, John GR, Lee SC, Brosnan CF, Spray DC. Reciprocal
regulation of the junctional proteins claudin-1 and connexin43 by
interleukin-1beta in primary human fetal astrocytes. J Neurosci
2000;20:RC114.
26. Salakhutdinov I, VandeVord P, Palyvoda O, Matthew H, Tatagiri
G, Handa H, Mao G, Auner GW, Newaz G. Fibronectin adsorption
to nanopatterned silicon surfaces. J Nanomater 2008;2008.
27. Ereifej ES, Khan S, Newaz G, Zhang J, Auner GW, VandeVord PJ.
Characterization of astrocyte reactivity and gene expression on
biomaterials for neural electrodes. J Biomed Mater Res A 2011;
99:141–150.
28. Cogan SF, Troyk PR, Ehrlich J, Plante TD, Detlefsen DE. Potential-
biased, asymmetric waveforms for charge-injection with activated
iridium oxide (AIROF) neural stimulation electrodes. IEEE Trans
Biomed Eng 2006;53:327–332.
29. Schmittgen TD, Livak KJ. Analyzing real-time PCR data by the
comparative C(T) method. Nat Protoc 2008;3:1101–1108.
30. Livak KJ, Schmittgen TD. Analysis of relative gene expression
data using real-time quantitative PCR and the 2(�Delta Delta C(T))
method. Methods 2001;25:402–408.
31. Zimmermann DR, Dours-Zimmermann MT. Extracellular matrix of
the central nervous system: From neglect to challenge. Histochem
Cell Biol 2008;130:635–653.
32. Tate CC, Garcia AJ, LaPlaca MC. Plasma fibronectin is neuropro-
tective following traumatic brain injury. Exp Neurol 2007;207:
13–22.
33. Mayeed MS, Al-Mekhnaqi AM, Auner GW, Newaz GM. A surface
accumulator of Escherichia coli in water flow. Comput Methods
Biomech Biomed Eng 2009;12:109–112.
34. Thanawala S, Palyvoda O, Georgiev DG, Khan SP, Al-Homoudi IA,
Newaz G, Auner G. A neural cell culture study on thin film elec-
trode materials. J Mater Sci Mater Med 2007;18:1745–1752.
35. Hermanns S, Klapka N, Gasis M, Muller HW. The collagenous
wound healing scar in the injured central nervous system inhibits
axonal regeneration. Adv Exp Med Biol 2006;557:177–190.
36. Mian A, Newaz G, Georgiev DG, Rahman N, Vendra L, Auner G,
Witte R, Herfurth H. Performance of laser bonded glass/polyimide
microjoints in cerebrospinal fluid. J Mater Sci Mater Med 2007;18:
417–427.
37. Dupont-Gillain CC, Alaerts JA, Dewez JL, Rouxhet PG. Patterned
layers of adsorbed extracellular matrix proteins: Influence on
mammalian cell adhesion. Biomed Mater Eng 2004;14:281–291.
38. Ni M, Tong WH, Choudhury D, Rahim NA, Iliescu C, Yu H. Cell
culture on MEMS platforms: A review. Int J Mol Sci 2009;10:
5411–5441.
39. Alaerts JA, De Cupere VM, Moser S, Van den Bosh de Aguilar P,
Rouxhet PG. Surface characterization of poly(methyl methacry-
late) microgrooved for contact guidance of mammalian cells. Bio-
materials 2001;22:1635–1642.
40. Thevenot P, Cho J, Wavhal D, Timmons RB, Tang L. Surface
chemistry influences cancer killing effect of TiO2 nanoparticles.
Nanomedicine 2008;4:226–236.
41. Kamath S, Bhattacharyya D, Padukudru C, Timmons RB, Tang L.
Surface chemistry influences implant-mediated host tissue
responses. J Biomed Mater Res A 2008;86:617–626.
42. Tang L, Wu Y, Timmons RB. Fibrinogen adsorption and host tis-
sue responses to plasma functionalized surfaces. J Biomed Mater
Res 1998;42:156–163.
43. Achyuta AK, Polikov VS, White AJ, Lewis HG, Murthy SK. Bio-
compatibility assessment of insulating silicone polymer coatings
using an in vitro glial scar assay. Macromol Biosci 2010;10:
872–880.
44. Keller TF, Schonfelder J, Reichert J, Tuccitto N, Licciardello A,
Messina GM, Marletta G, Jandt KD. How the surface nanostruc-
ture of polyethylene affects protein assembly and orientation.
ACS Nano 2011;5:3120–3131.
45. Polikov VS, Block ML, Fellous JM, Hong JS, Reichert WM. In vitro
model of glial scarring around neuroelectrodes chronically
implanted in the CNS. Biomaterials 2006;27:5368–5376.
46. Buffo A, Rolando C, Ceruti S. Astrocytes in the damaged brain:
Molecular and cellular insights into their reactive response and
healing potential. Biochem Pharmacol 2010;79:77–89.
47. Gervasi NM, Kwok JC, Fawcett JW. Role of extracellular factors in
axon regeneration in the CNS: Implications for therapy. Regen
Med 2008;3:907–923.
48. Laird MD, Vender JR, Dhandapani KM. Opposing roles for reac-
tive astrocytes following traumatic brain injury. Neurosignals
2008;16:154–164.
49. Asparuhova MB, Gelman L, Chiquet M. Role of the actin cytoskel-
eton in tuning cellular responses to external mechanical stress.
Scand J Med Sci Sports 2009;19:490–499.
50. Sarasa-Renedo A, Chiquet M. Mechanical signals regulating
extracellular matrix gene expression in fibroblasts. Scand J Med
Sci Sports 2005;15:223–230.
51. Avvisato CL, Yang X, Shah S, Hoxter B, Li W, Gaynor R, Pestell R,
Tozeren A, Byers SW. Mechanical force modulates global gene
expression and beta-catenin signaling in colon cancer cells. J Cell
Sci 2007;120:2672–2682.
52. Chiquet M, Renedo AS, Huber F, Fluck M. How do fibroblasts
translate mechanical signals into changes in extracellular matrix
production?Matrix Biol 2003;22:73–80.
53. Petrossians A, Whalen JJ, Weiland JD, Mansfeld F. Surface modi-
fication of neural stimulating/recording electrodes with high sur-
face area platinum-iridium alloy coatings. Conf Proc IEEE Eng
Med Biol Soc 2011;2011:3001–3004.
ORIGINAL ARTICLE
JOURNAL OF BIOMEDICAL MATERIALS RESEARCH A | JUN 2013 VOL 101A, ISSUE 6 1757