my presentation on db2 performance databases - idug
TRANSCRIPT
Welcome to my presentation on DB2 Performance Databases
How to create your own DB2 performance database and then how you can use it!
ABSTRACT: Many vendors of DB2 performance analysis tools offer a "performance
database" which consists of tables where you store db2 trace output as processed
by the analysis tool. When loaded, you can use the power of SQL to easily mine this
valuable information
1

Welcome to my agenda

Manulife is where I work. We are called John Hancock in the USA.

Some shops have been running standard traces for years.. but they never look at the data!
You should look at it… it is interesting
My target audience is DBAs who don’t have a PDB but they hava a DB2 monitor tool which
allows the creation of a PDB.
I hope I am not saying things that are TOO obvious… it is obvious to me now. But it wasn’t
obvious in the beginning.
My goal of this presentation is to give the big picture of a PDB (not reference… good
reference exists). I want to help others understand the value of a PDB
my first DB2 performance database was provided by CA Insight for DB2. It was fine. For
reasons beyond my input or control my shop switched from CA Inisght for DB2 to
Omegamon for DB2.
It turns out they both have “performance databases”. <the names may vary> But the
structure and contents of tables of the performance db was remarkably the same.
But that makes sense (in hindsight), obviously both are built upon the same input source >
the DB2 trace output (via SMF in my case)

Again. Lots of good reference DB2 trace reference information exists. This is a quick
summary on what you see after –DIS TRACE db2 command
I found the IBM reference documentation onTRACE and IFCIDs to not be good at
explaining the big picture. It is excellent reference documentation. It took me a while to get
to my still not-perfect understanding. I had to put the pieces together myself… I am still
putting it together..
I am not telling you what traces to run! Most shops are already running traces. I just want
you to utilize your traces more! And that can be done by putting the trace output in a PDB
Accounting Traces are the best. They provide details on application activity. The
accounting Trace output is generated when a accounting event occurs. This is normally
when a db2 thread completes its activity (ie end of CICS transaction… or batch job step).
But it is not always 1 to 1 even for CICS … ( I have learned to my surprise). And even
more so… distributed db2 activited (DRDA) is often summarized by Db2 according to
DSNZPARM of ACCUMACC value. This is probably important to set so you don’t generate
too much accounting output from high volume web applications. We have ACCUMACC set
to 10… I am thinking of setting it to 100… What do others do? (I would like to know).
There is a accounting trace output field that tells you many distributed acitivites are
summarized into this trace output… it is called PAR_

The differences between the PDB and PWH are explained in many places. It took me a
while to really figure it out. A PDB is totlaly under my control and was relatively easy to
setup. No expensive server to purchase or assign responsibility. Hands on type dbas
probably gravitate towards building a PDB
… maybe with more experience I will switch to PWH
This link is probably redundant… it can be easily googled. Make sure you pick OM XE for
DB2 documentation for your particular Version! For example.. My shop is at V5.2 but V5.3
is already available (with some new PDB tables available… to be mentioned soon)

Reading the PDB reference documentation leads to the obvious question… To File or
Save. It is a good question.

It took me too long to figure out the difference between SAVE and FILE. Using SAVE
produces the most detailed and non-aggreagated data. In my world it was OK. Merely
millions of records.
>> although I do have a new interesting high volume CICS application that is changing from
VSAM to DB2. It will be interesting the amount of new volume of data in my PDB.. I may
have to rethink my strategy….

There are many possible PDB tables. The most valuable and immediate
accounting tables include
DB2PMFACCT_GENERAL, DB2PMFACCT_PROGRAM (*)…
(*) was it a poor decision many years ago to call the
package data table DB2PMFACCT_PROGRAM? I think yes… it should be
package (I think)

The main important statistics table is DB2PM_STAT_GENERAL
And then there are relatively new bonus tables for dynamic and static sql statements.
Fascinating info here… but it may be a bit expensive to constantly gather (ie. Run these
traces)… so think about it.

The reference documentation is not explicit about HOW to build a PDB. What database
name to use? Where to put the db?
And tablespaces? They are ommited in the provided DDL. You make your own … it isn’t
that hard. May as well use UTS PBG (although you could partitioni)

No indexes are suggested in the reference. Build indexes for your anticipated use.
non-unique indexes are ok
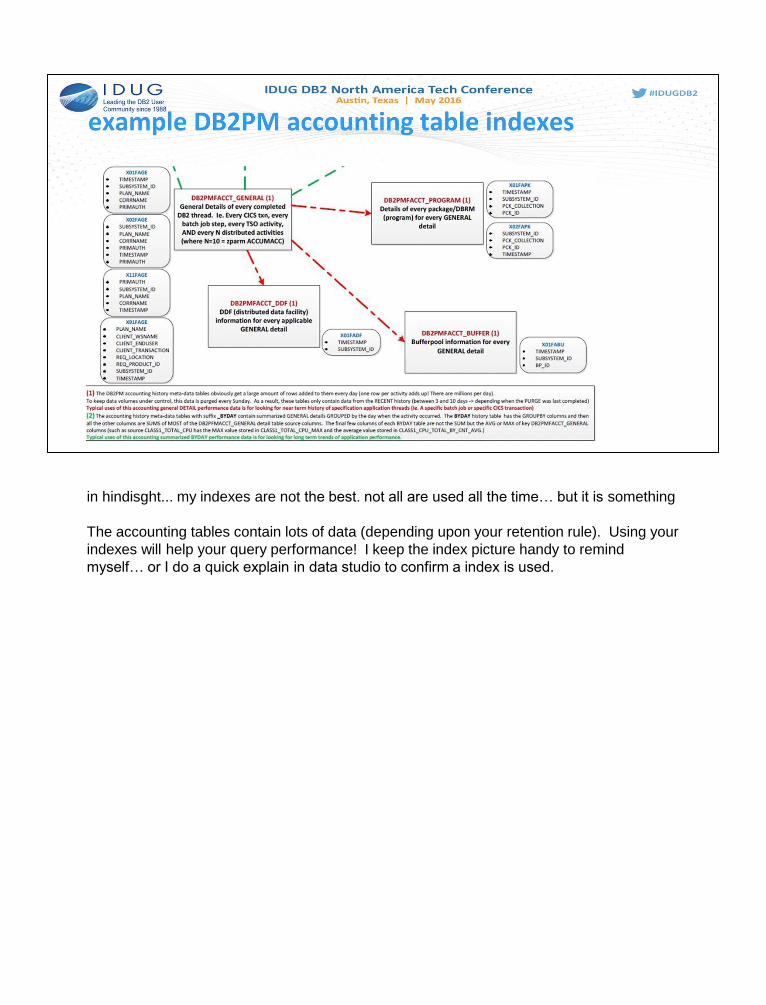
in hindisght... my indexes are not the best. not all are used all the time… but it is something
The accounting tables contain lots of data (depending upon your retention rule). Using your
indexes will help your query performance! I keep the index picture handy to remind
myself… or I do a quick explain in data studio to confirm a index is used.

The indexes I built on the STAT tables.
Really… the STAT tables contain relatively little data (often one row per minute per db2
subsystem) so even if you scan the whole table sometimes… not the end of the world

The new PDB tables in V5.3 for deadlock/timeout will be useful. I anticipte using this table
to capture trends.

Sample JCL for processing SMF. It was not obvious in the reference documentation on
how to build the jcl…. It was there… but not obvious (to me). Here is my example

LOAD JCL is easy… it is a simple load (no RI in my PDB) Here is my sample JCL for load.

You really need to think of a purge strategy. And then implement as regular job to
purge/maintain.
(*) I have millions of rows every day. It is lots. but not impossible.

Making a PDB variant is a valuable tool for looking at long term trends!
I built my own (as described above). Very useful to see a popular CICS txn over time… or
a distributed server activity over time.
For my ”OTHER” table, I summarized it by batch job (corrname) … including MAINPACK
would have helped break out the batch job steps. in hindisht, that wouldd have been a
good idea...

After some years of experience… The grouping fields could be refined to be more
general… but the above was a good start. In hindishgt, if I built them new again… they
would be slightly different if I built them new today
The field names are all based upon the source ACCT_GENERAL column names. I do not
change the names to make it more obvious.. It is best to use what IBM provided for later
reference and others!
My only new field name is ACTIVITY_LOCAL_DT which identifies the “date” for all the
summarized GENERAL records.
And DB2PMF_ACCT_GENERAL_CNT is at the end of my tables… to tell me how many
source GENERAL records when into this BYDAY summary.
>> for CICS and DRDA then this CNT will be high… for BATCH it might be one!
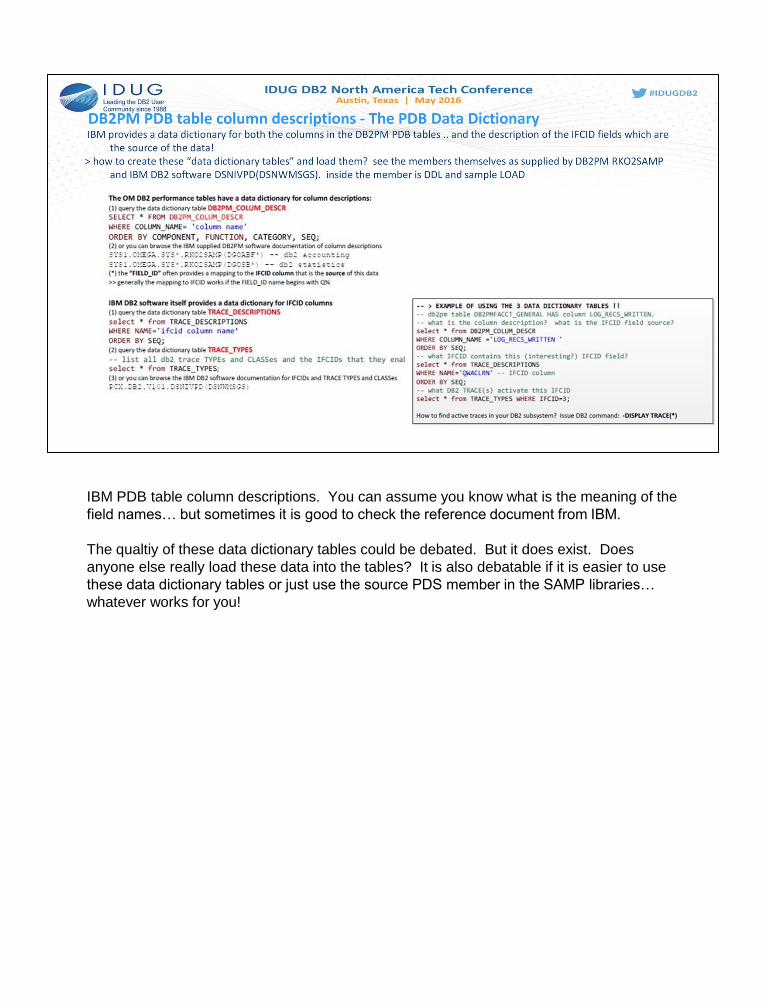
IBM PDB table column descriptions. You can assume you know what is the meaning of the
field names… but sometimes it is good to check the reference document from IBM.
The qualtiy of these data dictionary tables could be debated. But it does exist. Does
anyone else really load these data into the tables? It is also debatable if it is easier to use
these data dictionary tables or just use the source PDS member in the SAMP libraries…
whatever works for you!
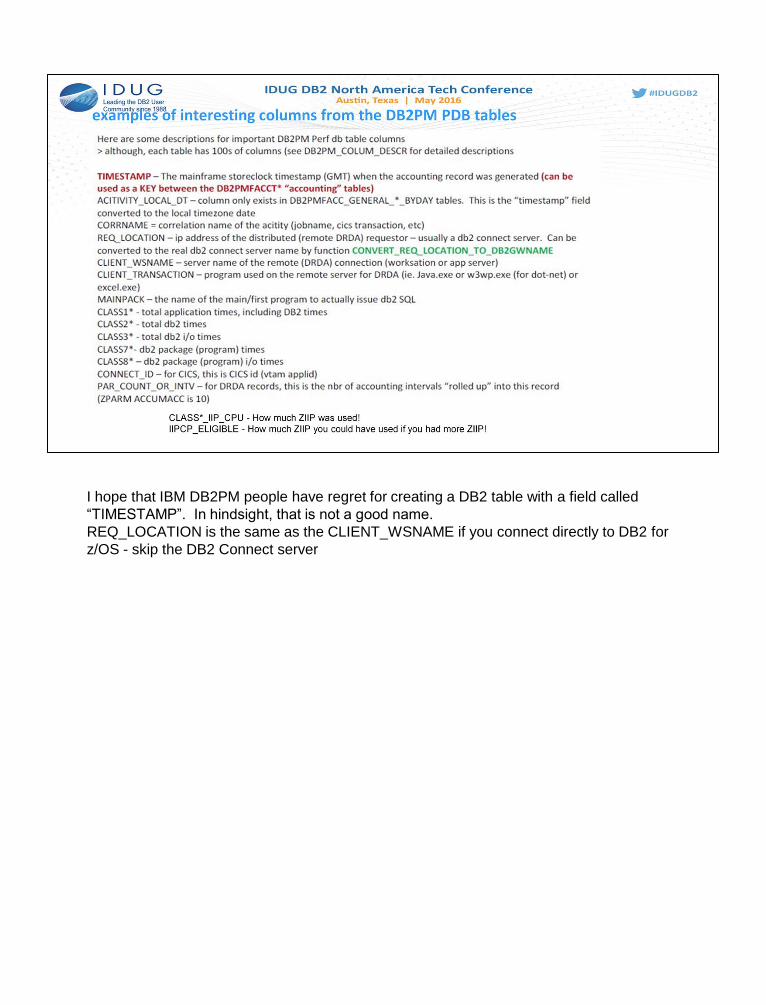
I hope that IBM DB2PM people have regret for creating a DB2 table with a field called
“TIMESTAMP”. In hindsight, that is not a good name.
REQ_LOCATION is the same as the CLIENT_WSNAME if you connect directly to DB2 for
z/OS - skip the DB2 Connect server

Now the magic question! How to use the PDB? What to do with all this wonderful data you
have now collected?
Remember… if you don’t use it then why do you bother building it? Do something!
DB2 trace output is powerful information… it is now relatively easy to look at now that it is in
the PDB!
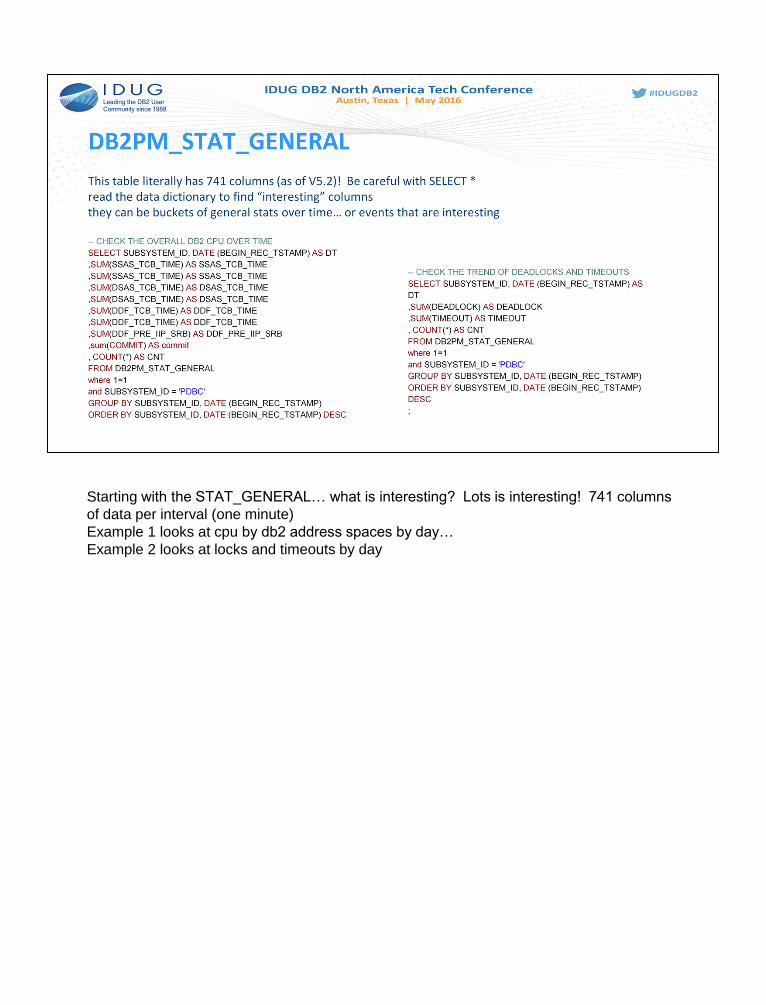
Starting with the STAT_GENERAL… what is interesting? Lots is interesting! 741 columns
of data per interval (one minute)
Example 1 looks at cpu by db2 address spaces by day…
Example 2 looks at locks and timeouts by day
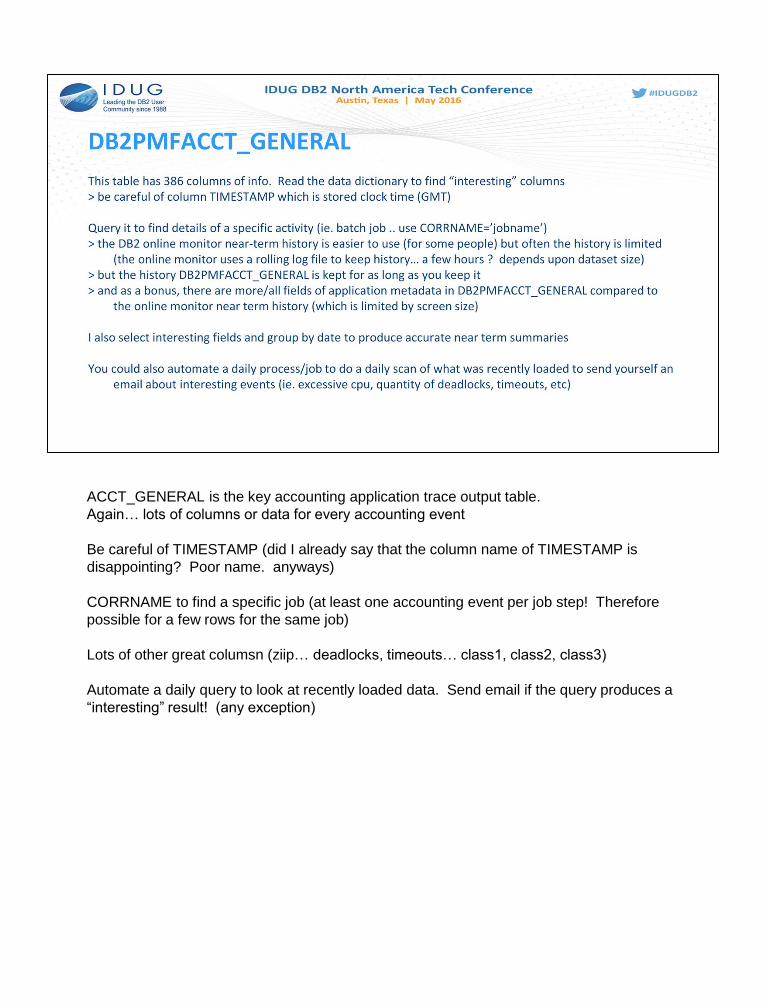
ACCT_GENERAL is the key accounting application trace output table.
Again… lots of columns or data for every accounting event
Be careful of TIMESTAMP (did I already say that the column name of TIMESTAMP is
disappointing? Poor name. anyways)
CORRNAME to find a specific job (at least one accounting event per job step! Therefore
possible for a few rows for the same job)
Lots of other great columsn (ziip… deadlocks, timeouts… class1, class2, class3)
Automate a daily query to look at recently loaded data. Send email if the query produces a
“interesting” result! (any exception)
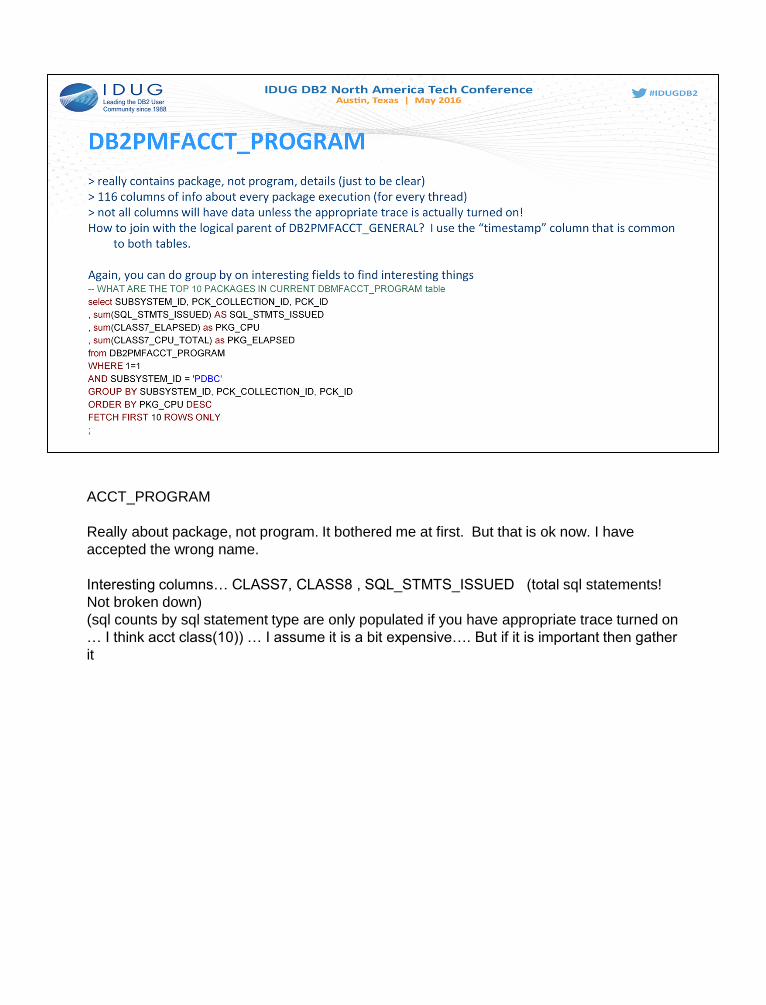
ACCT_PROGRAM
Really about package, not program. It bothered me at first. But that is ok now. I have
accepted the wrong name.
Interesting columns… CLASS7, CLASS8 , SQL_STMTS_ISSUED (total sql statements!
Not broken down)
(sql counts by sql statement type are only populated if you have appropriate trace turned on
… I think acct class(10)) … I assume it is a bit expensive…. But if it is important then gather
it
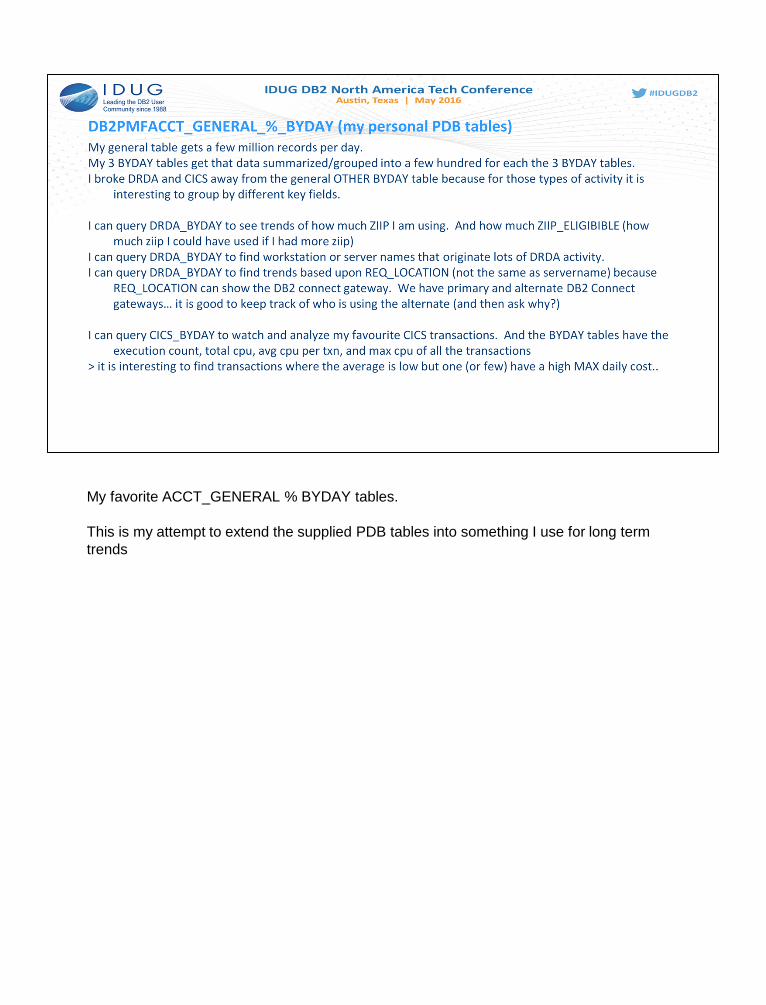
My favorite ACCT_GENERAL % BYDAY tables.
This is my attempt to extend the supplied PDB tables into something I use for long term
trends

Here are some examples of how I use my BYDAY tables…

Dyanmic sqt statement cache tables are new to my PDB.
But here are examples of some use
Who was in the cache a long time? Perhaps the query could be refined to sort by cpu… or
exec count? Send a alert in some cases
Who was executed the most? Why executed the most? How long was it in the cache?

Which CICS transactions (from my BYDAY) uses lots of daily cpu?
Again, this could be refined to send a email/alert if necessary… when something odd
shows up!
In my BYDAY tables I now have AVG_cpu and MAX_cpu columns at the end of my table..
This is good to look for widely varying performance by day… it helps you learn about the
apps

I think a analytics accelerator would be a very interesting tool to use with the PDB. The
PDB doesn’t have to be too HUGE. So if you can load it into the analytics accelerator then
you can query whatever way you want! No index required
And would IBM Watson be helpful? Interesting idea here…

IBM Data Studio. Really… it is the best thing since sliced bread

Many places exist to find more information on PDB

As a bit of bonus information… here are my thoughts about how to send automated emails
from data in the PDB.
If someone really wants to see my jcl to send emails then I can share a copy of the jcl… it is
basic and non-proprietary.

Honestly… I would appreciate feedback! This is my first presentation! (second time
presenting it) I would appreciate your feedback!
Do you use a PDB today? If yes then I would love to hear from you and hear about how
you use it.
If no, then I would like to hear if my presentation is inspiring you to consider such a
repository? Do you see value in it?
Speaker BIO: Brian Laube has been a DB2 for z/OS application DBA for 18 years
(15+ years with Manulife Financial and 3 years with Bell Canada International (now
part of CGI))
As a application DBA, my primary area of interest is DB2 application performance
and understanding what is going on inside the application and finding ways to make
it more efficient.
39