mutations in the gabrb1 gene promote alcohol consumption through increased tonic inhibition
TRANSCRIPT
ARTICLE
Received 6 Aug 2013 | Accepted 24 Oct 2013 | Published 26 Nov 2013
Mutations in the Gabrb1 gene promote alcoholconsumption through increased tonic inhibitionQuentin M. Anstee1,2,3,*, Susanne Knapp2,3,*, Edward P. Maguire4, Alastair M. Hosie5,z, Philip Thomas5,
Martin Mortensen5, Rohan Bhome5, Alonso Martinez3,w, Sophie E. Walker6, Claire I. Dixon6, Kush Ruparelia7,
Sara Montagnese7,w, Yu-Ting Kuo8,w, Amy Herlihy8, Jimmy D. Bell8, Iain Robinson9, Irene Guerrini10,
Andrew McQuillin10, Elizabeth M.C. Fisher11, Mark A. Ungless8, Hugh M.D. Gurling10, Marsha Y. Morgan7,
Steve D.M. Brown2, David N. Stephens6, Delia Belelli4, Jeremy J. Lambert4, Trevor G. Smart5 &
Howard C. Thomas2,3
Alcohol dependence is a common, complex and debilitating disorder with genetic and
environmental influences. Here we show that alcohol consumption increases following
mutations to the g-aminobutyric acidA receptor (GABAAR) b1 subunit gene (Gabrb1). Using
N-ethyl-N-nitrosourea mutagenesis on an alcohol-averse background (F1 BALB/cAnN x C3H/
HeH), we develop a mouse model exhibiting strong heritable preference for ethanol resulting
from a dominant mutation (L285R) in Gabrb1. The mutation causes spontaneous GABA ion
channel opening and increases GABA sensitivity of recombinant GABAARs, coupled to
increased tonic currents in the nucleus accumbens, a region long-associated with alcohol
reward. Mutant mice work harder to obtain ethanol, and are more sensitive to alcohol
intoxication. Another spontaneous mutation (P228H) in Gabrb1 also causes high ethanol
consumption accompanied by spontaneous GABA ion channel opening and increased
accumbal tonic current. Our results provide a new and important link between GABAAR
function and increased alcohol consumption that could underlie some forms of alcohol abuse.
DOI: 10.1038/ncomms3816
1 Institute of Cellular Medicine, The Medical School, Newcastle University, 4th Floor William Leech Building, Framlington Place, Newcastle Upon Tyne NE24HH, UK. 2 Mammalian Genetics Unit, MRC Harwell, Oxford OX11 0RD, UK. 3 Department of Gastroenterology and Hepatology, Imperial College, St Mary’sHospital Campus, Praed Street, London W2 1NY, UK. 4 Division of Neuroscience, Medical Research Institute, University of Dundee, Ninewells Hospital,Dundee DD1 9SY, UK. 5 Department of Neuroscience, Physiology and Pharmacology, University College London, Gower Street, London WC1E 6BT, UK.6 School of Psychology, University of Sussex, Falmer, Brighton, BN1 9QG, UK. 7 UCL Institute for Liver and Digestive Health, Royal Free Campus, UniversityCollege London Medical School, London NW3 2PF, UK. 8 MRC Clinical Sciences Centre, Imperial College London, Hammersmith Hospital, Du Cane Road,London W12 0NN, UK. 9 Division of Molecular Neuroendocrinology, National Institute for Medical Research, The Ridgeway, Mill Hill, London NW7 1AA, UK.10 Molecular Psychiatry Laboratory, Department of Mental Health Sciences, Royal Free and University College London Medical School, Windeyer Institute ofMedical Sciences, 46 Cleveland Street, London W1T 4JF, UK. 11 Department of Neurodegenerative Disease, Institute of Neurology, University College London,Queen Square, London, WC1N 3BG, UK. * These authors contributed equally to this work. w Present addresses: Cancer Genetic Group, Infection and Cancer,Department Microbiology and Parasitology, School of Medicine, University of Antioquia, Medellin, Colombia (A.M.); Department of Medical Imaging, Chi MeiMedical Center, Tainan City, Taiwan (Y.-T.K.); Department of Medicine, via Giustiniani, 2, 35128 Padova, Italy (S.M.). zDeceased. Correspondence andrequests for materials should be addressed to Q.M.A. (email: [email protected]).
NATURE COMMUNICATIONS | 4:2816 | DOI: 10.1038/ncomms3816 | www.nature.com/naturecommunications 1
& 2013 Macmillan Publishers Limited. All rights reserved.
Our understanding of the genetic and molecular basis ofalcohol dependence is incomplete. Alcohol abuse haslong been associated with facilitation of neurotransmis-
sion mediated by the brain’s major inhibitory transmitter, GABA,acting via GABAA receptors (GABAARs). Recently, a locus withinhuman chromosome 4, containing GABAAR subunit genesencoding a2, a4, b1 and g1 subunits has been associated withalcohol dependence in humans1–7. In particular, haplotypicvariations in the GABRA2 gene encoding the a2 subunit havebeen repeatedly linked with alcohol dependence2,8–10. However,the neurobiological basis by which genetic variation translatesinto alcohol abuse is largely unknown.
Ionotropic GABAARs are pentameric ligand-gated ion chan-nels, drawn from a family of 19 proteins, which underpins theexpression of B20–30 neuronal GABAAR isoforms11. Thesereceptors have distinct physiological and pharmacologicalproperties, are heterogeneously expressed in the mammalianCNS and as a consequence can differentially influencebehavioural phenotypes12,13. Synaptic GABAARs mediate phasicinhibition, whereas extrasynaptic GABAARs are activated byambient concentrations of GABA and mediate a tonic form ofinhibition. Recent evidence has suggested roles for both forms ofGABAergic transmission in the neurobiology of addiction14–17.
With regard to ethanol, both consumption and preference arereduced following disruption of GABA-mediated tonic inhibitionin d subunit knock-out (d� /� ) mice18 and a similar impact onethanol drinking was achieved by RNAi-induced suppression ofeither a4 (a subunit partner of the d subunit) or d subunitexpression in the rodent nucleus accumbens (NAc)17,18. Thereduced ethanol self-administration appeared to be aconsequence of the altered reinforcing properties of thedrug17,18. These actions on ethanol drinking and self-administration appear to be specific to the activity of a4bdreceptors and not a general effect on manipulating GABAergicactivity in the NAc, as no differences in ethanol self-administration have been found in a2� /� or a5� /�
mice19,20, when compared with wild-type (WT) counterparts.It has been suggested that ethanol may exert a direct action on
d-GABAARs to enhance their function, which might account forthe rodent self-administration data. However, whether ethanolexerts such direct effects is controversial21–24. An alternativeinterpretation of the behavioural data posits that the activity ofNAc extrasynaptic GABAARs influences the activity of neuralcircuits underlying certain addictive behaviours such as the desirefor alcohol. We were able to explore this possibility by exploitingthe availability of two novel mutant mouse lines in which singlepoint mutations in GABAAR b1 subunits have occurred. The firstline was identified through a phenotype-driven N-ethyl-N-nitrosourea (ENU) mutagenesis screen25,26 for alcohol-preferring mice, whereas the second was a spontaneousmutation identified using a genotype-driven approach27. Bothmutant mouse lines display increased alcohol consumption andself-administration, and are characterized by GABA channels thatcan open spontaneously, promoting an increased tonic inhibitionin NAc medium spiny neurons (MSNs). These findings stronglysuggest that the large tonic conductance of MSNs contributes tothe increased preference and intake of ethanol by Gabrb1þ /L285R
and Gabrb1þ /P228H mice. These data reveal a novel link betweenGABAAR function and increased alcohol consumption that couldlead to a better understanding of some forms of alcohol abuse.
ResultsAlcohol-preferring mouse strains. We identified two dominantmutations in Gabrb1 that induced a phenotypic switch fromalcohol aversion to a sustained, strongly heritable alcohol
preference. One mutation was generated through phenotype-driven random ENU mutagenesis25,26 (Gabrb1L285R), whereas theother was a spontaneous mutation (Gabrb1P228H) identifiedthrough gene-driven screening of a DNA/sperm archive27. Bothlines showed highly penetrant ethanol preference throughoutover eight and five backcross generations, respectively.
An ENU-induced Gabrb1 mutation confers alcohol preference:Alcohol-averse male BALB/cAnN mice were exposed to ENU25
and crossed to WT C3H/HeH females. G1 progeny (n¼ 1,047)were screened in a two-bottle choice test for preference for 10%(v/v) ethanol with mice showing ethanol preference backcrossedto C3H/HeH to test heritability. The ENU-induced mutation waslocalized to a region on mouse chromosome 5 (71.45–73.05 Mb),syntenic with a region on human chromosome 4, containing11 genes including Gabra4 and Gabrb1 (Supplementary Fig. S1).Sequencing identified just one mutation in the b1 subunit(Gabrb1 exon 8), a leucine-to-arginine exchange (L285R) in thehighly conserved third transmembrane domain (M3), near theM2–M3 linker (Supplementary Fig. S2A), an important area forGABA receptor activation and ion channel gating. The mutationwas absent in both parental strains.
A spontaneous Gabrb1 mutation confers alcohol preference: Todetermine whether other Gabrb1 mutations modified alcoholdrinking, we screened a DNA library containing B10,000 uniquesamples from ENU mutagenized male mice (F1 C57BL/6JxC3H/HeH) and identified one sample carrying a non-synonymousproline-to-histidine mutation (P228H) within M1 of the b1subunit. This proline is highly conserved in GABAARs fromvarious species (Supplementary Fig. S2B). While absent in bothbackground strains, the mutation occurred in the non-ENUmutagenized C3H DNA strand and therefore had arisenspontaneously. Significantly, as with Gabrb1þ /L285R above,Gabrb1þ /P228H mutants displayed a heritable ethanol preference(Supplementary Fig. S3).
Gabrb1þ /L285R mutant mice were significantly smaller thanWT (Po0.0001; Supplementary Fig. S4). A similar but lesspronounced size difference was also observed in Gabrb1þ /P228H
mutant mice. Both mutant lines exhibited complete femaleinfertility characterized by underdeveloped corpus luteii. Conse-quently, we could only study heterozygotes (Gabrb1þ /L285R andGabrb1þ /P228H) and their corresponding WT mice. Reducedbody size and impaired fertility most likely reflect hypothalamic–pituitary axis endocrine deficiency and so analysis of anteriorpituitary hormone content was performed. This demonstratedthat carriage of either mutant Gabrb1 allele (Gabrb1L285R orGabrb1P228H) was associated with significant hypothalamic–pituitary axis dysfunction (Supplementary Tables S1 and S2).Mutant mice displayed a significant preference for ethanol(Gabrb1þ /L285R: Fig. 1a,b; Gabrb1þ /P228H: SupplementaryFig. S3), but not for similarly presented sucrose, saccharin orquinine solutions, suggesting taste or calorific requirements werenot driving alcohol preference (Supplementary Table S3).Furthermore, all mice consumed similar daily fluid volumes,despite Gabrb1þ /L285R and, to a lesser extent, Gabrb1þ /P228H
mutant mice possessing lower body weights (SupplementaryFig. S4). The co-segregation of both alcohol preference and bodyweight traits were observed throughout all eight (for Gabrb1þ /L285R) and five (Gabrb1þ /P228H) generations studied, beingpresent in 123/130 (93%) of Gabrb1þ /L285R mice, effectivelyexcluding the possibility of separate mutations causing thesecomponents.
Gabrb1L285R and alcohol-seeking behaviour. The motivationfor Gabrb1þ /L285R mice to obtain alcohol was assessed usingoperant self-administration of fluid coupled with a sucrose-fading
ARTICLE NATURE COMMUNICATIONS | DOI: 10.1038/ncomms3816
2 NATURE COMMUNICATIONS | 4:2816 | DOI: 10.1038/ncomms3816 | www.nature.com/naturecommunications
& 2013 Macmillan Publishers Limited. All rights reserved.
technique19,20. Self-administration of ethanol over 1 h causedataxia, consistent with alcohol intoxication (SupplementaryFig. S5A). To determine whether the features of intoxicationobserved in mutant mice during the 1 h operant sessions were dueto increased intake or a heightened sensitivity to alcohol, WT andmutant mice were given a standard body-weight-adjusted dose ofethanol and tested for the presence of ataxia on the rotarod(ethanol 3 g per kg) and loss of righting reflex (ethanol 3.5 g perkg; Supplementary Fig. S5). Although study groups were relativelysmall (n¼ 7–8), limiting statistical power, there was a strongtendency for the mutant mice to be more impaired than the WTmice (two-way ANOVA, main effect of genotype: F(1,13)¼ 4.46;P¼ 0.05), and to recover more slowly (two-way ANOVA, timepoint*genotype interaction: F(1,13)¼ 1.76; P¼ 0.08). Genotypedid not affect the rate of loss of righting reflex, but there was atrend towards a more rapid recovery in WT mice (806±140versus 1466±448 s (mean±s.e.m.); t-test, t¼ 1.41; Po0.1). Asneither the peak, nor time course of blood or brain alcohol levelsdiffered significantly between mutant and WT mice followingethanol administration (Supplementary Fig. S6), these data suggestan increased sensitivity of Gabrb1þ /L285R mice to the ataxiceffects of ethanol (Supplementary Figs S5B,C and S6).
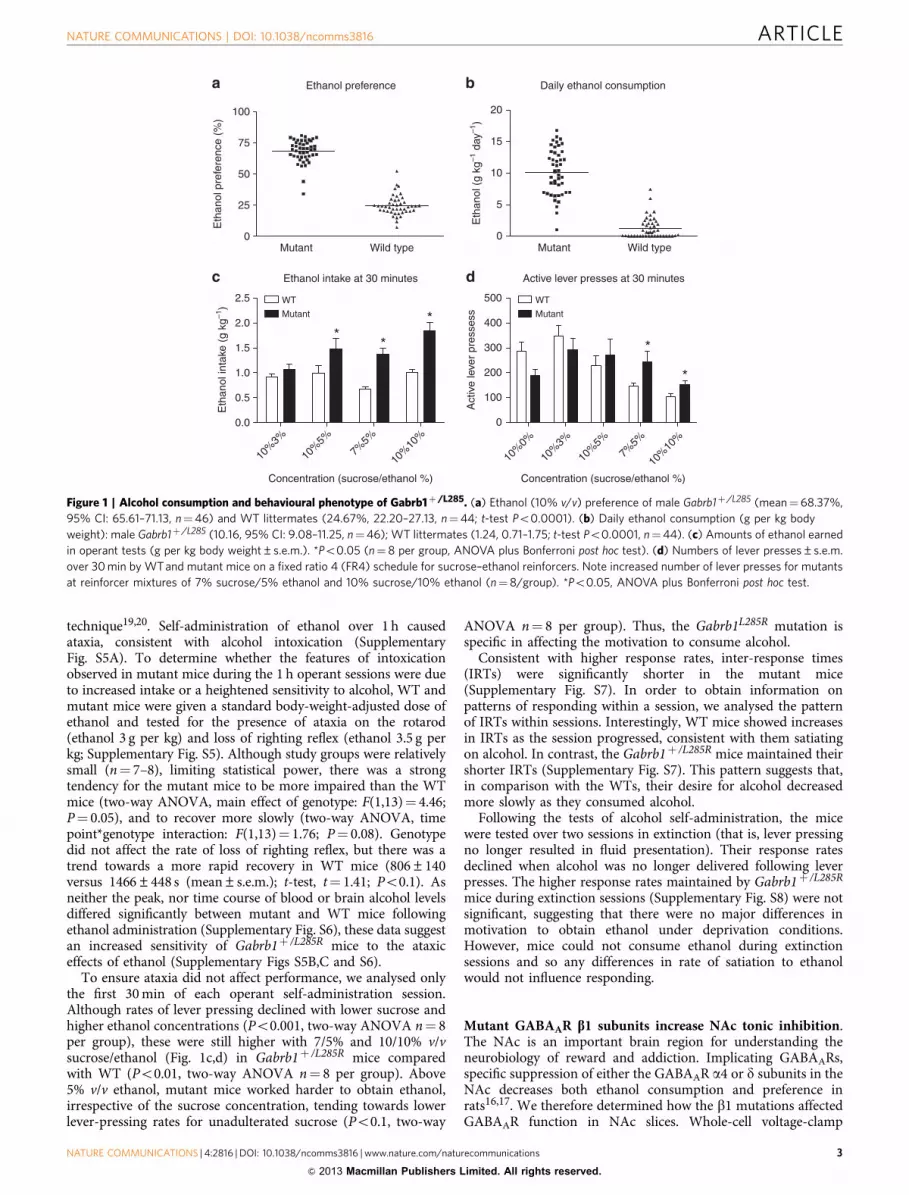
To ensure ataxia did not affect performance, we analysed onlythe first 30 min of each operant self-administration session.Although rates of lever pressing declined with lower sucrose andhigher ethanol concentrations (Po0.001, two-way ANOVA n¼ 8per group), these were still higher with 7/5% and 10/10% v/vsucrose/ethanol (Fig. 1c,d) in Gabrb1þ /L285R mice comparedwith WT (Po0.01, two-way ANOVA n¼ 8 per group). Above5% v/v ethanol, mutant mice worked harder to obtain ethanol,irrespective of the sucrose concentration, tending towards lowerlever-pressing rates for unadulterated sucrose (Po0.1, two-way
ANOVA n¼ 8 per group). Thus, the Gabrb1L285R mutation isspecific in affecting the motivation to consume alcohol.
Consistent with higher response rates, inter-response times(IRTs) were significantly shorter in the mutant mice(Supplementary Fig. S7). In order to obtain information onpatterns of responding within a session, we analysed the patternof IRTs within sessions. Interestingly, WT mice showed increasesin IRTs as the session progressed, consistent with them satiatingon alcohol. In contrast, the Gabrb1þ /L285R mice maintained theirshorter IRTs (Supplementary Fig. S7). This pattern suggests that,in comparison with the WTs, their desire for alcohol decreasedmore slowly as they consumed alcohol.
Following the tests of alcohol self-administration, the micewere tested over two sessions in extinction (that is, lever pressingno longer resulted in fluid presentation). Their response ratesdeclined when alcohol was no longer delivered following leverpresses. The higher response rates maintained by Gabrb1þ /L285R
mice during extinction sessions (Supplementary Fig. S8) were notsignificant, suggesting that there were no major differences inmotivation to obtain ethanol under deprivation conditions.However, mice could not consume ethanol during extinctionsessions and so any differences in rate of satiation to ethanolwould not influence responding.
Mutant GABAAR b1 subunits increase NAc tonic inhibition.The NAc is an important brain region for understanding theneurobiology of reward and addiction. Implicating GABAARs,specific suppression of either the GABAAR a4 or d subunits in theNAc decreases both ethanol consumption and preference inrats16,17. We therefore determined how the b1 mutations affectedGABAAR function in NAc slices. Whole-cell voltage-clamp
100 20
15
10
5
0
Ethanol preference
Ethanol intake at 30 minutes
Concentration (sucrose/ethanol %) Concentration (sucrose/ethanol %)
Daily ethanol consumption
Active lever presses at 30 minutes
*
WT
Mutant
WT
Mutant *
**
*
75
50
25
0
2.5
2.0
1.5
1.0
0.5
0.0
10%
3%
10%
5%7%
5%
10%
10%
0
10%
0%
10%
3%
10%
5%7%
5%
10%
10%
100
200
300
400
500
Mutant Wild type Mutant Wild type
Eth
anol
pre
fere
nce
(%)
Eth
anol
(g
kg–1
day
–1)
Eth
anol
inta
ke (
g kg
–1)
Act
ive
leve
r pr
esse
ss
Figure 1 | Alcohol consumption and behavioural phenotype of Gabrb1þ /L285. (a) Ethanol (10% v/v) preference of male Gabrb1þ /L285 (mean¼ 68.37%,
95% CI: 65.61–71.13, n¼46) and WT littermates (24.67%, 22.20–27.13, n¼44; t-test Po0.0001). (b) Daily ethanol consumption (g per kg body
weight): male Gabrb1þ /L285 (10.16, 95% CI: 9.08–11.25, n¼46); WT littermates (1.24, 0.71–1.75; t-test Po0.0001, n¼44). (c) Amounts of ethanol earned
in operant tests (g per kg body weight±s.e.m.). *Po0.05 (n¼ 8 per group, ANOVA plus Bonferroni post hoc test). (d) Numbers of lever presses±s.e.m.
over 30 min by WT and mutant mice on a fixed ratio 4 (FR4) schedule for sucrose–ethanol reinforcers. Note increased number of lever presses for mutants
at reinforcer mixtures of 7% sucrose/5% ethanol and 10% sucrose/10% ethanol (n¼8/group). *Po0.05, ANOVA plus Bonferroni post hoc test.
NATURE COMMUNICATIONS | DOI: 10.1038/ncomms3816 ARTICLE
NATURE COMMUNICATIONS | 4:2816 | DOI: 10.1038/ncomms3816 | www.nature.com/naturecommunications 3
& 2013 Macmillan Publishers Limited. All rights reserved.
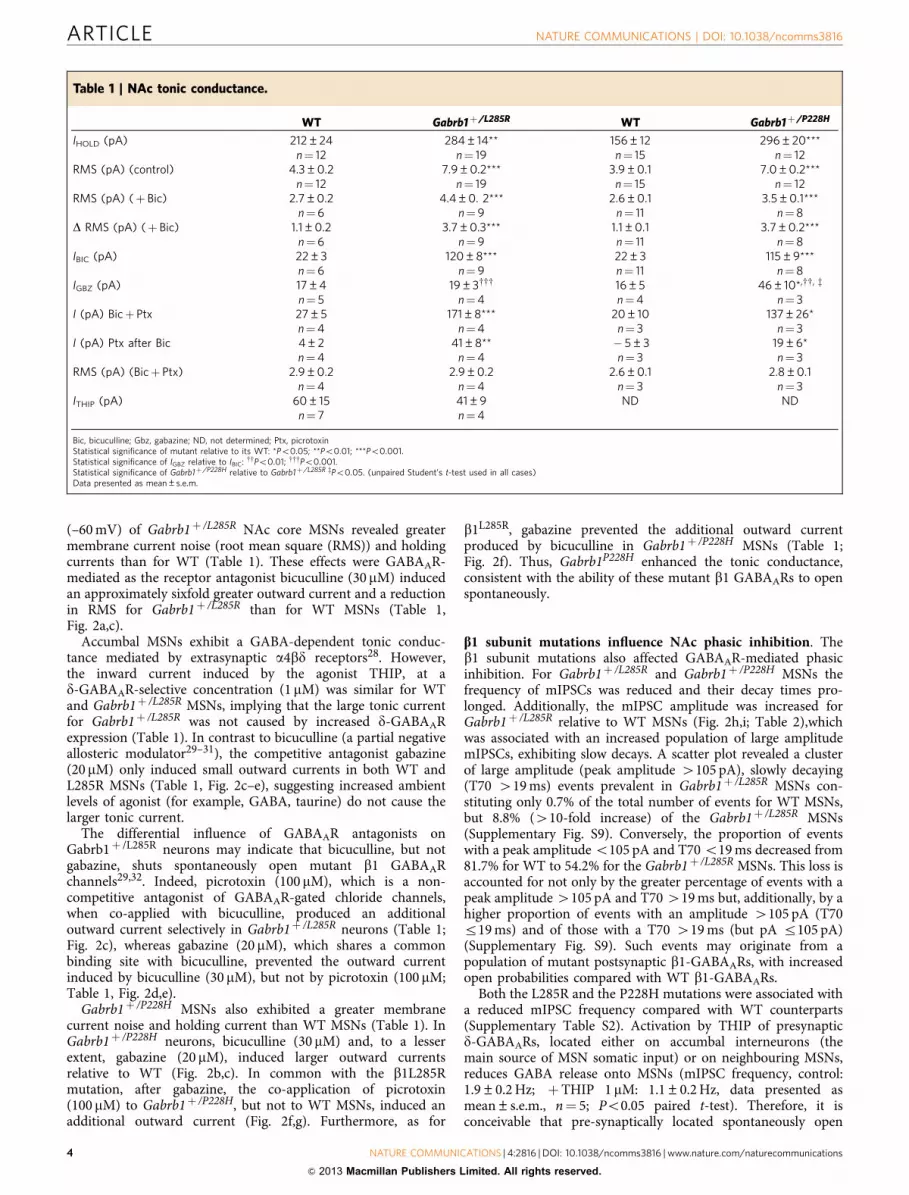
(–60 mV) of Gabrb1þ /L285R NAc core MSNs revealed greatermembrane current noise (root mean square (RMS)) and holdingcurrents than for WT (Table 1). These effects were GABAAR-mediated as the receptor antagonist bicuculline (30 mM) inducedan approximately sixfold greater outward current and a reductionin RMS for Gabrb1þ /L285R than for WT MSNs (Table 1,Fig. 2a,c).
Accumbal MSNs exhibit a GABA-dependent tonic conduc-tance mediated by extrasynaptic a4bd receptors28. However,the inward current induced by the agonist THIP, at ad-GABAAR-selective concentration (1 mM) was similar for WTand Gabrb1þ /L285R MSNs, implying that the large tonic currentfor Gabrb1þ /L285R was not caused by increased d-GABAARexpression (Table 1). In contrast to bicuculline (a partial negativeallosteric modulator29–31), the competitive antagonist gabazine(20 mM) only induced small outward currents in both WT andL285R MSNs (Table 1, Fig. 2c–e), suggesting increased ambientlevels of agonist (for example, GABA, taurine) do not cause thelarger tonic current.
The differential influence of GABAAR antagonists onGabrb1þ /L285R neurons may indicate that bicuculline, but notgabazine, shuts spontaneously open mutant b1 GABAARchannels29,32. Indeed, picrotoxin (100 mM), which is a non-competitive antagonist of GABAAR-gated chloride channels,when co-applied with bicuculline, produced an additionaloutward current selectively in Gabrb1þ /L285R neurons (Table 1;Fig. 2c), whereas gabazine (20 mM), which shares a commonbinding site with bicuculline, prevented the outward currentinduced by bicuculline (30 mM), but not by picrotoxin (100 mM;Table 1, Fig. 2d,e).
Gabrb1þ /P228H MSNs also exhibited a greater membranecurrent noise and holding current than WT MSNs (Table 1). InGabrb1þ /P228H neurons, bicuculline (30 mM) and, to a lesserextent, gabazine (20 mM), induced larger outward currentsrelative to WT (Fig. 2b,c). In common with the b1L285Rmutation, after gabazine, the co-application of picrotoxin(100 mM) to Gabrb1þ /P228H, but not to WT MSNs, induced anadditional outward current (Fig. 2f,g). Furthermore, as for
b1L285R, gabazine prevented the additional outward currentproduced by bicuculline in Gabrb1þ /P228H MSNs (Table 1;Fig. 2f). Thus, Gabrb1P228H enhanced the tonic conductance,consistent with the ability of these mutant b1 GABAARs to openspontaneously.
b1 subunit mutations influence NAc phasic inhibition. Theb1 subunit mutations also affected GABAAR-mediated phasicinhibition. For Gabrb1þ /L285R and Gabrb1þ /P228H MSNs thefrequency of mIPSCs was reduced and their decay times pro-longed. Additionally, the mIPSC amplitude was increased forGabrb1þ /L285R relative to WT MSNs (Fig. 2h,i; Table 2),whichwas associated with an increased population of large amplitudemIPSCs, exhibiting slow decays. A scatter plot revealed a clusterof large amplitude (peak amplitude 4105 pA), slowly decaying(T70 419 ms) events prevalent in Gabrb1þ /L285R MSNs con-stituting only 0.7% of the total number of events for WT MSNs,but 8.8% (410-fold increase) of the Gabrb1þ /L285R MSNs(Supplementary Fig. S9). Conversely, the proportion of eventswith a peak amplitude o105 pA and T70 o19 ms decreased from81.7% for WT to 54.2% for the Gabrb1þ /L285R MSNs. This loss isaccounted for not only by the greater percentage of events with apeak amplitude 4105 pA and T70 419 ms but, additionally, by ahigher proportion of events with an amplitude 4105 pA (T70r19 ms) and of those with a T70 419 ms (but pA r105 pA)(Supplementary Fig. S9). Such events may originate from apopulation of mutant postsynaptic b1-GABAARs, with increasedopen probabilities compared with WT b1-GABAARs.
Both the L285R and the P228H mutations were associated witha reduced mIPSC frequency compared with WT counterparts(Supplementary Table S2). Activation by THIP of presynapticd-GABAARs, located either on accumbal interneurons (themain source of MSN somatic input) or on neighbouring MSNs,reduces GABA release onto MSNs (mIPSC frequency, control:1.9±0.2 Hz; þTHIP 1 mM: 1.1±0.2 Hz, data presented asmean±s.e.m., n¼ 5; Po0.05 paired t-test). Therefore, it isconceivable that pre-synaptically located spontaneously open
Table 1 | NAc tonic conductance.
WT Gabrb1þ /L285R WT Gabrb1þ /P228H
IHOLD (pA) 212±24n¼ 12
284±14**n¼ 19
156±12n¼ 15
296±20***n¼ 12
RMS (pA) (control) 4.3±0.2n¼ 12
7.9±0.2***n¼ 19
3.9±0.1n¼ 15
7.0±0.2***n¼ 12
RMS (pA) (þ Bic) 2.7±0.2n¼6
4.4±0. 2***n¼ 9
2.6±0.1n¼ 11
3.5±0.1***n¼8
D RMS (pA) (þBic) 1.1±0.2n¼6
3.7±0.3***n¼ 9
1.1±0.1n¼ 11
3.7±0.2***n¼8
IBIC (pA) 22±3n¼6
120±8***n¼ 9
22±3n¼ 11
115±9***n¼8
IGBZ (pA) 17±4n¼ 5
19±3www
n¼416±5n¼4
46±10*,ww, z
n¼ 3I (pA) Bicþ Ptx 27±5
n¼4171±8***
n¼420±10
n¼ 3137±26*
n¼ 3I (pA) Ptx after Bic 4±2
n¼441±8**
n¼4� 5±3n¼ 3
19±6*n¼ 3
RMS (pA) (Bicþ Ptx) 2.9±0.2n¼4
2.9±0.2n¼4
2.6±0.1n¼ 3
2.8±0.1n¼ 3
ITHIP (pA) 60±15n¼ 7
41±9n¼4
ND ND
Bic, bicuculline; Gbz, gabazine; ND, not determined; Ptx, picrotoxinStatistical significance of mutant relative to its WT: *Po0.05; **Po0.01; ***Po0.001.Statistical significance of IGBZ relative to IBIC: wwPo0.01; wwwPo0.001.Statistical significance of Gabrb1þ /P228H relative to Gabrb1þ /L285R zPo0.05. (unpaired Student’s t-test used in all cases)Data presented as mean±s.e.m.
ARTICLE NATURE COMMUNICATIONS | DOI: 10.1038/ncomms3816
4 NATURE COMMUNICATIONS | 4:2816 | DOI: 10.1038/ncomms3816 | www.nature.com/naturecommunications
& 2013 Macmillan Publishers Limited. All rights reserved.
30 μM BIC
WT200
*** ***
***
*
*
WT
WT
150
100
Cur
rent
(pA
)
50
030 μM
bicuculline30 μM
bicuculline+ 100 μM PTX
20 μMgabazine
20 μM gabazine
20 μM gabazine
+ 30 μM bicuculline
20 μM gabazine
+ 30 μM bicuculline
+ 100 μM PTX
150
Current (pA
)
100
50
0
30 μM BIC
100 pA
20 μMgabazine
30 μMBIC
20 μMgabazine
20 μMgabazine
30 μMBIC
100 pA
120 s
100 pA
120 s
WT
WT 20 pA
10 ms+/–
WT+/–
30 μMBIC
100 μMPTX
100 μMPTX
100 μMPTX
120 s
WT
Gabrb1+/L285R
Gabrb1+/P228H
Gabrb1+/L285R
Gabrb1+/L285R
Gabrb1+/P228H
Gabrb1+/P228H
Gabrb1+/L285R
Gabrb1+/P228H
100 pA
120 s
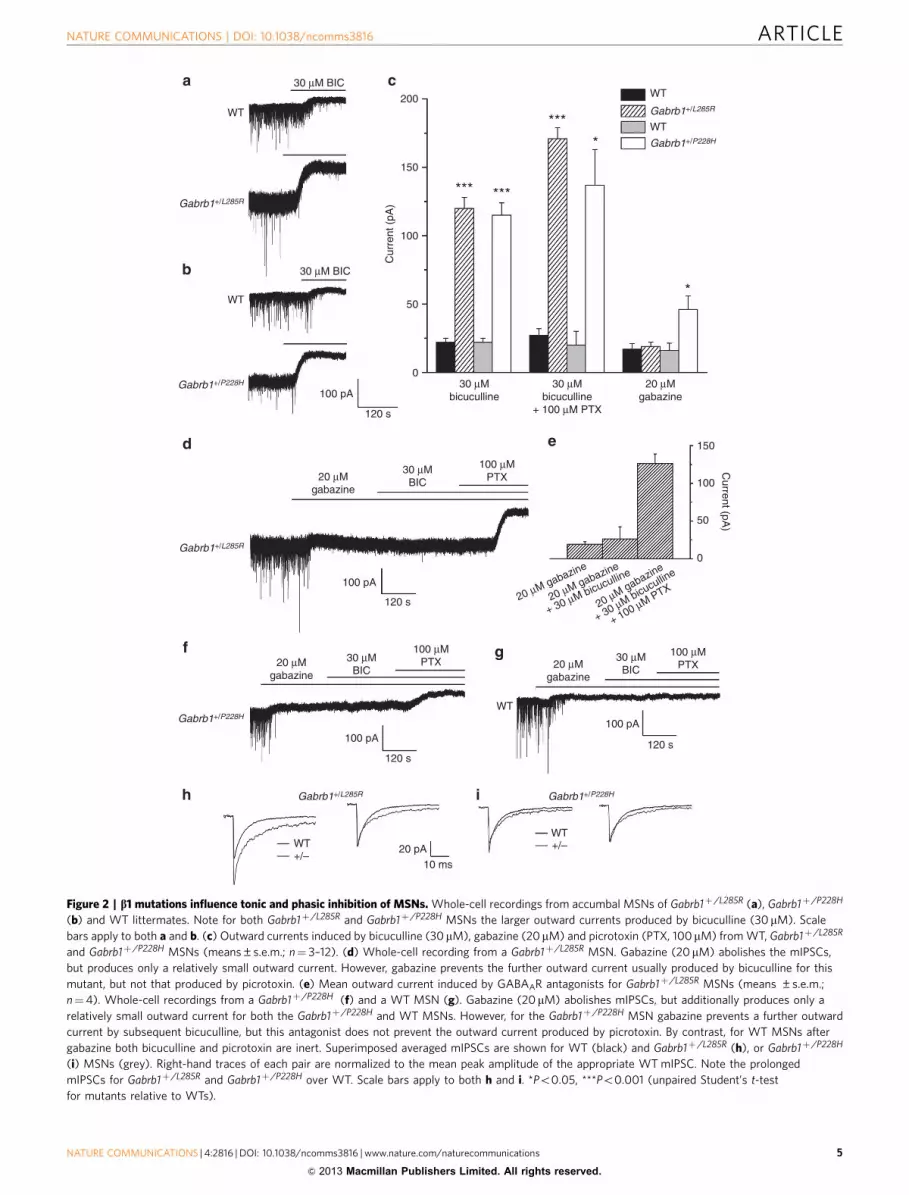
Figure 2 | b1 mutations influence tonic and phasic inhibition of MSNs. Whole-cell recordings from accumbal MSNs of Gabrb1þ /L285R (a), Gabrb1þ /P228H
(b) and WT littermates. Note for both Gabrb1þ /L285R and Gabrb1þ /P228H MSNs the larger outward currents produced by bicuculline (30mM). Scale
bars apply to both a and b. (c) Outward currents induced by bicuculline (30mM), gabazine (20mM) and picrotoxin (PTX, 100mM) from WT, Gabrb1þ /L285R
and Gabrb1þ /P228H MSNs (means±s.e.m.; n¼ 3–12). (d) Whole-cell recording from a Gabrb1þ /L285R MSN. Gabazine (20 mM) abolishes the mIPSCs,
but produces only a relatively small outward current. However, gabazine prevents the further outward current usually produced by bicuculline for this
mutant, but not that produced by picrotoxin. (e) Mean outward current induced by GABAAR antagonists for Gabrb1þ /L285R MSNs (means ±s.e.m.;
n¼4). Whole-cell recordings from a Gabrb1þ /P228H (f) and a WT MSN (g). Gabazine (20 mM) abolishes mIPSCs, but additionally produces only a
relatively small outward current for both the Gabrb1þ /P228H and WT MSNs. However, for the Gabrb1þ /P228H MSN gabazine prevents a further outward
current by subsequent bicuculline, but this antagonist does not prevent the outward current produced by picrotoxin. By contrast, for WT MSNs after
gabazine both bicuculline and picrotoxin are inert. Superimposed averaged mIPSCs are shown for WT (black) and Gabrb1þ /L285R (h), or Gabrb1þ /P228H
(i) MSNs (grey). Right-hand traces of each pair are normalized to the mean peak amplitude of the appropriate WT mIPSC. Note the prolonged
mIPSCs for Gabrb1þ /L285R and Gabrb1þ /P228H over WT. Scale bars apply to both h and i. *Po0.05, ***Po0.001 (unpaired Student’s t-test
for mutants relative to WTs).
NATURE COMMUNICATIONS | DOI: 10.1038/ncomms3816 ARTICLE
NATURE COMMUNICATIONS | 4:2816 | DOI: 10.1038/ncomms3816 | www.nature.com/naturecommunications 5
& 2013 Macmillan Publishers Limited. All rights reserved.
b1-GABAARs either on interneurons or neighbouring MSNswould similarly influence GABA release, thereby reducing MSNmIPSC frequency.
Mutant b1 subunit expression and spontaneous channelopening. To explore how the b1L285R and b1P228H mutationsaffected GABAAR function, we used heterologous expression ofWT and mutant recombinant GABAARs in HEK293 cells.Immunocytochemistry was used to assess the expression levels ofmyc epitope-tagged WT and mutant b1 subunits. The expressionlevels of b1L285R along with a2 and g2L subunits, includingenhanced green fluorescent protein (eGFP), revealed no differ-ences either for cell surface or overall total fluorescence(Supplementary Fig. S10). Similarly, the cell surface membraneand intracellular expression levels for b1P228H were also unalteredcompared with WT b1 subunits (Supplementary Fig. S11).
To examine whether the b1 subunit mutations (L285R andP228H) altered GABAAR receptor physiology and pharmacology,whole-cell recording was performed on a2b1L285Rg2 anda2b1P228Hg2 receptors expressed in HEK293 cells. Relative toWT, both mutations reduced the maximum current densityinduced by saturating GABA concentrations (1 mM; Fig. 3a).
As native GABAARs contain two b subunits and because ourin vivo studies necessarily used heterozygous mice, a proportionof native GABAARs could comprise a mixture of WT and mutantb1 subunits. To examine the amplitudes of GABA-evokedcurrents under these conditions, we recreated a binomial mixtureof GABAARs in HEK293 cells by co-expressing a2 and b1 witheither b1L285R or b1P228H and g2 subunits in an equimolar ratio,thereby reproducing native receptor isoforms likely to be presentin heterozygotes. Assuming receptor subunit assembly proceedsaccording to binomial probabilities, we would expect a mixture ofpentameric receptors (2a:2b:1g) to include: WT, full mutant(both b subunits are mutated) and two forms of partial mutantreceptors containing only one copy of the mutant b subunit. Themaximum current densities induced by saturating concentrationsof GABA (up to 1 mM) were larger for receptors containing onlyone copy of the mutant b subunit than those observed with fullmutant receptors, and this approached that of WT receptors(Supplementary Fig. S12).
GABA concentration–response curves revealed that GABApotency was increased (B2–3-fold) by b1L285R and b1P228H
(Fig. 3b,d; Supplementary Table S4). Significantly, the holdingcurrent (at � 40 mV) was greater for many mutant receptor-expressing cells compared with WT (Supplementary Table S4),indicative of spontaneous GABA channel activity33. Indeed,picrotoxin (100 mM) induced outward currents in the absence ofGABA for cells expressing b1L285R, and to a lesser extent forb1P228H mutant receptors, reflecting spontaneous channel activity(Fig. 3c). The spontaneous current revealed by picrotoxin (IPTX)accounted for B3–15% of the total current (¼ IGABA,maxþ IPTX)for these mutant receptors.
We also examined the level of spontaneous current for a4b1g2receptors, with WT or mutant b1 subunits, as an alternativeisoform that may populate synaptic and/or extrasynaptic sites.Maximal current densities and holding currents exhibitedgreater variability for the b1 mutants compared with WT(Supplementary Table S4), and a4b1L285Rg2 exhibited a sponta-neous current revealed by picrotoxin (Fig. 3c).
To examine the gating of GABA ion channels underlying thespontaneous current, we used outside-out patches from HEK293cells expressing a2b1g2, a2b1L285Rg2 or a2b1P228Hg2 receptors(Fig. 3e). Spontaneous channel activity was evident with mutantreceptors, but absent in WT, and abolished by the GABAantagonist, bicuculline (50 mM), acting as a negative allostericmodulator29 in the absence of GABA. Activating WT a2b1g2GABA channels with 10 mM GABA induced single-channelcurrents that were indistinguishable from the spontaneousopenings observed with the mutant receptors (Fig. 3e) and withonly minor differences in open and shut time durations(Supplementary Table S5). Overall, b1L285R, but to a lesserextent, b1P228H caused spontaneous channel opening andincreased receptor sensitivity to GABA when co-assembled witheither a2 or a4 and g2 subunits.
Given the importance of a4 and d subunits for tonic current inNAc MSNs16,17,28 we explored whether b1 mutants alsoconferred spontaneous channel activity on d-GABAARs. UsingHEK293 cells, b1 subunits were expressed with either a2 (co-located on same chromosome as b1, and expressed in accumbalsynapses34), or a4 (co-expressed in the accumbens with dforming extrasynaptic receptors)28. The b1L285R mutationincreased the maximum current density to saturating GABA(300 mM) for both a2b1L285Rd and a4b1L285Rd receptors,compared with WT equivalents (a2/4b1d), whereas b1P228H
did not (Supplementary Fig. S13). Both b1 mutants increasedGABA sensitivity by 3–5-fold at a2b1d-GABAARs (Fig. 4a,Supplementary Table S4), similar to the increased sensitivity formutant a2b1g GABAARs (Fig. 3b), but only b1L285R affecteda4b1d receptor sensitivity to GABA (Fig. 4b).
In the absence of GABA, picrotoxin (100 mM) induced outwardcurrents only for a2/4b1L285Rd GABAARs (Fig. 4c,d), witha2/4b1P228Hd showing similar levels of activity to WT. Giventhat b1L285R conferred substantial spontaneous activity ond-GABAARs, compared with b1P228H, the increased toniccurrents recorded in MSNs of the NAc and caused by the b1mutants are most likely due to the presence of a2/4b1L285Rg2, a2/4b1P228Hg2 and a2/4b1L285Rd isoforms.
Alcohol and GABAARs. Although alcohol may directly modulatesome GABAARs, this remains controversial21,22,35,36. Hereethanol (30–200 mM) co-applied with low concentrations(EC10) of GABA did not modulate a2/a4b1g2 GABAARscontaining either WT or mutant b1 subunits in HEK cells(Supplementary Table S4). Alcohol intoxication is associatedwith increased production of the endogenous neurosteroid
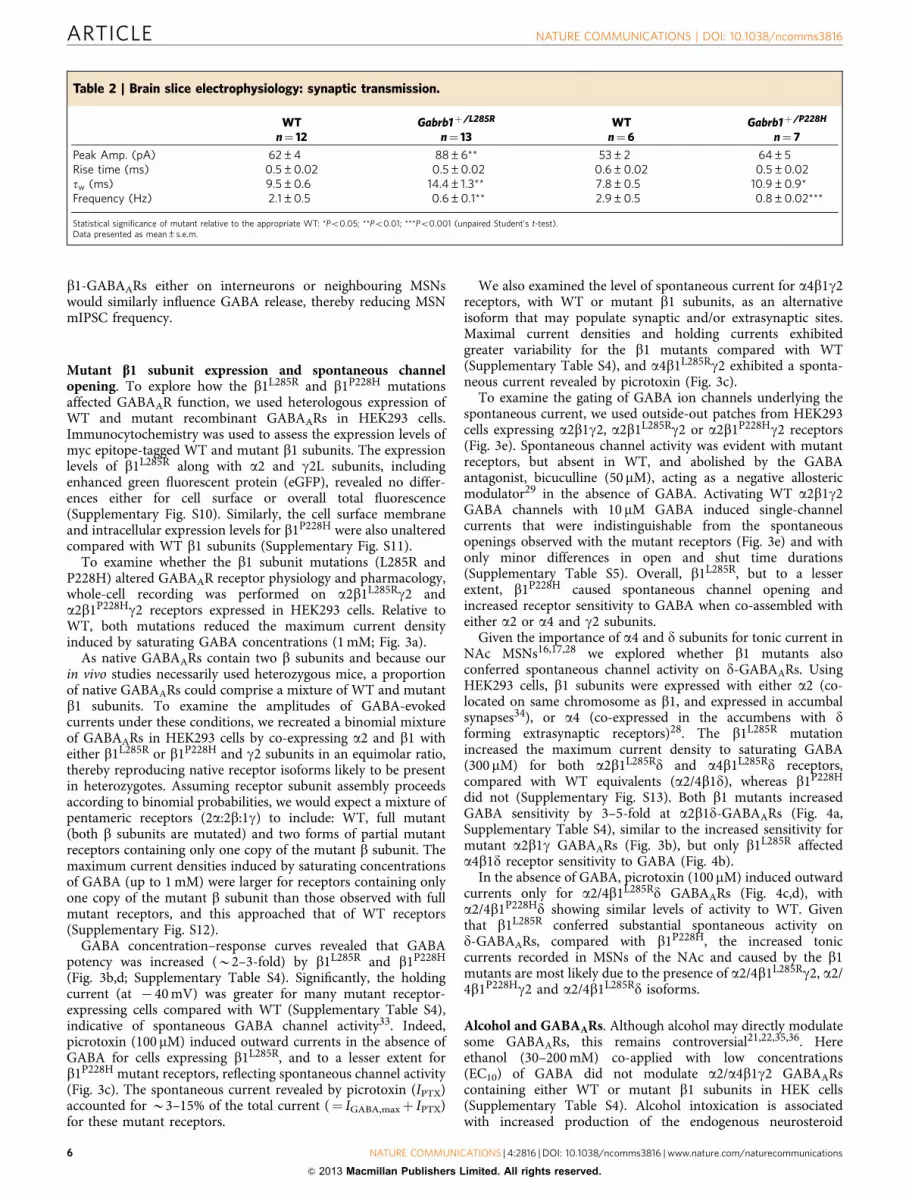
Table 2 | Brain slice electrophysiology: synaptic transmission.
WTn¼ 12
Gabrb1þ /L285R
n¼ 13WT
n¼6Gabrb1þ /P228H
n¼ 7
Peak Amp. (pA) 62±4 88±6** 53±2 64±5Rise time (ms) 0.5±0.02 0.5±0.02 0.6±0.02 0.5±0.02tw (ms) 9.5±0.6 14.4±1.3** 7.8±0.5 10.9±0.9*Frequency (Hz) 2.1±0.5 0.6±0.1** 2.9±0.5 0.8±0.02***
Statistical significance of mutant relative to the appropriate WT: *Po0.05; **Po0.01; ***Po0.001 (unpaired Student’s t-test).Data presented as mean±s.e.m.
ARTICLE NATURE COMMUNICATIONS | DOI: 10.1038/ncomms3816
6 NATURE COMMUNICATIONS | 4:2816 | DOI: 10.1038/ncomms3816 | www.nature.com/naturecommunications
& 2013 Macmillan Publishers Limited. All rights reserved.
allopregnanolone, an allosteric potentiator of GABAARs35.However, WT and b1 mutant GABAARs remained equallysensitive to potentiation by allopregnanolone (1mM) and benzo-diazepines (0.5 mM diazepam), and to inhibition by Zn2þ (100mM)or bicuculline (50mM) (Supplementary Figs S14 and S15). Similarly,neither b1 mutant when co-expressed with a2d or a4d sub-units demonstrated sensitivity to 30 or 100 mM ethanol (Fig. 4e).Potentiation of abd GABAAR function by neurosteroids (THDOC)was also unaffected by the mutation (Supplementary Fig. S13). Aprevious study in the dorsal striatum clearly demonstrated thatacute ethanol decreased the amplitude of the electrically evokedIPSCs recorded from MSNs of young rats, but with no effect onthe paired pulse ratio, suggesting a postsynaptic locus37. However,in our recordings from mature mouse NAc MSNs, ethanol(50 mM) had no significant effect on the spontaneous IPSCs(paired recordings n¼ 5 neurons from 5 mice per genotype;Supplementary Fig. S16). Note that although there was an apparenttrend for ethanol to increase the frequency of sIPSCs in theGabrb1þ /L285R MSNs, it was not significant in this sample. Infurther agreement with the recombinant receptor experiments,ethanol (50 mM) had no effect on the holding current of WT orGabrb1þ /L285R MSNs (paired recordings n¼ 5 neurons from 5mice per genotype; Supplementary Fig. S16). Thus, it is evident thatthe L285R and P228H mutations do not affect the co-assembly of b1with a2/4, d and g2 subunits, or their pharmacological properties.
DiscussionENU mutagenesis25 of alcohol-averse BALB/cAnN micegenerated a stable line carrying a non-synonymous dominant
mutation in Gabrb1 (L285R) with a strong phenotypic preferencefor alcohol. Given that the probability of a second ENU-inducedmutation within a 5-Mb region is estimated to be Po0.002(using both a Maximum Likelihood Estimation method,adopting a Poisson model, and a Markov chain Monte Carlomethod, with a Poisson Gamma model)38,39, the probability of asecond functional mutation within the 1.6-Mb genomic regionof interest is extremely remote and would continue to halvewith each of the subsequent eight backcross generations thathave been studied. This possibility has been further excludedby the absence of other exonic mutations following comparativesequencing across the candidate region. Importantly, the identi-fication of a second, independent line with a spontaneous, non-synonymous single base-pair mutation (P228H) in the samegene that also consistently exhibits ethanol preference andsimilar phenotypic traits over the five backcross generationsstudied, provides further confirmation that the phenotype iscaused by mutating Gabrb1.
Mutant and WT mice showed no differences in preference forsaccharin or quinine solutions, discounting taste as a driver forhigh alcohol consumption by the mutants. That Gabrb1þ /L285R
mice worked harder than WT to obtain alcohol compared withsucrose solutions indicates that motivation for alcohol was alsonot driven by calorific requirement or taste. Importantly, mutantsundertook this extra work despite possessing lower body weightsthan their WT counterparts. The mutant mice also showedgreater sensitivity to the sedative/ataxic effects of ethanol, whichtogether with increased consumption, contributed to an increasedincidence of intoxication.
eb
Krebs
GABA2
3
100
80
60
a
100
150
200
250
GABA + Bic
Krebs
1
Fre
quen
cy (
%)
–2–3 –1Channel current (pA)
1.5
40
20
1 10 100 1,0000.1GABA concentration (μM)
0
I GA
BA (
% m
ax)
0
50
I GA
BA d
ensi
ty (
pA/p
F)
100
80
GABA
Bic
–2–3 –1
Fre
quen
cy (
%)
1
0.5
Channel current (pA)
dc
5
812
60
40
20
Bic
Fre
quen
cy (
%)1
0.5
1
2
3
4Krebs
GABA
–2–3 –1Channel current (pA)
1 10 100 1,0000.1GABA concentration (μM)
0
α2β1γ2
α2β1L2
85R γ2
α2β1P22
8H γ2
α2β1γ 2α2β1L285Rγ2
I PT
X (
% I G
AB
A+
PT
X)
α2β1γ2
α2β1L2
85R γ2
α2β1P22
8H γ2
α4β1γ2
α4β1L2
85R γ2
α4β1P22
8H γ2
I GA
BA (
% m
ax)
α2β1γ2
α2β1P228Hγ2α2β1P228Hγ2
α2β1L285Rγ2
α2β1γ2
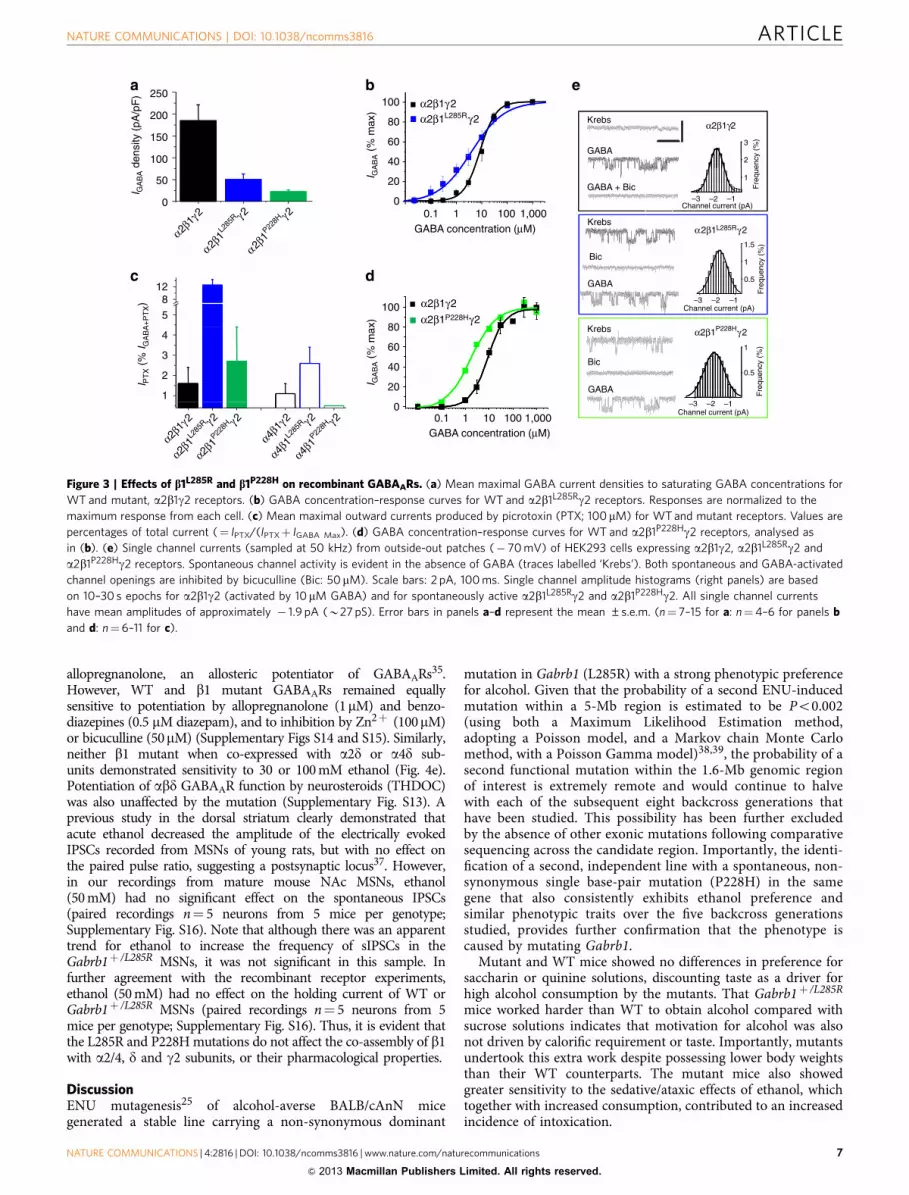
Figure 3 | Effects of b1L285R and b1P228H on recombinant GABAARs. (a) Mean maximal GABA current densities to saturating GABA concentrations for
WT and mutant, a2b1g2 receptors. (b) GABA concentration–response curves for WT and a2b1L285Rg2 receptors. Responses are normalized to the
maximum response from each cell. (c) Mean maximal outward currents produced by picrotoxin (PTX; 100mM) for WT and mutant receptors. Values are
percentages of total current (¼ IPTX/(IPTXþ IGABA Max). (d) GABA concentration–response curves for WT and a2b1P228Hg2 receptors, analysed as
in (b). (e) Single channel currents (sampled at 50 kHz) from outside-out patches (� 70 mV) of HEK293 cells expressing a2b1g2, a2b1L285Rg2 and
a2b1P228Hg2 receptors. Spontaneous channel activity is evident in the absence of GABA (traces labelled ‘Krebs’). Both spontaneous and GABA-activated
channel openings are inhibited by bicuculline (Bic: 50mM). Scale bars: 2 pA, 100 ms. Single channel amplitude histograms (right panels) are based
on 10–30 s epochs for a2b1g2 (activated by 10mM GABA) and for spontaneously active a2b1L285Rg2 and a2b1P228Hg2. All single channel currents
have mean amplitudes of approximately � 1.9 pA (B27 pS). Error bars in panels a–d represent the mean ±s.e.m. (n¼ 7–15 for a: n¼4–6 for panels b
and d: n¼6–11 for c).
NATURE COMMUNICATIONS | DOI: 10.1038/ncomms3816 ARTICLE
NATURE COMMUNICATIONS | 4:2816 | DOI: 10.1038/ncomms3816 | www.nature.com/naturecommunications 7
& 2013 Macmillan Publishers Limited. All rights reserved.
Previous studies in man demonstrated significant allelicassociation between the risk of alcohol dependence and GABRA2and GABRB1 polymorphisms4,5,40–42. Although deleting Gabra2in mice did not alter ethanol self-administration19, and humanpolymorphisms and mouse mutations may lack common effectson receptor function, our studies are supportive of the view thatthe GABAAR b1 subunit is a modifier of alcohol consumption.
The NAc is associated with reward and has an important rolein addiction. Our recordings from MSNs within the accumbalcore revealed that the b1 subunit mutations greatly impactupon both synaptic and tonic inhibitory transmission. ForGabrb1þ /L285R and Gabrb1þ /P228H, mIPSCs were prolongedand less frequent. Given our previous demonstration that MSNsexpress synaptic a2-GABAARs34, the changed mIPSC kineticssuggest that b1 subunits may co-assemble with a2 and g2subunits at inhibitory synapses. The GABAAR-mediated tonicconductance was greatly increased in the NAc of Gabrb1þ /L285R
and Gabrb1þ /P228H mice. The differential effects of GABAARantagonists suggest that this perturbation results fromspontaneous activity of mutant b1-GABAARs, though increasedreceptor sensitivity to GABA and, for Gabrb1þ /P228H, an increasein ambient GABA may also contribute.
Our recombinant receptor studies indicate that mutant b1subunits efficiently co-assemble with a and g or d subunits andare functionally expressed at the cell surface, with minimal effecton their pharmacological properties. Nevertheless, both b1P228H
and b1L285R mutations increased receptor sensitivity to GABAand caused their channels to open spontaneously in the absenceof GABA, particularly for L285R. Modelling the likely subunitcombinations of synaptic a2- and extrasynaptic d-containingGABAARs found in accumbal MSNs, we recreated recombinantequivalents of extrasynaptic (a2/4b1d) and synaptic (a2/4b1g2)-type receptors. Mutating the b1 subunit initiated spontaneous
GABA channel opening, with b1L285R exhibiting a greater degreeof spontaneous activity, implying that both ab1L285Rg andab1L285Rd receptors are the most significant contributors to theincreased spontaneous (tonic) current in the NAc of theGabrb1þ /L285R mouse. In comparison, b1P228H GABAARs wereless spontaneously active, but such activity was neverthelessclearly evident for a2b1P228Hg2.
Recombinant GABAARs (a2/a4b1g2, a2/a4b1d) incorporatingeither WT or mutant b1 subunits were consistently insensitive toethanol. Similarly, neither tonic nor phasic inhibition of WT andb1 mutant MSNs was affected by ethanol. Although low ethanolconcentrations (B10–30 mM) have been reported to enhanceneuronal and recombinant d-GABAAR21,23 function, otherstudies have failed to corroborate such effects22,24,43–45.
Thus, increased accumbal tonic current is associated with b1subunit mutations leading to increased ethanol consumption, butnot as a consequence of direct effects of ethanol on GABAARs.Notably, both ethanol preference and consumption are reducedin d� /� mice18, a genetic manipulation that reduces accumbaltonic currents28. The importance of the tonic current for ethanolreward is emphasized by RNAi knockdown of either a4 or dsubunits in the accumbens, which reduced ethanol consumptionand preference without affecting water or sucrose intake16,17.Collectively, this strongly suggests that the large tonicconductance of MSNs contributes to the increased preferenceand intake of alcohol by Gabrb1þ /L285R and Gabrb1þ /P228H
mice.Our study identifies GABAARs containing the b1 subunit as a
key element in modulating alcohol consumption and suggeststhat spontaneous GABA channel opening and increased tonicinhibition in the accumbens are critically important factors in thisdebilitating behavioural phenotype that is so costly to individualsand society.
120 α2β1δα2β1L285Rδ 120
140 α4β1δα4β1L285Rδα4β1P228Hδ
40
60
80
100 α2β1P228Hδ
40
60
80
100
0.01
0
20
GABA concentration (μM)
I GA
BA
(% m
ax)
0.01
GABA concentration (μM)
0
20I GA
BA
(% m
ax)
12 100
120300 μM GABA or 100 μM PTX
1.0
2.0
8
40
60
80
α2β1δ
i
α4β1δ
0
I PT
X (
% I G
AB
A+
PT
X)
0
20
Con
trol
(%
EC
10 G
AB
A)
pA: 100 (i), 450 (ii and iii),1750 (iv)
iii
α2β1L285Rδ
iv
α4β1L285Rδ
pA: 100 (i), 450 (ii), 75 (iii), 250 (iv)1 s
α2β1γδ
α4β1γδ
α2β1L2
85R δ
α4β1L2
85R δ
α2β1P22
8Hδ
α4β1P22
8Hδ
α2β1δ
α4β1δ
α2β1L2
85R δ
α4β1L2
85R δ
α2β1P22
8Hδ
α4β1P22
8Hδ
0.1 1 10 100 1,000 0.1 1 10 100
ii
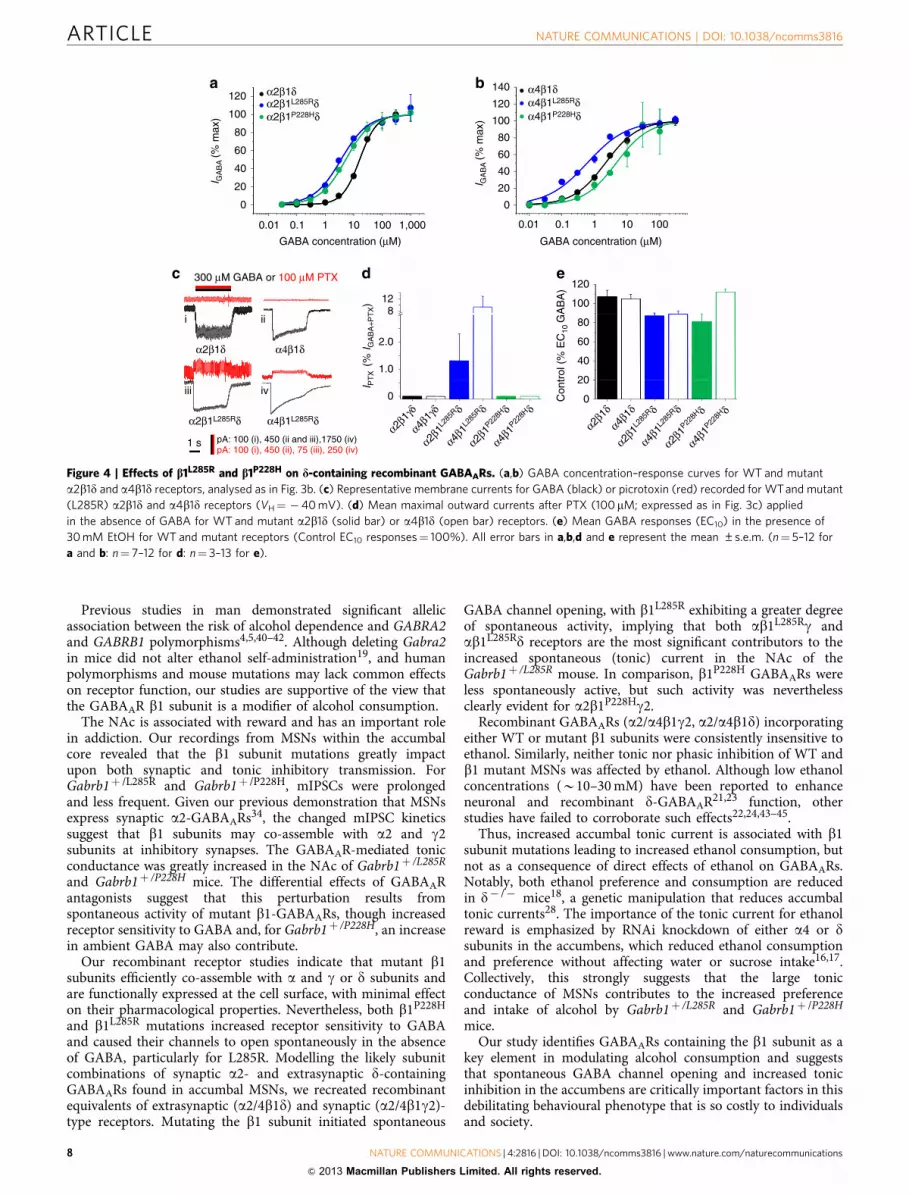
Figure 4 | Effects of b1L285R and b1P228H on d-containing recombinant GABAARs. (a,b) GABA concentration–response curves for WT and mutant
a2b1d and a4b1d receptors, analysed as in Fig. 3b. (c) Representative membrane currents for GABA (black) or picrotoxin (red) recorded for WTand mutant
(L285R) a2b1d and a4b1d receptors (VH¼ �40 mV). (d) Mean maximal outward currents after PTX (100mM; expressed as in Fig. 3c) applied
in the absence of GABA for WT and mutant a2b1d (solid bar) or a4b1d (open bar) receptors. (e) Mean GABA responses (EC10) in the presence of
30 mM EtOH for WT and mutant receptors (Control EC10 responses¼ 100%). All error bars in a,b,d and e represent the mean ±s.e.m. (n¼ 5–12 for
a and b: n¼ 7–12 for d: n¼ 3–13 for e).
ARTICLE NATURE COMMUNICATIONS | DOI: 10.1038/ncomms3816
8 NATURE COMMUNICATIONS | 4:2816 | DOI: 10.1038/ncomms3816 | www.nature.com/naturecommunications
& 2013 Macmillan Publishers Limited. All rights reserved.
MethodsMice. Mice were housed under standard conditions with a commercial diet (SDS,UK) and drinking water ad libitum. Using alcohol-averse background strains,12-week-old male BALB/cAnN mice were exposed to ENU25 and crossed to WTC3H/HeH females. G1 progeny (n¼ 1,047) were screened in a two-bottle choicetest for preference for 10% (v/v) ethanol at age 7–12 weeks. Mice showing ethanolpreference (42.5 s.d. above a control non-mutagenized BALB/cAnN x C3H/HeHcohort) were backcrossed to 8–12-week-old C3H/HeH females to test heritability.Our study was approved by the local ethical review panels of the MRC MammalianGenetics Unit (MRC Harwell), the University of Dundee and the University ofSussex, and complies with the UK Animal (Scientific Procedures) Act 1986.
Phenotyping. Male and female 7–12-week-old adult mice were singly housed withfree choice of water or ethanol (3 or 10% v/v) during two 10-day test periods.Consumption was determined by weighing the drinking bottles. The amountconsumed was corrected for leakage and evaporation and expressed as gramsethanol consumed daily per kg body weight of the mice measured at the beginningof each period. Preference was calculated as the ratio of ethanol over total amountof liquid imbibed. Taste preference was determined similarly using 15 and 120 mMsucrose (caloric value), 0.25 mM and 0.4 mM saccharin (no caloric value) and0.05 mM quinine. For self-administration of ethanol studies, animals (n¼ 8 group)were trained using a sucrose-fading procedure to self-administer up to 10% v/vethanol19,20. Intoxication was scored as normal, mild ataxia or ambulatoryimpairment, upon removal of the animals from the operant boxes at the end ofdaily sessions.
Mapping of ENU Mutation. A genome scan was performed on 13 animals (2 G2,11 G3) displaying high ethanol preference using 86 microsatellite markers dis-tributed throughout the genome to differentiate DNA of BALB/cAnN or C3H/HeHorigin. A further 169 animals were used to identify informative recombinants. Finemapping with additional microsatellite markers in the candidate region wasundertaken to narrow the location of the mutation.
Candidate gene sequencing. Exons and the exon/intron borders of twelve can-didate genes were sequenced from both directions in mutant and WT mice. Oli-gonucleotides were designed using Ensembl v36 predictions (http://ensembl.org).Data were analysed with BioEdit software. Primer sequences can be found inSupplementary Table S6.
Electrophysiology and analysis of brain slice preparations. Coronal slices(300 mm) containing the NAc were prepared from male Gabrb1þ /L285R,Gabrb1þ /P228H and WT littermates (age 2–5 months). As previously described34,slices were cut in oxygenated ice-cold maintenance solution containing (mM):140 K gluconate, 15 Na gluconate, 4 NaCl, 10 HEPES and 0.2 EGTA (pH 7.2;310–320 mOsm), before storage for at least 1 h at room temperature (20–23 �C) inoxygenated, extracellular solution (ECS) containing (mM): 126 NaCl, 2.95 KCl, 26NaHCO3, 1.25 NaH2PO4, 2 CaCl2, 10 D-glucose and 2 MgCl2 (pH 7.4; 300–310mOsm). MSNs were identified with an Olympus BX51 microscope equipped withDIC/infrared optics. Whole-cell voltage-clamp recordings (� 60 mV) wereperformed at 35 �C, using the ECS containing 1 mM strychnine, 2 mM kynurenicacid and 0.5 mM tetrodotoxin (TTX). Patch electrodes (3–4 MO) were filled with(mM): 135 CsCl, 10 HEPES, 10 EGTA, 1 CaCl2, 2 MgCl2 and 2 Mg-ATP, 5 QX-314(pH 7.2–7.3 with CsOH, 300–308 mOsm).
Recordings were discarded if series resistance changed by 420%. Currents werefiltered at 2 kHz (8-pole, low-pass Bessel filter) and recorded for offline analysis(DTR1205 recorder). Bicuculline methobromide, gabazine, THIP and strychninehydrochloride were prepared as aqueous stock solutions for dilution in ECS.Picrotoxin was prepared in ECS. All drugs were obtained from Sigma-Aldrich(Poole, UK) or Tocris Bioscience (Bristol, UK). THIP and ethanol were allowed toinfiltrate the slice for at least 10 min before data acquisition. Recordings weredigitized (NIDQMX, National Instruments) and sampled at 10 kHz before analysis(WinEDR/WinWCP). The mIPSCs were threshold-detected (� 4 pA, duration3 ms) and visually inspected. A minimum of 50–100 mIPSCs were used foranalysis, including peak amplitude, rise time (10–90%, r1 ms) and decay times.The decay phase of mIPSCs was best fit (98–10% of the peak amplitude) with a bi-exponential (y(t)¼Afaste(� t/tfast)þAslowe(� t/tslow)) function, where t is time, A isthe amplitude and t is the decay time constant. A weighted decay time constant(tw) was calculated from the equation: tw¼ t1P1þ t2P2, where t1 and t2 are decaytime constants and P1 and P2 the relative proportions of the decay described byeach component. The mIPSC frequency was determined in 20-s bins for 2 min,detected by the rate of rise (30–50 pA ms� 1), excluding spurious noise.
The mean current and associated RMS were calculated over 102.4 ms epochs for1 min, using a 10-kHz sampling rate. Epochs containing mIPSCs or unstablebaseline were excluded. To ensure changes in the holding current reflected a drugeffect, two 1-min control holding current periods (C1 and C2) were sampled and a1-min section after drug equilibration (D). The mean holding current for C1 andC2 were pooled and the s.d. calculated. The drug effect was accepted if the absolutechange in the holding current (D�C2) was greater than twice the standarddeviation of the controls (C1, C2). For electrophysiological analysis of brain slice
recordings all data reported represent the mean±s.e.m. of observations derivedfrom a minimum of three animals and each determination is derived from anindividual slice.
Site-directed mutagenesis. All point mutations in the GABAAR b subunit wereintroduced using Quikchange (Stratagene). Sequences of the full coding region ofmutated murine cDNAs were determined by automated fluorescent sequencing.Plasmid DNAs for transfection were purified using the Hi-Speed Plasmid Midi Kit(Qiagen).
Cell culture and electrophysiology. HEK293 cells (ATCC, Middlesex, UK) werecultured in Dulbecco’s modified Eagle’s medium with 10% v/v fetal calf serum,2 mM glutamine, 100 units per ml penicillin G and 100 mg ml� 1 streptomycin at37 �C in 95% air/5% CO2. Cells were transiently transfected by calcium phosphateco-precipitation using 1 mg of each plasmid DNA encoding for a2, a4, b1, d or g2and 0.5 mg Enhanced Green Fluorescent Protein (GFP; Clontech) and used forelectrophysiology after 20 h.
Whole-cell currents were recorded at room temperature (20–22 �C) from singleHEK293 cells voltage clamped at � 40 mV, using an Axopatch 200B amplifier(Molecular Devices, USA). Patch electrodes (3–5 MO) contained (mM): 144 KCl,2 MgCl2, 1 CaCl2, 10 HEPES, 11 EGTA and 2 adenosine triphosphate (pH 7.2).Cells were superfused with Krebs solution containing (mM): 140 NaCl, 4.7 KCl, 1.2MgCl2, 2.5 CaCl2, 10 HEPES and 11 glucose (pH 7.4). Recordings were filtered at5 kHz (6-pole Bessel, 36 dB per octave). Drugs and Krebs solution were appliedusing a modified U-tube. GABA, bicuculline, picrotoxin and ethanol were dissolveddirectly into Krebs solution (adjusted to pH 7.4). Allopregnanolone and diazepamwere diluted in Krebs from a 10 mM stock in DMSO. For whole-cell studies ofethanol potentiation, the GABA current evoked by a low GABA concentration(EC10) was initially determined, then 30–200 mM ethanol was applied for 30–60 sprior to the co-application of EC10 GABA and ethanol. Allopregnanolonepotentiation was determined by co-application with EC10 GABA and theneurosteroid. Dose–response relationship data were fitted with a non-linear leastsquares fitting routine using Origin 6.1 (Microcal). Data points represent the mean±s.e.m. of at least three experiments. The relative proportion of spontaneousGABAA receptor activation was ascertained by dividing the amplitude of currentsinduced by saturating concentrations of PTX (IPTX) by the summed currentamplitudes induced by saturating concentrations of PTX and GABA (IGABAþIPTX). Single-channel currents were recorded at room temperature from excisedoutside-out membrane patches maintained at � 70 mV (sampling rate 50 kHz;low pass-filtered at 10 kHz during recording, and at 2–5 kHz during analysis).Patches showing multiple simultaneous channel openings (channel stacking)exceeding 2% of all detected openings were discarded.
Single-channel data were analysed using WinEDR (v.3.3.8; Strathclydeelectrophysiology software, J Dempster) and QuB (2.0.0.13, Buffalo, NY).Amplitude histograms were created by fitting Gaussian components to theamplitude distributions using a non-linear least-squares routine. Open probabilities(Po) were defined as the ratio between the Gaussian areas of open and shuttime components. Individual open and shut time durations were idealized usingeither WinEDR’s 50% threshold detection method or by QuB’s segmental k-means(SKM) fitting routine. Open and shut dwell-time histograms were fitted with amixture of exponentials using a Levenberg–Marquardt non-linear least-squaresmethod from which the areas representing the individual exponential compo-nents and their relative time constants were obtained. Mean dwell-timedurations were calculated from the individual open and shut times weighted bytheir areas33,46,47.
Confocal microscopy and immunocytochemistry. GABAAR receptor a2, b1myc
or b1myc,L285R or b1myc,P228H, and g2S or g2L subunits were expressed with eGFPin HEK293 cells and incubated at room temperature with 9E10 antibody (to theextracellular myc epitope; Santa Cruz Biotechnology) followed by TRITC- or Cy5-conjugated secondary antibody. The myc epitope in the b1 subunit is electro-physiologically silent48. Transfected HEK293 cells were fixed in phosphate-bufferedsaline (PBS) containing 4% paraformaldehyde for 15 min before being quenchedwith 50 mM NH4Cl in PBS for 10 min. After washing in PBS, cells were incubatedfor 45 min at room temperature with 9E10 antibody. Cells were washed in PBScontaining 10% v/v fetal calf serum (FCS) and 0.4% w/v bovine serum albumin(BSA) before incubation for 45 min with a TRITC- or Cy5-conjugated secondaryantibody. Cells were washed and then mounted in glycerol before imaging using aZeiss Axiophot confocal microscope (LSM510 Meta). The detector gain, andamplifier offset and gain were set at the same levels for all FITC, TRITC and Cy5images of WT and mutant receptors to compare expression intensities. Thescanning slice depth was set to 2.1 mm.
Statistical analysis. Analyses were performed using SPSS v14 and SigmaStatsoftware (SPSS, USA). Data are presented as mean±s.e.m. or 95% confidenceintervals unless otherwise stated. Student’s t-tests were used for two group com-parisons (paired or unpaired as appropriate). Multifactorial linear model analysiswas used to investigate the effect of genotype on alcohol preference, correcting forgeneration, gender and weight. Two-way ANOVA, with the between-subject factor
NATURE COMMUNICATIONS | DOI: 10.1038/ncomms3816 ARTICLE
NATURE COMMUNICATIONS | 4:2816 | DOI: 10.1038/ncomms3816 | www.nature.com/naturecommunications 9
& 2013 Macmillan Publishers Limited. All rights reserved.
‘genotype’ and within-subject factor ‘session’, was used to evaluate potential gen-otype and reinforcer type effect and any interactions, and lever pressing inextinction. Categorized indices were compared using a Fisher’s exact test. The non-parametric Kolmogorov–Smirnoff test was used to compare cumulative probabilitydistributions of IPSC parameters. Statistical significance was routinely set atPo0.05 and at Po0.01 for the Kolmogorov–Smirnoff test.
References1. Whiting, P. J., McKernan, R. M. & Wafford, K. A. Structure and pharmacology
of vertebrate GABAA receptor subtypes. Int. Rev. Neurobiol. 38, 95–138 (1995).2. Edenberg, H. J. et al. Variations in GABRA2, encoding the alpha 2 subunit of
the GABA(A) receptor, are associated with alcohol dependence and with brainoscillations. Am. J. Hum. Genet. 74, 705–714 (2004).
3. Enoch, M. A. The role of GABA(A) receptors in the development ofalcoholism. Pharmacol. Biochem. Behav. 90, 95–104 (2008).
4. Parsian, A. & Zhang, Z. H. Human chromosomes 11p15 and 4p12 and alcoholdependence: possible association with the GABRB1 gene. Am. J. Med. Genet.88, 533–538 (1999).
5. Porjesz, B. et al. Linkage disequilibrium between the beta frequency of thehuman EEG and a GABAA receptor gene locus. Proc. Natl Acad. Sci. USA 99,3729–3733 (2002).
6. Reck, B. H., Mukhopadhyay, N., Tsai, H. J. & Weeks, D. E. Analysis of alcoholdependence phenotype in the COGA families using covariates to detect linkage.BMC Genet. 6(Suppl 1): S143 (2005).
7. Agrawal, A. et al. Association of GABRA2 with drug dependence in thecollaborative study of the genetics of alcoholism sample. Behav. Genet. 36, 640–650 (2006).
8. Bauer, L. O. et al. Variation in GABRA2 predicts drinking behavior in projectMATCH subjects. Alcohol Clin. Exp. Res. 31, 1780–1787 (2007).
9. Covault, J., Gelernter, J., Hesselbrock, V., Nellissery, M. & Kranzler, H. R.Allelic and haplotypic association of GABRA2 with alcohol dependence. Am. J.Med. Genet. B. Neuropsychiatr. Genet. 129B, 104–109 (2004).
10. Dick, D. M. et al. The role of GABRA2 in risk for conduct disorder and alcoholand drug dependence across developmental stages. Behav. Genet. 36, 577–590(2006).
11. Olsen, R. W. & Sieghart, W. International Union of Pharmacology. LXX.Subtypes of gamma-aminobutyric acid(A) receptors: classification on the basisof subunit composition, pharmacology, and function. Update. Pharmacol. Rev.60, 243–260 (2008).
12. Pirker, S., Schwarzer, C., Wieselthaler, A., Sieghart, W. & Sperk, G. GABA(A)receptors: immunocytochemical distribution of 13 subunits in the adult ratbrain. Neuroscience 101, 815–850 (2000).
13. Rudolph, U. & Mohler, H. Analysis of GABAA receptor function and dissectionof the pharmacology of benzodiazepines and general anesthetics throughmouse genetics. Annu. Rev. Pharmacol. Toxicol. 44, 475–498 (2004).
14. Boehm, 2nd S. L. et al. gamma-Aminobutyric acid A receptor subunit mutantmice: new perspectives on alcohol actions. Biochem. Pharmacol. 68, 1581–1602(2004).
15. Engin, E., Liu, J. & Rudolph, U. alpha2-containing GABA(A) receptors: a targetfor the development of novel treatment strategies for CNS disorders.Pharmacol. Ther. 136, 142–152 (2012).
16. Nie, H., Rewal, M., Gill, T. M., Ron, D. & Janak, P. H. Extrasynaptic delta-containing GABAA receptors in the nucleus accumbens dorsomedial shellcontribute to alcohol intake. Proc. Natl Acad. Sci. USA 108, 4459–4464 (2011).
17. Rewal, M. et al. Alpha4-containing GABAA receptors in the nucleusaccumbens mediate moderate intake of alcohol. J. Neurosci. 29, 543–549 (2009).
18. Mihalek, R. M. et al. GABA(A)-receptor delta subunit knockout mice havemultiple defects in behavioral responses to ethanol. Alcohol Clin. Exp. Res. 25,1708–1718 (2001).
19. Dixon, C. I., Walker, S. E., King, S. L. & Stephens, D. N. Deletion of the gabra2gene results in hypersensitivity to the acute effects of ethanol but does not alterethanol self administration. PLoS One 7, e47135 (2012).
20. Stephens, D. N., Pistovcakova, J., Worthing, L., Atack, J. R. & Dawson, G. R.Role of GABAA alpha5-containing receptors in ethanol reward: the effects oftargeted gene deletion, and a selective inverse agonist. Eur. J. Pharmacol. 526,240–250 (2005).
21. Wallner, M., Hanchar, H. J. & Olsen, R. W. Ethanol enhances alpha 4 beta 3delta and alpha 6 beta 3 delta gamma-aminobutyric acid type A receptors atlow concentrations known to affect humans. Proc. Natl Acad. Sci. USA 100,15218–15223 (2003).
22. Borghese, C. M. et al. The delta subunit of gamma-aminobutyric acid type Areceptors does not confer sensitivity to low concentrations of ethanol. J.Pharmacol. Exp. Ther. 316, 1360–1368 (2006).
23. Santhakumar, V., Wallner, M. & Otis, T. S. Ethanol acts directly onextrasynaptic subtypes of GABAA receptors to increase tonic inhibition.Alcohol 41, 211–221 (2007).
24. Baur, R., Kaur, K. H. & Sigel, E. Structure of alpha6 beta3 delta GABA(A)receptors and their lack of ethanol sensitivity. J. Neurochem. 111, 1172–1181(2009).
25. Nolan, P. M. et al. A systematic, genome-wide, phenotype-driven mutagenesisprogramme for gene function studies in the mouse. Nat. Genet. 25, 440–443(2000).
26. Justice, M. J., Noveroske, J. K., Weber, J. S., Zheng, B. & Bradley, A. MouseENU mutagenesis. Hum. Mol. Genet. 8, 1955–1963 (1999).
27. Coghill, E. L. et al. A gene-driven approach to the identification of ENUmutants in the mouse. Nat. Genet. 30, 255–256 (2002).
28. Maguire, E. P. et al. Extrasynaptic a4bd GABAARs mediate a tonicconductance in nucleus accumbens medium spiny neurons. Society forNeuroscience: Neuroscience 2012. p. 669.619/CC618 (2012).
29. McCartney, M. R., Deeb, T. Z., Henderson, T. N. & Hales, T. G. Tonically activeGABAA receptors in hippocampal pyramidal neurons exhibit constitutiveGABA-independent gating. Mol. Pharmacol. 71, 539–548 (2007).
30. Luddens, H. & Korpi, E. R. Biological function of GABAA/benzodiazepinereceptor heterogeneity. J. Psychiatr. Res. 29, 77–94 (1995).
31. Ueno, S., Bracamontes, J., Zorumski, C., Weiss, D. S. & Steinbach, J. H.Bicuculline and gabazine are allosteric inhibitors of channel opening of theGABAA receptor. J. Neurosci. 17, 625–634 (1997).
32. Bai, D. et al. Distinct functional and pharmacological properties of tonic andquantal inhibitory postsynaptic currents mediated by gamma-aminobutyricacid(A) receptors in hippocampal neurons. Mol. Pharmacol. 59, 814–824(2001).
33. Mortensen, M. et al. Activation of single heteromeric GABA(A) receptor ionchannels by full and partial agonists. J. Physiol. 557(Pt 2): 389–413 (2004).
34. Dixon, C. I. et al. Cocaine effects on mouse incentive-learning and humanaddiction are linked to alpha2 subunit-containing GABAA receptors. Proc. NatlAcad. Sci. USA 107, 2289–2294 (2010).
35. Kumar, S., Fleming, R. L. & Morrow, A. L. Ethanol regulation of gamma-aminobutyric acid A receptors: genomic and nongenomic mechanisms.Pharmacol. Ther. 101, 211–226 (2004).
36. Sundstrom-Poromaa, I. et al. Hormonally regulated alpha(4)beta(2)deltaGABA(A) receptors are a target for alcohol. Nat. Neurosci. 5, 721–722 (2002).
37. Blomeley, C. P., Cains, S., Smith, R. & Bracci, E. Ethanol affects striatalinterneurons directly and projection neurons through a reduction incholinergic tone. Neuropsychopharmacology 36, 1033–1046 (2011).
38. Keays, D. A., Clark, T. G. & Flint, J. Estimating the number of coding mutationsin genotypic- and phenotypic-driven N-ethyl-N-nitrosourea (ENU) screens.Mamm. Genome 17, 230–238 (2006).
39. Quwailid, M. M. et al. A gene-driven ENU-based approach to generating anallelic series in any gene. Mamm. Genome 15, 585–591 (2004).
40. Sun, F., Cheng, R., Flanders, W. D., Yang, Q. & Khoury, M. J. Whole genomeassociation studies for genes affecting alcohol dependence. Genet. Epidemiol.17(Suppl 1): S337–S342 (1999).
41. Song, J. et al. Association of GABA(A) receptors and alcohol dependence andthe effects of genetic imprinting. Am. J. Med. Genet. B Neuropsychiatr. Genet.117B, 39–45 (2003).
42. Edenberg, H. J. et al. Description of the data from the Collaborative Study onthe Genetics of Alcoholism (COGA) and single-nucleotide polymorphismgenotyping for Genetic Analysis Workshop 14. BMC Genet. 6(Suppl 1): S2(2005).
43. Botta, P. et al. Modulation of GABAA receptors in cerebellar granule neuronsby ethanol: a review of genetic and electrophysiological studies. Alcohol 41,187–199 (2007).
44. Yamashita, M., Marszalec, W., Yeh, J. Z. & Narahashi, T. Effects of ethanol ontonic GABA currents in cerebellar granule cells and mammalian cellsrecombinantly expressing GABA(A) receptors. J. Pharmacol. Exp. Ther. 319,431–438 (2006).
45. Kaur, K. H., Baur, R. & Sigel, E. Unanticipated structural and functionalproperties of delta-subunit-containing GABAA receptors. J. Biol. Chem. 284,7889–7896 (2009).
46. Mortensen, M., Ebert, B., Wafford, K. & Smart, T. G. Distinct activities ofGABA agonists at synaptic- and extrasynaptic-type GABAA receptors. J.Physiol. 588(Pt 8): 1251–1268 (2010).
47. Mortensen, M. & Smart, T. G. Single-channel recording of ligand-gated ionchannels. Nat. Protoc. 2, 2826–2841 (2007).
48. Connolly, C. N., Krishek, B. J., McDonald, B. J., Smart, T. G. & Moss, S. J.Assembly and cell surface expression of heteromeric and homomeric gamma-aminobutyric acid type A receptors. J. Biol. Chem. 271, 89–96 (1996).
AcknowledgementsThis work was supported by MRC (UK), Wellcome Trust and ERAB awards to H.C.T.,Q.M.A., S.K., T.G.S., D.N.S., D.B. and J.J.L. (all members of the MRC Addiction ResearchCluster and the MRC/IMPC UK GoLD ‘Genetics of Liver Disease’ consortium). Wethank Z. Tymowska-Lalanne, A. Kopp-Schneider, J. Saini, M. Kajihara, G. Lydall, E.Prescott and L. Jones for advice and/or technical support, and A. Parlow for
ARTICLE NATURE COMMUNICATIONS | DOI: 10.1038/ncomms3816
10 NATURE COMMUNICATIONS | 4:2816 | DOI: 10.1038/ncomms3816 | www.nature.com/naturecommunications
& 2013 Macmillan Publishers Limited. All rights reserved.

radioimmunoassay reagents, performed by D. Carmignac (NIMR) and I. Huhtaniemi’slaboratory.
Author contributionsH.C.T., S.D.M.B. and E.M.C.F. conceived the research. The ENU screen was conductedby A.M., S.K., Q.M.A. and H.C.T. In vivo phenotyping and preference testing wasconducted and overseen by S.K. and Q.M.A. Endocrine studies were performed by I.R.In vitro electrophysiology studies were conducted by A.M.H., P.T., M.M., R.B. and T.G.S.In vivo operant conditioning, ethanol kinetics and ataxia studies were performed byS.E.W., C.I.D. and D.N.S. Ex vivo brain slice electrophysiology studies were conducted byE.P.M., D.B. and J.J.L. Additional phenotyping, data/sample acquisition and scientificsupport was performed by Y.-T.H., A.H., M.A.U., J.D.B., M.Y.M., S.M., K.R., H.M.D.G.,A.M. and I.G. Data analysis and interpretation was performed by Q.M.A., S.K., T.G.S.,D.N.S., E.P.M., D.B., J.J.L. and H.C.T. The manuscript was written and revised by
Q.M.A., S.K., D.B., J.J.L., D.N.S., T.G.S. and HCT. All authors reviewed and approved thesubmitted manuscript. D.N.S., D.B., S.B., J.J.L., T.G.S. and H.C.T. are joint senior authors.
Additional informationSupplementary Information accompanies this paper at http://www.nature.com/naturecommunications
Competing financial interests: The authors declare no competing financial interests.
Reprints and permission information is available online at http://npg.nature.com/reprintsandpermissions/
How to cite this article: Anstee, Q. M. et al. Mutations in the Gabrb1 gene promotealcohol consumption through increased tonic inhibition. Nat. Commun. 4:2816doi: 10.1038/ncomms3816 (2013).
NATURE COMMUNICATIONS | DOI: 10.1038/ncomms3816 ARTICLE
NATURE COMMUNICATIONS | 4:2816 | DOI: 10.1038/ncomms3816 | www.nature.com/naturecommunications 11
& 2013 Macmillan Publishers Limited. All rights reserved.