musculoskeletal modelling of the shoulder complex and its
TRANSCRIPT
UNIVERSITY OF REGENSBURG
DOCTORAL THESIS
Musculoskeletal modelling of theshoulder complex and its application
for EMG assessed pathologies
Author:Maximilian AURBACH
Supervisor:Prof.Dr.-Ing. Sebastian
DENDORFER
A thesis submitted in fulfilment of the requirementsfor the degree of Dr. scientiarum humanarum (Dr. sc. hum.)
at the
Faculty of Medicine
University of Regensburg
conducted in the
Laboratory for Biomechanics
OTH Regensburg
submitted by
Maximilian Aurbach, M.Sc.
July 2020
Dean Prof. Dr. Dirk Hellwig
Supervisor Prof. Dr.-Ing. Sebastian Dendorfer
Mentors Prof. Dr. med. Tobias Renkawitz
Prof. Dr. Rainer Spang
Day of Defence 12.11.2020
ii

Declaration of AuthorshipI, Maximilian AURBACH, born at the 23.01.1990 in Heilbronn declare that this thesistitled, “Musculoskeletal modelling of the shoulder complex and its application forEMG assessed pathologies” and the work presented in it are my own. I confirm that:
• This work was done wholly or mainly while in candidature for a research de-gree at this University.
• Where any part of this thesis has previously been submitted for a degree orany other qualification at this University or any other institution, this has beenclearly stated.
• Where I have consulted the published work of others, this is always clearlyattributed.
• Where I have quoted from the work of others, the source is always given. Withthe exception of such quotations, this thesis is entirely my own work. I did notreceive paid help from mediation and advisory services e.g. PhD consultants.
• I have acknowledged all main sources of help.
• Where the thesis is based on work done by myself jointly with others, I havemade clear exactly what was done by others and what I have contributed my-self.
Signed:
Date:
iii


“If I have seen further it is by standing on the shoulders of Giants.”
Isaac Newton
“But I am very poorly today & very stupid & I hate everybody & everything. One lives onlyto make blunders.”
Charles Darwin
v
AbstractThe aim and purpose of the presented thesis is with regard to musculoskeletalmodel improvements of the human shoulder and simulation of pathologies. It ad-dresses three distinct research questions. From a modelling perspective using an in-verse dynamics approach, there is a discrepancy between computed glenohumeraljoint reaction forces and in-vivo measurements above 90° humeral abduction. In-vivo measurements and muscle activities derived from electromyographic measure-ments indicate a continuous increase in the joint reaction force above 90° abduction.Models using an inverse dynamics approach however tend to compute decreasingforces above 90° abduction. In order to address this issue, several modelling pa-rameters are tested and compared with regard to their effect on muscle activationand force development in the glenohumeral joint. Two clinical research questionsare addressed and simulated with an updated model. The first investigates severaloperative techniques of a long biceps tendon transposition from a biomechanicalperspective. As multiple techniques are used in the clinical practice, it is of inter-est how they compare in terms of joint reaction forces and whether one techniqueprovides an outcome which is closer to the healthy state of the shoulder-arm com-plex. The second simulates tears of the m. supraspinatus and evaluates musclerecruitment changes, changes of the joint reaction forces and a comparison to elec-tromyographic measurements. This is done in order to assess, how model predic-tions compare to observations in the clinical field and whether a generic model canpredict these changes. The major outcomes of this thesis are threefold: it postulatesthe mechanical muscle properties Hill muscle model as key parameter for the forcedevelopment in the glenohumeral joint during abduction, argues for an insertion ofthe long biceps tendon at the bicipital groove as superior operative technique froma biomechanical point of view and depicts a discrepancy between simulated symp-tomatic cases of a tear of the m. supraspinatus with regard to electromyographicmeasurements.
vi
ZusammenfassungDie Kernaspekte der vorliegenden Dissertation fokussieren sich auf die musku-loskeletalle Modellierung und Simulation von Pathologien des menschlichen Schul-terkomplexes. Die Arbeit adressiert innerhalb dieses Kontextes drei spezifische For-schungsfragen. Auf der Simulationsebene wurde die Muskelrekrutierung des Schul-terkomplexes und die Kraftentwicklung innerhalb des Glenohumeralgelenks beider Abduktion des Humerus untersucht. In-vivo Messungen basierend auf instru-mentalisierten Endoprothesen des Humeruskopfes zeigen einen kontinuierlichenAnstieg der resultierenden Reaktionskraft im Glenohumeralgelenk bis zu 150° Ab-duktion. Eine hohe Aktivierung der involvierten Muskulatur bei der Abduktionüber 90° wird ebenfalls durch elektromyographische Messungen bestätigt. Mus-kuloskelettale Modelle der Schulter, welche auf einem inversdynamischen Ansatzberuhen, berechnen jedoch zumeist sinkende Muskelaktivitäten und damit verbun-den erniedrigte Gelenkreaktionskräfte. Um dieser Diskrepanz nachzugehen, wur-den mehrere kinematische, kinetische und Muskelmodell Parameter auf ihre Aus-wirkung bezüglich Muskelaktivität und Gelenkreaktionskraft evaluiert und mit ex-perimentellen elektromyographischen Messungen und der Literatur verglichen. Fer-ner wurde der Muskelfaserverlauf der anterioren, lateralen und posterioren Deltoi-den mittels virtueller Torus-Objekte innerhalb des verwendeten Schultermodellesfür die Abduktion optimiert. Die erste der beiden klinischen Fragestellungen derdargelegten Arbeit bezieht sich auf eine Transposition der langen Bizepssehne. Meh-rere verschiedene tenodese Techniken oder eine Tenotomie finden hierbei im klini-schen Alltag Anwendung. Eine Untersuchung bezüglich biomechanischer Aspekteder unterschiedlichen Techniken ermöglicht hierbei Einblicke, welche am ehestendem Normalzustand im Bezug auf Gelenkskraftentwicklung entspricht. Zwei teno-dese Techniken und die Tenotomy wurden hierbei während der Ellbogenflexion,Pronation und einer kombinierten Bewegung simuliert, wobei die Reaktionskräfteund Momente im Schulter und Ellenbogengelenk mit einem intakten Modell vergli-chen wurden. Die zweite klinische Anwendung betrifft eine Ruptur des m. supra-spinatus. Die Kinematik und Muskelaktivität gesunder und pathologischer Proban-den wurden hierbei experimentell bei 6 verschiedenen Bewegungen gemessen. Die
vii
Probanden wurden in Simulationsmodellen mit und ohne Riss des m. supraspina-tus nachgebildet. Hierbei sollte ermittelt werden, ob ein generisches Modell Mus-kelrekrutierungsänderungen aufgrund eine Ruptur adäquat abbilden kann. Auf Si-mulationsebene konnte die Arbeit die mechanischen Eigenschaften des Hill Mus-kelmodelles als mögliche physiologische Ursache und Erklärung für die steigen-den Reaktionskräfte im Glenohumeralgelenk bei Abduktion >90° identifizieren. ImBezug auf die biomechanischen Auswirkungen verschiedener tenodese Technikender langen Bizepssehne scheint eine Verankerung an der Bicipitalrille aus mecha-nischer Sicht am ehesten die Kräfte des gesunden Modelles zu erzeugen. Dies liegtan der Präservation der generellen Richtung des Hebelarmes des langen Bizeps.Der Vergleich zwischen modellierten Aktivitäten mit und ohne Ruptur des m. su-praspinatus konnte keine Übereinstimmung der simulierten und experimentellenUnterschiede bei symptomatischen Patienten zeigen. Dies wird auf eine eventuelleVeränderung der Kinematik der Scapula zurückgeführt, welche nicht im verwen-deten Modell Berücksichtigt wird. Die Erkenntnisse könnten jedoch für asympto-matische Rupturen gültig sein. Hierbei ist die Aussage, das die Änderung in derMuskelrekrutierung nur geringfügig ist, jedoch die Kumulative Erhöhung signifi-kante Auswirkung auf die Gelenkreaktionskraft hat.
viii
AcknowledgementsFirst and foremost I would like to thank my supervisor Sebastian Dendorfer. Hisprofound knowledge, demeanour, guidance and humour have inspired me for al-most 10 years. I could not have wished for a better mentor and role model. Asimilar position is occupied by his right-hand man, Franz Süß. His serenity, criticalthinking and comprehensive skill-set always were a tremendous help and example.Special thanks also go to Lars Krenkel for the entertaining, constructive discussionrounds and all-round knowledge. My colleagues Simon Auer, Simon Groß, ClemensBirkenmaier, Bernd Gamisch and Melina Tauwald deserve extra credits. The yearsspent together in hardship and laughter forged friendships which I will always cher-ish. A special place among these friends has Maximilian Melzner. I cannot thankhim enough for his friendship, tremendous support and the awesome time together.Also thanks a lot to all for investing your time in the proofreading. Furthermore,I want to thank the Regensburg Centre of Biomedical Engineering in general andmore specific Alexander Leis for providing the organisational framework for thiswork and giving the best support in all administrative questions. Special acknowl-edgements also receive all the student assistants which helped in the measurementsand various aspects of this work during the years. Their eagerness to learn, enthu-siasm and also frustration always made me remember why I started on this pathin the first place. The contents of this thesis were created within the framework ofthe Interreg V, Project 38 by the EFRE, ZIEL-ETZ BY-CZ 2014-2020. In this context Iwant to thank my clinical and Czech project partners for the years of collaboration. Ialso received financial support by the Bavarian Academic Forum (BayWISS) – Doc-toral Consortium “Health Research”, which enabled me to participate in variousconferences and visit other research centres. For this I am really grateful, as theseexperiences were an integral part of my education. I furthermore want to acknowl-edge my mentors Sebastian and Dr. Tobias Renkawitz for their examination of thiswork, the committee of the defence and Jack for proofreading. Last but definitelynot least I want to thank my mother Angelika, brother Martin, Sophie, Hektor, Lokiand all my friends and flatmates for their love and support through the highs andlows. You made this journey amazing.
ix

Contents
Declaration of Authorship iii
Abstract vi
Acknowledgements ix
1 Introduction 38
2 Anatomy and functionality of the shoulder complex 43
3 Musculoskeletal modelling within the AnyBodyTM Modeling System 513.1 The shoulder model of the AnyBodyTM Modeling System . . . . . . . 513.2 Recruitment of muscles within the AnyBodyTM Modeling System . . 53
4 Evaluation of musculoskeletal modelling parameters of the shoulder com-plex during humeral abduction above 90° 554.1 Introduction . . . . . . . . . . . . . . . . . . . . . . . . . . . . . . . . . 554.2 Materials and Methods . . . . . . . . . . . . . . . . . . . . . . . . . . . 56
4.2.1 Experimental setup . . . . . . . . . . . . . . . . . . . . . . . . . 564.2.2 Musculoskeletal modelling . . . . . . . . . . . . . . . . . . . . 57
Torus obstacle method for the deltoid wrapping (T) . . . . . . 58Three element Hill muscle model (H) and strength scaling (S) 59Motion capture driven clavicular protraction/elevation (CL) . 60Force-dependent kinematics of the GH joint (FDK) . . . . . . 60Alteration of scapula/clavicle rhythm (RHY) . . . . . . . . . . 60Simulation . . . . . . . . . . . . . . . . . . . . . . . . . . . . . . 61Validation of model activity vs. EMG . . . . . . . . . . . . . . 61
4.3 Results . . . . . . . . . . . . . . . . . . . . . . . . . . . . . . . . . . . . 634.4 Discussion . . . . . . . . . . . . . . . . . . . . . . . . . . . . . . . . . . 67
1
Contents
4.5 Conclusion . . . . . . . . . . . . . . . . . . . . . . . . . . . . . . . . . . 69
5 Modelling of the torus obstacle method as wrapping approach for the del-toid muscle group and investigation of muscle model parameters 705.1 Introduction . . . . . . . . . . . . . . . . . . . . . . . . . . . . . . . . . 705.2 Materials and Methods . . . . . . . . . . . . . . . . . . . . . . . . . . . 73
5.2.1 Torus modelling . . . . . . . . . . . . . . . . . . . . . . . . . . 735.2.2 Moment arm evaluation . . . . . . . . . . . . . . . . . . . . . . 755.2.3 Force transmission . . . . . . . . . . . . . . . . . . . . . . . . . 765.2.4 Parameter evaluation of the Hill model . . . . . . . . . . . . . 775.2.5 Recruitment criterion . . . . . . . . . . . . . . . . . . . . . . . . 79
5.3 Results . . . . . . . . . . . . . . . . . . . . . . . . . . . . . . . . . . . . 805.3.1 Moment arm evaluation . . . . . . . . . . . . . . . . . . . . . . 805.3.2 Force transmission . . . . . . . . . . . . . . . . . . . . . . . . . 845.3.3 Parameter evaluation of the Hill model . . . . . . . . . . . . . 895.3.4 Recruitment criterion . . . . . . . . . . . . . . . . . . . . . . . . 91
5.4 Discussion . . . . . . . . . . . . . . . . . . . . . . . . . . . . . . . . . . 955.4.1 Torus modelling . . . . . . . . . . . . . . . . . . . . . . . . . . 955.4.2 Moment arm evaluation . . . . . . . . . . . . . . . . . . . . . . 965.4.3 Force transmission . . . . . . . . . . . . . . . . . . . . . . . . . 975.4.4 Parameter evaluation of the Hill model . . . . . . . . . . . . . 995.4.5 Recruitment criterion . . . . . . . . . . . . . . . . . . . . . . . . 100
5.5 Conclusion . . . . . . . . . . . . . . . . . . . . . . . . . . . . . . . . . . 101
6 Clinical application: Biceps tendon transfer 1026.1 Introduction . . . . . . . . . . . . . . . . . . . . . . . . . . . . . . . . . 1026.2 Materials & Methods . . . . . . . . . . . . . . . . . . . . . . . . . . . . 1056.3 Results . . . . . . . . . . . . . . . . . . . . . . . . . . . . . . . . . . . . 1076.4 Discussion . . . . . . . . . . . . . . . . . . . . . . . . . . . . . . . . . . 1156.5 Conclusion . . . . . . . . . . . . . . . . . . . . . . . . . . . . . . . . . . 117
7 The effect of tears of the m. supraspinatus on the forces and muscle acti-vation pattern of the shoulder complex 1187.1 Introduction . . . . . . . . . . . . . . . . . . . . . . . . . . . . . . . . . 1187.2 Materials and Methods . . . . . . . . . . . . . . . . . . . . . . . . . . . 122
7.2.1 Experimental setup . . . . . . . . . . . . . . . . . . . . . . . . . 122
2
Contents
7.2.2 Musculoskeletal computation of intact models and a simu-lated tear of the m. supraspinatus . . . . . . . . . . . . . . . . 124
7.2.3 Electromyographic comparison of healthy and pathological sub-jects . . . . . . . . . . . . . . . . . . . . . . . . . . . . . . . . . . 127
7.3 Results . . . . . . . . . . . . . . . . . . . . . . . . . . . . . . . . . . . . 1297.3.1 Musculoskeletal computation of intact models and a simu-
lated tear of the supraspinatus: Healthy subjects group withintact vs. pathological models . . . . . . . . . . . . . . . . . . . 129
7.3.2 Forces and muscle activities of intact models and pathologicalmodels of the healthy vs. the pathological group . . . . . . . . 139
7.3.3 EMG comparison between the healthy vs. the pathologicalgroup . . . . . . . . . . . . . . . . . . . . . . . . . . . . . . . . . 147
7.4 Discussion . . . . . . . . . . . . . . . . . . . . . . . . . . . . . . . . . . 1557.4.1 Musculoskeletal simulation of intact models and simulated
tears of the m. supraspinatus . . . . . . . . . . . . . . . . . . . 155Comparison between intact and pathological models of the
healthy group . . . . . . . . . . . . . . . . . . . . . . 155Comparison between intact models of the healthy group and
pathological models of the patient group . . . . . . . 1567.4.2 EMG comparison between healthy subjects and patients with
a tear of the m. supraspinatus . . . . . . . . . . . . . . . . . . . 1577.5 Conclusion . . . . . . . . . . . . . . . . . . . . . . . . . . . . . . . . . . 159
8 Conclusion 160
A Supplementary material to chapter 5 177A.1 Activity of the deltoids and GH joint reaction force of the ellipsoid
model . . . . . . . . . . . . . . . . . . . . . . . . . . . . . . . . . . . . . 177A.2 Lateral and posterior momentarm comparison . . . . . . . . . . . . . 179A.3 Moments transmitted onto the humerus from the tori . . . . . . . . . 181A.4 Muscle activities and joint reaction force of the torus model with p =
3 and all forces / moments transmitted . . . . . . . . . . . . . . . . . 183
B Supplementary material to chapter 6 185B.0.1 Joint reaction forces and moments on the elbow joint for the
flexion, pronation and pouring motion . . . . . . . . . . . . . 186
3
Contents
B.0.2 Joint reaction forces on the glenohumeral joint for the flexion,pronation and pouring motion . . . . . . . . . . . . . . . . . . 190
C Supplementary material to chapter 7 193C.0.1 Muscle activities of intact models and pathological models of
the healthy subject group . . . . . . . . . . . . . . . . . . . . . 194Neutral position . . . . . . . . . . . . . . . . . . . . . . . . . . 194Neutral position with 5N in hand . . . . . . . . . . . . . . . . 197Internal rotation . . . . . . . . . . . . . . . . . . . . . . . . . . . 200External rotation . . . . . . . . . . . . . . . . . . . . . . . . . . 203External rotation with 5N in hand . . . . . . . . . . . . . . . . 206
C.0.2 Forces acting on the glenoid of intact models and pathologicalmodels of the healthy subject group . . . . . . . . . . . . . . . 210Neutral position . . . . . . . . . . . . . . . . . . . . . . . . . . 210Neutral position with 5N in hand . . . . . . . . . . . . . . . . 212Internal rotation . . . . . . . . . . . . . . . . . . . . . . . . . . . 214External rotation . . . . . . . . . . . . . . . . . . . . . . . . . . 216External rotation with 5N in hand . . . . . . . . . . . . . . . . 218
C.0.3 Numeric comparison of forces and muscle activities of intactmodels and pathological models of the healthy subject group 220Neutral position . . . . . . . . . . . . . . . . . . . . . . . . . . 220Neutral position with 5N in hand . . . . . . . . . . . . . . . . 221Internal rotation . . . . . . . . . . . . . . . . . . . . . . . . . . . 222External rotation . . . . . . . . . . . . . . . . . . . . . . . . . . 223Eternal rotation with 5N in hand . . . . . . . . . . . . . . . . . 224
C.0.4 Kinematics of the humerus of healthy and pathological subjects 225Neutral position . . . . . . . . . . . . . . . . . . . . . . . . . . 225Neutral position with 5 N in hand . . . . . . . . . . . . . . . . 226Internal rotation . . . . . . . . . . . . . . . . . . . . . . . . . . . 227External rotation . . . . . . . . . . . . . . . . . . . . . . . . . . 228External rotation with 5N in hand . . . . . . . . . . . . . . . . 229
C.0.5 Muscle activities of intact models and pathological models ofthe healthy vs. the pathological group . . . . . . . . . . . . . . 231Neutral position . . . . . . . . . . . . . . . . . . . . . . . . . . 231Neutral position with 5N in hand . . . . . . . . . . . . . . . . 234
4

Contents
Internal rotation . . . . . . . . . . . . . . . . . . . . . . . . . . . 237External rotation . . . . . . . . . . . . . . . . . . . . . . . . . . 240External rotation with 5N in hand . . . . . . . . . . . . . . . . 243
C.0.6 Forces acting on the glenoid of intact models and pathologicalmodels of the healthy vs. the pathological group . . . . . . . . 247Neutral position . . . . . . . . . . . . . . . . . . . . . . . . . . 247Neutral position with 5N in hand . . . . . . . . . . . . . . . . 249Internal rotation . . . . . . . . . . . . . . . . . . . . . . . . . . . 251External rotation . . . . . . . . . . . . . . . . . . . . . . . . . . 253External rotation with 5N in hand . . . . . . . . . . . . . . . . 255Numeric comparison of forces and muscle activities of intact
models and pathological models of the healthy vs.the pathological group . . . . . . . . . . . . . . . . . 257
Neutral position . . . . . . . . . . . . . . . . . . . . . . . . . . 257Neutral position with 5N in hand . . . . . . . . . . . . . . . . 258Internal rotation . . . . . . . . . . . . . . . . . . . . . . . . . . . 259External rotation . . . . . . . . . . . . . . . . . . . . . . . . . . 260External rotation with 5N in hand . . . . . . . . . . . . . . . . 261
C.0.7 EMG comparison between the healthy vs. the pathologicalgroup . . . . . . . . . . . . . . . . . . . . . . . . . . . . . . . . . 263Neutral position . . . . . . . . . . . . . . . . . . . . . . . . . . 263Neutral position 5N in hand . . . . . . . . . . . . . . . . . . . 268Internal rotation . . . . . . . . . . . . . . . . . . . . . . . . . . . 273External rotation . . . . . . . . . . . . . . . . . . . . . . . . . . 278External rotation 5N in hand . . . . . . . . . . . . . . . . . . . 283
C.0.8 Median differences in the EMG between the healthy and patholog-cial group . . . . . . . . . . . . . . . . . . . . . . . . . . . . . . 288Neutral position . . . . . . . . . . . . . . . . . . . . . . . . . . 288Neutral position 5N in hand . . . . . . . . . . . . . . . . . . . 289Internal rotation . . . . . . . . . . . . . . . . . . . . . . . . . . . 290External rotation . . . . . . . . . . . . . . . . . . . . . . . . . . 291External rotation 5N in hand . . . . . . . . . . . . . . . . . . . 292
5
List of Figures
2.1 The joints and bones of the shoulder complex. (Adapted from Neu-mann, 2002 Figure 5-1.) . . . . . . . . . . . . . . . . . . . . . . . . . . . 44
2.2 Range of motion of the shoulder complex (Adapted from Schünke,Schulte, and Schumacher, 2007). . . . . . . . . . . . . . . . . . . . . . 45
2.3 The main muscles involved in the shoulder, posterior view. (Adaptedfrom Henry Gray: Anatomy of the Human Body 1918, IV. Myology,7. The Fascia and Muscles of the Upper Extremity. a. The MusclesConnecting the Upper Extremity, Fig. 409). . . . . . . . . . . . . . . . 46
2.4 The main muscles involved in the shoulder, anterior view. (Adaptedfrom Henry Gray: Anatomy of the Human Body 1918, IV. Myology,7. The Fascia and Muscles of the Upper Extremity. a. The MusclesConnecting the Upper Extremity, Fig. 410). . . . . . . . . . . . . . . . 47
2.5 The main muscles involved in the shoulder, top: rotator cuff musclesposterior view, bottom: rotator cuff muscles anterior view. (Adaptedfrom Henry Gray: Anatomy of the Human Body 1918, IV. Myology,7. The Fascia and Muscles of the Upper Extremity. a. The MusclesConnecting the Upper Extremity, Fig. 411 & 412). . . . . . . . . . . . . 48
3.1 Graphical representation of the AMS shoulder model (AMMR ver-sion V 2.2.2) from the posterior view. . . . . . . . . . . . . . . . . . . . 52
4.1 Optical motion capture and EMG sensor placement on a test subject . 574.2 Preliminary implementation of the tori as an alternative wrapping for
the deltoids . . . . . . . . . . . . . . . . . . . . . . . . . . . . . . . . . 584.3 Principle of operation of the 3 element muscle model according to
Hill. (Adapted from Delp et al., 1990 & O’Neill et al., 2013) . . . . . . 59
6

List of Figures
4.4 Resultant GH joint reaction force of the 16 combinations in %BW overthe abduction angle of the humerus. Grey depicts the reference forcedata (Retrieved 15. May, 2018 from http://www.OrthoLoad.com,files: s1r_210206_1_42, s2r_040408_1_2, s2r_270306_1_86s3l_190308_1_48,s4r_140207_1_70, s5r_131108_1_40, s8r_161208_1_17, s8r_161208_1_31)and the continuous line the unchanged Basic model . . . . . . . . . . 64
4.5 Activity of considered muscle groups over the abduction angle. Con-tinuous line: Mean EMG of all subjects. Grey area: standard deviationof EMG of all subjects. Dashed line: Mean activity of the Basic modelsof the considered muscle groups. Dash-dot line: Mean activity of theH-CL-T-S3 parameter combination. . . . . . . . . . . . . . . . . . . . 66
5.1 Deltoid muscle elements of the model of the AMMR v.7.2 with an-terior elements highlighted in red. Left: Abduction at 90◦ , Right:Abduction at 120◦ . . . . . . . . . . . . . . . . . . . . . . . . . . . . . . 72
5.2 Model with the translated tori in default position at 0◦ abduction (left)and muscle pathing at 120◦ abduction, tori are graphically omitted(right) . . . . . . . . . . . . . . . . . . . . . . . . . . . . . . . . . . . . . 74
5.3 Torus obstacles of the deltoid within the AMS. On the left is the modelin default position at 0◦ of abduction. On the right is the model at120◦ abduction, where the position of the tori translate on the longaxis of the humerus with a fixed distance to the acromion (blue coor-dinate system) as the humeral head moves under the scapula (greencoordinate system) . . . . . . . . . . . . . . . . . . . . . . . . . . . . . 75
5.4 Moment arms during glenohumeral abduction in the range 20− 120◦
of the anterior deltoid elements. Grey: moment arms from a cadaverstudy by Ackland et al., 2008 Black: anterior deltoid moment arms ofthe via point model, 6 associated model elements. Lines are labelledfrom 1-6 from the most anterior to the most lateral element. Orange:anterior deltoid moment arms of the ellipsoid model, 4 associatedmodel elements. Lines are labelled from 1-4 from the most anterior tothe most lateral element. Blue: anterior deltoid moment arms of thetorus model, 4 associated model elements. Lines are labelled from 1-4from the most anterior to the most lateral element. . . . . . . . . . . . 81
7

List of Figures
5.5 Moment arms during glenohumeral abduction in the range 20− 120◦.Each part of the deltoid (anterior, lateral, posterior) is represented by4 model elements (black lines), with an increasing numeration from 1-12 from the most anterior to the most posterior element. Grey depictsthe moment arms from a cadaver study (Ackland et al., 2008) . . . . 83
5.6 Activity of the anterior, lateral and posterior deltoid groups duringabduction between 30-120° of the EMG mean (blue) and it’s standarddeviation (blue envelope), the mean of the NOFM model (purple), theFXZ model (yellow) and the ALLFM configuration (red) with p = 5 . 85
5.7 Resultant GH joint reaction force in %BW over the abduction an-gle of the humerus. Grey depicts an envelope of the in-vivo data(Retrieved 15. May, 2018 from http://www.OrthoLoad.com, files:s1r_210206_1_42, s2r_040408_1_2, s2r_270306_1_86, s3l_190308_1_48,s4r_140207_1_70, s5r_131108_1_40, s8r_161208_1_17, s8r_161208_1_31)in comparison to the NOFM (purple), FXZ (yellow) and ALLFM ap-proaches in force transmission . . . . . . . . . . . . . . . . . . . . . . . 86
5.8 Forces transmitted from the anterior, lateral and posterior tori carrierelements onto the humerus from the ALLFM model (see 5.2.3) dur-ing abduction of the humerus in the range 30-120°. X,Y and Z com-ponents are expressed in the humerus coordinate frame (Figure 5.3,green coordinate system). . . . . . . . . . . . . . . . . . . . . . . . . . 88
5.9 Resultant GH joint reaction force over abduction angle of single al-terations of the Hill model. Single parameters are set to 50% of theirinitial value. Parameters are explained in detail in Table 5.1. Grey de-picts the in-vivo force data (Retrieved 15. May, 2018 from www.OrthoLoad.com,files: s1r_210206_1_42, s2r_040408_1_2, s2r_270306_1_86, s3l_190308_1_48,s4r_140207_1_70, s5r_131108_1_40, s8r_161208_1_17, s8r_161208_1_31). 89
5.10 Resultant GH joint reaction force over abduction angle of single alter-ations of the Hill model, single parameters set to 200% of their initialvalue. Parameters are explained in detail in Table 5.1. Grey depictsthe in-vivo force data(Retrieved 15. May, 2018 from www.OrthoLoad.com,files: s1r_210206_1_42, s2r_040408_1_2, s2r_270306_1_86, s3l_190308_1_48,s4r_140207_1_70, s5r_131108_1_40, s8r_161208_1_17, s8r_161208_1_31). 90
8
List of Figures
5.11 Activity of the m. supraspinatus muscle during humeral abduction inthe range 30-120° of four model configurations: polynomial recruit-ment criterion with power p=3 (green) and p=5 (purple). Dashedlines are with a force applied to the palm of 20 N . . . . . . . . . . . . 91
5.12 Activity of the anterior, lateral and posterior deltoid groups duringabduction between 30-120° of the EMG mean (blue), the mean of theALLFM model with p = 5 (purple) and the ellipsoid model with p =5 (orange). Standard deviations are provided by the correspondingshaded areas . . . . . . . . . . . . . . . . . . . . . . . . . . . . . . . . . 93
5.13 Resultant GH joint reaction force in %BW over the abduction angle ofthe humerus. Grey depicts an envelope of the in-vivo data from lit-erature (Retrieved 15. May, 2018 from http://www.OrthoLoad.com,files: s1r_210206_1_42, s2r_040408_1_2, s2r_270306_1_86, s3l_190308_1_48,s4r_140207_1_70, s5r_131108_1_40, s8r_161208_1_17, s8r_161208_1_31)in comparison to the torus model with p=5 and the ellipsoid modelwith p=5 . . . . . . . . . . . . . . . . . . . . . . . . . . . . . . . . . . . 94
6.1 Different origins of the biceps caput longum a) original model (ORG)b) tendon insertion on the bicipital groove at the humeral head (HH)c) tendon insertion on the coracoid at the origin of the caput breve (CB)105
6.2 IS force in the GH joint over the EL flexion angle during flexion forthe ORG, HH, CB and OFF model . . . . . . . . . . . . . . . . . . . . 108
6.3 IS force in the GH joint over the EL pronation angle during pronationfor the ORG, HH, CB and OFF model . . . . . . . . . . . . . . . . . . 109
6.4 IS force in the GH joint over the EL pronation angle during the pour-ing motion for the ORG, HH, CB and OFF model . . . . . . . . . . . . 110
6.5 Representation of the force direction acting on the glenoid, where thearrows indicate the largest shift from the ORG model to the surgicalmodels for flexion (magenta), pronation (green) and pouring (red) . . 111
6.6 PA force in the EL joint over the EL flexion angle during the flexionmotion for the ORG, HH, CB and OFF model . . . . . . . . . . . . . . 112
6.7 PA force in the EL joint over the EL pronation angle during the prona-tion motion for the ORG, HH, CB and OFF model . . . . . . . . . . . 113
6.8 PA force in the EL joint over the EL pronation angle during the pour-ing motion for the ORG, HH, CB and OFF model . . . . . . . . . . . . 114
9
List of Figures
7.1 EMG sensor placement of the 14 contemplated muscles of interest ona healthy test subject. . . . . . . . . . . . . . . . . . . . . . . . . . . . . 123
7.2 Scapula segment with the simulated glenoid (blue dots) and the coor-dinate system in which the forces acting on the glenoid are expressed.The Y direction of the coordinate system is referred to from inferiorto superior, the Z anterior to posterior and the negative X direction ascompression force. . . . . . . . . . . . . . . . . . . . . . . . . . . . . . 126
7.3 EMG computation steps of the middle deltoid of one subject dur-ing neutral position (5 N) trial. Top: raw EMG signal (blue). Sec-ond: wavelet de-noised signal (cyan), RMS of the rloess smoothedwavelet signal (orange). Third: RMS interpolated over abduction an-gle from MoCap model (blue) and computed for 5° increments (reddot). Fourth: normalized signal (blue) and 5° increments (red dots) tothe 85° position. . . . . . . . . . . . . . . . . . . . . . . . . . . . . . . . 128
7.4 Activities of the m. supraspinatus computed by the models of thehealthy control group over the abduction angle in 5° increments. Ac-tivities are from the neutral position, internal rotation and externalrotation trials without weight. . . . . . . . . . . . . . . . . . . . . . . . 130
7.5 Activities of the m. supraspinatus computed by the models of thehealthy control group over the abduction angle in 5° increments. Ac-tivities are from the neutral position, internal rotation and externalrotation trials with 5 N load in hand. . . . . . . . . . . . . . . . . . . . 131
7.6 Computed muscle activities of the anterior, posterior and lateral del-toids over the abduction angle in 5° increments during the internalrotation trial with 5 N load in hand. Blue depicts the activities of theintact model and red the modelled tear of the m. supraspinatus Bluedepicts the activities of the intact model and red the modelled tear ofthe m. supraspinatus of the healthy subject cohort. . . . . . . . . . . 133
7.7 Computed muscle activities of infraspinatus, subscapularis and teresminor over the abduction angle in 5° increments during the internalrotation trial with 5 N load in hand. Blue depicts the activities of theintact model and red the modelled tear of the m. supraspinatus of thehealthy subject cohort. . . . . . . . . . . . . . . . . . . . . . . . . . . . 134
10
List of Figures
7.8 Computed muscle activities of the biceps, triceps and pectoralis ma-jor over the abduction angle in 5° increments during the internal ro-tation trial with 5 N load in hand. Blue depicts the activities of theintact model and red the modelled tear of the m. supraspinatus of thehealthy subject cohort. . . . . . . . . . . . . . . . . . . . . . . . . . . . 135
7.9 Projected median GH joint reaction force of all models onto the glenoidof intact and pathological models of the healthy subject cohort dur-ing the internal rotation trial with 5 N load in hand. Intact/healthymodels (blue) and pathological models (red) with their starting valueat 25° abduction and the progression up to 85° abduction. . . . . . . . 137
7.10 Compression force, inferior-superior force and anterior-posterior forceof intact (blue) and pathological (red) models of the healthy subjectcohort during the internal rotation trial with 5 N load in hand overthe abduction angle in 5° increments. . . . . . . . . . . . . . . . . . . . 138
7.11 Flexion and external rotation angle over abduction of the heatly co-hort (blue) and pathological cohort (red) during the internal rotationtrial with 5 N load in hand. . . . . . . . . . . . . . . . . . . . . . . . . 140
7.12 Computed muscle activities of the anterior, posterior and lateral del-toids over the abduction angle in 5° increments during the internalrotation trial with 5 N load in hand. Blue depicts the activities of theintact model of the healthy subject group and red the modelled tearof the m. supraspinatus of the patient group. . . . . . . . . . . . . . . 141
7.13 Computed muscle activities of the infraspinatus, subscapularis andteres minor over the abduction angle in 5° increments during the in-ternal rotation trial with 5 N load in hand. Blue depicts the activitiesof the intact model of the healthy subject group and red the modelledtear of the m. supraspinatus of the patient group. . . . . . . . . . . . 142
7.14 Computed muscle activities of the biceps, triceps and pectoralis majorover the abduction angle in 5° increments during the internal rotationtrial with 5 N load in hand. Blue depicts the activities of the intactmodel of the healthy subject group and red the modelled tear of them. supraspinatus of the patient group. . . . . . . . . . . . . . . . . . . 143
11
List of Figures
7.15 Projected median GH joint reaction force of all models onto the glenoidof intact models of the healthy subject cohort and pathological mod-els of the patient group during the internal rotation trial with 5 Nload in hand. Intact models of the healthy control (blue) and patho-logical models of the patient group (red) with their starting value at25° abduction and the progression up to 85° abduction. . . . . . . . . 145
7.16 Compression force, inferior-superior force and anterior-posterior forceof intact models of the healthy control (blue) and pathological modelsof the patient group (red) during the internal rotation trial with 5 Nload in hand over the abduction angle in 5° increments. . . . . . . . . 146
7.17 EMG muscle activities normalized to the 85° position of the neutralposition trial with 5 N load in hand of the trapezius pars descendens,trapezius pars transversa and trapezius pars ascendens over the ab-duction angle in 5° increments during the internal rotation trial with 5N load in hand. Blue depicts the EMG activities of the healthy subjectgroup and red of the patient group. . . . . . . . . . . . . . . . . . . . . 149
7.18 EMG muscle activities normalized to the 85° position of the neutralposition trial with 5 N load in hand of the anterior deltoid, lateral del-toid and posterior deltoid over the abduction angle in 5° incrementsduring the internal rotation trial with 5 N load in hand. Blue depictsthe EMG activities of the healthy subject group and red of the patientgroup. . . . . . . . . . . . . . . . . . . . . . . . . . . . . . . . . . . . . . 150
7.19 EMG muscle activities normalized to the 85° position of the neutralposition trial with 5 N load in hand of the infraspinatus, serratus ante-rior and latissimus over the abduction angle in 5° increments duringthe internal rotation trial with 5 N load in hand. Blue depicts the EMGactivities of the healthy subject group and red of the patient group. . 151
7.20 EMG muscle activities normalized to the 85° position of the neutralposition trial with 5 N load in hand of the biceps, triceps and rhom-boideus minor over the abduction angle in 5° increments during theinternal rotation trial with 5 N load in hand. Blue depicts the EMGactivities of the healthy subject group and red of the patient group. . 152
12
List of Figures
7.21 EMG muscle activities normalized to the 85° position of the neutralposition trial with 5 N load in hand of the rhomboideus major andpectoralis major over the abduction angle in 5° increments during theinternal rotation trial with 5 N load in hand. Blue depicts the EMGactivities of the healthy subject group and red of the patient group. . 153
A.1 Resultant GHJF in the range of 20 − 120◦ humeral abduction. Thegrey shaded area is an envelope of the in-vivo data obtained by Bergmannet al. The orange line is the average calculated GHJF from the motioncapture models with ellipsoid wrapping and p = 5, with the orangeshaded area representing the standard deviation. . . . . . . . . . . . . 177
A.2 Activity of the anterior, lateral and posterior deltoid groups duringabduction between 30-120° of the EMG mean (blue) and the ellipsoidmodel with p = 5 (orange). Standard deviations are provided by thecorresponding shaded areas . . . . . . . . . . . . . . . . . . . . . . . . 178
A.3 Moment arms during glenohumeral abduction in the range 20− 120◦
of the lateral deltoid elements. Grey: moment arms from a cadaverstudy by Ackland et al., 2008 Black: lateral deltoid moment arms ofthe via point model, 4 associated model elements. Orange: lateraldeltoid moment arms of the ellipsoid model, 4 associated model ele-ments. Blue: lateral deltoid moment arms of the torus model, 4 asso-ciated model elements. . . . . . . . . . . . . . . . . . . . . . . . . . . . 179
A.4 Moment arms during glenohumeral abduction in the range 20− 120◦
of the posterior deltoid elements. Grey: moment arms from a cadaverstudy by Ackland et al., 2008 Black: posterior deltoid moment armsof the via point model, 2 associated model elements. Orange: poste-rior deltoid moment arms of the ellipsoid model, 4 associated modelelements. Blue: posterior deltoid moment arms of the torus model, 4associated model elements. . . . . . . . . . . . . . . . . . . . . . . . . 180
A.5 Moments transmitted from the anterior, lateral and posterior tori car-rier elements onto the humerus from the ALLFM model (see 5.2.3)during abduction of the humerus in the range 30-120°. X,Y and Zcomponents are expressed in the humerus coordinate frame (Figure5.3, green coordinate system). . . . . . . . . . . . . . . . . . . . . . . . 181
13
List of Figures
A.6 Activity of the anterior, lateral and posterior deltoid groups duringabduction between 30-120° of the EMG mean (blue), the ellipsoid (or-ange) and the torus model (purple) with p = 3. . . . . . . . . . . . . . 183
A.7 Resultant GH joint reaction force in %BW over the abduction an-gle of the humerus. Grey depicts an envelope of the in-vivo data(Retrieved 15. May, 2018 from http://www.OrthoLoad.com, files:s1r_210206_1_42, s2r_040408_1_2, s2r_270306_1_86, s3l_190308_1_48,s4r_140207_1_70, s5r_131108_1_40, s8r_161208_1_17, s8r_161208_1_31)in comparison to the the ellipsoid (orange) and the torus model (pur-ple) with p = 3. . . . . . . . . . . . . . . . . . . . . . . . . . . . . . . . . 184
B.1 Forces and moments acting on the EL joint over the EL flexion angleduring flexion for the ORG, HH, CB and OFF model . . . . . . . . . . 186
B.2 Forces and moments acting on the EL joint over the EL pronationangle during pronation for the ORG, HH, CB and OFF model . . . . 187
B.3 Forces and moments acting on the EL joint over the EL pronationangle during the pouring motion for the ORG, HH, CB and OFF model188
B.4 Forces in the GH joint over the EL flexion angle during flexion for theORG, HH, CB and OFF model . . . . . . . . . . . . . . . . . . . . . . . 190
B.5 Forces in the GH joint over the EL pronation angle during pronationfor the ORG, HH, CB and OFF model . . . . . . . . . . . . . . . . . . 191
B.6 Forces in the GH joint over the EL pronation angle during the pouringmotion for the ORG, HH, CB and OFF model . . . . . . . . . . . . . . 192
C.1 Computed muscle activities of the anterior, posterior and lateral del-toids over the abduction angle in 5° increments during the neutralposition trial. Blue depicts the activities of the intact model and redthe modelled tear of the m. supraspinatus. Blue depicts the activitiesof the intact model and red the modelled tear of the m. supraspinatusof the healthy subject cohort. . . . . . . . . . . . . . . . . . . . . . . . 194
C.2 Computed muscle activities of infraspinatus, subscapularis and teresminor over the abduction angle in 5° increments during the neutralposition trial with 5 N load in hand. Blue depicts the activities of theintact model and red the modelled tear of the m. supraspinatus of thehealthy subject cohort. . . . . . . . . . . . . . . . . . . . . . . . . . . . 195
14
List of Figures
C.3 Computed muscle activities of the biceps, triceps and pectoralis majorover the abduction angle in 5° increments during the neutral positiontrial. Blue depicts the activities of the intact model and red the mod-elled tear of the m. supraspinatus of the healthy subject cohort. . . . 196
C.4 Computed muscle activities of the anterior, posterior and lateral del-toids over the abduction angle in 5° increments during the neutralposition trial with 5 N load in hand. Blue depicts the activities of theintact model and red the modelled tear of the m. supraspinatus. Bluedepicts the activities of the intact model and red the modelled tear ofthe m. supraspinatus of the healthy subject cohort. . . . . . . . . . . 197
C.5 Computed muscle activities of infraspinatus, subscapularis and teresminor over the abduction angle in 5° increments during the neutralposition trial with 5 N load in hand. Blue depicts the activities of theintact model and red the modelled tear of the m. supraspinatus of thehealthy subject cohort. . . . . . . . . . . . . . . . . . . . . . . . . . . . 198
C.6 Computed muscle activities of the biceps, triceps and pectoralis ma-jor over the abduction angle in 5° increments during the neutral po-sition trial with 5 N load in hand. Blue depicts the activities of theintact model and red the modelled tear of the m. supraspinatus of thehealthy subject cohort. . . . . . . . . . . . . . . . . . . . . . . . . . . . 199
C.7 Computed muscle activities of the anterior, posterior and lateral del-toids over the abduction angle in 5° increments during the internalrotation trial. Blue depicts the activities of the intact model and redthe modelled tear of the m. supraspinatus. Blue depicts the activitiesof the intact model and red the modelled tear of the m. supraspinatusof the healthy subject cohort. . . . . . . . . . . . . . . . . . . . . . . . 200
C.8 Computed muscle activities of infraspinatus, subscapularis and teresminor over the abduction angle in 5° increments during the internalrotation trial. Blue depicts the activities of the intact model and redthe modelled tear of the m. supraspinatus of the healthy subject co-hort. . . . . . . . . . . . . . . . . . . . . . . . . . . . . . . . . . . . . . 201
C.9 Computed muscle activities of the biceps, triceps and pectoralis ma-jor over the abduction angle in 5° increments during the internal ro-tation trial. Blue depicts the activities of the intact model and red themodelled tear of the m. supraspinatus of the healthy subject cohort. 202
15
List of Figures
C.10 Computed muscle activities of the anterior, posterior and lateral del-toids over the abduction angle in 5° increments during the externalrotation trial. Blue depicts the activities of the intact model and redthe modelled tear of the m. supraspinatus. Blue depicts the activitiesof the intact model and red the modelled tear of the m. supraspinatusof the healthy subject cohort. . . . . . . . . . . . . . . . . . . . . . . . 203
C.11 Computed muscle activities of infraspinatus, subscapularis and teresminor over the abduction angle in 5° increments during the externalrotation trial. Blue depicts the activities of the intact model and redthe modelled tear of the m. supraspinatus of the healthy subject co-hort. . . . . . . . . . . . . . . . . . . . . . . . . . . . . . . . . . . . . . 204
C.12 Computed muscle activities of the biceps, triceps and pectoralis ma-jor over the abduction angle in 5° increments during the external ro-tation trial. Blue depicts the activities of the intact model and red themodelled tear of the m. supraspinatus of the healthy subject cohort. 205
C.13 Computed muscle activities of the anterior, posterior and lateral del-toids over the abduction angle in 5° increments during the externalrotation trial with 5 N load in hand. Blue depicts the activities of theintact model and red the modelled tear of the m. supraspinatus. Bluedepicts the activities of the intact model and red the modelled tear ofthe m. supraspinatus of the healthy subject cohort. . . . . . . . . . . 206
C.14 Computed muscle activities of infraspinatus, subscapularis and teresminor over the abduction angle in 5° increments during the externalrotation trial with 5 N load in hand. Blue depicts the activities of theintact model and red the modelled tear of the m. supraspinatus of thehealthy subject cohort. . . . . . . . . . . . . . . . . . . . . . . . . . . . 207
C.15 Computed muscle activities of the biceps, triceps and pectoralis ma-jor over the abduction angle in 5° increments during the external ro-tation trial with 5 N load in hand. Blue depicts the activities of theintact model and red the modelled tear of the m. supraspinatus of thehealthy subject cohort. . . . . . . . . . . . . . . . . . . . . . . . . . . . 208
C.16 Compression force, inferior-superior force and anterior-posterior forceof intact (blue) and pathological (red) models of the healthy subjectcohort during the neutral position trial over the abduction angle in 5°increments. . . . . . . . . . . . . . . . . . . . . . . . . . . . . . . . . . . 210
16
List of Figures
C.17 Projected median GH joint reaction force of all models onto the glenoidof intact and pathological models of the healthy subject cohort duringthe neutral position trial. Intact/healthy models (blue) and patholog-ical models (red) with their starting value at 25° abduction and theprogression up to 85° abduction. . . . . . . . . . . . . . . . . . . . . . 211
C.18 Compression force, inferior-superior force and anterior-posterior forceof intact (blue) and pathological (red) models of the healthy subjectcohort during the neutral position trial with 5 N load in hand overthe abduction angle in 5° increments. . . . . . . . . . . . . . . . . . . . 212
C.19 Projected median GH joint reaction force of all models onto the glenoidof intact and pathological models of the healthy subject cohort dur-ing the neutral position trial with 5 N load in hand. Intact/healthymodels (blue) and pathological models (red) with their starting valueat 25° abduction and the progression up to 85° abduction. . . . . . . . 213
C.20 Compression force, inferior-superior force and anterior-posterior forceof intact (blue) and pathological (red) models of the healthy subjectcohort during the internal rotation trial over the abduction angle in5° increments. . . . . . . . . . . . . . . . . . . . . . . . . . . . . . . . . 214
C.21 Projected median GH joint reaction force of all models onto the glenoidof intact and pathological models of the healthy subject cohort duringthe internal rotation trial. Intact/healthy models (blue) and patholog-ical models (red) with their starting value at 25° abduction and theprogression up to 85° abduction. . . . . . . . . . . . . . . . . . . . . . 215
C.22 Compression force, inferior-superior force and anterior-posterior forceof intact (blue) and pathological (red) models of the healthy subjectcohort during the external rotation trial over the abduction angle in5° increments. . . . . . . . . . . . . . . . . . . . . . . . . . . . . . . . . 216
C.23 Projected median GH joint reaction force of all models onto the glenoidof intact and pathological models of the healthy subject cohort duringthe external rotation trial. Intact/healthy models (blue) and patho-logical models (red) with their starting value at 25° abduction andthe progression up to 85° abduction. . . . . . . . . . . . . . . . . . . . 217
17
List of Figures
C.24 Compression force, inferior-superior force and anterior-posterior forceof intact (blue) and pathological (red) models of the healthy subjectcohort during the external rotation trial with 5 N load in hand overthe abduction angle in 5° increments. . . . . . . . . . . . . . . . . . . . 218
C.25 Projected median GH joint reaction force of all models onto the glenoidof intact and pathological models of the healthy subject cohort dur-ing the external rotation trial with 5 N in hand. Intact/healthy models(blue) and pathological models (red) with their starting value at 25°abduction and the progression up to 85° abduction. . . . . . . . . . . 219
C.26 Flexion and external rotation angle over abduction of the heathy co-hort (blue) and pathological cohort (red) during the neutral positiontrial. . . . . . . . . . . . . . . . . . . . . . . . . . . . . . . . . . . . . . . 225
C.27 Flexion and external rotation angle over abduction of the heathy co-hort (blue) and pathological cohort (red) during the neutral positiontrial with 5 N load in hand. . . . . . . . . . . . . . . . . . . . . . . . . 226
C.28 Flexion and external rotation angle over abduction of the heathy co-hort (blue) and pathological cohort (red) during the internal rotationtrial. . . . . . . . . . . . . . . . . . . . . . . . . . . . . . . . . . . . . . . 227
C.29 Flexion and external rotation angle over abduction of the heathy co-hort (blue) and pathological cohort (red) during the external rotationtrial. . . . . . . . . . . . . . . . . . . . . . . . . . . . . . . . . . . . . . . 228
C.30 Flexion and external rotation angle over abduction of the heathy co-hort (blue) and pathological cohort (red) during the external rotationtrial with 5 N load in hand. . . . . . . . . . . . . . . . . . . . . . . . . 229
C.31 Computed muscle activities of the anterior, posterior and lateral del-toids over the abduction angle in 5° increments during the neutralposition trial. Blue depicts the activities of the intact model of thehealthy subject group and red the modelled tear of the m. supraspina-tus of the patient group. . . . . . . . . . . . . . . . . . . . . . . . . . . 231
C.32 Computed muscle activities of the infraspinatus, subscapularis andteres minor over the abduction angle in 5° increments during the neu-tral position trial. Blue depicts the activities of the intact model of thehealthy subject group and red the modelled tear of the m. supraspina-tus of the patient group. . . . . . . . . . . . . . . . . . . . . . . . . . . 232
18
List of Figures
C.33 Computed muscle activities of the biceps, triceps and pectoralis majorover the abduction angle in 5° increments during the neutral positiontrial. Blue depicts the activities of the intact model of the healthysubject group and red the modelled tear of the m. supraspinatus ofthe patient group. . . . . . . . . . . . . . . . . . . . . . . . . . . . . . . 233
C.34 Computed muscle activities of the anterior, posterior and lateral del-toids over the abduction angle in 5° increments during the neutralposition trial with 5 N load in hand. Blue depicts the activities of theintact model of the healthy subject group and red the modelled tearof the m. supraspinatus of the patient group. . . . . . . . . . . . . . . 234
C.35 Computed muscle activities of the infraspinatus, subscapularis andteres minor over the abduction angle in 5° increments during the neu-tral position trial with 5 N load in hand. Blue depicts the activities ofthe intact model of the healthy subject group and red the modelledtear of the m. supraspinatus of the patient group. . . . . . . . . . . . 235
C.36 Computed muscle activities of the biceps, triceps and pectoralis majorover the abduction angle in 5° increments during the neutral positiontrial with 5 N load in hand. Blue depicts the activities of the intactmodel of the healthy subject group and red the modelled tear of them. supraspinatus of the patient group. . . . . . . . . . . . . . . . . . . 236
C.37 Computed muscle activities of the anterior, posterior and lateral del-toids over the abduction angle in 5° increments during the internalrotation trial. Blue depicts the activities of the intact model of thehealthy subject group and red the modelled tear of the m. supraspina-tus of the patient group. . . . . . . . . . . . . . . . . . . . . . . . . . . 237
C.38 Computed muscle activities of the infraspinatus, subscapularis andteres minor over the abduction angle in 5° increments during the in-ternal rotation trial. Blue depicts the activities of the intact modelof the healthy subject group and red the modelled tear of the m.supraspinatus of the patient group. . . . . . . . . . . . . . . . . . . . . 238
C.39 Computed muscle activities of the biceps, triceps and pectoralis majorover the abduction angle in 5° increments during the internal rotationtrial. Blue depicts the activities of the intact model of the healthysubject group and red the modelled tear of the m. supraspinatus ofthe patient group. . . . . . . . . . . . . . . . . . . . . . . . . . . . . . . 239
19
List of Figures
C.40 Computed muscle activities of the anterior, posterior and lateral del-toids over the abduction angle in 5° increments during the externalrotation trial. Blue depicts the activities of the intact model of thehealthy subject group and red the modelled tear of the m. supraspina-tus of the patient group. . . . . . . . . . . . . . . . . . . . . . . . . . . 240
C.41 Computed muscle activities of the infraspinatus, subscapularis andteres minor over the abduction angle in 5° increments during the ex-ternal rotation trial. Blue depicts the activities of the intact modelof the healthy subject group and red the modelled tear of the m.supraspinatus of the patient group. . . . . . . . . . . . . . . . . . . . . 241
C.42 Computed muscle activities of the biceps, triceps and pectoralis majorover the abduction angle in 5° increments during the external rotationtrial. Blue depicts the activities of the intact model of the healthysubject group and red the modelled tear of the m. supraspinatus ofthe patient group. . . . . . . . . . . . . . . . . . . . . . . . . . . . . . . 242
C.43 Computed muscle activities of the anterior, posterior and lateral del-toids over the abduction angle in 5° increments during the externalrotation trial with 5 N load in hand. Blue depicts the activities of theintact model of the healthy subject group and red the modelled tearof the m. supraspinatus of the patient group. . . . . . . . . . . . . . . 243
C.44 Computed muscle activities of the infraspinatus, subscapularis andteres minor over the abduction angle in 5° increments during the ex-ternal rotation trial with 5 N load in hand. Blue depicts the activitiesof the intact model of the healthy subject group and red the modelledtear of the m. supraspinatus of the patient group. . . . . . . . . . . . 244
C.45 Computed muscle activities of the biceps, triceps and pectoralis majorover the abduction angle in 5° increments during the external rotationtrial with 5 N load in hand. Blue depicts the activities of the intactmodel of the healthy subject group and red the modelled tear of them. supraspinatus of the patient group. . . . . . . . . . . . . . . . . . . 245
C.46 Compression force, inferior-superior force and anterior-posterior forceof intact models of the healthy control (blue) and pathological mod-els of the patient group (red) during the neutral position trial over theabduction angle in 5° increments. . . . . . . . . . . . . . . . . . . . . . 247
20

List of Figures
C.47 Projected median GH joint reaction force of all models onto the glenoidof intact models of the healthy subject cohort and pathological modelsof the patient group during the neutral position trial. Intact modelsof the healthy control (blue) and pathological models of the patientgroup (red) with their starting value at 25° abduction and the pro-gression up to 85° abduction. . . . . . . . . . . . . . . . . . . . . . . . 248
C.48 Compression force, inferior-superior force and anterior-posterior forceof intact models of the healthy control (blue) and pathological modelsof the patient group (red) during the neutral position trial with 5 Nload in hand over the abduction angle in 5° increments. . . . . . . . . 249
C.49 Projected median GH joint reaction force of all models onto the glenoidof intact models of the healthy subject cohort and pathological mod-els of the patient group during the neutral position trial with 5 N loadin hand. Intact models of the healthy control (blue) and pathologicalmodels of the patient group (red) with their starting value at 25° ab-duction and the progression up to 85° abduction. . . . . . . . . . . . . 250
C.50 Compression force, inferior-superior force and anterior-posterior forceof intact models of the healthy control (blue) and pathological mod-els of the patient group (red) during the internal rotation trial overthe abduction angle in 5° increments. . . . . . . . . . . . . . . . . . . . 251
C.51 Projected median GH joint reaction force of all models onto the glenoidof intact models of the healthy subject cohort and pathological modelsof the patient group during the internal rotation trial. Intact modelsof the healthy control (blue) and pathological models of the patientgroup (red) with their starting value at 25° abduction and the pro-gression up to 85° abduction. . . . . . . . . . . . . . . . . . . . . . . . 252
C.52 Compression force, inferior-superior force and anterior-posterior forceof intact models of the healthy control (blue) and pathological modelsof the patient group (red) during the external rotation trial over theabduction angle in 5° increments. . . . . . . . . . . . . . . . . . . . . . 253
21
List of Figures
C.53 Projected median GH joint reaction force of all models onto the glenoidof intact models of the healthy subject cohort and pathological modelsof the patient group during the external rotation trial. Intact modelsof the healthy control (blue) and pathological models of the patientgroup (red) with their starting value at 25° abduction and the pro-gression up to 85° abduction. . . . . . . . . . . . . . . . . . . . . . . . 254
C.54 Compression force, inferior-superior force and anterior-posterior forceof intact models of the healthy control (blue) and pathological modelsof the patient group (red) during the external rotation trial with 5 Nload in hand over the abduction angle in 5° increments. . . . . . . . . 255
C.55 Projected median GH joint reaction force of all models onto the glenoidof intact models of the healthy subject cohort and pathological mod-els of the patient group during the external rotation trial with 5 Nload in hand. Intact models of the healthy control (blue) and patho-logical models of the patient group (red) with their starting value at25° abduction and the progression up to 85° abduction. . . . . . . . . 256
C.56 EMG muscle activities normalized to the 85° position of the neutralposition trial with 5 N load in hand of the trapezius pars descendens,trapezius pars transversa and trapezius pars ascendens over the ab-duction angle in 5° increments during the neutral position trial. Bluedepicts the EMG activities of the healthy subject group and red of thepatient group. . . . . . . . . . . . . . . . . . . . . . . . . . . . . . . . . 263
C.57 EMG muscle activities normalized to the 85° position of the neutralposition trial with 5 N load in hand of the anterior deltoid, lateral del-toid and posterior deltoid over the abduction angle in 5° incrementsduring the neutral position trial. Blue depicts the EMG activities ofthe healthy subject group and red of the patient group. . . . . . . . . 264
C.58 EMG muscle activities normalized to the 85° position of the neutralposition trial with 5 N load in hand of the infraspinatus, serratus an-terior and latissimus over the abduction angle in 5° increments dur-ing the neutral position trial. Blue depicts the EMG activities of thehealthy subject group and red of the patient group. . . . . . . . . . . 265
22

List of Figures
C.59 EMG muscle activities normalized to the 85° position of the neutralposition trial with 5 N load in hand of the biceps, triceps and rhom-boideus minor over the abduction angle in 5° increments during theneutral position trial. Blue depicts the EMG activities of the healthysubject group and red of the patient group. . . . . . . . . . . . . . . . 266
C.60 EMG muscle activities normalized to the 85° position of the neutralposition trial with 5 N load in hand of the rhomboideus major andpectoralis major over the abduction angle in 5° increments during theneutral position trial. Blue depicts the EMG activities of the healthysubject group and red of the patient group. . . . . . . . . . . . . . . . 267
C.61 EMG muscle activities normalized to the 85° position of the neutralposition trial with 5 N load in hand of the trapezius pars descendens,trapezius pars transversa and trapezius pars ascendens over the ab-duction angle in 5° increments during the neutral position trial with 5N load in hand. Blue depicts the EMG activities of the healthy subjectgroup and red of the patient group. . . . . . . . . . . . . . . . . . . . . 268
C.62 EMG muscle activities normalized to the 85° position of the neutralposition trial with 5 N load in hand of the anterior deltoid, lateral del-toid and posterior deltoid over the abduction angle in 5° incrementsduring the neutral position trial with 5 N load in hand. Blue depictsthe EMG activities of the healthy subject group and red of the patientgroup. . . . . . . . . . . . . . . . . . . . . . . . . . . . . . . . . . . . . . 269
C.63 EMG muscle activities normalized to the 85° position of the neutralposition trial with 5 N load in hand of the infraspinatus, serratus ante-rior and latissimus over the abduction angle in 5° increments duringthe neutral position trial with 5 N load in hand. Blue depicts the EMGactivities of the healthy subject group and red of the patient group. . 270
C.64 EMG muscle activities normalized to the 85° position of the neutralposition trial with 5 N load in hand of the biceps, triceps and rhom-boideus minor over the abduction angle in 5° increments during theneutral position trial with 5 N load in hand. Blue depicts the EMGactivities of the healthy subject group and red of the patient group. . 271
23
List of Figures
C.65 EMG muscle activities normalized to the 85° position of the neutralposition trial with 5 N load in hand of the rhomboideus major andpectoralis major over the abduction angle in 5° increments during theneutral position trial with 5 N load in hand. Blue depicts the EMGactivities of the healthy subject group and red of the patient group. . 272
C.66 EMG muscle activities normalized to the 85° position of the neutralposition trial with 5 N load in hand of the trapezius pars descendens,trapezius pars transversa and trapezius pars ascendens over the ab-duction angle in 5° increments during the internal rotation trial. Bluedepicts the EMG activities of the healthy subject group and red of thepatient group. . . . . . . . . . . . . . . . . . . . . . . . . . . . . . . . . 273
C.67 EMG muscle activities normalized to the 85° position of the neutralposition trial with 5 N load in hand of the anterior deltoid, lateral del-toid and posterior deltoid over the abduction angle in 5° incrementsduring the internal rotation trial. Blue depicts the EMG activities ofthe healthy subject group and red of the patient group. . . . . . . . . 274
C.68 EMG muscle activities normalized to the 85° position of the neutralposition trial with 5 N load in hand of the infraspinatus, serratus an-terior and latissimus over the abduction angle in 5° increments dur-ing the internal rotation trial. Blue depicts the EMG activities of thehealthy subject group and red of the patient group. . . . . . . . . . . 275
C.69 EMG muscle activities normalized to the 85° position of the neutralposition trial with 5 N load in hand of the biceps, triceps and rhom-boideus minor over the abduction angle in 5° increments during theinternal rotation trial. Blue depicts the EMG activities of the healthysubject group and red of the patient group. . . . . . . . . . . . . . . . 276
C.70 EMG muscle activities normalized to the 85° position of the neutralposition trial with 5 N load in hand of the rhomboideus major andpectoralis major over the abduction angle in 5° increments during theinternal rotation trial. Blue depicts the EMG activities of the healthysubject group and red of the patient group. . . . . . . . . . . . . . . . 277
24
List of Figures
C.71 EMG muscle activities normalized to the 85° position of the neutralposition trial with 5 N load in hand of the trapezius pars descendens,trapezius pars transversa and trapezius pars ascendens over the ab-duction angle in 5° increments during the external rotation trial. Bluedepicts the EMG activities of the healthy subject group and red of thepatient group. . . . . . . . . . . . . . . . . . . . . . . . . . . . . . . . . 278
C.72 EMG muscle activities normalized to the 85° position of the neutralposition trial with 5 N load in hand of the anterior deltoid, lateral del-toid and posterior deltoid over the abduction angle in 5° incrementsduring the external rotation trial. Blue depicts the EMG activities ofthe healthy subject group and red of the patient group. . . . . . . . . 279
C.73 EMG muscle activities normalized to the 85° position of the neutralposition trial with 5 N load in hand of the infraspinatus, serratus an-terior and latissimus over the abduction angle in 5° increments dur-ing the external rotation trial. Blue depicts the EMG activities of thehealthy subject group and red of the patient group. . . . . . . . . . . 280
C.74 EMG muscle activities normalized to the 85° position of the neutralposition trial with 5 N load in hand of the biceps, triceps and rhom-boideus minor over the abduction angle in 5° increments during theexternal rotation trial. Blue depicts the EMG activities of the healthysubject group and red of the patient group. . . . . . . . . . . . . . . . 281
C.75 EMG muscle activities normalized to the 85° position of the neutralposition trial with 5 N load in hand of the rhomboideus major andpectoralis major over the abduction angle in 5° increments during theexternal rotation trial. Blue depicts the EMG activities of the healthysubject group and red of the patient group. . . . . . . . . . . . . . . . 282
C.76 EMG muscle activities normalized to the 85° position of the neutralposition trial with 5 N load in hand of the trapezius pars descendens,trapezius pars transversa and trapezius pars ascendens over the ab-duction angle in 5° increments during the external rotation trial with5 N load in hand. Blue depicts the EMG activities of the healthy sub-ject group and red of the patient group. . . . . . . . . . . . . . . . . . 283
25
List of Figures
C.77 EMG muscle activities normalized to the 85° position of the neutralposition trial with 5 N load in hand of the anterior deltoid, lateral del-toid and posterior deltoid over the abduction angle in 5° incrementsduring the external rotation trial with 5 N load in hand. Blue depictsthe EMG activities of the healthy subject group and red of the patientgroup. . . . . . . . . . . . . . . . . . . . . . . . . . . . . . . . . . . . . . 284
C.78 EMG muscle activities normalized to the 85° position of the neutralposition trial with 5 N load in hand of the infraspinatus, serratus ante-rior and latissimus over the abduction angle in 5° increments duringthe external rotation trial with 5 N load in hand. Blue depicts the EMGactivities of the healthy subject group and red of the patient group. . 285
C.79 EMG muscle activities normalized to the 85° position of the neutralposition trial with 5 N load in hand of the biceps, triceps and rhom-boideus minor over the abduction angle in 5° increments during theexternal rotation trial with 5 N load in hand. Blue depicts the EMGactivities of the healthy subject group and red of the patient group. . 286
C.80 EMG muscle activities normalized to the 85° position of the neutralposition trial with 5 N load in hand of the rhomboideus major andpectoralis major over the abduction angle in 5° increments during theexternal rotation trial with 5 N load in hand. Blue depicts the EMGactivities of the healthy subject group and red of the patient group. . 287
26
List of Tables
2.1 Muscles involved in the shoulder complex with their anatomical in-sertions, origins and functionality (Adapted from Schünke, Schulte,and Schumacher, 2007). . . . . . . . . . . . . . . . . . . . . . . . . . . . 50
4.1 Overview of the abbreviations of the altered/included model config-urations . . . . . . . . . . . . . . . . . . . . . . . . . . . . . . . . . . . . 62
4.2 Pearson correlations r between EMG and model activities in the range30-140° of the contemplated combinations ordered from lowest tohighest mean r for the seven contemplated muscle groups. Abbre-viations for the cases are provided in Table 4.1. . . . . . . . . . . . . . 63
5.1 Overview of the parameters used in the Hill model of the AMS andtheir description (Adapted from the reference manual of the AMS) . 78
5.2 RMSE between each muscle element and the associated reference datain mm. Each row is sorted from the anterior to posterior element ofthe respective muscle group. . . . . . . . . . . . . . . . . . . . . . . . . 82
6.1 Overview of the three investigated motions with regard to the kine-matics of the humerus and elbow . . . . . . . . . . . . . . . . . . . . . 106
6.2 Maximum deviation of the surgical models in comparison to the ORGinsertion point of the LBT during each motion task . . . . . . . . . . . 107
7.1 Contemplated muscles and their respective EMG sensor number ofthe experimental setup (see Figure 7.1 for a graphical representation). 123
27
List of Tables
7.2 Differences in median values of muscle activities and GH joint reac-tion forces between intact and pathological models of the healthy sub-ject cohort during the internal rotation trial with 5 N load in hand in5° increments. Asterisks indicate the significance level. AD = anteriordeltoid, LD = lateral deltoid, PD = posterior deltoid, INF = infraspina-tus, SS = subscapularis, BIC = biceps, TRI = triceps, TM = teres minor,PM = pectroalis major, CF = compression force, ISF = inferior-superiorforce, APF = anterior-posterior force . . . . . . . . . . . . . . . . . . . 136
7.3 Differences in median values of muscle activities, GH joint reactionforces and kinematics between intact models of the healthy subjectcohort and pathological models of the patient group during the inter-nal rotation trial with 5 N load in hand in 5° increments. Asterisksindicate the significance level. AD = anterior deltoid, LD = lateraldeltoid, PD = posterior deltoid, INF = infraspinatus, SS = subscapu-laris, BIC = biceps, TRI = triceps, TM = teres minor, PM = pectroalismajor, CF = compression force, ISF = inferior-superior force, APF =anterior-posterior force, FLX = Flexion angle, ER = external rotationangle . . . . . . . . . . . . . . . . . . . . . . . . . . . . . . . . . . . . . 144
7.4 Differences in median values of EMG activities normalized to the 85°position of the neutral position trial with 5 N load in hand betweenthe healthy subject cohort and patient group during the internal ro-tation trial with 5 N load in hand in 5° increments. Asterisks indi-cate the significance level. TD = trapezius descendens, TT = trapez-ius transversa, TA = trapezius ascendens, AD = anterior deltoid, LD= lateral deltoid, PD = posterior deltoid, INF = infraspinatus, SER =serratus anterior, LAT = latissimus, BIC = biceps, TRI = triceps, RMA= rhomboideus major, RMI = rhomboideus minor, PEC = pectoralismajor . . . . . . . . . . . . . . . . . . . . . . . . . . . . . . . . . . . . . 154
28
List of Tables
C.1 Differences in median values of muscle activities, GH joint reactionforces and kinematics between intact and pathological models of thehealthy subject cohort during the neutral position trial in 5° incre-ments. Asterisks indicate the significance level. AD = anterior del-toid, LD = lateral deltoid, PD = posterior deltoid, INF = infraspinatus,SS = subscapularis, BIC = biceps, TRI = triceps, TM = teres minor, PM= pectroalis major, CF = compression force, ISF = inferior-superiorforce, APF = anterior-posterior force, FLX = Flexion angle, ER = ex-ternal rotation angle . . . . . . . . . . . . . . . . . . . . . . . . . . . . 220
C.2 Differences in median values of muscle activities, GH joint reactionforces and kinematics between intact and pathological models of thehealthy subject cohort during the neutral position trial with 5 N loadin hand in 5° increments. Asterisks indicate the significance level. AD= anterior deltoid, LD = lateral deltoid, PD = posterior deltoid, INF= infraspinatus, SS = subscapularis, BIC = biceps, TRI = triceps, TM= teres minor, PM = pectroalis major, CF = compression force, ISF =inferior-superior force, APF = anterior-posterior force, FLX = Flexionangle, ER = external rotation angle . . . . . . . . . . . . . . . . . . . . 221
C.3 Differences in median values of muscle activities, GH joint reactionforces and kinematics between intact and pathological models of thehealthy subject cohort during the internal rotation trial in 5° incre-ments. Asterisks indicate the significance level. AD = anterior del-toid, LD = lateral deltoid, PD = posterior deltoid, INF = infraspinatus,SS = subscapularis, BIC = biceps, TRI = triceps, TM = teres minor, PM= pectroalis major, CF = compression force, ISF = inferior-superiorforce, APF = anterior-posterior force, FLX = Flexion angle, ER = ex-ternal rotation angle . . . . . . . . . . . . . . . . . . . . . . . . . . . . 222
29
List of Tables
C.4 Differences in median values of muscle activities, GH joint reactionforces and kinematics between intact and pathological models of thehealthy subject cohort during the external rotation trial in 5° incre-ments. Asterisks indicate the significance level. AD = anterior del-toid, LD = lateral deltoid, PD = posterior deltoid, INF = infraspinatus,SS = subscapularis, BIC = biceps, TRI = triceps, TM = teres minor, PM= pectroalis major, CF = compression force, ISF = inferior-superiorforce, APF = anterior-posterior force, FLX = Flexion angle, ER = ex-ternal rotation angle . . . . . . . . . . . . . . . . . . . . . . . . . . . . 223
C.5 Differences in median values of muscle activities, GH joint reactionforces and kinematics between intact and pathological models of thehealthy subject cohort during the external rotation trial with 5 N loadin hand in 5° increments. Asterisks indicate the significance level. AD= anterior deltoid, LD = lateral deltoid, PD = posterior deltoid, INF= infraspinatus, SS = subscapularis, BIC = biceps, TRI = triceps, TM= teres minor, PM = pectroalis major, CF = compression force, ISF =inferior-superior force, APF = anterior-posterior force, FLX = Flexionangle, ER = external rotation angle . . . . . . . . . . . . . . . . . . . . 224
C.6 Differences in median values of muscle activities, GH joint reactionforces and kinematics between intact models of the healthy subjectcohort and pathological models of the patient group during the inter-nal rotation trial with 5 N load in hand in 5° increments. Asterisksindicate the significance level. AD = anterior deltoid, LD = lateraldeltoid, PD = posterior deltoid, INF = infraspinatus, SS = subscapu-laris, BIC = biceps, TRI = triceps, TM = teres minor, PM = pectroalismajor, CF = compression force, ISF = inferior-superior force, APF =anterior-posterior force, FLX = Flexion angle, ER = external rotationangle . . . . . . . . . . . . . . . . . . . . . . . . . . . . . . . . . . . . . 257
30
List of Tables
C.7 Differences in median values of muscle activities, GH joint reactionforces and kinematics between intact models of the healthy subjectcohort and pathological models of the patient group during the neu-tral position trial with 5 N load in hand in 5° increments. Asterisksindicate the significance level. AD = anterior deltoid, LD = lateraldeltoid, PD = posterior deltoid, INF = infraspinatus, SS = subscapu-laris, BIC = biceps, TRI = triceps, TM = teres minor, PM = pectroalismajor, CF = compression force, ISF = inferior-superior force, APF =anterior-posterior force, FLX = Flexion angle, ER = external rotationangle . . . . . . . . . . . . . . . . . . . . . . . . . . . . . . . . . . . . . 258
C.8 Differences in median values of muscle activities, GH joint reactionforces and kinematics between intact models of the healthy subjectcohort and pathological models of the patient group during the in-ternal rotation trial in 5° increments. Asterisks indicate the signifi-cance level. AD = anterior deltoid, LD = lateral deltoid, PD = pos-terior deltoid, INF = infraspinatus, SS = subscapularis, BIC = biceps,TRI = triceps, TM = teres minor, PM = pectroalis major, CF = com-pression force, ISF = inferior-superior force, APF = anterior-posteriorforce, FLX = Flexion angle, ER = external rotation angle . . . . . . . . 259
C.9 Differences in median values of muscle activities, GH joint reactionforces and kinematics between intact models of the healthy subjectcohort and pathological models of the patient group during the ex-ternal rotation trials in 5° increments. Asterisks indicate the signifi-cance level. AD = anterior deltoid, LD = lateral deltoid, PD = pos-terior deltoid, INF = infraspinatus, SS = subscapularis, BIC = biceps,TRI = triceps, TM = teres minor, PM = pectroalis major, CF = com-pression force, ISF = inferior-superior force, APF = anterior-posteriorforce, FLX = Flexion angle, ER = external rotation angle . . . . . . . . 260
31

List of Tables
C.10 Differences in median values of muscle activities, GH joint reactionforces and kinematics between intact models of the healthy subjectcohort and pathological models of the patient group during the ex-ternal rotation trial with 5 N load in hand in 5° increments. Asterisksindicate the significance level. AD = anterior deltoid, LD = lateraldeltoid, PD = posterior deltoid, INF = infraspinatus, SS = subscapu-laris, BIC = biceps, TRI = triceps, TM = teres minor, PM = pectroalismajor, CF = compression force, ISF = inferior-superior force, APF =anterior-posterior force, FLX = Flexion angle, ER = external rotationangle . . . . . . . . . . . . . . . . . . . . . . . . . . . . . . . . . . . . . 261
C.11 Differences in median values of EMG activities normalized to the 85°position of the neutral position trial with 5 N load in hand betweenthe healthy subject cohort and patient group during the neutral po-sition trial in 5° increments. Asterisks indicate the significance level.TD = trapezius descendens, TT = trapezius transversa, TA = trapez-ius ascendens, AD = anterior deltoid, LD = lateral deltoid, PD = pos-terior deltoid, INF = infraspinatus, SER = serratus anterior, LAT =latissimus, BIC = biceps, TRI = triceps, RMA = rhomboideus major,RMI = rhomboideus minor, PEC = pectoralis major . . . . . . . . . . 288
C.12 Differences in median values of EMG activities normalized to the 85°position of the neutral position trial with 5 N load in hand betweenthe healthy subject cohort and patient group during the neutral po-sition trial with 5 N load in hand in 5° increments. Asterisks indi-cate the significance level. TD = trapezius descendens, TT = trapez-ius transversa, TA = trapezius ascendens, AD = anterior deltoid, LD= lateral deltoid, PD = posterior deltoid, INF = infraspinatus, SER =serratus anterior, LAT = latissimus, BIC = biceps, TRI = triceps, RMA= rhomboideus major, RMI = rhomboideus minor, PEC = pectoralismajor . . . . . . . . . . . . . . . . . . . . . . . . . . . . . . . . . . . . . 289
32
List of Tables
C.13 Differences in median values of EMG activities normalized to the 85°position of the neutral position trial with 5 N load in hand betweenthe healthy subject cohort and patient group during the internal ro-tation trial in 5° increments. Asterisks indicate the significance level.TD = trapezius descendens, TT = trapezius transversa, TA = trapez-ius ascendens, AD = anterior deltoid, LD = lateral deltoid, PD = pos-terior deltoid, INF = infraspinatus, SER = serratus anterior, LAT =latissimus, BIC = biceps, TRI = triceps, RMA = rhomboideus major,RMI = rhomboideus minor, PEC = pectoralis major . . . . . . . . . . 290
C.14 Differences in median values of EMG activities normalized to the 85°position of the neutral position trial with 5 N load in hand betweenthe healthy subject cohort and patient group during the external ro-tation trial in 5° increments. Asterisks indicate the significance level.TD = trapezius descendens, TT = trapezius transversa, TA = trapez-ius ascendens, AD = anterior deltoid, LD = lateral deltoid, PD = pos-terior deltoid, INF = infraspinatus, SER = serratus anterior, LAT =latissimus, BIC = biceps, TRI = triceps, RMA = rhomboideus major,RMI = rhomboideus minor, PEC = pectoralis major . . . . . . . . . . 291
C.15 Differences in median values of EMG activities normalized to the 85°position of the neutral position trial with 5 N load in hand betweenthe healthy subject cohort and patient group during the external ro-tation trial with 5 N load in hand in 5° increments. Asterisks indi-cate the significance level. TD = trapezius descendens, TT = trapez-ius transversa, TA = trapezius ascendens, AD = anterior deltoid, LD= lateral deltoid, PD = posterior deltoid, INF = infraspinatus, SER =serratus anterior, LAT = latissimus, BIC = biceps, TRI = triceps, RMA= rhomboideus major, RMI = rhomboideus minor, PEC = pectoralismajor . . . . . . . . . . . . . . . . . . . . . . . . . . . . . . . . . . . . . 292
33

List of Abbreviations
AC AcromioclavicularALLFM All forces and moments transmitted from carrier segments to the humerusAMMR AnyBody Managed Modeling RepositoryAMS AnyBody Modeling SystemBM Base modelBW Body weightCB long biceps tendon inserted at the caput breveCL Motion capture driven clavicular protraction & elevationDOF Degree of freedomEL ElbowEMG ElectromyographyFDK Force-ddependent kinematicsFXZ Only forces in X (compression) and Z (anterior-posterior) direction are transmittedGH GlenohumeralH Hill muscle modelHH long biceps tendon inserted at the bicipital groove on the humeral headIS Inferior-superiorLBT Long biceps tendon
34
ML Medial-lalteralMoCap Motion captureMRI Magnetic resonance imagingMVC Maximum voluntary contractionNOFM No forces and moments are transmitted from the three carrier segmentsOFF long biceps tendon disabled and turned offORG long biceps tendon in its original statePA Posterior-anteriorPEEK Polyether ether ketoneRHY Alteration of scapular/clavicle rhythmRMS Root mean squareRMSE Root mean square errorROM Range of motionS Strength scalingSC SernoclavicularSLAP Superior labrum from anterior to posteriorST ScapulothoracicT Torus obstacle method for deltoid wrapping
35

List of Symbols
r Pearson correlation coefficientp Power of the polynomial muscle recruitment criterionM Moment arm derived from the tendon excursion methodN NewtonNm Newton meter∂l Change in length of the tendon during a given amount of joint rotation∂θ Change in rotation angle during a given amount of joint rotation
36

Dedicated to Angelika & Martin.
37
Chapter 1
Introduction
Disorders of the musculoskeletal system ranked as one of the major contributingfactors for the inability to work(Meyer, Wenzel, and Schenkel, 2018). This fact is animmense burden on the affected individuals, healthcare and social welfare systemswhere the indirect costs are predominant (Woolf and Pfleger, 2003). Musculoskele-tal disorders in general cover a variety of pathologies, and one specific area witha high impact is the shoulder complex, as it affects millions of people world wide.The reported incidence of shoulder complaints e.g. in the Netherlands is estimatedat 11.2/1000 patients/year (van der Windt et al., 1995). The prevalence of shoulderpain has been found to be as high as 15.4% in men and 24.9% in women who re-ported weekly episodes of pain (Pribicevic, 2012) which is comparable to 20% and20.7% reported by similar studies (Pope et al., 1997; Yamamoto et al., 2010). Up to70% of these painful conditions can be attributed to injuries or degeneration of themuscles and tendons of the rotator cuff (Chard et al., 1991). Investigations of theprevalence of rotator cuff tears have identified age, history of trauma and use ofthe dominant arm as key risk factors for developing a pathology (Yamamoto et al.,2010; Minagawa et al., 2013). Yamamoto et al., 2010 tested the population of a vil-lage (n=683) employing physical examination and ultrasonography for determiningthe prevalence of rotator cuff tears. They reported a 20.7% positive rate in the testedsubjects, whereas 36% of these subjects where symptomatic, while 16.9% of the sub-jects without symptoms also tested positive for rotator cuff tears. Minagawa et al.,2013 did a similar study and found a prevalence of 22.1% in the general population,with the asymptomatic tear being twice as common as a symptomatic tear. How-ever, these asymptomatic tears can progress to become symptomatic and painfulwhile limiting the range of motion (Mall et al., 2010; Moosmayer et al., 2013).
38
Chapter 1. Introduction
A co-morbidity of rotator cuff tears is often instabilities of the long biceps tendonanchor, tears of the labrum, or long biceps instabilities (Hawi et al., 2017). If con-servative treatments of shoulder diseases with a long biceps tendon pathology andcuff tears fail, operative techniques are considered in order to relieve pain and re-gain strength and function (Boileau et al., 2002). While restoring the functionality ofthe rotator cuff is the main focus, the long biceps tendon is often cut to relieve pain(Walch et al., 2005). From a clinical point of view, there are a couple of ways to pro-ceed after releasing the long biceps tendon from the glenoid rim (Voss et al., 2017).Several varying techniques and constructs are available to perform a long bicepstendon tenodesis, including an array of intra-articular, suprapectoral, and subpec-toral fixation methods of the bisected tendon (Schoch, Geyer, and Drews, 2017) inorder to restore function.
When multiple surgical techniques are being used simultaneously, there is no con-sensus as to which method is preferable and how they affect the biomechanics ofthe shoulder-arm complex. Analysing the mechanical changes within the shoulder-arm complex of the aforementioned techniques could provide insights about postsurgical muscle function and joint stability.
Considering the muscles comprising the group of the rotator cuff, the most com-monly affected one is the m. supraspinatus (Moor et al., 2014). The m. supraspina-tus has two main purposes, that of stabilising the humeral head on the glenoid incombination with the other muscles making up the rotator cuff and to abduct thehumerus in conjunction with the deltoids and to a lesser extent, other muscles span-ning the glenohumeral joint. If an isolated tear occurs without ruptures of othermuscles of the rotator cuff and remains untreated, the tear size does not necessarilyprogress and can heal without surgical treatment (Fucentese et al., 2012). In order todiagnose a tear of the m. supraspinatus, several tools are typically used in clinicalpractice. Sonography (Mack et al., 1985; Crass, Craig, and Feinberg, 1988; Wienerand Seitz Jr, 1993; Moppes, Veldkamp, and Roorda, 1995) and magnetic resonanceimaging (Quinn et al., 1995; Ferri et al., 2005) show high sensitivity and specificityfor identifying this pathology. The full-can and empty-can tests are used for initialtesting to identify a tear of the m. supraspinatus, where the empty can test is morepainful for some patients (Itoi et al., 1999; Timmons et al., 2016).
39
Chapter 1. Introduction
In addition to these techniques, studies have been conducted which utilise elec-tromyography to assess muscle activation patterns of patients with rotator cuff tears(Witte et al., 2012; Witte et al., 2014a; Witte et al., 2014b; Kai et al., 2015; Sakaki etal., 2015). In conjunction to this, rehabilitation exercises have been analysed viaelectromyography in order to identify activation levels of the rotator cuff and m. su-parapsinatus in healthy subjects to a certain extent (Edwards et al., 2017). Anotherresearch focus is on how the m. supraspinatus and the deltoids are recruited duringthe empty and full can test (Reinold et al., 2007a). Ekstrom and Osborn, 2004 pro-vides an overview of studies conducting electromyographic measurements of them. supraspinatus which compare the empty and full can test and found no signif-icant difference between the tests. Patients also reported pain during the internalrotation or the empty can test. Furthermore, electromyography has been shown toplay an important role in the detection of myopathy (Fuglsang-Frederiksen, 2006).
With millions of people affected by this particular pathology, a large field of re-search has been dedicated to improvement of diagnostics, surgery, clinical outcomeand a general better understanding of the involved biomechanics. Cadaver stud-ies in the clinical field are being used for detailed examination; for e.g. strength ofthe rotator cuff muscles (Keating et al., 1993) or effects on the biomechanics of theglenohumeral joint (Soslowsky, Malicky, and Blasier, 1997; Oh et al., 2011). Wherecadaver studies excel in investigating resulting changes in morphology (e.g. Saku-rai et al., 1998) and effects on the involved structures of the shoulder, they can-not fully describe muscle activation patterns and therefore the forces acting on thejoints. Simulation based approaches however offer the opportunity to compute ef-fects of shoulder disorders during activities of daily living and their effects on thebiomechanics of the shoulder-arm complex. In particular musculoskeletal modelsallow for a subject specific calculation of muscles activities, their resulting forcesand consequently joint reaction forces without the need for in-vivo measurements.Several musculoskeletal models of the upper limb and shoulder region have beendeveloped (van der Helm; Charlton and Johnson, 2006; Favre, Snedeker, and Ger-ber, 2009) or adapted (Sins et al., 2015) over the years and are used in a variety ofapplications. Detailed overviews of existing models and their use are provided byPrinold et al., 2013 and Bolsterlee, Veeger, Dirkjan H E J, and Chadwick, 2013.
40
Chapter 1. Introduction
As tears of the rotator cuff are the dominant disorder within the shoulder complex,several simulation studies have focused on various aspects of the rotator cuff. Theseinclude the assessment of muscle transfers of latissimus dorsi, teres major or a com-bination of these two to compensate for inoperable massive rotator cuff tears in asimulation environment ( Magermans et al., 2004a; Magermans et al., 2004b) or thesimulated effects of full tears of the rotator cuff on the risk of impingement in hand-bike and handrim wheelchair propulsion (Drongelen] et al., 2013). Leschinger et al.,2019 simulated a rotator cuff repair with a variation in insertion of the virtual muscleand the change in joint reaction force. Hölscher et al., 2016a used a musculoskele-tal model to analyse the effects of various combinations of rotator cuff tears on theglenohumeral joint reaction force.
While these models see a variety of use to answer and describe clinical issues from abiomechanical perspective, they are still under constant improvement. One ma-jor issue is the discrepancy of simulated joint reaction forces in musculoskeletalmodels which use an inverse dynamics approach to in vivo measured force data inhumeral abduction above 90° (Bergmann et al., 2011). An increase in magnitude ofthe resultant glenohumeral joint reaction force occurs in patients with instrumentedimplants during humeral abduction above 90°, which is also indicated by a highactivity of the muscles spanning the shoulder joint from electromyographic mea-surements (Wickham et al., 2010). Musculoskeletal models using an inverse dynam-ics approach show lower activities and a decline in joint reaction force above 90°humeral abduction. Nikooyan et al., 2010 used these in vivo measurements for val-idation purposes of the Delft shoulder model (van der Helm, 1994a; van der Helm,1994b; Nikooyan et al., 2011). Other then these valuable (but scarce) in vivo forcemeasurements, electromyography is also utilized to validate musculoskeletal mod-els by comparing the measured amplitude to predicted model activities (Groot et al.,2004; Morrow, Kaufman, and An, 2010; Nikooyan et al., 2010; Nikooyan et al., 2011).A study which utilised electromyographic signals to drive a musculoskeletal modelwhich also incorporated patients with the instrumentalised implants was conductedby Nikooyan et al., 2012. They surmised that muscle co-contraction e.g. from them. latissimus dorsi causes the increase in glenohumeral joint reaction force above90° abduction. However, Sins et al., 2015 reported increasing reaction forces andshowed the contrast to existing models in force behaviour during abduction above90° where several changes were implemented.
41
Chapter 1. Introduction
Since they used an inverse dynamics approach, in theory no co-contraction shouldbe involved as a computational implementation of this phenomenon is not includedin this type of model.
Where various predictive models of the shoulder complex exist, a core modellingparameter seems to be missing as most of them fail to compute the joint reactionforce accurately.
The combination of musculoskeletal models and electromyographic measurementsare typically utilised in the two ways, that of either validating a model or usingpatient specific electromyographic signals as an input. A third option would alsobe of interest, whether a model can predict a change in muscle activation patternswhich can point towards a targeted use of electromyography as a tool for diagnosis.
Combining the afore mentioned clinical relevance of tears of the m. supraspinatus,electromyographic measurements and biomechanics derived from musculoskeletalsimulations leads to the outline and aim of this thesis, which addresses several re-search questions:
1. Investigation and improvement of an existing model of the shoulder complex:Is there an alternative explanation for the rising muscle activities and gleno-humeral joint reaction force above 90° abduction? (Chapter 4 & Chapter 5)
2. Computation of several operative techniques of a biceps tendon transfer:Is one technique closer to the healthy state of the shoulder-arm complex froma biomechanical point of view? (Chapter 6)
3. Simulation of a full tear of the m. supraspinatus with a focus on muscle acti-vation pattern and glenohumeral joint reaction force:Can a generic musculoskeletal model predict changes in the muscle recruit-ment of pathologies accurately? (Chapter 7)
This thesis is structured to answer these research questions with a clear outline andis hereby divided in sections with their own introductions, methods, results, discus-sions and conclusions. Chapters 2 & 3 provide an overview over the anatomy ofthe shoulder complex and the utilised musculoskeletal simulation program whichincorporates the basis for this presented work.
42
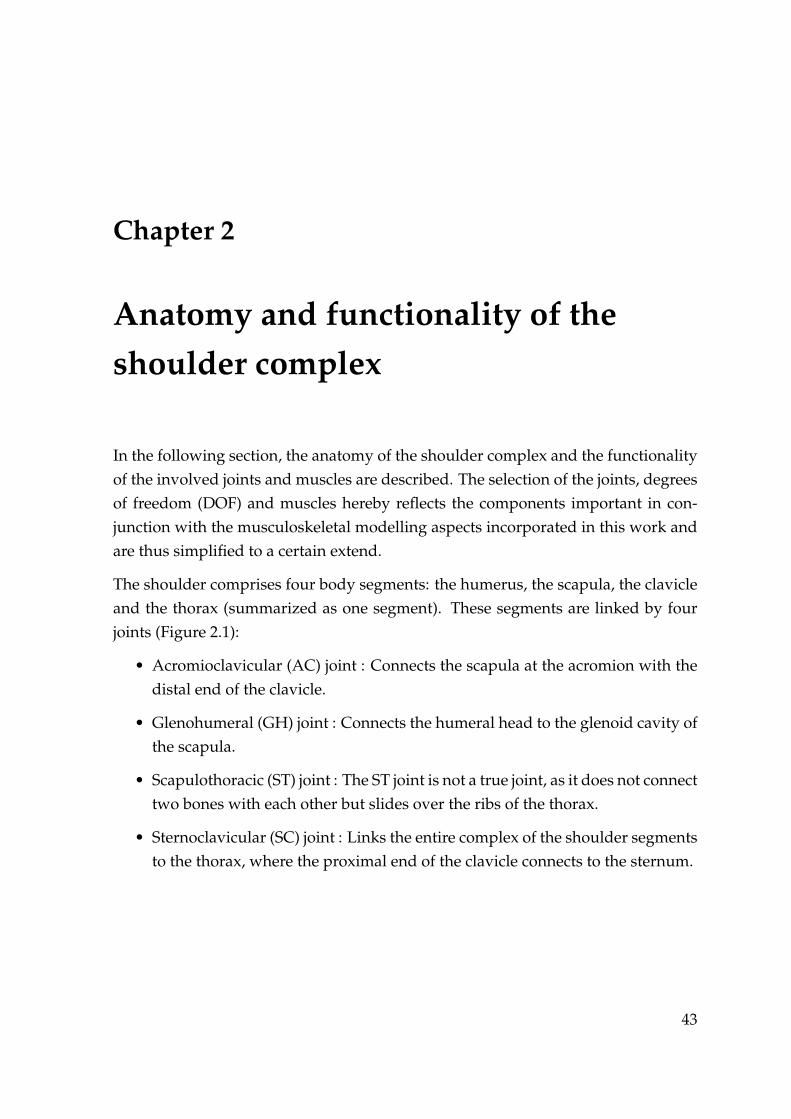
Chapter 2
Anatomy and functionality of theshoulder complex
In the following section, the anatomy of the shoulder complex and the functionalityof the involved joints and muscles are described. The selection of the joints, degreesof freedom (DOF) and muscles hereby reflects the components important in con-junction with the musculoskeletal modelling aspects incorporated in this work andare thus simplified to a certain extend.
The shoulder comprises four body segments: the humerus, the scapula, the clavicleand the thorax (summarized as one segment). These segments are linked by fourjoints (Figure 2.1):
• Acromioclavicular (AC) joint : Connects the scapula at the acromion with thedistal end of the clavicle.
• Glenohumeral (GH) joint : Connects the humeral head to the glenoid cavity ofthe scapula.
• Scapulothoracic (ST) joint : The ST joint is not a true joint, as it does not connecttwo bones with each other but slides over the ribs of the thorax.
• Sternoclavicular (SC) joint : Links the entire complex of the shoulder segmentsto the thorax, where the proximal end of the clavicle connects to the sternum.
43
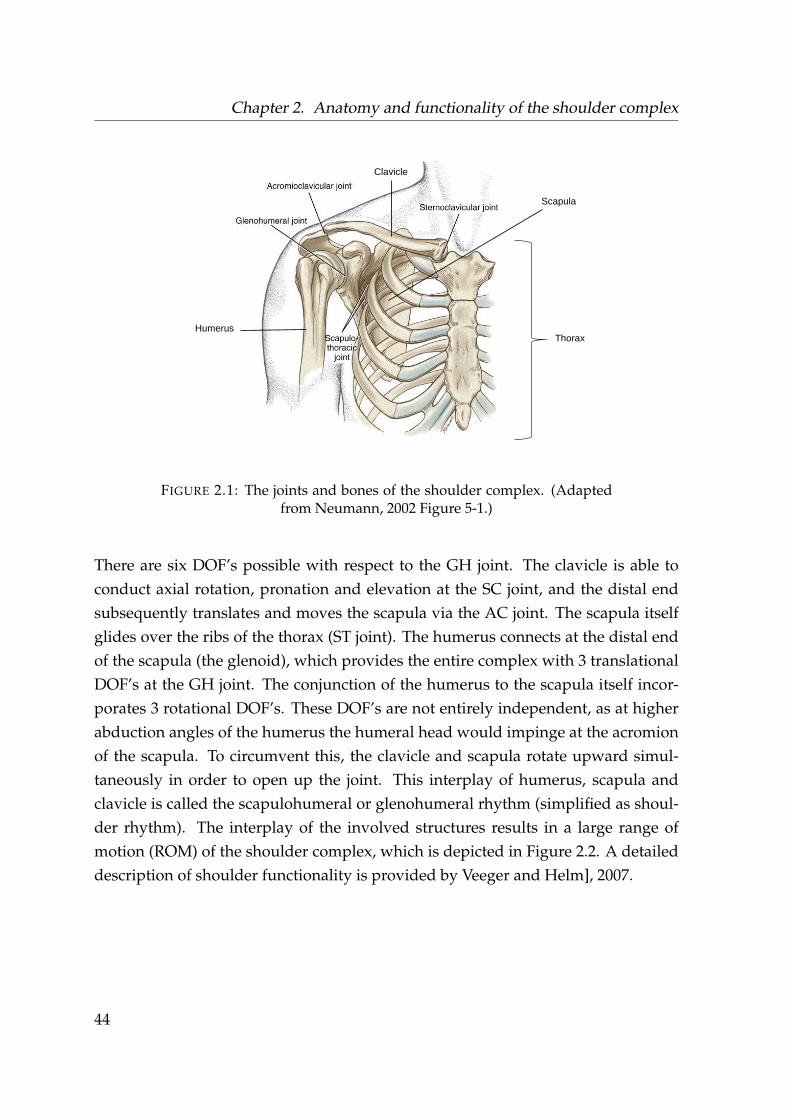
Chapter 2. Anatomy and functionality of the shoulder complex
Clavicle
Scapula
Humerus Thorax
FIGURE 2.1: The joints and bones of the shoulder complex. (Adaptedfrom Neumann, 2002 Figure 5-1.)
There are six DOF’s possible with respect to the GH joint. The clavicle is able toconduct axial rotation, pronation and elevation at the SC joint, and the distal endsubsequently translates and moves the scapula via the AC joint. The scapula itselfglides over the ribs of the thorax (ST joint). The humerus connects at the distal endof the scapula (the glenoid), which provides the entire complex with 3 translationalDOF’s at the GH joint. The conjunction of the humerus to the scapula itself incor-porates 3 rotational DOF’s. These DOF’s are not entirely independent, as at higherabduction angles of the humerus the humeral head would impinge at the acromionof the scapula. To circumvent this, the clavicle and scapula rotate upward simul-taneously in order to open up the joint. This interplay of humerus, scapula andclavicle is called the scapulohumeral or glenohumeral rhythm (simplified as shoul-der rhythm). The interplay of the involved structures results in a large range ofmotion (ROM) of the shoulder complex, which is depicted in Figure 2.2. A detaileddescription of shoulder functionality is provided by Veeger and Helm], 2007.
44
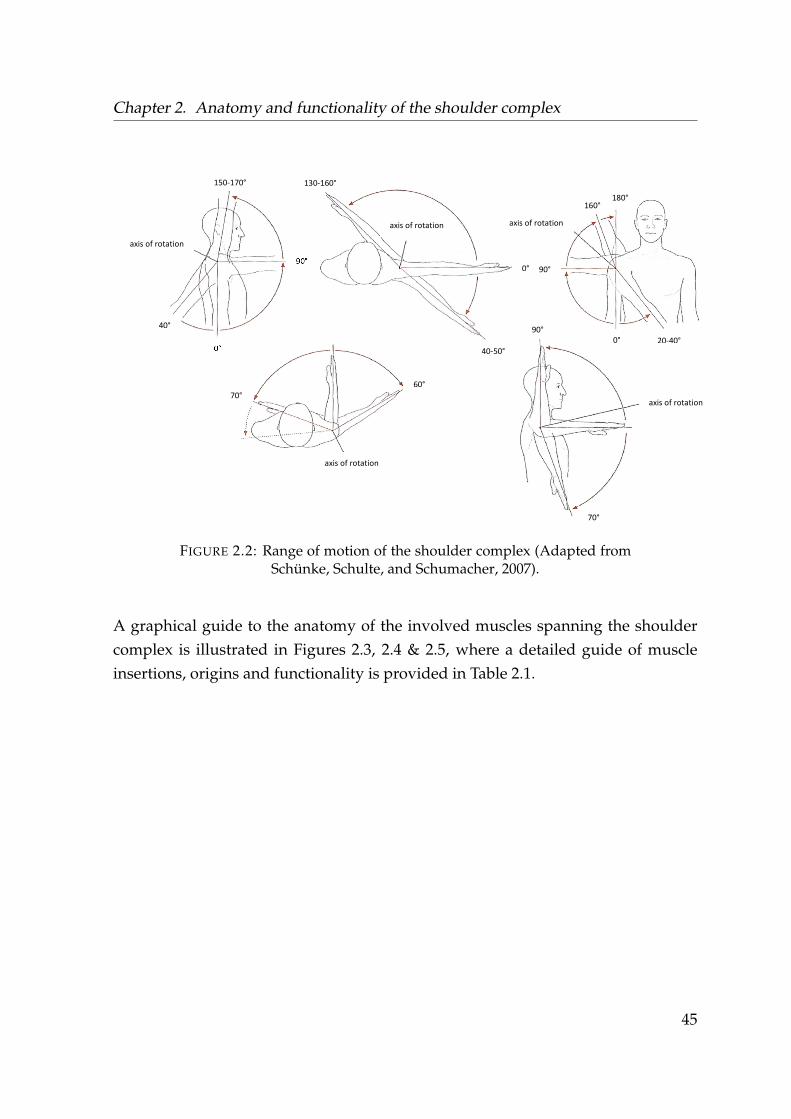
Chapter 2. Anatomy and functionality of the shoulder complex
150-170°
90°
0°
40°
axis of rotation
axis of rotation
130-160°
0°
40-50°
20-40°
180° 160°
90°
0°
axis of rotation
70° 60°
axis of rotation
90°
axis of rotation
70°
FIGURE 2.2: Range of motion of the shoulder complex (Adapted fromSchünke, Schulte, and Schumacher, 2007).
A graphical guide to the anatomy of the involved muscles spanning the shouldercomplex is illustrated in Figures 2.3, 2.4 & 2.5, where a detailed guide of muscleinsertions, origins and functionality is provided in Table 2.1.
45
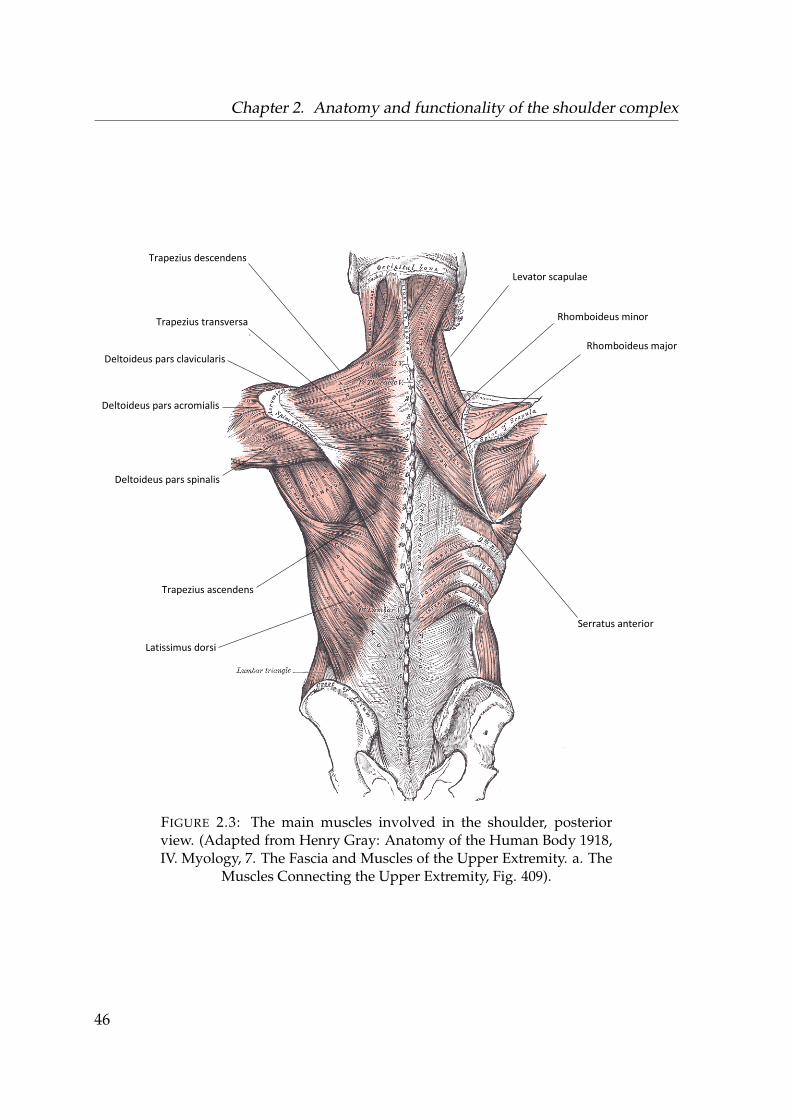
Chapter 2. Anatomy and functionality of the shoulder complex
Trapezius descendens
Trapezius transversa
Trapezius ascendens
Latissimus dorsi
Deltoideus pars clavicularis
Deltoideus pars acromialis
Deltoideus pars spinalis
Levator scapulae
Rhomboideus minor
Rhomboideus major
Serratus anterior
FIGURE 2.3: The main muscles involved in the shoulder, posteriorview. (Adapted from Henry Gray: Anatomy of the Human Body 1918,IV. Myology, 7. The Fascia and Muscles of the Upper Extremity. a. The
Muscles Connecting the Upper Extremity, Fig. 409).
46
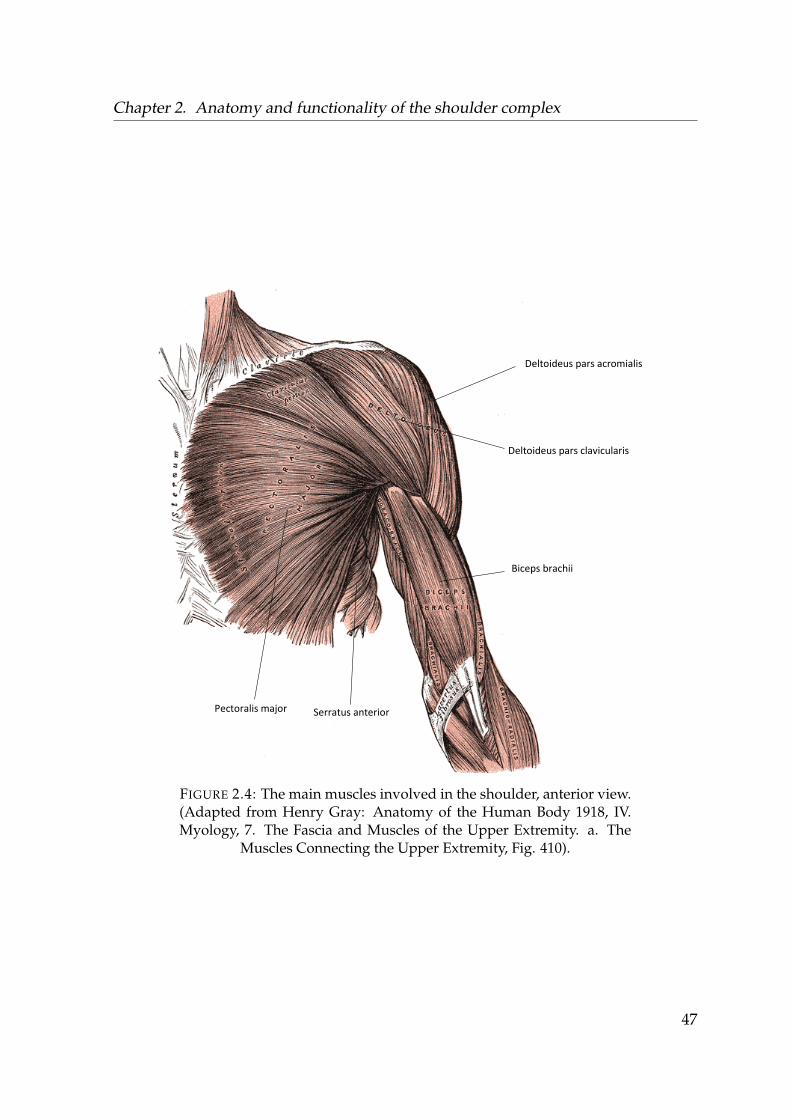
Chapter 2. Anatomy and functionality of the shoulder complex
Pectoralis major
Deltoideus pars acromialis
Deltoideus pars clavicularis
Biceps brachii
Serratus anterior
FIGURE 2.4: The main muscles involved in the shoulder, anterior view.(Adapted from Henry Gray: Anatomy of the Human Body 1918, IV.Myology, 7. The Fascia and Muscles of the Upper Extremity. a. The
Muscles Connecting the Upper Extremity, Fig. 410).
47
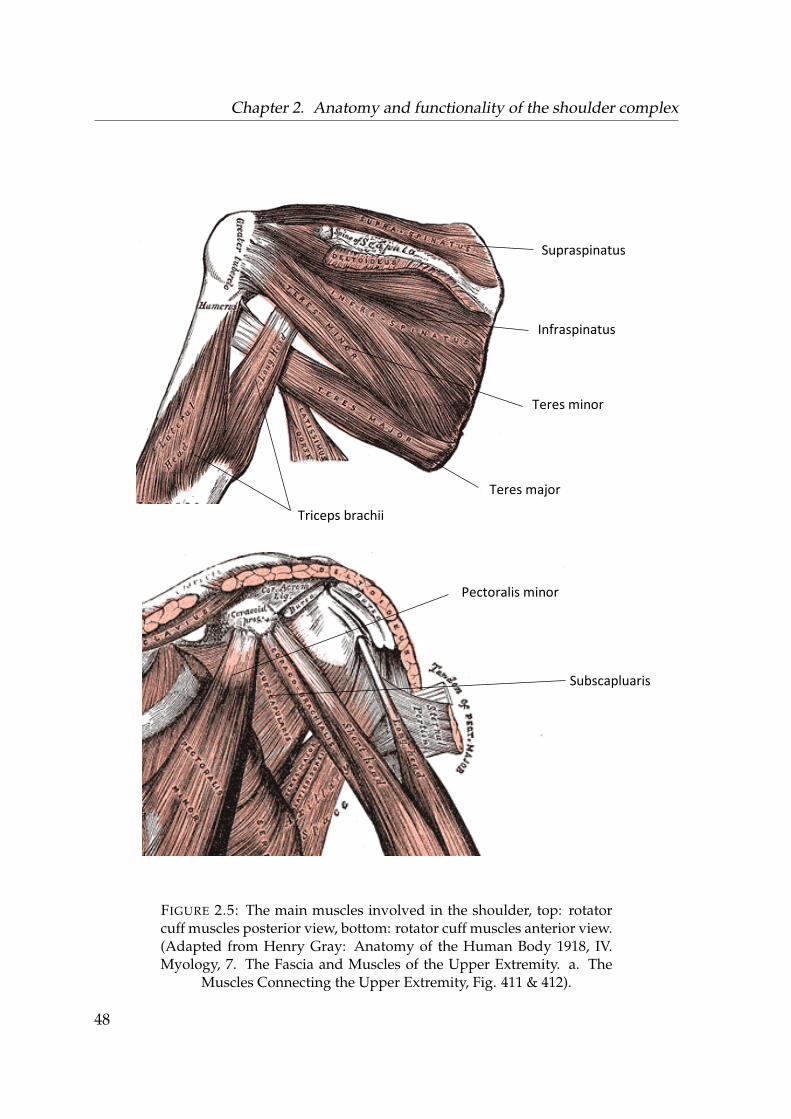
Chapter 2. Anatomy and functionality of the shoulder complex
Supraspinatus
Infraspinatus
Teres minor
Teres major
Subscapluaris
Triceps brachii
Pectoralis minor
FIGURE 2.5: The main muscles involved in the shoulder, top: rotatorcuff muscles posterior view, bottom: rotator cuff muscles anterior view.(Adapted from Henry Gray: Anatomy of the Human Body 1918, IV.Myology, 7. The Fascia and Muscles of the Upper Extremity. a. The
Muscles Connecting the Upper Extremity, Fig. 411 & 412).
48
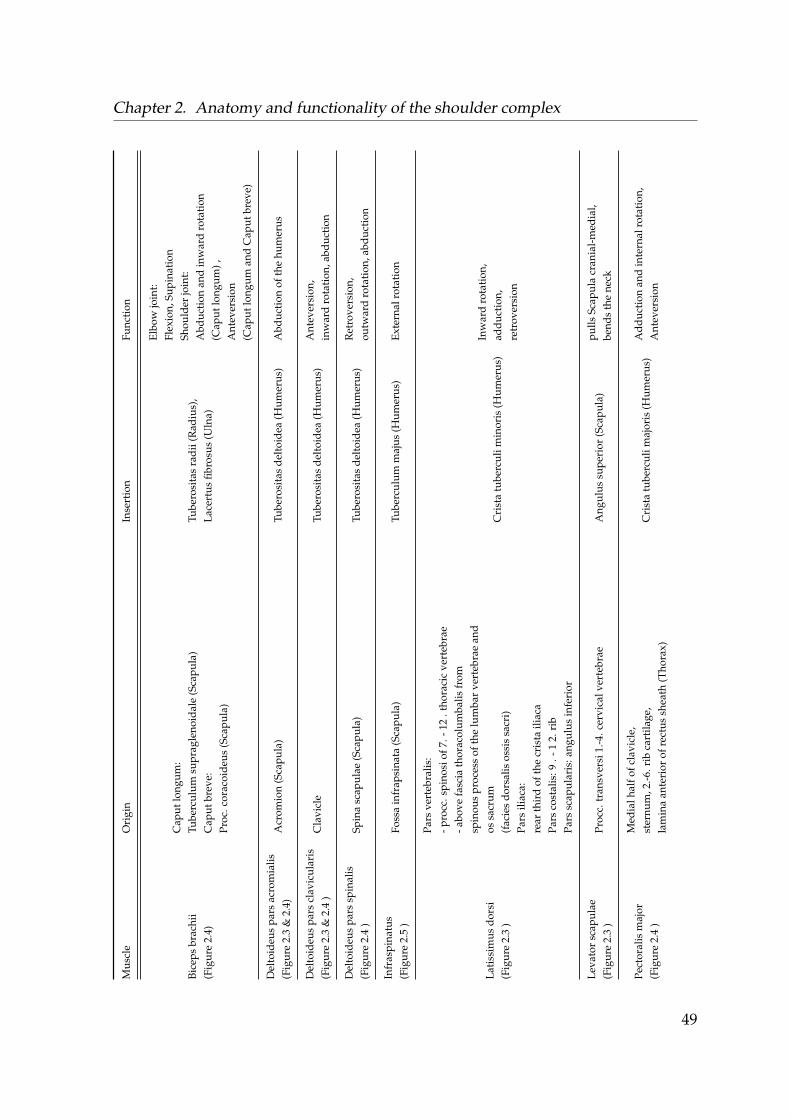
Chapter 2. Anatomy and functionality of the shoulder complexM
uscl
eO
rigi
nIn
sert
ion
Func
tion
Bice
psbr
achi
i(F
igur
e2.
4)
Cap
utlo
ngum
:Tu
berc
ulum
supr
agle
noid
ale
(Sca
pula
)C
aput
brev
e:Pr
oc.c
orac
oide
us(S
capu
la)
Tube
rosi
tas
radi
i(R
adiu
s),
Lace
rtus
fibro
sus
(Uln
a)
Elbo
wjo
int:
Flex
ion,
Supi
nati
onSh
ould
erjo
int:
Abd
ucti
onan
din
war
dro
tati
on(C
aput
long
um),
Ant
ever
sion
(Cap
utlo
ngum
and
Cap
utbr
eve)
Del
toid
eus
pars
acro
mia
lis(F
igur
e2.
3&
2.4)
Acr
omio
n(S
capu
la)
Tube
rosi
tas
delt
oide
a(H
umer
us)
Abd
ucti
onof
the
hum
erus
Del
toid
eus
pars
clav
icul
aris
(Fig
ure
2.3
&2.
4)
Cla
vicl
eTu
bero
sita
sde
ltoi
dea
(Hum
erus
)A
ntev
ersi
on,
inw
ard
rota
tion
,abd
ucti
on
Del
toid
eus
pars
spin
alis
(Fig
ure
2.4
)Sp
ina
scap
ulae
(Sca
pula
)Tu
bero
sita
sde
ltoi
dea
(Hum
erus
)R
etro
vers
ion,
outw
ard
rota
tion
,abd
ucti
on
Infr
aspi
natu
s(F
igur
e2.
5)
Foss
ain
frap
sina
ta(S
capu
la)
Tube
rcul
umm
ajus
(Hum
erus
)Ex
tern
alro
tati
on
Lati
ssim
usdo
rsi
(Fig
ure
2.3
)
Pars
vert
ebra
lis:
-pro
cc.s
pino
siof
7.-1
2.t
hora
cic
vert
ebra
e-a
bove
fasc
iath
orac
olum
balis
from
spin
ous
proc
ess
ofth
elu
mba
rve
rteb
rae
and
ossa
crum
(fac
ies
dors
alis
ossi
ssa
cri)
Pars
iliac
a:re
arth
ird
ofth
ecr
ista
iliac
aPa
rsco
stal
is:9
.-1
2.ri
bPa
rssc
apul
aris
:ang
ulus
infe
rior
Cri
sta
tube
rcul
imin
oris
(Hum
erus
)In
war
dro
tati
on,
addu
ctio
n,re
trov
ersi
on
Leva
tor
scap
ulae
(Fig
ure
2.3
)Pr
occ.
tran
sver
si1.
-4.c
ervi
calv
erte
brae
Ang
ulus
supe
rior
(Sca
pula
)pu
llsSc
apul
acr
ania
l-m
edia
l,be
nds
the
neck
Pect
oral
ism
ajor
(Fig
ure
2.4
)
Med
ialh
alfo
fcla
vicl
e,st
ernu
m,2
.-6.r
ibca
rtila
ge,
lam
ina
ante
rior
ofre
ctus
shea
th(T
hora
x)C
rist
atu
berc
ulim
ajor
is(H
umer
us)
Add
ucti
onan
din
tern
alro
tati
on,
Ant
ever
sion
49
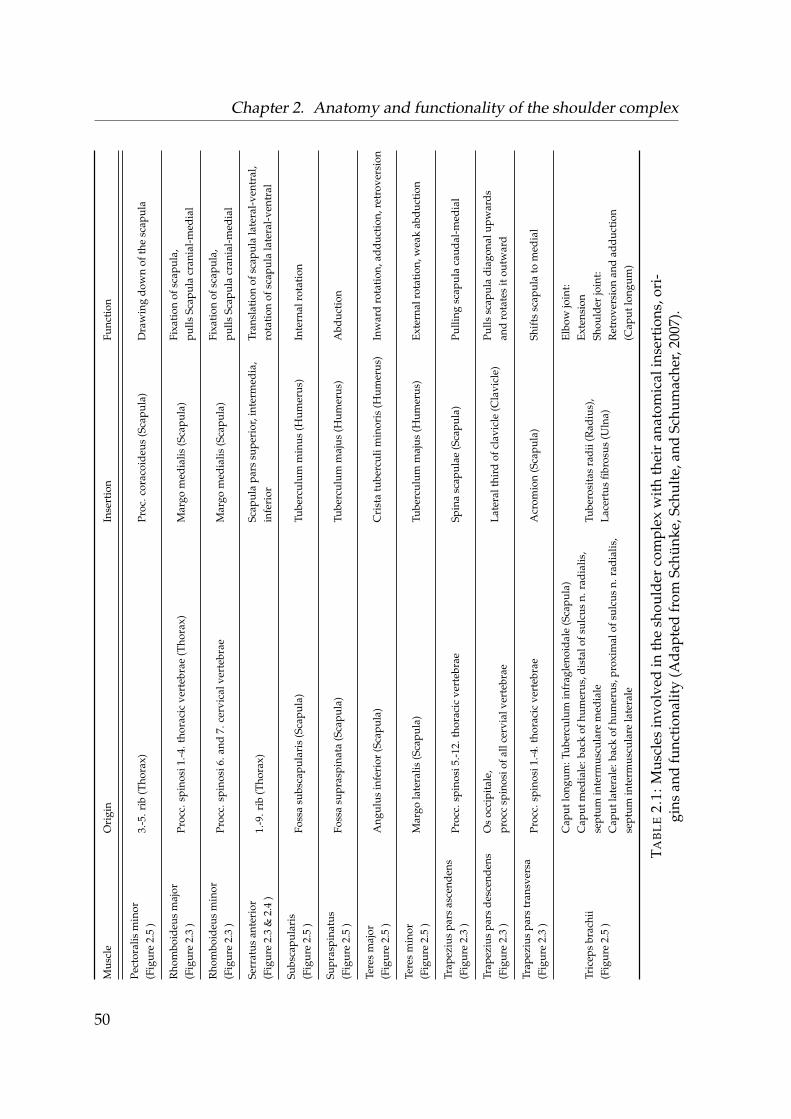
Chapter 2. Anatomy and functionality of the shoulder complexM
uscl
eO
rigi
nIn
sert
ion
Func
tion
Pect
oral
ism
inor
(Fig
ure
2.5
)3.
-5.r
ib(T
hora
x)Pr
oc.c
orac
oide
us(S
capu
la)
Dra
win
gdo
wn
ofth
esc
apul
a
Rho
mbo
ideu
sm
ajor
(Fig
ure
2.3
)Pr
occ.
spin
osi1
.-4.t
hora
cic
vert
ebra
e(T
hora
x)M
argo
med
ialis
(Sca
pula
)Fi
xati
onof
scap
ula,
pulls
Scap
ula
cran
ial-
med
ial
Rho
mbo
ideu
sm
inor
(Fig
ure
2.3
)Pr
occ.
spin
osi6
.and
7.ce
rvic
alve
rteb
rae
Mar
gom
edia
lis(S
capu
la)
Fixa
tion
ofsc
apul
a,pu
llsSc
apul
acr
ania
l-m
edia
l
Serr
atus
ante
rior
(Fig
ure
2.3
&2.
4)
1.-9
.rib
(Tho
rax)
Scap
ula
pars
supe
rior
,int
erm
edia
,in
feri
orTr
ansl
atio
nof
scap
ula
late
ral-
vent
ral,
rota
tion
ofsc
apul
ala
tera
l-ve
ntra
l
Subs
capu
lari
s(F
igur
e2.
5)
Foss
asu
bsca
pula
ris
(Sca
pula
)Tu
berc
ulum
min
us(H
umer
us)
Inte
rnal
rota
tion
Supr
aspi
natu
s(F
igur
e2.
5)
Foss
asu
pras
pina
ta(S
capu
la)
Tube
rcul
umm
ajus
(Hum
erus
)A
bduc
tion
Tere
sm
ajor
(Fig
ure
2.5
)A
ngul
usin
feri
or(S
capu
la)
Cri
sta
tube
rcul
imin
oris
(Hum
erus
)In
war
dro
tati
on,a
dduc
tion
,ret
rove
rsio
n
Tere
sm
inor
(Fig
ure
2.5
)M
argo
late
ralis
(Sca
pula
)Tu
berc
ulum
maj
us(H
umer
us)
Exte
rnal
rota
tion
,wea
kab
duct
ion
Trap
eziu
spa
rsas
cend
ens
(Fig
ure
2.3
)Pr
occ.
spin
osi5
.-12.
thor
acic
vert
ebra
eSp
ina
scap
ulae
(Sca
pula
)Pu
lling
scap
ula
caud
al-m
edia
l
Trap
eziu
spa
rsde
scen
dens
(Fig
ure
2.3
)O
soc
cipi
tale
,pr
occ
spin
osio
fall
cerv
ialv
erte
brae
Late
ralt
hird
ofcl
avic
le(C
lavi
cle)
Pulls
scap
ula
diag
onal
upw
ards
and
rota
tes
itou
twar
d
Trap
eziu
spa
rstr
ansv
ersa
(Fig
ure
2.3
)Pr
occ.
spin
osi1
.-4.t
hora
cic
vert
ebra
eA
crom
ion
(Sca
pula
)Sh
ifts
scap
ula
tom
edia
l
Tric
eps
brac
hii
(Fig
ure
2.5
)
Cap
utlo
ngum
:Tub
ercu
lum
infr
agle
noid
ale
(Sca
pula
)C
aput
med
iale
:bac
kof
hum
erus
,dis
talo
fsul
cus
n.ra
dial
is,
sept
umin
term
uscu
lare
med
iale
Cap
utla
tera
le:b
ack
ofhu
mer
us,p
roxi
mal
ofsu
lcus
n.ra
dial
is,
sept
umin
term
uscu
lare
late
rale
Tube
rosi
tas
radi
i(R
adiu
s),
Lace
rtus
fibro
sus
(Uln
a)
Elbo
wjo
int:
Exte
nsio
nSh
ould
erjo
int:
Ret
rove
rsio
nan
dad
duct
ion
(Cap
utlo
ngum
)
TAB
LE
2.1:
Mus
cles
invo
lved
inth
esh
ould
erco
mpl
exw
ith
thei
ran
atom
ical
inse
rtio
ns,o
ri-
gins
and
func
tion
alit
y(A
dapt
edfr
omSc
hünk
e,Sc
hult
e,an
dSc
hum
ache
r,20
07).
50
Chapter 3
Musculoskeletal modelling within theAnyBodyTM Modeling System
3.1 The shoulder model of the AnyBodyTM Modeling
System
The AnyBodyTM Modeling System (AMS) has been selected for all the musculoskele-tal modelling and simulation aspects of this work, as the AMS has demonstrated agood comparability between predicted joint loadings to in-vivo loads (e.g. Marraet al., 2015).
The shoulder sub-model within the AMS is based on the van der Helm model (vander Helm, 1994b), where specific parameters regarding e.g. insertion, origin, musclefibre length and cross-sectional area are implemented from multiple sources and canbe found in the AMS documentation. For the various computational studies con-ducted within the framework of this thesis, two iterations of the AMS are utilised.This originates from improvements of the utilised shoulder model, which were im-plemented by other research groups and were published during the duration of thiswork. These are the AMS V.7.1.0 with the shoulder model of the AnyBody man-aged modelling repository (AMMR) V. 2.2.0 and the AMS V.7.2.0 with the AMMRversion V 2.2.2.. A notable difference between these two shoulder models is the im-provement of the deltoid muscle group, where muscle insertion and origin points,strength of the elements and the wrapping were changed by Strzelczak et al., 2018.
51
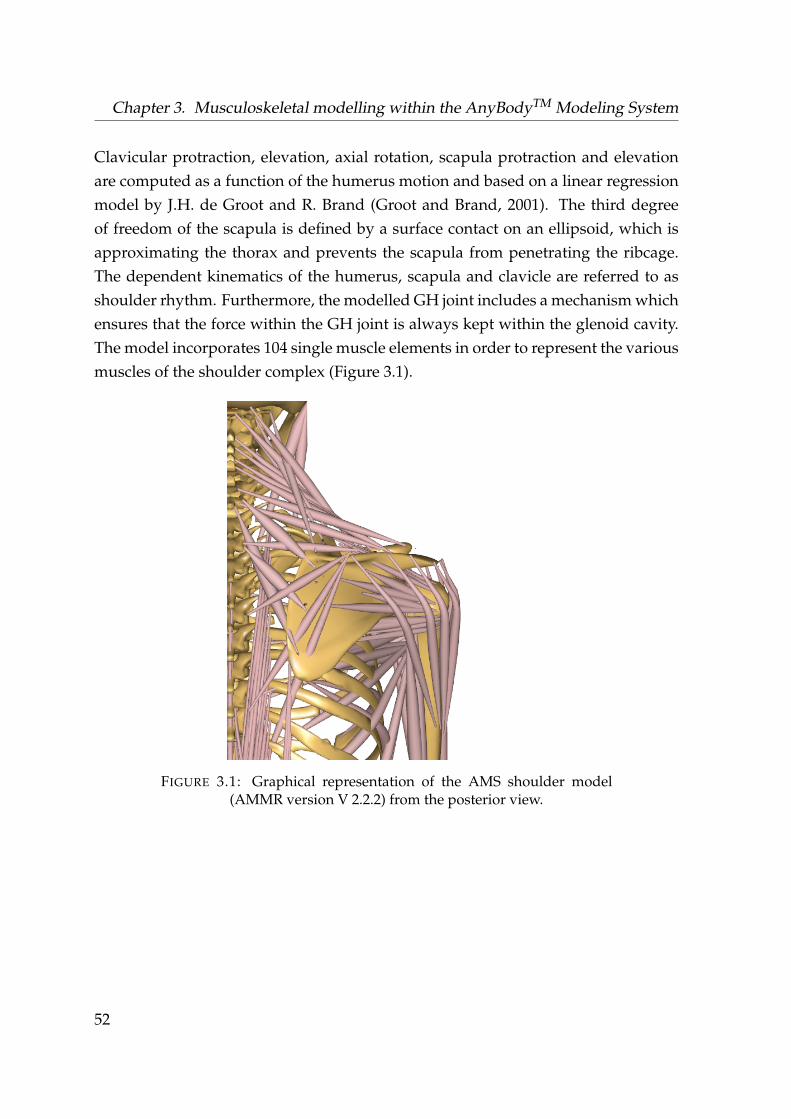
Chapter 3. Musculoskeletal modelling within the AnyBodyTM Modeling System
Clavicular protraction, elevation, axial rotation, scapula protraction and elevationare computed as a function of the humerus motion and based on a linear regressionmodel by J.H. de Groot and R. Brand (Groot and Brand, 2001). The third degreeof freedom of the scapula is defined by a surface contact on an ellipsoid, which isapproximating the thorax and prevents the scapula from penetrating the ribcage.The dependent kinematics of the humerus, scapula and clavicle are referred to asshoulder rhythm. Furthermore, the modelled GH joint includes a mechanism whichensures that the force within the GH joint is always kept within the glenoid cavity.The model incorporates 104 single muscle elements in order to represent the variousmuscles of the shoulder complex (Figure 3.1).
FIGURE 3.1: Graphical representation of the AMS shoulder model(AMMR version V 2.2.2) from the posterior view.
52
3.2. Recruitment of muscles within the AnyBodyTM Modeling System
The AMS offers several features which are utilised in this thesis. It allows for theinput of motion capture marker trajectories, where the kinematics of the segmentsare computed by a kinematically over-determinate optimization approach (Ander-sen et al., 2010). The involved body segments are scaled by these markers, wherethe distribution of the subject specific body weight follows a length-mass-fat scalinglaw (Rasmussen et al., 2005). In order to model test subjects which participate in mo-tion capture experiments, the initial segment length, body height, body weight andmarker trajectories are required as input parameters. For the computation of a largenumber of models e.g. to evaluate changes within the model or to compute multipletrials of different subjects, an external Python script is utilised (Lund, Rasmussen,and Andersen, 2019).
3.2 Recruitment of muscles within the AnyBodyTM Mod-
eling System
The computational approach used by the AMS is hereby based on the principlesof inverse dynamics. With the kinematics as known input, the system computesthe required muscle forces which are necessary to bring the segment masses, exter-nal loads and inertia effects into dynamic equilibrium. Since the musculoskeletalsystem is highly redundant by nature in terms of multiple muscles and elementsspanning a given joint, a muscle recruitment criterion is needed to distribute theloads onto multiple muscle elements within a simulation.
The following section describes the mathematical principles of how the AMS solvesthis redundancy. It is taken from Damsgaard et al., 2006 with small adaptations,where the AMS was originally developed by the authors of this paper.
53
Chapter 3. Musculoskeletal modelling within the AnyBodyTM Modeling System
The solution of the muscle recruitment problem in the inverse dynamics approachis generally formulated as an optimization problem on the form
Minimizef
G(fM) (3.1)
Subject to Cf = d, (3.2)
0 6 f (M)i 6 Ni, i ∈
{1, ..., n(M)
}, (3.3)
where G is the objective function, i.e., the assumed criterion of the recruitment strat-egy of the central nervous system, stated in terms of the muscle forces, f(M). G isminimized with respect to all unknown forces in the problem, f = [f(M)Tf(R)T]T,i.e., muscle forces, f(M), and joint reactions, f(R). Eq. 3.2 is the dynamic equilibriumequations, which enter as constraints into the optimization. C is the coefficient-matrix for the unknown forces and the right-hand side, d, contains all known ap-plied loads and inertia forces. The non-negativity constraints on the muscle forces,Equation 3.3, state that muscles can only pull, not push, and the upper bounds limittheir capability, i.e., Ni is the strength of the muscle. The most popular form of theobjective function, G, is the polynomial criteria.
G(f(M)) =n(M)
∑i=1
(f (M)iNi
)p
. (3.4)
G is stated with a variable power, p, and a normalizing function for each muscle, Ni.The normalized muscle force is often referred to as the muscle activity.
While these equations provide the underlying mathematics of the muscle recruit-ment within the AMS, Equation 3.4 is of special interest for this thesis as the powerp of the objective function is altered in Chapter 5.
54
Chapter 4
Evaluation of musculoskeletalmodelling parameters of the shouldercomplex during humeral abductionabove 90°
The following chapter has been published in a similar form in the Journal of Biome-chanics under Aurbach et al., 2020b.
4.1 Introduction
One of the aims of this thesis is to simulate a full thickness tear of the m. supraspina-tus and its biomechanical impact on muscle recruitment and joint reaction forces.Where one of the main purposes of the m. supraspinatus is to aid in the abduc-tion of the humerus, it is important to incorporate a model which has the ability topredict the muscle activities and acting forces accordingly. As stated as the first re-search question in chapter 1, the issue of discrepancy between in-vivo measured GHjoint reaction forces as compared to computed forces by a musculoskeletal simula-tion program is addressed in this section. While musculoskeletal models using aninverse dynamics approach achieve reasonable results for e.g. the knee joint (Marraet al., 2015), they seem to underperform with regard to the shoulder joint. Nikooyanet al., 2012 showed that with EMG as input for a model, joint reaction forces increase,and they traced it back to several muscles stabilizing the shoulder by co-contraction.
55
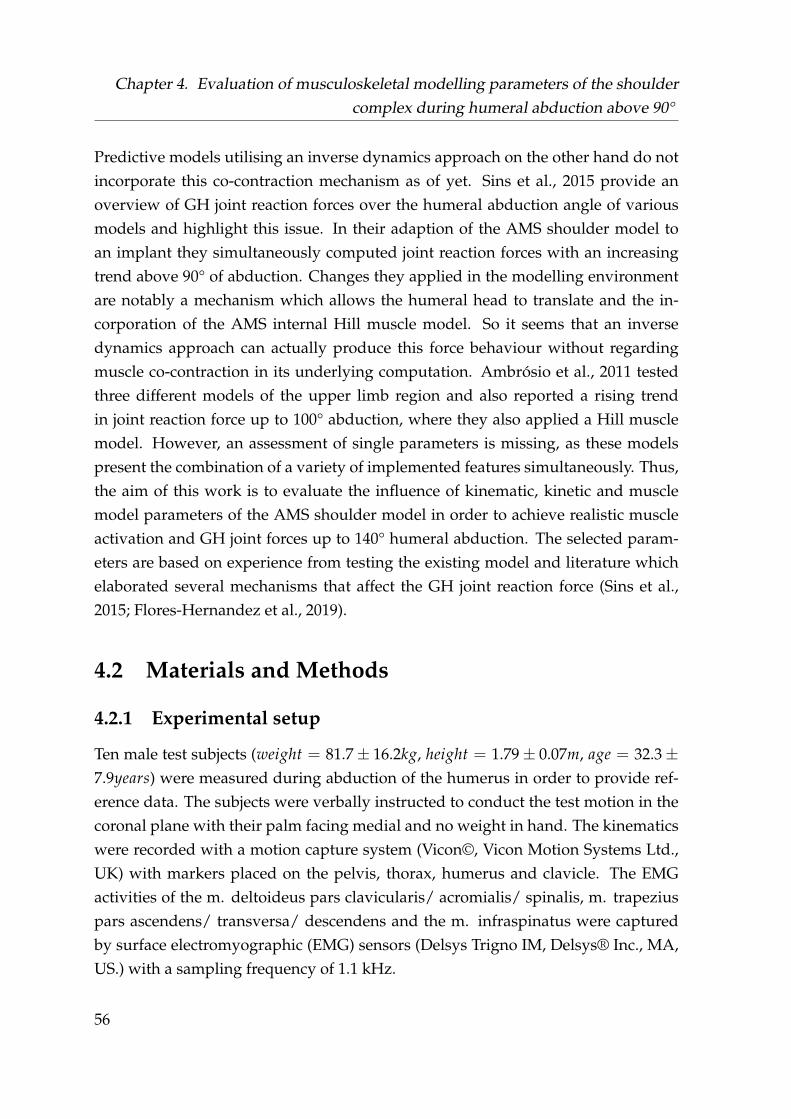
Chapter 4. Evaluation of musculoskeletal modelling parameters of the shouldercomplex during humeral abduction above 90°
Predictive models utilising an inverse dynamics approach on the other hand do notincorporate this co-contraction mechanism as of yet. Sins et al., 2015 provide anoverview of GH joint reaction forces over the humeral abduction angle of variousmodels and highlight this issue. In their adaption of the AMS shoulder model toan implant they simultaneously computed joint reaction forces with an increasingtrend above 90° of abduction. Changes they applied in the modelling environmentare notably a mechanism which allows the humeral head to translate and the in-corporation of the AMS internal Hill muscle model. So it seems that an inversedynamics approach can actually produce this force behaviour without regardingmuscle co-contraction in its underlying computation. Ambrósio et al., 2011 testedthree different models of the upper limb region and also reported a rising trendin joint reaction force up to 100° abduction, where they also applied a Hill musclemodel. However, an assessment of single parameters is missing, as these modelspresent the combination of a variety of implemented features simultaneously. Thus,the aim of this work is to evaluate the influence of kinematic, kinetic and musclemodel parameters of the AMS shoulder model in order to achieve realistic muscleactivation and GH joint forces up to 140° humeral abduction. The selected param-eters are based on experience from testing the existing model and literature whichelaborated several mechanisms that affect the GH joint reaction force (Sins et al.,2015; Flores-Hernandez et al., 2019).
4.2 Materials and Methods
4.2.1 Experimental setup
Ten male test subjects (weight = 81.7± 16.2kg, height = 1.79± 0.07m, age = 32.3±7.9years) were measured during abduction of the humerus in order to provide ref-erence data. The subjects were verbally instructed to conduct the test motion in thecoronal plane with their palm facing medial and no weight in hand. The kinematicswere recorded with a motion capture system (Vicon©, Vicon Motion Systems Ltd.,UK) with markers placed on the pelvis, thorax, humerus and clavicle. The EMGactivities of the m. deltoideus pars clavicularis/ acromialis/ spinalis, m. trapeziuspars ascendens/ transversa/ descendens and the m. infraspinatus were capturedby surface electromyographic (EMG) sensors (Delsys Trigno IM, Delsys® Inc., MA,US.) with a sampling frequency of 1.1 kHz.
56
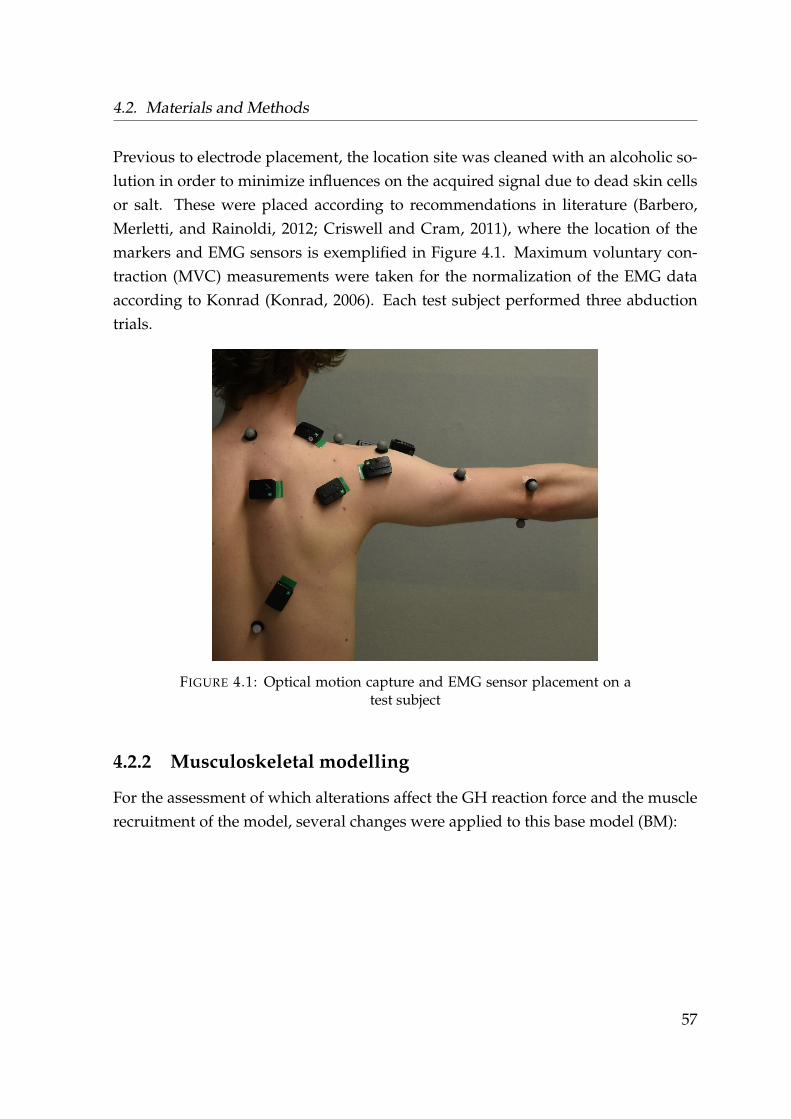
4.2. Materials and Methods
Previous to electrode placement, the location site was cleaned with an alcoholic so-lution in order to minimize influences on the acquired signal due to dead skin cellsor salt. These were placed according to recommendations in literature (Barbero,Merletti, and Rainoldi, 2012; Criswell and Cram, 2011), where the location of themarkers and EMG sensors is exemplified in Figure 4.1. Maximum voluntary con-traction (MVC) measurements were taken for the normalization of the EMG dataaccording to Konrad (Konrad, 2006). Each test subject performed three abductiontrials.
FIGURE 4.1: Optical motion capture and EMG sensor placement on atest subject
4.2.2 Musculoskeletal modelling
For the assessment of which alterations affect the GH reaction force and the musclerecruitment of the model, several changes were applied to this base model (BM):
57
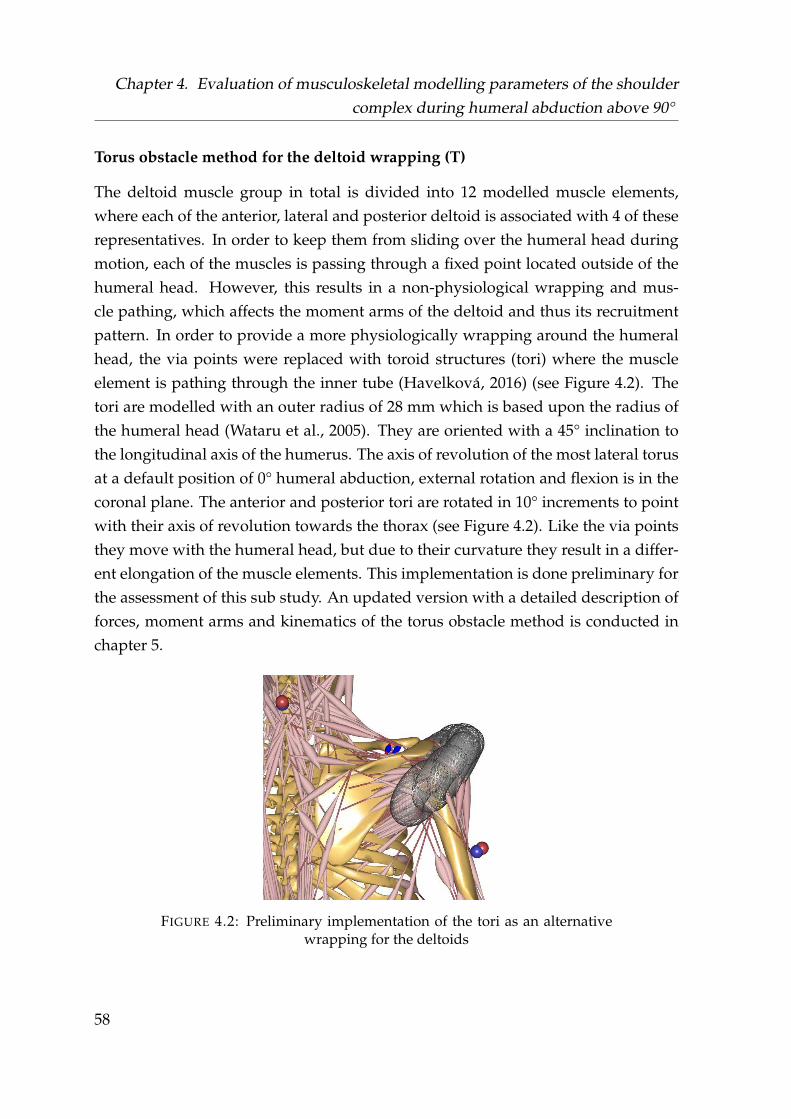
Chapter 4. Evaluation of musculoskeletal modelling parameters of the shouldercomplex during humeral abduction above 90°
Torus obstacle method for the deltoid wrapping (T)
The deltoid muscle group in total is divided into 12 modelled muscle elements,where each of the anterior, lateral and posterior deltoid is associated with 4 of theserepresentatives. In order to keep them from sliding over the humeral head duringmotion, each of the muscles is passing through a fixed point located outside of thehumeral head. However, this results in a non-physiological wrapping and mus-cle pathing, which affects the moment arms of the deltoid and thus its recruitmentpattern. In order to provide a more physiologically wrapping around the humeralhead, the via points were replaced with toroid structures (tori) where the muscleelement is pathing through the inner tube (Havelková, 2016) (see Figure 4.2). Thetori are modelled with an outer radius of 28 mm which is based upon the radius ofthe humeral head (Wataru et al., 2005). They are oriented with a 45° inclination tothe longitudinal axis of the humerus. The axis of revolution of the most lateral torusat a default position of 0° humeral abduction, external rotation and flexion is in thecoronal plane. The anterior and posterior tori are rotated in 10° increments to pointwith their axis of revolution towards the thorax (see Figure 4.2). Like the via pointsthey move with the humeral head, but due to their curvature they result in a differ-ent elongation of the muscle elements. This implementation is done preliminary forthe assessment of this sub study. An updated version with a detailed description offorces, moment arms and kinematics of the torus obstacle method is conducted inchapter 5.
FIGURE 4.2: Preliminary implementation of the tori as an alternativewrapping for the deltoids
58

4.2. Materials and Methods
Three element Hill muscle model (H) and strength scaling (S)
With the shoulder complex having a large range of motion, the muscle elementsexhibit a considerable change in length. Thus, the Hill muscle model (Hill, 1938)from the AMMR is used. This results in a varying strength of the muscle elementdepending on its length, which changes the muscle recruitment and introduces pas-sive forces. Figure 4.3 (A) depicts the schematic representation of a Hill muscleelement, where blue is the stiffness of the tendon and is called the serial elastic el-ement, orange the stiffness of the muscle fibres or parallel elastic element and red(CE) is the contractile element, which is responsible for active force production. Thefibre penation angle is taken into account under the angle α. Figure 4.3 (B) depictsthe tendon force which is exerted by an elongation of the element. Figure 4.3 (C)shows the force output of the muscle belly, where red highlights the variation of thestrength of the CE element if its elongated or contracted with regard to its optimalfibre length and by a larger elongation the passive force of the parallel elastic el-ement. The tendon slack length of the muscle elements used in the Hill model arescaled with a set of predefined positions by the AMMR with regard to the individualanthropometrics of the test subjects, whereas the other variables of the Hill modelare constants provided by the AMMR.
FIGURE 4.3: Principle of operation of the 3 element muscle model ac-cording to Hill. (Adapted from Delp et al., 1990 & O’Neill et al., 2013)
59
Chapter 4. Evaluation of musculoskeletal modelling parameters of the shouldercomplex during humeral abduction above 90°
Utilisation of the Hill model required to take strength scaling into account whichwas altered by a factor of two (S2) and three (S3) in order to assess whether it hasan influence on the force behaviour. The scaling is applied to the maximum forcethe muscle elements can produce, which simultaneously scales the resistant force ofthe passive stiffness elements. The factors were derived from previous testing onwhich scaling factors provide reasonable amplitudes in muscle activity with regardto literature (Wickham et al., 2010).
Motion capture driven clavicular protraction/elevation (CL)
The kinematics of clavicle and scapula are computed by the shoulder rhythm, whichdoes not account for subject individual kinematics. An initial testing of the motioncapture models has indicated a discrepancy between the marker placed on the ACjoint (see Figure 2.1) from the measurements to the position derived from the shoul-der rhythm. To account for subject individual motion, the DOF’s of the clavicularprotraction and elevation are replaced with the kinematics from this motion capturemarker.
Force-dependent kinematics of the GH joint (FDK)
During an active state of the muscles spanning over the GH joint, the humeral headtranslates in the proximo-distal and anterior-posterior direction (Graichen et al.,2000; Massimini et al., 2012). This is implemented using force dependant kinemat-ics (Skipper Andersen et al., 2017), which is a local forward dynamics approach.Spring forces representing the stiffness of the capsule act against the forces withinthe joint allowing for a translation of the humerus segment depending on the com-puted muscle forces from the inverse dynamics optimization. The spring stiffness isadjusted to fit the translation according to literature (Massimini et al., 2012), with amaximum of 6.0 mm in anterior-posterior and 2.5 mm in inferior-superior direction.
Alteration of scapula/clavicle rhythm (RHY)
The current rhythm for the scapula and clavicle is driven via a linear relationshipwith regard to the humeral elevation angle. An alternative rhythm was imple-mented where the kinematics follow a non-linear set of equations (Ludewig et al.,2009). The impact of a variation of the scapulothoracic rhythm on the GH joint reac-tion force was furthermore highlighted by Flores-Hernandez et al., 2019.
60

4.2. Materials and Methods
Simulation
From the six modifications T, H, S, CL, FDK and RHY, 16 different combinationsare considered. For each combination, 30 trials from the experimental setup havebeen calculated within the AMS, resulting in 480 models. The AMS V.7.1.0. is usedfor the study, where the shoulder is based on the model version from the AMMR V2.0.0.. Automatization, scaling and marker optimization are utilised as described inchapter 3.
Validation of model activity vs. EMG
The root mean square (RMS) of all EMG signals is calculated with a window sizeof 100 ms and the offset of the baseline is subtracted from each channel from theraw data. The signals are normalised to the MVC trials. In order to provide aninter-subject comparability, the abduction angle from the model was taken to re-place the time dependency. The RMS values are distributed equally between 30-140° using a polynomial interpolation. For validation, a linear relationship betweenEMG activity and muscle force is assumed (Ringelberg, 1985) and a Pearson correla-tion coefficient r is calculated between model activity and EMG. The mean resultantGH joint reaction force of each parameter combination is computed by interpolationover the adbudction angle and each subject’s force is normalized to its bodyweight(BW). The resultant GH joint reaction force is then compared in a qualitative man-ner to the in-vivo data provided by OrthoLoad (2008, Retrieved 15. May, 2018 fromhttp://www.OrthoLoad.com, files: s1r_210206_1_42, s2r_040408_1_2, s2r_270306_1_86s,3l_190308_1_48, s4r_140207_1_70, s5r_131108_1_40, s8r_161208_1_17, s8r_161208_1_31).
61
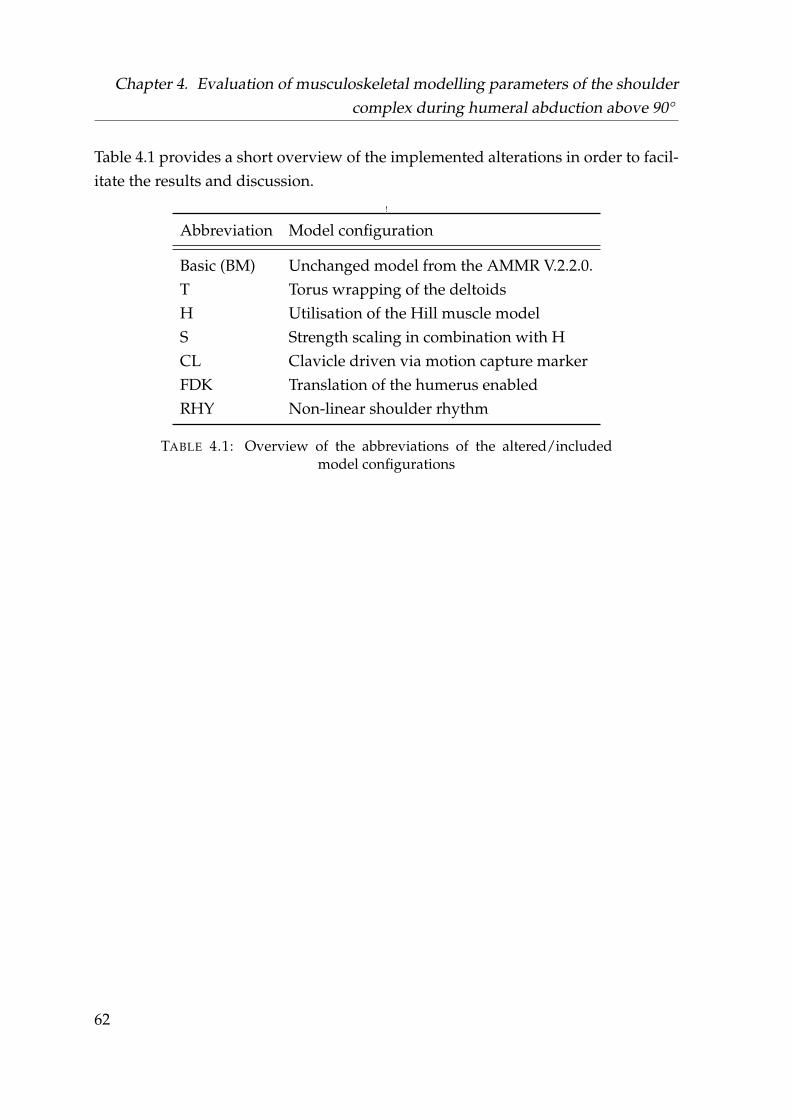
Chapter 4. Evaluation of musculoskeletal modelling parameters of the shouldercomplex during humeral abduction above 90°
Table 4.1 provides a short overview of the implemented alterations in order to facil-itate the results and discussion.
!
Abbreviation Model configuration
Basic (BM) Unchanged model from the AMMR V.2.2.0.T Torus wrapping of the deltoidsH Utilisation of the Hill muscle modelS Strength scaling in combination with HCL Clavicle driven via motion capture markerFDK Translation of the humerus enabledRHY Non-linear shoulder rhythm
TABLE 4.1: Overview of the abbreviations of the altered/includedmodel configurations
62
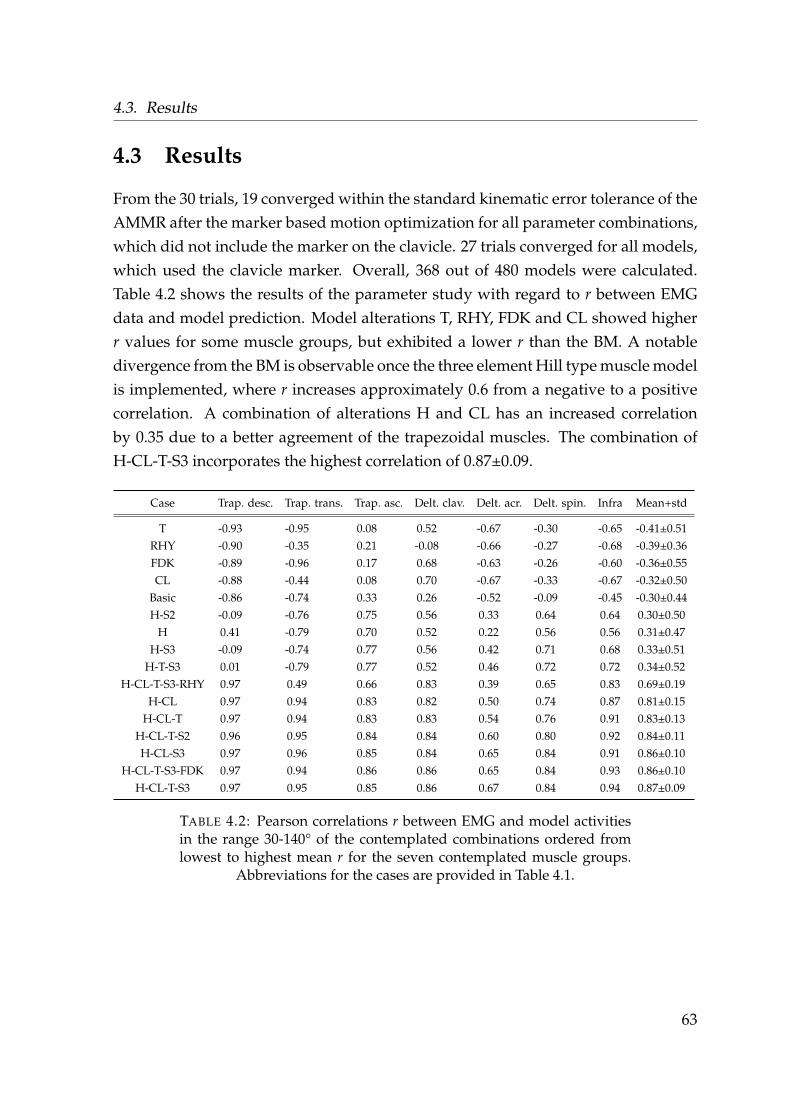
4.3. Results
4.3 Results
From the 30 trials, 19 converged within the standard kinematic error tolerance of theAMMR after the marker based motion optimization for all parameter combinations,which did not include the marker on the clavicle. 27 trials converged for all models,which used the clavicle marker. Overall, 368 out of 480 models were calculated.Table 4.2 shows the results of the parameter study with regard to r between EMGdata and model prediction. Model alterations T, RHY, FDK and CL showed higherr values for some muscle groups, but exhibited a lower r than the BM. A notabledivergence from the BM is observable once the three element Hill type muscle modelis implemented, where r increases approximately 0.6 from a negative to a positivecorrelation. A combination of alterations H and CL has an increased correlationby 0.35 due to a better agreement of the trapezoidal muscles. The combination ofH-CL-T-S3 incorporates the highest correlation of 0.87±0.09.
Case Trap. desc. Trap. trans. Trap. asc. Delt. clav. Delt. acr. Delt. spin. Infra Mean+std
T -0.93 -0.95 0.08 0.52 -0.67 -0.30 -0.65 -0.41±0.51RHY -0.90 -0.35 0.21 -0.08 -0.66 -0.27 -0.68 -0.39±0.36FDK -0.89 -0.96 0.17 0.68 -0.63 -0.26 -0.60 -0.36±0.55CL -0.88 -0.44 0.08 0.70 -0.67 -0.33 -0.67 -0.32±0.50
Basic -0.86 -0.74 0.33 0.26 -0.52 -0.09 -0.45 -0.30±0.44H-S2 -0.09 -0.76 0.75 0.56 0.33 0.64 0.64 0.30±0.50
H 0.41 -0.79 0.70 0.52 0.22 0.56 0.56 0.31±0.47H-S3 -0.09 -0.74 0.77 0.56 0.42 0.71 0.68 0.33±0.51
H-T-S3 0.01 -0.79 0.77 0.52 0.46 0.72 0.72 0.34±0.52H-CL-T-S3-RHY 0.97 0.49 0.66 0.83 0.39 0.65 0.83 0.69±0.19
H-CL 0.97 0.94 0.83 0.82 0.50 0.74 0.87 0.81±0.15H-CL-T 0.97 0.94 0.83 0.83 0.54 0.76 0.91 0.83±0.13
H-CL-T-S2 0.96 0.95 0.84 0.84 0.60 0.80 0.92 0.84±0.11H-CL-S3 0.97 0.96 0.85 0.84 0.65 0.84 0.91 0.86±0.10
H-CL-T-S3-FDK 0.97 0.94 0.86 0.86 0.65 0.84 0.93 0.86±0.10H-CL-T-S3 0.97 0.95 0.85 0.86 0.67 0.84 0.94 0.87±0.09
TABLE 4.2: Pearson correlations r between EMG and model activitiesin the range 30-140° of the contemplated combinations ordered fromlowest to highest mean r for the seven contemplated muscle groups.
Abbreviations for the cases are provided in Table 4.1.
63
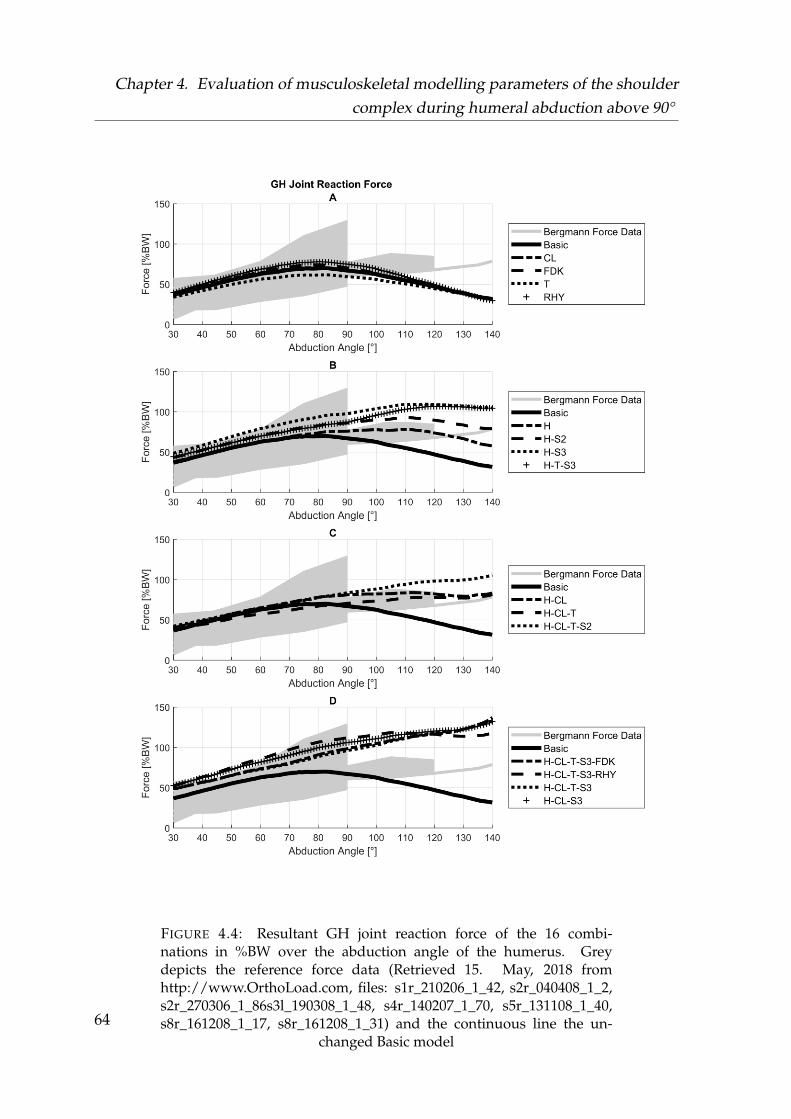
Chapter 4. Evaluation of musculoskeletal modelling parameters of the shouldercomplex during humeral abduction above 90°
FIGURE 4.4: Resultant GH joint reaction force of the 16 combi-nations in %BW over the abduction angle of the humerus. Greydepicts the reference force data (Retrieved 15. May, 2018 fromhttp://www.OrthoLoad.com, files: s1r_210206_1_42, s2r_040408_1_2,s2r_270306_1_86s3l_190308_1_48, s4r_140207_1_70, s5r_131108_1_40,s8r_161208_1_17, s8r_161208_1_31) and the continuous line the un-
changed Basic model64
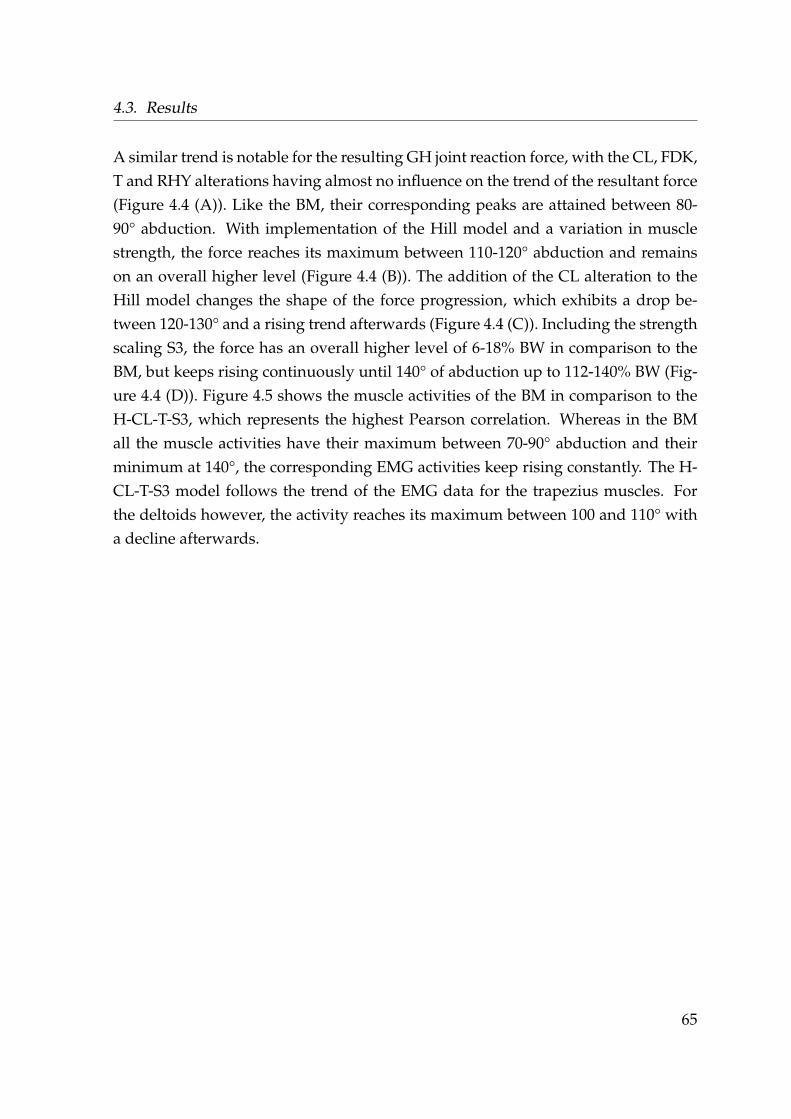
4.3. Results
A similar trend is notable for the resulting GH joint reaction force, with the CL, FDK,T and RHY alterations having almost no influence on the trend of the resultant force(Figure 4.4 (A)). Like the BM, their corresponding peaks are attained between 80-90° abduction. With implementation of the Hill model and a variation in musclestrength, the force reaches its maximum between 110-120° abduction and remainson an overall higher level (Figure 4.4 (B)). The addition of the CL alteration to theHill model changes the shape of the force progression, which exhibits a drop be-tween 120-130° and a rising trend afterwards (Figure 4.4 (C)). Including the strengthscaling S3, the force has an overall higher level of 6-18% BW in comparison to theBM, but keeps rising continuously until 140° of abduction up to 112-140% BW (Fig-ure 4.4 (D)). Figure 4.5 shows the muscle activities of the BM in comparison to theH-CL-T-S3, which represents the highest Pearson correlation. Whereas in the BMall the muscle activities have their maximum between 70-90° abduction and theirminimum at 140°, the corresponding EMG activities keep rising constantly. The H-CL-T-S3 model follows the trend of the EMG data for the trapezius muscles. Forthe deltoids however, the activity reaches its maximum between 100 and 110° witha decline afterwards.
65
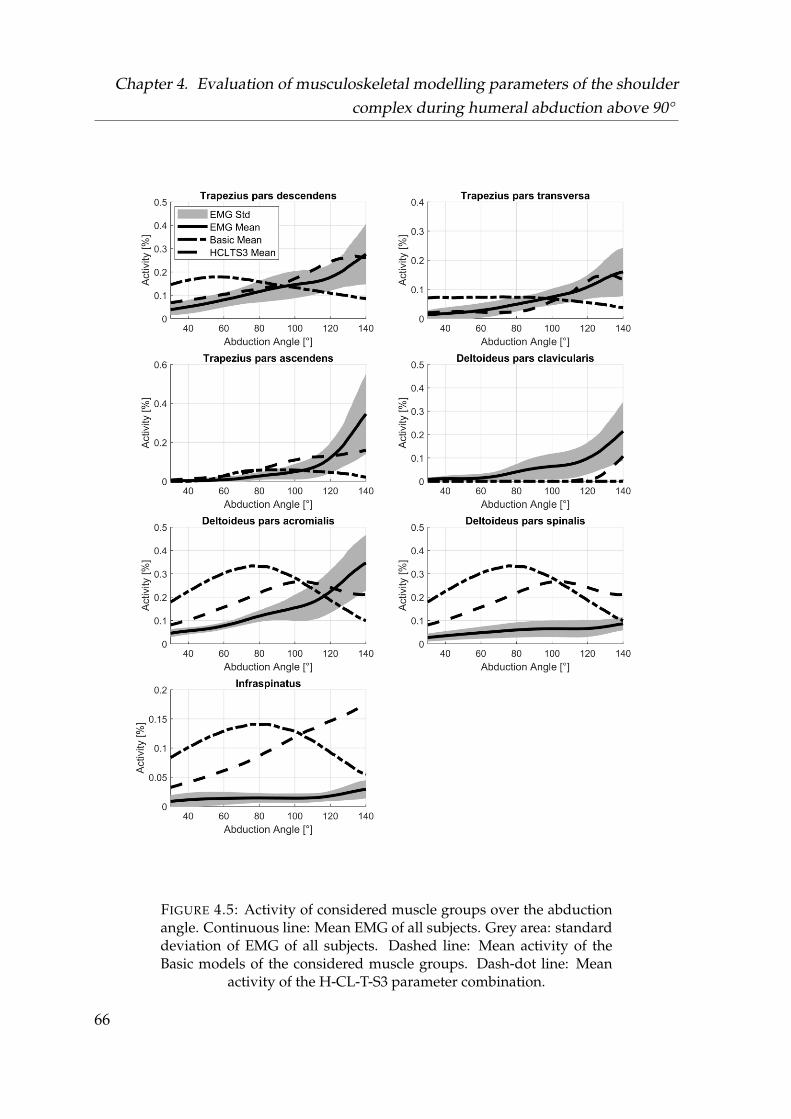
Chapter 4. Evaluation of musculoskeletal modelling parameters of the shouldercomplex during humeral abduction above 90°
FIGURE 4.5: Activity of considered muscle groups over the abductionangle. Continuous line: Mean EMG of all subjects. Grey area: standarddeviation of EMG of all subjects. Dashed line: Mean activity of theBasic models of the considered muscle groups. Dash-dot line: Mean
activity of the H-CL-T-S3 parameter combination.
66
4.4. Discussion
4.4 Discussion
With the aim to identify critical parameters for modelling the shoulder during ab-duction angles >90°, utilization of the Hill type muscle model showed the mostpronounced effect on the resultant GH joint reaction force.
Comparing EMG and model muscle activity has several issues. Among those areshifting of the muscle belly under the sensor (Barbero, Merletti, and Rainoldi, 2012)-and potential crosstalk (Rajaratnam, 2014; Solomonow et al., 1994). A common ap-proach is to asses muscle ON/OFF times (Lund et al., 2012). However, the focus ofthis study is on the behaviour of the model above 90° shoulder abduction. Therefore,a Pearson r between EMG and model activity was chosen as parameter of interestto evaluate the trends of the recruitment (Nikooyan et al., 2011).
Where implementation of the T, CL, FDK and RHY mechanisms yielded effects onthe muscle recruitment pattern (see Table 4.2) and the single components of the jointreaction force, the trend of the resultant force within the GH joint was maintained.Table 4.2 and Figure 4.5 indicate a discrepancy between the measured and simulatedmuscle activities of the deltoid parts. While the anterior deltoid shows almost no ac-tivation within the model during abduction, the posterior part carries the major partof the load. This depends on the muscle wrapping and hence the different momentarms, where the model of the AMMR v.7.1.0 which was used in this study was im-proved by Strzelczak et al., 2018 as stated in section 3.1. A detailed examination ofthe influences of these changes on model behaviour is conducted in section 5.
While the activity of the deltoids showed the lowest Pearson r in the H-CL-T-S3, thecurve progression appears to be in better agreement with literature (Wickham et al.,2010) than with the experimental EMG. This is most likely due to noise dominationand an overall low activity level as no additional weights were applied.
67
Chapter 4. Evaluation of musculoskeletal modelling parameters of the shouldercomplex during humeral abduction above 90°
The scaling of the strength (S) in combination with the Hill model was conductedfor two reasons, to take a scaling of the passive forces into account and a large dis-crepancy of the muscle activities predicted by the model in comparison to litera-ture (Wickham et al., 2010). This discrepancy however originated from the deltoidmodel of the AMMR v 7.1.0. and is not apparent in the studies conducted in section5. Upscaling the strength of the muscle elements by a factor of three is most likelynot physiologically reasonable. An alternative approach to manipulate the passiveforces is the alteration of how strong these activate depending on the elongation ofthe muscle elements. A closer investigation of the parameters of the Hill model andtheir effect on the GH joint reaction force is provided in chapter 5.
Using a motion capture marker (CL) to replace the clavicle elevation and protractionof the shoulder rhythm has improved the Pearson correlations in combination withthe Hill model. However, the previously described calibration sequence which de-termines the optimal fibre and tendon length of the virtual muscle elements use thehard coded rhythm. This results in a mismatch between assumed optimal positionsduring the calibration and subject individual kinematics of the shoulder rhythm.
While all the implemented changes deserve a continuative investigation on a moredetailed level, they do not influence the resultant joint reaction force, with exceptionfor the utilisation of the Hill model.
The biggest improvement in the correlation of the muscle activities and the trend be-haviour of the joint reaction force emerged with the utilization of the Hill model. Theshoulder joint exhibits one of the largest ranges of motion within the human body,hence antagonistic muscles e.g. the m. latissimus dorsi stretch above a thresholdwhere the passive non-linear stiffness is activated. These forces act against the pro-tagonist muscles like the deltoids, which have to exert a higher force to compensatefor the passive stiffness from the antagonistic muscle groups. Additionally, with thestrength of each muscle element depending on its elongation, the solver distributesthe forces to muscles with less mechanically advantageous moment arms when thestrength of a more suitable muscle declines. Both effects contribute to an increase ofthe GH joint reaction force above 90° abduction.
68
4.5. Conclusion
Where Nikooyan et al. showed that the latissimus dorsi activation as co-contractorcauses rising GH joint reaction forces after 90° abduction in their utilized model(Nikooyan et al., 2012), it is not active in the model used in this study. This indicatesthat the effect of the Hill model on the GH joint reaction force might be at least acomplementary explanation for the force behaviour after 90° abduction.
Ambrósio et al., 2011 have also shown this force behaviour and compared threemodels to each other, where all used the Hill model and traced it back to the com-plexity of one of their models.
To the best of my knowledge, the mechanical properties of the Hill model have notbeen described as possible explanation for the force behaviour in the GH joint as ofyet. Furthermore, the implemented changes FDK, RHY, CL and T all have a directinfluence on the elongation of the muscle elements and thus the active and passiveelements of the Hill muscle model. Where the major outcome of this study indicatedthat the Hill model is a physiologically reasonable explanation for the rising trendin resultant GH joint force above 90° abduction, these parameters should also becondiered for investigation in future work.
4.5 Conclusion
Under the premise of muscle activities and forces within the GH joint rising after90° of humeral abduction, it is proposed that the Hill type muscle model might beessential for accurately modelling the shoulder above 90° abduction as it yields twoeffects:
1. The passive stiffness of the three element Hill type model introduces an addi-tional set of forces into the equilibrium equations.
2. With a change in strength in dependency of the elongation of each muscleelement, the solver distributes the load to muscles with less mechanically ad-vantageous moment arms.
However, parameters of the Hill model are highly subject specific and taken intofocus for future research. The dependence of the strength-length relation of themuscle elements furthermore demand a strong emphasize of accurate modelling ofmuscle trajectories during dynamic movements.
69
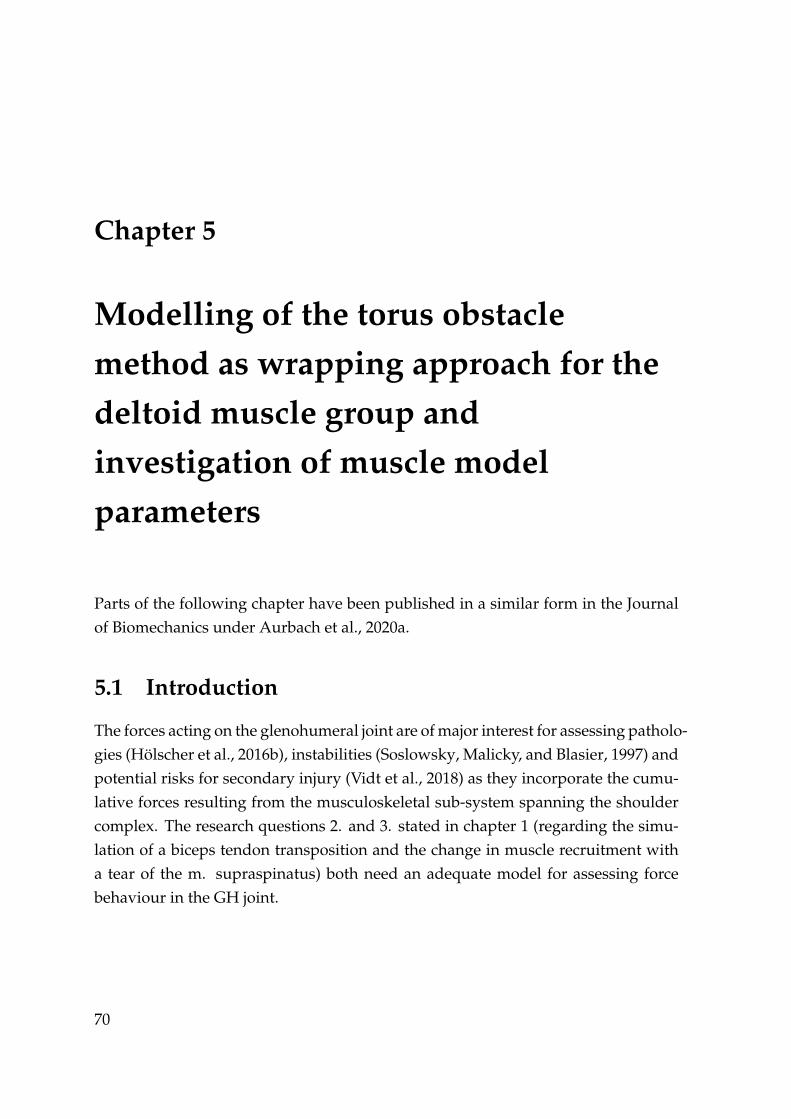
Chapter 5
Modelling of the torus obstaclemethod as wrapping approach for thedeltoid muscle group andinvestigation of muscle modelparameters
Parts of the following chapter have been published in a similar form in the Journalof Biomechanics under Aurbach et al., 2020a.
5.1 Introduction
The forces acting on the glenohumeral joint are of major interest for assessing patholo-gies (Hölscher et al., 2016b), instabilities (Soslowsky, Malicky, and Blasier, 1997) andpotential risks for secondary injury (Vidt et al., 2018) as they incorporate the cumu-lative forces resulting from the musculoskeletal sub-system spanning the shouldercomplex. The research questions 2. and 3. stated in chapter 1 (regarding the simu-lation of a biceps tendon transposition and the change in muscle recruitment witha tear of the m. supraspinatus) both need an adequate model for assessing forcebehaviour in the GH joint.
70

5.1. Introduction
Based on chapter 4, two issues emerged which need to be addressed in order toachieve an improvement in model behaviour:
1. There is a discrepancy in activation of the virtual muscle elements associatedwith the anterior, lateral and posterior deltoid with regard to EMG measure-ments (see Figure 4.5). The muscle group of the deltoids is the main protag-onist during humeral abduction in terms of activity and strength, thus con-tributing strongly to the forces acting on the shoulder joint. An opposite ac-tivation from anterior to posterior part subsequently alters the effective direc-tion of the forces acting on the glenoid. This makes drawing conclusions withregard to loading of the joint questionable.
2. The Hill model has a major influence on the muscle activation and resultingglenohumeral joint reaction force. As the underlying mathematical implemen-tation consists of several parameters, it is of interest how sensitive these are.
With regard to point 1, major improvements to the deltoid model of the AMS v.7.1.0were implemented by Strzelczak et al., 2018 in order to solve some of the issues as-sociated with the modelled deltoids, which are introduced in the AMS v.7.2.0.. Thetype of the muscle elements was changed from via points to a wrapping on ellip-soid objects. Additionally, the origin and insertion points of the muscle elementswere changed to a more even distribution and the initial strength from the AMSv.7.1.0 was redistributed, resulting in stronger lateral deltoid elements and weakerposterior ones.
However, the implemented ellipsoid obstacles bring up the issue that in abductionangles >90°, the muscle elements lose contact to the obstacles, which leads to theelements representing a straight line from their origin to insertion point. This re-sults in the muscle elements of the anterior deltoid sliding under the lateral mus-cle elements, which is exemplified in Figure 5.1. Furthermore, by losing contact totheir respective obstacle, the muscle elements cease to transmit forces onto the bonystructures.
71
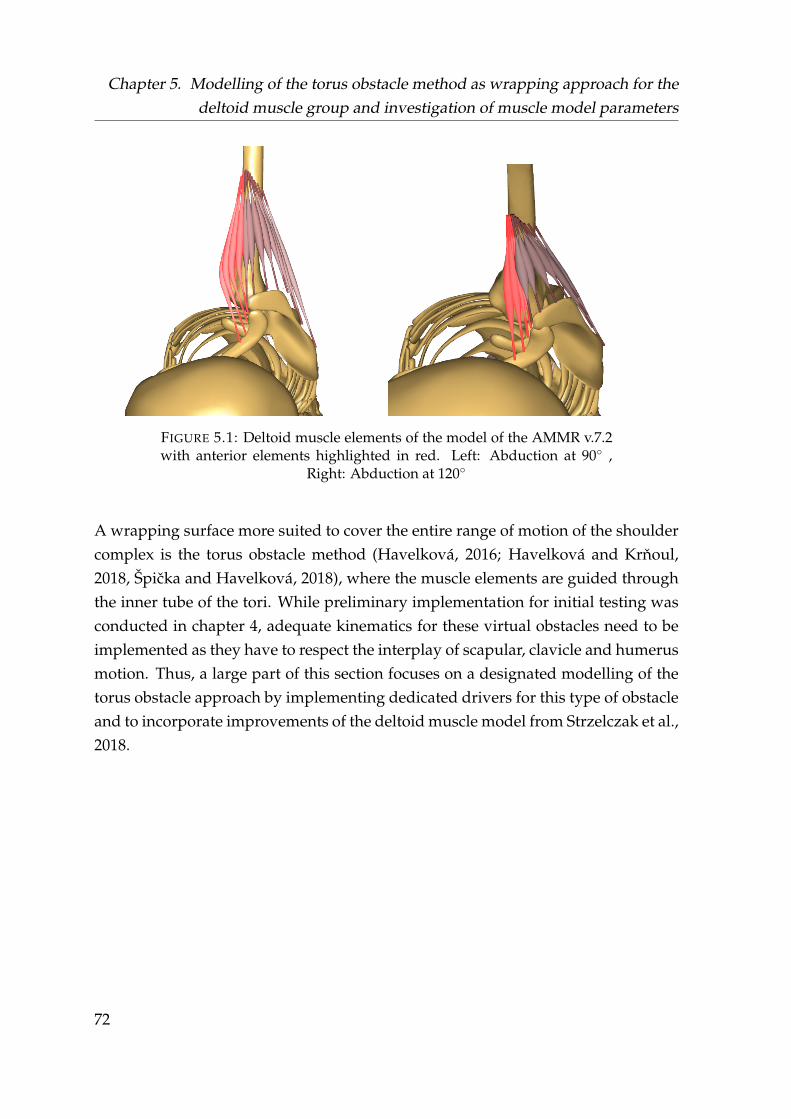
Chapter 5. Modelling of the torus obstacle method as wrapping approach for thedeltoid muscle group and investigation of muscle model parameters
FIGURE 5.1: Deltoid muscle elements of the model of the AMMR v.7.2with anterior elements highlighted in red. Left: Abduction at 90◦ ,
Right: Abduction at 120◦
A wrapping surface more suited to cover the entire range of motion of the shouldercomplex is the torus obstacle method (Havelková, 2016; Havelková and Krnoul,2018, Špicka and Havelková, 2018), where the muscle elements are guided throughthe inner tube of the tori. While preliminary implementation for initial testing wasconducted in chapter 4, adequate kinematics for these virtual obstacles need to beimplemented as they have to respect the interplay of scapular, clavicle and humerusmotion. Thus, a large part of this section focuses on a designated modelling of thetorus obstacle approach by implementing dedicated drivers for this type of obstacleand to incorporate improvements of the deltoid muscle model from Strzelczak et al.,2018.
72
5.2. Materials and Methods
5.2 Materials and Methods
5.2.1 Torus modelling
The AMS v.7.2.0. is used for modelling of the shoulder complex, where the shoul-der model from the AMMR Version v.2.2.2. is providing the basis. The origin andinsertion points of the 12 virtual muscle elements representing the deltoid are takenfrom the ellipsoid based wrapping approach by Strzelczak et al., 2018. In order toprovide the size of the tori for each virtual muscle element, an MRI based approachis employed to extract the wrapping geometry which is based on the method fromKam et al. Man, 2017. This study uses subject specific MRI scans of the shoulder asinput for the semi-automatic process of the model development.
The 12 insertion and origin points from the generic model of the AMS are taken andfitted onto the segments extracted from the MRI scan. The insertion and origin pointof each muscle and the centre point of the humeral head describe a plane, which isused to cut the deltoid muscle volume from the MRI. From each cut, the central lineis extracted and the position and the minor radius of each torus is calculated viaan optimization algorithm to fit the curvature of the central line. The optimizationprovides the minor radius for each torus and the initial contact point between thevirtual muscle element and the torus. The MRI measurements and the computationto fit the tori according to MRI images is hereby conducted by the project partnersand co-authors of the publication Aurbach et al., 2020a.
Figure 5.2 depicts the tori of each deltoid muscle element of the model, where onthe left the positioning at a default orientation of 0◦ humeral abduction is shown.The right side shows the pathing of the muscles at 120◦ abduction. The major radiusis set to 50 mm and the centre positioned on a straight line from the humeral headthrough the initial contact point on the transversal plane. This allows the muscleelements conditional sliding on the inner tube of the tori while still being separatefrom the neighbouring muscle element.
73
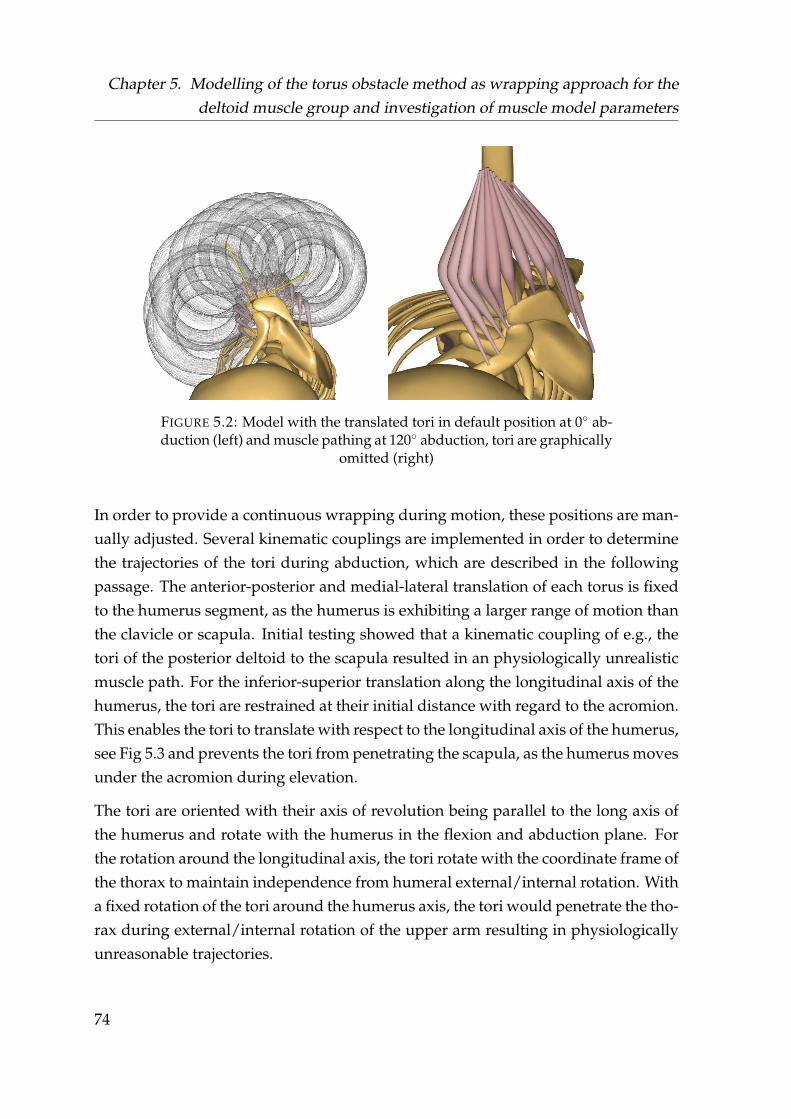
Chapter 5. Modelling of the torus obstacle method as wrapping approach for thedeltoid muscle group and investigation of muscle model parameters
FIGURE 5.2: Model with the translated tori in default position at 0◦ ab-duction (left) and muscle pathing at 120◦ abduction, tori are graphically
omitted (right)
In order to provide a continuous wrapping during motion, these positions are man-ually adjusted. Several kinematic couplings are implemented in order to determinethe trajectories of the tori during abduction, which are described in the followingpassage. The anterior-posterior and medial-lateral translation of each torus is fixedto the humerus segment, as the humerus is exhibiting a larger range of motion thanthe clavicle or scapula. Initial testing showed that a kinematic coupling of e.g., thetori of the posterior deltoid to the scapula resulted in an physiologically unrealisticmuscle path. For the inferior-superior translation along the longitudinal axis of thehumerus, the tori are restrained at their initial distance with regard to the acromion.This enables the tori to translate with respect to the longitudinal axis of the humerus,see Fig 5.3 and prevents the tori from penetrating the scapula, as the humerus movesunder the acromion during elevation.
The tori are oriented with their axis of revolution being parallel to the long axis ofthe humerus and rotate with the humerus in the flexion and abduction plane. Forthe rotation around the longitudinal axis, the tori rotate with the coordinate frame ofthe thorax to maintain independence from humeral external/internal rotation. Witha fixed rotation of the tori around the humerus axis, the tori would penetrate the tho-rax during external/internal rotation of the upper arm resulting in physiologicallyunreasonable trajectories.
74
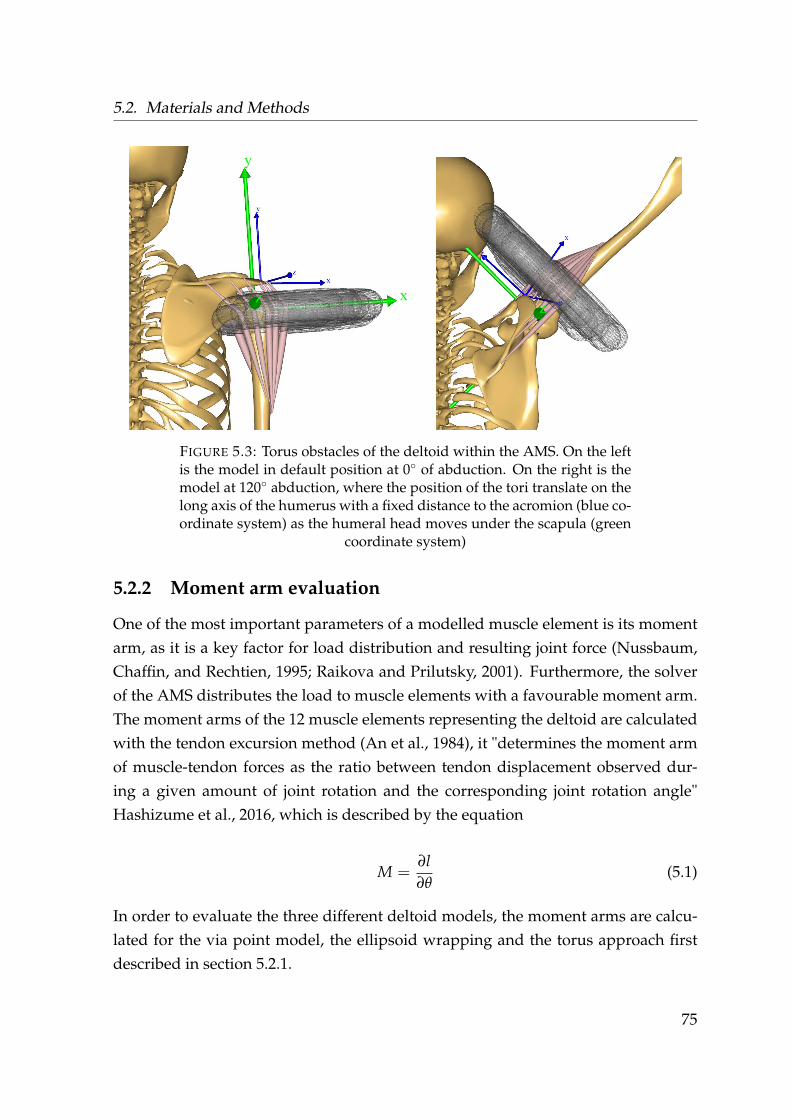
5.2. Materials and Methods
FIGURE 5.3: Torus obstacles of the deltoid within the AMS. On the leftis the model in default position at 0◦ of abduction. On the right is themodel at 120◦ abduction, where the position of the tori translate on thelong axis of the humerus with a fixed distance to the acromion (blue co-ordinate system) as the humeral head moves under the scapula (green
coordinate system)
5.2.2 Moment arm evaluation
One of the most important parameters of a modelled muscle element is its momentarm, as it is a key factor for load distribution and resulting joint force (Nussbaum,Chaffin, and Rechtien, 1995; Raikova and Prilutsky, 2001). Furthermore, the solverof the AMS distributes the load to muscle elements with a favourable moment arm.The moment arms of the 12 muscle elements representing the deltoid are calculatedwith the tendon excursion method (An et al., 1984), it "determines the moment armof muscle-tendon forces as the ratio between tendon displacement observed dur-ing a given amount of joint rotation and the corresponding joint rotation angle"Hashizume et al., 2016, which is described by the equation
M =∂l∂θ
(5.1)
In order to evaluate the three different deltoid models, the moment arms are calcu-lated for the via point model, the ellipsoid wrapping and the torus approach firstdescribed in section 5.2.1.
75

Chapter 5. Modelling of the torus obstacle method as wrapping approach for thedeltoid muscle group and investigation of muscle model parameters
Three different models are computed for each wrapping approach. External rotationand flexion angles of the humerus are set to 0° and a constant velocity of 10◦s ofhumeral abduction in the range of 20− 120◦ is applied. These results are comparedwith a cadaver study conducted by Ackland et al., 2008.
5.2.3 Force transmission
Where section 5.2.1 describes the driver scheme and orientation of the torus obsta-cles, the transmission of the forces exerted on and by the tori need further expla-nation. With a virtual muscle element having contact with a wrapping obstacle, itcan exert forces onto this object. Each torus of the 4 muscle elements associatedwith the anterior, lateral and posterior deltoid group is placed on a virtual mass-less carrier segments which moves as described in 5.2.1 according to the kinematicsof the humerus. These carrier segments are kinetically coupled to the centre of thehumeral head. Three configurations of the torus model are tested:
1. No forces and moments are transmitted from the three carrier segments (NOFM)
2. Only forces in X (compression) and Z (anterior-posterior) direction (FXZ) aretransmitted onto the humeral head (see Figure 5.3, green coordinate system)
3. All forces and moments exerted by the tori onto the carrier segments are trans-mitted onto the humeral head (ALLFM)
The behaviour of the deltoid muscle activity and glenohumeral joint reaction forceof the three configurations is evaluated with the same methodology of chapter 4 bycomparing the activities to the measured EMG and the GH joint reaction force tothe in vivo data from Bergmann, 2008. The AMMR v.2.2.0. is used for this studyand the Hill model is employed. Parameters are evaluated in the range of 30-120°humeral abduction. The models from chapter 4 which did not converge during thekinematic optimization were reworked, resulting in 30 functional models. Exceptfor using the Hill model, none of the evaluated alterations to the model of chapter 4were implemented.
76
5.2. Materials and Methods
5.2.4 Parameter evaluation of the Hill model
The study on the effect of various modelling parameters on the GH joint reactionforce of chapter 4 showed that the only applied parameter which had an influenceon the trend of the force after 90° is the utilization of the three element Hill model.
The Hill model is a simplification of physiological properties originating from themuscle structure and involved cell behaviour and types (Hill, 1938). Where there areseveral different expressions of the Hill model (Arslan et al., 2019) the standard Hillmodel uses three major components in order to describe the force a muscle elementcan exert. Table 5.1 describes all parameters and their constants implemented in theAMS in detail.
Several studies and models of the shoulder complex have incorporated the Hillmodel (e.g.Ambrósio et al., 2011; Sins et al., 2015), but a detail evaluation of criti-cal parameters is missing.
It is of interest, which of the involved parameters of the Hill model are sensitive toalterations.
A parameter study using the torus model described in section 5.2.1 with the con-figuration of transmitting all forces and moments (ALLFM) (see 5.2.3) is conducted,where each parameter of the Hill model of the AMMR V 2.2.2 is individually alteredto 50% and to 200% of its original value, where the other parameters are maintained.
77
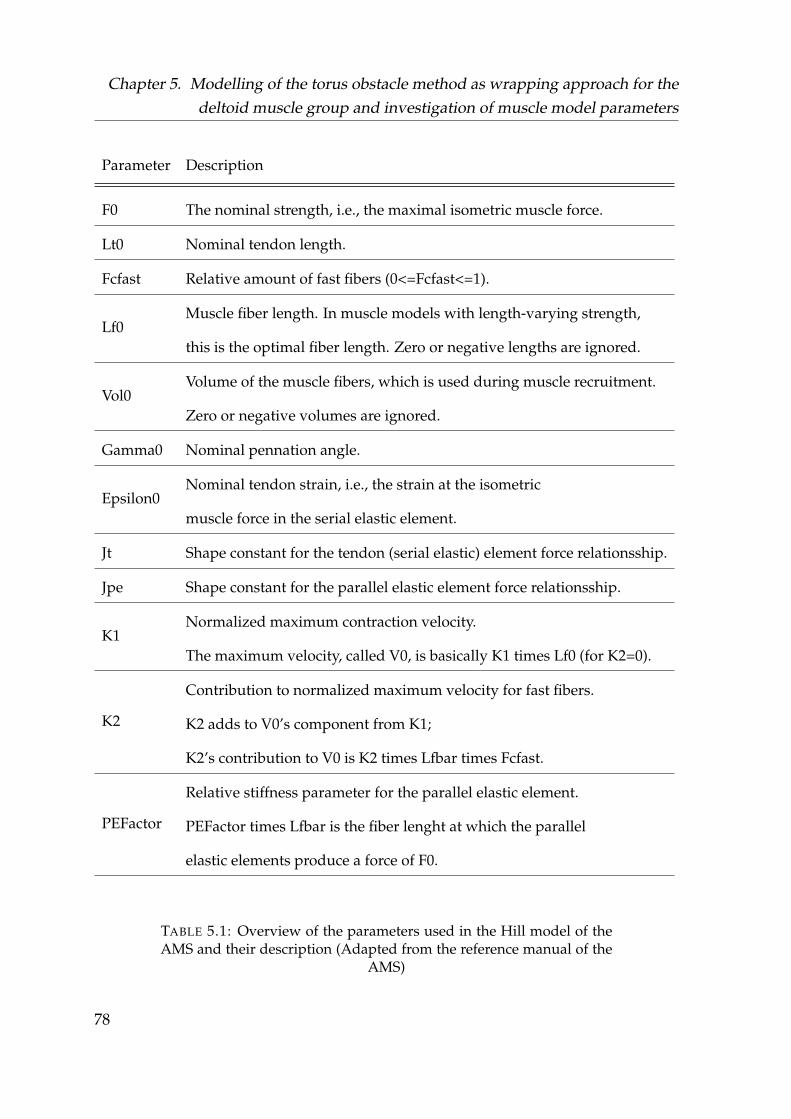
Chapter 5. Modelling of the torus obstacle method as wrapping approach for thedeltoid muscle group and investigation of muscle model parameters
Parameter Description
F0 The nominal strength, i.e., the maximal isometric muscle force.
Lt0 Nominal tendon length.
Fcfast Relative amount of fast fibers (0<=Fcfast<=1).
Lf0Muscle fiber length. In muscle models with length-varying strength,
this is the optimal fiber length. Zero or negative lengths are ignored.
Vol0Volume of the muscle fibers, which is used during muscle recruitment.
Zero or negative volumes are ignored.
Gamma0 Nominal pennation angle.
Epsilon0Nominal tendon strain, i.e., the strain at the isometric
muscle force in the serial elastic element.
Jt Shape constant for the tendon (serial elastic) element force relationsship.
Jpe Shape constant for the parallel elastic element force relationsship.
K1Normalized maximum contraction velocity.
The maximum velocity, called V0, is basically K1 times Lf0 (for K2=0).
K2
Contribution to normalized maximum velocity for fast fibers.
K2 adds to V0’s component from K1;
K2’s contribution to V0 is K2 times Lfbar times Fcfast.
PEFactor
Relative stiffness parameter for the parallel elastic element.
PEFactor times Lfbar is the fiber lenght at which the parallel
elastic elements produce a force of F0.
TABLE 5.1: Overview of the parameters used in the Hill model of theAMS and their description (Adapted from the reference manual of the
AMS)
78

5.2. Materials and Methods
Motion is conducted from a standing position from an initial position of 0° humerusflexion, 4° abduction and 20° internal rotation with a constant abduction velocityup to 120° abduction. F0 is not altered, as it is the same as in the simple musclemodel and originates from specific cadaver studies where the shoulder model isbuild upon.
The default human model with 75 kg and 1.75 m is used with the shoulder rhythmof the AMS and the resulting GH joint reaction force compared to the in vivo data.
5.2.5 Recruitment criterion
One of the aims of this thesis is the simulation of a tear of the m. supraspinatus andhow the recruitment of the other muscles changes accordingly once it is omitted.The m. supraspinatus carries out the roles of a stabilizer and abductor (Wuelkeret al., 1994a; see for an overview Gasbarro, Bondow, and Debski, 2017), which isreflected in studies measuring its EMG activity (Wickham et al., 2010; Reinold et al.,2007b). However, the inverse dynamic model shows a lower activity of the mus-cle group during abduction than is reported in literature from EMG measurements.Within the model the majority of the load is distributed onto the deltoid musclegroup as its is stronger and has a more mechanically advantageous moment arm.An approach to distribute the load more evenly between the muscle groups is toincrease the power of the polynomial recruitment criterion (see Equation 3.4). Ahigher polynomial power of the recruitment criterion penalties muscles with a highactivation, thus damping the main actors and shifting the load to a more even distri-bution. In order to assess a change of an alteration of the recruitment criterion of thesolver, a study is conducted with the torus model (ALLFM), where the Hill modelis used with the shoulder rhythm during abduction of the humerus with 0° externalrotation, 0° flexion and a constant velocity in humeral abduction from 30° to 120°.The model is computed in 4 different configurations:
1. Model with polynomial recruitment criterion of p=3
2. Model with polynomial recruitment criterion of p=5
3. Model with polynomial recruitment criterion of p=3, 20 N virtual load in hand
4. Model with polynomial recruitment criterion of p=5, 20 N virtual load in hand
79
Chapter 5. Modelling of the torus obstacle method as wrapping approach for thedeltoid muscle group and investigation of muscle model parameters
A virtual load acting in the direction of gravity is applied to the palm of the lattertwo models in order to make the activity of the m. surpaspinatus comparable toliterature (Wickham et al., 2010). A second study is conducted on model behaviourwith a polynomial power of the recruitment criterion of 5 by utilizing the motioncapture and EMG data from the reworked trials described in section 5.2.3. 30 sub-ject specific motion capture models are calculated for the evaluation of the deltoidactivity and the resultant GH joint reaction force each for the torus model in theALLFM configuration and the ellipsoid model, resulting in 60 models.
5.3 Results
In the following section the results of the various studies on model alterations aredescribed.
5.3.1 Moment arm evaluation
Figure 5.4 shows the computed moment arms of the muscle elements representingthe anterior deltoid from the study conducted in section 5.2.2 and the data from acadaver study conducted by Ackland et al., 2008 (grey) using the tendon excursionmethod. The reference data has a moment arm of 8 mm at 20° abduction with regardto the GH joint, which increases up to 30 mm at 120° abduction. The black graphsdepict the moment arms from the via point model, where 6 of the 12 model elementsare associated in this model with the anterior deltoid. They show a linear trend withan initially negative moment arm exhibited by all elements. The moment arms ofall three models become more positive from the anterior to more lateral elements.The moment arms of the ellipsoid model has the steepest increase over the entireROM, with an initial linear behaviour, but show an increased curvature from themost anterior to the most lateral element. The moment arms of the torus model startwith the steepest increase but flatten out at 40° in their inclination. At 120° degreeabduction, the ellipsoid model tends to over estimate the moment arms (32.5 to 38.4mm) in comparison to the reference data from literature (30.7 mm), where the torusmodel underestimates the moment arm (22.7 to 25.6 mm). The highest deviationfrom the reference data at 120° abduction is yielded by the via point model (6.0 to22.4 mm).
80
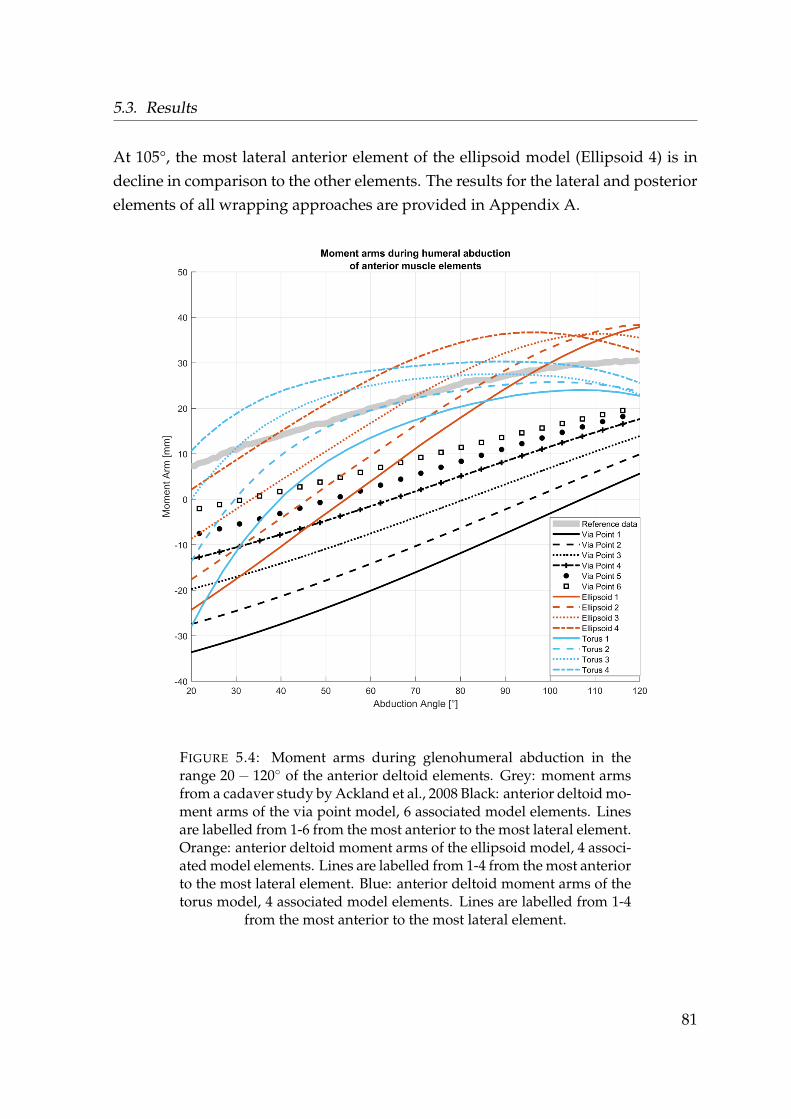
5.3. Results
At 105°, the most lateral anterior element of the ellipsoid model (Ellipsoid 4) is indecline in comparison to the other elements. The results for the lateral and posteriorelements of all wrapping approaches are provided in Appendix A.
FIGURE 5.4: Moment arms during glenohumeral abduction in therange 20− 120◦ of the anterior deltoid elements. Grey: moment armsfrom a cadaver study by Ackland et al., 2008 Black: anterior deltoid mo-ment arms of the via point model, 6 associated model elements. Linesare labelled from 1-6 from the most anterior to the most lateral element.Orange: anterior deltoid moment arms of the ellipsoid model, 4 associ-ated model elements. Lines are labelled from 1-4 from the most anteriorto the most lateral element. Blue: anterior deltoid moment arms of thetorus model, 4 associated model elements. Lines are labelled from 1-4
from the most anterior to the most lateral element.
81
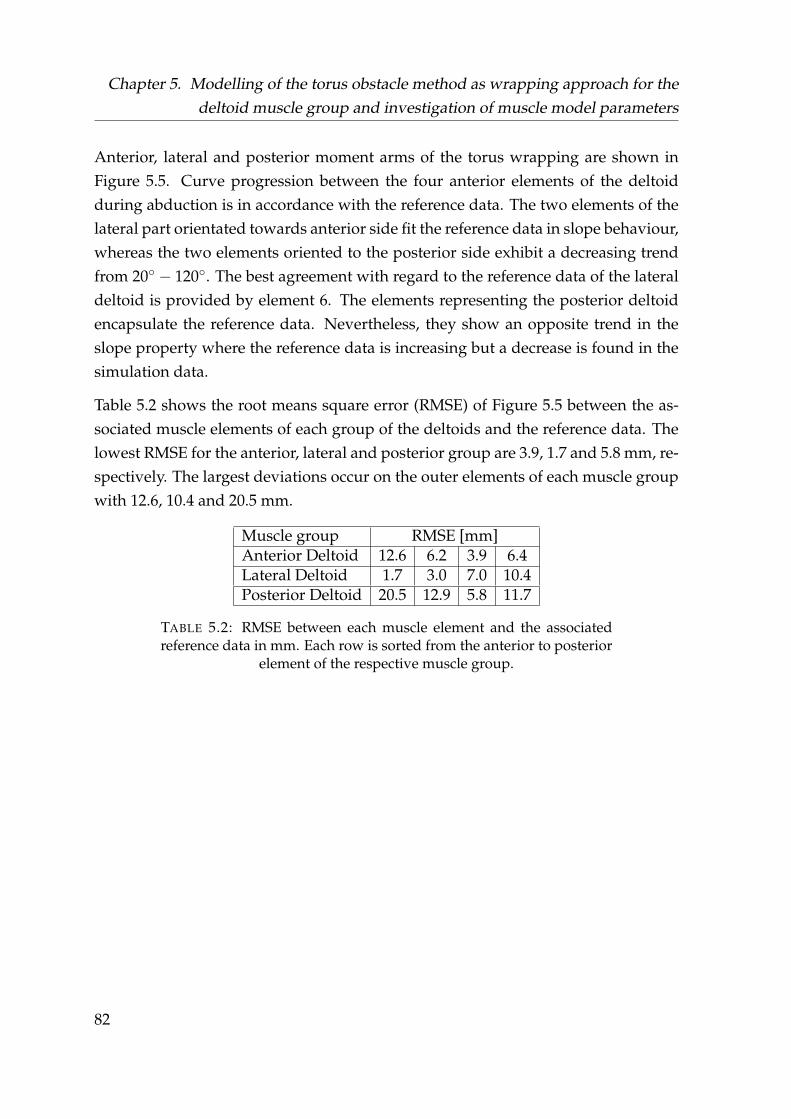
Chapter 5. Modelling of the torus obstacle method as wrapping approach for thedeltoid muscle group and investigation of muscle model parameters
Anterior, lateral and posterior moment arms of the torus wrapping are shown inFigure 5.5. Curve progression between the four anterior elements of the deltoidduring abduction is in accordance with the reference data. The two elements of thelateral part orientated towards anterior side fit the reference data in slope behaviour,whereas the two elements oriented to the posterior side exhibit a decreasing trendfrom 20◦ − 120◦. The best agreement with regard to the reference data of the lateraldeltoid is provided by element 6. The elements representing the posterior deltoidencapsulate the reference data. Nevertheless, they show an opposite trend in theslope property where the reference data is increasing but a decrease is found in thesimulation data.
Table 5.2 shows the root means square error (RMSE) of Figure 5.5 between the as-sociated muscle elements of each group of the deltoids and the reference data. Thelowest RMSE for the anterior, lateral and posterior group are 3.9, 1.7 and 5.8 mm, re-spectively. The largest deviations occur on the outer elements of each muscle groupwith 12.6, 10.4 and 20.5 mm.
Muscle group RMSE [mm]Anterior Deltoid 12.6 6.2 3.9 6.4Lateral Deltoid 1.7 3.0 7.0 10.4Posterior Deltoid 20.5 12.9 5.8 11.7
TABLE 5.2: RMSE between each muscle element and the associatedreference data in mm. Each row is sorted from the anterior to posterior
element of the respective muscle group.
82
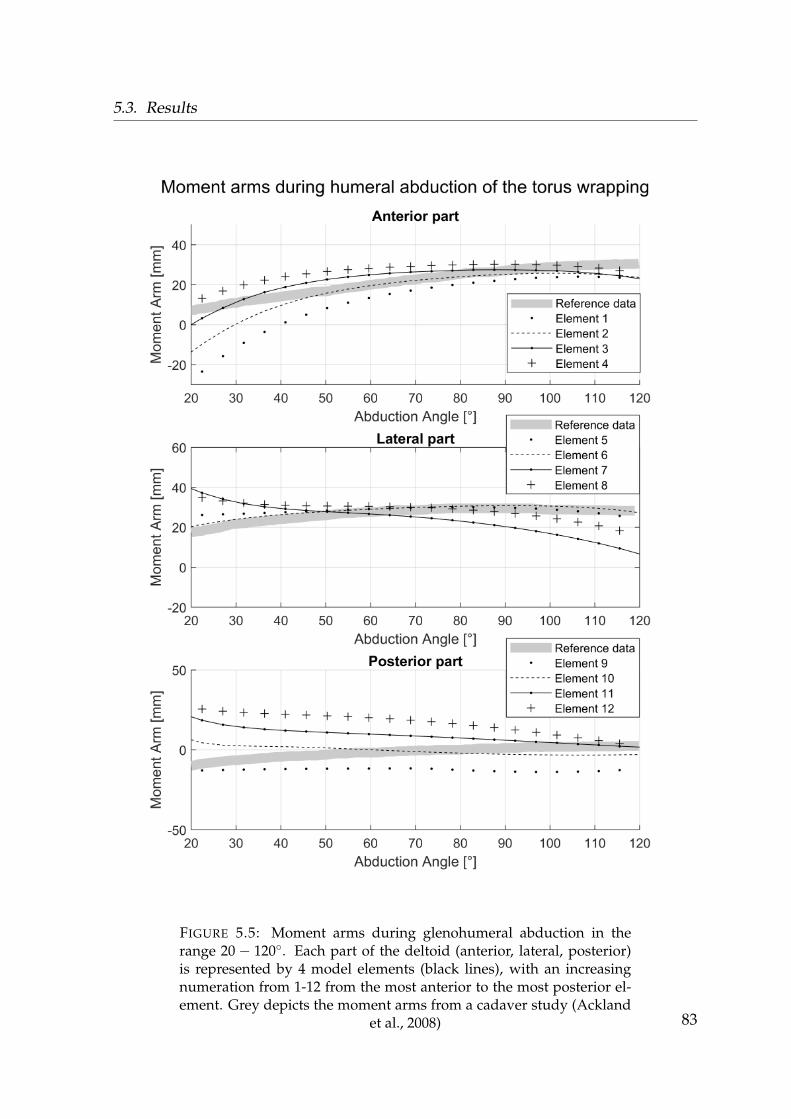
5.3. Results
FIGURE 5.5: Moment arms during glenohumeral abduction in therange 20− 120◦. Each part of the deltoid (anterior, lateral, posterior)is represented by 4 model elements (black lines), with an increasingnumeration from 1-12 from the most anterior to the most posterior el-ement. Grey depicts the moment arms from a cadaver study (Ackland
et al., 2008) 83
Chapter 5. Modelling of the torus obstacle method as wrapping approach for thedeltoid muscle group and investigation of muscle model parameters
5.3.2 Force transmission
The effects of the three different configurations in force transmission (5.2.3) on theactivation of the anterior, lateral and posterior deltoid are depicted in Figure 5.6.For the anterior activities, the Pearson correlation r is at 0.33 for the configuration ofno forces and moments (NOFM) transmitted from the virtual carrier segment to thehumerus with regard to the mean EMG of the 30 abduction trials. The correlationbecomes negative with r = -0.16 while transmitting only the X and Z componentsof the force (FXZ). The highest level of agreement with the EMG data r= 0.93 forthe case of transmitting all forces and moments (ALLFM). The mean EMG activityof the anterior deltoid has a steady increase up to 100° abduction, with a steeperinclination in the range 100-120° of humeral abduction.
The activity of the ALLFM model shows a steadily increasing trend up to 120° ofabduction, with an activity of 25.2 % where the EMG is at 18.9%. The NOFM modelpeaks at 90° abduction with 21% activity and declines to 18.9% activity at 120°. At60° abduction, the FXZ model reaches its peak with 18.3% activity and declines to16% at 120°. For the lateral activities, the correlation values between the modelactivity and the EMG activity are 0.05 (NOFM), 0.59 (FXZ) and 0.81 (ALLFM). TheEMG activity is constantly increasing in the interval 30-120° abduction from 7.0% to32.5%.
The NOFM model starts at the highest activity level of all models with, peaks at60° with 21.7% and declines to 18.9% at 120°. The FXZ model peaks at 80° abductionwith 22% and declines like the NOFM model. The ALLFM model is at 11.9% activityat 30° and has two peaks. One at 71° abudction with 19.2%, where it declines to 90°of abduction and rises afterwards up to 20.6% at 120°.
For the posterior muscle activity, the EMG shows a lower activation than the ante-rior or lateral part with a maximum of 9.3% at 95° abduction. The correlation valuesr between posterior EMG and models are -0.94, 0.13 and 0.73. Where the ALLFMmodel exhibits an increase up to 20% activity level at 120° abduction, the NOFM andFXZ models have a opposite trend with regard to the EMG data with no activity at70° abduction.
84
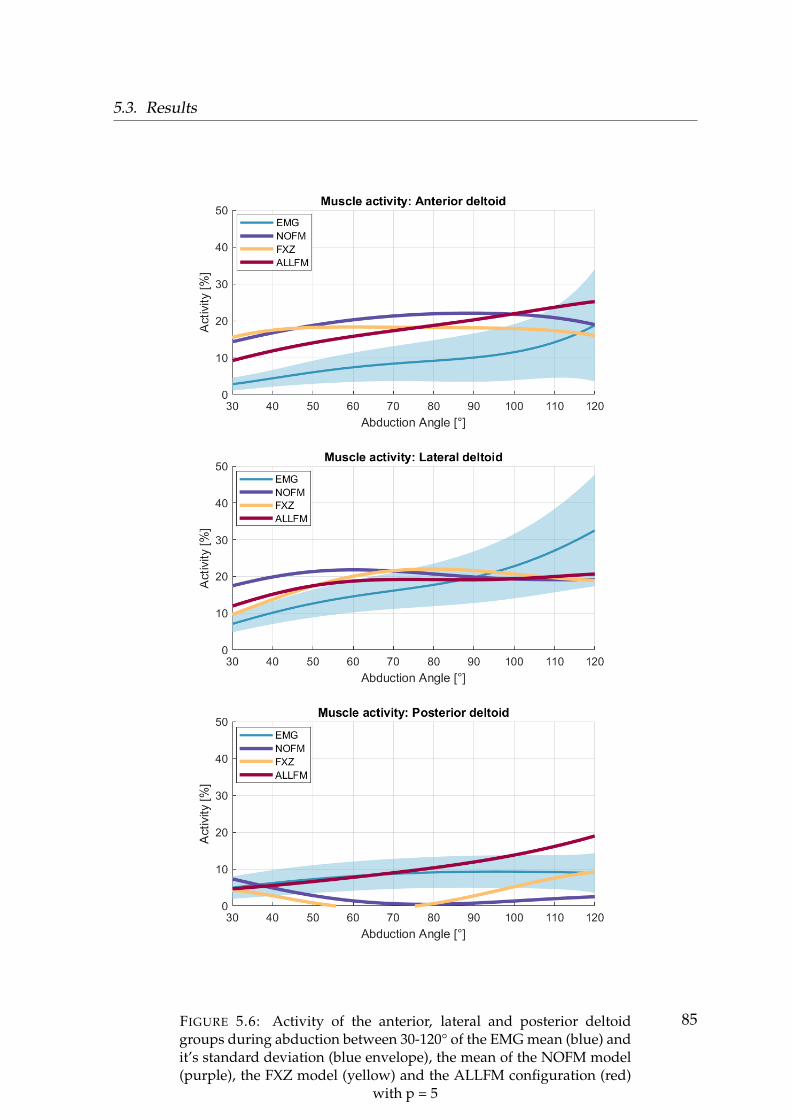
5.3. Results
FIGURE 5.6: Activity of the anterior, lateral and posterior deltoidgroups during abduction between 30-120° of the EMG mean (blue) andit’s standard deviation (blue envelope), the mean of the NOFM model(purple), the FXZ model (yellow) and the ALLFM configuration (red)
with p = 5
85
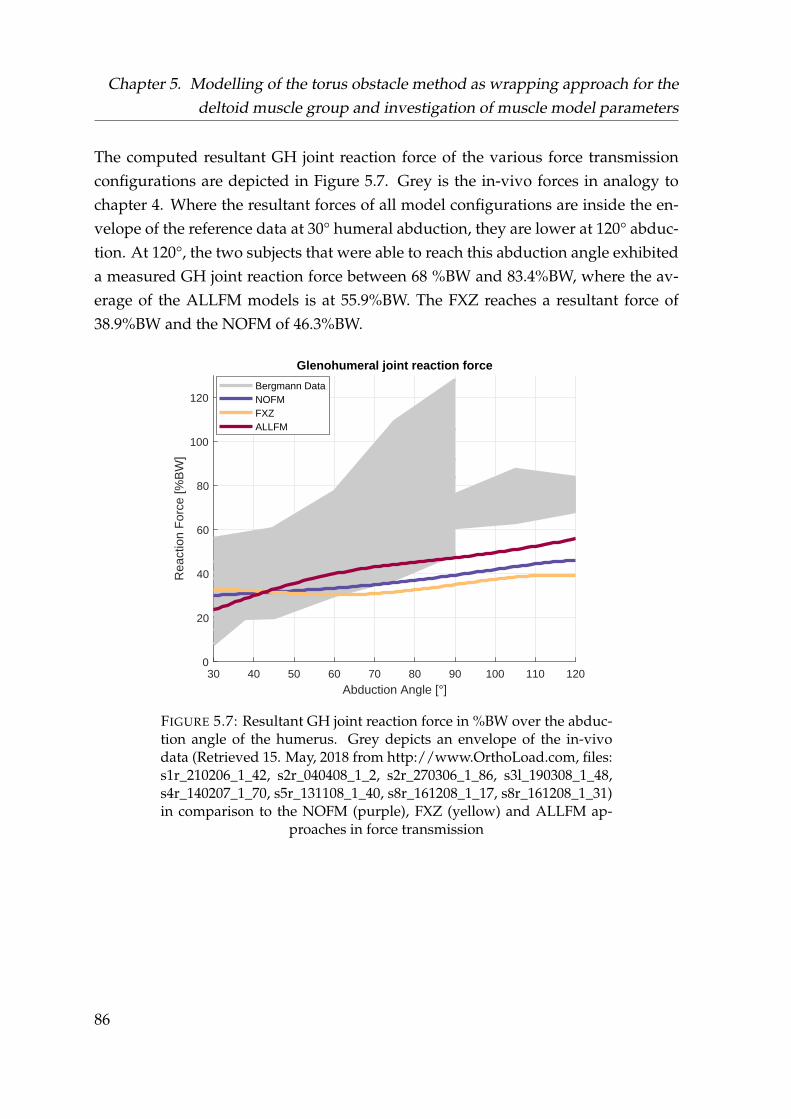
Chapter 5. Modelling of the torus obstacle method as wrapping approach for thedeltoid muscle group and investigation of muscle model parameters
The computed resultant GH joint reaction force of the various force transmissionconfigurations are depicted in Figure 5.7. Grey is the in-vivo forces in analogy tochapter 4. Where the resultant forces of all model configurations are inside the en-velope of the reference data at 30° humeral abduction, they are lower at 120° abduc-tion. At 120°, the two subjects that were able to reach this abduction angle exhibiteda measured GH joint reaction force between 68 %BW and 83.4%BW, where the av-erage of the ALLFM models is at 55.9%BW. The FXZ reaches a resultant force of38.9%BW and the NOFM of 46.3%BW.
30 40 50 60 70 80 90 100 110 120
Abduction Angle [°]
0
20
40
60
80
100
120
Rea
ctio
n F
orce
[%B
W]
Glenohumeral joint reaction force
Bergmann DataNOFMFXZALLFM
FIGURE 5.7: Resultant GH joint reaction force in %BW over the abduc-tion angle of the humerus. Grey depicts an envelope of the in-vivodata (Retrieved 15. May, 2018 from http://www.OrthoLoad.com, files:s1r_210206_1_42, s2r_040408_1_2, s2r_270306_1_86, s3l_190308_1_48,s4r_140207_1_70, s5r_131108_1_40, s8r_161208_1_17, s8r_161208_1_31)in comparison to the NOFM (purple), FXZ (yellow) and ALLFM ap-
proaches in force transmission
86
5.3. Results
From the ALLFM model configuration, the average forces exerted by the anterior,lateral and posterior virtual carrier segments on which the associated tori are placedare provided in Figure 5.8, where the X,Y and Z directions correspond to the coor-dinate frame of the humerus segment (Figure 5.3, green coordinate system).
The lowest exerted force from all three carrier elements applied onto the humerus isthe component acting in its longitudinal (Y) direction. The components exerting thehighest forces of each carrier segment correspond to the deltoid activation patternof the anterior, lateral and posterior part depicted in Figure 5.6. The anterior carrierelement has the highest force contribution in the Z or anterior-posterior direction,which increases starting at 23 N to 70 N over the entire range of abduction.
The lateral carrier element mainly applies a force in the negative X direction of thehumerus with a maximum force exerted of -41 N at 40° abduction and a decliningtrend afterwards. The main force exerted by the posterior carrier element acts in thenegative Z direction in opposition to the anterior force, where the trend is increasingand is at its peak at -23 N at 120° abduction. The associated moments can be foundin Appendix A.
87
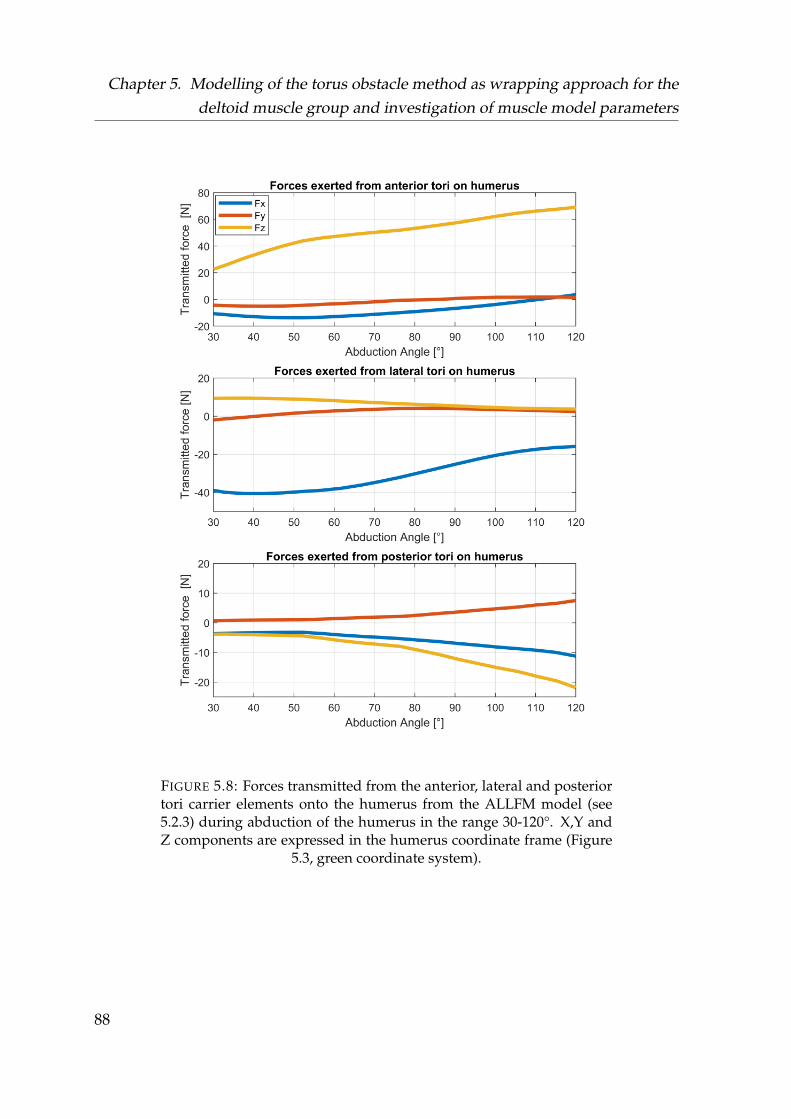
Chapter 5. Modelling of the torus obstacle method as wrapping approach for thedeltoid muscle group and investigation of muscle model parameters
FIGURE 5.8: Forces transmitted from the anterior, lateral and posteriortori carrier elements onto the humerus from the ALLFM model (see5.2.3) during abduction of the humerus in the range 30-120°. X,Y andZ components are expressed in the humerus coordinate frame (Figure
5.3, green coordinate system).
88
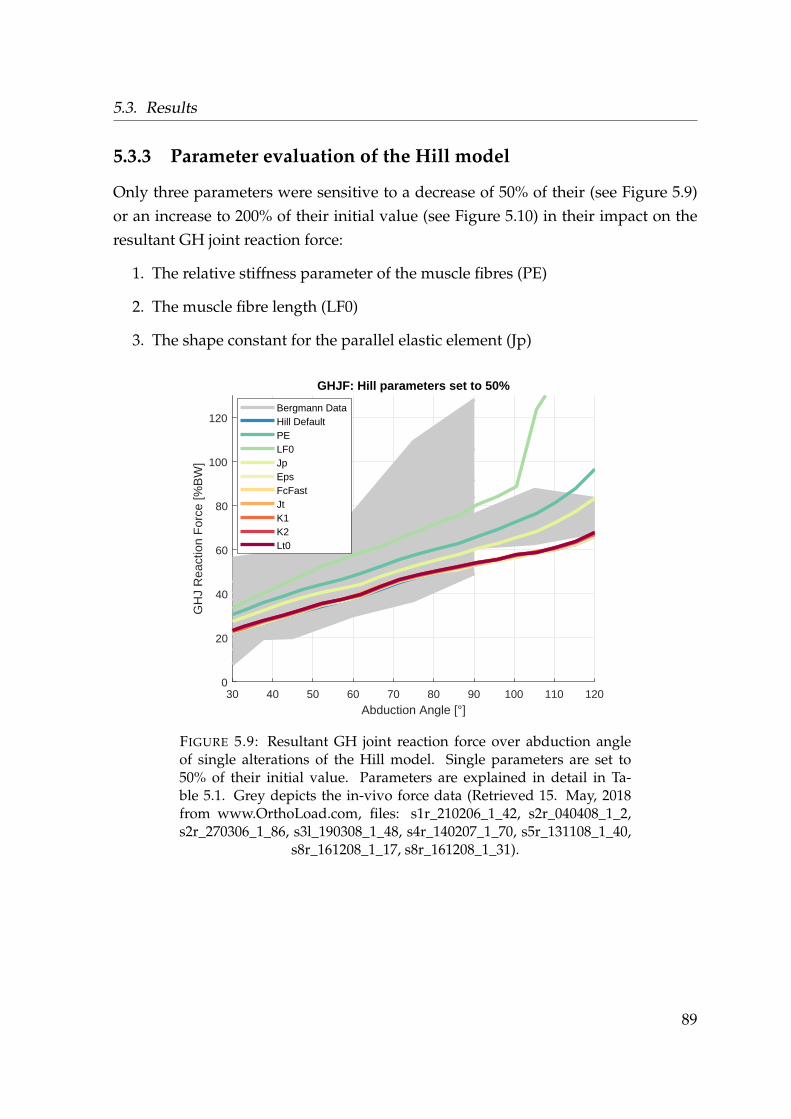
5.3. Results
5.3.3 Parameter evaluation of the Hill model
Only three parameters were sensitive to a decrease of 50% of their (see Figure 5.9)or an increase to 200% of their initial value (see Figure 5.10) in their impact on theresultant GH joint reaction force:
1. The relative stiffness parameter of the muscle fibres (PE)
2. The muscle fibre length (LF0)
3. The shape constant for the parallel elastic element (Jp)
30 40 50 60 70 80 90 100 110 120
Abduction Angle [°]
0
20
40
60
80
100
120
GH
J R
eact
ion
For
ce [%
BW
]
GHJF: Hill parameters set to 50%
Bergmann DataHill DefaultPELF0JpEpsFcFastJtK1K2Lt0
FIGURE 5.9: Resultant GH joint reaction force over abduction angleof single alterations of the Hill model. Single parameters are set to50% of their initial value. Parameters are explained in detail in Ta-ble 5.1. Grey depicts the in-vivo force data (Retrieved 15. May, 2018from www.OrthoLoad.com, files: s1r_210206_1_42, s2r_040408_1_2,s2r_270306_1_86, s3l_190308_1_48, s4r_140207_1_70, s5r_131108_1_40,
s8r_161208_1_17, s8r_161208_1_31).
89
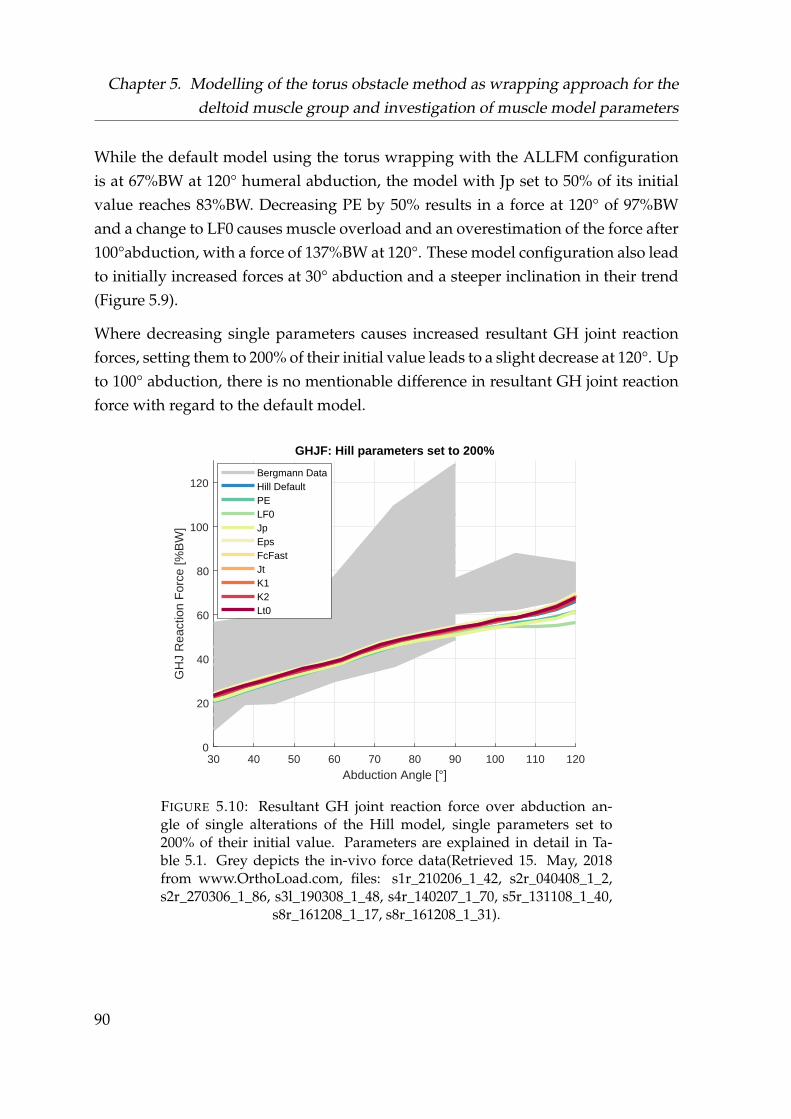
Chapter 5. Modelling of the torus obstacle method as wrapping approach for thedeltoid muscle group and investigation of muscle model parameters
While the default model using the torus wrapping with the ALLFM configurationis at 67%BW at 120° humeral abduction, the model with Jp set to 50% of its initialvalue reaches 83%BW. Decreasing PE by 50% results in a force at 120° of 97%BWand a change to LF0 causes muscle overload and an overestimation of the force after100°abduction, with a force of 137%BW at 120°. These model configuration also leadto initially increased forces at 30° abduction and a steeper inclination in their trend(Figure 5.9).
Where decreasing single parameters causes increased resultant GH joint reactionforces, setting them to 200% of their initial value leads to a slight decrease at 120°. Upto 100° abduction, there is no mentionable difference in resultant GH joint reactionforce with regard to the default model.
30 40 50 60 70 80 90 100 110 120
Abduction Angle [°]
0
20
40
60
80
100
120
GH
J R
eact
ion
For
ce [%
BW
]
GHJF: Hill parameters set to 200%
Bergmann DataHill DefaultPELF0JpEpsFcFastJtK1K2Lt0
FIGURE 5.10: Resultant GH joint reaction force over abduction an-gle of single alterations of the Hill model, single parameters set to200% of their initial value. Parameters are explained in detail in Ta-ble 5.1. Grey depicts the in-vivo force data(Retrieved 15. May, 2018from www.OrthoLoad.com, files: s1r_210206_1_42, s2r_040408_1_2,s2r_270306_1_86, s3l_190308_1_48, s4r_140207_1_70, s5r_131108_1_40,
s8r_161208_1_17, s8r_161208_1_31).
90
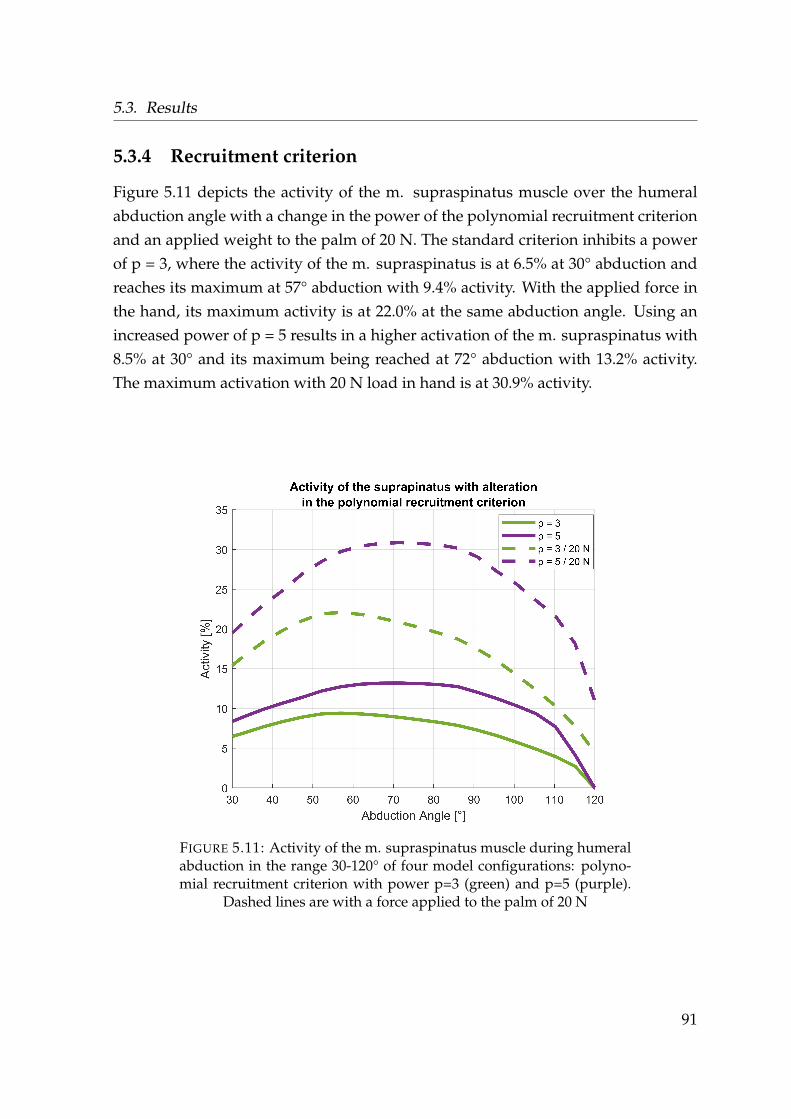
5.3. Results
5.3.4 Recruitment criterion
Figure 5.11 depicts the activity of the m. supraspinatus muscle over the humeralabduction angle with a change in the power of the polynomial recruitment criterionand an applied weight to the palm of 20 N. The standard criterion inhibits a powerof p = 3, where the activity of the m. supraspinatus is at 6.5% at 30° abduction andreaches its maximum at 57° abduction with 9.4% activity. With the applied force inthe hand, its maximum activity is at 22.0% at the same abduction angle. Using anincreased power of p = 5 results in a higher activation of the m. supraspinatus with8.5% at 30° and its maximum being reached at 72° abduction with 13.2% activity.The maximum activation with 20 N load in hand is at 30.9% activity.
FIGURE 5.11: Activity of the m. supraspinatus muscle during humeralabduction in the range 30-120° of four model configurations: polyno-mial recruitment criterion with power p=3 (green) and p=5 (purple).
Dashed lines are with a force applied to the palm of 20 N
91
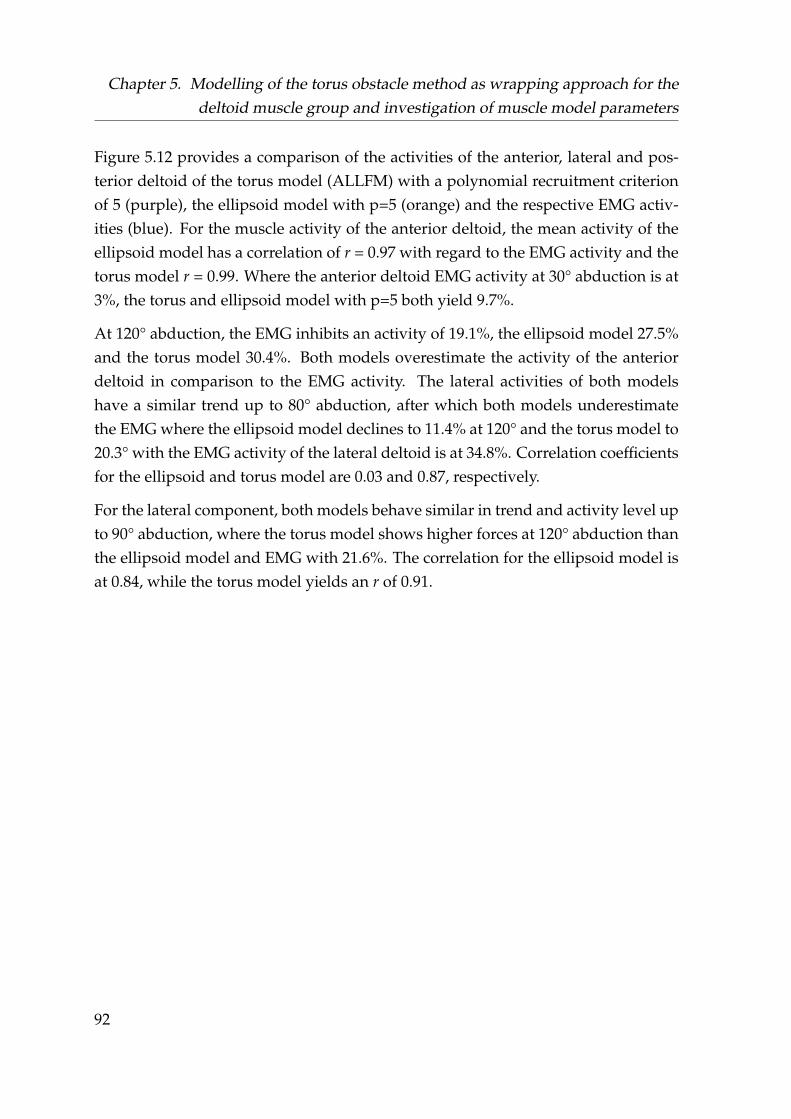
Chapter 5. Modelling of the torus obstacle method as wrapping approach for thedeltoid muscle group and investigation of muscle model parameters
Figure 5.12 provides a comparison of the activities of the anterior, lateral and pos-terior deltoid of the torus model (ALLFM) with a polynomial recruitment criterionof 5 (purple), the ellipsoid model with p=5 (orange) and the respective EMG activ-ities (blue). For the muscle activity of the anterior deltoid, the mean activity of theellipsoid model has a correlation of r = 0.97 with regard to the EMG activity and thetorus model r = 0.99. Where the anterior deltoid EMG activity at 30° abduction is at3%, the torus and ellipsoid model with p=5 both yield 9.7%.
At 120° abduction, the EMG inhibits an activity of 19.1%, the ellipsoid model 27.5%and the torus model 30.4%. Both models overestimate the activity of the anteriordeltoid in comparison to the EMG activity. The lateral activities of both modelshave a similar trend up to 80° abduction, after which both models underestimatethe EMG where the ellipsoid model declines to 11.4% at 120° and the torus model to20.3° with the EMG activity of the lateral deltoid is at 34.8%. Correlation coefficientsfor the ellipsoid and torus model are 0.03 and 0.87, respectively.
For the lateral component, both models behave similar in trend and activity level upto 90° abduction, where the torus model shows higher forces at 120° abduction thanthe ellipsoid model and EMG with 21.6%. The correlation for the ellipsoid model isat 0.84, while the torus model yields an r of 0.91.
92
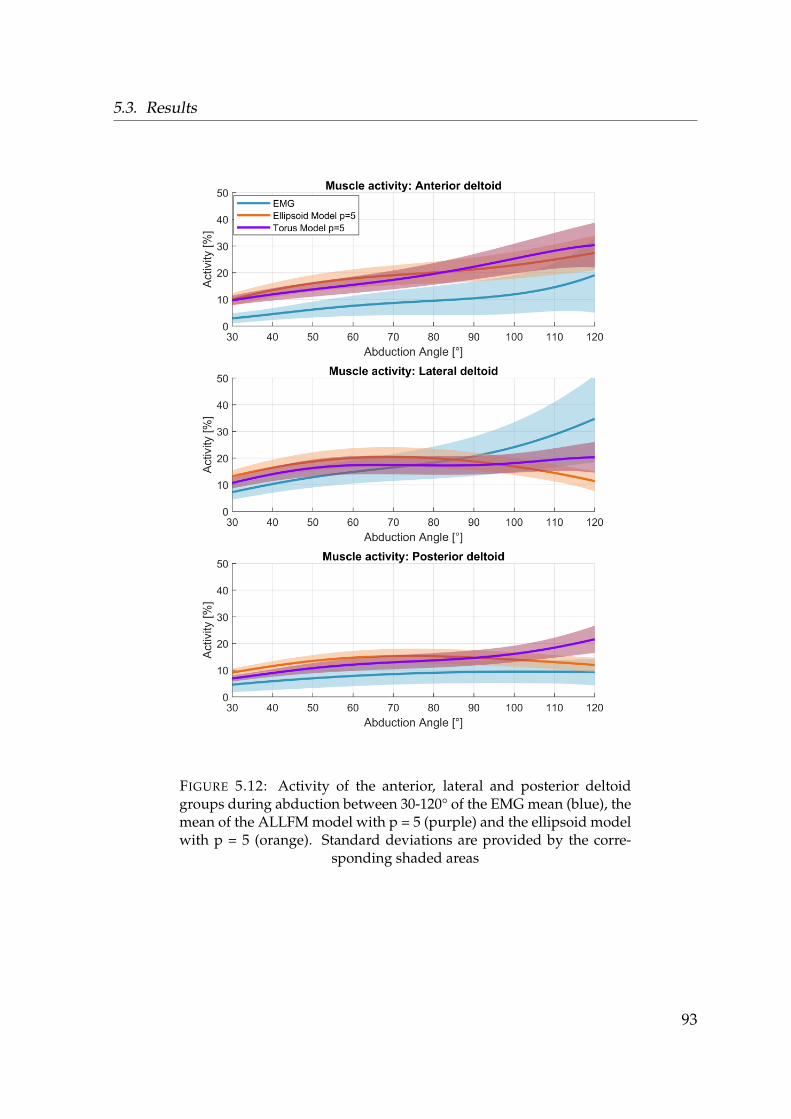
5.3. Results
FIGURE 5.12: Activity of the anterior, lateral and posterior deltoidgroups during abduction between 30-120° of the EMG mean (blue), themean of the ALLFM model with p = 5 (purple) and the ellipsoid modelwith p = 5 (orange). Standard deviations are provided by the corre-
sponding shaded areas
93
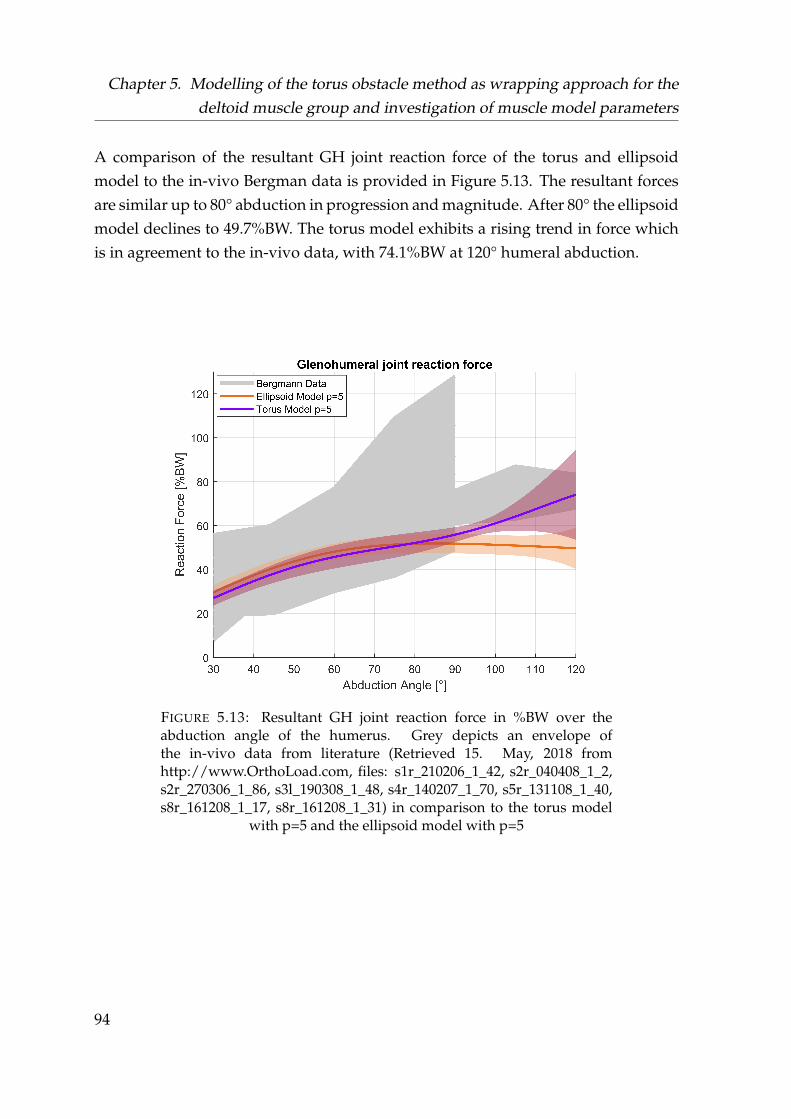
Chapter 5. Modelling of the torus obstacle method as wrapping approach for thedeltoid muscle group and investigation of muscle model parameters
A comparison of the resultant GH joint reaction force of the torus and ellipsoidmodel to the in-vivo Bergman data is provided in Figure 5.13. The resultant forcesare similar up to 80° abduction in progression and magnitude. After 80° the ellipsoidmodel declines to 49.7%BW. The torus model exhibits a rising trend in force whichis in agreement to the in-vivo data, with 74.1%BW at 120° humeral abduction.
FIGURE 5.13: Resultant GH joint reaction force in %BW over theabduction angle of the humerus. Grey depicts an envelope ofthe in-vivo data from literature (Retrieved 15. May, 2018 fromhttp://www.OrthoLoad.com, files: s1r_210206_1_42, s2r_040408_1_2,s2r_270306_1_86, s3l_190308_1_48, s4r_140207_1_70, s5r_131108_1_40,s8r_161208_1_17, s8r_161208_1_31) in comparison to the torus model
with p=5 and the ellipsoid model with p=5
94
5.4. Discussion
5.4 Discussion
The aim of chapter 5 was to improve and analyse the muscle activities of the deltoidgroup and the resultant GH joint reaction force with comparison to experimentallyderived muscle activities and in-vivo force measurements from literature. The torusapproach as a wrapping method for the deltoid muscle group yields several advan-tages. It prevents an overlapping of the different muscle elements over the entirerange of motion (see Figure 5.2-right) and furthermore, with a continuous muscle-obstacle contact, the forces (Figure 5.8) and moments (Figure A.5) resulting fromthe muscle elements onto the obstacles are continuously exerted onto the humerus,which results in higher forces than the ellipsoid model Figure 5.13. This is in betteragreement with the data from Bergmann, 2008.
Limitations and issues of comparing computed muscle activities to EMG measure-ments are discussed in section 4.4 and apply to all following sub-studies which uti-lize EMG as a validation method. All computed deltoid activities from the ellipsoidand torus model show a better agreement to the EMG than the via point model (seechapter 4.3).
5.4.1 Torus modelling
The two major limitations of this work are the use of data sets from different anatom-ical studies and the manual adjustment from the MRI based initial positions of thetori. Several parameters e.g. muscle cross-sectional area, insertion origin points ofthe deltoids and bone geometries are not from the same subject as the MRI scan. Thishas a direct influence on the workflow from the MRI fitting, as the cutting planes arecalculated from the anatomical data of the original model. This discrepancy influ-ences the initial positions of the tori derived from the MRI which results in crossingexisting obstacles of other muscle groups of the AnyBodyTM model e.g. a sphere inthe humeral head. Due to this reason, they are reworked manually to prevent thisissue.
A better approach for future consideration and to eliminate the limitations of thiswork is to conduct a cadaver study which should not only take into account thesubject specific anatomy, but also the curvature and orientation of the deltoid musclefibres during all rotational degrees of freedom of the humerus. This would allow fora mathematical description of the tori in dependency of humeral elevation.
95
Chapter 5. Modelling of the torus obstacle method as wrapping approach for thedeltoid muscle group and investigation of muscle model parameters
While the force data from the in vivo measurements shows a rising trend in GHjoint reaction force which is also achieved by the torus model, it must be noted thata quantitative comparison is not feasible. The data from literature is not only froma different subject group, but it is also done with individuals after a total shoulderarthroplasty, whom potentially have a different muscle recruitment and pretensionof the muscles in comparison to healthy subjects.
However, the focus of this study is on the feasibility of the torus wrapping of thedeltoids in general to be considered for future studies, as their structure has thebenefit of approximating the curvature of the deltoid similar to an ellipsoid wrap-ping but offers a better guidance such as a via point approach and a continuousforce transmission.
5.4.2 Moment arm evaluation
Figure 5.4 highlights the issue of the via point model with regard to its momentarm in the abduction plane. Where the moment arm of the anterior deltoid fromthe cadaver study (Ackland et al., 2008) is positive and keeps increasing over thecontemplated abduction range, all moment arms of the virtual deltoid elements ofthe via point model start of negative and are lower in amplitude. This leads to adissonant activation (see chapter 4.3) as the solver does not regard these elementsfor the load distribution during abduction. The ellipsoid and torus model behavesimilar in curve progression, which is largely dependent on the change in muscleelement origin/insertion and redistribution of the strength (see section 5.1). Due tothe curvature of the ellipsoid and torus objects, the moment arms become non-linearin nature, which is in accordance with the cadaver study.
With the use of the tendon excursion method (Equation 5.1), the moment arms arecomputed from the incremental change in length. As the tori restrict the muscle el-ements as they bend around the inner tube, the moment arms become smaller withregard to the ellipsoid model. When the muscle elements lose contact to the obsta-cles in the ellipsoid model, they exhibit their maximum shortening capacity as theyare represented by a straight line from insertion to origin. The relative change of themost anterior element hereby exceeds the more lateral placed elements, resulting inan intersection of the moment arms (see Figure 5.4).
96
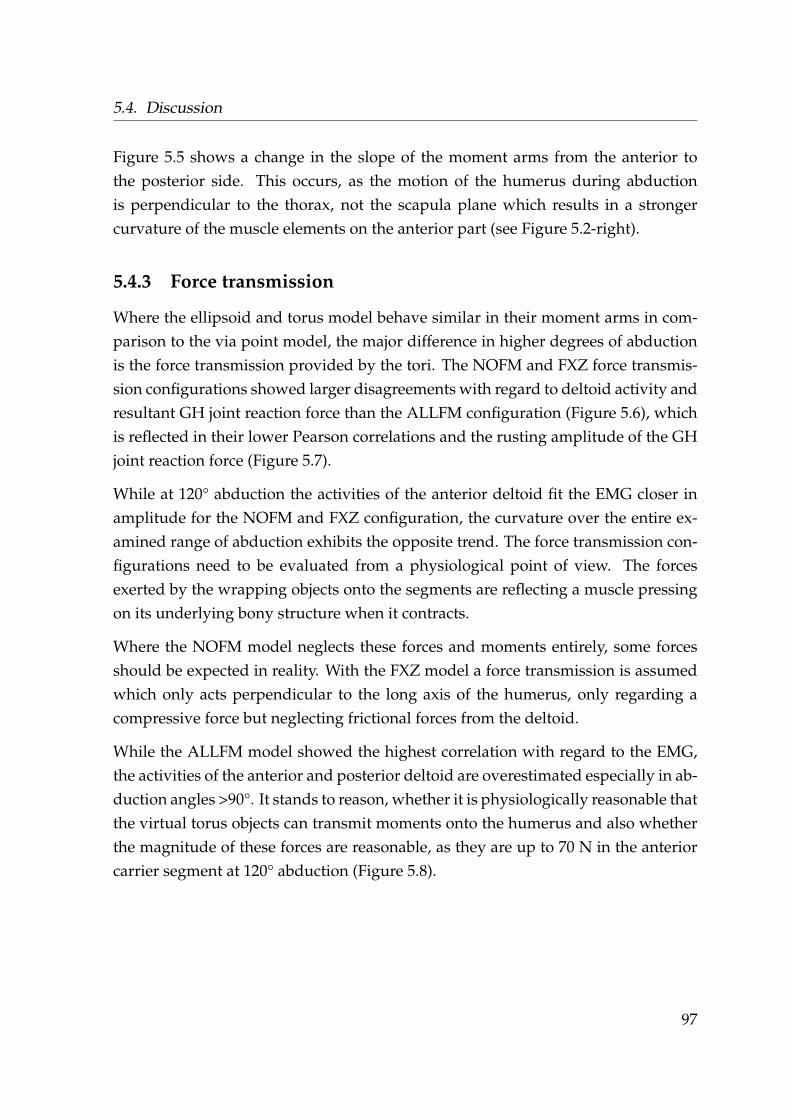
5.4. Discussion
Figure 5.5 shows a change in the slope of the moment arms from the anterior tothe posterior side. This occurs, as the motion of the humerus during abductionis perpendicular to the thorax, not the scapula plane which results in a strongercurvature of the muscle elements on the anterior part (see Figure 5.2-right).
5.4.3 Force transmission
Where the ellipsoid and torus model behave similar in their moment arms in com-parison to the via point model, the major difference in higher degrees of abductionis the force transmission provided by the tori. The NOFM and FXZ force transmis-sion configurations showed larger disagreements with regard to deltoid activity andresultant GH joint reaction force than the ALLFM configuration (Figure 5.6), whichis reflected in their lower Pearson correlations and the rusting amplitude of the GHjoint reaction force (Figure 5.7).
While at 120° abduction the activities of the anterior deltoid fit the EMG closer inamplitude for the NOFM and FXZ configuration, the curvature over the entire ex-amined range of abduction exhibits the opposite trend. The force transmission con-figurations need to be evaluated from a physiological point of view. The forcesexerted by the wrapping objects onto the segments are reflecting a muscle pressingon its underlying bony structure when it contracts.
Where the NOFM model neglects these forces and moments entirely, some forcesshould be expected in reality. With the FXZ model a force transmission is assumedwhich only acts perpendicular to the long axis of the humerus, only regarding acompressive force but neglecting frictional forces from the deltoid.
While the ALLFM model showed the highest correlation with regard to the EMG,the activities of the anterior and posterior deltoid are overestimated especially in ab-duction angles >90°. It stands to reason, whether it is physiologically reasonable thatthe virtual torus objects can transmit moments onto the humerus and also whetherthe magnitude of these forces are reasonable, as they are up to 70 N in the anteriorcarrier segment at 120° abduction (Figure 5.8).
97
Chapter 5. Modelling of the torus obstacle method as wrapping approach for thedeltoid muscle group and investigation of muscle model parameters
Another issue to be raised is the point of attack of these forces and moments. Asthe coordinate frames of the virtual anterior, lateral and posterior carrier segmentsare aligned with the coordinate frame placed in the centre of the humeral head inan initial position of 0° abduction, they are moving on the longitudinal axis of thehumerus head in order to prevent a penetration of the segments due to the kinemat-ics of the shoulder rhythm (see section 5.4.1).
However, the forces and moments are transmitted onto the reference point in thehumeral head. Furthermore, the model assumes a force transmission from the ante-rior, lateral and posterior deltoid onto the humerus segment. A force transmissionfrom the posterior deltoid onto the scapula or from the anterior deltoid onto theclavicle are also possible configurations. It is not clear, how these forces are dis-tributed in-vivo. Future work should investigate the pressure distribution onto thesegments with a cadaver study including a pressure measuring foil in order to assesthe point of attack and magnitude of these forces and provide a validation to thecomputed forces from the tori carrier segments.
The GH joint reaction force aggregates the kinetics from all muscle elements span-ning over the shoulder joint. While it is largely dependent on the deltoid activation,which consequently changes the recruitment of the other involved muscles and thusthe forces, it can only conditionally provide a measure of validation for looking atchanges to one isolated muscle group.
For the purpose of this thesis, it is opted for the ALLFM configuration and the torusapproach, as they yielded the best agreement to the EMG and in vivo force data.
98
5.4. Discussion
5.4.4 Parameter evaluation of the Hill model
From the parameter study on the variables of the Hill model, three properties showeda sensitivity in a decrease to 50% of their initial value or increase to 200% with regardto the resultant GH joint reaction force:
1. The relative stiffness parameter of the muscle fibres (PE)
2. The muscle fibre length (LF0)
3. The shape constant for the parallel elastic element (Jp)
The aim of this particular study was to identify possible crucial parameters whichcould be optimized.
The muscle fibre length defined in the Hill muscle model is equal to the optimalmuscle fibre length at which the virtual muscle element can exert its maximum ac-tive force (see Figure 4.3). Decreasing the muscle fibre length impacts the ratio be-tween its initial value and its relative change in length, which results in the muscleelements operating at a lower strength level as this curve gets compressed. Muscleelements with a mechanically less efficient moment arm but less relative shorteningare regarded more in this case as compared to the original state of the Hill model.This results in higher joint reaction forces.
The length of the muscle belly can be derived for example from MRI (Juul-Kristensenet al., 2000) or cadaver studies. As it is a geometrical property and can be measuredin-vivo or be extracted from cadaver studies. It is unlikely that the properties set inthe default model differ or show a variance of 50% or 200% of their already imple-mented length.
The PE and Jp constants are more questionable. Scovil and Ronsky, 2006 have showna large variance in reported parameters from literature and conducted a similar ap-proach by variation of the Hill parameters of±50% for walking and running modelswith a focus on the lower limb region.
A limitation of testing these parameters is the application to all muscle elementssimultaneously.
However, the Hill model with regard to shoulder muscles seems stable in its currentconfiguration and is thus used in its current form in chapters 6 & 7.
99
Chapter 5. Modelling of the torus obstacle method as wrapping approach for thedeltoid muscle group and investigation of muscle model parameters
5.4.5 Recruitment criterion
EMG measurements of the m. supraspinatus show a high activity during abductionin the coronal plane during normal abduction (Wickham et al., 2010) and internal/external rotation (Reinold et al., 2007c; Kai et al., 2015).
Wickham et al., 2010 have measured the activity of the surpaspinatus of test subjectsconducting humeral abduction up to 165° while holding a light dumbbell with theaverage weight of 2.5 ± 0.65 kg. Peak m. supraspinatus activity is reached at 88° ofabduction with an approximate 57 %MVC value.
The modelled muscle activities depicted in Figure 5.11 underestimate this peak,where the model using a polynomial recruitment with the power of 5 is in betteragreement as it reaches a maximum of 30.9% activity at 72° of abduction. Wherewith a recruitment criterion of p = 3 the deltoids carry the majority of the load asthey are stronger and have a better moment arm, an increased muscle synergy isforced by a higher power. This results in a higher activation of muscle elementsinhibiting a less favourable moment arm, which causes increased forces on the GHjoint. This relationship can be seen by comparing Figure 5.7 and Figure 5.13. Theresultant GH joint reaction force of the models using the ALLFM configuration dif-fer in amplitude at 120°, where a recruitment criterion with the power of 5 resultsin an average 74.1%BW which is between the two forces of the in-vivo force study(68%BW and 83.4%BW).
Andersen, 2018 has described the effects of a change in the power of the muscle re-cruitment during gait with a focus on the knee joint, where he investigated powersof 2, 3 and 4 for the polynomial recruitment criterion. Where in his study the differ-ences on force behaviour and force production of the involved muscles were small,they have a more severe effect on the shoulder joint. This might be due to a severedecomposition of the muscles in the shoulder model, where Holmberg and Klar-bring, 2012 have shown that higher decomposition influences muscle recruitmentwhen a polynomial criterion is utilised.
Overall the muscle activities did not exhibit notable fast activation or deactivationby using a higher order criterion and show a continuous trend, which is ultimatelyreflected in a continuous progression of the GH joint reaction force.
100
5.5. Conclusion
5.5 Conclusion
This model is assigned to assess m. supraspinatus tears, which take mostly effectduring abduction. The results from the validation shows a behaviour of the modelsuitable for abduction tasks in the range between 20− 120◦ by using the torus modelwith the ALLFM configuration, the Hill model and a polynomial recruitment crite-rion with the power of 5.
Overall there are four mechanisms identified which cause an increase in the resul-tant GH joint reaction force and improves model behaviour with regard to EMGmeasurements:
1. The passive forces arising from the muscle stiffness described by the Hill model
2. A change in recruitment induced by the Hill model where the strength of anelements is dependent on its elongation
3. Reaction forces of muscle elements onto surfaces/obstacles which are trans-mitted to the body segments
4. Increased muscle synergism causes muscle elements being recruited more whichhave a less mechanically efficient moment arm, thus increasing joint reactionforces
101
Chapter 6
Clinical application: Biceps tendontransfer
Parts of the introduction and discussion of this chapter were created in collaborationwith the project partner PD Dr. med. Carsten Englert.
6.1 Introduction
Instabilities of the long biceps tendon anchor, tears of the labrum or long biceps in-stabilities appear often as co-morbidity of rotator cuff tears (Baumgarten, Chang,and Foley, 2019). Very early stages of instability of the long biceps tendon (LBT)in the bicipital groove can be related to histopathological changes Glait et al., 2018and result finally in macroscopically luxation or rupture of the tendon. From a me-chanical point of view, the co-morbidity of LBT and SLAP (superior labral tear fromanterior to posterior) pathologies of rotator cuff tears has a direct influence on theforces acting on the glenoid. These changes are highly depending on the expansionand origin of the weakened rotator cuff (Boileau et al., 2002). In a m. supraspinatustear, the shoulder reaction force is deviated cranial anteriorly and cause an over-load of the LBT and the upper ventral third of the glenoid rim. Prolonged mechan-ical repetitive disuse is a well-known factor for the development of pathologicalprocesses leading to degenerative SLAP lesions of the shoulder joint. The onset ofsmall biomechanical changes can eventually progress to pathologic symptoms suchas subacromial impingement or in cuff tear arthropathy.
If conservative treatments of shoulder diseases with an LBT pathology and cuff tearsfail, operative techniques can be considered to relieve pain and regain strength and
102
6.1. Introduction
function (Boileau et al., 2002). Whereas the rotator cuff is the main issue, the longbiceps tendon is often cut to release pain (Walch et al., 2005). From a clinical point ofview, there are several ways to proceed after releasing the LBT from the glenoid rim(Voss et al., 2017; Voss et al., 2016; Voss, Imhoff, and Dyrna, 2018). Multiple varyingtechniques and constructs are available to perform an LBT tenodesis, including anarray of intra-articular, suprapectoral and subpectoral fixation methods of the cutend of the LBT (Schoch, Geyer, and Drews, 2017). Some surgeons prefer an opensubpectoral fixation of the LBT. This procedure is comparable to an arthroscopicmanoeuvre in terms of speed (Forsythe et al., 2020). Fixation of the LBT can be ac-complished using various materials and various designs for example titan, PEEK orPolyamide materials with an all suture anchor, suture loaded anchor or interferencescrews.
From a surgeons perspective, it is still controversial to suture the LBT inferior tothe bicipital groove to the pectoral tendon, short biceps tendon or at the top of thebicipital groove. In SLAP lesions of the LBT pathologies systematic reviews andmeta-analysis show similar functional outcome scores for various techniques (Hur-ley et al., 2018). In combined pathologies with single superior rotator cuff tears, thebiceps tenodesis in combination with rotator cuff repair results in a better outcomethan cuff repair with tenotomy. The multitude of applied operational techniqueswith only minor obvious clinical differences suggest that there is no obvious, supe-rior surgical technique which is reflected in short term clinical investigations (Baum-garten, Chang, and Foley, 2019; Gowd, Beck, and Waterman, 2020; Kerschbaum etal., 2019; Na et al., 2019). Clinical investigations of a LBT surgery have often followup periods from 6 months to five years, but the biomechanical impact of transposi-tion surgery involving the LBT will be lifelong.
103
Chapter 6. Clinical application: Biceps tendon transfer
A method to acquire joint forces and moments in order to investigate such pro-cedures or pathologies from a mechanical point of view is by a computational ap-proach. A study with a focus on shoulder injuries conducted by Hölscher computedthe acting force on the glenoid by simulation of different tears of the rotator cuff inorder to assess instabilities during simulated activities of daily living with repetitivemechanical use. Another application is the simulation of muscle transfers of latis-simus dorsi, teres major or a combination of these two to compensate for inoperablemassive rotator cuff tears in a simulation environment (Magermans et al., 2004a;Magermans et al., 2004b).
With the presented clinical issue and the utilization of a musculoskeletal model,the second research question introduced in chapter 1 is investigated, whether onesurgical technique is superior from a biomechanical point of view.
104
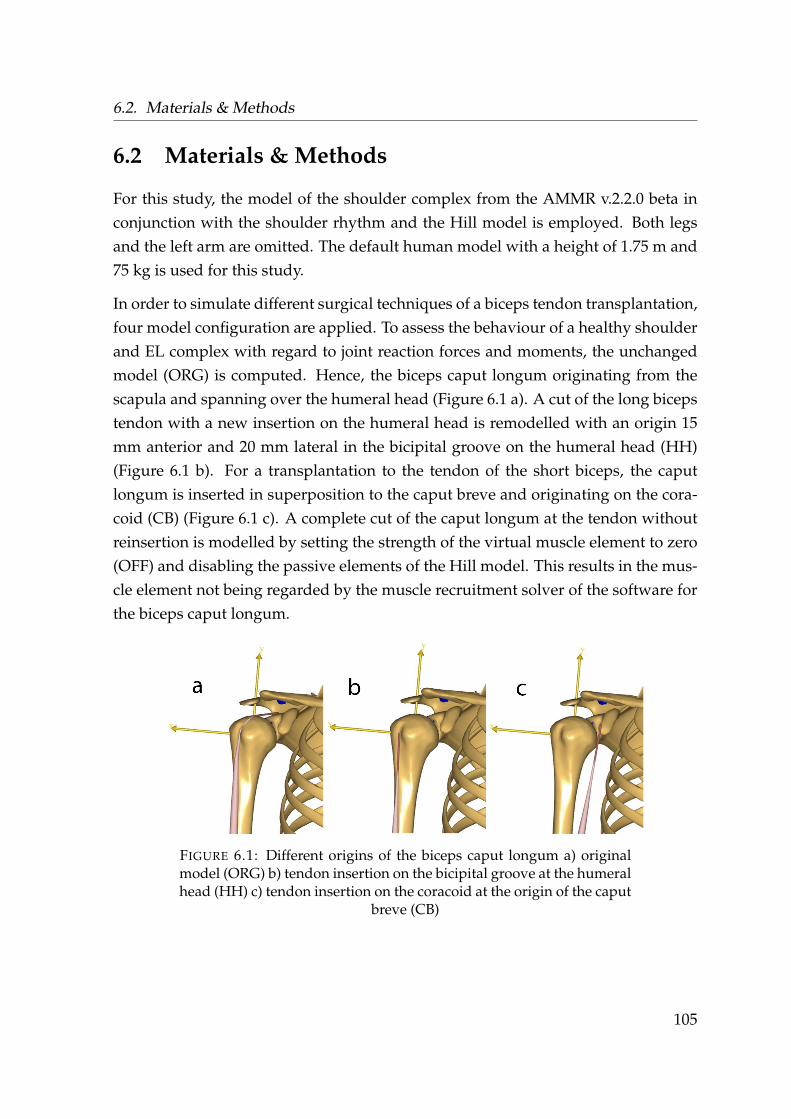
6.2. Materials & Methods
6.2 Materials & Methods
For this study, the model of the shoulder complex from the AMMR v.2.2.0 beta inconjunction with the shoulder rhythm and the Hill model is employed. Both legsand the left arm are omitted. The default human model with a height of 1.75 m and75 kg is used for this study.
In order to simulate different surgical techniques of a biceps tendon transplantation,four model configuration are applied. To assess the behaviour of a healthy shoulderand EL complex with regard to joint reaction forces and moments, the unchangedmodel (ORG) is computed. Hence, the biceps caput longum originating from thescapula and spanning over the humeral head (Figure 6.1 a). A cut of the long bicepstendon with a new insertion on the humeral head is remodelled with an origin 15mm anterior and 20 mm lateral in the bicipital groove on the humeral head (HH)(Figure 6.1 b). For a transplantation to the tendon of the short biceps, the caputlongum is inserted in superposition to the caput breve and originating on the cora-coid (CB) (Figure 6.1 c). A complete cut of the caput longum at the tendon withoutreinsertion is modelled by setting the strength of the virtual muscle element to zero(OFF) and disabling the passive elements of the Hill model. This results in the mus-cle element not being regarded by the muscle recruitment solver of the software forthe biceps caput longum.
FIGURE 6.1: Different origins of the biceps caput longum a) originalmodel (ORG) b) tendon insertion on the bicipital groove at the humeralhead (HH) c) tendon insertion on the coracoid at the origin of the caput
breve (CB)
105
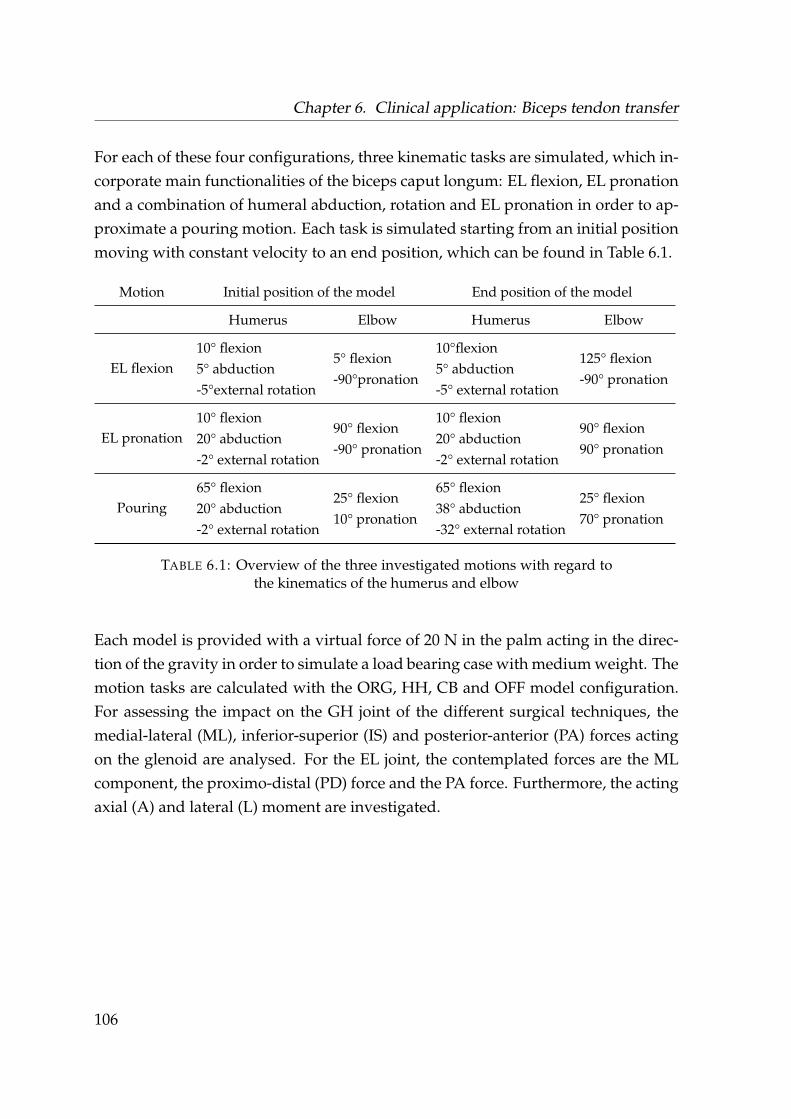
Chapter 6. Clinical application: Biceps tendon transfer
For each of these four configurations, three kinematic tasks are simulated, which in-corporate main functionalities of the biceps caput longum: EL flexion, EL pronationand a combination of humeral abduction, rotation and EL pronation in order to ap-proximate a pouring motion. Each task is simulated starting from an initial positionmoving with constant velocity to an end position, which can be found in Table 6.1.
Motion Initial position of the model End position of the model
Humerus Elbow Humerus Elbow
EL flexion10° flexion5° abduction-5°external rotation
5° flexion-90°pronation
10°flexion5° abduction-5° external rotation
125° flexion-90° pronation
EL pronation10° flexion20° abduction-2° external rotation
90° flexion-90° pronation
10° flexion20° abduction-2° external rotation
90° flexion90° pronation
Pouring65° flexion20° abduction-2° external rotation
25° flexion10° pronation
65° flexion38° abduction-32° external rotation
25° flexion70° pronation
TABLE 6.1: Overview of the three investigated motions with regard tothe kinematics of the humerus and elbow
Each model is provided with a virtual force of 20 N in the palm acting in the direc-tion of the gravity in order to simulate a load bearing case with medium weight. Themotion tasks are calculated with the ORG, HH, CB and OFF model configuration.For assessing the impact on the GH joint of the different surgical techniques, themedial-lateral (ML), inferior-superior (IS) and posterior-anterior (PA) forces actingon the glenoid are analysed. For the EL joint, the contemplated forces are the MLcomponent, the proximo-distal (PD) force and the PA force. Furthermore, the actingaxial (A) and lateral (L) moment are investigated.
106

6.3. Results
6.3 Results
The different insertion points of the LBT with ORG, HH, CB, and OFF, change themoment arm of the biceps caput longum. This results in a variation of the musclerecruitment of the modelling system, which effects the resulting forces within theGH and EL joint. A comprehensive overview of the results can be found in theappendix. In the following forces with a potential clinical relevance are discussed.
Table 6.2 provides the maximum deviation of the surgical models in comparison tothe ORG insertion point of the LBT during each motion task. The OFF model showsthe largest deviations from the ORG model for EL flexion and EL pronation. Duringthe pouring motion, the CB model yields the largest divergences in shoulder andEL forces and moments. The HH model exhibits for all three motions the smallestdifferences to the ORG model.
Model∆GH
MLF[N]
∆GH
ISF[N]
∆GH
PAF[N]
∆EL
MLF[N]
∆EL
PDF[N]
∆EL
PAF[N]
∆EL
AM[Nm]
∆EL
LM[Nm]
Flexion
HH 49 26 10 7 19 21 0.2 0.4CB 51 28 10 18 53 60 0.8 1.4
OFF 50 27 10 19 56 65 0.8 1.5
Pronation
HH 43 25 15 2 1 9 0.2 0.2CB 45 25 11 17 8 22 0.9 0.4
OFF 43 25 15 16 18 54 1.5 1.1
Pouring
HH 6 21 2 3 6 6 0.3 0.4CB 23 22 17 20 42 41 1.0 1.2
OFF 7 20 2 4 10 11 0.4 0.6
TABLE 6.2: Maximum deviation of the surgical models in comparisonto the ORG insertion point of the LBT during each motion task
107
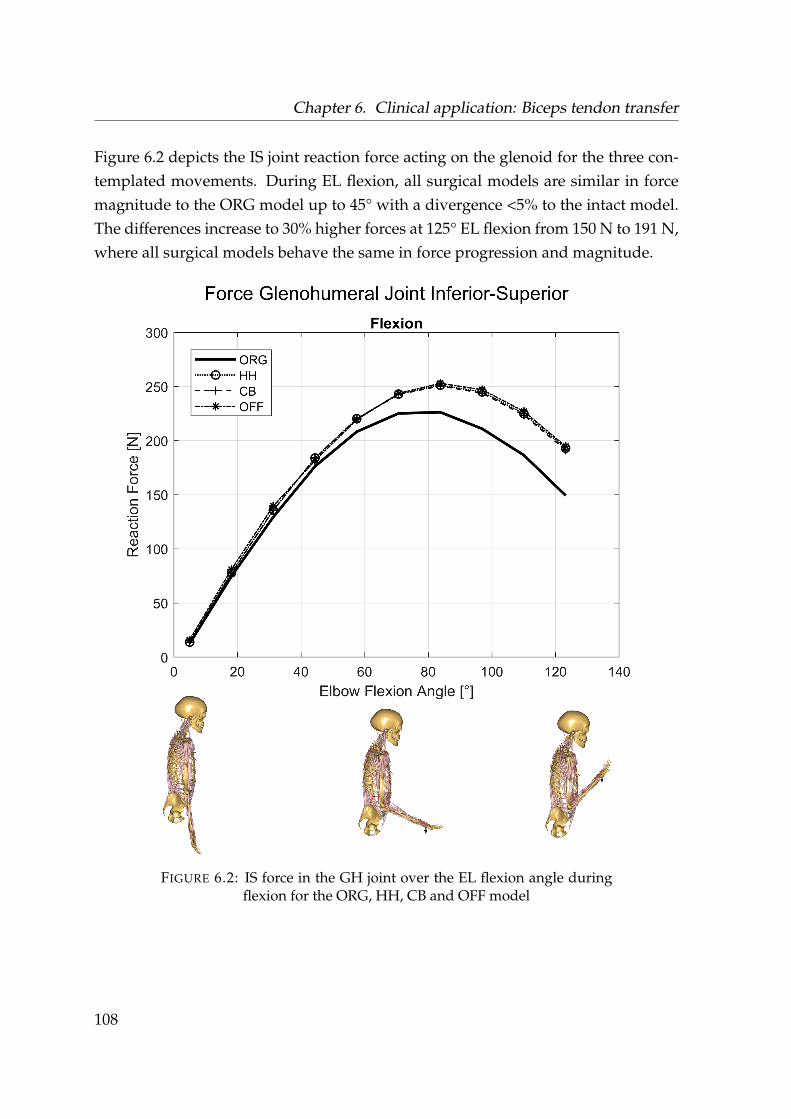
Chapter 6. Clinical application: Biceps tendon transfer
Figure 6.2 depicts the IS joint reaction force acting on the glenoid for the three con-templated movements. During EL flexion, all surgical models are similar in forcemagnitude to the ORG model up to 45° with a divergence <5% to the intact model.The differences increase to 30% higher forces at 125° EL flexion from 150 N to 191 N,where all surgical models behave the same in force progression and magnitude.
FIGURE 6.2: IS force in the GH joint over the EL flexion angle duringflexion for the ORG, HH, CB and OFF model
108
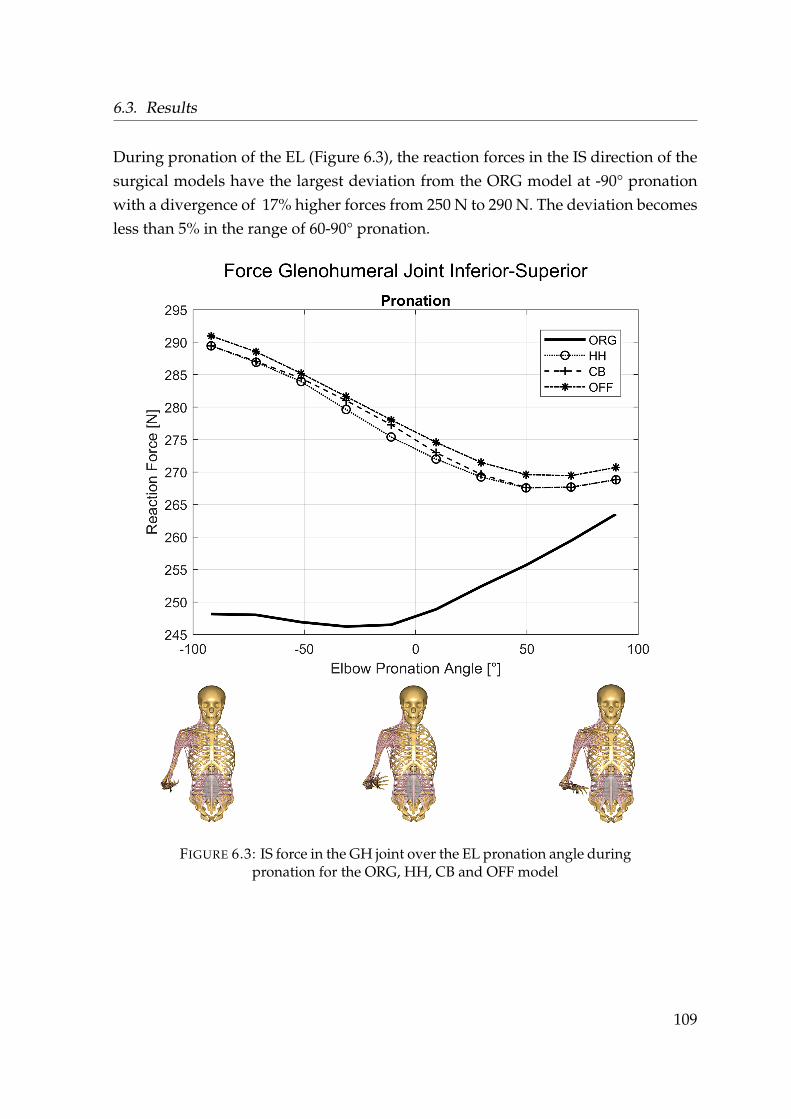
6.3. Results
During pronation of the EL (Figure 6.3), the reaction forces in the IS direction of thesurgical models have the largest deviation from the ORG model at -90° pronationwith a divergence of 17% higher forces from 250 N to 290 N. The deviation becomesless than 5% in the range of 60-90° pronation.
FIGURE 6.3: IS force in the GH joint over the EL pronation angle duringpronation for the ORG, HH, CB and OFF model
109
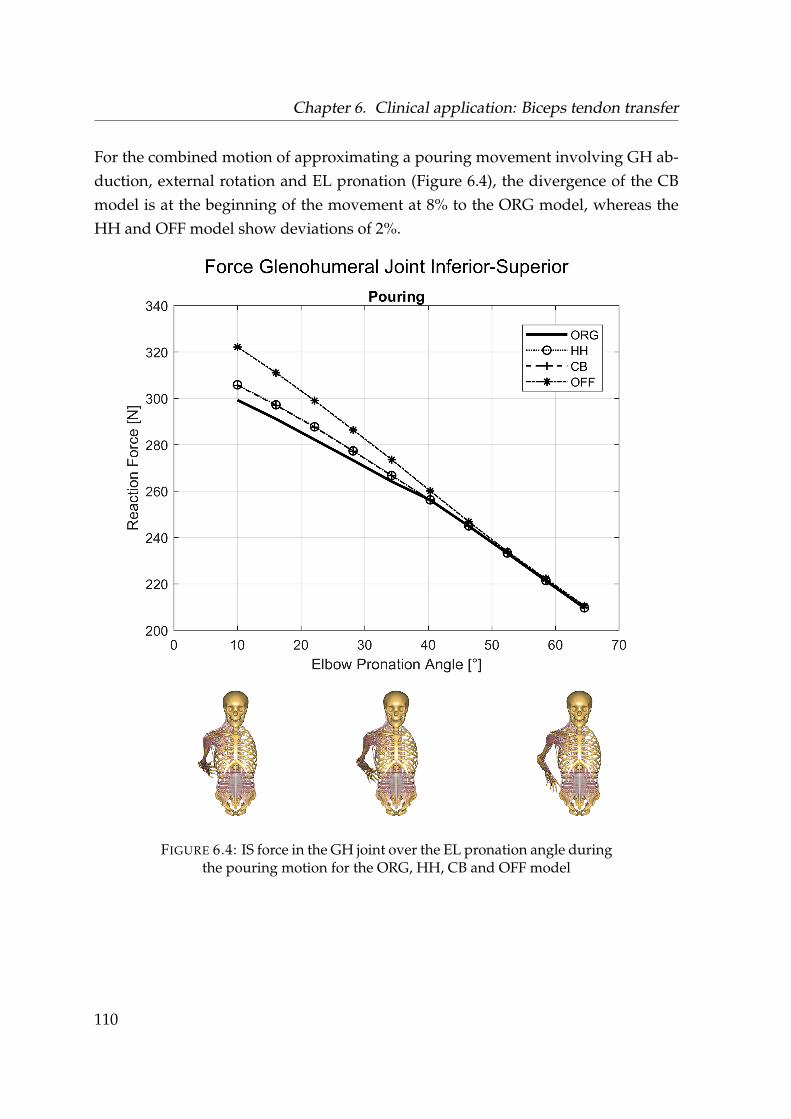
Chapter 6. Clinical application: Biceps tendon transfer
For the combined motion of approximating a pouring movement involving GH ab-duction, external rotation and EL pronation (Figure 6.4), the divergence of the CBmodel is at the beginning of the movement at 8% to the ORG model, whereas theHH and OFF model show deviations of 2%.
FIGURE 6.4: IS force in the GH joint over the EL pronation angle duringthe pouring motion for the ORG, HH, CB and OFF model
110
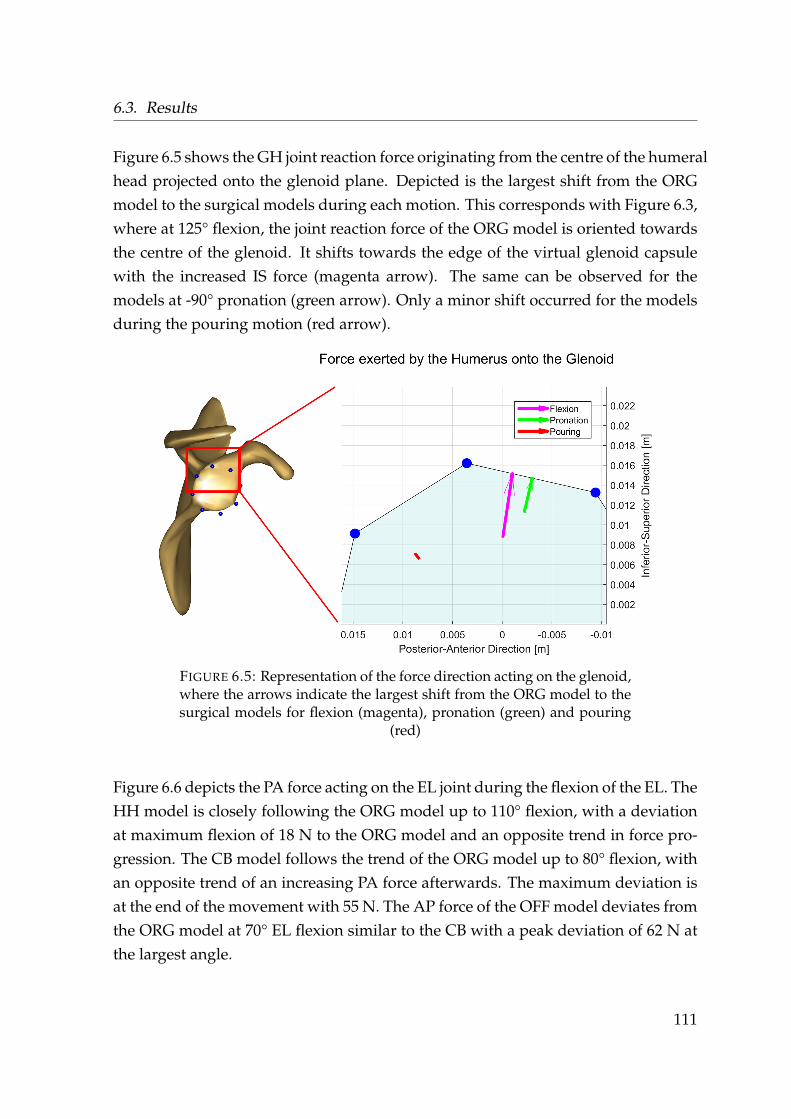
6.3. Results
Figure 6.5 shows the GH joint reaction force originating from the centre of the humeralhead projected onto the glenoid plane. Depicted is the largest shift from the ORGmodel to the surgical models during each motion. This corresponds with Figure 6.3,where at 125° flexion, the joint reaction force of the ORG model is oriented towardsthe centre of the glenoid. It shifts towards the edge of the virtual glenoid capsulewith the increased IS force (magenta arrow). The same can be observed for themodels at -90° pronation (green arrow). Only a minor shift occurred for the modelsduring the pouring motion (red arrow).
FIGURE 6.5: Representation of the force direction acting on the glenoid,where the arrows indicate the largest shift from the ORG model to thesurgical models for flexion (magenta), pronation (green) and pouring
(red)
Figure 6.6 depicts the PA force acting on the EL joint during the flexion of the EL. TheHH model is closely following the ORG model up to 110° flexion, with a deviationat maximum flexion of 18 N to the ORG model and an opposite trend in force pro-gression. The CB model follows the trend of the ORG model up to 80° flexion, withan opposite trend of an increasing PA force afterwards. The maximum deviation isat the end of the movement with 55 N. The AP force of the OFF model deviates fromthe ORG model at 70° EL flexion similar to the CB with a peak deviation of 62 N atthe largest angle.
111
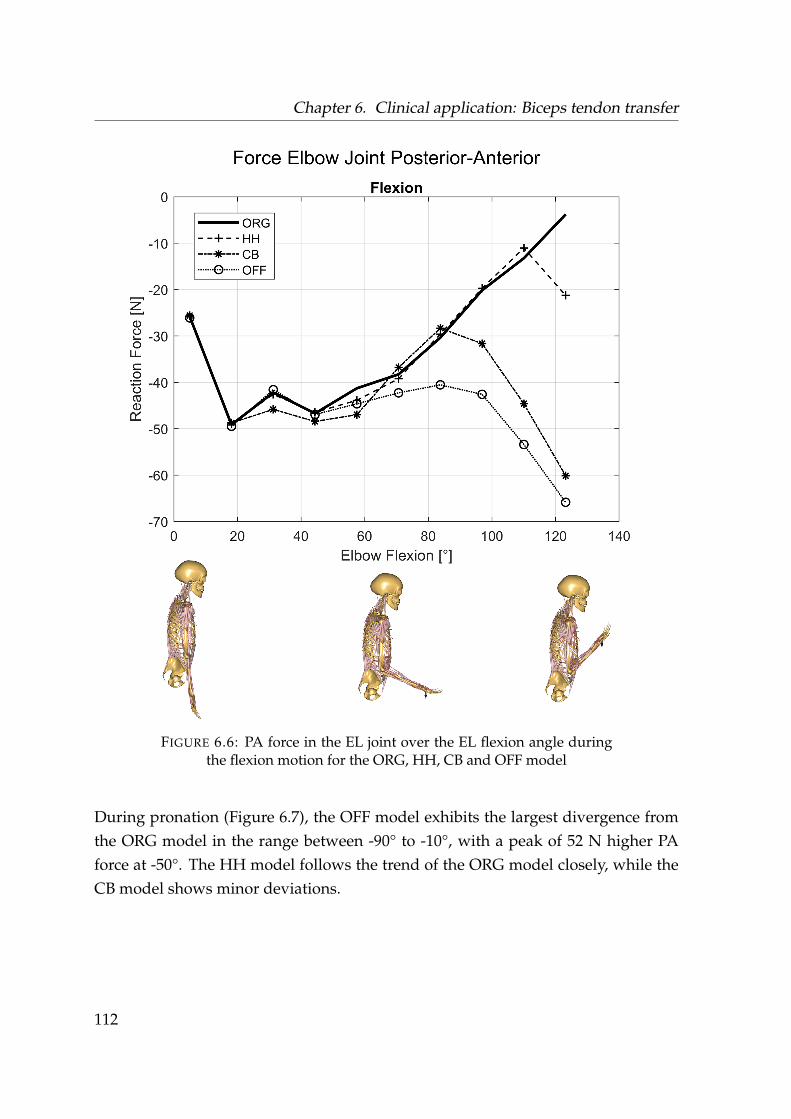
Chapter 6. Clinical application: Biceps tendon transfer
FIGURE 6.6: PA force in the EL joint over the EL flexion angle duringthe flexion motion for the ORG, HH, CB and OFF model
During pronation (Figure 6.7), the OFF model exhibits the largest divergence fromthe ORG model in the range between -90° to -10°, with a peak of 52 N higher PAforce at -50°. The HH model follows the trend of the ORG model closely, while theCB model shows minor deviations.
112
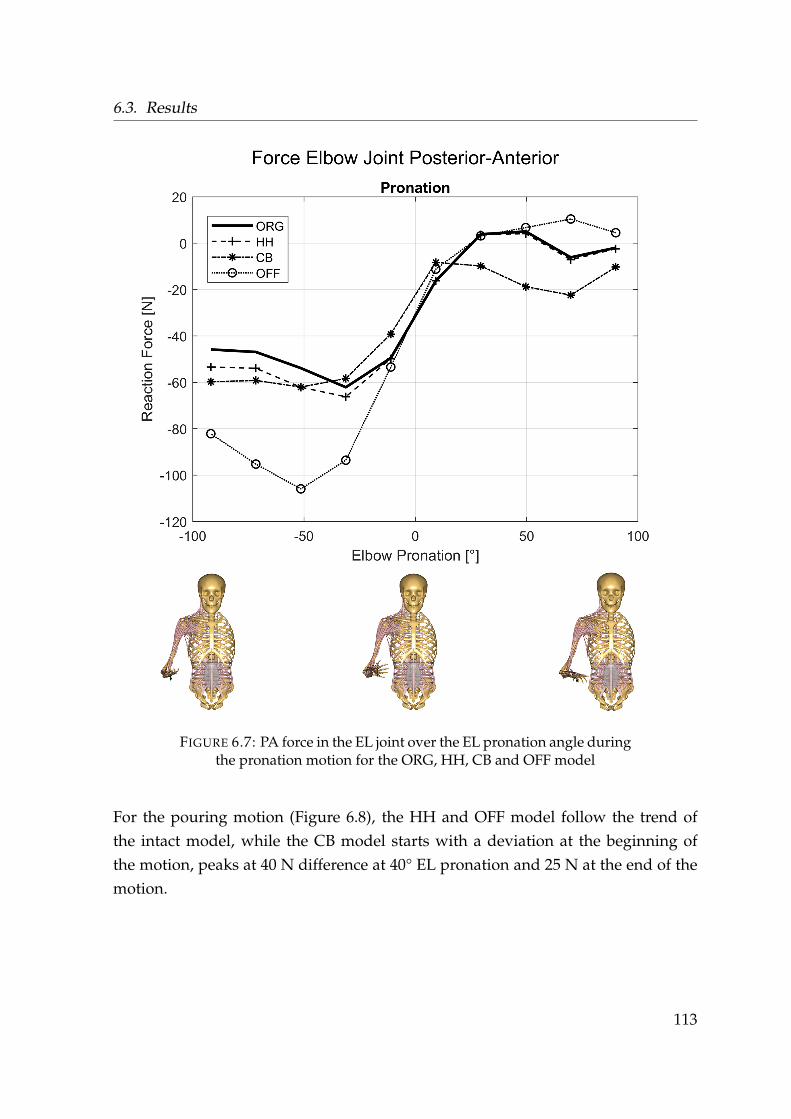
6.3. Results
FIGURE 6.7: PA force in the EL joint over the EL pronation angle duringthe pronation motion for the ORG, HH, CB and OFF model
For the pouring motion (Figure 6.8), the HH and OFF model follow the trend ofthe intact model, while the CB model starts with a deviation at the beginning ofthe motion, peaks at 40 N difference at 40° EL pronation and 25 N at the end of themotion.
113
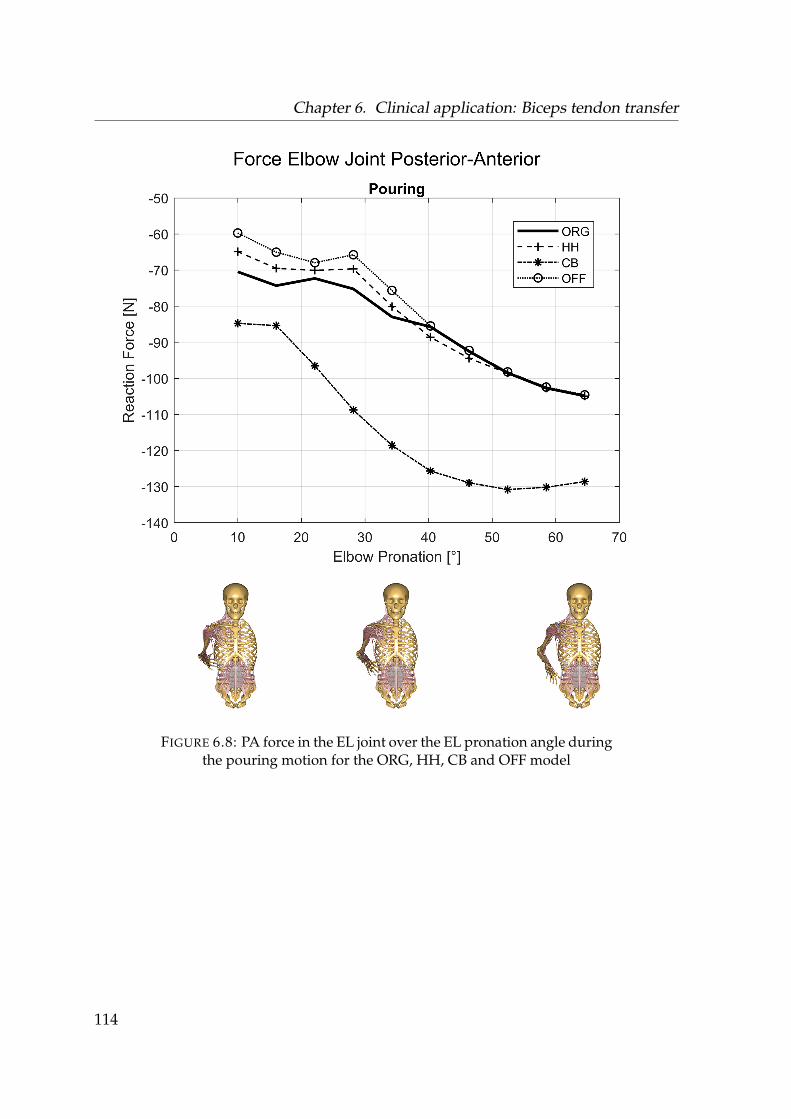
Chapter 6. Clinical application: Biceps tendon transfer
FIGURE 6.8: PA force in the EL joint over the EL pronation angle duringthe pouring motion for the ORG, HH, CB and OFF model
114

6.4. Discussion
6.4 Discussion
The results from the computational study suggest that a tenodesis of the LBT at thebicipital groove is showing the least divergence in forces and moments with regardto an intact biceps, as the direction of the moment arm of the LBT is preserved. Thiswould be in line with an assessment of Scapinelli et al., 1999, which concluded thereinsertion of the LBT at the bicipital groove as the method of choice. The LBT isspanning over the GH and the EL joints. Surgery to the LBT, which changes themechanics and muscle recruitment results in an impact to the joint reaction force tothe GH as well as the EL joint.
The GH joint reaction forces show almost no difference between the modelled patholo-gies. All diverge from the original model configuration in the IS direction, as withall modelled surgical techniques, the biceps tendon is no longer spanning over thehumeral head. This computed result is contradictory to an experimental study fromSoslowsky, Malicky, and Blasier, 1997, where they hypothesized that there would beno depression of the humeral head from the biceps tendon, which is contradictoryto other studies which describe a depression of the humeral head from the biceps(Halder et al., 2001; Warner and McMahon, 1995) However, these studies all arguefor the caput longum being a major stabilizer next to the m. supraspinatus andm. infraspinatus. This agrees with this study as higher shear forces implicate lessstability.
The higher forces occurring in the IS direction of the analysed procedures (Figure6.5) can be interpreted as an increased pressure of the humeral head onto the glenoidcavity. This is an indication of a more unstable configuration of the shoulder forall surgical techniques as shear forces increase while the compression componentdecreases. In higher abduction angles of the humerus, which is exemplified by thepouring motion, more muscles in the shoulder act together in order to conduct thegiven motion. Thus, the influence of the biceps becomes less prevalent and onlyresults in minor changes of the contact between humerus and glenoid. This indicatesthat the shoulder is less stable during motion where the biceps caput longum is themain active muscle.
115
Chapter 6. Clinical application: Biceps tendon transfer
Considering the forces acting on the EL joint, the difference in the contemplatedsurgical techniques becomes more distinct as less muscles are spanning the EL jointwith the biceps caput longum being one of the strongest. Where both the OFF andCB model show considerable deviations from the ORG model in flexion, pronationand the pouring motion, the HH model always follows closest in trend and magni-tude to the ORG model for all forces and moments (see Table 6.2 & B). While the lineof action of the biceps caput longum is almost the same with the HH technique incomparison to the ORG model, omitting the biceps or placing the origin on the cora-coid results in a different pulling direction. This is most prevalent in the PA forcedirection of the EL joint, where higher shear forces on the joint occur. However, tothe best of my knowledge, no study reported long-term issues in the elbow jointafter a tenodesis to the coracoid. In contrary, Gumina et al., 2011 reported good out-comes and restored functionality in long term behaviour after reinsertion of the LBTat the coracoid. This might be due to the simplification of the biceps caput longumspanning in a straight line from origin to insertion to the coracoid for a tendodesisat this point. In reality the moment arm is most likely oriented more lateral, thusproducing less shear forces in the elbow joint. Inserting the tendon origin of theLBT on the origin point of the caput breve has the limitation that two lines of actionare superimposed. This is a limitation as the model does not account for musclebulging and might not reflect the in-vivo moment arm accurately. In the in-vivocase, the muscle volumes would push each other apart, resulting in two differentlines of action and thus muscle recruitment of the system. This in turn affects thecalculated joint reaction forces. Another limitation is that the model does not regarda difference in pretension of the virtual muscle elements, which might occur after atenodesis influencing the muscular recruitment pattern.
The modelled outcome of the tenotomy, which exhibited the largest shear forces onthe EL joint supports the assessment, that instabilities in the elbow occur in patientswith a released or untreated tear of the biceps caput longum (Mariani et al., 1988).This is due to the increased activity of the biceps caput breve and no stabilization ofthe caput longum, which would generate a torque in the opposite direction.
116
6.5. Conclusion
While musculoskeletal models yield the possibility to allow insights into the actingforces on the joints, absolute values should be treated with care as these modelsare still under development and are constant subject of optimization. However,the assertion that inserting the origin of the LBT at the bicipital groove will produceforces and moments within the EL joint more similar to that of a healthy case shouldhold true as the moment arm is oriented in the same direction. From a mechanicalpoint of view, this surgical technique thus could be superior.
6.5 Conclusion
The outcome of this study with regard to the second research question addressedin chapter 1 indicates, that a reinsertion of the LBT at the bicipital groove is closestto the case of an intact LBT from a biomechanical point of view and superior to arelease of the tendon or a reinsertion at the coracoid. In SLAP lesions and rotatorcuff tears preserving the LBT entirely might be beneficial as it provides stability forthe GH joint in movements where the biceps is the main active muscle.
117
Chapter 7
The effect of tears of the m.supraspinatus on the forces andmuscle activation pattern of theshoulder complex
Chapters 4 and 5 are focused on modelling parameters, alterations and validationof a musculoskeletal model of the shoulder complex with a focus on humeral ab-duction. The following chapter uses the presented essential modelling aspects ofchapter 5 as it’s basis for the computation of a tear of the m. supraspinatus.
7.1 Introduction
As stated in chapter 1, lesions of the rotator cuff and especially the m. supraspinatusare musculoskeletal disorders which affect millions of people world wide. With therisk of the development of these pathologies growing due to age (Yamamoto et al.,2010; Minagawa et al., 2013) and the increasing global life expectancy(World HealthOrganization, 2016), these conditions will likely become even more prevalent.
The importance and mechanical role of the m. supraspinatus in abduction motionshas been described as an abductor (Howell et al., 1986) and humeral head compres-sor (Wuelker et al., 1994b).
118
7.1. Introduction
Wuelker et al., 1994b conducted a cadaver study and applied forces with hydrody-namic cylinders to the rotator cuff and deltoid muscles and concluded that the m.supraspinatus creates mainly a compression force and produces less torque than thedeltoids.
What cadaver studies using mechanically applied forces to simulate muscles do notaccount for however is the active force a muscle can produce depending on its elon-gation. While it is difficult to acquire the necessary parameters for an accurate mod-elling of the force-length relation (Rassier, MacIntosh, and Herzog, 1999), chapters 4and 5 have demonstrated the importance of respecting these properties for assessingshoulder force behaviour and muscle activation.
Using the assumption that a model is adequately incorporating the most neces-sary muscle parameters and kinematics of the involved bony structures, the mus-culoskeletal simulation approach might provide better insights for some researchquestions opposed to a cadaver study.
Steenbrink et al., 2009 simulated among other rotator cuff tear combinations an iso-lated tear of the m. supraspinatus which exhibited a posterior-superior point ofattack of the resultant force vector on the glenoid. The study analysed a static po-sition (79° elevation plane, 46° elevation, 31° external rotation, 90° elbow flexion)and concluded, that a tear of the m. supraspinatus does not necessarily introduceinstability of the joint but increases deltoid loading. As a modelling basis they usedthe Delft shoulder model. Vidt et al., 2018 simulated a tear of the m. supraspinatuswith the shoulder model from the OpenSim software and simulated patient specificpull and axilla wash tasks and concluded, that a tear of the m. supraspinatus causeslower peak forces with a smaller component of the compressive force. Steenbrink etal., 2010 have shown experimentally (EMG) and numerically, that the deltoid com-pensates for a loss of m. supraspinatus and m. infraspinatus while adductor mus-cles activate in order to stabilize the joint. However, their study highlighted a highvariability of patients applying different combinations of adductor ‘out-of-phase’contractions.
119
Chapter 7. The effect of tears of the m. supraspinatus on the forces and muscleactivation pattern of the shoulder complex
Common clinical initial tests for a tear of the m. supraspinatus that involve kine-matics of patients are the full can and empty can test, which are conventionallyconducted in the scapula plane. At 90° humeral abduction in the scapula plane, thepatient exerts an upward force against resistance provided by the clinician, whereweakness or pain are indicators of a rotator cuff tear. Conducting these tests in thecoronal plane have shown to exhibit equal or better results in terms of sensitivity(Gillooly, Chidambaram, and Mok, 2010).
EMG based studies of these tests argue for a better selectivity of the full can testwith the humerus rotated externally. These are based on the middle m. deltoideusand m. subscapularis exhibiting less activity, so the m. supraspinatus is exertedmore in isolation (Lee et al., 2014). Furthermore, the m. supraspinatus seems toexhibit comparable levels of activation in both internal (empty can) and external(full can) rotation (Reinold et al., 2007a), and the empty can test causes more pain tothe patients (Itoi et al., 1999; Timmons et al., 2016).
Hölscher et al., 2016b have analysed static positions, with the AMS and the via pointdeltoid model, which reflect the full and empty can test and compared the forcesacting on the glenoid between intact models and simulated tears of various rotatorcuff muscles. In agreement with the aforementioned studies, forces acting on theglenoid tended to point towards the edges of the glenoid indicating less stability.
To the best of my knowledge, a detailed description of muscle activities and poten-tial changes in recruitment during a large ROM has not been conducted yet.
To the best of my knowledge, a simulation of kinematics reflecting the empty andfull can test between healthy and pathological models in conjunction with EMGmeasurements of a wider ROM has not been done yet.
The aim of this section is to compute a change in muscle recruitment between ahealthy control group and a patient group with tears of the m. supraspinatus duringmotions which is reflect by the empty and full can test during abduction in thecoronal plane.
120
7.1. Introduction
By combining the ability of musculoskeletal models to reflect muscle activation pat-terns to a certain degree could allow for models pointing towards new regions ofinterest. A change in the computed recruitment might be comparable to a change inEMG measurements taken from patients with a tear of the m. supraspinatus in com-parison to a healthy control group. For this purpose, this study uses experimentallyderived input for the updated model of chapter 5.
Additionally, an alternative approach for EMG normalization without conductingMVC measurements is explored within the framework of this study due to two rea-sons which occurred during a pre-study:
1. MVC measurements might cause pain to patients with symptomatic rotatorcuff tears and might cause them to exert a lower force than otherwise expected
2. MVC measurements are extremely time consuming which potentially limitstheir use in clinical practice
121
Chapter 7. The effect of tears of the m. supraspinatus on the forces and muscleactivation pattern of the shoulder complex
7.2 Materials and Methods
7.2.1 Experimental setup
For assessing the effects of a tear of the m. supraspinatus with regard to changesin muscle recruitment and forces acting on the GH joint, a healthy cohort and apathological cohort are compared to each other. The benchmark cohort consistsof 19 healthy volunteers (weight = 67.9 ± 12.0kg, height = 1.74 ± 0.08m, age =
24.4± 8.5years). The pathological group is recruited by a clinician and contains 8patients (weight = 83.3 ± 13.6kg, height = 1.75 ± 0.05m, age = 57.9 ± 14.7years)with attested tears of the m. supraspinatus muscle.
Each subject performed 6 different humeral abduction tasks in the coronal plane upto their respective maximum range of motion:
1. Neutral position: Humeral abduction from a default position with the palmof the hand oriented medial
2. Neutral position (5 N): Humeral abduction from a default position with thepalm of the hand oriented medial with holding a dumbbell of 0.5 kg ≈ 5 N
3. Internal rotation: Humeral abduction with internal rotation of the humerus,palm oriented lateral with the elbow joint axis vertical to the coronal plane
4. Internal rotation (5 N): Humeral abduction with internal rotation of the humerus,palm oriented lateral with the elbow joint axis vertical to the coronal planewith holding a dumbbell of 0.5 kg ≈ 5 N
5. External rotation: Humeral abduction with external rotation of the humerus,palm oriented anterior with the elbow joint axis in the coronal plane
6. External rotation (5 N): Humeral abduction with external rotation of the humerus,palm oriented anterior with the elbow joint axis in the coronal plane with hold-ing a dumbbell of 0.5 kg ≈ 5 N
122
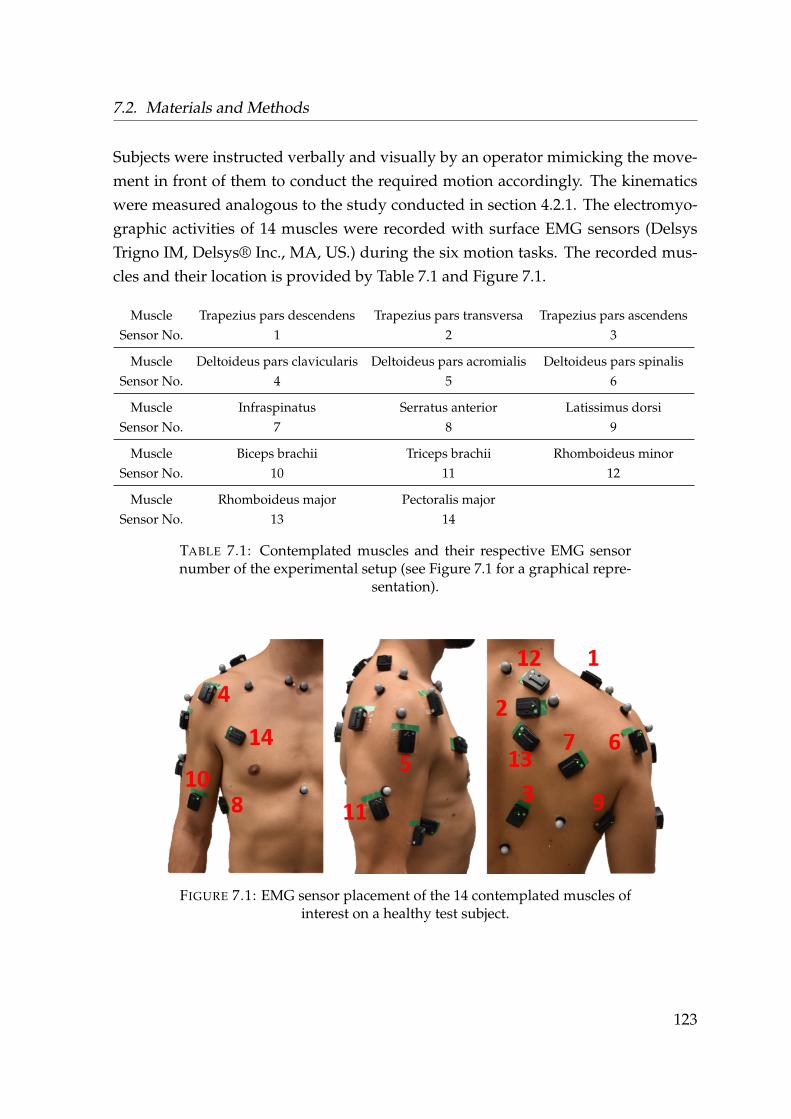
7.2. Materials and Methods
Subjects were instructed verbally and visually by an operator mimicking the move-ment in front of them to conduct the required motion accordingly. The kinematicswere measured analogous to the study conducted in section 4.2.1. The electromyo-graphic activities of 14 muscles were recorded with surface EMG sensors (DelsysTrigno IM, Delsys® Inc., MA, US.) during the six motion tasks. The recorded mus-cles and their location is provided by Table 7.1 and Figure 7.1.
Muscle Trapezius pars descendens Trapezius pars transversa Trapezius pars ascendensSensor No. 1 2 3
Muscle Deltoideus pars clavicularis Deltoideus pars acromialis Deltoideus pars spinalisSensor No. 4 5 6
Muscle Infraspinatus Serratus anterior Latissimus dorsiSensor No. 7 8 9
Muscle Biceps brachii Triceps brachii Rhomboideus minorSensor No. 10 11 12
Muscle Rhomboideus major Pectoralis majorSensor No. 13 14
TABLE 7.1: Contemplated muscles and their respective EMG sensornumber of the experimental setup (see Figure 7.1 for a graphical repre-
sentation).
FIGURE 7.1: EMG sensor placement of the 14 contemplated muscles ofinterest on a healthy test subject.
123
Chapter 7. The effect of tears of the m. supraspinatus on the forces and muscleactivation pattern of the shoulder complex
EMG sensors are placed according to Barbero, Merletti, and Rainoldi, 2012 andCriswell and Cram, 2011. In contrast to the EMG data sets computed in chapter4 and chapter 5, it is refrained from conducting MVC measurements in order to beconsiderate with potential pain of the pathological subjects and to satisfy the re-quirement of a minimal system which is suitable for a fast assessment.
The experiments were conducted by student assistants after a detailed briefing.
7.2.2 Musculoskeletal computation of intact models and a simu-
lated tear of the m. supraspinatus
The model configuration with the implemented tori (ALLFM) and a polynomialpower of 5 for the muscle recruitment is used for all the subjects from the bench-mark and pathological cohort (see chapter 5). In order to simulate a tear of the m.supraspinatus and to assess changes of the recruitment pattern and joint reactionforces, the computation is divided in three subgroups:
1. Intact models of the healthy group: These models provide a baseline on howthe muscle recruitment and resulting joint reaction forces behave in a healthycohort with an intact model.
2. Pathological models of the healthy group: By exclusion of the m. supraspina-tus but with the exact same underlying kinematics, this model group showsthe difference in muscle activation and joint reaction forces if all other param-eters of the model are kept the same.
3. Pathological models of the pathological group: The models of the pathologicalgroup take into account a tear of the m. supraspinatus and potential alterationsin the kinematics conducted by the patients.
124
7.2. Materials and Methods
Pathological models are simulated by exclusion of the six virtual muscle elementsof the m. supraspinatus muscle group. Models are scaled to the respective anthro-pometrics and weight of the measured subjects, segment motion optimized by themarker trajectories and an external python script controls the input parameters andautomatization (see chapter 3). Simulations are computed with the kinematic inputof the six motion capture trials. The subgroup of the intact and pathological mod-els of the healthy group hereby inhibit the same kinematics and differ only in theexclusion of the m. supraspinatus within the simulation.
Muscle activities and GH joint reaction forces are compared with the intact andpathological models of the healthy group and the intact models of the healthy groupto the pathological models of the pathological group in the abduction range 25-85° and computed in 5° increments. For the comparison between the healthy andpathological models, 18 muscle groups are considered: anterior deltoid, lateral deltoid,posterior deltoid, infraspinatus, subscapularis, teres major, teres minor, trapezius descen-dens, trapezius transversus, trapezius ascendens, serratus anterior, latissimus dorsi, bicepsbrachii, triceps brachii, pectoralis major, pectoralis minor, rhomboideus major, rhomboideusminor.
125
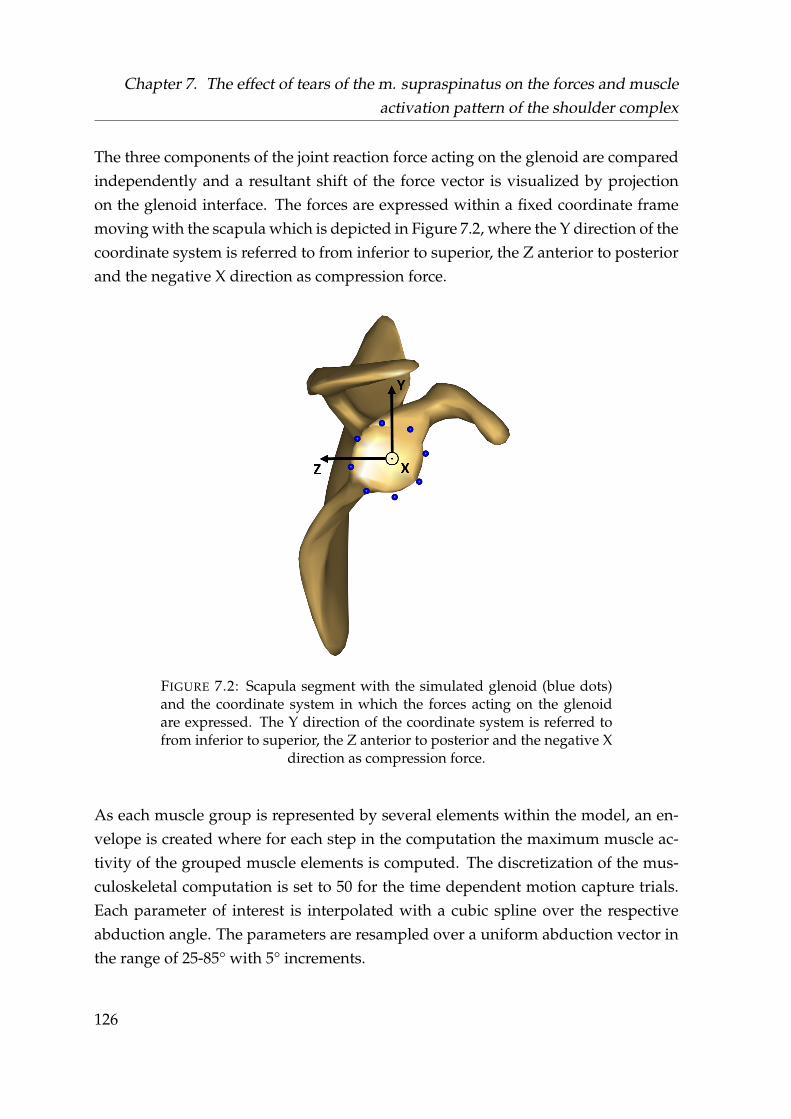
Chapter 7. The effect of tears of the m. supraspinatus on the forces and muscleactivation pattern of the shoulder complex
The three components of the joint reaction force acting on the glenoid are comparedindependently and a resultant shift of the force vector is visualized by projectionon the glenoid interface. The forces are expressed within a fixed coordinate framemoving with the scapula which is depicted in Figure 7.2, where the Y direction of thecoordinate system is referred to from inferior to superior, the Z anterior to posteriorand the negative X direction as compression force.
FIGURE 7.2: Scapula segment with the simulated glenoid (blue dots)and the coordinate system in which the forces acting on the glenoidare expressed. The Y direction of the coordinate system is referred tofrom inferior to superior, the Z anterior to posterior and the negative X
direction as compression force.
As each muscle group is represented by several elements within the model, an en-velope is created where for each step in the computation the maximum muscle ac-tivity of the grouped muscle elements is computed. The discretization of the mus-culoskeletal computation is set to 50 for the time dependent motion capture trials.Each parameter of interest is interpolated with a cubic spline over the respectiveabduction angle. The parameters are resampled over a uniform abduction vector inthe range of 25-85° with 5° increments.
126
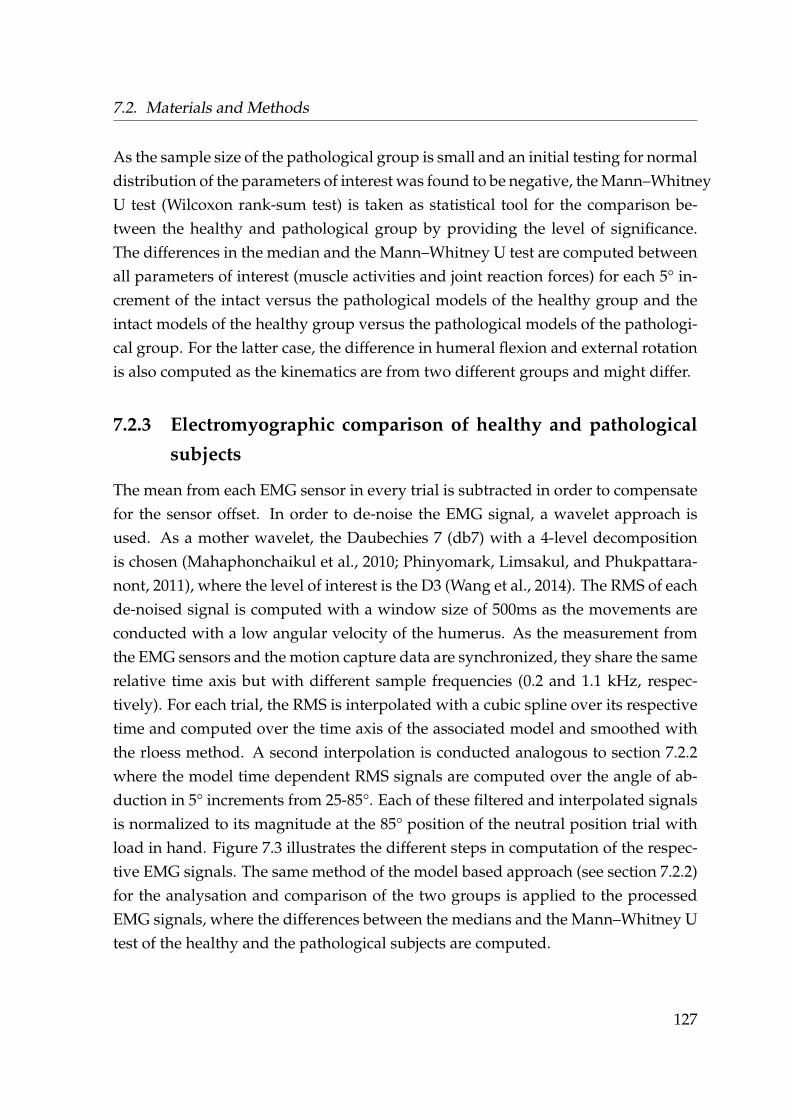
7.2. Materials and Methods
As the sample size of the pathological group is small and an initial testing for normaldistribution of the parameters of interest was found to be negative, the Mann–WhitneyU test (Wilcoxon rank-sum test) is taken as statistical tool for the comparison be-tween the healthy and pathological group by providing the level of significance.The differences in the median and the Mann–Whitney U test are computed betweenall parameters of interest (muscle activities and joint reaction forces) for each 5° in-crement of the intact versus the pathological models of the healthy group and theintact models of the healthy group versus the pathological models of the pathologi-cal group. For the latter case, the difference in humeral flexion and external rotationis also computed as the kinematics are from two different groups and might differ.
7.2.3 Electromyographic comparison of healthy and pathological
subjects
The mean from each EMG sensor in every trial is subtracted in order to compensatefor the sensor offset. In order to de-noise the EMG signal, a wavelet approach isused. As a mother wavelet, the Daubechies 7 (db7) with a 4-level decompositionis chosen (Mahaphonchaikul et al., 2010; Phinyomark, Limsakul, and Phukpattara-nont, 2011), where the level of interest is the D3 (Wang et al., 2014). The RMS of eachde-noised signal is computed with a window size of 500ms as the movements areconducted with a low angular velocity of the humerus. As the measurement fromthe EMG sensors and the motion capture data are synchronized, they share the samerelative time axis but with different sample frequencies (0.2 and 1.1 kHz, respec-tively). For each trial, the RMS is interpolated with a cubic spline over its respectivetime and computed over the time axis of the associated model and smoothed withthe rloess method. A second interpolation is conducted analogous to section 7.2.2where the model time dependent RMS signals are computed over the angle of ab-duction in 5° increments from 25-85°. Each of these filtered and interpolated signalsis normalized to its magnitude at the 85° position of the neutral position trial withload in hand. Figure 7.3 illustrates the different steps in computation of the respec-tive EMG signals. The same method of the model based approach (see section 7.2.2)for the analysation and comparison of the two groups is applied to the processedEMG signals, where the differences between the medians and the Mann–Whitney Utest of the healthy and the pathological subjects are computed.
127
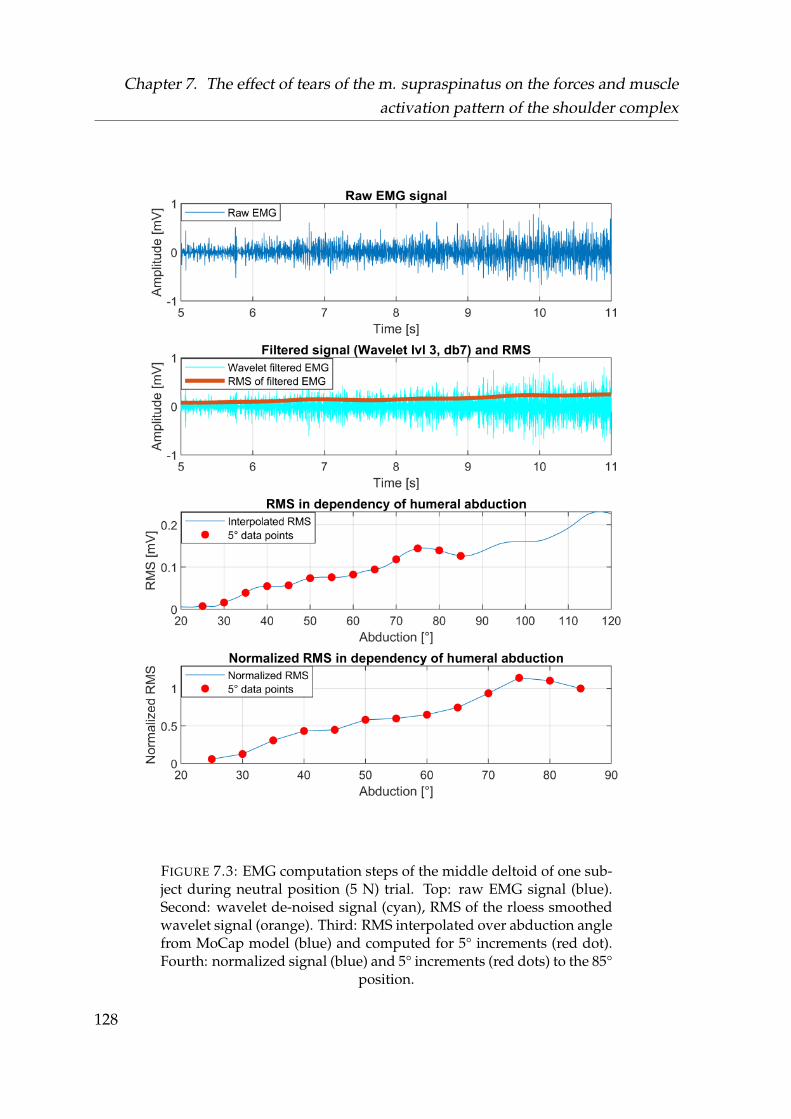
Chapter 7. The effect of tears of the m. supraspinatus on the forces and muscleactivation pattern of the shoulder complex
FIGURE 7.3: EMG computation steps of the middle deltoid of one sub-ject during neutral position (5 N) trial. Top: raw EMG signal (blue).Second: wavelet de-noised signal (cyan), RMS of the rloess smoothedwavelet signal (orange). Third: RMS interpolated over abduction anglefrom MoCap model (blue) and computed for 5° increments (red dot).Fourth: normalized signal (blue) and 5° increments (red dots) to the 85°
position.
128
7.3. Results
7.3 Results
The main results from the modelled effects of a tear of the m. supraspinatus and theEMG based analysis are presented in this section, but only a selection of the majorfindings is provided in detail. All computed parameters are provided in appendixC.
7.3.1 Musculoskeletal computation of intact models and a simu-
lated tear of the supraspinatus: Healthy subjects group with
intact vs. pathological models
From the 20 different data sets for each motion, the kinematic marker based op-timization converged for 19 trials in the neutral position, 18 trials in the neutralposition with 5 N, 19 trials for internal rotation, 18 trials for internal rotation withweight, 19 trials of the external rotation and 19 trials for the external rotation withweight. Disabling the m. supraspinatus did not cause model failure, thus the num-ber of compared intact models to pathological ones is the same and yields the samekinematics.
Figures 7.4 & 7.5 show the simulated activity of the m. supraspinatus of the intactmodels of the healthy subject group. The peak median activities for the trials with-out a simulated weight range between 8-9% activity. The median of trials with anapplied load peak at 13% activity. Where the peak median forces behave similar be-tween the 6 different trials, the behaviour over the abduction angle differs betweenthe neutrals position, internal and external rotation trials. A large variance is foundfor the m. supraspinatus activity over all angles.
129
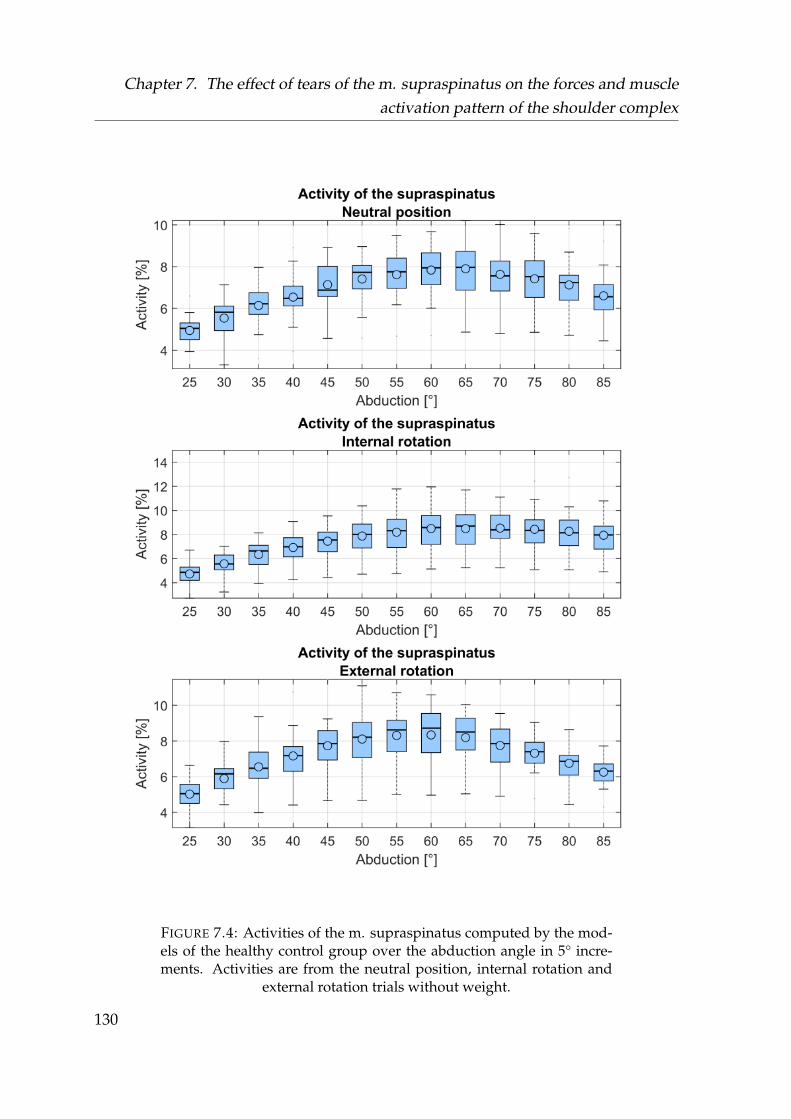
Chapter 7. The effect of tears of the m. supraspinatus on the forces and muscleactivation pattern of the shoulder complex
FIGURE 7.4: Activities of the m. supraspinatus computed by the mod-els of the healthy control group over the abduction angle in 5° incre-ments. Activities are from the neutral position, internal rotation and
external rotation trials without weight.
130
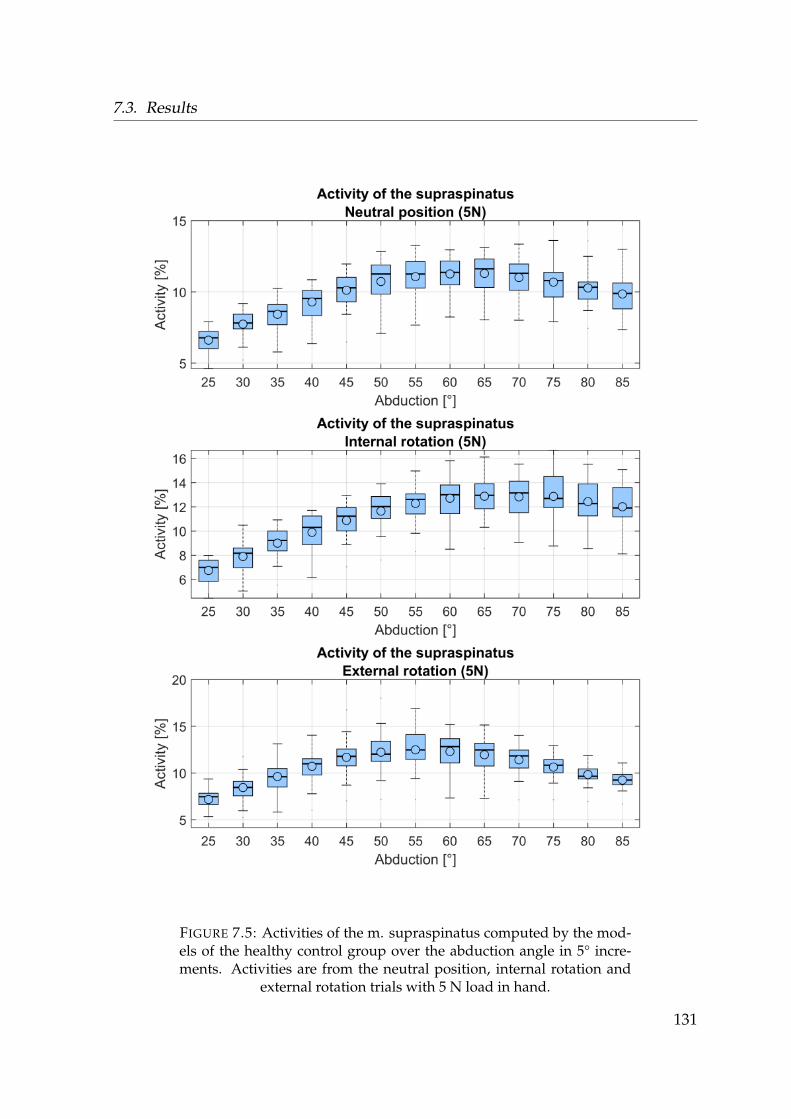
7.3. Results
FIGURE 7.5: Activities of the m. supraspinatus computed by the mod-els of the healthy control group over the abduction angle in 5° incre-ments. Activities are from the neutral position, internal rotation and
external rotation trials with 5 N load in hand.
131

Chapter 7. The effect of tears of the m. supraspinatus on the forces and muscleactivation pattern of the shoulder complex
The comparison between intact models and a simulated tear of the m. supraspinatusdid not show any differences in the activation of trapezius descendens / transversa/ ascendens, serratus anterior, latissimus, rhomboideus minor / major, teres majorand pectoralis minor elements. Teres major, latissimus, pectoralis minor and rhom-boideus minor elements did not exhibit a consistent or notable activation in all trials,where some outliers occured.
The evaluated parameters for the case of an internal rotation with an applied load of5 N in hand are depicted in detail in this section, as they exemplify the most notabledifferences on the muscle recruitment and thus GH joint reaction force.
Figures 7.6, 7.7 and 7.8 depict the muscle activities over the 5° humeral abductionincrements of the intact and pathologcial models of the internal rotation trial with aload of 5 N. As with the activity of the m. supraspinatus, a large distribution in themuscle activities occurs in all trials between different subjects.
132
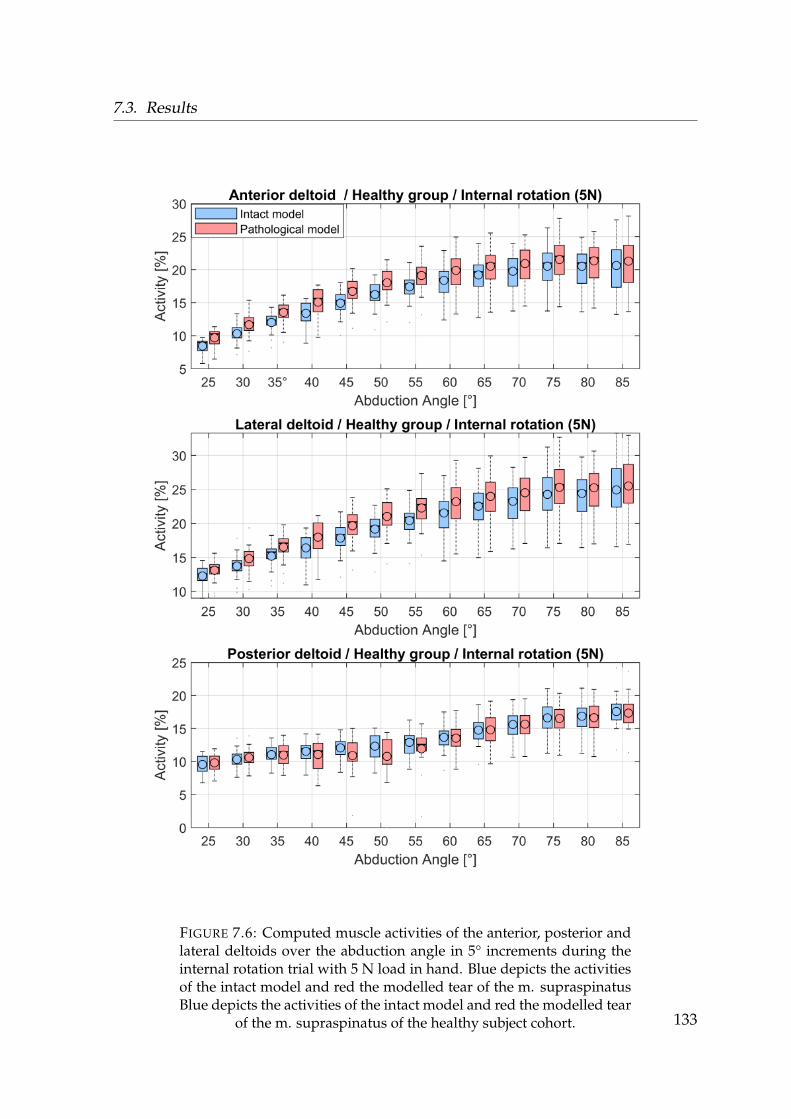
7.3. Results
FIGURE 7.6: Computed muscle activities of the anterior, posterior andlateral deltoids over the abduction angle in 5° increments during theinternal rotation trial with 5 N load in hand. Blue depicts the activitiesof the intact model and red the modelled tear of the m. supraspinatusBlue depicts the activities of the intact model and red the modelled tear
of the m. supraspinatus of the healthy subject cohort. 133
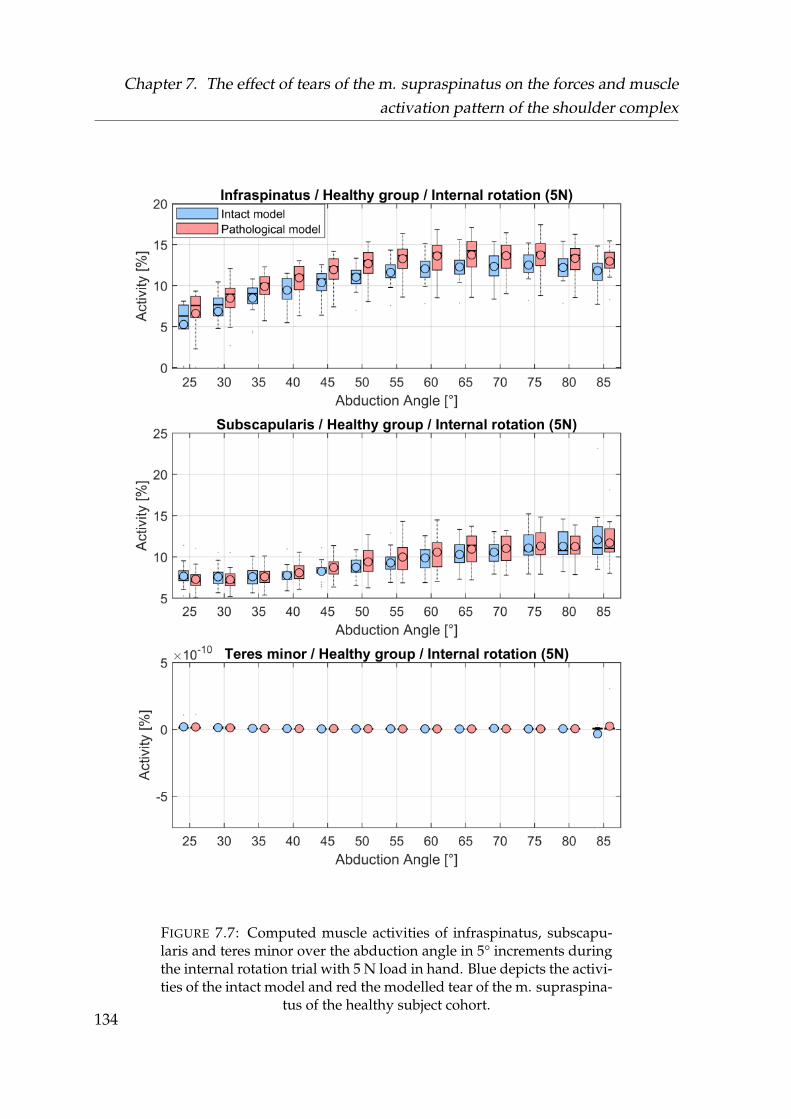
Chapter 7. The effect of tears of the m. supraspinatus on the forces and muscleactivation pattern of the shoulder complex
FIGURE 7.7: Computed muscle activities of infraspinatus, subscapu-laris and teres minor over the abduction angle in 5° increments duringthe internal rotation trial with 5 N load in hand. Blue depicts the activi-ties of the intact model and red the modelled tear of the m. supraspina-
tus of the healthy subject cohort.134
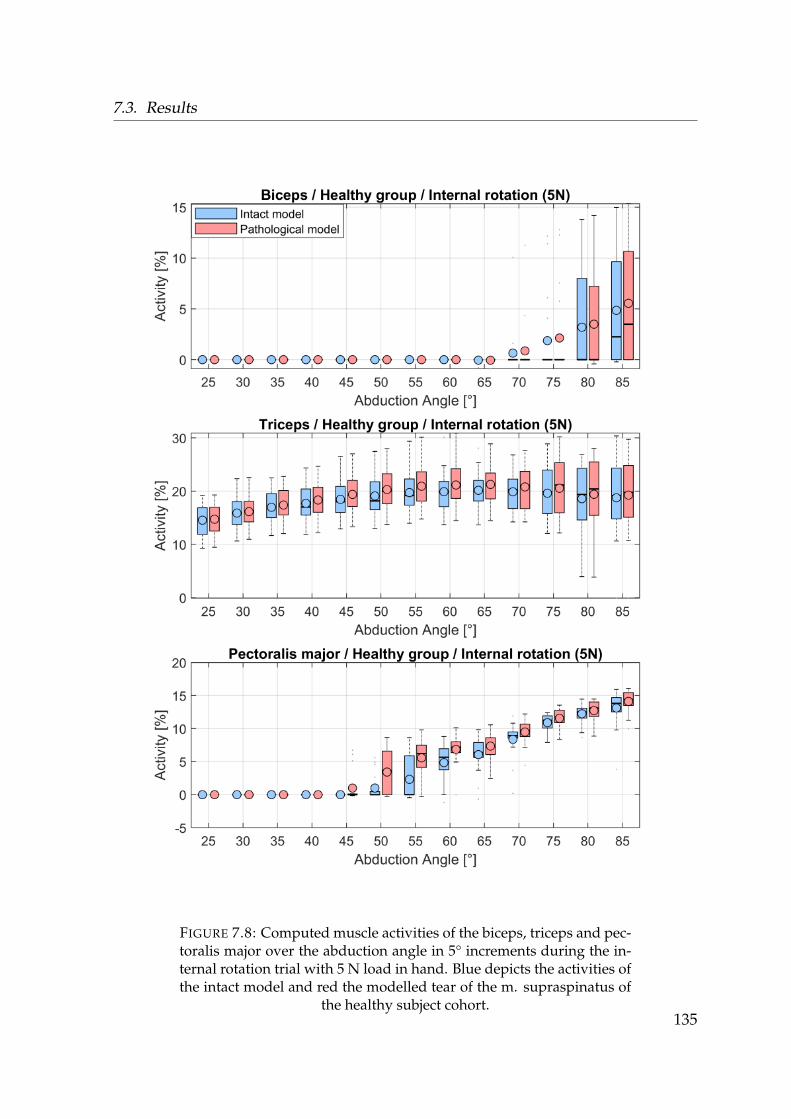
7.3. Results
FIGURE 7.8: Computed muscle activities of the biceps, triceps and pec-toralis major over the abduction angle in 5° increments during the in-ternal rotation trial with 5 N load in hand. Blue depicts the activities ofthe intact model and red the modelled tear of the m. supraspinatus of
the healthy subject cohort.135
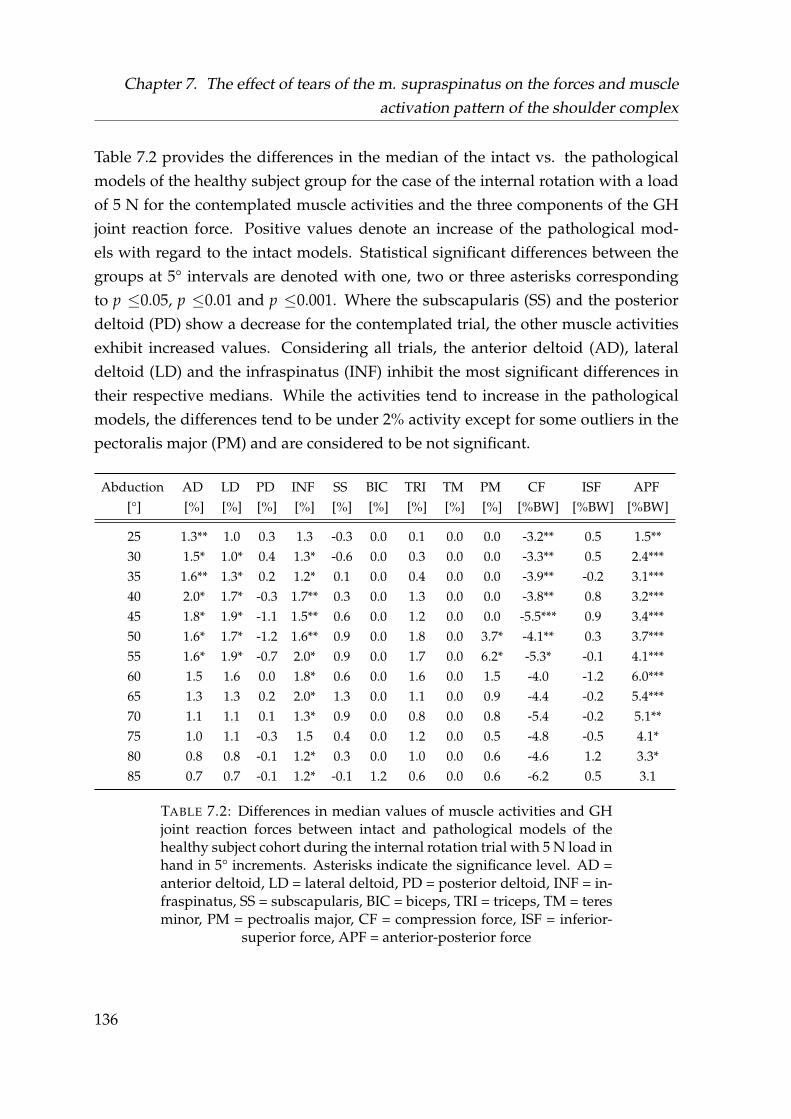
Chapter 7. The effect of tears of the m. supraspinatus on the forces and muscleactivation pattern of the shoulder complex
Table 7.2 provides the differences in the median of the intact vs. the pathologicalmodels of the healthy subject group for the case of the internal rotation with a loadof 5 N for the contemplated muscle activities and the three components of the GHjoint reaction force. Positive values denote an increase of the pathological mod-els with regard to the intact models. Statistical significant differences between thegroups at 5° intervals are denoted with one, two or three asterisks correspondingto p ≤0.05, p ≤0.01 and p ≤0.001. Where the subscapularis (SS) and the posteriordeltoid (PD) show a decrease for the contemplated trial, the other muscle activitiesexhibit increased values. Considering all trials, the anterior deltoid (AD), lateraldeltoid (LD) and the infraspinatus (INF) inhibit the most significant differences intheir respective medians. While the activities tend to increase in the pathologicalmodels, the differences tend to be under 2% activity except for some outliers in thepectoralis major (PM) and are considered to be not significant.
Abduction AD LD PD INF SS BIC TRI TM PM CF ISF APF[°] [%] [%] [%] [%] [%] [%] [%] [%] [%] [%BW] [%BW] [%BW]
25 1.3** 1.0 0.3 1.3 -0.3 0.0 0.1 0.0 0.0 -3.2** 0.5 1.5**30 1.5* 1.0* 0.4 1.3* -0.6 0.0 0.3 0.0 0.0 -3.3** 0.5 2.4***35 1.6** 1.3* 0.2 1.2* 0.1 0.0 0.4 0.0 0.0 -3.9** -0.2 3.1***40 2.0* 1.7* -0.3 1.7** 0.3 0.0 1.3 0.0 0.0 -3.8** 0.8 3.2***45 1.8* 1.9* -1.1 1.5** 0.6 0.0 1.2 0.0 0.0 -5.5*** 0.9 3.4***50 1.6* 1.7* -1.2 1.6** 0.9 0.0 1.8 0.0 3.7* -4.1** 0.3 3.7***55 1.6* 1.9* -0.7 2.0* 0.9 0.0 1.7 0.0 6.2* -5.3* -0.1 4.1***60 1.5 1.6 0.0 1.8* 0.6 0.0 1.6 0.0 1.5 -4.0 -1.2 6.0***65 1.3 1.3 0.2 2.0* 1.3 0.0 1.1 0.0 0.9 -4.4 -0.2 5.4***70 1.1 1.1 0.1 1.3* 0.9 0.0 0.8 0.0 0.8 -5.4 -0.2 5.1**75 1.0 1.1 -0.3 1.5 0.4 0.0 1.2 0.0 0.5 -4.8 -0.5 4.1*80 0.8 0.8 -0.1 1.2* 0.3 0.0 1.0 0.0 0.6 -4.6 1.2 3.3*85 0.7 0.7 -0.1 1.2* -0.1 1.2 0.6 0.0 0.6 -6.2 0.5 3.1
TABLE 7.2: Differences in median values of muscle activities and GHjoint reaction forces between intact and pathological models of thehealthy subject cohort during the internal rotation trial with 5 N load inhand in 5° increments. Asterisks indicate the significance level. AD =anterior deltoid, LD = lateral deltoid, PD = posterior deltoid, INF = in-fraspinatus, SS = subscapularis, BIC = biceps, TRI = triceps, TM = teresminor, PM = pectroalis major, CF = compression force, ISF = inferior-
superior force, APF = anterior-posterior force
136
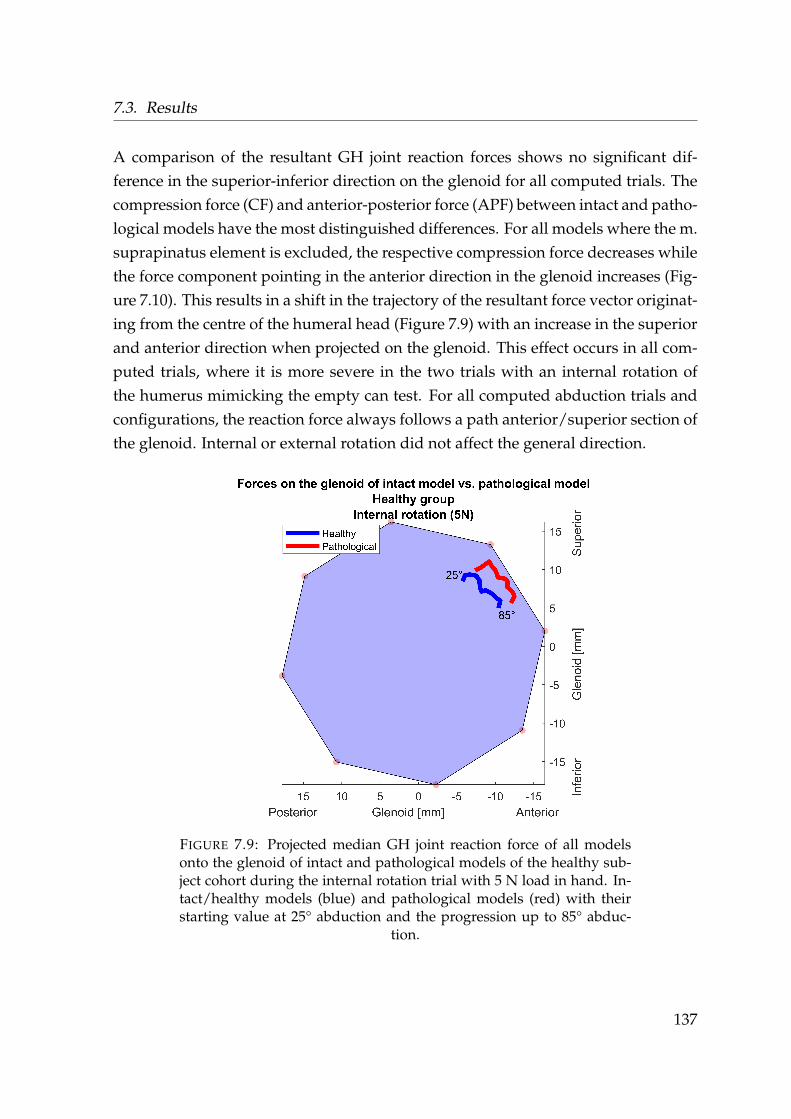
7.3. Results
A comparison of the resultant GH joint reaction forces shows no significant dif-ference in the superior-inferior direction on the glenoid for all computed trials. Thecompression force (CF) and anterior-posterior force (APF) between intact and patho-logical models have the most distinguished differences. For all models where the m.suprapinatus element is excluded, the respective compression force decreases whilethe force component pointing in the anterior direction in the glenoid increases (Fig-ure 7.10). This results in a shift in the trajectory of the resultant force vector originat-ing from the centre of the humeral head (Figure 7.9) with an increase in the superiorand anterior direction when projected on the glenoid. This effect occurs in all com-puted trials, where it is more severe in the two trials with an internal rotation ofthe humerus mimicking the empty can test. For all computed abduction trials andconfigurations, the reaction force always follows a path anterior/superior section ofthe glenoid. Internal or external rotation did not affect the general direction.
FIGURE 7.9: Projected median GH joint reaction force of all modelsonto the glenoid of intact and pathological models of the healthy sub-ject cohort during the internal rotation trial with 5 N load in hand. In-tact/healthy models (blue) and pathological models (red) with theirstarting value at 25° abduction and the progression up to 85° abduc-
tion.
137
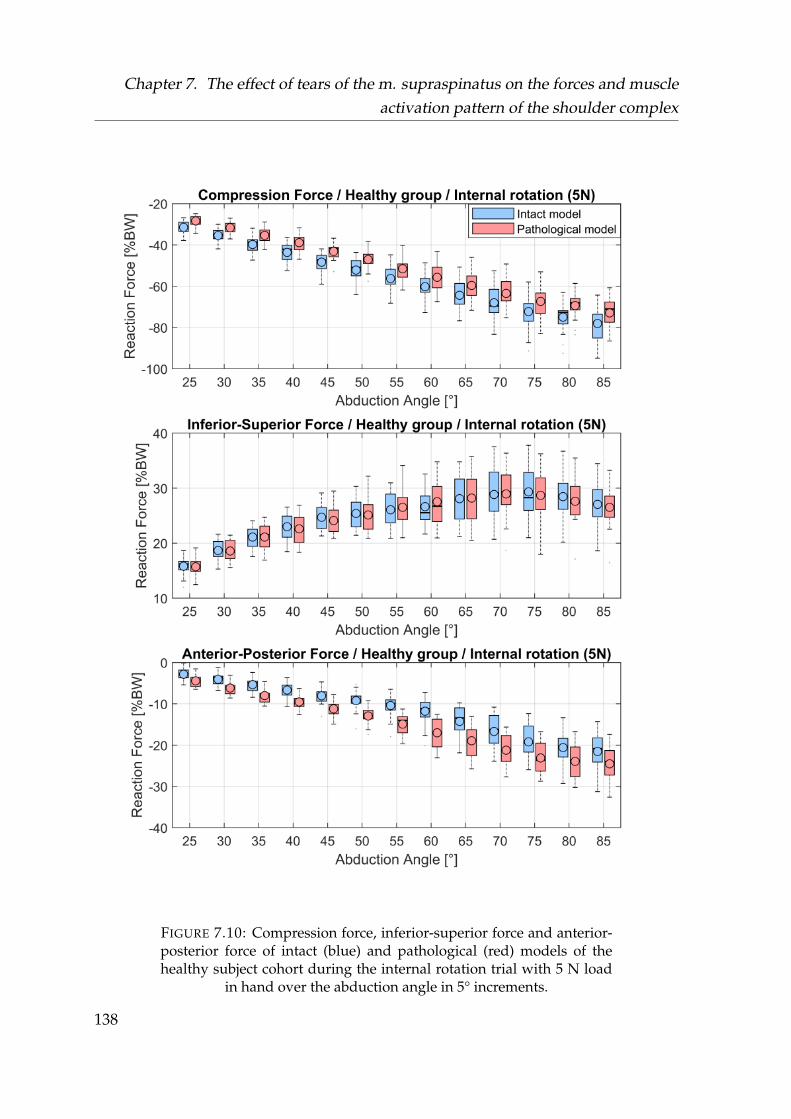
Chapter 7. The effect of tears of the m. supraspinatus on the forces and muscleactivation pattern of the shoulder complex
FIGURE 7.10: Compression force, inferior-superior force and anterior-posterior force of intact (blue) and pathological (red) models of thehealthy subject cohort during the internal rotation trial with 5 N load
in hand over the abduction angle in 5° increments.
138
7.3. Results
7.3.2 Forces and muscle activities of intact models and pathologi-
cal models of the healthy vs. the pathological group
Due to pain and the resulting inability to conduct the required motions adequately,several trials could not be conducted by the patient group. From the 8 different datasets for each motion of the pathological group, the kinematic marker based opti-mization converged for 8 trials in the neutral position, 8 trials in the neutral positionwith 5 N load in hand, 7 trials for internal rotation, 7 trials for internal rotation withload, 8 trials of the external rotation and 7 trials for the external rotation with anapplied force.
During the motion of the neutral trials with and without weight, no significant dif-ferences occurred in the kinematics of the flexion and external rotation, with thelargest deviation of -11.1° at 35° abduction during the neutral position with appliedload. Differences in the flexion angle over all trials remained under 10° and were notsignificant. A significant difference in external rotation angle is found in the internalrotation trial, where the pathological subjects trended to conduct less internal rota-tion. For the external rotation trials, the pathological subjects also tended to conductless external rotation then the healthy control group.
Figures 7.12, 7.13, and 7.14 depict the contemplated muscle activities of the intactmodels of the healthy group and the pathological models of the pathological group.During all trials, the medians of the simulated muscle activities are significantlyhigher in the pathological models of the pathological group, except for the sub-scapularis (see Table 7.3). The median differences in muscle activities are herebyhigher than in the comparison of intact and pathological models of the healthygroup which share the same kinematics (see section 7.3.1).
139
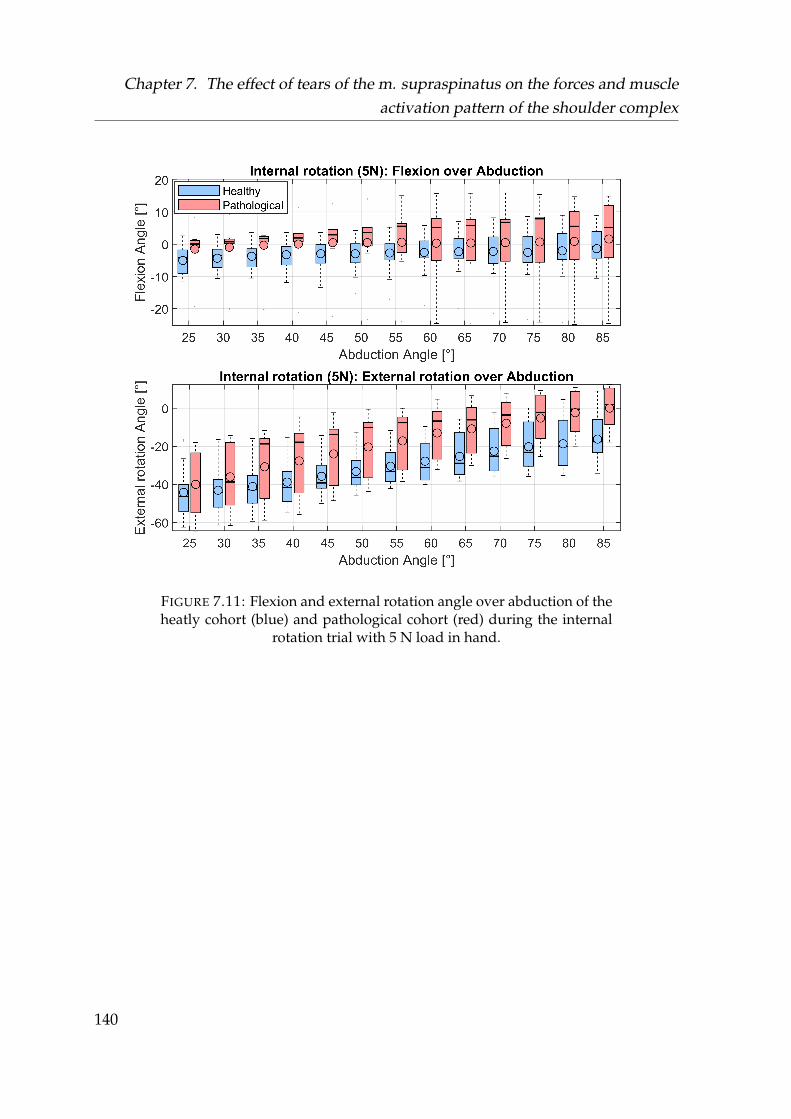
Chapter 7. The effect of tears of the m. supraspinatus on the forces and muscleactivation pattern of the shoulder complex
FIGURE 7.11: Flexion and external rotation angle over abduction of theheatly cohort (blue) and pathological cohort (red) during the internal
rotation trial with 5 N load in hand.
140
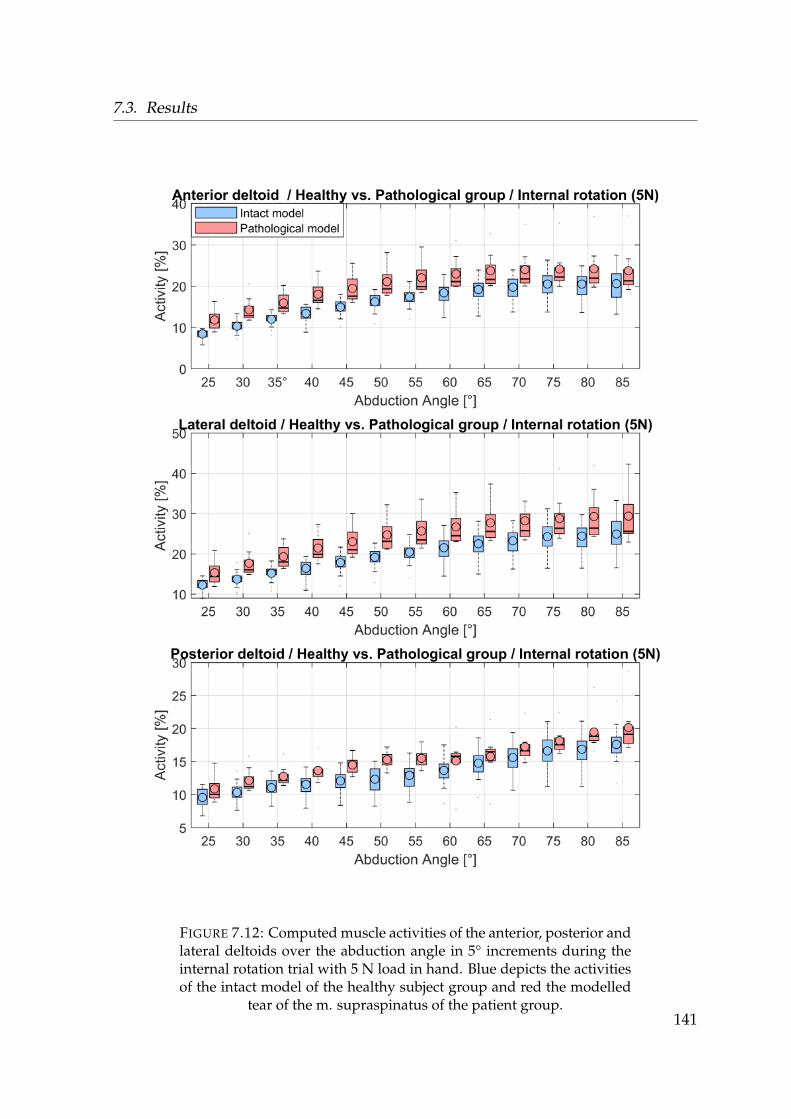
7.3. Results
FIGURE 7.12: Computed muscle activities of the anterior, posterior andlateral deltoids over the abduction angle in 5° increments during theinternal rotation trial with 5 N load in hand. Blue depicts the activitiesof the intact model of the healthy subject group and red the modelled
tear of the m. supraspinatus of the patient group.141

Chapter 7. The effect of tears of the m. supraspinatus on the forces and muscleactivation pattern of the shoulder complex
FIGURE 7.13: Computed muscle activities of the infraspinatus, sub-scapularis and teres minor over the abduction angle in 5° incrementsduring the internal rotation trial with 5 N load in hand. Blue depictsthe activities of the intact model of the healthy subject group and red
the modelled tear of the m. supraspinatus of the patient group.142
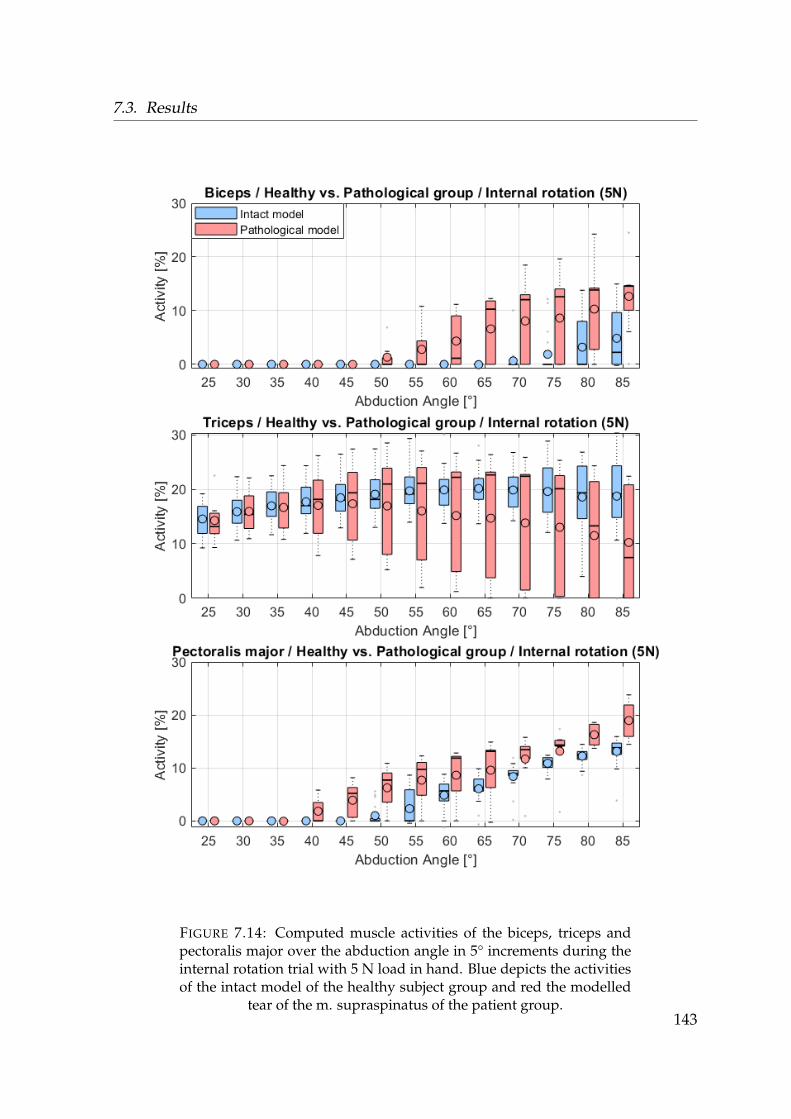
7.3. Results
FIGURE 7.14: Computed muscle activities of the biceps, triceps andpectoralis major over the abduction angle in 5° increments during theinternal rotation trial with 5 N load in hand. Blue depicts the activitiesof the intact model of the healthy subject group and red the modelled
tear of the m. supraspinatus of the patient group.143
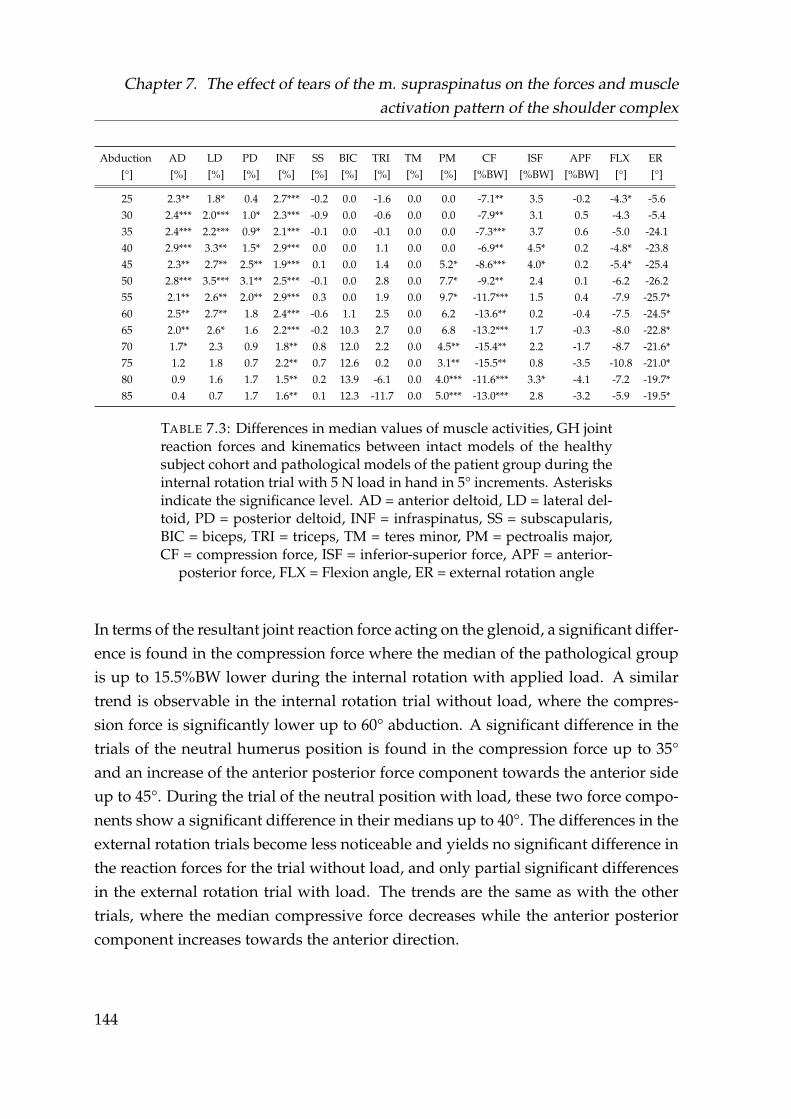
Chapter 7. The effect of tears of the m. supraspinatus on the forces and muscleactivation pattern of the shoulder complex
Abduction AD LD PD INF SS BIC TRI TM PM CF ISF APF FLX ER[°] [%] [%] [%] [%] [%] [%] [%] [%] [%] [%BW] [%BW] [%BW] [°] [°]
25 2.3** 1.8* 0.4 2.7*** -0.2 0.0 -1.6 0.0 0.0 -7.1** 3.5 -0.2 -4.3* -5.630 2.4*** 2.0*** 1.0* 2.3*** -0.9 0.0 -0.6 0.0 0.0 -7.9** 3.1 0.5 -4.3 -5.435 2.4*** 2.2*** 0.9* 2.1*** -0.1 0.0 -0.1 0.0 0.0 -7.3*** 3.7 0.6 -5.0 -24.140 2.9*** 3.3** 1.5* 2.9*** 0.0 0.0 1.1 0.0 0.0 -6.9** 4.5* 0.2 -4.8* -23.845 2.3** 2.7** 2.5** 1.9*** 0.1 0.0 1.4 0.0 5.2* -8.6*** 4.0* 0.2 -5.4* -25.450 2.8*** 3.5*** 3.1** 2.5*** -0.1 0.0 2.8 0.0 7.7* -9.2** 2.4 0.1 -6.2 -26.255 2.1** 2.6** 2.0** 2.9*** 0.3 0.0 1.9 0.0 9.7* -11.7*** 1.5 0.4 -7.9 -25.7*60 2.5** 2.7** 1.8 2.4*** -0.6 1.1 2.5 0.0 6.2 -13.6** 0.2 -0.4 -7.5 -24.5*65 2.0** 2.6* 1.6 2.2*** -0.2 10.3 2.7 0.0 6.8 -13.2*** 1.7 -0.3 -8.0 -22.8*70 1.7* 2.3 0.9 1.8** 0.8 12.0 2.2 0.0 4.5** -15.4** 2.2 -1.7 -8.7 -21.6*75 1.2 1.8 0.7 2.2** 0.7 12.6 0.2 0.0 3.1** -15.5** 0.8 -3.5 -10.8 -21.0*80 0.9 1.6 1.7 1.5** 0.2 13.9 -6.1 0.0 4.0*** -11.6*** 3.3* -4.1 -7.2 -19.7*85 0.4 0.7 1.7 1.6** 0.1 12.3 -11.7 0.0 5.0*** -13.0*** 2.8 -3.2 -5.9 -19.5*
TABLE 7.3: Differences in median values of muscle activities, GH jointreaction forces and kinematics between intact models of the healthysubject cohort and pathological models of the patient group during theinternal rotation trial with 5 N load in hand in 5° increments. Asterisksindicate the significance level. AD = anterior deltoid, LD = lateral del-toid, PD = posterior deltoid, INF = infraspinatus, SS = subscapularis,BIC = biceps, TRI = triceps, TM = teres minor, PM = pectroalis major,CF = compression force, ISF = inferior-superior force, APF = anterior-
posterior force, FLX = Flexion angle, ER = external rotation angle
In terms of the resultant joint reaction force acting on the glenoid, a significant differ-ence is found in the compression force where the median of the pathological groupis up to 15.5%BW lower during the internal rotation with applied load. A similartrend is observable in the internal rotation trial without load, where the compres-sion force is significantly lower up to 60° abduction. A significant difference in thetrials of the neutral humerus position is found in the compression force up to 35°and an increase of the anterior posterior force component towards the anterior sideup to 45°. During the trial of the neutral position with load, these two force compo-nents show a significant difference in their medians up to 40°. The differences in theexternal rotation trials become less noticeable and yields no significant difference inthe reaction forces for the trial without load, and only partial significant differencesin the external rotation trial with load. The trends are the same as with the othertrials, where the median compressive force decreases while the anterior posteriorcomponent increases towards the anterior direction.
144
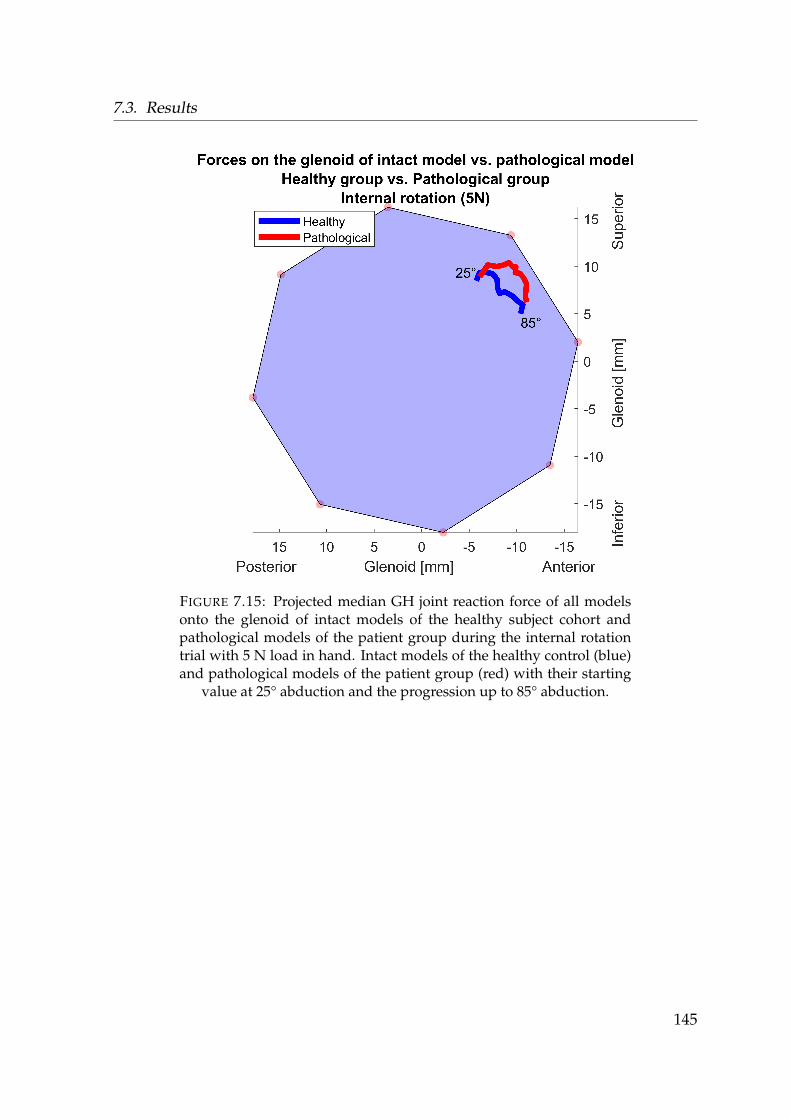
7.3. Results
FIGURE 7.15: Projected median GH joint reaction force of all modelsonto the glenoid of intact models of the healthy subject cohort andpathological models of the patient group during the internal rotationtrial with 5 N load in hand. Intact models of the healthy control (blue)and pathological models of the patient group (red) with their starting
value at 25° abduction and the progression up to 85° abduction.
145
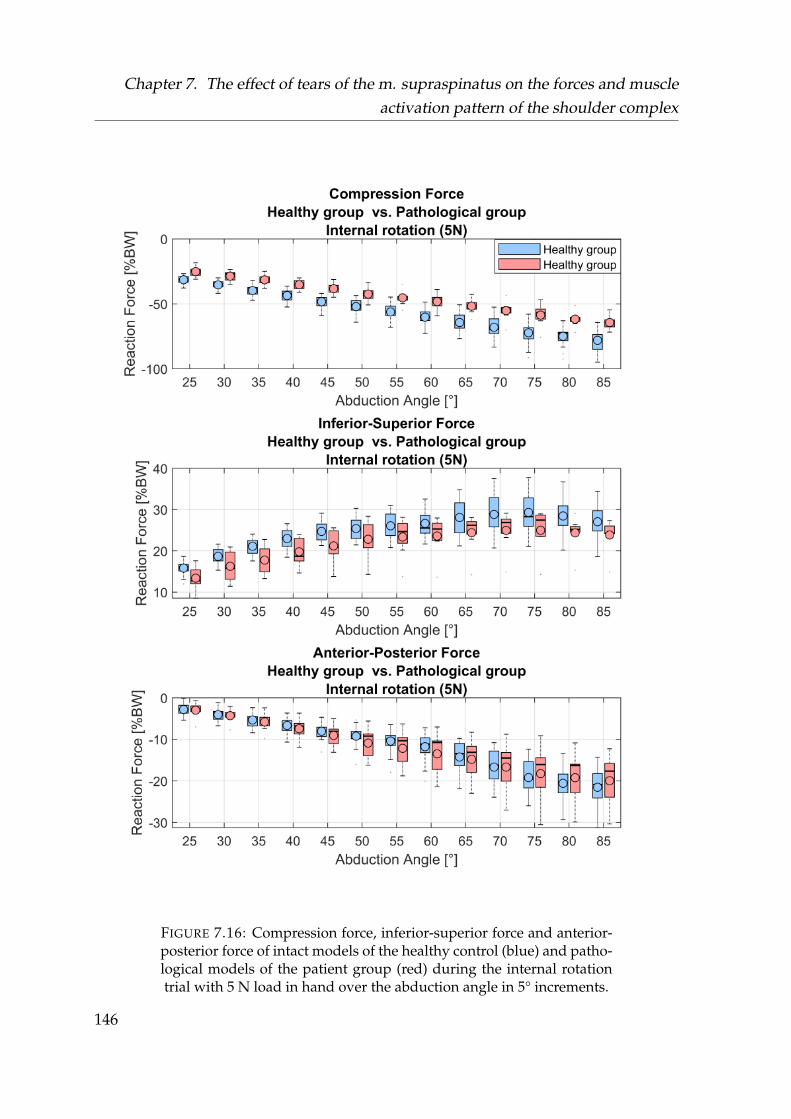
Chapter 7. The effect of tears of the m. supraspinatus on the forces and muscleactivation pattern of the shoulder complex
FIGURE 7.16: Compression force, inferior-superior force and anterior-posterior force of intact models of the healthy control (blue) and patho-logical models of the patient group (red) during the internal rotationtrial with 5 N load in hand over the abduction angle in 5° increments.
146
7.3. Results
7.3.3 EMG comparison between the healthy vs. the pathological
group
With 14 involved EMG sensors, loosening of the electrodes during the experimentswas a major issue. Each EMG signal of each trial was examined in retrospect andevery trial excluded where one sensor had lost contact and did not show an EMGsignal.
After exclusion of the corrupted trials, from the healthy group 18 trials were usedfor the neutral position, 18 trials for the neutral position with 5 N load, 14 for the in-ternal rotation, 14 for the internal rotation with 5 N load, 17 for the external rotationand 17 for the external rotation with 5 N load.
From the 8 different data sets for each trial of the pathological group, the kinematicmarker based optimization converged for 7 trials in the neutral position, 7 trialsin the neutral position with 5 N, 5 trials for internal rotation, 6 trials for internalrotation with weight, 6 trials of the external rotation and 5 trials for the externalrotation with weight.
Figures 7.17- 7.21 show the comparison between the EMG of the healthy to thepathologcial subject group normalized to the 85° position of their respective neutralposition trials with applied load. Table 7.4 provides the differences in the mediansof the EMG between the healthy and pathological subjects for the internal rotationtrial with 5 N load in hand. The resulting activities of all subjects and computeddifferences for the other trials is provided in C.0.7 and C.0.8.
147
Chapter 7. The effect of tears of the m. supraspinatus on the forces and muscleactivation pattern of the shoulder complex
The comparison of the medians between the healthy and the pathological group isinconclusive. Where most of the muscles evaluated during the 5° abduction incre-ments showed no significant differences, the results depict large variances betweenthe subjects. Significant differences in median values occurred during the trial in theneutral position in the processed EMG signals of the muscle groups of the anteriordeltoid (AD) in the ranges 25-50° abduction, the triceps (TRI) in the 75-85° abduc-tion and rhomboideus major (RMA) in the range 40-50°. In the neutral position withload in hand, only the rhomboideus minor showed a significant difference in the 25-45° abduction range. During internal rotation, only the rohmboideus major showeda significant difference in the abduction range 40-85°.
The internal rotation with weight showed more significant differences with the trapez-ius transversus (TT) in the range 35-85°, the trapezius ascendens (TA) in the range45-50°, the AD between 35-55° posterior deltoid (PD) at 35° and the rhomboideusmajor in the range of 25-70°. The external rotation trial did not have significant dif-ferences in the respective medians. During the external rotation trial with weight,significant differences were found for the TA in 70-85°, latissimus (LAT) 70-85° andthe biceps (BIC) at 85° abduction.
148
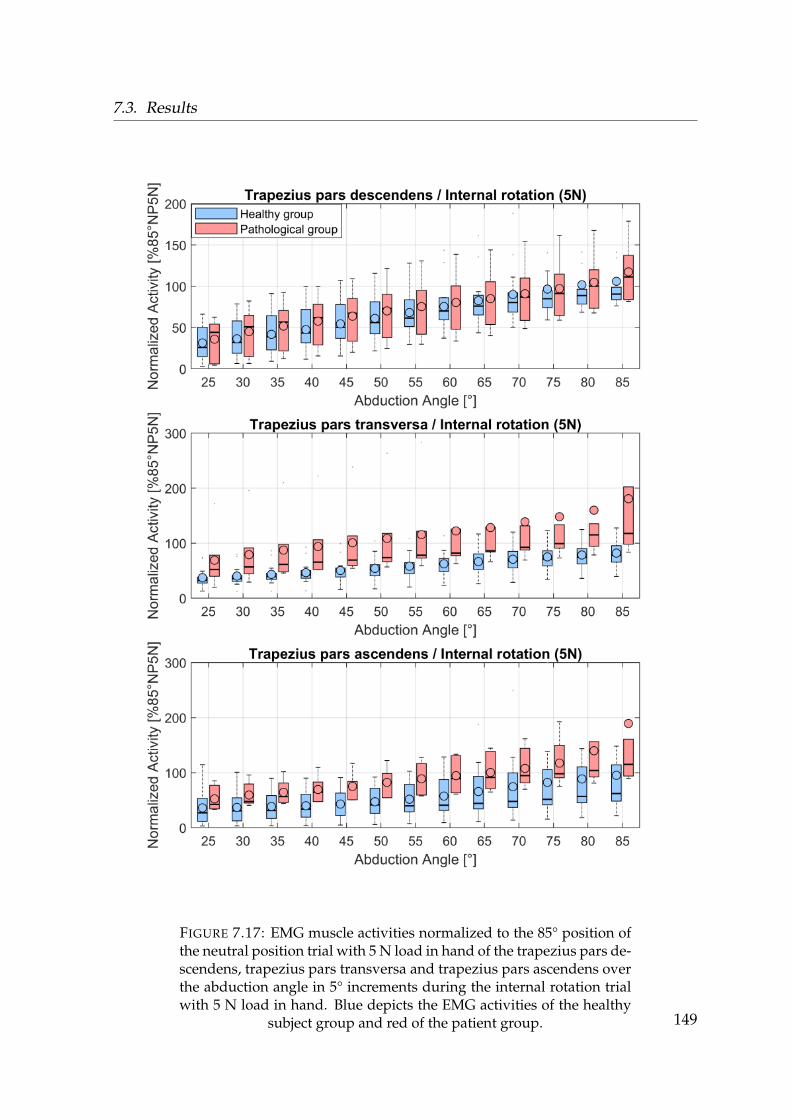
7.3. Results
FIGURE 7.17: EMG muscle activities normalized to the 85° position ofthe neutral position trial with 5 N load in hand of the trapezius pars de-scendens, trapezius pars transversa and trapezius pars ascendens overthe abduction angle in 5° increments during the internal rotation trialwith 5 N load in hand. Blue depicts the EMG activities of the healthy
subject group and red of the patient group. 149
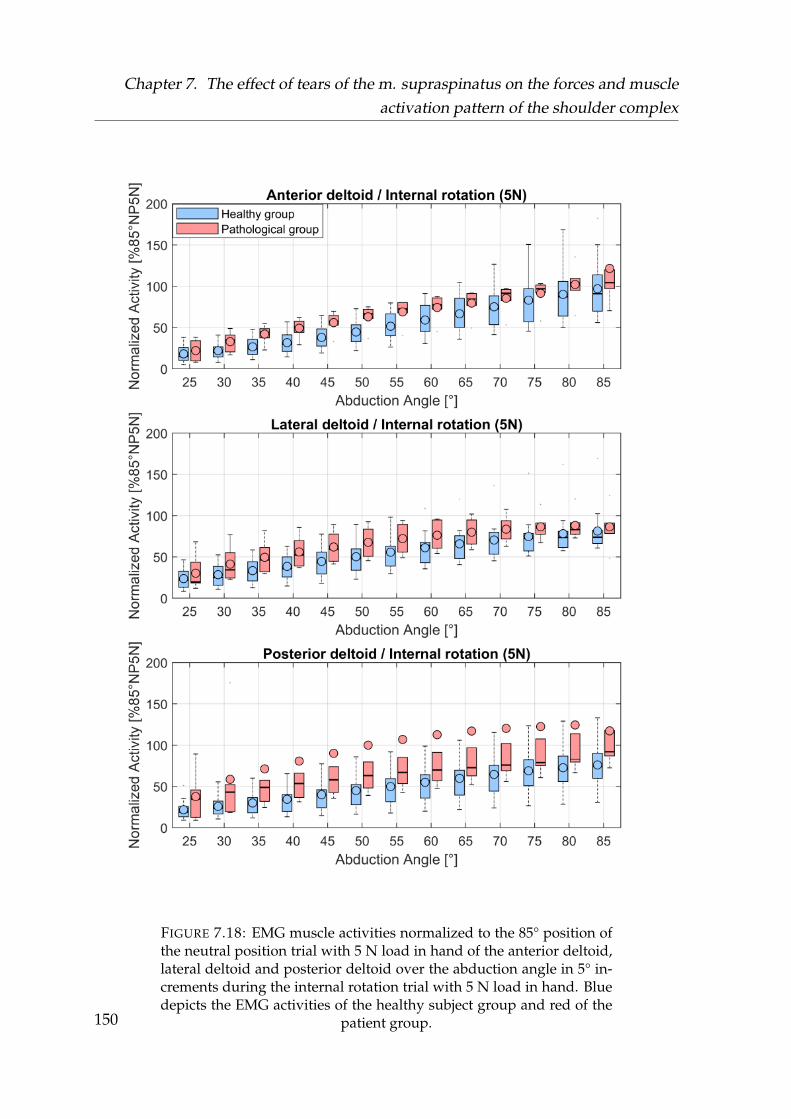
Chapter 7. The effect of tears of the m. supraspinatus on the forces and muscleactivation pattern of the shoulder complex
FIGURE 7.18: EMG muscle activities normalized to the 85° position ofthe neutral position trial with 5 N load in hand of the anterior deltoid,lateral deltoid and posterior deltoid over the abduction angle in 5° in-crements during the internal rotation trial with 5 N load in hand. Bluedepicts the EMG activities of the healthy subject group and red of the
patient group.150
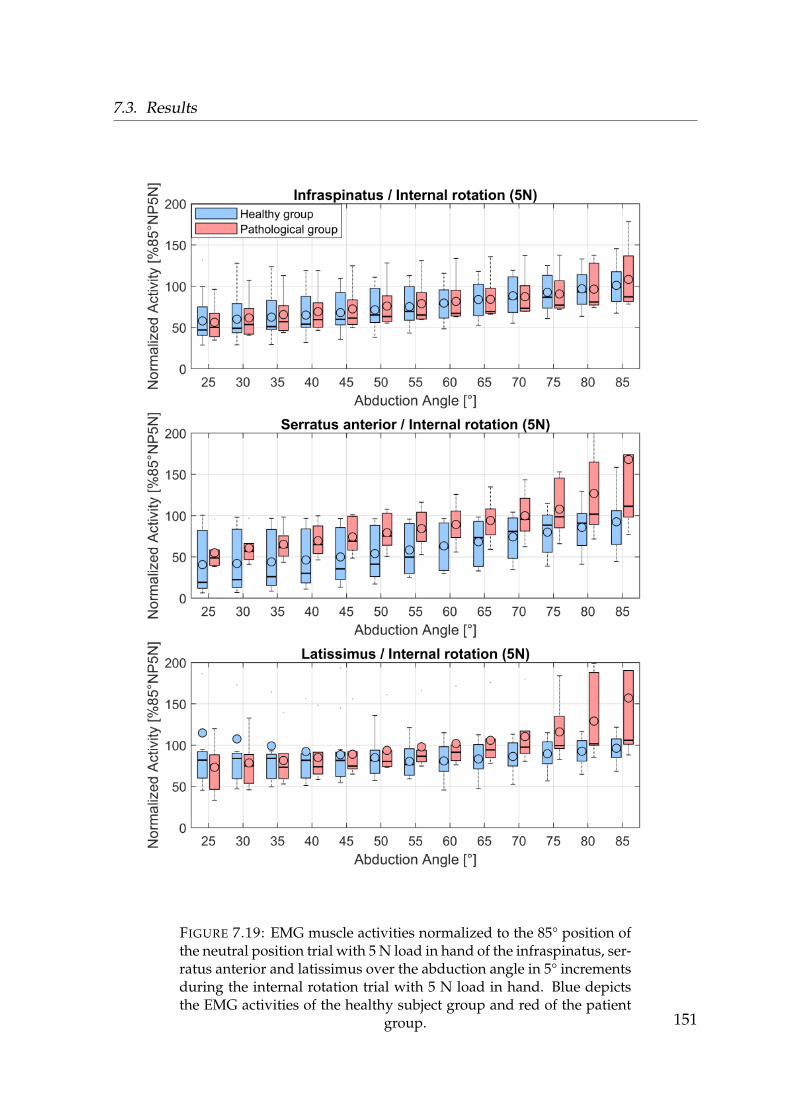
7.3. Results
FIGURE 7.19: EMG muscle activities normalized to the 85° position ofthe neutral position trial with 5 N load in hand of the infraspinatus, ser-ratus anterior and latissimus over the abduction angle in 5° incrementsduring the internal rotation trial with 5 N load in hand. Blue depictsthe EMG activities of the healthy subject group and red of the patient
group. 151
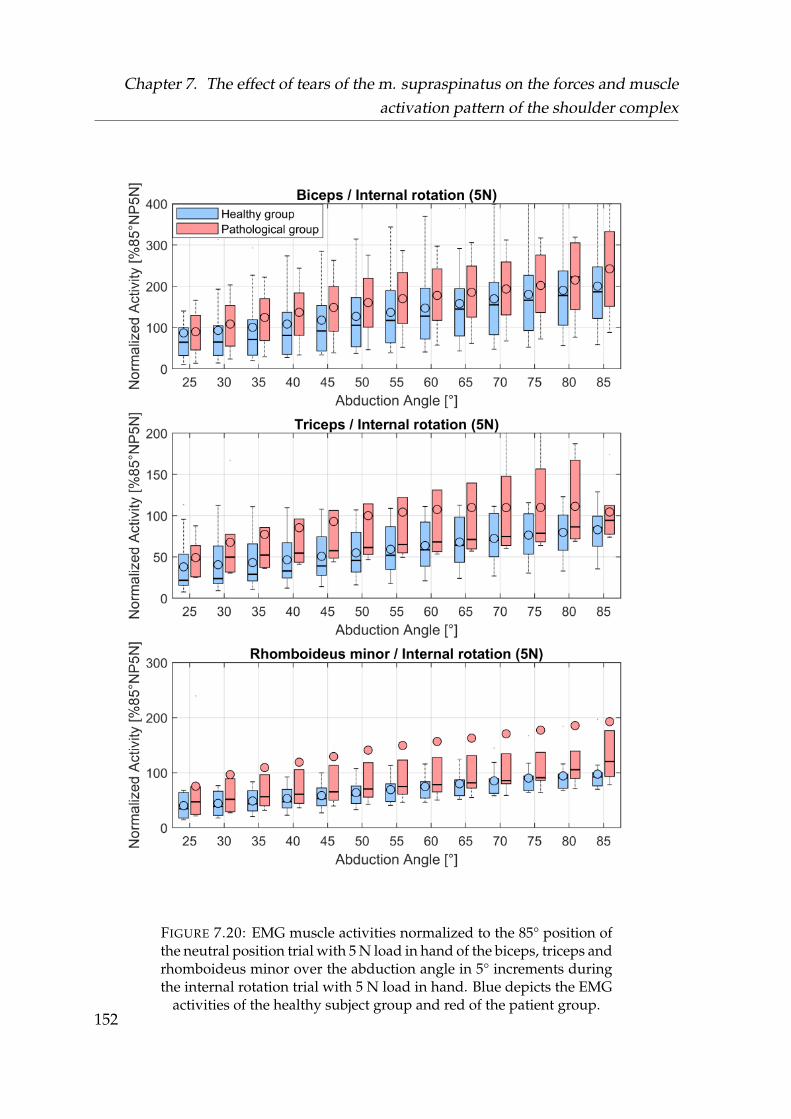
Chapter 7. The effect of tears of the m. supraspinatus on the forces and muscleactivation pattern of the shoulder complex
FIGURE 7.20: EMG muscle activities normalized to the 85° position ofthe neutral position trial with 5 N load in hand of the biceps, triceps andrhomboideus minor over the abduction angle in 5° increments duringthe internal rotation trial with 5 N load in hand. Blue depicts the EMG
activities of the healthy subject group and red of the patient group.152
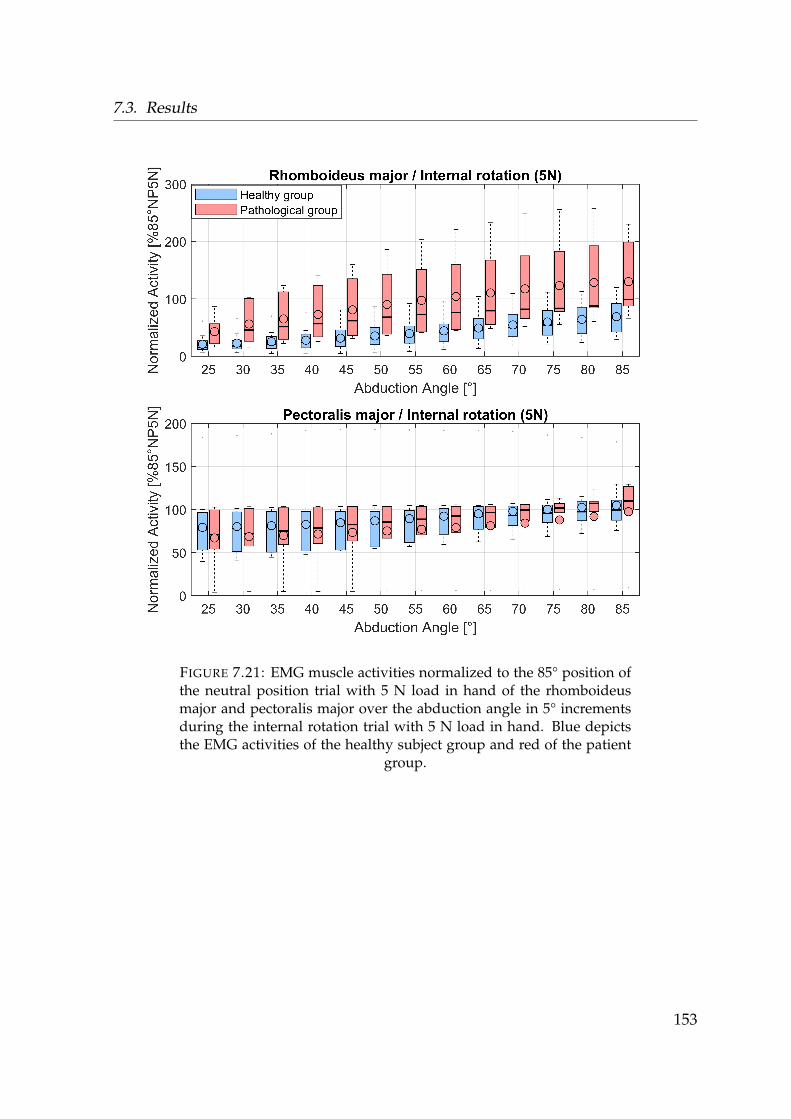
7.3. Results
FIGURE 7.21: EMG muscle activities normalized to the 85° position ofthe neutral position trial with 5 N load in hand of the rhomboideusmajor and pectoralis major over the abduction angle in 5° incrementsduring the internal rotation trial with 5 N load in hand. Blue depictsthe EMG activities of the healthy subject group and red of the patient
group.
153
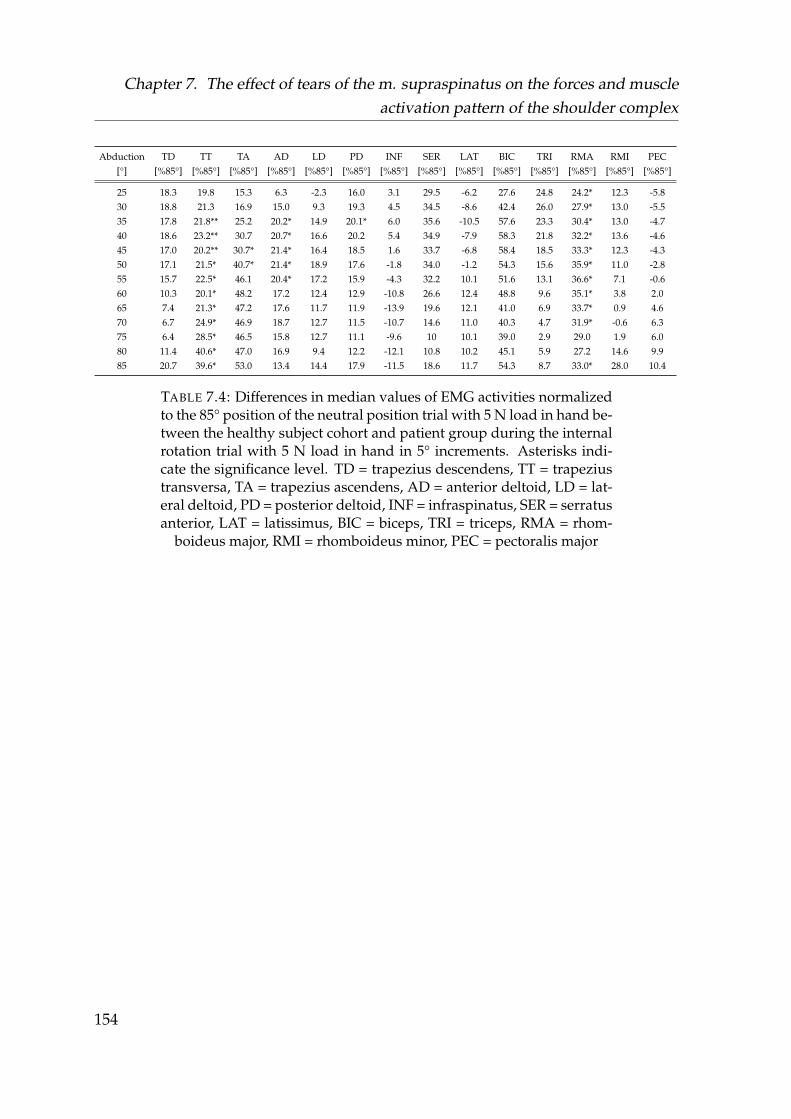
Chapter 7. The effect of tears of the m. supraspinatus on the forces and muscleactivation pattern of the shoulder complex
Abduction[°]
TD[%85°]
TT[%85°]
TA[%85°]
AD[%85°]
LD[%85°]
PD[%85°]
INF[%85°]
SER[%85°]
LAT[%85°]
BIC[%85°]
TRI[%85°]
RMA[%85°]
RMI[%85°]
PEC[%85°]
25 18.3 19.8 15.3 6.3 -2.3 16.0 3.1 29.5 -6.2 27.6 24.8 24.2* 12.3 -5.830 18.8 21.3 16.9 15.0 9.3 19.3 4.5 34.5 -8.6 42.4 26.0 27.9* 13.0 -5.535 17.8 21.8** 25.2 20.2* 14.9 20.1* 6.0 35.6 -10.5 57.6 23.3 30.4* 13.0 -4.740 18.6 23.2** 30.7 20.7* 16.6 20.2 5.4 34.9 -7.9 58.3 21.8 32.2* 13.6 -4.645 17.0 20.2** 30.7* 21.4* 16.4 18.5 1.6 33.7 -6.8 58.4 18.5 33.3* 12.3 -4.350 17.1 21.5* 40.7* 21.4* 18.9 17.6 -1.8 34.0 -1.2 54.3 15.6 35.9* 11.0 -2.855 15.7 22.5* 46.1 20.4* 17.2 15.9 -4.3 32.2 10.1 51.6 13.1 36.6* 7.1 -0.660 10.3 20.1* 48.2 17.2 12.4 12.9 -10.8 26.6 12.4 48.8 9.6 35.1* 3.8 2.065 7.4 21.3* 47.2 17.6 11.7 11.9 -13.9 19.6 12.1 41.0 6.9 33.7* 0.9 4.670 6.7 24.9* 46.9 18.7 12.7 11.5 -10.7 14.6 11.0 40.3 4.7 31.9* -0.6 6.375 6.4 28.5* 46.5 15.8 12.7 11.1 -9.6 10 10.1 39.0 2.9 29.0 1.9 6.080 11.4 40.6* 47.0 16.9 9.4 12.2 -12.1 10.8 10.2 45.1 5.9 27.2 14.6 9.985 20.7 39.6* 53.0 13.4 14.4 17.9 -11.5 18.6 11.7 54.3 8.7 33.0* 28.0 10.4
TABLE 7.4: Differences in median values of EMG activities normalizedto the 85° position of the neutral position trial with 5 N load in hand be-tween the healthy subject cohort and patient group during the internalrotation trial with 5 N load in hand in 5° increments. Asterisks indi-cate the significance level. TD = trapezius descendens, TT = trapeziustransversa, TA = trapezius ascendens, AD = anterior deltoid, LD = lat-eral deltoid, PD = posterior deltoid, INF = infraspinatus, SER = serratusanterior, LAT = latissimus, BIC = biceps, TRI = triceps, RMA = rhom-
boideus major, RMI = rhomboideus minor, PEC = pectoralis major
154

7.4. Discussion
7.4 Discussion
Where the model has been validated up to 120° abduction in chapter 5, four of theeight patients could not abduct their arm higher then 90° due to pain.The evaluationof all parameters of interest is thus limited in the range 25-85° as all subjects couldachieve this abduction angle.
7.4.1 Musculoskeletal simulation of intact models and simulated
tears of the m. supraspinatus
Comparison between intact and pathological models of the healthy group
The evaluation of simulated tears of the m. supraspinatus from the intact and patho-logical models of the same subject group highlight the change in recruitment whenthe underlying kinematics are exactly the same and the only difference is the exclu-sion of the six virtual muscle elements.
As the m. supraspinatus spans only over the GH joint, all muscles which connectthe scapula to the thorax did not show any difference in their respective activation.Where in general all muscle elements spanning over the GH joint showed increasedactivation, the anterior deltoid, lateral deltoid and infraspinatus showed a signifi-cant increase in their activation (see Table 7.2, Figures 7.6, 7.7, 7.8 & Appendix C).
However, changes in terms of absolute difference in activation magnitude are small.Sections 5.3.4 and 5.4.5 of chapter 5 argue for a higher order polynomial criterionof Equation 3.4 to increase muscle synergism and activate the m. supraspinatuselements more, which is in better agreement to literature (e.g. Wickham et al., 2010).By omitting the m. supraspinatus group from the pathological models, the higherorder criterion results in a more even distribution of the load the other muscles needto compensate for. Not using the higher order criterion would cause less activationof the m. supraspinatus and also cause lower activity increase in other muscles, butmight distinguish the main compensatory muscles better.
155

Chapter 7. The effect of tears of the m. supraspinatus on the forces and muscleactivation pattern of the shoulder complex
GH joint reaction forces for all trials showed a decrease in compression force andan increase in the anterior direction on the glenoid, with the resultant force pointingmore towards the edges. This is in line with findings by Steenbrink et al., 2009, Vidtet al., 2018 and Hölscher et al., 2016b. Even when all muscles spanning the shoul-der joint showed no significant increase, the cumulative differences are noticeable inthe components of the joint reactions forces. In the inferior-superior direction of theglenoid, the joint reaction forces were less noticeable than in the posterior-anterioror compression direction. This is due to the moment arm of the m. supraspina-tus. With a lower compression force however, the inferior-superior and posterior-anterior components have a larger impact on the resultant force direction.
The largest differences in the trajectory of the resultant GH joint reaction force onthe glenoid occurred during both internal rotation trials with and without weight inthe anterior and superior direction. This could be interpreted as the humeral headtranslating more towards the acromion and narrowing the space between them, thuscompressing the muscles and tendons. It would be in line with patients experienc-ing more pain during internal then in external rotation (Itoi et al., 1999; Timmonset al., 2016).
Comparison between intact models of the healthy group and pathological modelsof the patient group
Comparing the intact models of the healthy subject group to the pathological modelsof the patient group show similar results of the force trajectories projected on theglenoid for all trials, with significant lower compression forces and an increase in theanterior direction on the glenoid. During the external rotation trial without weight,no significant differences were found in the computed forces in all direction.
However, there are significant differences in the muscle recruitment for all com-puted trials in the anterior deltoid, lateral deltoid, infraspinatus, biceps, pectoralismajor and teres minor, which are four to five times higher then in the comparison be-tween the intact and pathological models of the healthy group. While the computedactivations between the healthy and pathological group are significantly differentfor all trials, the computed joint reaction forces become less distinguishable.
156

7.4. Discussion
The parameter which is variable between the compared groups is the kinematicsof the humerus. Patients tended to conduct less external rotation during the trials.While differences between the groups are not necessarily significant, a deviation isfound non the less. If the underlying modelling is assumed to be correct, this leadsto the potential conclusion that patients try to change their kinematics in a minorway in order to achieve a different recruitment of the muscles spanning the GHjoint which results in a better stability of the humeral head.
7.4.2 EMG comparison between healthy subjects and patients with
a tear of the m. supraspinatus
Two major limitations of the EMG study need to be addressed. For one, the cohort ofthe patients with 8 subjects where some of the trials were not usable is rather small.Furthermore, the approach of a sub-maximal normalization to the 85° position ofthe neutral position trial with 5 N load in hand makes the results more difficult tointerpret and to set in comparison to the modelled muscle activities.
A steep incline from 5-85° abduction indicates muscles with an increasing activa-tion during the abduction motion (e.g. the deltoids in Figure 7.18), where a lowerinclination points to muscles with a low activation (e.g. latissimus dorsi in Figure7.19)
The conjunction of differences in model activities and EMG activities in this contextshould be a indicator to muscle regions where a difference according to the modelcan be expected.
It has to be noted, that sensors placed on the rhomboid region are most likely cap-turing activities of the trapezius region as only surface EMG is used in this studyand the rhomboids are in a deeper muscles layer.
Significant differences in activation pattern in the EMG signals were found in thetrapezius pars transversa and ascendens, anterior and posterior deltoid and rhom-boideus major for the internal rotation trial with 5 N load in hand.
For the neutral position trial without weight, anterior and lateral deltoid, tricepsand rhomboideus major showed significant differences in the medians between thetwo groups. For the external rotation trial e.g. the latissimus and trapezius parsascendens exhibited significant differences in abduction angles >70°.
157
Chapter 7. The effect of tears of the m. supraspinatus on the forces and muscleactivation pattern of the shoulder complex
These EMG activation patterns are not in agreement with the predicted changes inmodel activity. As the sensors placed on the rhomboids are actually capturing theactivity of the trapezius, and trapezius and rhomboid sensors showed significantactivation patterns, the experimental outcome agrees rather with results describedby Steenbrink et al., 2010. They argued for contraction of the adductors of patientsin order to achieve stability where in the model e.g. the latissimus is not active.Furthermore, a significant change in the sensors placed on the trapezius muscleregions indicates an alteration of the shoulder rhythm in patients as this muscleregion is responsible for scapula kinematics. The utilised models all use the sameunderlying shoulder rhythm, which is not taking kinematic changes due to pain oralternative compensation schemes from the central nervous system in the form ofco-contraction into account.
The discrepancy would argue that the model in its current state cannot depict symp-tomatic cases of tears of the m. supraspinatus accurately, as they seem to showchanges in muscle regions which are either activated as co-contractors or affect thescapula kinematics.
This would indicate, that a group of patients with a tear of the m. supraspinatusfollows a different activation pattern.
The modelled results might be valid for asymptomatic cases where the kinematicsbehave the same in a healthy and pathological population.
If the model is to be trusted however, the changes in activation are distributedevenly to the surrounding muscle elements and changes in magnitude of the ac-tivity are small, which might be undetectable by EMG measurements due to a largevariance that already occurs in the healthy population (see Wickham et al., 2010).
158
7.5. Conclusion
7.5 Conclusion
From the EMG measurements it is concluded, that symptomatic patients with a tearof the m. supraspinatus might have changed kinematics and use different musclesin order to stabilize the joint which is not incorporated in the used model. The hy-potheses that a generic model could predict alterations in muscle recruitment is notconfirmed with this study, but that patient specific kinematics of the scapula areneeded to improve the prediction. The model however could describe changes inthe joint reaction forces acting on the glenoid for asymptomatic cases. This couldlead to a better understanding of early stages and development of co-morbidities ofa tear of the m. supraspinatus. Furthermore, the model would predict that asymp-tomatic cases of a tear of the m. supraspinatus are likely not detectable by the meansof EMG measurements during abduction in the coronal plane.
159
Chapter 8
Conclusion
The purpose of this thesis is to investigate the three research questions stated inchapter 1:
1. Investigation and improvement of an existing model of the shoulder complex:Is there an alternative explanation for the rising muscle activities and gleno-humeral joint reaction force above 90° abduction? (Chapter 4 & Chapter 5)
2. Computation of several operative techniques of a biceps tendon transfer:Is one technique closer to the healthy state of the shoulder-arm complex froma biomechanical point of view? (Chapter 6)
3. Simulation of a full tear of the m. supraspinatus with a focus on muscle acti-vation pattern and glenohumeral joint reaction force:Can a musculoskeletal model predict changes in the muscle recruitment ofpathologies accurately? (Chapter 7)
160
Chapter 8. Conclusion
To conclude this thesis, the answers to these three questions and the main pointsthis work elaborates on are stated as
1. Thee mechanical properties of the three element Hill model are a key mod-elling parameter and a physiologically reasonable explanation for force be-haviour in the glenohumeral joint above 90° humeral abduction. To the bestof my knowledge, this strong emphasize on the Hill model for the force be-haviour in the shoulder has not been described yet.
2. From a biomechanical perspective, the reinsertion technique of the biceps ca-put longum at the bicipital groove is the simulated closest to the healthy statewith regard to forces and moments acting on the elbow if the tendon can notbe reinserted at its original position. This is due to the preservation of its mo-ment arm with regard to the elbow. This technique seems superior to otherreinsertion techniques form a mechanical perspective.
3. A generic model can not predict muscle recruitment changes of patients witha symptomatic tear of the m. supraspinatus. Patient specific kinematics of thescapular seem necessary. The model however could be beneficial to exploreearly stages or asymptomatic cases.
161
Bibliography
Ackland, David C. et al. (2008). “Moment arms of the muscles crossing the anatom-ical shoulder”. In: Journal of anatomy 213.4, pp. 383–390. DOI: 10.1111/j.1469-7580.2008.00965.x.
Ambrósio, Jorge et al. (2011). “Multibody biomechanical models of the upper limb”.In: Procedia IUTAM 2. IUTAM Symposium on Human Body Dynamics, pp. 4 –17.ISSN: 2210-9838. DOI: https://doi.org/10.1016/j.piutam.2011.04.002. URL:http://www.sciencedirect.com/science/article/pii/S2210983811000034.
An, K. N. et al. (1984). “Determination of muscle orientations and moment arms”.In: Journal of biomechanical engineering 106.3, pp. 280–282. ISSN: 0148-0731. DOI: 10.1115/1.3138494.
Andersen, M. S. et al. (2010). “A computationally efficient optimisation-based methodfor parameter identification of kinematically determinate and over-determinatebiomechanical systems”. In: Computer methods in biomechanics and biomedical engi-neering 13.2, pp. 171–183. DOI: 10.1080/10255840903067080.
Andersen, Michael Skipper (2018). “How sensitive are predicted muscle and kneecontact forces to normalization factors and polynomial order in the muscle recruit-ment criterion formulation?” In: International Biomechanics 5.1, pp. 88–103. DOI:10.1080/23335432.2018.1514278. eprint: https://doi.org/10.1080/23335432.2018.1514278. URL: https://doi.org/10.1080/23335432.2018.1514278.
Arslan, Yunus Ziya et al. (2019). “11 - Exoskeletons, Exomusculatures, Exosuits: Dy-namic Modeling and Simulation”. In: Biomechatronics. Ed. by Marko B. Popovic.Academic Press, pp. 305 –331. ISBN: 978-0-12-812939-5. DOI: https://doi.org/10.1016/B978-0-12-812939-5.00011-2. URL: http://www.sciencedirect.com/science/article/pii/B9780128129395000112.
Aurbach, M. et al. (2020a). “Torus obstacle method as a wrapping approach of thedeltoid muscle group for humeral abduction in musculoskeletal simulation”. In:Journal of Biomechanics, p. 109864. ISSN: 0021-9290. DOI: https://doi.org/10.
162
Bibliography
1016/j.jbiomech.2020.109864. URL: http://www.sciencedirect.com/science/article/pii/S0021929020302876.
Aurbach, Maximilian et al. (2020b). “Evaluation of musculoskeletal modelling pa-rameters of the shoulder complex during humeral abduction above 90°”. In: Jour-nal of Biomechanics 106, p. 109817. ISSN: 0021-9290. DOI: https://doi.org/10.1016/j.jbiomech.2020.109817. URL: http://www.sciencedirect.com/science/article/pii/S0021929020302372.
Barbero, Marco, Roberto Merletti, and Alberto Rainoldi (2012). Atlas of Muscle Inner-vation Zones: Understanding Surface Electromyography and Its Applications. Milano:Springer. ISBN: 9788847024625. DOI: 10.1007/978-88-470-2463-2. URL: http://site.ebrary.com/lib/alltitles/docDetail.action?docID=10595021.
Baumgarten, Keith M., Peter S. Chang, and Elaine K. Foley (2019). “Patient-determinedoutcomes after arthroscopic rotator cuff repair with and without biceps tenode-sis utilizing the PITT technique”. In: Journal of shoulder and elbow surgery 28.6,pp. 1049–1055. ISSN: 1058-2746. DOI: 10.1016/j.jse.2019.01.024.
Bergmann, G. (2008). Charité Universitaetsmedizin Berlin “OrthoLoad”. Ed. by Orthoload.Bergmann, G. et al. (2011). “In vivo gleno-humeral joint loads during forward flex-
ion and abduction”. In: Journal of Biomechanics 44.8, pp. 1543–1552. ISSN: 00219290.DOI: 10.1016/j.jbiomech.2011.02.142.
Boileau, Pascal et al. (2002). “Arthroscopic biceps tenodesis: a new technique usingbioabsorbable interference screw fixation”. In: Arthroscopy : the journal of arthro-scopic & related surgery : official publication of the Arthroscopy Association of NorthAmerica and the International Arthroscopy Association 18.9, 1002—1012. ISSN: 0749-8063. DOI: 10.1053/jars.2002.36488. URL: https://doi.org/10.1053/jars.2002.36488.
Bolsterlee, Bart, Veeger, Dirkjan H E J, and Edward K. Chadwick (2013). “Clini-cal applications of musculoskeletal modelling for the shoulder and upper limb”.In: Medical & biological engineering & computing 51.9, pp. 953–963. DOI: 10.1007/s11517-013-1099-5.
Chard, M. D. et al. (1991). “Shoulder disorders in the elderly: A community sur-vey”. In: Arthritis & Rheumatism 34.6, pp. 766–769. DOI: 10.1002/art.1780340619.eprint: https://onlinelibrary.wiley.com/doi/pdf/10.1002/art.1780340619.URL: https://onlinelibrary.wiley.com/doi/abs/10.1002/art.1780340619.
Charlton, I. W. and G. R. Johnson (2006). “A model for the prediction of the forcesat the glenohumeral joint”. In: Proceedings of the Institution of Mechanical Engineers.
163
Bibliography
Part H, Journal of engineering in medicine 220.8, pp. 801–812. ISSN: 0954-4119. DOI:10.1243/09544119JEIM147.
Crass, Jeffrey R, Edward V Craig, and Samuel B Feinberg (1988). “Ultrasonographyof rotator cuff tears: a review of 500 diagnostic studies”. In: Journal of Clinical Ul-trasound 16.5, pp. 313–327.
Criswell, Eleanor and Jeffrey R. Cram, eds. (2011). Cram’s introduction to surface elec-tromyography. 2. ed. Sudbury, MA: Jones and Bartlett. ISBN: 9780763732745.
Damsgaard, Michael et al. (2006). “Analysis of musculoskeletal systems in the Any-Body Modeling System”. In: Simulation Modelling Practice and Theory 14.8, pp. 1100–1111.
Delp, S. L. et al. (1990). “An interactive graphics-based model of the lower extrem-ity to study orthopaedic surgical procedures”. In: IEEE transactions on bio-medicalengineering 37.8, pp. 757–767. ISSN: 0018-9294. DOI: 10.1109/10.102791.
Drongelen], Stefan [van et al. (2013). “The influence of simulated rotator cuff tearson the risk for impingement in handbike and handrim wheelchair propulsion”.In: Clinical Biomechanics 28.5, pp. 495 –501. ISSN: 0268-0033. DOI: https://doi.org/10.1016/j.clinbiomech.2013.04.007. URL: http://www.sciencedirect.com/science/article/pii/S0268003313000909.
Edwards, Peter K et al. (2017). “A systematic review of electromyography studiesin normal shoulders to inform postoperative rehabilitation following rotator cuffrepair”. In: journal of orthopaedic & sports physical therapy 47.12, pp. 931–944.
Ekstrom, Richard A. and Roy W. Osborn (2004). “Chapter 15 - Muscle Length Test-ing and Electromyographic Data for Manual Strength Testing and Exercises forthe Shoulder”. In: Physical Therapy of the Shoulder (Fourth Edition). Ed. by RobertA. Donatelli. Fourth Edition. Saint Louis: Churchill Livingstone, pp. 435 –463.ISBN: 978-0-443-06614-6. DOI: https://doi.org/10.1016/B978- 044306614-6.50017- X. URL: http://www.sciencedirect.com/science/article/pii/B978044306614650017X.
Favre, Philippe, Jess G. Snedeker, and Christian Gerber (2009). “Numerical mod-elling of the shoulder for clinical applications”. In: Philosophical transactions. SeriesA, Mathematical, physical, and engineering sciences 367.1895, pp. 2095–2118. ISSN:1364-503X. DOI: 10.1098/rsta.2008.0282.
Ferri, Melanie et al. (2005). “Sonography of full-thickness supraspinatus tears: com-parison of patient positioning technique with surgical correlation”. In: AmericanJournal of Roentgenology 184.1, pp. 180–184.
164
Bibliography
Flores-Hernandez, Cesar et al. (2019). “Scapulothoracic rhythm affects glenohumeraljoint force”. In: JSES Open Access 3.2, pp. 77 –82. ISSN: 2468-6026. DOI: https://doi.org/10.1016/j.jses.2019.03.004. URL: http://www.sciencedirect.com/science/article/pii/S2468602619300129.
Forsythe, Brian et al. (2020). “Arthroscopic Suprapectoral and Open Subpectoral Bi-ceps Tenodeses Produce Similar Outcomes: A Randomized Prospective Analy-sis”. In: Arthroscopy : the journal of arthroscopic & related surgery : official publicationof the Arthroscopy Association of North America and the International Arthroscopy As-sociation 36.1, pp. 23–32. ISSN: 0749-8063. DOI: 10.1016/j.arthro.2019.07.009.
Fucentese, Sandro et al. (2012). “Evolution of nonoperatively treated symptomaticisolated full-thickness supraspinatus tears.” In: The Journal of bone and joint surgery.American volume 94 9, pp. 801–8.
Fuglsang-Frederiksen, Anders (2006). “The role of different EMG methods in evalu-ating myopathy”. In: Clinical Neurophysiology 117.6, pp. 1173–1189. ISSN: 13882457.DOI: 10.1016/j.clinph.2005.12.018.
Gasbarro, Gregory, Benjamin Bondow, and Richard Debski (2017). “Clinical anatomyand stabilizers of the glenohumeral joint”. In: Annals of Joint 2.10. URL: http://aoj.amegroups.com/article/view/3864.
Gillooly, John Joseph, Ramiah Chidambaram, and Daniel Mok (2010). “The lateralJobe test: A more reliable method of diagnosing rotator cuff tears”. In: Internationaljournal of shoulder surgery 4.2, pp. 41–43. ISSN: 0973-6042. DOI: 10.4103/0973-6042.70822.
Glait, Sergio A. et al. (2018). “Regional histologic differences in the long head of thebiceps tendon following subpectoral biceps tenodesis in patients with rotator cufftears and SLAP lesions”. In: Knee surgery, sports traumatology, arthroscopy : officialjournal of the ESSKA 26.8, pp. 2481–2489. ISSN: 0942-2056. DOI: 10.1007/s00167-018-4839-0.
Gowd, Anirudh K., Edward C. Beck, and Brian R. Waterman (2020). “Editorial Com-mentary: Aim High or Go Low? Outcomes Are Equivalent for Arthroscopic Suprapec-toral and Mini-open Subpectoral Biceps Tenodesis”. In: Arthroscopy: The Journalof Arthroscopic & Related Surgery 36.1, pp. 33 –35. ISSN: 0749-8063. DOI: https://doi.org/10.1016/j.arthro.2019.08.022. URL: http://www.sciencedirect.com/science/article/pii/S0749806319307224.
165
Bibliography
Graichen, Heiko et al. (2000). “Glenohumeral translation during active and passiveelevation of the shoulder — a 3D open-MRI study”. In: Journal of Biomechanics 33.5,pp. 609–613. ISSN: 00219290. DOI: 10.1016/S0021-9290(99)00209-2.
Groot, J. H. de and R. Brand (2001). “A three-dimensional regression model of theshoulder rhythm”. In: Clinical biomechanics (Bristol, Avon) 16.9, pp. 735–743. ISSN:0268-0033. DOI: 10.1016/s0268-0033(01)00065-1.
Groot, Jurriaan H. de et al. (2004). “Isometric shoulder muscle activation patternsfor 3-D planar forces: a methodology for musculo-skeletal model validation”. In:Clinical biomechanics (Bristol, Avon) 19.8, pp. 790–800. ISSN: 0268-0033. DOI: 10.1016/j.clinbiomech.2004.05.013.
Gumina, Stefano et al. (2011). “Rupture of the long head biceps tendon treated withtenodesis to the coracoid process. Results at more than 30 years”. In: Internationalorthopaedics 35.5, pp. 713–716. ISSN: 0341-2695. DOI: 10.1007/s00264-010-1099-0.
Halder, A. M. et al. (2001). “Dynamic contributions to superior shoulder stability”.In: Journal of orthopaedic research : official publication of the Orthopaedic Research Soci-ety 19.2, pp. 206–212. DOI: 10.1016/S0736-0266(00)00028-0.
Hashizume, Satoru et al. (2016). “Comparison of the Achilles tendon moment armsdetermined using the tendon excursion and three-dimensional methods”. In: Phys-iological Reports 4.19, e12967. DOI: 10.14814/phy2.12967. eprint: https://physoc.onlinelibrary.wiley.com/doi/pdf/10.14814/phy2.12967. URL: https://physoc.onlinelibrary.wiley.com/doi/abs/10.14814/phy2.12967.
Havelková, L. (2016). “Biomechanical musculoskeletal model.” PhD thesis. Univer-sity of West Bohemia, Plzen.
Havelková L., Špicka J. Vychytil J. Aurbach M. and Z. Krnoul (2018). “Torus-obstaclemethod used for representing muscle path in musculoskeletal models.” In: In Pro-ceeding of the 8th World Congress of Biomechanics, Dublin, Ireland.
Hawi, Nael et al. (2017). “Pulley lesions in rotator cuff tears: prevalence, etiology,and concomitant pathologies”. In: Archives of orthopaedic and trauma surgery 137.8,pp. 1097–1105. DOI: 10.1007/s00402-017-2721-z.
Hill, Archibald Vivian (1938). “The heat of shortening and the dynamic constantsof muscle”. In: Proceedings of the Royal Society of London. Series B - Biological Sci-ences 126.843, pp. 136–195. DOI: 10.1098/rspb.1938.0050. eprint: https://royalsocietypublishing.org/doi/pdf/10.1098/rspb.1938.0050. URL: https://royalsocietypublishing.org/doi/abs/10.1098/rspb.1938.0050.
166
Bibliography
Holmberg, L. Joakim and Anders Klarbring (2012). “Muscle decomposition and re-cruitment criteria influence muscle force estimates”. In: Multibody System Dynam-ics 28.3, pp. 283–289. ISSN: 1384-5640. DOI: 10.1007/s11044-011-9277-4. URL:https://doi.org/10.1007/s11044-011-9277-4.
Hölscher, Thomas et al. (2016a). “Influence of rotator cuff tears on glenohumeral sta-bility during abduction tasks”. In: Journal of orthopaedic research : official publicationof the Orthopaedic Research Society 34.9, pp. 1628–1635. DOI: 10.1002/jor.23161.
– (2016b). “Influence of rotator cuff tears on glenohumeral stability during abduc-tion tasks”. In: Journal of orthopaedic research : official publication of the OrthopaedicResearch Society 34.9, pp. 1628–1635. DOI: 10.1002/jor.23161.
Howell, S. M. et al. (1986). “Clarification of the role of the supraspinatus musclein shoulder function”. In: JBJS 68.3, pp. 398–404. ISSN: 0021-9355. URL: https://journals.lww.com/jbjsjournal/Fulltext/1986/68030/Clarification_of_
the_role_of_the_supraspinatus.13.aspx.Hurley, Eoghan T. et al. (2018). “Biceps tenodesis versus labral repair for superior
labrum anterior-to-posterior tears: a systematic review and meta-analysis”. In:Journal of shoulder and elbow surgery 27.10, pp. 1913–1919. ISSN: 1058-2746. DOI:10.1016/j.jse.2018.04.011.
Itoi, Eiji et al. (1999). “Which is More Useful, the “Full Can Test” or the “Empty CanTest,” in Detecting the Torn Supraspinatus Tendon?” In: The American Journal ofSports Medicine 27.1. PMID: 9934421, pp. 65–68. DOI: 10.1177/03635465990270011901.eprint: https://doi.org/10.1177/03635465990270011901. URL: https://doi.org/10.1177/03635465990270011901.
Juul-Kristensen, B. et al. (2000). “Muscle sizes and moment arms of rotator cuff mus-cles determined by magnetic resonance imaging”. In: Cells, tissues, organs 167.2-3,pp. 214–222. ISSN: 1422-6405. DOI: 10.1159/000016784.
Kai, Yoshihiro et al. (2015). “Electromyographic study of rotator cuff muscle activ-ity during full and empty can tests”. In: Asia-Pacific Journal of Sports Medicine,Arthroscopy, Rehabilitation and Technology 2.1, pp. 36 –41. ISSN: 2214-6873. DOI: https://doi.org/10.1016/j.asmart.2014.12.001. URL: http://www.sciencedirect.com/science/article/pii/S2214687314000752.
Keating, J. F. et al. (1993). “The relative strengths of the rotator cuff muscles. A ca-daver study”. In: The Journal of bone and joint surgery. British volume 75.1, pp. 137–140. ISSN: 0301-620X.
167
Bibliography
Kerschbaum, Maximilian et al. (2019). “Novel implant-free loop Tenodesis vs. sim-ple Tenotomy of the long biceps tendon - a biomechanical investigation”. In: BMCmusculoskeletal disorders 20.1, p. 522. ISSN: 1471-2474. DOI: 10.1186/s12891-019-2919-z.
Konrad, Peter (2006). The ABC of EMG: a practical introduction to kinesiological elec-tromyography. Version 1.4. Noraxon USA, Inc. ISBN: 0977162214. URL: http://www.noraxon.com/.
Lee, Choon-Key et al. (2014). “Comparison of muscle activity in the empty-can andfull-can testing positions using 18 F-FDG PET/CT”. In: Journal of orthopaedic surgeryand research 9, p. 85. DOI: 10.1186/s13018-014-0085-4.
Leschinger, Tim et al. (2019). “A musculoskeletal shoulder simulation of momentarms and joint reaction forces after medialization of the supraspinatus footprint inrotator cuff repair”. In: Computer Methods in Biomechanics and Biomedical Engineer-ing 22.6. PMID: 30835541, pp. 595–604. DOI: 10.1080/10255842.2019.1572749.eprint: https : / / doi . org / 10 . 1080 / 10255842 . 2019 . 1572749. URL: https ://doi.org/10.1080/10255842.2019.1572749.
Ludewig, Paula M. et al. (2009). “Motion of the shoulder complex during multipla-nar humeral elevation”. In: The Journal of bone and joint surgery. American volume91.2, pp. 378–389. DOI: 10.2106/JBJS.G.01483.
Lund, Morten, John Rasmussen, and Michael Andersen (2019). “AnyPyTools: APython package for reproducible research with the AnyBody Modeling System”.In: Journal of Open Source Software 4.33, p. 1108. DOI: 10.21105/joss.01108.
Lund, Morten Enemark et al. (2012). “On validation of multibody musculoskele-tal models”. In: Proceedings of the Institution of Mechanical Engineers. Part H, Jour-nal of engineering in medicine 226.2, pp. 82–94. ISSN: 0954-4119. DOI: 10 . 1177 /0954411911431516.
Mack, Laurence A et al. (1985). “US evaluation of the rotator cuff.” In: Radiology157.1, pp. 205–209.
Magermans, D.J. et al. (2004a). “Biomechanical analysis of tendon transfers for mas-sive rotator cuff tears”. In: Clinical Biomechanics 19.4, pp. 350 –357. ISSN: 0268-0033.DOI: https://doi.org/10.1016/j.clinbiomech.2003.11.013. URL: http://www.sciencedirect.com/science/article/pii/S0268003303002687.
Magermans, D.J et al. (2004b). “Effectiveness of tendon transfers for massive rotatorcuff tears: a simulation study”. In: Clinical Biomechanics 19.2, pp. 116 –122. ISSN:
168
Bibliography
0268-0033. DOI: https://doi.org/10.1016/j.clinbiomech.2003.09.008. URL:http://www.sciencedirect.com/science/article/pii/S0268003303002195.
Mahaphonchaikul, K. et al. (2010). “EMG signal feature extraction based on wavelettransform”. In: ECTI-CON2010: The 2010 ECTI International Confernce on Electri-cal Engineering/Electronics, Computer, Telecommunications and Information Technol-ogy, pp. 327–331.
Mall, Nathan A. et al. (2010). “Symptomatic progression of asymptomatic rotatorcuff tears: a prospective study of clinical and sonographic variables”. In: The Jour-nal of bone and joint surgery. American volume 92.16, pp. 2623–2633. DOI: 10.2106/JBJS.I.00506.
Man, Kam (2017). “A validation method to find moment arm of the deltoid fromMRI images.” MA thesis. Ecole de technologie superieure universite du Quebec,Montreal, Canada.
Mariani, E. M. et al. (1988). “Rupture of the tendon of the long head of the bicepsbrachii. Surgical versus nonsurgical treatment”. In: Clinical orthopaedics and relatedresearch 228, pp. 233–239. ISSN: 0009-921X.
Marra, Marco A. et al. (2015). “A subject-specific musculoskeletal modeling frame-work to predict in vivo mechanics of total knee arthroplasty”. In: Journal of biome-chanical engineering 137.2, p. 020904. ISSN: 0148-0731. DOI: 10.1115/1.4029258.
Massimini, Daniel F. et al. (2012). “In-vivo glenohumeral translation and ligamentelongation during abduction and abduction with internal and external rotation”.In: Journal of orthopaedic surgery and research 7, p. 29. DOI: 10.1186/1749-799X-7-29.
Meyer, Markus, Jenny Wenzel, and Antje Schenkel (2018). “Krankheitsbedingte Fehlzeitenin der deutschen Wirtschaft im Jahr 2017”. In: Fehlzeiten-Report 2018: Sinn erleben –Arbeit und Gesundheit. Ed. by Bernhard Badura et al. Berlin, Heidelberg: SpringerBerlin Heidelberg, pp. 331–536. ISBN: 978-3-662-57388-4. DOI: 10.1007/978-3-662-57388-4_29. URL: https://doi.org/10.1007/978-3-662-57388-4_29.
Minagawa, Hiroshi et al. (2013). “Prevalence of symptomatic and asymptomatic ro-tator cuff tears in the general population: From mass-screening in one village”. In:Journal of orthopaedics 10.1, pp. 8–12. ISSN: 0972-978X. DOI: 10.1016/j.jor.2013.01.008.
Moor, B.K. et al. (2014). “Age, trauma and the critical shoulder angle accurately pre-dict supraspinatus tendon tears”. In: Orthopaedics & Traumatology: Surgery & Re-search 100.5, pp. 489 –494. ISSN: 1877-0568. DOI: https://doi.org/10.1016/j.
169
Bibliography
otsr.2014.03.022. URL: http://www.sciencedirect.com/science/article/pii/S1877056814001236.
Moosmayer, Stefan et al. (2013). “The natural history of asymptomatic rotator cufftears: a three-year follow-up of fifty cases”. In: The Journal of bone and joint surgery.American volume 95.14, pp. 1249–1255. DOI: 10.2106/JBJS.L.00185.
Moppes, Floris I van, Onno Veldkamp, and Jan Roorda (1995). “Role of shoulderultrasonography in the evaluation of the painful shoulder”. In: European journal ofradiology 19.2, pp. 142–146.
Morrow, Melissa M. B., Kenton R. Kaufman, and Kai-Nan An (2010). “Shouldermodel validation and joint contact forces during wheelchair activities”. In: Journalof Biomechanics 43.13, pp. 2487–2492. ISSN: 00219290. DOI: 10.1016/j.jbiomech.2010.05.026.
Na, Yuyan et al. (2019). “A meta-analysis comparing tenotomy or tenodesis for le-sions of the long head of the biceps tendon with concomitant reparable rotatorcuff tears”. In: DOI: 10.1186/s13018-019-1429-x.
Neumann, Donald A. (2002). Kinesiology of the musculoskeletal system : foundations forphysical rehabilitation. First edition. St. Louis : Mosby, [2002] ©2002. URL: https://search.library.wisc.edu/catalog/999931373602121.
Nikooyan, A. A. et al. (2010). “Validation of the Delft Shoulder and Elbow Modelusing in-vivo glenohumeral joint contact forces”. In: Journal of Biomechanics 43.15,pp. 3007–3014. ISSN: 00219290. DOI: 10.1016/j.jbiomech.2010.06.015.
Nikooyan, A. A. et al. (2012). “An EMG-driven musculoskeletal model of the shoul-der”. In: Human movement science 31.2, pp. 429–447. DOI: 10.1016/j.humov.2011.08.006.
Nikooyan, A. Asadi et al. (2011). “Development of a comprehensive musculoskeletalmodel of the shoulder and elbow”. In: Medical & biological engineering & computing49.12, pp. 1425–1435. DOI: 10.1007/s11517-011-0839-7.
Nussbaum, M. A., D. B. Chaffin, and C. J. Rechtien (1995). “Muscle lines-of-actionaffect predicted forces in optimization-based spine muscle modeling”. In: Journalof Biomechanics 28.4, pp. 401–409. ISSN: 00219290. DOI: 10.1016/0021-9290(94)00078-i.
Oh, Joo Han et al. (2011). “Does a critical rotator cuff tear stage exist?: a biome-chanical study of rotator cuff tear progression in human cadaver shoulders”. In:The Journal of bone and joint surgery. American volume 93.22, pp. 2100–2109. DOI:10.2106/JBJS.J.00032.
170
Bibliography
O’Neill, Matthew C. et al. (2013). “A three-dimensional musculoskeletal model ofthe chimpanzee (Pan troglodytes) pelvis and hind limb”. In: Journal of ExperimentalBiology 216.19, pp. 3709–3723. ISSN: 0022-0949. DOI: 10.1242/jeb.079665. eprint:https://jeb.biologists.org/content/216/19/3709.full.pdf. URL: https://jeb.biologists.org/content/216/19/3709.
Phinyomark, A., C. Limsakul, and P. Phukpattaranont (Jan. 2011). “Application ofWavelet Analysis in EMG Feature Extraction for Pattern Classification”. In: Mea-surement Science Review 11.2, pp. 45–52. DOI: 10.2478/v10048-011-0009-y.
Pope, Daniel P et al. (1997). “Prevalence of shoulder pain in the community: theinfluence of case definition”. In: Annals of the Rheumatic Diseases 56.5, pp. 308–312.ISSN: 0003-4967. DOI: 10.1136/ard.56.5.308. eprint: https://ard.bmj.com/content/56/5/308.full.pdf. URL: https://ard.bmj.com/content/56/5/308.
Pribicevic, Mario (2012). “The Epidemiology of Shoulder Pain: A Narrative Reviewof the Literature”. In: Pain in Perspective. Ed. by Subhamay Ghosh. Rijeka: Inte-chOpen. Chap. 7. DOI: 10.5772/52931. URL: https://doi.org/10.5772/52931.
Prinold, Joe A. I. et al. (2013). “Musculoskeletal shoulder models: a technical reviewand proposals for research foci”. In: Proceedings of the Institution of Mechanical En-gineers. Part H, Journal of engineering in medicine 227.10, pp. 1041–1057. ISSN: 0954-4119. DOI: 10.1177/0954411913492303.
Quinn, Stephen F et al. (1995). “Rotator cuff tendon tears: evaluation with fat-suppressedMR imaging with arthroscopic correlation in 100 patients.” In: Radiology 195.2,pp. 497–500.
Raikova, R. T. and B. I. Prilutsky (2001). “Sensitivity of predicted muscle forces toparameters of the optimization-based human leg model revealed by analyticaland numerical analyses”. In: Journal of Biomechanics 34.10, pp. 1243–1255. ISSN:00219290. DOI: 10.1016/s0021-9290(01)00097-5.
Rajaratnam, Bala (2014). “A Comparison of EMG Signals from Surface and Fine-Wire Electrodes During Shoulder Abduction”. In: International Journal of PhysicalMedicine & Rehabilitation 02.04. DOI: 10.4172/2329-9096.1000206.
Rasmussen, John et al. (2005). “A General Method for Scaling Musculo-SkeletalModels”. In: 2005 International Symposium on Computer Simulation in Biomechanics.
Rassier, D. E., B. R. MacIntosh, and W. Herzog (1999). “Length dependence of activeforce production in skeletal muscle”. In: Journal of applied physiology (Bethesda, Md.: 1985) 86.5, pp. 1445–1457. ISSN: 0161-7567. DOI: 10.1152/jappl.1999.86.5.1445.
171
Bibliography
Reinold, Michael M. et al. (2007a). “Electromyographic analysis of the supraspina-tus and deltoid muscles during 3 common rehabilitation exercises”. In: Journal ofathletic training 42.4, pp. 464–469. ISSN: 1062-6050.
– (2007b). “Electromyographic analysis of the supraspinatus and deltoid musclesduring 3 common rehabilitation exercises”. In: Journal of athletic training 42.4, pp. 464–469. ISSN: 1062-6050.
– (2007c). “Electromyographic analysis of the supraspinatus and deltoid musclesduring 3 common rehabilitation exercises”. In: Journal of athletic training 42.4, pp. 464–469. ISSN: 1062-6050.
Ringelberg, J. A. (1985). “EMG and force production of some human shoulder mus-cles during isometric abduction”. In: Journal of Biomechanics 18.12, pp. 939–947.ISSN: 00219290. DOI: 10.1016/0021-9290(85)90037-5.
Sakaki, Y. et al. (2015). “Electromyographic characteristics of shoulder muscles af-ter rotator cuff repair”. In: Physiotherapy 101. World Confederation for PhysicalTherapy Congress 2015 Abstracts, Singapore, 1-4 May 2015, e1319 –e1320. ISSN:0031-9406. DOI: https://doi.org/10.1016/j.physio.2015.03.1244. URL:http://www.sciencedirect.com/science/article/pii/S0031940615012742.
Sakurai, G. et al. (1998). “Morphologic changes in long head of biceps brachii inrotator cuff dysfunction”. In: Journal of orthopaedic science : official journal of theJapanese Orthopaedic Association 3.3, pp. 137–142. ISSN: 0949-2658. DOI: 10.1007/s007760050033.
Scapinelli, R. et al. (1999). “Subcutaneous rupture of the tendon of the long head ofthe biceps brachii in subacromial impingement syndrome”. In: La Chirurgia degliorgani di movimento 84.3, pp. 229–237. ISSN: 0009-4749.
Schoch, Christian, Michael Geyer, and Björn Drews (2017). “Suprapectoral bicepstenodesis using a suture plate: clinical results after 2 years”. In: Archives of or-thopaedic and trauma surgery 137.6, pp. 829–835. DOI: 10.1007/s00402-017-2664-4.
Schünke, M., E. Schulte, and U. Schumacher (2007). Prometheus - LernAtlas der Anatomie:allgemeine Anatomie und Bewegungssystem ; 182 Tabellen. Vol. Erik Schulte; UdoSchumacher. Unter Mitarb. von Jürgen Rude. Ill. von Markus Voll; Karl Wesker.Prometheus : LernAtlas der Anatomie / Michael Schünke. Thieme. ISBN: 9783131395221.URL: https://books.google.de/books?id=olMVD14AoO8C.
Scovil, Carol Y. and Janet L. Ronsky (2006). “Sensitivity of a Hill-based muscle modelto perturbations in model parameters”. In: Journal of Biomechanics 39.11, pp. 2055 –
172
Bibliography
2063. ISSN: 0021-9290. DOI: https://doi.org/10.1016/j.jbiomech.2005.06.005.URL: http://www.sciencedirect.com/science/article/pii/S0021929005002770.
Sins, Lauranne et al. (2015). “Adaptation of the AnyBody™ Musculoskeletal Shoul-der Model to the Nonconforming Total Shoulder Arthroplasty Context”. In: Jour-nal of biomechanical engineering 137.10, p. 101006. DOI: 10.1115/1.4031330.
Skipper Andersen, Michael et al. (2017). “Introduction to Force-Dependent Kinemat-ics: Theory and Application to Mandible Modeling”. In: Journal of biomechanicalengineering 139.9. DOI: 10.1115/1.4037100.
Solomonow, M. et al. (1994). “Surface and wire EMG crosstalk in neighbouringmuscles”. In: Journal of Electromyography and Kinesiology 4.3, pp. 131–142. ISSN:10506411. DOI: 10.1016/1050-6411(94)90014-0.
Soslowsky, L. J., D. M. Malicky, and R. B. Blasier (1997). “Active and passive fac-tors in inferior glenohumeral stabilization: a biomechanical model”. In: Journal ofshoulder and elbow surgery 6.4, pp. 371–379. ISSN: 1058-2746. DOI: 10.1016/s1058-2746(97)90005-7.
Steenbrink, F. et al. (2009). “Glenohumeral stability in simulated rotator cuff tears”.In: Journal of Biomechanics 42.11, pp. 1740 –1745. ISSN: 0021-9290. DOI: https://doi.org/10.1016/j.jbiomech.2009.04.011. URL: http://www.sciencedirect.com/science/article/pii/S0021929009002115.
Steenbrink, Frans et al. (2010). “The relation between increased deltoid activationand adductor muscle activation due to glenohumeral cuff tears”. In: Journal ofBiomechanics 43.11, pp. 2049 –2054. ISSN: 0021-9290. DOI: https://doi.org/10.1016/j.jbiomech.2010.04.012. URL: http://www.sciencedirect.com/science/article/pii/S0021929010002241.
Strzelczak, M. et al. (2018). “A new wrapping approach for the deltoid muscle mod-elling.” In: The Proceedings of the 20th Biennial Meeting of the Canadian Society forBiomechanics (2018).
Timmons, Mark K et al. (2016). “Empty can exercise provokes more pain and has un-desirable biomechanics compared with the full can exercise”. In: Journal of shoulderand elbow surgery 25.4, pp. 548–556.
van der Helm, F.C.T. (1994a). “A finite element musculoskeletal model of the shoul-der mechanism”. In: Journal of Biomechanics 27.5, pp. 551–569. ISSN: 00219290. DOI:10.1016/0021-9290(94)90065-5.
173
Bibliography
van der Helm, F.C.T. (1994b). “Analysis of the kinematic and dynamic behaviorof the shoulder mechanism”. In: Journal of Biomechanics 27.5, pp. 527–550. ISSN:00219290. DOI: 10.1016/0021-9290(94)90064-7.
van der Windt, D A et al. (1995). “Shoulder disorders in general practice: incidence,patient characteristics, and management.” In: Annals of the Rheumatic Diseases 54.12,pp. 959–964. ISSN: 0003-4967. DOI: 10.1136/ard.54.12.959. eprint: https://ard.bmj.com/content/54/12/959.full.pdf. URL: https://ard.bmj.com/content/54/12/959.
Veeger, H.E.J. and F.C.T. [van der Helm] (2007). “Shoulder function: The perfectcompromise between mobility and stability”. In: Journal of Biomechanics 40.10, pp. 2119–2129. ISSN: 0021-9290. DOI: https://doi.org/10.1016/j.jbiomech.2006.10.016. URL: http://www.sciencedirect.com/science/article/pii/S0021929006003812.
Vidt, Meghan E. et al. (2018). “Modeling a rotator cuff tear: Individualized shouldermuscle forces influence glenohumeral joint contact force predictions”. In: ClinicalBiomechanics 60, pp. 20 –29. ISSN: 0268-0033. DOI: https://doi.org/10.1016/j.clinbiomech.2018.10.004. URL: http://www.sciencedirect.com/science/article/pii/S0268003318304418.
Voss, Andreas, Andreas B. Imhoff, and Felix Dyrna (2018). “Intra-Articular Tenode-sis of the Long Head of the Biceps Tendon”. In: Operative Techniques in SportsMedicine 26.2, pp. 86 –90. ISSN: 1060-1872. DOI: https://doi.org/10.1053/j.otsm.2018.02.004. URL: http://www.sciencedirect.com/science/article/pii/S1060187218300157.
Voss, Andreas et al. (2016). “Open Subpectoral Tenodesis of the Proximal Biceps”.In: Clinics in sports medicine 35.1, pp. 137–152. ISSN: 0278-5919. DOI: 10.1016/j.csm.2015.08.007.
Voss, Andreas et al. (2017). “Open subpectoral biceps tenodesis in patients over 65does not result in an increased rate of complications”. In: BMC musculoskeletaldisorders 18.1, p. 430. ISSN: 1471-2474. DOI: 10.1186/s12891-017-1780-1.
Špicka J., Vychytil J. Ryba T. and L. Havelková (2018). “Development of a Personal-ized Musculoskeletal Human Shoulder Model.” In: In Proceeding of the Computa-tional Mechanics 2018. University of West Bohemia.
Walch, Gilles et al. (2005). “Arthroscopic tenotomy of the long head of the biceps inthe treatment of rotator cuff tears: clinical and radiographic results of 307 cases”.In: Journal of shoulder and elbow surgery 14.3, pp. 238–246. ISSN: 1058-2746. DOI:10.1016/j.jse.2004.07.008.
174
Bibliography
Wang, Gang et al. (2014). “The Analysis of Surface EMG Signals with the Wavelet-Based Correlation Dimension Method”. In: Computational and mathematical methodsin medicine 2014, p. 284308. DOI: 10.1155/2014/284308. URL: https://doi.org/10.1155/2014/284308.
Warner, J. J. and P. J. McMahon (1995). “The role of the long head of the biceps brachiiin superior stability of the glenohumeral joint”. In: The Journal of bone and jointsurgery. American volume 77.3, pp. 366–372. DOI: 10.2106/00004623-199503000-00006.
Wataru, Sahara et al. (2005). “Three-dimensional morphological analysis of humeralheads”. In: Acta Orthopaedica 76.3, pp. 392–396. ISSN: 1745-3674. DOI: 10.1080/00016470510030878.
Wickham, James et al. (2010). “Quantifying ’normal’ shoulder muscle activity dur-ing abduction”. In: Journal of electromyography and kinesiology : official journal of theInternational Society of Electrophysiological Kinesiology 20.2, pp. 212–222. DOI: 10.1016/j.jelekin.2009.06.004.
Wiener, Stephen N and William H Seitz Jr (1993). “Sonography of the shoulder inpatients with tears of the rotator cuff: accuracy and value for selecting surgicaloptions.” In: AJR. American journal of roentgenology 160.1, pp. 103–107.
Witte, P. B. de et al. (2014a). “The Supraspinatus and the Deltoid - not just two armelevators”. In: Human movement science 33, pp. 273–283. DOI: 10.1016/j.humov.2013.08.010.
Witte, PB de et al. (2014b). “Cranial humerus translation, deltoid activation, adduc-tor co-activation and rotator cuff disease—Different patterns in rotator cuff tears,subacromial impingement and controls”. In: Clinical Biomechanics 29.1, pp. 26–32.
Witte, Pieter Bas de et al. (2012). “Arm Adductor with arm Abduction in rotatorcuff tear patients vs. healthy–Design of a new measuring instrument”. In: Humanmovement science 31.2, pp. 461–471.
Woolf, Anthony D. and Bruce Pfleger (2003). “Burden of major musculoskeletal con-ditions”. In: Bulletin of the World Health Organization 81.9, pp. 646–656. ISSN: 0042-9686.
World Health Organization (2016). World health statistics 2016: monitoring health forthe SDGs, sustainable development goals. World Health Organization, 121 p.
Wuelker, N. et al. (1994a). “Function of the supraspinatus muscle. Abduction of thehumerus studied in cadavers”. In: Acta orthopaedica Scandinavica 65.4, pp. 442–446.ISSN: 0001-6470. DOI: 10.3109/17453679408995490.
175
Bibliography
Wuelker, Nikolaus et al. (1994b). “Function of the supraspinatus muscle: Abduc-tion of the humerus studied in cadavers”. In: Acta Orthopaedica Scandinavica 65.4,pp. 442–446. DOI: 10.3109/17453679408995490. eprint: https://www.tandfonline.com/doi/pdf/10.3109/17453679408995490. URL: https://www.tandfonline.com/doi/abs/10.3109/17453679408995490.
Yamamoto, Atsushi et al. (2010). “Prevalence and risk factors of a rotator cuff tear inthe general population”. In: Journal of shoulder and elbow surgery 19.1, pp. 116–120.ISSN: 1058-2746. DOI: 10.1016/j.jse.2009.04.006.
176
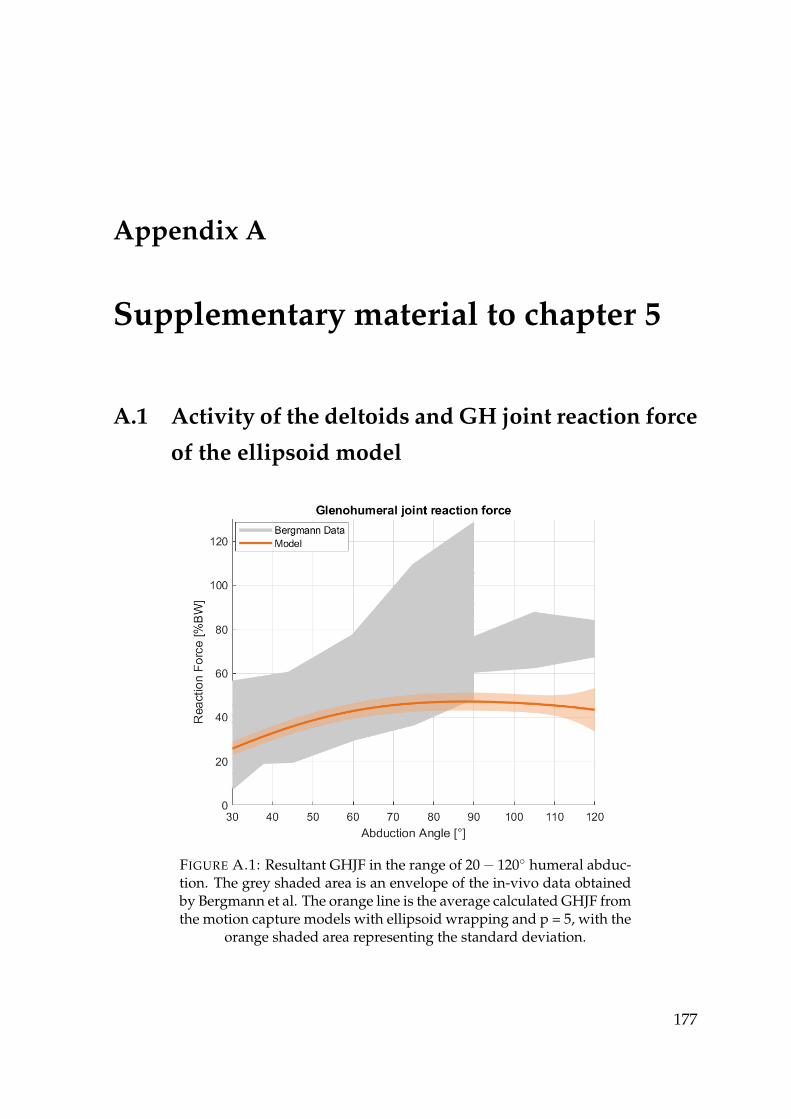
Appendix A
Supplementary material to chapter 5
A.1 Activity of the deltoids and GH joint reaction force
of the ellipsoid model
FIGURE A.1: Resultant GHJF in the range of 20− 120◦ humeral abduc-tion. The grey shaded area is an envelope of the in-vivo data obtainedby Bergmann et al. The orange line is the average calculated GHJF fromthe motion capture models with ellipsoid wrapping and p = 5, with the
orange shaded area representing the standard deviation.
177
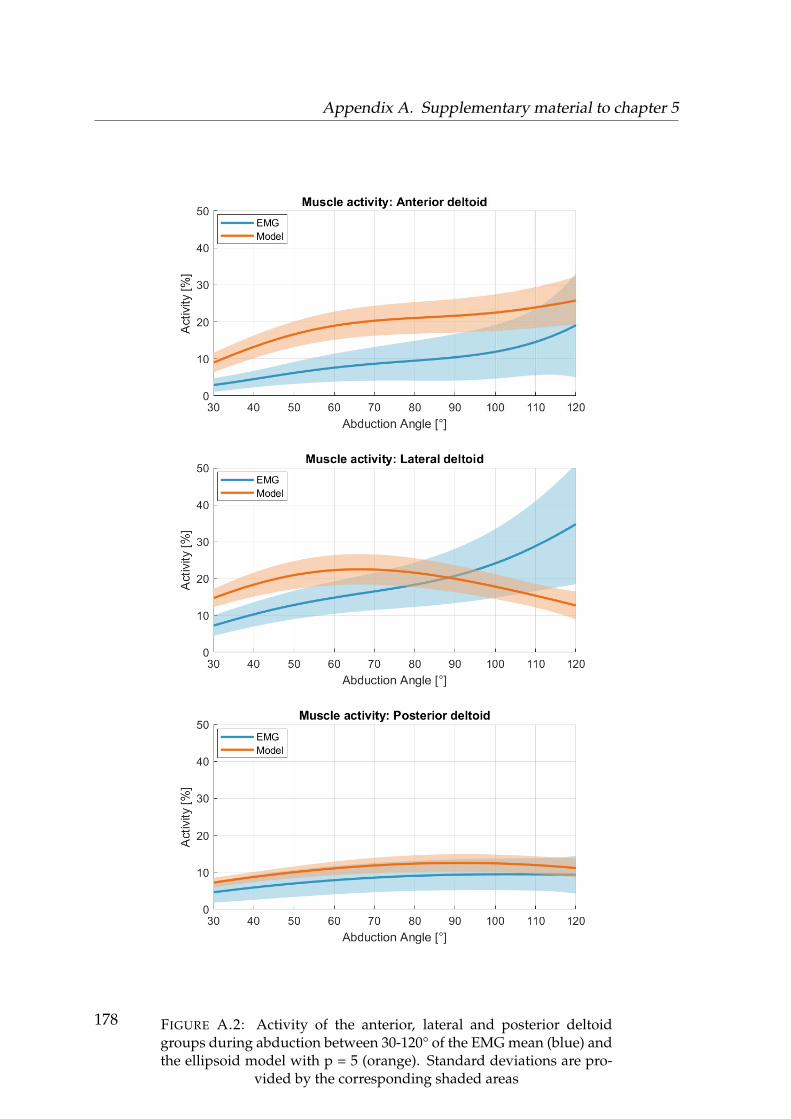
Appendix A. Supplementary material to chapter 5
FIGURE A.2: Activity of the anterior, lateral and posterior deltoidgroups during abduction between 30-120° of the EMG mean (blue) andthe ellipsoid model with p = 5 (orange). Standard deviations are pro-
vided by the corresponding shaded areas
178
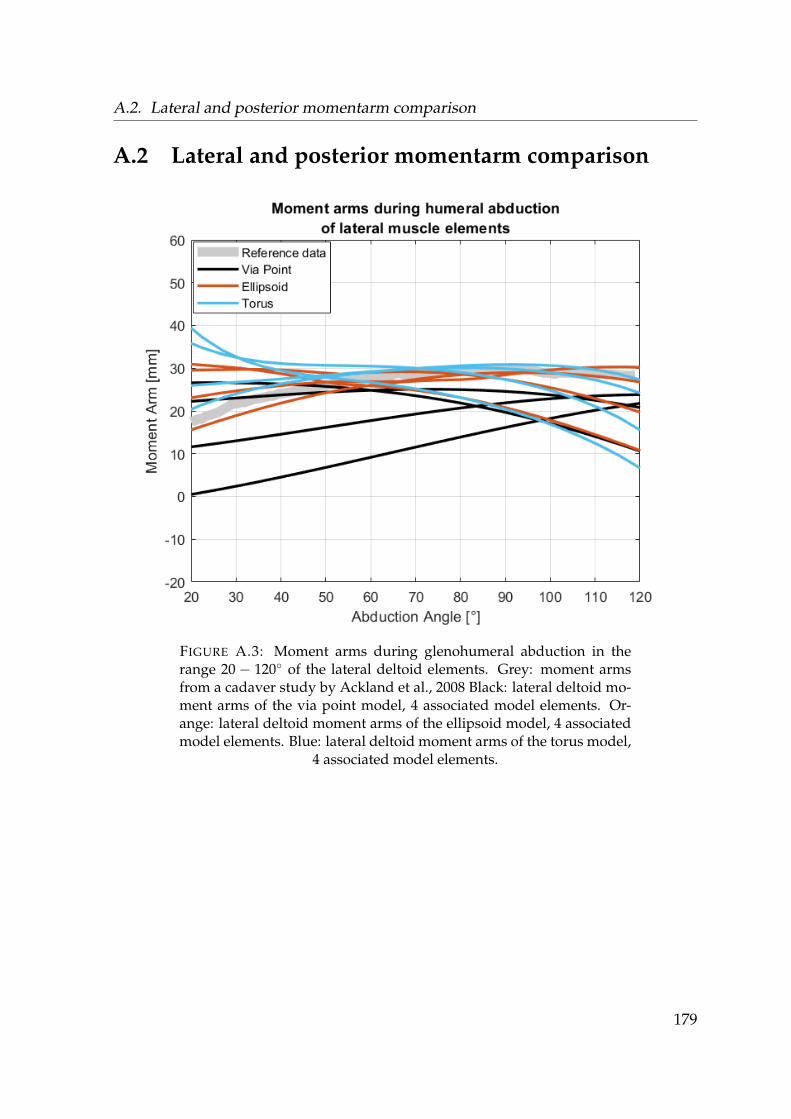
A.2. Lateral and posterior momentarm comparison
A.2 Lateral and posterior momentarm comparison
FIGURE A.3: Moment arms during glenohumeral abduction in therange 20 − 120◦ of the lateral deltoid elements. Grey: moment armsfrom a cadaver study by Ackland et al., 2008 Black: lateral deltoid mo-ment arms of the via point model, 4 associated model elements. Or-ange: lateral deltoid moment arms of the ellipsoid model, 4 associatedmodel elements. Blue: lateral deltoid moment arms of the torus model,
4 associated model elements.
179
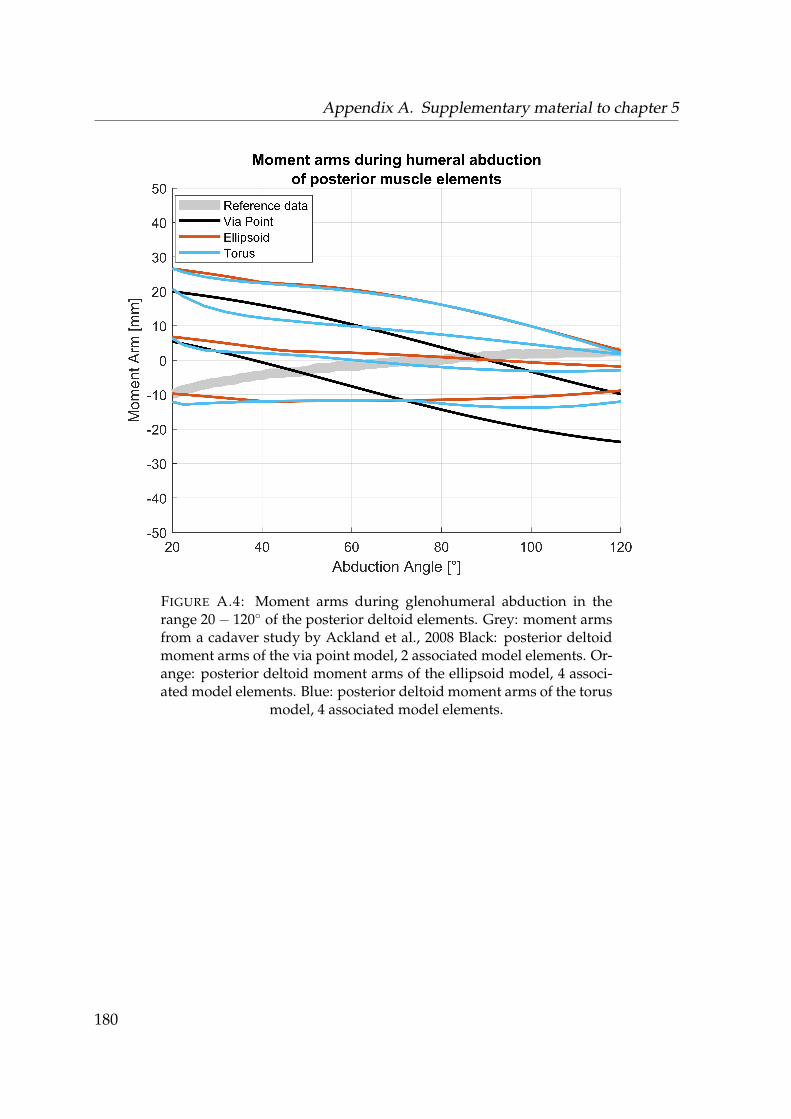
Appendix A. Supplementary material to chapter 5
FIGURE A.4: Moment arms during glenohumeral abduction in therange 20− 120◦ of the posterior deltoid elements. Grey: moment armsfrom a cadaver study by Ackland et al., 2008 Black: posterior deltoidmoment arms of the via point model, 2 associated model elements. Or-ange: posterior deltoid moment arms of the ellipsoid model, 4 associ-ated model elements. Blue: posterior deltoid moment arms of the torus
model, 4 associated model elements.
180
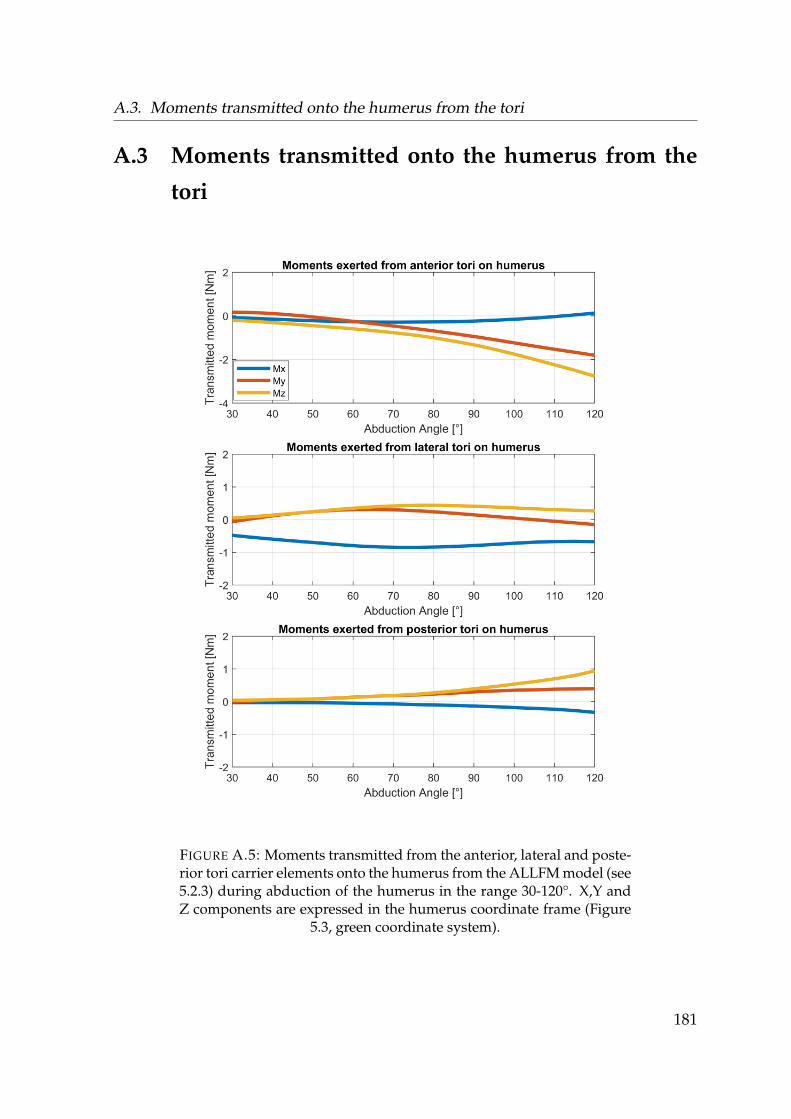
A.3. Moments transmitted onto the humerus from the tori
A.3 Moments transmitted onto the humerus from the
tori
FIGURE A.5: Moments transmitted from the anterior, lateral and poste-rior tori carrier elements onto the humerus from the ALLFM model (see5.2.3) during abduction of the humerus in the range 30-120°. X,Y andZ components are expressed in the humerus coordinate frame (Figure
5.3, green coordinate system).
181

Appendix A. Supplementary material to chapter 5
182

A.4. Muscle activities and joint reaction force of the torus model with p = 3 and allforces / moments transmitted
A.4 Muscle activities and joint reaction force of the torus
model with p = 3 and all forces / moments transmit-
ted
FIGURE A.6: Activity of the anterior, lateral and posterior deltoidgroups during abduction between 30-120° of the EMG mean (blue), the
ellipsoid (orange) and the torus model (purple) with p = 3.
183
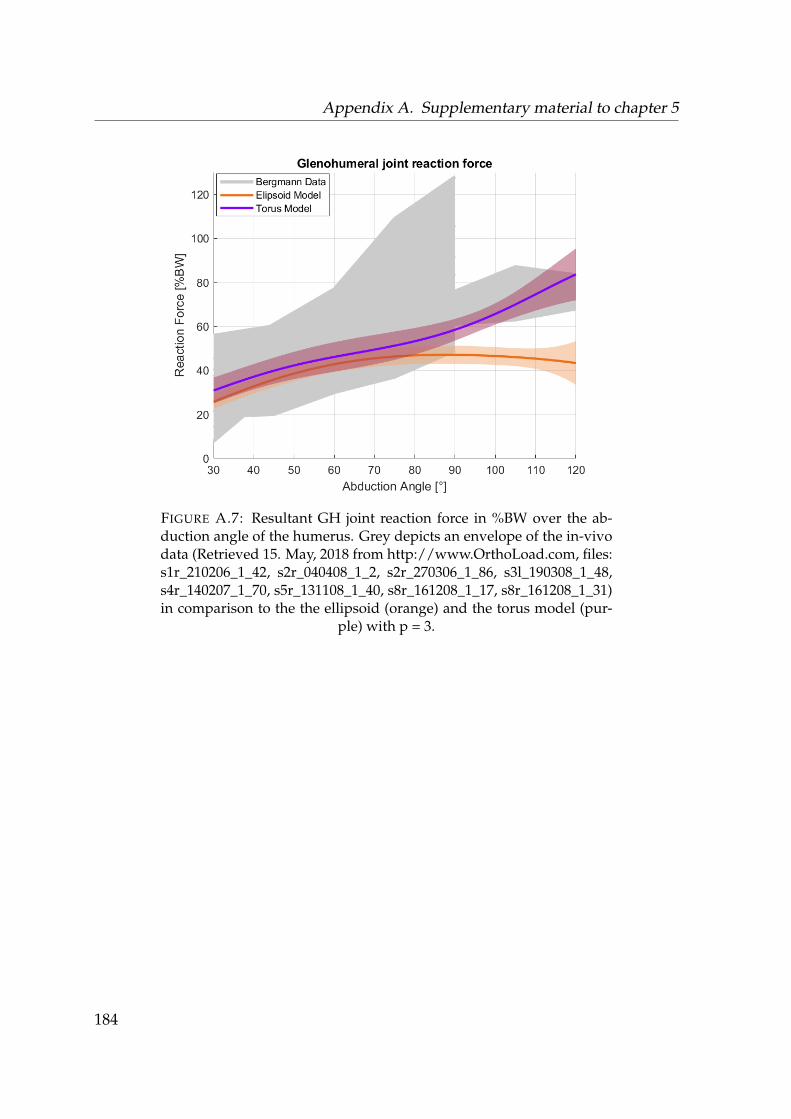
Appendix A. Supplementary material to chapter 5
FIGURE A.7: Resultant GH joint reaction force in %BW over the ab-duction angle of the humerus. Grey depicts an envelope of the in-vivodata (Retrieved 15. May, 2018 from http://www.OrthoLoad.com, files:s1r_210206_1_42, s2r_040408_1_2, s2r_270306_1_86, s3l_190308_1_48,s4r_140207_1_70, s5r_131108_1_40, s8r_161208_1_17, s8r_161208_1_31)in comparison to the the ellipsoid (orange) and the torus model (pur-
ple) with p = 3.
184

185
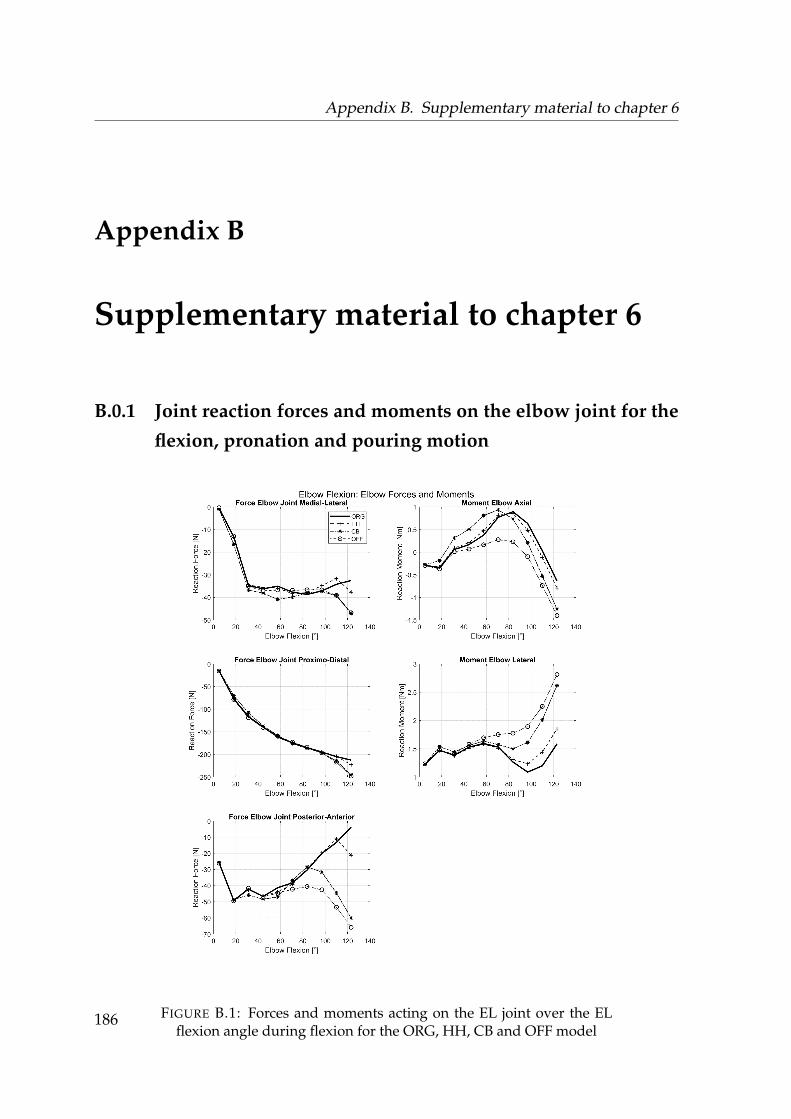
Appendix B. Supplementary material to chapter 6
Appendix B
Supplementary material to chapter 6
B.0.1 Joint reaction forces and moments on the elbow joint for the
flexion, pronation and pouring motion
FIGURE B.1: Forces and moments acting on the EL joint over the ELflexion angle during flexion for the ORG, HH, CB and OFF model
186
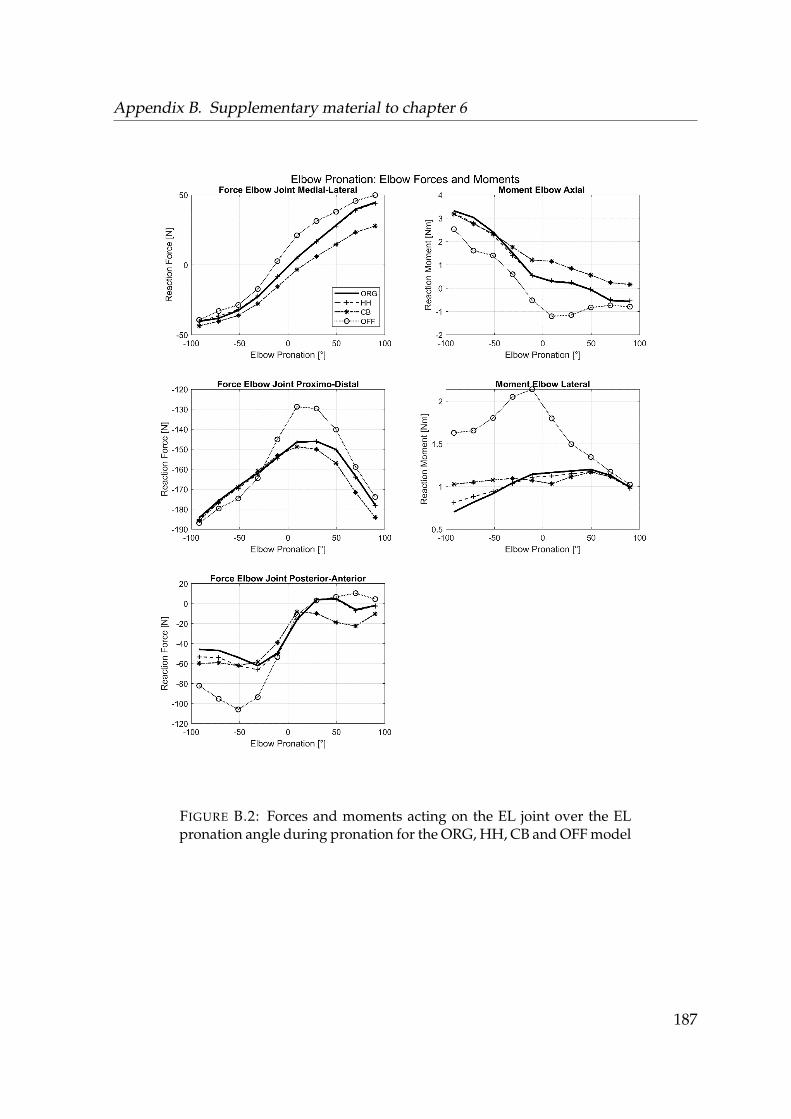
Appendix B. Supplementary material to chapter 6
FIGURE B.2: Forces and moments acting on the EL joint over the ELpronation angle during pronation for the ORG, HH, CB and OFF model
187
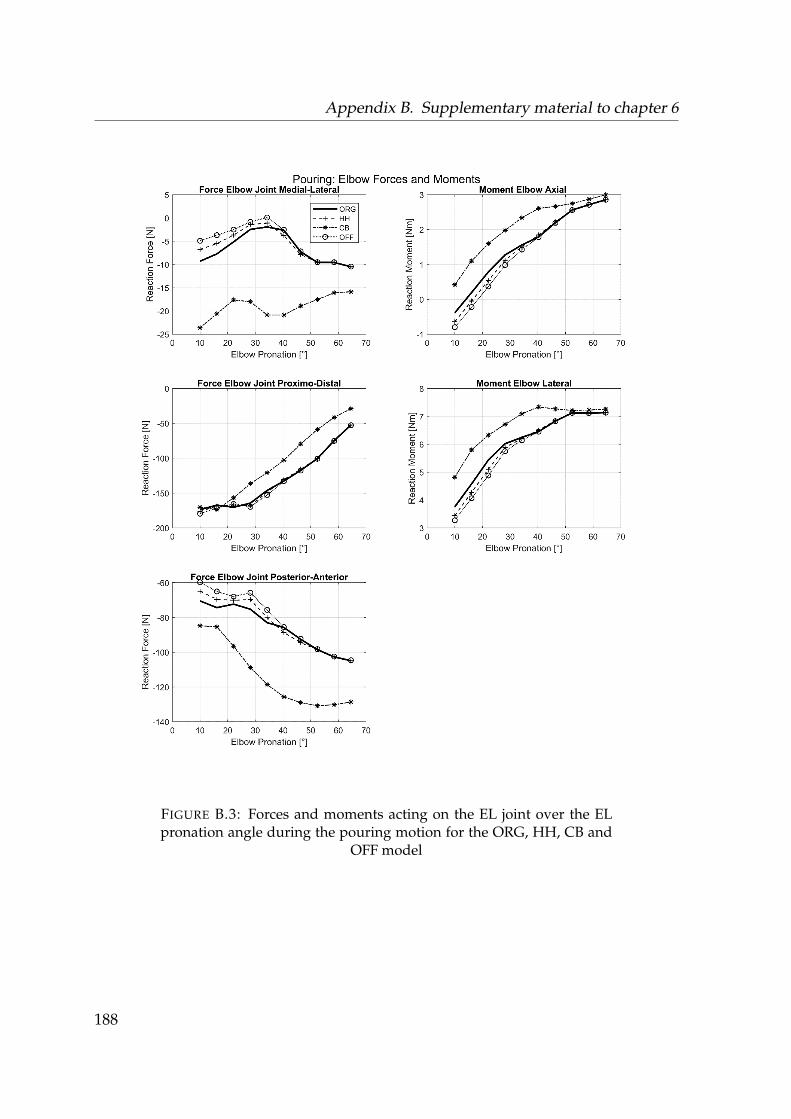
Appendix B. Supplementary material to chapter 6
FIGURE B.3: Forces and moments acting on the EL joint over the ELpronation angle during the pouring motion for the ORG, HH, CB and
OFF model
188

Appendix B. Supplementary material to chapter 6
189
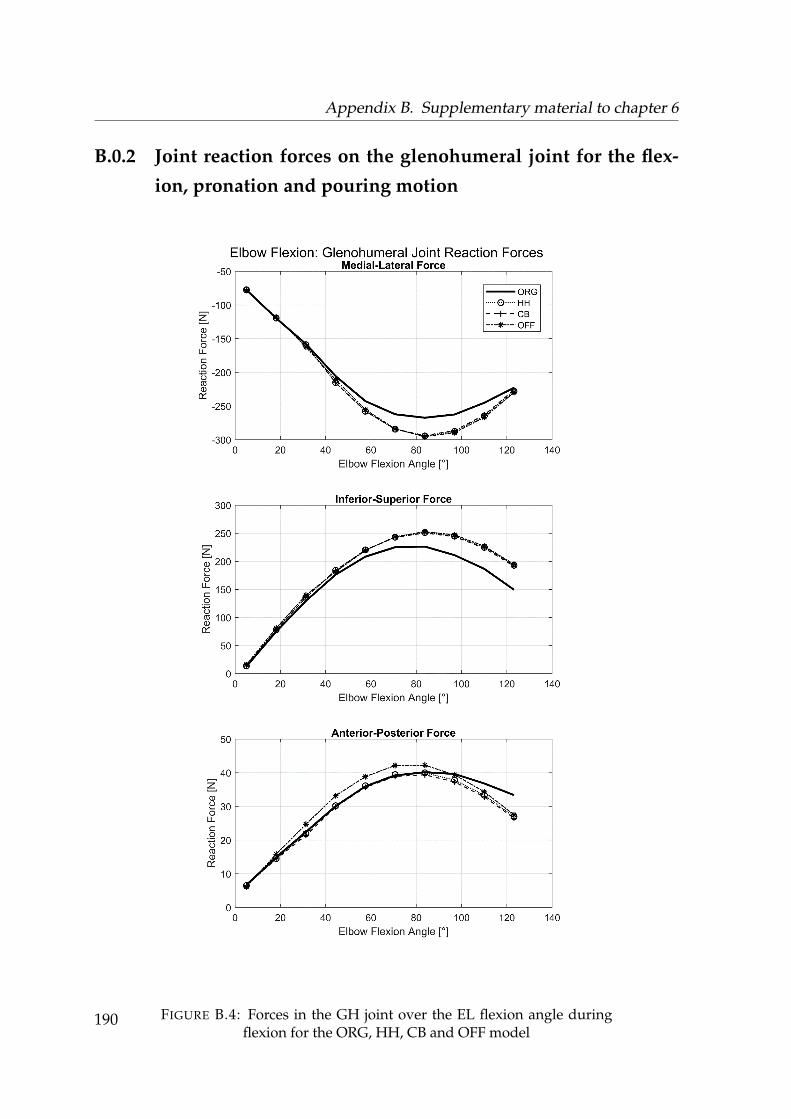
Appendix B. Supplementary material to chapter 6
B.0.2 Joint reaction forces on the glenohumeral joint for the flex-
ion, pronation and pouring motion
FIGURE B.4: Forces in the GH joint over the EL flexion angle duringflexion for the ORG, HH, CB and OFF model
190
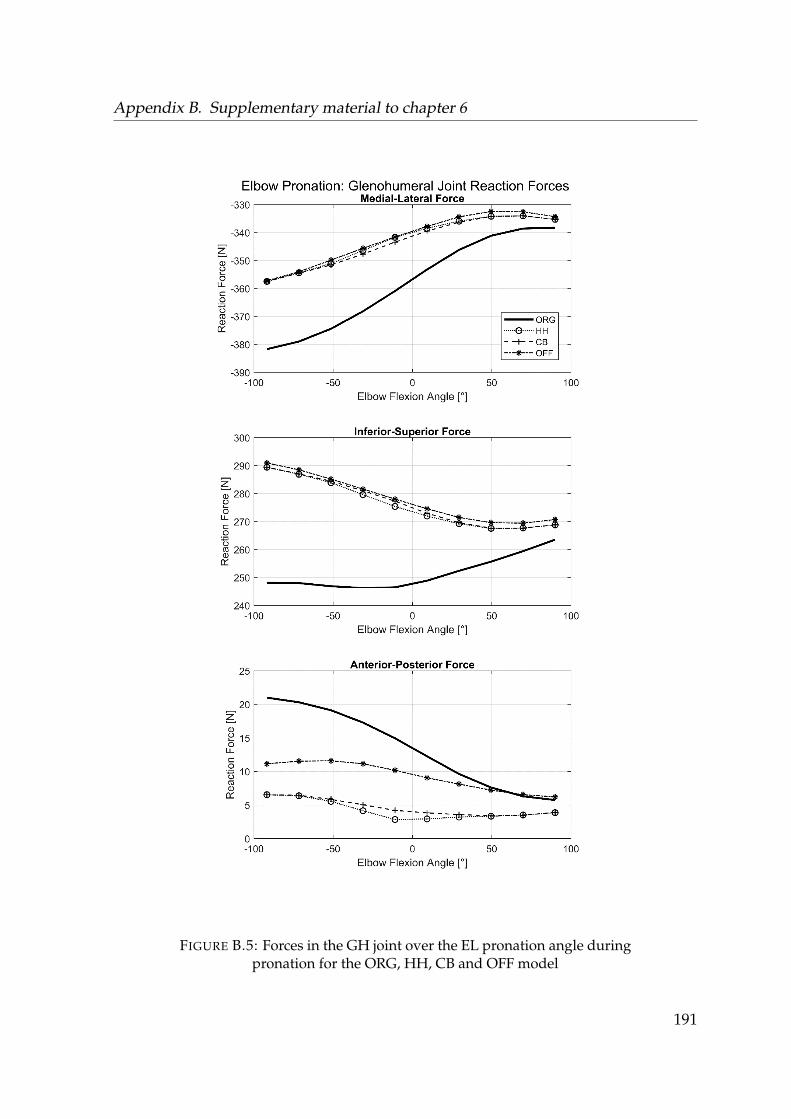
Appendix B. Supplementary material to chapter 6
FIGURE B.5: Forces in the GH joint over the EL pronation angle duringpronation for the ORG, HH, CB and OFF model
191
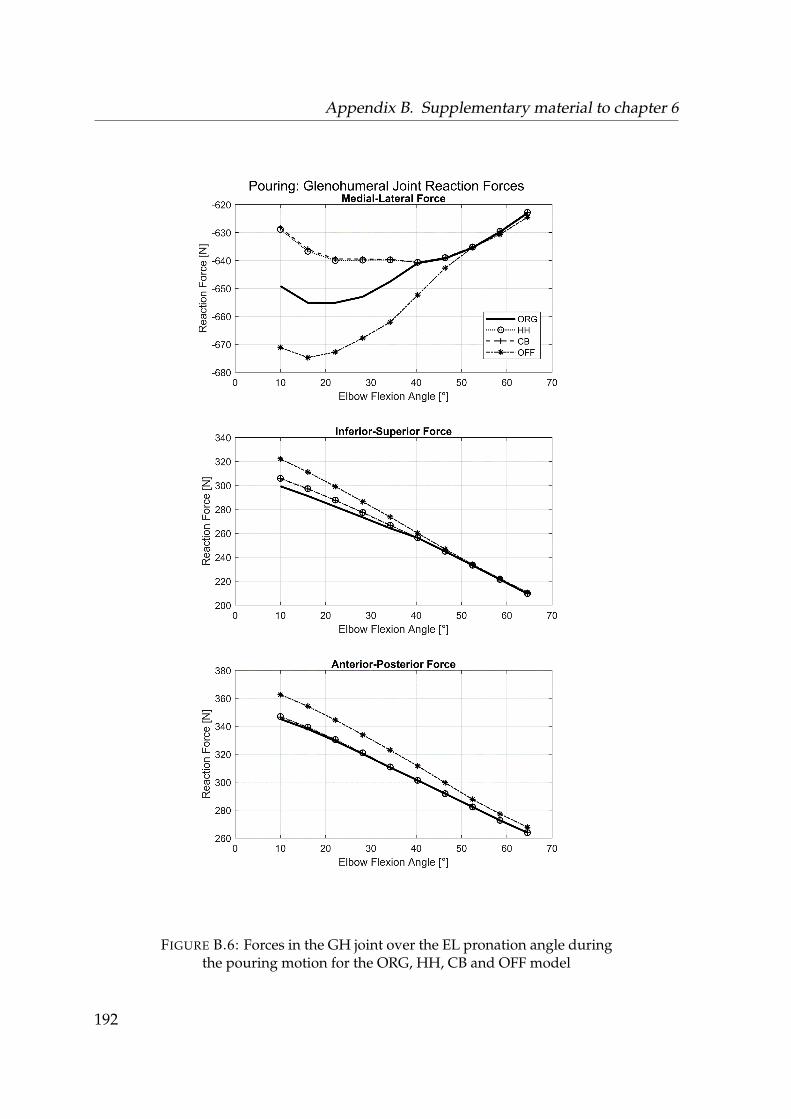
Appendix B. Supplementary material to chapter 6
FIGURE B.6: Forces in the GH joint over the EL pronation angle duringthe pouring motion for the ORG, HH, CB and OFF model
192

193

Appendix C. Supplementary material to chapter 7
Appendix C
Supplementary material to chapter 7
C.0.1 Muscle activities of intact models and pathological models
of the healthy subject group
Neutral position
FIGURE C.1: Computed muscle activities of the anterior, posterior andlateral deltoids over the abduction angle in 5° increments during theneutral position trial. Blue depicts the activities of the intact model andred the modelled tear of the m. supraspinatus. Blue depicts the activi-ties of the intact model and red the modelled tear of the m. supraspina-
tus of the healthy subject cohort.
194
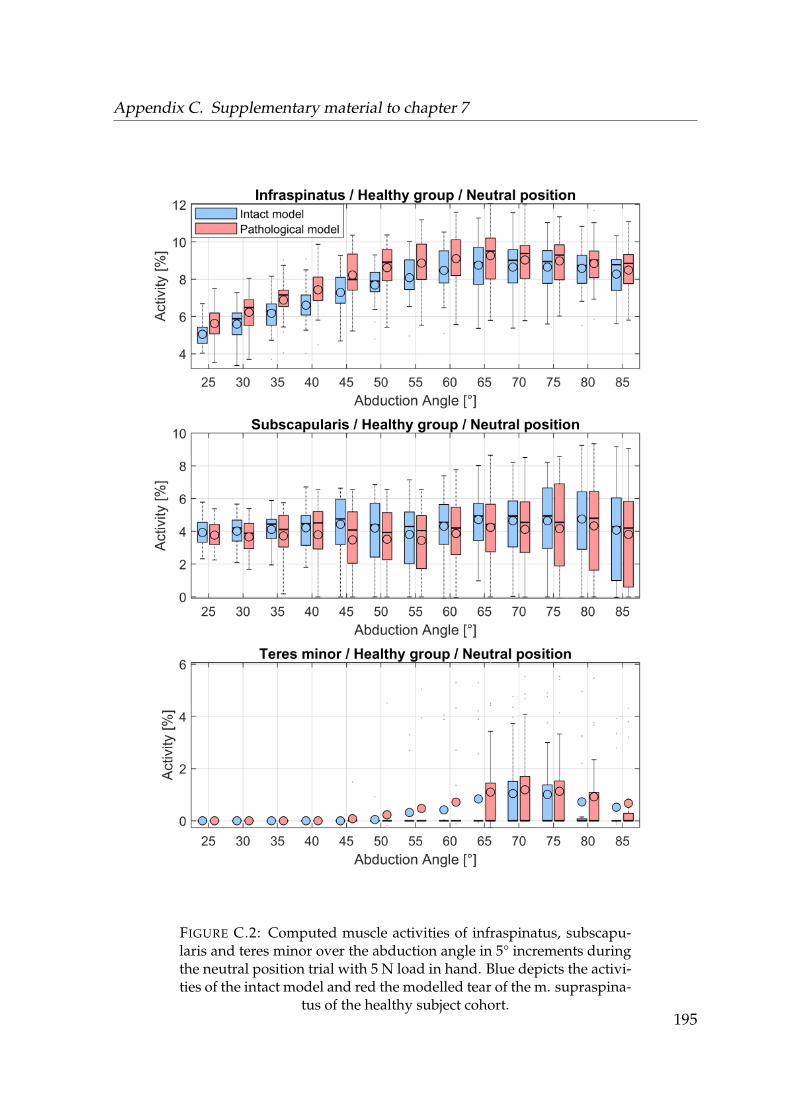
Appendix C. Supplementary material to chapter 7
FIGURE C.2: Computed muscle activities of infraspinatus, subscapu-laris and teres minor over the abduction angle in 5° increments duringthe neutral position trial with 5 N load in hand. Blue depicts the activi-ties of the intact model and red the modelled tear of the m. supraspina-
tus of the healthy subject cohort.195
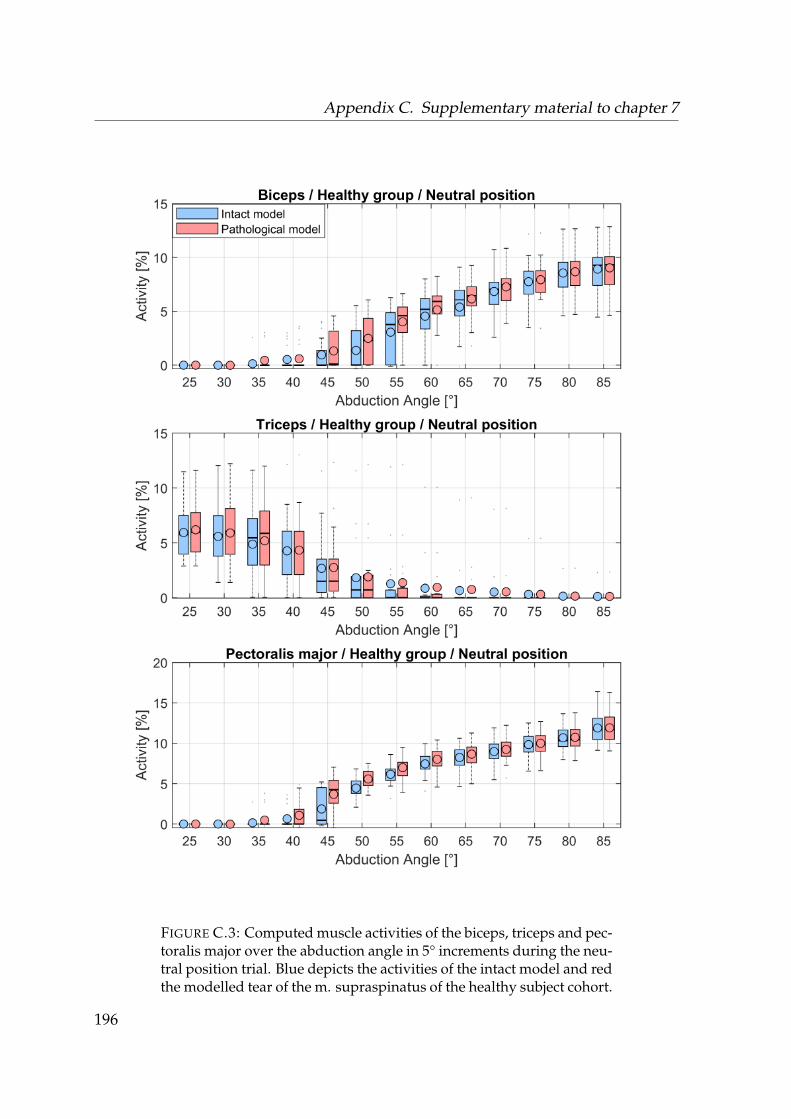
Appendix C. Supplementary material to chapter 7
FIGURE C.3: Computed muscle activities of the biceps, triceps and pec-toralis major over the abduction angle in 5° increments during the neu-tral position trial. Blue depicts the activities of the intact model and redthe modelled tear of the m. supraspinatus of the healthy subject cohort.
196
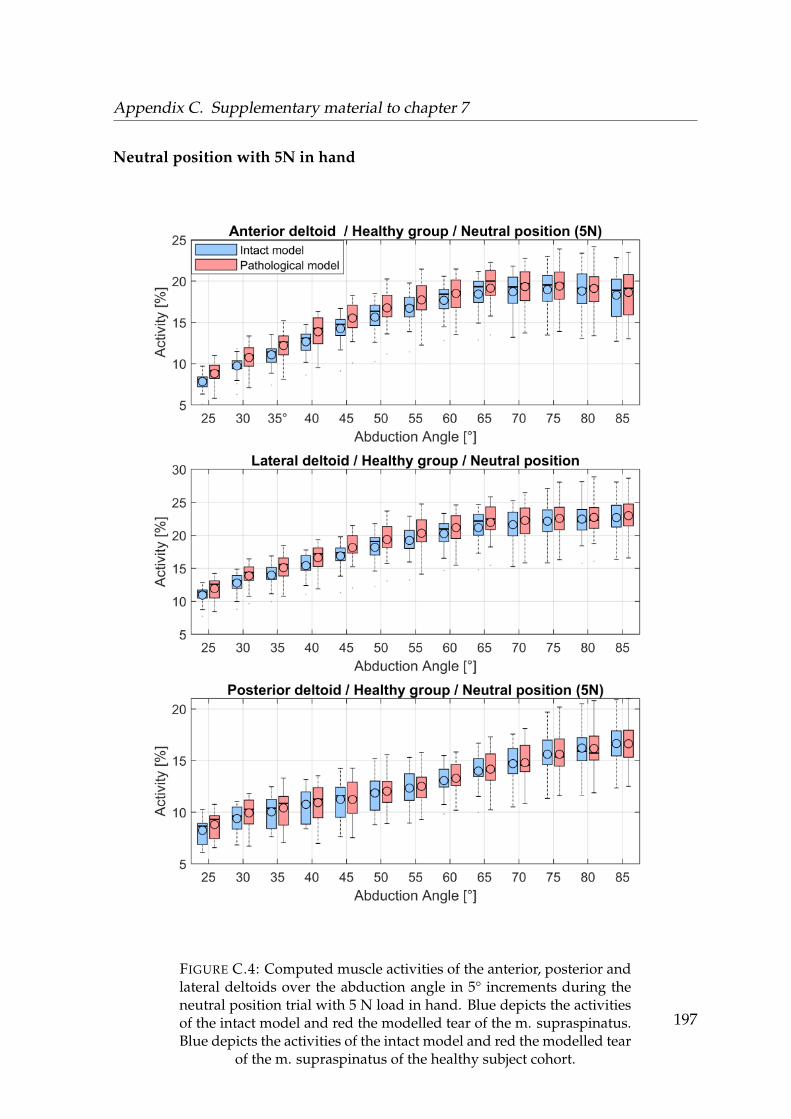
Appendix C. Supplementary material to chapter 7
Neutral position with 5N in hand
FIGURE C.4: Computed muscle activities of the anterior, posterior andlateral deltoids over the abduction angle in 5° increments during theneutral position trial with 5 N load in hand. Blue depicts the activitiesof the intact model and red the modelled tear of the m. supraspinatus.Blue depicts the activities of the intact model and red the modelled tear
of the m. supraspinatus of the healthy subject cohort.
197

Appendix C. Supplementary material to chapter 7
FIGURE C.5: Computed muscle activities of infraspinatus, subscapu-laris and teres minor over the abduction angle in 5° increments duringthe neutral position trial with 5 N load in hand. Blue depicts the activi-ties of the intact model and red the modelled tear of the m. supraspina-
tus of the healthy subject cohort.198

Appendix C. Supplementary material to chapter 7
FIGURE C.6: Computed muscle activities of the biceps, triceps and pec-toralis major over the abduction angle in 5° increments during the neu-tral position trial with 5 N load in hand. Blue depicts the activities ofthe intact model and red the modelled tear of the m. supraspinatus of
the healthy subject cohort.199
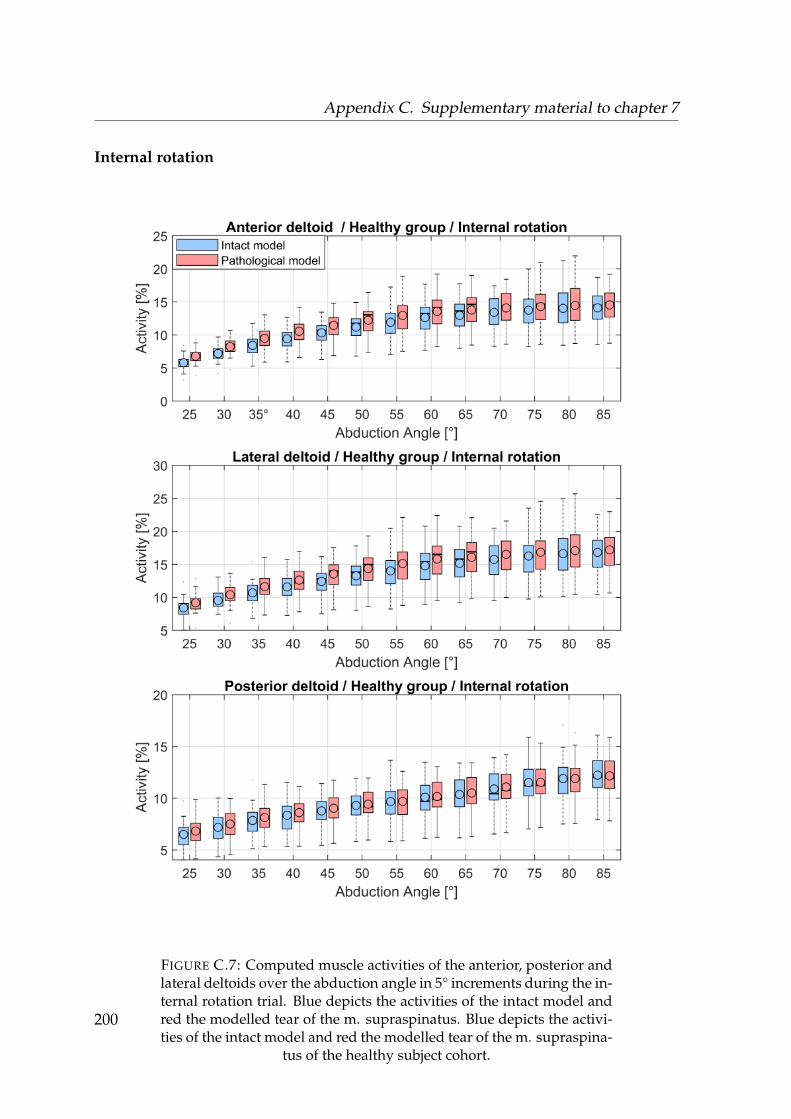
Appendix C. Supplementary material to chapter 7
Internal rotation
FIGURE C.7: Computed muscle activities of the anterior, posterior andlateral deltoids over the abduction angle in 5° increments during the in-ternal rotation trial. Blue depicts the activities of the intact model andred the modelled tear of the m. supraspinatus. Blue depicts the activi-ties of the intact model and red the modelled tear of the m. supraspina-
tus of the healthy subject cohort.
200
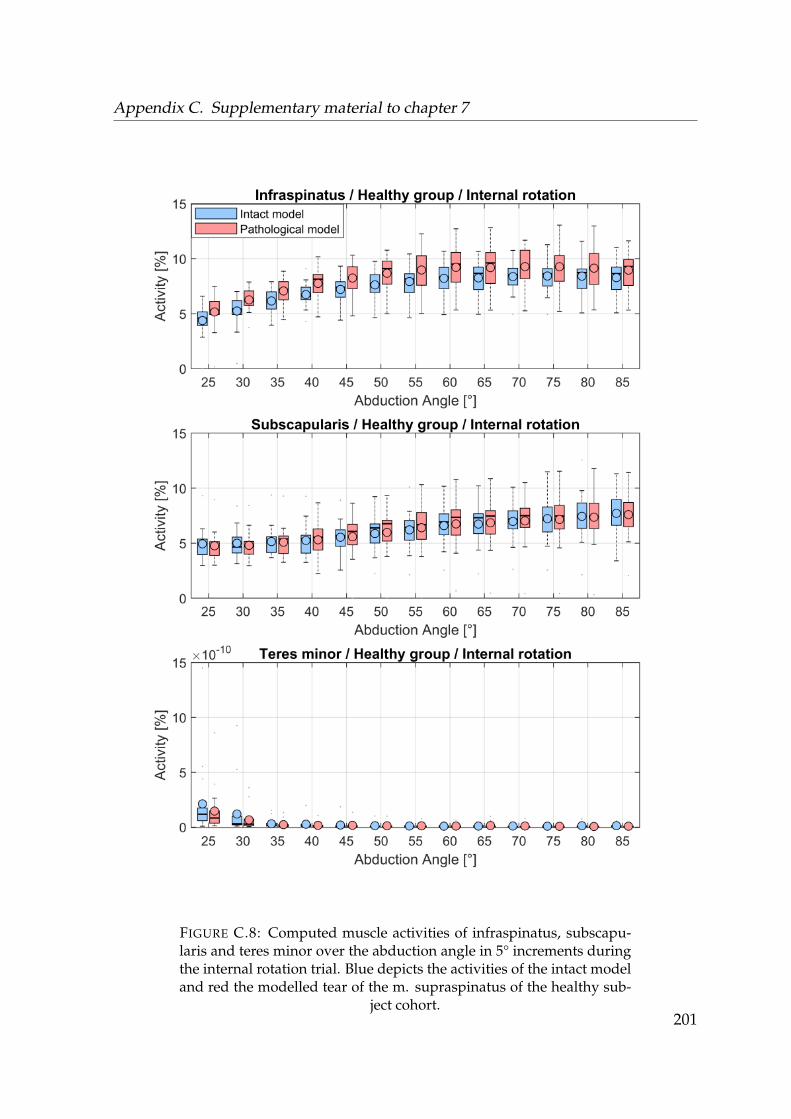
Appendix C. Supplementary material to chapter 7
FIGURE C.8: Computed muscle activities of infraspinatus, subscapu-laris and teres minor over the abduction angle in 5° increments duringthe internal rotation trial. Blue depicts the activities of the intact modeland red the modelled tear of the m. supraspinatus of the healthy sub-
ject cohort.201
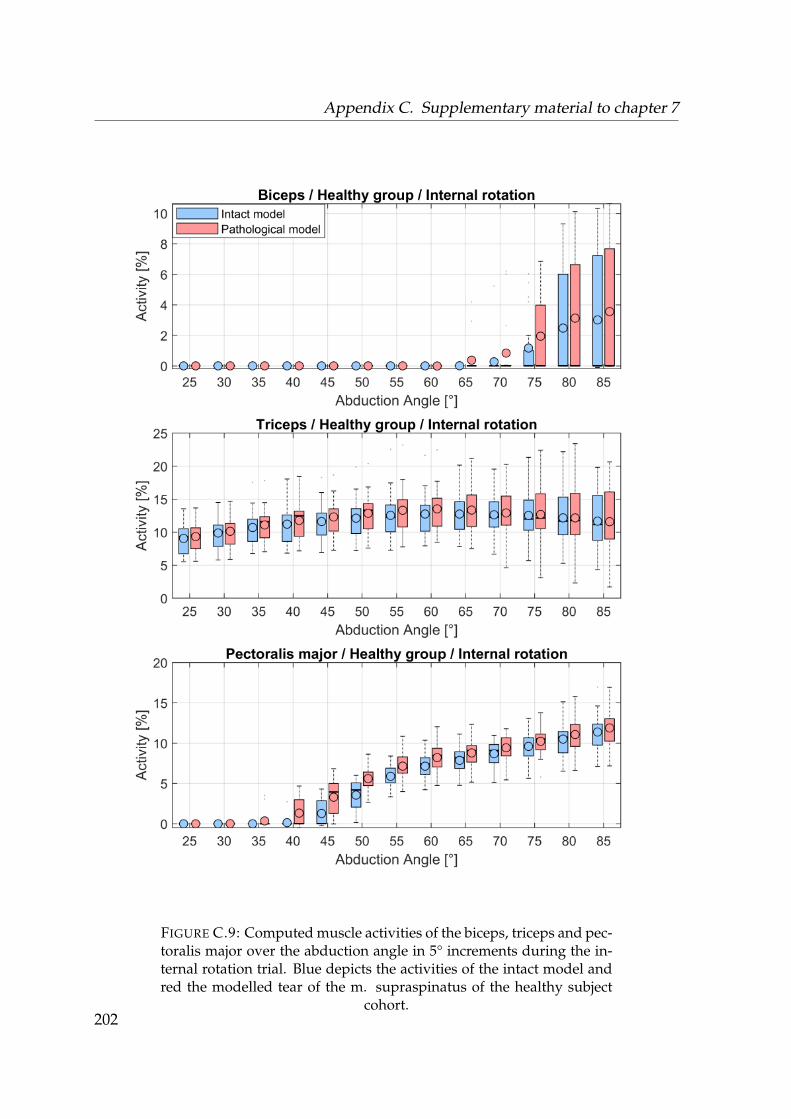
Appendix C. Supplementary material to chapter 7
FIGURE C.9: Computed muscle activities of the biceps, triceps and pec-toralis major over the abduction angle in 5° increments during the in-ternal rotation trial. Blue depicts the activities of the intact model andred the modelled tear of the m. supraspinatus of the healthy subject
cohort.202
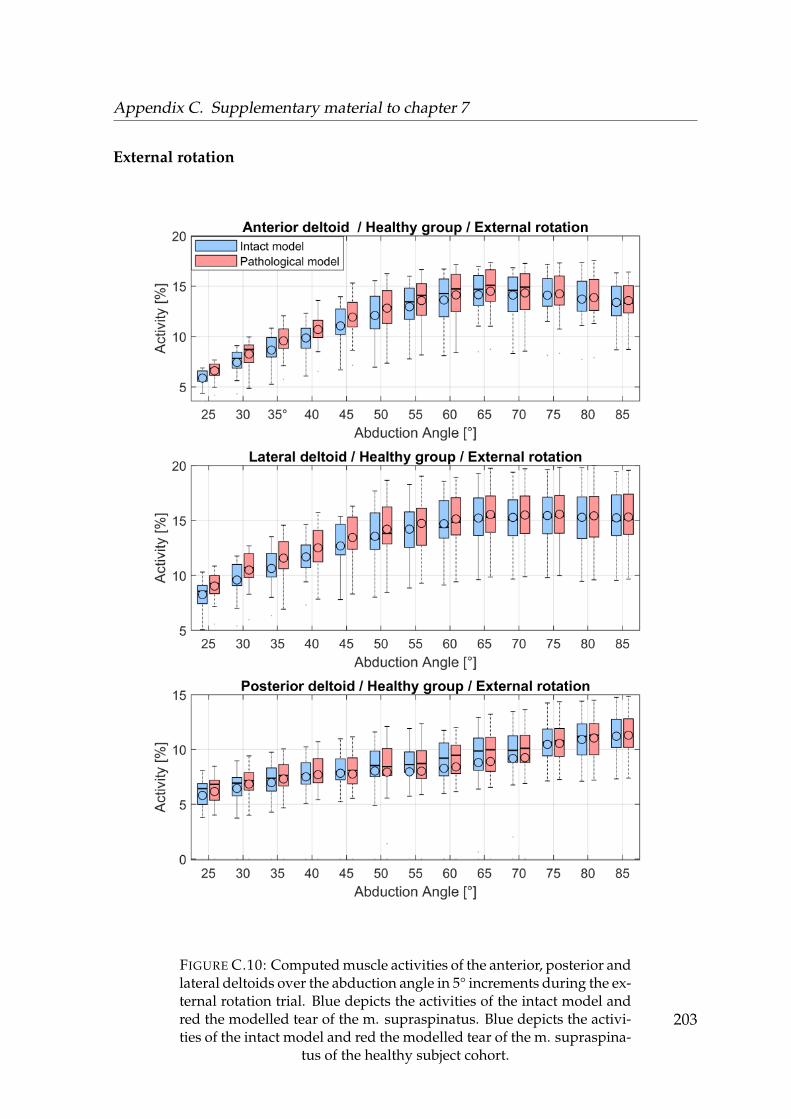
Appendix C. Supplementary material to chapter 7
External rotation
FIGURE C.10: Computed muscle activities of the anterior, posterior andlateral deltoids over the abduction angle in 5° increments during the ex-ternal rotation trial. Blue depicts the activities of the intact model andred the modelled tear of the m. supraspinatus. Blue depicts the activi-ties of the intact model and red the modelled tear of the m. supraspina-
tus of the healthy subject cohort.
203
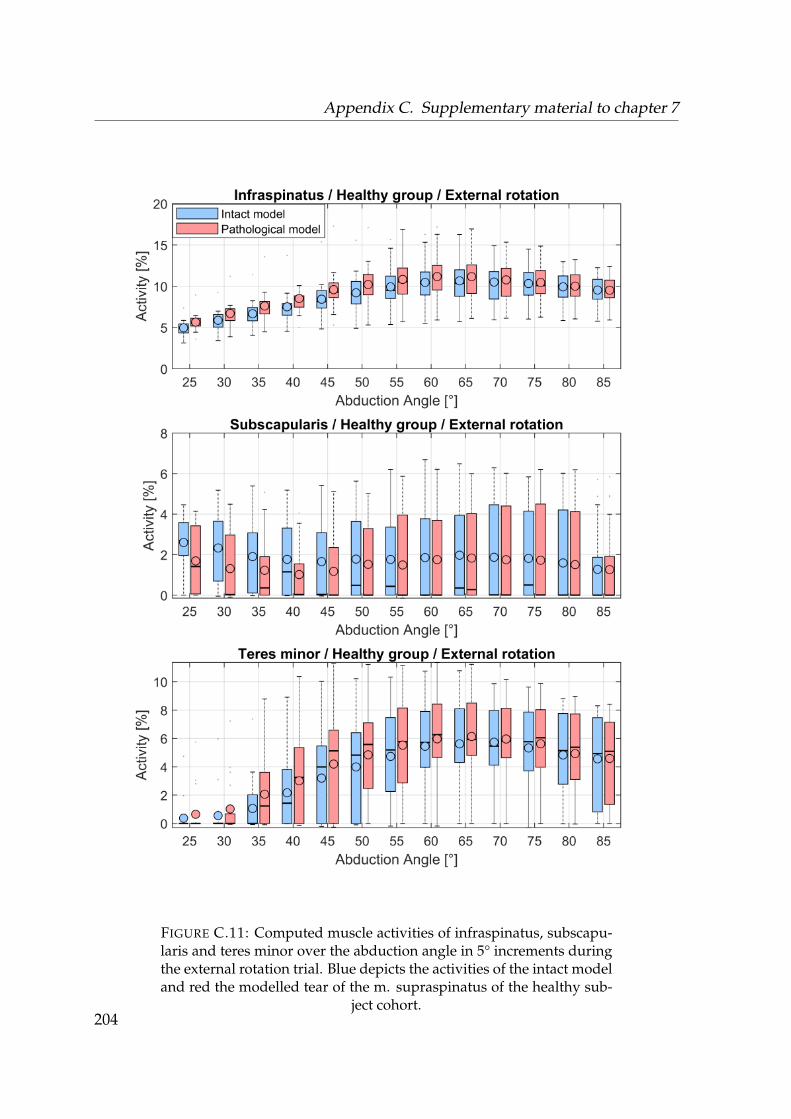
Appendix C. Supplementary material to chapter 7
FIGURE C.11: Computed muscle activities of infraspinatus, subscapu-laris and teres minor over the abduction angle in 5° increments duringthe external rotation trial. Blue depicts the activities of the intact modeland red the modelled tear of the m. supraspinatus of the healthy sub-
ject cohort.204
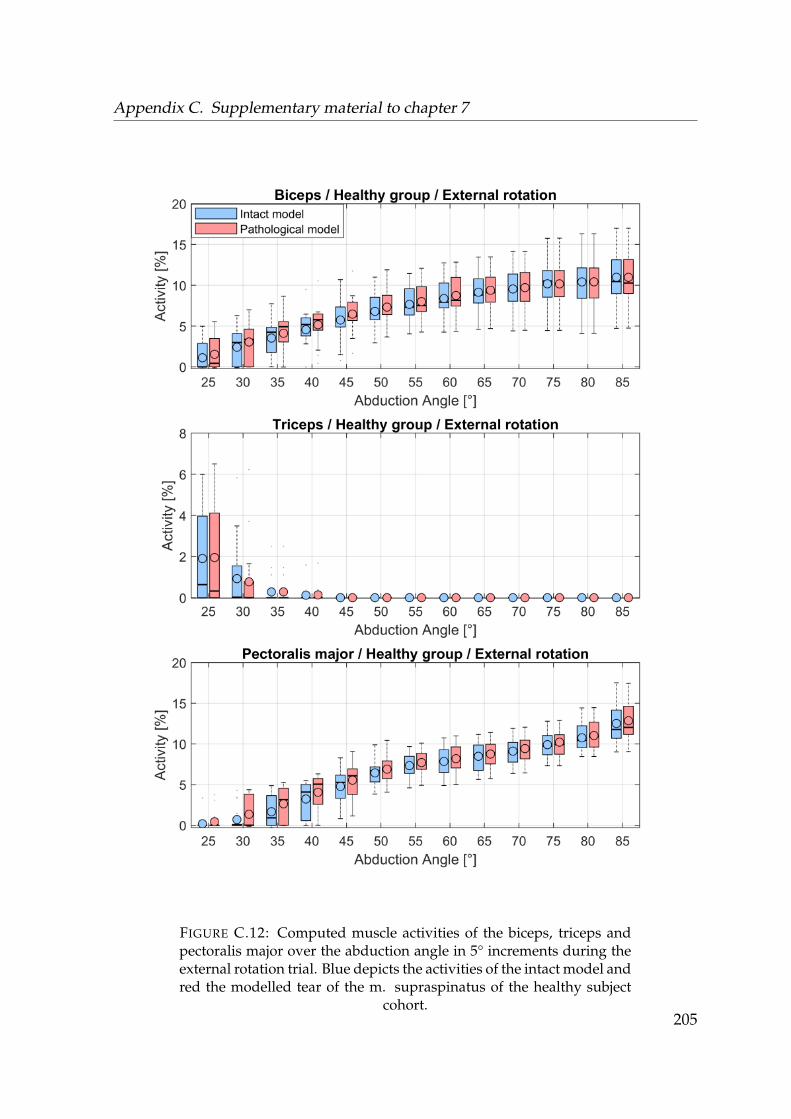
Appendix C. Supplementary material to chapter 7
FIGURE C.12: Computed muscle activities of the biceps, triceps andpectoralis major over the abduction angle in 5° increments during theexternal rotation trial. Blue depicts the activities of the intact model andred the modelled tear of the m. supraspinatus of the healthy subject
cohort.205
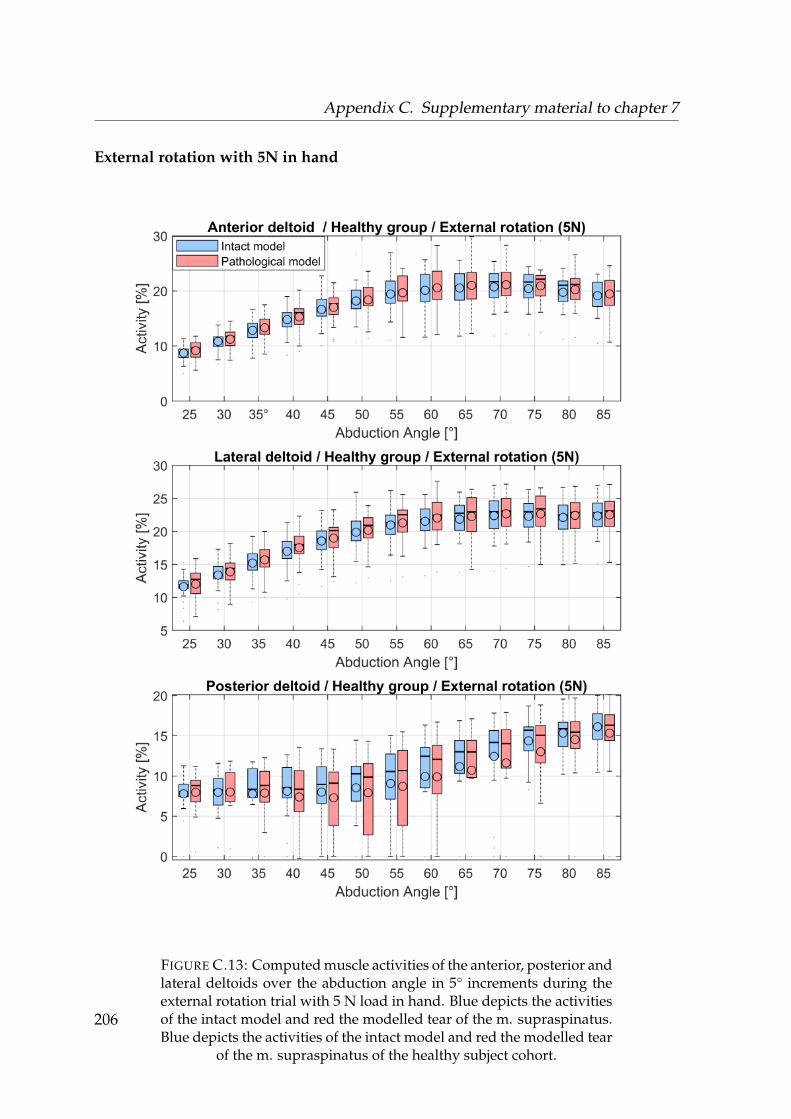
Appendix C. Supplementary material to chapter 7
External rotation with 5N in hand
FIGURE C.13: Computed muscle activities of the anterior, posterior andlateral deltoids over the abduction angle in 5° increments during theexternal rotation trial with 5 N load in hand. Blue depicts the activitiesof the intact model and red the modelled tear of the m. supraspinatus.Blue depicts the activities of the intact model and red the modelled tear
of the m. supraspinatus of the healthy subject cohort.
206
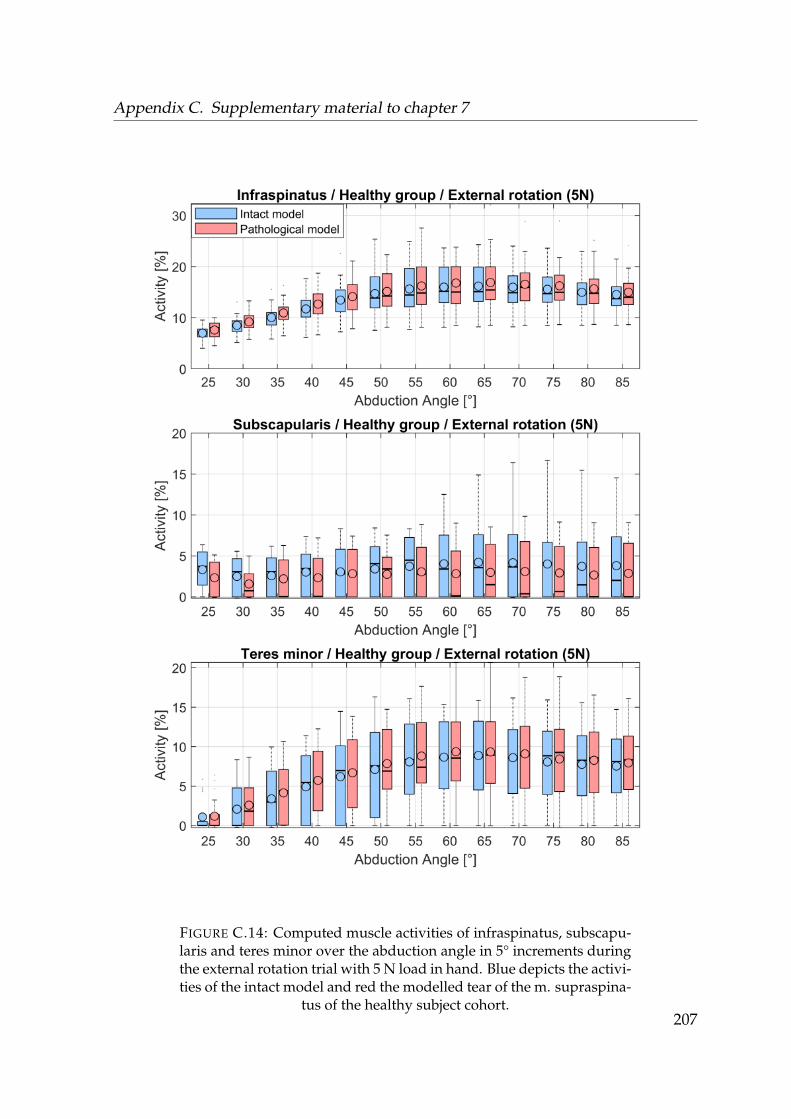
Appendix C. Supplementary material to chapter 7
FIGURE C.14: Computed muscle activities of infraspinatus, subscapu-laris and teres minor over the abduction angle in 5° increments duringthe external rotation trial with 5 N load in hand. Blue depicts the activi-ties of the intact model and red the modelled tear of the m. supraspina-
tus of the healthy subject cohort.207
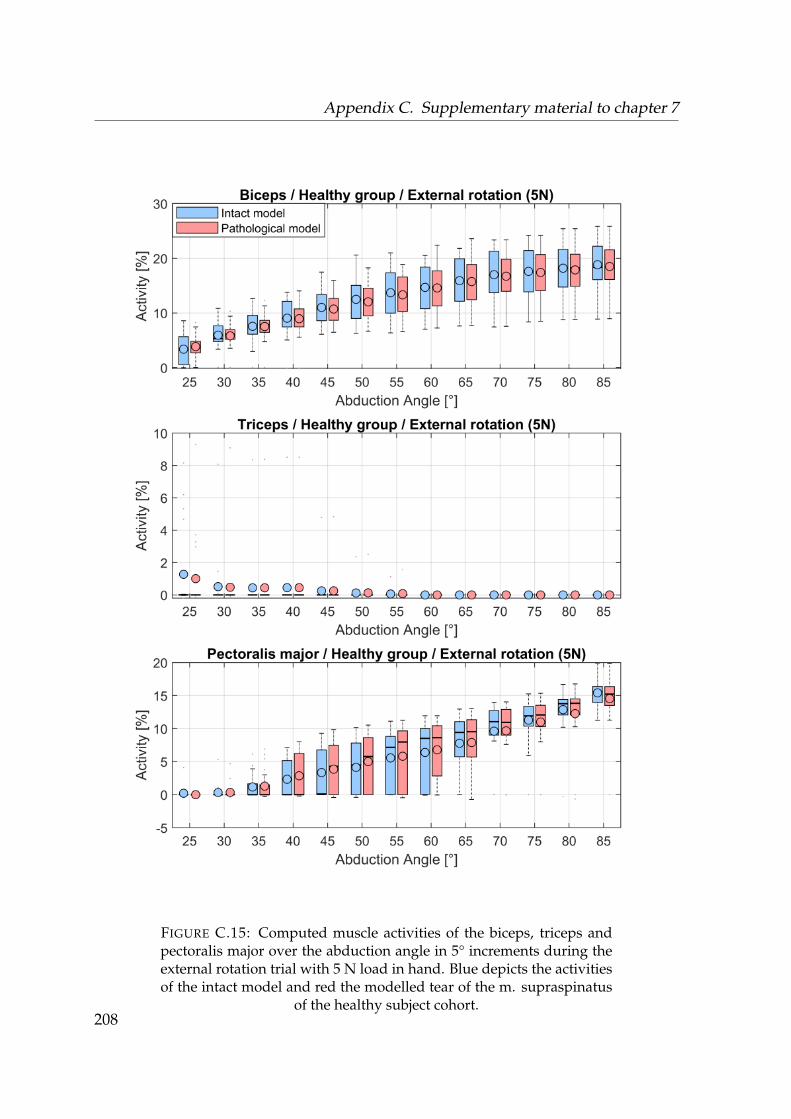
Appendix C. Supplementary material to chapter 7
FIGURE C.15: Computed muscle activities of the biceps, triceps andpectoralis major over the abduction angle in 5° increments during theexternal rotation trial with 5 N load in hand. Blue depicts the activitiesof the intact model and red the modelled tear of the m. supraspinatus
of the healthy subject cohort.208

Appendix C. Supplementary material to chapter 7
209
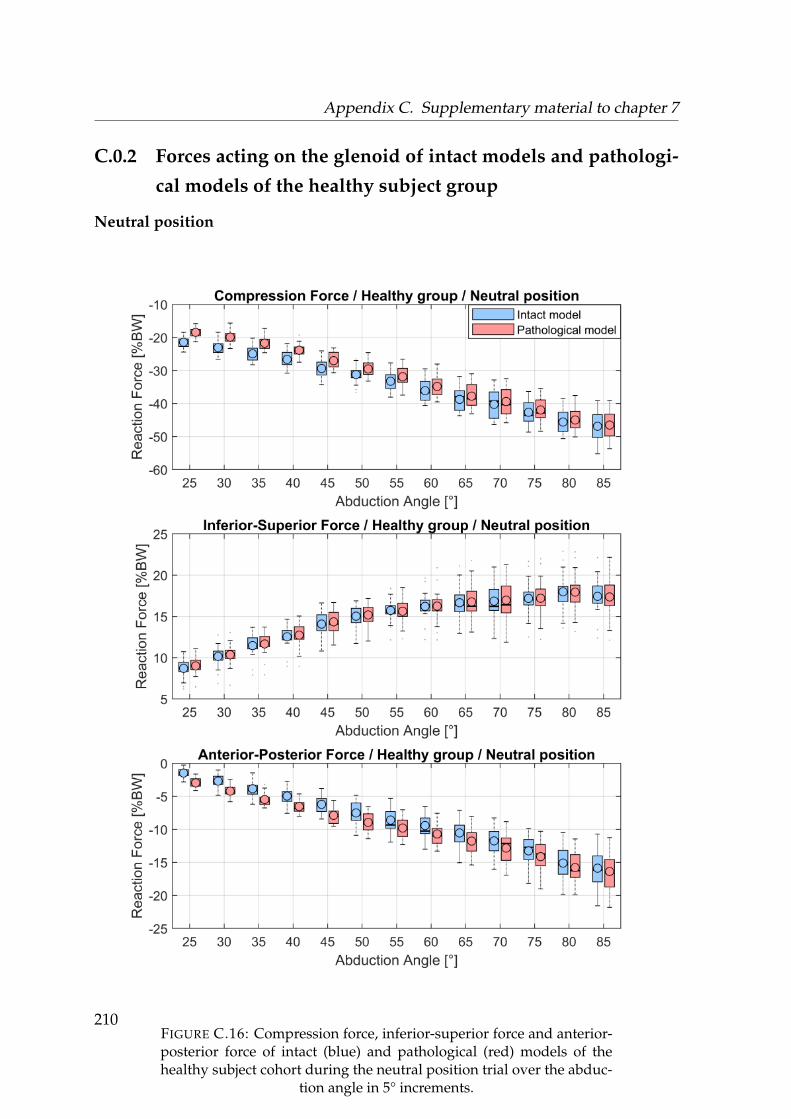
Appendix C. Supplementary material to chapter 7
C.0.2 Forces acting on the glenoid of intact models and pathologi-
cal models of the healthy subject group
Neutral position
FIGURE C.16: Compression force, inferior-superior force and anterior-posterior force of intact (blue) and pathological (red) models of thehealthy subject cohort during the neutral position trial over the abduc-
tion angle in 5° increments.
210

Appendix C. Supplementary material to chapter 7
FIGURE C.17: Projected median GH joint reaction force of all mod-els onto the glenoid of intact and pathological models of the healthysubject cohort during the neutral position trial. Intact/healthy models(blue) and pathological models (red) with their starting value at 25° ab-
duction and the progression up to 85° abduction.
211
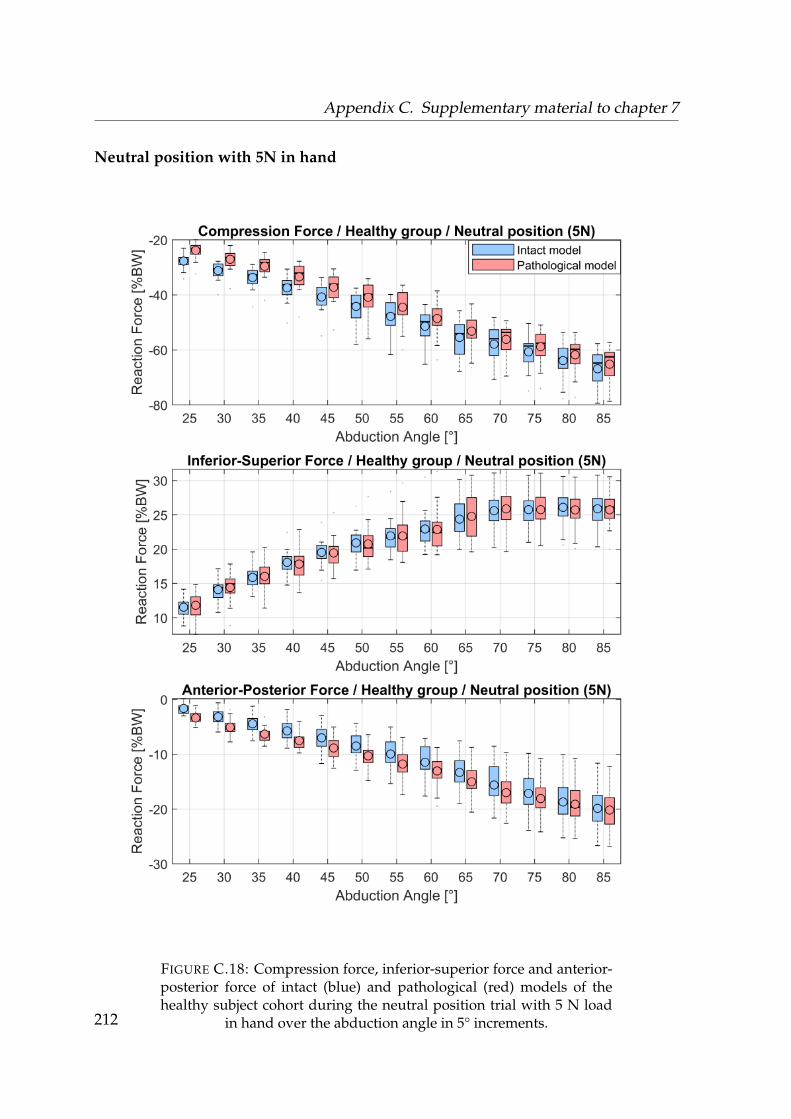
Appendix C. Supplementary material to chapter 7
Neutral position with 5N in hand
FIGURE C.18: Compression force, inferior-superior force and anterior-posterior force of intact (blue) and pathological (red) models of thehealthy subject cohort during the neutral position trial with 5 N load
in hand over the abduction angle in 5° increments.212
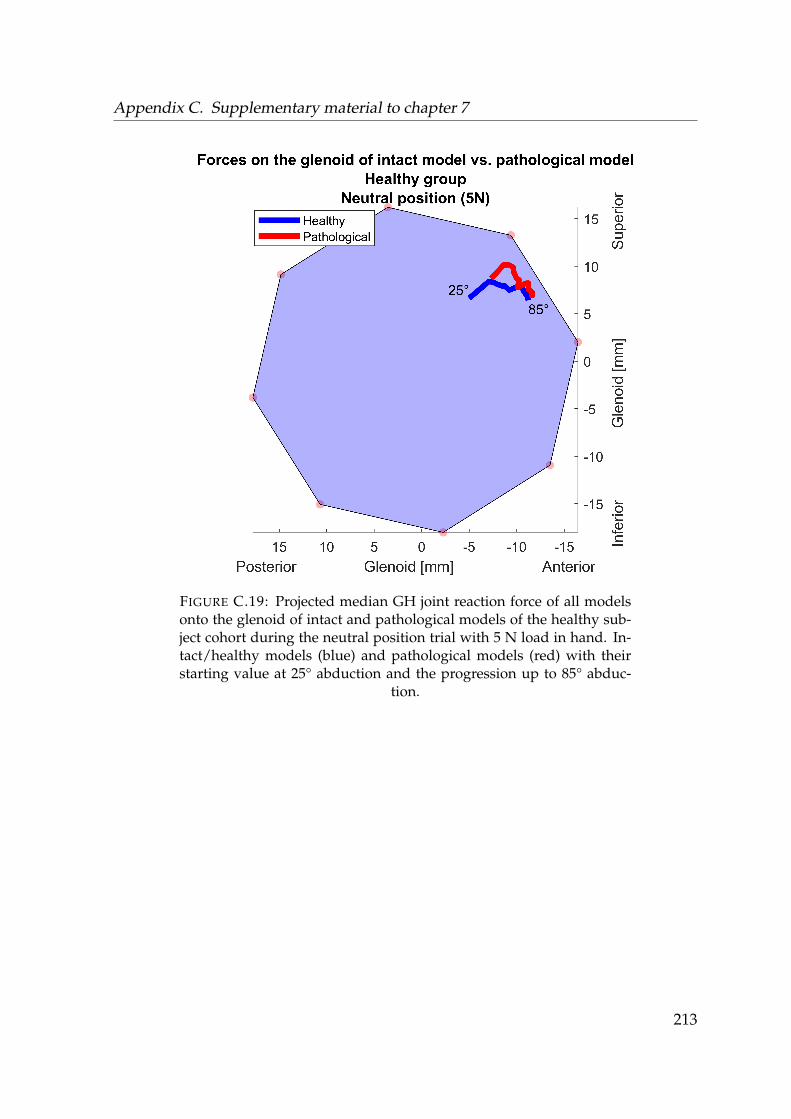
Appendix C. Supplementary material to chapter 7
FIGURE C.19: Projected median GH joint reaction force of all modelsonto the glenoid of intact and pathological models of the healthy sub-ject cohort during the neutral position trial with 5 N load in hand. In-tact/healthy models (blue) and pathological models (red) with theirstarting value at 25° abduction and the progression up to 85° abduc-
tion.
213
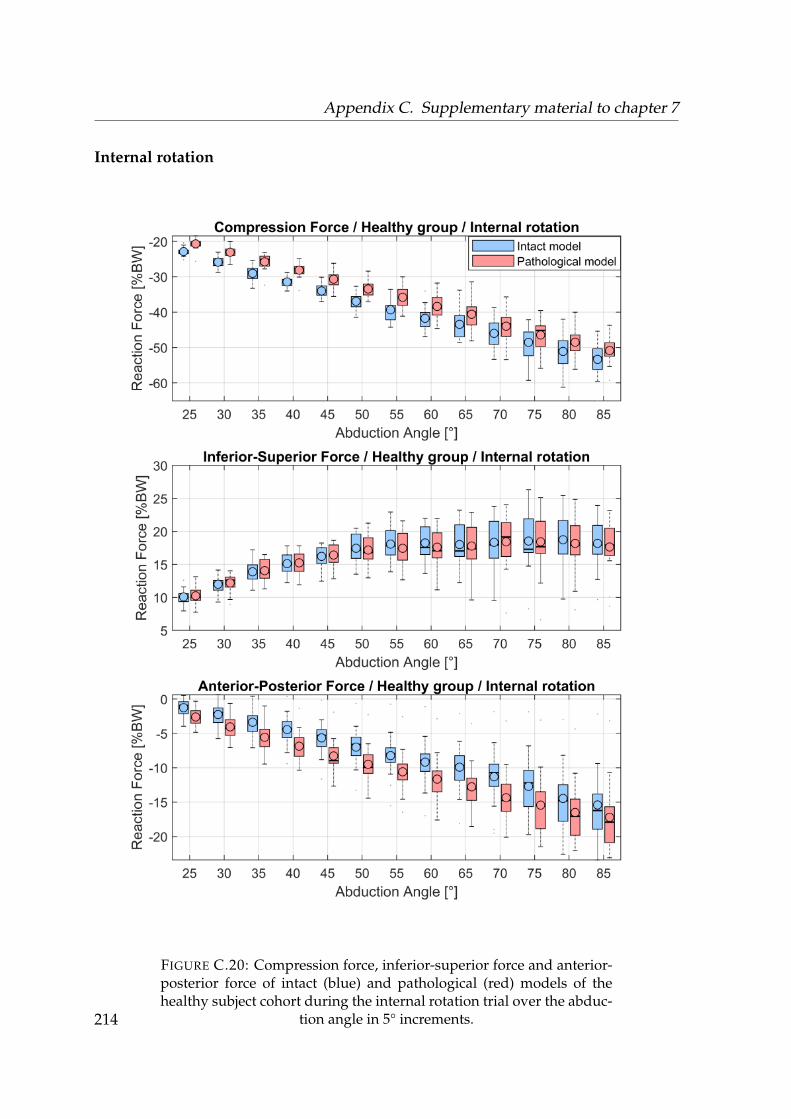
Appendix C. Supplementary material to chapter 7
Internal rotation
FIGURE C.20: Compression force, inferior-superior force and anterior-posterior force of intact (blue) and pathological (red) models of thehealthy subject cohort during the internal rotation trial over the abduc-
tion angle in 5° increments.214

Appendix C. Supplementary material to chapter 7
FIGURE C.21: Projected median GH joint reaction force of all mod-els onto the glenoid of intact and pathological models of the healthysubject cohort during the internal rotation trial. Intact/healthy models(blue) and pathological models (red) with their starting value at 25° ab-
duction and the progression up to 85° abduction.
215
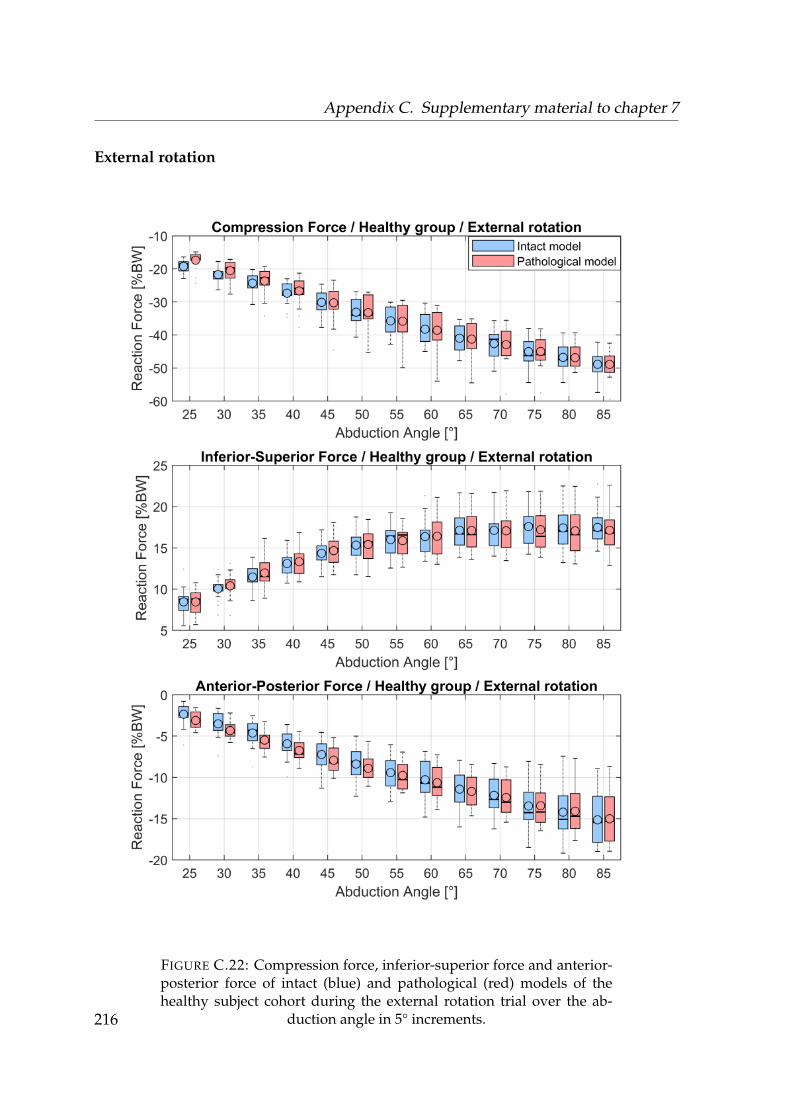
Appendix C. Supplementary material to chapter 7
External rotation
FIGURE C.22: Compression force, inferior-superior force and anterior-posterior force of intact (blue) and pathological (red) models of thehealthy subject cohort during the external rotation trial over the ab-
duction angle in 5° increments.216

Appendix C. Supplementary material to chapter 7
FIGURE C.23: Projected median GH joint reaction force of all mod-els onto the glenoid of intact and pathological models of the healthysubject cohort during the external rotation trial. Intact/healthy models(blue) and pathological models (red) with their starting value at 25° ab-
duction and the progression up to 85° abduction.
217
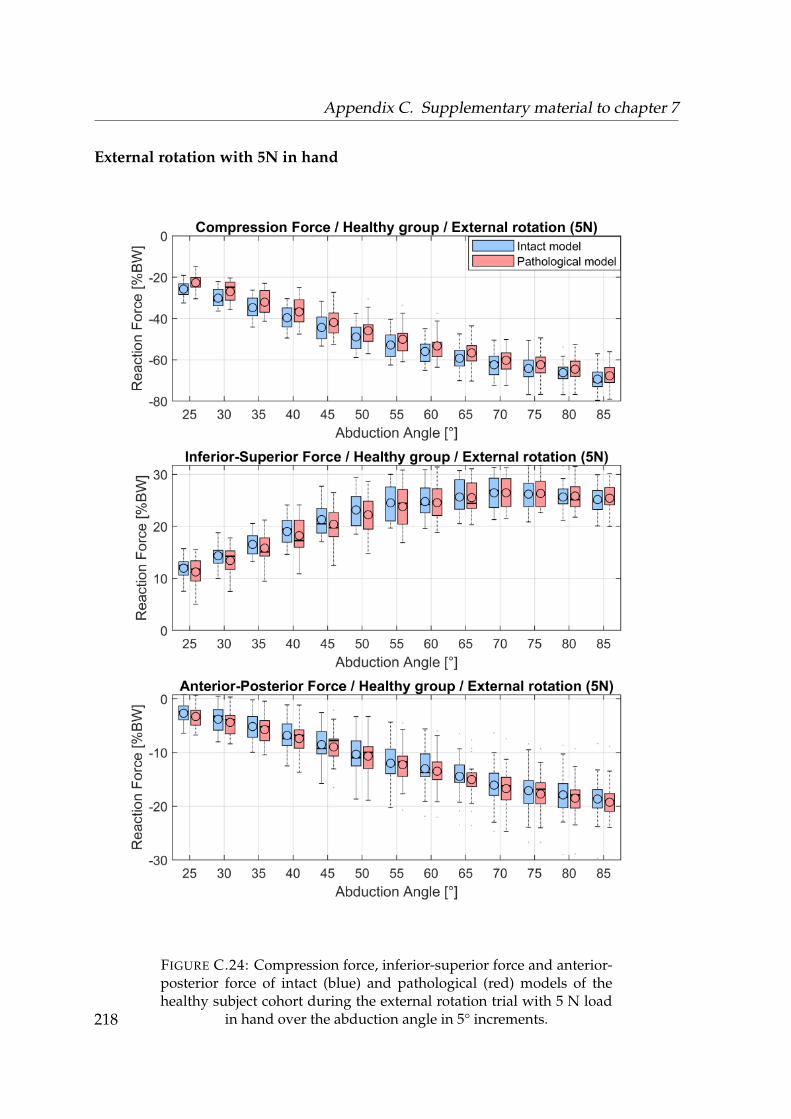
Appendix C. Supplementary material to chapter 7
External rotation with 5N in hand
FIGURE C.24: Compression force, inferior-superior force and anterior-posterior force of intact (blue) and pathological (red) models of thehealthy subject cohort during the external rotation trial with 5 N load
in hand over the abduction angle in 5° increments.218

Appendix C. Supplementary material to chapter 7
FIGURE C.25: Projected median GH joint reaction force of all mod-els onto the glenoid of intact and pathological models of the healthysubject cohort during the external rotation trial with 5 N in hand. In-tact/healthy models (blue) and pathological models (red) with theirstarting value at 25° abduction and the progression up to 85° abduc-
tion.
219

Appendix C. Supplementary material to chapter 7
C.0.3 Numeric comparison of forces and muscle activities of in-
tact models and pathological models of the healthy subject
group
Neutral position
Abduction AD LD PD INF SS BIC TRI TM PM CF ISF APF[°] [%] [%] [%] [%] [%] [%] [%] [%] [%] [%BW] [%BW] [%BW]
25 0.8* 1.1 0.3 0.5* -0.1 0.0 0.2 0.0 0.0 -3.0*** -0.3 1.5***30 0.8 1.2 0.5 0.6* -0.3 0.0 0.3 0.0 0.0 -2.6*** -0.2 1.6***35 1.0 0.7 0.4 0.9* -0.3 0.0 0.4 0.0 0.0 -3.2*** -0.2 1.6***40 0.9 0.8 0.4 0.8* 0.1 0.0 0.0 0.0 0.0 -2.7** -0.2 2.0***45 0.8 0.8 0.3 0.8* -0.7 0.1 0.0 0.0 3.8* -2.0* -0.1 1.9***50 1.0 0.9 0.0 1.0* -0.5 2.3 0.0 0.0 0.9* -1.9 -0.1 1.3**55 0.9 0.9 -0.1 0.9 -0.2 0.8 0.0 0.0 0.7* -0.5 0.1 0.6*60 0.6 0.9 0.2 0.7 -0.3 0.7 0.0 0.0 0.6 -1.9 0.2 0.7*65 0.6 0.4 0.3 0.6 -0.5 0.4 0.0 0.0 0.6 0.7 0.1 0.870 0.6 0.4 0.2 0.4 -0.4 0.4 0.0 0.0 0.3 1.1 -0.2 0.675 0.3 0.2 0.1 0.3 -0.4 0.3 0.0 0.0 0.2 -0.7 0.0 1.080 0.3 0.2 0.2 0.3 0.0 0.1 0.0 0.0 0.1 0.3 0.0 0.985 0.1 0.2 0.2 0.1 -0.1 0.0 0.0 0.0 0.0 0.2 0.1 0.4
TABLE C.1: Differences in median values of muscle activities, GH jointreaction forces and kinematics between intact and pathological mod-els of the healthy subject cohort during the neutral position trial in 5°increments. Asterisks indicate the significance level. AD = anterior del-toid, LD = lateral deltoid, PD = posterior deltoid, INF = infraspinatus,SS = subscapularis, BIC = biceps, TRI = triceps, TM = teres minor, PM =pectroalis major, CF = compression force, ISF = inferior-superior force,APF = anterior-posterior force, FLX = Flexion angle, ER = external ro-
tation angle
220

Appendix C. Supplementary material to chapter 7
Neutral position with 5N in hand
Abduction AD LD PD INF SS BIC TRI TM PM CF ISF APF[°] [%] [%] [%] [%] [%] [%] [%] [%] [%] [%BW] [%BW] [%BW]
25 1.0* 1.2* 0.7 0.8* 0.1 0.0 0.4 0.0 0.0 -4.2*** -0.2 2.0***30 1.1* 1.2* 0.7 0.9* -0.3 0.0 0.4 0.0 0.0 -4.1*** -0.5 2.2***35 1.2 1.4 0.5 0.9* -0.4 0.0 0.2 0.0 0.0 -4.5*** -0.1 1.9***40 1.2 1.5 0.4 1.3* -0.7 -0.9 0.6 0.0 0.0 -4.3** -0.1 1.8**45 1.0* 0.9 -0.2 1.2* -1.5 0.0 0.6 0.0 0.1 -4.2* 0.2 2.0*50 0.5 0.3 -0.1 0.7 -1.6 0.1 0.0 0.0 1.0 -3.5 0.6 1.5*55 0.7 0.9 0.1 0.6 -1.3 0.5 0.0 0.0 0.8 -2.9 0.0 2.2*60 0.3 0.2 0.2 0.4 -0.6 0.6 0.0 0.0 0.2 -1.7 0.2 1.365 0.7 0.3 -0.1 0.5 -0.6 0.3 0.0 0.0 0.1 -1.4 -0.3 1.770 0.4 0.7 -0.3 0.8 -0.5 0.2 0.0 0.0 0.0 -2.3 -0.1 1.275 0.2 0.1 -0.2 0.5 -0.2 0.2 0.0 0.0 0.0 -1.0 -0.1 1.180 0.2 0.2 -0.2 0.4 -1.0 -0.1 0.0 0.0 0.1 -3.3 0.2 0.785 0.2 0.3 0.1 0.7 -0.9 0.0 0.0 0.0 0.0 -2.2 0.1 0.3
TABLE C.2: Differences in median values of muscle activities, GH jointreaction forces and kinematics between intact and pathological modelsof the healthy subject cohort during the neutral position trial with 5 Nload in hand in 5° increments. Asterisks indicate the significance level.AD = anterior deltoid, LD = lateral deltoid, PD = posterior deltoid, INF= infraspinatus, SS = subscapularis, BIC = biceps, TRI = triceps, TM= teres minor, PM = pectroalis major, CF = compression force, ISF =inferior-superior force, APF = anterior-posterior force, FLX = Flexion
angle, ER = external rotation angle
221
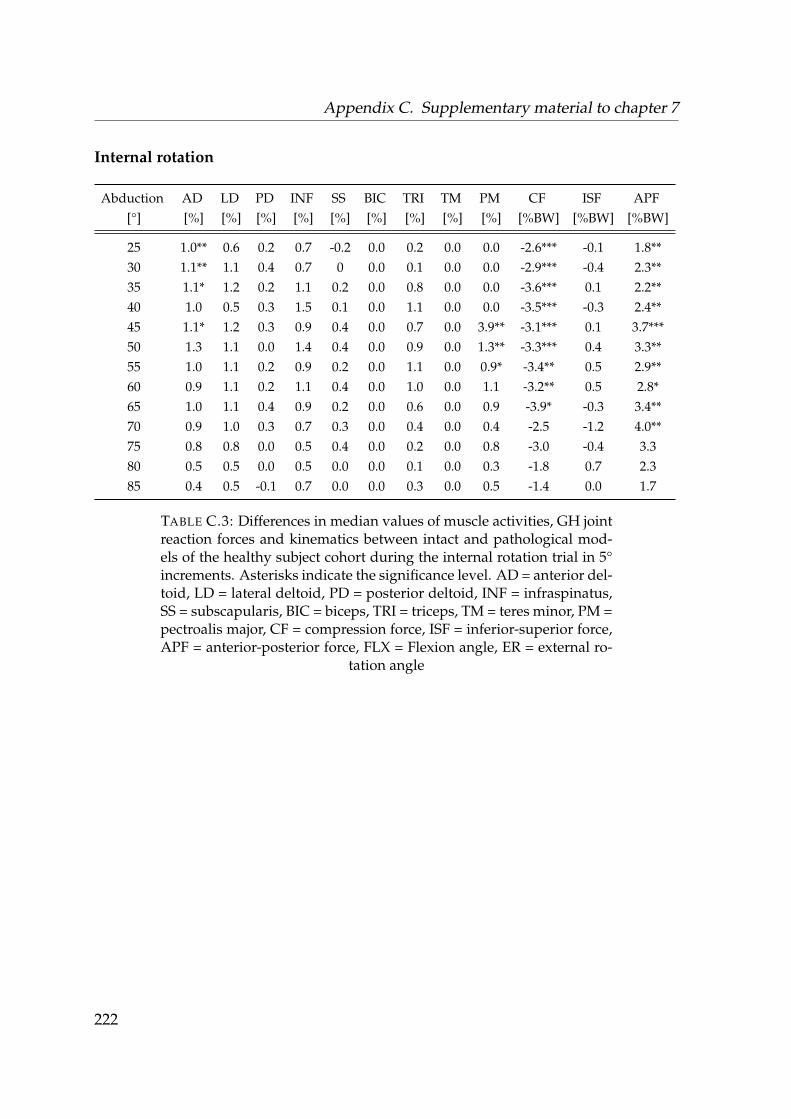
Appendix C. Supplementary material to chapter 7
Internal rotation
Abduction AD LD PD INF SS BIC TRI TM PM CF ISF APF[°] [%] [%] [%] [%] [%] [%] [%] [%] [%] [%BW] [%BW] [%BW]
25 1.0** 0.6 0.2 0.7 -0.2 0.0 0.2 0.0 0.0 -2.6*** -0.1 1.8**30 1.1** 1.1 0.4 0.7 0 0.0 0.1 0.0 0.0 -2.9*** -0.4 2.3**35 1.1* 1.2 0.2 1.1 0.2 0.0 0.8 0.0 0.0 -3.6*** 0.1 2.2**40 1.0 0.5 0.3 1.5 0.1 0.0 1.1 0.0 0.0 -3.5*** -0.3 2.4**45 1.1* 1.2 0.3 0.9 0.4 0.0 0.7 0.0 3.9** -3.1*** 0.1 3.7***50 1.3 1.1 0.0 1.4 0.4 0.0 0.9 0.0 1.3** -3.3*** 0.4 3.3**55 1.0 1.1 0.2 0.9 0.2 0.0 1.1 0.0 0.9* -3.4** 0.5 2.9**60 0.9 1.1 0.2 1.1 0.4 0.0 1.0 0.0 1.1 -3.2** 0.5 2.8*65 1.0 1.1 0.4 0.9 0.2 0.0 0.6 0.0 0.9 -3.9* -0.3 3.4**70 0.9 1.0 0.3 0.7 0.3 0.0 0.4 0.0 0.4 -2.5 -1.2 4.0**75 0.8 0.8 0.0 0.5 0.4 0.0 0.2 0.0 0.8 -3.0 -0.4 3.380 0.5 0.5 0.0 0.5 0.0 0.0 0.1 0.0 0.3 -1.8 0.7 2.385 0.4 0.5 -0.1 0.7 0.0 0.0 0.3 0.0 0.5 -1.4 0.0 1.7
TABLE C.3: Differences in median values of muscle activities, GH jointreaction forces and kinematics between intact and pathological mod-els of the healthy subject cohort during the internal rotation trial in 5°increments. Asterisks indicate the significance level. AD = anterior del-toid, LD = lateral deltoid, PD = posterior deltoid, INF = infraspinatus,SS = subscapularis, BIC = biceps, TRI = triceps, TM = teres minor, PM =pectroalis major, CF = compression force, ISF = inferior-superior force,APF = anterior-posterior force, FLX = Flexion angle, ER = external ro-
tation angle
222
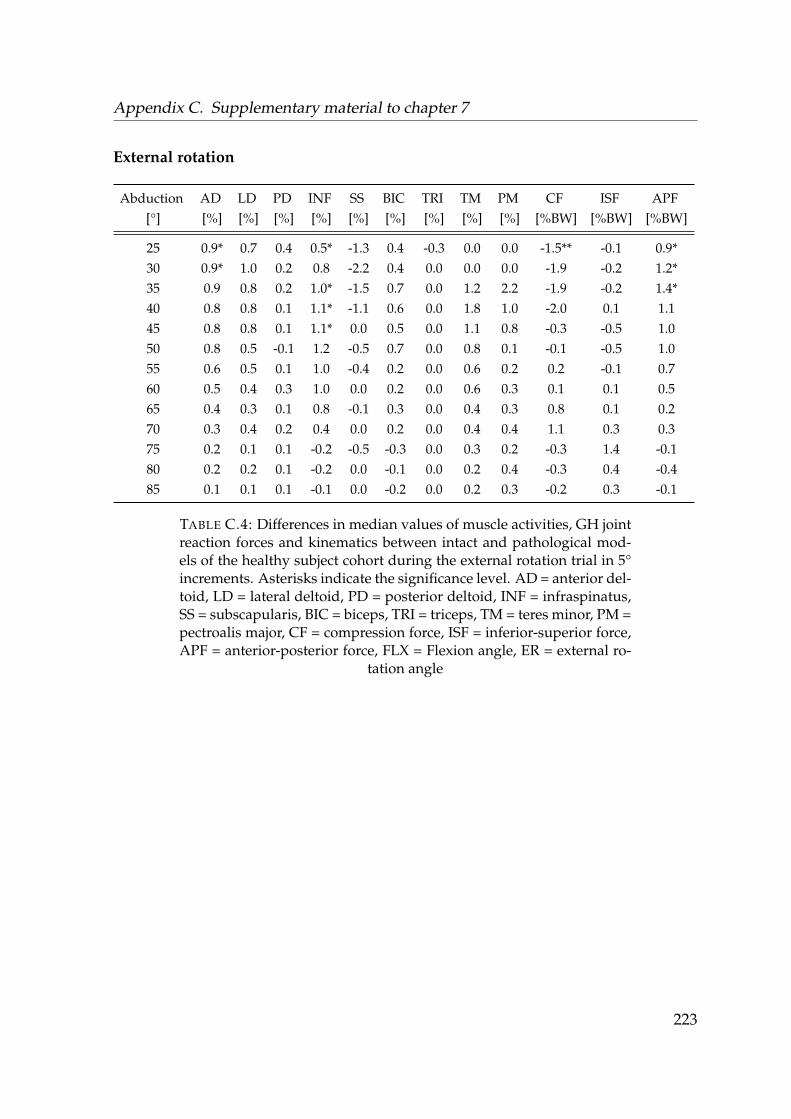
Appendix C. Supplementary material to chapter 7
External rotation
Abduction AD LD PD INF SS BIC TRI TM PM CF ISF APF[°] [%] [%] [%] [%] [%] [%] [%] [%] [%] [%BW] [%BW] [%BW]
25 0.9* 0.7 0.4 0.5* -1.3 0.4 -0.3 0.0 0.0 -1.5** -0.1 0.9*30 0.9* 1.0 0.2 0.8 -2.2 0.4 0.0 0.0 0.0 -1.9 -0.2 1.2*35 0.9 0.8 0.2 1.0* -1.5 0.7 0.0 1.2 2.2 -1.9 -0.2 1.4*40 0.8 0.8 0.1 1.1* -1.1 0.6 0.0 1.8 1.0 -2.0 0.1 1.145 0.8 0.8 0.1 1.1* 0.0 0.5 0.0 1.1 0.8 -0.3 -0.5 1.050 0.8 0.5 -0.1 1.2 -0.5 0.7 0.0 0.8 0.1 -0.1 -0.5 1.055 0.6 0.5 0.1 1.0 -0.4 0.2 0.0 0.6 0.2 0.2 -0.1 0.760 0.5 0.4 0.3 1.0 0.0 0.2 0.0 0.6 0.3 0.1 0.1 0.565 0.4 0.3 0.1 0.8 -0.1 0.3 0.0 0.4 0.3 0.8 0.1 0.270 0.3 0.4 0.2 0.4 0.0 0.2 0.0 0.4 0.4 1.1 0.3 0.375 0.2 0.1 0.1 -0.2 -0.5 -0.3 0.0 0.3 0.2 -0.3 1.4 -0.180 0.2 0.2 0.1 -0.2 0.0 -0.1 0.0 0.2 0.4 -0.3 0.4 -0.485 0.1 0.1 0.1 -0.1 0.0 -0.2 0.0 0.2 0.3 -0.2 0.3 -0.1
TABLE C.4: Differences in median values of muscle activities, GH jointreaction forces and kinematics between intact and pathological mod-els of the healthy subject cohort during the external rotation trial in 5°increments. Asterisks indicate the significance level. AD = anterior del-toid, LD = lateral deltoid, PD = posterior deltoid, INF = infraspinatus,SS = subscapularis, BIC = biceps, TRI = triceps, TM = teres minor, PM =pectroalis major, CF = compression force, ISF = inferior-superior force,APF = anterior-posterior force, FLX = Flexion angle, ER = external ro-
tation angle
223
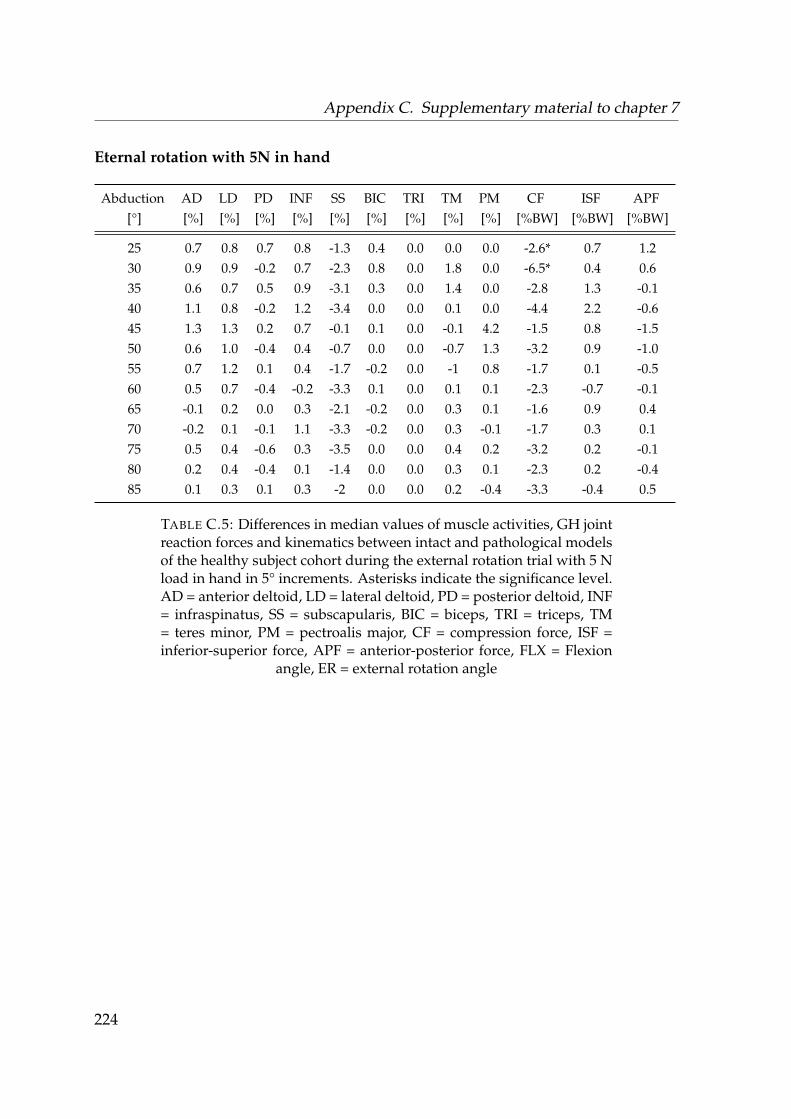
Appendix C. Supplementary material to chapter 7
Eternal rotation with 5N in hand
Abduction AD LD PD INF SS BIC TRI TM PM CF ISF APF[°] [%] [%] [%] [%] [%] [%] [%] [%] [%] [%BW] [%BW] [%BW]
25 0.7 0.8 0.7 0.8 -1.3 0.4 0.0 0.0 0.0 -2.6* 0.7 1.230 0.9 0.9 -0.2 0.7 -2.3 0.8 0.0 1.8 0.0 -6.5* 0.4 0.635 0.6 0.7 0.5 0.9 -3.1 0.3 0.0 1.4 0.0 -2.8 1.3 -0.140 1.1 0.8 -0.2 1.2 -3.4 0.0 0.0 0.1 0.0 -4.4 2.2 -0.645 1.3 1.3 0.2 0.7 -0.1 0.1 0.0 -0.1 4.2 -1.5 0.8 -1.550 0.6 1.0 -0.4 0.4 -0.7 0.0 0.0 -0.7 1.3 -3.2 0.9 -1.055 0.7 1.2 0.1 0.4 -1.7 -0.2 0.0 -1 0.8 -1.7 0.1 -0.560 0.5 0.7 -0.4 -0.2 -3.3 0.1 0.0 0.1 0.1 -2.3 -0.7 -0.165 -0.1 0.2 0.0 0.3 -2.1 -0.2 0.0 0.3 0.1 -1.6 0.9 0.470 -0.2 0.1 -0.1 1.1 -3.3 -0.2 0.0 0.3 -0.1 -1.7 0.3 0.175 0.5 0.4 -0.6 0.3 -3.5 0.0 0.0 0.4 0.2 -3.2 0.2 -0.180 0.2 0.4 -0.4 0.1 -1.4 0.0 0.0 0.3 0.1 -2.3 0.2 -0.485 0.1 0.3 0.1 0.3 -2 0.0 0.0 0.2 -0.4 -3.3 -0.4 0.5
TABLE C.5: Differences in median values of muscle activities, GH jointreaction forces and kinematics between intact and pathological modelsof the healthy subject cohort during the external rotation trial with 5 Nload in hand in 5° increments. Asterisks indicate the significance level.AD = anterior deltoid, LD = lateral deltoid, PD = posterior deltoid, INF= infraspinatus, SS = subscapularis, BIC = biceps, TRI = triceps, TM= teres minor, PM = pectroalis major, CF = compression force, ISF =inferior-superior force, APF = anterior-posterior force, FLX = Flexion
angle, ER = external rotation angle
224
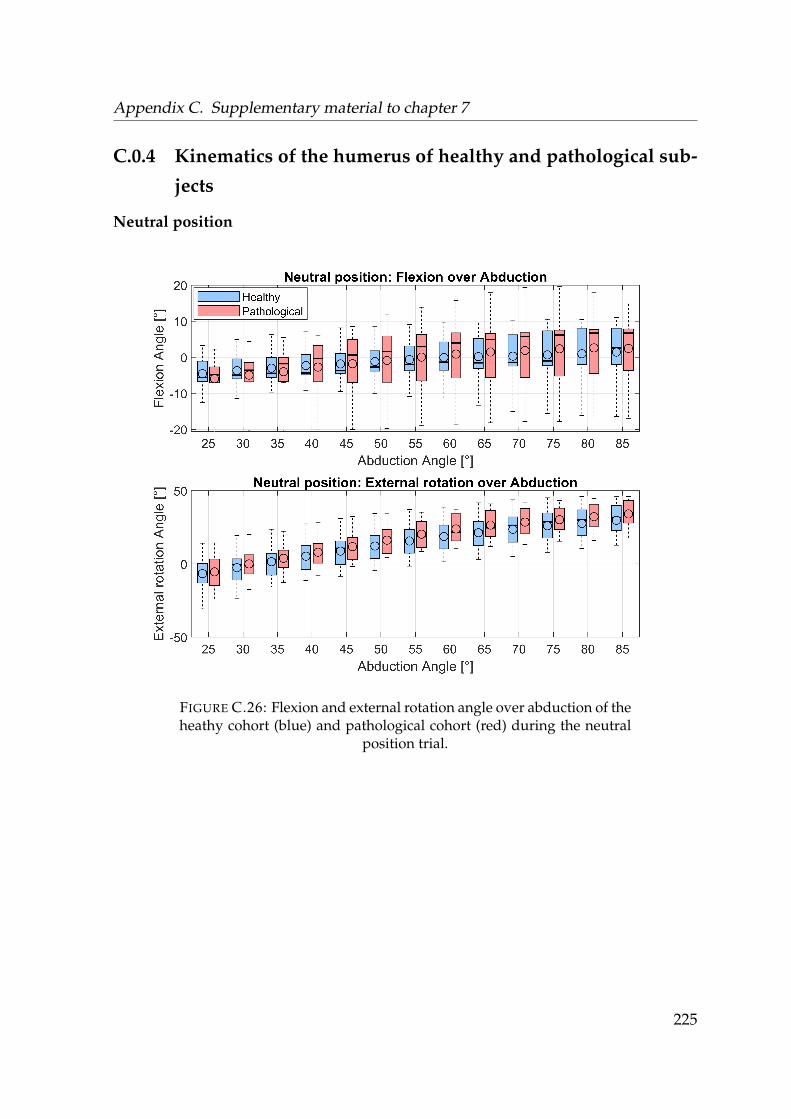
Appendix C. Supplementary material to chapter 7
C.0.4 Kinematics of the humerus of healthy and pathological sub-
jects
Neutral position
FIGURE C.26: Flexion and external rotation angle over abduction of theheathy cohort (blue) and pathological cohort (red) during the neutral
position trial.
225
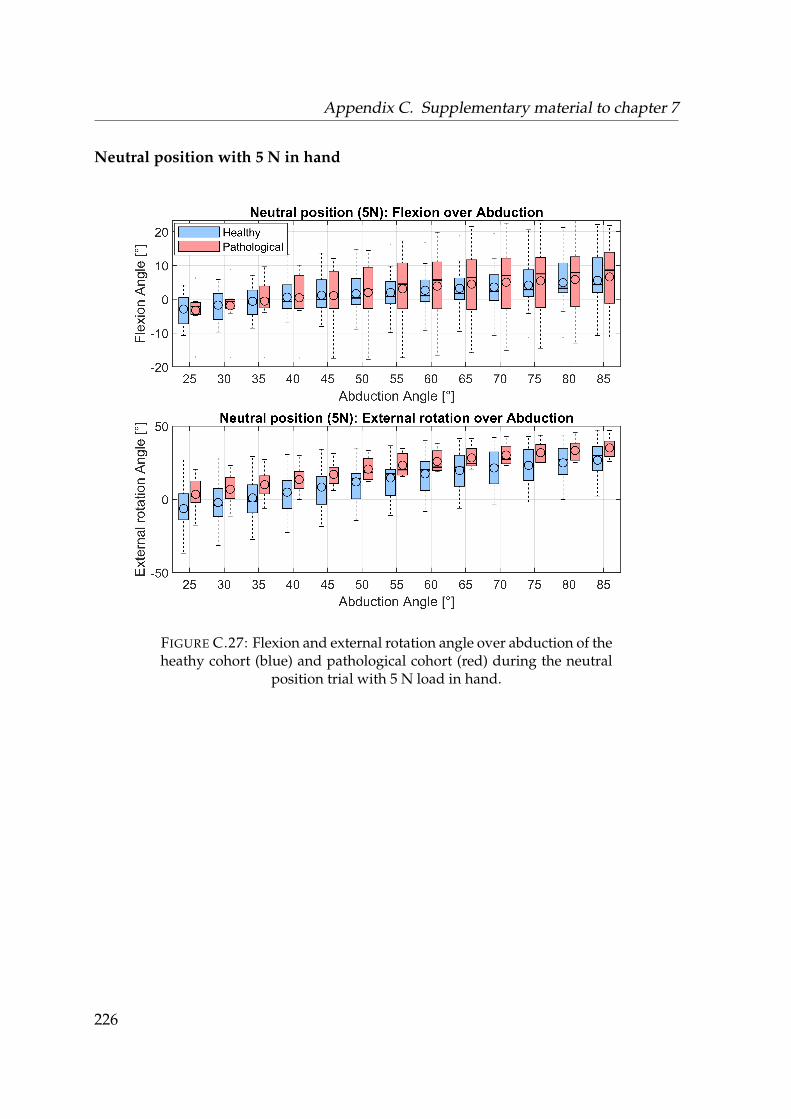
Appendix C. Supplementary material to chapter 7
Neutral position with 5 N in hand
FIGURE C.27: Flexion and external rotation angle over abduction of theheathy cohort (blue) and pathological cohort (red) during the neutral
position trial with 5 N load in hand.
226
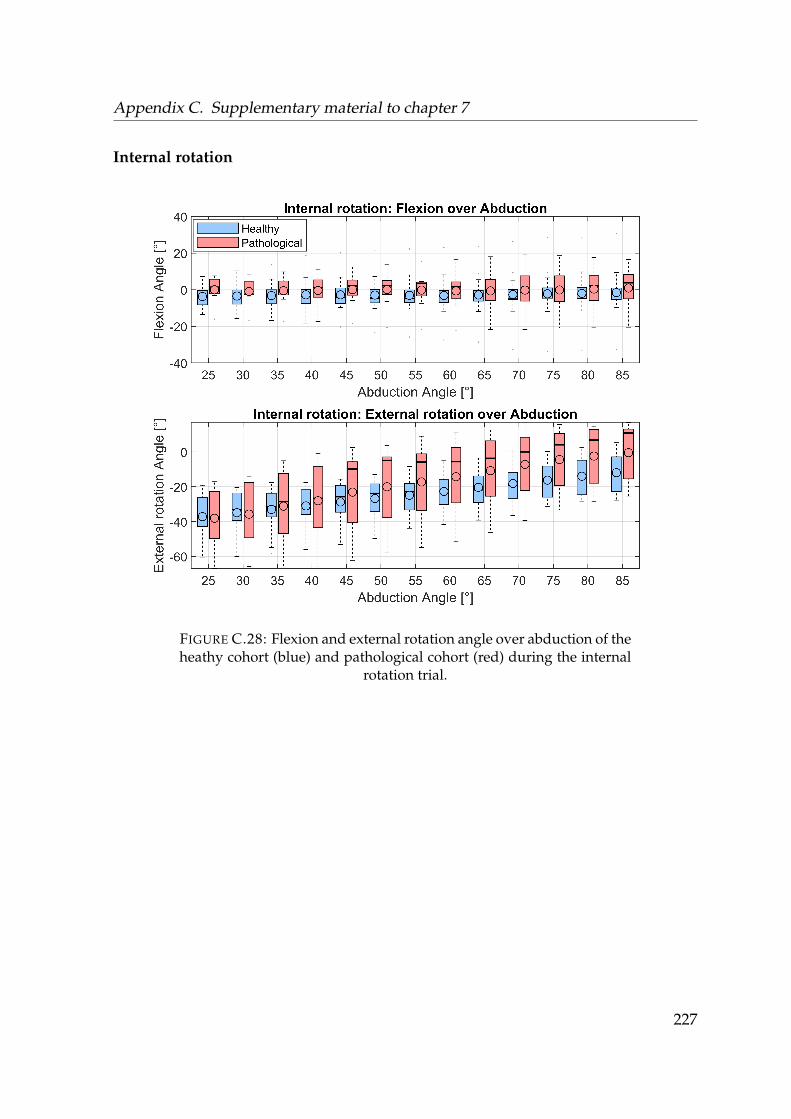
Appendix C. Supplementary material to chapter 7
Internal rotation
FIGURE C.28: Flexion and external rotation angle over abduction of theheathy cohort (blue) and pathological cohort (red) during the internal
rotation trial.
227
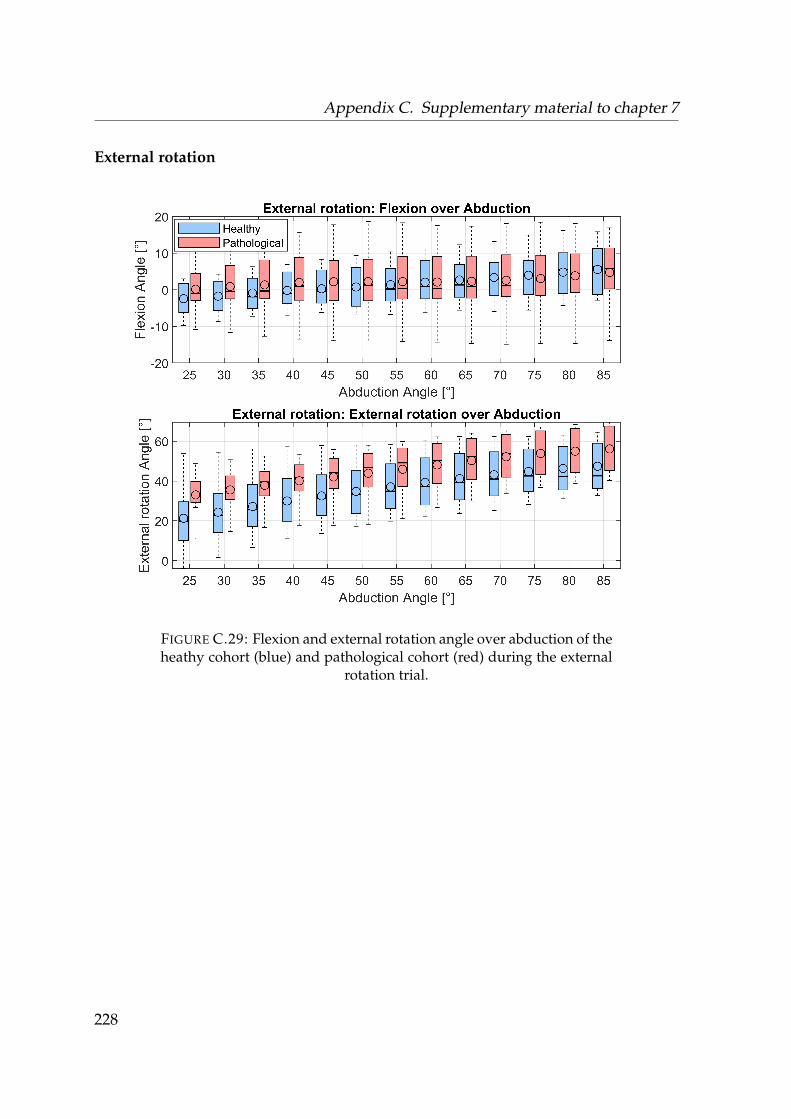
Appendix C. Supplementary material to chapter 7
External rotation
FIGURE C.29: Flexion and external rotation angle over abduction of theheathy cohort (blue) and pathological cohort (red) during the external
rotation trial.
228
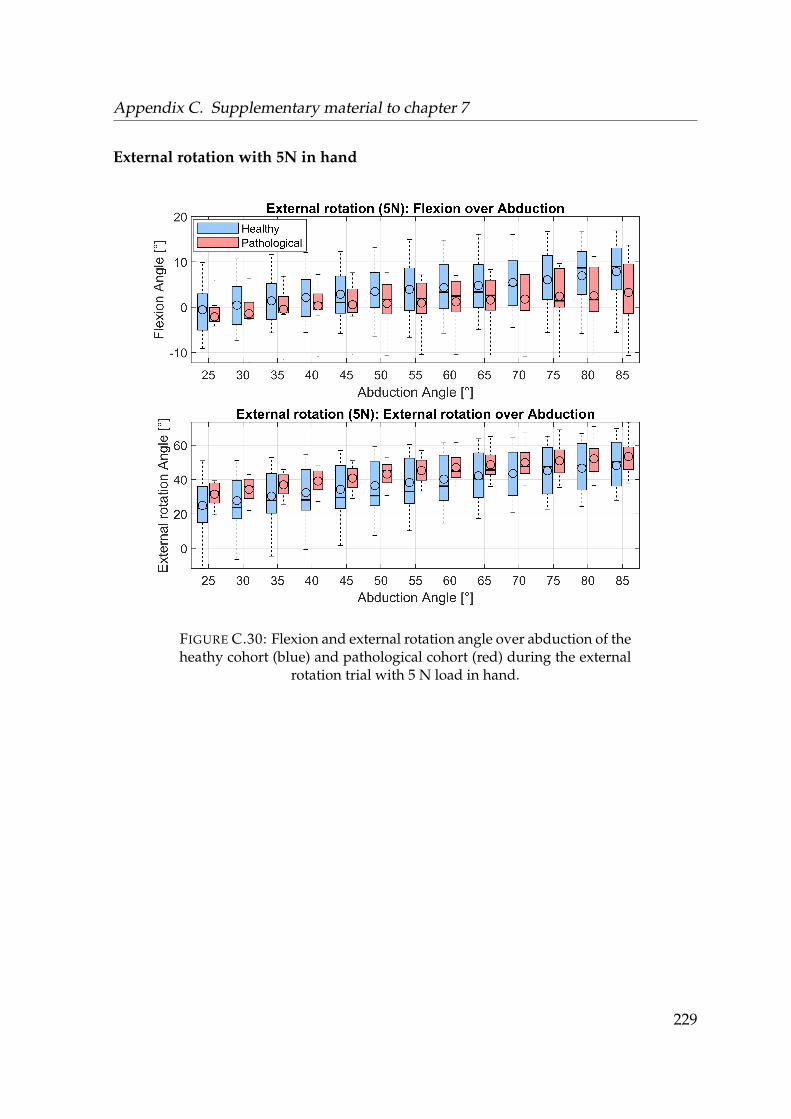
Appendix C. Supplementary material to chapter 7
External rotation with 5N in hand
FIGURE C.30: Flexion and external rotation angle over abduction of theheathy cohort (blue) and pathological cohort (red) during the external
rotation trial with 5 N load in hand.
229

Appendix C. Supplementary material to chapter 7
230
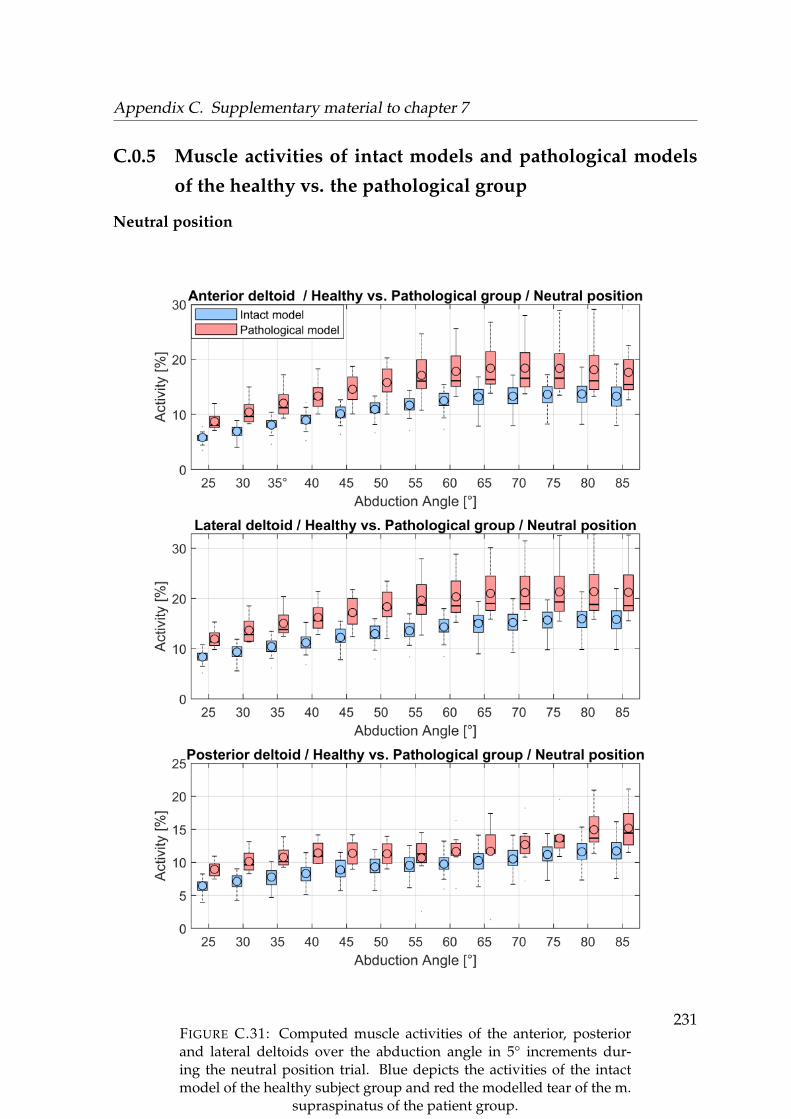
Appendix C. Supplementary material to chapter 7
C.0.5 Muscle activities of intact models and pathological models
of the healthy vs. the pathological group
Neutral position
FIGURE C.31: Computed muscle activities of the anterior, posteriorand lateral deltoids over the abduction angle in 5° increments dur-ing the neutral position trial. Blue depicts the activities of the intactmodel of the healthy subject group and red the modelled tear of the m.
supraspinatus of the patient group.
231

Appendix C. Supplementary material to chapter 7
FIGURE C.32: Computed muscle activities of the infraspinatus, sub-scapularis and teres minor over the abduction angle in 5° incrementsduring the neutral position trial. Blue depicts the activities of the intactmodel of the healthy subject group and red the modelled tear of the m.
supraspinatus of the patient group.232
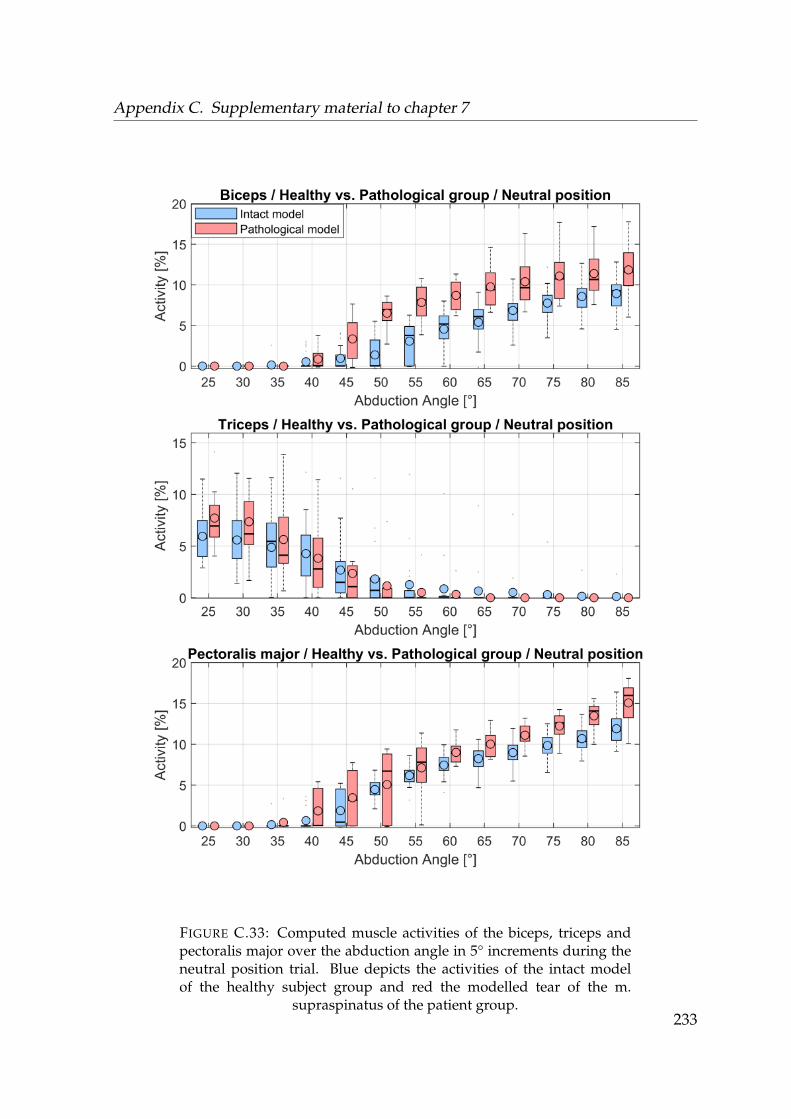
Appendix C. Supplementary material to chapter 7
FIGURE C.33: Computed muscle activities of the biceps, triceps andpectoralis major over the abduction angle in 5° increments during theneutral position trial. Blue depicts the activities of the intact modelof the healthy subject group and red the modelled tear of the m.
supraspinatus of the patient group.233
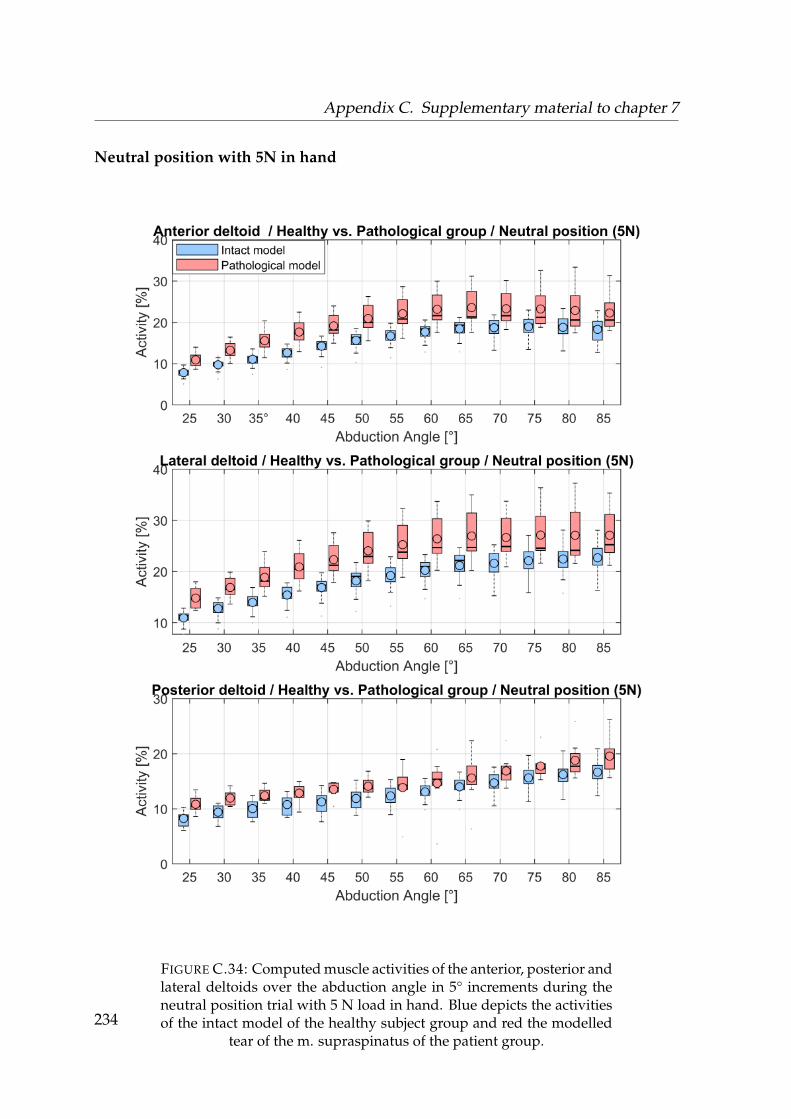
Appendix C. Supplementary material to chapter 7
Neutral position with 5N in hand
FIGURE C.34: Computed muscle activities of the anterior, posterior andlateral deltoids over the abduction angle in 5° increments during theneutral position trial with 5 N load in hand. Blue depicts the activitiesof the intact model of the healthy subject group and red the modelled
tear of the m. supraspinatus of the patient group.234
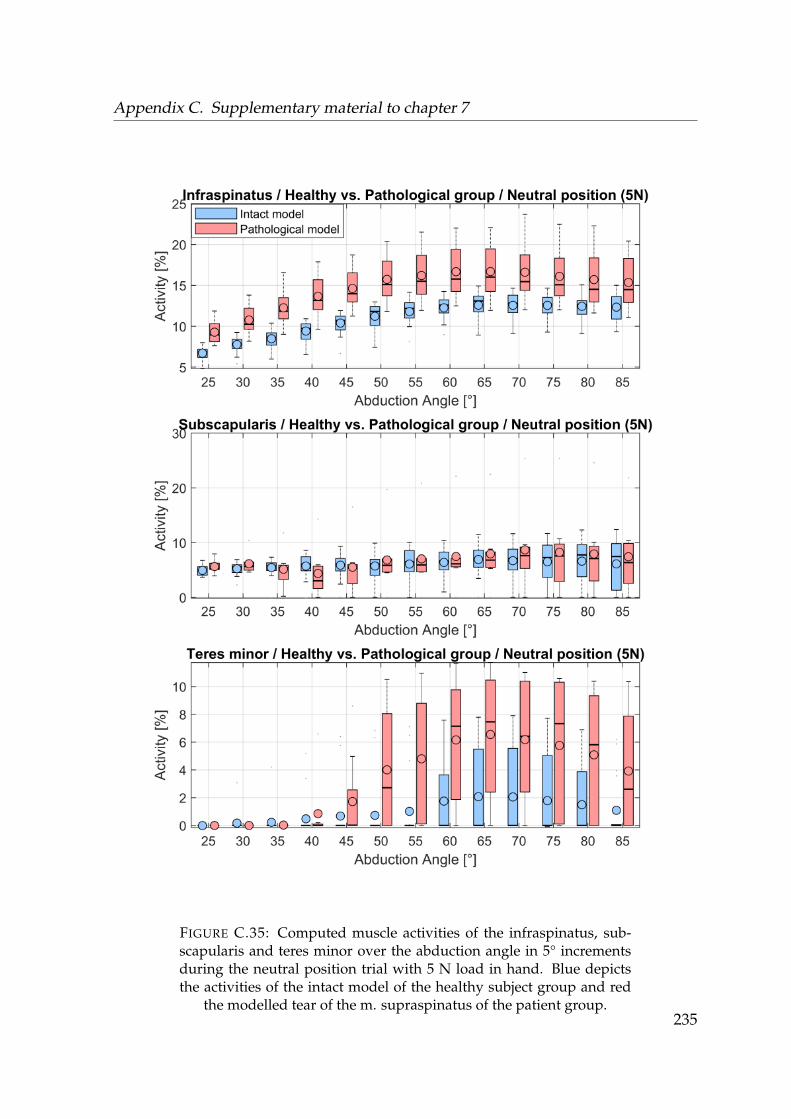
Appendix C. Supplementary material to chapter 7
FIGURE C.35: Computed muscle activities of the infraspinatus, sub-scapularis and teres minor over the abduction angle in 5° incrementsduring the neutral position trial with 5 N load in hand. Blue depictsthe activities of the intact model of the healthy subject group and red
the modelled tear of the m. supraspinatus of the patient group.235
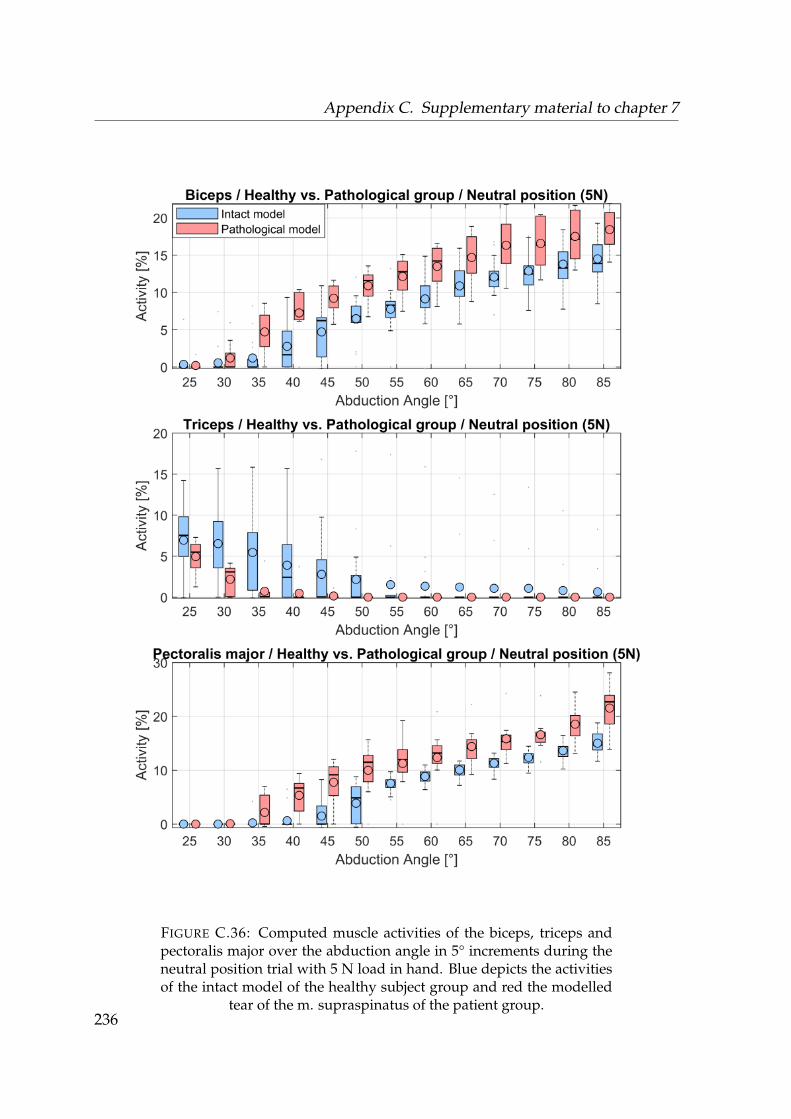
Appendix C. Supplementary material to chapter 7
FIGURE C.36: Computed muscle activities of the biceps, triceps andpectoralis major over the abduction angle in 5° increments during theneutral position trial with 5 N load in hand. Blue depicts the activitiesof the intact model of the healthy subject group and red the modelled
tear of the m. supraspinatus of the patient group.236
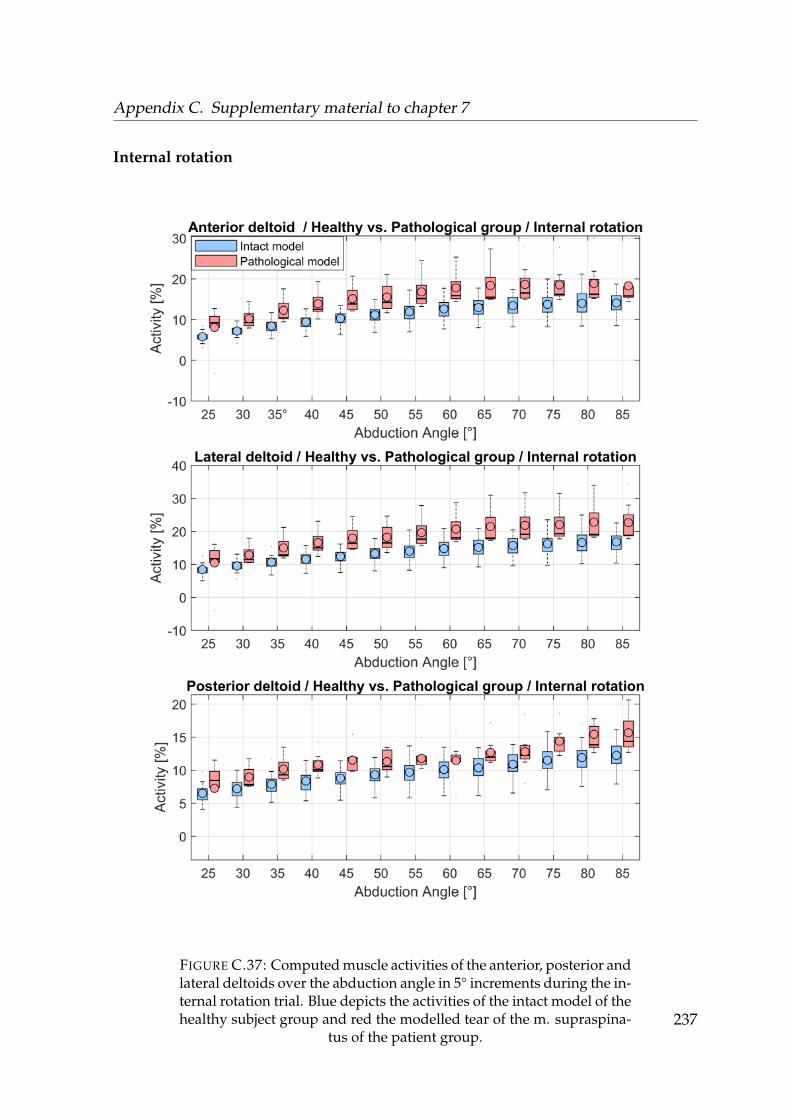
Appendix C. Supplementary material to chapter 7
Internal rotation
FIGURE C.37: Computed muscle activities of the anterior, posterior andlateral deltoids over the abduction angle in 5° increments during the in-ternal rotation trial. Blue depicts the activities of the intact model of thehealthy subject group and red the modelled tear of the m. supraspina-
tus of the patient group.237
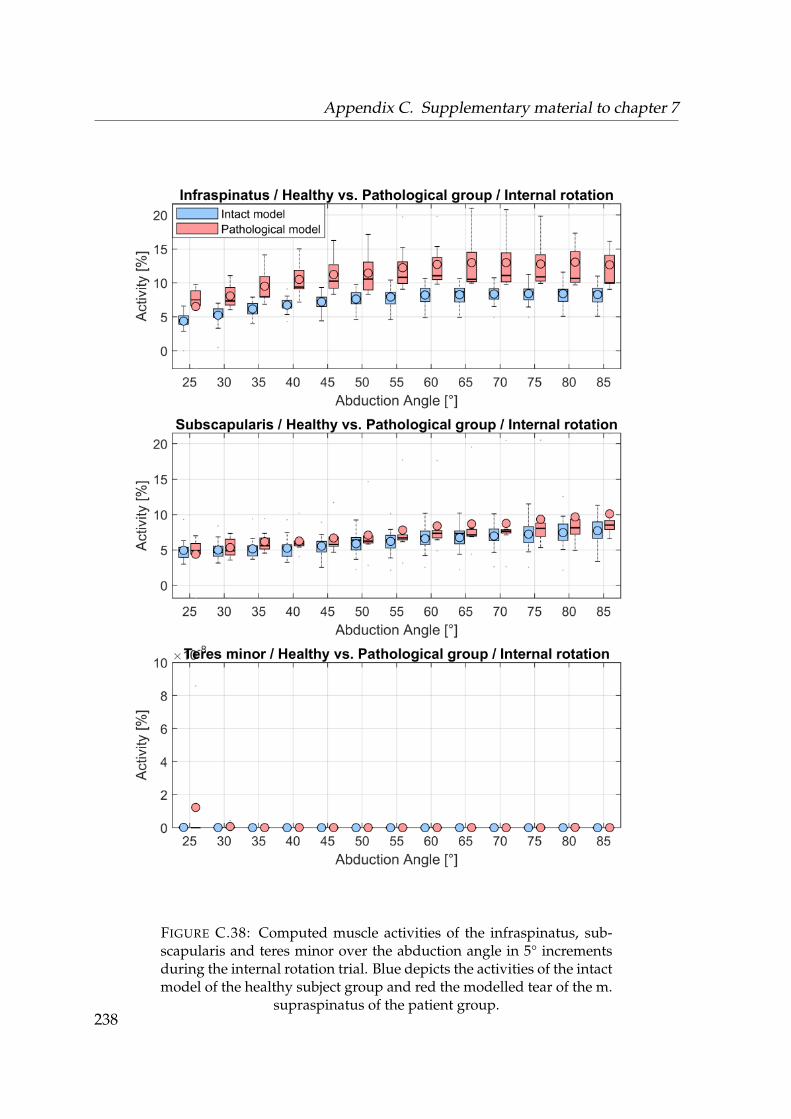
Appendix C. Supplementary material to chapter 7
FIGURE C.38: Computed muscle activities of the infraspinatus, sub-scapularis and teres minor over the abduction angle in 5° incrementsduring the internal rotation trial. Blue depicts the activities of the intactmodel of the healthy subject group and red the modelled tear of the m.
supraspinatus of the patient group.238
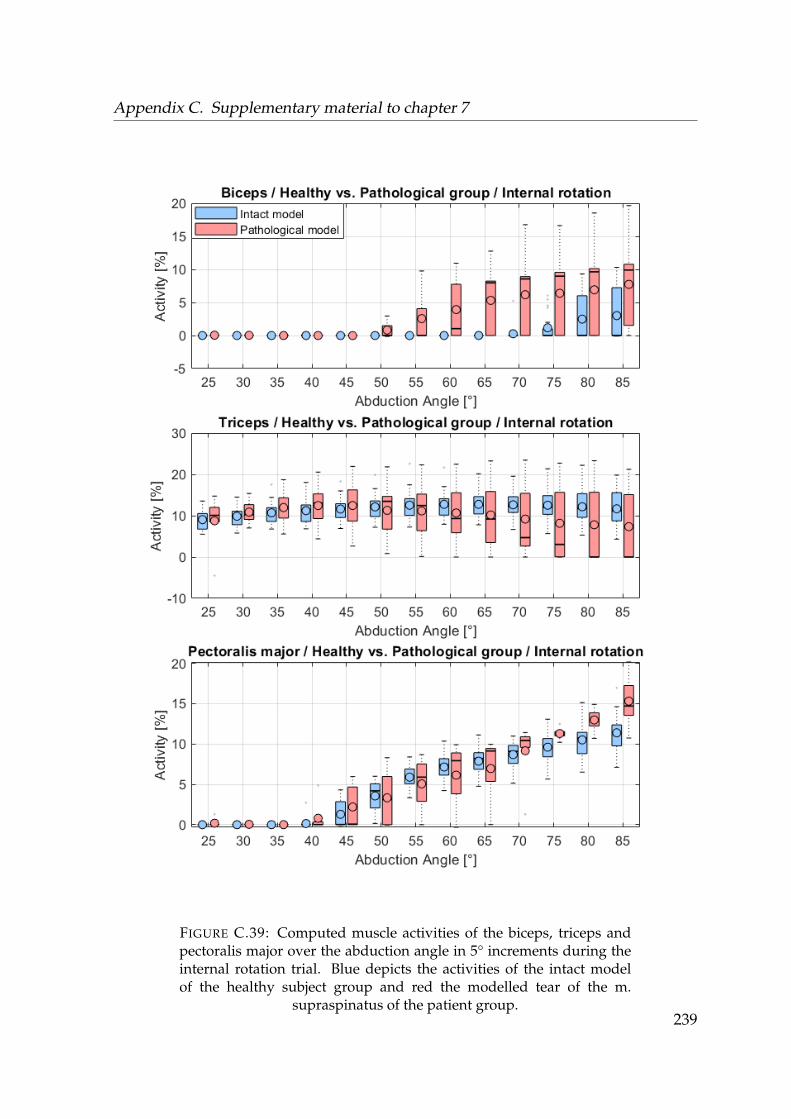
Appendix C. Supplementary material to chapter 7
FIGURE C.39: Computed muscle activities of the biceps, triceps andpectoralis major over the abduction angle in 5° increments during theinternal rotation trial. Blue depicts the activities of the intact modelof the healthy subject group and red the modelled tear of the m.
supraspinatus of the patient group.239

Appendix C. Supplementary material to chapter 7
External rotation
FIGURE C.40: Computed muscle activities of the anterior, posterior andlateral deltoids over the abduction angle in 5° increments during the ex-ternal rotation trial. Blue depicts the activities of the intact model of thehealthy subject group and red the modelled tear of the m. supraspina-
tus of the patient group.240
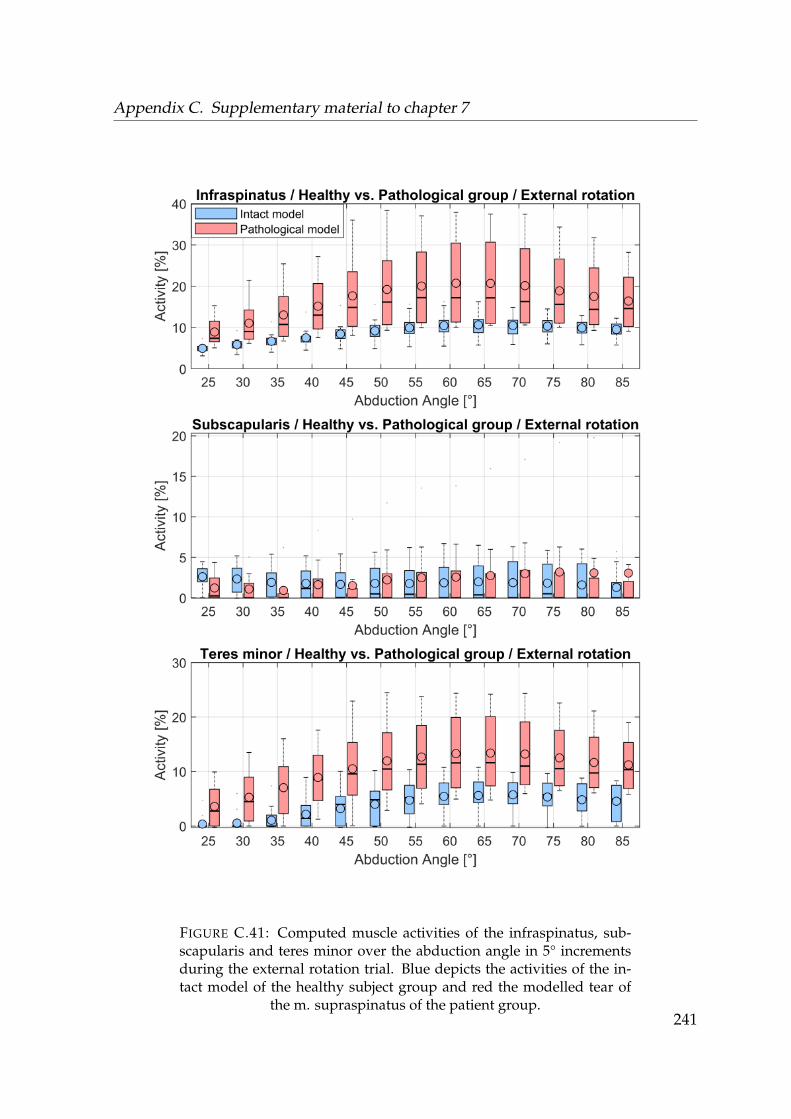
Appendix C. Supplementary material to chapter 7
FIGURE C.41: Computed muscle activities of the infraspinatus, sub-scapularis and teres minor over the abduction angle in 5° incrementsduring the external rotation trial. Blue depicts the activities of the in-tact model of the healthy subject group and red the modelled tear of
the m. supraspinatus of the patient group.241
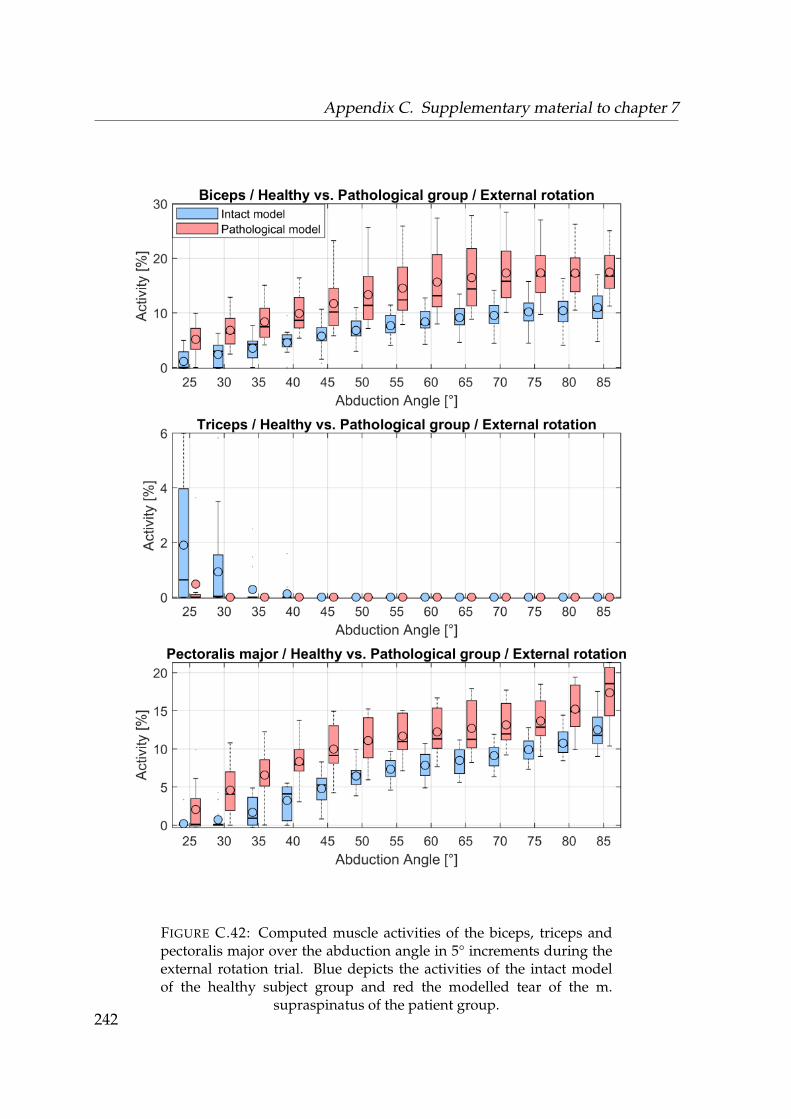
Appendix C. Supplementary material to chapter 7
FIGURE C.42: Computed muscle activities of the biceps, triceps andpectoralis major over the abduction angle in 5° increments during theexternal rotation trial. Blue depicts the activities of the intact modelof the healthy subject group and red the modelled tear of the m.
supraspinatus of the patient group.242
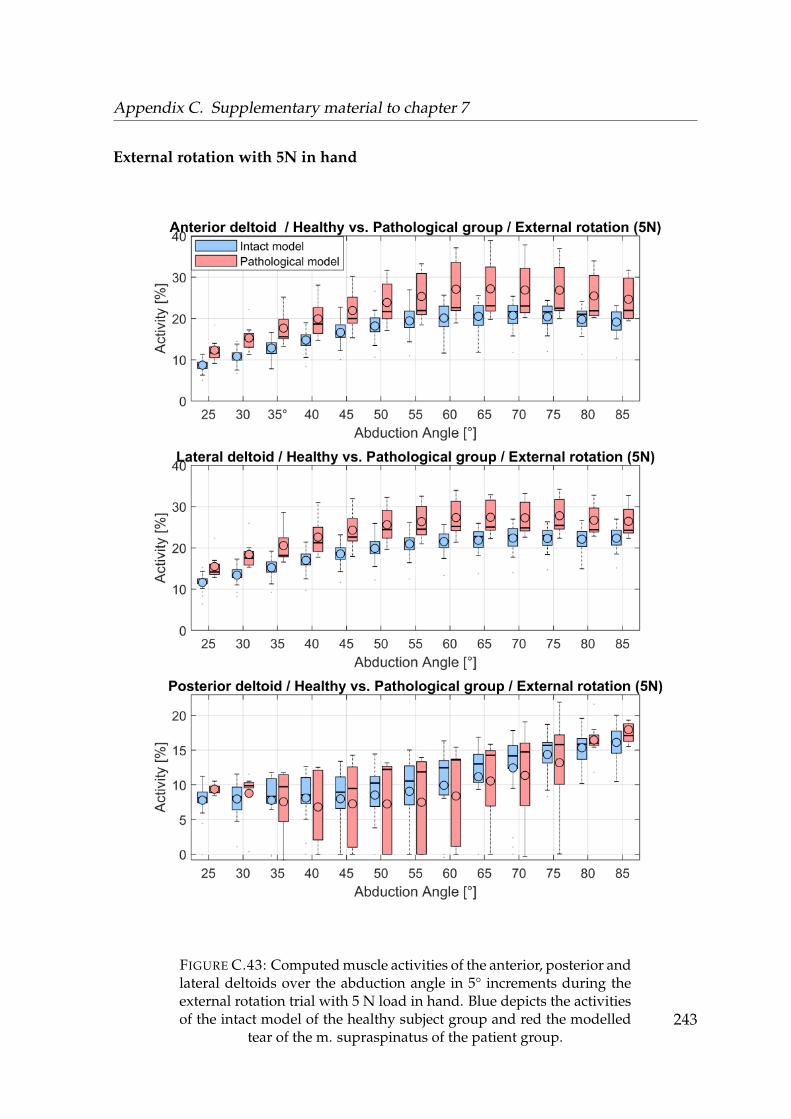
Appendix C. Supplementary material to chapter 7
External rotation with 5N in hand
FIGURE C.43: Computed muscle activities of the anterior, posterior andlateral deltoids over the abduction angle in 5° increments during theexternal rotation trial with 5 N load in hand. Blue depicts the activitiesof the intact model of the healthy subject group and red the modelled
tear of the m. supraspinatus of the patient group.243
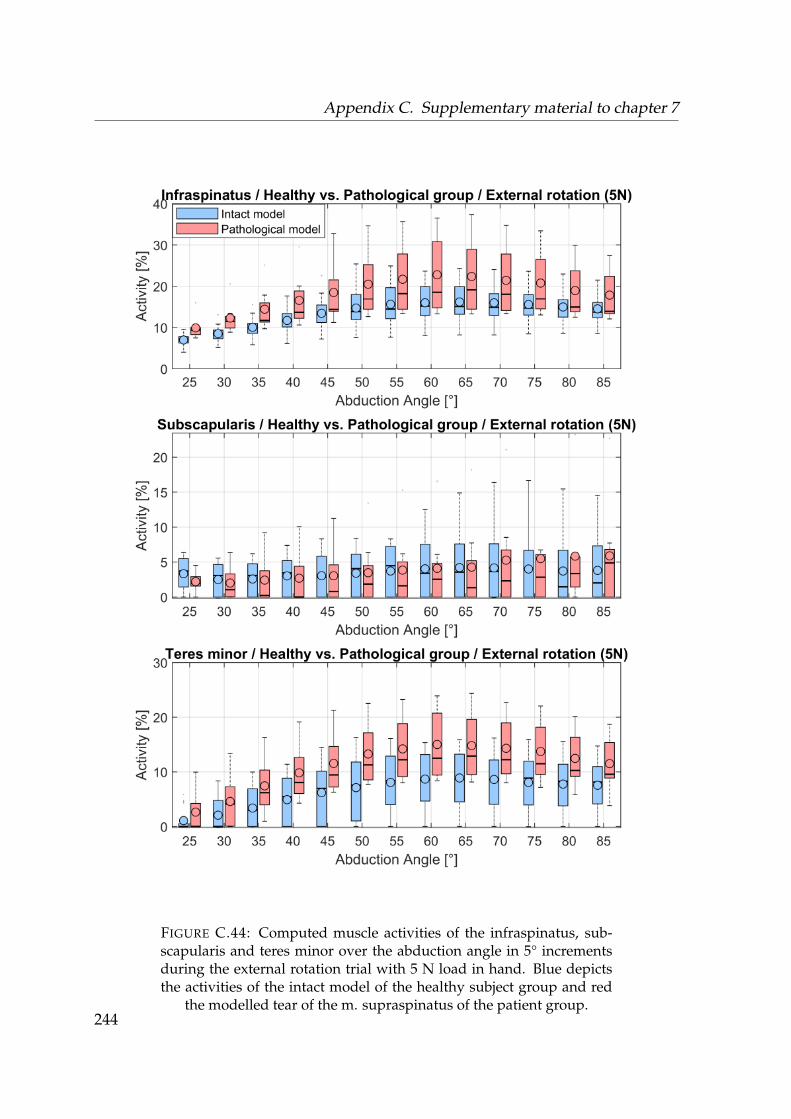
Appendix C. Supplementary material to chapter 7
FIGURE C.44: Computed muscle activities of the infraspinatus, sub-scapularis and teres minor over the abduction angle in 5° incrementsduring the external rotation trial with 5 N load in hand. Blue depictsthe activities of the intact model of the healthy subject group and red
the modelled tear of the m. supraspinatus of the patient group.244
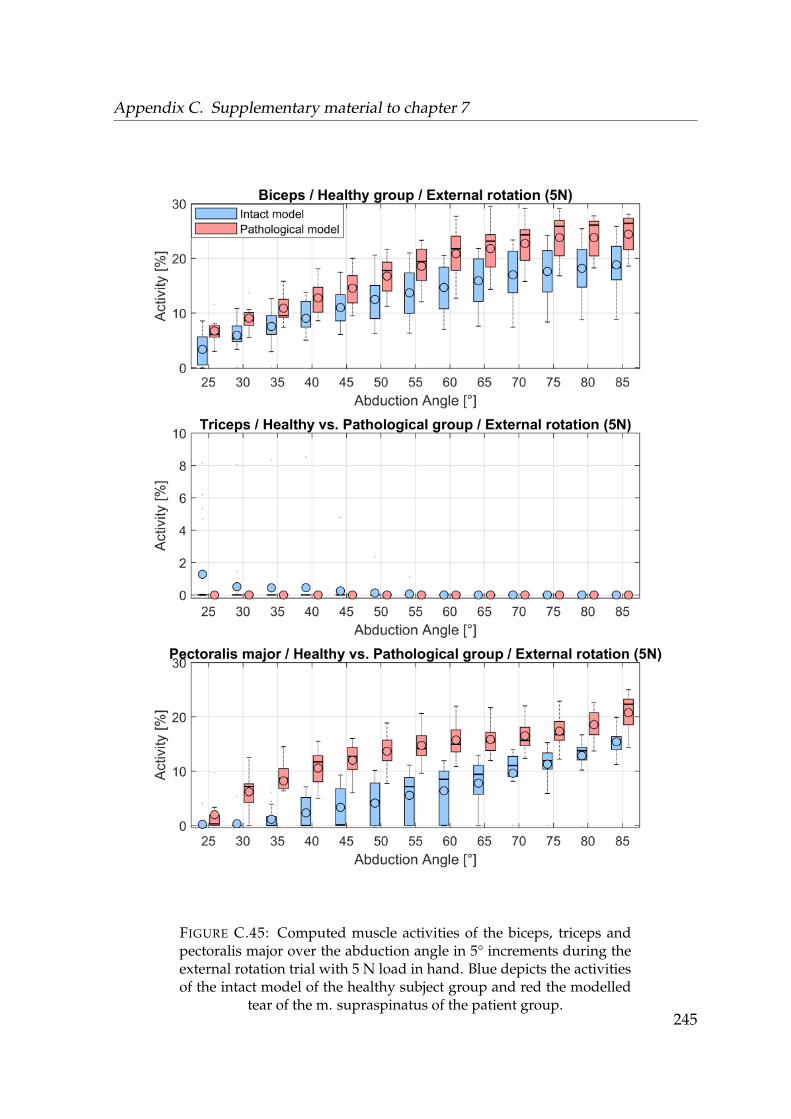
Appendix C. Supplementary material to chapter 7
FIGURE C.45: Computed muscle activities of the biceps, triceps andpectoralis major over the abduction angle in 5° increments during theexternal rotation trial with 5 N load in hand. Blue depicts the activitiesof the intact model of the healthy subject group and red the modelled
tear of the m. supraspinatus of the patient group.245

Appendix C. Supplementary material to chapter 7
246
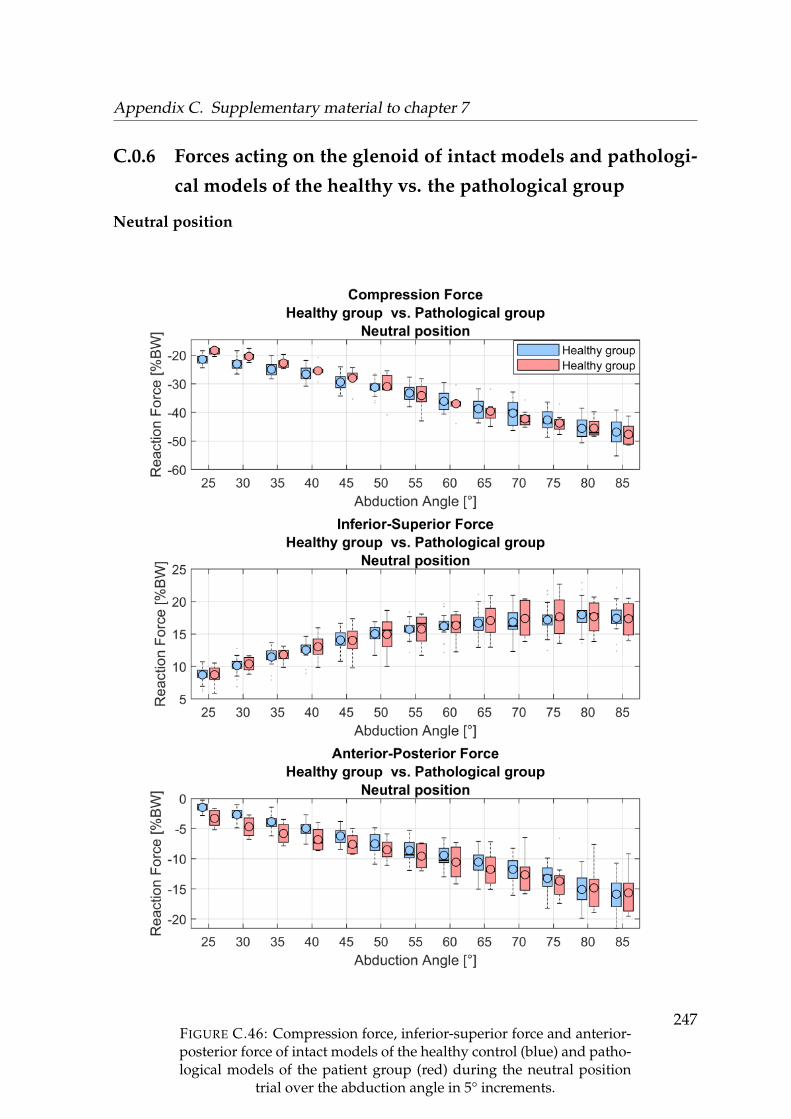
Appendix C. Supplementary material to chapter 7
C.0.6 Forces acting on the glenoid of intact models and pathologi-
cal models of the healthy vs. the pathological group
Neutral position
FIGURE C.46: Compression force, inferior-superior force and anterior-posterior force of intact models of the healthy control (blue) and patho-logical models of the patient group (red) during the neutral position
trial over the abduction angle in 5° increments.
247

Appendix C. Supplementary material to chapter 7
FIGURE C.47: Projected median GH joint reaction force of all mod-els onto the glenoid of intact models of the healthy subject cohort andpathological models of the patient group during the neutral positiontrial. Intact models of the healthy control (blue) and pathological mod-els of the patient group (red) with their starting value at 25° abduction
and the progression up to 85° abduction.
248

Appendix C. Supplementary material to chapter 7
Neutral position with 5N in hand
FIGURE C.48: Compression force, inferior-superior force and anterior-posterior force of intact models of the healthy control (blue) and patho-logical models of the patient group (red) during the neutral positiontrial with 5 N load in hand over the abduction angle in 5° increments. 249
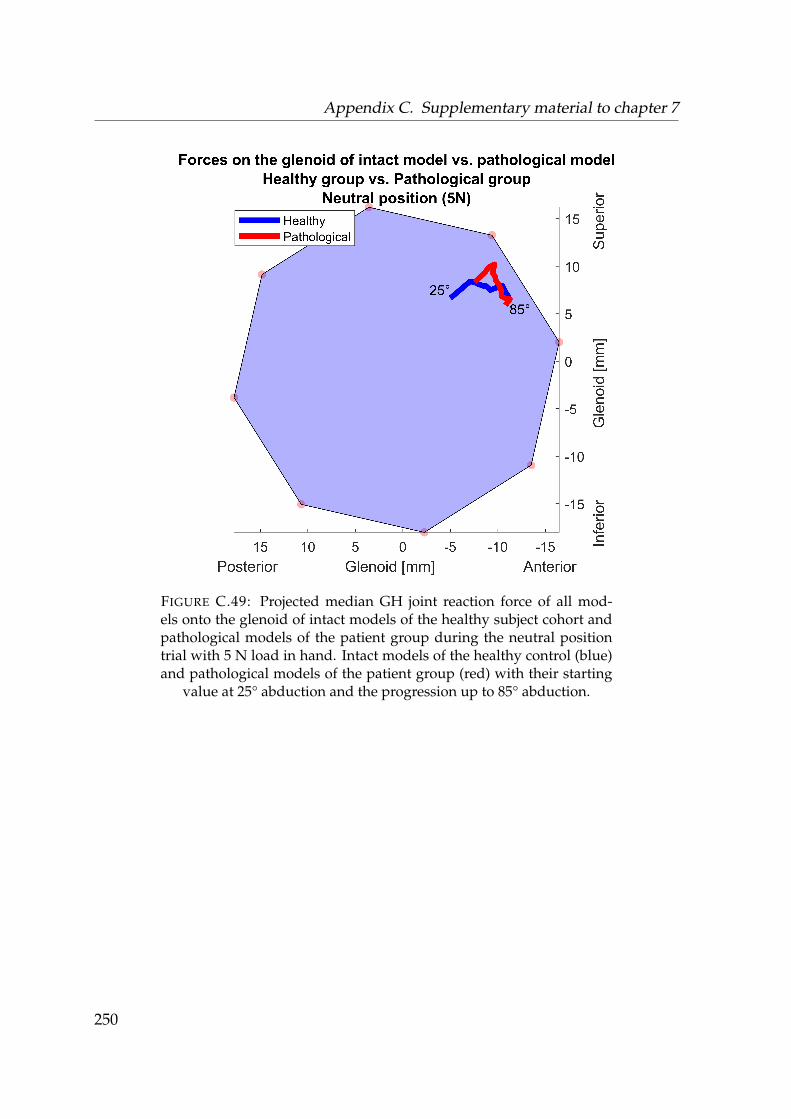
Appendix C. Supplementary material to chapter 7
FIGURE C.49: Projected median GH joint reaction force of all mod-els onto the glenoid of intact models of the healthy subject cohort andpathological models of the patient group during the neutral positiontrial with 5 N load in hand. Intact models of the healthy control (blue)and pathological models of the patient group (red) with their starting
value at 25° abduction and the progression up to 85° abduction.
250
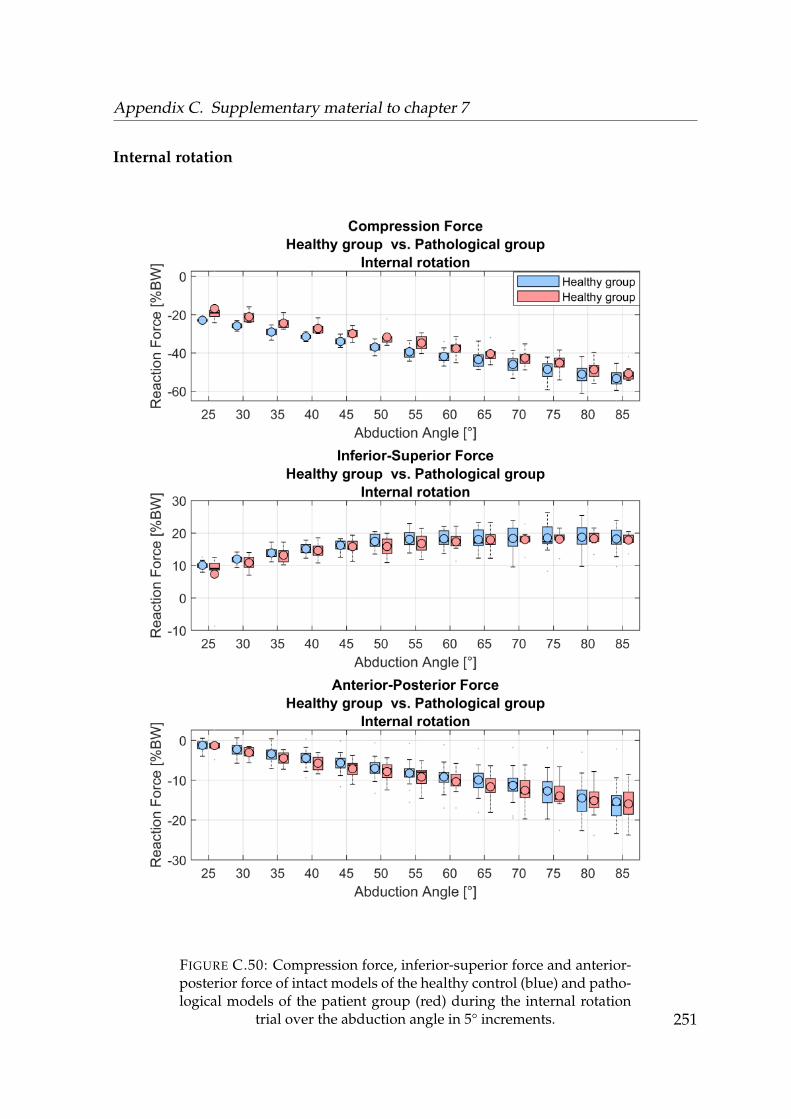
Appendix C. Supplementary material to chapter 7
Internal rotation
FIGURE C.50: Compression force, inferior-superior force and anterior-posterior force of intact models of the healthy control (blue) and patho-logical models of the patient group (red) during the internal rotation
trial over the abduction angle in 5° increments. 251
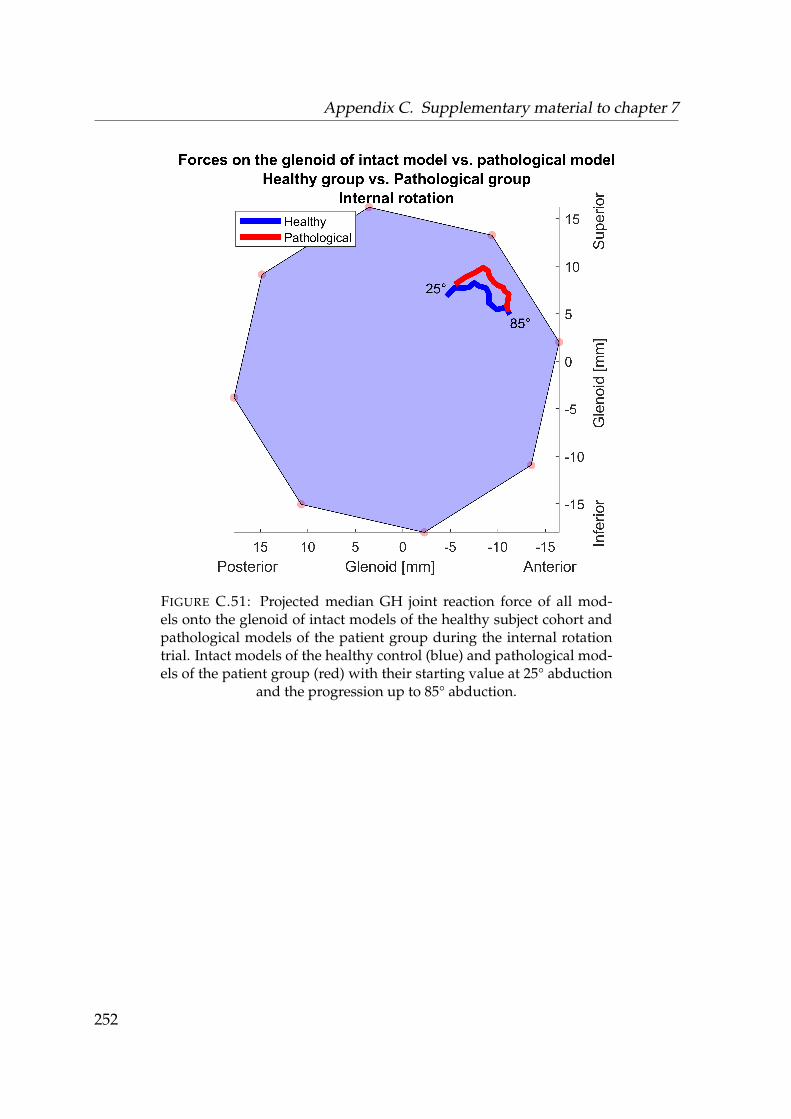
Appendix C. Supplementary material to chapter 7
FIGURE C.51: Projected median GH joint reaction force of all mod-els onto the glenoid of intact models of the healthy subject cohort andpathological models of the patient group during the internal rotationtrial. Intact models of the healthy control (blue) and pathological mod-els of the patient group (red) with their starting value at 25° abduction
and the progression up to 85° abduction.
252
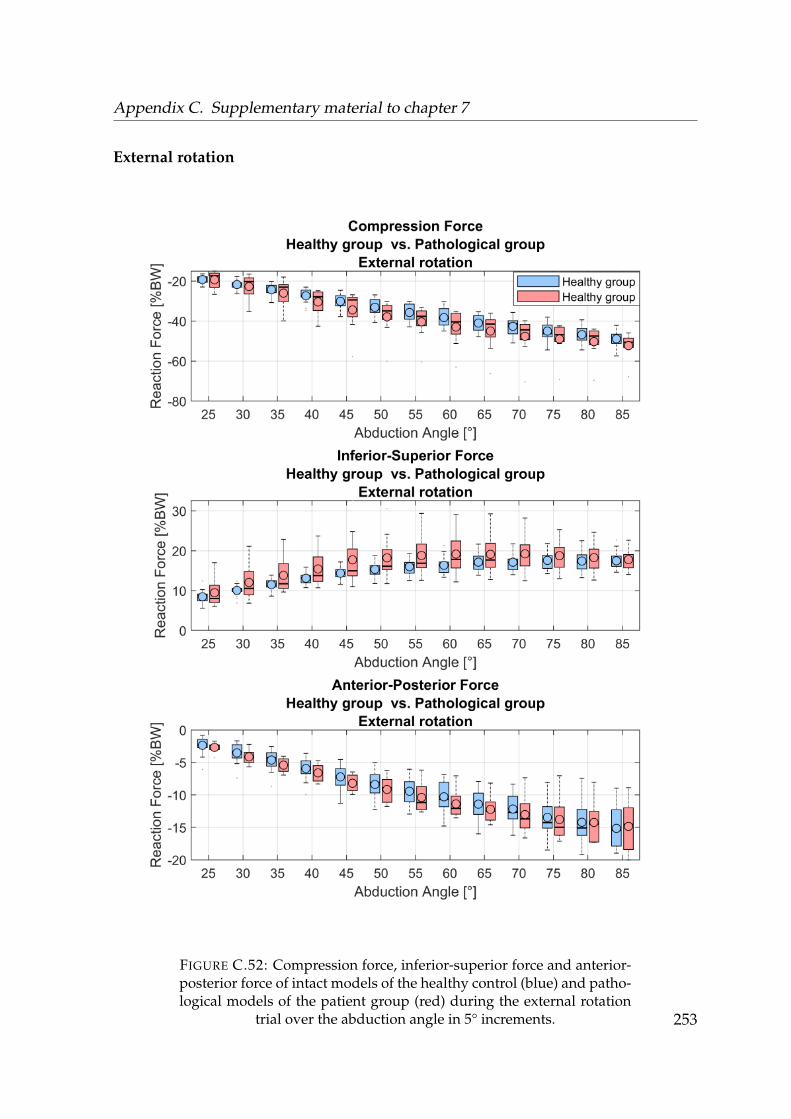
Appendix C. Supplementary material to chapter 7
External rotation
FIGURE C.52: Compression force, inferior-superior force and anterior-posterior force of intact models of the healthy control (blue) and patho-logical models of the patient group (red) during the external rotation
trial over the abduction angle in 5° increments. 253
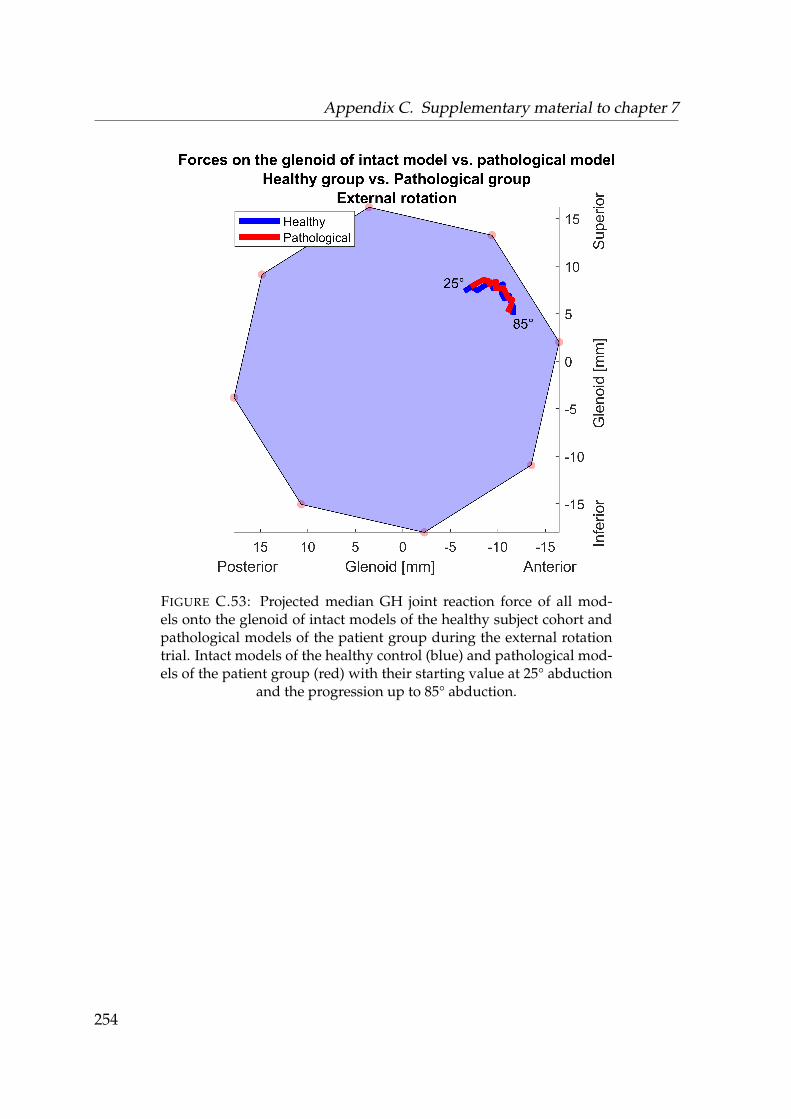
Appendix C. Supplementary material to chapter 7
FIGURE C.53: Projected median GH joint reaction force of all mod-els onto the glenoid of intact models of the healthy subject cohort andpathological models of the patient group during the external rotationtrial. Intact models of the healthy control (blue) and pathological mod-els of the patient group (red) with their starting value at 25° abduction
and the progression up to 85° abduction.
254
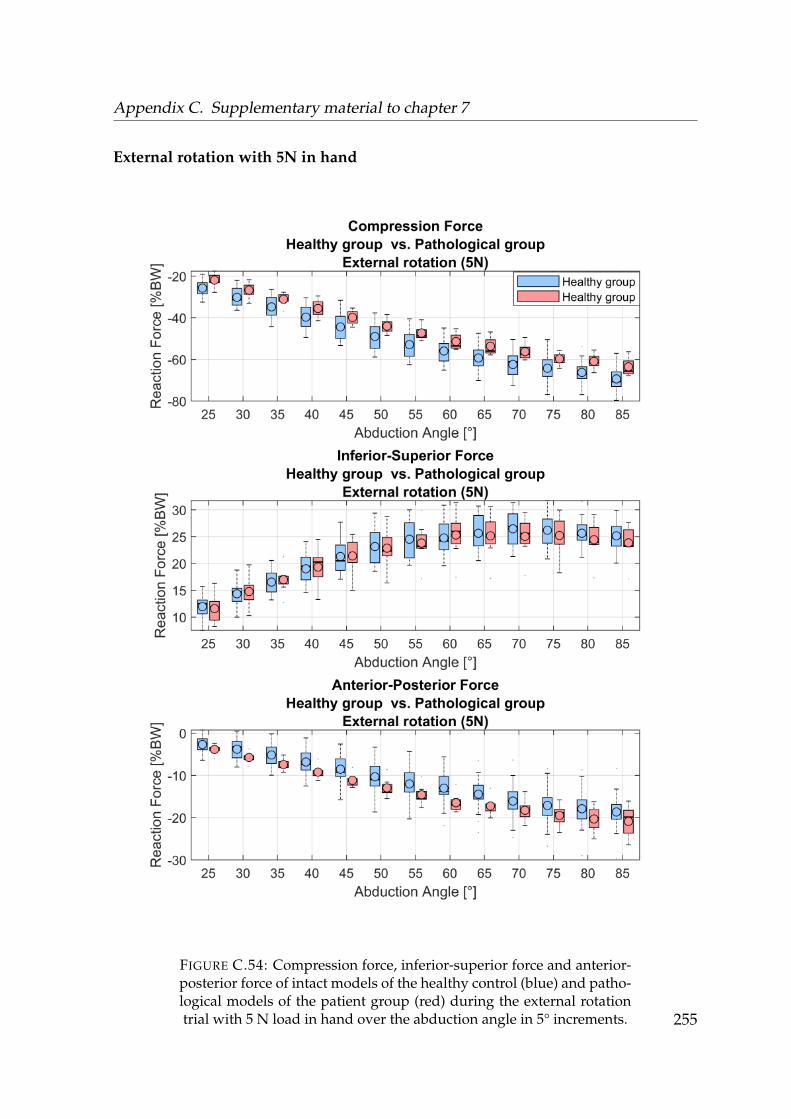
Appendix C. Supplementary material to chapter 7
External rotation with 5N in hand
FIGURE C.54: Compression force, inferior-superior force and anterior-posterior force of intact models of the healthy control (blue) and patho-logical models of the patient group (red) during the external rotationtrial with 5 N load in hand over the abduction angle in 5° increments. 255
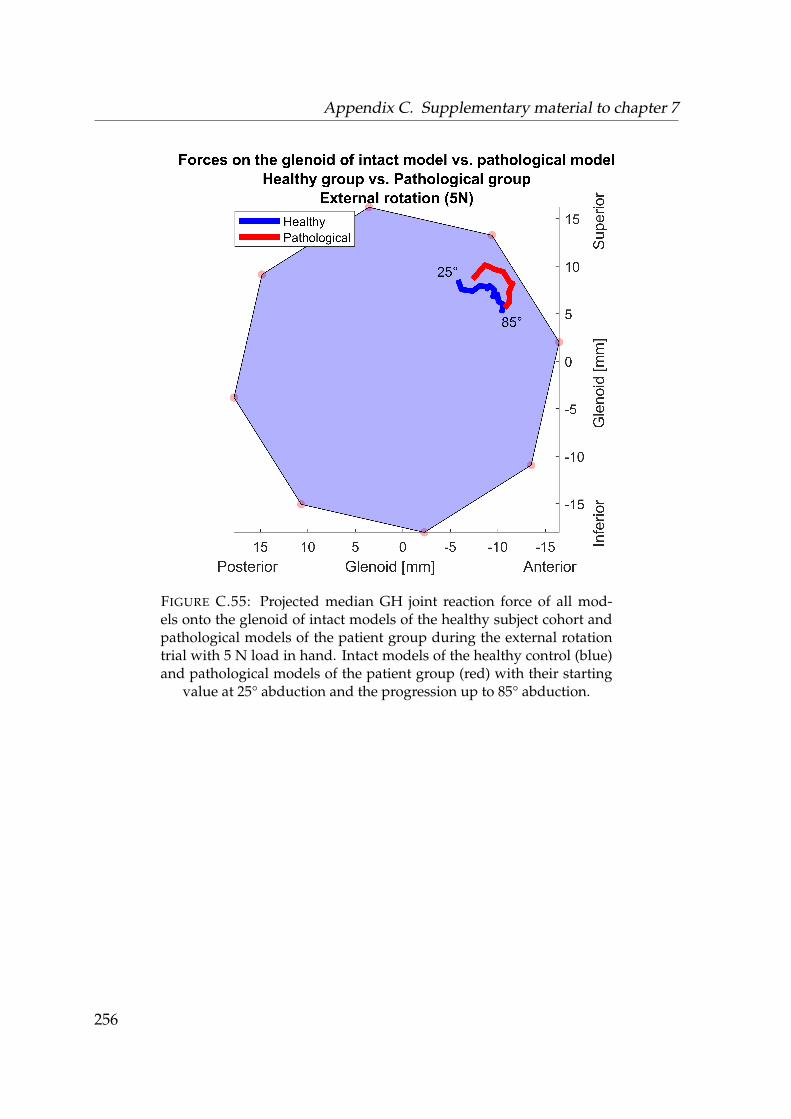
Appendix C. Supplementary material to chapter 7
FIGURE C.55: Projected median GH joint reaction force of all mod-els onto the glenoid of intact models of the healthy subject cohort andpathological models of the patient group during the external rotationtrial with 5 N load in hand. Intact models of the healthy control (blue)and pathological models of the patient group (red) with their starting
value at 25° abduction and the progression up to 85° abduction.
256
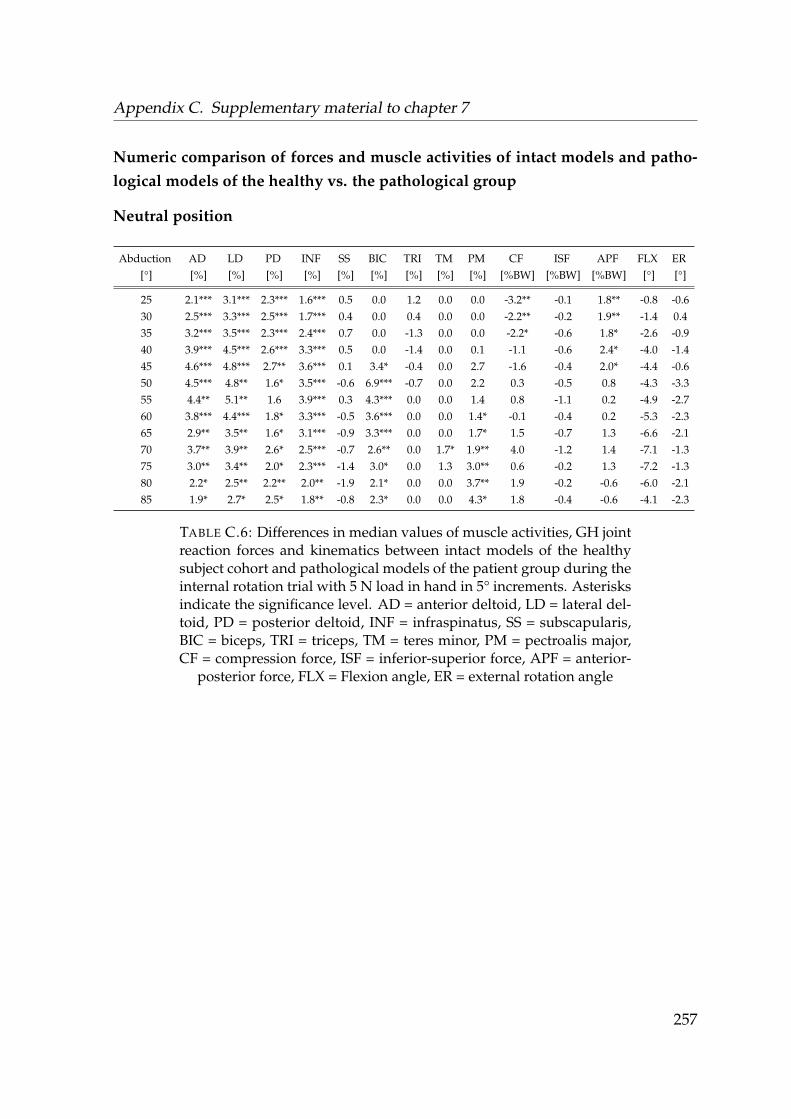
Appendix C. Supplementary material to chapter 7
Numeric comparison of forces and muscle activities of intact models and patho-logical models of the healthy vs. the pathological group
Neutral position
Abduction AD LD PD INF SS BIC TRI TM PM CF ISF APF FLX ER[°] [%] [%] [%] [%] [%] [%] [%] [%] [%] [%BW] [%BW] [%BW] [°] [°]
25 2.1*** 3.1*** 2.3*** 1.6*** 0.5 0.0 1.2 0.0 0.0 -3.2** -0.1 1.8** -0.8 -0.630 2.5*** 3.3*** 2.5*** 1.7*** 0.4 0.0 0.4 0.0 0.0 -2.2** -0.2 1.9** -1.4 0.435 3.2*** 3.5*** 2.3*** 2.4*** 0.7 0.0 -1.3 0.0 0.0 -2.2* -0.6 1.8* -2.6 -0.940 3.9*** 4.5*** 2.6*** 3.3*** 0.5 0.0 -1.4 0.0 0.1 -1.1 -0.6 2.4* -4.0 -1.445 4.6*** 4.8*** 2.7** 3.6*** 0.1 3.4* -0.4 0.0 2.7 -1.6 -0.4 2.0* -4.4 -0.650 4.5*** 4.8** 1.6* 3.5*** -0.6 6.9*** -0.7 0.0 2.2 0.3 -0.5 0.8 -4.3 -3.355 4.4** 5.1** 1.6 3.9*** 0.3 4.3*** 0.0 0.0 1.4 0.8 -1.1 0.2 -4.9 -2.760 3.8*** 4.4*** 1.8* 3.3*** -0.5 3.6*** 0.0 0.0 1.4* -0.1 -0.4 0.2 -5.3 -2.365 2.9** 3.5** 1.6* 3.1*** -0.9 3.3*** 0.0 0.0 1.7* 1.5 -0.7 1.3 -6.6 -2.170 3.7** 3.9** 2.6* 2.5*** -0.7 2.6** 0.0 1.7* 1.9** 4.0 -1.2 1.4 -7.1 -1.375 3.0** 3.4** 2.0* 2.3*** -1.4 3.0* 0.0 1.3 3.0** 0.6 -0.2 1.3 -7.2 -1.380 2.2* 2.5** 2.2** 2.0** -1.9 2.1* 0.0 0.0 3.7** 1.9 -0.2 -0.6 -6.0 -2.185 1.9* 2.7* 2.5* 1.8** -0.8 2.3* 0.0 0.0 4.3* 1.8 -0.4 -0.6 -4.1 -2.3
TABLE C.6: Differences in median values of muscle activities, GH jointreaction forces and kinematics between intact models of the healthysubject cohort and pathological models of the patient group during theinternal rotation trial with 5 N load in hand in 5° increments. Asterisksindicate the significance level. AD = anterior deltoid, LD = lateral del-toid, PD = posterior deltoid, INF = infraspinatus, SS = subscapularis,BIC = biceps, TRI = triceps, TM = teres minor, PM = pectroalis major,CF = compression force, ISF = inferior-superior force, APF = anterior-
posterior force, FLX = Flexion angle, ER = external rotation angle
257
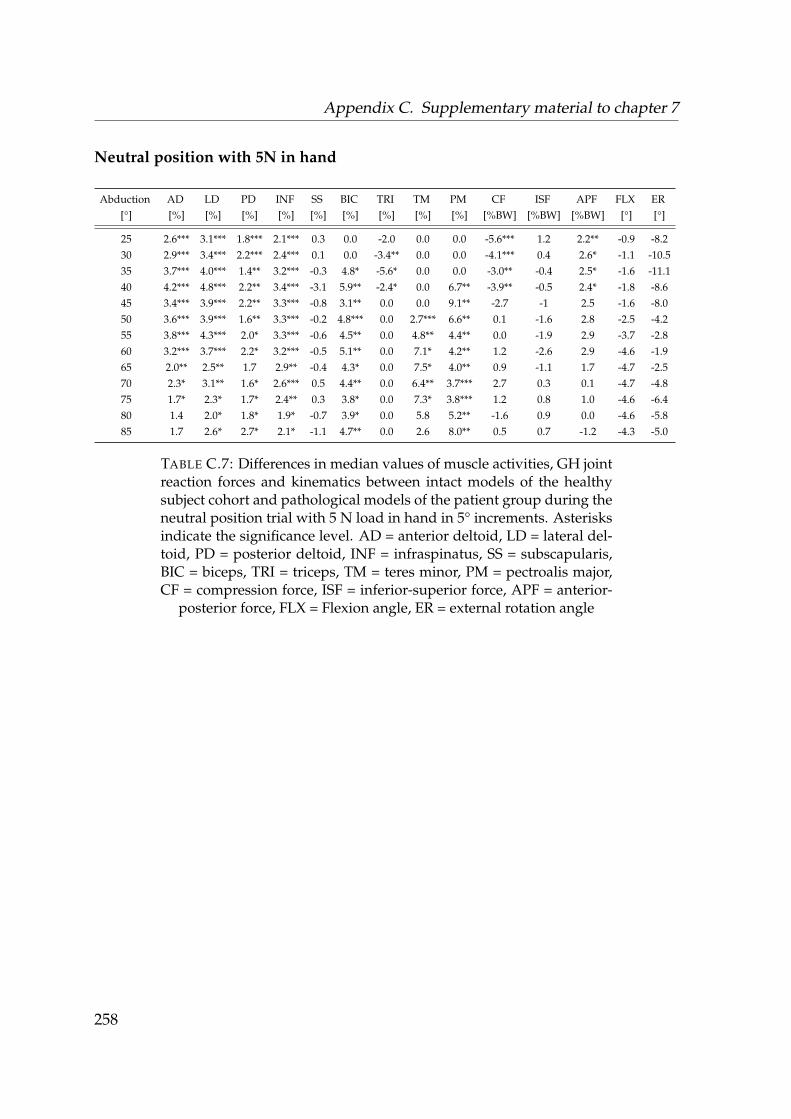
Appendix C. Supplementary material to chapter 7
Neutral position with 5N in hand
Abduction AD LD PD INF SS BIC TRI TM PM CF ISF APF FLX ER[°] [%] [%] [%] [%] [%] [%] [%] [%] [%] [%BW] [%BW] [%BW] [°] [°]
25 2.6*** 3.1*** 1.8*** 2.1*** 0.3 0.0 -2.0 0.0 0.0 -5.6*** 1.2 2.2** -0.9 -8.230 2.9*** 3.4*** 2.2*** 2.4*** 0.1 0.0 -3.4** 0.0 0.0 -4.1*** 0.4 2.6* -1.1 -10.535 3.7*** 4.0*** 1.4** 3.2*** -0.3 4.8* -5.6* 0.0 0.0 -3.0** -0.4 2.5* -1.6 -11.140 4.2*** 4.8*** 2.2** 3.4*** -3.1 5.9** -2.4* 0.0 6.7** -3.9** -0.5 2.4* -1.8 -8.645 3.4*** 3.9*** 2.2** 3.3*** -0.8 3.1** 0.0 0.0 9.1** -2.7 -1 2.5 -1.6 -8.050 3.6*** 3.9*** 1.6** 3.3*** -0.2 4.8*** 0.0 2.7*** 6.6** 0.1 -1.6 2.8 -2.5 -4.255 3.8*** 4.3*** 2.0* 3.3*** -0.6 4.5** 0.0 4.8** 4.4** 0.0 -1.9 2.9 -3.7 -2.860 3.2*** 3.7*** 2.2* 3.2*** -0.5 5.1** 0.0 7.1* 4.2** 1.2 -2.6 2.9 -4.6 -1.965 2.0** 2.5** 1.7 2.9** -0.4 4.3* 0.0 7.5* 4.0** 0.9 -1.1 1.7 -4.7 -2.570 2.3* 3.1** 1.6* 2.6*** 0.5 4.4** 0.0 6.4** 3.7*** 2.7 0.3 0.1 -4.7 -4.875 1.7* 2.3* 1.7* 2.4** 0.3 3.8* 0.0 7.3* 3.8*** 1.2 0.8 1.0 -4.6 -6.480 1.4 2.0* 1.8* 1.9* -0.7 3.9* 0.0 5.8 5.2** -1.6 0.9 0.0 -4.6 -5.885 1.7 2.6* 2.7* 2.1* -1.1 4.7** 0.0 2.6 8.0** 0.5 0.7 -1.2 -4.3 -5.0
TABLE C.7: Differences in median values of muscle activities, GH jointreaction forces and kinematics between intact models of the healthysubject cohort and pathological models of the patient group during theneutral position trial with 5 N load in hand in 5° increments. Asterisksindicate the significance level. AD = anterior deltoid, LD = lateral del-toid, PD = posterior deltoid, INF = infraspinatus, SS = subscapularis,BIC = biceps, TRI = triceps, TM = teres minor, PM = pectroalis major,CF = compression force, ISF = inferior-superior force, APF = anterior-
posterior force, FLX = Flexion angle, ER = external rotation angle
258
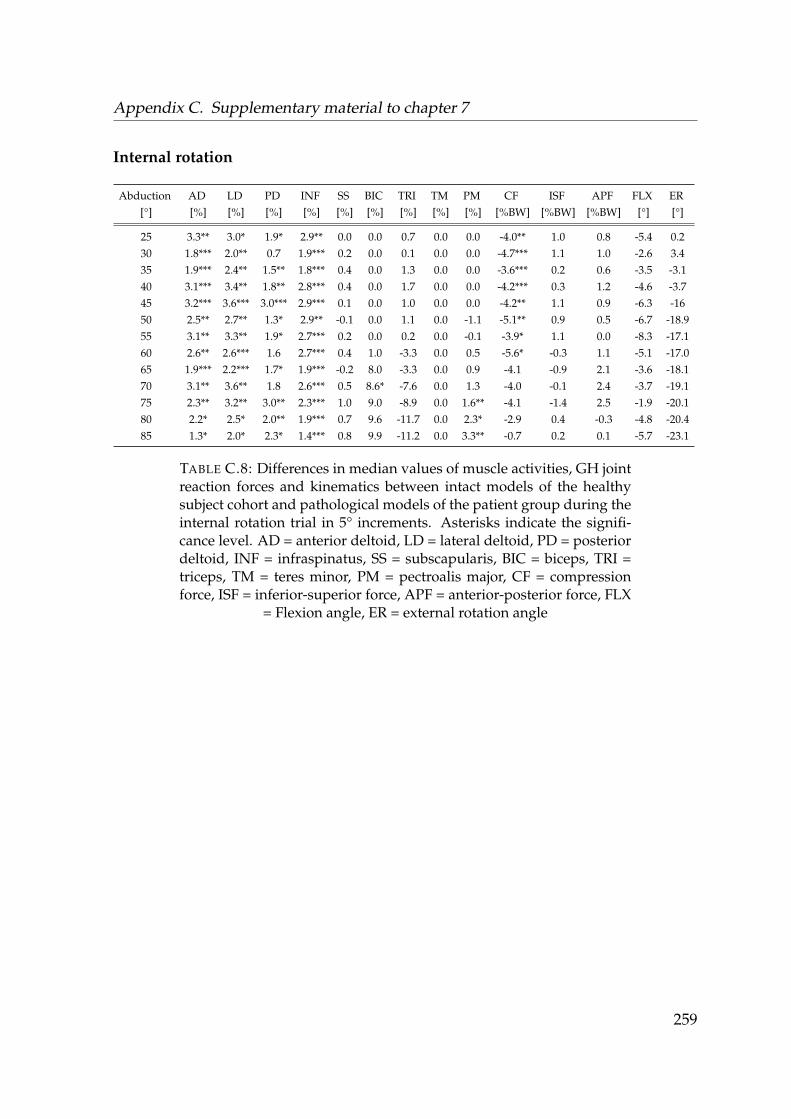
Appendix C. Supplementary material to chapter 7
Internal rotation
Abduction AD LD PD INF SS BIC TRI TM PM CF ISF APF FLX ER[°] [%] [%] [%] [%] [%] [%] [%] [%] [%] [%BW] [%BW] [%BW] [°] [°]
25 3.3** 3.0* 1.9* 2.9** 0.0 0.0 0.7 0.0 0.0 -4.0** 1.0 0.8 -5.4 0.230 1.8*** 2.0** 0.7 1.9*** 0.2 0.0 0.1 0.0 0.0 -4.7*** 1.1 1.0 -2.6 3.435 1.9*** 2.4** 1.5** 1.8*** 0.4 0.0 1.3 0.0 0.0 -3.6*** 0.2 0.6 -3.5 -3.140 3.1*** 3.4** 1.8** 2.8*** 0.4 0.0 1.7 0.0 0.0 -4.2*** 0.3 1.2 -4.6 -3.745 3.2*** 3.6*** 3.0*** 2.9*** 0.1 0.0 1.0 0.0 0.0 -4.2** 1.1 0.9 -6.3 -1650 2.5** 2.7** 1.3* 2.9** -0.1 0.0 1.1 0.0 -1.1 -5.1** 0.9 0.5 -6.7 -18.955 3.1** 3.3** 1.9* 2.7*** 0.2 0.0 0.2 0.0 -0.1 -3.9* 1.1 0.0 -8.3 -17.160 2.6** 2.6*** 1.6 2.7*** 0.4 1.0 -3.3 0.0 0.5 -5.6* -0.3 1.1 -5.1 -17.065 1.9*** 2.2*** 1.7* 1.9*** -0.2 8.0 -3.3 0.0 0.9 -4.1 -0.9 2.1 -3.6 -18.170 3.1** 3.6** 1.8 2.6*** 0.5 8.6* -7.6 0.0 1.3 -4.0 -0.1 2.4 -3.7 -19.175 2.3** 3.2** 3.0** 2.3*** 1.0 9.0 -8.9 0.0 1.6** -4.1 -1.4 2.5 -1.9 -20.180 2.2* 2.5* 2.0** 1.9*** 0.7 9.6 -11.7 0.0 2.3* -2.9 0.4 -0.3 -4.8 -20.485 1.3* 2.0* 2.3* 1.4*** 0.8 9.9 -11.2 0.0 3.3** -0.7 0.2 0.1 -5.7 -23.1
TABLE C.8: Differences in median values of muscle activities, GH jointreaction forces and kinematics between intact models of the healthysubject cohort and pathological models of the patient group during theinternal rotation trial in 5° increments. Asterisks indicate the signifi-cance level. AD = anterior deltoid, LD = lateral deltoid, PD = posteriordeltoid, INF = infraspinatus, SS = subscapularis, BIC = biceps, TRI =triceps, TM = teres minor, PM = pectroalis major, CF = compressionforce, ISF = inferior-superior force, APF = anterior-posterior force, FLX
= Flexion angle, ER = external rotation angle
259
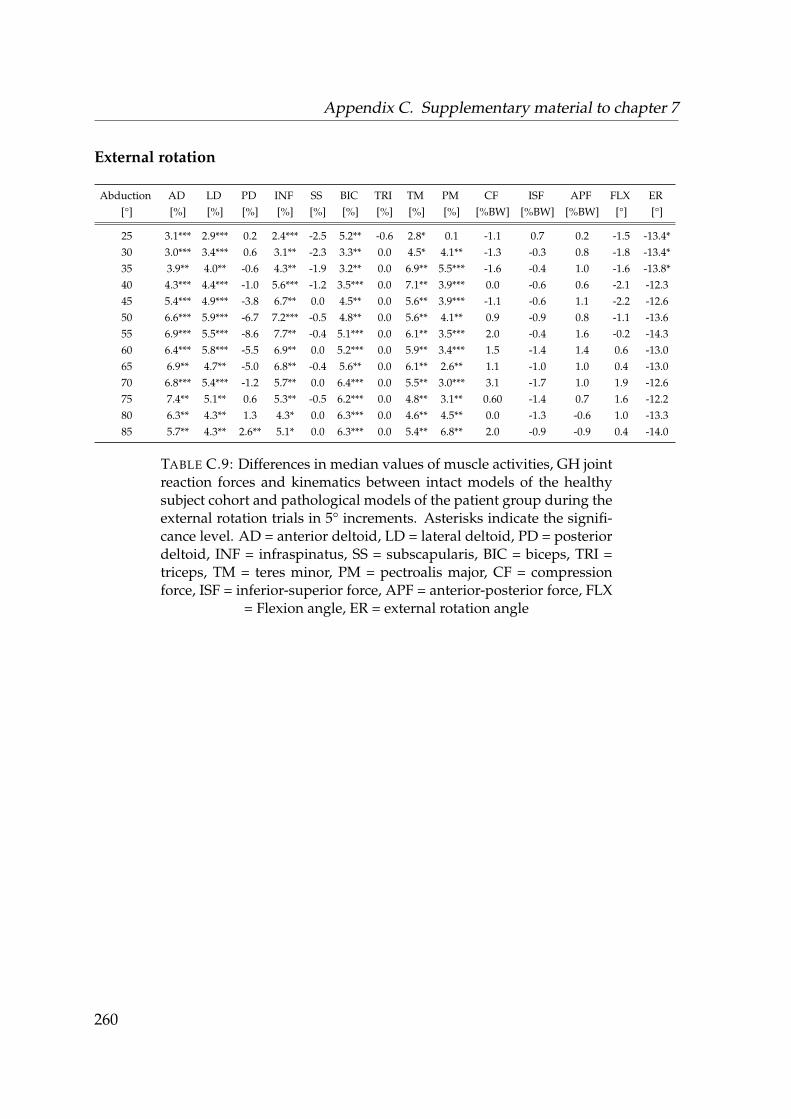
Appendix C. Supplementary material to chapter 7
External rotation
Abduction AD LD PD INF SS BIC TRI TM PM CF ISF APF FLX ER[°] [%] [%] [%] [%] [%] [%] [%] [%] [%] [%BW] [%BW] [%BW] [°] [°]
25 3.1*** 2.9*** 0.2 2.4*** -2.5 5.2** -0.6 2.8* 0.1 -1.1 0.7 0.2 -1.5 -13.4*30 3.0*** 3.4*** 0.6 3.1** -2.3 3.3** 0.0 4.5* 4.1** -1.3 -0.3 0.8 -1.8 -13.4*35 3.9** 4.0** -0.6 4.3** -1.9 3.2** 0.0 6.9** 5.5*** -1.6 -0.4 1.0 -1.6 -13.8*40 4.3*** 4.4*** -1.0 5.6*** -1.2 3.5*** 0.0 7.1** 3.9*** 0.0 -0.6 0.6 -2.1 -12.345 5.4*** 4.9*** -3.8 6.7** 0.0 4.5** 0.0 5.6** 3.9*** -1.1 -0.6 1.1 -2.2 -12.650 6.6*** 5.9*** -6.7 7.2*** -0.5 4.8** 0.0 5.6** 4.1** 0.9 -0.9 0.8 -1.1 -13.655 6.9*** 5.5*** -8.6 7.7** -0.4 5.1*** 0.0 6.1** 3.5*** 2.0 -0.4 1.6 -0.2 -14.360 6.4*** 5.8*** -5.5 6.9** 0.0 5.2*** 0.0 5.9** 3.4*** 1.5 -1.4 1.4 0.6 -13.065 6.9** 4.7** -5.0 6.8** -0.4 5.6** 0.0 6.1** 2.6** 1.1 -1.0 1.0 0.4 -13.070 6.8*** 5.4*** -1.2 5.7** 0.0 6.4*** 0.0 5.5** 3.0*** 3.1 -1.7 1.0 1.9 -12.675 7.4** 5.1** 0.6 5.3** -0.5 6.2*** 0.0 4.8** 3.1** 0.60 -1.4 0.7 1.6 -12.280 6.3** 4.3** 1.3 4.3* 0.0 6.3*** 0.0 4.6** 4.5** 0.0 -1.3 -0.6 1.0 -13.385 5.7** 4.3** 2.6** 5.1* 0.0 6.3*** 0.0 5.4** 6.8** 2.0 -0.9 -0.9 0.4 -14.0
TABLE C.9: Differences in median values of muscle activities, GH jointreaction forces and kinematics between intact models of the healthysubject cohort and pathological models of the patient group during theexternal rotation trials in 5° increments. Asterisks indicate the signifi-cance level. AD = anterior deltoid, LD = lateral deltoid, PD = posteriordeltoid, INF = infraspinatus, SS = subscapularis, BIC = biceps, TRI =triceps, TM = teres minor, PM = pectroalis major, CF = compressionforce, ISF = inferior-superior force, APF = anterior-posterior force, FLX
= Flexion angle, ER = external rotation angle
260
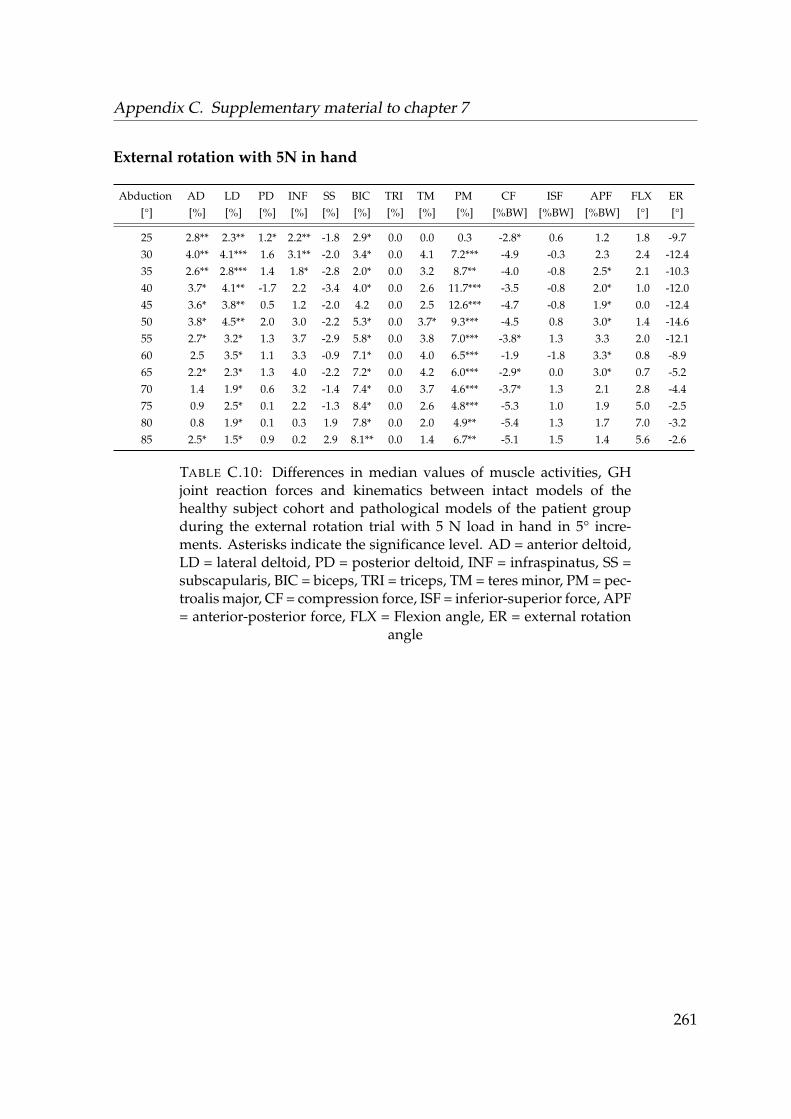
Appendix C. Supplementary material to chapter 7
External rotation with 5N in hand
Abduction AD LD PD INF SS BIC TRI TM PM CF ISF APF FLX ER[°] [%] [%] [%] [%] [%] [%] [%] [%] [%] [%BW] [%BW] [%BW] [°] [°]
25 2.8** 2.3** 1.2* 2.2** -1.8 2.9* 0.0 0.0 0.3 -2.8* 0.6 1.2 1.8 -9.730 4.0** 4.1*** 1.6 3.1** -2.0 3.4* 0.0 4.1 7.2*** -4.9 -0.3 2.3 2.4 -12.435 2.6** 2.8*** 1.4 1.8* -2.8 2.0* 0.0 3.2 8.7** -4.0 -0.8 2.5* 2.1 -10.340 3.7* 4.1** -1.7 2.2 -3.4 4.0* 0.0 2.6 11.7*** -3.5 -0.8 2.0* 1.0 -12.045 3.6* 3.8** 0.5 1.2 -2.0 4.2 0.0 2.5 12.6*** -4.7 -0.8 1.9* 0.0 -12.450 3.8* 4.5** 2.0 3.0 -2.2 5.3* 0.0 3.7* 9.3*** -4.5 0.8 3.0* 1.4 -14.655 2.7* 3.2* 1.3 3.7 -2.9 5.8* 0.0 3.8 7.0*** -3.8* 1.3 3.3 2.0 -12.160 2.5 3.5* 1.1 3.3 -0.9 7.1* 0.0 4.0 6.5*** -1.9 -1.8 3.3* 0.8 -8.965 2.2* 2.3* 1.3 4.0 -2.2 7.2* 0.0 4.2 6.0*** -2.9* 0.0 3.0* 0.7 -5.270 1.4 1.9* 0.6 3.2 -1.4 7.4* 0.0 3.7 4.6*** -3.7* 1.3 2.1 2.8 -4.475 0.9 2.5* 0.1 2.2 -1.3 8.4* 0.0 2.6 4.8*** -5.3 1.0 1.9 5.0 -2.580 0.8 1.9* 0.1 0.3 1.9 7.8* 0.0 2.0 4.9** -5.4 1.3 1.7 7.0 -3.285 2.5* 1.5* 0.9 0.2 2.9 8.1** 0.0 1.4 6.7** -5.1 1.5 1.4 5.6 -2.6
TABLE C.10: Differences in median values of muscle activities, GHjoint reaction forces and kinematics between intact models of thehealthy subject cohort and pathological models of the patient groupduring the external rotation trial with 5 N load in hand in 5° incre-ments. Asterisks indicate the significance level. AD = anterior deltoid,LD = lateral deltoid, PD = posterior deltoid, INF = infraspinatus, SS =subscapularis, BIC = biceps, TRI = triceps, TM = teres minor, PM = pec-troalis major, CF = compression force, ISF = inferior-superior force, APF= anterior-posterior force, FLX = Flexion angle, ER = external rotation
angle
261

Appendix C. Supplementary material to chapter 7
262
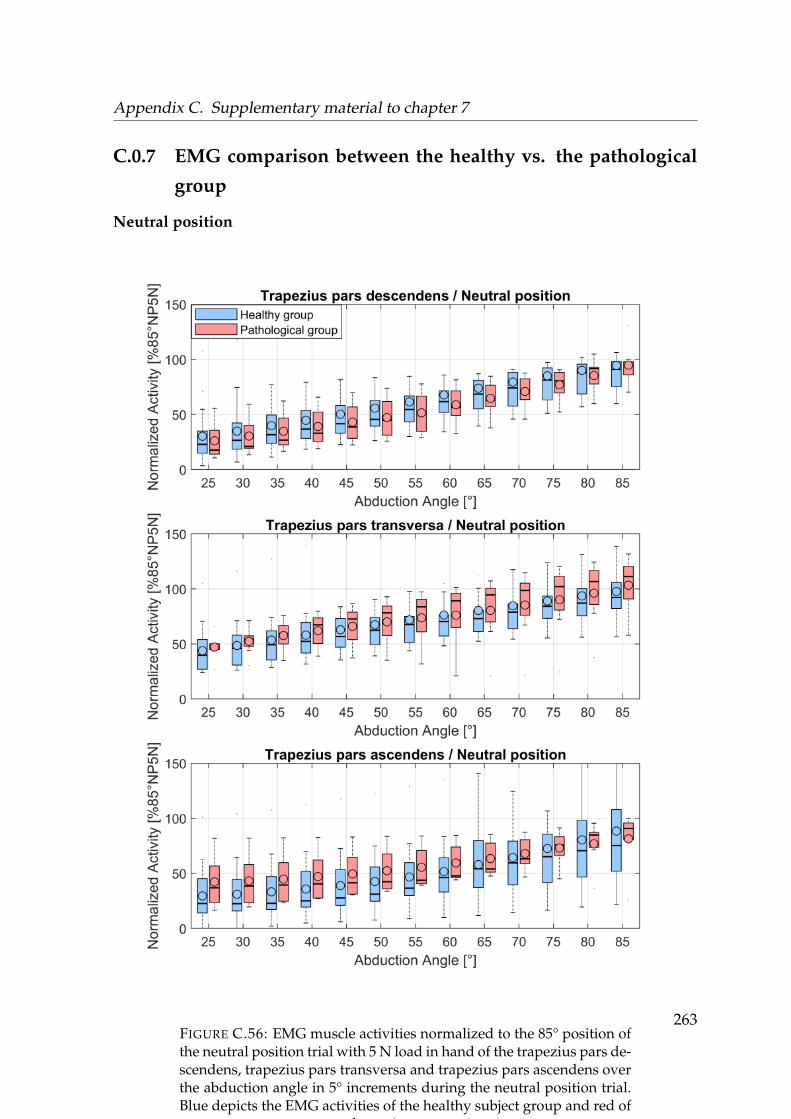
Appendix C. Supplementary material to chapter 7
C.0.7 EMG comparison between the healthy vs. the pathological
group
Neutral position
FIGURE C.56: EMG muscle activities normalized to the 85° position ofthe neutral position trial with 5 N load in hand of the trapezius pars de-scendens, trapezius pars transversa and trapezius pars ascendens overthe abduction angle in 5° increments during the neutral position trial.Blue depicts the EMG activities of the healthy subject group and red of
the patient group.
263

Appendix C. Supplementary material to chapter 7
FIGURE C.57: EMG muscle activities normalized to the 85° positionof the neutral position trial with 5 N load in hand of the anterior del-toid, lateral deltoid and posterior deltoid over the abduction angle in5° increments during the neutral position trial. Blue depicts the EMG
activities of the healthy subject group and red of the patient group.264
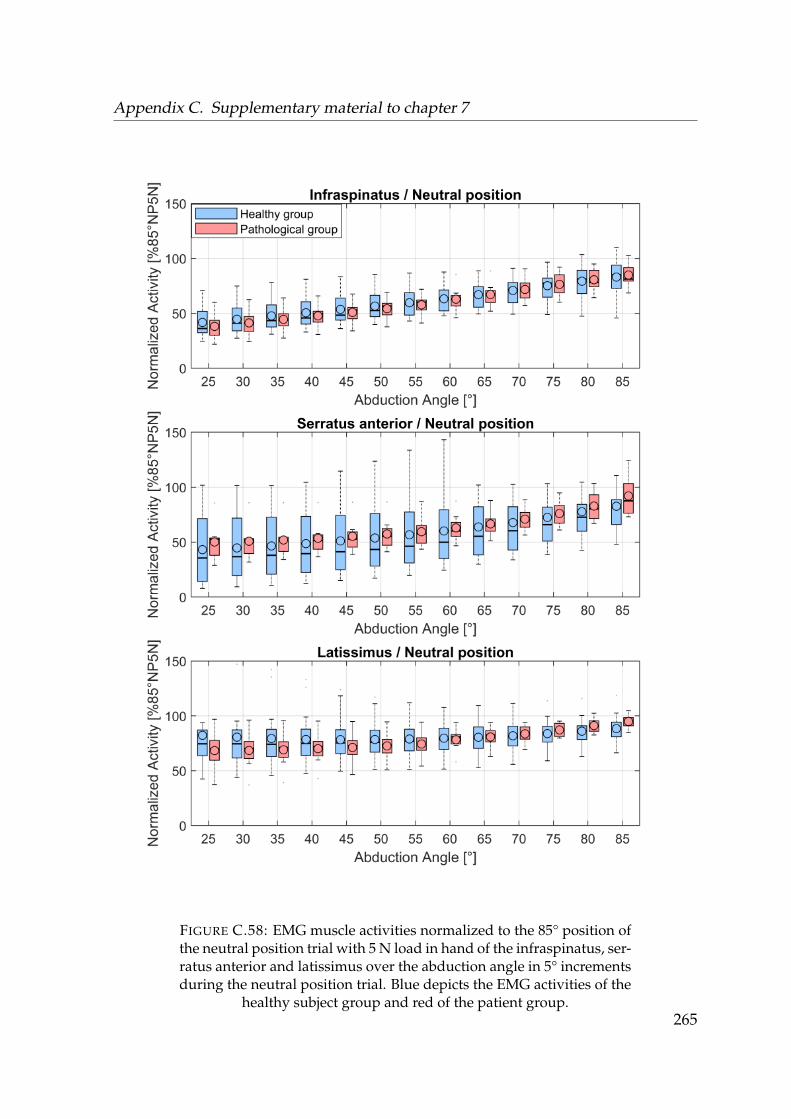
Appendix C. Supplementary material to chapter 7
FIGURE C.58: EMG muscle activities normalized to the 85° position ofthe neutral position trial with 5 N load in hand of the infraspinatus, ser-ratus anterior and latissimus over the abduction angle in 5° incrementsduring the neutral position trial. Blue depicts the EMG activities of the
healthy subject group and red of the patient group.265
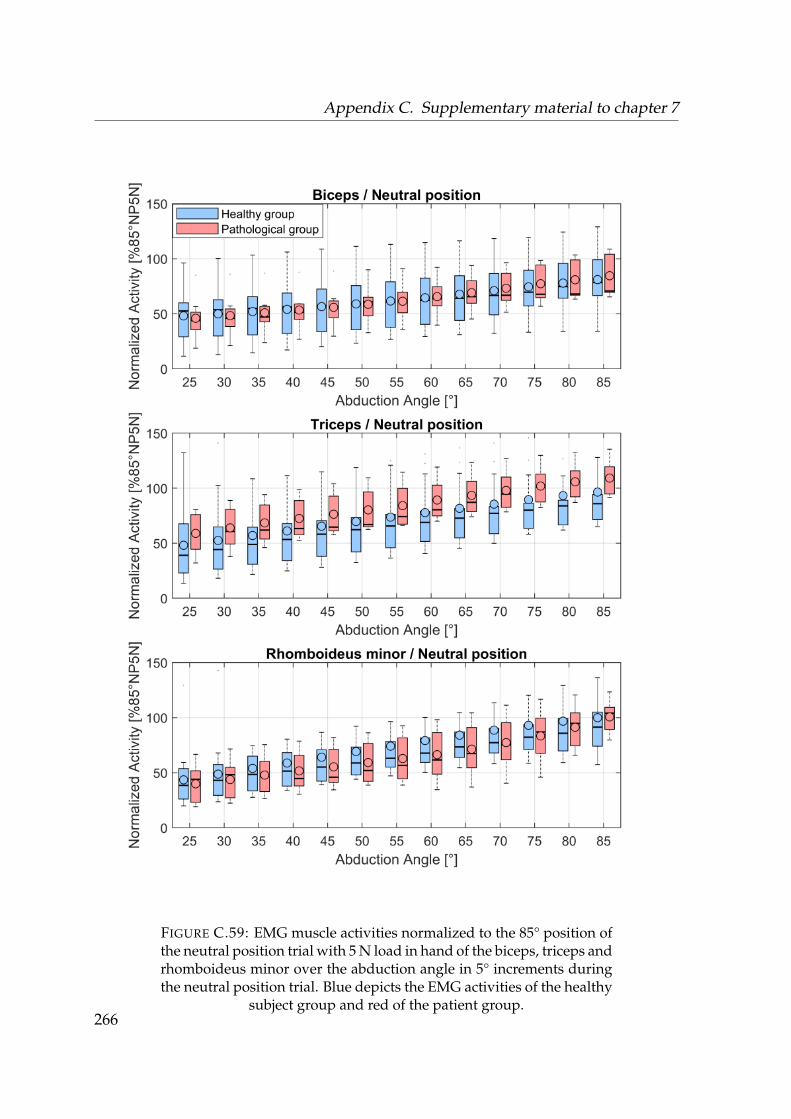
Appendix C. Supplementary material to chapter 7
FIGURE C.59: EMG muscle activities normalized to the 85° position ofthe neutral position trial with 5 N load in hand of the biceps, triceps andrhomboideus minor over the abduction angle in 5° increments duringthe neutral position trial. Blue depicts the EMG activities of the healthy
subject group and red of the patient group.266
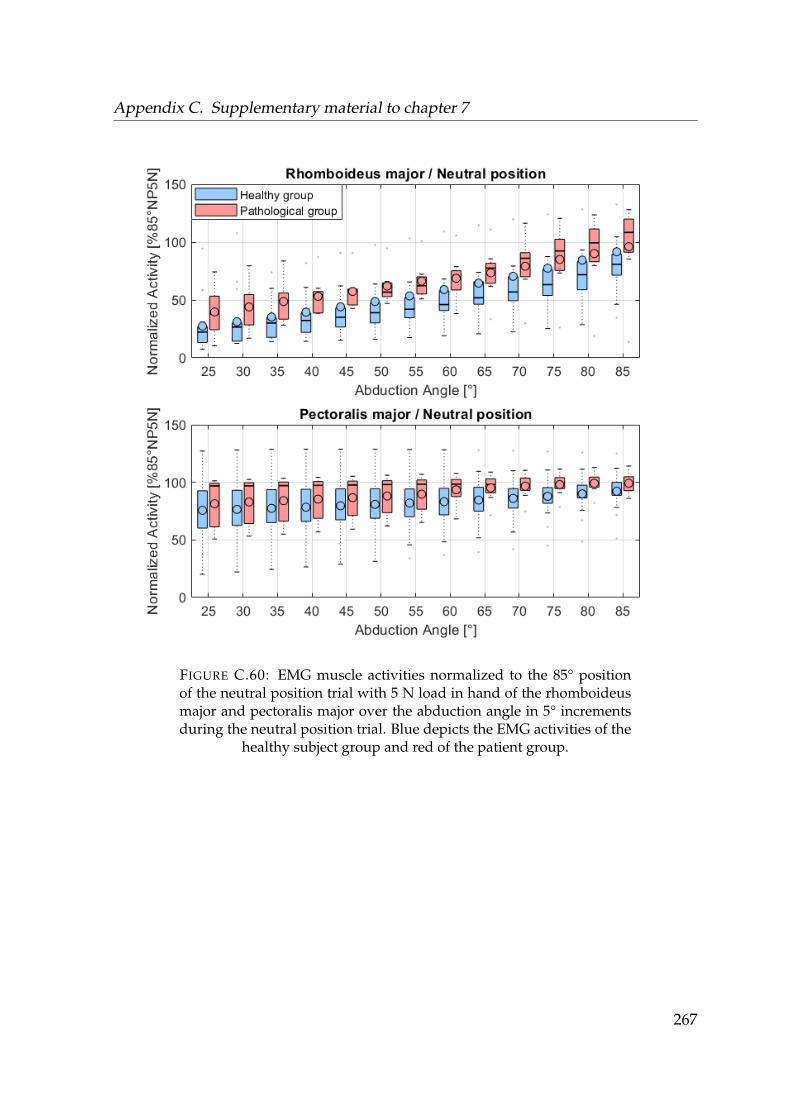
Appendix C. Supplementary material to chapter 7
FIGURE C.60: EMG muscle activities normalized to the 85° positionof the neutral position trial with 5 N load in hand of the rhomboideusmajor and pectoralis major over the abduction angle in 5° incrementsduring the neutral position trial. Blue depicts the EMG activities of the
healthy subject group and red of the patient group.
267

Appendix C. Supplementary material to chapter 7
Neutral position 5N in hand
FIGURE C.61: EMG muscle activities normalized to the 85° position ofthe neutral position trial with 5 N load in hand of the trapezius pars de-scendens, trapezius pars transversa and trapezius pars ascendens overthe abduction angle in 5° increments during the neutral position trialwith 5 N load in hand. Blue depicts the EMG activities of the healthy
subject group and red of the patient group.
268
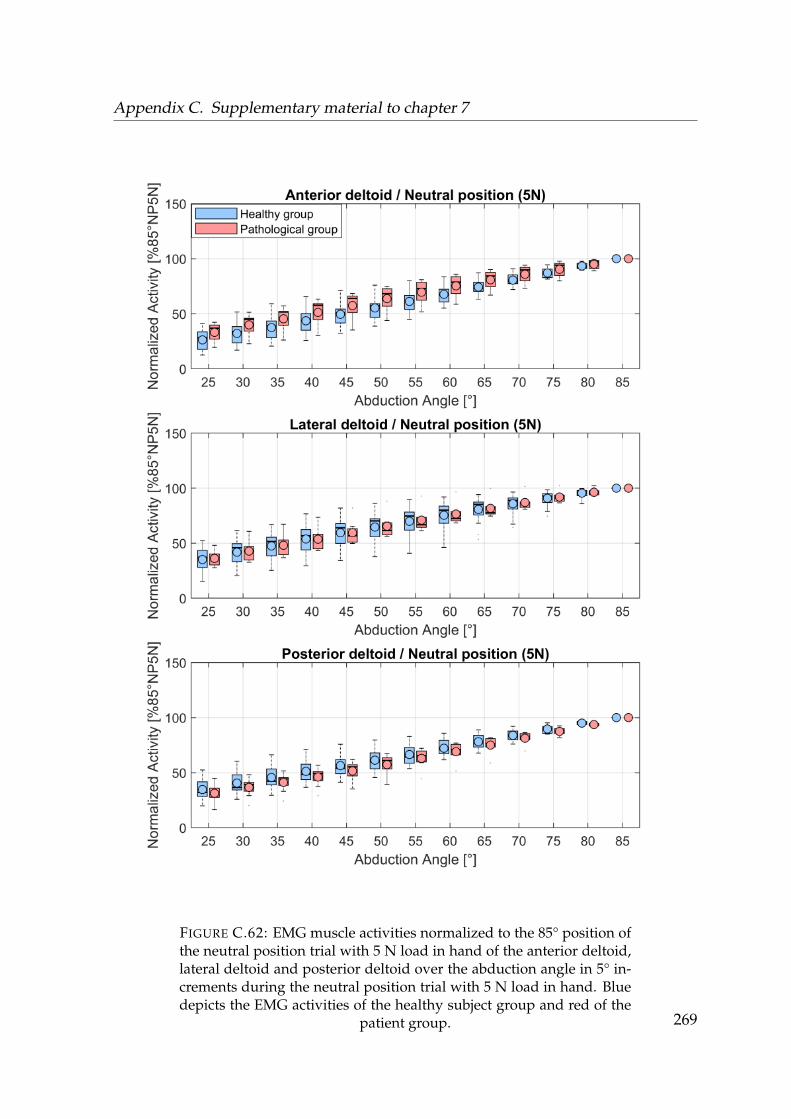
Appendix C. Supplementary material to chapter 7
FIGURE C.62: EMG muscle activities normalized to the 85° position ofthe neutral position trial with 5 N load in hand of the anterior deltoid,lateral deltoid and posterior deltoid over the abduction angle in 5° in-crements during the neutral position trial with 5 N load in hand. Bluedepicts the EMG activities of the healthy subject group and red of the
patient group. 269

Appendix C. Supplementary material to chapter 7
FIGURE C.63: EMG muscle activities normalized to the 85° position ofthe neutral position trial with 5 N load in hand of the infraspinatus, ser-ratus anterior and latissimus over the abduction angle in 5° incrementsduring the neutral position trial with 5 N load in hand. Blue depictsthe EMG activities of the healthy subject group and red of the patient
group.270
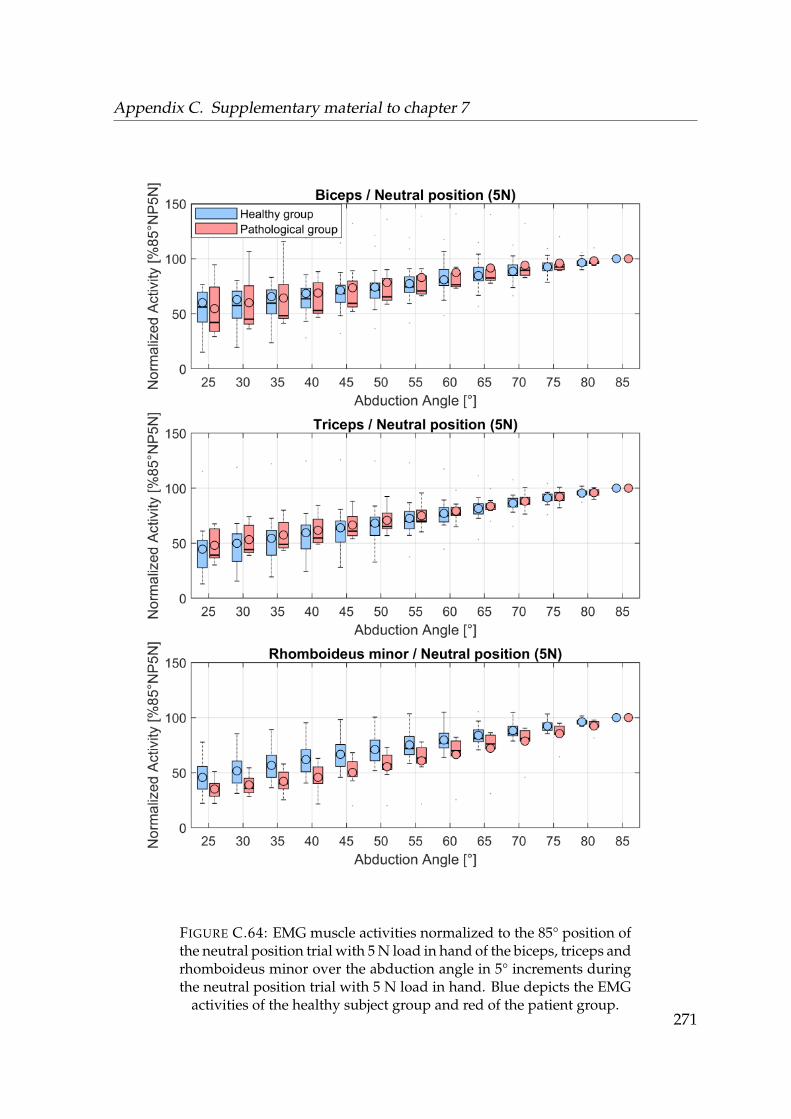
Appendix C. Supplementary material to chapter 7
FIGURE C.64: EMG muscle activities normalized to the 85° position ofthe neutral position trial with 5 N load in hand of the biceps, triceps andrhomboideus minor over the abduction angle in 5° increments duringthe neutral position trial with 5 N load in hand. Blue depicts the EMG
activities of the healthy subject group and red of the patient group.271
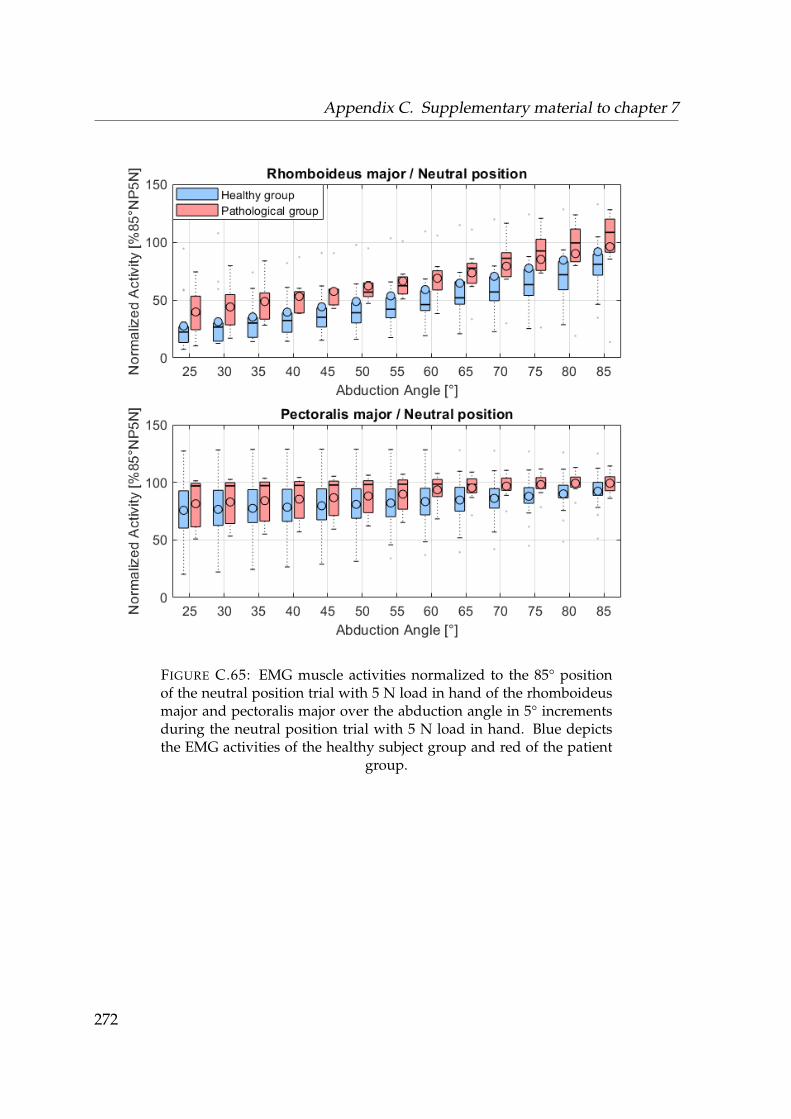
Appendix C. Supplementary material to chapter 7
FIGURE C.65: EMG muscle activities normalized to the 85° positionof the neutral position trial with 5 N load in hand of the rhomboideusmajor and pectoralis major over the abduction angle in 5° incrementsduring the neutral position trial with 5 N load in hand. Blue depictsthe EMG activities of the healthy subject group and red of the patient
group.
272

Appendix C. Supplementary material to chapter 7
Internal rotation
FIGURE C.66: EMG muscle activities normalized to the 85° position ofthe neutral position trial with 5 N load in hand of the trapezius pars de-scendens, trapezius pars transversa and trapezius pars ascendens overthe abduction angle in 5° increments during the internal rotation trial.Blue depicts the EMG activities of the healthy subject group and red of
the patient group.
273
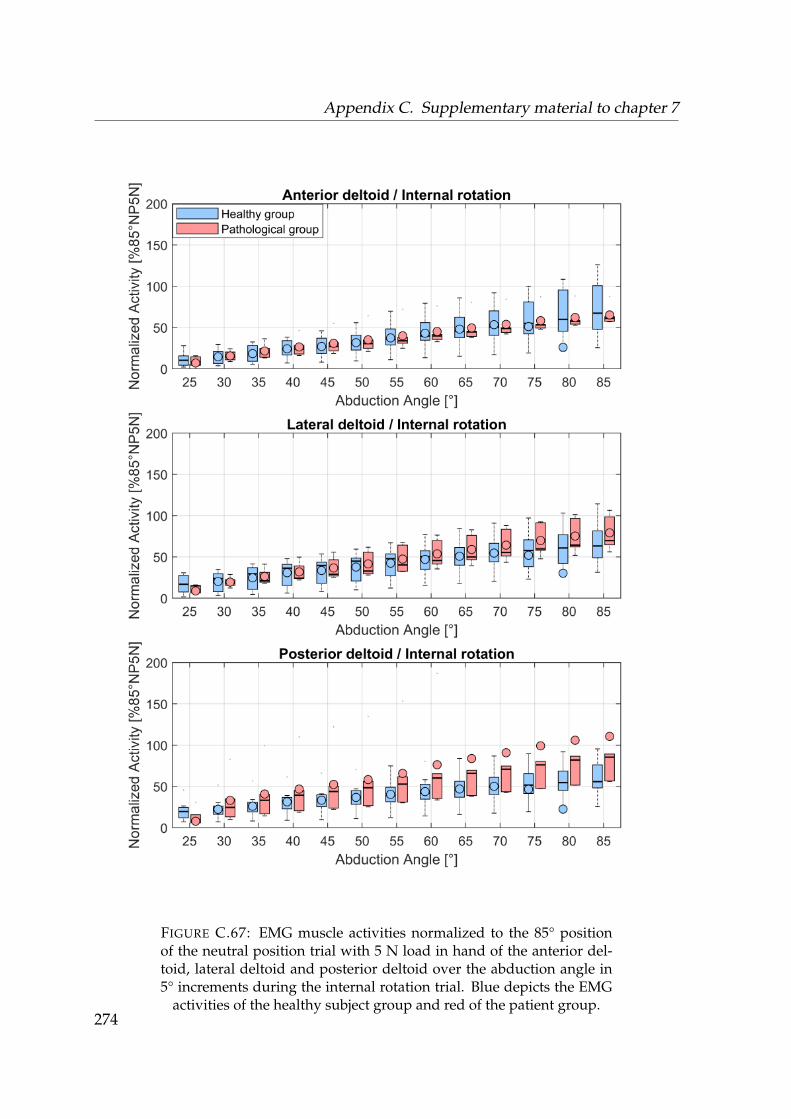
Appendix C. Supplementary material to chapter 7
FIGURE C.67: EMG muscle activities normalized to the 85° positionof the neutral position trial with 5 N load in hand of the anterior del-toid, lateral deltoid and posterior deltoid over the abduction angle in5° increments during the internal rotation trial. Blue depicts the EMG
activities of the healthy subject group and red of the patient group.274
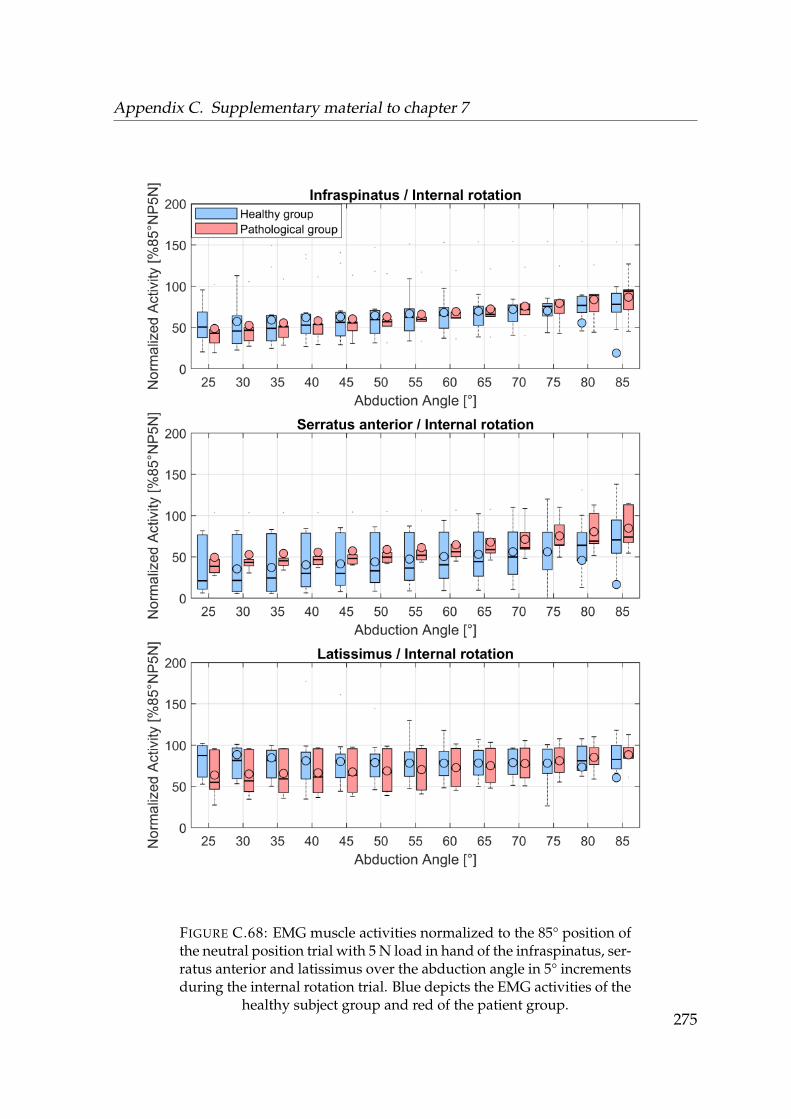
Appendix C. Supplementary material to chapter 7
FIGURE C.68: EMG muscle activities normalized to the 85° position ofthe neutral position trial with 5 N load in hand of the infraspinatus, ser-ratus anterior and latissimus over the abduction angle in 5° incrementsduring the internal rotation trial. Blue depicts the EMG activities of the
healthy subject group and red of the patient group.275
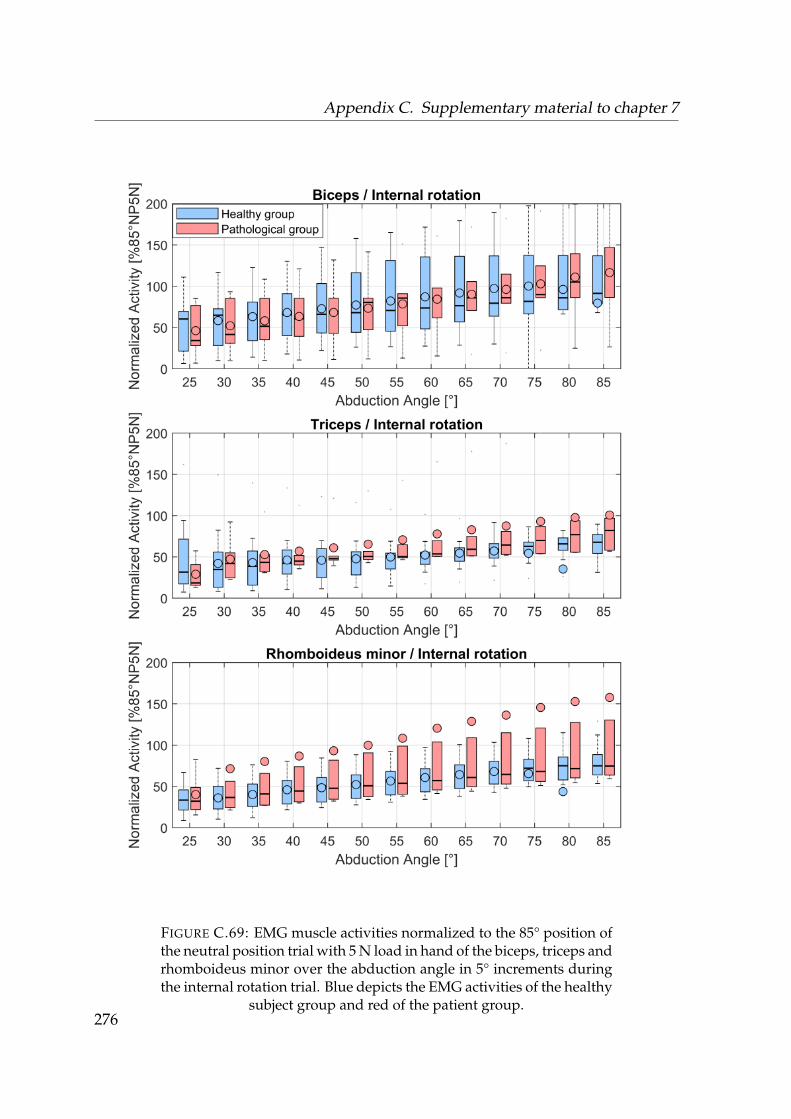
Appendix C. Supplementary material to chapter 7
FIGURE C.69: EMG muscle activities normalized to the 85° position ofthe neutral position trial with 5 N load in hand of the biceps, triceps andrhomboideus minor over the abduction angle in 5° increments duringthe internal rotation trial. Blue depicts the EMG activities of the healthy
subject group and red of the patient group.276
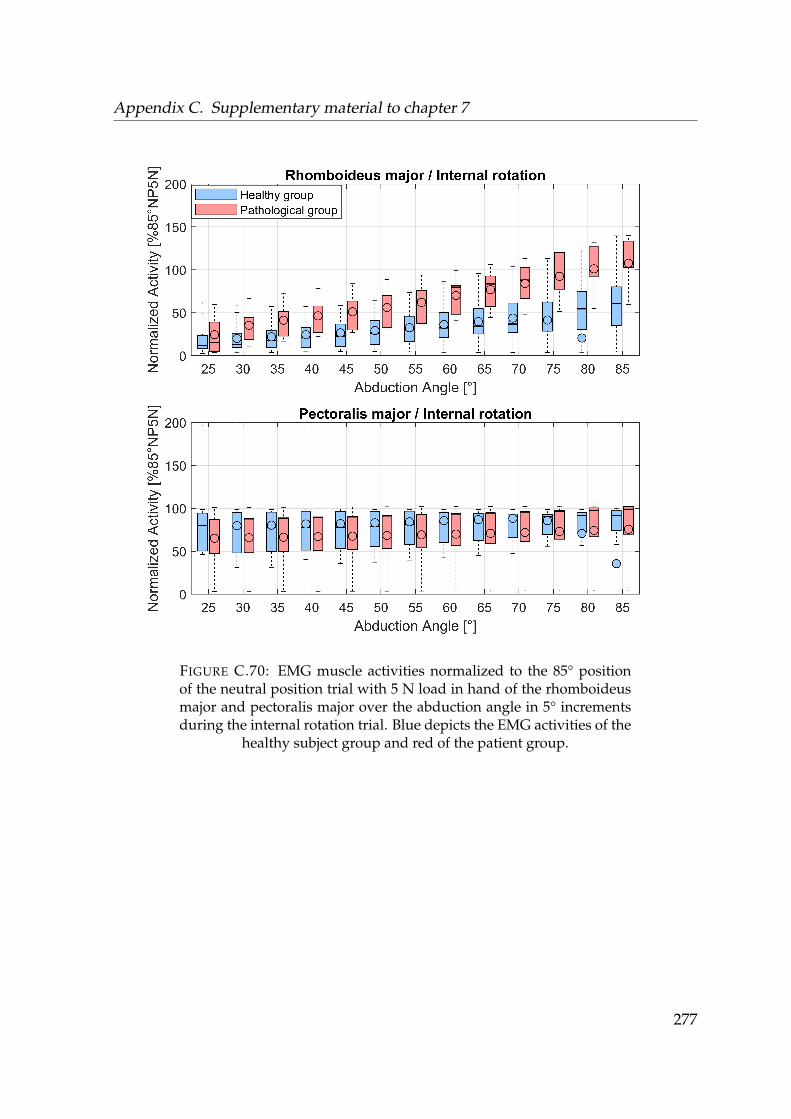
Appendix C. Supplementary material to chapter 7
FIGURE C.70: EMG muscle activities normalized to the 85° positionof the neutral position trial with 5 N load in hand of the rhomboideusmajor and pectoralis major over the abduction angle in 5° incrementsduring the internal rotation trial. Blue depicts the EMG activities of the
healthy subject group and red of the patient group.
277
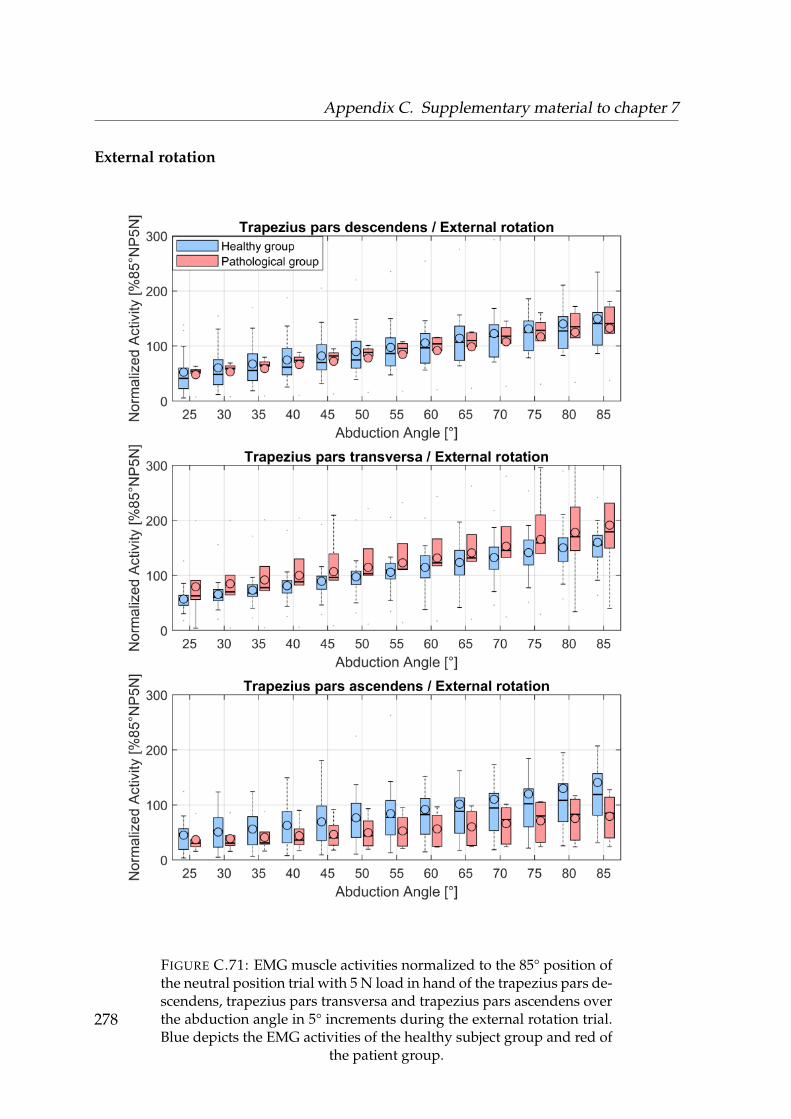
Appendix C. Supplementary material to chapter 7
External rotation
FIGURE C.71: EMG muscle activities normalized to the 85° position ofthe neutral position trial with 5 N load in hand of the trapezius pars de-scendens, trapezius pars transversa and trapezius pars ascendens overthe abduction angle in 5° increments during the external rotation trial.Blue depicts the EMG activities of the healthy subject group and red of
the patient group.
278

Appendix C. Supplementary material to chapter 7
FIGURE C.72: EMG muscle activities normalized to the 85° positionof the neutral position trial with 5 N load in hand of the anterior del-toid, lateral deltoid and posterior deltoid over the abduction angle in5° increments during the external rotation trial. Blue depicts the EMG
activities of the healthy subject group and red of the patient group.279
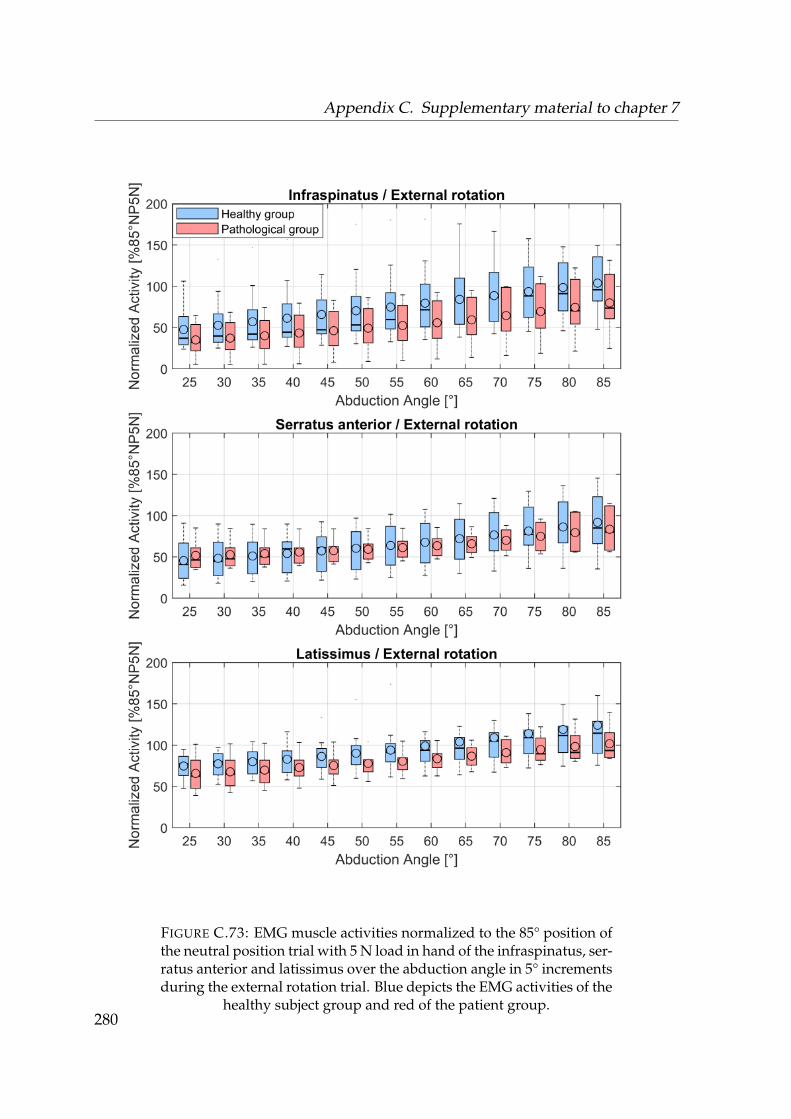
Appendix C. Supplementary material to chapter 7
FIGURE C.73: EMG muscle activities normalized to the 85° position ofthe neutral position trial with 5 N load in hand of the infraspinatus, ser-ratus anterior and latissimus over the abduction angle in 5° incrementsduring the external rotation trial. Blue depicts the EMG activities of the
healthy subject group and red of the patient group.280
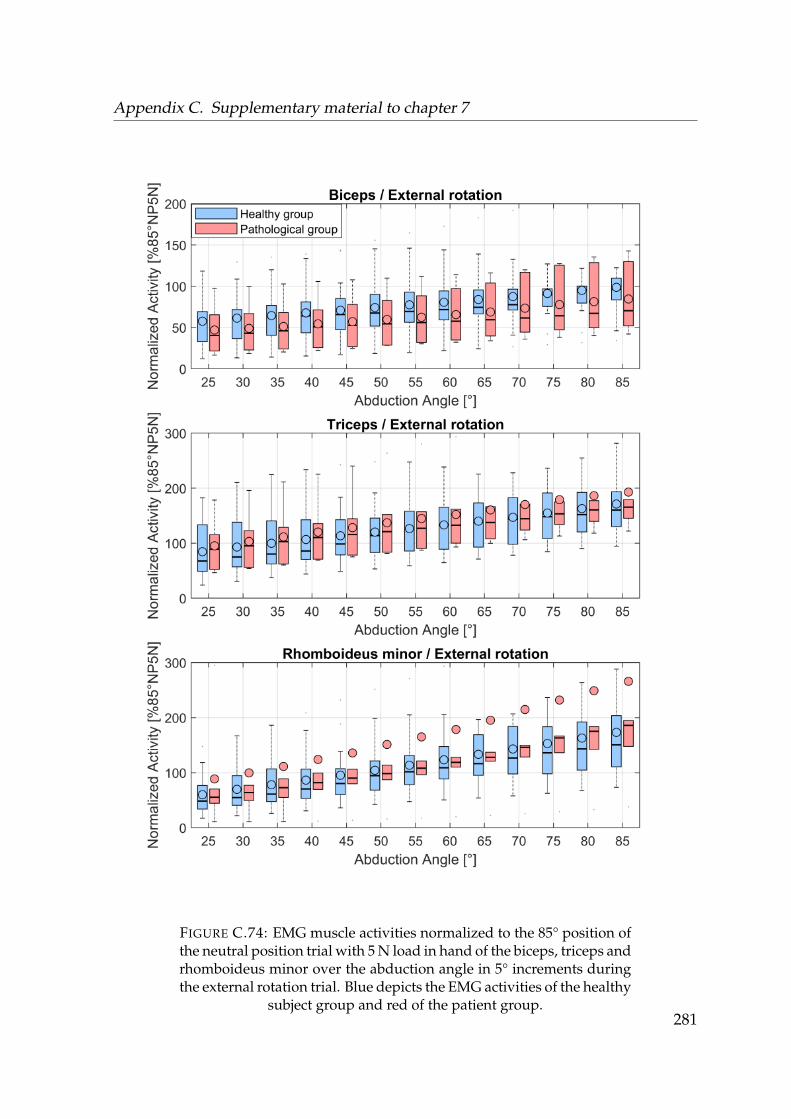
Appendix C. Supplementary material to chapter 7
FIGURE C.74: EMG muscle activities normalized to the 85° position ofthe neutral position trial with 5 N load in hand of the biceps, triceps andrhomboideus minor over the abduction angle in 5° increments duringthe external rotation trial. Blue depicts the EMG activities of the healthy
subject group and red of the patient group.281
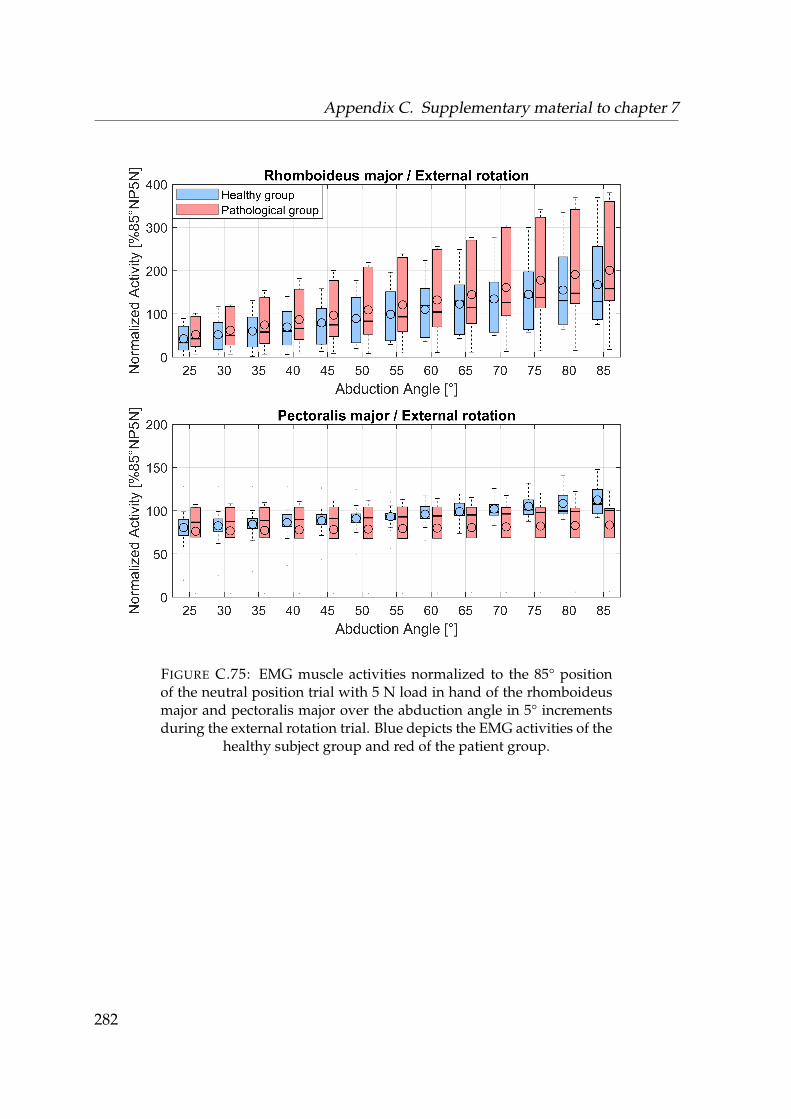
Appendix C. Supplementary material to chapter 7
FIGURE C.75: EMG muscle activities normalized to the 85° positionof the neutral position trial with 5 N load in hand of the rhomboideusmajor and pectoralis major over the abduction angle in 5° incrementsduring the external rotation trial. Blue depicts the EMG activities of the
healthy subject group and red of the patient group.
282
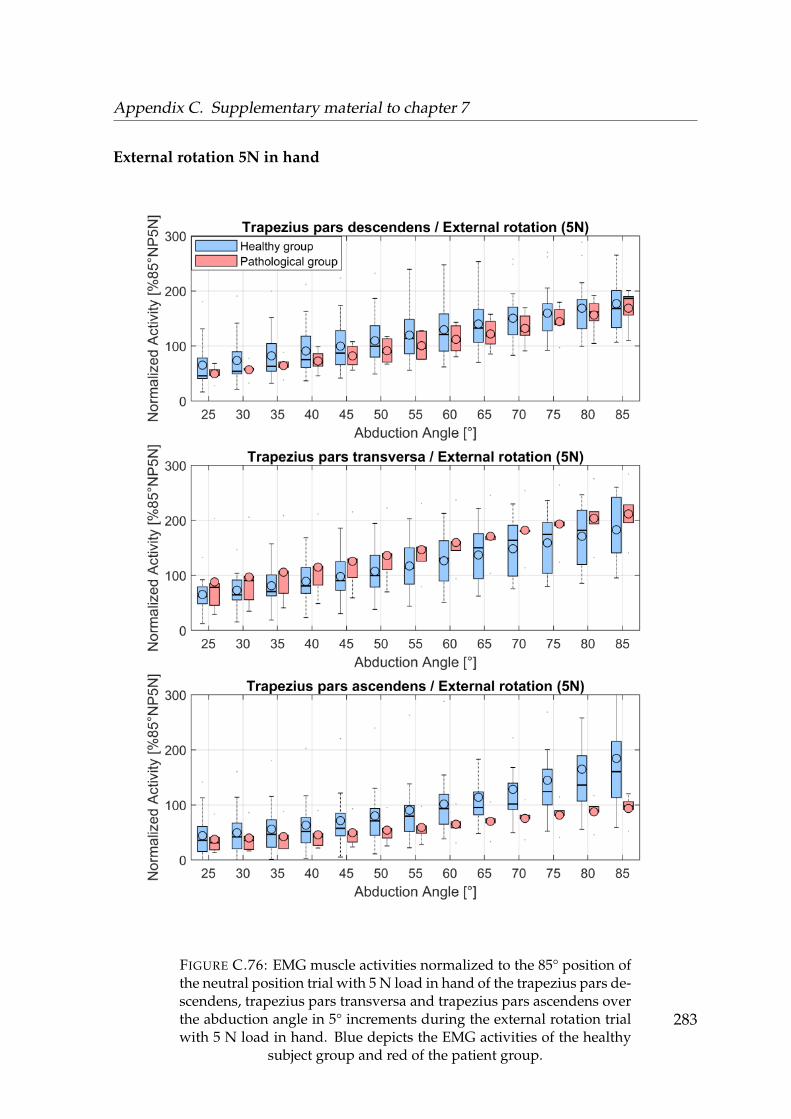
Appendix C. Supplementary material to chapter 7
External rotation 5N in hand
FIGURE C.76: EMG muscle activities normalized to the 85° position ofthe neutral position trial with 5 N load in hand of the trapezius pars de-scendens, trapezius pars transversa and trapezius pars ascendens overthe abduction angle in 5° increments during the external rotation trialwith 5 N load in hand. Blue depicts the EMG activities of the healthy
subject group and red of the patient group.
283
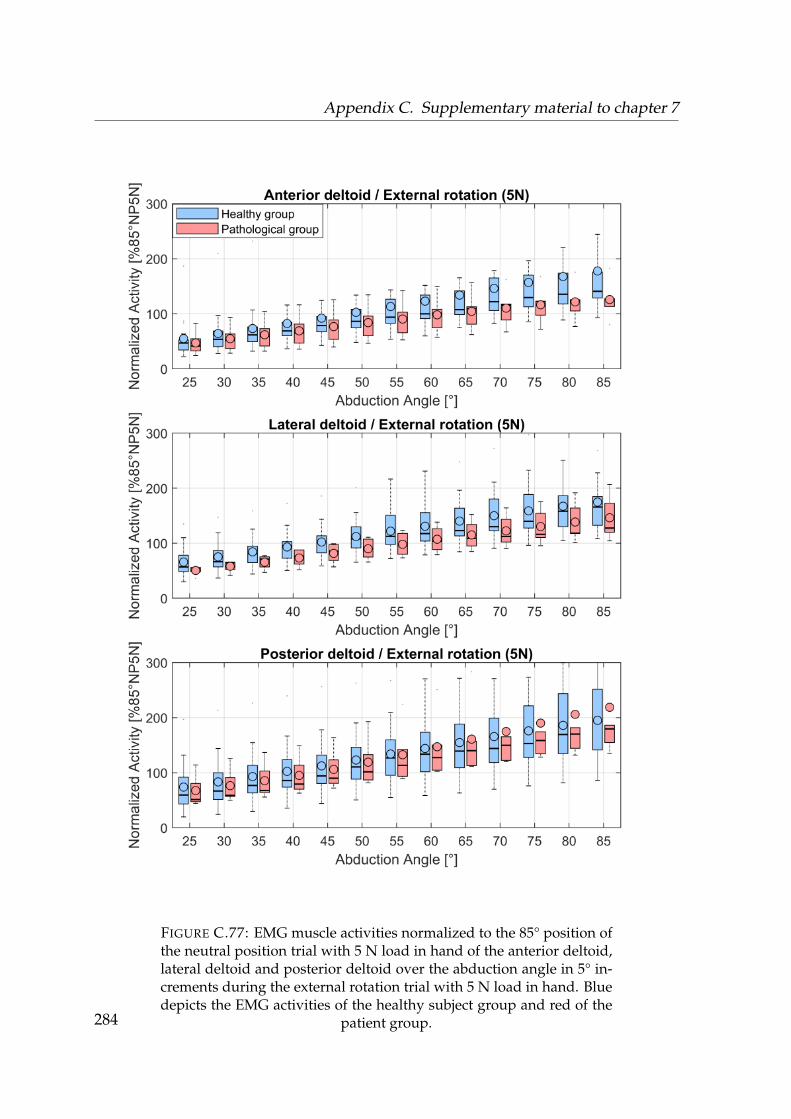
Appendix C. Supplementary material to chapter 7
FIGURE C.77: EMG muscle activities normalized to the 85° position ofthe neutral position trial with 5 N load in hand of the anterior deltoid,lateral deltoid and posterior deltoid over the abduction angle in 5° in-crements during the external rotation trial with 5 N load in hand. Bluedepicts the EMG activities of the healthy subject group and red of the
patient group.284
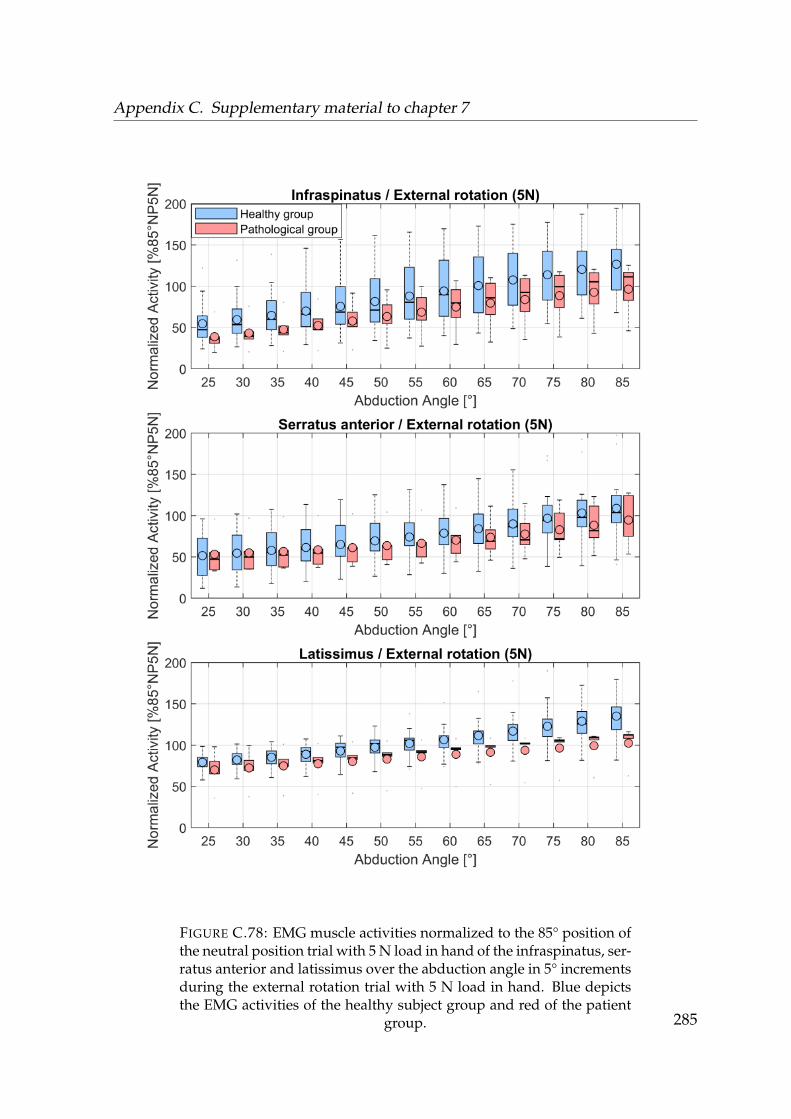
Appendix C. Supplementary material to chapter 7
FIGURE C.78: EMG muscle activities normalized to the 85° position ofthe neutral position trial with 5 N load in hand of the infraspinatus, ser-ratus anterior and latissimus over the abduction angle in 5° incrementsduring the external rotation trial with 5 N load in hand. Blue depictsthe EMG activities of the healthy subject group and red of the patient
group. 285
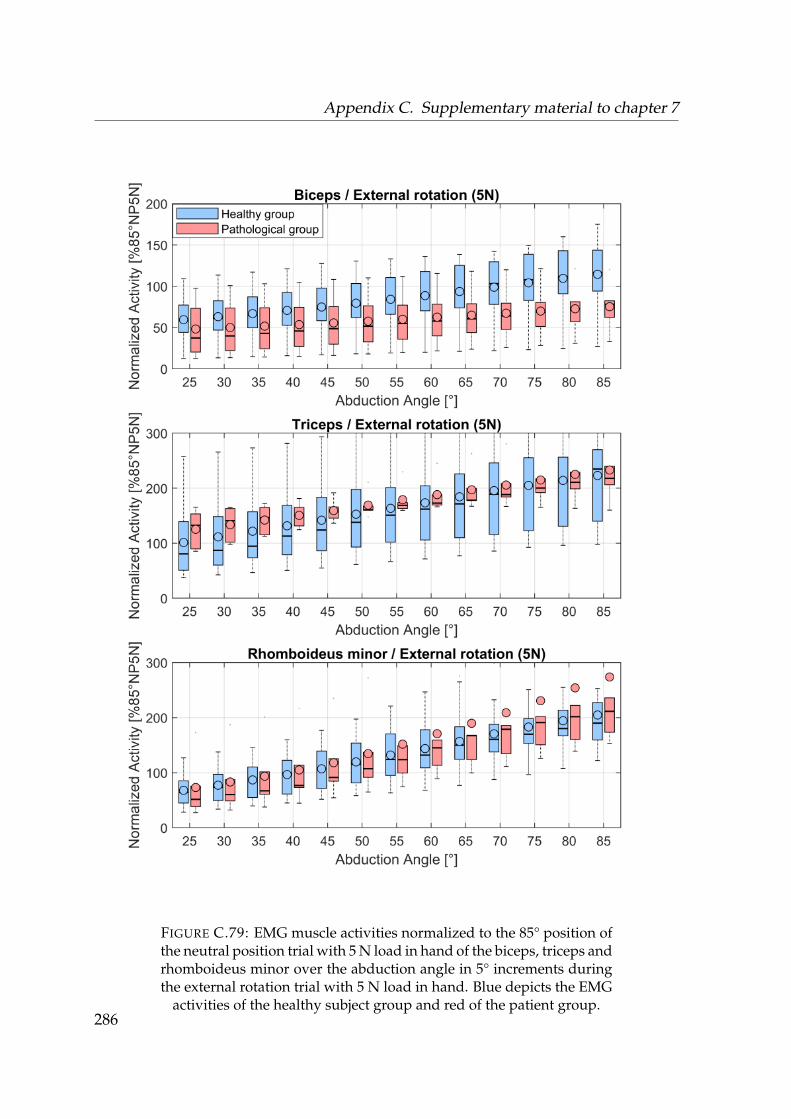
Appendix C. Supplementary material to chapter 7
FIGURE C.79: EMG muscle activities normalized to the 85° position ofthe neutral position trial with 5 N load in hand of the biceps, triceps andrhomboideus minor over the abduction angle in 5° increments duringthe external rotation trial with 5 N load in hand. Blue depicts the EMG
activities of the healthy subject group and red of the patient group.286
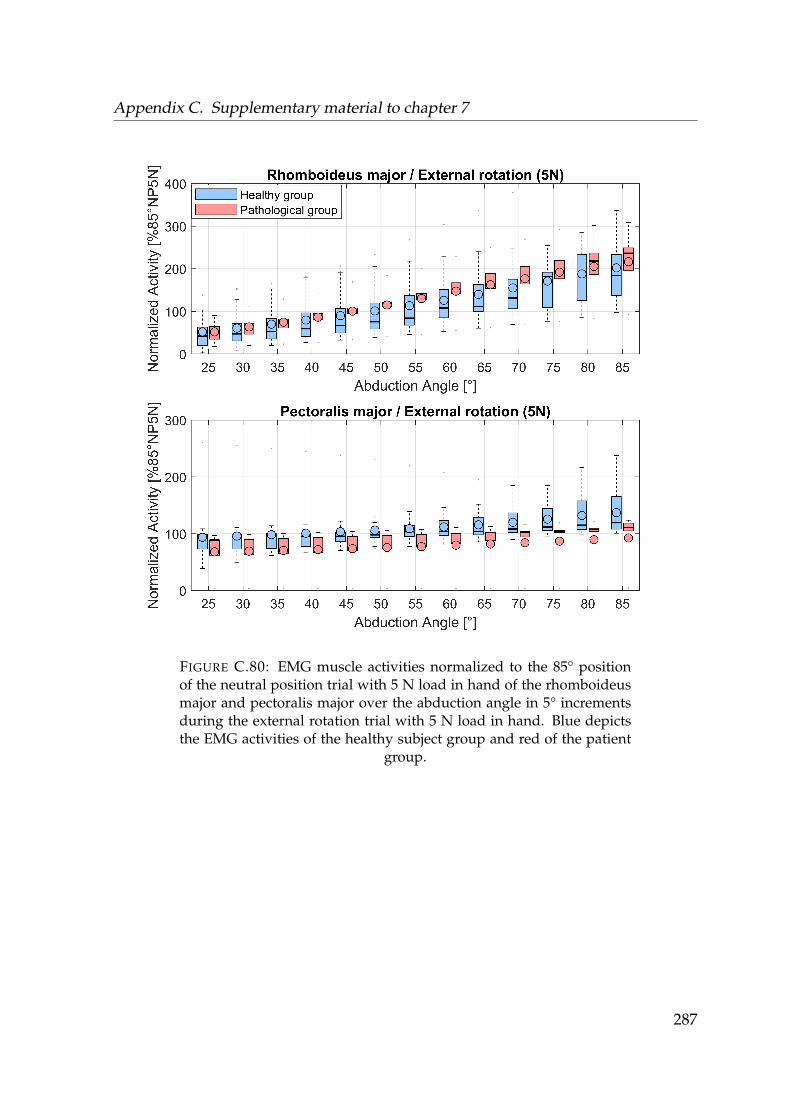
Appendix C. Supplementary material to chapter 7
FIGURE C.80: EMG muscle activities normalized to the 85° positionof the neutral position trial with 5 N load in hand of the rhomboideusmajor and pectoralis major over the abduction angle in 5° incrementsduring the external rotation trial with 5 N load in hand. Blue depictsthe EMG activities of the healthy subject group and red of the patient
group.
287

Appendix C. Supplementary material to chapter 7
C.0.8 Median differences in the EMG between the healthy and
pathologcial group
Neutral position
Abduction[°]
TD[%85°]
TT[%85°]
TA[%85°]
AD[%85°]
LD[%85°]
PD[%85°]
INF[%85°]
SER[%85°]
LAT[%85°]
BIC[%85°]
TRI[%85°]
RMA[%85°]
RMI[%85°]
PEC[%85°]
25 -5.2 7.7 14.3 17.2* 7.5 2.7 1.3 17.0 -4.7 -8.7 19.8 15.6 5.5 21.530 -5.6 8.7 16.1 18.5* 8.3 1.8 -0.2 15.1 -4.1 -7.7 16.5 18.3 5.2 21.035 -4.9 10.4 16.6 16.9* 7.9 4.4 0.3 13.6 -3.0 -7.8 13.0 19.6 -1.9 20.440 -3.8 15.0 15.4 15.1* 7.5 5.2 3.7 11.9 -3.0 -4.8 9.9 21.9* -6.8 19.845 -2.9 16.0 13.7 12.4* 6.9 5.9 4.7 11.6 -2.6 -1.2 6.5 23.3* -9.2 18.850 -0.7 15.8 11.3 11.9* 7.4 5.9 4.1 11.9 -2.3 1.9 4.7 17.8* -6.9 18.455 -3.6 16.1 7.2 10.2 8.1 5.8 2.0 11.4 -2.4 1.4 8.5 20.3* -6.4 17.560 -5.0 18.7 1.5 20.0 9.1 11.2 -0.8 10.2 2.6 1.1 11.5 23.4 -6.2 15.765 -5.7 21.6 -0.1 19.4 11.3 10.9 0.7 9.5 3.3 1.4 14.4 25.7 -6.0 12.470 -3.1 19.7 3.7 15.6 10.9 11.9 -0.5 9.9 3.6 0.2 17.6 29.1 -1.8 10.075 -0.9 17.9 10.6 9.0 12.0 10.6 -2.7 9.1 2.9 -1.9 20.7* 29.1 4.8 10.080 3.8 19.6 14.3 3.4 14.7* 10.2 -3.2 7.6 3.6 -6.7 21.3* 27.5 9.0 7.685 3.6 19.1 15.6 1.8 10.6* 13.1 -3.9 6.3 7.4 -7.6 23.4* 27.6 12.7 7.6
TABLE C.11: Differences in median values of EMG activities normal-ized to the 85° position of the neutral position trial with 5 N load inhand between the healthy subject cohort and patient group during theneutral position trial in 5° increments. Asterisks indicate the signifi-cance level. TD = trapezius descendens, TT = trapezius transversa, TA= trapezius ascendens, AD = anterior deltoid, LD = lateral deltoid, PD= posterior deltoid, INF = infraspinatus, SER = serratus anterior, LAT= latissimus, BIC = biceps, TRI = triceps, RMA = rhomboideus major,
RMI = rhomboideus minor, PEC = pectoralis major
288
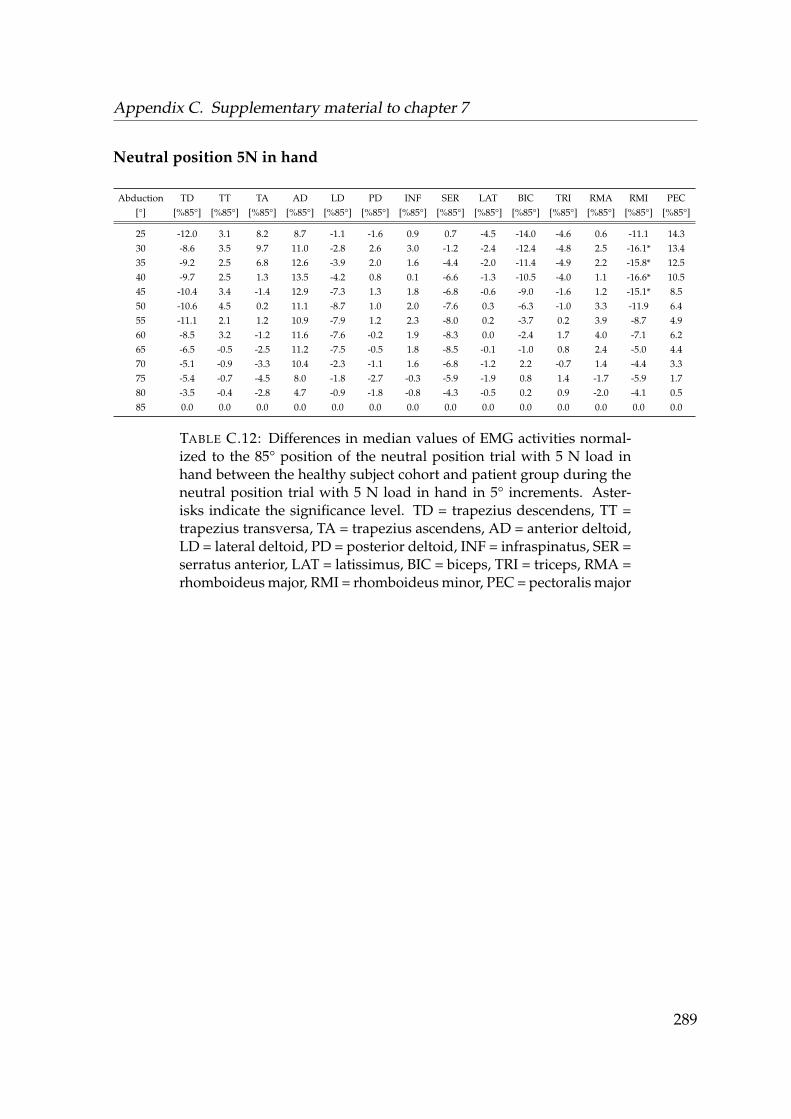
Appendix C. Supplementary material to chapter 7
Neutral position 5N in hand
Abduction[°]
TD[%85°]
TT[%85°]
TA[%85°]
AD[%85°]
LD[%85°]
PD[%85°]
INF[%85°]
SER[%85°]
LAT[%85°]
BIC[%85°]
TRI[%85°]
RMA[%85°]
RMI[%85°]
PEC[%85°]
25 -12.0 3.1 8.2 8.7 -1.1 -1.6 0.9 0.7 -4.5 -14.0 -4.6 0.6 -11.1 14.330 -8.6 3.5 9.7 11.0 -2.8 2.6 3.0 -1.2 -2.4 -12.4 -4.8 2.5 -16.1* 13.435 -9.2 2.5 6.8 12.6 -3.9 2.0 1.6 -4.4 -2.0 -11.4 -4.9 2.2 -15.8* 12.540 -9.7 2.5 1.3 13.5 -4.2 0.8 0.1 -6.6 -1.3 -10.5 -4.0 1.1 -16.6* 10.545 -10.4 3.4 -1.4 12.9 -7.3 1.3 1.8 -6.8 -0.6 -9.0 -1.6 1.2 -15.1* 8.550 -10.6 4.5 0.2 11.1 -8.7 1.0 2.0 -7.6 0.3 -6.3 -1.0 3.3 -11.9 6.455 -11.1 2.1 1.2 10.9 -7.9 1.2 2.3 -8.0 0.2 -3.7 0.2 3.9 -8.7 4.960 -8.5 3.2 -1.2 11.6 -7.6 -0.2 1.9 -8.3 0.0 -2.4 1.7 4.0 -7.1 6.265 -6.5 -0.5 -2.5 11.2 -7.5 -0.5 1.8 -8.5 -0.1 -1.0 0.8 2.4 -5.0 4.470 -5.1 -0.9 -3.3 10.4 -2.3 -1.1 1.6 -6.8 -1.2 2.2 -0.7 1.4 -4.4 3.375 -5.4 -0.7 -4.5 8.0 -1.8 -2.7 -0.3 -5.9 -1.9 0.8 1.4 -1.7 -5.9 1.780 -3.5 -0.4 -2.8 4.7 -0.9 -1.8 -0.8 -4.3 -0.5 0.2 0.9 -2.0 -4.1 0.585 0.0 0.0 0.0 0.0 0.0 0.0 0.0 0.0 0.0 0.0 0.0 0.0 0.0 0.0
TABLE C.12: Differences in median values of EMG activities normal-ized to the 85° position of the neutral position trial with 5 N load inhand between the healthy subject cohort and patient group during theneutral position trial with 5 N load in hand in 5° increments. Aster-isks indicate the significance level. TD = trapezius descendens, TT =trapezius transversa, TA = trapezius ascendens, AD = anterior deltoid,LD = lateral deltoid, PD = posterior deltoid, INF = infraspinatus, SER =serratus anterior, LAT = latissimus, BIC = biceps, TRI = triceps, RMA =rhomboideus major, RMI = rhomboideus minor, PEC = pectoralis major
289
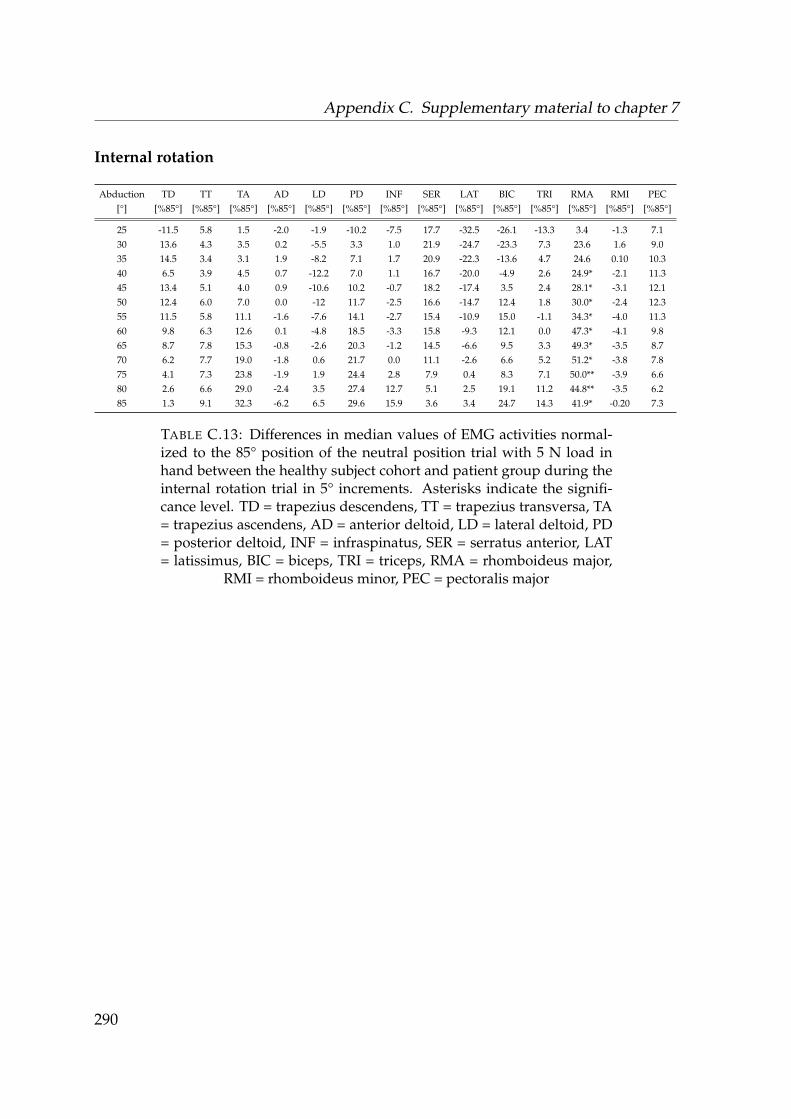
Appendix C. Supplementary material to chapter 7
Internal rotation
Abduction[°]
TD[%85°]
TT[%85°]
TA[%85°]
AD[%85°]
LD[%85°]
PD[%85°]
INF[%85°]
SER[%85°]
LAT[%85°]
BIC[%85°]
TRI[%85°]
RMA[%85°]
RMI[%85°]
PEC[%85°]
25 -11.5 5.8 1.5 -2.0 -1.9 -10.2 -7.5 17.7 -32.5 -26.1 -13.3 3.4 -1.3 7.130 13.6 4.3 3.5 0.2 -5.5 3.3 1.0 21.9 -24.7 -23.3 7.3 23.6 1.6 9.035 14.5 3.4 3.1 1.9 -8.2 7.1 1.7 20.9 -22.3 -13.6 4.7 24.6 0.10 10.340 6.5 3.9 4.5 0.7 -12.2 7.0 1.1 16.7 -20.0 -4.9 2.6 24.9* -2.1 11.345 13.4 5.1 4.0 0.9 -10.6 10.2 -0.7 18.2 -17.4 3.5 2.4 28.1* -3.1 12.150 12.4 6.0 7.0 0.0 -12 11.7 -2.5 16.6 -14.7 12.4 1.8 30.0* -2.4 12.355 11.5 5.8 11.1 -1.6 -7.6 14.1 -2.7 15.4 -10.9 15.0 -1.1 34.3* -4.0 11.360 9.8 6.3 12.6 0.1 -4.8 18.5 -3.3 15.8 -9.3 12.1 0.0 47.3* -4.1 9.865 8.7 7.8 15.3 -0.8 -2.6 20.3 -1.2 14.5 -6.6 9.5 3.3 49.3* -3.5 8.770 6.2 7.7 19.0 -1.8 0.6 21.7 0.0 11.1 -2.6 6.6 5.2 51.2* -3.8 7.875 4.1 7.3 23.8 -1.9 1.9 24.4 2.8 7.9 0.4 8.3 7.1 50.0** -3.9 6.680 2.6 6.6 29.0 -2.4 3.5 27.4 12.7 5.1 2.5 19.1 11.2 44.8** -3.5 6.285 1.3 9.1 32.3 -6.2 6.5 29.6 15.9 3.6 3.4 24.7 14.3 41.9* -0.20 7.3
TABLE C.13: Differences in median values of EMG activities normal-ized to the 85° position of the neutral position trial with 5 N load inhand between the healthy subject cohort and patient group during theinternal rotation trial in 5° increments. Asterisks indicate the signifi-cance level. TD = trapezius descendens, TT = trapezius transversa, TA= trapezius ascendens, AD = anterior deltoid, LD = lateral deltoid, PD= posterior deltoid, INF = infraspinatus, SER = serratus anterior, LAT= latissimus, BIC = biceps, TRI = triceps, RMA = rhomboideus major,
RMI = rhomboideus minor, PEC = pectoralis major
290
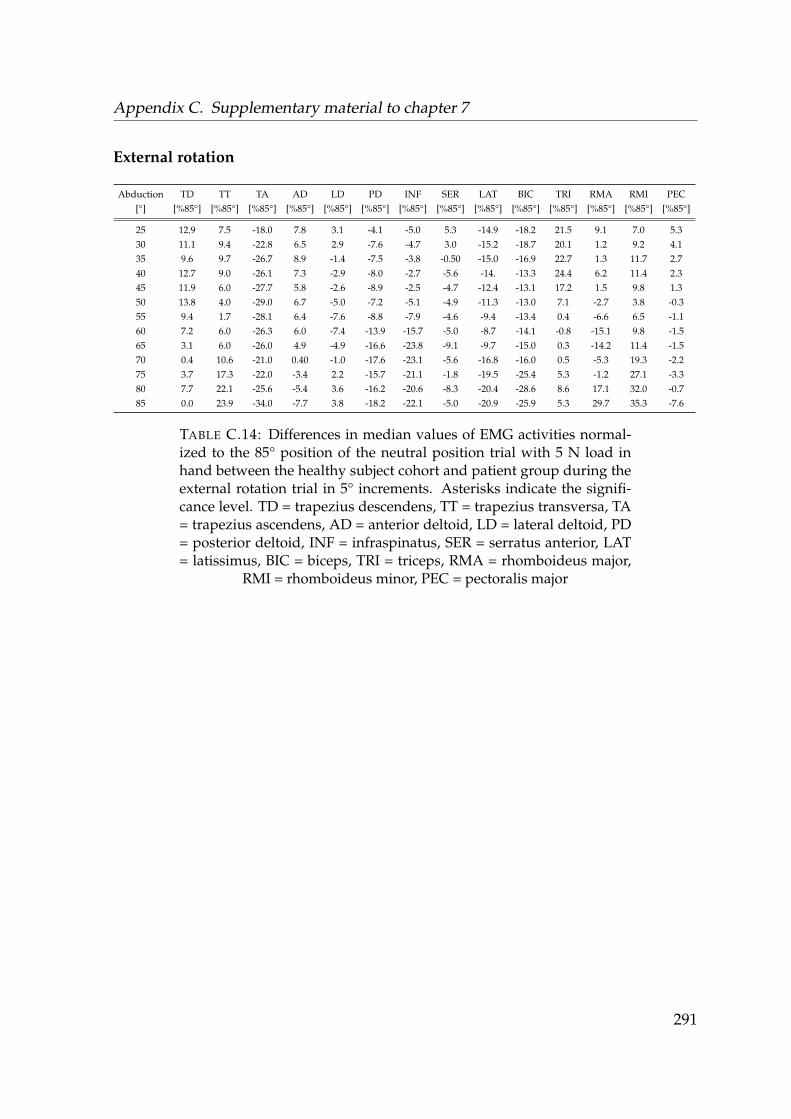
Appendix C. Supplementary material to chapter 7
External rotation
Abduction[°]
TD[%85°]
TT[%85°]
TA[%85°]
AD[%85°]
LD[%85°]
PD[%85°]
INF[%85°]
SER[%85°]
LAT[%85°]
BIC[%85°]
TRI[%85°]
RMA[%85°]
RMI[%85°]
PEC[%85°]
25 12.9 7.5 -18.0 7.8 3.1 -4.1 -5.0 5.3 -14.9 -18.2 21.5 9.1 7.0 5.330 11.1 9.4 -22.8 6.5 2.9 -7.6 -4.7 3.0 -15.2 -18.7 20.1 1.2 9.2 4.135 9.6 9.7 -26.7 8.9 -1.4 -7.5 -3.8 -0.50 -15.0 -16.9 22.7 1.3 11.7 2.740 12.7 9.0 -26.1 7.3 -2.9 -8.0 -2.7 -5.6 -14. -13.3 24.4 6.2 11.4 2.345 11.9 6.0 -27.7 5.8 -2.6 -8.9 -2.5 -4.7 -12.4 -13.1 17.2 1.5 9.8 1.350 13.8 4.0 -29.0 6.7 -5.0 -7.2 -5.1 -4.9 -11.3 -13.0 7.1 -2.7 3.8 -0.355 9.4 1.7 -28.1 6.4 -7.6 -8.8 -7.9 -4.6 -9.4 -13.4 0.4 -6.6 6.5 -1.160 7.2 6.0 -26.3 6.0 -7.4 -13.9 -15.7 -5.0 -8.7 -14.1 -0.8 -15.1 9.8 -1.565 3.1 6.0 -26.0 4.9 -4.9 -16.6 -23.8 -9.1 -9.7 -15.0 0.3 -14.2 11.4 -1.570 0.4 10.6 -21.0 0.40 -1.0 -17.6 -23.1 -5.6 -16.8 -16.0 0.5 -5.3 19.3 -2.275 3.7 17.3 -22.0 -3.4 2.2 -15.7 -21.1 -1.8 -19.5 -25.4 5.3 -1.2 27.1 -3.380 7.7 22.1 -25.6 -5.4 3.6 -16.2 -20.6 -8.3 -20.4 -28.6 8.6 17.1 32.0 -0.785 0.0 23.9 -34.0 -7.7 3.8 -18.2 -22.1 -5.0 -20.9 -25.9 5.3 29.7 35.3 -7.6
TABLE C.14: Differences in median values of EMG activities normal-ized to the 85° position of the neutral position trial with 5 N load inhand between the healthy subject cohort and patient group during theexternal rotation trial in 5° increments. Asterisks indicate the signifi-cance level. TD = trapezius descendens, TT = trapezius transversa, TA= trapezius ascendens, AD = anterior deltoid, LD = lateral deltoid, PD= posterior deltoid, INF = infraspinatus, SER = serratus anterior, LAT= latissimus, BIC = biceps, TRI = triceps, RMA = rhomboideus major,
RMI = rhomboideus minor, PEC = pectoralis major
291
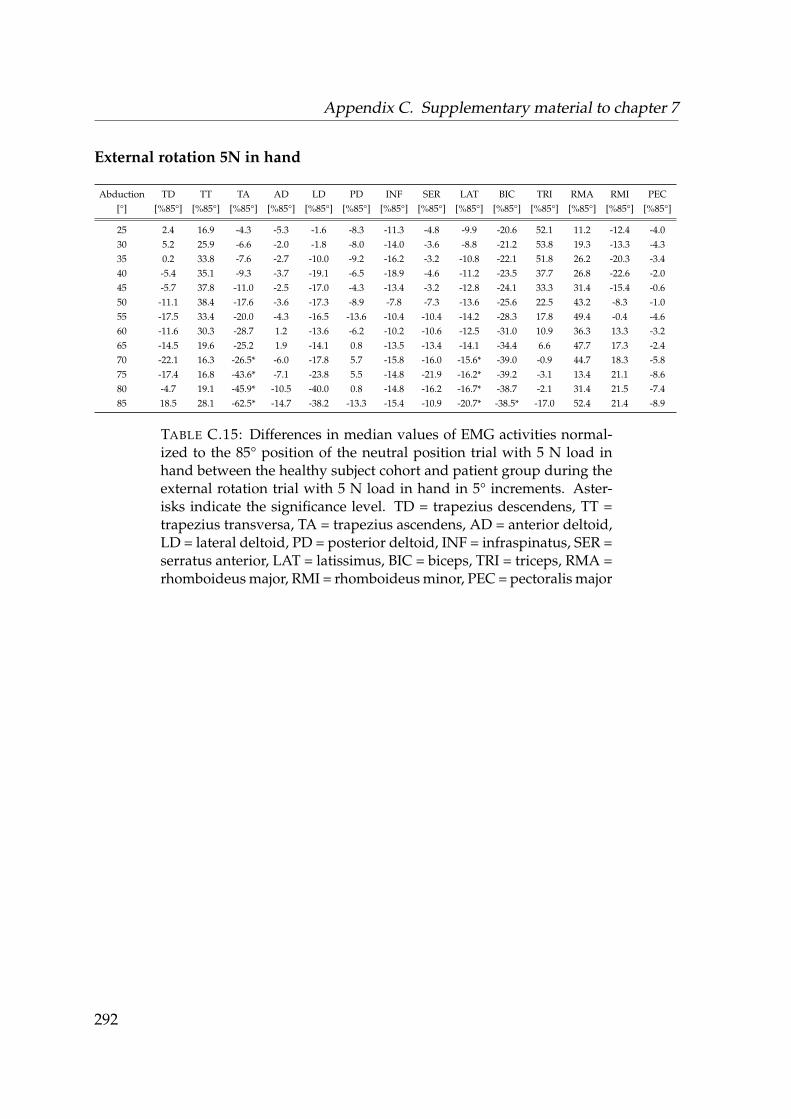
Appendix C. Supplementary material to chapter 7
External rotation 5N in hand
Abduction[°]
TD[%85°]
TT[%85°]
TA[%85°]
AD[%85°]
LD[%85°]
PD[%85°]
INF[%85°]
SER[%85°]
LAT[%85°]
BIC[%85°]
TRI[%85°]
RMA[%85°]
RMI[%85°]
PEC[%85°]
25 2.4 16.9 -4.3 -5.3 -1.6 -8.3 -11.3 -4.8 -9.9 -20.6 52.1 11.2 -12.4 -4.030 5.2 25.9 -6.6 -2.0 -1.8 -8.0 -14.0 -3.6 -8.8 -21.2 53.8 19.3 -13.3 -4.335 0.2 33.8 -7.6 -2.7 -10.0 -9.2 -16.2 -3.2 -10.8 -22.1 51.8 26.2 -20.3 -3.440 -5.4 35.1 -9.3 -3.7 -19.1 -6.5 -18.9 -4.6 -11.2 -23.5 37.7 26.8 -22.6 -2.045 -5.7 37.8 -11.0 -2.5 -17.0 -4.3 -13.4 -3.2 -12.8 -24.1 33.3 31.4 -15.4 -0.650 -11.1 38.4 -17.6 -3.6 -17.3 -8.9 -7.8 -7.3 -13.6 -25.6 22.5 43.2 -8.3 -1.055 -17.5 33.4 -20.0 -4.3 -16.5 -13.6 -10.4 -10.4 -14.2 -28.3 17.8 49.4 -0.4 -4.660 -11.6 30.3 -28.7 1.2 -13.6 -6.2 -10.2 -10.6 -12.5 -31.0 10.9 36.3 13.3 -3.265 -14.5 19.6 -25.2 1.9 -14.1 0.8 -13.5 -13.4 -14.1 -34.4 6.6 47.7 17.3 -2.470 -22.1 16.3 -26.5* -6.0 -17.8 5.7 -15.8 -16.0 -15.6* -39.0 -0.9 44.7 18.3 -5.875 -17.4 16.8 -43.6* -7.1 -23.8 5.5 -14.8 -21.9 -16.2* -39.2 -3.1 13.4 21.1 -8.680 -4.7 19.1 -45.9* -10.5 -40.0 0.8 -14.8 -16.2 -16.7* -38.7 -2.1 31.4 21.5 -7.485 18.5 28.1 -62.5* -14.7 -38.2 -13.3 -15.4 -10.9 -20.7* -38.5* -17.0 52.4 21.4 -8.9
TABLE C.15: Differences in median values of EMG activities normal-ized to the 85° position of the neutral position trial with 5 N load inhand between the healthy subject cohort and patient group during theexternal rotation trial with 5 N load in hand in 5° increments. Aster-isks indicate the significance level. TD = trapezius descendens, TT =trapezius transversa, TA = trapezius ascendens, AD = anterior deltoid,LD = lateral deltoid, PD = posterior deltoid, INF = infraspinatus, SER =serratus anterior, LAT = latissimus, BIC = biceps, TRI = triceps, RMA =rhomboideus major, RMI = rhomboideus minor, PEC = pectoralis major
292