multilocus patterns of nucleotide diversity and divergence reveal positive selection at candidate...
TRANSCRIPT
Copyright � 2009 by the Genetics Society of AmericaDOI: 10.1534/genetics.109.103895
Multilocus Patterns of Nucleotide Diversity and Divergence RevealPositive Selection at Candidate Genes Related to Cold Hardiness
in Coastal Douglas Fir (Pseudotsuga menziesii var. menziesii)
Andrew J. Eckert,*,† Jill L. Wegrzyn,‡ Barnaly Pande,‡ Kathleen D. Jermstad,§
Jennifer M. Lee,* John D. Liechty,* Brandon R. Tearse,‡
Konstantin V. Krutovsky** and David B. Neale*,§,1
*Section of Evolution and Ecology, †Center for Population Biology and ‡Department of Plant Sciences, University of California, Davis,California 95616, §Institute of Forest Genetics, Pacific Southwest Research Station, U.S. Department of Agriculture Forest Service,
Placerville, California 95667 and **Department of Ecosystem Science and Management,Texas A&M University, College Station, Texas 77843
Manuscript received April 13, 2009Accepted for publication July 3, 2009
ABSTRACT
Forest trees exhibit remarkable adaptations to their environments. The genetic basis for phenotypicadaptation to climatic gradients has been established through a long history of common garden, prove-nance, and genecological studies. The identities of genes underlying these traits, however, have remainedelusive and thus so have the patterns of adaptive molecular diversity in forest tree genomes. Here, wereport an analysis of diversity and divergence for a set of 121 cold-hardiness candidate genes in coastalDouglas fir (Pseudotsuga menziesii var. menziesii). Application of several different tests for neutrality,including those that incorporated demographic models, revealed signatures of selection consistent withselective sweeps at three to eight loci, depending upon the severity of a bottleneck event and the methodused to detect selection. Given the high levels of recombination, these candidate genes are likely to beclosely linked to the target of selection if not the genes themselves. Putative homologs in Arabidopsis actprimarily to stabilize the plasma membrane and protect against denaturation of proteins at freezingtemperatures. These results indicate that surveys of nucleotide diversity and divergence, when framedwithin the context of further association mapping experiments, will come full circle with respect to theirutility in the dissection of complex phenotypic traits into their genetic components.
A long history of common garden experiments hasshown that forest trees are adapted phenotypically
to local and regional climates (Morgenstern 1996).Latitudinal clines for phenological traits have beendocumented across a diverse set of temperate foresttree species ranging from Norway spruce [Picea abies(L.) Karst.] to European aspen (Populus tremula L.).The frequent nature of these patterns, as well as thehigh heritabilities and polygenic nature for many ofthese traits (Howe et al. 2003), suggest that forest treegenomes should be rife with signatures of positivenatural selection.
Early efforts to detect these signatures using molec-ular markers were largely unsuccessful (McKay andLatta 2002). One of the limiting factors for theseefforts was the genomic distribution, availability, andnonfunctional nature of the genetic markers that wereutilized (Merkle and Adams 1987). The development
of high-throughput allele-specific marker detection forlarge sets of functional genes has revolutionized thesearch for adaptive genetic variation within conifers(Gonzalez-Martınez et al. 2006). Surveys of nucleotidediversity across a diverse set of conifer species havehighlighted common genomic attributes, such as therapid decay of linkage disequilibrium (LD), and havedocumented the first tangible evidence of naturalselection in forest tree genomes (Savolainen andPyhajarvi 2007; Eveno et al. 2008; Palme et al. 2008,2009).
Here, we take a candidate gene approach to theidentification of genes underlying cold-hardiness phe-notypes in coastal Douglas fir [Pseudotsuga menziesii(Mirb.) Franco var. menziesii]. A 40-year history ofcommon garden experiments, provenance trials, andgenecological studies has documented the genetic basisof growth, germination, and bud phenology traits, aswell as the steep clines in genetic variability for thosetraits along environmental gradients (Campbell andSorensen 1973; Campbell 1979; Aitken and Adams
1996, 1997; St. Clair et al. 2005; St. Clair 2006). Thestructure of these clines is consistent with the hypothesis
Supporting information is available online at http://www.genetics.org/cgi/content/full/genetics.109.103895/DC1.
1Corresponding author: Department of Plant Sciences, Mail Stop 6,University of California, Davis, CA 95616. E-mail: [email protected]
Genetics 183: 289–298 (September 2009)
that diversifying selection (McKay and Latta 2002)or local selective sweeps (Slatkin and Wiehe 1998;Santiago and Caballero 2005) should characterizemost of the signatures of positive natural selection in thegenome of coastal Douglas fir. If this is the case, weexpect to observe signatures of elevated levels of in-termediate-frequency polymorphisms in the site fre-quency spectrum for those genes that underlie theseclinal traits.
While the phenotypes involved with adaptation tocold temperatures are well known, the identities of thegenes underlying these traits have remained elusive.Several quantitative trait loci (QTL) have been identi-fied ( Jermstad et al. 2001a,b, 2003), and a handful ofcandidate genes have been shown to collocate withthese QTL (Wheeler et al. 2005). The genes underlyingphysiological responses to cold, however, are well knownin Arabidopsis thaliana L. (Thomashow 1999). Similartypes of genes are thought to underlie cold-hardinessrelated traits in conifers (Yakovlev et al. 2006; Holliday
et al. 2008). An initial survey of nucleotide diversity at 18candidate genes in coastal Douglas fir, however, foundonly limited departures from neutrality (Krutovsky
and Neale 2005). The vast majority of candidate genes,as well as inference of demographic influences upongenomic patterns of nucleotide diversity, thus remain tobe investigated.
Mounting evidence indicates that patterns of positiveselection are pervasive throughout the genomes ofDrosophila (Begun et al. 2007), Arabidopsis (Clark
et al. 2007), and humans (Voight et al. 2006). Evidenceon a genome scale is only beginning to emerge forconifers (Namroud et al. 2008). We used an expandedset of candidate genes to address three goals: (i)describe patterns of polymorphism and divergencewithin a set of 121 candidate genes for cold hardiness,(ii) identify those genes with patterns of polymorphismand divergence inconsistent with neutral expectations,and (iii) discuss the types and prevalence of selectionacross a conifer genome.
MATERIALS AND METHODS
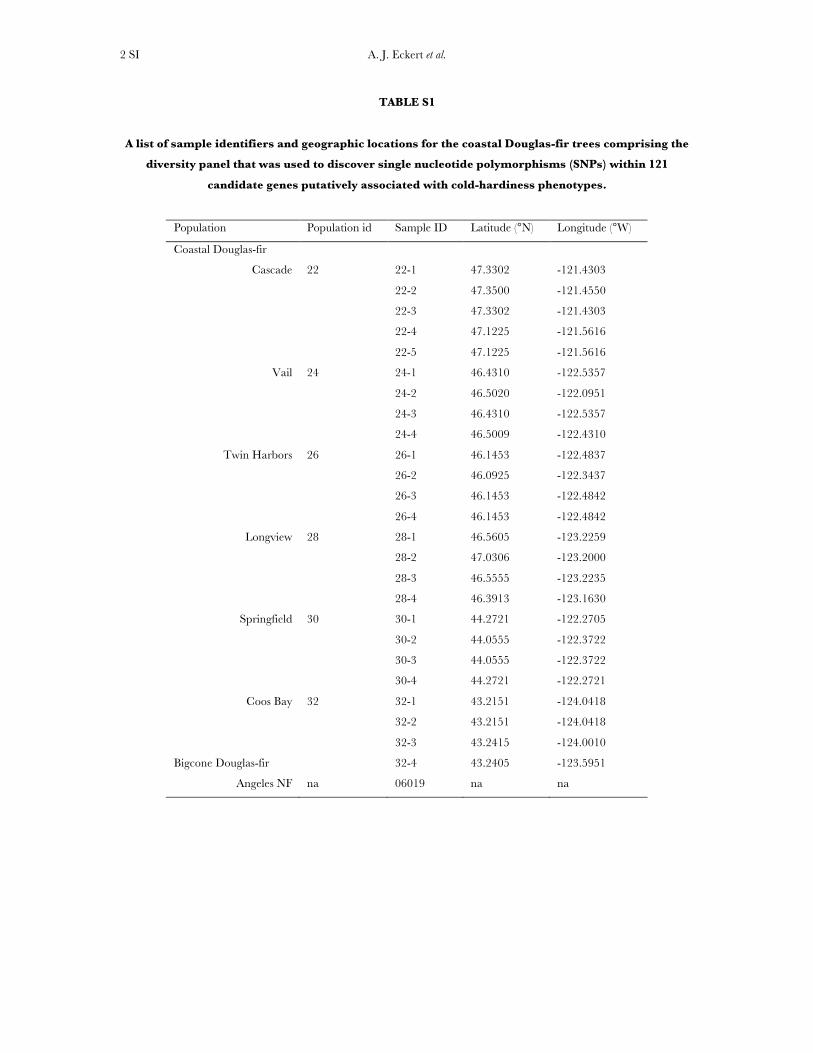
Plant material and DNA isolation: A sample of 24 unrelatedtrees obtained from six regions located across Washingtonand Oregon was assembled as a diversity panel (supportinginformation, Table S1) for the discovery of single-nucleotidepolymorphisms (SNPs). These regions are situated alongtemperature, precipitation, and genecological gradients identi-fied previously for coastal Douglas fir in Oregon and Washington(St. Clair et al. 2005; St. Clair 2006). A single sample ofbigcone Douglas fir [P. macrocarpa (Vasey) Mayr] collected fromthe Angeles National Forest was used as an outgroup. Totalgenomic DNA was isolated from haploid megagametophytetissues dissected out from multiple open-pollinated seedscollected from each tree, using a DNeasy 96 plant kit (QIAGEN,Valencia, CA). All DNA extractions and quantifications wereperformed at the U.S. Department of Agriculture NationalForest Genetics Laboratory (Placerville, CA).
Choice of candidate genes: Candidate genes with a putativerole in conferring tolerance to cold temperatures were selectedaccording to three criteria: (i) genes found to collocate withQTL for cold hardiness in Douglas fir (Wheeler et al. 2005), (ii)genes with physiological roles in cold tolerance response, and(iii) genes showing differential expression in microarray studiesin A. thaliana L. (Lee et al. 2005). Standard BLAST tools wereused to mine the Douglas fir expressed sequence tags (EST)collections housed at Virginia Polytechnic University (http://staff.vbi.vt.edu/estap) for orthologous sequences to selectedcandidate genes. Those collections represent four EST librar-ies, three of which are cold-hardiness libraries derived from 1-year-old seedlings subjected to fall, winter, and spring ambientair conditions in Corvallis, Oregon during 2003. A thresholdof 1E -10 was used to define homology during BLAST analyses.In total, 553 putative homologs were selected for primerdesign, of which 378 were able to have primers designedsuccessfully. A total of 121 of those 378 genes were selected onthe basis of diversity of function and sequence-based primervalidation from a single Douglas fir sample (Table S2 andTable S3).
PCR, DNA sequencing, and sequence analysis: Sequencedata for each candidate gene were obtained using standardPCR and Sanger sequencing protocols (Table S4). The PineAlignment and SNP Identification Pipeline (PineSAP) wasused to assemble, call bases for, align, and identify SNPs fromthe 5220 sequence reads (Wegrzyn et al. 2009). The finalalignments for each candidate gene were generated using aminimum Phred quality score of 20 for base calls associatedwith SNPs. All alignments were further trimmed, edited, andvalidated using CodonCode Aligner v. 2.0.4 (CodonCode,Dedham, MA). Gene annotation, data summaries, and labo-ratory protocols are given at our website (http://dendrome.ucdavis.edu/dfgp).
SNP genotyping and linkage mapping analyses: A subset ofthe 933 discovered SNPs (n ¼ 384) was chosen to validatepolymorphism identifications made by PineSAP and to in-vestigate the distribution of those polymorphisms acrossexisting linkage maps of Douglas fir through the genotypingof 192 progeny from a three-generation outbred pedigree (cf.Jermstad et al. 1998) using Illumina’s GoldenGate SNPgenotyping platform. This high-throughput platform workswell for the large and complex genomes of conifers (Pavy et al.2008). Multiplexed genotyping was conducted at the DNATechnologies Core facility located at the University of Cal-ifornia, Davis Genome Center. Signal intensities were quanti-fied and matched to specific alleles, using the BeadStudio v3.1.14 software (Illumina). A minimum GenCall50 (GC50)score of 0.20 was chosen for inclusion of SNP loci in the finaldata set and genotypic clusters were edited manually asneeded (Eckert et al. 2009a).
The existing linkage maps for coastal Douglas fir are basedlargely on anonymous RFLP markers. Here, we used 189 fullyinformative RFLP markers, 3 isozyme markers, and the 77segregating SNPs to infer a sex-averaged genetic linkage mapusing JoinMap v. 1.4 (Stam 1993). All SNP loci were assessedfor conformity to Mendelian segregation ratios prior tolinkage mapping, using goodness-of-fit x2-tests. We removedSNPs from the same candidate gene that mapped to ,0.5 cMfrom each other prior to the production of the final geneticmap. Generation of linkage maps within this pedigree is de-scribed in detail elsewhere ( Jermstad et al. 1998, 2001a,b,2003; Krutovsky et al. 2004). In brief, we used a LOD thresholdof 4.0 to assign markers to linkage groups followed by athreshold of 0.10 to order markers within those inferred linkagegroups. Recombination frequencies were converted to mapdistances in centimorgans, using the Kosambi mapping func-tion. Linkage map results are deposited and freely available at
290 A. J. Eckert et al.
the forest tree CMAP website (http://dendrome.ucdavis.edu/cmap/; accession no. TG05).
Linkage disequilibrium analyses: LD between pairs of siteswithin each candidate gene and between pairs of sites indifferent candidate genes mapped to the same linkage groupwere evaluated by using DnaSP v. 4.50.3 (Rozas et al. 2003). Weused the squared allelic correlation coefficient (r 2) betweenpairs of parsimony informative sites to estimate LD. We usedFisher’s exact tests to calculate P-values under the null hypoth-esis that LD estimates at least as extreme as those observedcould have arisen under linkage equilibrium. The decay of LDwith distance in base pairs between sites within the samecandidate gene was evaluated with nonlinear regression, usingthe Gauss–Newton algorithm as implemented in the nls func-tion of R (Hill and Weir 1988; Remington et al. 2001).
Population structure and historical demography: Theextent of structure among populations of coastal Douglas firobserved at chloroplast and nuclear microsatellites, as well asallozymes, is low and consistent with weak effects of isolationby distance (Li and Adams 1989; Viard et al. 2001; Krutovsky
et al. 2009). We analyzed patterns of differentiation for all 115polymorphic candidate genes, using pairwise measures ofdivergence (Dxy) among the six populations, and related thismeasure to geographical distance using Mantel tests.
To assess the effects of historical demography, especiallygiven the weak patterns of population structure, on the abilityto identify candidate genes under selection, we used a likeli-hood-free Markov chain Monte Carlo (MCMC) approach toestimate parameters under an instantaneous growth model(IGM) (Marjoram et al. 2003; Marjoram and Tavare 2006).This model is specified by two parameters, the ratio ( f ) of thecurrent effective population size (Nec) to the effective pop-ulation size prior to the growth event (Nep) and the time inunits of 4Nec generations at which the growth event began (t).We assigned uniform priors to both parameters, used theaverage Tajima’s D over the18 loci analyzed by Krutovsky
and Neale (2005) as the metric (D ¼ �0.248), and specifieda rejection threshold (e) of 0.05.
Parameters were estimated with Markov chains that wererun for 1.2 3 106 steps with the first 0.2 3 106 steps beingdiscarded as burn-in and a thinning interval of 100 steps. Theresulting 10,000 samples for each parameter were taken as anapproximation of their unknown posterior distributions. Thejoint posterior distribution of f and t was smoothed, using thekernel smoothing functions available in R. Convergence wasassessed through three independent MCMC runs by analyzingsimilarities between the resulting approximate posterior dis-tributions and using effective sample size (ESS) estimatescalculated using the CODA ver. 0.13-2 package in R.
To understand the effects of more complicated demo-graphic scenarios on our abilities to detect loci underselection, we also analyzed two bottleneck models, where weset the time of the bottleneck to occur at 10,000 (BIM_10; t ¼0.001) or 100,000 (BIM_100; t ¼ 0.015) years ago withbottleneck sizes that were 1% of the current population size.The duration of the bottleneck was set to 0.005 coalescent timeunits, and the estimate of Q upon which the simulations wereconditioned was adjusted so that the average simulated valueof up per locus was equal to the observed value for each of the18 loci used to fit the model. Model fit was assessed bysimulating 10,000 sets of 18 loci for which we calculated theaverage and standard deviation of Tajima’s D. We used thesesimulated sets of data to differentiate among models (in-stantaneous growth or the two bottleneck models), usingrejection sampling (e ¼ 0.05 for both D and the standarddeviation of D) and the relationship between acceptancerates and Bayes factors (BF ¼ P(S jBIM_i)/P(S jIGM), whereP(S jModel) is given by the acceptance rate and represents
the probability of the observed statistics given the model).The observed values of average D and the standard deviationof D were �0.248 and 0.837, respectively (Krutovsky andNeale 2005). Following Jeffreys (1998), we consideredvalues .10�1/2 for the BF as ‘‘substantial’’ evidence for a givenmodel (cf. Ross-Ibarra et al. 2009). This scheme conditions allcomparisons on the estimates of t and f from the instanta-neous growth model (i.e., these were not estimated again)given added demographic effects (e.g., bottlenecks).
Nucleotide diversity and neutrality tests: Several estimatorsof Q ¼ 4Neu, where Ne is the effective population size and u isthe mutation rate, were used to assess the magnitude ofnucleotide diversity across candidate genes. A likelihood-ratiotest was performed subsequently to test the null hypothesisthat Q is constant across loci (Hudson 1991). The number ofhaplotypes (h) and haplotypic diversity (Hd) were calculatedfor comparison with diversity estimators based on the sitefrequency spectrum. Pairwise divergence (Dxy) for each can-didate gene was calculated by comparing the sequences ofcoastal Douglas fir to a single sequence from bigcone Douglas-fir. We assumed for all calculations that our data conformed tothe infinite-sites model. Sites violating these assumptions, orthose with missing data, were ignored.
A suite of summary statistics was used to detect departures ofthe site frequency spectrum from neutral expectations withineach candidate gene. The significance of each statistic wasdetermined under three different null models, using 10,000coalescent simulations conditional on the observed value ofup. When simulating data under the demographic models,we adjusted the value of Q so that the median value of thesimulated up was equal to the observed data. This was done toaccount for the fact that up is only an unbiased estimator of Qunder genetic drift. The positive false discovery rate (FDR)method was used to correct for multiple testing (Storey
2003). We chose to focus on positive selection, because manyof the tests we employed are most powerful in differentiatingpositive from background selection (Zeng et al. 2006,2007a,b). We employed the DHEW test to search further fordepartures from neutrality. This test uses the combination ofTajima’s D, Fay and Wu’s normalized H, and the Ewens–Watterson test of neutrality to detect positive selection. Therejection region for this test was determined through 50,000coalescent simulations conditional on the observed value ofup. We used a nominal threshold of P ¼ 0.0005 in the cal-culation of this region for each locus to account for the factthat we are performing 115 independent tests.
Finally, we used polymorphism–divergence-based tests tosearch for candidate genes with reduced levels of polymor-phism relative to divergence. A maximum-likelihood imple-mentation of the Hudson–Kreitman–Aguade (HKA) test wascarried out with MLHKA ver. 2.0 (Wright and Charlesworth
2004). We implemented a likelihood-ratio test by choosingrandomly 20 candidate genes exhibiting neutral site frequencyspectra and 3 candidate genes exhibiting reduced levels ofpolymorphism relative to divergence. These 3 genes werechosen because they had reduced levels of polymorphismrelative to divergence (up/Dxy , 0.15). The likelihood func-tion was evaluated and parameters were estimated under bothmodels, using MCMC with 1.0 3 108 steps. Statistical signifi-cance was determined by comparing twice the differencebetween the log-likelihood scores to a x2-distribution with3 d.f., where in model 1 it was assumed that all 23 loci wereneutral and in model 2 it was assumed that the 3 focal geneswere nonneutral. Three independent MCMC simulationswere used to check for convergence of the likelihood scoreand parameter estimates.
We also computed the ratio of nonsynonymous (Ka) tosynonymous (Ks) divergence for each gene using DnaSP and
Positive Selection at Cold-Hardiness-Related Candidate Genes 291
correlated the Ka/Ks ratio to the polymorphism/divergenceratio using simple linear regression in R. This ratio is theaverage of each pairwise estimate of Ka/Ks of the coastalDouglas fir samples to the single bigcone Douglas fir. We usedbootstrapping (n ¼ 10,000 replicates) across samples toconstruct 95 and 99% confidence intervals for our measureof Ka/Ks.
RESULTS
Patterns of nucleotide diversity and divergence: Atotal of 59,173 bp of aligned sequence data, of which932 bp had missing, ambiguous, or indel data, weregenerated through the partial resequencing of 121candidate genes (GenBank accession nos. EU864545–EU867209). The average length of these gene fragmentswas 489 bp (6 204 bp). These genes are distributedthroughout the genome of coastal Douglas fir (FigureS1), with 64 of the 77 segregating SNPs being placedon the existing linkage map. These 64 SNPs represent42 candidate genes, 36 from this study and 6 fromKrutovsky and Neale (2005). Sequence data were ob-tained for 21 of the 24 samples per gene on average. Ofthe 121 candidate genes, 115 were polymorphic, yield-ing a total of 933 SNPs. The number of polymorphismsvaried greatly across genes with an average of 8 SNPs perlocus (range: 0–29). The majority of SNPs were silent(n¼ 732), with 478 of those being located in noncodingregions. The remaining 201 SNPs were nonsynony-mous, with an average of 2 nonsynonymous SNPs pergene (range: 0–12). The average SNP density rangedfrom a maximum of 1 SNP per 43 bp for silent sites to aminimum of 1 SNP per 112 bp for nonsynonymous sites.
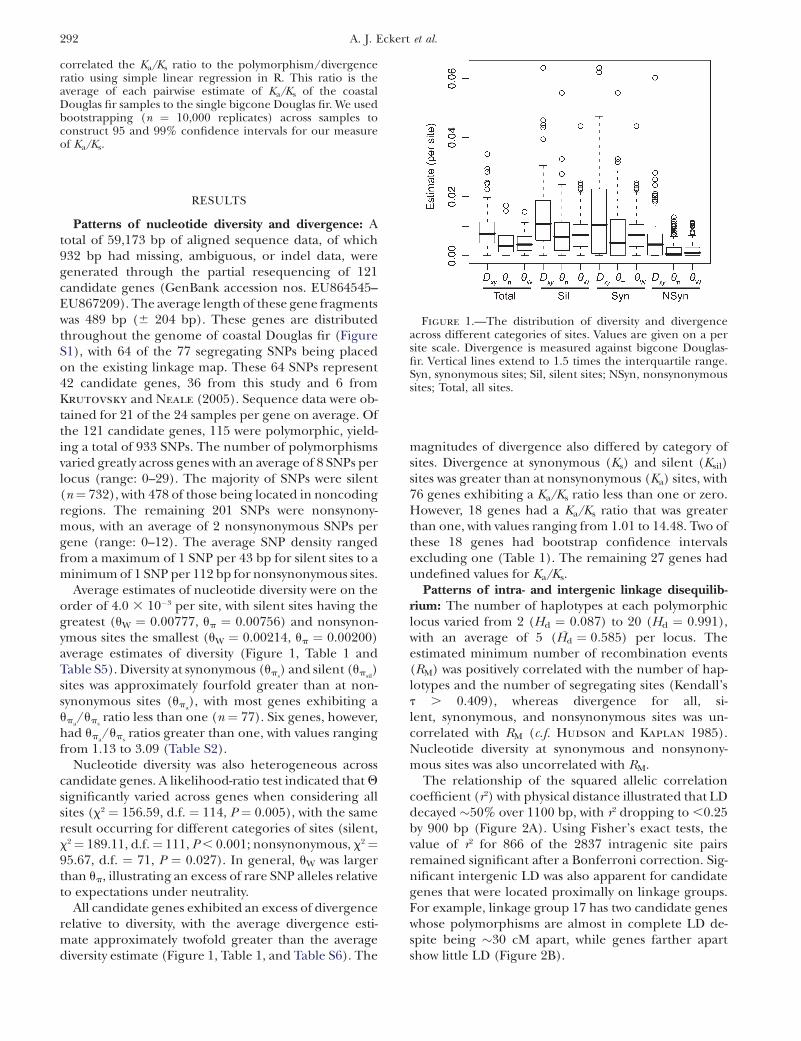
Average estimates of nucleotide diversity were on theorder of 4.0 3 10�3 per site, with silent sites having thegreatest (uW ¼ 0.00777, up ¼ 0.00756) and nonsynon-ymous sites the smallest (uW ¼ 0.00214, up ¼ 0.00200)average estimates of diversity (Figure 1, Table 1 andTable S5). Diversity at synonymous (ups
) and silent (upsil)
sites was approximately fourfold greater than at non-synonymous sites (upa
), with most genes exhibiting aupa
/upsratio less than one (n ¼ 77). Six genes, however,
had upa/ups
ratios greater than one, with values rangingfrom 1.13 to 3.09 (Table S2).
Nucleotide diversity was also heterogeneous acrosscandidate genes. A likelihood-ratio test indicated that Q
significantly varied across genes when considering allsites (x2 ¼ 156.59, d.f. ¼ 114, P ¼ 0.005), with the sameresult occurring for different categories of sites (silent,x2¼ 189.11, d.f.¼ 111, P , 0.001; nonsynonymous, x2¼95.67, d.f. ¼ 71, P ¼ 0.027). In general, uW was largerthan up, illustrating an excess of rare SNP alleles relativeto expectations under neutrality.
All candidate genes exhibited an excess of divergencerelative to diversity, with the average divergence esti-mate approximately twofold greater than the averagediversity estimate (Figure 1, Table 1, and Table S6). The
magnitudes of divergence also differed by category ofsites. Divergence at synonymous (Ks) and silent (Ksil)sites was greater than at nonsynonymous (Ka) sites, with76 genes exhibiting a Ka/Ks ratio less than one or zero.However, 18 genes had a Ka/Ks ratio that was greaterthan one, with values ranging from 1.01 to 14.48. Two ofthese 18 genes had bootstrap confidence intervalsexcluding one (Table 1). The remaining 27 genes hadundefined values for Ka/Ks.
Patterns of intra- and intergenic linkage disequilib-rium: The number of haplotypes at each polymorphiclocus varied from 2 (Hd ¼ 0.087) to 20 (Hd ¼ 0.991),with an average of 5 (Hd ¼ 0:585) per locus. Theestimated minimum number of recombination events(RM) was positively correlated with the number of hap-lotypes and the number of segregating sites (Kendall’st . 0.409), whereas divergence for all, si-lent, synonymous, and nonsynonymous sites was un-correlated with RM (c.f. Hudson and Kaplan 1985).Nucleotide diversity at synonymous and nonsynony-mous sites was also uncorrelated with RM.
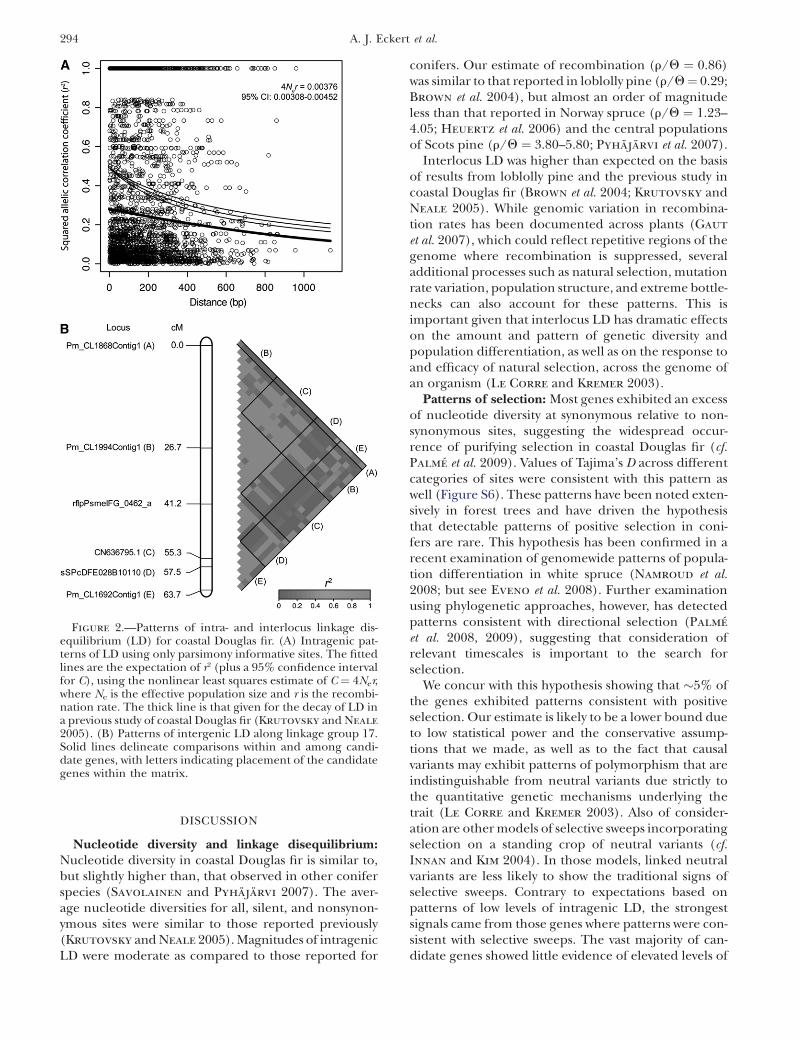
The relationship of the squared allelic correlationcoefficient (r2) with physical distance illustrated that LDdecayed �50% over 1100 bp, with r2 dropping to ,0.25by 900 bp (Figure 2A). Using Fisher’s exact tests, thevalue of r2 for 866 of the 2837 intragenic site pairsremained significant after a Bonferroni correction. Sig-nificant intergenic LD was also apparent for candidategenes that were located proximally on linkage groups.For example, linkage group 17 has two candidate geneswhose polymorphisms are almost in complete LD de-spite being �30 cM apart, while genes farther apartshow little LD (Figure 2B).
Figure 1.—The distribution of diversity and divergenceacross different categories of sites. Values are given on a persite scale. Divergence is measured against bigcone Douglas-fir. Vertical lines extend to 1.5 times the interquartile range.Syn, synonymous sites; Sil, silent sites; NSyn, nonsynonymoussites; Total, all sites.
292 A. J. Eckert et al.
Historical demography: The IGM yielded well-defined approximate posterior probability distributionsfor the parameters of interest. Replicated runs of theMCMC sampler converged to similar posterior proba-bility distributions, as well as to roughly similar pointestimates of the parameters (Figure S2, Table S7).Parameter estimates for this model are consistent withpopulation growth producing a modest increase ineffective population size ( f ¼ 0.60–0.73), beginning�0.039–0.045 coalescent time units ago. These translateinto minimum age estimates for the onset of growth of�270,000–310,000 years ago if we assume a mutationrate on the order of 1.0 3 10�9 mutations/bp/year(Willyard et al. 2006), a generation time of 50 years,and a genomewide estimate for Q of 5.92.
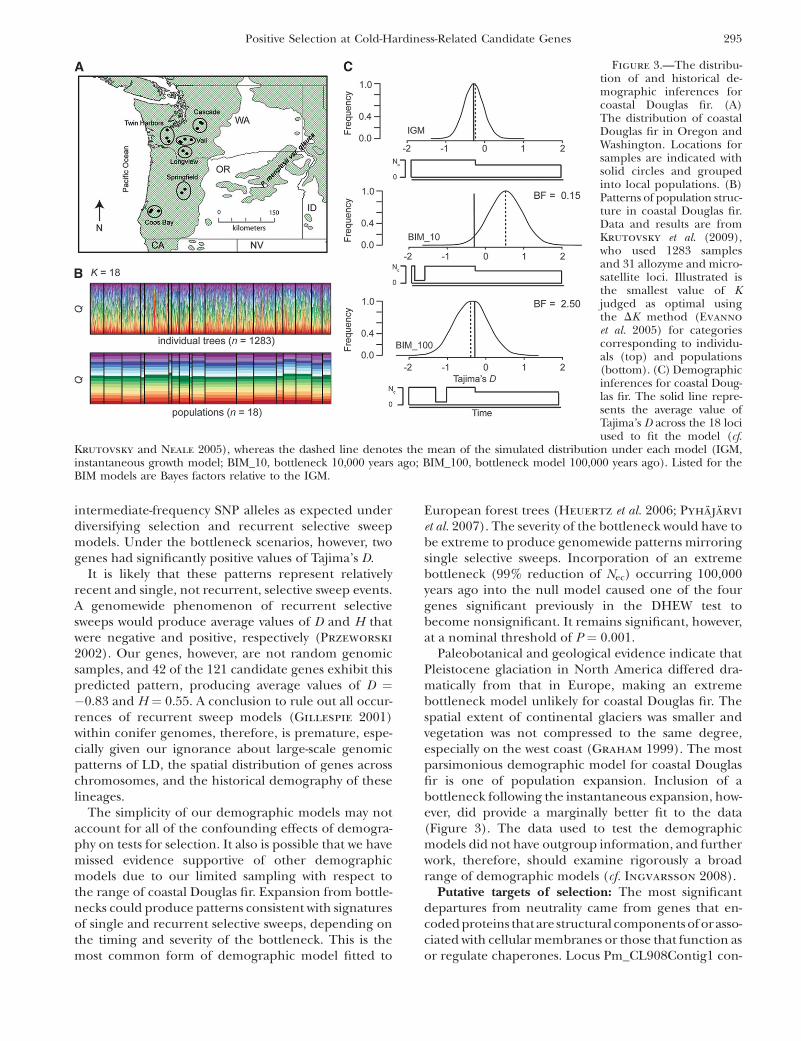
We also fit the data to two extreme bottleneck models,where the effective population size during the bottle-neck was 5% of the current size (Figure 3). All otherparameters were set to the mean values across theMCMC replications (Table S7). When this event wasset to occur at 10,000 years ago, the Bayes factor withrespect to the instantaneous growth model was 0.15.When the bottleneck, however, was set to be 100,000years ago, the Bayes factor was 2.5. Following Jeffreys
(1998), the IGM fits the data substantially better thanthe BIM_10 (BF ¼ 6.67, i.e., 1/0.15), but the IGM andBIM_100 models are not differentiated substantially bythe data (BF ¼ 2.50). We focus subsequently on the twobest models for the purpose of neutrality testing.
Neutrality tests: Six candidate genes exhibited clearpatterns of polymorphism and divergence consistentwith natural selection. The results from univariate testsare given in Table S8 and Table S9, as well as P-valuesunder null models corresponding to Wright–Fishermating, the instantaneous growth model, and theextreme bottleneck model set to occur at 100,000 yearsago. On average, the summary statistics reflected theexcess of low-frequency SNP alleles (D ¼ �0.142) andthe slight excess of high-frequency (Fay and Wu’s H ¼�0.106) derived SNP alleles.
A compound test based on D, H, and the Ewens–Watterson haplotype test (DHEW) identified four genesas having patterns of diversity consistent with selective
sweeps (Table 2, Figure S3). Products from all fourgenes function as structural components of the plasmamembrane or provide protection against temperature-dependent denaturation of proteins. Inclusion of demo-graphic models (IGM and BIM_100) into the simulationscaused one of these loci (CN634517.1) to becomenonsignificant.
Three genes exhibited a significant excess of diver-gence relative to diversity, using a maximum-likelihoodimplementation of the HKA test (x2 ¼ 12.60, d.f. ¼ 3,P ¼ 0.006). These excesses ranged from a two- tothreefold reduction in diversity relative to divergence(Table S10, Figure S3), which was also apparent acrossdifferent categories of sites (Figure S4). All three locifunction in generalized stress responses at the levels ofprotein folding and transcriptional regulation, withlocus Pm_CL908Contig1 also being significant for theDHEW test. A weak, yet statistically significant, relation-ship also existed between Ka/Ks and up/Dxy (F1,91¼ 4.79,P ¼ 0.031, r2 ¼ 0.05). The driver behind this result wasthree loci with extreme values of Ka/Ks (i.e., .5, cf. Table1), all of which had up/Dxy , 0.15 (Table 2). Removalof these three loci changed the relationship to benonsignificant.
Several additional genes exhibited patterns of poly-morphism consistent with balancing or diversifyingselection, depending upon the null model and sum-mary statistic that was used (Table S8 and Table S9).None of these were significant using the DHEW test. Forthree of these five genes, a significant and positiverelationship existed between geographical distance andpairwise Dxy among populations (Figure S5). Thispattern is suggestive of diversifying selection alongenvironmental gradients, especially given that only fivecandidate genes had a significant value of Mantel’s rand three of those five had positive values of D that werenominally significant. Two of these genes remainedsignificant at the FDR threshold of Q¼ 0.10 for Tajima’stest when an extreme bottleneck was included as partof the null model. These loci, CN636901.1 and Pm_CL1400Contig1, encode proteins that are involvedwith abiotic stress response and cell wall architecture,respectively.
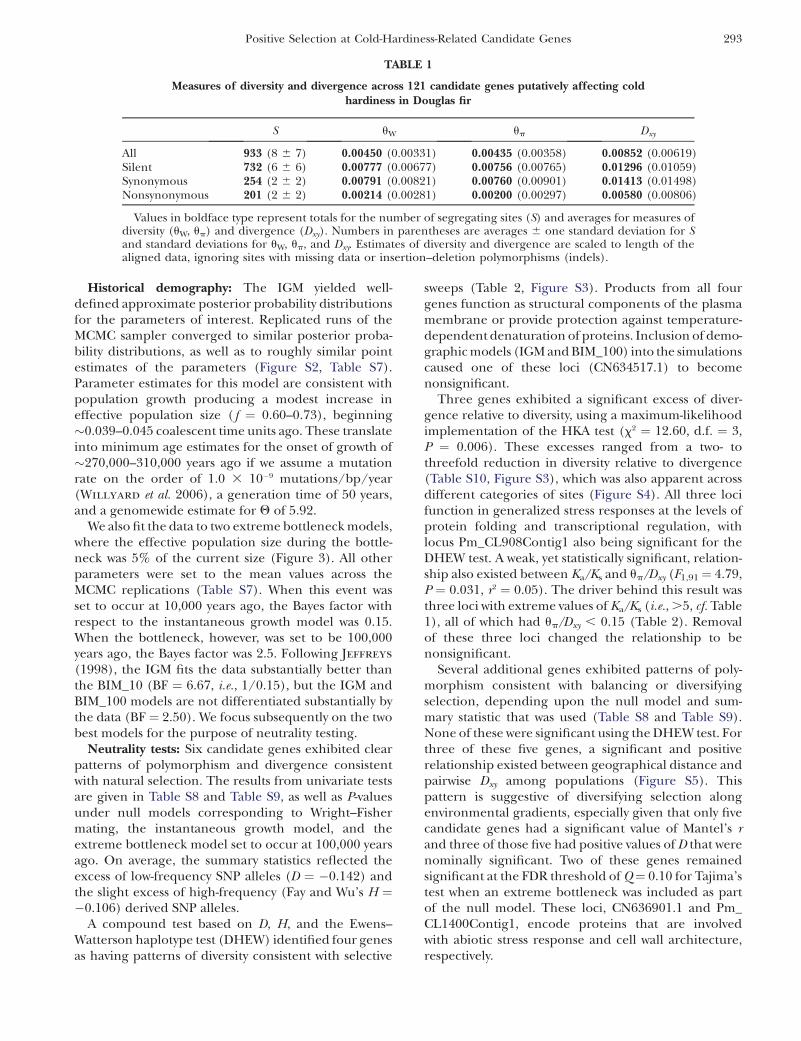
TABLE 1
Measures of diversity and divergence across 121 candidate genes putatively affecting coldhardiness in Douglas fir
S uW up Dxy
All 933 (8 6 7) 0.00450 (0.00331) 0.00435 (0.00358) 0.00852 (0.00619)Silent 732 (6 6 6) 0.00777 (0.00677) 0.00756 (0.00765) 0.01296 (0.01059)Synonymous 254 (2 6 2) 0.00791 (0.00821) 0.00760 (0.00901) 0.01413 (0.01498)Nonsynonymous 201 (2 6 2) 0.00214 (0.00281) 0.00200 (0.00297) 0.00580 (0.00806)
Values in boldface type represent totals for the number of segregating sites (S) and averages for measures ofdiversity (uW, up) and divergence (Dxy). Numbers in parentheses are averages 6 one standard deviation for Sand standard deviations for uW, up, and Dxy. Estimates of diversity and divergence are scaled to length of thealigned data, ignoring sites with missing data or insertion–deletion polymorphisms (indels).
Positive Selection at Cold-Hardiness-Related Candidate Genes 293
DISCUSSION
Nucleotide diversity and linkage disequilibrium:Nucleotide diversity in coastal Douglas fir is similar to,but slightly higher than, that observed in other coniferspecies (Savolainen and Pyhajarvi 2007). The aver-age nucleotide diversities for all, silent, and nonsynon-ymous sites were similar to those reported previously(Krutovsky and Neale 2005). Magnitudes of intragenicLD were moderate as compared to those reported for
conifers. Our estimate of recombination (r/Q ¼ 0.86)was similar to that reported in loblolly pine (r/Q¼ 0.29;Brown et al. 2004), but almost an order of magnitudeless than that reported in Norway spruce (r/Q ¼ 1.23–4.05; Heuertz et al. 2006) and the central populationsof Scots pine (r/Q ¼ 3.80–5.80; Pyhajarvi et al. 2007).
Interlocus LD was higher than expected on the basisof results from loblolly pine and the previous study incoastal Douglas fir (Brown et al. 2004; Krutovsky andNeale 2005). While genomic variation in recombina-tion rates has been documented across plants (Gaut
et al. 2007), which could reflect repetitive regions of thegenome where recombination is suppressed, severaladditional processes such as natural selection, mutationrate variation, population structure, and extreme bottle-necks can also account for these patterns. This isimportant given that interlocus LD has dramatic effectson the amount and pattern of genetic diversity andpopulation differentiation, as well as on the response toand efficacy of natural selection, across the genome ofan organism (Le Corre and Kremer 2003).
Patterns of selection: Most genes exhibited an excessof nucleotide diversity at synonymous relative to non-synonymous sites, suggesting the widespread occur-rence of purifying selection in coastal Douglas fir (cf.Palme et al. 2009). Values of Tajima’s D across differentcategories of sites were consistent with this pattern aswell (Figure S6). These patterns have been noted exten-sively in forest trees and have driven the hypothesisthat detectable patterns of positive selection in coni-fers are rare. This hypothesis has been confirmed in arecent examination of genomewide patterns of popula-tion differentiation in white spruce (Namroud et al.2008; but see Eveno et al. 2008). Further examinationusing phylogenetic approaches, however, has detectedpatterns consistent with directional selection (Palme
et al. 2008, 2009), suggesting that consideration ofrelevant timescales is important to the search forselection.
We concur with this hypothesis showing that �5% ofthe genes exhibited patterns consistent with positiveselection. Our estimate is likely to be a lower bound dueto low statistical power and the conservative assump-tions that we made, as well as to the fact that causalvariants may exhibit patterns of polymorphism that areindistinguishable from neutral variants due strictly tothe quantitative genetic mechanisms underlying thetrait (Le Corre and Kremer 2003). Also of consider-ation are other models of selective sweeps incorporatingselection on a standing crop of neutral variants (cf.Innan and Kim 2004). In those models, linked neutralvariants are less likely to show the traditional signs ofselective sweeps. Contrary to expectations based onpatterns of low levels of intragenic LD, the strongestsignals came from those genes where patterns were con-sistent with selective sweeps. The vast majority of can-didate genes showed little evidence of elevated levels of
Figure 2.—Patterns of intra- and interlocus linkage dis-equilibrium (LD) for coastal Douglas fir. (A) Intragenic pat-terns of LD using only parsimony informative sites. The fittedlines are the expectation of r2 (plus a 95% confidence intervalfor C), using the nonlinear least squares estimate of C ¼ 4Ner,where Ne is the effective population size and r is the recombi-nation rate. The thick line is that given for the decay of LD ina previous study of coastal Douglas fir (Krutovsky and Neale
2005). (B) Patterns of intergenic LD along linkage group 17.Solid lines delineate comparisons within and among candi-date genes, with letters indicating placement of the candidategenes within the matrix.
294 A. J. Eckert et al.
intermediate-frequency SNP alleles as expected underdiversifying selection and recurrent selective sweepmodels. Under the bottleneck scenarios, however, twogenes had significantly positive values of Tajima’s D.
It is likely that these patterns represent relativelyrecent and single, not recurrent, selective sweep events.A genomewide phenomenon of recurrent selectivesweeps would produce average values of D and H thatwere negative and positive, respectively (Przeworski
2002). Our genes, however, are not random genomicsamples, and 42 of the 121 candidate genes exhibit thispredicted pattern, producing average values of D ¼�0.83 and H ¼ 0.55. A conclusion to rule out all occur-rences of recurrent sweep models (Gillespie 2001)within conifer genomes, therefore, is premature, espe-cially given our ignorance about large-scale genomicpatterns of LD, the spatial distribution of genes acrosschromosomes, and the historical demography of theselineages.
The simplicity of our demographic models may notaccount for all of the confounding effects of demogra-phy on tests for selection. It also is possible that we havemissed evidence supportive of other demographicmodels due to our limited sampling with respect tothe range of coastal Douglas fir. Expansion from bottle-necks could produce patterns consistent with signaturesof single and recurrent selective sweeps, depending onthe timing and severity of the bottleneck. This is themost common form of demographic model fitted to
European forest trees (Heuertz et al. 2006; Pyhajarvi
et al. 2007). The severity of the bottleneck would have tobe extreme to produce genomewide patterns mirroringsingle selective sweeps. Incorporation of an extremebottleneck (99% reduction of Nec) occurring 100,000years ago into the null model caused one of the fourgenes significant previously in the DHEW test tobecome nonsignificant. It remains significant, however,at a nominal threshold of P ¼ 0.001.
Paleobotanical and geological evidence indicate thatPleistocene glaciation in North America differed dra-matically from that in Europe, making an extremebottleneck model unlikely for coastal Douglas fir. Thespatial extent of continental glaciers was smaller andvegetation was not compressed to the same degree,especially on the west coast (Graham 1999). The mostparsimonious demographic model for coastal Douglasfir is one of population expansion. Inclusion of abottleneck following the instantaneous expansion, how-ever, did provide a marginally better fit to the data(Figure 3). The data used to test the demographicmodels did not have outgroup information, and furtherwork, therefore, should examine rigorously a broadrange of demographic models (cf. Ingvarsson 2008).
Putative targets of selection: The most significantdepartures from neutrality came from genes that en-coded proteins that are structural components of or asso-ciated with cellular membranes or those that function asor regulate chaperones. Locus Pm_CL908Contig1 con-
Figure 3.—The distribu-tion of and historical de-mographic inferences forcoastal Douglas fir. (A)The distribution of coastalDouglas fir in Oregon andWashington. Locations forsamples are indicated withsolid circles and groupedinto local populations. (B)Patterns of population struc-ture in coastal Douglas fir.Data and results are fromKrutovsky et al. (2009),who used 1283 samplesand 31 allozyme and micro-satellite loci. Illustrated isthe smallest value of Kjudged as optimal usingthe DK method (Evanno
et al. 2005) for categoriescorresponding to individu-als (top) and populations(bottom). (C) Demographicinferences for coastal Doug-las fir. The solid line repre-sents the average value ofTajima’s D across the 18 lociused to fit the model (cf.
Krutovsky and Neale 2005), whereas the dashed line denotes the mean of the simulated distribution under each model (IGM,instantaneous growth model; BIM_10, bottleneck 10,000 years ago; BIM_100, bottleneck model 100,000 years ago). Listed for theBIM models are Bayes factors relative to the IGM.
Positive Selection at Cold-Hardiness-Related Candidate Genes 295
tains a GRAM domain, which characterizes membrane-associated proteins such as glucosyltransferases (Doerks
et al. 2000; Caro et al. 2007). The Arabidopsis homologof locus ES420171.1 is a multispanning G-protein cou-pled receptor that stabilizes the plasma membranein response to freezing temperatures (Breton et al.2003). Both CN634517.1 and Pm_CL61Contig1 havehomologs whose primary functions are to act as or in theregulation of chaperones (Romano et al. 2004). LocusPm_CL922Contig1 encodes a thaumatin-like protein,whose homolog in Arabidopsis has gene expressioninduced by fungal infection (Hu and Reddy 1997).While the link between cold hardiness and diseaseresistance is speculative, it is tempting to correlate overallhealth with the ability to grow and tolerate cold effi-ciently. Several of these genes are also responsive toabscisic acid (ABA). Controversy has surrounded the roleof ABA during cold acclimation in Arabidopsis, however,due to its general effect on plant growth in response tostress (Gilmour and Thomashow 1991).
Limitations and implications: There are several limi-tations to our analyses. We used a single sequence from arecently diverged outgroup so that misspecification ofancestral states is possible. This would reduce greatly thepower of the HKA test employed here and significantlyaffect estimation of H (cf. Baudry and Depaulis 2003).This also justifies our avoidance of McDonald–Kreitman-type analyses. Background selection could have pro-duced signatures of selective sweeps, but not with respectto H (Hudson and Kaplan 1995). Finally, we did notincorporate effects of population structure into ourhypothesis testing. The effects of undetected structureon inference of selection from summary statistics are tied
closely to sampling design and the strength of sub-structure (Przeworski 2002; Stadler et al. 2009), andthus conclusions regarding the conservative or liberalnature of our estimates are premature.
Selective sweeps, while not likely the dominant type ofselection across the genome of coastal Douglas fir, arenevertheless important. Here, we have identified severalgenes whose patterns of diversity and divergence areinconsistent with the standard neutral model, as well assimple demographic scenarios involving instantaneousgrowth and bottlenecks. Depending upon demographicassumptions, we have identified three to eight such loci.These genes are prime targets for further associationgenetic (cf. Eckert et al. 2009b) and functional studies,thus beginning to bring molecular population andquantitative genetic approaches full circle with respectto the dissection of complex traits.
The authors thank F. Thomas Ledig for contributing bigconeDouglas fir seeds, Valerie Hipkins and her staff at National ForestGenetics Laboratory for performing the DNA extractions, Katie Tsangand Jacqueline Silva for helping to obtain sequence data, and Jeff Ross-Ibarra for helpful discussion about demographic inference. Themanuscript was much improved by comments from two anonymousreviewers. Funding for this project was made available through a U.S.Department of Agriculture National Research Initiative Plant Genomegrant (04-712-0084).
LITERATURE CITED
Aitken, S. N., and W. T. Adams, 1996 Genetics of fall and wintercold hardiness of coastal Douglas-fir in Oregon. Can. J. For.Res. 26: 1828–1837.
Aitken, S. N., and W. T. Adams, 1997 Cold hardiness under stronggenetic control in Oregon populations of Pseudotsuga menziesiivar. menziesii. Can. J. For. Res. 27: 1773–1780.
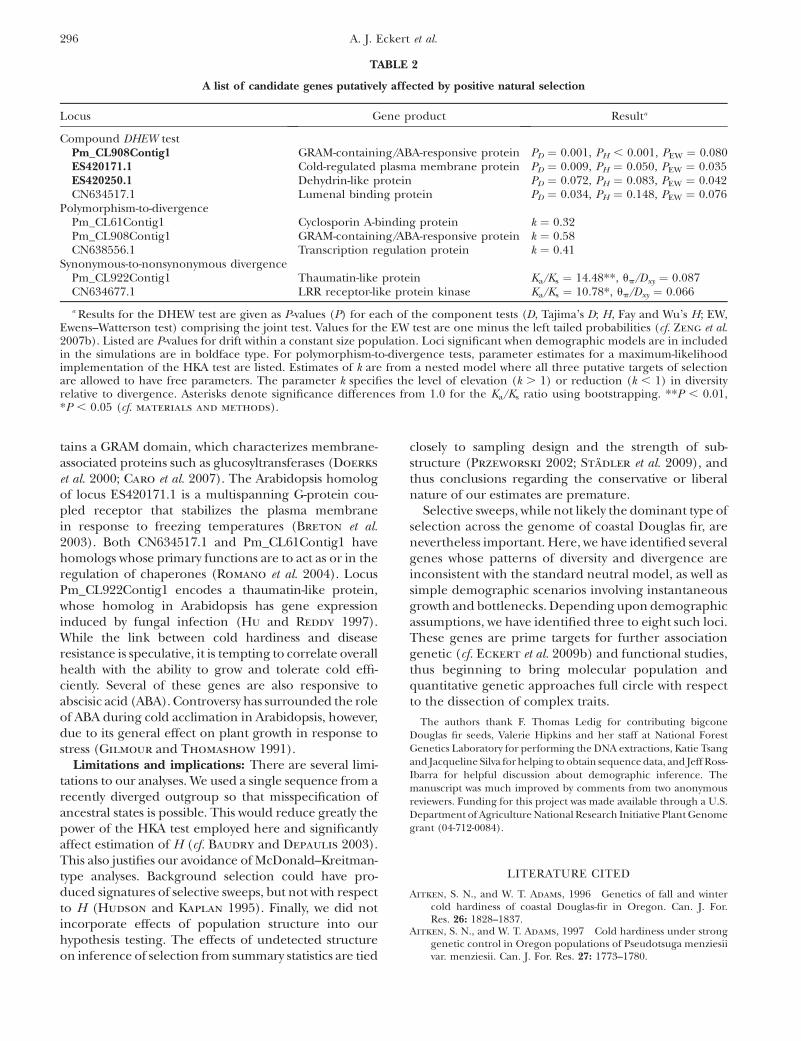
TABLE 2
A list of candidate genes putatively affected by positive natural selection
Locus Gene product Resulta
Compound DHEW testPm_CL908Contig1 GRAM-containing/ABA-responsive protein PD ¼ 0.001, PH , 0.001, PEW ¼ 0.080ES420171.1 Cold-regulated plasma membrane protein PD ¼ 0.009, PH ¼ 0.050, PEW ¼ 0.035ES420250.1 Dehydrin-like protein PD ¼ 0.072, PH ¼ 0.083, PEW ¼ 0.042CN634517.1 Lumenal binding protein PD ¼ 0.034, PH ¼ 0.148, PEW ¼ 0.076
Polymorphism-to-divergencePm_CL61Contig1 Cyclosporin A-binding protein k ¼ 0.32Pm_CL908Contig1 GRAM-containing/ABA-responsive protein k ¼ 0.58CN638556.1 Transcription regulation protein k ¼ 0.41
Synonymous-to-nonsynonymous divergencePm_CL922Contig1 Thaumatin-like protein Ka/Ks ¼ 14.48**, up/Dxy ¼ 0.087CN634677.1 LRR receptor-like protein kinase Ka/Ks ¼ 10.78*, up/Dxy ¼ 0.066
a Results for the DHEW test are given as P-values (P) for each of the component tests (D, Tajima’s D; H, Fay and Wu’s H; EW,Ewens–Watterson test) comprising the joint test. Values for the EW test are one minus the left tailed probabilities (cf. Zeng et al.2007b). Listed are P-values for drift within a constant size population. Loci significant when demographic models are in includedin the simulations are in boldface type. For polymorphism-to-divergence tests, parameter estimates for a maximum-likelihoodimplementation of the HKA test are listed. Estimates of k are from a nested model where all three putative targets of selectionare allowed to have free parameters. The parameter k specifies the level of elevation (k . 1) or reduction (k , 1) in diversityrelative to divergence. Asterisks denote significance differences from 1.0 for the Ka/Ks ratio using bootstrapping. **P , 0.01,*P , 0.05 (cf. materials and methods).
296 A. J. Eckert et al.
Baudry, E., and F. Depaulis, 2003 Effect of misoriented sites onneutrality tests with outgroup. Genetics 165: 1619–1622.
Begun, D. J., A. K. Holloway, K. Stevens, L. W. Hillier, Y.-P. Poh et al.,2007 Population genomics: whole-genome analysis of polymor-phism and divergence in Drosophila simulans. PLoS Biol. 5: e310.
Breton, G., J. Danyluk, J. B. F. Charron and F. Sarhan,2003 Expression profiling and bioinformatic analyses of a novelstress-regulated multispanning transmembrane protein familyfrom cereals and Arabidopsis. Plant Physiol. 132: 64–74.
Brown, G. R., G. P. Gill, R. J. Kuntz, C. H. Langley and D. B.Neale, 2004 Nucleotide diversity and linkage disequilibriumin loblolly pine. Proc. Natl. Acad. Sci. USA 101: 15255–15260.
Campbell, R. K., 1979 Genecology of Douglas-fir in a watershed inthe Oregon Cascades. Ecology 60: 1036–1050.
Campbell, R. K., and F. C. Sorensen, 1973 Cold acclimation inseedling Douglas-fir related to phenology and provenance. Ecol-ogy 54: 1148–1151.
Caro, E., M. M. Castellano and C. Gutierrez, 2007 A chromatinlink that couples cell division to root epidermis patterning inArabidopsis. Nature 447: 213–217.
Clark, R. M., G. Schweikert, C. Toomajian, S. Ossowski, G. Zeller
et al., 2007 Common sequence polymorphisms shaping geneticdiversity in Arabidopsis thaliana. Science 317: 338–342.
Doerks, T., M. Strauss, M. Brendel and P. Bork, 2000 GRAM, anovel domain in glucosyltransferases, myotubularins and otherputative membrane-associated proteins. Trends Biochem. Sci. 25:483–485.
Eckert, A. J., B. Pande, E. S. Ersoz, M. H. Wright, V. K. Rashbrook
et al., 2009a High-throughput genotyping and mapping of sin-gle nucleotide polymorphisms in loblolly pine (Pinus taeda L.).Tree Genet. Genomes 5: 225–234.
Eckert, A. J., A. D. Bower, J. L. Wegrzyn, B. Pande, K. D. Jermstad
et al., 2009b Association genetics of coastal Douglas-fir (Pseu-dotsuga menziesii var. menziesii, Pinaceae) I. Cold-hardiness re-lated traits. Genetics 182: 1289–1302.
Evanno, G., S. Regnaut and J. Goudet, 2005 Detecting the num-ber of clusters of individuals using the software STRUCTURE: asimulation study. Mol. Ecol. 14: 2611–2620.
Eveno, E., C. Collada, M. A. Guevara, V. Leger, A. Soto et al.,2008 Contrasting patterns of selection at Pinus pinaster Ait.drought stress candidate genes as revealed by genetic differenti-ation analyses. Mol. Biol. Evol. 25: 417–437.
Gaut, B. S., S. I. Wright, C. Rizzon, J. Dvorak and L. K. Anderson,2007 Recombination: an underappreciated factor in the evolu-tion of plant genomes. Nat. Rev. Genet. 8: 77–84.
Gillespie, J. H., 2001 Is the population size of a species relevant toits evolution? Evolution 55: 2161–2169.
Gilmour, S. J., and M. F. Thomashow, 1991 Cold acclimation andcold-regulated gene expression in ABA mutants of Arabidopsisthaliana. Plant Mol. Biol. 17: 1233–1240.
Gonzalez-Martınez, S. C., K. V. Krutovsky and D. B. Neale,2006 Forest tree population genomics and adaptive evolution.New Phytol. 170: 227–238.
Graham, A., 1999 Late Cretaceous and Cenozoic History of North Amer-ican Vegetation. Oxford University Press, New York.
Heuertz, M., E. De Paoli, T. Kallman, H. Larsson, I. Jurman et al.,2006 Multilocus patterns of nucleotide diversity, linkage dis-equilibrium and demographic history of Norway spruce [Piceaabies (L.) Karst]. Genetics 174: 2095–2105.
Hill, W. G., and B. S. Weir, 1988 Variances and covariances ofsquared linkage disequilibria in finite populations. Theor. Popul.Biol. 33: 54–78.
Holliday, J. A., S. Ralph, R. White, J. Bohlmann and S. N. Aitken,2008 Global monitoring of gene expression during autumncold acclimation among rangewide populations of Sitka spruce[Picea sitchensis (Bong.) Carr.]. New Phytol. 178: 103–122.
Howe, G. T., S. N. Aitken, D. B. Neale, K. D. Jermstad, N. C.Wheeler et al., 2003 From genotype to phenotype: unravelingthe complexities of cold adaptation in forest trees. Can. J. Bot.81: 1247–1266.
Hu, X., and A. S. Reddy, 1997 Cloning and expression of a PR5-likeprotein from Arabidopsis: inhibition of fungal growth by bacte-rially expressed protein. Plant Mol. Biol. 34: 949–959.
Hudson, R. R., 1991 Gene genealogies and the coalescent process.Oxf. Surv. Evol. Biol. 7: 1–44.
Hudson, R. R., and N. L. Kaplan, 1985 Statistical properties of thenumber of recombination events in the history of a sample ofDNA sequences. Genetics 111: 147–164.
Hudson, R. R., and N. L. Kaplan, 1995 The coalescent process andbackground selection. Philos. Trans. R. Soc. Lond. B Biol. Sci.349: 19–23.
Ingvarsson, P., 2008 Multilocus patterns of nucleotide polymor-phism and the demographic history of Populus tremula. Genetics180: 329–340.
Innan, H., and Y. Kim, 2004 Pattern of polymorphism after strongartificial selection in a domestication event. Proc. Natl. Acad.Sci. USA 101: 10667–10672.
Jeffreys, H., 1998 Theory of Probability. Oxford University Press,Oxford.
Jermstad, K. D., D. L. Bassoni, N. C. Wheeler and D. B. Neale,1998 A sex-averaged linkage map in coastal Douglas-fir (Pseudot-suga menziesii [Mirb.] Franco) based on RFLP and RAPD markers.Theor. Appl. Genet. 97: 762–770.
Jermstad, K. D., D. L. Bassoni, K. S. Jech, N. C. Wheeler and D. B.Neale, 2001a Mapping of quantitative trait loci controllingadaptive traits in coastal Douglas-fir. I. Timing of vegetativebud flush. Theor. Appl. Genet. 102: 1142–1151.
Jermstad, K. D., D. L. Bassoni, N. C. Wheeler, T. S. Anekonda, S. N.Aitken et al., 2001b Mapping of quantitative trait loci control-ling adaptive traits in coastal Douglas-fir. II. Spring and fall cold-hardiness. Theor. Appl. Genet. 102: 1152–1158.
Jermstad, K. D., D. L. Bassoni, K. S. Jech, G. A. Ritchie, N. C.Wheeler et al., 2003 Mapping of quantitative trait loci control-ling adaptive traits in coastal Douglas-fir. III. Quantitative traitloci-by-environment interactions. Genetics 165: 1489–1506.
Krutovsky, K.V., and D. B. Neale, 2005 Nucleotide diversity andlinkage disequilibrium in cold–hardiness and wood-quality re-lated candidate genes in Douglas-fir. Genetics 171: 2029–2041.
Krutovsky, K. V., M. Troggio, G. R. Brown, K. D. Jermstad andD. B. Neale, 2004 Comparative mapping in the Pinaceae. Ge-netics 168: 447–461.
Krutovsky, K. V., J. B. St. Clair, R. Saich, V. D. Hipkins and D. B.Neale, 2009 Estimation of population structure in coastalDouglas-fir [Pseudotsuga menziesii (Mirb.) Franco var. menziesii] us-ing allozyme and microsatellite markers. Tree Genet.Genomes (in press).
Le Corre, V, and A. Kremer, 2003 Genetic variability at neutralmarkers, quantitative trait loci and trait in a subdivided popula-tion under selection. Genetics 164: 1205–1219.
Lee, B.-H., D. A. Henderson and J.-K. Zhu, 2005 The Arabidopsiscold-responsive transcriptome and its regulation by ICE1. PlantCell 17: 3155–3175.
Li, P., and W. T. Adams, 1989 Range-wide patterns of allozyme var-iation in Douglas-fir (Pseudotsuga menziesii). Can. J. For. Res. 19:149–161.
Marjoram, P., and S. Tavare, 2006 Modern computational ap-proaches for analyzing molecular genetic variation data. Nat.Rev. Genet. 7: 759–770.
Marjoram, P., J. Molitor, V. Plagnol and S. Tavare, 2003 Markovchain Monte Carlo without likelihoods. Proc. Natl. Acad. Sci.USA 100: 15324–15328.
McKay, J. K., and R. G. Latta, 2002 Adaptive population diver-gence: markers, QTL and traits. Trends Ecol. Evol. 17: 285–291.
Merkle, S. A., and W. T. Adams, 1987 Patterns of allozyme variationwithin and among Douglas-fir breeding zones in southwest Ore-gon. Can. J. For. Res. 17: 402–407.
Morgenstern, E. K., 1996 Geographic Variation in Forest Trees. UBCPress, Vancouver, British Columbia, Canada.
Namroud, M.-C., J. Beaulieu, N. Juge, J. Laroche and J. Bousquet,2008 Scanning the genome for gene single nucleotide poly-morphisms involved in adaptive population differentiation inwhite spruce. Mol. Ecol. 17: 3599–3613.
Palme, A. E., M. Wright and O. Savolainen, 2008 Patterns of diver-gence among conifer ESTs and polymorphism in Pinus sylvestrisidentify putative selective sweeps. Mol. Biol. Evol. 25: 2567–2577.
Palme, A. E., T. Pyhajarvi, W. Wachowiak and O. Savolainen,2009 Selection on nuclear genes in a Pinus phylogeny. Mol.Biol. Evol. 26: 893–905.
Pavy, N., B. Pelgas, S. Beauseigle, S. Blais, F. Gagnon et al.,2008 Enhancing genetic mapping of complex genomes through
Positive Selection at Cold-Hardiness-Related Candidate Genes 297
the design of highly-multiplexed SNP arrays: application to thelarge and unsequenced genomes of white and black spruce.BMC Genomics 9: 21.
Przeworski, M., 2002 The signature of positive selection at ran-domly chosen loci. Genetics 160: 1179–1189.
Pyhajarvi, T., M. R. Garcıa-Gil, T. Knurr, M. Mikkonen, W.Wachowiak et al., 2007 Demographic history has influencednucleotide diversity in European Pinus sylvestris populations. Ge-netics 177: 1713–1724.
Remington, D. L., J. M. Thornsberry, Y. Matsuoka, L. M. Wilson,S. R. Whitt et al., 2001 Structure of linkage disequilibrium andphenotypic associations in the maize genome. Proc. Natl. Acad.Sci. USA 98: 11479–11484.
Romano, P. G. N., P. Horton and J. E. Gray, 2004 The Arabidopsiscyclophilin gene family. Plant Physiol. 134: 1268–1282.
Ross-Ibarra, J., M. Tenaillon and B. S. Gaut, 2009 Historical diver-gence and gene flow in the genus Zea. Genetics 181: 1399–1413.
Rozas, J., J. C. Sanchez-DelBarrio, X. Messegyer and R. Rozas,2003 DnaSP, DNA polymorphism analyses by the coalescentand other methods. Bioinformatics 19: 2496–2497.
Santiago, E., and A. Caballero, 2005 Variation after a selectivesweep in a subdivided population. Genetics 169: 485–488.
Savolainen, O., and T. Pyhajarvi, 2007 Genomic diversity in foresttrees. Curr. Opin. Plant Biol. 10: 162–167.
Slatkin, M., and T. Wiehe, 1998 Genetic hitch-hiking in a subdi-vided population. Genet. Res. 71: 155–160.
St. Clair, J. B., 2006 Genetic variation in fall cold hardiness incoastal Douglas-fir in western Oregon and Washington. Can. J.Bot. 84: 1110–1181.
St. Clair, J. B., N. L. Mandel and K. W. Vance-Borland,2005 Genecology of Douglas-fir in western Oregon andWashington. Ann. Bot. 96: 1199–1214.
Stadler, T., B. Haubold, C. Merino, W. Stephan and P. Pfaffel-
huber, 2009 The impact of sampling schemes on the site fre-quency spectrum in nonequilibrium subdivided populations.Genetics 182: 205–216.
Stam, P., 1993 Construction of integrated genetic linkage maps bymeans of a new computer package: JoinMap. Plant J. 3: 739–744.
Storey, J. D., 2003 The positive false discovery rate: a Bayesianinterpretation and the q-value. Ann. Stat. 31: 2013–2035.
Thomashow, M. F., 1999 Plant cold acclimation: freezing tolerancegenes and regulatory mechanisms. Annu. Rev. Plant Physiol.Plant Mol. Biol. 50: 571–599.
Viard, F., Y. A. El-Kassaby and K. Ritland, 2001 Diversity and ge-netic structure in populations of Pseudotsuga menziesii (Pinaceae)at chloroplast microsatellite loci. Genome 44: 336–344.
Voight, B. F., S. Kudaravalli, X. Wen and J. K. Pritchard, 2006 Amap of recent positive selection in the human genome. PLoS Bi-ol. 4: e72.
Wegrzyn, J. L., J. M. Lee, J. D. Liechty and D. B. Neale,2009 PineSAP–Pine alignment and SNP Identification Pipe-line. Bioinformatics (in press).
Wheeler, N. C., K. D. Jermstad, K. V. Krutovsky, S. N. Aitken, G. T.Howe et al., 2005 Mapping of quantitative trait loci controllingadaptive traits in coastal Douglas-fir. IV. Cold-hardiness QTLverification and candidate gene mapping. Mol. Breed. 15: 145–156.
Willyard, A., J. Syring, D. S. Gernandt, A. Liston and R. Cronn,2006 Fossil calibration of molecular divergence infers a moder-ate mutation rate and recent radiations for Pinus. Mol. Biol. Evol.24: 90–101.
Wright, S. I., and B. Charlesworth, 2004 The HKA test revisited:a maximum likelihood ratio test of the standard neutral model.Genetics 168: 1071–1076.
Yakovlev, I. A., C.-G. Fossdal, Ø. Johnson, O. Junttlia and T.Skrøppa, 2006 Analysis of gene expression during bud burstinitiation in Norway spruce via ESTs from subtracted cDNAlibraries. Tree Genet. Genomes 2: 39–52.
Zeng, K., Y. X. Fu, S. Shi and C.-I. Wu, 2006 Statistical tests fordetecting positive selection by utilizing high-frequency variants.Genetics 174: 1431–1439.
Zeng, K., S. Mano, S. Shi and C.-I. Wu, 2007a Comparisons of site-and haplotype-frequency methods for detecting positive selec-tion. Mol. Biol. Evol. 24: 1562–1574.
Zeng, K., S. Suhua and C.-I. Wu, 2007b Compound tests for the de-tection of hitchhiking under positive selection. Mol. Biol. Evol.24: 1898–1908.
Communicating editor: O. Savolainen
298 A. J. Eckert et al.
Supporting Information http://www.genetics.org/cgi/content/full/genetics.109.103895/DC1
Multilocus Patterns of Nucleotide Diversity and Divergence Reveal Positive Selection at Candidate Genes Related to Cold Hardiness
in Coastal Douglas Fir (Pseudotsuga menziesii var. menziesii)
Andrew J. Eckert, Jill L. Wegrzyn, Barnaly Pande, Kathleen D. Jermstad, Jennifer M. Lee, John D. Liechty, Brandon R. Tearse, Konstantin V. Krutovsky
and David B. Neale
Copyright © 2009 by the Genetics Society of America DOI: 10.1534/genetics.109.103895
A. J. Eckert et al. 2 SI
TABLE S1
A list of sample identifiers and geographic locations for the coastal Douglas-fir trees comprising the
diversity panel that was used to discover single nucleotide polymorphisms (SNPs) within 121
candidate genes putatively associated with cold-hardiness phenotypes.
Population Population id Sample ID Latitude (°N) Longitude (°W)
Coastal Douglas-fir
Cascade 22 22-1 47.3302 -121.4303
22-2 47.3500 -121.4550
22-3 47.3302 -121.4303
22-4 47.1225 -121.5616
22-5 47.1225 -121.5616
Vail 24 24-1 46.4310 -122.5357
24-2 46.5020 -122.0951
24-3 46.4310 -122.5357
24-4 46.5009 -122.4310
Twin Harbors 26 26-1 46.1453 -122.4837
26-2 46.0925 -122.3437
26-3 46.1453 -122.4842
26-4 46.1453 -122.4842
Longview 28 28-1 46.5605 -123.2259
28-2 47.0306 -123.2000
28-3 46.5555 -123.2235
28-4 46.3913 -123.1630
Springfield 30 30-1 44.2721 -122.2705
30-2 44.0555 -122.3722
30-3 44.0555 -122.3722
30-4 44.2721 -122.2721
Coos Bay 32 32-1 43.2151 -124.0418
32-2 43.2151 -124.0418
32-3 43.2415 -124.0010
Bigcone Douglas-fir 32-4 43.2405 -123.5951
Angeles NF na 06019 na na
A. J. Eckert et al. 3 SI
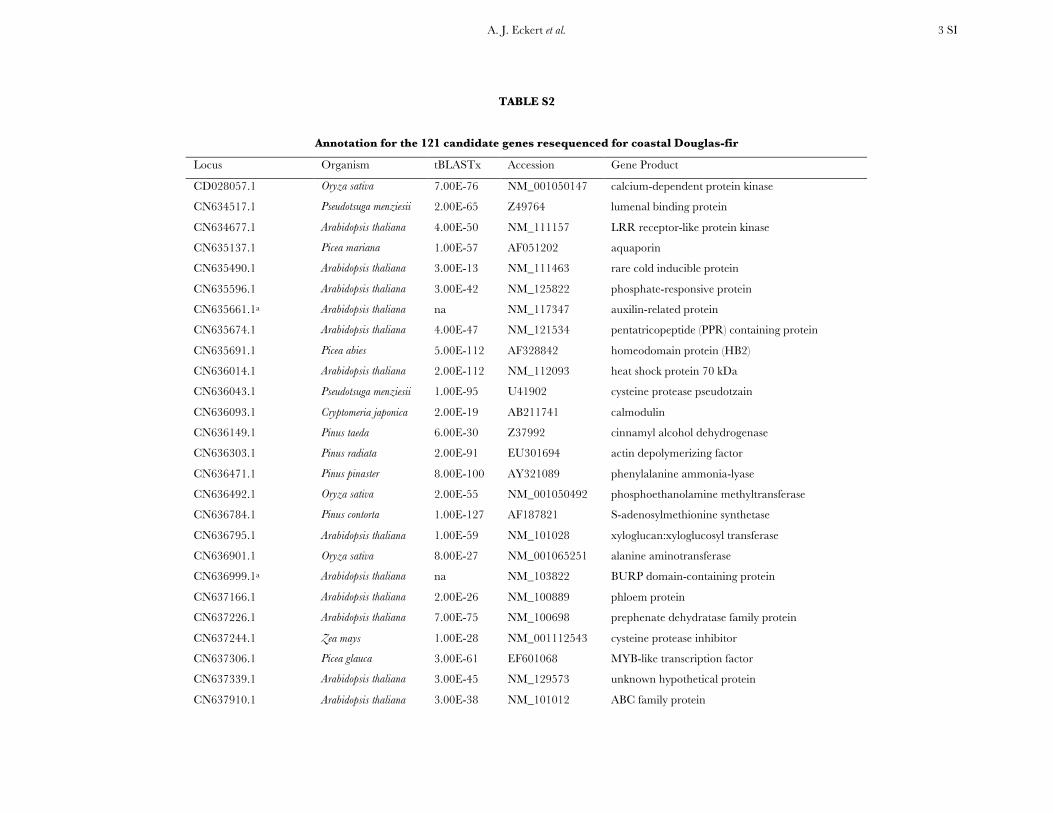
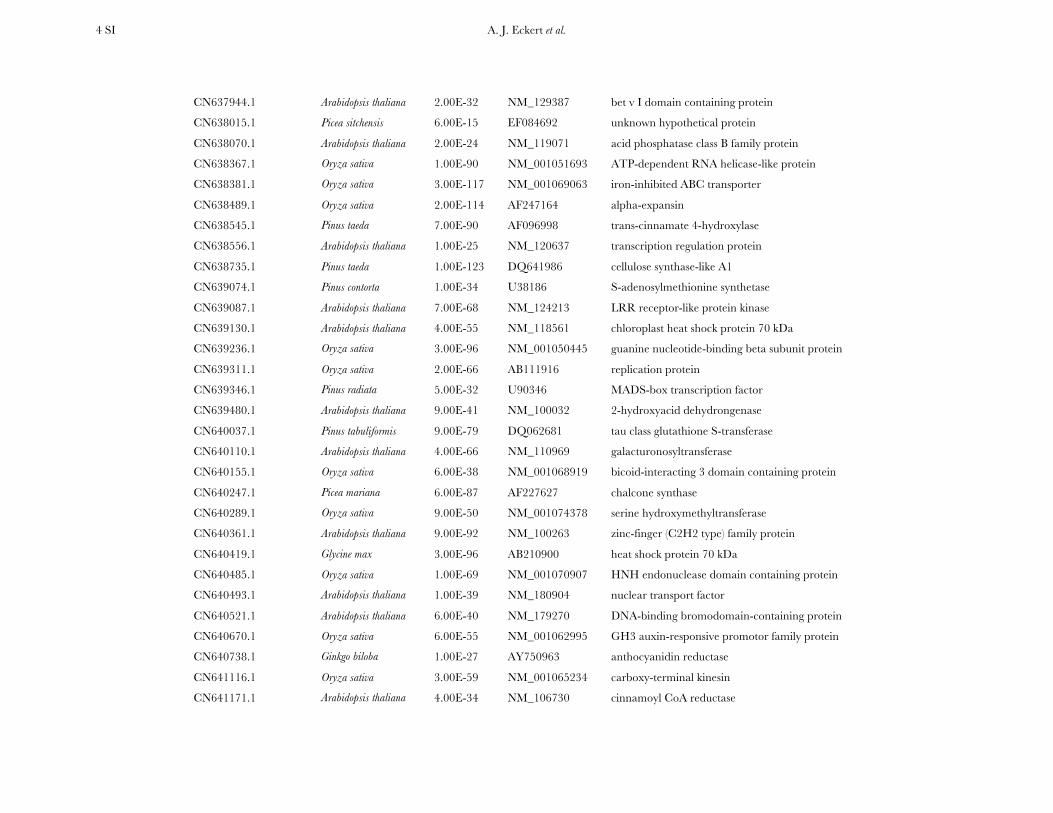
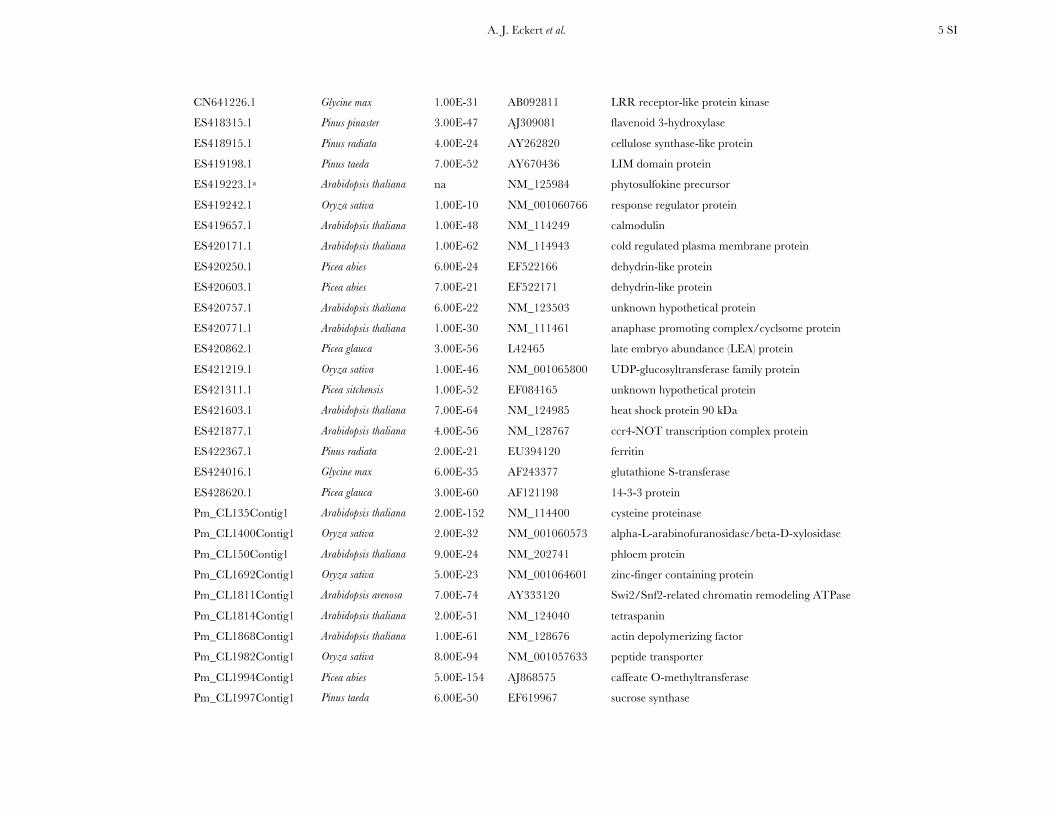
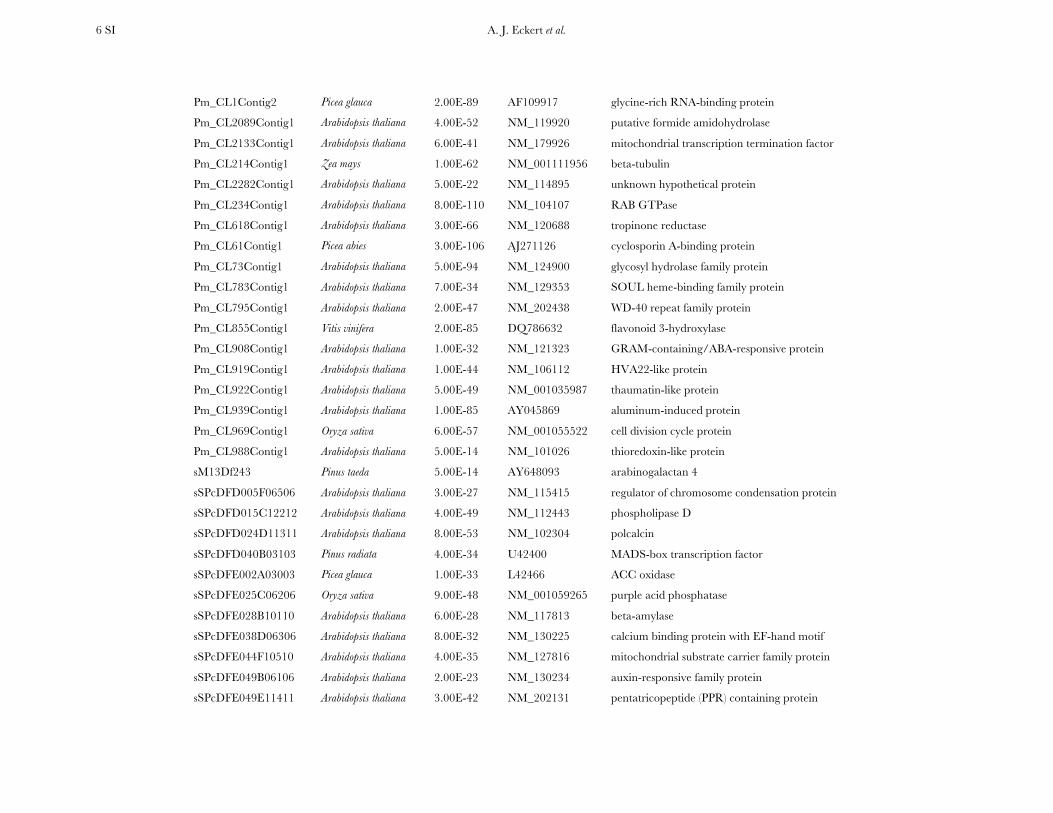
TABLE S2
Annotation for the 121 candidate genes resequenced for coastal Douglas-fir
Locus Organism tBLASTx Accession Gene Product
CD028057.1 Oryza sativa 7.00E-76 NM_001050147 calcium-dependent protein kinase
CN634517.1 Pseudotsuga menziesii 2.00E-65 Z49764 lumenal binding protein
CN634677.1 Arabidopsis thaliana 4.00E-50 NM_111157 LRR receptor-like protein kinase
CN635137.1 Picea mariana 1.00E-57 AF051202 aquaporin
CN635490.1 Arabidopsis thaliana 3.00E-13 NM_111463 rare cold inducible protein
CN635596.1 Arabidopsis thaliana 3.00E-42 NM_125822 phosphate-responsive protein
CN635661.1a Arabidopsis thaliana na NM_117347 auxilin-related protein
CN635674.1 Arabidopsis thaliana 4.00E-47 NM_121534 pentatricopeptide (PPR) containing protein
CN635691.1 Picea abies 5.00E-112 AF328842 homeodomain protein (HB2)
CN636014.1 Arabidopsis thaliana 2.00E-112 NM_112093 heat shock protein 70 kDa
CN636043.1 Pseudotsuga menziesii 1.00E-95 U41902 cysteine protease pseudotzain
CN636093.1 Cryptomeria japonica 2.00E-19 AB211741 calmodulin
CN636149.1 Pinus taeda 6.00E-30 Z37992 cinnamyl alcohol dehydrogenase
CN636303.1 Pinus radiata 2.00E-91 EU301694 actin depolymerizing factor
CN636471.1 Pinus pinaster 8.00E-100 AY321089 phenylalanine ammonia-lyase
CN636492.1 Oryza sativa 2.00E-55 NM_001050492 phosphoethanolamine methyltransferase
CN636784.1 Pinus contorta 1.00E-127 AF187821 S-adenosylmethionine synthetase
CN636795.1 Arabidopsis thaliana 1.00E-59 NM_101028 xyloglucan:xyloglucosyl transferase
CN636901.1 Oryza sativa 8.00E-27 NM_001065251 alanine aminotransferase
CN636999.1a Arabidopsis thaliana na NM_103822 BURP domain-containing protein
CN637166.1 Arabidopsis thaliana 2.00E-26 NM_100889 phloem protein
CN637226.1 Arabidopsis thaliana 7.00E-75 NM_100698 prephenate dehydratase family protein
CN637244.1 Zea mays 1.00E-28 NM_001112543 cysteine protease inhibitor
CN637306.1 Picea glauca 3.00E-61 EF601068 MYB-like transcription factor
CN637339.1 Arabidopsis thaliana 3.00E-45 NM_129573 unknown hypothetical protein
CN637910.1 Arabidopsis thaliana 3.00E-38 NM_101012 ABC family protein
A. J. Eckert et al. 4 SI
CN637944.1 Arabidopsis thaliana 2.00E-32 NM_129387 bet v I domain containing protein
CN638015.1 Picea sitchensis 6.00E-15 EF084692 unknown hypothetical protein
CN638070.1 Arabidopsis thaliana 2.00E-24 NM_119071 acid phosphatase class B family protein
CN638367.1 Oryza sativa 1.00E-90 NM_001051693 ATP-dependent RNA helicase-like protein
CN638381.1 Oryza sativa 3.00E-117 NM_001069063 iron-inhibited ABC transporter
CN638489.1 Oryza sativa 2.00E-114 AF247164 alpha-expansin
CN638545.1 Pinus taeda 7.00E-90 AF096998 trans-cinnamate 4-hydroxylase
CN638556.1 Arabidopsis thaliana 1.00E-25 NM_120637 transcription regulation protein
CN638735.1 Pinus taeda 1.00E-123 DQ641986 cellulose synthase-like A1
CN639074.1 Pinus contorta 1.00E-34 U38186 S-adenosylmethionine synthetase
CN639087.1 Arabidopsis thaliana 7.00E-68 NM_124213 LRR receptor-like protein kinase
CN639130.1 Arabidopsis thaliana 4.00E-55 NM_118561 chloroplast heat shock protein 70 kDa
CN639236.1 Oryza sativa 3.00E-96 NM_001050445 guanine nucleotide-binding beta subunit protein
CN639311.1 Oryza sativa 2.00E-66 AB111916 replication protein
CN639346.1 Pinus radiata 5.00E-32 U90346 MADS-box transcription factor
CN639480.1 Arabidopsis thaliana 9.00E-41 NM_100032 2-hydroxyacid dehydrongenase
CN640037.1 Pinus tabuliformis 9.00E-79 DQ062681 tau class glutathione S-transferase
CN640110.1 Arabidopsis thaliana 4.00E-66 NM_110969 galacturonosyltransferase
CN640155.1 Oryza sativa 6.00E-38 NM_001068919 bicoid-interacting 3 domain containing protein
CN640247.1 Picea mariana 6.00E-87 AF227627 chalcone synthase
CN640289.1 Oryza sativa 9.00E-50 NM_001074378 serine hydroxymethyltransferase
CN640361.1 Arabidopsis thaliana 9.00E-92 NM_100263 zinc-finger (C2H2 type) family protein
CN640419.1 Glycine max 3.00E-96 AB210900 heat shock protein 70 kDa
CN640485.1 Oryza sativa 1.00E-69 NM_001070907 HNH endonuclease domain containing protein
CN640493.1 Arabidopsis thaliana 1.00E-39 NM_180904 nuclear transport factor
CN640521.1 Arabidopsis thaliana 6.00E-40 NM_179270 DNA-binding bromodomain-containing protein
CN640670.1 Oryza sativa 6.00E-55 NM_001062995 GH3 auxin-responsive promotor family protein
CN640738.1 Ginkgo biloba 1.00E-27 AY750963 anthocyanidin reductase
CN641116.1 Oryza sativa 3.00E-59 NM_001065234 carboxy-terminal kinesin
CN641171.1 Arabidopsis thaliana 4.00E-34 NM_106730 cinnamoyl CoA reductase
A. J. Eckert et al. 5 SI
CN641226.1 Glycine max 1.00E-31 AB092811 LRR receptor-like protein kinase
ES418315.1 Pinus pinaster 3.00E-47 AJ309081 flavenoid 3-hydroxylase
ES418915.1 Pinus radiata 4.00E-24 AY262820 cellulose synthase-like protein
ES419198.1 Pinus taeda 7.00E-52 AY670436 LIM domain protein
ES419223.1a Arabidopsis thaliana na NM_125984 phytosulfokine precursor
ES419242.1 Oryza sativa 1.00E-10 NM_001060766 response regulator protein
ES419657.1 Arabidopsis thaliana 1.00E-48 NM_114249 calmodulin
ES420171.1 Arabidopsis thaliana 1.00E-62 NM_114943 cold regulated plasma membrane protein
ES420250.1 Picea abies 6.00E-24 EF522166 dehydrin-like protein
ES420603.1 Picea abies 7.00E-21 EF522171 dehydrin-like protein
ES420757.1 Arabidopsis thaliana 6.00E-22 NM_123503 unknown hypothetical protein
ES420771.1 Arabidopsis thaliana 1.00E-30 NM_111461 anaphase promoting complex/cyclsome protein
ES420862.1 Picea glauca 3.00E-56 L42465 late embryo abundance (LEA) protein
ES421219.1 Oryza sativa 1.00E-46 NM_001065800 UDP-glucosyltransferase family protein
ES421311.1 Picea sitchensis 1.00E-52 EF084165 unknown hypothetical protein
ES421603.1 Arabidopsis thaliana 7.00E-64 NM_124985 heat shock protein 90 kDa
ES421877.1 Arabidopsis thaliana 4.00E-56 NM_128767 ccr4-NOT transcription complex protein
ES422367.1 Pinus radiata 2.00E-21 EU394120 ferritin
ES424016.1 Glycine max 6.00E-35 AF243377 glutathione S-transferase
ES428620.1 Picea glauca 3.00E-60 AF121198 14-3-3 protein
Pm_CL135Contig1 Arabidopsis thaliana 2.00E-152 NM_114400 cysteine proteinase
Pm_CL1400Contig1 Oryza sativa 2.00E-32 NM_001060573 alpha-L-arabinofuranosidase/beta-D-xylosidase
Pm_CL150Contig1 Arabidopsis thaliana 9.00E-24 NM_202741 phloem protein
Pm_CL1692Contig1 Oryza sativa 5.00E-23 NM_001064601 zinc-finger containing protein
Pm_CL1811Contig1 Arabidopsis arenosa 7.00E-74 AY333120 Swi2/Snf2-related chromatin remodeling ATPase
Pm_CL1814Contig1 Arabidopsis thaliana 2.00E-51 NM_124040 tetraspanin
Pm_CL1868Contig1 Arabidopsis thaliana 1.00E-61 NM_128676 actin depolymerizing factor
Pm_CL1982Contig1 Oryza sativa 8.00E-94 NM_001057633 peptide transporter
Pm_CL1994Contig1 Picea abies 5.00E-154 AJ868575 caffeate O-methyltransferase
Pm_CL1997Contig1 Pinus taeda 6.00E-50 EF619967 sucrose synthase
A. J. Eckert et al. 6 SI
Pm_CL1Contig2 Picea glauca 2.00E-89 AF109917 glycine-rich RNA-binding protein
Pm_CL2089Contig1 Arabidopsis thaliana 4.00E-52 NM_119920 putative formide amidohydrolase
Pm_CL2133Contig1 Arabidopsis thaliana 6.00E-41 NM_179926 mitochondrial transcription termination factor
Pm_CL214Contig1 Zea mays 1.00E-62 NM_001111956 beta-tubulin
Pm_CL2282Contig1 Arabidopsis thaliana 5.00E-22 NM_114895 unknown hypothetical protein
Pm_CL234Contig1 Arabidopsis thaliana 8.00E-110 NM_104107 RAB GTPase
Pm_CL618Contig1 Arabidopsis thaliana 3.00E-66 NM_120688 tropinone reductase
Pm_CL61Contig1 Picea abies 3.00E-106 AJ271126 cyclosporin A-binding protein
Pm_CL73Contig1 Arabidopsis thaliana 5.00E-94 NM_124900 glycosyl hydrolase family protein
Pm_CL783Contig1 Arabidopsis thaliana 7.00E-34 NM_129353 SOUL heme-binding family protein
Pm_CL795Contig1 Arabidopsis thaliana 2.00E-47 NM_202438 WD-40 repeat family protein
Pm_CL855Contig1 Vitis vinifera 2.00E-85 DQ786632 flavonoid 3-hydroxylase
Pm_CL908Contig1 Arabidopsis thaliana 1.00E-32 NM_121323 GRAM-containing/ABA-responsive protein
Pm_CL919Contig1 Arabidopsis thaliana 1.00E-44 NM_106112 HVA22-like protein
Pm_CL922Contig1 Arabidopsis thaliana 5.00E-49 NM_001035987 thaumatin-like protein
Pm_CL939Contig1 Arabidopsis thaliana 1.00E-85 AY045869 aluminum-induced protein
Pm_CL969Contig1 Oryza sativa 6.00E-57 NM_001055522 cell division cycle protein
Pm_CL988Contig1 Arabidopsis thaliana 5.00E-14 NM_101026 thioredoxin-like protein
sM13Df243 Pinus taeda 5.00E-14 AY648093 arabinogalactan 4
sSPcDFD005F06506 Arabidopsis thaliana 3.00E-27 NM_115415 regulator of chromosome condensation protein
sSPcDFD015C12212 Arabidopsis thaliana 4.00E-49 NM_112443 phospholipase D
sSPcDFD024D11311 Arabidopsis thaliana 8.00E-53 NM_102304 polcalcin
sSPcDFD040B03103 Pinus radiata 4.00E-34 U42400 MADS-box transcription factor
sSPcDFE002A03003 Picea glauca 1.00E-33 L42466 ACC oxidase
sSPcDFE025C06206 Oryza sativa 9.00E-48 NM_001059265 purple acid phosphatase
sSPcDFE028B10110 Arabidopsis thaliana 6.00E-28 NM_117813 beta-amylase
sSPcDFE038D06306 Arabidopsis thaliana 8.00E-32 NM_130225 calcium binding protein with EF-hand motif
sSPcDFE044F10510 Arabidopsis thaliana 4.00E-35 NM_127816 mitochondrial substrate carrier family protein
sSPcDFE049B06106 Arabidopsis thaliana 2.00E-23 NM_130234 auxin-responsive family protein
sSPcDFE049E11411 Arabidopsis thaliana 3.00E-42 NM_202131 pentatricopeptide (PPR) containing protein
A. J. Eckert et al. 7 SI
sSPcDFF014F08508 Oryza sativa 3.00E-34 NM_001056474 hypothetical water stress induced protein
sSPcDFF015H05705 Oryza sativa 1.00E-34 NM_001055452 cytochrome P450 family protein
sSPcDFF044H10710 Arabidopsis thaliana 6.00E-31 NM_125091 auxin:hydrogen symporter/transporter
U22458.1 Populus tremula 3.00E-159 AM_072292 phytochrome B
Z49715.1a Arabidopsis thaliana na NM_104147 late embryogenesis abundant (LEA) protein
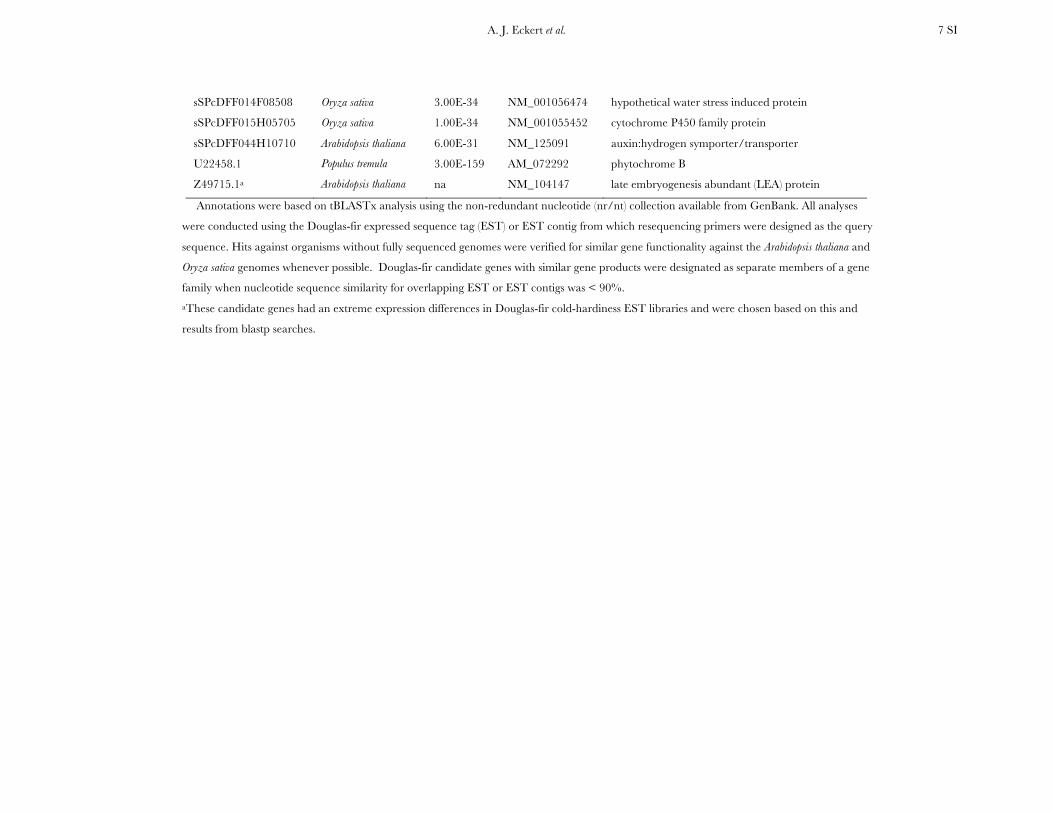
Annotations were based on tBLASTx analysis using the non-redundant nucleotide (nr/nt) collection available from GenBank. All analyses
were conducted using the Douglas-fir expressed sequence tag (EST) or EST contig from which resequencing primers were designed as the query
sequence. Hits against organisms without fully sequenced genomes were verified for similar gene functionality against the Arabidopsis thaliana and
Oryza sativa genomes whenever possible. Douglas-fir candidate genes with similar gene products were designated as separate members of a gene
family when nucleotide sequence similarity for overlapping EST or EST contigs was < 90%.
aThese candidate genes had an extreme expression differences in Douglas-fir cold-hardiness EST libraries and were chosen based on this and
results from blastp searches.
A. J. Eckert et al. 8 SI
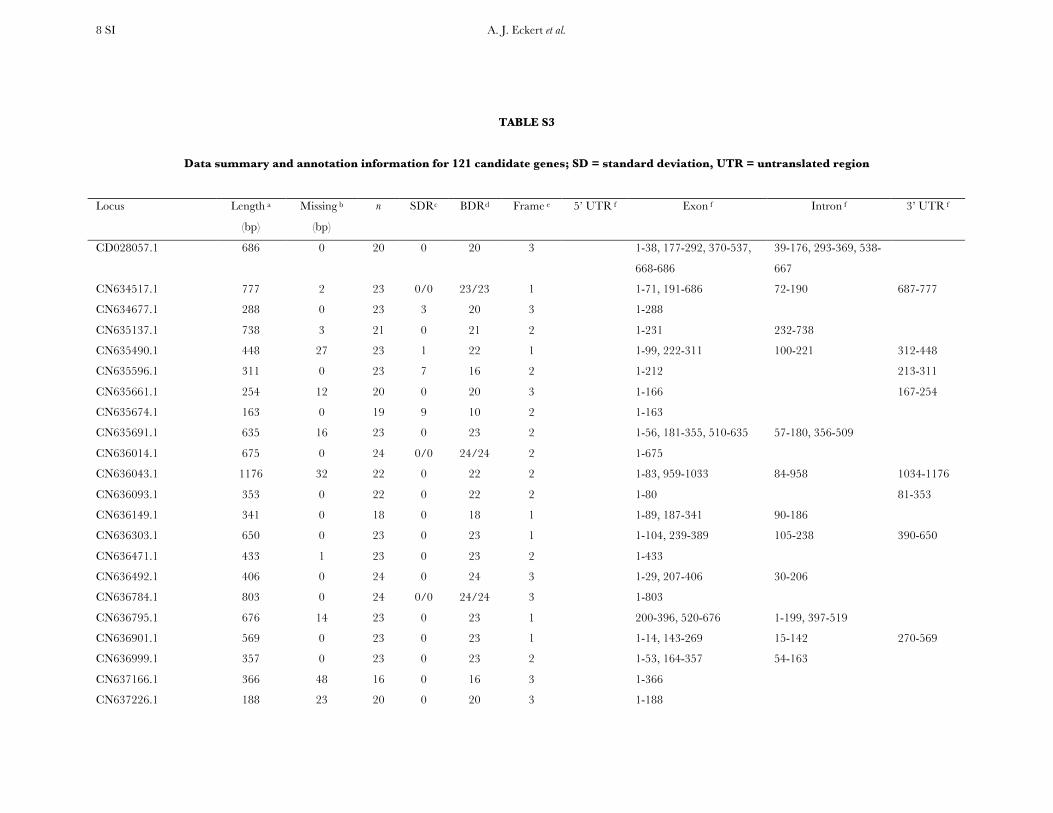
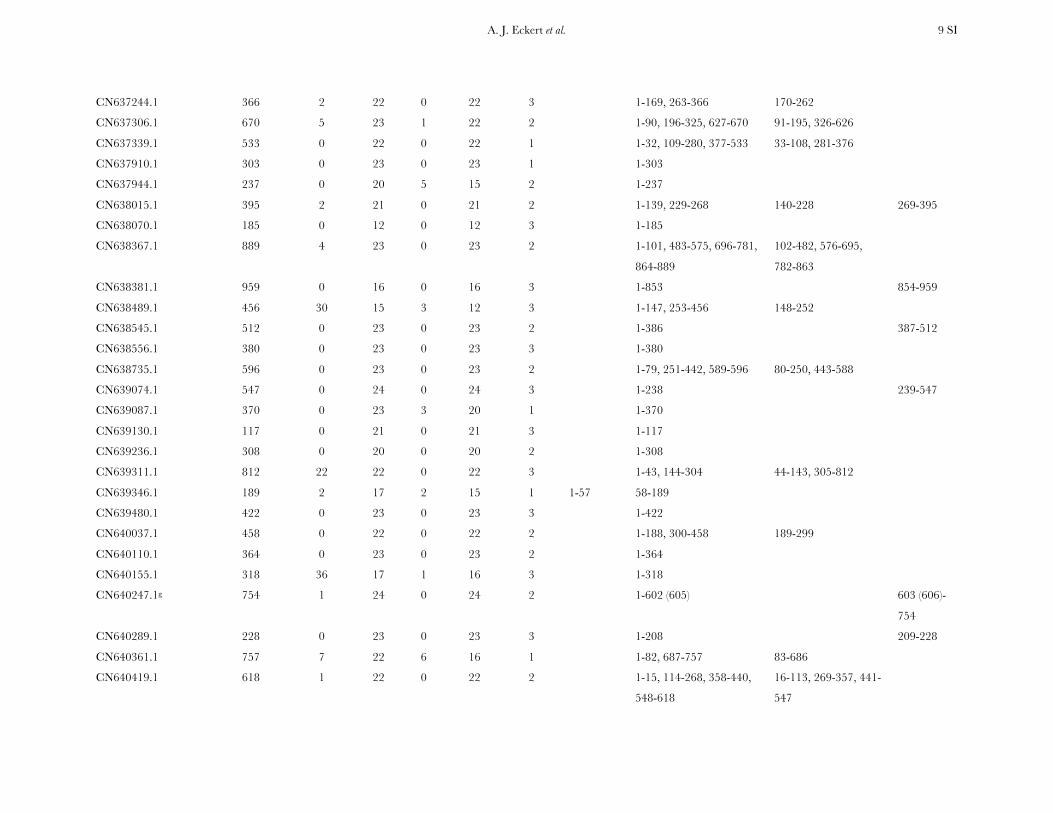
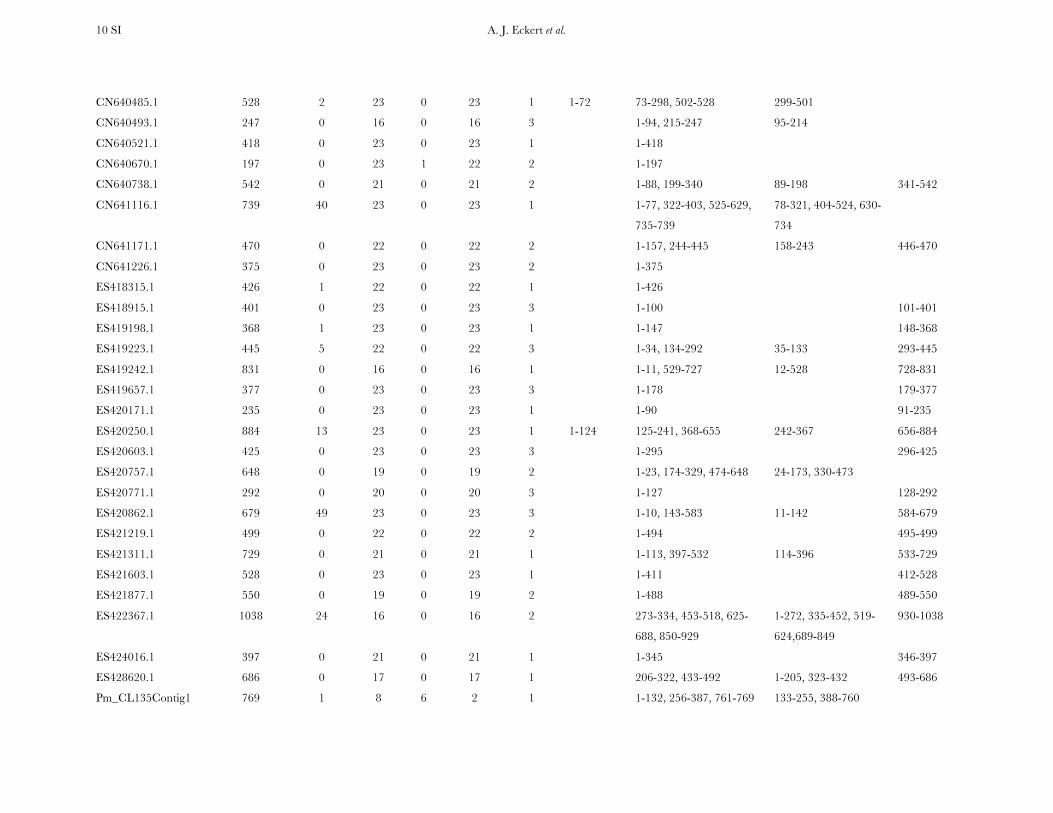
TABLE S3
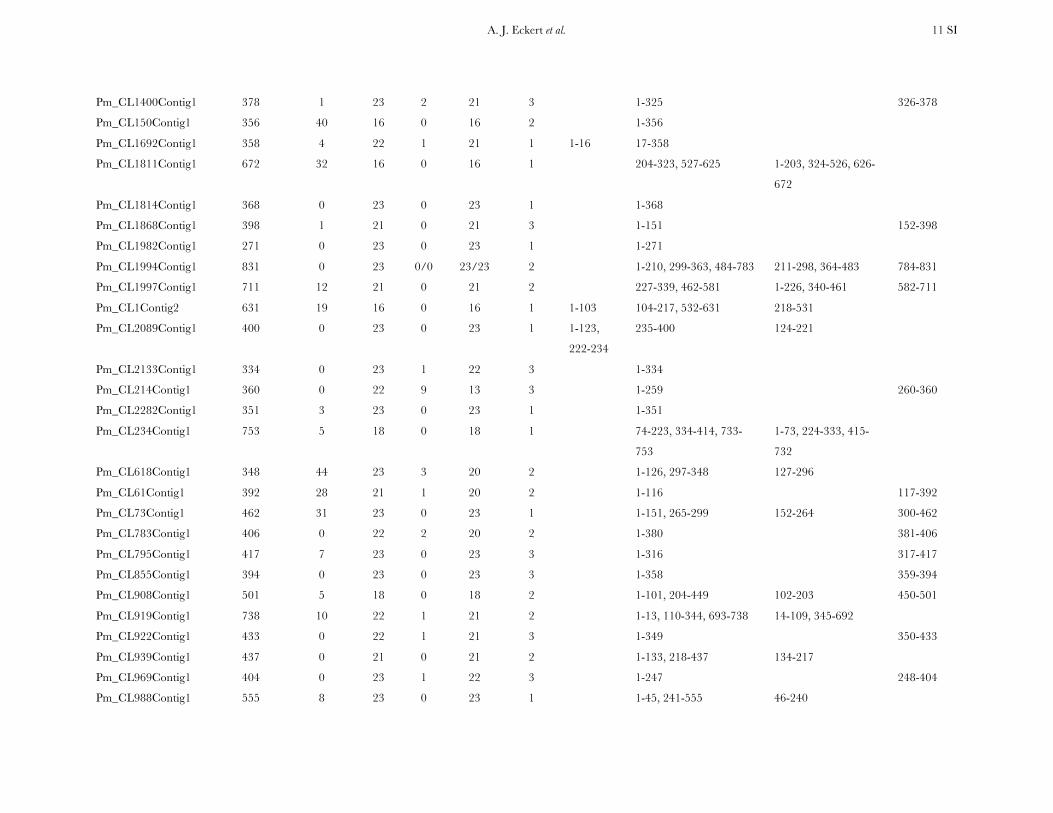
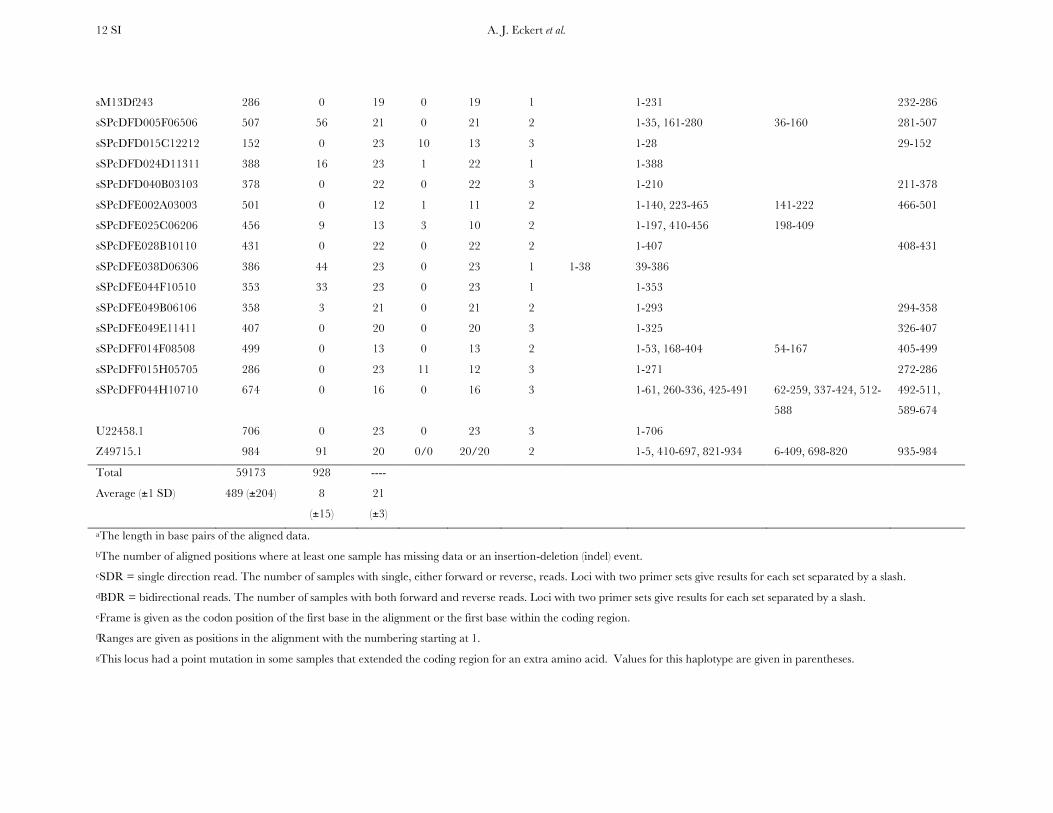
Data summary and annotation information for 121 candidate genes; SD = standard deviation, UTR = untranslated region
Locus Length a
(bp)
Missing b
(bp)
n SDRc BDRd Frame e 5’ UTR f
Exon f
Intron f
3’ UTR f
CD028057.1 686 0 20 0 20 3 1-38, 177-292, 370-537,
668-686
39-176, 293-369, 538-
667
CN634517.1 777 2 23 0/0 23/23 1 1-71, 191-686 72-190 687-777
CN634677.1 288 0 23 3 20 3 1-288
CN635137.1 738 3 21 0 21 2 1-231 232-738
CN635490.1 448 27 23 1 22 1 1-99, 222-311 100-221 312-448
CN635596.1 311 0 23 7 16 2 1-212 213-311
CN635661.1 254 12 20 0 20 3 1-166 167-254
CN635674.1 163 0 19 9 10 2 1-163
CN635691.1 635 16 23 0 23 2 1-56, 181-355, 510-635 57-180, 356-509
CN636014.1 675 0 24 0/0 24/24 2 1-675
CN636043.1 1176 32 22 0 22 2 1-83, 959-1033 84-958 1034-1176
CN636093.1 353 0 22 0 22 2 1-80 81-353
CN636149.1 341 0 18 0 18 1 1-89, 187-341 90-186
CN636303.1 650 0 23 0 23 1 1-104, 239-389 105-238 390-650
CN636471.1 433 1 23 0 23 2 1-433
CN636492.1 406 0 24 0 24 3 1-29, 207-406 30-206
CN636784.1 803 0 24 0/0 24/24 3 1-803
CN636795.1 676 14 23 0 23 1 200-396, 520-676 1-199, 397-519
CN636901.1 569 0 23 0 23 1 1-14, 143-269 15-142 270-569
CN636999.1 357 0 23 0 23 2 1-53, 164-357 54-163
CN637166.1 366 48 16 0 16 3 1-366
CN637226.1 188 23 20 0 20 3 1-188
A. J. Eckert et al. 9 SI
CN637244.1 366 2 22 0 22 3 1-169, 263-366 170-262
CN637306.1 670 5 23 1 22 2 1-90, 196-325, 627-670 91-195, 326-626
CN637339.1 533 0 22 0 22 1 1-32, 109-280, 377-533 33-108, 281-376
CN637910.1 303 0 23 0 23 1 1-303
CN637944.1 237 0 20 5 15 2 1-237
CN638015.1 395 2 21 0 21 2 1-139, 229-268 140-228 269-395
CN638070.1 185 0 12 0 12 3 1-185
CN638367.1 889 4 23 0 23 2 1-101, 483-575, 696-781,
864-889
102-482, 576-695,
782-863
CN638381.1 959 0 16 0 16 3 1-853 854-959
CN638489.1 456 30 15 3 12 3 1-147, 253-456 148-252
CN638545.1 512 0 23 0 23 2 1-386 387-512
CN638556.1 380 0 23 0 23 3 1-380
CN638735.1 596 0 23 0 23 2 1-79, 251-442, 589-596 80-250, 443-588
CN639074.1 547 0 24 0 24 3 1-238 239-547
CN639087.1 370 0 23 3 20 1 1-370
CN639130.1 117 0 21 0 21 3 1-117
CN639236.1 308 0 20 0 20 2 1-308
CN639311.1 812 22 22 0 22 3 1-43, 144-304 44-143, 305-812
CN639346.1 189 2 17 2 15 1 1-57 58-189
CN639480.1 422 0 23 0 23 3 1-422
CN640037.1 458 0 22 0 22 2 1-188, 300-458 189-299
CN640110.1 364 0 23 0 23 2 1-364
CN640155.1 318 36 17 1 16 3 1-318
CN640247.1g 754 1 24 0 24 2 1-602 (605) 603 (606)-
754
CN640289.1 228 0 23 0 23 3 1-208 209-228
CN640361.1 757 7 22 6 16 1 1-82, 687-757 83-686
CN640419.1 618 1 22 0 22 2 1-15, 114-268, 358-440,
548-618
16-113, 269-357, 441-
547
A. J. Eckert et al. 10 SI
CN640485.1 528 2 23 0 23 1 1-72 73-298, 502-528 299-501
CN640493.1 247 0 16 0 16 3 1-94, 215-247 95-214
CN640521.1 418 0 23 0 23 1 1-418
CN640670.1 197 0 23 1 22 2 1-197
CN640738.1 542 0 21 0 21 2 1-88, 199-340 89-198 341-542
CN641116.1 739 40 23 0 23 1 1-77, 322-403, 525-629,
735-739
78-321, 404-524, 630-
734
CN641171.1 470 0 22 0 22 2 1-157, 244-445 158-243 446-470
CN641226.1 375 0 23 0 23 2 1-375
ES418315.1 426 1 22 0 22 1 1-426
ES418915.1 401 0 23 0 23 3 1-100 101-401
ES419198.1 368 1 23 0 23 1 1-147 148-368
ES419223.1 445 5 22 0 22 3 1-34, 134-292 35-133 293-445
ES419242.1 831 0 16 0 16 1 1-11, 529-727 12-528 728-831
ES419657.1 377 0 23 0 23 3 1-178 179-377
ES420171.1 235 0 23 0 23 1 1-90 91-235
ES420250.1 884 13 23 0 23 1 1-124 125-241, 368-655 242-367 656-884
ES420603.1 425 0 23 0 23 3 1-295 296-425
ES420757.1 648 0 19 0 19 2 1-23, 174-329, 474-648 24-173, 330-473
ES420771.1 292 0 20 0 20 3 1-127 128-292
ES420862.1 679 49 23 0 23 3 1-10, 143-583 11-142 584-679
ES421219.1 499 0 22 0 22 2 1-494 495-499
ES421311.1 729 0 21 0 21 1 1-113, 397-532 114-396 533-729
ES421603.1 528 0 23 0 23 1 1-411 412-528
ES421877.1 550 0 19 0 19 2 1-488 489-550
ES422367.1 1038 24 16 0 16 2 273-334, 453-518, 625-
688, 850-929
1-272, 335-452, 519-
624,689-849
930-1038
ES424016.1 397 0 21 0 21 1 1-345 346-397
ES428620.1 686 0 17 0 17 1 206-322, 433-492 1-205, 323-432 493-686
Pm_CL135Contig1 769 1 8 6 2 1 1-132, 256-387, 761-769 133-255, 388-760
A. J. Eckert et al. 11 SI
Pm_CL1400Contig1 378 1 23 2 21 3 1-325 326-378
Pm_CL150Contig1 356 40 16 0 16 2 1-356
Pm_CL1692Contig1 358 4 22 1 21 1 1-16 17-358
Pm_CL1811Contig1 672 32 16 0 16 1 204-323, 527-625 1-203, 324-526, 626-
672
Pm_CL1814Contig1 368 0 23 0 23 1 1-368
Pm_CL1868Contig1 398 1 21 0 21 3 1-151 152-398
Pm_CL1982Contig1 271 0 23 0 23 1 1-271
Pm_CL1994Contig1 831 0 23 0/0 23/23 2 1-210, 299-363, 484-783 211-298, 364-483 784-831
Pm_CL1997Contig1 711 12 21 0 21 2 227-339, 462-581 1-226, 340-461 582-711
Pm_CL1Contig2 631 19 16 0 16 1 1-103 104-217, 532-631 218-531
Pm_CL2089Contig1 400 0 23 0 23 1 1-123,
222-234
235-400 124-221
Pm_CL2133Contig1 334 0 23 1 22 3 1-334
Pm_CL214Contig1 360 0 22 9 13 3 1-259 260-360
Pm_CL2282Contig1 351 3 23 0 23 1 1-351
Pm_CL234Contig1 753 5 18 0 18 1 74-223, 334-414, 733-
753
1-73, 224-333, 415-
732
Pm_CL618Contig1 348 44 23 3 20 2 1-126, 297-348 127-296
Pm_CL61Contig1 392 28 21 1 20 2 1-116 117-392
Pm_CL73Contig1 462 31 23 0 23 1 1-151, 265-299 152-264 300-462
Pm_CL783Contig1 406 0 22 2 20 2 1-380 381-406
Pm_CL795Contig1 417 7 23 0 23 3 1-316 317-417
Pm_CL855Contig1 394 0 23 0 23 3 1-358 359-394
Pm_CL908Contig1 501 5 18 0 18 2 1-101, 204-449 102-203 450-501
Pm_CL919Contig1 738 10 22 1 21 2 1-13, 110-344, 693-738 14-109, 345-692
Pm_CL922Contig1 433 0 22 1 21 3 1-349 350-433
Pm_CL939Contig1 437 0 21 0 21 2 1-133, 218-437 134-217
Pm_CL969Contig1 404 0 23 1 22 3 1-247 248-404
Pm_CL988Contig1 555 8 23 0 23 1 1-45, 241-555 46-240
A. J. Eckert et al. 12 SI
sM13Df243 286 0 19 0 19 1 1-231 232-286
sSPcDFD005F06506 507 56 21 0 21 2 1-35, 161-280 36-160 281-507
sSPcDFD015C12212 152 0 23 10 13 3 1-28 29-152
sSPcDFD024D11311 388 16 23 1 22 1 1-388
sSPcDFD040B03103 378 0 22 0 22 3 1-210 211-378
sSPcDFE002A03003 501 0 12 1 11 2 1-140, 223-465 141-222 466-501
sSPcDFE025C06206 456 9 13 3 10 2 1-197, 410-456 198-409
sSPcDFE028B10110 431 0 22 0 22 2 1-407 408-431
sSPcDFE038D06306 386 44 23 0 23 1 1-38 39-386
sSPcDFE044F10510 353 33 23 0 23 1 1-353
sSPcDFE049B06106 358 3 21 0 21 2 1-293 294-358
sSPcDFE049E11411 407 0 20 0 20 3 1-325 326-407
sSPcDFF014F08508 499 0 13 0 13 2 1-53, 168-404 54-167 405-499
sSPcDFF015H05705 286 0 23 11 12 3 1-271 272-286
sSPcDFF044H10710 674 0 16 0 16 3 1-61, 260-336, 425-491 62-259, 337-424, 512-
588
492-511,
589-674
U22458.1 706 0 23 0 23 3 1-706
Z49715.1 984 91 20 0/0 20/20 2 1-5, 410-697, 821-934 6-409, 698-820 935-984
Total 59173 928 ----
Average (±1 SD) 489 (±204) 8
(±15)
21
(±3)
aThe length in base pairs of the aligned data.
bThe number of aligned positions where at least one sample has missing data or an insertion-deletion (indel) event.
cSDR = single direction read. The number of samples with single, either forward or reverse, reads. Loci with two primer sets give results for each set separated by a slash.
dBDR = bidirectional reads. The number of samples with both forward and reverse reads. Loci with two primer sets give results for each set separated by a slash.
eFrame is given as the codon position of the first base in the alignment or the first base within the coding region.
fRanges are given as positions in the alignment with the numbering starting at 1.
gThis locus had a point mutation in some samples that extended the coding region for an extra amino acid. Values for this haplotype are given in parentheses.
A. J. Eckert et al. 13 SI
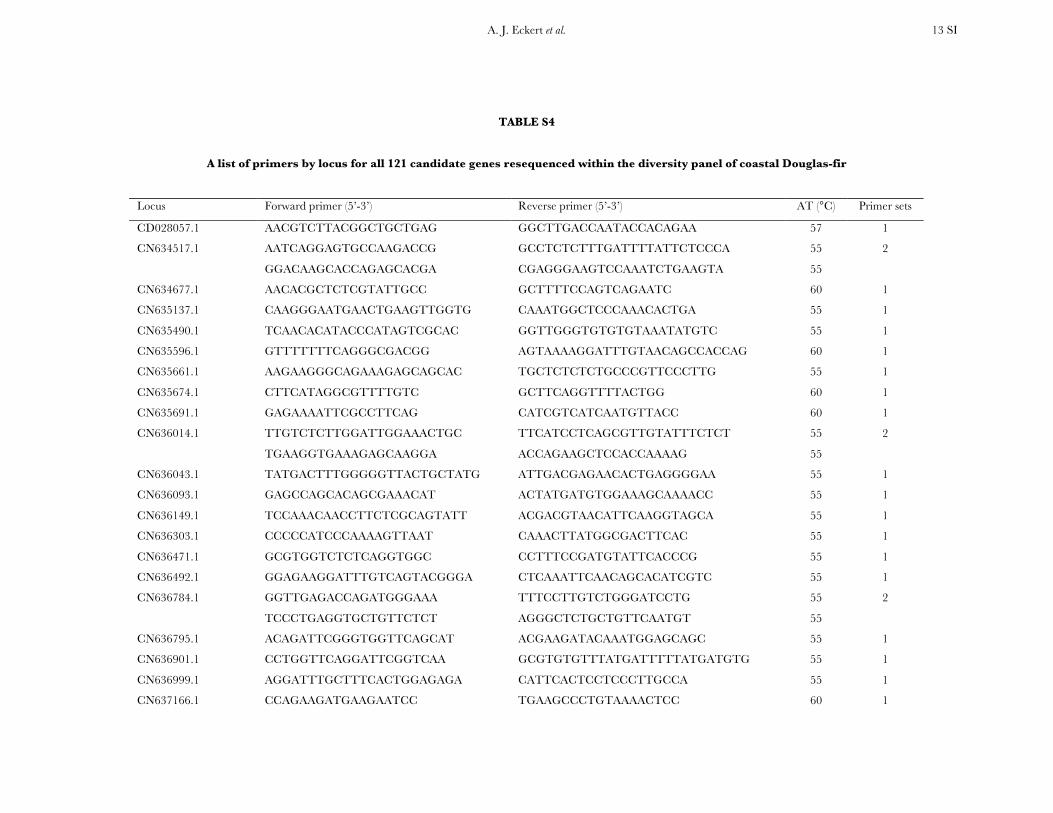
TABLE S4
A list of primers by locus for all 121 candidate genes resequenced within the diversity panel of coastal Douglas-fir
Locus Forward primer (5’-3’) Reverse primer (5’-3’) AT (°C) Primer sets
CD028057.1 AACGTCTTACGGCTGCTGAG GGCTTGACCAATACCACAGAA 57 1
CN634517.1 AATCAGGAGTGCCAAGACCG GCCTCTCTTTGATTTTATTCTCCCA 55 2
GGACAAGCACCAGAGCACGA CGAGGGAAGTCCAAATCTGAAGTA 55
CN634677.1 AACACGCTCTCGTATTGCC GCTTTTCCAGTCAGAATC 60 1
CN635137.1 CAAGGGAATGAACTGAAGTTGGTG CAAATGGCTCCCAAACACTGA 55 1
CN635490.1 TCAACACATACCCATAGTCGCAC GGTTGGGTGTGTGTAAATATGTC 55 1
CN635596.1 GTTTTTTTCAGGGCGACGG AGTAAAAGGATTTGTAACAGCCACCAG 60 1
CN635661.1 AAGAAGGGCAGAAAGAGCAGCAC TGCTCTCTCTGCCCGTTCCCTTG 55 1
CN635674.1 CTTCATAGGCGTTTTGTC GCTTCAGGTTTTACTGG 60 1
CN635691.1 GAGAAAATTCGCCTTCAG CATCGTCATCAATGTTACC 60 1
CN636014.1 TTGTCTCTTGGATTGGAAACTGC TTCATCCTCAGCGTTGTATTTCTCT 55 2
TGAAGGTGAAAGAGCAAGGA ACCAGAAGCTCCACCAAAAG 55
CN636043.1 TATGACTTTGGGGGTTACTGCTATG ATTGACGAGAACACTGAGGGGAA 55 1
CN636093.1 GAGCCAGCACAGCGAAACAT ACTATGATGTGGAAAGCAAAACC 55 1
CN636149.1 TCCAAACAACCTTCTCGCAGTATT ACGACGTAACATTCAAGGTAGCA 55 1
CN636303.1 CCCCCATCCCAAAAGTTAAT CAAACTTATGGCGACTTCAC 55 1
CN636471.1 GCGTGGTCTCTCAGGTGGC CCTTTCCGATGTATTCACCCG 55 1
CN636492.1 GGAGAAGGATTTGTCAGTACGGGA CTCAAATTCAACAGCACATCGTC 55 1
CN636784.1 GGTTGAGACCAGATGGGAAA TTTCCTTGTCTGGGATCCTG 55 2
TCCCTGAGGTGCTGTTCTCT AGGGCTCTGCTGTTCAATGT 55
CN636795.1 ACAGATTCGGGTGGTTCAGCAT ACGAAGATACAAATGGAGCAGC 55 1
CN636901.1 CCTGGTTCAGGATTCGGTCAA GCGTGTGTTTATGATTTTTATGATGTG 55 1
CN636999.1 AGGATTTGCTTTCACTGGAGAGA CATTCACTCCTCCCTTGCCA 55 1
CN637166.1 CCAGAAGATGAAGAATCC TGAAGCCCTGTAAAACTCC 60 1
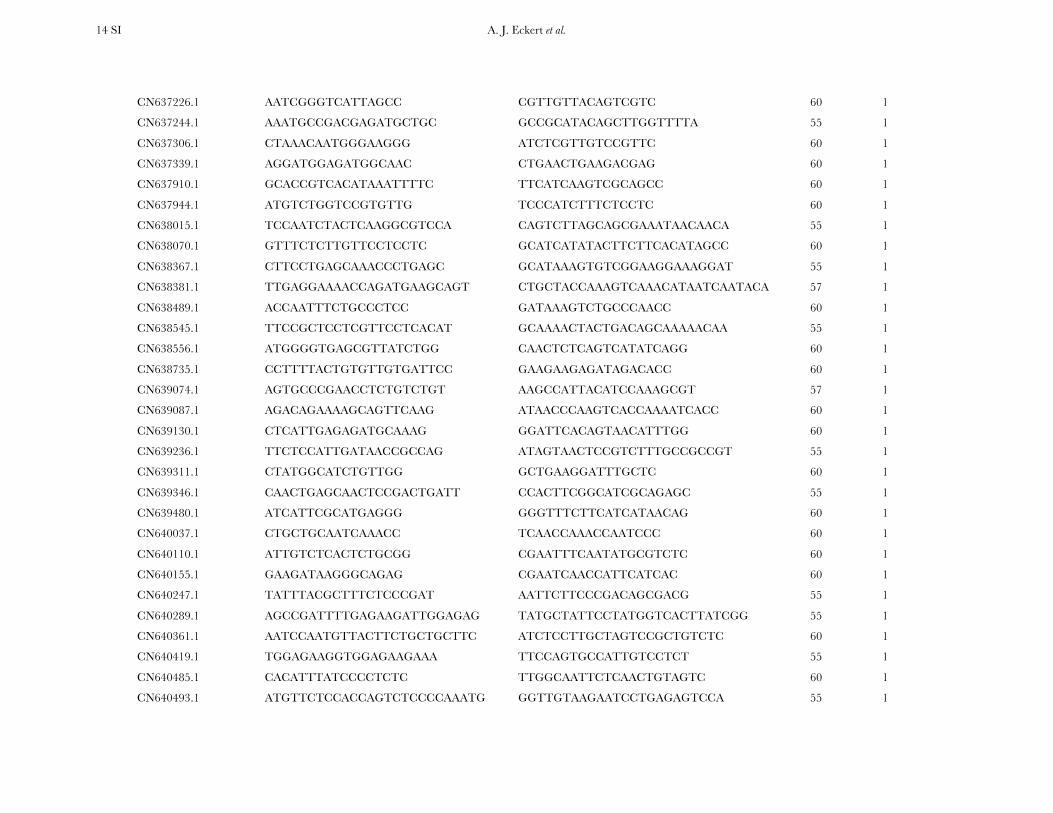
A. J. Eckert et al. 14 SI
CN637226.1 AATCGGGTCATTAGCC CGTTGTTACAGTCGTC 60 1
CN637244.1 AAATGCCGACGAGATGCTGC GCCGCATACAGCTTGGTTTTA 55 1
CN637306.1 CTAAACAATGGGAAGGG ATCTCGTTGTCCGTTC 60 1
CN637339.1 AGGATGGAGATGGCAAC CTGAACTGAAGACGAG 60 1
CN637910.1 GCACCGTCACATAAATTTTC TTCATCAAGTCGCAGCC 60 1
CN637944.1 ATGTCTGGTCCGTGTTG TCCCATCTTTCTCCTC 60 1
CN638015.1 TCCAATCTACTCAAGGCGTCCA CAGTCTTAGCAGCGAAATAACAACA 55 1
CN638070.1 GTTTCTCTTGTTCCTCCTC GCATCATATACTTCTTCACATAGCC 60 1
CN638367.1 CTTCCTGAGCAAACCCTGAGC GCATAAAGTGTCGGAAGGAAAGGAT 55 1
CN638381.1 TTGAGGAAAACCAGATGAAGCAGT CTGCTACCAAAGTCAAACATAATCAATACA 57 1
CN638489.1 ACCAATTTCTGCCCTCC GATAAAGTCTGCCCAACC 60 1
CN638545.1 TTCCGCTCCTCGTTCCTCACAT GCAAAACTACTGACAGCAAAAACAA 55 1
CN638556.1 ATGGGGTGAGCGTTATCTGG CAACTCTCAGTCATATCAGG 60 1
CN638735.1 CCTTTTACTGTGTTGTGATTCC GAAGAAGAGATAGACACC 60 1
CN639074.1 AGTGCCCGAACCTCTGTCTGT AAGCCATTACATCCAAAGCGT 57 1
CN639087.1 AGACAGAAAAGCAGTTCAAG ATAACCCAAGTCACCAAAATCACC 60 1
CN639130.1 CTCATTGAGAGATGCAAAG GGATTCACAGTAACATTTGG 60 1
CN639236.1 TTCTCCATTGATAACCGCCAG ATAGTAACTCCGTCTTTGCCGCCGT 55 1
CN639311.1 CTATGGCATCTGTTGG GCTGAAGGATTTGCTC 60 1
CN639346.1 CAACTGAGCAACTCCGACTGATT CCACTTCGGCATCGCAGAGC 55 1
CN639480.1 ATCATTCGCATGAGGG GGGTTTCTTCATCATAACAG 60 1
CN640037.1 CTGCTGCAATCAAACC TCAACCAAACCAATCCC 60 1
CN640110.1 ATTGTCTCACTCTGCGG CGAATTTCAATATGCGTCTC 60 1
CN640155.1 GAAGATAAGGGCAGAG CGAATCAACCATTCATCAC 60 1
CN640247.1 TATTTACGCTTTCTCCCGAT AATTCTTCCCGACAGCGACG 55 1
CN640289.1 AGCCGATTTTGAGAAGATTGGAGAG TATGCTATTCCTATGGTCACTTATCGG 55 1
CN640361.1 AATCCAATGTTACTTCTGCTGCTTC ATCTCCTTGCTAGTCCGCTGTCTC 60 1
CN640419.1 TGGAGAAGGTGGAGAAGAAA TTCCAGTGCCATTGTCCTCT 55 1
CN640485.1 CACATTTATCCCCTCTC TTGGCAATTCTCAACTGTAGTC 60 1
CN640493.1 ATGTTCTCCACCAGTCTCCCCAAATG GGTTGTAAGAATCCTGAGAGTCCA 55 1
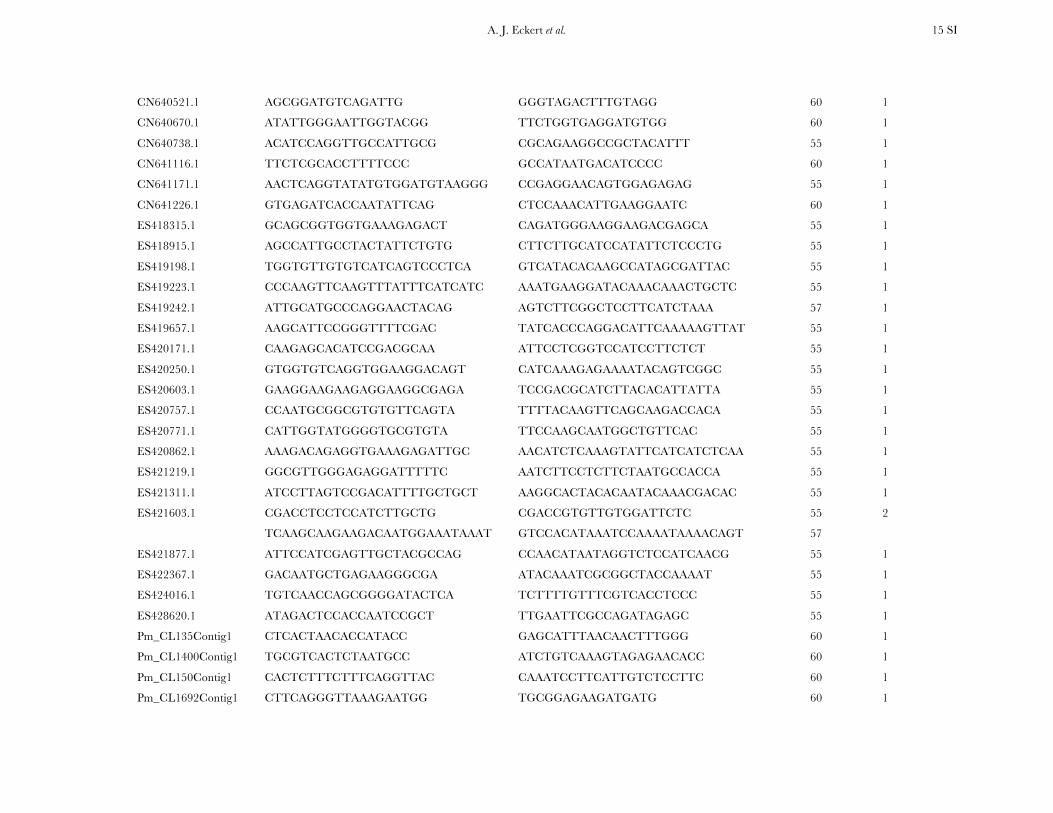
A. J. Eckert et al. 15 SI
CN640521.1 AGCGGATGTCAGATTG GGGTAGACTTTGTAGG 60 1
CN640670.1 ATATTGGGAATTGGTACGG TTCTGGTGAGGATGTGG 60 1
CN640738.1 ACATCCAGGTTGCCATTGCG CGCAGAAGGCCGCTACATTT 55 1
CN641116.1 TTCTCGCACCTTTTCCC GCCATAATGACATCCCC 60 1
CN641171.1 AACTCAGGTATATGTGGATGTAAGGG CCGAGGAACAGTGGAGAGAG 55 1
CN641226.1 GTGAGATCACCAATATTCAG CTCCAAACATTGAAGGAATC 60 1
ES418315.1 GCAGCGGTGGTGAAAGAGACT CAGATGGGAAGGAAGACGAGCA 55 1
ES418915.1 AGCCATTGCCTACTATTCTGTG CTTCTTGCATCCATATTCTCCCTG 55 1
ES419198.1 TGGTGTTGTGTCATCAGTCCCTCA GTCATACACAAGCCATAGCGATTAC 55 1
ES419223.1 CCCAAGTTCAAGTTTATTTCATCATC AAATGAAGGATACAAACAAACTGCTC 55 1
ES419242.1 ATTGCATGCCCAGGAACTACAG AGTCTTCGGCTCCTTCATCTAAA 57 1
ES419657.1 AAGCATTCCGGGTTTTCGAC TATCACCCAGGACATTCAAAAAGTTAT 55 1
ES420171.1 CAAGAGCACATCCGACGCAA ATTCCTCGGTCCATCCTTCTCT 55 1
ES420250.1 GTGGTGTCAGGTGGAAGGACAGT CATCAAAGAGAAAATACAGTCGGC 55 1
ES420603.1 GAAGGAAGAAGAGGAAGGCGAGA TCCGACGCATCTTACACATTATTA 55 1
ES420757.1 CCAATGCGGCGTGTGTTCAGTA TTTTACAAGTTCAGCAAGACCACA 55 1
ES420771.1 CATTGGTATGGGGTGCGTGTA TTCCAAGCAATGGCTGTTCAC 55 1
ES420862.1 AAAGACAGAGGTGAAAGAGATTGC AACATCTCAAAGTATTCATCATCTCAA 55 1
ES421219.1 GGCGTTGGGAGAGGATTTTTC AATCTTCCTCTTCTAATGCCACCA 55 1
ES421311.1 ATCCTTAGTCCGACATTTTGCTGCT AAGGCACTACACAATACAAACGACAC 55 1
ES421603.1 CGACCTCCTCCATCTTGCTG CGACCGTGTTGTGGATTCTC 55 2
TCAAGCAAGAAGACAATGGAAATAAAT GTCCACATAAATCCAAAATAAAACAGT 57
ES421877.1 ATTCCATCGAGTTGCTACGCCAG CCAACATAATAGGTCTCCATCAACG 55 1
ES422367.1 GACAATGCTGAGAAGGGCGA ATACAAATCGCGGCTACCAAAAT 55 1
ES424016.1 TGTCAACCAGCGGGGATACTCA TCTTTTGTTTCGTCACCTCCC 55 1
ES428620.1 ATAGACTCCACCAATCCGCT TTGAATTCGCCAGATAGAGC 55 1
Pm_CL135Contig1 CTCACTAACACCATACC GAGCATTTAACAACTTTGGG 60 1
Pm_CL1400Contig1 TGCGTCACTCTAATGCC ATCTGTCAAAGTAGAGAACACC 60 1
Pm_CL150Contig1 CACTCTTTCTTTCAGGTTAC CAAATCCTTCATTGTCTCCTTC 60 1
Pm_CL1692Contig1 CTTCAGGGTTAAAGAATGG TGCGGAGAAGATGATG 60 1
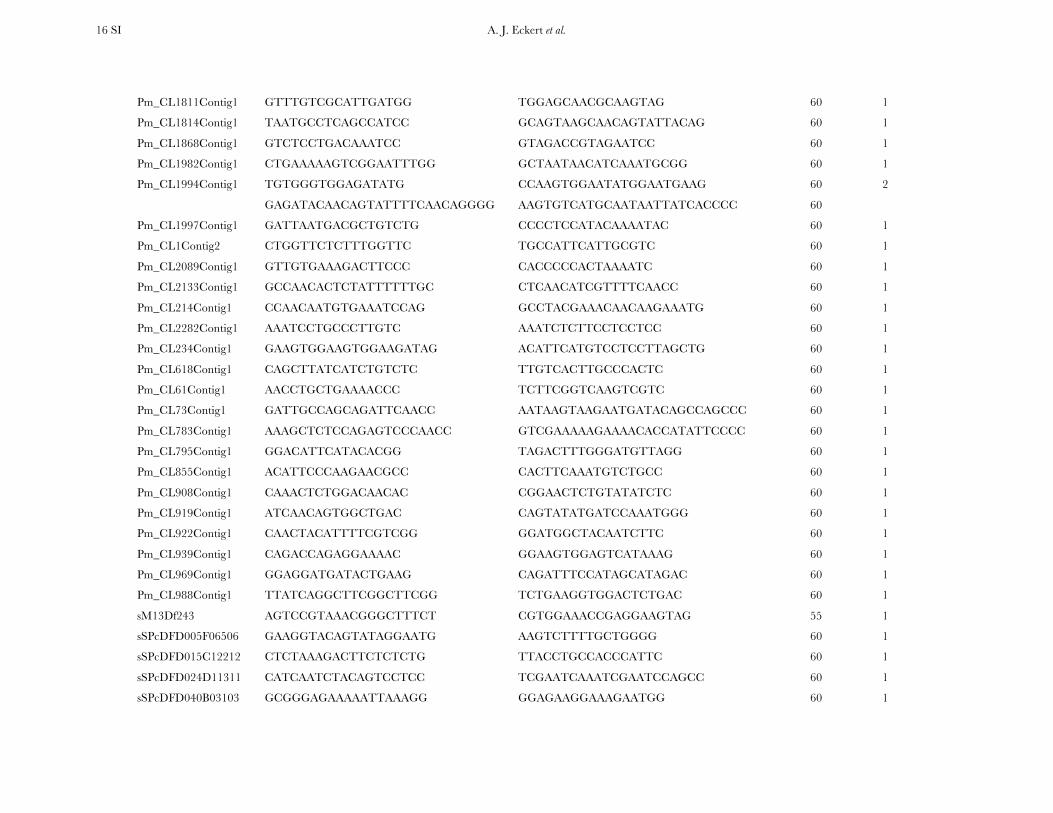
A. J. Eckert et al. 16 SI
Pm_CL1811Contig1 GTTTGTCGCATTGATGG TGGAGCAACGCAAGTAG 60 1
Pm_CL1814Contig1 TAATGCCTCAGCCATCC GCAGTAAGCAACAGTATTACAG 60 1
Pm_CL1868Contig1 GTCTCCTGACAAATCC GTAGACCGTAGAATCC 60 1
Pm_CL1982Contig1 CTGAAAAAGTCGGAATTTGG GCTAATAACATCAAATGCGG 60 1
Pm_CL1994Contig1 TGTGGGTGGAGATATG CCAAGTGGAATATGGAATGAAG 60 2
GAGATACAACAGTATTTTCAACAGGGG AAGTGTCATGCAATAATTATCACCCC 60
Pm_CL1997Contig1 GATTAATGACGCTGTCTG CCCCTCCATACAAAATAC 60 1
Pm_CL1Contig2 CTGGTTCTCTTTGGTTC TGCCATTCATTGCGTC 60 1
Pm_CL2089Contig1 GTTGTGAAAGACTTCCC CACCCCCACTAAAATC 60 1
Pm_CL2133Contig1 GCCAACACTCTATTTTTTGC CTCAACATCGTTTTCAACC 60 1
Pm_CL214Contig1 CCAACAATGTGAAATCCAG GCCTACGAAACAACAAGAAATG 60 1
Pm_CL2282Contig1 AAATCCTGCCCTTGTC AAATCTCTTCCTCCTCC 60 1
Pm_CL234Contig1 GAAGTGGAAGTGGAAGATAG ACATTCATGTCCTCCTTAGCTG 60 1
Pm_CL618Contig1 CAGCTTATCATCTGTCTC TTGTCACTTGCCCACTC 60 1
Pm_CL61Contig1 AACCTGCTGAAAACCC TCTTCGGTCAAGTCGTC 60 1
Pm_CL73Contig1 GATTGCCAGCAGATTCAACC AATAAGTAAGAATGATACAGCCAGCCC 60 1
Pm_CL783Contig1 AAAGCTCTCCAGAGTCCCAACC GTCGAAAAAGAAAACACCATATTCCCC 60 1
Pm_CL795Contig1 GGACATTCATACACGG TAGACTTTGGGATGTTAGG 60 1
Pm_CL855Contig1 ACATTCCCAAGAACGCC CACTTCAAATGTCTGCC 60 1
Pm_CL908Contig1 CAAACTCTGGACAACAC CGGAACTCTGTATATCTC 60 1
Pm_CL919Contig1 ATCAACAGTGGCTGAC CAGTATATGATCCAAATGGG 60 1
Pm_CL922Contig1 CAACTACATTTTCGTCGG GGATGGCTACAATCTTC 60 1
Pm_CL939Contig1 CAGACCAGAGGAAAAC GGAAGTGGAGTCATAAAG 60 1
Pm_CL969Contig1 GGAGGATGATACTGAAG CAGATTTCCATAGCATAGAC 60 1
Pm_CL988Contig1 TTATCAGGCTTCGGCTTCGG TCTGAAGGTGGACTCTGAC 60 1
sM13Df243 AGTCCGTAAACGGGCTTTCT CGTGGAAACCGAGGAAGTAG 55 1
sSPcDFD005F06506 GAAGGTACAGTATAGGAATG AAGTCTTTTGCTGGGG 60 1
sSPcDFD015C12212 CTCTAAAGACTTCTCTCTG TTACCTGCCACCCATTC 60 1
sSPcDFD024D11311 CATCAATCTACAGTCCTCC TCGAATCAAATCGAATCCAGCC 60 1
sSPcDFD040B03103 GCGGGAGAAAAATTAAAGG GGAGAAGGAAAGAATGG 60 1
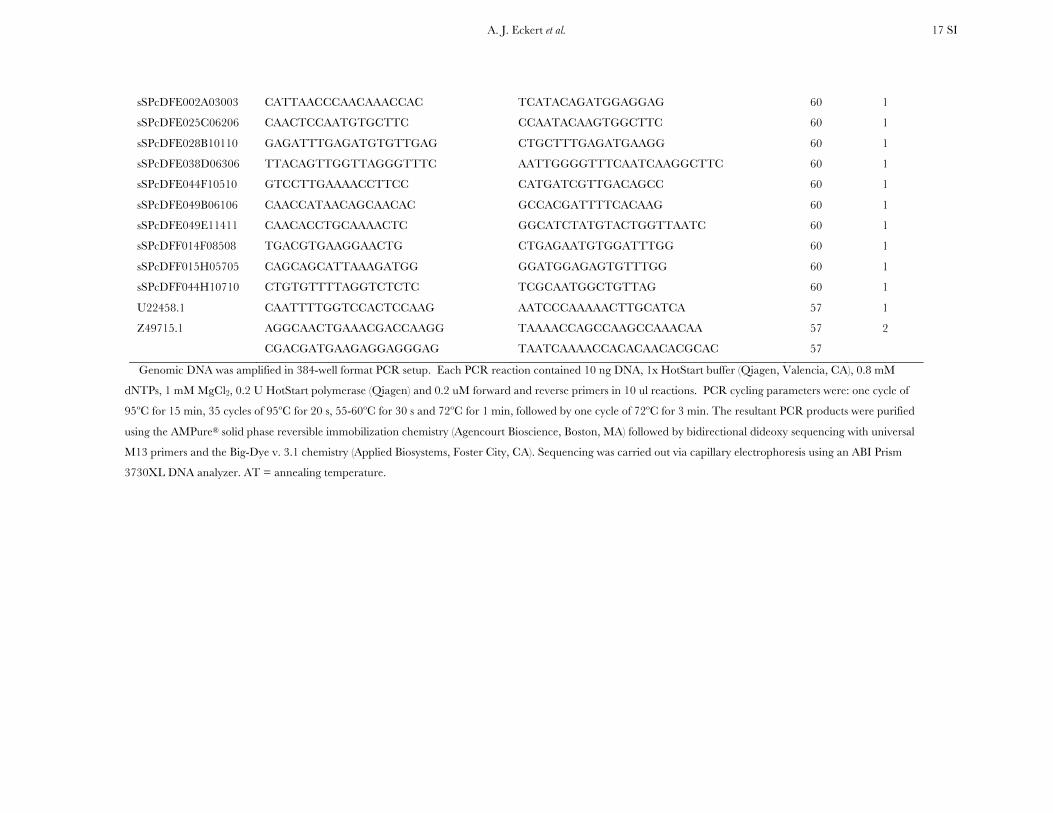
A. J. Eckert et al. 17 SI
sSPcDFE002A03003 CATTAACCCAACAAACCAC TCATACAGATGGAGGAG 60 1
sSPcDFE025C06206 CAACTCCAATGTGCTTC CCAATACAAGTGGCTTC 60 1
sSPcDFE028B10110 GAGATTTGAGATGTGTTGAG CTGCTTTGAGATGAAGG 60 1
sSPcDFE038D06306 TTACAGTTGGTTAGGGTTTC AATTGGGGTTTCAATCAAGGCTTC 60 1
sSPcDFE044F10510 GTCCTTGAAAACCTTCC CATGATCGTTGACAGCC 60 1
sSPcDFE049B06106 CAACCATAACAGCAACAC GCCACGATTTTCACAAG 60 1
sSPcDFE049E11411 CAACACCTGCAAAACTC GGCATCTATGTACTGGTTAATC 60 1
sSPcDFF014F08508 TGACGTGAAGGAACTG CTGAGAATGTGGATTTGG 60 1
sSPcDFF015H05705 CAGCAGCATTAAAGATGG GGATGGAGAGTGTTTGG 60 1
sSPcDFF044H10710 CTGTGTTTTAGGTCTCTC TCGCAATGGCTGTTAG 60 1
U22458.1 CAATTTTGGTCCACTCCAAG AATCCCAAAAACTTGCATCA 57 1
Z49715.1 AGGCAACTGAAACGACCAAGG TAAAACCAGCCAAGCCAAACAA 57 2
CGACGATGAAGAGGAGGGAG TAATCAAAACCACACAACACGCAC 57
Genomic DNA was amplified in 384-well format PCR setup. Each PCR reaction contained 10 ng DNA, 1x HotStart buffer (Qiagen, Valencia, CA), 0.8 mM
dNTPs, 1 mM MgCl2, 0.2 U HotStart polymerase (Qiagen) and 0.2 uM forward and reverse primers in 10 ul reactions. PCR cycling parameters were: one cycle of
95ºC for 15 min, 35 cycles of 95ºC for 20 s, 55-60ºC for 30 s and 72ºC for 1 min, followed by one cycle of 72ºC for 3 min. The resultant PCR products were purified
using the AMPure® solid phase reversible immobilization chemistry (Agencourt Bioscience, Boston, MA) followed by bidirectional dideoxy sequencing with universal
M13 primers and the Big-Dye v. 3.1 chemistry (Applied Biosystems, Foster City, CA). Sequencing was carried out via capillary electrophoresis using an ABI Prism
3730XL DNA analyzer. AT = annealing temperature.
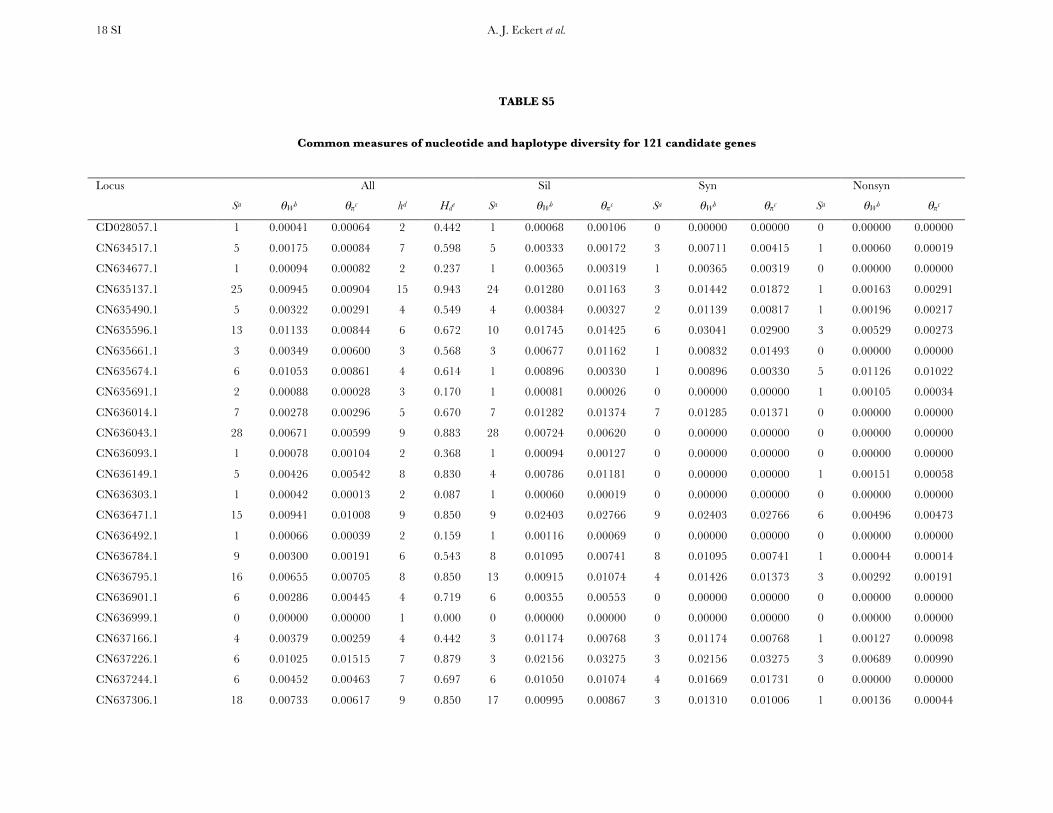
A. J. Eckert et al. 18 SI
TABLE S5
Common measures of nucleotide and haplotype diversity for 121 candidate genes
Locus All Sil Syn Nonsyn
Sa θWb θπc hd Hde Sa θWb θπc Sa θWb θπc Sa θWb θπc
CD028057.1 1 0.00041 0.00064 2 0.442 1 0.00068 0.00106 0 0.00000 0.00000 0 0.00000 0.00000
CN634517.1 5 0.00175 0.00084 7 0.598 5 0.00333 0.00172 3 0.00711 0.00415 1 0.00060 0.00019
CN634677.1 1 0.00094 0.00082 2 0.237 1 0.00365 0.00319 1 0.00365 0.00319 0 0.00000 0.00000
CN635137.1 25 0.00945 0.00904 15 0.943 24 0.01280 0.01163 3 0.01442 0.01872 1 0.00163 0.00291
CN635490.1 5 0.00322 0.00291 4 0.549 4 0.00384 0.00327 2 0.01139 0.00817 1 0.00196 0.00217
CN635596.1 13 0.01133 0.00844 6 0.672 10 0.01745 0.01425 6 0.03041 0.02900 3 0.00529 0.00273
CN635661.1 3 0.00349 0.00600 3 0.568 3 0.00677 0.01162 1 0.00832 0.01493 0 0.00000 0.00000
CN635674.1 6 0.01053 0.00861 4 0.614 1 0.00896 0.00330 1 0.00896 0.00330 5 0.01126 0.01022
CN635691.1 2 0.00088 0.00028 3 0.170 1 0.00081 0.00026 0 0.00000 0.00000 1 0.00105 0.00034
CN636014.1 7 0.00278 0.00296 5 0.670 7 0.01282 0.01374 7 0.01285 0.01371 0 0.00000 0.00000
CN636043.1 28 0.00671 0.00599 9 0.883 28 0.00724 0.00620 0 0.00000 0.00000 0 0.00000 0.00000
CN636093.1 1 0.00078 0.00104 2 0.368 1 0.00094 0.00127 0 0.00000 0.00000 0 0.00000 0.00000
CN636149.1 5 0.00426 0.00542 8 0.830 4 0.00786 0.01181 0 0.00000 0.00000 1 0.00151 0.00058
CN636303.1 1 0.00042 0.00013 2 0.087 1 0.00060 0.00019 0 0.00000 0.00000 0 0.00000 0.00000
CN636471.1 15 0.00941 0.01008 9 0.850 9 0.02403 0.02766 9 0.02403 0.02766 6 0.00496 0.00473
CN636492.1 1 0.00066 0.00039 2 0.159 1 0.00116 0.00069 0 0.00000 0.00000 0 0.00000 0.00000
CN636784.1 9 0.00300 0.00191 6 0.543 8 0.01095 0.00741 8 0.01095 0.00741 1 0.00044 0.00014
CN636795.1 16 0.00655 0.00705 8 0.850 13 0.00915 0.01074 4 0.01426 0.01373 3 0.00292 0.00191
CN636901.1 6 0.00286 0.00445 4 0.719 6 0.00355 0.00553 0 0.00000 0.00000 0 0.00000 0.00000
CN636999.1 0 0.00000 0.00000 1 0.000 0 0.00000 0.00000 0 0.00000 0.00000 0 0.00000 0.00000
CN637166.1 4 0.00379 0.00259 4 0.442 3 0.01174 0.00768 3 0.01174 0.00768 1 0.00127 0.00098
CN637226.1 6 0.01025 0.01515 7 0.879 3 0.02156 0.03275 3 0.02156 0.03275 3 0.00689 0.00990
CN637244.1 6 0.00452 0.00463 7 0.697 6 0.01050 0.01074 4 0.01669 0.01731 0 0.00000 0.00000
CN637306.1 18 0.00733 0.00617 9 0.850 17 0.00995 0.00867 3 0.01310 0.01006 1 0.00136 0.00044
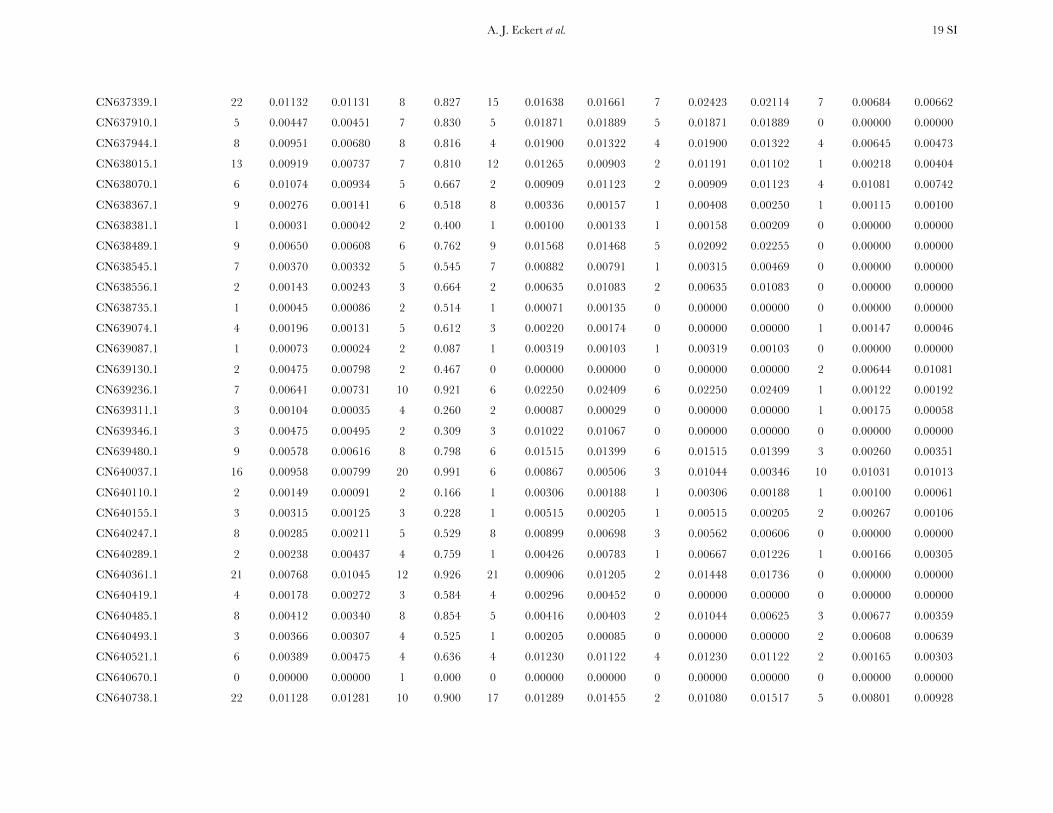
A. J. Eckert et al. 19 SI
CN637339.1 22 0.01132 0.01131 8 0.827 15 0.01638 0.01661 7 0.02423 0.02114 7 0.00684 0.00662
CN637910.1 5 0.00447 0.00451 7 0.830 5 0.01871 0.01889 5 0.01871 0.01889 0 0.00000 0.00000
CN637944.1 8 0.00951 0.00680 8 0.816 4 0.01900 0.01322 4 0.01900 0.01322 4 0.00645 0.00473
CN638015.1 13 0.00919 0.00737 7 0.810 12 0.01265 0.00903 2 0.01191 0.01102 1 0.00218 0.00404
CN638070.1 6 0.01074 0.00934 5 0.667 2 0.00909 0.01123 2 0.00909 0.01123 4 0.01081 0.00742
CN638367.1 9 0.00276 0.00141 6 0.518 8 0.00336 0.00157 1 0.00408 0.00250 1 0.00115 0.00100
CN638381.1 1 0.00031 0.00042 2 0.400 1 0.00100 0.00133 1 0.00158 0.00209 0 0.00000 0.00000
CN638489.1 9 0.00650 0.00608 6 0.762 9 0.01568 0.01468 5 0.02092 0.02255 0 0.00000 0.00000
CN638545.1 7 0.00370 0.00332 5 0.545 7 0.00882 0.00791 1 0.00315 0.00469 0 0.00000 0.00000
CN638556.1 2 0.00143 0.00243 3 0.664 2 0.00635 0.01083 2 0.00635 0.01083 0 0.00000 0.00000
CN638735.1 1 0.00045 0.00086 2 0.514 1 0.00071 0.00135 0 0.00000 0.00000 0 0.00000 0.00000
CN639074.1 4 0.00196 0.00131 5 0.612 3 0.00220 0.00174 0 0.00000 0.00000 1 0.00147 0.00046
CN639087.1 1 0.00073 0.00024 2 0.087 1 0.00319 0.00103 1 0.00319 0.00103 0 0.00000 0.00000
CN639130.1 2 0.00475 0.00798 2 0.467 0 0.00000 0.00000 0 0.00000 0.00000 2 0.00644 0.01081
CN639236.1 7 0.00641 0.00731 10 0.921 6 0.02250 0.02409 6 0.02250 0.02409 1 0.00122 0.00192
CN639311.1 3 0.00104 0.00035 4 0.260 2 0.00087 0.00029 0 0.00000 0.00000 1 0.00175 0.00058
CN639346.1 3 0.00475 0.00495 2 0.309 3 0.01022 0.01067 0 0.00000 0.00000 0 0.00000 0.00000
CN639480.1 9 0.00578 0.00616 8 0.798 6 0.01515 0.01399 6 0.01515 0.01399 3 0.00260 0.00351
CN640037.1 16 0.00958 0.00799 20 0.991 6 0.00867 0.00506 3 0.01044 0.00346 10 0.01031 0.01013
CN640110.1 2 0.00149 0.00091 2 0.166 1 0.00306 0.00188 1 0.00306 0.00188 1 0.00100 0.00061
CN640155.1 3 0.00315 0.00125 3 0.228 1 0.00515 0.00205 1 0.00515 0.00205 2 0.00267 0.00106
CN640247.1 8 0.00285 0.00211 5 0.529 8 0.00899 0.00698 3 0.00562 0.00606 0 0.00000 0.00000
CN640289.1 2 0.00238 0.00437 4 0.759 1 0.00426 0.00783 1 0.00667 0.01226 1 0.00166 0.00305
CN640361.1 21 0.00768 0.01045 12 0.926 21 0.00906 0.01205 2 0.01448 0.01736 0 0.00000 0.00000
CN640419.1 4 0.00178 0.00272 3 0.584 4 0.00296 0.00452 0 0.00000 0.00000 0 0.00000 0.00000
CN640485.1 8 0.00412 0.00340 8 0.854 5 0.00416 0.00403 2 0.01044 0.00625 3 0.00677 0.00359
CN640493.1 3 0.00366 0.00307 4 0.525 1 0.00205 0.00085 0 0.00000 0.00000 2 0.00608 0.00639
CN640521.1 6 0.00389 0.00475 4 0.636 4 0.01230 0.01122 4 0.01230 0.01122 2 0.00165 0.00303
CN640670.1 0 0.00000 0.00000 1 0.000 0 0.00000 0.00000 0 0.00000 0.00000 0 0.00000 0.00000
CN640738.1 22 0.01128 0.01281 10 0.900 17 0.01289 0.01455 2 0.01080 0.01517 5 0.00801 0.00928
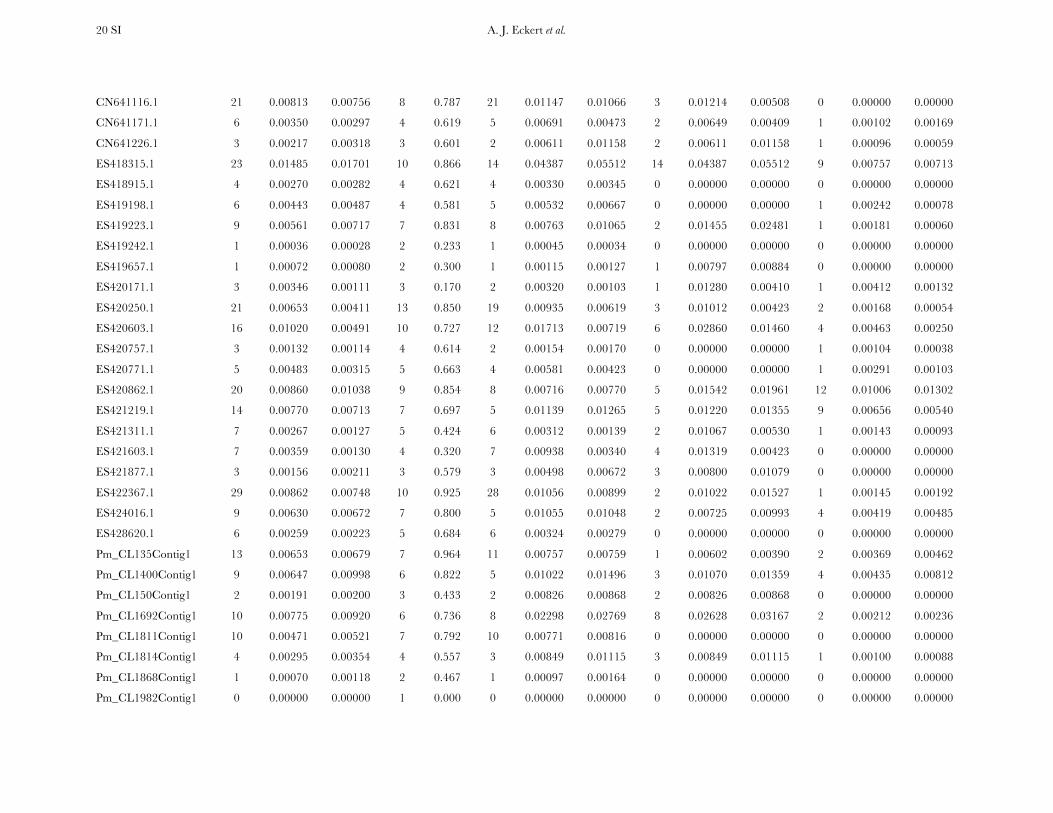
A. J. Eckert et al. 20 SI
CN641116.1 21 0.00813 0.00756 8 0.787 21 0.01147 0.01066 3 0.01214 0.00508 0 0.00000 0.00000
CN641171.1 6 0.00350 0.00297 4 0.619 5 0.00691 0.00473 2 0.00649 0.00409 1 0.00102 0.00169
CN641226.1 3 0.00217 0.00318 3 0.601 2 0.00611 0.01158 2 0.00611 0.01158 1 0.00096 0.00059
ES418315.1 23 0.01485 0.01701 10 0.866 14 0.04387 0.05512 14 0.04387 0.05512 9 0.00757 0.00713
ES418915.1 4 0.00270 0.00282 4 0.621 4 0.00330 0.00345 0 0.00000 0.00000 0 0.00000 0.00000
ES419198.1 6 0.00443 0.00487 4 0.581 5 0.00532 0.00667 0 0.00000 0.00000 1 0.00242 0.00078
ES419223.1 9 0.00561 0.00717 7 0.831 8 0.00763 0.01065 2 0.01455 0.02481 1 0.00181 0.00060
ES419242.1 1 0.00036 0.00028 2 0.233 1 0.00045 0.00034 0 0.00000 0.00000 0 0.00000 0.00000
ES419657.1 1 0.00072 0.00080 2 0.300 1 0.00115 0.00127 1 0.00797 0.00884 0 0.00000 0.00000
ES420171.1 3 0.00346 0.00111 3 0.170 2 0.00320 0.00103 1 0.01280 0.00410 1 0.00412 0.00132
ES420250.1 21 0.00653 0.00411 13 0.850 19 0.00935 0.00619 3 0.01012 0.00423 2 0.00168 0.00054
ES420603.1 16 0.01020 0.00491 10 0.727 12 0.01713 0.00719 6 0.02860 0.01460 4 0.00463 0.00250
ES420757.1 3 0.00132 0.00114 4 0.614 2 0.00154 0.00170 0 0.00000 0.00000 1 0.00104 0.00038
ES420771.1 5 0.00483 0.00315 5 0.663 4 0.00581 0.00423 0 0.00000 0.00000 1 0.00291 0.00103
ES420862.1 20 0.00860 0.01038 9 0.854 8 0.00716 0.00770 5 0.01542 0.01961 12 0.01006 0.01302
ES421219.1 14 0.00770 0.00713 7 0.697 5 0.01139 0.01265 5 0.01220 0.01355 9 0.00656 0.00540
ES421311.1 7 0.00267 0.00127 5 0.424 6 0.00312 0.00139 2 0.01067 0.00530 1 0.00143 0.00093
ES421603.1 7 0.00359 0.00130 4 0.320 7 0.00938 0.00340 4 0.01319 0.00423 0 0.00000 0.00000
ES421877.1 3 0.00156 0.00211 3 0.579 3 0.00498 0.00672 3 0.00800 0.01079 0 0.00000 0.00000
ES422367.1 29 0.00862 0.00748 10 0.925 28 0.01056 0.00899 2 0.01022 0.01527 1 0.00145 0.00192
ES424016.1 9 0.00630 0.00672 7 0.800 5 0.01055 0.01048 2 0.00725 0.00993 4 0.00419 0.00485
ES428620.1 6 0.00259 0.00223 5 0.684 6 0.00324 0.00279 0 0.00000 0.00000 0 0.00000 0.00000
Pm_CL135Contig1 13 0.00653 0.00679 7 0.964 11 0.00757 0.00759 1 0.00602 0.00390 2 0.00369 0.00462
Pm_CL1400Contig1 9 0.00647 0.00998 6 0.822 5 0.01022 0.01496 3 0.01070 0.01359 4 0.00435 0.00812
Pm_CL150Contig1 2 0.00191 0.00200 3 0.433 2 0.00826 0.00868 2 0.00826 0.00868 0 0.00000 0.00000
Pm_CL1692Contig1 10 0.00775 0.00920 6 0.736 8 0.02298 0.02769 8 0.02628 0.03167 2 0.00212 0.00236
Pm_CL1811Contig1 10 0.00471 0.00521 7 0.792 10 0.00771 0.00816 0 0.00000 0.00000 0 0.00000 0.00000
Pm_CL1814Contig1 4 0.00295 0.00354 4 0.557 3 0.00849 0.01115 3 0.00849 0.01115 1 0.00100 0.00088
Pm_CL1868Contig1 1 0.00070 0.00118 2 0.467 1 0.00097 0.00164 0 0.00000 0.00000 0 0.00000 0.00000
Pm_CL1982Contig1 0 0.00000 0.00000 1 0.000 0 0.00000 0.00000 0 0.00000 0.00000 0 0.00000 0.00000
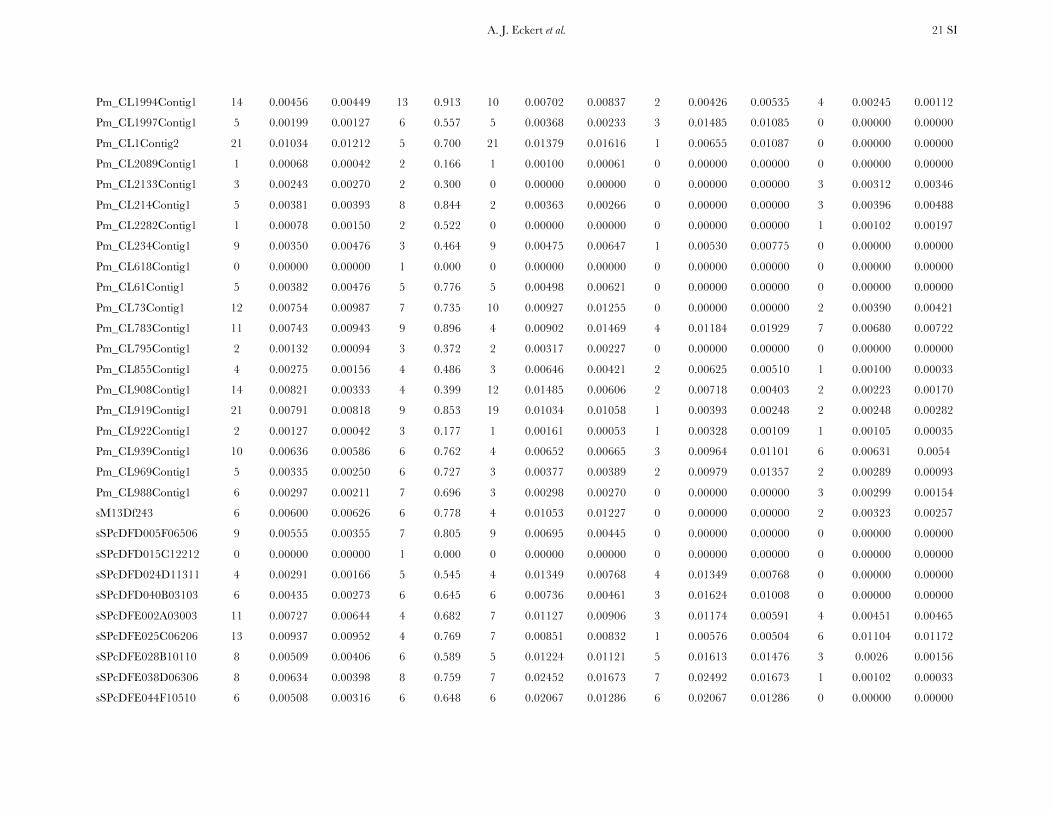
A. J. Eckert et al. 21 SI
Pm_CL1994Contig1 14 0.00456 0.00449 13 0.913 10 0.00702 0.00837 2 0.00426 0.00535 4 0.00245 0.00112
Pm_CL1997Contig1 5 0.00199 0.00127 6 0.557 5 0.00368 0.00233 3 0.01485 0.01085 0 0.00000 0.00000
Pm_CL1Contig2 21 0.01034 0.01212 5 0.700 21 0.01379 0.01616 1 0.00655 0.01087 0 0.00000 0.00000
Pm_CL2089Contig1 1 0.00068 0.00042 2 0.166 1 0.00100 0.00061 0 0.00000 0.00000 0 0.00000 0.00000
Pm_CL2133Contig1 3 0.00243 0.00270 2 0.300 0 0.00000 0.00000 0 0.00000 0.00000 3 0.00312 0.00346
Pm_CL214Contig1 5 0.00381 0.00393 8 0.844 2 0.00363 0.00266 0 0.00000 0.00000 3 0.00396 0.00488
Pm_CL2282Contig1 1 0.00078 0.00150 2 0.522 0 0.00000 0.00000 0 0.00000 0.00000 1 0.00102 0.00197
Pm_CL234Contig1 9 0.00350 0.00476 3 0.464 9 0.00475 0.00647 1 0.00530 0.00775 0 0.00000 0.00000
Pm_CL618Contig1 0 0.00000 0.00000 1 0.000 0 0.00000 0.00000 0 0.00000 0.00000 0 0.00000 0.00000
Pm_CL61Contig1 5 0.00382 0.00476 5 0.776 5 0.00498 0.00621 0 0.00000 0.00000 0 0.00000 0.00000
Pm_CL73Contig1 12 0.00754 0.00987 7 0.735 10 0.00927 0.01255 0 0.00000 0.00000 2 0.00390 0.00421
Pm_CL783Contig1 11 0.00743 0.00943 9 0.896 4 0.00902 0.01469 4 0.01184 0.01929 7 0.00680 0.00722
Pm_CL795Contig1 2 0.00132 0.00094 3 0.372 2 0.00317 0.00227 0 0.00000 0.00000 0 0.00000 0.00000
Pm_CL855Contig1 4 0.00275 0.00156 4 0.486 3 0.00646 0.00421 2 0.00625 0.00510 1 0.00100 0.00033
Pm_CL908Contig1 14 0.00821 0.00333 4 0.399 12 0.01485 0.00606 2 0.00718 0.00403 2 0.00223 0.00170
Pm_CL919Contig1 21 0.00791 0.00818 9 0.853 19 0.01034 0.01058 1 0.00393 0.00248 2 0.00248 0.00282
Pm_CL922Contig1 2 0.00127 0.00042 3 0.177 1 0.00161 0.00053 1 0.00328 0.00109 1 0.00105 0.00035
Pm_CL939Contig1 10 0.00636 0.00586 6 0.762 4 0.00652 0.00665 3 0.00964 0.01101 6 0.00631 0.0054
Pm_CL969Contig1 5 0.00335 0.00250 6 0.727 3 0.00377 0.00389 2 0.00979 0.01357 2 0.00289 0.00093
Pm_CL988Contig1 6 0.00297 0.00211 7 0.696 3 0.00298 0.00270 0 0.00000 0.00000 3 0.00299 0.00154
sM13Df243 6 0.00600 0.00626 6 0.778 4 0.01053 0.01227 0 0.00000 0.00000 2 0.00323 0.00257
sSPcDFD005F06506 9 0.00555 0.00355 7 0.805 9 0.00695 0.00445 0 0.00000 0.00000 0 0.00000 0.00000
sSPcDFD015C12212 0 0.00000 0.00000 1 0.000 0 0.00000 0.00000 0 0.00000 0.00000 0 0.00000 0.00000
sSPcDFD024D11311 4 0.00291 0.00166 5 0.545 4 0.01349 0.00768 4 0.01349 0.00768 0 0.00000 0.00000
sSPcDFD040B03103 6 0.00435 0.00273 6 0.645 6 0.00736 0.00461 3 0.01624 0.01008 0 0.00000 0.00000
sSPcDFE002A03003 11 0.00727 0.00644 4 0.682 7 0.01127 0.00906 3 0.01174 0.00591 4 0.00451 0.00465
sSPcDFE025C06206 13 0.00937 0.00952 4 0.769 7 0.00851 0.00832 1 0.00576 0.00504 6 0.01104 0.01172
sSPcDFE028B10110 8 0.00509 0.00406 6 0.589 5 0.01224 0.01121 5 0.01613 0.01476 3 0.0026 0.00156
sSPcDFE038D06306 8 0.00634 0.00398 8 0.759 7 0.02452 0.01673 7 0.02492 0.01673 1 0.00102 0.00033
sSPcDFE044F10510 6 0.00508 0.00316 6 0.648 6 0.02067 0.01286 6 0.02067 0.01286 0 0.00000 0.00000
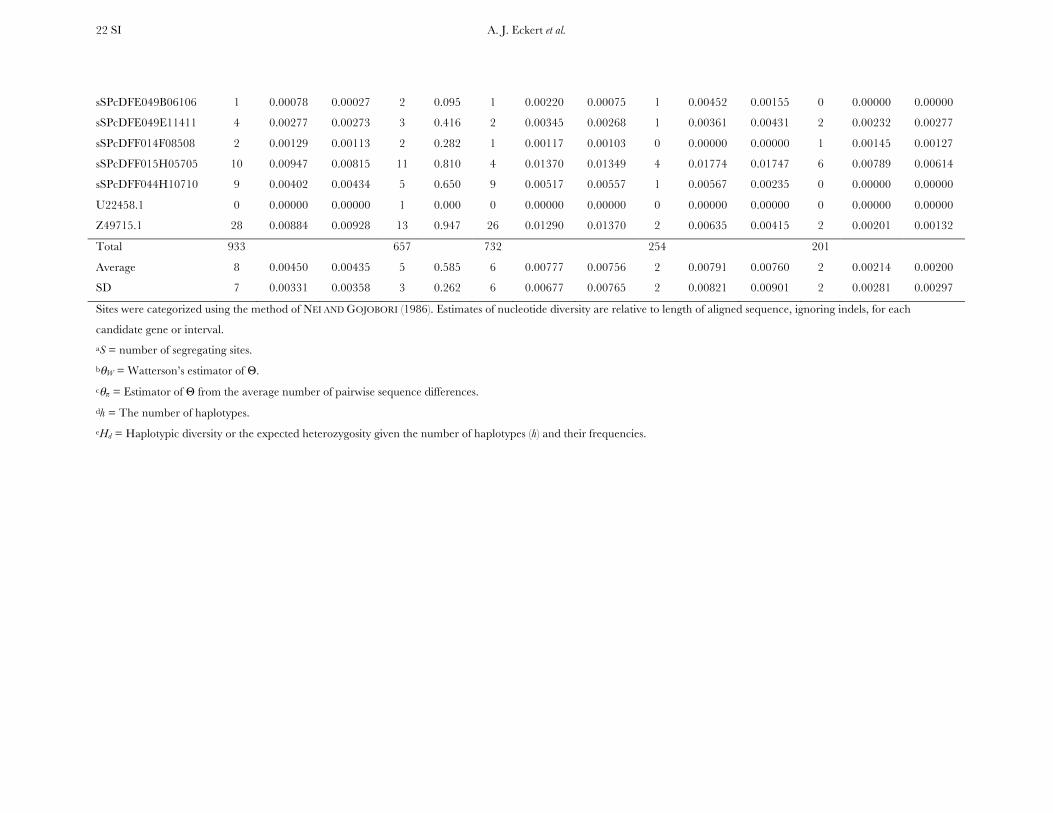
A. J. Eckert et al. 22 SI
sSPcDFE049B06106 1 0.00078 0.00027 2 0.095 1 0.00220 0.00075 1 0.00452 0.00155 0 0.00000 0.00000
sSPcDFE049E11411 4 0.00277 0.00273 3 0.416 2 0.00345 0.00268 1 0.00361 0.00431 2 0.00232 0.00277
sSPcDFF014F08508 2 0.00129 0.00113 2 0.282 1 0.00117 0.00103 0 0.00000 0.00000 1 0.00145 0.00127
sSPcDFF015H05705 10 0.00947 0.00815 11 0.810 4 0.01370 0.01349 4 0.01774 0.01747 6 0.00789 0.00614
sSPcDFF044H10710 9 0.00402 0.00434 5 0.650 9 0.00517 0.00557 1 0.00567 0.00235 0 0.00000 0.00000
U22458.1 0 0.00000 0.00000 1 0.000 0 0.00000 0.00000 0 0.00000 0.00000 0 0.00000 0.00000
Z49715.1 28 0.00884 0.00928 13 0.947 26 0.01290 0.01370 2 0.00635 0.00415 2 0.00201 0.00132
Total 933 657 732 254 201
Average 8 0.00450 0.00435 5 0.585 6 0.00777 0.00756 2 0.00791 0.00760 2 0.00214 0.00200
SD 7 0.00331 0.00358 3 0.262 6 0.00677 0.00765 2 0.00821 0.00901 2 0.00281 0.00297
Sites were categorized using the method of NEI AND GOJOBORI (1986). Estimates of nucleotide diversity are relative to length of aligned sequence, ignoring indels, for each
candidate gene or interval.
aS = number of segregating sites.
bθW = Watterson’s estimator of Θ.
cθπ = Estimator of Θ from the average number of pairwise sequence differences.
dh = The number of haplotypes.
eHd = Haplotypic diversity or the expected heterozygosity given the number of haplotypes (h) and their frequencies.
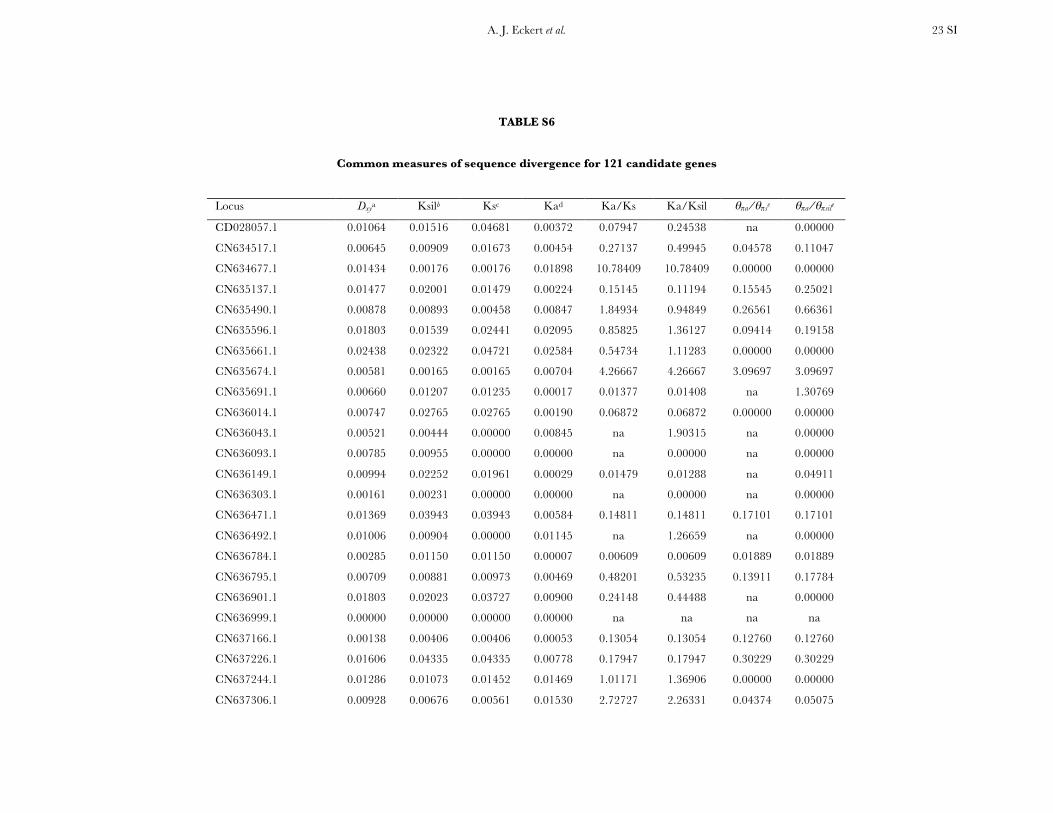
A. J. Eckert et al. 23 SI
TABLE S6
Common measures of sequence divergence for 121 candidate genes
Locus Dxya Ksilb Ksc Kad Ka/Ks Ka/Ksil θπa/θπse θπa/θπsile
CD028057.1 0.01064 0.01516 0.04681 0.00372 0.07947 0.24538 na 0.00000
CN634517.1 0.00645 0.00909 0.01673 0.00454 0.27137 0.49945 0.04578 0.11047
CN634677.1 0.01434 0.00176 0.00176 0.01898 10.78409 10.78409 0.00000 0.00000
CN635137.1 0.01477 0.02001 0.01479 0.00224 0.15145 0.11194 0.15545 0.25021
CN635490.1 0.00878 0.00893 0.00458 0.00847 1.84934 0.94849 0.26561 0.66361
CN635596.1 0.01803 0.01539 0.02441 0.02095 0.85825 1.36127 0.09414 0.19158
CN635661.1 0.02438 0.02322 0.04721 0.02584 0.54734 1.11283 0.00000 0.00000
CN635674.1 0.00581 0.00165 0.00165 0.00704 4.26667 4.26667 3.09697 3.09697
CN635691.1 0.00660 0.01207 0.01235 0.00017 0.01377 0.01408 na 1.30769
CN636014.1 0.00747 0.02765 0.02765 0.00190 0.06872 0.06872 0.00000 0.00000
CN636043.1 0.00521 0.00444 0.00000 0.00845 na 1.90315 na 0.00000
CN636093.1 0.00785 0.00955 0.00000 0.00000 na 0.00000 na 0.00000
CN636149.1 0.00994 0.02252 0.01961 0.00029 0.01479 0.01288 na 0.04911
CN636303.1 0.00161 0.00231 0.00000 0.00000 na 0.00000 na 0.00000
CN636471.1 0.01369 0.03943 0.03943 0.00584 0.14811 0.14811 0.17101 0.17101
CN636492.1 0.01006 0.00904 0.00000 0.01145 na 1.26659 na 0.00000
CN636784.1 0.00285 0.01150 0.01150 0.00007 0.00609 0.00609 0.01889 0.01889
CN636795.1 0.00709 0.00881 0.00973 0.00469 0.48201 0.53235 0.13911 0.17784
CN636901.1 0.01803 0.02023 0.03727 0.00900 0.24148 0.44488 na 0.00000
CN636999.1 0.00000 0.00000 0.00000 0.00000 na na na na
CN637166.1 0.00138 0.00406 0.00406 0.00053 0.13054 0.13054 0.12760 0.12760
CN637226.1 0.01606 0.04335 0.04335 0.00778 0.17947 0.17947 0.30229 0.30229
CN637244.1 0.01286 0.01073 0.01452 0.01469 1.01171 1.36906 0.00000 0.00000
CN637306.1 0.00928 0.00676 0.00561 0.01530 2.72727 2.26331 0.04374 0.05075
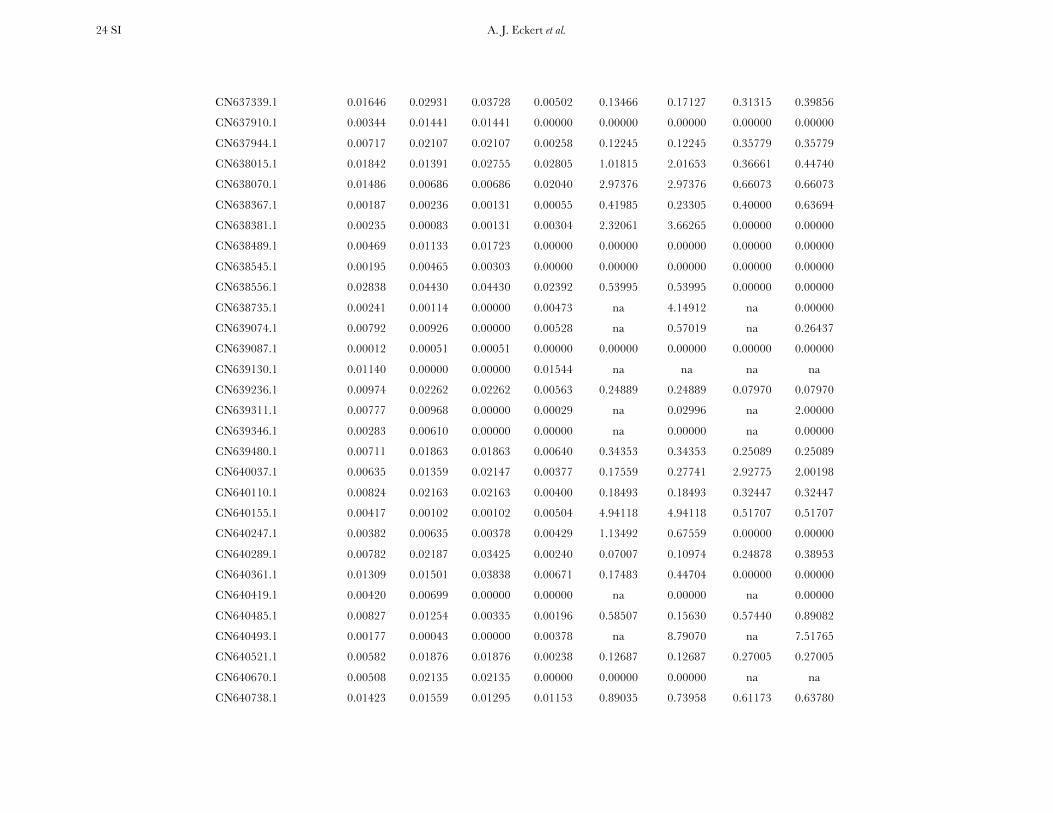
A. J. Eckert et al. 24 SI
CN637339.1 0.01646 0.02931 0.03728 0.00502 0.13466 0.17127 0.31315 0.39856
CN637910.1 0.00344 0.01441 0.01441 0.00000 0.00000 0.00000 0.00000 0.00000
CN637944.1 0.00717 0.02107 0.02107 0.00258 0.12245 0.12245 0.35779 0.35779
CN638015.1 0.01842 0.01391 0.02755 0.02805 1.01815 2.01653 0.36661 0.44740
CN638070.1 0.01486 0.00686 0.00686 0.02040 2.97376 2.97376 0.66073 0.66073
CN638367.1 0.00187 0.00236 0.00131 0.00055 0.41985 0.23305 0.40000 0.63694
CN638381.1 0.00235 0.00083 0.00131 0.00304 2.32061 3.66265 0.00000 0.00000
CN638489.1 0.00469 0.01133 0.01723 0.00000 0.00000 0.00000 0.00000 0.00000
CN638545.1 0.00195 0.00465 0.00303 0.00000 0.00000 0.00000 0.00000 0.00000
CN638556.1 0.02838 0.04430 0.04430 0.02392 0.53995 0.53995 0.00000 0.00000
CN638735.1 0.00241 0.00114 0.00000 0.00473 na 4.14912 na 0.00000
CN639074.1 0.00792 0.00926 0.00000 0.00528 na 0.57019 na 0.26437
CN639087.1 0.00012 0.00051 0.00051 0.00000 0.00000 0.00000 0.00000 0.00000
CN639130.1 0.01140 0.00000 0.00000 0.01544 na na na na
CN639236.1 0.00974 0.02262 0.02262 0.00563 0.24889 0.24889 0.07970 0.07970
CN639311.1 0.00777 0.00968 0.00000 0.00029 na 0.02996 na 2.00000
CN639346.1 0.00283 0.00610 0.00000 0.00000 na 0.00000 na 0.00000
CN639480.1 0.00711 0.01863 0.01863 0.00640 0.34353 0.34353 0.25089 0.25089
CN640037.1 0.00635 0.01359 0.02147 0.00377 0.17559 0.27741 2.92775 2.00198
CN640110.1 0.00824 0.02163 0.02163 0.00400 0.18493 0.18493 0.32447 0.32447
CN640155.1 0.00417 0.00102 0.00102 0.00504 4.94118 4.94118 0.51707 0.51707
CN640247.1 0.00382 0.00635 0.00378 0.00429 1.13492 0.67559 0.00000 0.00000
CN640289.1 0.00782 0.02187 0.03425 0.00240 0.07007 0.10974 0.24878 0.38953
CN640361.1 0.01309 0.01501 0.03838 0.00671 0.17483 0.44704 0.00000 0.00000
CN640419.1 0.00420 0.00699 0.00000 0.00000 na 0.00000 na 0.00000
CN640485.1 0.00827 0.01254 0.00335 0.00196 0.58507 0.15630 0.57440 0.89082
CN640493.1 0.00177 0.00043 0.00000 0.00378 na 8.79070 na 7.51765
CN640521.1 0.00582 0.01876 0.01876 0.00238 0.12687 0.12687 0.27005 0.27005
CN640670.1 0.00508 0.02135 0.02135 0.00000 0.00000 0.00000 na na
CN640738.1 0.01423 0.01559 0.01295 0.01153 0.89035 0.73958 0.61173 0.63780
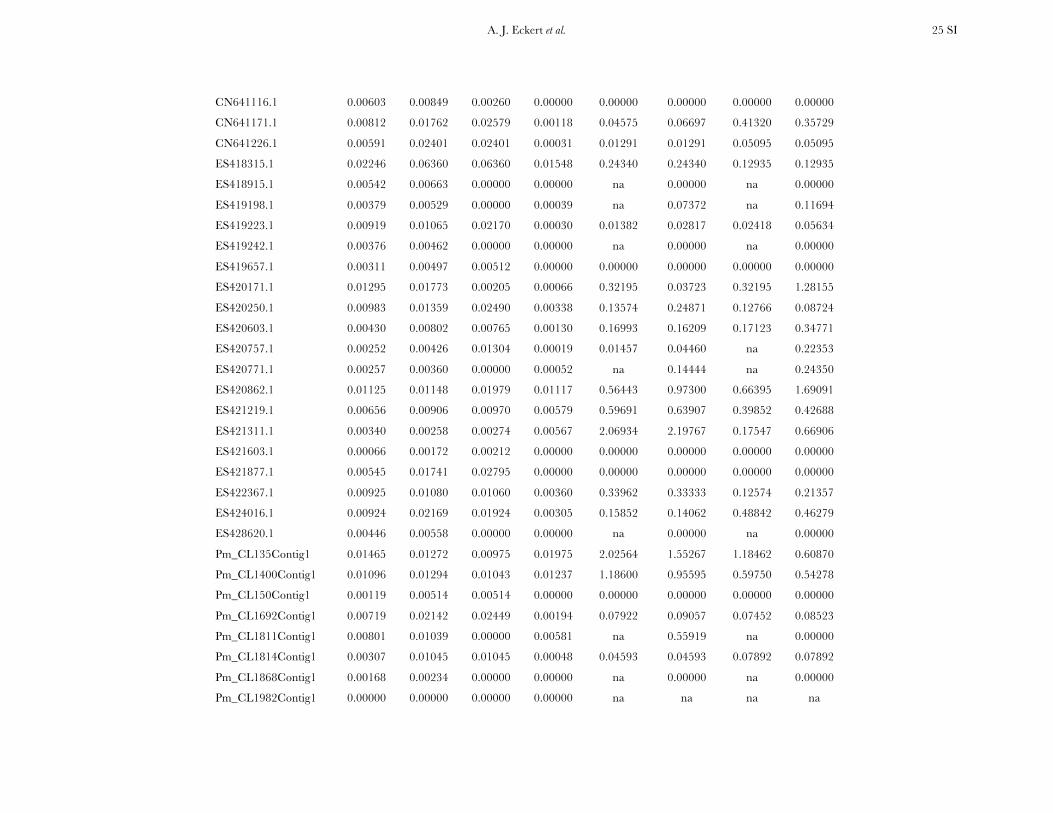
A. J. Eckert et al. 25 SI
CN641116.1 0.00603 0.00849 0.00260 0.00000 0.00000 0.00000 0.00000 0.00000
CN641171.1 0.00812 0.01762 0.02579 0.00118 0.04575 0.06697 0.41320 0.35729
CN641226.1 0.00591 0.02401 0.02401 0.00031 0.01291 0.01291 0.05095 0.05095
ES418315.1 0.02246 0.06360 0.06360 0.01548 0.24340 0.24340 0.12935 0.12935
ES418915.1 0.00542 0.00663 0.00000 0.00000 na 0.00000 na 0.00000
ES419198.1 0.00379 0.00529 0.00000 0.00039 na 0.07372 na 0.11694
ES419223.1 0.00919 0.01065 0.02170 0.00030 0.01382 0.02817 0.02418 0.05634
ES419242.1 0.00376 0.00462 0.00000 0.00000 na 0.00000 na 0.00000
ES419657.1 0.00311 0.00497 0.00512 0.00000 0.00000 0.00000 0.00000 0.00000
ES420171.1 0.01295 0.01773 0.00205 0.00066 0.32195 0.03723 0.32195 1.28155
ES420250.1 0.00983 0.01359 0.02490 0.00338 0.13574 0.24871 0.12766 0.08724
ES420603.1 0.00430 0.00802 0.00765 0.00130 0.16993 0.16209 0.17123 0.34771
ES420757.1 0.00252 0.00426 0.01304 0.00019 0.01457 0.04460 na 0.22353
ES420771.1 0.00257 0.00360 0.00000 0.00052 na 0.14444 na 0.24350
ES420862.1 0.01125 0.01148 0.01979 0.01117 0.56443 0.97300 0.66395 1.69091
ES421219.1 0.00656 0.00906 0.00970 0.00579 0.59691 0.63907 0.39852 0.42688
ES421311.1 0.00340 0.00258 0.00274 0.00567 2.06934 2.19767 0.17547 0.66906
ES421603.1 0.00066 0.00172 0.00212 0.00000 0.00000 0.00000 0.00000 0.00000
ES421877.1 0.00545 0.01741 0.02795 0.00000 0.00000 0.00000 0.00000 0.00000
ES422367.1 0.00925 0.01080 0.01060 0.00360 0.33962 0.33333 0.12574 0.21357
ES424016.1 0.00924 0.02169 0.01924 0.00305 0.15852 0.14062 0.48842 0.46279
ES428620.1 0.00446 0.00558 0.00000 0.00000 na 0.00000 na 0.00000
Pm_CL135Contig1 0.01465 0.01272 0.00975 0.01975 2.02564 1.55267 1.18462 0.60870
Pm_CL1400Contig1 0.01096 0.01294 0.01043 0.01237 1.18600 0.95595 0.59750 0.54278
Pm_CL150Contig1 0.00119 0.00514 0.00514 0.00000 0.00000 0.00000 0.00000 0.00000
Pm_CL1692Contig1 0.00719 0.02142 0.02449 0.00194 0.07922 0.09057 0.07452 0.08523
Pm_CL1811Contig1 0.00801 0.01039 0.00000 0.00581 na 0.55919 na 0.00000
Pm_CL1814Contig1 0.00307 0.01045 0.01045 0.00048 0.04593 0.04593 0.07892 0.07892
Pm_CL1868Contig1 0.00168 0.00234 0.00000 0.00000 na 0.00000 na 0.00000
Pm_CL1982Contig1 0.00000 0.00000 0.00000 0.00000 na na na na
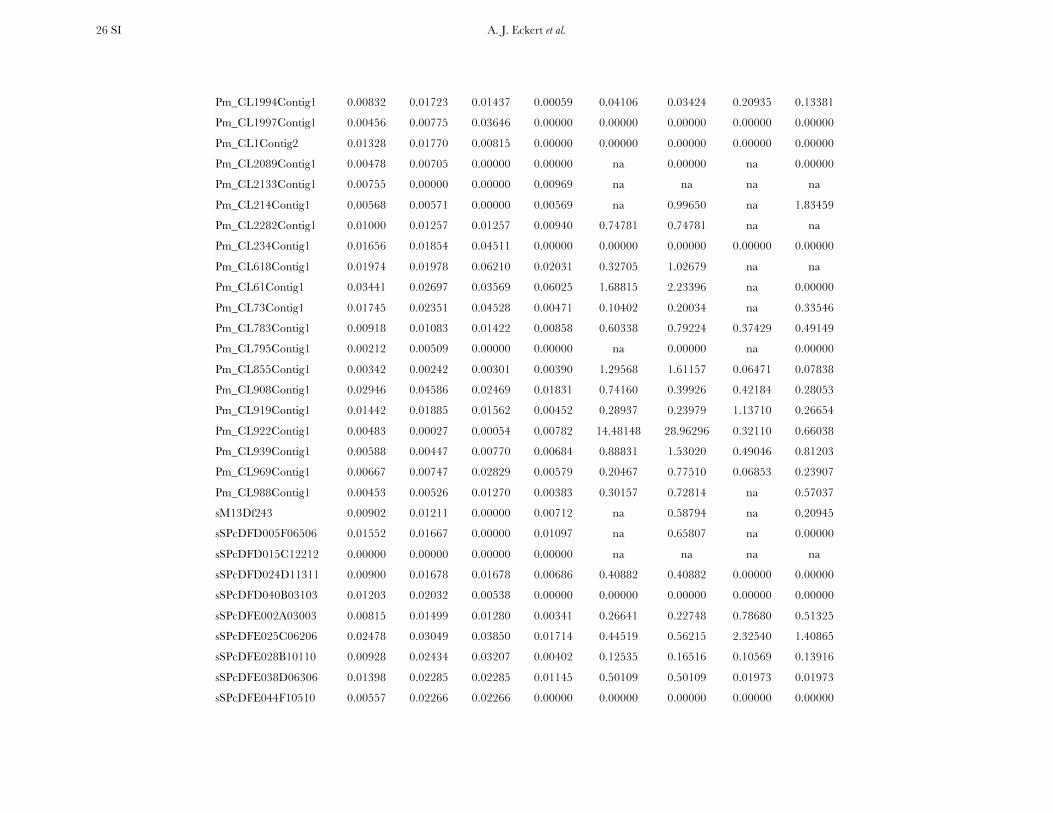
A. J. Eckert et al. 26 SI
Pm_CL1994Contig1 0.00832 0.01723 0.01437 0.00059 0.04106 0.03424 0.20935 0.13381
Pm_CL1997Contig1 0.00456 0.00775 0.03646 0.00000 0.00000 0.00000 0.00000 0.00000
Pm_CL1Contig2 0.01328 0.01770 0.00815 0.00000 0.00000 0.00000 0.00000 0.00000
Pm_CL2089Contig1 0.00478 0.00705 0.00000 0.00000 na 0.00000 na 0.00000
Pm_CL2133Contig1 0.00755 0.00000 0.00000 0.00969 na na na na
Pm_CL214Contig1 0.00568 0.00571 0.00000 0.00569 na 0.99650 na 1.83459
Pm_CL2282Contig1 0.01000 0.01257 0.01257 0.00940 0.74781 0.74781 na na
Pm_CL234Contig1 0.01656 0.01854 0.04511 0.00000 0.00000 0.00000 0.00000 0.00000
Pm_CL618Contig1 0.01974 0.01978 0.06210 0.02031 0.32705 1.02679 na na
Pm_CL61Contig1 0.03441 0.02697 0.03569 0.06025 1.68815 2.23396 na 0.00000
Pm_CL73Contig1 0.01745 0.02351 0.04528 0.00471 0.10402 0.20034 na 0.33546
Pm_CL783Contig1 0.00918 0.01083 0.01422 0.00858 0.60338 0.79224 0.37429 0.49149
Pm_CL795Contig1 0.00212 0.00509 0.00000 0.00000 na 0.00000 na 0.00000
Pm_CL855Contig1 0.00342 0.00242 0.00301 0.00390 1.29568 1.61157 0.06471 0.07838
Pm_CL908Contig1 0.02946 0.04586 0.02469 0.01831 0.74160 0.39926 0.42184 0.28053
Pm_CL919Contig1 0.01442 0.01885 0.01562 0.00452 0.28937 0.23979 1.13710 0.26654
Pm_CL922Contig1 0.00483 0.00027 0.00054 0.00782 14.48148 28.96296 0.32110 0.66038
Pm_CL939Contig1 0.00588 0.00447 0.00770 0.00684 0.88831 1.53020 0.49046 0.81203
Pm_CL969Contig1 0.00667 0.00747 0.02829 0.00579 0.20467 0.77510 0.06853 0.23907
Pm_CL988Contig1 0.00453 0.00526 0.01270 0.00383 0.30157 0.72814 na 0.57037
sM13Df243 0.00902 0.01211 0.00000 0.00712 na 0.58794 na 0.20945
sSPcDFD005F06506 0.01552 0.01667 0.00000 0.01097 na 0.65807 na 0.00000
sSPcDFD015C12212 0.00000 0.00000 0.00000 0.00000 na na na na
sSPcDFD024D11311 0.00900 0.01678 0.01678 0.00686 0.40882 0.40882 0.00000 0.00000
sSPcDFD040B03103 0.01203 0.02032 0.00538 0.00000 0.00000 0.00000 0.00000 0.00000
sSPcDFE002A03003 0.00815 0.01499 0.01280 0.00341 0.26641 0.22748 0.78680 0.51325
sSPcDFE025C06206 0.02478 0.03049 0.03850 0.01714 0.44519 0.56215 2.32540 1.40865
sSPcDFE028B10110 0.00928 0.02434 0.03207 0.00402 0.12535 0.16516 0.10569 0.13916
sSPcDFE038D06306 0.01398 0.02285 0.02285 0.01145 0.50109 0.50109 0.01973 0.01973
sSPcDFE044F10510 0.00557 0.02266 0.02266 0.00000 0.00000 0.00000 0.00000 0.00000
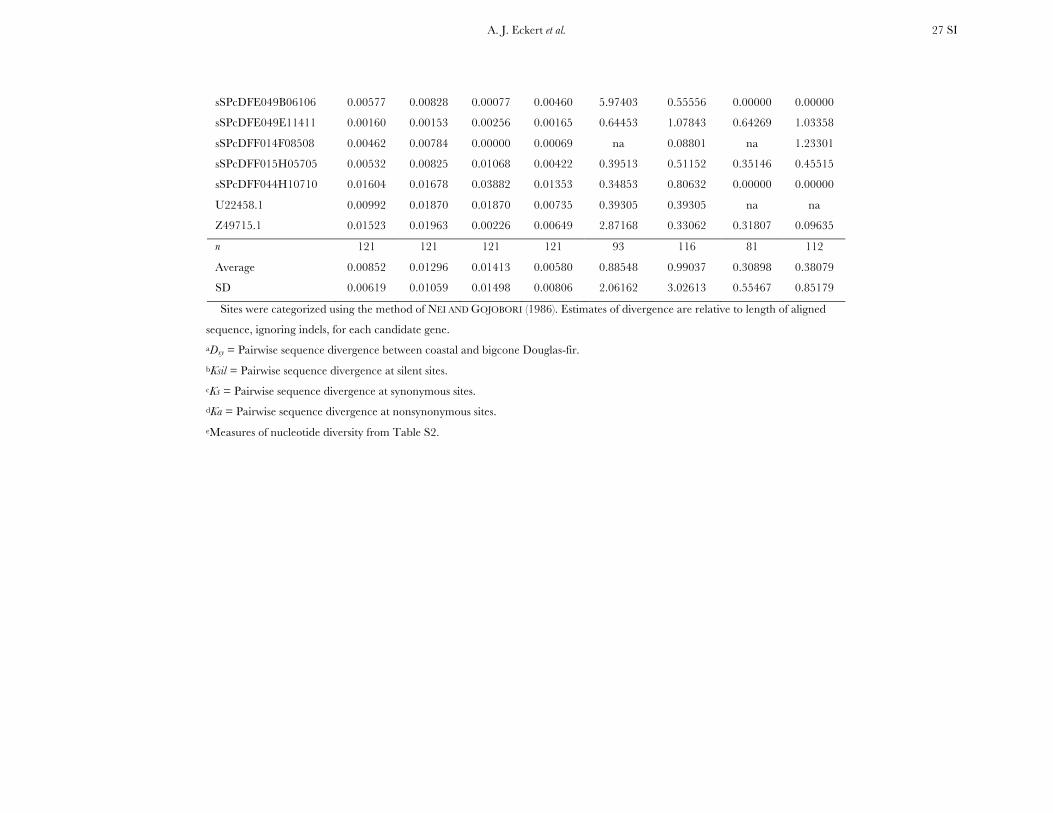
A. J. Eckert et al. 27 SI
sSPcDFE049B06106 0.00577 0.00828 0.00077 0.00460 5.97403 0.55556 0.00000 0.00000
sSPcDFE049E11411 0.00160 0.00153 0.00256 0.00165 0.64453 1.07843 0.64269 1.03358
sSPcDFF014F08508 0.00462 0.00784 0.00000 0.00069 na 0.08801 na 1.23301
sSPcDFF015H05705 0.00532 0.00825 0.01068 0.00422 0.39513 0.51152 0.35146 0.45515
sSPcDFF044H10710 0.01604 0.01678 0.03882 0.01353 0.34853 0.80632 0.00000 0.00000
U22458.1 0.00992 0.01870 0.01870 0.00735 0.39305 0.39305 na na
Z49715.1 0.01523 0.01963 0.00226 0.00649 2.87168 0.33062 0.31807 0.09635
n 121 121 121 121 93 116 81 112
Average 0.00852 0.01296 0.01413 0.00580 0.88548 0.99037 0.30898 0.38079
SD 0.00619 0.01059 0.01498 0.00806 2.06162 3.02613 0.55467 0.85179
Sites were categorized using the method of NEI AND GOJOBORI (1986). Estimates of divergence are relative to length of aligned
sequence, ignoring indels, for each candidate gene.
aDxy = Pairwise sequence divergence between coastal and bigcone Douglas-fir.
bKsil = Pairwise sequence divergence at silent sites.
cKs = Pairwise sequence divergence at synonymous sites.
dKa = Pairwise sequence divergence at nonsynonymous sites.
eMeasures of nucleotide diversity from Table S2.
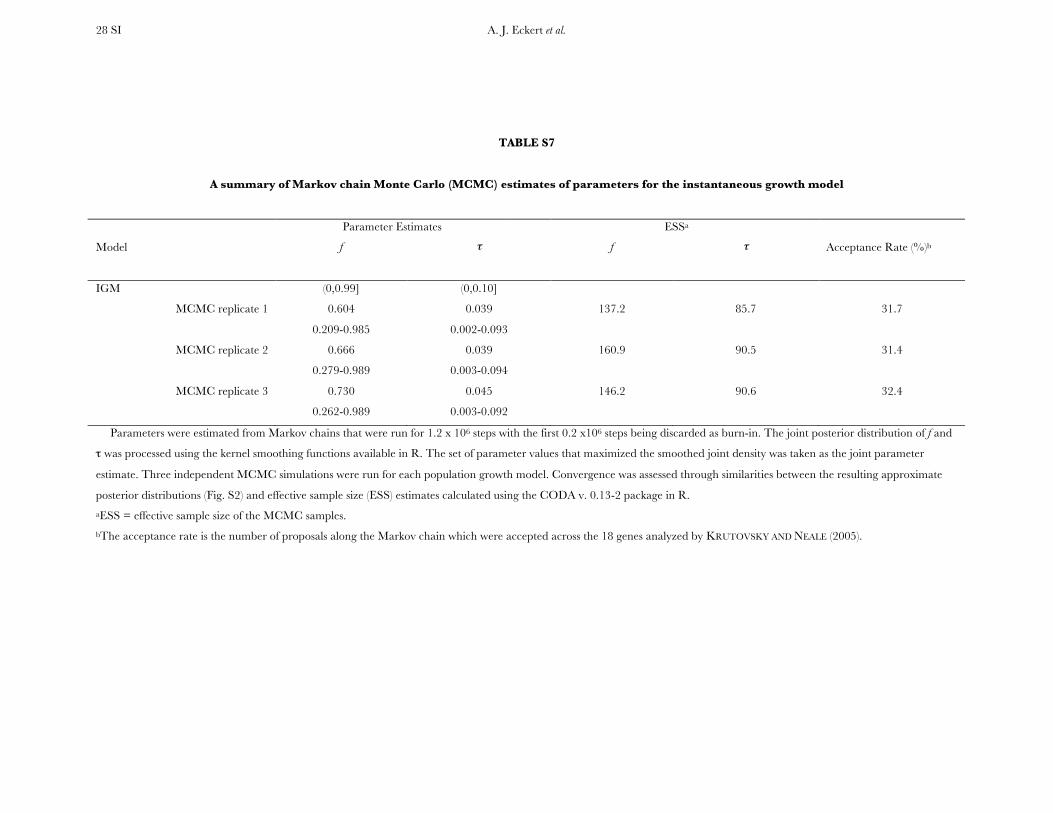
A. J. Eckert et al. 28 SI
TABLE S7
A summary of Markov chain Monte Carlo (MCMC) estimates of parameters for the instantaneous growth model
Parameter Estimates ESSa
Model f
τ
f τ Acceptance Rate (%)b
IGM (0,0.99] (0,0.10]
MCMC replicate 1 0.604
0.209-0.985
0.039
0.002-0.093
137.2 85.7 31.7
MCMC replicate 2 0.666
0.279-0.989
0.039
0.003-0.094
160.9 90.5 31.4
MCMC replicate 3 0.730
0.262-0.989
0.045
0.003-0.092
146.2 90.6 32.4
Parameters were estimated from Markov chains that were run for 1.2 x 10⁶ steps with the first 0.2 x10⁶ steps being discarded as burn-in. The joint posterior distribution of f and
τ was processed using the kernel smoothing functions available in R. The set of parameter values that maximized the smoothed joint density was taken as the joint parameter
estimate. Three independent MCMC simulations were run for each population growth model. Convergence was assessed through similarities between the resulting approximate
posterior distributions (Fig. S2) and effective sample size (ESS) estimates calculated using the CODA v. 0.13-2 package in R.
aESS = effective sample size of the MCMC samples.
bThe acceptance rate is the number of proposals along the Markov chain which were accepted across the 18 genes analyzed by KRUTOVSKY AND NEALE (2005).
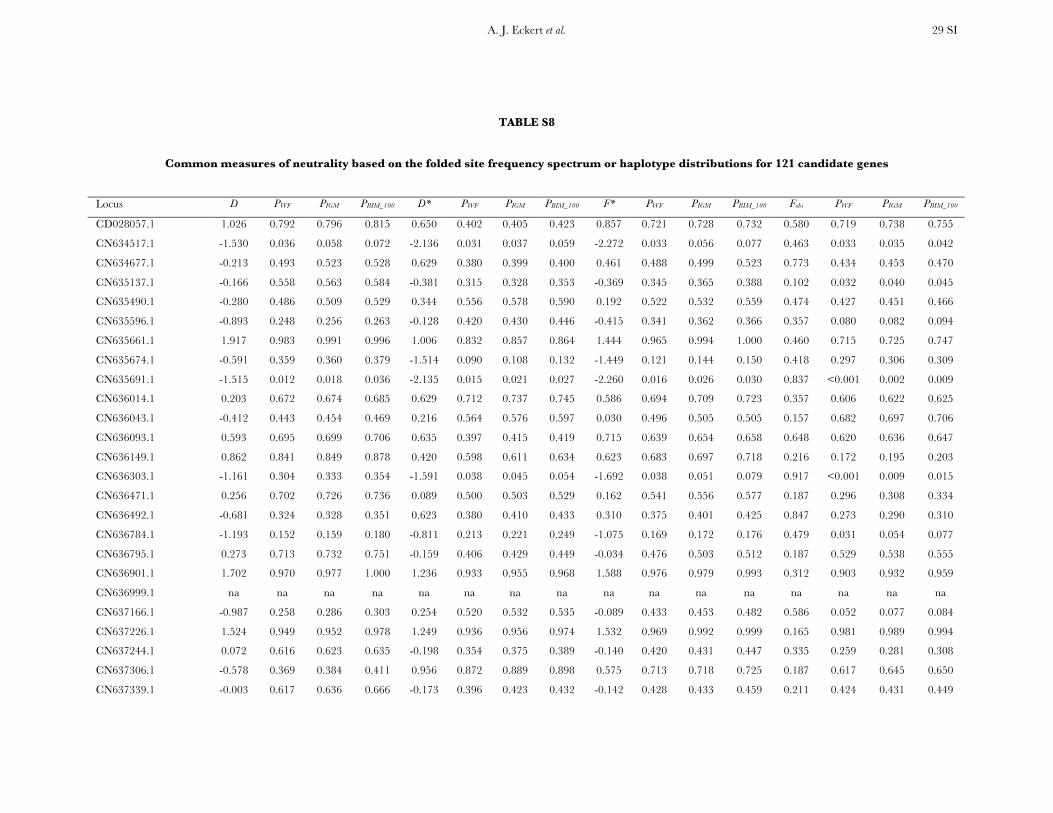
A. J. Eckert et al. 29 SI
TABLE S8
Common measures of neutrality based on the folded site frequency spectrum or haplotype distributions for 121 candidate genes
Locus D PWF PIGM PBIM_100 D* PWF PIGM PBIM_100 F* PWF PIGM PBIM_100 Fobs PWF PIGM PBIM_100
CD028057.1 1.026 0.792 0.796 0.815 0.650 0.402 0.405 0.423 0.857 0.721 0.728 0.732 0.580 0.719 0.738 0.755
CN634517.1 -1.530 0.036 0.058 0.072 -2.136 0.031 0.037 0.059 -2.272 0.033 0.056 0.077 0.463 0.033 0.035 0.042
CN634677.1 -0.213 0.493 0.523 0.528 0.629 0.380 0.399 0.400 0.461 0.488 0.499 0.523 0.773 0.434 0.453 0.470
CN635137.1 -0.166 0.558 0.563 0.584 -0.381 0.315 0.328 0.353 -0.369 0.345 0.365 0.388 0.102 0.032 0.040 0.045
CN635490.1 -0.280 0.486 0.509 0.529 0.344 0.556 0.578 0.590 0.192 0.522 0.532 0.559 0.474 0.427 0.451 0.466
CN635596.1 -0.893 0.248 0.256 0.263 -0.128 0.420 0.430 0.446 -0.415 0.341 0.362 0.366 0.357 0.080 0.082 0.094
CN635661.1 1.917 0.983 0.991 0.996 1.006 0.832 0.857 0.864 1.444 0.965 0.994 1.000 0.460 0.715 0.725 0.747
CN635674.1 -0.591 0.359 0.360 0.379 -1.514 0.090 0.108 0.132 -1.449 0.121 0.144 0.150 0.418 0.297 0.306 0.309
CN635691.1 -1.515 0.012 0.018 0.036 -2.135 0.015 0.021 0.027 -2.260 0.016 0.026 0.030 0.837 <0.001 0.002 0.009
CN636014.1 0.203 0.672 0.674 0.685 0.629 0.712 0.737 0.745 0.586 0.694 0.709 0.723 0.357 0.606 0.622 0.625
CN636043.1 -0.412 0.443 0.454 0.469 0.216 0.564 0.576 0.597 0.030 0.496 0.505 0.505 0.157 0.682 0.697 0.706
CN636093.1 0.593 0.695 0.699 0.706 0.635 0.397 0.415 0.419 0.715 0.639 0.654 0.658 0.648 0.620 0.636 0.647
CN636149.1 0.862 0.841 0.849 0.878 0.420 0.598 0.611 0.634 0.623 0.683 0.697 0.718 0.216 0.172 0.195 0.203
CN636303.1 -1.161 0.304 0.333 0.354 -1.591 0.038 0.045 0.054 -1.692 0.038 0.051 0.079 0.917 <0.001 0.009 0.015
CN636471.1 0.256 0.702 0.726 0.736 0.089 0.500 0.503 0.529 0.162 0.541 0.556 0.577 0.187 0.296 0.308 0.334
CN636492.1 -0.681 0.324 0.328 0.351 0.623 0.380 0.410 0.433 0.310 0.375 0.401 0.425 0.847 0.273 0.290 0.310
CN636784.1 -1.193 0.152 0.159 0.180 -0.811 0.213 0.221 0.249 -1.075 0.169 0.172 0.176 0.479 0.031 0.054 0.077
CN636795.1 0.273 0.713 0.732 0.751 -0.159 0.406 0.429 0.449 -0.034 0.476 0.503 0.512 0.187 0.529 0.538 0.555
CN636901.1 1.702 0.970 0.977 1.000 1.236 0.933 0.955 0.968 1.588 0.976 0.979 0.993 0.312 0.903 0.932 0.959
CN636999.1 na na na na na na na na na na na na na na na na
CN637166.1 -0.987 0.258 0.286 0.303 0.254 0.520 0.532 0.535 -0.089 0.433 0.453 0.482 0.586 0.052 0.077 0.084
CN637226.1 1.524 0.949 0.952 0.978 1.249 0.936 0.956 0.974 1.532 0.969 0.992 0.999 0.165 0.981 0.989 0.994
CN637244.1 0.072 0.616 0.623 0.635 -0.198 0.354 0.375 0.389 -0.140 0.420 0.431 0.447 0.335 0.259 0.281 0.308
CN637306.1 -0.578 0.369 0.384 0.411 0.956 0.872 0.889 0.898 0.575 0.713 0.718 0.725 0.187 0.617 0.645 0.650
CN637339.1 -0.003 0.617 0.636 0.666 -0.173 0.396 0.423 0.432 -0.142 0.428 0.433 0.459 0.211 0.424 0.431 0.449
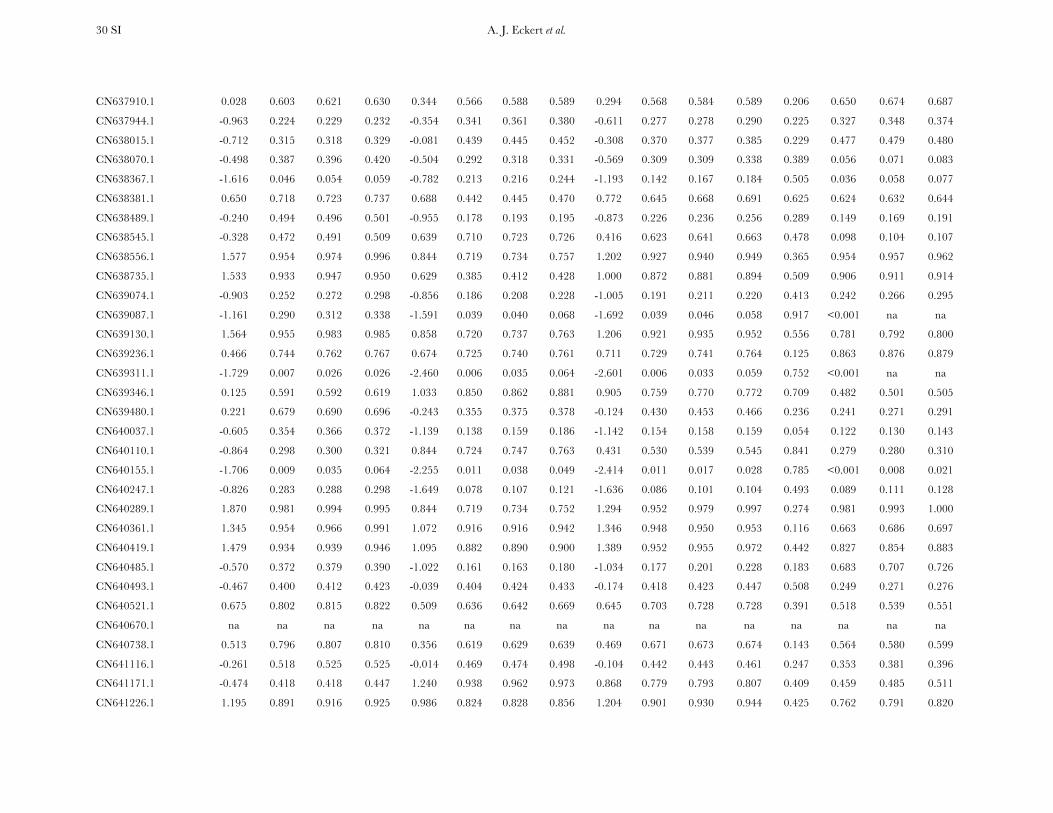
A. J. Eckert et al. 30 SI
CN637910.1 0.028 0.603 0.621 0.630 0.344 0.566 0.588 0.589 0.294 0.568 0.584 0.589 0.206 0.650 0.674 0.687
CN637944.1 -0.963 0.224 0.229 0.232 -0.354 0.341 0.361 0.380 -0.611 0.277 0.278 0.290 0.225 0.327 0.348 0.374
CN638015.1 -0.712 0.315 0.318 0.329 -0.081 0.439 0.445 0.452 -0.308 0.370 0.377 0.385 0.229 0.477 0.479 0.480
CN638070.1 -0.498 0.387 0.396 0.420 -0.504 0.292 0.318 0.331 -0.569 0.309 0.309 0.338 0.389 0.056 0.071 0.083
CN638367.1 -1.616 0.046 0.054 0.059 -0.782 0.213 0.216 0.244 -1.193 0.142 0.167 0.184 0.505 0.036 0.058 0.077
CN638381.1 0.650 0.718 0.723 0.737 0.688 0.442 0.445 0.470 0.772 0.645 0.668 0.691 0.625 0.624 0.632 0.644
CN638489.1 -0.240 0.494 0.496 0.501 -0.955 0.178 0.193 0.195 -0.873 0.226 0.236 0.256 0.289 0.149 0.169 0.191
CN638545.1 -0.328 0.472 0.491 0.509 0.639 0.710 0.723 0.726 0.416 0.623 0.641 0.663 0.478 0.098 0.104 0.107
CN638556.1 1.577 0.954 0.974 0.996 0.844 0.719 0.734 0.757 1.202 0.927 0.940 0.949 0.365 0.954 0.957 0.962
CN638735.1 1.533 0.933 0.947 0.950 0.629 0.385 0.412 0.428 1.000 0.872 0.881 0.894 0.509 0.906 0.911 0.914
CN639074.1 -0.903 0.252 0.272 0.298 -0.856 0.186 0.208 0.228 -1.005 0.191 0.211 0.220 0.413 0.242 0.266 0.295
CN639087.1 -1.161 0.290 0.312 0.338 -1.591 0.039 0.040 0.068 -1.692 0.039 0.046 0.058 0.917 <0.001 na na
CN639130.1 1.564 0.955 0.983 0.985 0.858 0.720 0.737 0.763 1.206 0.921 0.935 0.952 0.556 0.781 0.792 0.800
CN639236.1 0.466 0.744 0.762 0.767 0.674 0.725 0.740 0.761 0.711 0.729 0.741 0.764 0.125 0.863 0.876 0.879
CN639311.1 -1.729 0.007 0.026 0.026 -2.460 0.006 0.035 0.064 -2.601 0.006 0.033 0.059 0.752 <0.001 na na
CN639346.1 0.125 0.591 0.592 0.619 1.033 0.850 0.862 0.881 0.905 0.759 0.770 0.772 0.709 0.482 0.501 0.505
CN639480.1 0.221 0.679 0.690 0.696 -0.243 0.355 0.375 0.378 -0.124 0.430 0.453 0.466 0.236 0.241 0.271 0.291
CN640037.1 -0.605 0.354 0.366 0.372 -1.139 0.138 0.159 0.186 -1.142 0.154 0.158 0.159 0.054 0.122 0.130 0.143
CN640110.1 -0.864 0.298 0.300 0.321 0.844 0.724 0.747 0.763 0.431 0.530 0.539 0.545 0.841 0.279 0.280 0.310
CN640155.1 -1.706 0.009 0.035 0.064 -2.255 0.011 0.038 0.049 -2.414 0.011 0.017 0.028 0.785 <0.001 0.008 0.021
CN640247.1 -0.826 0.283 0.288 0.298 -1.649 0.078 0.107 0.121 -1.636 0.086 0.101 0.104 0.493 0.089 0.111 0.128
CN640289.1 1.870 0.981 0.994 0.995 0.844 0.719 0.734 0.752 1.294 0.952 0.979 0.997 0.274 0.981 0.993 1.000
CN640361.1 1.345 0.954 0.966 0.991 1.072 0.916 0.916 0.942 1.346 0.948 0.950 0.953 0.116 0.663 0.686 0.697
CN640419.1 1.479 0.934 0.939 0.946 1.095 0.882 0.890 0.900 1.389 0.952 0.955 0.972 0.442 0.827 0.854 0.883
CN640485.1 -0.570 0.372 0.379 0.390 -1.022 0.161 0.163 0.180 -1.034 0.177 0.201 0.228 0.183 0.683 0.707 0.726
CN640493.1 -0.467 0.400 0.412 0.423 -0.039 0.404 0.424 0.433 -0.174 0.418 0.423 0.447 0.508 0.249 0.271 0.276
CN640521.1 0.675 0.802 0.815 0.822 0.509 0.636 0.642 0.669 0.645 0.703 0.728 0.728 0.391 0.518 0.539 0.551
CN640670.1 na na na na na na na na na na na na na na na na
CN640738.1 0.513 0.796 0.807 0.810 0.356 0.619 0.629 0.639 0.469 0.671 0.673 0.674 0.143 0.564 0.580 0.599
CN641116.1 -0.261 0.518 0.525 0.525 -0.014 0.469 0.474 0.498 -0.104 0.442 0.443 0.461 0.247 0.353 0.381 0.396
CN641171.1 -0.474 0.418 0.418 0.447 1.240 0.938 0.962 0.973 0.868 0.779 0.793 0.807 0.409 0.459 0.485 0.511
CN641226.1 1.195 0.891 0.916 0.925 0.986 0.824 0.828 0.856 1.204 0.901 0.930 0.944 0.425 0.762 0.791 0.820
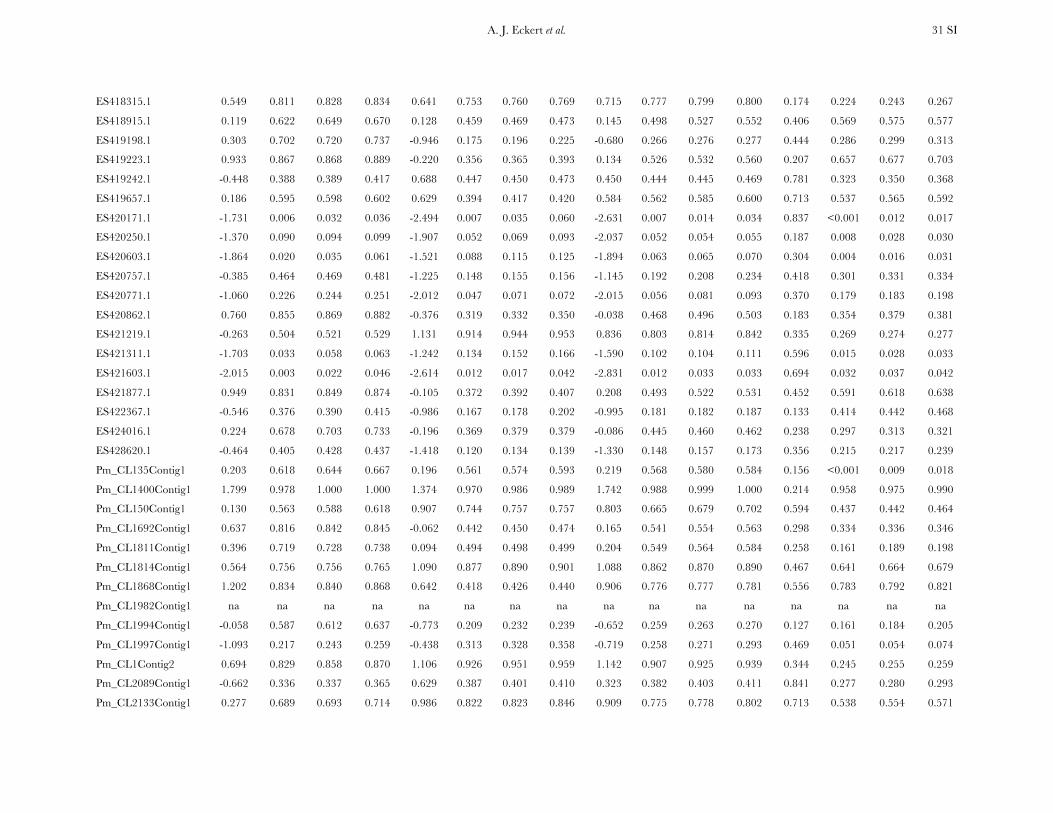
A. J. Eckert et al. 31 SI
ES418315.1 0.549 0.811 0.828 0.834 0.641 0.753 0.760 0.769 0.715 0.777 0.799 0.800 0.174 0.224 0.243 0.267
ES418915.1 0.119 0.622 0.649 0.670 0.128 0.459 0.469 0.473 0.145 0.498 0.527 0.552 0.406 0.569 0.575 0.577
ES419198.1 0.303 0.702 0.720 0.737 -0.946 0.175 0.196 0.225 -0.680 0.266 0.276 0.277 0.444 0.286 0.299 0.313
ES419223.1 0.933 0.867 0.868 0.889 -0.220 0.356 0.365 0.393 0.134 0.526 0.532 0.560 0.207 0.657 0.677 0.703
ES419242.1 -0.448 0.388 0.389 0.417 0.688 0.447 0.450 0.473 0.450 0.444 0.445 0.469 0.781 0.323 0.350 0.368
ES419657.1 0.186 0.595 0.598 0.602 0.629 0.394 0.417 0.420 0.584 0.562 0.585 0.600 0.713 0.537 0.565 0.592
ES420171.1 -1.731 0.006 0.032 0.036 -2.494 0.007 0.035 0.060 -2.631 0.007 0.014 0.034 0.837 <0.001 0.012 0.017
ES420250.1 -1.370 0.090 0.094 0.099 -1.907 0.052 0.069 0.093 -2.037 0.052 0.054 0.055 0.187 0.008 0.028 0.030
ES420603.1 -1.864 0.020 0.035 0.061 -1.521 0.088 0.115 0.125 -1.894 0.063 0.065 0.070 0.304 0.004 0.016 0.031
ES420757.1 -0.385 0.464 0.469 0.481 -1.225 0.148 0.155 0.156 -1.145 0.192 0.208 0.234 0.418 0.301 0.331 0.334
ES420771.1 -1.060 0.226 0.244 0.251 -2.012 0.047 0.071 0.072 -2.015 0.056 0.081 0.093 0.370 0.179 0.183 0.198
ES420862.1 0.760 0.855 0.869 0.882 -0.376 0.319 0.332 0.350 -0.038 0.468 0.496 0.503 0.183 0.354 0.379 0.381
ES421219.1 -0.263 0.504 0.521 0.529 1.131 0.914 0.944 0.953 0.836 0.803 0.814 0.842 0.335 0.269 0.274 0.277
ES421311.1 -1.703 0.033 0.058 0.063 -1.242 0.134 0.152 0.166 -1.590 0.102 0.104 0.111 0.596 0.015 0.028 0.033
ES421603.1 -2.015 0.003 0.022 0.046 -2.614 0.012 0.017 0.042 -2.831 0.012 0.033 0.033 0.694 0.032 0.037 0.042
ES421877.1 0.949 0.831 0.849 0.874 -0.105 0.372 0.392 0.407 0.208 0.493 0.522 0.531 0.452 0.591 0.618 0.638
ES422367.1 -0.546 0.376 0.390 0.415 -0.986 0.167 0.178 0.202 -0.995 0.181 0.182 0.187 0.133 0.414 0.442 0.468
ES424016.1 0.224 0.678 0.703 0.733 -0.196 0.369 0.379 0.379 -0.086 0.445 0.460 0.462 0.238 0.297 0.313 0.321
ES428620.1 -0.464 0.405 0.428 0.437 -1.418 0.120 0.134 0.139 -1.330 0.148 0.157 0.173 0.356 0.215 0.217 0.239
Pm_CL135Contig1 0.203 0.618 0.644 0.667 0.196 0.561 0.574 0.593 0.219 0.568 0.580 0.584 0.156 <0.001 0.009 0.018
Pm_CL1400Contig1 1.799 0.978 1.000 1.000 1.374 0.970 0.986 0.989 1.742 0.988 0.999 1.000 0.214 0.958 0.975 0.990
Pm_CL150Contig1 0.130 0.563 0.588 0.618 0.907 0.744 0.757 0.757 0.803 0.665 0.679 0.702 0.594 0.437 0.442 0.464
Pm_CL1692Contig1 0.637 0.816 0.842 0.845 -0.062 0.442 0.450 0.474 0.165 0.541 0.554 0.563 0.298 0.334 0.336 0.346
Pm_CL1811Contig1 0.396 0.719 0.728 0.738 0.094 0.494 0.498 0.499 0.204 0.549 0.564 0.584 0.258 0.161 0.189 0.198
Pm_CL1814Contig1 0.564 0.756 0.756 0.765 1.090 0.877 0.890 0.901 1.088 0.862 0.870 0.890 0.467 0.641 0.664 0.679
Pm_CL1868Contig1 1.202 0.834 0.840 0.868 0.642 0.418 0.426 0.440 0.906 0.776 0.777 0.781 0.556 0.783 0.792 0.821
Pm_CL1982Contig1 na na na na na na na na na na na na na na na na
Pm_CL1994Contig1 -0.058 0.587 0.612 0.637 -0.773 0.209 0.232 0.239 -0.652 0.259 0.263 0.270 0.127 0.161 0.184 0.205
Pm_CL1997Contig1 -1.093 0.217 0.243 0.259 -0.438 0.313 0.328 0.358 -0.719 0.258 0.271 0.293 0.469 0.051 0.054 0.074
Pm_CL1Contig2 0.694 0.829 0.858 0.870 1.106 0.926 0.951 0.959 1.142 0.907 0.925 0.939 0.344 0.245 0.255 0.259
Pm_CL2089Contig1 -0.662 0.336 0.337 0.365 0.629 0.387 0.401 0.410 0.323 0.382 0.403 0.411 0.841 0.277 0.280 0.293
Pm_CL2133Contig1 0.277 0.689 0.693 0.714 0.986 0.822 0.823 0.846 0.909 0.775 0.778 0.802 0.713 0.538 0.554 0.571
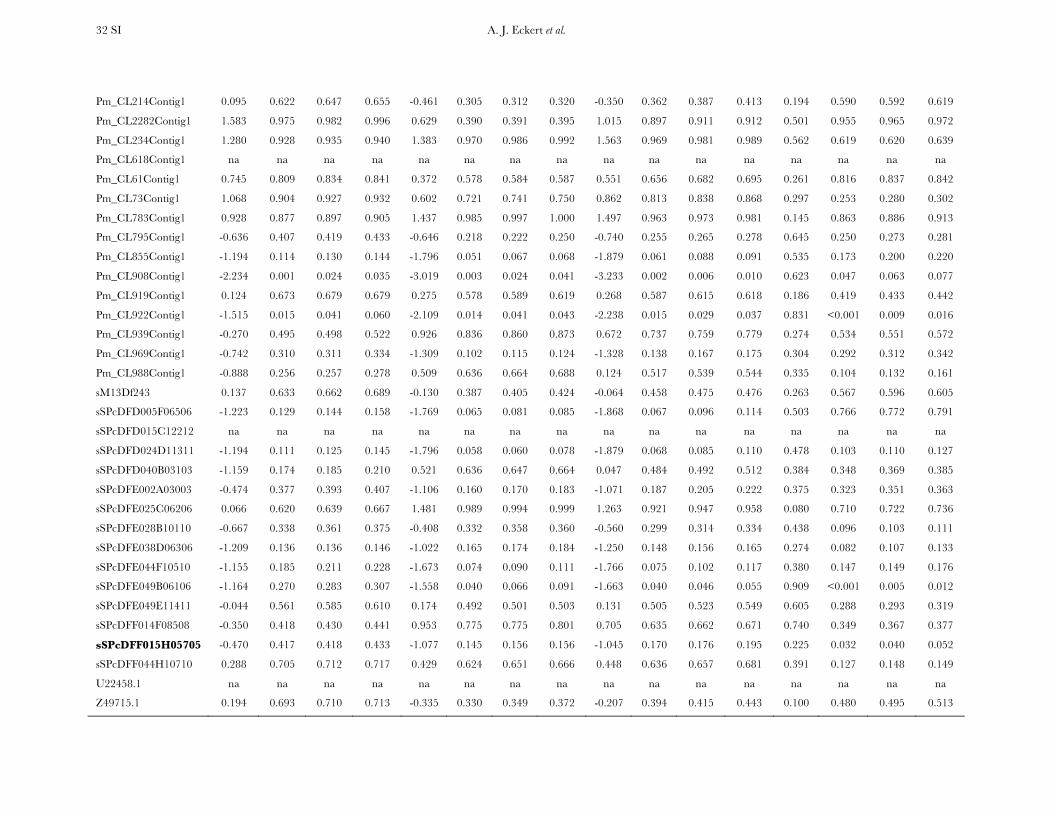
A. J. Eckert et al. 32 SI
Pm_CL214Contig1 0.095 0.622 0.647 0.655 -0.461 0.305 0.312 0.320 -0.350 0.362 0.387 0.413 0.194 0.590 0.592 0.619
Pm_CL2282Contig1 1.583 0.975 0.982 0.996 0.629 0.390 0.391 0.395 1.015 0.897 0.911 0.912 0.501 0.955 0.965 0.972
Pm_CL234Contig1 1.280 0.928 0.935 0.940 1.383 0.970 0.986 0.992 1.563 0.969 0.981 0.989 0.562 0.619 0.620 0.639
Pm_CL618Contig1 na na na na na na na na na na na na na na na na
Pm_CL61Contig1 0.745 0.809 0.834 0.841 0.372 0.578 0.584 0.587 0.551 0.656 0.682 0.695 0.261 0.816 0.837 0.842
Pm_CL73Contig1 1.068 0.904 0.927 0.932 0.602 0.721 0.741 0.750 0.862 0.813 0.838 0.868 0.297 0.253 0.280 0.302
Pm_CL783Contig1 0.928 0.877 0.897 0.905 1.437 0.985 0.997 1.000 1.497 0.963 0.973 0.981 0.145 0.863 0.886 0.913
Pm_CL795Contig1 -0.636 0.407 0.419 0.433 -0.646 0.218 0.222 0.250 -0.740 0.255 0.265 0.278 0.645 0.250 0.273 0.281
Pm_CL855Contig1 -1.194 0.114 0.130 0.144 -1.796 0.051 0.067 0.068 -1.879 0.061 0.088 0.091 0.535 0.173 0.200 0.220
Pm_CL908Contig1 -2.234 0.001 0.024 0.035 -3.019 0.003 0.024 0.041 -3.233 0.002 0.006 0.010 0.623 0.047 0.063 0.077
Pm_CL919Contig1 0.124 0.673 0.679 0.679 0.275 0.578 0.589 0.619 0.268 0.587 0.615 0.618 0.186 0.419 0.433 0.442
Pm_CL922Contig1 -1.515 0.015 0.041 0.060 -2.109 0.014 0.041 0.043 -2.238 0.015 0.029 0.037 0.831 <0.001 0.009 0.016
Pm_CL939Contig1 -0.270 0.495 0.498 0.522 0.926 0.836 0.860 0.873 0.672 0.737 0.759 0.779 0.274 0.534 0.551 0.572
Pm_CL969Contig1 -0.742 0.310 0.311 0.334 -1.309 0.102 0.115 0.124 -1.328 0.138 0.167 0.175 0.304 0.292 0.312 0.342
Pm_CL988Contig1 -0.888 0.256 0.257 0.278 0.509 0.636 0.664 0.688 0.124 0.517 0.539 0.544 0.335 0.104 0.132 0.161
sM13Df243 0.137 0.633 0.662 0.689 -0.130 0.387 0.405 0.424 -0.064 0.458 0.475 0.476 0.263 0.567 0.596 0.605
sSPcDFD005F06506 -1.223 0.129 0.144 0.158 -1.769 0.065 0.081 0.085 -1.868 0.067 0.096 0.114 0.503 0.766 0.772 0.791
sSPcDFD015C12212 na na na na na na na na na na na na na na na na
sSPcDFD024D11311 -1.194 0.111 0.125 0.145 -1.796 0.058 0.060 0.078 -1.879 0.068 0.085 0.110 0.478 0.103 0.110 0.127
sSPcDFD040B03103 -1.159 0.174 0.185 0.210 0.521 0.636 0.647 0.664 0.047 0.484 0.492 0.512 0.384 0.348 0.369 0.385
sSPcDFE002A03003 -0.474 0.377 0.393 0.407 -1.106 0.160 0.170 0.183 -1.071 0.187 0.205 0.222 0.375 0.323 0.351 0.363
sSPcDFE025C06206 0.066 0.620 0.639 0.667 1.481 0.989 0.994 0.999 1.263 0.921 0.947 0.958 0.080 0.710 0.722 0.736
sSPcDFE028B10110 -0.667 0.338 0.361 0.375 -0.408 0.332 0.358 0.360 -0.560 0.299 0.314 0.334 0.438 0.096 0.103 0.111
sSPcDFE038D06306 -1.209 0.136 0.136 0.146 -1.022 0.165 0.174 0.184 -1.250 0.148 0.156 0.165 0.274 0.082 0.107 0.133
sSPcDFE044F10510 -1.155 0.185 0.211 0.228 -1.673 0.074 0.090 0.111 -1.766 0.075 0.102 0.117 0.380 0.147 0.149 0.176
sSPcDFE049B06106 -1.164 0.270 0.283 0.307 -1.558 0.040 0.066 0.091 -1.663 0.040 0.046 0.055 0.909 <0.001 0.005 0.012
sSPcDFE049E11411 -0.044 0.561 0.585 0.610 0.174 0.492 0.501 0.503 0.131 0.505 0.523 0.549 0.605 0.288 0.293 0.319
sSPcDFF014F08508 -0.350 0.418 0.430 0.441 0.953 0.775 0.775 0.801 0.705 0.635 0.662 0.671 0.740 0.349 0.367 0.377
sSPcDFF015H05705 -0.470 0.417 0.418 0.433 -1.077 0.145 0.156 0.156 -1.045 0.170 0.176 0.195 0.225 0.032 0.040 0.052
sSPcDFF044H10710 0.288 0.705 0.712 0.717 0.429 0.624 0.651 0.666 0.448 0.636 0.657 0.681 0.391 0.127 0.148 0.149
U22458.1 na na na na na na na na na na na na na na na na
Z49715.1 0.194 0.693 0.710 0.713 -0.335 0.330 0.349 0.372 -0.207 0.394 0.415 0.443 0.100 0.480 0.495 0.513
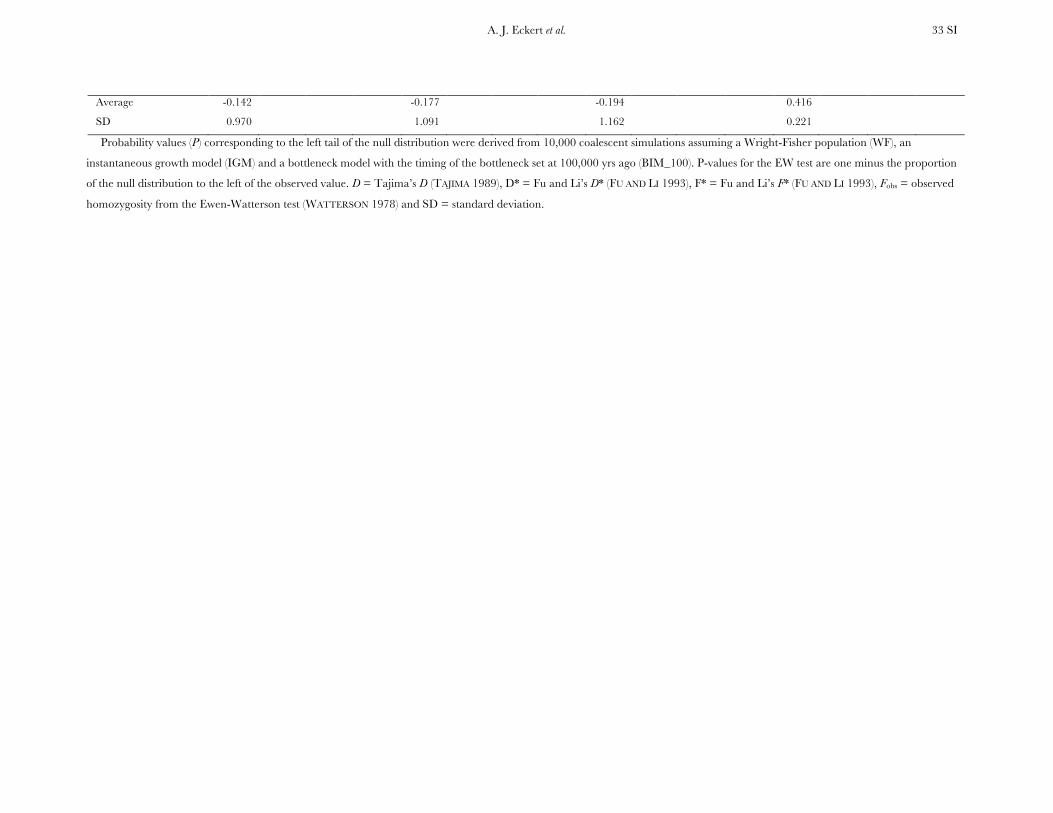
A. J. Eckert et al. 33 SI
Average -0.142 -0.177 -0.194 0.416
SD 0.970 1.091 1.162 0.221
Probability values (P) corresponding to the left tail of the null distribution were derived from 10,000 coalescent simulations assuming a Wright-Fisher population (WF), an
instantaneous growth model (IGM) and a bottleneck model with the timing of the bottleneck set at 100,000 yrs ago (BIM_100). P-values for the EW test are one minus the proportion
of the null distribution to the left of the observed value. D = Tajima’s D (TAJIMA 1989), D* = Fu and Li’s D* (FU AND LI 1993), F* = Fu and Li’s F* (FU AND LI 1993), Fobs = observed
homozygosity from the Ewen-Watterson test (WATTERSON 1978) and SD = standard deviation.
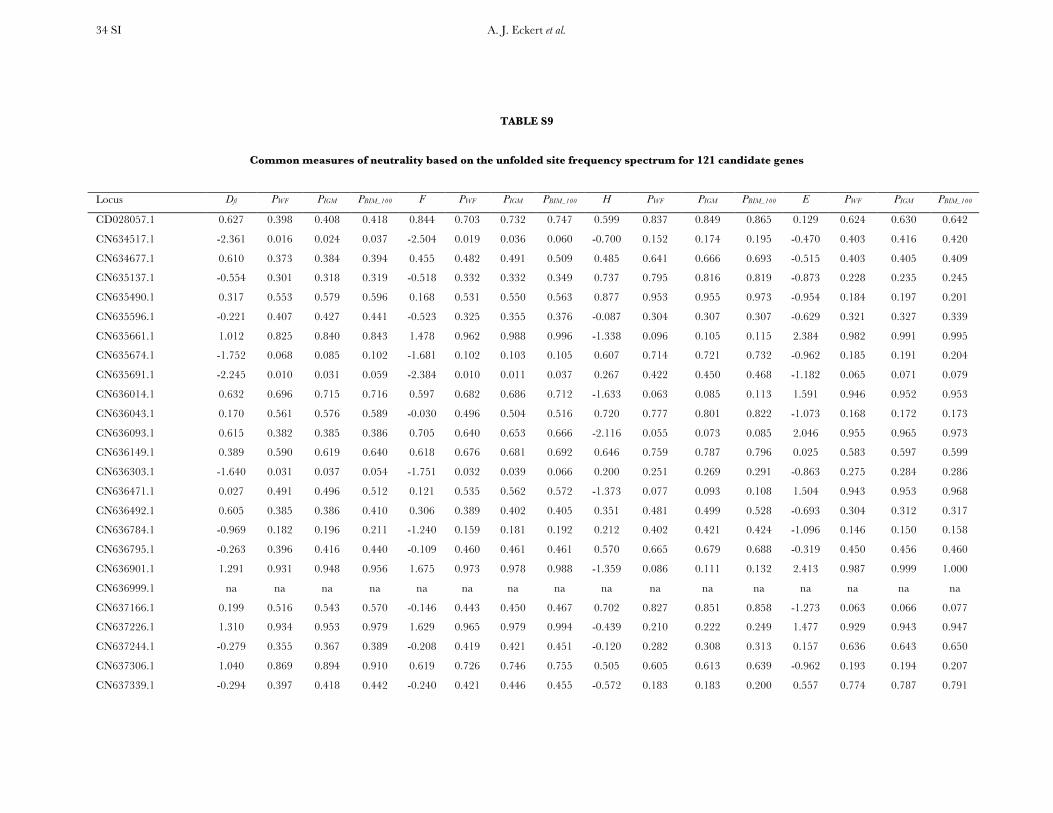
A. J. Eckert et al. 34 SI
TABLE S9
Common measures of neutrality based on the unfolded site frequency spectrum for 121 candidate genes
Locus Dfl PWF PIGM PBIM_100 F PWF PIGM PBIM_100 H PWF PIGM PBIM_100 E PWF PIGM PBIM_100
CD028057.1 0.627 0.398 0.408 0.418 0.844 0.703 0.732 0.747 0.599 0.837 0.849 0.865 0.129 0.624 0.630 0.642
CN634517.1 -2.361 0.016 0.024 0.037 -2.504 0.019 0.036 0.060 -0.700 0.152 0.174 0.195 -0.470 0.403 0.416 0.420
CN634677.1 0.610 0.373 0.384 0.394 0.455 0.482 0.491 0.509 0.485 0.641 0.666 0.693 -0.515 0.403 0.405 0.409
CN635137.1 -0.554 0.301 0.318 0.319 -0.518 0.332 0.332 0.349 0.737 0.795 0.816 0.819 -0.873 0.228 0.235 0.245
CN635490.1 0.317 0.553 0.579 0.596 0.168 0.531 0.550 0.563 0.877 0.953 0.955 0.973 -0.954 0.184 0.197 0.201
CN635596.1 -0.221 0.407 0.427 0.441 -0.523 0.325 0.355 0.376 -0.087 0.304 0.307 0.307 -0.629 0.321 0.327 0.339
CN635661.1 1.012 0.825 0.840 0.843 1.478 0.962 0.988 0.996 -1.338 0.096 0.105 0.115 2.384 0.982 0.991 0.995
CN635674.1 -1.752 0.068 0.085 0.102 -1.681 0.102 0.103 0.105 0.607 0.714 0.721 0.732 -0.962 0.185 0.191 0.204
CN635691.1 -2.245 0.010 0.031 0.059 -2.384 0.010 0.011 0.037 0.267 0.422 0.450 0.468 -1.182 0.065 0.071 0.079
CN636014.1 0.632 0.696 0.715 0.716 0.597 0.682 0.686 0.712 -1.633 0.063 0.085 0.113 1.591 0.946 0.952 0.953
CN636043.1 0.170 0.561 0.576 0.589 -0.030 0.496 0.504 0.516 0.720 0.777 0.801 0.822 -1.073 0.168 0.172 0.173
CN636093.1 0.615 0.382 0.385 0.386 0.705 0.640 0.653 0.666 -2.116 0.055 0.073 0.085 2.046 0.955 0.965 0.973
CN636149.1 0.389 0.590 0.619 0.640 0.618 0.676 0.681 0.692 0.646 0.759 0.787 0.796 0.025 0.583 0.597 0.599
CN636303.1 -1.640 0.031 0.037 0.054 -1.751 0.032 0.039 0.066 0.200 0.251 0.269 0.291 -0.863 0.275 0.284 0.286
CN636471.1 0.027 0.491 0.496 0.512 0.121 0.535 0.562 0.572 -1.373 0.077 0.093 0.108 1.504 0.943 0.953 0.968
CN636492.1 0.605 0.385 0.386 0.410 0.306 0.389 0.402 0.405 0.351 0.481 0.499 0.528 -0.693 0.304 0.312 0.317
CN636784.1 -0.969 0.182 0.196 0.211 -1.240 0.159 0.181 0.192 0.212 0.402 0.421 0.424 -1.096 0.146 0.150 0.158
CN636795.1 -0.263 0.396 0.416 0.440 -0.109 0.460 0.461 0.461 0.570 0.665 0.679 0.688 -0.319 0.450 0.456 0.460
CN636901.1 1.291 0.931 0.948 0.956 1.675 0.973 0.978 0.988 -1.359 0.086 0.111 0.132 2.413 0.987 0.999 1.000
CN636999.1 na na na na na na na na na na na na na na na na
CN637166.1 0.199 0.516 0.543 0.570 -0.146 0.443 0.450 0.467 0.702 0.827 0.851 0.858 -1.273 0.063 0.066 0.077
CN637226.1 1.310 0.934 0.953 0.979 1.629 0.965 0.979 0.994 -0.439 0.210 0.222 0.249 1.477 0.929 0.943 0.947
CN637244.1 -0.279 0.355 0.367 0.389 -0.208 0.419 0.421 0.451 -0.120 0.282 0.308 0.313 0.157 0.636 0.643 0.650
CN637306.1 1.040 0.869 0.894 0.910 0.619 0.726 0.746 0.755 0.505 0.605 0.613 0.639 -0.962 0.193 0.194 0.207
CN637339.1 -0.294 0.397 0.418 0.442 -0.240 0.421 0.446 0.455 -0.572 0.183 0.183 0.200 0.557 0.774 0.787 0.791
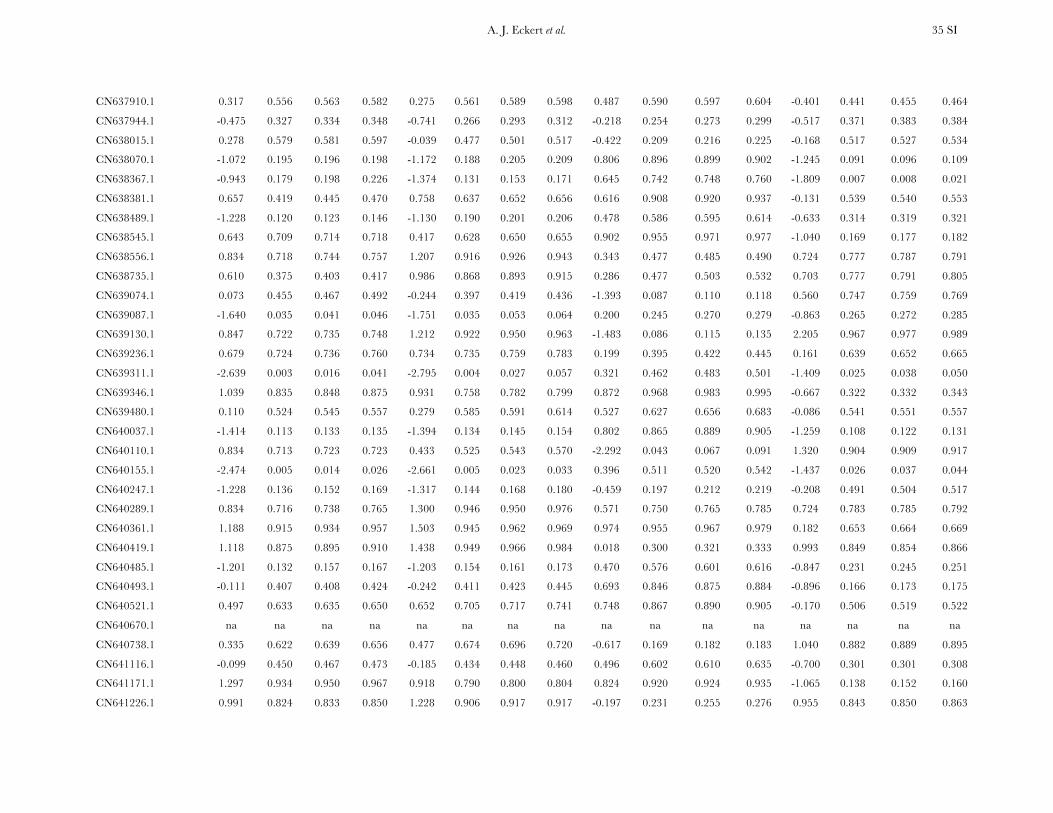
A. J. Eckert et al. 35 SI
CN637910.1 0.317 0.556 0.563 0.582 0.275 0.561 0.589 0.598 0.487 0.590 0.597 0.604 -0.401 0.441 0.455 0.464
CN637944.1 -0.475 0.327 0.334 0.348 -0.741 0.266 0.293 0.312 -0.218 0.254 0.273 0.299 -0.517 0.371 0.383 0.384
CN638015.1 0.278 0.579 0.581 0.597 -0.039 0.477 0.501 0.517 -0.422 0.209 0.216 0.225 -0.168 0.517 0.527 0.534
CN638070.1 -1.072 0.195 0.196 0.198 -1.172 0.188 0.205 0.209 0.806 0.896 0.899 0.902 -1.245 0.091 0.096 0.109
CN638367.1 -0.943 0.179 0.198 0.226 -1.374 0.131 0.153 0.171 0.645 0.742 0.748 0.760 -1.809 0.007 0.008 0.021
CN638381.1 0.657 0.419 0.445 0.470 0.758 0.637 0.652 0.656 0.616 0.908 0.920 0.937 -0.131 0.539 0.540 0.553
CN638489.1 -1.228 0.120 0.123 0.146 -1.130 0.190 0.201 0.206 0.478 0.586 0.595 0.614 -0.633 0.314 0.319 0.321
CN638545.1 0.643 0.709 0.714 0.718 0.417 0.628 0.650 0.655 0.902 0.955 0.971 0.977 -1.040 0.169 0.177 0.182
CN638556.1 0.834 0.718 0.744 0.757 1.207 0.916 0.926 0.943 0.343 0.477 0.485 0.490 0.724 0.777 0.787 0.791
CN638735.1 0.610 0.375 0.403 0.417 0.986 0.868 0.893 0.915 0.286 0.477 0.503 0.532 0.703 0.777 0.791 0.805
CN639074.1 0.073 0.455 0.467 0.492 -0.244 0.397 0.419 0.436 -1.393 0.087 0.110 0.118 0.560 0.747 0.759 0.769
CN639087.1 -1.640 0.035 0.041 0.046 -1.751 0.035 0.053 0.064 0.200 0.245 0.270 0.279 -0.863 0.265 0.272 0.285
CN639130.1 0.847 0.722 0.735 0.748 1.212 0.922 0.950 0.963 -1.483 0.086 0.115 0.135 2.205 0.967 0.977 0.989
CN639236.1 0.679 0.724 0.736 0.760 0.734 0.735 0.759 0.783 0.199 0.395 0.422 0.445 0.161 0.639 0.652 0.665
CN639311.1 -2.639 0.003 0.016 0.041 -2.795 0.004 0.027 0.057 0.321 0.462 0.483 0.501 -1.409 0.025 0.038 0.050
CN639346.1 1.039 0.835 0.848 0.875 0.931 0.758 0.782 0.799 0.872 0.968 0.983 0.995 -0.667 0.322 0.332 0.343
CN639480.1 0.110 0.524 0.545 0.557 0.279 0.585 0.591 0.614 0.527 0.627 0.656 0.683 -0.086 0.541 0.551 0.557
CN640037.1 -1.414 0.113 0.133 0.135 -1.394 0.134 0.145 0.154 0.802 0.865 0.889 0.905 -1.259 0.108 0.122 0.131
CN640110.1 0.834 0.713 0.723 0.723 0.433 0.525 0.543 0.570 -2.292 0.043 0.067 0.091 1.320 0.904 0.909 0.917
CN640155.1 -2.474 0.005 0.014 0.026 -2.661 0.005 0.023 0.033 0.396 0.511 0.520 0.542 -1.437 0.026 0.037 0.044
CN640247.1 -1.228 0.136 0.152 0.169 -1.317 0.144 0.168 0.180 -0.459 0.197 0.212 0.219 -0.208 0.491 0.504 0.517
CN640289.1 0.834 0.716 0.738 0.765 1.300 0.946 0.950 0.976 0.571 0.750 0.765 0.785 0.724 0.783 0.785 0.792
CN640361.1 1.188 0.915 0.934 0.957 1.503 0.945 0.962 0.969 0.974 0.955 0.967 0.979 0.182 0.653 0.664 0.669
CN640419.1 1.118 0.875 0.895 0.910 1.438 0.949 0.966 0.984 0.018 0.300 0.321 0.333 0.993 0.849 0.854 0.866
CN640485.1 -1.201 0.132 0.157 0.167 -1.203 0.154 0.161 0.173 0.470 0.576 0.601 0.616 -0.847 0.231 0.245 0.251
CN640493.1 -0.111 0.407 0.408 0.424 -0.242 0.411 0.423 0.445 0.693 0.846 0.875 0.884 -0.896 0.166 0.173 0.175
CN640521.1 0.497 0.633 0.635 0.650 0.652 0.705 0.717 0.741 0.748 0.867 0.890 0.905 -0.170 0.506 0.519 0.522
CN640670.1 na na na na na na na na na na na na na na na na
CN640738.1 0.335 0.622 0.639 0.656 0.477 0.674 0.696 0.720 -0.617 0.169 0.182 0.183 1.040 0.882 0.889 0.895
CN641116.1 -0.099 0.450 0.467 0.473 -0.185 0.434 0.448 0.460 0.496 0.602 0.610 0.635 -0.700 0.301 0.301 0.308
CN641171.1 1.297 0.934 0.950 0.967 0.918 0.790 0.800 0.804 0.824 0.920 0.924 0.935 -1.065 0.138 0.152 0.160
CN641226.1 0.991 0.824 0.833 0.850 1.228 0.906 0.917 0.917 -0.197 0.231 0.255 0.276 0.955 0.843 0.850 0.863
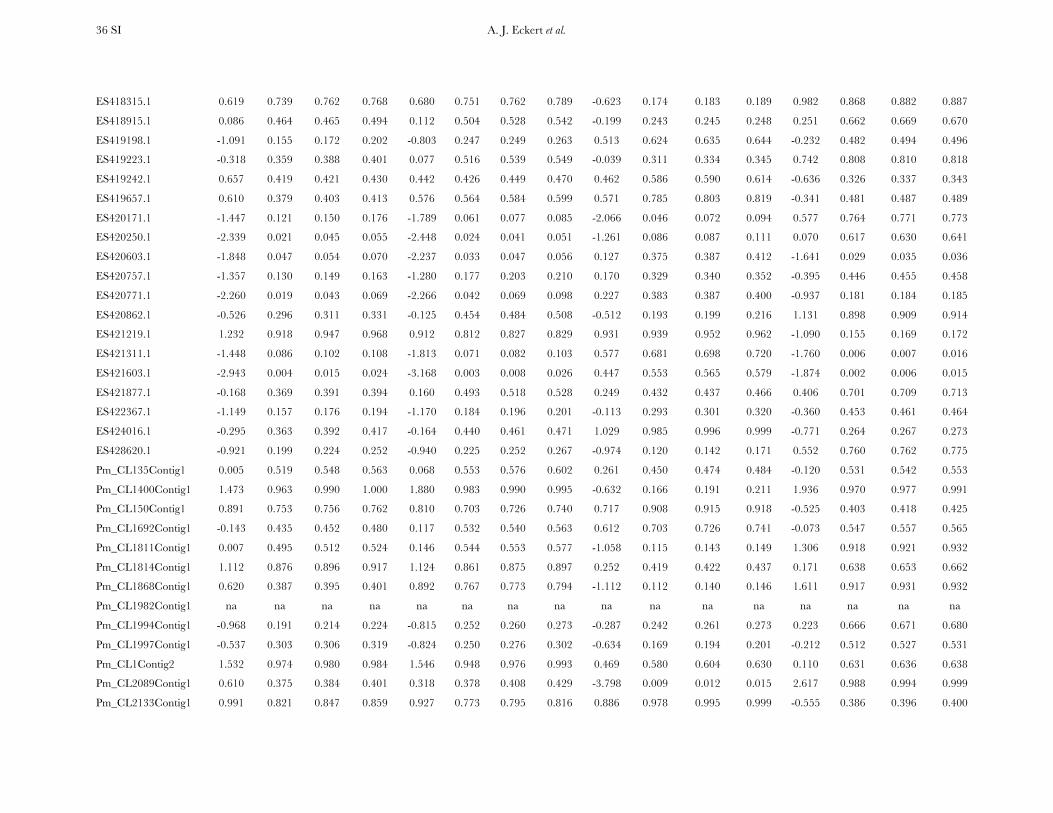
A. J. Eckert et al. 36 SI
ES418315.1 0.619 0.739 0.762 0.768 0.680 0.751 0.762 0.789 -0.623 0.174 0.183 0.189 0.982 0.868 0.882 0.887
ES418915.1 0.086 0.464 0.465 0.494 0.112 0.504 0.528 0.542 -0.199 0.243 0.245 0.248 0.251 0.662 0.669 0.670
ES419198.1 -1.091 0.155 0.172 0.202 -0.803 0.247 0.249 0.263 0.513 0.624 0.635 0.644 -0.232 0.482 0.494 0.496
ES419223.1 -0.318 0.359 0.388 0.401 0.077 0.516 0.539 0.549 -0.039 0.311 0.334 0.345 0.742 0.808 0.810 0.818
ES419242.1 0.657 0.419 0.421 0.430 0.442 0.426 0.449 0.470 0.462 0.586 0.590 0.614 -0.636 0.326 0.337 0.343
ES419657.1 0.610 0.379 0.403 0.413 0.576 0.564 0.584 0.599 0.571 0.785 0.803 0.819 -0.341 0.481 0.487 0.489
ES420171.1 -1.447 0.121 0.150 0.176 -1.789 0.061 0.077 0.085 -2.066 0.046 0.072 0.094 0.577 0.764 0.771 0.773
ES420250.1 -2.339 0.021 0.045 0.055 -2.448 0.024 0.041 0.051 -1.261 0.086 0.087 0.111 0.070 0.617 0.630 0.641
ES420603.1 -1.848 0.047 0.054 0.070 -2.237 0.033 0.047 0.056 0.127 0.375 0.387 0.412 -1.641 0.029 0.035 0.036
ES420757.1 -1.357 0.130 0.149 0.163 -1.280 0.177 0.203 0.210 0.170 0.329 0.340 0.352 -0.395 0.446 0.455 0.458
ES420771.1 -2.260 0.019 0.043 0.069 -2.266 0.042 0.069 0.098 0.227 0.383 0.387 0.400 -0.937 0.181 0.184 0.185
ES420862.1 -0.526 0.296 0.311 0.331 -0.125 0.454 0.484 0.508 -0.512 0.193 0.199 0.216 1.131 0.898 0.909 0.914
ES421219.1 1.232 0.918 0.947 0.968 0.912 0.812 0.827 0.829 0.931 0.939 0.952 0.962 -1.090 0.155 0.169 0.172
ES421311.1 -1.448 0.086 0.102 0.108 -1.813 0.071 0.082 0.103 0.577 0.681 0.698 0.720 -1.760 0.006 0.007 0.016
ES421603.1 -2.943 0.004 0.015 0.024 -3.168 0.003 0.008 0.026 0.447 0.553 0.565 0.579 -1.874 0.002 0.006 0.015
ES421877.1 -0.168 0.369 0.391 0.394 0.160 0.493 0.518 0.528 0.249 0.432 0.437 0.466 0.406 0.701 0.709 0.713
ES422367.1 -1.149 0.157 0.176 0.194 -1.170 0.184 0.196 0.201 -0.113 0.293 0.301 0.320 -0.360 0.453 0.461 0.464
ES424016.1 -0.295 0.363 0.392 0.417 -0.164 0.440 0.461 0.471 1.029 0.985 0.996 0.999 -0.771 0.264 0.267 0.273
ES428620.1 -0.921 0.199 0.224 0.252 -0.940 0.225 0.252 0.267 -0.974 0.120 0.142 0.171 0.552 0.760 0.762 0.775
Pm_CL135Contig1 0.005 0.519 0.548 0.563 0.068 0.553 0.576 0.602 0.261 0.450 0.474 0.484 -0.120 0.531 0.542 0.553
Pm_CL1400Contig1 1.473 0.963 0.990 1.000 1.880 0.983 0.990 0.995 -0.632 0.166 0.191 0.211 1.936 0.970 0.977 0.991
Pm_CL150Contig1 0.891 0.753 0.756 0.762 0.810 0.703 0.726 0.740 0.717 0.908 0.915 0.918 -0.525 0.403 0.418 0.425
Pm_CL1692Contig1 -0.143 0.435 0.452 0.480 0.117 0.532 0.540 0.563 0.612 0.703 0.726 0.741 -0.073 0.547 0.557 0.565
Pm_CL1811Contig1 0.007 0.495 0.512 0.524 0.146 0.544 0.553 0.577 -1.058 0.115 0.143 0.149 1.306 0.918 0.921 0.932
Pm_CL1814Contig1 1.112 0.876 0.896 0.917 1.124 0.861 0.875 0.897 0.252 0.419 0.422 0.437 0.171 0.638 0.653 0.662
Pm_CL1868Contig1 0.620 0.387 0.395 0.401 0.892 0.767 0.773 0.794 -1.112 0.112 0.140 0.146 1.611 0.917 0.931 0.932
Pm_CL1982Contig1 na na na na na na na na na na na na na na na na
Pm_CL1994Contig1 -0.968 0.191 0.214 0.224 -0.815 0.252 0.260 0.273 -0.287 0.242 0.261 0.273 0.223 0.666 0.671 0.680
Pm_CL1997Contig1 -0.537 0.303 0.306 0.319 -0.824 0.250 0.276 0.302 -0.634 0.169 0.194 0.201 -0.212 0.512 0.527 0.531
Pm_CL1Contig2 1.532 0.974 0.980 0.984 1.546 0.948 0.976 0.993 0.469 0.580 0.604 0.630 0.110 0.631 0.636 0.638
Pm_CL2089Contig1 0.610 0.375 0.384 0.401 0.318 0.378 0.408 0.429 -3.798 0.009 0.012 0.015 2.617 0.988 0.994 0.999
Pm_CL2133Contig1 0.991 0.821 0.847 0.859 0.927 0.773 0.795 0.816 0.886 0.978 0.995 0.999 -0.555 0.386 0.396 0.400
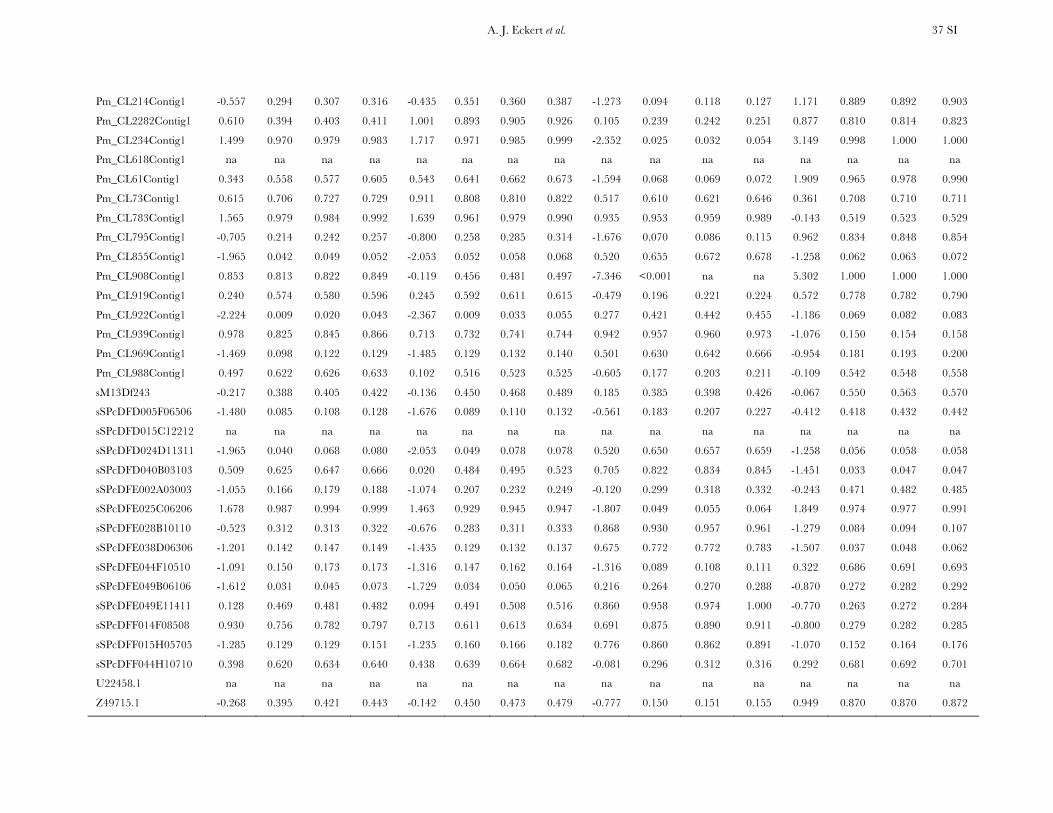
A. J. Eckert et al. 37 SI
Pm_CL214Contig1 -0.557 0.294 0.307 0.316 -0.435 0.351 0.360 0.387 -1.273 0.094 0.118 0.127 1.171 0.889 0.892 0.903
Pm_CL2282Contig1 0.610 0.394 0.403 0.411 1.001 0.893 0.905 0.926 0.105 0.239 0.242 0.251 0.877 0.810 0.814 0.823
Pm_CL234Contig1 1.499 0.970 0.979 0.983 1.717 0.971 0.985 0.999 -2.352 0.025 0.032 0.054 3.149 0.998 1.000 1.000
Pm_CL618Contig1 na na na na na na na na na na na na na na na na
Pm_CL61Contig1 0.343 0.558 0.577 0.605 0.543 0.641 0.662 0.673 -1.594 0.068 0.069 0.072 1.909 0.965 0.978 0.990
Pm_CL73Contig1 0.615 0.706 0.727 0.729 0.911 0.808 0.810 0.822 0.517 0.610 0.621 0.646 0.361 0.708 0.710 0.711
Pm_CL783Contig1 1.565 0.979 0.984 0.992 1.639 0.961 0.979 0.990 0.935 0.953 0.959 0.989 -0.143 0.519 0.523 0.529
Pm_CL795Contig1 -0.705 0.214 0.242 0.257 -0.800 0.258 0.285 0.314 -1.676 0.070 0.086 0.115 0.962 0.834 0.848 0.854
Pm_CL855Contig1 -1.965 0.042 0.049 0.052 -2.053 0.052 0.058 0.068 0.520 0.655 0.672 0.678 -1.258 0.062 0.063 0.072
Pm_CL908Contig1 0.853 0.813 0.822 0.849 -0.119 0.456 0.481 0.497 -7.346 <0.001 na na 5.302 1.000 1.000 1.000
Pm_CL919Contig1 0.240 0.574 0.580 0.596 0.245 0.592 0.611 0.615 -0.479 0.196 0.221 0.224 0.572 0.778 0.782 0.790
Pm_CL922Contig1 -2.224 0.009 0.020 0.043 -2.367 0.009 0.033 0.055 0.277 0.421 0.442 0.455 -1.186 0.069 0.082 0.083
Pm_CL939Contig1 0.978 0.825 0.845 0.866 0.713 0.732 0.741 0.744 0.942 0.957 0.960 0.973 -1.076 0.150 0.154 0.158
Pm_CL969Contig1 -1.469 0.098 0.122 0.129 -1.485 0.129 0.132 0.140 0.501 0.630 0.642 0.666 -0.954 0.181 0.193 0.200
Pm_CL988Contig1 0.497 0.622 0.626 0.633 0.102 0.516 0.523 0.525 -0.605 0.177 0.203 0.211 -0.109 0.542 0.548 0.558
sM13Df243 -0.217 0.388 0.405 0.422 -0.136 0.450 0.468 0.489 0.185 0.385 0.398 0.426 -0.067 0.550 0.563 0.570
sSPcDFD005F06506 -1.480 0.085 0.108 0.128 -1.676 0.089 0.110 0.132 -0.561 0.183 0.207 0.227 -0.412 0.418 0.432 0.442
sSPcDFD015C12212 na na na na na na na na na na na na na na na na
sSPcDFD024D11311 -1.965 0.040 0.068 0.080 -2.053 0.049 0.078 0.078 0.520 0.650 0.657 0.659 -1.258 0.056 0.058 0.058
sSPcDFD040B03103 0.509 0.625 0.647 0.666 0.020 0.484 0.495 0.523 0.705 0.822 0.834 0.845 -1.451 0.033 0.047 0.047
sSPcDFE002A03003 -1.055 0.166 0.179 0.188 -1.074 0.207 0.232 0.249 -0.120 0.299 0.318 0.332 -0.243 0.471 0.482 0.485
sSPcDFE025C06206 1.678 0.987 0.994 0.999 1.463 0.929 0.945 0.947 -1.807 0.049 0.055 0.064 1.849 0.974 0.977 0.991
sSPcDFE028B10110 -0.523 0.312 0.313 0.322 -0.676 0.283 0.311 0.333 0.868 0.930 0.957 0.961 -1.279 0.084 0.094 0.107
sSPcDFE038D06306 -1.201 0.142 0.147 0.149 -1.435 0.129 0.132 0.137 0.675 0.772 0.772 0.783 -1.507 0.037 0.048 0.062
sSPcDFE044F10510 -1.091 0.150 0.173 0.173 -1.316 0.147 0.162 0.164 -1.316 0.089 0.108 0.111 0.322 0.686 0.691 0.693
sSPcDFE049B06106 -1.612 0.031 0.045 0.073 -1.729 0.034 0.050 0.065 0.216 0.264 0.270 0.288 -0.870 0.272 0.282 0.292
sSPcDFE049E11411 0.128 0.469 0.481 0.482 0.094 0.491 0.508 0.516 0.860 0.958 0.974 1.000 -0.770 0.263 0.272 0.284
sSPcDFF014F08508 0.930 0.756 0.782 0.797 0.713 0.611 0.613 0.634 0.691 0.875 0.890 0.911 -0.800 0.279 0.282 0.285
sSPcDFF015H05705 -1.285 0.129 0.129 0.151 -1.235 0.160 0.166 0.182 0.776 0.860 0.862 0.891 -1.070 0.152 0.164 0.176
sSPcDFF044H10710 0.398 0.620 0.634 0.640 0.438 0.639 0.664 0.682 -0.081 0.296 0.312 0.316 0.292 0.681 0.692 0.701
U22458.1 na na na na na na na na na na na na na na na na
Z49715.1 -0.268 0.395 0.421 0.443 -0.142 0.450 0.473 0.479 -0.777 0.150 0.151 0.155 0.949 0.870 0.870 0.872
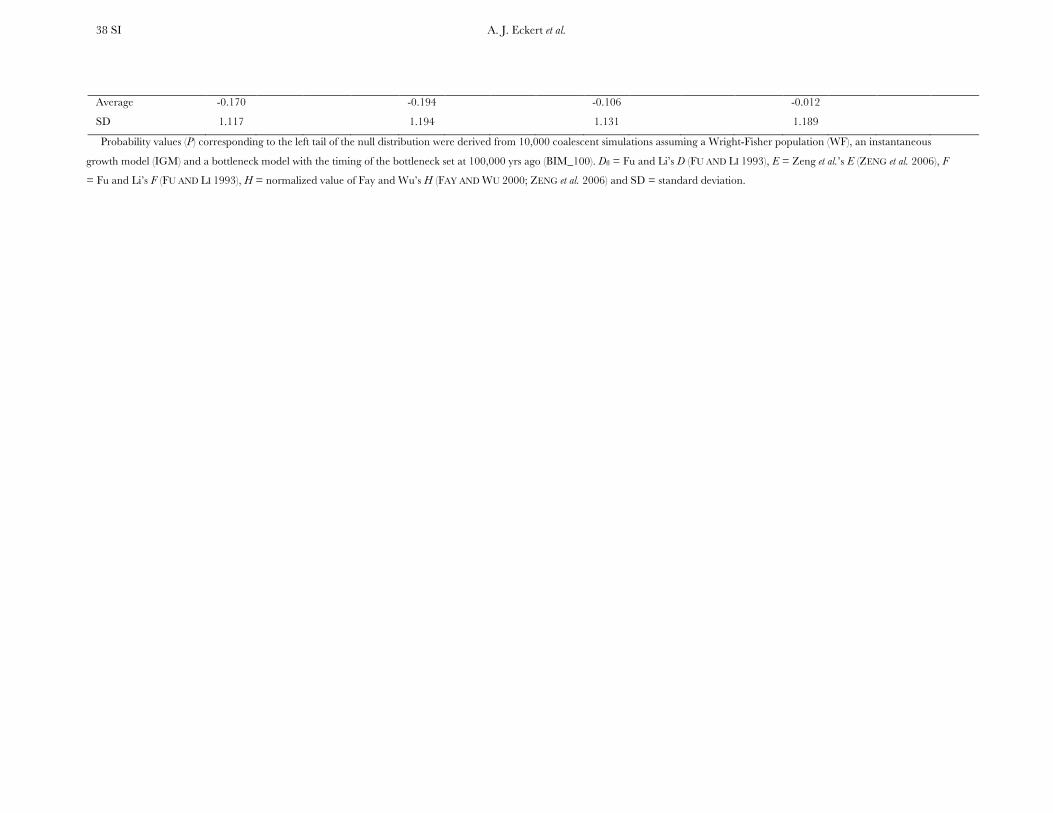
A. J. Eckert et al. 38 SI
Average -0.170 -0.194 -0.106 -0.012
SD 1.117 1.194 1.131 1.189
Probability values (P) corresponding to the left tail of the null distribution were derived from 10,000 coalescent simulations assuming a Wright-Fisher population (WF), an instantaneous
growth model (IGM) and a bottleneck model with the timing of the bottleneck set at 100,000 yrs ago (BIM_100). Dfl = Fu and Li’s D (FU AND LI 1993), E = Zeng et al.’s E (ZENG et al. 2006), F
= Fu and Li’s F (FU AND LI 1993), H = normalized value of Fay and Wu’s H (FAY AND WU 2000; ZENG et al. 2006) and SD = standard deviation.
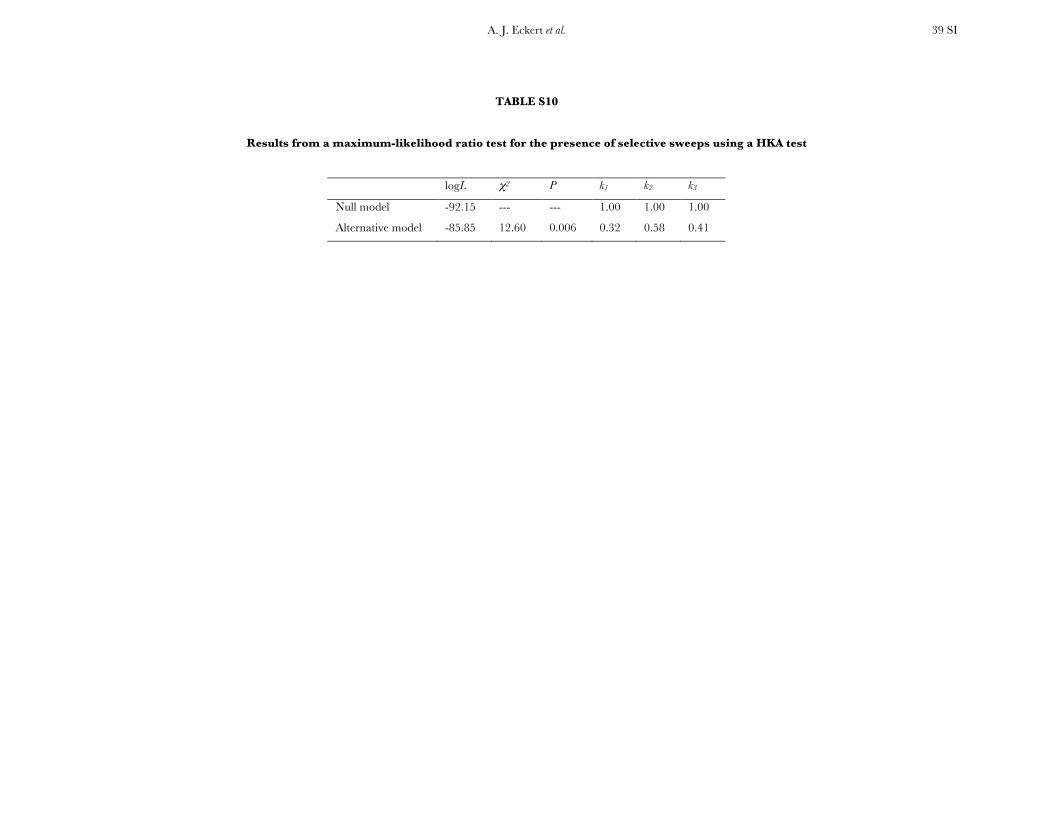
A. J. Eckert et al. 39 SI
TABLE S10
Results from a maximum-likelihood ratio test for the presence of selective sweeps using a HKA test
logL χ2 P k1 k2 k3
Null model -92.15 --- --- 1.00 1.00 1.00
Alternative model -85.85 12.60 0.006 0.32 0.58 0.41
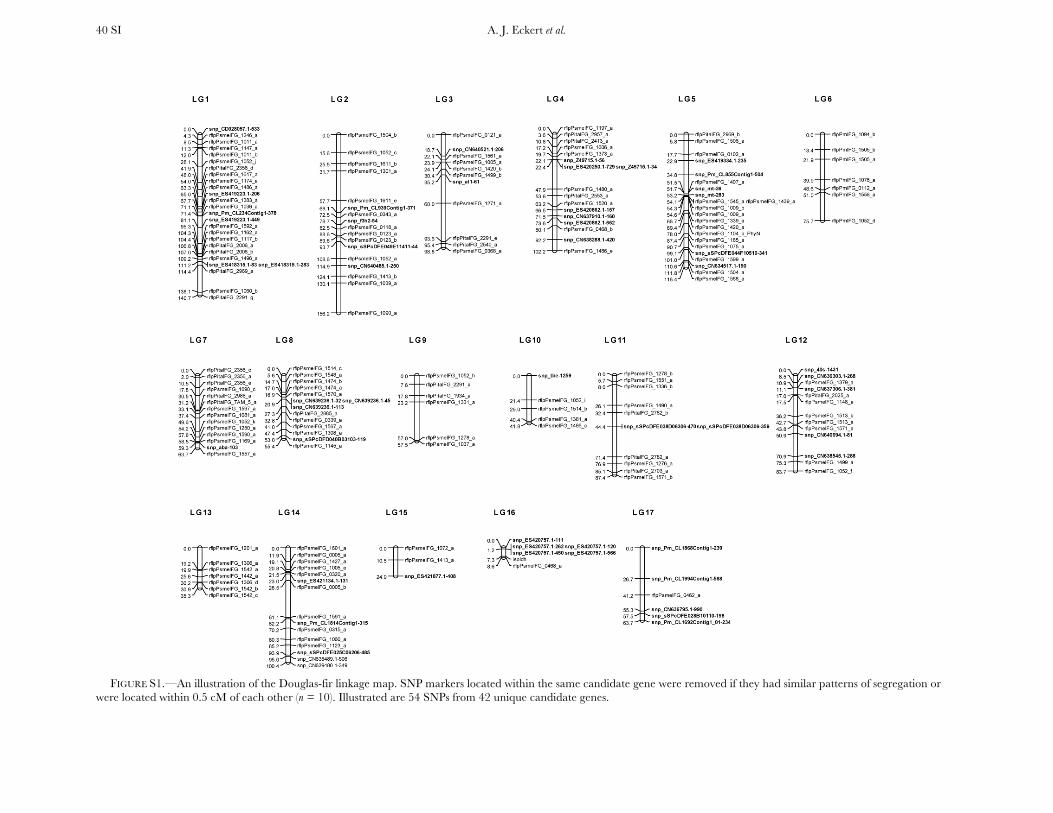
A. J. Eckert et al. 40 SI
FIGURE S1.—An illustration of the Douglas-fir linkage map. SNP markers located within the same candidate gene were removed if they had similar patterns of segregation or were located within 0.5 cM of each other (n = 10). Illustrated are 54 SNPs from 42 unique candidate genes.
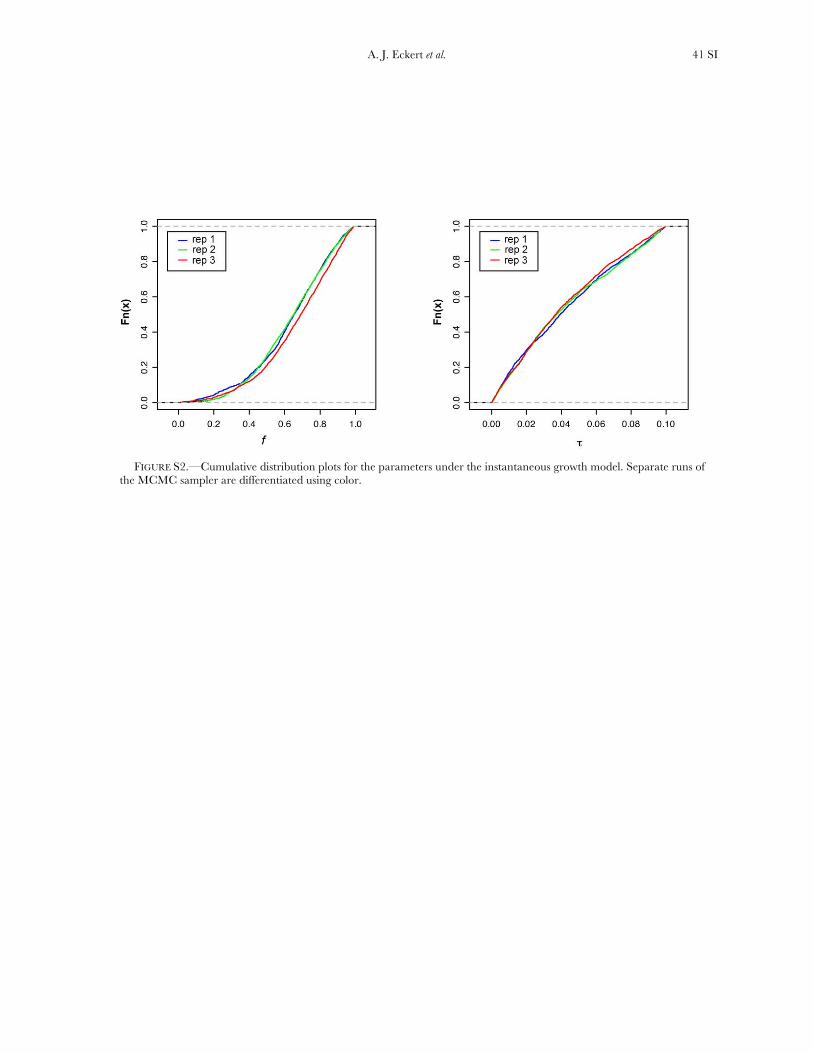
A. J. Eckert et al. 41 SI
FIGURE S2.—Cumulative distribution plots for the parameters under the instantaneous growth model. Separate runs of
the MCMC sampler are differentiated using color.
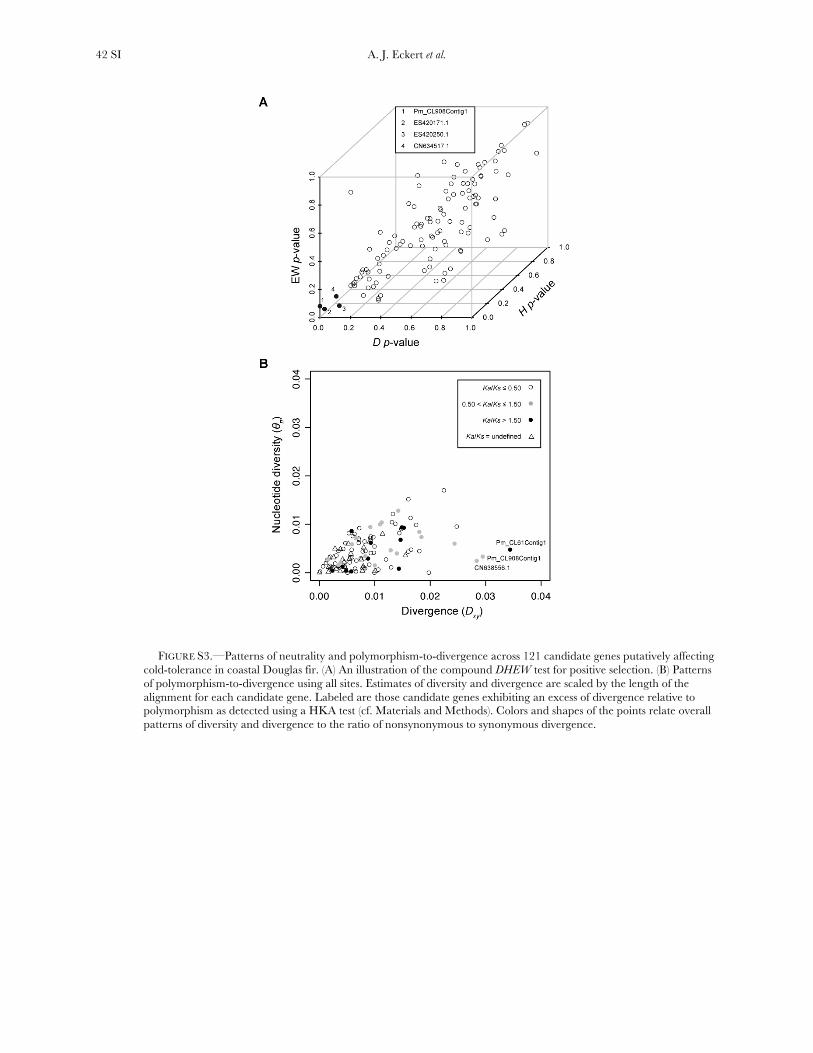
A. J. Eckert et al. 42 SI
FIGURE S3.—Patterns of neutrality and polymorphism-to-divergence across 121 candidate genes putatively affecting cold-tolerance in coastal Douglas fir. (A) An illustration of the compound DHEW test for positive selection. (B) Patterns of polymorphism-to-divergence using all sites. Estimates of diversity and divergence are scaled by the length of the alignment for each candidate gene. Labeled are those candidate genes exhibiting an excess of divergence relative to polymorphism as detected using a HKA test (cf. Materials and Methods). Colors and shapes of the points relate overall patterns of diversity and divergence to the ratio of nonsynonymous to synonymous divergence.
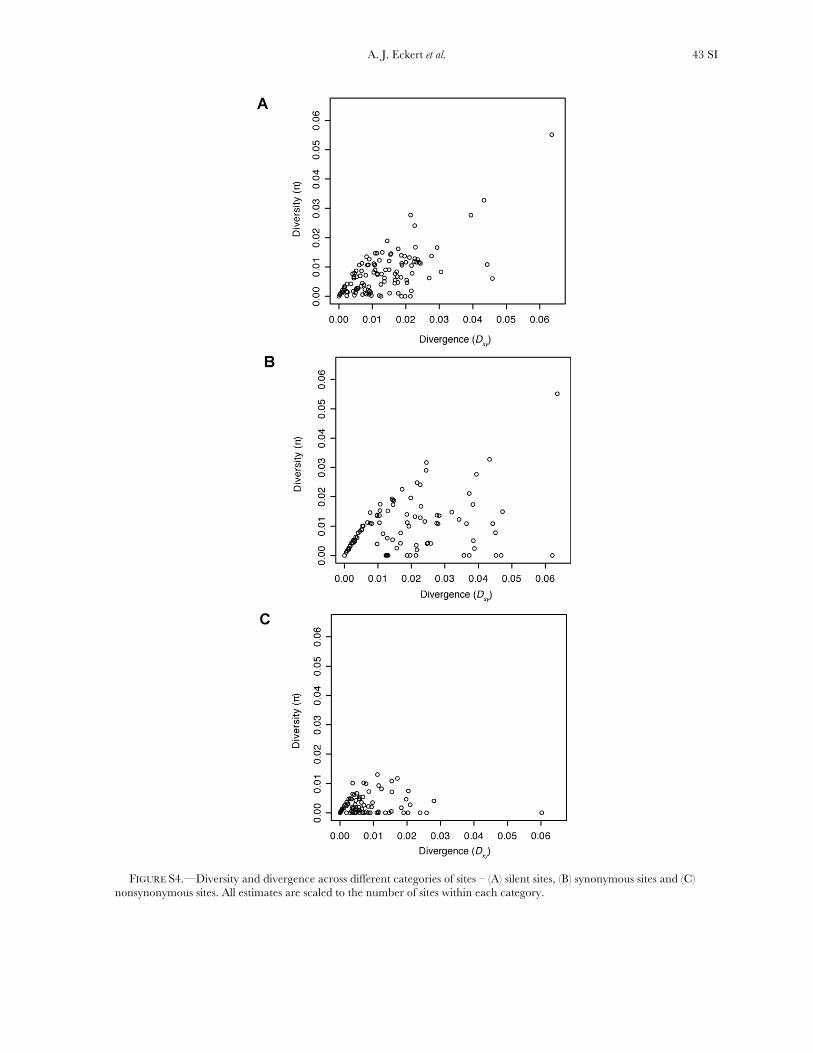
A. J. Eckert et al. 43 SI
FIGURE S4.—Diversity and divergence across different categories of sites – (A) silent sites, (B) synonymous sites and (C)
nonsynonymous sites. All estimates are scaled to the number of sites within each category.
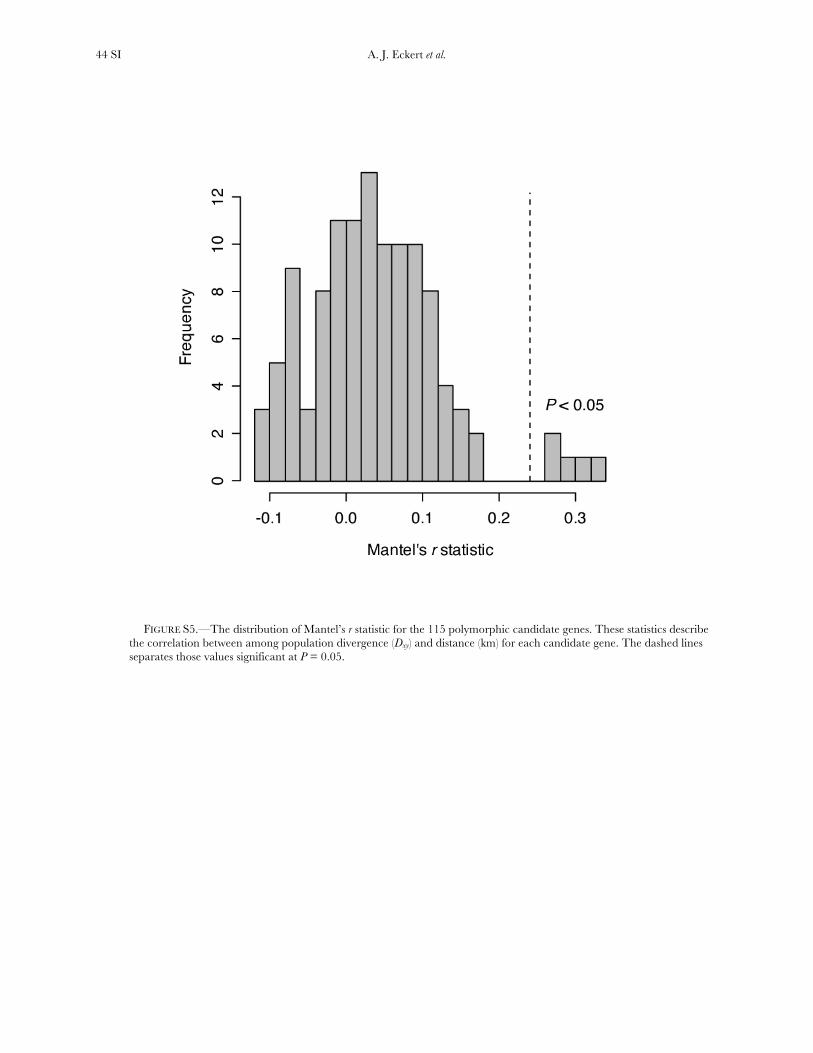
A. J. Eckert et al. 44 SI
FIGURE S5.—The distribution of Mantel’s r statistic for the 115 polymorphic candidate genes. These statistics describe the correlation between among population divergence (Dxy) and distance (km) for each candidate gene. The dashed lines separates those values significant at P = 0.05.
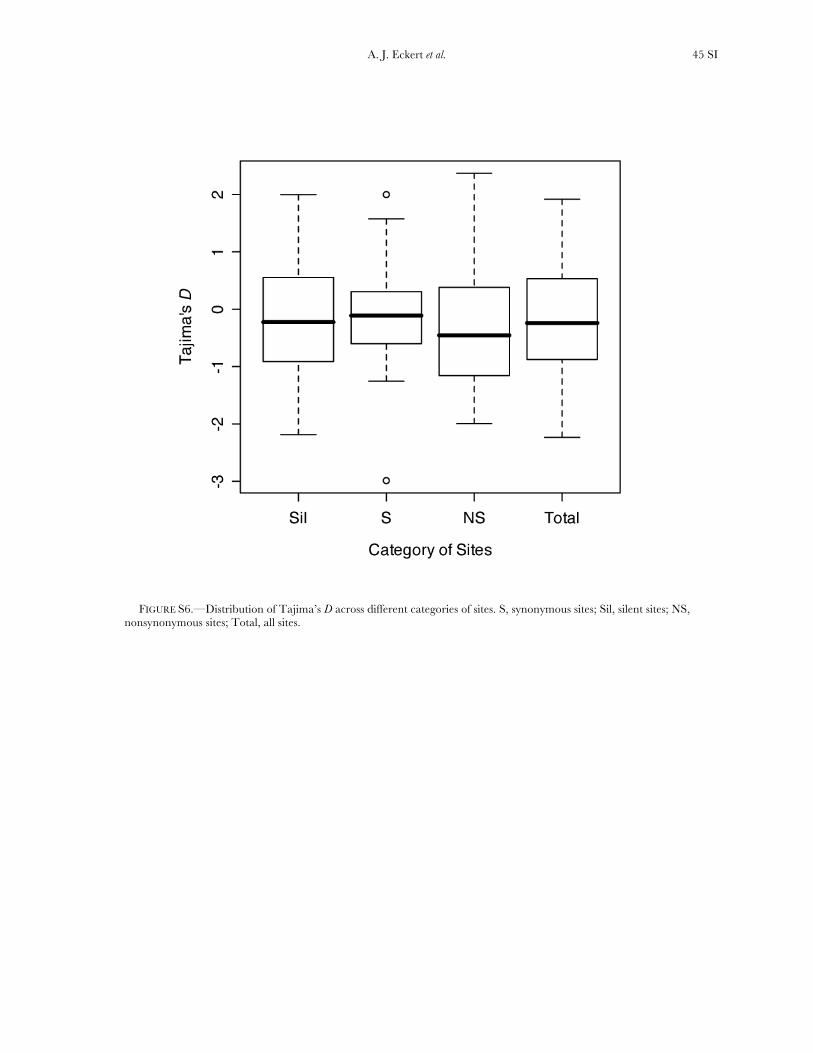
A. J. Eckert et al. 45 SI
FIGURE S6.—Distribution of Tajima’s D across different categories of sites. S, synonymous sites; Sil, silent sites; NS, nonsynonymous sites; Total, all sites.
A. J. Eckert et al. 46 SI
REFERENCES FAY, J. C. AND C.-I. WU, 2000 Hitchhiking under positive Darwinian selection. Genetics 155: 1405–1413. FU, Y.-X. AND W.-H. LI, 1993 Statistical tests of neutrality of mutations. Genetics 133: 693–709. NEI, M. AND T. GOJOBORI, 1986 Simple methods for estimating the numbers of synonymous and nonsynonymous nucleotide substitutions. Mol. Biol. Evol. 3: 418–426. TAJIMA, F., 1989 Statistical method for testing the neutral mutation hypothesis by DNA polymorphism. Genetics 123: 585–595. WATTERSON, G., 1978 The homozygosity test of neutrality. Genetics 88: 405–417. ZENG, K., Y. X. FU, S. SHI AND C.-I. WU, 2006 Statistical tests for detecting positive selection by utilizing high-frequency variants. Genetics 174: 1431–1439.