multidimensional discrimination in the online rental housing
TRANSCRIPT

Full Terms & Conditions of access and use can be found athttps://www.tandfonline.com/action/journalInformation?journalCode=rhpd20
Housing Policy Debate
ISSN: (Print) (Online) Journal homepage: https://www.tandfonline.com/loi/rhpd20
Multidimensional Discrimination in the OnlineRental Housing Market: Implications for FamiliesWith Young Children
Jacob William Faber & Marie-Dumesle Mercier
To cite this article: Jacob William Faber & Marie-Dumesle Mercier (2022): MultidimensionalDiscrimination in the Online Rental Housing Market: Implications for Families With Young Children,Housing Policy Debate, DOI: 10.1080/10511482.2021.2010118
To link to this article: https://doi.org/10.1080/10511482.2021.2010118
Published online: 24 Jan 2022.
Submit your article to this journal
Article views: 66
View related articles
View Crossmark data
Multidimensional Discrimination in the Online Rental Housing Market: Implications for Families With Young ChildrenJacob William Fabera,b and Marie-Dumesle Mercierb
aRobert F. Wagner School of Public Service, New York University, New York, USA; bDepartment of Sociology, New York University, New York, USA
ABSTRACTA half century after passage of the federal Fair Housing Act, studies continue to document racial discrimination in the housing market, which serves to reproduce racial inequality and residential segregation. Building on this work, we examine housing discrimination experienced by individuals belonging to multiple disadvantaged groups. Employing an online field experiment in 31 U.S. cities over 20 months, we investigate patterns of discrimination against female rental housing applicants at the intersections of race, ethnicity, family structure, and Section 8 housing voucher receipt. Consistent with prior work, we find discrimination against Black women and Section 8 recipients. We also find that only Black women and Latinas are penalized for being parents and for being single mothers to young children. Finally, examining the relevant policy landscape, we find evidence that state and local laws barring discrimination against Section 8 recipients may not be sufficient to protect voucher holders and their families and may instead prompt landlords to engage in subtler forms of discrimination (i.e., increased nonresponse). These findings reveal a dynamic pattern of multidimensional discrimination and support argu-ments for an intersectional approach to understanding and combatting inequality.
ARTICLE HISTORY Received 9 March 2021 Accepted 20 November 2021
KEYWORDS vouchers; race; discrimination; families
The search for housing is a crucial site for the reproduction of stratification in segregated America (Brown, 2021; Desmond, 2016; Krysan & Crowder, 2017; Logan & Stults, 2011; Pattillo, 2013; Taylor, 2019). Differential sorting across neighborhoods facilitates racial inequalities in a wide range of spatially organized phenomena shown to shape life chances (Sharkey & Faber, 2014). Whereasstructural factors, such as the legacy of the segregationist housing policies of the New Deal, are important drivers of mobility patterns (Aaronson, Faber, Hartley, Mazumder, & Sharkey, 2021; Faber, 2020; Iceland & Wilkes, 2006; Logan, 2016; Massey & Denton, 1993; Ross, 2011), studies continue to point to discrimination in the housing market as another driver (Bertrand & Duflo, 2017; Besbris & Faber, 2017; Choi, Herbert, Winslow, & Browne, 2019; Hanson, Hawley, Martin, & Liu, 2016; Korver-Glenn, 2018, 2021; Massey, Rugh, Steil, & Albright, 2016; Quillian, Lee, & Honoré, 2020; Turner et al., 2013). Blacks and Latinos receive fewer responses from landlords to their inquiries than Whites do (Hanson & Hawley, 2011; Quillian et al., 2020; Wang, Ewens, & Tomlin, 2014), are steered away from White neighborhoods (Besbris & Faber, 2017; Korver-Glenn, 2021), and pay more for mortgages than Whites do (Faber, 2013, 2018; Massey et al., 2016).
An important yet underexplored question is how discrimination operates at the intersection of race and other characteristics, such as family structure and source of income (Turner, 2015). Studies that do not consider these factors may underestimate the discrimination experienced by applicants
CONTACT Jacob William Faber [email protected]
HOUSING POLICY DEBATE https://doi.org/10.1080/10511482.2021.2010118
© 2022 Informa UK Limited, trading as Taylor & Francis Group
who are members of several disadvantaged groups, such as a woman who is Black and a single parent or a Hispanic woman who receives a housing voucher (or Section 8 voucher) (Collins, 2015; Collins & Bilge, 2016; Crenshaw, 1989; Friedman, 2015; Roscigno, 2007; Roscigno, Karafin, & Tester, 2009; Rosen, 2020).
In applying an intersectional approach to studying discrimination in the housing market, we make important contributions to the literature on intersectionality and stratification and provide insight into the sufficiency of existing antidiscrimination policies. Specifically, we undertake the first field experiment to examine discrimination at the intersection of race/ethnicity, family structure (i.e., marital and parental statuses), and income source (i.e., receipt of a housing voucher). We conducted our study from October 2017 to May 2019 in the online rental housing market of 31 of America’s largest cities. Our analyses of 4,058 email inquiries to landlords reveal a complex pattern of multidimensional discrimination. First, within the full sample, Black names are 3.5% less likely to receive a response from landlords. Among messages that do not signal voucher receipt, Black disadvantage increases to 8.0%. Second, we find that single motherhood imposes a penalty for Black women and Latinas, whereas family structure has no effect on White outcomes. Third, signaling a housing voucher reduces the probability of landlord response by 9.2%. Finally, we find that in cities where discrimination against voucher recipients is illegal, landlords are less likely to openly refuse vouchers but are more likely not to reply to apartment inquiries. This suggests that landlords in these cities may shift from explicit to implicit discriminatory behavior.
Our results highlight the importance of intersectionality in the housing market as well as the limitations of existing tools designed to combat discrimination. By specifically examining discrimination against housing voucher recipients in the context of other axes of disadvantage, the present study provides critical insight into patterns of discrimination against economically vulnerable households.
Conceptualizing Discrimination as Multidimensional
Given that individuals do not enter the housing market with just their race or ethnicity, it is crucial to understand how disadvantage (or advantage) associated with one’s race or ethnicity interacts with other characteristics to shape access to housing. To examine how social categories combine to produce inequality in the housing market, we draw on intersectionality theory and conceptualize discrimination as multidimensional (Collins, 2015; Crenshaw, 1989; Pedulla, 2014, 2018). Specifically, we consider the experiences of those facing discrimination at the intersection of race and other categories to better conceptualize and capture discriminatory processes (Best, Edelman, Krieger, & Eliason, 2011; Collins, 2015; Collins & Bilge, 2016; Crenshaw, 1989).
A key insight of intersectionality theory is that disadvantage based on two or more individual characteristics may produce unique forms of disadvantage (Best et al., 2011; Cho, Crenshaw, & McCall, 2013; Collins, 2015; Collins & Bilge, 2016; Crenshaw, 1989; Greenman & Xie, 2008; Hancock, 2013; Roscigno, 2007; Roscigno et al., 2009). Taking Black women as an example, Crenshaw (1989) explains that in addition to experiencing discrimination in ways that are similar to and different from White women and Black men, Black women may also experience two additional types of discrimina-tion that tend to be overlooked. The first type is double discrimination or the combined effects of practices that discriminate on the basis of race and on the basis of sex. The second type is discrimination as Black women—not the sum of race and sex discrimination, but as Black women specifically. Consequently, studies seeking to measure discrimination that do not account for these intersectional identities run the risk of missing important phenomena.
In explaining the link between social categories and disparate outcomes, scholars have cited the role of stereotypes (Kennelly, 1999; Pager & Karafin, 2009; Pedulla, 2014, 2018). In the housing context, Korver-Glenn’s (2018) study of discrimination in home sales documents the critical role that racial stereotypes play in shaping housing access. Ethnographic fieldwork and in-depth inter-views with real estate stakeholders in Houston, Texas, revealed that Asian, Black, Latino, and White respondents used and reported others using racial stereotypes throughout the home sale process. Discussions of race often had economic, moral, or cultural overtones, with Black often connoting
2 J. W. FABER AND M.-D. MERCIER

laziness, danger, financial irresponsibility, and poverty, and Latino (used interchangeably with Latina and Mexican) associated with hardworking, family oriented, undocumented, financially illiterate, and low income. White was associated with affluence, financial responsibility and literacy, and high levels of education. When put into action, “stereotype-infused” interactions and decisions “accumulated distinct consequences,” reinforcing multiple points of exclusion for minorities and distinct experi-ences of inclusion for Whites (652).
To explain how social categories intersect to produce unique forms of discrimination, recent studies have examined how stereotypes associated with these categories intersect. In his study of how race and periods of unemployment shape the ability to obtain a job, Pedulla (2018) examined the role of employers’ stereotypes about these two categories in generating disparate outcomes. Results from his field experi-ment revealed evidence of racial discrimination against Black applicants and unemployment penalties for White applicants. However, Pedulla (2018, p. 1481) did not find evidence that each social category is perceived as independent and aggregates in a “consistent, additive manner.” Instead, White and Black workers did not experience similar consequences of unemployment. He also did not find evidence of “amplified congruence,” where the joint effect of being in two negatively stereotyped groups resulted in more severe consequences than if the independent penalties were just added. Instead, the unemploy-ment penalty appeared weaker for Black applicants than for equally qualified White applicants (i.e., unemployment did not amplify the negative effects of discrimination). Pedulla (2018) concludes that these results provide evidence of “muted congruence”: when strong expectations about group member-ship are supplemented with stereotype-consistent information, additional information imposes limited additional effect. In the labor market context, stereotypes about Black workers and unemployed workers may overlap to such a great extent that employers assign little importance to information about a Black applicant’s unemployment history.
Discrimination in the Search for Housing
Race, Gender, and Class
Few studies examine how housing access is shaped by the intersection of race, gender, and class. One exception is a phone audit study by Massey and Lundy (2001), which found that compared with Whites, Blacks were less likely to speak to a rental agent, less likely to be told of a unit’s availability, more likely to pay application fees, and more likely to have creditworthiness mentioned as a potential problem in qualifying for a lease. The authors also found that racial effects interacted with and were generally exacerbated by gender and class. Within-group differences revealed that discrimination against Black women was worse than that experienced by Black men and White women.
As discussed above, these results may be connected to the negative perceptions of Black women (Kennelly, 1999; Korver-Glenn, 2018; Ocen, 2012; Pedulla, 2018; Roberts, 1992), who are stereotyped as single mothers (Kennelly, 1999) and lacking in feminine ideals, for example (Ocen, 2012). Black women are also stereotyped as the paradigmatic welfare recipient (Cammett, 2014; Hayat, 2016), despite evidence that among adults without a college degree, more Whites than Blacks participate in these programs (Cammett, 2014; Shapiro & Chaudhry, 2017). Stereotypes of White women are more difficult to identify because White women are less likely than Black women to be seen as monolithic and are less likely to be viewed negatively (Kennelly, 1999). In terms of Latinas, common stereotypes depict them as less aggressive or threatening than Latino men and as unskilled and less career oriented than White women (Yemane & Fernández-Reino, 2019).
Family Structure
Landlords may discriminate against families with children because of assumptions about noise, wear and tear on apartments, and increased government scrutiny (e.g., if a child tests positive for lead poisoning; Desmond, An, Winkler, & Ferriss, 2013). Single-parent households may face additional
HOUSING POLICY DEBATE 3

discrimination because of being perceived as morally suspect and a challenge to traditional family households (Lauster & Easterbrook, 2011). Landlords may also assume these families represent a greater financial risk, because of perceived (and actual) economic precarity.
One of the first studies to examine housing discrimination against families with children in the United States was a pilot commissioned by the U.S. Department of Housing and Urban development (HUD) in 2013, which entailed telephone and in-person paired tests in Dallas, Texas; Dayton, Ohio; and Los Angeles, California (Aron et al., 2016; Turner, 2015). Researchers sought to understand how interactions of race/ethnicity, age and sex of a child or children, and marital status of the parent might affect discrimination (Aron et al., 2016).
Overall, the study found that applicants with children were as likely as those without children to obtain an appointment and to learn about at least one available housing unit (Aron et al., 2016). Compared with families without children, however, families with children were shown fewer units and were told about units that were slightly larger and thus more expensive to rent. Researchers also found that compared with one-child families, two-child families were shown fewer units and shown units with slightly higher rents. The study found no evidence that race or ethnicity, marital status, or the age or sex of the children influenced the likelihood of discrimination against families with children. In sum, although families with children did not experience explicit refusal, landlords treated families differently on certain measured outcomes.
To improve our understanding of housing discrimination on the basis of family structure, the present study expands on the HUD pilot study in several ways. First, in addition to sampling a greater number of cities, we specifically examine how marital status shapes one’s access to housing by examining it in conjunction with and separate from parental status. Homing in on marital status apart from parental status permits insight into different questions, such as whether marriage accrues the same benefits to non-White renters that prior studies have shown it affords White renters and which stereotypes may inform these outcomes (Lauster & Easterbrook, 2011).
Second, we examine whether discrimination against families with children is more prevalent or takes different forms when families are less than financially qualified—a question left open by the HUD study, which only signaled that testers were “financially well qualified” for the home they were seeking to rent (Santos, Turner, Aron, & Howell, 2016),p 3. Recentestimates indicate that 60% of renter families have unaffordable housing cost burdens (with costs exceeding 30% of income) and 20% have extreme cost burdens (with costs that exceed 50% of income). These estimates indicate a clear need for research into this question. By signaling voucher receipt in the present study, we take an important step in understanding the experiences of economically vulnerable families with children.
Receipt of Housing Choice Vouchers
The Housing Choice Voucher program, created in 1974, is the federal government’s largest rental housing assistance program, serving over two million households (Bell, Sard, & Koepnick, 2018; Cunningham et al., 2018). The goals of the program are to increase access to safe, affordable housing in the private market and to provide opportunities for low-income households to obtain rental housing outside areas of poverty or minority concentration (Cunningham et al., 2018). The program is administered locally by public housing agencies (PHAs), which receive funds from HUD and pay subsidies directly to the landlord (Ellen, 2018). Voucher recipients then pay the difference between the rent charged by the landlord and the amount subsidized by the program.1
Landlords in many jurisdictions are not required to accept vouchers under the federal Fair Housing Act. However, in about a dozen states and more than 50 cities and counties, laws have been enacted prohibiting landlords from refusing to rent to voucher holders solely because of their source of income (often called SOI laws). Recent estimates indicate that local and state SOI laws cover about 50% of voucher holders (Poverty and Race Research Action Council, updated 2019). Although there is evidence that voucher holders in areas with voucher nondiscrimination protections are more
4 J. W. FABER AND M.-D. MERCIER

likely to succeed in using their vouchers (Bell et al., 2018), studies examining landlord acceptance of vouchers have found strong evidence of discrimination against voucher recipients (Moore, 2016; Phillips, 2017; Rosie, Hatch, & Mead, 2017).
In a pilot study commissioned by HUD, researchers examined landlord treatment of voucher holders in five cities: Fort Worth, Texas; Los Angeles; Newark, New Jersey; Philadelphia, Pennsylvania; and Washington, DC (Cunningham et al., 2018). The first stage of the study (the voucher acceptance test) entailed a female tester, who would be perceived as White, calling landlords and asking whether they accepted vouchers. This test revealed clear evidence of outright denial of vouchers (Cunningham et al., 2018). Denial rates were highest in Fort Worth (78%) and Los Angeles (76%) and lower in Philadelphia (67%). Notably, denial rates were substantially lower in Newark (31%) and Washington, DC (15%), two sites with voucher nondiscrimination protections. The authors note that although the results are suggestive of a desirable ordinance effect, other factors could inform denial rates, including housing market tightness and PHA performance. Significantly, given the high voucher denial rates during the voucher acceptance test, researchers were unable to conduct sufficient in-person tests in subsequent stages of the study to conclusively analyze whether differ-ential treatment against voucher holders varied by race, an issue we specifically examine in our study.
Based on interview and ethnographic data, Garboden, Rosen, Greif, Deluca, and Edin (2018b) identified three key factors that can influence a landlord’s participation in the voucher program: financial motivation, bureaucratic factors, and landlord perceptions of tenants. Although financial factors such as reliable rental payments and a possible voucher premium play a role in encouraging participation, negative experiences related to bureaucratic PHA hurdles and landlords’ perceptions of voucher tenants are often a significant deterrent to participation. In terms of landlord perception, researchers found a great deal of stigma against voucher tenants, with 20% of landlords in Baltimore, Maryland, 30% in Dallas, and 45% in Cleveland, Ohio, believing that voucher tenants were worse than other tenants. In many cases, researchers found it difficult to disentangle a landlord’s negative experiences with voucher tenants from a landlord’s prejudices. However, other studies do find evidence that these negative attitudes may be based on race and class stereotypes about the character of subsidized housing residents (for a review see Rosie et al., 2017; Tighe, 2012).
Experimental Design
We implemented an online field experiment to measure whether and how race, family structure, and voucher receipt trigger discrimination in the online rental housing market. Through email corre-spondence, we posed as prospective female renters and responded to posts for rental units in a manner that signaled (a) race/ethnicity; (b) family structure, specifically parental and marital statuses; and (c) source of income, with signals for receipt of a housing voucher and/or employment. We evaluate two primary outcomes: (a) whether our inquiries received any response at all and (b) whether a response was positive. This experimental design enables us to systematically evaluate the extent of discrimination against voucher holders in multiple cities and the sufficiency of state and local laws prohibiting voucher discrimination, while also investigating multidimensional bias against women of varying racial/ethnic backgrounds and family structure.
Our study took place on Craigslist, which granted us access to a public, online rental market for the 31 cities sampled in our study representing the geographic and demographic diversity of the country (see Table 1). Our sample was chosen to include 10 of the largest American cities and 21 additional cities that varied in the legal status of voucher discrimination (PRRAC 2019).
We selected an online setting because the search for housing increasingly takes place online, and online audits offer greater precision than in-person audits because all aspects of experimental variation are under investigator control (Boeing & Waddell, 2016; Oh & Yinger, 2015). Although there may be concern that the voucher-eligible population is unlikely to use online markets to find housing, there have been numerous reports of voucher discrimination on Craigslist, including in
HOUSING POLICY DEBATE 5

New York, New York (Murphy, 2016), Chicago, Illinois (Yousef, 2015), and Baltimore (Badger, 2016a). Furthermore, recent research has documented that the proportion of units available on Craigslist below HUD Fair Market Rents (FMRs) is representative of the American rental market (Boeing & Waddell, 2016). This research received approval from New York University’s Institutional Review Board.
Signaling Race/Ethnicity, Family Structure, and Voucher Receipt
After prior experiments assessing discrimination, we used first and last names to signal race, ethnicity, and gender (Bertrand & Duflo, 2017). We were primarily concerned with the experiences of White women, Black women, and Latinas because the vast majority (84%) of single-parent households are headed by women and because this household structure is substantially more common among these groups compared with Asians: 13% of Asian children are in single-family households, compared with 54% of Black children, 29% of Latinx children, and 20% of White children (U.S. Census Bureau, 2015). To examine the experience of Blacks and Latinas relative to Whites, we selected racially identifiable first names for women that were used in previous research (Gaddis, 2015; Lavender, 1988; Sharma, Mitra, & Stano, 2015) and the most racially homogeneous last names according to the U.S. Census (U.S. Census Bureau, 2000). Using each combination of the first and last names displayed in Table 2, we created nine signals of each race/ethnicity, which we randomly assigned to our messages.2
Our inquiries included signals of family structure similar to those used in previous research (Lauster & Easterbrook, 2011). For parental status, we randomly assigned mention of an infant, a third-grade child, or no child. It is possible that limiting our signals to the presence of one young child may result in a conservative estimate of the discrimination experienced by parents, given evidence that the presence of multiple children may result in greater discrimination than the presence of a single child (Aron et al., 2016). Although this issue is worthy of investigation, we undertake an empirically conservative approach for practical reasons.3 In terms of marital status, half of our messages signaled the presence of a husband. Each inquiry was randomly assigned one of four income signals: (a) no mention of employment, (b) mention of employment, (c) mention of employment with a Section 8 voucher, or (d) mention of just a Section 8 voucher.
Table 1. Cities in which field experiment took place by region and policy environment.
RegionVoucher discrimination:
Legal throughout the experimentVoucher discrimination:
Illegal at some point during the experiment
Northeast Providence, Allentown New York City (2008), Philadelphia (1980), Boston (1980), *Pittsburgh (2015)
Midwest Columbus, Indianapolis Chicago (1990), Milwaukee (June 2018), Oklahoma City (1985), St. Louis (2015), *Minneapolis (March 2017)
South Charlotte, El Paso, Fort Worth, Houston, San Antonio, *Dallas, *Austin, New Orleans, Atlanta, Jacksonville
Memphis (2002), Miami (2009), Washington, DC (2005), Baltimore City (April 2019)
West Phoenix, Los Angeles Denver (August 2018), San Diego (August 2018)
Note. SOI = Source of Income. PRRAC = Poverty & Race Research Action Council. Enactment year (and month, if it occurred during the study) is given in parentheses. SOI discrimination legality data are from PRRAC (November 12, 2019) and publicly available materials.
*The legal status of voucher antidiscrimination laws was contested in these cities during the study.
Table 2. First and last names used to signal home-seeker race/ethnicity.
Race/ethnicity First names Last names (percentage belonging to the race signaled)
White Emily, Sarah, Megan Wood (90%), Carlson (96%), Walsh (96%)Black Ebony, Keisha, Latoya Washington (90%), Jackson (53%), Banks (54%)Latina Ana, Maria, Rosa Rodriguez (93%), Hernandez (94%), Gonzalez (94%)
Note. White and Black names were selected from Gaddis (2017), whereas Latina names were selected from Lavender (1988) and Sharma et al. (2015). Last name data were taken from the U.S. Census Bureau (2000).
6 J. W. FABER AND M.-D. MERCIER

Rather than constructing paired responses that are identical on all but one characteristic, we randomly assigned the components of each message. The primary motivation behind this approach was practical: random assignment reduces the risk of detection by landlords if we unknowingly sent multiple messages to the same respondent. With a large sample, this method allows for statistical comparisons across experimental signals (e.g., married and unmarried signals) as well as within groups (e.g., Latina women with and without children; Besbris, Faber, Rich, & Sharkey, 2015; Besbris, Faber, & Sharkey, 2019; Gaddis, 2015; Lauster & Easterbrook, 2011). Because the order in which experimental signals are presented may affect estimations of any dimension of discrimination, we randomly assigned messages to signal race/ethnicity at either the beginning or the end of the message. Table A1 (in the Appendix) provides examples of experimental message structure with intended signals.4
Data Collection
On Mondays and Thursdays from October 2, 2017 to May 23, 2019, we responded to the most recent ad on Craigslist for a one- or two-bedroom unit5 that was posted on the first or second page of each of the cities randomly selected for that day’s data collection (either the newest post on the first page or the 100th newest post on the second page).6 Consistent with the literature on online field experiments, limiting data collection to twice a week reduced the risk of detection (Oh & Yinger, 2015). We also limited searches to units with rents below HUD FMRs in each city to avoid issues arising from the fact that voucher recipients who choose units with rents above FMR must pay the difference between FMR and the higher rent (we comment on potential bias caused by this sampling decision in the Discussion section below). In addition to a conservative sampling schedule, we created data collection protocols to avoid sending a housing agent multiple messages, including searching prior posts we responded to for identical information (i.e., the contact phone number). Although these steps were necessary to limit the risk of detection, they may have biased the sample toward smaller buildings and/or networks of buildings. Given prior work indicating that large housing complexes are sites of the most dramatic discrimination (Garboden et al., 2018b), this may also mean that our sampling procedures downwardly biased our results.
We gathered information from each advertisement, including the unit’s square footage, the numbers of bedrooms and bathrooms, the rent, the phone number of the advertiser (if included), and the full text of the title and advertisement. We also collected geographic information provided7
and the dates of the original posting as well as any update of the post. In total, we sent 4,058 inquiries to the representatives of rental units in 31 cities.8
After coding responses according to schemes used by earlier online audits(Besbris et al., 2015, 2019; Lauster & Easterbrook, 2011), we evaluate two primary outcomes: (a) whether our inquiries received any response at all (either positive or negative) and (b) whether our inquiries received a positive response. We define a positive response as one that indicates a willingness to show the unit, and code these 1. Nonresponse is coded 0 for the first outcome. For the second outcome, negative responses (e.g., those indicating that the unit is no longer available) and nonresponse are both coded 0. Nonresponse and negative responses are distinct, although related, phenomena. Whereas the former may be more ambiguous to interpret than the latter, disparities in nonresponse suggest aggregate patterns of discriminatory behavior (i.e., disparate impact via differentials in information conveyance; Turner et al., 2013). Whereas our measure of any response includes negative responses, independently modeling differences across experimental signals in explicit refusal provides insight into another potential form of bias (i.e., a willingness to communicate at all). In results available upon request, we estimated multinomial models of a three-category outcome (i.e., no response, response, and positive response). These results were substantively identical to the main findings presented here. The value of distinguishing nonresponse from negative responses is particularly important when we model the efficacy of antidiscrimination laws, as our results suggest that where these laws are in effect explicit bias (i.e., negative response) is replaced by implicit bias (i.e., nonresponse).
HOUSING POLICY DEBATE 7
Estimating Multidimensional Discrimination
We separately model the likelihoods of our two primary outcomes—receiving any response and receiving a positive response—using linear probability models, for ease of interpretation of interac-tions. Differences in outcomes across race/ethnicity, family structure, and voucher receipt are of primary concern, as are differences between cities that allow and prohibit voucher discrimination. Because we are also interested in whether these characteristics work in concert to shape housing opportunity, we estimate additional interacted models. Our statistical models control for the char-acteristics of the advertisement as well as experimental characteristics (e.g., variations in our message text, the month in which the message was sent, and the number of previous messages sent in each market). All models include robust standard errors. Because our experiment takes place at the initial stage of a housing search (i.e., outreach to brokers/landlords), we will likely understate the total extent of discrimination because we will not capture discrimination that may emerge in subsequent interactions, such as face-to-face interviews.
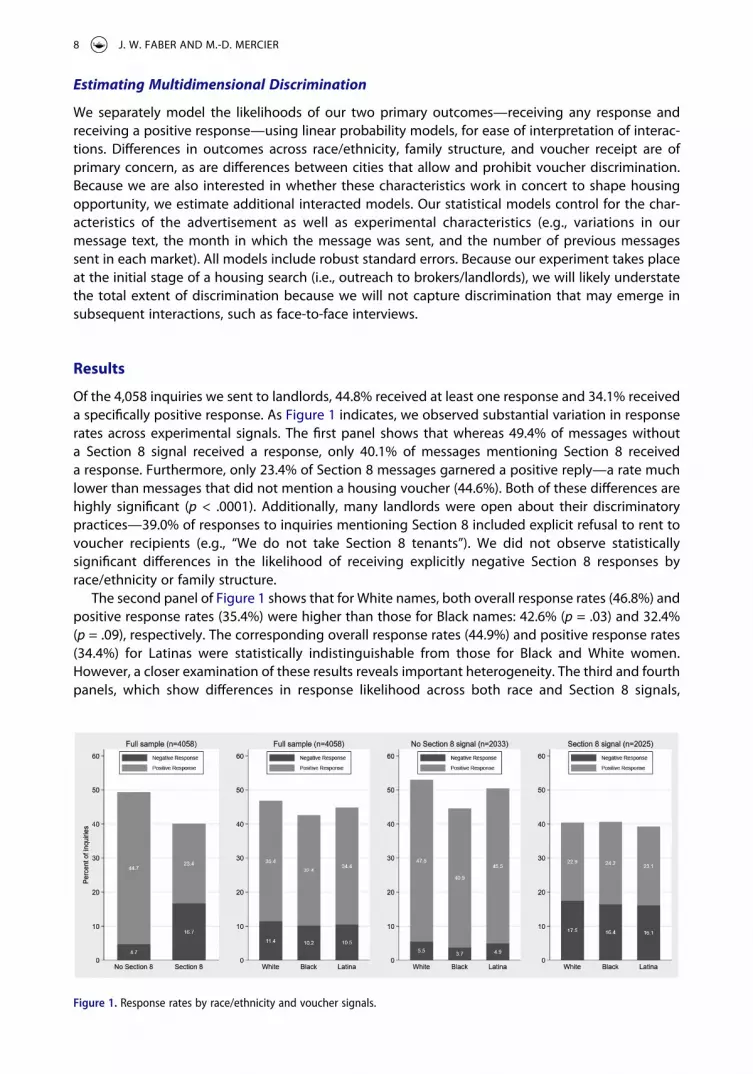
Results
Of the 4,058 inquiries we sent to landlords, 44.8% received at least one response and 34.1% received a specifically positive response. As Figure 1 indicates, we observed substantial variation in response rates across experimental signals. The first panel shows that whereas 49.4% of messages without a Section 8 signal received a response, only 40.1% of messages mentioning Section 8 received a response. Furthermore, only 23.4% of Section 8 messages garnered a positive reply—a rate much lower than messages that did not mention a housing voucher (44.6%). Both of these differences are highly significant (p < .0001). Additionally, many landlords were open about their discriminatory practices—39.0% of responses to inquiries mentioning Section 8 included explicit refusal to rent to voucher recipients (e.g., “We do not take Section 8 tenants”). We did not observe statistically significant differences in the likelihood of receiving explicitly negative Section 8 responses by race/ethnicity or family structure.
The second panel of Figure 1 shows that for White names, both overall response rates (46.8%) and positive response rates (35.4%) were higher than those for Black names: 42.6% (p = .03) and 32.4% (p = .09), respectively. The corresponding overall response rates (44.9%) and positive response rates (34.4%) for Latinas were statistically indistinguishable from those for Black and White women. However, a closer examination of these results reveals important heterogeneity. The third and fourth panels, which show differences in response likelihood across both race and Section 8 signals,
Figure 1. Response rates by race/ethnicity and voucher signals.
8 J. W. FABER AND M.-D. MERCIER

indicate dramatic Black–White disparities among inquiries that did not mention a voucher. Among messages that did not signal voucher receipt, the Black–White gap in the overall response rate increased to 8.4% (p = .002), whereas the gap in the positive response rate increased to 6.6% (p = .014). Black–Latina differences were also significant within this subsample, with Black names again faring worse. White–Latina differences were not statistically different. Results in the fourth panel indicate that among messages that signal voucher receipt, the three groups received statis-tically indistinguishable replies.
We also found variation across family structure signals, as well as racial heterogeneity in these signals’ effects. Whereas the first panel of Figure 2 shows that, on average, mentioning a child had no impact on the likelihood of receiving any response or a positive response, the second panel suggests a marriage effect. Specifically, messages that mentioned a husband were slightly more likely to receive a response (46.3%) than messages that did not (43.3%; p = .053). However, the mean difference in positive response rate (2.2%) was not statistically significant.9 The third and fourth panels show the effect of family structure on response rates by race/ethnicity. As the third panel indicates, when we signaled the presence of a child, White advantage in positive response rate emerged (p = .034) and as the fourth panel indicates, when we signaled the presence of a husband, a Latina advantage in positive response rate emerged (p = .048). We explore these dynamics in greater detail below, including separate analyses of total response rates and positive response rates.
Model Estimates of Multidimensional Discrimination
Table 3 presents selected results10 from a series of linear probability models predicting the likelihood that a message receives any response (Models 1–3) or a positive response (Models 4–6). Because we did not conduct a matched-pair study, all models include a full set of controls for experimental variables (e.g., message text and signal order) and apartment listing characteristics (e.g., number of bedrooms and bathrooms), as well as city fixed effects (i.e., to control for intercity heterogeneity), month fixed effects, and robust standard errors.
Model 1 is estimated among the full sample of sent messages. Within this sample, signaling a Black name decreases the likelihood of receiving any reply by 3.5%, whereas the Section 8 voucher signal decreases the likelihood of any reply by 9.2%. The coefficient for Latina signal is negative, although not significant. Models 2 and 3 disaggregate the sample by voucher signal. In Model 2, which is limited to messages that signal voucher receipt, no coefficients are significant. This indicates that when compared with White women signaling voucher use, Black women and Latina women signaling voucher use are just as likely to receive a response from a landlord. However, in Model 3,
Figure 2. Response rates by race/ethnicity and family structure.
HOUSING POLICY DEBATE 9

which is limited to messages without a voucher signal, we again find a decreased likelihood of receiving any response for Black women relative to White women. In this case, the response rate for Black women was 8.0% lower than that for White women.
Models 4–6 estimate the likelihood of receiving a positive response. Among the full sample we find a significant disadvantage for Section 8 recipients. Signaling Section 8 decreases the likelihood of a positive reply by 21%. The coefficients for Black and Latina are negative, but lack precision. Among the subsample of messages that do not signal voucher receipt, we again find a decreased likelihood (6.3%) of a positive response for Black women.
Table 4 presents selected results from six models, which explore whether the voucher signal functions differently among women of the same race/ethnicity. We examine within-group variation in the effect of voucher status by stratifying models by the White, Black, and Latina signals. Models 1 and 2, which are limited to inquiries sent from White women, indicate negative effects of mentioning Section 8 on both the likelihood of receiving any response and of receiving a positive response for this group. Results within the Latina sample (Models 5 and 6) also show a negative effect on both outcomes.
The above results are in line with what prior studies on voucher discrimination would predict: White and Latina women who do not signal voucher receipt fare better in their likelihood of receiving any response, and of receiving a positive response, compared with their voucher counter-parts. Results for Black women suggest that a somewhat different process may be shaping outcomes for this group. Unlike White and Latina women, Black women who do not signal voucher receipt have a similar likelihood of receiving any response from a landlord to Black women who signal voucher receipt (Model 3). With respect to the likelihood of receiving a positive response, however, the results are as expected: Black women not signaling voucher use experience an improved like-lihood of getting a positive response relative to their voucher counterparts (Model 4).
We also examine the relationship between the likelihood of receiving any response or a positive response by whether race or voucher receipt is signaled first (see Table A5). In doing so, we gain insight into how landlords might weigh signals as they are presented in our messages. It is possible
Table 3. Linear probability models of whether an apartment inquiry received at least one positive response.
Outcome: Any response Outcome: Positive response
All inquiries Section 8 signal No Section 8 signal All inquiries Section 8 signal No Section 8 signalSample Model 1 Model 2 Model 3 Model 4 Model 5 Model 6
Black − .035* .008 − .080** − .025 .010 − .063*(.016) (.024) (.028) (.015) (.023) (.026)
Latina − .012 − .013 − .014 − .004 .008 − .011(.015) (.026) (.022) (.013) (.022) (.022)
Child − .016 − .008 − .017 − .020 − .010 − .021(.018) (.026) (.021) (.014) (.017) (.022)
Husband .026 .035 .013 .016 .031+ .001(.017) (.021) (.023) (.012) (.016) (.022)
Section 8 − .092*** − .211***(.020) (.016)
No. observations 4,058 2,025 2,033 4,058 2,025 2,033
Note. All models include a full set of experimental and advertisement controls. Robust standard errors are given in parentheses. +p < .1. *p < .05. **p < .01. ***p < .001.
Table 4. Estimates of Section 8 effects stratified by race/ethnicity signal.
Race signal White name Black name Latina name
outcome Any response Positive response Any response Positive response Any response Positive responseModel 1 Model 2 Model 3 Model 4 Model 5 Model 6
Section 8 − .119*** − .240*** − .036 − .168*** − .124*** − .229***(.029) (.030) (.032) (.024) (.028) (.024)
No. observations 1,359 1,359 1,355 1,355 1,344 1,344
Note. All models include a full set of experimental and advertisement controls. Robust standard errors are given in parentheses. +p < .1. *p < .05. **p < .01. ***p < .001.
10 J. W. FABER AND M.-D. MERCIER
that once Section 8 is signaled, no further experimental signals register (consciously or uncon-sciously) for the respondent. We can explore this possibility because we randomized the order of Section 8 and race signals. When we separately estimate response rates for messages that signaled race before Section 8, we find that the coefficient for Black names is negative and significant, whereas Latina remains nonsignificant. Put differently, controlling for voucher receipt, signaling first that the applicant is Black results in a decreased likelihood of any response or a positive response relative to White applicants. However, when voucher receipt is signaled first, there is no difference in the likelihood of receiving a response for Black and Latina applicants relative to White applicants. These findings suggest that whereas signaling voucher receipt at the start of a message harms all applicants, a race signal at the start of a message uniquely penalizes Black applicants.
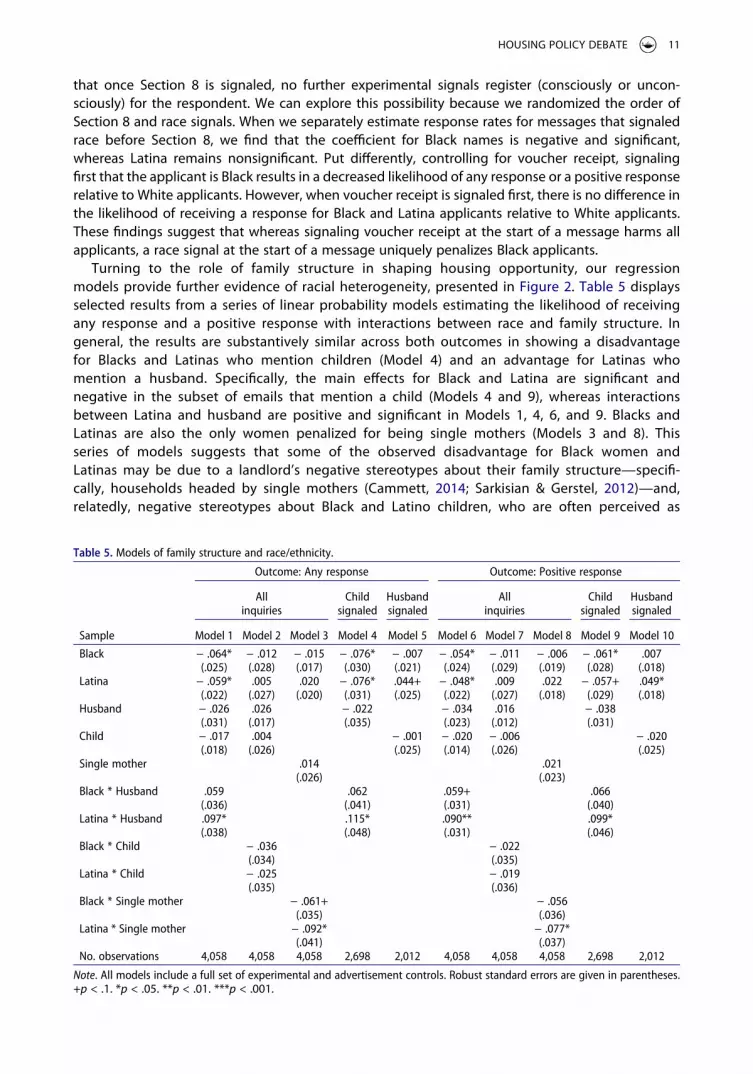
Turning to the role of family structure in shaping housing opportunity, our regression models provide further evidence of racial heterogeneity, presented in Figure 2. Table 5 displays selected results from a series of linear probability models estimating the likelihood of receiving any response and a positive response with interactions between race and family structure. In general, the results are substantively similar across both outcomes in showing a disadvantage for Blacks and Latinas who mention children (Model 4) and an advantage for Latinas who mention a husband. Specifically, the main effects for Black and Latina are significant and negative in the subset of emails that mention a child (Models 4 and 9), whereas interactions between Latina and husband are positive and significant in Models 1, 4, 6, and 9. Blacks and Latinas are also the only women penalized for being single mothers (Models 3 and 8). This series of models suggests that some of the observed disadvantage for Black women and Latinas may be due to a landlord’s negative stereotypes about their family structure—specifi-cally, households headed by single mothers (Cammett, 2014; Sarkisian & Gerstel, 2012)—and, relatedly, negative stereotypes about Black and Latino children, who are often perceived as
Table 5. Models of family structure and race/ethnicity.
Outcome: Any response Outcome: Positive response
All inquiries
Child signaled
Husband signaled
All inquiries
Child signaled
Husband signaled
Sample Model 1 Model 2 Model 3 Model 4 Model 5 Model 6 Model 7 Model 8 Model 9 Model 10
Black − .064* − .012 − .015 − .076* − .007 − .054* − .011 − .006 − .061* .007(.025) (.028) (.017) (.030) (.021) (.024) (.029) (.019) (.028) (.018)
Latina − .059* .005 .020 − .076* .044+ − .048* .009 .022 − .057+ .049*(.022) (.027) (.020) (.031) (.025) (.022) (.027) (.018) (.029) (.018)
Husband − .026 .026 − .022 − .034 .016 − .038(.031) (.017) (.035) (.023) (.012) (.031)
Child − .017 .004 − .001 − .020 − .006 − .020(.018) (.026) (.025) (.014) (.026) (.025)
Single mother .014 .021(.026) (.023)
Black * Husband .059 .062 .059+ .066(.036) (.041) (.031) (.040)
Latina * Husband .097* .115* .090** .099*(.038) (.048) (.031) (.046)
Black * Child − .036 − .022(.034) (.035)
Latina * Child − .025 − .019(.035) (.036)
Black * Single mother − .061+ − .056(.035) (.036)
Latina * Single mother − .092* − .077*(.041) (.037)
No. observations 4,058 4,058 4,058 2,698 2,012 4,058 4,058 4,058 2,698 2,012
Note. All models include a full set of experimental and advertisement controls. Robust standard errors are given in parentheses. +p < .1. *p < .05. **p < .01. ***p < .001.
HOUSING POLICY DEBATE 11

disorderly and aggressive (Ferguson, 2000; Gilliam, Maupin, Reyes, Accavitti, & Shic, 2016; Morris, 2007) and associated with crime (Quillian & Pager, 2001). The higher response rates among Latinas who mention a husband is somewhat surprising, especially considering prior work showing that Latino men are considered more aggressive and threatening (Yemane & Fernández-Reino, 2019). Perhaps landlords perceive a presumed economic stability in marriage as more important than their negative views toward Latinos.
We conducted robustness checks to confirm our race findings. We first tested whether our estimates of racial discrimination depended on the specific name used, based on previous research indicating that the strength of the race signal can depend on name choice (Gaddis, 2015). We re- estimated the magnitude of racial discrimination within the subsample of messages that did not include a Section 8 signal 27 times—each time removing one of the names from the sample. Figure A1 plots the coefficients for Black and Latina names from each of these models and indicates that no single name is driving the negative correlation between Black signals and the likelihood of receiving a positive response. Specifically, if we remove any name from the sample, the coefficient on the Black indicator variable remains significantly below zero. Similarly, removing any name from the sample does not change the null Latina result.
We conducted a similar analysis to investigate whether our estimates of discrimination against Black women and Latinas were driven by a single city. Figure A2 plots coefficients from 31 models in which we removed each city from the sample in turn. The pattern of racial discrimination was largely consistent across subsamples, although removing either New York City or Washington, DC, results in significant, negative coefficients for Latina signals. As with the discussion of Figure A1, we hesitate to draw inferences from these two specific subsamples.
Table 6 displays selected results from our final series of analyses, which estimate the efficacy of state and local laws prohibiting discrimination against voucher holders. These models use city random effects in lieu of fixed effects because of how little variation there is in the legality of Section 8 discrimination within cities (Allison, 2009). In Models 1–4 of this table, we estimate the linear probability of receiving any response (Models 1 and 2) or a positive response (Models 3 and 4) when we include indicator variables for whether an antivoucher discrimination law was in effect (a) at any time during our experiment or (b) at the time we sent the email inquiry (i.e., concurrent with our experiment). We also include an interaction between the Section 8 signal and two indicator variables. We expected that estimates of concurrent SOI laws’ effects would be more precise because this variable captures the change in legal environment in
Table 6. Models of source of income (SOI) antidiscrimination law efficacy.
Outcome: Any response
Outcome: Positive response
Outcome: Negative Section 8 response
Model 1 Model 2 Model 3 Model 4 Model 5 Model 6
Section 8 − .060** − .056** − .227*** − .215***(.021) (.019) (.020) (.017)
SOI antidiscrimination lawAny time during experiment .021 .026 − .199***
(.023) (.024) (.057)Concurrent with data collection .035 .026 − .178**
(.024) (.028) (.056)Any time * Section 8 − .054 .038
(.037) (.030)Concurrent * Section 8 − .083* .019
(.040) (.032)No. observations 4,058 4,058 4,058 4,058 874 874
Note. All models include a full set of experimental and advertisement controls as well as city-level random effects. Robust standard errors are given in parentheses.
+p < .1. *p < .05. **p < .01. ***p < .001.
12 J. W. FABER AND M.-D. MERCIER

fourcities (i.e., Baltimore; Denver, CO, Milwaukee, WI, San Diego, CA, Minneapolis, MN and Pittsburgh, PA which passed laws barring SOI discrimination, and Minneapolis and Pittsburgh, which lost such protections).
Whereas the first interaction term does not reach significance in Model 1, the second interaction term is negative and significant in Model 2. Results from Model 2 suggest that any response is less likely where and when it is illegal to discriminate against voucher recipients. However, neither interaction is significant in Models 3 or 4, suggesting no effect on the probability of receiving a positive response. We see similar results when the sample is stratified by legal environment: on average, the SOI effect is weaker on overall response rate in cities with SOI laws, but there are no differences in positive response rates (see Table A6).
Further light is shed on this dynamic in Models 5 and 6, which estimate the probability of receiving a negative response that specifically mentions Section 8 (e.g., “We do not accept Section 8”) within the sample of messages that included a Section 8 signal. Both models predict dramatically lower probabilities of receiving an explicitly discriminatory response in places where such discrimination is illegal. In total, these results suggest that SOI laws may prompt landlords to hide their discriminatory behavior. Overt discrimination against voucher holders declines (Models 5 and 6), but so does overall response (Model 2). We also explored whether SOI law effects varied by race or family structure, but found no evidence of such heterogeneity.
Discussion
Our study of online rental housing markets in 31 of the largest cities in the United States revealed substantively and statistically significant evidence of multidimensional discrimination. We find that race/ethnicity, family structure, and voucher receipt shape the likelihood of access to housing in compounding ways with important implications for families. Consistent with the prior literature, we find that race is a powerful predictor of access. Specifically, without mentioning voucher receipt, Black women were 8.0% less likely to receive any response and 6.3% less likely to receive positive responses than White women. In terms of White–Latina differences, we find lower average response rates and positive response rates for Latinas. However, these differences are not statistically sig-nificant, possibly because of weak White and/or Latina signals. We find evidence that anti-Latina bias and anti-Black bias are tied to racialized assumptions about family structure. Blacks and Latinas, but not Whites, are penalized for mentioning children or single motherhood, whereas Latinas who mention a husband receive more favorable replies than do White women who mention a husband.
On average, mentioning Section 8 receipt reduced the likelihood of any response by 9.2% and of a positive response by 21.1%. White and Latina voucher recipients fared worse in terms of both receiving any response and receiving a positive response than did their nonvoucher counterparts. For Black women signaling voucher receipt, we find a significant decrease in the likelihood of a positive response, although the magnitude appears smaller than that for Whites and Latinas. Additionally, we do not find a statistically significant decrease in the likelihood of receiving any response. The differences in outcomes observed for Black women compared with White women and Latinas could be indicative of “floor effects” or “muted congruence” (Pedulla, 2018),p 1494.In other words, as a baseline, Black women encounter severe discrimination in the housing market, so the stigma and stereotypes associated with voucher receipt (which may overlap with those about Blacks as a group) result in limited additional harm for Black women relative to Whites and Latinas (Korver- Glenn, 2018, 2021; Pedulla, 2018). Unlike Black women, however, the latter two groups still have advantage to lose when voucher receipt is signaled.
Housing vouchers could racialize White and Latina names, although likely in different ways. White names may be less likely to communicate Whiteness when paired with a Section 8 signal because of racialized stereotypes of voucher holders. Conversely, Latina names may be more effective signals when concurrently signaled with Section 8 because of the same stereotypes. White people may lose Whiteness and Latinas may gain non-Whiteness when they are assumed to be poor. Our current
HOUSING POLICY DEBATE 13

study was not designed to interrogate this theory, but it is consistent with work highlighting racial ambiguity associated with socioeconomic status (Gaddis, 2017). The overlap of race and poverty—as well as prejudices based on these statuses—makes disentangling these effects in a regression framework difficult. Our findings, therefore, represent a foundation upon which future work can build.
Our examination of signal order provides further insight into the interplay between race and voucher signal and serves to inform the design of future field studies. Coefficients on Black indicator variables were significant and negative among messages that presented the Black signal before the voucher signal, suggesting signal order is relevant to simultaneous estimation of multiple potential sources of discrimination. This finding implies that different patterns of self-identification carry different risks of exposure to bias and indicates that the order and perhaps the hierarchical nature of discriminatory heuristics is an important social phenomenon worth of additional study.
Evidence of significant bias against voucher recipients is of concern because these households are economically vulnerable and most have children under 18 (Mazarra, Sard, & Rice, 2016). Additionally, considering our finding that SOI laws, on average, appear insufficient to reduce overall levels of discrimination (i.e., they convert landlord behavior from explicit negative response to nonresponse), it is clear that many of these families encounter bias regardless of policy environment. Perhaps this finding should not be surprising given the fact that racial discrimination has been illegal for over half a century, yet we still find evidence of its persistence. Nevertheless, rigorous investigation of heterogeneity within SOI laws, including variation in enforcement, penalties, monitoring, and com-munication, should be pursued in future scholarship to understand when SOI laws most effectively protect voucher recipients and how existing policies might be improved.
Although our results provide critical insight into challenges families seeking housing might encounter based on race, ethnicity, family structure, voucher receipt, and the intersection of these statuses, there are limitations to our findings. There are numerous other sources of disadvantage and advantage, which may work in intersecting ways to shape discriminatory patterns. In the present study, because of concerns about statistical power, we signaled race with female names. As a consequence, we are unable to assess gender bias in this market, including gender-by-race bias. Similarly, our signals indicating a child are genderless and limited to one, relatively young child. It is possible that having an older child or multiple children may produce greater concern among landlords, especially if the applicant is a single mother. As noted earlier, because of concerns about statistical power and experimental viability (e.g., avoiding detection by landlords), we limited our analyses to White, Black, and Latina names. However, given the dramatic rise in hate crimes directed toward individuals of Asian descent during the COVID-19 pandemic (Kanno-Youngs, 2021), Asian women may have a unique experience in the rental market that should be examined in future work. We also acknowledge that landlords may have specific income, savings, and/or credit score minimums for potential tenants, which were not examined in the present study. Studies examining these additional phenomena could provide further insight into discrimination.
We also focus on the first interaction between landlord and home seeker. Housing searches are multistage processes, and if we assume discrimination is present at stages beyond initial contact, we are likely underestimating total discrimination. Studying steps after the initial inquiry is difficult in an audit framework, as it increases the risk of detection by landlords. However, developing innovative methods for assessing the presence of bias at different stages in this process is a crucial research task (Cunningham et al., 2018; Korver-Glenn, 2018, 2021).
Although Craigslist is the largest housing market and evidence suggests it is representative of the entire rental market (Boeing & Waddell, 2016), it is possible that discriminatory patterns are different in other contexts. For example, it is unclear whether such patterns are more or less severe in in- person searches, although qualitative work has documented systemic bias against people of color (Besbris & Faber, 2017; Desmond, 2016; Korver-Glenn, 2018, 2021) and voucher recipients in in- person settings (Rosenblatt & DeLuca, 2012). If landlords only list a subset of their inventory on
14 J. W. FABER AND M.-D. MERCIER

Craigslist, discrimination may be less severe among those units compared with their full inventory, assuming the choice to publicly list a unit is linked to less discriminatory practices. If so, our findings would underestimate total discrimination.
We are unable to assess the role of neighborhoods in shaping discriminatory patterns because of the unreliability of geographic data provided on Craigslist. One challenge is the fact that landlords have multiple options for identifying a unit’s location: providing no geographic information at all (approximately 5% of advertisements), dropping a pin on a map (59%), listing an address (28%), or mentioning an intersection (9%). Each of these options offers different geographic specificity and accuracy. Another challenge is variation across cities in the rates at which landlords provide such data. For example, 47% of Fort Worth listings include a dropped pin, compared with 79% in Allentown, Pennsylvania. These differences are likely systematic and thus could bias estimates of the role of neighborhood in shaping discrimination. Future work with more consistent geographic data should investigate whether neighborhood characteristics shape discrimination.
Finally, our decision to sample units below each market’s FMR was necessary to insure we applied to apartments that a voucher holder could reasonably afford, although it also points in multiple directions for future work. The availability of listings below FMR varies widely across and within metropolitan areas. Our data are insufficient to estimate the role of housing market affordability or the segregation of FMR-qualifying units. We hypothesize that our sample underestimates overall discrimination in the market, insofar as landlords of higher priced apartments might be more likely to discriminate (Besbris & Faber, 2017).
Despite these limitations, this study carries implications for our understanding of race, family, and policy. Although discrimination in the housing market is not a new phenomenon, continued monitoring of its extent and nature is crucial for understanding present-day segregation and racial stratification (Massey, 2005; Pager & Shepherd, 2008; Quillian et al., 2017, 2020). Our experimental design furthers our understanding of these phenomena by providing a better estimation of hetero-geneity in the experience of discrimination across and within racial/ethnic groups. For example, our finding that only Blacks and Latinas face discrimination for being single mothers suggests that previous estimates of discrimination based on race and family structure may obfuscate nuance regarding the ways lived experiences of competing privileges and disadvantages shape disparate outcomes. This finding also forces us to consider the consequences of discrimination as phenomena experienced by families rather than just individuals—when a mother is prevented from securing an apartment, so are her children. As such, the consequences of continued bias in the housing market are broader than typically conceptualized. Finally, our results not only substantiate concerns that race remains a powerful driver of opportunity in the United States, but also illustrate the need for more flexible and diverse empirical tools to fully understand discrimination and for more effective policy tools to combat it.
Notes
1. To obtain a voucher, families apply to a local PHA, which certifies that their income is below the eligibility threshold of 80% of the area median income (Ellen, 2018). Recipients pay 30% of their income toward rent, whereas the federal government subsidizes the remainder, up to the local maximum payment standard set between 90% and 110% of the Fair Market Rent (FMR). The FMR is defined as either the 40th or the 50th percentile of rent in the metropolitan area.
2. Table A2 displays response rates for each name used in our study.3. Assessing compounding discrimination against families with male adolescents relative to families with younger
children, for example, would require additional signals for older children and sex. We were concerned that additional experimental variations would limit statistical power.
4. Table A3 displays the number of observations for each combination of experimental signals.5. This variation allows us to assess the impact of unit size on bias against various family structures. Families may be
refused a unit if the landlord believes it is too small (Turner, 2015), including refusal to rent a one-bedroom apartment to a family with children because of housing code restrictions. Landlords may also simply prefer smaller households because of decreased wear and tear on the unit.
HOUSING POLICY DEBATE 15
6. The age of a post was unrelated to discriminatory patterns (i.e., there was no difference in outcomes between newest posts and 100th newest posts). There were also no observed differences between ads that had been updated at least once and those without an update.
7. Models include indicators for whether the advertisement included a specific address (28% of listings), a street intersection (9%), or latitude and longitude (59%).
8. Models include indicators for the month our message was sent and a continuous measure of the number of messages previously sent in each market to control for idiosyncrasies, in part because of national holidays and because of occasional issues with data collection (e.g., research assistant hiring cycles). The number of previous messages sent to landlords within the same city was not a significant predictor of response, nor were month-by- year interactions. Together, these null results suggest that detection by landlords was likely not a source of bias.
9. We found no variation in family structure effects across the Section 8 signal.10. Full results are available in Table A4.
Acknowledgments
Both authors contributed equally to the production of this article. Our work was supported by the Russell Sage Foundation (Award 83-17-24) and funding from New Yorl University’s Robert F. Wagner School of Public Service. The authors thank Matthew Desmond, Ingrid Gould Ellen, Patrick Fowler, S. Michael Gaddis, Maria Krysan, Brian McCabe, Katherine O’Regan, David Pedulla, Vincent Reina, Eva Rosen, Zawadi Rucks-Ahidiana, and Margery Turner for their extensive feedback on early drafts of this project. We are also very grateful for the contributions made by Sarah Aita, Claudia Babcock, Roberta Barnett, Shengdi Chen, Rediet Demissie, Arman Hirose-Afshari, Alimatou Juwara, Peter Mattingly, Kahinee Shah, and Haowen Zheng.
Disclosure Statement
No potential conflict of interest was reported by the authors.
Funding
This work was supported by the Russell Sage Foundation [Award 83-17-24].
Notes on Contributors
Jacob William Faber is an associate professor of sociology and public service at New York University. He leverages observational and experimental methods to study the mechanisms responsible for sorting individuals across space and how the distributions of people by race and class interact with political, social, and ecological systems to create and sustain economic disparities. His scholarship highlights the rapidly changing roles of numerous institutional actors in facilitating the reproduction of racial and spatial inequality.
Marie-Dumesle Mercier is a doctoral student in the Department of Sociology at New York University. Her research interests include the relationship between law, social change, and racial inequality. She holds an A.B. from Princeton University and a J.D. cum laude from the University of Michigan Law School.
References
Aaronson, D., Faber, J., Hartley, D., Mazumder, B., & Sharkey, P. (2021). The long-run effects of the 1930s HOLC “redlining” maps on place-based measures of economic opportunity and socioeconomic success. Regional Science and Urban Economics, 86, 103622.
Allison, P. D. (2009). Fixed effects regression models (Vol. 160). Thousand Oaks, CA: SAGE publications.Aron, L., Aranda, C., Wissoker, D., Howell, B., Santos, R., Scott, M., & Turner, M. A. (2016). Discrimination against families
with children in rental housing markets: Findings of the pilot study. Washington, DC: U.S. Department of Housing and Urban Development, Office of Policy Development and Research.
Badger, E. (2016a, August 3). A pervasive form of housing discrimination that’s still legal. The Washington Post. Retrieved from https://www.washingtonpost.com/news/wonk/wp/2016/08/03/a-pervasive-form-of-housing-discrimination- thats-still-legal/?utm_term=.037d0d2d0600
Bell, A., Sard, B., & Koepnick, B. (2018, December). Prohibiting discrimination against renters using housing vouchers improves results: Lessons from cities and states that have enacted source of income laws. Retrieved from https://www. cbpp.org/research/housing/prohibiting-discrimination-against-renters-using-housing-vouchers-improves-results
16 J. W. FABER AND M.-D. MERCIER
Bertrand, M., E. Duflo et al. (2017). Field experiments on discrimination. In A. V. Banerjee & E. Duflo (Eds.), Handbook of Economic Field Experiments. (Vol 1, pp. 309–393). Amsterdam, Netherlands: Elsevier.
Besbris, M., Faber, J. W., Rich, P., & Sharkey, P. (2015). Effect of neighborhood stigma on economic transactions. Proceedings of the National Academy of Sciences of the United States of America 112 (16) 4994–4998.
Besbris, M., Faber, J. W., & Sharkey, P. (2019, May). Disentangling the effects of race and place in economic transactions: Findings from an online field experiment. City & Community 18 , 1–27.
Besbris, Max, and Jacob William Faber. (2017). Investigating the relationship between real estate agents, segregation, and house prices: steering and upselling in New York State. Sociological Forum 32(4):850–73.
Best, R. K., Edelman, L. B., Krieger, L. H., & Eliason, S. R. (2011). Multiple disadvantages: An empirical test of intersection-ality theory in EEO litigation. Law & Society Review, 45(4), 991–1025.
Boeing, G., & Waddell, P. (2016). New insights into rental housing markets across the United States: Web scraping and analyzing craigslist rental listings. Journal of Planning Education and Research 37 (4) , 457–476.
Brown, D. A. (2021). The whiteness of wealth: How the tax system impoverishes black Americans–And how we can fix it. New York, NY: Crown Publishing Group.
Cammett, A. (2014). Deadbeat dads & welfare queens: How metaphor shapes poverty law. Boston College Journal of Law and Social Justice, 34(2), 233–265.
Cho, S., Crenshaw, K. W., & McCall, L. (2013). Toward a field of intersectionality studies: Theory, applications, and praxis. Signs: Journal of Women in Culture and Society, 38(4), 785–810.
Choi, A., Herbert, K., Winslow, O., & Browne, A. (2019, December 4). Long Island divided: Undercover investigation reveals evidence of unequal treatment by real estate agent. Newsday. Retrieved from https://projects.newsday.com/ long-Island/real-estate-agents-investigation/
Collins, P. H., & Bilge, S. (2016). Intersectionality. Hoboken, NJ: Wiley.Collins, P. (2015). Intersectionality’s definitional dilemmas. Annual Review of Sociology, 41(1), 1–20.Crenshaw, K. (1989). Demarginalizing the intersection of race and sex: A black feminist critique of antidiscrimination
doctrine, feminist theory and antiracist politics. University of Chicago Legal Forum, 1989(1), 139–167.Cunningham, M., Galvez, M., Aranda, C. L., Santos, R., Wissoker, D., Oneto, A., . . . Crawford, J. (2018). A pilot study of
landlord acceptance of Housing Choice Vouchers, executive summary. Washington, DC: U.S. Department of Housing and Urban Development, Office of Policy Development and Research.
Desmond, M., An, W., Winkler, R., & Ferriss, T. (2013). Evicting children. Social Forces, 92(1), 303–327.Desmond, M. (2016). Evicted. New York, NY: Crown Publishers.Ellen, I. G. (2018). What do we know about Housing Choice Vouchers? Regional Science and Urban Economics 80 , (2018),
1–5.Faber, J. W. (2013). Racial dynamics of subprime mortgage lending at the peak. Housing Policy Debate, 23(2), 328–349.Faber, J. W. (2018). Segregation and the geography of creditworthiness: Racial inequality in a recovered mortgage
market. Housing Policy Debate, 28(2), 215–247.Faber, J. W. (2020). We built this: Consequences of new deal era intervention in America’s racial geography. American
Sociological Review, 85(5), 739–775.Ferguson, A. (2000). Bad boys: Public schools in the making of black masculinity. Ann Arbor: University of Michigan Press.Friedman, S. (2015). Commentary: Housing discrimination research in the 21st century. Cityscape, 17(3), 143–150.Gaddis, S. M. (2015). Discrimination in the credential society: An audit study of race and college selectivity in the labor
market. Social Forces, 93(4), 1451–1479.Gaddis, S. M. (2017). How black are Lakisha and Jamal? Racial perceptions from names used in correspondence audit
studies. Sociological Science, 4, 469–489.Garboden, P., Rosen, E., Greif, M., Deluca, S., & Edin, K. J. (2018b). Urban landlords and the Housing Choice Voucher
program. Washington, DC: U.S. Department of Housing and Urban Development.Gilliam, W. S., Maupin, A. N., Reyes, C. R., Accavitti, M., & Shic, F. (2016). Do early educators’ implicit biases regarding sex
and race relate to behavior expectations and recommendations of preschool expulsions and suspensions? Yale University Child Study Center. Retrieved from http://ziglercenter.yale.edu/publications/Preschool%20Implicit% 20Bias%20Policy%20Brief_final_9_26_276766_5379.pdf
Greenman, E., & Xie, Y. (2008). Double jeopardy? The interaction of gender and race on earnings in the United States. Social Forces, 86(3), 1217–1244.
Hancock, A.-M. (2013). Empirical intersectionality: A tale of two approaches. UC Irvine Law Review, 3, 259–296.Hanson, A., Hawley, Z., Martin, H., & Liu, B. (2016). Discrimination in mortgage lending: Evidence from a correspondence
experiment. Journal of Urban Economics, 92, 48–65.Hanson, A., & Hawley, Z. (2011). Do landlords discriminate in the rental housing market? Evidence from an internet field
experiment in U.S. cities. Journal of Urban Economics, 70(2–3), 99–114.Hayat, N. B. (2016). Section 8 is the new N-Word: Policing integration in the age of black mobility. Washington University
Journal of Law and Policy, 51(1), 061–093.Iceland, J., & Wilkes, R. (2006). Does socioeconomic status matter? Race, class, and residential segregation. Social
Problems, 53(2), 248–273.
HOUSING POLICY DEBATE 17

Kanno-Youngs, Z. (2021, March 31). President acts to combat racism toward Asian-Americans. The New York Times, Section A, p. 15.
Kennelly, I. (1999). ‘That single-mother element’: How white employers typify black women. Gender and Society, 13(2), 168–192.
Korver-Glenn, E. (2018). Compounding inequalities: How racial stereotypes and discrimination accumulate across the stages of housing exchange. American Sociological Review, 83(4), 627–656.
Korver-Glenn, E. (2021). Race brokers: Housing markets and segregation in 21st century urban America. Oxford, UK: Oxford University Press.
Krysan, M., & Crowder, K. (2017). Cycle of segregation: Social processes and residential stratification. New York, NY: Russell Sage Foundation.
Lauster, N., & Easterbrook, A. (2011). No room for new families? A field experiment measuring rental discrimination against same-sex couples and single parents. Social Problems, 58(3), 389–409.
Lavender, A. D. (1988). Latina given names in five United States cities: Onomastics as a research tool in ethnic identity. Latina Journal of Behavioral Sciences, 10(2), 105–125.
Logan, J. R., & Stults, B. (2011). The persistence of segregation in the metropolis: New findings from the 2010 census (pp. 1–25). Census Brief prepared for Project US2010. Retrieved from http://www.s4.brown.edu/us2010
Logan, J. R. (2016). As Long As There Are Neighborhoods. City & Community, 15(1), 23–28.Massey, D. S., & Denton, N. A. (1993). American apartheid: Segregation and the making of the underclass. Cambridge:
Harvard University Press.Massey, D. S., & Lundy, G. (2001). Use of black English and racial discrimination in urban housing markets: New methods
and findings. Urban Affairs Review, 36(4), 452–469.Massey, D. S., Rugh, J. S., Steil, J. P., & Albright, L. (2016). Riding the stagecoach to hell: A qualitative analysis of racial
discrimination in mortgage lending. City & Community, 15(2), 118–136.Massey, D. S. (2005). Racial discrimination in housing: A moving target. Social Problems, 52(2), 148–151.Mazarra, A., Sard, B., & Rice, D. (2016, October). Rental assistance to families with children at lowest point in decade.
Retrieved from https://www.cbpp.org/research/housing/rental-assistance-to-families-with-children-at-lowest-point-in- decade
Moore, K. (2016, November 4). Panel paper: Discrimination in rental market search outcomes for Housing Choice Voucher households: Findings from a multi-site email audit experiment. Presented at the 2016 APPAM Fall Research Conference, Washington, DC. Retrieved from https://appam.confex.com/appam/2016/webprogram/Paper18324.html
Morris, E. W. (2007). ‘Ladies’ or ‘Loudies?’: Perceptions and experiences of black girls in classrooms. Youth and Society, 38 (4), 490–515.
Murphy, J. (2016, June 7). Crackdown on landlords who rebuff Section 8. City Limits. Retrieved from http://citylimits.org/ 2016/06/07/crackdown-on-landlords-who-rebuff-section-8/
Ocen, P. A. (2012). The new racially restrictive covenant: Race, welfare, and the policing of black women in subsidized housing. UCLA Law Review, 59(6), 1540–1582.
Oh, S. J., & Yinger, J. (2015). What have we learned from paired testing in housing markets? Cityscape, 17(3), 15–60.Pager, D., & Karafin, D. (2009). Bayesian bigot? Statistical discrimination, stereotypes, and employer decision making. The
ANNALS of the American Academy of Political and Social Science, 621(1), 70–93.Pager, D., & Shepherd, H. (2008). The sociology of discrimination: Racial discrimination in employment, housing, credit,
and consumer markets. Annual Review of Sociology, 34(1), 181–209.Pattillo, M. (2013). Housing: Commodity versus right. Annual Review of Sociology, 39(1), 509–531.Pedulla, D. S. (2014). The positive consequences of negative stereotypes: Race, sexual orientation, and the job
application process. Social Psychology Quarterly, 77(1), 75–94.Pedulla, D. S. (2018). How race and unemployment shape labor market opportunities: Additive, amplified, or muted
effects? Social Forces, 96(4), 1477–1506.Phillips, David C. (2017). “Landlords Avoid Tenants Who Pay with Vouchers.” Economics Letters 151:48–52.Poverty & Race Research Action Council. (2019). Expanding choice: Practical strategies for building a successful housing
mobility program. Appendix B: State, local, and federal laws barring source-of-income discrimination updated January 30, 2019. Retrieved from https://prrac.org/pdf/AppendixB.pdf
Quillian, L., Lee, J. J., & Honoré, B. (2020). Racial discrimination in the U.S. housing and mortgage lending markets: A quantitative review of trends, 1976–2016. Race and Social Problems, 12(1), 13–28.
Quillian, L., & Pager, D. (2001). Black neighbors, higher crime? The role of racial stereotypes in evaluations of neighbor-hood crime. American Journal of Sociology, 107(3), 717–767.
Quillian, L., Pager, D., Hexel O., & Midtbøen, A. H. (2017). Meta-analysis of field experiments shows no change in racial discrimination in hiring over time. Proceedings of the National Academy of Sciences 201706255.
Roberts, D. E. (1992). Racism and patriarchy in the meaning of motherhood. The American University Journal of Gender, Social Policy & the Law, 1(1), 1–38.
Roscigno, V. J., Karafin, D. L., & Tester, G. (2009). The complexities and processes of racial housing discrimination. Social Problems, 56(1), 49–69.
18 J. W. FABER AND M.-D. MERCIER

Roscigno, V. J. (2007). The face of discrimination: How race and gender impact work and home lives. Lanham, MD: Rowman & Littlefield.
Rosen, E. (2020). The voucher promise: “Section 8” and the fate of an American neighborhood. Princeton, NJ: Princeton University Press.
Rosenblatt, P., & DeLuca, S. (2012). ‘We don’t live outside, we live in here’: Neighborhood and residential mobility decisions among low-income families. City & Community, 11(3), 254–284.
Rosie, T. J., Hatch, M. E., & Mead, J. (2017). Source of income discrimination and fair housing policy. Journal of Planning Literature, 32(1), 3–15.
Ross, S. L. (2011). Understanding racial segregation: What is known about the effect of housing discrimination. In H. B. Newburger, E. L. Birch, & S. M. Wachter (Eds.), Neighborhood and life changes: How place matters in modern America (pp. 288–301). Philadelphia: University of Pennsylvania Press.
Santos, R., Turner, M. A., Aron, L., & Howell, B. (2016). Future directions for research on discrimination against families with children in rental housing markets. Washington, DC: U.S. Department of Housing and Urban Development.
Sarkisian, N., & Gerstel, N. (2012). Nuclear family values, extended family lives: The power of race, class, and gender. New York: Routledge.
Shapiro, D. T., & Chaudhry, R. (2017). Poverty reduction programs help adults lacking college degrees the most. Washington, DC. Retrieved from https://www.cbpp.org/sites/default/files/atoms/files/2-16-17pov.pdf
Sharkey, Patrick, and Jacob William Faber. (2014). Where, when, why, and for whom do residential contexts matter? Moving away from the dichotomous understanding of neighborhood effects. Annual Review of Sociology 40(1):559–79.
Sharma, R., Mitra, A., & Stano, M. (2015). Insurance, race/ ethnicity,and sex in the search for a new physician. Economics Letters, 137, 150–153.
Taylor, K.-Y. (2019). Race for profit: How banks and the real estate industry undermined black homeownership. Charlotte: University of North Carolina Press Books.
Tighe, J. R. (2012). How race and class stereotyping shapes attitudes toward affordable housing. Housing Studies, 27(7), 962–983.
Turner, M. A., Santos, R., Levy, D. K., Wissoker, D., Aranda, C., & Pitingolo, R. (2013). Housing discrimination against racial and ethnic minorities 2012. Washington, DC: U.S. Department of Housing and Urban Development, Office of Policy Development and Research.
Turner, M. A. (2015). Other protected classes: Extending estimates of housing discrimination. Cityscape, 17(3), 123–136.U.S. Census Bureau. (2000). Genealogy data: Frequently occurring surnames from census 2000. Washington, DC: Author.U.S. Census Bureau. (2015). Current population survey, 2015 Annual Social and Economic (ASEC) supplement. Washington,
DC: Author.Wang, L. C., Ewens, M., & Tomlin, B. (2014). Statistical discrimination or prejudice? A large sample field experiment.
Review of Economics and Statistics, 96(1), 119–134.Yemane, R., & Fernández-Reino, M. (2019). Latinos in the United States and in Spain: The impact of ethnic group
stereotypes on labour market outcomes. Journal of Ethnic and Migration Studies 47 (6) , 1240–1260.Yousef, O. (2015, October 14). Section 8 voucher holders face blatant discrimination on Craigslist. WBEZ News. Retrieved
from https://www.wbez.org/shows/wbez-news/section-8-voucher-holders-face-blatant-discrimination-on-craigslist /60a2494c-b3b4-4173-b229-ed5d6c517c71
HOUSING POLICY DEBATE 19

Appendix
Figure A1. Coefficient plot testing the sensitivity of the findings to each name. Note. This figure displays coefficients for the Black and Latina indicator variables from 27 models in which each name (i.e., each race signal) was removed from the sample in turn. Every model includes full covariates and city fixed effects and is estimated within the sample of messages that did not include a Section 8 signal.
Figure A2. Coefficient plot testing the sensitivity of the race findings to each city. Note. This figure displays coefficients for the Black and Latina indicator variables from 31 models in which each city was removed from the sample in turn. Every model includes full covariates and city fixed effects and is estimated within the sample of messages that did not include a Section 8 signal.
20 J. W. FABER AND M.-D. MERCIER

Table A1. Sample messages and characteristics signaled.
Message Child Married Employed Voucher Race Signal order
Hello! I saw your ad on Craigslist for the apartment. I am looking for an apartment for myself and my third grade child. I have a Section 8 housing voucher. I look forward to hearing from you. —Ebony Washington
Yes No No Yes Black Race at end
Hello! I saw your ad on Craigslist for the apartment. I am looking for an apartment for myself, my husband, and my infant. I have a full time job. Is this unit still available? —Rosa Hernandez
Yes Yes Yes No Latina Race at end
Hello, I am responding to your apartment ad on Craigslist. My name is Emily Meyer. I am looking for an apartment for myself. I have a full time job. I look forward to hearing from you.
No No Yes No White Race at front
Hi! I am interested in your apartment listing on Craigslist. I am looking for an apartment for myself and my third grade child. I have a full time job and a Section 8 housing voucher. I look forward to hearing from you. —Ebony Jackson
Yes No Yes Yes Black Race at end
HOUSING POLICY DEBATE 21
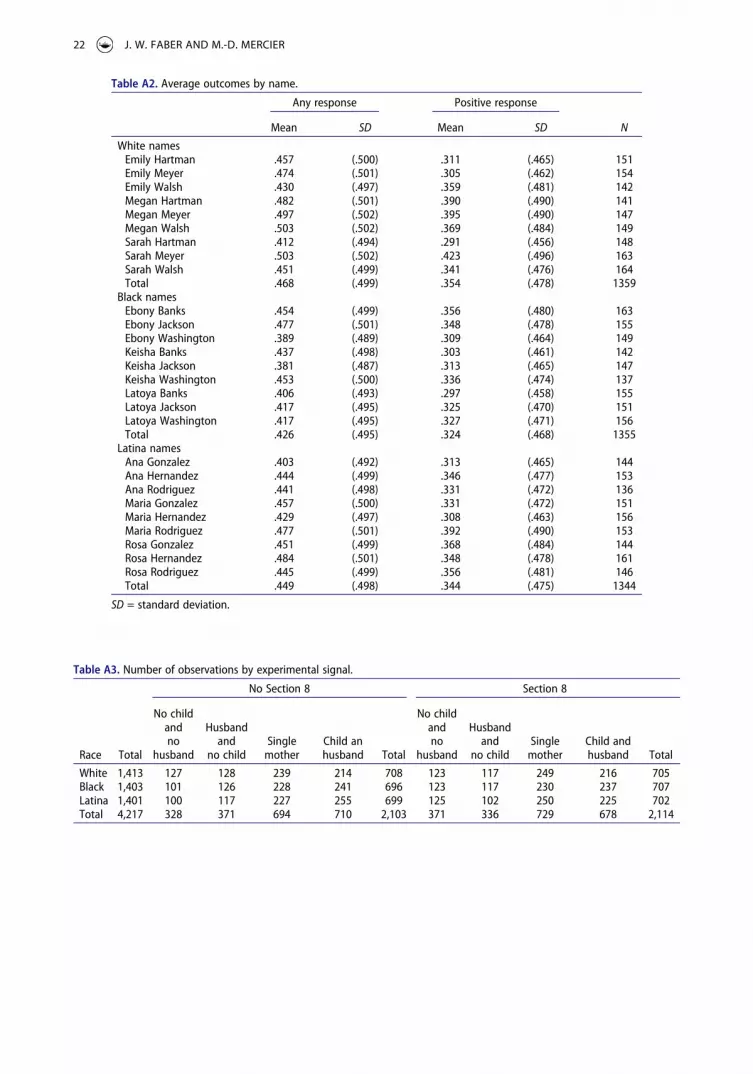
Table A2. Average outcomes by name.
Any response Positive response
Mean SD Mean SD N
White namesEmily Hartman .457 (.500) .311 (.465) 151Emily Meyer .474 (.501) .305 (.462) 154Emily Walsh .430 (.497) .359 (.481) 142Megan Hartman .482 (.501) .390 (.490) 141Megan Meyer .497 (.502) .395 (.490) 147Megan Walsh .503 (.502) .369 (.484) 149Sarah Hartman .412 (.494) .291 (.456) 148Sarah Meyer .503 (.502) .423 (.496) 163Sarah Walsh .451 (.499) .341 (.476) 164Total .468 (.499) .354 (.478) 1359
Black namesEbony Banks .454 (.499) .356 (.480) 163Ebony Jackson .477 (.501) .348 (.478) 155Ebony Washington .389 (.489) .309 (.464) 149Keisha Banks .437 (.498) .303 (.461) 142Keisha Jackson .381 (.487) .313 (.465) 147Keisha Washington .453 (.500) .336 (.474) 137Latoya Banks .406 (.493) .297 (.458) 155Latoya Jackson .417 (.495) .325 (.470) 151Latoya Washington .417 (.495) .327 (.471) 156Total .426 (.495) .324 (.468) 1355
Latina namesAna Gonzalez .403 (.492) .313 (.465) 144Ana Hernandez .444 (.499) .346 (.477) 153Ana Rodriguez .441 (.498) .331 (.472) 136Maria Gonzalez .457 (.500) .331 (.472) 151Maria Hernandez .429 (.497) .308 (.463) 156Maria Rodriguez .477 (.501) .392 (.490) 153Rosa Gonzalez .451 (.499) .368 (.484) 144Rosa Hernandez .484 (.501) .348 (.478) 161Rosa Rodriguez .445 (.499) .356 (.481) 146Total .449 (.498) .344 (.475) 1344
SD = standard deviation.
Table A3. Number of observations by experimental signal.
No Section 8 Section 8
Race Total
No child and no
husband
Husband and
no childSingle
motherChild an husband Total
No child and no
husband
Husband and
no childSingle
motherChild and husband Total
White 1,413 127 128 239 214 708 123 117 249 216 705Black 1,403 101 126 228 241 696 123 117 230 237 707Latina 1,401 100 117 227 255 699 125 102 250 225 702Total 4,217 328 371 694 710 2,103 371 336 729 678 2,114
22 J. W. FABER AND M.-D. MERCIER

Tabl
e A
4. F
ull c
ovar
iate
res
ults
.
Out
com
e: A
ny r
espo
nse
Out
com
e: P
ositi
ve r
espo
nse
Sam
ple
All i
nqui
ries
Sect
ion
8 si
gnal
No
Sect
ion
8 si
gnal
All i
nqui
ries
Sect
ion
8 si
gnal
No
Sect
ion
8 si
gnal
Mod
el 1
Mod
el 2
Mod
el 3
Mod
el 1
Mod
el 2
Mod
el 3
Blac
k−
.035
*(.0
16)
.008
(.024
)−
.080
**(.0
28)
− .0
25(.0
15)
.010
(.023
)−
.063
*(.0
26)
Latin
a−
.012
(.015
)−
.013
(.026
)−
.014
(.022
)−
.004
(.013
).0
08(.0
22)
− .0
11(.0
22)
Child
− .0
16(.0
18)
− .0
08(.0
26)
− .0
17(.0
21)
− .0
20(.0
14)
− .0
10(.0
17)
− .0
21(.0
22)
Hus
band
.026
(.017
).0
35(.0
21)
.013
(.023
).0
16(.0
12)
.031
+(.0
16)
.001
(.022
)Se
ctio
n 8
− .0
92**
*(.0
20)
− .2
11**
*(.0
16)
Full-
time
job
− .0
29+
(.014
)−
.021
(.018
)−
.047
*(.0
20)
− .0
25(.0
15)
.005
(.020
)−
.060
**(.0
22)
Gre
etin
g te
xt =
1−
.015
(.022
)−
.004
(.031
)−
.026
(.030
)−
.028
(.021
)−
.003
(.026
)−
.047
+(.0
27)
Gre
etin
g te
xt =
2−
.010
(.021
)−
.010
(.031
)−
.020
(.026
)−
.019
(.020
)−
.002
(.026
)−
.045
+(.0
24)
Sign
atur
e te
xt =
1−
.034
(.023
)−
.020
(.024
)−
.035
(.033
)−
.027
(.022
)−
.005
(.027
)−
.046
(.032
)Si
gnat
ure
text
= 2
.004
(.022
).0
46(.0
35)
− .0
32(.0
26)
− .0
04(.0
19)
.033
(.027
)−
.039
(.027
)N
th p
ost
in c
ity.0
06*
(.002
).0
08+
(.004
).0
04(.0
04)
.002
(.002
).0
01(.0
03)
.004
(.003
)Si
gnal
ord
er.0
19(.0
15)
.030
(.018
).0
14(.0
20)
.028
*(.0
14)
.044
**(.0
16)
.014
(.019
)Re
nt.0
00(.0
00)
.000
*(.0
00)
.000
(.000
).0
00(.0
00)
.000
(.000
).0
00(.0
00)
List
s sq
. ft.
.024
(.019
).0
32(.0
23)
.009
(.023
).0
23(.0
19)
.019
(.021
).0
25(.0
24)
List
ing
upda
ted
− .0
20(.0
14)
− .0
14(.0
20)
− .0
23(.0
19)
− .0
24(.0
15)
− .0
12(.0
17)
− .0
38+
(.022
)Be
droo
ms
= 1
.054
*(.0
20)
.007
(.024
).0
94**
(.028
).0
50*
(.018
)−
.009
(.022
).1
06**
*(.0
26)
Bedr
oom
s =
2−
.042
(.034
)−
.048
(.044
)−
.052
(.040
)−
.016
(.029
)−
.015
(.041
)−
.031
(.038
)Ba
thro
oms
= 1
.163
**(.0
52)
.112
(.073
).2
20**
*(.0
56)
.171
***
(.039
).1
22*
(.057
).2
51**
*(.0
51)
Bath
room
s =
2.0
58(.0
59)
.030
(.079
).1
04(.0
65)
.073
(.043
).0
58(.0
54)
.122
*(.0
54)
Bath
room
s =
3−
.024
(.073
)−
.044
(.115
).0
13(.0
86)
.012
(.060
)−
.009
(.089
).0
64(.0
78)
Page
− .0
21(.0
16)
− .0
12(.0
26)
− .0
34(.0
22)
− .0
12(.0
15)
.002
(.019
)−
.033
(.022
)N
ext
post
.023
(.017
).0
30(.0
22)
.021
(.024
).0
15(.0
16)
.013
(.022
).0
22(.0
22)
Ad in
clud
es p
hoto
of p
rope
rty
.059
*(.0
27)
.063
+(.0
32)
.054
(.035
).0
40(.0
25)
.007
(.029
).0
76*
(.032
)Ad
men
tions
add
ition
al p
rope
rtie
s−
.026
(.025
)−
.029
(.031
)−
.028
(.033
)−
.005
(.024
).0
03(.0
33)
− .0
10(.0
32)
Requ
ires
appl
icat
ion
fees
.029
(.023
).0
51*
(.024
).0
07(.0
32)
− .0
02(.0
19)
.002
(.027
)−
.007
(.028
)Re
quire
s te
nant
scr
eeni
ng.0
58*
(.028
).0
95*
(.035
).0
16(.0
40)
.008
(.026
).0
10(.0
24)
− .0
02(.0
39)
Ad m
entio
ns r
eal e
stat
e ag
ency
.057
(.041
).0
69(.0
53)
.040
(.047
).0
49(.0
34)
.048
(.050
).0
39(.0
41)
Has
lat./
long
..0
53+
(.031
).0
96*
(.037
).0
11(.0
49)
.039
(.030
).0
60(.0
43)
.012
(.045
)H
as in
ters
ectio
n.1
38**
(.041
).0
98(.0
60)
.183
**(.0
64)
.101
*(.0
41)
.052
(.055
).1
44*
(.062
)H
as o
ther
add
ress
.086
*(.0
36)
.102
*(.0
49)
.075
(.051
).0
47(.0
35)
.027
(.048
).0
58(.0
44)
Cons
tant
.156
(.115
)−
.110
(.147
).2
74*
(.132
).1
85+
(.095
)−
.086
(.117
).2
00(.1
30)
No.
obs
erva
tions
4,05
820
252,
033
4,05
820
252,
033
Not
e. A
ll m
odel
s in
clud
e ye
ar–m
onth
fixe
d eff
ects
as
wel
l as
code
r fix
ed e
ffect
s. R
obus
t st
anda
rd e
rror
s ar
e gi
ven
in p
aren
thes
es.
+p <
.1. *
p <
.05.
**p
< .0
1. *
**p
< .0
01.
HOUSING POLICY DEBATE 23
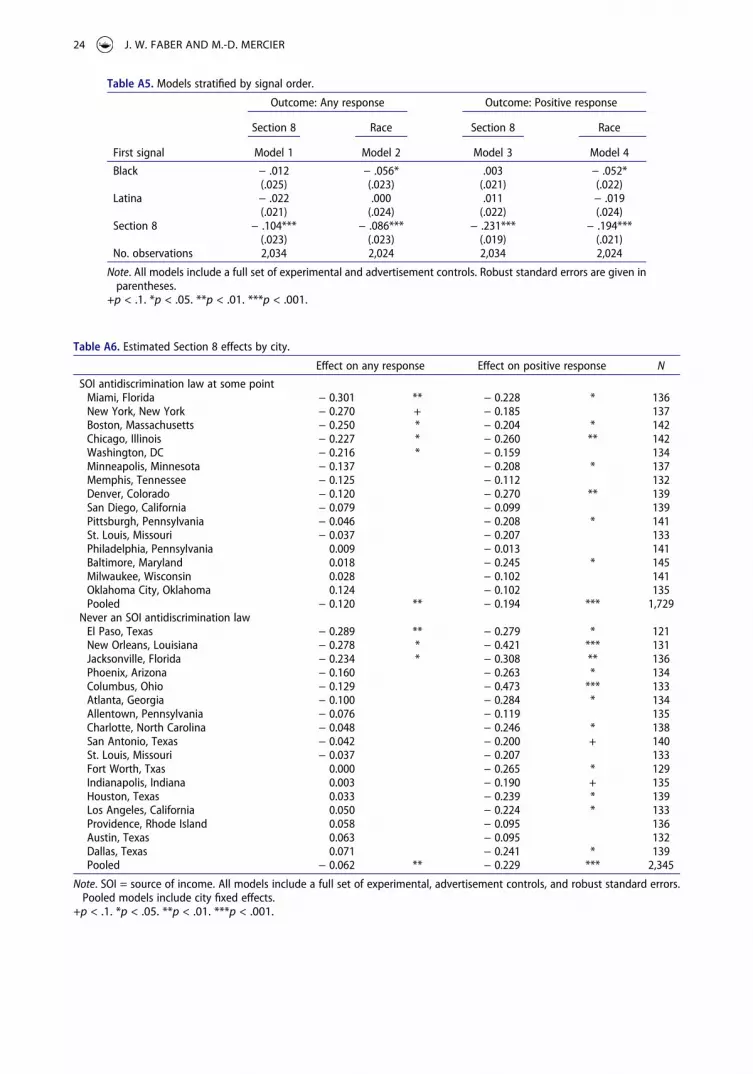
Table A5. Models stratified by signal order.
Outcome: Any response Outcome: Positive response
Section 8 Race Section 8 Race
First signal Model 1 Model 2 Model 3 Model 4
Black − .012 − .056* .003 − .052*(.025) (.023) (.021) (.022)
Latina − .022 .000 .011 − .019(.021) (.024) (.022) (.024)
Section 8 − .104*** − .086*** − .231*** − .194***(.023) (.023) (.019) (.021)
No. observations 2,034 2,024 2,034 2,024
Note. All models include a full set of experimental and advertisement controls. Robust standard errors are given in parentheses.
+p < .1. *p < .05. **p < .01. ***p < .001.
Table A6. Estimated Section 8 effects by city.
Effect on any response Effect on positive response N
SOI antidiscrimination law at some pointMiami, Florida − 0.301 ** − 0.228 * 136New York, New York − 0.270 + − 0.185 137Boston, Massachusetts − 0.250 * − 0.204 * 142Chicago, Illinois − 0.227 * − 0.260 ** 142Washington, DC − 0.216 * − 0.159 134Minneapolis, Minnesota − 0.137 − 0.208 * 137Memphis, Tennessee − 0.125 − 0.112 132Denver, Colorado − 0.120 − 0.270 ** 139San Diego, California − 0.079 − 0.099 139Pittsburgh, Pennsylvania − 0.046 − 0.208 * 141St. Louis, Missouri − 0.037 − 0.207 133Philadelphia, Pennsylvania 0.009 − 0.013 141Baltimore, Maryland 0.018 − 0.245 * 145Milwaukee, Wisconsin 0.028 − 0.102 141Oklahoma City, Oklahoma 0.124 − 0.102 135Pooled − 0.120 ** − 0.194 *** 1,729
Never an SOI antidiscrimination lawEl Paso, Texas − 0.289 ** − 0.279 * 121New Orleans, Louisiana − 0.278 * − 0.421 *** 131Jacksonville, Florida − 0.234 * − 0.308 ** 136Phoenix, Arizona − 0.160 − 0.263 * 134Columbus, Ohio − 0.129 − 0.473 *** 133Atlanta, Georgia − 0.100 − 0.284 * 134Allentown, Pennsylvania − 0.076 − 0.119 135Charlotte, North Carolina − 0.048 − 0.246 * 138San Antonio, Texas − 0.042 − 0.200 + 140St. Louis, Missouri − 0.037 − 0.207 133Fort Worth, Txas 0.000 − 0.265 * 129Indianapolis, Indiana 0.003 − 0.190 + 135Houston, Texas 0.033 − 0.239 * 139Los Angeles, California 0.050 − 0.224 * 133Providence, Rhode Island 0.058 − 0.095 136Austin, Texas 0.063 − 0.095 132Dallas, Texas 0.071 − 0.241 * 139Pooled − 0.062 ** − 0.229 *** 2,345
Note. SOI = source of income. All models include a full set of experimental, advertisement controls, and robust standard errors. Pooled models include city fixed effects.
+p < .1. *p < .05. **p < .01. ***p < .001.
24 J. W. FABER AND M.-D. MERCIER