multidimensional chromatography coupled to electrospray ionization time-of-flight mass spectrometry...
TRANSCRIPT

Journal of Chromatography B, 782 (2002) 267–289www.elsevier.com/ locate/chromb
M ultidimensional chromatography coupled to electrospray ionizationtime-of-flight mass spectrometry as an alternative to
two-dimensional gels for the identification and analysis ofcomplex mixtures of intact proteins
*Hongji Liu, Scott J. Berger, Asish B. Chakraborty, Robert S. Plumb, Steven A. CohenLife Sciences R& D Group, Waters Corporation, 34 Maple Street, Mail Stop TG, Milford, MA 01757,USA
Abstract
The limitations of 2-D gels for global proteomics have encouraged the development of alternative approaches foridentifying proteins in complicated mixtures, and determining their modification state. In this work, we describe theapplication of multidimensional liquid chromatography (SCX-RPLC) coupled with electrospray time-of-flight massspectrometry and off-line fraction collection to analyze complex intact protein mixtures. Methods were developed using bothstandard proteins and an enriched yeast ribosomal fraction sample containing|100 proteins, which permitted assessment ofthe effectiveness of the individual separation dimensions, as well as investigation of the interplay between separationcapacity and electrospray MS performance. 2002 Elsevier Science B.V. All rights reserved.
Keywords: Proteomics; Ribosomes; Proteins
1 . Introduction include reports on simplifying whole cell extractsprior to 1- or 2-D gels [5], and application of on-line
In both global and targeted proteomic studies, the electrophoretic [6,7] and chromatographic separa-limitations of 2-D gel electrophoretic methods are tions [8,9] coupled to mass detection.stimulating the development of non-gel based alter- Whole cell extracts contain a diverse set ofnatives. Recent reports from several groups have proteins, which vary from hydrophilic to hydro-demonstrated the utility of 1-D and 2-D chromato- phobic (including integral membrane proteins), high-graphic methods for the separation of global protein ly acidic to neutral to highly basic, and with pre-digests [1–4], but chromatographic methods for dicted masses ranging from below 10 kDa to incomplex mixtures of intact proteins are applied far excess of 150 kDa. This diversity of molecularless frequently to proteomic studies. Recent develop- properties results in a level of complexity where aments in global protein separations for proteomics single mode of chromatography produces fractions
enriched with similar components, but where thesheer number of proteins and modified proteins*Corresponding author. Tel.:11-508-482-2501; fax:11-508-prevents efficient detection and characterization of482-3625.
E-mail address: steven [email protected](S.A. Cohen). individual components. To date, no single dimension]
1570-0232/02/$ – see front matter 2002 Elsevier Science B.V. All rights reserved.PI I : S1570-0232( 02 )00554-8

268 H. Liu et al. / J. Chromatogr. B 782 (2002) 267–289
HPLC separation method can remotely approximate ration, which permits both fraction collection andthe effective resolving power of 2-D gel systems in on-line mass analysis using an ESI–TOF MS system.routine use today [10]. Using columns suitable for the analysis of a wide
Multi-dimensional HPLC separations and coupled range of proteins, we demonstrate the system’sHPLC–CE systems are currently being investigated utility to resolve mixtures of standard proteins, andas promising alternatives for intact protein sepa- more complex protein mixtures present in an en-rations in proteomics. The basic theory behind multi- riched yeast ribosomal protein fraction. Comparisonsdimensional separations, described by Giddings in of the 2-D system with a single dimension RPLCthe 1980s [11,12], and expanded upon by others separation conclusively demonstrate the power of the[13,14], shows that significant increases in system orthogonal IEX–RPLC system to present less com-peak capacity occur with 2-D systems having ortho- plex fractions to an analytical detector, with agonal separation mechanisms. Jorgenson’s group has resultantS /N enhancement for individual sampledescribed several 2-D LC systems for protein sepa- components. The volatile mobile phase used for therations. In one system combining IEX with RPLC, final reversed-phase step permitted direct coupling tothe effluent from the initial IEX step alternately ESI–TOF MS detection, which yielded tentativedelivered to one of two loading loops connected to a assignments for closely related molecular species,valve located between the IEX and RPLC columns including modified proteins, and nearly identical[15]. After the filling the first loop with IEX effluent, protein isoforms.the valve was used to direct the RPLC gradientthough the loop onto the RP column, placing thesecond loop in-line with the IEX column. The 2 . Experimentalprocess continued until the end of the IEX gradient.In a second system coupling SEC with RPLC, a 2 .1. Chemicalsvalve-switching method was employed to divert theeffluent from the first separation dimension to two Acetonitrile was purchased from J.T. Baker (Pitts-alternating RPLC columns for the second dimension burgh, USA), while formic acid, trifluoroacetic acid[10,16]. The SEC–RPLC system was also interfaced (TFA), standard proteins, and buffer componentswith ESI-MS detection for on-line identification of were obtained from Sigma–Aldrich (St. Louis, MO).protein mixture components. Class I (18 MV) deionized water was produced in
The most intensive studies to date have been house using an ElixS/GradientA10 (Millipore) waterreported by Lubman and colleagues [8,9,17] who purification system.have coupled a chromatofocusing first dimensionwith a reversed-phase LC second dimension for the 2 .2. Ion-exchange chromatographycharacterization of proteins in cancer cell extracts. Inthis work, protein masses were determined on-line LC separations were performed using one or twoby ESI–TOF MS, while peptide analysis of digested Waters 2795 liquid chromatographs (Waters, Mil-split fractions confirmed identifications. More recent- ford, MA), where eluted components were detectedly Unger and co-workers [18–20] described two- and by UV absorbance at 280 nm with a Model 2487three-dimensional chromatographic systems that Dual Wavelength Detector (Waters) and componentcombine size separation, ion-exchange and reversed- masses determined using an LCT� ESI–TOF MSphase modes to fractionate peptides and small pro- (Micromass UK). Cation-exchange chromatographyteins from partially purified hemofiltrate. In this case, was performed on a Shodex SP-420N column (4.63
fractions collected from the final reversed-phase step 35 mm; Showa Denko, Japan), and components werewere analyzed using MALDI–TOF MS. eluted with gradient profiles as described below.
In this report, we have focused on optimizing a Background contaminants originating from the ureacomprehensive two-dimensional HPLC system for used in the ion-exchange buffers were removed byintact proteins incorporating an initial ion-exchange passing mobile phases once through a 5 cm37.8 mm
step and a second dimension reversed-phase sepa- Symmetry C (Waters) column.18
H. Liu et al. / J. Chromatogr. B 782 (2002) 267–289 269
2 .3. Reversed-phase chromatography 2 .5. Two-dimensional chromatography: modelsoluble proteins
Reversed-phase chromatography was performedon either an 4.6333 mm Eichrom NPS C 1.5mm A solution of bovine serum albumin (BSA) and18
(Darien, IL, USA) or a 2.1350 mm Symmetry300� horse heart cytochromec was prepared in water toC column (Waters). Columns maintained at room give final concentrations of 66.8 and 10.0 mg/ml,4
temperature were developed using gradient condi- respectively. The separation of BSA and cytochrometions of 25–60% B at a flow-rate of 0.5 ml /min or c was performed using either linear or step gradient10–60% B at a flow-rate of 0.5 ml /min, where elution between 0 and 65% B with a flow-rate of 0.4eluent A was 0.1% TFA in water and eluent B was ml /min, where mobile phase A was 0.1% formic0.1% TFA in acetonitrile. The gradient time was acid containing 10% acetonitrile and mobile phase Bvaried from 10 to 200 min and the column effluent was 50 mM phosphate, pH 7.0 containing 1M NaClwas monitored by UV at 280 nm. and 10% acetonitrile. Over a total run time of 84
min, the eluent was divided into fourteen 6-min2 .4. Two-dimensional chromatography fractions and collected onto two NPS C 4.633318
mm columns, which were alternately developed withTwo-dimensional chromatography (SCX-RPLC) 4-min gradients (10–60% B, 1 ml /min).
was operated in two different modes. In the firstmode, the ion-exchange column was developed with 2 .6. Two-dimensional chromatography: enricheda linear gradient, and the effluent was alternately ribosomal protein fractiontrapped on a pair of reversed-phase columns, whichwere developed using gradient elution. In this appli- Ribosomal proteins were separated in the firstcation, the reversed-phase columns were operated dimension of the 2-D LC system using a Shodexwith 18-min gradients running from 20 to 50% B. SP-420N 4.6335 mm and a step gradient of 0–90%
In the second mode of operation the ion-exchange B in nine steps over 200 min at a flow-rate of 400column was developed using step elution, with each ml /min, using a variation of a previously publishedstep being alternately trapped on two RP columns, chromatographic study [21]. Eluent A was 50 mMwhich were developed using identical gradient con- methylamine, 6M urea, 0.5 mM DTT, adjusted toditions as with the continuous elution system. A pH 5.6 with acetic acid, containing 10% (v/v)schematic of the chromatographic system is shown in acetonitrile. Eluent B was eluent A plus 1M NaCl.Fig. 1. In this mode of operation, ten step ion- The individual elution steps were focused alternatelyexchange fractions were successively captured onto onto one of two identical reversed-phase columnsthe alternate reversed-phase columns, and while a (Waters Symmetry300 C , 3.5mm, 2.1350 mm),4
fraction was collected onto reversed-phase column 1, which were developed with a 20–50% B gradientthe second reversed-phase column was developed over 18 min at 0.5 ml /min, where eluent A waswith the acetonitrile gradient and its flow directed to 0.1% TFA in water and eluent B was 0.1% TFA inUV/ fraction collection and MS detectors. A column acetonitrile. The gradient tables for both the ion-selection valve (1) allowed the second column to be exchange and reversed-phase components of the two-switched to receive the SCX effluent while the other dimensional separation are given in Table 1.reversed-phase column was developed. The systemcontinued alternately collecting and eluting fractions 2 .7. Purification of large and small ribosomaluntil completion of the final the ion-exchange step. It subunits from Saccharomyces cerevisiaeis important to note that directing the reversed-phasegradient to waste during the initial 3–6 min, and Haploid yeast (S. cerevisiae strain BY4739final 0.5 min, of the gradient was necessary to [MATa leu2D0 lys2D0 ura3D0] were grown to mid-prevent non-volatile buffer components from ion log phase (OD 6.0) in shaker culture (SD media600
exchange from fouling the MS source, and reducing (Qbiogene), 250 rpm, 308C). A cell pellet wasspectral quality. obtained by centrifugation (5000g, 5 min, 48C) and

270 H. Liu et al. / J. Chromatogr. B 782 (2002) 267–289
Fig. 1. Schematic of the two- dimensional separation system. (A) The complete LC–LC-UV MS system and (B) detailed view of thepost-column configuration.
was washed once with cold distilled water. Ribosom- subunits, while use of the swinging bucket rotoral large subunits were purified using French press under essentially identical conditions (SW41, 40 000lysis and differential centrifugation/ultracentrifuga- rpm, 330 min, 48C) yielded only the large subunittion as described previously [22], except that ribo- (data not shown), as observed previously [22].somes were pelleted through a salt /sucrose cushion Ribosomal protein concentration (10 mg/ml) wasusing fixed angle centrifugation (Ti90 Rotor, 40 000 determined using the Bio-Rad (Hercules, CA) pro-rpm, 330 min, 48C). In contrast to the published tein assay and a bovine IgG standard. Samples wereprocedure, pelleting of ribosomes using the fixed quick-frozen and stored as aliquots at280 8C untilangle rotor yields both large and small ribosomal needed.
H. Liu et al. / J. Chromatogr. B 782 (2002) 267–289 271
Table 1 protein) were stored at 48C prior to injection, orGradients used for two-dimensional ribosomal protein separation quick-frozen for later use.
aTime Flow % A % B Curve
2 .9. Mass spectrometryA. Ion-exchange gradient0 0.4 100 0 –
20 0.4 95 5 1 LC/MS analysis was performed on a LCT ESI–40 0.4 84 16 1 TOF MS equipped with an orthogonal electrospray60 0.4 80 20 1
interface (Micromass, Manchester, UK). The instru-80 0.4 76 24 1ment was operated in positive ion mode with the100 0.4 72 28 1
120 0.4 68 32 1 following instrumental conditions: source tempera-140 0.4 64 36 1 ture, 1308C; desolvation temperature, 2508C; capil-160 0.4 60 40 1 lary voltage, 3.0 kV; cone voltage, 60 V; extraction180 0.4 10 90 1
cone, 3 V; and the RF, 450 V. Nebulization gas was200 0.4 100 0 1operated at 100 l /h while the desolvation gas was set
B. Reversed-phase gradient to 400 l /h. The TOF detector acquired data for a0 0.5 80 20 – maximum flight time of 65 ms with the MCP
18 0.5 50 50 6 operated at 2700 V.20 0.5 80 20 138 0.5 50 50 6
2 .10. Mass spectral deconvolution and ribosomal40 0.5 80 20 158 0.5 50 50 6 subunit assignment60 0.5 80 20 178 0.5 50 50 6 Deconvoluted masses of sample components were80 0.5 80 20 1
determined by a combination of manual and auto-98 0.5 50 50 6mated application of a maximum entropy (MaxEnt1)100 0.5 80 20 1
118 0.5 50 50 6 deconvolution algorithm included in the MassLynx�120 0.5 80 20 1 ver. 3.5 software package (Micromass). MaxEnt�138 0.5 50 50 6 spectra were generated from the entire acquiredm /z140 0.5 80 20 1
range to produce deconvoluted neutral mass spectra158 0.5 50 50 6in the mass range of 3000–46 000 Da, using a bin160 0.5 80 20 1
178 0.5 50 50 6 size of 0.5 Da, a Gaussian damage model with a180 0.5 80 20 1 width of 0.75 Da, and a processing limit of ten198 0.5 50 50 6 iterations or model convergence. LC/MS data were200 0.5 80 20 1
processed in an automated fashion by use ofa Curve 1 is a step function and curve 6 is a linear gradient step. OpenLynx� Software (Micromass), which automat-
ically selected TIC peaks using the PeakApexTrack� function, combined spectra comprising
2 .8. Chromatographic sample preparation for the approximate full width of each peak, and gener-ribosomes ated deconvoluted spectra using the MaxEnt1 algo-
rithm.Acid extraction based on the work of Hardy and Ribosomal protein assignment was accomplished
coworkers [23] was performed to remove nucleic by comparison of observed masses to those predictedacid contaminants prior to each analysis. Ribosomal from the yeast genome [24] sequence assuming theproteins were combined with 0.1 vol. of 1M MgCl presence or absence of the initiating methionine2
and 2 vol. of glacial acetic acid, and briefly mixed and/orN-acetylation. Additional identifications ofseveral times by light vortexing over 5 min. The processed and post-translationally modified ribosom-insoluble RNA fraction was pelleted by centrifuga- al subunits was made based on data obtained fromtion (Beckman-Coulter Model 22R, 10 000g, 3 min, the Yeast Protein Database [25,26] and other sourcesRT), and soluble protein extracts (est.|3.3 mg/ml as referenced.

272 H. Liu et al. / J. Chromatogr. B 782 (2002) 267–289
2 .11. Trypsin digestion buffer pH compatibility with the subsequent re-versed-phase dimension, and the use of positive ion
The collected ribosomal protein fractions, split mode mass detection. Buffers for optimal operationfrom a SCX-RP-ESI–TOF MS experiment, were of protein anion-exchange HPLC are usually in thedried by vacuum centrifugation, and then dissolved pH range of 7 or greater, which can cause columnin 50 mM NH HCO containing 2 mM DTT and degradation and poor chromatographic reproducibil-4 3
0.1% RapiGest� SF (Waters). Porcine trypsin ity with silica based reversed-phase columns. An(Promega, sequencing grade) was added at 1:50 (w/ additional consideration for this choice is the pres-w) ratio and incubated for 1 h at 378C. Digest was ence of nucleic acids in complex biologically derivedstored at280 8C until analyzed. samples (e.g. cell lysates or cytosolic fractions),
which would dominate competition for charged sites2 .12. Peptide mass fingerprinting by MALDI–TOF on SAX media, and potentially produce secondaryMS modes of protein retention (DNA/RNA affinity, and
polyphosphate based weak cation exchange).Peptide mass fingerprint (PMF) analyses of each
of the digested fractions was performed on a Micro-mass M@LDI� R TOF MS equipped with time lag 3 .2. Linear versus step gradients for ion-exchangefocusing, and operated in the positive ion reflector separationsmode. Acquired spectra were the sum of ten lasershots per position and ten positions per sample well. Although continuous linear gradients are the normSpectra were internally calibrated using 40 fmol of with protein ion-exchange chromatography, there are[Glu1]-fibrinopeptide (Sigma) spiked into the matrix two strong arguments against using linear gradientssolution, as well as a major trypsin autoproteolytic and in favor of a step gradient approach. First,peptide (MH152211.105). A 1-ml aliquot of digest capturing IEX effluent on alternating reversed-phasewas applied on the MALDI target plate followed by columns simply recombines any components re-an equal volume of alpha-cyano-4-hydroxycinnamic solved during the ion-exchange separation, negatingacid (10 mg/ml) in 49.95% methanol, 49.95% additional selectivity generated from application of aacetone and 0.1% TFA. Automated data acquisition gradient. More importantly, ‘‘fraction splitting’’,and processing of the PMF data were performed which occurs when peaks elute as the flow path isunder Mass Lynx� v3.5 software control. Proteins switched from one reversed-phase column to thewere identified by the PeptideAuto PMF database- other, is more likely in multidimensional separationssearching module, operating within ProteinLynx when peaks are broad. It is also directly related toGlobal Server� v1.1 (Micromass). Peptide MS the frequency of second dimension column switchingspectra were searched against a non-redundant trans- such that the advantage of rapid sampling in the firstlated yeast ORF database (ftp: / /genome-ftp.stanford. dimension may be negated.edu/pub/yeast /yeast protein /) with constraints of To minimize the likelihood of the fraction splitting
]30-ppm mass measurement accuracy, potential Met phenomenon, we explored step gradient elution foroxidation, and up to one missed trypsin cleavage. the ion-exchange separation. This allows one to
exploit the tendency of proteins to interact withion-exchange surfaces at multiple binding sites
3 . Results and discussion [27,28]. In accordance with this stoichiometric dis-placement model is the observation that proteins will
3 .1. Ion-exchange chromatography of proteins elute from an ion-exchange column at a buffer ionicstrength that may be only 0.01M greater than one at
Although both anion and cation-exchange HPLC which retention is essentially infinite due to thewere viable options for protein ion-exchange sepa- cooperative nature of multiple site binding. Byrations, cation-exchange HPLC was selected for the operating the ion-exchange column in a series offirst separation dimension primarily on the basis of stepped increments, the theory would predict that
H. Liu et al. / J. Chromatogr. B 782 (2002) 267–289 273
only those proteins with significant linear velocity at step gradient mode. This observation has been madea particular ionic strength will elute in that IEX when analyzing several model proteins includingfraction, and that neighboring step fractions should cytochromec and lysozyme (data not shown).be essentially devoid of those proteins.
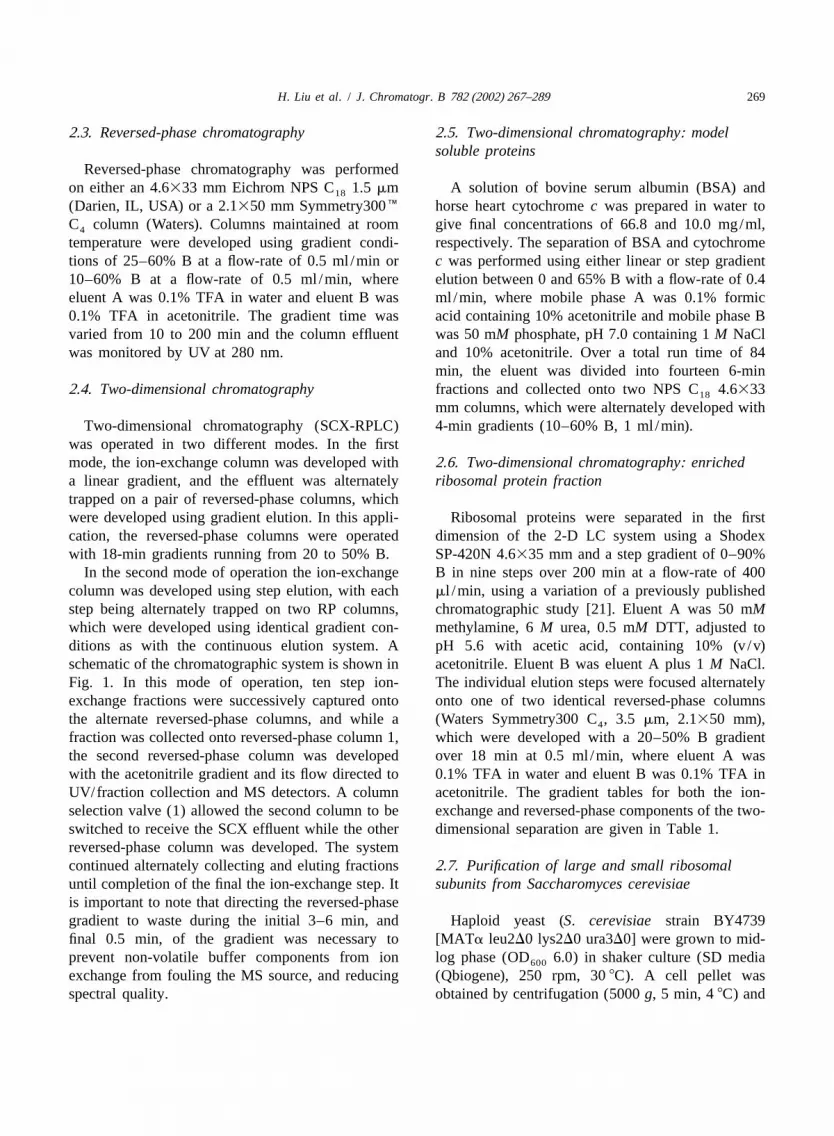
The advantages of a step gradient versus a lineargradient are illustrated in the separation of BSA 3 .3. Reversed-phase separations of proteinsshown in Fig. 2. The separation of two BSAisoforms is greatly improved by the use of a step Theory predicts that maximum peak capacity ingradient, where both the peak shape and resolution comprehensive 2-D separations is achieved using aare superior to that observed using linear gradient sampling time for the second dimension that allowselution. It is worth noting that given the broad peaks for a minimum of three fractions per peak [13].observed (peak width of 2.2–5.3 min) with the linear However, there are two significant practical limita-gradient, there is a high probability of splitting a tions to reducing the time of the reversed-phase step.peak into two or more fractions. In contrast, each First, there is a finite period of time to deliver theisoform is resolved into individual fractions using a gradient to the column (system delay) as well as the
Fig. 2. Chromatogram of BSA using a step or linear ion-exchange gradient. A 2-ml injection of a BSA solution (66 mg/ml) was made ontoa Shodex SP-420N column (4.6335 mm). The column was eluted with either (A) a step gradient or (B) a linear gradient profile with eluentA50.1% formic acid containing 10% acetonitrile and eluent B550 mM phosphate, pH 7.0 containing 1M NaCl and 10% acetonitrile.Separation utilized a flow rate of 1 ml /min, and UV detection at 280 nm.

274 H. Liu et al. / J. Chromatogr. B 782 (2002) 267–289
need to re-equilibrate the system after each step. 3 .4. Reversed-phase LC acid modifiersFurthermore, when using MS detection, the reversed-phase flow-rate is limited to a maximum of 1 ml /min The selection of the reversed-phase LC eluent isto provide optimal MS sensitivity, and avoid the very important in LC/MS. Historically TFA hasnecessity of discarding the vast majority of the been the acidic modifier of choice for the analysis ofeffluent to waste via a post-column splitter. Second, peptides and proteins, providing good peak shapeusing the optimum sample rate would also further and recovery, plus the added benefit of volatility tocomplicate post-run MS analysis as each protein facilitate easy removal. The recent use of ESI-MSwould be present in at least three IEX fractions. This for the analysis of proteins and peptides has resultedwould significantly increase the post-processing bur- in this selection being re-evaluated. Several studiesden for spectral deconvolution by several fold. have indicated that formic acid significantly in-
The reversed-phase gradient was optimized using creases mass spectrometer sensitivity for peptide anda four-protein mixture (BSA, lysozyme, cytochrome protein analyses [29,30], while TFA has been ob-c and carbonic anhydrase). Various gradient profiles served to suppress MS signal to a far greater extent.were studied using a 2.13 50 mm Symmetry300 C In our studies (Fig. 3), we found that mobile phase4
column containing 5-mm particles (data not shown). containing 2% formic acid (aq) resulted in three-foldThese results indicated that acceptable resolution greater MS sensitivity compared to mobile phasecould not be obtained with short gradient times (,2 containing 0.1% TFA (aq). This was in markedmin), but that baseline resolution could be obtained contrast to a previous report showing a 35-fold orwith longer separations (.5 min). The necessity of greater increase in response with formic acid com-scaling gradient times proportionately with column pared to TFA [29], which was observed usinglength, sets practical limits on column choice, and differing instrumentation and methods. However, weanalysis time for the second dimension separation. also observed that replacement of TFA with formicIncreasing the start point of the gradient to contain acid resulted in a significant reduction in chromato-.10% acetonitrile, permitted shallower gradients, graphic performance (Fig. 3). This is not as signifi-and increased resolution, without lengthening gra- cant for peptides, where reversed-phase separationsdient time. The conditions for analysis of this in low TFA, acetic acid, or formic acid result inmixture resulting in the best combination of peak minimal chromatographic penalty to obtain increasedresolution and cycle time was determined to be a MS sensitivity. Our results indicate that this is not10–60% B gradient over 10 min or longer, with a the case with proteins and where significant res-minimum system re-equilibration time of 2 min. olution sacrifices, and increased peak widths, would
Based on previous reports using reversed-phase prove unacceptable for the minor gains in sensitivity,chromatography in proteomics studies [8,9], we also and limits on sample complexity. As discussedcompared separations using 1.5-mm non-porous sil- further below, when analyzing complex mixturesica packing with roughly comparable porous materi- with ESI-MS detection, there is also an added benefitals (data not shown) as described in Section 2.3 of to high separation efficiency by eliminating competi-the Experimental section. It is worth noting that in tion for charging in the ESI source, and reducingcolumns with roughly equivalent dimensions instances of charge state deconvolution in the pres-(Symmetry300 3.5mm 4.6350 and 4.6353 mm 1.5 ence of multiple overlapping signals.mm NPS), operating at a flow-rate of 0.5 ml /min, theNPS silica material generated a backpressure of 34003 .5. Peak capacity of 1-D reversed-phasep.s.i. compared to 200–300 p.s.i. for porous silica. separations of ribosomal proteinsThis flow resistance severely limits the ability toconnect the NPS columns in 2-D LC systems, where Peak capacities for the 1-D and 2-D systems werethe reversed-phase column is connected in series to determined using the equation described in Ref. [31]an ion-exchange column typically operating at flow- with an enriched fraction of yeast ribosomal proteins.rates on the order of 0.4–1.0 ml /min. The number of ribosomal components in the purified

H. Liu et al. / J. Chromatogr. B 782 (2002) 267–289 275
Fig. 3. Comparison of the chromatographic separation of a ribosome protein mix using either (A) 0.1% TFA or (B) 2% formic acid as theaqueous buffer. A 25-ml injection of a ribosome solution was made onto a Waters Symmetry300 C 3.5-mm column. The column was eluted4
with a 10–60% B (containing the modifier in acetonitrile) gradient over 18 min. The column eluent was monitored by positive ion ESI-MS.
yeast ribosome can vary between 78 (the number of longer reversed-phase run, the peak capacity wasknown ‘‘canonical’’ [32,33] subunits), and 116 (the determined to be|240.number of unique subunit isoforms) depending onisoform expression levels. The presence of multiple 3 .6. Considerations for multidimensionalmodified forms for some proteins [22], and the more chromatographyrecent identification of additional ribosomal interact-ing proteins such as ASC1(BEL1) [1] produce The true power of applying multidimensionaladditional complexity. These proteins exhibit a size chromatography to complex samples is that samplerange of 3–45 kDa (mean MW|17 700), and while components may not differ sufficiently in theirprimarily basic (mean pI|10.1) the mixture poten- relative characteristics on an individual mode oftially contains at least 14 components with predicted separation. The ability to increase theoretical sepa-pI’s of 4.0–7.0. While complicated, this mixture of ration peak capacity in a 1-D RPLC separation byproteins represents an idealized sample in the respect means of longer columns, smaller particles, andthat purified components are expected at roughly shallower / longer gradients only increases separationequimolar amounts. efficiency, without actually addressing the underly-
In the 1-D reversed-phase system, 25mg of ing question of whether selectivity between com-ribosomal proteins were analyzed using a 10–60% B ponents differs sufficiently to permit resolution.gradient at a flow-rate of 0.5 ml /min developed over Furthermore, current success in achieving high 1-D198 or 18 min (Fig. 4). As expected, resolution RPLC peak capacity of biopolymers [34–36] have soincreases with the longer gradient; for example, the far come at the cost of using pressures that limitthree peaks at eluting at 96.9–98.5 min on the longer separation component selection, separation time-gradient are completely resolved, while effectively scales that significantly impact sample throughput,coeluting at|10.5 min during the shorter gradient. and instrumentation not readily adoptable by theUsing an average peak width (0.48 min) from the larger bioanalytical community. In the following

276 H. Liu et al. / J. Chromatogr. B 782 (2002) 267–289
Fig. 4. Reversed-phase chromatographic separation of a ribosome protein mix using (A) an 18- and (B) a 198-min gradient. A 25-mlinjection of ribosome solution was made onto a Waters Symmetry300 C column that was eluted with a 10–60% B gradient, where4
A50.1% TFA in water and B50.1% TFA in acetonitrile. The column eluent was monitored by positive ion ESI-MS.
sections we have attempted to increase peak capacity roughly equivalent resolution obtained by MS com-using two orthogonal separation mechanisms (SCX pared to UV detection (Fig. 5).and RPLC) that can be implemented using commer- Also essential to obtaining good mass spectra wascially available components, and under conventional the diversion of non-volatile components from thepressure regimes, to evaluate peak capacity and ion-exchange dimension prior to directing reversed-performance relative to single dimension separations phase column effluent into the MS source. Suchof comparable duration. non-volatile components (e.g. urea and buffer salts)
were observed to result in physical blockage of the3 .7. System configuration for 2-D LC /MS microspray/nanospray source, causing significant
suppression of analyte ionization, and reduced sen-Optimum performance in the 2-D LC/MS re- sitivity by generating multiple adducted peaks for
quired careful attention to maintaining peak fidelity, each component. Although IEX effluent was directedwhile preventing non-volatile components entering to waste during capture of proteins onto the RPthe MS source. Controlling system bandspread is column, residual IEX eluent present in the columncritical to maintaining peak fidelity in a system with when it was placed in line with the MS resulted inmultiple valves, fluidic connections, and post column spectra containing a high number of adduct peaksflow splitter in a separation where peak volumes (Fig. 6). Optimizing diversion valve timing as de-from the second dimension reversed-phase separation scribed in the Experimental section, such that allare |200 ml. In our optimized system, post column ion-exchange buffer captured in the reversed-phasetubing up to the 1:8 flow splitter was 0.0050 I.D. column was directed away from the MS system,PEEK and the post-split to MS source connection minimized these adducts and enhanced sensitivitywas accomplished using a 50-mm I.D. polyimide (Fig. 6, insets), while resulting in no loss of com-fused-silica capillary. Appropriate attention to mak- ponent detection. In this example, maximum relativeing proper component connections resulted in mini- signal (i.e. 100%) is roughly 2-fold higher for themal post-column bandspread, as evidenced by the raw mass spectra (B vs. A in Fig. 6), and more than
H. Liu et al. / J. Chromatogr. B 782 (2002) 267–289 277
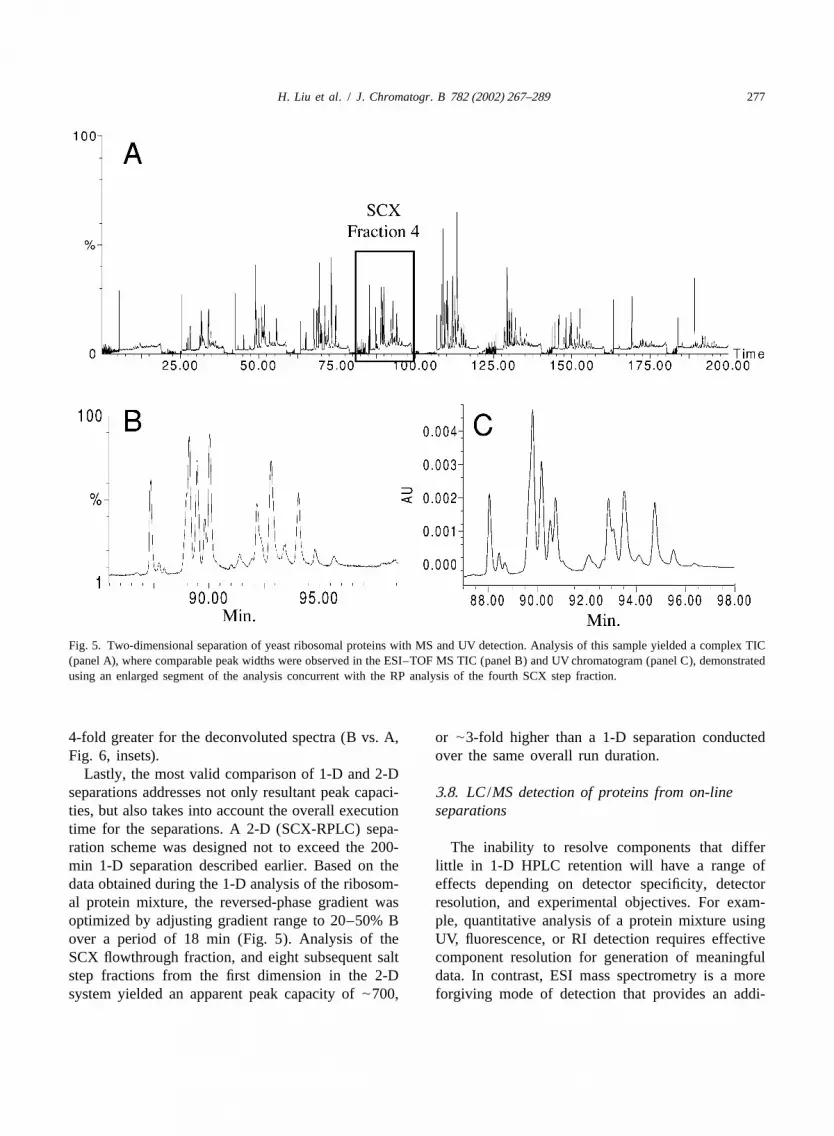
Fig. 5. Two-dimensional separation of yeast ribosomal proteins with MS and UV detection. Analysis of this sample yielded a complex TIC(panel A), where comparable peak widths were observed in the ESI–TOF MS TIC (panel B) and UV chromatogram (panel C), demonstratedusing an enlarged segment of the analysis concurrent with the RP analysis of the fourth SCX step fraction.
4-fold greater for the deconvoluted spectra (B vs. A, or|3-fold higher than a 1-D separation conductedFig. 6, insets). over the same overall run duration.
Lastly, the most valid comparison of 1-D and 2-Dseparations addresses not only resultant peak capaci-3 .8. LC /MS detection of proteins from on-lineties, but also takes into account the overall execution separationstime for the separations. A 2-D (SCX-RPLC) sepa-ration scheme was designed not to exceed the 200- The inability to resolve components that differmin 1-D separation described earlier. Based on the little in 1-D HPLC retention will have a range ofdata obtained during the 1-D analysis of the ribosom- effects depending on detector specificity, detectoral protein mixture, the reversed-phase gradient was resolution, and experimental objectives. For exam-optimized by adjusting gradient range to 20–50% B ple, quantitative analysis of a protein mixture usingover a period of 18 min (Fig. 5). Analysis of the UV, fluorescence, or RI detection requires effectiveSCX flowthrough fraction, and eight subsequent salt component resolution for generation of meaningfulstep fractions from the first dimension in the 2-D data. In contrast, ESI mass spectrometry is a moresystem yielded an apparent peak capacity of|700, forgiving mode of detection that provides an addi-
278 H. Liu et al. / J. Chromatogr. B 782 (2002) 267–289
mass spectral suppression of acidic and neutralproteins in the presence of equi-abundant or evenlower abundance basic proteins. When processingprotein ESI data, an additional concern is that theresultant spectral quality affects the ability toproduce interpretable deconvoluted spectra for com-ponent identification.
The choice of ESI–TOF MS as a detector for theon-line 1-D and 2-D separations was made toprovide the additional resolution necessary to resolveoverlapping charge state envelopes of multiplecoeluting components during the 1-D separation,while providing the mass accuracy (|20–50 ppmusing external calibration) to make tentative identifi-cations of eluted components. In practice, the use ofquadrupole based mass detection systems wouldplace greater demands on a separation, while highfield ICR based detectors place less of a demand,relative to the high resolution TOF analyzer used inthese studies.
LC/ESI–TOF MS experiments using lysozymedemonstrated that component identifications usingmaximum entropy deconvolution could accuratelyidentify components barely obvious from total ionchromatograms (Fig. 7). As can be seen from this
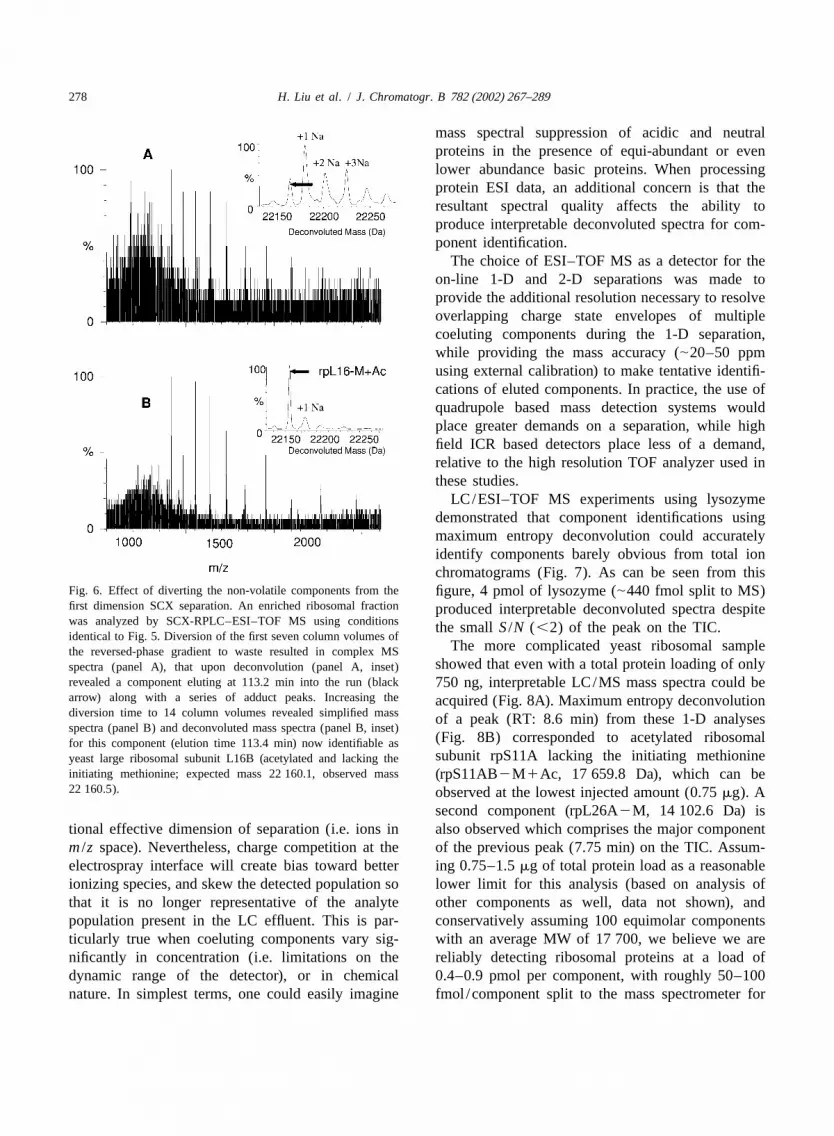
Fig. 6. Effect of diverting the non-volatile components from the figure, 4 pmol of lysozyme (|440 fmol split to MS)first dimension SCX separation. An enriched ribosomal fraction produced interpretable deconvoluted spectra despitewas analyzed by SCX-RPLC–ESI–TOF MS using conditions the smallS /N (,2) of the peak on the TIC.identical to Fig. 5. Diversion of the first seven column volumes of
The more complicated yeast ribosomal samplethe reversed-phase gradient to waste resulted in complex MSshowed that even with a total protein loading of onlyspectra (panel A), that upon deconvolution (panel A, inset)
revealed a component eluting at 113.2 min into the run (black 750 ng, interpretable LC/MS mass spectra could bearrow) along with a series of adduct peaks. Increasing the acquired (Fig. 8A). Maximum entropy deconvolutiondiversion time to 14 column volumes revealed simplified mass of a peak (RT: 8.6 min) from these 1-D analysesspectra (panel B) and deconvoluted mass spectra (panel B, inset)
(Fig. 8B) corresponded to acetylated ribosomalfor this component (elution time 113.4 min) now identifiable assubunit rpS11A lacking the initiating methionineyeast large ribosomal subunit L16B (acetylated and lacking the
initiating methionine; expected mass 22 160.1, observed mass (rpS11AB2M1Ac, 17 659.8 Da), which can be22 160.5). observed at the lowest injected amount (0.75mg). A
second component (rpL26A2M, 14 102.6 Da) istional effective dimension of separation (i.e. ions in also observed which comprises the major componentm /z space). Nevertheless, charge competition at the of the previous peak (7.75 min) on the TIC. Assum-electrospray interface will create bias toward better ing 0.75–1.5mg of total protein load as a reasonableionizing species, and skew the detected population so lower limit for this analysis (based on analysis ofthat it is no longer representative of the analyte other components as well, data not shown), andpopulation present in the LC effluent. This is par- conservatively assuming 100 equimolar componentsticularly true when coeluting components vary sig- with an average MW of 17 700, we believe we arenificantly in concentration (i.e. limitations on the reliably detecting ribosomal proteins at a load ofdynamic range of the detector), or in chemical 0.4–0.9 pmol per component, with roughly 50–100nature. In simplest terms, one could easily imagine fmol /component split to the mass spectrometer for

H. Liu et al. / J. Chromatogr. B 782 (2002) 267–289 279
Fig. 7. MS sensitivity of the reversed-phase separation process using TFA as the acid modifier. An injection of 40, 8 and 4 pmol oflysozyme was made onto a 5032.1 mm Symmetry300 C column. The column was eluted with a 20–50% B gradient over 18 min at 0.54
ml /min, where eluent A50.1% TFA in water and eluent B50.1% TFA in acetonitrile. Detection was performed by positive ionESI–MS-TOF scanning from 500 to 3000m /z.
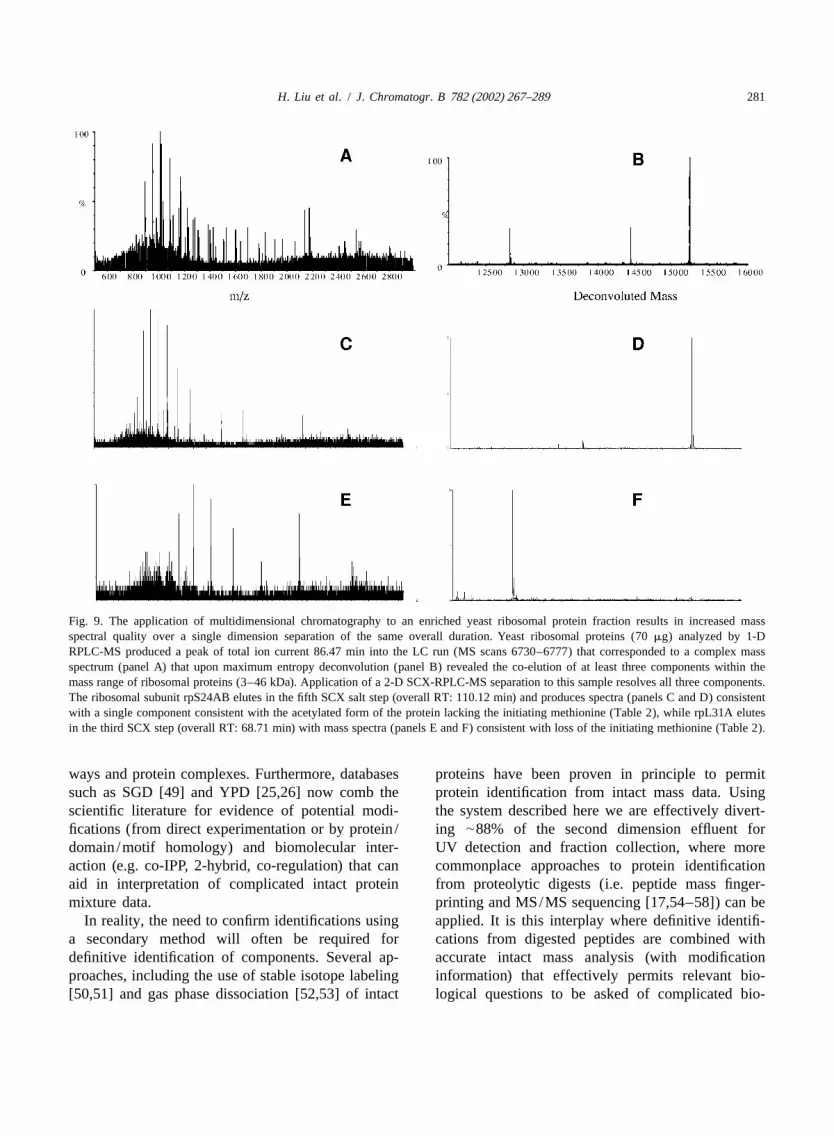
analysis. This apparent 4- to 10-fold increase in scans 6730–6777) contained at least three co-elutingapparent increased MS sensitivity for ribosomal components (masses of 12 821.80, 14 447.6, andproteins versus lysozyme may be due to reduced 15 239.8) in the mass range of ribosomal proteinssample losses when analyzing complex mixtures (3–46 kDa) as evidenced by the mass spectra (Fig.rather than single components, as well as issues 9A) and deconvoluted mass spectra (Fig. 9B) sum-relating to the relative behavior of individual proteins med over the full width of the peak. During the 2-Dduring separation and the electrospray ionization experiment, the two identifiable ribosomal subunitsprocesses. (rpS24AB2M1Ac, RT: 110.12 min, mass observed
15 240.5 Da, mass predicted 15 239.7; and3 .9. LC /ESI–TOF MS analysis of an enriched rpL31A2M, RT: 68.71 min, mass observedyeast ribosomal protein fraction 12 822.4, mass predicted 12 822.0), were resolved
from each other into differing salt elution steps, asAs described above, one argument at the heart of well as from a non-identified component (RT: 48.83,
employing multidimensional chromatography versus mass observed 14 448.5 Da) that elutes in the earliesta single mode of separation is not that the approach step elution from SCX (Table 2). Fig. 9C,D (MSgenerates higher theoretical peak capacity, but rather scans 8572–8580) and Fig. 9E,F (MS scans 5348–that the additional mode of separation resolves 5362) from the 2-D run clearly demonstrate thecomponents not otherwise resolved by either in- simplification of the raw and deconvoluted spectradividual separation mode due to chemical and/or from the two previously co-eluting ribosomalstructural similarity. The spectra in Fig. 9 demon- subunits. As would be predicted from coelutionstrate the utility of coupling 2-D chromatography during the 1-D separation, the relative reversed-with ESI-MS detection for analysis of the enriched phase elution times of rpS24AB, rpL31A, and theyeast ribosomal protein sample. During a high unidentified component in the reversed-phase dimen-resolution 1-D HPLC separation of the ribosomal sion of the 2-D separation are very similar (8.74,protein mixture (Fig. 4), the peak at 86.47 min (MS 8.71, and 8.83 min, respectively).

280 H. Liu et al. / J. Chromatogr. B 782 (2002) 267–289
analysis were deconvoluted using a maximum en-tropy deconvolution algorithm as described in theExperimental section. This procedure identified|160 individual components that included severalcomponents apparently eluting in multiple ion-ex-change fractions. Accounting for these cases, 157(126 unique) masses ranging from 6629 to 43 731Da were obtained from the analysis of an enrichedyeast ribosomal fraction.
As can be seen in Tables 2 and 3, tentativeassignments of 91 unique masses have been made to66 known ribosomal proteins (80 isoforms), with anadditional 35 of the 126 unique masses not yetassigned. Assignments were produced by searching alist of ribosomal subunit average masses calculatedfrom translated yeast open reading frame sequences,assuming either loss or retention of the initiatingmethionine and presence or absence of N-terminalacetylation. Several additional assignments weremade by applying known methylations, phosphoryla-tions and proteolytic maturations described in theyeast protein database [25,26], and additional pri-mary sources [22,37–48]. For the 2-D ribosomaldataset (Tables 2 and 3), assignment of|80% ofribosomal subunits (70% of all potential ribosomalFig. 8. The extracted deconvoluted spectra of a ribosomal sample
injected in four different concentrations. Injections of 15, 3, 1.5 subunit isoforms) was accomplished with an averageand 0.75mg, respectively, were made onto a 5032.1 mm Waters absolute mass error of|50 ppm (SD|25 ppm).Symmetry300 C column. The column was eluted with a 20–50%4 Table 3 also demonstrates that this approach pro-B gradient over 18 min at 0.5 ml /min, where eluent A50.1%
duced essentially equal coverage of proteins fromTFA in water and eluent B50.1% TFA in acetonitrile. Detectionboth the large and small subunits of the yeastwas performed by positive ion ESI–MS-TOF scanning from 500
to 3000m /z. The peak shown in the TIC traces (Fig. 8A) eluted ribosome. Achieving mass measurement accuracyfrom the reversed-phase system with a retention time of 8.5 min. (MMA) in the range of 20–50 ppm using same-dayDeconvoluted mass spectra for the peak are shown in Fig. 8B.
external calibrations is routinely accomplished byour laboratory, and efforts to employ internal on-linelock mass calibrations should produce further MMA
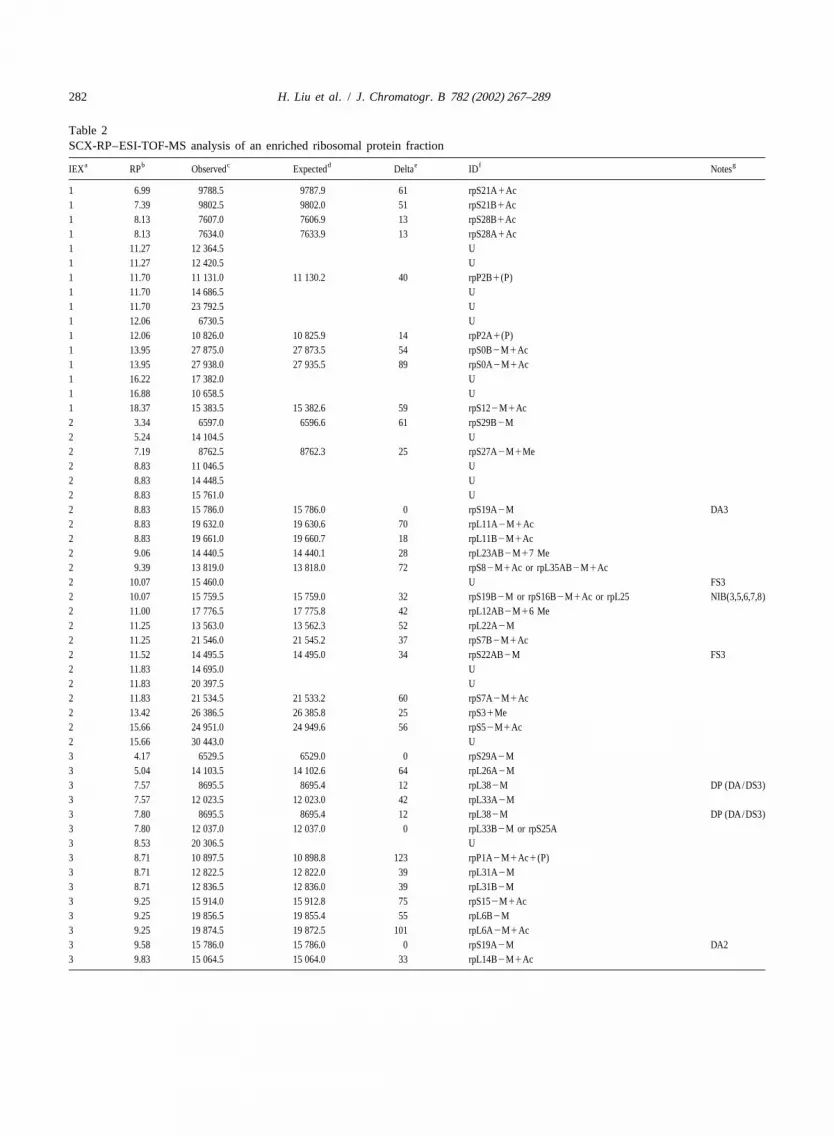
The resulting dataset from LC-LC/MS analysis of improvements to aid in distinguishing subunits withthis complicated mixture is a list of observed masses closely related masses.that can be correlated to overall retention time of the It can be reasonably argued that measurements ofexperiment (or MS scan number), or relative re- intact protein mass (even at low ppm MMA) bytention time within either dimension. The separation themselves are insufficient to conclusively identifyscheme used in this work (step SCX elution, fol- proteins, particularly given that most proteins arelowed by short RPLC gradients) can be most clearly modified in some manner from the predicted se-displayed by presenting an ordered set of observed quence. This challenge effectively grows at leastmasses organized first by SCX elution step and then linearly with the number of proteins in a database,by relative retention time in the second dimension and combinatorially with the number of possible(Table 2). modifications. Of course, this argument assumes no
To generate the data in Table 2, the raw mass 2-D pre-knowledge of a sample, which is often not thespectra from the 200-min SCX-RPLC–ESI–TOF MS case when analyzing established biochemical path-
H. Liu et al. / J. Chromatogr. B 782 (2002) 267–289 281
Fig. 9. The application of multidimensional chromatography to an enriched yeast ribosomal protein fraction results in increased massspectral quality over a single dimension separation of the same overall duration. Yeast ribosomal proteins (70mg) analyzed by 1-DRPLC-MS produced a peak of total ion current 86.47 min into the LC run (MS scans 6730–6777) that corresponded to a complex massspectrum (panel A) that upon maximum entropy deconvolution (panel B) revealed the co-elution of at least three components within themass range of ribosomal proteins (3–46 kDa). Application of a 2-D SCX-RPLC-MS separation to this sample resolves all three components.The ribosomal subunit rpS24AB elutes in the fifth SCX salt step (overall RT: 110.12 min) and produces spectra (panels C and D) consistentwith a single component consistent with the acetylated form of the protein lacking the initiating methionine (Table 2), while rpL31A elutesin the third SCX step (overall RT: 68.71 min) with mass spectra (panels E and F) consistent with loss of the initiating methionine (Table 2).
ways and protein complexes. Furthermore, databases proteins have been proven in principle to permitsuch as SGD [49] and YPD [25,26] now comb the protein identification from intact mass data. Usingscientific literature for evidence of potential modi- the system described here we are effectively divert-fications (from direct experimentation or by protein / ing|88% of the second dimension effluent fordomain/motif homology) and biomolecular inter- UV detection and fraction collection, where moreaction (e.g. co-IPP, 2-hybrid, co-regulation) that can commonplace approaches to protein identificationaid in interpretation of complicated intact protein from proteolytic digests (i.e. peptide mass finger-mixture data. printing and MS/MS sequencing [17,54–58]) can be
In reality, the need to confirm identifications using applied. It is this interplay where definitive identifi-a secondary method will often be required for cations from digested peptides are combined withdefinitive identification of components. Several ap- accurate intact mass analysis (with modificationproaches, including the use of stable isotope labeling information) that effectively permits relevant bio-[50,51] and gas phase dissociation [52,53] of intact logical questions to be asked of complicated bio-
282 H. Liu et al. / J. Chromatogr. B 782 (2002) 267–289
Table 2SCX-RP–ESI-TOF-MS analysis of an enriched ribosomal protein fraction
a b c d e f gIEX RP Observed Expected Delta ID Notes
1 6.99 9788.5 9787.9 61 rpS21A1Ac1 7.39 9802.5 9802.0 51 rpS21B1Ac1 8.13 7607.0 7606.9 13 rpS28B1Ac1 8.13 7634.0 7633.9 13 rpS28A1Ac1 11.27 12 364.5 U1 11.27 12 420.5 U1 11.70 11 131.0 11 130.2 40 rpP2B1(P)1 11.70 14 686.5 U1 11.70 23 792.5 U1 12.06 6730.5 U1 12.06 10 826.0 10 825.9 14 rpP2A1(P)1 13.95 27 875.0 27 873.5 54 rpS0B2M1Ac1 13.95 27 938.0 27 935.5 89 rpS0A2M1Ac1 16.22 17 382.0 U1 16.88 10 658.5 U1 18.37 15 383.5 15 382.6 59 rpS122M1Ac2 3.34 6597.0 6596.6 61 rpS29B2M2 5.24 14 104.5 U2 7.19 8762.5 8762.3 25 rpS27A2M1Me2 8.83 11 046.5 U2 8.83 14 448.5 U2 8.83 15 761.0 U2 8.83 15 786.0 15 786.0 0 rpS19A2M DA32 8.83 19 632.0 19 630.6 70 rpL11A2M1Ac2 8.83 19 661.0 19 660.7 18 rpL11B2M1Ac2 9.06 14 440.5 14 440.1 28 rpL23AB2M17 Me2 9.39 13 819.0 13 818.0 72 rpS82M1Ac or rpL35AB2M1Ac2 10.07 15 460.0 U FS32 10.07 15 759.5 15 759.0 32 rpS19B2M or rpS16B2M1Ac or rpL25 NIB(3,5,6,7,8)2 11.00 17 776.5 17 775.8 42 rpL12AB2M16 Me2 11.25 13 563.0 13 562.3 52 rpL22A2M2 11.25 21 546.0 21 545.2 37 rpS7B2M1Ac2 11.52 14 495.5 14 495.0 34 rpS22AB2M FS32 11.83 14 695.0 U2 11.83 20 397.5 U2 11.83 21 534.5 21 533.2 60 rpS7A2M1Ac2 13.42 26 386.5 26 385.8 25 rpS31Me2 15.66 24 951.0 24 949.6 56 rpS52M1Ac2 15.66 30 443.0 U3 4.17 6529.5 6529.0 0 rpS29A2M3 5.04 14 103.5 14 102.6 64 rpL26A2M3 7.57 8695.5 8695.4 12 rpL382M DP (DA/DS3)3 7.57 12 023.5 12 023.0 42 rpL33A2M3 7.80 8695.5 8695.4 12 rpL382M DP (DA/DS3)3 7.80 12 037.0 12 037.0 0 rpL33B2M or rpS25A3 8.53 20 306.5 U3 8.71 10 897.5 10 898.8 123 rpP1A2M1Ac1(P)3 8.71 12 822.5 12 822.0 39 rpL31A2M3 8.71 12 836.5 12 836.0 39 rpL31B2M3 9.25 15 914.0 15 912.8 75 rpS152M1Ac3 9.25 19 856.5 19 855.4 55 rpL6B2M3 9.25 19 874.5 19 872.5 101 rpL6A2M1Ac3 9.58 15 786.0 15 786.0 0 rpS19A2M DA23 9.83 15 064.5 15 064.0 33 rpL14B2M1Ac

H. Liu et al. / J. Chromatogr. B 782 (2002) 267–289 283
Table 2. Continued
a b c d e f gIEX RP Observed Expected Delta ID Notes
3 9.83 15 460.0 U FS2, CO53 9.83 15 759.5 15 759.0 32 rpS19B2M or rpS16B2M1Ac or rpL25 NIB(2,5,6,7,8)3 10.08 15 079.0 15 078.0 66 rpL14A2M1Ac3 11.06 22 169.0 22 167.6 63 rpS9B2M FS43 11.38 14 495.0 14 495.0 34 rpS22AB2M FS23 11.75 21 569.5 21 569.2 14 rpL9A or rpL9B2M1Ac3 12.19 18 898.5 18 897.5 53 rpL6B2M1Ac3 13.21 27 216.0 U3 13.21 27 362.5 27 360.8 62 rpS22M1Ac3 14.57 33 586.5 33 583.9 77 rpL52M or P02M NIB(4,5,6,7,8)4 7.37 18 112.0 18 111.1 50 rpL21A2M4 7.37 18 143.5 18 143.2 17 rpL21B2M4 8.98 20 422.0 20 420.4 98 rpL17B2M or rpL17A2M DP (DA/DS4)4 9.10 20 420.0 20 420.4 5 rpL17B2M or rpL17A2M DP (DA/DS4)4 9.47 11 937.0 11 936.2 71 rpS25A2M12 Me4 9.47 19 832.0 19 830.5 76 rpL6A2M4 9.81 15 627.5 15 626.5 64 rpL252M4 10.03 29 281.0 29 279.2 61 rpS4AB2M FS54 11.39 22 168.5 22 167.6 41 rpS9B2M FS34 12.17 16 949.0 16 948.5 30 rpS18AB2M1Ac CO84 12.36 16 899.0 16 897.8 71 S132M4 12.81 17 525.0 17 524.5 29 rpL24A2M1Ac4 12.81 27 984.0 27 980.8 114 rpL8B2M4 12.81 27 999.0 U4 14.06 27 509.0 27 507.2 65 rpL7A2M CO(6,8), FS(5)4 14.80 33 587.0 33 583.9 92 rpL52M or rpP02M NIB(3,5,6,7,8)5 6.64 17 660.5 17 659.8 40 rpS11AB2M1Ac5 6.97 15 401.0 15 400.2 52 rpL27A2M5 7.43 11 317.5 U5 7.43 15 507.0 U5 7.43 15 961.0 15 959.4 100 rpS19A1Ac5 7.43 27 279.0 27 277.4 59 rpL2AB2M5 8.01 11 004.5 11 004.1 36 rpL36B2M5 8.61 13 779.5 13 778.5 73 rpL35AB2M CO75 8.74 15 240.5 15 239.7 52 rpS24AB2M1Ac5 8.97 9960.0 9959.8 20 rpL43AB2M5 8.97 15 658.0 15 657.3 45 rpS17A2M5 8.97 15 674.5 15 672.2 115 rpS17B2M5 9.95 15 459.0 U CO35 9.95 15 758.5 15 759.0 32 rpS19B2M or rpS16B2M1Ac or rpL25 NIB(2,3,6,7,8)5 9.95 29 280.5 29 279.2 44 rpS4AB2M FS45 10.55 26 927.0 U5 10.55 26 998.5 26 996.5 74 rpS6AB5 10.77 21 758.5 U5 10.77 22 113.5 22 112.1 63 rpL16A2M1Ac5 11.35 22 162.0 22 160.1 86 rpL16B2M1Ac5 11.94 38 976.0 38 973.2 72 rpL4B2M1Ac5 11.94 39 006.0 39 003.2 72 rpL4A2M1Ac5 12.30 25 232.0 25 230.4 63 rpL102M CO75 13.30 28 613.0 28 612.4 21 rpS1A2M5 13.30 28 681.0 28 681.5 17 rpS1B2M5 14.05 27 509.0 27 507.2 65 rpL7A2M CO(7), FS(4,6)5 14.70 33 585.0 33 583.9 33 rpL52M or rpP02M NIB(3,4,6,7,8)6 7.07 13 510.0 13 510.0 37 rpL34B2M DP (DA6)6 7.31 13 509.0 13 510.0 74 rpL34B2M DP (DA6)6 7.98 12 278.5 U6 7.98 22 395.0 22 394.0 45 rpL13B2M
284 H. Liu et al. / J. Chromatogr. B 782 (2002) 267–289
Table 2. Continued
a b c d e f gIEX RP Observed Expected Delta ID Notes
6 8.65 14 641.0 14 640.2 55 rpL322M6 9.38 16 276.5 U6 9.38 16 591.5 16 590.5 60 rpL28 FS76 10.13 29 319.5 29 321.2 58 rpS4AB2M1Ac6 10.14 15 759.5 15 759.0 32 rpS19B2M or rpS16B2M1Ac or rpL25 NIB(2,3,5,7,8)6 10.14 29 295.0 U6 10.14 31 518.5 U6 10.53 43 668.0 43 668.8 18 rpL32M1Ac FS76 10.53 43 709.0 U6 14.14 27 507.0 27 507.2 7 rpL7A2M CO(4,8), FS(5,7)6 14.14 27 527.5 U CO86 14.91 33 586.0 33 583.9 63 rpL52M or rpP02M NIB(3,4,5,7,8)7 3.16 12 108.5 12 108.5 4 rpL42AB2M1 2 Me7 4.38 17 548.0 17 547.6 23 rpL24B7 4.53 17 614.5 17 613.7 45 rpL24A7 6.14 15 937.5 U DP (DA/DS7)7 6.69 15 939.5 U DP (DA/DS7)7 8.02 13 374.0 13 373.7 22 rpS26A2M7 8.42 22 359.5 22 358.6 40 rpS8AB2M7 8.69 13 779.0 13 778.5 36 rpL35AB2M CO57 9.41 16 591.0 16 590.5 30 rpL28 FS67 9.41 16 607.0 U7 9.97 15 759.0 15 759.0 0 rpS19B2M or rpS16B2M1Ac or rpL25 NIB(2,3,5,6,8)7 10.31 43 668.0 43 668.8 18 rpL32M1Ac FS67 11.14 20 433.0 20 432.1 44 rpL18AB2M7 11.14 20 450.5 U CO9 FS87 12.02 19 509.5 U7 12.38 16 914.5 U7 12.38 25 229.0 25 230.4 55 rpL102M CO57 13.34 28 699.5 U7 14.06 27 507.0 27 507.2 7 rpL7A2M CO(5), FS(6,8)7 14.74 33 585.0 33 583.9 33 rpL52M or rpP02M NIB(3,4,5,6,8)8 3.75 8677.0 8677.4 50 Processed rpS31 FS98 7.79 21 574.5 21 573.1 65 rpL19AB2M FS98 10.19 15 758.5 15 759.0 32 rpS19B2M or rpS16B2M1Ac or rpL25 NIB(2,3,5,6,7)8 11.28 20 449.5 U FS(7,9)8 12.20 16 948.0 16 948.5 30 rpS18AB2M1Ac CO48 14.10 27 508.0 27 507.2 29 rpL7A2M CO(4,6), FS(7)8 14.10 27 527.5 U CO6, FS98 14.87 33 586.5 33 583.9 77 rpL52M or P02M NIB(3,4,5,6,7)9 3.79 8677.0 8677.4 50 Processed rpS31 FS89 7.50 21 575.0 21 573.1 88 rpL19AB2M FS89 7.84 24 293.0 24 291.2 74 rpL15AB2M9 8.24 24 334.0 24 333.2 33 rpL15AB2M1Ac9 11.17 20 450.0 U CO7 FS89 14.07 27 525.0 U FS9
a SCX step fraction: due to experimental construction, fraction 1 contains material not retained on the SCX column that bound the RP column under initialbinding conditions, while fraction 0 (0–20 min of gradient) served as a blank run, while the first RP column was loaded.
b Relative reversed-phase LC gradient time measured from the start of each RP gradient, rather than the start of the overall 2-D experiment.c Neutral mass determined by application of a maximum entropy algorithm using a 0.5-Da output bin size.d Average neutral mass of ribosomal subunit(s) calculated from yeast genomic ORF data.e Absolute difference in PPM between observed and expected ribosomal subunit masses.f Ribosomal subunit identification using the standardized nomenclature [32,33], except that isoforms (A and B) of a subunit with complete identity are
grouped as ‘‘AB’’. ‘‘U’’ listed for unidentified components. Modifications: Ac, acetylation;2M, loss of methionine; Me, methylation; (P), phosphorylation;Processed, mature proteolytic fragment.
g Notes relating to chromatographic behavior (COx, RP carry-over with fraction x; DP, doublet peak of component that is seen twice in same fraction; FSx,IEX fraction splitting of component with fraction x) or possible additional modifications (DA/DSx, possible deamidation or disulfide related species ofcomponent in fraction x; DAx, possible deamidation related species of component in fraction x). NIB, or near isobaric is listed when an observed mass
] ] ]corresponds to more than one ribosomal subunit within experimental error.
H. Liu et al. / J. Chromatogr. B 782 (2002) 267–289 285
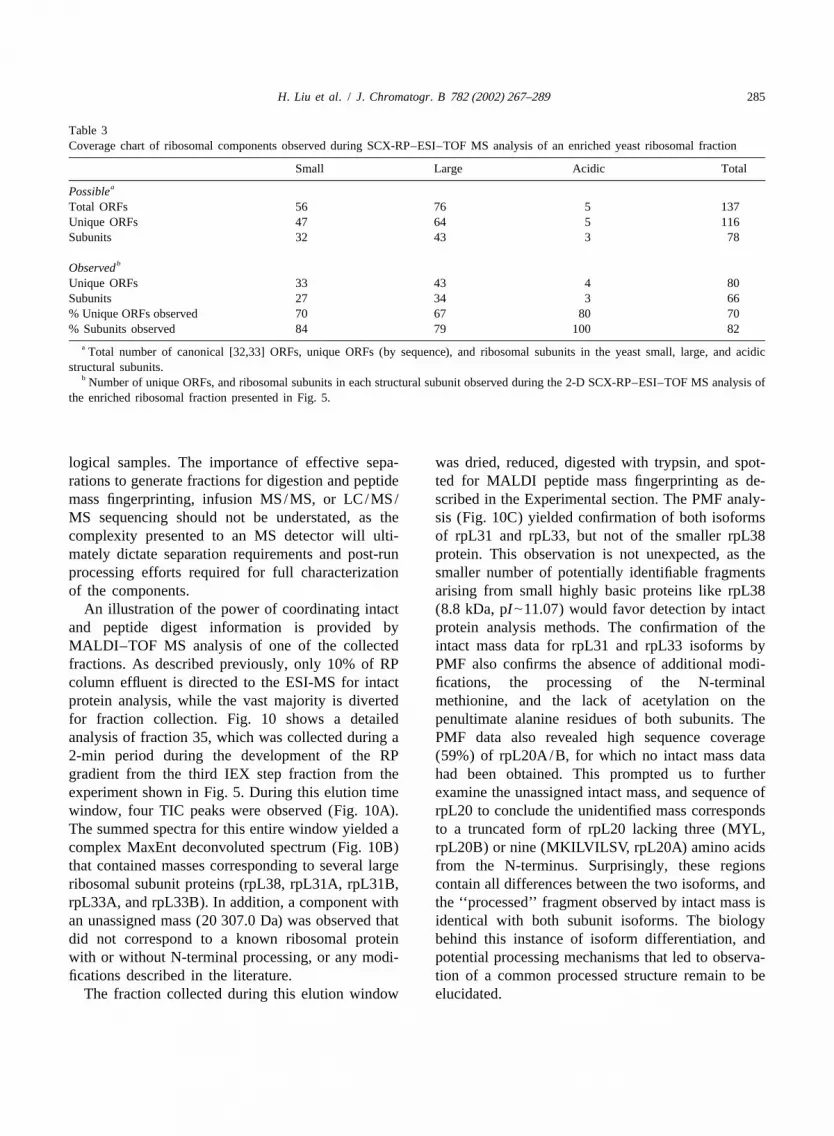
Table 3Coverage chart of ribosomal components observed during SCX-RP–ESI–TOF MS analysis of an enriched yeast ribosomal fraction
Small Large Acidic TotalaPossible
Total ORFs 56 76 5 137Unique ORFs 47 64 5 116Subunits 32 43 3 78
bObservedUnique ORFs 33 43 4 80Subunits 27 34 3 66% Unique ORFs observed 70 67 80 70% Subunits observed 84 79 100 82
a Total number of canonical [32,33] ORFs, unique ORFs (by sequence), and ribosomal subunits in the yeast small, large, and acidicstructural subunits.
b Number of unique ORFs, and ribosomal subunits in each structural subunit observed during the 2-D SCX-RP–ESI–TOF MS analysis ofthe enriched ribosomal fraction presented in Fig. 5.
logical samples. The importance of effective sepa- was dried, reduced, digested with trypsin, and spot-rations to generate fractions for digestion and peptide ted for MALDI peptide mass fingerprinting as de-mass fingerprinting, infusion MS/MS, or LC/MS/ scribed in the Experimental section. The PMF analy-MS sequencing should not be understated, as the sis (Fig. 10C) yielded confirmation of both isoformscomplexity presented to an MS detector will ulti- of rpL31 and rpL33, but not of the smaller rpL38mately dictate separation requirements and post-run protein. This observation is not unexpected, as theprocessing efforts required for full characterization smaller number of potentially identifiable fragmentsof the components. arising from small highly basic proteins like rpL38
An illustration of the power of coordinating intact (8.8 kDa, pI|11.07) would favor detection by intactand peptide digest information is provided by protein analysis methods. The confirmation of theMALDI–TOF MS analysis of one of the collected intact mass data for rpL31 and rpL33 isoforms byfractions. As described previously, only 10% of RP PMF also confirms the absence of additional modi-column effluent is directed to the ESI-MS for intact fications, the processing of the N-terminalprotein analysis, while the vast majority is diverted methionine, and the lack of acetylation on thefor fraction collection. Fig. 10 shows a detailed penultimate alanine residues of both subunits. Theanalysis of fraction 35, which was collected during a PMF data also revealed high sequence coverage2-min period during the development of the RP (59%) of rpL20A/B, for which no intact mass datagradient from the third IEX step fraction from the had been obtained. This prompted us to furtherexperiment shown in Fig. 5. During this elution time examine the unassigned intact mass, and sequence ofwindow, four TIC peaks were observed (Fig. 10A). rpL20 to conclude the unidentified mass correspondsThe summed spectra for this entire window yielded a to a truncated form of rpL20 lacking three (MYL,complex MaxEnt deconvoluted spectrum (Fig. 10B) rpL20B) or nine (MKILVILSV, rpL20A) amino acidsthat contained masses corresponding to several large from the N-terminus. Surprisingly, these regionsribosomal subunit proteins (rpL38, rpL31A, rpL31B, contain all differences between the two isoforms, andrpL33A, and rpL33B). In addition, a component with the ‘‘processed’’ fragment observed by intact mass isan unassigned mass (20 307.0 Da) was observed that identical with both subunit isoforms. The biologydid not correspond to a known ribosomal protein behind this instance of isoform differentiation, andwith or without N-terminal processing, or any modi- potential processing mechanisms that led to observa-fications described in the literature. tion of a common processed structure remain to be
The fraction collected during this elution window elucidated.

286 H. Liu et al. / J. Chromatogr. B 782 (2002) 267–289
Fig. 10. Detailed analysis of collected fraction 35. The expanded view for the reversed-phase gradient LC/MS of the third IEX fraction (A)shows a region collected as fraction 35 encompassing four TIC peaks (shown in the box). The effluent was split with 10% analyzed by intactprotein ESI–TOF MS and the remaining 90% collected for tryptic digestion and analysis peptide mass fingerprinting. The deconvolutedmass spectra of this region (B) reveals at least six components, five of which can be assigned to known ribosomal proteins (rpL38,rpL31A/B, and rpL33A/B) modified only by removal of the initiating methionine, and one unassigned mass (20 307.0 Da). Peptide massfingerprinting data for this fraction (C) confirms assignments for the assigned subunits, and led to the identification of a truncatedrpL20A/B, with the intact mass consistent with subunits lacking several residues from the N-termini. Arrows point to peptides that permitprotein isoform characterization.
H. Liu et al. / J. Chromatogr. B 782 (2002) 267–289 287
3 .10. Quality of 2-D LC–LC /MS separations Another potential mechanism for the appearanceof components in multiple fractions is carry-over
The data from the LC/MS analysis are also an from the reversed-phase step. This well-describedimportant element in assessing the chromatographic phenomenon [59] has been attributed to proteinperformance of a 2-D separation. Both TIC and UV remaining on the stationary phase following a gra-response indicate at least 107 peaks are resolved or dient run and appearing in subsequent analyses evenpartially resolved by the system, far in excess of the if no further injection is made. As our system53 peaks resolved or partially resolved in the 1-D distributes the ion-exchange step elution to alternat-separation. However, neither UV nor TIC response ing reversed-phase columns, carry-over will be char-alone or in tandem is capable of identifying peaks acterized by the appearance of a particular mass inappearing in more than one ion-exchange fraction fractionn followed by its appearance in fractionthat are due to a single protein structure. Only from n12. Proteins exhibiting carry-over behavior (Tabledeconvoluted MS spectra can individual masses that 2) include rpL35AB2M (nominal mass 13 779) andappear in multiple fractions be recognized. In those rpL102M (nominal mass 25 229), both observed incases where this occurs, the assignment of such fractions 5 and 7.signals to the same protein is confirmed by consistent In several cases the same nominal mass is ob-retention times in the reversed-phase separation. served in consecutive fractions, but with significantly
A major concern with protein separations, par- different (Dt.0.20 min) reversed-phase retentionticularly with multi-dimensional methods, is the times. These are not likely to be identical proteinpossibility that a single molecular species is observed structures, although they may be closely relatedin multiple fractions. This phenomenon complicates structures such as those derived from deamidation ordata analysis and can lead to erroneous data interpre- other minor modifications including disulfide bondtation as to the number of distinct entities separated. reduction that cause only a small change in mass.There are potentially two major causes for multiple The mass accuracy of the LC–TOF analysis may beoccurrences of the protein reidentification. First, if a insufficient to distinguish such minor changes inprotein elutes at the end of an ion-exchange step, structure. Again, detailed analysis of peptides de-some of mass may remain bound on the column to rived from digests of the collected fractions willbe eluted in the subsequent step. We have attempted reveal the nature of the relationship between theseto minimize this ‘‘fraction splitting’’ by implement- components.ing a step-gradient protocol rather than the more Only six masses (nominally 15 460, 15 759,usual continuous gradients used for protein chroma- 20 450, 27 509, 27 525 and 33 585) out of a totaltography. This fraction splitting phenomenon is greater than 120 (,5% of the total) appear in morecharacterized by the appearance of the same mass at than two fractions. Three of these, with nominalcomparable reversed-phase retention time in con- masses of 15 460, 20 450 and 27 525, are unassignedsecutive ion-exchange fractions. Of the 91 tentatively (labeled ‘‘U’’ in Table 2). Mass 15 759, which isidentified ribosomal components, 67 were isolated in consistent with at least three nearly isobaric subunitsa single ion-exchange fraction. This minimal overlap (rpS19B2M, rpS16B2M1Ac and rpL25), appearsbetween fractions is clear vindication for the step over a wide range of reversed-phase retention timesgradient approach to coupling ion-exchange chroma- (9.83–10.19 min). Similarly, nominal mass 33 585tography with a reversed-phase step. However, even (assigned as rpL52M or rpP02M) appears in sixwith the step gradient operation in the ion-exchange fractions, but may arise from two nearly isobaricmode, several incidences of fraction splitting were proteins. In addition, variations in reversed-phaseobserved. Examples (Table 2) include rpS31 in retention times are consistent with several distinctfractions 8 and 9, rpL28 in fractions 6 and 7, S9B2 structures. Only one assigned ribosomal protein,M in fractions 3 and 4 and rpS4AB2M in fractions rpL7A2M with nominal mass 27 509, appears in4 and 5. In all four examples much weaker signals more than two IEX fractions with essentially theare observed in the later eluting fraction, indicating same retention in the reversed-phase step for each ofthat the bulk of the protein mass eluted in the earlier those fractions.fraction.
288 H. Liu et al. / J. Chromatogr. B 782 (2002) 267–289
4 . Conclusions this system will provide maximum information to aresearcher. This is in contrast to global digestion
We have presented a practical multi-dimensional procedures [1,2] where loss of information regardingchromatographic system with on-line MS detection the intact proteins makes identifying post-translation-and off-line fraction collection for the analysis of al modifications or co-translational protein process-protein mixtures. Detection with an ESI–TOF instru- ing difficult. The system as currently configuredment provided good MMA in the range of 20–50 provides a potentially viable alternative to 2-D gelsppm. A detailed analysis of a yeast ribosomal protein that can be implemented using commercially avail-preparation with the 2-D LC–LC/MS system al- able technology to acquire intact protein mass data,lowed tentative identification of.80% of the identify the component(s) with peptide based identifi-subunits in the complex. The configuration with two cation strategies, and provide a rational basis toreversed-phase columns for the second dimension examine the existence of specific protein modifica-separation provided two major benefits over a single tions.column configuration. First, the overall analysis timewith two columns was reduced by at least 30% dueto the efficiency of off-line loading and re-equilibra-
R eferencestion steps. Also significant was the ability to dis-criminate between elution problems occurring in the
[1] A.J. Link, J. Eng, D.M. Schieltz, E. Carmack, G.J. Mize,IEX step (fraction splitting) and those occurring inD.R. Morris, B.M. Garvik, J.R. Yates III, Nat. Biotechnol. 17
the second step (carry-over). (1999) 676.The value derived from applying two orthogonal [2] S.P. Gygi, B. Rist, S.A. Gerber, F. Turecek, M.H. Gelb, R.
Aebersold, Nat. Biotechnol. 17 (1999) 994.separation modes increases proportionally to sample[3] H. Gao, Y. Shen, T.D. Veenstra, R. Harkewicz, G.A. Ander-complexity, but the benefits also extend to samples
son, J.E. Bruce, L. Pasa-Tolic, R.D. Smith, J. Microcol. Sep.such as the ribosomal protein fraction with inter-12 (2000) 383.
mediate complexity but highly similar proteins (size, [4] M.T. Davis, J. Beierle, E.T. Bures, M.D. McGinley, J. Mort,pI, common cellular molecular environments, etc.). J.H. Robinson, C.S. Spahr, W. Yu, R. Luethy, S.D. Patterson,As currently implemented, we believe protein sam- J. Chromatogr. B Biomed. Sci. Appl. 752 (2001) 281.
[5] A. Butt, M.D. Davison, G.J. Smith, J.A. Young, S.J. Gaskell,ples of much greater complexity and diversity can beS.G. Oliver, R.J. Beynon, Proteomics 1 (2001) 42.successfully analyzed using the 2-D LC/ESI-MS
[6] P.K. Jensen, L. Pasa-Tolic, K.K. Peden, S. Martinovic, M.S.approach presented here. Current experimental re-Lipton, G.A. Anderson, N. Tolic, K.K. Wong, R.D. Smith,
sults do not, however, completely describe the Electrophoresis 21 (2000) 1372.limitations of the approach. Ribosomal proteins are, [7] P.K. Jensen, L. Pasa-Tolic, G.A. Anderson, J.A. Horner,
M.S. Lipton, J.E. Bruce, R.D. Smith, Anal. Chem. 71 (1999)on average, more hydrophilic than many proteins,2076.especially membrane-associated species, and more
[8] D.B. Wall, M.T. Kachman, S.S. Gong, S.J. Parus, M.W.work is required to delineate the applicability toLong, D.M. Lubman, Rapid Commun. Mass Spectrom. 15
hydrophobic proteins where issues of recovery from (2001) 1649.either the IEX or RP columns could be problematic. [9] D.B. Wall, S.J. Parus, D.M. Lubman, J. Chromatogr. B
Biomed. Sci. Appl. 763 (2001) 139.In addition, the ribosomal proteins only span a[10] G.J. Opiteck, S.M. Ramirez, J.W. Jorgenson, M.A. Moseleylimited mass range, the largest identified structure
III, Anal. Biochem. 258 (1998) 349.being only 43.6 kDa. We can anticipate a much[11] J.C. Giddings, J. High Resolut. Chromatogr. Chromatogr.
higher useful range, though, as Lubman and co- Commun. 10 (1987) 319.workers, for example, have reported on-line ESI– [12] J.C. Giddings, Anal. Chem. 56 (1984) 1258A.
[13] R.E. Murphy, M.R. Schure, J.P. Foley, Anal. Chem. 70TOF MS results for proteins up to 85 kDa [8].(1998) 1585.Lastly, although we can only tentatively identify
[14] J.M. Davis, Anal. Chem. 63 (1991) 2141.proteins and potential modifications using the intact[15] M.M. Bushey, J.W. Jorgenson, Anal. Chem. 62 (1990) 161.
mass data, it is in conjunction with more convention- [16] G.J. Opiteck, J.W. Jorgenson, Anal. Chem. 69 (1997) 2283.al peptide analysis techniques including peptide mass [17] B.E. Chong, F. Yan, D.M. Lubman, F.R. Miller, Rapidfingerprinting or CID MS/MS sequence analysis that Commun. Mass Spectrom. 15 (2001) 291.

H. Liu et al. / J. Chromatogr. B 782 (2002) 267–289 289
[18] K.K. Unger, K. Racaityte, K. Wagner, T. Miliotis, L.E. [37] D. Becker-Ursic, J. Davies, Biochemistry 15 (1976) 2289.Edholm, R. Bischoff, G. Marko-Varga, J. High Resolut. [38] R.J. Arnold, B. Polevoda, J.P. Reilly, F. Sherman, J. Biol.Chromatogr. 23 (2000) 259. Chem. 274 (1999) 37035.
[19] K. Wagner, T. Miliotis, G. Marko-Varga, R. Bischoff, K.K. [39] B.-U. Doris, J. Davies, Biochemistry 15 (1976) 2289.Unger, Anal. Chem. 74 (2002) 809. [40] T. Kruiswijk, A. Kunst, R.J. Planta, W.H. Mager, Biochem. J.
[20] K. Wagner, K. Racaityte, K.K. Unger, T. Miliotis, L.E. 175 (1978) 221.Edholm, R. Bischoff, G. Marko-Varga, J. Chromatogr. A 893 [41] J. Lhoest, Y. Lobet, E. Costers, C. Colson, Eur. J. Biochem.(2000) 293. 141 (1984) 585.
[21] M. Capel, D. Datta, C.R. Nierras, G.R. Craven, Anal. [42] Y. Lobet, J. Lhoest, C. Colson, Biochim. Biophys. Acta 997Biochem. 158 (1986) 179. (1989) 224.
[22] S.-W. Lee, S.J. Berger, S. Martinovic’, L. Pasa-Tolic’, G.A. [43] T. Naranda, J.P.G. Ballesta, Proc. Natl. Acad. Sci. USA 88Anderson, Y. Shen, R. Zhao, R.D. Smith, Proc. Natl. Acad. (1991) 10563.Sci. USA 99 (2002) 5942. [44] C. Santos, B. Ortiz-Reyes, T. Naranda, M. Remacha, J.P.G.
[23] S.J.S. Hardy, C.G. Kurland, P.Voynow, G. Mora, Biochemis- Ballesta, Biochemistry 32 (1993) 4231.try 8 (1969) 2897. [45] F. Sanchez-Madrid, F. Vidales, J.P.G. Ballesta, Eur. J.
[24] A. Goffeau, B.G. Barrell, H. Bussey, R.W. Davis, B. Dujon, Biochem. 114 (1981) 609.H. Feldmann, F. Galibert, J.D. Hoheisel, C. Jacq, M. [46] F.J. Vidales, M.T.S. Robles, J.P.G. Ballesta, Biochemistry 23Johnston, E.J. Louis, H.W. Mewes, Y. Murakami, P. Philip- (1984) 390.psen, H. Tettelin, S.G. Oliver, Science 274 (1996) 546. [47] S. Zinker, J.R. Warner, J. Biol. Chem. 251 (1976) 1799.
[25] M.C. Costanzo, J.D. Hogan, M.E. Cusick, B.P. Davis, A.M. [48] D. Finley, B. Bartel, A. Varshavsky, Nature 338 (1989) 394.Fancher, P.E. Hodges, P. Kondu, C. Lengieza, J.E. Lew- [49] J.M. Cherry, C. Adler, C. Ball, S.A. Chervitz, S.S. Dwight,Smith, C. Lingner, K.J. Roberg-Perez, M. Tillberg, J.E. E.T. Hester, Y. Jia, G. Juvik, T. Roe, M. Schroeder, S. Weng,Brooks, J.I. Garrels, Nucleic Acids Res. 28 (2000) 73. D. Botstein, Nucleic Acids Res. 26 (1998) 73.
[26] P.E. Hodges, A.H. McKee, B.P. Davis, W.E. Payne, J.I. [50] T.D. Veenstra, S. Martinovic, G.A. Anderson, L. Pasa-Tolic,Garrels, Nucleic Acids Res. 27 (1999) 69. R.D. Smith, J. Am. Soc. Mass Spectrom. 11 (2000) 78.
[27] I. Mazsaroff, F.E. Regnier, J. Chromatogr. 443 (1988) 119. [51] S. Martinovic, T.D. Veenstra, G.A. Anderson, L. Pasa-Tolic,[28] W. Kopaciewicz, M.A. Rounds, J. Fasnauh, F.E. Regnier, J. R.D. Smith, J. Mass Spectrom. 37 (2002) 99.
Chromatogr. 266 (1983) 3. [52] R.A. Zubarev, D.M. Horn, E.K. Fridriksson, N.L. Kelleher,[29] C.G. Huber, A. Premstaller, J. Chromatogr. A 849 (1999) N.A. Kruger, M.A. Lewis, B.K. Carpenter, F.W. McLafferty,
161. Anal. Chem. 72 (2000) 563.[30] A. Apffel, S. Fischer, G. Goldberg, P.C. Goodley, F.E. [53] P.A. Demirev, J. Ramirez, C. Fenselau, Anal. Chem. 73
Kuhlmann, J. Chromatogr. A 712 (1995) 177. (2001) 5725.[31] L.R. Snyder, in: C. Horvath (Ed.), High-Performance Liquid [54] W.J. Henzel, T.M. Billeci, J.T. Stults, S.C. Wong, C.
Chromatography, Advances and Perspectives, Academic Grimley, C. Watanabe, Proc. Natl. Acad. Sci. USA 90 (1993)Press, New York, 1980, p. 207. 5011.
[32] R.J. Planta, W.H. Mager, Yeast 14 (1998) 471.[55] P. James, M. Quadroni, E. Carafoli, G. Gonnet, Biochem.
[33] W.H. Mager, R.J. Planta, J.-P. Ballesta, J.C. Lee, K. Mizuta,Biophys. Res. Commun. 195 (1993) 58.
K. Suzuki, J.R. Warner, J. Woolford, Nucleic Acids Res. 25[56] M. Mann, P. Hojrup, P. Roepstorff, Biol. Mass Spectrom. 22
(1997) 4872.(1993) 338.
[34] Y. Shen, N. Tolic, R. Zhao, L. Pasa-Tolic, L. Li, S.J. Berger,[57] D.J.C. Pappin, P. Hojrup, A.J. Bleasby, Curr. Biol. 3 (1993)
R. Harkewicz, G.A. Anderson, M.E. Belov, R.D. Smith,327.
Anal. Chem. 73 (2001) 3011.[58] M. Mann, M. Wilm, Anal. Chem. 66 (1994) 4390.
[35] Y. Shen, R. Zhao, M.E. Belov, T.P. Conrads, G.A. Anderson,[59] W.G. Burton, K.D. Nugent, T.K. Slattery, B.R. Summers,
K. Tang, L. Pasa-Tolic, T.D. Veenstra, M.S. Lipton, H.R.L.R. Snyder, J. Chromatogr. 443 (1988) 363.
Udseth, R.D. Smith, Anal. Chem. 73 (2001) 1766.[36] L. Tolley, J.W. Jorgenson, M.A. Moseley, Anal. Chem. 73
(2001) 2985.