multi-scaling models of tcp/ip and sub-frame vbr video traffic
TRANSCRIPT
JOURNAL OF COMMUNICATIONS AND NETWORKS, VOL. 3, NO. 4, DEC. 2001 383Multi-Scaling Models of TCP/IP and Sub-FrameVBR Video Tra�cAshok Erramilli, Onuttom Narayan, Arnold Neidhardt, Iraj SanieeAbstract: Recent measurement and simulation studieshave revealed that wide area network tra�c displays com-plex statistical characteristics - possibly multifractal scaling- on �ne timescales, in addition to the well-known propertyof self-similar scaling on coarser timescales. In this paperwe investigate the performance and network engineering sig-ni�cance of these �ne timescale features using measured TCPand MPEG2 video traces, queueing simulations and analyticalarguments. We demonstrate that the �ne timescale featurescan a�ect performance substantially at low and intermediateutilizations, while the longer timescale self-similarity is impor-tant at intermediate and high utilizations. We relate the �netimescale structure in the measured TCP traces to ow con-trols, and show that UDP tra�c - which is not ow controlled- lacks such �ne timescale structure. Likewise we relate the�ne timescale structure in video MPEG2 traces to sub-frameencoding. We show that it is possibly to construct a relativelyparsimonious multi-fractal cascade model of �ne timescalefeatures that matches the queueing performance of both theTCP and video traces. We outline an analytical method toestimate performance for tra�c that is self-similar on coarsetimescales and multi-fractal on �ne timescales, and show thatthe engineering problem of setting safe operating points forplanning or admission controls can be signi�cantly in uencedby �ne timescale uctuations in network tra�c. The workreported here can be used to model the relevant character-istics of wide area tra�c across a full range of engineeringtimescales, and can be the basis of more accurate networkperformance analysis and engineering.Index Terms: self-similarity and long range dependence,performance and queueing analysis, TCP, UDP, MPEG2 traf-�c modeling, multifractalsI. IntroductionIT is now generally accepted that appropriately aggre-gated wide area network packet network tra�c exhibitsself-similar scaling over a wide range of timescales [1], [2],[3], [4], [5], [6], [8]. More recent measurement studies haveindicated that beyond self-similarity, wide area TCP traf-A. Erramilli is with Qnetworx, 1119 Campus Drive West, Mor-ganville, NJ 07751, USA. E-mail: [email protected]. Narayan is with the Physics Department, University of Califor-nia, Santa Cruz, CA 95064. E-mail: [email protected]. Neidhardt is with Telcordia Technologies Inc., 331 New-man Springs Road, Red Bank, NJ 07701, USA. E-mail:[email protected]. Saniee is with Bell Laboratories, Lucent Technologies, 600 Moun-tain Avenue, Murray Hill, NJ 07974, USA. E-mail: [email protected] in part by NSF grant NCR-9628067.c Qnetworx, University of California at Santa Cruz, TelcordiaTechnologies Inc., and Lucent Technologies. All rights reserved.
�c shows more complex statistical characteristics - per-haps multi-fractal scaling - on �ner timescales. From theviewpoint of network engineering, such observations of self-similar or multi-fractal scaling are of interest only to theextent that these features can impact tra�c performance.The performance and tra�c engineering implications ofself-similarity have already been demonstrated (see for ex-ample [7], [9]). The object of this paper is to examine theperformance and network engineering signi�cance of the�ne timescale features that are \beyond self-similarity", togain an understanding of situations when they are conse-quential, to verify multifractal models for these features insuch situations, and to develop analysis methods based onthese descriptions.A second objective of this paper is to investigate theapplication of the same modeling methodology, based onmulti-fractal scaling, to model tra�c features of VBR videotra�c below a frame level. Although there has been con-siderable research on video tra�c (for a representative, butfar from exhaustive list see [10], [11], [3], [12]), much ofthe prior literature (see [11], [3]) is concerned with mod-eling uctuations in video tra�c at and above the framelevel. However, as has been argued [10], performance canbe very often determined by uctuations at the cell level.One would thus expect characterizations at the slice levelto be more accurate than the frame level for many queueingscenarios.Fine time-scale, or large frequency, features of a tra�cstream are typically lost when individual streams are aggre-gated in the core of a network, where as has been shown,the long time correlations and low frequencies dominatethe overall performance. However, at the edge of the net-work, where call admission control and conformance testsare typically performed, these �ne time-scale characteris-tics of the individual stream become relevant, irrespectiveof the subsequent aggregation in the network core.Typically, �ne timescale features in tra�c are less ro-bust than coarse timescale uctuations: they can be readilymodi�ed through bu�ering or shaping, and are more sensi-tive to ow control parameters, content, coding scheme andcoding parameters. For this reason, our focus is on a struc-tural methodology that can capture the full range of �netimescale features observed in network tra�c: TCP owcontrol induced uctuations below the timescales of TCPsegment round-trip times, and video sub-frame character-istics that are determined by the coding schemes. Theseare discussed next.1229-2370/99/$10.00 c 1999 KICS
JOURNAL OF COMMUNICATIONS AND NETWORKS, VOL. 3, NO. 4, DEC. 2001 384A. Beyond self-similarity: observed �ne time-scale featuresGiven the demonstrated signi�cance of long timescalecorrelations on network performance, a self-similar tra�cmodel, Fractional Brownian Motion (FBM), has been pro-posed as a parsimonious and tractable model of packet traf-�c [13]. In this model, the number of arrivals (e.g., packets,cells, bytes) in an observation interval (0; t) can be repre-sented by a self-similar uctuation about its expectation:A(t) = mt+pamZ(t); (1)where A(t) denotes the number of arrivals up to time t,m is the mean arrival rate, a is the peakedness parameter,and Z(t) is a standard (mean zero, variance t2H) FBM.The uctuations observed over di�erent timescales are self-similar in that Z(�t) is distributed as �HZ(t), where H isthe Hurst parameter characterizing the self-similarity.In networking terms, FBM is an accurate model of tra�carrivals under the following conditions: i) the tra�c is ag-gregated from a large number of low activity independentusers ii) the timescales of interest (i.e, those that largelydetermine queueing behavior) fall within the scaling regioniii) the impact of ow controls is not signi�cant [4], [14],[15], [16], [17]. The simple self-similar model can breakdown, for example, on �ner timescales over which pro-tocol interactions (e.g. TCP) or encoding schemes (e.g.,MPEG2) can determine packet or cell transmission pat-terns.For the case of TCP tra�c, recent measurement stud-ies [18], [19] show that low-aggregate, broadband, widearea TCP/IP tra�c departs from FBM at time scalesshorter than a lower cuto� in two key respects. Firstly,the marginal distribution of tra�c counts is clearly non-Gaussian. Thus a purely second order description|interms of the mean and second moment|is not complete(which is to say that two streams with the same secondorder descriptions can give rise to very di�erent queueingbehavior). Secondly, the scaling exponent of the varianceon timescales shorter than the lower cuto� is smaller thanthe asymptotic exponent. As a re�nement of these two de-viations from FBM, it is claimed [18], [19] that wide areaTCP/IP tra�c below the lower cuto� exhibits multi-fractalscaling, with di�erent moments of the tra�c process show-ing scaling characterized by distinct exponents (in contrast,the scaling behavior in FBM is characterized by only a sin-gle exponent, namely, the Hurst parameter). Analysis ofdetailed simulations of TCP also support these observa-tions [20], [21]. The lower cuto� is empirically observed [18]to be of the order of the round-trip time of a TCP segment.The case of VBR video tra�c presents special challengesto the modeler. For one, video tra�c shows complex tem-poral structure, with characteristic features on short (sub-frame), intermediate (1-100 frames) and long timescales(> 100 frames). Much of the earlier work in this area hasfocused on the last two regimes. Secondly, tra�c charac-teristics can depend sensitively on the coding scheme (e.g.,H.261, MPEG) as well as speci�c parameters employed inthe coding (as with MPEG2). We use MPEG2 video as
representative of VBR video tra�c, and consider just oneaspect in its modeling: tra�c uctuations at the slice, orthe sub-frame level. Typically, tra�c on the sub-framelevel is highly bursty and irregular, and as demonstratedin this paper, these features can be adequately describedusing multi-fractal scaling.While it is inevitable that on the shortest timescales anypacket tra�c must be a non-Gaussian process, the impor-tant feature in wide area TCP/IP and VBR video tra�cis that, unlike earlier work on LAN tra�c [7], this is foundto have a signi�cant impact on network performance [22].Thus a compact representation of short time scale features,either using multifractals or alternative models [23], areuseful in understanding the queueing delays of WAN traf-�c.B. Scope and summary of workWe investigate the �ne timescale features in wide areaTCP/IP and MPEG2 video tra�c, using a series of simu-lation experiments and an analysis of the problem of settingnetwork operating points. We use the TCP packets froma one-hour trace due to Digital Equipment Corporation,gathered at Digital's primary Internet access point [24].The analysis reported here was conducted on multiple 6-minute samples of the 1 hour TCP trace, but for clarityof presentation, we report on a single 6-minute trace inthis paper. For video tra�c, the MPEG2 trace we studyconsists of 6 minutes of gymnastics at the 1996 AtlantaOlympics containing 280,000 time slices of duration 4/3 mseach, with a minimum, mean and maximum of 15,815 and5514 bytes per time slice respectively [25]. Traces of vary-ing durations from other events at the Olympics were alsoinvestigated, and show the same essential features. Whileour primary focus in this paper are the tra�c sensitive fea-tures within a single stream, it is understood that networktra�c consists of (perhaps) limited aggregates of such in-dividual streams.We verify that both the TCP/IP and video traces showthe same �ne timescale deviations from FBM as reportedin [18], [19] for TCP/IP tra�c, on the basis of a multi-fractal scaling analysis. There is a crossover from the �netimescale to coarser timescale behavior at approximatelythe single frame level for video tra�c; for TCP, a similarcrossover is observed in the data at � 512ms.1 The impacton performance of the �ne timescale features is demon-strated in both cases by aggregating the tra�c over time tothe level of the the crossover time and interpolating down tothe �ner timescales in various ways. Using a multi-fractalcascade to interpolate the �ne timescale structure appearsto work adequately. We also perform shu�ing experiments,1This value, close to the granularity of timers used in many TCPimplementations, may suggest that the crossover is an artifact. How-ever, for the data analyzed here, the timestamps were speci�ed to�s and had an accuracy of � 1ms; which eliminates this possibil-ity. Moreover, such a crossover time has also been observed in otherstudies, with its value depending on the network environment: forinstance, in Ref. [18], it is of the order of one second. In detailedTCP simulations using �ne grained timers, the crossover time hasbeen observed to vary with the round-trip time.
JOURNAL OF COMMUNICATIONS AND NETWORKS, VOL. 3, NO. 4, DEC. 2001 385similar to those in Ref. [7] for LAN tra�c, in order to showthat low-frequency features remain important.Motivated by these results, we obtain analytical esti-mates for the viable operating point for a network, un-der the assumption that its tra�c can be represented byan FBM process on long timescales, crossing over below alower cuto� to the FBM behavior to a purely multi-fractalcascade.2 These estimates agree with the simulation re-sult that one has to operate at a reduced utilization due toburstiness at �ne timescale features in the tra�c, and showhow this reduction depends on network parameters. An-other important (but not surprising) �nding is that multi-fractal scaling exponents alone are not su�cient to describethe tra�c: one needs to specify themagnitude of the uctu-ations in (di�erent moments of) the tra�c. We �x these byassuming that the behavior below the lower cuto� shouldsatisfy the \boundary conditions" imposed by the behaviorabove it.C. Origins of �ne timescale tra�c featuresAs mentioned earlier, the �ne timescale features arisedue to very di�erent mechanisms in TCP and VBR videotra�c. For TCP, where the data is obtained from directmeasurements on a network, it has been argued [18] thatthe �ne timescale behavior is due to the manner in whichTCP regulates the load o�ered by each individual source tothe network. The fact that the transition between the �neand coarse time behavior occurs at a timescale of the orderof the round-trip time of a TCP segment lends support tothis scenario. As additional evidence, we shall show laterin this paper that when TCP ow controls are not present(as is the case with UDP transport), WAN tra�c revertsto simple FBM behavior. On the other hand, for MPEG2video the �ne timescale structure exists in the manner inwhich frames are encoded, and arises independent of anynetwork interactions. A common descriptive framework forthese two very di�erent mechanisms might appear unlikely.However, in a queueing context, both these mechanismsgenerate a highly irregular distribution of packet/ cell/byte counts over a time interval, and as we demonstratein this paper, multi-fractal cascades mimic such irregulardistributions su�ciently well for estimating performance.There is however one important di�erence in the waythese models should be interpreted for TCP and VBR videotra�c. It should be stressed that this paper is primar-ily concerned with \open loop" characterizations of TCPtra�c (such as self similar or multi-fractal descriptions),in that it considers the e�ect of observed characteristicson network congestion, but does not explicitly address thee�ects of network congestion on the o�ered tra�c. Indis-putably, a closed loop model that captures these interac-tions is necessary for predictive purposes. The multi-fractalcascades studied here are an important intermediate stepto achieving this goal because to some extent they mimicthe e�ects of TCP ow control. Thus the open loop char-acterizations studied here should be viewed as a necessary2For video tra�c, there is also the intermediate scale, from thesingle frame to the group of frames (GOF) level, to be taken care of.
intermediate step to achieving the long term objectives ofa phenomenological model that completely captures theinteractions between network state and tra�c ows. Ofcourse, this is not an issue for real-time VBR video tra�c.D. OutlineThe rest of this paper is organized as follows: Section2 provides a short background on mono-fractal and multi-fractal scaling. Section 3 characterizes the data, showing atransition point between �ne and coarse time scale behav-ior in the case of TCP and MPEG2 tra�c, with the �netime scale uctuations described reasonably well as a multi-fractal cascade. Section 4 describes experiments, in whichthe tra�c traces are aggregated to this transition point,and then interpolated down to �ne timescales in a varietyof ways, with the simulated performance compared to thatof the original in each case. Section 5 obtains analyticalperformance estimates for a simple model which is multi-fractal on �ne timescales and FBM on coarser timescales.Finally, Section 6 summarizes our conclusions with sugges-tions for further work.II. Multi-Fractal ScalingSince the main focus of this paper is to investigate theusefulness and implications of a multi-fractal description oftra�c, we summarize some of the basic concepts associatedwith multi-fractals. Consider a tra�c arrival process A(t);de�ned as the total tra�c that arrives in the interval [0; t):The associated increment process X�(i); is de�ned byX�(i) = A(i�) �A((i� 1)�): (2)The basic scaling hypothesis is that the moments of theincrement process behave as:Xi X�(i)q � C(q)���(q) for�! 0: (3)In practice, the scaling hypothesis can be said to be rea-sonable if the above behavior is satis�ed over a rangeof timescales (for the processes considered in this paper,these would apply to the �ne timescales). In general thestructure function �(q) de�ned above |if it exists| willbe a decreasing and nonlinear function of q: Notice that�(q = 0) must be equal to unity. When �(q) is linear inq; the scaling behavior is said to be mono-fractal, and asingle scaling exponent completely determines the scalingbehavior of all the moments of the tra�c arrival process.Multi-fractal scaling can also be described in terms of an�-spectrum f(�) if certain regularity conditions are satis-�ed, in which case f(�) is de�ned byf(�) = infq ��q + �(q)� (4)with q ranging over (�1;1) in the in�mum. Under theregularity conditions, the �-spectrum can be interpreted asthe Hausdor� dimension of the set of points on the time axiswith the same local exponent �: If the regularity conditionsare not satis�ed, then at least three separate �-spectra canbe de�ned [26].
JOURNAL OF COMMUNICATIONS AND NETWORKS, VOL. 3, NO. 4, DEC. 2001 386
-80
-70
-60
-50
-40
-30
-20
-10
0
0 2 4 6 8 10 12
ln(S
um X
(i)^q
)
ln(Delta)
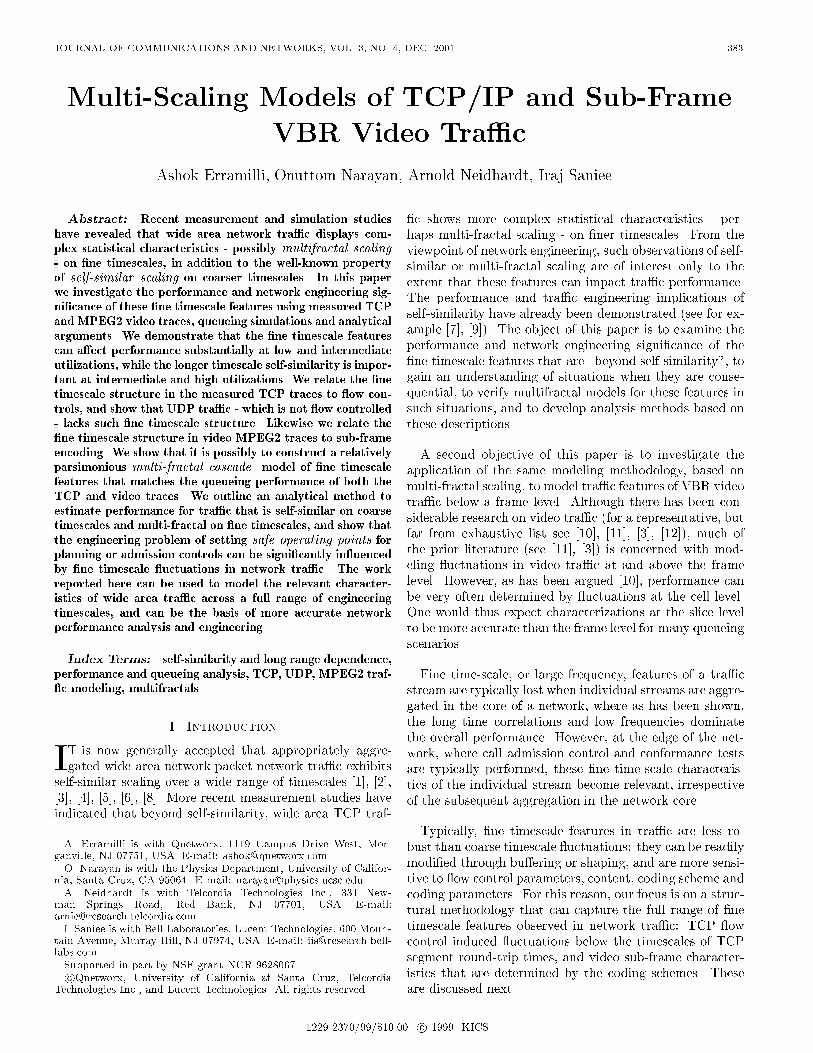
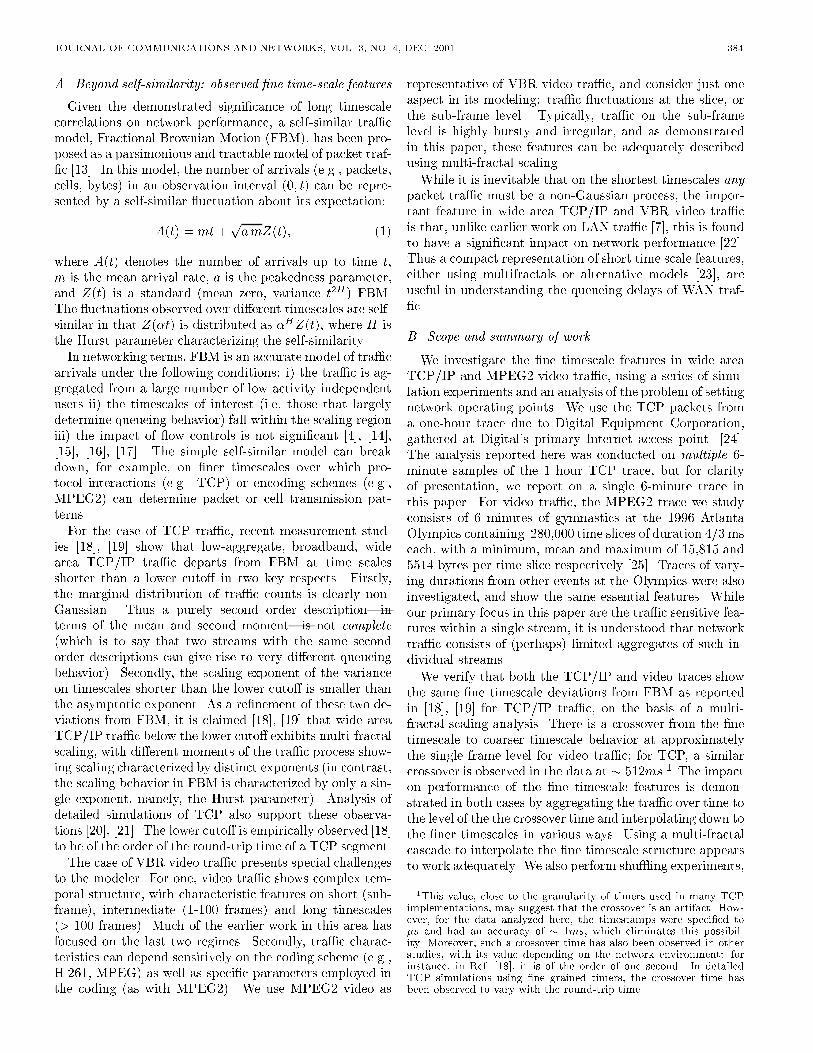
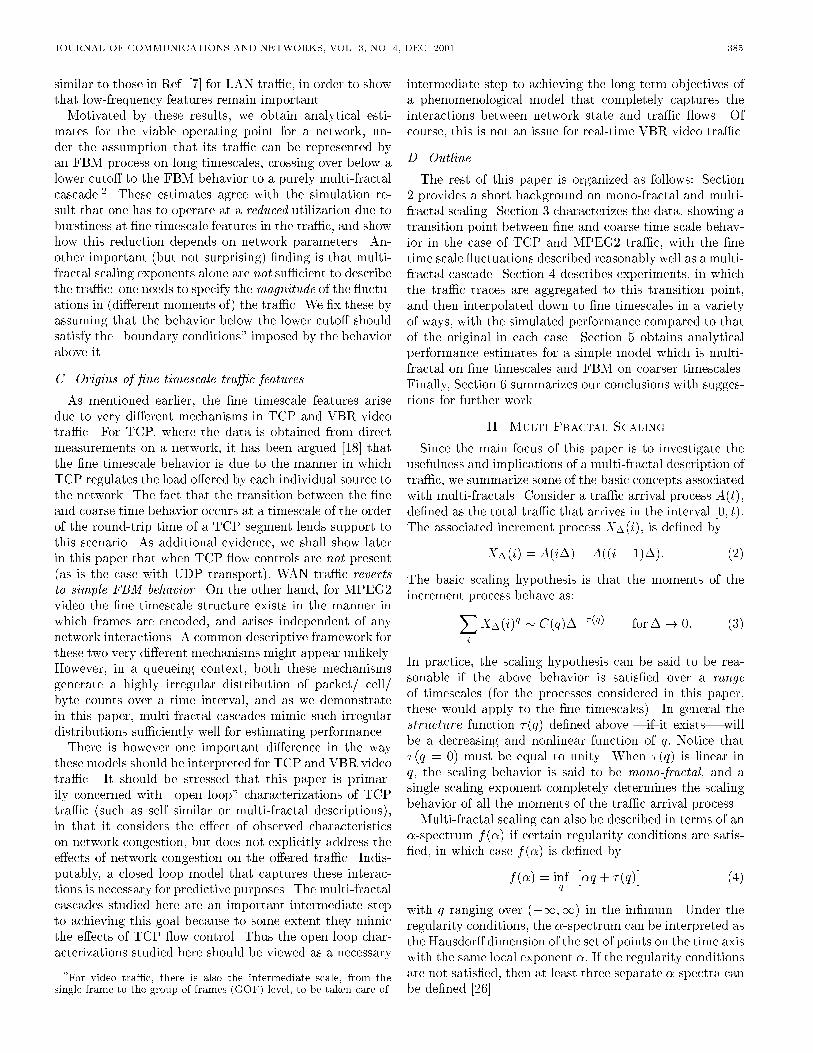
q=1q=2q=3q=4q=5q=6q=7q=8Fig. 1. Log-log plot for TCP tra�c of various moments of the aggre-gated increment process, Pi X�(i)q ; as a function of the size ofthe aggregation interval �: Natural logarithms have been used. X�is measured as a fraction of the total byte count in the entire trace,so that the logarithms of all the moments approach zero at the rightend of the plot. � is measured in ms.When the scaling is mono-fractal, so that �(q) is linear inq (and �(0) = 1), it is easy to see that f(�) has a value ofunity at a single point, and �1 for all other �: That is tosay, the same exponent � describes the scaling behavior ofthe tra�c arrival process for all time t: In practical terms,multi-fractal scaling is indicated by the presence of a broad�-spectrum.One of the standard techniques to generate multi-fractalscaling on �ner timescales is the cascade construction.In the semi-random version of this approach, a coarsetimescale count over an interval is distributed over �nertimescales by assigning a fraction p to one half of the in-terval and the remainder to the other half. The choice ofwhich of the two intervals to assign the fraction p is donerandomly. The distribution process is repeated for a num-ber of stages, and the result is marked by extreme irregu-larity over a range of �ne timescales. There are numerousvariations in the cascade construction [18]. For instance,the construction can also be strictly deterministic (i.e., thetra�c is distributed in the �xed ratio p : 1 � p at everystage). III. Scaling Properties of dataFig. 1 shows a log-log plot of the various moments ofthe TCP data. The moments of the increment process areplotted as a function of the size of the aggregation interval�, in accordance with Eq.(3). There is a visible change inthe behavior of all the di�erent moments at � � 512 ms,with the slopes of the curves changing at around this point.Below 512 ms, one can �t the di�erent moments in Fig. 1 tostraight lines of di�erent slopes. At timescales coarser than512 ms, the tra�c is approximately FBM. This is shown inFig. 2 and Fig. 3, where beyond 512 ms the tra�c is approx-imately Gaussian with self-similar uctuations. It appearsthat the scaling in the variance assumes its asymptotic be-havior before the marginal distribution of counts \looks"
fully Gaussian.
10
12
14
16
18
20
22
24
26
28
0 2 4 6 8 10 12
ln(v
aria
nce)
ln(scale)Fig. 2. Log-log plot for TCP tra�c of the variance in the byte counts pertime interval, as a function of the size of the time interval. Naturallogarithms have been used. The straight line above approximately512 ms corresponds to the low frequency FBM behavior of the tra�c uctuations.
0
2
4
6
8
10
12
14
16
18
0 20000 40000 60000 80000 100000 120000 140000
freq
uenc
y
bytes per 512 msecFig. 3. Marginals of the TCP tra�c aggregated to 512 ms, showingroughly Gaussian behavior.For a pure FBM process, the tra�c would have beenself-similar (and Gaussian) on all timescales. Conversely,for a pure multifractal, the tra�c would have looked self-similar but non-Gaussian on all timescales. As Figs. 1, 2and 3 demonstrate, neither of these descriptions is satis-factory. There are two separate regimes, separated by � �512 ms. Our strategy is to model the tra�c as FBM oncoarse timescales, and interpolate down to �ne timescalesusing a multifractal description. The linearity of the plotsin Fig. 1 in the �ne timescale regime conforms to Eq.(3).The extent of this regime is approximately the same ashas been observed with other tra�c measurements in [18].The slopes in the �ne timescale regime, which de�ne �(q);are plotted against q in Fig. 4, and show clear nonlinear-ity, invalidating a mono-fractal description in this regime.By comparison, the familiar FBM arrival process can besaid to exhibit mono-fractal scaling, when the uctuations
JOURNAL OF COMMUNICATIONS AND NETWORKS, VOL. 3, NO. 4, DEC. 2001 387
-8
-6
-4
-2
0
2
4
6
-4 -2 0 2 4 6 8
tau(
q)
q
DEC TCPmfc1-q
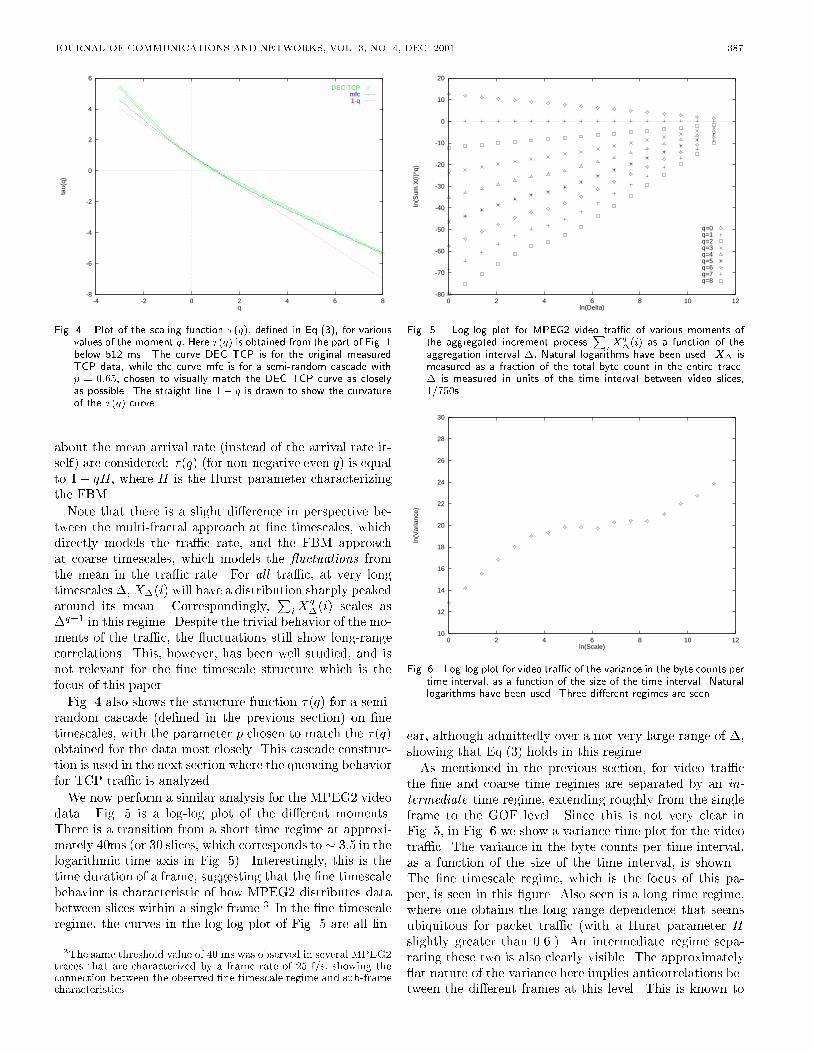
Fig. 4. Plot of the scaling function �(q); de�ned in Eq.(3), for variousvalues of the moment q: Here �(q) is obtained from the part of Fig. 1below 512 ms. The curve DEC TCP is for the original measuredTCP data, while the curve mfc is for a semi-random cascade withp = 0:65; chosen to visually match the DEC TCP curve as closelyas possible. The straight line 1 � q is drawn to show the curvatureof the �(q) curve.about the mean arrival rate (instead of the arrival rate it-self) are considered: �(q) (for non-negative even q) is equalto 1� qH; where H is the Hurst parameter characterizingthe FBM.Note that there is a slight di�erence in perspective be-tween the multi-fractal approach at �ne timescales, whichdirectly models the tra�c rate, and the FBM approachat coarse timescales, which models the uctuations fromthe mean in the tra�c rate. For all tra�c, at very longtimescales �; X�(i) will have a distribution sharply peakedaround its mean. Correspondingly, PiXq�(i) scales as�q�1 in this regime. Despite the trivial behavior of the mo-ments of the tra�c, the uctuations still show long-rangecorrelations. This, however, has been well studied, and isnot relevant for the �ne timescale structure which is thefocus of this paper.Fig. 4 also shows the structure function �(q) for a semi-random cascade (de�ned in the previous section) on �netimescales, with the parameter p chosen to match the �(q)obtained for the data most closely. This cascade construc-tion is used in the next section where the queueing behaviorfor TCP tra�c is analyzed.We now perform a similar analysis for the MPEG2 videodata. Fig. 5 is a log-log plot of the di�erent moments.There is a transition from a short time regime at approxi-mately 40ms (or 30 slices, which corresponds to� 3:5 in thelogarithmic time axis in Fig. 5). Interestingly, this is thetime duration of a frame, suggesting that the �ne timescalebehavior is characteristic of how MPEG2 distributes databetween slices within a single frame.3 In the �ne timescaleregime, the curves in the log-log plot of Fig. 5 are all lin-3The same threshold value of 40 ms was observed in several MPEG2traces that are characterized by a frame rate of 25 f/s, showing theconnection between the observed �ne timescale regime and sub-framecharacteristics.
-80
-70
-60
-50
-40
-30
-20
-10
0
10
20
0 2 4 6 8 10 12
ln(S
um X
(i)^q
)
ln(Delta)
q=0q=1q=2q=3q=4q=5q=6q=7q=8Fig. 5. Log-log plot for MPEG2 video tra�c of various moments ofthe aggregated increment process Pi Xq�(i) as a function of theaggregation interval �: Natural logarithms have been used. X� ismeasured as a fraction of the total byte count in the entire trace.� is measured in units of the time interval between video slices,1=750s.
10
12
14
16
18
20
22
24
26
28
30
0 2 4 6 8 10 12
ln(V
aria
nce)
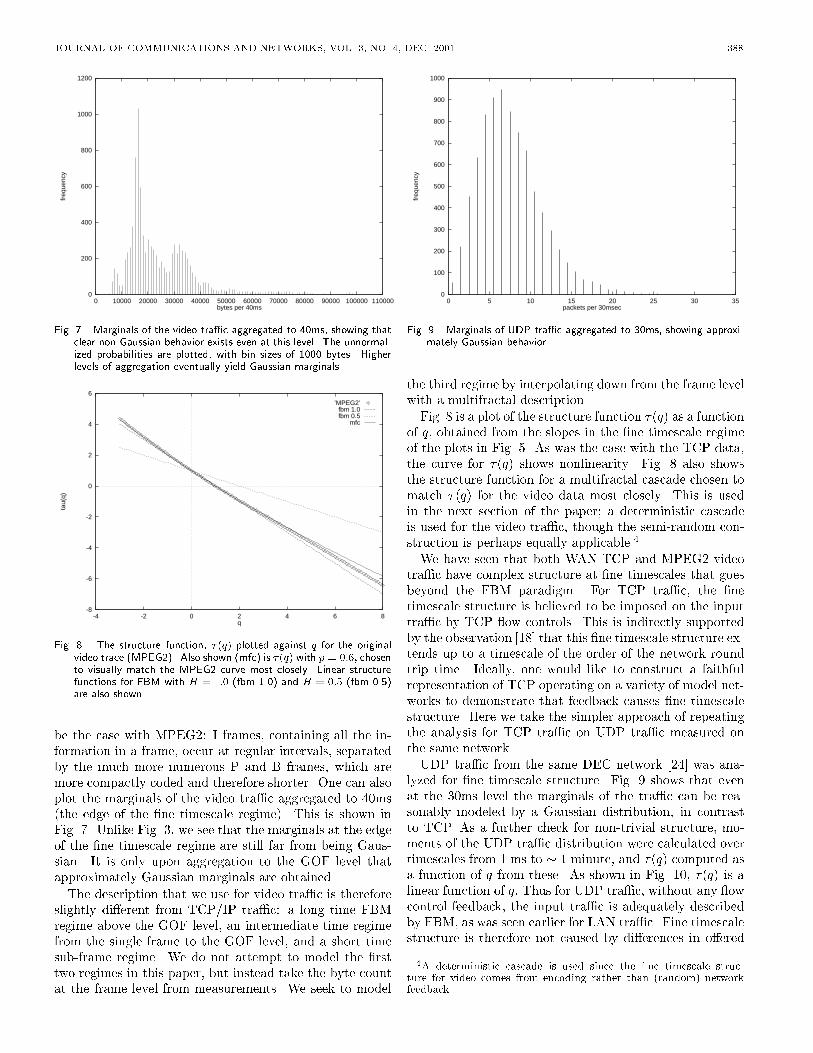
ln(Scale)Fig. 6. Log-log plot for video tra�c of the variance in the byte counts pertime interval, as a function of the size of the time interval. Naturallogarithms have been used. Three di�erent regimes are seen.ear, although admittedly over a not very large range of �;showing that Eq.(3) holds in this regime.As mentioned in the previous section, for video tra�cthe �ne and coarse time regimes are separated by an in-termediate time regime, extending roughly from the singleframe to the GOF level. Since this is not very clear inFig. 5, in Fig. 6 we show a variance-time plot for the videotra�c. The variance in the byte counts per time interval,as a function of the size of the time interval, is shown.The �ne timescale regime, which is the focus of this pa-per, is seen in this �gure. Also seen is a long time regime,where one obtains the long range dependence that seemsubiquitous for packet tra�c (with a Hurst parameter Hslightly greater than 0.6.) An intermediate regime sepa-rating these two is also clearly visible. The approximately at nature of the variance here implies anticorrelations be-tween the di�erent frames at this level. This is known to
JOURNAL OF COMMUNICATIONS AND NETWORKS, VOL. 3, NO. 4, DEC. 2001 388
0
200
400
600
800
1000
1200
0 10000 20000 30000 40000 50000 60000 70000 80000 90000 100000 110000
freq
uenc
y
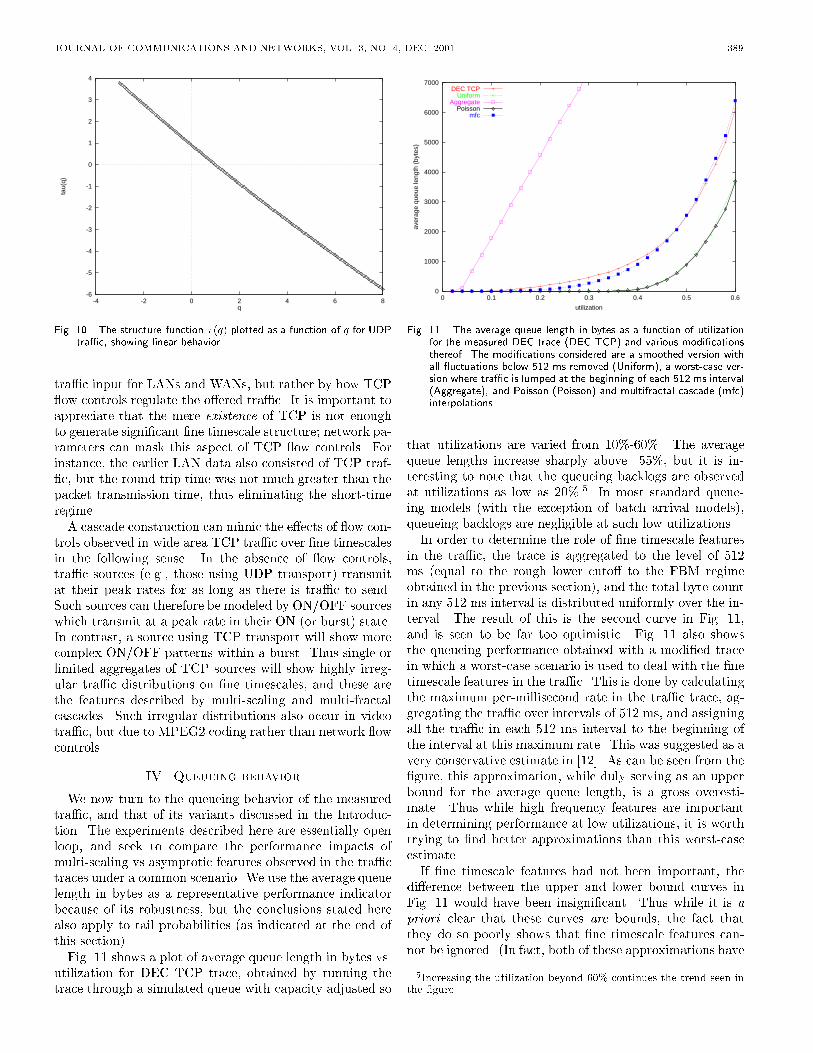
bytes per 40msFig. 7. Marginals of the video tra�c aggregated to 40ms, showing thatclear non-Gaussian behavior exists even at this level. The unnormal-ized probabilities are plotted, with bin sizes of 1000 bytes. Higherlevels of aggregation eventually yield Gaussian marginals.
-8
-6
-4
-2
0
2
4
6
-4 -2 0 2 4 6 8
tau(
q)
q
’MPEG2’fbm 1.0fbm 0.5
mfc
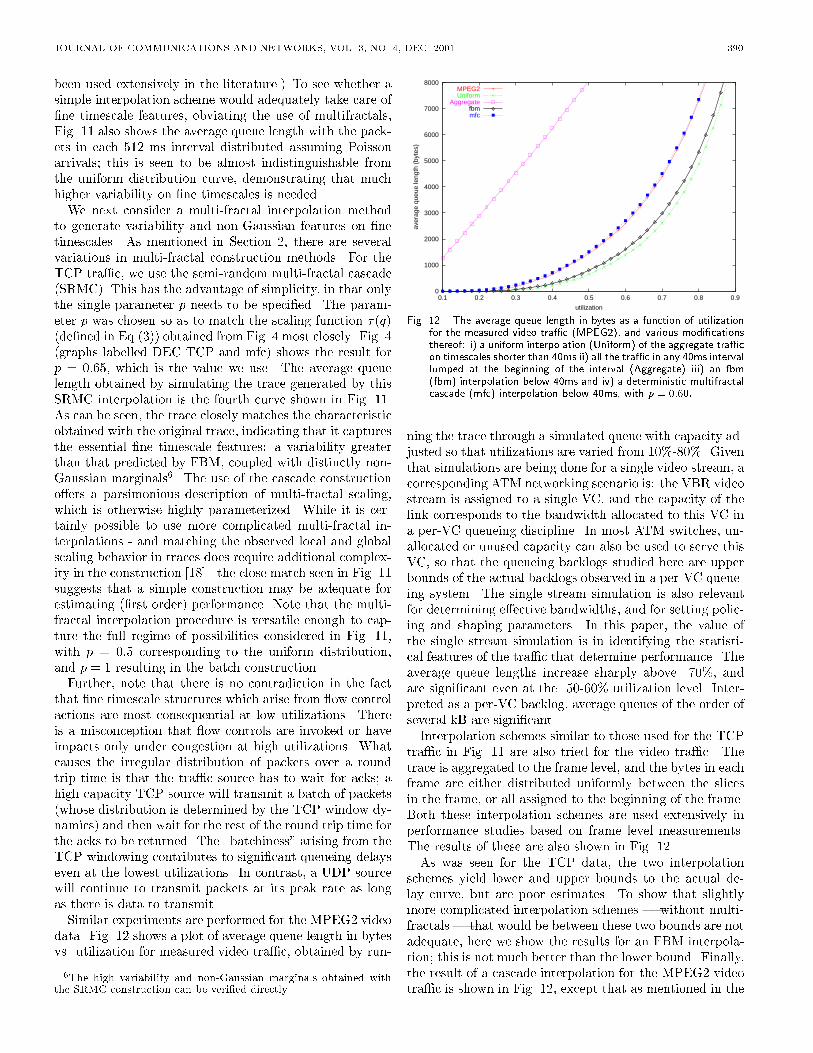
Fig. 8. The structure function, �(q) plotted against q for the originalvideo trace (MPEG2). Also shown (mfc) is �(q) with p = 0:6; chosento visually match the MPEG2 curve most closely. Linear structurefunctions for FBM with H = 1:0 (fbm 1.0) and H = 0:5 (fbm 0.5)are also shown.be the case with MPEG2: I frames, containing all the in-formation in a frame, occur at regular intervals, separatedby the much more numerous P and B frames, which aremore compactly coded and therefore shorter. One can alsoplot the marginals of the video tra�c aggregated to 40ms(the edge of the �ne timescale regime). This is shown inFig. 7. Unlike Fig. 3, we see that the marginals at the edgeof the �ne timescale regime are still far from being Gaus-sian. It is only upon aggregation to the GOF level thatapproximately Gaussian marginals are obtained.The description that we use for video tra�c is thereforeslightly di�erent from TCP/IP tra�c: a long time FBMregime above the GOF level, an intermediate time regimefrom the single frame to the GOF level, and a short timesub-frame regime. We do not attempt to model the �rsttwo regimes in this paper, but instead take the byte countat the frame level from measurements. We seek to model
0
100
200
300
400
500
600
700
800
900
1000
0 5 10 15 20 25 30 35
freq
uenc
y
packets per 30msecFig. 9. Marginals of UDP tra�c aggregated to 30ms, showing approxi-mately Gaussian behavior.the third regime by interpolating down from the frame levelwith a multifractal description.Fig. 8 is a plot of the structure function �(q) as a functionof q; obtained from the slopes in the �ne timescale regimeof the plots in Fig. 5. As was the case with the TCP data,the curve for �(q) shows nonlinearity. Fig. 8 also showsthe structure function for a multifractal cascade chosen tomatch �(q) for the video data most closely. This is usedin the next section of the paper; a deterministic cascadeis used for the video tra�c, though the semi-random con-struction is perhaps equally applicable.4We have seen that both WAN TCP and MPEG2 videotra�c have complex structure at �ne timescales that goesbeyond the FBM paradigm. For TCP tra�c, the �netimescale structure is believed to be imposed on the inputtra�c by TCP ow controls. This is indirectly supportedby the observation [18] that this �ne timescale structure ex-tends up to a timescale of the order of the network roundtrip time. Ideally, one would like to construct a faithfulrepresentation of TCP operating on a variety of model net-works to demonstrate that feedback causes �ne timescalestructure. Here we take the simpler approach of repeatingthe analysis for TCP tra�c on UDP tra�c measured onthe same network.UDP tra�c from the same DEC network [24] was ana-lyzed for �ne timescale structure. Fig. 9 shows that evenat the 30ms level the marginals of the tra�c can be rea-sonably modeled by a Gaussian distribution, in contrastto TCP. As a further check for non-trivial structure, mo-ments of the UDP tra�c distribution were calculated overtimescales from 1 ms to � 1 minute, and �(q) computed asa function of q from these. As shown in Fig. 10, �(q) is alinear function of q: Thus for UDP tra�c, without any owcontrol feedback, the input tra�c is adequately describedby FBM, as was seen earlier for LAN tra�c. Fine timescalestructure is therefore not caused by di�erences in o�ered4A deterministic cascade is used since the �ne timescale struc-ture for video comes from encoding rather than (random) networkfeedback.
JOURNAL OF COMMUNICATIONS AND NETWORKS, VOL. 3, NO. 4, DEC. 2001 389
-6
-5
-4
-3
-2
-1
0
1
2
3
4
-4 -2 0 2 4 6 8
tau(
q)
qFig. 10. The structure function �(q) plotted as a function of q for UDPtra�c, showing linear behavior.tra�c input for LANs and WANs, but rather by how TCP ow controls regulate the o�ered tra�c. It is important toappreciate that the mere existence of TCP is not enoughto generate signi�cant �ne timescale structure; network pa-rameters can mask this aspect of TCP ow controls. Forinstance, the earlier LAN data also consisted of TCP traf-�c, but the round trip time was not much greater than thepacket transmission time, thus eliminating the short-timeregime.A cascade construction can mimic the e�ects of ow con-trols observed in wide area TCP tra�c over �ne timescalesin the following sense. In the absence of ow controls,tra�c sources (e.g., those using UDP transport) transmitat their peak rates for as long as there is tra�c to send.Such sources can therefore be modeled by ON/OFF sourceswhich transmit at a peak rate in their ON (or burst) state.In contrast, a source using TCP transport will show morecomplex ON/OFF patterns within a burst. Thus single orlimited aggregates of TCP sources will show highly irreg-ular tra�c distributions on �ne timescales, and these arethe features described by multi-scaling and multi-fractalcascades. Such irregular distributions also occur in videotra�c, but due to MPEG2 coding rather than network owcontrols. IV. Queueing behaviorWe now turn to the queueing behavior of the measuredtra�c, and that of its variants discussed in the Introduc-tion. The experiments described here are essentially openloop, and seek to compare the performance impacts ofmulti-scaling vs asymptotic features observed in the tra�ctraces under a common scenario. We use the average queuelength in bytes as a representative performance indicatorbecause of its robustness, but the conclusions stated herealso apply to tail probabilities (as indicated at the end ofthis section).Fig. 11 shows a plot of average queue length in bytes vs.utilization for DEC TCP trace, obtained by running thetrace through a simulated queue with capacity adjusted so
0
1000
2000
3000
4000
5000
6000
7000
0 0.1 0.2 0.3 0.4 0.5 0.6
aver
age
queu
e le
ngth
(by
tes)
utilization
DEC TCPUniform
PoissonAggregate
mfc
Fig. 11. The average queue length in bytes as a function of utilizationfor the measured DEC trace (DEC TCP) and various modi�cationsthereof. The modi�cations considered are a smoothed version withall uctuations below 512 ms removed (Uniform), a worst-case ver-sion where tra�c is lumped at the beginning of each 512 ms interval(Aggregate), and Poisson (Poisson) and multifractal cascade (mfc)interpolations.that utilizations are varied from 10%-60%. The averagequeue lengths increase sharply above 55%, but it is in-teresting to note that the queueing backlogs are observedat utilizations as low as 20%.5 In most standard queue-ing models (with the exception of batch arrival models),queueing backlogs are negligible at such low utilizations.In order to determine the role of �ne timescale featuresin the tra�c, the trace is aggregated to the level of 512ms (equal to the rough lower cuto� to the FBM regimeobtained in the previous section), and the total byte countin any 512 ms interval is distributed uniformly over the in-terval. The result of this is the second curve in Fig. 11,and is seen to be far too optimistic. Fig. 11 also showsthe queueing performance obtained with a modi�ed tracein which a worst-case scenario is used to deal with the �netimescale features in the tra�c. This is done by calculatingthe maximum per-millisecond rate in the tra�c trace, ag-gregating the tra�c over intervals of 512 ms, and assigningall the tra�c in each 512 ms interval to the beginning ofthe interval at this maximum rate. This was suggested as avery conservative estimate in [12]. As can be seen from the�gure, this approximation, while duly serving as an upperbound for the average queue length, is a gross overesti-mate. Thus while high frequency features are importantin determining performance at low utilizations, it is worthtrying to �nd better approximations than this worst-caseestimate.If �ne timescale features had not been important, thedi�erence between the upper and lower bound curves inFig. 11 would have been insigni�cant. Thus while it is apriori clear that these curves are bounds, the fact thatthey do so poorly shows that �ne timescale features can-not be ignored. (In fact, both of these approximations have5Increasing the utilization beyond 60% continues the trend seen inthe �gure.
JOURNAL OF COMMUNICATIONS AND NETWORKS, VOL. 3, NO. 4, DEC. 2001 390been used extensively in the literature.) To see whether asimple interpolation scheme would adequately take care of�ne timescale features, obviating the use of multifractals,Fig. 11 also shows the average queue length with the pack-ets in each 512 ms interval distributed assuming Poissonarrivals; this is seen to be almost indistinguishable fromthe uniform distribution curve, demonstrating that muchhigher variability on �ne timescales is needed.We next consider a multi-fractal interpolation methodto generate variability and non-Gaussian features on �netimescales. As mentioned in Section 2, there are severalvariations in multi-fractal construction methods. For theTCP tra�c, we use the semi-random multi-fractal cascade(SRMC). This has the advantage of simplicity, in that onlythe single parameter p needs to be speci�ed. The param-eter p was chosen so as to match the scaling function �(q)(de�ned in Eq.(3)) obtained from Fig. 4 most closely. Fig. 4(graphs labelled DEC TCP and mfc) shows the result forp = 0:65; which is the value we use. The average queuelength obtained by simulating the trace generated by thisSRMC interpolation is the fourth curve shown in Fig. 11.As can be seen, the trace closely matches the characteristicobtained with the original trace, indicating that it capturesthe essential �ne timescale features: a variability greaterthan that predicted by FBM, coupled with distinctly non-Gaussian marginals6. The use of the cascade constructiono�ers a parsimonious description of multi-fractal scaling,which is otherwise highly parameterized. While it is cer-tainly possible to use more complicated multi-fractal in-terpolations - and matching the observed local and globalscaling behavior in traces does require additional complex-ity in the construction [18] - the close match seen in Fig. 11suggests that a simple construction may be adequate forestimating (�rst order) performance. Note that the multi-fractal interpolation procedure is versatile enough to cap-ture the full regime of possibilities considered in Fig. 11,with p = 0:5 corresponding to the uniform distribution,and p = 1 resulting in the batch construction.Further, note that there is no contradiction in the factthat �ne timescale structures which arise from ow controlactions are most consequential at low utilizations. Thereis a misconception that ow controls are invoked or haveimpacts only under congestion at high utilizations. Whatcauses the irregular distribution of packets over a roundtrip time is that the tra�c source has to wait for acks; ahigh capacity TCP source will transmit a batch of packets(whose distribution is determined by the TCP window dy-namics) and then wait for the rest of the round trip time forthe acks to be returned. The \batchiness" arising from theTCP windowing contributes to signi�cant queueing delayseven at the lowest utilizations. In contrast, a UDP sourcewill continue to transmit packets at its peak rate as longas there is data to transmit.Similar experiments are performed for the MPEG2 videodata. Fig. 12 shows a plot of average queue length in bytesvs. utilization for measured video tra�c, obtained by run-6The high variability and non-Gaussian marginals obtained withthe SRMC construction can be veri�ed directly
0
1000
2000
3000
4000
5000
6000
7000
8000
0.1 0.2 0.3 0.4 0.5 0.6 0.7 0.8 0.9
aver
age
queu
e le
ngth
(by
tes)
utilization
MPEG2Uniform
Aggregatefbmmfc
Fig. 12. The average queue length in bytes as a function of utilizationfor the measured video tra�c (MPEG2), and various modi�cationsthereof: i) a uniform interpolation (Uniform) of the aggregate tra�con timescales shorter than 40ms ii) all the tra�c in any 40ms intervallumped at the beginning of the interval (Aggregate) iii) an fbm(fbm) interpolation below 40ms and iv) a deterministic multifractalcascade (mfc) interpolation below 40ms, with p = 0:60:ning the trace through a simulated queue with capacity ad-justed so that utilizations are varied from 10%-80%. Giventhat simulations are being done for a single video stream, acorresponding ATM networking scenario is: the VBR videostream is assigned to a single VC, and the capacity of thelink corresponds to the bandwidth allocated to this VC ina per-VC queueing discipline. In most ATM switches, un-allocated or unused capacity can also be used to serve thisVC, so that the queueing backlogs studied here are upperbounds of the actual backlogs observed in a per-VC queue-ing system. The single stream simulation is also relevantfor determining e�ective bandwidths, and for setting polic-ing and shaping parameters. In this paper, the value ofthe single stream simulation is in identifying the statisti-cal features of the tra�c that determine performance. Theaverage queue lengths increase sharply above 70%, andare signi�cant even at the 50-60% utilization level. Inter-preted as a per-VC backlog, average queues of the order ofseveral kB are signi�cant.Interpolation schemes similar to those used for the TCPtra�c in Fig. 11 are also tried for the video tra�c. Thetrace is aggregated to the frame level, and the bytes in eachframe are either distributed uniformly between the slicesin the frame, or all assigned to the beginning of the frame.Both these interpolation schemes are used extensively inperformance studies based on frame level measurements.The results of these are also shown in Fig. 12.As was seen for the TCP data, the two interpolationschemes yield lower and upper bounds to the actual de-lay curve, but are poor estimates. To show that slightlymore complicated interpolation schemes | without multi-fractals | that would be between these two bounds are notadequate, here we show the results for an FBM interpola-tion; this is not much better than the lower bound. Finally,the result of a cascade interpolation for the MPEG2 videotra�c is shown in Fig. 12, except that as mentioned in the
JOURNAL OF COMMUNICATIONS AND NETWORKS, VOL. 3, NO. 4, DEC. 2001 391
0
1000
2000
3000
4000
5000
6000
7000
8000
0.1 0.2 0.3 0.4 0.5 0.6 0.7 0.8 0.9
aver
age
queu
e le
ngth
(by
tes)
utilization
2 MPEG2
mfc
Uniform
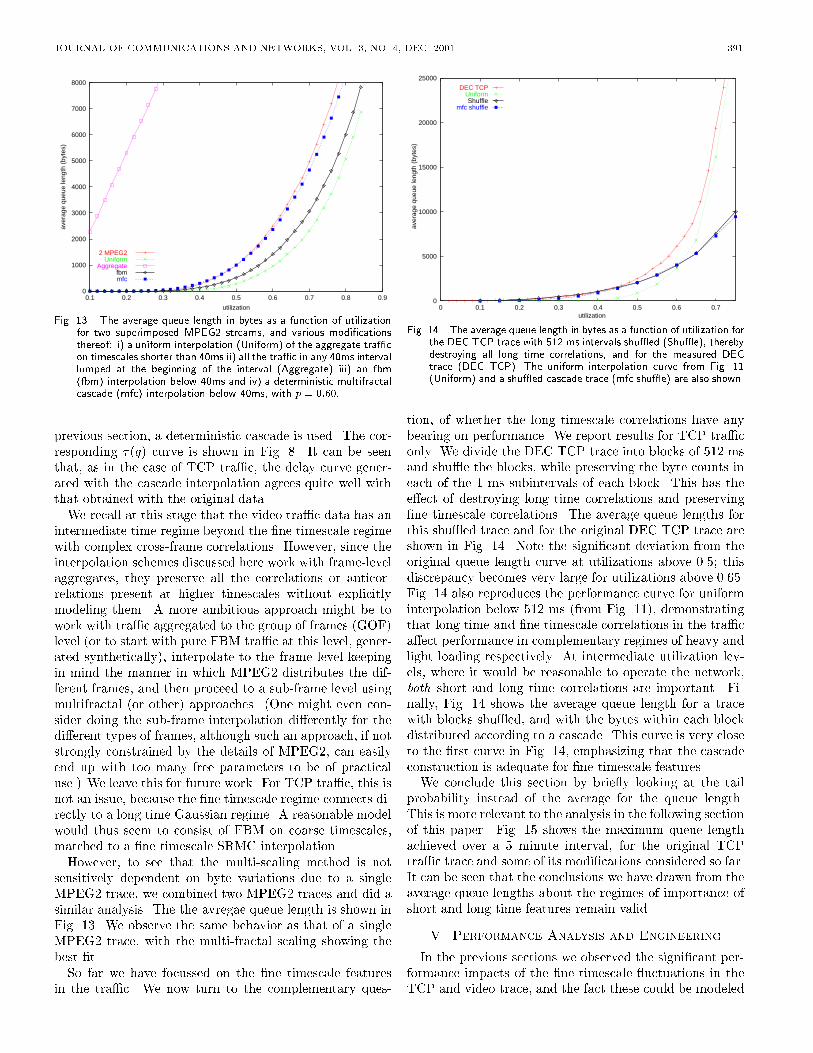
fbmAggregateFig. 13. The average queue length in bytes as a function of utilizationfor two superimposed MPEG2 streams, and various modi�cationsthereof: i) a uniform interpolation (Uniform) of the aggregate tra�con timescales shorter than 40ms ii) all the tra�c in any 40ms intervallumped at the beginning of the interval (Aggregate) iii) an fbm(fbm) interpolation below 40ms and iv) a deterministic multifractalcascade (mfc) interpolation below 40ms, with p = 0:60:previous section, a deterministic cascade is used. The cor-responding �(q) curve is shown in Fig. 8. It can be seenthat, as in the case of TCP tra�c, the delay curve gener-ated with the cascade interpolation agrees quite well withthat obtained with the original data.We recall at this stage that the video tra�c data has anintermediate time regime beyond the �ne timescale regimewith complex cross-frame correlations. However, since theinterpolation schemes discussed here work with frame-levelaggregates, they preserve all the correlations or anticor-relations present at higher timescales without explicitlymodeling them. A more ambitious approach might be towork with tra�c aggregated to the group of frames (GOF)level (or to start with pure FBM tra�c at this level, gener-ated synthetically), interpolate to the frame level keepingin mind the manner in which MPEG2 distributes the dif-ferent frames, and then proceed to a sub-frame level usingmultifractal (or other) approaches. (One might even con-sider doing the sub-frame interpolation di�erently for thedi�erent types of frames, although such an approach, if notstrongly constrained by the details of MPEG2, can easilyend up with too many free parameters to be of practicaluse.) We leave this for future work. For TCP tra�c, this isnot an issue, because the �ne timescale regime connects di-rectly to a long time Gaussian regime. A reasonable modelwould thus seem to consist of FBM on coarse timescales,matched to a �ne timescale SRMC interpolation.However, to see that the multi-scaling method is notsensitively dependent on byte variations due to a singleMPEG2 trace, we combined two MPEG2 traces and did asimilar analysis. The the avregae queue length is shown inFig. 13. We observe the same behavior as that of a singleMPEG2 trace, with the multi-fractal scaling showing thebest �t.So far we have focussed on the �ne timescale featuresin the tra�c. We now turn to the complementary ques-
0
5000
10000
15000
20000
25000
0 0.1 0.2 0.3 0.4 0.5 0.6 0.7
aver
age
queu
e le
ngth
(by
tes)
utilization
DEC TCP
Shufflemfc shuffle
Uniform
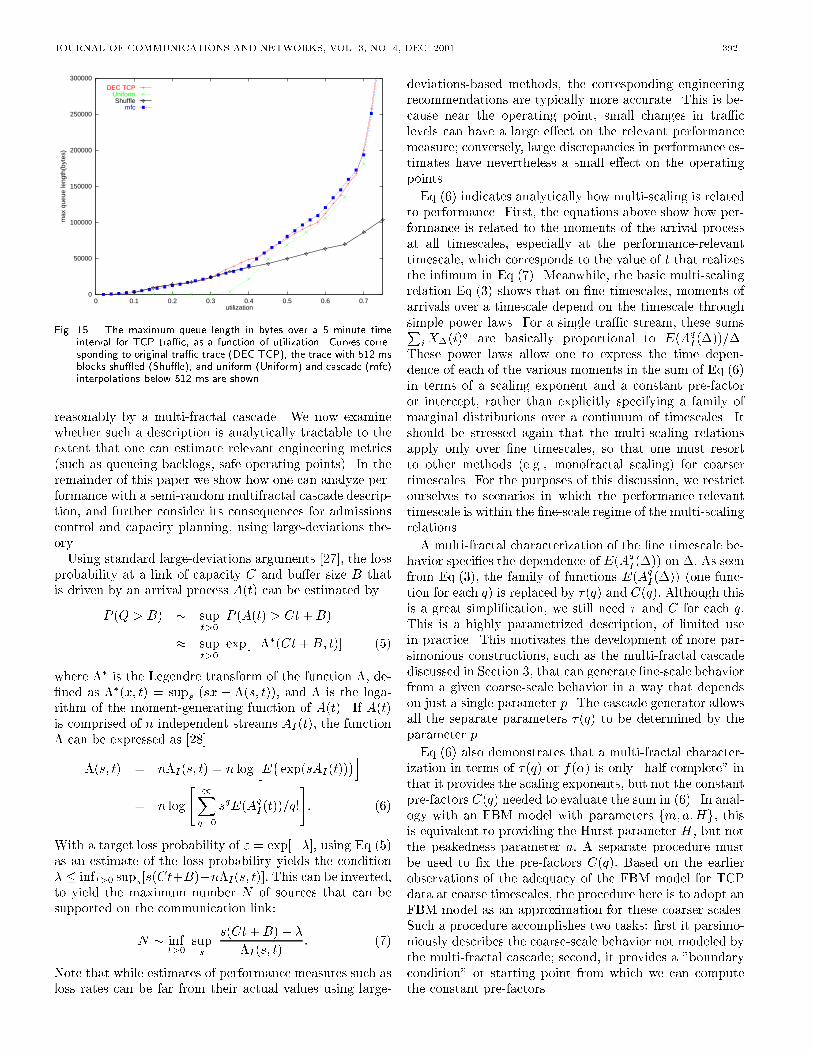
Fig. 14. The average queue length in bytes as a function of utilization forthe DEC TCP trace with 512 ms intervals shu�ed (Shu�e), therebydestroying all long time correlations, and for the measured DECtrace (DEC TCP). The uniform interpolation curve from Fig. 11(Uniform) and a shu�ed cascade trace (mfc shu�e) are also shown.tion, of whether the long timescale correlations have anybearing on performance. We report results for TCP tra�conly. We divide the DEC TCP trace into blocks of 512 msand shu�e the blocks, while preserving the byte counts ineach of the 1 ms subintervals of each block. This has thee�ect of destroying long time correlations and preserving�ne timescale correlations. The average queue lengths forthis shu�ed trace and for the original DEC TCP trace areshown in Fig. 14. Note the signi�cant deviation from theoriginal queue length curve at utilizations above 0.5; thisdiscrepancy becomes very large for utilizations above 0.65.Fig. 14 also reproduces the performance curve for uniforminterpolation below 512 ms (from Fig. 11), demonstratingthat long time and �ne timescale correlations in the tra�ca�ect performance in complementary regimes of heavy andlight loading respectively. At intermediate utilization lev-els, where it would be reasonable to operate the network,both short and long time correlations are important. Fi-nally, Fig. 14 shows the average queue length for a tracewith blocks shu�ed, and with the bytes within each blockdistributed according to a cascade. This curve is very closeto the �rst curve in Fig. 14, emphasizing that the cascadeconstruction is adequate for �ne timescale features.We conclude this section by brie y looking at the tailprobability instead of the average for the queue length.This is more relevant to the analysis in the following sectionof this paper. Fig. 15 shows the maximum queue lengthachieved over a 5 minute interval, for the original TCPtra�c trace and some of its modi�cations considered so far.It can be seen that the conclusions we have drawn from theaverage queue lengths about the regimes of importance ofshort and long time features remain valid.V. Performance Analysis and EngineeringIn the previous sections we observed the signi�cant per-formance impacts of the �ne timescale uctuations in theTCP and video trace, and the fact these could be modeled
JOURNAL OF COMMUNICATIONS AND NETWORKS, VOL. 3, NO. 4, DEC. 2001 392
0
50000
100000
150000
200000
250000
300000
0 0.1 0.2 0.3 0.4 0.5 0.6 0.7
max
que
ue le
ngth
(byt
es)
utilization
DEC TCP
mfc
UniformShuffle
Fig. 15. The maximum queue length in bytes over a 5 minute timeinterval for TCP tra�c, as a function of utilization. Curves corre-sponding to original tra�c trace (DEC TCP), the trace with 512 msblocks shu�ed (Shu�e), and uniform (Uniform) and cascade (mfc)interpolations below 512 ms are shown.reasonably by a multi-fractal cascade. We now examinewhether such a description is analytically tractable to theextent that one can estimate relevant engineering metrics(such as queueing backlogs, safe operating points). In theremainder of this paper we show how one can analyze per-formance with a semi-random multifractal cascade descrip-tion, and further consider its consequences for admissionscontrol and capacity planning, using large-deviations the-ory.Using standard large-deviations arguments [27], the lossprobability at a link of capacity C and bu�er size B thatis driven by an arrival process A(t) can be estimated byP (Q > B) � supt>0 P (A(t) > Ct+B)� supt>0 exp[���(Ct+B; t)] (5)where �� is the Legendre transform of the function �; de-�ned as ��(x; t) = sups (sx � �(s; t)); and � is the loga-rithm of the moment-generating function of A(t). If A(t)is comprised of n independent streams AI (t); the function� can be expressed as [28]�(s; t) = n�I(s; t) = n log hE� exp(sAI(t))�i= n log" 1Xq=0 sqE(AqI (t))=q!#: (6)With a target loss probability of " = exp[��]; using Eq.(5)as an estimate of the loss probability yields the condition� � inft>0 sups[s(Ct+B)�n�I(s; t)]: This can be inverted,to yield the maximum number N of sources that can besupported on the communication link:N � inft>0 sups s(Ct+B)� ��I(s; t) : (7)Note that while estimates of performance measures such asloss rates can be far from their actual values using large-
deviations-based methods, the corresponding engineeringrecommendations are typically more accurate. This is be-cause near the operating point, small changes in tra�clevels can have a large e�ect on the relevant performancemeasure; conversely, large discrepancies in performance es-timates have nevertheless a small e�ect on the operatingpoints.Eq.(6) indicates analytically how multi-scaling is relatedto performance. First, the equations above show how per-formance is related to the moments of the arrival processat all timescales, especially at the performance-relevanttimescale, which corresponds to the value of t that realizesthe in�mum in Eq.(7). Meanwhile, the basic multi-scalingrelation Eq.(3) shows that on �ne timescales, moments ofarrivals over a timescale depend on the timescale throughsimple power laws. For a single tra�c stream, these sumsPiX�(i)q are basically proportional to E(AqI (�))=�.These power laws allow one to express the time depen-dence of each of the various moments in the sum of Eq.(6)in terms of a scaling exponent and a constant pre-factoror intercept, rather than explicitly specifying a family ofmarginal distributions over a continuum of timescales. Itshould be stressed again that the multi-scaling relationsapply only over �ne timescales, so that one must resortto other methods (e.g., monofractal scaling) for coarsertimescales. For the purposes of this discussion, we restrictourselves to scenarios in which the performance-relevanttimescale is within the �ne-scale regime of the multi-scalingrelations.A multi-fractal characterization of the �ne timescale be-havior speci�es the dependence of E(AqI (�)) on �: As seenfrom Eq.(3), the family of functions E(AqI (�)) (one func-tion for each q) is replaced by �(q) and C(q): Although thisis a great simpli�cation, we still need � and C for each q:This is a highly parametrized description, of limited usein practice. This motivates the development of more par-simonious constructions, such as the multi-fractal cascadediscussed in Section 3, that can generate �ne-scale behaviorfrom a given coarse-scale behavior in a way that dependson just a single parameter p. The cascade generator allowsall the separate parameters �(q) to be determined by theparameter p.Eq.(6) also demonstrates that a multi-fractal character-ization in terms of �(q) or f(�) is only \half-complete" inthat it provides the scaling exponents, but not the constantpre-factors C(q) needed to evaluate the sum in (6). In anal-ogy with an FBM model with parameters fm; a;Hg; thisis equivalent to providing the Hurst parameter H , but notthe peakedness parameter a: A separate procedure mustbe used to �x the pre-factors C(q): Based on the earlierobservations of the adequacy of the FBM model for TCPdata at coarse timescales, the procedure here is to adopt anFBM model as an approximation for these coarser scales.Such a procedure accomplishes two tasks: �rst it parsimo-niously describes the coarse-scale behavior not modeled bythe multi-fractal cascade; second, it provides a "boundarycondition" or starting point from which we can computethe constant pre-factors.
JOURNAL OF COMMUNICATIONS AND NETWORKS, VOL. 3, NO. 4, DEC. 2001 393To summarize, our approach is based on:� �nding analytical expressions for the scaling exponentsof a multi-fractal cascade, which is feasible, at least forsimple cascades;� using the \boundary condition" of an FBM descriptionover coarser timescales to determine the constant pre-factors.This approach, of matching FBM at coarse timescales toa multi-fractal cascade at �ne timescales, should be rea-sonable for modeling TCP tra�c. For video, there is anintermediate time regime which has to be modeled as well.Assuming that the cascade construction is applied at thelevel of individual streams, the moments of the MFC in-terpolated process over �ne timescales are approximatelygiven by:E(AqMFC(t)) = E(AqFBM (�))(t=�)1��(q) (8)where we assume that an FBM description is valid fortimescales greater than �; and a multi-fractal cascade isused below it. Eq.(8) is the condition of continuity ofE(AqI (t)) across �: In terms of the parameter p of the semi-random MFC, the function �(q) is given by�(q) = 1 + log2 "pq + (1� p)q2 #: (9)The boundary condition at � is obtained fromE(AqFBM (�)) = k�q=2Xk=0 � q2k�(m�)q�2k(am�2H )k(2k � 1)!!(10)where we have used the fact that AFBM (�) = m� +pamXFBM (�); with XFBM (�) a normal random variablehaving zero mean and �2H variance.7 Thus, in princi-ple, given a description of the tra�c in terms of a coarsetimescale FBM model, with a multi-fractal cascade gener-ator of �ne timescale uctuations, one can estimate severalperformance measures.The values of the parameters for this analytical modelare taken to match the observations for TCP tra�c notedin the previous sections. First, a transition between selfsimilarity and multifractality was found to occur at � = 512ms. At coarser timescales, the tra�c exhibited featuresof an FBM with m = 92:0, a = 204, and H = 0:8, inunits of bytes and milliseconds. At �ner timescales, thestructure function matched that of a semi-random cascadewith p = 0:65. Accordingly, these are the parameter valuesused in the analytical calculations.We will now compare the prediction of Eq.(7) for thenumber of sources N of TCP ows that can be supported,using either an exactly self-similar model (FBM), or anasymptotically self-similar model whose �ne timescale be-havior is described by the multi-fractal cascade of Section3. In order to do this, we have to choose speci�c valuesfor various network parameters. The tolerance for losses is7(2k�1)!! is the double factorial: (2k�1)!! = (2k�1)(2k�3) : : : 1:
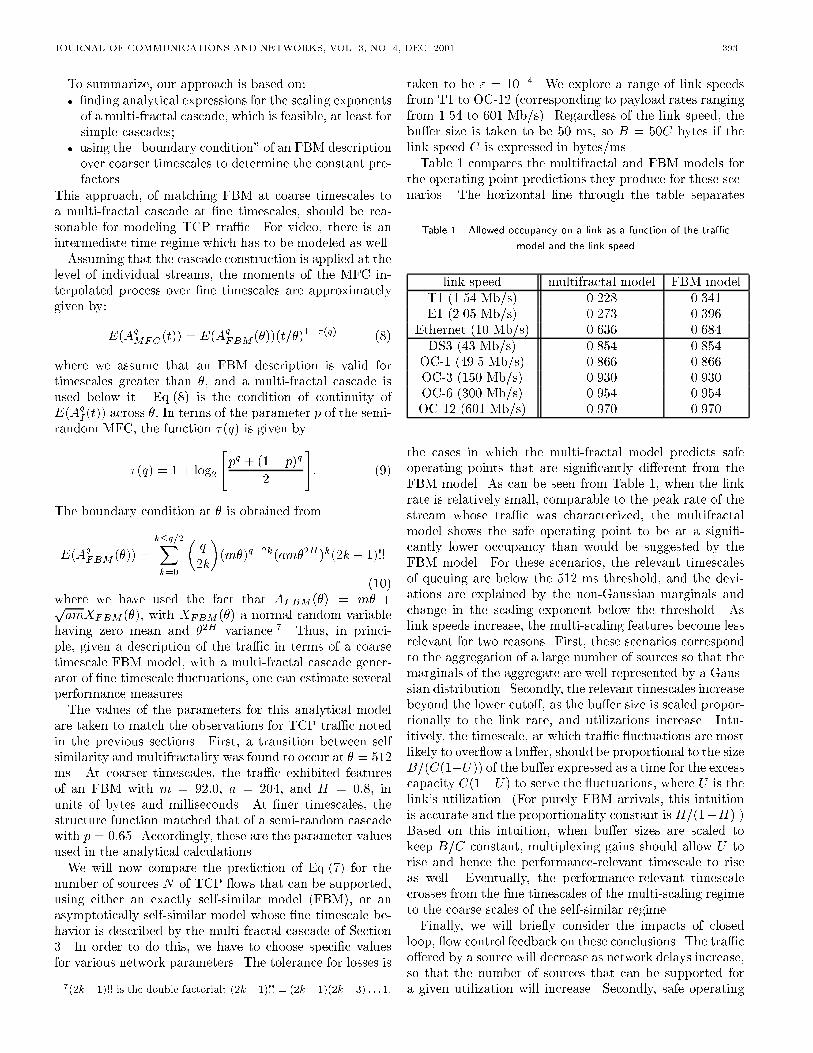
taken to be " = 10�4. We explore a range of link speedsfrom T1 to OC-12 (corresponding to payload rates rangingfrom 1.54 to 601 Mb/s). Regardless of the link speed, thebu�er size is taken to be 50 ms, so B = 50C bytes if thelink speed C is expressed in bytes/ms.Table 1 compares the multifractal and FBM models forthe operating-point predictions they produce for these sce-narios. The horizontal line through the table separatesTable 1. Allowed occupancy on a link as a function of the tra�cmodel and the link speedlink speed multifractal model FBM modelT1 (1.54 Mb/s) 0.228 0.341E1 (2.05 Mb/s) 0.273 0.396Ethernet (10 Mb/s) 0.636 0.684DS3 (43 Mb/s) 0.854 0.854OC-1 (49.5 Mb/s) 0.866 0.866OC-3 (150 Mb/s) 0.930 0.930OC-6 (300 Mb/s) 0.954 0.954OC-12 (601 Mb/s) 0.970 0.970the cases in which the multi-fractal model predicts safeoperating points that are signi�cantly di�erent from theFBM model. As can be seen from Table 1, when the linkrate is relatively small, comparable to the peak rate of thestream whose tra�c was characterized, the multifractalmodel shows the safe operating point to be at a signi�-cantly lower occupancy than would be suggested by theFBM model. For these scenarios, the relevant timescalesof queuing are below the 512 ms threshold, and the devi-ations are explained by the non-Gaussian marginals andchange in the scaling exponent below the threshold. Aslink speeds increase, the multi-scaling features become lessrelevant for two reasons. First, these scenarios correspondto the aggregation of a large number of sources so that themarginals of the aggregate are well represented by a Gaus-sian distribution. Secondly, the relevant timescales increasebeyond the lower cuto�, as the bu�er size is scaled propor-tionally to the link rate, and utilizations increase. Intu-itively, the timescale, at which tra�c uctuations are mostlikely to over ow a bu�er, should be proportional to the sizeB=(C(1�U)) of the bu�er expressed as a time for the excesscapacity C(1�U) to serve the uctuations, where U is thelink's utilization. (For purely FBM arrivals, this intuitionis accurate and the proportionality constant is H=(1�H).)Based on this intuition, when bu�er sizes are scaled tokeep B=C constant, multiplexing gains should allow U torise and hence the performance-relevant timescale to riseas well. Eventually, the performance-relevant timescalecrosses from the �ne timescales of the multi-scaling regimeto the coarse scales of the self-similar regime.Finally, we will brie y consider the impacts of closedloop, ow control feedback on these conclusions. The tra�co�ered by a source will decrease as network delays increase,so that the number of sources that can be supported fora given utilization will increase. Secondly, safe operating
JOURNAL OF COMMUNICATIONS AND NETWORKS, VOL. 3, NO. 4, DEC. 2001 394points should also increase. Our experience indicates thatthe utilizations at which open loop models predict poor per-formance (e.g., high losses) roughly coincide with regions ofpoor performance (e.g. low throughputs caused by exces-sive delays) predicted by closed loop models. An alterna-tive to the open loop models studied here is to perform de-tailed network simulations based on TCP level source mod-els that incorporate the details of TCP dynamics. However,in practice, from the viewpoint of network operations suchdetailed models are not usable as many of the parametersthat describe TCP source behavior cannot be estimatedfrom network level measurements. For this reason, IP owlevel models (e.g., self similar or multi-scaling descriptions)that can be parameterized on the basis of network levelmeasurements are useful. In fact, much of network engi-neering today is done on the basis of open loop analyticaland simulation models of network elements. Models thatadditionally incorporate �ne timescale uctuations in traf-�c can be expected to provide more accurate engineeringrules over a wider range of scenarios. Finally, it is expectedthat the open loop tra�c description framework will stillbe valid with network congestion, but the values of some ofthe speci�c parameters (e.g., the cascade parameter p) willchange, while FBM parameters associated with the asymp-totic long-time behavior will be una�ected [7]. The longerterm challenge is to develop phenomenological models thatcan predict these changes.VI. Conclusions and Further WorkIn this paper we have investigated a structural modelingapproach to describe the �ne timescale behavior in widearea TCP and MPEG2 video tra�c. This is a problemof engineering importance, as demonstrated by the perfor-mance impacts of these �ne timescale uctuations studiedin this paper. The following summarizes our �ndings:� Tra�c has �ne timescale features that cannot be de-scribed by simple Gaussian self-similar models earliershown to be adequate for LAN tra�c. This conclusionis based on the speci�c WAN TCP and MPEG videotraces analyzed in this report, as well as many moresimilar traces not explicitly discussed here. The con-clusion con�rms recent studies on other WAN TCPtraces [18], [19].� These �ne timescale features in the tra�c adverselya�ect performance at low utilizations. Long time cor-relations, which were shown to be very important forLAN tra�c performance [7], continue to a�ect perfor-mance at high utilizations.� For WAN TCP and MPEG video, the �ne timescalefeatures �t reasonably to a multifractal cascade de-scription, in accordance with recent work [18], [19]. Inboth cases, aggregating tra�c to the "edge" of the �netimescale regime and interpolating down with a multi-fractal cascade matches performance (as measured bytrace-driven simulations) very well.� (a) For TCP, the complex behavior in the �netimescale regime is believed to be caused by TCP ow controls that operate within the round-trip time
(RTT) of packet receipt acknowledgements [21]. Thisshort time regime gives way to FBM behavior whenaggregated to the RTT, reminiscent of LAN tra�c.(b) For video tra�c, the �ne timescale behavior oc-curs at the sub-frame level, and is due to the intrinsicproperties of MPEG coding scheme. Between the sub-frame and group of frames (GOF) levels, the codingcycles between di�erent types of frames in the well-known pattern of MPEG2. This does not follow anysimple scaling law, but has been described by Marko-vian models [11], [12]. For time scales greater than theGOF level, one sees FBM behavior.� For tra�c that can be modeled by FBM at longtimescales and a multifractal at �ne timescales (asseems to be the case for TCP tra�c) we obtain ana-lytical performance estimates and engineering param-eters, such as the number of sources that can be ad-mitted given QoS parameters. The analytical treat-ment also shows that the usual multifractal descriptionin terms of (a family of) scaling exponents is incom-plete and must be supplemented by estimating pref-actors/amplitudes. Unfortunately, this is an aspect ofstatistical inference that is currently overlooked. Muchattention is paid to estimate scaling exponents, whilewhat is really required is the joint estimation of scalingexponents and prefactors.� (a) For WAN TCP, where the �ne timescale featuresare believed to arise from network feedback, a morecomplete description would consist of modeling TCPfeedback explicitly, and generating these features fromthe ow control in closed loop models. However, treat-ing the �ne timescale parameters as being given a pri-ori, as we have done, is a useful �rst step in analysis.(b) For MPEG video, where the �ne timescale featuresarise from the coding mechanism, it is not necessary toincorporate feedback. It would be useful to relate the�ne timescale behavior directly to speci�c features ofMPEG coding. This is a subject for further research,along with the modeling of the intermediate regimebetween the �ne and coarse timescales.� For WAN UDP tra�c, which has neither complex cod-ing nor network feedback e�ects, a simple FBM de-scription is found to be adequate for both tra�c char-acterization and engineering analysis.There are numerous avenues to expand this work, in-cluding repeating these experiment with additional dataand video traces (in progress); implementing the numer-ical methods to analyze tra�c generated by multi-fractalcascades; and extensions to analyze and describe packettra�c over the full range of engineering timescales of inter-est. In the longer term, the objective is to develop robust,tractable, parsimonious and predictive network tra�c mod-els and management methods that are usable in practice.
JOURNAL OF COMMUNICATIONS AND NETWORKS, VOL. 3, NO. 4, DEC. 2001 395AcknowledgmentsWe thank Walter Willinger for useful discussions, andAmarnath Mukherjee [25] for kindly supplying us with thevideo data for this work. The TCP data was obtainedfrom http://ita.ee.lbl.gov/html/contrib/DEC-PKT.html,thanks to the Digital Equipment Corporation. This workis supported in part by NSF grant NCR-9628067.References[1] For a review see Self-similar network tra�c and performanceevaluation, K. Park and W. Willinger (John Wiley, 2000).[2] W. E. Leland, M. S. Taqqu, W. Willinger, and D. V. Wilson, \Onthe Self-Similar Nature of Ethernet Tra�c (Extended Version)",IEEE/ACM Trans. on Networking, Vol. 2, No. 1, pp. 1-15, Feb1994.[3] J. Beran, R. Sherman, M. S. Taqqu and W. Willinger, \Long-Range Dependence in Variable-Bit-Rate Video Tra�c", IEEETrans. Commun., Vol. 43, No. 2-4, pp. 1566-1579, Apr 1995.[4] M.E. Crovella and A. Bestavros, \Self-Similarity in WorldWide Web Tra�c: Evidence and Possible Causes", IEEE/ACMTransactions on Networking, Vol. 5, No. 6, pp. 835-846, Dec1997.[5] D.E. Du�y, A.A. McIntosh, M. Rosenstein and W. Willinger,\Statistical Analysis of CCSN/SS7 Tra�c Data from WorkingSubnetworks", IEEE J. Selected Areas in Comm., Vol. 12, No.3, pp. 544-551, 1994.[6] A. Erramilli and J.L. Wang, \Monitoring Packet Tra�c Levels",Proc. IEEE Globecom, pp. 274-280, San Francisco CA 1994.[7] A. Erramilli, O. Narayan, and W. Willinger, \ExperimentalQueueing Analysis with Long-Range Dependent Packet Tra�c",IEEE/ACM Transactions on Networking, Vol. 4, No. 2, pp. 209-223, Apr 1996.[8] G. Iacovoni, V. Manca, D. Vergni, \Single source TCP be-haviour: A multifractal analysis", Proc. ICC/IEEE,, San Fran-cisco, CA ,2000.[9] K.R. Krishnan, A. L. Neidhardt and A. Erramilli, \Scaling Anal-ysis in Tra�c Management of Self-Similar Processes", Proc. ofITC-15, Vol.2, pp 1087-96, June 1997.[10] P. Pancha and M. El-Zarki, \MPEG Coding for Variable BitRate Video Transmission", IEEE Communications, Vol. 32, No.5, pp 54-66, May 1994.[11] D. P. Heyman and T.V. Lakshman, \Source models for VBRbroadcast-video tra�c", IEEE/ACM Trans. on Networking, Vol.4, No. 1, pp 40-8, Feb 1996.[12] A. Elwalid, D. Heyman, T. V. Lakshman and D. Mitra, \Funda-mental bounds and approximations for ATM multiplexers withapplications to video teleconferencing", IEEE J. Selected Areasin Comm., Vol. 13, No. 6, pp 1004-16, Aug 1995.[13] I. Norros, \A Storage Model with Self-Similar Input", QueueingSystems, Vol. 16, No. 3-4, pp. 387-396, 1994[14] D.R. Cox, \Long-Range Dependence: A Review", Statistics: AnAppraisal, Proc 50th Anniversary Conference, ed by David andDavid, Iowa State University Press, 1984.[15] T.G. Kurtz, \Limit Theorems for Workload Input Models", inStochastic Networks: Theory and Applications, ed. F.P. Kelly,S. Zachary and I. Ziedins, Oxford University Press, 1996.[16] M.S. Taqqu, W. Willinger, and R. Sherman, \Proof of a Funda-mental Result in Self-Similar Tra�c Modeling", Computer Com-munication Review, Vol. 27, pp. 5-23, 1997.[17] W. Willinger, V. Paxson and M.S. Taqqu, \Self-similarity andHeavy Tails: Structural Modeling of Network Tra�c", A Prac-tical Guide to Heavy Tails: Statistical Techniques and Applica-tions, R. Adler, R. Feldman, and M.S. Taqqu (Eds.) Birkhauser,Boston MA, 1998.[18] A. Gilbert, A. Feldmann, W. Willinger, \Data Networks as cas-cades: Explaining the multifractal nature of Internet WAN traf-�c", Proc. ACM Sigcomm, pp. 42-55, 1998.[19] R.H. Reidy and J. Levy Vehel, \TCP Tra�c is multifractal: Anumerical study", INRIA Research Report No. 3129, Preprint1997.[20] I. Saniee, \Multiscaling in Low-Aggregate Fast Packet NetworkTra�c", Bellcore Report, Sep 22, 1998 (available by request fromTelcordia Technologies Inc.).
[21] A. Feldmann, A. Gilbert, P. Huang and W. Willinger, \Dynam-ics of IP Tra�c: A study of the role of variability and the impactof control", Proc. ACM Sigcomm, pp. 301{313, 1999.[22] A. Erramilli, O. Narayan, A. Neidhardt, I. Saniee, \PerformanceImpacts of Multi-Scaling in Wide Area TCP-IP Tra�c", to bepublished in Infocom 2000.[23] A. Erramilli, O. Narayan, A. Neidhardt and I. Saniee, unpub-lished.[24] Trace due to Digital Equipment Corporation, collected byJe� Mogul of Digital's Western Research Lab. This trace andothers are available at http://ita.ee.lbl.gov/html/contrib/DEC-PKT.html. The TCP packets from the �rst one hour trace atthis site were analyzed. The UDP trace traces analyzed also cor-respond to the �rst hour trace at this site.[25] This data was supplied by Amarnath Mukherjee of Knoltex Cor-poration.[26] K.J. Falconer, \Techniques in fractal geometry", Wiley, NewYork 1997.[27] J.A. Bucklew, \Large deviation techniques in decision, simula-tion, and estimation" Wiley, New York, 1990.[28] �(s; t)=st is also referred to as the e�ective bandwidth for thetra�c; see for instance F. Kelly, \Notes on e�ective bandwidths",in Stochastic Networks: Theory and Applications, ed. F.P. Kelly,S. Zachary and I. Ziedins, Oxford University Press, 1996.