mueller et al. 2013 taxonomic sufficiency
TRANSCRIPT

Taxonomic sufficiency in freshwater ecosystems: effects oftaxonomic resolution, functional traits, and data transformation
Melanie Mueller1, Joachim Pander2, AND Juergen Geist3
Aquatic Systems Biology Unit, Department of Ecology and Ecosystem Management, TechnischeUniversitat Munchen, Muhlenweg 22, D-85350 Freising, Germany
Abstract. Taxonomic sufficiency (TS) has been proposed for assessing community composition andenvironmental impacts as a way to balance the need to indicate the biology of the organisms present withtime and effort needed for species identification. TS has been applied most often to marine and freshwatermacroinvertebrates, but tests of its usefulness are lacking for other freshwater groups. We analyzed theeffects of taxonomic resolution, functional groupings, and data transformation on multivariate communitypatterns in periphyton, macrophytes, macroinvertebrates, and fishes, and on the quantification ofbiodiversity and environmental gradients. The applicability of TS differed strongly among taxonomicgroups, depending on the average taxonomic breadth of the species sets. Numerical data resolution hadmore pronounced effects on community patterns than taxonomic resolution. Richness was stronglyaffected by data aggregation, but diversity indices were statistically reliable up to order level. Taxonomicaggregation had no significant influence on ability to detect environmental gradients. Functionalsurrogates based on biological traits, such as feeding type, reproductive strategy, and trophic state, werestrongly correlated (r = 0.64–0.85) with taxonomic community composition. However, environmentalcorrelations were generally lower with data aggregated to functional traits rather than to species. TS wasuniversally applicable within taxonomic groups for different habitats in one biogeographic region.Aggregation to family or order was suitable for quantifying biodiversity and environmental gradients, butmultivariate community analyses required finer resolution in fishes and macrophytes than in periphytonand macroinvertebrates. Sampling effort in environmental-impact studies and monitoring programswould be better invested in quantitative data and number of spatial and temporal replicates than intaxonomic detail.
Key words: freshwater biodiversity, taxonomic surrogates, community pattern, functional diversity,ecological traits, fishes, macroinvertebrates, macrophytes, algae.
Loss of biodiversity is proceeding faster in freshwater than in any other major biome (Dudgeon et al.2006, Strayer and Dudgeon 2010, Geist 2011). Time-and cost-effective methods for the quantification ofchanges in ecosystem community structure areneeded in the context of biodiversity conservationand for assessing and monitoring human impacts(Bevilacqua et al. 2012). On the other hand, acomprehensive scientific picture of their currentstatus is essential to provide for the conservation offreshwater ecosystems (Millennium Ecosystem As-sessment 2005, Bellier et al. 2012). Several authors andmonitoring protocols regard species-level identifica-
tion (Maurer 2000, Giagrande 2003, Drew 2011),identification of subspecies (Schaumburg et al. 2007),or DNA-based identification methods (e.g., Sweeneyet al. 2011) as most appropriate in this context.However, identification of many freshwater species,e.g., algae or macroinvertebrates, and excessivequantitative sampling can be very difficult and timeconsuming (Johnson et al. 2006). Consequently,several attempts have been made to increase the timeand cost efficiency of monitoring efforts by minimiz-ing sampling or laboratory effort by reducing taxo-nomic or numerical resolution.
Ellis (1985) proposed taxonomic sufficiency (TS) asa concept for assessment of marine pollution thatbalances the need to interpret the biology of theorganisms present against the time and effort neededfor species identification. TS involves identifying taxato the coarsest taxonomic level possible without
1 E-mail addresses: [email protected] [email protected] To whom correspondence should be addressed. E-mail:
Freshwater Science, 2013, 32(3):762–778’ 2013 by The Society for Freshwater ScienceDOI: 10.1899/12-212.1Published online: 11 June 2013
762

losing significant ecological detail (e.g., differences inmultivariate community patterns or diversity). In thelast 2 decades, an increasing number of studiesaddressing the applicability of identification levelscoarser than species has been published. Thesestudies mainly covered marine ecosystems (42%)and especially marine macroinvertebrates (36% of allstudies; reviewed by Bevilacqua et al. 2012). To ourknowledge, in freshwater ecosystems, TS has beenapplied systematically only to macroinvertebrates(reviewed by Jones 2008), and its suitability for othergroups is only known from single case studies(plankton: Hansson et al. 2004, diatoms: Heino andSoininen 2007). Especially for vertebrates, plants, andalgae, few studies have been done to test theapplicability of TS for all ecosystem types (Bevilacquaet al. 2012). Multivariate community patterns ofmarine and freshwater macroinvertebrates seem tobe consistent from species at least up to family level(Bevilacqua et al. 2012), but biodiversity measures,such as richness, evenness, Shannon Index, orSimpson’s Index have the potential to be stronglyunderestimated by the use of coarser taxonomic levels(Maurer 2000). Multivariate community patterns andbiodiversity measures are used often in freshwaterscience to assess effects of anthropogenic disturbanceand to determine areas of conservation priority (e.g.,Balmford et al. 1996), so such information would be ofhigh value for freshwater ecologists.
The degree to which the results of ecologicalanalyses change if a coarser level of taxonomicresolution is used is largely influenced by the numberof species that are being condensed (Bevilacqua et al.2012). Furthermore, the degree of taxonomic related-ness among the investigated species and the distri-bution of species to coarser taxonomic levels (even oruneven distribution) also may influence the applica-bility of TS. These characteristics can differ stronglyamong taxonomic groups and ecosystem types.Several indices are available for measuring taxonomicdiversity (e.g., average taxonomic breadth; Clarke andWarwick 2001), but their usefulness for predicting theappropriate taxonomic resolution before undertakingtime- and cost-intensive identification work has neverbeen tested systematically in freshwater ecosystems.Moreover, ecological similarity of species is notnecessarily correlated with taxonomic relatedness(Losos et al. 2003, Poff et al. 2006). Alternativegroupings, such as feeding type, reproductive strat-egy, locomotion type, and habitat preference, canprovide valuable information about ecosystem func-tions and processes (Usseglio-Polatera et al. 2000,Mouillot et al. 2005, Siefert 2012). However, the effectsof aggregation to functional guilds on multivariate
community patterns have not yet been investigatedcomprehensively for all relevant taxonomic groups infreshwater systems.
Quantification of the impact of environmentalfactors on biological communities plays an importantrole in assessments of human disturbance and naturalvariability that goes beyond simple description ofchanges in multivariate community patterns ordiversity. To date, few studies of marine macroinver-tebrates have considered the capability of detectingenvironmental gradients by using coarser taxonomiclevels than species or other classification types likefunctional groupings (e.g., Olsgard et al. 1997, 1998).
The outcome of ecological analyses also can beinfluenced by the numerical resolution of the data(Clarke and Warwick 2001). Differences in numericalresolution can be founded on the degree of quantita-tive detail in the sampling strategy (quantitative, %
abundance, or presence–absence data) or on post hocdata transformation. Especially in applied freshwaterscience, presence–absence data or % abundance dataoften are used subsequent to nonquantitative sam-pling methods (e.g., Barbour et al. 1999, Schaumburget al. 2007). Various degrees of transformation areused commonly in multivariate analyses of ecologicaldata. These techniques include !(x)-transformation toallow the intermediate abundant species to play apart, log(x)- or 4!(x)-transformation to increase con-sideration of rarer species, or use of presence–absencedata to down-weight the effects of common andabundant species. However, choice of the numericalresolution of the data is more a biological than astatistical question. This choice can affect the conclu-sions of an analysis more than the choices of similaritymeasure or ordination method (Clarke and Warwick2001) and may affect the applicability of TS.
Knowledge of the applicability of different taxo-nomic and numerical resolutions and functionalsurrogates currently is limited to single-case studies(e.g., algae: Hansson et al. 2004) or remains untested(e.g., macrophytes, fishes: none of 678 publicationsreviewed by Bevilacqua et al. 2012) for most fresh-water groups. Furthermore, most studies are based ononly one data set, do not consider taxonomic levelscoarser than family level (see Bevilacqua et al. 2012),compare different taxonomic groups, include effectsof numerical resolution and alternative groupings, ortest the detected threshold levels statistically. Theseconstraints limit direct comparisons between data setsand taxonomic groups within one ecosystem type.Application of TS and other taxonomic surrogates infreshwater ecosystems requires identification of usesfor which TS or functional surrogates could beadvantageous and situations in which the lack of
2013] TAXONOMIC SUFFICIENCY IN FRESHWATER ECOSYSTEMS 763
taxonomic information might severely limit thequality of assessments for all major taxonomic groups.This knowledge will help find an optimal balancebetween level of detail of the results and effort. To ourknowledge, our study is the first to analyze compre-hensively the applicability of TS (up to phylum level)and functional surrogates for multivariate analyses ofcommunity patterns, univariate analyses of diversityindices, and detection of environmental gradientswith 3 freshwater data sets, each including abundancedata for several taxonomic groups (periphyton,macrophytes, macroinvertebrates, and fishes).
The following hypotheses were tested: 1) Taxonom-ic resolution of periphyton, macrophyte, macroinver-tebrate, and fish community data affects the outcomeof ecological analyses (multivariate community pat-tern, diversity measures, capability to detect environ-mental gradients). The extent of loss of information isexpected to depend on the average taxonomic breadthof the investigated taxonomic group and set ofspecies. 2) Classification into functional groupsresolves a different outcome of ecological analyses(multivariate pattern, diversity) than grouping indi-viduals according to Linnean taxonomy and canimprove the capability to detect environmentalgradients. 3) Numerical resolution of the data (e.g.,relative abundance or presence–absence data insteadof quantitative data) has a stronger influence on theresults of community analyses than taxonomic reso-lution (e.g., genus or family instead of species level).
Methods
Data sets
The hypotheses were tested using 3 large, full-resolution data sets (quantitative species abundancedata) from lentic and lotic freshwater habitats. Dataset 1 was focused on a pairwise comparison of sitesupstream and downstream of weirs in 5 differentrivers (10 sampling locations; Mueller et al. 2011).Data set 2 was aimed at a comparison of biodiversityand abiotic habitat variables in different floodplainhabitats (river stretches, oxbow sections, smallponds). Data were collected in the River Danubefloodplain in Bavaria, Germany (42 sampling loca-tions; Stammel et al. 2012). Data set 3 was collected tocompare abiotic habitat characteristics and communi-ty composition in 3 calciferous and 3 siliceous riversdistributed throughout Bavaria, Germany (30 sam-pling locations; JP, MM, and JG, unpublished data).Each data set included the taxonomic groups periphy-ton, macroinvertebrates, macrophytes, and fishes anda set of environmental variables (water temperature,dissolved O2, specific conductance, pH, water depth,
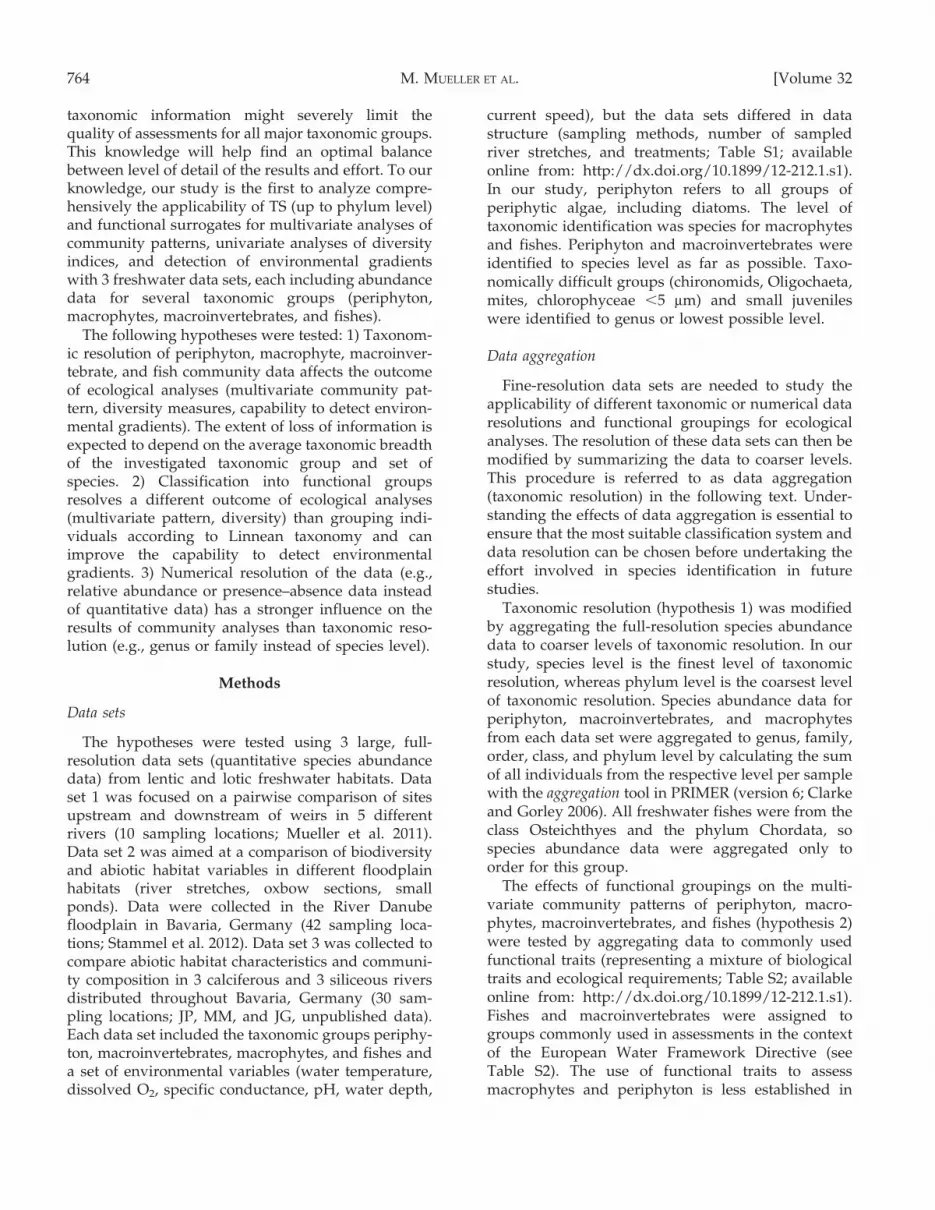
current speed), but the data sets differed in datastructure (sampling methods, number of sampledriver stretches, and treatments; Table S1; availableonline from: http://dx.doi.org/10.1899/12-212.1.s1).In our study, periphyton refers to all groups ofperiphytic algae, including diatoms. The level oftaxonomic identification was species for macrophytesand fishes. Periphyton and macroinvertebrates wereidentified to species level as far as possible. Taxo-nomically difficult groups (chironomids, Oligochaeta,mites, chlorophyceae ,5 mm) and small juvenileswere identified to genus or lowest possible level.
Data aggregation
Fine-resolution data sets are needed to study theapplicability of different taxonomic or numerical dataresolutions and functional groupings for ecologicalanalyses. The resolution of these data sets can then bemodified by summarizing the data to coarser levels.This procedure is referred to as data aggregation(taxonomic resolution) in the following text. Under-standing the effects of data aggregation is essential toensure that the most suitable classification system anddata resolution can be chosen before undertaking theeffort involved in species identification in futurestudies.
Taxonomic resolution (hypothesis 1) was modifiedby aggregating the full-resolution species abundancedata to coarser levels of taxonomic resolution. In ourstudy, species level is the finest level of taxonomicresolution, whereas phylum level is the coarsest levelof taxonomic resolution. Species abundance data forperiphyton, macroinvertebrates, and macrophytesfrom each data set were aggregated to genus, family,order, class, and phylum level by calculating the sumof all individuals from the respective level per samplewith the aggregation tool in PRIMER (version 6; Clarkeand Gorley 2006). All freshwater fishes were from theclass Osteichthyes and the phylum Chordata, sospecies abundance data were aggregated only toorder for this group.
The effects of functional groupings on the multi-variate community patterns of periphyton, macro-phytes, macroinvertebrates, and fishes (hypothesis 2)were tested by aggregating data to commonly usedfunctional traits (representing a mixture of biologicaltraits and ecological requirements; Table S2; availableonline from: http://dx.doi.org/10.1899/12-212.1.s1).Fishes and macroinvertebrates were assigned togroups commonly used in assessments in the contextof the European Water Framework Directive (seeTable S2). The use of functional traits to assessmacrophytes and periphyton is less established in
764 M. MUELLER ET AL. [Volume 32

standard evaluation. Therefore, commonly appliedfunctional classifications were selected from differentliterature sources for these groups. For each taxo-nomic group, all traits were summarized in a matrix(All Traits) containing the number of specimens fromeach trait state per sample (e.g., 61 fishes withreproduction type rheophilic, 12 fishes with repro-duction type indifferent, 10 with trophic statusomnivore; cf. functional trait niche, Poff et al. 2006).Details about the selected functional traits and therespective literature sources are provided in Table S2.
The numerical resolution (hypothesis 3) of each dataset, taxonomic group, and level of taxonomic resolutionwas modified by data transformation using the pre-treatment transformation (overall) procedure in PRIMER(Clarke and Gorley 2006). Numerical resolution in ourstudy reached from untransformed quantitative data(finest level) over !(x)-transformed and % abundancedata to presence–absence data (coarsest level).
Multivariate analyses
Comparison of resemblance matrices.—After dataaggregation, resemblance matrices (Bray–Curtis sim-ilarity) were calculated for all taxonomic groups,respective levels of taxonomic resolution, levels ofnumerical resolution (note that Bray–Curtis similarityis equal to Sørensen Index for presence–absence data),and functional traits (taxonomic and numericalresolution: 3 data sets 3 4 taxonomic groups 3 6taxonomic levels 3 4 numerical resolutions = 288Bray–Curtis matrices; functional groupings: 3 datasets 3 18 traits = 54 Bray–Curtis matrices). The 2nd-stage approach in the PRIMER package was used toanalyze differences among multivariate communitypatterns derived from different data-aggregationmodes (taxonomic resolution, numerical resolution,functional groupings). This procedure uses multivar-iate Spearman rank correlation (r) to compareresemblance matrices based on Bray–Curtis similarityand is commonly applied in assessments of TS(Somerfield and Clarke 1995). Nonmetric multidimen-sional scaling (NMDS) was run on the resulting 2nd-stage matrices (r as resemblance measure) to visualizesimilarities and dissimilarities among Bray–Curtismatrices. To test hypotheses 1 and 2, Bray–Curtismatrices derived from different taxonomic and nu-merical resolutions were compared in a 2nd-stageanalysis, resulting in twelve 2nd-stage matrices andNMDS plots (3 data sets 3 4 taxonomic groups). To testhypothesis 2, Bray–Curtis matrices derived fromfunctional groupings were compared with those fromthe taxonomic groupings (species, genus, family, order,class, and phylum) in a separate 2nd-stage analysis,
resulting in twelve 2nd-stage matrices and NMDS plots(3 data sets 3 4 taxonomic groups).
Permutational multivariate analysis of variance(PERMANOVA; Anderson et al. 2008) was run inPRIMER to compare the effects of numerical resolu-tion on multivariate community patterns with those oftaxonomic resolution (hypothesis 3). PERMANOVAis a routine for testing the multivariate response toone or more factors on the basis of any resemblancemeasure. The values in the matrix are not treated asindependent of one another (Anderson et al. 2008),which enables comparison of matrices derived fromthe same data (e.g., different taxonomic or numericallevels). For each taxonomic group and data set, 2PERMANOVA analyses were run on the respective2nd-stage matrices. Two separate 1-way PERMA-NOVA designs were applied. Taxonomic resolution(6 factor levels: species, genus, family, order, class,and phylum) was used as a fixed factor in the 1st
design and numerical resolution (4 factor levels:untransformed quantitative, !(x)-transformed, %
abundance, and presence–absence data) was used asthe fixed factor in the 2nd design. Pseudo-F values andpermutational p-values were used to compare theeffect strength of taxonomic vs numerical resolution.
Taxonomic resolution and environmental gradients.—The ability to recover ecological patterns of periphy-ton, macrophytes, macroinvertebrates, and fishes atdifferent taxonomic resolutions (hypothesis 1)/func-tional groupings (hypothesis 2) was tested usingBiota-Environmental-Stepwise matching (BEST) anal-yses in PRIMER (Clarke and Warwick 2001). Taxadata sets were used as response variables (all 342Bray–Curtis matrices generated in the previousanalyses), and environmental variables (water tem-perature, dissolved O2, specific conductance, pH,water depth, current speed) were used as predictors.The BEST procedure uses a stepwise search andSpearman rank correlation to find a minimumcombination of environmental variables that maxi-mizes correlation with the biotic data. The taxonomiclevel and transformation type resulting in the maxi-mum Spearman correlation coefficient between envi-ronmental variables and biotic data (r2) was used toidentify the best description of community patterns(following Olsgard et al. 1997).
Univariate analyses of Spearman rank correlationcoefficients and diversity measures
To identify the threshold of significant loss ofinformation for each taxonomic group, we usednonparametric univariate statistical analysis withr-values, r2-values, and diversity indices as the response
2013] TAXONOMIC SUFFICIENCY IN FRESHWATER ECOSYSTEMS 765

variables and taxonomic resolution as the factor (withfactor levels: species, genus, family, order, class, andphylum). This approach is applied similarly in micro-array analyses (Listgarten and Emili 2005) and machinelearning (Demsar 2006) to test the validity of classificationalgorithms, and Demsar (2006) proposed the use ofnonparametric tests for comparisons across data sets. Asignificant loss of information resulting from coarseningtaxonomic resolution (hypothesis 1) in our study isdefined as a statistically significant drop of r-values(indicating a change in multivariate community pattern;2nd-stage analysis), r2-values (indicating a change in thecapability to detect environmental gradients; BESTanalysis), or diversity indices (indicating a change inrichness, evenness, Shannon Index, or Simpson’s Index)from a finer level of taxonomic resolution to the nextcoarsest level (e.g., from species to genus). Richness,evenness (Pielou 1975), Shannon Index (Shannon andWeaver 1949), and Simpson’s Index (Simpson 1949) werecalculated for each taxonomic level using the DIVERSEprocedure in PRIMER. In addition, we calculated thefunctional diversity (measured as richness, evenness,Shannon Index, Simpson’s Index) for each functional trait(hypothesis 2). Diversity values were pooled over all datasets, whereas r-values and r2-values were pooled over alldata sets and levels of numerical resolution. All datawere tested for normality using the Shapiro–Wilk testand for homogeneity of variances using the Levene test.Because correlation coefficients and diversity indiceswere not normally distributed, the Kruskal–Wallisanalysis of variance (ANOVA) and post hoc pairwiseMann–Whitney U-test were used to test for differencesbetween aggregation levels. Bonferroni correction wasapplied to correct for multiple comparisons. All univar-iate statistics were carried out in the software program R(version 3.0.0; R Development Core Team, Vienna,Austria; www.r-project.org).
To test if the extent of information loss depends ontaxonomic diversity (higher-taxa/species ratio [W] andthe distribution of species to higher taxa) of theinvestigated set of species (hypothesis 1), the averagetaxonomic breadth (D+) for each aggregation level wascorrelated with the r-values between the respectiveresemblance matrices using linear regression and Spear-man rank correlation. According to Clarke and Warwick(2001), the average taxonomic breadth is defined asDz
=(XX
ivj
vij)=(S S{1½ �=2), where S is the observed
number of species in the sample, the double summationranges over all pairs i and j of these species, and vrepresents the taxonomic distances through the classifi-cation tree between every pair of individuals. It wascalculated for each data set, taxonomic group, andaggregation level using the function DIVERSE in
PRIMER. Linear regressions and correlation analyseswere carried out in the software program R.
Results
Effects of taxonomic resolution on multivariatecommunity patterns
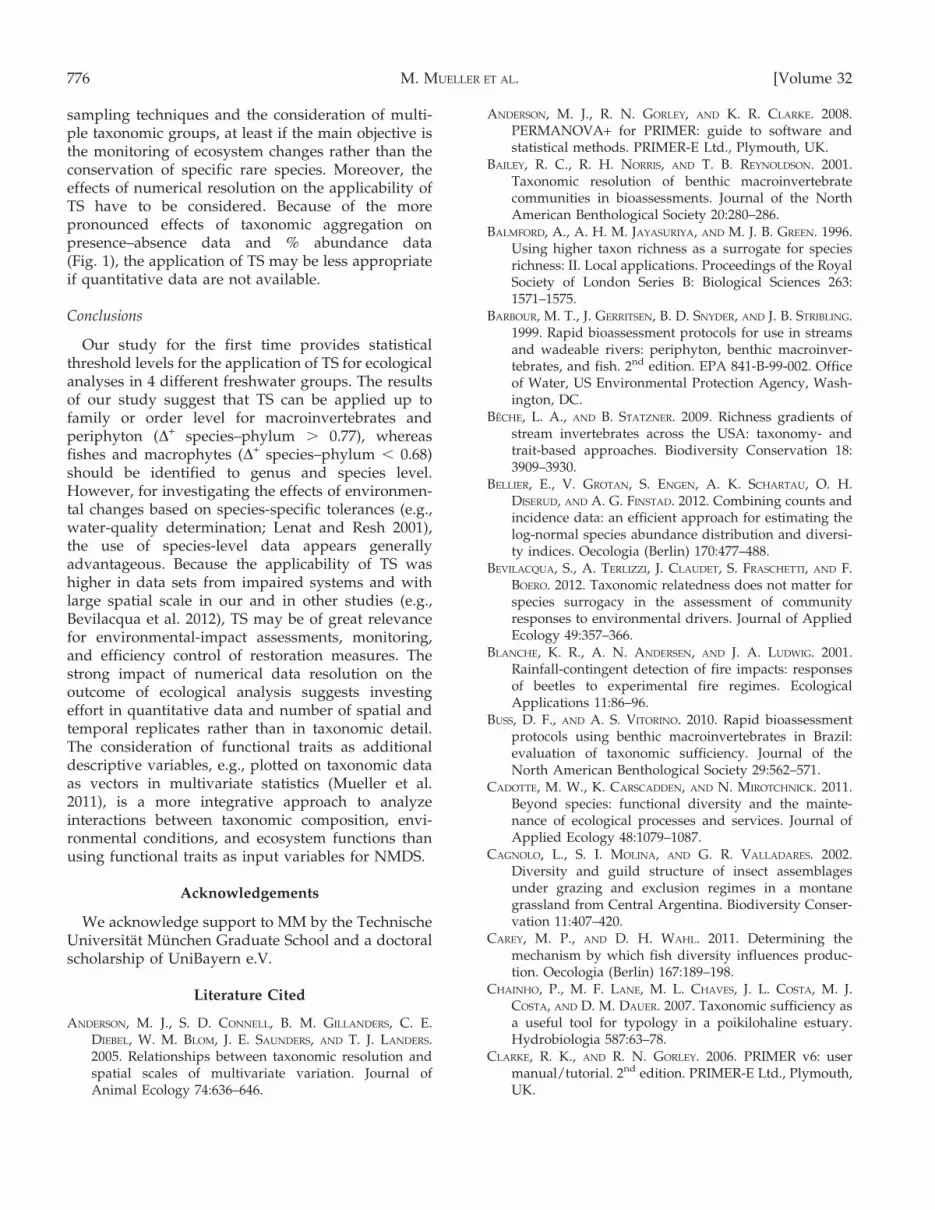
Effects of taxonomic resolution on multivariate com-munity patterns strongly differed among the taxonomicgroups periphyton, macrophytes, macroinvertebrates,and fishes (Figs 1, 2A–D). The lowest effects of coarsen-ing taxonomic resolution were detected by 2nd-stageanalysis in periphyton, followed by macroinvertebrates.A significant loss of information for macrophytes andfishes occurred at the genus (Mann–Whitney U-test,macrophytes, p , 0.001; Figs 1, 2B) and family levels(Mann–Whitney U-test, fishes, p , 0.01; Figs 1, 2D),respectively. In contrast, macroinvertebrate and periphy-ton community structure changed significantly fromspecies to order (Mann–Whitney U-test, macroinverte-brates, p , 0.01; Figs 1, 2C) and from species to class level(Mann–Whitney U-test, periphyton, p , 0.01; Figs 1, 2A).A strong aggregation up to phylum or class levelrevealed a significantly different community compositionfor each taxonomic group (Figs 1, 2A–D). This structurewas constant across data sets, but as a comparison of r-values from the 3 data sets indicates, the correlationsamong taxonomic levels were higher for anthropogenicdisturbance (effects of weirs, data set 1, mean r = 0.79)than for natural variability both for large-scale (differentrivers, data set 3, mean r = 0.67) and small-scale data(different habitats within one river system, data set 2,mean r = 0.66). Regression and correlation analysis of D+
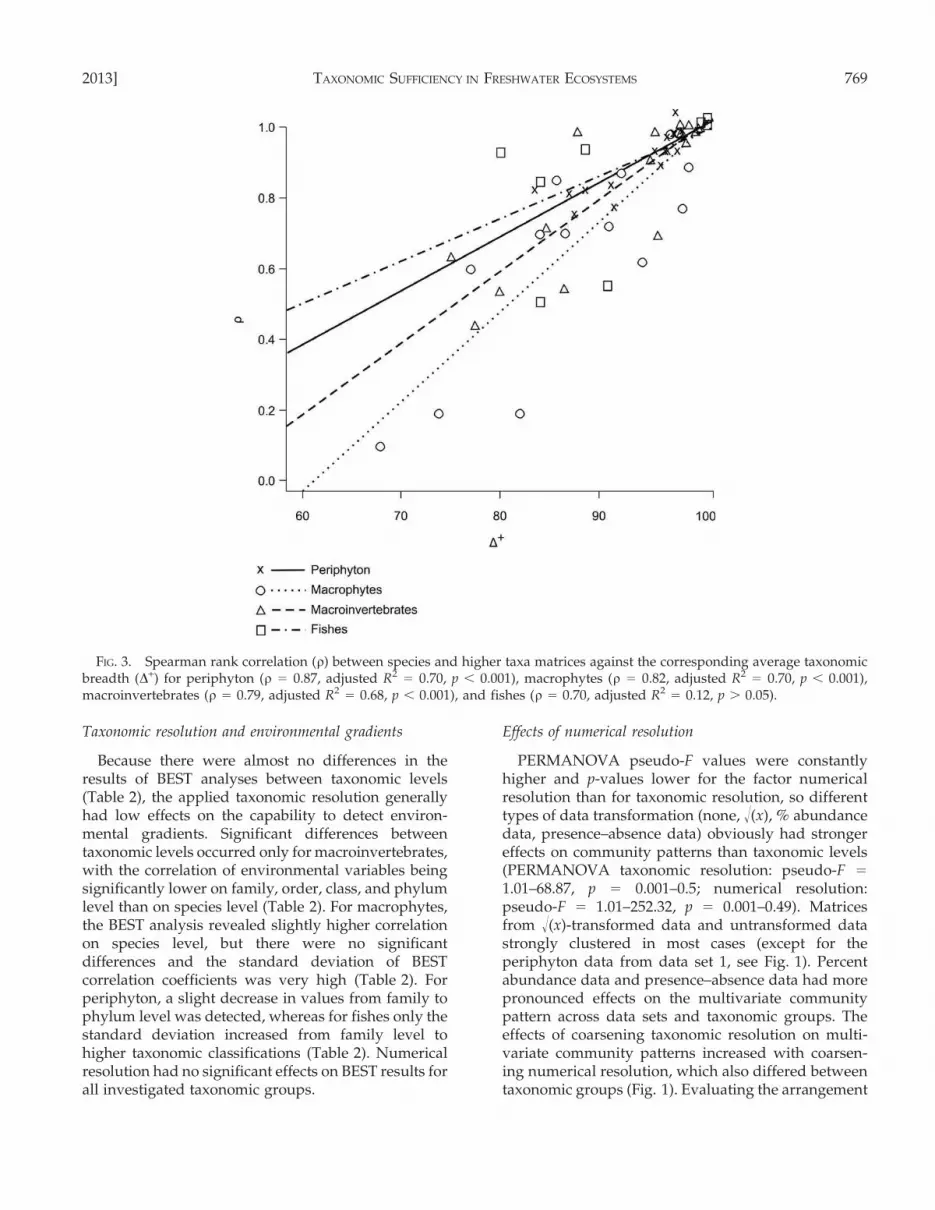
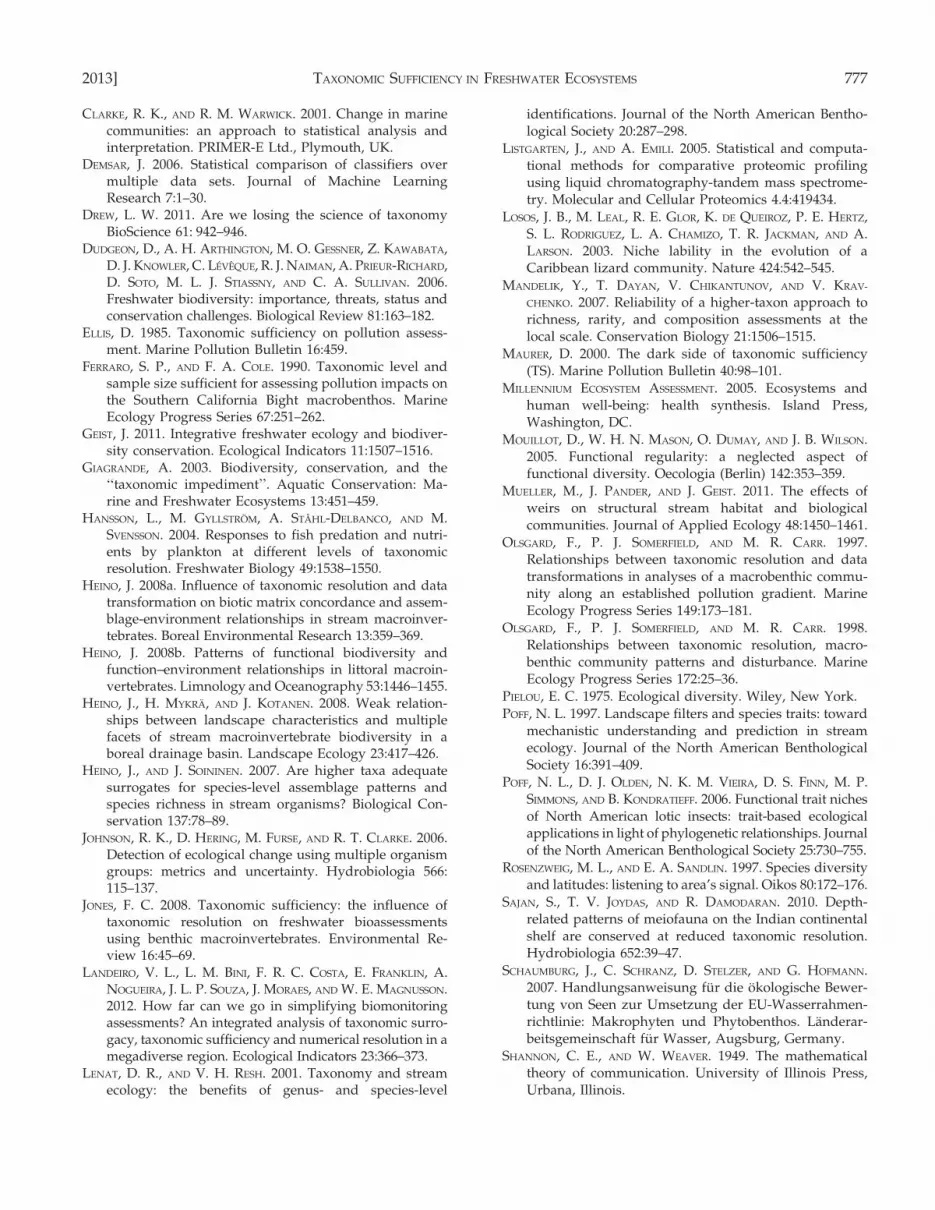
and r-values between resemblance matrices of differenttaxonomic levels revealed a strong relationship betweenboth parameters for all taxonomic groups with r rangingbetween 0.70 for fishes and 0.87 for periphyton (Fig. 3). Incontrast, a comparison of W and the decline in r forperiphyton and macrophytes indicates a less pronouncedrelationship in these groups. W between species andgenus level was lower for periphyton (W = 0.56) with rstaying constant, whereas for macrophytes, W was higher(W = 0.68), but r decreased significantly from species togenus level. At the same time, the D+ was higher forperiphyton (D+ species–genus = 0.98) than for macro-phytes (D+ species–genus = 0.89).
Effects of taxonomic resolution on the quantificationof biodiversity
The univariate comparisons of richness, evenness,Shannon Index, and Simpson’s Index from differenttaxonomic levels suggest that diversity measures aregenerally affected by taxonomic resolution in a very
766 M. MUELLER ET AL. [Volume 32

similar way as the multivariate community patterns.As expected, increasing aggregation resulted in adecrease of richness and diversity indices, but withdifferences in the extent of decrease among differenttaxonomic groups. In the groups of macroinverte-brates and macrophytes, the quantification of biodi-
versity applying TS did not strongly differ from usingspecies-level data as a baseline. The detected decreasewith coarser taxonomic level was strongest for richness(Table 1), moderate and identical for Shannon Indexand Simpson’s Index (Table 1), and less pronouncedfor evenness. Significant differences in evenness
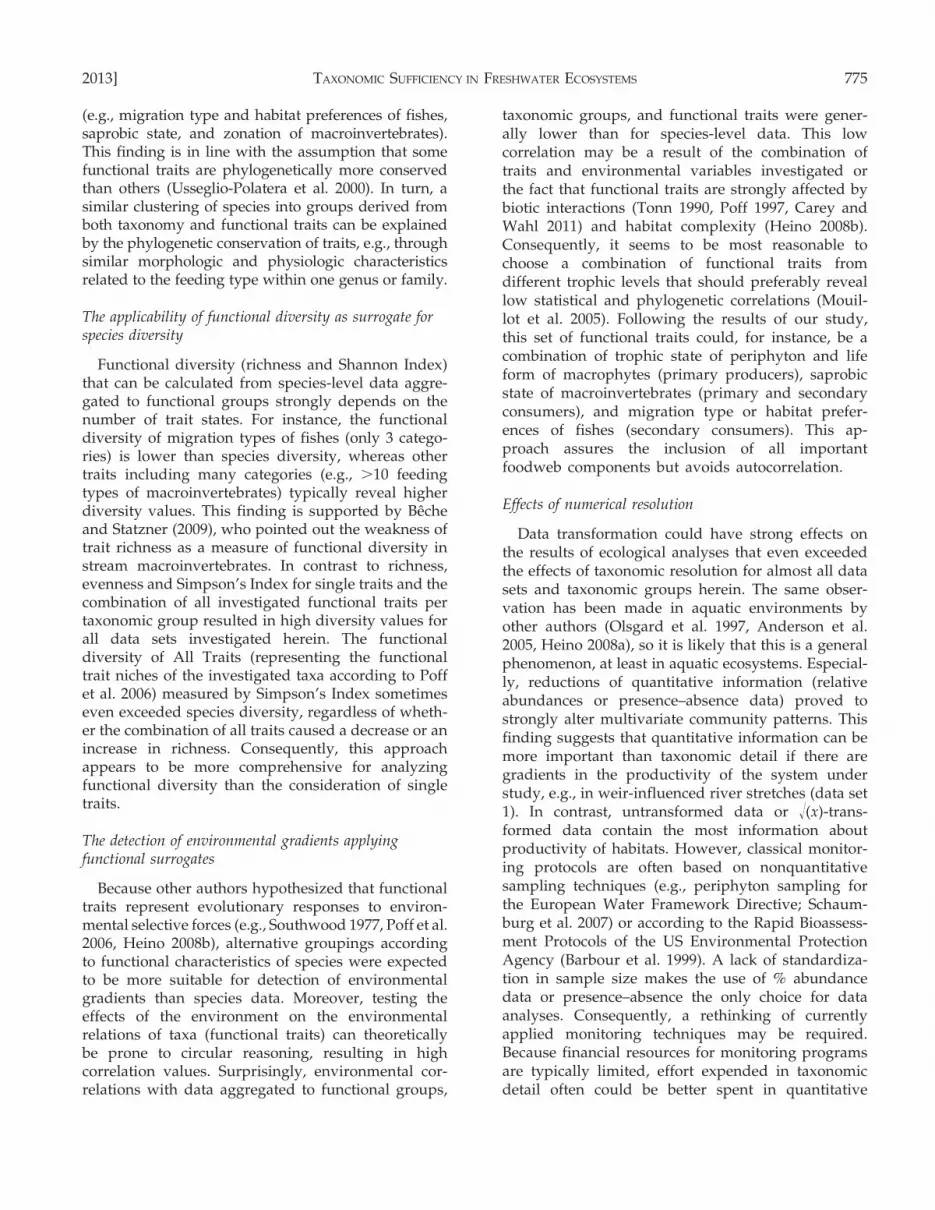
FIG. 1. Second-stage nonmetric multidimensional scaling (NMDS) plots of resemblance matrices from different taxonomic andnumerical resolutions. The taxonomic groups periphyton (P), macrophytes (MP), macroinvertebrates (MIV), and fishes (F) arearranged in rows with data sets (1, 2, 3) in columns.
2013] TAXONOMIC SUFFICIENCY IN FRESHWATER ECOSYSTEMS 767
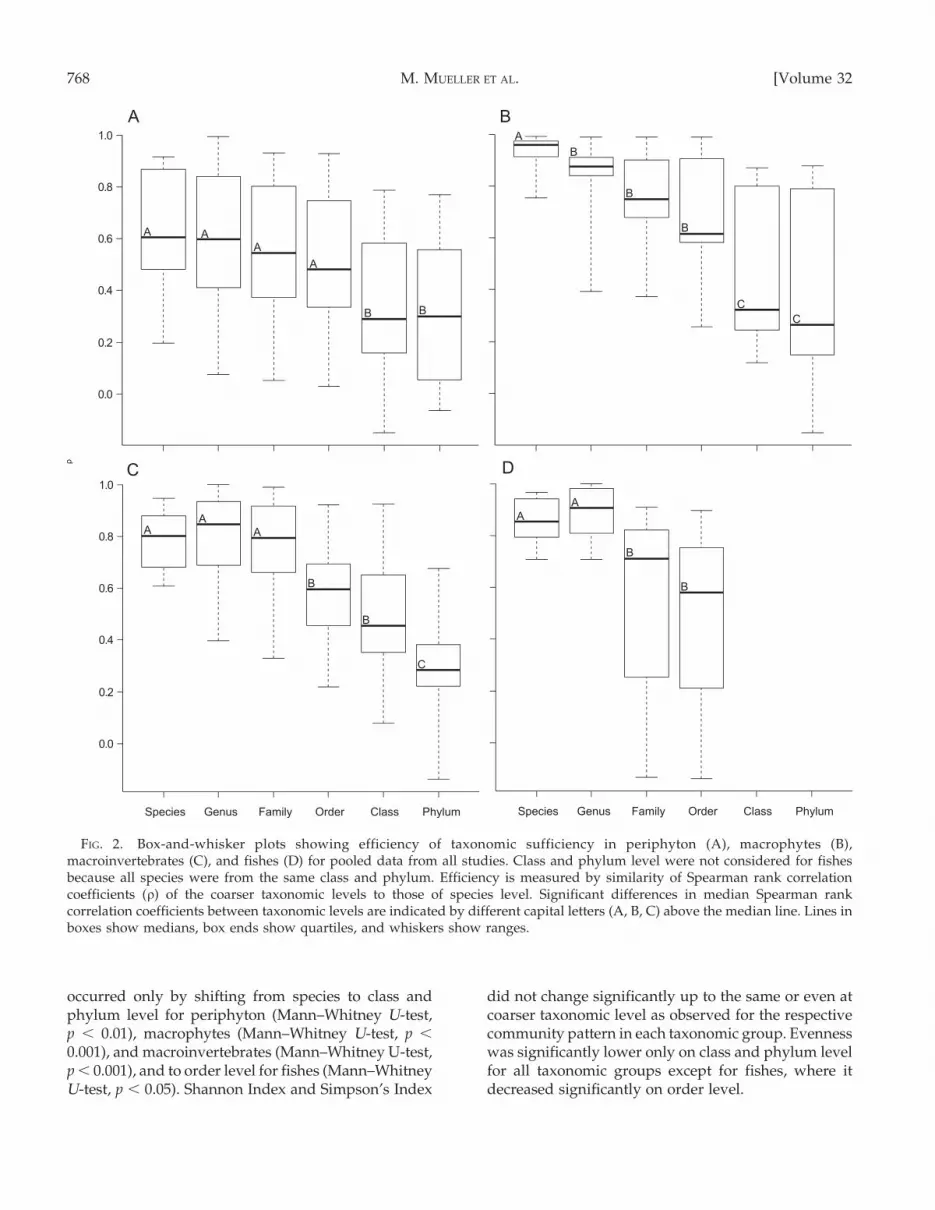
occurred only by shifting from species to class andphylum level for periphyton (Mann–Whitney U-test,p , 0.01), macrophytes (Mann–Whitney U-test, p ,
0.001), and macroinvertebrates (Mann–Whitney U-test,p , 0.001), and to order level for fishes (Mann–WhitneyU-test, p , 0.05). Shannon Index and Simpson’s Index
did not change significantly up to the same or even atcoarser taxonomic level as observed for the respectivecommunity pattern in each taxonomic group. Evennesswas significantly lower only on class and phylum levelfor all taxonomic groups except for fishes, where itdecreased significantly on order level.
FIG. 2. Box-and-whisker plots showing efficiency of taxonomic sufficiency in periphyton (A), macrophytes (B),macroinvertebrates (C), and fishes (D) for pooled data from all studies. Class and phylum level were not considered for fishesbecause all species were from the same class and phylum. Efficiency is measured by similarity of Spearman rank correlationcoefficients (r) of the coarser taxonomic levels to those of species level. Significant differences in median Spearman rankcorrelation coefficients between taxonomic levels are indicated by different capital letters (A, B, C) above the median line. Lines inboxes show medians, box ends show quartiles, and whiskers show ranges.
768 M. MUELLER ET AL. [Volume 32
Taxonomic resolution and environmental gradients
Because there were almost no differences in theresults of BEST analyses between taxonomic levels(Table 2), the applied taxonomic resolution generallyhad low effects on the capability to detect environ-mental gradients. Significant differences betweentaxonomic levels occurred only for macroinvertebrates,with the correlation of environmental variables beingsignificantly lower on family, order, class, and phylumlevel than on species level (Table 2). For macrophytes,the BEST analysis revealed slightly higher correlationon species level, but there were no significantdifferences and the standard deviation of BESTcorrelation coefficients was very high (Table 2). Forperiphyton, a slight decrease in values from family tophylum level was detected, whereas for fishes only thestandard deviation increased from family level tohigher taxonomic classifications (Table 2). Numericalresolution had no significant effects on BEST results forall investigated taxonomic groups.
Effects of numerical resolution
PERMANOVA pseudo-F values were constantlyhigher and p-values lower for the factor numericalresolution than for taxonomic resolution, so differenttypes of data transformation (none, !(x), % abundancedata, presence–absence data) obviously had strongereffects on community patterns than taxonomic levels(PERMANOVA taxonomic resolution: pseudo-F =
1.01–68.87, p = 0.001–0.5; numerical resolution:pseudo-F = 1.01–252.32, p = 0.001–0.49). Matricesfrom !(x)-transformed data and untransformed datastrongly clustered in most cases (except for theperiphyton data from data set 1, see Fig. 1). Percentabundance data and presence–absence data had morepronounced effects on the multivariate communitypattern across data sets and taxonomic groups. Theeffects of coarsening taxonomic resolution on multi-variate community patterns increased with coarsen-ing numerical resolution, which also differed betweentaxonomic groups (Fig. 1). Evaluating the arrangement
FIG. 3. Spearman rank correlation (r) between species and higher taxa matrices against the corresponding average taxonomicbreadth (D+) for periphyton (r = 0.87, adjusted R2
= 0.70, p , 0.001), macrophytes (r = 0.82, adjusted R2= 0.70, p , 0.001),
macroinvertebrates (r = 0.79, adjusted R2= 0.68, p , 0.001), and fishes (r = 0.70, adjusted R2
= 0.12, p . 0.05).
2013] TAXONOMIC SUFFICIENCY IN FRESHWATER ECOSYSTEMS 769
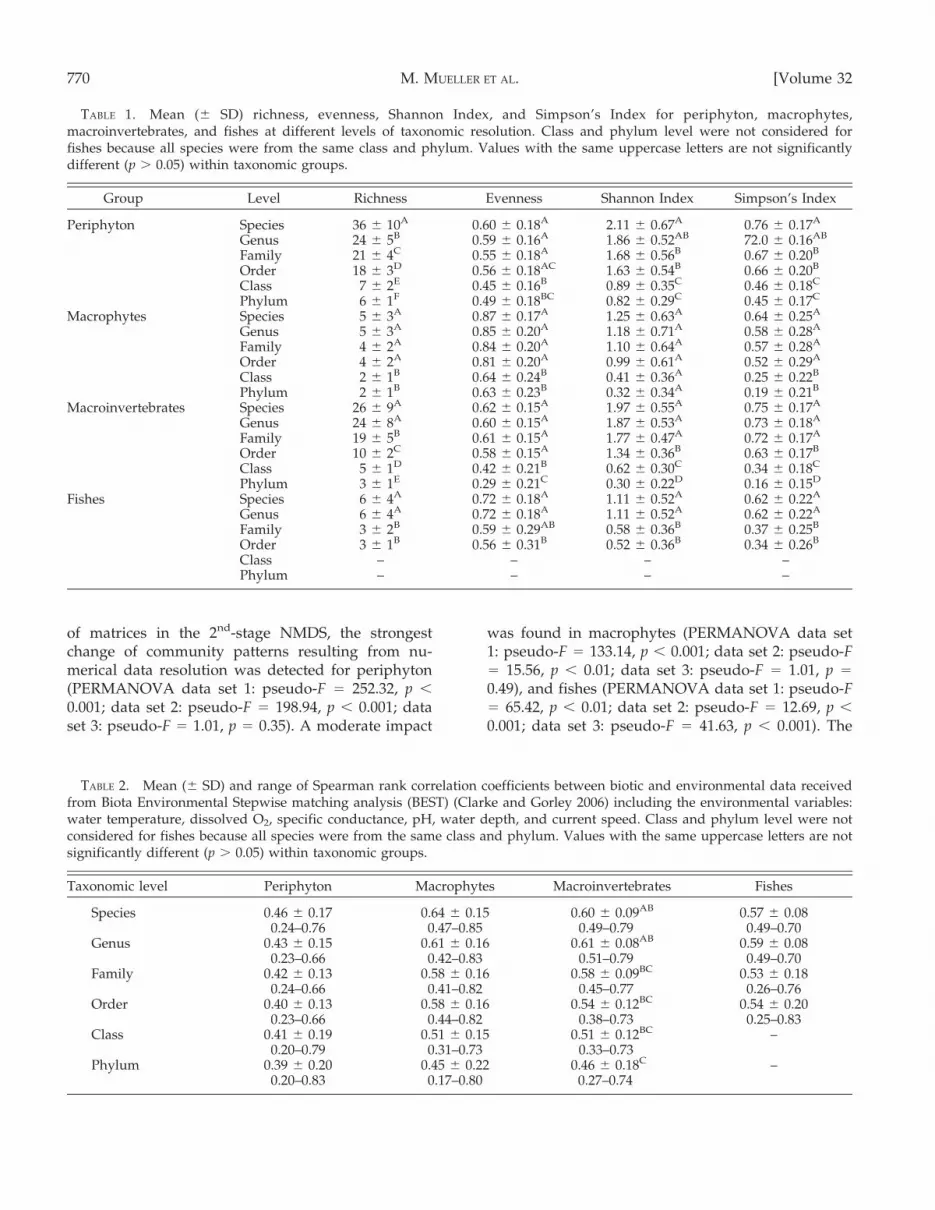
of matrices in the 2nd-stage NMDS, the strongestchange of community patterns resulting from nu-merical data resolution was detected for periphyton(PERMANOVA data set 1: pseudo-F = 252.32, p ,
0.001; data set 2: pseudo-F = 198.94, p , 0.001; dataset 3: pseudo-F = 1.01, p = 0.35). A moderate impact
was found in macrophytes (PERMANOVA data set1: pseudo-F = 133.14, p , 0.001; data set 2: pseudo-F= 15.56, p , 0.01; data set 3: pseudo-F = 1.01, p =
0.49), and fishes (PERMANOVA data set 1: pseudo-F= 65.42, p , 0.01; data set 2: pseudo-F = 12.69, p ,
0.001; data set 3: pseudo-F = 41.63, p , 0.001). The
TABLE 1. Mean (6 SD) richness, evenness, Shannon Index, and Simpson’s Index for periphyton, macrophytes,macroinvertebrates, and fishes at different levels of taxonomic resolution. Class and phylum level were not considered forfishes because all species were from the same class and phylum. Values with the same uppercase letters are not significantlydifferent (p . 0.05) within taxonomic groups.
Group Level Richness Evenness Shannon Index Simpson’s Index
Periphyton Species 36 6 10A 0.60 6 0.18A 2.11 6 0.67A 0.76 6 0.17A
Genus 24 6 5B 0.59 6 0.16A 1.86 6 0.52AB 72.0 6 0.16AB
Family 21 6 4C 0.55 6 0.18A 1.68 6 0.56B 0.67 6 0.20B
Order 18 6 3D 0.56 6 0.18AC 1.63 6 0.54B 0.66 6 0.20B
Class 7 6 2E 0.45 6 0.16B 0.89 6 0.35C 0.46 6 0.18C
Phylum 6 6 1F 0.49 6 0.18BC 0.82 6 0.29C 0.45 6 0.17C
Macrophytes Species 5 6 3A 0.87 6 0.17A 1.25 6 0.63A 0.64 6 0.25A
Genus 5 6 3A 0.85 6 0.20A 1.18 6 0.71A 0.58 6 0.28A
Family 4 6 2A 0.84 6 0.20A 1.10 6 0.64A 0.57 6 0.28A
Order 4 6 2A 0.81 6 0.20A 0.99 6 0.61A 0.52 6 0.29A
Class 2 6 1B 0.64 6 0.24B 0.41 6 0.36A 0.25 6 0.22B
Phylum 2 6 1B 0.63 6 0.23B 0.32 6 0.34A 0.19 6 0.21B
Macroinvertebrates Species 26 6 9A 0.62 6 0.15A 1.97 6 0.55A 0.75 6 0.17A
Genus 24 6 8A 0.60 6 0.15A 1.87 6 0.53A 0.73 6 0.18A
Family 19 6 5B 0.61 6 0.15A 1.77 6 0.47A 0.72 6 0.17A
Order 10 6 2C 0.58 6 0.15A 1.34 6 0.36B 0.63 6 0.17B
Class 5 6 1D 0.42 6 0.21B 0.62 6 0.30C 0.34 6 0.18C
Phylum 3 6 1E 0.29 6 0.21C 0.30 6 0.22D 0.16 6 0.15D
Fishes Species 6 6 4A 0.72 6 0.18A 1.11 6 0.52A 0.62 6 0.22A
Genus 6 6 4A 0.72 6 0.18A 1.11 6 0.52A 0.62 6 0.22A
Family 3 6 2B 0.59 6 0.29AB 0.58 6 0.36B 0.37 6 0.25B
Order 3 6 1B 0.56 6 0.31B 0.52 6 0.36B 0.34 6 0.26B
Class – – – –Phylum – – – –
TABLE 2. Mean (6 SD) and range of Spearman rank correlation coefficients between biotic and environmental data receivedfrom Biota Environmental Stepwise matching analysis (BEST) (Clarke and Gorley 2006) including the environmental variables:water temperature, dissolved O2, specific conductance, pH, water depth, and current speed. Class and phylum level were notconsidered for fishes because all species were from the same class and phylum. Values with the same uppercase letters are notsignificantly different (p . 0.05) within taxonomic groups.
Taxonomic level Periphyton Macrophytes Macroinvertebrates Fishes
Species 0.46 6 0.17 0.64 6 0.15 0.60 6 0.09AB 0.57 6 0.080.24–0.76 0.47–0.85 0.49–0.79 0.49–0.70
Genus 0.43 6 0.15 0.61 6 0.16 0.61 6 0.08AB 0.59 6 0.080.23–0.66 0.42–0.83 0.51–0.79 0.49–0.70
Family 0.42 6 0.13 0.58 6 0.16 0.58 6 0.09BC 0.53 6 0.180.24–0.66 0.41–0.82 0.45–0.77 0.26–0.76
Order 0.40 6 0.13 0.58 6 0.16 0.54 6 0.12BC 0.54 6 0.200.23–0.66 0.44–0.82 0.38–0.73 0.25–0.83
Class 0.41 6 0.19 0.51 6 0.15 0.51 6 0.12BC –0.20–0.79 0.31–0.73 0.33–0.73
Phylum 0.39 6 0.20 0.45 6 0.22 0.46 6 0.18C –0.20–0.83 0.17–0.80 0.27–0.74
770 M. MUELLER ET AL. [Volume 32
least pronounced effects were found for macroinver-tebrates (PERMANOVA data set 1: pseudo-F =
12.73, p , 0.001; data set 2: pseudo-F = 17.76, p =
0.001; data set 3: pseudo-F = 17.35, p , 0.001; Fig. 1).
Functional traits as alternative grouping
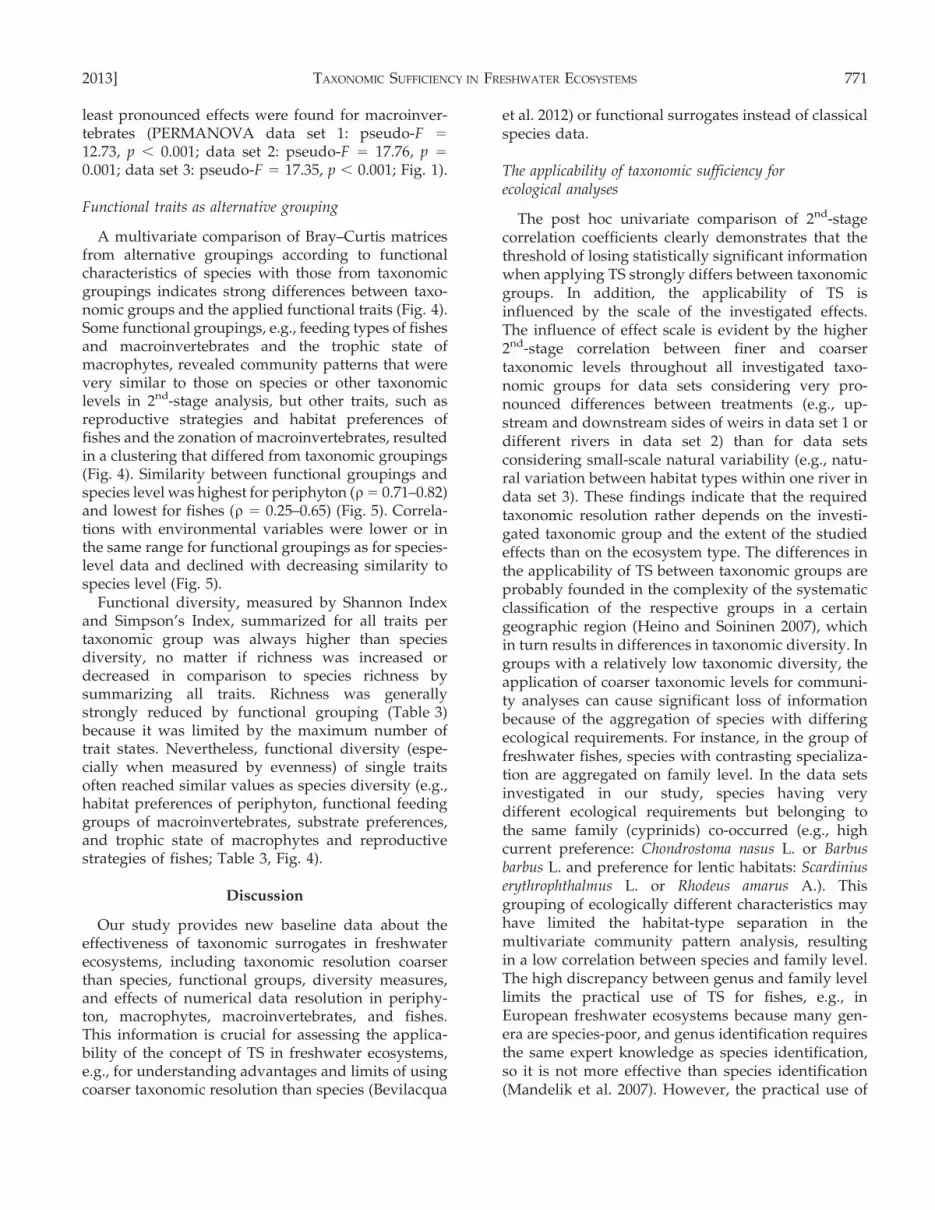
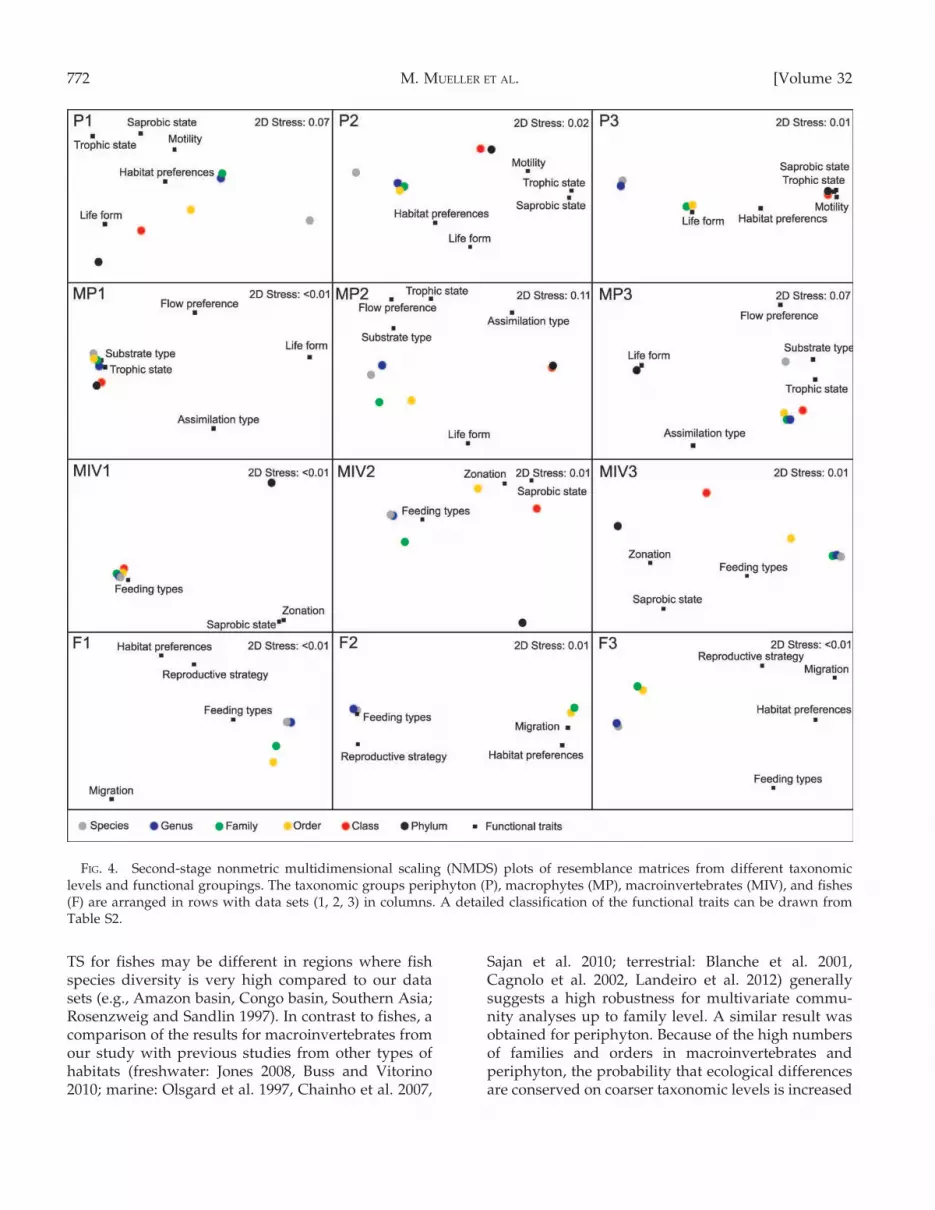
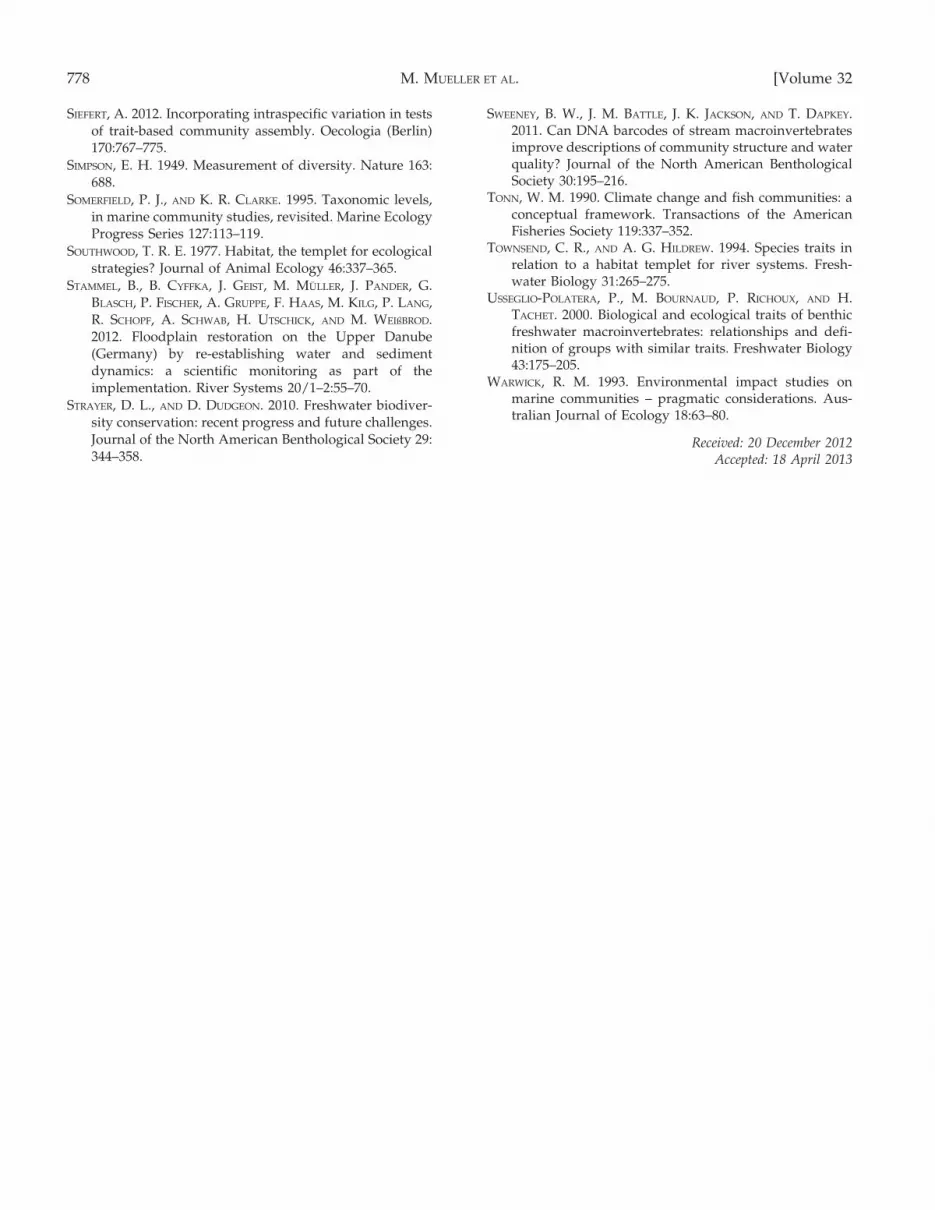
A multivariate comparison of Bray–Curtis matricesfrom alternative groupings according to functionalcharacteristics of species with those from taxonomicgroupings indicates strong differences between taxo-nomic groups and the applied functional traits (Fig. 4).Some functional groupings, e.g., feeding types of fishesand macroinvertebrates and the trophic state ofmacrophytes, revealed community patterns that werevery similar to those on species or other taxonomiclevels in 2nd-stage analysis, but other traits, such asreproductive strategies and habitat preferences offishes and the zonation of macroinvertebrates, resultedin a clustering that differed from taxonomic groupings(Fig. 4). Similarity between functional groupings andspecies level was highest for periphyton (r = 0.71–0.82)and lowest for fishes (r = 0.25–0.65) (Fig. 5). Correla-tions with environmental variables were lower or inthe same range for functional groupings as for species-level data and declined with decreasing similarity tospecies level (Fig. 5).
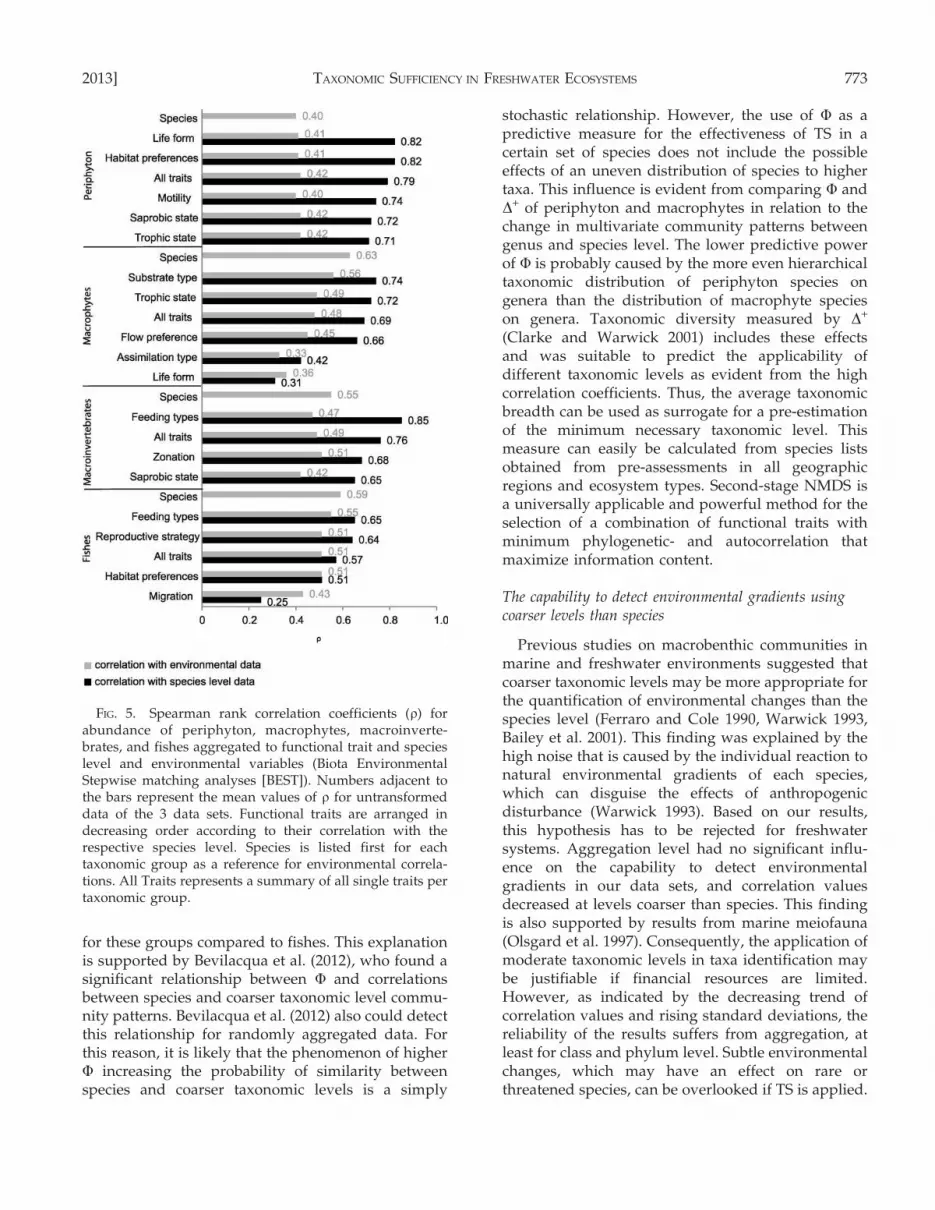
Functional diversity, measured by Shannon Indexand Simpson’s Index, summarized for all traits pertaxonomic group was always higher than speciesdiversity, no matter if richness was increased ordecreased in comparison to species richness bysummarizing all traits. Richness was generallystrongly reduced by functional grouping (Table 3)because it was limited by the maximum number oftrait states. Nevertheless, functional diversity (espe-cially when measured by evenness) of single traitsoften reached similar values as species diversity (e.g.,habitat preferences of periphyton, functional feedinggroups of macroinvertebrates, substrate preferences,and trophic state of macrophytes and reproductivestrategies of fishes; Table 3, Fig. 4).
Discussion
Our study provides new baseline data about theeffectiveness of taxonomic surrogates in freshwaterecosystems, including taxonomic resolution coarserthan species, functional groups, diversity measures,and effects of numerical data resolution in periphy-ton, macrophytes, macroinvertebrates, and fishes.This information is crucial for assessing the applica-bility of the concept of TS in freshwater ecosystems,e.g., for understanding advantages and limits of usingcoarser taxonomic resolution than species (Bevilacqua
et al. 2012) or functional surrogates instead of classicalspecies data.
The applicability of taxonomic sufficiency forecological analyses
The post hoc univariate comparison of 2nd-stagecorrelation coefficients clearly demonstrates that thethreshold of losing statistically significant informationwhen applying TS strongly differs between taxonomicgroups. In addition, the applicability of TS isinfluenced by the scale of the investigated effects.The influence of effect scale is evident by the higher2nd-stage correlation between finer and coarsertaxonomic levels throughout all investigated taxo-nomic groups for data sets considering very pro-nounced differences between treatments (e.g., up-stream and downstream sides of weirs in data set 1 ordifferent rivers in data set 2) than for data setsconsidering small-scale natural variability (e.g., natu-ral variation between habitat types within one river indata set 3). These findings indicate that the requiredtaxonomic resolution rather depends on the investi-gated taxonomic group and the extent of the studiedeffects than on the ecosystem type. The differences inthe applicability of TS between taxonomic groups areprobably founded in the complexity of the systematicclassification of the respective groups in a certaingeographic region (Heino and Soininen 2007), whichin turn results in differences in taxonomic diversity. Ingroups with a relatively low taxonomic diversity, theapplication of coarser taxonomic levels for communi-ty analyses can cause significant loss of informationbecause of the aggregation of species with differingecological requirements. For instance, in the group offreshwater fishes, species with contrasting specializa-tion are aggregated on family level. In the data setsinvestigated in our study, species having verydifferent ecological requirements but belonging tothe same family (cyprinids) co-occurred (e.g., highcurrent preference: Chondrostoma nasus L. or Barbusbarbus L. and preference for lentic habitats: Scardiniuserythrophthalmus L. or Rhodeus amarus A.). Thisgrouping of ecologically different characteristics mayhave limited the habitat-type separation in themultivariate community pattern analysis, resultingin a low correlation between species and family level.The high discrepancy between genus and family levellimits the practical use of TS for fishes, e.g., inEuropean freshwater ecosystems because many gen-era are species-poor, and genus identification requiresthe same expert knowledge as species identification,so it is not more effective than species identification(Mandelik et al. 2007). However, the practical use of
2013] TAXONOMIC SUFFICIENCY IN FRESHWATER ECOSYSTEMS 771
TS for fishes may be different in regions where fishspecies diversity is very high compared to our datasets (e.g., Amazon basin, Congo basin, Southern Asia;Rosenzweig and Sandlin 1997). In contrast to fishes, acomparison of the results for macroinvertebrates fromour study with previous studies from other types ofhabitats (freshwater: Jones 2008, Buss and Vitorino2010; marine: Olsgard et al. 1997, Chainho et al. 2007,
Sajan et al. 2010; terrestrial: Blanche et al. 2001,Cagnolo et al. 2002, Landeiro et al. 2012) generallysuggests a high robustness for multivariate commu-nity analyses up to family level. A similar result wasobtained for periphyton. Because of the high numbersof families and orders in macroinvertebrates andperiphyton, the probability that ecological differencesare conserved on coarser taxonomic levels is increased
FIG. 4. Second-stage nonmetric multidimensional scaling (NMDS) plots of resemblance matrices from different taxonomiclevels and functional groupings. The taxonomic groups periphyton (P), macrophytes (MP), macroinvertebrates (MIV), and fishes(F) are arranged in rows with data sets (1, 2, 3) in columns. A detailed classification of the functional traits can be drawn fromTable S2.
772 M. MUELLER ET AL. [Volume 32
for these groups compared to fishes. This explanationis supported by Bevilacqua et al. (2012), who found asignificant relationship between W and correlationsbetween species and coarser taxonomic level commu-nity patterns. Bevilacqua et al. (2012) also could detectthis relationship for randomly aggregated data. Forthis reason, it is likely that the phenomenon of higherW increasing the probability of similarity betweenspecies and coarser taxonomic levels is a simply
stochastic relationship. However, the use of W as apredictive measure for the effectiveness of TS in acertain set of species does not include the possibleeffects of an uneven distribution of species to highertaxa. This influence is evident from comparing W andD+ of periphyton and macrophytes in relation to thechange in multivariate community patterns betweengenus and species level. The lower predictive powerof W is probably caused by the more even hierarchicaltaxonomic distribution of periphyton species ongenera than the distribution of macrophyte specieson genera. Taxonomic diversity measured by D+
(Clarke and Warwick 2001) includes these effectsand was suitable to predict the applicability ofdifferent taxonomic levels as evident from the highcorrelation coefficients. Thus, the average taxonomicbreadth can be used as surrogate for a pre-estimationof the minimum necessary taxonomic level. Thismeasure can easily be calculated from species listsobtained from pre-assessments in all geographicregions and ecosystem types. Second-stage NMDS isa universally applicable and powerful method for theselection of a combination of functional traits withminimum phylogenetic- and autocorrelation thatmaximize information content.
The capability to detect environmental gradients usingcoarser levels than species
Previous studies on macrobenthic communities inmarine and freshwater environments suggested thatcoarser taxonomic levels may be more appropriate forthe quantification of environmental changes than thespecies level (Ferraro and Cole 1990, Warwick 1993,Bailey et al. 2001). This finding was explained by thehigh noise that is caused by the individual reaction tonatural environmental gradients of each species,which can disguise the effects of anthropogenicdisturbance (Warwick 1993). Based on our results,this hypothesis has to be rejected for freshwatersystems. Aggregation level had no significant influ-ence on the capability to detect environmentalgradients in our data sets, and correlation valuesdecreased at levels coarser than species. This findingis also supported by results from marine meiofauna(Olsgard et al. 1997). Consequently, the application ofmoderate taxonomic levels in taxa identification maybe justifiable if financial resources are limited.However, as indicated by the decreasing trend ofcorrelation values and rising standard deviations, thereliability of the results suffers from aggregation, atleast for class and phylum level. Subtle environmentalchanges, which may have an effect on rare orthreatened species, can be overlooked if TS is applied.
FIG. 5. Spearman rank correlation coefficients (r) forabundance of periphyton, macrophytes, macroinverte-brates, and fishes aggregated to functional trait and specieslevel and environmental variables (Biota EnvironmentalStepwise matching analyses [BEST]). Numbers adjacent tothe bars represent the mean values of r for untransformeddata of the 3 data sets. Functional traits are arranged indecreasing order according to their correlation with therespective species level. Species is listed first for eachtaxonomic group as a reference for environmental correla-tions. All Traits represents a summary of all single traits pertaxonomic group.
2013] TAXONOMIC SUFFICIENCY IN FRESHWATER ECOSYSTEMS 773
The applicability of higher-taxon diversity as surrogate forspecies diversity
Besides the effects of TS on multivariate communitypatterns, there were also effects on the quantification ofbiodiversity, depending on the diversity measureapplied. Although Heino and Soininen (2007) found astrong correlation between species richness and highertaxon richness for stream macroinvertebrates anddiatoms, the strong decrease of richness alreadyoccurring by aggregation to genus or family level inour study indicates that biodiversity can be stronglyunderestimated if richness is used as the only diversitymeasure. In contrast, evenness, Shannon Index, andSimpson’s Index are even less affected by taxonomicdata aggregation than multivariate community pat-terns. However, the most pronounced loss of informa-tion was detected from order to class level for all datasets, taxonomic groups, and diversity indices. Conse-quently, the order level seems to be a critical thresholdof taxonomic resolution for aquatic ecology, belowwhich the explanatory power of biodiversity measuresstrongly decreases. If the concept of TS is being appliedto new systems or habitats, an initial combination ofseveral measures of diversity (Heino et al. 2008) andmultivariate community analyses, calculated from
genus, family, or order level (adapted to the specifictaxonomic group and the available resources) canserve as a reliable surrogate for species diversity forperiphyton and macroinvertebrates. In contrast, thestrong changes in the outcome of the analysis fromspecies to family level observed for macrophytes andfishes suggest that genus- or species-level identifica-tion is necessary for these groups.
The applicability of functional surrogates formultivariate analyses
Alternative groupings according to functional traitscan potentially reveal additional information concern-ing ecosystem properties beyond taxonomic composi-tion (Usseglio-Polatera et al. 2000, Poff et al. 2006).Thereby, low statistical and phylogenetic correlationsamong traits, e.g., as detected in our study for migrationtypes of fishes and life form of macrophytes (r specieslevel ƒ 0.31), are desirable to ensure statisticalindependence and to maximize information content(Townsend and Hildrew 1994, Cadotte et al. 2011, Poffet al. 2006). For the faunal groups in our study,functional traits related to feeding types of fishes andmacroinvertebrates were more strongly correlated withspecies-level data than traits referring to habitat use
TABLE 3. Mean (6 SD) functional diversity for functional traits of periphyton, macrophytes, macroinvertebrates, and fishes incomparison to species diversity (Species). Functional traits are arranged according to the order in Fig. 5. A detailed description ofeach trait is given in Table S2. All Traits represents a summary of all single traits per taxonomic group. Values with the sameuppercase letters are not significantly different (p . 0.05) within taxonomic groups.
Assemblage Grouping Richness Evenness Shannon index Simpson’s index
Periphyton Species 36 6 10A 0.60 6 0.18A 2.11 6 0.67A 0.76 6 0.17A
Life form 5 6 1B 0.68 6 0.18BC 1.12 6 0.31B 0.58 6 0.16B
Habitat preferences 6 6 1C 0.62 6 0.18AB 1.08 6 0.31B 0.55 6 0.17B
All traits 25 6 2D 0.75 6 0.09C 2.41 6 0.27C 0.88 6 0.03C
Motility 5 6 0B 0.50 6 0.24AD 0.81 6 0.38D 0.42 6 0.22D
Saprobic state 4 6 3E 0.34 6 0.21E 0.50 6 0.37E 0.25 6 0.19E
Trophic state 5 6 1B 0.31 6 0.20E 0.51 6 0.34E 0.25 6 0.19E
Macrophytes Species 6 6 4A 0.97 6 0.03A 1.59 6 0.61A 1.06 6 0.07AB
Substrate type 4 6 2AB 0.85 6 0.16A 1.04 6 0.49AB 0.72 6 0.30BC
Trophic state 3 6 1BC 0.83 6 0.20A 0.86 6 0.46AB 0.62 6 0.33C
All traits 14 6 5E 0.91 6 0.06A 2.32 6 0.33C 0.91 6 0.05A
Flow preference 3 6 2B 0.84 6 0.16A 0.92 6 0.49B 0.63 6 0.33C
Assimilation type 2 6 1D 0.69 6 0.20B 0.42 6 0.34D 0.32 6 0.27D
Life form 2 6 1E 0.48 6 0.24B 0.17 6 0.25E 0.10 6 0.16E
Macroinvertebrates Species 21 6 6A 0.56 6 0.14A 1.69 6 0.46A 0.68 6 0.17A
Feeding type 9 6 2B 0.65 6 0.17B 1.41 6 0.39B 0.66 6 0.17B
All traits 18 6 3C 0.74 6 0.10C 2.15 6 0.32C 0.85 6 0.06C
Zonation 4 6 1D 0.54 6 0.21A 0.79 6 0.30D 0.45 6 0.18D
Saprobic state 5 6 1E 0.59 6 0.21AC 0.96 6 0.38E 0.52 6 0.21D
Fishes Species 5 6 4A 0.74 6 0.21A 1.08 6 0.61A 0.63 6 0.29A
Feeding type 3 6 1B 0.66 6 0.30ABC 0.58 6 0.36B 0.41 6 0.28B
Reproductive strategy 3 6 1C 0.69 6 0.23AC 0.72 6 0.35B 0.47 6 0.23B
All traits 9 6 3D 0.85 6 0.10D 1.82 6 0.24C 0.84 6 0.05C
Habitat preferences 2 6 1E 0.56 6 0.28BC 0.29 6 0.30D 0.20 6 0.21D
Migration 2 6 1E 0.46 6 0.29B 0.17 6 0.23D 0.11 6 0.17D
774 M. MUELLER ET AL. [Volume 32
(e.g., migration type and habitat preferences of fishes,saprobic state, and zonation of macroinvertebrates).This finding is in line with the assumption that somefunctional traits are phylogenetically more conservedthan others (Usseglio-Polatera et al. 2000). In turn, asimilar clustering of species into groups derived fromboth taxonomy and functional traits can be explainedby the phylogenetic conservation of traits, e.g., throughsimilar morphologic and physiologic characteristicsrelated to the feeding type within one genus or family.
The applicability of functional diversity as surrogate forspecies diversity
Functional diversity (richness and Shannon Index)that can be calculated from species-level data aggre-gated to functional groups strongly depends on thenumber of trait states. For instance, the functionaldiversity of migration types of fishes (only 3 catego-ries) is lower than species diversity, whereas othertraits including many categories (e.g., .10 feedingtypes of macroinvertebrates) typically reveal higherdiversity values. This finding is supported by Becheand Statzner (2009), who pointed out the weakness oftrait richness as a measure of functional diversity instream macroinvertebrates. In contrast to richness,evenness and Simpson’s Index for single traits and thecombination of all investigated functional traits pertaxonomic group resulted in high diversity values forall data sets investigated herein. The functionaldiversity of All Traits (representing the functionaltrait niches of the investigated taxa according to Poffet al. 2006) measured by Simpson’s Index sometimeseven exceeded species diversity, regardless of wheth-er the combination of all traits caused a decrease or anincrease in richness. Consequently, this approachappears to be more comprehensive for analyzingfunctional diversity than the consideration of singletraits.
The detection of environmental gradients applyingfunctional surrogates
Because other authors hypothesized that functionaltraits represent evolutionary responses to environ-mental selective forces (e.g., Southwood 1977, Poff et al.2006, Heino 2008b), alternative groupings accordingto functional characteristics of species were expectedto be more suitable for detection of environmentalgradients than species data. Moreover, testing theeffects of the environment on the environmentalrelations of taxa (functional traits) can theoreticallybe prone to circular reasoning, resulting in highcorrelation values. Surprisingly, environmental cor-relations with data aggregated to functional groups,
taxonomic groups, and functional traits were gener-ally lower than for species-level data. This lowcorrelation may be a result of the combination oftraits and environmental variables investigated orthe fact that functional traits are strongly affected bybiotic interactions (Tonn 1990, Poff 1997, Carey andWahl 2011) and habitat complexity (Heino 2008b).Consequently, it seems to be most reasonable tochoose a combination of functional traits fromdifferent trophic levels that should preferably reveallow statistical and phylogenetic correlations (Mouil-lot et al. 2005). Following the results of our study,this set of functional traits could, for instance, be acombination of trophic state of periphyton and lifeform of macrophytes (primary producers), saprobicstate of macroinvertebrates (primary and secondaryconsumers), and migration type or habitat prefer-ences of fishes (secondary consumers). This ap-proach assures the inclusion of all importantfoodweb components but avoids autocorrelation.
Effects of numerical resolution
Data transformation could have strong effects onthe results of ecological analyses that even exceededthe effects of taxonomic resolution for almost all datasets and taxonomic groups herein. The same obser-vation has been made in aquatic environments byother authors (Olsgard et al. 1997, Anderson et al.2005, Heino 2008a), so it is likely that this is a generalphenomenon, at least in aquatic ecosystems. Especial-ly, reductions of quantitative information (relativeabundances or presence–absence data) proved tostrongly alter multivariate community patterns. Thisfinding suggests that quantitative information can bemore important than taxonomic detail if there aregradients in the productivity of the system understudy, e.g., in weir-influenced river stretches (data set1). In contrast, untransformed data or !(x)-trans-formed data contain the most information aboutproductivity of habitats. However, classical monitor-ing protocols are often based on nonquantitativesampling techniques (e.g., periphyton sampling forthe European Water Framework Directive; Schaum-burg et al. 2007) or according to the Rapid Bioassess-ment Protocols of the US Environmental ProtectionAgency (Barbour et al. 1999). A lack of standardiza-tion in sample size makes the use of % abundancedata or presence–absence the only choice for dataanalyses. Consequently, a rethinking of currentlyapplied monitoring techniques may be required.Because financial resources for monitoring programsare typically limited, effort expended in taxonomicdetail often could be better spent in quantitative
2013] TAXONOMIC SUFFICIENCY IN FRESHWATER ECOSYSTEMS 775
sampling techniques and the consideration of multi-ple taxonomic groups, at least if the main objective isthe monitoring of ecosystem changes rather than theconservation of specific rare species. Moreover, theeffects of numerical resolution on the applicability ofTS have to be considered. Because of the morepronounced effects of taxonomic aggregation onpresence–absence data and % abundance data(Fig. 1), the application of TS may be less appropriateif quantitative data are not available.
Conclusions
Our study for the first time provides statisticalthreshold levels for the application of TS for ecologicalanalyses in 4 different freshwater groups. The resultsof our study suggest that TS can be applied up tofamily or order level for macroinvertebrates andperiphyton (D+ species–phylum . 0.77), whereasfishes and macrophytes (D+ species–phylum , 0.68)should be identified to genus and species level.However, for investigating the effects of environmen-tal changes based on species-specific tolerances (e.g.,water-quality determination; Lenat and Resh 2001),the use of species-level data appears generallyadvantageous. Because the applicability of TS washigher in data sets from impaired systems and withlarge spatial scale in our and in other studies (e.g.,Bevilacqua et al. 2012), TS may be of great relevancefor environmental-impact assessments, monitoring,and efficiency control of restoration measures. Thestrong impact of numerical data resolution on theoutcome of ecological analysis suggests investingeffort in quantitative data and number of spatial andtemporal replicates rather than in taxonomic detail.The consideration of functional traits as additionaldescriptive variables, e.g., plotted on taxonomic dataas vectors in multivariate statistics (Mueller et al.2011), is a more integrative approach to analyzeinteractions between taxonomic composition, envi-ronmental conditions, and ecosystem functions thanusing functional traits as input variables for NMDS.
Acknowledgements
We acknowledge support to MM by the TechnischeUniversitat Munchen Graduate School and a doctoralscholarship of UniBayern e.V.
Literature Cited
ANDERSON, M. J., S. D. CONNELL, B. M. GILLANDERS, C. E.DIEBEL, W. M. BLOM, J. E. SAUNDERS, AND T. J. LANDERS.2005. Relationships between taxonomic resolution andspatial scales of multivariate variation. Journal ofAnimal Ecology 74:636–646.
ANDERSON, M. J., R. N. GORLEY, AND K. R. CLARKE. 2008.PERMANOVA+ for PRIMER: guide to software andstatistical methods. PRIMER-E Ltd., Plymouth, UK.
BAILEY, R. C., R. H. NORRIS, AND T. B. REYNOLDSON. 2001.Taxonomic resolution of benthic macroinvertebratecommunities in bioassessments. Journal of the NorthAmerican Benthological Society 20:280–286.
BALMFORD, A., A. H. M. JAYASURIYA, AND M. J. B. GREEN. 1996.Using higher taxon richness as a surrogate for speciesrichness: II. Local applications. Proceedings of the RoyalSociety of London Series B: Biological Sciences 263:1571–1575.
BARBOUR, M. T., J. GERRITSEN, B. D. SNYDER, AND J. B. STRIBLING.1999. Rapid bioassessment protocols for use in streamsand wadeable rivers: periphyton, benthic macroinver-tebrates, and fish. 2nd edition. EPA 841-B-99-002. Officeof Water, US Environmental Protection Agency, Wash-ington, DC.
BECHE, L. A., AND B. STATZNER. 2009. Richness gradients ofstream invertebrates across the USA: taxonomy- andtrait-based approaches. Biodiversity Conservation 18:3909–3930.
BELLIER, E., V. GROTAN, S. ENGEN, A. K. SCHARTAU, O. H.DISERUD, AND A. G. FINSTAD. 2012. Combining counts andincidence data: an efficient approach for estimating thelog-normal species abundance distribution and diversi-ty indices. Oecologia (Berlin) 170:477–488.
BEVILACQUA, S., A. TERLIZZI, J. CLAUDET, S. FRASCHETTI, AND F.BOERO. 2012. Taxonomic relatedness does not matter forspecies surrogacy in the assessment of communityresponses to environmental drivers. Journal of AppliedEcology 49:357–366.
BLANCHE, K. R., A. N. ANDERSEN, AND J. A. LUDWIG. 2001.Rainfall-contingent detection of fire impacts: responsesof beetles to experimental fire regimes. EcologicalApplications 11:86–96.
BUSS, D. F., AND A. S. VITORINO. 2010. Rapid bioassessmentprotocols using benthic macroinvertebrates in Brazil:evaluation of taxonomic sufficiency. Journal of theNorth American Benthological Society 29:562–571.
CADOTTE, M. W., K. CARSCADDEN, AND N. MIROTCHNICK. 2011.Beyond species: functional diversity and the mainte-nance of ecological processes and services. Journal ofApplied Ecology 48:1079–1087.
CAGNOLO, L., S. I. MOLINA, AND G. R. VALLADARES. 2002.Diversity and guild structure of insect assemblagesunder grazing and exclusion regimes in a montanegrassland from Central Argentina. Biodiversity Conser-vation 11:407–420.
CAREY, M. P., AND D. H. WAHL. 2011. Determining themechanism by which fish diversity influences produc-tion. Oecologia (Berlin) 167:189–198.
CHAINHO, P., M. F. LANE, M. L. CHAVES, J. L. COSTA, M. J.COSTA, AND D. M. DAUER. 2007. Taxonomic sufficiency asa useful tool for typology in a poikilohaline estuary.Hydrobiologia 587:63–78.
CLARKE, R. K., AND R. N. GORLEY. 2006. PRIMER v6: usermanual/tutorial. 2nd edition. PRIMER-E Ltd., Plymouth,UK.
776 M. MUELLER ET AL. [Volume 32
CLARKE, R. K., AND R. M. WARWICK. 2001. Change in marinecommunities: an approach to statistical analysis andinterpretation. PRIMER-E Ltd., Plymouth, UK.
DEMSAR, J. 2006. Statistical comparison of classifiers overmultiple data sets. Journal of Machine LearningResearch 7:1–30.
DREW, L. W. 2011. Are we losing the science of taxonomyBioScience 61: 942–946.
DUDGEON, D., A. H. ARTHINGTON, M. O. GESSNER, Z. KAWABATA,D. J. KNOWLER, C. LEVEQUE, R. J. NAIMAN, A. PRIEUR-RICHARD,D. SOTO, M. L. J. STIASSNY, AND C. A. SULLIVAN. 2006.Freshwater biodiversity: importance, threats, status andconservation challenges. Biological Review 81:163–182.
ELLIS, D. 1985. Taxonomic sufficiency on pollution assess-ment. Marine Pollution Bulletin 16:459.
FERRARO, S. P., AND F. A. COLE. 1990. Taxonomic level andsample size sufficient for assessing pollution impacts onthe Southern California Bight macrobenthos. MarineEcology Progress Series 67:251–262.
GEIST, J. 2011. Integrative freshwater ecology and biodiver-sity conservation. Ecological Indicators 11:1507–1516.
GIAGRANDE, A. 2003. Biodiversity, conservation, and the‘‘taxonomic impediment’’. Aquatic Conservation: Ma-rine and Freshwater Ecosystems 13:451–459.
HANSSON, L., M. GYLLSTROM, A. STAHL-DELBANCO, AND M.SVENSSON. 2004. Responses to fish predation and nutri-ents by plankton at different levels of taxonomicresolution. Freshwater Biology 49:1538–1550.
HEINO, J. 2008a. Influence of taxonomic resolution and datatransformation on biotic matrix concordance and assem-blage-environment relationships in stream macroinver-tebrates. Boreal Environmental Research 13:359–369.
HEINO, J. 2008b. Patterns of functional biodiversity andfunction–environment relationships in littoral macroin-vertebrates. Limnology and Oceanography 53:1446–1455.
HEINO, J., H. MYKRA, AND J. KOTANEN. 2008. Weak relation-ships between landscape characteristics and multiplefacets of stream macroinvertebrate biodiversity in aboreal drainage basin. Landscape Ecology 23:417–426.
HEINO, J., AND J. SOININEN. 2007. Are higher taxa adequatesurrogates for species-level assemblage patterns andspecies richness in stream organisms? Biological Con-servation 137:78–89.
JOHNSON, R. K., D. HERING, M. FURSE, AND R. T. CLARKE. 2006.Detection of ecological change using multiple organismgroups: metrics and uncertainty. Hydrobiologia 566:115–137.
JONES, F. C. 2008. Taxonomic sufficiency: the influence oftaxonomic resolution on freshwater bioassessmentsusing benthic macroinvertebrates. Environmental Re-view 16:45–69.
LANDEIRO, V. L., L. M. BINI, F. R. C. COSTA, E. FRANKLIN, A.NOGUEIRA, J. L. P. SOUZA, J. MORAES, AND W. E. MAGNUSSON.2012. How far can we go in simplifying biomonitoringassessments? An integrated analysis of taxonomic surro-gacy, taxonomic sufficiency and numerical resolution in amegadiverse region. Ecological Indicators 23:366–373.
LENAT, D. R., AND V. H. RESH. 2001. Taxonomy and streamecology: the benefits of genus- and species-level
identifications. Journal of the North American Bentho-logical Society 20:287–298.
LISTGARTEN, J., AND A. EMILI. 2005. Statistical and computa-tional methods for comparative proteomic profilingusing liquid chromatography-tandem mass spectrome-try. Molecular and Cellular Proteomics 4.4:419434.
LOSOS, J. B., M. LEAL, R. E. GLOR, K. DE QUEIROZ, P. E. HERTZ,S. L. RODRIGUEZ, L. A. CHAMIZO, T. R. JACKMAN, AND A.LARSON. 2003. Niche lability in the evolution of aCaribbean lizard community. Nature 424:542–545.
MANDELIK, Y., T. DAYAN, V. CHIKANTUNOV, AND V. KRAV-
CHENKO. 2007. Reliability of a higher-taxon approach torichness, rarity, and composition assessments at thelocal scale. Conservation Biology 21:1506–1515.
MAURER, D. 2000. The dark side of taxonomic sufficiency(TS). Marine Pollution Bulletin 40:98–101.
MILLENNIUM ECOSYSTEM ASSESSMENT. 2005. Ecosystems andhuman well-being: health synthesis. Island Press,Washington, DC.
MOUILLOT, D., W. H. N. MASON, O. DUMAY, AND J. B. WILSON.2005. Functional regularity: a neglected aspect offunctional diversity. Oecologia (Berlin) 142:353–359.
MUELLER, M., J. PANDER, AND J. GEIST. 2011. The effects ofweirs on structural stream habitat and biologicalcommunities. Journal of Applied Ecology 48:1450–1461.
OLSGARD, F., P. J. SOMERFIELD, AND M. R. CARR. 1997.Relationships between taxonomic resolution and datatransformations in analyses of a macrobenthic commu-nity along an established pollution gradient. MarineEcology Progress Series 149:173–181.
OLSGARD, F., P. J. SOMERFIELD, AND M. R. CARR. 1998.Relationships between taxonomic resolution, macro-benthic community patterns and disturbance. MarineEcology Progress Series 172:25–36.
PIELOU, E. C. 1975. Ecological diversity. Wiley, New York.
POFF, N. L. 1997. Landscape filters and species traits: towardmechanistic understanding and prediction in streamecology. Journal of the North American BenthologicalSociety 16:391–409.
POFF, N. L., D. J. OLDEN, N. K. M. VIEIRA, D. S. FINN, M. P.SIMMONS, AND B. KONDRATIEFF. 2006. Functional trait nichesof North American lotic insects: trait-based ecologicalapplications in light of phylogenetic relationships. Journalof the North American Benthological Society 25:730–755.
ROSENZWEIG, M. L., AND E. A. SANDLIN. 1997. Species diversityand latitudes: listening to area’s signal. Oikos 80:172–176.
SAJAN, S., T. V. JOYDAS, AND R. DAMODARAN. 2010. Depth-related patterns of meiofauna on the Indian continentalshelf are conserved at reduced taxonomic resolution.Hydrobiologia 652:39–47.
SCHAUMBURG, J., C. SCHRANZ, D. STELZER, AND G. HOFMANN.2007. Handlungsanweisung fur die okologische Bewer-tung von Seen zur Umsetzung der EU-Wasserrahmen-richtlinie: Makrophyten und Phytobenthos. Landerar-beitsgemeinschaft fur Wasser, Augsburg, Germany.
SHANNON, C. E., AND W. WEAVER. 1949. The mathematicaltheory of communication. University of Illinois Press,Urbana, Illinois.
2013] TAXONOMIC SUFFICIENCY IN FRESHWATER ECOSYSTEMS 777
SIEFERT, A. 2012. Incorporating intraspecific variation in testsof trait-based community assembly. Oecologia (Berlin)170:767–775.
SIMPSON, E. H. 1949. Measurement of diversity. Nature 163:688.
SOMERFIELD, P. J., AND K. R. CLARKE. 1995. Taxonomic levels,in marine community studies, revisited. Marine EcologyProgress Series 127:113–119.
SOUTHWOOD, T. R. E. 1977. Habitat, the templet for ecologicalstrategies? Journal of Animal Ecology 46:337–365.
STAMMEL, B., B. CYFFKA, J. GEIST, M. MULLER, J. PANDER, G.BLASCH, P. FISCHER, A. GRUPPE, F. HAAS, M. KILG, P. LANG,R. SCHOPF, A. SCHWAB, H. UTSCHICK, AND M. WEIßBROD.2012. Floodplain restoration on the Upper Danube(Germany) by re-establishing water and sedimentdynamics: a scientific monitoring as part of theimplementation. River Systems 20/1–2:55–70.
STRAYER, D. L., AND D. DUDGEON. 2010. Freshwater biodiver-sity conservation: recent progress and future challenges.Journal of the North American Benthological Society 29:344–358.
SWEENEY, B. W., J. M. BATTLE, J. K. JACKSON, AND T. DAPKEY.2011. Can DNA barcodes of stream macroinvertebratesimprove descriptions of community structure and waterquality? Journal of the North American BenthologicalSociety 30:195–216.
TONN, W. M. 1990. Climate change and fish communities: aconceptual framework. Transactions of the AmericanFisheries Society 119:337–352.
TOWNSEND, C. R., AND A. G. HILDREW. 1994. Species traits inrelation to a habitat templet for river systems. Fresh-water Biology 31:265–275.
USSEGLIO-POLATERA, P., M. BOURNAUD, P. RICHOUX, AND H.TACHET. 2000. Biological and ecological traits of benthicfreshwater macroinvertebrates: relationships and defi-nition of groups with similar traits. Freshwater Biology43:175–205.
WARWICK, R. M. 1993. Environmental impact studies onmarine communities – pragmatic considerations. Aus-tralian Journal of Ecology 18:63–80.
Received: 20 December 2012Accepted: 18 April 2013
778 M. MUELLER ET AL. [Volume 32