moving glm ballistocardiogram artifact reduction for eeg acquired simultaneously with fmri
TRANSCRIPT
www.elsevier.com/locate/clinph
Clinical Neurophysiology 118 (2007) 981–998
Moving GLM ballistocardiogram artifact reduction for EEGacquired simultaneously with fMRI
Justin L. Vincent a, Linda J. Larson-Prior a, John M. Zempel a,b, Abraham Z. Snyder a,b,*
a Department of Radiology, Campus Box 8225, Mallinckrodt Institute of Radiology, Washington University School of Medicine,
4525 Scott Ave., St. Louis, MO 63110, USAb Department of Neurology, Washington University School of Medicine, 4525 Scott Ave., St. Louis, MO 63110, USA
Accepted 23 December 2006
Abstract
Objective: Simultaneous acquisition of electroencephalogram (EEG) and functional magnetic resonance imaging (fMRI) enables studiesof brain activity at both high temporal and high spatial resolution. However, EEG acquired in a magnetic field is contaminated by bal-listocardiogram (BKG) artifact. The most commonly used method of BKG artifact reduction, averaged artifact subtraction (AAS), wasnot designed to account for overlapping BKG waveforms generated by adjacent beats. We describe a new method based on a movinggeneral linear model (mGLM) that accounts for overlapping BKG waveforms.Methods: Simultaneous EEG–fMRI at 3 Tesla was performed in nine normal human subjects (8–11 runs/subject, 5.52 min/run). Gra-dient switching artifact was effectively reduced using commercially supplied procedures. Cardiac beats were detected using a novel cor-relation detector algorithm applied to the EKG trace. BKG artifact was reduced using both mGLM and AAS.Results: mGLM recovered BKG waveforms outlasting the median inter-beat interval. mGLM more effectiv1ely than AAS removed var-iance in the EEG attributable to BKG artifact.Conclusions: mGLM offers advantages over AAS especially in the presence of variable heart rate.Significance: The BKG artifact reduction procedure described herein improves the technique of simultaneous EEG–fMRI. Potentialapplications include basic investigations of the relationship between scalp potentials and functional imaging signals as well as clinicallocalization of epileptic foci.� 2007 International Federation of Clinical Neurophysiology. Published by Elsevier Ireland Ltd. All rights reserved.
Keywords: Ballistocardiogram; Electrocardiogram; Simultaneous EEG–fMRI; Artifact reduction
1. Introduction
1.1. Overview
Non-invasive measurement of neural activity is a primarygoal of systems neuroscience as it seeks to understand brainfunction in health and disease. Two widely used experimen-tal techniques, functional magnetic resonance imaging
1388-2457/$32.00 � 2007 International Federation of Clinical Neurophysiolo
doi:10.1016/j.clinph.2006.12.017
* Corresponding author. Address: Department of Radiology, CampusBox 8225, Mallinckrodt Institute of Radiology, Washington UniversitySchool of Medicine, 4525 Scott Ave., St. Louis, MO 63110, USA. Tel.: +1314 362 6907; fax: +1 314 362 6110.
E-mail address: [email protected] (A.Z. Snyder).
(fMRI) and electroencephalography (EEG), differ greatlyin spatial and temporal resolution. fMRI, currently the pre-eminent method in cognitive neuroscience, indirectly mea-sures neuronal activity via the blood oxygenation leveldependent (BOLD) signal (Ogawa et al., 1990). fMRI pro-vides relatively high spatial resolution but low temporal res-olution. EEG directly measures neuronal activity with hightemporal resolution but poor spatial resolution. Simulta-neous EEG–fMRI enables the electrophysiological andBOLD correlates of transient phenomena, e.g., fluctuatingarousal and epileptiform discharges, to be non-invasivelystudied in complementary spatial and temporal domains.
However, simultaneous EEG–fMRI is challengingbecause of artifacts owing both to the static magnetic field
gy. Published by Elsevier Ireland Ltd. All rights reserved.
982 J.L. Vincent et al. / Clinical Neurophysiology 118 (2007) 981–998
and to switching of the imaging gradients. Gradient switch-ing artifact has overwhelming amplitude but is relativelystraightforward to eliminate provided that the EEG isrecorded with appropriate hardware and adequate tempo-ral resolution (Allen et al., 2000). Ballistocardiogram(BKG) artifact was noted in the first report of simultaneousEEG–fMRI (Ives et al., 1993); it is lower in amplitude thangradient switching artifact but less straightforward to elim-inate. Because BKG spectral components overlap criticalEEG bands of interest, artifact reduction by simple band-pass or spectral filtering is not feasible (see Section 4.3).
Electroencephalographic BKG artifact is thought to begenerated by pulsatile motion of the recording electrodes(Jager et al., 2005) although more exotic mechanisms,e.g., the Hall effect (Muri et al., 1998), may also contribute.The BKG amplitude is theoretically proportional to themagnetic field. Thus, it is ordinarily minimal outside theMRI environment but often approaches 200 lV peak topeak at 3T. More complete accounts of the origins ofBKG artifact may be found in the prior literature (Allenet al., 1998; Goldman et al., 2000; Sijbers et al., 2000; Jageret al., 2005; Srivastava et al., 2005; Nakamura et al., 2006).
This paper describes a new technique for BKG artifactreduction based on a moving general linear model(mGLM) that overcomes limitations inherent in the mostcommonly used method, averaged artifact subtraction(AAS). We first review the extant methodology to placemGLM in algorithmic context. The mathematical basis
Table 1BKG artifact reduction methods
Citation first author Year Spatial filter Waveform computati
Allen 1998 Arithmetic averageSijbers 2000 Median filter, WavefoKruggel 2000 Arithmetic averageGoldman 2000 Exponentially weightBonmassar 2002 Autoregressive (KalmBenar 2003 ICA, PCAEllingson 2004 Median filterScarff 2004 SCICAKim 2004 Arithmetic averageSrivastava 2005 ICANiazy 2005 Optimal basis set (OBWan 2006 WNNRBriselli 2006 ICANakamura 2006 ICAIn 2006 Autoregressive (KalmVincent OLS mGLM (present
EKG ElectrocardiogramEOG ElectrooculogramICA Independent components analysisAAS Average artifact subtractionOLS mGLM Ordinary least squares moving general lPCA Principal components analysisRLS Recursive least squares adaptive noise cSCICA Spatially constrained ICAWNNR Wavelet-based non-linear noise reductio
Published BKG artifact reduction methods. Only one paper from each group‘‘adaptive filter’’ columns are separate only where this distinction makes sense
a Recorded but not formally required for BKG artifact reduction.b Cardiac beat detector algorithm described.
of mGLM and its relationship to AAS are given in detail.We also provide a detailed account of our method for car-diac beat detection. The reported experiment (Sections 3and 4) compares mGLM to AAS. AAS currently is the pro-cedure distributed in commercial EEG–fMRI packages(Brainlab�, www.brainlab.com; and Scan 4.3� Edit,www.neuro.com) and remains today the standard againstwhich new methodology is compared (e.g., Srivastavaet al., 2005; Niazy et al., 2005). The Discussion considersthe relative advantages of various BKG artifact reductionstrategies in relation to the characteristics of the BKGencountered in practice.
1.2. Extant BKG artifact reduction methods
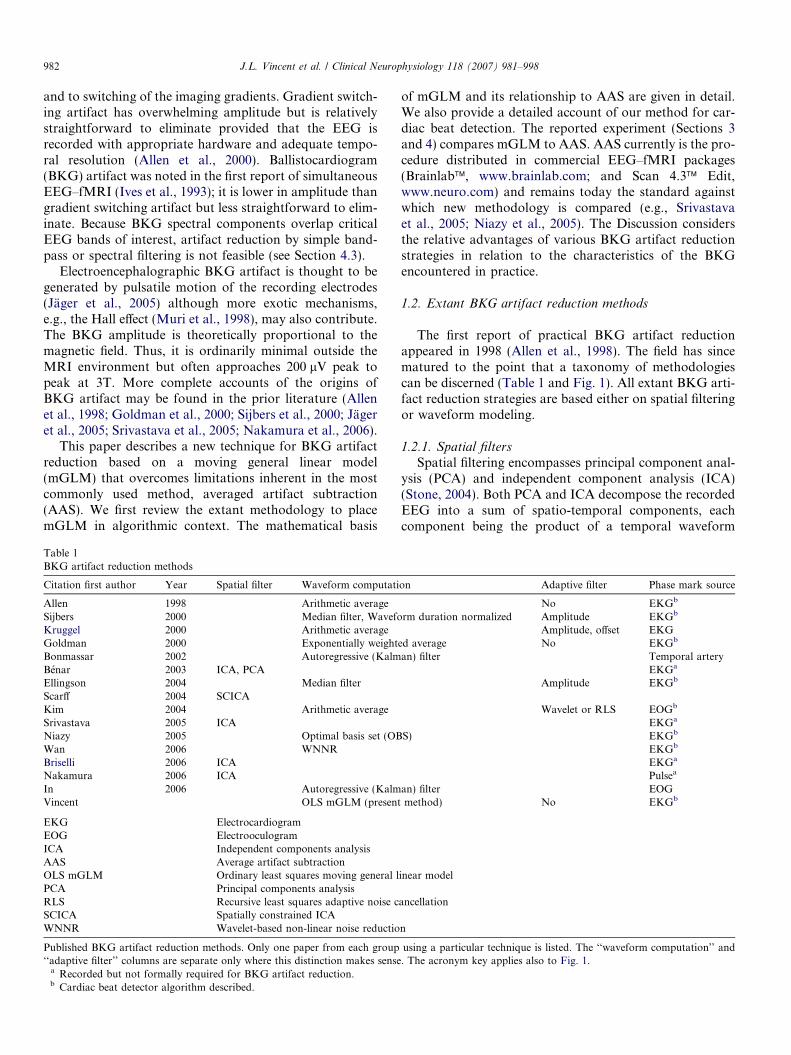
The first report of practical BKG artifact reductionappeared in 1998 (Allen et al., 1998). The field has sincematured to the point that a taxonomy of methodologiescan be discerned (Table 1 and Fig. 1). All extant BKG arti-fact reduction strategies are based either on spatial filteringor waveform modeling.
1.2.1. Spatial filters
Spatial filtering encompasses principal component anal-ysis (PCA) and independent component analysis (ICA)(Stone, 2004). Both PCA and ICA decompose the recordedEEG into a sum of spatio-temporal components, eachcomponent being the product of a temporal waveform
on Adaptive filter Phase mark source
No EKGb
rm duration normalized Amplitude EKGb
Amplitude, offset EKGed average No EKGb
an) filter Temporal arteryEKGa
Amplitude EKGb
Wavelet or RLS EOGb
EKGa
S) EKGb
EKGb
EKGa
Pulsea
an) filter EOGmethod) No EKGb
inear model
ancellation
n
using a particular technique is listed. The ‘‘waveform computation’’ and. The acronym key applies also to Fig. 1.
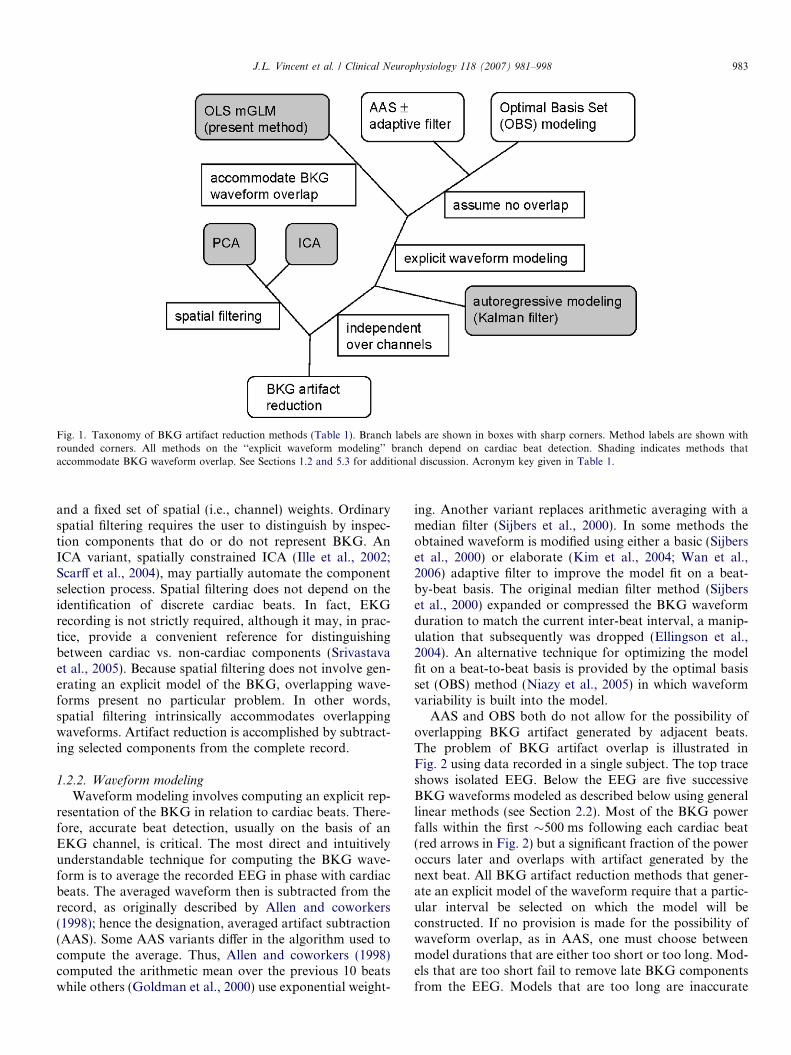
Fig. 1. Taxonomy of BKG artifact reduction methods (Table 1). Branch labels are shown in boxes with sharp corners. Method labels are shown withrounded corners. All methods on the ‘‘explicit waveform modeling’’ branch depend on cardiac beat detection. Shading indicates methods thataccommodate BKG waveform overlap. See Sections 1.2 and 5.3 for additional discussion. Acronym key given in Table 1.
J.L. Vincent et al. / Clinical Neurophysiology 118 (2007) 981–998 983
and a fixed set of spatial (i.e., channel) weights. Ordinaryspatial filtering requires the user to distinguish by inspec-tion components that do or do not represent BKG. AnICA variant, spatially constrained ICA (Ille et al., 2002;Scarff et al., 2004), may partially automate the componentselection process. Spatial filtering does not depend on theidentification of discrete cardiac beats. In fact, EKGrecording is not strictly required, although it may, in prac-tice, provide a convenient reference for distinguishingbetween cardiac vs. non-cardiac components (Srivastavaet al., 2005). Because spatial filtering does not involve gen-erating an explicit model of the BKG, overlapping wave-forms present no particular problem. In other words,spatial filtering intrinsically accommodates overlappingwaveforms. Artifact reduction is accomplished by subtract-ing selected components from the complete record.
1.2.2. Waveform modeling
Waveform modeling involves computing an explicit rep-resentation of the BKG in relation to cardiac beats. There-fore, accurate beat detection, usually on the basis of anEKG channel, is critical. The most direct and intuitivelyunderstandable technique for computing the BKG wave-form is to average the recorded EEG in phase with cardiacbeats. The averaged waveform then is subtracted from therecord, as originally described by Allen and coworkers(1998); hence the designation, averaged artifact subtraction(AAS). Some AAS variants differ in the algorithm used tocompute the average. Thus, Allen and coworkers (1998)computed the arithmetic mean over the previous 10 beatswhile others (Goldman et al., 2000) use exponential weight-
ing. Another variant replaces arithmetic averaging with amedian filter (Sijbers et al., 2000). In some methods theobtained waveform is modified using either a basic (Sijberset al., 2000) or elaborate (Kim et al., 2004; Wan et al.,2006) adaptive filter to improve the model fit on a beat-by-beat basis. The original median filter method (Sijberset al., 2000) expanded or compressed the BKG waveformduration to match the current inter-beat interval, a manip-ulation that subsequently was dropped (Ellingson et al.,2004). An alternative technique for optimizing the modelfit on a beat-to-beat basis is provided by the optimal basisset (OBS) method (Niazy et al., 2005) in which waveformvariability is built into the model.
AAS and OBS both do not allow for the possibility ofoverlapping BKG artifact generated by adjacent beats.The problem of BKG artifact overlap is illustrated inFig. 2 using data recorded in a single subject. The top traceshows isolated EEG. Below the EEG are five successiveBKG waveforms modeled as described below using generallinear methods (see Section 2.2). Most of the BKG powerfalls within the first �500 ms following each cardiac beat(red arrows in Fig. 2) but a significant fraction of the poweroccurs later and overlaps with artifact generated by thenext beat. All BKG artifact reduction methods that gener-ate an explicit model of the waveform require that a partic-ular interval be selected on which the model will beconstructed. If no provision is made for the possibility ofwaveform overlap, as in AAS, one must choose betweenmodel durations that are either too short or too long. Mod-els that are too short fail to remove late BKG componentsfrom the EEG. Models that are too long are inaccurate
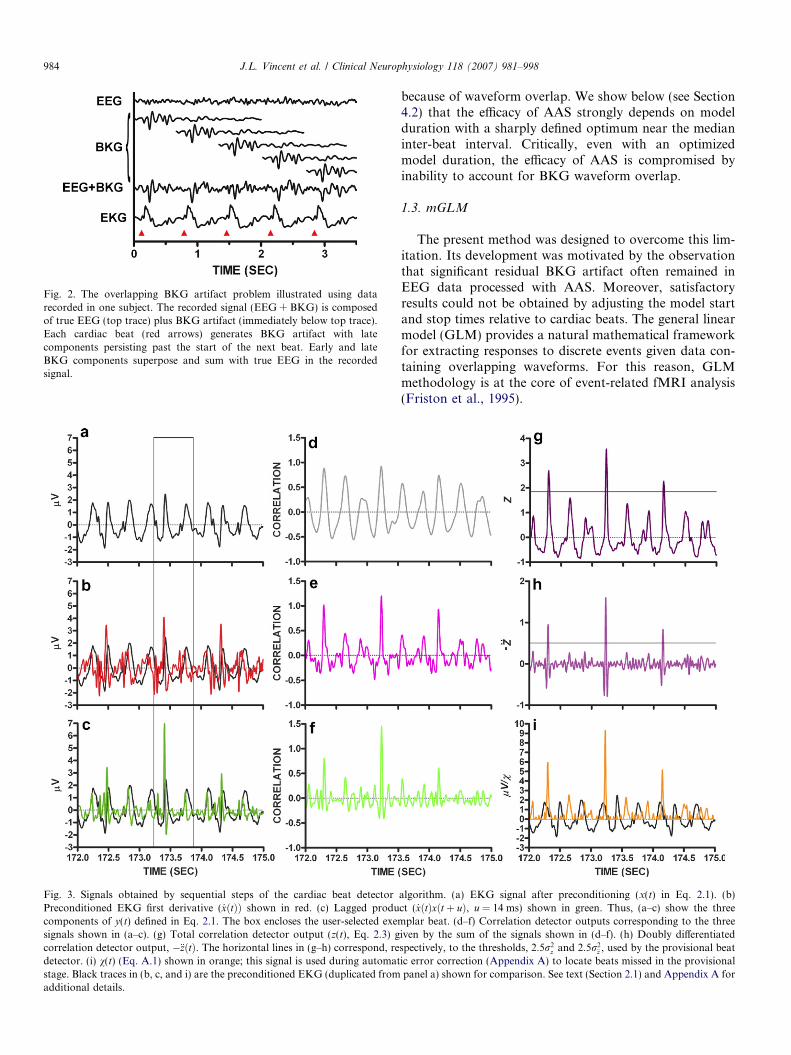
Fig. 2. The overlapping BKG artifact problem illustrated using datarecorded in one subject. The recorded signal (EEG + BKG) is composedof true EEG (top trace) plus BKG artifact (immediately below top trace).Each cardiac beat (red arrows) generates BKG artifact with latecomponents persisting past the start of the next beat. Early and lateBKG components superpose and sum with true EEG in the recordedsignal.
Fig. 3. Signals obtained by sequential steps of the cardiac beat detectorPreconditioned EKG first derivative ( _xðtÞÞ shown in red. (c) Lagged producomponents of y(t) defined in Eq. 2.1. The box encloses the user-selected exemsignals shown in (a–c). (g) Total correlation detector output (z(t), Eq. 2.3) gcorrelation detector output, �€zðtÞ. The horizontal lines in (g–h) correspond, redetector. (i) v(t) (Eq. A.1) shown in orange; this signal is used during automatstage. Black traces in (b, c, and i) are the preconditioned EKG (duplicated fromadditional details.
984 J.L. Vincent et al. / Clinical Neurophysiology 118 (2007) 981–998
because of waveform overlap. We show below (see Section4.2) that the efficacy of AAS strongly depends on modelduration with a sharply defined optimum near the medianinter-beat interval. Critically, even with an optimizedmodel duration, the efficacy of AAS is compromised byinability to account for BKG waveform overlap.
1.3. mGLM
The present method was designed to overcome this lim-itation. Its development was motivated by the observationthat significant residual BKG artifact often remained inEEG data processed with AAS. Moreover, satisfactoryresults could not be obtained by adjusting the model startand stop times relative to cardiac beats. The general linearmodel (GLM) provides a natural mathematical frameworkfor extracting responses to discrete events given data con-taining overlapping waveforms. For this reason, GLMmethodology is at the core of event-related fMRI analysis(Friston et al., 1995).
algorithm. (a) EKG signal after preconditioning (x(t) in Eq. 2.1). (b)ct ( _xðtÞxðt þ uÞ, u = 14 ms) shown in green. Thus, (a–c) show the three
plar beat. (d–f) Correlation detector outputs corresponding to the threeiven by the sum of the signals shown in (d–f). (h) Doubly differentiatedspectively, to the thresholds, 2:5r2
z and 2:5r2€z , used by the provisional beat
ic error correction (Appendix A) to locate beats missed in the provisionalpanel a) shown for comparison. See text (Section 2.1) and Appendix A for
J.L. Vincent et al. / Clinical Neurophysiology 118 (2007) 981–998 985
We modeled the BKG artifact-contaminated EEG as alinear superposition of EEG and overlapping BKG wave-forms phased to cardiac beats (see Fig. 2). In the presentimplementation, the BKG waveform is represented as aFourier series with a GLM used to compute the coeffi-cients. As in AAS, the model is updated at each beat usingthe surrounding local record; hence, the designation, mov-ing GLM (mGLM). Also, as in AAS, mGLM depends onaccurate identification of EKG beats and operates indepen-dently over EEG channels. The principal difference is thatmGLM is designed to accommodate overlapping BKGwaveforms.
2. Algorithm development
2.1. EKG beat detection
Beat detection in conventionally recorded EKG gener-ally is straightforward as the QRS complex is a sharp fea-ture greater in amplitude than any other EKG component.Beat detection then can be achieved by simple threshold-ing. However, this scheme often fails with EKG acquiredduring MRI because of severe waveform distortions owingto the static magnetic field. Our beat detection algorithm isbased on thresholding the output of a correlation detector.In overview, this algorithm includes several sequentialstages: (1) EKG signal preconditioning; (2) expansion fromone to three-dimensions; (3) identification of a three-dimensional template; (4) computation of the correlationdetector output and beat detection by peak identification;(5) automated error correction by analysis of the inter-beatinterval time series generated from the provisionallydetected beat sequence.
2.1.1. EKG preconditioning
The EKG time series, x(t), over a full fMRI run, ispassed through a digital high-pass filter (2nd order Butter-worth, half-amplitude frequency 2 Hz) (Fig. 3a, blacktrace). The mean is removed and the result is amplitudescaled to unit variance. Thus, after preconditioning,Æxæ = 0 and Æx2æ = 1, where h�i � ð1=W Þ
R W0 �dt and W cor-
responds to the whole record.
2.1.2. Expansion of dimensionality from 1 to 3
The scalar, x(t), is expanded into three signals, here rep-resented as the column vector,
yðtÞ ¼xðtÞ_xðtÞ
_xðtÞxðt þ uÞ
264
375; where _xðtÞ � dx=dt: ð2:1Þ
The three components of y(t) are shown in Fig. 3a–c. Dif-ferentiation (computed by backwards differences, Fig. 3b,red trace) de-emphasizes the relatively slow componentsthat are characteristic of EKG recorded in a strong mag-netic field. The third component of y(t) (the ‘‘lagged prod-uct’’) (Fig. 3c, green trace) was designed to capture QRS-
like transients with maximal up-slopes preceding peak val-ues by a fixed interval, u. In our dataset, the mode intervalbetween the maximum upslope and the peak of the QRScomplex was 14 ms. Accordingly, the constant, u, was setto 14 ms. Before proceeding to the next algorithmic step,each component of y(t) is made zero-mean, unit varianceas described above for x(t).
2.1.3. Template identification
A three-dimensional EKG template, ~yðsÞ, 0 6 s < L, isextracted from y(t�t0), with t0, the time corresponding tothe start of a typical beat, supplied to the algorithm. Theexemplar beat is manually identified in the current imple-mentation. We empirically set the template duration, L,to 0.7 times the estimated mean cardiac period, this periodbeing determined by analysis of the y(t) auto-covariancefunction,
cyyðsÞ ¼ hy0ðt � t0Þ � yðt � t0 þ sÞi; ð2:2Þ
where y 0 is the transpose of y. The angle-brackets in Eq. 2.2denote the time average over a modest interval (5 s) follow-ing t0. The latency of the first positive maximum of cyy(s),s > 0, estimates the cardiac period. Restricting the searchrange to 0.5 < s < 1.5 s corresponds to heart rates between40 and 120 beats per minute.
2.1.4. Correlation detector
Correlation of the template, ~yðtÞ, against y(t) yields thesignal,
zðtÞ ¼ ð1=LÞZ L
0
½~yðsÞ�0 � yðt þ sÞds: ð2:3Þ
Thus, the scalar quantity, z(t), includes the summed outputsof three correlation detectors corresponding to the dimen-sionality of y(t) (Fig. 3d–f). Local maxima of z(t) (Fig. 3g)indicate beat onsets. To increase the reliability of beat detec-tion, the algorithm also computes (by central differences) thedoubly time differentiated signal,�€zðtÞ ¼ �d2z=dt2 (Fig. 3h)which, theoretically, is also maximal at beat onsets. Magni-tude criteria for z and �€z are computed by evaluating thevariances, r2
z ¼ hðz� �zÞ2i and r2€z ¼ hð€z� �€zÞ2i over the whole
record, where the overbar denotes mean value. Beats are pro-visionally assigned to local maxima of z(t) provided thatz(t) > 2.5rz and �€zðtÞ > 2:5r€z.
The above-described algorithm correctly detected over97% of the QRS complexes. Additional automated analysisof the provisionally detected beat sequence substantiallyreduced the incidence of false alarms and misses. Detailsof the automatic error correction algorithm are given inAppendix A. Rare, residual errors are manually overriddenusing an interactive scheme built into the beat detectormodule.
2.1.5. Cardiac beat detector performance evaluation
The complete beat detection algorithm (including auto-matic error correction) was evaluated by comparing its per-formance against the EKG trace. The occurrence of an
986 J.L. Vincent et al. / Clinical Neurophysiology 118 (2007) 981–998
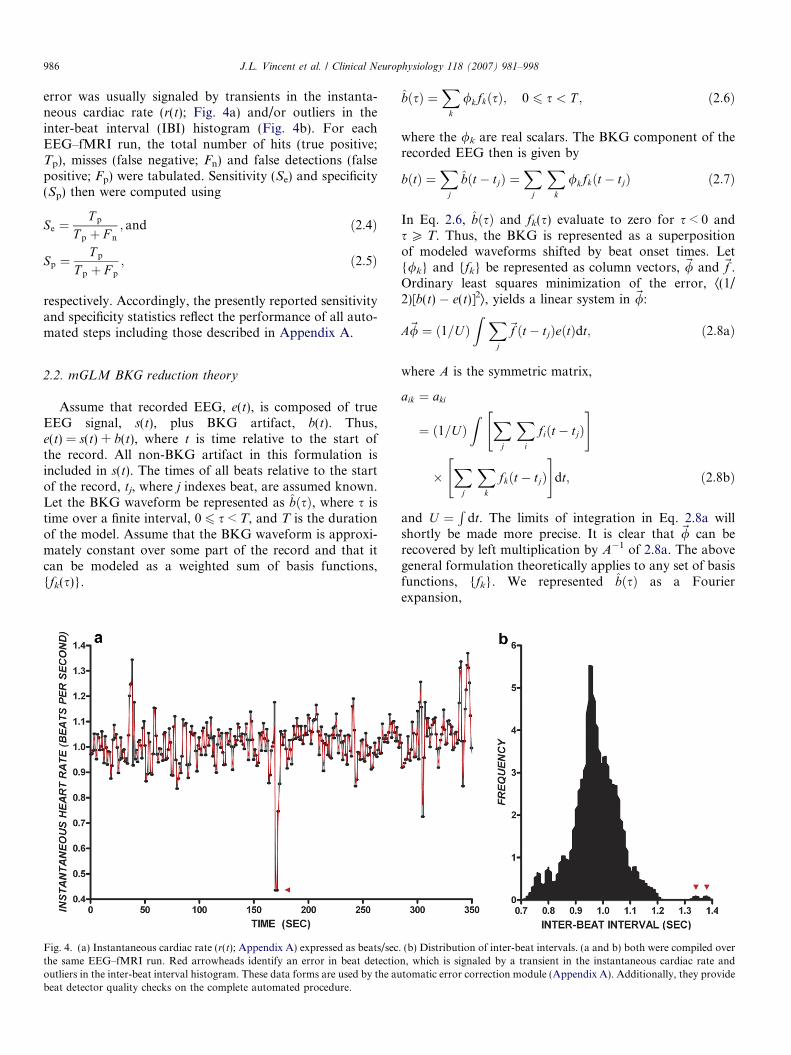
error was usually signaled by transients in the instanta-neous cardiac rate (r(t); Fig. 4a) and/or outliers in theinter-beat interval (IBI) histogram (Fig. 4b). For eachEEG–fMRI run, the total number of hits (true positive;Tp), misses (false negative; Fn) and false detections (falsepositive; Fp) were tabulated. Sensitivity (Se) and specificity(Sp) then were computed using
Se ¼T p
T p þ F n
; and ð2:4Þ
Sp ¼T p
T p þ F p
; ð2:5Þ
respectively. Accordingly, the presently reported sensitivityand specificity statistics reflect the performance of all auto-mated steps including those described in Appendix A.
2.2. mGLM BKG reduction theory
Assume that recorded EEG, e(t), is composed of trueEEG signal, s(t), plus BKG artifact, b(t). Thus,e(t) = s(t) + b(t), where t is time relative to the start ofthe record. All non-BKG artifact in this formulation isincluded in s(t). The times of all beats relative to the startof the record, tj, where j indexes beat, are assumed known.Let the BKG waveform be represented as bðsÞ, where s istime over a finite interval, 0 6 s < T, and T is the durationof the model. Assume that the BKG waveform is approxi-mately constant over some part of the record and that itcan be modeled as a weighted sum of basis functions,{fk(s)}.
Fig. 4. (a) Instantaneous cardiac rate (r(t); Appendix A) expressed as beats/secthe same EEG–fMRI run. Red arrowheads identify an error in beat detectiooutliers in the inter-beat interval histogram. These data forms are used by the aubeat detector quality checks on the complete automated procedure.
bðsÞ ¼X
k
/kfkðsÞ; 0 6 s < T ; ð2:6Þ
where the /k are real scalars. The BKG component of therecorded EEG then is given by
bðtÞ ¼X
j
bðt � tjÞ ¼X
j
Xk
/kfkðt � tjÞ ð2:7Þ
In Eq. 2.6, bðsÞ and fk(s) evaluate to zero for s < 0 ands P T. Thus, the BKG is represented as a superpositionof modeled waveforms shifted by beat onset times. Let{/k} and {fk} be represented as column vectors, ~/ and ~f .Ordinary least squares minimization of the error, Æ(1/2)[b(t) � e(t)]2æ, yields a linear system in ~/:
A~/ ¼ ð1=UÞZ X
j
~f ðt � tjÞeðtÞdt; ð2:8aÞ
where A is the symmetric matrix,
aik ¼ aki
¼ ð1=UÞZ X
j
Xi
fiðt � tjÞ" #
�X
j
Xk
fkðt � tjÞ" #
dt; ð2:8bÞ
and U ¼R
dt. The limits of integration in Eq. 2.8a willshortly be made more precise. It is clear that ~/ can berecovered by left multiplication by A�1 of 2.8a. The abovegeneral formulation theoretically applies to any set of basisfunctions, {fk}. We represented bðsÞ as a Fourierexpansion,
. (b) Distribution of inter-beat intervals. (a and b) both were compiled overn, which is signaled by a transient in the instantaneous cardiac rate andtomatic error correction module (Appendix A). Additionally, they provide
J.L. Vincent et al. / Clinical Neurophysiology 118 (2007) 981–998 987
f2kðsÞ¼ cosð2pks=T Þf2kþ1ðsÞ¼ sinð2pks=T Þ
� �; 06 s< T ; f kðsÞ¼ 0 otherwise:
ð2:9Þ
The optimal integration interval in 2.8a theoretically de-pends on the behavior of the BKG. If the BKG waveformis constant, then a single GLM extending over the entire re-cord should yield the best waveform estimate. However,the BKG waveform may evolve over time. A movingGLM strategy (multiple solutions computed over succes-sive epochs) allows the model to adapt to waveform evolu-tion. Thus, for beat j, we obtain bjðsÞ, solving a GLM onthe interval, tj � U/2 6 t < tj + U/2, where U is the periodof integration in 2.8a. Epochs containing non-BKG artifact(typically attributable to subject movement) are excludedfrom the linear model (see Section 3.4) and the integrationlimits then are extended on the right and/or left to maintainU constant in 2.8a. Prior to subtraction of bjðsÞfrom the re-cord, the first and last 32 ms of the computed waveform aremultiplied by a Hanning taper,
HðtÞ ¼ ð1=2Þ½1þ cosðpt=DÞ�; 0 < t < D; ð2:10Þ
where D = 32 ms, to minimize discontinuities in the BKG-artifact-reduced record.
2.3. Relationship of mGLM to AAS
AAS estimates the EKG waveform on the interval, T, asthe moving average of the recorded EEG over some num-ber, N, of successive beats.
bjðsÞ ¼ ð1=NÞXjþN=2�1
i¼j�N=2
eðti þ sÞ; 0 6 s < T : ð2:11Þ
mGLM reduces to AAS when successive heart beats areseparated by intervals not less than T and the GLM inte-grals include no basis function fragments. In this circum-stance, A becomes the identity matrix (as the fk areorthogonal), Eq. 2.8a reduces to
/k ¼ ð1=NÞX
j
Zfkðt � tjÞeðtÞdt; ð2:12Þ
where N is the number of waveforms included in the sum,and Eqs. 2.6 and 2.12 are equivalent. If beats overlap or theintegrals include waveform fragments, then basis functionorthogonality no longer holds and mGLM no longer isequivalent to AAS.
In mGLM, adjusting the integration interval, U, corre-sponds in AAS to including more or less beats in the aver-aged waveform. For both AAS and mGLM, accurateestimation of the BKG waveform comparably improvesas more of the record is included in the model equations;at the same time, ability to follow BKG evolution is com-parably reduced. This sensitivity/specificity tradeoff is the-oretically considered in Appendix B and systematicallyexplored in the Results (Section 4.3). In mGLM, shorten-ing U increases the relative influence of basis function frag-
ments on either edge of the integration intervals, which canlead to numeric instabilities in the solution of the mGLMequations. A systematic examination of mGLM numericalstability in relation to U is included in the Results (Section4.3). Numeric stability is not a problem in AAS.
AAS and mGLM differ greatly with respect to theeffect of varying the BKG model duration, T. In AAS,mismatch between T and the true BKG waveform dura-tion leads to mis-estimation of the model; extending T
beyond the typical inter-beat interval quickly leads topoor performance (see Section 4.2). The mGLM strategysolves this problem. However, extending T in mGLMrequires the number of basis functions to be proportion-ally increased to maintain complete support, whichincreases the dimensionality of the linear system. Suchdimensionality increases theoretically can lead to compro-mised precision in the solution of the linear system. In thepresent implementation, mGLM was run with T = 1.024 sand basis functions covering DC to 30 Hz. Solving themGLM equations therefore involved inverting 63 · 63symmetric matrices, which is well within the capacity ofstandard double precision arithmetic. We did not hereexplore higher dimensionality mGLM. The issue of linearsystem dimensionality may arise in future applications ofthe mGLM technique to electrophysiological signals withbandwidths greater than those typically encountered insimultaneous EEG–fMRI.
3. Methods
3.1. Subjects and experimental protocol
Nine healthy participants (ages 20–32, five females) wererecruited from the campus of Washington University. Allgave written informed consent under a protocol approvedby the local Institutional Review Board and were compen-sated for their time. Simultaneous EEG–fMRI data wereacquired while the subjects were awake and at rest withthe eyes variably open or closed.
3.2. Image acquisition
Imaging was performed on a Siemens 3T Allegra scan-ner (Erlangen, Germany). Functional data were acquiredusing a gradient echo, echo-planar imaging (EPI) sequence(T2* evolution time = 30 ms; a = 90�; 32 slices, 4 mm3 vox-els). The fMRI sequence paused for 1 s between successivevolumes to allow recording of EEG uncontaminated bygradient switching artifact. Each fMRI run included 110volumes of 3.013 s duration (including the 1 s pause) fora total time of 5.52 min. Eight to eleven runs were acquiredin each subject.
3.3. EEG acquisition
EEG data were recorded using a MagLink� (Compu-medics Neuroscan, El Paso, TX) system equipped with a
988 J.L. Vincent et al. / Clinical Neurophysiology 118 (2007) 981–998
24 bit Synamps/2� DC amplifier module. The head capcontained MR compatible (sintered Ag/AgCl) electrodesattached to carbon fiber leads in series with a currentlimiting resistor for subject safety. Electrode impedanceswere kept below 20 kX. Scan 4.3� Acquire (Compumed-ics Neuroscan) was used to record standard, 21-channel10/20 EEG plus VEOG, EKG, and two ear lobe chan-nels, all referenced to an electrode between CZ andCPZ (20 KHz sampling rate). Scanner generated TTLpulses were recorded and later used in the gradient arti-fact reduction step. EKG was recorded using a bipolarderivation connected to the MagLink� cap. The electro-physiological data were band pass filtered (1–30 Hz,48 dB roll-off). MR gradient artifact was effectively elim-inated using Scan 4.3� Edit (Compumedics Neuroscan).The gradient-artifact-reduced electrophysiological datathen were decimated to 500 Hz and exported for furtherprocessing on Sun Solaris� Unix workstations. Thenovel procedures described herein were coded in C andFORTRAN.
3.4. BKG artifact reduction
For each fMRI run, an exemplar beat was selected byinspection of the EKG record. This identification wasaided by reference to the expanded EKG trace (y(t),Eq. 2.1) illustrated in Fig. 3, which enabled the experi-mentalist to visualize QRS complexes in distortedrecords. All beats then were automatically detected asdescribed above (Section 2.1). Manual insertion and dele-tion of beats was performed as necessary. The identicalbeat onset time series, {tj}, then was provided to bothmGLM and AAS. The EEG record was inspected byan expert electroencephalographer (J.Z.) who created alist of epochs containing non-BKG artifact (usuallyattributable to movement) to be excluded from boththe mGLM and AAS computations.
To systematically compare mGLM to AAS, mGLMwas run as described above (Section 2.2) using an inte-gration period, U, of 10 s. AAS was run as originallydescribed (Allen et al., 1998) except that the movingaverage, bjðsÞ, was centered on beat j (Eq. 2.12) ratherthan including only preceding beats. The number ofincluded beats (N in Eq. 2.12) was set to 11, i.e., 5beats to the left and right of beat j, which correspondsto U = 10 s at 66 beats per minute. Both mGLM andAAS were run on all EEG channels for all experimen-tal runs. The time shifted templates, bjðt � tjÞ, com-puted by either method were modified by a 32 msHanning taper (Eq. 2.11) applied to both edges ofthe waveform. The taper-modified templates then weresubtracted from e(t) to generate the BKG-artifact-reduced-record, s(t). The mGLM template duration(T) was consistently set to 1.024 s. The template dura-tion in AAS was systematically varied to examine theeffect of this parameter on BKG artifact reductionsuccess.
4. Results
4.1. Beat detection
Over all EEG–fMRI runs and subjects, the mean (±s.d.)sensitivity of the automatic beat detection algorithm was99.95% (±0.14%). The average specificity was 99.96%(±0.12%). These results demonstrate that our algorithmrobustly detected QRS complexes in the presence ofEKG distortion due to the magnetic field. In particular,the sensitivity and specificity was 100% for the run dis-played in Fig. 3. Errors were identified by visual inspectionof the instantaneous cardiac rate plots and inter-beat inter-val histograms (Fig. 4). Missed beats almost always wereattributable to compromise of the EKG record consequentto subject motion.
4.2. BKG artifact reduction
BKG artifact was present in all electrodes and subjects.Fig. 5 displays 24 s of EEG data from a representative sub-ject before (panel a) and after (panel c) mGLM artifactreduction. The shape of the extracted BKG waveforms var-ied across channels (Fig. 5b).
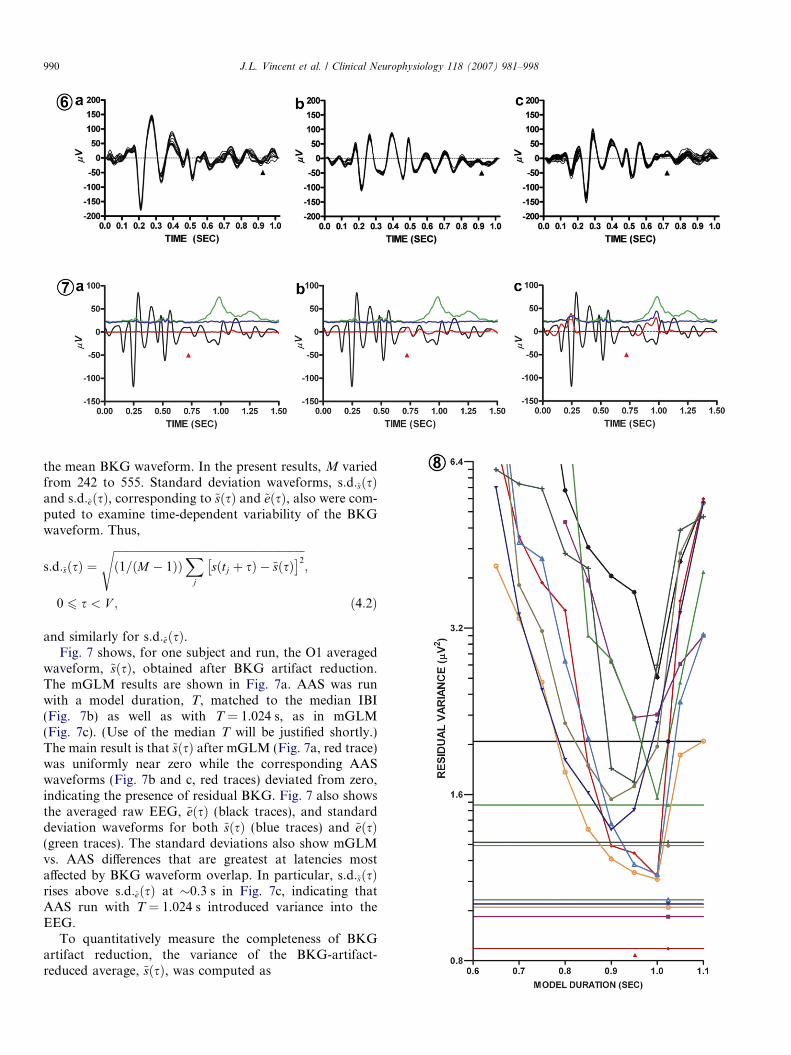
Fig. 6 displays superimposed BKG waveforms com-puted in three representative subjects. In all three cases,the waveform is dominated by �10 Hz periodicity. Similarwaveforms may be seen in results from other laboratories(Muri et al., 1998; Jager et al., 2005). BKG deflections out-lasting the median inter-beat interval (black arrows) areevident in all three subjects. The BKG waveforms recov-ered by mGLM may be partially under-determined whenthe model includes substantial overlap and the heart rateis highly regular. By underdetermined, we mean that Eq.2.8a may have a range of possible solutions on the intervalof BKG waveform overlap. Specifically, in the presence ofa metronomic heart rate, any quantity may be added to thestart of the model waveform (Eq. 2.6) and subtracted fromthe end without greatly changing the least squares fit. Thisphenomenon (waveform pseudo-variability) probably doesnot reduce the efficacy of mGLM as a means of BKG arti-fact reduction except at the lowest temporal frequencies(see Section 4.3). Waveform pseudo-variability is discussedmore fully in the Supplementary materials.
mGLM was compared to AAS by averaging EEG inphase with cardiac beats both before and after BKG arti-fact reduction. The average waveforms were consistentlyevaluated on a period of 1.5 s. Thus, we obtained
~sðsÞ ¼ ð1=MÞX
j
sðtj þ sÞ; 0 6 s < V ; ð4:1Þ
where s(t) is the theoretically true EEG signal, M is thenumber of included beats, tj is the time of beat j andV = 1.5 s. The recorded EEG (after gradient artifact reduc-tion), e(t), was similarly averaged to obtain ~eðsÞ. If all BKGhas been removed, ~sðsÞ should uniformly converge to zeroas M becomes infinite. Similarly, ~eðsÞ should converge to
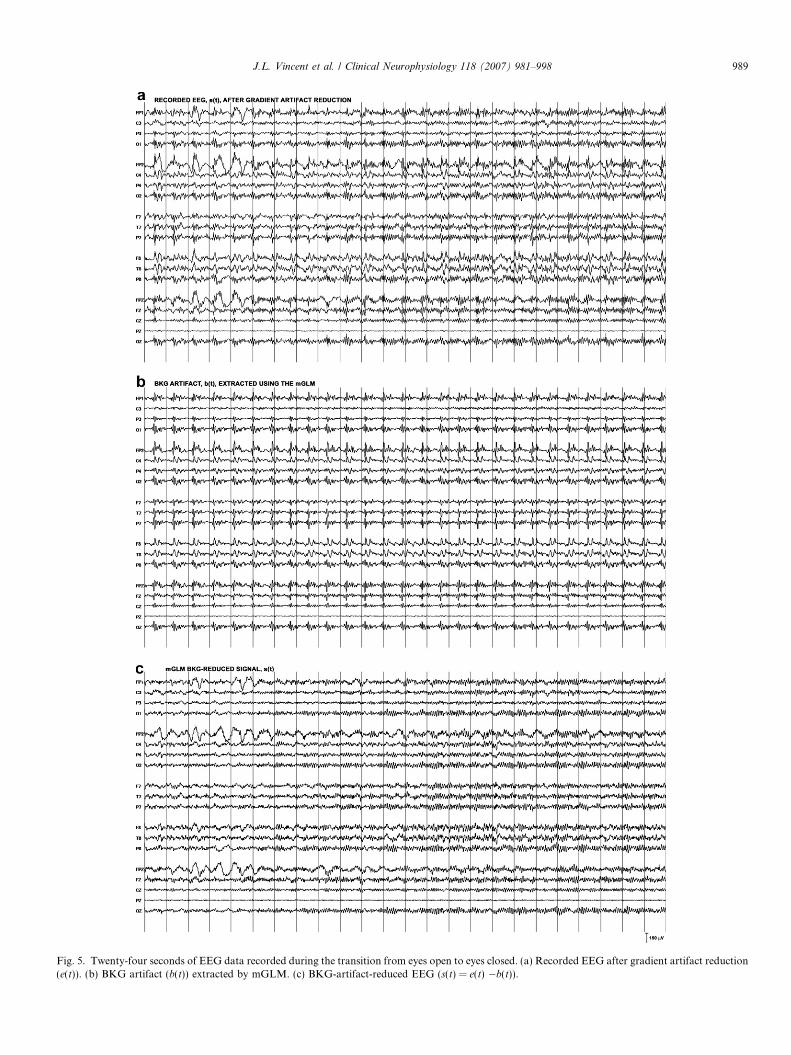
Fig. 5. Twenty-four seconds of EEG data recorded during the transition from eyes open to eyes closed. (a) Recorded EEG after gradient artifact reduction(e(t)). (b) BKG artifact (b(t)) extracted by mGLM. (c) BKG-artifact-reduced EEG (s(t) = e(t) �b(t)).
J.L. Vincent et al. / Clinical Neurophysiology 118 (2007) 981–998 989
990 J.L. Vincent et al. / Clinical Neurophysiology 118 (2007) 981–998
the mean BKG waveform. In the present results, M variedfrom 242 to 555. Standard deviation waveforms, s:d:~sðsÞand s:d:~eðsÞ, corresponding to ~sðsÞ and ~eðsÞ, also were com-puted to examine time-dependent variability of the BKGwaveform. Thus,
s:d:~sðsÞ ¼ffiffiffiffiffiffiffiffiffiffiffiffiffiffiffiffiffiffiffiffiffiffiffiffiffiffiffiffiffiffiffiffiffiffiffiffiffiffiffiffiffiffiffiffiffiffiffiffiffiffiffiffiffiffiffiffiffiffiffiffiffiffiffiffiffiffiffiffiffið1=ðM � 1ÞÞ
Xj
sðtj þ sÞ � ~sðsÞ� �2
s;
0 6 s < V ; ð4:2Þ
and similarly for s:d:~eðsÞ.Fig. 7 shows, for one subject and run, the O1 averaged
waveform, ~sðsÞ, obtained after BKG artifact reduction.The mGLM results are shown in Fig. 7a. AAS was runwith a model duration, T, matched to the median IBI(Fig. 7b) as well as with T = 1.024 s, as in mGLM(Fig. 7c). (Use of the median T will be justified shortly.)The main result is that ~sðsÞ after mGLM (Fig. 7a, red trace)was uniformly near zero while the corresponding AASwaveforms (Fig. 7b and c, red traces) deviated from zero,indicating the presence of residual BKG. Fig. 7 also showsthe averaged raw EEG, ~eðsÞ (black traces), and standarddeviation waveforms for both ~sðsÞ (blue traces) and ~eðsÞ(green traces). The standard deviations also show mGLMvs. AAS differences that are greatest at latencies mostaffected by BKG waveform overlap. In particular, s:d:~sðsÞrises above s:d:~eðsÞ at �0.3 s in Fig. 7c, indicating thatAAS run with T = 1.024 s introduced variance into theEEG.
To quantitatively measure the completeness of BKGartifact reduction, the variance of the BKG-artifact-reduced average, ~sðsÞ, was computed as
b
J.L. Vincent et al. / Clinical Neurophysiology 118 (2007) 981–998 991
r2~s ¼ ð1=V Þ
Z V
0
½~sðsÞ � l~s�2ds; ð4:3Þ
where l~s is the mean of ~sðsÞ over V = 1.5 s. For AAS, theeffectiveness of BKG artifact reduction strongly dependedon the model duration, T (Fig. 8). If T was too short,AAS failed to model late components of the BKG, as illus-trated in Fig. 7b. On the other hand, if T was too long,AAS introduced spurious variance into the EEG recordas shown in Fig. 7c. However, no value of T made AASas effective as mGLM, which was always run withT = 1.024 s (Fig. 8).
Systematic comparison of AAS vs. mGLM was under-taken with T (in AAS) matched to the median IBI com-puted over each run. This procedural decision was basedon the empirical observation that the optimal value of T
in AAS was most often closer to the median IBI than themean. (The problem of optimizing T in AAS is discussedin Section 5.2.) Fig. 9 shows the results of a comprehensivequantitative comparison of mGLM vs. AAS for eachelectrode collapsed over all runs and subjects. For all elec-trodes, r2
~s (Eq. 4.3) was always least after mGLM, indicat-ing that mGLM more effectively than AAS reduced BKGartifact. Residual artifact almost always was greater forAAS run with T = 1.024 s in comparison to T matchedto the median IBI.
Statistical comparison of mGLM vs. AAS was per-formed using the Wilcoxon paired sample test applied tor2
~s (Eq. 4.3) computed for all subjects and runs. Highly sig-nificant effects (lower r2
~s obtained with mGLM) wereobserved for all electrodes whether the AAS T wasmatched to the median IBI (all p < 0.0001) or set to1.024 s (all p < 0.0001). Comparable statistical results were
Fig. 8. Dependence of AAS BKG artifact reduction on model duration (T).subject. Each run is represented by a different color and symbol. The plotted qwith cardiac beats (Eq. 4.3). The plots show how this variance depends on theThe straight lines represent r2
~s after mGLM (T = 1.024 s) rendered with the sadefined AAS T optimum approximately at the median IBI (red arrowhead at �value.
Fig. 6. mGLM modeled BKG waveforms, bjðsÞ (Eq. 2.6) computed for electrfrom one run. The arrowhead indicates the median IBI in each case. AdditiSupplementary materials.
Fig. 7. EEG (channel O1, one run in one individual) averaged in phase with car(a–c) compare mGLM vs. AAS. (a) mGLM, T = 1.024 s. (b) AAS, T = medianaveraged in phase with cardiac beats (~eðsÞÞ. The median IBI is indicated by theoccurs at variable inter-beat intervals. Red: mean waveform after BKG artifactcorresponding to ~eðsÞ. Blue: s:d:~sðsÞ (Eq. 4.2), the standard deviation waveform(a), indicating improved artifact reduction with mGLM compared to AAS. Allof residual true EEG as the number of included beats (481) is finite. The ~eðsÞ (nsharp rise beginning at �1 s that reflects variability in the timing of the ne(�22 lV rms) mostly reflects true EEG power. In panel (c), transient elevationsof the BKG waveform that is especially pronounced when the model durations:d:~sðsÞ traces (blue) at �0.5 s indicates a brief window of heightened BKG wFig. 1a).
also obtained with T in AAS matched to the mean IBI ofeach run.
4.3. Dependence of mGLM on the integration interval
Our final analysis concerns the dependence of mGLMBKG reduction on the mGLM integration interval, U,(Eq. 2.8a). This analysis was carried out on the first twotechnically satisfactory runs acquired in each individual(18 runs in total); U was systematically varied in logarith-mic intervals over the range 4–100 s while the model dura-tion T, was fixed at 1.024 s. The measured quantity wasfraction of signal variance eliminated by mGLM BKGreduction.
The results are shown in Fig. 10. In Fig. 10a, power lossis expressed as dB ¼ 10log10 r2
e=r2s
� �, where r2
e and r2s are
EEG signal variances before and after mGLM BKG reduc-tion; the variously colored traces correspond to individualruns in individual subjects. For all values of U, mGLMreduced signal variance by approximately 3–8 dB, depend-ing primarily on the individual. Approximately parallelcurves are expected as the primary effect of mGLM is toremove BKG artifact, which is variably present in differentindividuals. Power loss was somewhat greater for thesmallest values of U but rapidly tended to asymptote at lar-ger values. This functional dependence will shortly beshown to reflect mGLM specificity. Fig. 10b shows thepower loss spectra (2048 point FFT) corresponding tothe same data for selected values of U (10, 16, and 25 s).The plotted quantity is the average over runs and subjectsof dB(f) = 10log10[pe(f)/ps(f)], where pe(f) and ps(f) are EEGpower at frequency f before and after mGLM BKGreduction. Clearly, r2
e ¼R
peðf Þdf and similarly for r2s .
The m-shaped curves correspond to eleven 5.52 min runs acquired in oneuantity is the variance, r2
~s , of the artifact-reduced EEG averaged in phaseAAS model duration, T, in the range 0.6–1.1 s. Note logarithmic r2
~s scale.me color and plot symbol as the corresponding AAS results. Note sharply0.96 s). The minimum AAS r2
~s is always above the corresponding mGLM
ode O1 in three subjects (a–c). Each display shows the first 18 waveformsonal examples of the waveforms shown in panel (c) are discussed in the
diac beats before and after BKG artifact reduction (see Section 4.2). PanelsIBI = 0.722 s. (c) AAS, T = 1.024 s. Black: gradient-artifact-reduced EEGred arrowheads. The late components of ~eðsÞ reflect the next beat, which
reduction (~sðsÞ, Eq. 4.1). Green: s:d:~eðsÞ, the standard deviation waveformcorresponding to ~sðsÞ. Note that ~sðsÞ (red trace) is closest to zero in panelBKG artifact-reduced averaged waveforms (~sðsÞÞ contain small quantitieson-artifact-reduced) s.d. trace (green; necessarily identical in a–c) shows a
xt beat. The systematic elevation of all s:d:~sðsÞ (blue) traces above zeroof the s:d:~sðsÞ trace (blue) at �0.25 s and �1.0 s reflect AAS mis-estimation(T = 1.024 s) exceeds the median IBI. The small, biphasic transient in allaveform variability, consistent with previous reports (Jager et al., 2005;
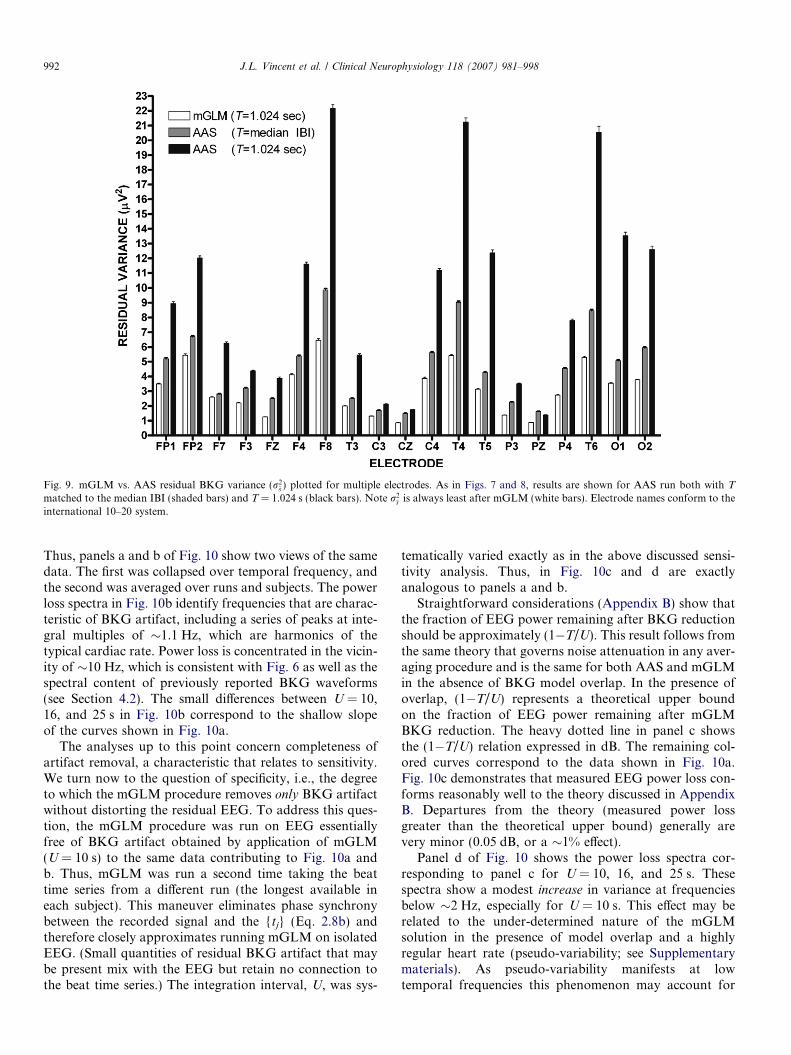
Fig. 9. mGLM vs. AAS residual BKG variance (r2~s ) plotted for multiple electrodes. As in Figs. 7 and 8, results are shown for AAS run both with T
matched to the median IBI (shaded bars) and T = 1.024 s (black bars). Note r2~s is always least after mGLM (white bars). Electrode names conform to the
international 10–20 system.
992 J.L. Vincent et al. / Clinical Neurophysiology 118 (2007) 981–998
Thus, panels a and b of Fig. 10 show two views of the samedata. The first was collapsed over temporal frequency, andthe second was averaged over runs and subjects. The powerloss spectra in Fig. 10b identify frequencies that are charac-teristic of BKG artifact, including a series of peaks at inte-gral multiples of �1.1 Hz, which are harmonics of thetypical cardiac rate. Power loss is concentrated in the vicin-ity of �10 Hz, which is consistent with Fig. 6 as well as thespectral content of previously reported BKG waveforms(see Section 4.2). The small differences between U = 10,16, and 25 s in Fig. 10b correspond to the shallow slopeof the curves shown in Fig. 10a.
The analyses up to this point concern completeness ofartifact removal, a characteristic that relates to sensitivity.We turn now to the question of specificity, i.e., the degreeto which the mGLM procedure removes only BKG artifactwithout distorting the residual EEG. To address this ques-tion, the mGLM procedure was run on EEG essentiallyfree of BKG artifact obtained by application of mGLM(U = 10 s) to the same data contributing to Fig. 10a andb. Thus, mGLM was run a second time taking the beattime series from a different run (the longest available ineach subject). This maneuver eliminates phase synchronybetween the recorded signal and the {tj} (Eq. 2.8b) andtherefore closely approximates running mGLM on isolatedEEG. (Small quantities of residual BKG artifact that maybe present mix with the EEG but retain no connection tothe beat time series.) The integration interval, U, was sys-
tematically varied exactly as in the above discussed sensi-tivity analysis. Thus, in Fig. 10c and d are exactlyanalogous to panels a and b.
Straightforward considerations (Appendix B) show thatthe fraction of EEG power remaining after BKG reductionshould be approximately (1�T/U). This result follows fromthe same theory that governs noise attenuation in any aver-aging procedure and is the same for both AAS and mGLMin the absence of BKG model overlap. In the presence ofoverlap, (1�T/U) represents a theoretical upper boundon the fraction of EEG power remaining after mGLMBKG reduction. The heavy dotted line in panel c showsthe (1�T/U) relation expressed in dB. The remaining col-ored curves correspond to the data shown in Fig. 10a.Fig. 10c demonstrates that measured EEG power loss con-forms reasonably well to the theory discussed in AppendixB. Departures from the theory (measured power lossgreater than the theoretical upper bound) generally arevery minor (0.05 dB, or a �1% effect).
Panel d of Fig. 10 shows the power loss spectra cor-responding to panel c for U = 10, 16, and 25 s. Thesespectra show a modest increase in variance at frequenciesbelow �2 Hz, especially for U = 10 s. This effect may berelated to the under-determined nature of the mGLMsolution in the presence of model overlap and a highlyregular heart rate (pseudo-variability; see Supplementarymaterials). As pseudo-variability manifests at lowtemporal frequencies this phenomenon may account for
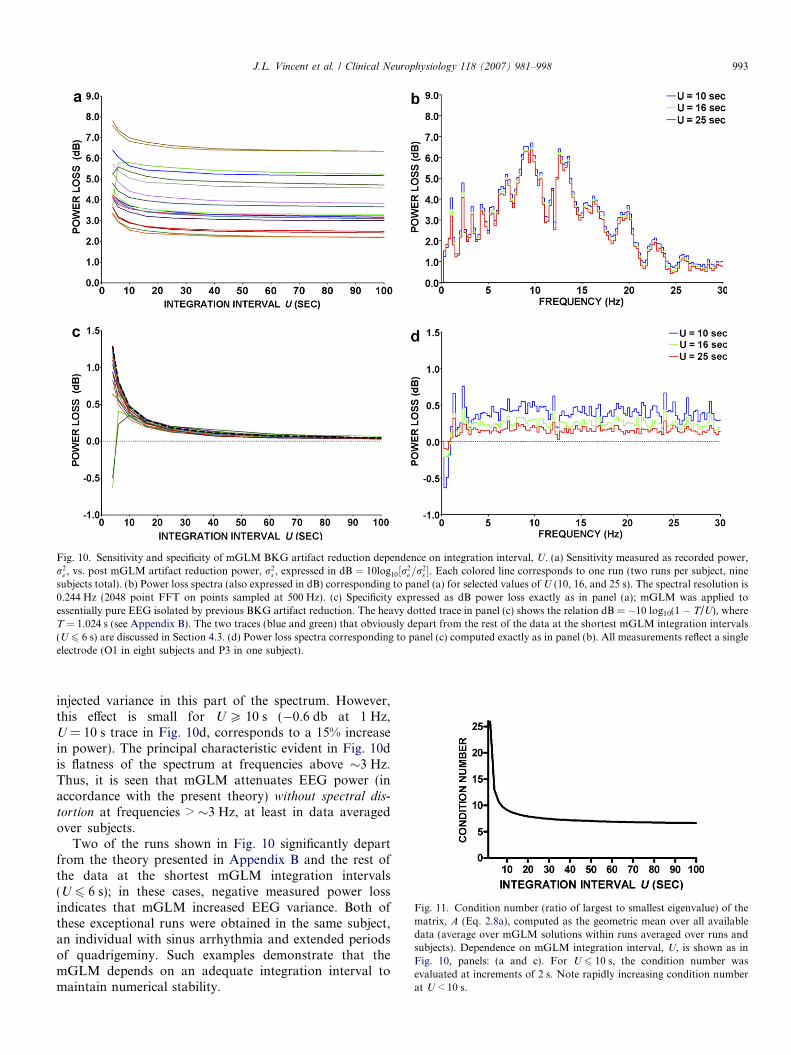
Fig. 10. Sensitivity and specificity of mGLM BKG artifact reduction dependence on integration interval, U. (a) Sensitivity measured as recorded power,r2
e , vs. post mGLM artifact reduction power, r2s , expressed in dB ¼ 10log10½r2
e=r2s �. Each colored line corresponds to one run (two runs per subject, nine
subjects total). (b) Power loss spectra (also expressed in dB) corresponding to panel (a) for selected values of U (10, 16, and 25 s). The spectral resolution is0.244 Hz (2048 point FFT on points sampled at 500 Hz). (c) Specificity expressed as dB power loss exactly as in panel (a); mGLM was applied toessentially pure EEG isolated by previous BKG artifact reduction. The heavy dotted trace in panel (c) shows the relation dB = �10 log10(1 � T/U), whereT = 1.024 s (see Appendix B). The two traces (blue and green) that obviously depart from the rest of the data at the shortest mGLM integration intervals(U 6 6 s) are discussed in Section 4.3. (d) Power loss spectra corresponding to panel (c) computed exactly as in panel (b). All measurements reflect a singleelectrode (O1 in eight subjects and P3 in one subject).
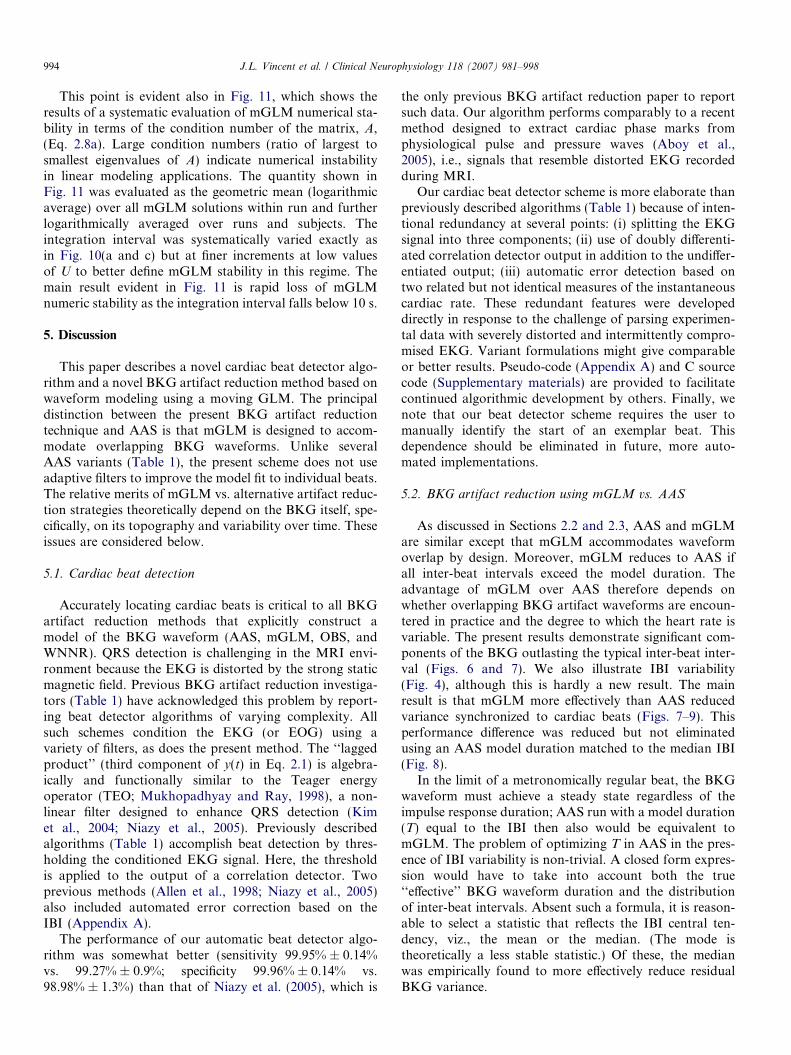
Fig. 11. Condition number (ratio of largest to smallest eigenvalue) of thematrix, A (Eq. 2.8a), computed as the geometric mean over all availabledata (average over mGLM solutions within runs averaged over runs andsubjects). Dependence on mGLM integration interval, U, is shown as inFig. 10, panels: (a and c). For U 6 10 s, the condition number wasevaluated at increments of 2 s. Note rapidly increasing condition numberat U < 10 s.
J.L. Vincent et al. / Clinical Neurophysiology 118 (2007) 981–998 993
injected variance in this part of the spectrum. However,this effect is small for U P 10 s (�0.6 db at 1 Hz,U = 10 s trace in Fig. 10d, corresponds to a 15% increasein power). The principal characteristic evident in Fig. 10dis flatness of the spectrum at frequencies above �3 Hz.Thus, it is seen that mGLM attenuates EEG power (inaccordance with the present theory) without spectral dis-
tortion at frequencies > �3 Hz, at least in data averagedover subjects.
Two of the runs shown in Fig. 10 significantly departfrom the theory presented in Appendix B and the rest ofthe data at the shortest mGLM integration intervals(U 6 6 s); in these cases, negative measured power lossindicates that mGLM increased EEG variance. Both ofthese exceptional runs were obtained in the same subject,an individual with sinus arrhythmia and extended periodsof quadrigeminy. Such examples demonstrate that themGLM depends on an adequate integration interval tomaintain numerical stability.
994 J.L. Vincent et al. / Clinical Neurophysiology 118 (2007) 981–998
This point is evident also in Fig. 11, which shows theresults of a systematic evaluation of mGLM numerical sta-bility in terms of the condition number of the matrix, A,(Eq. 2.8a). Large condition numbers (ratio of largest tosmallest eigenvalues of A) indicate numerical instabilityin linear modeling applications. The quantity shown inFig. 11 was evaluated as the geometric mean (logarithmicaverage) over all mGLM solutions within run and furtherlogarithmically averaged over runs and subjects. Theintegration interval was systematically varied exactly asin Fig. 10(a and c) but at finer increments at low valuesof U to better define mGLM stability in this regime. Themain result evident in Fig. 11 is rapid loss of mGLMnumeric stability as the integration interval falls below 10 s.
5. Discussion
This paper describes a novel cardiac beat detector algo-rithm and a novel BKG artifact reduction method based onwaveform modeling using a moving GLM. The principaldistinction between the present BKG artifact reductiontechnique and AAS is that mGLM is designed to accom-modate overlapping BKG waveforms. Unlike severalAAS variants (Table 1), the present scheme does not useadaptive filters to improve the model fit to individual beats.The relative merits of mGLM vs. alternative artifact reduc-tion strategies theoretically depend on the BKG itself, spe-cifically, on its topography and variability over time. Theseissues are considered below.
5.1. Cardiac beat detection
Accurately locating cardiac beats is critical to all BKGartifact reduction methods that explicitly construct amodel of the BKG waveform (AAS, mGLM, OBS, andWNNR). QRS detection is challenging in the MRI envi-ronment because the EKG is distorted by the strong staticmagnetic field. Previous BKG artifact reduction investiga-tors (Table 1) have acknowledged this problem by report-ing beat detector algorithms of varying complexity. Allsuch schemes condition the EKG (or EOG) using avariety of filters, as does the present method. The ‘‘laggedproduct’’ (third component of y(t) in Eq. 2.1) is algebra-ically and functionally similar to the Teager energyoperator (TEO; Mukhopadhyay and Ray, 1998), a non-linear filter designed to enhance QRS detection (Kimet al., 2004; Niazy et al., 2005). Previously describedalgorithms (Table 1) accomplish beat detection by thres-holding the conditioned EKG signal. Here, the thresholdis applied to the output of a correlation detector. Twoprevious methods (Allen et al., 1998; Niazy et al., 2005)also included automated error correction based on theIBI (Appendix A).
The performance of our automatic beat detector algo-rithm was somewhat better (sensitivity 99.95% ± 0.14%vs. 99.27% ± 0.9%; specificity 99.96% ± 0.14% vs.98.98% ± 1.3%) than that of Niazy et al. (2005), which is
the only previous BKG artifact reduction paper to reportsuch data. Our algorithm performs comparably to a recentmethod designed to extract cardiac phase marks fromphysiological pulse and pressure waves (Aboy et al.,2005), i.e., signals that resemble distorted EKG recordedduring MRI.
Our cardiac beat detector scheme is more elaborate thanpreviously described algorithms (Table 1) because of inten-tional redundancy at several points: (i) splitting the EKGsignal into three components; (ii) use of doubly differenti-ated correlation detector output in addition to the undiffer-entiated output; (iii) automatic error detection based ontwo related but not identical measures of the instantaneouscardiac rate. These redundant features were developeddirectly in response to the challenge of parsing experimen-tal data with severely distorted and intermittently compro-mised EKG. Variant formulations might give comparableor better results. Pseudo-code (Appendix A) and C sourcecode (Supplementary materials) are provided to facilitatecontinued algorithmic development by others. Finally, wenote that our beat detector scheme requires the user tomanually identify the start of an exemplar beat. Thisdependence should be eliminated in future, more auto-mated implementations.
5.2. BKG artifact reduction using mGLM vs. AAS
As discussed in Sections 2.2 and 2.3, AAS and mGLMare similar except that mGLM accommodates waveformoverlap by design. Moreover, mGLM reduces to AAS ifall inter-beat intervals exceed the model duration. Theadvantage of mGLM over AAS therefore depends onwhether overlapping BKG artifact waveforms are encoun-tered in practice and the degree to which the heart rate isvariable. The present results demonstrate significant com-ponents of the BKG outlasting the typical inter-beat inter-val (Figs. 6 and 7). We also illustrate IBI variability(Fig. 4), although this is hardly a new result. The mainresult is that mGLM more effectively than AAS reducedvariance synchronized to cardiac beats (Figs. 7–9). Thisperformance difference was reduced but not eliminatedusing an AAS model duration matched to the median IBI(Fig. 8).
In the limit of a metronomically regular beat, the BKGwaveform must achieve a steady state regardless of theimpulse response duration; AAS run with a model duration(T) equal to the IBI then also would be equivalent tomGLM. The problem of optimizing T in AAS in the pres-ence of IBI variability is non-trivial. A closed form expres-sion would have to take into account both the true‘‘effective’’ BKG waveform duration and the distributionof inter-beat intervals. Absent such a formula, it is reason-able to select a statistic that reflects the IBI central ten-dency, viz., the mean or the median. (The mode istheoretically a less stable statistic.) Of these, the medianwas empirically found to more effectively reduce residualBKG variance.
J.L. Vincent et al. / Clinical Neurophysiology 118 (2007) 981–998 995
These results have two implications. First, they sug-gest that accommodating overlapping BKG waveformsis a worthwhile design consideration in any BKG artifactreduction strategy. Second, if AAS is used for any rea-son, efficacy compromise due to BKG waveform overlapcan be mitigated by selecting a model duration near themedian IBI. Fig. 8 suggests that this selection should bemade with care, as residual BKG variance in AAS risesrapidly as T deviates from the optimum, particularly forvalues greater than the median inter-beat interval. Ulti-mately, however, our results suggest that it may be moreconvenient and effective simply to use mGLM with afixed model duration.
5.3. General comparison of mGLM to other BKG artifact
reduction methods
The following discussion considers extant BKG artifactreduction methods (Fig. 1 and Table 1) from the perspec-tive of theory vs. practice.
5.3.1. Spatial filteringSpatial filtering includes PCA and ICA. Methods in this
class assume that the recorded signal is composed of multi-ple superposed components, some being true EEG andsome being artifact, e.g., BKG. Spatial filtering does notdepend on detection of cardiac beats and intrinsicallyaccommodates overlapping BKG waveforms. These twoalgorithmic properties are advantages, the second one espe-cially so in view of the present results.
However, ICA/PCA separates BKG artifact from trueEEG on the basis of computed spatial (channel) weights.The key operational assumption is that the recorded signalsreflect shared noise sources that appear in each channelwith weights that are stable over time. This assumption isreasonable for volume conducted sources, e.g., EOG (Junget al., 2000; Ille et al., 2002; Scarff et al., 2004). However,considerable evidence suggests that the BKG artifact isgenerated by pulsatile motion of the recording electrodesand leads (Moosmann et al., 2003; Jager et al., 2005;Nakamura et al., 2006). Hence, the BKG may be, at leastin part, unique at each electrode, a circumstance not wellsuited to modeling by spatial filtering. The estimatedBKG waveforms illustrated in Fig. 5 demonstrate thatthe shape of the BKG waveform varies from channel tochannel.
Slow evolution of the BKG waveform on a time scale oftens of seconds theoretically can arise on the basis of accu-mulated change in head position relative to the main field.Similarly, respiration may induce cyclic variation on the�10 s time scale (Muri et al., 1998). All methods shownin Fig. 1 except PCA/ICA naturally accommodate slowvariation of the BKG waveform. ‘‘Moving ICA’’ is possi-ble in principal but, in practice, ICA is applied to wholeruns, e.g., epochs of duration several minutes (e.g., Srivast-ava et al., 2005). Beat-to-beat waveform variability is dis-cussed below in Section 5.3.3.
5.3.2. Autoregressive modeling
Autoregressive (AR) modeling formulates the BKG asthe output of a linear (Kalman) filter, the input being arelated signal such as the temporal artery mechanical pres-sure pulse (Bonmassar et al., 2002) or the electrooculogram(In et al., 2006). The fundamental assumption in AR mod-eling is that the BKG waveform can be expressed as a fil-tered version of the input, which is plausible as the likelyorigin of both signals is physical motion. Like PCA/ICA,AR modeling does not depend on cardiac beat detectionand does intrinsically accommodate waveform overlap.
Inspection of Fig. 1 suggests that AR modeling andmGLM are related, the only difference being that onemethod (mGLM) generates an explicit representation ofthe BKG waveform while the other (AR modeling) doesnot. Indeed, AR and mGLM are algebraically similar.Both methods are based on ordinary least squares param-eter estimation. In effect, mGLM is similar to AR withdelta functions (cardiac triggers) substituted for the arterialpulse wave at the input stage.
5.3.3. AAS + adaptive filtering and OBS
Several AAS methods listed in Table 1 follow waveformaveraging with an adaptive filtering step intended toaccommodate beat-to-beat BKG waveform variability.The OBS method (Niazy et al., 2005) maximally achievesthis objective, as all measured variance in the BKG wave-form (over arbitrarily long epochs) is available to fit eachbeat. Clearly, accommodating beat-to-beat waveform vari-ability enhances BKG artifact reduction as defined byreduced variance synchronized to cardiac pulses. However,the same algorithmic property theoretically also increasesthe fraction of true EEG that is mistaken for BKG andtherefore wrongly eliminated. This effect cannot occur withmGLM as presently implemented and AAS as originallydescribed (Allen et al., 1998) as these methods include nobeat-specific adaptive filters.
The advantage of accommodating short-term waveformvariability depends on the degree to which this feature is acharacteristic of the BKG in practice. Considerable evi-dence documents BKG waveforms that are reasonablyconsistent over �10 s (Allen et al., 2000; Fig. 5; Benaret al., 2003; Fig. 2; Ellingson et al., 2004; Fig. 2; Fordet al., 2004; Figs. 14–15; Jager et al., 2005; Fig. 3;In et al., Fig. 4.). To be sure, measurable beat-to-beatwaveform variability is present in the BKG, specifically,in the phase of the deflection approximately 500 ms post-beat onset (Jager et al., 2005; blue s:d:~sðsÞwaveform inFig. 7). Neither AAS nor mGLM accounts for such vari-ability. While it is possible to account for beat-to-beat var-iability, it is unclear whether algorithms designed to do so(e.g., OBS, WNNR) do not also significantly distort thetrue EEG.
A definitive answer to this question requires measuringBKG artifact reduction specificity, i.e., the degree to whichthe algorithm reduces only the BKG and preserves the trueEEG. To address this question with respect to the present
996 J.L. Vincent et al. / Clinical Neurophysiology 118 (2007) 981–998
method, the mGLM procedure was run on EEG essentiallyfree of BKG artifact. We found that power loss generallyfollows the theory given in Appendix B, which states thatthe fraction of EEG power retained after either AAS ormGLM is (1�T/U) in the absence of BKG waveform over-lap. In other words, specificity increases in accordance withfamiliar law of averaging as more of the record is used toestimate the BKG. In the presence of beat overlap, the(1�T/U) relation theoretically acts as an upper bound onmGLM BKG reduction specificity. Fig. 10d shows thatmGLM operates without spectral distortion for frequencies> �3 Hz. Fig. 10c suggests that waveform overlap does notlead to major departures from the (1�T/U) theory as long
as the GLM integration interval is adequate, which, in prac-tice, corresponds to U P �10 s.
There unambiguously is a numerical stability penalty forusing excessively short mGLM integration intervals. Thetheoretical cost of long integration intervals (equivalently,increasing N in AAS) is reduced ability to track BKGwaveform evolution. This effect, if present, should havemanifested in Fig. 10a as power loss curves failing toasymptote as the integration intervals increase. The datasuggest that such BKG waveform evolution is minor. Wealso more directly investigated the question of slow BKGevolution by comparing the estimated BKG waveforms(using Eq. 4.1) computed at the beginning vs. the end of5.5 min runs without observing much change (data notshown). The principal cost of increasing U thereforeappears to be computation time, which rises directly in pro-portion to U (see Section 5.4 below). Thus, in off-line appli-cations, the results shown in Fig. 10 suggest that it may bepreferable to run mGLM with U = 16 or 25 s rather than10 s.
5.4. Processing time and suitability of mGLM for on-line
implementation
The methods described herein were developed for basiccognitive neuroscience research. BKG artifact reduction isperformed after gradient artifact reduction. Therefore,EEG preprocessing as presently implemented is at least atwo-step procedure. The cardiac beat detector modulerequires user interaction. Also, provision is made to manu-ally identify epochs containing excessive motion artifact tobe excluded from the mGLM computations (Eq. 2.8a).These procedural costs are acceptable in the research set-ting where data quality rather than on-line functionalityis the chief concern. Adaptive BKG artifact reduction(e.g., Kim et al., 2004; Wan et al., 2006) may offer advan-tages in clinical applications where head motion can be asignificant problem and labor intensive manual editing isimpractical.
However, the mGLM approach to BKG artifact reduc-tion is not fundamentally incompatible with on-line imple-mentation. The basic method is procedurally similar toAAS (see above Section 5.2) but computationally moredemanding. Like AAS, which has been implemented on-
line (Hamandi et al., 2004), but unlike PCA/ICA andOBS, mGLM operates sequentially and independently onsuccessive portions of the record. Inversion of the linearsystem is performed once for all channels and accountsfor a small fraction of the CPU load. With 25 channelrecords and an mGLM integration interval (U) of 10 s,our procedure executes somewhat faster than real-time ona 1.28 GHz CPU (Sun-Fire V-250�). Execution time isproportional to U and number of channels. Hence, in viewof the results shown in Figs. 10 and 11, some compromisebetween execution speed and numerical stability maybe required in high density recording, real-timeimplementations.
5.5. Significance of BKG artifact reduction
The objective of this work is technical enhancement ofsimultaneous EEG–fMRI through improved BKG artifactreduction. As the BKG scales with main field strength(Allen et al., 1998) it is a more significant problem at 3Tthan at 1.5T. For the same reason, we may expect thatthe importance of BKG artifact reduction will increase inparallel with future improvements in high-field MRItechnology.
5.5.1. BKG artifact reduction in cognitive neuroscience
Simultaneous EEG–fMRI is an emerging technique inbasic investigations of human brain function as well as inclinical studies in patients with epilepsy. Complete BKGartifact reduction is most critical in studies of the relationbetween the EEG and functional imaging signals. Exampleexperiments of this type include measuring the BOLD cor-relates of spontaneously varying EEG rhythms (e.g., Laufset al., 2003; Moosmann et al., 2003) and correlating theelectrophysiological and BOLD manifestations of trial-to-trial variability in event-related responses (Debener et al.,2005). BKG artifact reduction may be less critical in con-ventional event-related potential recording because averag-ing itself attenuates any signal that is randomly phased tothe task, including the BKG. Some investigators, particu-larly those working at 1.5T, ignore the BKG in event-related potential experiments (e.g., Becker et al., 2005)while others, particularly those working at 3T, do not(e.g., Scarff et al., 2004; In et al., 2006).
5.5.2. BKG artifact reduction in clinical EEG–fMRI
Simultaneous EEG–fMRI is performed for clinical pur-poses primarily to localize seizure foci by averaging BOLDmodulations in phase with epileptiform transients (Warachet al., 1996), as in conventional event-related BOLD imag-ing (Friston et al., 1995). BKG artifact compromises thesestudies only to the extent that it interferes with detection ofepileptiform spikes, a function that today continues to beperformed by human readers. Some clinical groups main-tain that BKG generally presents a minimal problem inpractice (Gotman et al., 2004) whereas others includeBKG artifact reduction in their technique (Hamandi
J.L. Vincent et al. / Clinical Neurophysiology 118 (2007) 981–998 997
et al., 2004). The importance of BKG artifact reductionmay increase as spike detection becomes more automated(Ko and Chung, 2000) and inverse source localization isapplied to epileptiform activity (Boon et al., 2002). Thesecomputations can be performed on records acquired sepa-rately from EEG–fMRI (e.g., Benar et al., 2006). However,BKG artifact reduction may gain increased value as a pre-mium is placed on limiting the number of clinical proce-dures to a minimum.
Acknowledgements
The authors thank Professor Marcus E. Raichle forguidance and facilities. Supported by: NS06833 (J.V.,L.L.P., and A.Z.S.) K12NS01690 (J.Z.) NS048056(A.Z.S.).
Appendix. Supplementary data
Supplementary data associated with this article can befound, in the online version, at doi:10.1016/j.clinph.2006.12.017.
References
Aboy M, McNames J, Thong T, Tsunami D, Ellenby MS, Goldstein B.An automatic beat detection algorithm for pressure signals. IEEETrans Biomed Eng 2005;52:1662–70.
Allen PJ, Polizzi G, Krakow K, Fish DR, Lemieux L. Identification ofEEG events in the MR scanner: the problem of pulse artifact and amethod for its subtraction. Neuroimage 1998;8:229–39.
Allen PJ, Josephs O, Turner R. A method for removing imaging artifactfrom continuous EEG recorded during functional MRI. Neuroimage2000;12:230–9.
Benar C, Aghakhani Y, Wang Y, Izenberg A, Al-Asmi A, Dubeau F,et al. Quality of EEG in simultaneous EEG–fMRI for epilepsy. ClinNeurophysiol 2003;114:569–80.
Benar CG, Grova C, Kobayashi E, Bagshaw AP, Aghakhani Y, DubeauF, Gotman J. EEG–fMRI of epileptic spikes: concordance with EEGsource localization and intracranial EEG. Neuroimage2006;30:1161–70.
Becker R, Ritter P, Moosmann M, Villringer A. Visual evoked potentialsrecovered from fMRI scan periods. Hum Brain Mapp 2005;26:221–30.
Bonmassar G, Purdon PL, Jaaskelainen IP, Chiappa K, Solo V, BrownEN, et al. Motion and ballistocardiogram artifact removal forinterleaved recording of EEG and EPs during MRI. Neuroimage2002;16:1127–41.
Boon P, D’Have M, Vanrumste B, Van Hoey G, Vonck K, VanWalleghem P, et al. Ictal source localization in presurgical patientswith refractory epilepsy. J Clin Neurophysiol 2002;19:461–8.
Briselli E, Garreffa G, Bianchi L, Bianciardi M, Macaluso E, Abbafati M,et al. An independent component analysis-based approach on ballis-tocardiogram artifact removing. Magn Reson Imag 2006;24:393–400.
Debener S, Ullsperger M, Siegel M, Fiehler K, von Cramon DY, EngelAK. Trial-by-trial coupling of concurrent electroencephalogram andfunctional magnetic resonance imaging identifies the dynamics ofperformance monitoring. J Neurosci 2005;25:11730–7.
Ellingson ML, Liebenthal E, Spanaki MV, Prieto TE, Binder JR, RopellaKM. Ballistocardiogram artifact reduction in the simultaneous acqui-sition of auditory ERPS and fMRI. Neuroimage 2004;22:1534–42.
Ford MR, Sands S, Lew HL. Overview of artifact reduction and removalin evoked potential and event-related potential recordings. Phys MedRehabil Clin N Am 2004;15:1–17.
Friston KJ, Holmes AP, Poline JB, Grasby PJ, Williams SC, FrackowiakRS, et al. Analysis of fMRI time-series revisited. Neuroimage1995;2:45–53.
Goldman RI, Stern JM, Engel J Jr, Cohen MS. Acquiring simultaneousEEG and functional MRI. Clin Neurophysiol 2000;111:1974–80.
Gotman J, Benar CG, Dubeau F. Combining EEG and FMRI in epilepsy:methodological challenges and clinical results. J Clin Neurophysiol2004;21:229–40.
Hamandi K, Salek-Haddadi A, Fish DR, Lemieux L. EEG/functionalMRI in epilepsy: the Queen Square experience. J Clin Neurophysiol2004;21:241–8.
Ille N, Berg P, Scherg M. Artifact correction of the ongoing EEG usingspatial filters based on artifact and brain signal topographies. J ClinNeurophysiol 2002;19:113–24.
In MH, Lee SY, Park TS, Kim TS, Cho MH, Ahn YB. Ballistocardiogramartifact removal from EEG signals using adaptive filtering of EOGsignals. Physiol Meas 2006;27:1227–40.
Ives JR, Warach S, Schmitt F, Edelman RR, Schomer DL. Monitoring thepatient’s EEG during echo planar MRI. Electroencephalogr ClinNeurophysiol 1993;87:417–20.
Jager L, Hoffmann A, Werhahn KJ, Reiser MF. Analysis and correctionof ballistocardiogram contamination of EEG recordings in MR.Fortschr Rontgenstr 2005;177:1059–64.
Jung TP, Makeig S, Humphries C, Lee TW, McKeown MJ, Iragui V,et al. Removing electroencephalographic artifacts by blind sourceseparation. Psychophysiology 2000;37:163–78.
Kim KH, Yoon HW, Park HW. Improved ballistocardiac artifact removalfrom the electroenceophalogram recorded in fMRI. J. NeurosciMethods 2004;135:193–203.
Ko CW, Chung HW. Automatic spike detection via an artificial neuralnetwork using raw EEG data: effects of data preparation andimplications in the limitations of online recognition. Clin Neurophysiol2000;111:477–81.
Kruggel F, Wiggins CJ, Herrmann CS, von Cramon DY. Recording of theevent-related potentials during functional MRI at 3.0 Tesla fieldstrength. Magn Reson Med 2000;44:277–82.
Laufs H, Krakow K, Sterzer P, Eger E, Beyerle A, Salek-Haddadi A,et al. Electroencephalographic signatures of attentional and cognitivedefault modes in spontaneous brain activity fluctuations at rest. ProcNatl Acad Sci USA 2003;100:11053–8.
Moosmann M, Ritter P, Krastel I, Brink A, Thees S, Blankenburg F,et al. Correlates of alpha rhythm in functional magnetic resonanceimaging and near infrared spectroscopy. Neuroimage2003;20:145–58.
Mukhopadhyay S, Ray GC. A new interpretation of nonlinear energyoperator and its efficacy in spike detection. IEEE Trans Biomed Eng1998;45:180–7.
Muri RM, Felblinger J, Rosler KM, Jung B, Hess CW, Boesch C.Recording of electrical brain activity in a magnetic resonanceenvironment: distorting effects of the static magnetic field. MagnReson Med 1998;39:18–22.
Nakamura W, Anami K, Mori T, Saitoh O, Cichocki A, Amari S.Removal of ballistocardiogram artifacts from simultaneously recordedEEG and fMRI data using independent component analysis. IEEETrans Biomed Eng 2006;53:1294–308.
Niazy RK, Beckmann CF, Iannetti GD, Brady JM, Smith SM. Removalof FMRI environment artifacts from EEG data using optimal basissets. Neuroimage 2005;28:720–37.
Ogawa S, Lee TM, Kay AR, Tank DW. Brain magnetic resonanceimaging with contrast dependent on blood oxygenation. Proc NatlAcad Sci USA 1990;87:9868–72.
Scarff CJ, Reynolds A, Goodyear BG, Ponton CW, Dort JC, EggermontJJ. Simultaneous 3-T fMRI and high-density recording of humanauditory evoked potentials. Neuroimage 2004;23:1129–42.
Sijbers J, Van Audekerke J, Verhoye M, Van der Linden A, Van Dyck D.Reduction of ECG and gradient related artifacts in simultaneouslyrecorded human EEG/MRI data. Magn Reson Imaging2000;18:881–6.

998 J.L. Vincent et al. / Clinical Neurophysiology 118 (2007) 981–998
Srivastava G, Crottaz-Herbette S, Lau KM, Glover GH, Menon V.ICA-based procedures for removing ballistocardiogram artifactsfrom EEG data acquired in the MRI scanner. Neuroimage2005;24:50–60.
Stone JV. Independent component analysis: a tutorial introduction. Cam-bridge: MIT Press; 2004.
Wan X, Iwata K, Riera J, Ozaki T, Kitamura M, Kawashima R. Artifactreduction for EEG/fMRI recording: nonlinear reduction of ballisto-cardiogram artifacts. Clin Neurophysiol 2006;117:668–80.
Warach S, Ives JR, Schlaug G, Patel MR, Darby DG, Thangaraj V,Edelman RR, Schomer DL. EEG-triggered echo-planar functionalMRI in epilepsy. Neurology 1996;47:89–93.