monsoonlike circulations in a zonally averaged numerical model with topography
TRANSCRIPT
MARCH 2000 779R A O E T A L .
q 2000 American Meteorological Society
Monsoonlike Circulations in a Zonally Averaged Numerical Model with Topography
V. BRAHMANANDA RAO, J. PABLO REYES FERNANDEZ, AND SERGIO H. FRANCHITO
Instituto Nacional de Pesquisas Espaciais, INPE, Sao Jose dos Campos, Brazil
(Manuscript received 14 May 1998, in final form 30 March 1999)
ABSTRACT
A primitive equation global zonally averaged general circulation model is used to study the effects of thetopography on the atmospheric annual cycle. A smoothed zonally averaged topography that has a form similarto that observed was used. The control experiment showed that the model was capable of capturing the zonallyaveraged behavior of the annual cycle. The model is able to capture some characteristics of the monsoonlikecirculation such as the seasonal wind reversal and the easterly jet in the boreal summer. Even in the absenceof topography the model was able to reproduce the monsoonlike features. However, the circulation was weakand the position of its components was altered. This suggests that the topography has an important role inmodifying the intensity and position of the monsoon circulation. Sensitivity tests were made in order to investigatethe effects of high elevation and its steep southern slope. Two experiments were performed: 1) increasing theelevation of orography without changing the steepness of the slope, and 2) increasing both the elevation andthe steepness of the slope. The results indicated that the steepness of the southern slope seems to control themonsoonlike flow in the model. The model was also capable of reproducing a monsoonlike response to changedexternal conditions. When the values of the earth’s orbital parameters (precession, obliquity, and eccentricity)were changed to those of 9000 yr BP, the precipitation and circulation intensified, which seems to agree withpaleoclimatic evidence.
1. Introduction
The annual variation of atmospheric circulation incertain parts of the Tropics is known as the monsoon.The monsoon is associated with a reversal of 1808 inthe low-level winds from winter to summer (Fein andStephens 1987). A large fraction of the global popu-lation living in the Asian monsoon region is affectedcritically by the vagaries of the monsoon. Prediction ofthe onset date and rainfall intensity is one of the difficulttasks of meteorologists. Skillful prediction can be madeonly after a clear understanding of the dynamics of amonsoon system. Regarding the basic mechanisms of amonsoon system, the shift of the wind from winter tosummer due mainly to the presence of the Tibetan Pla-teau is believed to be the primary triggering mechanismof the monsoon onset over India (Riehl 1979). The pla-teau acts both as a mechanical barrier and as an elevatedheat source. The mechanical barrier effect seems to beimportant for the winter monsoonal circulation, and thethermal effect appears to be the main mechanism forthe establishment of the summer monsoon (Murakami1987). The important role of the Tibetan Plateau in the
Corresponding author address: Dr. V. Brahmananda Rao, InstitutoNacional de Pesquisas Espasiais, INPE, CP515, 12201-970, Sao Josedos Campos, SP, Brazil.E-mail: [email protected]
development of the monsoonal circulation has been de-scribed in studies using atmospheric models. Murakamiet al. (1970) noted that the inclusion of the mountainwas essential for the realistic simulation of the low-levelwesterlies and the upper easterly jet. Das and Bedi(1981) pointed out that the plateau barrier is necessaryfor simulating the monsoon system and that the increaseof the heating over the plateau intensifies the circulation.The numerical simulation studies of Kuo and Qian(1981, 1982) indicated that the monsoonal circulationis maintained by the sensible and latent heating and thatthe mechanical effects of the plateau play a modifyingrole. Hahn and Manabe (1975) showed that even in theabsence of the Tibetan Plateau some monsoon featuresoccur. However, the intensity of circulation is reduced.They pointed to the importance of the plateau barrierin determining the position and intensity of the variouscomponents of the monsoonal circulation. Excellent re-views of observational and modeling studies regardingthe influence of the Tibetean Plateau on the monsoonare given by Meehl (1992), Murakami (1987), andKrishnamurti (1987).
An intercomparison of hydrologic processes in 29Atmospheric Model Intercomparison Project (AMIP)models by Lau et al. (1996) showed that the modelsgenerally portray an earthlike climate. However, somemodels show significant errors in the total global waterbalance. There are other problems common to all models

780 VOLUME 128M O N T H L Y W E A T H E R R E V I E W
such as underestimating the frequency of the occurrenceof light precipitation events (,1 mm day21). The sim-ulated boreal summer rainfall distributions have largevariability over the Indian subcontinent and Bay of Ben-gal. The northward migration of the monsoon convec-tive zones are not well simulated. The East Asian mon-soon rainband over the subtropical western Pacific isill-defined or absent in all models. The problem wasfurther investigated by Stephenson et al. (1998). Theyalso discussed the failures of the models to deal withtopography. Recently, a most comprehensive study onAMIP monsoon studies was made by Gadgil et al.(1998). They made a detailed comparison of monsoonprecipitation in 30 AMIP models. Although the modelsare able to capture some of the observed characteristicsof monsoon rainfall over African, Indian, and Austra-lian–Indonesian regions, there are still quantitative dif-ferences. Whereas some models simulated the observedseasonal migration of the primary rain belt over theheated continents, in several others the rain belt remainsunrealistically over the equatorial oceans in all the sea-sons. This is true even in the case of the rainfall patternover the Indian region for July–August (the peak ofmonsoon months). The simulation of the mean summerrainfall pattern over the Indian region and its interannualvariations are not well simulated in most of the models.This suggests that the three-dimensional atmosphericgeneral circulation models (GCMs) are not yet perfectand there is need for further improvement in the sim-ulation of several aspects of the monsoon system bythese models.
An alternative to the three-dimensional GCMs is thesimple models such as the zonally averaged GCMs(ZAGCMs). The advantage of these models is that thecause and effect relationship is straightforward. Further,they are highly economical unlike the GCMs. ZAGCMscan effectively be used to study the dynamics of themonsoon. Webster and Lau (1977), Webster and Chou(1980), and Webster (1983) conducted a series of ex-periments with ZAGCMs where the Asiatic continentand adjacent oceans were included. However, they didnot take into account the effects of the topography. Inthese works, the monsoonal circulation was studied fo-cusing on the heat contrast between the continent andthe ocean rather than on the topography. They pointedout the important role of the interactive ocean in de-termining the magnitude and spatial variation of theupper-level circulation. Although these studies providesome useful information, they should be extended inorder to investigate the effect of orography on the mon-soonal circulation.
In addition, ZAGCMs can also be used to test thesensitivity of monsoonal circulation for some of the ex-ternal conditions. Monsoon strength underwent majorchanges during the glacial maximum at 18 000 yr BPand subsequent to it. The monsoon was weak duringand after the glacial maximum, and between 10 000 and5000 yr BP monsoon rains got reestablished (Kutzbach
and Gallimore 1988; Kutzbach and Guetter 1986; DeNoblet et al. 1996). The earth’s orbital parameters duringthe Early Holocene might have influenced the climatethrough their effects on the seasonal cycle of radiation.
In the present study, we use a ZAGCM with topog-raphy for simulating the zonally averaged annual cycle.Since monsoonal circulations are the annual variationsin certain parts of the Tropics, we attempt to investigatethe capability of the ZAGCM to capture seasonal mon-soonlike variations. Special emphasis is given to theimpact of orography on the monsoonlike flow. Anotherobjective of the paper is to verify if the model respondsto changed external condition such as those during theEarly Holocene (9000 BP). One must keep in mind thatthe model is designed to calculate zonal means and notexactly the regional features such as the actual Asianmonsoon. However, since the monsoon is a response tothe annual cycle, the capability of the model in capturingsome monsoonlike variations (hereafter referred to assimply monsoon) will be investigated. For this purpose,we use a smoothed zonally averaged topography in theZAGCM (section 2f), which is different from the actualHimalayan–Tibetan plateau. To our knowledge, the to-pographic effect was not taken into account in the earlierZAGCMs. Section 2 contains the model description, thesimulation of the annual cycle, and the monsoon cir-culation. The effects of the topography on the monsoonfeatures are presented in section 3. Section 4 containsthe results of the Holocene experiment. The summaryand conclusions are given in section 5.
2. The model
The ZAGCM used in the present study is similar tothat developed by Franchito and Rao (1992). The modelis essentially mechanistic and has been utilized exten-sively to study various aspects of climate and climaticchange (Franchito and Rao 1992, 1995; Rao and Fran-chito 1993; Varejao-Silva et al. 1998; Franchito et al.1998). It is a two-layer global primitive equation modelin sigma coordinate and includes parameterizations offriction, diabatic heating, and large-scale eddies. Thefraction of the latitude belt covered by each type ofsurface is obtained from Saltzman and Vernekar (1972).The surface albedo and the surface water availabilityare obtained through the weighted mean of these specificvalues using as weight the fraction of the latitude beltcovered by each type of surface.
In the present study, several improvements have beenmade. The model resolution is increased and the diabaticheating parameterizations are modified in order to takeinto account physical processes that were not consideredin the earlier version of the model. The present versionincludes a parameterization of the daily solar radiationand an explicit equation for the water vapor. The for-mulations of the sensible and latent heat fluxes arechanged in order to include the effect of air temperaturenear the surface. The parameterizations of cumulus con-

MARCH 2000 781R A O E T A L .
TABLE 1. Formulations of the surface and atmospheric fluxes.
Surface fluxes
i Hs(i) Parameterization
1234
Shortwave radiationLongwave radiationSensible heat fluxLatent heat flux
sf (1 2 x)(1 2 ra)(1 2 rs) Ro
sB(n1T 2 T )4 42 s
rCD max (Vmin, |Vs|)cp(Ts 2 Ta)rCD max (Vmin, |Vs|)L[q*(Ts) 2 q*(Ta)] w
Atmospheric fluxes
i Ha(i) Parameterization
1234
Shortwave radiationLongwave radiationSensible heat fluxLatent heat flux
x(1 2 ra) Ro
sB[gT 2 (n1 1 n2)T ]4 4s 2
2Hs(3)L(Pls 1 Pc)
vection and large-scale precipitation are also incorpo-rated in the model. Because of the different heat storagecharacteristics, continental and oceanic temperatures gothrough different annual cycles. So, in the present ver-sion of the model the surface energy budget at eachlatitude belt is computed separately for each portion ofland, ocean, and snow/ice. The energy budget in theentire latitude belt is obtained through the weightedmean of the surface energy budget at each portion usingas weight the fractions of land, ocean, and snow/ice inthe latitude belt. Another improvement is the inclusionof the topography. The model modifications are indi-cated below.
a. Equation of the moisture conservation
The present model includes an explicit water vaporequation (Haltiner and Williams 1980):
]psq3/]t 5 2=(psy 3q3) 1 psS, (1)
where y 3 and q3 are the meridional wind and the specifichumidity at 750 hPa, respectively; ps is the surface pres-sure; and S is given by the difference between the evap-oration and condensation:
S 5 g(E 2 P)/[ps(ds)3]. (2)
In expression (2), (ds)3 corresponds to Ds in thelower model layer.
b. Solar radiation flux
The formulation of the solar radiation flux is similarto that used by Franchito and Rao (1992) (Table 1).However, in the earlier version of the model, the valueof R0 corresponded to the mean annual solar radiationflux at the top of the atmosphere. In the present model,the effect of the daily solar radiation flux is taken intoaccount. So, R0 is given by
R0 5 S cosZg, (3)
where S is the solar constant, and Z is the zenith anglecalculated using the expression:
cosZ 5 H sinw sind 1 cosw cosd cosH, (4)
where w, d, and H are the latitude, the solar declination,and the hour angle, respectively. The astronomical pa-rameters necessary for the calculation of the zenith angleare obtained following the procedure given by Berger(1978).
c. Sensible and latent heat fluxes
In the original version of the model, the formulationof the sensible [Hs(3)] and latent [Hs(4)] heat fluxeswere the same as those proposed by Saltzman and Ver-nekar (1971). In the present model, however, we use thebulk parameterization of these fluxes (Haltiner and Wil-liams 1980; Held and Suarez 1978):
H (3) 5 rC max(V , |V |)c (T 2 T ), (5)s D min s p s a
H (4) 5 rC max(V , |V |)L[q*(T ) 2 q*(T )]w,s D min s s a
(6)
where r is the air surface density (1.25 kg m23); CD,the drag coefficent (1 3 1023 over land, and 3 3 1023
over ocean); w, the water availability at surface; Vs, thesurface wind; Vmin 5 1.5 m s21; Ts and Ta, the surfaceand air surface temperatures; and q*(Ts) and q*(Ta), thesaturation specific humidity at temperatures Ts and Ta,respectively. Also, Hs(4) 5 LE. The surface air tem-perature is obtained following the procedure used byHeld and Suarez (1978):
Ta 5 nT1 1 (1 2 n)T3, (7)
where
n 5 (lnps 2 lnp1)/(lnp3 2 lnp1). (8)
In expressions (7) and (8), T1 and T3 are the temper-atures at the levels s 5 0.25 and s 5 0.75, respectively,and p1 and p3 are the pressures at these levels.
d. The energy balance at the surface
Since we are taking into account the daily values ofR0 (and not the diurnal cycle of R0), the effect of thesubsurface heat flux is neglected in the model [Hs(5) 50]. Assuming that the surface has zero heat capacity,the energy balance at the surface is given by
H (i) 5 0, i 5 1, 2, 3, 4, (9)O s
where the surface energy fluxes Hs(i) are given in Table1. This assumption may have implications for the mon-soon flow simulation. The observed delay in land sur-face warming of continent is about 1–2 months and thisis important for monsoon circulations. Therefore, thezero heat capacity model may provoke an earlier onsetof monsoon.
The land surface temperature is calculated applyingexpression (9) to the fraction of land in the latitude belt.In the case of the portions of ocean and snow/ice, we
782 VOLUME 128M O N T H L Y W E A T H E R R E V I E W
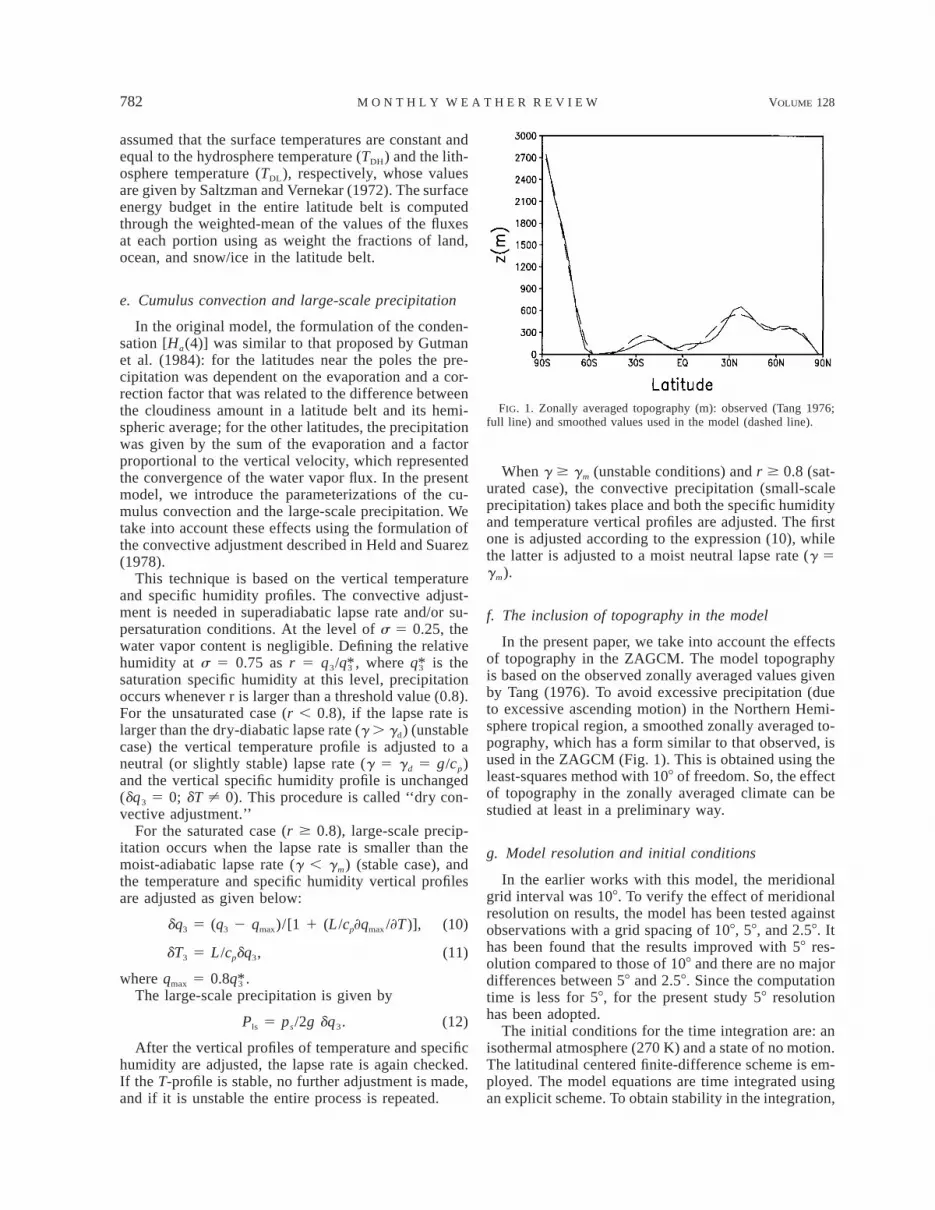
FIG. 1. Zonally averaged topography (m): observed (Tang 1976;full line) and smoothed values used in the model (dashed line).
assumed that the surface temperatures are constant andequal to the hydrosphere temperature (TDH) and the lith-osphere temperature (TDL), respectively, whose valuesare given by Saltzman and Vernekar (1972). The surfaceenergy budget in the entire latitude belt is computedthrough the weighted-mean of the values of the fluxesat each portion using as weight the fractions of land,ocean, and snow/ice in the latitude belt.
e. Cumulus convection and large-scale precipitation
In the original model, the formulation of the conden-sation [Ha(4)] was similar to that proposed by Gutmanet al. (1984): for the latitudes near the poles the pre-cipitation was dependent on the evaporation and a cor-rection factor that was related to the difference betweenthe cloudiness amount in a latitude belt and its hemi-spheric average; for the other latitudes, the precipitationwas given by the sum of the evaporation and a factorproportional to the vertical velocity, which representedthe convergence of the water vapor flux. In the presentmodel, we introduce the parameterizations of the cu-mulus convection and the large-scale precipitation. Wetake into account these effects using the formulation ofthe convective adjustment described in Held and Suarez(1978).
This technique is based on the vertical temperatureand specific humidity profiles. The convective adjust-ment is needed in superadiabatic lapse rate and/or su-persaturation conditions. At the level of s 5 0.25, thewater vapor content is negligible. Defining the relativehumidity at s 5 0.75 as r 5 , where is theq /q* q*3 3 3
saturation specific humidity at this level, precipitationoccurs whenever r is larger than a threshold value (0.8).For the unsaturated case (r , 0.8), if the lapse rate islarger than the dry-diabatic lapse rate (g . gd) (unstablecase) the vertical temperature profile is adjusted to aneutral (or slightly stable) lapse rate (g 5 gd 5 g/cp)and the vertical specific humidity profile is unchanged(dq3 5 0; dT ± 0). This procedure is called ‘‘dry con-vective adjustment.’’
For the saturated case (r $ 0.8), large-scale precip-itation occurs when the lapse rate is smaller than themoist-adiabatic lapse rate (g , gm) (stable case), andthe temperature and specific humidity vertical profilesare adjusted as given below:
dq 5 (q 2 q )/[1 1 (L /c ]q /]T )], (10)3 3 max p max
dT 5 L /c dq , (11)3 p 3
where qmax 5 .0.8q*3The large-scale precipitation is given by
Pls 5 ps/2g dq3. (12)
After the vertical profiles of temperature and specifichumidity are adjusted, the lapse rate is again checked.If the T-profile is stable, no further adjustment is made,and if it is unstable the entire process is repeated.
When g $ gm (unstable conditions) and r $ 0.8 (sat-urated case), the convective precipitation (small-scaleprecipitation) takes place and both the specific humidityand temperature vertical profiles are adjusted. The firstone is adjusted according to the expression (10), whilethe latter is adjusted to a moist neutral lapse rate (g 5gm).
f. The inclusion of topography in the model
In the present paper, we take into account the effectsof topography in the ZAGCM. The model topographyis based on the observed zonally averaged values givenby Tang (1976). To avoid excessive precipitation (dueto excessive ascending motion) in the Northern Hemi-sphere tropical region, a smoothed zonally averaged to-pography, which has a form similar to that observed, isused in the ZAGCM (Fig. 1). This is obtained using theleast-squares method with 108 of freedom. So, the effectof topography in the zonally averaged climate can bestudied at least in a preliminary way.
g. Model resolution and initial conditions
In the earlier works with this model, the meridionalgrid interval was 108. To verify the effect of meridionalresolution on results, the model has been tested againstobservations with a grid spacing of 108, 58, and 2.58. Ithas been found that the results improved with 58 res-olution compared to those of 108 and there are no majordifferences between 58 and 2.58. Since the computationtime is less for 58, for the present study 58 resolutionhas been adopted.
The initial conditions for the time integration are: anisothermal atmosphere (270 K) and a state of no motion.The latitudinal centered finite-difference scheme is em-ployed. The model equations are time integrated usingan explicit scheme. To obtain stability in the integration,

MARCH 2000 783R A O E T A L .
FIG. 2. Difference between the simulated zonally averaged surfacetemperature at 208N and at the equator for 10 yr of model integration.Units, K.
FIG. 3. Annual variation of the zonally averaged surface temper-ature (K). Interval 2 K: (a) model, and (b) observations (NCEP–NCAR reanalysis data).
the Brown and Campana scheme (1978) and Asselinfilter are used. The model is integrated for 10 yr usingdaily values of the solar radiation. It converges to steadyannual cycle in 1 yr. There is no interannual variation(see Fig. 2) because the seasonal values of the surfacetemperature in the ocean and snow/ice parts of a latitudebelt are the same in all the years of integration. Theresults reported here are for the third year.
3. Simulation of the annual cycle and monsooncirculation, and the effects of the zonallyaveraged topography on the monsoonlikefeatures
What characterizes monsoon is the annual variation.The monsoon is associated with a reversal of 1808 inthe low-level winds from winter to summer (Fein andStephens 1987). To verify the ability of the ZAGCM tocapture some seasonal monsoonlike variations, the mod-el is run to simulate the annual cycle of the zonallyaveraged atmosphere. For this purpose, the ZAGCM isrun using the present-day daily values of the solar ra-diation at the top of the atmosphere. First, the simulatedcharacteristics of the annual cycle and monsoonlike cir-culation are shown. In the second part of this section,the results concerning the effects of zonally averagedtopography on the monsoon circulation are presented.We will show the model results for the latitudinal do-main 508S–508N because in the present study we arefocusing on the tropical latitudes. As mentioned in theintroduction, the model results refer to the zonal-meangeneral circulation behavior rather than the behavior inthe Asian sector. Also, the topography used in the modelis a smoothed zonally averaged topography, which isdifferent from the Himalayan–Tibetan plateau. It mustbe kept in mind that the ZAGCM is a mechanistic mod-el. Our objective is to investigate the capability of this
simple model to capture seasonal monsoonlike varia-tions rather than to simulate the regional features of theobserved Asian monsoon system. Thus, some quanti-tative differences between the model simulations andthe observations are expected. The observed data usedin this section are obtained from the National Centersfor Environmental Prediction–National Center for At-mospheric Research (NCEP–NCAR) reanalysis data(mean values for 1968–96). Details regarding these dataare given by Kalnay et al. (1996).
a. Simulation of the annual cycle and monsoonlikecirculation
In this section the simulated zonally averaged annualcycle is compared with the observations. We will at-tempt to investigate the ability of the model to capturemonsoon variations. Figures 3a,b show the annual var-iation of surface temperature (mean land–sea surfacetemperature) as simulated by the model and in obser-vations, respectively. As can be seen, the maxima arereasonably well simulated. Note that in the model themaximum occurs about a month earlier compared toobservations. This may due to the zero soil heat capacity

784 VOLUME 128M O N T H L Y W E A T H E R R E V I E W
FIG. 4. Annual variation of the zonally averaged zonal wind at 250 hPa: (a) model and (b) observations (Interval 5 m s21), and at 750hPa: (c) model and (d) observations (interval 2 m s21). The observed values are obtained from the NCEP–NCAR reanalysis data.
assumed in this study. This maximum is located in theregion where the summer monsoon develops.
Figures 4a,b show the simulated and observed annualvariation of the zonally averaged zonal wind at 250 hPa.As can be seen, there is a qualitative good agreementbetween the simulation and observations. The positionsof the maxima of the zonal wind at 250 hPa are wellsimulated in both the hemispheres although the mag-nitudes are lower in the simulation than in the observedvalues. It is also seen that the region of easterlies nearthe equator is well simulated, but in the model results,the winds are stronger than observations forming aneasterly jet. The occurrence of an upper-level easterlyjet is one of basic characteristics of monsoon circulation.Figures 4c,d show the simulated and observed annualvariation of the zonally averaged zonal wind at 750 hPa.The region of the maxima are well simulated in boththe hemispheres although their magnitudes are againunderestimated. Also, the model results show the pres-ence of low-level westerlies in the Northern Hemispheretropical region during the boreal summer. This is anotherobserved characteristic of monsoon circulation.
The simulated annual cycle of the zonally averagedmeridional wind at 250 hPa is in good agreement withthe observations, as can be seen in Figs. 5a,b. Althoughthe regions of northerlies and southerlies at 750 hPa are
simulated reasonably well, the magnitude of the windsis overestimated (Figs. 5c,d). This is due to the fact thatin the present model the meridional winds at 750 hPahave approximately the same magnitude but oppositesign as those of the meridional winds at 250 hPa. Ascan be noted in Fig. 5, the model seems to be capableof capturing another characteristic of monsoon circu-lation: the presence of upper-level northerlies and low-level southerlies in the Northern Hemisphere tropicalregion during the boreal summer.
Figure 6 shows the annual cycle of the zonally av-eraged vertical velocity (Ã) at 500 hPa and the precip-itation. The simulated values agree qualitatively wellwith the observations. The Hadley cell is stronger inwinter hemisphere and the regions of rising motion andsubsidence are well reproduced by the model. The sea-sonal variation of the precipitation shows a low-latitudemaxima occurring during the boreal summer as in theobservations. Thus, the model reproduces another mon-soon feature, that is, the occurrence of strong risingmotion and heavy rainfall associated with the convec-tion in the tropical region during the boreal summer.
Vertical shear is strongly related to monsoon flow.Webster and Yang (1992) proposed that the zonal windshear, U-index (U850 2 U200, averaged over 408–1108E,equator–208N), provides a good index for the large-scale

MARCH 2000 785R A O E T A L .
FIG. 5. Annual variation of the zonally averaged meridional wind at 250 hPa, (a) model and (b) observations, and at 750 hPa, (c) modeland (d) observations (interval 0.3 m s21). The observed values are obtained from the NCEP–NCAR reanalysis data.
monsoon circulation. Taking into account that the zonalwind shear index may dectect equatorial longitudinalcirculation rather than the local Hadley circulation re-lated to the Asian monsoon, Goswami et al. (1997, man-uscript submitted to Quart J. Roy. Meteor. Soc.) pro-posed the use of the meridional wind shear index, V-in-dex (V850 2 V200, averaged over 708–1108E, equator–308N). To investigate the relation between the zonallyaveraged vertical wind shear and the monsoon circu-lation simulated by the model, Fig. 7 is prepared. In thepresent study, the zonally averaged U- and V-indicesare given by the differences between the winds at themodel levels 250 hPa and 750 hPa. As can be seen inFigs. 7a–d, the annual cycles of the U- and V-indicesare qualitatively in agreement with the observations.However, the U-index is underestimated in the winterhemisphere around 308N (S) and overestimated in thetropical region during the boreal summer, while theV-index is stronger than the observations at almost alllatitudes. This is in agreement with the simulated annualcycles of the u- and y-winds shown in Figs. 4 and 5,respectively. It can be noted from Fig. 7 that the sim-ulated values of the U- and V-indices are stronger thanthe observations in the Northern Hemisphere tropicalregion during the boreal summer. This suggests that themodel overestimates the strength of monsoon circula-
tion, in agreement with the excessive precipitation ratesshown in Fig. 6.
The results presented above show that the simulatedzonally averaged annual cycle is in a reasonably goodagreement with the observations. The results also in-dicated that the model is able to capture some charac-teristics of monsoon circulations. As mentioned earlier,in the regions affected by the monsoon regime there isa reversal of the low-level wind from winter to summer.Although the present model is a zonally averaged modelwe will now investigate how well it is capable of cap-turing this regional feature. For this purpose, Fig. 8 isprepared. This figure shows the streamlines at 925 hPaand 250 hPa in the simulation and in the observations.The observations are obtained from the NCEP–NCARreanalysis data along 808E, which strongly represent themonsoon. The model winds at 925 hPa are obtained bylogarithmic interpolation. Taking into account the sim-plicity of the model, the simulation of the southwestand northeast monsoonlike flow should be consideredexcellent. As can be seen in Figs. 8a,b, in the borealsummer the low-level southeasterly winds diverge outof the Southern Hemisphere subtropical high becomingsouthwesterly winds as they cross the equator. Also, asnoted earlier, the upper-tropospheric easterly jet in thesummer season is well simulated (Figs. 8c,d). Thus,

786 VOLUME 128M O N T H L Y W E A T H E R R E V I E W
FIG. 6. Annual variation of the zonally averaged vertical velocity à at 500 hPa (1024 hPa s21): (a) model and (b) observations, and theprecipitation (mm day21): (c) model and (d) observations. The observed values are obtained from the NCEP–NCAR reanalysis data.
these basic features of the monsoon system are capturedby the present model. The reason for the differencesbetween the complex picture at the middle and highlatitudes of the Northern Hemisphere in the NCEP–NCAR data and the model results may be attributed tothe fact that the data correspond to values of the windalong 808E and the simulations refer to zonally averagedvalues. Also, the NCEP–NCAR data are influenced bythe observed three-dimensional topography and themodel takes into account only a smoothed zonally av-eraged topography.
The preceding section illustrates that the presentZAGCM is capable of capturing some basic features ofa monsoon circulation. Because the simulations arebased on a simple 2D model, it is not expected that themodel would exactly reproduce the observed featuresof the actual monsoon.
b. Effects of the zonally averaged topography on themonsoonlike circulation
To investigate the effects of zonally averaged topog-raphy on the monsoon circulation we will compare theannual cycle simulated by the model with and withouttopography. The results show that the rising motion inthe tropical region during the boreal summer is weak-
ened when the topographic effects are not taken intoaccount in the model (see Figs. 9a and 6a). As a con-sequence of the decrease of the rising motion, there isa decrease of the precipitation when a flat surface isconsidered. The topography influences both the inten-sification and the position of the tropical convectivezone. As can be inferred from Fig. 9b, Fig. 6c (casewith topography), and Fig. 6d (observations), the sea-sonal migration of the tropical convective zone is betterrepresented when the topography is included in the mod-el. As mentioned in the introduction, some of the GCMshave difficulty in reproducing this effect.
Figures 10a,b show the streamlines at 250 hPa and925 hPa, respectively, for the case without topography.It can be seen that even in the absence of the topographythe principal features of the monsoon circulation suchas the seasonal wind reversal and the upper-troposphericeasterly jet are captured by the model. However, in thecase of no topography the subtropical jet does notabruptly jump northward to its summertime position asobserved (Lau and Yang 1996), but it slowly movesnorthward throughout May and June. When the topog-raphy is included, the model reproduces reasonably wellthe rapid northward jump of the westerly jet across themountain during the monsoon onset, and the establish-ment of the upper-tropospheric easterly jet and the low-

MARCH 2000 787R A O E T A L .
FIG. 7. Annual variation of the zonally averaged: U-index (U250 2 U750) simulated by the model (a), and observed (b), and V-index (V250
2 V750) simulated by the model (c) and observed (d). The observed values are obtained from the NCEP–NCAR reanalysis data.
level westerlies to the south of the mountain (Fig. 8).To further illustrate the mountain effect Figs. 11a,b areprepared. Figures 11a,b show the horizontal wind vec-tors at 750 hPa for the cases with and without mountain,respectively. Both the figures show the onset of summermonsoon in the beginning of boreal summer. However,there are several important differences between the twocases. A careful comparison of the figures shows thatin the case without mountain the change at 58N fromnortheasterlies to southwesterlies occurs around 20 May.This change gradually penetrates to 158N by about thebeginning of July, whereas in the case with mountainthe change at 58N occurs in the beginning of May andat 158N it occurs in the beginning of June. In this casewith mountain the southwesterly monsoonal circulationpenetrates to even 208N, which did not happen in thecase without mountain. At 208N in the mountain casethe westerlies continue up to about the end of Augustand then change to easterlies. Thus, in the case withmountain the summer monsoonlike circulation occursrather suddenly and penetrates farther north. These fea-tures are reminiscent of the southwest monsoonal cir-culation in the real atmosphere and show the importantrole of the mountain in the realistic simulation of mon-soon circulations. This agrees with results from studies
using GCMs (Hahn and Manabe 1975) and observations(Yin 1949; Lau and Yang 1996).
Figures 12a,b show, respectively, the 3-month meansof the zonally averaged zonal and meridional winds ve-locity at 250 hPa and 750 hPa for June–August (JJA).The period JJA will be called as summer season. Ascan be seen in Fig. 12a, the presence of the topographyintensifies the summer monsoon circulation. Withoutmountain, the maxima in low-level westerlies and theupper easterly jet are around 2.4 m s21 and 9.3 m s21,respectively. When the mountain is included, these val-ues increased to 3.0 m s21 and 12.7 m s21, respectively.This is in agreement with GCM results obtained byMurakami et al. (1970), although in the latter the mag-nitude of the changes was larger. It can be also seen inFig. 12a that the position of the upper easterly jet isshifted 58 northward when the topography is includedin the model. It can be noted in Fig. 12b that the low-level southerlies in JJA are stronger in the southern slopeof the mountain compared to the case of no mountain.The presence of strong low-level southerlies and uppernortherlies to the south of the Tibetan Plateau was notedby Kuo and Qian (1981) and agrees with observations(see Murakami 1987).
Figures 13a,b show the zonally averaged total pre-

788 VOLUME 128M O N T H L Y W E A T H E R R E V I E W
FIG. 8. Annual variation of streamlines: (a) simulated at 925 hPa, (b) observed at 925 hPa and 808E, (c) simulated at 250 hPa, and (d)observed at 250 hPa and 808E. The observed values are obtained from the NCEP–NCAR reanalysis data.
cipitation and the vertical velocity at 500 hPa for JJA,respectively. As can be noted, the precipitation is higheralong the southern slope of the mountain (Fig. 13a) duemainly to the cumulus convection (Fig. 13c). Also, themaximum of the precipitation is displaced 58 northwardcompared to its position when the mountain is removed.As can be seen in Fig. 13b, the rising motion is increasedin this region. These results are consistent with thoseobtained by Hahn and Manabe (1975) and Kuo and Qian(1981, 1982).
Table 2 shows the U- and V-indices, the total precip-itation, and the convective precipitation, averaged overthe equator–308N, for JJA in the cases with and withouttopography. It can be seen that both the U- and V-indicesare stronger in the case with topography, suggesting thatthe monsoonlike circulation is also stronger comparedwith the case of flat surface. This is agreement with theenhancement of the precipitation when the topographyis included in the model. The increase of the total pre-cipitation is due to mainly the increase of the convectiveprecipitation (cumulus convection). The U- and V-in-dices in both the cases with and without topography arestrong compared with the observations, suggesting thatthe model overestimates the strength of monsoon cir-culation, as mentioned earlier.
Figures 14a–c show the latitudinal distribution of the
net radiation flux at the land surface and its partitioninginto sensible and latent heat fluxes, respectively, for JJA.As can be noted, there is significant differences in theheating fields. The surface net radiation and the sensibleand latent fluxes are larger in the southern slope of themountain compared with the case of flat surface. Theincrease of heating along the southern foothills fromconvective heating seems to be due to cumulus con-vection, as suggested in Fig. 13c and Table 2. When thetopography is included, the increase in the latent heatingis slightly higher than that in the sensible heat flux. Theinclusion of topography causes a decrease in the surfacetemperature (Fig. 14d) by the lapse-rate effect (Kitch1997). These results agree, in general, with those ob-tained from other studies with GCMs (Hahn and Manabe1975; Kuo and Qian 1981, 1982). However, in the pres-ent model the values of the sensible heat flux are smallerthan those of the latent heat flux in the tropical regionin both the cases with and without topography. Thus,the model results underestimate the role of the sensibleheat flux as a heating source, mainly in the case withno mountain.
The topography interacts with the monsoon flow be-cause of both its high elevation and its steep southernslope. To investigate how these factors may affect thesimulation of the monsoon circulation, two experiments

MARCH 2000 789R A O E T A L .
FIG. 9. Annual variation of simulated zonally averaged: (a) verticalvelocity à at 500 hPa (1024 hPa s21); (b) precipitation (mm day21).Cases with no mountain.
FIG. 10. Annual variation of streamlines simulated by the modelwithout topography: (a) at 250 hPa and (b) at 925 hPa.
are performed. In the first, we increase the height of thetopography without changing the steepness (experiment1); in the other, we increase the height of the topographyin the tropical region of the Northern Hemisphere as inthe case of the experiment 1 but with a steeper slope(experiment 2). Figure 15 shows the zonally averagedtopography used in the experiments 1 and 2. The orig-inal zonally averaged topography used in the ZAGCM(section 3) is also plotted in Fig. 15. The results showthat the precipitation in the southern slope of the moun-tain is higher in experiment 2 compared with experiment1. The enhancement of precipitation is due to the in-crease in the rising motion in this region (Figs. 16a,b).The role of gradient of slopes as a key factor of con-trolling vertical velocities and the rate of condensationof saturated air packets was pointed out by Stephensonet al. (1998). Thus, the results above suggest that thesteepness of the slope controls the strength of the mon-soonlike circulation in the present model.
4. The Holocene experiment
In this section, the ZAGCM is run in order to testthe sensitivity of the monsoon circulation for changed
external conditions. For this purpose we use values ofthe orbital parameters for 9000 yr BP (Early Holocene).The obliquity was 24.238 (the modern value is 23.458),perhelion was 30 July (the modern value is 3 January),and eccentricity was 0.0193 (the modern value is0.0167). The control experiment is the simulation of thepresent-day climate shown in section 3 (case includingtopography).
The model results are presented considering thechanges in the zonally averaged variables (Holoceneminus control experiment). Figure 17b shows the de-partures from the modern control values of the insola-tion at the top of the atmosphere (Fig. 17a). As can benoted, the larger increase of insolation occurred at highlatitudes in the Northern Hemisphere. Although themean annual insolation was equivalent to its present-day value, the seasonal cycle was enhanced during theEarly Holocene, with the Northern Hemisphere receiv-ing more solar radiation in the summer season and lessinsolation during the winter. The latitudinal distributionof the changes in the insolation at the top of the at-mosphere shown in Fig. 17 is similar to that given byde Noblet et al. (1996) for the mid-Holocene minuspresent-day climate conditions. However, the magnitude

790 VOLUME 128M O N T H L Y W E A T H E R R E V I E W
FIG. 11. Annual variation of the horizontal wind vector at 750 hPasimulated by the model: (a) with topography and (b) without topog-raphy. Units, m s21.
FIG. 12. Three-month means (JJA) of the zonally averaged: (a)zonal winds at 250 hPa and 750 hPa, and (b) meridional wind at 250hPa and 750 hPa simulated by the model with mountain (full line)and with no mountain (dashed line). Units, m s21.
of the changes are larger for the early Holocene minuspresent-day case.
The increase of the solar radiation at the top of theatmosphere provoked a stronger summer monsoon inthe early Holocene. As can be seen in Fig. 18, thesurface temperature during the boreal summer wasaround 0.9 K higher during the early Holocene than inthe modern control experiment. Also, the land surfacetemperature was around 1.0 K higher during the borealsummer in the Holocene experiment (not shown). Thiswarming extended from the surface throughout themidatmosphere. The increase of the temperature in theNorthern Hemisphere during the summer season pro-voked an enhancement of the precipitation (around0.55 mm day21) in the tropical region of the NorthernHemisphere.
Another Holocene experiment was conducted usingthe ZAGCM without topography. The changes (Holo-cene minus modern control experiment) (not shownhere) were similar to those shown above. However, themagnitude of the changes was larger when the topog-raphy was included into the model.
Results from GCMs show an increase of the surfacetemperature of 2–4 K and an enhancement of precipi-tation of 1–2 mm day21 (Kutzbach and Gallimore 1988;Mitchell et al. 1988; Kutzbach and Guetter 1986; Mitch-ell 1977). Again, the model results are consistent withthose obtained from more sophisticated models. Also,the simulations are in agreement with observational data(COHMAP Members 1988; Crowley 1983; Street andGrove 1979). Thus, the present ZAGCM is capable ofreproducing the sensitivity of monsoonal circulations tochanged external conditions such as those of the EarlyHolocene.
5. Summary and conclusions
This paper investigates the feasibility of using aZAGCM for studying the influence of the topographyon the annual cycle. For this purpose, a smoothed zon-ally averaged topography, which has a form similar tothat observed, is included in a two-layer primitive equa-tion global ZAGCM. The model has 58 lat resolution

MARCH 2000 791R A O E T A L .
FIG. 13. Three-month means (JJA) of the zonally averaged: (a) total precipitation (mm day21 ); (b) vertical velocity v at 500 hPa(1024 hPa s21 ) simulated by the model with mountain (full line) and with no mountain (dashed line). The zonally averaged convectiveprecipitation (full line) and large-scale precipitation (dashed line) simulated by the model (a) with topography and (b) withouttopography.
TABLE 2. Simulated and observed values of the zonally averagedU-index (U250 2U750), and V-index (V250 2 V750) (m s21), total pre-cipitation and convective precipitation (mm day21). The observationsare obtained from the NCEP–NCAR reanalysis data.
U-index V-index P Pc
Run with topographyRun without topographyObservations
26.5322.0520.61
20.9220.5720.65
5.084.644.57
5.054.64
and includes a bulk parameterization of the sensible heatflux and the parameterization of the large-scale precip-itation and cumulus convection. The model simulationsare compared with the observations obtained from theNCEP–NCAR reanalysis data. The results showed thatthere is good agreement between the simulated and ob-served annual cycles.
As monsoon is a response to annual cycle, the ca-pability of the model in capturing some monsoonlikevariations is investigated. The role of topography incontrolling the monsoon flow and its response tochanged external conditions are studied. Since there is
a larger amount of land in the Northern Hemispherecompared to the Southern Hemisphere, which, in turn,contains a larger amount of ocean, the monsoon cir-culation in the present model is driven by the differ-ential heating between land (to the north) and ocean(to the south). The model includes the effects of sen-sible and latent (condensation) heat fluxes and topog-raphy and thus contains the basic ingredients necessaryfor the simulation of a monsoon circulation. However,the land–ocean thermal contrast is reduced in the modeldue to the fact that the different fractions of the earth’ssurface covered by ocean, land, ice, and snow are con-sidered in each latitude belt. So, in analyzing the resultsone must keep in mind that they are obtained from a2D zonally averaged mechanistic model. The resultscorrespond to zonal means and not to regional featuresof the actual Asian monsoon. Also, the model includesa smoothed zonally averaged topography, which is dif-ferent from the Himalayan–Tibetan Plateau. So, themodel cannot reproduce exactly all the features ob-served in the monsoon system.
The results showed that the model even in the absenceof topography is able to capture some of the basic fea-

792 VOLUME 128M O N T H L Y W E A T H E R R E V I E W
FIG. 14. Three-month means (JJA) of the zonally averaged: (a) surface net radiation, (b) sensible heat flux, (c) latent heat flux, in W m22,and (d) land surface temperature (K). The full line corresponds to the values simulated by the model with mountain and the dashed linerefers to those obtained from the model with no mountain.
FIG. 15. Zonally averaged topography used in the experiment 1(increasing the elevation without changing the steepness of slope)and in the experiment 2 (increasing both the elevation and the steep-ness of the slope). The zonally averaged topography used in thesimulation of the annual cycle (Fig. 1) is also plotted for comparison.
tures of the monsoon circulation such as the seasonalwind reversal and the easterly jet in the boreal summer.However, in the absence of mountain the monsoon isweak and the subtropical jet does not abruptly jumpnorthward to its summertime position as noted in theobservations. In the case with mountain, the model re-produces the rapid northward jump of the westerly jetacross the mountain during the circulation onset. Furthermonsoon circulation penetrates farther north. Thisshows that the topography has an important role in caus-ing the sudden seasonal wind changes. Evaluation of U-and V-indices indicated that the model overestimates thestrength of the monsoon circulation in both the caseswith and without topography. However, the presence ofthe mountain intensifies the summer monsoon circula-tion and enhances the precipitation in the region. Thisincrease in precipitation is due mainly to the convectiveprecipitation.
The model was also run in order to investigate theeffects of high-elevation orography and its steep south-ern slope on the monsoonlike circulation. Two exper-iments were performed: 1) increasing the elevation oforography without changing the steepness of the slope,

MARCH 2000 793R A O E T A L .
FIG. 16. Simulated zonally averaged: (a) precipitation (mm day21),and vertical velocity at 500 hPa (1024 hPa s21) in experiment 1 (fullline) and experiment 2 (dashed line).
FIG. 17. Insolation at the top of the atmosphere: (a) modern controlvalues, and (b) departures (Holocene minus control experiment) fromthe modern control values. Units, W m22.
FIG. 18. Changes in the surface temperature (K). The Holocene ex-periment minus control experiment.
and 2) increasing both the elevation and the steepnessof the slope. The results showed that the steeper south-ern slope causes an increase in the rising motion and,consequently, an enhancement of the precipitation.Thus, the steepness of the southern slope seems tocontrol the strength of monsoon flow in the model.
To investigate the ability of the ZAGCM to test thesensitivity of the monsoonlike circulation to changedexternal conditions, the model was run using the solarradiation conditions during the Early Holocene (9000yr BP). The Holocene experiment showed that the pre-cipitation and circulation intensified, which agrees withpaleoclimatic evidence. It can be concluded that despitethe limitations of the present simple model, it was ableto capture the essential mechanisms responsible for pastclimatic change.
In summary, the present model is not only able tosimulate a monsoonlike circulation, but it is also capableof reproducing its sensitivity to changed external con-ditions. In general, the model results are consistent withthose obtained from sophisticated and complex three-dimensional GCMs and are in agreement with the ob-
servations, showing that the ZAGCM is a good com-plement to GCMs studies.
Acknowledgments. Thanks are due to the official re-viewers for many useful suggestions.

794 VOLUME 128M O N T H L Y W E A T H E R R E V I E W
REFERENCES
Berger, A., 1978: Long-term variations of daily insolation and qua-ternary climatic changes. J. Atmos. Sci., 35, 2362–2367.
Brown, J. A., and K. A. Campana, 1978: An economical time-dif-ferencing system for numerical weather prediction. Mon. Wea.Rev., 106, 1125–1136.
COHMAP Members, 1988: Climatic changes of the last 18 000 years:Observations and model simulations. Science, 241, 1043–1052.
Crowley, T. J., 1983: The geological record of climate change. Rev.Geophys. Space Phys., 21, 828–877.
Das, P. K., and H. S. Bedi, 1981: A numerical model of the monsoontrough. Monsoon Dynamics, J. Lighthill and R. P. Pearce, Eds.,Cambridge University Press, 351–363.
de Noblet, N., P. Bracount, S. Joussaume, and V. Masson, 1996:Sensitivity of simulated Asian and African summer monsoonsto orbitally induced variations in insolation 126, 115, and 6 KBP. Climate Dyn., 12, 589–603.
Fein, J., and P. L. Stephens, 1987: Monsoons. Wiley InterScience,632 pp.
Franchito, S. H., and V. B. Rao, 1992: Climatic change due to landsurface alterations. Climatic Change, 22, 1–34., and , 1995: On the simulation of sea surface temperaturewith a zonally averaged model. Global Atmos. Ocean Syst., 3,35–53., , and R. R. Silva, 1998: A parameterization of radiativefluxes suitable for use in a statistical-dynamical model. Meteor.Atmos. Phys., 69, 23–38.
Gadgil, S., S. Sajani, and participating AMIP Modelling Groups,1998: Monsoon precipitation in AMIP runs. WMO/TD-NO. 837,88 pp.
Gutman, G., G. Ohring, and J. H. Joseph, 1984: Interaction betweenthe geobotanic state and climate: A suggested approach and atest with a zonal model. J. Atmos. Sci., 41, 2663–2678.
Hahn, D. G., and S. Manabe, 1975: The role of mountains in theSouth Asian monsoonal circulation. J. Atmos. Sci., 32, 1515–1541.
Haltiner, G. J., and R. T. Williams, 1980: Numerical Prediction andDynamical Meteorology. 2d ed. John Wiley and Sons, 477 pp.
Held, I. M., and M. J. Suarez, 1978: A two-level primitive equationmodel designed for climatic sensitivity experiments. J. Atmos.Sci., 35, 206–229.
Kalnay, E., and Coauthors, 1996: The NCEP/NCAR 40-Year Re-analysis Project. Bull. Amer. Meteor. Soc., 77, 437–471.
Kitch, A., 1997: Mountain uplift and surface temperature changes.Geophys. Res. Lett., 24, 185–188.
Krishnamurti, T. N., 1987: Monsoon models. Monsoons, J. S. Feinand P. L. Stephens, Eds., John Wiley and Sons, 467–522.
Kuo, H. L., and Y.-F., Qian, 1981: Influence of the Tibetean Plateauon cumulative and diurnal changes of weather and climate insummer. Mon. Wea. Rev., 109, 2337–2356., and , 1982: Numerical simulation of the development ofmean monsoonal circulation in July. Mon. Wea. Rev., 110, 1879–1897.
Kutzbach, J. E., and P. J. Guetter, 1986: The influence of changingorbital parameters and surface boundary conditions on climatesimulations for the past 9000 years. J. Atmos. Sci., 43, 1726–1759., and R. G. Gallimore, 1988: Sensitivity of a coupled atmosphere/mixed layer ocean model to changes in orbital forcing at 9000years BP. J. Geophys. Res, 93, 803–821.
Lau, K.-M., and S. Yang, 1996: Seasonal variation, abrupt transition,
and intraseasonal variability associated with the Asian summermonsoon in the GLA GCM. J. Climate, 9, 965–985., J. H. Kim, and Y. Sud, 1996: Intercomparison of hydrologicprocesses in AMIP GCMs. Bull. Amer. Meteor. Soc., 77, 2209–2227.
Meehl, G. A., 1992: Effect of tropical topography on global climate.Annual Review of Earth and Planetary Sciences, G. W. Wheth-erill, A. L. Albee, and K. C. Burke, Eds., Vol. 20, Annual Re-views, Inc., 85–112.
Mitchell, J. F. B., 1977: The effect on climate of changing the Earth’sorbital parameters: Two summer integrations with fixed sea-sur-face temperature. Met 0 20 Tech. Note 11/100, 18 pp. [Availablefrom The Meteorological Office, Bracknell, Berkshire RG12252, United Kingdom.], N. S. Grahame, and K. H. Needham, 1988: Climate simulationsfor 9000 years before present: Seasonal variations and the effectof the Laurentide ice sheet. J. Geophys. Res., 93, 8283–8303.
Murakami, T., 1987: Orography and monsoons. Monsoons, J. S. Feinand P. L. Stephens, Eds., John Wiley and Sons, 331–364., R. V. Godbole, and R. R. Kelkar, 1970: Numerical simulationof the monsoon along 808E. Proc. Conf. on the Summer Monsoonof Southeast Asia, Norfolk, VA, Navy Weather Research Facility,39–51.
Rao, V. B., and S. H. Franchito, 1993: Response of a simple modelto the sea surface temperature anomalies. Ann. Geophys., 11,846–856.
Riehl, H., 1979: Climate and Weather in the Tropics. Academic Press,611 pp.
Saltzman, B., 1968: Steady state solutions for the axially-symmetricclimate variables. Pure Appl. Geophys., 69, 237–259., and A. D. Vernekar, 1971: An equilibrium solution for theaxially-symmetric component of the Earth’s macroclimate. J.Geophys. Res., 76, 1498–1524., and , 1972: Global equilibrium solutions for the zonallyaveraged macroclimate. J. Geophys. Res., 77, 3936–3945.
Stephenson, D. B., F. Chauvin, and J.-F. Royer, 1998: Simulation ofthe Asian summer monsoon and its dependence on model hor-izontal resolution. J. Meteor. Soc. Japan, 76, 237–265.
Street, F. A., and A. T. Grove, 1979: Global maps of lake-level fluc-tuations since 30 000 years BP. Quat. Res., 12, 83–118.
Tang, C.-M., 1976: The influence of meridional sloping topographyon baroclinic instability and its implications for macroclimate.J. Atmos. Sci., 33, 592–601.
Varejao Silva, M. A., S. H. Franchito, and V. B. Rao, 1998: A coupledbiosphere–atmosphere climate model suitable for studies of cli-matic change due to land surface alterations. J. Climate, 11,1749–1767.
Webster, P. J., 1983: Mechanisms of monsoon low-frequency vari-ability: Surface hydrological effects. J. Atmos. Sci., 40, 2110–2124., and K. M. Lau, 1977: A simple ocean–atmosphere climatemodel: Basic model and a simple experiment. J. Atmos. Sci., 34,1063–1084., and L. C. Chou, 1980: Seasonal structure of a simple monsoonsystem. J. Atmos. Sci., 37, 354–367., and S. Yang, 1992: Monsoon and ENSO: Selective interactivesystems. Quart. J. Roy. Meteor. Soc., 118, 877–926.
Yin, M. T., 1949: A synoptic-aerologic study of the onset of thesummer monsoon over India and Burma. J. Meteor., 6, 393–400.