molecular genetic manipulation of wine yeasts
TRANSCRIPT
1,n¡.
'ir1 ¡ ¡.¡ ;1.,:.,.: Ì i.Uiri^
1. L2_n>tr"ffiRrlìÍ{T
MOLECULAR GENETIC MANIPULATIONOF WINE YEASTS
BY
JENNY E. PETERING
B.Sc.(Hons) Monash University
A thesis submitted for the Degree of Doctor of Philosophy in the Faculty of
Agricultural and Natural Resource Sciences at The University of Adelaide.
Deparrnent of Plant Science
Waite Agricultural Research Institute
The University of Adelaide
tÉ \.,q
YO
December 1991

-11-
DECLARATION
The work presented in this thesis is my own unless otherwise acknowledged, and has
not previously been submitted to any university for the award of any degree of
diploma. This thesis may be made available for loan orphotocopying provided that an
acknowledgement is made in the instance of any reference to this work.
Jenny E. Petering
December 1991
111
ACKNOWLEDGMENTS
I sincerely thank my supervisors Dr Peter Langridge and Dr Paul Henschke for
their invaluable guidance, support and friendship throughout my candidature. Their
continual encouragement and advice was essential to my progress, and was very much
appreciated. I would like to acknowledge The Australian V/ine Research Institute for
the provision of an Australian Grape and Wine Research Council scholarship, and I
thank the staff and students of the institute for their coopedion and technical advice.
Various staff members of the V/aite and V/ine Institutes have provided me with
assistance during the course of this study. I specifically thank Andrew Dunbar
(photography), Lynne Giles (statistical analyses), Jan Nield and Nancy Davis
(laboratory organisation). I am also very grateful to my fellow postgraduate students
and friends, especially Carole Smith, Graham Due, Michael Burnet, Anne Tassie,
David Hein (Zeke), Phil Murphy, Jack Christopher and Dene Cuthbertson for their
camaraderie and humour over the past few years.
Finally, and most importantly, I thank my family - especially my parents- for
absolutely everything but particularly for their continual support and encouragement
throughout my studies.
-tv-
Publications arising from this thesis
Petering, J., P. Langridge and P. Henschke (1988). Fingerprinting wine yeasts.
Aust. NZ V/ine Ind. J. 3Q): a8-52.
Petering, J.E., P.A. Henschke and P. Langridge (1991). The Escherichia coli þ-
glucuronidase gene as a ma¡ker for Sacclnromyces yeast strain identification. Am. J.
Enol. Vitic. 42:6-12.
Petering, J.E., M.R. Symons, P. Langridge and P.A. Henschke (1991).
Determination of killer toxin activity in fermenting grape juice by using a marked
Saccharomyc¿s wine yeast strain. Appl. Env. Microbiol. 57: 3232-3236.
Conference proceedings
Petering, J.E., P.A. Henschke and P. Langridge (1989). Genetic engineering of wine
yeasts. Proc. 7th Aust. rü/ine Ind. Tech. Conf. Adelaide, Australia. pp.176-179.
Petering, J.E., P. Langridge and P.A. Henschke (1990). Identification of yeast strains
by molecular biology techniques. Proc. 9th Int. Oenol. Symp. Cascais, Portugal.
pp.178- 191.
-v-
Summary
A system has been established for the transformation of wine yeast strains. This
system utilizes a mutant Sacclaromyces cerevisíae acetolacøte synthase gene which confers
resistance to the herbicide sulfometuron methyl and acts as a dominant selection ma¡ker.
Satisfactory transformation efficiencies were achieved with both a self-replicating plasmid
and an integrating vector in several wine yeast strains. The integrating vector was
successfully targeted to the ILV2locus on chromosome XIII of the yeast genome, and was
stably maintained throughout fermentation. Fermentation trials indicated that the
transformation system does not adversely affect the growth kinetics or fermentation rate of
the wine yeast strain. Similarly, there were no significant differences in the pH
measurements or the alcohol content of wines produced by the parent and transformed
strÍuns.
This transformation system was used to develop a procedure for the genetic marking
of wine yeast strains. Marking was achieved by the introduction into wine yeasts of the
Escheríchia coli p-glucuronidase (GUS) gene. The GUS gene was adapted for expression
in yeast by ligating the Sacclaromyces cerevisiae alcohol dehydrogenase promoter and
terminator sequences to the coding region of the Escherichia coli uidA gene. The GUS
construct was introduced into the genome of a wine yeast strain by integration into
chromosome XIII. The marked strain did not show any significant differences in
fermentation performance when compared with the original parent strain. Stability of the
marker was confirmed by the observation that the GUS construct was maintained in > 99Vo
of the total yeast population at the end of the fermentation. A simple assay procedure was
developed to detect GUS activity in the marked yeast cells or colonies. This method
provides a means for genetic marking and subsequent rapid identification of wine yeast
strains of choice.
-vl-
The application of the marked strain to studies in oenology was demonstrated in two
separate investigations. First, the efficiency of killer toxin in fermenting grape juice was
determined. The ma¡ked killer strain was cured of its M-dsRNA genome to enable direct
assessment of the efficiency of killer toxin under fermentation conditions. Killer activity was
clearly evident in fermenting Riesling grape juice of pH 3.1 at 18oC but depended on the
proportion of killer to sensitive cells at the time of inoculation. Killer activity was detected
only when the ratio of killer to sensitive cells exceedd l:2. At the highest ratio of killer to
sensitive cells tested (2:1), complete elimination of sensitive cells was not achieved.
Secondly, inoculation efficiency of the marked strain under various fermentation
conditions was analysed. Va¡iables studied were time of inoculation, addition to the must of
SO2 (100 mglL),production of killer toxin and fermentation temperature. Results indicated
that dominance of the ferment by the inoculated strain could be ensured by an early
inoculation regardless of any other variable. A combination of SO2 treatment and low
fermentation temperature (10oC) was also effective in ensuring inoculation success.
This thesis describes, therefore, the establishment of wine yeast transformation
procedure and subsequent use in the development of a yeast genetic marking system; and
demonstrates the application of ma¡ked yeast strains to the wine industry.
-v11-
Table of Contents
Chapter I General introduction and Project aims.
Chapter 2 Literature Review..2.1,
2.2
ORIGIN AND CLASSIFICATION OF WINE YEASTS..
GENETIC FEATURES OF WINE YEASTS..
2.2.1 Life cycle and sporulation.............
2.2.2 Chromosomes and ploidy.....
2.2.3 Extrachromosomal elements..
2.3 GENETTC TECHNIQUES FOR YEAST STRAIN IMPROVEMENT.......
2.3.1 Clonal selection.
2.3.2 Clonal selection after mutagenesis.
2.3.3 Hybridization......2.3.4 Rare mating....
2.3.5 Spheroplast fusion.....
2.3.6 Recombinant DNA technology.............
2.4 TARGETS FOR WINE YEAST STRAIN DEVELOPMENT
2.4.1 Sedimentation and flocculation.............
2.4.2 Non-foaming mutants....
2.4.3 Sulfite and Sulfide Production...........
Ethanol tolerance.
Higher alcohols..
Killer factor.
Malolactic fermentation
Genetic marking..
2.5 CONCLUSIONS
Chapter 3 Materials and MethodsSTRAINS AND MEDIAYEAST TRANSFORMATION METHODS.............
3.2.1 Alkali cation transformation
3.2.2 Spheroplast fusion method....
3.2.3 Electroporation of intact yeast cells.........
3.3 RECOMBTNANT DNA TECHNIQUES........
3.3.I Restriction digests, fragment isolation and 1igation...............
3.3.2 Electrophoresis of DNA
3.3.3 Bacterial transformation.
3.3.4 Plasmid isolation..
2.4.4
2.4.5
2.4.6
2.4.7
2.4.8
3.1
3.2
3.3.5 Yeast DNA isolation..
Page
1
3.3.6 Southern hybridization..........
PROTEIN SYNTHESIS 4N4LYSIS............
3.4.L Incorporation of radioactivity into yeast proteins....
3.4.2 Electrophoresis of proteins..............
PULSED FIELD GEL ELECTROPHORESIS.....p-GLUCURONIDASE (GUS) ASSAYS.
3.6.L Enzyme activity assays.....
3.6.2 Agar plate assays.....
3.6.3 Microscopic visualization..........
3.7 KILLER YEAST MANIPULATIONS..
3.7.L Curing of killer strain 34M........
3.7.2 Assay for cured strain.......
3.7.3 dsRNA isolation..
3.8 MICROVINIFICATION TRIALS..
3.8.1 Fermentation procedure
3.8.2 Wine analysis..
3.9 LARGE SCALE LABORATORY FERMENTATIONS
Chapter 4 Establishing a system for the geneticmanipulation of wine yeasts..
4,1 INTRODUCTION...
3.4
3.5
3.6
-v111-
Selection systems for identifying transformants......
Gene transfer vectors....
Tranformation procedures.............
Expression and secretion of foreign proteins....
35
35
35
36
36
37
37
38
38
38
38
38
39
39
39
40
40
42
42
42
45
48
50
52
52
52
57
60
&68
69
4.1.5 Chapter aims
4.2 RESULTS.......Choice of a selectable marker.............
Choice of a transformation procedure
Analysis of transformants.........
4.3.4 Fermentation trials.......4.3.5 Gene regulation during fermentation............
4.3 DISCUS SION.
Chapter 5 Development of a system for wine yeast
strain marking and identification5.1 INTRODUCTION
5.1.1 Yeast chromosomal fingerprints.
5.1..2 Marked strains.....
4.t.t4.t.24.r.3
4.t.4
4.2.r
4.2.2
4.3.3
72
72
74
78
795.2 RESULTS......
-D(-
5.2.1 V/ine yeast chromosome fingerprinting....
5.2.2 GUS-Vector construct.
5.2.3
5.2.4
5.2.5
Transformation and Southern analysis....
Development of a GUS assay for yeasts
p-Glucuronidase enzyme activity....
79
80
81
83
87
89
92
93
5.2.6 Fermentation triaIs.............
5.2.7 Stability of GUS construct.
5.3 DIS CUS SION.
Chapter 6 Determination of killer toxin activity infermenting grape juice using a markedS ac charomy c e s strain...
6.1. INTRODUCTION..6.2 RESULTS
6.2.1 Curing of Strain 34M........6.2.2 Analysis of killer activity during fermentation.
6.3 DISCUSSION.
Chapter 7 Comparison of fermentation conditionsby use of a marked strain
109
99
99
101
101
r02
r07
109
110
111
t1ltt2tl4lt7It9119
r25
r27
7.1 INTRODUCTION...7.1.L Killer yeast inoculation.............
7 .I.2 Addition of sulfur dioxide to grape must.
7.1.3 Temperature of fermentation.
7.2 RESULTS
7.2.1 Fermentations conducted at 20oC
7.2.2 Fermentations conducted at l0oC
7.2.3 Killer activity in the indigenous yeast population
7 .3 DISCUS SION.
Chapter I General Conclusions
References
Appendix 1 Pubtications 156
-1-
chapter 1 .General introduction and Project aims
Yeasts were employed in the production of wine for several thousand years before
their existence was recognised by Antonie van læeuwenhoek in 1680. During the second
half of the nineteenth century, Louis Pasteur demonstrated that living yeast cells were
responsible for fermentation, or the conversion of sugar to ethanol and ca¡bon dioxide
@emain and Solomon, 1981). Originally, yeasts present on grape skins and equipment
were responsible for the "spontaneous" fermentation involved in wine-making. For the last
century, however, the availability of pure yeast cultures has improved reproducibility in
fermentations and the quality of the product (Tubb and Hammond, 1987). It is now
possible to select specific yeast str¿ins on the basis of their fermentation performance and
the characteristics of their product.
Although the wine indusüry rapidly adopted pure culture inoculation technology, it
has taken little active interest in yeast genetics and strain development programs (Thornton,
19S3). Recent trends in the wine market, however, demand the modification of traditional
wine yeast strains in the development of more cost-effective wine making practices.
Towa¡d this end, it is important to define the requirements of the wine indusury in genetic
terms - to select specific targets for yeast breeding programs. In order to identify these
targets, it is necessary to consider the most desirable characteristics of a wine yeast
(Thornton,1983):
- the efficient conversion of gape sug¿lr to alcohol;
- the rapid initiation of fermenøtion immediately upon inoculation;
- the ability to ferment at low temperatures such as 10-14oC;
- tolerance to sulfur dioxide (used in wine making as a sterilizing agent and as
an anti-oxidant);
- tolerance to ethanol (in order to ferment to dryness);
W/\ITE INSTITUÏE
!IFRÀRY
-2-
- low foaming activity;
- low production of volatile acids, acetaldehyde and sulphite;
- low hydrogen sulfide or mercaptan production;
- relatively low higher alcohol production;
- effective flocculation at the end of fermentation to aid clarification;
- relatively high glycerol production to contribute to the sensory qualities of the
wine;
- the production of desirable fermentation bouqueq
- resistance to killer toxins and other zymocidal compounds.
To date, no wine yeast in commercial use has all the cha¡acteristics listed above, and
it is well established that wine yeasts vary in their wine making abilities. The major source
of this va¡iation is the genetic constitution of the wine yeasts (Thornton, 1983). Although
some of the requirements listed above are complex and difficult to define genetically without
a better understanding of the biochemistry involved, they comprise specific targets for wine
yeast modification programs.
- Other possible targets for strain modification are processes involved in yeast
management and in the synthesis of new prducts. For example, genetic manipulation can
be used to insert specific markers into wine yeast strains as an aid to strain identification.
This would be particularly useful for wineries using more than one straid, and in the
optimization of must processing strategies. An area which has not yet been exploited is the
use of wine yeasts to produce valuable by-products. Spent yeast from industrial processes
is already used to produce yeast extracts and as an ingredient in foods and flavourings.
Possibilities exist to produce higher value materials such as vitamins, enzymes,
carbohydrates and lipids from wine yeasts. Genetic manipulation could facilitate maximum
formation of the required product.
-3-
These and other potential applications of genetic manipulation to industrial yeast
strains have been recognised for some time (Spencer and Spencer, 1983). Since the
pioneering genetic studies of V/inge (1935), in which the basic life-cycle of Sacclnromyces
was established, yeast strains have been interbred to produce new hybids. Classical genetic
methods which have been involved in yeast manipulation programs to date include mutation
and selection, hybridization, rare mating and spheroplast fusion (Tubb and Hammond,
1987). These techniques have enjoyed only limited success in the past, essentially for two
reasons. First, methods such as cross breeding involve mating which requires spore
formation; industrial yeasts, however, tend to be polyploid, which means they have a
reduced ability to form spores. Secondly, although other techniques do not require spore
formation on the part of yeast strains, they do involve gross and non-specific exchanges of
genetic material. Therefore, while it is possible to intoduce favourable cha¡acteristics into
yeast strains using these techniques, it is quite probable that deleterious properties will be
introduced simultaneously.
The relatively new methods of recombinant DNA technology overcome some of the
problems inherent in the more traditional techniques. Recombinant DNA technology does
not require spore formation by the parental yeast strains. It is, by nature, highly specific in
its action as it allows the transfer of single genes from one yeast strain to another. Another
advantage of this technology is that it offers the potential to introduce genes from any
organism (plant, animal, bacterial or fungal) into yeast strains.
The application of recombinant DNA technology to industrial yeast strains is still a
relatively young area of research. Although the brewing indusÇ has invested some effort
in this field, the technology is still not yet well enough established for commercial or
industrial use. There have been no reports to date of the successful application of
recombinant DNA technology to wine yeast strain improvement. The aim of this project is
to establish a system for genetic engineering of wine yeast strains which will be suitable for
industrial application. The following criteria a¡e considered most important in achieving
-4-
this aim: an efficient transformation method for the introduction of foreign DNA into wine
yeasts; demonstration that the introduction of foreign DNA does not adversely affect the
fermentation performance of the yeast strain; stability of the foreign DNA in the yeast
population throughout the fermentation; and appropriate expression of the foreign gene in
the yeast cell.
A further objective is to utilise this sysæm in the development of a strain which will
have commercial application. The targeted area for development will be the genetic marking
of wine yeast strains. The aims here a¡e twofold. First, to introduce a novel property into
wine yeasts to enable rapid and unequivocal strain identification. Secondly, an attempt will
be made to demonstrate the potential application of such a ma¡ked strain in oenological
studies.
-5-
Chapter 2 Literature Review
2.T ORIGIN AND CI/.SSIFICATION OF WINE YEASTS
The original wine yeasts strains were derived from the natural population of yeasts
that occur on the skins of grapes. Reports of the isolation of yeast species from grapes,
wines and winery equipment from the different wine regions a¡ound the world have been
reviewed by Kunkee and Amerine (1970), Kunkee and Goswell (1977), Benda (1982),
Lafon-Lafourcade (1983) and Farkas (1983). Approximately 200 wine yeast species are
listed in the table by Kunkee and Goswell (1977), however, many of these species are only
occasionally associated with grapes and wines. According to Lafon-Lafourcade (1983),
there a¡e only about 14 yeast species that are frequently isolated from musts and wines and
a further 4O species which are sometimes present.
The general conclusions that have been drawn from these reports are that a
progression of yeast species are involved in natural fermentation. Grapes and freshly
extracted grape juice have a dominant flora of apiculate yeasts such as Kloeckera apiculata
and Hanseniaspora uvarurn, as well as species of Candida, Hansenula, Metschníkowia and
Pichia. These species exhibit limited growth during the early stages of alcoholic
fermentation but are inhibited as the ethanol concentration rises to 3-4Vo (voVvol). The
more alcohol tolerant species of. Søcclnromyces, often initially present in smaller numbers,
then proliferate and dominate the remainder of the fermentation. Fermented wines may be
spoiled by the growth of alcohol tolerant species such as Zygosacclnromyces bailii, species
of Sacclnromyces and film-forming yeasts such as Pichiamentbranaefaciens.
V/ine yeasts of the genus Saccløromyc¿s have been catagonzed taxonomically to at
least 29 different species or varieties (Lodder, 1970; Kunkee and Goswell, 1977). Most of
these species are separated primarily on the basis of their sugar fermentation and
-6-
assimilation patterns. In many cases, however, a mutation in a single gene can result in the
loss of capacity to ferment a sugar - few would consider such a mutant strain as a new
species. A more fundamental means of classification is based on DNA sequence
homology. Vaughan and Martini (1980) have reported ttrat ttre G+C content of the DNA of
S. cerevisiae, S. bayanus, S. chevalieri, S. italicils, and S. uvarum ranges from 38.5 to
39.5Vo. Furthermore the DNA sequence homology is greater than9D%o. They concluded
that it is best to consider all these strains as belonging to the one species; S. cerevisiae
having taxonomic priority. Because of its dominance in alcoholic fermentation, .S.
cerevisiae has emerged, almost universally, as the single most important species associated
with the winemaking process. As a consequence, this species is now widely recognised as
'the wine yeast'.
In some established vineyards of Europe, grape juice is still allowed to ferment
naturally with the yeasts originating from the grapes and the flora established on winery
equipment. However, in countries such as Australia, USA and South Africa, many
winemakers use pure yeast starter cultures (usually a strain of S. cerevisiae) to inoculate the
must. Pure culture inoculation was first described by Hansen (1886, 1888), who
introduced its use into brewery practice. The advantages of inoculating with a pure culture
of S. cerevisiae are that it promotes a rapid and even onset of fermentation; allows the
conduct of a controlled fermentation; and inhibits the growth of indigenous yeasts which
may detract from wine quality and even lead to wine spoilage (Rankine and Lloyd, 1963;
Rankine, 1977; Kunkee, 1984).
Although the term pure culture is still in use, is should be noted that this does not
necessarily mean that the cultwe is genetically uniform. The cultures ¿¡re pure in the sense
that they were derived from a single cell. However, after years of mass propagation of
these cultures, mutations are likely to occur and may be expressed (even though they are
recessive) through mitotic crossing-over or gene conversion. An example of the
heterogeneity of a'pure' culture is given by Zimmerman (1978) who isolated a strain with
-7-
considerably improved characteristics from successive single-cell cultures of an Epernay
yeast.
2.2 GENETC FEATURES OF WINE YEASTS
Genetic studies with S. cerevisiae were pioneered at the Carlsberg Laboratories in
the 1930's by Winge who first observed haploid and diploid phases in the life cycle of
Sacchnromyces (Winge, 1935). The early literature on yeast genetics has been reviewed by
Lindegren, L949;V/inge and Roberts, 1958; and Mortimer and Hawthorne, 1969. A brief
review of the genetics of S. cerevisiae will be described here, particularly as it relates to
wine yeast strains and methods for strain modification.
2.2.t Life c]¡cle and sporulation
S. cerevísiae can exist in either the haploid or diploid state. Strains in which the
haploid form is stable and can be maintained for many generations, are termed heterothallic.
The haploids from such strains exist as one of the two mating types, MATa or MATcr, and
mate to form diploids when a cell of one mating type comes into contact with a cell of the
other mating type.
Strains in which cell fusion and diploid formation occur among cells derived from a
single spore a¡e termed homothallic. This behaviour is caused by the allele HO (Harashima
et al.,197 ;Hicks and Herskowitz, t976), such strains being genotypically HO/HO. The
presence of the HO gene brings about a high frequency of switching between mating types
during vegetative growth. Under the influence of this gene, the mating type locus, MAT,
readily changes from MATa to MATø or vice versa. The MAT gene is found on
chromosome III of the yeast genome together with two silent genes HMLcr and HMRa
which provide the information to allow the switch of mating type at the MAT locus. Cells
of homothallic yeasts have to bud at least once before they are competent to switch mating
-8-
type, but thereafter a high frequency of switching occurs at each budding for many
generations (flerskowitz and Oshima, 1981). The surveys that have been made of wine
yeasrs indicate that they are t¡pically homothallic (Thornton and Eschenbruch,1976; Snow,
L979; Kusewicz and Johnston, 1980). Because of poor spore viability it has in many cases
been impossible to isolate complete tetrads, and therefore it has not been possible to
determine whether the original strain is genotypically HOÆIO or HO/ho. The overall
information available however, indicates that the majority of wine yeasts are genotypically
HO/HO.
In both homothallic and heterothallic strains, mating takes place when the cells of
opposite mating type come into close proximity. Cells of a-mating type produce an
oligopeptide (12 or 13 amino acid residues) calted ct-factor which arrests a-mating type cells
in the Gl phase and causes a-cells and c-cells to adhere to each other. Cells of a-mating
type produce a-factor which has simila¡ effects on cr<ells. In the presence of these factors
the cells adhere and cytoplasmic fusion takes place to form a heterokaryon. Nuclear fusion
follows rapidly to give î zy5ote (Lindegren and Lindegren, 1943). By subsequent cell
division this forms the diploid phase of the yeast life cycle which can be stably maintained
for many generations.
Meiosis and sporulation of diploid cells is triggered by nitrogen deprivation in the
presence of a non-fermentable ca¡bon source, and will only occur if MATa and MATa
genes a¡e both present. Following entry into meiosis the chromosomes in the yeast nucleus
undergo premeiotic DNA synthesis, pairing, recombination and segregation. Spore walls
grow and envelope four haploid genomes (two each of a and d mating types), forming the
characteristic four-spored ascus. V/hen placed in suitable nutrient media, the spores
germinate to form haploids and begin the cycle once more.
However, wine yeasts behave very differently from laboratory strains: they
generally sporulate inefficiently, they produce few viable spores of which most are unable
-9-
to mate, their chromosomal constitutions are unknown, they show a grert deal of genetic
heterogeniety and generally lack selectable genetic ma¡kers (Snow, 1983; Spencer and
Spencer, 1983; Beckerich et al.,1984; Subden, 1987; Rank et a1.,1988).
2.2.2 Chromosomes and oloidy
The chromosomes of S. cerevisíae a¡e located in the cell nucleus and account for 80-
857o of the total yeast DNA (Petes, 1980). In haploid strains, chromosomal DNA has a
molecular weight of l0l0Da, which is equivalent to 17000 kilobase pairs (kbp). To date,
approximately 750 loci have been mapped to 17 chromosomes (Mortimer et a1.,1989).
Each chromosome is a single DNA molecule of between 150 and 2500 kbp. As is the case
with higher eukaryotes, yeast chromosomes also contain basic histone molecules. In
contrast with higher organisms, however, S. cerevisiae DNA contains a relatively small
fraction of repeated sequences @angman andZaktan, 1981).
Mobile genetic elements are found in Saccharomyces strains. These elements
(called Ty) consist of a 5.1 kbp DNA sequence flanked by a 250 bp repeated sequence
(Boeke et a1.,1985). As many as 35 copies of Ty can be present per haploid genome and
their ability to ranspose from one chromosomal location to another can result in substantial
rearrangements of the genome (Scherer et a1.,1982). The random excision and insertion of
Ty elements into the genomes of wine yeasts can therefore inactivate genes encoding
desirable proteins and cause genetic instability of selected strains. The reverse can also
occur, so that improved wine yeast strains evolve.
In most laboratory studies, the strains of. S. cerevisiøe used are either haploid or
diploid. Industrial strains, however, are predominantly diploid or polyploid. The precise
determination of the chromosome number of yeast strains is difficult, since they are too
small for direct chromosome counts. Methods including the determination of DNA-content
per cell, measurement of cell volume, and irradiation and death rate have been used to
-10-
esrimate the ptoidy of yeast strains (Gunge and Nakatomi, L97I; Lewis et al.,1976; Aigle
et a1.,1983; Takagi et al., 1985). These procedures, however, are problematic. The
determination of DNA content is dependent on very specific cell concentrations. Va¡iation
in the chromosomal sizes of industrial strains could also affect the precision of the test.
Although the cell size is clearly a function of ploidy, most individual strains of the same
ploidy have sizes significantly different from other strains in the same ploidy group.
Furthermore, aneuploidy cannot be determined by these methods. The majority of attempts
to estimate the ploidy of brewing and distitling yeasts have relied on measuring the DNA-
content per cell and comparing this with the value obtained from defined haploid strains.
Results from these studies suggest that many brewing and distilling yeasts are polyploid,
particularly riploid, tetraploid or aneuploid (Tubb and Hammond, 1987)
Where strains have been crossed to laboratory haploids, segregations of genetic
ma¡kers can provide insight into the ploidy of industrial yeast strains. Using this approach,
Cummings and Fogel (1978) were able to show that two wine yeasts were almost certainly
normal diploids since matings of ascospores with cells of laboratory strains gave regulat 2;2
segregations for markers on 13 of the 16 known yeast chromosomes. One of the wine
yeast strains studied by Thornton and Eschenbruch (1976) was also probably diploid, as it
showed 2:2 segregations for most markers on six different chromosomes. On the other
hand, Takahashi (1978), in a study of a widely used commercial German wine yeast (Hefix
1000), concluded that it was about, if not exactly, tetraploid and had an alalala mating
locus genotype.
Circumstantial evidence supporting the wide-spread occurrence of aneuploidy
and/or polyploidy among wine yeast strains includes observations of poor spore viability,
great variability in growth rates among spore progeny, and a very low frequency of mating-
competent meiotic segregants. It is not yet clea¡ whether polyploidy on wine yeasts is
advantageous. Some resea¡chers claim that the polyploid state might enable industrial
yeasts to harbour a high dosage of genes important for efficient fermentation (Mowshowitz,
-11-
L979; Stewart et a1.,1981). It is known, however, that polyploid/anueploid state makes
analyses of important oenological traits more difficult and complicates the genetic
improvement of wine yeast strains.
2.2.3 ExEachromosomal elements
A number of extrachromosomal genetic elements have been described in yeast, and
are discussed below.
2 um DNA
Most laboratory strains of S.cerevisiae contain a class of small extrachromosomal
DNA molecules that are about 2pm in length (Sinclair et al.,1967). The molecules are
generally referred to as the 2pm plasmids. There are usually 50 to 100 copies of 2pm DNA
per cell and they represent approximately 5Vo of the total yeast DNA. These circular DNA
molecules consist of two identical repeats of 599 bp separated by two unique regions of
2774 and 2346 bp (Broach, 1981). Portions of the DNA a¡e transcribed into three
different polyadenylated mRNA molecules which can direct protein synthesis ínvitro. One
of these genes (FI-P) produces a protein which is actively involved in 2pm recombination
(Cox, 1983), while ttre others (REPI and REP2) are required for stable replication (Broach,
1982). Their function in the yeast cell has not been established and since phenotypically
normal yeast strains have been identified that lack the 2 pm plasmid (Livingston,1977),
they are not required for cell viability. Other than its own maintenance, the 2 ¡rm plasmid
appears to confer no advantage on the host cell.
Although most of this information has been obtained with laboratory strains, a2¡tm
DNA of similar structure is found in wine yeast strains. The 2pm DNA seryes an important
tool in the genetic manipulation of wine yeasts, as many plasmid vectors are based on the
2pm origin of replication.
-t2-
Mitochondrial DNA
In laboratory strains, mitochondrial DNA has a molecular weight of.about 50 x 106
Da and consists of a 75 kbp circular molecule. It is present at 10-40 molecules per haploid
cell and represents between 5 and 207o of the total cell DNA. It is very A-T rich compared
with chromosomal DNA resulting in a lower bouyant density (Fangman andZakran, 1981).
Mitochondrial DNA shows typical cytoplasmic inheriønce and its replication is independent
of nuclear control, taking place throughout the cell cycle (Newlon and Fangman, L975).
The mitochondrial genome caries the genetic information for only a few essential
mitochondrial components; more thang}Vo of mitochondrial proteins are coded by nuclear
genes (Dujon, 1981). Mutations in mitochondrial DNA produce petite strains which are
unable to utilize non-fermentable substrates. Such respiratory-deficient mutations can range
from point mutations (mir) through deletion mutations (p-) to complete elimination of
mitochondrial DNA (po).
The generation of petite mutants of wine yeasts occurs spontaneously at quite high
rates. It is important to note, however, that yeasts with different mtDNAs can differ in their
flocculation characteristics, lipid metabolism, higher alcohol production and the formation
of flavour compounds (Lewis et al., 7976; Hammmond and Eckersly, 1984). This
indicates the importance of mtDNA encoded functions. For this reason, petite strains are
not used for wine making.
Killer factor
Many strains of Saccharomyces yeast contain cytoplasmic double-stranded RNA
molecules (dsRNA), encapsidated in virus-like particles (Tipper and Bostian, 1984). There
are two main varieties of dsRNA molecules with characteristic properties. L dsRNA is
present in most yeast strains and encodes the capsid protein of the virus-like particles. M
dsRNA is present only in killer strains of. Saccharomyces (Wickner, 1983) and has been
-13-
shown to encode both a killer toxin, which is lethal to sensitive strains, and the immunity
factor which prevents self-killing. Both L and M dsRNA molecules are linear but they have
little sequence homology. In killer strains there are normally about 12 copies of M dsRNA
per cell and about 100 copies of L dsRNA per cell. Killer strains can be cured of M dsRNA
by growth at elevated temperature or by treatment with cyclohexamide (Fink and Styles,
1973); such cured strains often produce more L dsRNA. The maintenance, regulation and
expression of M dsRNA a¡e all regulated by nuclear genes, many of which have been
mapped (Wickner, 1983).
Killer activity has been detected in yeasts isolated from estabtished vineyards and
wineries in va¡ious regions of the world including Europe and Russia (Barre, 1984; Gaia,
1984: Naumov and Naumova, 1973), South Africa (Tredoux et a1.,1986) and Australia
(Heard and Fleet, 1987a,b). Killer factors are of interest to the wine industry for two
reasons. First, van Vuuren and Wingfield (1986) showed that stuck or sluggish wine
fermentations can be caused by contaminating killer yeasts. Secondly, in theory, selected
killer yeasts could be used as the inoculated strain to suppress growth of undesirable wild
strains of Saccharomyces cerevísiac during grape juice fermentation.
Other senetic elements
Several minor genetic elements have been described over the years. The y factor
(Cox, 1965) is a potentiator of nonsense suppression. It is inherited cytoplasmically and
has been shown not to be associated with dsRNA, 2pm DNA or the mitochondrial genome.
tURE3l allows cells growing on ammonia or glutamate to use ureidosuccinate and so
bypass ura2 mutants. It is inherited cytoplasmically but is not distributed to all progeny at
meiosis (Aigle and Lacroute, 1975). 20S RNA is a sporulation-specifrc RNA molecule
whose synthesis is controlled by a cytoplasmic genetic element. It is not present in
vegetative cells and is only produced by cells under sporulation conditions (Kadowaki and
Halvorson, l97 L).
-14-
Due to the lack of appropriate investigations, none of these minor genetic elements
have been described in wine yeast strains.
2.3 GENETIC TECHNIQUES FOR YEAST STRAIN IMPROVEMENT
Several genetic techniques can be used in yeast improvement programs. Some of
these techniques are used to recombine or rearrange the entire genome, whereas others alter
specific regions of the genome. Techniques having the greatest potential in the genetic
improvement of wine yeast strains include clonal selection; clonal selection after
mutagenesis; hybridization; spheroplast fusion; ra¡e-mating; and recombinant DNA
technology. All of these methods have been used with industrial strains (either brewing,
distilling or wine yeasts) and will be described below.
2.3.1 Clonal selection
This method takes advantage of the natural genetic va¡iation present in wine yeast
strains. Some degree of heterozygosity is almost certain to be present in all yeast strains
and new substrains may arise, possibly through mutation, but more likely through mitotic
recombination during vegetative growth. The selection procedure requires the testing of
large numbers of clones derived from single cells of the parental strain. An example of the
successful use of clonal selection in which va¡iants of an Epernay yeast with improved
fermentation characteristics were isolated has already been cited (Zimmerman, 1978). It has
also been used to select non-foaming wine yeast mutants (Ouchi and Akiyama, 1971;
Eschenbruch and Rassell, 1975); variants with improved ethanol tolerance (Brown and
Oliver, 1982); and strains with reduced H2S production (Rupela and Taura, 1984).
-15-
2.3.2 Clonal selection after mutagenesis
Selection after mutagen treatment has been used in the improvement of wine,
brewing, baking and distiller's yeasts. The common mutagens used with wine yeasts have
been UV or X-rays, ethyl methane sulfonate (EMS), N-Methyl-N-nitro-N-ninosoguanidine
(NTG), N-nitrosourea, or diethylstilbestrol (Tubb and Hammond, 1987). Since many of
the desirable mutations ¿¡re recessive, their expression in diploid or polyploid wine strains
has resulted from homozygosity brought about by gene conversion or mitotic crossing
over.
Molzahn (1977) employed mutagenesis to successfully isolate brewing yeast
mutants with increased flocculation, and with modified abilities to produce diacetyl and
hydrogen sulfide. Ingraham and Guymon (1960) used ultraviolet light to generate
isoleucine and valine requiring mutants that produced only trace amounts of isoamyl alcohol
and isobutyl alcohol respectively. From EMS treated wine yeasts, Rous ef al. (1983)
isolated leucine auxotrophic recessive mutants that also produced reduced concentrations of
higher alcohols.
Mutagenesis has the potential to disrupt or eliminate undesirable characteristics and
to enhance favourable properties in wine yeasts. However, the heavy mutagen treatment
frequently used could produce mutations in addition to the one of interest, which is a
possible disadvantage of this method.
2.3.3 Hybridization
Hybridization involves the mating of haploids of opposite mating-types to yield a
heterozygous diploid. Recombinant progeny are recovered by sporulating the diploid,
recovering individual haploid ascospores and repeating the mating/sporulation cycle. The
fact that wine yeasts are generally homothallic complicates the use of this procedure.
-16-
However, this problem can be overcome by direct spore-cell mating, as mating type
switching does not occur until the third or fourth generation of growth after spore
germination Clakano and Oshima, 1970).
Thornton (1982) used selective hybridization of pure culture wine yeasts to
significantly improve fermentation efficiency (from 84 to 937o). Also, useful killer wine
yeast strains have been bred by hybridization of a killer sake yeast with mesophilic (Hara er
a/., 1980) and cryophitic (Hara et a1.,1981) wine yeass. Hybridization programs are also
hampered by the poor sporulation and low spore viability of wine yeast strains.
Consequently, this breeding method has not been widely employed in the improvement of
wine yeasts.
2.3.4 Rare mating
Industrial yeast strains which fait to show a mating-type can be force-mated with
haploid a or o str¿ins. In this procedure, known as rare mating, a large number of cells of
the parental strains are mixed together and a strong positive selective pressure is applied to
identify the ra¡e hybrids. Hybrids are usually selected as respiratory-suffrcient prototrophs
from crosses between a respiratory-deficient mutant of the industrial strain and an
auxorrophic haploid strain (Gunge and Nakatomi, 1971). Hybrids produced by rare mating
are often able to sporulate (Spencer and Spencer,1977) providing another possible route
for the genetic analysis of industrially important cha¡acteristics. By rare mating,Tubb et al.
(1981) constructed brewing strains with the ability to ferment dextrins.
An important development has been the use of r¿rre mating to generate progeny
('cytoductants' or 'heteroplasmons') which receive cytoplasmic contributions from both
parents but retain the nuclear genome of only one of them. This form of strain construction
has been termed cytoduction. The technique has become highly effrcient through the use of
haploid strains which carry the karl mutation and are, therefore, defective in nuclear fusion
-17 -
(Conde and Fink, 1976). Such strains can be used as donors of cytoplasmic genetic
material to industrial strains. For example, transfer of the double stranded (ds) RNA
determinants for the Kl zymocin (and associated immunity) has been used to produce
brewing strains with anti-contamination properties (Young, 1981,1983; Hammond and
Eckersley, 1984).
2.3.5 Spheroplast fusion
Spheroplast fusion provides another direct asexual technique for manipulating
industrial yeasts genetically and, like rare mating, can be used to produce either hybrids or
cytoductants. The procedure was first described by van Solingen and van der Platt (1977).
Spheroplasts are formed by removal of the cell wall with an appropriate lytic er^zyme
preparation such as Zymolyase (a glucanase from Arthrobacter luteus) in a medium
containing an osmotic stabilizer (usuatly 1.0 M sorbitol) to prevent cell lysis. Spheroplasts
from different strains are fused together in the presence of polyetþlene glycol and calcium
ions, and then allowed to regenerate their cell walls in an osmotically stabilized agar
medium. Spheroplast fusion can also be obtained by electroporation in a weak
inhomogeneous alternating electric field. Fusion of the aligned cells can then be induced by
applying a higher-intensity elecric field (Tubb and Hammond, 1987).
Spheroplast fusion of non-sporulating yeast strains serves to remove the natural
bariers to hybridisation. Cells of different species, or levels of ploidy, can be fused. The
use of spheroplast fusion to modify an industrial yeast is illustrated by the construction of
brewing strains able to ferment dextrins (Freeman, 1981; Russell et a1.,1983). Yokomori
et at. (1989) produced cytoductants of a sake wine yeast by spheroplast fusion that
exhibited good fermentation performances and produced quality wine with low volatile
acids. Spheroplast fusion has also been used to create yeast strains with improved tolerance
to ethanol (Seki er a1.,1983).
-18-
2.3.6 Recombinant DNA technoloe.v
The various mating procedures described above result in parental strains
contributing major portions of their respective genomes. This hybridization is essentially
empirical and a lengthy selection procedure is often required to obtain a suitable strain from
the large number of recombinant types produced. Recombinant DNA technology,
however, provides the opportunity to specifically alter single characteristics in wine yeast
strains. Furthermore, genetic engineering permits introduction of genes from any source
into wine yeasts.
The addition of exogenous DNA to yeast and its subsequent incorporation into the
genetic framework of the cell, resulting in the acquisition of a novel cha¡acteristic, is termed
transformation (described in Section 4.1). Transformation has not yet been used in the
improvement of wine yeast strains but has been successfully applied to brewing yeasts.
For example, enhanced degradation of sta¡ch and sugar utilization by brewing yeasts has
been achieved by cloning starch-degrading enzymes into brewing yeasts (Stewart, 1981;
Meaden et a1.,1985). A p-glucanase gene from Bacil/¿s has also been introduced and
expressed in brewing yeasts (Cantwell et a1.,1936). The transformed yeasts effectively
secrete substantial levels of p-glucanase enzyme which degrades p-glucan in wort.
In addition to the inroduction of specific genes into wine yeasts, recombinant DNA
approaches offer wider applicability. For example, the potential exists to eliminate specific
undesirable strain characteristics by gene inactivation. Also, it may be possible to develop
new gene products with modified characteristics by site directed mutagenesis.
2.4 TARGETS FOR WINE YEAST STRAIN DEVELOPMENT
Although the techniques involved in the genetic manipulation of industial yeasts are
quite well established, the wine industry has been slow to engage in yeast genetics and
-19-
srrain development programmes (Thornton, 1983). This is due in part to the technical
difficulties involved in such programmes, and partly to the fact that the requirements of the
wine industry have not been defined in genetic terms. Despite these obstacles, the genetic
basis for several characteristics of oenological importance has been determined and there a¡e
a number of examples of wine yeast strain improvement. These examples are included
below in a list of specific targets for yeast genetics in wine-making.
2.4.1 Sedimentation and flocculation
The aggregation of dispersed yeast cells into flocs towards the end of fermentation
is calted flocculation. Non-flocculent yeasts settle slowly following fermentation and form
a fine sediment which is easily disturbed on racking. This property may necessitate longer
settling times, centrifugation or the use of fining agents to clarify the wine with a
consequent increase in production costs. Flocculent yeasts, however, form a heavy
sediment and a clear wine which can be easily racked close to the lees.
The nature of the interactions among flocculent yeast cells is poorly understood, and
basically two models for the mechanism exist. Those based on physicochemical principles
propose cooperative bonding between cell surface polysaccharides (Mill, 1964). The
observation that protease treatment leads to an irreversible loss of flocculation supports this
theory (Miki et a1.,1930) . Alternatively, flocculation interactions may be mediated by a
specific cell surface recognition mechanism, involving lectin-like binding of surface
proteins to polysaccharides on adjacent cells (Iaylor and Orton, 1978).
Genetic studies of yeast flocculation were first reported by Gilliland (1951) and
Thorne (1951). Since then, a number of genes have been reported for the flocculence
phenotype in Sacclnromyces species: FLOl, flo3, FLO5, flo6, flo7, FLO8, fsu1, fsu2 and
tupl (Johnston and Reader, 1983; Yamashita and Fukui, 1983; Lipke and Hull-Pilsbury,
1984). Of these genes, the dominant flocculation gene, FLOl, which is 37cM distal to
-20-
adel. on chromosome 1, has been most extensively analysed both genetically and
biochemically (Johnston and Reader, 1983; Miki er a1.,1982 a,b).
The property of flocculation was introduced into a powdery wine yeast strain lvD26
by mating spores of MD26 with a haploid laboratory yeast strain which ca:ried the
dominant FLO1 gene (Thornton, 1985). Following the hybridization step, a series of
backcrosses to the original wine yeast parent were performed - the outcome of this genetic
modification program was the conversion of the powdery yeast MD26 to a flocculent yeast
while retaining its positive winemaking properties. More recently, molecula¡ cloning of the
FLO1 gene (Watari et a1.,1989) has provided the opportunity for specific introduction of
the flocculation char¿cteristic into industrial yeast strains by transformation.
2.4.2 Non-foaming mutants
The production of froth-head during fermentation is an undesirable trait of wine
yeasts as up to SVo of the capacity of the fermentation vessel may have to be reserved to
prevent the froth from spilling out. Selection of non-foaming mutants of the widely used
Kyokai No. 7 srain of sake yeast was achieved by Ouchi and Akiyama (1971) by either a
cell agglutination or a froth flotation method.
The cell aggluúnation method is based on the observation that a normal sake yeast
was agglutinated when mixed in acid solution with certain species of lactobacilli, whereas a
non-foaming strain was not (Momose et a1.,1968). Ouchi and Akiyama (1971) were able
to enrich for non-foaming mutants by a series of repeated selection cycles. \ù/ashed cells
from a culture of normal Kyokai No. 7 were mixed with cells of Inctobacillw plantarurnrn
dilute citric acid. After mixing and allowing to settle, an aliquot of the upper part of the
suspension was used as the inoculum for another round of yeast growth. After the ninth
selection step most of the clones sampled were non-foaming. When cells of the parental
-21-
strain \ilere mutaganized by exposure to UV light prior to selection cycles, 1007o of the
sampled clones at the seventh cycle were non-foamers.
Selection by the froth flotation method was described by Akiyama et al. (1971),
who found that cells from the normal foaming strain adhered to the CO2 gas bubbles
formed during fermentation, while cells of a non-foaming strain did not. Non-foaming
mutants were progressively enriched in repeated selection cycles by bubbling air through
the culture. Aliqouts of the culture, now enriched for non-foaming mutants, were used as
the inoculum for the next round. After nine selection cycles, approximately 507o of the
tested clones were non-foamers; when the series was started with UV-iradiated cells, about
807o of.the sampled clones were non-foamers after seven cycles. Using the froth flotation
technique, Eschenbruch and Rassell (1975) were able to select non-foaming mutants from
two strains of New Zealandwine yeasts.
In studies of the nature of cell walls, Ouchi and Nunokawa (1973) found that non-
foaming mutants have fewer hydrophobic groups on their surface, probably because of
masking by phosphomannan. The genetic basis for foaming has been investigated by
Kasahara et at. (1974), who found that the non-foaming sake mutations were recessive.
Tetrad analysis revealed that the foaming character was under the control of at least two
genes. Using wine yeasts, Thornton (1978 a,b) also showed that two dominant genes
(designated FROI and FRO2) control foaming, that they are allelic to the sake yeast genes
and that they are linked on chromosome VII, 2l cMfrom one another and near ade3.
2.4.3 Sulfite and Sulf,rde Production
The formation of SO2 and H2S by wine yeasts geatly affects the quality of wine.
Sulfur dioxide is regularly added to disinfect fermentation equipment, to conûol organisms
that would compete with the yeast fermentation and to prevent excessive oxidation of the
wine. Health concerns have led to efforts to restrict its use as an additive. Hence the
- 22-
production of SO2 itself has become a matter of some importance. Although SO2, when
properly used, has beneficial effects, the same cannot be said of H2S. From an oenological
perspective, HzS is one of the most undesirable yeast metabolites affecting the smell and
taste of wines.
The formation of these two substances during wine making has been well reviewed
by Eschenbruch (1974). Both a¡e complex processes that a¡e not yet fully understood.
From a genetic viewpoint, however, it is important to note that wide va¡iation has been
found between yeast strains. Most S. cerevisia¿ strains produce between 10 a¡d 30 mglliter
of SO2 when tested under comparable conditions but some form as little as 10 mg while
others form in excess of 100 mg/liter @schenbruch, 1974; Eschenbruch and Bonish,
1976b). Strain variation in H2S producúon has also been revealed (Zambonelli, 1964 a,b;
Rankine, 1968; and Eschenbruch et a1.,1978).
Studies into the sulfur metabolism of high and low sulfîte-producing strains have
revealed considerable differences in the levels of activity of sulfate petmease (Dott et al.,
tg77), ATP-sulphurylase (Heinzel and Truper, 1978) and sulfite reductase (Dott and
Truper, 1976). These differences suggest that it may be possible to introduce specific
properties from low sulfite producing yeasts into selected wine yeast strains.
Sulfide can be formed from sulfate or sulfite, elemental sulfur applied to grapes as a
fungicide or from cysteine (Eschenbruch,l974). Its formation can be indirectly influenced
by the amount of yeast growth, pantothenate or pyridoxine deficiencies or excess levels of
certain amino acids, metal ions and yeast cell autolysis (Snow, 1983). The reduction of
elemental sulfur may occur both enrymaticatly or by reaction with thiol groups.
The variation and genetic control of H2S production has been investigated by
Zambonelli Qge a,b; 1965 a,b,c). In screening 100 srains for H2S production from
sulfate or sulfite, he found four strains that produced none under all conditions tested; the
-23-
rest formed varying amounts, from traces to over 200 pg/50m1culture medium. When H2S
positive strains were crossed with negative strains, the hybrid produced H2S and spores
segregated for H2S production at a ratio of 2:2. However, since the amount of H2S
produced by the positive clones varied considerably, segregation of modifying genes was
indicated.
In two later papers, Zambonelli et al. (1975) and Romano et al. (1976) reported
genetic results with prototrophic mutants of sulf,rte reductase. This enzyme is essential for
the biosynthesis of the sulfur amino acids and the prototrophy of the reductase-negative
strains was ascribed to leakiness of the reductase mutation. From a survey of several
s¡ains, it was concluded that a number of factors influence the production of sulfide from
sulfate: inhibition of sulfite reductase by endogenous factors, reduced function of the
reductase caused by mutation, enzymatic blockage after the reductase step causing
methionine auxotrophy and the state of genetic heterozygosity of the cell.
Given these various sources of sulfide and the number of influences on its
formation, one could not expect to find a single gene that would eliminate it. However, the
fact that strains do vary in their capacity to produce it suggests that there is considerable
nan¡ral genetic heterogeneity that could be exploited. The specific introduction of mutations
in certain enzymes of the sulfur, sulfur amino acids and pantothenate and pyridoxine
pathways may result in reduced production of sulfide (Snow, 1983).
2.4.4 Ethanol tolerance
The inhibitory action of ethanol produced in the course of fermentation or added
externally, is complex. A number of parameters have been used as indicators of the relative
sensitivity or tolerance of yeast strains to the alcohol. These include fermentation rate;
biomass yield; g¡owth rate and cell viability (Oliver, 1987).
-24-
One of the major target sites of ethanol in the yeast cell is the plasma membrane, as
well as the membrane of the va¡ious cellula¡ organelles (Thomas and Rose, 1979). The
damage caused by ethanol to the cell membrane results in altered membrane organization
and permeability. It has been shown that ethanol causes the leakage of essential cofactors
and coenzymes from Zymomonas rnobíIis (Osman and Ingram, 1985). The leakage of
these components, which a¡e essential for the activity of enzymes involved in glycolysis
and alcohol production, \ilas sufficient to explain the inhibitory effect of ethanol on
fermentationinZ. ntobilß as well as in yeasts (Ingram and Buttke' 1984).
There have been many other mechanisms proposed for the inhibitory effects of
ethanol. These include the inhibition and denaturation of various intacellular proteins and
glycolytic enzymes (Nagodawithana et a1.,1977), inhibition solute transport systems (van
Uden, 1985), inhibition of glucose-induced proton fluxes (Juroszek et aI., 1987),
accelerated passive re-entry of protons in a manner resembling the action of an uncoupler
(Leao and van Uden, 1984, Cartwright et al. 1986), derepression of the optimum and
maximum temperature for growth (Sa-Correia and van Uden, 1983) and the enhancement
of thermal death ([æao and van Uden, L982) and petite mutations in yeast (Cabeca-Silva et
a1.,1982). Furthermore, the inhibitory effects of alcohols were observed to increase with
increasing carbon number, suggesting that the potency of alcohols is related to lipid
solubility (van Uden, 1984). In short, ethanol has a complex inhibitory action. This has
been reviewed by van Uden (1985).
Given the pleiotropic nature of the effect of ethanol on yeast, it is most unlikely that
any single gene will be responsible for the sensitivity or tolerance of the organism to the
alcohol. A number of mutant nuclear genes have been found to confer an ethanol-sensitive
phenotype on yeast (Jones, 1977; Sugden and Oliver, 1983). However, attempts to isolate
ethanol-tolerant mutants by conventional agar plate screening methods, have failed (Ismail
and Ali, 1971a,b). This failure is not surprising given the nature of ethanol toxicity - it is
likely that the mutation of a number of genes will be required to improve the ethanol
-25-
tolerance tolerance of yeast and, furthennore, such improvements are likely to be small,
since S. cerevisiac is already a highly tolerant organism. In this situation, when only small
quantitative increases are likely to be obtained as a result of multiple mutations, the use of
continuous selection is preferred. Brown and Oliver (1932) adopted a system in which the
intensity of selection was determined by the yeast culture itself via a feedback control
circuit. Using this system, they successfully isolated yeast mutants with increased ethanol
tolerance.
2.4.5 Hieher alcohols
Higher alcohols a¡e alcohols with carbon numbers greatü then that of ethanol, such
as isobutyl and isoamyl alcohol. They are formed from either sugar metabolism or
intermediates in the branched chain amino acids pathway leading to leucine, isoleucine and
valine by transamination, decarboxylation and reduction (Webb and Ingraham, 1963).
Alttrough they have undesirable flavor and odor characteristics, they are usually present in
wines below the flavor threshold and may, in some cases, contribute to wine quality
(Kunkee and Amerine, 1970). However, their reduction in wines that are to be distilled
(for example, for brandy production) could be of considerable importance, since they are
concentrated by the distilling prccess (Snow, 1983).
Ingraham and Guymon (1960) and Ingraharn et al. (1961) were able to produce
unusually low levels of isobutanol and iso-amyl alcohols in fermentations carried out with
valine, isoleucine, and leucine mutants. However, these mutants \¡/ere of no commercial
use as their growth rate and fermentation rate were compromised. A leu- mutant derived
from the widely used Montrachet wine yeast (UCD, Enology 522) was reported to produce
more than 507o less isoamyl alcohol during fermentation than the prototrophic parent
(Snow, 1933). Taste panel trials indicated no difference between wines produced with the
mutant and the Montrachet parent strain.
-26 -
2.4.6 Killer factor
Killer strains of yeast were first recognised by Bevan and Makower (1963). Killer
yeasts secrete polypeptide toxins which kill sensitive strains of the same genus and less
frequently, strains of different genera (Philliskirk and Young, 797 5; Tipper and Bostian,
1984). The oenological significance of killer yeasts is still largely speculative. It is
considered that such strains could be used to resrict the growth of undesirable wild strains
of S. cerevisiae and other closely related Saccharomyces species during and after alcoholic
fermentation.
Ouchi and Akiyama (I97 6) introduced the killer plasmid into sake and wine yeast by
crossing them with a wild killer strain isolated as a contaminant from a sake mash.
Repeated backcrossing with a selection at each generation for particular characteristics of the
sake strain gave killer hybrids that produced sake or grape wine of comparable quality to ttre
parent. This backcrossing program of Ouich and Akiyama was hampered by poor
sporulation and spore viability. To overcome these problems, Ouchi et al. (L979) employed
a donor of killer character that was deficient in nuclea¡ fusion, mated this with a haploid
(derived from a sake yeast), and selected for sake strains containing cytoplasmic elements
of both strains. This strain gave results in trial fermentations that were better than the
parental strain with regard to rapidity of fermentation, volatile flavour components and
acidity.
2.4.7 Malolactic fermentation
Malolactic fermentation involves the decarboxylation of L-malate to L-lactate and
CO2 and is caried out by several species of lactic acid bacteria. These species all belong to
one of three genera: Lactobacillus, Leuconostoc or Pediococcus (Snow, 1983). This
process performs three significant roles for the winemaker: i) reduction in acidity; ii)
microbiological stability following $owth of the bacteria; and iii) changes in wine flavour
-27 -
caused by products of the bacterial fermentation (Kunkee and Goswell, 1977). The
fermentation can be brought about by holding the wine under conditions that are favourable
for the growth of the bacteria already present or by inoculation with the appropriate
bacterial species.
An advantage to the winemaker would be to have the malolactic fermentation occur
during or shortly after the alcoholic fermentation so the wine can be adjusted for cella¡
storage without risk of becoming spoiled. This could be achieved if the wine yeast were
able to carry out the malolactic fermentation. To this end, attempts have been made to
transfer the genetic information necessary for the malolactic fermentation from lactic acid
bacteria to a wine yeast. Fusions between S. bailli, S. rowii and Schiz. pombe with S'
cerevisíae have been made, but the resultant hybrids had less ability to ferment malate than
the parent strains (Subden and Osothsilp, 1987). The cloning and expression of the
malolactic gene (L-malate:NAD carboxylase) from l¿ctobacillus delbrucc,tii (Williams er
al.,1984) andl¿uconnostoc oenas (Lautensach and SuMen, 1984) in Escherichia colí and
inS. cerevisi¿¿ has been reported. However, in both cases, the level of conversion of
malate to lactate by the engineered yeast strain was insufficient to be of practical benefit.
This lack of success may be due to problems with expression of the cloned genes, or to the
limited ability of the yeast host to take up the malate. In an attempt to overcome these
problems, curent research is directed towa¡ds the cloning and introduction of genes
encoding malate permease and the malic eîzyme from Schiz. pombe into S. cerevisiae
(Subden and Osothsilp, 1987).
2.4.8 Genetic marking
As an aid to yeast management, particularly for wineries using more than one yeast
strain, the genomes of commercial wine yeasts can be tagged. A marking system assists in
monitoring yeast strains used in fermentations and discourages the illegal use of commercial
-28-
wine yeast smins. A deliberately marked oenological strain was developed by Vezinhet
and colleagues (Vezinhet and Lacroix, 1984; Vezinhet, 1985) by selecting for natural
mutants in a population of the Lalvin V yeast. The strain, which is now commercialized as
Kl, is double ma¡ked with two antibiotic markers, diuron and erythromycin. An extensive
survey of yeasts for resistance to these antibiotics demonstrated that few strains are
naturally resistant to both drugs simultaneously.
2.5 CONCLUSIONS
Limited success has been achieved to date in the genetic improvement of wine yeast
strains. For example, Thornton (1983) was able to introduce the flocculation character
from a laboratory strain into a wine yeast by hybridization and a series of subsequent
backcrosses to the wine yeast parent. Also, a leucine auxotroph derived from a widely
used Montrachet wine yeast was reported to produce at least SOVI less isoamyl alcohol
during fermentation than the prototrophic parent (Snow, 1983). Seki el c/. (1985) were
able to construct a killer wine yeast by spheroplast fusion and showed that the growth of
sensitive cells in grape juice was inhibited by the killer fusant. Success was achieved in the
selection of a genetically marked wine yeast strain (Vezinhet, 1985), which has provided an
insight into the kinetics of yeast populations during fermentation (Delteil and Aizac, 1988).
Most of the attempts to develop improved wine yeast strains have relied on
traditional genetic techniques such as mutation and selection, hybridization, rare mating and
spheroplast fusion. These techniques are problematic because they involve unspecific
alterations or exchanges of genetic material in yeast srains. These problems can be avoided
by the use of recominant DNA technology in yeast improvement programs. Recombinant
DNA technology has not yet been employed in the production of an improved wine yeast
strain. However, classical genetic studies have provided background information which
could be used in genetic engineering programs. For example, the dominant flocculation
gene, FLOl, which has been extensively analysed both genetically and biochemically
-29-
(Johnston and Reader, 1983; Miki er al.,1982 a,b), could be introduced into wine yeasts to
produce flocculent strains. An alternative to the use of hybridization and cytoduction to
introduce the killer cha¡acter into wine yeasts would be to clone the toxin and immunity
genes into wine yeast strains. Both the toxin and immunity genes reside on the same M-
dsRNA molecule, and reverse transcription has already been used to produce a cDNA
molecule of these two genes (Bostian et a1.,1984).
Genetic engineering could also be used to eliminate or reduce undesirable
characteristics by gene disruption. Snow (1983) suggested that the deliberate introduction
of mutations in certain enzymes of the sulfur, sulfur amino acids, pantothenate and
pyridoxine pathways might enable stepwise elimination of these characteristics and hence a
reduction in sulfide production in wine yeasts. Integrative disruption of specific ILE, LEU
amd VAL genes of wine yeasts may result in lower concentrations of higher alcohols.
Recombinant DNA techniques could also be used to eliminate the foaming charateristics of
wine yeast stains by specific disruption of the FROI and FRO2 genes on chromosome
VII.
The extent to which recombinant DNA technology can influence the breeding of
improved wine yeast stains will largely depend upon the requirements of the wine industry
and advances in the field of wine biochemisury. The true potential of this technology will
become apparent once the research is under way.
-30-
Chapter 3 Materials and Methods
3,1 STRAINS AND MEDIA
The Escherichia coli strain used for bacterial transformations was DH5a [F-,
endAl, hsdLlT, supE44, thi-L, )u-, rec{L, gyrA96, reLAL, L (argF-lacZYA) U169,
ø$}tacz/lMrl5l. Haploid yeast strain Oll (MAT- a, his 3-11, 3-15 , leu 2-3,2-112, ura 3-
251,3-373) was obtained from Dr. H.B. Lukins, Department of Biochemistry, Monash
University. V/ine yeast strains used in this study were obtained from The Australian Wine
Resea¡ch Institute Collection and a¡e listed in Table 3.1.
Bacterial growth media was LB Íl%o bacto-tryptone (Difco), 0.5Vo yeast extract
(Difco), 17o NaCll. Ampicillin (100 pg/ml) was added to molten media at 50oC. Yeast
growrh media was YPD llVo yeastextr¿rct (Difco), 2%obacttpeptone (Difco),Z%o glucosel,
SD I0.67Vo Bacto yeast nitrogen base without amino acids @ifco),2%o glucosel, or YEPG
fl%o yeast extract (Difco), 27o bacto-peptone @ifco), ZVo glycerol). Chloramphenicol
(dissolved in ethanol) and cycloheximide were added to molten media (YEPG and YPD
respectively) just prior to pouring plates. Sulfometuron methyl (SM) (obtained from
DuPont deNemours and Co.) was dissolved in acetone and added to molten SD medium
just prior to pouring plates. As SM is light sensitive, plates containing SM were incubated
in the dark.
3.2 YEAST TRANSFORMATION METHODS
3.2.1 Alkali cation transformation
Alkali cation transformation of yeast was performed according to the methd of Ito
et al. (1983) with slight modification. Yeast cells were grown to late logarithmic phase (OD
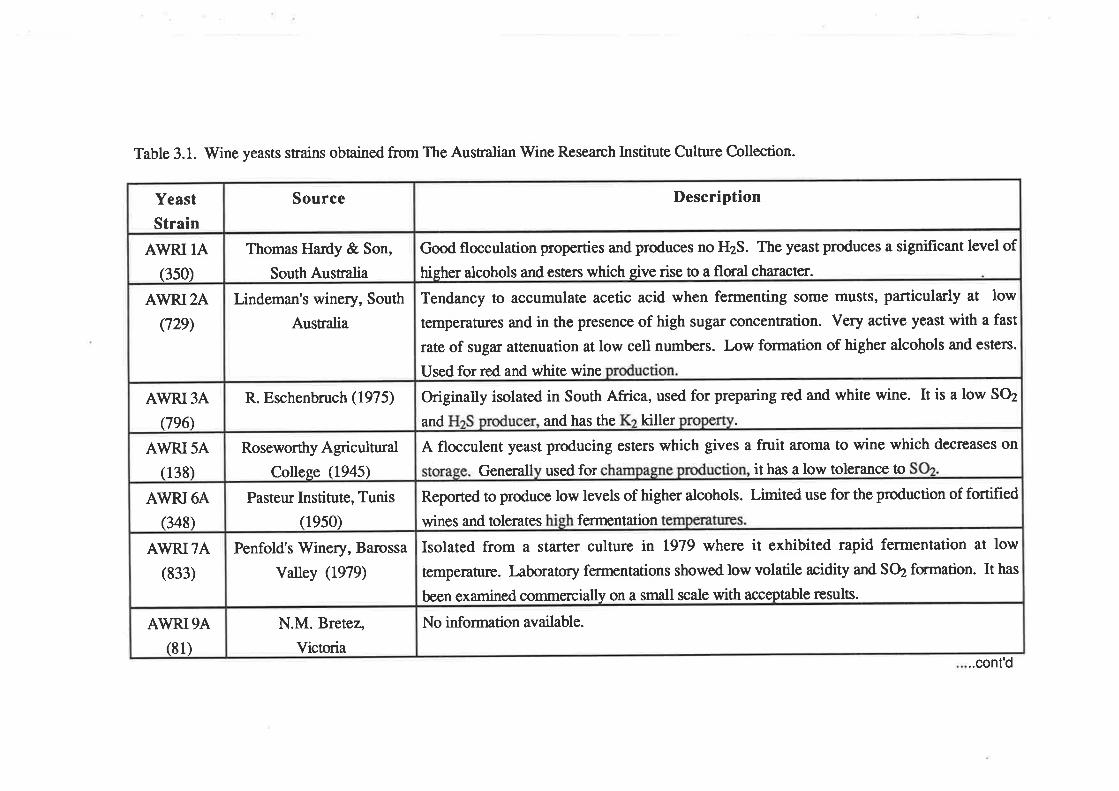
Table 3.1. Wine yeasts strains obtained from The Australian Wine Research Institute Culmre Collection.
AWRI9A(81)
AWRITA
(833)
AWRI6A(348)
AWRI5A(138)
A\ryRI3A
096',)
AWRI2A
(729\
AWRI IA(3s0)
Yeast
Strain
N.M. Bretez,
Victoria
Penfold's Winery, Ba¡ossa
Valley (1979)
Pasteur Institute, Tunis
(19s0)
Roseworthy Agricultural
Collese (1945)
R. Eschenbruch (1975)
Lindeman's winery, South
Ausralia
Thomas Ha¡dy & Son,
South Australia
Source
No information available.
Isolated from a stafier culture in 1979 where it exhibited rapid fermentation at low
temperature. l,aboratory fermentations showed low volatile acidity and SOz formation. It has
been examined commercially on a small scale with acceptable results.
Reported to produce low levels of higher alcohols. Limited use for the production of fortified
wines and tolerates fermentation
A flocculent yeast producing esters which gives a fruit aroma to wine which decreases on
Generall used for it has a low tolerance to
Originally isolated in South Africa, used for preparing red and white wine. It is a low SOz
and and has the killer
Tendancy to accumulate acetic acid when fermenting some musts, particularly at low
temperatures and in the presence of high sugar concentration. Very active yeast with a fast
rate of sugÍu attenuation at low cell numbers. Low formation of higher alcohols and esters.
Used for red and white wine
Good flocculation properties and produces no HzS. The yeast produces a significant level of
higher alcohols and esters which give rise to a floral character.
Description
..cont'd
AWRI l2A(143)
AWRI llA(R2)
AWRI lOA
(83s)
AWRI SA
(834)
Te Kawata
Petaluma winery, South
Australia
Dept. of Agriculture,
Vy'estern Australia (JnD
Unknown
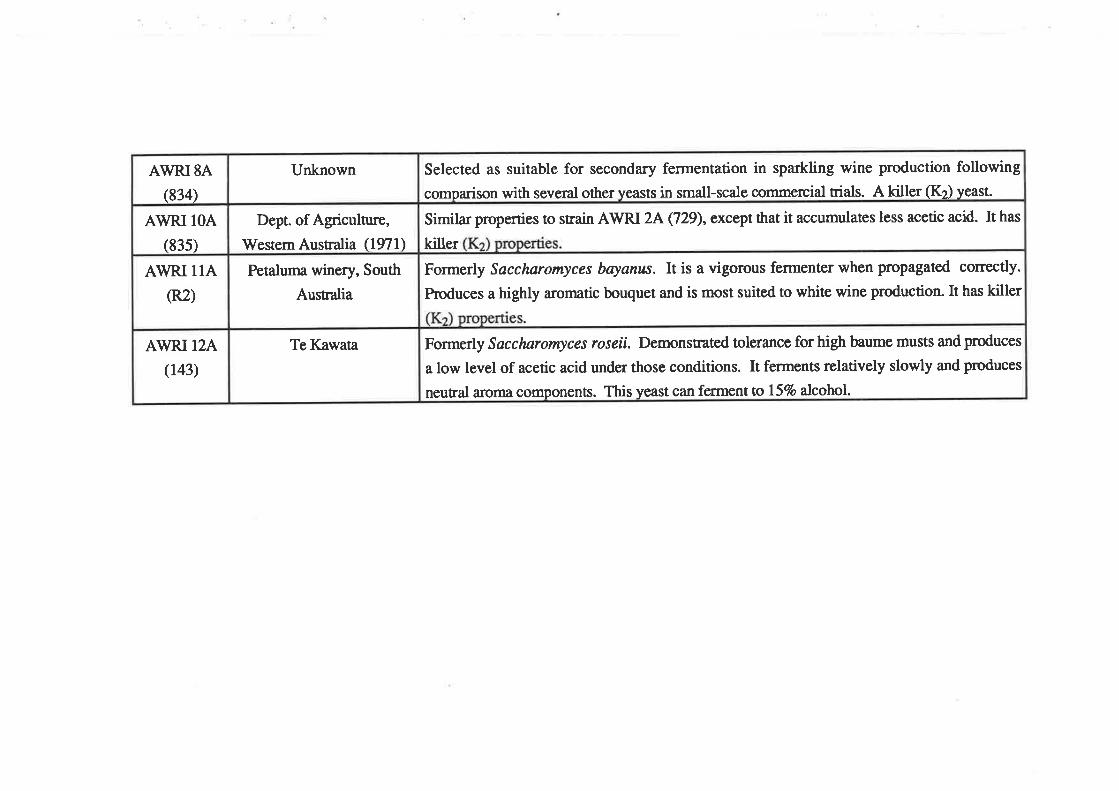
Formerly Saccharomyces roseü. Demonsnated tolerance for high baume musts and produces
a low level of acetic acid under those conditions. It ferments relatively slowly and produces
neutral aroma components. This yerist can ferment to l5Vo alcohol.
Formerly Saccharomyces boyantn It is a vigorous fennenter when propagated correctly.
P¡oduces a highly aromatic bouquet and is most suited to white wine production. It has killer
Simila¡ properties to strain A\ryRI 2A (729), except that it accumulates less acetic acid. It has
killer
Selected as suitable for secondary fermentation in sparkling wine production following
comparison with several other yeasts in small-scale commercial triats. A killer (KÐ yeast.
-31-
610 4-8) ar 28oC in liquid YPD. Cells were han¡ested, washed once in 10 ml TE buffer
(lgml,{ Tris, pH7.5, LmM EDTA), suspended ín 20 ml LiOAcÆE buffer (10mM Tris-
HCl, pH7.5, 0.lM LiOac, lmM EDTA) and mixed gently by shaking at 30oC for t hour.
Approximately 8 x 10⁷ cells were ha¡vested and suspended in 100 pl of LiOAcÆE buffer.
Plasmid DNA (10pg) [and sometimes ca¡rier DNA (salmon spenn, Sigma) was added to 5
pgl was added in a total volume <10 pl and the suspension was incubated at 28oC for 30
mins. Seven times the volume of filter -sterilized PEG reagent (40Vo polyethylene glycol
4000, 0.1M LiOAc, 10mM Tris-HCl, pH7.5, lmM EDTA) was added and the mixture was
vortexed before incubation at 28rc for I hour. Cells were then heat shocked by incubation
at 42oC for 5 mins, ha¡vested, and resuspended in I ml sterile water.
For the selection of auxotrophic ma¡kers in the transformation of strain Ol1, 100 pl
of cell suspension was spread on SD media containing 50 pg of amino acid per ml (L-
histidine and L-leucine for plasmid pCY2-4-10; L-histidine and uracil for plasmids pAW219
and pRIM-C3). Selection of the CAT gene on plasmid pAW119 was performed by
spreading 100 pl of the cell suspension on YEPG media containing 5 mg/ml
chloramphenicol. The RIM-C gene of plasmid pRM-C3 was selected by plating 1@ pl of
the cell suspension on YPD containing 2þglmlof cycloheximide. In order to select for the
SMRL gene on plasmids pCP2-4-10 and pWX509, 100 pl aliquots of the cell suspension
was plated on solid SD media containing 10 pg/ml sulfometuron methyl (and 50 ¡tglml of
L-histidine, L-leucine and uracil when selecting Ol1 transformants).
3.2.2 Soheroplast fusion method
The sheroplast fusion method was performed essentially as described in Burgers
and Percival (1987). Cells were grown overnight with vigorous aeration in 50 ml YPD to
approximately 3 x 10⁷ cells/ml. After harvesting, cells were washed successively with 20
ml of sterile water and 20 ml of 1.2M sorbitol, followed by 5 min spins. They were
resuspended in 20 ml SCEM (1.2M sorbitol, 0.1M sodium citrate, pH 5.8, 10mM EDTA,
-32-
30mÀ/t p-mercaptoethanol), I mg/ml zymolyase 20000 (Seikagaku Koguo Co. LTD) was
added, and the cells were incubated at 30oC with occasional inversions. Spheroplasting
was monitored by measuring the decrease in turbidity at 800 nm of a lO-fold dilution of
spheroplasts in water. 'When spheroplasting had proceeded to 90Vo (about 20-30 mins) the
spheroplasts were harvested by centrifugation at 3009 for 5 mins. They were gently
resuspended in 20 ml of 1.2M sorbitol and pelleted for 5 mins at 3009. The spheroplasts
were gently resuspended in 20 ml of STC (1.2M sorbitol, 10mM Tris-HCl, pH 7.5, lOmM
CaClz) and pelleted again for 5 mins. This pellet was resuspended in 2 ml of STC.
Aliquots (100 pl) were mixed with plasmid DNA (10 pg) land sometimes carrier DNA
(salmon spenn, Sigma) was added to 5 ¡rg I in a total volume <10 pl in a 10ml plastic tube.
After 10 minutes at room temperature, I ml of PEG (10mM Tris-HCl, pH 7.5, 10mM
CaC!2,20Vo polyethylene glycol 8000; filær særilized) was added and mixed gently. After
a further 10 min room temperature incubation spheroplasts were harvested by a 4 min
centrifugation. The pellet was gently resuspended in 150 ¡rl of SOS (1.2M sorbitol,
6.5mM CaCI2,0.257o yeast extract,O.SVo bactopeptone; filter sterilized) and left at 30oC
for 20-40 mins. Eight milliliters of TOP (1.2M sorbitol, 2.57o agar in SD medium) kept at
45oC was added. The tube was inverted quickly several times to mix and plated
immediately on SORB plates [SD plates containing 0.9M sorbitol, 37o glucose and
sulfometuron methyl (10pdml)1.
3.2.3 Electroporation of intact yeast cells
Transformation of yeast cells by electroporation was performed according to the
method of Hashimoto et aI., 1985. Yeast cells were grown overnight in 100 ml YPD at
28oC. Logarithmic phase cells were harvested, washed in sterile distilled water and
resuspended in 2 ml of the water. A 50 ¡rl aliquot of this cell suspension was transferred to
a 1.5 ml Eppendorf tube. Plasmid DNA (10 ttg) and 60 ¡tl of TOVo PEG4000 were added
and mixed thoroughly by vortexing. After standing for t hour at room temperature, 40 pl
of the cell suspension was placed in a parallel-electrode chamber. This electrofusion
-33-
chamber was equipped with two platinum plate electrodes 2 mm apart. Electric field pulses
were applied by an electric capacitor discharge method using a BioRad Gene Pulseril unit.
Th¡ee successive pulses of an initial intensity of 5 KV/cm were applied with a capacitance
of I ¡rF. After application of the pulses, the cell-DNA mixture was left to stand for I hour.
The cell suspension was then transferred to an Eppendorf tube. One milliliter of sterile
water was added to the tube and cells were sedimented by centrifugation. The sedimented
cells were resuspended in 200 pl sterile water, and 100 pl aliquots were plated onto SD
media containing 10 pglml sulfomenuon methyl.
3.3 RECOMBTNANT DNA TECHNIQIJES
3.3.1 Resriction digests. fraement isolation and ligation
Restriction enzymes were obtained from Boehringer Mannheim and digests were
performed in buffers supplied by the manufacturer. All digests were performed for l-2
hours at 37oC. DNA fragments were isolated with a GENE CLEAN (BIO 101) kit
following supplier's instructions. Dephosphorylation of fragment ends was achieved by
incubation of DNA with 1 unit of calf-intestinal alkaline phosphatase (Boehringer-
Mannheim) for 30 minutes Lt37oC in buffer as reconìmended by supplier. DNA ligations
were carried out using T4 DNA ligase (Boehringer-Mannheim) in the recommended buffer.
3.3.2 Electroohoresis of DNA
Agarose gel elctrophoresis (described in Maniatis et al., t982) was used for the
separation of DNA molecules up to 20 kbp in size. Samples were electrophoresed in 0.8 -
I.OVo agarose gels in TAE buffer (40mI4 Tris-acetate, pH 8.0, lmM EDTA) at a constant
curent of approximately 5OmA. One part of gel-loading buffer (0.257o bromophenol blue,
0.257o xylene cyanol, l1%oFicoll [type 400]) was added to five parts of DNA sample prior
to gel loading. After electrophoresis, gels were stained with ethidium bromide and
-34-
visualized ona254nm UV light box. DNA fragments required for cloning were observed
on a 360 nm UV lighrbox.
3.3.3 Bacterial transformation
Transformation of the E. coli strain DH5cr was performed according to the method
of Hanahan (1983).
3.3.4 Plasmidisolation
Rapid small-scale plasmid isolation was as described by Ish-Horowicz and Burke
(1e81).
3.3.5 Yeast DNA isolation
Total DNA was isolated by a procedure based on that described by Davis et al.
(1980). The yeast culture was grown in 10ml YPD to late log phase. Cells were pelleted
by centrifugation at 30009 for 5 mins, washed once in TE buffer and resuspended in 0.8 ml
of 1.2M sorbitol, 0.1M EDTA, pÍn.4, and 14mM p-mercaptoethanol. Zymolyase 20000
(Seikagaku Kogyo Co. LTD) was added to a total concentration of 1 mg/ml and the
suspension was incubated for 20 mins at 30oC. Spheroplasts were pelleted by
centrifugation at 30009 for 5 mins, then resuspended in 0.8 ml TE buffer. To this
suspension 80 pl of 1 M Tris-HCl, pH 7.4,80 pl of 0.5 M EDTA, and 40 ¡rl of a 1'0Vo
SDS solution were added. After mixing, the suspension was incubated at 65oC for 30
mins. A 4M potassium acetate solution (0.25 ml) was then added and the suspension
incubated on ice for t hour. After centrifugation at 150009 for 25 mins, the supernatant
was carefully decanted into a fresh tube. An equal volume of 99.5Vo ethanol was added to
this supernant, and after mixing the solution was centrifuged at 100009 for 10 mins. The
pellet was then dried and resuspended in 500 pt TE buffer, and RNase A (Boehringer
-35-
Mannheim) was added to a final concentration of 100pg/ml. The suspension was incubated
at37oC for 30 mins, then extracted twice with and equal volume of phenoVchloroform.
The salt concentration of the aqueous phase was adjusted to 0.3M by the addition of 3M
sodium acetate, and 2 volumes of cold 99.5Vo ethanol were added. After mixing the
solution was placed at -20oC for 2 hours or longer. DNA was pelleted by centrifugation at
100009 for 10 mins. The pellet was washed twice in7SVo ethanol, dried and resuspended
in 50 -100 pl TE buffer.
3.3.6 Southern h)rbridization
Southern blotting and hybridizations were ca¡¡ied out by the procedure of Southern
(1975) with minor modifications. The membrane used was Hybond N+ (Amersham), and
DNA fixation was achieved by exposing the membrane to UV light for 5 mins.
Hybridizations were performed ú 42oC in solutions consistin g of. 4Vo polyethylene glycol
4000,2 x SSPE, l7o SDS,507o formamide,O.S%o blotto and carrierDNA (0.5 mg/ml final
concentration). DNA probes were prepared with an oligolabeling kit from Amersham.
Autoradiography was performed by exposure of the membrane to X-ray film (Fuji RX)
between two intensifying screens overnight at -80oC.
3.4 PROTEIN SYNTFIESIS ANALYSIS
3.4.1 Incorporation of radioactivitv into ]reast proteins
A sample of yeast cells removed from the ferment (500 pl) was incubated with 3H-
Leucine (5 pci) for 2 hours at 30oC. Cetls were then pelleted by centrifugation in a
microfuge and resuspended in a2%o SDS solution (500 pl). Glass beads were added to U2
volume and the suspension was vortexed for 20 minutes. At five minute intervals the
suspension was placed on ice to avoid over heating. The solution was then centrifuged for
5 mins in a microfuge, the supernatant was removed and placed in a fresh tube. Proteins
-36-
were precipitated by the addition of 5 volumes of cold acetone and incubation at -20pCfor2
hours or longer.
3.4.2 Electrophoresis of proteins
Protein profiles were obtained by SDS-poylacrylamide gel electrophoresis on l07o
polyacrylamide separating gels according to the procedure of Laemmli (1970).
Fluorography of the gel was achieved by soaking the gel in glacial acetic acid for 5 mins,
and then in a solution of 2OVo PPO (2,5 diphenyloxazole) in glacial acetic acid for I hour.
The gel was then rinsed in water for t hour and dried under vaccuum. Autoradiography
was performed by exposing the dried gel to X-ray film (Fuji RX) between two intensifying
screens at -80oC for 4-6 weeks.
3.5 PULSED FIELD GEL ELECTROPHORESIS
Transverse alternating field electrophoresis (TAFE) was carried out using a
Geneline @eckman) unit. Yeast chromosomes were prepared in agarose plugs essentially
according to supplier's recommendations. Yeast cells were glown to early stationary phase
in YPD media and approximately I x 10e cells were ha¡vested by centrifugation at 30009
for 5 mins. To minimize problems with degradation of DNA, cells were processed as
quickly as possible after harvesting. Cells were washed twice in ET buffer (50 mM EDTA,
1 mM Tris-HCl, pH 8.0) and resuspended in 2 ml ET buffer. Two milliliters of low
melting point agarose mixture (IVo low melting point agarose (Adelab Scientific) in 0.lM
EDTA, 10 mM Tris, pH 8.0, 20 mM NaCl) at 50oC was added, along with 0.2 ml of a
zymolyase solution. The suspension was mixed by vortexing and immediately loaded into
a beckman plug mold by pasteur pipette. The plugs were solidifred by refrigeration for 30
mins, then carefully pushed from the mold into 10 ml of 10X ET buffer. An additional
0.15 ml zymolyase solution (10 mg/ml) was added, and the plugs we¡e incubated for 48
hours at 37oC with one change of buffer. Plugs were then transfened to 10 ml of 10X ET
-37 -
buffer containing 17o sodium lauroyl sa¡cosinate and 1 mg/ml Proteinase K. The plugs
were then incubated at 50oC for 48 hours, with one change of buffer and enzyme
replacement. The resulting plugs were then washed 4 times in ET buffer, and stored in ET
buffer at 4oC.
Chromosomal DNA molecules were separated by elecrophoresis in a L%o l-ow
endoosmosis (LE) (Adel-ab Scientific) agarose gel in TAFE buffer (l0ml\'l Tris,4.35mM
acetic acid, 0.5mM EDTA). Electrophoresis was carried out at l2oc with a constant
crurent of 150 mA; pulse times were 60 seconds for 18 hours, ttren 35 seconds for 6 hours.
3.6 p-GLUCURONIDASE (GUS) ASSAYS
3.6.1 Enzvme activitv assavs
Yeast cells were grown to log phase, then 1 ml of the culture was pelleted by
centrifugation, and the cells resuspended in 1 ml GUS extraction buffer (50mM Na2HPO4,
pH7.0, 1OmM beta-mercaptoethanol, 10mM Na2EDTA,O.I7o sarcosyl, 0.17o triton X-
100). Glass beads (Sigma, 1000-1050 microns) were then added to approximately half the
volume, and the suspension was vortexed for 10 mins at 1000 r.p.m. After centrifugation,
the supernatant was removed and used as the cell extract. 1-50 pl extract was added to 0.5
ml assay buffer (lmM MUG in extraction buffer) and incubated at 37oC. At various time
intervals, 100 pl samples were removed from the assay mix and added to 900p1 stop buffer
(0.2M Na2CO3). Solutions were then assayed in a spectrophotofluorometer with xenon
lamp (Aminco SPF-125 TM), excitation 365 nm, emission 455 nm. Standard solutions of
4-methylumbelliferone (I,fÐ (Sigma) in the range of 100 nM to I ttM were prepared for
reference values. lpM MU corresponded to 100 relative units.
Protein content of samples was determined using a bicinchoninic acid protein assay
kit (Sigma Co.).
-38-
3.6.2 Agarplate assa],s
Yeast colonies were grorvn on solid YPD media containing 50-100 pglml X-
GLUC. After approximately 36 hours growth, a solution containing 0.1M Na2HPO4,
pH7.0, 17o sarcosll, 50 pglml X-GLUC and O.7Vo agarose was poured as a thin overlay
on the plaæ and allowed to set. After 4-5 houn incubation at37oc a blue precipitate could
be detected in the transformed colonies.
3.6.3 Microscooic visualization
Yeast cells were grown overnight in YPD media, harvested and resuspended in a
solution of 0.1M Na2HPO4, pH 7.0, 17o sarkosyl and 50-100 pgml X-GLUC. This
suspension was incubated at 37oC for 2-6 hours or until a deep blue colour had formed.
Aliquots of the suspension were then visualized under a microscope.
3.7 KILLER YEAST MANIPULATIONS
3.7.1 Curins of killer strain 3AM
A culture of strain 3AM was grown overnight in YPD at 28oC. Serial dilutions
were made in O.9Vo NaCl and 0.1 ml aliquots (containing approximately 100 cells) were
spread on YPD plates and incubated at 37oC. After 48 hours incubation, single colonies
were selected at random and assayed for killer activity as described below.
3.7 .2 Assa]r for cured strain
YPD (containing l7o agar) was autoclaved at 120oC for 20 mins. After cooling to
49oC, the medium was buffered to pH 4.2withal07o ta¡trate solution. Methylene blue (to
-39-
g.ffi3Vo 11l7v) and killer sensitive strain 5A (to lF cells per ml) were added to the medium
prior to pouring the plates. Colonies isolated after heat treatment were then patched onto
these assay plates and incubated at 18oC for approximately 72 hours. Curing was
recognised by the absence of growth inhibition (clear zones) and lack of blue stained cells
around the patched colony.
3.7.3 dsRNA isolation
The dsRNA extraction procedure was essentially that described by Fried and Fink
(8). Samples of RNA were analysed by electrophoresis on L.SVo agarose slab gels at a
constant current of 100 mA. Gels werc stained with ethidium bromide and photographed
on a short wave UV light box.
3.8 MCROVINIFICATIONTRIALS
3.8. I Fermentation procedure
Starter cultures were prepared by inoculating 10 ml of YPD medium contained in a
conical flask with a loopful of yeast and incubated with vigorous aeration at 28oC. After
reaching stationary phase, cells were subcultured into YPD and incubated with vigorous
aeration at 28oC. After 24 houn, the cell density was determined by microscopic counts.
Samples were used to inoculate Riesling must (200 ml) to a density of 5 x 1S cells per ml.
The must contained 220 gper litre total sugü and had a pH of 3.1. Fermentations were
carried out in 250 ml conical flasks fitted with airlocks. The juice was sterilized by
membrane filtration (0.a5 pM) prior to inoculation and fermentations were carried out at
18oC with agitation (approximately 100 o.p.m). Samples were removed anaerobically and
aseptically during fermentation by needle and syringe through ports covered with rubber
sepra. They were analysed for the progress of fermentation by refractometer readings and
yeast growth was measured spectrophotometrically at 650nm.
-40-
3.8.2 Wine anah¡sis
Residual sugars and acetic acid concentrations were determined with appropriate kits
from Boehringer-Mannheim. Measurement of sulfur dioxide in wine was as according to
Rankine and Pocock (1972). The alcohol content was determined by near infra-red
reflectance spectroscopy according to 'Instnrctions for the Use of the Technicon260Infra-
analyser', Bran & Luebbe, Australia. The instrument was calibrated according to Sneyd er
a1.,1990.
3.9 I.A,RGE SCALE LABORATORY FERMENTATIONS
Grape juice was obtained from St. Hallet's winery, Ba¡ossa Valley, during the 1991
harvest. PedroXímines grapes were machine harvested and crushed on the same moming.
Immediately after crushing, grape must was pumped into the winery press. Samples of
twenty litres were collected in plastic containers (25 litre capacity) which had been fitted
with airlocks. The grape must samples were then transported to The Australian Wine
Research Institute for fermentation triats. Diammonium orthophosphate (DAP) was added
to all samples to 0.3gll-. Sodium metabisulhte (150 mg/L) additions were then made to
some samples to achieve a total sulfur dioxide concentration of 100 mg/L. Grape must was
then allowed to stand for 4 hours prior to inoculation.
Sta¡ter cultures were prepared by inoculating 100 ml of YPD medium contained in a
conical flask with a loopful of yeast and incubated with vigorous aeration overnight at
28oC. This culture was used to inoculate 2L of Rhine Riesling grape juice which was
incubated for 24 hours at 28oC with vigorous aeration. The cell density of this starter
culture was determined by microscopic counts, and grape must samples were inoculated to
a density of 4 x 10⁶ cells/ml.
-41-
Samples (10 ml) were taken from the centre of the vessel at regular times throughout
the fermentation. Progress of fermentation was monitored by refractometer readings and
yeast growth was measured spectrophotometrically at 650nm. Duplicate aliquots of each
sample (0.1 ml) were plated onto solid YPD media and incubated for 48 hours at 28oC.
Colonies were then assayed for GUS activity by the method described in Section 3.6.2.
- 42-
Chapter 4 Establishing a system for the genetic
manipulation of wine Yeasts
4.1 INTRODUCTION
The components of a transformation system which need to be considered include the
selection procedure for isolating transformants, the type of vector used to introduce the
foreign DNA, and conditions for cellula¡ uptake of DNA.
4.1.1 selection systems for identif)¡ing transformants
The infoduction of recombinant DNA into yeast strains requires some way of
detecting the very small proportion of cells (the transformants) which actually receive and
express the foreign DNA.
Yeast strains were first transformed with vectors which contained auxotrophic
markers such as LE(12 for selection (Hinnen et al., 1978; Beggs, 1978). Auxotrophic
markers are limited in that they require a yeast host strain that is mutated in the
corresponding marker gene, and therefore usually has to be a laboratory bred haploid strain.
For example, a leu2 mutant (deficient in the synthesis of leucine) is required as the recipient
strain when the wild type LEU2 gene is included as the selectable marker. Transformants
can then be selected for their ability to grow without leucine.
Recessive auxotrophic mutations can not be readily selected in amphiploid or
polyploid industrial strains, nor are they likely to allow normal production yields.
Therefore 'dominant' ma¡kers are required that enable transformants of wild-type wine
yeast snains to be selected without prior genetic manipulation. A number of dominant
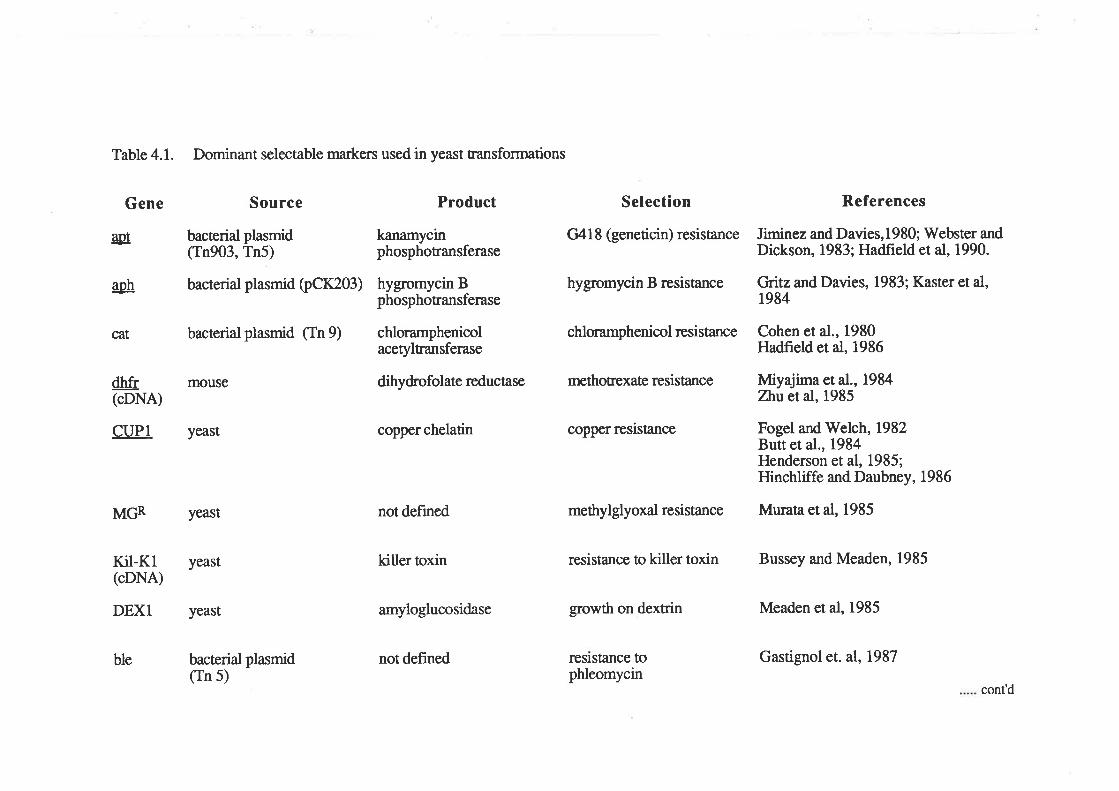
Table 4.1. Dominant selectable ma¡ken used in yeast transformations
Source ProductGene
aDt
aoh
at
bacterial(Tn903,
plasmidTn5)
bacterial plasmid (pCK203)
bacterial plasmid (tn 9)
kanamycinphosphotransferase
hygromycin Bphosphotransferase
chloramphenicolacetyltansferase
dihydrofol ate reductase
copper chelatin
not defined
killer toxin
amyloglucosidase
Selection
G418 (geneticin) resistance
hygromycin B resistance
chloramphenicol resistance
methotrexate resistance
copper resistance
References
Jiminez and Davies,1980; Webster andDickson, 1983; Hadfield et al, 1990.
Gritz and Davies, 1983; Kaster et al,1984
Cohen et al., 1980Hadfreld et al, 1986
Miyajima et al., 1984Zhuetal,1985
Fogel and Welch,1982Butt et al., 1984Henderson et al, 1985;Hinchliffe and Daubney, 1986
dhfr mouse(cDNA)
CUP1 yeast
MGR yeast
Kil-K1(cDNA)
yeast
DEX1 yeast
mettrylglyoxal resistance Murata et al, 1985
resistance to killer toxin Bussey and Meaden, 1985
growth on dextrin Meaden et al, 1985
rcsrstance tophleomycin
bacterial plasmid(In 5)
ble not defined Gastignol et. al, 1987
cont'd
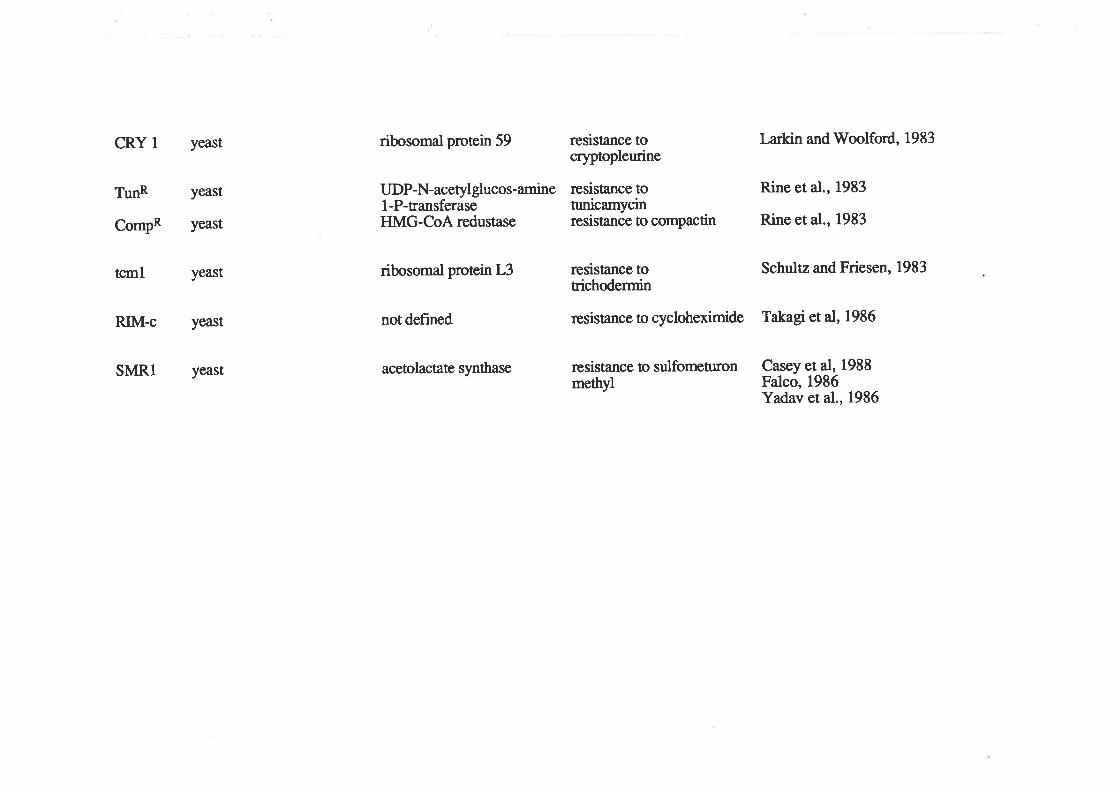
CRY 1 yeast ribosomal protein 59
acetolactate synthase
resistance tocryptopleurine
resistance to sulfometuronmethyl
Larkin and Woolford, 1983
Rine et al., 1983
Rine et al., 1983
Casey et al, 1988Falco, 1986Yadav et al., 1986
TunR
CompR
yeast
yeast
UDP-N-acetylglucos-amine resistance tol-P-tansferase tunicamycinHMG-CoA redustase resistance to compactin
ribosomal protein L3
not defined
resistance to Schultz and Friesen, 1983tichodermin
resistance to cycloheximide Takagi et al, 1986
tcrnl yeast
RM-c yeast
SMR1 yeast
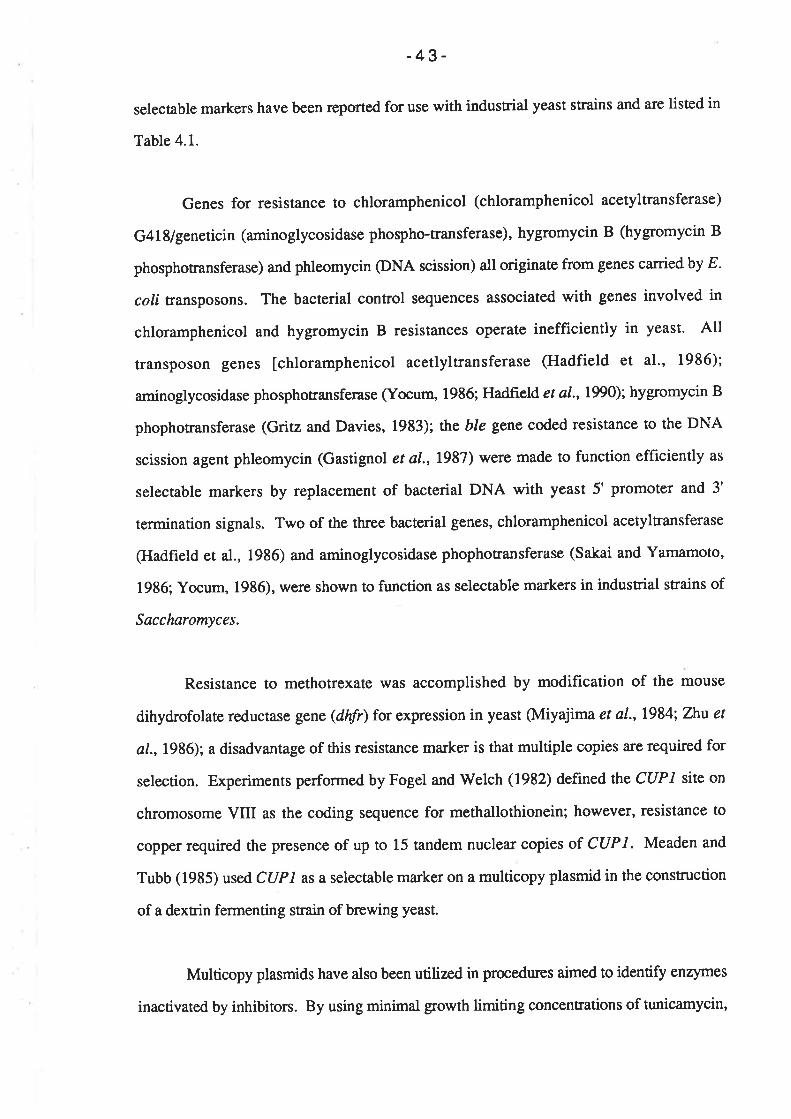
-43-
selectable markers have been reported for use with industrial yeast strains and are listed in
Table 4.1.
Genes for resistance to chloramphenicol (chloramphenicol acetyltransferase)
G418/geneticin (aminoglycosidase phospho-transferase), hygromycin B (hyg¡omycin B
phosphotransferase) and phleomycin @NA scission) all originate from genes calried by E.
coli transposons. The bacterial control sequences associated with genes involved in
chloramphenicol and hygromycin B resistances operate inefficiently in yeast. All
rransposon genes [chloramphenicol acetlyltransferase (Hadfield et â1., 1986);
aminoglycosidase phosphotransferase (Yocum, 1986; Hadfield et a1.,1990); hygromycin B
phophotransferase (Gritz and Davies, 1983); the ble gene coded resistance to the DNA
scission agenr phleomycin (Gastign ol et al., 1987) were made to function efhciently as
selectable markers by replacement of bacterial DNA with yeast 5' promoter and 3'
termination signals. Two of the three bacterial genes, chloramphenicol acetyltransferase
(Hadfîeld et al., 1936) and aminoglycosidase phophotransferase (Sakai and Yamamoto,
1986; Yocum, 1986), were shown to function as selectable markers in industrial strains of
Sacclnromyces.
Resistance to methotrexate was accomplished by modif,rcation of the mouse
dihydrofolate reductase gene (dhlr) for expression in yeast (Miyajima et a1.,1984; Zhu et
¿/., 1986); a disadvantage of this resistance ma¡ker is that multiple copies are required for
selection. Experiments performed by Fogel and Welch (1982) defined the CUPI site on
chromosome VIII as the coding sequence for methallothionein; however, resistance to
copper required the presence of up to 15 tandem nuclear copies of CUP I . Meaden and
Tubb (1985) usedCUPl as a selectable ma¡ker on a multicopy plasmid in the construction
of a dextrin fermenting strain of brewing yeast.
Multicopy plasmids have also been utilized in procedures aimed to identify enzymes
inactivated by inhibitors. By using minimal growth limiting concentrations of tunicamycin,
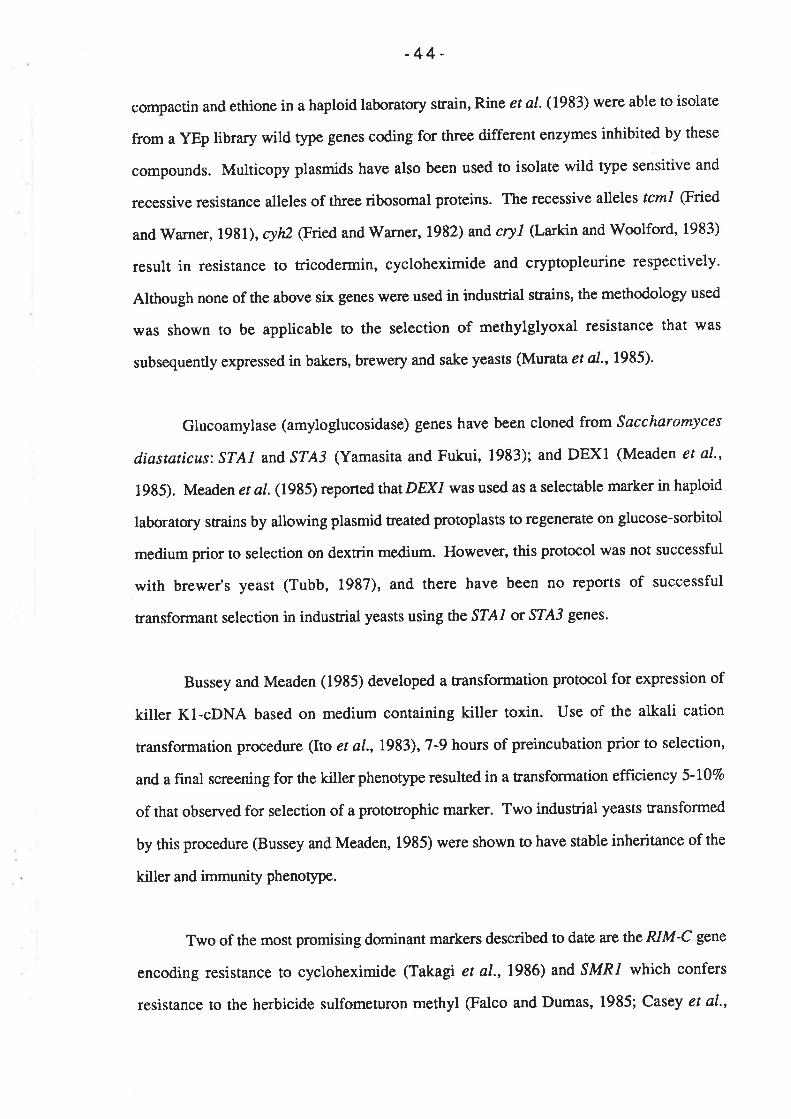
-44-
compactin and ethione in a haploid laboratory strain, Rine er aI. (1983) were able to isolate
from a YEp library wild type genes coding for three different enzymes inhibited by these
compounds. Multicopy plasmids have also been used to isolate wild type sensitive and
recessive resistance alleles of three ribosomal proteins. The recessive alleles tcml (Fned
and Warner, 1981), cyh2 (Fn¡$and Warner,1982) and cryL (La¡kin and Woolford' 1983)
result in resistance to tricodermin, cycloheximide and cryptopleurine respectively.
Although none of the above six genes were used in industrial strains, the methodology used
was shown to be applicable to the selection of methylglyoxal resistance that was
subsequently expressed in bakers, brewery and sake yeasts (Murata et a1.,1985)'
Glucoamylase (amyloglucosidase) genes have been cloned from S¿ccharomyces
diastaticus: STAI and STA3 (Yamasita and Fukui, 1983X and DEX1 (Meaden et al.,
1985). Meaden et aI. (1985) reported thatDE)U was used as a selectable ma¡ker in haploid
laboratory strains by allowing plasmid treated protoplasts to regenerate on glucose-sorbitol
medium prior to selection on dextrin medium. However, this protocol was not successful
with brewer's yeast (Tubb, 1987), and there have been no reports of successful
transformant selection in industrial yeasts using the STAI or S?"Ai genes.
Bussey and Meaden (1985) developed a transformation protocol for expression of
killer K1-cDNA based on medium containing killer toxin. Use of the alkali cation
transformation procedure (Ito et a1.,1983), 7-9 hours of preincubation prior to selection,
and a final screening for the killer phenotype resulted in a transformation efficiency 5-107o
of that observed for selection of a prototrophic marker. Two industrial yeasts transformed
by this procedure (Bussey and Meaden, 1985) were shown to have stable inheritance of the
killer and immunity phenotype.
Two of the most promising dominant markers described to date are the RIM-C gene
encoding resistance to cycloheximide (Takagi et a1.,1986) and SMRI which confers
resistance to the herbicide sulfometuron methyl (Falco and Dumas, 1985; Casey et al.,
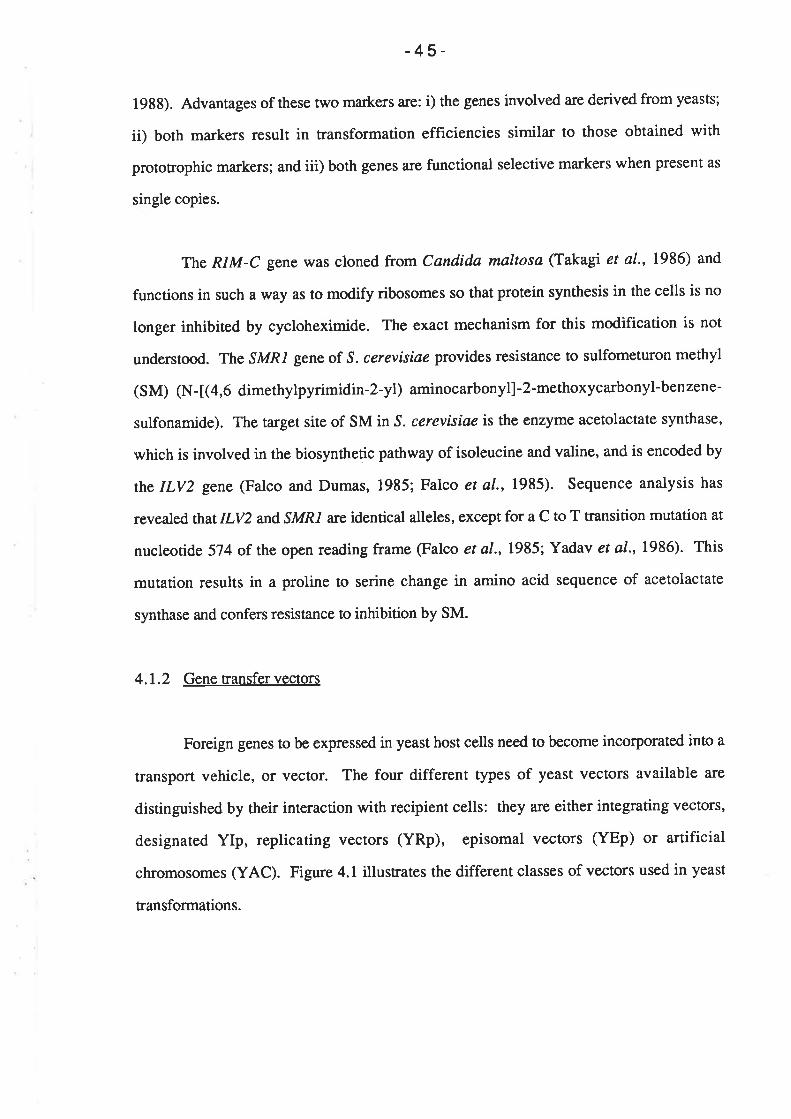
-45-
1988). Advantages of these two markers are: i) the genes involved are derived from yeasts;
ii) both markers result in transformation efficiencies simila¡ to those obtained with
prototrophic markers; and iii) both genes are functional selective markers when present as
single copies.
The RIM-C gene was cloned from Candida maltosa (Takagi et al., 1986) and
functions in such a way as to modify ribosomes so that protein synthesis in the cells is no
longer inhibited by cycloheximide. The exact mechanism for this modification is not
understood. The SMRI gene of S. cerevisiae provides resistance to sulfometuron methyl
(SM) (N-t(4,6 dimethylpyrimidin-2-yl) aminocarbonyll-2-methoxycarbonyl-benzene-
sulfonamide). The target site of SM in S. cerevisí¿e is the enzyme acetolactate synthase,
which is involved in the biosynthetic pathway of isoleucine and valine, and is encoded by
the ILV2 gene (Falco and Dumas, 1985; Falco et al., 1985). Sequence analysis has
revealed thatILV2 and SMRI are identical alleles, except for a C to T transition mutation at
nucleotide 574 of the open reading frame (Falco et a1.,1985; Yadav et a1.,1986). This
mutation results in a proline to serine change in amino acid sequence of acetolactate
synthase and confers resistance to inhibition by SM.
4.1.2 Gene transfer vectors
Foreign genes to be expressed in yeast host cells need to become incorporated into a
transport vehicle, or vector. The four different types of yeast vectors available are
distinguished by their interaction with recipient cells: they are either integrating vectors,
designated YIp, replicating vectors (YRp), episomal vectors (YEp) or artificial
chromosomes (YAC). Figure 4.1 illustrates the different classes of vectors used in yeast
transformations.
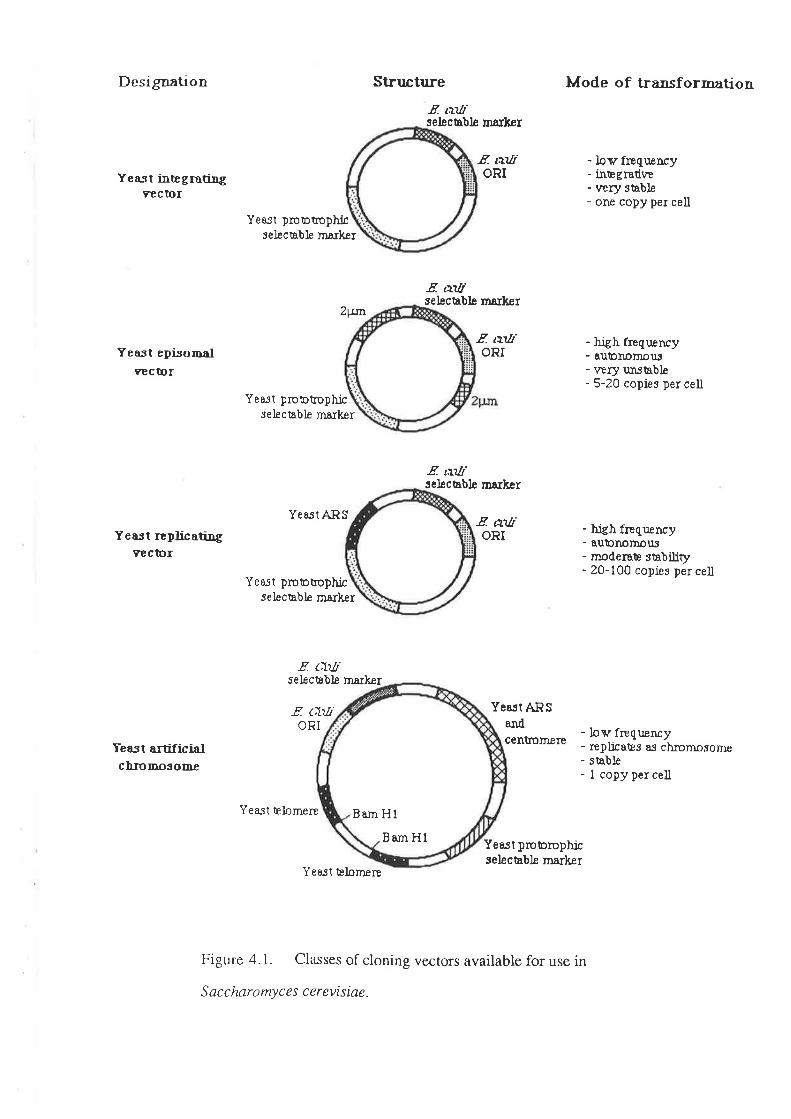
Designatton
Yea-gt ilægrating9€Ctor
Yeast episornnìYecl0r
Yeast replicating9ector
Yeast a¡tificialgþ¡mn36mp
Yeast prootrophicselecuble marker
YeaJt protcüopLicselec¡able marker
Yeeet ARS
-E aúfseþctable ma¡ke¡
E l¡üiORI
E att'selectable ma¡ker
E aüt'ORI
E ¿tút'selectable markcr
E aút'ORI
Mode of transforrnation
- low frequncy- inægratiue- \¡ery stable- one copy per cell
- high freqræncy- aubnorDì.ft- very unshbh- 5-20 copÞs per cell
- h:gh frequncy- aubnomoui,- moderaÞ slabiliry- 20-100 copies percell
- low frequency- replicales as chtornosorne- stablÊ- 1 copy per cell
Structr¡¡e
Z¡tn
Yeait pmbtrophicselectable ma¡k¡r
E CLTIselecuble ma¡ker
E öhlr Yeast ARSORI and
centorlere
Yeasl Elcmere
Yeast proorophicselecuble marker
Yeasl Þlomere
Figure 4.1. Classes of cloning vectors available for use in
S ac c hnro my c es c erevisiae.
Bam Hl
Barn Hl
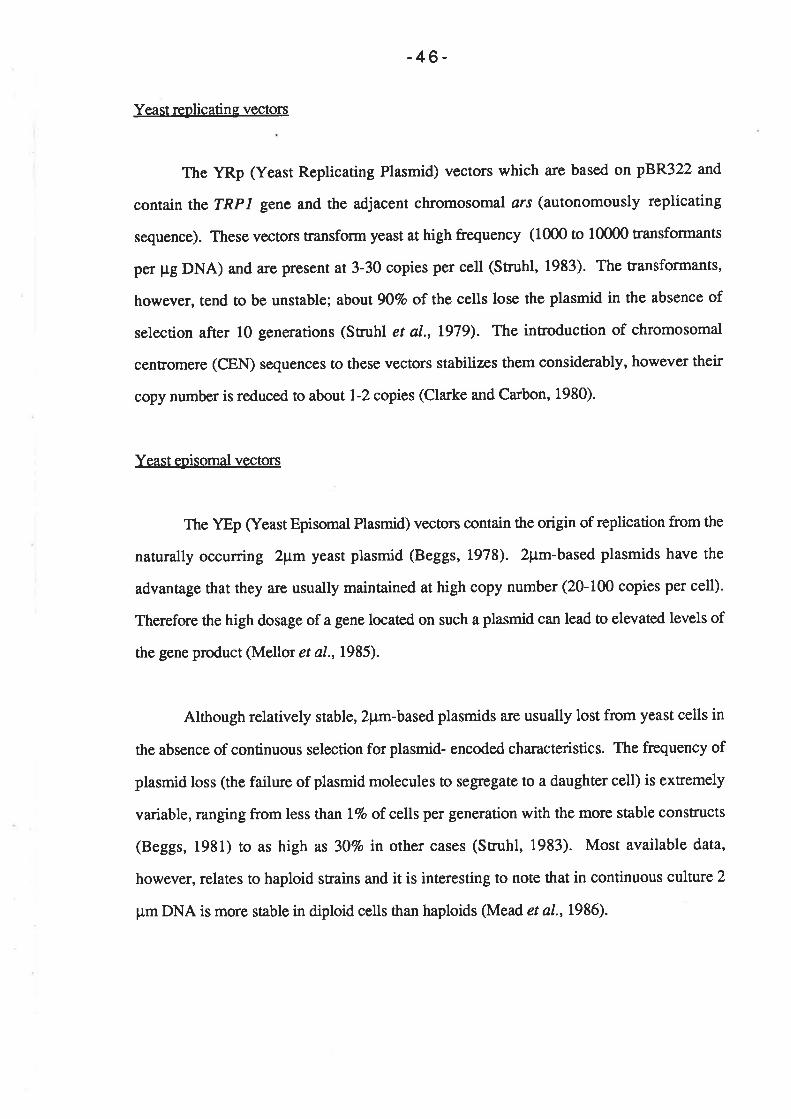
-46-
Yeast replicatin g vectors
The YRp (Yeast Replicating Plasmid) vectors which are based on pBR322 and
contain the TRP I gene and the adjacent chromosomal ørs (autonomously replicating
sequence). These vectors transform yeast at high frequency (1000 to 10000 transformants
per pg DNA) and are present at 3-30 copies per cell (Struhl, 1983). The transformants,
however, tend to be unstable; about 90Vo of the cells lose the plasmid in the absence of
selection after l0 generations (Struhl et al., t979). The introduction of chromosomal
centromere (CEN) sequences to these vectors stabilizes them considerably, however their
copy number is reduced to about 1-2 copies (Cla¡ke and Carbon, 1980).
Yeast eoisomal vectors
The YEp (Yeast Episomal Plasmid) vectors contain the origin of replication from the
naturally occurring 2pm yeast plasmid (Beggs, 1978). 2pm-based plasmids have the
advanrage that they are usually maintained at high copy number (20-100 copies per cell).
Therefore the high dosage of a gene located on such a plasmid can lead to elevated levels of
the gene product (Mellor et a1.,1985).
Although relatively stable, 2pm-based plasmids are usually lost from yeast cells in
the absence of continuous selection for plasmid- encoded characteristics. The frequency of
plasmid loss (the failure of plasmid molecules to segregate to a daughter cell) is extremely
variable, ranging from less tha¡ l7o of cells per generation with the more stable constructs
(Beggs, 1981) to as high as 307o in other cases (Struhl, 1983). Most available data,
however, relates to haploid strains and it is interesting to note that in continuous culture 2
pm DNA is more stable in diploid cells than haploids (Mead et a1.,1986).
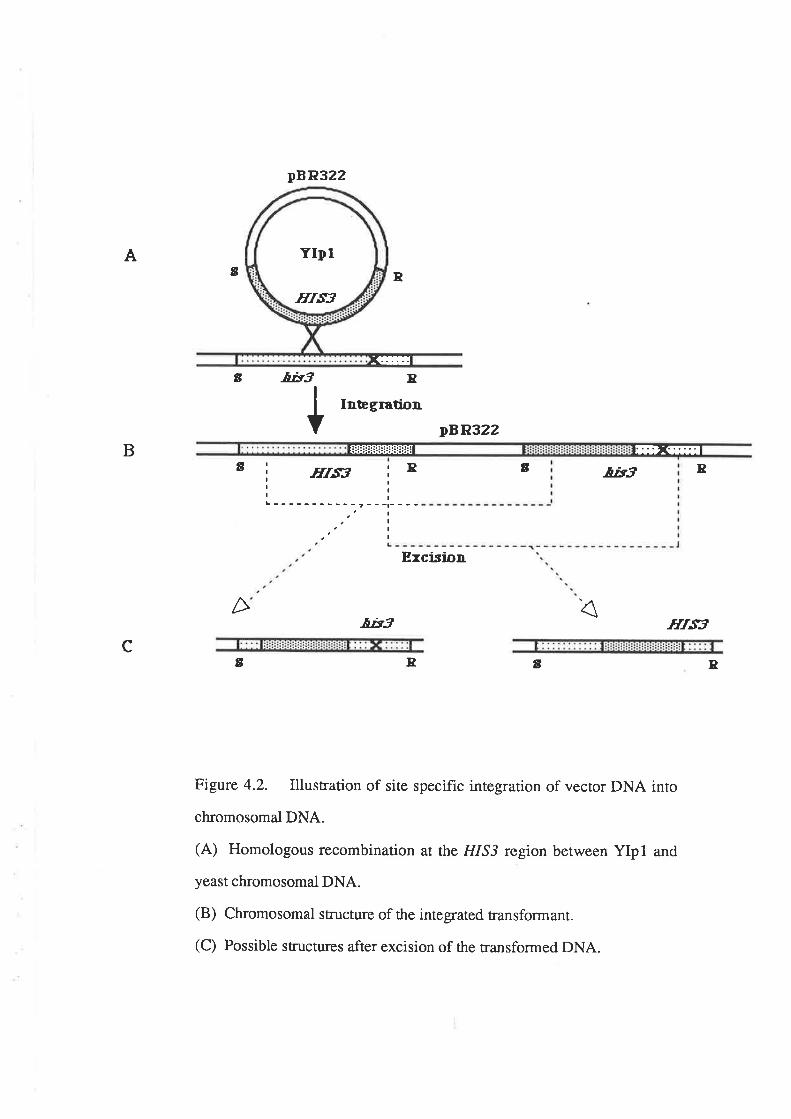
A
DBR322
t
B
n
Inægration
a
a .&-¡y.3
pBR322
YIpl
fiTÑ
:üütt
Ba i nræ i*
l¡l¡t----
.l.t
.l.l
a R.ã¡y'3
Excision
D 4.Ely.3 TffÑ
ca R a P
Figure 4.2. Illustration of site specific integration of vecror DNA into
chromosomal DNA.
(A) Homologous recombination ar rhe HIS3 region between YIpl and
yeast chromosomal DNA.
(B) Chromosomal structure of the integrated transformant.
(C) Possible structures after excision of the transformed DNA.
ffi P:(m
-47 -
Inteerative vectors
The YIp (Yeast Integrative Plasmid) vectors can only achieve clonal expression
through integration into the genome by homologous recombination. They must carry at
least one region homologous to a yeast chromosomal sequence; a selectable marker; and
they must lack any drs sequence whose presence would confer autonomous replication.
Site specific integration of vector DNA into chromosomal DNA may tte mediated by
homologous recombination between ch¡omosomal and vector DNA. As shown in Figure
4.2 for the example of the HIS3 gene region on chromosome XV, homologous
recombination results in a duplication of the cloned yeast gene (Struhl et al., L979).
Transformed cells often contain only one copy (sometimes a few copies) of the vector,
which replicates with and under the control of chromosomal DNA. The nontandem
duplicated structure is not completely stable. After 15 generations of growth in nonselective
medium, approximately l%o of the colonies a¡e His-. This segregation is accompanied by
the complete loss of transforming DNA and almost certainly results from a reversal of the
original transformation event - ie., excision by homologous recombination.
V/ith yields of approximately l-10 transformants per pg DNA, transformation
frequencies obtained with circular integrating vectors a¡e several orders of magnitude lower
than those achieved with self-replicating plasmids. Orr-Weaver et al.. (1981) demonstrated
that the efficiency of transformation with intregrating plasmids is increased l0- to 1000-
fold when the plasmid DNA is fust made linea¡ by restriction enzyme digestion within the
region of homology to the yeast genome. They also showed that plasmids consistently
integrated at the chromosomal location corresponding to the region of the plasmid that had
been cleaved by the restriction endonuclease. It was concluded that double-strand breaks in
DNA are highly recombinogenic and interact directly with homologous chromosomal
sequences by strand invasion and repair synthesis during recombination. This localization
-48-
effect has been ærmed targetting and is the basis for many of the replacement and disruption
techniques used to manipulate genes on yeast chromosomes.
Yeast artificial chromosomes
The isolation and cloning of yeast telomeric DNA opened the way for combining
these individual functional elements into an a¡tificial chromosome. Muray and Szostak
(1983) constructed a series of linea¡ plasmids, all of which contained a selectable ma¡ker
(eg. TRPI, HIS3, URA3), ars replicator, CEN3 DNA, and telomeres from Tetrahymena
ribosomal DNA. The plasmids varied in length from 9.8 to 55kb. The very large (>50kb)
linea¡ plasmids containing ¿rs, CEN and telomeric DNA are present at one or two copies
per cell and are more mitotically stable than their circula¡ ørs,CEN counterparts. This
søbility contrasts with the behaviour of short (<16kb) linea¡ plasmids in which the addition
of telomeric DNA reduces the mitotic stability and increases copy number.
The generation of Yeast artificial chromosome (YAC) vectors has provided
technology for cloning foreign DNA fragments of several hund¡ed kilobase pairs. This
system offers a tenfold increase in the size of DNA molecules than can be cloned in a
microbial host, and therefore provides a system for the analysis of complex DNA genomes.
4.1.3 Tranformation procedures
DNA can be introduced into yeast by removing the cell wall enzymatically to
produce spheroplasts. Hinnen et al. (1978) first succeeded in the transformation of
spheroplasts by using a polyethylene glycol-CaCl2 medium which was originally developed
for protoplast fusion of plant cells (van Solingen and van der Plaat, L977). Ha¡ashima er
al.. (1984) have shown that transformants obtained under these conditions were diploids or
polyploids in cell size, shape and segregation patterns of genetic ma¡kers after crossing wittr
a standard haploid strain, although the strains used as recipients in the transformation were
-49-
haploids. It is therefore considered that transformation of spheroplasted yeast cells is
directly associated with cell fusion.
An alternative transformation procedure, which avoids cell wall dissolution,
involves the treatment of whole cells with alkali cation salts or sulftrydryl reagents and
polyethylene glycol (lto et a1.,1983). This is generally less eff,rcient (by 1-2 orders of
magnitude) but the overall simplicity of the procedure makes it the prefered method for
many applications. Furthermore transformants can be detected after only 36 hours
incubation, whereas regeneration of yeast cell walls takes 3-7 days after spheroplast fusion.
Recently, the method of electroporation has become available for yeast
transformation. This procedu¡e involves exposure of a sqspension of cells and cloned
DNA to a high voltage electric discharge (Zimmerman and Vienken, 1982; Potter et al.,
1984). In essence, electroporation makes use of the fact that the cell membrane acts as an
electical capacitor which is unable (except through ion channels) to pass cwrent. Subjecting
membranes to a high voltage electric field results in their temporary breakdown and the
formation of pores that a¡e large enough to allow macromolecules to enter or leave ttre cell.
The recovery of membrane integrity is a natural decay process which can be delayed at 0oC.
In 1985 Karube et al. succeeded in using electric f,reld pulses to introduce plasmid
DNA into yeast spheroplasts with an efficiency of 103 transforrnants per pg DNA and
Hashimoto et al. (L985) used electroporation to transform intact cells, although only a low
efficiency, of approximately 90 transformants per ¡rg DNA, was achieved. Since then,
various modifications of the electroporation methd have been described (Simon and
McEntee, 1989; Rech er al. 1990) and an efficiency of as high as 107 Eansformants per pg
DNA has been reported (Meilhoc et al. l99O).
Various other yeast transformation procedures have been described including a
spheroplast treatment which does not involve cell fusion (Bergers and Percival, 1987);
-50-
agitation of whole cells with glass beads (Costa¡rzo and Fox, 1988); and the direct treaünent
of colonies from agar plates (Keszenman-Pereyra and Hieda, 1988). However, the alkali
cation method of lto et al. (1983), remains the favoured protocol for most yeast
manipulations.
4.I.4 Expression and secretion of foreign oroteins
For a transformed yeast strain to express a foreign gene, the vector must contain
various DNA sequences and signals which regualte the processing of a foreign DNA
sequence into a protein. These collectively are termed the "expression complex". The
expression complex comprises a promoter and terminator srrrounding the multiple cloning
sites for foreign gene insertion, and it may also contain signals for protein secretion.
Promoters originating from yeast genes are used since promoters ate fairly host-specific and
those from higher eukaryotes tend to have lower efficiency of initiation of transcriptions
when used in yeast (Beg gs et aI., 1980; Rothstein et aI., 1984). Table 4.2 gives some
conìmon examples of promoter elements derived from yeast.
Promoters for glycolytic enzymes are popular as these enzymes are among the best
represented proteins in a yeast cell. Each can represent l-57o of total cell protein - and it is
assumed that this high-level expression is is due to the association of strong promoters with
these genes (Goodey et a1.,1987). Some of these promoters a¡e inducible or repressible
(Brent, 1985) such that by the addition of an inducer or repressor, protein production is
either switched on or off. This trait is used to achieve regulated expression of heterologous
proteins in yeast. As an example, the transcription of the acid phosphatase gene is tightly
repressed when inorganic phosphate is present in the gowth medium and induced by
depletion of inorganic phosphate. Other examples have been discussed by Kingsman et al.
(1985) and Goodey et al. (1987).
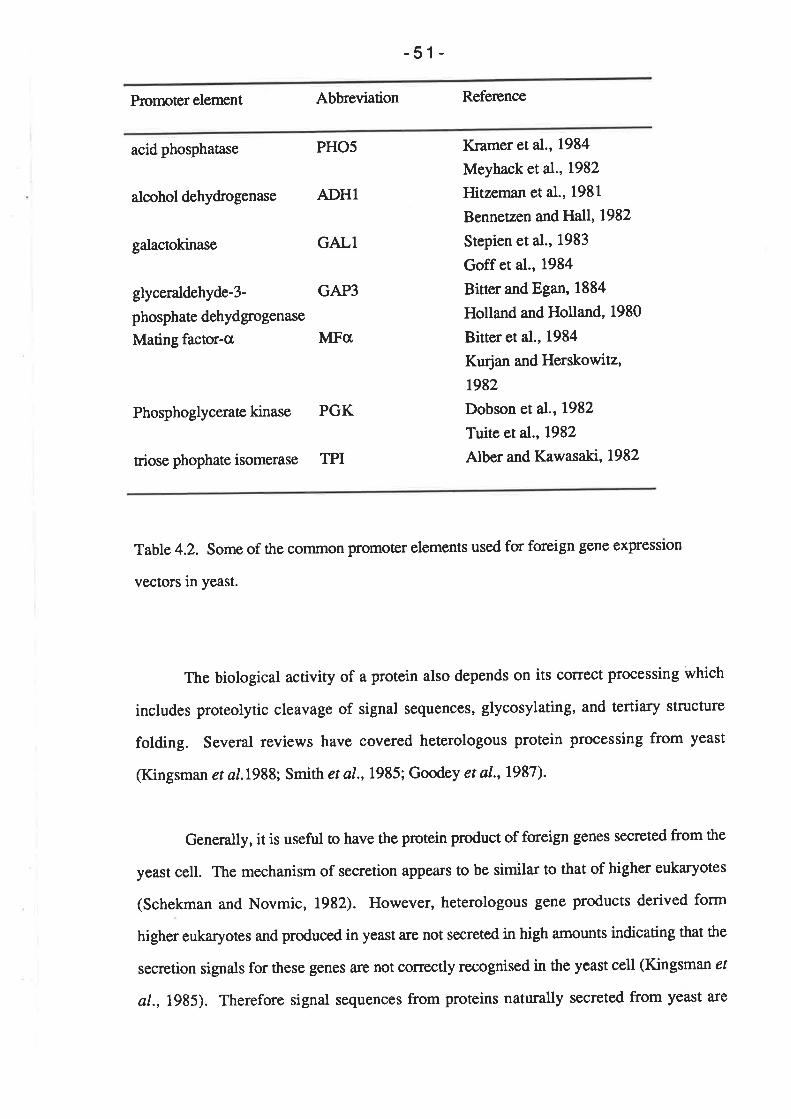
-51-
Promoter element Abbreviation Reference
acid phosphatase PHO5
alcohol dehydrogenase ADH1
galactokinase GALl
glyceraldehyde-3- GAP3
phosphate dehydgrogenase
Mating factor-cr MFa
Kramer et al., 1984
Meyhack etaI., L982
Hitzeman et al., 1981
Bennetzen and Hall, 1982
Stepien et al., 1983
Goff et al., 1984
Bitter and Egan, 1884
Holland and Holland, 1980
Bitter et al., 1984
Kurjan and Herskowitz,
1982
Dobson et aI.,1982
Tuite et a1., 1982
Alber and Kawas akt, 1982
Phosphoglycerate kinase PGK
triose phophate isomerase TPI
Table 4.2. Some of the conìmon promoter elements used for foreign gene expression
vectors in yeast.
The biological activity of a protein also depends on its correct processing which
includes proteolytic cleavage of signal sequences, glycosylating, and tertiary structure
folding. Several reviews have covered heterologous protein processing from yeast
(Kingsman et al.L988; Smith et a1.,1985; Goodey et a1.,1987).
Generally, it is useful to have the protein product of foreign genes secreted from the
yeast cell. The mechanism of secretion appears to be similar to that of higher eukaryotes
(Schekman and Novmic, 1982). However, heterologous gene products derived form
higher eukaryotes and produced in yeast are not secreted in high amounts indicating that the
secretion signals for these genes are not correctly recognised in the ycast cell (Kingsman ef
ø/., 1985). Therefore signal sequences from proteins naturally secreted from yeast are
- 52-
usually used, such as that for acid phosphatase (Smith et al., 1985), the a-mating type
factor (Julius et a1.,1984), and invertase @erlman and Halvorsen, 1983).
4.1.5 Chapter aims
The question arises as to which of these systems is most useful to the wine
indusüry, and what are the limitations or advantages of particular vectors. A desirable
vector should have the following attributes: i) good transformation efficiency, ii) stable
inheritance of nansferred genes; and iü) usefulness in a wide range of industrial strains. It
is also imperative that the vector or the transformation procedure does not adversely affect
the characteristics of the yeast strain under fermentation conditions.
A current limiting factor in the commerciat application of recombinant DNA
technology to industrial food and beverage yeasts is the presence of non-food yeast
nucleotide sequences in the transformants. In light of regulatory and market requirements
then, it is important to consider the possibility of producing transformants containing only
yeast sequences when assessing the advantages of vector systems.
The aim of this chapter is to investigate a number of selectable markers, vector
systems and transformation protocols to establish a system (which meets the criteria
discussed above) for the application of recombinant DNA technology to wine yeasts.
4,2 RESULTS
4.2.1 Choice of a selectable ma¡ker
In order to choose an efficient dominant selectable marker for use in wine yeast
transformations, an experiment was performed to test three available markers.
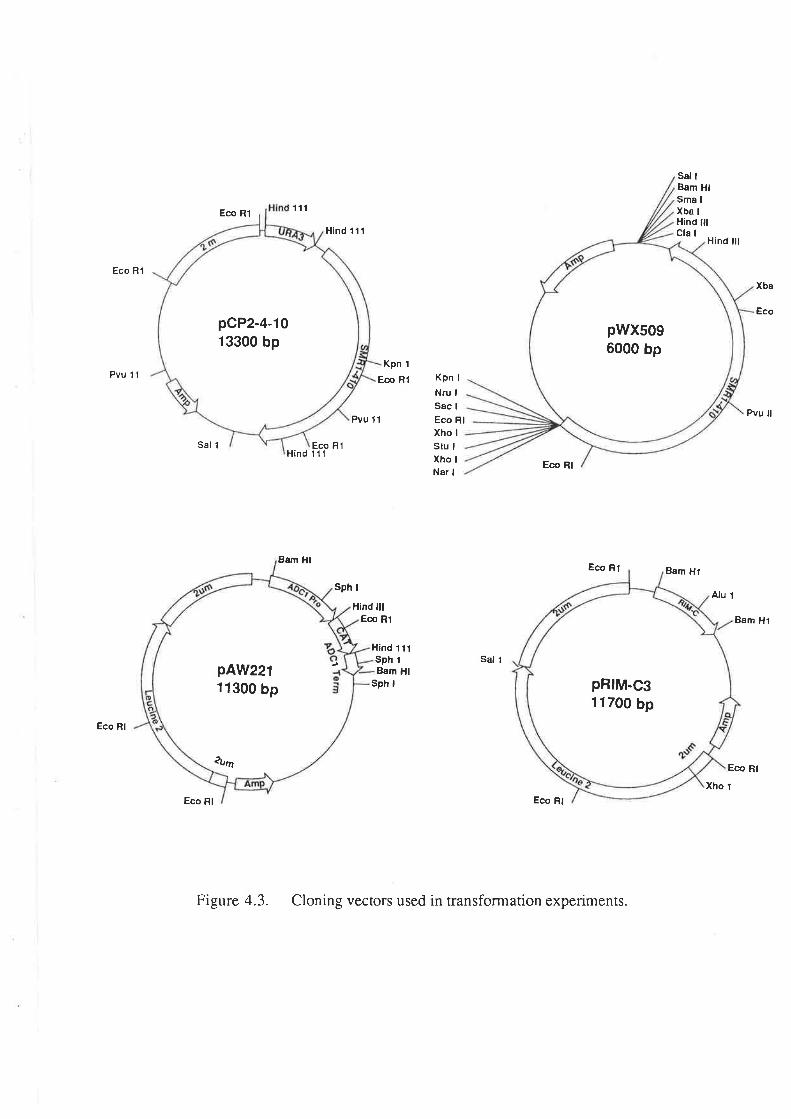
pcP2-4-1013300 bp
Ec! R1111
Hind 111
Kpn 1
Eco Rf Kpn I
Nru I
Sac I
Eco FlPvu 1f
Sal 1
H¡ndEc¡ R111f
Xho I
SIU I
Xho I
Nar IEco Rl
8am HtEco Rf
sph I
H¡nd lllEco R1
H¡nd 1f lSph 1
8am HlSph I
Eco Rl Eco Rl
Figure 4.3. Cloning vectors used in transforrnation experiments.
Sal IBam HtSma IXba I
H¡nd lltCla I
Hind lll
Eco Rl
Pvu 11
Eco Rl
Sal I
Bam Hl
Xba
Eco
Pvu ll
Bam Hl
Eco Rt
Alu 1
Xho l
pwxs096000 bp
4rm
pAW22111300 bp pRtM-C3
1f700 bp
-53-
Ð Chloramphenicol Resistance
Chloramphenicol (Cm) inhibits protein synthesis ca¡ried out by 70S ribosomes, as
found in procaryotes and mitochondria, but not by 80S ribosomes, found in the cytoplasm
of eukaryotic cells. Eukaryotic cells may be inhibited by Cm if their growth depends upon
utilising a ca¡bon source that can only be assimilated via mitochondrial-dependent aerobic
metabolism. Resistance to Cm by certain bacteria is mediated by plasmid encoded
chloramphenicol acetyl transferase GAD (Shaw, 1933). This enzyme causes inactivation
of the antibiotic by acetylation derived from acetyl-CoA.
The CAT coding sequence from Tn9 has been shown to confer resistance to
chloramphenicol in yeast when present as a single copy per cell (Hadfield et al., 1986),
The sequence, however requires yeast promoter and terminator signals for expression.
Therefore, the CAT coding region was cloned into the HindIII site of the vector AAH5
(Ammerer, 1933) which contains the yeast alcohol dehydrogenase 1 (ADCI) promoter and
terminator sequences. A clone with the coding sequence in correct orientation with respect
to the promorer (pAW 221) (Figure 4.3) was selected for transformation experiments.
ü) Clcloheximide
The cycloheximide resistance gene from Candida maltosa (RIM-C) has already
been described. The plasmid pRIM-C3 (Figure 4.3) which contains the resistance gene
was obtained fromDr. M. Takagi for transformation trials.
üi) Sulfometuron methyl
Plasmid pCP2-4-10 which contains the SMR1-410 gene was obtained from Dr. G
Casey for transformation studies.
-54-
In order to test the suitability of each of these selectable ma¡kers for use in the
transformation of wine yeasts, it was first necessary to determine the minimum inhibitory
levels of the relevant chemicals on a range of yeast strains. Yeast growth (colony size) was
assessed on solid media containing the inhibitors. Table 4.3 depicts the growth responses
of yeast strains to a rìange of concentrations of chloramphenicol, sulfometuron methyl and
cycloheximide. It should be noted that the minimal inhibitory concentration of
cycloheximide was not accurately determined, as complete growth inhibition of all strains
was achieved with the lowest concentration tested (2 ttglml). However, as successful
selection of pRIMC-3 transformants had been reported using 10 pglml cycloheximide
(Takagi et al., 1986), it was decided that 2 pgml would be a suitable concentration for
transformation experiments. Complete growth inhibition of all strains tested was achieved
at a concentration of 10 pg/mt sulfometuron methyl and 5 mg/ml chloramphenicol. These
concentrations were used in transformation studies.
The effîciency of each marker was tested in transformation experiments using each
respective plasmid on the haploid laboratory yeast strain Ol1. This strain is auxotrophic for
both uracil and leucine. Approximately 5 lrg of plasmid DNA was used to transform OLl
using ttre lithium acetate methd (Ito et al.,1983). Aliquots of the Eansformation mix were
then plated out on different selection media for direct comparison of the auxotrophic and
dominant ma¡kers on each plasmid. Table 4.4 shows the numbers of transformants
obtained in each case.
These results indicate that under conditions described here transformants of
plasmids pAW2Zl and pRIM-C3 can be selected directly for their auxotrophic ma¡ker
(leucine), but not for their dominant ma¡kers (chloramphenicol and cycloheximide,
respectively). PlamsidpCP2-4-10, however, resulted in an equal number of transformants
when selected by either the auxorophic (uracil) or the dominant (sulfometuron methyl)
ma¡kers.
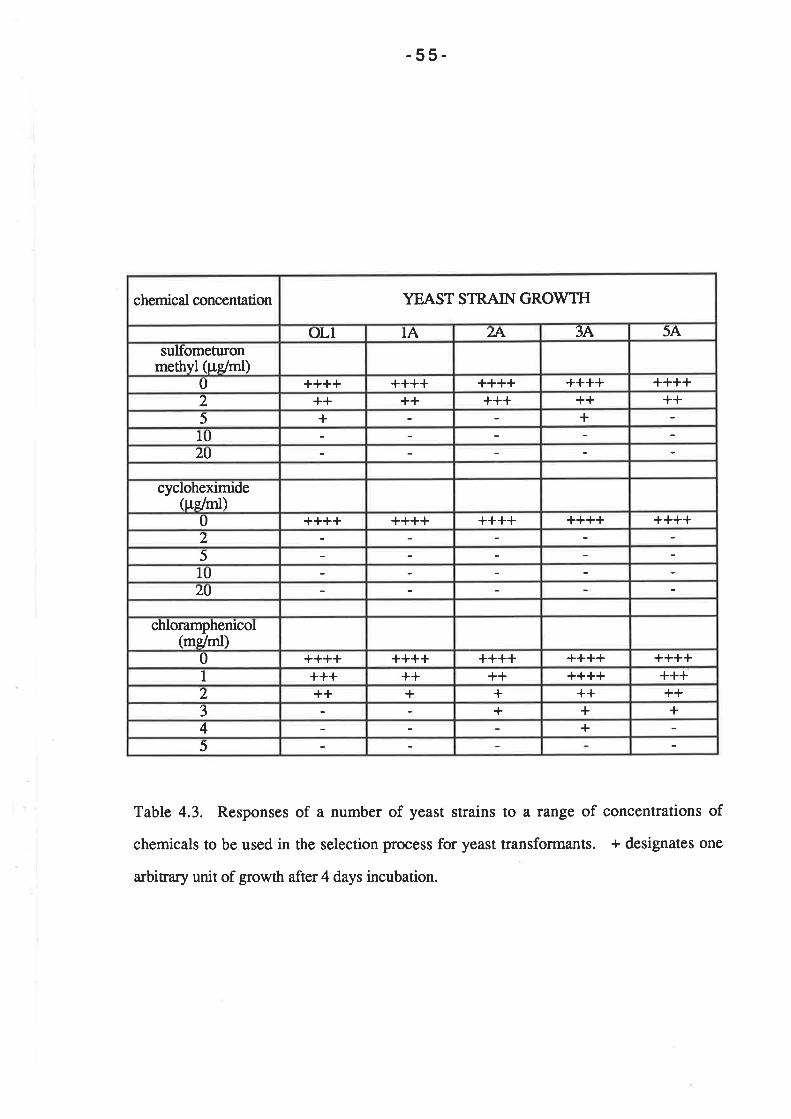
-55-
Table 4.3. Responses of a number of yeast strains to a range of concentrations of
chemicals to be used in the selection process for yeast transformants. + designates one
arbitrary unit of growth after 4 days incubation.
5
+4+++3
++++++++z++++++++++++++I
++++++++++++++++++++0
chloramphenicol(mslml)
zrJ
105
2++++++++++++++++++++0
cycloheximide(ue/ml)
20l0
++5
+++++++++++2++++++++++++++++++++0
sulfbmeturonmethyl (pelml)
5A3A?4.IAoLl
YEAST STRAIN GROW'THchemical concentation
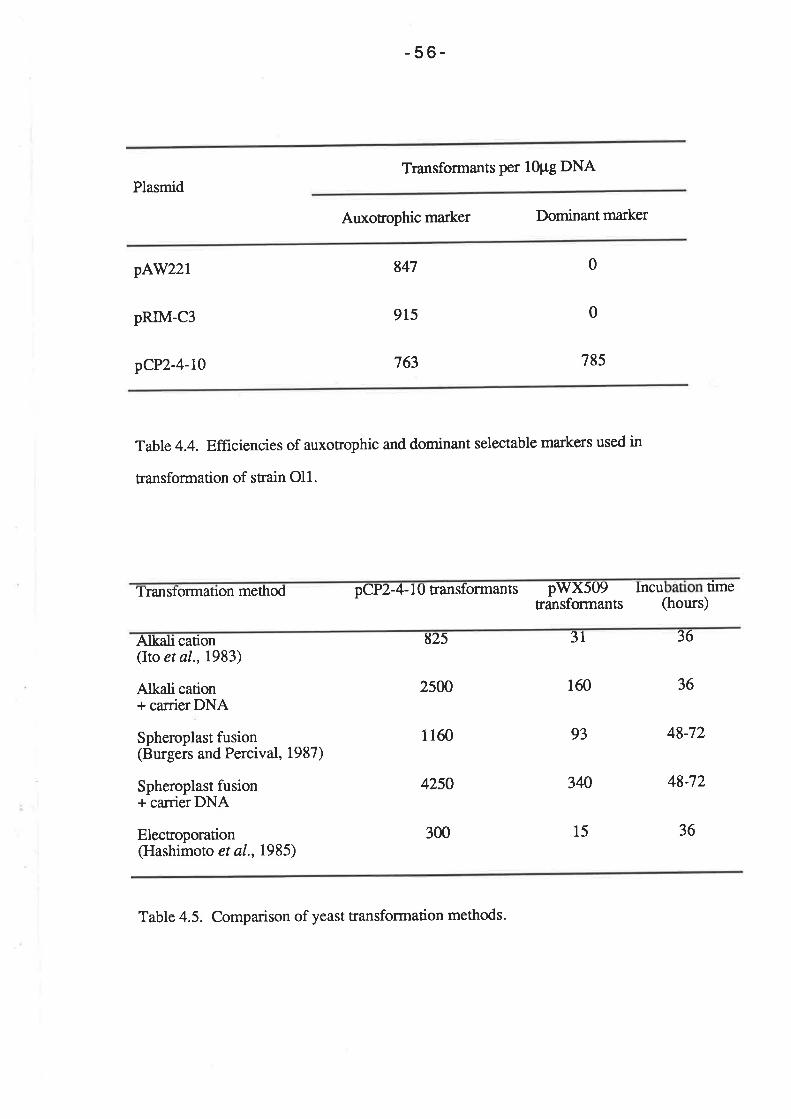
-56-
Transformants per 10Pg DNAPlasmid
Auxotrophic ma¡ker Dominant marker
pl+W221
pRIM-C3
pCP2-4-10
847
915
763
0
0
785
Table 4.4. Efficlencies of auxotrophic and dominant selectable markers used in
transformation of strain O11.
'lïanstormatron method pCP2-4-r0 transformants PWX509 Incu timetransformans (hours)
Alkali cation(Ito er al.,1983)
Alkali cation+ ca¡rierDNA
Electroporation(Hashimoto et al., 1985)
Spheroplast fusion(Burgers and Percival, 1987)
Spheroplast fusion+ ca¡rierDNA
825 36
36
31
160
93
340
2500
1 160
4250
48-72
48-72
36300 15
Table 4.5. Comparison of yeast transformation methods'
-57 -
In order to confirm appropriate levels of expression of the dominant ma¡kers on
plasmids pAW22l and pRIM-C3, transformants which had been selected by their
auxotrophic markers were streaked onto the relevant dominant selection media. Both
pAVf221 and pRM-C3 transfonnants showed positive growth on the dominant selection
media, thus they displayed an indirect resistance phenotype. One can conclude that
appropriaæ levels of the RIM-C andCAT genes are achieved in S. cerevísiae, but that direct
exposure of transformants to either chloramphenicol or cycloheximide is not feasible. It is
possible that post-transformation incubation prior to selection would result in isolation of
transformants based on cycloheximide or chloramphenicol resistance. In fact, the
transformation method described by Takagi et al. (L986) includes an overnight incubation
of transformants prior to exposure to cycloheximide. Transformation of Oll using pRIM-
C3 and pltW22l was therefore repeated with an altered selection procedure. Following
transformation, cells were plated directly onto non-selective media, incubated overnight at
28oC, and then overlayed with selective media. This procedure, however, again failed to
yield tansformants with either plasmid.
Due to ease of selection and a transformation comparable efficiency with theURA3
marker, the SMRI gene was used in further transformation experiments.
4.2.2 Choice of a transformation procedure
A number of transformation methods were tested to find one most suitable for
manipulation of wine yeast strains:
Ð ttre alkali cation method of Ito et aI. (1983):
ä) the alkali cation method of Ito et al. (7983) with the addition of carrier
DNA to the plasmid DNA;
üi) the spheroplast fusion method of Burgers and Percival (1987);
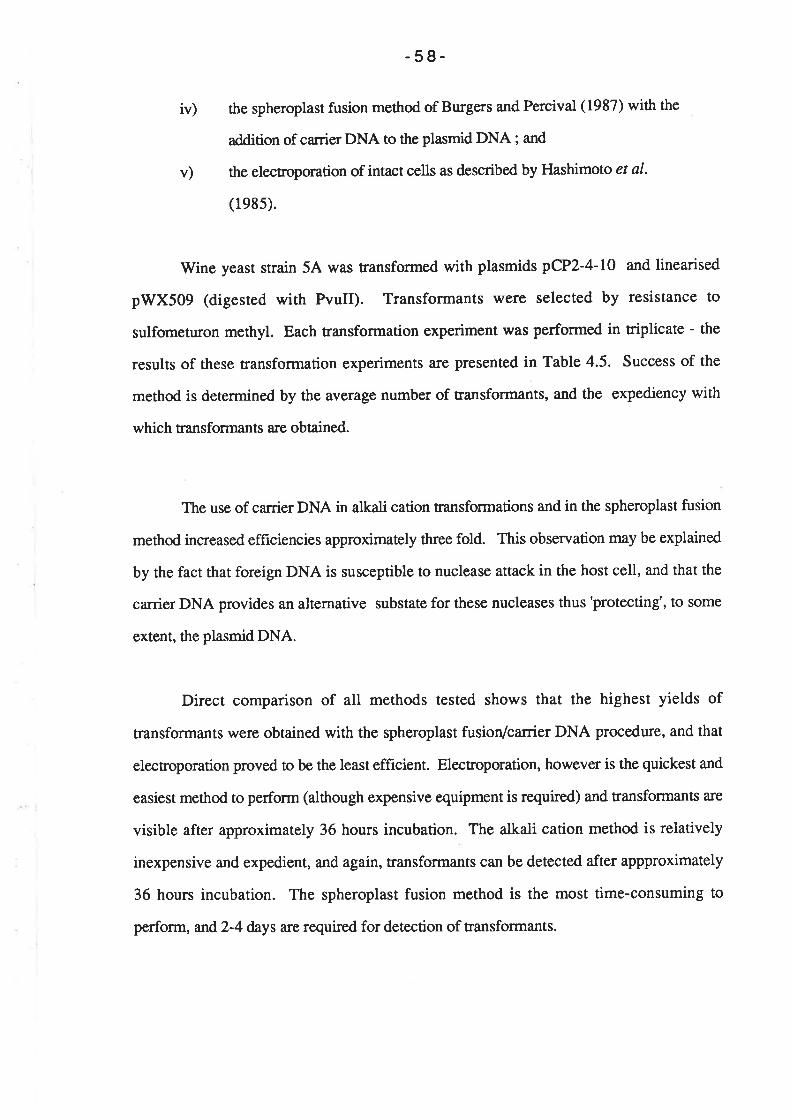
-58-
iv) the spheroplast fusion method of Burgers and Percival (1987) with the
addition of ca¡rierDNA to ttre plasmid DNA; and
the electroporation of intact cells as described by Hashimoto et al.
(1e85).
Wine yeast strain 5A was transformed with plasmids pCP2-4-L0 and linearised
pV/X509 (digested with PvuII). Transformants were selected by resistance to
sulfometuron methyl. Each transformation experiment was performed in triplicate - the
results of these transformation experiments are presented in Table 4.5. Success of the
method is determined by the average number of transformants, and the expediency with
which transformans a¡e obtained.
The use of carrier DNA in alkali cation transformations and in the spheroplast fusion
method increased efficiencies approximately three fold. This observation may be explained
by the fact that foreign DNA is susceptible to nuclease attack in the host cell, and that the
carrier DNA provides an alternative substate for these nucleases thus'protecting', to some
extent, the plasmid DNA.
Direct comparison of all methods tested shows that the highest yields of
transformants were obtained with the spheroplast fusiorVca¡rier DNA procedure, and that
electroporation proved to be the least efficient. Electroporation, however is the quickest and
easiest method to perform (although expensive equipment is required) and ransfotmants are
visible after approximately 36 hours incubation. The alkali cation methd is relatively
inexpensive and expedient, and again, transformants can be detected after appproximately
36 hours incubation. The spheroplast fusion method is the most time-consuming to
perform, and2-4 days are required for detection of transformants.
v)
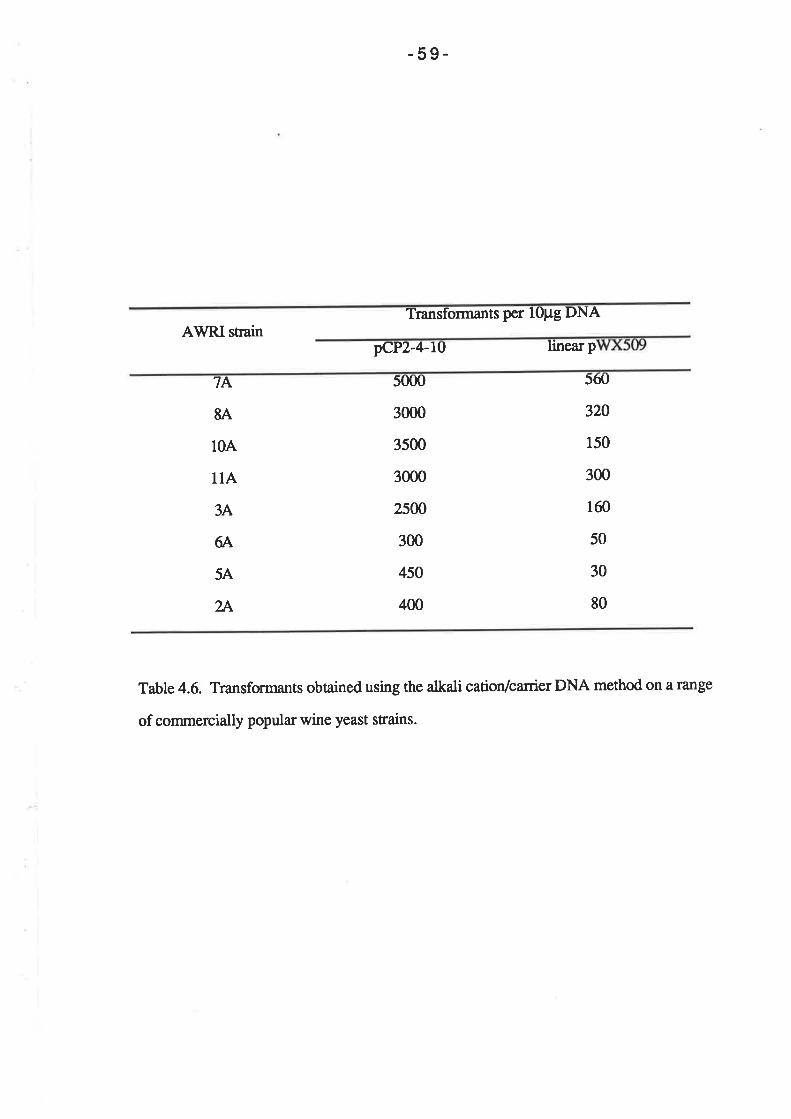
-59-
Transformants per 10pg DNAAWRI strain
pCP2-4-10 linea¡ p
7A
&q.
10A
114
3A
6A
5A
2A
50u)
3000
3500
3000
25W
300
450
400
)ó(,
320
150
300
160
50
30
80
Table 4.6. Transformants obtained using the alkali cation/ca¡rier DNA method on a range
of commercially popula¡ wine yeast strains.
-60-
Considering all factors, the alkali catiory' ca¡rier DNA method was selected. This
method was used to transform a number of wine yeasts from the AWRI collection with
plasmids pCP2-4-10 and prilX509, selecting directly for resistance to sulfometuron
methyl. Results from this experiment (Table 4.6) verify that the selectable marker and
transformation method are suitable for a wide range of wine yeasts strains. Figure 4.4
shows the results of the transformation of one of these wine yeast strains (74) with pCP2-
4-10, circular pV/X509 and linea¡ pWX509. Plate A shows the transformants obtained
with pCP2-4-lO; an efficiency of 5000 transformants per 10 pg DNA was obtained. Plate
B is the control ransformation in which no DNA was present in the transformation mixture.
Five colonies are present on this plate and represent the background spontaneous mutants
which are resistant to sulfometuron methyl. Plate C shows the transformants obtained with
linearised pV/X509 - an efficiency of 560 transformants per 10pg DNA was achieved.
Plate D shows the results of transformation with circula¡ p\ü/X509, and in this case the
efficiency was similar to that obtained in the control transformation (Plate B). One can
conclude, therefore, that transformation with circular pWX509 was not successful.
4.3.3 Analysis of transformants
Transformants of strain 5A were analysed for the presence of plasmids pCP2-4-10
or pWX509. Total DNA was isolated from 3 transformants of pCP2-4-10 (5A-pCP2-a-
l0), 3 transformants of pWX509 (54-pWX509) and a control, unüansformed colony of
54. The DNA was digested with PvuII, electrophoresed on a 0.8Vo agÍuose gel and
transferred by Southern blotting to a nylon membrane. Both plasmids contain sequences of
pBR322. Therefore, the presence of each plasmid could be detected by hybridization of
the membrane with radiolabeled pBR322.
Figure 4.5 depicts the result of this hybridization experiment. As expected, no
hybridization signal is apparent in the lanes containing DNA from the untransformed colony
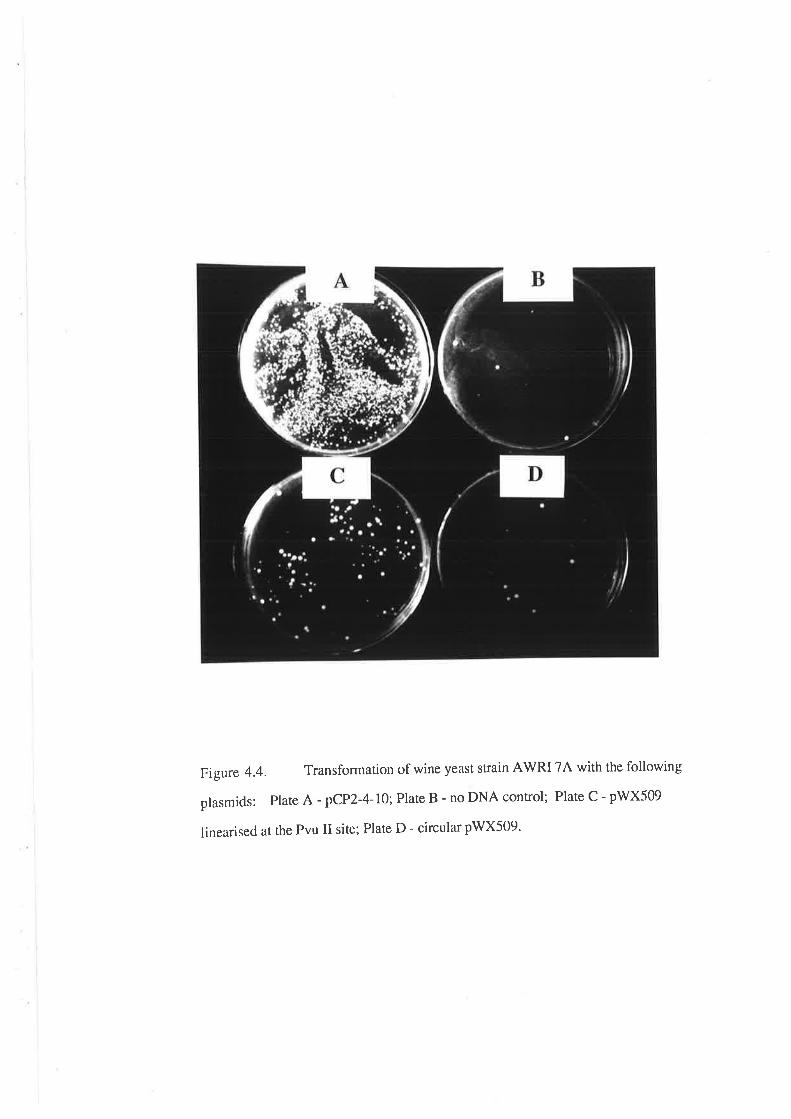
Figure 4.4. Transformation of wine yeast srain AWRI TA with the following
plasmids: Plate A - pCP2-4-10: Plate B - no DNA control; Plate C - pWX509
linearised at the Pvu II site; Plate D - circular pWX509'
Figure 4.5. Southern hybridization detecting plasmids pCP-2-4-10 and
plWX509 in transformants of strain 54. Panel A: Total yeast DNA samples
electrophoresed on a l%o agarose gel, stained with ethidium bromide and
visualised on a UV light box. Panel B: Autoradiogram of gel depicted in
Panel A, after hybridization with a radiolabeled sample of pBR322.
Lanes: 1
2
3-5
6-8
9
t0-t2
13-15
16
L7
18
19
î. hind III markers
5A
5A -pCP2-4-10
5A-pWX509
5A digested with hu tr
5A-pCP2-4-10 digested with Pvu II
5A-pWX509 digested with Pvu tr
pCP2-4-10
pCP2-4-10 digested with Pvu II
prWX509
pWX509 digested with Pvu tr
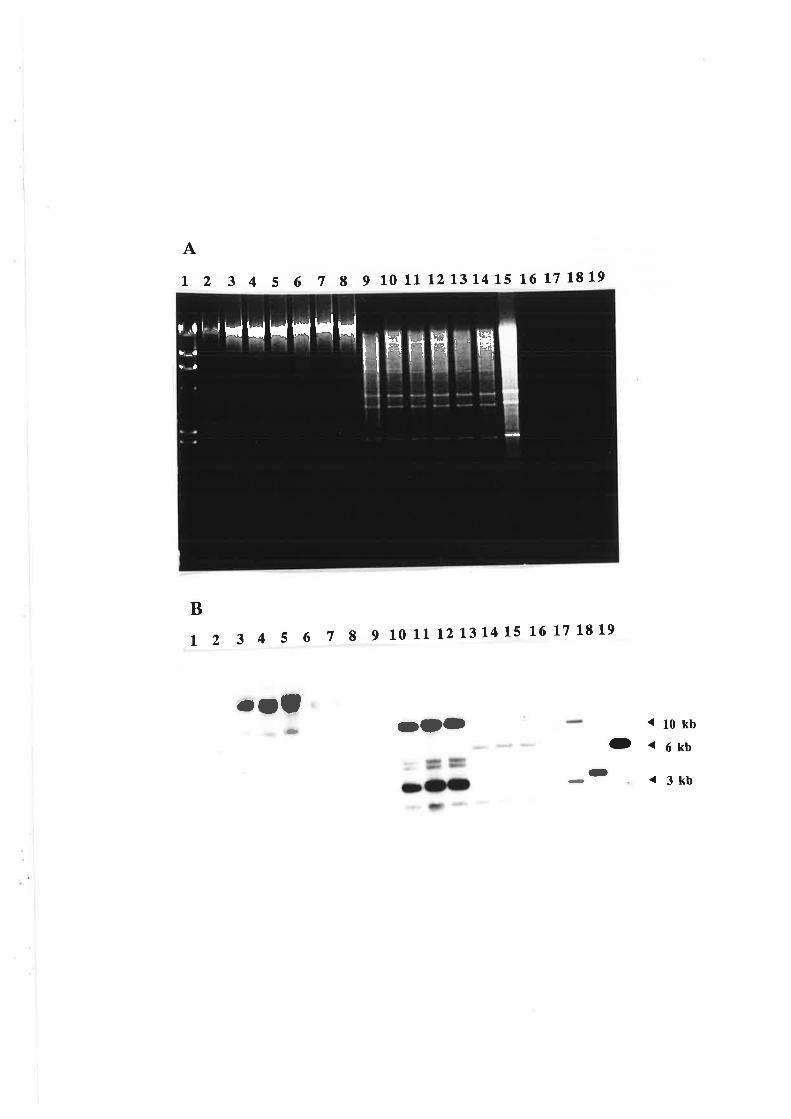
A
L 2 3 4 5 6 7I910 11'L21314 15 16 17 18 19
t234 56 7 89101112L3141s16171819
.olOO-
B
-< 10kb
(D < 6kb
< 3kb(t
r.rr rhlldldlqtlilllHrlF Ë¡-a
ra
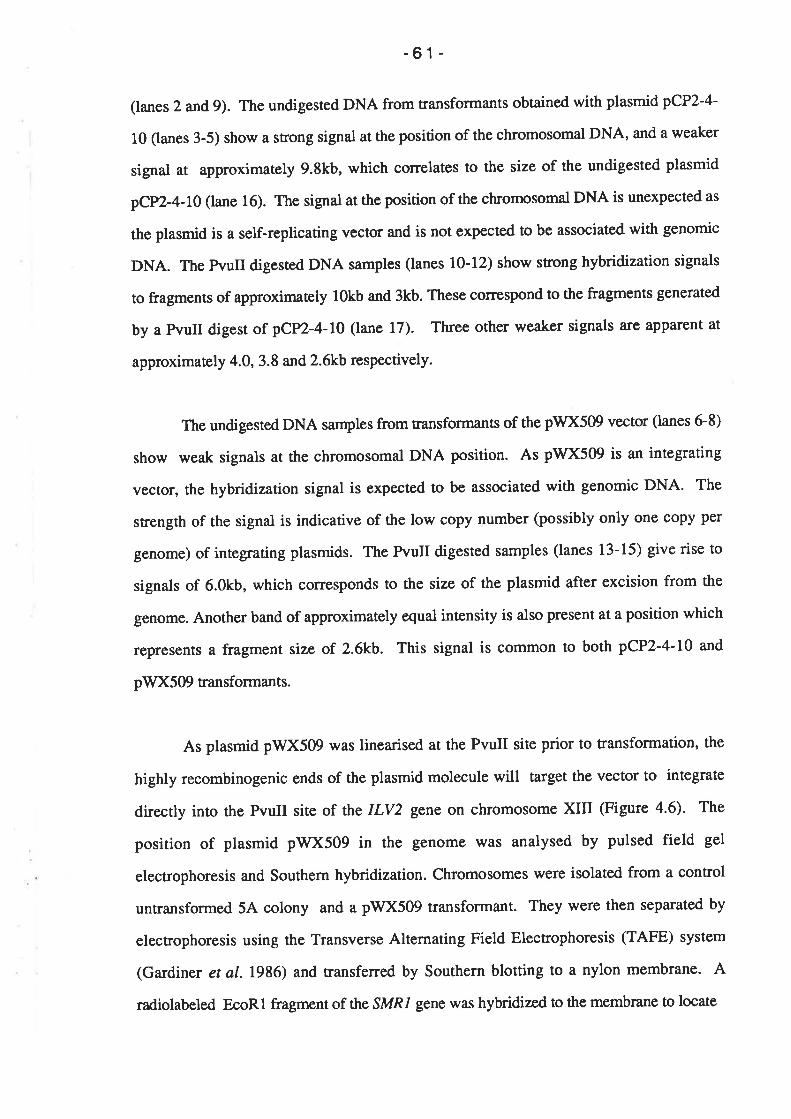
-61-
(lanes 2 andg). The undigested DNA from transformants obtained with plasmid pCP2-4-
10 (lanes 3-5) show a strong signal at the position of the chromosomal DNA, and a weaker
signal at approximately 9.8kb, which correlates to the size of the undigested plasmid
pCp2-4-10 (lane 16). The signal at the position of the chromosomal DNA is unexpected as
the plasmid is a self-replicating vector and is not expected to be associated with genomic
DNA. The PvuII digested DNA samples (lanes 10-12) show strong hybridization signals
to fragments of approximaæly 10kb and 3kb. These correspond to the fragments generated
by a PvuII digest of pCP2-4-10 (lane 17). Three other weaker signals are apparent at
approximately 4.0, 3.8 and 2.6kb respectively.
The undigested DNA samples from transformants of the pWX509 vector (lanes 6-8)
show weak signals at the chromosomal DNA position. As pWX509 is an integrating
vector, the hybridization signal is expected to be associated with genomic DNA. The
strength of the signal is indicative of the low copy number (possibly only one copy per
genome) of integrating plasmids. The PvuII digested samples (lanes 13-15) give rise to
signals of 6.0kb, which corresponds to the size of the plasmid after excision from the
genome. Another band of approximately equal intensity is also present at a position which
represents a fragment size of 2.6kb. This signal is common to both pCP2-4-10 and
pWX509 transformants.
As plasmid pWX509 was linearised at the PvuII site prior to transformation, the
highty recombinogenic ends of the plasmid molecule will target the vector to integrate
directly into the PvuII site of the ILV2 gene on chromosome XIII (Figure 4.6). The
position of plasmid pWX509 in the genome was analysed by pulsed field gel
electrophoresis and Southern hybridization. Chromosomes were isolated from a control
untra¡sforïned 5A colony and a pV/X509 transformant. They were then separated by
electrophoresis using the Transverse Alternating Field Electrophoresis (TAFE) system
(Gardiner et at. 1986) and transferred by Southern blotting to a nylon membrane. A
radiolabeled EcoRl fragment of the SMRL gene wÍrs hybridized to the membrane to locate
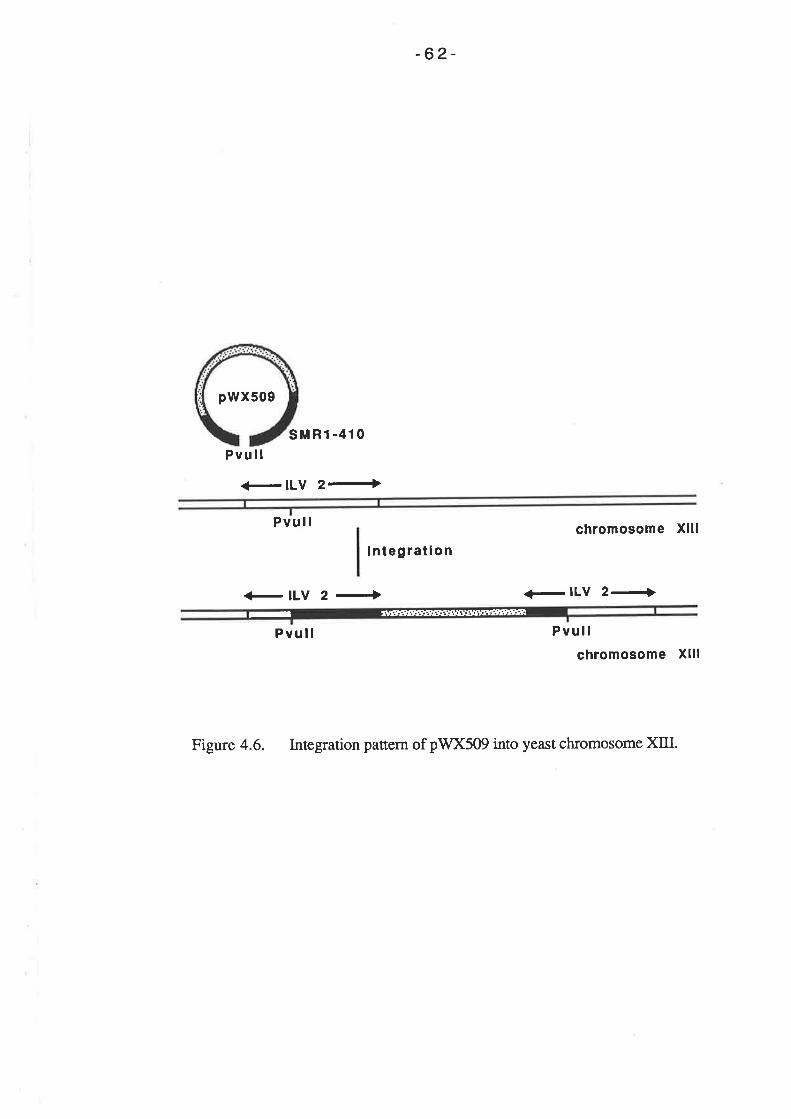
- 62-
pwxs09
sMRf-410Pvull
{-lLV 24
Pvull
a- llv 2
I nteg rat¡ o n
chromosome Xlll
<-lLV 24,I
Pvull
Figure 4.6. Integration pattern of pWX509 into yeast chromosome XIIL
Pvullchromosome Xlll
-63-
the ILV2 gene. The signal resulting from this hybridization (Figure 4.7) is present in both
the untransformed an'd transformed strains and, as the ILV2locus has previously been
mapped to chromosome XIII (Mortimet et al.,1989), this band represents chromosome
XIII. The membrane was then stripped of the SMRI probe and rehybridized with a labeled
pBR322 plasmid to identify the position of the integrated plasmid. Figure 4.7 shows that
the pBR322 probe does not hybridize to the untransformed strain but, in the tranformant,
has hybridized to the same band as the SMRI probe, indicating that plasmid pWX509 has
been successfully targetted to chromosome )üII.
An experiment uras performed to determine whether plasmid pV/X509 had
integrated into every copy of the ILV2 gene in the transformant. Given that wine yeast
strains are diploid or polyploid, there will be more than one copy of the ILV2 gene present
in the nucleus of strain 54. One application of the transformation system described in this
chapter could be to disrupt (and therefore inactivate) undesirable genes in wine yeasts. In
order to achieve gene inactivation, it is necessary to disrupt every copy of that particular
gene in the cell. It is therefore important to know whether this transformation procedure
targets plasmid pWX509 to every copy of the ILV2 sequence.
Total DNA was isolated from control strain 5A and from srain 5A transformed with
pWX509 (5A-pWX509). Both DNA samples were digested with EcoRV. There are no
EcoRV sites in plasmid pWX509. Therefore EcoRV generated fragments of chromosome
XtrI in which pWX509 has integrated in the ILV2 gene will be 6kb longer than fragments
which contain the intact ILV2 gene. The DNA samples were electophoresed on a t%o
agarose gel and transferred to a nylon membrane. The membrane was hybridized with a
radioactively tabeled sequence of the ILV2 gene. Results of this hybridization are presented
in Figure 4.8. A fragment of approximately 5.9kb is detected in the untansformed strain
5A DNA (Panel B). This band represents EcoRV fragments containing intact ILV2 genes.
In the transformant DNA (54-pWX509) two fragments were highlighted - one at 5.9kb and
the other at approximately 12kb. The 12kb fragment represents EcoRV fragments which
Figure 4.7. Southern hybridization depicting ttre chromosomal location
of the pWX509 vector in tansformed strain 5A-pWX509. Panel A: Yeast
chromosomes sepafated on al%o agarose gel by transverse altemating freld
electrophoresis. Panel B: Autoradiogram of gel depicted in Panel A
probed with a radiolabeled sequence of ¡he ILV2 gene. Panel C:
Autoradiogram of gel depicted in Panel A probed with a radiolabeled
sequence ofpBR322.
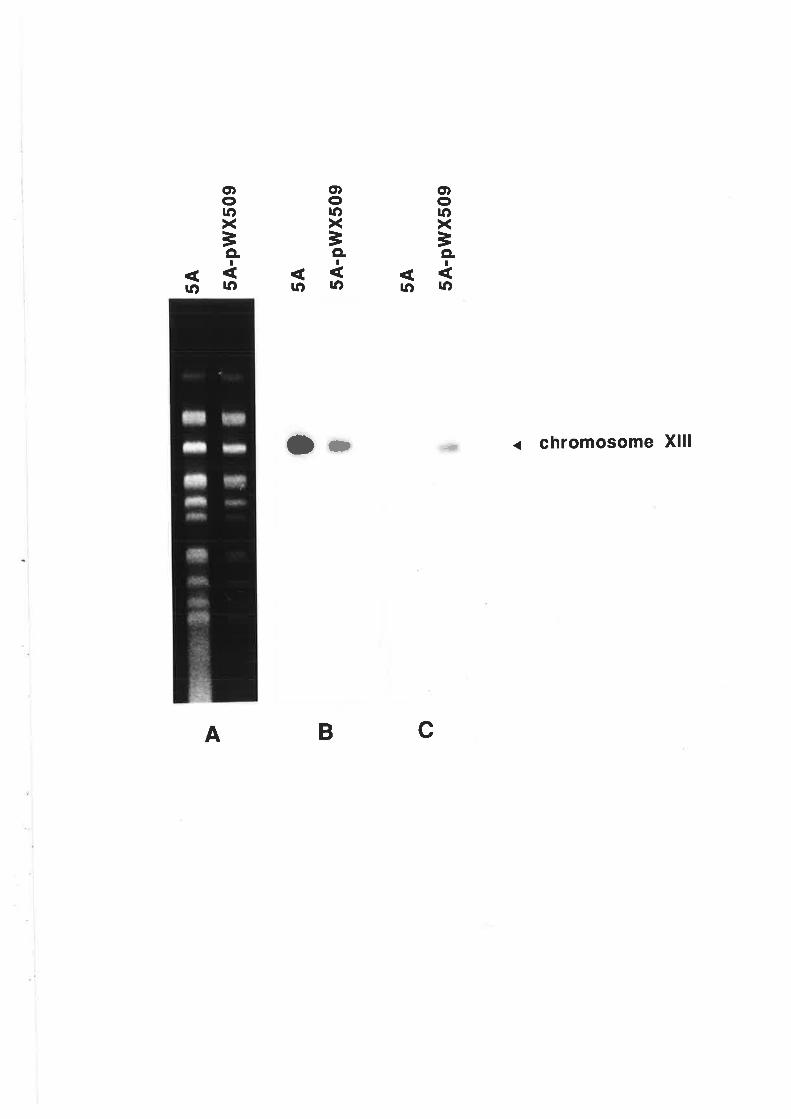
Þ5A 5A
'pW
X50
9
5A 5A-p
WX
509
5A 5A-p
WX
509
I I@ o
I A o - o = o o o =J o =
Figure 4.8. Southern hybridization to detect copy number of integrated
plasmid pWX509 in transformant 5A-pìWX509. Panel A: Total cellular DNA
digested with Eco RV, electrophored on a l7o agarose gel, stained with ethidium
bromide and visualised on a UV light box. Panel B: Autoradiogram of gel
depicted in Panel A probed with a radiolabeled sequence of the ILV2 gene.
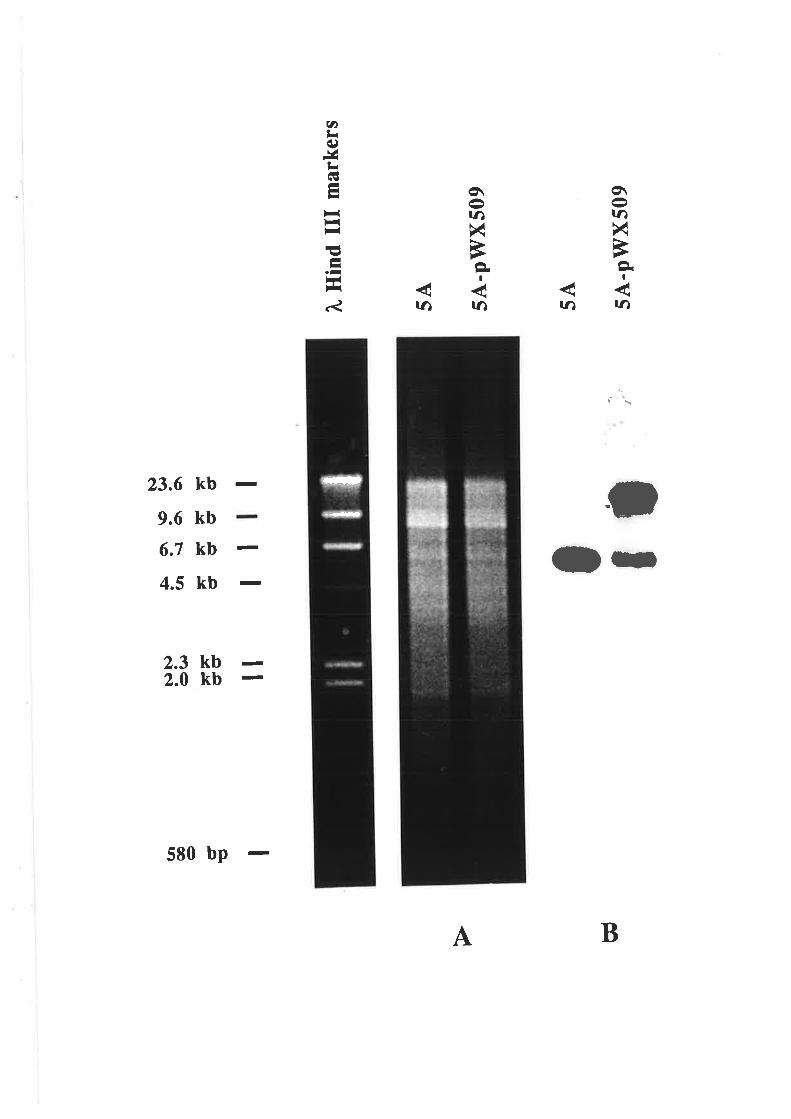
(,r æ I
b,J o
\¿ t,
úú tl
\J5O
\\O(,
(,r
\¡
O\
O\
Fxx
xúú
úú
f wI ¡
l, H
ind
III m
arke
rs
5A 5A-p
WX
509
5A
t5A
-pW
X50
9
I
-64-
contain pWX509 integrated into the ILV2 gene. The 5.9kb fragment detected in the
transformant DNA sample indicate that there are some intact copies of the ILV2 gene
present in this strain. Therefore plasmid pV/X509 has not integrated into every available
copy of the ILV2 gene.
It is interesring to note that the hybridization signal of fragment 12kb is
approximately twice as intense as the signat of the 5.9kb fragment in the 5A-pWX509 DNA
. There are two possible explanations for this observation. First, there may be twice as
many copies of the ILV2 gene which have integrated copies of pWX509 as there are of
intact ILV2 genes. If this is the case, it may reflect the ploidy level of chromosome XtrI of
strain 5A; that is, the strain may be triploid for chromosome XIII. Secondly, there may be
more than one copy of the plasmid pWX509 integrated into one particularlZV2 síte. If this
event has occurred, it is not possible to draw any conclusions about the ploidy level of
chromosome XIII.
4.3.4 Fermentation trials
Transformants of strain 5A were subjected to fermentation trials in order to
determine whether the introduction of foreign DNA had a deleterious effect on yeast
performance. Trials were conducted on:
Ð a control untransformed 5A;
ü) 5A transformed wittr the self-replicating plasmid (54-
pCP2-4-10); and
üi) 5A transformed with the integrating plasmid (54-pWX509).
Three colonies of each type of strain were inoculated in duplicate into Riesling grape
juice and fermented at 25oC. Samples were taken at regular intervals and assayed for sugar
content (by refractometer) and yeast growth (by optical density at 650nm). Average
readings were plotted on graphs (Figure 4.9). No significant differences were found
between the three strains.
-65-
The pH and percent alcohol (voVvol) were also measured for each of the ferments.
Average readings are presented in Table 4.7. Agun, there are no significant differences in
data beween the three strains.
On completion of each ferment, aliquots of the yeast population were appropriately
diluted and equal volumes were plated onto selective (SD containing 10 fLg/nl sulfometuron
methyl) and non-selective (YPD) media in order to analyse stability of the introduced
plasmids. The number of colonies per plate after 48 hours incubation at 28oC are recorded
in Table 4.8 The number of colonies on the YPD media represents the total colony forming
units present at the end of the ferment The colonies growing on selecúve media represent
colony forming units which have retained the ptasmid.
These results indicate that approximately 85Vo of the cells of the strain Eansformed
with the self-replicating plasmid (pCP2-a-10) have retained the plasmid throughout
fermentation. No plasmid loss is evident from the strain transformed with the integrative
vector (pWX509).
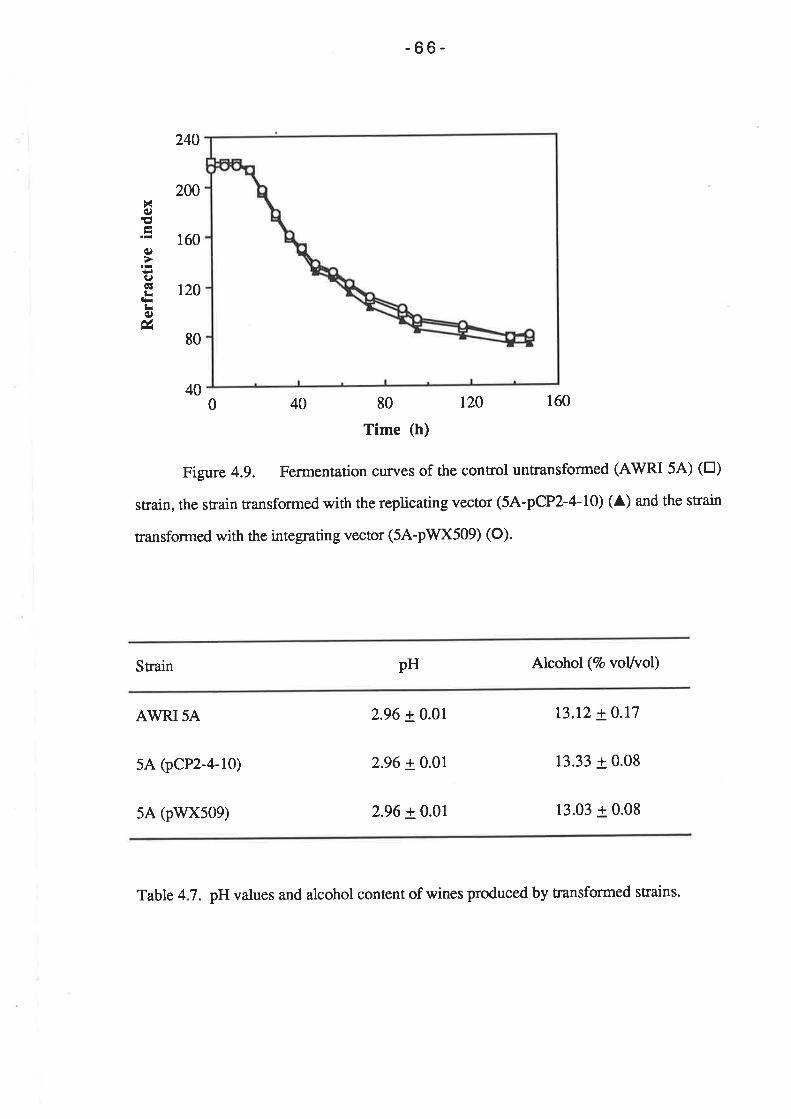
240
2W
160
r20
80
40
X€)E
(¡)
I6ltrC-¡rq)
ú
-66-
80
Time (h)
r20 1600 40
Figure 4.9. Fermentation curyes of the control untransformed (AWRI 5A) (tr)
strain, the strain transformed with the replicating vector (54-pCP2-4-10) (A) and the strain
transformed with the integrating vector (54-pWX509) (O).
Strain pH Alcohol (Vo voUvol)
AWRI5A
5A (pCP2-4-10)
sA (pwx509)
2.96 + 0.01
2.96 + 0.01
2.96 + 0.01
13.12 + 0.17
13.33 + 0.08
13.03 + 0.08
Table 4.7 . pHvalues and alcohol content of wines produced by transformed strains.
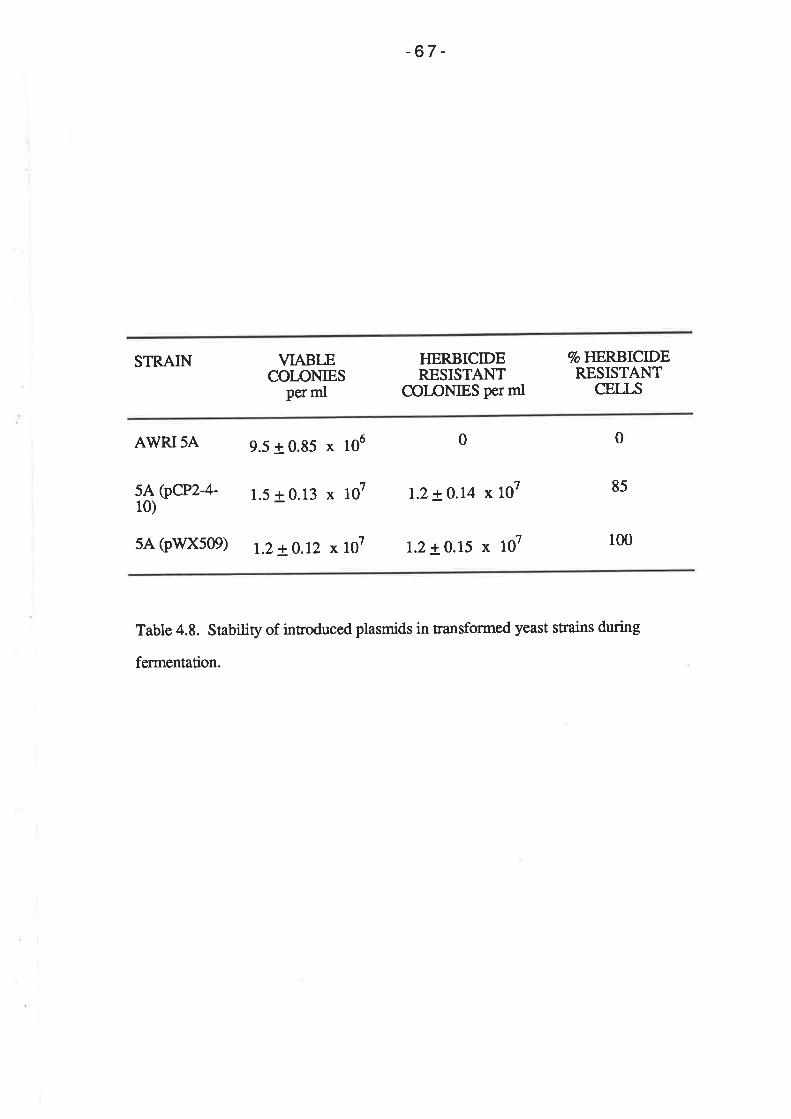
-67 -
STRAIN VIABIECOI-ONIES
per ml
IIERBICIDERESISTANT
CTOLONIES per ml
7o FIERBICIDERESISTANT
CELI.S
AWRISA 9.5 + 0.85 x 10⁶
5A (pCP2-4-10)
1.5 + 0.13 x 10⁷ r.2 +0.14 x 10⁷
00
85
5A (pWX509) LZ + 0.12 x 10⁷ 1.2 + 0.15 x 10⁷ 100
Table 4.8. Søbitity of introduced plasmids in transformed yeast strains during
fermentation.
-68-
4.3.5 Gene regulation during fermentation
The possibility of isolating promoters which a¡e 'switched on' at specific stages of
fermentation was investigated. This investigation involved the analysis of protein synthesis
in a wine yeast snain at different times of a fermentation. Variations in the profile of
proteins synthesized at different fermentation stages would ¡eflect specific promoter
regulation. For example, the presence of a protein late in the ferment that had been absent
in early stages would indicate that the promoter associated with this protein had been
'switched on' late in the fermentation.
Riesling grape juice was inoculated with an overnight culture of strain AWRI 54.
Fermentation was conducted at 18oC under anaerobic conditions with gentle agitation.
Samples were removed aseptically and analysed for yeast growth (by optical density) and
sugar utilization (by refractive index). At th¡ee stages of the fermentation - early phase @)'
mid phase (M), and late phase (L) - samples were removed and incubated with radioactively
labeled leucine for two hours. These three stages of fermentation are depicted in Figure
4.10 (Panel A). Following each incubation, total cellula¡ proteins were isolated from the
suspension and stored for analysis. Protein samples were later electroPhoresed on a
polyacrylamide gel, stained with coomassie blue and treated by fluorography. The
fluoragraphic treatment is performed prior to autoradiography, and enhances the detection
of radioactivity.
Results of the coomassie blue staining and autoradiography a¡e shown in Figure
4.10 (Panel B). The autoradiogram indicates that the highest level of incorportation of
radioactive leucine occurred in the early phase of fermentaion (and yeast growth). The level
of incorporation decreased as the fermentation progressed and by late phase is difficult to
detect by autoradiography. Although definition of the bands is poor, it appears that some
bands my be specific to the mid or late phases of fermentation. An example of such a band
Figure 4.10. Protein synthesis during fermentation. Top panel:
Fermentation progrcss of strain AWRI5A depicted by yeast growth (O) and
sugar utilization (tr). Samples were removed from the ferment at early (E)'
middle (M) and late (L) stages as indicated. Lower panel Protein profiles of
each different sample after coomassie blue staining and fluorography.
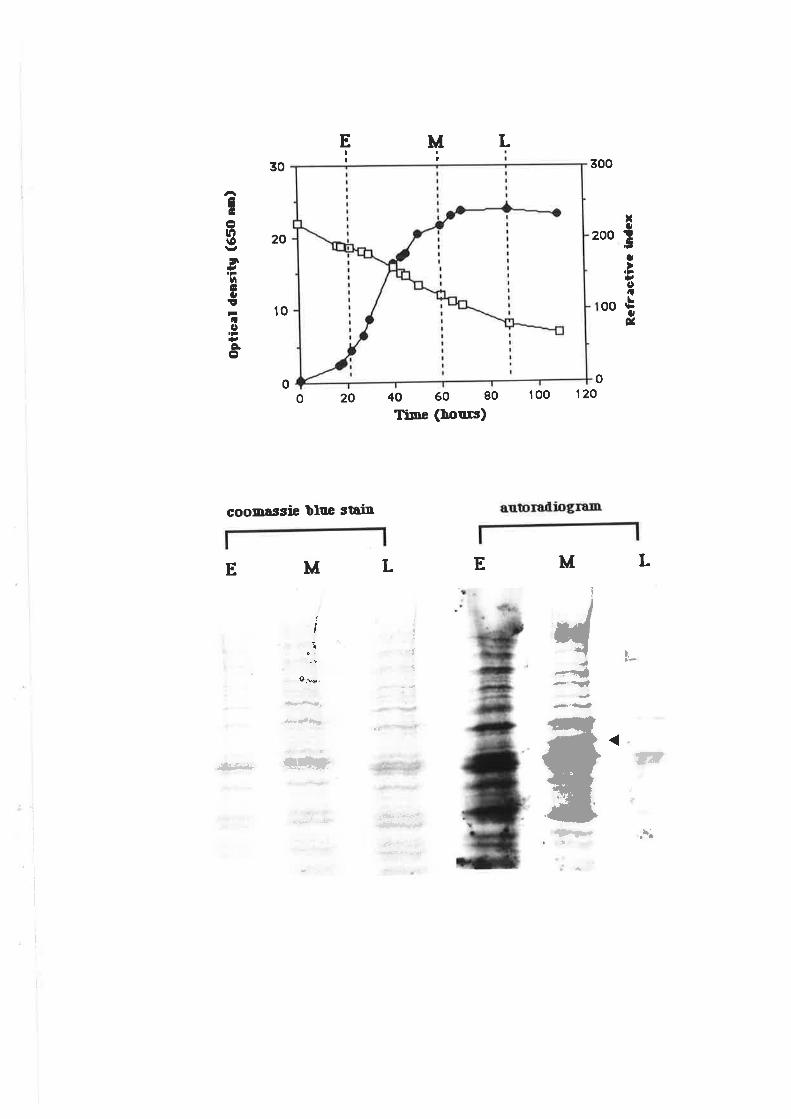
LMf
EI¡ 300
200xt,!cat
IonLb¡,/
00
30
20
Eolf¡út(hca,!
FcorFItÈo
t0
0040 60 80
TiDE (ùou¡s)
L E
100 120200
coolnîstie ùluc stain
LMM
iI
:1
o,'K.
E
t
a
llt
.¡a
i
4dã
-^-í*,¿t
I
{1
õ-fratc
.*å.f* Çt*}
{>l*ofl¡;x;'-{¡fuà+1r}
a¡'
l
I
l
I
I
I
l
ì
l
,
-69-
is indicated by an arrow. This band may r€present a protein which is selectively expressed
in the later stages of fermentation.
4.3 DISCUSSION
A system has been described for the stable introduction of foreign DNA to a range
of wine yeast strains. This system utilizes the SMRI gene (Casey et al., 1988) as a
dominant selectable ma¡ker. Advantages of this marker over others that have previously
been reported include the fact ttrat the gene is derived from a natural ILV2 yeast gene, and
therefore shares sufficient homology with sequences on the yeast genome to target direct
integration. Only one copy of the gene is required to confer resistance to the herbicide
sulfometuron methyl upon transformed cells. Moreover, the use of genetically engineered
organisms in the wine industry is likely to be more acceptable if the introduced DNA
comprises naturally occurring yeast sequences.
The most efficient transformation method tested in this study, with respect to yield
of ûansformants, cost and expediency was a modification of the alkati cation method (Ito et
at.,1983). This modi|rcation included the incubation of competent yeast cells with carrier
DNA and plasmid DNA at the time of cellula¡ uptake. This method was shown to be
successful with a range of commercially popular wine yeast strains.
Southern hybridization analysis of transformants confirmed the presence of both the
self-replicating (pCP2-4-10) and integrating (pWX509) vectors. Plasmid pWX509 was
linea¡ised at the },lutr site of the SMRI gene prior to transformation. This was designed to
targer the plasmid to the ILV2 gene on chromosome XIII. TAFE separation and Southern
hybridization of chromosomes from the pWX509 transformant revealed that the plasmid
had been successfully targetted to chromosome XtrI.
-70-
Fermentation trials indicaæd that there were no significant changes in the growth or
fermenation rates between the original strain 5A and the strains transformed with either the
self-replicating plasmid (pCP2-4-10) or the integrating vector (pWX509). Similarly, there
were no significant differences in the pH measurements or the alcohol content of the
resultant wines.
Stability of the introduced plasmids throughout fermentation was measured by
comparing colony forming units (cfu) in aliquots of the finished ferment on both selective
and non-selective media. These results indicated that the self-replicating plasmid displayed
instability, with approximately 857o of the total yeast cells reøining the plasmid throughout
fermentation. No plasmid loss was detected in the transformed strain which contained the
integrating vector.
Southern analysis of the pWX509 transformants showed that the vector did not
integmte into every copy of the ILV2 gene. It should be noted that only one transformant
was analysed in this experiment, so it is possible that all copies of the gene are disrupted in
some cases. Also, different transformation conditions may encourage integration into all
possible sites. For example, increasing the amount of plasmid DNA in the transformation
mixture may result in disruption of all homologous sites. Nevertheless one can conclude
from this result that under the transformation conditions described in this chapter,
integration will not necessarily occur in alt copies of the targeted gene.
This is an important observation considering that one possible application of this
transformation system may be to inactivate undesirable genes. For example, Suizu et al.
(1990) recently inacrivated the CARI gene of a laboratory haploid S. cerevisiae strain by
homologous integration. The disruption of this gene, which codes for arginase, resulted in
a yeast strain which did not produce urea. The chemical reaction of urea and ethyl alcohol
in alcoholic beverages produces ethyl carbamate, which is a suspected carcinogen and,
therefore, an undesirable compound in wine. The CARI gene disruption of a wine yeast
-7 l-
strain may be desirable in terms of reducing potential levels of ethyl ca¡bamate in wine.
However, to achieve gene disruption, integration would be required into every copy of the
CARI gene of the polyploid wine yeast cells. Results of this chapter show that this may
not occgr in a one-step transformation procedure. Multiple transformation events, each one
requiring a different selectable marker, may provide a means for gene inactivation in wine
yeast strains.
Conclusive results about regulated gene expression during fermentation were not
obtained in this study. Atthough protein synthesis investigations indicated that some genes
may be transcribed at specific stages of fermentation, the search for regulated promoters
will require a more thorough and detailed analysis. For example, mRNA species should be
isolated from different stages of fermentation and used to produce cDNA libraries.
Differential screening of these libraries may reveal stage-specific clones. These clones
could then be used to screen a genomic library in order to identify the associated promoter
elements
The identification of promoters in this type of study would increase the scope for
designing efficient strategies for foreign gene expression during fermentation. For
example, the products of some introduced genes may interfere with growth of the yeast
strain. Switching on foreign gene expression towards the end of a fermentation after a high
yeast biomass has been reached may result in more economical yields of the foreign
product.
It can be concluded that the system described in this chapter can be used to target
foreign DNA to specific regions of the yeast genome such that it will be maintained stably in
the strain throughout fermentation. The transformation procedure is applicable to a wide
range of wine yeast strains and does not adversely affect the fermentation performance of
the yeast.
-72-
Chapter 5 Development of a system for wine yeast
strain marking and identification
5.1 INTRODUCTION
Winemakers have recognized the importance of the yeast strain in determining the
flavour and quality of wine, and the economics of its production (Rankine, 1968). Pure
culture inoculation now dominates the industry, particularly in the newer wine producing
regions. This practice provides greater reliablility and control of the fermentation through
more rapid onset and completion resulting in wines with fewer flavour defects (Rankine,
lg77). Furthermore, this technology enables strain differences to be utilized in the
production of a wide variety of wines. The selecúon and cha¡acterization of wine yeasts by
The Australian V/ine Resea¡ch Institute supported and enhanced the utility of pure culture
inoculation technology (Rankine, 1968). More recently, the availability of active dried
yeasts have given the winemaker even greater scope for exploiting the oenological
properties of different strains. These factors have led to the use of several yeast cultures in
the winery; a practice which addresses the need for a suitable yeast identification scheme.
The process of oenology employs a raw material containing an unknown load of
indigenous yeasts, some of which are capable of producing off-flavours and spoiling wine.
Natural grape must will undergo a spontaneous fermentation by the indigenous yeasts to
produce wine. In the case of wines produced by pure culture inoculation, it is considered
that the addition of S02 will suppress the indigenous yeast population and thereby
encor¡rage fermentation by the inoculated strain (Kunkee and Amerine, 1970; Benda, 1982;
Kunkee, 1984).
Only recently have quantitative kinetic studies of the ecology of grape juice
fermentation been made (Fleet et al. 1984; Hea¡d and Fleet, 1985, 1986a). These
-73-
investigations, made with both inoculated and uninoculated grape juices under a range of
oenological conditions, provide evidence which challenges the conceptthat Saccharomyces
necessarily suppresses non-Saccharomyces yeasts to establish itself as the dominant
organism. Fermentation conducted at low temperature, for example 1@C, and to a lesser
extent at high pH, for example pH 3.5, resulted in greater growth and survival of Kloeckcra
apiculata and several Candida species than previously believed, and in some cases
approached that of Saccharomyc¿J yeasts (Hea¡d and Fleet, 1938). Furthermore, it was
shown that SO2 did not necessarily suppress the growth of non-S¿ccharomyces yeasts
(Heard and Fleet, 1988a).
These findings, therefore, call into question the effectiveness of some oenological
pracrices for controlling the growth and survivat of indigenous yeasts. Relevant studies
have been hindered by the lack of suitable techniques for the differential quantitation of the
inoculated strain and wild yeast. While methds for differentiating between Sacclnromyces
and many non-Saccharomyces yeasts have recently been developed (Heard and Fleet,
1986b), few methods arc yet available to distinguish between the inoculated srain and wild
strains of Sacclnrornyces. The reason for this is simply that oenological strains are merely
wild strain s of Sacclnromyces selected for desirable properties. Therefore, no classical
taxonomic differences exist which would permit strain differentiation.
Research presented in this chapter involves two different approaches to monitor
yeast in the production of wine. The first investigates a methd for identifying yeasts to the
strain level by producing a chromosomal fingerprint. The second approach involves
tagging a wine yeast with a genetic marker enabling the efficiency of oenological practices
to be determined.
-74-
5.1.1 Yeast chromosomal fingerprints
Saccharomyces cerevisiae may be identifîed by classical methds including cell
shape and mode of reproduction; sugars fermented; ca¡bon and nitrogen compounds
assimilated; vitamin requirements; sensitivity to inhibitors; co-enzyme Q system and DNA
base composition (Kreger-van Rij, 1984; Kreger-van Rij, 1987), or by the pattern of
responses to some 80 physiological tests (Barnet¡. et at., t983). A considerable input of
expertise and time precludes the application of these methods to ¡outine identification.
Furthermore, these methods are not useful in distinguishing strains of S. cerevisiae.
Two fundamentally different approaches to identifying strains of yeast have been pursued,
namely phenotypic and genotypic analysis. In the fîrst, a yeast characteristic or family of
components is measured or profiled. Giant colony morphology has proved useful but may
require at least 2-4 weeks for conclusive results (Heard and Fleet, 1987). Serology
(Nishikawa et al.,lg7g) is rapid but generally lacks specificity and resolution. Fatty acid
composition as measured by gas chromatography is relatively rapid and a generally
accessible technique (Oosthuizen et a1.,1987) but its potential for strain identification still
needs to be confirmed. Yeast protein fingerprinting in the form of electrophoretic patterns
of selected enzymes (Subden et a1.,1982), total soluble cell protein (van Vuuren and van
der Meer, 1987) and exrracellular yeast proteins (Ciolfi, 1938) indicate high specificity and
sensitivity. All tt¡ee protein methds generated unique fingerprints enabling identification
of closely related süains. An important disadvantage of all phenotypic methods is the
rigorous requirement for control of cultural conditions in order to minimize the variation of
results.
In the genotypic approach, DNA composition and structure is analysed. The
principal advantage of DNA analysis is the complete independence of results on yeast
cultural conditions. Two early methods which have been widely applied to yeast
systematics a¡e DNA base composition and DNA homology (Price et a1.,1978; Kurtzman
-75-
and phaff, 1987). DNA base composition is measured by either thermal denaturation
procedures or by bouyant density measurements and gives only a tentative indication of
strain identity. DNA homology, which measures the degree of affinity or association
between fragments of single-stranded DNA from two yeasts, is a measure of strain
relatedness but generally is not sufficiently sensitive to reveal strain identity.
Of greater interest, however, is characterization of DNA by the techniques of
restriction analysis and pulsed freld gel electophoresis. Restriction endonucleases cut DNA
at specific points. This action generates a unique range of DNA fragments whose size is
readily determined by agarose gel electrophoresis resulting in a characteristic pattern of
bands in the gel. This technique has only recently been applied to yeast and is becoming a
critical technique in yeast systematics (Kreger-van Rij, 1934). Both nuclear (Proffrn et al.,
¡984;Panchall et a1.,19S7) and mitochondrial DNA (mtDNA) (l-ee et al.,1985) have been
cha¡acterised. Restriction of nuclear DNA yields a large number of poorly resolved
fragments. Therefore, specific probes which only hybridize to sequences found in one or a
few of the fragments are used to generate simpler patterns. Ciriacy and Grossman (1988)
screened eight wine yeasts with three probes constn¡cted from the alcohol dehydrogenase
gene (ADH), 2 pM DNA and Ty sequence. The ADH and2 pM DNA probes revealed
little difference between strains, while Ty, a dispersed repetitive sequence, produced unique
fingerprints.
Analysis of mtDNA purifîed from srains of yeast isolated from wine has been
reported by Dubourdieu et al. (1987). Digestion of mtDNA with the restriction enzyme
EcoRl yielded from 4 to 10 fragments in the 23 strains assayed. All but two strains
showed unique frngerprints. The technique, therefore, provides unequivocal identification
of wine yeast but the complexity of mtDNA isolation precludes application to routine
analysis.
-76-
A recently developed technique, pulsed field electrophoresis, has extended the size
range of DNA molecules which can be fractionated by the electrophoretic technique
(Shwartz and Cantor, 1984). Utilizing this technique, it is now possible to
electrophoretically separate intact yeast chromosomes on a gel. Chromosomes from
S.cerevisiae have been shown to range in size from 150kbp (chromosome I) to
approximately 2,500 kbp (chromosome XII) (Carle and Olson, 1985; DeJonge et al.,
1936). The method involves the application of an altemating electric field to the slab gel
which forces the chromosomes to periodically change their direction or mobility; it is
thought that the smaller chromosomes migrate more rapidly through the gel because they
can reorientate themselves more rapidly to the changing electric field through the gel and
become stuck in the gel matrix less frequently. A variety of electrode a¡rangements have
been used and many a¡e available as commercial units.
Field inversion gel elctrophoresis (FIGE) is the least complex arangement (Carle er
a1.,1986). A standard horizontal submarine gel is used but the electric field is alternatively
inverted and the frequency of inversion is controlled. Unequal periods of field inverson
produces a net migration in one direction, while the duration and frequency of the electric
pulses affects migration rates of different sized macromolecules. This method allows the
resolution of DNA molecules of several hundred thousand base pairs. However, this is not
adequate for yeast chromosomal DNA which extends into the megabase (mbp) range.
Orthogonal field alternation gel electrophoresis (OFAGE) differs from FIGE
essentially by the angle betweeen the two alternating electric fields. In FIGE, the field is
inverred by 180o whereas the inversion in OFAGE is 12@ in the plane of the gel. The
orthogonal field causes the DNA molecules to zigzag across the plane of the gel. The
resolution range, which also depends on the pulse frequency, is extended to the 9,000 kbp
range (Carle and Olson, 1984). A disadvantage of OFAGE is that the lanes of DNA
migration are not straight, making comparisons between samples difficult.
-77 -
In 1986, two new concepts were published: Transverse Alternating Field
Electrophoresis (TAFE) and Contour-clamped Homogenous Electric Field (CHEF)
electrophoresis. In TAFE, the gel is oriented vertically with a simple four electrode a:ray
placed on either side of the gel (Gardiner and Patterson, 1986). Sample molecules are
forced to zi1zagthrough the thickness of the gel. As all lanes experience the same electrical
field effects the bands remain straight. As the molecules move down the gel, they are
subjected to continual variations in field strength and reorientation angle - but to all lanes
equally.
Also in 1986, Chu er ¿/. demonstrated that the critical factor in resolving large DNA
is keeping the angle between the two directions of alternating fields grcater than 90 degrees.
Field gradients were not necessary for high resolution. To avoid field distortions arising
from the finite size of an electrophoresis chamber, the researchers designed a hexagonal
a¡aay that placed pairs of electrodes at a 12C0. angle. In their CI{EF system, rather than use
long electrodes, the resea¡chers broke the electrodes up into short segments. Then, using
resistors (and later transistors), they clamped and forced the elcrodes to their ideal voltages.
The samples in the CHEF system experience a large, highly uniform electric field with no
edge effects.
The chromosome banding patterns of S. cerevisiae (Carle and Olson, 1985; De
Jonge et a1.,1986), Candida albicans (Snell and Wilkens, 1986) and Schizosaccharomyces
pombe (Smith et al., 1987; Voll¡ath and Davis, 1937) have been determined using pulsed
freld gel electrophoresis. The karyotypes of the va¡ious yeasts show great va¡iation in the
size and number of chromosomes. Such variants are noted even among strains of the one
species (De Jonge et al., 1936). The technique of pulsed field gel electrophoresis,
therefore, offers an improved system for the identification of wine yeast strains.
-78-
5.L.2 Marked strains
Determining the efficiency of winemaking practices (such as monitoring yeast
propagation and fermentation for contamination) is hampered by the absence of suitable
methods to differentially quantify the inoculated wine yeast strain and indigenous yeasts.
Some studies have exploited the naturally occurring killer or zymocidal ma¡ker present in
some strains as a tool for such analysis (Heard and Fleet, 1988). This ma¡ker can be used
in either of two ways: (i) samples can be plated onto nutrient media for a total count and
replica plated onto media containing toxin to determine the proportion of marked strain; or
(ii) the proportion of the marked strain can be determined by replica plating onto a lawn of
sensitive yeast.
However, a deliberately marked oenological strain as developed by Vezinhet and
colleagues (Vezinhet and Lacroix, 1984; Vezinhet, 1985) provides a more powerful
technique for investigations of ttris type. The strain, which is now commercialized as Kl,
is double marked with two antibiotic markers, diuron and erythromycin. An extensive
survey of yeasts for resistance to these antibiotics demonstrated that few strains are
naturally resistant to both drugs simultaneously. Kl was developed by selecting for natural
mutants in a population of the Lalvin V yeast.
The results of extensive winery trials using this marked strain have already been
published @elteil and Aizac, 1988). The main emphasis of these trials was to investigate
the efficiency of various inoculation techniques, including method of yeast propagation,
direct inoculation, inoculum level and timing of inoculation. The marked strain enabled data
to be accumulated on the effect of winery procedures by ttre extent of K1 domination during
fermentation. Recommendations could then be given for improving the efficiency of
fermentation control.
-79-
The ma¡ked strain, Kl, provides an insight into the kinetics of yeast populations
during fermentation and therefore represents a major advance in the control of wine
production. However, a major limitation exists in the fact that wine yeast strains of choice
cannot be easily marked.
A procedure is described here which employs recombinant DNA technology to
introduce the Eschcrichia colí þglucuronidase (GUS) gene as a ma¡ker into any desired
yeast strain. The GUS gene was developed as a reporter gene system for use in nematodes
and more recently in the study of plant gene expression (Jeffersen et al., 1986, 1987). The
advantages of the GUS system as a ma¡ker in yeast strains include its low background
levels in S.cerevisíae andother yeasts associaæd with grape must fennentation and its ease
of assay by fluorimetry, spectrophotometry and agar plate tests.
5.2 RESULTS
5.2.1 Wine )reast chromosome fingerprinting
The TAFE gel banding patterns of twelve winemaking yeasts were compa¡ed with
that of a standa¡d strain of S. cerevisl¿¿ (Beckman334). Seven srains are shown in Figure
5.1. The standa¡d strain produced 13 bands (numbered from bottom of the gel), although
bands 10 and 11 were usually fused. Bands 9 and 12, which stained more intensely, are
doublets. On the basis of data from geneúc maps of S. cerevfuiae (Mortimer and Schild,
1985) and chromosome physical size (Anand, 1986), Beckman have assigned the following
chromosome numbers to the bands starting from the bottom of the gel: chromosome
number I, VI,I[,IX,V[I,V,XI,X, doublet of II and XIV, XI[, XVI, doublet of VII and
XV, and IV. Chromosomes )flI and XVtr were not detected. The largest, chromosome fV
(band l3), was estimated to be in the range of 1500 to 2500 kbp and the smallest detected,
chromosome I, at 245 kbp. The two pairs of co-migrating chromosomes, tr and XIV (band
9), and YII and XV (band 12) arc apparent as more intensively stained bands.
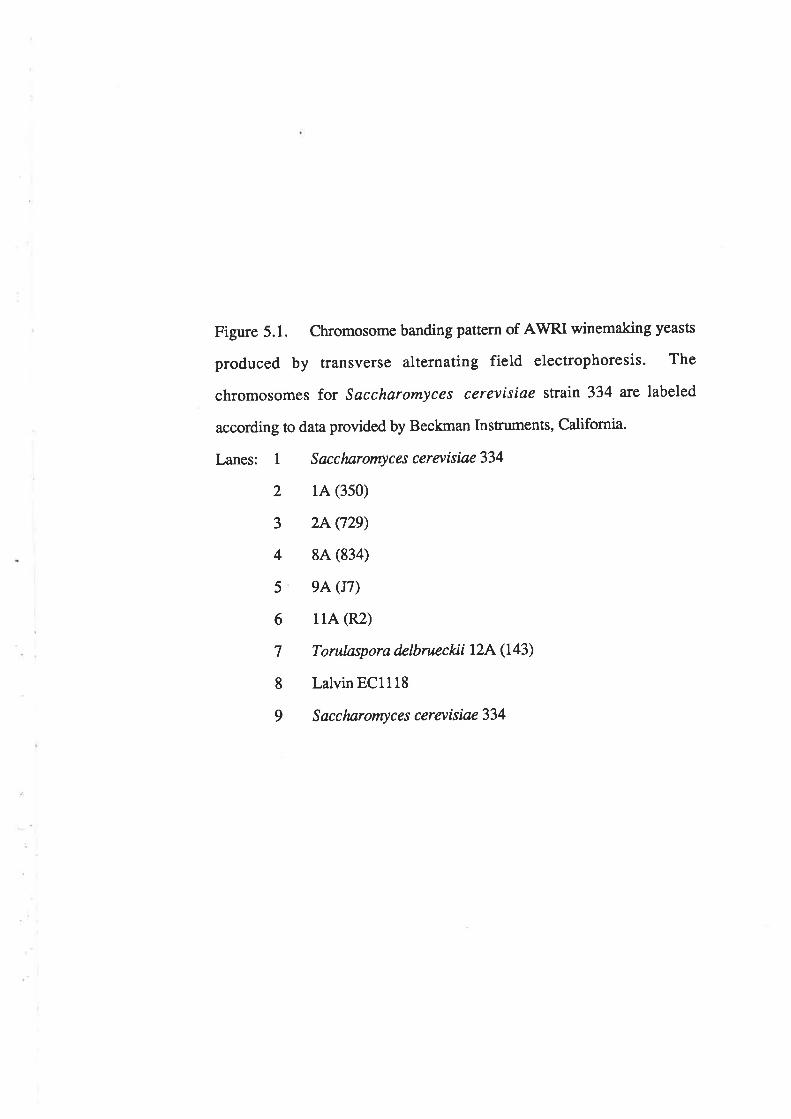
Figure 5.1. Chromosome banding pattern of AWRI winemaking yeasts
produced by transverse alternating field electrophoresis. The
chromosomes for Saccharomyces cerevisiae strain 334 are labeled
according to data provided by Beckman Instruments, California.
Lanes: I Sacclnrornyces cera¡isíae334
2 1A (3s0)
3 2A (729)
4 8A (834)
s 9A (J7)
6 114 (R2)
7 Torulaspora delbrueckü I2A(L43)
8 Lalvin ECl118
9 Saccharomyces cerevisiae334
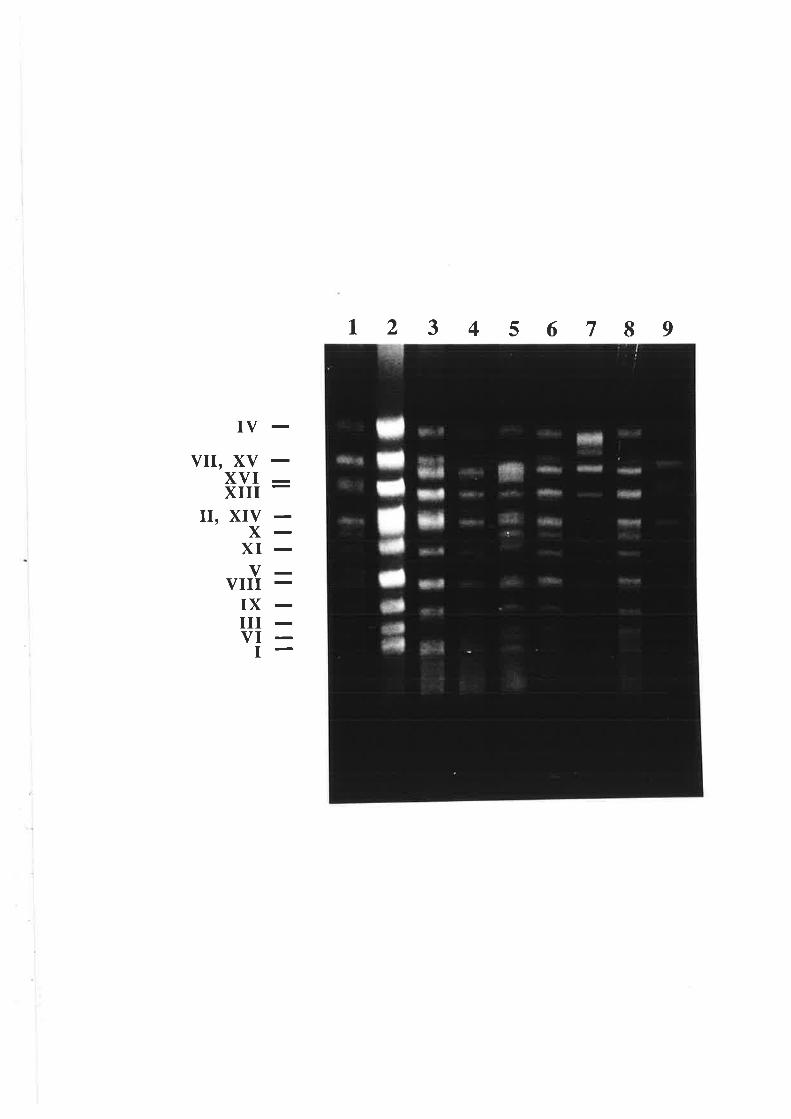
12 3 4 5 6719
IV
vII, XVxvrXIII
II, XIVx
XIvVIII
IXIIIVII-
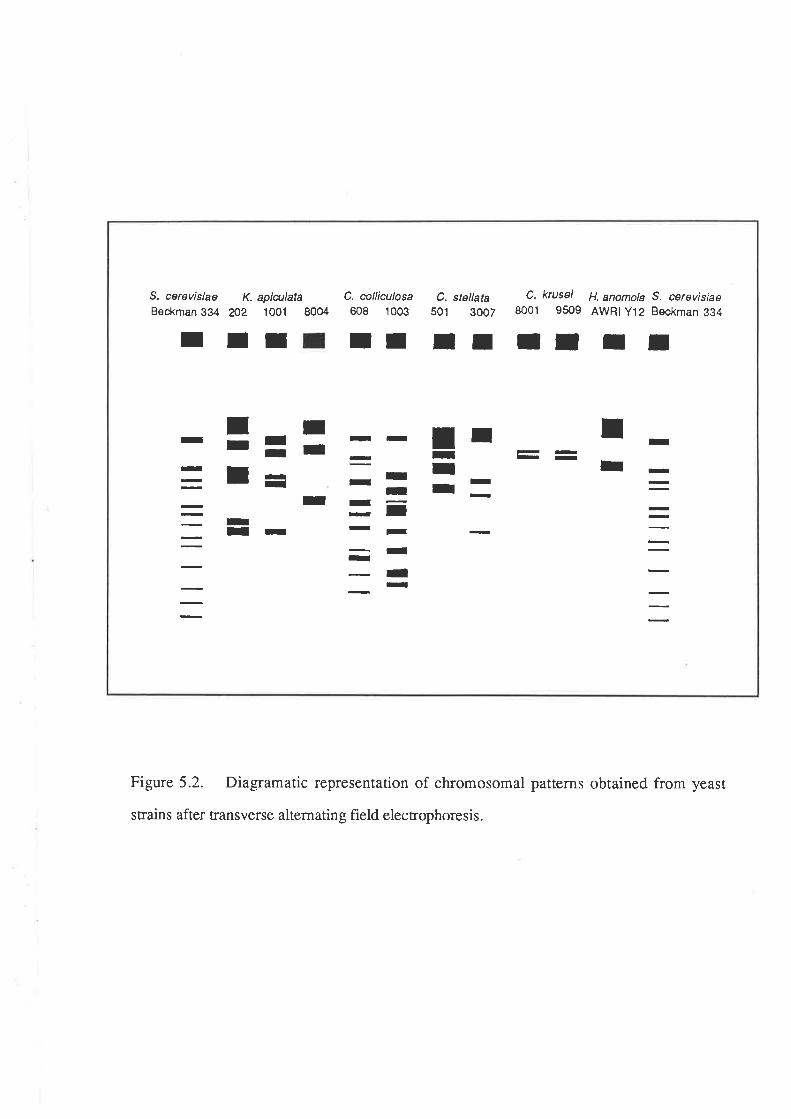
C. krusel H. anomola S. cerevisiae8001 9509 ¡WnlY12 Beckman 334
I
=== =- Ir -: r r
r= :- =E
r -r,rl-
r =- =Irlrrr
==
=
C. stellata501 3007
II IT TS. cerevislae K. aplalata C. celliculosaBeckman 3U n2 1001 8004 608 1003
I
I
II IT
I
-
Figure 5.2. Diagramatic representation of chromosomal patterns obtained from yeast
strains after transverse alternatin g field elecrophoresis.
-80-
The twelve wine strains investigated revealed banding patterns different from that of
the standard str¿in. Only one strain, 124, showed a pattern that was dramatically different
from the standard. This strain will be discussed separately below. Three variations are
app¿ìfent: position, number and intensity of bands. Band position on the gel provides an
estimate of chromosome physical size. All eleven strains showed various degrees of
chromosome polymorphism except for chromosomes IV (band 13), XI (band 7) and IX
(band 4). Considerable chromosome polymorphism has been reported ín Saccharomyces
strains from other sotuces @e Jonge et a1.,1986; Casey et aI., 1988b)' The number of
bands does not necessarily correlate with the number of chromosomes as already indicated
by the standard srrain. Most of the wine yeasts exhibit less than 13 bands indicating that
several groups of chromosomes were not resolved under these conditions. Such groups of
chromosomes may be identifred by broad or mofe intensely stained bands'
The banding pattern for strain l2A Torulospora delbrucckü was fundamentally
different when compared to those of Saccløromyces yeasts, suggesting a gleatly reduced
number of chromosomes. Several non-Saccharomyces yeasts isolated from fermenting
grape must and wine were analysed and a¡e depicted diagramatically in Figure 5.2. The
chromosome fingerprints of these yeasts are generally quite different to those of
Saccharomyces strains, in particular, strains of Kloeckera apiculata, Candida stellata,
Candida kruseí and Hanseniaspora anomala did not show small chromosomes. These
results suggest that this methd may readily distinguish between Sacclaromyces and non-
S ac c lnromyces strains.
5.2.2 GUS-Vector construct
The efficiency of the E. coli ß-glucuronidase gene as a marker gene in yeasts is
dependent upon maintenance of the gene in a growing population and efficient gene
expression.
Figure 5.3. Construction of plasmids pAW218 and pAW219. The
1.8kb Hind III GUS fragment was ligated with a Hind III digested AAH5
ptasmid. This ligation gave rise to the AAH5 plasmid containing the GUS
gene in either the wrong orientation with respect to the promoter (pAW218),
or the correct orientation with respect to the promoter (pAW219).
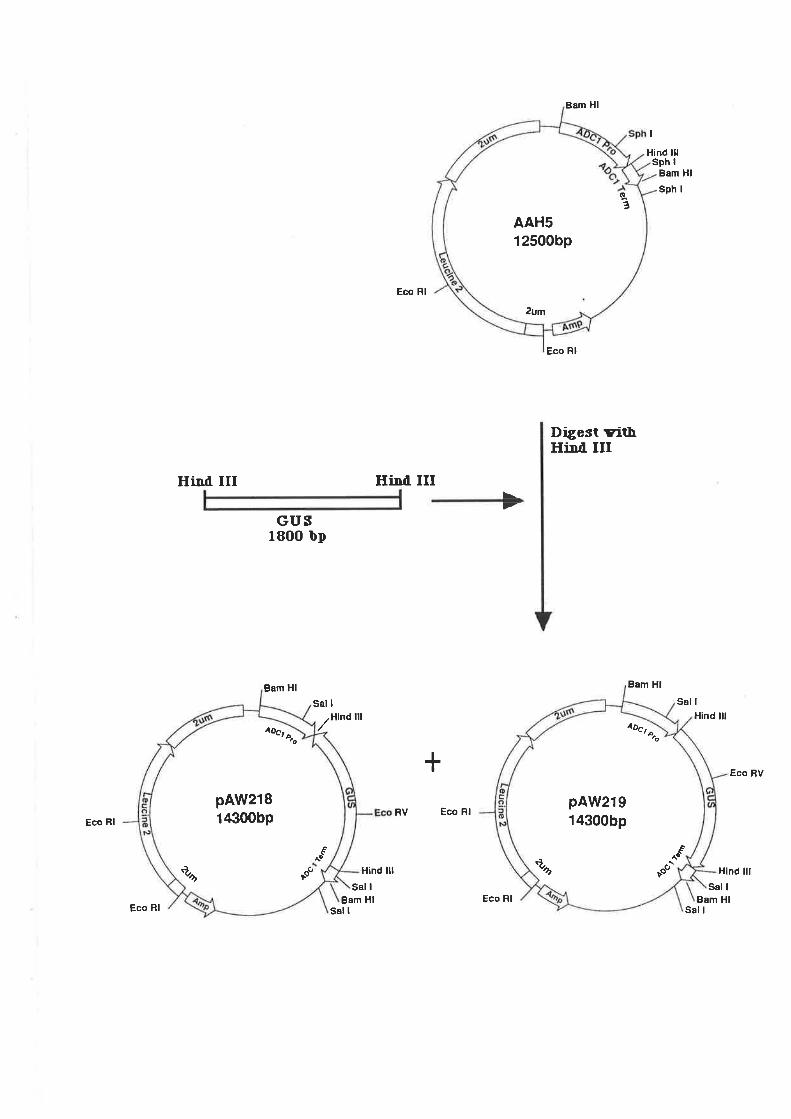
Ec! Rl
HiDl III
Bam Hl
Eco Rl
Digest viltrHind III
Sph IBam Hl
Sph I
Sal I
¡
Hind lll
Hitrd III\-
GUS1800 bp
Bam Hl
Sal ¡
,--
Eco Rl
Bam Hl
/HtnótttHind lll
Sal IBam Hl
Eco BV
Hind lll
+
Fv Eco RlEco Rl
Hind lll
Sal IBam Hl
2um
oa
AAH51 2500bp
Þénò ^f
1o4ôc,
pAW21814300bP
p"".¿,ò ^f
1oAOc,
pAW21914300bp
Eco Rl Sal I Sal I
Figure 5.4. Construction of plasmid pAV/220. The 3.7kb Bam Hl
fragment of pAW219 was ligated with the Bam Hl digested pWX509 to give
rise to pAW220.
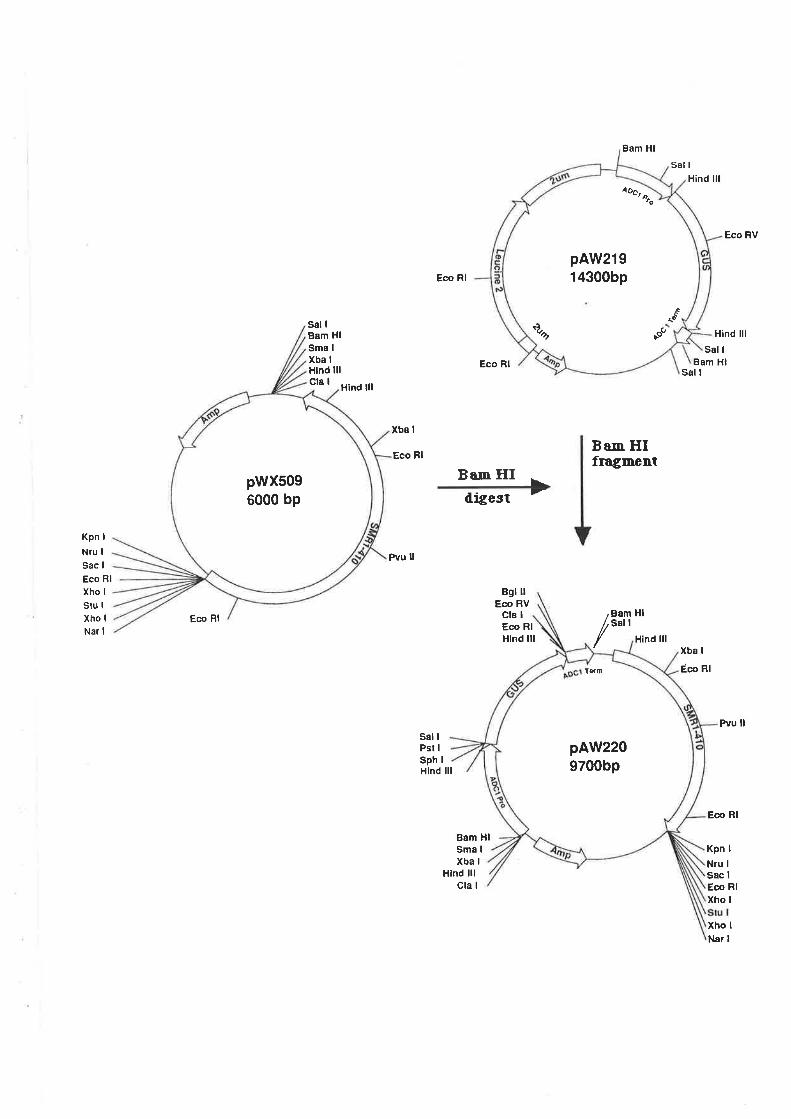
Bam Hl
Bam HIfragment
H¡nd lll
Sal I
Sal I
Bam Hl
Eco RV
Hind lll
Pvu ll
Eco Rl
Kpn I
Nru I
Sac I
Eco RlXho I
Xho I
Nar I
Sal I
Eco Rl
Sal IBam HlSma I
xba IHlnd lllCla I
Eco Rl
Hind lll
Xba I
Eco Bl
Pvu ll
iligestBan HI \-
7
Kpn I
Nru I
Sac I
Eco ßlXho I
Stu I
Xho I
Nar I
Eco Rt
Bgl llEco RV
Cla I Bam H¡Sal IEco Rl
H¡nd ¡ll I Hind lllXba I
Ëco Rl
Sal IPst I
Sph I
Hind lll
Bam HlSma I
Xba I
Hind lllCla I
p"nø ^tê
+o4oô,
pAW21914300bp
pwx5096000 bP
Tdm
pAW2209700bp
-81-
Expression of the GUS coding region was achieved by use of the yeast alcohol
dehydrogenase (ADCI) promoter and terminator sequences. The GUS gene was isolated
as a Hind Itr fragment from the plasmid pKLG4. This was ligated into the Hind Itr site
of the vector AAH5 (Ammerer, 1983). Clones with the GUS coding region, in both
orientations with respect to the ADCL promoter, were obtained (Figure 5.3). A clone with
the GUS coding region in the correct orientation with respect to the ADCI promoter was
identified (ptasmid pAW2l9). Plasmid pArW219 was then digested with Bam Hl. This
digestion results in excision of the GUS gene flanked by the ADCI expression signals.
The GUS coding region with attachd ADCL signals cassette was cloned into the Bam Hl
site of vecror pWX509 (Casey et a1.,1988a) - grving rise to plasmid pAW220 (Figure 5.4).
5.2.3 Transformation and Southern analysis
The SMR¡-410 gene on plasmid pAW220 is almost identical in sequence to the
ILV2 gene - a single base point mutation leads to resistance to the herbicide sulfometuron
methyl. Therefore, sufficient homology exists between the two sequences to target
integration to the ILV2 gene via homologous recombination with SMRl-410.
Recombination is enhanced by digesting plasmid pAW220 with Pvu II prior to
transformation. This gives rise to a linea¡ molecule with SMRI -410 se4uences at either
end. The DNA ends are highly recombinogenic and integration is most likely to occur at
the Pvu tr site in the ILV 2 gene. The result of this event wilt be two ILV2 genes flanking
the GUS cassette, one of which will contain the SMR I-410 mutation conferring herbicide
resistance upon the transformed cell (see Figure 5.5).
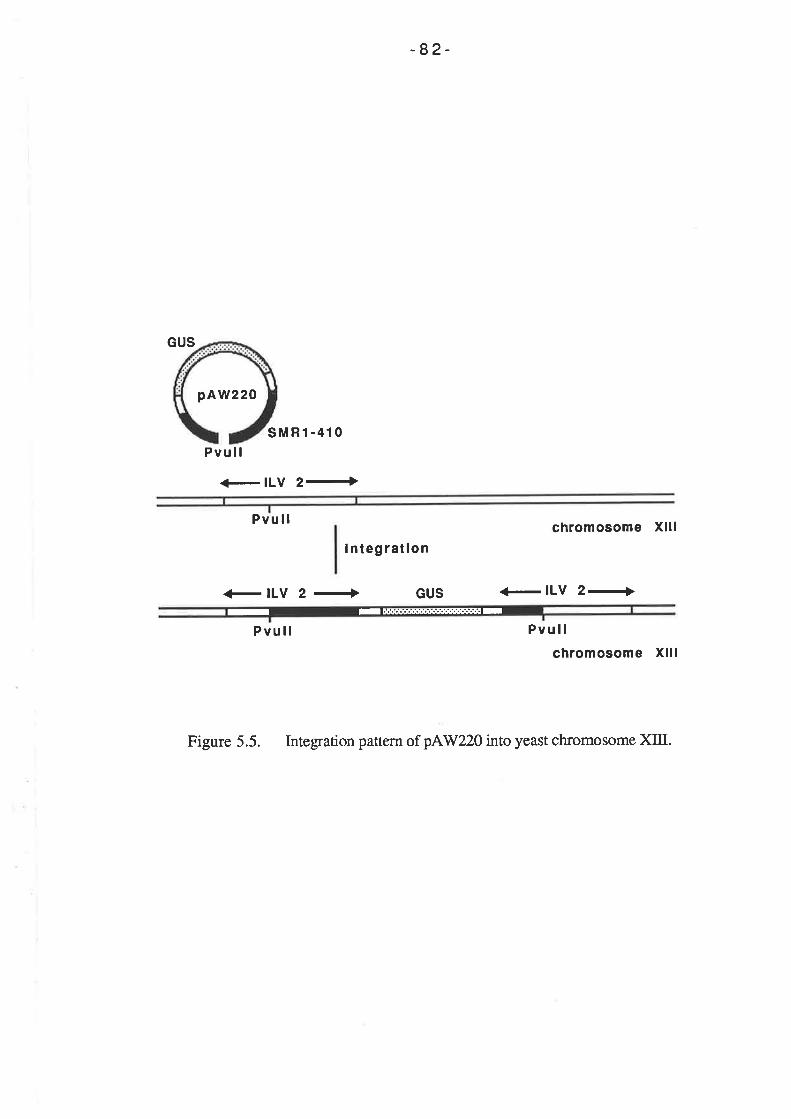
-82-
GUS
pAW220
sMRl -410Pvull
{-lLV 2€
Pvull
lnteg ratlon
<-lLV 2+ GUS
chromosome Xlll
{-lLV 2+,IEffiI
-
-
Pvull Pvullchromosome Xlll
Figure 5.5. Integration pattern of pAV/220 into yeast chromosome XIII.

Figure 5.6. Southern hybridization detecting the 9.7kb GUS vector in
transformed strain 3AM. Panel A: Hind III molecular weight markers.
Panel B: Total yeast DNA digested with Pvu II and electrophoresed on a
l%o agarosegel. The gel was stained with ethidium bromide and visualized
on a UV light box. Panel C: Southern hybridization performed on
samples depicted in Panel B, probed with a radiolabeled sequence of the
GUS gene.
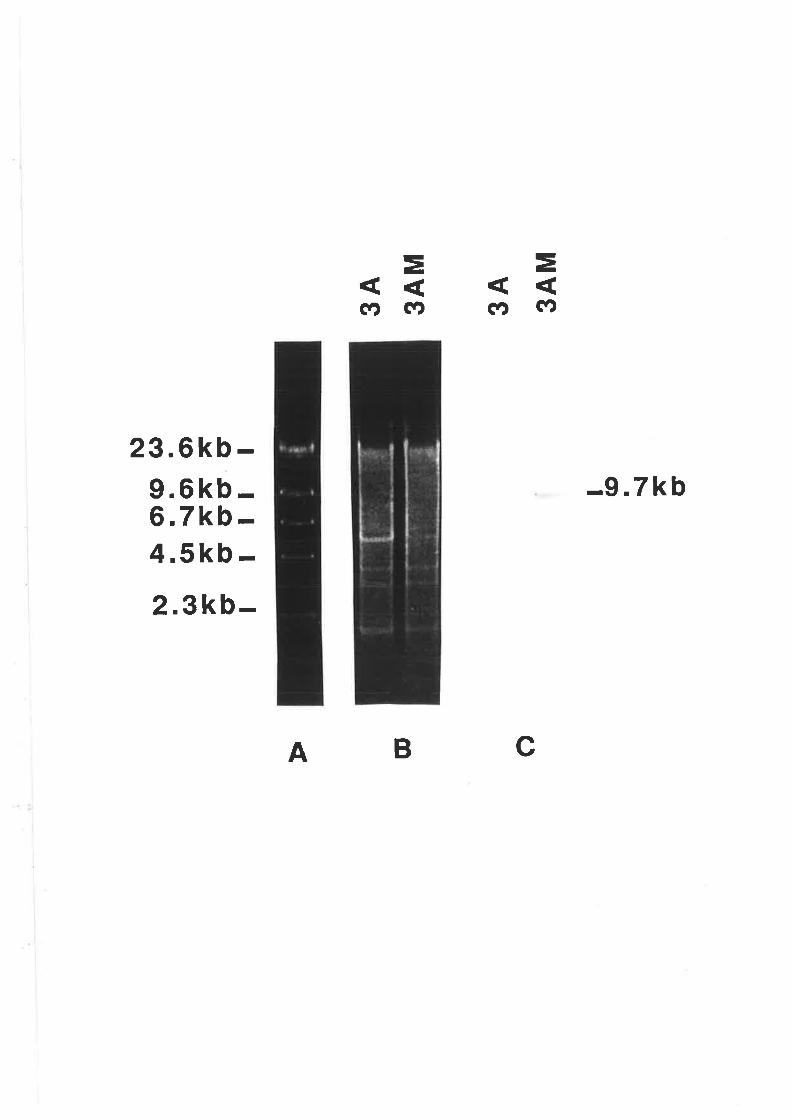
=coc)
=c!)eÐ
23.6kb-9.6 kb -6.7 kb -4.5kb-2.3kb-
-9.7kb
cBA
Figure 5.7. Southern hybridization depicting the chromosomal location
of the GUS vector in strain 3AM. Panel A: Yeast chromosomes sepafated
on a l%o agarose gel by transverse alternating field electrophoresis. Panel
B: Southern hybridization of chromosome patterns depicted in Panel A
probed with a sequence of the ILyz gene. Panel C: Chromosome patterns
depicted in Panel A probed with a radiolabeled sequence of the GUS gene.
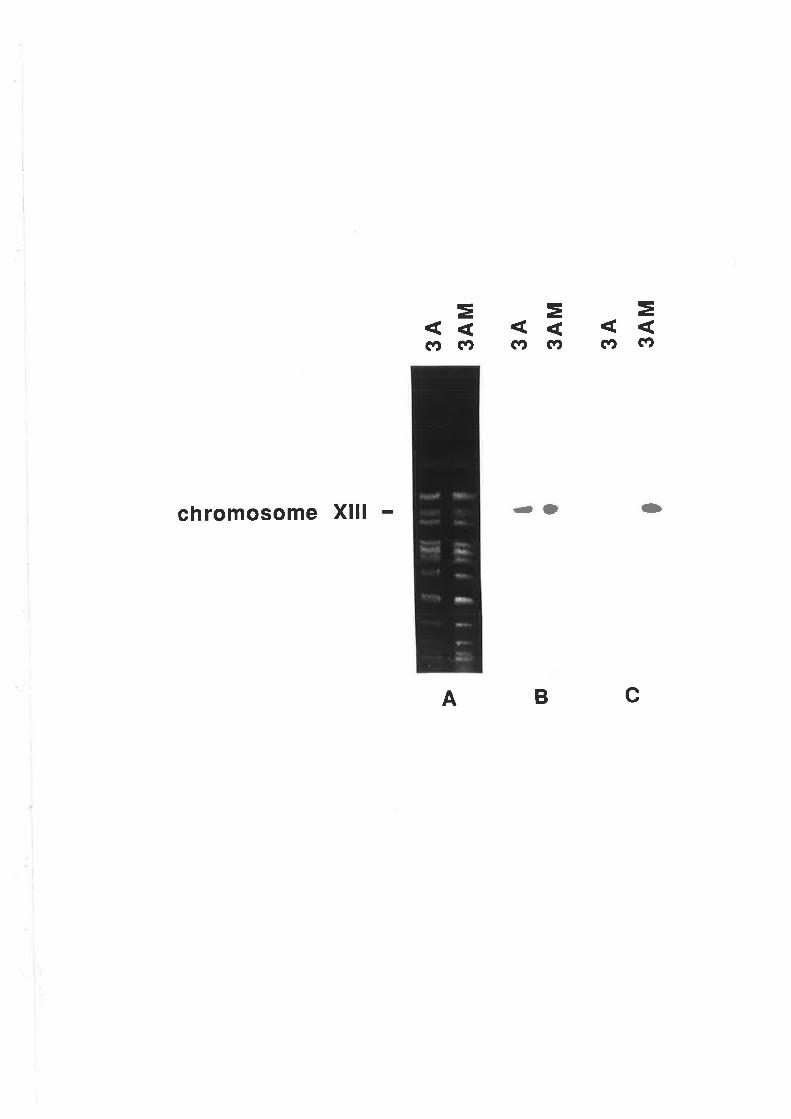
o ¿ - o 3 o U' o 3 o ã I
E o
I I
3A 3AM
3A 3AM
3A 3AM
t
-83-
Pvu tr digested plasmid, p{W22},was introduced into wine yeast smin 3A by the
method of Ito et at. (1983). Transformants were selected for resistance to the herbicide
sulfometuron methyl (at 10 pglml). A transformed colony (designated 3AM) was then
screened for the presence of the GUS construct. Total DNA was isolated and digested with
pvu II, thereby releasing the GUS-vector construct intact from the chromosomal DNA. A
Southern hybridization was then performed using the Hind III fragment from plasmid
pKLG4 to probe for the GUS sequence (Figure 5.6). A band of approximately 9.7 kbp
was evident in the transformed strain indicating the presence of the GUS construct.
The chromosomal location of the GUS construct in the transformed strain was
determined. Intact chromosomes were prepared from strain 3AM, separated by pulsed field
gel elecrophoresis on a TAFE unit and screened by Southern hybridization with the GUS
sequence. Results of this analysis (Figure 5.7) show that the GUS construct has integrated
into chromosome (XI[). This chromosome also contains the ILV2 gene; the expected site
of integration.
5.2.4 Development of a GUS assa]' for yeasts
A number of substrates are available commercially for GUS detection assays. Two
of these substrates were selected for development of a GUS assay for yeasS:
Ð 5-bromo-4-chloro-3-indolyl-p-glucuronide(X-GLUC). Thissubstrateis
available for histochemical localization of p-glucuronidase activity in tissues and cells. The
X-GLUC molecule is cleaved by the p-glucuronidase enzyme to produce an indoxyl
derivative which, upon oxidation, gives rise to an insoluble and higtrly coloured indigo dye.
ü) 4-methyl umbelliferyl glucuronide (MUG). This fluorogenic substrate has
been described in the literatr¡re for assay of p-glucuronidase activity (Jefferson, 1987). The
compound is not fluorescent until cleaved by B-glucuronidase to release 4-methyl
umbelliferone which is fluorescent only when the hydroxyl group is ionized. The PK" of
-84-
the hydroxyl is between 8 and 9 but maximal fluorescence will only be obtained if the
product is in solution at a pH greater than the PK".
previous reports of GUS activity in yeast had not been documented, therefore an
empirical investigation was necessary to deærmine appropriate conditions for detection of
the GUS construct i¡ Saccharomyces strains. GUS activity had been detected in
filamentous fungi by growth on agar media containing X-GLUC; transformed strains
giving rise to blue colonies (Roberts et a1.,1989). An initial experiment was performed to
determine whether GUS activity could be detecæd in yeast cells simply by incubation with
the substrate X-GLUC.
plasmids pAV/218 and pAV/219 were transformed into the Saccharomyces lab
strain O11. Both types of transformants were grcwn to stationary phase in liquid culture
and after harvesting, were resuspended in 0.1M Na2HPO4, pH 7.0. The substrate X-
GLUC (sopg/ml) was added and the suspensions were incubated at 30oC. At regular
intervals, the cells were checked for development of blue colour. After a 24 hour
incubation, no colour was evident in either of the transformants.
Possible explanations for this negative response include: Ð the substrate is not
entering the cell and therefore is not exposed to the p-glucuronidase enzymel' or ii) the
ADCI-GUS construct is not directing suff,rcient expression of the GUS coding region and
therefore, inadequate levels of the p-glucuronidase enryme exist in the yeast cell-
To investigate the possibility that the substrate is not coming into contact with the
enzyme, the experiment was repeated but this time the yeast cell wall was physically
disrupted by agitation with glass beads. The result of this experiment is presented in Figure
5.8 (A). The positive response obtained after physical disruption of the yeast strain
conraining pAW219 indicates that sufficient expression of the GUS gene is achieved with
the ADH-GUS construct. The positive response was only recorded with the transformant
-85-
in which the GUS coding region is oriented correctly with respect to the ADH promoter.
This conf,¡ms that fortuitous expression of the GUS gene was not sufficient to generate a
detectable level of GUS activity. Furthermore, it can be concluded that over the time course
of this experiment, the X-GLUC was not taken up by the cells nor could it diffuse into
intact cells.
A number of other treaEnents were tested for the ability to induce permeation of the
yeast cell wall and to facilitate detection of GUS activity. These teatments included:
Ð addition of the ionic detergents sa¡kosyl or SDS (sodium dodecyl
sulphate) to the cell suspension (total concentrations ranging from 0 -
SVo);
ü) addition of the non-ionic detergent triton-X to the cell suspension (total
concenFation ranging from 0 -57o); and
üi) addition of the sulphydral reagent p-mercaptoethanol to the cell
suspension (total concentration ranging from 0 - 100 mM).
Cells of strain Oll containing plasmid pAV/219 were suspended in 0.1M Na2HPO4
containing 50 mM X-GLUC prior to the addition of each compound. Each suspension was
then incubated at 37oC for 4 hours. Results of these treatnents are presented in Figure 5.8
(B). Addition of the ionic detergents sarkosyl and SDS (at concentrations of l7o) resulted
in the fastest colour development, and after 4 hours these suspensions were the deepest
blue. A decrease in rate of colour development was evident in samples which contained the
detergent in concentrations higher than l%o. This could be due to a partial denaturation of
the p-glucuronidase enzyme, which would result in a decrease in enzyme acúvity.
Addition of triton-X was also successful in inducing leakiness in the yeast cells, however,
colour development was slower with this treatment. Treatment of the suspensions with p-
mercaptoethanol (up to 100mM) was not succesful, in the time course of this experiment, in
facilitating detection of GUS activity. It can be concluded, therefore, that treaünent of cells
Figure 5.8. Visual assays to determine suitable conditions for the
detection of GUS activity in yeast cultures. Panel A: Saccharomyces
cerevisiae srain OLl transformed withpAW2lS and pArü/219. Cells were
suspended in 0.1M Na2HPO4, pH 7.0 and vortexed for five minutes with
glass beads. Panel B: Saccløromyces cerdísiae strain Ol1 transformed
with pAV/219. Cells were suspended in O.lM Na2HPO4 and substances
were added as indicated.
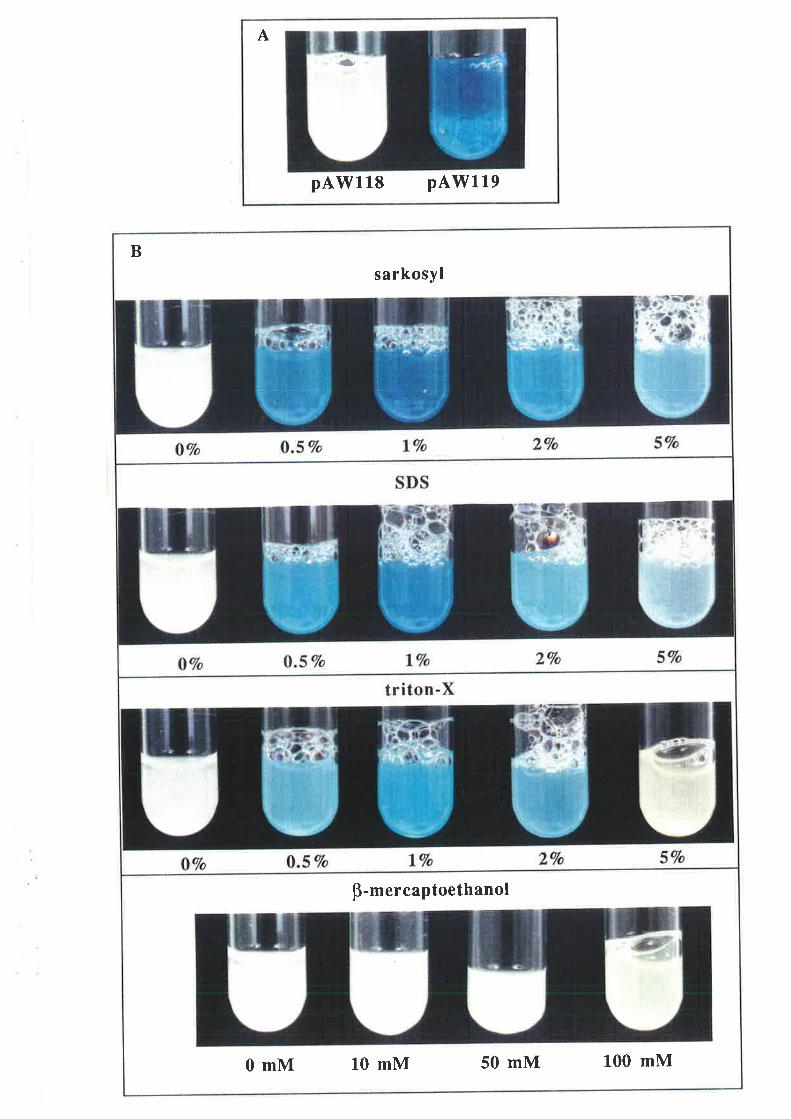
A
pAWllE pAWr 19
¡lt
10 mM 50 mM 100 mM0mM
p-mercaptoethanol
sarkosyl
ì
B
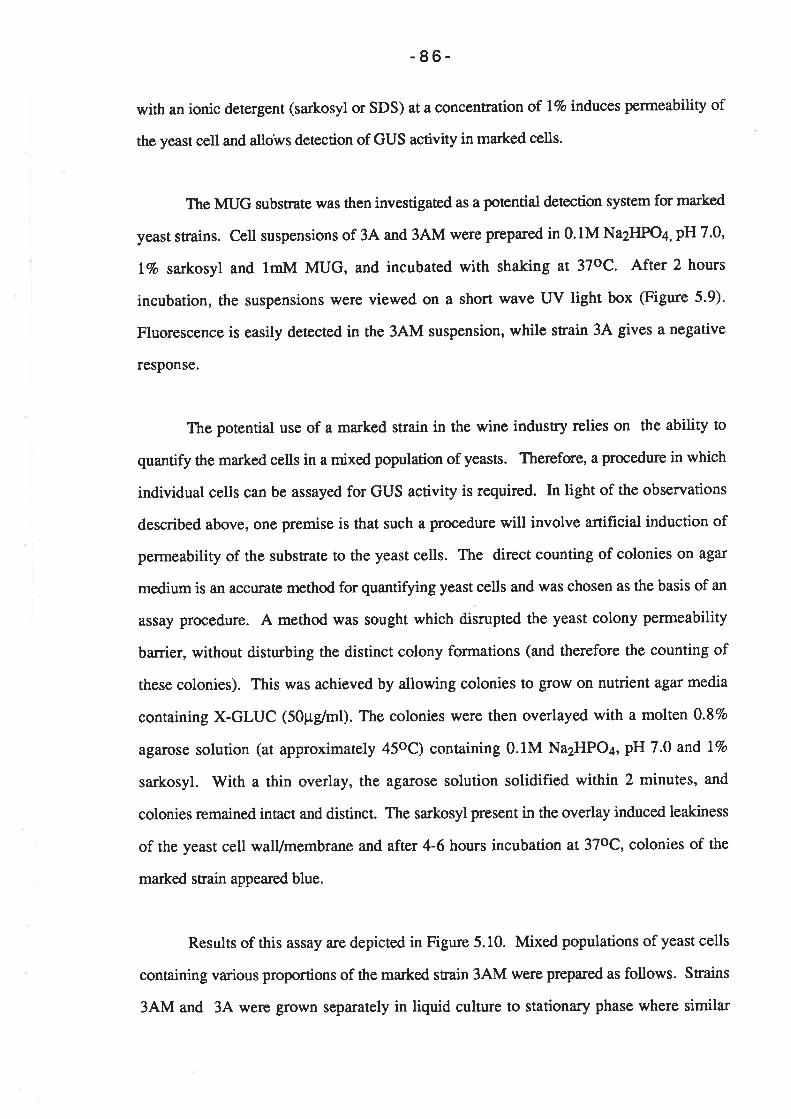
-86-
with an ionic detergent (sarkosyl or SDS) at a concentr¿tion of l7o induces permeability of
the yeast cell and allows detection of GUS activity in marked cells.
The MUG substrate was then investigated as a potential detection system for ma¡ked
yeasr strains. Cell suspensions of 3A and 3AM were prepared in 0.1M Na2HPO4, pH 7.0'
17o sa¡kosyl and lmM MUG, and incubated with shaking at 37oC. After 2 hours
incubation, the suspensions were viewed on a short wave UV light box (Figure 5.9).
Fluorescence is easily detected in the 3AM suspension, while strain 3A gives a negative
response.
The potential use of a marked strain in the wine indusury relies on the ability to
quantify the marked cells in a mixed population of yeass. Therefore, a procedure in which
individual cells can be assayed for GUS activity is required. In light of the observations
described above, one premise is that such a procedure will involve a¡tificial induction of
permeability of the substrate to the yeast cells. The direct counting of colonies on agal
medium is an accurate methd for quantifying yeast cells and was chosen as the basis of an
assay procedure. A method was sought which disrupted the yeast colony permeability
barrier, without disturbing the distinct colony formations (and therefore the counting of
these colonies). This was achieved by allowing colonies to grow on nutrient agar media
containing X-GLUC (sOpg/ml). The colonies were then overlayed with a molten 0.87o
agarose solution (at approximately 45oC) containing 0.1M Na2HPO4, pH 7.0 and l7o
sarkosyl. V/ith a thin overlay, the agarose solution solidified within 2 minutes, and
colonies remained intact and distinct. The sarkosyl present in the overlay induced leakiness
of the yeast cell walVmembrane and after 4-6 hours incubation at 37oC, colonies of the
ma¡ked strain appeared blue.
Results of this assay are depicted in Figure 5.10. Mixed populations of yeast cells
containing va¡ious proportions of the marked strain 3AM were prepared as follows. Srains
3AM and 3A were grown separately in liquid culture to stationary phase where similar
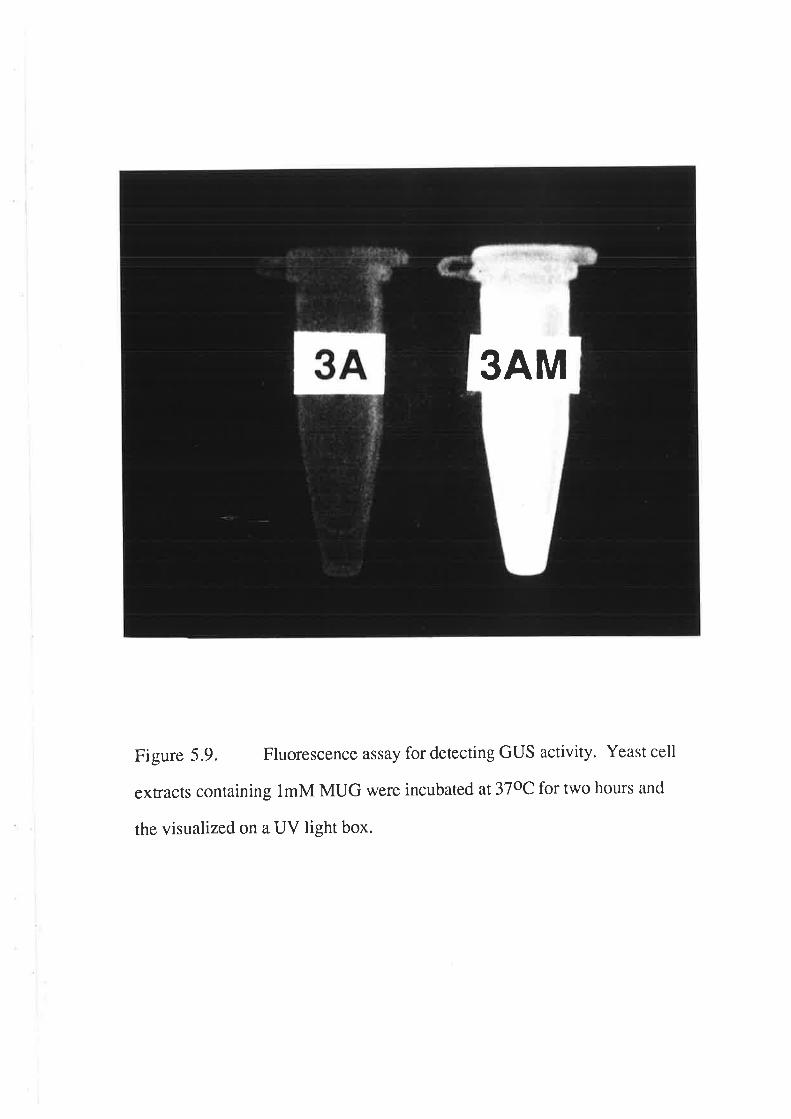
3AM
Figure 5.9. Fluorescence assay for detecting GUS activity. Yeast cell
extracts containing lmM MUG were incubated at37oC for two hours and
the visualized on a UV light box.
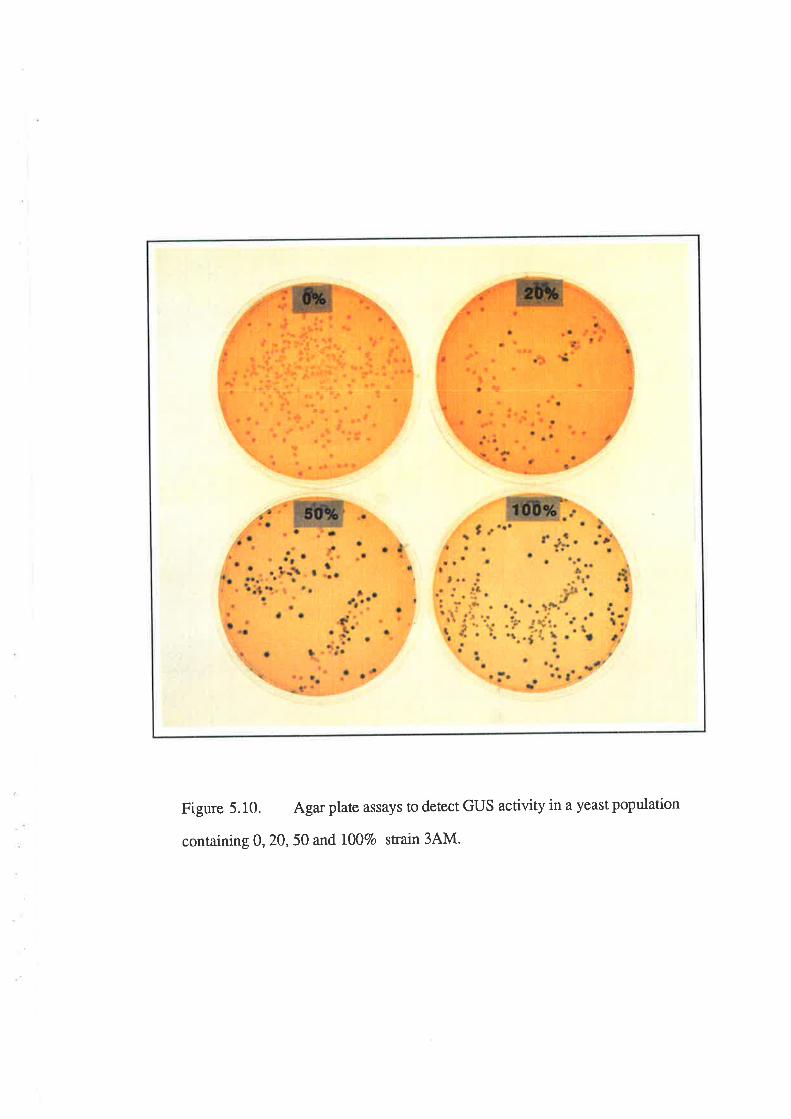
Figure 5.10. Agar plate assays to detect GUS activity in a yeast population
containing 0,20,50 and l00Vo strain 3AM.
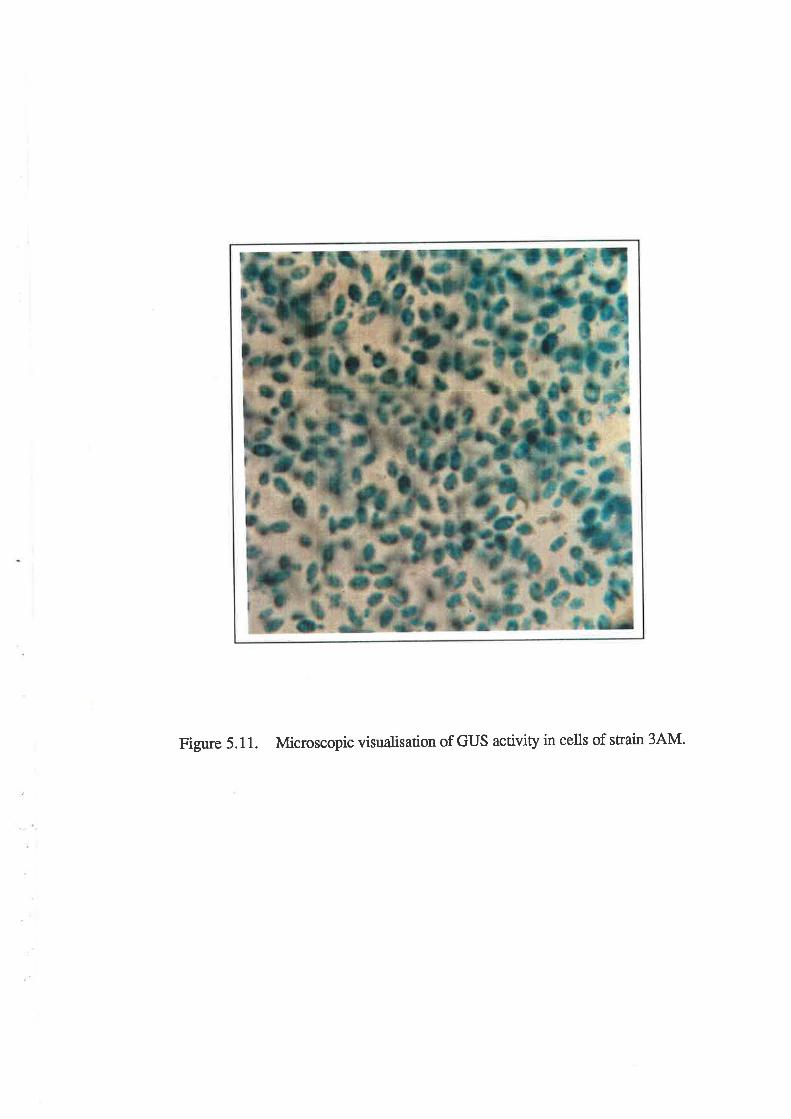
Figure 5.11. Microscopic visualisation of GUS activity in cells of strain 3AM.
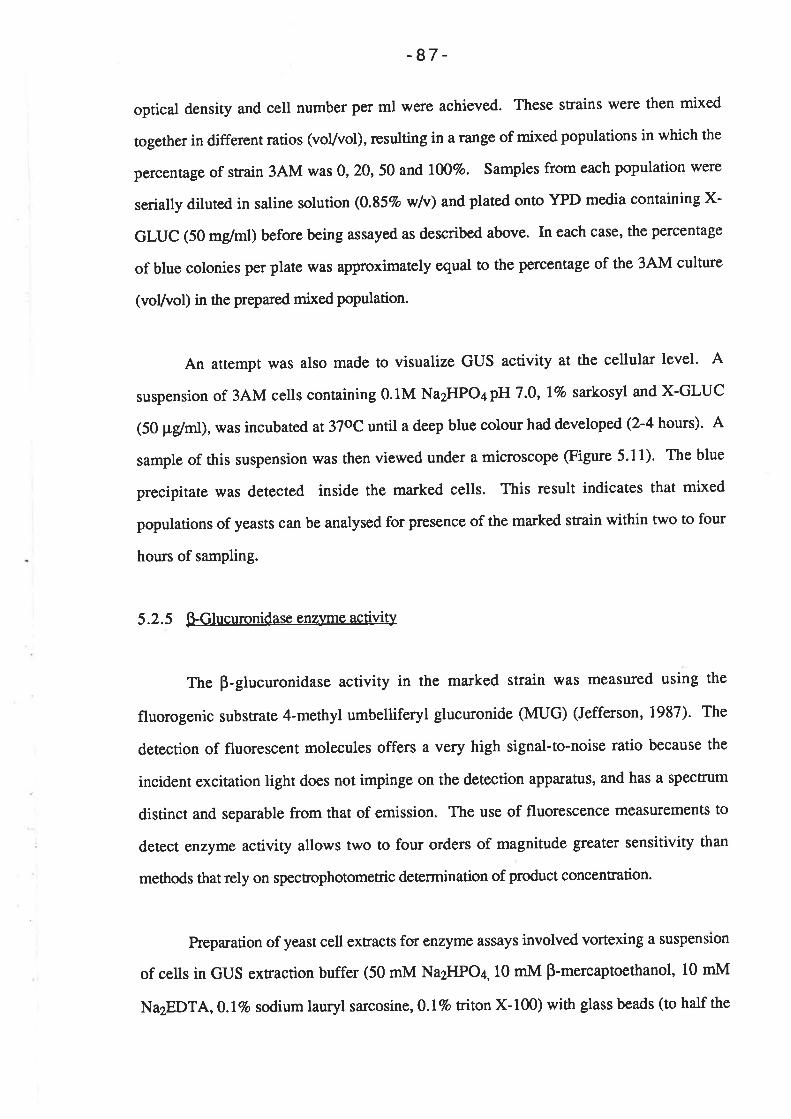
-87 -
optical density and cell number per ml were achieved. These snains were then mixed
together in different ratios (voVvol), resulting in a range of mixed populations in which the
percentage of strain 3AM was 0, 20, 50 and L0O7o. Samples from each population were
serially diluted in saline solution (O.857o w/v) and plated onto YPD media containing X-
GLUC (50 mg/ml) before being assayed as described above. In each case, the percentage
of blue colonies per plate was approximately equal to the percentage of the 3AM culture
(voVvol) in the prepared mixed population.
An attempt was also made to visualize GUS activity at the cellular level. A
suspension of 3AM cells containing 0.lM Na2HPO4pH 7.0, 17o sarkosyl and X-GLUC
(50 pglml), was incubated at 3Tocuntil a deep blue colour had developeÀ Q-a hours). A
sample of this suspension was then viewed under a microscope (Figure 5.11). The blue
precipitate was detected inside the ma¡ked cells. This result indicates that mixed
populations of yeasts can be analysed for presence of the marked smin within two to four
hours of sampling.
5.2.5 ÈGlucuronidase enzyme activity
The p-glucuronidase activity in the marked strain was measured using the
fluorogenic substrate 4-methyl umbelliferyl glucuronide (MUG) (Jefferson, 1987). The
detection of fluorescent molecules offers a very high signal-to-noise ratio because the
incident excitation light does not impinge on the detection apparatus, and has a spectrum
distinct and separable from that of emission. The use of fluorescence measurements to
detect enzyme activity allows two to four orders of magnitude greater sensitivity than
methods that rely on spectrophotometric determination of product concentration.
Preparation of yeast cell extracts for enzyme assays involved vortexing a suspension
of cells in GUS exrraction buffer (50 mM NazHPO¿, 10 mM p-mercaptoethanol, 10 mM
Na2EDTA,Q.lfto sodium lauryl sarcosine, 0.17o triton X-100) with glass beads (to half the
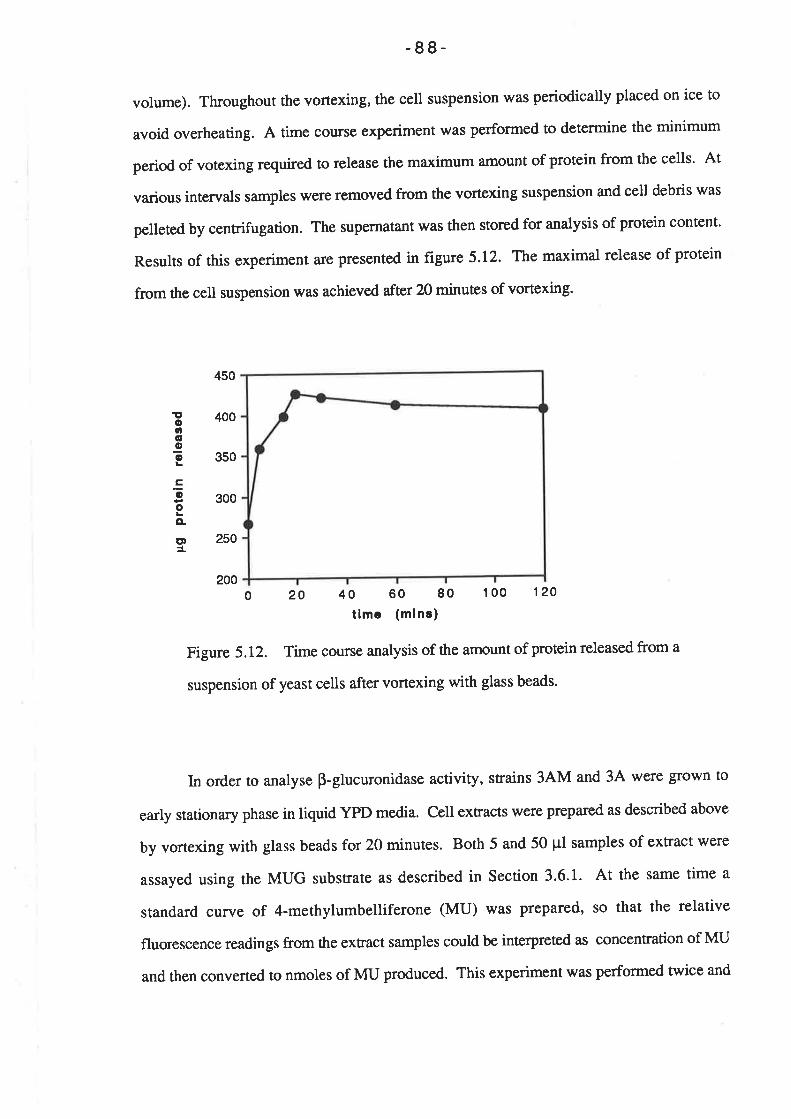
-88-
volume). Throughout the vortexing, the cell suspension was periodically placed on ice to
avoid overheating. A time cogrse experiment was performed to determine the minimum
period of votexing required to release the mar<imum amount of protein from the cells' At
va¡ious intervals samples were removed from the vortexing suspension and cell debris was
pelleted by centrifugation. The supernatant was then stored for analysis of protein content'
Results of this experiment afe presented in figure 5.12. The maximal release of protein
from the cell suspension was achieved after 2O minutes of vortexing'
450
400
350
300
250
20020 40 60 80 1 00 120
tlmc (mlns)
Figure 5. 12. Time course analysis of the annunt of protein released from a
suspension of yeast cells after vortexing with glass beads'
In order to analyse p-glucuronidase activity, strains 3AM and 3A were grown to
early stationary phase in liquid YPD media. Cell extracts were prepared as described above
by vortexing with glass beads for 20 minutes. Both 5 and 50 pl samples of exEact were
assayed using the MUG substrate as described in Section 3.6.1. At the same time a
standard curye of 4-methylumbelliferone (MU) was prepared, so that the relative
fluorescence readings from the extract samples could be interpreted as concentration of MU
and then converted to nmoles of MU produced. This experiment was performed twice and
!oo6Io
ÊõoÀTD1
0
-89-
average readings are presented graphically in Figure 5.13. The protein content of each
extract was found to be 5 mg/mt for strain 3AM and 4.4 mg/rnl for the 3A extract' No
enzyme activity was detected in strain 34, while the average p-glucuronidase activity of
strain 3AM was calculated to be 0.65 nmoles MU/mirVmg protein'
50 100 150
time (mins)
Figure 5.13. p-Glucuronidase enzyme assays: (O) 50 ¡rl strain 3AM extract;
(O)spl strain 3AM extract; (tr) 50 pl strain 3A extract.
5.2.6 Fermentation trials
The 3AM strain was used in a fermentation trial to monitor the effects of
transformation on the yeast oenological properties. Three different transformants were
isolated and used to inoculate separate starter cultures. Three colonies of control, un-
Eansformed 3A yeast were also inoculated into sta¡ter cultures. Each of these six cultures
was inoculated in duplicate into flasks of Riesling grape juice at a concentration of 4 x 10⁶
cells/ml. Fermentations were carried out under anaerobic conditions at 18oC. Samples
were taken at regular intervals and assayed for yeast growth (by measuring optical density
25
20
15
10
5
0
E(ÐI
!oÈ
Àttt(¡)
EÉ
0
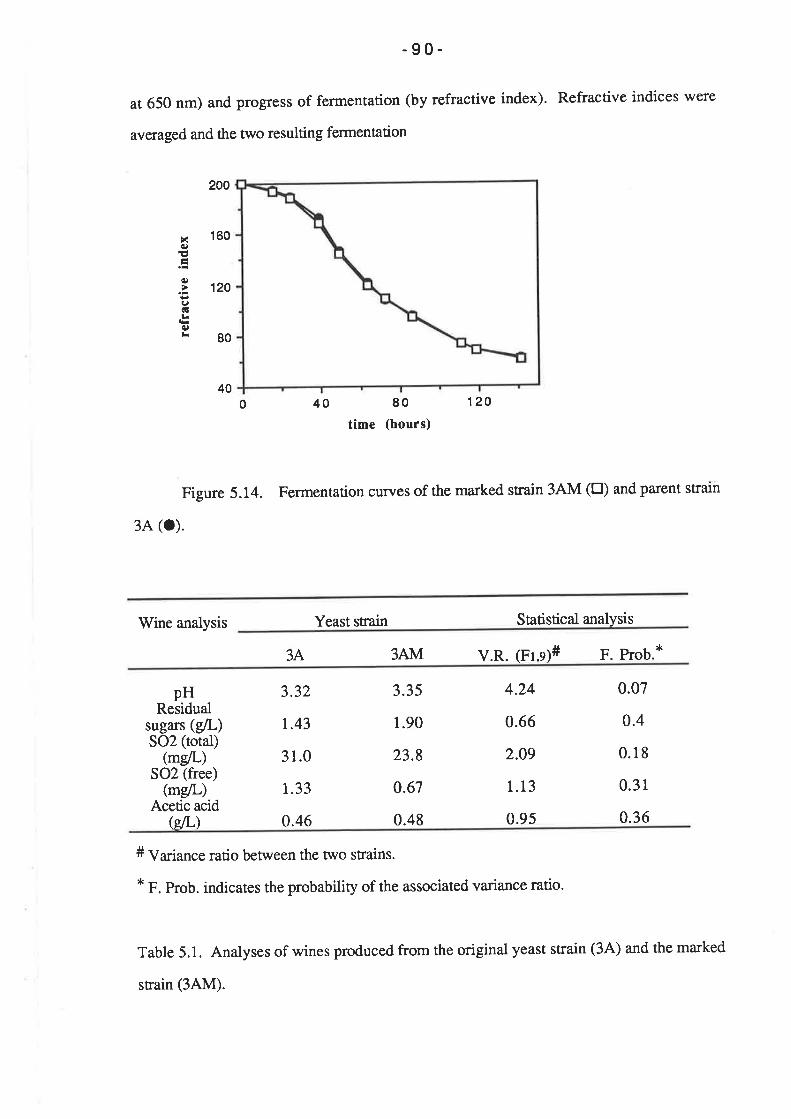
-90-
at 650 nm) and progress of fermentation (by refractive index). Refractive indices were
averaged and the two resulting fermentation
40 120
Figure 5.14. Fermentation cuwes of the marked str¿in 3AM (EI) and parent strain
3A (o).
Wine analysis Yeast strain Statistical analysis
3A 3AM V.R. (Ft,s¡# F. Prob.*
200
160
120
80
40
X(¡)E
(9
Iãl
(Ð
0 80
time (hours)
pHResidual
sugars (g/L)SO2 (total)
(mg/L)SO2 (free)
(melL)Acetic acid
(s/L\
3.32
r.43
31.0
1.33
0.46
3.35
1.90
23.8
0.67
0.48
4.24
0.66
2.09
1.13
0.9s
0.07
0.4
0.18
0.31
0.36
# Va¡iance ratio beween the two strains.
* F. Prob. indicates the probability of the associated variance ratio.
Table 5.1. Analyses of wines produced from the original yeast strain (34) and the ma¡ked
strain (3AM).
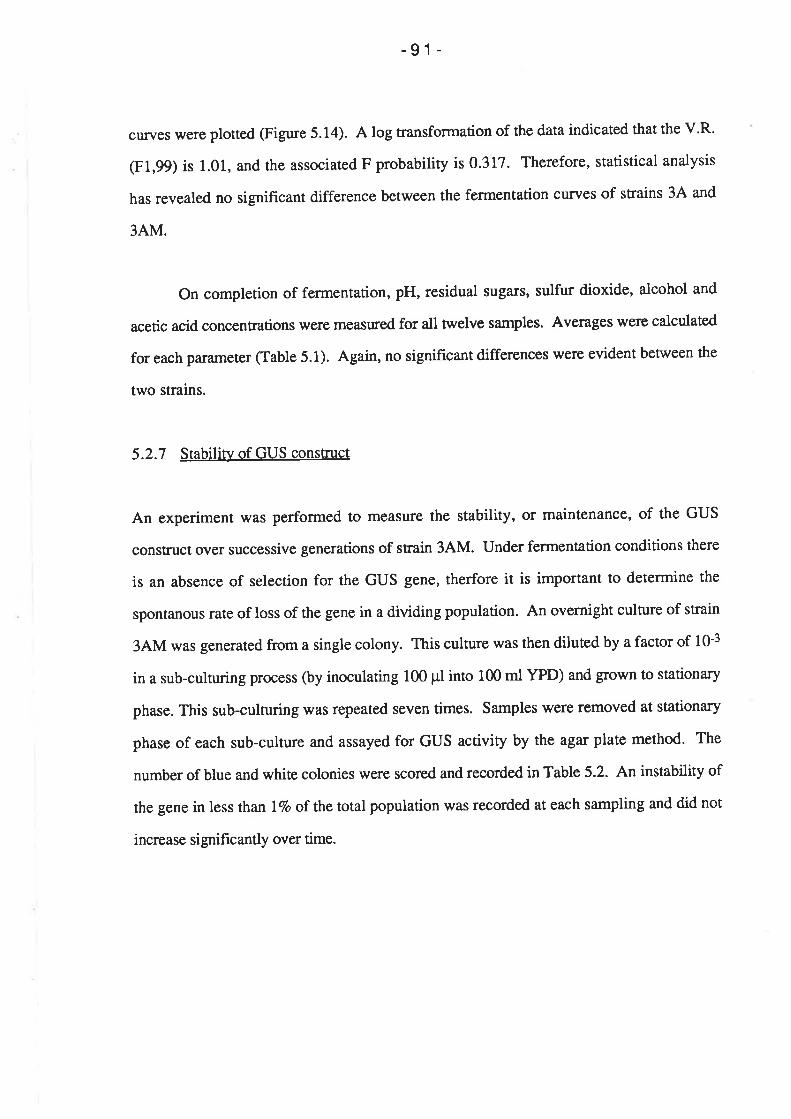
-91-
curves were plotted (Figure 5.14). A log transformation of the data indicated that the V.R.
(Fl,99) is 1.01, and the associated F probability is 0.317. Therefore, statistical analysis
has revealed no significant difference between the fermentation curves of sEains 3A and
3AM.
On completion of fermentatiotr, pH, residual sugars, sulfur dioxide, alcohol and
acetic acid concentrations were measured for all Welve samples. Averages were calculated
for each par¿rmeter (table 5.1). Again, no significant differences were evident between the
two strains.
5.2.7 Stability of GUS construct
An experiment was performed to measure the stability, or maintenance, of the GUS
construct over successive generations of strain 3AM. Under fermentation conditions there
is an absence of selection for the GUS gene, therfore it is important to determine the
spontanous rate of loss of the gene in a dividing population. An overnight culture of strain
3AM was generated from a single colony. This culture was then diluted by a factor of 10-3
in a sub-culturing process (by inoculating 100 pl into 100 ml YPD) and grown to stationary
phase. This sub-culturing was repeated seven times. Samples were removed at stationary
phase of each sub-culture and assayed for GUS activity by the agar plate method. The
number of blue and white colonies were scored and recorded in Table 5.2. An instability of
the gene in less than l7o of the total population was recorded at each sampling and did not
increase signifrcantly over time.
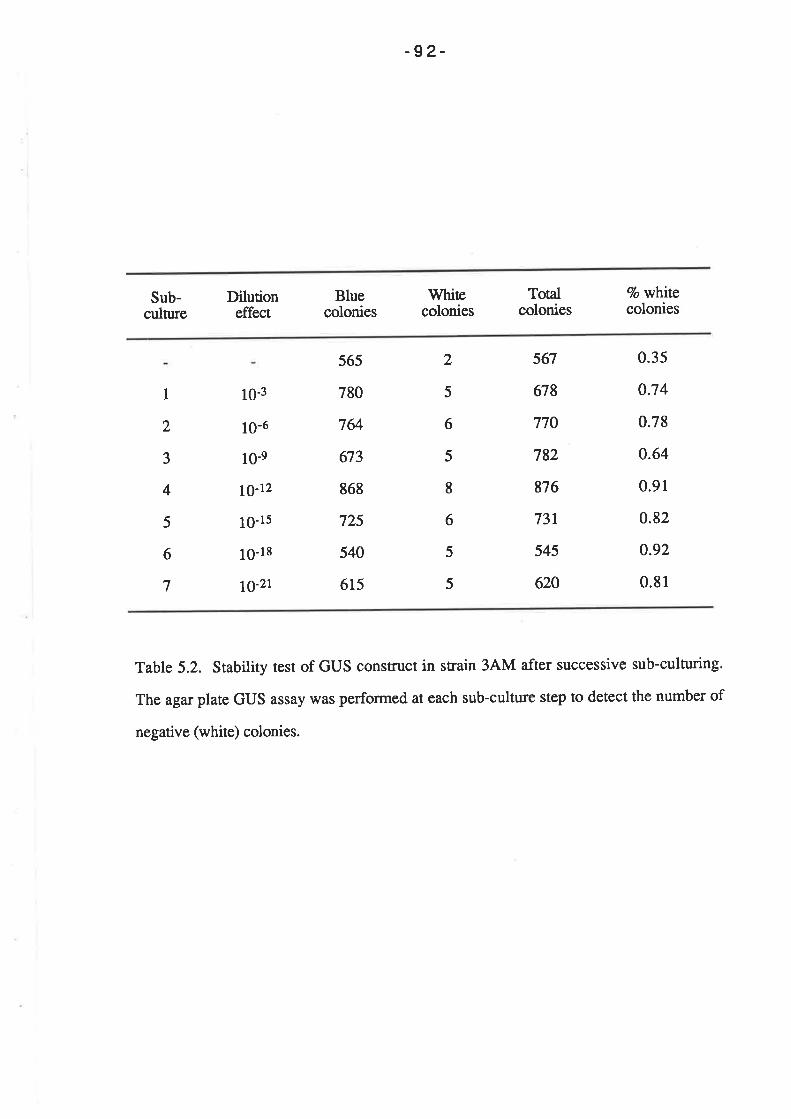
-92-
Sub-culn¡re
Dilutioneffect
Bluecolonies
Whitecolonies
Totalcolonies
4o whitecolonies
I
2
3
4
5
6
7
10-3
10-ó
10-e
10-12
10-15
l0-18
10-21
565
780
7&
673
868
725
540
615
567
678
770
782
876
73r
545
620
0.35
0.74
0.78
0.64
0.91
0.82
0.92
0.81
2
5
6
5
I6
5
5
Table 5.2. Stability test of GUS construct in strain 3AM after successive sub-culturing.
The agar plate GUS assay was performed at each sub-cultu¡e step to detect the number of
negative (white) colonies.
-93 -
5.3 DISCUSSION
Close examination of pulsed field gel electrophoresis fingerprints of twelve wine
yeasts indicate that none of the strains have identical electrophoretic chromosomal profiles.
Similar results have recently been reported by Vezinhet et al. (1990). In an analysis of 22
wine yeasts isolated from various wine growing regions, only 3 strains (originating from
the same vineyard) could not be differentiated.
These differences in profiles result from chromosome rearrangements which have
taken place in yeast strains during the course of evolution. The high degree of
polymorphism among wine yeast strains is perhaps not surprising in view of their diverse
origins. It is likely that the strains hetd in The Australian'Wine Research Institute Yeast
Collection have undergone reproductive isolation for some time by virtue of their
localization in different viticultural regions of the world.
Pulsed field gel electrophoresis can be used to gain a better understanding of the
processes which generate chromosome-length polymorphisms between strains. For
example, the FIGE and OFAGE systems have been used to show that certain chromosome-
length polymorphisms segregate in a2:2raio,indicating single structural alterations of the
chromosomes (Ono and Ishino-Arao, 1983). Chromosome-length polymorphisms,
however, can also result from two or more structural alterations per chromosome and are
not restricted to specific chromosomes. The TAFE system has been used for the analysis of
chromosomal segregants and inheritance (Bilinski and Casey, 1989), and Viljoen et aI.
(1989) used the OFAGE system to establish possible amamorptr/telemorph relations in
yeasts. Another application of pulsed-field gel electrophoresis is the localization of specif,rc
genes and the distinction of two yeast strains that differ only in the chromosomal
localisation of specific genes. Pretorius and Marmur (1988) probed a Southern blot of an
OFAGE gel containing the resolved chromosomes of four S. cerevisi¿e strains with the
-94-
cloned STA2 glucoamylase gene and showed that the strains differed only in the presence
and/or ch¡omosomal location of the gene.
Results obtained with chromosome fingerprinting of wine yeasts reveal an
immediate application of TAFE technology to Resea¡ch and Development and Quality
Control in wine fermentations. At fxed pulse and electrophoresis times the pattern for any
strain is highly reproducible and results in a unique signature easily distinguished from
other contaminating strains. The relatively rapid technique of electnophoretic karyotyping of
yeasts may therefore be applied to improvement of yeasts by clonal selection during
successive rounds of fermentation. This methd would ensu¡e that contaminant strains of
S. cerevisiac were not inadvertently selected. P¡ocesses which cause chromosome damage
could.also be identif,red using this techmique (Contopoulou et a1.,1987). The effect of
environmental selection pressures (such as storage conditions or culture media) on the
genomes of wine yeasts may also be determined. Such information could have significant
impact on the preparation of starter cultures and the mode of storage of wine yeasts. In
addition, in developing new strains for industrial applications, TAFE analyses can be useful
for monitoring chromosome profiles of parent and progeny strains employed in such
research. Fingerprints that examine all chromosomes within a yeast strain can also be
viewed as genetic 'snapshots' of that yeast at a fixed point in time and therefore can be used
to monitor chromosome stability. This system is, therefore, useful for routinely monitoring
the stability of a yeast strain used within a winery as well as for distinguishing srains used
in different wineries.
However, for quantitative studies of yeast growth kinetics during fermentation
where large numbers of cells need to be monitored for statistical analyses, the TAFE
identification system is unsuitable. The time involved in the preparation of plugs, and the
number of gels required for the analysis of large numbers of colonies precludes the TAFE
system from this application. For this reason, the GUS marking system was developed.
Results presented in this chapter show that expression of the E.coli GUS gene can be
-95-
achieved in Sacclnromyces strains by a construct in which the GUS coding region is linked
to the yeast alcohol dehydrogenase (ADCI) promoter and teminator sequences. The
construct was successfully targeted to the site of the ILV2 gene on chromosome XIII of
wine yeast strain 3A. Fermentation tials indicaæd that the transformation procedu¡e did not
significantly alter vinification properties of wine yeast strain 3A. Commercial ferments
would need to be ca¡ried out to confirm that the üansformation procedure does not produce
organoleptic changes in the wine.
The transformation system used to introduce the construct has been used
successfully to mnsform a range of strains in The Australian Wine Research Institute yeast
collection (see Section 4.2.2). The implications are, therefore, that the GUS marking
system can be used to tag any wine yeast strain of choice. In this respect the GUS consntct
offers a unique marking system for wine yeasts. The marked oenological strain Kl
(Vezinhet and Lacroix, 1984; Vezinhet, 1985) was developed by selecting natural mutants
in a population of the Latvin V yeast. This procedure is a time consuming and non-specific
methd of genetic manipulation and, therefore, it is not readily applied to wine yeasts of
interest.
Assaying for the GUS ma¡ker can be achieved by fluorimetry, spectrophotometry,
or by agar plate method. Although natural transport of X-GLUC or MUG substrates did
not occur across yeast cell membranes in the time course of experimens described here, this
problem was overcome by inducing artificial permeation in assay procedures.
Analysis of a large sample of colonies during the successive sub-culturing of strain
3AM revealed an instability of the GUS construct. This instability was detected by the
presence of white colonies in the agar plate assay procedure. The frequency of colonies
which responded negatively to the GUS plate assay was always less than l%o of the total
plate count and did not increase significantly over the period of sub-culturing.
Occassionally a sectored colony was detected, suggesting either excision of the gene by
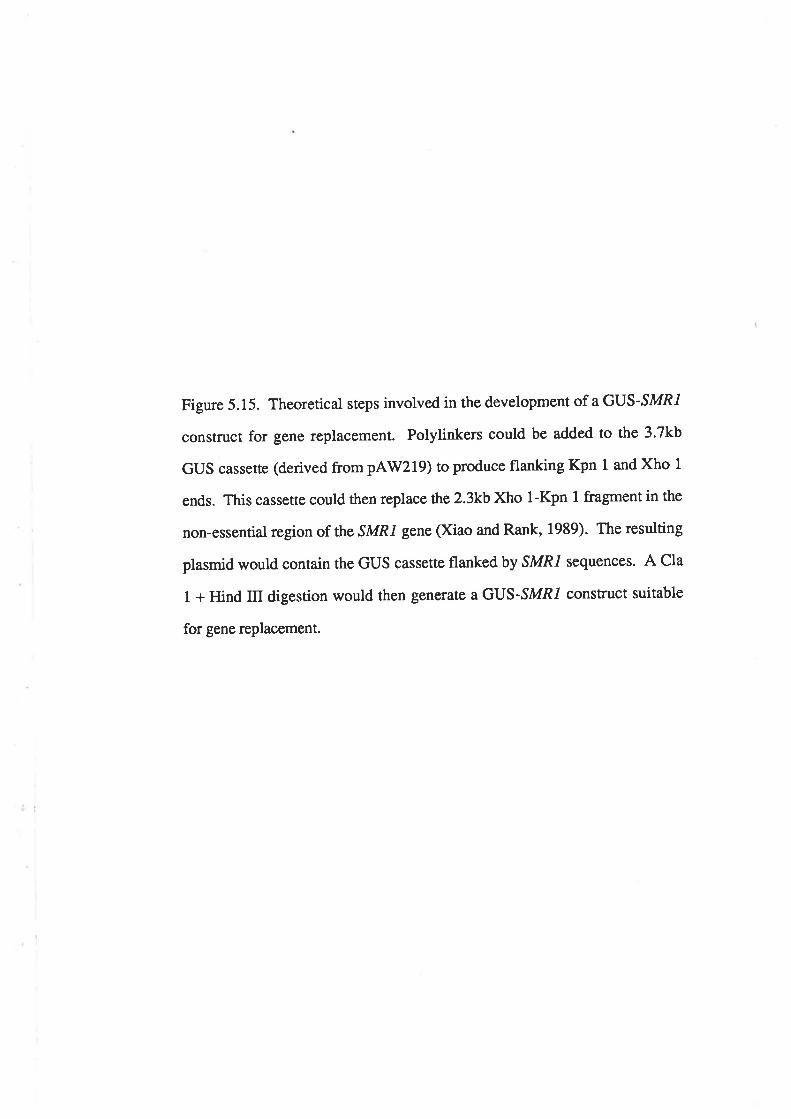
Figure 5.15. Theoretical steps involved in the development of a GUS-SMR1
construct for gene replacement. Polylinkers could be added to the 3.7kb
GUS cassette (derived from pAW2l9) to produce flanking Kpn 1 and Xho 1
ends. This cassette could then replace ttre 2.3kb Xho 1-Kpn I fragment in the
non-essential region of the SMRI gene (Xiao and Rank, 1989). The resulting
plasmid would contain the GUS cassette flanked by SMRI sequences. A Cla
1 + Hind III digestion would then generate a GUS-SMRI construct suitable
for gene replacement.
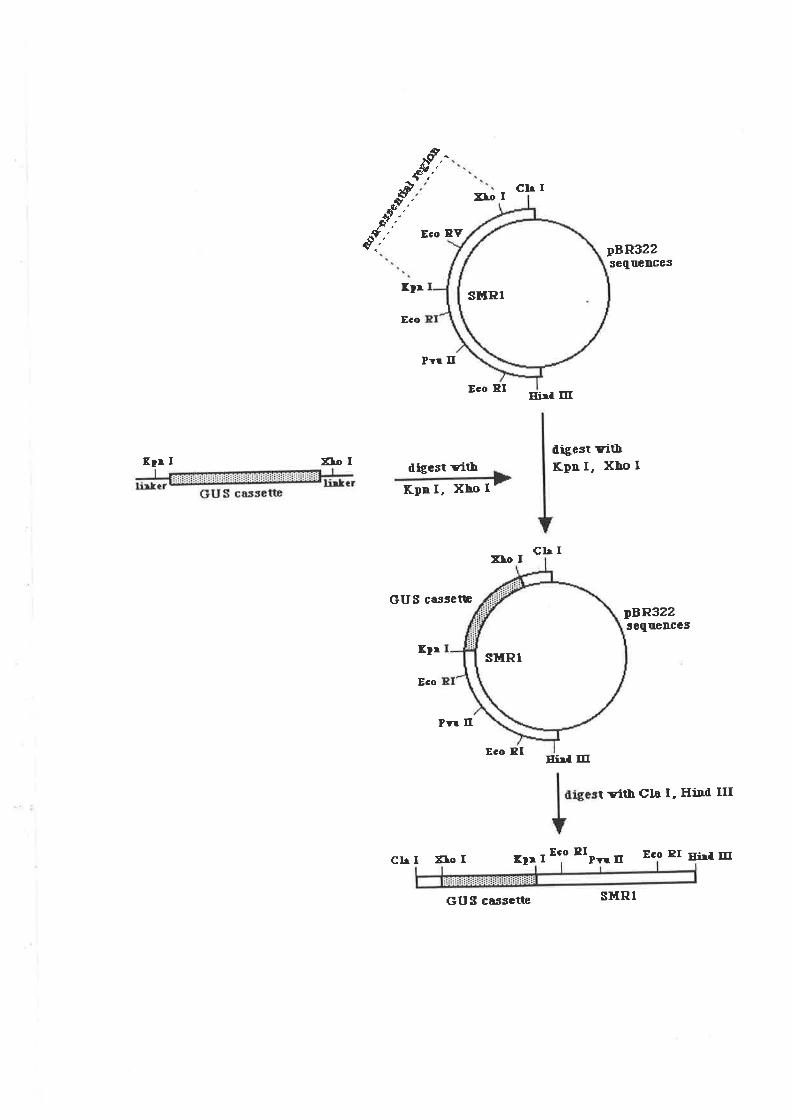
d'g
,*;dl'
ChI
E¡rI EoI
Xfo I
Dco EY
Etr
Eco
Pvr II
Eco EI
ûigest vittrKpn I, Xho I
pBR.322scqnÊnce5
Ei.ra m
Cl¡ I
aligest YithKpn I, Xho I
Ð,oI
GUS cassetæ
Elr
Eco
Pvr II
aBR322teqlrÊDEeS
t Yilh Clû I, HiDn III
Eco PI Ei¡f III
Cl¡ I Xfo I t¡r I IPvr If Eco EI Ei¡,1 ItrEco P
SI.iRt
sËRr
SI|IRT
GUS ca¡set'te
-96-
homologous recombination (Struhl et al.,1979) or loss of the gene after mitotic crossing
over (Roeder et a1.,1988). The implications of this instability of the GUS gene require
consideration. In mixed-population kinetic studies involving a GUS-marked strain, the
proportion of the marked strain will be underestimated due to the 'false negative' cells
which have lost the ma¡ker gene. This underestimation can be corrected if the frequency of
instability is calculated by appropriate control experiments'
The instability detected in this chapter indicate that statistical analysis of herbicide
resistant colonies performed in section 4.3.4 was not sensitive enough to detect a <17o loss
of the integrative vector. That experiment could be improved by analysing a larger number
of colonies. Furthermore, determination of the proportion of herbicide resistant colonies
may be better achieved by replica-plating colonies from non-selective media directly onto
selective media.
Loss of the gene through excision by homologous recombination may have been
avoided by adopting an alternative method of targeting the GUS constuct to the ILV2 gene.
For example, instead of introducing the plasmid pAlV,I22l by homologous recombination,
the GUS construct could be integrated to the genome of yeast by the process of gene
replacement (Rothstein, 1983). It would be possible to clone the GUS construct into a non-
essential region of the SMRI coding region (Xiao and Rank, 1989), thus producing a
chimaeric GUS-SMRI cassette where the GUS construct is flanked by SMRI upstream
sequences. The release of this cassette by restriction enzyme digestion would generate a
fragment with both recombinogenic ends homologous to yeast chromosome XtrI DNA at
the ILV2locus. Transformation of yeast with this fragment would result in integration by
gene replacement at the ILV2 locus (Figure 5. 15). The use of this method to introduce the
GUS construct to yeast strains offers the prospect of greater stability.
In determining suitable procedures for the introduction of a stable GUS construct in
wine yeasts, it is also important to consider the phenomenon of mitotic recombination and
-97 -
gene conversion (Zimmerman, 1990). This source of instability in wine yeasts can be
overcome by a procedure which involves sporulation and isolation of clones from single
ascospores. The haploid homothallic spore diploidizes shortly after germination giving rise
to a completely homozygous diploid. A problem with this technique, however lies in poor
sporulation ability of wine yeasts, and in the laborious selection procedures involved in
obtaining a spof€ with identical properties to the original parcnL
The GUS system described in this chapter will enable a wide range of yeast strains
to be marked, providing the means for unequivocal identification and monitoring during
fermentation. Recent investigations by Heard and Fleet (1985,1986,1988) made with both
inoculated and uninoculated grape juices under a range of fermentation conditions suggest
that Sacclaromyces strains are not necessarily the dominant organism during vinification.
These studies, along with a lack of knowledge regarding incidence and importance of wild
strains of Saccharomyces in fermenting grape juice, call for detailed monitoring of
inoculated strains under va¡ious oenological conditions. The agar plate method will find
application in the monitoring of sta¡ter cultures, effect of prefermentation processes on the
microbial populations of must, and the efficiency of inoculation. Furthermore, the cell
suspension assay has the advantage of obtaining results from the starter culture or ferment
populations within two to four hours of sampling.
It is important to note, however, that the GUS system has been developed using
recombinant DNA technology and utilizes a gene derived from E. coli. Consequently, yeast
strains marked with the GUS gene are not immediately available for use in the Australian
Wine Industry. It is envisaged, however, that public perception of genetically engineered
organisms and legislations limiting their release will be less restricting over time. The
benefits of recombinant DNA technology have been widely reported and microorganisms
have been successfully exploited for the production of a range of pharmaceutical products
such as interferon, insulin and human g¡owth hormone (Bloom, 1980; VÍoodruff, 1980).
Genetically engineered organisms are being constructed for a variety of environmental
-98-
applications. These include their use in agriculture as pesticides (Bishop et al-,1988); or
for agronomic crop production; pollution control of toxic waste in land filled sites,
wastewater trearment facilities or after accidental spillages; and in mining and the petro-
chemical industry for enhancing oit and mineral recovery (Keeler, 1988). A genetically
engineered agrobacterium which controls crown gall in plants has recently been released in
Australia (Kerr, 1989). These advances will lead to a mofe informed general public on
matters involving genetically engineered organisms and, perhaps, will smooth the way for
others.
In conclusion, two systems for the identification of yeast strains have been
described. Advantages of TAFE system a¡e that it facilitates a better understanding of
processes involved in yeast genome rea¡Tangements, and can be used to monitor
chromosome stability in wine yeasts. The GUS system enables the monitoring of specifrc
wine yeast strains in commercial fermentations which contain an unknown load of
indigenous yeasts.
-99-
Chapter 6 .Determination of kitler toxin activity in
fermenting grape juice using a marked
Saccharomyces strain
6.1. INTRODUCTION
Killer activity in yeasts was first reported in strains of S. cerevisiae in 1963 by
Bevan and Makower. Killer yeasts secrete pol¡peptide toxins which kill sensitive strains of
the same genus and less frequently, strains of different genera (Philliskirk and Young,
1975; Tipper and Bostian, 1984). Previous studies indicate that the toxin of
Sacclnromyces is a protein which binds to a receptor on the cell wall of the sensitive yeast,
disrupting the electrochemical gradient across the cell membrane and hence the intracellular
ionic balance (De la Pena et a1.,1981; Skipper and Bussey, 1977).
Production of the toxin and immunity to it are determined by a cytoplasmically
inherited double stranded (ds) RNA plasmid, otherwise known as the M-genome (Bostian
et al., 1980) which is found only in cells containing an additional dsRNA species
designated the L-genome. Both types of dsRNA exist in virus-like particles and require a
protein encoded by the L-dsRNA for encapsidation (Bostian et a1.,1980; Ha¡ris, 1978).
Based upon properties of the toxin, killer yeasts have been classified into eleven
groups (K1 through Krr) (Naumov and Naumova,1973; Young and Yagiu, 1978). Those
unique to Saccharomyces fall into the first three (K1, K2 and K¡). The Saccharomyces
toxin is reversibly inactivated at low pH (2.0) and irreversibly inactivated at pH in excess of
5.0 (Young and Yagiu, 1978). More specifrcally, the biological activity of K1 is optimal
berween pH 4.6 and 4.8, while K2 shows optimal activity between 4.2 and 4.7 (Shimazu er
ø/., 1985). Compared with K1, the K2 toxin is stable over a wider pH range (2.8 to 4.8)
(Rogers and Bevan, 1978) and is therefore more relevant in wine fermentation.
-100-
Killer activity has been detected in yeasts isolated from established vineyards and
wineries in various regions of the world including Europe and Russia (Barre, 1984; Gaia,
1984; Naumov and Naumova,1973), South Africa (Tredoux et a1.,1986) and Australia
(Heard and Fleet, 1987a,b). This widespread occu¡¡ence has prompted interest in the
oenological significance of killer wine yeasts. In theory, selected kitler yeasts could be
used as the inoculated strain to suppfess growth of undesirable wild strains of s. cerevisiae
during grape juice fermentation. In addition, as killer interactions have been reported to
occur between yeasts of different genera (Radler et al., 1985; Rosini, 1985a), the
possibility exists to genetically engineer broad spectrum killer strains of S. cerevisiae
(Boone et a1.,1990).
Studies have been conducted to assess the efficiency of killer toxin on sensitive
yeast strains. However, reports have been contradictory on the expression of killer activity
under fermentation conditions (Cuinier and Gros, 1983; Delteil and Aizac, 1988; Lafon-
Lafourcade and Ribereau-Gayon, 1984). Attempts to determine the population kinetics of
killer and sensitive strains during wine fermentation have been restricted because of the
difficulty involved in identifying the two types when grown in mixed cultures. Approaches
used to date include i) choice of killer and sensitive strains that can be distinguished by their
growth rates (Bare, 1984) or production of hydrogen sulf,rde (Rosini, 1985b); ii) use of
auxotrophic and respiratory deficient mutants of killer strains and appropriate plating
conditions under which they can be identified (tlara et a1.,1980, 1981; Seki er aI., 1985);
iii) use of killer and sensitive strains which can be distinguished by differences in colony
morphology (Heard and Fleet, 1987a); and iv) assaying colonies directly for killer activity
(Longo et a1.,1990). All of these methods a¡e limited by the fact that the assays involved
are laborious and time-consudng, or that only killer strains with specific characteristics can
be studied.
wAt'tE lNsTtTUlE
lDn¡BY-101-
This chapter describes the use of a marked S. cerevísiø¿ killer strain in a mixed
culture inoculum to quantify directly the effect of killer toxin on a sensitive s- cerevisiae
strain under fermentation conditions. As a wide range of yeast strains can be readily and
stably marked, this sysæm of analysis is unlimited in application and provides a simple and
unequivocal nrcans of quantifying killer yeast strains in mixed culture ferments.
6.2 RESULTS
6.2.1 Curing of Strain 3AM
In order to specifically analyse the effect of killer toxin in fermentations, an
experiment was designed to comprire two isogenic strains which differ only in the presence
of the M-dsRNA genome and therefore, in their ability to produce killer toxin.
Killer strain 3AM has previously been ma¡ked with the Escherichia coli þ-
Glucuronidase (GUS) gene (see Chapter 5). This system allows the ma¡ked strain to be
readily identified in a mixed population by a simple plate assay which ¡esults in the
formation of a blue precipitate in ma¡ked colonies. Strain 3AM was cured of its M-dsRNA
pla.smid by heat treaünent (wickner, lg74), the cured or sensitive colonies being identifred
by kilter plate assays. Figure 6.1 shows the response of snain 3AM and an isolated cured
derivative (designated 3AMC) to rhe killer plate assay. The zone of inhibition clearly
evident around strain 3AM is absent around 3AMC, indicating that strain 3AMC is not
producing killer toxin. As stain 3AMC is derived from 3AM, it inherits the GUS gene and
therefore is also a ma¡ked strain.
Double stranded RNA species were isolated from strains 3AM and 3AMC and
analysed by standard electrophoresis techniques (Figure 6.2). A band representing the M-
dsRNA genome is present in srain 3AM, and absent in strain 3AMC.
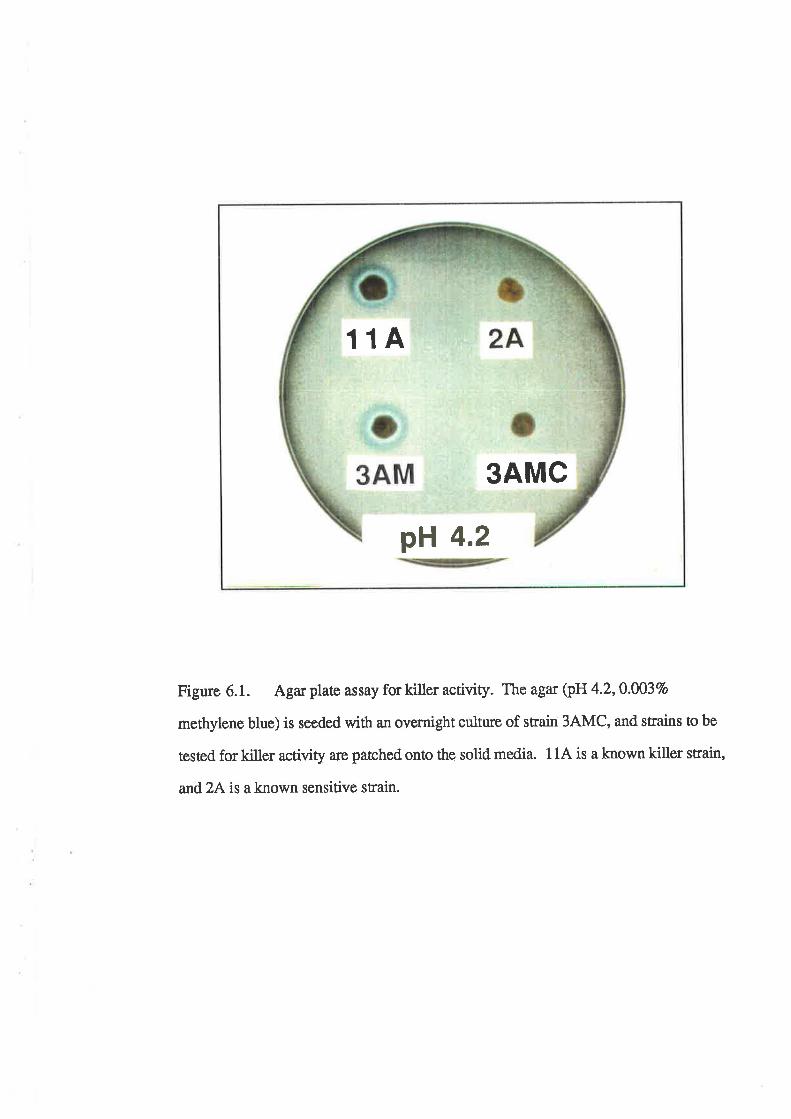
3AM 3AMC
114
pH 4.2
-Figure 6.1. Agar plate assey for killer actívity. The agar (pII4.2,A.ffi:3%a
methylene blue) is seeded with an ovornight culture of strain 3AMC, and strains to be
tested for killer activity are patched orìto the solid media. 11A is a known killer strain,
and 2A is a known sensitive stain.
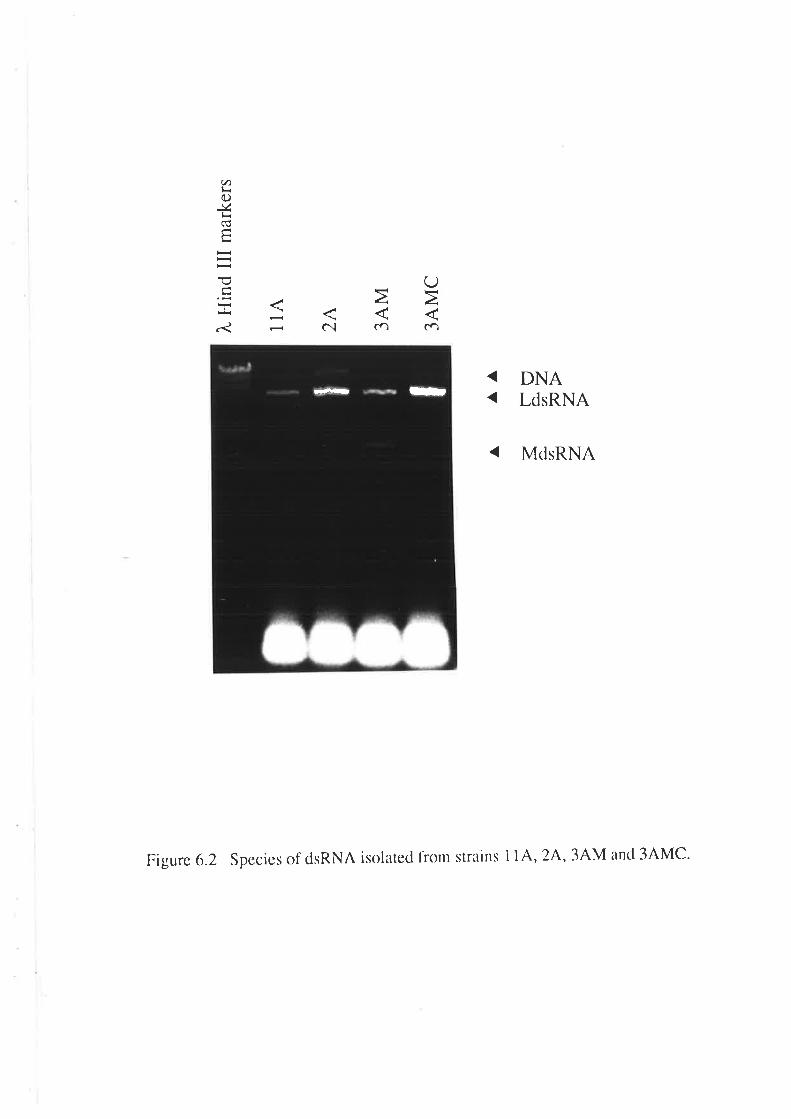
oe -.1
CD þ cn CÞ c) o ?¿ .¿ z |¿ o 't) N
) ', 7 '-l (.¡) ? '-ì a
À H
ind
III m
arke
rs
1tA
2A 3AM
3AM
C
A 7 o- .'â z
AA äz F>
zI
-102-
Fermentation trials were then performed on strains 3AM and 3AMC to determine the
effect of the curing procedure on yeast growth and fermentation rates. Starter cultures of
each strain were inoculated in triplicate into flasks of Riesling grape juice at a concentration
of 5 x 10⁶ cell per ml. Samples were taken at regular intervals and asssayed for yeast
growth and progress of fermentation. The average readings for each strain were plotted
over time (Figure 6.3). There are no significant differences in the g¡owth or fermentation
rates between strains 3AM and 3AMC.
6.2.2 Anal)¡sis of killer activity during fermentation
Strains 3AM and 3AMC were analysed for killer activity in Riesling juice by co-
inoculating each strain with the sensitive Saccharomyc¿J strain 54. Control ferments of
each strain (34M, 3AMC and 5A) as pure inoculums were also performed. Each ferment
was conducted in duplicate at 18oC with gentle agitation under anaerobic conditions. GUS
plate assays were then performed to identify the ma¡ked strain (3AM or 3AMC). Colonies
of the marked strain turn a deep blue colour as a result of this assay, allowing simple
identification.
GUS plate assays were also performed on the control ferments to confirm the
validity of the assay. Plate assays on the control 5A ferment were consistently negative'
highlighting the absence of background GUS activity in natural yeast cells. However,
control 3AM and 3AMC ferments gave values of between 99 - lAÙVo of total colonies per
plate for the marked strain count. This level of instability corresponds to that determined in
Chapter 5. The background reversion frequency was taken into account throughout the
analysis.
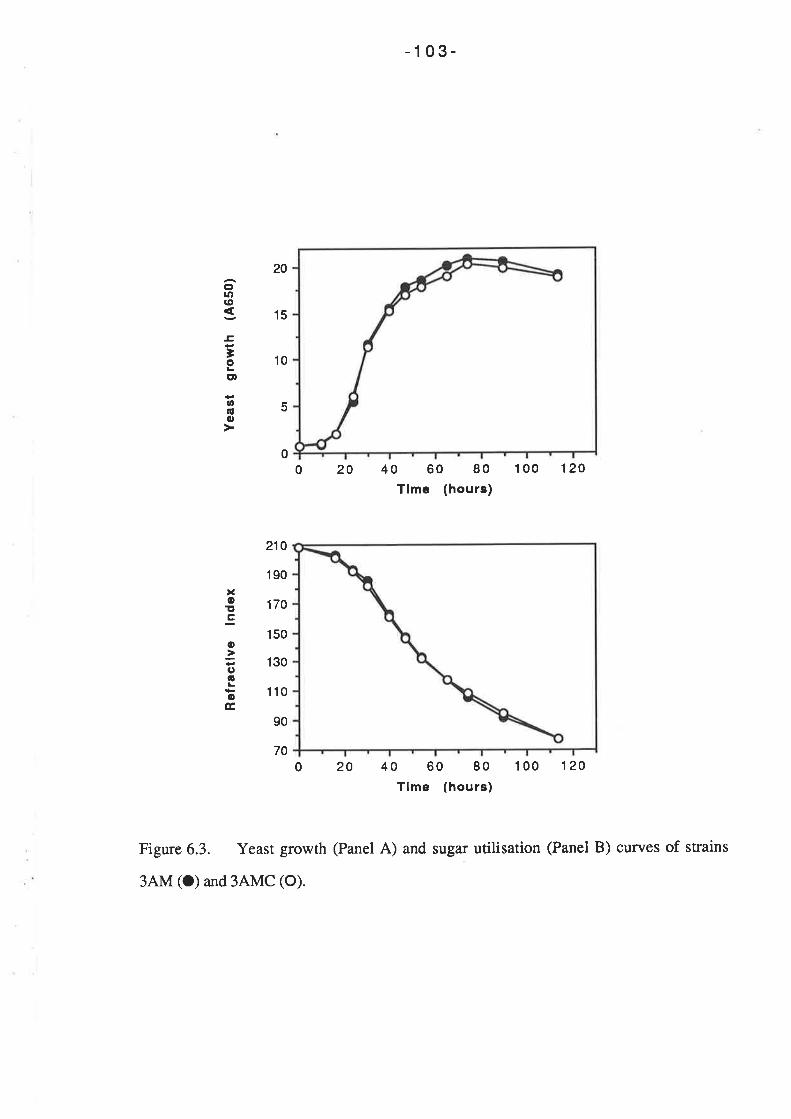
-103-
15
10
20 40 60 80
Tlmc (hours)1 00 120
210
190
170
150
130
110
90
70o20 40 60 80
Tlme (hours)100 120
Figure 6.3. Yeast growth (Panel A) and sugar utilisation (Panel B) curves of strains
3AM (O) and 3AMC (o).
20
5
0
C'ro(D
E
'oo)
o6o
0
xo!soÈoo
oE
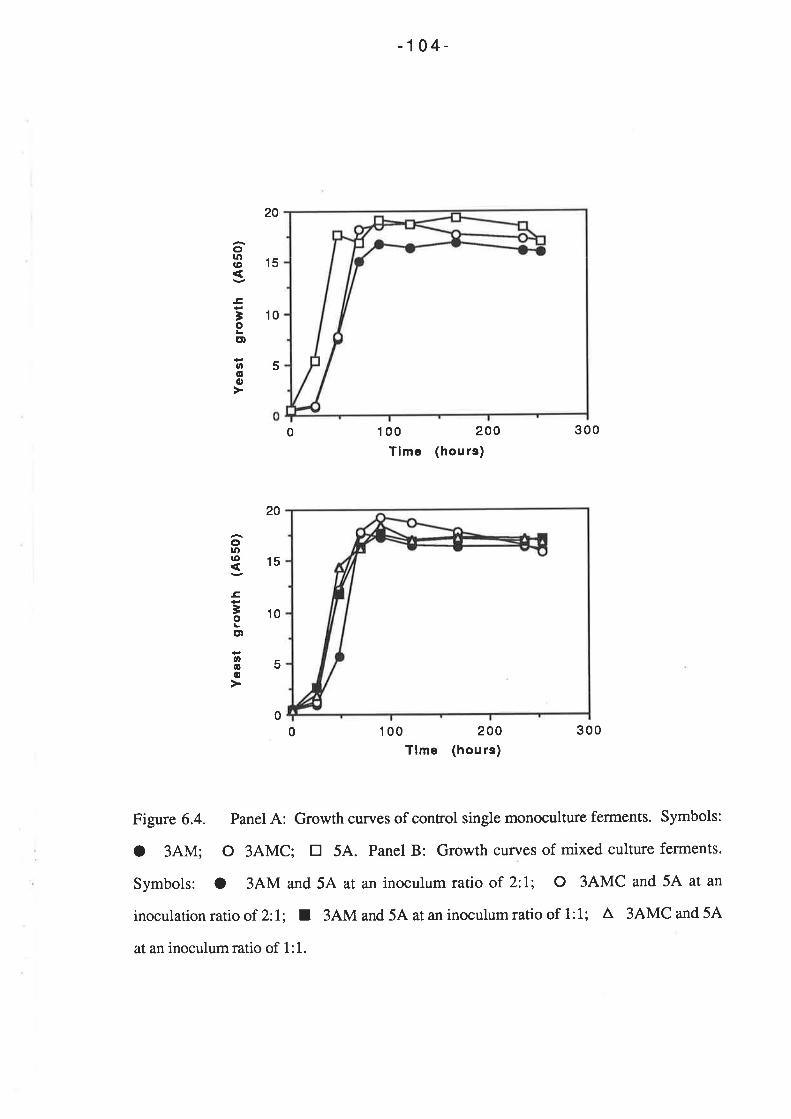
20
-1 04-
1 00 200Tlmc (hours)
1 00 200Tlme (hours)
5
oloro
!
'oEt
o6o
15
10
15
10
0 300
300
20
ou)to
Eìoog,6o
5
00
Figure 6.4. Panel A: Growth curves of control single monoculture ferments. Symbols:
O 3AM; O 3AMC; tr 54. Panel B: Growth curves of mixed culture ferments.
Symbols: a 3AM and 5A at an inoculum ratio of 2:l; O 3AMC and 5A at an
inoculation ratio of 2:1; I 3AM and 5A at an inoculum ratio of 1:1; A 3AMC and 5A
at an inoculum ratio of 1:1.
-105-
The following mixed culture ferments were carried out:
Ð 3AM and 5A at an inoculum ratio of 1:1;
ü) 3AMC and 5A at an inoculum ratio of 1:1;
üi) 3AM and 5A at an inoculum ratio of 2:1; and
iv) 3AMC and 5A at an inoculumratio of 2:1.
These mixed ferments exhibited normal growth kinetics, as did the three control
ferments (Figure 6.4).
The time course of growth (colony forming unis per ml) of each strain in the mixed
culture ferments is plotted in Figure 6.5. At inoculum ratios of 1:1, there was a notable
increase in the proportion of killer strain 3AM, whereas the cured strain 3AMC fails to exert
any dominance over the sensitive strain under otherwise identical conditions. Statistical
analysis was used to test the null hypothesis that the ratio of killer : sensitive cells remains
1:1 throughout the ferment. A goodness of fit test (normal test) rejected the null
hypothesis, with p-value << 0.001. However, identical analysis of the cured : sensitive
strain ferment accepted the null hypothesis that the ratio of the two smins remains at 1:1
throughout the ferment. With an increased proportion of strains 3AM and 3AMC in the
inoculum (ratio 2:1), the dominating effect of strain 3AM was more pronounced, whereas
strain 3AMC again showed no apparent change in proportion over time. The dominance of
strain 3AM in mixed culture ferments is illustrated more clearly when the percentage of each
strain is plotted over the time of the ferment (Figure 6.6). For an inoculum ratio of 1:1',
3AM increased to approximately 807o after 3 days but for a higher inoculum ratio of 2:1,
3AM eventually accounted for 977o of the total yeast population. It is important to note that
the süain 5A persisted, albeit at low levels, throughout the ferments.
Experiments were conducted to determine the lowest inoculum ratio of killer to
sensitive cells at which significant killer activity can be observed. Mixed ferments of strain
3AM and 5A ar inoculum ratios of 1:2 and l:4 respectively were carried out

Figure 6.5. Growth curves of each srain in mixed-culture ferments
expressed as cfu per ml. (A) Mixed ferment of 3AM (O) and 5A (tr) at an
inoculum ratio of 1:1. (B) Mixed ferment of 3AMC (O) and 5A (tr) at an
inoculum ratio of 1:1. (C) Mixed ferment of 3AM (O) and 5A (tr) at an
inoculum ratio of 2:1. (D) Mixed ferment of 3AMC (O) and 5A (tr) at an
inoculum ratio of 2:1.
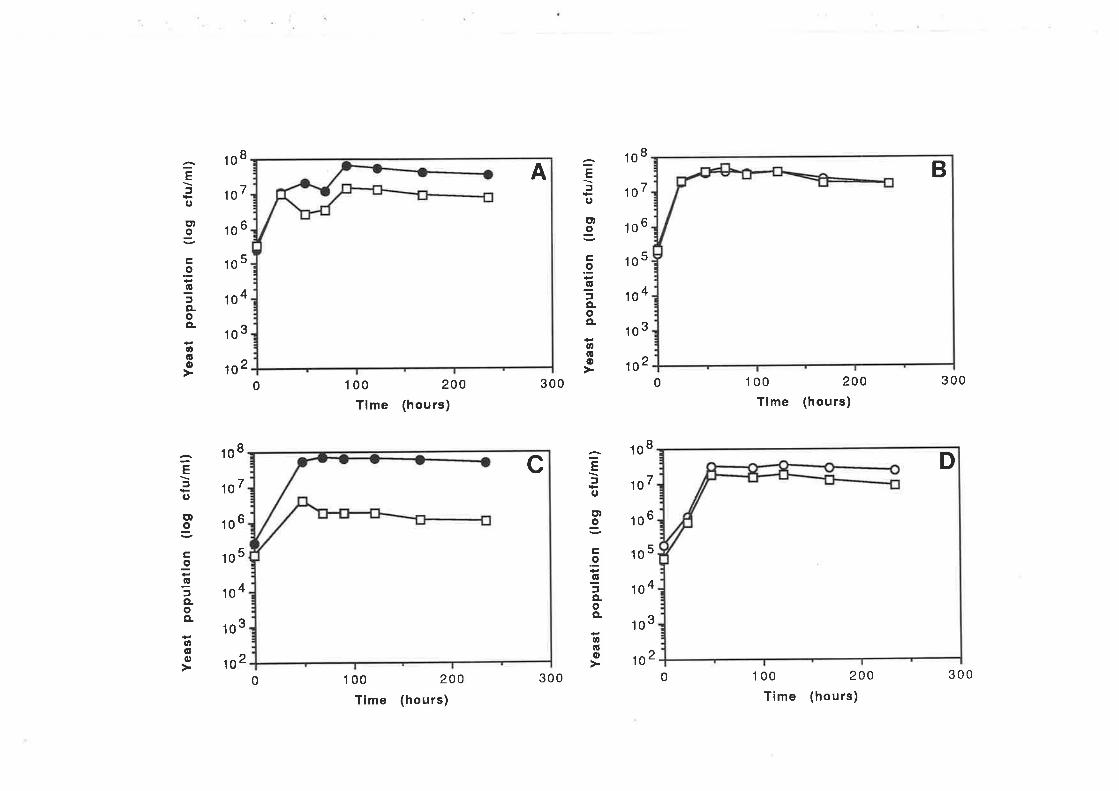
A =EJ
o
Eto
Ê,
.9ofCLoo.
at,oo
âEfo
olo
a.96aooo.
!,6o
=Ef(,
oto
c,
.9(ú
Jo-oo-
al,(úo
=Ef(,
(,)9
cI6
o.oo.
a(!o
108
ß7
106
t10"
104
103
rc2
108
ß7
106
E10"
104
103
ß2
108
107
106
E10"
rc4
103
ß23000 100
Tlme
200(hours)
100
Time
200(hours)
3000
108
ß7
106
t10-
104
103
rc200 100
Time
200(hours)
100
Time
200
(hours)
B
c D
300 300
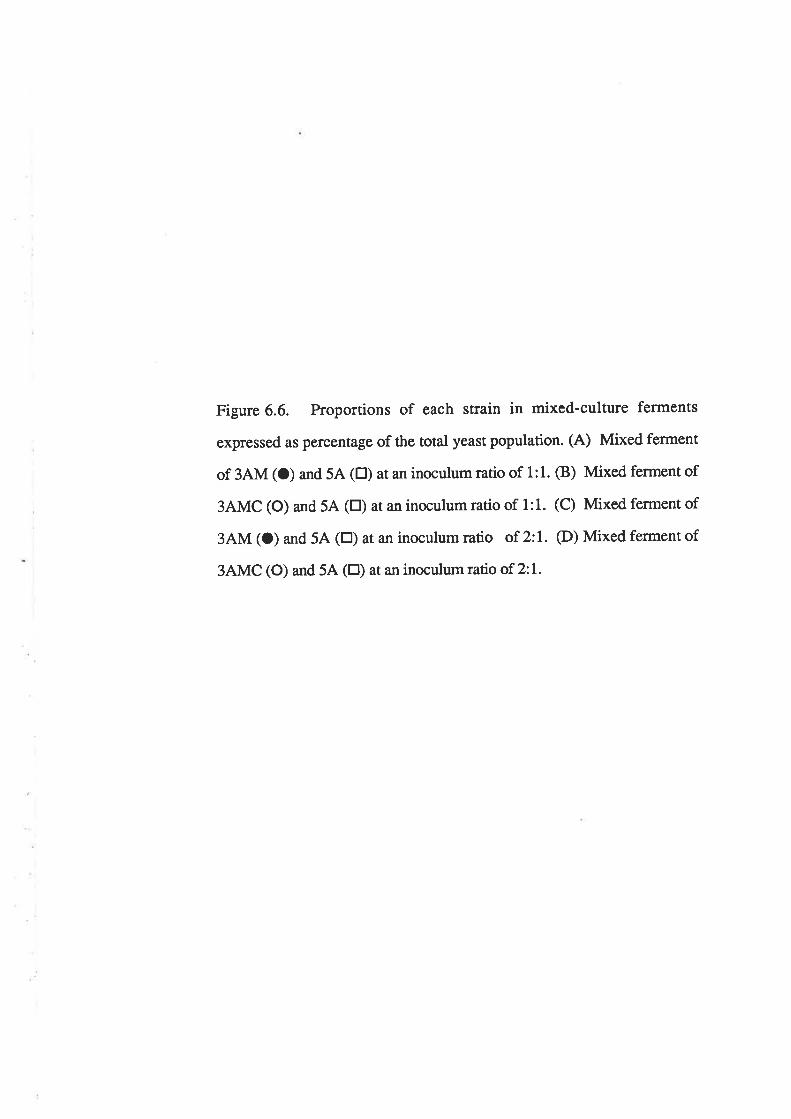
Figure 6.6. Proportions of each strain in mixed-culture ferments
expressed as percentage of the total yeast population. (A) Mixed ferment
of 3AM (O) and 5A (D) at an inoculum ratio of 1:1. (B) Mixed ferment of
3AMC (O) and 5A (tr) at an inoculum ratio of 1:1. (C) Mixed ferment of
3AM (O) and 5A (tr) at an inoculum ratio of 2:1. (D) Mixed ferment of
3AMC (O) and 5A (tr) at an inoculumratio of 2:L.
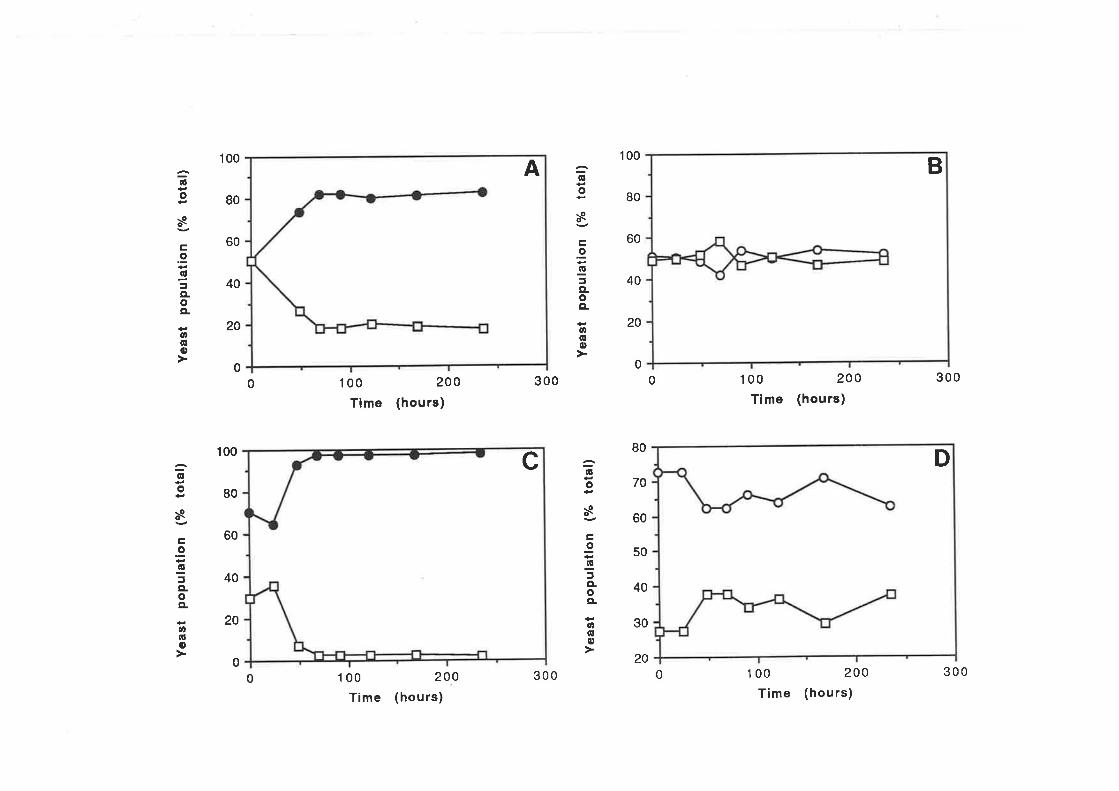
o
.o -:o
3 o
,o : o
:f o c *9p o o
= o c -9ru o o
-¡o
-:o
3 o t o c i9ru o o
o oG) o o
Yea
st p
opul
atlo
n (1
" to
tal)
otu
àor@
oõo
ooo
Yea
st p
opul
atio
n (V
" to
tal)
rÞq)
5(¡ø
>te
õooo
ooo
Yea
st p
opul
at¡o
n (o
/" t
otal
)
otu
50r@
ooo
ooo
Yea
st p
opul
atlo
n (%
tota
l)
otu
Þdr
@o
oooo
o
o oC¡) o o
¡O -:o
3 o t o c il ru o o
(¡) o o
G) o o
Þ
0@
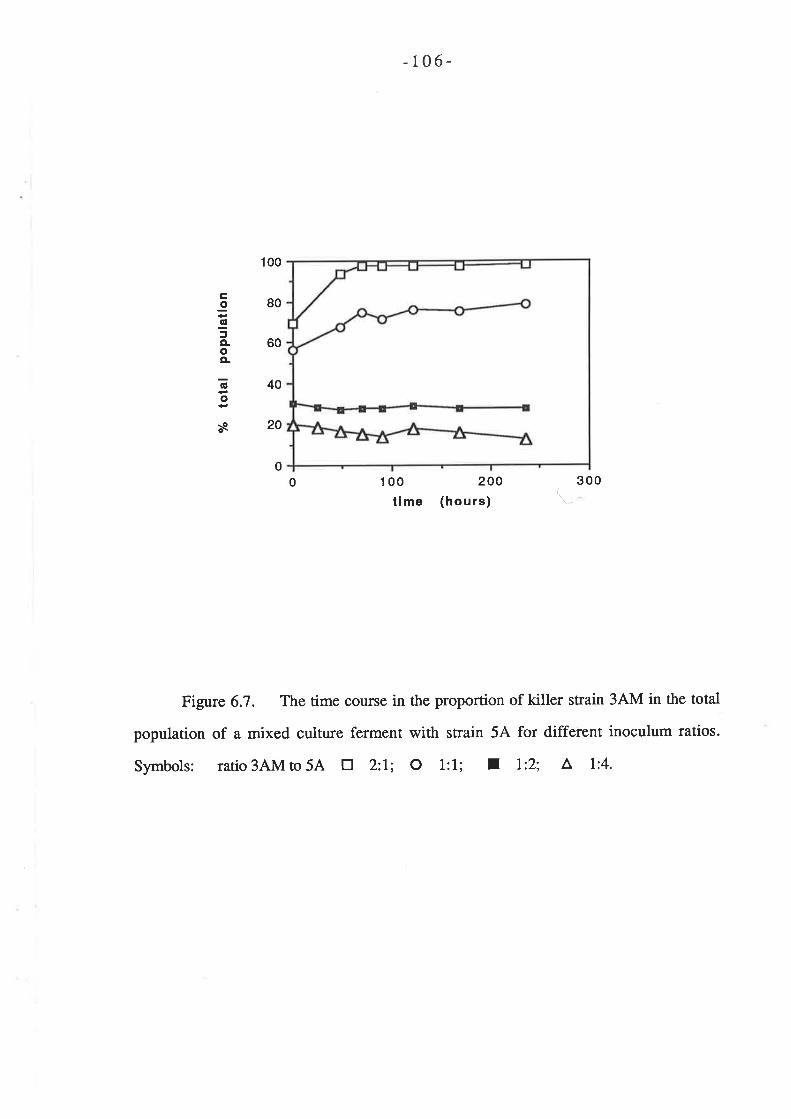
-106-
100
80
60
40
ÊIql
fo.oo-
Eo
s20
00 100
tlme200
(hours)300
(."_
Figure 6.7. The time couße in the proportion of killer strain 3AM in the total
population of a mixed culture ferment with strain 5A for different inoculum ratios.
Symbols: ratio 3AM to 5A tr 2:l; O 1:1; I t:2; ^
l:4-
-107 -
under conditions described above. No change from the initial proportion of strain 3AM
was detected in either of these ferments. The results of all mixed culture ferments involving
stain 3AM are summarised in Figure 6.7.
6.3 DISCUSSION
The GUS marking system has enabled a direct comparison to be made
between the inoculation efficiency of a killer strain (3AM) and a cured isogenic derivative
(3AMC) in fermenting grape juice. At a ratio of killer to sensitive cells of 1:1 the cured
strain 3AMC remained at 50Vo of the total population while the killer strain increased to
807o. The ability of strain 3AM to dominate 5A during fermentation is likely to be due to
the production of killer toxin by strain 3AM and not to a difference in respective gowth
rates favouring the killer strain. We can conclude, therefore, that the killer toxin has
displayed significant activity under these fermentation conditions. This result is of
parricular interest to the oenologist since the K2 toxin produced by strain 3A is reported to
show maximum activity at pH 4.2 (Rogers and Bevan, 1978), which is 0.5 to I pH unit
higher than generally found in grape musts.
In cases where killer activity has been reported in fermenting grape juice, a
discrepancy exists as to whether effective killing action occurs when the proportion of killer
cells is less than 507o of a mixed culture ferment. Heard and Fleet (1987a) did not observe
killer action when the ratio of killer to sensitive cells was approximate|y l:7 whereas others
have reported killer activity with killer to sensitive cell ratios of 1:10 and lower (Bane,
1984; Hara et al., 1980,1981). Our results showed that an increase in ratio of killer to
sensitive cells to approximaæly 2:l resulted in a pronounced dominance of the fermenøtion
by strain 3AM to 97Vo of the total mixed population by the end of the fermentation.
However, with killer to sensitive cell ratios of 1:2 or 1:4, no effective killer action was
evident. It is possible that differences in either composition of medium, fermentation
-108-
conditions or strain sensitivity may account for discrepancies in reports of killer toxin
efficiency.
The relevance of killer strains in wine making has been the focus of attention in
countries where selected yeast cultures are inoculated into musts to induce fermentation.
This focus has intensified since the observations that yeasts which a¡e naturally present in
the must also play significant roles in supposedly "pure" culture fermentations (Heard and
Fleet, 1985; Lafon-Lafourcade and Ribereau-Gayon, 1934). These natural yeasts include
species from the genera Kloeckera, Candida, Hansenulaandsaccharomyces. Killer
Saccharomyc¿s wine yeast strains may be effective in suppressing natural Saccharomyces
yeasts during fermentation and the possibility exists to engineer broad range killer yeasts to
control strains from other genera. For these reasons, further study is needed to determine
appropriate fermentation conditions for effective killer activity.
The GUS marking system provides a method which allows a broad range of killer
strains to be rapidly and unequivocally identified in a mixed culture. This system can be
employed to gain a better understanding of killer activity during fermentation.
-109-
Chapter 7 Comparison of fermentation conditions
by use of a marked strain
7.1 INTRODUCTION
One of the most significant technological advances in winemaking has been the
commercial availabitity of selected yeasts, usually strains of S. cerevisiae, for inoculation
into the juice (Reed and Nagodawaithana, 1988). It is assumed that the inoculated ,S.
cerevisiae will suppress and outgrow the indigenous yeasts and dominate the fermentation.
Although this assumption is widely accepted, there is little documented evidence of its
validity.
In studies conducted at several Austalian wineries, Hea¡d and Fleet (1985) showed
that growth of Kloeckera apiculata and Candida species was not suppressed in
fermentations inoculated with commercial strains of S. cerevisiae. Similar observations
have been reported by Martinez et al. (1989). Therefore, it can be concluded that
inoculation of grape juice with a high population of S. cerevisiae will not necessarily
prevent growth of indigenous non-S¿ccharomyce.r yeasts.
The assumed dominance of inoculated strains of S. cerevisiae over indigenous
strains of this species, has also been called to question, highlighted by the fact that
conventional cultural techniques for identifying wine yeasts do not distinguish between
strain types. Using electrophoretic methods to distinguish between stains of S. cerevisiae,
Bouix et al. (1931) showed that the inoculated strain did not always dominate the
fermentation. Ma¡tinez et aI. (1989) used hydrogen sulfide production as a marker to
differentiate between strains of S. cerevisiae anddemonstrated that the inoculated strain
tended to dominate but that indigenous strains remained in significant numbers throughout
the fermentation. Loiseau et al. (1987) and Delteil and Aizac (1988) conducted
-110-
investigations using genetically ma¡ked strains of S. cerevísiae that could be followed
independently of indigenous srains. They concluded that dominance of the inoculated
strain was not always assured and depended on the specific conditions of fermentation (for
example, method of inoculation).
In light of these observations, one must conclude that inoculation of any particular
strain of S. cerevisiae does not necessarily guarantee its dominance or exclusive
contribution to the fermentation. Clearly, further studies on the subject of strain dominance
are required. An experiment was devised, therefore, to monitor the gfowttr of an inoculated
strain under different conditions of fermentation. The use of a genetically marked strain
provided the means for accurate identification and quantitation of the inoculated strain
throughout the fermentation. Conditions of fermentation to be investigated included
production of killer toxin by the inoculated strain, pre-treatment of the must with SO2, and
temperature of fermentation. These conditions of fermentation a¡e discussed briefly below.
7 .l.l Killer yeast inoculation
The subject of killer yeasts has already been addressed in Chapter 6 and therefore
will not be discussed here in detail. Several studies have now demonstrated that killer-
producing and killer sensitive strains of S. cerevisiae may occur as pa¡t of the natural flora
of wine fermentations (Heard and Fleet, 1987a,b). Laboratory experiments have
demonstrated that killer strains can inhibit sensitive strains and become the dominant strain
in mixed-culture wine fermentations (Heard and Fleet, l987a,b; Longo et a1.,1990). Two
important reasons exist for killer yeasts to be of interest to winemakers. First, they may be
responsible for a number of stuck or undesirable fermentations. Inoculated S. cerevisiae
strains could be destroyed by indigenous killer strains of S. cerevisiae or non-
Saccharomyces species, leading to premature termination of the fermentation, slow
fermentation or completion of the fermentation by a less desi¡able strain. Secondly, there
may be some advantage in conducting the fermentation with desired killer strains of S.
-111-
cerevisiaeithe expectation being that the growth of less desired indigenous strains would be
supressed. Kiler strains of S. cerevisiae are now commercially available to winemakers
but little evidence exists to assure their activity against indigenous yeasts in any particular
wlnery.
7 .1.2 Addition of sulfur dioxide to Srape must
Addition of SO2 to grape juice for the purposes of controlling oxidation and
restricting gfowth of indigenous microflora is a well established practice in winemaking
(Beech and Thomas, 1985). In the case of wines produced by natural fermentation, it is
considered that the addition of SO2 will suppress the growth of indigenous non-
Sacclnromyces yeasts and encourage dominance of fermentation by the more SO2 tolerant
strains of S. cerevisiøe (Ribereau-Gayon et al., 197 5). For wines produced by inoculation,
it is assumed that added SO2 will control indigenous non-Saccharomyces, as well as
indigenous S. cerevisiae and encourage fermentation by the inoculated strain. However,
experimental evidence supporting these effects of SO2 on yeast ecology in ferments is
scatce. Growth of indigenous yeasts in commercial wine ferments has been found where
the usual concentrations of SOz (50-100 mg/L) have been added to the juice (Fleet et al.,
1984; Heard and Fleet, 1985, 1986a). More specifically, growth of K. apiculata, one of
the main indigenous yeasts, was not inhibited by total added SO2 concentrations of 100-150
mglL (Heard and Fleet, 1988a). These findings contradict the assumption that SO2 conEols
indigenous yeasts and challenge one of the reasons for using SO2 in winemaking.
7.1.3 Temperanre of fermentation
Temperature control has become an important practice in modern winemaking. In
recent years there has been a trend to ferment white wines in particulaÍ, al lower
temperatures (lG15oC) to encourage ttre formation of volatile flavoun such as esters and to
reduce losses of products, including ethanol, by evaporation (Killian and Ough, 1979;
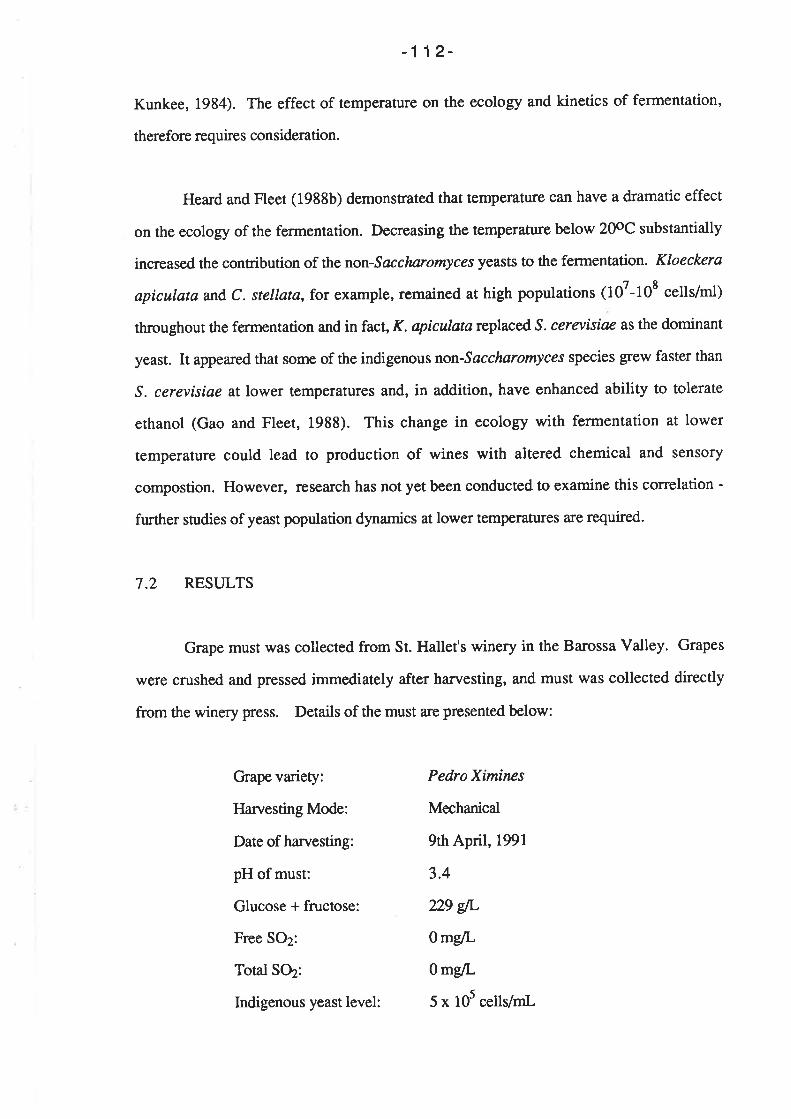
-112-
Kunkee, 1984). The effect of temperatr¡re on the ecology and kinetics of fermentation,
therefore requires consideration.
Heard and Fleet (1988b) demonstated that temperature can have a dramatic effect
on the ecology of the fermentation. Decreasing the temperature below 20oC substantially
increased the contribution of the non-S¿c cløromyces yeasts to ttre fermentation. Kloeckera
apiculataand C. stellata,for example, remained at high populations (107-108 cells/ml)
throughout the fermentation and in fact, K. apiculata replaced S. cerevisiae as the dominant
yeast. It appeared that some of the indigenous non-Saccharotnyces species grew faster than
S. cerevisiae at lower temperatures and, in addition, have enhanced ability to tolerate
ethanol (Gao and Fleet, 1988). This change in ecology with fermentation at lower
temperature could lead to production of wines with altered chemical and sensory
compostion. However, research has not yet been conducted to examine this correlation -
further studies of yeast population dynamics at lower temperatures are required.
7.2 RESULTS
Grape must was collected from St. Hallet's winery in the Barossa Valley. Grapes
were crushed and pressed immediately after harvesting, and must was collected directly
from the winery press. Details of the must are presented below:
Grape variety:
Hanesting Mode:
Date of harvesting:
pH of must:
Glucose + fructose:
Free SO2:
Total SO2:
Indigenous yeast level:
PedroXímines
Mechanical
9th April, 1991
3.4
229 slL
0 me/L
0 mg/L
5 x ld cels/ml-
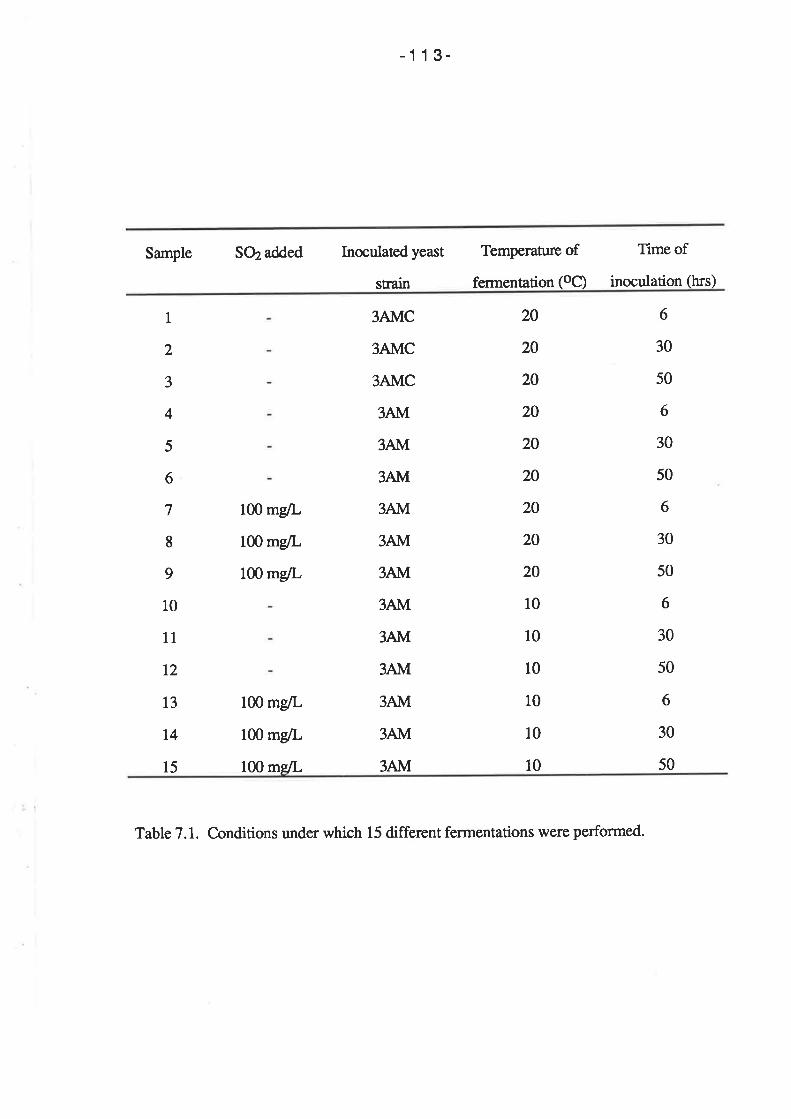
-113-
Sample SO2 added Inoculated yeast
strain
Temperature of
fermentation (oC)
Time of
inoculation (hrs)
1
2
3
4
5
6
7
I9
10
11
L2
t3
t4
l5
100 mg/L
100 mg/L
100 mg/L
100 mg/L
100 mg/L
100 msll-
3AMC
3AMC
3AMC
3AM
3AN,I
3ANd
3AN{
3AM
3Al\d
3Alvl
3Al\4
3AN,I
3AM
3AN,I
3AN,t
20
20
20
20
20
20
20
20
20
10
r0
10
10
10
10
6
30
50
6
30
50
6
30
50
6
30
50
6
30
50
Table 7.1. Conditions under which 15 different fermentations were performed.
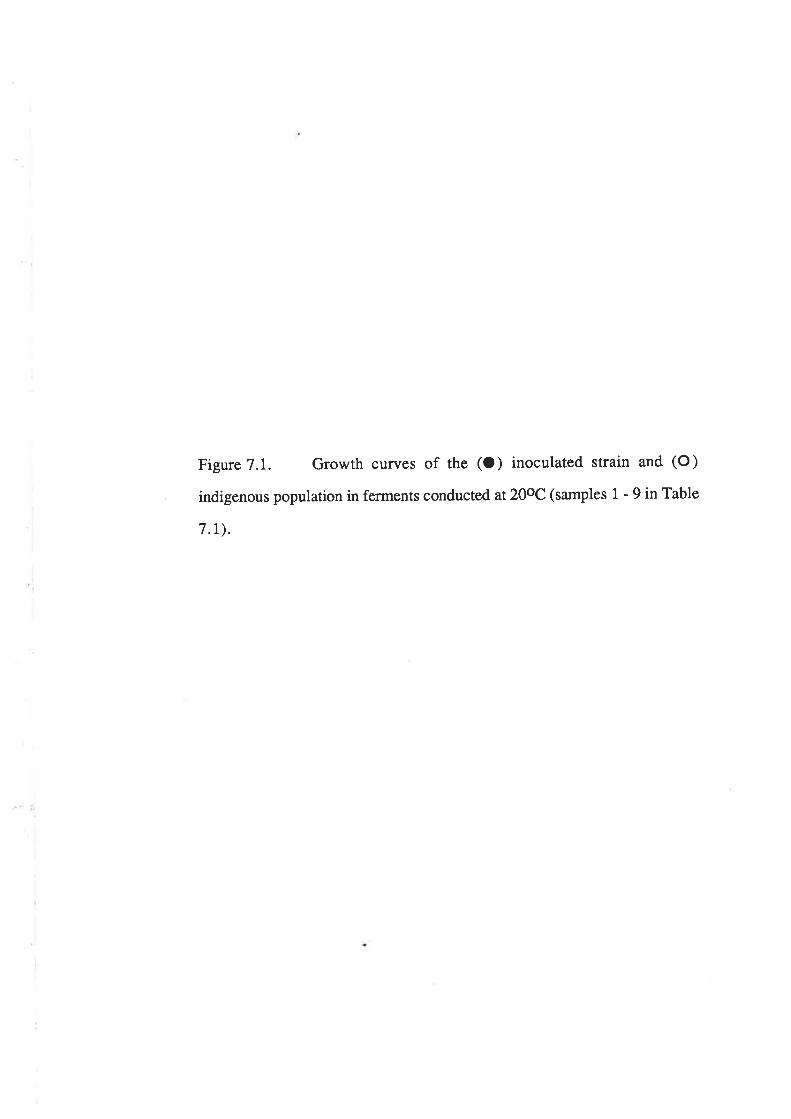
Figure 7.1. Growth curves of the (O) inoculated strain and (O)
indigenous population in ferments conducted at 20oC (samples 1 - 9 in Table
7.r).
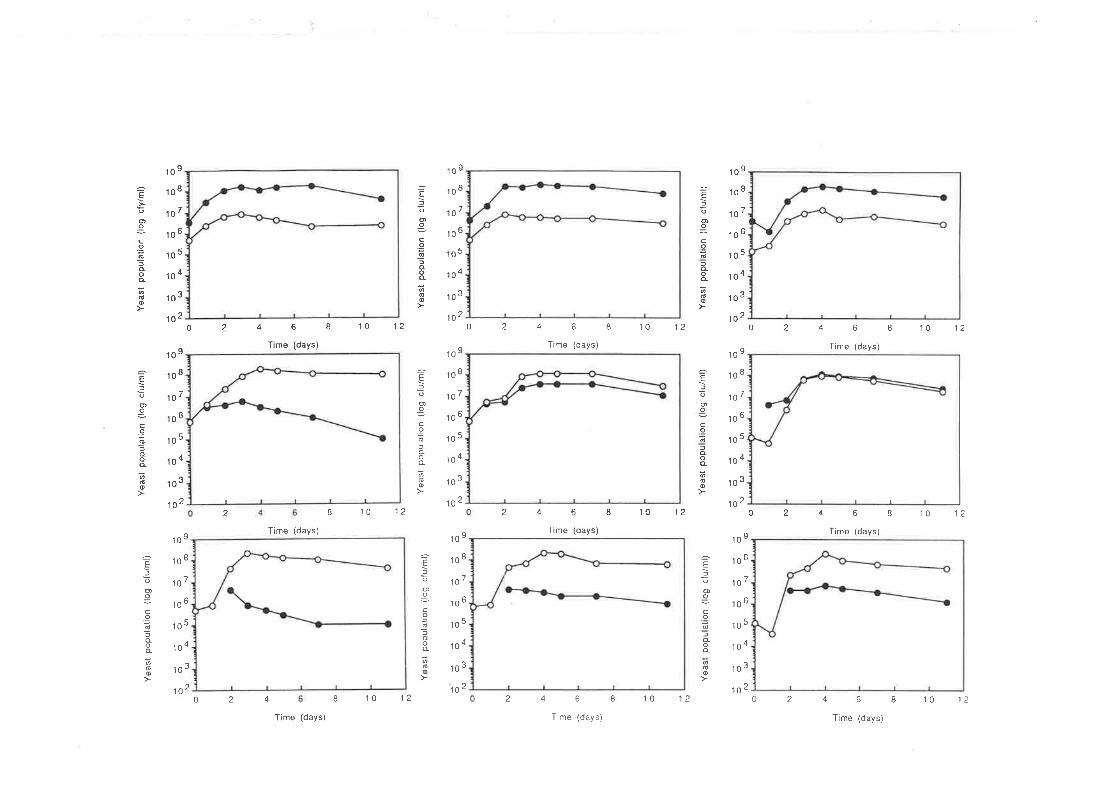
Èf
oo
c.oõfooo@o
=E
oo
co6tooo
d@
:El
oo
c€!foo
do
âEf
oo
c.9ofooo6@
=El
oIcodlèoo
õo
:Efooo
coõfaoo
õ@
109
108
ß7
106
105
104
103
102
109
108
107
106
105
104
103
102
109
108
107
106
10"
104
103
rc2
109
'to "
107
106
10J
104
10"
102
Ef
oo
coõfooo6@
El
oo
coõfooo
oo
o 2 4o 2 4
2
2
68 10 '12
8 10 12
8 10 12
0 246Time (days)
246
8 10 12
8 10 12
6 I r0 12
109
108
107
to6
10-
104
103
102
109
o10"
107
106
'to "
104
103
102
Time (days)
Time (days)
Time (days)
Time (days)
468
109
10"
107
A10"
1OJ
104
103
102
o10'o
10"
107
to6
105
104
a10"
102
ô10"
o10"
107
106
10"
104
10"
102
Time (days)
46
Time (days)
Ef
oo
coñlooa
ño
o2 10 12
8 10 120 2 I 10 12 64
Time (days)
0 4
Time (days)
Figure 7.2. Growth curves of the (O) inoculated strain and (O)
indigenous population in ferments conducted at 10oC (samples 10-15 in Table
7.r).
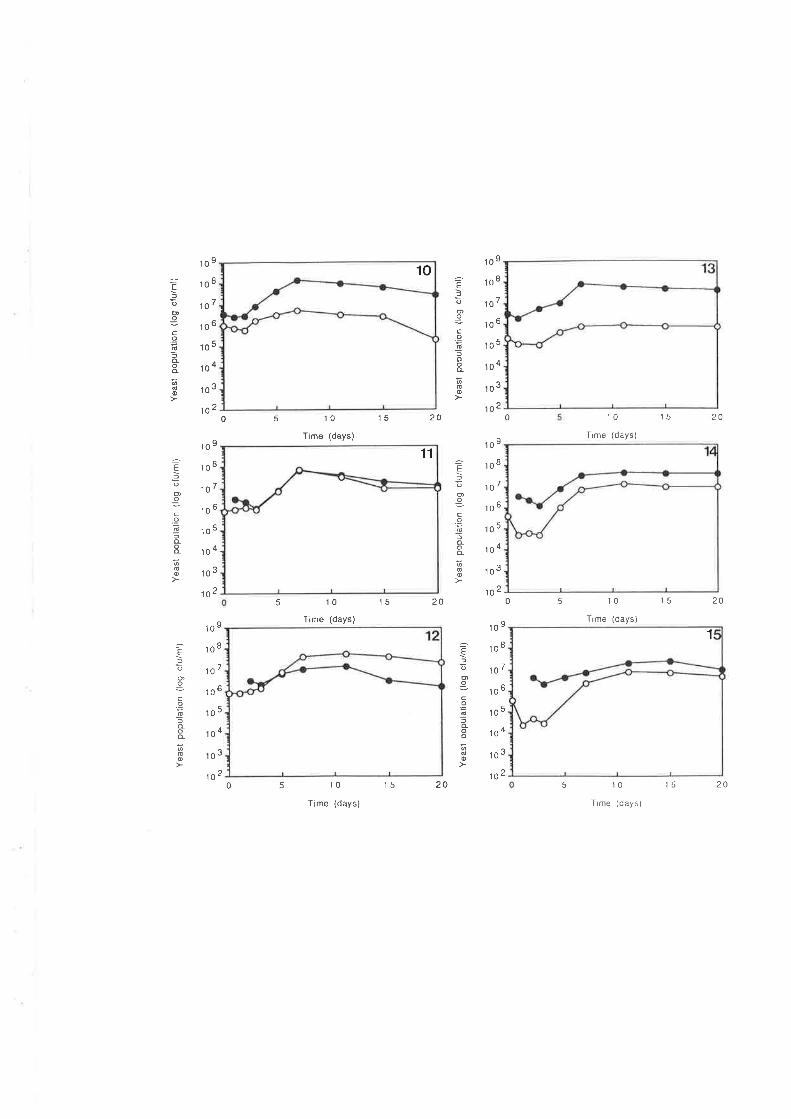
10
f
oo
C.9õloooño
Elooo
c_9õlooodo
-E-o_9
c.sdfaoo
õ@
=Ef
oo
cod-aoõo
-Eoo
coo
=oood@
109
108
107
106
105
lo4
103
102
109
108
107
106
10"
104
103
102o 5 't o
Time (days)
10
Time (days)
15 20
0 5
10
Time (days)
10
T¡me (days)
15
15
20
20
20
ÈJ
oo
c.9õlooo
6o
o'to "
108
107
106
10'
104
103
'to?
o10 "
108
107
106
l0J
104
110-
1025 15 20
20
109
o10"
1o 7
106
105
104
103
102
109
o10"
107
A10"
105
104
103
1020 5 10
Time (days)
'1 5 5 '1 0
T¡me (days)
11
1
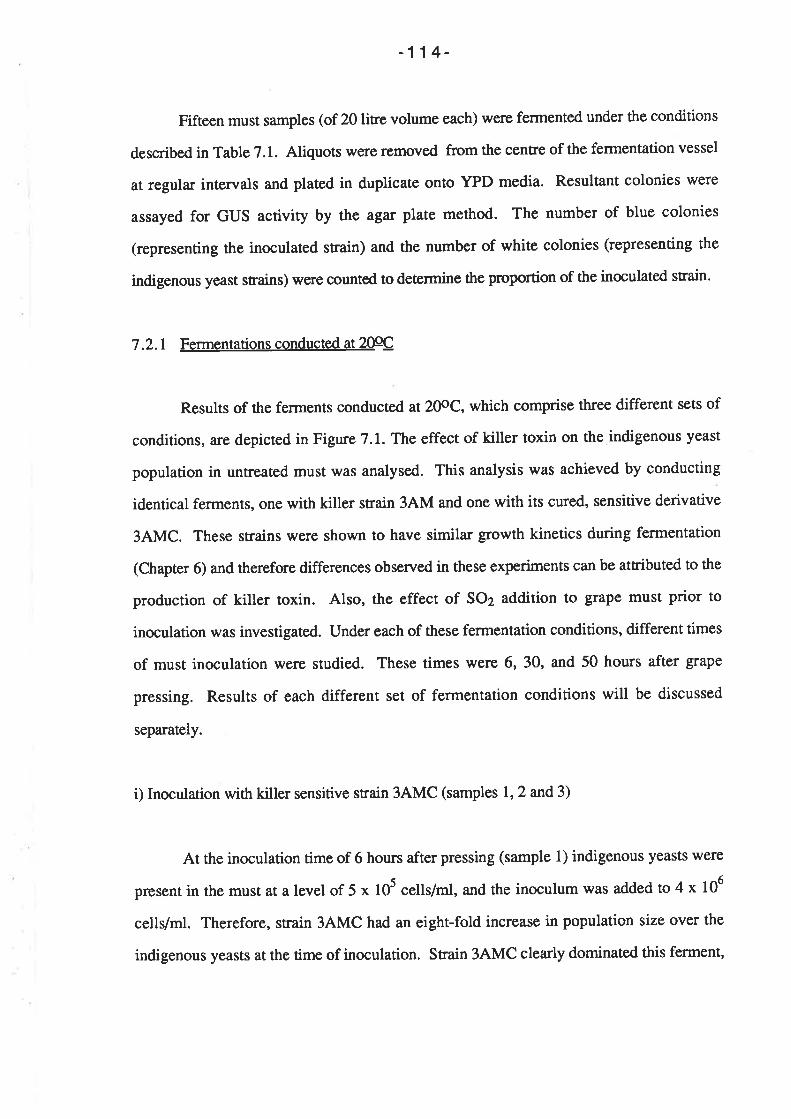
-114-
Fifteen must samples (of 20litre volume each) were fermented under the conditions
described in Table 7.1. Aliquots were removed from the centre of the fermentation vessel
at regular intervals and plated in duplicate onto YPD media. Resultant colonies were
assayed for GUS activity by the agar plate method. The number of blue colonies
(representing the inoculated strain) and the number of white colonies (representing the
indigenous yeast strains) were counted to deærmine the proportion of the inoculated strain.
7.2.1 Fermentations conducted at 2@e
Results of the ferments conducted at 20oC, which comprise three different sets of
conditions, are depicted in Figure 7.1. The effect of killer toxin on the indigenous yeast
population in untreated must was analysed. This analysis was achieved by conducting
identical ferments, one with killer strain 3AM and one with its cured, sensitive derivative
3AMC. These strains were shown to have simila¡ growth kinetics during fermentation
(Chapter 6) and therefore differences observed in these experiments can be attributed to the
production of killer toxin. Also, the effect of SO2 addition to grape must prior to
inoculation was investigated. Under each of these fermentation conditions, different times
of must inoculation were studied. These times were 6, 30, and 50 hours after grape
pressing. Results of each different set of fermentation conditions will be discussed
separately.
i) Inoculation with killer sensitive strain 3AMC (samples 1,2 and 3)
At the inoculation time of 6 hours after pressing (sample 1) indigenous yeasts were
present in the must at a level of 5 x 10⁵ cells/rnl, and the inoculum was added to 4 x 10⁶
cells/ml. Therefore, strain 3AMC had an eight-fold increase in population size over the
indigenous yeasts at the time of inoculation. Strain 3AMC clearly dominated this ferment,
-115-
reaching 1.5 x 10⁸ cells/ml and accounting for 957o of the population by day three of the
ferment.
When inoculation was delayed until 30 hours after pressing of the grapes (sample
2), the indigenous yeast population had reached a cell density of 5 x 10⁶ cells/ml just prior
to the addition of strain 3AMC. At this inoculation time, then, 3AMC represented only
45Vo ofthe total population. Under these conditions, the indigenous yeasts reached a level
of 1.9 x 10⁸ cells/ml (95Vo of the population) on day 4 and clearly dominated throughout
the ferment. Snain 3AMC reached a peak cell density on day 3 of only 6 x 10⁶ cells/ml,
and after this point displayed a steady decrease in population size. By day 11 of the ferment
it had decreased to 1 x lff cells/ml, and represented less than l7o of the total population.
In the ferment in which inoculation was performed 50 hours after pressing (sample
3), the indigenous yeast population had entered log phase of growth and reached 3.9 x 10⁷
cellVrnl by the time of inoculation. The indigenous yeasts therefore had a ten-fold higher
population density than the inoculated strain and maintained dominance over the ferment.
Strain 3AMC displayed a rapid ¡eduction in populaúon size (or death rate) and by day 4had
dropped to 5 x lOs cells/ml and accounted for less than l7o of the total population.
ü) Inoculation with the killer strain 3AM (samples 4,5, and 6)
The kinetics of killer yeast 3AM in untreated must at an inoculation time of 6 hours
after pressing (sample 4) was similar to that of strain 3AMC under identical conditions
(sample 1). Strain 3AM reached I x 108 cells by day 2 of the ferment, accounting for 967o
of the total population and clearly dominated throughout the ferment.
At inoculation times of 30 and 50 hours after grape presssing, 3AM was dominated
by the indigenous yeast population. However it disptayed different growth kinetics to
3AMC. In the 30 hour inoculum (sample 5), 3AM reached a density of 4 x 10⁷ cells/ml and
e)
-116-
represented 25Vo of the total population. A fairly constant population size was maintained
by 3AM throughout this ferment, and by day 11 it represented 35Vo of the total population,
compared to less thanl%o represented by strain 3AMC at the same time.
In the ferment inoculated 50 hours after pressing (sample 6), strain 3AM accounted
for only l57o ofthe total population at the time of inoculation, and was strongly dominated
by the indigenous yeasts throughout the ferment. However, it differed from strain 3AMC
in that a constant cell density (between 1 and 4 x lff cells/ml) was maintained after
inoculation. No dramatic reduction in population size of strain 3AM was evident in this
ferment, although growth of the strain was clearly suppressed.
iü) Inoculation with 3AM of must pre-treated with sulfur dioxide (samples 7, 8, and
Addition of SO2 to the grape must had the expected effect of reducing the
indigenous yeast population. Four hours after the addition of SO2 (and 6 hours after grape
pressing), the indigenous yeast level had dropped from 5 x 10⁵ cells/ml to I x 105 cells/ml.
At this time the f,rst inoculation of 3AM was performed (sample 7) and a concomitant
reduction in the inoculum population occurred. The population density of 3AM dropped
from 4 x 10⁶ cells/ml at the time of inoculation to I x 106 cells/ml on day one of the
ferment, at which point the inoculum represented 82Vo of the total population. After day
one, both the inoculated srain and the indigenous population had recovered from the SO2
treatment, and entered log phase of growth. By day four 3AM had reached 2 x 10⁸ cells/ml
(accounting for 937o of the total population) and clearly dominated the ferment. At this time
of inoculation, the addition of SO2 reduced the efficiency of the inoculum in attaining
dominance of the ferment when compared to the untreated must sample (sample 4).
In ferments conducted with an inoculation time of 30 hours after pressing, the
addition of SO2 to the must increased the inoculation efficiency. Under these conditions
-117-
(sample 8), the level of inoculated strain was approximately 10-fold higher than the
indigenous yeasts at the time of inoculation. However, the indigenous population entered
log phase of growth before the inoculated strain and by day three had reached a cell density
of 7 x 10⁷ cells/ml - approximately equal to that of strain 3AM. From this point of the
ferment onwards, strain 3AM was present as approximaæly 55Vo of the total population and
therefore only narrowly dominated the fermentation. This contrasts to the ferment in
untreated must with the same inoculation time (sample 5), in which the indigenous yeast
population was dominant.
There was little difference in the kinetics of strain 3AM in both untreated (sample 6)
and SO2 (sample 9) treated must with an inoculation time of 50 hours after pressing. In
both cases the indigenous population had reached 2 x 10⁸ cells/ml and accounæd fot 977o
of the ferment by day 4 of the ferment. Strain 3AM remained at a steady cell density
throughout both of these ferments, with a population of 2 x 10⁶ cells/ml by day seven.
7.2.2 Fermentations conducted at l@e
Two conditions were compared at a fermentation temperature of l0oC: no treatment
of must prior to inoculation; and treatment with SOz (100 mglL) prior to inoculation. Both
conditions were investigated with the marked strain 3AM and are presented graphically in
Figure 7 .2.
Ð Inoculation of untreated must
In the untreated must inoculated 6 hours after pressing (sample l0), the indigenous
population and strain 3AM exhibited a two day lag phase, during which 3AM was present
as78Vo of the total population. By day 7, 3AM peaked at 1 x 10⁸ cells/ml and accounted
for 967o of the total number of yeast cells. At this time of inoculation, strain 3AM exerted a
similar dominance over the ferment as it did in ttre 20oC ferment (sample 4).
-118-
\ù/ith an inoculation time of 30 hours after pressing (sample 1l) both indigenous
yeasts and 3AM showed a lag phase up to day 3, at which point strain 3AM comprised
approximately 50Vo of the total population. On day 7 of the ferment, 3AM reached a peak
of 7 x 10e cells/ml and at this point was 48Vo of the total population. Strain 3AM accounted
for approximately 507o of the total population throughout the ferment and therefore
inoculation eff,rciency under these conditions was grcater at 10oC than it was in the ferment
conducted at 2@C (sample 5).
The indigenous yeast population dominated the untreated must ferment when
inoculation of 3AM was performed 50 hours after grape presssing. At the time of
inoculation, the indigenous yeast population had reached 9.5 x 10⁵ cells/ml and strain 3AM
accounted for 77Vo of the total yeast population. However, the indigenous yeast population
entered log phase of grou'th before the inoculated strain and by day seven had a density of 4
x 107 cells/ml and represented 797o of the total population. The dominance of the
indigenous yeast population was not as great under these conditions as it was in the zWC
ferment (sample 6).
ü) Inoculation of sulfur dioxide treated must
Srain 3AM clea¡ly dominated the ferment when the inoculum was added to the SOz
treated must 6 hours after grape pressing (sample 13). In contrast to the 20oC ferment
inoculated at this time (sample 7), pre-reatnent of SO2 increased the dominance of 3AM.
The lower temperature slowed recovery of the indigenous population after addition of SO2,
allowing strain 3AM to enter log phase growth without competition. From day 1 onwards,
strain 3AM accounted for greater thang3%o of the total population and reached a maximum
cell density of 9 x 10⁷ cells/ml (987o of the total population) by day seven.
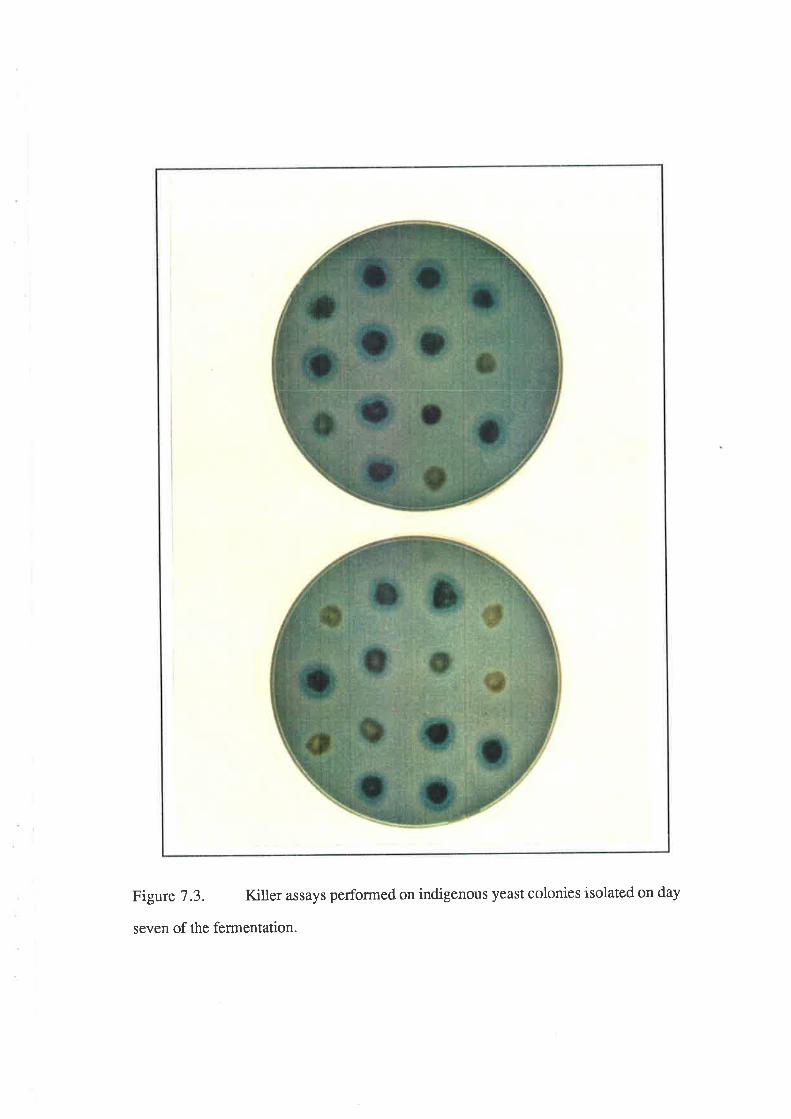
Figure 7.3. Killer assays performed on indigenous yeast colonies isolated on day
seven of the fermentation.
-119-
V/hen inoculation was performed 30 hours after pressing (sample l4), the level of
indigenous yeasts had dropped below lF cells/ml and 3AM dominated the ferment as it
comprised approximately SOVo of the total population for the duration of the fermentation.
At this time of inoculation, strain 3AM achieved greaær dominance of the SO2 treated must
at 10oC than it did in the 20oC ferment (sample 8).
When inoculation was delayed for 50 hours after pressing (sample 15), strain 3AM
was still able to dominate the ferment in SO2 treated must at 10oC. At the time of
inoculation, strain 3AM accounted for 977o of the total population. The indigenous
population, however, recovered from the SO2 treatment and entered log phase of growth
after day 3. From day 5 onwards, strain 3AM represented approximately 70Vo of the total
population. The efficiency of inoculation under these conditions is markedly improved at a
temperature of 10oC, compared to simila¡ conditions at 20oC (sample 9) in which the
indigenous yeast population was dominant.
7 .2.3 Killer activit), in the indigenous yeast population
In order to interpret the role of killer activity in the zOoC ferments, killer assays
were performed on a number of GUS negative colonies (indigenous yeasts) isolated from
SO2 Eeated and non-treated ferments. These indigenous yeasts were isolated from samples
taken on day seven from ferments No. 2 (non-treated must) and 9 (SO2 treated must).
Assays were performed by testing their ability to kill strain 3AMC and results are presented
in Figure 7.3. Twenty eight indigenous yeast colonies were assayed, and of these, twenty
(7IVo) displayed distinct killer activity against srain 3AMC.
7.3 DISCUSSION
General trends have been observed in inoculation efficiency under different
conditions. Results presented here clearly demonstrate the importance of the time of
-120-
inoculation in ensuring dominance of the ferment by the inoculated strain. Under all
conditions examined, the inoculated strain clearly dominated the ferment (accounting for >
gOVo of the total population by day three) when it was added to the must within six hours of
pressing. These results are to be expected, as a delay in inoculation time allows the
indigenous population to increase in cell number. Consequently, the indigenous population
is more competitive at the time of inoculation.
The killer (3AM) and killer sensitive (3AMC) strains both achieved a similar
dominance of the ferment with an inoculation time of six hours after pressing. This result
suggests that the greater population size of the selected strain at the time of inoculation is
sufficient alone to ensure dominance of the fermentation and that the production of killer
toxin does not play an important role under these conditions. It should be noted that the
indigenous population did not display a reduction in cell density in the presence of the killer
strain. Therefore, it appears that the indigenous yeast cells are being suppressed rather than
actively killed by strain 3AM. This obsen¡ation can be explained by the fact that 757o of the
indigenous yeasts isolated from the ferments on day seven displayed killer activity (see
Figure 7.3) and therefore are immune to the killer toxin.
Differences were observed, however, between the growth kinetics of the killer and
sensitive strains when inoculation was performed at 30 and 50 hours after pressing. Under
these conditions, in which the indigenous population was dominant, the sensitive strain
showed a marked decrease in population density and appeared to be killed by the
indigenous yeasts. The killer strain, however, displayed either an increase in growth (after
30 hour delay in inoculation), or maintained a constant cell density (after a 50 hour delay in
inoculation). In interpreting these observations, it is again important to remember that757o
of the indigenous yeasts on day seven displayed killer activity. This killer activity of the
indigenous yeasts explains the cell death displayed by the sensitive strain 3AMC in the
ferments inoculated 30 and 50 hours after pressing. The fact that killer activity was not
evident against strain 3AMC in the ferment inoculated after six hours (sample 1) can be
-121 -
explained by results obtained in Chapter 6. These results showed that the efficiency of
killer activity was dependent on the proportion of killer to sensitive cells in the ferment.
When killer cells a¡e present as less than 50Vo of the population, as they were at inoculation
time and throughout this ferment, killer activity was not detected.
The finding thatTl{zo of the indigenous yeast colonies tested displayed killer activity
is somewhat surprising considering that Hea¡d and Fleet (1987a) identif,red only 9 killer
yeast from a total of 61 S. cerevisiae and 36 non-Saccharomyces strains isolated from
Australian wineries. However, when one considers the probable species and origin of the
colonies tested, this result is perhaps not unexpected. First, it is likely that the colonies
tested were strains of S. cerevisíae. The colonies were isolated on day seven of 20oC
ferments and, invariably, S. cerevisiae is the only species isolated from fermenting wine
after the first three or four days (Kunkee and Amerine, l97O; Fleet, 1990). Secondly, it is
likely that the origin of S. cerevisiae strains in wine is the winery and its equipment
(Ma¡tini and Martini, 1990). Killer strains of S. cerevßiae arecurrently popular choices for
use as starter cultures in the Australian wine industry. Of 57 dried wine yeasts currently
available to rhe Australian industry, 2l are killer strains (Henschke, 1990). It is likely
therefore, that killer yeasts will be increasingly colonising equipment of Australian wineries
and contributing to the indigenous yeast population of freshly extracted grape juice.
The addition of SO2 had the expected effect of reducing the indigenous yeast
population in the grape must of ferments conducted at 20oC. However, when inoculation
was performed within six hours of pressing, and four hours after the addition of SO2, the
inoculated yeast strain was also reduced by the added preservative. The pre-treatnent of the
must with SOz did not increase the efficiency of inoculation in this case.
When the inoculum lryas added 30 hours after pressing, the addition of SO2 was
effective in improving the effîciency of the inoculated strain at 20oC. In this case, the
indigenous yeast population was decreased while the inoculated srain did not suffer an
-122-
initial reduction in population. However, by 50 hours after pressing, the indigenous
population had recovered from the SO2 treaunent, entered log phase of growth and reached
a high cell density (2 x L07 cells/ml). The inoculated strain was then easily dominated by
the indigenous yeasts. Therefore, one can conclude that the addition of SO2 was not an
effective sterilisation process in this case.
The different efficiencies of SO2 treatment with respect to time of inoculation can be
understood by considering the mechanism of SO2 action on yeast cells. In solution, SO2
undergoes dissociation to form bisulfite and sulfite ions. The antimicrobial activity is due to
penetration of yeast cell membranes by the free, undissociated form of SO2 and its
subsequent inactivation of intracellula¡ constituents (Schmiz, 1980). In the cell membrane,
the SO2 activates ATPase causing a decrease in the ATP concentration. Also, once the
molecula¡ SO2 has entered the cell, it dissociates, because of the pH difference between the
grape juice and the cell, and becomes trapped. The combined effects of ATP depletion and
the activity of sulfite and bisulfite ions inside the cell lead to cell inactivation and death
(Schmiz, 1980; Beech and Thomas, 1985; Stratford and Rose, 1985).
It should also be noted that SO2 can be bound to grape juice constituents or
fermentation products, thus reducing its efficacy as an antimicrobial agent. Binding of SO2
by grape juice constituents, principally sugars, has been reported by Blouin (1966) and
Rankine (1966). The main fermentation products that bind with SO2 are acetaldehyde,
pynrvic acid and 2-ketoglutaric acid and to a lesser extent, galacturonic acid, sugars and
anthocyanins. This phenomenon has been reviewed by Beech et al. (1979), Beech and
Thomas (1985) and Lafon-Lafourcade (1985). The strongest bonding of SO2 is formed
with acetaldehyde. For 50 mg/l of free SO2, 99Vo is bound with acetaldehyde in the wine
(Lafon-Lafourcade, 1985) and the resulting sulfonate has little inhibitory effect against
yeasts (Usseglio-Tomasset et al., 1981; Beech and Thomas, 1985). Because the
dissociation constant (1.4 x 10⁻⁶ to 1.5 x l0-ó) of this reaction in wine is high (Rankine,
-123-
1966; Burroughs and Sparks, 1973), the binding reaction is not easily reversed and the SO2
bound by the acetaldehyde is effectively removed from inhibitory action (Rankine, 1966).
Molecula¡ SO2 in the musts of these ferments then, would either enter the yeast cells
and then dissociate, causing death; or become effectively irreversibly bound to constituents
in the juice. The result of these processses would be a reduction in the amount of available
SO2 in the ferment over time. This reduction in available molecula¡ SO2 explains the
decrease in efficacy of SO2 treatment over the three different times of inoculation.
The lower fermentation temperature of 10oC substantially enhanced the efficiency of
SO2 in its action of suppressing indigenous yeast strains. Even at inoculation times of 30
and 50 hours after pressing, the inoculated strain was able to dominate the ferment although
the degree of dominance decreased over time. The increase in antimicrobial activity of SO2
at 10oC can be explained by the fact that the lower temperature decreases cell growth and
production rate of fermentation products such as acetaldehyde. Therefore the level of
available molecular SO2 (for diffusion into cells of the indigenous yeasts) would be higher
over the first few days of the fermentation at 10oC than at 20oC.
The direct signifîcance of results presented in this chapter to the wine industry is
difficult to assess, as procedures such as cold settling and juice cla¡ification were not
conducted prior to inoculation. These procedures are likely to have a major impact on the
populations of indigenous yeasts in the juice. The extent of these influences a¡e unclear and
require study. Some growth of indigenous yeasts may be expected during settling - the
types of species that grow and their rate of growth will depend on the temperature and other
conditions.
However, conclusions have beeen drawn from these results regarding the efficiency
of inoculation in the presence of different levels of indigenous yeast species. Most
importantly, perhaps, this chapter hightights the suitability of the genetically marked strain
-124-
in conducting investigations of yeast ecology during fermentation. Very few studies of this
type have been conducted due to the diff,rculties with strain identification. The ma¡ked
strain provides the means for further studies into, for example, the impact of winery
p¡ocesses such as cold senling and juice cla¡ification on indigenous yeast populations.
-125-
Chapter I General Conclusions
Results obtained during the course of this project have demonstrated the potential
application of molecular genetic yeast manipulations to the wine industry. A procedure
which enables the introduction of new genetic material to wine yeasts has been described
and, subsequently, employed in the development of a genetic marking system for wine
yeast strains. This system utilises the E.coIí p-glucuronidase (GUS) gene as a marker and,
unlike previous marking systems described to date, enables a wide range of wine yeast
strains to be readily marked. Furthermore, methods have been developed whereby GUS
activity can be detected in single cells or colonies within a two to four hour period. The
GUS ma¡king system, therefore, provides a means for rapid and unequivocal identification
and monitoring of yeast strains during fermentation.
Marked strains have potential application in monitoring the efficiency of various
aspects of wine production on the indigenous yeast load. These aspects include yeast
propagation, the preparation of pure starter cultures and prefermentation processes. Ma¡ked
strains can also play an important role in oenological studies aimed to increase our
knowledge and understanding of yeast kinetics, ultimately allowing the optimization of
fermentation conditions. This potential role of marked stains has been demonstrated in two
separate oenological studies conducted during this project. First, the activity of killer toxin
in fermenting grape juice was assessed. Second, an analysis of inoculation efficiency under
various fermentation conditions was performed.
In conclusion, this project has three distinct components: the establisment of a wine
yeast transformation procedure; use of this transformation procedure in the development of
a genetic marking system; and demonstration of the practicality and application of ma¡ked
strains to the wine industry.
-126-
Results described in this thesis also have broader implications. It has been
dernonstrated that a foreign gene can be stably introduced and expressed at the ILV2 site in
the genome of wine yeast strains without adversely affecting fermentation performance.
The SMRI410 gene is, therefore, both an appropriate selectable marker and target site for
the integration of foreign DNA into wine yeasts. As the SMRI-410 gene is derived from
yeast, it would be possible to construct integrating vectors devoid of bacterial sequences.
This would be an important development in facilitating the acceptance of recombinant yeasts
in food and beverage production. The challenge now is to define specific targets in the
wine-making process to which this technology can be applied"
-127 -
References
Aigle, M. and F. Lacroute (1975). Genetic aspects of [URE3], a non-mitochondrial,
cytoplasmically inherited mutation in yeast. Mol. Gen. Genet. 136:327-335.
Aigle, M., D. Erbs and M. Moll (1983). Determination of brewing yeast ploidy by DNA
measurement. J. Inst. Brew. Ð:72-74.
Akiyama, H., C. Kumagai, Y. Tanaka and K. Ouchi (1971). Studies on non-foaming
yeast. VII. Selection of the practical non-foaming yeasts for sake brewing from various
stock cultures. J. Soc. Brew. Japan 66: 516-522.
Alber, T. and G. Kawasaki (1982). Nucleotide sequence of the triose phosphate
isomerase gene of Saccharomyces cerevisiae.J. Mol. Appl. Genet. l:419-434.
Ammerer, G. (1983) Expression of genes in yeast using the ADC1 promoter. In R. Wu,
L. Grossman and K. Moldave (eds.), Methods in Enzymot. Vol 101. Academic Press
Inc., New York, pp 192-201.
Anand, R. (1986). Pulsed freld gel electrophoresis: a technique for fractionating large
DNA molecules. Trends in Genetics Nov: 278-283.
Barnett, J.4., R.W. Payne, and D. Yarrow (1933). Yeasts: characteristics and
identification. Cambridge University Press, Cambridge.
Barney, M.C., G.P. Jansen and J.R. Helbert (1980). Use of spheroplast fusion and
genetic Eansformation to introduce dexrin utilization into Sacclnromyces uvarurn. J. Am.
Soc. Brew. Chem.38: l-5.
Barre, P. (1934). Le mecanisme killer dans la concurrence entre souches de levures.
Evaluation et prise en compte. Bull. O.I.V. 64I-642:635-643.
Beckerich, J.M., P. Fournier, C. Gaillardin, H. Heslot, M. Rochet, and B.
Treton (1984). Yeasts. In: Ball, C. (ed.), Genetics and breeding of industrial
microorganisms. CRC Press, Boca Raton, Florida, pp. 115-157.
-128-
Beech, F.V/., and S. Thomas (1985). Action antimicrobienne de I'anhydride
sulfureux. Bull. O.I.V. 5E: 564-581.
Beech, F.W., L.F. Burroughs, C.F. Timberlake, and G.C. Whiting (1979). Progres
recents sur I'aspect chimique et I'action antimicrobienne de I'anhydride sulfureux
(SOz). Bull. O.I.V. 2: 1001-1022.
Beggs, J.D. (1978). Transformation of yeast by
plasmid. Nature 275: lO4-L09.
a replicating hybrid
Beggs, J.D. (1981). In D. von'Wettstein, J. Friis, M. Kielland-Brant and A. Stenderup
(eds.), Molecular Genetics in Yeast, Alfred Benzon Synposium 16. Munksgaard,
Copenhagen.
Beggs, J.D., J. Van den Berg, A. Van Ooyen and C. Vy'eissmann (1980). Abnormal
expression of chromosomal rabbit p-globin gene in Saccharomyces
cerevisiae. Nature 283: 835-840.
Benda, I. (1932). Wine and Brandy. In: G. Reed (ed.), Prescott and Dunn's industrial
microbiology. AVI technical books. V/estport, Connecticut, pp 293-402.
Bennetzen, J.L. and B.D. Hall (1982). The primary structure of Saccharomyces cerevisiae
gene for alcohol dehydrogenase 1. J. Biol. Chem. 257:30t8-3026.
Bilinski, C.4., and G.P. Casey (1989). Developments in sporulation and breeding of
brewer's yeast. Yeast 5:429-438.
Bishop, D.H.L., P.F. Entwistle, I.R. Cameron, C.J. Allen, and R.D.
Pessee (19S8). Field trials of genetically engineered Baculovirus insecticides. In: M.
Sussman, C.H. Collins, F.A. Skinner and T.E. Stewa¡t-Tull (eds.), The Release of
Genetically Engineered Microorganisms. Academic Press, London; pp 143-180.
Bitter, G.A. and K.M. Egan (1984). Expression of heterologous genes in Saccharomyces
cerevisiae from vectors utilizing the glyceraldehyde-3-phosphate dehydrogenase gene
promoter. Gene 32: 263-274.
-129 -
Bitter, G.4., K.K. Chen, A.R. Banks and P.H. Lai (1984). Secretion of foreign proteins
from S¿ccharomyces cerevisiae directed by cr-factor gene fusions. Proc. Natl. Acad. Sci.
USA. 81: 5330-5334.
Bloom, B.R. (1980). Interferons and the immune system. Nature 284:593-595.
Blouin, J. (1966). Contribution a I'etude des combinaisons de I'anhydride sulfureux dans
les mouts et les vins. Ann. Technol. Agnc. 15: 359-401.
Boeke, J.D., D.J. Garfinkel, C.A. Styles, and G.R. Fink (1985). Ty elements transpose
through an RNA intermediate. Cell40: 491-500.
Boone, C., A.M. Sdicu, J. Wagner, R. Degre, C. Sanchez, and H.
Bussey. (1990). Integration of the yeast Kl killer toxin gene into the genome of marked
wine yeasts and its effect on vinification. Am. J. Enol. Vitic. 4l:37-42.
Bostian, K.4., J.E. Hopper, D.J. Rogers, and D.J. Tipper. (1980). Translational
analysis of the killer-associated virus-like particle dsRNA genome of Saccharomyces
cerevísíae; M-dsRNA encodes toxin. Cell 19: 403-414.
Bouix, M., J.Y. Leveau, and C. Cuinier (1981). Determination de I'origine des levures de
vinification, par une methode de differenciation fine des souches. Connaisance de la Vigne
et du Vin 15:41-52.
Brent, R. (1985). Repression of transcription in yeast. CeIl42:3-4.
Broach, J.R. (1981). The yeast plasmid2 ¡tm circle. In: Strathern, J.N., E.V/. Jones and
J.R. Broach (eds.), The molecular biology of the yeast .Saccharomyces: life cycle and
inheritance. Cold Spring Harbour, New York. pp. 445-470.
Broach, J.R. (1982). The role of site-specific recombination in expression of the yeast
plasmid 2 Vm circle. Rec. Adv. Yeast Mol. Biol. L:93-LL2
Brown, S.W. and S.G. Oliver (1982).Isolation of ethanol-tolerant mutants of yeast by
continuous selection. Eu¡. J. Appl. Microbiol. Biotechnol. 16: 119-122.
Burgers, P.M.J. and K.J. Percival (1987). Transformation of yeast spheroplasts without
cell fusion. Anal. Biochem. 163:391-397.
-130-
Burroughs, L.F. and A.H. Sparks (1973). Sulphite-binding power of wines and ciders. I.
Equilibrium constants for the dissociation of carbonyl bisulphite compounds. J. Sci. Food
Agric. 24:187-198.
Bussey, H. and P. Meaden (1985). Selection and stability of yeast transformants
expressing cDNA of an Ml killer toxin-immunity gene. Curr. Genet. 9:285-291.
Butt, T.R., E. Sternberg, J. Herd and S.T. Crooke (1984). Cloning and expression of a
yeast copper metallothionein gene. Gene 27:23-33.
Cabeca-Silva, C., A. Madeira-Lopes and N. van Uden (1982). Temperature relating of
ethanol-enhanced petite mutation in Sacclaromyces cerevísi¿e: mitochondria as t¿ugets of
thermal death. FEMS Microbial. I-ett.15: 149-151.
Cantwell, B.A., G. Brazil, N. Murphy and D.J. McConnell (1986). Comparison of
expression of the endo-ß-1,3-1,4-glucanase gene from Bacilhts subtilis in Saccharomyces
cerevisiae from the CYC-1 and ADH-1 promoters. Cur. Genet. 11: 65-70.
Carle, G.F. and M.V. Olson (1985). An electrophoretic karyotype for yeast. Proc. Natl
Acad. Sci. USA þ:5647-5664.
Carle, G.F. and M.V. Olson (1984). Separation of chromosomal DNA molecules from
yeast by orthogonal-field-alternation gel electrophoresis. Nucleic Acids Res. 12: 5647-
5664.
Ca¡le, G.F., M. Frank and M.V. Olson (1936). Electrophoretic separation of large DNA
molecules by periodic inversion of the electric field. Science232:65-68.
Cartwright, C.P., J. Juroszek, M.J. Beaven, F.M.S. Ruby, S.M.F. De Morais and A.H.
Rose (1986). Ethanol dissipates the proton motive force across the plasma membrane ofSaccharomyces cerevisiae . J. Gen. Microbiol. 132: 369-377 .
Casey, G.P., W. Xiao and G.H. Rank (1988a). A convenient dominant selection marker
for gene transfer in industrial strains of Saccharomyces yeast: SMRI encoded resistance to
the herbicide sulfometuron methyl. J. Inst. Brew. 94:93-97 .
-131-
Casey, G.P., Wei Xiao, and G.H. Rank (19SSb). Application of pulsed field
chromosome electrophoresis in the study of chromosome XIII and the electrophoretic
karyotype of industrial strains of Saccharomyces yeasts. J. Inst. Brew. 94:239-243.
Chu, G., D. Vollrath, and R.V/. Davis (1986). Separation of large DNA molecules by
contour-clamped homogenous electric fields. Science 234: I 582-1 5 85.
Ciolfi, G. (19SS). Riconoscimento e carattenzzazione dei lieviti. Vini d'Italia 29:9-16.
Ciriacy, M. and M. Grossman (1988). Characterisierung von Saccharomyces cerevisiae
weinhefen durch specifische DNA-markierungen. V/ein-Wiss. 43 : 1 86- 193.
Clarke, L. and J. Carbon (1980). Isolation of yeast centromere and construction of
functional small chromosomes. Nature 287 : 504-509.
Cohen, J.D., T.R. Eccleshall, R.B. Needleman, H. Federofl B.A. Buchferer and J.
Marmur (1980). Functional expression inyeast of the Esclrcrichia coli plasmid gene coding
for chloramphenicol acetyltransferase. Proc. Natl. Acad. Sci. USA. 77:1078-1082.
Conde, J. and G.R. Fink (L976). A mutant of Saccharomyces cerevisiae defective for
nuclear fusion. Proc. Natl. Acad. Sci. USA 73:365L-3655.
Contopoulou, C.R., V.E. Cook, and R.K. Mortimer. (1987). Analysis of DNA double
strand breakage and repair using orthogonal field alternation gel
electrophoresis. Yeast 3: 7 l-7 6.
Costanzo, M.C. and T.D. Fox (1938). Transformation of yeast by agitation with glass
beads. Genetics 120: 667 -670.
Cox, B.S. (1965). A cytoplasmic suppressor of super-suppressor in
yeast. Heredity 20: 505-521.
Cox, M.M. (1983). The FLP protein of the yeast 2 ltm plasmid: expression of a
eukaryotic genetic recombination system in Escherichia coli (gene expression/site specific
recombination/gene cloning). Proc. Natl. Acad. Sci. USA 89: 4223-4227.
Cuinier, C. and C. Gros (1933). Enquete sur la repartition des levures killers en
France. Vignes et Vivs 38:25-27.
-132-
Cummings, J. and S. Fogel (1987). Genetic homology of wine yeasts with
Saccharomyces cerevisiae. J.Inst. Brew . M: 267 -270.
De Jonge, P., F.C.M. De Jongh, R. Meijers, H.Y. Steensma, and W.A.
Scheffers (1986). Orthogonal-fietd alternation gel elecrophoresis banding patterns of
DNA from yeast. Yeast 2:193-2O4.
De la Pena, P., F. Barros, S. Gascon, P.S. Lazo, and S. Ramos. (1981). Effect of killer
yeast toxin on sensitive cells of Saccharomyces cerevisiæ.1. Biol. Chem.255: 10420-
10425.
Delteil, D. and T. Aizac (19S8). Comparison of yeast inoculation techniques by the use of
a 'ma¡ked strain'. Aust. NZ lVine Ind. J. 3(3): 53-56.
Demain, A.L. and N.A. Solomon (1981). Industrial microbiology: introducing an issue
on how products useful to man a¡e manufactured by micro-organisms. Sci. Am. 245:.43-
51.
Dobson, M.J., M.F. Tuite, N.A. Roberts, A.J. Kingsman, S.M. Kingsman, R.E.
Perkins, S.C. Conroy, B. Dunbar and L.A. Fothergill (1982). Conservation of high
efficiency promoter sequences in Saccharomyces cerevisiae. Nucleic Acids.
Res. 10: 2625-2637.
Dott, W. and H.G. Truper (1976). Sulfrte formation by wine yeasts. IV. Properties of
sulfite reductase. Arch. Microbiol. 108: 99-104.
Dott, W., M. Heinzel and H.G. Truper (1977). Sulfite formation by wine yeasts. IV.
Active uptake of sulfate by "low" and "high" sulfite producing wine yeasts. Arch.
Microbiol. ll2: 283-285.
Dubourdieu, D., A. Sokol, J. Zucca, P. Thalouarn, A. Dattee, and M.
Aigle (1987). Identification des souches de levures isolees de vins par I'analyse de leur
ADN mitochondrial. Connais Vigne Vin 21: 267-78.
Eschenbruch, R. (L974).Sulfite and sulfide formation during wine making - a
review. Am. J. Enol. Vitic. 25:157-16L.
-133-
Eschenbruch, R. and J.M. Rassell (1975). The development of non-foaming yeast strains
for wine-making. Vitis 
-134-
Freeman, R.F. (1981). Construction of brewing yeasts for production of low
carbohydrate beers. Eur. Brew. Conv. Proc. Cong. 18th, Copenhagen. pp. 497-5M.
Gaia, P. (1934). Lieviti in associazione contemporanea. Vini Ital. þ:47-56.
Gao, C. and G.H. Fleet (1988). The effects of temperature and pH on the ethanol tolerance
of the wine yeast s Saccløromyces ceraisiac, Candida Stellata and Kloeclrcra apiculata. J.
Appl. Bacteriol. 6: 405-410.
Gardiner, K., W. Laas, and D. Patterson (19S6). Fractionation of large mammalian DNA
restriction fragments using vertical pulsed-field gradient gel electrophoresis. Som. Cell
Mol. Genet. 12: 185-195.
Gastignol, 4., M. Ba¡on and G. Tiraby (1987). Phleomycin resistance encoded by the ble
gene transposon Tn5 as a dominant selectable marker in Saccløromyces cerevisiae.Mol.
Gen. Genet.M: 342-348.
Gilliland, R.B. (1951). The flocculation characteristics of brewing yeasts during
fermentation. Proc. Eur. Brew. Conv. Congtr., Brighton, 1951. pp. 35-58.
Goff, C.G., D.T. Moir, T. Kohno, T.C. Gravius, R.A. Smithand A. Taunton-
Rigby (1984). Expression of calf prochymosin in Saccharomycescerevisiae. Gene 2l: 35-46.
Goodey, 4.R., S. Doel, J.R. Piggott, M.E.E. Watson and B.L.A.
Carter (1937). Expression and secretion of foreign polypeptides in yeast, In D.R. Berry,
I. Russell and G.G. Stewa¡t (eds.), Yeast Biotechnology. Allen and Unwin, London,
UK, pp 401-429.
Gritz, L. and J. Davies (1983). Plasmid-encoded hygromysin B resistance: the sequence
of hygromycin B phosphotransferase gene and its expression in Escherichia coli and
Sacclnromyces cerev iae. Gene 25: 179-188.
Gunge, N. and Y. Nakatomi (1971). Genetic mechanisms of rare matings of the yeast
Sacclaromyces cerevisiaeheterozygous for mating type. Genetics 4: 41-58.
-135-
Hadfield, C., A.M. Cashmore and P.A. Meacock (1986). An efficient chloramphenicol-
resistance ma¡ker for Sacclnromyces cerevisiae and Escherichia coli. Gene 45: 149-158.
Hadfield, C., B.E. Jordan, R.C. Mount, G.H.J. Pretorius and E. Burak (1990). G418-
resistance as a dominant marker and reporter for gene expression in Saccharomyces
cerevisiae. Curr. Genet. 1E: 303-313.
Hammond, J.R.M. and K.W. Eckersley (1984). Fermentation properties of brewing yeast
with killer character. J. Inst. Brew. 99: L67-177.
Hammond, J.R.M. and K.W. Eckersley (1984). Fermentation properties of brewing yeast
with killer cha¡acter. J. Inst. Brew. 99:167-L77.
Hansen, E.C. (1886). Undersogelser over alkoholsjaersvanpenes fysiologi og morfologi.
V. Methoder til fremstilling af renkulturer af saccharomyceter og ligende
mikroorganismer. Meddr. Carlsberg Lab. /: 257 -322.
Hansen, E.C. (1388). Undersogelser fra gjaeringsindustriens praxis. Meddr. Carlsberg
Lab. /: 257 -322.
Hara, S., Y. Iimura, and K. Otsuka. (1980). Breeding of useful killer wine yeasts. Am.
J. Enol. Vitic. p:28-33.
Hara, S., Y. Iimura, H. Oyama, T. Kozeki, K. Kitano, and K. Otsuka (1981). Breeding
of cryophilic killer wine yeasts. Agric. Biol. Chem. 45: 1327 -1334.
Hara, S., Y. Iimura, H. Oyama, T. Kozeki, K. Kitona and K. Otsuka (1981). The
breeding of cryophilic killer wine yeasts. Agric. Biol. Chem. 46: 1327-1334.
Harashima, S., A. Takagi and Y. Oshima (1984). Transformation of protoplasted yeast
cells is directly associated with cell fusion. Mol. and Cell Biol. 4:77L-778.
Harashima, S., Y. Nogi, and Y. Oshima. (1974). The genetic system controlling
homothallism in S ac c laromyc¿s yeasts. Genetics 77 : 639 -650.
Haris, M.S. (1978). Virus-like particles and double stranded RNA from killer and non-
killer strains of Sacclaromyces cerevisiae. Microbiology Lt l6t'L74.
-136-
Hashimoto, H., H. Morikawa, Y. Yamada and A. Kimura (1985). A novel method for
transformation of intact yeast cells by electroinjection of plasmid DNA. Appl. Microbiol.
Biotechnol. 2t: 336-339.
Heard, G.M. and G.H. Fleet. (1985). Growth of natural yeast flora during the
fermentation of inoculated wines. Appl. Environ. Microbiol. 59: 727 -729.
Hea¡d, G.M. and G.H. Fleet. (1986a). Occurrence and growth of yeast species during the
fermentation of some Australian wines. Food Technol. in Aust. 3E:22-25.
Heard, G.M. and G.H. Fleet. (1986b). Evaluation of selective media for enumeration of
yeasts during wine fermentation. J. Appl. Bateriol. 69:477-481.
Hea¡d, G.M. and G.H. Fleet. (1987a). Occunence and growth of killer yeasts during
wine fermentation. Appl. Environ. Microbiol. 5i: 217 t-2174.
Hea¡d, G.M. and G.H. Fleet. (1987b). The occurrence of killer character in yeasts during
the fermentation of Australian wines. Aust. and N.Z. Wine Ind. J. 1(4): 68-70.
Hea¡d, G.M. and G.H. Fleet. (1988a). The effect of sulphur dioxide on yeast growth
during natural and inoculated wine fermentation. Aust. and N.Z. Wine Ind. J. 1:57-60.
Hea¡d, G.M. and G.H. Fleet (1988b). The effects of temperature and pH on the growth
of yeast species during the fermentation of grape juice. J. Appl. Bacteriol. 65:23-28.
Heinzel, M and H.G. Truper (1976). Sulfite formation by wine yeasts. II. Properties of
ATP-sulfurylase. Arch. Microbiol. 107 : 293-297 .
Henderson, R.C.A., B.S. Cox and R. Tubb (1935). The transformation of brewing
yeasts with a plasmid containing the gene for copper resistance. Curr. Genet. 9: 133-138.
Henschke, P.A. (1990). Yeast strains available to winemakers 1991. The Australian
Wine Research Institute Technical Review No. 69: l2-I7.
Herskowitz, I. and Y. Oshima (1981). In: J.N. Strathern, E.V/. Jones & J.R. Broach,
(eds.), The molecular biology of the yeast Saccløromyces, Life cycle and inheritance, Cold
Spring Harbor Laboratory, p.181.
-137 -
Hicks, J. and I. Herskowitz(1976).Interconversion of mating types in yeast. I. Direct
observations of the action of the homothallism (HO) gene. Genetics E3: 245-258.
Hinchliffe, E. and C.J. Daubney (1986). The genetic modification of brewing yeast with
recombinant DNA. Am. Soc. Brew. Chem.44:98-101.
Hinnen, 4., J.B. Hicks and G.R. Fink (1978). Transformation of yeast. Proc. Natl.
Acad. Sci. USA 75:1929-1933.
Hitzeman, R.4., F.A. Hagie, H.L. Levine, G.V. Goeddel, G. Ammerer and B.D.
Hall (1981). Expression of human gene for interferon in yeast. Nature 293:717-722.
Holland, J.P. and M.J. Holland (1980). Structural comparison of two non-tandemly
repeated yeast glyceraldehyde-3-phosphate dehydrogenase genes.J. Biol.
Chem. 255:2596-2605.
Ingraham, J.L. and J.F. Guymon (1960). The formation of higher aliphatic alcohols by
mutant strains of Sacclnromyces cerevisiae. Arch. Biochem. Biophys. EE: 157-166.
Ingraham, J.L., J.F. Guymon and E.A. Crowell (1961). The pathway of formation of n-
butyl and n-amyl alcohols by a mutant strain of sacclaromyces cerevisiae. Arch. Biochem.
Biophys. !l: 169-175.
Ingram, L.O. and M. Buttke (1984). Effects of alcohols on microorganisms. Adv
Microbiol. Physiol. 25: 253-300.
Ismail, A.A. and A.M.M. Ali (1971a). Selection of high ethanol-yielding Sacclnromyces.
I. Ethanol tolerance and the effect of training in Saccharomyces cerevísíae Hansen. Folia
Microbiol. t6: 346-349.
Ismail, A.A. and A.M.M. Ati (1971b). Selection of high ethanol-yielding Saccha¡omyces.
II. Genetics of ethanol tolerance. Folia Microbiol. lé: 350-354.
Ito, H., Y. Fukuda, K. Murata and A. Kimura (1983). Transformation of intact yeast cells
treated with alkali cations. J. Bacteriol. 153: 163-168
Jeffersen, R.A., S.M Burgess and D. Hirsch (1986). p-Glucuronidase fuom Escherichia
coli as a gene fusion marker Proc. Natl. Acad. Sci. USA 83:8447-9451.
-138-
Jeffersen, R.4., T.A. Kavanagh, and M.V/. Beven (1937). Gus fusions: p-glucuronidase
as a sensitive and versatile gene marker in higher plants. EMBO J 6:390L-3907.
Jiminez, A. and J. Davies (19S0). Expression of a transposable antibiotic resistance
element in S accharomy ces. Nature 287 : 869 -87 l.
Johnston, J.R. and H.P. Reader (1983). Genetic control of flocculation. In: J.F.T.
Spencer, D.M. Spencer and A.R.V/. Smith (eds.), Yeast Genetics: Fundamental and
Applied Aspects, Springer-Verlag, New York, pp.205-224.
Jones, E.V/. (1977). Proteinase mutants of Saccharomyces cerevisiae. Genetics 85:23-
33.
Julius, D., R. Schekman and J. Thorner (1984). Glycosylation and processing of prepro-
cr-factor through the yeast secretory pathway. Cell36: 309-318.
Juroszek, J., M. Feuillat, and C. Charpentier. (1987). Effect of ethanol on glucose-
induced movements of protons across the plasma membrane of Saccharomyces cerevisiae
NCYC 431. Can. J. Microbiol. 33: 93-97.
Kadowaki, K. and H.O. Halvorson (1971). Appearance of a new species of ribonucleic
acid during sporulation in Saccharomyces cerevisiae. J. Bacteriol. 105: 826-830.
Karube, I., E. Tamiya and H. Matsuoka (1985). Transformation of Saccharomyces
cerevisiae spheroplasts by high electric pulse. FEBS Lett. 182:90-94.
Kasahara, H., K. Ouchi, K. Kurata, T. Ishido and Y. Nunokawa (1974). Genetic
characters of non-foaming mutants of sake yeast. J. Ferment. Technol. 52:348-351.
Kaster, K.E., S.G. Burgett and T.D. Ingolia (1984). Hygromycin B resistance as a
dominant selectable marker in yeast. Curr. Genet. 8: 353-358.
Keeler, K.H. (1988). Can rile guarantee the safety of genetically engineered organisms in
the environment ? Crit. Rev. Biotechnol. S: 85-97.
Kerr, A. (1989). Commercial release of a genetically engineered bacterium for the control
of crown gall. Agricultural Science 2(6\:41-44.
-t39 -
Keszenman-Pereyra, D. and K. Hieda (1938). A colony procedure for transformation of
S ac c haromy ces cerevi siae. Curr. Genet. 13 : 2l-23.
Killian, R.E. and C.S. Ough (1979). Fermentation esters - formation and retention as
affected by fermentation temperature. Am. J. Enol. Vitic. 30: 301-305.
Kingsman, 4.J., C. Stanway and S.M. Kingsman (1988). The expression ofhomologous and heterologous genes in yeast. Antonie van Leeuwenhoek J.
Microbiol. 53: 325-333.
Kingsman, S.M., A.J. Kingsman, M.J. Dobson, J. Mellor and N.A.
Roberts (1935). Heterologous gene expression in Saccharomyces cerevisiae. In G.E.
Russell (ed.), Biotechnol. Genet. Eng. Rev., Vo1.3. Intercept, Ponteland, Newcastle upon
Tyne, pp. 377-416.
Kramer, R.4., T.M. DeChiara, M.D. Schaber and S. Hilliker (1984). Regulated
expression of a human interferon gene in yeast: Control by phophate concentration or
temperature. Proc. Natl. Acad. Sci. USA 81:367-370.
Kreger-van Rij, N.J.W. (1987). Classification of yeasts. In: A.H. Rose and J.S Harrison
(eds), The Yeasts: Biology of Yeasts. London, Academic press, pp. 5-61.
Kreger-van Rij, N.J.W. ed. (1984). The Yeasts: A taxonomic study. Elsevier Science
Publishing Co., Amsterdam.
Kunkee, R.E. (1984). Selection and modification of yeasts and lactic acid bacteria for
wine fermentation. Food Microbiol. l: 315-332.
Kunkee, R.E. and M.A. Amerine, M.A. (1970). Yeast in winemaking. In A:H. Rose and
J.S. Harrison (eds.) Yeast Technology. Vol. 3. Academic Press, London, pp.5-72.
Kunkee, R.E. and R.W. Goswell(1977).Table wines. In: A.H Rose and J.S Ha¡rison
(eds.), The Yeasts. Vol. 3. Yeast technology. Academic Press, London. pp. 315-385.
Kurjan, J. and I. Herskowitz(1982). Structure of yeast pheromone gene (MFcr): a
putative g-factor precursor contains four tandem copies of mature ü,-factor. Cell 30: 933-
943.
-140-
Kurtzman, C.P. and H.J. Phaff (1937). Molecular taxonomy. In A.H. Rose and J.S.
Ha¡rison (eds.), The Yeasts: Biology of Yeasts. Academic press, London, pp. 63-94.
Kusewicz, D., and J. Johnston (1980). Genetic analysis of cryophilic and mesophilic
wine yeasts. J. Inst. Brew. W:25-27.
Lafon-Lafourcade, S. (1985). Role des microorganisms dans la formation de substances
combinant le SOz. Bull. I.O.V.5E: 590-604.
Lafon-Lafourcade, S. (1983). Wine and brandy. In: H.J. Rehm and G. Reed (eds.),
Biotechnology Vol. 5. Food and feed production with microorganisms. Verlag Chemie,
Weinheim. pp. 81-163.
Lafon-Lafourcade, S. and P. Ribereau-Gayon (1984). Developments in the microbiology
of wine production.Prog. Ind. microbiol. 19: 1-45.
La¡kin, J.C and J.L. Woolford (19S3). Molecula¡ cloniing and analysis of the CRYl
gene: a yeast ribosomal protein gene. Nucleic Acids Res. 1l: 403-420.
Lautensach, A. and R.E. Subden (198a). Cloning of malic acid assimilating activity from
Leuconostoc oenos in E. coli. Microbios. þ:29-39.
Leao, C. and N. van Uden (1984). Effects of ethanol and other alkanols on passive proton
flux in the yeast Sacclnromyces cerevisiae.Biochim. Biophys. Acta. 774:43-48.
I-eao, C. and N. van Uden (1982). Effects of ethanol and other alkanols on the kinetics
and the activation parameters of thermal death in Saccharomyces cerevísíae. Biotechnol.
Bioeng. 24: l58l-1590.
Lee, S.Y., F.B. Kundsen, and R.O. Poynton (1985). Differentiation of brewery yeast
strains by restriction endonuclease analysis of their mitochondrial DNA. J. Inst.
Brew.9l: 169-173.
Lewis, C.W., J.R. Johnston and P.A. Martin (1976). The genetics of yeast
flocculation. J. Inst. Brew. 82: 158-160.
-L4l-
Lindegren, C.C. (1949).The Yeast Cell, Its Genetics and Cytology. Educational Publ.,
St. Louis.
Lindegren, C.C., and G. Lindegren (1943). A new methd for hybridizing yeast. Proc.
Natl. Acad. Sci. USA 29:306-308.
Lipke, D.N. and C. Hull-Pillsbury (1984). Flocculation of Saccharornyces cerevísiae tttpl
mutants. J. Bacteriol. 159: 797-799.
Livingston, D.M. (1977).Inheritance of the 2 pm DNA plasmid from
S accharomyces. Genetics 86: 7 3-84.
Lodder, J. (1970). The Yeasts (second edition). North Holland Publ. Co.,
Amsterdam.
Loiseau, G., F. Vezinhet, M. Valade, A. Vertes, C. Cuinier, and D.
Detteil (1937). Controle d'efficacite de levurage par la mise en oeuvre de souches de
levures oenologiques marquees. Revue Francais d'Oenologie 106: 29-36.
Longo, E., J.B. Yelazqaez, J. Casado, P. Calo, and T.G. Villa. (1990). Role of killer
effect in fermentations conducted by mixed cultures of Saccharomyces cerevisíae. FEMS
Microbiol. Lett. 7 I : 331-336.
Martinez, J., C. Millan, and J.M. Orega (1989). Growth of natural flora during
fermentation of inoculated musts from 'Pedro Ximenez' grapes. S. Afr. J. Enol.
Vitic. 10: 31-35.
Martini, A. and A.V. Martini (1990). Grape must fermentation: past and present. In:
Spencer, J.F.T. and D.M. Spencer (eds.), Yeast Technology, Berlin: Springer Verlag, pp
t05-123.
Mead, D.J., D.C.I. Gardner and S.G. Oliver (1985). Enhanced stability of a 2pm-based
recombinant plasmid in diploid yeast. Biotechnol. Letters 8:39L-396.
Meaden, P., K. Ogden, H. Bussey and R.S. Tubb (1985) A DEX gene conferring
production of extracellular amyloglucosidase on yeast. Gene 34:325-334.
-142-
Meilhoc, E., J. Masson and J. Teissie (1990). High efficiency transformation of intact
yeast cells by elecric f,reld pulses. Biotechnol. E:223-227 -
Mellor, J., M.J. Dobson, N.A. Roberts, A.J. Kingsman and S.M.
Kingsman (1985). Gene ll:215-226.
Meyhack, 8., V/. Bajwa, H. Rudolph and A. Hinnen (1932). Two yeast acid phophatase
structural genes are the result of a tandem duplication and show different degrees of
homology in their promoter and coding sequences. EMBO J.1: 675-680.
Miki, B.L.A., N.H. Poon, A.P. James and V.L. Seligy (1980). Flocculation in
Sacclaromyces cerevisiae: mechanism of cell-cell interactions. In: Stewart, G.G. and I.
Russell (eds.), Current developments in yeast resea¡ch. Pergamon Press, Canada Ltd.,
Toronto, pp. 165-170.
Miki, B.L.A., N.H. Poon, A.P. James and V.L. Seligy (19S2b). Possible mechanism for
flocculation interactions governed by gene FLOI in Saccharomyces cerevisiae.J.
Bacteriol. 150: 878-889.
Miki, B.L.A., N.H. Poon and V.L. Seligy (1982a). Repression and induction of
flocculation interactions in Sacclnromyces cerevisíae. J. Bacteriol. 150: 890-899.
Mill, P.J. (1964). The nature of the interactions between flocculent cells in the flocculation
of Saccharomyces cerevisiae. J. Gen. Microbiol.35: 61-68.
Miyajima, 4., I. Miyajima, K. Arai and N. Arai (1984). Expression of plasmid R388-
encoded type II dihydrofolate reductase as a dominant selective marker in S.
cerevisiae. Mol. Cell. Biol. 4:407-414.
Molzahn, S.W. (1977).A new approach to the application of genetics to brewing
yeast. J. Am. Soc. Brew. Chem. !L:54-59.
Momose, H., N. Okazaki and R. Tonoike (1968). Studies on the aggegation of yeasts
caused by lactic acid bacteria. I. Aggregation of yeast in mixture of pure-cultured yeast cells
and lactic acid bacterial cells. J. Soc. Brew. Japan 63: 686-688.
Mortimer, R.K. and D.E. Hawthorne (1969). Yeast Genetics. In: A.H. Rose and J.S
Ha¡rison (eds.), The Yeasts, Volume 1. Academic Press, New York, pp 385-471.
-143-
Mortimer, R.K. and D. Schild (1985). Genetic map of Saccharomyces cerevisiae, edition
9. Microbiol. Rev. 49: I8l-2L2.
Mortimer, R.K., D. Schild, C.R. Conopoulou and J.A. Kans (1989). Genetic map of
S ac c laromy c e s c er ev i s iac, Editron 1 0. Yeas t 5: 321' 403 .
Mowshowitz, D.B. (1979). Gene dosage effects on the synthesis of maltose in yeast. J.
Bacteriol. 137 : 1200-1207.
Murata, K., Y. Fukuda, M. Shimosaka, K. Watanabe, T. Saikusa and A.
Kimura (1985). Phenotypic character of the methylglyoxal resistance gene in
Sacclnormyces cerevisíae: expression in Esclvrichia colí andapplication to breeding wild-
type yeast strains. Appl. Environ. Microbiol. Ð: L2N-1207.
Murray, A.V/. and J.V/. Szostak (1983). Construction of artificial chromosomes in
yeast. Nature 305: 189-193.
Nagodawithana, T.W., T. Whitt and A.J. Cutaia (1977). Study of the effect of feedback
of ethanol on selected enzymes of the glycolytic pathway. J. Am. Soc. Brew.
Chem.35: 179-183.
Naumov, G.I. and T.I. Naumova. (1973). Comparative genetics of yeast communication.
XI[. Comparative study of killer strains of Saccharomyces from different
collections. Genetika 9: 140-145.
Newlon, C.S. and W.L. Fangman (1975). Mitochondrial DNA synthesis in cell cycle
mutants of Sacclnromyces cerevisiae. Cell5: 423-428.
Nishikawa, N., M. Kohgo, and T. Ka¡akawa (1979). Serological classification of
brewers yeast and related yeasts with commercial factor sera. J. Ferment.
Technol. fl:364-368.
Oliver, S.G. (1987). Physiology and genetics of ethanol tolerrance in yeast. In: Stewart,
G.G., I. Russell, R.D. Klein and R.R. Hiebsch (eds.), Biological research on industrial
yeasts, Vol 1. CRC Press Inc. Boca Raton, Florida, pp. 81-98.
-t 44-
Ono, B-f., and Y. Ishino-Arao (1988). Inheritance of chromosome length polymorphisms
in Saccharomyces cerevísiae. Cur. Genet 14: 473-418.
Oosthuizen, 4., J.L.F. Koch, B.C. Viljoen, H.B. Muller and P.M. Lategan (1987). The
value of long chain fatty acid composition in the identification of some brewery yeasts. J.
Inst. Brew. 93: I7 4-I76.
Orr-Weaver, T.L., J.W. Szostak and R.J. Rothstein (1981). Yeast transformation: A
model system for the study of recombination. Proc. Natl. Acad. Sci. USA 78: 6354-
6358.
Osman, Y.A. and L.O. Ingram (1985). Mechanism of ethanol inhibition of fermentation in
Zymomonas mobilis CP4. J. Bacteriol. 164:173-L80.
Ouchi, K. and H. Akiyama(1971). Non-foaming mutants of sake yeasts. Selection by
cell agglutination method and by froth flotation method. Agric. Biol. Chem.35: lO24-
ro32.
Ouchi, K. and Y. Nunokawa (1973). Non-foaming mutants of sake yeasts. Their
physicochemical characteristics. J. Ferment. Technol. 51: 85-95.
Ouchi, K., R.B. Vy'ickner, A. Toh-e and H. Akiyama (L979). Breeding of killer yeast forsake brewing by cytoduction. J. Ferment. Technol.5T:483-487.
Panchal, C.J., L. Bast, T. Dowhanick, and G.C. Stewart (1987). A rapid, simple and
reliable method for differentiating brewing yeast strains based on DNA restriction
patterns. J. Inst. Brew. 93:325-327.
Perlman, D. and H.O. Halvorsen (1983). A putative signal peptidase recognition site and
sequence in eukaryotic and prokaryotic signal peptides. J. Mol. Biol. 167: 39I-409.
Petes, T.D. (1980). Molecular genetics of yeast. Ann. Rev. Biochem. 49:845-876
Philliskirk, G. and T.W. Young. (1975). The occurrence of killer chamcter in yeasts ofvarious genera. Antonie van I eeuwenhoek J. Microbiol.4l: t47-15I.
-r45 -
Potter, H., L. V/ier and P. Leder (1984). Enhancer-dependent expression of human rimmunoglobulin genes inroduced into mouse pre-B lymphocytes by electroporation. Proc.
Natl. Acad. Sci. USA 8l:7161-7165.
Pretorius, I.S. and J. Marmur (1988). Localization of yeast glucoamylase genes by PFGE
and OFAGE. Curr. Genet. 14:9-I3.
Price, C.W., G.B. Fuson, and H.J. Phaff (1978). Genome comparison in yeast
systematics: Delimination of species within the genera Sclananniomyces, Saccharomyces,
Debaryomyc¿s and Pichia. Microbiol. Rev. 42: L6l-I93.
Proffitt, J.H., J.R. Davie. D. Swinton, S. Hattman (1984). 5'-Methyl cytosine is not
detecable in Saccharomyces cerevisiae DNA. Mol. Cell Biol. 4: 985-988.
Radler, F., P. Pfeiffer, and M. Dennert. (1985). Killer toxins in new isolates of the yeasts
Hanseniaspora uvarurn and Pichia kluyveri. FEMS Microbiol. I-ett.29:263-267 .
Rank, G.H., G. Casey and W. Xiao (1988). Gene uansfer in industrial Saccharomyces
yeasts. Food Biotech. 2: l-41.
Rankin, B.C. (1966). Sulphur dioxide in wines. Food Tech. in Aust. 18: L34-I41.
Rankine, B.C. (1968). The importance of yeasts in determining the composition and
quality of wines. Vitis 7: 22-49.
Rankine, B.C. (1977). Modern developments in selection and use of pure yeast cultures
for winemaking Aust. Wine Brew. Spirit Rev. 96: 3I-34.
Rankine, B.C. and B. Lloyd (1963). Quantitative assessment of dominance of added yeast
in wine fermentations. J. Sci. Food Agric. 14:739-798.
Rankine, B.C. and K.F. Pocock (1972). Alkalimetric determination of sulfur dioxide in
wine. Austral. V/ine Brew. Spirit Rev.91: 62,64,66.
Rech, E.L., M.J. Dobson, M.R. Davey and B.J. Mulligan (1990). Inroduction of yeast
artificial chromosome vector into Saccharomyces cerevisiae cells by
electroporation. Nucleic Acids Res. 18: 1313.
-146-
Reed, G. and T.W. Nagodawithana (1988). Technology of yeast usage in
winemaking.Am. J. Enol. Vitic.39: 83-90.
Ribereau-Gayon, J., E. Peynaud, P. Ribereau-Gayon, and P. Sudraud (1975). Sciences
et techniques du vin. Tome tr. Dunod, Paris.
Rine, J., W. Hansen, E. Hardeman and R.V/. Davis (1933). Targeted selection of
recombinant DNA clones through dosage effects. Proc. Natl. Acad. Sci. USA. &: 6750-
6754.
Roberts, I.N., R.P. Oliver, P.J. Punt, and C.A.M.J.J. van den
Hondel (1989). Expression of the Escherichia coli p-glucuronidase gene in industrial and
phytophathogenic filamentous fungi. Curr. Genet. 15: 177-180.
Roeder, G.S., and S.E. Stewart (1988). Mitotic recombination in yeast. Trends in
Genetics 4:263-267.
Rogers, D. and E.A. Bevan. (1978). Group classif,rcation of killer yeasts based on cross
reacúons between strains of different species and origin. J. Gen. Microbiol. 105: 199-
202.
Romano, P., C. Zambonelli and M.G. Soli (1976). Biosynthesis of sulphur amino acids
in Saccharomyces cerevisae. II. Analysis of sulphur dioxide producing strains. Arch.
Microbiol. 108: 21 l-215.
Rosini, G. (1985a). Interaction between killer strains of Hansenula anomalavar. anomala
and Saccharomyces cerevisiae yeast species. Can. J. Microbiol. 3!: 300-302.
Rosini, G. (1985b). Effet d'une levure "killer" de Saccharomyces cerevisiae sur une
souche de levure sensible de la meme espece non producrice de H2S et selectionee pur la
vinification dans un mileu de culture mixte. Bull. O.I.V.648-649:214-217.
Rothstein, R. (1986). In: D.M. Glover (ed.), DNA cloning: a practical approach. IRL
Press, Washington DC, pp.45-66.
Rothstein, S.J., C.M. Lazarus, W.E. Smith D.C. Baulcombe and A.A.
Gatenby (1984). Secretion of a wheat cr-amylase expressed in yeast. Nature 308: 662-
665.
-147 -
Rous, C.V., R. Snow and R.E. Kunkee (1983). Reduction of higher alcohols by
fermentation with a leucine-auxotrophic mutant of wine yeast. J. Inst. Brew. 89:274-
278.
Rupela, O.P. and P. Tauro (1984). Isolation and characterization of low hydrogen
sulphide producing wine yeasts. Enz. Microb. Technol. 6:419-421.
Russell, I., I.F. Hancock and G.G. Stewa¡t (1983). Construction of dextrin fermentative
yeast strains that do not produce phenolic off-flavours in beer. J. Am. Soc. Brew.
Chem. 4l 45-51.
Sa- Correia, I. and N. van Uden (1983). Temperature profiles of ethanol tolerance -
effects of ethanol on the minimum and the maximum temperature for growth of the yeasts
Saccharomyces cerevisiae and Kluyveromyces fragilis. Biotechnol. Bioeng. þ: 1665-
1667.
Schekman, R., and P. Novick (1982). The secretory process in yeast cell surface
assembly. In: J. Strathern, E.W. Jones, and J.R. Broach (eds.), The molecular biology of
the yeast Saccharomyc¿s, Vol. 2. Cold Spring Harbor, New York, pp 361-398.
Scherer, S., C. Mann, and R.\il. Davis (1932). Reversion of a promoter deletion in
yeast. Nature 289: 815-819.
Schmiz, K.L. (1980). The effect of sulphite on the yeast Saccharomyces
cerevisiae. Arch. Microbiol. 125: 89-95.
Schultz, L.D. and J.D. Friesen (1983). Nucleotide sequence of the tcml gene (ribosomal
protein M3) of Sacclnromyces cerevisiae.J. Bacteriol. 155: 8-14.
Schwa¡tz, D.C. and C.R. Cantor (198a). Separation of yeast chromosome-sized DNAs
by pulsed field gradient gel electrophoresis. Cell 37:67-75.
Seki, T., E.H. Choi, and D. Ryu (1985). Construction of killer wine yeast strains. Appl.
Environ. Microbiol. 49: l2ll-L215.
-148-
Seki, T., S. Myoga, S. Limtong, S. Uedono, J. Kumnuata and H'
Taguchi (1933). Genetic construction of a yeast for high ethanol production. Biotechnol.
Lett. l: 351-356.
Shaw, W.V. (1983). Chloramphenicol acetyltransferase: enzymology and molecular
biology. CRC Crit. Rev. Biochem. !l: 1-46.
Shimazu, K., T. Adachi, K. Kitano, T. Shimazaki, A. Totsuku. S. Hara and H.H.
Dittrich. (1985). Killer properties of wine yeasts and cha¡acterisation of killer wine
yeasts. J. Ferment. Technol.63: 421-429.
Simon, J.R. and K. McEntee (1939). A rapid and efficient procedure for transformation
of intact Saccharomyces cerevisiae by electroporation. Biochem. Biophys. Res.
Comm. 164: Ll57-1164.
Sinclair, J. H., B.J. Stevens, P. Sanghavi and M. Rabinowitz(1967). Mitochondrial-
satellite and circula¡ DNA filaments in yeast. Science 156: 1234-1237.
Skipper, N. and H. Bussey. (1977). Mode of action of yeast toxins: energy requirement
for Saccløromyces cerevisiae killer toxin. J. Bacteriol. 129:668-677.
Smith, C.L., T. Matsumoto, O. Niwa, S. Klco, J.B Fan, M. Yanagida, and C.R.
Cantor. (1937). An electrophoretic karyotype for Schizosaccløromyces pombe by pulsed
field gel electrophoresis. Nucleic Acids Res. É: 4481-4489.
Smith, R.4., M.J. Duncan and D.T. Moir (1985). Heterologous protein secretion from
yeast. Science 229: L2l9-1224.
Snell, R.G. and R.J. Wilkins (1986). Separation of chromosomal DNA molecules from
C. albicans by pulsed field gel electrophoresis. Nucleic Acids Res. 
-149-
Snow, R. (1983). Genetic improvement of wine yeast. In: Spencer, J.F.T., D.M.
Spencer and A.R.W. Smith (eds.), Yeast genetics, fundamental and applied aspects.
Springer-Verlag, New York, pp 439-459.
Spencer, J.F.T., and D.M. Spencer (1983). Genetic improvement of industrial
yeasts. Ann. Rev. Microbiol. 37: l2L-142.
Spencer, J.F.T. and D.M. Spencer (1977). Hybridization of non-sporulating and weakly
sporulating strains of brewer's and distiller's yeasts. J. Inst Brew. E3:287'289.
Stepien, P.P., R. Brousseau, R. 'Wu, S. Narang and D.Y. Thomas (1983). Synthesis of
human insulin gene. VI. Expression of the synthetic proinsulin gene in
yeast. Gene 24: 289-297.
Stewart, G.G. (19S1). The genetic manipulation of industrial yeast strains. Can. J.
Microbiol. 27 : 97 3-992.
Stewart, G.G., I. Russell and C. Panchal (1981). The genetic manipulation of industrial
yeast strains. In: Stewart, G.G. and I. Russell (eds.), Current developments in yeast
resea¡ch. Pergamon Press, Toronto. pp. 14-24.
Stratford, M. and A.H. Rose (19S5). Transport of sulphur dioxide by Saccharomyces
cerevisiae. J. Gen. Microbiol. 132: I-6.
Struhl. K. (19S3). The new yeast genetics. Nature 305: 391-397.
Struhl, K., D.T. Stinchcomb, S. Scherer and R.W. Davis (1979). High-frequency
transformation of yeast: Autonomous replication of hybrid DNA molecules. Proc. Natl.
Acad. Sci. USA 76: 1035-1039.
Subden, R.E. (1987). Current developments in wine yeasts. CRC Crit. Rev.
Biotech. t:49-65.
Subden, R.E. and C. Osothsilp (1987). Malic acid metabolism in wine yeasts. In:
Stewarr, G.G., I. Russell, R.D. Ktein and R.R. Hiebsch (eds.). Biological research on
industrial yeasts, Vol 2. CRC Press inc., Boca Raton, Florida, pp. 67-76.
-150-
Subden, R.E., D. Irwin, J.D. Cunningham, and A.G. Meiering. (1982).'Wine yeast
isozymes. I. Genetic differences in 18 stock cultures. Can. J. Microbiol. 28: lO47-LOSO.
Sugden, D.A. and S.G. Oliver (1933). Reduced ethanol tolerance: one of the pleiotropic
effects of the pep4.3 mutation in Saccharomyces cerevisiae. Biotechnol. Len. 5: 419-422.
Suizu, T., Y. Iimura, K. Gomi, K. Takahashi, S. Ilara, K. Yoshizawa and G.
Tamura (1990). Constmction of urea non-producing yeast Saccharomyces cerevisiae by
disruption of the CAR1 gene. Agric. Biol. Chem. 54:537-539.
Takagi, 4., S. Harashima and Y. Oshima (1985). Hybridization and polyploidization of
Sacclnromyces cerevisi¿¿ strains by transformation-associated cell fusion. Appl. Environ.
Microbiol. 49: 244-246.
Takagi, M., S. Kawai, I. Shibuya, M. Miyazaki and K. Yano (1986). Cloning in
Saccharomyces cerevisiae of a cycloheximide resistance gene from the Candida maltosa
genome which modifies ribosomes. J. Bacteriol. 168: 417-419.
Takahashi, T. (1978). Genetic analysis of a German wine yeast. Bull. Brew.
Sci. 24: 39-47.
Takano, I. and Y. Oshima (1970). Allelism tests among various homothallism contolling
genes and gene systems in Saccharomyces. Genetics 64:229-238.
Taylor, N.V/. and W.L. Orton (1978). Aromatic compounds and sugars in flocculation of
Saccharomyces cerevisiae.l.Inst. Brew. 84: 53-57 .
Thomas, D.S. and A.H. Rose (1979).Inhibitory effect of ethanol on growth and solute
accumulation by Saccharomyces cerevisiae as effected by plasma membrane lipid
composition. Arch. Microbiol. 122: 49-55.
Thorne, R.S.W. (1951). Some aspects of yeast flocculence. Proc. Eur. Brew. Conv.
Congr., brighton, 1951. pp.2I-34.
Thornton, R.J. (1982). Selective hybridisation of pure culture wine yeasts. II.
Improvement of fermentation efficiency and inheritance of SO2 tolerance. Eur. J. Appl.
Microbiol. Biotechnol. 14: L59-I64.
-151-
Thornton, R.J. (1983). New yeast strains from old - the application of genetics to wine
yeasts. Food Technol. Australia S: 46-50.
Thornton, R.J. (1985). The introduction of flocculation into a homothallic wine yeast. A
practical example of the modification of winemaking properties by the use of genetic
techniques. Am. J. Enol. Vitic. X:47-49.
Thornton, R.J. (197Sa). The mapping of two dominant genes for foaming in wine
yeasts. FEMS L-ett. L:207-209.
Thornton, R.J. (l97Sb). Investigation on the genetics of foaming in wine yeasts. Eur. J.
Appl. Microbiol. Biotechnol. 5: 103-107.
Thornton, R.J., and R. Eschenbruch (197í).Homothallism in wine yeasts. Antonie van
Leeuwenhoek J. Microbiol. 42: 503-509.
Tipper, D.J. and K.A. Bostian. (1984). Double stranded ribonucleic acid killer systems in
yeasts. Microbiol. Rev. $: 125-156.
Tredoux, H.G., R.P. Tracey, a¡¿ A. Tromp. (1986). Killer factor in wine yeasts and its
effect on fermentation. S. Afr. J. Enol. Vitic. 7:105-112.
Tubb, R.S. and J.R.M. Hammond (1987). Yeast genetics. In: Priest, F.G. and I.
Campbell (eds.), Brewing microbiology. Elsevier Applied Science Publishers, Essex,
England, pp. 47-82.
Tubb, R.S., B.A. Searle, A.R. Goodey and A.J.P. Brown (1981). Rare mating and
transformation for construction of novel brewing yeasts. Eur. Brew. Conv. Proc. Cong.
l8th, Copenhagen. pp. 487-496.
Tuite, M.R., M.J. Dobson, N.A. Roberts, R.M. King, D.C. Burke, S.M. Kingsman and
A.J. Kingsman (1982). Regulated high effrciency expression of human interferon-alpha in
Saccharomyces cerevisae.Embo J. 1: 603-608.
Usseglio-Tomasset, L., G. Ciolfi, and A. Pagliara. (1981). Estimating sulphur dioxide
resistance of yeasts. I: The delaying action on fermentation start. Vini d'Ital. 23:78-90.
-152-
van Solingen, P. and J.B. van der Plaat (L977). Fusion of yeast spheroplasts. J
Bacteriol. 130: 946-947.
van Uden, N. (1985). Ethanol toxicity and ethanol tolerance in yeasts. Ann. Rep.
Ferment. Proc. S: 11-58.
van Uden, N. (1984). Temperature profiles of yeast. Adv. Microb. Physiol.2S:195-
25r.
van Vuuren, H.J.J. and B.D. V/ingfield (1986). Killer yeasts - cause of stuck
fermentations in a wine cellar. S. Afr. J. Enol. Vitic. 7: 113-118.
van Vuuren, H.J.J. and L. van der Meer (1987). Fingerprinting of yeasts by protein
electrophoresis. Am. J. Enol. Vitic. ü: 49-53.
Vaughan, A.E. and A. Ma¡tini. DNA base composition and DNA-DNA reassociation of
the "wine" species of the genus Saccharomyces Hansen. VI Int. ferm. Symp./V Int.
Symp. Yeast, London (Canada).
Vezinhet, F. (1935). Le marquage genetique de souches de levures oenologiques. Rev.
Fr. Oenol. 97: 47 -52.
Vezinhet, F. and S. Lacroix (1934). Marquage genetique de levures:outil de controle des
fermentations en souche pure. Bull. OIV 57: 759-773.
Vezinhet, F., B. Blondin and J. Hallet (1990). Chromosomal DNA patterns and
mitochondriat DNA polymorphism as tools for identification of enological strains of
S ac c haromy c es cerev isiae. Appl. Microbiol. Biotechnol . 32: 568-57 l.
Viljoen, 8.C., J.L.F. Kock, M. Miller, and D.J. Coetzee (1989). The value of
orthogonal-field-alternation gel electrophoresis and other criteria in the delimination of
anomorphic/telomorphic relations. System. Appl. Microbiol. 1 1: 305-31 1.
Vollrath, D. and R.\il. Davis (1987). Resolution of DNA molecules greater thatn 5
megabases by contour-clamped homogenous electric fields. Nucleic Acids Res. !l: 7865-
7876.
-153-
Watari, J., Y. Takata, M. Ogawa, N. Nishikawa and M. Kamimura (1989). Molecular
cloning of a flocculation gene in Saccharomyces cerevisiae. Agnc. Biol. Chem.53: 901-
903.
webb, A.D. and J.L. Ingraham (1963). Fusel oil: a review. Adv. Appl
Microbiol. 5:317-353.
'Webster, T.D. and R.C. Dickson (1983). Direct selection of Saccharomyces cerevisiae
resistant to the antibiotic G418 following transformation with a DNA vector carrying the
kanamycin resistance gene of Tn903. Gene X:243-252.
Vy'ickner, R.B. (1974). "Killer chatacter" of Saccharom]'ces: curing by growth at elevated
temperatures. J. Bacteriol. 717 : 1356-1357.
'Wickner, R.B. (1983). Genetic control of replication of the double-stranded RNA
segments of the killer systems in Saccharomyces cerevisiae. Arch. Biochem.
Bioohvs. 222: l-ll.
Williams, S.4., R.A. Hodges, T.L. Strike, R. Snow and R.E. Kunkee (1984). Cloning
the gene for the malolactic fermentation of wine from Inctobacilltts delbruckii in Escherichia
coli and yeasts. Appl. Environ. Microbiol. 47:288-293.
V/inge, O. (1935). On haplophase and diplophase in some Saccharomycetes. C.R. Lab.
Carlsberg Ser. Physiol. 22: 77 -1I2.
Winge, O. and C. Roberts (1958). In: H. Cook (ed.), The Chemistry and Biology of
Yeasts, Academic, New York, pp. 123-56.
Woodruff, H.B. (1980). Natural products from microorganisms. Science 208: 1225-
1229.
Xiao, W. and G.H. Rank (1989) The construction of recombinant industrial yeasts free of
bacterial sequences by directed gene replacement into a non-essential region of the genome.
Gene 76:99-107.
Yadav, N., R.E. McDevitt, S. Benard and S.C. Falco (1986). Single amino acid
substitutions in the enzyme acetolactate synthase confer resistance to the herbicide
sulfometuron methyl. Proc. Natl. Acad. Sci. USA 83:44L8-4422.
-154-
Yamashita, I. and S. Fukui (1983). Mating signals control expression of both starch
fermentation genes and a novel flocculation gene FLOS in the yeast
Sacccharomyces. Agric. Biol. Chem. 47: 2889-2896.
Yokomori, Y., H. Akiyama and K. Shimizu (1989). Breeding of wine yeasts through
protoplast fusion. Yeast (Spec. Iss.) pp. S145-5150.
Young, T.W. (1981). The genetic manipulation of killer character into brewing yeasts. J.
Inst. Brew. 87 : 292-295.
Young, T.W. (1983). The properties and brewing performance of brewing yeasts
possessing killer cha¡acter. J. Am. Soc. Brew. Chem. 4l: l-4.
Young, T.W. and M. Yagiu. (1978). A comparison of the killer character in different
yeasts and its classification. Antonie van I-eewenhoek J. Microbiol.44: 59-77.
Zambonelli, C. (1964a). Ricerche biometriche sulla produzione di idrogeno solforato da
solfati e solfiti in Saccharomyces cerevísiae var. ellipsoideus. Ann. Microbiol. 14: 129-
t4r.
Zambonelli, C. (1964b). Ricerche genetiche sullla produzione di idrogeno solforato in
Saccharomyces cerevisiae var. ellipsoideu.s. Ann. Microbiol. 14: 143-153.
Zambonelli, C. (1965a). Richerche genetiche sulla produzione di idrogeno solforato in
Saccharomyces cerevisiae var. ellipsoidew. II. Ereditarieta del carattere dal punto di vista
quantitativo. Ann. Microbiol. 15: 89-97.
Zambonelli, C. (1965b). Ricerche genetiche sulla produzione di idrogeno solforato in
Saccaromyces cerevísiae vw. ellípsoidew. trI. Ulteriori studi sulla eredita¡ieta del carattere
quantitativo. Ann. Microbiol. l5: 99-106.
Zambonelli, C. (1965c). Stabilita ed eredita¡ieta delle variazione nella produzione de H2S
indotte dal nitrato fenil-mercurico in Saccharomyces cerevisae var. ellipsoideus. Ann.
Microbiol. 15: 181-195.
-155-
Zambonelli, C., P. Mutinelli and G. Pachetti (1975). Biosynthesis of sulphur amino acids
\n Saccharomyces cerevisiae. I. Genetic analysis of leaky mutnts of sulphite
reductase. Arch. microbiol. 102: 247 -251.
Zhu, J., R. Contreras, D. Gheyson, J. Ernst and W. Friers (1985). A system for
dominant transformation and plasmid amplification in Saccharomyces
cerevisiae. Biotechnol. 3: 45 1-456.
Zimmerman, F.K. (1978). On the use of systematically selected yeasts in large wineries.
Proc. 5th Int. Oenol. Symp., Aukland.
Zimmerman, F.K. (1990). Genetics and stabilization of yeast for still and sparkling wine
production. Proc. 9th Int. Oenological symposium, Portugal. pp 166-177 -
Zimmermann, U. and J. Vienken (1982). Electric field-induced cell-to-cell fusion. J.
Membr. Biol. fl: 165-182.
-156-
Appendix 1 Publications
Petering J., Langridge, P. & Henshke, P. (1988). Fingerprinting wine yeasts: the application of chromosome electrophoresis. Australian & New Zealand Wine Industry Journal, 3(3), 48-52.
NOTE:
This publication is included in the print copy of the thesis held in the University of Adelaide Library.
Petering, J. E., Henschke, P. A. & Langridge, P. (1991). The Escherichia coli
ß-glucuronidase gene as a marker for Saccharomyces yeast strain
identification, American Journal of Enology and Viticulture, 42(1), 6-12.
NOTE:
This publication is included in the print copy
of the thesis held in the University of Adelaide Library.

Apprr eo ¡.r o Er.rv rnor.r M ENTAL Mr cnosr or-ocv, Nov. 1991, p. 3232-32360099 -2240 I 9I I II32 3 2-05 $02, 00/0Copyright o 1991, American Society for Microbiology
Vol. 57, No. 11
Determination of Killer Yeast Activity in Fermenting Grape Juice byUsing a Marked Saccharomyces Wine Yeast Strain
JENNY E. PETERING,I MICHAEL R. SYMONS,II PETBN LANGRIDGE,'NNO PAUL A. HENSCHKE'*
Department of Plant Science, Waite Agricultural Research Institute, The University of Adelaide, South Australia 5000,rand The Australian Wine Research Institute, P.O. Box 197, Gten Osmond, South Australia 5064,2 Australia
Received 7 June 199l/Accepted 26 August 1991
'lhe Escherichia coli þ-ghrcrtronidase gene has been used as a marker gene to monitor a killer Saccharomycescerevisiøe strain in mixed-culture ferments. The marked killer strain was cured of its M-dsRNA genome toenable direct assessment of the efficiency of killer toxin under fermentation conditions. Killer activity wasclearly evident in fermenting Rhine Riesling grape juice of pH 3.1 at l8'C, but the extent of killing dependedon the proportion of killer to sensitive cells at the time of inoculation. Killer activity was detected only whenthe ratio ofkiller to sensitive cells exceeded lz2. At the highest ratio ofkiller to sensitive cells tested (2:l),complete elimination of sensitive cells was not achieved.
Killer activity in yeasts was first reported for strains ofSaccharomyces cerevisiae in 1963 by Bevan and Makower(2). Killer yeasts secrete polypeptide toxins which kill sen-sitive strains of the same genus and, less frequently, strainsofdifferent genera (20, 30). Previous studies indicate that thetoxin of Saccharomyces cerevisiae is a protein which bindsto a receptor on the wall of the sensitive yeast cell, disrupt-ing the electrochemical gradient across the cell membraneand hence the intracellular ionic balance (6, 28).
Production of the toxin and immunity to it are determinedby a cytoplasmically inherited double-stranded (ds) RNAplasmid, otherwise known as the M genome (4). TheM-dsRNA killer plasmids are dependent satellites of L-A-dsRNA, and L-BC-dsRNA exists as a species unrelated tothe first or to M. All types of dsRNA exist in virus-likeparticles and require a protein encoded by the L-A-dsRNAfor encapsidation (4, 12, 30).
On the basis of the properties of the toxin, killer yeastshave been classified into 11 groups (K, through K11) (18, 33).Those unique to Saccharomyces strains fall into the firstthree groups (Kr, Kr, and K.). The Saccharomyces toxin isreversibly inactivated at low pH (2.0) and irreversibly inac-tivated at pH in excess of 5.0 (33). More specifically, thebiological activity of K, is optimal between pH 4.6 and 4.8,while K, shows optimal activity between pH 4.2 and 4.7 (27).The K, toxin is stable over a wider pH range than the K,toxin (2.8 to 4.8) (23) and is therefore more relevant in winefermentation.
Killer activity has been detected in yeasts isolated fromestablished vineyards and wineries in various regions of theworld, including Europe and Russia (1, 9, 18), South Africa(31), and Australia (14, 15). This widespread occurrence hasprompted interest in the enological significance of killer wineyeasts. In theory, selected killer yeast strains could be usedas the inoculated strain to suppress the growth of undesir-able wild strains of S. cerevisiae during grape juice fermen-tation. In addition, as killer interactions have been reportedto occur between yeasts of different genera (21, 25), the
* Corresponding author.T Present address: Petaluma Pty Ltd., Piccadilly, South Australia
5151, Australia.
possibility of genetically engineering broad-spectrum killerstrains of S. cerevisia¿ exists (3).
Studies have been conducted to assess the efficiency ofkiller toxin on sensitive yeast strains. However, reports onthe expression of kilter activity under fermentation condi-tions have been contradictory (5, 7, 16). Attempts to deter-mine the population kinetics of killer and sensitive strainsduring wine fermentation have been restricted because of thedifficulty involved in identifying the two types when they aregrown in mixed cultures. Approaches used to date include (i)choice of killer and sensitive strains that can be distinguishedby their growth rates (1) or their production of hydrogensulfide (24), (ii) use of auxotrophic and respiratory-deficientmutants of killer strains and appropriate plating conditionsunder which they can be identified (10, 11,26), (iii) use ofkiller and sensitive strains which can be distinguished bydifferences in colony morphology (14), and (iv) assayingcolonies directly for killer activity (17). All of these methodsare limited by the fact that the assays involved are laboriousand time-consuming or that only killer strains with specificcharacteristics can be studied.
We describe here the use of a marked S. cerevisiae killerstrain in a mixed-culture inoculum to quantify directly theeffect of killer toxin on a sensitive S. cerevisiae strain underfermentation conditions. As a wide range of yeast strains canbe readily and stably marked, this system of analysis isunlimited in application and provides a simple and unequiv-ocal means of quantifying killer yeast strains in mixed-culture ferments.
MATERIALS AND METHODS
Strains and media. Sensitive S. cerevisiae strains 5A(AV/RI 138) and 2A (AWRI 729) and killer (Kr) strain 114(AWRI 92F) were obtained from the Australian Wine Re-search Institute. Generation of the marked killer (Kr) strain3AM (AWRI 796) has been previously described (19). Yeastgrowth medium was YPD (I%o yeast extract [Difco], 2%Bacto Peptone [Difco] and2Vo glucose).
Curing of killer strain 3AM. A culture of strain 3AM wasgrown overnight in YPD al28"C. Serial dilutions were madein0.9% NaCl, and 0.1-ml aliquots (containing approximately100 cells) were spread on YPD plates and incubated at3'7"C.
3232
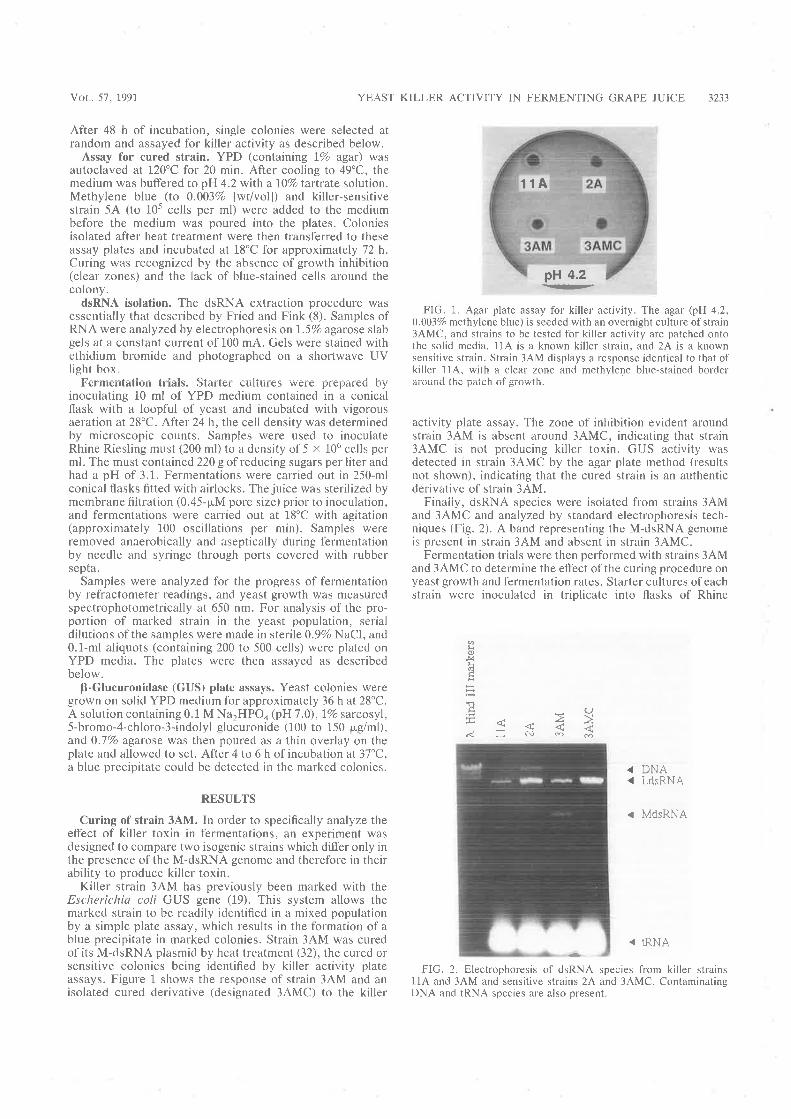
Vor. 57, 1991
After 48 h of incubation, single colonies were selected atrandom and assayed for killer activity as described below.
Assay for cured strain. YPD (containing l% agar) wasautoclaved at 120'C for 20 min. After cooling to 49"C, themedium was buffered to pH 4.2 with a l0% tartrate solution.Methylene blue (to 0.003% [wt/vol]) and killer-sensitivestrain 5A (to 105 cells per ml) were added to the mediumbefore the medium was poured into the plates. Coloniesisolated after heat treatment were then transferred to theseassay plates and incubated at 18"C for approximately 72 h.Curing was recognized by the absence of growth inhibition(clear zones) and the lack of blue-stained cells around thecolony.
dsRNA isolation. The dsRNA extraction procedure wasessentially that deseribed by Fried and Fink (8). Samples ofRNA were analyzed by electrophoresis on 1.5Øo agarose slabgels at a constant current of 100 mA. Gels were stained withethidium bl-omide and photographed on a shortwave UVlight box.
Fermentation trials. Starter culiures were prepared byinoculating 10 ml of YPD medium contained in a conicalflask with a ioopiul oí yeasi and incubate<i with vigorousaeration at 28"C. After 24 h, the cell density was determinedby microscopic counts. Samples were used to inoculateRhine Riesling must (200 ml) to a density of 5 x 10⁶ cells per'
ml. The must contained220 g of reducing sugars per liter andhad a pH of 3.1. Fermentations were carried out in 250-mlconical flasks fitted with airlocks. The juice was sterilized bymembrane fiitration (0.45-f¡M pore size) prior io inoculation,and fermentations were carried out at 18'C with agitation(approximately 100 oscillations per min). Samples wereremoved anaerobically and aseptically during fermentationby needle and syringe through ports covered with rubbersepta.
Samples were analyzed for the progress of fermentationby refractometer readings, and yeast growth was measuredspectrophotometrically at 650 nm. For analysis of the pro-portion of malked strain in the yeast population, serialdilutions of the samples were made in sterile 0.9% NaCl, and0.1-ml aliquots (containing 200 to 500 cells) were plated onYPD media. The plates were then assayed as describedbelow.
B"Glucuronidase (GUS) platc assays. Yeast colonies weregrown on solid YPD medium for approximately 36 h at 28"C.A solution containing 0.1 M NarHPOo (pH 7.0), l%o sarcosyl,5-bromo-4-chloro-3-indolyl glucuronide (100 to 150 pg/ml),and 0.77o agarose was then poured as a thin overlay on theplate and allowed to set. After4 to 6 h of incubation aI 37"C,a blue precipitate could be detected in the marked colonies.
RESULTS
Curing of strain 3AM. In order to specifically analyze Íheeffect of killer toxin in fermentations, an experiment wasdesigned to compare two isogenic strains which differ only inthe presence of the M-dsRNA genome and therefore in theirability to produce killer toxin.
Killer strain 3AM has previously been marked with theEscherichia coli GUS gene (19). This system allows themarked strain to be readily identified in a mixed populationby a simple plate assay, which results in the formation of ablue precipitate in marked colonies. Strain 3AM was curedof its M-dSRNA plasmid by heat treatment (32), the cured or'sensitive colonies being identified by killer activity plateassays. Figure 1 shows the response of strain 3AM and anisolated cured derivative (designated 3AMC) to the killer
YEAST KILLER ACTIVITY IN FERMENTING GRAPE JUICE 3233
pH 4.2!-F
FIG. t. Agal plate assay for killer activity. The agar'(pH 4.2,0.003% methylene blue) is seeded with an overnight culture of strain3AMC, and strains to be tested for killer activity are patched ontothe solid media. 114 is a known killer strain, and 2A is a knownsensitive strain. Strain 3AM displays a response identical to that ofkitler 11,{, with a clear zone and methylene blue-stained borderaround thc patch of gro'wth.
activity plate assay. The zone of inhibition evident aroundstrain 3AM is absent around 3AMC, indicating that strain3AMC is not producing killer toxin. GUS activity wasdetected in stl'ain 3AMC by the agar plate method (resultsnot shown), indicating that the cured strain is an authenticderivative of stlain 3AM.
Finally, cisRNA species were isoiated from stlains 3AMand 3AMC and analyzed by standard electrophoresis tech-niques (Fig. 2). A band representing the M-dsRNA genomeis present in strain 3AM and absent in strain 3AMC.
Fermentation trials were then performed with strains 3AMand 3AMC to determine the effect of the curing procedure onyeast growth and fermentation rates. Starter cultures ofeachstrain were inoculated in triplicate into flasks of Rhine
< MdsRNA
< tRNA
FIG. 2. Electrophoresis of dsRNA species from killer strains114 and 3AM and sensitive strains 2A and 3AMC. ContaminatingDNA and tRNA species ale also present.
Lo.51Lõ
úÊU,F>:1{<
LdsRNADNA
3AMC
114
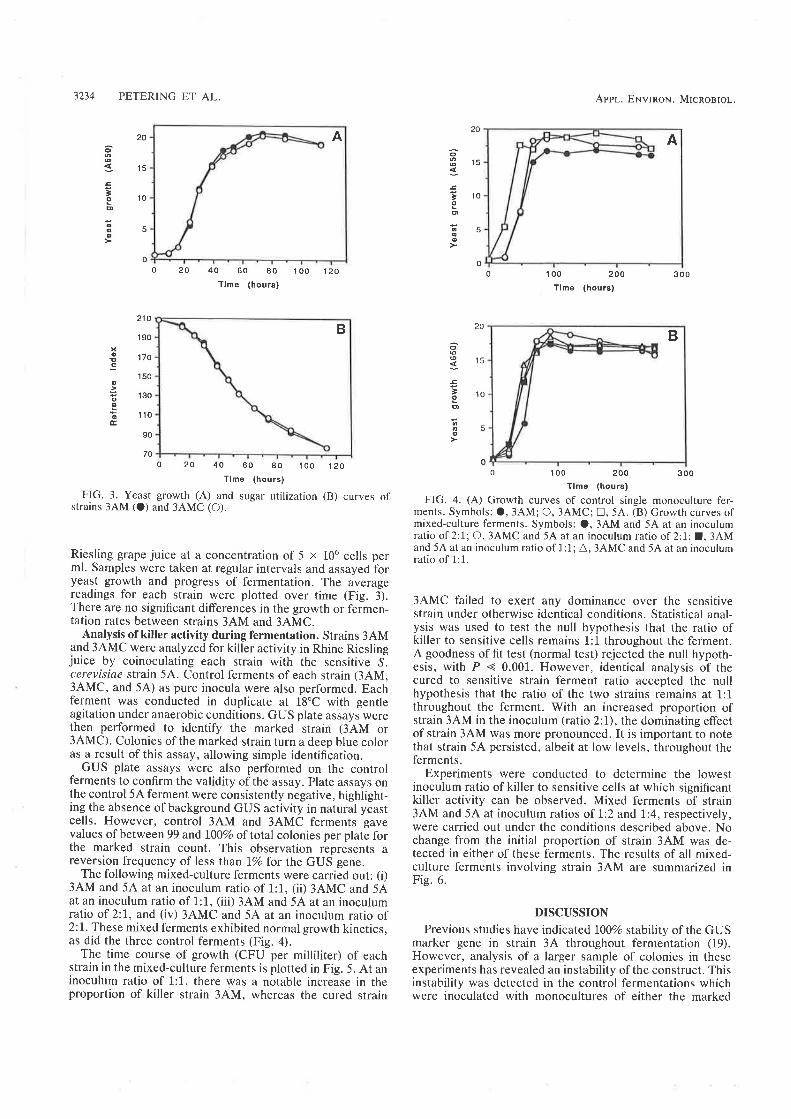
A
J234 PETERING ET AL.
20
15
10
40 60 80 1 00 120Tlme (hours)
210
'190
170
150
130
110
90
700 20 40 60 Bo 100 120
Tlme (hours)
FIG. 3. Yeast growth (A) and sugar utilization (B) curves ofstrains 3AM (O) and 3AMC (O).
Riesling grape juice at a concentration of 5 x 10⁶ cells perml. Samples were taken at regular intervals and assayed foryeast growth and progress of fermentation. The averagereadings for each strain were plotted over time (Fig. 3).There are no significant differences in the growth or fermen-tation rates between strains 3AM and 3AMC.
Analysis of killer activity during fermentation. Strains 3AMand 3AMC were analyzed for killer activity in Rhine Rieslingjuice by coinoculating each strain with the sensitive .!.cerevisiae strain 5A. Control ferments of each strain (34M,3AMC, and 5A) as pure inocula were also performed. Eachferment was conducted in duplicate at 18'C with gentleagitation under anaerobic conditions. GUS plate assays werethen performed to identify the marked strain (3AM or3AMC). Colonies of the marked strain turn a deep blue coloras a result of this assay, allowing simple identification.
GUS plate assays were also performed on the controlferments to confirm the validity ofthe assay. Plate assays onthe control 5A ferment were consistently negative, highlight-ing the absence of background GUS activity in natural yeastcells. However, control 3AM and 3AMC ferments gavevalues ofbetween 99 and I00Vo oftotal colonies per plate forthe marked strain count. This observation represents areversion frequency of less than IVo for the GUS gene.
The following mixed-culture ferments were carried out: (i)3AM and 5A at an inoculum ratio of 1:1, (ii) 3AMC and 5Aat an inoculum ratio of 1:1, (iii) 3AM and 5A at an inoculumratio of 2:1, and (iv) 3AMC and 5A at an inoculum ratio of2:1. These mixed ferments exhibited normal growth kinetics,as did the three control ferments (Fig. a).
The time course of growth (CFU per milliliter) of eachstrain in the mixed-culture ferments is plotted in Fig. 5. At aninoculum ratio of 1:1, there was a notable increase in theproportion of killer strain 3AM, whereas the cured strain
Appl. ENvlnor.¡. Mrcnosror.
'15
'lo
1 00 200Tlme (hours)
300
't5
10
0 1 00 200 300TlmE (hours)
FIG, 4. (A) Growth curves of control single monoculture fer-ments. Symbols: O, 3AM; O, 3AMC; !, 54. (B) Growth curves ofmixed-culture ferments. Symbols: a, 3AM and 5A at an inoculumratio of 2:1; O,3AMC and 5A at an inoculum ratio of 2:1; l,3AMand 5A at an inoculum ratio of 1:1; A, 3AMC and 5A at an inoculumratio of 1:1.
3AMC failed to exert any dominance over the sensitivestrain under otherwise identical conditions. Statistical anal-ysis was used to test the null hypothesis that the ratio ofkiller to sensitive cells remains 1:1 throughout the ferment.A goodness offit test (normal test) rejected the null hypoth-esis, with P < 0.001. However, identical analysis of thecured to sensitive strain ferment ratio accepted the nullhypothesis that the ratio of the two strains remains at 1:1throughout the ferment. With an increased proportion ofstrain 3AM in the inoculum (ratio 2:1), the dominating effectof strain 3AM was more pronounced. It is important to notethat strain 5A persisted, albeit at low levels, throughout theferments.
Experiments were conducted to determine the lowestinoculum ratio of killer to sensitive cells at which significantkiller activity can be observed. Mixed ferments of strain3AM and 5A at inoculum ratios of 1:2 and 1:4, respectively,were carried out under the conditions described above. Nochange from the initial proportion of strain 3AM was de-tected in either of these ferments. The results of all mixed-culture ferments involving strain 3AM are summarized inFig. 6.
DISCUSSION
Previous studies have indicatedl00% stability of the GUSmarker gene in strain 3A throughout fermentation (19).However, analysis of a larger sample of colonies in theseexperiments has revealed an instability of the construct. Thisinstability was detected in the control fermentations whichwere inoculated with monocultures of either the marked
20
oo
E¡oo
6o
o
E!oo
co
55
o0o20 0
20
xo!so¿ooo
cÉ5
ooo
cÈoo
€o
o
A
B B
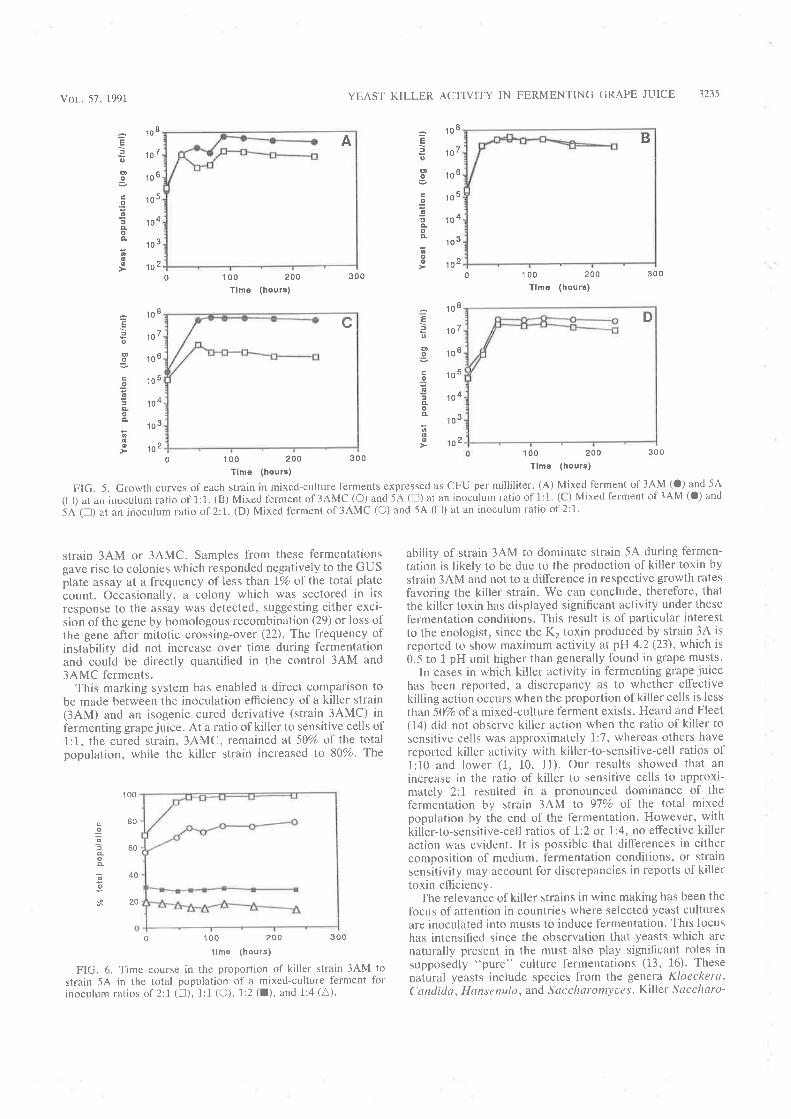
A
Vor. 57, 1991 YEAST KILLER ACTIVITY IN FERMENTING GRAPE JUICE 3235
IEf
oo
co6feoÈ
6oo
'toB
'ro7
106
10J
ro4
ro3
'to2
roB
'toT
106
ro5
104
'lo3
102
Eao
oo
cI!5Èoo6oo
0
0
'I 00 200Tlmo (hours)
1 00 200Tlme (hours)
Efo
6o
ooaÂÕo
6oo
to8
lo7
ro6
105
ro4
103
1o2
'1 00 200Tlm6 (hours)
1 00 200Tlmo (hours)
300
300
0 300
300
âEJoqItrIgaÊoÂ
Ø6o
'lo I
ro7
ro6
10"
ro4
ro3
1o2
FIG. 5. Growth curves of each strain in mixed-culture ferments expresseci as CFU per miliiliter. (A) Ìvíixeci íermeni oi3ÂÌr{ (O) ai-rd 5A
(D) ar ar-r inoculum ratio of 1:1. (B) Mixed ferment of 3AMC (O) and 5A (n) at an inoculum ratio of 1:1. (C) Mir-erl fermenr of 3AM (o) andj,f (¡) ut an inoculum ¡atio of 2:1. (D) Mixed ferment of 3AMC (O) and 5A (!) at an inoculum ratio of 2:1.
strain 3AM or 3AMC. Samples from these fermentationsgave rise to colonies which responded negatively to the GUSplate assay at a frequency of less than lVo of the total plateðount. Occasionally, a colony which was sectored in itsresponse to the assay was detected, suggesting either exci-sion of the gene by homologous recombination (29) or loss ofthe gene after mitotic crossing-over (22). The frequency ofinstability did not increase over time during fermentationand could be directly quantified in the control 3AM and
3AMC f'erments.This marking system has enabled a direct comparison to
be made between the inoculation efficiency of a killer strain(3AM) and an isogenic cured derivative (strain 3AMC) in
fermenting grape juice. At a l'atio of killer to sensitive cells of1:1, the cured strain, 3AMC, remained ã1 50% of the totalpopulation, while the killer strain increased to 8070. The
ability of strain 3AM to dominate strain 5A during fermen-tation is likely to be due to the production of kilter toxin bystrain 3AM and not to a difference in respective growth ratesfavoring the killer strain. We can conclude, therefore, thatthe killer toxin has displayed significant activity under these
fermentation conditions. This result is of particular interestto the enologist, since the K, toxin produced by strain 3A is
reported to show maximum activity at pH 4.2 (23), which is0.5 to 1 pH unit higher than generally found in grape musts.
In cases in which killel activity in fermenting grape juicehas been reported, a discrepaney as to whether effectivekilling action occurs when the proportion of killer cells is less
than507o of a mixed-culture ferment exists. Heard and Fleet(14) did not observe killer action when the ratio of killer tosensitive cells was approximately 1:7, whereas others have
reported killer activity with killer-to-sensitive-cell ratios of1:10 and lower (1, 10, i1). Our results showed that an
increase in the ratio of killer to sensitive cells to approxi-mately 2:1 resulted in a pronounced dominance of thefermentation by strain 3AM to 97% of the total mixedpopulation by the end of the fermentation. However, withkiller-to-sensitive-cell ratios of l'.2 or l'.4, no effective killeractiou was evident. It is possible that differences in eithercomposition of medium, fermentation conditions, or strainsensitivity may account for discrepancies in reports of killertoxin efficiency.
The relevance of killer strains in wine making has been thefocus of attention in countries where selected yeast culturesare inoculated into musts to induce fermentation. 'l'his tbcushas intensified since the observation that yeasts which are
naturally present in the must also play significant roles insupposedly "pure" culture fermentations (13, 16). Thesenatural yeasts include species from the genera Kloeckero,C ct nd i du, H a ns e n u I a, and S ac c haro my c e s . Killer S ac c h aro-
cog)ooÈão
s
100
BO
60
40
20
0 1 00 200 300
tlme (hours)
FIG. 6. Time course in the proportion of killer strain 3AM tostrain 5A in the total population of a mixed-culture fet'ment forinoculum ratios of 2:1 (n), 1:1 (O), 1:2 (l), and 1:4 (A).
B
c D
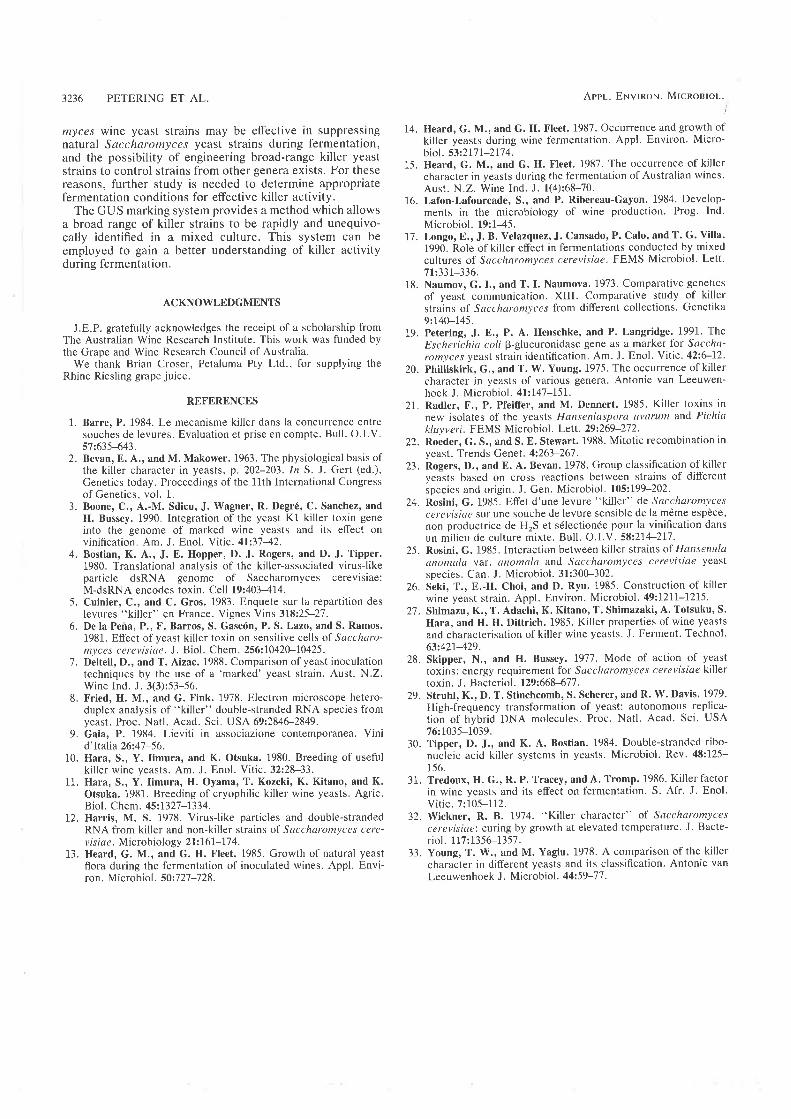
3236 PETERING ET AL.
myces wine yeast strains may be effective in suppressingnatural Saccharomyce.r yeast strains during fermentation,and the possibility of engineering broad-range killer yeaststrains to control strains from other genera exists. For thesereasons, further study is needed to determine appropriatefermentation conditions for effective killer activity.
The GUS marking system provides a method which allowsa broad range of killer strains to be rapidly and unequivo-cally identified in a mixed culture. This system can beemployed to gain a better understanding of killer activityduring fermentation.
ACKNOWLEDGMENTS
J.E.P. gratefully acknowledges the receipt of a scholarship fromThe Australian Wine Research lnstitute. This work was funded bythe Grape and Wine Research Council of Australia.
We thank Brian Croser, Petaluma Pty Ltd., for supplying theRhine Riesling grape juice.
REFERENCES
1. Barre, P. 1984. Le mecanisme killer dans la concurrence entresouches de levures. Evaluation et prise en compte. Butl. O.l.V.57 2635-643.
2. Bevan, E. 4., and M. Makower. 1963. The physiological basis ofthe killer character in yeasts, p. 202-201. ^ln S. J. Gert (ed.),Genetics today. Proceedings ofthe 11th lnternational Congressof Genetics, vol. 1.
3. Boone, C., A.-M. Sdicu, J. Wagner, R. Degré, C. Sanchez, andH. Bussey. 1990, Integration of the yeast Kl killer toxin geneinto the genome of marked wine yeasts and its effect onvinification. Am. J. Enol. Yitic. 413'742.
4. Bostian, K. A.., J. E, Hopper, D. J. Rogers, and D. J. Tipper.1980. Translational aoalysis of the killer-associated virus-likeparticle dsRNA genome of Saccharomyces cerevisiae:M-dsRNA encodes toxin. Cell 19':403414.
5. Cuinier, C., and C. Gros, 1983. Enquete sur la repartition des
levures "killer" en France. Vignes Vìns 318:.25-27.6. De la Peña, P., F. Barros, S. Gascón, P. S. Lazo, and S. Ramos.
1981. Effect of yeast killer toxin on sensitive cells of Saccharo-myces cerevisi¿r¿. J. Biol. Chem. 256:1042U10425.
7. Delteil, D., and T, Aizac, 1988. Comparison of yeast inoculationtechniques by the use of a'marked' yeast strain. Aust. N.Z.Wine lnd. J. 3(3):53-56.
8. Fried, H. M., and G. Fink. 1978. Electron microscope hetero-duplex aoalysis of "killer" double-stranded RNA species fromyeast. Proc. Natl. Acad. Sci. USA 692284Ç2849.
9. Gaia, P. 1984. Lieviti in associazione contemporanea. Vinid'ltalia 26t47-56.
10. Hara, S., Y. Iimura, and K. Otsuka. 1980. Breeding of usefulkiller wine yeasts. Am. J. Enol. Vitic. 32:28-33.
11. Hara, S., Y. Iimura, H. Oyama, T. Kozeki, K. Kitano, and K.Otsuka. 1981. Breeding of cryophilic killer wine yeasts. Agric.Biol. Chem. 45t1327-\334.
12. Harris, M. S. 1978. Virus-like particles and double-strandedRNA from killer and non-killer strains of Saccharomyces cere-vlslae. Microbi ology 2lz16l-17 4.
13. Heard, G. M., and G, H. Fleet. 1985. Growth of oatural yeastflora during the fermentation of inoculated wines. Appl, Envi-ron. Microbiol . 50272'7J28.
Appl. ENvlnor.¡. MlcnonloL.i
14. Heard, G. M., and G. H. Fleet. 1987. Occurrence and growth ofkiller yeasts during wine fermentation. Appl' Environ. Micro-biol. 53z2I7I2Il4.
15. Heard, G. M., and G. H. Fleet. 1987. The occurreoce of killercbaracter in yeasts during the fermentation of Australian wines.Aust. N.Z. Wine Ind. J. f(4):68-70.
16. Lafon-Lafourcade, S., and P. Ribereau-Gayon. 1984. Develop-ments in the microbiology of wine production' Prog. Ind'Microbiol. 19:1-45.
17. Longo, E., J. B. Velazquez, J. Cansado, P. Calo, and T. G. Villa.1990. Role of killer effect in fermentations conducted by mixedcultures of Saccharomyces cerevisiae. FEMS Microbiol' Lett.7l:331-336.
18. Naumov, G. I., and T. I. Naumova, 1973. Compalative genetics
of yeast communication. XIII. Comparative study of killerstrains of Saccharomvces from different collections. Genetika9:140-145.
19. Petering, J. E., P. A. Henschke, and P' Langridge. 1991. TheEscherichia coll p-glucuronidase gene as a marker for Saccha-romyces yeast strain identification. Am. J. Enol. Yilic' 42:Ç12.
20. Philliskirk, G., and T. W. Young' 1975. The occurrence of killercharacter in yeasts of various genera. Antonie van Leeuwen-hoek J. Microbiol. 4l:147-151.
21. Radler, F., P. Pfeiffer, and M. Dennert. 1985. Kitler toxins innew isolates of the yeasts Hanseniaspora uvúrum and Pichiakluyveri. FEMS Microbiol. Lett. 29:269-272.
22. Roeder, G. S., and S. E. Stewart. 1988. Mitotic recombination inyeast. Trends Gene¡. 4:263-267.
23. Rogers, D., and E. A, Bevan. 1978. Group classification of killeryeasts based on cross reactions between strains of differentspecies and origin. J. Gen. Microbiol, 105:199-202.
24. Rosini, G. 1985. Effet d'une levure "killer" de Saccharomycescerevisiue sur une souche de levure sensìble de la même espèce,
non productrice de HrS et sélectionée pour la vinification dans
un milieu de culture mixte. Bull. O.l.Y. 58:214-217.25. Rosini, G. 1985. Interaction between killer strains of Hansenula
anomala var. unomala and Sncchurotnyces cerevisiae yeàsfspecies. Can, J. Microbiol. 3l:300-302.
26. Seki, T., E.-H. Choi, and D. Ryu. 1985. Construction of killerwine yeast strain. Appl. Environ. Microbiol' 49:I2ll-I2I5'
27. Shimazu, K., T. Adachi, K. Kitano, T. Shimazaki, A. Totsuku, S.
Hara, and H. H. Dittrich. 1985. Killer properties of wine yeasts
and characterisation of killer wine yeasts. J. Ferment. Technol'63:'421429.
28. Skipper, N., and H. Bussey. 1977. Mode of action of yeasttoxins: energy requirement for Succharomyces cerevisiae killertoxin. J. Bacteriol. 129:668-677.
29. Struhl, K., D, T, Stinchcomb, S. Scherer, and R. W. Davis. 1979'
High-frequency transformation of yeast: autonomous replica-tion of hybrid DNA molecules. Proc. Natl' Acad' Sci. USA76:1035-1039.
30. Tipper, D. J,, and K. A. Bostian. 1984. Double-stranded ribo-nucleic acid killer systems in yeasts. Microbiol. Rev' 48:125-156.
31. Tredoux, H. G., R. P. Tracey, and A. Tromp' 1986. Killerfactorin wine yeasts and its effect on fermentation. S. Afr' J. Enol.Vitic. 7:105-112.
32. Wickner, R, B. 1974. "Killer character" of Saccharomycescerevisiue', curing by growth at elevated temperature. J' Bacte-riol. l17:135G1357.
33. Young, T, W., and M. Yagiu. 1978. A comparison of the killercharacter in different yeasts and its classification. Antonie van
Leeuwenhoek J. Microbiol. 44t59-77.