modeling void coalescence during ductile fracture of a steel
TRANSCRIPT

Materials Science and Engineering A366 (2004) 269–281
Modeling void coalescence during ductile fracture of a steel
J.P. Bandstraa, D.A. Kossb,∗, A. Geltmacherc, P. Maticc, R.K. Everettd
a University of Pittsburgh at Johnstown, Johnstown, PA 15904, USAb Penn State University, University Park, PA 16802, USA
c Naval Research Laboratory, Washington, DC 20375, USAd Office of Naval Research International Field Office, London, UK
Received 23 January 2003; received in revised form 5 August 2003
Abstract
Ductile fracture of HY-100 steel at high stress triaxialities occurs by avoid-sheet mode of failure in which large elongated voids,formed at MnS inclusions, coalesce as a result of a localized deformation instability that develops between neighboring voids. In thisstudy, micro-mechanical modeling using finite element analysis has been employed to examine the deformation localization behavior withinvoid arrays based on experimentally observed inclusion microstructures of HY-100 steel. Treating the elongated voids as through-thicknessholes, we utilize image-based multi-hole models, each depicting roughly 125 voids, to identify the significance of the critical features (size,spacing, clustering) of the void microstructure on the deformation localization process and ultimately void-sheet coalescence and failure. Thedeformation localization is especially sensitive to the presence of a few large voids spaced within roughly 30 hole diameters of each otherand oriented on planes 45◦ ± 15◦ to the maximum applied principal stress. The results also show that deformation localization develops morereadily at high stress triaxialities. Smaller, “secondary” voids can promote the onset of strain localization between large voids, even if theynucleate after a rather large void nucleation strain. Within microstructures consisting of solely of small voids, high density clusters can causeintense strain localization, but it is confined within the scale of the cluster.© 2003 Elsevier B.V. All rights reserved.
Keywords: Ductile fracture; Coalescence; Steel
1. Introduction
Ductile fracture usually involves the nucleation, growthand coalescence of voids in a plastically deforming mate-rial. In many structural alloys, especially most structuralsteels, void nucleation occurs at small strains and failureis controlled by void growth and coalescence. Hot workedsteels typically contain elongated inclusions or inclusionstringers with their long axes oriented in the rolling direc-tion. When notched tensile specimens are loaded transverseto the rolling direction, the resulting elongated voids growuntil coalescence occurs, frequently due to a “void-sheet”mechanism[1–8]. Void-sheet failure occurs in a manner thatcreates a zig-zag fracture profile comprised of segments ori-ented roughly±45◦ to the principal stress axis and charac-terized by sheets of microvoids nucleated at a “secondary”
∗ Corresponding author. Tel.:+1-814-865-5447;fax: +1-814-865-2917.
E-mail address: [email protected] (D.A. Koss).
population of particles. These secondary particles are nor-mally fine carbide precipitates[5,8] or small sulfide particles[3] in quenched and tempered steels.
The mechanism of void linking during void-sheet fail-ure has been analyzed on the basis of deformation local-ization between the primary voids. One approach is toexamine the void-sheet localization process by utilizing animperfection-based analysis of a plastic material containingvoids[9] or, more specifically, to depict the evolution of theplastic flow localization in a shear band forming along a rowof uniformly spaced cylindrical voids contained on a planeinclined to the maximum principal stress[10]. Another ap-proach, based on fracture surface observations in HY-100steel, is to perform numerical analyses in which 2.5�mthick, elongated inclusions (typically 30–100�m long) aresimulated as either two or six cylindrical holes with a di-ameter of 2.5�m, spaced 70�m apart and contained withinan inclined plane oriented 45◦ to the stress axis[11,12]. Acritical assumption in that analysis is that the presence ofelongated, “cigar-shaped” voids, which have been shown
0921-5093/$ – see front matter © 2003 Elsevier B.V. All rights reserved.doi:10.1016/j.msea.2003.08.018
270 J.P. Bandstra et al. / Materials Science and Engineering A366 (2004) 269–281
to grow to >200�m along their length[13], can perturbthe far-field stress state locally such that the intervoid lig-ament experiences plane-strain deformation between theprimary voids. These previous results indicate that, despitetheir small size and spacing, even pairs of cylindrical voidsspaced∼28 void diameters apart can cause strain local-ization to occur in the material between the voids (albeitonly at high degrees of stress triaxiality), thus inducing avoid-sheet mechanism of coalescence[11,12]. However, itis important to recognize that both modeling proceduresidentified above assumeuniformly spaced voids constrainedto a single plane that is inclined to the maximum principalstress axis.
In steel microstructures, the primary voids associatedwith elongated MnS inclusions are neither periodic nor uni-formly distributed[2,3,5–7]. Furthermore, in HY-100 steel,the material basis for this study, the inclusions are concen-trated within microstructural bands[14,15]. As expected,the modeling efforts described above do not fully capturethe relevant microstructure with respect to a void-sheetmechanism, since the spatial distributions of voids and in-teractions among groups of voids have been shown to beimportant[16–20].
In this paper, we present an image based,multi-holecomputational model based on an observed inclusion mi-crostructure in HY-100 steel. As the basis for a realisticvoid microstructure, we rely on quantitative metallographyperformed on HY-100 steel in which the density, size andspatial distributions of MnS inclusions were characterized[14]. In this steel, the large, elongated MnS inclusionsnucleate voids at small strains[21] and, at high stresstriaxialities, eventually coalesce by the void-sheet mecha-nism [6,7]. This study relies on image-based modeling tosimulate the inclusion microstructure in HY-100 steel asarrays of multi-sized holes whose locations correspond toelongated voids that have formed at the inclusions. Theobjective of this modeling effort is to examine the influenceof the material microstructure on the evolution of strainlocalization within that voided microstructure. We confineour analysis to material with strain hardening behaviorsimulating that of HY-100. (The influence of strain hard-ening and strain-rate hardening, both of which will delaydeformation localization, is not addressed in this study;strain hardening effects have been studied in the contextof a two-hole model[12,22].) In its application, the modelutilizes the inclusion/void microstructure to identify whichfeatures (notably size, spacing, clustering of voids) are sig-nificant from the standpoint of the deformation localizationpatterns and eventual coalescence of voids. In addition, arational procedure has been used to evaluate the effects ofvariations of the void microstructure, such as the presenceof voids with a range of sizes, the removal of large or smallvoids, and local variations in void microstructure. The sen-sitivity of deformation localization between large voids tothe nucleation of small, secondary voids that form at finitestrains on is also briefly explored. Thus, this study is an
attempt to determine the influence of actual inclusion/voidmicrostructure on the ductile fracture process as it relates tolocalized deformation behavior within that microstructure.
2. Background
2.1. Microstructural characteristics of inclusions/voids
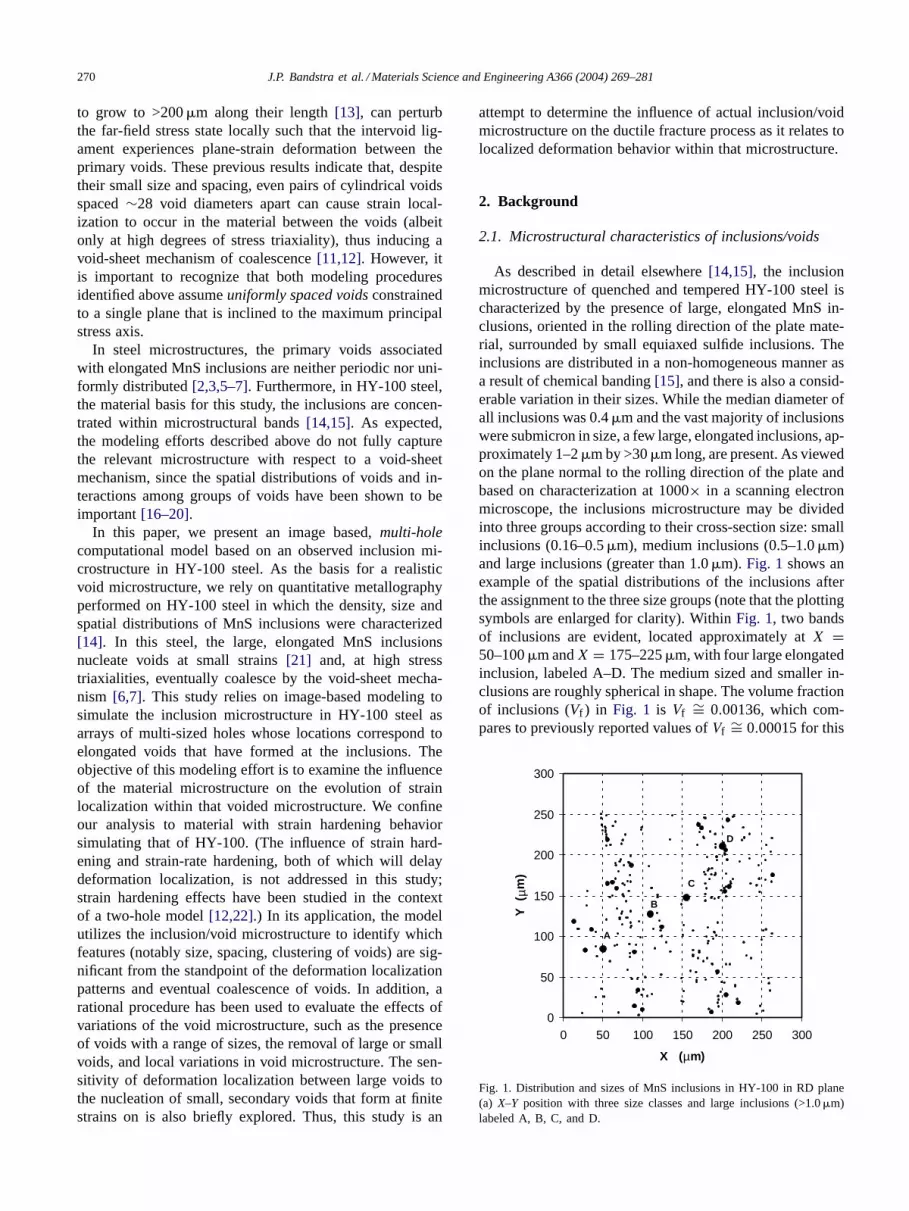
As described in detail elsewhere[14,15], the inclusionmicrostructure of quenched and tempered HY-100 steel ischaracterized by the presence of large, elongated MnS in-clusions, oriented in the rolling direction of the plate mate-rial, surrounded by small equiaxed sulfide inclusions. Theinclusions are distributed in a non-homogeneous manner asa result of chemical banding[15], and there is also a consid-erable variation in their sizes. While the median diameter ofall inclusions was 0.4�m and the vast majority of inclusionswere submicron in size, a few large, elongated inclusions, ap-proximately 1–2�m by >30�m long, are present. As viewedon the plane normal to the rolling direction of the plate andbased on characterization at 1000× in a scanning electronmicroscope, the inclusions microstructure may be dividedinto three groups according to their cross-section size: smallinclusions (0.16–0.5�m), medium inclusions (0.5–1.0�m)and large inclusions (greater than 1.0�m). Fig. 1 shows anexample of the spatial distributions of the inclusions afterthe assignment to the three size groups (note that the plottingsymbols are enlarged for clarity). WithinFig. 1, two bandsof inclusions are evident, located approximately atX =50–100�m andX = 175–225�m, with four large elongatedinclusion, labeled A–D. The medium sized and smaller in-clusions are roughly spherical in shape. The volume fractionof inclusions (Vf ) in Fig. 1 is Vf ∼= 0.00136, which com-pares to previously reported values ofVf ∼= 0.00015 for this
0
50
100
150
200
250
300
0 50 100 150 200 250 300
X (µm)
Y
( µm
)
A
B
C
D
Fig. 1. Distribution and sizes of MnS inclusions in HY-100 in RD plane(a) X–Y position with three size classes and large inclusions (>1.0�m)labeled A, B, C, and D.
J.P. Bandstra et al. / Materials Science and Engineering A366 (2004) 269–281 271
steel[6,7]. This difference is due to the existence of the largevoids and the two bands of dense inclusions in the regionexamined inFig. 1.
2.2. Model development
We developed an image-based computational finite ele-ment modeling technique to examine the interactive effectsof the observed MnS inclusion population on the strain evo-lution and deformation localization for two levels of ap-plied multiaxial stresses. Given the propensity for voids tonucleate in steels at the large MnS inclusions shortly af-ter yielding [22–24], we assume the inclusions are voidsites; thus, the terms “inclusions” and “voids” are usuallyused interchangeably in this paper. Importantly, fractog-raphy [7] and subsequently X-ray tomography[13] haveidentified the presence of elongated “cigar-shaped” voids,typically 200–300�m long, between which a local condi-tion of plane-strain deformation is likely to form[11,12]. Inour study, we rely primarily but not exclusively on model-ing all of the inclusion-initiated voids as through-thicknessholes in a thick plate deforming under conditions of planestrain through the thickness. While this is a reasonable as-sumption for the large, elongated primary voids, which (aswill be shown later) dominate the deformation localiza-tion process, treating the small secondary voids, which re-main comparatively equiaxed, as through-thickness holeswill over-estimate their effects on the localization process.We also briefly address the issue of secondary void nucle-ation at large strains by modeling the small inclusions aswell-bonded elastic particles that nucleate voids high strains,such as at an equivalent strain of 0.5.
Our model is based on the HY-100 steel inclusion mi-crostructure shown inFig. 1. It includes two bands of inclu-sions that produce local variation of void densities. In thisregion there are four large inclusions that had the follow-ing equivalent circle diameters:A = 5.9�m, B = 2.2�m,C = 1.3�m, andD = 3.0�m. In addition to the large in-clusions, small inclusions (0.5�m) and medium sized in-clusions (between 0.5 and 1.0�m in major dimension) arealso present. In this study, we will also construct other mi-crostructures based onFig. 1 to evaluate specific effects ofthe void microstructure on the deformation localization pro-cess. For example, all the small inclusions can be removedfrom the model so that the influence of the smaller inclu-sions on the deformation localization process can be as-sessed. Alternatively, the microstructure can be modified toretain all of the small voids while removing the large ones inorder to illustrate the deformation localization response ofa microstructure that does not contain large voids (e.g. afterimproved processing). We shall also address selected voidvolume fraction issues and illustrate the important effect ofapplied stress state.
In order to benchmark the effects of inclusion/void mi-crostructures, we will also examine the case in whichequal-sized voids 0.5�m × 0.5�m in size are arranged in
a regular square array spaced 125.5�m apart (void volumefraction,Vf = 0.0016) as a basis of comparison and to as-sess the effects of a regular, cell-like spacing. We will alsoexamine another microstructure consisting of equal-sizedrandomly located voids. In this case, 320 one-element voidswere introduced for an equivalentVf = 0.0020.
The finite element models were developed with sufficientrefinement in element size so that individual inclusionscan be included in the model. All finite element analyseswere performed using the ABAQUS program (ABAQUSis a trademark of Hibbitt, Karslson, and Sorenson, Inc.Pawtucket, RI). The element formulation used for all theseanalyses was 4-node bilinear, reduced integration withhourglass control (ABAQUS element CPE4R). The elementshape was square to support the 400× 400 element gridconstruction. The material definition was an elastic-plasticrate-independent model utilizing multi-linear isoptropichardening and von Mises yield surface. Based on the mi-crostructure inFig. 1, a 200�m × 200�m model size wasselected. This model size permits for a large number of in-clusions to be used in the model and allows for some modelvariations within the 250�m× 250�m microstructure fieldof view.
As illustrated inFig. 2, the following method was em-ployed in developing the model so that it would provide areasonably accurate representation of both the microstruc-ture and the material behavior. Similar to the two-voidmodel described previously[11,12], the MnS inclusionswere modeled as voids due to their low void nucleationstrains[20] while the matrix material has the stress-strain re-sponse of bulk HY-100 steel. The analyses were performedin plane strain, which as mentioned previously, is based onthe concept that, during void growth and coalescence by thevoid-sheet process, a plane-of-no-extension is imposed onthe ligament of material between elongated voids[11,12].The overall model was constrained with the bottom of theblock fixed in the vertical direction and one node in thecenter of the bottom also fixed horizontally. The nodes onthe top of the block were constrained to remain horizontalwith a normal stress applied on the top face. The right andleft hand vertical sides were constrained to remain verticaland equal normal stresses are applied on the left and righthand faces. The model was loaded with an applied constantstress biaxiality,σ1/σ2, as shown inFig. 2.
Initial computational analyses indicated that the bound-aries of the model had an effect on predicted behavior sincethese boundaries act as planes of symmetry, but this condi-tion is not representative of the actual behavior since there isno symmetry in the inclusion distribution. In order to mini-mize the boundary effects, the model was defined in termsof a core region (containing the void microstructure) and aframe region, as shown inFig. 2. Within the core region,the inclusion-initiated void elements have no strength. Inthe frame region, the voids were modeled to progressivelygain material strength as their distance from the core in-creases. The elements adjacent to the core thus have 1/n of

272 J.P. Bandstra et al. / Materials Science and Engineering A366 (2004) 269–281
Fig. 2. (a) The model schematic showing applied stresses and boundary conditions; the top surface remains straight and horizontal; the sides remainstraight and vertical. (b) The model shown with “core” and “frame” regions to alleviate boundary effects.
the HY-100 strength, wheren is the number of elementsthrough the frame. The next element out has 2/n of the matrixstrength and this continues until the elements on the bound-aries have the matrix strength. Initially a frame region with awidth of one quarter of the model was used and undesirableboundary effects were not present. That is, the model didnot show any interaction with the actual voids in the modeland the “virtual” voids acting due to the symmetry bound-ary. A model with a reduced frame thickness of one-eighthof the model size was developed showing minimal bound-ary effects. This model showed similar results to the thickerframe but allowed for a larger core region which is the ac-tual area of study. As a result of these model studies and re-finements, results from model studies indicate that the coreand frame region successfully reduce the boundary effectswhile allowing for an accurate representation in the core re-gion. Results from model studies indicate that the core andframe region successfully reduce the boundary effects whileallowing for an accurate representation in the core region.
For the final model, a grid of 400× 400 elements waschosen. This model allows for a small inclusion size of0.5�m×0.5�m, which is not as small as the smallest inclu-sions observed (≈0.2�m), but we feel sufficiently small toallow for a reasonably accurate model of the inclusion dis-tribution. The core region was a 150�m×150�m region ofthe microstructure and the frame region is 50 elements con-tained within a region 25�m thick. The model used explicitfinite element analysis with 2D plane strain elements. Theelements used have a single integration point and mass scal-ing was used to allow the solution to proceed with a largeenough time step to allow reasonable run times. The use ofmass scaling necessitated monitoring the kinetic energy por-tion of the total energy in the model so that it remained verysmall throughout the solution. The run time of a typical casewas approximately 2–3 days of CPU time and the analy-sis generated 1–2 gigabytes of stored data. Thus, this modelsize was at the limit of element size refinement for exist-
ing computer capabilities. A fully three-dimensional analy-sis would be preferable for this type of microstructure-basedmodeling since it inherently would be more realistic thanthe two-dimensional model used here. One limitation isthe need for three-dimensional microstructure quantifica-tion involving serial sectioning or three-dimensional imag-ing. Also, due to the computer resources just mentioned,to allow for the same size resolution used in the currentmodel, a three-dimensional model would take at least anorder of magnitude greater run time and stored data, mak-ing it unrealistic at this time. However, in the near futureas computer capabilities increase, three-dimensional modelsto study the type of behavior in the current study will befeasible.
3. Results and discussion
Using the multi-hole models, we have examined the influ-ence of void microstructure on the deformation localizationbehavior (and ultimately the void linking) for the followinginclusion/void microstructures:
• As a benchmark, we examined a distribution of64 equal-sized voids distributed as single elements(0.5�m × 0.5�m) in aregular pattern (initially a squarearray) of repeating distances every 25 elements (voidvolume fraction,Vf = 0.002).
• The second benchmark microstructure consisted ofequal-sized butrandomly located voids; for this case, 320one-element voids were introduced was an equivalentVf = 0.002.
• Four differentregions of the inclusion/void microstruc-tures, shown inFig. 1, were examined. As shown inFig. 3and labeled regions 1–4, these microstructures contain theessential features of the overall microstructure but cap-ture different regions within it. The volume fractions of

J.P. Bandstra et al. / Materials Science and Engineering A366 (2004) 269–281 273
A
B
C
D
A
B
C
D
A
B
C
D
A
B
C
D
(a) (b)
(c) (d)
Fig. 3. Definitions of regions 1–4 showing MnS inclusion microstructure included in each model—each block represents 50�m: (a) region 1, (b) region2, (c) region 3, and (d) region 4.
voids in these microstructures ranged fromVf ∼= 0.0010to 0.0016.
• For region 1 inFig. 3, we also examined a case in whichall the small inclusions were removed so that the influenceof the smaller inclusions on the localization and failureprocess could be assessed.
• Alternatively, we modified the microstructure of region1 to retain all of the small and medium inclusion-relatedvoids while removing the three large ones in order exam-ine the deformation localization response of a microstruc-ture that does not contain large voids.
• Finally, we will comment on the effect of the stress state byproviding results of computations performed atσ1/σ2 =0.2 and 0.45. Most of the analyses were performed us-ing an applied stress biaxiality,σ1/σ2 = 0.45 (equiva-lent to a stress triaxiality ratio ofσm/σeq = 1.52). Thiscase is close to the stress state of experimental notchedHY-100 steel tensile specimens that fail in a well definedvoid-sheet coalescence mode; in contrast, at stress biaxi-ality of 0.2 (stress triaxiality= 0.87), void-sheet coales-cence doesnot occur in HY-100[6,7].
The results will be presented in the following two forms:(a) conventional strain contours indicating the spatial
distribution of equivalent strains within a given microstruc-ture at an applied equivalent strain value of≈0.12 (whichcorresponds to the failure strain of HY-100 steel at thisstress state[6,7]) and (b) at a similar applied strain level,a statistical assessment of the strain distributions that indi-cate the fraction of elements subject to large strains (=0.5)as well as thevariance of the strain values between theelements.
All strains reported are equivalent plastic strains,εeq, suchthat
dεeq =√
2
3dε
pij dε
pij
whereεpij are the plastic strain components.
3.1. Strain contour behavior
As a basis for contrasting the effects of the microstruc-tural distribution of voids, we present inFig. 4 the straindistributions within two arrays of equal-sized small voids(each initially 0.5�m with Vf ∼= 0.002) after a far-field ap-plied strain of 0.12 is imposed under plane-strain conditionswith σ1/σ2 = 0.45. As expected from previous experimental

274 J.P. Bandstra et al. / Materials Science and Engineering A366 (2004) 269–281
Fig. 4. Equivalent plastic strain distributions within (a) a regular arrays of 64 equal-sized voids and (b) a random distribution of 320 equal-sized voids.In both cases, the applied strain is 0.12, the maximum principal stress is vertical, and the void volume fraction is 0.002 within the voided region.
studies under uniaxial conditions[16], the square array ofvoids,Fig. 4a, shows the tendency for strain to concentrateon planes of high shear stress inclined±45◦ to the maximumprincipal stress (which is vertical in all of our figures). How-ever, the level of local strain (≈0.24) within the shear bandsis limited to roughly 2× the applied strain as the weak shearbands distribute strain in a rather diffuse manner throughoutthe specimen.
As has been demonstrated previously using both experi-mental and computational approaches[16–19,25], allowingthe small equal sized voids to be located randomly has alarge effect on strain distributions within the void array. InFig. 4b, the void clusters within the random array of 320voids create local conditions that promote strain localizationin which local strains exceed the far-field values by morethan a factor of four. Thus, the random void array inFig. 4bexhibits a strong tendency for strain localization to occuramong those groups of closely spaced voids located alongplanes±45◦ to the maximum principal stress. For example,in Fig. 4b the applied strain of 0.12 is sufficient to elevatesome local strains to >0.5 and create localized deformationthat extends to lengths of≈60–90�m. These local strainlevels should be sufficient to nucleate secondary voids, suchas at carbide particles in steels[26–28], and may initiate thevoid-sheet coalescence process.
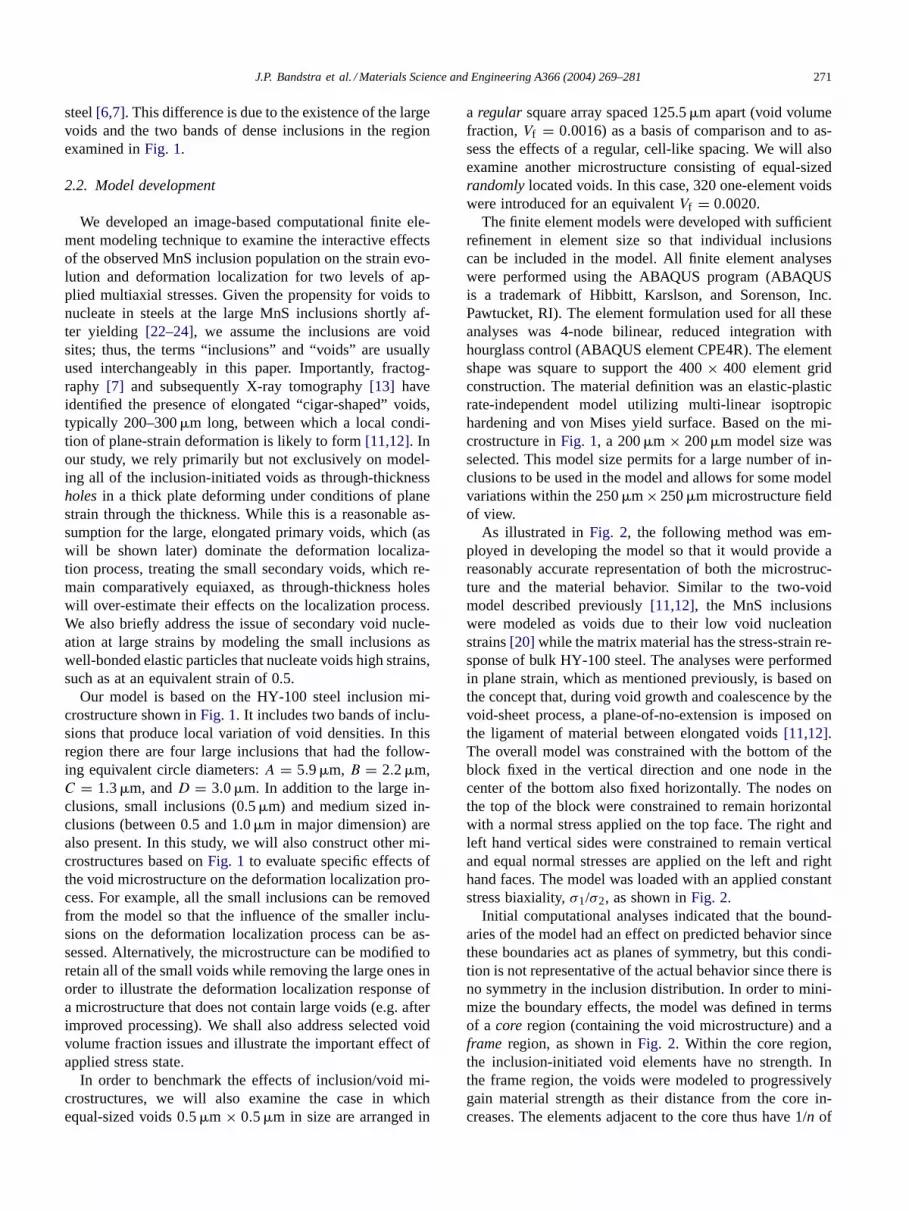
Based on the inclusion/void microstructure shown inFig. 3, the deformation behavior within four different re-gions of the microstructure containing voids with a rangeof sizes (0.5–5.9�m) was examined under imposed loadingconditions similar to those above (i.e.σ1/σ2 = 0.45). Theresults are shown in the form of strain distributions withinthe void arrays inFig. 5. Probably most striking among the
results inFig. 5 is the strong tendency for strain localizationto occur as an extended “shear band” in regions 1 and 2.In both cases, the shear band is associated with the sametwo large voids (voids A and B) that are within≈75�m ofeach other (≈20 void diameters) and happen to be locatedalong a plane inclined≈45◦ to theσ1. Accompanying thestrain localization, there is large degree of void growth notonly of the two large voids but also among the small voidswithin the shear band. The small voids outside of the bandexhibit very low growth and little tendency to localize de-formation. Finally, it is significant that, in contrast to thecase of random but equal-sized voids inFig. 4b, deforma-tion of the “real” microstructure inFigs. 5a and 5bresultin high levels of local strain (>0.5) that extend overlongdistances within the microstructure (≈160�m) as com-pared to≈75�m within the equal-sized (small) void casein Fig. 4b. As a result, the presence of the large voids, ifpositioned to induce deformation localization, create localshear bands that would likely induce secondary void nucle-ation and void-sheeting over distances that are likely to besufficiently large to cause material failure.
In contrast to their tendency to cause the deformationlocalization evident inFig. 5a and b, large voids do notalways trigger shear banding. For example,Fig. 5c showsthat, when sufficiently separated (≈125�m or roughly 40void diameters), even voids on a 45◦ plane do not cause acontinuous intense band of localized deformation. Similarly,region 4 of the microstructure is also resistant to deformationlocalization, as shown inFig. 5d. In this case, while twolarge voids are in proximity to each other (voids B and Care roughly 50�m apart), but they lie on a plane inclined atan angle of 65◦ to the maximum principal stress. Thus, the
J.P. Bandstra et al. / Materials Science and Engineering A366 (2004) 269–281 275
Fig. 5. Equivalent strain contour plots showing local strain distributions for (a) region 1, (b) region 2, (c) region 3, and (d) region 4; seeFig. 3 forlocations of the regions. The maximum principal stress is vertical, and the applied strain is 0.12.
potential for large voids to cause deformation localizationover large distances within the microstructure depends onboth void spacing and orientation (and as will be shownlater, the degree of stress triaxiality).
The effect of the angular orientation of the large voids wasalso examined by re-locating void B in region 1 to positionsranging from 0◦ to 45◦ inclined to maximum principal stress.
Those results show that if the large voids are located at ei-ther 45◦ or 30◦ an intense strain localization occurs, albeitin the 30◦ and 15◦ cases with assistance from small voidsalong the shear band.Table 1summarizes the effect of largevoid angular orientation with respect to level of strain local-ization. The angle given in the table is the angle between aline connecting the large voids and the horizontal (minor)

276 J.P. Bandstra et al. / Materials Science and Engineering A366 (2004) 269–281
Table 1Extent of strain localization with a variation in the angular orientationbetween two large voids
Large voidangle (θ)(◦)
Two large voids onlyεlocal at εfar = 0.12
Two large voids with apopulation of small voidsεlocal at εfar = 0.12
0 – >0.3515 0.22 >0.530 0.37 >0.5
∼40 0.50 >0.5
principal stress direction. The results inTable 1indicate adirect increase in strain localization as the angular orienta-tion changes from 0◦ to closer to 45◦, particularly in thelarge void only cases. With the additional presence of smallvoids, significant strain localization occurs between the largevoids due to the presence of the small voids, although at thelower angles, the high strain band takes a zig-zag path be-tween clusters of small voids and is not as direct as in thelarger angle cases.
By removing the small voids from region 1, the effect ofthese small voids on the strain behavior was assessed, andthe results are shown inFig. 6. With the large and mediumvoids remaining, the void volume fraction is decreased in thecore region from 0.0039 to 0.0032, but the resulting straincontours (Fig. 6a) still show a very strong localized bandof high strain between the two large voids and very lowstrains outside of the band, very similar to the region 1 case,when the small voids are present. On the other hand, theremoval of the large voids, leaving the small and mediumvoids in region 1 (Vf = 0.00078), inhibits the deforma-tion localization and severely limits the microstructural scaleover which localization develops, as shown inFig. 6b. Highstrains occur in this case only near the voids or betweenvery closely spaced voids. These results indicate that at
Fig. 6. Equivalent strain contour plots of region 1 but with (a) large and medium voids only and (b) small and medium voids only. The applied strain is 0.12.
moderately high stress triaxialities, the presence of even afew large voids (2–6�m), when contained within inclusionbands with spacings≤ 75�m and orientated≈45◦ to themaximum principal stress, controls the intense strain local-ization over large distances. In this case, the small/mediumvoids merely contribute to the strain localization withinbands established by the large voids.
In summary, the following generalizations are made withrespect to the influence of void microstructure on strain lo-calization and, therefore, the tendency to induce a localizedvoid-sheet mode of failure. For the relatively high level ofstress triaxiality in these cases (σ1/σ2 ≤ 0.45 orσm/σeq ≤1.5), there is a strong tendency for intense strain localizationover large distances within microstructures that contain largeelongated voids spaced within approximately 75�m apart(≈20 void diameters) and oriented at≈45◦ to the maximumprincipal stress. If the large voids are present at a favorableorientation but are far apart (≈40 void diameters), intensestrain localization does not occur. The role of the small andmedium voids is to enhance the tendency for intense strainlocalization in the presence of large voids. Random distribu-tions of small voids can also induce strain localization, butthe localization is confined to the comparatively small scaleof the clusters in the microstructure.
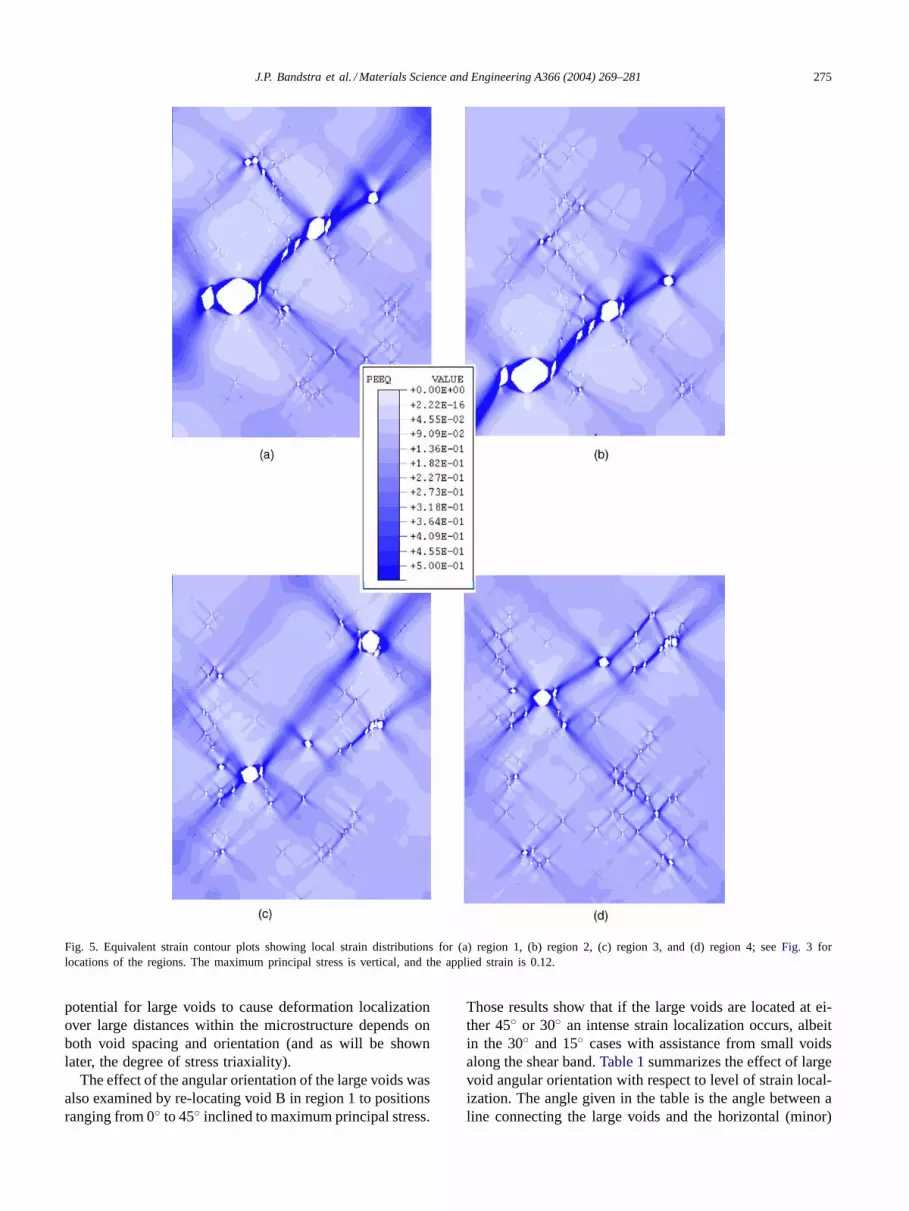
Finally, as an illustration of the relationship betweenthe deformation localization examined in this study andvoid-sheet coalescence, we presentFig. 7 [13]. Fig. 7ashows an image obtained using X-ray computed tomogra-phy of voids coalescing prior to the fracture of a notchedtensile specimen from the same HY-100 steel plate thatour microstructure was based on (in both cases, the imag-ing is of the same plane normal to the rolling direction ofthe plate). In this figure, the elongated voids are viewedalong their length and the large primary voids have linkedby a sheet of microvoids inclined roughly 45◦ to the
J.P. Bandstra et al. / Materials Science and Engineering A366 (2004) 269–281 277
Fig. 7. A comparison of (a) voids linking at strain near failure in HY-100 steel as imaged by X-ray computed tomography (after[13]) and (b) deformationlocalization within region 1 of the present study. The model is based on the same HY-100 plate deformed under similar stress triaxaility as in (a). Inboth cases, the applied stress is vertical and the plate orientation is the same.
tensile axis; some of the smaller “secondary” voids are alsovisible within the void sheet.Fig. 7b reproduces the strainlocalization patterns that develop in region 1 of model (asshown earlier inFig. 5). The deformation localization be-tween the large voids is readily evident, and extensive voidgrowth of a few small, “secondary” voids is also apparentin the model. Even though the scale of the void linking inthe steel shown inFig. 7a is more extensive than in ourmodel, we believe that the strain localization process evi-dent inFig. 7b is eventually responsible for the void-sheetcoalescence apparent inFig. 7a.
3.2. On the statistics of strain values
An alternate method of assessing strain distributions is bya statistical assessment that examines the strains, not by geo-metric position in the model as in the contour plots, but ratherby the distribution of strain values within elements. Thestrain values used for statistical analysis in this case are onlythose elements in the model core region, and the statisticalmeasures calculated are the variance of strain values and thefraction of the number of elements within whichεeq = 0.5.The strain value of 0.5 is chosen since it is a typical void nu-cleation strain for small carbides in steels[26–28]and shouldcorrespond to the onset of void-sheet formation[11,12].
As shown inTable 1, the cases that indicate strong de-gree of strain localization and, therefore, a tendency forvoid-sheet behavior, have variances from 0.04 to 0.05 andfractions of elements with strains greater than 0.5 from 0.025to 0.049. The other cases that result in diffuse strains, andno strong strain localizations, have much smaller strain vari-ances (from 0.004 to 0.008) and far smaller fractions of
elements with strains greater than 0.5 (from 0.003 to 0.013).Thus, the very noticeable difference in the values ofTable 1is that the cases associated with astrong strain localizationhave a much larger (an order of magnitude) variance in strainvalues than those cases which exhibit diffuse strain distribu-tions. This result is due to the existence of high strain valuesfar from the mean in the localized bands and the large frac-tion of values less than the mean in the shielded regions.As a result, for cases exhibiting a tendency for deformationlocalization, the fraction of large strains (εeq > 0.5) is sig-nificantly greater.
The strain distribution results are also presented inFig. 8in the form of histograms for cases typifying the differenttypes of strain distribution behavior. In this figure, the num-ber of occurrences above a strain level of 0.5 are summed andpresented as one category. As seen inFig. 8, the strain dis-tributions range from very few elements undergoing strainsgreater than 0.5 (Fig. 8a, the regular array of voids) to casesthat result in intense strain localization between two largevoids and with it a significant fraction of the elements atstrains greater than 0.5 (especiallyFig. 8c—region 1). Asseen inFig. 8a, deformation of the regular void distribu-tion creates a strain histogram that has a well-defined peaknear the mean strain(ε ∼= 0.12), but very few elements showstrains >0.5. Conversely, the void microstructure in region 1(Fig. 8c) contains large, closely spaced, and favorably ori-ented voids. Deformation of this microstructure results in abroader peak in strain distributions as similar fractions ofelements tend to experience a comparatively wide range ofstrains in the range 0.04 ≤ ε ≤ 0.15; importantly, in thiscase, there a significant fraction of elements subject to large“localization” strainsε > 0.5 (Table 2).

278 J.P. Bandstra et al. / Materials Science and Engineering A366 (2004) 269–281
0
2
4
6
8
10
12
14
16
18
20
0 0.1 0.2 0.3 0.4 0.5Strain
Per
cent
of c
ore
0
2
4
6
8
10
12
14
16
18
20
0 0.1 0.2 0.3 0.4 0.5Strain
Per
cent
of c
ore
(a) regular arrays of small voids (b) random array of small voids
0
2
4
6
8
10
12
14
0 0.1 0.2 0.3 0.4 0.5
Strain
Per
cent
of c
ore
0
2
4
6
8
10
12
14
0 0.1 0.2 0.3 0.4 0.5
Strain
Per
cent
of c
ore
(c) Region 1 (d) Region 3
Fig. 8. Histograms of strain distributions showing percent of elements with given strain values for (a) the regular array of small voids, (b) the randomarray of small voids, (c) region 1 of the microstructure, and (d) region 4 of the microstructure.
Table 2Strain distribution statistics at an applied strain of 0.12 and a stressbiaxiality of 0.45 (variance refers to values of equivalent plastic strains)
Case Deformationlocalization?
Variance Fraction above0.5 strain
Regular array of smallvoids
No 0.004 0.003
Random array of 320small voids
Limited 0.008 0.009
Random 320 smallvoids plus 2 largevoids at 45◦
Intense 0.043 0.049
Region 1 Intense 0.048 0.027Region 1—large and
medium voids onlyIntense 0.047 0.036
Region 1—small andmedium voids only
Limited 0.003 0.003
Region 2 Intense 0.046 0.025Region 3 Limited 0.017 0.013Region 4 Limited 0.012 0.011
Fraction above 0.5 strain refers to the fraction of the elements that havethese strain levels.
3.3. Local strain development under applied loading
The evolution of strain localization among the voids (aswell as the tendency for void-sheet coalescence) can also beassessed and compared among the various cases by examin-ing local strain values with respect to applied far-field strain.In the present case, we define local strain as the equivalentstrain within the high strain bands. Since these locations arenot known a priori, the actual regions used to define localstrains can only be identified after the analyses are com-pleted. Once the strain localization band was identified, nineelements were chosen distributed approximately evenly overthe length of the band. The selection of these elements wasdone by choosing the one element in the center of the bandand then four elements equally spaced on either side of thecenter but along the length of the shear band. Elements invoids or near the edge of voids were not chosen.These ninevalues were then averaged and the resultant was taken asthe local strain.
While several cases of the void microstructure wereconsidered[22], the following illustrations extend the
J.P. Bandstra et al. / Materials Science and Engineering A366 (2004) 269–281 279
1
0.
0 0 0 0. 0.
A
Lo
cal
ε Mv
v
0.
1
1.
2
0 0 0 0 0
Ap
Loca
leq
M
No
0 0 0 0 0 0 0
Lo
cal
εeq
M
M
M 2
M
No
0
5
1.5
.05 .1 15 2
pplied εeq
eq
Model 1
odel 1-large and mediumoids only
Model 1-small and mediumoids only
No voids
0
5
5
2.5
3
.05 .1 .15 .2
plied ε eq
ε Model 1
odel 1 with MnS nucleation at 0.5
Model 1 - large and medium voids
voids
0
0.5
1
1.5
.05 .1 .15 .2 .25 .3
Applied εeq
odel 1 s1/s2=0.45
odel 2 s1/s2=0.45
odel 1 s1/s2 = 0.
odel 2 s1/s =0.2
voids
(a)
(b)
(c)
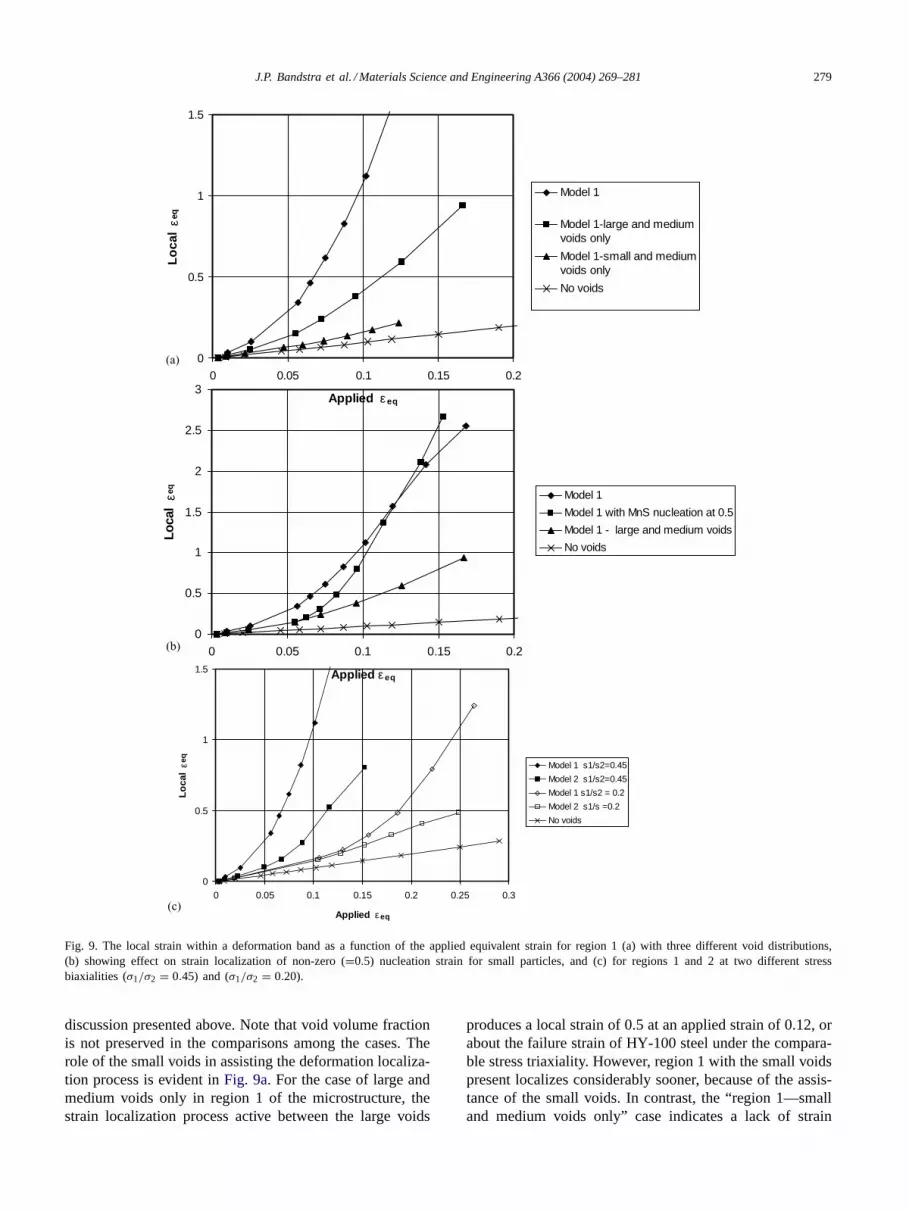
Fig. 9. The local strain within a deformation band as a function of the applied equivalent strain for region 1 (a) with three different void distributions,(b) showing effect on strain localization of non-zero (=0.5) nucleation strain for small particles, and (c) for regions 1 and 2 at two different stressbiaxialities (σ1/σ2 = 0.45) and (σ1/σ2 = 0.20).
discussion presented above. Note that void volume fractionis not preserved in the comparisons among the cases. Therole of the small voids in assisting the deformation localiza-tion process is evident inFig. 9a. For the case of large andmedium voids only in region 1 of the microstructure, thestrain localization process active between the large voids
produces a local strain of 0.5 at an applied strain of 0.12, orabout the failure strain of HY-100 steel under the compara-ble stress triaxiality. However, region 1 with the small voidspresent localizes considerably sooner, because of the assis-tance of the small voids. In contrast, the “region 1—smalland medium voids only” case indicates a lack of strain
280 J.P. Bandstra et al. / Materials Science and Engineering A366 (2004) 269–281
localization, given the absence of the large voids. Thus,while distributed small voids do not cause localization, theirpresence in the vicinity of large voids accelerates the onsetof localization. It is important to recognize that the predictedeffect of the small voids is likely over-estimated, since thesmall voids in HY-100 remain equiaxed and do not have theelongated shape of the large primary voids. Thus, simulatingthe small, secondary voids as though-thickness holes over-estimates their ability to induce deformation localization.
Voids may nucleate at small particles, such as carbides, athigher strains than the large sulfide inclusions. The poten-tial effect of such a void nucleation strain on the deforma-tion localization behavior is illustrated inFig. 9b. For thiscase, the small and medium inclusions are assumed to be-have in the model as well-bonded particles until a strain of0.5 is attained within the deformation band; at this point,the elements representing these inclusions lose all strength,becoming “secondary” microvoids. As seen inFig. 9b, thesecondary void nucleation case follows the “region 1—largeand medium voids only” deformation behavior until an ap-plied strain of 0.06, at which point the inclusions in thelocalization region nucleate to voids and the strain local-ization rate proceeds more quickly than “region 1” case.Thus, the effect of delayed nucleation of the “secondary”population of inclusions is to delay slightly the onset ofrapid localization, but localization appears to be (surpris-ingly) accelerated once the secondary population nucleatesvoids.
The important influence of stress biaxiality is illustrated inFig. 9cwhich contrasts the deformation localization processfor regions 1 and 2 at two level of stress biaxiality. Consistentwith earlier analyses based on a two-hole model[11], bothregions 1 and 2 are much more susceptible to deformationlocalization at smaller applied strains at a stress biaxialityof 0.45 (stress triaxiality= 1.5) than at an applied stressbiaxiality of 0.2. These predictions are consistent with ourearlier simulation[11,12] and with experimental results ofHY-100 steel that show that the void-sheet mechanism isinhibited at low stress triaxialities[7,8].
Finally, while not examined here, strain hardening andstrain-rate hardening are both well known factors in con-trolling deformation localization processes. It should alsobe recognized that HY-100 has a relatively small strainhardening capacity which, when combined with the mi-crostructure/stress state conditions described in this study,promotes the deformation localization processes that resultin void-sheet coalescence. Such behavior is supported bycomputationally in the context of a two-hole model in whichstrain hardening is shown to delay deformation localiza-tion between pairs of holes whose size and spacing simu-late the elongated primary voids in HY-100[12,22]. Perhapsmore significantly, we also note that experimental observa-tions of void sheet coalescence are usually confined to highstrength/low strain hardening metals containing elongatedinclusions and deformed under high stress triaxiality ratiossuch as near notches or cracks[1–8].
4. Conclusions
Based on an observed inclusion microstructure withinHY-100 steel, multi-hole image-based computational anal-yses have been performed to examine the deformation lo-calization processes that occur among elongated voids witha range of sizes. The two-dimensional plane-strain analyseswere performed primarily with a biaxial stress loading con-dition corresponding to the relatively high stress triaxialityratio of σm/σeq ≈ 1.5. The results indicate the followingconclusions:
1. There is a strong tendency for intense strain localization(and concomitant void sheet coalescence) over large dis-tances within microstructures that contain large elongatedvoids spaced within approximately 75�m (≈20 void di-ameters) and oriented at≈45◦ to the maximum appliedprincipal stress.
2. If the large voids are present at a favorable orientationbut are far apart (≈40 void diameters), intense strainlocalization does not occur; it is also inhibited by a lowerstress triaxiality.
3. Even if they have a significant void nucleation strain,small voids can promote the onset of strain localizationbetween large voids.
4. Within microstructures consisting of solely of smallvoids, void clusters can cause intense strain localization,but it is confined to the scale of the clusters.
5. Deformation localization is suppressed by imposing alow stress triaxiality ratio.
These results also reinforce the notion that large, elon-gated voids are able to induce deformation localization andvoid-sheet coalescence over an extended scale within themicrostructure, provided the material is subject to deforma-tion under high stress triaxiality and it possesses relativelylow strain and strain-rate hardening. Thus, large elongatedinclusions that void readily will limit fracture resistance (bypromoting the void-sheet coalescence), but that situation willlikely be confined to high strength alloys (i.e. usually lowstrain hardening) deformed at relatively low temperatures(i.e. low strain-rate hardening) and under conditions of highstress triaxaility (i.e. cracks or notches).
Acknowledgements
We are grateful to Dana Goto and Arthur Gurson for manyvaluable discussions. This research was supported by theOffice of Naval Research, and we appreciate the encourage-ment of Dr. George Yoder.
References
[1] H.C. Rogers, Trans. Met. Soc. AIME 218 (1960) 498.[2] S. Lee, J.W. Rhyu, K.-M. Cho, J. Duffy, Metall. Trans. 24A (1993)
901.
J.P. Bandstra et al. / Materials Science and Engineering A366 (2004) 269–281 281
[3] W.A. Spitzig, Metall. Trans. 14A (1983) 471.[4] M.J. Haynes, R.P. Gangloff, Met. Mat. Trans. A 29A (1998) 1599.[5] T.B. Cox, J.R. Low, Metall. Trans. 5 (1974) 1457.[6] D.M. Goto, D. Chae, D.A. Koss in Progress in Mechanical Behavior
of Materials, Fleming Printing Co., Victoria, BC, 1999, p. 150.[7] D.M. Goto, D.A. Koss, V. Jablokov, Metall. Mater. Trans. A 32A
(1999) 2835.[8] J.W. Hancock, A.C. Mackenzie, J. Mech. Phys. Solids 24 (1976) 147.[9] M. Saje, J. Pan, A. Needleman, Int. J. Fract. 19 (1982) 163.
[10] V. Tvergaard, Int. J. Solids Struct. 25 (1989) 1143.[11] J.P. Bandstra, D.M. Goto, D.A. Koss, Mater. Sci. Eng. A 249 (1998)
46.[12] J.P. Bandstra, D.A. Koss, Mater. Sci. Eng. A319–322 (2001) 490.[13] R.K. Everett, A.B. Geltmacher, K.E. Simmonds, C. Young, D.A.
Koss, Scripta Mater., in press.[14] R.K. Everett, A.B. Geltmacher, Scripta Mater. 40 (1999) 567.[15] D. Chae, D.A. Koss, A.L. Wilson, P.R. Howell, Metall. Mater. Trans.
A 31A (2000) 995.
[16] E.M. Dubensky, D.A. Koss, Metall. Trans. A 18A (1987) 1887.[17] R. Becker, J. Mech. Phys. Solids 35 (1987) 577.[18] P.E. Magnusen, D.J. Srolovitz, D.A. Koss, Acta Metall. Mater. 38
(1990) 1013.[19] D.J. Benson, Int. J. Plast. 11 (1995) 571.[20] A.B. Geltmacher, D.A. Koss, P. Matic, M.G. Stout, Acta Metall. 44
(1996) 2201.[21] V. Jablokov, D.M. Goto, D.A. Koss, Metall. Mater. Trans. A 32A
(2001) 2985.[22] J.P. Bandstra, Ph.D. Thesis, The Pennsylvania State University, 1999.[23] R.H. Van Stone, T.B. Cox, J.R. Low, J.A. Posida, Int. Met. Rev. 30
(1985) 157.[24] W.M. Garrison, N.R. Moody, J. Phys. Chem. Solids 48 (1987) 1035.[25] R. Becker, R.E. Smelser, J. Mech. Phys. Solids 42 (1994) 773.[26] J.L. Maloney, W.M. Garrison, Sripta Met. 23 (1989) 2097.[27] F. LeRoy, J.D. Embury, G. Edward, M.F. Ashby, Acta Metall. 29
(1981) 1509.[28] D. Kwon, R.J. Asaro, Metall. Trans. A 21A (1990) 117.