modeling preferences
TRANSCRIPT

Modeling Preferences
Herbert Gintis∗
August 30, 2004
1 Introduction
Modern economic theory developed under the assumption that only two basic factsare needed concerning human preferences. The first is that agents have consistentpreferences that permit modeling choice as the result of the maximization of apreference function subject to appropriate material and informational constraints.The second is that economic agents are self-interested in the sense that the solecriteria relevant to an agent in evaluating an economic transaction is the effect ofthe transaction on his personal holdings. The core of modern economic theorycan be derived from these minimal assumptions (Mas-Colell, Whinston and Green1995).
Empirical evidence has brought both of these assumptions under attack in re-cent years. The psychological experiments of Daniel Kahneman, Amos Tversky,and others (Kahneman, Slovic and Tversky 1982, Kahneman and Tversky 2000)have shown that human preferences deviate in a systematic fashion from the ax-ioms deployed in neoclassical models of individual choice. Economic experimentsbeginning with Güth, Schmittberger and Schwarz (1982) have shown that the self-interest assumption does not generally hold when agents interact strategically. Theseexperimental results must alter the way economists treat the relationship betweentheory and evidence. We require a behavioral economic theory, firmly based on theinterplay between model-building and testing.
Since economic choice appears to depend on factors traditionally studied outsideeconomics, behavioral theorists will doubtless explore the models and empiricalfindings produced in other behavioral disciplines, including biology, anthropology,psychology, and sociology. The challenge is how to deepen the explanatory force
∗Herbert Gintis ([email protected],http://www-unix.oit.umass.edu/gintis) is on the faculty ofthe Santa Fe Institute and the Central European University. He would like to thank Werner Güth andAlex Possajennikov for valuable comments, and the John D. and Catherine T. MacArthur Foundationfor financial support.
1

Modeling Preferences 2
of economic theory while maintaining the analytical clarity and modeling powerfor which it is justly acclaimed. This paper offers a provisional framework for sucha transdisciplinary model of human behavior.
Section 2 defends the centrality of the postulate of preference consistency, hold-ing that, while the space over which agents optimize often has more parameters thansuggested in standard decision theory (e.g., the agent’s current position in time andasset space may be privileged, as in prospect theory and models of allocation overtime), it remains that agents generally have transitive preferences over the appro-priate domain, and can be modeled as optimizing subject to appropriate constraints(including the cost of information acquisition). This may be called a “defense ofthe rational actor model,” but there is so much extraneous baggage attached to theconcept of rational action that it wise to employ the term with extreme care.
Preference consistency follows not from general principles of “rational thought,”but rather from principles of evolutionary biology that apply to virtually all livingorganisms. Section 3 argues that since biological fitness is a scalar variable, andsince the choice behavior of an organism is generally adapted to fitness maximizationin the range of environments over which it evolved, then preferences are likely tobe consistent, at least over choices relevant to fitness and well-being.
If preferences are consistent, then it is reasonable to model agents as choosingbest responses, subject to informational and behavioral constraints, in their strategicinteractions. This means game theory is a preferred tool for modeling human behav-ior. Moreover, the genetic and cultural constituents of preferences are the product ofDarwinian evolution: those preferences that are more capable of producing copiesof themselves, through biological reproduction or cultural imitation, will tend toexpand at the expense of less capable preferences. Thus, evolutionary game theoryis a preferred tool for modeling human preference development. Section 4 arguesthat the criteria for adequate modeling in evolutionary game theory and classicalgame theory are quite distinct, and the traditional equilibrium concepts of classi-cal game theory, including subgame perfection and sequential equilibrium, are notsufficiently powerful as explanatory criteria for evolutionary game theory.
Genes are strands of DNA located along chromosomes in cell nuclei. Culturalforms are patterns of synaptic organization in the brain. Despite their highly con-trasting physical form, genes and culture share a common evolutionary dynamic,based on their common status as forms of information capable of replication, mu-tation, and adaptation through selection across time. Since preferences dependon both genes and culture, the analysis of preference development is covered bygene-culture coevolutionary theory. Section 5 sketches the basic principles of gene-culture coevolution (Cavalli-Sforza and Feldman 1981, Boyd and Richerson 1985).
Models of gene-culture coevolution show that cultural adaptations need not be,and often are not, fitness enhancing for the groups that embrace them (Edgerton
August 30, 2004

Modeling Preferences 3
1992). This is because the process of imitation on which cultural dynamics rest iserror-prone, and the conformist transmission of culture (the tendency of agents tofollow the majority rather than seek independent confirmation) frequently magnifiessuch errors. The tendency for cultural forms to be prosocial and fitness enhancingis due to weak group selection, which is described in Section 6.
One of the most contentious issues in gene-culture coevolution is the importanceof strong group selection in modeling human prosocial behavior. Strong groupselection occurs when a prosocial behavior lowers the within-group fitness of theagents that engage in it, but groups that enjoy a high frequency of such agentsexpand at the expense of other groups, the net result of which is a population-wideequilibrium with a positive fraction of agents engaging in such prosocial behavior.Such a behavior is called altruistic because it benefits others at the expense of theindividual who confers the benefits. Section 7 presents a brief overview of thecurrent status of strong group selection.
It is a curious fact that one of the central principles of sociological theory, thatagents internalize norms through a process of socialization goes virtually unnoticedin economic and biological models of human preferences. Yet the phenomenon isquite well documented, and adds an important dimension to models of humanpreferences. We address this issue in Section 8, which defends the idea that humancapacities to internalize norms is a major force in attenuating the conflict betweenself-interest and group-benefit, and accounts for altruistic behavior through weakgroup selection alone.
This hostility towards the concept of norm internalization is motivated in partby the difficulty in explaining how such an apparent fitness-reducing capacity couldhave evolved. Why do not sociopaths, who have normal human intelligence but whodo not internalize norms, outcompete agents whose preference function includeselements that are apparently fitness-reducing? Section 9 supplies an answer to thisquestion.
Section 10 provided a simple example of how some of the ideas expressed inthis paper can be applied to the analytical modeling of cultural evolution.
2 Preference Consistency
By a preference ordering � on a set A, we mean a relation such that x � y maybe either true or false for all x, y ∈ A. The first consistency condition on � iscompleteness, which means for all x, y ∈ A, either x � y or y � x. The secondconsistency condition is transitivity: x � y and y � z implies x � z. The thirdconsistency condition is maximization, which says that from any set, the agentchoose an element that is weakly preferred to any other member of the set. The
August 30, 2004

Modeling Preferences 4
final consistency condition is the continuity condition, which assumes that the setA is a subset of a real vector space, and says that if xn, yn ∈ A and xn � yn fori = 1, 2, . . ., then if limn xn = x ∈ A and limn yn = y ∈ A, then x � y.
If these four conditions hold, there always exists a utility function such that theagent behaves as if maximizing this utility function over the set A (Kreps 1988).Economists have called an agent with consistent preferences a rational actor, andthe analysis of his behavior is termed rational choice theory. Because the term“rational” has so many connotations going beyond the above consistency conditions,it is probably wise to use the term sparingly, and for the sake of clarity, it shouldnever be invoked to argue for conditions going beyond completeness, transitivity,maximization, and continuity.
Only because there has been so much misunderstanding concerning preferenceconsistency, I state the following.
a. a rational agent need not be self-interested;
b. the choices of a rational agent need not further his well-being in any substantivesense;
c. a rational agent may prefer to have different preferences from his actual pref-erences;
d. a rational agent need not have complete information, or the ability to processinformation costlessly;
e. a rational agent need not conform to the expected utility theorem.
Many have interpreted the findings of Kahneman, Tversky and their coworkersas exhibiting strongly irrational behavior. In every case, however, one can inter-pret their results as exhibiting preferences consistency over the appropriate choicespace. For instance, time inconsistency does not violate the principle of transi-tive preferences over the relevant choice space, and there are powerful analyticalmodels employing hyperbolic discounting (Laibson 1997, O’Donoghue and Rabin1999, 2001). More generally, Ahlbrecht and Weber (1995) show that preferenceconsistency is restored when the distance between the time of choice and the timeof delivery of the object chosen is explicitly included in the analysis.
For instance, if x0 means $10 delivered immediately and x365 means $10 de-livered in a year from today, and similarly for y7 and y372. Then the observationthat x0 � y7 and y372 � x365 is no contradiction. Indeed, let zt mean “amount ofmoney delivered at t days from today,” and suppose u(zt ) = z/(t + 1) (hyperbolicdiscounting). The value of x0 is thus u(zt ) = u(100) = 10/1 = 10 and the value ofy7 is u(zt ) = u(117) = 11/8 = 1.375, so x0 � y7. But u(x365) = 10/366 = 0.027
August 30, 2004

Modeling Preferences 5
while u(y372) = 11/373 = 0.029, so y372 � x365. This result is, of course, com-pletely obvious, but it is often ignored in discussions of preference consistency.
Another set of findings often cited in affirming the irrationality of preferencesare loss aversion and status quo bias. However, Kahneman and Tversky’s prospecttheory shows that preference consistency can be restored (although they do notinterpret their results in this manner) by including the agent’s current endowment inthe specification of the set of available choices (Kahneman and Tversky 1979, Rabin2000).
The framing effects discovered by Kahneman, Tversky et al. have also beeninterpreted as implying gross preference inconsistency. In fact, however, they canoften (I have not made an exhaustive investigation of the various examples) beinterpreted as the effect of an alternation in the status quo vantage point fromwhich the judgement is made. When the appropriate reference point is ambiguous,decision-makers can appear to exhibit choice inconsistency. Kahneman and Tverskygive a dramatic example from health care policy. Suppose we expect a flu epidemicin which we expect 600 people to die if nothing is done. If program A is adopted,200 people will be saved, while if program B is adopted there is a 1/3 probability 600will be saved and a 2/3 probability no one will be saved. In one experiment, 72% ofa sample of respondents preferredA to B. Now suppose that if program C is adopted,400 people will be die, while if D is adopted there is a 1/3 probability nobody willdie, and a 2/3 probability 600 people will die. Now, 78% of respondents preferredD to C, even though A and C are equivalent, and B and D are equivalent. Note thatin the A vs. B choice, alternatives are over gains, whereas in the C vs. D choice, thealternatives are over losses, and decision-makers are loss-averse. The inconsistencystems from the fact that there is no natural reference point for the decision-maker,since the gains and losses are experienced by others, not the decision-maker himself.
3 The Evolutionary Foundations of Preference Consistency
Why might we expect preference consistency to obtain? The answer from classicaldecision theory is that humans are “rational beings,” and the conditions for rationalchoice are the only conditions that satisfy the “demands of reason.” There are severalproblems with this justification. The most important is that the rational choice modeloften applies extremely well to nonhuman species, including insects and plants(Alcock 1993), whose mental apparatus falls far short of the capacity to exercise“rational thought.” Perhaps equally important, it is clear that humans often makechoices that fail the test of “reason,” (e.g., weaknesses of will, including substanceabuse, procrastination, impulsive behavior), yet their choices do not violate therational choice conditions.
August 30, 2004

Modeling Preferences 6
A more plausible explanation of the ubiquity of rational choice comes fromevolutionary biology. Biologists define the “fitness” of an organism as its expectednumber of offspring, and the basic tenet of evolutionary biology is that the behaviorof organisms is the product of natural selection. In any given state (of hunger,danger, sexual arousal, and so on), each of an organism’s choices will have anexpected fitness. Since fitness is a scalar variable, if organisms maximized fitnessdirectly, the conditions for preference consistency would be directly satisfied, sincewe could simply represent the organism’s utility function as its fitness.
Organisms, including humans, do not directly maximize fitness, however. Forinstance, moths fly into flames, few animals are capable of avoiding automobiles inthe road, and humans voluntarily limit family size. Rather than directly maximizingfitness, organisms have relatively simple preference orderings that are themselvessubject to selection according to their ability to promote fitness under the normalenvironment to which these organisms have been historically subjected (Darwin1872). We can expect preferences to satisfy the completeness condition because anorganism must be able to make a choice in any situation it habitually faces, or it willbe out-competed by another whose preference ordering can make such a choice.
For similar evolutionary reasons, we would expect the transitivity conditionto hold over choices that have some evolutionary meaning to the rational agent.Of course, unless the current environment of choice is the same as the historicalenvironment under which the individual’s preference system evolved, we would notexpect an individual’s choices to be fitness maximizing, or even welfare-improving.For instance, people in advanced technological societies have a tendency to obesitythat can be explained by a preference for high-calorie foods that may not be fitness-enhancing to day, but may well have been in the evolutionary history of our specieswhich, until about 10,000 years ago, reflection the conditions of existence of smallhunter-gatherer bands under threat of starvation.
Evolutionary arguments can also be given for the maximization of expected andnonlinearly weighted utility (Cooper 1987, Robson 1996). Let A be a choice set,and suppose each x ∈ A determines a lottery that pays i offspring with probabilitypi(x), for i = 0, 1, . . . , n. Then the expected number of offspring from this lotteryis
ψ(x) =n∑j=1
jpj (x).
Let L be a lottery on A that delivers xi ∈ A with probability qi for i = 1, . . . , k.The probability of j offspring given L is then
k∑i=1
qipj (xi)
August 30, 2004

Modeling Preferences 7
so the expected number of offspring given L is
n∑j=1
j
k∑i=1
qipj (xi) =k∑i=1
qi
k∑i=1
jpj (xi)
=k∑i=1
qiψ(xi),
which is the expected value theorem with utility function ψ(·). For non-expectedutility maximization, see Robson (1996).
4 Evolutionary GameTheory and Nash Equilibrium Refinements
Preferences depend on the interaction between genes and culture, both of whichdevelop over time according to an evolutionary dynamic. Thus, evolutionary gametheory, in which agents are continually subjected to strategic interaction, representedby a stage game, is the natural setting for analysis preference development andequilibrium. While every stable equilibrium of an evolutionary dynamic is a Nashequilibrium of the stage game, and every convergent time path of the evolutionarydynamic is a Nash equilibrium of the stage game, the converses of these assertionsare almost always false. Only exceptionally will Nash equilibria of the stage gamebe stable evolutionary equilibria.
Economists have long considered many Nash equilibria in many games to beintuitively implausible. The criteria of plausibility, however, have had little to dowith evolutionary dynamics. Such refinements as subgame perfection, trembling-hand perfection, sequential equilibrium, and Bayesian perfection, have been offeredas a means of discarding such unacceptable equilibria. These standard refinementsof Nash equilibrium were developed in the context of classical game theory, withits assumption that games are one-time interactions among rational agents. Theyhave virtually no attractive dynamic properties.
The reason for this is simply that the Nash equilibrium criterion requires, ineffect, that the equilibrium be neutrally stable with respect to deviations by oneplayer alone. Dynamic stability, by contrast, requires stability with respect tosimultaneous deviations on that part of all players. Many standard equilibriumrefinements (e.g., subgame perfection) continue to consider only one-player devi-ations. Other equilibrium refinement notions, such as trembling-hand perfect andsequential equilibrium, do consider simultaneous deviations, but even extremelywell-behaved equilibria may be dynamically unstable, as is, for instance, the mixedstrategy equilibrium of the Battle of the Sexes. Moreover, standard refinements takethe limit as the extent of deviations tend to zero. In real-world applications, errors
August 30, 2004

Modeling Preferences 8
do not tend to zero, so the robustness of a model to perturbations becomes of thefirst order of importance.
I shall illustrate this fact by analyzing a behavioral version of one of the strongestprinciples of classical game theory: rational players never use strategies that can beeliminated by the iterated deletion of strictly dominated strategies. The counterpartof this in evolutionary game theory is the assertion that such strategies are never partof a stable evolutionary equilibrium. But suppose there are small errors in the sensethat with a small probability a player switches to an alternative strategy. It is easyto give examples where with quite small errors, even strictly dominated strategiesare not eliminated, even approximately, in the long run.
Consider, for instance, the stage game in Figure 1, which is analyzed in Huyck,Wildenthal and Battalio (2002). It is easy to see that a1 is strictly dominated by amixed strategy combination of the other four strategies, after which a2 is strictlydominated by a mixed combination of the other three, and so on.
����������������������������������������������������������������������������������������������������������������������������������������������������������������������������������������������������������������������������������������������������������������������������������������������������������������������������������������������������������������������������������������������������������
a2
a3
a5
a4
a1
��������������������������������������������������������������������������������������������������������������������������������������������������������������������������������������������������������������������������������������������������������������������������������������������������������������������������������������������������������������������������������������������������������������������������������������������������������������������������������������������������������������������������������������������������������������������������������������������������������������������������������������������������������������������������������������������������������������������������������������������������������������������������������������������������������������������������������������������������������������������������������������������������������������������������������������������������������������������������������������������������������������������������������������������������������
0,11
0,0
9,00,0
0,0
7,7����������������������������������������������������������������������������������������������������������������������������������������������������������������������������������������������������������������������������������������������������������������������������������������������������������������������������������������������������������������������������������������������������������
����������������������������������������������������������������������������������������������������������������������������������������������������������������������������������������������������������������������������������������������������������������������������������������������������������������������������������������������������������������������������������������������������������
����������������������������������������������������������������������������������������������������������������������������������������������������������������������������������������������������������������������������������������������������������������������������������������������������������������������������������������������������������������������������������������������������������
6,6
0,0
0,00,8
10,0
0,0��������������������������������������������������������������������������������������������������������������������������������������������������������������������������������������������������������������������������������������������������������������������������������������������������������������������������������������������������������������������������������������������������������������������������������������������������������������������������������������������������������������������������������������������������������������������������������������������������������������������������������������������������������������������������������������������������������������������������������������������������������������������������������������������������������������������������������������������������������������������������������������������������������������������������������������������������������������������������������������������������������������������������������������������������������
a1 a4 a5a3a2������������������������������������������������������������������������������������������������������������������������������������������������������������������������������������������������������������������������������������������������������������������������������������������������������������������������������������������������������������������������������������������������������������������������������������������������������������������������������������������������������������������������������������������������������������������������������������������������������������������������������������������������������������������������������������������������������������������������������������������������������������������������������������������������������������������������������������������������������������������������������������������������������������������������������������������������������������������������������������������������������������������������������������������������������������������������������������������������������������������������������������������������������������������������������������������������������������������������������������������������������������������������������������������������������������������������������������������������������������������������������������������������������������������������������������������������������������������
0,10
0,0
8,04,4
0,0
0,0������������������������������������������������������������������������������������������������������������������������������������������������������������������������������������������������������������������������������������������������������������������������������������������������������������������������������������������������������������������������������������������������������������������������������������������������������������������������������������������������������������������������������������������������������������������������������������������������������������������������������������������������������������������������������������������������������������������������������������������������������������������������������������������������������������������������������������������������������������������������������������������������������������������������������������������������������������������������������������������������������������������������������������������������������������������������������������������������������������������������������������������������������������������������������������������������������������������������������������������������������������������������������������������������������������������������������������������������������������������������������������������������������������������������������������������������������������������
��������������������������������������������������������������������������������������������������������������������������������������������������������������������������������������������������������������������������������������������������������������������������������������������������������������������������������������������������������������������������������������������������������������������������������������������������������������������������������������������������������������������������������������������������������������������������������������������������������������������������������������������������������������������������������������������������������������������������������������������������������������������������������������������������������������������������������������������������������������������������������������������������������������������������������������������������������������������������������������������������������������������������������������������������������
0,0
5,5
0,0 0,0
0,9
11,7��������������������������������������������������������������������������������������������������������������������������������������������������������������������������������������������������������������������������������������������������������������������������������������������������������������������������������������������������������������������������������������������������������������������������������������������������������������������������������������������������������������������������������������������������������������������������������������������������������������������������������������������������������������������������������������������������������������������������������������������������������������������������������������������������������������������������������������������������������������������������������������������������������������������������������������������������������������������������������������������������������������������������������������������������������
3,3
Figure 1: From Van Huyck, Wildenthal, and Battalio (2002). Only strategy 5survives the iterated elimination of strictly dominated strategies.
I simulated this stage game in an evolutionary game with 200 agents, eachrandomly programmed to play one of the five strategies. The agents were randomlypaired in each period to play the stage game, and after every tenth period, 5% ofthe more poorly playing agents were replaced by copies of the better performingagents. In each period a fractionµ of agents randomly mutated to randomly chosenstrategies. With a mutation rate less that 0.002, there was a strong tendency for thedominated strategies to disappear. However, with a mutation rate of 0.004, even thedirectly strongly dominated strategy (a1) holds a significant share of the population,as shown in Figure 2. Moreover, whenµ = 0.005, strategy 4 has higher payoff thanstrategy 5, when µ = 0.007, strategy 3 has the highest payoff, and when µ = 0.01,strategy 2 has the highest payoff. Strategy 1 has the lowest of all payoffs at anymutation rate.
It seems clear that the evaluation of Nash equilibria has much to gain from
August 30, 2004

Modeling Preferences 9
Figure 2: Simulation of Van Huyck, Wildenthal, and Battalio (2002) with a mu-tation rate of 0.004 per period.
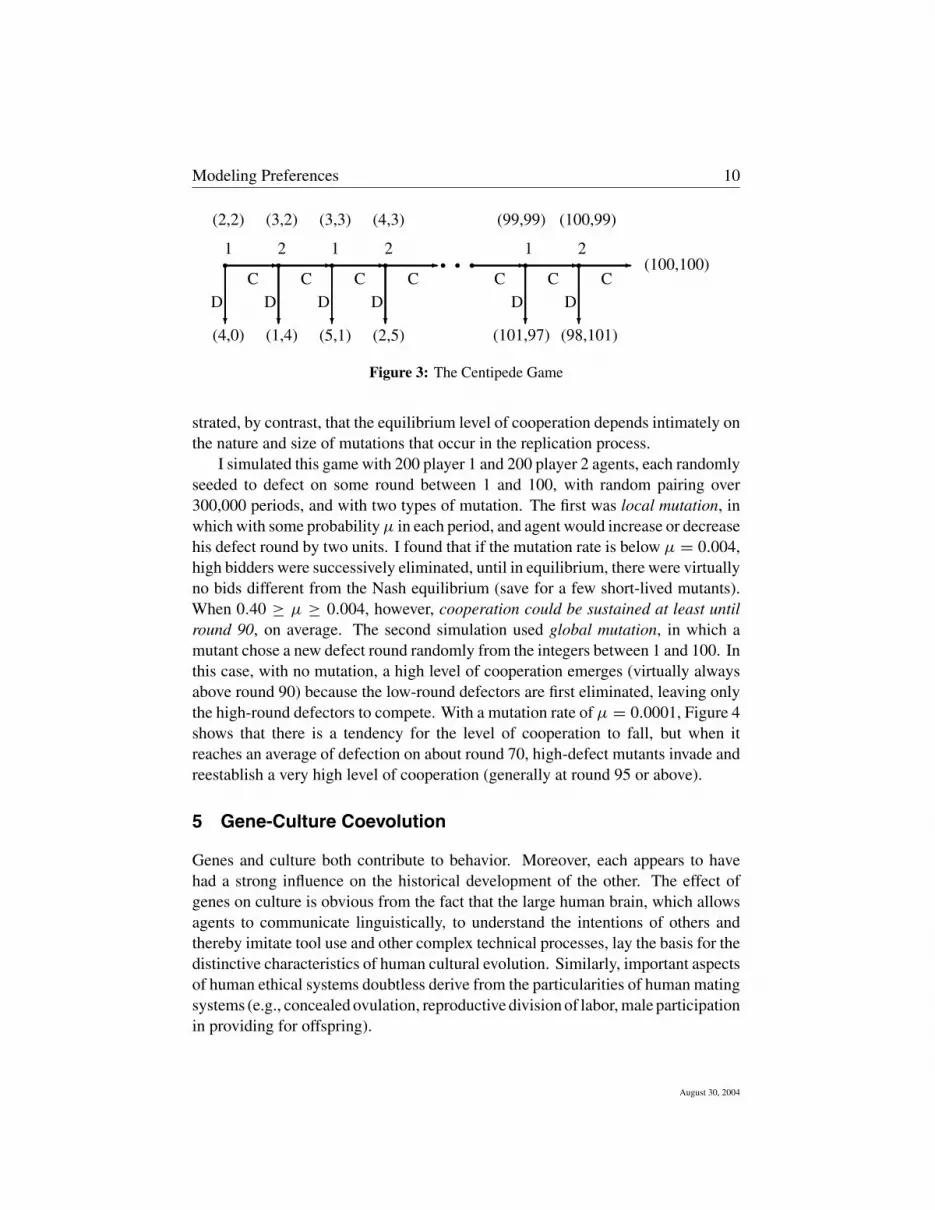
assessing the sensitivity of solutions to small rates of mutation and signal error. Ideal with this issue by simulation in this paper, but it is worthy of serious economictheorizing. Even the form of mutation and error can be of significance. I demon-strate this with the famous Centipede Game (Rosenthal 1981), the extensive formgame tree of which is depicted in Figure 3. The players start with $2 each, and theyalternate rounds. On the first round, player one can defect (D) by stealing $2 fromplayer two, and Nature gives player one $1. Then player two can defect (D) andsteal $2 from player one, and the game is over, or he can cooperate (C), and Naturegives player two $1. This continues until one or the other defects, or each playerhas $100.
The only Nash equilibrium of this game has player one defecting on the firstround. Now, of course, intuition suggests that this is not the way real players wouldact in this situation, and empirical evidence corroborates this intuition (McKelveyand Palfrey 1992). Kreps, Milgrom, Roberts and Wilson (1982) show that if eachplayer assumes the other is “irrational” with positive probability, then cooperationcan be sustained for many rounds. A behavioral game-theoretic simulation demon-
August 30, 2004
Modeling Preferences 10
����������������������������������������������������������������������������������������������������������������������������������������������������������������������������
�
����������������������������������������������������������������������������������������������������������������������������������������������������������������������������������������������
�
DC
(4,0)
(2,2)
����������������������������������������������������������������������������������������������������������������������������������������������������������������������������
�
����������������������������������������������������������������������������������������������������������������������������������������������������������������������������������������������
�
DC
(1,4)
(3,2)
����������������������������������������������������������������������������������������������������������������������������������������������������������������������������
�
����������������������������������������������������������������������������������������������������������������������������������������������������������������������������������������������
�
DC
(5,1)
(3,3)
����������������������������������������������������������������������������������������������������������������������������������������������������������������������������
�
����������������������������������������������������������������������������������������������������������������������������������������������������������������������������������������������
�
DC
(2,5)
(4,3)
� � �����������������������������������������������������������������������������������������������������������������������������������������������������������������������������
C����������������������������������������������������������������������������������������������������������������������������������������������������������������������������
�
����������������������������������������������������������������������������������������������������������������������������������������������������������������������������������������������
�
DC
(101,97)
(99,99)
����������������������������������������������������������������������������������������������������������������������������������������������������������������������������
�
����������������������������������������������������������������������������������������������������������������������������������������������������������������������������������������������
�
DC
(98,101)
(100,99)
(100,100)1 2 1 2 1 2
Figure 3: The Centipede Game
strated, by contrast, that the equilibrium level of cooperation depends intimately onthe nature and size of mutations that occur in the replication process.
I simulated this game with 200 player 1 and 200 player 2 agents, each randomlyseeded to defect on some round between 1 and 100, with random pairing over300,000 periods, and with two types of mutation. The first was local mutation, inwhich with some probabilityµ in each period, and agent would increase or decreasehis defect round by two units. I found that if the mutation rate is below µ = 0.004,high bidders were successively eliminated, until in equilibrium, there were virtuallyno bids different from the Nash equilibrium (save for a few short-lived mutants).When 0.40 ≥ µ ≥ 0.004, however, cooperation could be sustained at least untilround 90, on average. The second simulation used global mutation, in which amutant chose a new defect round randomly from the integers between 1 and 100. Inthis case, with no mutation, a high level of cooperation emerges (virtually alwaysabove round 90) because the low-round defectors are first eliminated, leaving onlythe high-round defectors to compete. With a mutation rate of µ = 0.0001, Figure 4shows that there is a tendency for the level of cooperation to fall, but when itreaches an average of defection on about round 70, high-defect mutants invade andreestablish a very high level of cooperation (generally at round 95 or above).
5 Gene-Culture Coevolution
Genes and culture both contribute to behavior. Moreover, each appears to havehad a strong influence on the historical development of the other. The effect ofgenes on culture is obvious from the fact that the large human brain, which allowsagents to communicate linguistically, to understand the intentions of others andthereby imitate tool use and other complex technical processes, lay the basis for thedistinctive characteristics of human cultural evolution. Similarly, important aspectsof human ethical systems doubtless derive from the particularities of human matingsystems (e.g., concealed ovulation, reproductive division of labor, male participationin providing for offspring).
August 30, 2004

Modeling Preferences 11
Figure 4: Simulation of the Centipede Game with global mutation at rate µ =0.0001 per period.
The effect of culture on genes is more subtle, but no less important. For instance,the cultural practice of dairy farming is responsible for lactose tolerance, whichis controlled in humans by one dominant gene. Indeed, lactose only occurs inmother’s milk, and most adult mammals lack the enzyme that processes lactose.However, some European peoples have long kept cows, and the cultural practicewas transmitted to parts of western Asia and Africa for several thousand years ago.In each of these regions, lactose tolerance has evolved, and not elsewhere.
Similarly, the preference for male offspring in contemporary China, itself aproduct of the gender division of labor and traditional property rights practices,is likely to have an important impact on sex ratios over the next several decades(Tuljapurkar, Nan and Feldman 1995).
Operating over longer time scales, the human vocal tract has been modified toenhance our ability to speak. Infant humans, like all other primates, can eat andbreathe at the same time, but in humans, the vocal tract matures in such a manneras to facilitate speech, at the expense of permitting food to enter the windpipe, thusincreasing the risk of choking to death. The evolutionary benefits of language must
August 30, 2004

Modeling Preferences 12
have been sufficient to offset this cost.Culturally evolved moral norms can affect fitness if norm violators are pun-
ished by others. Men who cannot control their antisocial impulses are ostracizedor killed in small-scale societies, and women who behave inappropriately in socialcircumstances are unlikely to find or keep husbands. Such prosocial emotions asshame and empathy, which involve characteristic physiological response mecha-nisms regardless of the particular cultural cues that evoke them, are also doubtlessthe product of gene-culture coevolution.
The effect of culture on genes can be described as learned behavior and at thelevel of individuals can significantly affect evolution at the level of the species.This dynamic was first described by Baldwin (1896), and is known as the Baldwineffect (Simpson 1953). Its application to humans is relatively uncontroversial, butit appears relevant for other species as well (Ancel 1999)
Formal models of genetic transmission and cultural transmission are surpris-ingly similar. Like genes, cultural forms are forms of information that are transmit-ted from generation to generation, are subject to mutation, and are selected accordingto their capacity to enhance the fitness of agents who bear them.1 Moreover, justas genes are transmitted from parent to child (so called vertical transmission), socultural forms are passed from old to new carriers, perhaps with mutation (includinghorizontal and oblique as well as vertical transmission). For this reason, culturalchange is endemic, and cultural dynamics are akin to epidemiological models ofdisease transmission and diffusion. Moreover, cross-cultural comparisons can bemade to the degree that some cultural forms have higher fitness than others by virtueof the ease with which they are transmitted, or the extent to which they promote therelative success of the social groups in which they are prevalent.2
Surprisingly, under plausible conditions, exactly the same dynamic equationsgovern the evolution of culture and genes, although the former act over much shortertime periods than the latter. For genetic evolution at a single locus, suppose thereare n alternative types of genes (called alleles), which we label g1, . . . , gn. Sup-pose a (diploid) individual with alleles i and j at this locus has fitness wij , whichwe interpret at the probability of surviving to sexual maturity. Suppose also thatsexually mature individual are randomly paired in each time period, and let pi(t) bethe frequency of allele gi in period t , so the expected fitness of an individual with
1By contrast, the general practice in sociology (Durkheim 1967[1902], Parsons 1967) and anthro-pology (Boas 1938) is to treat culture as a coherently interrelated system of meanings and practicesthat characterize a specific society. In these disciplines, cross-cultural comparisons have no meaning:cultures are equally valuable and powerful according to their own priorities and values.
2This also contrasts with the treatment of culture in sociology and anthropology, where cross-cultural evaluations are often abjured, on the grounds that cultures are equally valuable to theirmembers.
August 30, 2004

Modeling Preferences 13
allele i at one locus is given by wi(t) = ∑nj=1wijpj (t). If we write the average
fitness in the population asw(t) = ∑nj=1 pi(t)wi(t), then it is easy to show that the
following equations hold:
pi = pi[wi(t)− w(t)] for i = 1, . . . , n. (1)
This is called a replicator dynamic, and under appropriate conditions, can be ex-tended to several genetic loci.
In the case of cultural evolution, we interpret g1, . . . , gn and cultural formsthat induce the individual to play different strategies in a stage game involving therepeated pairing of agents from the population. We let wij be the expected payoffto type i when playing against type j , so wi(t) is the expected payoff of culturaltype i at time t . Now suppose in every time period dt , each agent with probabilityαdt learns the payoff to another randomly chosen agent, and if the other’s payoff ishigher than his own, changes to the other’s strategy with a probability proportionalto the difference in their payoffs, say with probability β(wj(t)−wi(t)), as long asthis is positive. Then it is easy to show that the fraction of agents assuming differentcultural forms satisfies the replicator equation
pi(t) = αβpi(t)[wj(t)− w(t)]. (2)
Moreover, the coefficient αβ can be chosen to equal unity by rescaling the timevariable. In this case (1) and (2) are identical.
6 The Evolution of Cultural Prosociality: Weak Group Selection
Human preferences evolved over more than one hundred thousand years of small-scale hunter-gatherer history in the Pleistocene era. The major cultural innovationsover this period included an increase in group size, collective living and cooper-ation among unrelated families, linguistic communication, tool use, and huntingwith projectile weapons. These cultural uniformities are the basis for the genesunderlying human preferences today.
Modeling human preference development requires that we introduce the conceptof the group, by which is meant a semi-permanent alliance of seven to fifteen familiesthat live, hunt, and engage in defensive and offensive hostilities with other humangroups. The group has the same status for biologists and anthropologists as the firmand the family does for economists: it was the basic form of human organizationuntil about 10,000 years ago, and is still represented by more than 1000 hunter-gatherer societies around the world. The dynamics of human culture, for most ofour species’ history, is intimately connected to the dynamics of group formation,change, and dissolution.
August 30, 2004

Modeling Preferences 14
In a group context, genes and culture evolve along quite different time scales,and the role of between-group interactions in genetic and cultural evolution are quitedistinct. Basically, migration among human groups tends to create a common humangene pool, since immigrants take their genes along with them and transmit themaccurately in their new settings. By contrast, immigrants rarely pass their culturaltraits even to the next generation, since there is a strong tendency for groups tofoster, and even demand, cultural homogeneity.
The weakness of migration in producing intergroup homogeneity, and the strengthof conformist transmission (the tendency of individuals to adopt the cultural formsthat are ascendant in their communities) produces a situation in which there is agreat deal of within-group cultural homogeneity and between-group heterogeneity.Thus, the variance of cultural forms across groups is likely to be large, from whichit follows that the rate of increase in the frequency of fitness-enhancing culturalforms will be very rapid.
To see this, suppose there are groups i = 1, . . . , m, and let qi be the fraction ofthe population in group i. Let πi be the mean fitness of group i, so π = ∑
i qiπiis the mean fitness of the whole population. Groups grow from one period to thenext in proportion to their relative fitness, so if q ′
i is the fraction of the populationin group i in the next period, then
q ′i = qi
πi
π.
Suppose there is a cultural trait with frequency fi in group i, so the frequency ofthe trait in the whole population is f = ∑
i qifi . If π ′i and f ′
i are the mean fitnessof group i and the frequency of the trait in group i in the next period, respectively,then f
′ = ∑i q
′if
′i , and writing �fi = f ′
i − fi , we have
f′ − f =
∑q ′if
′i −
∑qifi
=∑
qiπi
π(fi +�fi)−
∑qifi
=∑
qi
(πiπ
− 1)fi +
∑qiπi
π�fi.
Now writing �f = f′ − f , this becomes
π�f =∑
qi(πi − π)fi +∑
qiπi�fi. (3)
The second term in (3) is just E[π�f ], the expected value of π�f , over all groups,weighted by the relative size of the groups. If the trait in question renders individualsbearing it no less fit than other group members (i.e., the cultural trait is individuallyfitness-enhancing), this term will be nonnegative, since�fi ≥ 0 within each group.
August 30, 2004

Modeling Preferences 15
To interpret the first term, note that the covariance between the variables π and fis given by
cov(π, f ) =∑i
qi(πi − π)(fi − f ),
and since∑
i qi(πi − π)f = 0, we can write (3) as
π�f = cov(π, f )+ E[π�f ]. (4)
This is the famous Price equation (Price 1970, Price 1972). Now suppose πi =αfi + β + εi where α > 0 and β are the regression coefficients of the least squareregression of f on π . Then π = αf + β, then
cov(π, f ) =∑i
(πi − π)(fi − f )/n (5)
=∑i
αqi(fi − f )2/n = αvar(f ). (6)
Weak group selection of the cultural trait represented by f , by which we mean(4) when the second term is nonnegative, is thus strongly enhanced by the tendencyfor within-group cultural uniformity.
In this approach, then prosocial cultural traits tend to evolve because societieswith these traits are more successful in competition with other groups (Parsons1964). For example, every known society has some form of religion (Brown 1991),very few religions expand beyond the group within which it originated. This islikely because most religions (or cults, if practiced within a larger society) haveat best fitness-neutral, and usually fitness-reducing aspects, such as the belief thatillness is caused by ill-willed neighbors or that ancestors are jealous of and angeredby a person’s material success (Edgerton 1992). A casual study of the world’sgreat religions indicates that they overwhelmingly profess prosocial values, such asrespect for property and hard work, be slow to anger, be charitable and forgivingtowards one’s neighbors, and be prepared to sacrifice in battle against one’s enemies.There is little doubt but that this prosocial stance of the great religions accounts fortheir success.
7 Strong Group Selection: Altruism
Every day the newspaper reports acts of kindness, bravery, dedication, self-sacrifice,and collective solidarity that are difficult to explain in terms of self-interest. Theinherent difficult of accurately assessing the motivations for behavior through par-ticipant observation, however, have led economic theorists virtually to ignore such
August 30, 2004

Modeling Preferences 16
behavior. Recent laboratory findings, however, clearly show the ubiquity of altru-istic cooperation and punishment (for a recent overview see Gintis, Bowles, Boyd,and Fehr, 2004). Such laboratory behavior is often explained as an aberration basedon the fact that only in the past several thousand years have humans faced one-shotand anonymous interactions, so laboratory behavior is not an adaptive response(Trivers 2004). This viewpoint is uncompelling for a number of reasons, includ-ing the fact that human subjects behave quite differently when in a repeated gameand/or non-anonymous context, where reputations can be built. Moreover, humansubjects, when asked to explain their behavior, do so by drawing on broadly ethicalprinciples of fairness and reciprocity.
Moreover, if the conditions under which humans emerged are similar to theconditions of modern primates and/or contemporary hunter-gatherer societies, non-repeated interactions among strangers were probably common in human prehistory.In such societies, there is a constant flow of individuals into and out of groups.Exogamy alone, according to which young males or females relocate to other groupsto seek a mate, gives rise to considerable inter-group mixing and frequent encounterswith strangers and other agents with whom one will not likely interact in the future.Contemporary foraging groups, who are probably not that different in migratorypatterns from their prehistoric ancestors, are remarkably outbred compared to eventhe simplest farming societies, from which we can infer that dealing with strangersin short-term relationships was a common feature of our evolutionary history. HenryHarpending (Internet communication) found, in his studies of the Bushmen in theKalahari, that there was essentially random mating over hundreds of kilometers.See Fix (1999) for an overview and analysis of the relevant data.
To an important extent, for the purposes of modeling human behavior, it matterslittle whether altruistic behavior is an adaptation or a form of aberrant behavior.However, if standard forms of altruistic functioning, such as exhibiting empathy,shame, or reciprocity when these behaviors are net personal costs, then we canexpect them to be extinguished in the course of future human evolution. Thus, it issome interest to investigate whether such altruistic behaviors can be stable in someevolutionary dynamic. We call cases in which this occurs instances of strong groupselection.
The Price equation (4) is precisely relevant here, altruistic behavior taking theform of the second term being negative, reflecting the fact that altruists incur awithin-group fitness deficit. For most species, altruism among non-relatives cannotoccur because most inter-group differences are genetic as opposed to cultural, andthe covariance term in (4) will be close to zero, leaving little room for altruismto emerge. However, in humans the first term can be quite large, as argued in theprevious section. Thus strong group selection for altruism in humans is by no meansprecluded.
August 30, 2004

Modeling Preferences 17
Several paper written by myself and colleagues have exploited this fact. Eventhough altruists must bear a fitness cost for behavior not shared by self-regardingtypes, in most cases this cost may not be high—shunning, gossip, and ostracism,for instance (Bowles and Gintis 2004)—in which case altruistic punishment can bemaintained.
Gintis (2000) argues that periodic social crises in human prehistory, occurringat roughly thirty year intervals on average, are probable, since population con-tractions were common (Boone and Kessler 1999), population crashes in foraginggroups occurring perhaps at a mean rate of once per thirty years (Keckler 1997).These and related archeological facts suggest that foraging groups had relativelyshort lifespans, and their ability to persist depended on agents who cooperated (andpunished) whether or not they could expect to be repaid. An application of Price’sequation with plausible parameters shows that strong reciprocity (the predispositionto cooperate, and to punish defectors, without regard for future payoffs), could bothemerge and remain evolutionarily stable.
Another model is based on a deep asymmetry between altruistic cooperationand altruistic punishment. Boyd, Gintis, Bowles and Richerson (2003) show thataltruistic punishment allows cooperation in quite larger groups because the payoffdisadvantage of altruistic cooperators relative to defectors is independent of the fre-quency of defectors in the population, while the cost disadvantage of those engagedin altruistic punishment declines as defectors become rare. Thus, when altruisticpunishers are common, selection pressures operating against them are weak. Thefact that punishers experience only a small disadvantage when defectors are raremeans that weak within-group evolutionary forces, such as conformist transmission,can stabilize punishment and allow cooperation to persist. Computer simulationsshow that selection among groups leads to the evolution of altruistic punishmentwhen it could not maintain altruistic cooperation.
The evolutionary stability of altruism can also be based on the notion that in-tergroup contests play a decisive role in group-level selection. Bowles, Choi andHopfensitz (2003) show that intergroup conflicts may explain the evolutionary suc-cess of both altruistic forms of human sociality towards non-kin, and group-levelinstitutional structures such as food sharing and monogamy that have emerged anddiffused repeatedly in a wide variety of ecologies during the course of human his-tory. Ingroup-beneficial behaviors may evolve if they inflict sufficient costs onoutgroup individuals and group-level institutions limit the individual costs of thesebehaviors, thereby attenuating within-group selection against these behaviors.
August 30, 2004

Modeling Preferences 18
8 Programmable Preferences and the Internalization of Norms
Gene-culture coevolutionary theory tends to treat cultural forms as either conven-tions, such a language and dress, which is arbitrary but virtually uniform within asociety, or knowledge, such as hunting and growing techniques, methods of toolconstruction and use, and principles of personal hygiene and medical treatment.Conventional beliefs, including religious beliefs, also fall into this category. How-ever, there are other forms of culture that do not fit into this category, because theyare mental representations that cannot, even in principle, have truth values. Theseconsist of ethical norms and values that an agent can selectively embrace or reject.
Internalized norms and values are embodied in the synaptic structure of thehuman brain, where they contribute to the constitution of individual preferences.Internal norms are criteria for evaluating alternative actions enforced in part by in-ternal sanctions, including shame and guilt, as outlined in previous sections. Agentsfollow internal norms when they value certain behaviors for their own sake, in ad-dition to, or despite, the effects these behaviors have on personal fitness and/orperceived well-being. The ability to internalize norms is nearly universal amonghumans. While widely studied in the sociology, it has been virtually ignored outsidethese fields (but see Caporael et al., 1989 and Simon, 1990).
Socialization models have been criticized for suggesting that people adopt normsindependent of their perceived payoffs. In fact, people need not blindly followthe norms and values that have been inculcated in them. Rather, agents at leastat times treat compliance as a strategic choice (see Section refexsection). The“oversocialized” model of the individual presented in the sociology literature can becounteracted by adding a phenotypic copying process reflecting the fact that agentsshift from lower to higher payoff strategies (Gintis 2003b). Moreover, agents arecapable of trading off values against the satisfaction of personal wants in much thesame manner as they trade off one material satisfaction against another (Andreoniand Miller 2002).
All successful cultures foster internal norms that enhance personal fitness, suchas future-orientation, good personal hygiene, positive work habits, and control ofemotions. Cultures also universally promote altruistic norms that subordinate theindividual to group welfare, fostering such behaviors as bravery, honesty, fairness,willingness to cooperate, and empathy with the distress of others (Brown 1991).
Given that most cultures promote cooperative behaviors, and accepting the factthat individuals internalize the norms that are passed to them by parents and in-fluential elders, it becomes easy to explain human cooperation. If even a fractionof society internalized the norms of cooperation and punish free riders and othernorm violators, a high degree of cooperation can be maintained in the long run.The puzzles are two: why do we internalize norms, and why do cultures promote
August 30, 2004

Modeling Preferences 19
cooperative behaviors?Gintis (2003a) provides an evolutionary model in which the capacity to inter-
nalize norms develops because this capacity enhances individual fitness. He usesthis framework to model Herbert Simon’s (1990) explanation of altruism. Simonsuggested that altruistic norms could ‘hitchhike’ on the general tendency of inter-nal norms to be fitness-enhancing. However, Simon provided no formal model ofthis process and his ideas have been widely ignored. This paper shows that Si-mon’s insight can be analytically modeled and is valid under plausible conditions.A straightforward gene-culture coevolution argument then explains why fitness-reducing internal norms are likely to be prosocial as opposed to socially harmful:groups with prosocial internal norms will outcompete groups with antisocial, orsocially neutral, internal norms.
9 A Explanation of Norm Internalization
Why do humans have the capacity to internalize norms? From a biological stand-point, internalization may be an elaboration of imprinting and imitation mecha-nisms found in several species of birds and mammals, but its highly developed formin humans indicates it probably had great adaptive value during our evolutionaryemergence as a species. Moreover, from an economic standpoint, the everyday ob-servation that people who exhibit a strongly internalized moral codes lead happierand more fulfilled lives than those who subject all actions to a narrow calculation ofpersonal costs and benefits of norm compliance, suggests it might not be ‘rational’to be self-interested.
We argued in the previous section that if internalization of some norms is person-ally fitness enhancing (e.g., preparing for the future, having good personal hygiene,positive work habits, and/or control of emotions), then genes promoting the capac-ity to internalize can evolve. Given this genetic capacity, altruistic norms will beinternalized as well, provided their fitness costs are not excessive. In effect, altruism‘hitchhikes’ on the personal fitness-enhancing capacity of norm internalization.3
But, why should the internalization of any norms be individually fitness-enhanc-ing? The following is a possible explanation, based on the observation that inter-nalization alters the agents goals, whereas instrumental and conventional culturalforms merely aid the individual in attaining pre-given goals. In humans, as much asin other species, these goals are related to, but not reducible to, biological fitness.
Organisms do not, in any circumstance, maximize fitness. Rather, organismshave a relatively simple state-dependent preference function that is itself subject to
3This mechanism was asserted by Simon (1990), who instead of ‘internalization of norms’, usedthe term ‘docility,’ in the sense of ‘capable of being easily led or influenced.’
August 30, 2004

Modeling Preferences 20
selection according to its ability to promote individual fitness (Alcock 1993). In aslowly-changing environment, this preference function will track fitness closely. Ina rapidly changing environment, however, natural selection will be too slow, andthe preference function will not track fitness well.
The development of cultural transmission, in the form of instrumental tech-niques and conventions, and the ensuing increase in social complexity of hominidsociety, doubtless produced such a rapidly changing environment, thus conferringhigh fitness value on the development of a non-genetic mechanism for altering theagent’s preference function. Internalization is adaptive because it allows the humanpreference function to shift in directions conducive to higher personal fitness. Theinternalization of norms is thus adaptive because it facilitates the transformation ofdrives, needs, desires, and pleasures (arguments in the human preference function)into forms that are more closely aligned with fitness maximization. Internaliza-tion is limited to our species, moreover because no other species places such greatemphasis on cultural transmission.
Homo sapiens has a ‘primordial’preference function that does not well serve itsfitness interests, and which is more or less successfully ‘overridden’ by internalizednorms. This primordial preference function knows nothing of ‘thinking ahead,’ butrather satisfies immediate desires. Lying, cheating, killing, stealing, and satisfyingshort-term bodily needs (wrath, lust, greed, gluttony, sloth) are all actions thatproduce immediate pleasure and drive-reduction, at the expense of our overall well-being in the long run. This fact explains the congenital weakness of human naturein its tendency to succumb to the unruly temptations of the flesh.
In particular, with the development of complex tools and hunting techniques,the personal and group gains from human capital formation doubtless became asignificant factor in human fitness. Yet, like all known species, humans are exces-sively present-oriented, with only the most meager premoridal capacity to incurcurrent sacrifices on behalf of long-term gains. The internalization of norms al-lows present-oriented individuals to engage in human capital formation simply byincluding the norm of hard work and present sacrifice, and the value of skill acquisi-tion, in the current utility function. Well socialized agents do not accumulate skillsbecause their discount rate is low, but because they positively value the process ofskill acquisition and current sacrifice.
This evolutionary argument is meant to apply to the long period in the Pleis-tocene during which the human character was formed. Social change since theagricultural revolution some 10,000 years ago has been far too swift to permit eventhe internalization of norms to produce a close fit between preference and fitness.Indeed, with the advent of modern societies, the internalization of norms has beensystematically diverted from fitness (expected number of offspring) to welfare (netdegree of contentment) maximization. This, of course, is precisely what we would
August 30, 2004

Modeling Preferences 21
expect when humans obtain control over the content of ethical norms. Indeed,this misfit between welfare and fitness is doubtless a necessary precondition forcivilization and a high level of per capita income. This is true because, were wefitness maximizers, every technical advance would have been accompanied by anequivalent increase in the rate of population growth, thus nullifying its contributionto human welfare, as predicted long ago by Thomas Malthus. The demographictransition, which has led to dramatically reduced human birth rates throughout mostof the world, is a testimonial to the gap between welfare and fitness. Perhaps themost important form of prosocial cultural transmission in the world today is thenorm of having few, but high quality, offspring.
10 Example: A Simple Model of Cultural Evolution
Consider a group in which members can either adopt, or fail to adopt, a certaincultural norm A. We shall call those who adopt norm A altruists, and we callthose who do not adopt norm A self-interested types, or “B-types.” Altruism iscostly, in that self-interested types have fitness 1, as compared with altruists, whosehave fitness 1 − s, where 0 < s < 1. We assume in each period that agentspair off randomly, mate, and have offspring in proportion to their fitness, afterwhich they die (we call this a biologically adaptive dynamic). Families pass ontheir cultural norms to their offspring, so offspring of AA parents are altruists,offspring of BB parents are self-interested, and half of the offspring of AB-familiesare altruists, the other half self-interested (vertical transmission). We also assumethat the self-interested offspring ofAB- and BB-families are susceptible to influenceby community institutions promoting altruistic norms, a fraction of such offspringbecoming altruists (oblique transmission).
Suppose there are n males and n females at the beginning of the period. If thefraction of altruists is α, there will be nα2 AA-families, who will have nα2(1−s)2βoffspring, all of whom are altruists, where we choose β so that population growsat some rate g(α), depending on the degree of prosociality of norm A. There willalso be 2nα(1 −α)AB-families, who will have 2nα(1 −α)(1 − s)β offspring, halfof whom are altruists. Finally there will be n(1 − α)2 BB-families who will haven(1 − α)2β offspring. Adding up the number of offspring, we see that we musthave β = g(α)/(1 − sα)2. Thus the frequencies of AA, AB, and BB offspring aregiven by
fAA = α2(1 − s)2
(1 − αs)2, fAB = 2α(1 − α)(1 − s)
(1 − αs)2, fBB = (1 − α)2
(1 − αs)2. (7)
Next, a fraction αγ of offspring of AB- and BB- families who are self-interestedswitch to being altruists under the influence of oblique transmission. The change
August 30, 2004

Modeling Preferences 22
in the fraction of altruists in the next generation is given is given by
α = f (α) = α(1 − α)(γ − s)
1 − sα. (8)
Suppose we also have a cultural replicator dynamic with strength σ leadingaltruists to abandon trait A:
α = −σα(1 − α)s (9)
We now combine these two sources of change in the fraction of altruists, giving
α = h(α) = f (α)− σα(1 − α)s. (10)
In reduced form, we now have
α = α(1 − α)
1 − sα(γ − s − sσ (1 − sα)). (11)
We call the situation α = 0, α ∈ [0, 1] a cultural equilibrium of the dynamicalsystem. We then have
Theorem 1. We assume γ ≥ 0 is given and fixed throughout.
(a) If
s < smin = γ
1 + σ, (12)
α = 1 is a globally stable altruistic equilibrium.
(b) If
smin < s < smax = 1
2σ
{1 + σ −
√(1 + σ)2 − 4γ σ
}, (13)
both α = 0 and α = 1 are locally stable equilibria of the system and there isthird unstable equilibrium α∗ ∈ (0, 1) separating the basins of attraction of thetwo stable equilibria: both self-interested and altruistic equilibria are stable.
(c) If s > smax, then α = 0 is a stable self-interested equilibrium of the system.
Proof: There are three zeros of (11), of which two are α = 0 and α = 1. The thirdis α∗ = (s(1 + σ)− γ )/s2σ . If s < smin, then h′(0) > 0, α∗ < 0, and h′(1) > 0,so the unique stable equilibrium is α = 1, proving (a). If smin < s < smax, thenα∗ ∈ (0, 1), h′(0), h′(1) < 0, so both α = 0 and α = 1 are stable. α∗ must then beunstable, proving (b). Finally, if s > smax, α∗ > 1, h′(0) < 0, and h′(1) > 0, soα = 0 is the only stable cultural equilibrium, proving (c).
Theorem 1 implies what might be called the Fundamental Theorem of Sociology:
August 30, 2004

Modeling Preferences 23
Corollary 1.1. Altruistic norms persist in a cultural equilibrium only if there is astrictly positive rate of cultural transmission of altruism via social institutions.
Proof: If γ = 0, then smax = 0, so s > smax. By Theorem 12, α = 0 is the onlystable cultural equilibrium.
Theorem 12 shows that the higher the personal cost of altruistic behavior, themore stringent the conditions under which altruism will emerge. This result illus-trates the power of a theory that models the tension between prosocial socializationinstitutions and the psychological mechanism of norm internalization on the onehand, and the replicator dynamic that induces agents to shift to higher payoff be-haviors, whatever the effect of these behaviors on others, and on society as a whole,on the other hand. This tension is also revealed in the following:
Corollary 1.2. If the strength of the replicator dynamic σ satisfies
σ <γ − s
s,
the altruistic cultural equilibrium is globally stable. If
γ − s
s< σ <
γ − s
s(1 − s),
both the self-interested and the altruistic cultural equilibria are locally stable, andthe basin of attraction of the altruistic equilibrium shrinks as σ increases. Finally,if
σ >γ − s
s(1 − s),
the self-interested cultural equilibrium is globally stable.
11 Conclusion
Behavioral economic theory, as I have outlined it, embraces the preference consis-tency hypothesis, and hence uses the rational actor model in the sense that it assumesagents maximize subject material and informational constraints. The human pref-erence function, however, is in general a product of gene-culture coevolution, andin particular includes altruistic elements, in part because human preferences areprogrammable through the socialization process. Modeling human choice behaviorin this context requires borrowing from related behavioral disciplines, but in sucha way as to maintain the analytical clarity that economic theory currently enjoys.
August 30, 2004

Modeling Preferences 24
References
Ahlbrecht, Martin and Martin Weber, “Hyperbolic Discounting Models in Pre-scriptive Theory of Intertemporal Choice,” Zeitschrift für Wirtschafts- undSozialwissenschaften 115 (1995):535–568.
Alcock, John, Animal Behavior: An Evolutionary Approach (Sunderland, MA:Sinauer, 1993).
Ancel, L. W., “A Quantitative Model of the Simpson-Baldwin Effect,” Journal ofTheoretical Biology 196 (1999):197–209.
Andreoni, James and John H. Miller, “Giving According to GARP: An Experimen-tal Test of the Consistency of Preferences for Altruism,” Econometrica 70,2(2002):737–753.
Baldwin, J. M., “A New Factor in Evolution,” American Naturalist 30 (1896):441–451.
Boas, Franz, General Anthropology (Boston: Heath, 1938).
Boone, James L. and Karen L. Kessler, “More Status or More Children? SocialStatus, Fertility Reduction, and Long-Term Fitness,” Evolution & HumanBehavior 20,4 (July 1999):257–277.
Bowles, Samuel and Herbert Gintis, “The Evolution of Strong Reciprocity: Co-operation in Heterogeneous Populations,” Theoretical Population Biology 65(2004):17–28.
, Jung-kyoo Choi, and Astrid Hopfensitz, “The Co-evolution of Individ-ual Behaviors and Social Institutions,” Journal of Theoretical Biology 223(2003):135–147.
Boyd, Robert and Peter J. Richerson, Culture and the Evolutionary Process(Chicago: University of Chicago Press, 1985).
, Herbert Gintis, Samuel Bowles, and Peter J. Richerson, “Evolution of Altru-istic Punishment,” Proceedings of the National Academy of Sciences 100,6(March 2003):3531–3535.
Brown, Donald E., Human Universals (New York: McGraw-Hill, 1991).
Caporael, Linnda, R. Dawes, J. Orbell, and J. C. van de Kragt, “Selfishness Ex-amined: Cooperation in the Absence of Egoistic Incentives,” Behavioral andBrain Science 12,4 (December 1989):683–738.
August 30, 2004

Modeling Preferences 25
Cavalli-Sforza, Luigi L. and Marcus W. Feldman, Cultural Transmission and Evo-lution (Princeton, NJ: Princeton University Press, 1981).
Cooper, W. S., “Decision Theory as a Branch of Evolutionary Theory,” Psycholog-ical Review 4 (1987):395–411.
Darwin, Charles, The Origin of Species by Means of Natural Selection (London:John Murray, 1872). 6th Edition.
Durkheim, Emile, De La Division du Travail Social (Paris: Presses Universitairesde France, 1967[1902]).
Edgerton, Robert B., Sick Societies: Challenging the Myth of Primitive Harmony(New York: The Free Press, 1992).
Fix, Alan, Migration and Colonization in Human Microevolution (Cambridge:Cambridge University Press, 1999).
Gintis, Herbert, “Strong Reciprocity and Human Sociality,” Journal of TheoreticalBiology 206 (2000):169–179.
, “The Hitchhiker’s Guide to Altruism: Genes, Culture, and the Internalizationof Norms,” Journal of Theoretical Biology 220,4 (2003):407–418.
, “Solving the Puzzle of Human Prosociality,” Rationality and Society 15,2(May 2003):155–187.
, Samuel Bowles, Robert Boyd, and Ernst Fehr, Moral Sentiments and MaterialInterests: On the Foundations of Cooperation in Economic Life (MIT Press,2004).
Güth, Werner, R. Schmittberger, and B. Schwarz, “An Experimental Analysis ofUltimatum Bargaining,” Journal of Economic Behavior and Organization 3(May 1982):367–388.
Huyck, John B. Van, John Wildenthal, and Raymond C. Battalio, “Tacit Co-operation, Strategic Uncertainty, and Coordination Failure: Evidence fromRepeated Dominance Solvable Games,” Games and Economic Behavior 38(2002):156–175.
Kahneman, Daniel and Amos Tversky, “Prospect Theory: An Analysis of DecisionUnder Risk,” Econometrica 47 (1979):263–291.
and , Choices, Values, and Frames (Cambridge: Cambridge UniversityPress, 2000).
August 30, 2004

Modeling Preferences 26
, Paul Slovic, and Amos Tversky, Judgment under Uncertainty: Heuristics andBiases (Cambridge, UK: Cambridge University Press, 1982).
Keckler, C. N. W., “Catastrophic Mortality in Simulations of ForagerAge-of-Death:Where Did all the Humans Go?,” in R. Paine (ed.) Integrating ArchaeologicalDemography: Multidisciplinary Approaches to Prehistoric Populations. Cen-ter for Archaeological Investigations, Occasional Papers No. 24 (Carbondale,IL: Southern Illinois Univerisity Press, 1997) pp. 205–228.
Kreps, David M., Notes on the Theory of Choice (London: Westview, 1988).
, Paul Milgrom, John Roberts, and Robert Wilson, “Rational Cooperation inthe Finitely Repeated Prisoner’s Dilemma,” Journal of Economic Theory 27(1982):245–252.
Laibson, David, “Golden Eggs and Hyperbolic Discounting,” Quarterly Journal ofEconomics 112,2 (May 1997):443–477.
Mas-Colell, Andreu, Michael D. Whinston, and Jerry R. Green, MicroeconomicTheory (New York: Oxford University Press, 1995).
McKelvey, R. D. and T. R. Palfrey, “An Experimental Study of the Centipede Game,”Econometrica 60 (1992):803–836.
O’Donoghue, Ted and Matthew Rabin, “Doing it Now or Later,” American Eco-nomic Review 89,1 (March 1999):103–124.
and , “Choice and Procrastination,” Quarterly Journal of Economics116,1 (February 2001):121–160.
Parsons, Talcott, “Evolutionary Universals in Society,” American Sociological Re-view 29,3 (June 1964):339–357.
, Sociological Theory and Modern Society (New York: Free Press, 1967).
Price, G. R., “Selection and Covariance,” Nature 227 (1970):520–521.
, “Extension of Covariance Selection Mathematics,” Annals of Human Genet-ics 35 (1972):485–490.
Rabin, Matthew, “Risk Aversion and Expected-Utility Theory: A Calibration The-orem,” Econometrica 68,5 (2000):1281–1292.
Robson, Arthur J., “A Biological Basis for Expected and Non-expected Utility,”Journal of Economic Theory 68 (1996):397–424.
August 30, 2004

Modeling Preferences 27
Rosenthal, Robert W., “Games of Perfect Information, Predatory Pricing and theChain-Store Paradox,” Journal of Economic Theory 25 (1981):92–100.
Simon, Herbert, “A Mechanism for Social Selection and Successful Altruism,”Science 250 (1990):1665–1668.
Simpson, John Gaylord, “The Baldwin Effect,” Evolution 7 (1953):110–117.
Trivers, Robert L., “Mutual Benefits at All Levels of Life,” Science 304 (14 May2004):964–965.
Tuljapurkar, Shripad, Li Nan, and Marcus W. Feldman, “High Sex Ratios in China’sFuture,” Science 267 (10 February 1995):874–876.
c\Papers\Gene-Culture Coevolution\Modeling Preferences.tex August 30, 2004
August 30, 2004